BEFORE
THE
ILLINOIS
POLLUTION
CONTROL
BOARD
IN
THE
MATTER
OF:
WATER
QUALITY
STANDARDS
AND
EFFLUENT
LIMITATIONS
FOR THE
CHICAGO
AREA
WATERWAY
SYSTEM
AND
LOWER
DES
PLANES
RIVER
PROPOSED
AMENDMENTS
TO
35 ILL.
ADM.
CODE 301,
302,
303, and 304
TO:
NOTICE
OF
FILING
John
Therriault,
Clerk
Illinois
Pollution
Control Board
James
R.
Thompson
Center
100
West
Randolph
Street,
Suite
11-500
Chicago,
IL
60601
Deborah
J.
Williams,
Assistant
Counsel
Stefanie
N.
Diers,
Assistant
Counsel
Illinois
Environmental
Protection
Agency
1021
North
Grand
Avenue
East
P.O.
Box
19276
Springfield,
IL
62794-9276
Marie Tipsord,
Hearing
Officer
Illinois
Pollution
Control
Board
James R.
Thompson
Center
100 West
Randolph Street,
Suite
11-500
Chicago,
IL
60601
Persons
included
on the
attached
SERVICE
LIST
PLEASE
TAKE
NOTICE
that I
have electronically
filed
today
with the
Office
of
the
Clerk of
the
Pollution
Control Board
PRE-FILED
TESTIMONY
OF G.
ALLEN
BURTON
AND
GREG
SEEGERT,
by
Midwest
Generation,
a
copy
of
which is
herewith
served
upon you.
MIDWEST
ENERATION,
L.L.C.
iSusaetti
)
)
)
)
)
)
)
)
R08-9
(Rulemaking
— Water)
Date:
September
8,
2008
Electronic Filing - Received, Clerk's Office, September 8, 2008
Susan M.
Franzetti
Nijman
Franzetti
LLP
10 S.
LaSalle
St.,
Suite
3600
Chicago,
IL 60603
(312)
251-5590
(phone)
(312) 251-
4610
(fax)
Kristy A.
N.
Bulleit
Brent
Fewell
Hunton &
Williams,
LLP
1900
K. Street,
NW
Washington,
DC
20006
(202)
855-1500
(phone)
(202)
778-7411
(fax)
Electronic Filing - Received, Clerk's Office, September 8, 2008
CERTIFICATE
OF SERVICE
I,
the undersigned, certify
that on this
8
th
day
of
September,
2008,
have caused
to
be
filed
electronically
the
attached
PRE-FILED TESTIMONY
OF
G. ALLEN
BURTON AND
GREG
SEEGERT,
by
Midwest Generation,
and NOTICE OF FILING
upon
the
following person:
John
Therriault,
Clerk
Illinois
Pollution
Control Board
James
R. Thompson
Center
100
West
Randolph Street, Suite
11-500
Chicago, IL
60601
by
personal
delivery to the
following person:
Marie
Tipsord,
Hearing
Officer
Illinois Pollution
Control
Board
James R.
Thompson
Center
100
West Randolph
Street,
Suite
11-500
Chicago,
IL 60601
by
U.S.
Mail,
first class
postage prepaid,
to the following
persons:
Deborah J.
Williams, Assistant
Counsel
Stefanie N.
Diers, Assistant
Counsel
Illinois
Environmental
Protection
Agency
1021
North
Grand Avenue
East
P.O.
Box 19276
Springfield, IL
62794-9276
AND the
participants
listed
on the attached SERVICE
LIST via
CD Disc.
Susan
M.
Fr
etti
Electronic Filing - Received, Clerk's Office, September 8, 2008
SERVICE LIST
Frederick
M.
Feldman
Ronald M.
Hill
Margaret T.
Conway
Metropolitan
Water
Reclamation District
of Greater
Chicago
111
East Erie
Street
Chicago, IL
60611
Bill
Richardson,
Chief Legal
Counsel
Illinois
Department of
Natural Resources
One Natural
Resources
Way
Springfield, IL
62702-127 1
Keith Harley
Elizabeth
Schenkier
Chicago Legal
Clinic,
Inc.
205
West Monroe,
4th Floor
Chicago, IL
60606
Katherine D.
Hodge
Monica I. Rios
Hodge
Dwyer
Zeman
3150
Roland
Avenue
P.O.
Box 5776
Springfield, IL
62705-5776
Dennis
Duffield
Director of
Public Works &
Utilities
City of
Joliet
921 E.
Washington St
Joliet, IL
60431
Claire
Manning
Brown
Hay& Stephens
LLP
700
First
Mercantile
Bank Bldg
205 5.
Fifth St
Springfield,
IL
62705-2459
Frederick
Keady
Vermillion
Coal Company
1979
Jolms
Drive
Glenview,
IL 60025
Chicago,
IL 60614
Matthew Dunn,
Chief
Environmental
Bureau
Office of the Attorney
General
100 West Randolph,
12th
Floor
Chicago,
IL 60601
Ann Alexander
Natural Resources
Defense Counsel
101 N. Wacker
Dr.,
Ste. 609
Chicago,
IL
60606
Thomas
V.
Skinner
Thomas W. Dimond
Kevin Deshamais
Jennifer
A. Simon
Mayer Brown LLP
71
South
Wacker Drive
Chicago, Illinois 60606-463
7
Albert Ettinger
Jessica Dexter
Environmental
Law
&
Policy Center
35 E. Wacker Dr., Suite 1300
Chicago, IL
60601
Richard Kissel
Roy Harsch
DrinkerBiddle
191 N. Wacker Dr., Suite 3700
Chicago, IL 60606-1698
Charles
Wesseihoft
James Harrington
Ross& Hardies
150 N. Michigan Ave
Chicago,
IL
60601-7567
Dr. Thomas J.
Murphy
2325 N. Clifton Street
Chicago, IL 60614
Electronic Filing - Received, Clerk's Office, September 8, 2008
Georgia
Viahos
Naval
Training
Center
2601A Paul
Jones St
Great Lakes, IL
60088-2845
W.C.
Blanton
Blackwell
Sanders
LLP
4801
Main St, Suite 1000
Kansas City, MO
64112
Jerry
Paulsen
Cindy
Skukrud
McHenry
County
Defenders
132
Cass Street
Woodstock, IL
60098
Bernard Sawyer
Thomas
Granto
Metropolitan
Water
Reclamation District
6001 W.
Pershing Rd
Cicero, IL 60650-4112
Fredric Andes
Erika
Powers
Barnes
&
Thornburg
1
North
Wacker Dr
Suite
4400
Chicago, IL 60606
Kay Anderson
American Bottoms
One American Bottoms Road
Sauget,
IL
62201
Robert VanGyseghem
City
of
Geneva
1800 South St
Geneva,
IL 60134-2203
Lisa Frede
Chemical Industry Council of Illinois
1400
E. Touhy Ave., Suite 110
Des Plaines,
IL 60018
Jack Darin
Sierra
Club
70 E. Lake St
Chicago, IL 60601-7447
Tom
Muth
Fox
Metro Water Reclamation District
628 State Route 31
Oswego, IL 60543
Bob
Carter
Bloomington
Normal
Water Reclamation
P0
Box 3307
Bloomington,
IL 61702-3307
Kenneth W.
Liss
Andrews
Environmental
Engineering
3300
Ginger
Creek Drive
Springfield,
IL
62711
Marc
Miller
Jamie S.
Caston
Office of
Lt.
Governor Pat Quinn
Room
414 State
House
Springfield,
IL
62706
Vicky McKinley
Evanston
Environmental Board
223 Grey Avenue
Evanston,
IL 60202
James L. Daugherty
Thorn Creek Basin Sanitary District
700 West End Avenue
Chicago Heights,
IL 60411
Tracy Elzemeyer
American
Water Company
727 Craig
Road
St. Louis, MO 63141
Electronic Filing - Received, Clerk's Office, September 8, 2008
Irwin
Polls
Ecological
Monitoring and Assessment
3206
Maple Leaf
Drive
Glenview, IL 60025
Jeffrey C. Fort
Arid J.
Tesher
Sonnenschein
Nath &
Rosenthal
LLP
7800
Sears
Tower
233 S.
Wacker Drive
Chicago,
IL
60606-6404
Cathy
Hudzik
City
of Chicago
Mayor’s
Office of
Intergovernmental
Affairs
121 North LaSalle
Street, Room 406
Chicago, IL
60602
Sharon Neal
Commonwealth Edison
125
South Clark Street
Chicago, IL 60603
Beth
Steinhorn
2021
Timberbrook
Springfield, IL 62702
Traci Barkley
Prairie Rivers
Networks
1902
Fox Drive, Suite
6
Champaign,
IL 61820
Susan Hedman
Andrew
Armstrong
Environmental
Counsel
Environmental
Bureau
Suite
1800
69 West Washington
Street
Chicago, IL 60602
Stacy Meyers-Glen
Openlands
Suite 1650
25
East Washington
Chicago,
IL 60602
James
Huff
Huff & Huff, Inc.
915 Harger Road, Suite
330
Oak Brook,
IL 60523
Alec M. Davis
Illinois Environmental
Regulatory Group
215
East Adams Street
Springfield,
IL
62701
Electronic Filing - Received, Clerk's Office, September 8, 2008
BEFORE
THE ILLINOIS
POLLUTION
CONTROL
BOARD
iN
THE
MATTER
OF:
)
)
WATER
QUALITY
STANDARDS
AND
)
EFFLUENT
LIMITATIONS
FOR
THE
)
R08-9
CHICAGO
AREA
WATERWAY SYSTEM
)
(Rulemaking
- Water)
AND
THE
LOWER
DES
PLAINES
RIVER:
)
PROPOSED
AMENDMENTS
TO
35111.
)
Adm. Code
Parts
301, 302,
303
and
304
)
PRE-FILEI)
TESTIMONY
OF G. ALLEN
BURTON
Good morning,
my
name
is
Allen
Burton.
I
currently
serve
as the Director
ofNOAA’s
Cooperative
Institute
for Limnology
and
Ecosystems
Research and
a Professor
in the
School of
Natural
Resources
and
Environment
at the University
of Michigan.
Prior
to
joining
the
University
of
Michigan
in August
of this year,
I was
a
Professor
and
Chair
of the
Department
of
Earth
and
Environmental
Sciences
at Wright
State University
in
Columbus,
Ohio.
Over the
past
30
years,
my research
has
focused
on developing
effective
methods
for
identif’ing
significant
effects
and stressors
in
aquatic
systems
where sediment
and
storm
water
contamination
is a
concern.
I serve
on
the
U.S. EPA
Science
Advisory
Board
committees,
a
National
Research
Council
committee
(in 2007),
and
am the
“Immediate
Past
President”
of the Society
of
Environmental
Toxicology
& Chemistry,
and have
served
on
numerous
national
and
international
scientific
committees,
review
panels,
councils
and editorial
boards
with more
than
200
publications.
I
have
an M.S.
and Ph.D.
from the
University
of Texas, where
I
focused
on
aquatic toxicology.
My
resume can
be found
at Attachment
1, Appendix
A.
I
have been
retained
by
Midwest Generation
(“MWGen”)
to
provide
technical
support
in
the
evaluation
of the Illinois
EPA
Water Quality
Standards
and
Effluent
Limitations
for
the
Chicago
Area
Waterway
System and
theLower
Des Plaines
River: Proposed
Amendments
to
35
III.
Adm.
Code
Parts 301,
302,
303 and
304
(the
“Proposed
UAA Rules”)
and
supporting
Electronic Filing - Received, Clerk's Office, September 8, 2008
documentation
provided
to the Illinois Pollution
Control Board (the
“Board”)
in the rule-making
docketed as
R08-09.
The
focus of my testimony
is contained
in my
written report
and
assessment of
the
Illinois
EPA’s Proposed
UAA Rules attached hereto
as Attachment
1, which
includes supporting
tables, citations, and
appendices.
My
area of
expertise
is in the evaluation
of
freshwater
ecosystem stressor
effects,
particularly
focusing
on
the role of sediment
and storm water
quality. In the
mid-1990’s,
on
behalf of
Commonwealth
Edison (the
former owner
of the MWGen electric
generating
stations),
I
was
asked to
lead
an evaluation
of sediment
quality on the Des
Plaines
River
in support of the
Upper
Illinois
Waterway
(“UTW”) Task
Force process. My work
entailed,
among
other
things,
an
evaluation
of
sediment
contamination
and toxicity, review
of
the literature
on
temperature,
turbidity
and barge
traffic effects, in situ
toxicity
evaluations around
MWGen’s
Joliet
generating
stations,
and
laboratory
evaluations
of temperature
effects.
My
testimony
will
focus
on the chemical,
biological,
and physical
stressors in the UIW,
the
role
of these
stressors
in
biological
impairment,
and the
interrelationship
with
other key
watershed
factors
that affect heavily
human-dominated,
effluent
dominant waterway
such as the
UIW. My
testimony
will
also
identify
what
I consider to be
fundament flaws
relating
to the
Illinois
Environmental
Protection
Agency’s
(“Illinois EPA”)
overall
approach
to the
Proposed
UAA
Rules,
including the
Agency’s
failure to consider the
dominant
physical,
chemical,
and
biological
factors
affecting
the
UIW and the
interplay of
those stressors with
indigenous
populations,
and
the Agency’s
failure to
rely upon peer-reviewed
and
quantitative
approaches
that
would support
the
proposal.
Unfortunately,
as I have
concluded, and
as set
forth more
fully
below
and
in my
detailed
report,
it is my
position
that
these
flaws are fatal to
certain
aspects of
the
aquatic
life use designations
in the
Illinois EPA’s Proposed
UAA
Rules,
particularly
for
the
2
Electronic Filing - Received, Clerk's Office, September 8, 2008
proposed Upper Dresden Island
Pool aquatic
life use
designation, which are not supported by the
facts
or weight of evidence in this proceeding.
1.
The Des
Plaines
Watershed
Is One Of The Most Heavily Urbanized
And Polluted
Rivers In
The State And, Due To The Many Significant Stressors,
Certain Segments
Will Not
Achieve
CWA Aquatic Life Goals.
The Des
Plaines River is like many watersheds in highly urbanized areas in that
it
is
heavily
dominated by human activities that
result
in significant stressors on the aquatic
ecosystem.
The
river flow
itself
is dominated by discharges ofmunicipal wastewater,
which
account
for more than 70% of the
flow during low flow periods.
As
documented
by
the Illinois
EPA in its
recent integrated
water quality
assessment reports submitted to the U.S.
Environmental
Protection
Action (“U.S. EPA”), the Des Plaines River is heavily
polluted and
ranks among
the most
impaired water bodies in Illinois. Pollutants
such as organic
chemicals,
nutrients,
metals, pathogens, ammonia, sedimentationlsiltation, total dissolved and
suspended
solids,
chlorides, and
dissolved oxygen, are ubiquitous. In 2004, Illinois
EPA
identified more
than 800
causes and
sources of impairments. The most common sources
of
impairment are
municipal
point source
discharges, combined sewer overflows
(“CSO”), urban
runoff/storm
sewers,
contaminated
sediments,
channelization,
flow
regulation,
hydro-modification,
and
habitat alteration.
Importantly, thermal modification has never been identified by
the Illinois
EPA as a cause
of impairment.
The upper part of
the UIW, known as the Chicago Area
Waterway
System (“CAWS”),
consists of 78 miles of
engineered canals and modified river channels, and flow has been
significantly
altered by a
series of regulated locks and dams. The CAWS was created to
drain
urban
runoff, treated
wastewater and support commercial navigation.
The
heavily human
3
Electronic Filing - Received, Clerk's Office, September 8, 2008
dominated
nature of this
waterway
and the attendant stressors that shape the aquatic ecosystem
will not change. Until the stressors causing the beneficial use impairments are reduced
significantly,
there will
be
ongoing
risks
to the
aquatic
biota and to humans that
consume
fish in
the CAWS and Des
Plaines River.
The Upper
Dresden Pool
(“UDP”) area just like many areas in the Des Plaines watershed
has multiple causes and
sources
of
use impairment. Dominant stressors for the UDP include
contaminated
sediments,
metals, nutrients, synthetic organics (e.g.,
pesticides, carcinogenic
polycyclic
aromatic
hydrocarbons (“PAHs”), pharmaceuticals and
personal
care
products
(“PPCPs”)), and
flow regime
alteration
and degraded
habitats.
The lower area of Hickory Creek,
nearest to the
Brandon tailwaters, does not
support aquatic life or primary recreation uses due to
impairments such as
fecal coliforms,
chloride, alteration to streamside or littoral vegetation, flow
alterations,
sedimentation/siltation,
total dissolved and suspended solids,
zinc,
nitrogen,
phosphorus and
algae. It is important to
understand that with many urbanized
watersheds,
such
as the Des Plaines,
the
removal of one stressor alone will not be
sufficient
to restore
a
watershed
to
beneficial use
attainment.
2.
Wet Weather
Impacts
In The UIW
Are Significant And Will Continue To Cause
Significant
Loadings
From
Sewage And Other Contaminants.
Although
water quality in the UIW
has improved somewhat since the 1970s, there is no
documented
evidence of
significant improvement in beneficial
use attainment.
Despite
reductions
of untreated
discharges of sewage
from the Metropolitan Water Reclamation District
of
Greater
Chicago’s
(“MWRDGC”) tunnel and reservoir plan
(“TARP”),
significant loadings of
raw
sewage with
associated
solids,
nutrients and chemical contaminants will continue into the
foreseeable
future. In addition,
significant loadings and associated pollutants from both urban
A
Electronic Filing - Received, Clerk's Office, September 8, 2008
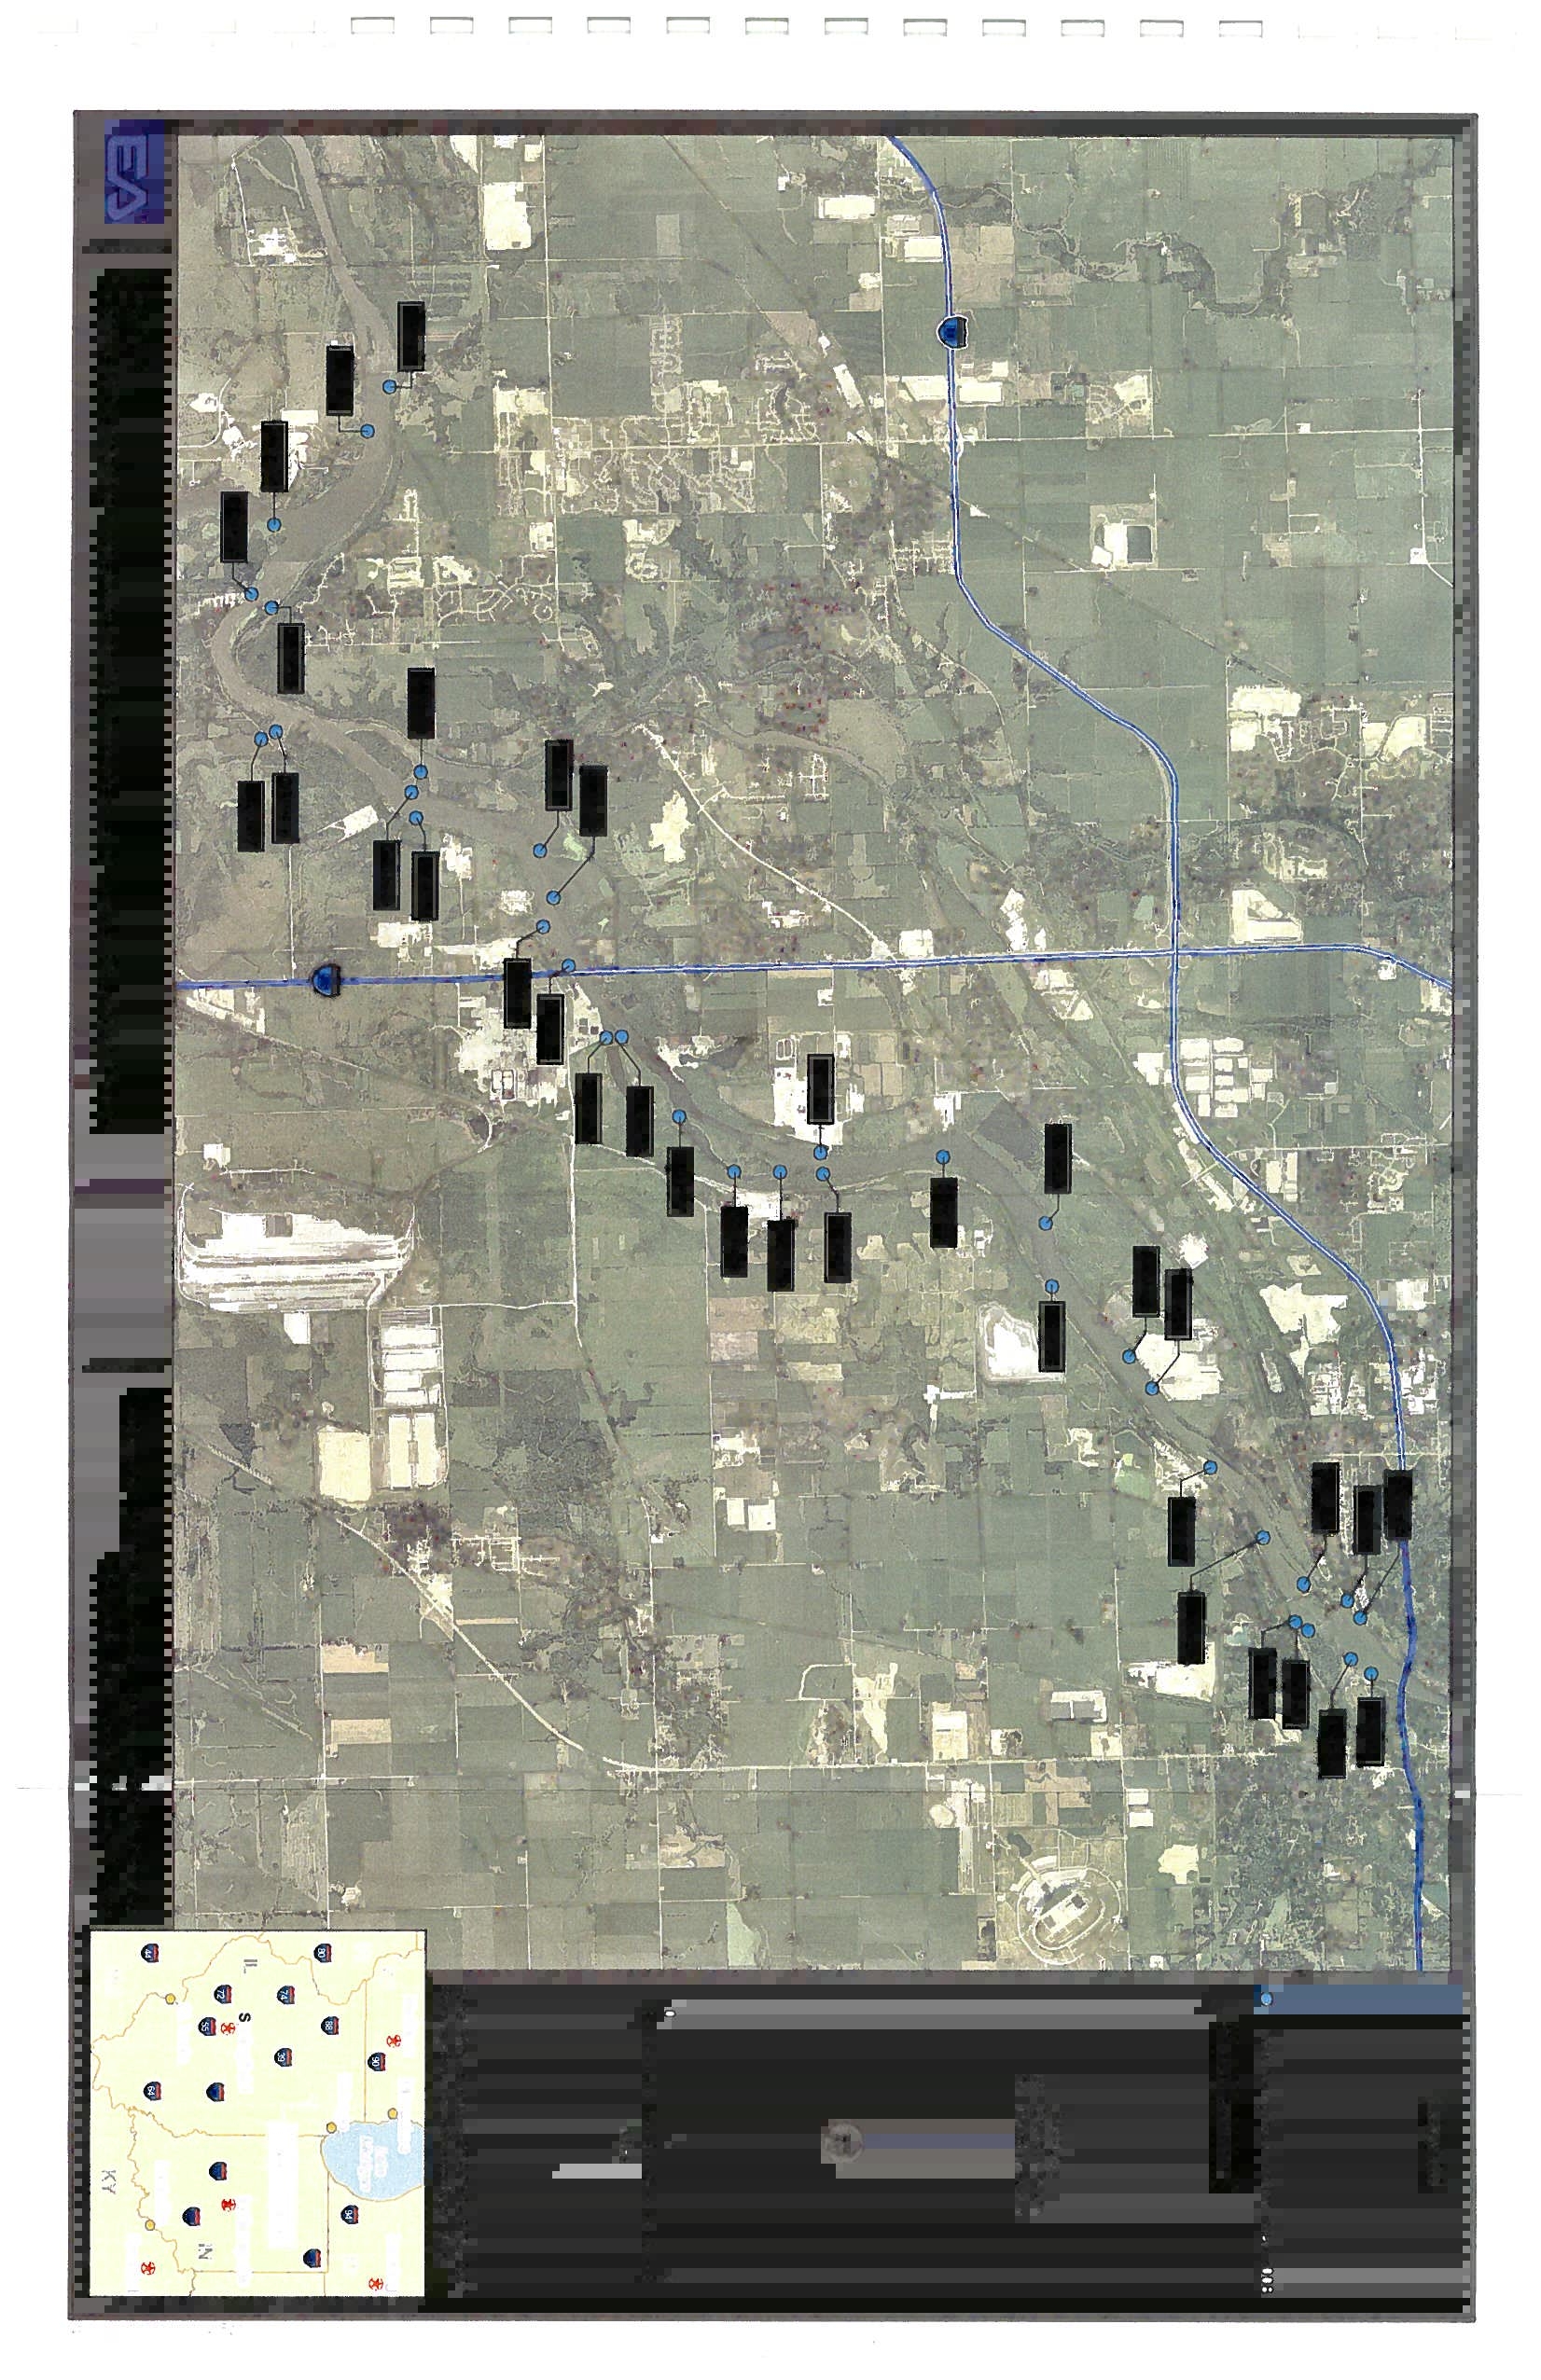
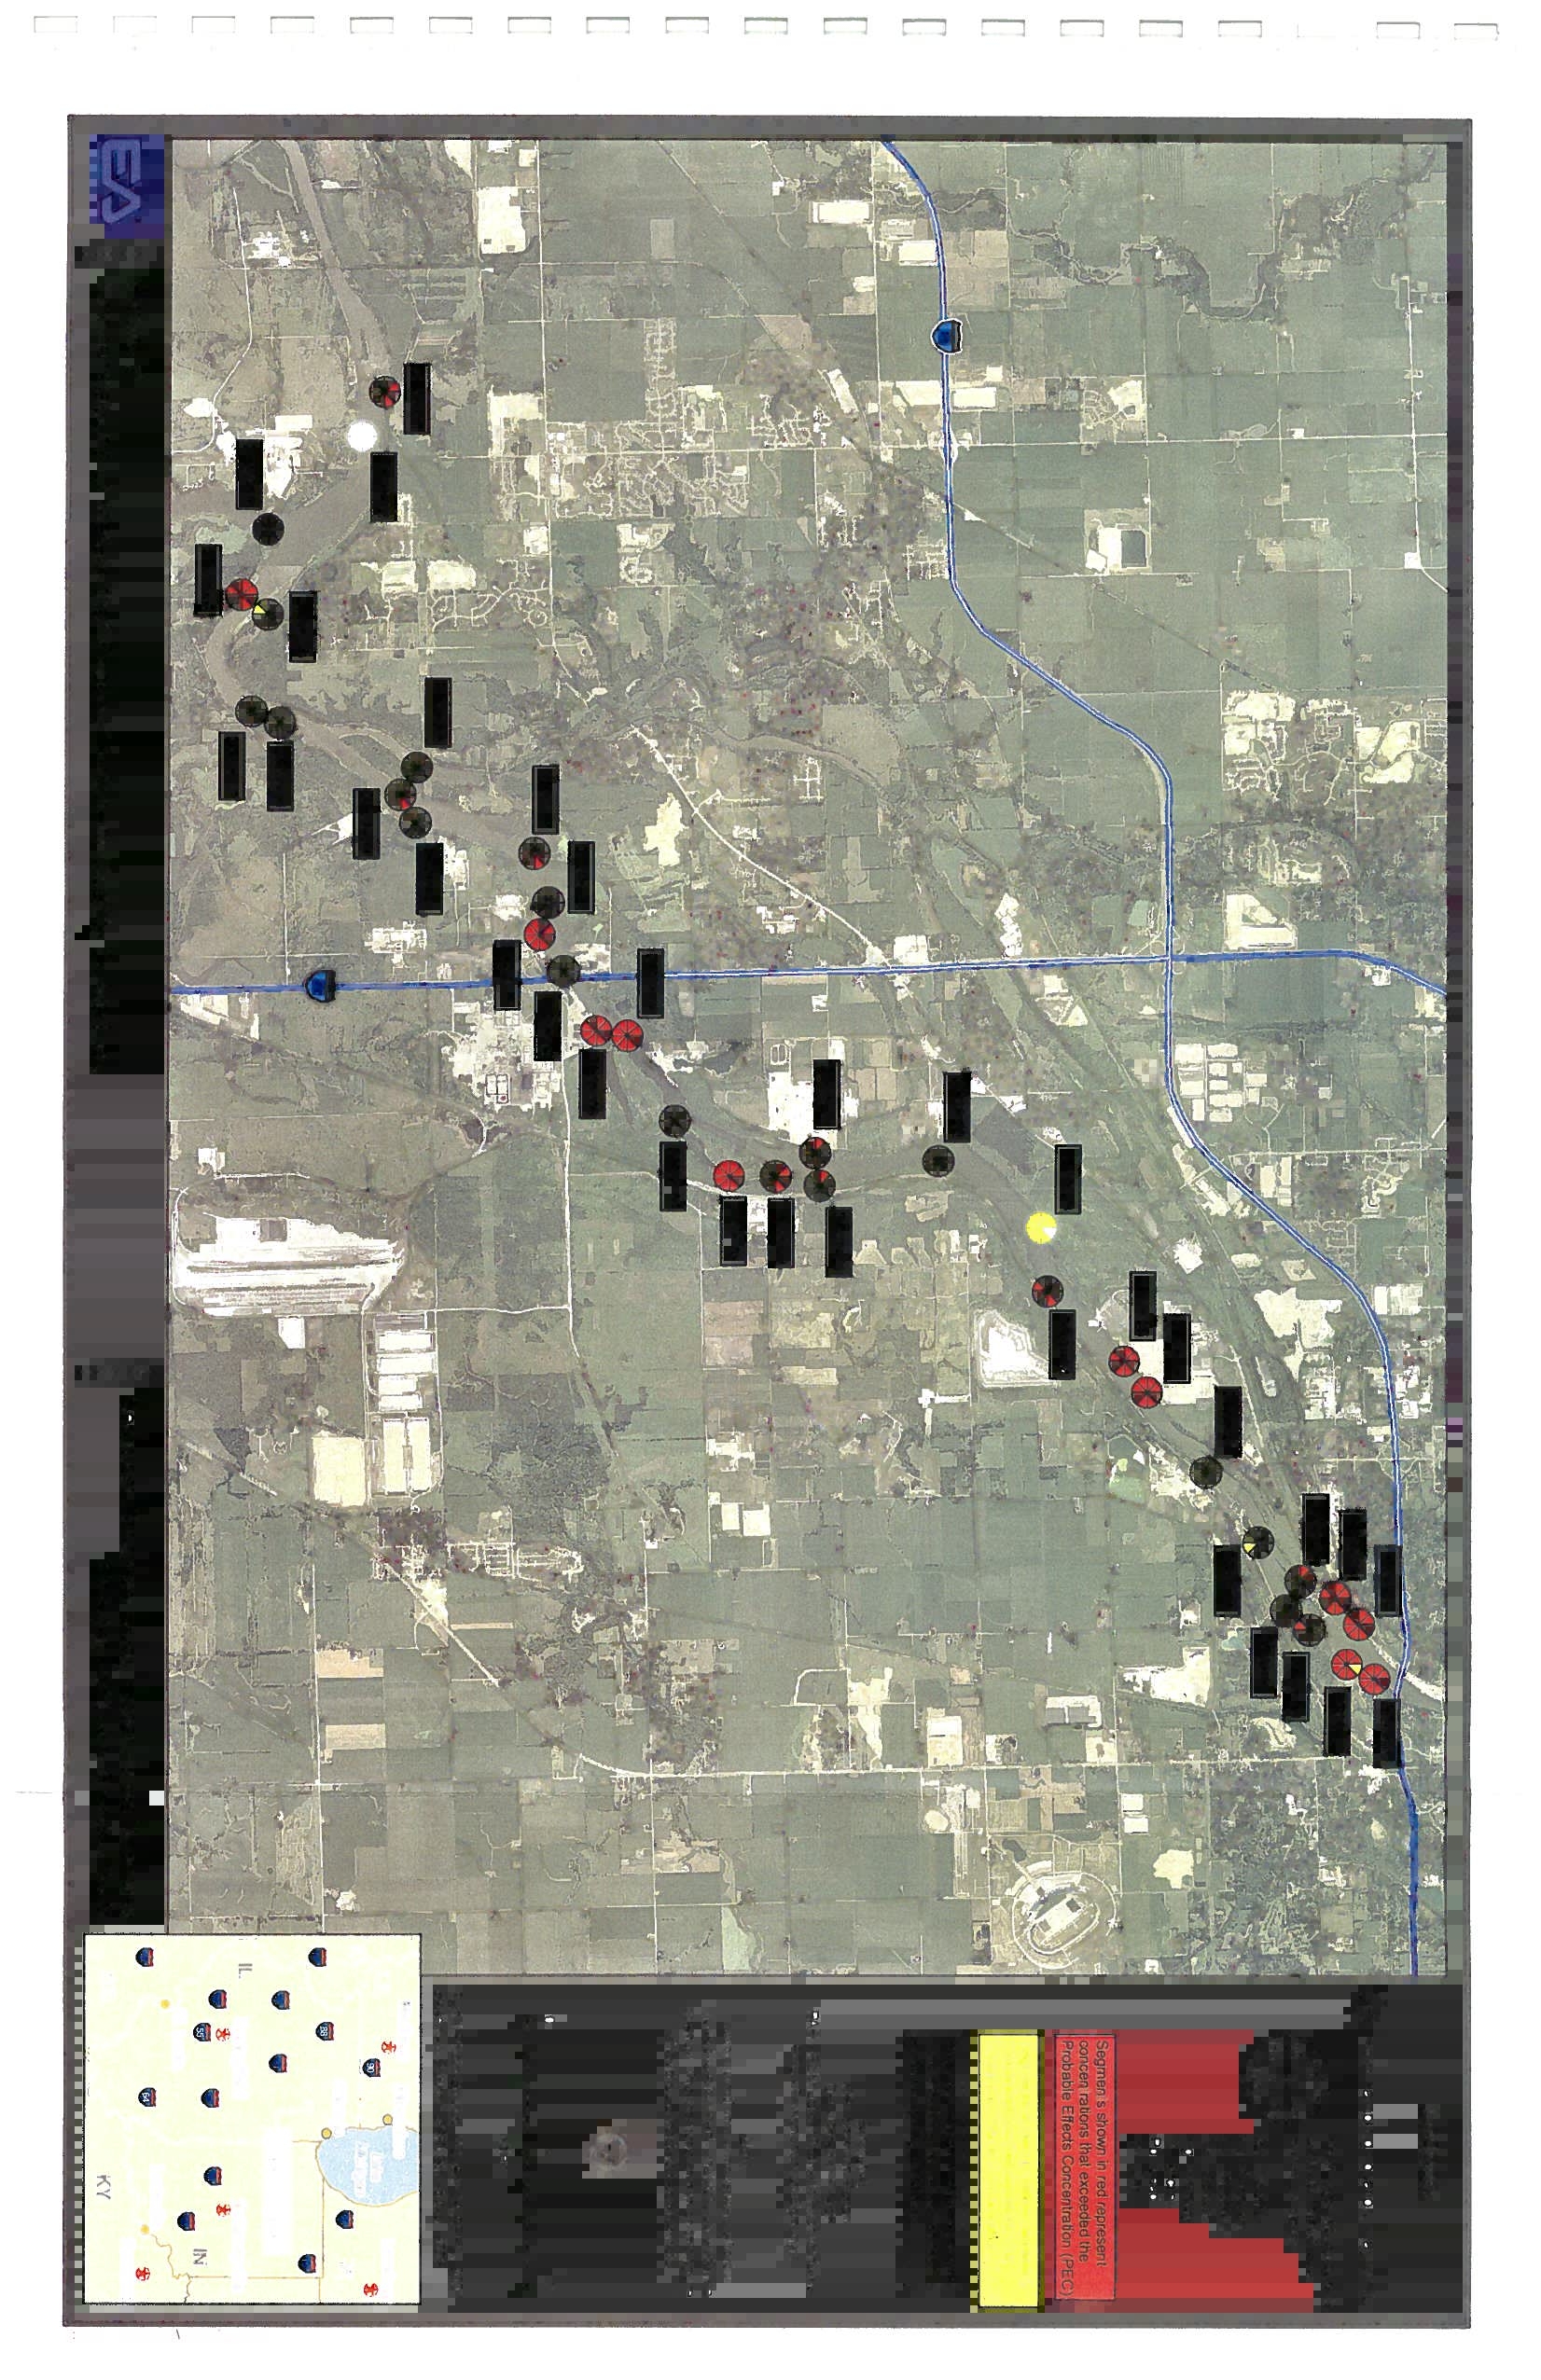
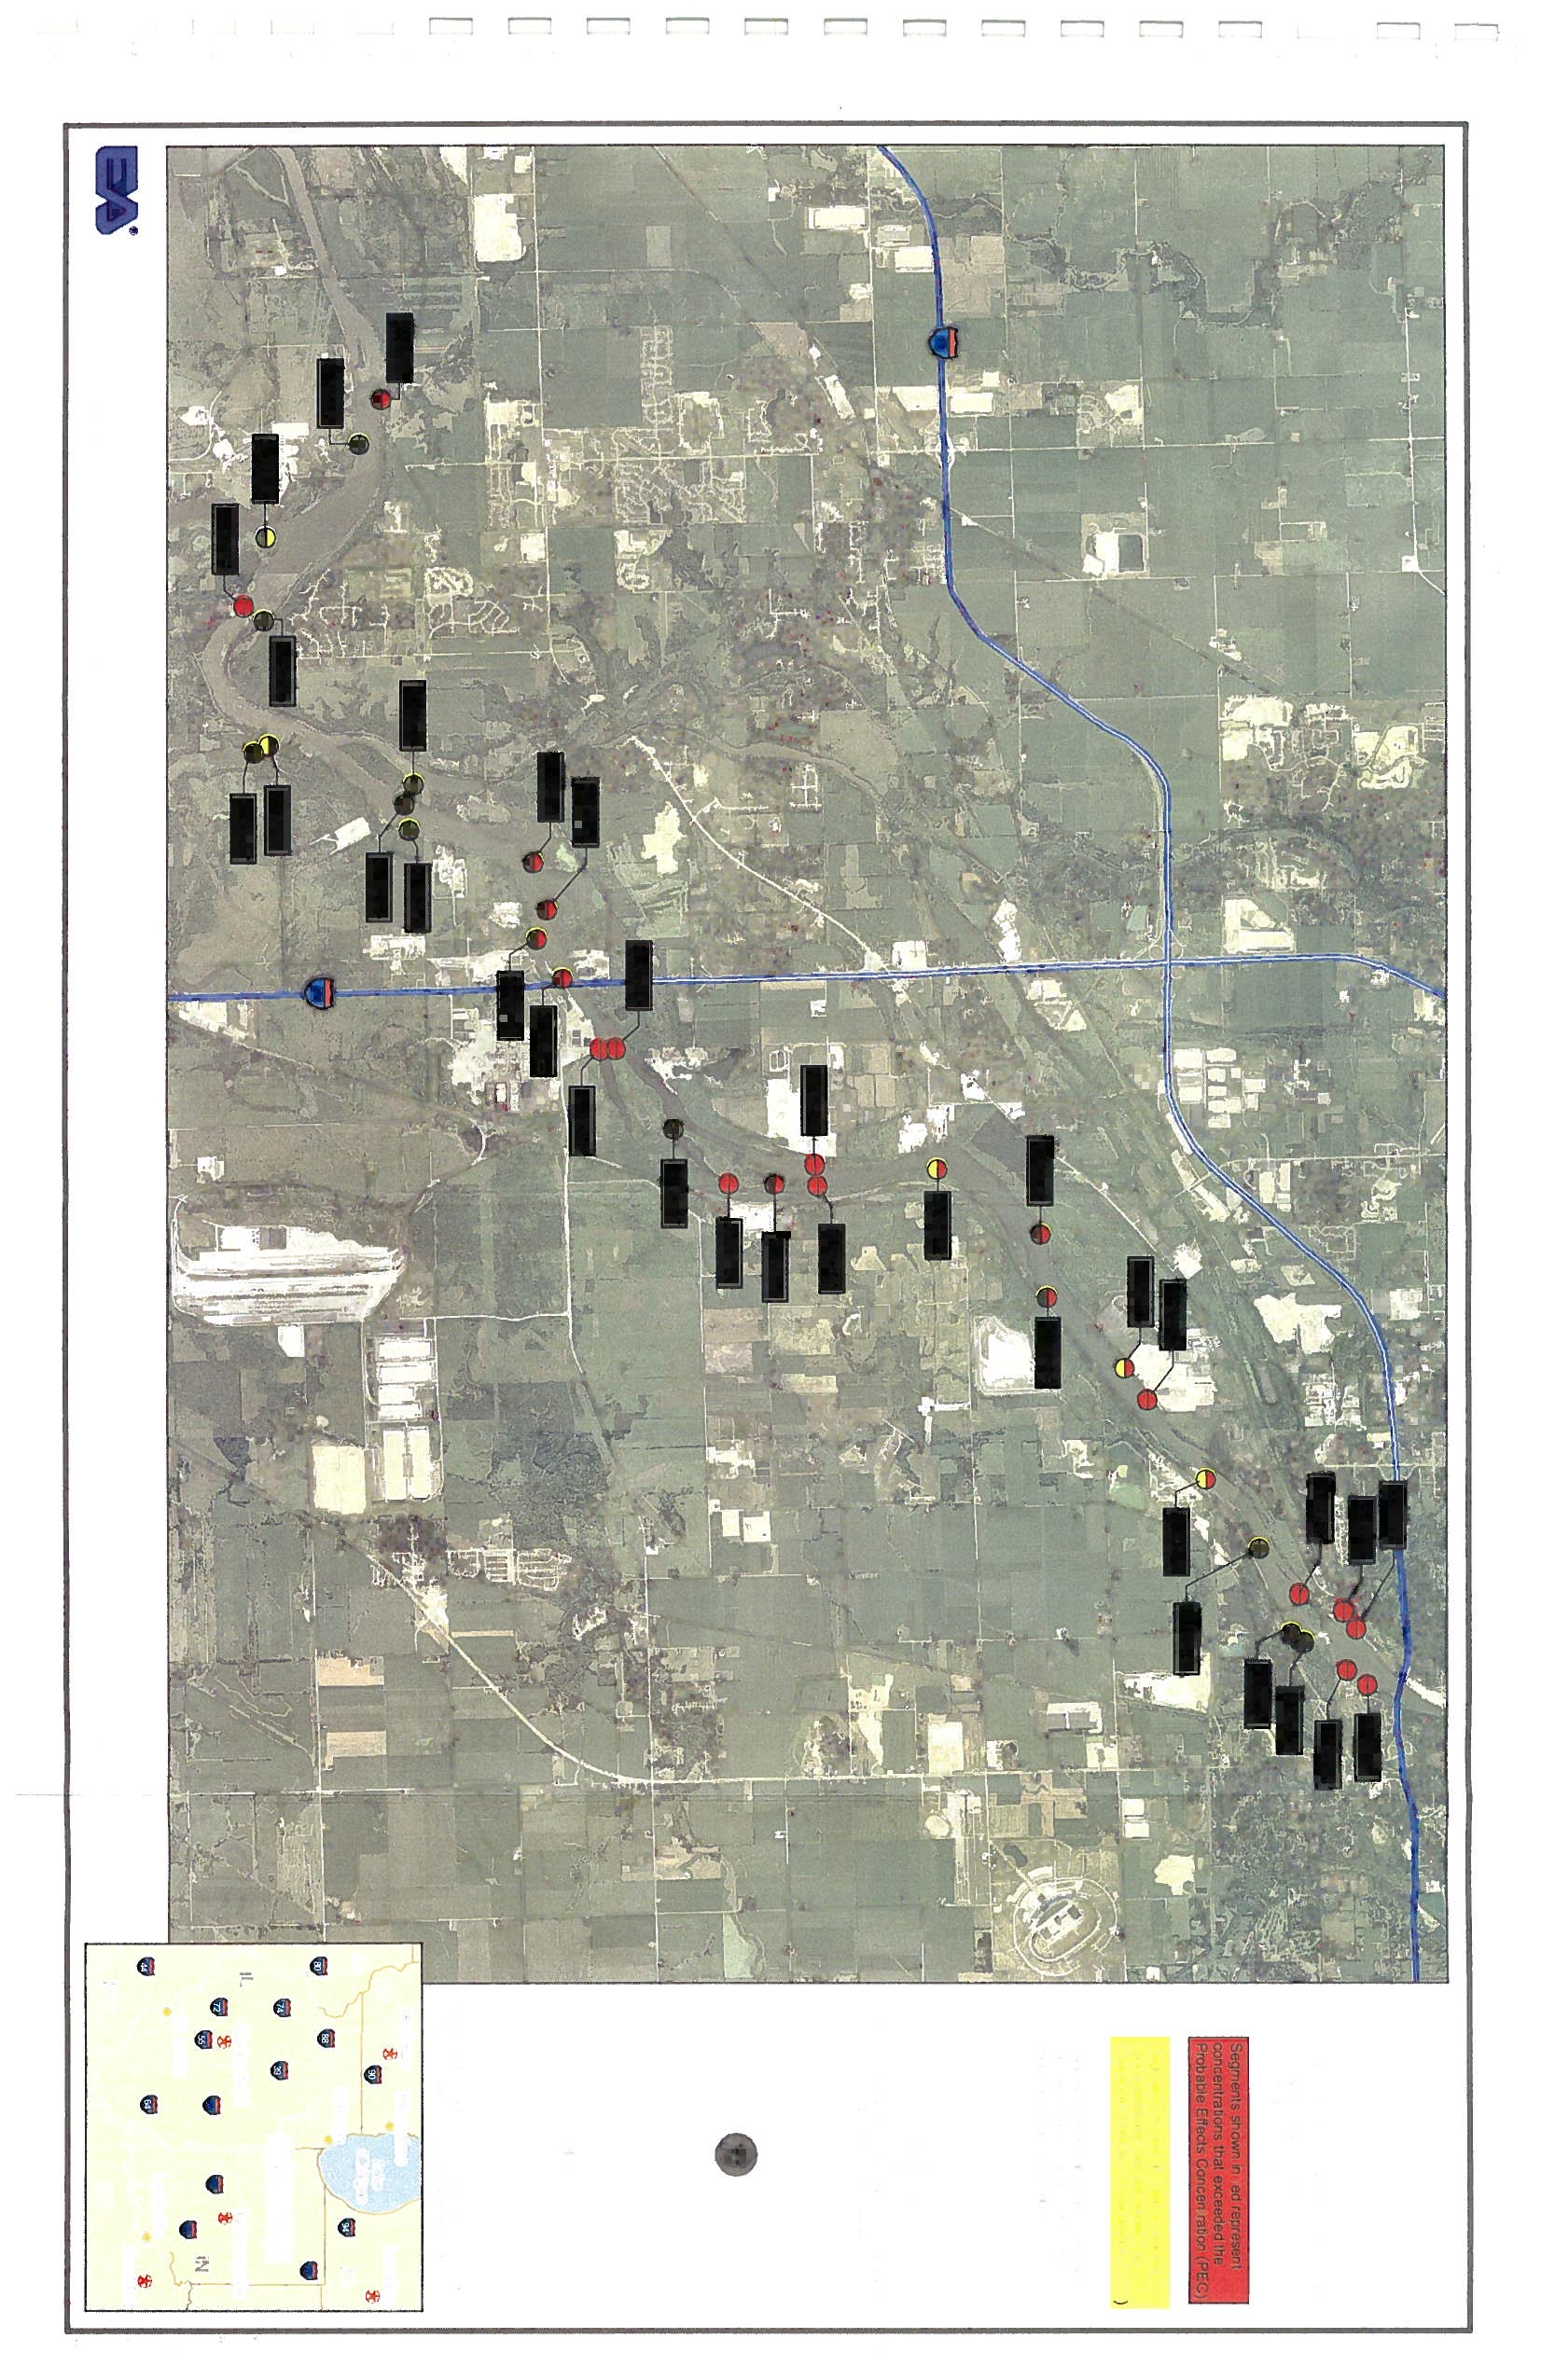
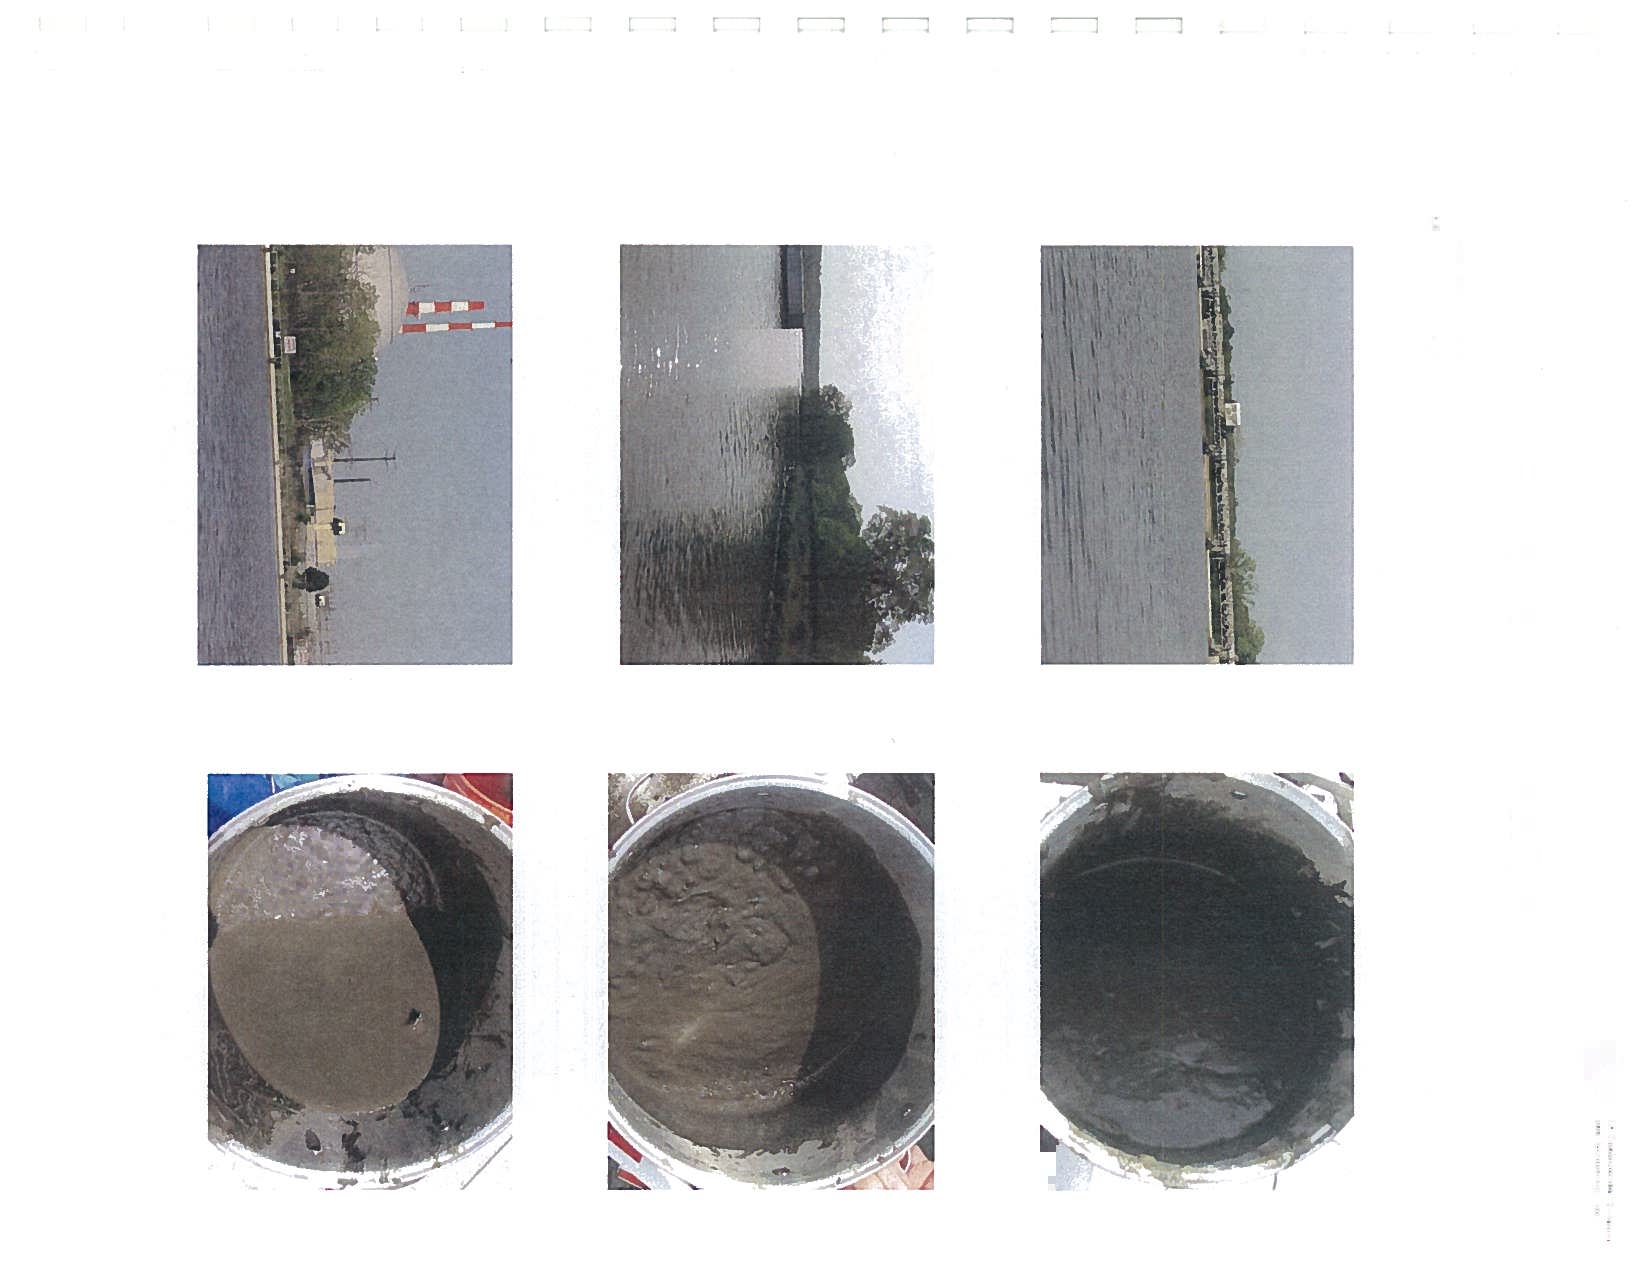
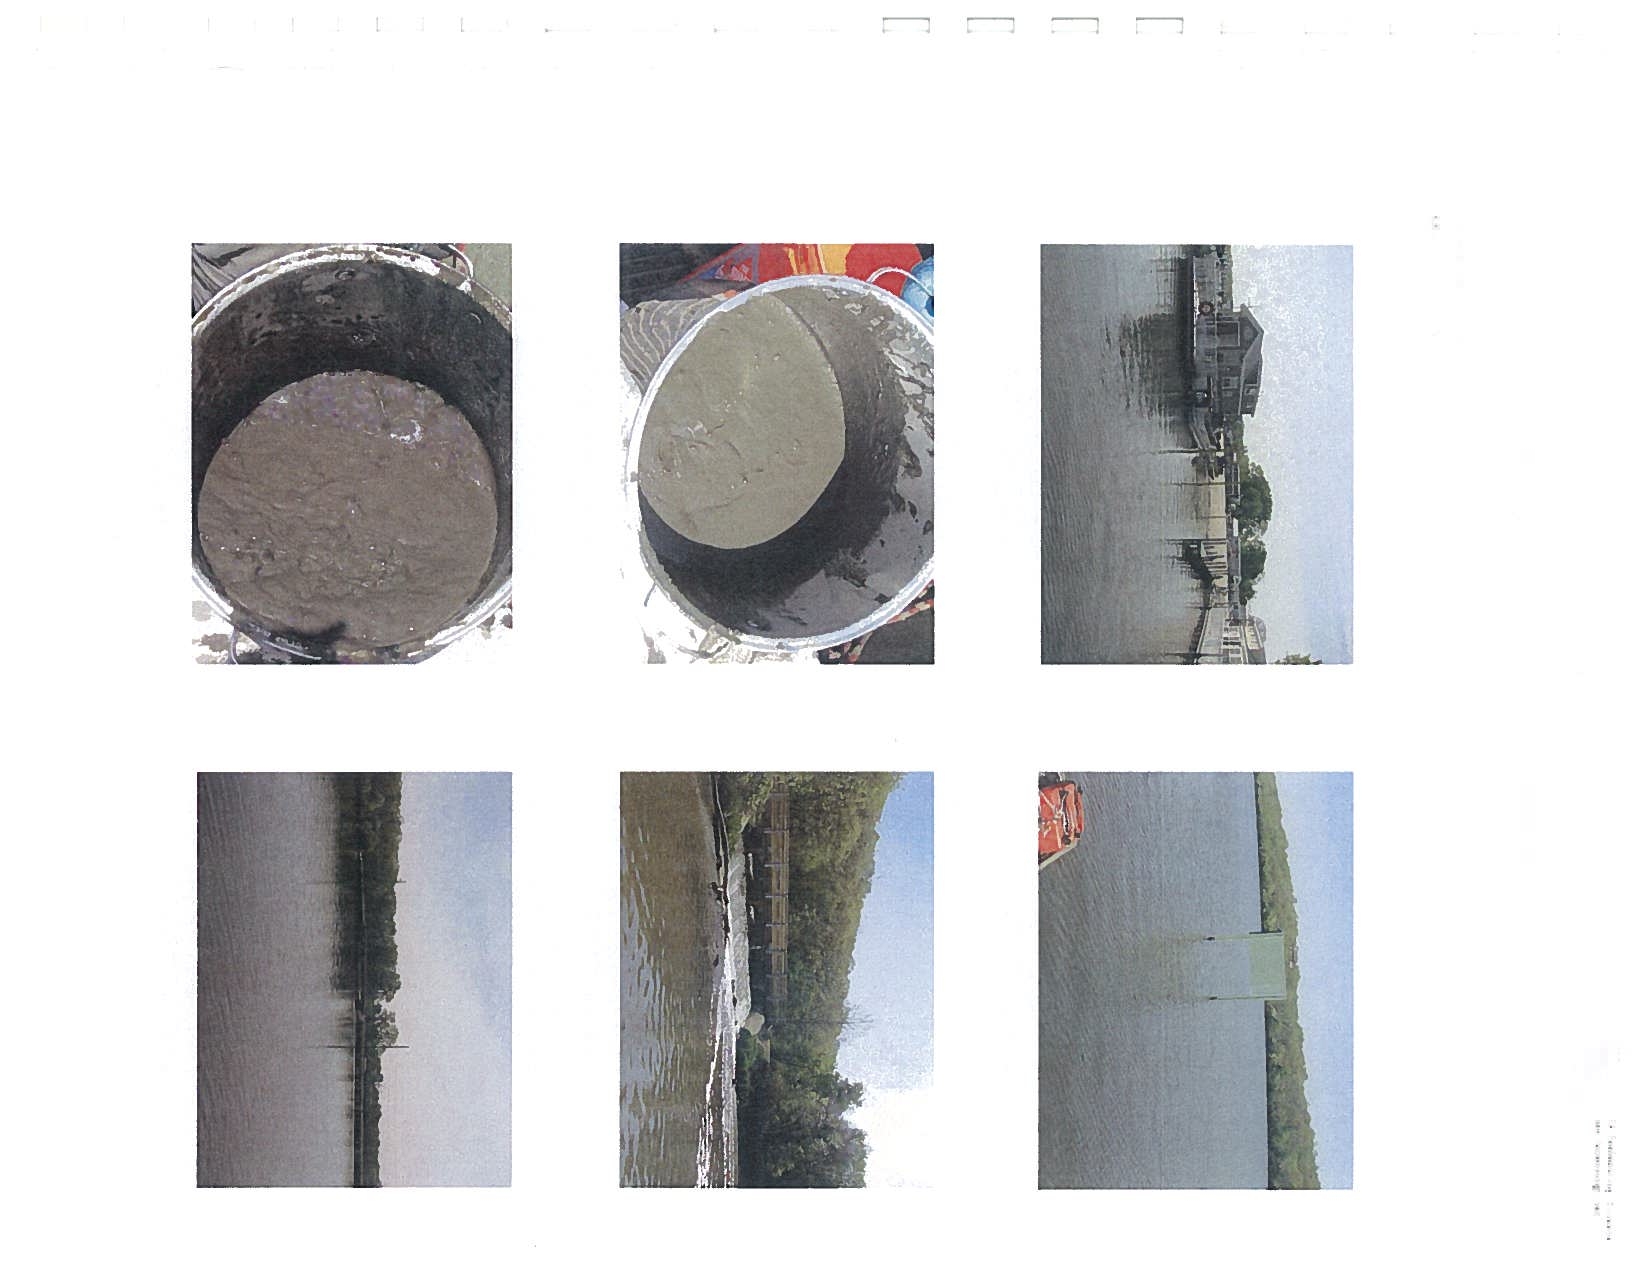
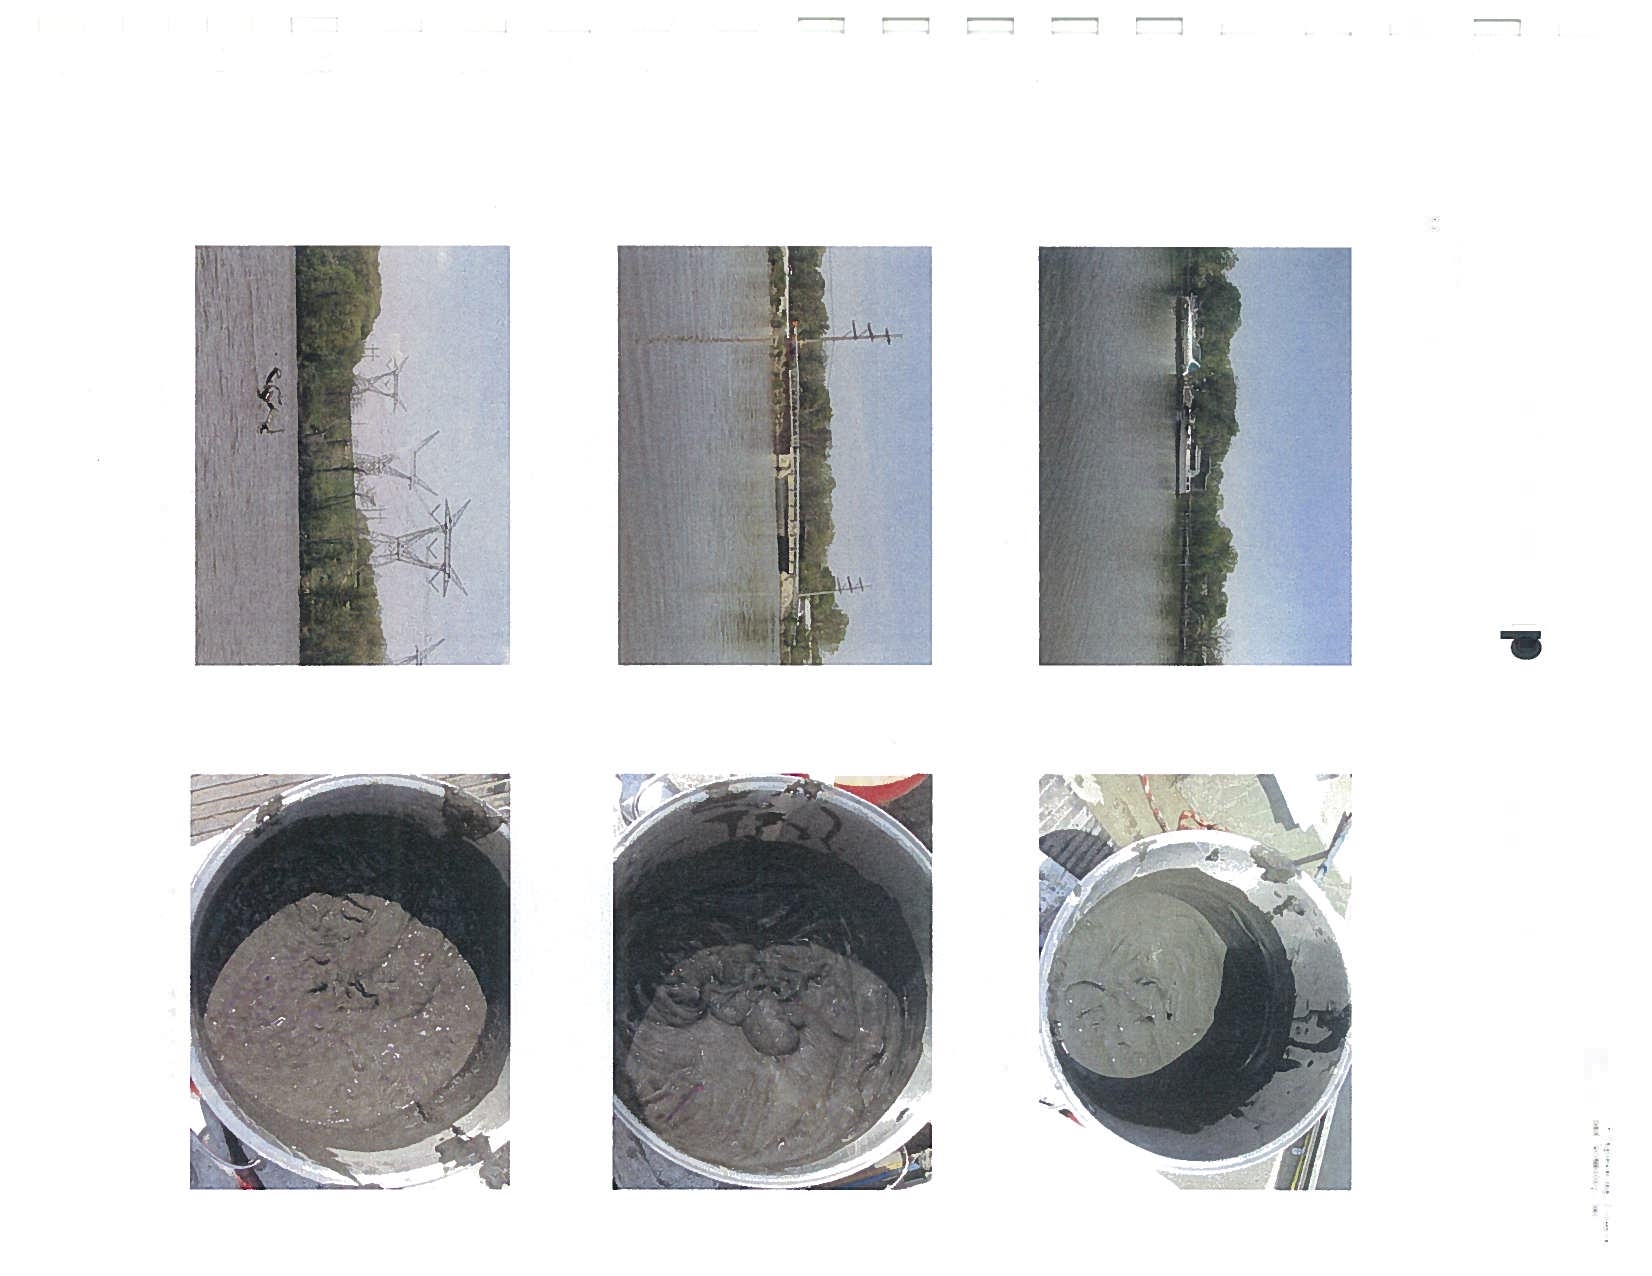
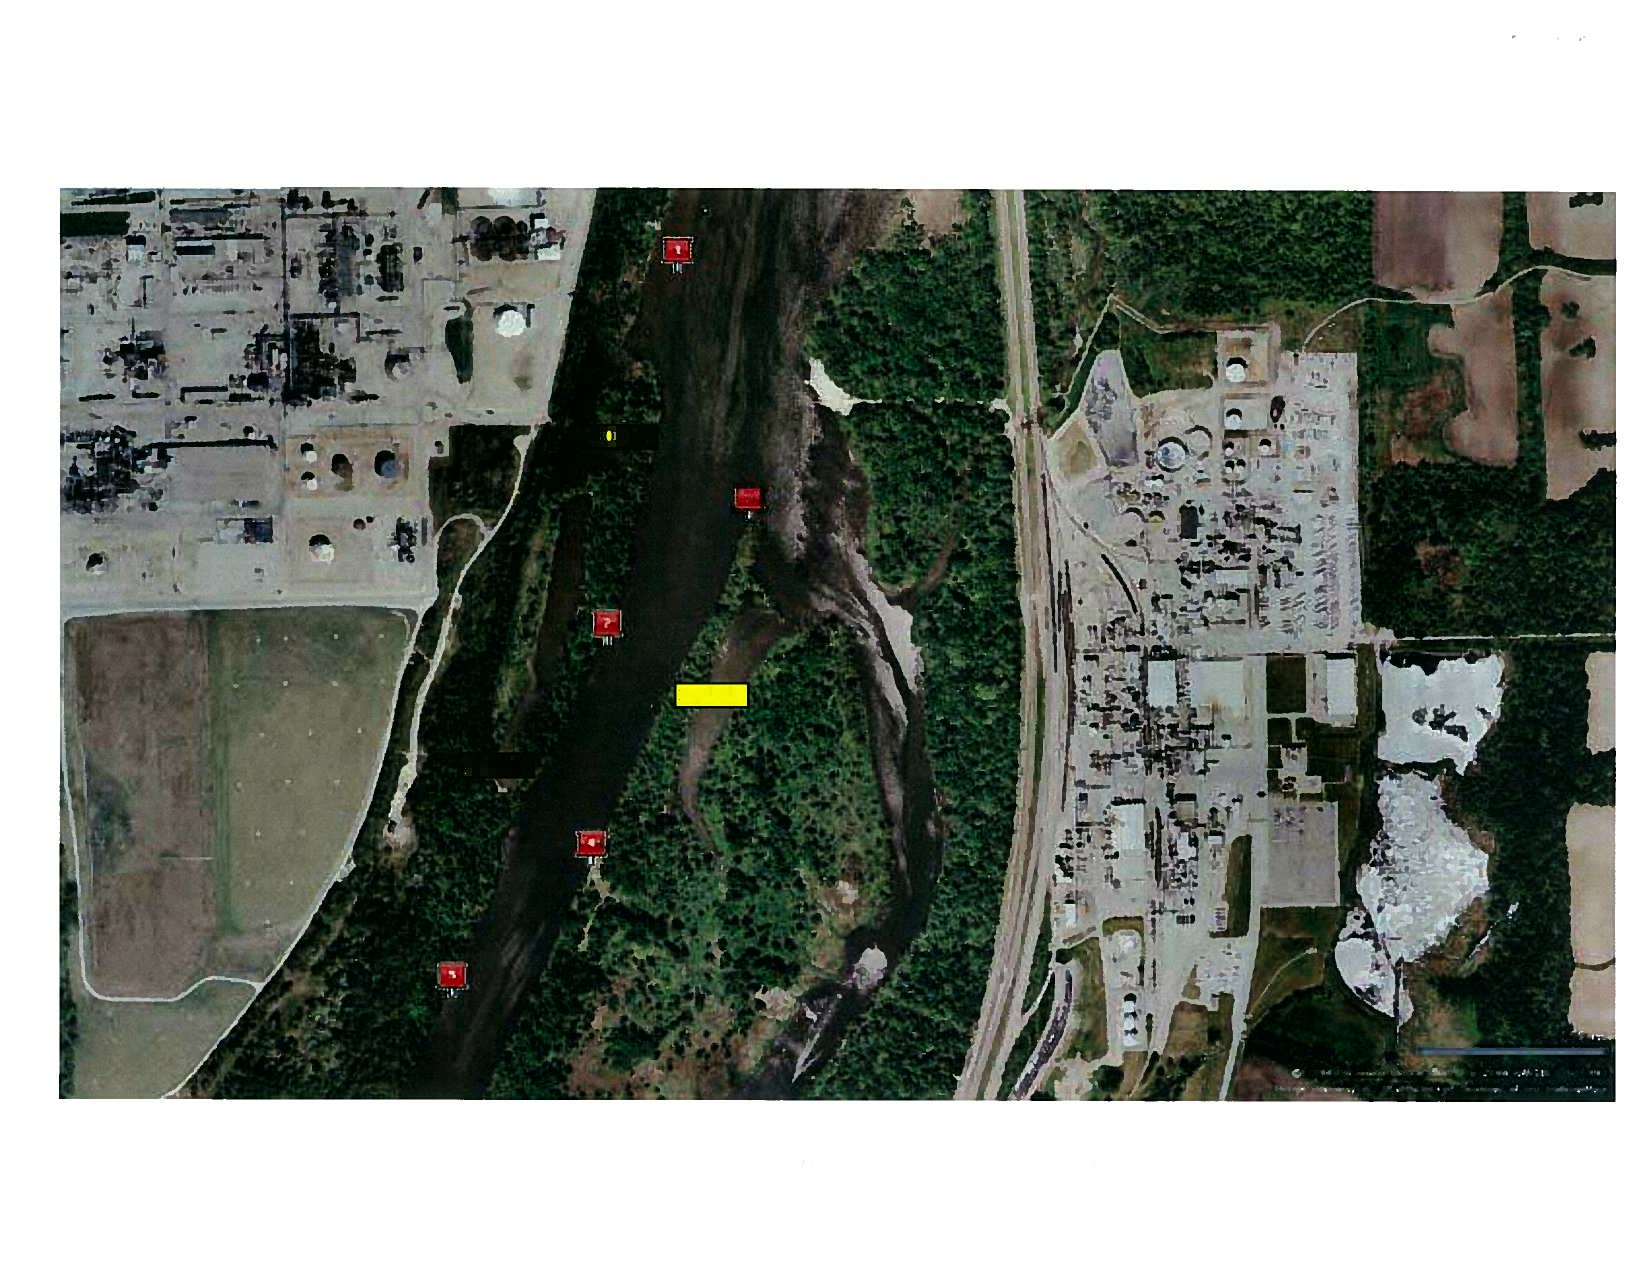
characterization.
The
extensive
EA
2008
Sediment
Survey conducted this
past
May (2008)
documented
exceedances
of
sediment
guidelines
for metals, PAHs and
PCBs
at
almost
every
sample location.
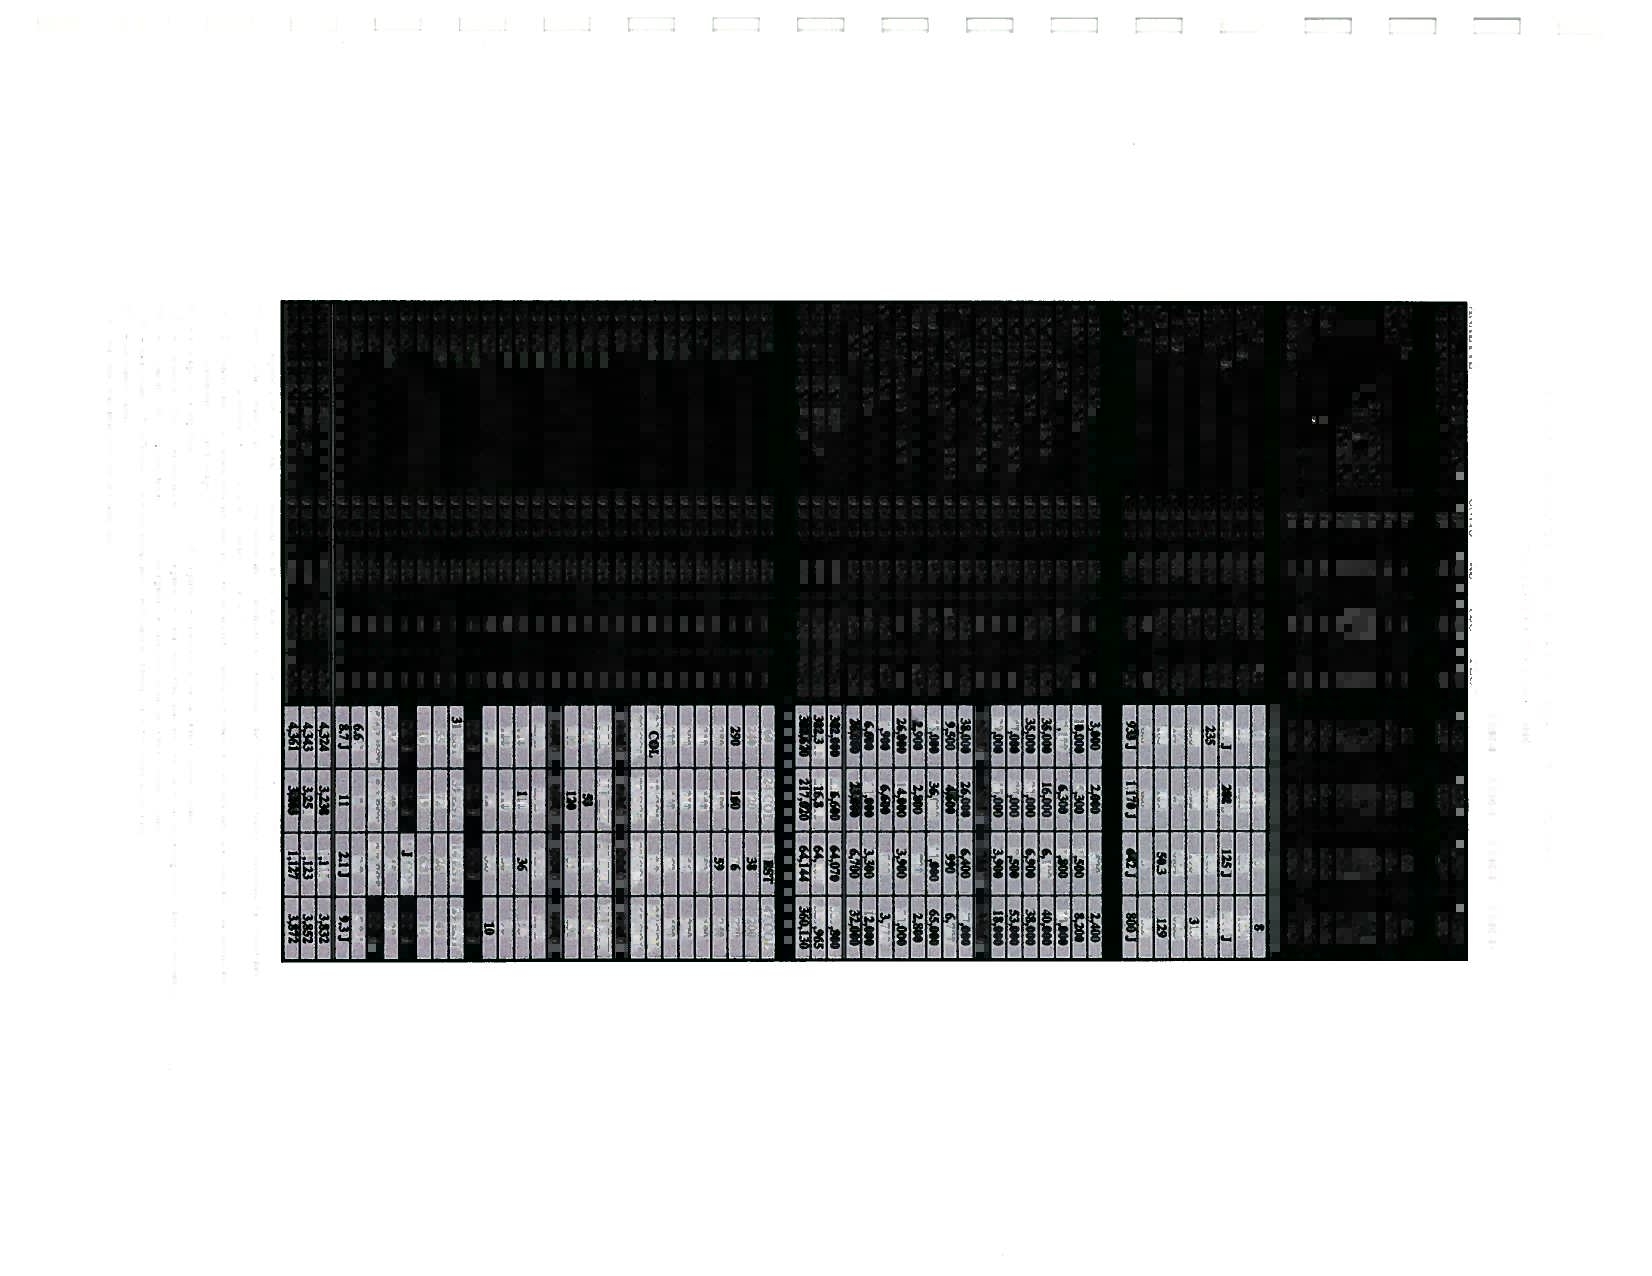
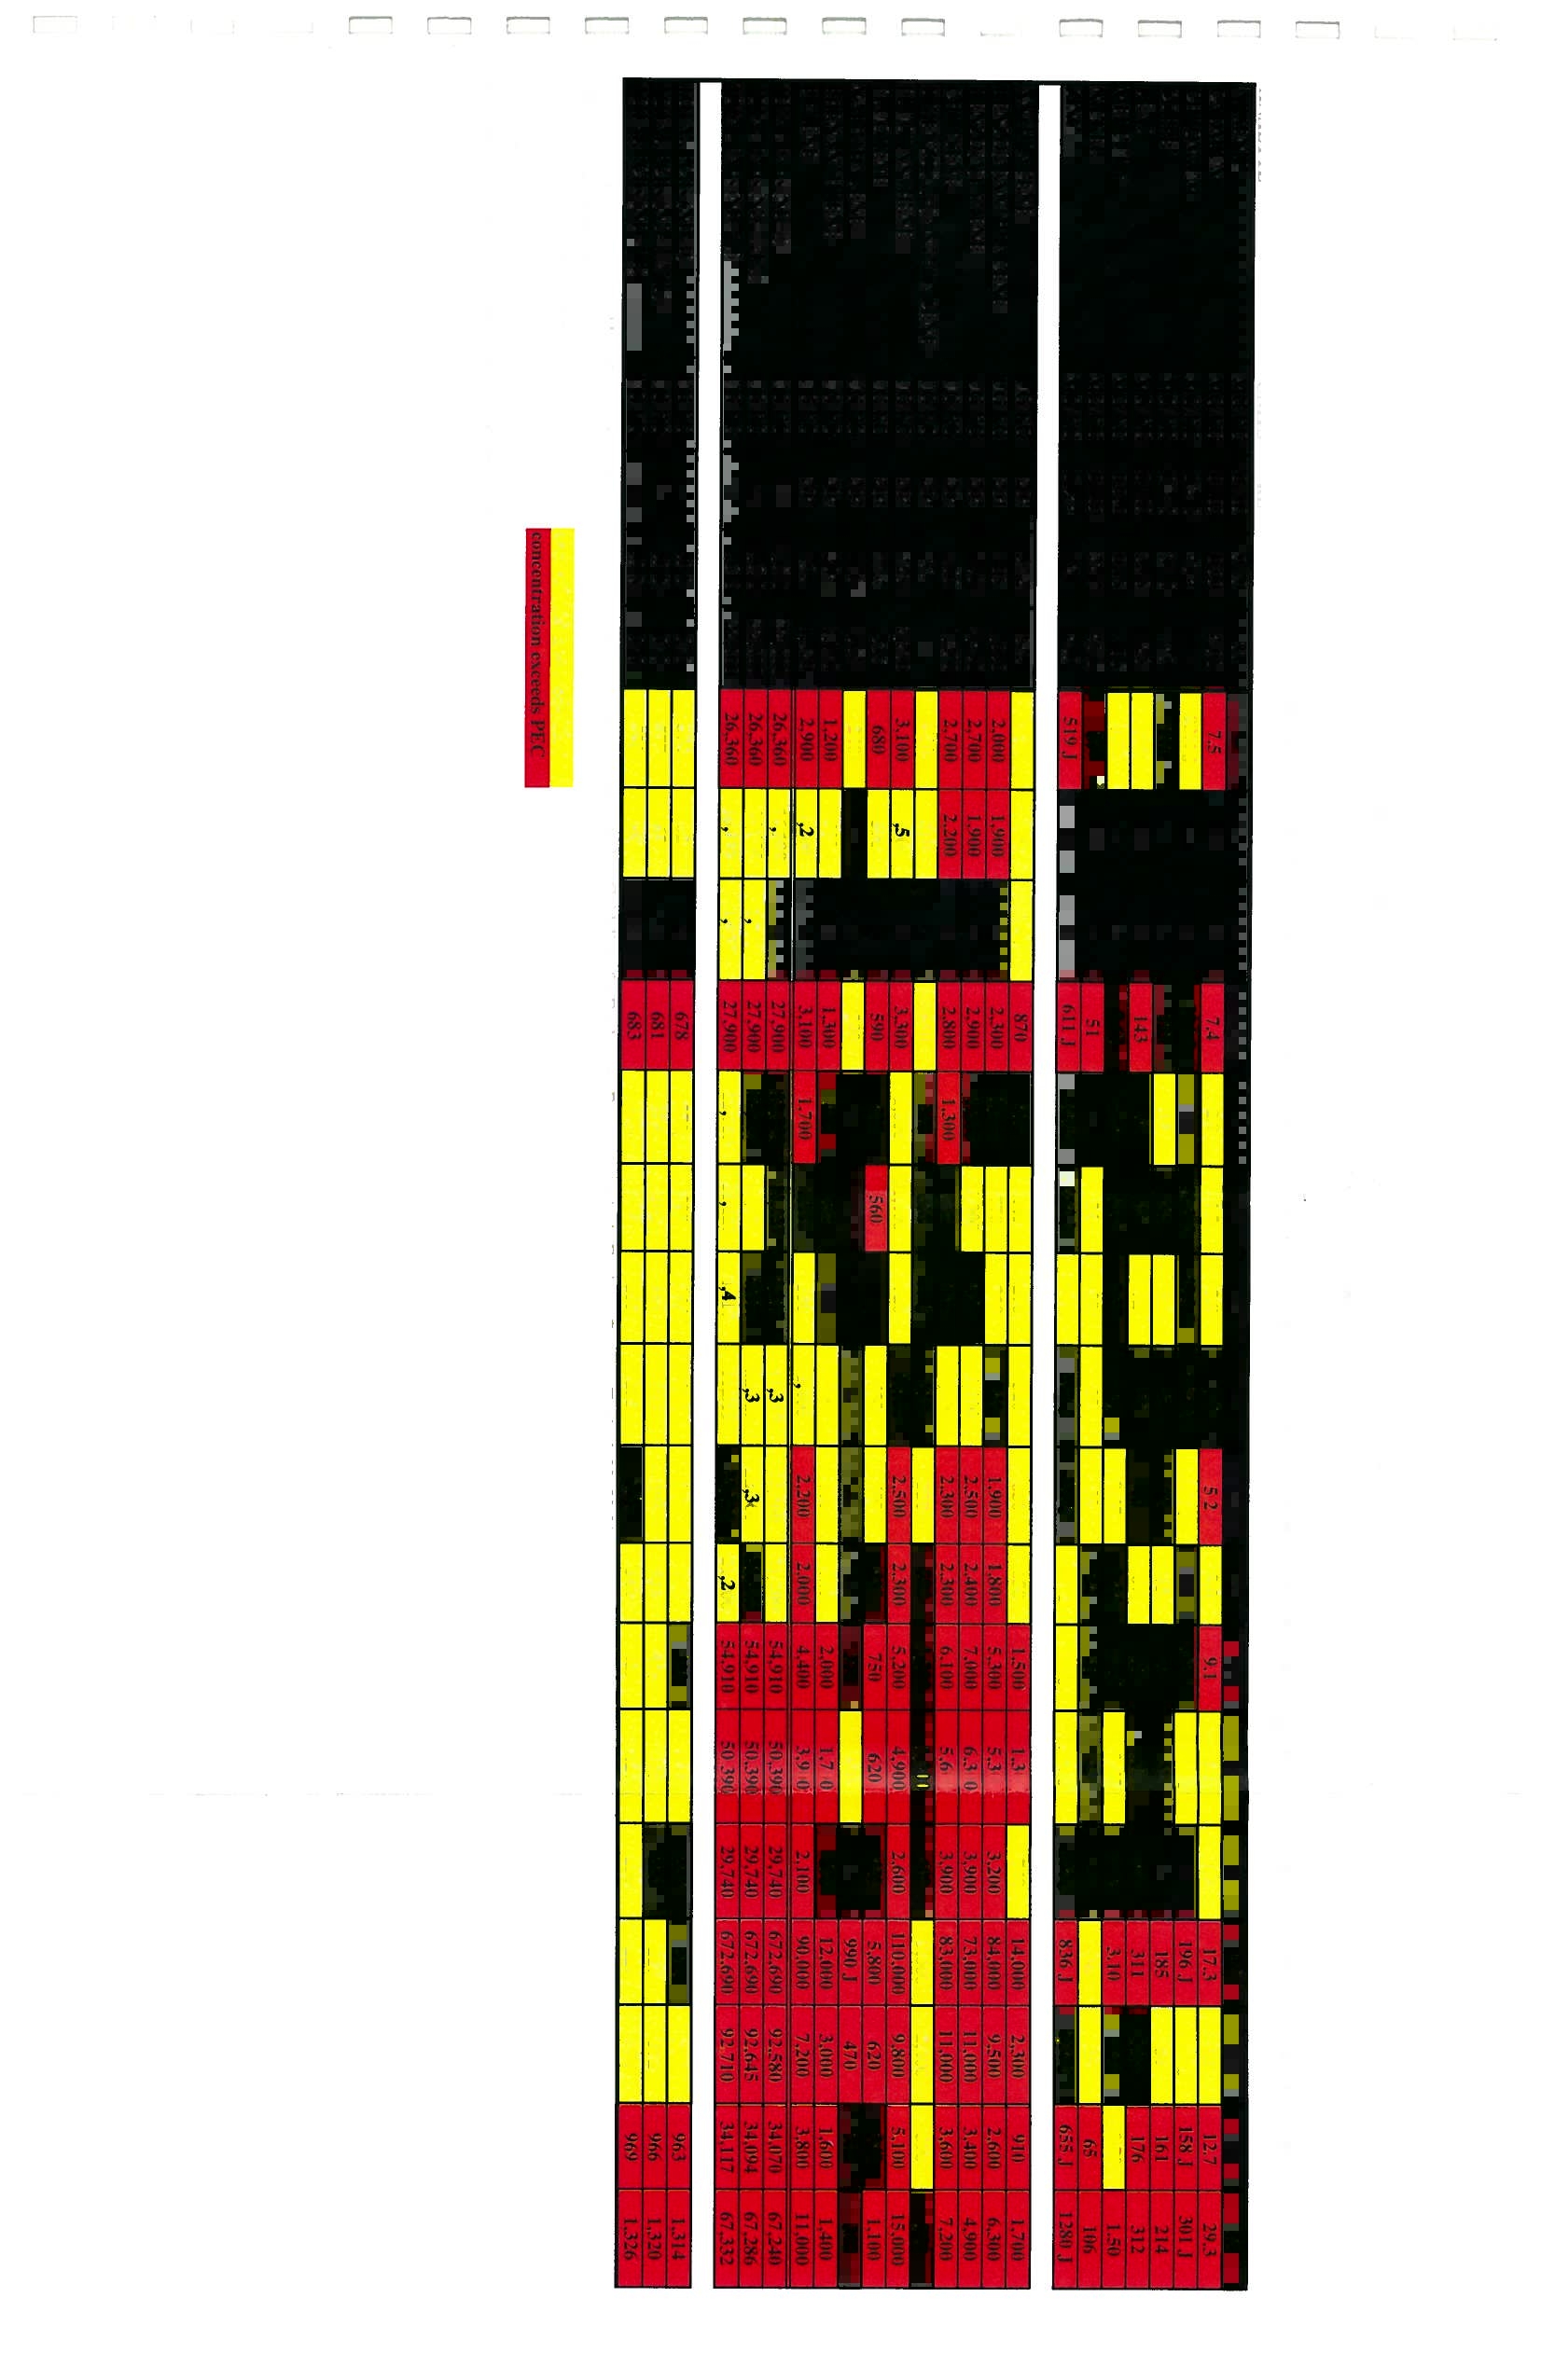
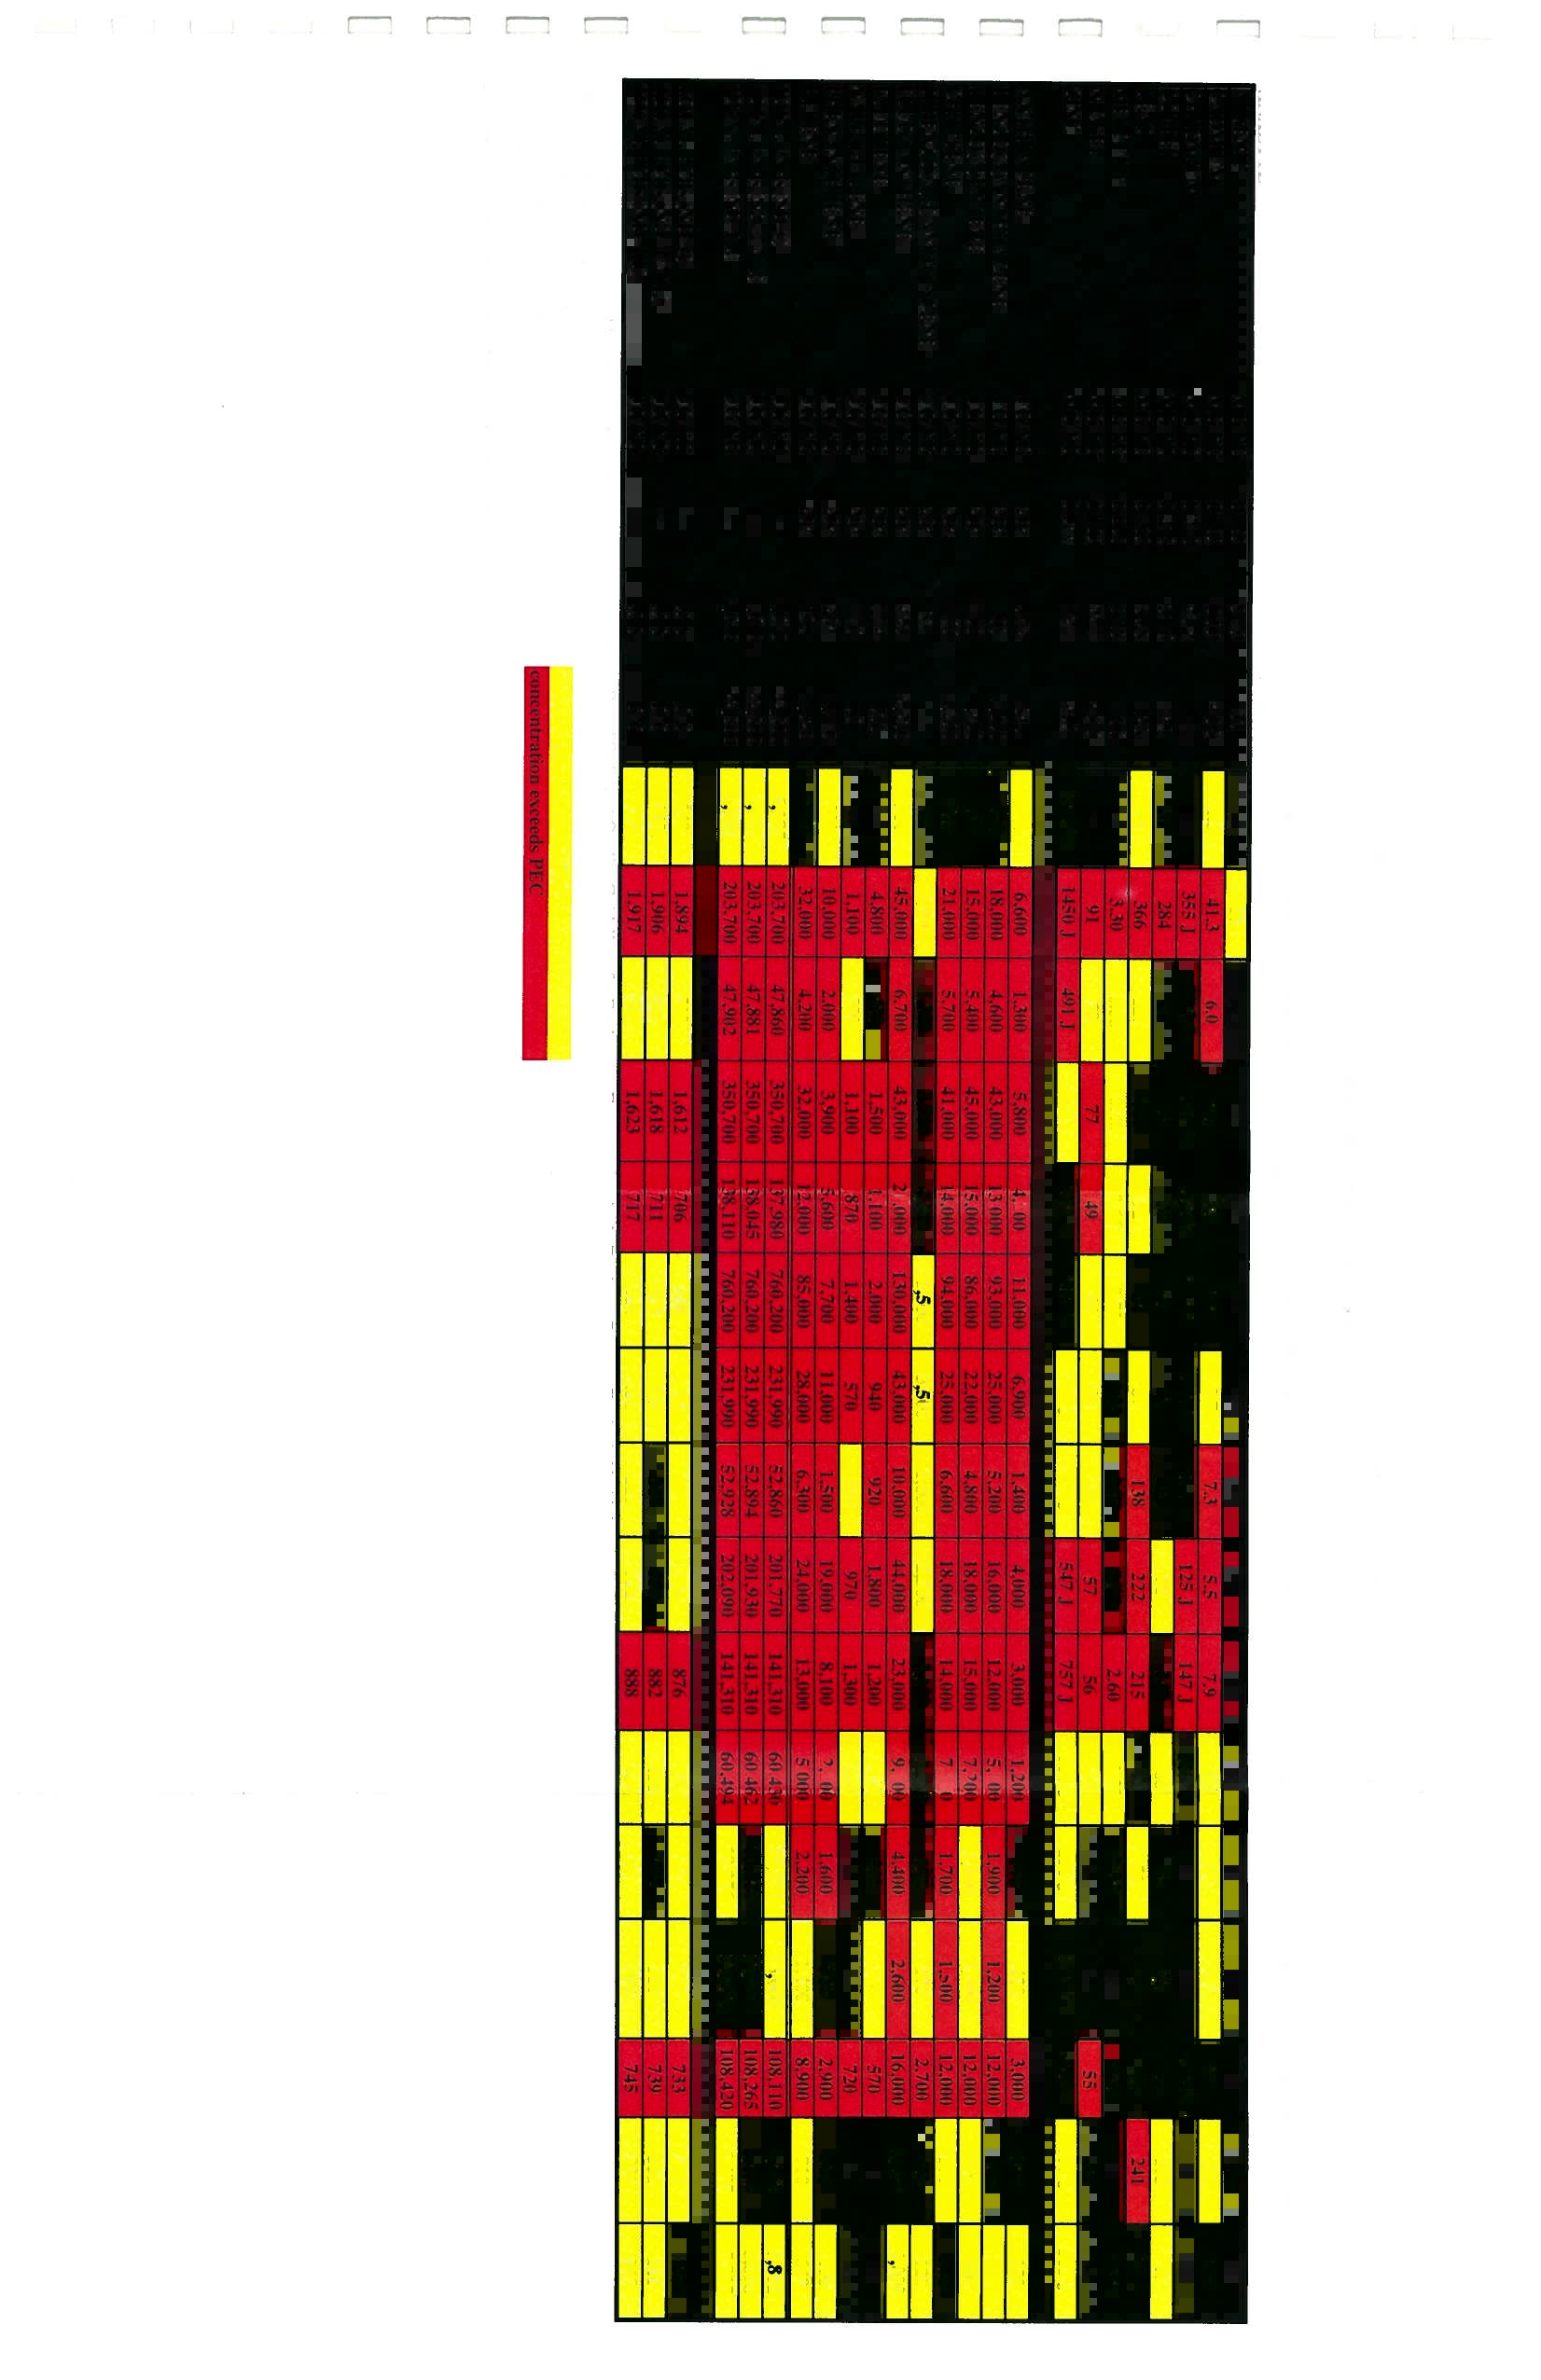
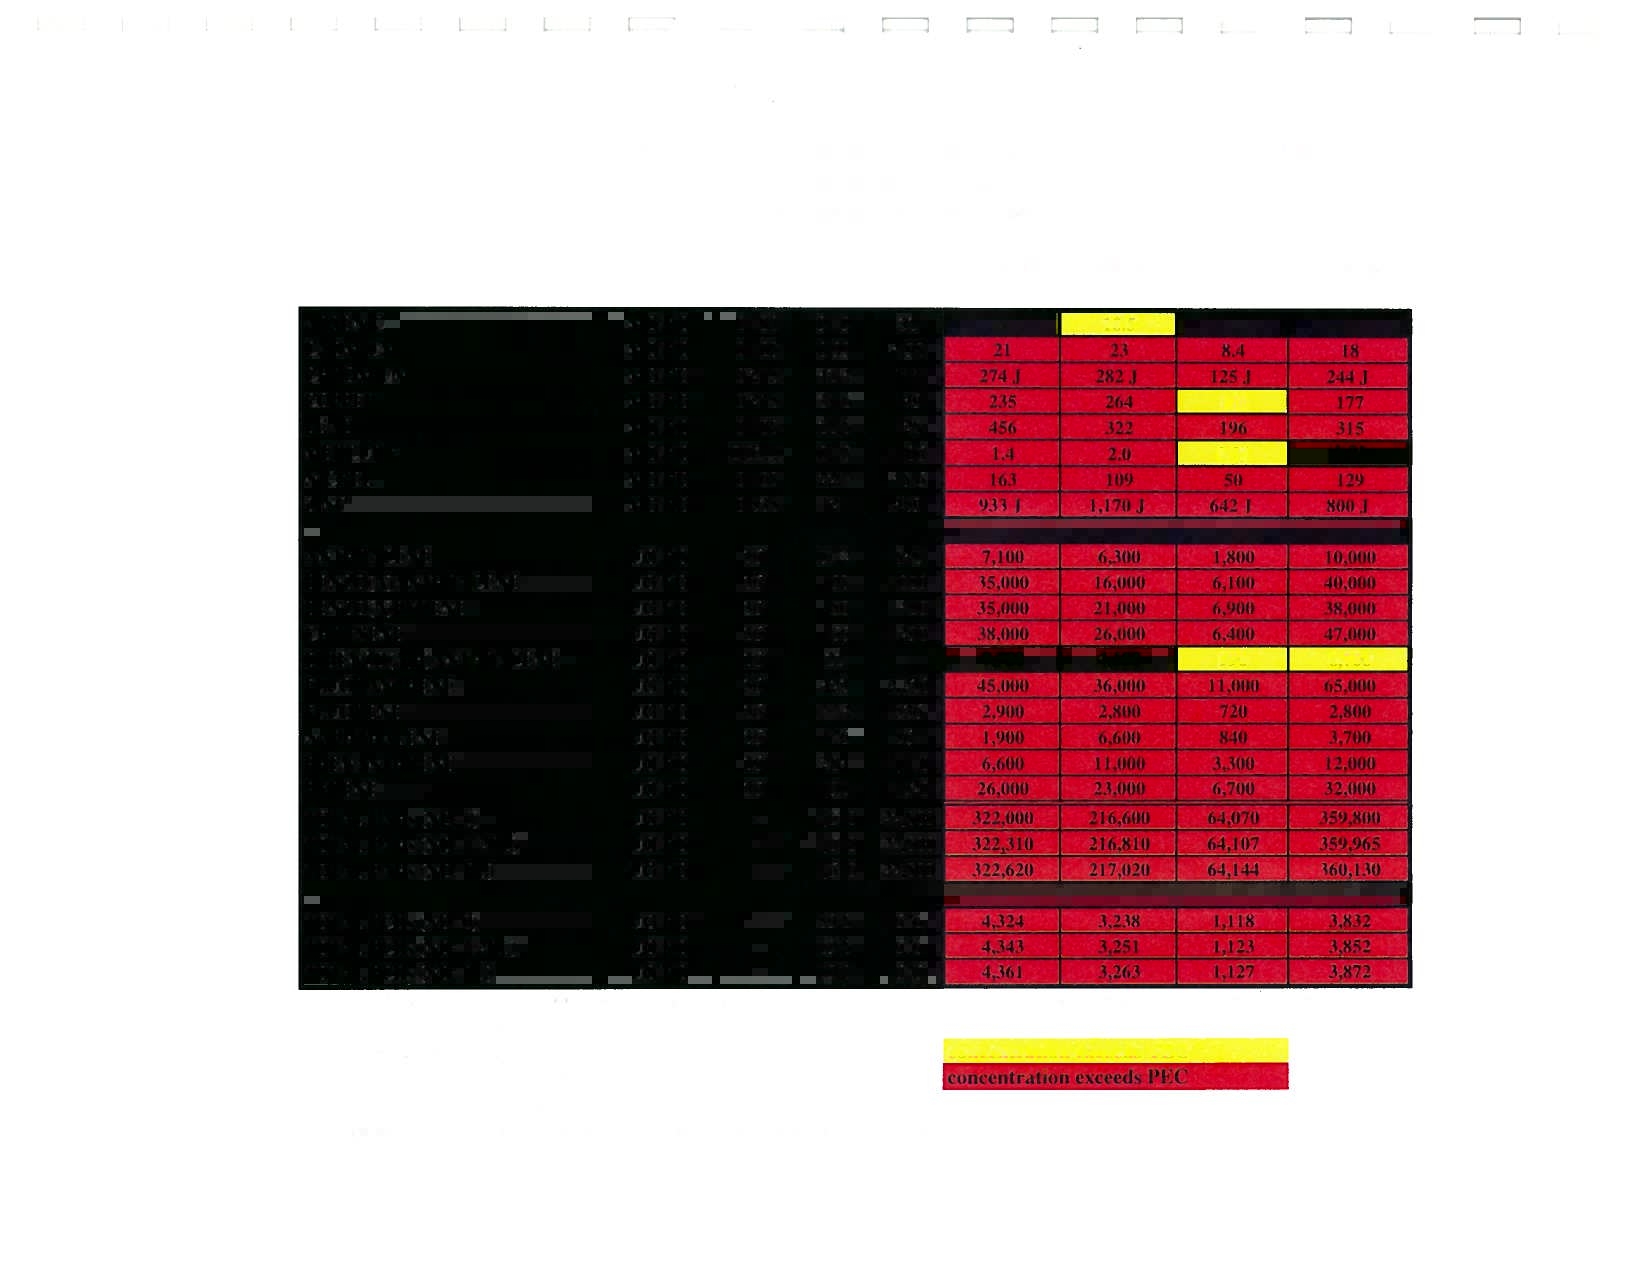
Table
11
of
the 2008
Sediment
Survey
provides a comparison
of sediment
concentrations
for
organics
and metals
for
samples
collected this
year
with
those collected
by me
in
1994
and 1995.
The organic
contaminants for the
vast majority of
sediments
sampled
between
1994 and
2008
in the
UIW
(CSSC to
the
Dresden Pool) exceed
sediment
quality
guidelines
(“SQGs”)
for
probable
adverse
biological effects.’
The
fact
that
both
the
Upper
Dresden and the
Lower
Brandon
Pools had
high
concentrations
of both metals
and
organic
constituents
indicates
that large
portions
ofthese pools are
of poor
sediment
quality
and
include
the
higher
quality
habitats of the
Brandon Lock & Dam
tailwaters.
Although some
of the sediment
contamination
of the Des Plaines
River is
attributable to
historical
discharges
and human
activities,
much
of it is on-going
and
will continue
to
persist
due
to
the existing
point and
nonpoint sources
discussed above.
There
are no
known plans to
remove
contaminated
sediments
in
the
UDP
area. Such a removal
would
be
one
of
the largest
in the
United
States,
likely
costing
hundreds
of millions of
dollars due
to
the spatial
extent of the
extreme
contamination.
However,
even the removal
of significantly
contaminated
and
acutely
toxic
sediments
from
depositional
areas
identified
would only provide
temporary
improvement,
as the
continued
loadings
of
a broad array of
chemicals from
point and
nonpoint
sources
would
result
in the
re-accumulation
of
contaminated
sediments. Further,
the fact
that
the 2008
Sediment
Survey
reveals highly
contaminated sediments
similar
to
what I observed
in
the
mid-
90’s,
strongly
suggests
that depositional
sediments
remain significantly
degraded
and
are not
SQGs
are commonly
accepted
benchmarks and
have been widely used in
the
U.S.
for
many years
to
establish
“clean-up”
levels
for federal
and
state remediation
activities
and to
determinô which sediments
are
toxic and thus
represent
a threat to
aquatic
biota.
7
Electronic Filing - Received, Clerk's Office, September 8, 2008
being reduced,
contrary
to
the
Illinois
EPA’
s
assumption
that sediment quality
in
the CSSC
and
UDP
is improving.
Based on my
experience, most
depositional
sediments that are
acutely toxic are
located
in
areas
suitable as
fish
habitat, not
in high current areas,
such as the
main channel.
Indeed, the
prime habitat for
spawning
in this study area are
the shallow waters
below
Brandon
Lock
&
Dam
where sediments
are contaminated
and
exceed
sediment
quality guidelines.
Shallow
waters,
including those
throughout
the UIW, are
prone to a
phenomenon known
as
photoinduced
toxicity
due to
the
presence of even
ug/L (ppb) levels of
PAHs,
which
is
toxic to
zooplankton,
benthic
macroinvertebrates,
fish
and
amphibians
in surficial layers
ofwaters. In
addition to
photoinduced
PAH
toxicity
in overlying
waters, the concentrations
of PAHs
found in the
sediments
(parts per
million) are high
enough to cause acute
toxicity without
UV stimulation
and
exceed
Probable
Effect
Concentrations
(“PECs”)
by
up to 30-fold.
A
recent study
by the U.S.
Geological Survey
(“USGS”) found
that
total PAHs
in
the
sediments of
the Upper
Illinois River Basin
are among the
highest
for sites
nationwide, and
nearby sites
in
Western
Springs and
Riverside, tributaries
upstream from the
UDP, are
among the
highest
5% in
the
nation, exceeding
probable
effect
levels for adverse
effects on
aquatic
life.
The
USGS
study
also
revealed
that concentrations
of DDT, PCBs,
methyl
mercury,
and dieldrin
in fish
and
sediments
in
the
Upper Des Plaines
and its
tributaries
are
among
the
highest
concentrations
observed
nationwide.
The USGS
findings are consisting
with
the
results of the
2008
Sediment
Survey,
which
revealed significant
concentrations
of
PAHs
throughout the
Dresden
and
Lower
Brandon
Pools. See
Tables
7
— 10, 2008 Sediment
Survey.
0
0
Electronic Filing - Received, Clerk's Office, September 8, 2008
4.
Suspended
Sediments
And Turbidity
Are Significant Stressors.
Studies have
shown
that turbidity
is
a
major
stressor in both the
CSSC
and the
UDP.
Turbidity
is due to
eroded soils and resuspended sediments,
both ofwhich contribute during high
flow events. Turbidity
during low flow events is primarily
a result of resuspension of bedded
sediments, which
in the UIW often
occurs
from
barge
traffic.
A study that
I
conducted in
1998
showed that Ceriodaphnia
dubia survival was affected
by turbidity. As well, filter feeding
zooplankton are known
to be sensitive to suspended solids at levels of
50-100 mg/L
(e.g.,
IEQ
1995).
This dominant
stressor of the UIW, aggravated
by
barge and navigation traffic, is likely
to impact
zooplankton populations throughout the waterway.
5.
Nutrient
Enrichment
And Ammonia
Are
Significant Stressors.
Nutrients,
such as nitrogen and
phosphorus,
are a common pollutant of human
dominated
watersheds, disrupting
aquatic ecosystems by increasing biological productivity, leading to
increased bacterial
respiration (and thus anoxia), increased algae and nuisance weeds,
and thus
a
switch to less
desirable fish and invertebrate
species.
Nutrient
loading
from
sources such as
municipal sewage and agricultural
runoff contribute to eutrophic conditions, impair
beneficial
uses,
and reduce oxygen
levels that favor pollution tolerant species. As documented in the
Lower Des
Plaines UAA Report and
elsewhere, the waters of the UIW
from
above Chicago
through
the Dresden Pool
exhibit high levels of nitrogen and phosphorus. When
nitrogen is
elevated, another
stressor of particular concern is
ammonia, which can
be
particularly toxic to
certain aquatic
species.
In
fact,
studies have found
ammonia to be
a
primary sediment
stressor
in
the UIW
and Brandon Pool area,
and it is significantly correlated with sediment
acute toxicity,
particle size and
organic contaminants.
9
Electronic Filing - Received, Clerk's Office, September 8, 2008
Recent USGS studies
have
documented phosphorus concentrations exceeding U.S. EPA
desired goals to
prevent excessive growth of
algae and other nuisance
plants
in every water
sample
collected from
urban
or
mixed land-use watersheds in the UIW. These studies have
also
found the
concentration of
ammonia in the CSSC at Romeoville as the highest
measured in the
Upper Illinois
River Basin, the fourth
highest of 109 streams and rivers measured
nationwide
by
the USGS,
and among
the highest in the Mississippi
River
basin. The USGS has
attributed the
primary
degradation of the UIW to
elevated concentrations of ammonia and
phosphorus, and the
presence of
organic
wastewater contaminants such as disinfectants, pharmaceuticals
and steroids,
insecticides,
and
organochiorines. These USGS studies also found that water
quality conditions
in the UIW
have
resulted
in
decreased numbers and diversity of pollution-sensitive
species of
fish and benthic
invertebrates.
6.
Municipal
Wastewater
Plants Will Continue To Discharge Endocrine
Disruptors
And Other
Emerging
Contaminants.
The UIW
and the UDP are also
adversely impacted
by
organic compounds
collectively
referred to as
“emerging
contaminants,” which include endocrine-disrupting
compounds (EDCs)
found
in many
pharmaceutical and
personal care products (PPCPs) and veterinarian
and
livestock
operations. Numerous
studies have found that fish downstream of
municipal
wastewaters
suffer from
exposures to estrogenic chemicals with extreme
reproductive disruption
and feminization.
Recent
studies by U.S.
EPA of effluent dominated streams and other
water
bodies,
including
the North
Shore Channel in Chicago, identified numerous
pharmaceutical
compounds
in
fish tissues, of
which antihistam.ines
and antidepressants were most frequent. A
recent lake
study
conducted in Canada found
that fish exposed to levels commonly found
in both
untreated
10
Electronic Filing - Received, Clerk's Office, September 8, 2008
and treated municipal wastewaters (5
—6 ng/L) resulted
in
feminization of males and
ultimately a
near
extinction
of the
fathead
minnow species from
the lake.
Other studies, including
segments
of the Potomac River Basin, where
80 to 100%
of
the
male smailmouth
bass
are intersex, have
identified
EDCs at
concentrations
significantly in excess
of those that
can result in male
feminization.
These finding are of serious concern
for the sustainability
of wild fish populations
in waterways receiving municipal wastewaters, such
as the UIW.
7.
The
Illinois EPA Has Never Identified Temperature
As A Limiting Factor
To
Attainment of Beneficial Uses.
As noted
earlier, despite the
many causes of impairment to the Des
Plaines
River,
thermal
modification has never been
identified
by the Illinois EPA as a cause
of
impairment. While
temperature in some
cases can be
a
stressor, studies have
shown that warm and cold temperatures
can be both advantageous and
detrimental to
aquatic biota. Although
it
was not discussed in the
Lower
Des Plaines River
UAA Report
(hereafter referred to as the
“LDR UAA
Report”), another
concern regarding
temperature
is
that there
are
winter maximum
temperatures which are
impacted by
municipal wastewater effluents and may impede
some fish
reproductive
processes.
The sections of the LDR
UAA Report titled “Selection
of
the
Temperature Standard” and
“Critique
of the Current
Secondary
Contact and Indigenous
Aquatic Life Standard”
contain
inaccurate
statements
regarding temperature effects on riverine species
and
ecosystem processes.
High and low
temperatures may or may not be detrimental to aquatic life that reside in the UIW.
The
authors of the LDR
UAA Report incorrectly imply and
over-generalize
that high
temperatures are
always detrimental. Moreover, as discussed
below, the LDR
UAA Report
inaccurately
presents my prior
work
on
the
UIW in several ways. Contrary to the
LDR
UAA
Report,
there is no simple
relationship between temperature
and aquatic toxicity.
Both low and
11
Electronic Filing - Received, Clerk's Office, September 8, 2008
high temperatures
can
increase and
decrease toxicity
due to
exposures
from
other
chemical
stressors, such as
those found in the UIW.
Toxicity
is
dependent
upon species,
presence
of
other
toxicants, toxicant
type
and concentration.
The LDR
UAA
Report’s
over-simplification
that
high
temperatures
increase
toxicity is simply
incorrect
and misleading.
Nitrification
is also
inhibited by cold temperatures
and ammonia
is
not always
consumed
in
the upper sediment
layers.
Nitrification,
which is the biological
oxidation
of ammonia,
is very sensitive to
toxicants,
which abound
in the UIW’s
depositional sediments.
The former
study that
I directed while at
Wright State
University
(the
“Wright
State
Study”) did not attempt
to establish temperature
limits
for
the UIW.
The LDR UAA Report’s
discussion
of
the Wright
State Study
is
misleading,
leaving
out key portions
of
the conclusions
and
misinterpreting others.
The Wright State
Study findings
substantiated
previous studies by
my laboratory
and others. These
key findings documented
that acute
toxicity exists
in
short-term
exposures for
multiple species in waters
and sediments
of the
LTIW without any water
temperature
elevation.
Toxic sediments
abound in
most
tributary
mouth, tailwater,
and pooi
depositional
areas,
which generally
provide
better habitats
for fish. These same
habitats are
typically
shallow waters which
are subject
to
rapid
mortality
as a result of photoinduced
toxicity
of PAHs,
as discussed above.
Both
cold and hot
temperatures
accentuate
toxicity
originating
from UIW waters
and sediments.
Statistically
significant
correlations
between sediment
ammonia
and
fluorene
concentrations
and toxicity were
also observed.
Ammonia was also
significantly
correlated to depositional
sediments
and the presence
of high
concentrations of
organics.
These correlations were
based
on
sediment
data collected
from throughout
the
UIW.
Outside
the
thermal
discharge
plume, temperature
was not observed
as a factor of
in
situ toxicity.
12
Electronic Filing - Received, Clerk's Office, September 8, 2008
The
laboratory toxicity test results produced by
the Wright State Study
further document
the role
of sediment
toxicity
and how
it increases in the presence of
temperature extremes.
The
Toxicity Identification
Evaluation Phase I experiments
further
substantiate
the
findings of the
Chemical Screening
Risk Assessment and the ammonia
correlations with toxicity,
suggesting
that ammonia is a
primary system stressor to benthic and
epibenthic
species.
However,
these
seven day, static
renewal experiments do not
adequately mimic dynamic, in situ
conditions
where light,
temperature, turbidity,
water
quality and food conditions change
over minutes to
hours. The most
reliable
indicator
of in situ conditions are the indigenous
communities
actually
present in the
waterway.
These are the most reliable data for
evaluations of thermal
impacts.
8.
Several
UAA Factors Are Met, Based
On Severity And Prevalence
Of Sediment
Contamination
And Continued Chemical And
Biological Stressors From
Human
Dominated
Activities.
Based on my
professional opinion, at least
three ofthe six
UAA
Factors set forth at 40
C.F.R.
131.10 apply
in the present case,
demonstrating that the UTW (including
the CSSC and
UDP)
does not
meet CWA
aquatic life goals. I did not evalute UAA Factor 2,
as flow alterations
were not
part of my
evaluation.
Moreover, it is my opinion that it is not feasible to
correct these
factors or
limitations
sufficient to attain CWA goals.2 The
application
of
these three UAA
Factors does
not support
the.upgrading of use
designations
under
the
Proposed UAA
Rules.
Moreover,
under U.S.
EPA’ s rules, a
determination that
any
one
of
these Factors
applies would
support the
downgrading
of the
use
designations. The UAA factors that apply
include:
Factor
3.
Human caused conditions or sources ofpollution prevent
the
attainment
of
the
use
and
cannot be remedied
or would cause
more
environmental damage to
correct
than to leave
2
An
evaluation
of the potential
applicability
of
the other UAA Factors, such
as
Factor 2
related to flow
conditions,
was
outside
the
scope of my review.
1,.,
13
Electronic Filing - Received, Clerk's Office, September 8, 2008
in place. Human caused
conditions or
sources
ofpollution prevent
both the CSSC and the
Lower Des
Plaines
River
from
attaining the Clean
Water Act’s
aquatic life goals. It is the
primary reason supporting
not upgrading
the use designation
for either waterway
to Clean Water
Act “fishable”
use
designations.
The evidence
of excessive
impairments
is
clear from the results
of sediment surveys,
including
the 2008
Sediment Survey.
A multitude
of
physical and chemical
impairment causes and
sources
exist
throughout
the
watershed
as discussed
and documented
above. The sources will not be removed
due to the human
dominated nature of the watershed
and thô connectivity between the UDP
and the UIW. In-situ remediation
of contaminated
sediments would
likely
cost
hundreds
of millions of
dollars or more
based on
the costs of
remediating other similar systems.
Factor 4. Dams,
diversions
or other hydrologic
modflcations preclude the attainment
of
the use, and it is notfeasible to
restore
the water
body to
its
original conditions or
to
operate
such modflcations in
a way that
would result in the attainment
ofthe use. The UIW habitat is
heavily and
permanently modified. Barge traffic
is a major protected
use and will
continue
to
result in degraded habitat and
resuspended
contaminated sediments.
Factor 5. Physical conditions associated with
the naturalfeatures
of
the water body,
such as the
lack ofproper substrate, cover, flow, depth,
poois, riffles
and the
like, unrelated
to
quality preclude
attainment ofaquatic flfe protection
uses. The rationale
for
Factor 4 above
applies
here as well. Due to the many stressors, habitat is
of poor quality throughout most of the
UIW and
cannot be feasibly corrected.
14
Electronic Filing - Received, Clerk's Office, September 8, 2008
Conclusion
The
rationales
used
and conclusions
reached
by the Illinois
EPA
to
support
its Proposed
UAA Rules
are in my
view
detrimentally
flawed.
Illinois
EPA’s presentation
of
data,
data
interpretation,
and
supporting
statements
are
often biased,
and
fail to
provide
a
scientifically-
balanced
representation
of previous
UIW
studies,
peer-reviewed
literature,
and
accepted
approaches
that
reflect
state-of-the-science.
Multiple
lines of evidence
clearly
establish
that the
CSSC,
as well as
the
UDP,
is a highly
modified,
effluent-dominated
waterway
that
receives
massive amounts
of
pollutants
from
various regulated
and
unregulated
discharges
and is
generally
poor habitat.
Acute toxicity
of water
and sediments,
unrelated
to
temperature,
is and
will
remain
a
major
limitation
on
the
potential
of this water
body
to
achieve
CWA
aquatic
life
goals.
Major
nonpoint
source
loadings
of
solids,
nutrients,
metals,
and organics
will continue
from growing
urban
areas,
sewers, construction,
and agriculture
in this
human-dominated
watershed
and
therefore
will
continue
to
contaminate
waters, sediments,
and
the food
of aquatic
biota
throughout
the
UIW.
Modified
and
limited habitats
(channelization,
barge
traffic, lock
and dams),
extreme
turbidity
and
siltation,
and
stressor
loadings
will
not improve
in the
foreseeable
future
and
will continue
to
dominate
water
quality
conditions
and use
impairments.
Consequently,
development
of new, modified
standards,
including
thermal
standards,
will not
address
the key
issue
of excessive
and pervasive
pollution
sources,
excessive
use
impainnents
and
limited
habitats
in this
watershed.
Thank
for the
opportunity
to testify
before the
Board.
BY:______________________
G. Allen
Burton,
Ph.D.
15
Electronic Filing - Received, Clerk's Office, September 8, 2008
Electronic Filing - Received, Clerk's Office, September 8, 2008
Attachment
1
Review
of the Illinois EPA Water Quality Standards
and
Effluent Limitations for the Chicago Area
Waterway
System and the
Lower Des Plaines
River:
Proposed
Amendments to
35
Ill. Adm.
Code
Parts
301, 302,
303,
and 304
Electronic Filing - Received, Clerk's Office, September 8, 2008
Review
of the
Illinois EPA Water Quality Standards
and Effluent Limitations
for the Chicago
Area Waterway System and the Lower Des Plaines River:
Proposed
Amendments to
35
Ill. Adm.Code Parts 301, 302,
303
and 304.
by
G. Allen Burton, Jr., Professor and Director
Cooperative Institute of Limno logy
&
Ecosystem
Research
School
of Natural Resources & Environment
University of Michigan
Ann Arbor, MI
September 4, 2008
Table of Contents
Section
1.
Introduction
2
2.
Overview of The Des Plaines Watershed
2
3.
Wet Weather Impacts
5
4. Sediment Quality
7
5.
Suspended
Sediments
14
6.
Nutrients
14
7.
Emerging Contaminants
15
8.
Temperature
16
9.
UAA Factors
17
10. Conclusions
18
11.
References Cited
19
Appendices
Appendix
A: Resume
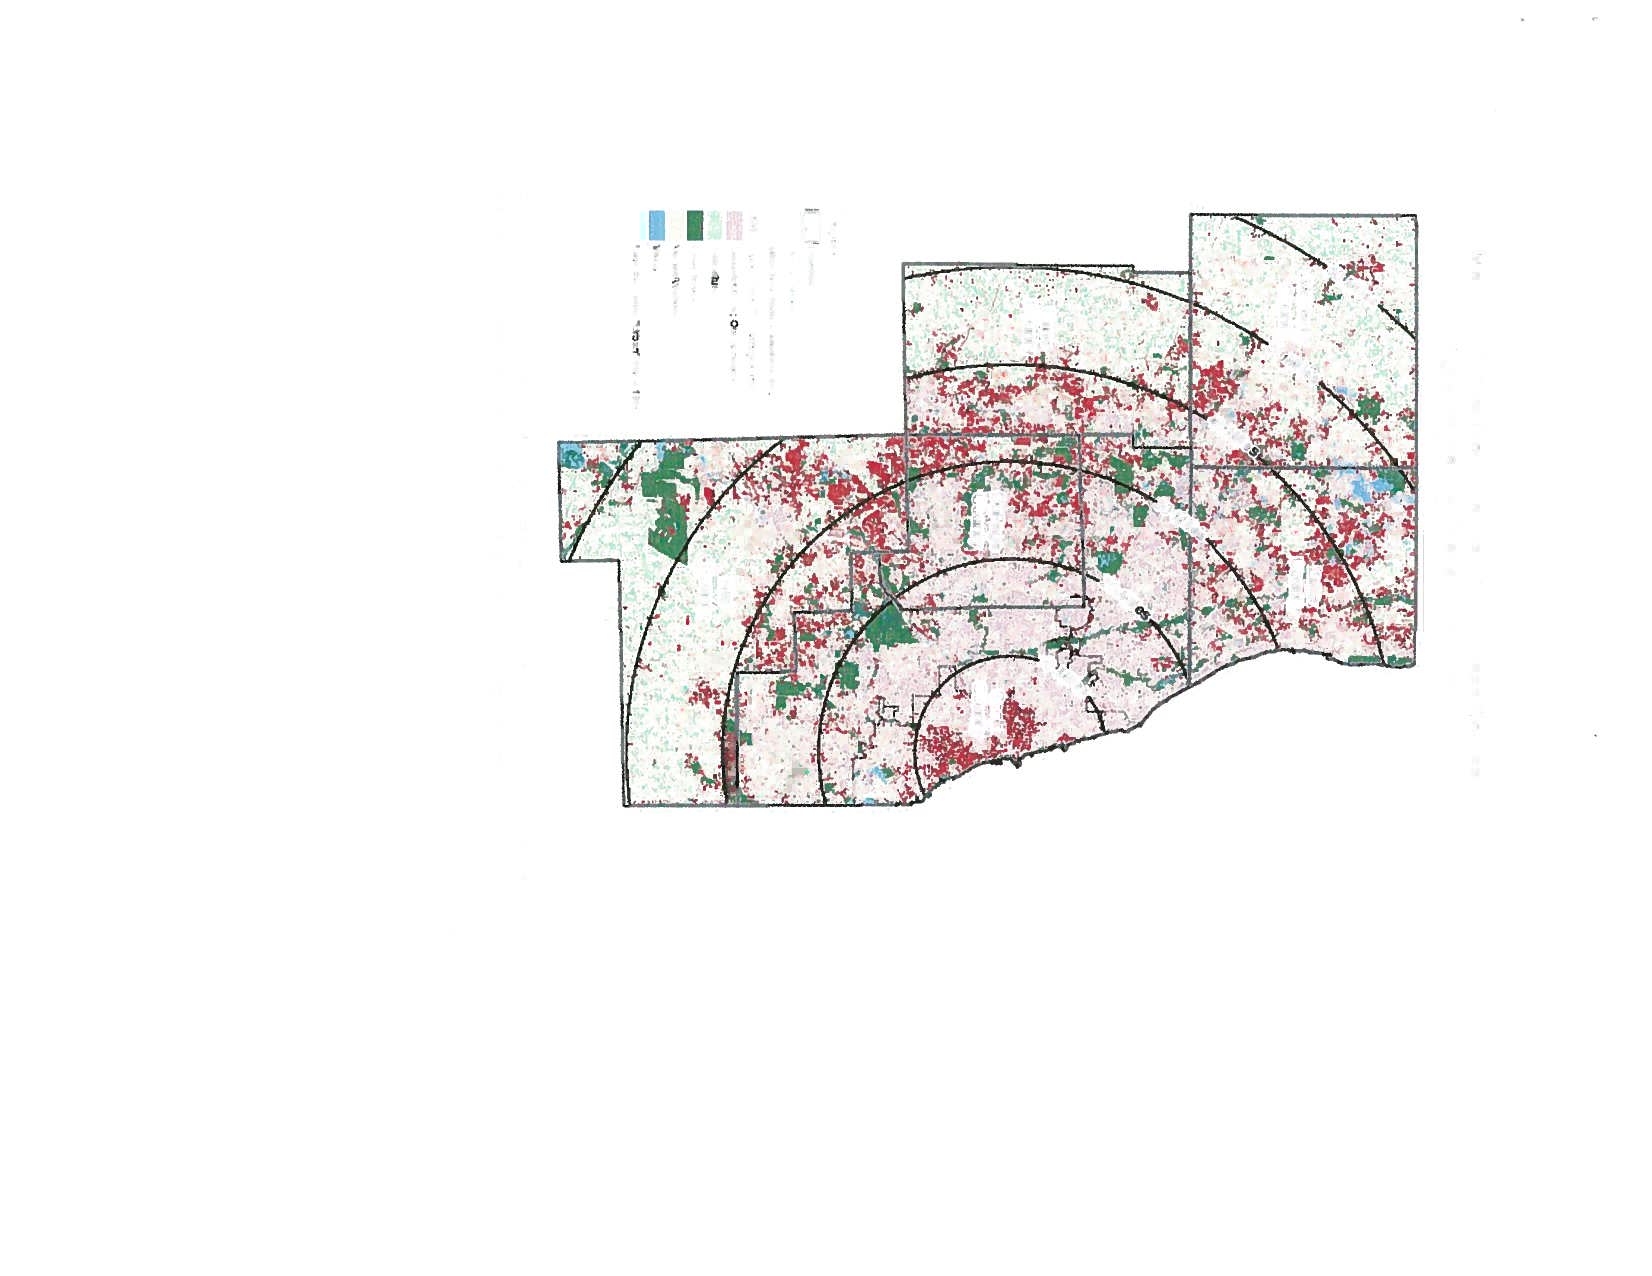
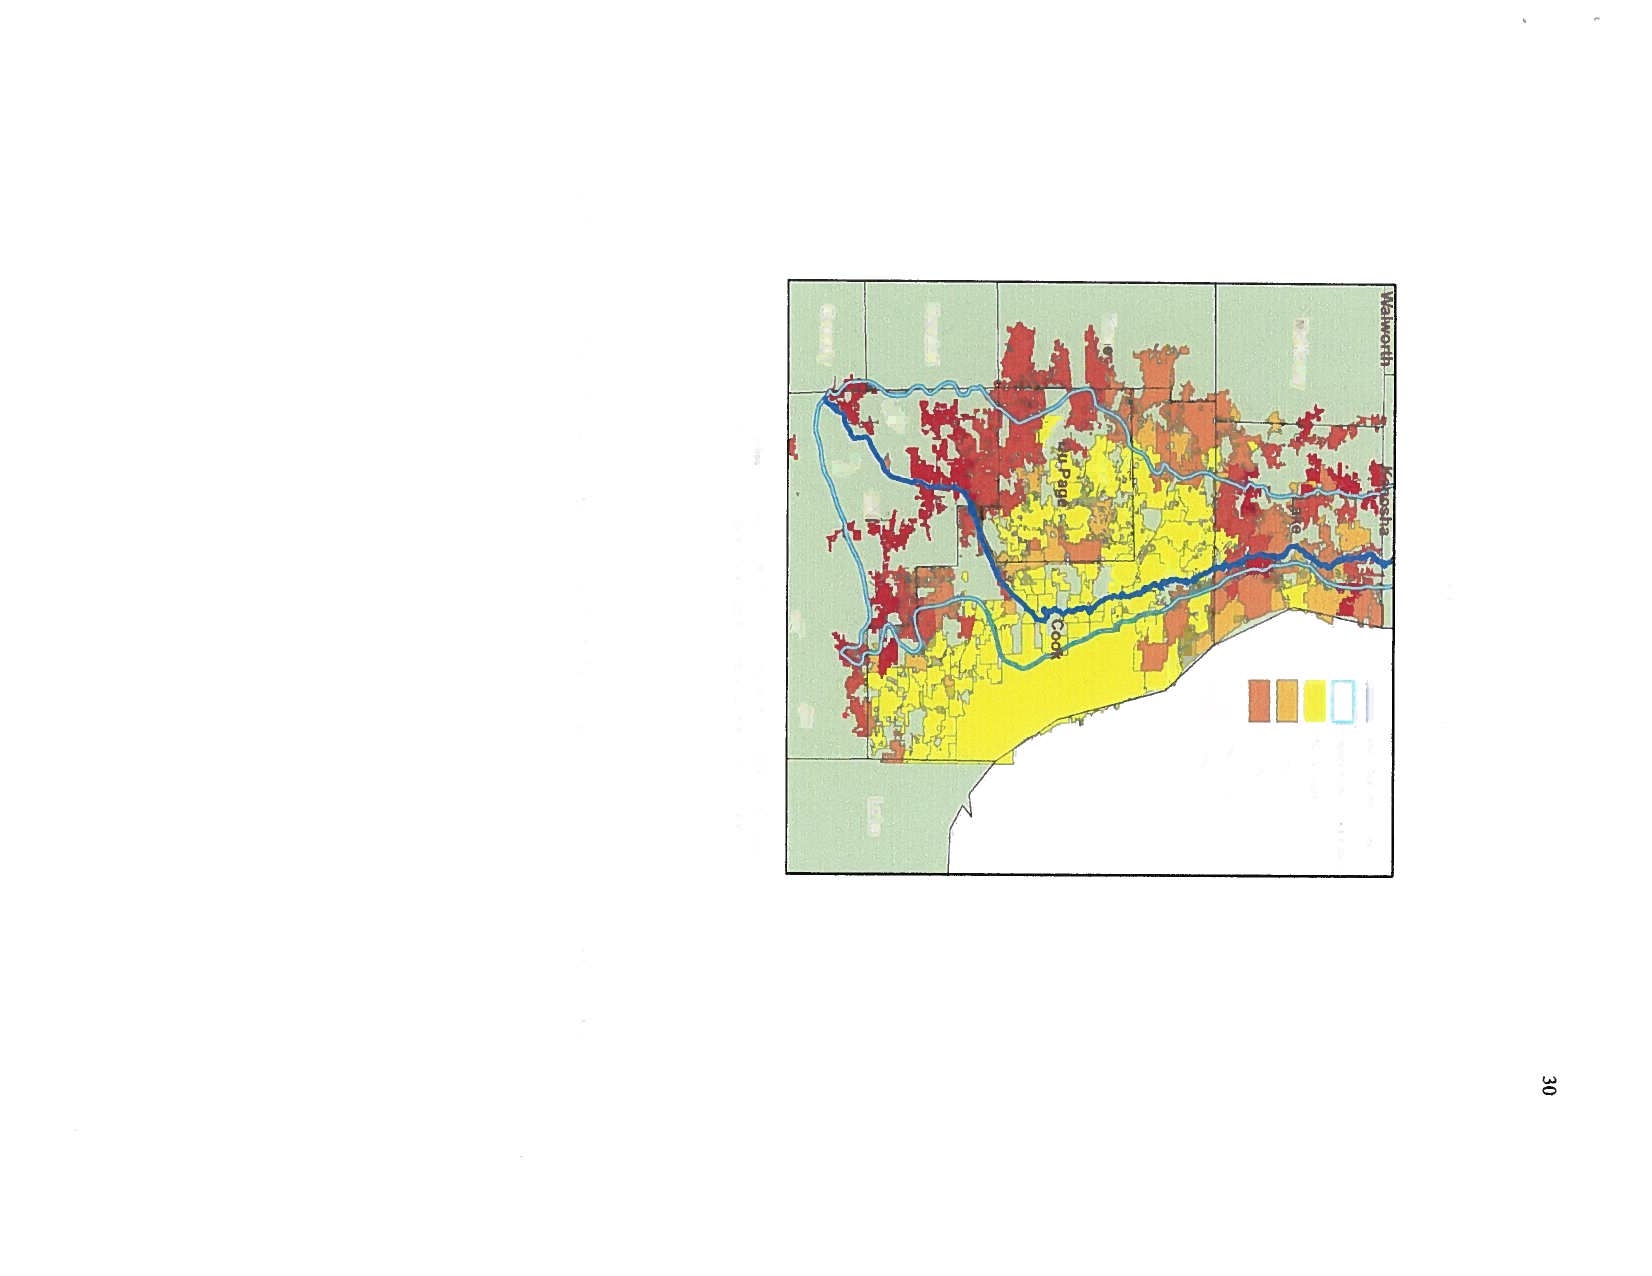
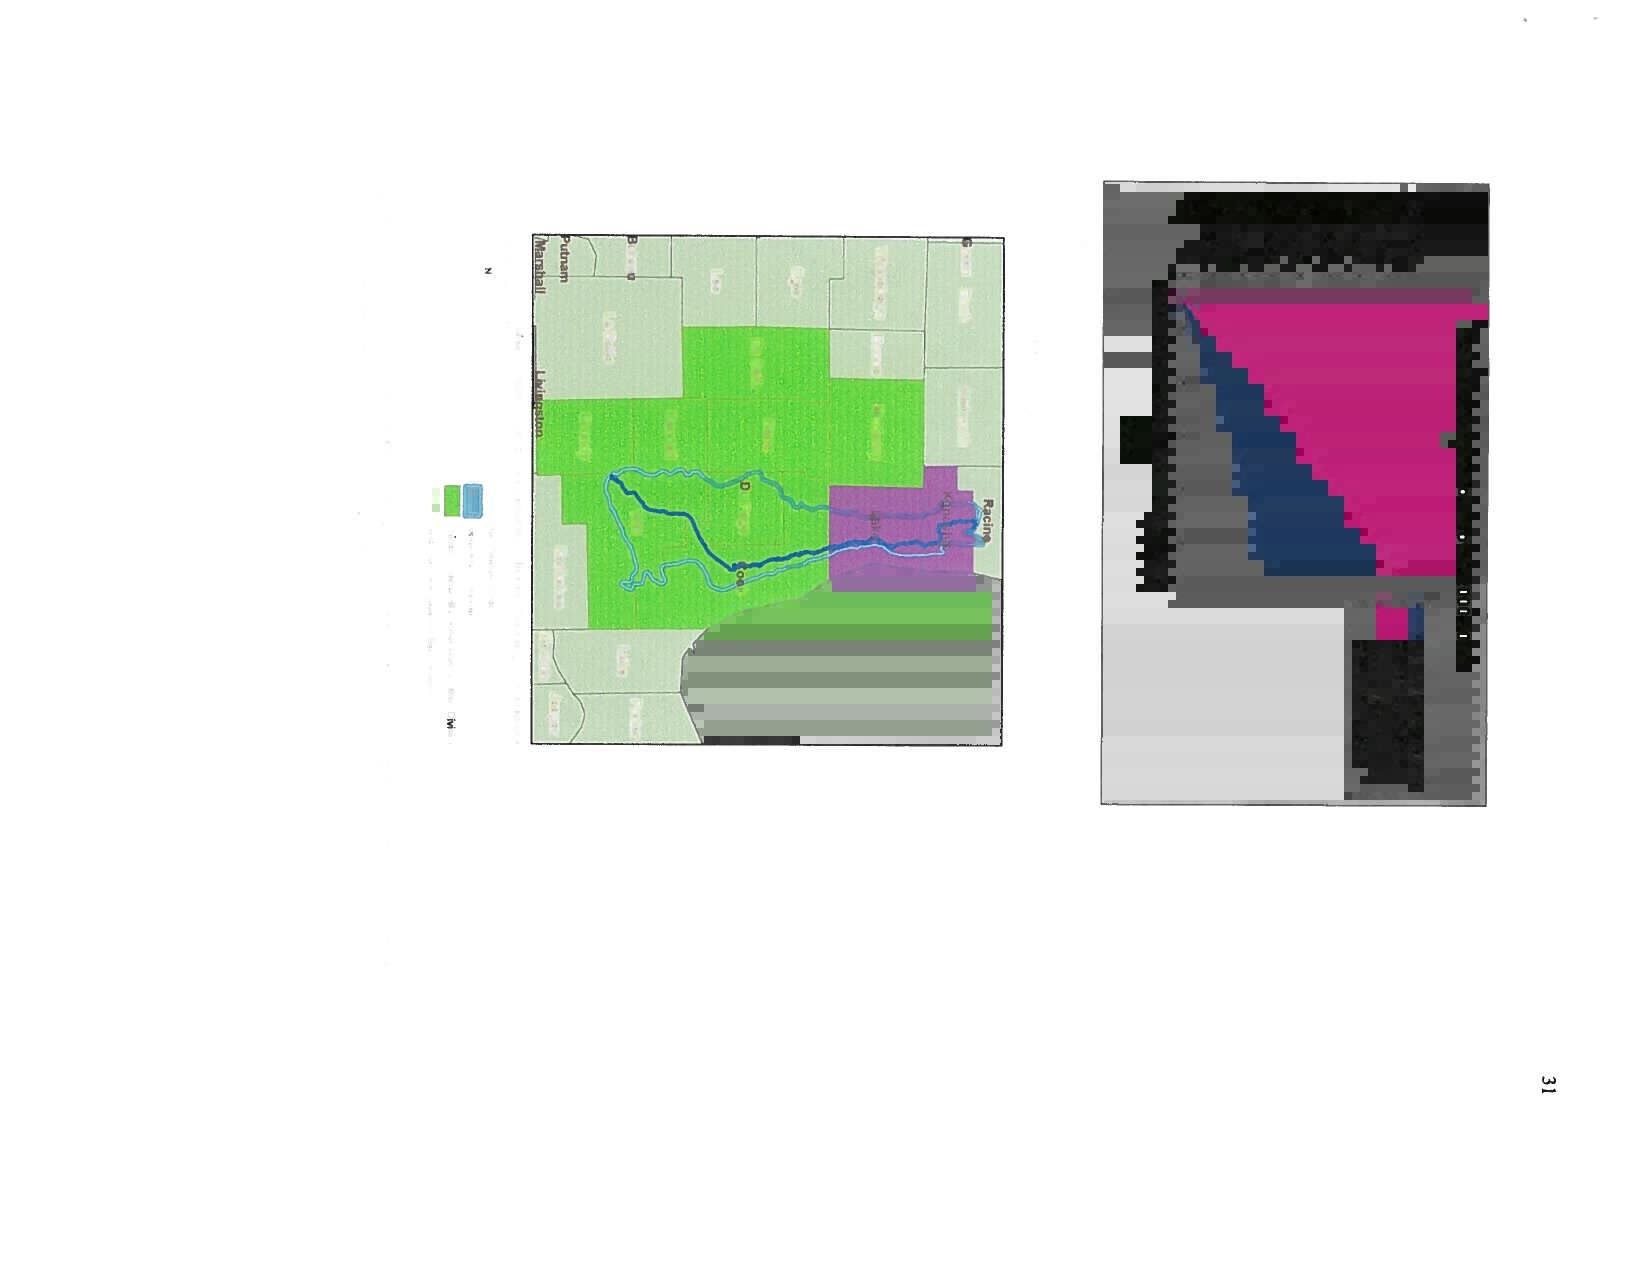
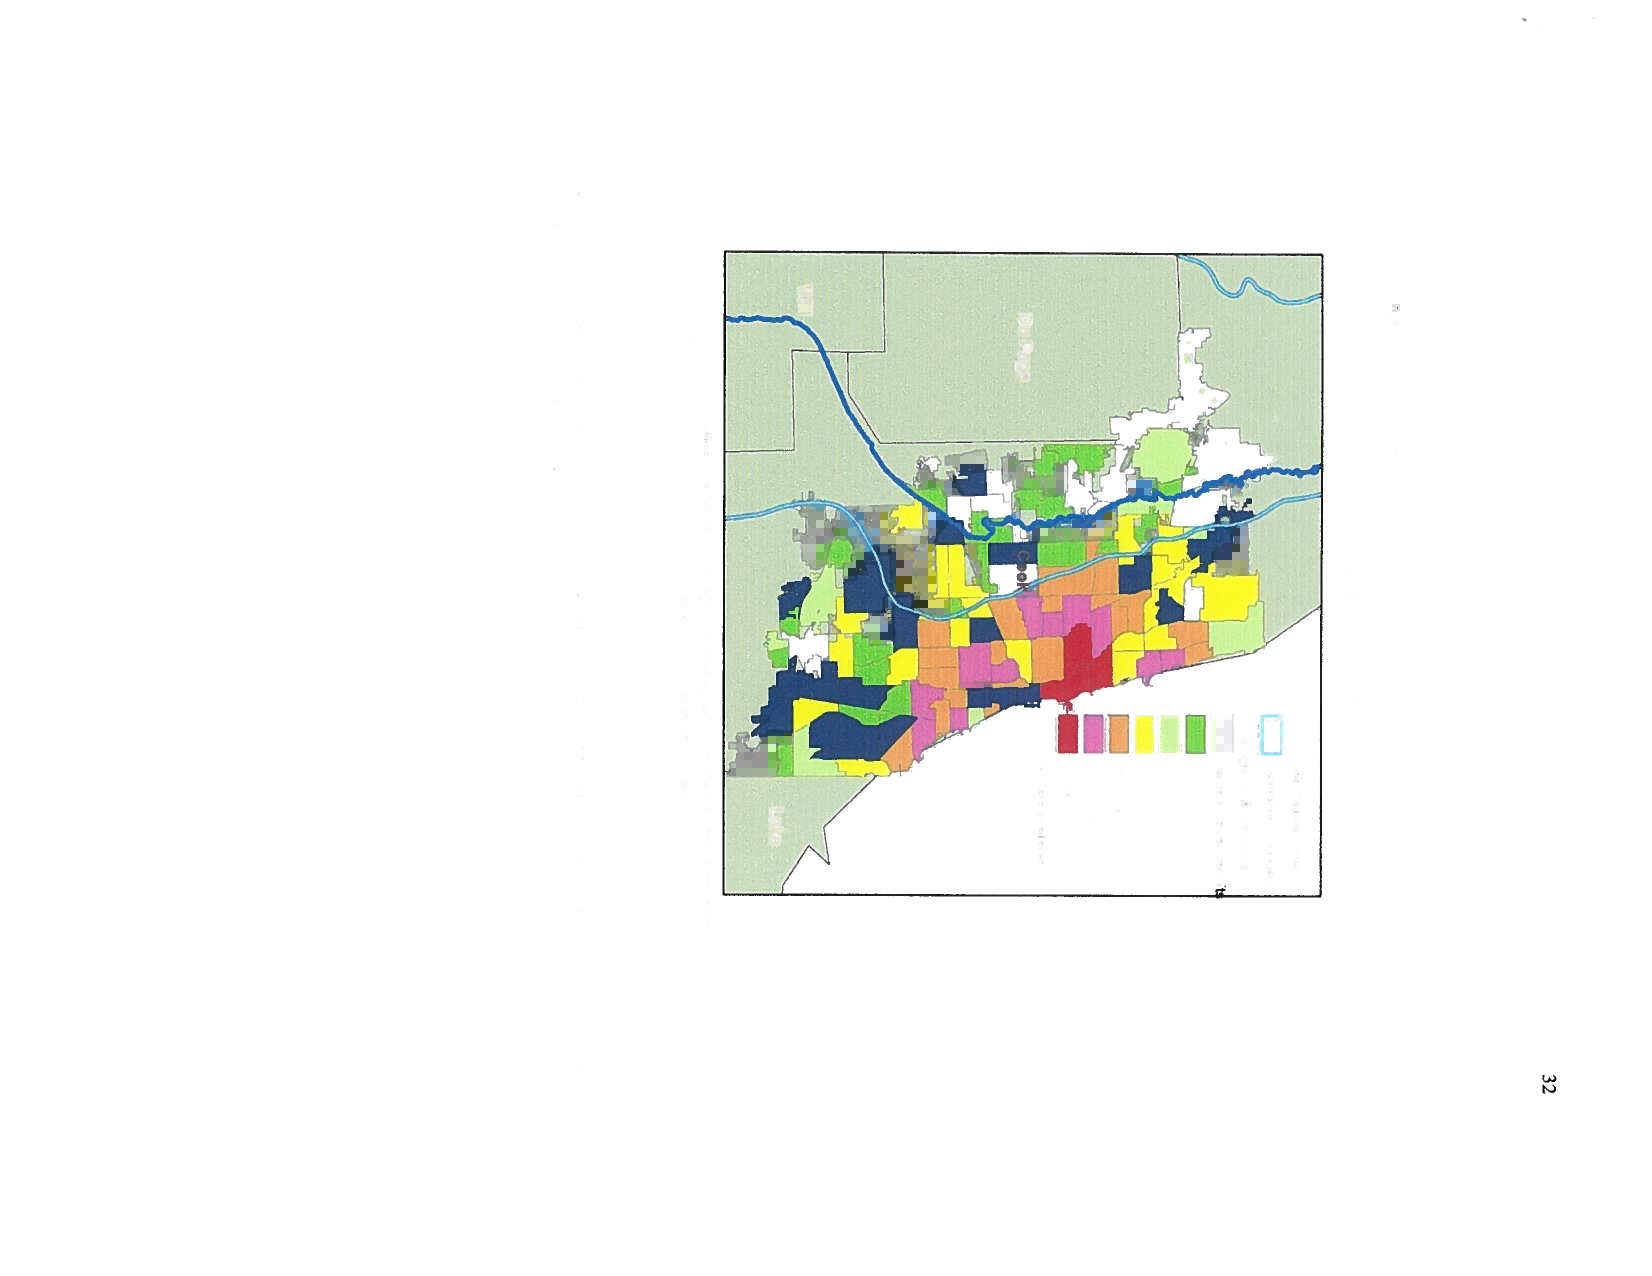
Appendix B: Land use and recent development in
the Des Plaines watershed
Appendix
C:
EA Engineering, Science, and Technology
Report on sediment chemistry
Electronic Filing - Received, Clerk's Office, September 8, 2008
2
I.
Introduction
I have been
asked by Midwest Generation to review and comment on the Illinois EPA
Water
Quality Standards
and Effluent Limitations for the Chicago Area Waterway System and the
Lower Des Plaines
River: Proposed Amendments
to 35111. Adm. Code Parts 301, 302, 303 and
304 (the “Proposed
UAA
Rules”) and
supporting
documentation provided to the Illinois
Pollution
Control
Board (the “IPCB”) in the rule-making docketed as R08-09.
In the
mid-1990’s, I lead evaluations of sediment quality on the Des Plaines River for
Commonwealth Edison in support of the Upper Illinois Waterway (UIW) Task Force process
(Burton, 1995, 1998; Burton and Brown 1995). These studies involved evaluations of sediment
contamination
and
toxicity on the upper 55 miles
of the UIW, reviews of the
literature
on
temperature,
turbidity and barge traffic effects, in situ toxicity evaluations around the Joliet
power stations, and
laboratory evaluations of temperature effects.
My area
of expertise
is in the
evaluation of
freshwater ecosystem stressor effects, particularly focusing on the role of sediment
and
storm water quality (Appendix A). Therefore, this review deals with the stressors in the
UIW, their role in
biological impairment, and
interrelationships with other key watershed factors.
Effective
management of aquatic ecosystem quality requires a comprehensive,
watershed based
framework,
because upstream inputs affect downstream ecosystems. This process is well
understood and was the foundation for the U.S. EPA’s TMDL approach. Each aquatic
ecosystem is both unique
and complex. Protective
management approaches such as NPDES
permit limits, water and sediment
quality
standards, and Best Management Practices have
numerous
assumptions
and uncertainties that confound the ability to ensure they
are
effective.
Determining
what will be effective requires an interdisciplinary approach and understanding
of
how dominant physical,
chemical and biological factors interact. This dictates
that
state-of-the-
science
approaches be used that generate an adequate level of quality data and that the associated
uncertainties and assumptions be clearly understood and stated. The current consensus is that
reliable “weight-of-evidence”
based
approaches are necessary in environmental quality
assessments,
providing for sound decision-making (e.g., Burton et al. 2002ab; Wenning et al.
2005,
USEPA 2000). These
approaches should characterize and link the key “exposure”
(i.e.,
stressor) components with indigenous biological “effect”
components using
reliable, peer-
reviewed, and quantitative
approaches where reference conditions, dominant stressors (including
their spatial and
temporal patterns), and, fmally, associated risk is clearly defined.
Unfortunately,
this important process has not been followed in the supporting documentation for
the Proposed
UAA Rules, as explained below.
II.
Overview of the Des
Plaines Watershed and its Impairments
A wealth of
information exists on the Des
Plaines River and its watershed. It is clearly a
watershed that is heavily
dominated
by human activities, with no pristine waters. It
drains nearly
855,000
acres in Lake, Cook,
DuPage and Will counties (Appendix B). The majority of
Chicago’s metropolitan
area drains into the Des
Plaines River and its tributaries. Much of the
current data has
been summarized by the
Illinois EPA (IEPA 2004, 2008). This human-
dominated
watershed is
characterized primarily by urban and agricultural
land
uses
(AquaNova
Electronic Filing - Received, Clerk's Office, September 8, 2008
3
& Hey 2003; CDM
2007;
Groschen
et
al. 2004).
The river is effluent dominated, receiving
municipal
wastewaters from many cities, including the
31
largest in the nation. Municipal
wastewater constitutes
more
than 70% of the flow during low flow periods (CDM 2007 —
Attachment B to
Illinois EPA Statement
of Reasons). The Illinois
EPA 2004
303(d)
List report
on Illinois
water quality for 2004 identified a large number of possible causes of beneficial
use
impairment in
this system (IEPA 2004). The 2004 303(d) List included the following
list of
causes of
impairments:
organic
chemicals,
nutrients, metals, pathogens, ammonia,
sedimentation/siltation,
total dissolved
and suspended solids, chlorides, flow alterations,
dissolved
oxygen, flow and habitat alteration, combined sewer overflow, urban runofFstorm
sewers, and fish
consumption advisories. Surprisingly, in
the
Illinois
EPA 2008 Integrated
Water Quality
Report and Section 303(d) List, Final Draft dated June 30, 2008,
many
of
the
2004 303(d)
List causes and sources of impairment were deleted from this most recent Illinois
EPA
report (IEPA
2008). While the Illinois EPA’s reasons for deleting certain of the 2004-listed
causes and
sources of impairments are not explained in the 2008 Final Draft Integrated Report,
some of its reasons are
provided
and show that the deletion of the causes and sources of
impairments is
not due to their having ceased being impairments to the
system.
Rather, these
deletions are due to changes in the “criteria” that the Illinois EPA uses to identify such
impairments.
For example, with respect to total nitrogen and dissolved oxygen
causes of
impairments, the
Illinois EPA states:
We
have stopped using total nitrogen,
as a
cause
of
impairment
for
aquatic life use. Total nitrogen appeared as nitrogen (total) on
previous 303(d) lists. We do not have a standardfor total nitrogen
related to aquatic life. In streams, we typically do not have total
nitrogen data. The methods, criteria and the manner in which
nitrogen was reported as a cause of impairment ofaquatic life use
have
changed
many times over previous assessment
cycles. These
criteria
had
never been shown
to be
related to
aquatic life use
impairment in any scientjfIc study and had never been used or
proposed as
water
quality
standards.
Illinois now believes that the
criteria
by
which it placed total nitrogen on previous 3 03(d) lists
were
not scientifically valid. Illinois does not believe that a
scient’fically
valid criterion currently exists for determining
when
nitrogen
is
causing an impairment
of
aquatic life use in this state.
Dissolved oxygen (which is a cause of
impairment
used to indicate
low dissolved
oxygen) has been changed from a pollutant
to
a
nonpollutant cause of impairment. Although low dissolved oxygen
may be caused by
pollutants, the impairment does not result from
the discharge of
dissolved oxygen into the water. Furthermore,
federal regulations in CWA Section
502(6)
do
not
define dissolved
oxygen or low
dissolved oxygen as a pollutant. Because only
pollutant causes of
impairment appear on the
3 03(d)
List this
means that all entries of dissolved oxygen
have been delisted.
Electronic Filing - Received, Clerk's Office, September 8, 2008
4
Thus, while the Illinois EPA’s 2008 draft list of causes and sources of impairments may be
shorter than the UIW
2004 list
of
impairments,
it does not appear to reflect any real
improvements in
the quality of the subject waterway.
The quality of the Des Plaines River ranks among the worst in the state (and likely the nation), in
number of impaired reaches (USEPA 303d Fact Sheet). Every reach of the Des Plaines River
reported in the
Illinois EPA 2008 Integrated Report had multiple
causes (i.e.,
stressors)
and
sources that contributed to
non-attainment
of beneficial uses. (In the 2004 3 03(d) List, a total of
more than 800
causes and sources of impairments were identified). Of the Illinois EPA-
identified
impairments, the most common sources of impairment on many reaches are municipal
point sources, contaminated sediments, channelization, flow regulation, hydro-modification,
combined sewer
overflow
(CSO),
and urban runofI7storm sewers.
In the Illinois EPA
2002
305b Report,
“thermal modification” was listed as a possible cause of impairment, although it
was not identified as a
stressor for the Des Plaines River
in
2002.
The
more recent Illinois EPA
2004, 2006 and
2008, Integrated 305b/303d reports do not list thermal modification
as a possible
cause of
impairment in the Des Plaines River. The Upper Dresden Pool (UDP) area has multiple
causes
and sources of use impairment identified by the Illinois EPA (Appendix B-i of IEPA
2006 305(b) Report).
The causes include:
DDT, flow regime alterations, phosphorus, mercury,
PCBs, total suspended solids, and sedimentationlsiltation. The sources of impairment identified
include: urban
runoff, municipal point sources, contaminated sediments,
and impacts from
hydrostructure/flow regulationlmodification.
The upper part of the UIW is known as the Chicago Area Waterway System (CAWS) consisting
of 78 miles of
man-made canals and modified river channels. These were created to drain
urban
runoff,
treated wastewater and support commercial navigation (CDM 2007). All of this artificial
and modified system is further
altered
by
five
structures
(i.e.,
engineered
locks) that control flow.
With no high
quality habitat and the continual presence of contaminants that spike to high levels
during
periodic events, no pollution sensitive aquatic life is expected. Unfortunately, water
flows downstream and the
contaminants identified as causes of impairment also travel great
distances
affecting downstream areas. Indeed, the growing incidence of hypoxia in the Gulf
of
Mexico is largely due to nitrogen inputs from
agricultural runoff
in the upper Midwest (e.g.,
Scavia and Donnelly 2007), while the UDP area is only a few miles downstream of the CAWS.
The Illinois EPA has
found the Chicago Sanitary and Ship Canal
(CS SC)
has
7
causes of
impairments
originating from 8 major source categories (IEPA 2006, 2008). Because most
of
the
water (approximately 70%) is municipal wastewater effluent (with additional contributions
from urban runoff)
it contains significant loadings of stressors that will impact the lower reaches.
In
addition, the flow alterations upstream will impact downstream flows. Some of the stressors
are more likely to be transported
long distances downstream, such
as
fine
solids, metals, and the
more
problematic organic chemicals (such as, larger polycyclic aromatic hydrocarbons,
pyrethroid
and
chlorinated pesticides). This is evidenced by the high levels of contaminants
in
depositional
sediments in the UDP, as discussed further below.
Further
downstream from the CS SC, there arc four significant tributaries that empty into the
upper Des Plaines
River. Each of these key tributaries provide the potential for a refuge for fish
from the Des
Plaines, a source of aquatic life, and correspondingly a source of pollution.
Unfortunately, these
waterways
have several
causes
and sources
of
impairment. Hickory Creek
Electronic Filing - Received, Clerk's Office, September 8, 2008
5
discharges directly
into the Brandon Road Lock
&
Dam
tailwaters
which
have good
quality
habitat.
However, according to the Illinois EPA’s Integrated Reports, the lower areas nearest to
the
Brandon tailwaters (GGO2 and 06) do not support aquatic life or primary
recreation
uses due
to
the following
impairments: fecal coliforms, chloride, alteration
to
streamside or littoral
vegetation,
flow
alterations, sedimentation/siltation, total dissolved and suspended solids, zinc,
nitrogen,
phosphorus and algae. The sources of these 11 causes of impairments are thought to be
combined
sewer overflows, municipal point source discharges, urban runoff, channelization,
flow
regulation
structures
and land
development
(IEPA
2006, 2008).
Grant Creek does not
support aquatic life
due to unknown impairment sources (lEAP 2006, 2008). Jackson Creek
does
not support
aquatic life
due to
altered
flow, phosphorus and aquatic
plants (IEPA 2006,
2008). Finally,
DuPage River segments do not support aquatic life, fish consumption and
primary
contact beneficial uses due to altered flow, sedimentation/siltation, silver, phosphorus,
aquatic
plants, PCBs, chloride, DDT,
hexachlorobenzene,
nitrogen, fecal
coliforms, and
dissolved
oxygen. These 12 causes of impairment were stated to originate from 6 sources,
including
hydrostructures, land development, upstream impoundments, urban runoff, municipal
point sources, and contaminated
sediments (IEPA 2006, 2008) which are documented
to be
accumulating at
the mouth of the DuPage River in the Des Plaines River (see below).
The
high degree of impairment and the multiple causes and sources
are
to be
expected,
based on
the
dominance of
human activities and the limited nonpoint source runoff controls in the
watershed.
In fact, these dominant stressors and the resulting
biological
impairments
are similar
to other waterways
that are human dominated (e.g., Burton et al. 2000; Burton and Pitt 2001).
The unique,
human-dominated nature of this watershed makes the critically important issue of
reference
waterway selection difficult. The reality is that the Des
Plaines watershed is
one of the
most
heavily human-dominated
waterways in the nation. This will not change. While the
quality of the Des Plaines can be
improved via a comprehensive watershed management
program, it
will always be a
heavily
modified waterway.
Until
the stressors that dominate as
causes of the beneficial use
impairments (identified above) are reduced significantly, there will
be risks to
the aquatic biota and to humans that
consume fish and recreate in the UDP.
In
the following
discussion, evidence will be presented that supports the fmdings of the recent
Illinois
EPA
305(b) Reports on the
primary
causes
of beneficial use impairments in the UDP
and
why these stressors
and impairments will persist in the foreseeable future. These dominant
stressors
include: contaminated
sediments, metals, synthetic organic chemicals (including
pesticides,
PAHs and
pharmaceuticals
and
personal care products (PPCPs), nutrients, flow
regime
alteration and
degraded
habitats. Unless the great majority of these stressors (and their
sources) are removed, the
CSSC and UDP will continue to be impaired.
III.
Wet Weather
Impacts in the UIW
While water quality in the
UIW has improved since the 1970s,
the recent Illinois EPA 305(b)
Reports found no
significant
changes in beneficial use attainment. This is despite the
MWRDGC
improvements
(including
TARP) to reduce the impacts from wet weather
events
to
the
waterway. The
lack of improvement is likely the
result of two key factors. First, there will
Electronic Filing - Received, Clerk's Office, September 8, 2008
6
be
continuing,
significant inputs from many
large CSOs (Appendix B) that provide large
loadings of raw
sewage with associated solids,
nutrients and chemical contaminants. Based on
MWRDGC data,
during the period from January
1,
2007
through August 6,
2008,
there
were 117
CSO events at
4 major CSO stations (www.mwrdgc.dst.il.us/CSO/display_only.aspx).
Second,
there will
continue to be significant nonpoint source inputs from both urban and, to a lesser
extent,
agricultural runoff given the nature of the watershed
and
its continued development
(Appendix
B).
A press release by the University of Illinois —Urbana Champaign (August
1,
2007) reported that
“flood peaks in the
Chicago metropolitan area are higher than they used to
be, and they
are also higher than estimates currently
used by
water managers, according
to an
Illinois-Indiana Sea Grant study. . . .the steady increase in
flood
discharges
in
small
streams
over
the past 100 years is due to
increases
in urbanization and precipitation, with urbanization playing
the major role..
.Between 1954 and 1999, urbanization,
on average,
increased
from
about 11
percent
to
52 percent in the
12
Chicago watersheds... the 10 largest historical storms have
occurred
since 1950, and these storms were much larger than any in the previous 50 years.”
These urbanization trends
are
also reflected in data through 2006 shown in Appendix B, showing
changes in land use,
development, population,
and housing from the USGS, Chicago
Metropolitan
Agency for Planning, and
U.S.
Census Bureau. It
is apparent that the Des Plaines
watershed’s
trait of being human dominated is increasing steadily with time and will likely
continue
long-term, despite the recent economic slow-down. This fmding is also
reflected in the
recent
comprehensive USGS study and US Census Bureau data (Groschen et al 2004). Growth
has been greatest in the
counties
surrounding
Chicago (ranging from 14 to 42 percent: Du Page
16%,
Grundy25%, Lake 25%, Kane 27%, Kendall
38%,
McHenry42%, Will
41%).
Agricultural runoff is contributing four groups of stressors: clay/silt sediments, nutrients (from
fertilizers and
livestock), metals (a common contaminant of fertilizers),
pathogens (from
livestock),
pesticides, and pharmaceuticals (from livestock). The recently banned insecticide
Diazinon (toxic in the part per
trillion range)
is
still
being
marketed
and used. It was frequently
found in the Des Plaines River
watershed
(93% of samples). In agricultural parts of the
watershed,
Atrazine
was
found in every sample (Groschen et a!. 2004).
While
the recent
and
near-future improvements from TARP are noteworthy,
this
will continue
to
be
a highly
impacted waterway, being effluent-dominated and receiving large
amounts of
untreated
nonpoint source (NPS) runoff containing a wide range of nutrients, pathogens, metals,
petroleum products, “new-age”
pesticides
and
pharmaceutical and personal
care products (PPCP)
which are
often referred to as emerging contaminants. Many of these chemicals are known to
be
toxic at the
part-per-trillion level and/or hormone disruptors (Burton and Pitt 2001; Burton
et a!.
2000). Urban
and agricultural storm waters in streams are often acutely toxic (Burton et a!.
2000;
Burton and Pitt 2001; Hatch and Burton 1999; Tucker and Burton 1999). In addition to
the
chemicals, solids erode from
urban,
construction and
agricultural lands
and constitute the
number one
pollutant of river systems (USEPA 2002; Burton and Pitt 2001). Many of the above
stressors have
been identified by the Illinois EPA as the primary causes of impairment on the
Des
Plaines (IEPA
2004, 2006, 2008); the others are known to be common in human-dominated
waterways as discussed above and
below.
The above
NPS inputs will continue
for many years, likely decades, and will continue to
adversely impact
the
downstream ecosystems. The sheer
magnitude of urbanization and
Electronic Filing - Received, Clerk's Office, September 8, 2008
7
agriculture in the watershed (Appendix B) and lack of effective NPS controls dictates that NPS
related
degradation will be the dominant source of impairment for the foreseeable future. This is
not surprising,
because NPS runoff is the leading cause of water quality problems in the U.S.
(USEPA
2002).
IV.
Sediment Quality
It is
well known that chemicals (nutrients, syiithetic organics and metals) and pathogens tend to
associate
with solids due to polar and non-polar binding affinities (Burton 1992). Therefore,
those
sediments
that have greatest surface areas (clays, silts, colloids) will accumulate the
greatest
concentrations, and
thus
serve as both
a
sink and a source of contamination. Indeed,
contaminated
sediments
are the cause of use impairment of4l of 42 Great Lakes Areas of
Concern and
the
dominant cause for Superfund site designation in our waterways. Depositional
sediments
are not stationary and continue to contaminate resident organisms and downstream
waters via common fate processes, such as resuspension, advection, bioturbation and diffusion.
All of these fate
processes exist on the Des Plaines River and vary spatially and temporally.
In
cases, for
example, where overlying water quality may be relatively good (i.e., meet water
quality
standards),
contaminant concentrations will steadily increase in depositional sediments
and
provide an environment for bio
accumulation
in
benthic
organisms
(e.g.,
Burton
et a?.
1992;
Wenning et a?.
2005). The U.S. Environmental Protection Agency (USEPA) has shown
dramatic correlations between fish tissue consumption
advisories and
the
levels of sediment
contamination.
On the Des Plaines, most of the reaches assessed in the Illinois EPA 3 05(b)
Reports have fish
consumption advisories and the levels of mercury and PCBs found in
sediments
suggest a substantial risk exists to those consuming fish from the Des Plaines River.
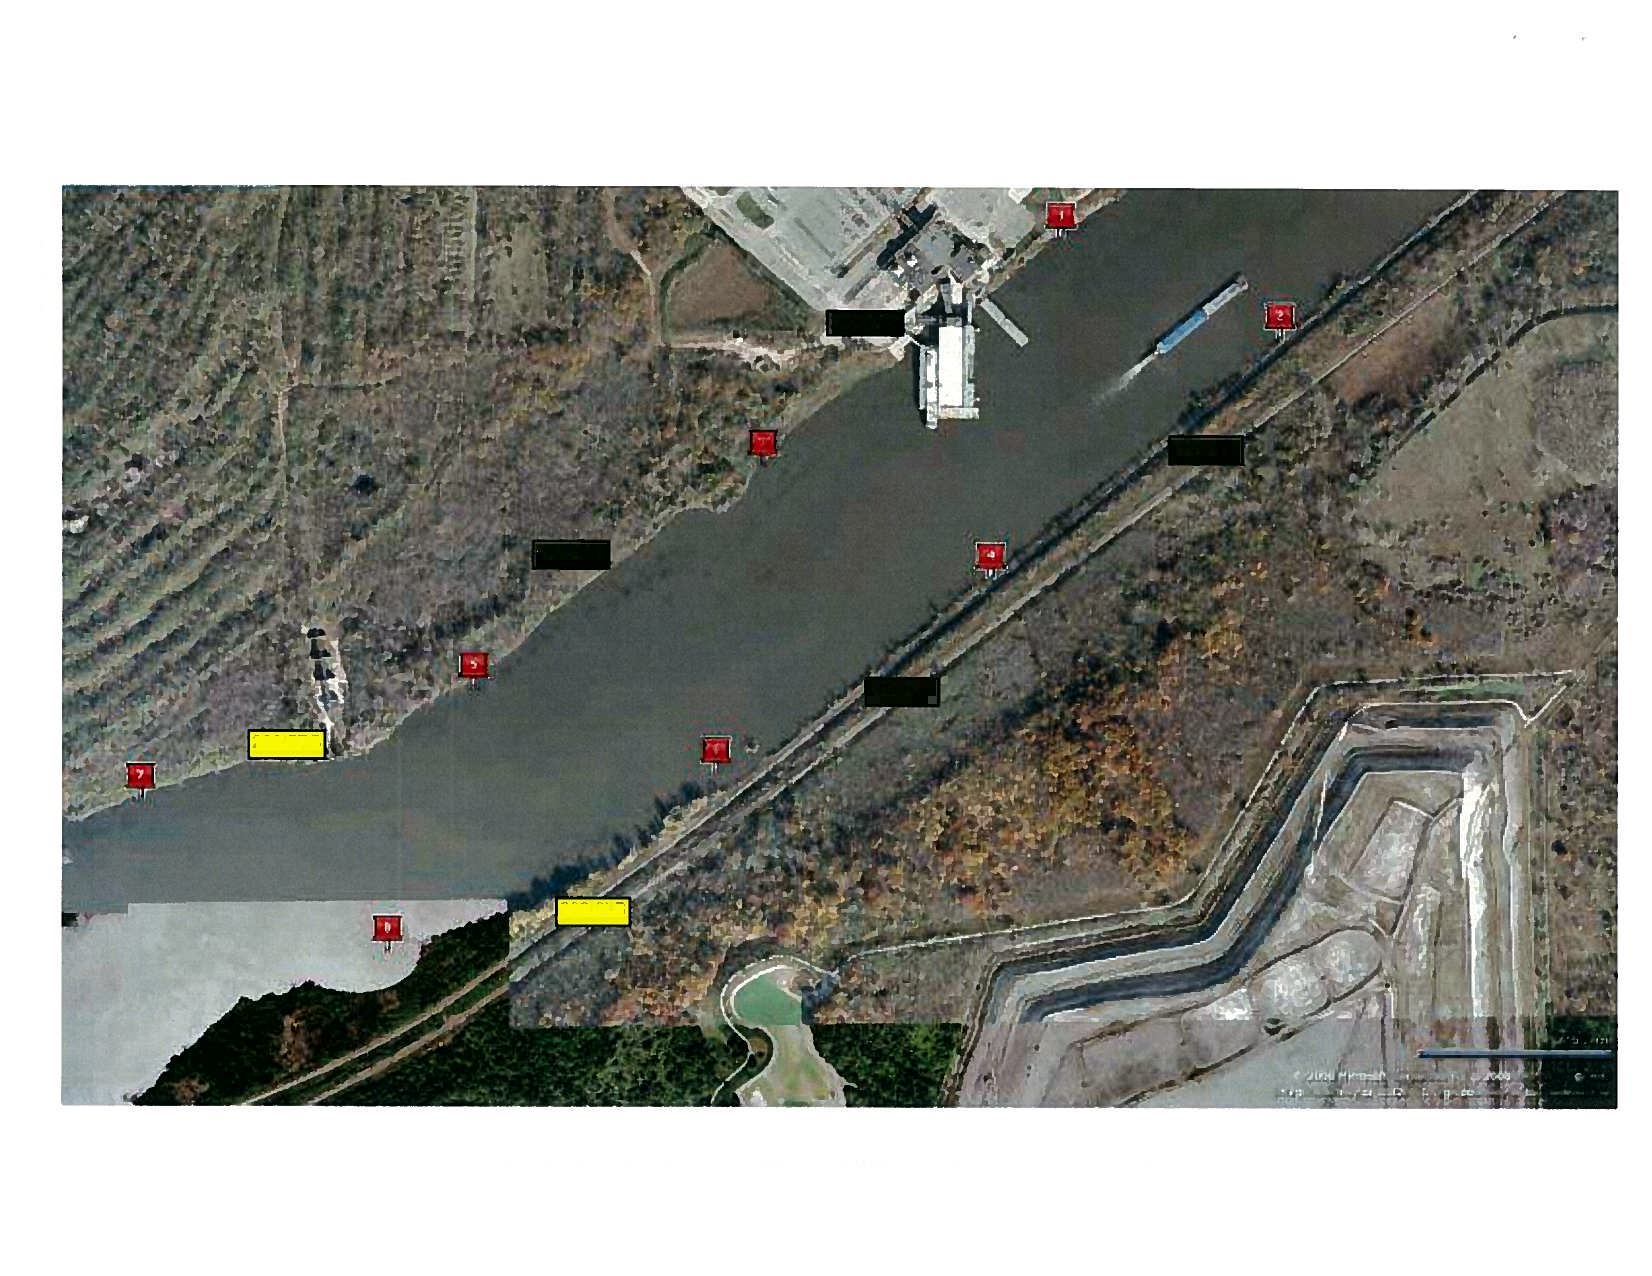
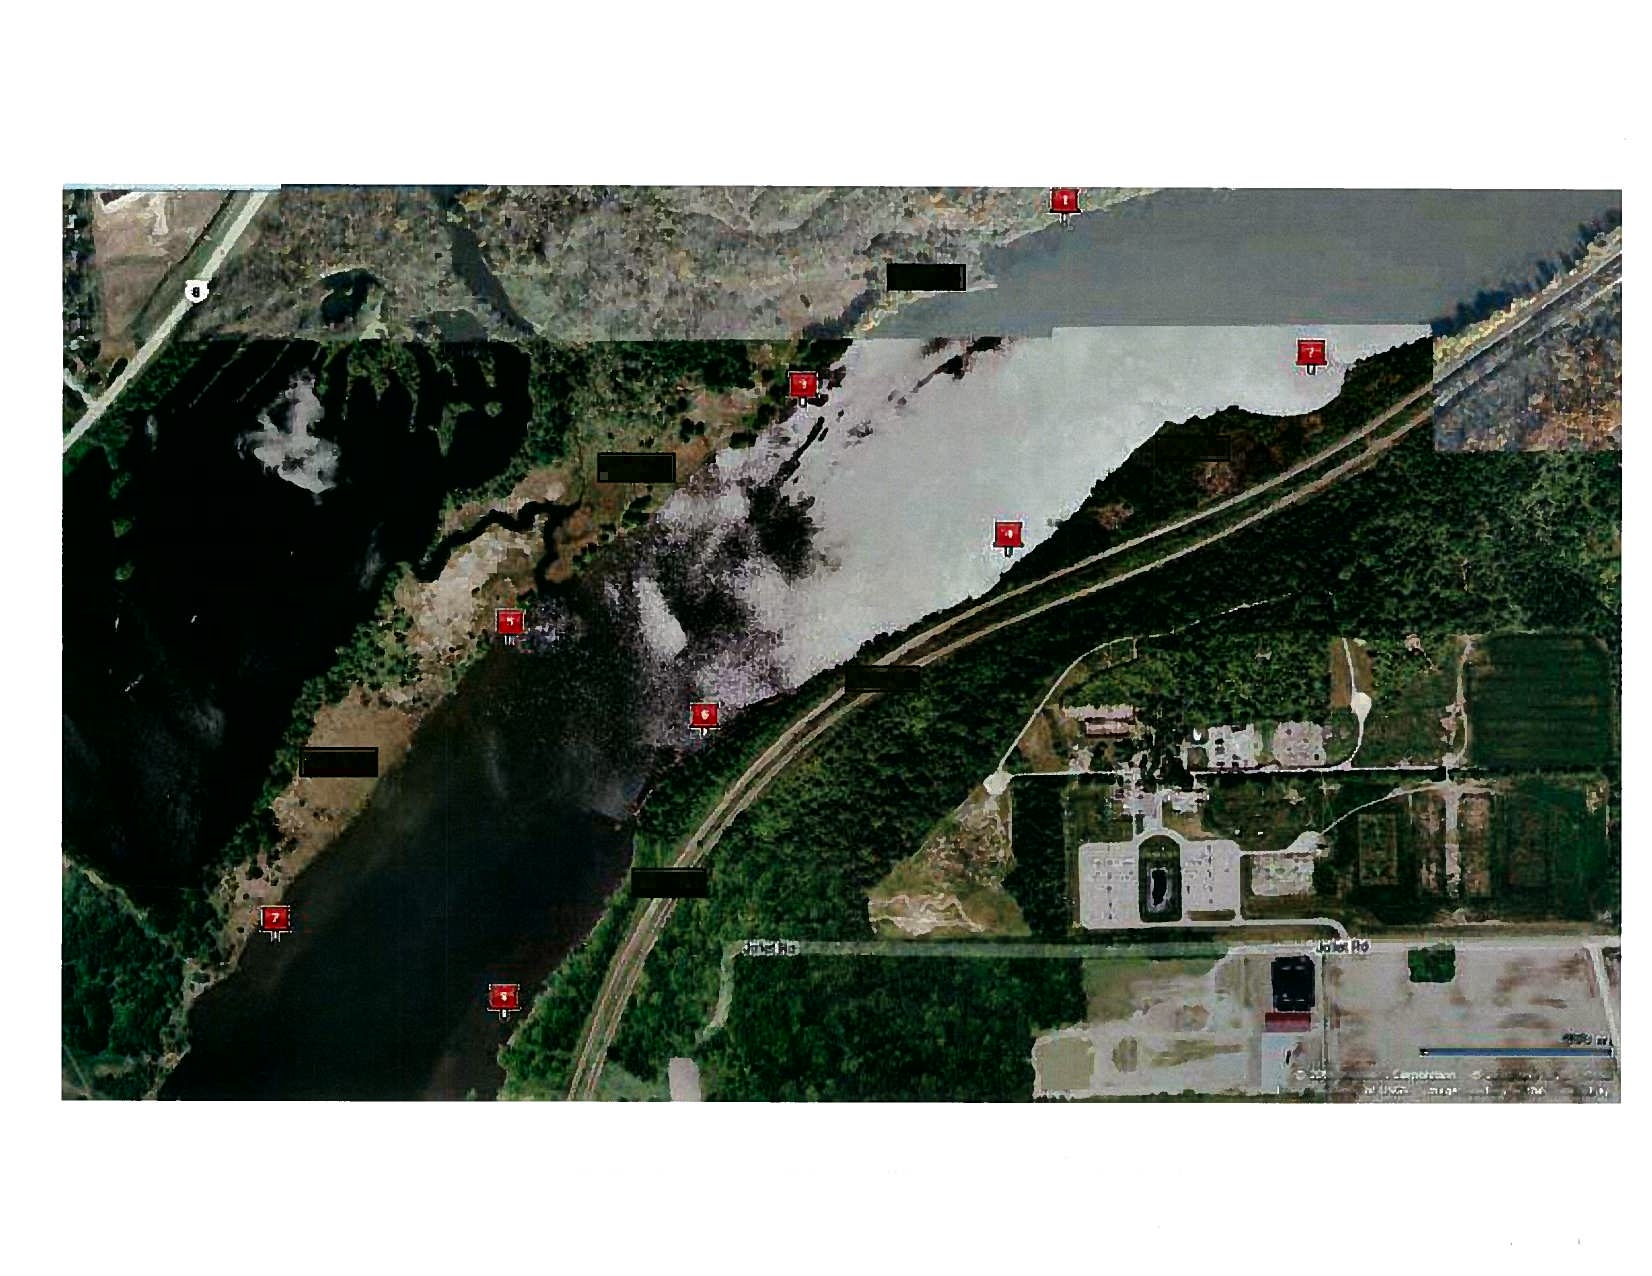
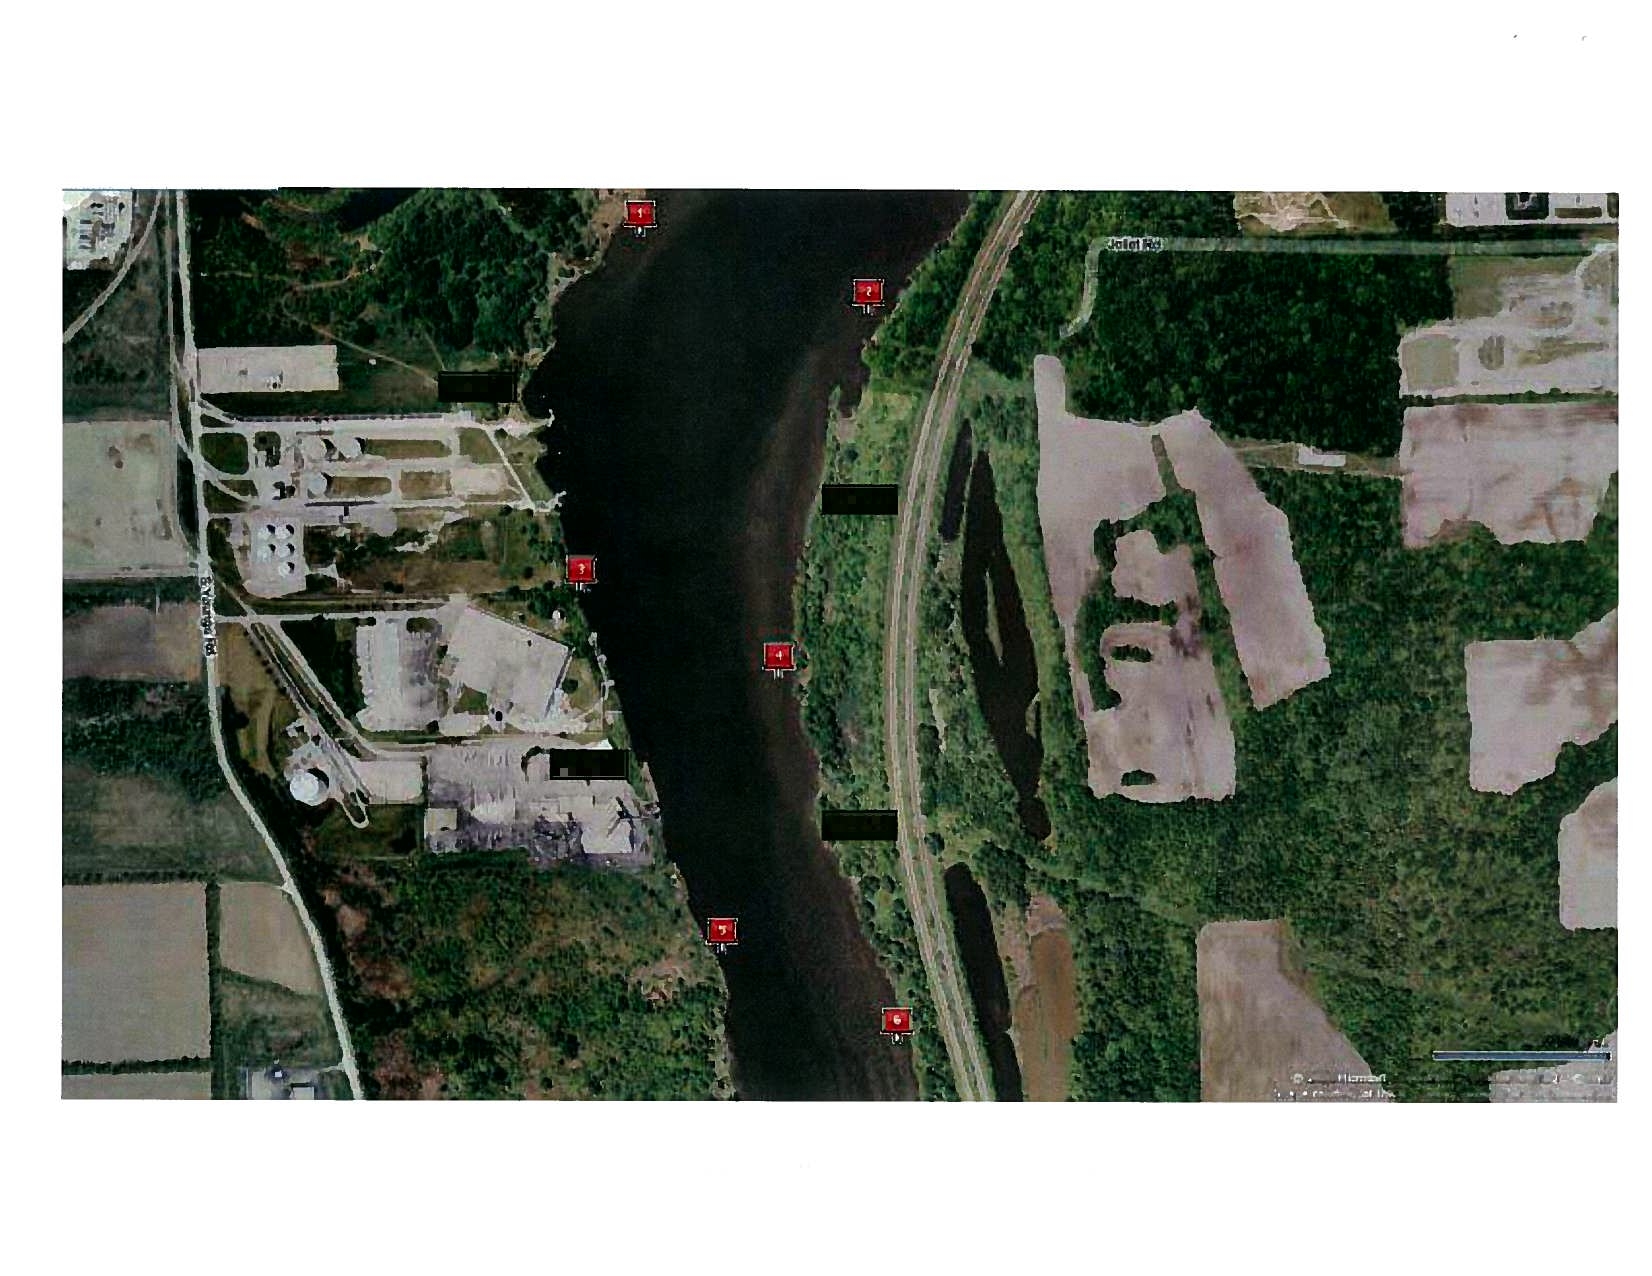
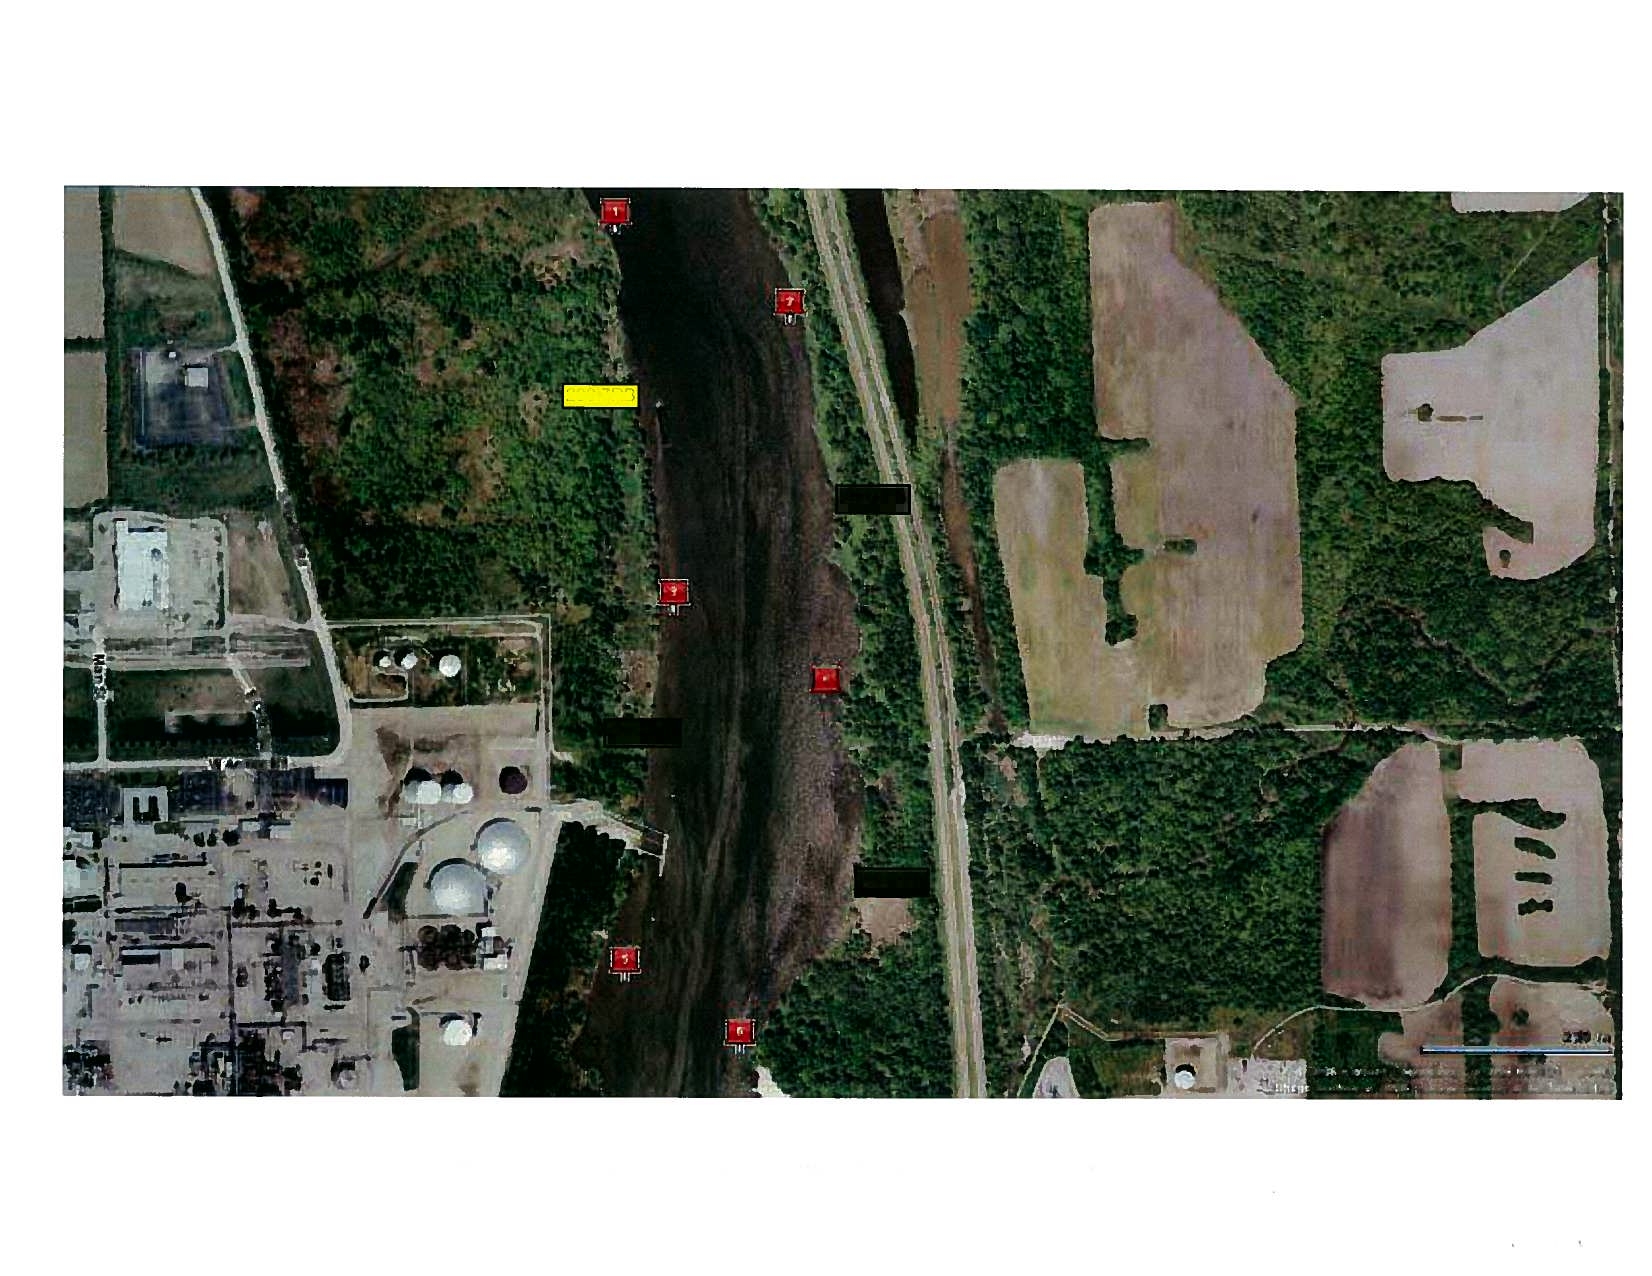
There have been
several studies of sediment chemical contamination and toxicity in the UIW,
from
the CSSC downstream through the Dresden Pool
since the
1990s (Burton et
a?.
1995;
Groschen et a?. 2004;
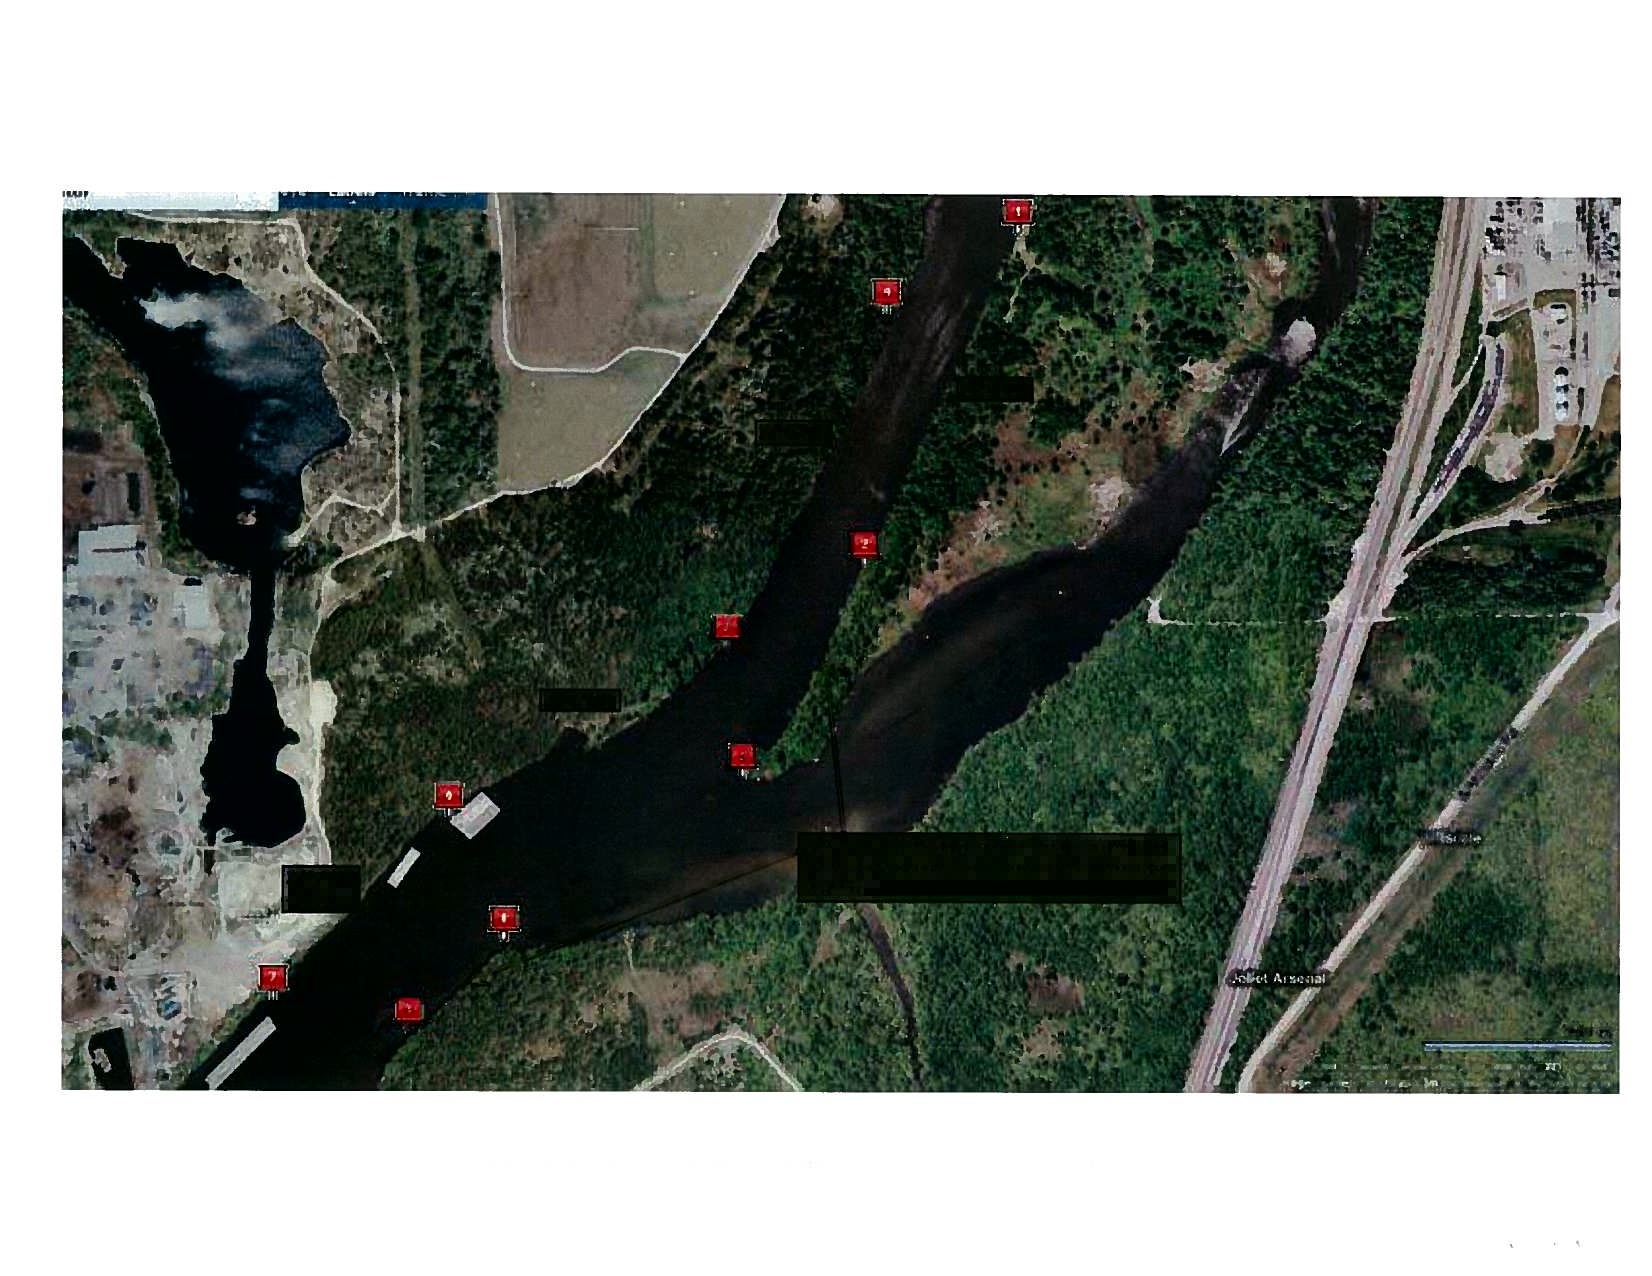
MWRDGC 2008, EA Engineering, Science, and Technology 2008). The
most recent
study by EA (2008) was conducted in the Dresden Pool and the lower portion of the
Brandon Pool between May 6 -9,
2008.
This
extensive
physical and
chemical
survey
included 35
sediment samples (31 in the Dresden Pool and four in the Lower Brandon Pool). Analyses
included total
organic carbon, total solids (percent moisture), grain size (sieve and hydrometer),
arsenic, silver, cadmium, chromium, copper, lead,
mercury,
nickel,
zinc,
polycyclic aromatic
hydrocarbons
(PAHs), and polychlorinated biphenyls (PCB congeners).
These studies
have documented that the depositional sediments (clays and silts) have been and
continue
to be severely contaminated with metals, synthetic organics and nutrients throughout
the UIW
(from northern Chicago to the Dresden Island Lock and Dam). The depositional
sediments are often
acutely or chronically toxic
to
benthic invertebrates (Table 1 below; Tables
9-11
Appendix C). All have shown typical high degrees of riverine spatial heterogeneity (i.e.,
natural variation
across
the
river and longitudinally). This high degree of spatial heterogeneity
makes
determinations of improvement through time extremely difficult. Indeed, high levels of
sediment
contamination and exceedances of internationally accepted sediment quality guidelines
(SQGs)
are as
common now as in the early 1990s.
Electronic Filing - Received, Clerk's Office, September 8, 2008
8
Contamination of the Des Plaines River sediments is not only historical but is on-going due to
the point and nonpoint
sources
discussed
above. Nutrients, metals, pathogens and synthetic
organics
(primarily polycyclic aromatic hydrocarbons
(PAHs) and new age pesticides such as
pyrethroids) are
common constituents today of both point and nonpoint source loadings in
waterways such as
the Des Plaines (Burton and
Pitt
2002;
USGS 1999). Although there are no
known plans to
dredge sediment locations in the UPD area,
even the removal of significantly
contaminated
and acutely toxic sediments from depositional areas identified throughout the
UIW
(Burton 1995) would provide but a temporary improvement. The hydrologic conditions and
continued
point and nonpoint source loadings would eventually result in contaminated sediments
re-accumulating because
the myriad of sources
will not be removed. The Illinois EPA-identified
problems
associated with TSS, siltation and contaminated sediments (IEPA 2004, 2008) suggest
widespread watershed
sources
of these
major
stressors.
Indeed,
sediment sampling in the UIW (CSSC to Dresden Island Lock and Dam) between 1994
and 2008 showed that the concentrations of organic contaminants in the depositional sediments
of the UIW exceed
widely
used
sediment quality guidelines
(SQGs) for
probable
adverse
biological effects
(Appendix C) (Burton 1995, USEPA 2001, MWRDGC 2008, EA Engineering,
Science, and Technology
2008).
SQGs
are
widely used to determine which sediments are toxic
and thus represent a
threat to the aquatic biota (Wenning
et a?.
2005).
They
have
been used in
Superfund,
RCRA and State investigations for many years and are frequently used to establish
“clean-up” levels for
remediation activities
(Wenning
et a?. 2005). One of the biological-effects
approaches that has been widely used to assess sediment quality relative to the potential for
adverse effects on
benthic organisms in freshwater ecosystems
is the Threshold Effects
Concentration (TEC)/Probable Effects Concentration (PEC) (MacDonald et a?. 1996) approach.
TECs typically
represent concentrations below which adverse biological
effects are not expected
to
occur, while PECs typically represent concentrations in the middle of the effects range and
above
which effects are expected to occur more often than not. (MacDonald et
a?.
2000).
Comparing the analytical results of sediment sampling to the SQGs, the Burton, U.S. EPA, and
MWRDGC surveys all document that these sediments are highly contaminated and are likely
to
cause adverse biological
effects (e.g., Buchnian 1999; McDonald
eta?.
2000ab,
Wenning eta?.
2005). Recent
studies by the MWRDGC (2007) and EA Engineering, Science, and Technology
(2008) found that Brandon Road
and
both upper and lower Dresden Pool sediments continue to
be
highly contaminated with nutrients, cyanide, metals, and synthetic organic chemicals.
Sediments from a majority
of the sampling locations had both an odor and
a
sheen
indicative of
petroleum
products.
A
sediment survey was conducted in the Upper Dresden Pool and the lower portion of the
Brandon Pool between May 6 -9,
2008
by
EA
Engineering, Science
&
Technology
(“EA
2008
Sediment Survey”).
A copy of the report prepared by EA on the EA 2008 Sediment Survey is
attached as Appendix C. In
the EA 2008 Sediment Survey,
35
sediment samples, 31 in the
Upper
Dresden Pool and four in the Lower Brandon Pool, were collected for
physical
and
chemical characterization. The
physical composition of the sediment was determined by total
organic carbon,
total solids (percent moisture) and grain
size
(sieve and hydrometer)
analysis.
Electronic Filing - Received, Clerk's Office, September 8, 2008
9
The target
analytes for
identifying the chemical
composition of
the sediments included
arsenic,
silver, cadmium,
chromium, copper,
lead, mercury, nickel, zinc,
polycyclic
aromatic
hydrocarbons
(PAHs), polychlorinated
biphenyls
(PCB congeners).
The extensive
EA 2008
Sediment
Survey
conducted
this past May
(2008) documented exceedances
of sediment
guidelines
for
metals,
PAHs and PCBs at
almost
every sample location
(Tables
9
and 10,
Appendix
C). A
majority of the
sampling locations had
both
an odor
and a sheen, both
of which
are indications
of sediment contamination.
(Appendix C
at
p.
10).
As
explained
in the EA
2008 Sediment
Survey report (Appendix
C at
p.
9), one of the biological-
effects approaches
that
have
been used
to assess sediment
quality
relative
to the potential
for
adverse
effects
on
benthic organisms
in freshwater
ecosystems is
the Threshold Effects
Concentration
(TEC)/Probable
Effects Concentration
(PEC) (MacDonald
et al. 1996) approach.
The TEC and PEC
concentrations are
sediment guidelines
used
to
identify potential adverse
biological
effects associated with
contaminated
sediments. TECs
typically represent
concentrations
below
which
adverse biological
effects are not expected
to occur,
while
PECs
typically represent
concentrations
in
the middle of the effects
range and above which
effects
are
expected to occur
more often than not.
(MacDonald
et.
al. 2000)
In the
Lower Brandon Pool,
metals concentrations
of the sediments,
with
limited
exceptions,
exceeded
the PEC
values.
The
total
PA}{ and PCB concentrations
exceeded the
PEC values in
all four samples
(Appendix C at
p.
1
1). In the
IJDP, concentrations
of metals, PAHs
and PCB
congeners
were
elevated.
Metals concentrations
exceeded the
PEC
values at several
locations.
Total
PAH
concentrations
exceeded PEC
concentrations at 61%
of the locations sampled
(19
locations)
and
total PCB concentrations
exceeded PEC
values
at
29% of the
locations sampled
(8
locations).
(Figures 2 and 3,
Appendix C).
The fact that both the
Upper
Dresden and the
Lower
Brandon Pools
had
high concentrations
of both metals and
organic
constituents
indicates that
large portions
of these pools are
of poor sediment
quality. This includes
the higher
quality
habitats
of
the
Brandon
Road Lock
& Dam tailwaters.
Many of these
areas
had
extremely
high levels of sediment
contamination,
greatly
exceeding
SQGs.
For
example,
at
the
lower
end of the Dresden
Pool,
near
Bay Hill Marina,
96% of the
metal
and organic SQGs
were exceeded with
75% exceeding the
PECs (Appendix
C,
Table
9);
while upstream near
the DuPage
River,
1-55
and
Jackson
Creek
Dam
(stations
DR-13, 15,
and
16) between
79 and 100% of
the PECs were exceeded.
Remarkably
at DR-13
the PAH
PEC
was
exceeded
by
nearly 30 fold
and Benzo-a-pyrene
(a potent
human
carcinogen)
exceeded
the PEC
by
50-fold.
All 35
stations exceeded
the SQGs for
total PAHs, showing
pervasive
and extreme
sediment
contamination
indicative
of urban-dominated
watersheds. Of the
35
stations, 80%
exceeded the PECs
(up to
30-fold).
Because
the
U.S. EPA’s
2001 sediment survey
and recent surveys by
MWRDGC (2007) and
the
EA
2008 Sediment Survey
all found highly
contaminated depositional
sediments
similar
to
the
levels we found
in the mid-90’s
UIW work (Burton
1995), it is likely that
depositional sediments
are not
being
cleaned
out,
capped,
or significantly
degraded. Further,
contrary
to statements
made by Illinois EPA
that sediment
quality
is improving,
there are
no
reliable
data
establishing
a
trend of improving
sediment quality.
In fact, it appears
that there
has
been
no
improvement in
sediment
contaminant
levels,
as evidenced by
the
recent
2008
EA
Sediment
Survey
(Appendix
Electronic Filing - Received, Clerk's Office, September 8, 2008
10
C).
The 2008 EA
Sediment
Survey results were compared to the results of sediment sampling
from
the same
study area in 1994-1995 (Burton 1995) and to metals
data compiled previously by
the
MWRDGC (2007). Eighteen of the 1994-95 sediment study locations were
re-sampled
in
the
EA 2008 Sediment Survey. For the detected metals, the majority of the detected concentrations
from the 2008 EA
Sediment Survey
are either higher or within a factor of two or less, indicating
that overall, the sediment quality has remained the same or has degraded in several areas (see
Table 11 to EA
2008
Sediment
Study Report). A comparison of the results for PAHs and PCBs
was more
difficult because the 1994-95
study generally had higher detection limits than did the
EA 2008 study.
However, concentrations of both total PAHs
and total PCBs were elevated in
both studies,
indicating no basis to support the Illinois
EPA opinion that sediment quality is
improving.
The results indicate that sediment quality remains poor in both the Dresden and
Brandon Pools.
As
discussed above, surficial sediments are being routinely contaminated from urban, residential,
transportation and
agricultural runoff and a wide variety of small
to
large point
sources. These
sources
will continue to contaminate the depositional sediments and, as these sediments are
resuspended, they will continue to
contaminate
the more biologically sensitive and productive
lower reaches of the
UIW system along with the Brandon tailwaters and UDP.
The
main channel of the UDP, a
relatively
well scoured area, contains large grained sediments
that are non-toxic (Burton 1995).
However,
most
depositional
sediments
showed acute toxicity
and lie in the
limited habitat areas for fish (Burton 1995). The main channel is not primary
habitat and not
suitable for spawning. Indeed, one of the prime habitat for spawning in this
study
area is
the tail waters below Brandon Road Lock & Dam where sediments are contaminated
(Burton 1995, EA 2008).
PA}I
SQGs
were exceeded and
greatly
exceed levels known to be
acutely
toxic
to
aquatic life, particularly in the presence of sunlight. These shallow areas allow
for photoinduced-toxicity
of low ug/L
(ppb)
levels of PAHs. The photoinduced
PAHs will be
toxic to zooplankton, benthic
macroinvertebrates, fish and amphibians
in surficial layers of
waters
throughout the UIW. This phenomenon is well established in the peer-reviewed literature
(e.g.,
Hatch and Burton 1998, 1999; Ireland et al. 1996). Portions of the UIW have significant
areas that are shallow
(<im depth) and thus subject to photoinduced PAH toxicity. In addition,
the
levels
found in the sediments
(parts per million)
are
high
enough to cause acute
toxicity
without UV
stimulation, with or without carbon loadings, based on accepted SQGs (EA 2008).
Station DR-29 at the end of the
tailwaters
even exceeded the PEC guidelines.
A
recent USGS study
(Groschen
et
al. 2004)
did
an extensive water quality
evaluation
of the
Upper Illinois
River Basin. It found that total PAHs in the sediments of the upper Illinois River
Basin were among the highest 25% of all sites nationwide and sites in Western Springs and
Riverside were
among
the highest 5% of the nation, exceeding probable effect levels for adverse
effects on
aquatic life. The lowest concentrations at Milford were still ranked in the top
55% of
the
nation (Groschen et al. 2004). These PAH loadings originate from nonpoint sources and will
not
decline as there
are
no
management practices
in
place
to
reduce
these nonpoint source
loadings.
Sediment concentrations of total DDT, PAHs and PCBs were related to urban sources
in
the Chicago
metropolitan area. Concentrations of DDD and DDT in Western Springs were
among
the top 3%
nationwide and concentrations in fish increase being among the highest
concentrations found nationwide.
Methyl
mercury
concentrations
in fish and sediment were also
Electronic Filing - Received, Clerk's Office, September 8, 2008
11
the
highest nationwide on the Des Plaines at Russell. Fish in this system also
have
exceedingly
high levels of PCBs,
DDT
and dieldrin in fish tissue. Cadmium and nickel have also been
implicated as
causing fish impairment. (See Groschen
et al.
2004
for additional information.)
These recent fmdings soundly document that this is one of the most (if not the most) impaired
watersheds in
the nation. The Illinois EPA has not considered
the important
results
and
findings
of the USGS Study.
These
study
results demonstrate
that the Illinios EPA has ignored these
multiple chemical stressors that should be taken into account in determining the use designations
for the CSSC and the
UDP.
Electronic Filing - Received, Clerk's Office, September 8, 2008
o-t,
2ts
CD
Q
-‘
CD
I,.,
CD
:5
:5
r.J
ct
N)
‘—I
-
:5
0
:5
—
o
—
N)
0
vi
CD
C’)
ooooooooooooocv,
nfl
no
finn
non
nn
no
+
+
+
9+
+
9+
+
9+
9+
+
+
+
9+
9+
D
LD
‘.0
‘.0‘.0‘.0
‘.0
‘.0
‘.0
00
000000
00
00
00
CD
‘.0
0i
Ui
.
W
N)
i-
C
‘.0
00
-J
0,
U’
.
W
C’)
‘:‘
i-
N)
(.1’
W
N)
‘.0
.
C
N)
‘.0
i-
-
.
00
—
‘-
W
C
W
I-
I-
U’
‘.0
W
N)
U3
N)
I—h
UiWW
W0
:
00N)C
WWN)
LD-JUi
-----
ZN)
-I’>
l-
W
I-
WN)W’.OU,U,N)O
CO4
O0OW-W0
C0i’.D
AAA
A
A
A
A
ppppppppppppppp
Ui
-
W
I-I-
I-
N)
0
I-
N)
I-
N)
I-
0
------
wJ-
oo
‘J00GC0000-00CCC
COJ
dz
.‘>
N)WN)JiF.-’.D
W-+-
00CWC0W--.J’.D
-‘.D0.,
‘.DUiWC00JN)UiQCO
I—’.DW
Q
QJ
.—+
CD
000000000000000000000
nnn
nn
finn
finn
nnnnon
nn
fin
-+
++
-
P
-
.+
--
.+
-
F
+
+
f
+
OOCCCCC’.D’.D’.D’.D00d0dooo&do
.)
0
Ui
.
W
N)
0
‘.0
0
U’
-
W
N)
I—i
C
.0
00
—i
0
U’
•
-I—-
-
-
0.
-N))-_
PP-
N
!“W
ZZ
ZN)
I-
Ui
.
-J
O
0
N)
Ui
C
Ui
.
N)
I-
00
Ui
s-i
>
Ui>
s-i
j
:r
N)N)
U’
00
Ui
00
N)
0)
-
.
Ui
N)
-J
N)
Ui
2
2
2
>>00>W
3fl
0tc
N)
Ui
N)
I-
N)
I—a
N)
s-i
N)
)-
Ui
Ui
0
0,
s-I
0
.
-,J
Ui
s-i
‘-0
2
2
w
2
00
I-
Ui
UiUi
s-I
C
C
I—’-
N)N)
‘.0
.
00N)
>>
U’
>
0
000
N)N)
..
.
Vi
I-
N)
N)
N)
N)
I-
N)
Ui
N)N)
N)
s-—
‘.0
I-
0
Cii
0,
Ui
C
Ui
N)
00
‘.0
s-i
C
Cii
UI
‘.0
2
2
2
‘.0
?‘
UI
C-
‘.0
‘.0
Ui
OC
0,
0,
Cii
C
N)
C
U’
CC
.
C
>
>
i
>
‘.0
0
3=
DD0
0OCCC
A
AC
C
A
-PPPPPb9t’b
ZZQ2ot
I-
I-
C-
Ui
00
.
Ui
)-
Ui
N)
I-
N)
CC
Ui
Ui
>
I->
‘.0
-I
--
-———-
--
-
I-
N)
N)
N)
N)
.
N)
00
N)
Cii
I-
)-
.
Ui
Ui
.
N)
Ui00Ui
00
Z
2
2
0i
C
.
I-
00
.
‘.0
Ui
‘.0
.
C
Ui
N)
OC
N)
0>>
Vi
>
CC
3
I-
C-
I-
‘.0
‘.0
I-
s-I
N)N)
N)
I—s
t-
U)
)-
Cii
00
N)
U’
U)
CC
0
CC
N)
‘.0
00
‘.0
CC
00
‘.0
4
s-i
22
2
‘.o
o
00
CC
N)
)-
-
‘.0
00
N)
C
0
C
00
U)
CC
C
C
>>
CC>
Vi
N)
‘.0
p
Vi
Electronic Filing - Received, Clerk's Office, September 8, 2008
-I.
0
00
“cs
•
CD
CD
666666ooooooocooooooov’
2
r
n
r,r,
c
rrr
n
c
r
r
c
n
c
CD
Qi
0
0
C’
000
0
‘.0
‘.0
‘.0
‘.0
‘.0‘.0
‘.0‘.0
00
0000
00
0000
00
CD
..i
a
u
.
w
0
‘.o
o
U,
.
w
r
I-
C
‘.o
cc
-
o
U,
.
w
flmtlfln,—I-<
0
-‘
CD
0
D
CD
CD
0
CD
-‘
=
c-C
CDQ
V.
V.
CD
—“
Q)
DJ
.
-1
0
1.0
U,
‘.0
*_
-‘
I-
-
(,
C
I-
Ui
.
‘.0
-V
C
.-
Ui
,%J
00
00
2:
00
0
.;.-
i-
cc
z
,.-i
.
1.0
r.-J
z
.
U,
F)
‘.0
I-’
I—
—
I_I
—
•—I—
I———
‘•
p-
.
..i
cc
‘.ri
.
U,
‘.rI
-.j
w
o
U
0,
I-
0
w
cc
w
u
w
.
Q
OcJ
CM
.0D
V
CD
0
0
r-..
vi
-
00
vi
‘.0
Ni
vi
U’
0.
4
I-
4
0,
O
‘.0
Ni00
N.)
I-
NJ
.
N.)
NJ
vi
0
—-
-—
1-
I-
.
.
0
vi
vi
vi
NJ
vi
cc
JD.
U,
0
00
0
1.0
‘.0
..i
)-
vi
NJ
O
NJ
vi
-
-
00
U’
%J
0
00
NJ
.
00
NJ
.
0’.
1.0
i-
00
0’.
0
I-
‘.0
0
00
0’.
U
vi
‘.11
NJNJ
U
l—
N)
i-
NJ
1-
NJ
NJ
vi
00
.
N)
‘.0
0’.
0
00
l-
-.i
0
NJ
0
00
.
NJ
.
vi
vi
vi
0’.
0
U,
0’.
0’i
C
)-
U,
NJ
J
.
NJ
0’.
I-
.
‘.0
0
U,
U’
NJ
NJ
00
-.i
0000000
C,
t
C,
C,
r
r-.
--
--
.-;
-
0
0000
00
i
0’.
U’
.
vi
NJ
C
--pp
CO
U.)
Ni
NJ
00
vi
U,
I-’
vi
.
vi
vi
vi
NJ
C—s
0
i—a
0
vi
-J
-.J
1.0
NJ
..
NJ
U,
1.0
l-
NJ
0’.
00
‘.0
00
NJ
C
vi
i.i
NJ
NJ
NJ
NJ
U
NJ
I
vi
1.0
00
00W
‘..J
00
I
U,
Ui
.
Ui
Ui
C
00000
A
a’.vi-PP
0’.
vi
NJ
U’
NJ
i-
)-
-i
II
I-
vi
NJ
0’.0’.
-J
‘.0
NJ
I-
.
C
Ui
00
‘.0
NJ
i-
NJ
I-
NJ
NJ
..
vi
1.11
%J
0
00
s1
Do
-..j
i-
cc
a’.a’.
vi
NJ
;t;
00
--
-----
-----
-----
I---
-
0000C
00o--viPP
,PPPPP’.PPPP
U,
-.J
...J
vi
1.0
‘.0
U,
-J
vi
NJ
U,
‘-J
a’.
.
I-
‘.0
I-
Ui
NJ
I-
.
-------------------
Jh
C
a’.
i-
vi
-
vi
4.4.
-
.
.
vi
NJ
4
)-
U,
.
U,
J
o’.
U
.
00
NJ
.
-J
00
4
0-.
0
NJ
0’.
0’.
vi
C
0
0
NJ
vivivi
—-
-——-
-—-
I—-
•——-
-—
I-
I-
.
NJ
U,
I-
N.)
NJ
.
vi
vi
vi
3
.
vi
-J
F—s
0’.
NJ
vi
NJNJ
vi
.J
NJ
U,
I-
0
)-
0
NJ
1.0
00
‘.0
J
.
0’.
00
NJ
0
vi
0’.
0
.
NJ
U,
0
i—h
‘.0
—.4
NJ
‘.0
0
-
.
Ui
-
0
0
00
vi
NJ’.0
Electronic Filing - Received, Clerk's Office, September 8, 2008
14
V.
Suspended Sediments
in the CSSC and UDP
Prior
studies have
shown
that
turbidity
has
and
continues to be a stressor
in both
the CSSC and the UDP.
Turbidity is
due
to eroded
soils and resuspended
sediments, both of which
contribute
during
high
flow
events.
Turbidity during
low flow events is primarily
a result of resuspension
of
bedded
sediments,
which
in the UIW
often
occurs
from
barge
traffic.
Ceriodaphnia dubia
survival was
adversely affected by
turbidity (86-100% mortality)
as would be
expected (Burton
1995). Filter
feeding zooplankton
are known
to be sensitive to suspended
solids at levels of
50-100 mgIL (e.g.,
IEQ
1995).
This dominant stressor
of
the UIW
likely
impacts zooplankton
populations throughout
the waterway
and is aggravated by
barge
and
navigation
traffic.
VI.
Nutrients
Nutrients are
a
common
contaminant of
human-dominated
watersheds,
disrupting aquatic ecosystems
by
increasing biological
productivity,
leading
to increased
bacterial
respiration
(thus anoxia), increased
algae
and nuisance weeds,
and thus a switch to
less
desirable
fish and invertebrate
species. Nutrient
rich waters
become
eutrophic,
impair beneficial
uses, and experience
oxygen declines
that favor
pollution tolerant
species.
The
waters
of the UIW from above Chicago
through the Dresden
Pool have
high levels
of
nitrogen and
phosphorus
(MWRDGC 2007).
It is not until below Dresden
Pool that
levels drop
significantly
for
nitrogen,
ammonia, phosphorus
and fecal coliforms. When
nitrogen is elevated,
a
stressor of
particular
concern
is
ammonia.
Ammonium is typically
considered
to be the
ionic
form, while
the
term
ammonia
is inclusive of both
the ionic
(dominant
form) and
unionized (NH
4
OH)
forms. The
unionized form
is
more toxic
to
some
species, such as rainbow
trout, but not others (e.g.,
Hyalella
azteca). The
U.S.
EPA is
currently considering revising
their ammonia
criteria
as
recent evidence has
found it is
not protective of freshwater
mussels and
snails.
Criteria
continuous
concentrations
for chronic
protection
of unionid mussels were
0.3 to 1.0 mg/L (Augspurger
eta!. 2003). More than
half the nearly
300
species
of
mussels are in decline
in North
America.
These findings
suggest that levels
commonly
found
in the UIW are toxic
and may explain their
absence from the
UDP.
Previous
studies found ammonia
to be a primary
sediment stressor
in the
UIW
and Brandon Pool area.
It
was
significantly
correlated with sediment
acute toxicity,
particle size
and organic contaminants
(Burton
1995; Groschen
et a!. 2004). The
1999-200 1 USGS study
found
phosphorus concentrations
exceeded
U.S. EPA
desired
goals to
prevent
excessive growth of algae
and other nuisance plants
in every water
sample
collected
from urban
or
mixed land-use watersheds
in the UIW (Groschen
et a!. 2004).
In the
recent
USGS study
(Groschen
et a!. 2004)
of the Upper Illinois River
Basin,
the flow-weighted
mean
of ammonia in the
Chicago Sanitary and
Ship Canal (CSSC) at Romeoville
was the highest
measured
in
the
Upper
Illinois River
Basin, the
fourth highest
of 109 streams
and rivers measured
nationwide
by the USGS,
and
among
the highest in
the Mississippi River
basin. The USGS
study
findings
state
that the
primary causes
of degradation of the UIW
are elevated
concentrations
of ammonia
and
phosphorus
and the
presence of
organic wastewater
contaminants
such as disinfectants,
pharmaceuticals
and steroids,
insecticides,
and organochlorines.
The USGS
Study also found that these
water
quality conditions have
resulted in
decreased numbers and diversity
of
pollution-sensitive
species
of
fish and benthic invertebrates.
Recently, environmental
groups from states
bordering the
Mississippi River
have filed a
petition with
the
U.S.
EPA to
take
aggressive action (including
numeric nutrient
limits) to
address the
growing problem
of
hypoxia in the Gulf
of Mexico
that originates from nutrient
loadings. It is believed
that nitrogen and
phosphorus
pollution alone
prevents waters from
attaining “fishable-swimmable”
goals. Illinois
is the
largest
contributor to the Gulf
dead zone with
16.8% of the total nitrogen
and 12.9% of the phosphorus.
“Toxic
algal
blooms in Illinois
have
closed lakes
to swimming and fishing
and burdened water suppliers
Electronic Filing - Received, Clerk's Office, September 8, 2008
15
with increased
treatment costs. These blooms have killed livestock, pets and, tragically, a teenager in
Wisconsin in
2002.” (Environmental Lay & Policy Center 2008; National Research Council 2008).
Despite the
removal of nutrients
by
the Illinois EPA as a cause of impairment in its 2008 Integrated
Report — it is
obviously a major cause based on the above studies, and is not surprising given the high
loadings from
both point and nonpoint sources.
Toxicity
Identification Evaluation (TIE) results (Lower Brandon Pool and Tailwaters) also suggested
ammonia
and
PAHs as primary toxicants (Burton 1998). While ammonia is reduced by nitrification, this
microbial process is greatly inhibited
in undisturbed
sediments because
oxygen is typically low or absent
(Wetzel 1983).
So as long as there continues to be high loadings of natural
organic compounds and
suspended solids,
there will be ideal environments in the LT[W for ammonia production by heterotrophic
bacteria. There are at
least
3
lines
of
evidence (chemistry, TIE testing, laboratory toxicity tests) showing
ammonia
is
a
major stressor throughout the
UIW.
VII.
Emerging
Contaminants
The term “emerging
contaminants” has become common and refers to more recently identified organic
compounds that have
been found to be relatively common in the environment and are of concern because
they accumulate in
wildlife and humans, cause endocrine-hormone disruption resulting in loss of male
species
and
population collapses (Ankley et al. 2007). Examples of these compounds include endocrine
disrupting compounds
(EDCs,
such as 17 alpha-ethymylestradiol (EES) found in birth control pills),
many
pharmaceutical and personal care products (PPCPs) which have been
identified often in waters
below
municipal
wastewater outfalls and livestock operations, and some of the newer pesticides
that
have
replaced banned
pesticides in recent years. Numerous European and US studies have found that fish
downstream of
municipal wastewater plants suffer from exposures to estrogenic chemicals with extreme
reproductive disruption
and feminization (Vajda
et
a!. 2008; http://toxics.usgs.gov/regional/emc/
estrogenicity.html
and http://toxics.usgs.gov/highlights/wastewater-fish.html).
A
1999-2000
nationwide survey (139 streams in 30 states) by the USGS of pharmaceuticals, hormones,
and
other
organic
wastewater contaminants focused on streams downstream of intense urbanization and
livestock
production. These
compounds were found in
80%
of the streams. The compounds originate
from a wide range
of residential, industrial and agricultural sources with 82 of the 95
analyzed
being
detected. The most
frequently detected were coprostanol (fecal steroid), cholesterol (plant and animal
steroid),
N,N-diethytoluamide (insect repellant), caffeine, triclosan (antimicrobial disinfectant),
tri(2ochloroethyl)
phosphate (fire retardant), and 4-nonylphenol (nonionic detergent metabolite) (Kolpin
et a!.
2002). Some of
these compounds are noted EDCs. A survey was also conducted by the U.S. EPA
in 2006 of 5 states
in effluent dominated streams (Stahl et a!. 2007). Eight of
24 pharmaceutical
compounds were
detected in fish tissues, of which antihistamines and antidepressants were most frequent.
One of these sites
was
the North Shore Channel in Chicago where 24 largemouth bass were sampled
A
more recent
similar
study was conducted by the USGS in the IJ[W. It found 5 of
45 compounds
typically
found in
domestic and industrial wastewater in waters that drained more than 25% urban areas
(Groschen
et a!. 2004).
A
recent
7
year
whole lake study in Canada exposed fish to levels commonly found in both
untreated
and
treated
municipal
wastewaters (5 — 6 ng/L). The chronic exposure resulted in
feminization
of males and
ultimately a near
extinction of the fathead minnow species from
the lake. This finding is of grave concern
for the sustainability
of wild fish populations in waterways
receiving
municipal wastewaters. Levels in
the
Potomac Basin
stormwaters of 90-370 ng estradiollL have been detected
from agricultural areas.
Electronic Filing - Received, Clerk's Office, September 8, 2008
16
Levels as low a
1 ng/L can result in male feminization (Jobling et al. 2006). In the Potomac Basin 80 to
100% of the male
smallmouth bass are intersex (www.mawaterquality.org).
For purposes of
the UAA waterways at issue, these studies have shown that urban waters, like the
Chicago Area
Waterway System and the Lower Des Plaines River, are impacted by these “emerging
contaminants.”
This is particularly true of highly urbanized waters, like the Chicago Sanitary and Ship
Canal and the
Upper Dresden Pool, which are effluent-dominated. The presence of these emerging
contaminants is
another stressor that will adversely affect the aquatic community.
VIII.
Temperature
It is noteworthy
that thermal modifications have not been identified as one of the 23 impairment causes
on the
Des Plaines River
(1EPA 2002, 2006, 2008). While temperature can certainly
be
a
stressor,
a
literature
review found that warm temperatures can be both advantageous and detrimental to aquatic biota
(IEQ
1995). Another
concern not
discussed in the Lower Des Plaines
River
UAA Report is that
there
are
winter
maximum temperatures which are impacted by municipal wastewater effluents and may impede
some fish
reproductive processes. The “Selection of the Temperature Standard” and “Critique of the
Current
Secondary Contact and Indigenous Aquatic Life Standard” sections have inaccurate statements
regarding temperature effects on
riverine
species and ecosystem
processes. High
and low temperatures
may or
may not be detrimental to aquatic life that resides in the UIW. There is not a
simple relationship,
as noted
from many past studies (e.g., Cairns et al. 1973; Cairns et al. 1978; review by Burton and Brown
1995). Both
low and
high temperatures can increase and decrease toxicity due to exposures from other
chemical
stressors, such as found in the UIW, and these relationships are both species and toxicant type
and concentration
dependent. The Lower Des Plaines River UAA Report’s over-simplification that high
temperatures
increase toxicity is simply incorrect. Nitrification is also inhibited by cold temperatures and
ammonia is not
always
consumed in the upper sediment layers. Nitrification is very sensitive to
toxicants, which
abound in the UIW’s depositional sediments. As further discussed below, the authors of
the Lower Des
Flames River UAA Report incorrectly imply and over-generalize that high temperatures
are
always detrimental.
One of the
negative effects of high temperatures cited in the
Lower Des Flames River Report is the
creation
of blue green algae blooms in waterways.
However,
the authors fail to note that blue green
algae
are not a
concern on the UIW due to its flow conditions. Toxic cyanobacterial
blooms
do not
apply to
the
UIW, yet their
presentation in the Lower Des Plaines River UAA Report implies that they do.
Similarly, the
Lower Des Plaines River UAA Report also
inaccurately presents
my prior
work on the
UIW. On
p.
2-97 of the Report, the subsection title is “Experiments by Wright University to Establish
Temperature
Limits”. This study, which I directed while at Wright State University, did not attempt to
establish temperature limits for the UIW (the “Wright State Study”).
The UAA Report’s discussion
of the
Wright
State Study is misleading, leaving out key
portions
of
the conclusions and misinterpreting
others.
The
Wright State Study findings substantiated
previous studies by my laboratory
and
others. The key
findings documented that acute
toxicity
exists in short-term exposures for multiple species in waters and
sediments of the UIW
without any water temperature elevation. Toxic sediments abound in most
tributary mouth,
tailwater, and pool depositional areas, which include the better (but limited) habitats for
fish. These
same habitats are
typically shallow
waters
which are subject to rapid mortality as a result of
photoinduced toxicity of PAHs,
as discussed
above.
Both cold and hot temperatures accentuated toxicity
originating
from UIW waters and
sediments. Statistically significant
correlations between sediment
ammonia and fluorene
concentrations
and
toxicity were observed. Ammonia was also significantly
correlated to
depositional sediments and the presence of high concentrations of organics. These
Electronic Filing - Received, Clerk's Office, September 8, 2008
17
correlations
were based
on sediment
data
collected from
throughout
the
UIW.
In situ toxicity was not
observed
due
to
temperature
outside the thermal discharge
plume.
The laboratory
toxicity test results produced
by the
Wright
State Study
further document the
role of
sediment toxicity
and how it is increased
in the presence
of temperature
extremes. The Toxicity
Identification
Evaluation
Phase I experiments
further
substantiate
the
findings
of
the Chemical
Screening
Risk
Assessment
and
the ammonia
correlations with toxicity,
suggesting
that ammonia
is a primary
system
stressor
to
benthic and
epibenthic species. However,
these 7 day, static
renewal
experiments do
not adequately
mimic dynamic,
in situ conditions
where light, temperature,
turbidity,
water quality and
food conditions change
over minutes
to hours.
The most
reliable
indicator
of in situ conditions
are the
indigenous communities
present in the waterway.
These are the most reliable
data
to
use for evaluations
of
thermal
impacts.
IX.
Review
of the UAA Factors’
The
current
and
future status of this watershed
and the relevant data
clearly
show
that several
UAA
factors are met in
the CSSC
and
UDP. The
rationale supporting
the statements
below are
provided in the
text above and literature
citations; and through
a
weight-of-evidence
based, decision-making
process
involving
the
following
12 lines-of-evidence:
magnitude
of SQG exceedances, prevalence
of sediment
contamination,
likelihood of
continuing sediment
contamination, extreme
degraded
status of
waterway
compared
to others in the nation,
human dominance of
watershed,
profuse NPS inputs,
excessive habitat
modification
and
degradation,
human risk from pathogens
and fish
consumption,
toxicity levels in water
and
sediment,
correlations of toxicity
with chemical stressors,
indigenous biotic
indices, and excessive
numbers
of
use
impairments
throughout
the watershed.
A.
UAA
Factor 3. Human caused
conditions
or
sources
of pollution prevent the
attainment
of the use and cannot
be
remedied
or would
cause more environmental
damage
to
correct
than to leave in place:
Human
caused
conditions
or
sources of pollution
prevent both the
CSSC
and
the Upper
Dresden
Island
Pool
from attaining the Clean
Water Act’s
aquatic
life goals. It is
the primary reason that upgrading
the
use
designation
for
either waterway to Clean
Water Act “fishable”
use designations is not appropriate.
The evidence of
excessive
impairments
is clear from the
results of recent
Illinois EPA
efforts (IEPA
305(b)
and
303(d)
reports) and
surveys by
the MWRDGC.
A multitude
of
physical
and chemical
impairment causes
and sources
exist throughout the watershed
as discussed
and
documented above.
The
sources
will not be removed due
to the
human-dominated
nature of the
watershed
and the connectivity
between
the
UDP
and the UIW.
In-situ remediation of
contaminated
sediments would
likely take
hundreds
of millions of dollars
based
on the costs
of remediating other
similar systems
(NRC
2007).
B.
UAA Factor
4. Dams, diversions
or other hydrologic
modifications
preclude the
attainment of
the
use, and it
is not feasible to restore
the water
body to
its original
conditions
or to operate
such
modifications
in
a way
that would result
in the
attainment of the use.
UAA Factor 2 not
considered as the impacts
of altered regimes were
not part
of
this review.
Electronic Filing - Received, Clerk's Office, September 8, 2008
18
The
CSSC and UDP
habitat is heavily
and permanently modified.
Barge traffic
will
continue
to
be a
protected use and
will continue to result
in degraded habitat,
resuspended
contaminated
sediments
and
a
physical hazard
to
recreational
users.
C.
UAA
Factor
5.
Physical
conditions associated
with
the natural features of
the water
body,
such as the lack
of proper substrate,
cover, flow,
depth, pools, riffles
and the
like, unrelated to quality
preclude
attainment
of
aquatic
life protection
uses.
See
rationale
for Factor
4
above.
Habitat
is of poor quality through
most of
the UIW and cannot be
feasibly corrected.
Conclusions
An extensive database
exists on the MW
(including the
CSSC
and UDP)
concerning its physical,
chemical, biological
and toxicity characteristics.
These
multiple
lines-of-evidence
clearly
establish
this is
a
highly modified waterway
that has poor riverine
habitat, is
effluent
dominated
and receives significant
amounts
of
untreated, nonpoint source
runoff. Primary
stressors
to
the
aquatic biota in
the CSSC and the
UDP are:
metal
and synthetic organic
chemical
contaminated
sediments,
elevated nutrients
and ammonia,
pharmaceuticals
and personal care
products,
unnaturally
altered flow regimes,
lack of
pools and
riffles
and
generally
poor substrates and
habitat conditions.
These stressors have
been documented
via multiple
studies
that quantitatively
measured
their presence
recently
and showed
adverse
biological effects
result
through
on-site
studies
and
peer-reviewed literature.
This included studies that
documented acute toxicity
of waters and
sediments in the
UDP unrelated to temperature.
Other research
by
Cairns
et al., (1973,
1978)
showed
the
complexity of temperature
and chemical interactions
in organisms which
refUte the
simplistic
conclusions of the
UAA report.
Laboratory-based results
require extrapolation to
field
conditions
and
indigenous
benthic and fish
communities, which have
been
thoroughly
characterized
in
the
LTIW and are the
most
important
line-of-evidence. Depositional
sediments
throughout
the MW are
contaminated with
levels of
multiple
contaminants that,
in many locations,
pose a
hazard
to
aquatic
biota,
wildlife
and
humans.
Major nonpoint
source loadings of
solids, nutrients, metals,
and organics will
continue
from small
to
major urban
areas, sewers,
construction, and agriculture
in
this human-dominated
watershed and therefore
will continue to contaminate
waters,
sediments
and
the food of aquatic biota
throughout
the
MW.
Modified and limited habitats
(channelization,
barge
traffic, lock and dams),
extreme turbidity and
siltation, and stressor loadings
will not
improve in
the foreseeable future and
will
continue to
dominate water
quality conditions and
use impairments. Development
of new, modified
standards will
not address the key issue
of
excessive
and pervasive pollution
sources,
excessive
use
impairments
and
limited habitats in
this
watershed.
The
conclusions
and
the rationales
used
by Illinois
EPA (i.e., proposed Illinois
EPA Water Quality
Standards
and Effluent Limitations
for
the
Chicago
Area Waterway
System
and the Lower Des
Plaines
River:
Proposed Amendments
to
35111.
Adm. Cede
Parts 301, 302,
303
and
304) are
flawed.
The
presentation
of
data,
data interpretation, and
supporting
statements are often
biased, and fail
to
provide
a
scientifically-balanced
representation of
previous Upper
Illinois Waterway
studies, peer-reviewed
literature and accepted
approaches
that are
the state-of-the-science.
Electronic Filing - Received, Clerk's Office, September 8, 2008
19
References
Cited
Ankley GT,
Brooks BW, Huggett DB,
Sumpter JP. 2007. Repeating history: pharmaceuticals in the environment.
Environ. Sci.
Technol. 8211-8217.
Augspurger
T, Keller
AE, Black MC, Cope WG, Dwyer FJ. 2003. Water quality guidance for protection
of
freshwater mussels
(unionidae) from ammonia exposure. Environ. Toxicol. Chem. 22:2569-2575.
Booth DB, Karr IR,
Schauman
5,
Konrad CP, Morley SA, Larson MG, Burges SJ.
2004. Reviving urban streams:
land use,
hydrology,
biology, and human behavior. J Am Water Resources Assoc. no. 03187.
Brix
Ky,
DeForest DK, Adams WJ.
2001. Assessing acute and chronic copper risks to freshwater aquatic life using
species sensitivity
distributions for different taxonomic groups. Environ Toxicol Chem 20:1846-1856.
Buchman MF. 1999.
NOAA Screening
Quick
Reference Tables,
NOAA
HAZMAT Report 99-1. Seattle WA.
Burton, G.A., Jr., D.
Gunnison and G.R. Lanza. 1987. Survival of enteric pathogens in freshwater
sediments. AppI.
Environ. Microbiol. 53: 633-638.
Burton, G.A.,
Jr. 1991.
Assessing freshwater sediment toxicity. Environ. Toxicol. Chem. 10:
1585-1627.
Burton, G.A., Jr.
1992. Sediment Toxicity Assessment. Lewis Publishers. Boca
Raton,
FL.
457p
Burton, G.A., Jr.
1992. Sediment collection and processing:
factors affecting realism. In, Sediment
Toxicity Assessment.
Lewis Publishers. Boca Raton, FL.
pp.
37-66.
Burton, G.A., Jr.
1992. Assessing contaminated aquatic sediments (a two
part feature series - Special
Editor).
Environ. Sci. Technol. Vol.
26:1862-1863.
Burton, G.A., Jr. 1995.
The Upper Illinois Waterway Study,
1994-1995 Sediment Contamination Assessment Final
Report.
Commonwealth Edison, Co.,
Chicago, IL.
Burton, G.A.
Jr. 1998. The Upper
Illinois Waterway Ecological Survey: Continuous In Situ Toxicity
Monitoring and Thermal
Effect Characterization Tasks. Commonwealth
Edison Corp. Chicago, IL.
Burton,
G.A., Jr. 2002.
Sediment quality criteria in use around the world.
Limnology
3:65-76.
Burton, G.A., Jr. and
H. Brown. 1995. Reviews of the Literature
Concerning: 1) Effects of Temperature on
Freshwater
Fish, 2) Effects on
Freshwater Biota from Interactions of Temperature and Chemicals,
and
3)
Effects
of
Turbidity and
Barge-Traffic on Aquatic
Ecosystems. Commonwealth Edison, Co. Chicago, IL.
Burton,
G.A., Jr., and R.
Pitt. 2001. Stormwater Effects Handbook: A
Tool Box for Watershed
Managers, Scientists and
Engineers. CRC/Lewis Publishers, Boca Raton,
FL, 924
pp.
Burton, G.A.,
Jr., R. Pitt, and S.
Clark. 2000.
The
role
of whole effluent toxicity test methods in
assessing
stormwater and
sediment contamination. CRC Critical Reviews in Environmental
Science &
Technology 30: 4
13-447.
Burton,
G.A., Jr., P.
Chapman, and E. Smith. 2002. Weight of
Evidence Approaches for Assessing
Ecosystem
Impairment. Human and
Ecological Risk Assessment 8:1657-1673.
Burton, G.A., Jr., G.
E. Batley, P.M. Chapman,
V.E. Forbes, E.P. Smith, T. Reynoldson, C.E.
Schlekat,
P.J.
den Besten,
A.J. Bailer, AS.
Green and R.L. Dwyer. 2002. A
Weight-of-Evidence Framework for
Electronic Filing - Received, Clerk's Office, September 8, 2008
20
Assessing
Sediment
(Or Other) Contamination:
Improving Certainty
in
the
Decision-Making
Process.
Human and Ecological
Risk Assessment 8:1675-1696.
Burton
GA, Jr., Rowland
CD, Greenberg MS,
Lavoie DR, Nordstrom JF,
Eggert
LM.
2003. A tiered,
weight-of-evidence
approach
for evaluating aquatic
ecosystems,
in, M. Munawar
(ed.),
Sediment Quality
Assessment
and Management:
Insight
and
Progress,
2003 Ecovision World
Monograph
Series, Aquatic
Ecosystem
Health and Management
Society Pubi., Hamilton,
Ontario.
pp.
3-2 1.
Cairns
JJ
Jr,
Buikema
AL Jr, Heath AG, Parker
BC. 1978. Effects of temperature
on aquatic organism
sensitivity to
selected
chemicals. Virginia
Water Resources
Research Center. Bulletin
106.
Blacksburg,
VA.
Cairns
ii Jr,
Heath AG,
Parker
BC. 1973. The effects of
temperature
upon
the
toxicity
of chemicals to aquatic
organisms.
Report
to
Congress by the Environmental
Protection
Agency. Part
3. Serial No. 93-14.
Washington
DC.
CDM.
2007.
Chicago
Area Waterway System
Use Attainability Analysis--Final
Report prepared
for the Illinois
Environmental Protection
Agency
by CDM. (211
pp.)
August, 2007.
CornEd.
1996. Aquatic
Ecological
Study of the Upper
Illinois
Waterway. Final
Report. Chicago,
IL.
EA
Engineering,
Science
and
Technology. 2008. Sediment
Chemistry Study Upper
Illinois Waterway,
Upper
Dresden and
Lower Brandon Pools. August
2008 report
to
Nijman Franzetti LLP.
Chicago IL.
Greenberg,
M.S.,
G.A.
Burton,
Jr.,
P.B. Duncan.
2000. Considering Groundwater-Surface
Water
Interactions
in
Sediment
Toxicity Assessment.
SETAC
Globe.
March, April,
pp.
42-44.
Groschen GE, Arnold
TL, Harris MA, Dupre
DH,
Fitzpatrich
FA, Scudder BC,
Morrow WS, Terrio
PJ, Warner KL,
Murphy EA. 2004.
Water quality in the upper
Illinois River
basin,
Illinois, Indiana
and
Wisconsin,
1999-200 1.
Resont VA,
US
Geological
Survey Circular
1230. http://il.water.usgs.Igov/nawqaluirb.
Gutreuter
S, Dettmers JM, WahI
DH. 2003.
Estimating
mortality rates of
adult
fishes
from
entrainment
through
the
propellers
of river towboats.
Trans Am
Fisheries
Soc
132:646-661.
Hart
DD, Finelli CM. 1999.
Physical-biological
coupling
in streams: the
pervasive effects of flow on
benthic
organisms.
Annu
Rev Ecol Syst
30:363-395.
Hart DD,
Clark
BD,
Jasentuliyana
A. 1996. Fine-scale field
measurement
of
benthic
flow environments inhabited
by
stream
invertebrates. Limnol.
Oceanogr.
41:297-308.
Hart
DD, Johnson
TE, Bushaw-Newton
KL,
Horwitz
RJ,
Bednarek AT, Charles
DF, Kreeger DA,
Velinsky Di.
2002. BioScience 52:669-68
1.
Hatch, A.C.
and
G.A. Burton,
Jr. 1998. Effects of
photoinduced toxicity
of fluoranthene
on amphibian embryos
and
larvae.
Environ. Toxicol. Chern.
17:1777-1785.
Hatch, A.C.
and
G.A. Burton,
Jr. 1999.
Sediment toxicity and stormwater
runoff
in a contaminated
receiving
system:
Consideration of
different bioassays in the
laboratory and field. Chemosphere
39:1001-1017.
Hatch,
A.C.
and GA.
Burton,
Jr. 1999. Photoinduced
toxicity
of PAHs
to Hyalella
azieca and Chirono,nus
tentans:
Effects
of mixtures and behavior.
Environmental PoIlutionlO6:157-167.
IEQ (Institute
for
Environmental
Quality) 1995. Reviews
of the literature
concerning:
1) Effects of
temperature
on
freshwater
fish,
2)
Effects on
freshwater biota from
interactions of temperature
and
chemicals, and
3)
Effects
of
turbidty
and barge-traffic on aquatic
ecosystems. Final
report for Commonwealth
Edison
Co.
Chicago, IL.
Illinois Environmental
Protection
Agency. 2002. Illinois Water
Quality Report
2002. Bureau
of Water. Springfield,
IL.
Electronic Filing - Received, Clerk's Office, September 8, 2008
21
Ireland, D.S., G.A. Burton,
Jr.,
and G.G. Hess.
1996.
In Situ toxicity evaluations of turbidity and
photoinduction of
polycyclic
aromatic hydrocarbons. Environ. Toxicol. Chem. 15:574-581.
Kidd
KA,
Blanchfield
PJ,
Mills KR, Palace VP, Evans RE, Lazorchak JM, Flick RW. 2007. Collapse of a fish
population after
exposure to
a
synthetic estrogen. Proc. Nat. Acad. Sci. 104:8897-8901.
Kolpin DA,
Furlong ET, Meyer MT, Thurman EM, Zaugg SD, Barber LB, Buxton HT. 2002. Pharmaceuticals,
hormones,
and
other organic wasterwater contaminants in U.S. streams, 1999-2000: A national reconnaissance.
Environ. Sci.
Technol 32:1201-1211.
Lowery
DDR,
Pasch RW, Scott EM. 1987.
Hydroacoustic
survey of
fish populations
of the
lower Cumberland River.
US Amrmy
Eng Distr,
Nashville TN.
MacDonald DD,
CG
Ingersoll and TA Berger. 2000a.
Development
and
evaluation
of
consensus based
sediment
quality
guidelines for freshwater ecosystems. Arch Environ Contam Toxicol. 39:20-31.
MacDonald DD, LM DiPinto, J Field, CG Ingersoll,
ER Long and RC Swartz. 2000b. Development and
Evaluation
of
consensus-based sediment effect concentrations for polychlorinated biphenyls. Environ.
Toxicol Chem. 19:1403-1413.
MWRDGC
(Metropolitan Water Reclamation District of Great Chicago). 2007. Water and sediment quality along
the
Illinois
waterway from
the Lockport Lock
to the
Peoria Lock during 2006. Report No. 07-39. January 2008.
MWRDGC
(Metropolitan Water Reclamation District of Great Chicago). 2008 Ambient water
quality
monitoring
in
the Chicago area waterway
system: A summary of biological, habitat, and sediment quality data between 2001 and
2004.
Report No. 08-2.
January 2008.
National Research
Council. 2007.
Sediment dredging at Superfund megasites. National Academy
of Science.
Washington DC.
National
Research
Council. 2008. Mississippi River
water quality and the Clean Water Act: Progress, Challenges
and
opportunities. National
Academy
of Science, Washington, DC.
PoffNL, Allen JD, Bain
MB, Karr JR, Prestegaard KL, Richter BD, Sparks RE, Stromberg JC. 1997.
The natural
flow regime.
BioScience 47:769-784
Santucci VJ,
Gephard SR, Pescitelli SM. 2005. Effects
of multiple low-head dams on fish, macroinvertebrates,
habitat, and
water quality in the Fox
River, Illinois. N Am J Fisheries Mgmt 25:975-992.
Scavia D, Donnelly
KA. 2007. Reassessing hypoxia forecasts
for the Gulf of Mexico. Environ Sci Technol 41:8 111-
8
117.
Stahl L,
Wathen J, Snyder B,
O’Donnel
J,
Pitt
3.
2007. EPA pilot study of PPCPs in fish tissue. Abstr. Annu.
Meeting Soc
Environ Toxicol Chem.
Milwaukee WI.
Todd
BL, Rabeni CF. 1989.
Movement and habitat use by stream-dwelling smallmouth bass. Trans
Am Fish
Soc
118:229-242.
Tucker, K.A. and
G.A. Burton, Jr. 1999. Assessment of
nonpoint
source runoff in a stream using in situ and
laboratory approaches.
Environ. Toxicol. Chem. 18:2797-2803.
U.S.
Environmental
Protection Agency. 2000. Methods for Measuring
the Toxicity and Bioaccumulation of
Sediment-associated
Contaminants
with Freshwater Invertebrates. 2’ Edition.
EPA/600/R-99/064.
Office
of
Research and
Development and Office
of Water. Washington, DC.
U.S.
Environmental
Protection Agency. 2001. Methods for
Collection, Storage and Manipulation of Sediments for
Chemical
and
Toxicological Analyses: Technical Manual.
Office
of Water. EPA-823-B-0 1-002. Washington, DC.
Electronic Filing - Received, Clerk's Office, September 8, 2008
22
U.S. Environmental
Protection Agency
2002.
National
Water
Quality
Inventory 2000 Report.
Office
of Water.
Washington
DC.
EPA-841-R-02-001.
U.S.
Environmental
Protection Agency. 2000.
Stressor Identification Guidance
Document.
Office
of
Water and
Office of Research
&
Development. EPAJ822IB-001025.
Washington,
DC.
U.S. Geological Survey.
1999. The Quality of
Our Nation’s Waters. Nutrients
and
Pesticides.
USGS
Circular 1225.
Reston, VA.
Vajda
AM, Barber LB, Gray
JL,
Lopez
EM, Woodling
JD, and Norris
DO.
2008. Reproductive
disruption in fish
downstream
from
an estogenic
wastewater
effluent. Environ.
Sci Technol. 42:3407-3414.
Wenning RJ,
Batley GE, Ingersoll CG,
Moore
DW. 2005.
Use of
sediment
quality guidelines
and related tools for
the assessment
of
contaminated sediments.
Society of Environmental
Toxicology
and Chemistry.
Pensacola, FL.
Wetzel RG. 1983. Limnology,
2d
ed.
Saunders
College
Publ., Philadelphia.
Wolter
C,
Arlinghaus
R.
2003. Navigation
impacts on freshwater fish
assemblages:
the
ecological
relevance of
swimming
performance.
Rev Fish Biol
Fisheries 13:63-89.
Electronic Filing - Received, Clerk's Office, September 8, 2008
23
APPENDIX
A
Resume
G. Allen Burton
Dr.
Burton recently began as
Director of
NOAA’s
Cooperative
Institute
of Limnology
and
Ecosystem Research,
and
is a Professor
in the School of
Natural Resources and Environment
at
the University
of Michigan.
Previously,
he
was Professor
and
Chair of the Earth &
Environmental Sciences
Department at
Wright State University,
in Dayton,
Ohio. While
at
WSU he directed the
Institute for Environmental
Quality, started
the PhD program
in
Environmental
Sciences, and
was the
Brage Golding Distinguished
Professor of
Research. His
research on aquatic
ecosystem
stressors
has
taken him
to
all seven continents
and Visiting Scientist
positions in New Zealand,
Italy and Portugal.
Recently he
was the
President
of
the
international
Society
of
Environmental
Toxicology
& Chemistry and
served on
National Research Council
and U.S. EPA Science
Advisory Board
committees.
He has served on numerous
national
and international boards
and panels with over 200
publications.
Education
Ouachita Baptist
University
B.S.
1976
Biology
&
Chemistry
Auburn University
M.S.
1978
Microbiology
University
of
Texas
@
Dallas
M.S.
1981
Environmental
Sciences
University
of
Texas
@
Dallas
Ph.D.
1984
Env.
Sci.
(Aquatic
Toxicology)
Professional Positions:
1980-1984.
Life
Scientist.
U.S.
Environmental
Protection
Agency,
Dallas,
Texas
1984-1985.
Visiting Fellow.
NOAA’s Cooperative
Institute for Research in Environmental
Sciences,
University of Colorado.
1985-1990. Assistant
Professor, Dept. of Biological
Sciences,
Wright St. Univ.
1990-1996.
Associate
Professor, Dept.
of Biological Sciences,
Wright St. Univ.
1985-present. Coordinator,
Environmental Health
Sciences
Program,
WSU.
1994-2006,
Director,
Institute
for Environmental Quality,
WSU.
1996-present.
Professor.
Dept.
of Biological Sciences, Wright
St. Univ.
2000-2003. Brage
Golding
Distinguished
Professor of Research,
WSU.
2002-2003. Director,
Environmental Sciences
Ph.D. Program, WSU.
2003-2005. Associate
Director,
Environmental
Sci. Ph.D. Program,
WSU.
2005.
Interim
Chair,
Geological Sciences
Department, WSU.
2006-2008.
Chair, Department
of
Earth & Environmental
Sciences, WSU.
2008-present.
Professor,
School of
Natural Resources
& Environment, University
of Michigan
Director,
Cooperative
Institute of Linmology
& Ecosystem Research
Awards and
Other
Professional
Activities
(Select):
1992-1999.
U.S.
EPA National
Freshwater
Sediment Toxicity
Methods Committee
1994, 2001. Visiting Senior
Scientist,
Italian
Institute
for Hydrobiology.
1994,
1995,
1998,
1999.
External
Review
Panel.
Environmental Biology
Research
Program.
Exploratory
Research.
Office of Research and
Development,
U.S.
EPA.
1996.
Visiting
Senior
Scientist, New Zealand
Inst. of
Water
and Atmospheric
Research.
1994-1997.
NATO Senior Research
Fellow,
University of
Coimbra, Portugal.
1993-1996.
Board of
Directors, Soc. of
Environmental Toxicology
and Chemistry
2002. Meeting Chair,
5
th
International Symposium
on Sediment
Quality
Assessment.
1999-2001.
U.S. EPA
Scientific Advisory Panel, Office
of
Pesticide
Programs
200
1-2004,
Editorial
Board,
Aquatic Ecosystem Health
&
Management
and
Chemosphere.
2000-2003.
Brage
Golding Distinguished
Professor
of Research.
2003-2006.
World
Council,
Society of Environmental Toxicology
&
Chemistry
(SETAC)
Electronic Filing - Received, Clerk's Office, September 8, 2008
24
2006.
Vice
President,
World
Council,
SETAC
2007.
President.
Society
of
Environmental
Toxicology
& Chemistry
2005-2009.
U.S.
EPA
Science
Advisory
Board Committees
(2).
2006-2007.
National
Research
Council
Committee
on Sediment Dredging
at Superfund
Megasites.
2008.
Past
President,
Society
of Environmental
Toxicology
and Chemistry.
Recent
Research
Projects
($7,655,912
total;
Select since 2005):
1. U.S.
Environmental
Protection
Agency
STAR Grant
Program.
Defining
and Predicting
PCB Fluxes
and
Their
Ecological
Effects
in River
Systems
for
Risk
Characterizations.
March 2005-
February
2008.
S325,000.
2.
City of
Dayton.
Great
Miami River
Water
Quality
vs. Stormwater
Inputs.
2005.
$56,382.
3. U.S.
Environmental
Protection
Agency, Cooperative
Research
and Development
Agreement.
Toxicity
Evaluation
of Ground
Water/Surface
Water
Interactions.
EPA
No.
304-04.
2005-2006.
$56,090.
4.
Bayer
CropScience and
BASF. An
Assessment
of Fipronil Effects
on Benthic
Invertebrates
in Freshwater
Ecosystems.
2005-2006.
$325,295.
5.
Copper
Development
Association,
RioTinto, and
International
Copper
Association.
An
Assessment
of
Copper Effects
on
Benthic
Invertebrates
in Freshwater
Ecosystems.
2005-2007.
$80,884.
6.
RIVM, the Netherlands.
Weight-of-Evidence
based GIS
System for
Stressor Detection.
QERAS
Project.
$10,000.
2006.
7.
European
Copper
Association.
2006. An
Assessment
of Copper
Effects
on Benthic
Invertebrates
in
Freshwater
Ecosystems,
Project
Amendment.
$36,575.
8.
Nickel
Producers
Environmental
Research Association.
Comparison
of Nickel
Sensitivity
in Cultured
and
Field
Collected Ceriodaphnia
spp.
2006-2007.
$27,122.
9.
Strategic
Environmental
Restoration
and
Demonstration
Program (SERDP).
USDOD,
USDOE,
USEPA.
Sediment
Ecosystem
Assessment
Protocol
(SEAP):
An
Accurate and
Integrated
Weight-of-
Evidence
Based
System. Feb
2007-Jan 2010.
S903,000.
10. Copper
Development
Association.
Copper and
Sediments:
Defining the
State-of-the-Science
and Key
Data
Gaps.
$36,000.
2007.
11.
International
Copper Association,
Dissolved
Organic
Carbon Dynamics
in
Brandenberg
Pond,
Ohio.
S2,700.
2007.
12.
International
Zinc
Association.
Zinc
and Sediments:
Defining
the
State-of-the-Science
and Key
Data
Gaps.
S12,000.
2007.
13. City
of Dayton.
Stormwater
Effects on the
Mad River,
Ohio.
$66,997
($50,000
to WSU).
2007.
14. Nickel
Producers
Environmental
Research
Association.
Determining
Realistic
Sediment
Toxicity
Threshold
Effect Levels
for
Freshwater
Species.
$131,206.
2007-2008
15. Wright
State University
Research
Challenge.
Seed grant
for Center of
Excellence: Nanoscale
Science
&
Engineering
of Multi-functional
Materials.
(Co-PI) 2007-2008.
$60,000
(AB
- $30,000)
16.
International
Copper
Association
and Copper
Development
Association.
An Assessment
of
Copper
Effects
on Benthic Invertebrates
in
Freshwater Ecosystems,
Project
Amendment.
$19,278.
2007-2008.
17.
Environment
Agency
— United
Kingdom.
A Quantitative
Approach
for Scientifically-Based
Decision
Making:
Linking Physical
and
Chemical
Factors
with
Ecosystem
Responses.
$20,900.
2007-2008.
Publications
(144
excluding
technical
reports; Select
since
2005):
1. Burton
GA
Jr.,
Greenberg
MS,
Rowland
CD,
Irvine
CA, Lavoie
DR,
Brooker
JA, Eggert
LM, Raymer
DFN,
McWilliam
RA. 2005.
In Situ
exposures
using
caged organisms:
a
multi-compartment
approach
to
detect aquatic
toxicity
and
bioaccumulation.
Environ. Pollut.
134:133-144.
2.
Burton GA
Jr, Nguyen
LTH, Janssen
C, Baudo
R,
McWilliam
R, Bossuyt
B,
Beltrami
M,
Green A. 2005.
Field
validation of
sediment
zinc
toxicity.
Environ
Toxicol.
Chem
24:541-553.
3. Kapo,
K., Burton
GA.
2006.
A
GIS
based weight
of evidence
approach for
identifying
aquatic
impairment.
Environ.
Toxicol.
Chem.
25:2237-2249.
4. Custer
KW,
Burton
GA,
Coleho R,
Smith
P.
2006.
Determining
stressor presence
in streams
receiving
urban and
agriculture
runoff:
development
of a
benthic
in situ toxicity
identification
evaluation
(BiTIE)
Method.
Environ
Toxicol
Chem
25:2299-2305
Electronic Filing - Received, Clerk's Office, September 8, 2008
25
5.
Burton, GA,Green
A, Baudo
R, Forbes
V, Nguyen LTH,
Janssen
CR,
Kukkonen
J, Leppanen
M, Maitby
L,
Soares
A, Kapo K,
Smith P,
Dunning
J.
2007. Characterizing
sediment acid
volatile sulfide
concentrations
in
European
stream.
Environ
Toxicol
Chem
26:1-12.
6. Baird, DJ,
Burton
GA, Cuip SM,
Maitby L.
2007. Summary
and
recommendations
from a
SETAC Pellston
Workshop
on in
situ
measures
of
ecological effects.
Integr Environ
Asseess Mgmt
3:275-278.
7.
Crane M,
G.
Allen
Burton, Joseph
CuIp, Marc
S. Greenberg,
KellyR.
Munkittrick,
Rui G.L.G.
Ribeiro,
Michael
H.
Salazar
and Sylvie
D.
St-Jean.
2007.
Review
of In
Situ Approaches
for
Stressor and
Effect
Diagnosis.
Integr
Environ
Assess Mgmt.
3:234-245.
8.
Custer
KW, Burton
GA
Jr.
2007.
Isonychia
spp. and macroinvertebrate
community responses
to
stressors
in
streams utilizing
the
benthic
in situ
toxicity identification
evaluation
(BiTIE) method.
Environ
Pollut. 151:101-109.
9.
National
Research
Council
(A. Burton
coauthor).
2007.
Sediment
Dredging
at Superfund
Megasites: Assessing
the
Effectiveness.
National
Academies
Press.
Washington
DC.
Electronic Filing - Received, Clerk's Office, September 8, 2008
26
APPENDIX
B
Land Use and Recent
Development in the Des
Plaines Watershed
Area Converted
to Urban Land
Use
1992-2001
N
Figure B-i.
Estimated
land
converted
to
urban land
use
between 1992 and 2001
based on a comparison of
the
NLCD 1992 and 2001
datasets
(USGS, MRLC NLCD
1992/2001 Retrofit Change
Product).
1JMies
Data Source: USGS MRLC
NLCD
o
5
10
20
1992/2001
Retrofit Change Product
A
Electronic Filing - Received, Clerk's Office, September 8, 2008
27
A
Urban
Area Boundary
Expansion
1990-2000
Cook, Dupage,
Lake
and
Will Counties
(IL)
Figure B-2.
U.S.
Census
urban boundary change
between 1990 and 2000
census for Cook, Du
Page,
Lake,
and Will counties
in
Illinois.
L_________J
Mites
05
10
20
v.4-
Data Source:
U.S. Census
Bureau
Urban areas
USGS
watershed
boundary (HUC)
Electronic Filing - Received, Clerk's Office, September 8, 2008
‘2
I
The
following
three
figures
are
from the
Chicago
Metropolitan
Agency
for Planning
(CM4P)
Data
Bulletin:
2001
Land
Use Inventory
for
Northeastern
Illinois,
September
2006
(wwn’.
cnlap.
illinoisgov).
28
,J
xi:
J
xt
2) XC
Char
9
Regior.aI
Change ii
Land Use.
1990-
2001
_r
I
—
.
E Rr
:re—
LIn
_
Figure
B-3.
Regional
change
in land
use from
1990-2001.
Chart tO:
P.roent Naw
Urtanzation
and Dtstance
from
Downtown
Ch,cgo
—
lO2
C’-
do-SO
ty,nc, In
$
i
non
Stit
I aOIk.l’
Figure
B-4.
Percent
new urbanization
and
distance
from
downtown
Chicago.
Electronic Filing - Received, Clerk's Office, September 8, 2008
29
Map
10: “Urbanized”
Lands
(2001)
Classified
as
“Agriculture”
or
“Vacant”
in 1990
Figure
B-5.
Urban lands
in 2001
that were agricultural
or vacant in 1990.
The 2001 land
use
data
was
compiled from interpretation
of aerial photography
and other sources).
Electronic Filing - Received, Clerk's Office, September 8, 2008
30
% Population
Increase
in
Municipalities
2000-2006
A
F1.JMiIes
Data
Source:
U.S.
Census
Bureau
200
data
0
5
10
20
and
population
estimates,
2001-2006
Figure
B-6.
U.S.
Census
estimated
population
increase
(%)
in
municipalities
from year
2000 to
2006.
Electronic Filing - Received, Clerk's Office, September 8, 2008
31
0.08
0.07
0.06
0.05
0.04
0.03
• 0.01
Lii
0
Metropolitan
Division
Areas
Des Plaines
River
%ershed
boundary
Chicago-Nape’.ille.Joet
Metropolitan
Divaion
Lake-Kenosha
Metropdrtan
Dolsioo
Figure
B-7 (a+b).
Estimated
population
growth
(2000-2005,
U.S. Census
Bureau) by Metropolitan
Division
(Northeastern
Illinois
Planning
Commission).
Estimated
Population
Growth
2000-2005
—
ChicagoINaperlleIJoHet
Metropolitan
Dksion
—
Lake Co./Kenosha
Co.
L
Metropolitan Di4sion
2000
2001
2002
2003
2004 2005
Year
*
See
metropolitan
divisions
in figure
below
rL......Juites
Data Source:
Northeastern
Illinois Planning
Commission
0 510
20
Electronic Filing - Received, Clerk's Office, September 8, 2008
32
Change
in Annual
Building
Permit
Numbers
by Municipality
or
Chicago
Community
Area
(Year
2000
versus 2003)
LJMiIes
Greater
Chicago Housing and
Development
Website
0
25
5
10
and
US. Census
Bureau
Figure
B-S. Change in number
of
annual building
permits (year 2000
versus 2003)
for
municipalities
and
communities
of the Greater
Chicago area.
A
Electronic Filing - Received, Clerk's Office, September 8, 2008
33
Number
of New
Private Housing
Units
Authorized
by Building
Permits
(by County)
25,000
:::
10,000
Will
5,000
Lake
Du Page
_-____z____-___
0
I
2001
2002
2003
2004
2005
2006
Year
Figure B-9. Number
of new private housing
units authorized
by building permits
(2001-2006) for Cook,
Du Page,
Lake, and
Will
Counties (U.S. Census
Bureau).
Combined
Sewer
Overflow
Figures:
According to the Metropolitan
Water Reclamation
District
of
Greater Chicago, from January
1, 2006 to
June 13, 2008 (latest MWRD
data update), there
were
a
combined total
of 117 combined
sewer overflows
reported at the four major
pumping
stations of
North Branch, Racine
Ave., Westchester,
and 1
25
th
St.
There have been
17 system-wide CSO events
(multiple stations per
event) this
summer
(June
3
— August
6, 2008).
Individual maps
of reaches
with CSO
events
by date
for
2008 to the present can
be
accessed
at
www,rnwrdc.dst.i1.us’CSO’dispiav
onl’.aspx
These maps are
updated the
day following an
overflow
event. The seven
most current daily
maps
are retained online
with the oldest being deleted
when
a new
map is added.
Electronic Filing - Received, Clerk's Office, September 8, 2008
APPENDIX
C
EA
Engineering,
Science,
and Technology Report on
Sediment
Chemistry
34
Electronic Filing - Received, Clerk's Office, September 8, 2008
SEDIMENT
CHEMISTRY
STUDY
UPPER
ILLINOIS
WATERWAY,
DRESDEN
AND
LOWER
BRANDON
POOLS
Prepared
for
Nijman
Franzetti
LLP
10 S.
LaSalle
St.
Suite
3600
Chicago,
IL 60603
Prepared
by
EA Engineering,
Science,
and
Technology
444
Lake
Cook Rd.
Suite
18
Deerfield,
IL
60015
(847)
945-8010
September
2008
Electronic Filing - Received, Clerk's Office, September 8, 2008
TABLE
OF
CONTENTS
Page
LIST OF
FIGURES
ii
LIST
OF
TABLES
ii
1.
FIELD SAMPLING
1
2.
ANALYTICAL
TESTING
PROGRAM
6
2.1
Laboratory
Control
Samples
7
2.2
Detection
Limits
8
3.
DATA
ANALYSIS
9
3.1
Calculation
of
Total
PCBs
arid Total
PARs
9
3.2
Comparison
to Sediment
Benchmarks
9
4.
VISUAL
OBSERVATIONS
OF SEDIMENT
9
5.
SEDIMENT
CHEMISTRY
RESULTS
11
6.
COMPARISON
TO HISTORICAL
DATA
12
7.
REFERENCES
13
Upper Illinois
Waterway
Sediment
Sampling
September
2008
Electronic Filing - Received, Clerk's Office, September 8, 2008
LIST OF FIGURES AND TABLES
Number
Thle
Figure 1
Sediment Sampling Locations in the Dresden and Lower Brandon Pools
Figure 2
Concentrations of Metals that Exceed Sediment Quality
Guidelines
Figure 3
Concentrations of Total PAHs and Total PCBs that Exceed Sediment Quality
Guidelines
Number
Title
Table 1
Sediment Sampling Locations in the Dresden and Lower Brandon Pools
Table 2
Required
Containers, Preservation Techniques, and Holding Times For
Sediment
Samples
Table 3
Required Containers,
Preservation
Techniques, and Holding Times For Aqueous
Samples (Equipment Blanks)
Table
4
Analytical Methods for Sediment Analysis
Table 5
Laboratory QC
Samples
Table 6
Summary of Field Observations of Sediment from the Dresden and Lower
Brandon Pools
Table 7
Concentrations
of
Target Analytes in Sediment, Dresden
Pool,
May 2008
Table
8
Concentrations of Target Analytes in Sediment, Lower Brandon Pool, May
2008
Table 9
Concentrations of Target
Analytes that Exceeded
Sediment Quality Guidelines,
Dresden Pool, May
2008
Table
10
Concentrations
of
Target Analytes that Exceeded Sediment
Quality Guidelines,
Dresden
Pool, May 2008
Table 11
Comparisons of Sediment Concentrations to Historical Data, Dresden
and
Lower Brandon Pools, May 2008
Upper Illinois Waterway
Sediment Sampling
September 2008
11
Electronic Filing - Received, Clerk's Office, September 8, 2008
SEDIMENT
CHEMISTRY
STUDY
UPPER ILLINOIS WATERWAY, DRESDEN AND
LOWER
BRANDON
POOLS
EA
Engineering, Science, and Technology conducted a sediment study
in Dresden
Pool
and the
lower portion of
Brandon
Pool,
which includes
the Des
Plaines, Kankakee, and Illinois Rivers
(i.e., the
study area) (Figure 1). The purpose of this project was to
determine
if the sediment
chemistry
of the study area may preclude the attainment of a
higher aquatic life use. Results
of
this sediment
analysis were compared to sediment benchmarks and previous sediment sampling
efforts in
the same study area. Sampling locations were targeted in areas
adjacent
to the main
channel of the
river
that would
potentially
provide suitable
aquatic habitat. Therefore, sampling
locations tended
to
be
in shallow areas with lower water velocities and the
potential
for higher
rates
of fine-grained sediment deposition.
Thirty-five (35) sediment samples — 31 in the Dresden Pool and four
in the Lower Brandon
Pool
— were collected for
physical and chemical characterization (Figure 1).
The physical
composition
of the sediment was described by total organic
carbon, total solids
(percent
moisture), and grain size
(sieve
and hydrometer).
The target analytes for the chemical
determination
of the sediment were: arsenic, silver, cadmium,
chromium, copper, lead,
mercury,
nickel, zinc, polycyclic aromatic
hydrocarbons
(PAHs),
and polychlorinated biphenyls
(PCB
congeners).
1.
FIELD SAMPLING
Sediment samples
were collected using a petite, stainless steel Ponar grab
sampler.
At each
location, five discrete grab samples were collected,
combined
in a stainless steel container,
and
gently homogenized using a
stainless steel spoon/spatula. General
observations
of
the sediment,
including color
and odor, were noted in the field log book
(Appendix A), and
digital
photographs
(Appendix B) and GPS coordinates (Table 1)
were collected at each location.
Sediment
samples were collected from 31 sites in the Dresden
Pool and four in the
Lower
Brandon Pool
between
6
May and
9
May 2008. Two field
duplicate samples were collected —
one
from location DRO8- 11 and
one from
location
DRO8-28 — and submitted for chemical
analysis. Multiple grabs
(five) were collected at each location and homogenized to form
one
sample for each
site.
Each
sample was homogenized in a stainless steel
bowl
using a stainless
steel spoon
until the sediment was thoroughly mixed and of
uniform consistency.
When
compositing was completed, sub-samples of sediment were
removed for bulk chemistry testing.
The homogenized material
was transferred into appropriate labeled containers and each container
was sealed with a
custody seal. Once sealed, the sample containers were placed in a cooler
on
wet ice and
documented on a chain of custody form. All
equipment that came in contact with
the
sediment was decontaminated between each location (see
Section 2.4). Sediment samples were
kept in a cooled,
insulated cooler onboard the workboat during each
work
day. At the end of
each day,
coolers were appropriately packed, iced,
and shipped
by
overnight courier
to the
laboratory
with
chain
of custody (COC)
documentation.
Upper Illinois Waterway
Sediment
Sampling
September 2008
Electronic Filing - Received, Clerk's Office, September 8, 2008
Sediment
samples
were
shipped via
overnight delivery
to the analytical
laboratory,
TestAmerica—Pittsburgh,
on the day of collection.
The sample containers,
preservatives,
and
holding time requirements for sediment samples
are provided in Table 2-1.
Holding times
for
the sediment samples
began when
the sediment was
collected, homogenized, and
placed in the
appropriate sample containers.
Sample
Documentation
A
log of field activities, sampling location
coordinates,
site observations, and sediment
recoveries were recorded in a permanently
bound,
dedicated field logbook
(Appendix A).
Personnel names,
local weather conditions,
and other information
that may impact the
field
sampling program were also recorded. Each
page of the logbook was numbered
and dated
by the
personnel entering
information.
A sample numbering system was used to communicate
between the field crew
and
the analytical
laboratory. Sampling locations and samples
were numbered as follows:
Example:
DRO8-Ol
The first two letters
denote the site
designation (DR=Dresden
Reach;
BR=Brandon Reach),
the
next two digits denote the sampling year
(08=year 2008), and the last two
digits indicate
the
sampling location
number.
Upper Illinois Waterway
Sediment
Sampling
September
2008
2
Electronic Filing - Received, Clerk's Office, September 8, 2008
Table 1. Sediment Sampling
Locations
in the Dresden
and Lower Brandon Pools
Northing (m)
I
Easting (m)
Sample
ID
Date
Sampled
filinois
East NAD83
DRESDEN POOL
DRO8-01
5/6/2008
525571.56
304526.11
DRO8-02
5/6/2008
525297.55
305069.83
DR08-03
5/6/2008
524167.37
306199.93
DRO8-04
5/6/2008
523905.67
307041.08
DRO8-05
5/6/2008
524149.62
307200.08
DRO8-06
5/6/2008
524200.28
308708.26
DRO8-07
5/6/2008
524024.17
308799.00
DRO8-08
5/6/2008
525951.89
309184.50
DRO8-09
5/6/2008
525848.05
309429.79
DRO8-10
5/6/2008
525895.80
309742.74
DRO8-11
5/6/2008
527391.25
310137.04
DRO8-12
5/6/2008
527559.48
310717.80
DRO8-13
5/6/2008
527437.18
311063.46
DRO8-14
5/7/2008
527750.97
311542.61
DRO8- 15
5/7/2008
528202.60
312423.72
DRO8-16
5/7/2008
528301.38
312425.35
DRO8-
17
5/7/2008
529093.41
313371.70
DRO8-1 8
5/7/2008
529752.25
314044.20
DRO8-19
5/7/2008
530313.47
314050.10
DRO8-20
5/7/2008
530791.69
313816.52
DRO8-21
5/7/2008
530828.70
314066.66
DRO8-22
5/7/2008
532283.21
313855.07
DRO8-23
5/7/2008
533534.28
314667.19
DRO8-24
5/7/2008
533613.87
315436.00
DRO8-25
5/8/2008
534546.85
316278.60
DRO8-26
5/8/2008
534824.74
316663.47
DRO8-27
5/8/2008
535537.06
317628.58
DRO8-28
5/8/2008
536176.57
318479.56
DRO8-29
5/9/2008
536667.62
319046.21
DRO8-30
5/9/2008
536568.31
319522.71
DRO8-31
5/9/2008
536567.16
319485.10
LOWER
RANDON POOL
BRO8-01
5/8/2008
537485.12
320111.97
BRO8-02
5/8/2008
537246.47
319934.34
BRO8-03
5/8/2008
537195.15
319237.12
BRO8-04
5/8/2008
537352.76
319435.33
Upper Illinois Waterway
Sediment Sampling
September2008
3
Electronic Filing - Received, Clerk's Office, September 8, 2008
Eguiyment
Blanks
Equipment
blanks were
collected
to
determine
the
extent
of
contamination,
if
any,
from
the
sampling
equipment
used
as
part
of
the
project.
Four
equipment
blanks
were
collected
for
the
project,
one
during each
day
of
the
sampling.
Equipment
blanks
are
collected
by
pouring
deionized
water,
which
was
provided
by
EA’s
Ecotoxicology
Laboratory,
over
the
petit
Ponar
grab
sampler
that
was
decontaminated
using
the
procedure
outlined
in
Section
2.4.
The
rinsate
water was
placed
in
laboratory-prepared
containers,
submitted
to
TestAmerica—Pittsburgh
via
overnight
delivery,
and
tested
for
the
same
chemical
parameters
as the
sediments.
Eguiyinent
Decontamination
Procedures
Equipment
that
came
into
direct
contact
with
sediment
during
sampling
was
decontaminated
prior
to
deployment
in
the
field
to
minimize
cross-contamination.
This
included
the
petit
Ponar
sampler
and
stainless steel
processing
equipment
(spoons,
knives,
and
bowls).
Any
equipment
that
was
reused in
the
field
was
decontaminated
on-board
the
sampling
boat
between
sample
locations.
While
performing
the
decontamination
procedure,
phthalate-free
nitrile
gloves
were
used
to
prevent
phthalate
contamination
of
the
sampling
equipment
or
the
samples.
The
decontamination
procedure
utilized
is
described
below:
•
Rinse equipment
using
site
water
•
Rinse
with
10
percent
nitric
acid
(HNO
3
)
•
Rinse
with
distilled
or
de-ionized
water
•
Rinse
with
methanol
followed
by
hexane
•
Rinse
with
distilled
or
de-ionized
water
•
Air
dry
(in
area
not
adjacent
to the
decontamination
area)
Waste
liquids
produced
during
decontamination
procedures
were
contained
at
the
areas
of
decontamination.
Decontamination
waste
liquid
produced
on-board
the
boat
were
collected
in 5-
gallon
buckets
with
lids
and
returned
to
EA’s
warehouse
facility
for
proper
disposal.
Upper
illinois
Waterway
Sediment
Sampling
September
2008
4
Electronic Filing - Received, Clerk's Office, September 8, 2008
Table 2. Required Containers, Preservation Techniques, and Holding Times
for
Sediment Samples
(a)
Source: USEPA/USACE
1995
From time of
sample collection.
Additional
volume will
be
provided for samples designated as MSIMSDs.
P = plastic; G
= glass.
Sufficient volume is provided from the 8 oz noted under Metals.
Table 3.
Required Containers, Preservation Techniques, and Holding Times for Aqueous Samples
(Equipment Blanks)
Parameter
Required
Volume
(b)
Container
Preservative
Holding Time
Inorganics
I Liter
P
Metals
pH<2
with
HNO3
6
months
(including
Mercury)
Cool, 4°C
(28
days for Hg)
Organics
G, teflon
lined,
H,S0
4or HC1 to
Total Organic
Carbon
3- 4OmLs
28
days
speta cap
pH<2; Cool, 4°C
PAHs and PCB
4
Liters
G, Teflon lined
Cool, 4°C
40
7 days
days
until
from
extraction,extraction
Congeners
cap
to analysis
Source:
USEPJIJUSACE 1995
(a)
From time
of sample collection.
(b)
Additional
volume will need
to be
provided for samples
designated as MSIMSDIMDs
(c)
P
= plastic; G = glass.
Upper Illinois Waterway
Sediment Sampling
September2008
Parameter
I
Required
Volume
(b)
Container
I
Preservative
I
Holding Time
II
Inorganics
Metals(including
Mercury)
I
8oz.
II
G
II
4°C
II
(28
6
days
months
for Hg)
Physical
Parameters
32
ox
I
P,G
I
t°C
6 months
Grain Size and
Total
Solids
Organics
Total Organic Carbon
(d)
G
4°C
14 days
14 days until extraction,
PCB
Congeners
4
oz.
G
4°C
40 days from extraction
to analysis
14
days until
extraction,
PAHs
(d)
G
4°C
40
days from
extraction
to analysis
(a)
(b)
(c)
(d)
5
Electronic Filing - Received, Clerk's Office, September 8, 2008
2.
ANALYTICAL TESTING PROGRAM
Samples collected
during the field effort were tested for
target analytes using
analytical
methods
listed in
Table 4
as
described in the laboratory’s analytical standard operating procedures
(SOP).
Sediment samples were
tested for the following analytes:
•
Metals
(arsenic, cadmium, chromium,
copper,
lead, mercury, nickel, silver, and
zinc)
•
PAHs,
•
PCB congeners,
•
total
organic
carbon
(TOC),
grain size, and
•
total
solids.
Table 4. Analytical Methods for Sediment
Analysis
Analyte
Analytical
Method
Sediment
Metals
SW846 6020
Mercury
SW846 7471
A
Polynuclear Aromatic
SW846 8270C SIM
Hydrocarbons (PARs)
Polychionnated
Biphenyls
SW846 8082
(PCB)
Congeners
Total Organic Carbon
Lloyd Khan
Grain Size
ASTM D422
Total Solids
SM 2540B
To meet
program-specific regulatory requirements for chemicals of concern, all
methods/SOPs
were
followed as
stated with some specific requirements noted below:
PCB Congeners
PCBs for this project
were analyzed
and quantified as individual congeners by
SW846
Method
8082.
Twenty-six (26) PCB congeners were determined in the various
matrices. These 26
congeners include
all of the “summation” and
“highest
priority” congeners,
plus several
of the
“secondary
priority” congeners.
Total
Organic
Carbon
(TOC)
TOC in
sediments was determined using the 1988 EPA Region II combustion
oxidation
procedure (referred to as the Lloyd Kahn procedure).
Polynuclear
Aromatic
Hydrocarbons
— PAHs
To achieve the target detection limits (TDLs) referenced in QA/QC Guidance for Sampling
and
Analysis of
Sediments, Water,
and
Tissues
for Dredged Material Evaluations - Chemical
Evaluations
(EPA 823-B-95-00l, April
1995), the PAHs were determined utilizing
SW846
Method
8270C using Selective Ion Monitoring
(SIM).
Upper Illinois
Waterway
Sediment
Sampling
September2008
6
Electronic Filing - Received, Clerk's Office, September 8, 2008
Metals
Metals
were determined
utilizing Inductively
Coupled
Plasma
(ICP)
or Inductively
Coupled
Plasma/Mass
Spectrometry
(ICP/MS)
according
to the SW846
Method
6020,
with the
exception
of
mercury.
For
mercury,
samples will be
analyzed
by
Cold Vapor
Atomic Absorption
(CVAA)
method
[SW846 7470A
(aqueous) or
7471A (sediment)].
2.1
Laboratory
Quality
Control
Samples
Project specific
[matrix spike (MS)
I matrix spike
duplicates
(MSD)] and
internal laboratory
QAJQC samples
(including method
blanks, laboratory
control
samples,
and surrogates)
were
analyzed. Quality
control
samples
were analyzed
at the
frequency
stated
in
Table 5. Standard
Reference
Materials (SRMs) were
obtained
from the National
Institute of
Standards
and
Technology (NIST)
or a comparable
source, if available.
Table
5. Laboratory
QC
Samples
QC
Sample
Frequency
Standard
Reference Material
1 per analytical
batch
of 1-20
samples, where
available
Method Blanks
1 per analytical
batch of 1-20
samples -
Laboratory Control Sample
I per
analytical
batch
of 1-20
samples
Surrogates
Spiked into all field and
QC samples (Organic
Analyses)
Sample
Duplicates
1 per analytical batch
of 1-20 samples (Inorganic
Analyses)
Matrix Spike/Matrix
Spike Duplicate
I per
analytical batch of 1-20
samples
The
following
internal
laboratory
QAIQC samples
were analyzed
for this project:
Standard reference
materials (SRMs)
represent
performance-based
QAJQC.
A
standard reference
material
is
a soil/solution with
a certified concentration
that
is
analyzed as a sample
and
is used to
monitor
analytical
accuracy.
SRMs were
analyzed
for the PCB
congeners and PAHs
in
sediment.
Control
criteria apply only
to those
analytes having
SRM true values
greater than
10 times the MDL
established
for
the
method.
The
method (reagent)
blank was used
to monitor
laboratory
contamination.
The
method
blank is usually
a sample of laboratory
reagent
water
processed
through
the
same
analytical procedure
as the
sample (i.e., digested,
extracted,
distilled).
One
method blank was
analyzed at a frequency
of one
per
every analytical
preparation
batch of
20
or
fewer
samples.
The Laboratory
Control Sample
(LCS) is a
fortified
method
blank consisting
of
reagent
water
or
solid
fortified
with
the analytes
of interest
for
single-analyte
methods
or selected analytes
for multi-analyte
methods according
to the
appropriate
analytical
Upper Illinois
Waterway
Sediment Sampling
September
2008
7
Electronic Filing - Received, Clerk's Office, September 8, 2008
method. LCS’s were prepared and analyzed with each analytical batch, and analyte
recoveries were used to monitor
analytical
accuracy and
precision.
• A sample duplicate is a second aliquot of a field sample that is
analyzed
to monitor
analytical
precision associated with that particular sample. Sample duplicates
were
performed for every batch of 20 or fewer samples.
Surrogates
are organic compounds that are similar to analytes of interest in chemical
composition, extraction, and chromatography, but are not normally found in
environmental samples. These
compounds
were spiked
into all blanks, standards,
samples,
and spiked samples prior to analysis for organic parameters. Generally,
surrogates are not used for inorganic analyses. Percent recoveries
were calculated
for
each surrogate. Surrogates
were spiked into samples according to the requirements
of
the
reference analytical method. Surrogate spike recoveries were
evaluated
against the
standard laboratory acceptance criteria limits,
and were used to assess method
performance and sample measurement bias. If sample dilution caused the surrogate
concentration to fall below the quantitation limit,
surrogate recoveries were
not
calculated.
2.2
Detection
Limits
The
detection
limit is a statistical concept that corresponds to the minimum concentration
of an
analyte
above
which
the
net analyte signal can be
distinguished with a specified probability
from
the
signal
because of the noise inherent in the analytical system. The
method
detection limit
(MDL)
was
developed
by USEPA and is defined as
“the minimum concentration of a substance
that can be
measured and reported with 99% confidence that the analyte
concentration
is greater
than zero” (40
CFR 136, Appendix B). The reporting
limit
(RL)
is the lowest concentration
at
which an analyte
can be detected in
a
sample and its concentration
can
be reported with
a
reasonable degree
of
accuracy and precision. The RL is typically
three to five times higher
than
the
MDL
and is determined based on corrections
necessary for sample dilutions,
percent
moisture in the
sample
(for
sediments), and sample weight.
Samples
collected during the field effort
were
tested
for target analytes using analytical
methods
and
target
detection limits (TDLs)
for
sediment and water (equipment blanks) listed in in
the
QAIQC
Guidance
for Sampling and Analysis
of
Sediments,
Water, and Tissues
for Dredged
Material
Evaluations - Chemical Evaluations (EPA
823-B
-95-001,
April 1995). All
analytical
parameters,
except total organic carbon (TOC), were
quantified to the MDL. All detected
values
greater
than or equal to the MDL, but less than the
laboratory RL, were qualified as estimated.
TOC
samples
were
quantified to
the
laboratory
RL.
For sediment analyses, sample weights
were
adjusted for
percent moisture (up to 50% moisture), where
appropriate, prior
to analysis
to
achieve the
lowest possible reporting limits.
Upper Illinois
Waterway
Sediment
Sampling
September
2008
8
Electronic Filing - Received, Clerk's Office, September 8, 2008
3.
DATA
ANALYSIS
3.1 Calculation
of Total PCBs and
Total PAHs
For each sample, total
PCB
concentrations
were
determined
by summing the
concentrations
of
the 18 summation
congeners and multiplying
the total
by a factor
of two.
Multiplying
by
a factor
of
two
estimated
the
total PCB concentration
and accounted
for additional
congeners that were
not
tested as part
of this program.
These
determinations were
based upon
testing
of
specific
congeners recommended
in the Inland
Testing
Manual
(ITM)
(USEPAIUSACE
1998) and
upon
the National
Oceanic
and Atmospheric
Administration
(NOAA 1993)
approach for total
PCB
determinations.
Total PAH
concentrations
were determined
for each sample
by summing
the concentrations
of
the individual
PAHs. For both
the
total
PCB
and total
PAH concentrations,
two values
were
reported,
each representing
the following
methods for
treating concentrations
below
the
analytical
detection limit:
Non-detects
=0
(ND=0)
Non-detects
= 1/2 of the
method detection
limit (ND=½MDL)
Substituting
one-half the
method detection
limit for
non-detects (ND=½MDL)
provides
a
conservative
estimate of the concentration.
This
method,
however,
tends
to produce
results that
are
biased high, especially
in data sets where
the majority
of
samples
are non-detects.
This
overestimation
is important to
consider when
comparing
the calculated
total
values to
criteria
values.
3.2 Comparison
to Sediment Benchmarks
Sediment
quality guidelines
are numerical
chemical
concentrations
intended to
either
be
protective of biological
resources or predictive
of adverse
effects
to those resources,
or
both
(Wenning and
Ingersoll
2002).
The
SQGs
were
developed
as informal
(non-regulatory)
guidelines
for
use
in interpreting
chemical
data
from analyses
of sediments.
One
of
the
biological-effects
approaches that have
been
used
to assess
sediment quality relative
to
the
potential for
adverse
effects on
benthic
organisms
in freshwater
ecosystems is
the
Threshold
Effects
Concentration
(TEC) /
Probable Effects
Concentration
(PEC) approach
(MacDonald
et
al.
1996).
These
sediment quality
guidelines
were
used to
identify
potential
adverse
biological
effects
associated
with contaminated
sediments.
TECs
typically represent
concentrations
below
which
adverse biological
effects are not
expected to
occur,
while
PECs
typically
represent
concentrations
in the
middle of the effects
range and above
which
effects
are expected
to
occur
more often than
not (Macdonald et al.
2000).
Concentrations
that
are between the TEC
and
PEC
represent the
concentrations
at which
adverse
biological
effects occasionally
occur.
4.
VISUAL OBSERVATIONS
OF SEDIMENT
At
each sampling
location, the sediment
was
photograph
and described,
and any noticeable
petroleum
odors
or sheens in
the sediment
were
recorded
in
the logbook (Appendix
A).
The
Upper
Illinois Waterway
Sediment
Sampling
September
2008
9
Electronic Filing - Received, Clerk's Office, September 8, 2008
results of
the field observations indicated that the sediments
were comprised of a mixture of fine
grained sands, silts,
and clays. Sediment
from
the
majority of the sampling locations had
both
sheen and an
odor, as summarized in Table 6.
Table 6.
Summary of field observations of the sediment
in the Dresden and Lower Brandon Pools.
LOCATION
DEPTH
SEDIMENT
FIELD
SHEEN
ODOR
DRO8-01
4•9
Dark brown to gray silt
X
x
DR08-02
4.1
Dark to light gray silt with
sand
and clay
X
--
DRO8-03
2.8
Light gray sand with silt
--
--
DR08-04
3.9
Light gray silt with sand
X
x
DRO8-05
2.6
Light gray with fine-grained
sands
X
X
DRO8-06
4.8
Light gray clayey
silt
--
x
DRO8-07
4.8
Dark gray to black fine grained silt with clay
--
--
DRO8-08
3.3
Light gray fine-grained
silt
--
--
DR08-09
6.2
Gray silt with fine-grained
sand
--
--
DRO8-1O
2.3
Dark brown
sandy
silt
X
X
DRO8-1 1
3.8
Dark
brown
sandy
silt
X
x
DRO8-l2
1.7
Dark gray silty sand
--
x
DRO8-13
4.2
Dark gray clayey silt
X
X
DRO8-l4
3.1
Dark
gray
sandy silt
X
X
DRO8-15
5.7
Gray clayey silt
X
x
DRO8-16
3.8
Dark gray
to
black clayey silt
X
X
DRO8-17
3.4
Dark gray silt with fine grained sands
X
x
DRO8-18
4.1
Black silt
X
X
DRO8-19
3.1
Dark brown silt with medium
grained sands
--
-
DRO8-20
1.1
Dark gray sandy silt
X
x
DRO8-21
2.1
Dark brown to
gray sandy
silt
X
x
DRO8-22
2.3
Dark brown sandy silt
X
X
DR08-23
5.2
Dark
brown
sandy
silt
X
X
DRO8-24
2.8
Dark brown sandy silt
X
x
DRO8-25
1.8
Dark brown sandy silt
X
x
DRO8-26
2.0
Dark brown sandy silt
X
X
DRO8-27
2.3
Dark brown sandy silt
X
X
DRO8-28
1.9
Dark
gray sandy silt
X
X
DRO8-29
0.8
Dark gray sandy silt
X
x
DR08-30
2.2
Dark gray sandy silt
X
x
DRO8-31
0.9
Dark gray sandy silt
--
x
N-
•.:
BRO8-01
3.6
Dark gray silt with fine-grained
sands
X
X
BRO8-02
4.7
Dark
gray silt
X
x
BRO8-03
1.6
Dark
gray silt
X
X
BR08-04
2.1
Dark
gray
silt with
fine-grained sands
X
x
Upper Illinois
Waterway
Sediment Sampling
September
2008
10
Electronic Filing - Received, Clerk's Office, September 8, 2008
5.
SEDIMENT
CHEMISTRY
RESULTS
The
results
of
the
physical
and chemical
analysis
of
samples
from
Dresden
pool
are
summarized
in Table
7, and
the results
for
samples
from
the
Lower
Brandon
pooi
are
summarized
in
Table
8.
The
target
analytes
for
the
physical
and
chemical
description
of
the
sediment were
total
organic
carbon,
total
solids
(percent
moisture),
grain
size,
metals
(arsenic,
silver,
cadmium,
chromium,
copper,
lead,
mercury,
nickel,
and
zinc),
PAHs,
and
PCB
congeners.
Sample
weights
were
adjusted
for
percent
moisture
(up
to 50
percent
moisture)
prior
to
analysis
to achieve
the lowest
possible detection
limits.
Analytical
results
are reported
on a
dry
weight
basis.
Analytical
results
and
definitions
of organic
and
inorganic
data
qualifiers
are
provided
in Tables
7
and
8.
Values
for
detected
chemical
constituents
are
shaded
and
bolded
in
the
data
tables,
and
RLs/MDLs are
presented
for
non-detected
chemical
constituents.
Analytical
narratives
that
included
an
evaluation
of laboratory
quality
assurance/quality
control
results
and
copies
of final
raw
data
sheets
(Form
I’s)
were
provided
by the
laboratory.
TestAmerica—Pittsburgh
will
retain
and
archive
the
results
of
these
analyses
for seven
years
from
the
date
of issuance
of
the final
results.
Concentrations
of tested
metals,
PAHs,
and
PCB
congeners
were
elevated
in the
sediments
collected
in both
the
Dresden
and
the
Lower
Brandon
pools,
and
comparisons
to TECs
and
PECs
indicated
that
detected
concentrations
of
metals,
PAHs,
and
total
PCBs
had
concentrations
between
the
TEC
and
the
PEC
at almost
every
sampling
location
(Tables
9
and
10).
In
the
Dresden
pooi,
detected
concentrations
for
the
metals
exceeded
PEC
values
at
several
locations
(Table
9):
cadmium
— 12
locations
(39
percent);
chromium
—
6 locations
(19
percent);
copper
—
4 locations
(13
percent);
lead
— 9
locations
(29
percent);
mercury
- 4
locations
(13
percent);
nickel
—
9
locations
(29
percent);
and
zinc
—
9
locations
(29
percent).
For
the tested
organic
constituents in
the Dresden
pool,
total
PAH
concentrations
(ND=l/2MDL)
exceeded
PEC
concentrations
at a
total
of
19
locations
(61
percent)
and
total
PCB
concentrations
(ND=1/2MDL)
exceeded
PEC
concentrations
at
a
total
of
8
locations
(26
percent)
(Table
9).
In
the
Lower
Brandon
pool,
detected
concentrations
of
each
of the
metals,
with
the
exception
of
arsenic,
copper,
and
mercury,
and
the total
PAH
and total
PCB
concentrations
(ND=1/2MDL)
exceeded
PEC
values
in
each
of
the
four
samples
(Table
10).
The
sediment
chemical
analysis
indicated
that
both
the
Dresden
and
the
Lower
Brandon
pools
had
high
concentrations
of
metals
(Figure
2)
and
tested
organic
constituents
(Figure
3),
indicating
that
large
portions
of
the
Dresden
and
Lower
Brandon
Pools
are
of poor
sediment
quality.
Detected
concentrations
were
frequently
higher
than
the
PEC
value,
which
is
the
concentration above
which
adverse
biological
effects
are
expected
to
occur
more
often
than
not
(MacDonald
et
al.
2000).
These
data
indicate
that
the
sediment
quality
in
this
portion
of the
Dresden
Pool
and the
lower
portion
of Brandon
Pool
would
overall
be
characterized
as
poor.
For
metals
(Figure
2), only
two
sampling
locations did
not
exceed
the
TEC
for the
suit of
eight
metals
evaluated
(DRO8-02 and
DRO8-03).
All
other
sample
locations
exceeded
at least
the
TEC
for
a
minimum
of
five
metals
and
many
exceeded the
PEC
for
a
majority
of the
eight
metals
evaluated
(Tables 9
and
10).
There
is
a clustering
of
sediments
with
elevated
metal
Upper
Illinois
Waterway
Sediment
Sampling
September
2008
11
Electronic Filing - Received, Clerk's Office, September 8, 2008
concentrations
(concentrations
that
exceed the
PEC)
at
three
groups
of
locations
- locations
BRO8-O1
through
BRO8-04;
locations
DRO8-13,
DRO8-15,
and
DRO8-16;
and
locations
DRO8-24
through
DRO8-26
(Figure
2).
Lower
quality
sediments
as determined
by
exceeding
the
TECs
and
PECs
for
total
PAHs
and
total
PCBs
were
observed
at
all
sample
locations
for
PAHs
and
all but
one
sample
location
(DR08-03)
for
PCBs
(Figure
3).
Similar
to
the
metals
data,
a
clustering
of
the
sample
locations
with
the
poorest
sediment
quality
(concentrations
that
exceed
the
PEC
for both
PAHs
and
PCBs)
were
observed
at
three
groups
of
locations
— locations
BRO8-01
through
BRO8-04;
locations
DRO8-04,
DRO8-15,
and
DRO8-16;
and
locations
DRO8-18,
DRO8-20
and
DRO8-21
(Figure
3).
6.
COMPARISON
TO
HISTORICAL
DATA
Data
from
this
study
was
compared
to the
results
of
sediment
sampling
conducted
in
the
same
study
area
in
1994-1995
(Burton
1995)
and
metals
data
from
three
locations
as
compiled
by
MWRDGC
(2007).
Sampling
locations
in this
study
were
targeted
in
areas
adjacent
to
the
main
channel
of
the
river
that
would
potentially
provide
suitable
aquatic
habitat.
Therefore,
sampling
locations
tended
to
be
in
shallow
areas
with
lower
water
velocities
and
higher
rates
of
fine
grained
sediment
deposition.
Most
chemicals
in
the
environment,
including
metals,
PAHs,
and
PCBs,
tend
to
be
particle
reactive,
binding
to sediment
particles
in
the
water
column
and
are
subsequently
deposited
along
with
the
sediment
particles,
predominately
in areas
where
water
velocities decrease,
allowing
for
increased
rates
of
deposition
and
organic
matter
accumulation.
Similar
to
previous
studies
(Burton
et al.
1995,
MWRDGC
2007),
this
study
also
indicates
that
the
sediments
in
the
Dresden
and
the
Lower
Brandon
pools have
poor
sediment
quality.
To
determine
whether
the
sediment
quality
at specific
locations
has
improved
since
the
1994-1995,
18
of
those
locations
were
re-sampled
in
this
study,
and
the
detected
concentrations
of
metals
and
PAHs
were
compared
(Table
11).
Sediment
samples
in
most
riverine
systems
have
a high
degree
of
spatial
heterogeneity,
making
it
often
difficult
to
make
absolute
determinations
of
sediment
quality
improvement
over
time
when
comparing
samples
from
different
sampling
events.
The
results
of
the sampling
effort
during
the
2008
study
in
comparison
to
the
1994-1995
study
are
provided
as
a
weight
of
evidence
type
approach
and
should
be
considered
as
the
total
system
rather
than
simply
focusing
on
specific
sampling
locations.
For
the
detected
metals,
the
majority
of
the detected
concentrations
from
the
2008
study
are
either
higher
or
within
a
factor
of
two
or
less,
indicating
that
overall,
the
sediment
quality
has
essentially remained
the same
or
has
degraded
in
several
areas
(Table
11).
When
environmental
samples
are
compared
using
the weight
of
evidence
approach,
a factor
of two
is
a general
rule
of
thumb
to determine
if sample
concentrations
are similar
when
compared. For
sediment
samples
with
metal
concentrations
that
exceeded
either
the TEC
or
the
PEC,
the
concentrations
in
the
2008
study
were
often
less
than
a
factor
of
two
compared
to the
results
of
the
1994-1995
study.
A
direct
comparison
of
the
PAH
and
PCB
data
between
the
2008
study
and
the
1994-1995
study
is
complicated
by
the
vast
improvements
in
instrumentation
commercially
available
and
techniques
for
detecting
specific
PAHs
and
PCBs.
Many
of the
individual
organic
parameters
had
considerably
higher
detection
limits
in
the
1994-1995
study
than
in
the
2008
study.
Based
Upper
Illinois
Waterway
Sediment
Sampling
September
2008
12
Electronic Filing - Received, Clerk's Office, September 8, 2008
on
the results in
Table 11,
it is our opinion that
the differences
are not improvement
of the
sediment
quality,
but rather improvements
in detection
limits
and are
most likely similar between
the
two sampling
periods.
Regardless
of this discrepancy,
concentrations
of total PAHs
and
total
PCBs were
elevated in both studies,
with
concentrations
that
commonly
exceeded TEC and
PEC
values,
further evidence
that the overall
sediment quality
in the Dresden
and the Lower Brandon
pools
is poor.
This
comparison indicates
that,
overall,
the
metals concentrations
were generally
comparable
between
the two
sampling efforts,
and concentrations of
total PAHs
and total PCBs were
elevated
in both years.
While given the fact
that the sampling
efforts for both
the 1994-1995 and
2008
studies were not set
up
with
an
experimental design
to allow trend analysis
or
statistical
analysis,
there was no
clear trend to indicate
that the sediment quality
of the
Dresden and Lower
Brandon pools
was
either
greatly improving or
degrading
between
the 1994-1995
study and the
2008 study.
However, the
results do
indicate that the sediment
quality
remains
poor, as
evidenced by
the high
number
of sampling locations
that
exceeded the PECs
for many of the
metals
(Figure 2), and total
PAHs and
total PCBs (Figure 3);
and that
almost all sampling
locations
had
concentrations
that were between
the TEC and
the PEC. It is our
opinion that
the
system has
not substantially
improved with
regards
to
sediment
quality
over the last 13
years.
7.
REFERENCES
Burton, G.A.
1995. The Upper
Illinois
Waterway
Study, 1994-1995
Sediment
Contamination
Assessment.
Prepared
for the Commonwealth
Edison
Company,
Chicago,
Illinois. Final.
MacDonald,
D.D., R.S.
Carr,
F.D. Calder, E.R.
Long, and C.G.
Ingersoll. 1996.
Development
and
Evaluation of Sediment
Quality
Guidelines for Florida
Coastal
Waters.
Ecotoxicology
5:253-278.
MacDonald
D.D., C.G. Ingersoll,
and T.A.
Berger.
2000. Development
and
Evaluation
of
Consensus-Based
Sediment
Quality Guidelines
for
Freshwater
Ecosystems. Arch.
Environ.
Contam. Toxicol.
39:
20-3
1.
Metropolitan
Water
Reclaimation
District of Great Chicago
(MWRDGC).
2007. Water and
sediment quality
along
the Illinois
Waterway from
the
Lockport Lock
to the Peoria Lock
during
2006.
Report No. 07-39.
January 2008.
National
Oceanic and
Atmospheric Administration
(NOAA). 1993.
Sampling
and Analytical
Methods
of the
National
Status and Trends
Program:
National
Benthic Surveillance
and
Mussel Watch
Projects
1984-1992. Vol 1:
Overview
and
Summary
of
Methods.
NOAA
Tech. Memo.
NOS ORCA
71.
Silver Spring,
MD.
U.S.
Environmental
Protection
Agency
(USEPA). 2001
Methods for
Collection, Storage,
and
Manipulation of Sediments
for
Chemical and Toxicological
Analyses:
Technical Manual.
Office of
Water.
EPA-823-B-0
1-002. October.
tipper Illinois Waterway
Sediment Sampling
September
2008
13
Electronic Filing - Received, Clerk's Office, September 8, 2008
U.S. Environmental Protection Agency (USEPA).
1997. Test Methods for Evaluating Solid
Waste. Physical/Chemical Methods.
3
rd
Edition,
including final update III. EPA
SW-846, Washington D.C.
U.S.
Environmental Protection Agency
(USEPA) /
U.S.
Army Corps
of
Engineers
(USACE).
1998. Evaluation of Dredged Material Proposed
for Discharge in Waters
of
the
U.S.-
Testing Manual (Inland Testing Manual).
EPA-823-B-98-004.
U.S.
Environmental Protection Agency (USEPA)
/ U.S. Army Corps Engineers (USACE).
1995.
QAJQC
Guidance for Sampling and Analysis
of Sediments,
Water,
and Tissues for
Dredged Material Evaluations.
EPA-823-B-95-OO1.
Wenning, R.J. and C.G.
Ingersoll. 2002.
Summary
of
the SETAC Pellston Workshop on
Use of
Sediment
Quality Guidelines
and Related Tools for the Assessment of Contaminated
Sediments;
17-22
August 2002. Fairmount,
Montana, USA. Society of Toxicology and
Chemistry
(SETAC). Pensacola,
FL, USA.
Upper Illinois
Waterway
Sedi,ne,zt
Sampling
September
2008
14
Electronic Filing - Received, Clerk's Office, September 8, 2008
Lecienci
€
Field
Sampling
Location,
May
2008
,i—Fmpie
Identificationi
ms
BR
-
Bran
don
Reach
DR
-
Dresden
Reach
0
1
2
I
1
I
‘H
Aerial
Photo
Source:
IJSDA-FSA-APFO,
2007
Basernap
Source:
ESRI
StreetMap,
2006
Figure
Sediment
Sampling
Locations
in
the
Dresden
and
Lower
Brandon
Pools
Sediment
Chemistry
Study,
Upper
Illinois
Waterway
Dresden
and
Lower
Brandon
Pools
ect
Locai
Electronic Filing - Received, Clerk's Office, September 8, 2008
Lge
n
d
Sediment
Chemistry
Study,
Upper
Illinois
Waterway
Dresden
and
Lower
Srandon
Pools
Field
Sampling
Location,
May
2008
Each
segment
represents
a
specific
analyte,
as
shown
on
the
left
As
-Arsenic
Cd
-
Cadmium
Cr
-
Chromium
Cu
-
Copper
Hg
-
Mercury
Ni
-
Nickel
Pb
-
Lead
Zn-Zinc
lyi
It’
?1’1I
iiiI
Segments
shown
in
yellow
represent
concentrations
that
exceeded
the
Threshold
Effects
Concen-ation
(TEC)
Segments
shown
in
white
represent
concentrations
that
did
not
exceed
sediment
quality
guidelines
BR
-
Brandon
Reach
DR
-
Dresden
Reach
-
Hydrocarbons
PCB
-
Polychiorinated
Biphenyls
Note
Some
location’s
symbols
were
slightiy
moved
to
allow
each
analyte’s
exceedence
to
show.
The
locations
shown
on
this
figure
should
be
considered
approximate
0
‘1
2
‘H
Miles
Aerial
Photo
Source;
USDA-FSAAPFO,
2007
Basemap
Source:
ESRI
StreetMap,
2006
Madison
Milwaukee
Lansing
Chicago
Pmect
Loca
IrrdianapoIs
Louisville
Zn
As
Ni
Cd
Hg
Cr
Pb
Cu
Lake
Midrigan
Electronic Filing - Received, Clerk's Office, September 8, 2008
Legend
Segments
shown in
white
represent
concentrations
that
did not exceed
sediment
quality
guidelines
Acronyms
BR-
Brandon
Reach
DR
- Dresden Reach
PAH
- Polynuclear Aromatic
Hydrocarbons
P05
- Polychiorinated
Biphenyls
Preject Location
Indianapolis
Field
Sampling
Location, May
2008
e
To
=
Total
PAHs
Bottom
= Total
PCBs
1!fl
Segments
shown
in yellow
represerT
concentrations
that exceeded the
I
Threshold
Effects Concentration
(TEC)
0
0
1
2
I
I
—
Miles
Aerial
Photo
Source:
USDA-FSA-APFO, 2007
Basemap
Source:
ESRI StreetMap,
2006
Figure
3
Concentrations
of Total
PAHs
and Total
PCBs that
Exceed
Sediment
Quality
Guidelines
Madison
Milwaukee
*
-J
vvI
Lake
Midigan
Chicago
Lansing
Sediment
Chemistry
Study,
Upper
Illinois
Waterway
Dresden
and
Lower Brandon
Pools
Louis
Springfield
c
/
Louisville
*
Frankfort
MO
KY
Electronic Filing - Received, Clerk's Office, September 8, 2008
TABLE
7A. CONCENTRATIONS
OF
TARGET
ANALYTES
IN
SEDLMENT
DRESDEN
POOL,
MAY
2008
I
DRO8-01
I
DR08-02
I
DRO8-03
j
DRO8-04
DRO8-05
I
DRO8-06
DRO8.07
I
DRO8-08
I
DRO8-09
I
DRO8-10
I
DRO8-11
DRO8-IIFD
I
DRO8-12
0R08-13
I
DRO8-14
DRO8.15
I
DRO8-16
I
[
CADMIUM
CHROMIUM
COPPER
LEAD
MERCURY
‘41CKEL
.NTHRACENE
BENZO(A)ANTHRACENE
8ENZO(A)PYRENE
BENZO(8)FLUORANTHENE
F!ENZO(K)IILUORANTHENE
CHRYSENE
DIBENZO(A,H)ANTHRACENE
FLUORANTHENE
LUORENE
I’IDENO(l
,2,3-CD)PYRENE
APHTHALENE
PHENANTHRENE
MG/KG
MG/KG
MG1KG
MG/KG
MG/KG
MG/KG
UG/KG
UG/KG
UG/KG
UG/KG
UG/KG
UG/KG
UG/KG
UG/KG
UGIKG
UG/KG
UG/KG
UG/KG
0.11
0.22
0.22
0.11
0.05
0.11
204
204
204
204
204
204
204
204
204
204
204
204
0.99
43.4
31.6
35.8
0.18
22.7
57
108
150
166
33
423
77
176
204
TOTAL PAHs
(ND=RL)
UG/KG
-
1.610
4.98
ill
149
128
1.06
48.6
845
1.050
1.450
1,290
2,230
536
561
1,170
-
*Source:
MacDonald
et al. 2000.
Development
and Evaluation
of Consensus-Based
Sediment
Quality
Guidelines
for
Freshwater
Ecosystems.
Arch. Environ.
Contam.
Toxicol.
39: 20-31.
NOTE:
Shaded
and bold
values
indicate
parameters for
detected
constituents.
Values
not shaded
or bold represent
non-detected
concentrations
reported
at the RIJMDL.
Physical
parameters
(ie..
grain size
and TOC)
are reported
as
percent
total
sample.
RL
= average
reporting
limit
B
(organic)
= detected
in the laboratory
method
blank
TEC
= Threshold
Effect
Concentration
J
(organic)
= compound
was detected,
but below
the reporting
limit (value
is
estimated)
PEC
= Probable
Effect
Concentration
J
(inorganic)
= detected
in the
laboratory
method
blank
FD
= field
duplicate
U
= compound
was
analyzed,
but
not detected
COL
= more than
40% difference
between
initial
and
confirmation
results;
the
lower
result is reported
ANALYTE
UNITS
RL
TEC*
PEC*
TOTAL
ORGANIC
CARBON
MG/KG
0.90
I
--
I
—
I
41.400
24.400
6.700
28.700
21.800
26.500
33.200
‘1 ÀY
T+CLAY
PERCENTSOLIDS
%
--
I
--
I
--
32.8
45.9
66.9
39
54.6
31.1
32.7
41.3
-
46.2
57.5
53.5
53.1
66.9
43.3
54.8
35.9
36.4
ARSENIC
%
MG/KG
19.2
GRAVEL
%
--
—
--
0.0
0.0
0.0
0.7
0.7
0.0
0.0
0.0
0.4
0.1
0.1
0.7
0.0
:2.9
1.5
0.0
0.8
SAND
%
--
--
—
16.3
50.3
73.1
25.1
51.1
2.2
4.3
6.2
49.5
67.4
62.3
60.1
88.2
39.9
61.7
9.9
21.0
COARSESAND
%
--
--
—
0.2
0.3
0.1
1.0
2.2
0.0
0.0
0.t
0.3
0.3
3.1
2.8
1.0
0.4
1.4
0.0
1.8
MEDIUMSAND
%
--
—
—
0.6
2.7
3.5
4.0
4.4
0.1
0.2
0.5
3.8
3.3
11.7
11.3
14.4
6.5
9.1
1.7
6.0
FINE SAND
%
--
—
—
15.5
47.3
69.5
20.1
44.5
2.1
4.1
5.6
45.4
63.8
47.5
46.0
72.8
33.0
51.2
8.2
13.2
SILT
%
—
--
--
64.4
27.4
21.0
58.4
38.6
69.8
73.3
75.1
36.0
22.8
28.7
28.7
6.6
30.2
26.4
61.8
47.2
0.11
22.3
9.79
83.6
33
6.0
49.7
14.500
23.600
16.600
13.200
29.400
13.300
26.300
28300
15.8
27.0
9.6
U1.VER
74.2
28.1
48.2
INC
22.4
97.9
18.7
MG/KG
95.7
kCENAPHTHENE
0.11
14.0
93.8
MG/KG
LCENAPHTHYLENE
9.7
50.0
0.54
UG/KG
121
8.9
10.6
32.5
37.6
204
r
-,
2.3
59
I
519J
&
UG/KG
204
39.3
5.2
27.!
10.4
11.8
57.3
36.8
RRNZO(GHTWERYI
.ENE
28.3
I
7
I
300
130J
130U
lAO
31.0
90.1
26
78.2
4
3
LI
IJG/KG
17.3
196
J
6
204
3.1
51.9
J
.7
185
12.7
158
J
64
46.8
0.72
272
• 311
31
36.3
110
0.3
25
0.36
I
43
PYRENE
1.1
2041
836J
I
—
TOTAL
PARs
(ND=0)
UG/KG
TOTAL PAHs
(ND=1/2RL)
204
UG/KG
195
1,520
1.610
UG/KG
—-
I
1,610
22800 I
263601
22,800
I
26,360
I
16,198
1,7;;
22,800
60
I
16,198
1,977
27,
EST
= estimated
value
I
810
Z000I
21,200
21,200
21,200
I1000I
67,240
14,094
67,286
4,117
67,332
Page
1 of
2
Electronic Filing - Received, Clerk's Office, September 8, 2008
TABLE
7A.
CONCENTRATIONS
OF TARGET
ANALYTES
IN SEDIMENT
DRESDEN POOL,
MAY 2008
GRAVEL
SAND
COARSE
SAND
MEDIUM
SAND
FINE SAND
SILT
CLAY
SILT+CLAY
%
%
%
%
%
%
%
%
5.3
28.4
0.6
3.0
24.8
50.6
15.6
66.2
0.0
32.5
0.6
2.4
29.5
44.3
23.2
67.5
ARSENIC
MG/KG
0.11
9.79
33
CADMIUM
MG/KG
0.11
0.99
4.98
CHROMIUM
MG/KG
0.22
43.4
111
COPPER
MG/KG
0.22
31.6
149
LEAD
MG/KG
0.11
35.8
128
MERCURY
MG/KG
0.05
0.18
1.06
NICKEL
MG/KG
0.11
22.7
48.6
SILVER
MGIKG
0.11
--
--
1NC
MG/KG
0.54
121
459
-
ACENAPHTHYLENE
UG/KG
204
--
--
ANTHRACENE
UG/KG
204
57
845
BENZO(A)ANTHRACENE
UG/KG
204
108
1,050
BENZO(A)PYRENE
UG/KG
204
150
1,450
BENZO(B)FLUORANTHENE
UGIKG
204
-
—
‘3ENZO(GHI)PERYLENE
UG/KG
204
--
--
‘3ENZO(K)FLUORANTHENE
UG/KG
204
-
CHRYSENE
UG/KG
204
166
1,290
‘)IBENZO(A,H)ANTHRACENE
UG/KG
204
33
--
FLUORENE
UG/KG
204
77
536
INDENO(I ,2,3-CD)PYRENE
UG/KG
204
--
--
NAPHTHALENE
UG/KG
204
176
561
PHENANTHRENE
UG/KG
204
204
1,170
PYRENE
UG/KG
204
195
1,520
TOTAL PAHs
(ND=0)
IJG/KG
—-
1,610
22,800
TOTAL PAFIs
(ND=1/2RL1
UG!KG
---
1.610
22.800
1.7
53.2
1.9
8.4
42.9
34.3
10.9
45.2
0.6
85.2
1.8
14.8
68.6
10.0
4.2
14.2
1,610
22,800
L
203,700
0.0
80.9
1.1
9.0
70.8
13.4
5.7
19.1
1.0
74.4
2.3
16.9
55.2
16.8
7.7
24.5
0.4
71.9
3.3
15.8
52.8
21.8
5.9
27.7
0.0
55.6
0.5
2.8
52.3
34.5
10.0
44.5
*Solirce
MacDonald
Ct
al. 2000. Development
and Evaluation
of
Consensus-Based
Sediment Quality
Guidelines
for Freshwater
Ecosystems.
Arch.
Environ.
Contam. Toxicol.
39: 20.31.
NOTE: Shaded
and bold
values
represent
detected
concentrations.
Physical
parameters
(ie.,
grain size and TOC)
are
reported
as percent
total sample.
RL = average
reporting
limit
B
(organic)
= detected
in the laboratory
method
blank
TEC
= Threshold Effect
Concentration
J
(organic) = compound
was detected,
but
below
the reporting
limit
(value
is estimated)
PEC
= Probable Effect
Concentration
J
(inorganic)
=
detected in the laboratory
method
blank
FD = field duplicate
U = compound
was analyzed,
but
not detected
COL = more
than 40% difference
between initial
and confirmation
results;
the
lower
result
is reported
EST = estimated
value
0.0
62.7
0.8
4.6
57.3
32.5
4.7
37.2
ANALYTE
UNITS
RL
TEC*
PEC*
I
DRO8-17
I
DRO8-18
I
DRO8-19
I
DRO8-20
I
DRO8-21
DRO8-22
I
DROS-23
DRO8-24
DRO8.25
I
DRO8-26
I
DR08.27Ti08-28
I
DRO8-28FD
I
DRO8-29
DR08-30
I
DR08.i
TOTAL
ORGANIC CARBON
MG/KG
0.90
—
—
15,100
43,900
25,600
70,800
15,11w
P47,400
37,000
37,500
33,500
73,000
24,800
21,400
26,300
83,500
45,000
21,500
PERCENT
SOLIDS
%
--
—
—
47.7
39.8
40.1
61.3
58.6
58.3
57.7
49.4
57
50.6
57.3
67.3
66.2
54
57.8
59.7
0.0
2.8
44.9
1.1
67.2
80.8
1.3
0.2
2.4
42.3
79.4
0.6
2.3
11.0
53.9
0.0
63.3
3.7
21.2
55.9
0.2
41.5
48.1
5.6
20.0
53.8
41.9
ACENAPHTHENE
24.9
7.1
3.6
18.1
41.6
14.8
5.1
1.1
7.9
325
55.2
15.5
3.3
4.1
11.3
26.5
30.0
UG/KG
22.8
3.9
18.1
204
43.0
13.3
19.4
40.1
15.4
36.1
17.8
58.4
57.9
FLUORANTHF.NF.
UG/KG
204
423
2,230
TOTAL
PAH5 (ND=RL)
UG/KG
138,045
760,200
231,990
52,894
138,110
760,200
231,990
52,928
‘
Page 2 of
2
Electronic Filing - Received, Clerk's Office, September 8, 2008
TABLE
7B.
CONCENTRATIONS
OF TARGET
ANALYTES
IN
SEDIMENT
DRESDEN
POOL, MAY
2008
DRO8-01
I
DRO8-02
I
DRO8.03
I
DRO8-04
I
DRO8-05
DRO8-06
I
DRO8-07
I
DRO8-08
I
DRO8-09
I
DRO8-10
DROX-li
I
DROX-11FD
I
DRO8.12
I
DRO8-13
DRO8-14
I
DRO8-15
I
DRO8-16
I
ANALYTE
UNITS
RE
TEC*
PEC*
PCB
8
*
UG/KG
1.42
--
--
3.9
1.1
U
0.97 U
5.5
COL
1.9
2.2 EST
1.5
U
1.6
COL
2.5
COL
2.9
4.4
FST
4.9
2.3
1.8
3.7 EST
5.5
COL
2.8
COL
PCB 18
*
UG/KG
1.42
--
--
13
1.6
0.97 U
23
8.1
7
2.6
6.6
10
11
18
18
8.5
6.8
11
26
25
COL
PCB 28
*
UG/KG
14.18
--
--
28
3.23
0.7J
38
16
19
6.83
14
19
21
29
29
16
9.63
23
51
38
PCB
44
*
UG!KG
1.42
--
--
27
2.8
0.81
3
37
15
17
6.3
15
19
19
26
25
14
9.8
19
49
53
PCB
49
UG/KG
1.42
--
--
2.8
COL
0.87J
33
12
17
6.1
13
16
16
21
20
11
11
17
46
46
PCB 52
*
UG/KG
1.42
--
--
33
3.4
0.86.)
43
17
21
7.7
17
23
21
29
27
15
13
23
58
73
PCB
66
*
UG/KG
1.42
--
--
26
2.7
0.71
J
30
13
17
6.7
13
16
16
—
22
21
12
7.5
17
41
48
PCB
77
*
UG/KG
1.42
--
--
4.6
0.36
J
COL
0.97
U
5.3
2.1 COL
2.9
COL
1.13
COL
2.4 COL
2.9 COL
2.6
0.93
U
3.2
1.6
1.5 COL
2.8 COL
6.6
COL
7.4
COL
PCB
87
UG/KG
1.42
--
--
11
COL
1.3 COL
0.363
COL
12
C0L
5.5
COL
7.9
COL
3.1
COL
6.1
COL
7.9
COL
6.2 COL
7.9
COL
7.4 COL
4.3 COL
5.4
COL
6.7
COL
19 COL
33 COL
PCB
90
UG/KG
1.42
--
--
1.5
U
1.1 U
0.97
U
1.3 U
1 U
1.6 U
1.5
U
1.2
U
1.1
U
0.96 U
0.93
U
0.94
U
0.97 U
1.2 U
1
U
1.4
U
2.8 U
PCB 101
*
UG/KG
1.42
--
--
33 EST
3.4
EST
0.863
EST
37 EST
15 EST
23
EST
8.4 EST
18 EST
23 EST
18
EST
22
COL
21 COL
11 EST
14 EST
19 COL
56 COL
86 EST
PCB
105
*
UG/KG
1.42
--
--
9.2
1.1
0.97
U
9.4
4.5
6.6
2.6
4.5
6.5
5.4
6.6
6.5
3.8
4.3
5.5
14
23
PCB
118
*
UGIKG
1.42
--
--
22
2.3
0.64)
25
10
16
6
11
16
12
15
15
8.2
10
13
36
65
PCB126*
UG/KG
1.42
--
--
1.5U
1.1U
0.97U
1.3U
1
U
1.6U
1.5U
1.2U
1.1U
0.96U
0.93 U
0.94U
0.97U
1.2U
1U
1.4U
2.8U
PCBI28*
UG/KG
1.42
--
--
‘:4.6
0.61J
0.23
4.9
1.9
3.6
1.5
2.4
3.3
2.4
2.4
2.4
1.2
2.3
2.3
8.4
15
PCB
138
*
UG/KG
1.42
--
--
23
2.6EST
0.65JEST
23
9.3
17
6.7EST
11
16
11
12
12
6.3
10
13
36
66
PCB 153
*
UGIKG
1.42
--
--
24
2.7
0.65.)
COL
24
9.4
19
6.7
12
16
12
11
12
6.1
9.2
14
40
68
PCB 156
UG/KG
1.42
--
--
2.4
0.27J
0.97 U
2.5
0.98J
1.9
0.73)
1.2
1.7
1.2
1.3
1.3
0.743
1.2
1.2
3.7
7.4
PCB169*
UG/KG
1.42
--
--
1.5U
1.IU
0.97U
1.3U
1U
1.6U
1.5U
1.2U
1.1U
0.96U
0.93U
0.94U
0.97U
1.2U
1U
1.4U
2.8U
PCB 170
*
UG/KG
1.42
--
--
9.2 EST
1.1
EST
0.3
J
EST
8.6
EST
3.2 EST
7.1 EST
2.6
EST
4.4
EST
6
EST
4.2 EST
3.8
EST
3.9
EST
1.9
EST
3.2 EST
5 EST
14 EST
22
EST
PCB
180
*
UGIKG
1.42
--
--
17
1.7
0.97
U
16
5.5
13
4.7
7.6
10
7.2
6.2
6.4
3.1
5.5
8.4
25
42
PCB
183
UG/KG
1.42
--
--
4.5
0.47
J
0.97
U
4.3
1.5
3.5
1.23
2.1
2.8
2.1
1.8
1.9
0.93
1.5
2.4
7
11
PCB 184
UG/KG
1.42
--
--
0.753
COL
1.1
U
0.97
U
1.3
U
I
U
0.543
COL
1.5 U
1.2 U
1.1
U
0.39
J
COL
0.93 U
0.94
U
0.97
U
1.2
U
COL
1.1
J
COL
2.8 U
PCB 187
*
UGIKG
1.42
--
--
9.6
1.2
0.263
9.3
3.4
7.8
2.8
4.8
6.3
4.6
4.1
4.3
2
3.8
5.4
15
23
PCB
195
UG/KG
1.42
--
--
2.2 EST
0.31
T COL
0.97
U
1.9
0.753 EST
1.7
EST
0.623
EST
0.973
1.2
0.953
EST 0.88 COL
0.9
COL
0.413
EST
1.2 COL
1.2
2.9 T
COL
4.9
PCB
206
UGIKG
1.42
--
--
3.3
0.543
0.15.)
3.1
0.86
J
2.7
0.883
1.3
2.1
1.6
3
2.6
0.383
15
1.2
3.8
8.2
PCB 209
UGIKG
1.42
--
--
3.8
0.6)
0.97
U
2.9
0.79
J
2.5
0.85
J
1.3
1.8
1.5
2.8
2.5
0.97 U
16
1
4
10
TOTAL
PCBs (ND=0)
UG/KG
---
59.8
676
574.2
61.54
13.28
678
270.6
398.4
146.4
290.6
391
340.6
423
423.2
226
224.6
370.2
963
1314.4
TOTAL
PCBs
(ND=1/2RL)
UG/KG
---
59.8
676
577.2
64.84
20.07
680.6
272.6
401.6
150.9
293
393.2
342.52
425.79
425.08
227.94
227
372.2
965.8
1320
TOTAL
PCBs (ND=RL)
UG/KG
---
59.8
676
580.2
68.14
26.86
683.2
274.6
404.8
155.4
295.4
395.4
344.44
428.58
426.96
229.88
229.4
374.2
968.6
1325.6
*Source:
MacDonald
et al. 2000.
Development
and Evaiuation
of Consensus-Based
Sediment
Quality
Guidelines
for
Freshwater
Ecosystems.
Arch. Environ.
Contam.
Toxicol. 39: 20-31.
NOTE: Shaded
and
bold values
indicate detected
concentrations.
Values
not
shaed or
bold indicated
non-detected
concentrations
represented
by the average
RL.
RL
= average reporting
limit
B
(organic)
= detected
in the laboratory
method blank
TEC = Threshold
Effect Concentration
J
(organic)
= compound was
detected,
but
below the
reporting limit
(value
is
estimated)
PEC
= Probable
Effect Concentration
J
(inorganic)
=
detected in
the laboratory
method
blank
FD = field
duplicate
U
= compound
was analyzed,
but
not
detected
COL = more
than
40% difference
between
initial and
confirmation results;
the
lower
result
is
reported
EST
= estimated value
Page
1 of
2
Electronic Filing - Received, Clerk's Office, September 8, 2008
I:
fl
.1
E
z
II
••
ii
••
--
C,,
.c
Oz
—t
-
a
Q.
rn
p.’
<
p’_.,
‘
4.’.
t
-,‘
—‘
—.
.
—
.
n
—0
n
no
8
0.0
p.’
II
C
(P
8
%.9
.
.
.
g•
°.
8
8
8
c.
(PC
(P
Pt
(.‘
C
(P
.‘
0
0
—.
0
—
C
,
—
(P
-‘
-t
(P
°
a
-‘
C
g
0
(P
(P
(P
o
(P
-
0Q-’-
C
-,
.
-8
C,
!
—
-,
(P
pp
o
CO
C
p.)
(P
‘C
t’J
*
—I
00
00
00
‘C
00
00
00
00
C,.’
00
00
00
00
00
00
00
00
‘C
00
C,.’
00
C
O
z
tT5
—
-
T1
*
p.)
CD
CD
C’)
0
C’)
--
-
.0.’C
C
C0
CC
C
0
0’C
00
C
C0C
C0
0CC
0
cc
c
r
m
O
cm
n
r
r
nn
r
n
r
r
ô
ô
r
r
r
r
c
m
---
>
>
>
J
—
‘C
GO
—
OP
-
4.’.
GO
t-
r-
c-.’
c
C
‘C
00
00
00
GO
—)
C-
Ut
Lit
C’J
—
0
0
0
—C
-..‘
‘C
-
GO
GO
‘-C
‘
‘C
‘C
C
Vt
-•.)
4.’.
—..)
C
0
‘0
C
cd.’
GO
GO
Q
GO
Lit
*
*
*
*
n
(.
(Th
fl
*
*
*
*
*
*
*
*
*
*
*
zz
II
II
—c
rk)’
CQ
Q
Q
c
Q
Q
Q
C
C
Q
Q
C
C
Q
C
C
C
C
C
I
I
p.)
J
C’J
p..
pJ
N)
t)
tJ
C’
t
C’.)
t’J
(
PJ
p.S)
t
p.j
C’)
p.j
(
cM
:
:
I
I
:
I
I
I
:
I
I
GO
GO
GO
OP
C
-
—.)
-.)
op
oo
:
-
:::-
t-)
)
%
.
b
.
-
..
0%
E
E
“
E
00
.
t
t-
-.
;
.‘
c.’
c.’
.‘
.‘
.‘
00
O
8
-
t-
r-
r-
—
t
!
!
E
-J
-_.‘
—
i..’
t
h..’
t’)
p..)
C’.)
C.’.
E
:
•
.
i
.
L:
C,.’
-
00
cc
0
•
0
p
U’
:
•
O
:
0%00
-
1
‘
(it
.J
:-‘.‘
::
;
;
0%
0%-J
.
-
•.‘
—
bi
e
—
C’)
0%
C
:
E
:
2
8
C,.’
I-
r*
C1
UI
0
0
C
0
2
:
C
O
•I-
-J
I••
‘C
C,.’
-‘
J•.
:
i..’
M
O
r
O
c
C,.’
‘
:
0%
‘C
0%
C,)
Li
W
-J
.
—
-
—
—
‘C
—
—
—
c
Electronic Filing - Received, Clerk's Office, September 8, 2008
AteAIVT*’
209
TABLE 8. CONCENTRATIONS
OF TARGET ANALYTES IN SEDIMENT
LOWER BRANDON POOL, MAY 2008
tU[AL I’UBs (NUKL)
EU/KU
UNITS
RL
TEC** PEC**
UG/KG
6.93
--
—
II
2.lJ
93J-
*
PCi congeners used
for
Total PCB summation, as
per Table
9-3
of the ITM (USEPAIUSACE
1998)
5
Source MacDonald et at. 2000. Development and
Evaluation
of Consensus-Based Sediment Quality Guidelines for Freshwater
Ecosystems. Arch.
Environ.
Contam.
Toxicol.
39: 20-3 I.
NOTE:
Shaded
and bold values indicate
detected
concentrations. Values not shaed or bold indicated non-detected concentrations
represented by the average RL.
RL
= average reporting limit
B
(organic) = detected in the
laboratory
method
blank
TEC = Threshold Effect Concentration
J
(organic)
= compound was
detected, but
below
the reporting
limit (value is
estimated)
PEC
= Probable Effect Coo;entration
J
(inorganic) = detected in the
laboratory
method blank
COL = more than
40%
difference between initial
and confirmation results; the
lower
result
is reported
EST = estimated value
U = compound
was analyzed,
but not detected
I
BROO-Ot
I
111(08-02
111(08-03
I
111(08-04
I
TOTAL ORGANIC
CARBON
%
--
--
--
4.23
6.61
5.28
4.80
PERCENT SOLIDS
%
--
--
--
53.9
39.5
45.2
50.3
GRAVEL
%
--
—
--
3.5
0.0
0.0
0.5
SAND
%
—
—
--
54.7
19.2
19.4
58.0
COARSE
SAND
%
—
—
--
2.2
0.1
0.0
4.4
MEDIUM SAND
%
—
—
--
4.6
0.7
0.8
12.6
FINE SAND
%
--
—
--
47.9
18.4
18.6
41.0
SILT
%
—
—
—
29.2
64.4
68.6
24.0
CLAY
%
--
—
—
12.5
16.4
11.9
17.5
SILT+CLAY
%
—
—
—
41.7
80.8
80.5
41.5
SILVER
MG/KG
0.11
9.79
33
.s9Nt3
ani1
6
8.
CADMIUM
MG/KG
0.11
0.99
4.98
•‘2iP
23.3
8.4
18.4
CHROMIUM
MG/KG
0.22
43.4
ill
8214J
2823
1253
2443
COPPER
MG/KG
0.22
31.6
149
235
264
146
177
EAD
MG/KG
0.11
35.8
128
456
322
1%
315
ERCURY
MG/KG
0.04
0.18
1.06
1.4
2
0.84
0.83
CKEL
MG/KG
0.11
22.7
48.6
163
109
50.3
129
LVER
MG/KG
0.11
-
--
6.8
6.8
3
5.2
INC
MG/KG
0.54
121
459
Y3T
1TT
6423
8003
CENAPHTHENE
UG/KG
361
--
--
520
2,400
CENAPHTHYLENE
UG/KG
361
—
--
1.500 •••
CENE
UGIKG
361
52
845
6,300
1,800
10.000
.NTHRACENE
UG/KG
361
108
1,050
35,000
6,100
PYRENE
UG/KG
361
150
1.450
6,900
FT..UORANTHENE
UG/KG
361
-
--
7J
27,000
53,000
‘)PERYLENE
UG/KG
361
--
--
J!
3,900
18,000
FUJORANTHENE
UG/KG
361
--
--
620 U
420 U
74 U
330 U
E___________ UG/KG
361
166
1,290
6,400
47,000
.*,H)ANTHRACENE
UG/KG
361
33J)
--
990
6.700
PLUORANTHENE
UG)KG
361
423
2,230
45.000
11.000
65,000
FL
E________ UGIKG
361
Th4
536
2.900
720
2,800
1,2,3-CD)PYRENE
UG/KG
361
--
--
J2!2. IZ!!L. ..L
ALENE
UG)KG
361
176
561
1.900
6,600
840
3,700
ANTHRENE
UG)KG
361
204
1,170
600
11
000
3,300
12.000
UG/KG
361
1W
1,520
]Y IW
]W
TO
PAils
(ND=0)
UG/KG
--
1,610
22,800
322,000
64070
0
PAHa(ND=t/2RL)
UG/KG
---
1,610
22,800
10
216.810
64.107
359
TOTAL
PAHn
(ND=RL)
UG/KG
—-
1,610
22,800
. PF
IT
,1
pç
*______________
UG/KG
6.93
--
--
60
24
COL
II EST
47
COL
p(’
*
UG/KG
6.93
--
--
240
120
38
200
PC
*
UG/KG
69.3
--
--
290
160
76
j%
44
*
UG/KG
6.93
--
--
280
190
59
240
PC 4
UG/KG
6.93
--
--
210
140
52
190
a
UG/KG
6.93
--
--
300
210
66
270
C
UG/KG
6.93
--
--
200
140
52
190
B 77
*
UG/KG
6.93
--
--
23 COL
18 COL
8.9
21
COL
B 87
UG/KG
6.93
--
--
80
COL.
72 COL
20
COL
65 COL
B 90
UG/KG
6.93
--
--
9.3
U
6.3
U
2.2
U
9.9 U
B
101*
UG/KG
6.93
--
--
COL
19OESF
S7EST
I9OEST
B 105
*
UG/KG
6.93
—
--
56
53
16
48
PCB
118*
UG/KG
6.93
--
--
140
120
39
130
PCB 126
*
UG/KG
6.93
--
—
9.3 U
6.3 U
2.2 U
9.9 U
B
128
*
UG/KG
6.93
—
—
23 B
23 B
7.2 B
20 B
B
138*
UG/EG
6.93
—
—
110
110
36
93
B 153
*
UG/KG
6.93
--
--
100
110
38
90
B 156
UG/KG
6.93
--
--
12
12
3.8
10
B 169
*
UG/KG
6.93
--
—
9.3 U
6.3 U
2.2 U
9.9 U
B 17(1
*
UG/KG
6.93
—
--
31
EST
39 EST
14 EST
29 EST
B 180
UG/ICG
6.93
—
—
55
72
26
49
B 183
UG/KG
6.93
--
--
19
6.8
14
PCB 184
UG/KG
6.93
—
—
9.3 U
6.3 U
I
J
COL
9.9 U
PCB 187
*
UGIKG
6.93
—
--
40
15
29
PCB 195
UG/KG
6.93
—
—
EST
8.3 EST
2.7 EST
9.9 U
B 206
UG/KG
6.93
—
--
3
8
2.9
5.J;’
676
Electronic Filing - Received, Clerk's Office, September 8, 2008
TABLE
9.
CONCENTRATIONS
OF
TARGET
ANALYTES
THAT
EXCEEDED
SEDIMENT
QUALITY
GUIDELINES
1,500
--
390
410
--
1,200
--
16,198
--
16,198
1,717
16,198
1,977
DRESDEN
POOL,
MAY
2008
ANALYTE
UNITS
CADMIUM
MG/KG
RL
TEC*
PEC*
0.109
0.99
4.98
MERCURY
MG/KG
0.050
0.18
1.06
0.72
NICKEL
MG/KG
0.109
22.7
48.6
37
ARSENIC
MG/KG
0.109
9.79
33
--
--
--
--
--
--
--
--
--
--
--
--
--
ZINC
MG/KG
0.544
121
459
BENZO(A)ANTHRACENE
UG/KG
2.9
ANTHRACENE
UG/KG
204
57.2
845
I
DRO8-01
I
DRO8-02
DRO8-03
I
DRO8-041
DRO8-05
I
DRO8-06
I
DRO8-07
I
DRO8-08
I
DRO8-09
1DR08-101
DRO8-11
I
DRO8-11FD
I
DRO8-12
I
DRO8-13
I
DRO8-14 DRO8-15
I
DRO8-16
CHROMIUM
MG/KG
0.2
18
43.4
1
11
93.4
J
--
--
106
J
--
59.2
J
45.9
J
46.4
J
59.5
J
--
56.2
J
54.5
J
--
COPPER
MG/KG
0.218
31.6
149
112
--
--
123
44
68
52
62
73
43
57
60
--
LEAD
MG/KG
0.109
35.8
128
125
--
--
54
86
72
66
98
67
91
91
47
4.5
2.8
3.6
204
108
1.050
3.0
4.1
BENZO(A)PYRENE
UG/KG
204
150
1,450
CHRYSENE
UG/KG
204
166
1,290
DIBENZO(A,H)ANTHRACENE
UG/KG
204
33
--
FLUORANTHENE
UGIKG
204
423
2,230
FLUORENE
UG/KG
204
77.4
536
NAPHTHALENE
UG/KG
204
176
561
PHENANTHRENE
UG/KG
204
204
1,170
PYRENE
UG/KG
204
195
1,520
TOTAL
PAHs
(ND=0)
UG/KG
--
1,610
22,800
TOTAL
PAHs
(ND=1/2RL)
UG/KG
--
1,610
22,800
TOTAL
PAHs
(ND=RL)
UG/KG
--
1,610
22,800
1.3
140
0.24
0.56
0.27
0.29
0.45
0.44
0.56
0.45
0.72
440
410
24
29
29
38
24
41
45
27
213J
264J
225J
296J
455J
267J
354J
356J
204J
270
320
H
51.9J
64
110
0.30
25
314J
U
770
210
740
1,000
360
1,100
920
280
1,100
230
77J
210
1,400
720
1,400
520
430
TOTAL
PCBs
(ND=0)
UG/KG
--
59.8
676
574
62
--
TOTAL
PCBs
(ND=1/2RL)
UG/KG
--
59.8
676
577
65
--
TOTAL
PCBs
(ND=RL)
UG/KG
--
59.8
676
580
68
--
1,200
490
330
11,127
1,400
4,017
11,319
ii,i
7
J
4,217
11,319
11,127
4,417
11,319
*Source:
MacDonald
et al.
2000.
Development
and
Evaluation
of Consensus-Based
Sediment
Quality
Guidelines
tr
Freshwater
RL
= average
reporting limit
TEC
= Threshold
Effect
Concentration
concentration
exceeds
TEC
PEC
= Probable
Effect
Concentration
FD
=
field
duplicate
J
(inorganic)
=
detected
in
the
laboratory
method
blank
398
146
291
405
155
Ecosystems. Arch.
Environ.
Contam. Toxicoi.
39:
20-31.
402
151
293
393
343
426
425
I
228
I
227
I
372
295
395
344
I
429
I
391
341
I
423
I
423
I
_26
1
225
- I
370
427
230
229
374
Page
1
of 2
Electronic Filing - Received, Clerk's Office, September 8, 2008
TABLE
9.
CONCENTRATIONS
OF
TARGET
ANALYTES
THAT
EXCEED
SEDIMENT
QUALITY
GUIDELINES
DRESDEN
POOL,
MAY
2008
TOTAL
PCBs
(ND=RL)
RL = average
reporting
limit
TEC
= Threshold
Effect
Concentration
PEC
= Probable
Effect
Concentration
FD
=
field duplicate
140
130
590
570
590
600
570
590
89
120
1,500
1,000
510
400
710
640
6,463
5,881
6,479
5,898
6,495
5,915
326
137
331
141
336
145
ANALYTE
UNITS
RL
TEC*
PEC*
ARSENIC
MG/KG
0.109
9.79
33
--
CADMIUM
MG/KG
0.109
0.99
4.98
1.5
CHROMIUM
MG/KG
0.2 18
43.4
111
--
COPPER
MG/KG
0.218
31.6
149
37
LEAD
MG/KG
0.109
35.8
128
40
MERCURY
MG/KG
0.050
0.18
1.06
--
NICKEL
MG/KG
0.109
22.7
48.6
--
ZINC
MG/KG
0.544
121
459
145J
I
DRO8-17
I
DRO8-18
DRO8-19
I
DRO8-20
I
DRO8-21
I
DRO8-22
I
DRO8-23
I
DRO8.24
I
DRO8-25
DRO8-26
I
DRO8-27
I
DRO8-28
I
DRO8-28FD
1DR08-291
DRO8-30
I
DRO8-31
I
ANTHRACENE
UG/KG
204
57.2
845
140
BENZO(A)ANTHRACENE
UG/KG
204
108
1,050
500
BENZO(A)PYRENE
UG/KG
204
150
1,450
580
CHRYSENE
UG/KG
204
166
1,290
610
DIBENZO(A,H)ANTHRACENE
UG/KG
204
33
--
90
FLUORANTHENE
UG/KG
204
423
2,230
960
FLUORENE
UG/KG
204
77.4
536
--
NAPHTHALENE
UG/KG
204
176
561
--
PHENANTHRENE
UG/KG
204
204
1,170
300
PYRENE
UG/KG
204
195
1,520
700
TOTAL
PAHs
(ND=0)
UG/KG
--
1,610
22,800
6,185
TOTAL
PAHs
(ND=1/2RL)
UG/KG
--
1,610
22,800
6,185
I
TOTAL
PAHs
(ND=RL)
UG/KG
--
1,610
22,800
6,185
I
--
--
--
--
I
--
--
--
--
10
--
4.9
3.9
3.4
3.7
4.4
1.7
1.7
3.7
2.2
2.0
77.3
J_
79.1
J
55.3
J
47.4
J
57.3
J
I
il.
56.5
J
--
--
57.2
J
--
--
87
—
—
59
49
73
.
— 68
38
33
50
103
47
1
i
)
84
87
[
90
51
57
99
105
‘ S
0.51
0.32
0.30
0.24
--
0.29
--
0.24
46
35
34
--
--
32
--
312J
335J I
330J
158J
172J
429J
333J
383J
TOTAL
PCBs
(ND=0)
UG/KG
TOTAL
PCBs
(ND=1/2RL)
UG/KG
--
59.8
676
143
I
UG/KG
59.8
*Source:
MacDonald
et
al. 2000. Development
and Evaluation
of
Consensus-r
676
140
59.8
I
676
_.__._1 C’_
146
J
(inorganic)
= detected
in
the laboratory
method
blank
concentration
exceeds
TEC
519
480
447
217
548
521
482
449
219
550
I
524
484
451
221
552
y
Guid
- ines for
Freshwater
Ecosystems.
Arch.
Environ.
Contam. Toxicol.
39:
20-31.
436
I
473
378
438
475
380
439
477
382
Page
2 of
2
Electronic Filing - Received, Clerk's Office, September 8, 2008
TABLE
10.
CONCENTRATIONS
OF
TARGET
ANALYTES
THAT
EXCEED
SEDIMENT
QUALITY
GUIDELINES
LOWER
BRANDON
POOL,
MAY
2008
ANALYTE
UNITS
RL
TEC*PEC*
ANTHRACENE
UG/KG
361
57.2
BENZO(A)ANTHRACENE
UG/KG
361
108
BENZO(A)PYRENE
UG/KG
361
150
CHRYSENE
UG/KG
361
166
DIBENZO(A,H)ANTHRACENE
UG/KG
361
33
FLUORANTHENE
UG/KG
361
423
FLUORENE
UG/KG
361
77.4
NAPHTHALENE
UG/KG
361
176
PHENANTHRENE
UG/KG
361
204
PYRENE
UG/KG
361
195
TOTAL
PAHs(ND=0)
UG/KG
--
1,610
TOTAL
PAHs
(ND=1/2RL)
UG/KG
--
1,610
TOTAL
PAHs
(ND=RL)
UG/KG
--
1,610
TOTAL
PCBs
(ND=0)
UG/KG
--
59.8
676
I
TOTAL
PCBs
(ND=1/2RL)
UG/KG
--
59.8
676
I
TOTALPCBs(ND=RL)
UG/KG
--
59.8
676
*Source:
MacDonald
et
al.
2000.
Development
and
Evaluation
of
Consensus-Based
Sc
Ecosystems.
Arch.
Environ.
Contam.
Toxicol.
39:
20-3
1.
RL
=
average
reporting
limit
TEC
=
Threshold
Effect
Concentration
PEC
=
Probable
Effect
Concentration
J
(organic)
=
compound
was
detected,
butbelow
the
reporting
limit
(value
is
estimated)
I
BRO8-01
I
BRO8-02
I
BRO8-03
I
BRO8-04
ARSENIC
MG/KG
0,108
9.79
33
I
CADMIUM
MG/KG
0.108
0.99
4.98
CHROMIUM
MG/KG
0.215
43.4
111
COPPER
MG/KG
0.215
31.6
149
LEAD
MG/KG
0,108
35.8
128
MERCURY
MG/KG
0.0355
0.18
1.06
NICKEL
MG/KG
0.108
22.7
48.6
ZINC
MG/KG
0.535
121
459
Quality
Guidelines
for
Freshwater
concentration
exceeds
TEC
Electronic Filing - Received, Clerk's Office, September 8, 2008
LI
-
-
L
L.I
11
C
1
-0
N
coO
C
DC
:
0
0
D
.<
z
r1
.
m
.1
a
a
a
C
00
c
—a
S
p
‘C
cm
p
—a
t%J
0
8
‘C
00
C
‘C
00
4—
--a
0
‘C
C’
—a
C
p
2
0%
p
C
t-)
0
t-a
cm
8
cm
©
C’
‘A
—a
8
—a
8
—a
8
a
8
a
C
p
cm
p
ka
a
0
4
;!
‘
•4
a
--a
8
I
cm
00
8
S
—a
—-a
C
‘C
I-a
cm
8
k
8
‘C
C
‘0
a
ta
00
00
cm
0
a
cm
o
1,1
00
-J
-I
00
00
a
C’
--a
cm
C
00
000
cmm
Ca
—a
p
a--a
00
p
a-a
p
C’
p
a-a
p
-
-
Oa
-
C
C
g
C-
cm
S
a--a
—I
0
a-a
00
C
8
8
cm
C
cm
a-a
C
%
00
a’
00
a-a
cm
S
a
cm
8
a--a
—a
S
I-a
-a
0
0
cm
8
p
I--a
--
0
0
p
00
p
cm
‘0
—
C’
S
:
a
‘C
-
a--a
—1
C
00
8
C’
‘A
8
4
b:i
9’
‘0
a--a
-a
a’
‘0
8
cm
cm
8
a-)
a--a
S
.
‘0
I--a
8
cm
00
S
00
-a
S
I-)
-a
8
I--a
cm
8
00
a
C
‘C
C
p
‘0
p
—a
C
00
cm
cm
00
C
0’
-a
C
cm
—a
a
cm
C
—a
cm
8
-a--a
-cm
C’
C
‘0
a-a
a--a
-a
‘C
a--a
C
--
a
0’A
;-0
cm
00
p
a
—a
p
a
00
C
-a
-
a
§
S
a
I-a
a--a
i
—a
I--a
I-a
00I”0
001-C00
p
A
‘0
‘Acm
—a
._0
p
—a
C’
-0.
a
S
C
‘C
cm
cm
C
S
A
cm
8
§
I-a
cm
8
cm
13
-
cm
—
u;-.
58
‘01-a
a’C
Qa--)
C
—a
cm
C
C
cm
—a
0
cm
0
cm
a
Ca
‘C
a
C
C’
-a
‘C
9’
S
0
O’
cm
8
.
—
-)
cm
8
8
cm
00
‘A
a-)
cm
‘C5
-a
cm
cm
1-3
a--a
9’
I-a
C
b
a
-a
9’
cm
‘C
Electronic Filing - Received, Clerk's Office, September 8, 2008
APPENDIX A
FIELD LOGBOOK
Electronic Filing - Received, Clerk's Office, September 8, 2008
LocatiOn
—
Profrct
/
Cent
A))1i1-
;r4
3AI
c!::&.
I
-J
)
02
---——-Th.
EZZZZ
I
Li
T-*o
i1
.
/?.t(
—
-
-
-
-
I
I
JQyApF
‘eL,
_-i_
‘-z
fl9
I
-
-
I
41
--
7
-
LCJ
(I
hwt
-44
Hi
L
i
HI
Electronic Filing - Received, Clerk's Office, September 8, 2008
-
I
c
Z’)
r••
::‘
3:.
r
;ç
JI
1
1ii
c;
-U
-
-
0;
-‘ç;
:3-
0
F—’
r
H
--
:
:
<
-1:’
-‘----
_4_
‘(
7—1
‘,
LL:)
;
-J_.
U)
•
rI
j
I
P-
-
V
S
I
-r
4)-
(s
p
,rl
r
-
9’
-‘I
;•;
:
>
Electronic Filing - Received, Clerk's Office, September 8, 2008
VfvJ
!;
‘—‘
>“\)S
4
‘-m)
1ç
1
\4A
-
9
cc)
(--f:
1)4.-)
?‘
‘
)
4
k’
)c:i
JZ
AA
-
‘i
-r
:
4’J
kc2.L3
\
—
C
o-
-z-€
ç$
zJ(k5F-j
r1
*)
(A..-V5
/}c
[
3-
h
L1
t
jJ?7p
j>.12t
?
-k
£°?
çj7I
UI
q(i
I
‘C
Cv
1
-
q
I
h
-
H
ç\I
Dit
w
c\
V
I
.
J4Y2
U3lecj
-_
Electronic Filing - Received, Clerk's Office, September 8, 2008
&
I
4
k)
id-I
C
i,\..r3
L
U
‘c
I
J
--
-.
1
A’O:’
\
:-s,
C
.1.
-
-
2
ç
c
::
-
t;
1-
-
Pt
*
•.e\
cc
-‘.
0::
&
f
-
-
4
U-
-
)
—;
-
I
3
C-.
0
H
0
:
rS
+-
r\
;
.
V
-
o
)
c,4-
0
-4-.
V
I
)
-
•
-.3
Electronic Filing - Received, Clerk's Office, September 8, 2008
ii
-
H
H
H
_)
-
\t
jThrr
-
‘J
f._I
°
hi
i--
?°
41
Q
1,
I
-4
(I$;H
H
WL
\AU
i-1
i-i:
%-;\4
wo$AcS
41dV1
?
J
4\e;:,
c-ç,
-1
-
ç)’
-
ç
S4
k
.‘
cvY
AA
A;A3
p---j
L
2’k
/r
j
-
s
iSSt
-
•
•k-Y
4
i
•.--••
r1
2-4
I
1
I)
1X’Ocj
i
Electronic Filing - Received, Clerk's Office, September 8, 2008
Ti
I
.
‘s
c.
cr)
4i
..M..
3..
.:
r
.
&
.
...
:..
-
ç
—
H.
ij::
jct
._.jCflL.
I)
i2
I
-
1•
C
/
—--
-
—
-
-
t—--
j__
I:
--
_ç(
:Qfl
.L,
-4-
:ç47
r’
iy.-I
ch’
;U
:irs
--
r-
()
rfl
•
cc
‘Hf
3
I-;
H
i!i
fui
-
.
-
5?
-
.
c-fl.
.40\
-
.\n
•I
Electronic Filing - Received, Clerk's Office, September 8, 2008
-r”
14
t
,ç
A
-
9
(c
v1
(I
s,
—
-
?
S_t
-
‘
_‘9
1
’p
crP
-
9
1’L)
m’-c
-w
tAA
-
i
‘.y’o
-
Y’’
i
42I
)LW
Z-
Q
zciHSh)
—
iøh
8n)ru
S;--%<L-4.
44-
‘
—
—-$I
-‘-
)
a.f”
-
-,
v
-L
—
-
--J’
_?
>
-
‘-‘
i
.
—-
:kP
)‘w
*NQ
--
‘Z
c
((;-4
-ç.{
Vy)
_\_;
-vp
—
-tc\Sh\
*
‘V!S
.
Electronic Filing - Received, Clerk's Office, September 8, 2008
•
‘,
j;
:
:
U
0
C1
tE
I
\à.
Z.
cç
7
:
4.
s-h:
.
2S.
LI
0
5
—
1
I
-4-
-,
•1
3-.—
V.
.j:
-
e
iI
0.
-r
I
0-
Electronic Filing - Received, Clerk's Office, September 8, 2008
I
I
0;
U
4
,S
.
):
?
.:
.L
-1
._)-
c
:—
49,—
C.
.
>:
0
,.4.
I
2
ç4
:s
H
0
1.
ç3>
0
I
>
s
,p.
Electronic Filing - Received, Clerk's Office, September 8, 2008
Jr
V9
;
I4
I
Q
I
‘4
.J.
Lj:
rl
.
ç4
:
oJ
.;7
iJ]
.
.:.
--_
,-
)
c
ri.
N
•$•
•.
I
1.
[4
10.1
I.I
I’.
I
2 .
Electronic Filing - Received, Clerk's Office, September 8, 2008
.1
.
.
.*-T’
:
-
3
-J
4-
f)
cL
1
-z
r
T’T
‘
V.
-
---
‘-
.
)
l. l .
-
L.
0
..‘i
-
:‘çc-
.
.
(
..
.
—-
:
4
.
‘i ‘
. .
,-
. L
.
.
.
N!
-4
c
—
.c
1
11
‘A.
..J:
‘ i/
•1
,
.. q---,--
C
z-
- -.-
.
Li
0
:çf.
Electronic Filing - Received, Clerk's Office, September 8, 2008
/
/
/
‘c
19\-9
&q
Y!yvr2
_J
1Q
j
I’J
(f\)
-
+I_
4’P
-
—
i-w-
bi
yy
—
saj
.7/7
i’ll!
‘J)
c”
(1
—
I
-‘
IT”V’
11
cJ7
•
--
—_---1-
(fJ..U:)!)
/
OI?/O
•
•
.
....
/
1)
)
/
7J
xi
i?
\A9
v’v
qc
rti
c
),
Q\
-)
A
)
Pc)1
•1
•.______—._—_______
.-.,-
..
—
I
‘
‘
V((
tç
I
/
—
5r
j
Th
-
-
wt
)ieQ
.‘oio_
Electronic Filing - Received, Clerk's Office, September 8, 2008
:e°
ij
.
..
Ic
‘
sm
0
‘j:
4__J.•.
_j
3
•) .
L
..
..
.
i[
:j.
‘f1
c;-.
0:
(.
:
-
v.
ç-
-
-J
‘
;
-
:-‘
-
—--‘
_S:
:
-
cc
:
.
•:
—
‘z.
,
.
,
,:
>.
r
‘
•
.
U’:p-
.
?
.
).
7
.
tq
?
(f
0,
Electronic Filing - Received, Clerk's Office, September 8, 2008
3t
NeCLS
-
-“vFc
4
m1
L2j4
-
-L
-
[YI
‘
-
-
I1
I
iS
7K,-’
-S
SV?Ic
$
‘?‘j
-‘
rf1J
‘
c
4)
ki
+1
c
-j
\44
chY
)
(1
—1•
—
..
..
.
I
I
-
.
-
1
s;b
UV
OG
-
-
6z
—
4”I’ç
M
j
w
Lc)cii
v-4
L
11
I
C
i
_)-_1
A-
-
3
-
A1J
-‘
-
-
;--w’;
1
-
A.’5
-
—
A;--Ni
11)11
-
-
Electronic Filing - Received, Clerk's Office, September 8, 2008
I
H;
£
/
i-,-,
‘4V
4L
54
/
-.
-
S
•
2.1%)
‘-
r7j
r
>
t?7
+
\-Q
)-A-ç
t
9
ri
\
-
L
-j
—
‘ch
1A
_____
?
c-f-s
c
?
,
ç/))
ZQ
x.4t-yp?5
vJ’Vft
—
H
_-wrr5
—
—
•)••J
•
H
j
H
j77.
Electronic Filing - Received, Clerk's Office, September 8, 2008
-
I
-
S
-
‘‘?)
-
N
h
‘Th__ç
-.1.
Y
J’?
(\
I-)
\1A_\
Av;r?—i5
)c\Av,
±
I
4
c
I
I
(r
\
A
\“
I
?
Q
//
(
,,
S
-‘
“V
(r’
H
1
—-’-f
c,-iC)
‘1
1
Nrç3c
?
TA4f
‘
_;
6
[
r
‘-P
41
SA1
))
‘,_$
‘
S
4
-
-
-
-
c
k
2C
cz\Qj
\j\,t
M
-
!‘
I
M
2
N
-ti’
-
‘1
ç
c
4IT
I
c
q
1
It
—
_L
L
-
4tt
.-
fl)W
ti
f\
1
I
pSj
l)
Il
iLc
IOiIb
U)i)flH
4
—
I
I
F
Electronic Filing - Received, Clerk's Office, September 8, 2008
,‘
Lte
c;en
-
jLicL
c2
-
—
&
C1
-
u
cL
?
)
.
•Stfy
,rL-k-t.;
6lJ-V
C
IC
1
‘L1
-
(
‘L4-
jt
S/-(c
Ci
r4’
,o
/Yy
Q._yv_4
—.
•
••
LVk
f
-
-
-
V
--
-
-
-
—
-
--
-
V——
-
—
V•—
_
-
-
-i
V
—
V_
—
—
V
—
-
-
V
-
V
-
V
-
-
V
V
-
V
-
V
-
-
-
V
V
V
V
-:
-
-:
VV
V
V
V
V
V
V
V
V
V
VVVVVVVVVVV
VVVVVV
?V.
V
.
2X3
L1
DV7
2
-
VVL.,
Electronic Filing - Received, Clerk's Office, September 8, 2008
APPENDIX
B
SAMPLING
PHOTOGRAPHS
Electronic Filing - Received, Clerk's Office, September 8, 2008
Photographic
Record
EA
Engineeñng.
Scienc.,
and
Thchnology,
Inc.
Dresden
Pool
May
6-9,
2008
Location
DRO8-O1
Location DRO8-03
Location
DRO8-02
Location DRO8-03
Location
DRO8-O1
Location UR08-02
.—..
Electronic Filing - Received, Clerk's Office, September 8, 2008
Photographic Record
EA
reering.
Scenc.,
and Technology.
Inc.
Dresden Pool
May 6-9, 2008
Location DR08-04
Location DRO8-04
Location DRO8-04
Location DRO8-05
Location DRO8-05
Location
DRO8-06
Electronic Filing - Received, Clerk's Office, September 8, 2008
Photographic Record
and Techno’ogy,
Inc.
EA Enginearing.
Science.
Dresden Pool
May 6-9,
2008
Location DRO8-08
Location
DRO8-07
Location DRO8-06
Location DRO8-06
Location DRO8-07
Location uKIn-O8
Electronic Filing - Received, Clerk's Office, September 8, 2008
Photographic
Record
EA Engieeañng.
Sciancu,
and Technology.
Inc.
Dresden Pool
May 6-9,
2008
Location
DR08-1O
Location DRO8-09
Location DRO8-09
I
Location DRO8-1O
Location DRO8-1O
I
Location DRO8-11
Electronic Filing - Received, Clerk's Office, September 8, 2008
-D
0
0
CD
-D
CD
C,
0
-‘
Cl)
0)0.
00
2.
0
0
—.
0
0
0
S-.
—.
0
0
0
0
0
0
0
0
0
0
I
Electronic Filing - Received, Clerk's Office, September 8, 2008
and Techno’ogy.
Inc.
LA Engineering.
Science.
Dresden
Pool
May
6-9, 2008
Photographic
Record
Location DRO8-13
Location DRO8-13
Location DRO8-14
Location DRO8-14
Location DRO8-14
Location DRO8-15
Electronic Filing - Received, Clerk's Office, September 8, 2008
Photographic
Record
EA Engiiienring.
Scance,
and
Tachnulogy.
Inc.
Dresden Pool
May 6-9,
2008
Location DRO8-15
Location DRO8-15
Location DRO8-16
Location
DRO8-16
Location DRO8-17
Location DRO8-17
Electronic Filing - Received, Clerk's Office, September 8, 2008
EA
Enginanring.
Scienci.
and
Techaology.
INC.
Dresden Pool
May 6-9, 2008
Photographic
Record
Location
DRO8-19
Location DRO8-18
Location DRO8-18
Location DRO8-19
Location DRO8-20
Location DRO8-20
Electronic Filing - Received, Clerk's Office, September 8, 2008
and Technolagy.
Inc.
EA Enginerning.
Science.
Dresden Pool
May 6-9,
2008
Photographic Record
Location DRO8-21
Location
DRO8-21
Location DRO8-22
Location DRO8-22
Location DRO8-23
Location JJRO8-23
Electronic Filing - Received, Clerk's Office, September 8, 2008
Photographic
Record
EA Engineering,
Science.
and Technology,
Inc.
Dresden Pool
May 6-9,
2008
Location
DRO8-24
Location DRO8-24
Location DRO8-24
Location
DRO8-25
Location DRO8-25
Location DRO8-25
Electronic Filing - Received, Clerk's Office, September 8, 2008
Photographic
Record
and
Technelagy.
Inc.
EA
Engineering.
Sciepc.,
Dresden Pool
May
6-9,
2008
Location DRO8-26
Location
DRO8-26
Location DRO8-27
Location DRO8-27
Location
DRO8-28
Location
DRO8-28
Electronic Filing - Received, Clerk's Office, September 8, 2008
Photographic
Record
and
TechnologY.
Inc.
EA
Enginennag.
Science,
Dresden
Pool
May
6-9,
2008
Location
DRO8-29
fl,
Location
DRO8-29
Location
DRO8-30
Location
DRO8-29
Location
DRO8-30
I
Electronic Filing - Received, Clerk's Office, September 8, 2008
Ets
EA
Euginnrina_.
Scinc.,
and
T.chnology.
Inc.
Dresden
Pool
May
6-9, 2008
Photographic
Record
Location DRO8-31
Location DRO8-31
Electronic Filing - Received, Clerk's Office, September 8, 2008
EA Engln.erin,
Science,
and Technology.
Inc.
Photographic Record
Lower
Brandon Pool
May 6-9, 2008
Location BRO8-O1
Location BRO8-O1
Location BRO8-02
Location BRO8-02
Location BRO8-02
Location BRO8-03
Electronic Filing - Received, Clerk's Office, September 8, 2008
Lower
Brandon
Pool
May
6-9,
2008
Photographic
Record
and TIchnoIogy,
Inc.
EA Engiii.onnu.
Scialic.,
Location
BRO8-03
Location
BRO8-04
Electronic Filing - Received, Clerk's Office, September 8, 2008
BEFORE THE ILLINOIS POLLUTION
CONTROL
BOARD
IN
THE MATTER OF:
)
)
WATER
QUALITY STANDARDS AND
)
EFFLUENT LIMITATIONS
FOR THE
)
R08-9
CHICAGO AREA WATERWAY
SYSTEM
)
(Rulemaking
- Water)
AND THE
LOWER DES PLAINES RiVER:
)
PROPOSED
AMENDMENTS TO 35111.
)
Adm.
Code Parts 301, 302,
303 and 304
)
PRE-FILED TESTIMONY OF GREG
SEEGERT
Good morning,
my
name
is Greg Seegert.
I am
employed as a Senior
Scientist and Chief
Ichthyologist
with EA Engineering,
Science, and Technology (“EA Engineering”).
I have been
employed with EA
Engineering since 1982
and have over 35 years of
experience in the
areas
of
aquatic ecology and
ichthyology. I have a
Bachelor and Master of Science in
Zoology from the
University of Wisconsin.
I have attached my
curriculum vita hereto as Exhibit 1.
I have extensive involvement
in aquatic
life field studies in the Upper Illinois
Waterway
(“UIW”) for many
years
and am very familiar
with the physical and biological conditions of
this
waterway.
I have been engaged
by Midwest
Generation (“MWGen” or Midwest
Generation) to
review and
analyze relevant information
and
data
to assess the use designation
issues relating to
aquatic
life goals for
the
Chicago
Area
Waterways
(“CAWS”) and
the
Lower
Des Plaines River
(“LDR”), as these
relate
to Illinois
Environmental
Protection
Agency’s (“Illinois
EPA” or
“IEPA”) Proposed
UAA Rules.
My testimony
will
focus
on the following items:
(1) a review of the
regulatory
requirements applicable
to use attainability
analysis
(“UAA”)
pursuant to 40 C.F.R.
§ 131.10(g)
used in assessing whether
certain waters can
attain the Clean Water Act (“CWA”)
goals
for
aquatic life uses;
(2) an assessment
of
whether
CWA aquatic life uses are
attainable in the
South
Branch
of
the
Chicago River and Chicago Sanitary
Ship Canal
(collectively referred
to
herein as
Electronic Filing - Received, Clerk's Office, September 8, 2008
the
“CSSC”)
and the
LDR.
as
well
as an
assessment
of
the
UAA
factors
applicable
to
the
CSSC
and LDR;
(3)
a
review
of the
aquatic
habitat
suitability
for the
CSSC
and
Upper
Dresden
Island
Pool
(“UDP”)
directly
relevant
to
Illinois
EPA’s
Proposed
UAA
Rules;
and (4)
a review
of fish
and
qualitative
habitat
evaluation
index
(“QHEI”)
surveys
conducted
in the UDP.
As
I will testify,
and
as
set forth
in greater
detail
in the
attachedEA
Engineering
report
(Exhibit
2, Report
on the
Aquatic
Life
Use Attainability
Analysis
for
the
South
Branch
of
the
Chicago
River,
the
Chicago
Sanitary
and Ship
Canal
and the
Upper
Dresden
Island
Pool),
the
Illinois
EPA
failed to
adequately
consider
and
assess
the unique
aspects
of
the CSSC
and UDP
in
determining
whether
these
water
bodies
are
capable
of attaining
CWA
aquatic
life
goals.
Due
to
the
limiting
physical
and biological
conditions
of
these water
bodies
(conditions
wholly
unrelated
to thermal
discharges),
the
present
fish
community
in
the CSSC
and
the
UDP
is limited
in
diversity
and
quality
and does
not
represent
a
balanced
population.
Therefore,
it
is
my
professional
opinion,
based
on extensive
experience
and
firsthand
knowledge
of these
waters,
that
the limiting
conditions
adversely
affecting
them
preclude
the
attainment
of
CWA
aquatic
life
goals.
1.
A
Minimum
of Four
of Six UAA
Factors
Apply
to the
CSSC
and
LDR,
Thus
Precluding
Attainment
of
CWA
Aquatic
Life
Use
Goals.
Under
U.S.
EPA’s
rules,
the
existence
of
any one
of the
six
UAA
factors
alone
is
sufficient
to demonstrate
that
a water
body
is
not
capable
of
meeting
CWA
aquatic
life
use goals.
I have
assessed
the
potential
applicability
of
the UAA
factors
(excluding
Factor
6,
widespread
economic
and
social
impacts)
to the
CSSC
and
LDR
with
respect
to
aquatic
life
uses, and
it is
my
professional
opinion,
that UAA
factors
2,
3,
4, and 5
are all
applicable.
Electronic Filing - Received, Clerk's Office, September 8, 2008
UAA
Factor
2—
Flow Conditions
Factor 2
applies in the event
that
natural, ephemeral,
intermittent or
low flow conditions
or water levels
prevent use attainment,
unless
such
conditions
may be
mitigated
by
the discharge
of sufficient
volumes
of effluent discharges
without violating
state
water
quality,
standards. 40
C.F.R.
§131 .l0(g)(2).
Flows in the
CAWS
are highly
variable and
do
not
follow
a
normal
seasonal
cycle
which
is necessary
to support
a
balanced aquatic community.
As discussed in
Exhibit
2, the
CAWS
is specifically
designed
and managed to regulate
and minimize peak
flows
attributable
to
flooding and combined
sewer
overflow input in
order to facilitate barge
traffic.
The Illinois
EPA
acknowledged
that
it did not
consider whether extreme
flow
changes occurred
and
what negative
impact such
changes
may have on aquatic
life. See March
10, 2008, Hearing
Transcript,
p.
193.
It is well
known that
high
flow regimes
such as those in the
CAWS can
adversely
affect
fish by
causing
nest
abandonment
and
displacement of recently
hatched fry
(juvenile
fish) and
causing
sediment
deposition
to bury
and suffocate
eggs. Similarly,
low flow
regulation,
which is controlled
by
the
U.S.
Army Corps
of
Engineers
in anticipation of flooding,
can
also adversely
affect fish
by exposing
fish
nests
and eggs to ambient
air
and causing
stranding in
shallow areas,
which leads
to increased
predation
on fish. These artificially
controlled
flow conditions,
which
are a necessary
part
of the
navigation on the
CAWS,
constitute
a
significant
factor
that
prevents
use attainment.
Therefore,
in my opinion, Factor
2 is clearly
met.
UAA
Factor 3 — Barge
Traffic
and
Sedimentation
Factor 3 applies where
use attainment
of a water body
cannot be met due
to
human
caused conditions
or sources
of pollution
that cannot
be
remedied
or, if attempted
to be
Electronic Filing - Received, Clerk's Office, September 8, 2008
rernedid,
would cause greater
environmental
harm than leaving in place. 40
C.F.R.
§
131.1 0(g)(3).
The heavy barge traffic and navigation, protected uses in the
CSSC
and UDP,
have a direct, adverse
impact on the aquatic ecosystem.
For
example, barge
traffic can
adversely
affect
aquatic
organisms through
physical injury, stranding, disrupting spawning,
uprooting
aquatic vegetation
used
as habitat,
increasing turbidity, and increasing mortality
through
the re
suspension
of sediments,
both contaminated
and uncontaminated. As noted in
Exhibit 2, several
surveys
have
documented
direct mortality of fish as
a
result
of propeller
strikes. Additionally,
moving barges
produce
wakes
or waves that push water
into the backwater
channels, causing
rapid changes
in
water
levels
and stirring up harmful
sediment.
In
addition to barge
traffic, a key limiting
factor to the CAWS aquatic ecosystem is
the
physical
and chemical
makeup of the river
sediments and
how sediments are dispersed and
accumulated
in the river.
Despite Illinois
EPA agreeing that sediment could limit suitable habitat
quality,
the Agency
acknowledged that
it evaluated
the impact of sediment resuspension only in
a very “cursory”
manner (and
only
then for
assessing compliance with the cadmium chronic
water quality
standard). See
March 11, 2008,
Hearing Transcript,
pp.
143-144, 148-149.
Based
on EA’s extensive
studies
in
the CAWS,
the
fine, silty,
and organic nature of sediments in
the
CSSC and LDR are not
suitable for
many higher
quality fish species which require hard, clean
substrate for spawning
and reproduction.
Excess
sediment can fill
interstitial spaôes of
spawning
gravels, impair
fish food sources,
fill rearing
pools, and reduce beneficial
habitat
structure.
Studies,
including those conducted
by Mr. Chris Yoder,
have documented that streams in highly
urbanized
areas typically
do not achieve
CWA’s
“fishable/swimmable”
goals due to the
multiple
stressors and physical
limitations.
Even the removal
of one limiting factor, such as
sediments,
would not improve
aquatic habitat,
as the urban nature
of
the
CAWS and the many
sources of
-T
,1
Electronic Filing - Received, Clerk's Office, September 8, 2008
pollutants
would continue
to cause additional
fine, silty
sediments to be
deposited, thus
preventing
the
improvement
of aquatic life habitat.
Deleterious
sedimentation
in the
CAWS
is
both unpreventable
and irreversible
and will remain
a major impediment
to
biological
improvements.
In a 2003 evaluation
of the
Dresden Pool, EA Engineering
found
that
sedimentation
was moderate
to severe
in 70% of the areas where
QHEI scores were
assessed.
Our recent July 2008
habitat
survey
of the
UDP
again found that much
of the
area
was
heavily
silted.
See Exhibit
2, Attachment
2.
Contaminated
sediments
are also
a significant limiting
factor to the CAWS.
See Allen
Burton
Pre-Filed Testimony
and Report. Toward
this end,
extensive studies
have found
that
contaminated
sediments
occur
in all three
navigational
pools (Brandon, Dresden,
and
Lockport),
but predominantly
in the
side-channels
and backwater areas.
Despite these extensive
studies,
the
Illinois
EPA
failed to consider
whether
contaminated
sediments in the Brandon
and
Upper
Dresden
Pools precluded these
waters
from
attaining CWA
aquatic life goals. See
March
10,
2008,
Hearing Transcript,
p.
164.
Consequently,
because
of the direct
physical harm
and serious habitat
degradation
that
has
occurred and will continue
to occur
as a result of
ongoing barge traffic
and
sedimentation
(both toxic and otherwise),
it is my
opinion
that
UAA factor
3
for the
CSSC
and the UDP
is met.
UAA
Factor 4
—
Dams and Other
Hydrologic
Modifications
Factor
4 applies in situations
where darns,
diversions,
or
other types of
hydrologic
modifications
preclude
use attainment, and
restoration is
not feasible. 40
C.F.R. §131.10(g)(4).
As mentioned
previously, the
CAWS
is specifically
designed and
operated to
facilitate barge
traffic
and to convey massive
quantities
of storm water and municipal
wastewater.
The CSSC
S
Electronic Filing - Received, Clerk's Office, September 8, 2008
and
LDR are a series of large pools separated by locks and dams to control
water flow. These
impoundments
have a significant effect on the fish communities by transforming
the river from a
lotic (flowing waters) to a lentic
(lake-like) system.
Impoundments adversely affect lotic
fish species by
eliminating
riffles,
reducing
stream
velocity,
increasing sedimentation, interrupting
fish migration, reducing insects
that provide a
food source, and reducing
overall habitat complexity
and
biological integrity. Fish
species that
are habitat
generalists, such
as
the
common carp, gizzard
shad,
and channel catfish, as
well as
pelagic
species, such as emerald
shiner and freshwater
drum, do
quite well within
impounded
systems.
Whereas, fish species, such
as fluvial specialists, including most darters and
madtoms
and some suckers,
are adversely impacted.
Others,
such as simple lithophils, which
include
species such
as
the
redhorse and most
darters, which require clean,
hard
substrates, are also
adversely
impacted. As described
in greater
detail in Exhibit 2, it is well documented
that
impounded
river systems, such
as the
CSSC and UDP, have correspondingly lower indices
of
biological
integrity (“IBI”) scores
upstream
of each dam. For example, extensive
studies of the
nearby
Fox River, funded
in part by
U.S. EPA, documented significant and widespread
adverse
impacts
on the aquatic communities
due
to the effects
of
impounding.
See
Exhibit 2, Attachment
3. Notably,
only about 50%
of the Fox
River is impounded relative to the Brandon and
Dresden
Pools, which are
100% and
93% impounded,
respectively. The impoundments
exclude or reduce
large groups
or classes of fishes,
including
species that
are obligate riffle dwellers (e.g.,
most
darters and
madtoms and some
minnows) and other
species that prefer fast moving
water and
hard substrates
(e.g., many sucker species,
and
some minnows and sunfish).
Ic
Electronic Filing - Received, Clerk's Office, September 8, 2008
The
dams
and
locks
in
the
CSSC
and
UDP
currently
function
as originally designed
and
constructed
and their
impact
on
aquatic
communities
is
unmistakable
and
irreversible.
Therefore,
I
have
concluded
that
UAA
factor
4
equally
applies.
UAA
Factor
5
— Physical
Features
Factor
5 applies
to
water
bodies
where
there
is a
lack
of natural
features
such
as
proper
substrate,
cover,
flow,
depth,
pools,
riffles,
and
the
like,
unrelated
to
water
quality,
that
preclude
attainment
of aquatic
life protection
uses.
40
C.F.R.
§
131.1
0(g)(5).
The
physical
factors
that
characterize
the CSSC
and LDR,
some
of which
have
already
been
discussed,
are
limiting
to
aquatic
communities.
These
factors
include
excessive
siltation,
lack
of
suitable
substrate,
minimal
instream
cover,
lack
of
riffles,
and
lack
of fast
moving
water.
These
unalterable
limits
in
the
physical
condition
and
habitat
features
of
the
LDR,
even
without
consideration of severity
of sediment
contamination,
preclude
the
attainment
of
aquatic
life
uses
consistent
with
the
General
Use
requirements.
Based
on
these
physical
limitations
alone,
I have
concluded
that
UAA
Factor
5
applies
as well.
The
UAA
analysis
also
entails
consideration
of potential
remedial
efforts
that,
if
taken,
may
facilitate
achievement
of
CWA
goals.
In
this case,
the
one
remedial
option
that could
have
the
most
significant
influence
of helping
the
CAWS
and
UDP
achieve
CWA
aquatic
life goals
would
be to
remove
the
locks
and
dams
entirely.
However,
the locks
and
dams
are essential
to
navigation,
which
is a protected
use
within
this
waterway;
and
no one
has
seriously suggested
that navigational
use in
the
CAWS
will
be discontinued
in the
foreseeable
future.
7
Electronic Filing - Received, Clerk's Office, September 8, 2008
2.
Habitat
Conditions
in the
CSSC, Including the
UDP, are Degraded
and
Irreversible
and Preclude
Attainment
of CWA
Aquatic
Life
Goals.
The qualitative
habitat
evaluation
index (“QHEI”)
is a measure of habitat
suitability.
Most experts,
including Mr. Edward
Rankin,
the developer of the
QHEI
system,
conclude that
streams
with QHEI
scores
greater than
60 generally are capable
of supporting
balanced
indigenous
fish populations
that are
consistent with the goals
of the CWA. Scores
between
45
and
60
must
be
examined more closely
to determine
whether or not balanced
fish
populations
are
supportable.
Between
1993 and 2008, EA
Engineering has
collected habitat data
and derived
QHEI
scores for over 100
sites for the
CSSC
and LDR,
including the UDP, as
part of
studies conducted
in
1993-1994,
in
2003, and most
recently
in July 2008.
See Exhibit
2. In 1993 and
1994, QHEI
scores were derived
at
169
locations
in the
Lockport,
Brandon Road, and
Dresden Pools,
and
were,
on average,
found to
be
low (mean scores
in the 40s), demonstrating
that habitat
generally
was
of poor quality.
The
low QHEI
scores
were
attributed
to
the lack
of
riffle/run habitat, lack
of
clean,
hard substrates
(i.e.,
gravel/cobble),
excessive siltation, channelization,
poor
quality
riparian
and
floodplain areas,
and
lack
of cover. Habitat was
found to be poorest in
the
Lockport
Pool, marginally
better
in the
Brandon
Pool,
and
better still
in the Dresden Pool;
but QHEI
scores were
still well
below
60 in
most
of the Dresden
Pool.
With respect
to the
UDP,
specifically,
QHEI
data subsequently
collected by EA in 2003
and in July 2008,
confirm that
the average score
in the UDP is generally
between 45
to
50,
which
is
at
the
lower
end of the range
of habitat that may
have the potential
to support
CWA aquatic
life goals.’ These low
scores are a
strong
indication
that
the majority of
habitat in
the UDP is not
EA
Engineering
compared
its
2008 QHEI scores
to scores calculated by
MBI in 2006 for
three sites that
appear to
be
in close
proximity.
See Exhibit
2. While
the score for one of the sites
appears to be
comparable and
within an
acceptable range of
difference, scores
calculated
by MBI for
the other two sites were
substantially
inflated relative
8
Electronic Filing - Received, Clerk's Office, September 8, 2008
sufficient
to
support
CWA
aquatic
life
goals.
As documented
in Exhibit 2,
Attachment
2,
there
is
very little
“good”
quality habitat
present in
the
UDP and a much greater
abundance
of
“poor”
habitat.
Relative to
the Brandon
or Lockport
Pools
in the CSSC, habitat
in
the UDP is “less
poor” than
that
in
the CSSC,
but is still poor
nonetheless.
As
documented
in Exhibit
2, Attachment
2, the July
2008 survey of UDP
conducted
by
myself and
my associate,
Mr. Vondruska,
is particularly
relevant to
the issue of
habitat quality in
UDP.
During
the
July
2008
QHEI
field
survey
of
the
UDP, the
entire
linear distance
of each
bank was
surveyed
separately.
We established
a series
of
contiguous, 500 meter
zones along
each
shore
of the
UDP. Over a two-day
period,
we evaluated
50 such zones,
which
is
significantly
more
than the two
or
three
evaluated
by MBI
or Mr. Rankin. The
extensive and
contiguous
nature
of
the 50-site
QHEI
survey
by
EA eliminated
potential bias that may
arise
from
the
selection
and
scoring
of only a
limited
number
of
QHEI site locations.
QHEI scores
were
calculated
using
two
scoring
procedures:
the standard Ohio
EPA
QHEI
scoring
procedure
used
by Mr.
Rankin and
the “MBI-modified
procedure.” The MBI-modified
procedure
is MBI’s
recently
developed version
of the
QHEI that
takes into
account the impounding
of a waterway
and
which was
used
by
MBI during
their
2006
assessment
of the
CAWS
and UDP.
The UDP
2008
QHEI
study results
clearly
support
my
opinion
that the UDP is not
capable
of attaining
the Clean
Water
Act
aquatic
life goals because:
>
Almost
all of the
QHEI
scores are
below
60.
Based on the
Ohio EPA
scoring
procedure,
45
of the
50
(90%) QHEI
scores were <60, and
49 of
50 (9 8%) of the scores
were <60
using the
Modified MBI procedure.
>
Approximately
Half of
the QHEI scores
were <45.
to EA’s scores (e.g.,
69 v. 54
and 81.5
v. 67.5).
The
scores for
these two
sites are not within the
acceptable
range of
difference. Further
analysis
of MBI’s
scoring as discussed
in Exhibit
2 confirm that MBJ’s scores
are
simply
too
high and
are not supported
by the facts.
9
Electronic Filing - Received, Clerk's Office, September 8, 2008
Based on the Ohio EPA procedure,
20 of the 50 (40%) scores were
<45
and
well
over half
(32 of
50 or 64%)
of
the scores
using the MBI procedure were
<45W
>
The mean
QHEI score is closer to 45 than to 60.
The mean QFIEI scores were
47.4 and 42.0 for the Ohio EPA
and
MBI protocols,
respectively.
Thus, on average, the
QHEI scores are well below the
“good” cutoff of 60,
regardless
of the
QHEI scoring procedure used.
Moreover, these scores are closer to the 45-point
cutoff that,
under
Ohio EPA’s use classification
protocol, would automatically qualif’ the
UDP as a
limited
or modified use category
that is intended for waters that
cannot
attain the
Clean Water
Act
aquatic life
goal. (See discussion
below in Section 4 regarding Ohio EPA’s use
classification
protocol).
Furthermore, the spatial
distribution
of QHEI scores
(Exhibit
2, Attachment 2f)
clearly
shows that, except
for the Brandon tailwaters,
the vast majority of habitat in UDP is
poor or
occasionally fair.
Consistent with Ohio EPA
protocols, the area within the navigational channel
was not
evaluated.
However, due
to a lack of cover
and
constant disturbance due to barge
traffic, the
navigational
channel, which
comprises roughly
50% of the UDP, certainly would
have scored
well below 45 had it been evaluated.
This further accentuates
the limited amount of
good habitat
available within the
UDP. Roughly half
of the UDP is within the navigational channel,
which
is
unsuitable,
poor habitat and the remaining
half is characterized
by
poor
to
fair quality
habitat,
with
only a
very limited
area of good habitat.
Balanced indigenous
fish populations that are consistent with
CWA
aquatic
life goals
must have suitable habitat, including,
for
example,
sufficient riffles, boulder/cobble
substrates,
and fast water areas to spawn and reproduce.
Such physical features, however,
are lacking
from
10
Electronic Filing - Received, Clerk's Office, September 8, 2008
the
UDP,
except for the
Brandon tailwater
area, which
accounts for only
a small
fraction
(around
7 percent) of the
entire Dresden
Pool. Although
the
Brandon
tailwater may
technically
qualify
as
good
habitat, it is
isolated and
surrounded
by
predominantly poor
to
fair habitat
in the
Dresden
Pool.
The
Illinois EPA appears
to be giving
significant
weight to
the
existence
of
this very
limited
area
of
good habitat
and speculating that,
based on the
availability
of
this
habitat,
that
the
entire
Dresden
Pool
can minimally
attain CWA
goals. However,
this
assumption
is
refuted by
the
overwhelming
evidence to the
contrary and
indicates a
fundamental
misunderstanding
of
aquatic ecosystems
and how they function.
Illinois
EPA has
acknowledged
that
it did
not
consider whether
this very limited
“good” habitat was
usable by the fish
community
due to
the
presence
of legacy
pollutants and sediments.
See March ii,
2008,
Hearing
Transcript,
p.
74.
As detailed
in Exhibit 2, the adverse
effects
of
dams
on aquatic life
in river
systems,
such
as
the nearby Fox River,
are well documented.
Impounded
systems
such as the
CSSC
and
UDP
do not
function as natural river
systems, whose predictable,
seasonal
flows
serve
to
flush
accumulated sediments
downstream
and trigger
migratory movements
of
certain
fish
species.
These
adverse effects of dams
include, for example,
lower
Index
of Biotic
Integrity
(IBI)
scores,
significantly
lower
QHEI
scores
in
impounded
areas, poor
macroinvertebrate
populations
dominated
by
pollution-tolerant
species due
to
increased volumes
of sediments
and
lower
sediment quality,
lack
of species
dependent on riffle/run
habitats, and
fragmented fish
populations characterized
by much lower
species richness. The
influence
of the dams
in
the
CSSC
and the UDP are expected
to be even more profound
than
those
observed
in
the Fox
River,
due to
height
of
the
darns,
the
greater extent of impounding,
and the
erratic
and
highly
variable
flow levels in
the CSSC and
UDP.
11
Electronic Filing - Received, Clerk's Office, September 8, 2008
The areas in
the
UDP most adversely impacted by the
effects of
impounded
and
erratic
flows
are the shallow areas, such as the Brandon
tailwaters. See Julia
Wozniak
Pre-Filed
Testimony, Attachment 5 (Flow Graphs). These tailwaters offer
all of the
riffle
habitat in the
UDP
and,
therefore, are
important
for
potential
spawning
of
obligate riffle
species,
such as
darters and
madtoms. As previously described, however, the
adverse effects
of the
erratic and
drastic flow fluctuations include
increased stranding of nests, larvae
and
adult fish
during
low
flows and, conversely, the sweeping away of nests, eggs, and larvae during
increased
flows.
Due to
its
permanent
and irreversible habitat limitations, the Dresden
Pool is not
capable
of supporting viable populations of certain fishes such
as
most darters, walleye
and sauger, some
suckers (including redhorse and white
sucker), most madtoms, and certain
minnow
and
centrarchids
(e.g., smailmouth bass). The species that are thriving in the Dresden
Pool are
habitat
generalists. The absence
or low abundance of many minnows, darters,
and suckers — the
most diverse groups of fish species in Illinois
— does not reflect a balanced
indigenous
population
consistent
with the CWA goals. The
poor habitat structure and limitations in the
Dresden Pool,
such as heavy siltation and the lack
of riffles and
fast
water,
are fixed and
irreversible and
thus
the Dresden Pool will not
support habitat specialists, despite
proposed
changes
to water
quality
standards.
EA
also conducted
a review of MBI’s 2006
IBI metric values and scores
presented as
Attachment S to
the
Illinois
EPA Statement
of
Reasons.
As
discussed
in
Exhibit. 2,
numerous,
substantive mistakes
were
identified in
MBI’s 2006 report, some of
which were
acknowledged
by
Mr. Yoder in his pre-filed testimony, and inaccurately raised the
IBI
scores for the
CSSC
and
UDP. These
mistakes
included, for example, misidentification
of
several fish
species, inaccurate
or improper tallying of fish species, incorrect assignment to breeding guilds,
arbitrary
assignment
12
Electronic Filing - Received, Clerk's Office, September 8, 2008
of drainage area,
the use
of
defective
pH
and
dissolved oxygen probes
which
resulted in
seriously
erroneous entries
made in the
field notebooks,
and the failure to revise
clearly
flawed
data and
scores, all of
which call
into question the reliability
of MBI’s
IBI scores
and
incorrectly
portray
a higher
biological integrity
than actually
exists in
the
UDP.
3.
Much of the Data
Relied Upon
by IEPA
to Establish Uses in the
LDR
are
Significantly
Flawed.
TEPA
relied
heavily
on fish (i.e.,
IBI) and especially
habitat data provided
by
MBI.
However,
my review
of those data indicates
that much
of
those
were flawed.
QHEI Scores
First,
the MBI
QHEI
scores
were calculated
from a very small
(3
locations) and non
representative
portion
of
the
UDP. Second,
as documented
in Exhibit 2, Attachment
2,
many of
the QHEI scores
provided
by MBI, including
those from
the UDP,
are
wrong. In
some cases,
these mistakes
were
due
to multiple
math
errors,
which
could and should
be
corrected. However,
they also
made a number
of methodological
errors
such as incorrectly
interpreting
current
speed,
ignoring the
obviously impounded
nature
of sites, not
properly
accounting
for
channelization,
over-scoring
cover
types
and amounts,
incorrectly
assessing
riparian
width,
and erroneously
considering
some
areas
to
possess
at least some
sinuosity
when they possessed
none. Although
individually
some of the
necessary scoring
changes
would
be
relatively
small,
collectively they
result in systematic
scoring
inflation
that
wrongly
gives
the impression that
habitat
in
the UDP
(and elsewhere)
is
better
than it really
is.
IBI Scores
MBI also made
mistakes
in calculating
IBI scores
at numerous locations
including
those
within
the
UDP. These mistakes
included
misidentif,ing species,
incorrectly assigning
species
13
Electronic Filing - Received, Clerk's Office, September 8, 2008
to
breeding guilds,
using one drainage area
for all their locations,
including
exotic species
(which,
according
to their protocols should
have been excluded)
in the
total
species
richness
metric,
incorrectly
tallying
sunfish
species,
and
incorrectly
tallying
the number
of
fish caught.
The
large
number
of errors on the metrics
result in
many, perhaps most of
the IBI
scores
being
wrong.
The
various QHEI
and
IBI errors
occurred
despite the fact
that MBI submitted
revised
data sets
that
were supposed to address
these issues,
many
of
which had already been
brought
to
their attention.
The fact that
even
after being
brought to
their attention, many errors
remain
indicates that
MBI’ s QA/QC
procedures
are fundamentally flawed
and therefore
the data
they
provide
should
be disregarded
or, at
a minimum,
limited in their consideration
as questionable
or
non-credible
data.
4.
Comparison of
UDP
and
CSSC
to
Ohio Use
Classification
System Categories.
The
Illinois EPA’s proposed
use designation
rule
for
the UDP assigns
a
site-specific, use
designation
that,
by
the
Agency’s
own
description,
is intended to be “unique,”
while also
contending that
the UDP
shares
characteristics
with Illinois
General
Use
waters that
enable
it
to
attain CWA
aquatic
use
goals. The
comparison
to Illinois
General Use waters
is
misleading and
misguided,
as General
Use waters
do
not have
the
combination
of channelization, impoundment,
commercial
navigation,
irregular
flows,
and
significant
inputs
from
urban storm
water and
wastewater
discharges
that
characterize
the
UDP. The
Illinois EPA’s
proposed use
designation
for the UDP
is not
an appropriate
designation
and is not scientifically
supportable.
With respect
to the CSSC,
the
Illinois EPA
agrees that it
cannot attain the
CWA’s aquatic
use goal
and has proposed
a lower aquatic
life use
referred
to as “Aquatic Life Use
B.”
The
1A
19
Electronic Filing - Received, Clerk's Office, September 8, 2008
Illinois
EPA
further
agrees
that the
CSSC has
poor habitat
and
that the
aquatic
community
suffers
adversely
from
the
artificially
controlled
flow
conditions
and
heavily
industrialized
nature
of this
waterway,
including
the
high volume
of barge
traffic.
What
is less
clear
is whether
the
proposed
language
of
the “Aquatic
Life
Use
B”
use
classification
accurately
classifies
highly-modified
streams that
are characterized
by
poor
habitat, heavily
industrialized
use
and
very limited
aquatic
community
aquatic
life
potential.
In this regard,
a review
of the
Ohio
EPA’s use
classification
approach
of describing
categories
of streams,
such
as
“Limited
Warm Water,”
“Modified
Warm
Water” and
its use of
subclassifications,
such
as “Impounded”(I),
for streams
like
the CSSC,
shows
that
the Ohio use
classification
approach
would
serve as
a better
and
clearer
model
on
which to expand
the
current
Illinois
use classification
system.
While
I agree
with the
Illinois EPA’s
attempt
to
expand and
refine the
existing Illinois
use
classification
system,
its
proposed
language does
not
provide
a
sound
and
clearly articulated
basis for
doing
so. In my
opinion,
the more
generic
descriptions
of
use classifications
used by the
Ohio
EPA, which
still
identify the
key stream
characteristics
that
qualify
a waterbody
for
a
given use classification,
is a more
scientifically
credible
approach
to
establishing
a multi-tiered
use
classification
under
state
water
quality
regulations.
In 2004,
Mr.
Rankin
recommended
to
Illinois
EPA that
the
Ohio
Modified
Warmwater
Habitat
Use
for impounded
rivers
(MWH-I)
would
be the most
appropriate
use category
for UDP
(See
Attachment
Rto
Illinois EPA’s
Statement
of Reasons).
Despite
Illinois EPA
agreeing
with
Mr.
Rankin’s conclusion,
the
Agency
without
explanation
has
completely
ignored Mr.
Rankin’s
recommendation
and
instead determined
that the
UDP can attain
the
CWA
aquatic
life goals.
It
is
important
to note that
Ohio’s
MWH-I use
designation
applies
to waters
that
are not capable
of
attaining
the
CWA’
s aquatic
life goals,
due
to
the limiting
factors
inherent
to impounded
waters.
15
Electronic Filing - Received, Clerk's Office, September 8, 2008
Mr.
Rankin
reached
this
conclusion
based
largely
on
the physical
habitat
limitations
he
observed
as a result
of systematic
alteration
and urbanization.
The
extensive
biological
data
collected
by
EA Engineering supports
Mr.
Rankin’s
assessment.
Because
the
impounded
nature
of
a
waterbody
has
such
a significant
effect
on
the aquatic
life
uses that
it
can attain,
a use
classification
description
that recognizes
the “impounded”
attribute
of
certain
waterbodies
serves
as a
reliable
and helpful
tool
in
crafting
scientifically
sound
use
categories
within
a state’s
use
classification
system.
Although
no single
attribute
separates
limited
use from
modified
use,
several
factors
have
been identified
as
being particularly
important.
According
to
Rankin
(See
Attachment
R
to
Illinois
EPA’
s
Statement
of Reasons),
factors
that
have
a
high
influence
are:
• Channelized
or no
Recovery
from Channelization
•
Silt/Muck
substrates
•
No
sinuosity
•
No or
sparse
cover
Based
on these
and
other
QHEI attributes
associated
with
“lower”
aquatic
life
uses,
particularly
moderate
to
heavy silt,
fair/poor
riffle/pool
development,
the
absence
of
riffles,
and
the
amount
of embeddedness,
Mr.
Rankin
recommended
various
uses
for the
CAWS
and
LDR.
Of particular
relevance
is
the fact
that Rankin
did
not recommend
any
of the segments
subject
to
this Rule-Making
be classified
as
warmwater
habitat,
an aquatic
life
use consistent
with
CWA
goals.
Instead,
he recommended
modified
or
limited
resource
water
for
each
and
every
segment
he evaluated.
For
example,
he
recommended
Limited
Resource
Water
for
most
of
the
CSSC,
but
noted
that
a
portion
of it
might
be
able to
support
a
Modified-Channelized
category
of
fauna.
16
Electronic Filing - Received, Clerk's Office, September 8, 2008
For
the
LDR, he
recommended
the
category
Modified-Impounded,
the
same
category
that
EA
believes
is appropriate
for
the UDP
(Exhibit
2, Attachment
2).
EA Engineering
has compared
the
attributes
of
the
UDP
using
attributes
of
Ohio’s
use
designation
classification
system.
The
UDP
has far
more
in
common
with
Ohio’s
modified
warm
water
use
designation
(which does
not
meet
CWA
goals)
than
Ohio’s
warm
water
habitat
use
designation
(which
does
meet
CWA
goals).
Both Messrs.
Rankin
and Yoder
have concluded
in at
least
one
published
report
that
as
the predominance
of
modified
habitat
attributes
relative
to
warm
water
attributes
increases
to
a ratio
of
greater
than 1.0
to 1.5
to 1,
the likelihood
of
having
IBI
scores
consistent
with
warm
water
habitat
use
declines.
For
comparison
purposes,
the ratio
for the
Dresden
Pool
is 4:1,
which
is significantly
greater
than
the
1.5:1
threshold
recommended
by both
Rankin
and
Yoder.
Therefore,
based
on Messrs.
Yoder’s
and
Rankin’s
own
assessment
guidelines,
the
Dresden
Pool
is more
akin
to
a modified
warm
water
system
not
capable
of
achieving
CWA
goals.
5.
Extensive
Fish Surveys
Confirm
that
the CSSC,
Including
the UDP,
is Dominated
by
Pollutant
Tolerant
Species,
Reflecting
Degraded
Habitat
Conditions.
EA
Engineering
has
been
conducting
fish surveys
in
the Upper
Illinois
Waterway
(“UIW”)
and CAWS
since
1980.
A brief
summary
of our
results
as
well
as an overview
of
what
they mean
is appropriate
because
these
results
clearly
demonstrate
that the
fish
community
in
the
CSSC
and
the
UDP
is
a
result
of
the habitat
limitations
discussed
above.
Since
1993,
EA
Engineering
has
made
a total
of
3,159
collections
from the
Dresden,
Brandon,
and
Lockport
Pools
to
assess
the
resident
fish
populations.
This
compares
to only
22
collections
made
by MBI
from
these
pools,
only
six
of
which were
collected
from
the
UDP,
and
all
of
which
were
17
Electronic Filing - Received, Clerk's Office, September 8, 2008
collected
during
a single
year (2006).
A more
detailed
discussion
of these
fish
surveys
is
attached to
the EA
Engineering
report.
See
Exhibit 2,
Attachment
1.
Larval
Fish
In 1994,
EA
collected
fish
eggs and
larvae
at
16 locations
in the UIW,
including
six
locations
in
Lockport
Pool,
one in Brandon
Pool, one
in the
Upper
Des
Plaines
River,
and
eight
in Dresden
Pool. Over
the course
of
the study,
tens
of thousands
of
eggs
and
larval and
young-
of-the-year
(YOY)
fish
were
collected.
Among
the
larval
and YOY
fish
collected, the
six most
commonly
collected
species
or
taxa
during
this study (Lepomis
spp.,
gizzard shad,
common carp,
bluntnose
minnow,
unidentified
Pimephales
spp.,
and
emerald shiner)
share early
life
history
characteristics
that
appear
to be
most successful
in this
system.
These
include
adaptations
that
allow
eggs and/or
larvae to
tolerate
low dissolved
oxygen
concentrations
and
have
minimal
contact
with
the
sediment.
Collectively,
these
six species
or
taxa accounted
for
more
than
86%
of all
Iarvae/YOY
collected.
Juvenile
and
Adult
Fish
In
1993
and
1994,
EA Engineering
conducted
fish sampling
along
a 53-mile
stretch
of
the
UIW,
including
18 locations
in Lockport
Pool,
six in Brandon
Pool,
one
in
the Upper
Des
Plaines
River, 22
in Dresden
Pool,
and
six downstream
of
Dresden Island
Lock
and Dam.
Fish
were collected
by
electrofishing,
gillnetting,
and
seining,
and
most
locations were
sampled
both
years.
This
two-year
study
resulted
in
the capture
of 25,349
adult
and
juvenile
fish
representing
82 species.
Numerically
dominant
species
were bluntnose
minnow
(20.0%),
gizzard
shad
(19.4%), common
carp (11.3%),
and
emerald
shiner
(10.5%).
Thus,
the
UIW
was
dominated
by
a combination
of
prolific
pelagic
species
(e.g.,
gizzard
shad
and emerald
shiner) and
highly
IQ
I0
Electronic Filing - Received, Clerk's Office, September 8, 2008
tolerant
species
(e.g.,
bluntnose
minnow
and common
carp). Thus, at
all
life stages
from
egg
through
adult, the UIW
fish community
is dominated by
highly
tolerant
and
pelagic
fishes; a
clear
response
to
the severe habitat limitations
within
the system.
The
most common and
consistent trends
in the UIW were spatial.
These
spatial
patterns
were:
• A very poor
native
fish
assemblage
was present in Lockport
Pool. The
assemblage
in
Lockport
Pool was characterized
by low
native
fish
abundance
(catch rates
typically
<50
fish/km),
low
species richness,
and domination
by highly tolerant species.
•
The community
was marginally
better in Brandon
Pool but was still
very poor.
•
The
fish
communities
in the
Upper Dresden Pool
and
the 5-mile Stretch,
Dresden
Pool
downstream of the
Kankakee River,
and
downstream
of Dresden Lock
and
Dam
were
relatively similar to each
other
and
noticeably
better
than those
upstream of Brandon
Lock and Dam.
•
Results
at thermally-influenced
sampling stations
were comparable
to those
at other
stations.
Based on
biological criteria
established
by Ohio EPA, the
fish community in the
five
areas
would be classified
as
follows:
Lockport
Pool
very poor
Brandon
Pool
very
poor
Upper
Dresden
Pool
and the 5-mile Stretch
poor
Dresden
Pool downstream
of the
Kankakee
River
poor
Downstream
Dresden
Lock and Dam
fair
As
discussed
in greater
detail
in Attachment
1 of
Exhibit 2, the highest
incidence
of
diseased
fish as measured
by
abnormalities
such as deformities, erosion,
lesions, and
tumors
(“DELTs”)
were observed
in the upper
three
segments
of the study area
(i.e., Lockport
Pool,
Brandon
Pool and Upper
Dresden Pool).
DELT percentage
rates ranged from
a
low
of
7.5%
I
Electronic Filing - Received, Clerk's Office, September 8, 2008
(downstream
of
Dresden
Dam) to
a high
of 14.6%
(Brandon Pool).
DELT
anomalies
were
greatest
among
bottom
feeders
such
as carp,
channel
catfish,
and redhorse
species.
For
large
rivers
like the
UIW,
any site
with
>3%
DELT
anomalies
receives
the
lowest
possible
IBI metric
score.
DELT
anomalies
exhibited
by fish
in
the UIW
are 2-5
times higher
than
the
Ohio EPA’s
criterion
for
the lowest
metric
score.
The following
conclusions
were
reached,
based on
the 1993-1994
surveys:
•
Habitat
severely
limited the
fish
community.
o Fish diversity
and
abundance
followed
clear-cut
patterns, with
conditions
being
poorest
in Lockport
Pool and
generally
improving
in a downstream
direction.
• The
spatial
pattern
appeared
to be
unrelated to
operation
of
the CornEd
power
plants.
• Growth
and
condition
of
most
species
were
generally within
expected
ranges, except
for
smalimouth
bass.
•
The incidence
of diseased
fish
is very high
in the UIW.
• Reproduction
in the upper
portion
of
the study
area
is
primarily limited
to
a few
tolerant
or pelagic fishes.
•
None of
the
measures
used
in this
study
to
evaluate
individual
or
community
health
indicated
that CornEd
power plants
were contributing
to
the poor
fauna observed
in
much
of
the
UIW.
o
Based on
the
lack
of
impacts
and habitat-imposed
constraints,
it
was concluded
that
the
aquatic
community
of the UIW
would essentially
be the same
as it
is currently
if CornEd
plants were
load-restricted
or even
taken
off line.
In 1995, EA
conducted
additional
fish studies
within the
same study
area,
the results
of
which
closely paralleled
those
of
the 1993-1994
study.
A
detailed
discussion
of
the 1995
study
and
fish
surveys
conducted
annually from
1997
to
present
are provided
in
Exhibit
2.
20
Electronic Filing - Received, Clerk's Office, September 8, 2008
Species
Composition
(1993-2005)
The fish surveys
conducted from 1993
through 2005 for the
UPD and
the 5-mile
Stretch,
produced 143,156
fish representing
82
species
and four
hybrids.
The
ten most
abundant
species
collected
during
this period were,
in descending order of
abundance, bluntnose
minnow
(22.2%),
gizzard shad
(+
Dorosoma
spp.)
(20.4%),
bluegill (17.2%),
green sunfish (7.0%),
emerald shiner
(6.6%),
orangespotted
sunfish
(4.4%),
largemouth
bass
(3.4%),
common carp (2.8%),
bullhead
minnow (2.3%), and
spottail
shiner
(1.9%). These same
species were also the ten
most
abundant
collected during
both the
period
before the AS96-10
Adjusted Standard went
into
effect
(i.e.,
1993-1995) and after
that (i.e.,
1997-2005).
For all years
combined,
16
moderately
and
highly
tolerant species
(plus two other
taxa) composed 52.8%
of
the catch. Conversely,
only
1.7% of
the fish collected were
intolerant
or moderately intolerant.
This species
assemblage
does
not
reflect
a balanced
indigenous
population. And although
there
has
been a
modest
improvement
in
the UDP in the terms
of fish abundance
since
1993,
the same ten species
continue
to
dominate
the community
of the UPD and
the
5-mile
Stretch and remained unchanged
since
before the
Adjusted Standard
went
into effect. In conclusion,
it is my professional
opinion
that the
preponderance
of moderately
tolerant
and highly tolerant
fishes reflects the degraded
habitat
of
Dresden
Pool, and not the
effects of thermal
discharges.
It also reflects the
limited
availability of
good
quality
habitat that is necessary
to attain a
balanced,
indigenous
species
that equates to
the
attainment
of the
CWA
aquatic use goals.
Conclusion
It is
my professional
opinion,
based
on many years
of experience and
firsthand
knowledge of the
CAWS and
the UDP,
that irreversible
physical and
biological
factors
limit the
Electronic Filing - Received, Clerk's Office, September 8, 2008
biological
potential
of
the
CSSC and
UDP (conditions
wholly
unrelated
to
thermal effects)
and
prevent these waters from attaining CWA
aquatic life use goals. It is
also my
opinion
that the
Illinois EPA in developing the UAA Proposed Rules
has completely
ignored
many
attributes,
constraints and habitat limitations of the UDP that prevent this
waterway from
attaining CWA
aquatic use goals.
Limiting
habitat
conditions such as
channelization,
impoundment,
commercial
navigation (a protected use), lack
of
riffles and fast water, irregular and
extreme
water flows,
excessive sedimentation and
siltation, toxic sediments, and
significant inputs
from urban
storm
water and wastewater discharges
will continue to prevent the occurrence of
balanced
indigenous
fish populations.
These are irreversible
conditions
with unmistakable negative
impacts on
the
aquatic community which the
UAA
Proposed Rules will not and cannot
change to
the extent
necessary
to attain the CWA aquatic use
goals.
Greg Seegert
22
Electronic Filing - Received, Clerk's Office, September 8, 2008
EXHIBIT 1
Resume for Mr.
Greg Seegert
of EA
Engineering, Science,
and
Technology, Inc.
Electronic Filing - Received, Clerk's Office, September 8, 2008
Professional
Profile
Gregory
L.
Seegert
Gregory
L Seegert
Chief
Aquatic
Biologist
Mr.
Seegert
is a senior
scientist at
EA’s office in
Deerfield,
Illinois as well as Chief
Ichthyologist
at
EA.
His
areas
of
special
expertise
are aquatic ecology
and
aquatic
toxicology.
In his
35 years of experience
in
these areas,
Mr.
Seegert has conducted studies
throughout the
Midwest and much of the
East
and
Southeast.
He
is a recognized expert on
biocriteria
and
biological sampling
methods
to assess impacts
to aquatic
life. He
works
regularly with the private
sector and
regulatory
agencies
in designing
and implementing
bioassay and
aquatic biological
studies. He
has
designed
and directed
numerous
studies
investigating
the
effects
of water intakes
and
discharges
on aquatic life.
Issues
regularly addressed
by Mr. Seegert
include factors
affecting
the
abundance and distribution
of fishes,
entrainment
at hydroelectric facilities,
316(a) and
(b),
aquatic toxicology,
bioaccumulation, endangered
species,
and
ecological risk.
Professional
Experience
Qualifications
Education
MS.;
University of
Wisconsin—Milwaukee;
Zoology;
1973
B.S.; University
of
Wisconsin—Madison;
Zoology;
1970
Specialized Training
SEAK Expert
Witness Training;
2007
EA
Project
Manager Training; 1997
EA
Expert Witness Training;
1990
EA
Toxicity
Reduction Evaluation Training;
1989
Professional
AffiliationslAppointments
American Fisheries Society
National
Society and
three
State
Chapters
American Society
of
lchthyologists
and
Herpetologists
Wisconsin Society
of Ornithology
Aquatic
Ecology—Designed,
conducted,
managed,
and
reviewed
aquatic
studies throughout the East,
South,
and Midwest.
Recognized
expert
on the distribution
of fishes and fish taxonomy,
biocriteria, and Index
of
Biotic
Integrity
(IBI)
theory and implementation.
Worked
on
small streams,
wetlands, large rivers
(e.g., Ohio,
Wabash,
Mississippi),
ponds,
reservoirs, and the Great
Lakes. Worked
with
numerous utilities
in
studying
the effects of
thermal
discharges
on aquatic life. Evaluated
impingement
and
entrainment
losses
of aquatic
organisms and the
effects
of construction
and
flow
alterations on
salmonids. Annually
directs a large fish study
that covers most of the
Ohio
River. Regularly
conducts
surveys
of endangered fishes.
Instructor at several
workshops
on fish
identification.
Habitat Evaluation—Used
a
variety
of qualitative
and quantitative techniques
(e.g.,
Ohio Environmental
Protection
Agency’s
[EPA’s]
Qualitative Habitat
Evaluation
Index,
ORSANCO
Habitat Class) to evaluate
the suitability of
waterbodies
for
fishes. Using
correlation analysis,
determined which
habitat (e.g.,
amounts
of
cover, silt, cobble,
ORSANCO
class)
or physical
(e.g., river
flow, depth, temperature)
variables significantly
affected
biological
variables
(e.g., catch-per-unit-effort,
Index of Well
Being
mod scores,
IBI scores, fish biomass,
diversity).
Determined
how
fish communities
in the Upper Illinois
Waterway responded
to habitat quality
as measured by the
Qualitative
Habitat
Evaluation
Index. Determined
how changes
in physical
variables
(current
velocity,
depth) and
the amount
of useable habitat
would affect
fish and macroinvertebrate
in the Red
River
of the North as
a result of
planned water diversions.
Clean
WaterAct Section 316(a)—Designed
and
conducted
field
studies in 1995 and 2000
as
part of316(a)
demonstrations
at
a
paper mill on the Pigeon
River in North Carolina.
Also prepared all associated
reports.
Prepared
316(a) demonstrations for
the
WE-Energies
Oak Creek/Elm Road project
and the Point Beach
Nuclear
Plant, both
on Lake Michigan, as
well as demonstrations
for plants
on the Wabash and
Muskingum Rivers.
Used
EA-collected biological
data to develop
alternative thermal limits for
the Lower DesPlaines River.
Clean
Water Act Section 316(b)—From
1998
through 2003, served as a
principal advisor to
Utility Water Act
Group (UWAG) on
freshwater issues and has
worked
with them
and
various
industry
representatives
in
developing
comments
on EPA’s 3 16(b) Phase
I and II rules.
During
this period,
attended various workshops,
conferences,
and
meetings representing UWAG
and various utilities.
On behalf of a
group of Ohio
River
users,
developed
and
submitted comments
regarding EPA’s
Ohio River Case Study
Example. On behalf of
the
American
Petroleum
1
Electronic Filing - Received, Clerk's Office, September 8, 2008
Professional
Profile
Gregory L.
Seegert
Institute, developed a position paper relative to establishment of
the Calculation Baseline and
various related
issues.
Based on these reviews, has made numerous presentations at
various industry forums. Has
managed
or
directed
entrainment
and/or impingement
studies
at
approximately
50
plant sites. These include
studies on lakes,
reservoirs,
small rivers, large rivers, and Lake Michigan. For Electric Power
Research Institute,
was
project
director on
impingement
studies at 15
power
plants on the Ohio
River.
Also
managed impingement and
entrainment
studies at
5
American
Electric Power plants on smaller Midwestern rivers.
Environmental Toxicology—Conducted numerous acute and life cycle bioassays to determine
the effects of
effluents and
of
numerous individual organic
and
inorganic chemicals on aquatic organisms. These
tests
involved
a
wide variety
of freshwater and marine fish and macroinvertebrates. Determined the
upper thermal
tolerance of
smailmouth
redhorse and golden redhorse. On behalf of Cincinnati Gas and Electric,
evaluated the effects of
ash
pond and cooling tower blowdown on
aquatic
organisms.
Designed
and
conducted laboratory and field
studies at
two
Ashland Oil refineries. For the Minnesota Pollution Control Board, evaluated the effects of
chlororganics from
the St. Regis
paper
plant
at
Sartell
on aquatic life and human health. Directed two 28-day
dioxin biouptake
studies
at a
Champion International paper mill in Quinnesec, Michigan. At this same site, directed a long-term
research and
development
effort to assess and mitigate
impairment
of the flavor of fish in the receiving
waterbody.
Critical Reviews—On behalf
of
various
companies
and trade associations (e.g., American
Petroleum Institute),
conducted
detailed reviews of various state and federal technical and regulatory documents. Several of
these
reviews
have
led to
extensive
revisions in the subject
document.
Chlorine-related literature is an area of
particular
expertise
and, as a result, Mr. Seegert’s
expertise has been solicited regularly by EPA, various
states, and numerous
industrial
clients. For American
Petroleum Institute, reviewed the status of biocriteria development in
the United
States. Also reviewed several
ecoregion
IBI reports in Indiana.
Mining
Studies—Directed all aquatic and water
quality activities associated with a 2-year,
$1
million study
designed
to assess the impacts
of
New
Source coal mining in West Virginia. In conjunction with this
study,
developed
a unique system
of ranking the biological resources
of
each
waterbody,
developed
detailed
methodologies
to
monitor
the aquatic environment
before, during, and after mining, and ranked all the fishes of West
Virginia
with
regard
to their susceptibility
to
coal
mining. Directed a five-year
study of issues
related
to
effluent quality,
sedimentation, tissue
contamination, loss of spawning
habitat, alterations in flows, and rates of
recolonization at the
site
of a proposed copper/zinc
mine in Wisconsin. Directed and managed
a long
term study to evaluate biological
recovery
following
the pumpout
of a flooded coal mine in
Ohio.
Hydropower Development—Evaluated
effects of hydropower development
on aquatic life at
numerous sites
throughout
the Midwest and
Southeast. Designed
and conducted
population surveys of
various fish species to
evaluate
impacts on these species. Measured
entrainment rates and entrainment mortality at various sites
and
assessed
the impact of these losses
on resident and migratory warmwater and
coldwater
fishes. Evaluated
effects
of flow alterations and flow reductions
on stream fishes.
Selected Publications
and
Presentations
Organizer
and moderator of
a
national
workshop
on evaluatinglarge
river fish
communities.
Seegert,
G.L. (B.M. Burr, D.J. Eisenhour,
K. M. Cook, C.A. Taylor, R.W. Sauer,
E.R.
Atwood,
co-authors).
1996.
Nonnative fishes in Illinois
waters:
What do the records reveal?
Trans. Ill. Acad. Sci.
89:73-91.
Seegert,
G.L. (B.M. Burr, K. M. Cook,
D.J.
Eisenhour,
K.R. Piller, W.J. Poly, R.W. Sauer,
C.A. Taylor, E.R.
Atwood, co-authors). 1996.
Selected Illinois fishes in jeopardy: New records
and
status evaluations.
Trans. Ill.
Acad. Sd. 89:169-186.
Seegert,
G.L.
1986. Rediscovery
of the greater redhorse in Illinois. Trans. iii. Acad. Sci.
79:293-294
Seegert, G.L. 1984. Fisheries studies of Pool 5A of the
Upper
Mississippi River, 1982, in Proc.
40th
Upper
Mississippi River Conservation Committee.
UMRCC, Rock Island, Illinois.
Electronic Filing - Received, Clerk's Office, September 8, 2008
Professional
Profile
Gregory
L.
Seegert
Seegert,
G.L.
(J.
Fava
and P. Cumbie,
co-authors).
1983. How representative
are the data sets
used
to
derive
national water
quality criteria?, in
Proc. Seventh Aquatic
Toxicological
Symposium.
ASTM,
Philadelphia.
Seegert,
G.L.
(R.B. Bogardus,
co-author).
1980. Ecological and environmental
factors
to be
considered
in
developing
chlorine criteria,
in Water
Chlorination: Environmental
Impact and Health
Effects, Vol. 3
(R.L. Joiley,
ed.).
Ann Arbor
Science, Ann Arbor,
Michigan.
Seegert,
G.L.
(A.S.
Brooks,
J. Vande
Castle, and K. Gradall,
co-authors). 1979. The
effects of
monochloramine on
selected riverine
fishes. Trans. Am.
Fish. Soc. 108:88-96.
The fish community
of the Chippewa
River
and
Dells
Pond near
Eau Claire, Wisconsin. Presented
at
WI AFS
meeting.
1998. Eau
Claire,
WI. January.
Entrainment
and impingement
studies at two
power
plants
on
the Wabash River in Indiana.
1998. Presented
at
Electric Power
Research Institute
Clean Water
Act Section 316(b)
Technical Workshop.
Berkeley Springs, West
Virginia.
September.
Status
and application
of biocriteria.
1998. Presented
at the TAPPI Environmental
Conference. Vancouver,
British
Columbia.
April.
Improvements
to the
Pigeon River
following
modernization
of the
Champion
International Miii.
1997.
Presented
at
the
TAPPI Environmental
Conference.
Minneapolis,
Minnesota.
May.
Improvements to the
Pigeon River
following
modernization
of the Champion
International Mill.
1997.
Presented at
the
TAPPI Biological
Symposium.
San Francisco,
California.
October.
Geographic
and historic
changes in
Ohio River Fish
Communities.
1997. Presented
at the Ohio River Fisheries
Conference. Cincinnati,
Ohio.
January.
Small mammals
of the Ohio River
floodplain
in western Kentucky
and adjacent Illinois.
1982. Trans. Kentucky
Acad. Sci. Co-authored
by R.K.
Rose.
Factors
in the design
of
chlorine
toxicological
research.
1982. In: R.L.
Jolley,
ed. Water chlorination:
environmental
impact
and
health effects,
Vol. 4,
Ann Arbor
Science,
Ann
Arbor, Michigan. Co-authored
by
J.A. Fava.
Low level
chlorine analysis
by amperometric
titration.
1979.
J. Water
Poll.
cont.
Fed. 51:2636-2640.
Co-authored
by A.S.
Brooks.
WAPORA,
Inc.
1978.
Review
of the Mattic
and Zittel paper:
site-specific evaluation
of power plant
chlorination.
Project 218.
Submitted to Edison
Electric
Institute,
Washington,
D.C.
A preliminary
look at the
effects
of
intermittent
chlorination on
selected
warmwater
fishes. 1978.
Pages 95-1
10. In:
R.L.
Jolley, H. Gorchev,
and M. Hamilton
eds.,
Water
chlorination: environmental
impact
and
health
effects, Vol. 2.
Ann
Arbor Science.
Ann
Arbor, Michigan.
Co-authored
by A.S. Brooks.
The effects
of
intermittent
chlorination
on
coho salmon,
alewife,
spottail shiner,
and rainbow smelt.
1978. Trans.
Am. Fish.
Soc.
107:346-353. Co-authored
by A.S. Brooks.
Dechlorination
of water for
fish
cultures:
a comparison
of the activated
carbon,
sulfite
reduction,
and photochemical
methods.
1978.
3.
Fish. Res.
Bd. Can.
35:88-92. Co-authored
by A.S. Brooks.
Diel variations
in sensitivity
of fishes to potentially
lethal stimuli.
1977. Prog. Fish.
Cult. 39:144-147.
Co-authored
by R.E.
Speiler
and T.A.
Noeske.
Electronic Filing - Received, Clerk's Office, September 8, 2008
Professional
Profile
Gregory
L.
Seegert
The
effects
of intenriittent
chlorination
of rainbow
trout
and
yellow perch.
1977.
Trans.
Am. Fish.
Soc.
106:278-
286.
Co-authored
by A.S.
Brooks.
The
effects
of
intermittent
chlorination
of the biota
of
Lake
Michigan.
1977.
Special Report
#31, Center for
Great
Lakes
Studies,
University
of Wisconsin.
Milwaukee,
Wisconsin.
Co-authored
by A.S.
Brooks.
The
effects
of
a
30-minute
exposure
of selected
Lake Michigan
fishes
and invertebrates
to residual
chlorine.
1977.
Pages
9 1-99. In: L.D.
Jensen,
ed.
Biofouling
control procedures:
technology
and ecological
effects,
Marcel
Dekker,
Inc.,
New York,
New
York.
Co-authored
by A.S.
Brooks.
The
effects
of
intermittent
chlorination
on selected
warm water
fishes.
1977. Presented
at the Conf.
on
Water
Chlorination:
Environmental
Impact
and Health
Effects. 31
October
—4 November
1977.
Gatlinburg,
Tennessee.
Co-authored
by A.S.
Brooks.
The
effects
of
intermittent
chlorination
on selected
Great
Lakes
fishes.
1977. Presented
at the 38th
Midwest
Fish &
Wildlife
Conf.
5-8
December
1975.
Dearborn,
Michigan.
Co-authored
by A.S. Brooks.
Toxicity
of chlorine
to
freshwater
organisms
under
varying
environmental
conditions.
1976.
Pages
277-298. In:
R.L. Jolley,
ed.
Proceedings
of
the Conference
on Environmental
Impact
of
Water
Chlorination,
22-24
October
1975,
Conference
761096.
Oak Ridge
National
Laboratory.
Oak Ridge,
Tennessee.
Co-authored
by
A.S. Brooks.
The Beaver
Dam
River. 1976.
Pages 210-213.
In:
D.D.
Tessen,
ed. Wisconsin’s
favorite
bird
haunts. Wisconsin
Society
for
Ornithology.
Green
Bay, Wisconsin.
The
effects of heat
on
plasma
potassium
levels, hematocrit,
and
cardiac activity
in the alewife,
common
shiner,
and
two
other teleosts.
1973.
Presented
at
the
16
th
Conf. on Great
Lakes Research.
16-18 April.
Huron, Ohio.
Co
authored
by
C.R. Norden.
The effects
of lethal
heating on plasma
potassium
levels,
hematocrit
and cardiac
activity in
the alewife
(Alosa
pseudoharengus)
compared
with three other
teleosts.
Pages 154-162.
In:
Proceedings
of
the
l6” Conf. Great
Lakes
Res.
International
Association
Great
Lakes
Res.
Numerous
presentations
at state,
division,
and national
American
Fisheries
Society Meetings.
Topics
have
included:
•
Effects
of power plant
intakes
• General
fish surveys
• Threatened
and
endangered
species
surveys
• Thermal
assessments
IBI protocols
Large
river
sampling
methods
Toxicity
studies
Use
attainability
Biological
variability
Habitat assessment
Electronic Filing - Received, Clerk's Office, September 8, 2008
Professional
Profile
Gregory
L.
Seegert
Professional
Recognition
Chief Instructor for several
fish identification
workshops
sponsored
by
the Indiana American
Fisheries
Society, Co
Instructor for two, 3-day
fish identification workshops
sponsored
by
the
Wisconsin
American
Fisheries
Society.
Candidate for President,
Wisconsin Chapter of
American
Fisheries
Society. 1998 and
2008.
Chairperson,
Fish Physiology
Section,
American
Society of Ichthyologists
and
Herpetologists,
1997
Annual
Meeting.
Seattle,
Washington.
Member,
Endangered Species
Committee, American
Fisheries
Society. 1996
and 1998.
Invited speaker
at various seminars and
workshops.
c
Electronic Filing - Received, Clerk's Office, September 8, 2008
EXHIBIT
2
EA Engineering,
Science,
and
Technology’s
Report on the
Aquatic
Life
Use
Attainability
Analysis
for the
South Branch
of
the
Chicago
River,
the
Chicago
Sanitary and
Ship
Canal,
and the
Upper Dresden Island
Pool
Electronic Filing - Received, Clerk's Office, September 8, 2008
Aquatic
Life
Use
Attainability
Analysis
for
the
South
Branch
of
the
Chicago
River,
the
Chicago
Sanitary
and Ship Canal,
and
the
Upper
Dresden
Island
Pool
Prepared
for:
Nijman
Franzetti,
LLP
10
South
LaSalle
St.,
Suite
3600
Chicago,
IL
60603
Prepared
by:
EA
Engineering,
Science,
and
Technology
444
Lake
Cook
Road,
Suite
18
Deerfield,
IL
60015
September
2008
14581.01
Electronic Filing - Received, Clerk's Office, September 8, 2008
TABLE
OF
CONTENTS
Section
INTRODUCTION
1
II.
EXECUTIVE
SUMMARY
2
III.
THE
ARTIFICIAL,
CONTROLLED
FLOW
CONDITIONS
iN
THE
CAWS
AND
UDP
SATISFY
UAA
FACTOR
2
5
IV.
BARGE
TRAFFIC
AND
SEDIMENTATION
PRESENT
IN
THE
CSSC
AND
UDP
SATISFY
UAA
FACTOR
3
7
A.
Barge
Traffic
in
the
CSSC
and
UDP
Limits
the
Quality
of
Aquatic
Life
Attainable
8
B.
Adverse,
Physical
Aspects
of
Sedimentation
in
the
CSSC
and
UDP
Significantly
Limit
the
Quality
of
Aquatic
Life
Attainable
9
V.
DAMS
AND
OTHER
HYDROLOGIC
MODIFICATIONS
iN
THE
CSSC
AND
UDP
PRECLUDE
ATTAINMENT
OF
AQUATIC
LIFE
GOALS
UNDER
UAA
FACTOR
4
10
A.
The
Adverse
Effects
of
Dams
on
Aquatic
Life
11
B.
The
Fox
River
Studies
of
the
Adverse
Effects
of
Dams
12
VI.
THE
“NATURAL”
FEATURES
OF
THE
CAWS
AND
UDP
PRECLUDE
ATTAINMENT
OF
AQUATIC
LIFE
USES
UNDER
UAA
FACTORS
15
A.
Habitat
Conditions
in
the
CAWS
and
UDP
Are
Inadequate
To
Support
A Balanced
Fish
Population
16
1. QHEI
Scoring
Process
and
Support
Categories
18
2.
The
July
2008
EA
QHEI
Field
Survey
of
the
UDP
19
3.
Comparison
of
EA
2008
QHEI
Scores
and MBI
2006
QHEI
Scores
21
a) QHEIs
for
UDP
RM
279.5
22
b)
QHEIs
for
UDP
RM
285.5
(Brandon
Tailwaters)
23
4.
The
MBI
2006
IBI
Metric
Values
and
Scores
Also
Are
Unreliable
26
5. Key
Habitat
Types
required
for
a
Balanced
Fish
Community
are Lacking
27
6.
Siltation
in
the
Dresden
Pool
is Excessive
29
B. The
Extensive
Urbanization
of
the
CAWS
and
UDP
Prevent
Attainment
of
the
Clean
Water
Act
Aquatic
Life
Goals
30
C.
Remediation
to
Address
Habitat
Limitations
is not
Feasible
in
the
CAWS
and
UDP
32
Electronic Filing - Received, Clerk's Office, September 8, 2008
TABLE OF
CONTENTS (cont.)
Section
VII.
APPROPRIATE USE DESIGNATION
FOR UPPER
DRESDEN
POOL
33
A.
Upper Dresden
Pool Has Most of Ohio’s
Modified
Warmwater
Habitat
Streams
Characteristics
and Almost
None of Ohio’s Warmwater
Habitat
Characteristics
33
B. The Habitat
in the UDP Generally
Will Not Support an Aquatic
Life
Use Consistent
with CWA Goals
34
VIII.
LIST
OF REFERENCES
35
Electronic Filing - Received, Clerk's Office, September 8, 2008
REPORT
ON
THE
AQUATIC
LIFE
USE
ATTAINABILITY ANALYSIS
FOR
THE
SOUTH
BRANCH
OF
THE
CHICAGO
RIVER,
THE
CHICAGO
SANITARY
AN]) SHIP
CANAL,
AN])
THE
UPPER
DRESDEN ISLAND
POOL
I.
INTRODUCTION
EA
Engineering,
Science,
and
Technology,
Inc. (EA)
is a
national
environmental
company,
with
offices
located
across
the
nation,
including
its EA
Midwest
office
in
Deerfield,
Illinois.
EA
provides
a variety
of
environmental
services,
including
expertise
in aquatic
ecology,
habitat
assessment,
stream
hydrology,
and water
quality.
EA
Midwest
specializes
in aquatic
studies.
Our
senior
staff
collectively
has
over
150
years
of experience
in this area.
EA
Midwest’s
work
in
the
area
of
aquatic
studies
is
extensive.
BA
Midwest
has
conducted
aquatic
studies
at
numerous
industrial
facilities.
These
aquatic
studies
have
been
performed
at
approximately 100
power
plants
and
at sites
with
similar
issues
(e.g.,
paper
mills, steel
mills,
wastewater treatment
plants,
etc.).
EA also
has reviewed
the
use
attainment
and non-attainment
status
of
several
streams
in Ohio
and
provided
input to
various
clients
as to
which
UAA
factors
were
relevant
and
applicable
at a
particular
site.
BA has
studied
aquatic
habitat
throughout
the
United
States.
These
studies
have involved
a
variety
of qualitative
and
quantitative
methods
for
evaluating/measuring
habitat.
Some
of the
methods
used include:
• Montana
Method
and
PHABSIM
(Physical
Habitat
Simulation), qualitative
and
quantitative
methods,
respectively
for determining
how
water flow
affects
fishes;
•
Methods
used by
ORSANCO
and the
states
of Ohio,
Wisconsin,
Michigan,
Illinois,
and
North
Carolina
to
measure
habitat
quality
in
biological
sampling
reaches;
•
A Delphi
approach
to assessing
habitat
quality
in the
Osage
River,
Missouri
•
Methods
approved
by the
U.S.
EPA, including
the
Rapid Bioassessment Protocol;
and
•
Habitat
Suitability
Index
Curves
EA
also
has
extensive
experience
in the
use
of Qualitative
Habitat
Evaluation
Index
(QHEI)
procedures
to assess
the
quality
of
aquatic
habitat.
Soon
after
the QHEI
was
first
developed
nearly 20
years
ago,
EA was
involved
in
a project
to
assess
several
streams
in
Northwestern
Ohio to
determine
the
replicability
of
QHEI
scores
reported
by
Ohio
EPA.
Since
then,
EAs
has
used the
QHEI
to evaluate
many streams
and
rivers
in
Illinois,
Indiana.
Ohio,
and
elsewhere,
including
in
the
Lower
Des
Plaines
River (LDR).
Electronic Filing - Received, Clerk's Office, September 8, 2008
EA
biologists have been
studying the Upper Illinois
Waterway (UIW),
including
the Des
Plaines
River
(DPR)
and the Chicago Sanitary
and
Ship Canal (CS
SC)
since
the company
first
came to
the
Chicago
area in
the
late
1970’s. EA has
conducted studies of
the DPR
and
the CSSC
on
a
nearly annual basis
since
that
time. EA biologists have
made literally
thousands
of fish
collections
from the waterway.
A summary
of the fish
and habitat studies
conducted
by
EA from
1993 through
2006
is provided
as Attachment
1.
Several
years ago, Midwest
Generation
(MWGen)
retained
EA to
review and
comment on
the
LDR and the Chicago
Area Waterway
System
(CAWS) Use
Attainability Analyses
being
conducted
by the
Illinois Environmental
Protection
Agency (Illinois EPA
or Agency).
As
part
of
its
work for
MWGen, EA reviewed
and analyzed
relevant information
and data to
assess
use
designation
issues related
to
aquatic
life goals for the CAWS
and the LDR. EA,
through
the
services
of Greg Seegert, also
participated
in several Illinois EPA
stakeholder
meetings.
Mr.
Seegert
served
as a biological
expert on
the Biological
Committee
established
by
Illinois EPA
as
part of the
LDR
UAA
process.
For this report,
MWGen requested
that EA
evaluate the regulatory
requirements in 40
CFR
§
131.10
(g),
known
as the UAA
factors, to determine
whether
the Clean Water
Act goals
for
aquatic
life
are attainable
for the South Branch
of the Chicago
River, the CSSC and
the LDR,
which
are the
areas
in the UIW where
the MWGen electrical
generating stations
are
located.
For
the LDR, our review
focused
on
the
Upper
Dresden Island
Pool (UDP) area as
defined in
the
proposed
UAA rules
by
the
Illinois
EPA.
EA’s review
was
limited to evaluating
the
attainability
of aquatic
life goals under the
Clean Water
Act by applying the
first five UAA factors.
EA’ s
review
did not include
a review of
the
applicability
of UAA Factor 6 relating
to
widespread
economic
and social harm.
This report
presents the results
of EA’s
review and
evaluation of
the
UAA factors
as
applied to
the
aforesaid areas
of the CAWS and LDR.
II. EXECUTIVE
SUMMARY
Based
on EA’s evaluation
and application
of the UAA factors,
it was found that
the
South
Branch
of
the Chicago
River, the
CSSC, and the
UDP are not capable
of attaining the
Clean
Water
Act
aquatic
life goals.
For
purposes
of this report, references
to
the
CSSC
include
that
portion of the South
Branch of
the Chicago River
on which the
MWGen Fisk
Generating Station
is located
and which is
immediately upstream
of the
CSSC. EA concluded
that at
least one of
the
UAA factors
applied to
each
of these
areas.
The present
fish community in
the CSSC and the
LDR, including
the UDP, is of limited
diversity
and quality. It does
not represent
a balanced
population.
It is
the result of the
following
conditions,
which
satisfy
the referenced
UAA
factors,
none of which are
reversible
in the
foreseeable
future:
•
Artificial, controlled
flow
conditions (UAA
Factor 2): The
flow
in the
CAWS
does
not follow
a normal
seasonal
cycle which is
necessary
to support
a balanced
aquatic
community.
The flow
is artificially
controlled to support the
navigational
use of the
system and to manage
the periodic
peak flows. Peak flows,
in
particular,
adversely
affect
certain fish
by
causing
nest abandonment
and/or
displacement
of recently
hatched fry
and
Electronic Filing - Received, Clerk's Office, September 8, 2008
by
mobilizing
fine
sediments
and
then
depositing
them
over
their
eggs,
leading
to
suffocation
of the
eggs or
reduced
hatching
success.
Flow
controls
in the
CAWS
also
result
in fast,
significant
drops
in
water
levels,
which
can strand
fish in
shallow areas,
especially
backwaters,
leading
to
direct
mortality
or increased
predation. Such
conditions
can
also
lead
to
nests
and
eggs
randomly
distributed
on
the
bottom
being
exposed
to the
air.
•
Barge
Traffic
(UAA
Factor
3):
Barge
traffic
adversely
affects
fish
directly
by
propeller
strikes
and
indirectly
by
a variety
of
mechanisms,
especially
by
re-suspension
of
sediments.
Barge
traffic
causes
some
direct
mortality,
constantly re-suspends
soft
sediments
that
can
bury
bottom
organisms
and fish
eggs,
contributes
to
toxicity
which
negatively
impacts
those
types
of
organisms,
and causes
temporary
changes
in water
levels.
•
Sedimentation
(UAA
Factor
3): Sedimentation
is
a result
of
the
impounding
of
the
CSSC
and the
UDP
and
also
the
result
of
the urban
character
of
the
watershed,
including
the existence
of
Combined
Sewer
Overflows
(CSOs)
and
non-point source
or
run-off
pollution
that
flows
into
the
waterway.
Sedimentation
causes
burial
of
eggs
and
limits
the
availability
of clean
substrates
needed
to
support
a balanced,
diverse
fish
population.
•
Dams/Impoundment
(UAA
Factors
2
and
4): The
presence
of
dams
and
the
impounding
effect
they
cause
limit
fish
populations
in
many
ways,
but particularly
by
eliminating
certain
types
of
good
habitats,
such
as riffles
and
fast
water,
and impairing
existing
habitat
by
causing
excessive
siltation.
Simply
put,
the
dams
on
the
CSSC
and
the
LDR
have
changed
the waterway
from
a river
to a
lake
and
the
fish
community
has
responded
(or
been
impaired)
accordingly.
•
Lack
of
Adequate
Habitat
(UAA
Factor
5):
Various
key
habitat
types
(e.g.,
riffles
and
fast
water)
are
lacking.
Further,
overall
habitat
is
only
fair to
poor
thus
precluding
attainment
of
CWA
aquatic
life
goals.
The
lack
of
quality
habitats
in UDP
was recently
documented
by EA
through
an intensive
habitat
study
of the
UDP
performed
in July
2008.
•
Urbanization
(UAA
Factor
5):
The
degree
of
urbanization
in the
CSSC
and
the
UDP
precludes
attainment
of
CWA
aquatic
life
goals.
Urbanization
not
only
contributes
to
increased
sediment
loads,
but
also
leads
to CSO
overflows,
changes
in
the
natural
flow
pattern
and a
variety
of
factors
that
are
not
well
understood
but whose
collective
influence
is widely
accepted.
With
respect
to
the
CS
SC,
the
Illinois
EPA
agrees
that
it
can
not
attain
the
Clean
Water
Act’s
aquatic
use goal
and
has
proposed
a lower
aquatic
life
use referred
to
as “Aquatic Life Use
B”.
The
Illinois
EPA
further
agrees
that
the
CSSC
has
poor
habitat
and that
the
aquatic
community
suffers
adversely
from
the artificially
controlled
flow
conditions
and
heavily
industrialized
nature
of
this
waterway,
including
the
high
volume
of
barge
traffic.
What
is
less
clear
is
whether
the proposed
language
of
the
“Aquatic
Life
Use
B” use
classification accurately
classifies
highly-modified
streams
that
are
characterized
by
poor
habitat,
heavily
industrialized use,
and
Electronic Filing - Received, Clerk's Office, September 8, 2008
limited
aquatic
life
potential.
In
this
regard,
the
Ohio
EPA’s
use
classification
approach
of
describing
categories
of streams,
such
as
“Limited
Warm
Water”,
“Modified Warm Water”
and
its
use
of subclassifications,
such
as
“Impounded”,
for
streams
like
the
CSSC,
is a
more
workable
and
clearer
approach
to
establishing
a
multi-tiered
use
classification
under
state
water
quality
regulations.
Also,
to the
extent
that
there are
other
waterways
in
the
state
that
may
share
these
same
stream
characteristics,
an
approach
that
describes
categories
and
subcategories
of
use
classifications
would
allow
similar
waterways
to
be
similarly
classified,
thereby eliminating
the
need
or
risk
of having
to
continually
develop
new
use
classification
categories because
the
Illinois
EPA’s
currently
proposed
aquatic
life
use
designations
are
effectively
site-specific
use
descriptions
rather
than
classifications
of aquatic life
uses.
With
respect
to
the
UDP,
the
Illinois
EPA’s conclusion
that
the
UDP is capable
of
“minimally
attaining”
the
Clean
Water
Act’s
aquatic
life
goals
is not
supported
by
the
weight
of
the
relevant
evidence.
As
documented
by
EA’s
July
2008
50-site
QHEI/Habitat
Study
and
its
prior
2003
QHEI/Habitat
Study
of
the
UDP,
there
is little
good
quality
habitat
(i.e.,
areas
with
QHEI
scores
greater
than
60)
present
and
there
is
a
considerable
amount
of poor
habitat
(i.e.,
areas
with
scores
below
45)
present.
Roughly
half
of
the
UDP
is
navigational
channel
area
that
is
unsuitable,
poor
habitat
and
the
remaining
half
is
characterized
by
poor
to
fair
quality
habitat,
with
only
a very
limited
area
of
good
habitat.
As
acknowledged
in
EA’s
QHEI
Study
of
the
UDP
in
2003
(EA
2003),
habitat
is
marginally
better
in
the
UDP
as
compared
to
Brandon
Pool
or
Lockport
Pool
in
the
CSSC.
More
accurately
stated,
habitat
in
UDP
is
“less
poor”
than
that
in
the
CSSC,
but
it
is
still
poor
nonetheless.
The
only
place
where
many
“natural”
features
are
evident
is
in
the
very
limited
area
of
the
Brandon
tailwaters.
This
is
an
isolated
pocket
of
good,
not
great, habitat
surrounded
by
miles
of
fair
to poor
habitat.
EA’s
July
2008
Study
confirmed
that
siltationlsedimentation
remains
a
significant
problem
in
the
UDP
and
will
prevent
certain
better
quality
fish
species
from
spawning
and
living
in
the
UDP.
The
UDP
is
located
in
an
urbanized
area.
Several
studies
have
demonstrated
that
biological
measures
consistently
decline
significantly
as
urbanization
increases.
These
declines occurred
regardless
of
site-specific
habitat
quality.
The
amount
of impervious
cover
in
the
Des
Plaines
Basin
is
significant,
ranging
from
3
0-56%
(US
Army
Corps
of Engineers
1997),
which
studies
have
shown
results
in
significant
declines
in
biological
quality
measured
by
such
indices
as the
Index
of
Biological
Integrity
(IBI).
The
Pre-filed
Testimony
of
Mr.
Richard Lanyon
(at
page
6),
General
Superintendent,
Metropolitan
Water
Reclamation
District
of
Greater
Chicago
(MWRDGC),
cites
a
similar
percentage
(42%)
of impervious
area
for
Cook
County. Further,
the
UDP
does
not
resemble
an
Illinois
General
Use
water
—
the
current
use
designation
for
streams
that
are
capable
of
attaining
the
Clean
Water
Act
goals.
Other
General
Use
waters
in
Illinois do
not
have
the
combination
of
commercial
navigation,
receipt
of
wastewater
from
a
city
of
three
million
people,
a much
altered
winter
temperature
regime
because
of those
wastewater
inputs,
extensive
urbanization,
channelization,
reversal
of
flow,
periodic
but
irregular
flow
alterations,
an
electric barrier,
extensive
sedimentation,
and
an
almost
complete
loss
of
riffles
and
fast
water.
The
Illinois
EPA
has
acknowledged
the
uniqueness
of
the
waterway
and
justified
its
site-specific
use
classification
approach
(e.g.,
“Upper
Dresden
Island
Pool”
use
designation)
on
the
basis
that
these
waters
are
unique.
The
UDP
certainly
is
unique
as
compared
to General Use
Waters.
It
clearly
does
not
have
the
extent
of good
or
great
habitat
that
is
characteristic
of
General Use
Electronic Filing - Received, Clerk's Office, September 8, 2008
Waters
and
it will
not
in
the
foreseeable
future.
The
possibility
of remediation
actions
in
the
UDP
to
address
UAA
factors
that
are
preventing
attainment
of
Clean
Water
Act
goals
must
be
considered
whenever
a
proposed
use
designation
falls
below
the
Clean
Water
Act
goals.
Here,
the
main
limiting
factor
in this
waterway
system
is
the
impoundments.
To
remediate
the
impounded
nature
of the
waterway would
require
removing
or
greatly
modifying
the
locks
and
dams
now
present.
However,
such
remediation
would
in turn
severely
impair
or
prevent
the
existing
navigational
use
for
which
this
waterway
was
intended,
and
which
is
also
a protected
use
of
the
CAWS
and
the
UDP
under
the
Clean
Water
Act.
Short
of
removing
or
greatly
modifying
the
existing
locks
and
dams
on the
waterway, some
more
limited
types
of
remediation
could
be implemented
(e.g.,
the
amount
of
instream
cover
potentially
could
be
increased).
However,
due
to the
extensive
amount
of
habitat
area
that
would
need
to
be
successfully
improved
by such
measures
in
order
to
have
any
measureable
effect
on
fish
populations
and species,
they
would
have
to
occur
on an
unprecedented
scale. Illinois
EPA
has
acknowledged
that
there
are
no
such
plans
for
remediation
at
the
scale
required
here.
Moreover,
unless
the
dams
themselves
are
removed,
the
factors
that
are
most
severely
limiting
(i.e.,
lack
of
riffles,
fast
water,
clean
cobble/boulder
areas,
and
impoundment)
will
continue
to
limit
the
system
by
preventing
the
species
that
depend
on
such
areas
from
establishing
viable
populations.
III.
THE
ARTIFICIAL,
CONTROLLED
FLOW
CONDITIONS
IN
THE
CAWS
AND
1JTP
SATISFY
UAA
FACTOR
2
The
second
of
the six
UAA
factors
(“UAA
Factor
2”)
provides
as
follows:
Natural,
ephemeral,
intermittent,
or low
flow
conditions
or water
levels
prevent
the
attainment
of
the
use,
unless
these
conditions
may
be
compensated
for
by
the
discharge
of
sufficient
volume
of
effluent
discharges
without
violating
State
water
conservation
requirements
to
enable
uses
to
be
met.
(40
CFR
§
131.1
0(g)(2))
For
the
reasons
stated
below,
the
flow
conditions
present
in
the
CSSC
and
the
UDP
satisfy
the
requirements
of
UAA
Factor
2.
Rather
than
being
managed
to
optimize,
or
to at
least
accommodate
aquatic
life,
flows
in
the
CSSC
and
the
UDP
are
managed
to
provide
minimum
flows/levels
to
accommodate
barge
traffic
and
handle
periodic
flow
peaks,
including
flow
peaks
that
are
amplified
by
CSO
inputs.
Riverine
fishes
are
adapted
to
handle
occasional
high
flows
and
the attendant
changes
in
water
levels.
However,
these
fish
adaptations
are
based
the flow
of the
river
following
a
normal
seasonal cycle
(i.e.,
generally
highest
in the
late
winter
and
spring
and
lowest
in the
late
summer
and
early
fall).
Thus,
most
fishes,
including
those
species
present
in the
CAWS,
spawn
from
May
through
July
when
flows
should
be
more
stable
(EA
31 6b
Study).
However, the
flow
in
the
CAWS
does
not
follow
a normal
seasonal
cycle.
It cannot
due
to
the
flow
management
system
necessary
to
support
the
navigational
use
of
the system
and
to
manage
periodic storm
event
and
5
Electronic Filing - Received, Clerk's Office, September 8, 2008
runoff
flows.
Because
of
its
constrained
nature,
the water
level
alterations
described
herein
are
most
pronounced
in
the
CSSC,
but
they
are also
a significant
factor
in
the
UDP.
In
a
natural
system,
high
spring
flows
result
in
a
flushing
effect
which
is then
followed
by
relatively
constant
flows
through
the
course
of the
summer.
However,
in
the LDR
there
is
no
seasonality
to these
flushing
events;
they
occur
any time
there
is
significant
rainfall
in
the
Metropolitan
Chicago
area
because
the
CSSC
cannot
accommodate
the
large
volumes
of
runoff
water
that
result
from
a heavy
rainfall.
In a natural
system,
these
spring
flows
flush
out
accumulated
sediment
and
trigger
migratory
movement
of
certain
big
river
fishes.
The
managed
but
unpredictable
flow
regimes
in the
CSSC
may
not
provide
the
necessary
flushing
or
provide
migratory
cues
at
the
proper
time.
Collectively,
the
random
fluctuations
in flows
in
the CSSC
are
detrimental
to
the
fishes
in the
CAWS
because
they
do
not follow
the expected seasonal
pattern
and thus,
may
occur
when
fishes,
especially
larval
fishes,
are
most
vulnerable.
Also,
because
of
the
artificial
nature
of
the
CAWS,
flow
fluctuations
are
more
pronounced
and
much
more
frequent
than
in a
natural
system.
Depending
on
the species,
high
flows
can
adversely
affect
fish
by
causing
nest
abandonment
and/or
displacement
of
recently
hatched
fry.
High
flows
can
also
adversely
affect
fish by
mobilizing
fine
sediments
and
then
depositing
them
over
their
eggs,
which
can
lead
to
suffocation
of the
eggs
or
reduced
hatching
success.
It has
previously
been
determined
that
the
species
faring
best
in
the
CAWS
and
UDP
are
those
that
have
special
adaptations, which
allow
their
eggs
to survive
better
under
the
silty
conditions
prevalent
in
most
of
the CAWS
and UDP
(ComEd
1996).
At
the
other
end
of the
flow
variation
spectrum
in the
CAWS
are
occasional
precipitous
drops
in
water
levels,
which
are done
in
anticipation
of
high
CSO
discharges and
rainfall
inputs.
When
water
levels
drop
fast
enough,
fishes
can be
stranded
in
shallow
areas,
especially
backwaters.
This
can
lead to
direct
mortality
of
stranded
fishes
or
increased
predation
by
avian
or
mammalian
predators.
It can
also lead
to
nests
and eggs
that
are
distributed
on
the
bottom
being
exposed
to
the air,
which
can result
in
either
predation
or dessication.
EA
biologists
personally
experienced
such
extreme
flow
fluctuations
while
conducting
field
work
in
the CAWS.
A sudden
and
significant
drop
in
the water
level
resulted
in
the
EA
biologists’
boat
being
literally
left
“high
and
dry”
in
the
Lockport
Pool.
As was
noted
in the
testimony
of Illinois
EPA
witnesses
in
the
UAA
Rule-Making
Proceeding,
R08-09,
extreme
water
level
variations
of four
to
six
feet
within
only
a
twenty-four
hour
period
occur
in the
CSSC
(See
UAA
Hearing
1/31/08
Transcript
at
p.
227;
see
also
flow
diagrams
in Pre-fi
led
Testimony
of
Julia
Wozniak,
Midwest
Generation,
Attachment
4). It
was agreed
that
the
adverse
effects
of
such
extreme
variations
in
water
level
on habitat,
by
disrupting
fish
spawning
and
feeding,
are
greater
than
the
potential
effects
of
temperature
(UAA
hearing
1/31/08
at
p.
227).
Similarly,
in
the
UDP,
extremely
low
water
levels
were
encountered during
fish
surveys
recently
conducted
by
EA in
the
Brandon
tailwaters
during
July
2008.
Shallow
areas
will
be
most
affected
by
these
sudden
flow/level
changes
because,
on a proportional
basis,
depth
will
change
most
in
shallow
areas.
To
the
extent
they
occur,
flow
fluctuations
are felt
most
severely
in
the
Brandon
tailwaters.
This
area
offers
the
only
riffle
habitat
in
UDP
and
therefore
is
crucial
to
the
spawning
success
of
species
that
spawn
exclusively
in
such
areas;
particularly darters,
madtoms,
I;
Electronic Filing - Received, Clerk's Office, September 8, 2008
and other obligate
riffle
species.
Flow fluctuations
in this area
will adversely
affect
these and
other species by:
•
stranding larvae,
possibly even adult
fish,
•
reducing hatching success of eggs,
•
sweeping away larvae if flows
increase suddenly,
which
could
cause
direct
mortality or subject them to increased
predation, and
•
conversely, extremely low water
levels would expose
eggs,
larvae,
and
adults to predators, including avian and
mammalian
predators.
As was
observed
by Mr. Rankin during the QHEI survey
conducted in the
UDP during
late
March 2004, “the lack offlow throughout much
of
the reach we boated
through
would
limit
species and taxa dependent
on flow” (See
Attachment
R to
Illinois EPA
Statement of
Reasons,
at
section entitled “Des Plaines River [Recommended Category: MWH-I,
Other]”).
With
regard to
fluctuations
in
flow, it
is probable that all of the fish species
that the Illinois EPA
has
identified
on its
Representative
Aquatic Species (RAS) list for the UDP (the “Modified
RAS”)
would
benefit
from a
more stable
flow regime if one existed in the UDP. Those
species that
would
likely benefit most would be the nest builders,
such as the
various catfishes and
sunfishes.
Based
on EA field data from the Ohio
River, gizzard shad also seem to reproduce
best (i.e.,
have the
strongest
year classes)
when
flows during the spawning season (May-July) are
fairly low
and
stable.
So long as
water
levels remain fairly constant, the species on the Modified
RAS
list
should be able to reproduce in the
system, but the absence of natural flow
conditions will
prevent
establishment
of
a community
consistent with the Clean Water Act aquatic life
goals.
Because commercial navigation
is and will continue to
be a
protected use in the CSSC
and the
UDP, the
random and extreme flow fluctuations
will continue because they are
necessary
to
maintain
navigation
and to provide flood
control. The Agency agrees that the
navigational use
and flow management
control constraints
for the UDP will continue an.d are
not reversible
for the
foreseeable future (UAA January
29, 2008 Hearing Transcript at
pp.
41
and
43).
Because of how
the water (flow)
management system is
operated by the Army Corps of Engineers
and
MWRDGC, these conditions
cannot be countered
or compensated for by the
discharge of any
sufficient volume of effluent discharge.
Thus, these artificial
flow conditions
satisfy the
requirements of UAA Factor 2.
IV. BARGE TRAFFIC AND
SEDIMENTATION PRESENT
IN THE
CSSC
AND UDP SATISFY
UAA FACTOR 3
The third of the six
UAA factors (“UAA Factor
3”) provides as follows:
Human-caused conditions
or sources of pollution prevent
the
attainment
of the use and cannot
be remedied or
would cause more
environmental
damage to correct than
to
leave
in
place.
(40
CFR
§131.10(g)(3))
7
Electronic Filing - Received, Clerk's Office, September 8, 2008
UAA
Factor
3
focuses
on the effect
of “human
caused conditions
and
sources of
pollution” in the
waterway.
Both
the CSSC
and the
UDP
satisf’
UAA
Factor
3,
primarily due to
the
adverse
effects
of barge
traffic and
sedimentation
upon
the aquatic
life community.
As
noted above,
because
barge traffic is part
of the protected
navigational
use of the CSSC
and
UDP,
these
adverse
effects are not
reversible.
Similarly, there
are
no
known plans
for reducing
sedimentation
in either
waterbody
and the contributing
sources will continue
to add
sediment to
the
waterway.
A. Barge Traffic
in the CSSC
and UDP Limits
the Quality of Aquatic
Life Attainable
The constant
barge traffic
through the
CSSC and UDP adversely
affect
aquatic
organisms,
particularly
macroinvertebrates,
mussels, and
fishes, by:
•
physically injuring
or stranding
fishes;
•
disrupting
or disturbing
spawning
habitat;
•
uprooting aquatic
vegetation;
•
increasing turbidity
via re-suspension
of
bottom materials; and
enhancing toxicity
by re-suspending
and dispersing
the fine-grained
sediments
shown to
be
associated
with
toxic
compounds.
The
net
effect
of barge traffic
on the
CSSC
and UDP is to make
the
main
channel and
channel
border
areas a less
hospitable
environment
for
most aquatic life.
Direct
mortality
to
the aquatic
community
due
to barge
traffic
has
been
well-documented.
A
joint study
by the United
States Geological
Survey
(USGS) and
the Illinois Natural
History
Survey
(INHS) documented
direct mortality
to aquatic life
caused
by towboats.
Gutreuter
et
a!.
(2003)
found that
various
medium
to
large
fish were
killed
as a result
of
propeller
strikes in Pool
26
of the Mississippi
River, as well
as the lower
portion of the Illinois
River.
They
estimated
that 790,000
gizzard shad were
killed
in this area alone
as a result of propeller
strikes. The
number
of fish killed
was a function
of the
number
of fish killed
per
kilometer times
the amount
of
barge traffic
(kilometers
traveled).
On a
large river
such
as the Mississippi,
at
least
some
fish
will
be able to move away
and avoid
oncoming
barge traffic (Lowery
1987, Todd
et a!. 1989).
In a smaller,
narrower
river
like
the Des
Plaines, and
in the
confined,
narrow CSSC, propeller
avoidance would
likely be
more difficult,
so it is reasonable
to assume that
the mortality rate
estimated
for
the
Mississippi
River
and
the lower
Illinois
River
will at least be
as
high
and likely
higher
in
the
CSSC
and the
UDP.
Another effect
of
barge
traffic
is short-term
but significant
changes
in
river levels. As
a barge
approaches,
it pushes
water
into
adjacent
backwaters,
then,
as it passes, this water
is sucked
out
of
the backwater, which
causes rapid
changes in water
levels. The
surge effects likely displace
fish eggs and
larvae from
their
nests.
Barge traffic also
stirs up sediment.
The props from
the
barges stir up ana re-suspenu
tIne
particulate
matter.
Aside from
any toxIc
propertIes these
sediments may possess,
the
re-suspended
sediment
can exert harml
effects
by burying
invertebrates
and
fish
eggs.
8
Electronic Filing - Received, Clerk's Office, September 8, 2008
In
addition
to
constant barge
traffic through the system,
the
section
of
the river
in the
UDP from
the
1-55 Bridge
upstream
for
about 1 mile is a major
barge fleeting area.
Barges are
often tied up
one
after the other, often
two abreast,
throughout
this
mile-long
stretch (See
EA photographs
taken
July
10,
2008 attached
as Attachment 2a).
These barges are located
in
close
proximity to
the
shoreline, which
is an area
of
better habitat
for fish than
is the main
channel. The presence
of
this
major
barge fleeting
area, with the attendant
adverse effects
on
fish, further
diminishes the
quality
of the shoreline
habitat in this
area for aquatic
life. However, as noted
by
the
Illinois
EPA, the commercial
activity
that is
a
protected use under the
proposed use
designation for the
UDP includes
barge fleeting (UAA
January 19,
2008 Hearing Transcript
at
p.
24).
Hence, the
adverse
effects caused
by barge fleeting
in the
UDP
are a protected use
and are
not reversible.
B. Adverse,
Physical
Aspects
of Sedimentation
in the CSSC
and
UDP Significantly
Limit the
Quality
of
Aquatic Life Attainable.
A key
limiting factor to
improved
biological conditions
in
the
CSSC
and
UDP
is
the physical
characteristics of
the sediment
itself
(i.e., fine,
silty, organic).
The fine, silty,
and organic
nature
of the sediments
are not
suitable
for many
higher
quality
fish
species which
need a hard, clean
substrate
for spawning.
Even if the
stream could
be remediated
and the existing
sediment
(contaminated
or not)
removed,
the
urban
nature
of the waterway
itself (e.g.,
impounded) would
ensure
that
additional fine, silty
sediment (whether
clean
or contaminated) would
continue to be
deposited,
thereby
preventing
an
improved habitat
for better quality
aquatic life (UAA
February
1, 2008
Hearing
Transcript
at
p.
41, Testimony
of C.
Yoder “So in excessive
amounts,
[silt] can
be detrimental.
A lot
of nonpoint
source
problems
when
you
hear nonpoint due to
sedimentation
affects,
due to excessive
siltation.”).
The unpreventable
and irreversible accumulation
and
physical
quality
of
the
sediments
that will always
be present in the
system is
limiting further
biological
improvements
in the CSSC
and UDP, with
existing, depositional
area sediment
contamination
exacerbating
the fundamental
siltation
problem.
The
July
2002 draft
guidance
by the
U.S. EPA
on
non-point
source pollution identified
many
detrimental
effects
on aquatic
life
caused
by excessive
sedimentation
from urban runoff
(U.S.
EPA, July
2002,
p.
26-31).
Sediment,
whether
contaminated
or not, was
found
to
be
the leading
cause of impairment,
accounting
for
38% of the impaired
waters in the
nation.
More recently,
the
US EPA
reported
that
“[s]edimentation
and siltation
problems account
for
more
identified
water
quality impairments
of
US
waters
than
any
other pollutant”
(U.S. EPA,
August 2003).
Excessive
erosion,
transport,
and deposition
of
sediment
in surface
waters
are
significant forms
of pollution. Sediment
imbalances
impair many
waters’ designated
uses.
Excessive
sediment
can impair
aquatic life
by filling interstitial
spaces
of spawning gravels,
impairing fish food
sources,
filling rearing
pools, and reducing
beneficial
habitat structure
in
stream channels. Yoder
et
al.
2000
found
that
streams
in highly urbanized
areas
-- which the CSSC
and the
UDP
certainly
are
-- typically
do
not
achieve Clean
Water Act
goals.
The
extensive studies
performed
by CornEd in the
mid-90’s (Burton
1995a, 1995b, 1998,
and
1999) found
that
contaminated
sediments
occur in
all
three navigational
pools
(i.e.,
Lockport,
Brandon
and the Upper Dresden
Pools)
and are
present
primarily in side-channels
and
backwater
areas.
Sediment inputs from
local drainages
appear
to have covered the historically
contaminated
sediments
in some areas,
especially along
the lower reaches
of
Dresden
Pool.
9
Electronic Filing - Received, Clerk's Office, September 8, 2008
However, substantial deposits of
fme-grained
and potentially
contaminated
materials
remain
throughout the UIW, including in the limited
habitat
areas in the
UAA area,
posing
a
permanent
impediment
to
significant improvement
of
overall
ecological integrity
in the
system.
In the
2003
habitat evaluation of the Dresden Pool
conducted
by
EA,
it was
found that
sedimentation
was
moderate
to severe in
many (23
out of 34,
or 70%) of the areas
where QHEI
scores
were
calculated
(EA
2003). During the
July
2008 QHEI
survey, sediment was
rated
as
moderate
or
severe at
33 out of 50
locations
(66%).
Based
on the
observations of EA
field
crews
during
the
2003
and 2008 Upper
Dresden
Pool field
surveys, sedimentation
appears to
have
gotten
worse
over
the
past 5-10
years
in
some
areas (e.g.,
DuPage Delta).
V.
DAMS AND
OTHER HYDROLOGIC MODIFICATIONS
IN THE
CSSC
AND
UDP PRECLUDE ATTAINMENT OF AQUATIC
LIFE GOALS
UNDER
UAA
FACTOR 4
The fourth
of the
UAA factors
(“UAA
Factor 4”) provides as follows:
Dams, diversions, or other types of
hydrologic modifications preclude
the
attainment of use, and it is not feasible to restore the water body
to its
original
condition or to operate such modification in a way that would
result in
attainment
of the
use. (40 CFR
§131.10(g)(4))
Both the
CSSC
and the UDP satisfy UAA Factor 4 because of the adverse
effects of
the dams
present in these
waterways,
particularly
the impounded pool
areas formed by
these dams
and the
water level manipulations that accompany their presence. As further
discussed
below,
studies of
similarly impounded
Illinois waters
support the
finding that
their adverse
effects
preclude the
attainment of the Clean Water Act aquatic life goals.
The entire CSSC and LDR is basically a series of pools separated by locks
and
dams.
Flow in
the
system is controlled entirely
by
diversions from Lake Michigan, effluents
from large
POTWs,
and water level manipulation to accommodate barge traffic. It is the
impounding
effect
caused
by
these dams that has the greatest effect on the fish community. This
impounding
changes most of the system from its original lotic (riverine) nature to its
current,
modified lentic
(lake-like) condition. As
the
Illinois EPA’s witness Mr. Yoder agreed, the
locks along
the
various reaches
of
the
CSSC could have an effect more significant than
temperature
on the
aquatic
community (UAA January
31,
2008 Hearing
Transcript
at
p.
228). Similarly,
in
Dresden
Pool,
only 1 mile
out
of a 15-mile long pool is not impounded. Such
profound changes
in
habitat
conditions adversely
affect
the fish community.
Fish species most
affected
by the impounded nature of the CSSC and LDR
are
so-called
fluvial
specialists (e.g., mostly darters, many suckers, etc.), whereas habitat
generalists (e.g.,
common
carp,
gizzard shad, channel catfish), and pelagic species
(e.g.,
emerald shiner,
freshwater drum)
do quite well under
impounded conditions. Similarly, simple lithophiles (e.g.,
redhorse
and most
darters),
which
require clean,
hard
substrates, do poorly in impounded waters
because of
increased
siltation, while those that are nest builders (e.g.,
centrarchids) or
have
modified
spawning strategies (e.g., bluntnose
minnow) do quite well under the
same
set of
circumstances.
10
Electronic Filing - Received, Clerk's Office, September 8, 2008
Dams
adversely
affect
many
lotic
species
by:
•
eliminating
riffles;
•
reducing
the
amount
of
fast
water;
•
increasing
sedimentation;
•
interrupting
migration;
•
reducing
the
number
and
variety
of
aquatic
insects
such
as
mayflies
and
stoneflies
that
serve
as
prey
for
many
lotic
fishes;
and
•
reducing
habitat
complexity.
(Santucci
et
al.
2005,
Poffet
al.
1997,
American
Rivers
2002).
The
result
of
the
adverse
effects
of
dams
is
a simplified
habitat
that
can
support
only
a
simplified
(i.e.,
less
diverse)
fish
community
(Santucci
et
al.
2005,
Guenther
and
Spacie
2006,
Edds
et
a!.
2005).
Such
a
simplified
fish
community
does
not,
and
cannot
due
to the
limited
quality
of
the
habitat,
attain
the
Clean
Water
Act’s
aquatic
life
goals.
Studies
have
shown
that
the
reductions
in
the
diversity
of
the
fish
community
are
greatest
where
the
spacing
between
dams
is
least,
such
as
is
the
case
in
the
CSSC
and
the
LDR
(Lyons
et
a!.
2001).
Studies
on
the
Fox
River
in
Illinois
sponsored
by
U.S.
EPA
clearly
demonstrated
these
impacts
as shown
by
declines
in
IBI
scores
upstream
of each
dam
(Santucci
and
Gephard
2003).
The
adverse
impacts
on
aquatic
communities
caused
by
dams
are
well-recognized
by
other
Region
V
states.
For
example,
Wisconsin
and
Michigan
are
actively
promoting
dam
removal.
Ohio
has
a
separate
use
classification
that
recognizes
effects
from
dams,
as reflected
by
the
subcategory
of
their
Modified
Warmwater
Habitat
(MWH)
designation
described
as
applicable
to
waters
that
are
“impounded”.
In addition,
Ohio
also
retains
a
MWH
subcategory
for
“Channel-Modified”
conditions
(See
Table
7-15 of
Ohio
Administrative
Code, Chapter
3745-1,
effective
July
7,
2003).
The
impounding
effect
of
dams
in
the
CSSC
and
UDP
is
pervasive
and
irreversible.
Its
effect
is
particularly
severe
because
it
eliminates
or greatly
reduces
large
groups
or
classes
of
fishes,
including
all species
that
are
obligate
riffle
dwellers
(e.g.,
most
darters
and
madtoms,
some
minnows)
and
other
species
that,
though
not
obligate
riffle
dwellers,
spend
much
of
their
life
in
fast
water
areas
and/or
over
hard
substrates
(e.g.,
many
sucker
species,
as
well
as
some
minnows,
darters,
and
sunfish).
With
large
segments
of
the
fish
community
reduced
or
eliminated,
maintenance
of
a
fish
community
consistent
with
the
goals
of
the
CWA
is
not
possible.
Further
documentation
on
the
adverse
effects
of
dams
on
riverine
fish
communities
is
provided
below.
A.
The
Adverse
Effects
of
Dams
on
Aquatic
Life
It
is well
established
that
dams
reduce
the
abundance
and
diversity
of aquatic
life
in
riverine
systems
(American
Rivers
2002,
Santucci
et
a!.
2005,
Guenther
and
Spacie 2006,
Edds
et
al.
2005). Dams
do
this
by:
•
interrupting
or
eliminating
migration (American
Rivers
2002,
Guenther
and
Spacie
2006);
11
Electronic Filing - Received, Clerk's Office, September 8, 2008
•
altering
natural
flow
regimes
(Poffet
al.
1997);
•
impounding
the
river,
thereby
inundating
riffle/run areas
(Santucci
et
al.
2005,
Eley
eta!.
1981);
•
reducing
current
speeds
throughout
the
area
impounded
(Poff
et
a!.
1997,
Santucci
et
a!.
2005);
and
•
allowing
sediment
to
build
up
behind
them
as well
as
interrupting the
normal
sediment
flow
(Poffet
a!.
1997).
The
degree
to
which
dams
cause
these
adverse
effects
and
associated
changes in the
quality
of
fish
communities
depends
on
the
degree
of
fragmentation
(Lyons
eta!.
2001).
Rivers
that
have
dams
close
to
one
another
such
that
a large
percentage
of
the
area
between
adjacent dams
was
impounded
are
affected
more
than
rivers
on which
dams
are
widely
spaced
(Lyons
et
al.
2001).
Similarly,
dams
that
are
high
and
have
no
mechanism
to
pass
fish
would
be
expected
to
have
a
greater
impact
than
low
head
dams
that
are
frequently
overtopped
during
highwater
or
those
that
have
fish
ladders
that
allow
fish
to move
from
one
pooi
to the
other.
For
example,
the
Federal
Energy
Regulatory
Commission
(FERC)
typically
prescribes
fish
ladders
whenever
hydro
licenses
are
up for
renewal.
In
recognition
of the
adverse
effects
that
dams
have
on
fish
communities,
Ohio
has
adopted
a use
classification
called
“Modified-Impounded”,
specifically
to
deal
with
dam-affected
rivers
and
to
recognize
that
such
rivers
typically
do
not
attain
the
Clean
Water
Act
aquatic
life
goals.
The
Modified-Impounded
designation
is
the designation
Mr.
Rankin
opined
was
the
most
appropriate
category
for
the
Upper
Dresden
Pool.
(See
Attachment
R to
Illinois
EPA
Statement
of
Reasons,
section
entitled
“Des
Plaines
River
[Recommended
Category;
MWFI-I,
Other”).
For
the
same
reason,
Wisconsin
and
Michigan
are
actively
promoting
dam
removal.
The
American Fisheries
Society
recently
held
a
symposium
devoted
to
the
effects
of
dams
on
aquatic
life
and
the
subject
of
dam
removal.
Studies
on
a
medium-size,
warmwater
river
in
Wisconsin
showed
that
the
fish
community
improved
noticeably
following
removal
of a
dam
(Kanehi
eta!.
1997).
B.
The
Fox
River
Studies
of
the
Adverse
Effects
of
Dams.
The
adverse
effects
of
dams
on
aquatic
life
also
have
been
documented
on
the
nearby
Fox
River
in northeastern
Illinois.
The
Fox
River
studies,
which
were
partially
funded
by
U.S.
EPA
Region
V, evaluated
fish
and
macroinvertebrate
communities
in free-flowing,
mid-reach,
and
above-darn
(i.e.,
impounded)
sections
of
the
Fox
River.
The
authors
noted
that
55%
of
the
river’s
surface
area
and
47%
of
its length
within
the
study
reach
was
impounded.
As a
result
of
impoundment,
they
found
the
following
adverse
impacts:
•
lower
IBI
scores
in
the
impounded
reaches;
•
poorer
macroinvertebrate
scores
in the
impounded
reaches;
the
macroinvertebrate
community
in
open
water
areas
of
the
impounded reaches
was
dominated
almost
exclusively
by
pollution-tolerant
worms
and
midges;
•
QHEI
scores
were
significantly
lower
in
the
impounded
reaches;
fish
species
richness
was
lower
ifl
impounded
reaches;
17
Electronic Filing - Received, Clerk's Office, September 8, 2008
•
dams
fragmented
the fish
community;
and
•
wider
dissolved
oxygen
and
pH fluctuations
were
found
in the
impounded reaches
compared
to
the
free-flowing
reaches.
The
authors
concluded
that
“low-head
dams
adversely
affect
warmwater
stream
fish
and
macro
invertebrate
communities
by
degrading
habitat
and
water
quality
and
fragmenting
the
river
landscape”
(See
“Effects
of Multiple
Low-Head
Dams
on Fish,
Macroinvertebrates,
Habitat,
and Water
Quality
in the
Fox River,
Illinois”
attached
to this
report
as
Attachment
3).
The
authors
also
reported
that
the fish
species
most
adversely
affected
by
impoundment were
darters,
suckers,
and
intolerants,
the same
species
described
here as
adversely
affected
by
similar
conditions
in
the
CAWS
and
UDP.
Also, as
expected,
the
Fox
River
studies
found
that
tolerant
species
abundance
increased
in
impounded
segments,
whereas
the number
of
harvestable-sized
sport
fish
decreased.
The
study findings
noted
that it
was habitat
quality
that
was
“an
important
factor
affecting
aquatic
biota
in
the
Fox
River”
and
emphasized
“the
importance
of
habitat
quality
to lotic fish
and
macro
invertebrate
communities”.
The
authors
explained
the
correlation
between
habitat
quality
and
aquatic
life
quality
as
follows:
We
found
strong
correlations
between
habitat
quality
andfish
and
invertebrate
community
quality,
and
index
scores
were
consistently
higher
in free-flowing
reaches
than in
impoundments.
Differences
in habitat
quality
reflected
differences
in habitat
diversity
between
free-flowing
and
impounded
areas.
Free-flowing
areas
were
made
up
ofa variety
ofphysicalfeatures
(i.e.,
riffles,
runs,
and
natural
pools)
that
provided
a wide
array
of
water
depths,
current
velocities,
substrate
types,
and cover
characteristics.
In
contrast,
impoundment
habitat
was more
homogenous
and
typically
consisted
ofextensive,
deeper
open-water
areas;
lower
and
more
unform
current
velocities;
and
substrates
dominated
by
deposited
fine silts
and
sands
(Attachment
3 atp.
987).
The
Fox
River
study
found
that
the effects
of impoundments
in the
waterway
were
not
limited
to
the area
in
the
immediate
vicinity
of each
dam,
but rather
the
adverse
effects
of
the
dams
were
more wide-ranging.
The study
reported
the following
assessment
of
these
adverse
effects:
[L]ow-head
dams
adversely
affected
the
biotic
integrity
ofthe
Fox
River
on
local
and
landscape
scales.
Local
effects
were
largely
related
to
the
impoundments
thatformed
upstream
of
each
dam,
whereas
landscape-level
effects
rosefrom
fragmentation
ofthe
river
basin and
restricted
movements
offish.
[They]
found
that
the
use
ofimpoundments
by important
macroinvertebrate
and
fish
taxa
was limited
by degraded
habitat
and
poor
summer
water
quality
conditions.
Abundance,
richness,
and
biotic
integrity
offish
and
invertebrate
assemblages
were
consistently
lower
in
impoundments
than
in the free-flowing
river.
Degraded
habitat,
water
quality,
13
Electronic Filing - Received, Clerk's Office, September 8, 2008
and
biotic
communities
were
found
throughout
impoundments,
not
just
in
the
most impacted
areas
immediately
above
dams.
Conversely,
good
habitat
quality,
water
quality,
macroinvertebrate
assemblages,
and
sportfish
and
nongame
fish
communities
occurred
throughout
free-flowing
reaches,
not
just
in
areas
immediately
below
dams (Attachment
3
atp.
986).
The
conditions
in the
CAWS
and
the
UDP
strongly
parallel
those
in the
nearby
Fox
River.
The
influence
of
dams
in
the
CSSC
and
UDP
is
likely
to
be
greater
than
in
the
Fox
River
because
the
dams
in
the
CSSC
portion
of
the
CAWS
are
“high”
dams
rather
than
the
low-head
dams
found
in
the
Fox
River.
Similarly,
Brandon
Pool
is
100%
impounded
and
Dresden
Pool
is
93%
impounded,
compared
to
the
roughly
50%
impounded
areas
in
the
Fox
River.
Thus, if
anything,
adverse
impacts
due
to
impoundment
should
be
greater
in
the
CAWS
and
the
UDP
than
those
found
in the
Fox
River.
The
Fox
River
study
confirms
and
corroborates
the
conclusion
that
fluvial specialists
(e.g.,
most
darters,
many
suckers)
and
simple
lithophiles
(e.g.,
redhorse
and
most
darters),
which
require
clean,
hard
substrates,
do
poorly
in
impounded
situations
because
of
the
increased
siltation,
and
conversely,
habitat
generalists
(e.g.,
common
carp,
gizzard
shad,
channel
catfish) and
pelagic
species
(e.g.,
emerald
shiner,
freshwater
drum)
do
quite
well
under
impounded
conditions.
Nest
builders
(e.g.,
centrarchids)
or
those
having
modified
spawning
strategies
(e.g.,
bluntnose
minnow)
also
do
quite
well
under
impounded
conditions.
In
summary,
darns
prevent
the
attainment
of
CWA
aquatic
life
goals
in
the
CSSC and
the
UDP
for
the
following
reasons:
•
the
impounding
nature
of these
multiple
dams
has
changed
the
system from
a river to
a
series
of
lakes;
•
riffles
have
been
eliminated
except
in
the
Brandon
tailwaters;
•
the
amount
of fast
water
has
been
reduced;
•
migration
has
been
interrupted;
and
•
habitat
complexity
has
been
reduced.
The
resultant
simplified
habitat
has
lead
to
a
simplified
fish
community,
one
in
which
fish
habitat
generalists
can
persist,
but
habitat
specialists
are
eliminated
or
greatly
reduced.
The
effects
are
pervasive
and
irreversible,
meaning
that
the
aquatic
communities
of
the
CSSC
and
the
UDP
currently
do
not
meet
CWA
aquatic
life
goals,
nor
are
they capable
of
attaining
those
goals
in the
future.
14
Electronic Filing - Received, Clerk's Office, September 8, 2008
VI.
THE
“NATUR&L”
FEATURES
OF
THE
CAWS
AND
UDP
PRECLUDE
ATTAINMENT
OF
AQUATIC
LIFE
USES
UNDER
UAA
FACTOR
5
The
fifth
of the
UAA
factors
(“UAA
Factor
5”) provides
as
follows:
Physical
conditions
related
to
the
natural
features
of
the
water
body,
such
as
the
lack
of
proper
substrate,
cover,
flow,
depth,
pools,
riffles,
and
the
like,
unrelated
to
water
quality,
preclude
attainment
of
aquatic
life
protection
uses.
(40
CFR
§
131.1
0(g)(5))
As discussed
in
greater
detail
in the
section
of
this
report
on
QHEI
scores
(See
Section
A2
below),
many
habitat
features
required
for
a
balanced
fish
community
are
lacking
or
greatly
reduced
in
the
CSSC
and
UDP.
The
physical
factors
in
these
portions
of
the
UIW
that
adversely
affect
the
abundance
and
variety
of
fishes
are:
•
excessive
amounts
of
silt;
•
insufficient
amounts
of
hard
substrates
such
as
cobble
and
boulder;
•
minimal
instream
cover
except
for
rooted
macrophytes;
•
lack
of
riffles;
and
•
lack
of fast
water.
These
unalterable
limitations
in
the
physical
conditions/habitat
features
of the
waterbody,
even
without
the presence
of contamination,
preclude
the
attainment
of
aquatic
life
protection uses
consistent
with
General
Use
requirements.
The
presence
of
these
physical
conditions
in
the
CSSC
and
the
UDP
satisfy
the
conditions
described
in
UAA
Factor
5 and
prevent
these
waters
from
attaining
the
Clean
Water
Act
aquatic
life
goals.
Some
might
argue
that
because
the
predominant
physical
features
of the
CAWS
and
UDP
are
“man-made”,
they
do not
equate
to the
“natural
features”
of the
waterway
referenced
in
UAA
Factor
5 and
instead
are addressed
by
their
evaluation
in
the
context
of
UAA
Factors
2
and
3
above.
There
is almost
nothing
“natural”
about
the
CSSC
and
UDP
areas
when
that
term
is used
to
mean
areas
that
have
not
been
modified.
But
the
unique
characteristics
of
the
CSSC
and,
to
a
lesser
extent,
the
UDP
may
well
be
considered
for
UAA
purposes
as
“natural
features”
for
this
waterway.
For
the
CSSC,
it
is
largely
a
man-made
and
artificially
controlled
waterway
created
for navigational
purposes
and
to
convey
wastewater
away
from
Lake
Michigan.
its
“natural
features”
are
in essence
the
concrete,
sheet-piling
or
rock-lined,
steep
walls,
but
for
whose
construction
this,
waterway
would
not
exist
and
which
are
responsible
for
its
inability
to
attain
Clean
Water
Act
goals.
For
the
UDP,
the
features
addressed
here
(e.g.,
riffles,
fast
water)
are
natural.
The
factors
that
caused
these
natural
features
to be
limited
stem
from
the
purpose
to
which
this
area
was
dedicated
many
years
ago.
The
waterway
became
what
it is
based
on
societal
decisions
regarding
what
purposes
the
CSSC
and
the
LDR
would
serve;
namely,
serving
as
a
conduit for
commercial
barge
traffic
and
a
means
of transporting
wastewater, treated
and
otherwise,
away
from
Lake
Michigan.
Until
those
value
judgments
are
reversed,
the
system
will
operate
under
the
same
set
of
habitat
constraints
as
are
currently
in
place.
Regardless
of
their
characterization
as either
“natural”
or “man-made”
features,
and
as
further
discussed
below,
15
Electronic Filing - Received, Clerk's Office, September 8, 2008
these
features,
or
the
lack
thereof;
are
not
reversible
to
the
extent
necessary
to
support
an
aquatic
community
that
meets
the
Clean
Water
Act’s
goals.
A.
Habitat
Conditions
in
the
CAWS
and
UDP
are
Inadequate
to
Support
a
Balanced
Fish
Population
Large
amounts
of
silt
prevent
an adequate
exchange
of
oxygen
in
bottom
materials.
Many
species
of
fish
lay their
eggs
on
the bottom
or
bury
them
in the
bottom
substrates.
When
silt
loads
are
high,
eggs
are
smothered
and
hatching
success
is eliminated
or greatly
reduced
(U.S.
EPA
1986).
Many
“high
quality”
invertebrates
(e.g.,
mayflies
and
stoneflies)
also
have
high
oxygen
demands
that
cannot
be
met
when
siltation
is excessive.
These
organisms
are
prey
for
many
of the
fishes
necessary
to
achieve
a
balanced
fish
community
(e.g.,
redhorse, darters,
madtoms,
and
certain
minnows).
Without
adequate
food
resources,
viable
populations
of
such
fishes
can
not
develop.
Many
fish
species
need
cobble/boulder
substrates
to
spawn
(this
includes
the
group
Ohio
EPA
calls
the
“simple
lithophils”).
Various
small
to
medium
size
fishes
(e.g.,
darters,
rnadtoms,
and
some
minnows)
use the
cover
within
the
interstitial
spaces
as
cover
to
avoid
predation.
Many
of
these
same
species
as well
as
others
(e.g.,
redhorse,
small
channel
catfish)
also
feed
extensively
in such
areas
on
the
mayflies,
stoneflies,
and
caddisflies
(collectively
referred
to
as
“EPT”)
that
are
the
common
invertebrate
inhabitants
of
such
areas.
Large
amounts
of
silt embed
the
hard
substrates
making
them
unavailable
to
fishes
and
macroinvertebrates.
Given
the
number
and
severity
of
these
limitations
in
the
CAWS
and
the
UDP,
establishment
of
a fish
community
consistent
with
the
CWA
aquatic
life
goals
is
not
possible,
regardless
of
what
numeric
or narrative
standards
are
established
for
the various water
quality
parameters,
including
thermal
water
quality
standards.
EA
has
been
studying
the
aquatic
community
in
the
CSSC
and
the
UDP
since
1993.
A
detailed
summary
of
the
results
of these
studies
is
presented
in
Attachment
I
to this
report.
EA
made
1361
fish
collections
in
1993-1995,
1310
collections
from
Dresden
Pool
alone
during
1997-2005,
and
488
more
collections
from
Brandon
and
Lockport
Pools
in
1997-2005,
for
a total
of3
159
collections
from
1993-2005.
This
compares to
22
collections
made
by
MBI
from
these
pools,
with
all
collections
confined
to
a single
year,
2006.
The
most
significant findings
from
these
extensive
studies
of the
waterway
merit
a
brief
discussion
here
before
presenting
the
most
recent
study,
a QHET
field
survey
of the
UDP
conducted
by
EA
in July
2008.
The
contention
that
lowering
the ambient
temperature
of the
CSSC
and
UDP
will
significantly
improve
the
quality
of
the
aquatic
community
is
simply
not
supported
by
the
results
of
the
fish
surveys
conducted
from
1993
to
the present.
Some
may
contend
that
because
these
studies
have
shown
the
presence
of
spawning
activity
in
the
CSSC
and
UDP,
this translates
to
the
conclusion
that
better
water
quality
conditions
in these
waters
will
result
in an
aquatic
community
that
attains
the
Clean
Water
Act
aquatic
life
goals.
A
close
review
of the
data
shows
that
this
is not
an
accurate
conclusion.
The
evidence
of
spawning
is predominantly
associated with
fish
species/taxa
that
have
the
ability
to
lay
eggs
that
have
minimal
contact
with
sediment, can
tolerate
low
dissolved
oxygen
concentrations,
and
do
not
require
the
coarse
or
hard
substrates
that
are
rare
in
much
of
this
system.
The
study
results
suggest
a complex
but
highly stressed
and
habitat-limited
fishery
that
is
heavily
dependent
for
its
diversity
on:
1)
species
adapted
to
16
Electronic Filing - Received, Clerk's Office, September 8, 2008
contaminated
conditions,
2) a few
critical spawning
and nursery
areas,
primarily in
UDP,
and 3)
immigration
from
Lake
Michigan
and
tributary
drainages.
Turning to
the quality
of
the fish community
in these waters,
the most
common
and
consistent
trends
during the
1993-1995
studies
were
spatial.
These
spatial
patterns
were:
1.
A very
poor
native
fish assemblage
was
present
in
Lockport
Pool.
The
assemblage
in
Lockport
Pool
was characterized
by
low native
fish
abundance
(catch rates
typically
<50
fish!km),
low
species
richness, and
domination
by
highly
tolerant
species.
Using
the
IWBmod
criteria
established
by
Ohio EPA,
the Lockport
Pool
would be
classified
as very
poor.
2. The
community
was marginally
better
in Brandon
Pool but
was
still
very
poor.
3.
The fish
communities
in
the Upper
Dresden
Pool
and
the 5-mile
Stretch,
Dresden
Pool
downstream
of the
Kankakee
River, and
downstream
of
Dresden
Lock
and Dam
were
relatively similar
to each other.
While
the
fish community
in
the
Upper
Dresden
Pool
was better
than
in the
Brandon
Pool,
it still
fell
into the
“poor” classification
under
the
IWBmod
criteria.
4. Results
at thermally-influenced
sampling
stations
were comparable
to
those
at other
stations.
The
spatial pattern
appeared
unrelated
to the operation
of
the electric
generating
stations.
None
of the
measures
used in the
studies
to
evaluate
individual
or
community
health
of fish species
indicated
that the
electric
generating
stations
were
contributing
to
the poor fish
communities
observed in
much
of
the
UIW.
5.
The incidence
of
diseased
fish was
(and
continues
to be)
very high
in the UIW.
6.
Habitat
severely
limited
the fish community
7.
Based on
the lack
of
impacts
and habitat-imposed
constraints,
it was
concluded
that
the
aquatic community
of
the
UIW
would
essentially
be the same
as it
is
currently
if
CornEd
plants were
load-restricted
or even
taken off
line.
For
the Upper
Dresden
Pool
and the
5-mile
Stretch,
electrofishing
and
seining during
the
12
study
years
produced
143,156
fish representing
82
species
and four hybrids.
Only
ten
species
collectively
represented
85-90%
of the fish
community.
The
10 most
abundant
species
collected
were, in
descending
order
of abundance:
bluntnose
minnow
(22.2%),
gizzard
shad
(+
Dorosonia
spp.)
(20.4%),
bluegill
(17.2%),
green
sunfish
(7.0%),
emerald
shiner
(6.6%),
orangespotted
sunfish
(4.4%),
largemouth
bass
(3.4%), common
carp
(2.8%),
bullhead
minnow (2.3°/o),
and
spottail
shiner
(1.9%).
These same
species
were
also
the
10 most
abundant
collected
during
each
period
(i.e.,
1993-1995
and
1997-2005):
17
Electronic Filing - Received, Clerk's Office, September 8, 2008
1993-1995
1997-2005
Species
No.
Rank
%
No.
Rank
/
Bluntnose minnow
3,626
1
27.8
28,170
1
21.7
Gizzard shad (+Dorosoma)
2,924
2
22.4
26,220
2
20.2
Bluegill
327
10
2.5
24,283
3
18.7
Green Sunfish
413
7
3.2
9,544
4
7.3
Emerald shiner
853
3
6.5
8,568
5
6.6
Orangespotted
sunfish
373
8
2.9
5,872
6
4.5
Largemouth bass
760
5
5.8
4,050
7
3.1
Common carp
796
4
6.1
3,217
8
2.5
Bullhead minnow
345
9
2.6
2,916
9
2.2
Spottail shiner
689
6
5.3
2,068
10
1.6
85.1
88.3
The fact that the same 10
species dominated the area before the current
ComEd/MWGen
Adjusted
Standard went into
effect as have dominated after it went into
effect indicates
that the
slightly higher thermal standards
allowed by the Adjusted Standard did not
affect fish
populations.
Ohio EPA (1987, plus 2006 update)
classifies fish based on their tolerance to
environmental
perturbations such as decreasing
water and habitat quality. Of the 82 species
collected
from
Dresden Pool, eight species are
classified as intolerant and another eight
species
classified as
moderately intolerant; For the twelve
study years combined, the 16
moderately and
highly
tolerant
species (plus
two
other taxa) composed 52.8%
of
the
catch.
The
42
intermediately
tolerant species (plus six other taxa) composed 42.4%
of the catch. At the
other end
of the
spectrum
are the intolerant and
moderately intolerant fishes, which exhibit a
distinct and
rapid
decreasing trend in abundance
with decreasing habitat and/or water
quality.
Only
1.7% of the
fish
collected
were
intolerant
or moderately intolerant.
The preponderance
of
moderately
tolerant and highly tolerant fishes
reflects the degraded habitat of Dresden Pool.
In summary, the present fish community
in UDP is somewhat more
abundant, has
slightly more
species,
and generally has
higher IWBmod scores compared
to
1993-1995.
However, the
community continues to
be dominated
by species at the high end of the
tolerance
scale
and the
community dominants have
changed over
the period.
1.
OHEI
Scoring Process and Support
Categories
The Qualitative Habitat Evaluation
Index (QHEI) was developed by Mr. Ed
Rankin,
who at the
time
of
its development was
employed by the Ohio EPA. The QHEI is a
simple but
fairly
robust
method
of
evaluating the physical
habitat in streams (Rankin 1989). The
index
is
composed of
six components (often referred to as “metrics”):
Substrate
Instream
cover
Channel
morphology
Bank
erosion and
riparian zone
18
Electronic Filing - Received, Clerk's Office, September 8, 2008
Pool/run/riffle
quality
•
Stream
gradient
Within
each
metric, scoring
criteria are established for each possibility for
that metric.
For
example,
in the substrate metric,
boulders
are assigned a score of 10, while
muck
and
silt
substrates rate
only
a 2. The sum of the metric scores equals the QHEI score.
Rankin
(1989) found that
there was a direct relationship between QHEI
scores
and
the
quality
of
the
fish community. Based
on examination of QHEI scores from many
streams,
Rankin (1989)
concluded
that streams with QHEI
scores>
60 were capable of supporting
fish
communities
that
were consistent
with CWA goals,
while streams with scores <45 typically did
not
support
such
communities. According
to Rankin (1989), streams with
scores between
45 and 60
need to be
examined
closely to determine whether
they can or cannot support balanced
fish
populations. He
emphasizes that the
QHEI at a single site does
not accurately reflect the
potential of
that stream,
rather “general basin
characteristics and overall
habitat quality influence
stream fish
communities
more than does
site-specific habitat”.
2. The
July
2008 EA
OHEI
Field
Survey
of the 1JDP
Within the
CAWS, there seems to
be uniform agreement that
habitat quality
in the
South Branch
of the
Chicago
River and the
CSSC is poor and will
not support Clean Water
Act aquatic life
goals
(See, e.g., UAA January
29, 2008 Hearing
Transcript at
p.
108-9 [Suiski
Testimony] and
Attachment
R
[2004
Rankin Report]
to the Illinois EPA
Statement of Reasons).
There seems to
be wide-spread
agreement
as well that conditions
in the UDP are
marginal.
The Illinois EPA,
however,
speculates, with little
or no supporting
evidence, that the
UDP can
“marginally
attain”
the
Clean Water Act goals.
However,
the
weight of the evidence
shows that
attainment
of
these
goals
in the UDP will not occur,
absent extensive
and wide-ranging improvements to the
waterway, the
most significant
of which would
be the removal
of the dams and
locks and
cessation
of
barge traffic.
As
discussed
in greater
detail below, this conclusion is supported by
the following facts:
•
the preponderance
of QHE1s are below
60;
•
many
QHEI score
are below 45 — the
accepted threshold that
represents
an
inability
to attain
the Clean Water
Act aquatic life
goal;
•
the mean
of all the
QHEI scores calculated
using Ohio EPA
protocols is
about 47,
much closer
to 45 than to
60;
•
the mean
of
all
the QHEI scores
calculated using MBI’s
protocol
is 42,
below the
accepted threshold
of 45;
•
certain
key habitat types (e.g., riffles,
fast water, hard substrates)
are
greatly reduced;
•
siltation
is excessive;
and
•
urbanization
is high within
the watershed.
1Q
Electronic Filing - Received, Clerk's Office, September 8, 2008
When Mr.
Rankin, the
developer
of the
QHEI, visited the
area in
2004,
he
concluded
that the
appropriate
classification
for the
UDP would be
“Modified
Warmwater
Habitat,
Impounded”,
using
the
use
classification
terminology
of the Ohio
EPA for a stream
that does
not attain
Clean
Water Act aquatic
life goals
(See Attachment
R
to Illinois
EPA Statement of
Reasons).
In
contrast,
when
MBI
visited the
UDP not long after,
in 2006, it concluded
that
although
the
area
was
impaired,
it could marginally
meet
CWA aquatic
life goals
(See
Attachment
S
to
Illinois
EPA Statement
of Reasons:
Aquatic Life
and Habitat Data Collected
in 2006 on
the Illinois and
Des Plaines
Rivers.
Midwest
Biodiversity
Institute,
prepared for
U.S.
EPA Region
5
[2006]).
However, the
evaluations
performed
by both Mr. Rankin
and
MBI
were
based
on a very
limited
and
not necessarily
representative
subset of
the
UDP area.
In each visit, only two
and three
locations within
the
UDP,
respectively,
were scored
for
QHEI values.
EA has
now much more
extensively
sampled the
UDP
than was
done during
either Mr: Rankin’s
or the MBI’s
visit to the area.
In 2003,
EA conducted a
QHEI field survey
of
the
Dresden Pool
that
included 34
sites
(EA 2003).
Based on
the 2003
QHEI
field survey, EA
calculated QHEI
scores
similar to those reported
by Rankin in 2004
and lower than
those
reported by
MBI in
2006.
To consider
whether EA’s
2003 QHEI
scores were still
representative, EA senior
biologists,
Greg Seegert and
Joe
Vondruska,
surveyed
the entire UDP
from the
Brandon
tailwaters
to
the
1-55 Bridge
in July 2008.
Both Messrs.
Seegert and Vondruska
have years
of
experience
working
in the
UDP and in
conducting
QHEIs.
Mr.
Vondruska
is a
certified data
collector
based
on training
provided
by Ohio EPA.
Mr. Seegert
has used the QHEI
methodology
to
evaluate
habitats at many
sites in several
states.
During
the
July
2008 QHEI
field survey
of
the UDP,
each
bank of
the
UDP was
surveyed
separately.
The entire
linear
distance
was
surveyed
except
where
barges or other
obstructions
(e.g., the
Empress Casino)
blocked
access
to the shore.
EA established
a series of contiguous,
500
meter
zones
along each
shore
of the
UDP.
Over a
two-day
period on July 10-1
1, 2008, EA
evaluated
50
such zones,
far more
than
the two
or three
evaluated
by MBI or Mr.
Rankin. The
extensive
and
contiguous nature
of the 50-site
QHEI survey
by EA eliminated
any potential bias
that
may
arise
from
the selection
and scoring
of
only a
limited
number of QHEI site
locations.
The
latest
guidance
from
Ohio
EPA
(OEPA
2006) was
used
to score each QHEI
metric. EA
obtained
a
series
of aerial
photos
to assess
floodplain
and riparian
zone quality accurately,
as
recommended
by Mr. Yoder.
Except for the
two tailwater
zones,
substrate
composition was
obtained
by
slowly
motoring
the
boat
through
each
500 m zone
and using a metal pole
to
regularly
probe
the bottom.
At
the
two shallower
tailwater
zones,
both biologists
walked much
of
the zone to assess
substrate
conditions. The
start and
end
of each zone was marked
with GPS
coordinates
and
a
photo
log that
included
three
to four
photos
for each zone was
compiled
(See
Attachment
2b). Also,
the area evaluated
at each location
was marked
on aerial photos (See
Attachment
2c).
A spreadsheet
showing
for each
zone
the value
for each QHEI metric
and the QHEI
total score
was prepared
(See Attachment
2d).
QHEI scores were calculated
using
two
QHEI
scoring
procedures:
the standard
Ohio EPA QHEI
scoring
procedure
(OEPA 2006) used
by Rankin
and
the
“M131-modified
procedure.”
The
MBI-modified
procedure
is the MBI’s
recently developed
version
of the QHEI that takes
impounding
of waterways
into account and which
was
used
by
20
Electronic Filing - Received, Clerk's Office, September 8, 2008
MBI during their
2006 assessment of the CAWS.
The QHEI
scores
under
both the
Ohio
EPA
and MBI-modified QHEI procedures
for the EA July
2008
QHEI
field survey
are
presented in
Attachment 2e to this
report.
The
findings
set
forth below are based on the EA
2008 QHEI
field survey
results.
The
UDP
2008
QHEI
scores
clearly
support the
conclusion that the
UDP is not
capable
of
attaining
the
Clean Water Act
aquatic
life goals.
> Almost all
of
the QIIEI scores are
below 60.
Based
on the
Ohio EPA scoring procedure, 45 of the 50 (90%)
QHEI scores
were
<60,
and 49 of
50
(98%) of the scores were <60 using the Modified
IVIBI procedure
(Attachment
2d).
Approximately Half of the QHEI
scores were <45.
Based on the Ohio EPA procedure, 20 (40%) of the scores were <45
and well
over half
(32 of 50
64%) of the scores using the MBI procedure were <45
(Attachment 2d).
>
The mean QHEI score is closer to 45 than to 60.
The mean
QHEI
scores were 47.4
and
42.0
for the OEPA and
MBI protocols,
respectively.
Thus, on average, the QHEI scores are far below
the “good”
cutoff of 60 and,
depending
on the
QHEI scoring procedure used, either near or below
the
45 cutoff that
automatically
pushes an
area
into Ohio EPA’s limited or modified use category that is intended for
waters that
cannot
attain the
Clean Water Act aquatic life goal.
The spatial distribution
of QHEI scores in the UDP is visually depicted in the
charts
contained in
Attachment 2f to this report.
All of the charts show that little good quality
habitat (i.e.,
areas
with
QHEI scores
?60)
is present, that a considerable amount
of
poor habitat (i.e.,
areas
with
scores
<45)
is
present, and that, on average, UDP habitat is
of
poor
to
fair quality.
Consistent with Ohio EPA protocols, the
area
within
the
navigational
channel
was not
evaluated.
However, due to
a
lack
of cover and constant disturbance due to
barge
traffic, the
navigational
channel area, which
comprises roughly 50% of
the UDP, certainly would
have scored
well below
45
had
it been evaluated. This further accentuates
the limited amount of good
habitat
available
within the
UDP. Roughly half of the UDP is
navigational channel area that is
unsuitable, poor
habitat and the remaining half is characterized
by poor
to
fair
quality habitat,
with
only a
very
limited area of good habitat.
3.
Comparison
of EA 2008
OHEI
Scores and MBI 2006
OIIEI
Scores
EA
compared the 2008 QHEI scores it calculated at three sites that appear to be
located
in the
vicinity of the three sites scored
by
MBI in 2006
(Attachment S). At one
of
the
three locations
(MBI
RM 283.9), the scores calculated by EA and MBI were within a
couple of
points
(i.e.,
36
[EAJ
v.
33.5
[MBIJ),
well
within
the range
expected
for scores
obtained at the
same
site by
different
investigators. However, at MBI
RM
279.5, located in the UDP
approximately
1.6 mi
upstream of
155, MBI scored the
site as having a QHEI of 69
versus the EA
QHEI
score
of 54.
‘?l
Electronic Filing - Received, Clerk's Office, September 8, 2008
Similarly, in the Brandon tailwaters (RM 285.8), MBI
scored
the
site at 81.5
versus
the EA
score
of 67.5. The differences at the latter two sites are not
within the
acceptable
range of
difference.
Based on EA’s review, the MBI QHEI scores for these
two sites are too
high
based
on
actual site
conditions. As discussed below, these differences
simply cannot be
explained by
potential
temporal or seasonal changes to the waterway that may have
occurred since
MBI
conducted
its
evaluation
in 2006.
(a) QHEIs for UDP RM 279.5
RM 279.5 was described by MBI as its “Power Line Crossing”
location. The
MBI
and
EA RM
279.5 QHEI scores for the individual metrics are provided and
compared
below:
Metric Score
Metric
MBI
EA
Substrate
19
20
Cover
17
8
Channel
Morphology
7
4
ErosionlRiparian
10
10
Pool/Velocity
8
6
Riffle Quality
0
0
Gradient
8.
6
69
54
The MBI and EA QHEI scores
for the substrate, erosion/riparian, and riffle
quality
metrics are
identical or comparable. The difference of 15 points between MBI and EA’s
metric scores
is
attributable to the other four metrics.
The biggest difference is for the
cover metric, 17 by
MBI
and
8 by EA.
MBI listed the
following five cover types that EA did not find at
this location
in
July 2008:
undercut
banks, shallows in slow water, root mats, root wads, and aquatic
macrophytes.
MBI
considered
cover to be “moderate” while EA considered it
“sparse”.
Shallows in
slow
water is somewhat subjective, but
is
typically considered only
adjacent
to
riffle/run habitat. It might vary depending
on
river
stage but this area does
not have
undercut
banks, root
mats,
root
wads,
or aquatic macrophytes. Similarly, habitat quantity was
clearly
sparse in July 2008. The same conditions should
have existed
when
MBI
visited the
site. The
lack
of cover in
terms
of quantity coupled with four
cover types being
absent
indicates that the
MBI cover score
was at least
8 points too high.
The
difference in the
channel
morphology metric score is due to MBI’s finding
that
sinuosity
was “low” (as
opposed to “none”
by EA) and that development was “fair”
(as
opposed to “poor”
by EA).
Sinuosity is a term indicating the
amount
of curvature in
a
wateway.
According to Ohio
EPA
QHEI
scoring
guidance:
22
Electronic Filing - Received, Clerk's Office, September 8, 2008
No
sinuosity
is
a straight
channel.
Low
sinuosity
is
a channel
with only
1
or
2
poorly
defined
outside
bends
in a sampling
reach,
or perhaps
slight
meandering
within
mod(fied
banks.
The
LDR at
this
location
is straight;
it
has no
bends,
poorly
defined
or
otherwise
(See
Attachment
2c).
According
to
the same
Ohio
EPA
document
in
regard
to
development:
poor
means
rffles
are absent,
or fpresent,
shallow
with
sand
andfine
gravel
substrates;
pools,
if present
are shallow.
Glide
habitats,
if
predominant,
receive
a Poor
rating.
MBI’s
own
form acknowledges
that
no riffle
is present
at
this location.
The
entire
area
is clearly
a
glide,
as defined
by
Ohio EPA
(2006).
Thus,
this metric
should
be
scored
a
4,
not a
7.
Lastly,
MBI
indicates
in
Exhibit
6 that
the
gradient
at
this
location
is
1.0 ft/mi.
EA
calculated
it
to
be
about
0.1
ft/mi
(the difference
between
the
headwater
stage
at the Dresden
Island
Dam and
the
tailwater
stage
at the
Brandon
Road
Lock
and
Dam).
Given that
the gradient
at
the
location
upstream
of
this
one
(i.e.,
RM 283.9)
was
considered
by
MBI to
be
0.1
ft/mi
and
RM
279.5
is
closer
to
the dam,
EA does
not
believe
the
MBI
1.0
fl/mi
gradient
value
is correct
for
RM
279.5.
In
summary,
the
MBI
score for
this location
is at
least
10
points too
high and
probably
as much
as
12 to 13
points
too high.
(b)
QHEIs
for
UDP RM
285.5
(Brandon
Tailwaters)
MBI
created
an “excellent”
score
of 81.5
for
RM
285.5
located
in
the
Brandon
Tailwaters,
whereas
Rankin
(2004)
and
EA
(2008)
gave
it
“good”
scores
of 69.5
and
67.5,
respectively.
EA
and
MBI
had
identical
scores
for
the
cover
and pool/current
velocity
metrics,
but
MBI
scored
the
other
five metrics
higher
than
EA.
The
biggest
difference
was
for
substrate,
which
MBI
scored
a
17.5
and
EA
a
12.5. MBI
considered
the
dominant
substrates
to be
cobble
and gravel.
EA
agreed
that
cobble
was
a
dominant
substrate
but determined
that hardpan
was
the
second
dominant
substrate.
EA knew
this to
be
the case
based on
our
long-time
familiarity
with
this
location.
This
was
confirmed
by
walking
through
much
of the zone.
The
distinction
between
clean
hard
substrates
and
hard
substrates
embedded
in
hardpan
is
difficult
to
make
unless
the
investigator
either
has
considerable
experience
in
probing
the bottom
or
unless part
of
the zone
is
waded.
It
does
not
appear
that
MBI waded
any
portion
of
the zone.
The substrate
distinction
would
not
likely
be evident
if the
QHEI
substrate
score
was
based
only
on
a
standard
electrofishing
run
through
the
area,
which apparently
is
what MBI
did (See
Attachment
S).
MBI
also
inflated
or
“over-scored”
several
other metrics
at
this location.
For
example,
it
indicated
that sinuosity
was
“low”
even
though
no
bends
were
present.
It
considered
development
to
be
“good”.
Development
is good
in
the upper
half
of
the
zone
but poor
in
the
lower
half.
MBI
acknowledges
as
much
as
their
drawing
of the site
(Exhibit
7)
shows
muck
and
slow
water
in
the
lower
portion
of
the zone.
Clearly
the EA
characterization
of
development
Electronic Filing - Received, Clerk's Office, September 8, 2008
within the
zone as good/poor is more accurate than the
uniformly
good
rating
given
by
MBI.
MBI’s higher riparian zone score
is
largely the result of its considering
the
riparian
zone to
be
“wide”. However, the left bank is within a few feet of a railroad
track
and the
right
bank is
narrow.
Because of the hardpan present throughout much of the area,
EA
correctly
characterized
the riffles as
being
“moderately”
embedded whereas MBI erroneously
believed
that
embeddedness was “low”. Lastly, the gradient
used by
MBI is too high.
The
correct
value
for
the
gradient metric should be
6
instead
of 8.
It is also important to consider
that
Mr. Rankin, the developer of the
QHEI,
scored
this area as
69.5, within
2
points
of EA’s score. Despite what Mr. Yoder may have
speculated
during his
UAA hearing testimony, the
magnitude of the difference between Mr.
Rankin’s
score and
the
MBI score cannot be explained
by
the
fact that Mr. Rankin viewed the
area in
March,
whereas
MBI
visited the site during the summer;
this
seasonal
difference
would account
for, at
most, a
difference
of
3
points (See
UAA February 1, 2008 Hearing Transcript at
pp.
143-146).
The
correctness of BA’s scores for the various
QHEI metrics is supported by
Mr.
Rankin’s
Report (Attachment R to the Statement
of Reasons). MBI indicated that there
was no
channelization, that
sinuosity was low, and
that some fast water was present
at the one or
both
of
the non-tailwater locations
(i.e., RM 279.5 and
283.9) they sampled in UDP.
However,
like EA,
Mr.
Rankin found that UDP was channelized,
had no sinuosity, and, except
for the Brandon
tailwaters,
had no
fast water.
The fact that
MBI did not score the QHEI
correctly also
means that
Exhibit 6, which compares warmwater
and modified warmwater
attributes, is
seriously
flawed
and
should be disregarded.
In summary, MBI and EA
QHEI scores were similar
at only one of the three
locations
scored
by
MBI. At the
other two locations,
MBI scored the sites 14-15 points higher
than
did
EA.
However,
for the reasons discussed
above, the
QHEI scores reported by EA
are
more reflective
of actual conditions than
are the higher
scores reported by
MBI.
According
to Mr. Yoder’s testimony,
the
QHEI scores in Attachment
S
were wrong
because the
impounded
nature of the CSSC and
UDP was not taken
into account. It is
difficult to understand
how the
MBI
field
crew
somehow overlooked
the fact that the
area they
were sampling was
almost
entirely impounded. Also
incredible
is the fact
that according to the hand
written notes
on the field data sheets
(See Exhibit
7), this significant error was
not
recognized and corrected
until almost two years later
in
January 2008 when
Mr. Yoder prepared to testify
in these
proceedings.
It
appears that
the original
entry for the
two relevant metrics was
erased
and the
box
“Impounded” was checked instead.
In most cases,
this
resulted
in the QHEI
score dropping
by
10
points.
MBI
produced
Exhibit
5, which
was designed to correct
the
scoring
errors
in
Attachment
S.
Although the
impoundment
scoring error has been corrected,
Exhibit 5
unfortunately still contains
numerous errors, mostly related
to tallying the
final
QHEI
score. In
fact, all the “revised” scores were
tallied incorrectly. Provided below are
examples of
these
errors:
•
Grant Creek--- Based on the
boxes
checked on the field data
sheet
(See
Exhibit
7),
the
correct score for the Channel Morphology
metric is 6,
but a score of 13 is reported by MBI on Exhibit 5. Mr. Yoder
was
24
Electronic Filing - Received, Clerk's Office, September 8, 2008
asked about this error
during his February 1, 2008 UAA hearing
testimony and could not explain
it. The Pool metric at the
Grant Creek
location adds up
to 6 in Exhibit 7, but a score of
9
is shown on
Exhibit
5. Collectively,
these two errors result the QHEI score for Grant
Creek being inflated
by 10 points.
RM 268.0--- According to the
boxes checked on the data sheet
for this
location (See
Exhibit
7),
the correct score for the Pool/Glide metric is
6, but
the
score shown in Exhibit
5 for this metric is 9. Thus,
the MBI
QHEI score
for
this
location should be
57,
not
60.
• RM 271.1---
Again, two scoring mistakes
were
made;
the
Riparian
score should be 10 not
9 and the Poo,l score should
be
12 not
13.
The
latter
mistake is particularly
odd, because according to MBI’s own
data sheet, the maximum
possible
score
for
this
metric
is
12.1
MBI’s 2006 QHEI scores at
17 locations were changed
from their values
presented in
Attachment
S
to
the “revised” values presented
in Exhibit 5 to account for “overlooking”
impoundment
initially. However,
in every case, the new,
revised, and
supposedly
corrected
values
are still wrong, sometimes
by a little, sometimes
by a
lot
(e.g.,
Grant Creek). The
100%
failure
rate to supply correct revised
values casts further
doubts on MBI’s
QA/QC
procedures.2
l
The following
thirteen locations all had erroneous
values presented-in Exhibit
5
due to various math
errors: RMs
242.1,243.3,246.5,247.8,
251.4, 256.1, 265.0, 274.0,
276.4, 276.5, 279.5, 283.9, and 290.0.
2
The MBI field crew’s
lack of attention to
QA/QC procedures was also evident in the MBI 2006 fish
survey work.
In
his
February
1, 2008 UAA hearing testimony,
Mr. Yoder acknowledged that
the MBI field
crew had used
defective
pH and DO probes. What is particularly
troubling is that
no one on
MBI’s field crew recognized
this
obvious problem
until well after the field
work had been completed. According
to
the
fish
field data
sheets (Exhibit
20),
a pH
of
11.2
was recorded at
Rlvl
290.1
on the first day (7/21/06) that sampling began
in
the Des Plaines
RiverICSSC
system. Such an absurdly
high pH would have
told an experienced crew leader
that either the meter or
the
probe
was
defective. This obviously defective
meter/probe was
used by MBI throughout
the remainder of the
July 2006 sampling trip. During
this time, several
nonsensical pH values of 2.62, 10.95, 9.96, and
10.25 were
recorded
and reported without question
by the three
MBI crew members (Exhibit 20).
Moreover, the defective
equipment
problem remained undetected and
continued through the September 2006 MBI field work
when a series
of
even
more bizarre
pH values
were
“measured”
and dutifully recorded. For example, on September
7, 2006, MBI
reported
a pH of 12.95 at RM 276.4 (Exhibit
20). Anyone with even a passing familiarity of
pH values would
recognize that this value
was
wrong.
On the next sampling
day,
September
9,
2006,
an
even more
stunning series of
events occurred. At RM 297.0, MBI reported the
pH to be 15.19 and at RM 298.3, 14.08,
both of which
are difficult
to do given that the pH scale for “natural”
substances only goes to 14. For example, the pH
of household
ammonia
is
about
11.5,
bleach is
about
12.5, and liquid
drain cleaner is about 14. pH values in natural
waters, even
water
quality
challenged ones like this, rarely
if
ever
exceed about
9.
MB1 continued to report
numerous
erroneous pH
values (e.g., ranging from 11 to 14) for an additional week
of sampling
that
should
have
raised QAIQC
questions
for
an
additional week
of
sampling.
Electronic Filing - Received, Clerk's Office, September 8, 2008
4. The MBI 2006 IBI Metric Values and Scores Also
Are Unreliable
Among
the
data
that the
Illinois EPA is
relying on to support its proposed
use
designations is
the
IBI study performed
by
MBI/Yoder
in 2006 and memorialized in a report
marked as
Attachment
S
to the Illinois EPA Statement
of
Reasons. During Mr. Yoder’s UAA
hearing
testimony, he
acknowledged several mistakes in how IBI scores were originally
calculated
by
MBI
in its 2006
Report. These mistakes included erroneously considering emerald shiner to be
a simple
lithophil, including an erroneously identified silver shiner, and erroneously
including
round goby
and other exotic species in the species total (UAA February 1, 2008 Hearing
Transcript
at
pp.
135-139).
In response to these acknowledged mistakes, the
MBI
replaced the Attachment S
IBI values
with
the
IBI values in Exhibit 21 (Id. at
p.
156), which
supposedly
corrected
the
original, erroneous
values. However, a spot check
of the data in Exhibit 21 revealed that all of the
previous
identified errors are still
present. Exotic species such as round goby and
oriental weatherfish
continue
to be erroneously included in the species
richness metric.
3A check
of five
sampling
locations (RMs 290.1, 289 [2
passes], 285.8, and 274.0)
to
confirm that emerald
shiner
had been
removed from the simple
lithophil count showed that it had not. In all five cases,
it was still
erroneously included, which in some
cases, resulted in inflated IBI scores.
4No
data
sheets were
provided
for the nine locations in the Illinois
River. Given the fact that 15 of
the 18
passes on
the Illinois River resulted
in scores for the simple lithophil metric being either 5
or
3,
declines of
two
or four IBI units
would
be expected
if
this
metric is scored correctly.
Another problem with the
simple lithophil metric scores
is
that
MBI
arbitrarily
assigned a
drainage area of 1000 2
mi to all 23
sites they sampled. EA could not obtain a
drainage area for
Grant Creek,
the
smallest
drainage sampled, but
the other sites ranged in size
from 740 mi
2
for
the CSSC at Ruby St. to 8529
mi
2 for the Illinois River at Marseilles. Because the IBI
scoring
criteria
for this
metric
vary according to
drainage area, many of the IBI scores
presented by
MBI
are likely
still wrong
in
Exhibit 21 due to the
inaccurate draining area values
used (this is
true
even if the emerald shiner
mis-classification issue
was corrected).
During the course
of
reviewing
only about
10% of the MBI data sheets to
determine whether
the
mistakes acknowledged
by Mr. Yoder had been corrected,
EA
found
a
variety of other
errors.
First,
the sunfish metric was often incorrectly
scored. MBI did not include crappies
in the
sunfish count, which
it should have, and
included redear sunfish, which it should
not
have. In
several cases, the total native species
richness totals
were wrong but
the cause of the
errors could
not be
identified.
Often,
the relative number
minus tolerants was wrong;
typically
because
exotics or hybrids were erroneously included.
For example, the field data sheet for RM 287.9
in July 2006 (Exhibit 20) lists only five
species, one
of which was
round goby. The species richness metric for this location
on
Exhibit
21 shows a
total of five
species, so round
goby
was still erroneously included. A similar situation occurred
at RM
290.1 in July where both
oriental
weatherfish and
round goby are still
erroneously included in the species total shown
on Exhibit
21.
For example, at RM
285.8,
the
percent
simple lithophiles would drop from 26% to 8% if
emerald
shiner was
excluded
and
the metric score would go from
5 to
1. Thus, the IBI should be 26 rather than
30 as
reported in
Exhibit
21.
Electronic Filing - Received, Clerk's Office, September 8, 2008
There
are
similar
Quality
Assurance/Quality
Control
(QA/QC)
problems
identified
in
the
information
presented
in
Exhibit
32.
This exhibit
contains
a
plot
of
QHEI
scores collected
by
various
investigators
over
a number of
years. However,
Exhibit 32
is
of
limited
value
because
the methods
for
calculating
the QHEI
have
changed (e.g.,
MB!
accounts for
impoundment
whereas
no
previous
investigators
took
this
into account
directly).
Also,
it is not
clear
whether
the
MBI values
in this plot
came
from
Attachment
S or
Exhibit
5. If
the
MB!
values
came
from
Attachment
S,
they
contain
significant
errors that
overstate
the QIIEI
values.
If
the
MB!
values
came
from Exhibit
5, most
are
still wrong;
admittedly
somewhat
less wrong,
but
still
wrong.
Given the
number of
mistakes
found
in data sheets
from only
5 of 46
MB! site
collections,
it
is
clear
that proper
QA/QC
procedures
were not
followed
by MI3I. EA
submits
that the
presence
of
the
extensive
amount
of
errors in Attachment
S, and Exhibits
20 and
21
renders
the
accuracy
and
credibility
of the
MB! data
set highly
suspect.
EA submits
that
the Board
should
disregard
the
data
presented
by
MB! in
Attachment
S and
Exhibits
20
and
21 until
and unless
a
corrected
and
accurate
set
of
data is
provided.
Further,
EA cautions
that
the
usefulness
of
the
QHEI
data
in
Exhibit
32 is minimal
due
to differing
methods
of
how QHEI
values
were
calculated
and
the use
of
erroneous MBI-calculated
QHEI
values.
5.
Key
Habitat
Types
reiuired
for a Balanced
Fish
Community
are
Lacking
To have
a fish
community
consistent
with Clean
Water
Act aquatic
life
goals,
a
variety
of
habitat
types must
not
only be
present,
but present
in amounts
sufficient
to support
viable
populations
of
various
fishes. However,
in the
UDP, riffles
and fast
water
areas
are
essentially
confined
to the
Brandon
tailwater
area.
This
area is roughly
one mile
long
and
represents
about
7%
of
the area
within
Dresden
Pool
(Note:
Dresden
Pool is the
appropriate
basis for
comparison
because
the
“UDP”
is a regulatory
construct
proposed
by the Illinois
EPA that
is not recognized
by
the fish
populations
that have
access
to the entire
pool).
Boulder/cobble
substrates,
though
not
confined
to the
tailwater area,
occur
in appreciable
amounts
in only a
few
of
the other 48
zones EA
evaluated.
The
small
and
few areas
of
good habitat
located in
the Brandon
tailwater
area are
overwhelmed
by
the large
preponderance
of poor to
fair habitat
that
characterizes
the UDP.
Species-groups
that need
these key habitat
types
in
order
to flourish
include:
•
most darters,
walleye
and
sauger,
•
many
suckers,
including
redhorse,
northern
hog
sucker,
and
white sucker
(this
group of
species is often
referred
to as
the
“round-bodied”
suckers
and
is highly
valued
in rivers),
•
most
madtorns,
•
some
minnows
(e.g.,
longnose
dace, stonerollers,
hornyhead
chub,
suckermouth
minnow,
and
rosyface shiner),
and
•
some
centrarchids,
especially
smallmouth
bass.
Minnows,
darters,
and
suckers are
the most diverse
groups in
Illinois.
Having the
number of
species
in these
groups
reduced
or
eliminated
makes it essentially
impossible
to have a
balanced
fish
community.
The reduction
in
round-bodied
suckers
results
in
lower
TB!
scores, also
indicative
of
unbalanced
fish
communities.
The species
that are
doing
well
in the
UDP
are
27
Electronic Filing - Received, Clerk's Office, September 8, 2008
habitat generalists, those with
a high tolerance to
silt,
and those
preferring
lentic rather
than
lotic
conditions. Regardless of how well those species do, the community will
remain
unbalanced
and
will not attain Clean Water
Act goals because of a lack of habitat
specialists
like the
species
listed above. These habitat limitations
are
fixed
and
will
not
improve
regardless
of
whether
and
how the water quality standards
are changed.
In this
discussion
of
the
types
of fish species that can and cannot
reasonably
be
expected
to be
present in the CSSC and CAWS, it is important to include
a
review of the
fish
survey data
presented in the UAA Rule-Making through the testimony
of Mr.
Yoder
because
of
the
presence
of clear errors in fish identification
that these data contain. During the
January
2008
UAA
hearings, Mr. Yoder was questioned concerning the MBI’s 2006 fish
identification
results
for
the
LDR. He agreed that the silver shiner identified by MBI was actually an
emerald
shiner.
(UAA
February 1,
2008 Hearing
Transcript at
p.
128) He further agreed that the
specimen
MBI had
identified as a
blacknose
shiner was more likely a pallid shiner. (Id.) Mr.
Yoder
testified
that he
had “full
confidence”
in the identification of the other three fish species
(brown
bullhead,
highfin
carpsucker,
and black redhorse)
in the 2006 MBI survey that were
questioned
by
Midwest
Generation.
Subsequently,
in the document introduced
by
Illinois EPA as Exhibit 37, the
MBI
provided
photographs of these three questioned fish species. EA has reviewed the
photographs
of these
fish. Two
photographs
of what MBI called a brown bullhead are
instead photos
of a
yellow
bullhead. MWGen also requested documentation from Illinois EPA
regarding the
MBI’ s alleged
identification of highfin carpsucker, because
of the
large number MBI
reportedly
found in the
Illinois River. In Exhibit 37, MBI provided two photos
of
what EA agrees is
a
highfin
carpsucker. However, the specimen in question is from the Vermillion
River,
which is
clearly
not part of the CAWS, the LDR, or the Illinois River. Therefore, a specimen
from
the
Vermillion
River does not address the
question of whether specimens
reported by
MBI as
highfin
carpsuckers
from the Illinois River were
properly
identified. Therefore, the
MBI reports
of
highfin carpsuckers are questionable and unconfirmed by either field
specimens
or photographs.
With regard
to the third
species,
black
redhorse, MBI again provided
two
photographs.
One
specimen
is from
Raccoon
Creek in Ohio and is, therefore,
irrelevant
with regard
to these
proceedings. The other specimen,
which appears to be a black
redhorse, is
labeled as
Kankakee
River or Des Plaines River, so this specimen may or may not be from a
waterway
that
is the
subject
of
these hearings. In summary, MBI misidentified three species (silver
shiner,
blacknose
shiner, and brown bullhead) and provided inappropriate documentation
regarding two
others.
EA cautions that the fish identification data and numbers reported by MBI in
this
proceeding
are
not reliable for these species.5
EA also notes
that MWGen had
requested
copies of all field fish data sheets from
the Illinois
EPA for the
July and
September 2006 fish
study performed
by
the MBI/Yoder. According to the information in
Exhibit
21 in the
UAA
proceeding,
all locations in the Des Plaines River, the CS SC, and Grant
Creek were allegedly
sampled
twice, once
in
July and once
in September. However, in Exhibit 20, which
contains the data sheets for this
2006
study,
there
are no
data sheets for
sampling sites
located
at
River Mile (RM) 273.5, 274.0 and Grant Greek
during
the July
sampling.
Hence,
either this sampling was not
performed
or
the
accuracy of the July fish sampling
at
these
locations has not
been
documented by the
completion
and
submission of field data sheets.
28
Electronic Filing - Received, Clerk's Office, September 8, 2008
Miltner
et
a!.
2000).
The
range
for
percent
urban
area
(8-50%)
is broader
but
the
negative
effect
of
urbanization
is
still
plainly
evident
(Steedman
1988,
Wang
eta!.
1997,
Yoder
eta!.
1999,
and
Groschen et a!.
2004).
In
1990,
5
8.7%
of the
area
in the
Des
Plaines
subbasin
was
classified
as
urban
(NAWQA
1998)
and,
given
the
extensive
development
that
has occurred
since
1990
in
the Joliet
area,
that
percentage
is
likely
higher
now.
Even
the
5
8.7%
figure
equals
or exceeds
all
reported
thresholds
for
significant
effects.
The Chicago
Army
Corps
of
Engineers
in their
1997
Annual
Report
indicated
that
the
percent
impervious
area
for
the
Des
Plaines
Basin
ranged
from
30.1-56.4%;
again
well
above
all reported
thresholds.
The
studies
cited
above
demonstrate
that
biological
measures
consistently
decline
significantly
as
urbanization
increases.
This
phenomenon
has
been
demonstrated
in the
CAWS
and
LDR
as
well
as
in
nearby
Midwestern states.
Groschen
et a!.
2004
noted
that
fish and
benthic
communities
declined
at
levels
of
15-25%
urbanization
in the
Fox and
Des
Plaines
River
Basins.
In
fact,
as
support
for the
decline
in
the
fish
community,
they
reference
a
written
communication
from
Illinois
EPA
witness,
Mr.
Roy Smogor. Mr.
Yoder,
another
witness
appearing
on
behalf
of
Illinois
EPA
in these
proceedings,
has
reached
similar
conclusions.
In
a 1996
paper
(Yoder
and
Rankin
1996),
Mr.
Yoder
reported
that
85%
of
urban
sites
sampled
had
poor
or
very
poor
(i.e.,
non-attaining)
biological
index
scores.
In
a
1999
paper
(Yoder
et
a!. 1999),
he
reported
that
threshold
levels
for percent
urban
land
use
ranged
from
8-33%.
In this
same
paper,
Mr.
Yoder
discussed
the inability
of
urban
streams
to
attain
a use
classification
that
meet
the
Clean
Water
Act
aquatic
life
goals,
which
is
called
the
“Warm
Water
Habitat”
or
“WWH”
use
under
Ohio’s
use
classification
system.
Mr.
Yoder
concluded
that:
[T]he
recent
finding
that
no
urban
headwater
stream
sites
in
the
Ohio
EPA
database
attain
the
WWH
biocriteria
(Yoder
and
Rankin
1997)
only
serves
to
further
the
notion
that
the
degree
of
watershed
urbanization can
preclude
the
WWH
use
regardless of
the
site
specific
habitat
quality.
(Yoder
et
al.
1999
at
p.
25)
In
a subsequent paper
(Yoder
et al.
2000
at
p.
32),
Mr.
Yoder
similarly
found
that:
Only
a
very
few
sites
exhibited
attainment
at
urban
land
uses
between
40-60%
and
none
occurred
above
60%.
These
former
sites
had
either
an intact,
wooded
rzparian
zone,
a
continuous
influx
of groundwater,
and/or
the
relatively
recent
onset
of
urbanization.
These
results
indicate
that
it
might
be possible
to
mitigate
the
negative
effects
of
urbanization by
preserving
or
enhancing
near
and
instream
habitats,
particularly
the
quality
of
the
riarian
buffer
zone.
The
results
also
suggest
that
there
is
a
threshold
of
watershed
urbanization
(e.g.,
>60%)
beyond
which
attainment
of
warmwater
habitat
is
unlikely.
With
regard
to
the
threshold
of
watershed
urbanization above
which
attainment
of
Clean
Water
Act
aquatic
goals
is unlikely,
the
Des
Plaines
River
watershed
was
already
59%
urbanized
in
Electronic Filing - Received, Clerk's Office, September 8, 2008
1990, right
at the
threshold
of 60% cited in
the Yoder et al.
studies
described
above.
In a
later
paper
(Miltner,
White, and
Yoder 2004),
IBI values in the
watersheds
studied
“declined
signflcantly when
the amount ofurban
land use measured
as
imperious
cover
exceeded
13.8%,
and
fell
below expectations consistent
with the
Clean Water Act
goals
when
impervious
cover
exceeded 27.1
%“.
According
to the Army
Corps of Engineers,
the amount
of
impervious
cover
in the Des Plaines Basin
is 3 0-56%.
Similar
results
have been observed in
nearby Wisconsin
where Wang
et al. (1997
at
p.
9)
noted
that:
Watersheds with
more than 20% urban
land
invariably
had IBI
scores
<
30 (poor-very poor), although
their
habitat
scores
varied
from 5
(very poor) to
70 (good). There
appeared to be
a sharp
threshold
between
10%
and
20% urban land use
across which
IBI
scores declined dramatically.
Clearly,
the
severe negative
consequences on the quality
of
aquatic
life
communities
caused
by
urbanization
have
been well-documented
in these and other
studies. It
is
important
to
note that
the
declines noted
by
these
studies occurred regardless
of site-specific
habitat
quality.
In
other
words, in highly
urbanized areas, even
streams with good habitat
(i.e., high
QHEI
scores)
often
fail to
attain CWA goals. Given
the high percentage
of urban
land
use and
impervious
area
within the CSSC and
the UDP, it is clear that
even in the absence
of the
poor
habitat quality
and
the
other
limiting
factors
discussed
above,
the CSSC and the
UDP would not
likely
achieve
attainment
of the Clean
Water Act aquatic life
goals due to the high levels
of
urbanization in this
area.
C.
Remediation to Address
Habitat Limitations
is not Feasible
in the Caws
and UDP
The possibility
of remediation
to
address UAA factors
that are preventing
attainment
of Clean
Water Act
goals must be considered
whenever
a proposed
use designation falls
below the
Clean
Water
Act goals. Here,
the main limiting factor
in
this waterway system
is the
impoundments.
To remediate the
impounded nature of
the waterway would require
removing
or greatly
modifying
the locks and dams
now present.
However, such
remediation would
in
turn severely
impair or prevent the
existing navigational
use for
which this waterway
was
intended,
and
which
is also a
protected use
of
the
CAWS
and the UDP under
the Clean
Water
Act.
Further,
the
system
now
has
a series
of flow controls
in place
that are specifically
designed
to
send
Chicago’s
wastewater to the Illinois
River
rather than to
Lake Michigan.
Even if
navigation
were no longer
deemed a protected use,
which the Illinois EPA
acknowledges
will not
occur, the
City of Chicago
and
Illinois EPA would
still be
faced
with the problem of
how
to
dispose of
wastewater
from
a
city
of
three
million people. Clearly,
impounding
from the
dams and
the
attendant
problems
it causes
(e.g.,
lack
of
riffles and fast water, increased
siltation,
etc.)
cannot
be
rernediated over
the
foreseeable
future (i.e., the next
10-20 years).
32
Electronic Filing - Received, Clerk's Office, September 8, 2008
Short of
removing or greatly modifying the
existing
locks and dams on the
waterway,
some more
limited types of
remediation
could be
implemented
(e.g.,
the amount of
instream
cover
could be
increased).
However, due to the extensive amount of
habitat area that would
need to
be
improved by
such measures in order to have any
measureable effect on fish
populations
and
species, they would have to occur on an
unprecedented scale. Illinois EPA
has
acknowledged
that there are no
such plans for remediation at the scale
required here.
Moreover,
unless
the
dams
themselves are removed, the factors that are most severely
limiting (i.e.,
lack of
riffles,
fast
water,
and
clean
cobble/boulder areas) will continue to limit the
system
by
preventing
the
species
that depend on such
areas
from
establishing viable populations.
VII. APPROPRIATE USE DESIGNATION FOR UPPER DRESDEN
POOL
Illinois EPA has proposed to assign the UDP its own use designation.
While
admitting
that the
UDP is somewhat impaired, Illinois EPA suggests that it has the
potential to
“marginally
meet”
CWA
goals.
However, the above analysis and review of stream data, facts
and
recognized
studies, along with the additional support cited below, show that the
extent of
the
impairments in
the UDP
prevent it from
attaining the Clean Water Act aquatic life goals.
With
regard to the UDP,
Mr. Rankin
of
the
CABB/MBI
advised the Illinois EPA
“we
suggest
that the Ohio
Modfled
Warmwater Habitat
Use for
impounded rivers (MWH-I)
would be the
most appropriate category.” This Ohio use designation category applies to
waterbodies
that
are
not capable of attaining the Clean Water Act’s aquatic life goals. This
conclusion
acknowledged
the existence of and took into account the presence of the limited area of
better
habitat in
the
Brandon
tailwaters.
Mr. Rankin
correctly
noted that the
tailwater area was isolated,
which could
influence its potential. He also acknowledged the impounded nature of the UDP
and
that it
was
subject to barge traffic. Finally, he noted that “systematic alteration and
urbanization
also
contributes to the physical limitations we observed’. Mr. Rankin’s
independent opinion
as
to the
appropriate use designation for the UDP, as the developer of the QHEI system
(Rankin 1989)
relied on by the Illinois EPA, should be given
significant
weight.
He notes that
he did
not have
access to the biological data at the time of his assessment. Toward that end, the
extensive, long-
term biological data sets collected by EA from this area show the fish
community,
both existing
and potential, to be consistent with the MWH-Impounded Use classification,
thus
supporting Mr.
Rankin’s findings
and recommendation.
A.
Upper Dresden Pool Has
Most of Ohio’s Modified
Warmwater
Habitat
Streams
Characteristics and Almost
None of Ohio’s Warmwater
Habitat
Characteristics
In a prior submittal by Midwest Generation to Illinois EPA (EA
2003)
as
part of
the UAA
Stakeholder process for the LDR, EA applied to the
UDP
each of the
attributes of
each
use type
established by Ohio EPA
for its use designation
system.
EA found that
the UDP
possessed
only
one
characteristic (max depth
>40
cm) of the Warm Water
Habitat Use that
under
Ohio’s
use
classification system meets
the
Clean Water Act aquatic life
goals. In
comparison,
the
UDP
possessed seven
characteristics
of the MOdlfiCd
Warmwater Habitat
Use that
under
Ohio’s
system does not
meet the Clean Water Act aquatic life goals.
Comparison of
these
characteristics in this manner is a standard analysis
technique used by Ohio
EPA
to
determine
the
proper aquatic life
use for a particular water
body.
fin
ii
Electronic Filing - Received, Clerk's Office, September 8, 2008
With
regard
to
this
approach,
Yoder
and Rankin
(1996), both
then
with
Ohio EPA,
stated
that
“as
the predominance
of
modUied
habitat
attributes increase
to
a
modUled
warmwater
ratio of
greater
than 1.0-1.5,
the
likelihood
of
having IBI
scores
consistent
with
WWH
use
declines”.
In
Dresden
Pool,
the ratio
is
4:1, far
greater than
the
1.5:1 trigger
point
suggested
by
Messrs.
Yoder
and Rankin.
Thus,
it is
clear,
based
on
this well-established
methodology,
that
the
UDP
is not
capable
of
attaining
a Warmwater
(i.e.,
General)
Use, which
meets
the Clean
Water
Act
aquatic
life goals.
Clearly,
a lower aquatic
life use
classification
is
warranted.
B.
The Habitat
in the UDP
Generally
Will Not
Support
an Aquatic
Life
Use
Consistent
with
CWA
Goals.
An
alternative
way of looking
at the
question of
what
aquatic life
use the
UDP can
support
is
to
consider
how
little good
habitat
there is:
1.
The
only
area of good
habitat is
confined
to
a roughly
1-mile long
section
in
the
Brandon tailwaters.
Given
that
Dresden
Pool is about
15
miles long,
this
area
of
good
habitat
represents
only about
7%
of
the
linear distance
of
the Pool, and
even
this small
area
may
be
of limited
value because
of toxic
sediments
that
cannot
reasonably
be
remediated.
2.
Based on 2003
data, the
average
QHEI
in UDP was
about
45
(EA 2003).
The
average
score in this
same area
in
July
2008
was about 47
using Ohio
EPA
scoring
procedures
and
only 42 using
the
MBI
version
of the QHEI
(Attachment
2d).
The
figures in
Attachment
2f
provide
a visual
depiction
of
how
QHEI scores
vary spatially
over
the
UDP.
It is clear
from
these figures
that
QHEI
scores
in
most of
the
7-8 mile reach
comprising
the UDP were
well
below the
accepted
cutoff of
60.
In fact, they
are,
on average,
much
closer
to the cutoff
of
45 for
limited
warmwater
habitat (LWH)
under
the Ohio
Use
Classification
System.
3.
The
version
of the
QHEI currently
being used
by
Mr. Yoder
and MBI
includes
an
automatic
deduction
of up to
10 points
for all
areas
that are impounded.
This
represents
a clear acknowledgement that impounding
a river
not only
affects
individual
QHEI
metrics,
but also has
a cumulative
and
pervasive
effect
on the
quality
of
the aquatic
life within
such
areas.
It is
this scoring
adjustment
that
causes
the
scores
in the
UDP
calculated
using
the
MBI version
of the
QHEI
to
be
about
five points
lower
than the Ohio
EPA version.
Electronic Filing - Received, Clerk's Office, September 8, 2008
VIII.
LIST OF REFERENCES
American Rivers. 2002.
The Ecology of Dam Removal:
A
Summary
of
Benefits and Impacts.
American Rivers. Washington,
D.C.
Booth,
D.B., and C.R. Jackson.
1997. Urbanization
of aquatic
systems: degradation
thresholds,
stormwater detection,
and the limits
of
mitigation.
Journal of the
American
Water
Resources Association
33 (5): 1077-1090.
Burton,
G.A., Jr.
1995a.
The Upper Illinois
Waterway Study
Interim
Report: 1994-1995
Sediment Contamination
Assessment. Institute for Environmental
Quality, Wright
State
University. Prepared
for Commonwealth Edison
Co,. Chicago, IL.
1995b. Reviews
of Literature Concerning: 1) Effects of
Temperature on
Freshwater Fish, 2)
Effects on Freshwater B iota
and
Interactions
of
Temperature and
Chemicals, and 3) Effects
of Turbidity and Barge Traffic on Aquatic
Ecosystems.
Institute for Environmental
Quality, Wright State
University.
Prepared for
Commonwealth
Edison Co.,Chicago,
IL.
Burton,
G.A., Jr., K. Kroeger, J. Brooker,
and D. Lavoie. 1998. The Upper Illinois
Waterway
Ecological Survey
(July 1997-March 1998). Continuous
In Situ
Toxicity
Monitoring and
Thermal Effect Characterization
Tasks. Final Report. Institute for
Environmental
Quality,
Wright
State University. Prepared
for Commonwealth Edison Co.,
Chicago, IL.
Burton, G.A., Jr., and
C.
Rowland.
1999. The
Upper Illinois Waterway
Ecological
Survey (July
1998-October 1998).
Continuous In Situ Toxicity Monitoring
and
Thermal
Effect
Characterization
Tasks. Final Report. Institute for Environmental Quality,
Wright State
University. Prepared
for Commonwealth Edison
Co., Chicago,
IL.
Commonwealth Edison Company
(ComEd). 1996. Aquatic Ecological Study of the
Upper
Illinois
Waterway.
Dreher, D. 1997. Watershed Urbanization
Impacts on Stream
Quality
Indicators in
Northeastern
Illinois. Pages 129-13 5, in
D. Murray and
R.
Kirshner (ed.) Assessing the
Cumulative
Impacts
of Watershed Development
on Aquatic Ecosystems and Water
Quality.
Northeastern
Illinois Planning
Commission. Chicago, IL.
EA Engineering, Science, and
Technology. 2003. Appropriate Thermal Water
Quality
Standards for the Lower
Des
Plaines River.
Report to Midwest
Generation,
Chicago, IL.
Edds, D.R.,
J.S. Tiernann,
M.L. Wildhaber, D.P. Gillette. 2005.
Spatiotemporal
patterns of fish
assemblage structure
in a river impounded by
low-head
dams.
Copeia
2005 (3):539-549.
Electronic Filing - Received, Clerk's Office, September 8, 2008
Eley, R,
J.
Randolph,
and
J. Carroll.
1981.
A comparison
of
pre- and
post-impoundment
fish
populations
in the Mountain
Fork
River in
southeastern
Oklahoma.
Proceedings
of the
Oklahoma
Academy
of
Science
61:
7-14.
FitzHugh,
T.
2002. Watershed
Characteristics
and
Aquatic
Ecological
Integrity:
A
Literature
Review.
TNC Freshwater
Initiative.
Groschen,
George
E., Arnold,
Tern L.,
Harris, Mitchell
A., Dupre,
David
H., Fitzpatrick,
Faith
A., Scudder,
Barbara
C.,
Morrow,
Jr.,
Williams
S.,
Terrio, Paul
J.,
Warner,
Kelly
L.,
and
Murphy, Elizabeth
A..
2004. Water
Quality
in the
Upper
Illinois River
Basin,
Illinois,
Indiana,
and
Wisconsin.
1999-200
1: Reston,
VA,
U.S..
Geological
Survey
Circular
1230,
42
p.
Guenther,
C.B.
and A.
Spacie.
2006.
Changes
in
fish assemblage
structure
upstream
of
impoundments
within
the upper Wabash
River
basin,
Indiana.
Transactions
of the
American
Fisheries
Society
135 (3):
570-5 83.
Gutreuter,
S.,
J. M. Dettmers,
and D.H. Wahi.
2003.
Estimating
mortality
rates
of
adult
fishes
from
entrainment
through
the
propellers
of river towboats.
Transactions
of the
American
Fisheries
Society 132:646-661.
Kanehi,
P.D.,
J. Lyons,
and
J.E.
Nelson.
1997. Changes
in the
habitat
and
fish
community
of
the
Milwaukee
River,
Wisconsin,
following
removal
of
the Woolen
Mills
Dam.
North
American
Journal
of Fisheries
Management
17:387-400.
Klein,
R. 1979. Urbanization
and
Stream Quality
Impairment.
Water
Resources
Bulletin
15(4).
Lowery,
D.R.,
R.
W. Pasch,
and
E.M. Scott.
1987. .Hydroacoustic
survey
of
fish
populations
of
the
lower
Cumberland
River.
U.S.
Army Engineer
District,
Nashville.
Nashville,
TN.
Lyons,
J.,
R.R.
Peitte,
and
K.W.
Niermeyer.
2001.
Development,
validation,
and
application
of
a
fish-based index
of
biotic integrity
for Wisconsin’s
large
warmwater
rivers.
Transactions
of
the American
Fisheries
Society
130:1077-1094.
Maxted,
J. and E.
Shaver.
1996.
The
Use of
Retention
Basins
to Mitigate
Stormwater
Impacts.
on
Aquatic Life.
In:Effects of
Watershed
Development
and
Management.on
Aquatic
Ecosystems.
Roesner, L.A.
(ed.),
Proceedings
of
Engineering
Foundation
Conference.
August,
1996.
Snowbird,
UT.
May,
C.R.,
Homer, J.,
Karr,
B.,
Mar,
B.W., and
E.
Welch. 1997.
Effects
of
Urbanization
on
Small
Streams
in
the Puget
Sound Lowland
Ecoregion.
Watershed
Protection
Techniques
2(4): 483-494.
Metropolitan
Washington
Council
of Governments
(MWCOG).
1992.
Watershed
Restoration
Sourcebook.
Department
of
Environmental
Programs,
MWCOG
,Washington,
DC.
36
Electronic Filing - Received, Clerk's Office, September 8, 2008
Miltner,
Robert J., White, Dale, and Yoder, Chris.
2004. The
Biotic Integrity
of
Streams in
Urban and Suburbanizing Landscapes. Landscape and
Urban
Planning
69(1):87-100.
NAWQA.
1998. USGS Fact Sheet-072-98. USGS.
Water Resources
Division,
Urbana,
IL
Ohio EPA.
1987 (plus
2006
updates).
Biological
criteria for the
protection of
aquatic
life:
Volume II: User’s manual for biological field
assessment
of
Ohio
surface waters.
Ohio
EPA,
Division
of Water Quality Planning and
Assessment,
Columbus, Ohio.
125pp.
plus
appendices.
Ohio EPA.
2006. Methods for assessing habitat in flowing
waters:
Using a
Qualitative
Habitat
Evaluation Index (QHEI). Ohio EPA. Columbus, Ohio.
Poff, N.L.,
J.D.
Allan,
M.B. Bain, J.R. Karr, K.L. Prestegaard, B.D.
Richter, R.E.
Sparks,
and
J.C. Stromberg. 1997. The natural flow regime.
BioScience
47(1
1):769-784.
Rankin, E.T. 1989. The Qualitative
Habitat Evaluation Index
(QHEI): Rationale,
Methods, and
Applications. Ohio EPA
Division of Water Quality Planning and
Assessment,
Ecological
Assessment
Section. Columbus, OH.
Santucci,
V.J. and S.R. Gephard. 2003. Fox River
fish
passage feasibility study.
Final Report of
the Max McGraw Wildlife Foundation to the Illinois Department of Natural
Resources,
Springfield.
Santucci, V.J., S.R. Gephard,
and S.M. Pescitelli. 2005. Effects of multiple
low-head dams on
fish, macroinvertebrates, habitat, and water
quality in the Fox
River,
Illinois.
North
American
Journal of Fisheries
Management 25:975-992.
Steedman,
R. J. 1988. Modification and assessment
of
an
index of
biotic integrity to
quantify
stream quality in Southern
Ontario. Canadian Journal of Fisheries and Aquatic
Sciences
45: 492-501.
Todd, B.L., and
C.F. Rabeni. 1989. Movement and habitat
use by
stream-dwelling
smallmouth
bass. Transactions of the American
Fisheries Society 118:229-242.
U.S. Army Corps of Engineers, Chicago
District. Lake Michigan Diversion
Accounting--Water
Year 1997 Report,
Table 3 — SCALP Landuse Designations
for
the Modeled
Basins,
p.
10 (http://1 55.79.114.1 98/divacct/1
997_Diversion.htrnl)
U.S.
EPA.
1986 Quality Criteria for Water.
EPA Publication 440/5-86-001.
EPA
Washington,
DC.
US
EPA. August, 2003. Strategy for Water Quality Standards and Criteria.
Office of
Science
and Technology.
EPA-823-R-03-0 10. Washington, D.C.
37
Electronic Filing - Received, Clerk's Office, September 8, 2008
Wang, L, J. Lyons, and R. Gatti.
1997. Influences of
watershed land use on
habitat
quality
and
biotic integrity in Wisconsin Streams. Fisheries 22 (6):6-12.
Yoder,
C.O. and E.T. Rankin. 1996.
Assessing the
condition and status of
aquatic
life
designated
uses in urban and suburban watersheds. Pages 20
1-226 in:
L.A.
Roesner
(ed.)
Effects of Watershed Development and Management on Aquatic
Ecosystems.
American
Society
of
Civil Engineers.
New York, NY.
Yoder. C.O., R. Miltner, and D. White.
1999.
Assessing the Status of
Aquatic Life
Designated
Uses in Urban and Suburban Watersheds. Pages 16-28 in R.
Kirschner (ed.)
National
Conference on Retrofit
Opportunities for Water
Resources Protection in
Urban
Environments. EPA/6325/R-99/002.
Yoder,
C.O.,
R.J. Miltner,
and
D.
White. 2000. Using
Biological Criteria to
Assess
and C1assif
Urban Streams
and Develop
Improved Landscape Indicators. In
Proceedings
of
the
National Conference
on Tools for Urban Water Resource
Management
and
Protection.
Published by U.S. EPA, Office of Research and Development.
Washington,
D.C.
EPA!625/R-00/0O1.
0
30
Electronic Filing - Received, Clerk's Office, September 8, 2008
ATTACHMENT
1
Detailed
Summary of
EA Engineering,
Science, and
Technology’s
Stream Surveys
for the
Upper Iffinois
Waterway
(UIW),
1993—2006
Electronic Filing - Received, Clerk's Office, September 8, 2008
Detailed
Summary
of
EA Engineering Stream Surveys for the
Upper
Illinois
Waterway
(UIW) 1993—2006
I.
Overview
EA Engineering, Science, and Technology (EA) has conducted annual stream
surveys in
the
Upper Illinois Waterway (UIW) since 1993, with the exception of only 1996.
The
studies
conducted in
the 1993-1995 time period by EA and other contractors
for
Commonwealth
Edison
(CornEd)
were subsequently relied upon by the Illinois Pollution
Control Board
(IPCB)
to grant
CornEd an Adjusted Standard regarding thermal water quality standards in the
A96-1 0
proceeding. The studies subsequently conducted
on an
annual basis beginning
in 1997
to the
present have been performed by EA at the request
of
ComEd (through 1999)
or
Midwest
Generation
EME (since 2000). These studies are not required
by
the terms of
the
IPCB Order
granting the adjusted standard
in AS96- 10 or in any NPDES permits issued
to the
subject
electrical generation stations formerly owned
by CornEd and now owned by
MWGen.
These
annual studies have been performed on a voluntary basis in
order
to monitor
conditions
in the
UIW and to continue to confirm that compliance
with
the
alternate
thermal water
quality
standards
granted in AS96- 10 is not having an adverse impact on the aquatic
community.
These
annual stream surveys have been submitted to the Illinois EPA upon their completion.
Due to
the
voluminous nature of these stream survey reports, this detailed summary has
been
prepared
to present the key data and findings contained therein
which are relevant
to the
UAA R08-09
rule-making proceeding.
II.
EA
1993-1994 Studies
By the terms of the NPDES permits
issued to the Joliet
9
& 29, Will County,
Fisk, and
Crawford
Stations,
in
the early
1990’s, CornEd,
then the owner of those plants, was
required to
undertake a
comprehensive
aquatic study
of the combined thermal impacts of these
facilities on
receiving
waterways. Specifically,
ComEd
was to:
“prepare
a comprehensive thermal impact demonstration assessing
the effects of cooling water discharges
from [each power
plant] in
conjunction
with its other generating facilities
on the
Chicago
Sanitary and Ship Canal
and on the Des Plaines River. The
study
[was to include]:
(a) assessment of the physical
characteristics of the
affected
waters relative
to their ability to support and sustain aquatic
life;
(b)
assessment
of
the thermal environment
of
the affected
waters
and the effects of
the various heat inputs, and documentation
of
compliance with water quality standards;
I
Electronic Filing - Received, Clerk's Office, September 8, 2008
(c)
assessment
of
waters,
sediments,
and
organisms
for
toxic
materials
to determine
the
extent to
which these
materials
may
limit
aquatic
life;
and
(d)
assessment
of
current
populations
of
macrophytes,
macroinvertebrates,
and
fishes.”
In
addition, the
NPDES
permits
required
a
preliminary
assessment
related
to §316(b)
of
the
Clean
Water
Act that
consists
of
“limited
biological
studies
near the
cooling
water
intake
to
document
whether
previous
conclusions
(i.e.,
lack of
fish
species diversity
and
early
life
stages
due
to
poor water
quality)
remain
valid.”
To
address
these requirements,
EA classified
and evaluated
habitat to address
(a)
above,
and
along with
other
CornEd
experts
assessed the
impact
of
the
thermal
environment
on
aquatic
life
(a
and b
above),
assessed
current
fish
populations
(Item
d),
and did a larval
fish
study
to
address
the §316(b)
concerns as
cited above.
The
studies
were
conducted
over
the
period
from
1993
to
1994.
The study
area
included
the
following
portions
of the
UIW:
Lockport
Pool, Brandon
Pool,
Upper Dresden
Island
Pool, which
are all
part of
the current
UAA
rule-making
proceeding.
The
UIW
study
area
also
included
portions
of
the Lower
Des Plaines
River downstream
of the
1-55 Bridge
which
are
not part of
the
UAA rule-making
proceeding,
including
the
area
referred
to
as the
“Five
Mile
Stretch”
of
the
Lower
Des Plaines
River
below
the 1-55
Bridge. The
studies were
subject
to the
oversight
of a
Task
Force of
experts
that
reviewed
and approved
all study
plans.
The
Task Force
included
representatives
from
IEPA,
USEPA
Region V,
MWRD, and
several
stakeholder
groups.
The
studies
conducted
were extensive
and the
resultant
reports,
even
in summary
form
(CornEd
1996)
are voluminous.
Therefore,
we
have presented
a summary
of the
results
below.
A.
HABITAT
Habitats within
the Upper
Illinois
Waterway
(UIW)
were initially
classified
on a
broad
scale
according
to
mesohabitat
type. Percentages
of each
mesohabitat
in the
UIW
were:
main
channel
(51.6%), main
channel
border (22.4%),
backwaters
(10.4%),
tributary
delta (7.0%),
tailwater
(4.6%),
tributary
mouth
(3.0%),
and
intake/discharge
(1.0%).
Habitat quality
at individual
sampling
locations
on
the UIW was
assessed
using
the
Qualitative
Habitat Evaluation
Index
(QHEI) to
determine
to
what extent
habitat
was
limiting
the aquatic
biota
of
the
UIW.
It
was
found that
QHEI
scores
varied
depending
on
mesohabitat
type. Mean
QHEI
scores were
lowest
in main channel
habitats,
the
dominant
mesohabitat
in the
UIW.
Conversely,
mean
QHEI scores
were best
in tailwaters,
one
of
the least
available
mesohabitats
in
the UIW
representing
only
4.6%
of
the
UIW study
area.
7
Electronic Filing - Received, Clerk's Office, September 8, 2008
In
1993 and 1994, QHEI
scores were
derived at 169
locations’ in the
Lockport,
Brandon
Road,
and
Dresden
Pools. Roughly
half
of these
scores (85 locations) were
calculated
by
EA
with
the
other half
(84 locations)
calculated
by other CornEd
contractors (CornEd
1996).
This
level
of
coverage
is
far
greater than that
of the QHEI survey
work performed in 2006
by
MBI
(Yoder)
or
in 2004
by
the CABB (Rankin).
All
of the CornEd
contractors reported
similar
scores
in
the
study
area, evidencing a
good
degree
of consistency in how the
different contractors
performed
the
QHEI
scoring work.
QHEI scores in the
UIW were,
on
average, found to be low
(mean scores in the
40s).
Thus,
habitat
generally is poor.
The low
QHEI
scores are the result
ofa lack ofriffle/run
habitat, lack
of clean,
hard
substrates
(i.e.,
gravel/cobble),
excessive siltation,
channelization,
poor
quality
riparian
and
floodplain areas, and
lack
of cover.
Habitat was found to
be poorest in
Lockport
Pool,
marginally
better in
Brandon
Pool,
and
better
still in Dresden Pool; but
mean QHEI
scores
were
still
<60
in Dresden Pool.
Other factors,
notably low dissolved
oxygen concentrations,
constant barge
traffic,
and
toxics,
especially
in the
sediments,
were also
found to likely
limit the aquatic
biota
of the UIW.
These
factors
and the habitat limitations
identified
previously are
largely irreversible and
cannot
practically
be
mitigated.
B.
LARVAL
FISH
During
the spring
and summer
of 1994,
fish
eggs and larvae were
collected
at 16
locations in the
UIW.
This
included
six locations
in Lockport Pool,
one in Brandon Pool,
one in
the Upper Des
Plaines River,
and eight
in Dresden
Pool.
Fish
were
collected by net tows,
benthic
pumping,
dipnetting, stationary
netting,
light trapping,
seining, and
the physical examination
of
vegetation.
A total of 1240
samples were collected.
The
purpose of the study
was to determine
what
portion of the
fish community
found in the
Illinois
River
drainage
is currently
using this
physically limited and
impacted subunit
of the
system
as a
spawning
or nursery area,
as well as
when and where those
uses
occur.
The study
was not
intended to quantifv
the extent
or success of
spawning
activity
or make
quantitative
comparisons
with reproductive
performance
in other
systems.
Over
the
course
of the
study,
about 29,400
fish
eggs
and about 21,800 larval
and
young-of-the-
year (YOY)
fish
were
collected.
Most
of the eggs that
could be identified
were
found to
be those
of
common carp.
Among the larval and
YOY fish collected,
the
six
most
commonly
collected
species
or taxa during
this
study (Lepomis
spp.,
gizzard shad, common
carp,
bluntnose
minnow,
unidentified
Pimephales
spp., and emerald
shiner) share
early life history characteristics
that
appear
to
be
most successful
in this
system.
These
include adaptations
that
allow
eggs
and/or
Eight of these locations
were
in the
Illinois River
just downstream of Dresden
Island Lock
and Dam
3
Electronic Filing - Received, Clerk's Office, September 8, 2008
larvae
to tolerate
low dissolved
oxygen
concentrations
and have minimal
contact with the
sediment.
Collectively, these species or taxa accounted for more
than
86% of all
larvae/YOY
collected.
The
first
five
species/taxa
have
either adhesive
or
buoyant eggs, a
characteristic
that
isolates their eggs from the contaminants and high oxygen demand of the
substrate. They
are
spawning “generalists” that release
eggs
over a
wide
variety of
substrates and
specifically
do
not
require
the
coarse
or
hard
substrates (gravel or cobble) so rare in this
system. They
prefer to
spawn in slack water or protected areas and the larvae tend to reside in similar
areas. The
larvae
of some of these species or taxa are pelagic or haye cement glands such that
they can
attach
to
vegetation
or local
structure
and remain off the substrate. Most of these
species
or taxa
have
well-developed
respiratory structures or have parents that fan the eggs and early
larvae, thus
reducing
the problem
of low dissolved oxygen levels near the sediment surface.
The last
species,
emerald
shiner,
shares
many of these characteristics and it is extremely
prolific as well.
Adults
of all six species or taxa are moderately
or
highly tolerant.
The results suggest
a
complex
but highly stressed and habitat-limited fishery
that is
heavily
dependent
for
its
diversity on: 1) species adapted to contaminated conditions;
2) a few
critical
spawning and nursery areas,
primarily in Upper Dresden Pool and the 5-mile
Stretch;
and 3)
immigration
from
Lake Michigan and tributary drainages.
C. JUVENILE AND ADULT FISH
Fish
sampling was
conducted
along 53 miles
of
the
UIW (RM
270.2
— RM 323.4) at
46 locations
in
1993 and at 42 locations in 1994. Most locations were sampled both years. This
includes 18
locations in Lockport
Pool, six in Brandon Pool, one in the Upper Des Plaines
River, 22 in
Dresden Pool, and six downstream
of Dresden Island Lock and Dam. Fish
were
collected by AC
3-phase electrofishing (EF) at 40-45
locations depending on year, gilinetting
at
3 1-38
locations
each year, and seining
at 26-27 locations each year. In all, 968 fish collections (398
EF, 322 gill
net, 248 seine) were made during
the 1993-1994 study. As had been the case
in previous
years,
electrofishing
was conducted for 15 minutes in an upstream direction during 1993.
However, to
be consistent with the techniques being used
by
other researchers,
each
electrofishing zone
in
1994
was
500 meters
long and was fished in a downstream direction. The 500
meter long zone,
downstream approach
has been continued in all subsequent monitoring of the system by
EA.
Sampling was conducted in May, August,
and
October/November
of both
years; in July
and
September at all
plants in 1993; in June both years near the Dresden Station; and
all the
plants
in
June
1994.
Since
1994, sampling in the study area has typically been
conducted from May
through September.
The
1993-1994 programs resulted
in the
capture
of
25,349 adult and juvenile fish
representing
82
species.
Numerically
dominant species
were
bluntnose
minnow (20.0%),
gizzard shad (19.4%),
common carp (11.3%), and emerald shiner (10.5%). Thus, the UIW
was
dominated by
a
combination of prolific pelagic species
(i.e., gizzard shad and emerald
shiner) and
highly
tolerant
species (i.e.,
bluntnose minnow
and
common carp). Although all fish collected
were
processed,
-r
,1
Electronic Filing - Received, Clerk's Office, September 8, 2008
exotic
species were
not
included in
most analyses
because
of the
confounding
influence
they
exert. Exotic
species
often
do not
follow
expected
trends
with
regard to
water
quality.
Similarly,
highly tolerant
fishes
(as defined
by Ohio
EPA)
were
excluded
from certain
analyses
(e.g.,
modified Index
of Well-Being
[IWBmodJ)
Although
various
seasonal
(i.e., spring
vs. summer
vs. fall)
and
habitat
differences
were
noted,
most
of
these
were either
not statistically
significant
or
were
not
consistent.
The most
common
and consistent
trends
were spatial.
These spatial
patterns
were:
1. A very
poor
native
fish assemblage
was
present in Lockport
Pool.
The
assemblage
in
Lockport
Pool was
characterized
by
low
native
fish
abundance
(catch
rates typically
<50
fish/km),
low
species
richness,
and
domination
by
highly
tolerant
species.
2.
The
community
was
marginally
better in Brandon
Pool but
was
still
very
poor.
3. The
fish communities
in the
Upper
Dresden
Pool and the
5-mile
Stretch,
Dresden
Pool
downstream
of the
Kankakee
River,
and
downstream
of Dresden
Lock
and
Dam
were
relatively
similar
to each other
and noticeably
better
than those
upstream of
Brandon
Lock and Dam.
2
4.
Results
at thermally-influenced
sampling
stations
were
comparable
to
those
at
other
sampling
stations.
Mean
IWBmod
(an index
of fish
community
health)
scores
were:
Lockport
Pool
1.4
Braridon
Pool
2.8
Upper
Dresden
Pool and the
5-mile
Stretch
5.2
Dresden
Pool downstream
of the
Kankakee
River
5.3
Downstream
Dresden
Lock
and
Dam
6.5
Using IWBrnod
criteria
established
by Ohio EPA,
each segment
would
be classified
as
follows:
Lockport
Pool
very
poor
Brandon
Pool
very
poor
Upper
Dresden
Pool and
the 5-mile
Stretch
poor
Dresden
Pool downstream
of the
Kankakee
River
poor
Downstream
Dresden
Lock
and Dam
fair
2
Historically,
Upper
Dresden
Pool has
been used
in
our reports
to denote
Dresden
Pool
upstream of the
Kankakee
River
and Lower
Dresden
Pool
denoted
the
Illinois River
(i.e.,
the
portion
of Dresden
Pool below
the
confluence
with the
Karikakee). To
avoid
confusion,
we herein
refer to the
old
Upper Dresden
Pool
area as
Upper
Dresden Pool
and 5-mile Stretch.
If
we use
the
term Upper
Dresden
Pool,
we
are referring
only to
the
portion
of
the
pooi
upstream of
1-55,
consistent
with
its usage during
this
rule-making.
5
Electronic Filing - Received, Clerk's Office, September 8, 2008
During the two-year
study period, 5,104
young-of-the-year
(YOY)
fish (24.2%
of the
catch)
representing
39
species were collected:
Species
Total
Percent
Gizzard
shad
3,130
61.3
Bluntnose minnow
506
9.9
Emerald
shiner
161
3.2
Largemouth bass
141
2.8
Unidentified
Lepomis
128
2.5
White sucker
126
2.5
Bullhead minnow
126
2.5
All
other species
786
15.4
The
seven most
abundant
species or taxa accounted
for 85%
of the YOYs
collected.
Gizzard
shad alone accounted
for 61% of the YOYs,
with the highly
tolerant bluntnose
minnow
being the
next most abundant
(10%). As judged
by the presence of YOYs,
reproductive
success
in
Lockport Pool
and
Brandon
Pool was confined
almost entirely to gizzard
shad and
highly
tolerant
species
like
bluntnose minnow and
fathead minnow. A few
(25)
white
sucker
YOY
were
collected
in Brandon Pool, however,
most,
probably all
of these
drifted
in from
the
Upper
Des Plaines River.
This
conclusion
is
supported
by the
fact that no white
sucker larvae
were
collected
from Brandon Pool
during the 1994 ichthyoplankton
study
but they
were
found in
the
Upper
Des Plaines River
(EA 1995 a), and the fact
that nearly four
times as many
(91) YOY
were
collected from the single
sampling location
on
the Upper Des
Plaines River as
the four (1993)
to
six (1994)
locations sampled
in Brandon Pool (EA
1994 and 1995b). Drift
is a
common
dispersal mechanism
for stream fishes,
so it is not surprising
to find a
few white
sucker
YOY in
Brandon
Pool that would
have been hatched
elsewhere.
A total of
2,128
fish
were tagged
in the UIW; however,
only 18 tagged fish
were
recaptured, and
only
two
of
these fish moved
an appreciable distance.
A
largemouth
bass
moved
--4 miles
upstream
in
11
months and a
white crappie moved 1
1.5 miles
downstream.
Although
data
are
sparse,
they suggest that
fishes in the Upper Illinois
Waterway
exhibit
limited
movement.
Percentages of fish
afflicted with
some sort
of
abnormality
in each pool were as
follows:
Lockport Pool
17.1%
Brandon Pool
22.1%
Upper
Dresden
Pool and
the
5-mile Stretch
15.8%
Dresden Pool downstream
of the Kankakee
River
8.7%
Downstream Dresden
Lock
and Dam
10.0%
Thus,
the
incidence
of
abnormalities
was highest in
the upper
three
segments.
DELT
(Deformities, Erosion,
Lesions,
and
Tumors) anomalies
are
of particular
concern
because
they
are
strongly
correlated
with water quality.
A summary
of DELT
anomalies
throughout
the
Upper
Illinois Waterway
is
presented
below:
6
Electronic Filing - Received, Clerk's Office, September 8, 2008
Dresden Pool
Upper Dresden
Downstream
of
Lockport Pool
Brandon Pool
downstream of
Pool
and the 5-
Dresden Dam
(%)
(%)
.
the
Kankakee
mile Stretch
(/o)
River
(%)
(/o)
10.9
14.6
12.6
8.0
7.5
As was
the
case with total anomalies, DELT
anomalies were also highest in
the three
upstream
segments. Eighty percent of all DELT anomalies were the result of fin erosion.
The
percent
of
DELT anomalies was greatest among bottom feeders such
as
common carp,
channel catfish, and
redhorse species. A high incidence
of
DELT anomalies
is an
indication
of
stress
caused
by
a
variety of environmental factors, including chemically
contaminated
substrates. For
large river
sites like the
UIW,
Ohio EPA
gives any site with >3% DELT anomalies the
lowest possible
IBI
(Index of Biotic Integrity) metric score. Thus, depending
on
the segment, DELT
anomalies
percentages exhibited
by
fish in
the UIW
are
2-5 times higher than the 3%
criterion
established
by Ohio EPA for the lowest metric score.
In summary, it was found that during
1993-1994:
• Habitat severely limited
the fish community.
• Fish
diversity and abundance followed
clear-cut
patterns,
with conditions
being poorest
in
Lockport
Pool and generally improving in a downstream direction.
• The spatial pattern appeared to be unrelated
to
operation of the CornEd
power plants.
• Growth and
condition
of most species were generally within expected
ranges,
except
for
smalimouth bass.
W-
values
for smailmouth bass (typically
<90)
were
consistently below
optimum values. For several species,
Wr
values were highest in
Lockport Pool and
decreased in a downstream direction.
•
The
incidence
of diseased fish is very high in the UIW.
• Reproduction in
the upper portion of the study area is primarily
limited to a few
tolerant
or pelagic fishes.
• None of the measures used in this
study to evaluate
individual
or community
health
indicated that CornEd power plants were contributing to the
poor fauna observed
in much
of the UIW.
• Based on the lack of impacts and habitat-imposed constraints, it was
concluded
that the
aquatic community
of
the
UIW
would essentially
be
the same as it is
currently if
CornEd
plants were load-restricted or even taken
off
line.
III.
1995
Study
The 1995
study (EA 1996) was very similar to the
1993-1994 studies in
terms of
the area
covered, the sampling
gears
used, and the level of effort
expended. In 1995,
a
total of
393
collections
were made. When coupled with the effort in 1993
and 1994, a
total
of 1361
fish
7
Electronic Filing - Received, Clerk's Office, September 8, 2008
collections were used
to support the CornEd
Petition to the
IPCB
for the
Adjusted
Standard
regarding
thermal
standards. The spatial
patterns
seen
in 1995
closely
tracked
those
observed
in
1993-1994
(CornEd 1996). Most
trends
or
observations
noted
in
1993-1994
were
also
apparent
in 1995, namely:
• Habitat
was poor
at most
locations.
• DO values
were
typically
lower in Brandon
and
Lockport
Pools
compared
to
Dresden
Pool.
• Numerically
dominant species
were bluntnose
minnow (29.8%),
emerald
shiner
(13.2%),
common carp (8.9%),
and gizzard
shad (8.2%). Thus, the
UIW
was
dominated
by
a
combination of prolific
pelagic
species
(i.e., gizzard shad
and
emerald
shiner)
and
highly
tolerant species
(i.e., bluntnose
minnow
and common
carp).
These
same
four species
dominated
catches
in 1993
and 1994.
• A very
poor fish assemblage was
present
in
Lockport Pool. The
assemblage
in
Lockport
Pool was
characterized by
low fish abundance and
domination
by
highly
tolerant
species.
o
The
community was marginally
better
in Brandon
Pool but was
still
very
poor.
•
The fish
communities
in
Upper
Dresden
Pool and
the 5-mile
Stretch
below
the
1-55
Bridge,
Lower Dresden
Pool, and downstream
of Dresden
Lock and
Dam
were relatively
similar
to each other and noticeably
better
than those upstream
of
Brandon
Lock and
Dam but still
considered to represent
a limited aquatic community.
•
IWBmod scores were:
Lockport
Pool
2.9
Brandon Pool
2.7
Upper Dresden
Pool
and
the
5-mile Stretch
5.5
Lower Dresden
Pool
5.4
Downstream
Dresden
Dam
6.7
Using
IWBmod
criteria established
by
Ohio EPA, each
segment
would
be
classified
as
follows:
Lockport
Pool
very poor
Brandon Pool
very poor
Upper Dresden
Pool and the 5-mile
Stretch
poor
Lower
Dresden Pool
poor
Downstream
Dresden Dam
fair
o
Highly
tolerant and
pelagic species
composed 42% of the
YOY
catch.
o The
percentage
of
fish with DELT
anomalies was
high throughout
the
study
area.
R
Electronic Filing - Received, Clerk's Office, September 8, 2008
IV.
1997-2005 Annual Surveys
At the
request of CornEd (1997-1999) and subsequently
by
MWGen, EA
has
conducted
annual
adult
fish
monitoring in the lower Des Plaines River, between the Brandon
Road
Lock
and
Dam
and its confluence with the Kankakee River
(i.e.,
Upper Dresden
Pool and the
5-mile
Stretch
below the 1-55 Bridge) since 1997. Provided below is a summary
of the
methodologies
and
findings from the 1997-2005 studies. The annual fish monitoring
conducted
by
EA
included
areas
that are a part
of
the pending UAA proceeding or immediately
downstream.
Those
areas
are
the
Brandon
Pool,
the Lockport Pool, the
Upper Dresden
Pool and the
5-mile
Stretch of
the
Lower Des Plaines River immediately downstream ofthe Upper Dresden
Pool.
Although a
considerable amount of work has been conducted in the Brandon and
Lockport
Pools
during
this
period, the majority of the effort has focused on Upper Dresden Pool
and the
5-mile
Stretch.
Thus, this section only discusses work in the Upper Dresden Pool and
the 5-mile
Stretch.
For
some
of
the analyses below, study results from what was historically
called Upper
Dresden
Pool
have been
segregated into and compared between two segments: 1)
Upstream 1-55
(the
secondary contact waters of the lower Des Plaines River
from
the 1-55 bridge
upstream
to the
Brandon Road Lock and Dam, i.e., Upper Dresden Pool as defined in the
UAA
rule-making
proceeding)
and 2) Downstream 1-55 (the General Use waters of the
lower Des
Plaines
River
from the 1-55
bridge
downstream to its
confluence
with
the
Kankakee River,
referred to as
the 5-
mile Stretch in this hearing.)
Electrofishing was conducted each year using
a
boat-mounted system
energized by a
230-volt,
5,000-watt,
three-phase AC generator. In 1993, electrofishing was based on
time (15
minutes
per location) and was conducted in an upstream location. Since 1993,
electrofishing has
been
based on distance (500 meters per location) and conducted in a
downstream
direction,
which
is
consistent with other researchers’ methodologies, such as the Ohio
EPA and the
Midwest
Biodiversity Institute (MBI). Due to the change in electrofishing
methods,
data from 1993
are
excluded from
certain
analyses and comparisons. EA has made
727 electrofishing
collections in
Upper Dresden Pool and the 5-mile Stretch since 1995.
Seining was conducted each year using a straight seine that was 25 feet (7.6 m)
long by 6
feet
(1.8 m) deep
with
3/16
inch
(4.8 mm)
Ace
mesh.
The
effort
consisted of a
single haul
at each
sampling location. EA has made 583
seine collections from Upper Dresden
Pool and
the 5-mile
Stretch since 1995.
Experimental gilinetting was
conducted only during 1993-1995. Therefore,
those data are
excluded from the following analyses.
In summary, EA
made 1361 fiSh
collections in 1993-1995, 1310
collections
from
Dresden Pool
alone
during 1997-2005, and 488
more collections from Brandon
and
Lockport Pools
in
1997-
2005, a
total of3 159
collections from 1993-2005. This
compares to 11
collections
made by MBI
from
these
pools,
with all collections confined
to a single year, 2006.
9
Electronic Filing - Received, Clerk's Office, September 8, 2008
A.
TAXONOMIC COMPOSITION AND
ABUNDANCE
- Upper
Dresden
Pool
and the 5-mile Stretch
Electrofishing and seining during the
12 study years produced
143,156 fish
representing
82
species and four hybrids
(Table
1).
The 10 most abundant
species collected
were, in
descending
order
of
abundance: bluntnose minnow (22.2%), gizzard shad
(+
Dorosoina spp.)
(20.4%),
bluegill (17.2%),
green sunfish (7.0%), emerald shiner (6.6%),
orangespotted
sunfish (4.4%),
largemouth bass
(3.4%),
common
carp (2.8%), bullhead minnow (2.3%),
and
spottail
shiner
(1.9%).
These same species were also the 10 most abundant
collected during
each period (i.e.,
1993-1995 and
1997-2005):
1993-1995
1997-2005
Species
No.
Rank
%
No.
Rank
%
Bluntnose minnow
3,626
1
27.8
28,170
1
21.7
Gizzard shad
(+
Dorosoma)
2,924
2
22.4
26,220
2
20.2
Bluegill
327
10
2.5
24,283
3
18.7
Green Sunfish
413
7
3.2
9,544
4
7.3
Emerald shiner
853
3
6.5
8,568
5
6.6
Orangespotted sunfish
373
8
2.9
5,872
6
4.5
Largemouth bass
760
5
5.8
4,050
7
3.1
Common carp
796
4
6.1
3,217
8
2.5
Bullhead
minnow
345
9
2.6
2,916
9
2.2
Spottail shiner
689
6
5.3
2,068
10
1.6
85.1
88.3
Collectively, these 10 species composed remarkably similar percentages of the
catches
during
these
two periods (85.1%
vs.
88.3%)
and, individually, the percentages were
also
quite similar
between periods for
bluntnose
minnow, gizzard shad
(+
Dorosoma spp.),
emerald shiner,
orangespotted
sunfish,
largemouth
bass, and bullhead minnow. In fact, bluegill
was the
only
dominant species that exhibited an appreciable difference between
these
two
periods: 2.5% of the
catch during 1993-1995 compared to
18.7% during the period of 1997-2005.
Therefore,
with the
exception
of
some “re-shuffling”
among the ranks, the fish community of
Upper Dresden
Pool
and the 5-mile Stretch continues to
be dominated
by
the same species that
dominated
the
community
during the period
of 1993-1995. The fact that the same 10 species
dominated the
area before the Adjusted Standard went into
effect as have
dominated after it went
into
effect
indicates that the slightly higher thermal standards allowed
by
the Adjusted
Standard
did
not
affect fish populations.
B.
TOLERANCE OF FISHES - Dresden Pool
Ohio EPA
(1987,
piuS 2006 updates) classifies fish based on their tolerance
to
environmental
perturbations such
as decreasing
water
and
habitat
quality. At the high end
of the
spectrum
are
the intolerant
and moderately intolerant fishes, which exhibit a
distinct and
rapid
decreasing
trend in
abundance with decreasing habitat and/or water quality. Of
the 82
species
collected
10
Electronic Filing - Received, Clerk's Office, September 8, 2008
from Dresden
Pool, eight species are classified as intolerant
and another
eight
species
classified
as moderately
intolerant.
At the other end of the
spectrum
are the
highly
tolerant and
moderately
tolerant fishes that can become a predominant component of
the fish
community
in areas with
degraded habitat and/or water quality.
In
Dresden Pool, nine
highly tolerant
species
and
seven
moderately tolerant species have been collected.
Therefore,
an equal
number of
intolerant
and
moderately intolerant species (16) and highly tolerant and
moderately tolerant
species (16)
have
been collected. However, for years combined and for both
periods,
the relative
abundances
of
moderately and highly tolerant fishes have been markedly higher than
those of
the
intolerant and
moderately intolerant fishes. Of the remaining
50
species, 42 are
classified as
having
intermediate
tolerance and eight (mostly exotics) are unclassified.
Ohio EPA Tolerance
1993-1995
1997-2005
Years
Combined
Classification
No.
%
No.
%
No.
%
Intolerant
18
0.1
158
0.1
176
0.1
Moderately Intolerant
346
2.7
2,000
1.5
23346
1.6
Intermediate Tolerance
6,012
46.1
54,647
42.0
60,659
42.4
Moderately Tolerant
1,275
9.8
27,515
21.2
28,790
20.1
Highly Tolerant
5,156
39.5
41,724
32.1
46,880
32.8
For years combined, the
16 moderately and highly tolerant species (plus two
other taxa)
composed 52.8% of the catch. The 42 intermediately tolerant species (plus six
other taxa)
composed
42.4%
of the catch. The preponderance
of
moderately tolerant and highly
tolerant
fishes
reflects
the
degraded habitat of Dresden
Pool. For years combined,
only 1.7%
of the fish
collected were intolerant or moderately intolerant.
The relative abundances of all tolerance classifications,
except for the
moderately
tolerant fishes,
were similar between
the two periods. The relative
abundance of moderately
tolerant
fishes was
markedly
higher
for
the
period
of 1997-2005 than
for the period of 1993-1995,
due
solely to the
increased
abundance of bluegill.
V.
Summary of Fish
Community Changes from
1993-2006
Although the fish community
in
both
the pre- and post-Adjusted
Standard
periods
was
dominated
by the same 10 species and the community
continues to be
dominated by
moderately
and highly tolerant species,
there has been a modest improvement in Upper
Dresden Pool in
some measures (EA 2008).
In Upper Dresden Pool, electrofishing catch rates
(CPEs)
for all
native
fishes
combined have consistently been higher during the post-Adjusted
Standard
period
(BA
2008).
IWBmod scores during the post-Adjusted Standard period have
consistently
been as
high or higher compared to the pre-Adjusted Standard period; however, the
difference
has been
statistically
significant
in only two of the 10 post Adjustment Standard
years (BA
2008).
Native
species
richness
during the post-Adjusted Standard period has also usually
been as
high
or higher
as
during the
pre-Adjusted
Standard period. For this measure, the
difference
was
statistically
significant in
three
of 10 years.
11
ii
Electronic Filing - Received, Clerk's Office, September 8, 2008
In
summary, the present
fish community
in
Upper Dresden
Pool is somewhat
more
abundant, has
slightly
more species,
and generally has higher
IWBmod
scores
compared to 1993-1995.
However,
the community
continues
to
be dominated
by species at the high
end of the
tolerance
scale and
the community dominants
have not
changed
over
the period.
1.,
I .
Electronic Filing - Received, Clerk's Office, September 8, 2008
VI.
List of References
Commonwealth Edison Company (CornEd). 1996. Aquatic
Ecological Study
of the
Upper
Illinois Waterway (Volume 1 and
2).
EA Engineering,
Science, and
Technology,
Inc.
(BA).
1994. The Upper
Illinois
Waterway
study: Interim
Report:
1993
fisheries
investigation RM
270.2-323.2.
Report
by EA
to
Commonwealth Edison Company, Chicago,
IL.
1995a. The Upper Illinois Waterway
study:
Interim Report: 1994
ichthyoplankton investigation RM 276.2-321.7. Report
by
BA
to
Commonwealth
Edison
Company, Chicago, IL.
1995b. The Upper Illinois Waterway study: Interim Report:
1994
fisheries
investigation RM 270.2-323.2. Report
by
EA
to
Commonwealth Edison
Company,
Chicago, IL.
1996. 1995 Upper Illinois
Waterway fisheries investigation
RM
270.2-323.2.
Report
by BA
to
Commonwealth Edison Company, Chicago, IL.
1998. 1997 Upper Illinois Waterway
fisheries
investigation RM
272.1-285.5.
Report by BA
to
Commonwealth Edison
Company, Chicago, IL.
1999. 1998 Upper Illinois Waterway
fisheries
investigation RM
272.1-285.5.
Report
by
BA to Commonwealth
Edison Company, Chicago, IL.
2000. 1999 Upper
Illinois Waterway fisheries investigation RM
272.1-285.5.
Report by BA to Midwest
Generation and Commonwealth Edison Company,
Chicago,
IL.
2001. 2000 Upper Illinois
Waterway fisheries investigation RM
274.4-296.4.
Report by BA to Midwest Generation
EME, LLC, Chicago, IL.
2002. 2001
Upper Illinois Waterway fisheries investigation RM
274.4-296.4.
Report by BA to Midwest Generation
EME, LLC, Chicago, IL.
2003. 2002 Upper Illinois
Waterway fisheries investigation RM
274.4-296.4.
Report
by
BA to Midwest
Generation EME,
LLC,
Chicago,
IL.
2004. 2003
Upper Illinois Waterway
fisheries investigation RM
274.4-285.5.
Report by BA to Midwest Generation
EMB, LLC, Chicago, IL.
2005. 2004 Upper Illinois Waterway fisheries investigation RM
274.4-285.5.
Report by
BA to Midwest
Generation EME, LLC, Chicago, IL.
2007. 2005
Upper
Illinois
Waterway fisheries
investigation RM
274.4-296.0.
Report by BA
to
Midwest Generation EME, LLC, Chicago, IL.
2008. 2006 Upper Illinois Waterway fisheries investigation
RM
274.4-296.0.
Report by
EA to Midwest Generation
EME, LLC,
Chicago, IL.
12
I
.I
Electronic Filing - Received, Clerk's Office, September 8, 2008
Ohio Environmental Protection
Agency. 1987 (and 2006 updates).
Biological
criteria for
the
protection of aquatic life: Volume II:
User’s
manual for biological field
assessment
of
Ohio surface
waters.
Ohio EPA, Division
of
Water Quality Planning
and
Assessment,
Columbus,
Ohio.
125
pp.
plus appendices.
Electronic Filing - Received, Clerk's Office, September 8, 2008
Electronic Filing - Received, Clerk's Office, September 8, 2008
ATTACHMENT
2
Qualitative
Habitat
Evaluation
Index (Q1IEI) Study
of
Upper
Dresden
Island Pool, July 2008
Electronic Filing - Received, Clerk's Office, September 8, 2008
Electronic Filing - Received, Clerk's Office, September 8, 2008
ATTACHMENT 2A
Photographs of
barge fleeting
area along the right
bank of the lower
Des Plaines River
between
RM 278.0 (1-55 bridge)
and RM 279.1.
Electronic Filing - Received, Clerk's Office, September 8, 2008
1.
Electronic Filing - Received, Clerk's Office, September 8, 2008
Barge fleeting
area along right bank
of
lower
Des Plaines River
between RM 278.0
(1-55
bridge) and RM
279.1.
Facing
upstream.
H
—
I
I
Facing upstream.
Facing downstream.
Facing
upstream.
Facing downstream.
Electronic Filing - Received, Clerk's Office, September 8, 2008
Electronic Filing - Received, Clerk's Office, September 8, 2008
ATTACHMENT
2B
Photograph
documentation
log for the July 2008
QHEI
study
Electronic Filing - Received, Clerk's Office, September 8, 2008
Electronic Filing - Received, Clerk's Office, September 8, 2008
Brandon
Road Lock
and Dam
Tailwater
Near
mid-point
of MBI’s
Site
RM
“285.8” facing
downstream
and
left
bank.
Near
mid-point
of MBI’s
Site
RM “285.8”
facing upstream
and
richt bank.
Near
mid-point
of MBI’s
Site RM “285.8”
facing downstream
and
richt
bank.
e
Near
mid-point
of MBI’s
Site RlvI
“285.8” facing
upstream.
I
I
Electronic Filing - Received, Clerk's Office, September 8, 2008
RM285.l
Left Bank
Middle of
zone facing
upstream.
—
I;
Middle of zone facing
downstream.
Upstream end facing downstream.
2
Downstream end facing
upstream.
Electronic Filing - Received, Clerk's Office, September 8, 2008
RM
285.0
Right
Bank
2i4___
,
.—,—
‘-
,.*.
!!!HF
Upstream end
facing downstream.
LI-
.
-
—
-
:::
Middle
of zone
facing
upstream.
Middle
of zone facing
downstream.
—
—
r--
—
tH
3
Downstream
end
facing
upstream.
Electronic Filing - Received, Clerk's Office, September 8, 2008
RM 284.8 Left Bank
&
4hEE!
-,— -
‘-‘
Upstream end facing downstream.
Middle
of zone facing upstream.
Middle of zone facing downstream.
4
Downstream end facing
upstream.
Electronic Filing - Received, Clerk's Office, September 8, 2008
RM
284.7 Right
Bank
-..-.
Upstream end
facing downstream.
.w
.
i
—-
Middle of zone
facing upstream.
Middle of zone
facing
downstream.
Downstream
end facing
upstream.
Li
5
Electronic Filing - Received, Clerk's Office, September 8, 2008
RM 284.5 Left
Bank
Middle of zone facing
upstream.
Upstream
end facing downstream.
Middle
of
zone
facing
downstream.
6
Downstream end
facing upstream.
Electronic Filing - Received, Clerk's Office, September 8, 2008
RM 284.4
Right
Bank
Downstream
end
facing
upstream.
Upstream
end
facing
downstream.
Middle
of zone facing
upstream.
Middle
of zone facing
downstream.
7
Electronic Filing - Received, Clerk's Office, September 8, 2008
RM
284.2 Left
Bank
Upstream end facing downstream.
Middle of zone facing upstream.
Downstream
end facing upstream.
Middle
of zone
facing downstream.
8
Electronic Filing - Received, Clerk's Office, September 8, 2008
RM 284.1
Right
Bank
Upstream
end
facing
downstream.
Middle
of zone
facing
upstream.
—
Middle
of zone
facing
downstream.
9
Downstream
end facing
upstream.
Electronic Filing - Received, Clerk's Office, September 8, 2008
RM 283.9 Left Bank
Upstream end facing downstream.
Middle
of zone facing
up
stream.
Middle of zone facing downstream.
10
Downstream end facing
upstream (no photo).
Electronic Filing - Received, Clerk's Office, September 8, 2008
Middle
of
zone facing
upstream.
RM
283.8
Right
Bank
i
Upstream
end
facing
downstream.
r
-
Middle
of
zone
facing
downstream.
11
Downstream
end
facing
upstream.
Electronic Filing - Received, Clerk's Office, September 8, 2008
RM 283.6 Left Bank
Middle of zone facing
upstream.
Middle of
zone
facing
downstream.
Downstream end
facing upstream.
Upstream
end facing downstream.
12
Electronic Filing - Received, Clerk's Office, September 8, 2008
RM 283.5
Right
Bank
s-..
::.
,
L
Upstream
end
facing
downstream.
Middle
of
zone
facing
upstream.
Middle
of
zone
facing
downstream.
13
Downstream
end facing
upstream.
Electronic Filing - Received, Clerk's Office, September 8, 2008
RM 283.3
Left
Bank
Upstream
end
facing
downstream.
-
-
.t
Middle
of
zone facing
upstream.
—__
.r2EE1
Middle
of zone
facing
downstream.
14
Downstream
end
facing
upstream.
Electronic Filing - Received, Clerk's Office, September 8, 2008
RM 283.2 Right
Bank
Upstream
end
facing downstream.
-
Middle
of zone
facing upstream.
Middle of
zone facing
downstream.
15
Downstream
end
facing upstream.
Electronic Filing - Received, Clerk's Office, September 8, 2008
RM 283.0 Left
Bank
Middle of zone facing upstream.
Middle
of zone
facing downstream.
Downstream end facing
small backwater.
Upstream end facing downstream.
I—
16
Electronic Filing - Received, Clerk's Office, September 8, 2008
I
-
RM 282.9
Right
Bank
Upstream
end
facing
downstream.
“
-LIIL.
lA..
Middle
of
zone
facing
upstream.
Middle
of zone
facing
downstream.
Downstream
end facing
upstream.
-
it2L:
17
Electronic Filing - Received, Clerk's Office, September 8, 2008
00
C
Cl)
I.
I
CD
C
N
C
CD
C)
Cl)
CD
CD
C
N
C
CD
C)
C
ci)
CD
Cl)
CD
CD
C)
C
I
Electronic Filing - Received, Clerk's Office, September 8, 2008
RM 282.5 Right
Bank
Upstream
end
facing downstream.
Middle
of zone
facing
downstream.
..
Construction
activities adjacent
to
this
location.
Middle
of zone
facing
upstream.
Downstream
end facing upstream.
Electronic Filing - Received, Clerk's Office, September 8, 2008
-t
CD
S
CD
C)
C
CD
S
CD
C
N
C
CD
C)
S
I
CD
C
N
C
CD
CD
C
cl)
Electronic Filing - Received, Clerk's Office, September 8, 2008
RM 282.2
Right
Bank
-
-
--
.2
-
—
—-
Upstream
end facing
downstream.
Middle
of
zone
facing
downstream.
Downstream
end
facing
upstream.
Middle
of zone
facing
up stream.
21
Electronic Filing - Received, Clerk's Office, September 8, 2008
C
N
C
0
N
C
C
rJ)
C
0
I
I.
Electronic Filing - Received, Clerk's Office, September 8, 2008
RM 281.9
Right
Bank
Middle
of
zone
facing
downstream.
L.
Downstream
end facing
upstream.
Upstream
end
facing
downstream.
I
Middle
of zone
facing
upstream.
23
Electronic Filing - Received, Clerk's Office, September 8, 2008
RM 281.7
Left Bank
Middle of zone
facing
upstream.
Middle
of
zone
facing
downstream.
Downstream
end facing
upstream.
Upstream
end facing
downstream.
.—.
24
Electronic Filing - Received, Clerk's Office, September 8, 2008
RM
281.6
Right
Bank
EL
jZE
Upstream
end
facing
downstream.
Middle
of zone
facing
upstream.
Middle
of zone
facing
downstream.
25
Downstream
end
facing
upstream.
Electronic Filing - Received, Clerk's Office, September 8, 2008
CD
CD
CD
rI)
CD
CD
N
C
CD
CD
0
dD
CD
CD
CD
CD
0
N
0
CD
CD
0
CD
Electronic Filing - Received, Clerk's Office, September 8, 2008
RM281.3
Right Bank
Middle
of zone
facing
downstream.
L
J
Downstream
end facing
upstream.
Upstream end
facing downstream.
Middle
of zone
facing
upstream.
27
Electronic Filing - Received, Clerk's Office, September 8, 2008
RM 281.0
Right Bank
Upstream
end facing
downstream.
Middle of zone facing
up stream.
I
---
-
--E
Øj
Middle
of
zone
facing downstream.
:
28
h
Downstream
end facing upstream.
Electronic Filing - Received, Clerk's Office, September 8, 2008
RM 280.9
Left
Bank
Middle
of
zone facing
upstream.
29
Upstream
end
facing
downstream.
-
0
Middle
of zone
facing
downstream.
Downstream
end
facing
upstream.
Electronic Filing - Received, Clerk's Office, September 8, 2008
RM
280.7 Right Bank
-..-
-
Upstream
end
facing downstream.
__
—--
M kid Ic ol zonc
Iic in tipsi warn.
Middle of zone
facing downstream.
30
Downstream end facing
upstream.
Electronic Filing - Received, Clerk's Office, September 8, 2008
RM
280.6 Left
Bank
Downstream
end
facing
upstream.
Upstream end
facing
downstream.
Middle
of zone
facing
up stream.
Middle
of zone
facing
downstream.
31
Electronic Filing - Received, Clerk's Office, September 8, 2008
RM 280.4 Right Bank
-1;
%-
Upstream
end facing downstream.
Middle of zone
facing
upstream.
Middle
of zone facing downstream.
32
Downstream
end facing
upstream.
Electronic Filing - Received, Clerk's Office, September 8, 2008
RM 280.3
Left
Bank
Middle
of zone
facing
upstream.
Downstream
end facing
upstream.
Upstream
end
facing
downstream.
Middle
of zone
facing
downstream.
I
33
Electronic Filing - Received, Clerk's Office, September 8, 2008
RM 280.0 Right Bank
Middle
of zone facing
upstream.
Middle of
zone
facing
downstream.
Downstream end
facing upstream.
Upstream
end facing downstream.
34
Electronic Filing - Received, Clerk's Office, September 8, 2008
RM
279.8
Left
Bank
‘
Middle of
zone facing
downstream.
35
Downstream
end facing
upstream.
Upstream
end
facing
downstream.
Middle of
zone
facing up stream.
Electronic Filing - Received, Clerk's Office, September 8, 2008
RM 279.7 Right
Bank
jfr
.
I
Upstream
end facing downstream.
:-F
Middle of zone
facing
upstream.
I
Middle of zone
facing
downstream.
36
Downstream
end
facing
upstream.
Electronic Filing - Received, Clerk's Office, September 8, 2008
RM
279.5 Left
Bank
Middle
of zone facing
downstream.
37
Downstream
end facing
upstream.
Upstream
end
facing
downstream.
-
I•_iI
1f
—
____
Middle
of zone
facing
up
stream.
Electronic Filing - Received, Clerk's Office, September 8, 2008
RM 279.4 Right Bank
Middle of zone facing upstream.
.-
..
.7-
-;_
Upstream end facing downstream.
Middle
of zone facing downstream.
38
Downstream end facing upstream.
Electronic Filing - Received, Clerk's Office, September 8, 2008
RM279.1
Left
Bank
Downstream tip of Treats
Island facing upstream.
uII-
Mouth
of
Treats
Island
side channel facing
downstream.
Downstream
end facing
upstream.
Upstream
end facing downstream.
39
Electronic Filing - Received, Clerk's Office, September 8, 2008
RM279.1 Right
Bank
Upstream
end facing downstream.
Middle of zone facing
upstream.
-
-
.
jjj4’
Middle of zone facing
downstream.
40
Downstream
end facing
upstream.
Electronic Filing - Received, Clerk's Office, September 8, 2008
RM 278.9
Right
Bank
Upstream
end facing
downstream.
Middle
of zone
facing upstream.
Middle
of zone
facing
downstream.
Downstream
end
facing
upstream.
t
41
Electronic Filing - Received, Clerk's Office, September 8, 2008
I
C)
C
N
C
C)
C)
C
JD
C)
C
N
C
CD
C)
I
CD
C)
c1
C
Electronic Filing - Received, Clerk's Office, September 8, 2008
RM 278.7
Right Bank
Upstream
end
facing downstream.
Middle
of zone facing upstream.
L
Middle
of zone facing
downstream.
43
Downstream
end facing upstream
(no photo).
Electronic Filing - Received, Clerk's Office, September 8, 2008
RM 278.4
Left
Bank
‘
—.
Upstream end facing
downstream.
r
.—
-_
-
Middle of zone facing upstream.
Downstream end
facing upstream (no photo).
Middle of zone facing downstream.
44
Electronic Filing - Received, Clerk's Office, September 8, 2008
U’
C
1•
CD
C
N
C
CD
CD
I
CD
C
N
C
CD
I
C
J)
CD
CD
0•
C
CD
‘I
t
t’J
0
Electronic Filing - Received, Clerk's Office, September 8, 2008
C,)
CD
CD
C)
0
C,)
CD
I.
CD
0
N
0
CD
C)
CD
I
CD
0
N
0
CD
C)
0
I
Electronic Filing - Received, Clerk's Office, September 8, 2008
CD
CD
CD
C
CD
CD
C
N
C
CD
CD
I
I
CD
CD
I
CD
C
N
C
CD
CD
C
cJ)
Electronic Filing - Received, Clerk's Office, September 8, 2008
C
C
J)
C
IJ
0
0
C,)
:
0
I
0
C
Cl)
0
I
Electronic Filing - Received, Clerk's Office, September 8, 2008
ATTACHMENT
2C
Aerial photographs
showing the
sites evaluated during
the July 2008
QHEI study
Electronic Filing - Received, Clerk's Office, September 8, 2008
I
ne
yellow
lines
approximate
l
1285.8
(mid-point
actually
RM
285.5).
The
red
lines
I
approximate
Midwest
Generations
fish
sampling
July
2008.
Location
402
(RM
284.4).
EA
evaluated
both
areas
Areas
within
the
Brandon
Road
Lock
and
Dam
tailwater
that
were
assessed
with
the
QHEI
during
July
2008.
Electronic Filing - Received, Clerk's Office, September 8, 2008
ctiaic
*dtr
p.,.
II
p4
•
Areas
assessed
with
the
QHEI
between
River
Miles
284.4
and
285.1
during
July
2008.
Electronic Filing - Received, Clerk's Office, September 8, 2008
p
Areas
assessed
with
the
QHEI
between
River
Miles
283.5
and
284.2
during
July
2008.
-S.
Electronic Filing - Received, Clerk's Office, September 8, 2008
Areas
assessed
with
the
QHEI
between
River
Miles
282.5and
283.3
during
July
2008.
rr
,r
‘4
Electronic Filing - Received, Clerk's Office, September 8, 2008
Areas
assessed
with
the
QHEI
between
River
Miles
281.6and
282.3
during
July
2008.
Electronic Filing - Received, Clerk's Office, September 8, 2008
‘i.-.--
.
r
---I——I’
(I
I’.
Areas
assessed
with
the
QHEI
between
River
Miles
280.9
and
281.3
during
July
2008.
Electronic Filing - Received, Clerk's Office, September 8, 2008
f
Areas
assessed
with
the
QHEI
between
River
Miles
280.3
and
280.7
during
July
2008.
ii
Electronic Filing - Received, Clerk's Office, September 8, 2008
4
I
p
.4
:
I’4
I-t
•1’i,
1
Areas
assessed
with
the
QHEI
between
River
Miles
279.7
and
280.0
during
July
2008.
Electronic Filing - Received, Clerk's Office, September 8, 2008
Ito?
350r
—.
1
Lb
-
.,
.i
adjacent
t..
.
Island
and
1
70m
downstream
from
the
mouth
of
theside
channel.
Areas
assessed
with
the
QHEI
between
River
Miles
278.9
and
279.5
during
July
2008.
Electronic Filing - Received, Clerk's Office, September 8, 2008
•
2(9.4)
-
hered
arrows
denote
Midwest
enerations
fish
sampling
Location
405.
Area
within
the
Treats
Island
Side
Channelthat
was
assessed
with
the
QHEI
during
July
2008.
Electronic Filing - Received, Clerk's Office, September 8, 2008
.1.1
1
h
-
:__
-
-“
s—
C:
W’4F--
a
r
,
—
1
iwest
Generation’s
408.
Areas
within
the
Mouth
of
Jackson
Creek
that
were
assessed
with
the
QHEI
during
July
2008.
•
%t
1!TI
Electronic Filing - Received, Clerk's Office, September 8, 2008
I
78.O[J
I-510m
I
Areas
assessed
with
the
QHEI
between
River
Miles
278.0
and
278.7
during
July
2008.
=
17
Electronic Filing - Received, Clerk's Office, September 8, 2008
Electronic Filing - Received, Clerk's Office, September 8, 2008
ATTACHMENT
2D
Summary
of QHEI metrics
and scores for the July 2008 QHEI study
Electronic Filing - Received, Clerk's Office, September 8, 2008
U,
iqiqiq
Gradient
CD
(0
CD
CD
CD
CD
CD
CD
CD
CD
CD
CD
CD
CD
CC)
CD
(0
CD
CD
CD
CD
CD
CD
CD
CD
CD
C
a
CD
L
C) 0 0 0
C)
0 C)
C) 0 C)
C)
0
C)
0 0 0 C)
C) C) C) 0 0 0 C) 0
0
CD
0 =
C)
C
C’)
a
-)
80
(0
CD (0 co
a
(C
(C
CD
CD
CD
(C
CD
CD
CD
CD
(C
(0
(0
CD
CD
CD
CD
CD
(0
CD
(0
O
a)
D
CD
CD
CD
CD
CD
CD
CO
CD
CD
CD
CO
CD
CD
CO
CO
CO
CD
CD
CD
CD
CD
CD
CD
CO
0..
a,
Bank
Erosion&
tr,
co
Riparian
3
Zone
a)
CD
(‘4
CD N
N
CD N
N (‘(N
(‘iNN
CD
04
CD
a,
0Q
U)
c
C
w
CD
CDCD
CD
CD
F-
CD
F-
CD
CD
U)
U)
CD
CD
CD
CD
CD
CD
CD
CC)
CD
CC)
CL)
CD
F-
CD
F-
IL)
CD
CD
Instream
L))
CD
F-
CY
CO
—
0
CD
14
CL)
C)
—
—.
CO
Cover
—
Substrate
2C)
CD00C)00?
IC
a
• O
CD
oCDCDCOCDCOCDCOcD
CDCDU)CDCDCOCDCDCDCDU)
j
0
0
9
j
j
_j
—j
C
CD
c
CD
‘)
CD
CD
CD
CJ
c
C’)
N
N
-
—
- .:
CC)
CD
CD
CD
CD
CD
CO
CD
CD
CD
0)
CD
CO
CO
0)
CD
CD
CD
CO
CD
CD
CD
CD
0)
CD
CD
CD
CO
óo
E
E
N
C’)
c)
N
C’)
C’)
cj
C’)
N
N
C’)
N
j
N
C’)
C’)
C’)
C’)
N
N
C’)
C’)
C’)
N
N
N
CD
ft
CD
fl
N
-N
o
Electronic Filing - Received, Clerk's Office, September 8, 2008
-I
)I
el
II
I
!
Iiin
L)
U)
14)
10
i3i
U) C
00
i
I
4
-
U)
It)
()
C)
‘t
C4 (C
3
ILI
jj]
<I I
L0(0LOU)Lfl
10CC)
18Q
1
U)I
—
U)
‘- C) N-
i
io
0)
(0
OoEII
IC)
(0
(0
IC)
() •
0
Gradient
(0
U)
(C)
CC)
(0
U)
CII
(0
(II
CD
(0
(0
CD
CD (0
ci
C
Z C 00
0 C
C
C
8
=
0
C
N
0
I
c’J
.r8
C.)
a)
-s
_ c
(0
0a)
(0
CD
N-
(0
CD
CC
CD
(4)
CD
CD —
o
flo_
o
0(0
OC
- C
-8
CC)
Co
.-. I
Co
a)
C
I
a)
0..
owI
ç
1
0)
CO
0)
CO
(0
CO
CO
Co
D
. -I
Bank
I
CC
. (a
3Erosion&I
10U)1L)U)
U)
010
Ifl
c>
U)0IQC
(0
-C’I’
Ripàrian
I
o
C))
CO
CO
0)
0)
(0
(0
Zone
a)c
0
II)
Ci)
-8
>Q)I
l
-&
coi
COc.
‘jj
..I
o
C
I
o
c
ocoo
0
.oo
C c
>T
E —<
°‘20I
Oc00
oo0
a)
0
0).C
0
C)
C)
(0
CD
CO
CO
CO
N-
CD
(0
CC)
CO
)
0.
co
. 0.0.
C’.ECOOEE
C
CD -
CD
CD
lnstream
0)0)
0(0
‘ .c
o-c
Cover
Cfl..C
IOU)
-
U)
CO
C ,.,Ca)cDcc
Substrate
CD
(0
d
C
E
.2
1!
E
E
EE
C
C
000
(0(0(0(0(0(0(0(0
(-8
(0(0(0(0(00) (0
-
U)
C
0
I.
0)
0)
c
(0(flU)EEl
0)C0)0)
(1)
I
d
0
d
C
0)
0)
0)
0)
C
c
0)
0) IX
(0
(0
—
o
—
0
I.°
0
2
oI CO
a)
(0
CO
CO
N-
N-
N-
N-
.
N-
N-
N-
N-
N-
Cl)
C
0
8
E
E
I
N
c
-o -D
00
CO
N-
IX
C’3
C1
(‘1
Cl
(N
(N
(N
N-
U)
0
(N
°
(N
(N
(N
(0
N-
N-
(NCD
(N
C’)
-)
(NC’)
Electronic Filing - Received, Clerk's Office, September 8, 2008
ATTACHMENT
2E
QHEI
field
data
sheets
(both Ohio
EPA and
MBI-modified)
from
the
July 2008
QHEI
study
Electronic Filing - Received, Clerk's Office, September 8, 2008
-
.
Qualitative
HabitatEvaluation
ndex
f
and
Use
Assessment
Field
Sheet
QHEI
Score
Stream
& Location:
%
‘f,’
-
•3-&
7’)/L-
RM:8’SDate:oFJ)oI
08
Full
Name
&
Affiliation:
T&’
C.4
-
-
STORET#:
18_
__.
- POOL
RIFFLE
—
—
aI substrates;
ignorE
-
_ge
from
point-sources)
2]
,TkEAMcoVER.lndicatepresenceQto
quality
2
Moderate
amounts
3:
O-Absent;”i-Very
but
not
of highest
smallquality
amounts
or
or
in small
if more
amounts
commonofof
highest
marginal
AMOUNT
quality
3
Highest
quality
in moderate
or
greater
amounts
(eq
very
large
boulders
in deep
or fast
water
large
Check
ONE
(0r2 &
average)
diameter
log
that
is
stable
well
developed
rootwad
in
deep flast
water
or deep
well defined
functional
pools
Q
EXTEl
5%C11j
.....i.
‘rt2
jt1I1
_L
L
DPPRI(i11
hIAmI
V AQtM
t40
Primary
Contact
Secondary Contact
(circle one
and comment
on
back)
I,
PooIIf4
lñiEatifo,rebh
6iáiiid
ru/lu
Current
(f
Comments
‘
Maximum
12
‘-‘
Indicate
for
functional
riffles;
Best
areas
must
be
large
enough
to support
a population
-
‘of
riffle-obligate species:
..
Check.çNE
(Or2
& average).
DNO
RIFFLE
[metric-Ol
RIFFLE
DEPTH
RUN
DEPTH
RIFFLE
I
RUN SUBSTRATE
RIFFLE
I
RUN
EMBEDDEDNESS
-
Q
BESTARE45eñ
QJNTAB
TFifs
Grail
ImetncO1
CtsJ
‘
“‘
6]
GRADiENT
(c9/
Jmi)
Q
%POOL:(J
%GLIDE:(OD
DRAINAGE(I.mI
2
)
Q
IRY11
%RUN
L?)%RIFFLE
CD
EPA 4520
River
Code:
1]
TRATE
Ch
e
.k
ONLYTw0
substrate
PIPE
E
mate %‘or
note every
1
OO’RFLE
J
Check
ONE
(Or 2
&
average)
OF
Cömmènts
Comments
3]
Check
ONE
in
each category
(Or
2 & average)
C.
Cover
Maximurn/31
Channel
Maximum.
c(or
?
per
bank &
average)
i;
Indicate
predominant
land
use’s
-
-
,Jpàst400n7 rlparian.
Riparlan
—
I
.r
/
f
25%
(I
2.3
)
Maximum
,ç
-—.‘
10
/
-
CURRENT
VELOCITY
Check
ALL that
a’ply
I
I Rcration
PotntIaI
II
/
V/
U
-
I
—
iMaxbnumi
Gradient
Maximum
10
06/11/08
Electronic Filing - Received, Clerk's Office, September 8, 2008
Qualitative
Habitat
Evaluation
Index
and
Use
Assessment
Field
Sheet
QHEI
Score
Stream
&:
LocaUoh:
..
/af
—
tJ
—
A
RM:
8
S•t
Date:
I(2I
08
Full
Name
&
Affiliation:
•Tht
t)uLh
C
4
Lati
Lonq.:
Office
verffiedQ
-— — —
—
—
INAD
83- dac!mI
) —
—
—
—
—
—
——
RiverCode:
-
-
STORET
#:
—
location
1]
SUBSTRATE
Check
ONLYTwo
substrate
7YPE
BOXES;
estimate
%
or note eveiy
type
present
BEST
TYPES
RIFFLE
OTHER
TYPES
POOL
RIFFLE
Do
BW
tO-iL-.
E]
—
00
QJ
EWj9]-I.
—
00
—
00
0
EJ
cj-
—
Ju
GRE_
—
C
QI[2
$_
—
00
—
C
C
—
D
(Score
natural substrates;
ignore
NUMBER
OF
BEST
TYPES
24o1
ore
L21
slucige
from point
sources)
Conme.nts
D1LQJ
41
Oto3:
O-
Check
ONE
(Or 2
&
average)
QUALITY
- I
DM6DE
4i
Substrate
SILT
_
!MODERATE1j
Maximum
20
()
Maxunum((
amounts
rootwad
in
dee
or
deep,
-
-J
!!
1
Comi
3]
CHANNEL
MORPHOLOGY
Check
ONE
in each
category
(Or
2
&
average)
SIN.USITY DEVELOPMENT
CHANNELIZATION
•
DWJM
1
DJJ’i:
J
0
PDATE1[3]J
C
C
El
I]
OVEINf
J
C
Cöñièbt
41
lANb
F
I
Iowhstream
LF
STABILITY
Channel
Maximum
WK(Or
2perbank
&
average)
ntland
use(s)
Rlpariañ
Maximum
10
LJU
JD
Cominenjs.
)
/,.
‘
,
1
J
1
/
4
M
5]
PQOLP3LIDEAND
RIFFLE/RUN
QUALITY
MA-XiMUMbEPTH
CHANNEL
WIDTH
CURRENT
VELOCITY
Recreation
Potential
ChëckONE(ONLY!)
Check
ONE
(Or
2 & average)
Check
ALL
that a
ly
Primary
Contact
DEAS
Secondary
Contact
o
0ti*L4F
PRQ
O
FLD4
[1J
C
vERjASr[1]
(cirdo
one
and comment
on back)
I
opm[2I
0
P9OL
FFW
[01
Dj
C
RM1T[
1J
DjIj11
Pool
/
D
0 2m[0J
Indicate
for reach
pools and
nifies
Cuirent
j
Comments
Maximum
____
Indicate
for
functional
riffles;
Best
areas
must
be large
enough
to support
a
population
of
riffle-obligate species:
Check
ONE
(Cr2
& avemgei.
NO
RIFFLE
Imetric-Ol
•RlFELEDERTH.
•
RUN.DEPTH
c
.RlFFLEbRUNSUBSTRATE..
RIFFLE!
RUN
EMDDEDNESS
0
DL
Lfl2I
0
TRE
jIJ
C
MAXMUM
50cmi1
O
0
GNSTrieI%td[0j
-
-
-
Coinmèflts
6]
GRADIENT
(
4Cr
ftlml)
C
DRAINAGE
AREA
0
MODJA
6-1I
(mI2)
0
I1iGHVERY
IG
[10
61
%POOL:(
%GLlDE:CQ)
%RUN:
C_J%RIFFLE:CD
uNuNLzI.
O
MODERATE:[OJ
Himel
—
O
E$iNSIYt-11
Maxim:rn
B
‘.—
Gradient
Maximum
•10
__.i
EPA
4520
7/ft/or
06/11/08
Electronic Filing - Received, Clerk's Office, September 8, 2008
QualltativeHabjtát
Evaluation
Index
and
Use
Assessment
Field
Sheet
HEI
Score
‘
2]
INsTREAM COVER
qUality;
Indicate
2-Moderate
presence
0
amounts,
to
3: 0-Absent;
but
not
1-Very
of highest
smallquality
amounts
or
in
or
small
if
more
amounts
commonofof
highest
marginal
AMOUNT
ciuality
3-Highest
quality
in
moderate
or greater
amounts
(e
g
very
large
boulders
In deep
or fast
water
large
Check
ONE
(0r2
& average)
diameter
log that
is
stable
well
developed
rootw
1d
in deep!
fast
water
or
deep
well
defined
functional
pools
Q
_LOJZ2J
_o
ACATERS
fl
O25
i[7)
1i
1L
U
••.•
U
‘UlMiNlNi3QNST1jJUjOJi
U
A&I
D1A4
D
Indicate
fredomThantia;d
useft
DN*
U’
nct
10Dm
nparlan
Riparlan
—
Comments:
Maximum
5]
POOL/GLIDEAND
RIFFLE/RUN
QUALITY
MAXIMUM
DEPTH
CHANNEL
WIDTH
CURRENT
VELOCITY
Recreation Potential
Cheàk
ONE
(ONLYI)
Check
ONE
(Or2
&
average)
Check
ALL
that ap
ly
Primary
Contact
•—
U
Secondary
Contact
UO$j4L
U
VEAST)j11W
DERJ
(cjrcio
one
andcomrnentonback)
U
O4[21
Q
POOL
WIO!RcmFFLMDTIt[OJ
U
U
Drvpcij
Pool!
U
.
2?n
[0]
Indicate
for
reach
pools
and nffles
Current
Comments
Maximum
Indicate
for
functional
riffles;
Best
areas
must
be
large
enough
to
support
a
population
‘
of
riffle-obligate
species:
Check
ONE
(0r2&
average).
RIFFLE
metrlc—0]
RlFELEDEPTH
RUNOEPTH
RIFELE
IRUNSUBSTRATE
RIFFLE!
RUN
EMBEDDEDNESS
UR4cit[2f
QM
UMe5p
[2
DE
U
S11I
DMAXIM1JM
-5m
[‘J
Q
MDTA
r1
U
PW4
-
-.
siAA
5d1
D1INSABLE
(
F1siW[oJ
QoDtEror
‘Ci
-
-
am
D::
Maximum
6]
GRADIENT
(
<O
I
ftlml)
D
%POOL:(jQ)
%GLlDE:CD
Gradient
DRAINAGE
A>RE
%RUN
C__D%RIFFLE
CD
Maximum
EPA4520
2
-cj-yi.--P
AC
/l6
1
O6i’11/O8
/
Strèäm
&
Location:
Pks
K.
.
i
tE
River
Code:_
1]
SUBSTRATE
C
e
RM:-5j
Date:67J)
o
108
.Scorers
Full
Name
&
Affiliation:
C
-.&
tt
CA
Lat.fLoncg.:
n,
L
(&
ffi
Q
f
5-3
Office
verified
- —
—
——
iNAD83.decimT°i_J
j
-
.2-_
..
“J
•
1.__
location
-
-
STORET#:
ONLYTw0
substrate
TYPE
BOXES
%
or
note
every
type
present
L RIFFLE
OTHER
TYPES
POOL
RIFFLE
—
U
DuK*
—
U
—
U
—
(Score
natUral
subsfrates
ignore
NUMBER
OF
BEST
TYPES
4gmtI
sludge
from
pont
sources)
Commêrit
DlejQ1
Check
ONE
(Or2
&
average)
QUALITY
DHV21
SILT
Substrate
iI
L.)
ürnum
3-
Cover
Cömmen.
Maximum
3]
CHANNEL MORPrIOi_OGY
Check
ONE
In
each
category
(Or 2
& average)
SINUOSITY
DEVELOPMENT
CHANNELIZATION
STABILITY
U
U
Ii
U
Comments
Maximum
4]
BAKE
SIdNANDRIPARIANZONE
Check
ONE
in
each
catégoryfàr
E4
CH
BMK(Or
2perbank
&
average)
River
riglitlooking
downstream
RIPARIAN
WIDTH
FLOOD
PLAIN
QUALITY
Electronic Filing - Received, Clerk's Office, September 8, 2008
River
Code:
-
STORET#:
1]
SUBSTRATE
Check
ONLYTwo
substrate.
TYPE
BOXES;
.
estimate
%
or
note
evely
type
present
Check
ONE
(Or
2 &
average)
BEST
TYPES
POOl
RIFFLE
OTHER
TYPES
POOL
RIFFLE
ORIGIN
QUALITY
.r
GD
t5RILABS
oI_
C D
UA
N[4J_
—
D3IMESTONEt11
DDJ
C
DLJL
SILT
sste
DC
—
C
Ditt2E
_
[3D
—
11(3
L
—
C
C
—
Dpjj9
QL4
DD
1
‘LJ
CJ[
-
(Score
natural
substrates
ignore
DJI
F
19T
ITrn
NUMBER
OF
BEST
TYPES
L
sludge
from point
sources)
jj0J
20
omm
FINL
C
3
2IlNsTREAMCOVER
:..
•:.
Indicate
presence
0
to
3:
0-Absent;
1-Very
small
amountsi
if more common
of marginal
—LtJOUNT
..
.. .qUaity;.
2Moderate
amounts,
but
not
of highest
quality
or
in small
amounts
of highest
quality
3
Highest
quality
in moderate
or
greater
amounts
Ce g very
large
boulders
in
deep
or
fast
water
large
Check
ONE
(0r2
&
a,yrage)
diameter
log
that is
stable
well developed rooyad
in
deep
/
fast water
or
deep well
defined
functional
pools
C
tEIEN)
‘.
z
NR)[11
o9T[
O
Cover
Maximum
C
predominant
land use(s)
past
lOOmriparian.
Riparlan
Maximum
9
44
J-
,
MJZZ?
J-l--
O
10
5] POOL
JLJDE
AND
RIFFLE/RUN
QUALITY
.
MAXIMUM
DEPTH
CHANNEL
WIDTH
CURRENT
VELOCITY
Recreation
PotentlaI
Check
ONE
—
(pNLY!)
Check
ONE
(Or 2
&
average)
Check
ALL that
ápniy
Primary
Contact
I
DTWt
Secondary
Contact
I
*%
I
(ckcIeonoandcommentonj
D[1]
2jt
D
O2rnJOT
Indicate
for
reach
pools and
iimes
Comments
Pool!
Indicate
for
functional
riffles;
Best
areas
must
be
large
enough
to support
a population
Maximum
Q
of
riff!e-obligate
species:
Check
QNE
(0r2
& average).
reO
RIFFLE
[metric-Ol
.
...:.RUNDERTH. .‘
:
RIFFLE:kRUNSUBSTTE....
RIFFLE
I RUN
EMBEDDEDNESS
C
BEST
Th1W21
DNMy
E2
D
bblL
DJ1
DMXIMUM
50cri1
D11
C
-
C
BESTARES
56ii-
D
UNSTABLE4
F1eaT01
ci
RIfle /
[rne&lc0]
.
-
øj
6]
GRADIENT
(<er
I
ftlml)
C
VER
LWt2.4J
-.
%POOL
%GLIDE
Gi
Gradgen
DRAINAGE
AREA
C
.
Maximum
£
I,’mi2)
C
HIGWVERYIGf1[W$J
%RUN
C
J%RIFFLE
(J•••
10
,
EPA4520
-
.
-
Qualitative
Habitht
Evaluation
Index
and
Use
Assessment
Field
Sheet
Q
core
Stream
&Location:
7e
?ot
f’
—
So
,4J
RM:,2
g5’ç
Date:oJ
I
LJ
08:
J&
J’
.
j
Scorers
Full
Name
&
Affiliation:
c
Iji4.
4
Cy%1,y4
Oificeverifted
L24L
I8g.L/L
Comments:
3]CHANNEL
MORPHOLOGY
Check
ONE
in each
category
(0r2
& average)
SINU.QSITY.
DEVELOPMENT
CU
STABILITY
.
P.
D9JRAT3I
C
D4
4
C
E111
Channel
Comments
Maximum
L!J
4]
BANK
EROSION AND
RIPARIAN
ZONE
Check
ONE
in each
category
for EACH
BANK(0r2
per
bank &
average)
River
right ioeking
downstream
L R
RIPARIAN
WIDTH
Fl
I A I I
EROSION
C
I1P
C
Comments
3
/16
10
P
06/11)08
Electronic Filing - Received, Clerk's Office, September 8, 2008
Qualitative
Habitat
Evaluation
Index
and Use
Assessment
Field
Sheet
QHEI
Score
.
P)
4
t,g
2
River
Code:
-
-
STORET
#:
1] SUBSTRATE
Check
ONLYTwo
substrate
TYPE
BOXES;
estimate
%
or note every type
present
BEST
TYPES
POOL
RIFFLE
OTHER
TYPES
POOL RIFFLE
00 BLDR.ISLA.BS.L101_
—
El
DH DPANL4I;_
—
El El
BOULDER
[9] ..
—
El
ElP.ETRITVS.[3] _._.
DDCOBBLE[8]:::
-_
ElElMuc.K[2].;.::.__
DEl
GRAVEL(7]
.._
21’QSILT[2]
El
SAND [6]
El El
ARTIFICIAL
[0]_
—
El
El
BEDRO!K
(5
—
—
(Scoro
natural substmtes
Ignore
El
NUMBER OF
BEST
TYPES:
or more
L2j
sludge
from
point-sources)
El
Comments
El3
or less
[0F,.
c
2]
INSTREAM
COVER
Indicate presence
0 to
3:
0-Absent;
1-\
quality;
2-Moderate
amounts,
but not
c..
quality;
3-Highest
quality
in
moderate
or greeter
arndunts
(e.g.,
very Is.
diametor
log that
is stable,
wall developed
rootwd in
deep!
fast water, or
deep,
well
Ill
..
_.L_ POOLS
.ZOorL1
—.
—
OVERHANGING
VEGETATION
[1]
—
ROOTWADS
(1]
_L.
—
sHALLpWS.IN
SLOW
WATER
1]:
__
BOULDERScll.:.
/
_R0PTMAT5E1]:
Cover
Comments
3
Maximum
3] CHANNEL
MORPHOLOGY
Cticck
ONE in
cacti category
(Cr2 & average)
SINUOSITY
DEVELOPMENT
CHANNELIZATION
STABILITY
El
HIGH
[4]
Q
EXCELLENT
[TJ
El
NONE
[6]
HIGH
[31
El
MODERATE [3]
El
GOOD
[51
El
RECOVERED
[4]
0
MODERATE
[21
El
LOW
[2]
El
FAIR [3]
J
RECOVERING
L3]
LOW
[1]
NONE
[1)
.f
POOR
[11
2
RECENT
OR
NO RECOVERY
[l
Channel
(_Th
Comments
.
.
Maximum
4j BANK EROSION
AND
RIPARIAN
ZONE
Check
ONE in
each category
for EACH
BANK(Or
2
por
bank &
average)
Rv,rri.jhtIookjnadownsIrci,n
RIPARIAN
WIDTH
FLOOD PLAIN
QUALITY
,
EROSION
I1 El
WII5E
>5Om[4]
.:
0 Il
El
ÔOER,AflóNTiL•ÔEL11
E1
NONE
I
LITTLE
[3]
El El
MODERATE
10 50m [3]
El El
SHRUB
OR
OLD FIELD
[2]
URBAN
OR
INDUSTRIAL
[01
El
El
MODERATE
[2)
0 El
NARROW 5 1Dm
[2]
El El
RESIDENTIAL
PARK NEW FIELD
[1
El El
MINING
I
CONSTRUCTION
[0]
El
El
HEAVY!
SEVERE [1]
El
VERY
NARROW
< Sm [1)
El El
FENCED
PASTURE [1]
Indicate predorr:nant land use(s)
21
El
NONE [0]
El El
OPEN
PASTURE
ROWCROP
(0]
past
lOOm npanan
Riparian
Comments
())
Maximum
5]
POOL
/
GLIDE AND RIFFLE/RUN
QUALITY
MAXIMUM
DEPTH
CHANNEL
WIDTH
CURRENT
VELOCITY
Recreation
Potential
Check ONE (ONLY!)
Check ONE (0r2
&
average)
Check ALL that
apply
Primary
Càntact
.
ml [6]
El
POOL
WIDTH> RIFFLE
WIDTH [2]
D
TORRENTIAL
[
1L.’LOW
[11
Secondary Contact
El
07.-c1m [4]
.,lPuoLWIiSH
.IFFLEWiDm.(i]
UVERYFAST
[1]...:
EJINTERSTITIAL
[-1].
(circ!eoneondcommentonback)
El
04<0 7m [23
El
POOL
WIDTH
< RIFFLE
WIDTH (0]
El
FAST
[1]
El
INTERMITTENT
2]
El
02-<0.4m
[13
El
MODERATE til.:.
El:EbbIEs[1]...
.
Pool!
/
El
<0.2ni.0J
Indicate
fórrech
- doil
añitifileá.
Current
Comm
ciits
Maximum
Indicate
for functional
riffles;
Best
areas must
be large
enough to support
a
population ,“
of
riffle-obligate
species:
Check ONE
(Cr2 & average).
.
iriiiO
RIFFLE [metrlc-Ol
RIFFLE DEPTH
RUN DEPTH
RIFFLE
I
RUN
SUBSTRATE
RIFFLE
I
RUN
EMBEDDEDNESS
El
BEST
JRE.S
cv
r21
El
MAXIMUM
> 50cm
ri
El
STBLE
‘e g
Cobble, Pojde
)
0
‘O’E [2]
El
BEST AREAS
5 10cm
Mi
El
F.1AXIMUM <50cm
111
El
MOD
STABLE
(e g Large
Gravel)
[11
El
LOW [1]
C
BES
r
AREAS <5cm
0
UNSTABLE
(e
g Fine
Gravel,
Sand) (0]
El
MODERATE
[0]
/
.
...
El
EXTENSIVE
f-li ..
.
Ufl
Comments
..
eiximurn
6]
GRADIENT
,
(
El
VERY
LOW
-LOW [2-4]
%POOL:(J/i’O
)
%GLIDE:
1
‘)
Gradient(i
DRAINAGE
AREA
El
MODERATE
[6-10]
r-
.
Maximum
.j&rni2)
El
HIGH-VERYHIGH10-6J
%RUN:
t
j%RlFFLE:t,
j
10
-‘
EPA 4520
>--7
‘?
/1611)
06/11/08
,1
/
Stream
&
Location:
_RM:
VJJ.Date:
°71
_iI 08
.Scorers
Full Name
&
Affiliation:
1e
LfA-
f’41/f/f
I!;ii.
18
I8
Oft7ceventiecf
El
Check ONE
(Cr2 &
average)
re, comm
Substrate
Maximum
20
‘‘9l
AMJNT
Check ONE
(0r2 & average)
El
EXT
NSIVE?.75%
[fl]
El
MØ%[7]
SPARSE 5-<25%
[3]
I
El
NEARLY:ABSENT<5%:[1]
Electronic Filing - Received, Clerk's Office, September 8, 2008
Qualitative
Habitat
Evaluation
Index
.
and
Use
Assesm.ént
Field. Sheet
HE! cor
Stream
&
Loàation:
j
7
(y
—
c2
..
RM:
/
7
Date:
ô-f
L
11
08.
Full
Name
&
Affiliation:
.Toe
JusL.
iL
RiverCode:-_-___STORET#:
.
.Li1..a
I8.
OffIce,ehidu
1]
SUBSTRATE
Check
ONLYTw0
substrate
TYPE
BOXES;
estimate
%
or
note
every
type
present
Check
ONE
(Or
2
&
average)
BEST
TYPES
POOL
RIFFLE
OTHER
TYPES
POOL
RIFFLE
ORIGIN
QUALITY
j
D
C
—
C
A14J
i_
DtuMEbNE
t1
C
C
C
C
AR1JIAL
[0]_
—
D4BONLI
cL2I
C
C
(Score
naturaubsfrates
ignore
F’%
DpL[I
fin
NUMBER
OF
BEST
TYPES
jmL2
sludge
from
point
sources)
C$E[
20
Comments
.
2]
INSTREAM
COVER
Indicate
presence
0
to
3:
0-Absent;
1-Very
small
amounts
oilf
more
common
of
marginal
AMOUNT
Uality;
2-Moderate
amounts,
but
not
of
highest
quality
or
in
small
amounts
of
highest
quality
3
Highest
quality
in
moderate
or
greater
amounts
(e
g
very
large
boulders
in
deep
or
fast
water
larqe
Check
ONE
(Or
2&average)
diameter
log
that
is
stable
well
developed
rootwad
in
deep!
fast
water
or
deep
well
defined
functional
poois
Q
EXTE
VEf75%14
—L!r1a.
—.
C
LG1Ni9ftIk
I
Qt
MRW1
/
9QLIE.SJ[11
—
oG
QPrsj1
f
MamumQ}
3]CH4.L.MORI?iiOLOGY
siNuosrry
:DEvELopMENT
C4j7
C
E
tLE[7I
,E1
ODRATEj3J
C
Gó5j
C
DflflA1iff
II1
Channel
mments
Maximum
4]
BANK
EROSION
AND
RIPARIAN
ZONE
Check
ONE
in
each
category
for
EACH
BANK
(Or
2
per
bank
&
average)
River
rlghtlooking
downstrom
RIPARIAN
WIDTH
FLOOD
PLAIN
QUALITY
L
EROSION.
iS
iS
têWj?
C
PJ
IJEC
C
5°3M
C
DoAi
C
C
D
A!fl!ItØ$i
CC
OM2J
C
JA
1E
C
DpTj)ioJ
C
IILNC
C
JJfjj
Indicate
predominant
land
use(s)
El
C
N9N[0I
5
T
C
CioEAsTuR
OoRP)[9%
past
lOOm
ripanan
Rlparlan
Comments
.
Maximum
I
‘ID
51
POOL
/.GLIDE
AND
RIFFLE/RUN
QUALITY
‘
>
-‘______________
MAXIMUM
DEPTH
CHANNEL
WIDTH
CURRENT
VELOCITY
Recreation
Potential
Chéck0NE:ONLY!)
Check
ONE
(Or
2
&
average)
CheckALL
that
ap
ly
Primary
Contact
I
T6W
C:Hj
C6ÔW
Secondrt,
“ontact
I
C&
ñ4j
Pbo
tTH
[1
C
Fé?iIj4
CR
rTTj1]
(circle
one and
comment
on
backJ
C
O4o7rnb]
C
pOdbMDm
<
RILEDTH[
CR1.iTftENtI2]
CyiuII
.
MOEt,J
oj
P001/
D-Ô
2n1J01
lndiE
for
reach
8&i”nd
Current
II
/
o
I
Comments
Maximum
‘U
Indicate
for
functional
riffles;
Best
areas
must
be
large
enough
to
support
a
population
,..
.
of
riffle-obligate
species:
Check
ONE
(Or2&
éverage).
.
,NO
RIFFLE
[metrlc-0]
RIFFLE
DEPTH
RUN
DEPTH
RIFFLE
I
RUN
SUBSTRATE
RIFFLE
I
RUN
EMBEDDEDNESS
C
BEt
AJT2r
C
rI
J4[2j
C
D2E
-
C
B
R4Lt0
1]
C
MAXIMUM
50&n
[1]
C
STA(L
i4[IL
Cr11
C
BETREAS
DNSJ4((
Fict)
[0]
C
4ØLRTUo]
Riffle!
(
6]
GRADIENT
(
ftIml)
DI
%POOL:(J
%GLlDE:Q
Gradient
DRAINAGjl
%RUN
D%RIFFLE
CD
MaYImumLj
EPA
4520
-
/
(
(
(
()
-‘
06111/08
_YL1iUr
Comments
Electronic Filing - Received, Clerk's Office, September 8, 2008
Qualitative
Habit
Evaluation
Index
and
Use
Assessment
Field
Sheet
QHEI
$core
Stream&Location:
.Z2-P//
,&r-
‘5
(8
RM:L.5Date:O7I/)IO8
Full
Name
&
Affiliation:
7e
t.Jo
L&c
6Z
River
Code:
-
-
— __STORET#:
fltjT3j
I8.
t2fe
Office
venfledQ
11
SUBSTRATE
Check
ONLYTwo
substrate
7YPEOXES;
estimate
%
or note
every
type
present
Check
ONE
(Or 2
&
average)
BEST
TYPES
POOL
RIFFLE
OTHER
TYPES
POOL
RIFFLE
ORIGIN
QUALITY
QQ
BLDRISLABS[10]..I....
C
DHARDPAN[4]
—
DUMESWNE[1]
HEAVY[,2].
C
C
BOULDER
[9]
•.....
Q
DETRITUS
[3] .-
—
.TILLS
[1]-’
fJ
MODERATE
[1]
Substrate
JrD
COBBLE[8]
C
CMUCK[2]
—
CWETLANDSLDT
SILT
.NORMAL[0]
‘
O
0
GRAVEL
[7]
—
Q
SILT
[2]
::
?HARDPAN
[0]
Q
FREE
ij
C C
SAND
[61
—
Q
Q
ARTIFICIAL
[01_
—
C
SANDSTONE
[0]
1EXTENSIVE 2]
_____
U U
BEDROCK
[51
—
—
(Sccm
naturil
ubstrates
ignore
C RlPlRAP[0]
DE
MODERATE
[11
1ium
NUMBER
OF
BEST
TYPES:J4
ormdre
[2]
sludge
from
point-sources)
D.LACUSTRINE0J
NORMAL
LO]
20
Comments
lose
[01
DcoA.21
C
NONW
2]
INSTREAM
COVER
quality;
indicate
2-Moderate
presence
0
amounts,
to
3: 0-Absent;but
not1-Very
of
highest
small
quality
amounts
or
or
In small
if
more
amounts
commonof
of
highest
marginal
AMOUNT
quolity;
3-Highest
quality
in moderate
or
greater
amounts
(e.g.,
very
large
boulders
in
deep
or fast
water,
large
Check
ONE (0r2
&
average)
diameter
lcg that
s stable,
well
developed
rootwad
in
deep!
fast water,
or
ep,
well-defined,
functional
pools.
Q
EXTENSIVE75%L11I
—
UNDERCUT
BANKS
(l1
.._L
POOLS
>
70cm
[23
OXUOWS
BACKWATERS
[I]
Q
MODERATE
25
75% [7]
—
OVERHANGING VEGETATION
[1]
—
ROOTWADS
[1]
_L..
AQUATIC
MP1ROPHTES
[1]
.
SPARSE
5-<25%
[3]
—
SHALLOWS
(IN
SLOW
WATER)
[1]
..L
BOULDERS
[1]
,,_
LOGS
OR WOODY
DEBRIS
[1]
1
IAD!
V
AFF
°1
rn
_ROOTMATS[1]
.
2
Cover
Maximum
20
INK
(Or2
per bank
&
average)
qSHTILAGEi3-
U
jTItRON
[0]
Indicate
predominant
land
useftJ
past lOOm
riparian.
Riparlan
Con7ments
1
Maximum
5]
POOL/GLIDEAND
RIFFLE/RUN
QUALITY
MAXIMUM
DEPTH
CHANNEL
WIDTH
CURRENT
VELOCITY
Recreation
Potential
Check ONE
(ONLY’)
Check
ONE (Or
2 & average)
Check
ALL
that apply
Primary
Contact
Q
0.7<lrn
tm
[6]
141
U
POOL
WIDTH>
RIFFLE
WIDTH
[2]
D
TORRENTIAL
[1] SLOW
[1]
Secondary
Contact
i
POOLWIDTH.=
RIFFLE
WiDTH
LI] U
VERY.FAST
111..:
C
1NTERSTITIAL.L.1].
(circ!aoneandcommentonback)
004<0
7m
[2]
Q
POOL
WIDTH
<RIFFLE
WIDTH
[0]
C
FAST
[1]
0
iNTERMITTENT
[2]
_____
Q
0.2,<OArn
[1]
C
MODERATE
[1).
C
EDDIES
p].
.
Pool/$
C
<0.2m
[0]
Indicate
fa? reach
- pooI
Id
,iffles.
Current
Comments
Maximum
Indicate
for
functional
riffles;
Best
areas
must
be
large
enough
to
support
a population
of
riffle-obligate species:
Check
ONE
(0r2
&
avorege).
,dJNO
RIFFLE
[me nc—
-
]
RIFFLE
DEPTH
RUN
DEPTH
RIFFLE
I RUN
SUBSTRATE
RIFFLE
I
RUN
EMBEDDEDNESS
C
BEST
AREft.S
>10cm
[2j
Q
MAXIMUM
> 50cm
[2]
C
STABLE
O;9.,
obbIàBàuIdo
)
121
C
NONE
L2]
[1
BESTAREAS5.lOcm:[1j
C
MAXIMUM
<50cm
[1]
C
MOD:STABLE(e.g.,
rae.GravelH]
C
LOW[I]
.
I
BEST
AREAS
<5rn
C
UNSTABLE
Fine
Grvel,
Sand[0]
C
MODERATE
[0]
“g9(
‘
[metricO]
.
CEXTENSIVEI-1]..
Ufl
1
Comments
1axwnurn,
6]
GRADIENT
O(
ftIm
C
VERY
LOW
. LOW
[2.41
%POOL:%GLlDE:C
)
Gradlentr
DRAINAGEA
ml
2
)
Q
HIGH-VERY
HIGH
[10,6]
%RUN:
(
)%RIFFLE:E)
MaximLLjJ
EPA
4520
/
5
[
2
j,
37
J..J
?
/
/
(,
f
c
06/11/08
Comments
‘)l
C.,
--v-
If
2
.QQ’(
Check
ONE
in each
category
(Or
2 &
average)
--.---.-“i
4:2
STABILITY
DMt21
1
Channel
MaxImum
Electronic Filing - Received, Clerk's Office, September 8, 2008
Qualitative
Habitat Evaluation
Index.
.
..;...
and
Use
Assessment
Field
Sheet
QHEI
Score
Vi
RM:?q
Date:
11
‘Li
08
Scorers
Full
Name
&
Affiliation:
Z
‘.
ZE4
/tirv)i
Lati
Lona.:/j
I
,i
Office
verified
tit
I.
• .9. L
.L .I_
i”L
——
—
location
Substrate
0
Maximum
20
2]INSTREAM
COVER
qUality;
Indicate
2-Moderate
presence
0
amounts,
to
3:
0-Absent;
but
not
1-Very
of
highest
smaN
quality
amountsor
in
or
small
if
moreamounts
commonofof
highest
marginal
AMbIINT
quality
3
Highest
quality
in
moderate
or greater
amounts
(e
g
very
large
boulders
In deep
or fast
water
large
Check
ONE
(0r2&average)
diameter
log
that
is
stable
well
developed
rootwad
in deep!
fast
water
or deep
well
defined
functIonal
pools
Q
_%AUR
_BR
C
L
tqji
—
9WD$j
L
..L..
WJILOVJER)t1J
—
NOOYJER1J
YABSET
<‘1]
Comments.
J
c-
3]
CHANNEL MORPHOLOGY
Check
ONE
in
each
category
(Or
2
&
average)
SlNUOSfl
DEVELOPMENT
C
C
C
ODERAT3]
C
&t5I
C
COW14:
Cm
..
.
4]
BANK
EROSION
AND
RIPARIAN
ZONE
Check
ONE
in each
category
for EACH
BANK
(Or 2
per
bank
& average)
River
riehtiooidng
downstream
RI
PARIAN
WIDTH
—
—.
b
R
EROSION
wijV
rS
LE3)Q
D
C
CLOIDUSJR1Ø1
C
DL1
Indicate
predominant land use(s)
past lOOmrlpailan.
Riparlan
:ii/vA
/oi,
5]
POOL
IGLIDEAND
RIFFLE/RUN
QUALITY
-
MAXIMUM DEPTH
CHANNEL
WIDTH
CURRENT
VELOCITY
Recreation
Potential
Check
ONE(ONLY!)
Check
ONE
(Or
2 &
average)
Check
ALL
that
a ply
Primary
Contact
DO
4D
7rhJ
C
POOL
flDTIRIFFLE
WIDTh
[0J—’FAST
[1
DTNtEMITrENt[21
C
OiriN
-
dDiIAT&i1]
Pool?
C
4
!ñThcate
f6Freacipoois
and
Hfflei
—
Current
f
Comments
Indicate
for
functional
riffles;
Best
areas
must
belarge
enough
to
support
a
population
-
of
riffle-obligate
species:
Check
ONE
(0r2
& average).
O
RIFFLE
[metrlc-Ol
. RIFFLEDEPTH..
..
..
RUNDEF.TH.
.. RlFFLEiRUNSUBSTRATE.
. RIFFLE
I
RUN
EMBEDDEDNESS
C
Bj
Ocmt2]
C
MMUMEJPrn
L21
C
C
BSTAREAS
5-,OcinilI
C
MAXILJtV5Om
[1)
CbrQIYTABLE
C
‘o
C
sT?
AiEê’g
Fi[OJ
C
Motoi
Riffle
ir
------..---,
D!1M
Comments
a
im
8
‘——-‘
6]
GRADlENT(/J.(_ft!mI)
%POOL:D
%GLIDE:C50)
Gradient
DRAINAGE AREA
ml
2
)
C
%RUN
3%RIFFLE
C
D
Maximum
[}
EPA
4520
•
-
06111/08
Stream
&
Location:
P44
i
River
Code:
-
-
STORET#:
1]
SUBSTRATE
Check
ONLVTw0
substrate
1YPEnO)tES
estimate
%
or
note
every
LEST
TYPES
POOL
RIFFLE
_DDi
—
DC1
_C
_C
Check
ONE
(Or
2 &
average)
Cover
Maximum
20
STABILITY
C
L’j-
ij
C
E
C
CH
1SEYEJ11C
CVE
65th41
C
E
C
NONM
C
C
Comments
Channel
Maximum
20
C(L.
7/(JOc
Electronic Filing - Received, Clerk's Office, September 8, 2008
Qualitative
Habitat
Evaluation
Index
and
Use
Assessment
FieldSheet
QHEI
Score:
-.
RM:/,?Date:?-Ii!
08
Scorers
Full
Name & Affiliation:
7
[/oJ,vdti..-
é
w/
Lat./Lona.:
.i
- / io , ,
-
Office verified
—
I flR2. Iml.JJ
fL 5
f
IU
•
I
.12
location
MaxumØ
Channel
Maximum
(
Stream
&
Location:
2’
PZ,J.
!i-
River
Code:
-
-
STORET
#:
1]SIJBSTRATE
Check
ONLY
Two
substrate
Th’PE BOXES;
estimate
%
or
note
every
type
present
Check ONE
(Or 2 &
average)
BEST TYPES
POOL
RIFFLE
OTHER
TYPES
POOL
RIFFLE
ORIGIN
QUALITY
DU
BB’L10]
D DAANt4
—
Di)]
—-
DEWUI
siur
D
[JI
Substrate
1
-
C
C C
ARTLciAL[o]
—
—
D4jO]
C
C
BEJ,R[5]
(Score
natural
subsbates
ignore
FDE%
&1J
Maximum
NUMBER
OF
BEST
-rYpE
ormore[2J
sludge
from
point
sources)
Dj[JP
20
Comments:
2]
INSTREAM
COVER
qualityIndicate
2
presence
Moderate
0
amounts
to 3: 0-Absent;
but not
1-Very
of
highest
smallquality
amounts
or in
or1flre
small
amounts
commonofof
highest
marginal
AMOUNT
quality
3
I-hghest quality
in
moderate
or greater
amounts
(eq very
large boulders
in deep or
fast
water
large
Check
ONE (0r2
& average)
diameter
log that is
stable
well
developed
rootwad in
deep /ast water
or deep
well-defined
functIonal
pools
Q
__Nk
_L
—
L11
—
RpOAp[1]
A
1
C
—
1ii
_L.
91
cQ LLfl
C
Comments
3]
CdAN1EL
MORPHOLOGY
Check
ONE in each category
(Or
2 & average)
SINUOSITY
DEVELOPMENT
CHANNELIZATION
STABILITY
C
4
C
Eftij
C
C
E1[
Q:[J
C
V$REDdb
DMDERi2].
C
J4
[1
C
IRj
C
c.yyii
Con,méhts.
4]
BANK
EROSION
AND
RIPARIAN
ZONE
Check
ONE
in
each
category
for EACH
BANK (0r2
per bank &
average)
River
right
looking downetream
RIPARIAN
WIDTH
FLOOD
PLAIN
QUALITY
L R
... EROSION
C
CiHEAWiSE(EREILC
DV
ROLt
C
j
I
Predominant
land use(s)
-
Comments..
J
1.
Maximum
$
Li
ad.
,
10
51
POOL
GLIDEAND
RIFFLE/RUN
QUALITY
MAXIMUM
DEPTH
CHANNEL
WIDTH
CURRENT
VELOCITY
Recreation
Potential
CheckONE(ONLY!)
Check ONE
(Or2
& average)
CheckALLihat
apply
Primary Contact
kL:
Secondary
Contact
C
04-O
Th.
2J
C
POOL
WIDTI
RIFFLEWJDTH
[0J
C
C
INTERMITTEN?’[
2]
C
0
Ji1ij
CIjf1
Pool!
C
0
2ii0i
lndIcatfarreach
pois and
nffiei
Current!!
I
Comments
-
Maximum
Indicate
for functional
riffles;
Best areas
must
be
large
enough to
support
a
population
-
of
riffle-obligate
species:
Check
ONE (0r2
&
average).
RIFFLE
[metrlc-01
RIFFLE:bEPTH..
RUN.DEPTH
.
.RlFFLEIRUNSUBsjRATE.
. RIFFLE
I
RUN
EMBEDDEDNESS
C
A30ci[2i
C
1UUM>
5
2I
C
e
gI
C
Nô
C
i0iij1
CMAXIMUM50cm
111
Cpg
Cpfj
C
Essd1W
C
UNSTA.BLE(fr
Fii)[0].
C
MbERtE[OJ
SOrTIe!
(
Comments
ax,:m
[
8
6] GRADIENT(
‘Q’(
ftlmi)
C
%POOL:C/)
%GLIDE:C
Gradlentr7°)
DRAINAGE
AREA
-‘
i
4
Maximum
(‘
C
hIGH?LVERY’HIGH
[iO.61
%RUN
(
)%RIFFLE
C
)
10
._‘
EPA4520
7
/
/
(
-
06111/08
Electronic Filing - Received, Clerk's Office, September 8, 2008
Qualitative
Habitat
Evaluation
Index
and
Use
Assessment
Field. Sheet
QHEI
Score.
08
Scorers
Full Name &
Affiliation:
J3e
&4
Lat.fLonu.:
41
Ii
‘
-1o
.
Office verified
River Cocle:_
-
-
STORET#:
•
IJQ.
location
1] SUBSTRATE
Check
ONLVTw0
substrate
7YPE’BOXES;
estimate
%
or
note every
type present
Check ONE (Or
2
&
average)
BEST
TYPES
PD
L
RIFFLE
OTHER
TYPES
POOL RIFFLE
ORIGIN
QUALITY
/ I
DD
LR
—
D D
CI4L —
—
D
SILT
Substrate
EJ D
—
ii
D D
[0] —
—
—
1ifl
D
D
BEDROC[514.._.
(core
natural substrates
ignore
9
%
c!Yu’
T
4
1]
Maximum
NUMBER
OF
BEST
TYPESr9Oe[9
sludge
from
point
sources)
DSTN
ORjJ
20
Comments.
-
:.
2]INSTREAM
.
:.
COVER
..
uaIity;
Indicate
2-Moderate
presence
0 to
amounts,
3:
0-Absent;but
not
1-Very
of highest
smallquality
amounts
or
or
In
small
if more
amounts
commonof
of
highest
marginal
AMOUNT
quality
3 Highest
quality
in
moderate
or greater
amounts
(e
g very
large
boulders
in deep or
fast water
lame
Check
ONE (Or2&
average)
diameter
log that
is stable
well
developed
rootwad
in deep
I
fast
water
or
deep
well-defined
functional
pools
EJ
ENSIVE
JII
2
j?±MJ
$ji
it
BODE
I1
/LÔGIET[11
EJ
Cover
3
MaxfrnumIJ
3]CHAANEL
MORPHOLOGY
Check
ONE in
each
category (0r2
& average)
SINUOSITY
DEVELOPMENT
CHANNELIZATION
DD
D
J
DA$i4
jogii
O[1J
D
Càthmeñfr
4] BANK-EROSION
AND
RIPARIAN
ZONE
Check
ONE In
each category
for EACH BANK
(Or
2 per
bank
& average)
River
rlghtiooking
downstream
RIPARIAN
WIDTH
FLOOD
PLAIN
QUALITY
EROSION.
.
D
D tIE&
LSEVERE
tID
DE
owUi
D
DrFENb
Indicate
predominant land
use(s)
D
D
NE
[0JiI
D
D
SROCJPJ
past lOOm
npanan
Riparian
Comments
Maximum
‘-1
10
5]
POOL/,GLIDEAND
RiFFLE/RUN
QUALITY
MAXIMUM
DEPTH
CHANNEL
WIDTH
CURRENT
VELOCITY
Recreation
Potential
ChkONEjONLY!)
Check
ONE
(Or
2 & average)
Check
ALL tha
apply
Primary
Contact
%> [6J4
Q
POOL WIDTH>
RIFFLE
WIDTH
L2] EJ
TORRENTIAL
r
ii
SLOW [11
Conta’
$‘OOL WIDTH
= RIFFLE
WIDTH
[I]
D
VERY
FAST ji]
D
INTERSTITIAL
[I]
(circle
one and comment
t
on
back)
D
O4O7f2]
Q
POOL WIDTH
<RIFFLE
WIDTH
[0J
D
FAST
[1]
D INTERMITTENT
[
2]
Q
0i.4iii)
D
MODERATE
[I] D EDDIES
LII
Pool!
o
<021i1
L0J.
Indica
e for
reach
pools
ad nffles
Cunent
Comments
Maximum
-
Indicate
for functional
riffles; Best
areas
must
be
large
enough
to support
a
population
of
riffle-obligate
species:
Check
ONE (0r2 &
average).
wi”O
RIFFLE
[metric-OJ
RlFFLEDERTH..
..
. RUNDEPTH
:RIFELEI
RUN.SUBSTRATE.•
RIFFLE
I
RUN
EMBEDDEDNESS
0
BESTA
10ij[2
0
50121
DSTAäI!N
6b
Tdj2j
0
tt4-’
0sIiiij
OMAXIMUM
50m111 0
0
CÔW1IW
0ES&ñ
I]
ME1?tDT
Riffle
/f(i
6]
GRADIENT
(
£04
ifImi)
%POOL:Q?J
%GLIDE:(__J
Gradientr7’
DRAINAGE
AREA
Maximum
II
(?
mIS)
0
%RUN:
(
)%RIFFLE:C
.)
io
EPA 4520
fJ1
01
Stream
&
Location:
f
2
Q5
,
4
w’t
yOJey
COmments
STABILITY
DJ
Channel
Maximum20
8’
;Lr
IfL(c4
06/11/08
Electronic Filing - Received, Clerk's Office, September 8, 2008
Qualitative
Habitat
Evaluation
Index
-
and
Use
Assessment
Field
Sheet
QHEI
Score
Stream
&
Location:
je-
/c’/U
‘L’er
-
th
RM:
2
Date:O?jj/OI
08
Full
Name
&
Affiliation:
Z1
o’’
River
Code:
—
— —
- —
—
STORET
#:q
L-:9
L:J79L1)
I8
Office
verified
1]
SUBSTRATE
Check
ONLYTwo
substrate
7YPEBOXES;
estimate
%
or note
every
type
present
Check
ONE
(Or 2
&
average)
BEST
TYPES
POOL
RIFFLE
OTHER
TYPES
POO1-RIFFLE
ORIGIN
QUALITY
c:)
DEl
BLORISLABS
[.10J_
Q
Q
HARDPAN[4]
C
LIMESTONE
[1)..
HEAVYf2]
El I]
BOULDER
[9]
—
—
El
El
DETRITUS
[3]
,Z
—
ILLS
[11
SIL
MODERATE
[1]
Substrate
El El
COB
BLE
[8]
I] El
MUCK
[21
EJ
WETLANDS
[01
T
.,.‘NORMAL
[0]
—
‘D
GRAVEL
[71
—
0
El
SILT
[21
::
—
11ARDPAN
[0]
0
FREE
[J
I
7.
El
I]
SAND
[6]
—
El El
ARTIFICIAL
[0]_
—
C
SANDSTONE
[0]
.EXTENSIVE [2]
‘
El
El
BEDROCK
[5]
(Score
natural sustrates
ignore
El
PIP/RAP
[0]
øt0%
EJ
MODERATE
[1]
?fmm
NUMBER
OF
BEST
TYPES:
1
4
or
more
[2]
sludge
from
point-sources)
EJ.LACUSTRINE:[0]
IQRMAL
[0]
20
J3
orIess
[01
ElSHALE[.1]
El
NONE
[1].
Comments
El
COAEi[-2j
;-.
(iL)
-‘
2] INS
TREAM
COVER
quality;
Indicate
2-Moaerate
presence
0
amounts,
to
3: 0-Absent;
but
not
1-Very
of highest
small
quality
amountsor
in
or
small
if
more
amounts
common
ofof
highest
marginal
AMOUNT
quality;
3-Highest
quality
in moderate
or
greater
amounts
(e.g.,
very large
boulders
in deep
or
fast
water, large
Check
ONE
(Or
2&
average)
diameter
log
that is
stable,
wefi developed
rootwad
in deep/fast
water,
or
deep, well-defined,
functional
pools.
D
EXTENSIVE
>75%1i1l
—
I.NDERUT
BANKS
111.
:,::
.__L
POOLS
>
7Oàm
121
—
bXBOWS.BAcKWATERSE1j
MQER
-%
171
—
OVERHANGING
VEGETATION
[1]
—
ROOTWADS
[1]
....L.
AQUATIC
MAÔROPHVTES
[1]
SPARSE
5-<25°o
[3]
—
SHALLOWS
(IN
SLOW WATER)
[1]
—
BOULDERS
[1]
1
LOGS
OR
WOODY
DEBRIS
[1]
El
NEARLY
ABSENT
<5%
[1]
Mamum;
DC.
Comments
‘-
J
i.
i’
-J
51
POOL
/
GLIDEAND RIFFLE/RUN
QUALITY
I.
MAXIMUM
DEPTH
CHANNEL
WIDTH
______________
Check
ONE (ONLY!)
Check
ONE
(Or 2
& average)
1 T
6J
El
POOL
WIDTH>
RIFFLE
WIbTh
[2]
LJ0.71iñ
141
2PO0L
WIDTH
=
RIFFLE
WIDTH
LI]
.
El
O.4-<0.7m
[2]
QPóOIJWIDtF(< RIFFLE
WiDTH
[Ô]
—
___________________
El
O.2-<0.4m
[1]
Pool!
El
< O.2ni
[0]
Current
Comments
Maximum
Indicate
for
functional
riffles;
Best
areas
must
be
large
enough
to
support
a population
of riffle-obligate species:
Check
ONE
(0r2
&
average).
.PFEJmetLcpl
RIFFLE
DEPTH
RUN
DEPTH
RIFFLE
I RUN
SUBSTRATE
RIFFLE
I
RUN
EN(BEDDEDNESS
El
BEST
AREAS
>10cm
[2]
0
MAXIMUM?
50cm
[2]
D.STABLE
(e.g.
Co
bl, Boulder)
[2]
El
NOfE
[
El
BEST
AREaS
5
lOom
[1]
El
IAXI1’IUV
< 50cm
[11
El
MOD
ST1BLE
(eq
Large
Cra
el) [1]
0
LOW
[1]
-
El
BEST
AREAS
<5cm
El
UNSTABLE
(eq
FIne
Gravel
Sand)
[0]
El
MODERATE
[01
HirtIel
lmetrIcOJ
El
EXTENS!VE
Comments
Maximum
I
8
6] GRADIENT
‘O
ftlml)
El
VERY LOW-LOW
[241
%POOL:QOj
%GLlDE:cJ
Gradienf(
DRAINAGE
m1
2
)
DHIGH-VERYHIGHLIO-6]
%RUN:
(
)%RIFFLE:
Maxirnurn1JJ
EPA4520
(5o._
-
(‘CC
‘-,,/
06/11/08
f
(
oá-
Comments
3] c
MORPHOL0GY
Check
ONE
in each
category
(Or2
& average)
C
r.
N
STABILITY
El
ER6E[?1i
1
ChanneI1
Maximum
jJ
Check ONE
in
each
cate
ory
for
EAC
I
BAlK
(Or 2 per
bank &
average)
-
1W
Li
U,
indicate
predominant
land
use(s)
past
lOOm
riparian.
Rlparian
Maximum
10
CURRENT
VELOCITY
Recreation Potential
Check
ALL
that apply
Primary
Contact
El
fl
TORRENTIAL
“tRY.FAST[l]
[1J
y
WSLOW
[1]
Secondary
Contact
0
INTERSTITIAL
Ml
(circle ona
andcommenton
back)
U
FAST
[1]
0
INTERMITTENT
[21
El
MODERA
TE[1]
-:
El,.piEs
[1].
Indicate
for reach
- pools
and
riffles.
Electronic Filing - Received, Clerk's Office, September 8, 2008
Check ONE (Or 2 &
average)
QUALITY
1
MODERATE
E-1J
I
NORMAL
[0]
I
‘EXTEN.slvE.r-2J.
:i
MP.PER’1E[-11
1.NORMALjO].
INONE[1]
f
Stream
&
Location:
’s
21
//dc
/((J&r
— 2’.3,
River
Code:_
Qualitative Habitat
Evaluation
Index
and
Use Assessment
Field Sheet
QHEI
Score:
RM:’L’3
fDate:oI)
(108.
Full Name
&
Affiliation:
t--ul
e4
tf’ej
--STORET#:
2!i’!.
fzio
I8Z.L3LJ.
orncelvo:ralD
1]
SUBSTRATE
Check
ONLYTwo
substrate
TYPEBOXES;
estimate
%
or note
ev€
•-sent
LRIFFLE
L_
POOL RIFFLE
—
substrates;
ignore
sludge from
point-sources)
Comments
‘I
UKIL,IN
j
UMESTONE
1]
o
flLL:[I].:.
O
WETLANDS.[0J
BARPPA.N
[0].
‘SANDSTONE
[01.
0
RIPIRAiM0];
0
LACUS1RINE
0j
0
SHALE
.1-11
0
COAL FINES
-2J
Substrate
0
Maximum
20
2]
INSTREAM COVER
quality;Indicate2-Moderate
presence Oto
amounts,
3:
0-Absent;but
not
i-ry
of highest
sma
quality
amounts
or in
or
small
if more
amounts
common
of
of
highest
marginal
AMOUNT
quality;
3-Highest quality
in
moderate or greater amounts
(e.g.,
very large boulders
in deep or
fast
water, large
Check
ONE (0r2
& average)
diameter
log that is stable,
well
developed rootad
in deep!
fast water, or deep,
well-defined, functional
pools.
Q
!EXTE
SIVE>-75%
[11] -
UNDERCUi BANKS [1]
._.L..POOLS>
70cm [2]
—
OXBQWS
BACKWATERS [1]
2MODEATE
25
75%
[7]
_,L
OVERHAGING
VEGETATION [1]
—
ROOTWADS
[1]
_L
AdUATIC rACOPH’fTES
[1]
SPARSE
5-<25% [3]
—
SHALLOWS
(INSLOW
WATER)
[1]
—
BOULDERS
(11
_LOGS
OR
WOODY
DEBRIS
[1]
0
NEARLY ABSENT
<5%
[11
—
ROOTMATSEI]
-
-
Cover
Comments
-5-.
Maximum
3]
CHANNEL MORPHOLOGY
Check ONE
in oath category
(0r2
& average)
SINUOSITY
DEVELOPMENT
C
0
HIGH
j4j
.
0
EXCELLENT
[71
0
MODERATE
[3]
0
GOOp
[5]
DLOW[2].
0
FAIR[3]
‘NoNE[.1]
,,2’POOR[l]
Comments
SION
AND
doj,ntre,m
UL
Comments
eck
ONE
in each cab
— CHBANK(Or2perbank&
average)
F’
.
-
Channel
Maximum20
5
3
4
Cd,nL
I
n
‘“flant land use(s)
1
P’ “““
*
an.
Riparlan
ic
Maximum
5]
POOL/GLIDEAND
RIFFLE/RUN
QUALITY
-
-
-
MAXIMUM DEPTH
CHANNEL
WIDTH
CURRENT VELOCITY
Recreation
Potential
Check
ONE (ONLY!)
Check ONE (0r2
&
average)
Check
ALL tht
apply
Primary Contact
zi>
0
7-<Im
I m
[6]
[4]
.‘POOL
0
POOL
WIDTH
WIDTH>
=
RIFFLERIFFLE WIDTHWIDTH
[1][2]
00
TORPENTLALVERY
FAST
[1]
[1]
LSLOW
0
INTERSTITIAL
[1]
[1]
I
(c
Scondary
rcloonQandcommantonbnck)
Contact
0
0
4<0 7rn
[2]
0
POOL
WIDTH <RIFFLE
WIDTH [0]
0
FAST
[1]
0
INTERMITTENT
[21
EJ0.2—cO.4m
[1]
0
MODERATE[1]
0
EDDiES(i]:::
Pool!
0
<0.2m
[0]
Indicaie for
roach . b
oil
and
nffieá.
Cuirent
Comments
Maximum
Indicate for functional
riffles;
Best areas
must
be large
enough
to support
a
population
J
-
of
riffle-obligate
species:
Check ONE
(0r2 &
average).
RIFFLE metrlc-OJ
RIFFLE
DEPTH
RUN DEPTH
RIFFLE
I
RUN
SUBSTRATE
RIFFLE
I
RUN
EMBEDDEDNESS
C
BEST
1
-.RE,S’
iCon [2]
Q
4!UM>
50cr’ [2]
0
STABLE e
g Cobb.o, Boiderj
LZj
C
L
21
C
BES
APEAS 5
ICor”
[9
0
MI UM 5cm
[
0
‘d’OD
STABLE
(e g
Large Grav,’) [ii
0
LOW [i]
0
BEST
ARAS
<5am
0
UNSTABLE:(e
FhieôreI.Sand)[0J
o
MODRAtE
[Oj
Riffle!
[metricoj
I—I
.,
Run
qj
—[
‘Maximum
-‘
8
‘—_—-
Gradient
j
Maximum
.‘
Comments
6] GRADIENT
O.(
f)
Q
VERY
LOW
-
LOW [2-4]
%POOL:Ji
%GLIDE:()
DRAINAGE
AREA
,
mi
2)
I.HGH-VERYFHGH
[10-6]
%RUN:
C
-
D%RIFFLE:CZE)
EPA4520
/-tpd
-
06/11/08
Electronic Filing - Received, Clerk's Office, September 8, 2008
QualitatveHabitat
Evaluation
Index
and Use
Assessment Field
Sheet
QHEI
Score
___
Stream
&
Location:
ic
f/cci,
ii
River
Code:
-
-
STORET#.
-
1] SUBSTRATE
Check
ONLYTw0
substrate
7YPE
BOXES;
estimate %
or
note
evety type
present
BEST
TYPES
POOL
RIFFLE
OTHER
TYPES
POOL
RIFFLE
D
L1
BLOR ISLABS
i0]_
—
D
DHARDPAN
14]
—
—
C
C
C BOULDER
[9].
_.
I]
C
DETRITUS
[3]
DC
COBBLE.[8]..
_._
—
C C
[2]:.::
—
GRAVEL
[7]
_J_.
—
C
C
SILT [2]
—
CD
SANDEGI:.
•::
:.k
—
C
DARTIiIcIALWL........
—
C C
BEDROCK
15]
—
(Score
natural
subsUates;
ignore
NUMBER
OF
BEST
TYPES:
EJ4or
more
[2]
sludge
from
point-sources)
Comments
,.e or loss
[OJ
2]
INS
TREAM
COVER
Indicate presence
0
to
3: 0-Absent
1-Very small
amounts
or
r
a common
of
marginal
quality; 2-Moderate
amounts,
but
not
of highest
qualIty
or
in
small
amounts
of highest
quality;
3-Highest
quality
in
moderate
or
greater amounts
(e.g.,
very lerge
boulders in
deep
or fast water,
large
diameter
log that
is
stable,
welldeveloped
rootwad
in deep?
fast
water,
or deep,
well-defined,
functional
pools.
IJNDERÔUT
BANKS-
[1
],.
- .......L.
POOLS70m
121
—
QXBOWS
BACKWATERS
i]
u
—
OVERHANGING
VEGETATION
cii
—
ROO1WAD
cii
.....L..
AQ1J1C
MOPHYTS
111
2
—
SHALLOWS
(IN
SLOW
WATER)
[1]
BOULDERS
[11
I
LOGS
OR WOODY
DEBRIS
[11
,,,Z
ROOTMATS[11
.:
—
—
Comments
31
CHANNEL
MORPHOLOGY
Check ONE
in
each
category
(Or
2 &
average)
SINUOSITY
DEVELOPMENT
C
HIGH
[4]
C
EXCELLENT
[7]
C
MODERATE
E31
Q
GOOD
151
C
LbW.[2.-
:
C FA!R.(31
,1öNE
[1]
J-PÔoai1]
Comments
4] B
Ri
,dominant
land
use(s)
—
past
1
,.._.Z..7.
Rlparlan
(
Maximum
10
CURRENT
VELOCITY
Recreation
Potential
C,,
Check
ALL that
apply
Primary
Contact
L
j
I
C
DyE
TORRENTIAL
liP
1]
‘SLOW
C
INTERSTITIAL
[1]
1h1
I
Seconria,y
one
and comment
Contact
on badc)
E
I
C
FASTID
DINTERMITTENT.E23
C
MODERATE.if.
CEDIEsJ.J
Pool!
,—
C
Indicate
for
roach -
pdoliaOd
,iffie.i
Current
Comments
Maximum
Indicate
for
functional
riffles;
Best
areas
must
be
large
enough
to
support
a
population
of
riffle-obligate
species:
Check
ONE (Cr2
& average).
F
N0
RIF LE
[metrlcol
RIFFLE
DEPTH
RUN
DEPTH
RIFFLE!
RUN SUBSTRATE
RIFFLE
I
RUN
EMBEDDEDNESS
Q
BES’
ADEAS,
10cm
123
C
!M
VIMLJPII
50c”
121
C
STAtLE
e
g
Cobble
odldc
) [23
0
NO E
[2]
D
BEST
RES
S
1
c’r
1]
C
MAXIr’ur’
< 0cm
Eli
C
MOD
STABLE
eg
La go C
a
e’)
1]
C
LO”
i]
-
C
BESTAREAS-<
Ernotrc=0j5cm
0
UNSTABLE
(e..,
Fhe
Ga’eI,
ni) [0]
C
••
MODERATEEXTENSIVE
1-13
Idi
.
comments
Maximum
61
GRADIENT(
<(
ftimi)
C
VERY
LOW- LOW
1241
%POOL:C/j
%GLIDE(
)
Gradient
DRAINAGE
AREA
C
MODERATE
[6-10]
:
::
Maximum
(f2mi2)
Li
HIGH
-VERY
HiGH
110-61
%RUN:
)%RIFFLE:(J)
10
EPA4520
‘$‘2-..
/C(_
7
((,fr3
06111/08
(
0
/ I
08
Sornr
Full Name
&
Affiliation:
%
é1-
Lat./ Long.:
i
Office verifier!
(NAD R . daIn.I
9 — —
.
I8.
L
location
C
Check
ONE
(Cr2 &
average)
Substrate
0
Maximum
20
STABILITY
Maximum
E)]
C
t2E
ULJ
Commentsj
Channel
Maximum
diieàk
ONE
in each
cate oryforEAC”
1ANK
(0r2
per bank &
average)
‘TV
1D
Electronic Filing - Received, Clerk's Office, September 8, 2008
Qualitative
Habitat
Evaluation
Index
and
Use
Assessment
Field
Sheet
QHEI
Score
Stream
&
Location
.
2
.j
Pl-
t’his.
Lr3 S7Z.
RM:,2’3SDate:C>I/1
108
Scorers
Full Name & Affiliation:
Te
River Code:
-
-
STORET#:
Lat.fLong.:i
Mua..ecImapi
.
.i 2.
18S3.
j39.
Office,vefledQ
1]
SUBSTRATE
Check
ONLYTw0
substrate
TYPE
BOXES;
estimate
%
or note every type
present
Check ONE
(Or 2 &
average)
BEST TYPES
POOL
RIFFLE
OTHER TYPES
POOL RIFFLE
ORIGIN
QUALITY
..j
DD BLOR.IslABS[1OJ__...
Q
DHARDPAN[41.
—
DL!MESTONE[1].
00
BOULDER
[9]
—
Q Q
DETRITUS
[3]
Z
—
D
TILLS
SILT
D
MODERATE
[1]
Substrate
0 EJ
COBBLE
[8]
._.:
0 EJ
MUCK
[2]
—
—
0
WETLANDS
[0]
..NORMAL
[0]
GD
00
SANDGRAVEL
[b]
[71
.-.-k-
——
2ZISILT
0 0
ARTIFICIAL
[2]
[0]
.4..._
—
——
‘HARDAN[0]
SAN DSTONE
[0]
DFREEjIJ
E)CENSIVE
[2]
L,
I
2.
I
00
BEDROCK
[5]
—
(Score natural
substrates
ignore
C
RIPIRAP [0)
.J.DEQA
D
MODERATE
[
j1
ui
NUMBER OF BEST
TYPES
D
4
or more
[2]
sludge from
point
sources)
C LACUSTRINE
[0]
J.JORMAL [0]
20
‘3 or less
[0]
C
SI1ALEfrI]
C
NONE 1]
Comments
. -
•1
0
.
..
2]
INSTREAM
.
COVER
quality;
Indicate
2-Moderate
presence 0 to
amcunts,
3
0-Absent;but
not
1-Very
of highest
smallquality
amounts
or in
or
small
if
more
amounts
common
ofof
highest
marginal
AMOUNT
quality; 3-Highest quafty
in
moderate or greater
amounts
(e.g., very
large
boulders
in deep
or fast water,
large
Check
(Or 2
&
average)
diameter log that is stable,
we!l
developed rootvad
in deep
/ fast
water,
or
deep,
well-defined,
functional
pools.
Q
.ExTENslE.:?75%E11J
UNDERCUT
BANKS
[I]
._L_
POOLS>
70cm
[2]
.__
OXBOWS, BACKWATERS
[1]
,1IODERATE
25
75%
[7]
VEGETATION
[1]
—
ROOTWADS
[1]
AQUATIC MACROPHVTES
[1]
0
SPARSE
5-<25%
[3]
SHALLOWS
(IN SLOW
WATER) [1]
—
BOULDERS
[1]
1./LOGS OR WOODY
DEBRIS
[1]
D
NEARLYABSENT <5% [1]
ROOTMATS
[1]
..
:.
.• .
Cover
ç
-
Maximum
LJ
Channel
Maximum
iaht land use(s)
-
Riparlan.
pm
i.
Maxium
5] POOL
/
GLIDE
AND
RIFFLE
/ RUN
QUALITY
MAXIMUMbERTH
CHANNEL:.WIDIH
CURRENT
VELOCITY
Recreation Potential
Check ONE ONLY’)
Check ONE (Or
2 & average)
Check
ALL th ap ly
Primary
Contact
miii —
0
PODW.&E
VI1P1H
[0J
DAff
2J
D..Cpi&
POOI/(fj
1
1Idicate
for reach
- pools and riffles.
Current
g
l
Comments
Maximum
12
Indicate for
functional
riffles;
Best areas
must
be largeenough
to
support
a population
of
i-ifflé-obligate
species:
ChE.qk
ONE
(0r2& average).
.
_NO RIFFLE
[metric-Ol
RIFFLE
DERTH
RUN DEPTH
RIFFLE
I
RUN
SUBSTRATE
RIFFLE
I
RUN
EMBEDDEDNESS
o
Di
O
c?iti
0
El
BA5&
C UNSTABS01
ULp4
Riffe/
D[1IMaxim:h&J
%POOL:QOt3j
%GLIDE(
)
Gradient
f’i
%RUN:
cD%RIFFLE:c
)
Maximurnj
e
/
(o
-
06/11/08
Comments
3] CHANNEL MORPi-IOLOGY
Check
ONE
m eaci caiegory
(Or 28
average)
SINUOSITY
DEVELOPMENT
-
N
STABILITY
DV
0
ift[tj
DIM42
[1i
Th11J*
Comments
kONEin
éach,cát
F
:or2perbank
&
average)
Comm
ënts
6]
GRADIENT
<,
(
V
o4coJ
DRAINAGE
AREA
C
(ml)
0
HlGR,HLGJ1iO41
EPA
4520
Electronic Filing - Received, Clerk's Office, September 8, 2008
and
Qualitative
Use
Assessment
Habitat Evaluation
FIeld
Sheet
Index
HEI
core.
Stream &
Location
J25 P/-4
_23
Li?
RM
‘53Date
O’j
L’!
08
Full Name
& Affiliation:
,‘vaPJ
River
Code:
-
-
STORET
#:
InMuaaaopImal.
tI
Lopg.:
L’
7 7t18
. I
Office verified
--
1] SUBSTRATE
Check ONLYTw0 substrate
7YPE
BOXES;
estimate
%
or note every
type
present
Check ONE (0r2
&
average)
BEST
TYPES
POOL
RIFFLE
OTHER
TYPES
POOL
RIFFLE
UU
BLbRLABS[10]_
—
Q
UD
BOULDERL9].
..J
U
—
D
COBBLE
[81
_
U
—
DGRAVEL.L7J.:..
_!___—
U
—
U U
SAND [6
—
U
UARTIF!C!AL
[0] —
—
U
EJ
BEDROCK
L51
—
(Score r.elural
subslrates;
ignore
NUMBER OF BEST
TYPES:
U4
or more j2j
sludge
from point-sources)
Comments
3orlossO1
2] INSTREAM
COVER
quality;Indicate2-Moderate
presence
0
amounts,
to
3: 0-Absent;but
not
1-Very
of highest
smellquality
amounts
or
In
or
small
if more
amounts
common
ofofhighest
marginal
AMOUNT
quality; 3-HighesL
quality in
moderate or greeter
amounts
(e.g., very
large
boulders in
deep
or fast water, large
Check
0
(Or
2 &
averagc.i
diameter log that is
stable,
wdll
developed rootwad
in deep
/
fast
water,
or deep,
well-defined,
functional
pools.
Q
EXTENSIVE
75%
I11J
—
UNDERCUT
BANKS
[1]
__.L_.
POOLS
70cm
[2]
—
OXBOWS
BACKWATERS
[1]
Q
MODERATE 2575%
[7]
OVERHANGING
VEGETATION [1]
—
ROOTWADS
[1]
.....L.
AQUATIC MACROPHYTES
[11
Q
SPARSE
5<25% [3]
SHALLOWS (IN
SLOW WATER) [1]
L
BOULDERS
[1)
LOGS
OR WOODY
DEBRIS
[1]
NEARLY ABSENT
<5% [1]
—
ROOTMATS
[1]
. •.
.
.
.
.
—
.
.
.
Cover
Maximum!
1
20L1
5
Ji
-
-
3nt land use(s)
t
Rlparian
,,
Comments
I
/
Maximum
7.J
L.Y
.f•
ö
Yci
1O
5]
POOL /
GLIDE
AND
RIFFLE
/ RUN
QUALITY
MAXIMUM DEPTH
CHANNEL
WIDTH
CURRENT VELOCITY
Recreation
Potential
Check
ONE (ONLY!)
Check
ONE
(Cr2 & average)
Check
ALL th apply
Primary Contact
2J>
Im [6]
U
POOL WIDTH>
RIFFLE
WiDTH
[2)
U
TORRENTIAL
1]ZSLOW
[1]
Secondary
Contact
Q
DO
07<lrn
4-<0
Tm
[41
[2]
J.P0QTh
U
POOL
WIDTH <RIFFLE
= RIFFLE
WIDTHWIDTH
[0]
[1]
UU
VERY
FAST
[1]
FAST
L1
00
INTERMITTENTINTERSTITIAL
1].
[
2]
I
(circTe oneandcommantonback)
I
Q
0.2-<0.4m
[1]
U
MPDERATE[1I.
UED.DiES[1]•...••;
Pool!
U
< 0.2m [0]
lndicthéfor roach
-pools
and riffles.
Current
Comments
Maximum
Indicate
for functional riffles; Best
areas must
be large
enough to
support a population
of
riffle-obligate species:
Check
ONE
(Or
2 & avcrage.
vO
RIFFLE [metrlc-0]
RIFFLE DEPTH
RUN DEPTH
RIFFLE
I
RUN
SUBSTRATE
RIFFLE
I
RUN
EMBEDDEDNESS
U
DSTArEAS
lOcil
21 U
t’YUM>
5O”
U
STABLE
c
g
Cobb’e
Boda
)
U
BEST
aREaS
5
0cm
t1
1
U
I1AXI iur
< 50c-n
[1
U
F
OD
STABLE
e
g
Large
Cra
eI
1]
•
I
UNSTABLE
FIne GrvéI,SanI)
[0]
U
NUNIjJ.
UMPbTEt0]
Riffle!
U
tE*E
E-1’
Run
B
Gradient
Maximum
7
/
(
06/11/08
4
Substrate
0
Maximum
20
Comments
OGY
Check
ONE in each
category
(Or 2 & average)
C-
eck
ONE In
each
Gate
4
STABILITY
U
DETE)
Channel
N
Maximum
20
joly for EACH
BANK (Cr2 per bank
&
average)
[
Comments
6]
GRAbIENT<
ô4
ft/mi)
DRAINAGE A
(O
m12)
EPA 4520
%POOL:Q”J
%GLIDE:C)
%RUN:
(
)%RIFFLE:C
D
Electronic Filing - Received, Clerk's Office, September 8, 2008
Channel
Maximum
ANIL(Ii1
Indicate
predàrninant land use’s
past
lOOm
ilparian.
Riparlan
Maximum
10
c_
7/ff(P
06/11/08
Qualitative
Habitat
Evaluation
Index
and
Use
Assessment
Field
Sheet
1-IEI
s
core
Stream
&
Location
,-
RM
3
2Date
41/
11/08
4
6’
ScorefFuII
Name
&
Affiliation:
Qe
ti’
—
f*
-,/,me
ftj
River
Code:--
STORET#:
7Th
18L
L!E—
°°sD
11
SUBSTRATE
Check
ONLYTwo
substrate
TYPE
BOXES;
estimate
%
or note
every
type
present
Check
ONE
(Or
2 &
average)
BESTTYPES
POOL
RIFFLE
OTHER
TYPES
POOL
RIFFLE
ORIGIN
QUALITY
1
GD
I.sJ_
00
—
DjJMENEr1J
—
0
D[DTR
—
SILT
DMODERATh[fl
Substrate
0
GEL
O
—
0
—
Q
I]
CL[O
—
—
0
EJF
O
0
Score
natural
substrates
ignore
D$
P
E
Maximum
NUMBER.OF
BEST
TYPES:
ptmI
sludge
from
point-sources)
D4J)i
20
Comments
D&jiEL2
o&oN&rj4
.-
:.
5
Jj2
I1
J(
/caLk,
e
Coji.
I/J
2]
INSTREAM
COVER
quality
Indicate
2
presence
Moderate
0
amounts
to
3 0 Absentbut
not
I
ofVery
highest
small
quality
amounts
or
in
or
small
if
more
amounts
common
ofofhighest
marginal
AMOUNT
quality
3
Highest
quality
in
moderate
or
greater
amounts
(e g
very
large
boulders
in
deep
or fast
water
large
Check
ONE
(0r2
& average)
diameter
log
that
is
stable
well
developed
rootwad
In
deep
/ fast
water
or
deep
well-defined
functional
pools
_OOTJM1
JL
.ç,
C
Comments
4
e&i
4
ttJ
-
d/fj/,..r
“
Maximum
/5-
I
j,
20
heck
ONE
in
ea
öry (Cr2
& average)
Cömnehts.
)r
2 per
bank
&
average)
Y_ip
5]:POQ./GLIDEAND
RIFFLE/RUN
QUALITY
MA)cIMUM DEPTH
CHANNEL
WIDTH
CURRENT
VELOCITY
Recreation Potential
CheákONEONLY!)
Check
ONE
(Or 2
&
average)
Check
ALL
thatpply
Primary
Contact
‘7
—
mEk
0
POOM
FFLEjD
[21
DORREN
Seco’idary
Contact
UL41
DmWI[1
DIRS2JL
[d]
(circle
one
end
comment
an back)
O
OAØnft2J
0
eOO
IH-RIFFIDTH
101
DLFA
DEE1W2
O[j
Pool/f
O
0
2m
[Qj
indicate
for reach
pools
and nffles
Current
i
Comments
.
Maximum____
Indicate
for
functional
riffles;
Best
areas
must
be
large
enough
to
support
a
population
of
riffle-obligate
species:
Check
ONE
(0r2
&emge)..
uO
RIFFLE
[metrlc-Ol
RIFFLE
DEPTH
RUN
DEPTH
RIFFLE
I RUN
SUBSTRATE
RIFFLE!
RUN
EMBEDDEDNESS
OJ1
13’
__
O
TI
ASLI0m
[11
0
MAXIMI44J0cm
[1I
0
DSAL
gt.argëi)
I]
lbwfi
OE5ciZ
0
AB1I
aI#tOJ
Riffle!
{metIcOI
.
O:jM
Ru
Comments..
.
aximum
6] GRADIENT
(()
(
ftlrnl)
0
%POOL
(/OZfj
%GLIDE
(
)
GradIenti%1
DRAINAGEAREA
0
.
Maximum
(ml2)
0
LHVERYHIGJI061
%RUN
L)%RIFFLE
C Z
10
EPA
4520
Electronic Filing - Received, Clerk's Office, September 8, 2008
Cover
Maximum
Channel
—-“
Maximum
Stream
&
Location:
River
Code:
-
Qualitative
Habitat
Evaluation
Index
and
Use
Asse
smént.
Field
Sheet
QHEI
Score:
Zls
fr
74
dc
4’
RM:2.ODate:
Ld1108
Full
Name
& Affiliation:
.
Ico-
-STORET#:
I’.L7
OfficeverIiiedQ
II
SUBSTRATE
Check
ONLYTwo
substrate
TYPE
BOXES;
estimate
%
or
note evety type
present
Check ONE
(Or
2
&
average)
BEST
TYPES
POOL
RIFFLE
OTHER
TYPES
POOL
RIFFLE
ORIGIN
QUALITY
(J1
1D
BLDRISLABS[10]._..........
—
0
tJiiJiAN[4]_
—
DLIMESTONELIJ
HEAVY[21
0 i:
BOULDER
[9]
C
Q [fFti[3ft._t.
—
11LLS
[1]
0
MODERATE
[1]
Substrate
ØD
COBBLE
[8]
0 0
MICKJ2J
—
C
WETLANDS
[0j
SILT
NORMAL
0J
P—
D
C C
SAND
GRAVEL
[6]
[71
...L..
.L_
——
CC
DAjC4L
—
C
HARDPAN
[0]
FREEj1J
i6
J_
—
C
SANDSTONE
[0]
EXTENSIVE
[2]
C C
BEDROCK
[5]
—
(Sàore
natural
substrates; ignore
[J
RIPIRAP
L01.
C
M0PERATE[1J
iun
NUMBER
OF BEST
TYPES
4o
sludge from
pornt sources)
C
LACUSTRINE
[0j
C
NORMAL
[0]
20
C3Isé[oSj
C
SHALE[-1]’.
.2f
NONE [1]
Comments
DcdALFINEsC-2]•
21
INSTREAM
COVER
quality;
Indicate
2-Moderate
presence
0
amounts,
to 3:
0-Absent;
but not
1-Very
of highest
small
quality
amounts
or
or
in
small
if more
amounts
common
ofof
highest
marginal
AMOUNT
quality; 3-Highest
quality
in
moderate
or greater
amounts
(e.g., very large
boulders
in deep
or
fast water, large
Check ONE
(0r2 & average)
diameter
Io that
is
stable,
well
developed
rootwad
in deep
I
fast water, or
deep,
well-defined,
functional
pools.
C
EXTENSIVE
>75%
111]
—
UNDERCuT
BANKS
[I]
._±
POOLS
> 70cm
121
—
OXBOWS,
BACgWATERS
ru-
_MODERATE
25-75%
[71
J_
OVERHANGING
VEGETATION
[1]
—
ROOTWADS
[1]
_
AQUATIC
MACROPHYTES
Q
SPARSE 5-25%
[3]
‘‘
fr
BOULDERS
LII
J_
LOGS
OR WOODY DEBRIS
Lii
T
“
Comments
3j.c14.4W,VELMORPi-IOLOGY
Check
ONE in
each
category
(0r2 & average)
SINUOSITY
DEVELOPMENT
CHANNELIZATION
STABILITY
C
.. C.TE
it
C
El
C
odb
[]-
C
I]
sMODETE[211
C•[]3
C
NON]
JIOOR
[11
REçNT9NO
RECOERY[IJ
Comments
4]
p
A A
Comments
(Or2per
bank
&
average)
Indicate
predàminant
land
use(s) —
past lOOm
riparian.
Riparian
Maximum
10
5] POOL
/.GL1DEAND
RIFFL’E./RUN.QUALITV
MA)UMUM:flEPTH
CHANNEL
WIDTH
CURRENT
VELOCITY
1
Recreation
Potential
Cheàk
ONE:
(ONLY!)
Check
ONE
(Or 2 & average)
Check
ALL that
apply
Primary
Contact
‘
CJI
[41d
C
VEYYAST
CIERSJL1frt
ccrrc,a one
ancjcmmenton
back)
C
0A07m[2
C
POOLMDTH
FLEIDTH
[0]
C
FAstri
DTjMrr!EW[2i
COjfl
CMDE]Jj
D114IYi.
Pool/(
C
c.n2i[or
Indicate
for reach
pools and
nifies
Current
Comments
Maximum
Indicate
for
functional
riffles; Best
areas
must
be
large
enough
to
support
a
population
of
riffle-obligate
species:
Check
ONE (0r2 & average).
-
1
NO
RIFFLE
[me r c-0]
RIFFLE
DERTH.
.. RUN
.QEPTH
:.
. RIFFLEI
RUNSUBSTRATE.
RIFFLE
IRUN
EMBEDDEDNESS
C
BES1AAS
I0ñt[21 C
MA
UM50crn.[2]
C
STABE
bbiiir)
[2]
C
igN
C
BEST
AAs’L10rn’t1J
C
MAXlMUM50crn1fl
C
6vy
CsEif5nft
‘l
nAia
,
o
MODE&E-10I
s,mei
D.IIMaXIrnUm
LJ
6]
GRADIENT
(
0.1 ftlmi)
C
%POOL:Q
%GLIDE:C
Gradient
DRAINAGE
At
C
HFHthLIOèJ
%RUN
(
)%RIFFLE
C
)
MaxImurnI)
EPA 4520
LC
06111/08
Electronic Filing - Received, Clerk's Office, September 8, 2008
Qualitative Habitat
Evaluation
Index
and Use.
Asséssrneñt
Field.:.Sheet
QHE,I
Stream
&
Location Lc
/tfs Iit,
2&
RM
29Date
6-I
/1108
Full Name
&
Affiliation:
r
)d
4
.-
River
Code:
- —
-
—
— _STORET#:
2-kL
18j.
.L9
11
SUBSTRATE.
Check
ONLYTwo substrate Th’PE BOXES;
• Øthtimate
%
or
note
eve&
type freseht
7
Check
ONE
(0r2
&
average)
BEST TYPES
POOL
RIFFLE
OTHER TYPES
POOL RIFFLE
ORIGIN
QUALITY
C C BLDR1SLAB5Ji01_
—
C C
A9PN$[4)_
—
C
JE[1]
—
D.D[3
—
SILT
DDEl1
3Z
CDDC
td
O[6J_
51çq_
—
—
C
Q
Score
ç493l_
natural substrates
—
Ignore
F
D
E
NuMBEa.oF
BEST
TYPES:..D
sludge from point-sources)
DJ
Comments
&-
Is[01
D
C
ONEEi]
ç
(,-O/:1
2] INSiREAMCo.vEI4
qualityIndicate
2
presence
Moderate
0
amounts
to 3: 0-Absent;
but
not
1-Very
of highest
smallquality
amounts
or
in
or
small
If more
amounts
common
ofofhighest
marginal
AMOUNT
quality 3
Highest
quality
in
moderate
or greater
amounts (e
g very large boulders in
deep
or
fast water large
Check
ONE (Or
2
& average)
diameter
log that
is stable
well
developed rootwad
In deep!
fast water or deep well
defined
functional
pools
C
IETENEL{1
— Rqj
D•
mt lend
use(s)
•
•
•
••
•
-
Riparian
Comments
Maximum
•
10-
51
PQQL./
GLIbE
AND RIFFLE?
RUN QUALITY
MAXIMUMtEPTH
CHANNEL
WIDTH
CURRENT
VELOCITY
Recreation
Potential
Check ONE(ONLY!)
•
Chek
NE
1
(Or2
& average)
.
CheckALLtha
p
ly
Primary
Contact
C
C
P DTFF1PTh
Dtg
D3[11
DdDERATE
C
Pool!
—
Tndlcate
for reach
-pools
and riffles.
Current
Comments
Maximum
Indicate for
functional
riffles; Best areas
must
be large
enough
to supporta population
r-(
•
of riffle-obligate
species:
Check ONE
(0r2
&
average).
O
RIFFLE
Emetrlc-Ol
RIFFLE DEPTH
RUN DEPTH
RIFFLE
I
RUN
SUBSTRATE RIFFLE
I
RUN
EMBEDDEDNESS
*4
R:IJ4
U
UNjAB(eF*Ghd4OJ
JY1MaxlmumJ
6] GR4DIENT
(m
I
wtñl)
C
%POOL:(
)
%GLlDE(j)
Gradient
.
DRAINAGEtOmls)
%RUN:
(
J%RIFFLE:cj
Maximum
EPA4520
Substrate
EJ
Maximum
20
CömIneñts
ONE in each
category
(0r2 & average)
Cover
Maximum
ff
I
20J
>4 Zk
/-_
‘7/,’
/0
-•
0611
1/08
Electronic Filing - Received, Clerk's Office, September 8, 2008
Qualitative
Habitat
Evaluation
Index
—
and
Use
Assessment
Field
Sheet
QHEI
Score
&3
RM:WDate:-’7j/C)IO8
Full
Name
&
Affiliation:
‘Ioc
J,Jj
I.
Ci)-
/.(e
V/f-4J
River
Code:
—
—- —
— —-
—
—
STORET#:
I.
I8.
•
Office
verffieffQ
‘11
SUBSTRATE
Check
ONLYTwa
substrate
Th’PE
BOXES;
estimate
%
or
note
every
type
present
Check
ONE
(Or
2 &
average)
BEST
TYPES
POOL
RIFFLE
OTHER
TYPES
POOL
RIFFLE
ORIGIN
QUALITY
El
El
BLOR
ISLABS
(10]_
—
Q
Q
HARDPAN
[4)
—
—
El
LIMESTONE
[13
,HEAVV
[.23
El
El
BOULDER
93
—
Q
El
DETRITUS
E3J
2ILLSF1
SILT
MODERATE
-1J
DEl
coBLEL8].
.
.
—
C
DMUKL21.
::.
—
DWETLAND
DLLO1.
J
r.j
GRAVEL
[7]
V’
—
SILT
[2)
—
HARDPAN
[0)
El
FREE
1J
i’’D
SAND
[6]
—
C]
E]ARTIFICIAL[03_
—
DSANDSTONE[0]
2EXTENSIVE2
0
C]
BEDROCK
[5]
—
—
(Score
natural
substrates
ignore
El
RIPIRAP
[0]’
0D
4
C]
MODERATE
(ii
NUMBER
OF
BEST
TYPES
El
4 or
more
[2]
sljdge
from
point
sources)
C
LACUSTRINE
[0)
qj
C
NORMAL
[0]
or
less
[0[
D.SIIALE
[-1]
C
NONE
[1]
Comments
.
.
El
cÔA
ES
[-21
2]
INSTREAM
COVER
Indicate
presence
0 to
3:
0-Absent;
f-Very
small
amounts
or
common
of marginal
quality;
2-Moderate
amounts,
but
not of
highest
quality
or
in small
‘AMOUNT
amounts
of
highest
quslty;
3-Highest
qualty
in modorate or greater
amounts
(e.g.,
very
large
boulders
in deep
or
fast
water,
large
Check
ONE
10r2
&
average)
dhmeter
log
that
is stable,
well
dcveloped
rootwad
in
deep
/
fast
water,
or
deep,
well-defined,
functional
pools.
,EENSIVE75%
F!1J
—
UNDERCUT
BANKS [1]
_L.
POOLS>
70cm
[2]
—
OXBOWS
.BAGKWATERS
[1]
MODERATE
25 75%
(7]
—
OVERHANGING
VEGETATION
[1]
/
ROOTWADS
(1)
_.
AQUA’TlC
MACROPHVTES
ij
Q
SPARSE
5<25%
[3]
SHALLOWS
(IN
slow
WATER)
ill
/
LOGS’
ORWOODYDEBRIS
Q
NEARLY
ABSENT
<5%
1]
L
C.....
Comments
..
Maximum
3
10
5]
POOL
/
GLIDEAND
RIFFLE/RUN
QUALITY
MAXIMUM
DEPTH
CHANNEL
WIDTH
CURRENT
VELOCITY
[icreation
Potential
Chek
ONE
(ONLY!
Check
ONE
(Or
2 &
omge)
Check
ALL
I’
‘---‘-
-
Primary
Contact
Im
[6]
0
POOL
WIDTH>
RIFFLE
WiDTH
(2]
C
TORRENTIAL
[
iLL
Secondary
Co’?tact
U
O.7-Ii
L4]
,
POOL
WIDTH
=
RIFFLE
WIDTH
fl
C
VERY
FASTL1
[
tclleoneandcammontondclI
[JO
4-<0
Tm
[21
El
POOL
WIDTH
<RIFFLE
WIDTH
[0]
C
FAST
[I]
O
0.2-<OAm
[I]
C
MODERATE
iI
[
Pooh
C
0.2ñi
[0]
lódicae
foreach
Current
Comments
,
Maximum
Indicate
for
functional
riffles;
Best
areas
must
be
large
enough
to
support
a
population
r-
t
-
-o
of
riffle-obligate
species:
Check
ONE
(Or
2
&
average).
0
RIFFLE
[me
nc-]
RIFFLE
DEPTH
RUN
DEPTH
RIFFLE
I
RUN
SUBSTRATE
RIFFLE
I
RUN
EMBEDDEDNESS
El
BEST
APEAS >
lOcir
23
El
UM
—
5c’n
[23
9
STABLE
e
cobble
Boulder,
L
21
El
NOr4E[2j
9
BEST
EAS
5 lCcm
[II
fl
AXIMUrI
flC,1
MI
9
1OD
STABLE
c
g
La
e
Grav&t
ri
LO’
lii
_____
C
BEST
AREAS
<Scni
C
UNSTABLE
(e
g
FIne
Gravel
Sand)
[0]
C
MODERATE
[0]
RIffle!
—
[metrlc=01
.
.
El
EXTENSIVE [-I]
Ru
Comments
Ma.omurn
6]
GRADIENT
(<0.1
ftlmi)
9
VERY
LOW
-LOWL4J
%POOL:CD
%GLIDE(__j
Gradientm
DRAINAGEA
mia)
Q
HIGH-VERY
HIGH
[10-6]
%RUN:
C/1%RIFFLE:C
)
MaximirL)
EPA4520
>I,50&.
/
(j
(0
//(ô
06/11/08
(I
/LJJ
7
.
.
Stream
&
Location
/ie’
Substrate
Maximum
ED
20
Corn
iénts
LOGY
Check
ONE
in
each
category
(Or
2
&
average)
cu_n....
Y
NAND--R
mstream
I..
R
Cover
Maximum
IT
Channel
Maximum
AN
ZONE
Check
ONEm
each
cats
-
-
BANK
(Or
2
per
bank
& average)
-:i
cafe
I IdL
d4)I5’
‘SLOW.,[I]:
].INTERSTIT!AL
[-1]
]:INTERMIflENT
[.2
]EoDiES(I]::
pools
and
riffles.
Electronic Filing - Received, Clerk's Office, September 8, 2008
-
and
QualitativeUse
Assessment
Habitat
Evaluation
Field
Sheet
Index
HEI
cor
e
Stream
&
Location:
Jç
P/.ah-’ec
£ir
—
RM:&?.Z.Date: &?-I
!
LI
08
Full
Name
&
Affiliation:
C)
juijL..
E4-
vw.-;
RiverCode:-___-___STORET#:
I?1L
I8
LZ5
Office
verIflic1
1]
SUBSTRATE
Check
ONLYTwo
substrate
IYPEBOXES;
estimate
%
or note
every
type
present
Check
ONE
(Or 2
&
avrage)
BEST
TYPES
POQIRIFFLE
OTHER
TYPES
POOL
RWFLE
ORIGIN
QUALITY
DO
B(.PR.lSLPtBS[10l_-i..
—
Q
DHARDPAN[4]
—
—
DL!MEIpNE[1]:
HEAVY(.2j
O 0
BOULDER
[9]
—
—
I1
Q
DETRITUS
(3]
V
—
El
TILLS
[1]
,
.
0
MODERATE
Lii
El
0
COBBLE
[8]
—
0
El
MUCK
[2]
—
—
El
WETLINDS
[0]
0
NORMAL
[0]
00
GRAVEL
[7]
—
SILT
[2]
—
HARDPAN
[0]
0
FREEJJ.
DO
SAND
[6]
—
0
0
ARTIFICIAL
[0]_
—
JSANDSTONE[0]
EXTENSIVE
[2]
O
0
BEDROCK
[5]
—
—
(Sco
e natural
.ubstrates
ignore
El
R1PIRAP
[0)
.oDEb,.
El
MODERATE
[1]
NUMBER
OF
BEST
TYPES
El
4
or
more
[21
sludge
from point
sources)
El
LACUSTRINE
[0]
cQ
NORMAL
[01
3 or
less [0)
DSHALEL1j
El NONE
(1]
Comments
:
;
-
2] INSTREAM
COVER
quality;
mdi
ate
2Moderate
presence
0
amounts,
to
3
0
Absentbut
not
1
ofVery
highest
smallquality
amounts
or in
on
smallore
amounts
common
ofofhighest
marginal
AMOUNT
quality;
3-Highest
quality
in
moderate
or greater
amounts
(e.g., very
large
boulders
in deep or
fast
water,
large
Check
ON E
(0r2&
average)
diameter
log that
is
stable,
well developed
rootwad
in deep
I
fast
water,
or deep, well-defined,
functional
pools.
Q
EXT
NSlE
11J
UNDERCUT
BANKS
[I]
_......L.
POOLS
>70cm
(2]
—
OXEOWS,
BACKWATERS
[1]
,MODERATE25
75%
(7]
—
OVERHANGING VEGETATION
LI]
—
ROOTWADS
[1]
..2.
AQUATIC
MACROPHVTES
(I]
,
SPARSE
5<25%
[3]
—
SHALLOWS
(IN
SLOW
WATER)
[1]
/
BOULDERS
[1]
—
LOGS OR
WOODY
DEBRIS
[1]
0
NEARLY
ABSENT
<5% [1]
—
ROOTMATS
[1]
—
—
STABILITY
DMRATEL2I
/O
-
tv.t
4]
BANK EROSION
AND
RIPARIAN
ZONE
Check ONE
in
each category
for
EACH
BANK(Or
2 per bank
& average)
River
right
looking downstream
L
RI PARIAN
WIDTH
PL
‘TY
ERION.
—
/Th
Cover
Maximum
20
-•
-
ONS41GE
11
NONE
I LIULE
L3)
El
El
MODERATE
10 5Dm [3]
0
0
MODERATE
[21
0
El
NARROWS
lOm
(2]
El El
HEAVY
l,SEVERE
[1]
C
—‘i
dominant
land use(s)
D
g
NONE
[0]
-
. .
. ,-..
.
...
riparlan.
Riparian
Comments
-.
.
M
imum
4,
Jj
€,
j,,
;
.
19
,o
/al
,
10
5]
POOL
/
GLIDE
AND
RIFFLE
/
RUN
QUALiTY
If-
i
r&
Q4
V
MAXIMUM
DEPTH
CHANNEL
WIDTH
CURRENT
VELOCITY
Recreation
Potential
Check
ONE
(ONLY!)
Check
ONE (Or2
&
average)
Check
ALL that
apply
Primary
Contact
“>
DO
7-<Im
I m
[6]
(4]
POOL
El
POOL
WIDTH>
WIDTh
RIFFLE
RIFFLE
WIDTH
WIDTH
[2]
Li]
ElEl
TORRENTIAL
VERY
FAST
[1]
I]
0
‘SLOW
INTERSTITIAL(
[1]
-
I]
frfrdeoanommantonback)
Secondary
Contact
0
0 4-<0
7rn
[2]
El
POOL WIDTH
<
RIFFLE WIDTH
[0]
0
FAST
[1]
0
INTERk1TrENT
[2]
Efo:2-o.4m:i1
D
MODERATE
jIJ
. o
Eoi5iEs11J:;:
-.
Pooh
El
< 02m
LOl
Indicate
for
reach
- óóIñd
rifftè.
Cu,rent
Comments
Maximum
Indicate
for
functional
riffles;
Best
areas must
be
large enough
to
support
a
population
,.
of
riffle-obligate
species:
CheDk
ONE
Or 2
&
average).
(mt!icP]
RIFFLE
DEPTH
RUN
DEPTH
RIFFLE
I
RUN
SUBSTRATE
RIFFLE
I
RUN
EMBEDDEDNESS
0
BEST
AREAS>
i0m
[2j
El
MAXIMUM
> 50cm
[2]
D.STABLE(e.g,
cobb!,L’!der)
[2].
0
NONE
[2)
0
BEST
ARAS
5-1Oci
!1]
0
MAXIMUM
< 50cm
El]
C
MOD.
STABLE
(e.g4
Làrgè
GraieI)
[1]
El
LOW
LII
0
BEST
AREAS
< Scm
0
UNSTABLE
e;g.,
Fine
Gravel,
Sand)
[0J
El
MODERATE
[0]
ijei
.
.
[metnic=0]
El
EXTENSIVE
L-1J
..
Ufl
Comments
tlaCImurn
6]
GRADIENT
.
J)
J
VERY
LOW
- LOW
[2-4]
%POOL:Qozr)
%GLIDE:Q
J
Gracflentrf
71
DRAINAGE
AREA
El
MODERATE[610]
.
r
Maximum
1
!
k)
I
mi2)
El
HIGH-VERY
H!GH[10-6]
%RUN:
L
J%RIFFLE:
)
EPA4520
IrSOL
-
.
-
.—.
Substrate
0
Maximum
20
Comiñèhts:
3]C1
PEL
MORPHOLOGY
Check
ONE 9
each category
(0r2
&
average)
Channel
Maximum
7/f/O
06111/08
Electronic Filing - Received, Clerk's Office, September 8, 2008
QHEI
Score:
23
Date:
J
/oI
08
Full
Name
&
Affiliation:
(?-
/pJ’-
1
61-
ç/f/4-
River
Code_
—
—- — —
-
STORET#
I
c
10
1J1
L
LQ.
I8
±a:
Office
venffec(Q
11
SUBSTRATE
Check
ONLYTwo
substrate
Th’PE
BOXES;
estimate
%
or
note every
type
present
Check
ONE
(Or 2
&
average)
BEST
TYPES
POOL
RIFFLE
OTHER
TYPES
POOL
RIFFLE
ORIGIN
QUALITY
D D
BLDR
lSLAB’Ll0L......
—
C C
HARPPAN
4j
—
—
D,IYITONE Lii
,‘HEAVY.L-21
C C
BOULDER
[9] .
.
—
—
C C
DTRITUS
[3]
—
C
!ILLS[i.].:.
•
1
LT
C
MODERATE [.1]
Substrate
C C
COBBLE
[8]
—
—
Q
Q
MUCK
[2]
C
WETLANDS
[0]
C
NORMAL
[0]
C
Q
GRAVEL
L7]
—
,,
Q
SILT
[2]
—
ZHARDPAN
[01
C
FREE
(1J
21 U
SAND
[6]
.._k..
—
1]
[1
ARTIFICIAL
[0]_
U
U
BEDROCK
[5]
—
21SANDSTONE [0]
.EXTENSIVE
[2]
‘
)
—
(Score
nstural
substrates
gnoie
C]
RIPIRAP
[0]
PDEb+
U
MODERATE
[1]
Iium
NUMBER
OF
BEST
TYPES:
Q
4
or.more
[2]
sludge
from
point-sources)
DIUSTR,NE:L0
D.NORMAL
Lol.
20
ommen
s
or
less
[0]
C]
SHALE
1]
C]
NONE
Lu]
..
U
COAL
FIN
ES’-2J
2] INSTREAM
COVER
quality;
Indicate
2-Moderate
presence
0
amounts,
to
3:
0-Absent;.1-Verybut
not
of
highest
smallquality
amounts
or in
or
small
if
more
amounts
common
of
of
highest
marginal
AMOUNT
quality;
3-Highest
quality
in
moderate
or
greater
amounts
(e.g.,
very
large
boulders
in deep
or
fast
water,
large
Check
ONE
(Or
2&
average)
diametcr!og
that
is stable,
well
developed
rootwad
in
deep/fast
water,
or
deep, well-defined,
functional
pools.
C]
EXTENSIVE’75%
Liii
—
UNDERCUT
BANKS
Lii
......L...
POOLS
>70cm
[21
_.L_
OXBOWS
BACKWTERS
[i]
,%
MODERATE
2675%
[7]
—
OVERHANGING VEGETATION
[1]
—
ROOTWADS
[1]
AQUATIC
MACROPHYTES
[1]
C
SPARSE
5.c25%
[3]
—
SHALLOWS
(IN
SLOW
WATER)
[1]
BOULDERS
[1]
/
LOGS
OR WOODY
DEBRIS
[1]
C]
NEARLY
ABSENT
<5,0 [1]
ROOTMATS[i]
..
.
.
—
.
—
STABILITY
DJA[
Cover
Maximum
1
2OIL.
i2.It
4] BANK
EROSION
AND
RIPARIAN
ZONE
Check
ONE in
each
category
for EA
CH
BANK
(0r2 per
bank &
average)
River
right looking
downetream
RIPARIAN
WIDTH
ri
EROSION
O
wi°
‘5Om.[4]
RI
Ii
NPNE;t
LIE.[3]
•
DMOPERA
E.lØOm[3J,’
fl
U
MODER1E:[2]
C] EJ
NARROW5.1Om
LI
IJ
U
U
Uldpffl1&o
indicate
predominant
landuse(s)
past
100mrb
ar/an.
Rlparlan
Maximum
10
Comments
5]
POOL
/
GLIDE
AND
RIFFLE
/
RUN
QUALITY
MAXIMUM
DEPTH
CHANNEL
WIDTH
CURRENT
VELOCITY
Recreation
Potential
Check
ONE
(ONLY!)
Check
ONE (Or
2
& average)
Check ALL
that
apply
Primary
Contact
CO
C
0.7.im
4-<0
Im [6]
7m
E41
[2]
.2P00L
UU
POOLPOOL
WIDTH
WIDTH>
WIDTH
=
<RIFFLE
RIFFLERIFFLE
WiDTHWIDTH
WIDTH
L11
[0][2]
U
CC
VERYTORRENTIAL
FAST
[1]
FAST
[I]
2FSLOW
U
INTERMITTENT
[‘I]
1_lI
[2]
(circle
Secondary
one
andcommenton
Contact
bac)
I
U
MOóERATE[i’j.
C
äDis
fI]
Pool!
U
<0.2m
[Q]
Indicto
fór
reach
- pools
and rffls
Current
ç>í
Comments
Ma(im
urn
C)
Indicate
for functional
riffles;
Best
areas
must
be
large
enough
to
support
a population
of
riffle-obligate species:
Check
ONE
(0r2
&
arage).
I
t -
NO
R FFLE
[me
r
c—0]
RIFFLE
DEPTH
RUN
DEPTH
L.E
I RUN
EMBEDDEDNESS
BEST AREAS>
iOcn[21
Q
MAXIM’JM
>50cm
[2]
C
NONE
[2]
U
BESTAREAS
5-10cm
ii
U
MAXIMUM<
50cm
L1
C
LOW
F11
-
C
BEST
AREAS
5crn.
UObERATEto1
RIffIe/
1
i
1
[metricDI
C
EXTENSIVE
t
’
11
Comments
M
a.,
v.m
8
6]
GRADIENT
1
<Oj
ftfmi)
C
VERY
LOW
- LOW
t2-4J
%POOL:(/j
%GLlDE:
GradIent
DRAlNAGE(AmIz)
D
HRYHIGH[10.6]
%RUN:
(
)%RIFFLE:F
MaximurnjJ
EPA4520
t,s’’a,
‘
1’
8
06)11/08
/‘
I’
Stream
&
Location:
Qualitative
Habitat
Evaluation
Index
and
Use
Assessment
FIeld
Sheet
fr
4y
/&r
,28
0
t3
LB
Comments
31
(M
r
MORPHOLOGY
Check
ONE
in each
category
(0r2 &
average)
U
U
HEAW/SEVERE [1]
i
C
Channel
Maximum
20
_______
Li
U
C
.IIFLE
I RUN
SUBSTRATE
RIFFI
STAB.LE
(e.g.,CobIIöBouicier)[2[.
C
MOP.
STABLE
(e.g.,
LargoGraieI)
[1].
C
UNSTABLE
(e.g..
FIñGraéISahd)t0I
Electronic Filing - Received, Clerk's Office, September 8, 2008
Qualitative
Habitat
Evaluation
Index.
and
Use
Assessment
Field
Sheet
QHEI
Score
Stream
&
Location:
lcs
Pi€s
?f(J—
- ?
‘?.-
RM:Z.Date:OH
1/108
Scorers
Full
Name
&
Affiliation:
j
t1-JL
Lati
Lonq.:
L
.
a
Office
verifled,—
.
18Z
River
Code:
-
-
STORET#:
I
1
i
-
1] SUBSTRATE
Check
ONLY
Two
substrate
7YPE BOXES;
estimate
%
or note
every
type
present
Check
ONE (Or
2
&
average)
•
BEST
TYPES
POOL
RIFFLE
OTHER
TYPES
POOL
RIFFLE
ORIGIN
QUALITY
C
C LDR
iBS1iL.
—
DRD
4j
DtLMETONEI1’
HELI
C
C
—
C
—
C
C
MODE4EI
J
Substrate
—
—
ZD
C
I]
1cJL
[OL
—
D’
!%_‘
C
C
R$j5I
—
pore
natural
substrates
ignore
C
M9DRTEt(1
Maximum
NUMBER
OF
BEST
TYPE
studge
from
point sources)
DyT
20
2]
INSTREAMCOVER
quality
Indicate
2
presence
Moderate
0
amounts
to
3: 0-Absent;
but
not
1-Very
of
highest
small
quality
amountsor
In
or
small
if
ri5ie
amounts
commonof
of
highest
marginal
AMOUNT
quality
3 Highest
quality
in
moderate
or
greater
amounts
(e
g
very
large boulders
in deep
or fast
water
large
Check
ONE
(0r2
&
average)
diameter
log
that is
stable
well developed
rootwad
in deep!
fast
water
or deep
well-defined
functional
pools
Q
EXTENSI$L5%
tt
±
_
_(IN)AVRY[11
__L9
k1I
oDEsñipJ
Q
NEARLY
ABSENT
<
[!I
—
c
Comméñtd
Maxi,rnzrn
g
20
____
3] CHANNEL
MORPHOLOGY
Check
ONE
in
each
catego’y
(Or2
& average)
d
{i’-
4--
—P
SINUbSITY. . DEVELOPMENT
CHANNELIZATION
STABILITY
cinents::
..
4
.
..
Maximum
t)IbI-’1
),1—-’’3
EZ—•---\
4]
BANK
EROSION
AND
RIPARIAW
ZONE
Check
ONE
in each
category
for
EACH
BANK
(Or
2perban)f
&
average)
River
right
iceking
downstream
RIPARIAN
WIDTH
FLOOD
PLAIN
QUALITY
I
EROSION
r
a
okfAI
DçLq
CC
SVERE
[1]
C
C
C C
indicate
predominant
land
use(s)
CC
opjójJ
past
lOOm
rlparian
Riparlan
Comments
.
Maximum
13’S
10
____,
5]
POOL/.GLIDEAND
RIFFLE/RUN
QUALITY
MAXIMUM:.DEPTH
CHANNEL
WIDTH
CURRENT
VELOCITY
rRecreation
Potential
Check
ONE ONLY!)
Check
ONE
(Or
2 & average)
Check
ALL
th ap
ly
Primary
Contact
D:
DIpJ14J2I
D
Secondary
Contact
L1
CLTjit1i
DjI
3
C
1IT1frb1
(circie
one and
comment
on
back)
C?L4
Di
lpT
E1
CFtNi]
DTERMfliENtti2E
____
C
oij
DtETJ
Pool!
‘7&rch
-p7diiffi
Current
comments
Maximu
,
Indicate
for
functional
riffles;
Best
areas
must
be
large
enough
to
support
a
population
.
-
of riffle-obligate species:
Check
ONE
(Or2
&
average).
giO
RIFFLE
.tmetrlc-0]
RlFFLEDEPTH
RUN
DEPTH
RIEELELRUNSUBSTRATE
RIFFLE
I RUN
EMBEDDEDNESS
C
BEet
MO)ii
L2 C
MUM59[2j
C
C
C
BESTAEA5
m
C
MAXIMUM
<
Ocm
[1]
C
C
C
C
liNSABEeg
GavSflr0j
C
MgRL01
q
4merIcO1
C
E NSWE[I1
Run
Comments
•----•-
-
Maximum
6] GRADIENT(
O.I
ftlmi)
CYW1
%POOL:(
%GLlDE:CJ
GradIent(’
DRAINAGE
AREA
C
Maximum’
(4mi2)
C
T
4
f9j6I.
%RUN:
(
J%RIFFLE:C
Z
10
EPA4520
‘r-L2P
7//&/OP
06/11/08
Electronic Filing - Received, Clerk's Office, September 8, 2008
Qualitative Habitat
Evaluation
Index
and
Use
Assessment
Field
Sheet
QHEI
Scored
DL
DLI
LI
Stream
&
Location:
15
ir-c
//v
0
4j?
RM:
?
oDate:
U
FufI Name
&
Affiliation:
e
,,J
River
Code:
- — —
—- —
—
STORET#:
‘fl
L
/88.
JS..33
OeedLI
1] SUBSTRATE
•
Check
ONLYTwo
substrate
Th’PE
BOXES;
estimate
%
or note
every
ty
present
Check
ONE
(0r2
&
average)
POOLRIFFLE
‘JLRIFFLE
ORIGIN
QUALITY
—
LI
LIMESTONE
[1i.•
HE.VY[-2]:
—
—
LI
TILLS
[1)
LI
MODERATE
[
1
Substrate
—
—
—
DWETLANDS[0]
DNORMAL[01
....‘,.
—
.,ZHARDPAN
[0]
LI
FREEIê
—
—
,‘SANDSTONE
(0]
E)CrENSIVE
[23
tural
substrates
Ignore
LI
RIPIRAP
[0]
OO4,
LI
MODERATE
[11
,
,e
from point
sources)
LI
LACUSTRINE
[0]
‘‘
LI
NORMAL
[01
20
,,b
DSHALE[1]
LINONE[1]
LI’COAU
PIN
ES:I-2J
%)
SILT
LILIr
LI’
LI
LI
C
LI
Comments
2]
INSTREAM COVER
quality;
Indicate
2-Moderate
presence
0
amounts,
to
3:
A’-Absent;
but not
1-Veryof
highest
smallquality
amounts
or
in
or
small
if more
amounts
commonof
of
highest
marginal
AMOUNT
quality;
3-Highest
quality
in
moderate
or
greater
amounts
(e.g., very
largeboulders
in
deep or
fast water,
Iarcie
Check
ONE (Or
2 &
average)
diameter
log
that is
stable,
well
developed
rootwad
in
deep!
fast
water, or
deep,
well-dellned,
functional
pools.
LI
iEXTENjVE.75%
[!f1
-
4DERCUT
BANKS
[1]
_L_..
POOLS
1
7Qcm
[2]
—
OXBOWS
CKwATERS
jij
MODERATE5 75%
m
—
OVERHANGINGNEGETATION
[11
.. _ROOTWADS
[13
..j..
AQUAT(&MACROPHYTE
[1]
LI
SPARSE
5-25%
f]
SHALLOWS
(IN
SLW
WATER)
[1]
BOULDERS
tir
/
ioGS
OR
W’OODY
DEBRIS
L1J
LI
NEARLY
ABSENT
<5%
1J
ROOTMATS[1J
S-.
:
Comments’
c
Ma4mumEi
L
Comments
Channel
‘(Or 2perbank
&
average)
Maximum
LLJ
indicate
predominant
land
use(s)
past
lOOm
ripanan.
Riparlan
Maximum
j
I.5
10
5]
POOL
/
GLIDE
AND
RIFFLE
/
RUN
QUALITY
MAXIMUM
DEPTH
CHANNEL
WIDTH
CURRENT
VELOCITY
[Ricreation Potential
Check
Li
0.7-1rn[4]
im
ONE
[6]
(ONLYI
.1’OOLWIDTH.R!FFLEWiDTh
LI
POOL
Check
WIDTH
ONE
(Or
RIFFLE
2
& average)
WiDTH
[21
11]
LI
LI
VERYTORRENTIAL
FAST[ij...”:Check
[
ALL
11
J2’SLOW
LI
that
INTERSTITIAL
apply
[1]
[4]
..
(circiooneandcommontonb)j
Secondary
Primary’
ContactContact
II
DO
4<0
7m
[2]
LI
POOL
WiDTH
< RIFFLE
WIDTH
(0]
LI
FAST
[13
LI
INTERMITTENT
[2)
LI
0
2-cO
4m
[1]
LI
MODERATE
[I]
LI EDDIES
(13
Pool!
LI
<
().‘2m
[0]
- Iridiáatcfor
readi
- pbols
and flues:
Current
Comments
Max!mumt
‘ Indicate
for
functional
riffles;
Best
areas
must
be
large
enough
to support
a
population
of
riffle-obligate species:
Check
ONE
(Or2
&
average).
•
-0
L2!LSSJ.
RIFFLE
DEPTH
RUN
DEPTH
RIFFLE
I RUN
SUBSTRATE
RIFFLE!
RUN
EMBEDDEDNESS
LI
BEST P
REPS>
4
0cm
[2]
LI
MAY1MUM>
50cm
[2]
LI
STABLE
(a
g
CoLbIe
Bøuld
[2]
C]
O..E
[21
LI
BESTAREoS
5
10cm
[1]
fl
MAXIMUM
< 50cm
[11
LI
MOD
STP.BLE
1
e
g
Large
C,eI)
[j
LI
LOW [1]
LI
BEST
AREAS
<
5cm
U
UNSTABLE
(e
g FIne
Gravel,
Sand)
[0]
LI
MODERATE
(0]
RIme
‘
[metrico]
1
ri
LI
ETENSI”E
[
11
RUfl
1
Comments
-
M,ximum
6]
GRADIENT
<
ô
ftlmi)
LI
VERYLOW
- LOW
t2-41
%POOL:Qf
%GLIDE:C
Gradient
DRAINAGE
AREA
LI
MODERATE
[6-10]
‘
Maximum
(7mi2)
LI
HIGH
-VERY
HlGH’[1O6j
%RUN:
(
)%RIFFLE:
10
EPA
4520
(rZ_
f/
f—
06/11/08
Electronic Filing - Received, Clerk's Office, September 8, 2008
Qualitative
Habitat
Evaluation
Index
and_Use
Assessment
Field
Sheet
QHEI
Score
______
Stream
&
Location:
Pfcs
fwe-v
9
‘?13
RM:
L.!Date:-’rl
I
U08
Full
Name
& Affiliation:
De
LL
-
4
LST
1
Ei
/e?
1y
___&iL.!t!iL
!8Z.Lf
OfflceverIfled
it
Check
ONE (Or
2
& average)
POOL
RIFFLE
ORIGIN
QUALITY
—
DLISONE
11]
HEAVY
1-21
:
D
TILLS
[1J.,
:.
D
MODERATE
[-1]
Substrate
—
DEitANDSD1
SILT
NOALLOJ
aHARDPAN
[0]
D
FREEJIJ
—
ISANDSTONE
[0]
ZEXTENSIVE 121
ore
natural
substrates
ignore
D
RIP1RAP
[0]
[I
MODERATE
[1j
sludge
from
point-sources)
D
LACUSTRINE[0J
D
NORMAL
[0]
iiiurn
20
DSHLEL1je-
D
NONE
[1]
D
COAl
7
ES
[-2]
Comments
f4
2]
INSTREAM
COVER
Indicate
presenceö.
to
3: 0-Absent;
1-Very
small
amounts
or if
quality;
2-Moderate
amounts,
but
not of
highest
quality
or in small
re
amounts
common
of
of
highest
marginal
AMOUNT
quality;
3-Highest
quality
in
moderate
or
greater
amounts
(e.g.,
very
large
boulders
in
deep
or
fast
water,
large
Check
ONE
(0r2 &
average)
diameter
log that
is
stable,
well
devoloped
rootwad
in deep
/ fast
water,
or deep,
well-defined,
functional
pools.
D
EXTENSiVE.’75%’t11]
-.
_UNDERÜT
BANKS
III
_L
POOLS>
70
[21
—
OXBOWS,
BACKWATERS:[1j
MODERATE
25-75%
[7].
—
OVERHANGING
VEGETATION [1]
—
ROOTWADS
[I]
...A..
AQUATIC
MACROPHYTES
LI]
Q
SPARSE
5c25/
0
[3]
_SHALLOWS
(IN
SLOW
WATER)
[I]
BOULDERS
[1]
/
LOGS
ORW000YDEBRIS[1J
Q
NEARLYABSENT
<Sh
[1]
ROOTMATS
Lii”
lndicatopredomInant
land use(s)
Rlparian
Maximum
10
Comments
5]
POOL
IGLIDEAND
RiFFLE/RUN
QUALITY
/
‘—
MAXIMUM DEPTH
CHANNEL
WIDTH
CURRENT
VELOCITY
Recreation
Potential
Check
ONE
(ONLY.’)
Check
ONE
(0r2
&
average)
Check
ALL
(ha
apply
Primary
contact
Im [6]
C
POOL
WIDTH>
RIFFLE
WIDTH
[2]
ID
TORRENTIAL
(1]
LOW
[11
Seoqdery
Con
ac
0
07 ‘I
in
[4]
‘POOL
WIDTH
= RIFFLE
WIDTH
[1]
0
VERY
FAST
[11
I]
INTERSTITIAL
[1]
(cIrcle
one and
comment
on back)
Q
0
4-’cO
Tm
[21
0
POOL
WIDTH
<RIFFLE
WIDTH
[0]
0
FAST
[1]
0
INTERMrFrENT
121
Q
O.2.<0.4ni
[1]
DMDDERATE
[‘1
‘
DEDDiSi].
..
P001/
Q
c
O.2n1 [0]
Indicate
for
recIi
- pooh
and
riffles.
Current
Comments
Maximum
Indicate
for
functional
riffles;
Best
areas
must
be
large
enough
to
support
a
population
of
riffle-obligate
RIFFLE
species:
Check
ONE
(Or
2 & average).
rO
[metrlc—0]
RIFFLE.
DEPTH
RUN
DEPTH
RIFFLE
I
RUN
SUBSTRATE
RIFFLE
I
RUN
EMBEDDEDNESS
O
BEST
ARES
>10cm
ID
MAXIM
UIa,
50cm
[21
0
STABLE
e
g
cobbicouIder,
121
0
NONE
t21
ID
BEST
APEAS
510cm
LII
ID
MaXIMUM
< 5cm
[I)
ID
MOD
STABLE
Ce
a
Large
Gravel)
[II
fl
LOW
Ill
ID
BEST
AREAS
5cm-.:
ID
UNSTABLE(e..,
FIne
GraveI,and).[0J
ID
MODERATE.[0J
Riffle?
[metrlcOj
.
ID
EXTENSIVE
[-1)
Ma
Comments
8
\._—
6] GRADIENT
ID
VERY
LOW
- LOW
[2-4]
%POOL:Qs)
%GLlDE:C)
Gradient
DRAlNAGE(AmIa)
0
HIGH-VERY
HIGH[1o-61
%RUN:
(J%RIFFLE:(J
D
Maximum
____
• EPA4520
1..)r-2j
ftf’
7116(oP
06111/08
•STORET#:
River
Code:_
—
1]
SUBSTRATE
nate%ornotee
POOL
RIFFLE
r
—
[
—
Cover
Comments
Maximum
20
3]
CHANNEL
MORPHOLOGY
Check
ONE
ineach
category
(0r2
& average)
SINIJOSITY
DEVELOPMENT
--
STABILITY
ID
HIGH
[4]
0
EXCELLENT
[7]
ID
DHIGH
[31
ID
MOIi’ERATE
[31
C]
ÔOOD
[5J
F
Q
MODERATE
[2]
0
LOWj2]
ID
FAIR3
.
:
1ONE
[1]
..
POOR
[11
C]
]
.
Channel
Comments
Maximum
4]
BANK
EROSION AND
RIPARIAN
ZONE
Check
ONE
In
each
category
for
EACH
BANK
(0r2
per
bank
&
average)
PJvorrghtlooktndown’ireani
RIPARIAN
WIDTH
FLOOD
PLAIN
QUALITY
EROSION
ID EJ
V
E
.[4I1ir,’2
ID
FORE
SWAMP.[
5
ID
1i’CONSERVATION
TI[.LAGE
[I]
ID
J’NONE
I
LITTLE
[3]
C]
C]
MODEIATE
10
5Dm
[3]
0
ID
SHRUB
OR
OLD
FIELD
[21
..
ID ID
uRBAN
OR
INDUSTRIAL
[0]
C]
C]
MODERATE
[21
[JO
NARROW
5
10111121
C
ID
RESIDENTIAi
PARK
NEW
FrELD
[1
ID
ID
MINING
I CONSTRUCTION
[0]
I]
ID
HEAVY!
SEVERE
[1]
0
2
VERY
NARROW
<5m
[1]
ID
C]
[2TNONE
101
ID
0
FENCED
PASTURE
(1J
!
p
E]PEN
PAST
OWC1ÔIdJ’
.,
Electronic Filing - Received, Clerk's Office, September 8, 2008
River
Code:__-___-___STORET#:
—
II
1
SUBSTRATE
Check
ONLYTw0 substrate
TYPE
BOXES;
estimate
%
or
note
every
type
present
Check
ONE
(0r2
& average)
BEST
TYPES
POOL
RIFFLE
OTHER
TYPES
POOL
RIFFLE
ORIGIN
QUALITY
DO
BLDR
ISLABS
[10]_
—
0
0
HARDPAN
[41.
0
LIMESTONE[i].
HEAVY.[-2]
Q
C]
BOULDER
[9]
—
1]
[]
DETRITUS
[3]
—
—
0
TILLS
[11
SILT
0
MODERATE
[I]
Substrate
00
COBBLE
[81
j_.
—
0
0
MUCK
[2]
—
—
C
WETLiNDS[01
C
NORMAL
[01
DO
GRAVEL
L7i
.i.....
—
JSILT
[21
V
[0]
0
FREEJ5J
El
C]
SAND
[61
Jr..
—
0
0
ARTIFICIAL
[01
—
—
‘SANDSTONE
I)
.XTENSIVE
21
0
0
BEDROCK
[5]
(Score
natural
suf’slrates
ignori’
El
RIIIRAP
[O]
C
MODERATE
L
1
Maximum
NUMBER
OF
BEST
TYPES:
0
4or
more
[2]
sludge
from
point-sources)
DLCUSTRINEOJ
cJDNOIMAL[OJ.
20
J2’3
oiiess[.0]
D.sLE.[1]:;.
C
NONE
[1]
Comments
.
.
.
.4,)
2]
INSTREAM
COVER
Indicate
prasonce
0
to 3:
0-Absent;
1-Very
small
amounts
or
if
more
common
of marginal
quality;
2-Moderate
amounts,
but
not
of
highest
quality
or
in small
amounts
of
highest
AMOUNT
quaty;
3-Hiqhest
quafty
in
moderate
or
greeter
amounts
(e.g..
very
large
boulders
in
deep
or fast
water,
large
Check
ONE
(0r2&averagefl
diameter
log
that
is
stabI,
well
developed
rootwad
in
deep!
fast
water,
or deep,
well-defined,
funclional
pools.
Q
EX•TENSIVE:>75%
(1].
UNDERCUT
BANKS
[iJ
._.L....
POOLS
> 70cm
[2]
—
OXBOWS BACKWATERS
[11
25
75%
[7]
OVERHANGING
VEGETATION
[1]
—
ROOTWADS
[11
....
AQUATiC
MACROPHYTES
[11
2SPARSE
5<25%
[3]
SHALLOWS
(IN
SLOW
WATER)
[1]
—
BOULDERS
[1]
LOGS
OR
WOODY
DEBRIS
[13
0
NEARLY
ABSENT <5%
[1]
ROOTMATS
[1]
.
.
•.
.
.
.
.
—
Cover
MaximumØ
Comments
3]
CHANNEL
MORPHOLOGY
Check
ONE
in each
category
(0r2
& average)
SINUOSITY
DEVELOPMENT
O
HIGH[4J
.
El
EXCELLENT
L7J
C
M.ODERATh
[31
0
GOOD[51.
JLOW
E2]:
.
0
FAIR
[3]
0
NONE
LI]
POOR
LI]
Comments
4]
BA
Rivc
5]
POOL
/
GLIDE
AND
RIFFLE
/
RUN
QUALI1’f
MAXIMUM
DEPTH
CHANNEL
WIDTH
Chçck
ONE
(ONLY:’)
Chock
ONE
(Or
2 &
average)
Za
1iL6l.:
‘.
El
POoL.WlPTH
FLE
WIDTH
121
C]
0
7
<Im
4j
POOLWIO1
H
RIFFLE
WIDTH
Li]
D.0A7m
121
0
POOL
WIDTH
<RIFFLE
WIDTH
[0]
D0.2<0Arii
[1]
El
°
02m
[0]
Comments
Pool?
Current
Maximum
12
Indicate
for
functional
riffles;
Best
areas
must
be
large
enough
to
support
a
population
,.
.
-
of
riffle-obligate
species:
Check
ONE
(Or
2&
average).
jrO
Ryt
9
-p]•
RIFFLE-DEPT
..
...
—.
-
LE
I
RUN
EMBEDDEDNESS
C
NONE
[2]:
C
LOW
LII
0
MODERATE [0]
RIffle/[
_
C
EXTENSIVE [-1]
MaximumLJ}
Stream
&
Location:
Qualitative
Habitat
Evaluation
ndex
HEI
S
ore
___
and
Use
Assessment
Field
Sheet
‘
C
___
PliM5...
f?t1w
L!?I
RM:(.1Date:/(OIO8
..Scorers
Full
Name
&
Affiliation:
1
,L
v-%L
Office
verified
Lat./Long.:1f
‘-1
9
I8
L
location
0
STABILITY
DJjTJj
DMERAtE123!
Cómmëhts
Channel
Maximum
E in
each
category
for
EACHBANK(Or2perbank&
average)
15
ÔWSVAtONr1LLA]
ominant
land
use(s)
Riparlan
Maximum
(
CURRENT
VELOCITY
Recreation
Potential
Check
ALL that
apply
Primary
Contact
C
TORRENTIAL
[11.SLóW[1l.
••.
Secondary
Contact
O
VERY
FAST
[1]
El
INTERSTITIAL
[1]
(circlo
one
andcommenton
back)
O
FAST
[1]
-.
D,IItTENT[-2J
C
MODERATE
LII
C
EDDiES
L]
Indicate
for
reach
- pools
and
riffles.
[J,
Conrnients
Electronic Filing - Received, Clerk's Office, September 8, 2008
Qualitative
Habitat
Evaluation
Index
and
Use
Assessment
Field
Sheet
QHEI
Score
Stream
&
Location:
/)/q
iL-
—
RM:
2.$”/
Date:
;‘-i
‘1108
Scorers
Full
Name
&
Affiliation:
Y
tLjJ&
.
I
I8
i
-c
Office
verified
STABILITY
Cover
Maximum
4]
BANK
EROSION AND RIPARIAN
ZONE
Check
ONE
In each
category
for
EACH
BANK
(Or
2
per bank
&
average)
Riv,rrlgIltIookInadownstr!Im
RIPARIAN
WIDTH
FLOOD
PLAIN
QUALITY
EROSION
Q
Q
WIDE
>50m
[4]
0
.‘F0REST, SVAMP13j
‘.,
‘,
iS ii
CONSERVATION
TILLPGE
[1]
0
NONE
I L1TTLE
[3]
Q
LI
MODERATE
10 5OTi
[33
0
LI
SHFUB
OR
OLD
FIELD
[2]
I] LI URBAN
OR
INDUSTRIAL
[0]
C] LI
MODERATE
[2]
Q
C]
NARRoWS
tOni
[2]
0
0
RESIDEN11AL
PARKNEW
FIEI1D
[11
0
0
MINING
I
CONSTRUCTION
[0)
LI
LI
HEAW
/
SEVERE
11]
LI LI
VERY
NARROW
< 5m
[I]
LI LI
FENCED
PASTURE
11]
Indicate
prodominant
land use(s)
LI
NONE
[0]
LI
LI
OPEN
PASTURE
ROWCROP
[0)
past
lOOm
noanan
Riparlan
Comments
I
Maximum
y..)-i:.
I
/..
10
5]
POOL
/
GLIDEAND RIFFLE/RUN
QUALITY
I
MAXIMUM
Check
ONE
(ONLY!)
DEPTH
Check
CHANNEL
ONE
(Or 2
WIDTH
&
average)
CURRENT
Check
ALL
VELOCITY
that
apply
Recreation
Primary
Contact
Potential
I
‘>
LID
7.cfm
ml [6]
[4]
‘POOL
LI
POOL
WIDTH
WIDTH>
=
RIFFLE
RiFFLE
WIDTHWIDTH
[11
[2]
I]
LI
VERY
TORRENTIAL
FAST
[1]
[1)
LI
ISLOW
INTERSTITIAL
[1]
(
I]
(cloneandcommenronJ
Secondary
Contact
I
LI
0 4-<D
Tm [2)
LI
POOL
WIDTH
<
RIFFLE
WIDTH
[0]
LI
FAST
[1]
0
INTERMIrrENT
[2]
DO
2.cO
4m
[I)
LI
MODERATE
[1)
I]
EDdIES
[I]
Pool?
LI
<
O.2m[D)
Indicad
for
,each
- póâls
mid
rifflei
Current
Comments
Maximum
Indicate
for
functional
riffles;
Best
areas
must
be large
enough
to
support
a
population
,,.
of riffle-obligate
species:
Check
ONE
(0r2
&
average).
NO
RIFFLE
[metric—0i
RIFFLE
DEPTH
RUN
DEPTH
RIFFLE
I
RUN
SUBSTRATE
RIFFLE
I
RUN
EMBEDDEDNESS
LI
BEST
REP.S
> 10cm
[2]
0
MAXIMUM>
50cm
f23
LI
STABLE
(a
CoFbIe
Bojder)
[2]
LI
‘ONE
[2]
[]
BEST
APEAS
5
10cm [1]
LI
MAXIMUM
< 50cm
[11
LI
MOD
STABLE
leg
Large
Gravel)
[1]
LI
LOW [1]
Li
BEST
• :.
AREAS
.
[rnetric=0I
<
5cm
Li
UNSTABLE
(a
g
FIne
Gravel,
Sand)
[0]
C]
MODERATE [0]
rtIIe I
LI
EENSW[-1j
un
Comments
Maximum
6]
GRADIENT
(
<Oif
ft/mI)
LI
V.LOW
LOW
[241
%POOL:G
%GLlDE:C)
Gradient
DRAINAGE
AREA
LI
MODERATE
[6-10]
......
Maximum
mI
2
)
LI
HIGH
. VERY
HIGH
LI0$I
%RUN
C
D%RIFFLE:C.J
10
i
EPA
4520
)‘
I,
5’O
k-t-yr
/
(9
74”
1
of
06/11/08
..
/
/
River
Code:
-
-
STORET#:
1]
SUBSTRATE
Check
ONLVTwo
substrate
7YPE
BOXES;
estimate
%
or
note
every
type
present
Check
ONE
(Or 2
&
average)
BEST
TYPES
POOL
RIFFLE
OTHER
TYPES
POOL
RIFFLE
ORIGIN
QUALITY
LI
LI
BLbR7.SLABS[10I_
—
LI LI
HARØPAN[4]
:
—
LILrpNg[1]
:[I
LI
LI
BOULDER
[9]
—
C] LI
DETRITUS
[3]
.j
—
LI
TILLS
[11
SILT
MODERATE
[13
Substrate
LI
LI
COBBLE
[8]
—
I] LI
MUCK
[2]
—
LI LI
GRAVEL
[7]
—
LI
WETLANDS
(0)
LI
NORMAL
(0]
r’%
—
%‘SILT
[2]
—
IHARDPAN
[0]
LI
FREE
lj
LILI
SAND
[6]
-
0
—
—
LI
0
ARTIFICIAL
[0]_
—
l’SANDSTONE
[01
ZEXTENSIVE
[2]
/
1]
LI
BEDROCK
[5)
—
—
(Sccre
natural
substrates
gnore
LI RIPIRAR[0I
)DEO
C]
MODERATE
[1]
,Jum
NUMBER
OF
BEST
TYPES:
04
or
inore[2]
sludge
from
point-sources)
JLI
NOR?JAL.[OJ
.
20
Co
mmen
ts
‘3oiIess.L0l
LI
NONE
LII
0
cOAL
FIESLL2J
2] INSTREAM
COVER
Indicate
presence
0
to
3: 0-Absent;
1-Very
small amounts
or
if
quality;
2-Moderate
amounts,
but
not
of
highest
quality
or
in
small
e
amounts
common
of
of
highest
marginal
AMOUNT
quality;
3-Highest
quality
in
moderate
or
greater
amounts
(e.g.,
vary large
boulders
in
deep
or fast
water,
larao
Check
ONE
(Or
2& average)
diameter
log that
is stable,
well developed
roor,gad
in
deep
lfast
water,
or deep,
well-defined,
functional
pools.
.ETNSI’I/E.75%
LIII
—
UNDERCUT
BANKS
[1)
_._L_
POOLS>
70cm
[2)
—
OXBOWS
BAGI(WATERS
[fl
MODERATE
25
75%
[7]
—
OVERHANGING
VEGETATION
[1]
—
ROOTWADS
[I
....a..
AQUA11C
&LCROPHYJES
jij
C]
SPARS5-<25%
L3]
SHALLOWS
(IN
SLOW
WATER)
[1]
BOULDERS
(1)
—
LOGS
OR
WOODY
DEBRIS
[I]
LI
NEARLY
ABSENT
<5%
[1]
Comments
C
Channel
Maximum
Electronic Filing - Received, Clerk's Office, September 8, 2008
Qualitative
Habitat
Evaluation
Index
and
Use
Assessment
Field
Sheet
HEI
Score
Stream
& Location:
Pe,
P/ce
fZftie-y
,
2
5’f.
q8
RM:2(573Date:’7-I
/ o108
Srrc
Full
Name
& Affiliation:
(1
(1—
6
‘c1”ltj
Li..
I8..
L2I
°:D
I_i
Cover
Ci
MaximurnJ
ominant
land use(s)
past
1
-.. •-,---
—-
Riparian
‘
Comments
-.
,-
\
Maximum
‘7
c2
10
51
POOL
/
GLIDEAND RIFFLE/RUN
QUALITY
MAXIMUM DEPTH
CHANNEL
WIDTH
CURRENT
VELOCITY
Recreation Potential
Check
ONE
(ONLY!)
Check
ONE
(Or
2 & avergo)
Check
ALL
that apply
Primary
Contact
.21>
1 m
[6]
D
POOL
WIDTH>
RIFFLE
WIDTH
[2]
LI
TORRENTIAL
[1]
rSLOW
[11
Secondary
Contact
Q
U I
<im [4]
POC)L
WiDTH
= RIFFLE
WIDTH
[1]
LI
VERY
FAST
[11
0
INTERSTITIAL[1J
(crcTeondmmentonk)
fl
0.4-D.7m[2J
C
POOL
WIDTH
<RIFFLE
WiDTh
10]
DFAST
[1]
..
LI
INTERMUENt
[-2]
_____
I]
O.2-<0.4m[1j
LIMODERATE:C11
.:
DEDDiEs[1]•••
Pool!
I]
cO.2m
[01
Indicate
for reach
- ooliañddffleé.
Current
Comments
Maximum
Indicate
for functional
riffles;
Best
areas
must
be large
enough
to support
a
population
of riffle-obligate species:
Check
ONE
(0r2 &
average).
NO
RIFFLE
[metrIc
01
RIFFLE
DEPTH
RUN
DEPTH
RIFFLE
I RUN
SUBSTRATE
RIFFLE
I
RUN
EMBEDDEDNESS
LI
BEST
AREAS
>1(crn[2]
LI
MAXIML!M
> 50C!O
2]
LI
STABLE
(e.g.
CcbbIe5ouIdor)
[2]
0
NONE
[2]
LI
BEST•AIEAS
5-lOcm[1]
LI
MAXIMUM.<
50cm [1]
LI
MOD:TABLE
(e.g.,.Largc
Grave!)
[1]
LI
LOW.[.1]
.-
-
j]
BEST
AREAS
<5cm
LI
UNSTABLE
(e
g
Fine
Gravel
Sand)
[0]
LI
MODERATE
[0]
NitTlel
[rnetrlc=0]
LI
EXTENSIVE
ru
Uti
Comments
Ma.’,murn
6]
GRADIENT(I-.O,I_ftlmi)
LI
VERY
LOW-LOW
2-4]
%POOL:5
%GLIDE:C
D
Gradient
DRAINAGE AREA
LI
MODERATE
[6-10]
Maximum
C
(
m1
2
)
LI
HIGH .
VERY HIGH
t10’61
%RUN:
()%RIFFLE:(jj
10
EPA4520
OL
,?
7f(1c)fr
06111/08
River
Code:
-
-
STORET#:
-
II
SUBSTRATE
Check
ONLYTwosubstrate
Th’PEBOXES;
estimate
%
or
note
every
type
present
Check
ONE
(Or
2
&
average)
BEST
TYPES
POOL
RIFFLE
OTHER
TYPES
POOL
RIFFLE
ORIGIN
QUALITY
C
LI
BLOR
ISLABS
[10]__.
—
C
LI
HARDPAN
L4]
—
—
I]
LIMESTONE
fi]
.91IEAVY
12]
C
C
BOULDER
[9]
—
C LI
DETRITUS
[3]
—
—
C
TILLS
[1]
SILT
MODERATE
[1]
Substrate
C C
COBBLE
[81
—
C LI
MUCK
[2]
—
—
LI
WETLANDS
[0]
LI
NORMAL
[0]
C C
GRAVEL
[7]
—
SILT
[2]
—
HARDPAN[0]-
C
FREEII]
C C
SAN!)
[6]
—
C] LI
ARTIFICIAL
[0]_
—
.2SANDSTONE [0]
XTENSIVE
[2]
_____
I
LI
LI
BEDROCK
[5]
—
—
(Score
natural
iubslrites
gnore
C]
RIPIRAP
[0]
,Vt0
4
C]
MODERATE
[1]
NUMBER
OF
BEST
TYPES
0
4 or more
[2]
s’udqe
from
point
sources)
LI
LACLJSTRINE
[0]
ff
LI
NORMAL
[0]
20
3:or
less
[0]
LI
SHALE
[-1V’
..
C
NONE
[1]
Comments
,
LIôALFINEsNJ
.
2] INSTREAM
COVER
quality;
indicate
2-Moderateamounts,presence
0
to 3: 0-Absent;
but
not
1-Veryof
highest
small
quality
amounts
or in
orlfmore
small
amounts
commonof
of
highest
marginal
AMOUNT
quality;
3-Highest
qualky
in
moderate
or
greater
amounts
(e.g.,
very
large
boulders
in
deep
or fast
waler, large
Check
ONE
(Or?
verge)
di.rnter
log
that is
stable,
well developed
rootwed
in deep
I
fast
water,
or deep,
well-defined,
functional
pools.
C
EXTENSIVE
75%L1i]
—
UNDERCUT
BANKS
[1]
._L_
POOLS
> 70cm
[2]
OXBOWS
BACKWATERS
[1]
2
MODERATE
2575%
[7]
—
OVERHANGING
VEGETATION
[1]
—
ROOTWADS
[ii
AQUATIC
MACROPHYTES [1]
SPARSE
5125%
[3]
SHALLOWS
(IN
SLOW
WATER)
[1]
BOULDERS
[1]
LOGS
OR WooDY
DEBRIS
[1]
1 NEARLY
ABSENT
<50,
j1
ROOTMATS[1]..
:
:
CornmenW
7ORPHOLQGY
Check
ONE
in
each
category
(0r2
&
average)
STABILITY
N
ZONE
Check
ONE
in each
catgory
for EA
CH BANK
(0r2
per bank
&
average)
FL
Channel
Maximum
Electronic Filing - Received, Clerk's Office, September 8, 2008
•
Qualitative
Habitat
Evaluation
Index
and
Use
Assessment
Field Sheet
QHEI
Score
DL:’
CD
DC.
.D.
DC.
DC
])
2
(
f/j4r’
2/31B
RM:oZ’)3Date:t’I/1IO8
Scorers
Full
Name
&
Affiliation:
Voo-’
fef
Lat.fLona.:
1/
I
iii
io
f
,
‘
Office
verified
—
—
—
tNAD83.decInif) —
£
•
-
‘
I
I’
U
•
i
.1i
River
Code:
-
STORET
#:
f’
location
11
SUBSTRATE
Check
ONLYTw0
substrate
TYPE
BOXES;
‘
estimate
%
or
note
every
type
present
Check
ONE
(Or 2
&
average)
OTHERTYPESPOOLRIFFLE
ORIGIN
QUALITY
1’S’
C
Df4J;
—
C
LIMESTONELI].
i1EAVYL-21
C
Q
DETI1Lf
i-
JTILLS
1]
ODERATE
[I]
Substrate
C
C
WETLANDS
[0]
S LT
EJ
NORMAL
[0]
.
a11ARDPAN
[01
C
FREE
LIJ
C
DRTflCJ10I_
—
DSANDSTONELO]
,2EXTENSIVE[21
)
(Score
natural
substrates
igno
e
C
RIPIRAP
[0]
MODERATE
[11
NUMBER
OF
BEST
TYPES
mo1[23
sludge
from
point
source)
ULACUSTRINE [0]
,D
NORMAL
[01
20
Dqfté[Ok
C
NONE
LI]
..
Comments
C
GOAL
ES’[
21
9
2]
INS TREAM
COVER
quality;
Indicate
2-Moderate
presence
0
amounts,
to
3: 0-Absent;but
not
1-Very
of
highest
smallquality
amounts
or in
oruTore
small
amounts
commonof
of
highest
marginal
AMOUNT
quality;
3-1-lighest
quality
in
moderate
or
greater
amounts
(e.g.,
very
large
boulders
in deep
or fast
water,
large
e
r
- average
dime1er
log
that
is
stable,
well
developed
rootwad
in deep
I fast
water,
or
deep,
well-dcflnod,
functional
pools.
Q
EXTENSIVE >75%
Liii
UNDERcUT
ANKS1IJ
.
POOLS
>
iocin.E21
oxBows,:BAGKwArERs
LII
ODERATF-25-75%
UI
Lii.
—
ROOTWAS
Ij
...
AQUATIc
MAcRâPH’YTEStlJ
rSPAR5E
5q5%
L3j.
-IALLOWS
(IN
SLOW
WATER)
Eli
PrinTMTe
r-,i
!
BOULDERS
Lii
1
-‘LOGSÔR
WOODY DEBRIS
LII
c
MamumØl
3]
CHANNEL MORPHOLOGY
Check
ONE
in
each
category
(Or
2
& average)
SINUGSIP(
DEVELOPMENT
CHANNELIZATION
STABILITY
C
fl41
.
Q
Q
jf
R
RR111
Comments..
•
4]
BANK
EROSION
AND
RIPARIAI’I
ZONE
checNE
inach
category
for
EACH
BANK
(Or
2porbank
&
average)
R1varrightIodkdowntrern
RIPARIAN
WIDTH
/
FLOOD
PLAIN
QUALITY
EROSION
..
C
C
DP
jJERÔ
jR10
past
lOOm
n’perlan.
Riparlan
Comments
Z)
Maximum
5] POOL
L.GL1DEAND
RIFFLE/RUN
QUALITY
-
MAXIMUM
DEPTH
CHANNEL
WIDTH
CURRENT
VELOCITY
Recreation Potential
Chock
ONEONLYI)
Chock
ONE
(Or
2
&
average)
CheckALL
thai
apply
Primary
Contact
C
POOLWiPTH
aPi
Secondary
Contact
C
CyERFAS1’
il
DIIERtArt1
(circle one
and
comment
on back)
DO
4
7ni
L21
C
PooL1MDTimFFLEAnDTh[oI
Did
4
CijTErrir
C
02mW
C
EIisiiI
Pooh
.
In&tateiiach
-‘,ddh7es.
Current
-
Comments
Maximum
Indicate
for
functional
riffles;
Best
areas
must
be
large
enough
to
support
a
population
-
of
ri.ffIeobigate
species:
Check
ONE
(0r2
&
average).
i’iO
RIFFLE
[metrlc-0]
R!FELE.DEFc1H.
- RUN-DEPTH
RIFFLE
IRUN:SUBSTRATE-
RIFFLE
I
RUN
EMBEDDEDNESS
C
tA3’T0ciñ[4
C
MAXIMU
50[2’J
CL
RTWØ[
C
NoE(1
C
ii
C
MAXIMW
5Qctl1
C
C
ó1iij
C
C
tJNTAE
tTGj&hdyLo]
CTE[O]
RIffIeI(f
1
L!tO1
6]
GRADIENT
(
-<04
ftImI)
C
%POOL:C/
Cj
%GLIDB:C__D
Gradient
-
DRAINAGE AREA
C
MPDRAIE
L6-lo)
Maximum
mi2)
C
HII
YHG106J
%RUN
(J
)%RIFFLE
(J
10
EPA4520
,i
1
5oL
i—o6Ii1Io8
Stream
&
Location:
Comments.
Channel
Maximum
Electronic Filing - Received, Clerk's Office, September 8, 2008
Comments
3J
CHANNEL
MORPHOLOGY
Check
ONE
in
each
category
(0r2
&
average)
SINUOSITY
DEVELOPMENT
CHANNELIZATION
El
HIGH
[4]
El
EXCELLENT [7]
1]
NONE
[6]
El
MODERATE
[3]
El
GOOD
[5]
El
RECOVERED
[4]
1]
LOW
[2]
El
FAIR
[3]
El
RECOVERING
[3]
1ONE
[1]
,‘POOR
[1]
RECENT
OR
NO
RECOVI
Comments
4]
E
R
and
Qualitative
Use
Assessment
Habitat
Evaluation
Field
Sheet
Index
HEI
s
corer
Check
ONE
(0r2
&
average)
Stream
&
Location
77-
P7’Ji
—
i5’7
oiL
RM
2f
Date
p7-I
‘L108
C’
Scorers
Full
Name
&
Affiliation:
T
River
Code:
—
-
—
—
—-
—
_STORET#:
Ofl9)
/3
officevenfierJQ
1]
SUBSTRATE
Check
ONLYTw0
substrate
TYPE
BOXES;
estimate
%-or
note
every
type
present
BEST
TYPES
POOL
RIFFLE
OTHER
TYPES
POOL
RIFFLE
ORIGIN
El
El
BLDRSLABS[1O]_...
—
El El
HARDPAN[4]
_..._
—
El
I4MJPN..EL.11.
El
El
BOULDER
[9]
El
El
DETRITUS
[3]
v
—
11LL5
[1]
_____
El
El
COBBLE
[61
[1
El
MUCK
12]
El
WTLANDS
[03
,El
GRAVEL
[7]
_
—
El
El
SILT
[2]
::z
—
El
HARDPAN
0]
El
SAND
[6]
El
El
ARTIFICIAL
[0]
—
El
SAN
DSTONE[01
_____
El
El
BEDROCK
[5]
—
(Scr’re
natural
subDtrates
ignore
El
RIPIRA?
[01
NUMBER
OF
BEST
TYPES
El
4 or
more
[2]
sludge
from
point
sources)
El
LACUSTRINE
(0]
c
J3
dr•Ieás
[0]
yI
omments
,-.
.
El
COAL
.)
INES[-2].
‘c;
Pv1./&
•r;4v.
I-
•i
L”cc.4.
2]
INSTREAM
COVER
Indicate
presence
0 to
3: 0-Absent;
1-Very
small
amounts
or if
more
common
of
marginal
quality;
2-Moderate
amounts,
but
not
of highest
quality
or in
small
amounts
of
highest
AMOUNT
quality;
3-Highest
quality
in
moderate or greator
amounts
(e.g.,
very
large
bou!ders
in
deep
or
fast waler,
large
Check
ONE
(Or2
& average)
diameter
log
that
is
stable,
well
developed
rooh’ad
in deep
I
fast
water,
or
deep,
well-defined,
functional
pools.
El
ETESIYE75%t1.11
—
UNDERCUT BANKS
[1]
..-L
POOLS>
70cm
[2]
—
OXBOWS
BACKWATERS
[1]
El
MODERATE
2575%
[7]
OVERHANGING
VEGETATION
[1]
—
ROOTWADS
(11
..j
AQUATIC
MACROPHVTES
[1]
El
SPARSE 5-<25%
[33
—
SHALLOWS
(IN
SLOW
WATER)
[1]
BOULDERS
[1]
LOGS
OR
WOODY
DEBRIS
[1]
ØNEARLYABSENT
<5%
[1]
_RQpTMATS[1]
:.
:
Substrate
Maximum
20
Cover
Maximum
20
q
STABILITY
4
V’SJ..j
IANDRIPA
AN
ZONE
‘
L
R
Channel
Maximum
)r
2
per
bank
&
average)
5
oEiriJ
El
El4tto
El
a
Indicate
predominent land
use(s)
past
lOOm
riparian.
Rlparlan
‘
Comments
Maximum
5]
POOL
/
GLIDE
AND
RIFFLE
/
RUN
QUALITY
MAXIMUM
DEPTH
CHANNEL
WIDTH
CURRENT
VELOCITY
Recreation
Potential
Check
ONE
(ONLY!)
Check
ONE
(Or 2
& average)
Check
ALL
that
apply
Primary
Contact
>
ui
1
[6]
El
POOL
WIDTH>
RIFFLE
WIDTH
[2]
El
TORRENTIAL
[.4]
äLOW
[11..
-
Cncow,dap/
‘o,#ai
ti
0.7-<lm
[41.
J’POOL
WIDTH
RIFFLE
WJOTH[13
El
VER’
FAST
[1]
El
INTERSTITIAL
(.1]
eoyeandcommentonbactc)
1
El
0.4-<07rn
[2]
El
POOL
WIDTH
<
RIFFLE
NIDTH
[03
El
iAsr
ij
El
INTERMITTENT
(-2]
_____
El
0.2-<0.4rn
[11
El
MOERATE[1]:
El EDDIES[1J..
‘
PooI/1’7
El
< 0.2m
[0]
Ind,cte
for
reach
- pools
a.d
riffles
CuFTent
Comments
Maximum
Indicate
for
functional
riffles;
Best
areas
must
be
large
enough
to
support
a
population
-
of
riffle-obligate
species:
Check
ONE
(0r2
& average).
RIFFLE
DEPTH
RUN
DEPTH
RIFFLE
I
RUN
SUBSTRATE
RIFFLE
I
RUN
EMBEDDEDNESS
El
i3EST
AREAS> 10cm
[2]
El
MAXlMUM’
50cm
[2]
El
STABLE
(d.g.,
Cobble,Boulder)
[2].
0
NONE[2]
El
BEST
AREAS
5-10cm
[i]
El
MAXIMUM
<50cm
[1]
El
MOD.
STABLE
(;g..
Larae
a)
[3
0
LOW
[1]
.
.
El
BEST
ARAS
<Scm
El
UNSTABLE
(ó.g.,
FIne
Gravel,
Sand)
(0]
El
MODERATE
[0]
Rime!
[metrlc0l
.
ElE)ENslVE[-1li
1
_im:i
Comments
8
Electronic Filing - Received, Clerk's Office, September 8, 2008
and
Qualitative
Use
Assessment
Habitat
Evaluation
Field
Sheet
Index
HE! S
core.
Stream
&
Location
,f)j
P
(oJe.’s
i3v€.,
-L
2
3’
Date
oft
FVI
08
Full
Name
& Afflhlation:
r1.-
LatiLona.:
j
LI c:
i r
6
L
Office verified
River
Code:
-
-
STORET#:
-
(NAD83.docTrn__L_’L.L.—
‘
location
1] SUBSTRATE
Chock
ONLYTw0
substrate
7YPE
BOXES;
estimate
% or
note
every
type present
BEST
TYPES
POOL
RIFFLE
OTHER
TYPES
POOL
RIFFLE
DO
BLOR
ISLABS
[10]_
0
Q
HARDPAN
E4j
—
—
O 0
BOULDER
9]
—
—
Q
Q
DETRITUS
[3]
—
O
0
COBBLE
[2j
—
0 0
MUCK [2]
.
—
LI LI
GRAVEL
UI .
—
_C.SLT
[]
-
—
L
0
•sANb
j
_j
—
0
0
ARTIFICIAL
[0)_
—
O 0
BEDROCK
[5]
—
—
(Score natural
substrates;
ignore
NUMBER
OF
BEST
TYPES:
0.4 ormore[2)
sludge
from point-sources)
Comments
,-.,
12r3
or less [0]
2]
INS
TREAM
COVER
Indicate presence
0 to
3: 0-Absent;
1-Very
smal[amountsin
quality;
2-Moderate
amounts,
but not of
highest quality
or
in small amounts
of
higi
quality;
3-Highest
quality
in
moderate
or
greater
amounts
(e.g., very
large boulders
In
deep or fast
water,
large
diameter
log that is
slable,
well
developed
rootwad
in deep
/ fast water,
or
deep, well-defined,
functional
pools.
—
UNDERCUT
BANKS
[1]
POOLS
>70cm
[2]
—
XOSi
CIRS
Ei1
—
OVERHANGING
VEGETATION
[11
ROOTWADS
[1]
-.
AbUAqliffiSjjt
—
SHALLOWS
(IN
SLOW
WATER)
[11
BOULDERS
[1)
LbGOWãöYBi[fl
——
ROOTMATS
Fl]
Comments
3].
cHANNEL
MORPHOLOGY
Check
ONE
in
each
category
(0r2 & average)
SINUOSITY
DEVELOPMENT
0
H!GHE4J
.
0
EXCELLENT
UI
O
MODERATE
[2]
o
GOOD
[5j
o
LOW
[2].:
‘
0.
FAIR
L3).
QNL1I
,Z’
PpOR [1]
Comments
4]
BA.
River
P
predominant
land use(s)
...3m
riper/an.
Riparlan
(
“
Comments
Z.
.
Maximum
10
I 7
5]
POOL
/
GLIDE
AND
RIFFLE
/ RUN
QUALITY
MAXIMUM
DEPTH
CHANNEL
WIDTH
CURRENT
VELOCITY
Recreation
Potential
Check
ONE
(ONLY!)
Check
ONE
(Or 2
&
average)
Check
ALL that
apply
Primary
Contact
I
m [6]
0
POOL
WIDTH>
RIFFLE WIDTH
[2]
0
TORRENTIAL
[
1JJLOW
[1]
Secondary
Contact
U
O.7-i1rn
[4]
.!POOL.WIDTH
RIFFLE
WIDTH
LI]
O:VERyFAsT;L11...:
DJNTERSTiTIAL
F-I]
O
0 4-<0 7m
[21
0
POOL
WIDTH <RIFFLE
WIDTH [0]
0
FAST
[1]
0
INTERMITTENT
[2]
_____
O
0
2.<0 4m [1]
0
MODERATE
[1]
0 EDDIES
[1]
Pool! ,—
LI
<
0.2ñi[OI
lñdirJiteEfârech
-
pools and
riffles.
Current
Comments
Maximum
Indicate
for
functional
riffles;
Best
areas
must
be
large
enough
to support
a
population
of
riffle-obligate
species:
Check
ONE
(Or 2 &
average).
iNO
R
IF
F
L
E
[metric.-]
-0
RIFFLE
DEPTH
RUN
DEPTH
RIFFLE
I
RUN SUBSTRATE
RIFFLE
I
RUN
EMBEDDEDNESS
O
BESTAPEAS
> lOca’
[2)
0
YI’UM’
50cm
[21
0
STABLE
(a
g
Cobble
Bou
1
de
1
)
[2]
0
O
1
E
[2j
O
BESTPEAS
5
lOsi’i
1]
LI
MAXIMur!
50cri
Fli
0
MOt
STABLE
e
g
Large crve
1
)
L
4
0
LOW
F
4
]
O
BESTARE.S
<
5iii
0
UNSTABLE
(e.g Fine
GveI,Sand)[O]
o
MODERATE
[0]
Riffle?
• .
.
[rnetric9
.
.
.
C
EXTENSIVE
r..4]
Run
Comments
.
Maximum
0
6]
GRADIENT
I
VERY LOW
LOW
£241
%POOL:
%GLIDE(
D
Gradient1
DRAINAGE
AREA
0
MODERATE
L6-101
F
‘
Maximum
m12)
LI
HIGH
..VERY
HIGH
Ei0$1
%RUN
J%RIFFLE
J•
10
—
EPA 4520
5
i
)
f(.L
(
06/11/08
Check
ONE
(Or2
&
average)
C
Substrate
Maximum
20
-7.
l
AMOUNT
Check
ONE
(Or
2 & average)
r
iIjr’fii
Cover
Maximum
20
STABILITY
0
YE
Check
ONE
in
each
catè ory
for EACH
B NK
(Or2perbank
&
average)
F
Channel
Maximum
S
C
DUR’
oNDJAior
O
Ddtjoj
Electronic Filing - Received, Clerk's Office, September 8, 2008
Qualitative
Habitat
Evaluation
Index
and Use
Assessment
Field
Sheet
QHEI
Score
j
P
i’i
,f’i.--
RM:r93Date:ri(/O8
Full Name
&
Affiliation:
UafrsL€c
,14°’!!IYL.
.51LL
18Z.
Office verifiedQ
Maxfrnum
Channel
Maximum
Øj
El
Djgcojjo
Indicate
predbminant
land use(s
past lOOm
riparian.
Riparlan
Maximum
uIj
i$L
9”I-’
DJhJMa,dmum
%POOL{/OO_)
%GLIDE:(J__)
Gradient
%RUN:
%RlFFLE:
Maximum
/(C
7IHO
06111/08
Stream
&
Location:
Check ONE
(0r2
&
average)
C
River
Code:
-
-
STORET#:
1]
SUBSTRATE
Check
ONLYTw0
substrate 7YPE
BOXES;
estimate
%
or note
every type
present
BEST TYPES
POOL RIFFLE
OTHER
TYPES
POD’
RIFFLE
El El
8LDR4SLABSO1
—
El
DADAL4L -—
DC
—
El
DDE
TA_
—
El [1
.-
El
DMuçK-
El
El
—
—
56JZ
— El
D.IçIAL[bJ_
Li
E]
El
6o_
(Score natural
substrates
ignore
El
NUMBER
OF
BEST
TYPES
2
I
o4
sludge
from point
sources)
El
Comments
El3
oriessfo].
w
c:IAy,
d/L1€
/
s/
yjf,C..
2]
INSTREAM COVER
quality
Indicate
2
presence
Moderate
0
amounts
to 3
0
Absent
but not
I
of
Very
highest
smallquality
amounts
or
in
or
small
if more
amounts
common
ofofhighest
marginal
AMOUNT
quality
3
Highest
quality in
moderate or greater
amounts
(e g very
large
boulders in
deep or fast
water large
Check
ONE
(0r2&
average)
diameter
log
that is
stable well
developed rootwaJn
deep!
fast
water or deep well
defined functional
pools
D
EENSI5%
Substrate
Maximum
20
—I
Comm
“ Check ONE in
each
crteory
(0r2
& average)
Comm,éht
1K
(0r2 per
bank &
average)
ES
n
5].
POOL I
GLiDE AND
RIFFLE/.RUN.QUALITY
MAXIMUM’ DEPTH
CHANNEL
WIDTH
CURRENT
VELOCITY
[reatlon Potential
Chek
ONE?
(NLY!)
Check
ONE (Or 2 &average)
ChéckALLth
apply
Primary Contact
D(p
ti
tJojg
-rj
],
pjt4
PooiIf
Indicate
for reach
—pools and riffles.
Current
I
?
I
Comments
MaximurnLj
Indicate
for functional
riffles; Best
areas must
be large
enough to
support a population
ef riffle-obligate
species:
.
Check
ONE
(0r2&
average).
RIFFLE
Imetrlc-Ol
RIFFLE DEPTH
RUN
DEPTH
RIFFLE
I RUN
SUBSTRATE
RIFFLE
I RUN
EMBEDDEDNESS
Eln1
DBESTAASO1I1
- -,-
?,•
El
ElJ]
MAXIMUM
4506n!
1]
El
—.
D.JRt*I
MOD1STABLE arØGrffIJi
l
El
7RES&f
fmetr1cO3
UUi4je
FnGraveIIaiif0j?
Comments
6]
GRADIENT
(
I
ftlmi)
El
DRAINAGE
AREA
El
OE6Ø
(7Omi2)
El
HlGYERY11iGIt[i061
EPA
4520
-> I,
S0
;L
Electronic Filing - Received, Clerk's Office, September 8, 2008
River
Code:
-
-
STORET#:
Qualitative
Habitat
Evaluation
Index
and..Use
Assessment
Field
Sheet
HEI
.:.
core.
Stream
&
Location:
D
f’7j
Mi€.v
08.
scorers
Full
Name
& Affiliation:
%
LatjLonq.:
L/I
U
c
i
I
6
Office
verified
— —
—
—
INAD
83. dcIm5T
—
—
—
.
.l..
“..J•
—
—
—
location
Subs
kate
Maximum
20
2]
INSTREAM
COVER
quality;
Indicate
2-Moderate
presence
0
amounts,
to
3:
0-Absent;but
not
1-Velyof
highest
smallquality
amountsor
or
In
small
if more
amounts
common
ofofhighesrmarginl
AMOUNT
quality;
3-Highest
quality
in moderate
or
greateramounts
e.g.,
very
large boulders
in
deep
orfast
water,
large
drimter
log that
is
stibIe
v,c’ll
developed
rootiari
in deep
I fast
water
or deep
well-defined
functional
pools
Q
TET
15
[i1J.
—
UNDERCUT
BANKS
[Ij
......L
POOLS
>70cm
12)
___XB4S1
A
IERXU
—
OVERHANGING
VEGETATION
11]
—
ROOTWADS
LII
.i&.
AQUA1PRPJd[
o3
—
SHALLOWS
(IN
SLOW
WATER)
[I)
—
BOULDERS
(1J
—
éocfdbYflEBRISI]
Q
NEAR
SE
—
ROOTMATS11
Cover
Comments
Maximum
3]
cHAl:NELMoRPHoLoGY
Check
ONE
in
each category
SIN.UOSITh.
DEVELOPMENT
D
W
0
ELEN1
[
ci
ODR[J
0
Pfri
QI
PW
j’
Comments:
4]
BKOSIONAND.RIM4RI4IiIZONE
Chäck
ONE in
each
categoryfdr
EACH BANK(Or2perbank
&
average)
Rivarrlghtiaokingdownstraam
L R
RIPARIAN
WIDTH
Fl
nr
—
ITY
EROSION,
Ihl
IP
-
Q
E[
4
Q
D3
L
U U
MODERATE
[21.:
:.-
:
Li
Li
NARROW
5-1oiL2t.’f;
Li
L
Li
DiIEAVY:SEVEREIIJ
1]
LiVE
NAiROWc5rn[IT
DL
DDNONE[oj
:•
Comments
Channel
Maximum
LJJ
._JU
ILAlP1
UVAL...
-
I
Indicate
predominant
land use(s)
past lOOm
riparian.
Riparlan
,
Maximum
7,
10
CURRENT
VELOCITY
5]
POOL/GLIL.EAND
RIFFLE/RUN
QUALITY
MAXIMUMDEPTH
CHANNEL
WIDTH
Check
ONE. (ONLY!)
Check
ONE
(Or
2
& average)
Check
ALL
that
apply
Li
p!H
121
DiftAPI1
DØ.t4I
&L1fliI
D’
0jij
D4oM
Li
POOLWWflHRIFFLE
WIDTH
LOJ
DFASJ
DRTEN2j
DLMPERTEI
indicate
for reach
-pools
and
nfflés.
Comments
Recreation
Potential
Primary
Contact
Secondary
Contact
(circle
one and comment
on
back)
Pooh
—S
Current
Maximum
12
‘_
Indicate
for functional riffles;
Best
areas
must
be
large
enough
to support
a population
of
riffle-obligate
species:
Check
ONE (0r2
&
average).
NO
RIFFLE
[metrlco]
RIFFLE,.DEPTH
RUN:DEPTH
.. :.RIFFLE.jRUNSUBSTRATE..
RIFFLE
I RUN.
EMBEDDEDNESS
Df
Li
L$
1
I
Li
T419Jj1
LI
MAXIMU
.c50cm[1]
Li
EST
AREAS
E
-
-
-
Comments
6]
GRADIENT
(
•Oi
I
ftlmi)
Li
:[
DRAINAGE
AREA
Li
MODEATE
[6-10]
(Yi4mI2)
I]
tOi
EPA
4520
-
D:Mjo1
fh
(
DE*SiY•E;..JMaximurn
sLi
Gradient
Maximum
10
%POOL:CJ
%GLIDE:C__)
%RUN:
(Mj%RIFFLE:C.j
(‘
(
<-
06/11108
Electronic Filing - Received, Clerk's Office, September 8, 2008
Qualitative
Habitat
Evaluation
Index
and
Use
Assessment
Field
Sheet
QHEI
Score
Streám&
Loôation:
/&/
3
A3
-‘o/t13
RM:2_7OPDatec’7I//I
08
jcJ
4
CL.J€r.4
Scorers
Full
Name
&
Affiliation:
7E’e
Jk
&y
River
Code:
- —
—
—
—
STORET#:
(NAD
83
docIJ/I
I8
J.
.
.23
11
SUBSTRATE
Check
ONLYTwo
substrate
TYPE
BOXES;
estimate
%
or
note
every
type
present
Check
ONE (0r2
&
average)
BEST
TYPES
POOL
RIFFLE
OTHER
TYPES
POOL
RIFFLE
ORIGIN
QUALITY
DC
BLDRTSIABSLIOI_
—
LI
DH4RDANE4P_
DME$E1j
DLI
BLi-
—
LI LI
[tEi*J[3
LI
fILIS1]!
D4ODE!Et1]
Substrate
LI
LI
—
LI
D’]r;_
—
DJ4O11
SILT
LID
G171_
2$J
[21
—
GD
R4PJ
LI
0
—
LI
LI
—
SDST1Q]
Jtt2]
DDBEDOFKt5J_
LI
Maximum
Comments
Iess[O
6
LI
!jLI
-
2]
INSTREAM
COVER
quality
Indicate2
presence
Moderate
0
amounts
to
3 0
Absent
but
not
I
of
Very
highest
smallquality
amounts
or in
or
small
if
more
amounts
commonofofhighest
marginal
AMOUNT
quality
3 Highest
quality
in
moderate
or
greater
amounts
(e
g
very
large boulders
In deep
or fast
water
lame
Check
ONE
(0r2&
average)
diameter
log that
is
stable
well
developed
rootwad
in
deep
I
fast water
or
deep
well-defined
fUnctional
pools
LI
ETENSIVE75%tfl
_1J
—
B
ULDERS11
—
ObSIOR
0D2iDBRI
LI
RYBjT
<511]
d2Marnuml
3]
CHANNEL IviORPHOLOG’r
Cneck
ONE in
each
catec
:sINUrr
4
(.
DEVELOPMENT
C
D}[4
LICLLE1
r1
i
U
AIg
4
[3
Channel
Comments
Maxurnirn
4]
BANK
EROSION
AND
RIPARIAN
ZONE
Check
ONE
in each
category
for
EACH
BANK
(0r2 per
bank
&
average)
River right
iooking
downstream
RIPARIAN
WIDTH
FLOOD
PLAIN
QUALITY
EROSLON
——-‘
-
cLL
AWL,gL
C
Ui
1
IMV TI
Liii
U
Indicate
p,adomlflaflt
land
use(s)
LI
Comments
-
i
noI
lOOm
nparian
Maximum
Rlpar,an
(-—E:
1
5]
POOL/.GL1b AND
RIFFLE/RUN
QUALITY
MAXIMUMbEPTH
CHANNEL
WIDTH
CURRENT
VELOCITY
Recreation
Potential
ChêckONE(C)NLY!)
Check
ONE (0r2
&
average)
CheckALLthat
ap
ly
Primary
Contact
DP
TJE1
LI
DWis
Secondary
Contact
ffiuf4:I
?P
LI
VER
S1mj
DILEW1jJ
Ieoneendcommentonba&
LI
o4oih
[21
LI
POi.WIDTH
jIF
WIDTH
[01
LItf
DrINRMrIt$T
____
LIMPAj
D
Pooi/(
D,o
2mt0]
Indicate
for reach
pools
and
nifies
Current
Comments
Maximum
indicate
for functional riffles;
Best
areas
must
beiarge
enough
to
support
a
population
of riffle-obligate species:
Chec.k.ONE(0r2&average).
0
RIFELE
DEPTH
RUN
DEPTH
RIFFLF
I
PUN
URTPATF
L
I
LI
I
LI
(mefrIc0
Comments:
6] GRADIENT
(<Os
ftlml)
LI
DRAINAGE
AREA
LI
MP
Tj60
zf
(>
miz)
C
HIGH
‘VERYII!GH
1O-6
Comments
m.
I I.
EPA
4520
8’
%POOL:G1
%GLJDE:c
GradientP
%RUN:
C
J%RIFFLE:Cj
Maximum
11
_
lo1
(((•
•
7
f
1
(J
2-
06/11/08
Electronic Filing - Received, Clerk's Office, September 8, 2008
Stream &
Location:
l2-.
and
QualitativeUse
Assessment
Habitat
Evaluation
Field
Sheet
Index
QHEISe.
ZR
RM:QfC3Date:t1J/O8
Scorers
Full
Name
&
Affiliation:
i
(L
4
L
O
RiverCode:-___-___STORET#:
O1’f
I
I8
Office
verfflS’dD
1]
SUBSTRATE
Chock
ONLYTw0
substrate
7YPE
BOXES;
or
note every
type
present
Check
ONE (Or
2 &
average)
POOLRIFFLE
OTHERTYPES,.
RIFFLE
ORIGIN
QUALITY
—
—
—
D
LIMESTONE
[1].
.HEAVYf2]
—
—
Cl
TILLS
LII
Cl
MODERATE
1]
Substrate
—
—
C
WETLANDS
[0]
SILT
:z
1ORMAL
[0]
-
—
—
.,21ARDPAN[0]
DFREELIJ
(
—
CD
.‘SANDSTONE
[01
.E)(TENSIVE
[21
—
(Score nturaI
substrVs
ignore
C
RIPIRAP
[01
—
VDEO,
Cl
MODERATE
L I
tanmum
NUMBER
OF
BEST
TYPES:
D.4
or.moré[2]
sludge
from
point-sources)
DqTpj.
IAL[OL.
20
!or
less
[0]
Cl
SHALE
[1]
Cl
NONE (I)
/
Comments
,-. .
.
2] INSTREAM
COVER
quality;
In-Jicato
2-Mocerate
presence
0
amounts,
to 3: 0-Absent;hut
not
1-Veryof
hghest
smallquality
amounts
or
in
FTmore
small
amounts
common
of
of
highest
marginal
AMOUNT
quality;
3-Highest
quality
in
moderate
or greater
amounts
(e.g.,
very
large boulders
in deep
or fast
water, large
Check
ONE(0r2
average)
diameter
log
that
is
stable,
well developed
rootwad
in deep
/
fast
water,
or
deep,
well-defined,
functional
poois.
aEX
TENSiVEZ5%Eij,
—
UNDERCUT
BANKS
[I]
._L.
POOLS
>70cm
[2]
—
OXBOWS
BACKWATERS
[I]
Z
MODERATE
25
75%
[7]
—
OVERHANGING
VEGETATION
[I]
—
ROOTWADS
[I]
..._...
AQUATIC
MACROPHYTES
[1]
Q
SPARSE
5<25%
[3]
SHALLOWS
(IN
SLOW
WATER)
[1]
—
BOULDERS
[1]
—
LOGS
OR WOODY
DEBRIS
[I]
Q
NEARLY
ABSENT
<5%
[Ij
—
RGOTMATS[11
..
.
..--•
Cover
Comments
Maximum
1i
3] CHANNEL
MORPHOLOGY
Check
ONE in each
category
(Cr2
&
average)
SINUOSITY
DEVELOPMENT
C
STABILITY
O
HIGH
[4]
I]
EXCELLENT
[71
Cl
MODERATE
[3]
Q
GOOD
[51
DbE1i2J
Cl
LOW [2]
DJAIR
[31
,NONE[I]
‘POOR
[I].:.:
Comments
4]
E
R
U—
Comméñts
Channel
Maximum
,..edorninant
land
use(s
past lOOm
riØarian.
Riparian
,
Maxim
urn
7’
10
5] POOL
/ GLIDE
AND
RIFFLE/RUN
QUALITY
MAXIMUM
DEPTH
CHANNEL
WIDTH
CURRENT
VELOCITY
Recreation
Potential
Check
ONE
(ONLY!)
Check
ON
(Or 2
&
iverage)
Check
ALL
that
apply
Primary
Contact
-21>1
m
[6]
D
POOL WIDTH>
RIFFLE WIDTH
[2]
Cl
TORRENTIAL
[1]
ZSLOW
[II
Secondary
Contact
0
0 7-<Im
L41
POOi.. iN1DTh
RIFFLE
WiDTH
LIJ
Cl
VERY
FAST
Eli
Cl
INTERS
ITIAL
(II
I
(clrcleona
undcommentonback)
Do
4-<0
7m [2]
D
POOL WIDTH
<RIFFLE
WIDTH
[0]
Cl
FAST
[11
Cl
INTERMITTENT
[21
‘—
O
0
2-<0.4m [1]
0
MODERATE
[I]
[J
EDDIES
[1]
Pool!
r-’
Cl
<O2m [0]
:
Indict
f& nch
- ••7••,
riffled.
Current
Comments
-
Maximum
Indicate
for
functional
riffles;
Best areas
must
be
large
enough
to support
a
population
of
riffle-obligate
species:
Check
ONE (Or2
&
average).
,-
RIFFLE
DEPTH
RUN
DEPTH
RIFFLE
I RUN
SUBSTRATE
RIFFLE
I
RUN
EMBEDDEDNESS
BEST AREAS
>10cm
[2]
Cl
MAXIMUM>
50cm
121
Cl
STABLE
(e g Cobble
BouldQr)
[21
Cl
‘‘ONE
[2]
C
BEST AREAS
5 10cm
ii
Cl
MAXIMUM
50cm
[11
DM00
STABLE
(e
g
Large
Gravel)
Fli
C
LOW
Eli
C
BbST
AREAS
<5cm
Cl
UNSTABLE
(e
g
Fine Gravel
Sand) [0]
0
MODERATE
tO]
[motrlc=0]
.
C
EXTENSIVE
E1]
Comments
A
aximum
6] GRADIENT
-
DRAINAGE
AREA
,
tjrni
0
Cl
VERY
MODERATE•[6-l0].
LOW.
-
L6W[2.4]
•:
%POOL:Qgrr
%GLIDE:(
Maximum
Gradient
f9
II
I
*mi2)
Cl
HIGH-VERY
HIGH
Ejö-61
%RUN:
(JD%RIFFLE(
J
io
EPA4520
>(,foJ—
rr’i)
K
/,
.(
ft..C6l11IO8
I--.,
Electronic Filing - Received, Clerk's Office, September 8, 2008
QuaitatWe Habitat
EvaIuatioAhdEx
HEI
:
and
Use Assessment
Fted
Sheet
core
7)s
P7is
fi
Lic
r -
RM:
Date:
o
/1!
08
-
Scorers
Full Name
&
Affiliation:
.ir
JANI
- — -
—
— _(.L.
181
j
,q
Office
verified
D
1]
SUBSTRATE
Check
ONLYTwp substrate 7YPE BOXES;
estimate
%
or
note every type
present
Check ONE
(Or 2 &
average)
BEST
TYPES
POOL
RIFFLE
OTHERTYPES
POOL
RIFFLE
.
ORIGIN
QUALITY
D
EJ
BLDR1SLABS
[10J_
—
D
—
D
LIMESTONE
[1]
EAVY[
2]
GD
BOULDER
[9]
—
Q
—
‘9iLLS
[1]
IJ
MODERATE
[1] Substrate
JrD
COBBLE
[8]..
—
D
Dbdi4
—
D.WETLANDS
[0]
SILT
NO.RMAL [0]
GD
GRAVEL
171
—
14ARDPAN
[0]
El
FREE (1)
D D
SAND [6J.
.._.
—
Q
QiFitOL_
—
El
SANDSTONE
101
ErENSIVE.L-2I
D
D
BEDROCK [5]
.
(Sàorè natüràlsubtrates;
Ignore
El RIPI.P.[Q1::.--
El
MODERATE [1j
ium
NUMBER
OF BEST
TYPES
sludge
from
point
source-)
El
LACUSTRINE
[01
qJNORMAL
10]
20
Comments
t,-..---—-
d’
‘—
El
COAL
FIJES
1Z21
c,
.
2]
INSTREAM COVER
quality;
indicate
2-Moderate
presence
0 to
amounts,
3: 0
Absent;
but not
1-Very
of highest
smallquality
amounts
or in
or
small
more
amounts
common
of
of
highest
marginal
AMOUNT
quality:
3-Highest quality
in
moderate
or greater
amounts (e.g.,
very
large
boulders in deep
or
fast water, large
Check ONE
(Or 2
& average)
diameter
log that is stable,
well
developed rootwad
in deep
I
fast
water,
or
doep, well-defined,
functional
poois.
D
EENSIYE
75%
11
UNDERCUT BANKS
11]
:.
.
POOLS
>70cm [2]
—
oxaows;
BAGRwATERS.E1j
MODERATE
25-75%
171
...L....
OVERHANGING VEGETATION
[1]
—
ROOTWADS
[1]
..L..AQUATIC
MACROPHVTES
[]
..‘SPARSE
5-’c25%
[3]
—
SHAlLOWS
(IN
SLOW
WATER)
LI]
....L...
BOULDERS
111.
J,_
LOGS
OR WOODY DEBRIS
111
El
NEARLYABSENT
5%
Ij
—
ROOTMATS
11]
Cover
Comments
Maximum
3]
i-iANNEL
MORPHOLOGY
Check ONE
in cach category
(Or 2
& average)
SINUOSITY
DEVELOPMENT
CHANNELIZATION
STABILITY
El
HIGH
[4)
.
El
EXCELLENT[7J
El
NONE[61
••:
..:
El
MODERATE
[3]
El
G0OD[5] .
.
El
REPOVEREb[41
.
• . .
DOIRATE121.
:
LOW [2]
El
FAIR
[31
‘RECOVERING
131
‘LOWf1j
NONE
L1
.
POOR
111
.
El
RECENT
OR
NO
RECOVERY
[11
Comments
‘BANOW1NE[Q
eradominanf
land
use(s)
7, riparian.
Riparlan
,.
Maximum
Oci
10
5] POOL
/
GLIDEAND
RIFFLE/RUN
QUALITY
-
MAXIMUM
DEPTH
CHANNEL
WIDTH
CURRENT
VELOCITY
RecreationPotential
Check
ONE (ONLY!)
Check ONE
(Or2
& average)
Check ALL thapply
Primary
Contact
•r
j•
DPOOL
WIDTH RIFFLE
WIDTH [2]
0
TORRENTIAL.
E-1.LOW
111
.
Secondary Contact
O
U.7<lrn
141
.,j
POOL
WIDTH
= RIFFLE WIDTH
LII U
VERY
FAST
Lii.
LIINT.ERSTITIAL
Mi
(rcteona nndcommonton back)
El
0.4.cO.7m
[2)
0
POOL WIDTH
< RIFFLE WiDTH
[0]
El
FAST [1]
. . El
INTERMITTENT
J2)
El
0.2-<O.4m [1]
0
MODERATE
[1].
. Q
EDDIES
[4]
Pool!
El
<0.2m
[0]
lndicte
101
reach -pools
and riffles.
Current
Comments
Maxh7iurn
Indicate
for
functional
riffles; Best areas must
belarge
enough
to support
a
population j
of riffle-obligate
species:
Check
ONE
(0r2
& average).
ORIFFLEtmetrlc—0I
RIFFLE DEPTH
RUN
DEPTH
RIFFLE
I
RUN
SUBSTRATE
RIFFLE
IRUNEMBEDDEDNESS
0
sr
EaS,
lOon’
121
0
IMUM
Ocm
1”
El
StABLE
(eg
Ccbb’e
Bo...ldo
)
[2]
—
El
BEST AREAS
510cm IJ El
MAXIMUM
< 50cm
[1]
0
MbO.
STABLE(ê.g.,
LargèGrWel) i]
El
BEST AREAS <Scñi:
El
UNSTABLE
(eg.,
Fine Gravél,Sand)[0J
[metrlc’O]
Comments
%POOL:J
%GLIDE:(5J
%RUN:
c%RIFFLE(
Stream
& Location:
d5•
6 A--
J
c’e
‘./r4
River
Code:
-
-
STORET#:
Channel
‘.
Maximum
-rbank
&
average)
EPA
4520
6] GRADIENT
(.4Q(
ftlmi)
DRAINAGE
AREA
El
D!41E
[61O]
(.‘ml2)
DHGHYIGO$j.
>
(I
5c; -.
Gradient
Maximum
10
7/1(O
06111108
Electronic Filing - Received, Clerk's Office, September 8, 2008
Qualitative
Habitat
Evaluation
Index
and
Use
Assessment
Field
Sheet
QHEI
Score:
Dts’
.P/aic
(?iv—
q-1.
RL.3
RM:-’.LDate:eH,’oI
08.
Scorers
Full Name
&
Affiliation:
3
(/L,L-
jeer/rZ
LatJLonq.:
L.f
j
q
q
i
i
4
‘7
verffled
— —
—
— lNAOS3-docIm.....
—
——
iL.
‘
—
.L.
—
£2
location
I1
Substrate
Maximum
20
indicate
predominant
land use(s)
past ‘Worn
riparian.
Riparlan
Maximum
10
Gradient
Maximum
10
fCc
(fl(V
06/11/08
Stream
&
Location:
River
Code
-
STORET#:
1]
SUBS
TRATE
Check
ONLYTwo
substrate
PIPE
BOXES;
estIate
%
or note
every
type
present
POOL
RIFFLE
OTHER
TYPES
POOL
RIFFLE
GD
cBDSBS
ttOI
—
D
Q
HARAN
4_
DD
BLth]
7’
—
C
D[_
-
C
Ct1f
—
Q
—
,D
GR[
—
C
GD
C
D[J1_
—
O
C
BEDf9K[5Jv
—
(Score
natural
substrates
ignore
F
NUMBER
OF
BEST
TYPES
Z
prflL0r$21
sludge
from
point sources)
Cómmèñts
Check
ONE (Or
2 &
average)
2jINSTREAMCOVER
quality
Indicate
2
presence
Moderate
0
amounts
to
3:
0-Absent;butnot1-Verysmall
ofhighest
quality
amounts
or
in
or
small
if more
amounts
common
ofofhIghest
marginal
AMOUNT
quality
3
Highest
quality
in
moderate
or
greater
amounts
(e
g
very
large
boulders
In deep
or fast
water
large
Check
ONE
(0r2&
average)
diameter
log
that is
stable
well
developed
rootwad
in
deep!
fast water
or deep
well defined
functIonal
pools
0
—
0
_yEIG9
SF11
/
Aj
9ESt3J.
—
SH3IN
SLdWjAIATERL1]
—
LÔG&bR
WoolDEi3RJSi1J
C
NEARYABSENT5%ji
_qTMJ
.
Cover
Comhients.
Maximum
3.CHAWNEL
MORPHOLOGY
Check
ONE
in
each
category
(0r2
& average)
SINIJOSflY
DEVELOPMENT
CHANNELIZATION
STABILITY
P9qRij’c
C
CommEnts
4]P..SløN:ANDRiP4R!4NZONEcñeck
ONE
in
each category
for
EACH
BANK
(0r2
per bank
&
average)
River
right
looking
downstream
RIPARIAN
WIDTH
FLOOD
PLAIN
QUALITY
‘.
[±1
coiN
0
C
DWIIAS1JR
ROWCRO
0
Comrnent
5]
POOL!
GIiIDEAND
RIFFLE/RUN
QUALI1Y
r
MAXIMUMDEPTH
CHANNEL
WIDTH.
CURRENT
VELOCITY
Recreation
Potential
CheckONEjONLY!)
Check ONE
(0r2
&
average)
..
CheckALLth
apply
I
Primary
Contact
DW’
Secondary
Contact
Dj14j4J
DVEYFA’S1[1J
DITER
TIAr1]
I
fcirciooneandcommontonback)
C
O07ni[2l
U
POOiMDTH<
rnFFLEDTH
i0j
C
s[Ij
0
FN?E
T1E42]
D-Q.ji[1i
Pooi/f
11
Comments
Co(trof
Indicate
for
reach
pools
anrfilffles
Maximum
Current
7
____
Indicate
for functional riffles;
Best
areas
must
be large
enough
to support
a
population
.
of riffle-obligate
species:
Check
ONE
(0r2
& average).
RIFFLE
[metrlc0]
.RIFFLBDERTH
..... .
..
:RIFELE:tRUNSUBSTRATE.:
RIFFLE
I
RUN:
EMBEDDEDNESS
C
BS[2]
DUM0L2]
C
TA
e
o6
—
Dth
33
1[11
C
MMUM
S0cif1]
C
JTtI
LJJJNS
Ln!°]
—
Comments
6]
GRADIENT
(
0.!
ftlml)
C
%POOL:(,D
%GUDE:(jj
DRAINAGE AREA
m12)
DWVRI01
%RUN
(
)%RIFFLE
C
Z
EPA4520
>l,iOL.
Electronic Filing - Received, Clerk's Office, September 8, 2008
Qualitative
Habitat
Evaluation
lhdex
•.•••
and_Use
Assessment
Field
Sheet
HEI
Score
____
Stream
&
Location
D€3 P/
-
-?
?-
‘&
RM
79
Date
JJ
L
LI
08
_Scorers
Full
Name
&
Affiliation:
.J’e’
()J
1
E
LatJLona.:
141
lu
, ii
a i
7-
c
0fflc9
Verified
-
1NA083-d
ma1__
•
JL
‘2
L_
location
11
SUBSTRATE
Check
ONLYTw0
substrate
TYPE
BOXES;
etftate
%
or
note
every
typ
present
Check
ONE
(0r2
&
average)
• BEST
TYPES
POOL
RIFFLE
OTHER
TYPES
POOL
RIFFLE
ORIGIN
QUALITY
DC
C
DLI_
—
DL4SNEL11
CD
B[9J
..
C
•
—‘
DI!.US;_
--.-.
C DERATE11J
Subshate
-
SILT
_____
ZD
I_
11
DflçIJ
]_
LJ
1
J_m
Ali[O]
—
Q Q
S[2_
—
DN[O)
C C
f_
—
1]
C
ARTJFICIAL[OJL__.
—
DNDSJE1OJ’
EXEIVE
C2]
____
O
C
—
(Score
natural
subsfrates
Ignore
C
IÔIWW
PDEO
4
,
DóD,RAJ1r
turn
NUMBER
OF
BEST
TYPES4
o1!jJ2]
sludge
from
point
sources)
DM94RiE’
20
comments
D3
ores
[0]
2]
INSTREAMCOVER
qualityIndicate
2
presence
Moderate
0
amounts
to
3 0 Absent
but
notI
of
Very
highest
smallquality
amounts
or
in
oFitmore
small
amounts
common
ofofhIghest
marginal
AMOUNT
quality
3 HIghest
quality
in
moderate
or greater
amounts
(e
g
very
large
boulders
in deep
or fast
water large
Check
ONE
(Or
2 &
average)
diameter
log
tht is
stable
well
developed
rootwad
in
deep!
fast
water
or
deep
well
defined
functional
pools
D
EWI7i1J-.
___4_____a
1
__
C
ERHANEATJQN[1]
—
91
rI
..L4EtpAiic
CROPHVtEâFiJ
RWP.
EI1
11J
NEARtiYABSENf%
[11
3]
CHANNEL
MOPPI—’OLQGY
Check
ONE in
each
category
(Or
2
&
average)
SINUOSITY
DEVELOPMENT
c
—
— —
-
CC
EtLNTM
DERATE1ä
EJ
9LJ
Comments
.
Cover
Maximumj
If
2&’
LJ
—
CM4gLp1
twf,eI
(
DNJMaxim:,
k
_____________________
S
\____‘
Gradient
Maximum
10
J
/_•
‘_7
/
1
(O
.
06/11/08
River
Code:
-
-
STORET#:
Comments
Comments
channel
Maximum
20
(Or 2perbank
&
avaragó)
D”U)i
oj
Indicate
predominant
land
use(s)
past lOOm
riparian.
Riparian
Maximum
I’S
10
5]
POØ/GLE.EAND
RIFFLEIRUN.QUALITV
MAXIMUM DEPTH
CHANNEL.
WIDTH
CURRENTVELOCITY
Recreation
Potential
Check
NEtENLY!)
Check
ONE
(Or
2 & average)
.
Check ALL
th apply
Primary
Contact
[21
O
DE1Aflf
Secondary
Contact
iii
PQ
iii
LtELTI
[iJ
C
IT1
lt[
(circle
one and
commenton
back)
CP
4
lm[2]
C
POOL
W1p1H
c RIFjEVjOTH
[Oj
DAsrfi]J
DNTERMIN121
____
C2j[]
PooI/(
7nd,cate
for reach
- poofand
riffles.
Current
i
Comments
Maximum
,
ofIndicate
riffle-obligate
for
functional
species:
riffles;
Best
areas
Check.ONE
must
be.
(0r2&
large
avomge).
enough
to
support
a populatIon
NO
RIFFLE
[metric—0]
-
RIFFLE
DEPTH
RUN
DEPTH
RIFFLE
I RUN
SUBSTRATE
RIFFLE
I RUN
EMBEDDEDNESS
C
BEST
Scii[2j
C
UM5P$r2]
Ck[2j
C
MXIMUM
<5
6
m
nj
C
JLE
pIg%eI
[1i
C
(mecc0]
UNSTBLEêlS1t0J
Comments
6]
GRADIENT
(
4
O,(
ftlmi)
C
VERY
COV
ff[2.4J
DRAINAGE
AREA
C
MOERLj
mi
2
)
C
HIG
VERY
HIGH
110
61
EPA
4520
%POOLJ
%GLIDE:(J/)
%RUN:
(
)%RIFFLE:C)
Electronic Filing - Received, Clerk's Office, September 8, 2008
Qualitative
Habitat
Evaluation
Index
and
Use
Assessment
Field
Sheet
HEI
core
Streàm&
Location:
1)e
)c4
ilv’
)
y-
s
RM:t-Y.Date:
al—I
LJ
08
•Scorers
Full
Name
&
Affiliation:
&
J-s4.-
t
1
f
71
I8
17
Office
vedfledQ
River
Code:
-
-
STORET
#:
11
SUBSTRATE
Check
ONLYTwo
substrate
Th’PEBOXES
estimate
%
or
note
every
type
present
Check
ONE
(Or 2
&
average)
BEST
TYPES
POOL
RIFFLE
OTHER
TYPES
POOL
RIFFLE
ORIGIN
QUALITY
CD
QTiätAS[1oi_
C
D1Ap
—
DcIMESTRNEI
D
Or
C
—
C
DLVHtA3N_
—
SILT
DMDE1J
Substrate
j
—
—
iILI
Irfl
CD
—
C
CTIF14101
—
DNPS9LQ1
E)I
L_J
r,
i)DE
ri
•‘
[ii]
fBEDRowI5
—
(Score
natural
substratss
ignore
AgYçr
,.
Maximum
NUMBER
OF
BEST
TYPES..
sludge
from
point
sources)
20
2]
INSTREAM
COVER
quality
Indicate
2
presence
Moderate
0
amounts
to
3:
0-Absent;
but
not
1-Very
of
highest
small
quality
amounts
or
in
or
small
if more
amounts
commonofof
marginal
AMOUNT
higt,-
1
quality-
3
Highest
quality
in
moderate
or greater
amounts
(e
very large
boulders
in
deep or
fast
water
le
Check
ONE
(Or 2&average)
diameter
log
that is
stable
well
developed
roo
d
in
deep!
ast
water
or deep
well defined
functional
pools
C
Comments:
Maximum
0
Channel
—
Maximum
01:
epredbminant
land
use(s)
.,t
IOOmriparlan.
Rfparlan
Maximum
7,
10
%POOL:j
%GLIDE:/O77j
Gradientr
%RUN:
(
J%RIFFLE:E)
Maximurn
i(-
?I(D6111108
C(2td&s
-9-s
3]CHA$A.EL•MORPHQLOGY
Check
ONE
In
eachcategory
(Or2
&
average)
SINUOSLfl
DEVELOPMENT
CHANNELIZATION
STABILITY
poot
C
‘
Comments.
.
4]
BANK
River
righ
F
SION
ANDRIPAJ
‘
1
4N
ZONE
‘CliéckONE
in each
category
for
EAC
1NK(0r2
per
bank &
average)
FL(
‘TY
I
I
DOR
AND
RIFFLE/RUN
QUALITY
‘—
DEPTh
CHANNEL
WIDTH
CURRENT
VELOCITY
Recreation Potential
Check
ONE
(Or
2 & average)
Check
ALL
thaf
apply
Primary
Contact
DPI
Secondary
Contact
WOMDTH=FFLEDTHI
D
FL1]
cjrcie
one
and
comment
on
back)
Indicate
for
reach
-pools
and
nffies.
Pool?
Current
Comments
Maximum
lndióate
for
functional
riffles;
Best
areasjnust
be
large
enough
to
support
a
population
of
riffle-obligate
species:
.Chbck
ONE
(Cr2
&
average).
,O
RiFFLE.metrIc-0J
RIFFLED:EPTH•:
.. ...
. RIJNDEPTH..
...
RIFFLE4RUN..SUBSTTE.
RIFFLE
I RUN
EMBEDDEDNESS
C
E1c[21
C
MAXIMUMcji2
dJ2i
-
-
CEs
IQm
[fI
C
WXJMUM
5Othj4j]
CEStc1im
DBFtGT)
[Oj
[metrIç0]
-
Conents
6]
GRADIENT
C:
____
DRAINAGE
AREA
C
MQDE
tL6$
(?‘r1Q
m12)
C
5vERYHIGA4i
0$]
EPA
4520
Electronic Filing - Received, Clerk's Office, September 8, 2008
Qualitative
Habitat
Evaluation
index
and
Use
Assessment
Field
Sheet
QHEI
Score
08
Scorers
Full Name
& Affiliation:
9
LaULong.:iij
‘ti-
-
I8.
L 724
Office
vrit1ed
Riverq
9
;___-___-__STORET#:
InMumaI,__
11
SUBSTIATE
Check
ONLYTwo
substrate
TYPE
BOXES;
estimate
%
or
note every
type
preitéht
Check
ONE (Or
2 &
average)
BEST
TYPES
POOL
RIFFLE
OTHER
TYPES
POOL
RIFFLE
—
c
I
ITY
GD
BI!b
[1pj
—
D
DL4]_
—
r
GD
DE[
—
D
D)T[31_
—
D
DyJ?_
—
[
GD
—
D
D4_
E
GD
D
D;E9I
—
GD
tK
[5jZ
—
(Score
natural
substrates
ignore
[
NUMBER
OF
BEST
TYPES
sludge
from
point
sources)
Li
Comments
[
quality
2
presence
Moderate
Oto3:
amounts
D-Absent;.i-Very
but
not
of highest
smallquality
amounts
or in
or
small
if more
amounts
commonof
of
highest
marginal
AMOUNT
quality
3 Highest
quality
in
moderate
or
greater
amounts
(e
g
very
large
boulders
in deep
or rast
water
large
Check
ONE
(0r2&average)
diameter
lothaf
is
stable
well
developed
rootwad
in
deep/
fast water
or
deep
well-defined
functional
pools
D
EtI,E
>%[iJ—
_S
C
OI3pNj1]
__vv
_wi]_
_i1ir
.
edornlnant
land
use(s)
,,.,.,.7r1panan.
Riparfan
Comments:
3
Maximum
/V
io
5]
POOL/GLIDEAND
RIFFLE/RUN
QUALITY
MA
IMUMD
EPTH
CHANNEL
WIDTH
CURRENTVELOCITY
Recreation
Potential
Ch1ONEONLY!)
Check
ONE
(Cr2 &
average)
Check
ALL
that
apply
Primary
Contact
POO[WIDi
H RWFLE
WIDTH
LII LI
VERST
Secondary Contact
[J
C
ITERSTnL[
tJs
(circle
one
and
comment
on
back)
D.çA7
C
POOL
V1IDTH
<RlFFLE
WIDTH
fOj
C
____
DQs4ijiI
DODERATEjIf4
DDDIESL
PooI/1i
7ñi&&e
forreach
pJä1ñd
Current
4g
Comments
Maximum
____
Indicate
for functional riffles;
Best
areas
must
be large
enough
to
support
a
population
of
riffle-obligate
species:
.
Check
ONE
(Or
2 &
average).
0 RIFFLE
[metrlc-O]
RIFFLE
DEPTH
RUN
DEPTH
RIFFLE
I RUN
SUBSTRATE
RIFFLE
I RUN
EMBEDDEDNESS
C
B
S1I°
[2J
C
MXIMUM5Q}[2]
D4N
DfAiS4’cr[1j
DIó[f
-
UBEJ
AREAtSchi
C
UNSTABLE
(eg F1neGr4ve1,
Shd
tO]
C
MODRATEJO
rc:me
I
(
1metr[çO]
-
DxrENsrvfl[iJM
Ufl
Comments
aximurn,
6]
GRADIENT(<OtI_filmi)
C
VERY lOW
LPWE1
%POOL
C
)
%GLIDE
(73
Gradlent(
DRAINAGE
AREA
C
Maximum
(>-4.mi2)
C
HGWVERYHIGH
jiøA
%RUN
(
D%RIFFLE
CJD
10
JI
EPA
4520
I,
cc)
2.—
‘c
‘/‘
f
06111/08
—
U
Stream
&
Location:
Comments
hect
ONE
in
h cat
ory
(0r2 &
avórage)
C
3
Maximum
Cover
1
Channel
Maximum
0
Electronic Filing - Received, Clerk's Office, September 8, 2008
Siroam
& Loc
n:
/k’
O
River
Code:
STOREr
#:
1]
SUBSTRATE
Cheek
ONLY1W
L(rae
TYPE
BOXES:
esmae
<.
or
n
OVOaJ
typO
3001
BEST
POOL
RIFFLE
POOL
RIFFLE
DO
BLDRISLAES[1O1_
U
DHARDPANE1I
—
O
Li
BOULDER
[91
*
DO
DETRITUS
rs
DO
C0BBLE[a3
—
C
DWiUGK(2]
—
O
0
GRAVEL
[71
0
0
SILT
2I
DO
SAND
[1
—
U]
DART
CALL9]
00
BEDROCK
[53
(Scoc
a
cat substrates;
rears
NUMBER
OF
BEST
TYPES:
0
4
or more
[7
sdgo
from
point-sources)
Comments
Ci
3 or Ieee
[0]
Checo
ONE
(0r2
&
evoragrc)
ORIGJN
QUAUTY
O
LIMESTONE
(1]
0
HEAVY
[.2]
DTILLS[1j
C
MODERATE
[.11.
O
WETLANDS
[0]
0
NORMAL
[03
O
HAROPAN
[9]
DFREE(i.3
C
SANDSTONE
O)
EXTENSIVE
[-23
O
RIP1RAP
(0]
oDE.
Q
MODERATE
[t]
O
LACUSTRINE
£03
0
NORMAL
O
SHALE
[-13
0
NONE 31]
O
COAL
FINES
[.23
Ciiainel
India
We predominant
land
use(s)
pest
WOrn
riparirm.
Riparian
Maxirnucr,
‘/
10
—
PotI
Cnnerd
100031
1?
I”JBI
MODIFIED
t&hs
Eiauaon
idex
id
Use
Assessment
Field
Sheet
- -
Scorers
Full Name
&
Affiliation:
LoLl
Long.:
10cr
r,,In,...
*
*
18
051cc
—
*
— —
._
toceOoc
23
!s)STREAM
COVER
lad
ItO Ore000ce
0
(
3:
3-Aheont;
1-Very
sn’aIt
amlunts
or
if
more
common
of
marginal
AOIJNT
qun[ty:
2-rooderata
mnounte,
bat not
or
lsghest
quritctv
or 0
small
amounts
tO
ntghest
IL
3
o
ut
icdrac
or
1
0
a
a
iL
r
1
larg
bo
0
l
0
ot
0
d
pcr
at
a
cc
01(0
Or
2
&
0
r•ian:eter
log
(hats
ronNie,
cell devalo
ad rccowsrd
in deep;
1051
water,
or
-deep,
a’etI.defined,
furiabonl
pools.
0
EXTENSIVE
>75%
1113
UNDERCUT
BANKS
[13
__,
POOLS
2’
70cm
[23
OXBOWS,
BACKWATERS
[11
0
MODERATE
2R75%
[7!
OVERHANGING YEOETATION
[‘0
ROOTWADS
[3
AGUATIC
MACROPHYTES
(‘1]
0
SPARSE
S.e25%
[33
SHALLOWS
(IN
SLOW
WATER)
[1]
*
BOULDERS
(13
LOGS
OR
WOODY
DEBRIS
11]
0
NEARLY
ABSENT
a5
[‘ij
ROOTMATS
11]
Cover
Comments
Mmdcnw>
1/
2O:
31
CHANNEL
MORPHOLOGY
Chaos
ONE 10
each Oclapory
(Or
2 & 000raprr)
SINUOSITY
DEVELOPMENT
CHANNELIZAIION
STABILITY
ED
HIGH
(41
0
EXCELLENT
[7]
0
NONE
(6]
0
t-IIGH
[33
O
MODERATE
(3]
0
GOOD
(5]
0
RECOVERED
[4]
0
MODERATE
[2]
O
LOW
[23
0
FAIR
333
0
RECOVERING
[33
LOW [13
‘NONE[1]
POOR
(1]
C]
RECE-NTORNORECOVBRY[13
Comments
IOIPN
nOon
[1]
Comments
Ll
BAN!’
EROSIOI’
t
A4’D R1PA
PIA
IV
ZONE
Ct
aol’ O”IEn
as’--
(eooc
for
EI’Cr!
5ANKO
2
po
aons
“3
-
cv
eqlO
tk5
dnsOca,
,,
RIPAR
IAN
WIDTH
FLOOD
PLAIN
QUALIFY
EROSION
0
0
WIDE>
SCm
[4]
0
0
FOREST,
SWAMP
[33
Li
0
CONSERVATiON TILLAGE
[13
Li
0
NONE
I
LITTLE
[3]
U]
C
MODERATE
3050m
(33
0
0
SHRUB
OR
OLD FIELD
(2]
0
0
URBAN
OR
INDUSTRIAL
[01
O
C
MODERATE
[23
0
0
NARROW
5.1Gm
[23
U
0
RESIDENTIAL,
PARK,
NEW
FIELD
[1]
0
0
MINING!
CONSTRUCTION
[03
O
0
HEAVY!
SEVERE
[1]
0
0
VERY
NARROW
<Sm
[13
0
1]
FENCED
PASTURE
[13
0
0
NONE
[0]
0
0
OPEN
PASTURE,
ROWOROP
[03
5]
POOL!
GLIDE
AND
RIFFLE!
RUN
QUALITY
MAXIMUM
DEPTh
CHANNEL
WIDTH
Check ONE
(ONLY!)
Chock
ONE
(Or
2 &
tm
[63
0
POOL
WIDTH>
RIFFLE
WIDTH[2
O0,7-<lm[41
OPOOLWIDTHZRIFFLEW1DT1O[i]
C
0.4-a0,7m
[2]
[J
POOL
WIDTH
<RIFFLE
WIDTH
[0]
O
0.2.t(l,4m
[13
-•
—
O”
0 2m [0]
Ii
npohn’0c
1
f
11
Coil
tmev
Is
CURRENT
VELOCITY
Chack
ALL
that epoly
O
TORRENTIAL
[.-1]2ISLOW
[13
O
VERY
FAST
[‘1]
0
INTERSTITIAL
f-I]
O
FAST
[13
0
INTERMIfl’ENT
[.2]
O
MODERATE
[13
0
EDDiES
[1]
Ifldicate
ion reach
- OOiS
and
olOes
Recreation
Potentiai
Primary
Contact
Secondaiy
,,C c,,mtn,rr
Contact
ri:,
I
[ndicate
for
t’unctionai
riffles;
Best
areas
must
be
large enough
to support
a population
of
riffle-obligate species:
CheakONE(0r-&avmago).
l0>lFF
RIFFLE
DEPTH
RUN
DEPTH
RlFFL1RUN_SUBSTRATE
RIFFLE
I RUN
EMBEDDEDIES
O
BESTAREAS
s
10am
[23
UMAXIMUM>
50cm
(21
0
STABLE
(e.g.,
Cobble,
Boulder)
[23
0
NONE
[2]
0
BEST
AREAS
6,10cm
1]
OMAXI&’UM
a
50cm
[1)
0
MOD.
S’rABLE(e.g.,
t.erge
Gravel
[1]
9
LOW
113
IDES”AOEAS<S,.
1
F(daCTABLE(
F wG”
- I
eel,,
UOIODCRA
n1
P1.
*
[
1
F
TENSIVF
I I
O?RItlcflt&
GRAD!ENT
itNO
‘!ER1LOW’LOWt2.:!]
OEL
:
os°
al’r
Li
11301
HiGh
—VERY
HUH
(W-03
%POOL:i,,,,,J
%GL3E2E:(
,
GraaHrrr
%UN:
(,_,,j%RMFLEt(
,,)
“
Electronic Filing - Received, Clerk's Office, September 8, 2008
Stream
&
Location:
/Is
A’7 &ry
— 28’!”!
C
3] CHANNEL
MORPHOLOGY
Cneck ONE- in each ratepory (Or
25 average)
SIN UOS(TY
DEVELOPMEIST
CHANNELIZATION
0ä[4J
0
EXCELLENT
17]
0
NONE [5]
0
MODERATE
[3]
0
GOOD
[51
0
RECOVERED
4J
o
LOW
(9
0
FAIR
[31
0
RECOVERING rs
NONE
[1J
‘ POOR
U]
0
RECENT
OR NO RECOVERY
[1]
Comments
/(
14131
MODiFIED
QualitaDve HaNtat
Evalluatlon
llndex
Ct “n
ra
and Use
Assessment
R&d
Sheet
RW2if?O8te
o$!L1
08
_S
corers Full
Name &
Affiliation:
:7€
t44
River
Code:
STORET
#:
tat/Long.:
/5
Office
1]
SUBSTRATE
Check
ONLYTW0
substrate
‘(‘TEE
BOXES:
estmete
or
note
every
type
present
Check ONE Or
7
&
everrrge)
BEST TYPES
POOL
RIFFLE
OTHER
TYPE!
POOl. RIFFLE
ORIGIISI
QUALITY
00
BLDR (SLABS
[101_
0 0
HAROPAN
[4] —
—
0
LIMESTONE
[1]
0
HEAVY
-2]
00
BOULDER
(9
—
0 0
DETRITUS(S) —
—
O11LLS[’I]
SILT
0
MODERATE [-13
Substrate
00
COBBLE
[53
—
0
QMUCK(9
—
OWETLANDS
[0]
0
NORMAL
[0]
-
00
GRAVEL[T]
—
0
0SILT[23
0HARDPAN[0J
OFREE[1J -
-
LID
SAND
16]
—
,
—
0 0
ARTIFICIAL
(0I_
——
0
SANDSTONE
(9
0
EXTCNBIVE [2
o
0
BEDROCK [53
—
_,
(Score
natural substretes; ignore
0
RIPIRAP
[01
,
t00E0
40
0
MODERATE
[1]
r;4,
NUMBER
OF
BEST
TYPES:
0
4 or more
[2)
sludge from point-sources)
0
LAc-USTRINE(9
%0
NORMAL
[01
“
-
C
Oaorless[o]
OSHALEf-1]
ONONE[l)
ommen
5
0
COAL FINES (‘2]
21-INS
TREAM
COVER
Indicate presence Oto 3-:
0-Absent:
1-Very
smell enrounie or it more
comrnot of
merginel
AMOUNT
cur
r, 3
H guest ,ual
ty
rqda
goal t
c_or
2
M,o,.
M,
-n
a a.
riteas
r
5g
bui oct
s
C
o
large
h
gt
r
5
boil
,
u’lrh4
I’
ci-’
or
deer
in
em
nr
rIl
fee
on ountswel”r0
hrj’.
highest
rh5._.
c
No
—
0
7
er
n
diameter
log
that is stable, well
developed
rootwed in deep
/
fast water,
or
deep-
well-defined,
functional pools.
0
EXTENSIVE
>75%
(lii
UNDERCUT BANKS [1]
—
POOLS > 70cm
f2] —
OXBOWS,
BACKWATERS
[1]
0
MODERATE
2545%
[7]
OVERHANGING
VEGETATION [1]
—
ROOTWADS (1]
—,
AOUATIC
MACROPHYTES
[1]
0
SPARSE
5-c25%
[3]
—
SHALLOWS (IN
51.0W
WATER) [1]
—-
BOULDERS
[1]
—
LOGS OR WOODY DEBRIS
[Ii
0
NEARLY
ABSENT
‘5% (1]
—
ROOTMATS
U]
Cover
4
- -
Comments
etaxirrrurrr
7
H
STABILiTY
HIGH
[3]
0
MODERATE
[2]
0
LOW[1]
Channet
7- - - -
A-icwirnurn
H
yr
-
20
1
BANK
EROSION AND
RIPARIAN ZONE
Check
ONE in each category [or
EACH BANK (Or2perbanic &
average)
-
Rivsr
drrhrhoking
dswnsrrssnt
r
RIPARIAN
WIDTH
r.’
FLOOD
PLA1N
QUALITY
:
p
EROSION
Q
C
WIDE> 5Dm
[4]
0 0
FOREST,
SWAMP
[3]
0 0
0NSERVATION
TILLAGE
[1]
0 0
NONE I
LITTLE
U]
0 0
MODERATE 10-SCm [3]
0 0
SHRUB
OR OLD FIELD
[2]
0
0 URBAN
OR
INDUSTRIAL
[0]
O 0
MODERATE
[2]
0 0
NARROW
5.1Dm [2]
0
0
RESIDENTIAL. PARK, NEW FiELD
1]
LI U
MINING
I
CONSTRUCTION [03
0 0
HEAVY (SEVERE
[1]
0
0
VERY NARROW
< Sm
[1]
0
0
FENCED PASTURE [1]
indicate
predomirrsnu land use(s)
-
0 0
NONE [0]
0
0
OPEN PASTURE, ROWCROP
[0]
pest
l00,’n riparlrrn.
R4oerlen
c -
Comments
Mavrrnwn
--
5] POOL/GLIDE
AND
RIFFLE/RUN
QUALITY
—
--
MAXIMUM
DEITh.
CHANNEL
WIDTH
CURRENT
VELOCITY
Recreation
Potentia!
Check ONE
(ONLYi)
Check ONE (Or
2 &
average)
Check ALL that spoly
Primary
Contact
0
0,7-elm
Im [6]
H]
00
POOLPOOL
WIDTH
WIDTH>
RIFFLEWIDTH[1]
RIFFLE
WIDTH
[2]
0
0
VERYTORRENTIAL
FAST
[1]
(‘13.21
0
SLOW
INTERSTITIAL
[1]
(‘1]
1
udn$rssns:nr
Secondary
veemees’-
Contact
west
I
o
0,4-cO-Tm (2)
0
POOL W1DTN
C
RIFFLE
WIDTH
[O]/.’FAST
[1]
0
INTERMiTTENT
[-2] “‘‘“‘‘“
o
0,2-<O.4m [1]
—--------i
.
.21
MODERATE
[1]
.21
EDDIES
-[13
Peel?
o
‘.0 2m [0)
rlmiocndadJ
TI
nrrcot
firrcorJy.
‘oo1
,,r
d
nffl’.’,
Comments
-
£f-’-:
----
Ht.
,)
[ndioate for
functional
riffles; Best areas
mUst be
large enough to support
a
population
-
of
riffle-obligate species:
Check ONE (0r2&average).
RIFFLE DEP
RUN
DoPT’e
RIFFLE
I
RUN
SUBS mATE
PIFFLE
/
RUN
EMBED)EDNESS
0
BEST AREAS>
lOcni
[2)
QMAXIMUM> 50cm
[23
0
STABLE
(e.g., Cobble, Boulder)[23
0
NONE
[2]
0
BEST AREAS
5-10cm
11)
0
MAXIMUM a 50cm
[1]
0
MOD. STABLE
(eg., L-srge Gravel)
[1]
GLOW
[1]
, - , -- - -- -
OSEST AREAS-c
Scm
-
0
UNSTABLE
(e.g.. Fine Gravel. Sand)
[0]
0
MODERATE
(9
4;
Imetrrm’OJ
0
EXTENSIVE
[--I]
-,
Comments
-
vra..n-ac--,
6]
GRADIENT
L_._,Jr/miu 0
VERY LOW - (.0W (2-4]
DRAINAGE
AREA
0
MODERATE (0-10]
0
HIGH
- VERY
NIGH
[104]
EPA 4520
:-
-;
-
<
r
%POOL:(’.,_,_) %GL[DE:ç
%RUN:
CD%RIFFLE:EED
Grert/ent
;‘
--
;vtaz;ntrrnor
-
ke
:
Oft/Il/flit
- Hi
/
Electronic Filing - Received, Clerk's Office, September 8, 2008
MBI MODIFIED
Qatatkte
abftat
Evahiaton 1ndex
and Use Assessment
F&d
Sheet
Stream & Location;
.,,
It:’
Scorers Full Name
&
AW lion:
Jr
Vt:/J,
River Cede:
STQRET#:
Let.!
Lanq.:
18
QffirO ‘Ct*
q
Ii
SUBSTRATE
Chack ONLY
Two achatrete TYPE
d3OXES:
aelinrate
or note every
type
OrCeent
Check ONE
(Or
2 &
average)
BEST T’{PES
POOL
RIFFLE
POOL
RIFFLE
ORIGIN
QJI
DR
/SLASS [I0J_
J L
HARD°AN
[4
Li
UMESTONC
[1]
LI
HEAd/V
[21
LI LI
BOULDER [93
[]LI
DETRITUS f3]
LIT1LLS[1]
LI
MODERATE
[-1)
LI LI
COBBLE
[9]
LI LI
MUCK [2]
LI
WETLANDS [0]
LI
NORMAL [0]
LI
LI
GRAVEL
[7)
F]
LI
3111
f23
LI
HAROPAN [0]
DFREE[1]
LI
LI: SAND
[6)
J LI
ARTIFICIAL [03
* LI
SANDSTONE [0]
LI
EXTENSIVE
[.23
LI LI
BEDROCK
[51
——
i&nre natural
substrates:
ignore
LI
çDE
LI
MODERATE
[1j
NUMBER OF BEST
TYPES:
LI
4cr
more
[2]
sludge born pcdnt-sources)
U
CTRINE [03
‘cLI
NORMAL
t3
LI
3or ICSS
[0]
LISHALEE-lI
LINONE [13
.5
LI
COAL FINES [.2]
INSrRSAM
COVER
lrvtcate preeen’te
0 to 3: 0-Absent: 1-Very
small amounts or if more common
of
marginal
AMOUNT
quality; 2—Moderate
amounts, but not of
highest
uality or
in
snail amounts of highest
3
5 cnla
r
m
j
v
rvlrg”h’ tkr ndeoo
as tCr l9rg’
ChaceONC
Or2r
an
ditn’nter lnq’thmn a stable,
well drtveioxtd rootwad in ceep
/ fast
wtter,or deep. welt—defined,
functional
pools.
LI
EXTENSIVE
>75%
[11]
UNDERCUT BANKS
(11
POOLS > 70cm 32]
——
OXSOWS, BACKWATERS
[1]
LI
MODERATE
2&JS%
[73
—
OVERHANGING
VEGETATION [1]
ROOTWADS [1]
AQUATIC MACROPHYTES [1]
33
SPARSE
5-<25%
[3]
* SHALLOWS
(IN SLOW
WATER) [1)
*BOULDERS
[13
LOGS OR WOODY DEBR1S [1]
LI
NEARLY
ABSENT <5%[1]
ROOTMATS [1]
*
Cavcr!
Comments
Ma:Ümtim
‘‘
20
3]
cHANNEL MORPHOLOGY
Ctnck
ONE
in
each
mwtegory (Or 24 average)
SINUOSITY
DEVELOPMENT
CHANNEIJZATION
STABILiTY
LI
HIGH [4]
LI
EXCELLENT
m
LI
NONE [6]
33.
HIGH [33
LI
MODERATE [3]
LI
GOOD
[53
LI
RECOVERED
[43
LI
MODERATE
[2]
LOW [2]
LI
FAIR
[31
LI
RECOVEPJNG
[33
LOW
[1]
NONE [1]
33,
POOR
[-1]
LI
RECENT OR NO
RECOVERY [1]
Comments
tdij
4] BANK
EROSION
AND
RIPARIAN ZONE Chock ONE in
each category
fr
EACH BANK
(Or
Cperbonk A
average)
Rtw
rj
trvr,wrwrn
,, RIPARIAN
WIDTH
,.,
FLOOD PLAIN
QUALiTY
EROSION
j
Wjt ‘ Som [4]
Ii
Ô
FOREST,
SWAMP
[3]
LI
CONSERVATION TILLAGE
[13
LI LI
NONE I
LITTLE
[31
LI LI
MODERATE
‘lO-SOm
[t]
LI LI
SHRUB
OR OLD FIELD
[2]
LI Li URBAN
OP. INDUSTRIAL [0]
LI
LI
MODERATE
[2]
LI LI
NARROW
5-IOn, [2]
LI LI
RESIDENTIAL, PARK,
NEW
FIELD
[11
LI
LI
MINING /
CONSTRUCTION
[93
LI Li
HEAVY I SEVERE
[1]
LI LI
VERY
NARROW
<Sm [1]
LI LI
FENCED PASTURE [1]
LI LI
NONE
[01
LI LI
OPEN PASTURE, RDWCROP
[0]
Si POOL.
/ GLIDE
AND RIFFLE!
RUN QUALITY
NIAXIMUM
DEPTH
CHANNEL
WIDTH
Chock ONE (ONdY))
Chock ONE
(0r2
& evoroge)
I rn
[6]
LI
POOL WIDTH > RIFFLE
WIDTH
[7)
LI
0.7-elm
(41
LI
POOL WIDTH = RIFFLE
WIDTH (11
LI
O.4-<O.7m
[2)
LI
POOL
WIDTH <RIFFLE
WIDTH
[0)
LI
0,2’<O.4n;
[I]
LI
< O.2m 10]
Comments
Inrilcte
pn,riarninanr laid use(S
past
lOOm
riparian.
Rfprian
3
Maxinvjrr;
3
10
Pool!
Current
7
Meynriurn
Indicate for
functional riffles; Best
areas
must be
large enOugh to support
a
population
-
of riffIeobIigate
species:
Check ONE (0r2
&
avsrag).
U.U
RI- .e
RIFFLE DEPTH
RUN
DEPTH
RiFFLE
/
RUN
SUBSTRATE RIFFLE!
RUN EMEEDDEDNESS
LI
BEST AREAS>
10cm [2]
LI
MAXIMUM> SOon,
[2]
LI
STABLE
(e.g., Cobble, Boulder3
[23
LI
NONE [23
fl
BEST
APEAS 5 Ocmn 1
.J
P
t
H — 50
LI
OD S
3LE
ie
org
aid)
Ii
LI
oW
I
LI
BEST
AREAS
e
5c
LI
UNSTABLE
(e.g..
Fine
Geavel, Send)
[0]
LI
MODERATE
iiffts!t
‘r’
[mstnwao3
LI
EXTENSIVE -‘i
Comments
-
h:exim’t-e;.
63
GRADIENT
pjn,n
F]
VERY
t.OW
-LOW
[74]
%POOL:CD
%GL(DEI
Th
Gradient,,
DRAINAGE
AREA
LI
MODERATE [0.101
rg/n,,n,
%R[FFLE(
EPA 4520
7
iqipot’nd’Yi
[‘-iI
Suhsfaete
Max/n turn
20
Comments
Mxi,nran
3
20
CURRENT
VELOCITY
Check ALL that
apply
Li
TORRENTIAL [41 (3TSLOW [1]
LI
VERY
FAST
[1)
LI INTERSTITIAL
[-1]
LI
FAST [1]
LI
INTER9UTTENT
[-2]
LI
MODERATE [1]
LI EDDIES
[1)
indicate
for
rCScfi
- pools and
office.
• Recreation PotentiaI
Primaiy
Contact
Secondaiy
Contact
;.4
•Y
Electronic Filing - Received, Clerk's Office, September 8, 2008
MBi
MODIFIED
QuaHtatve
Habftat Evakaton
hidex
I
and
Use Assessment
Fied
Sheet
RM
/
Date
0+1:
//08
Pull
Name
&
Afflliallon
c:,:
River Code;
STORET
#:
Lat.!
Lang,:
—_____
‘I]
SUt3STRATE
Check
ONLYTWo
substrate
7YPOXES:
estimate
%
or note
twera
tyoc
qreaont
Check
ONE
(Or 2 &
BEST TYPES
POOt RIFFlE
POOL
RIFFLE
ORIGIN
QUALITY
C C
L3LDR !SLASS (1O]._.
——
C C
HAROPAN
14]
U
LIMESTONE
[lj
C
HEAVY &2]
C C
BOULDER
16]
—
C
C
DETRITUS
13]
*
C
TILLS [I]
C
MODERATE
1$]
C
C
coBsL
j
C
C
MticIc
C
w rtos
SILT
ORMAL [0]
C
C
GRAVEL
171
—
C C
SiLT
121
—
—
C
HARDPAN
[0]
C
FREE
11]
C
C
SAND 6]
—
C C
ARTIFICIAL
—
C
SANDSTONE
[0] “‘“,““
f>ñt4SlVE
[2]
CC
BEDROCK
CSJ
*
(Score natural
subs(rales: ignore
C
RIPIRAP
[GI
C
M0DERT
Ml
NUMBER OF
BEST
TYPES;
C
4
or more
[2]
sludge corn
point.wurcas)
C
LACUSTRINE
10]
NORMAL
(0]
Q
3 -(
C
SHALE
[-1]
C
NONE
1]
Comments
C
COAL
FiNES
14]
21
WSTPEAM
COVER
Indicate
quality;
2Moclarats
presence 0
amoums,
t
3:
0Absent:
but
not
iVery
of
highest
smat
quality
amountsor
in
or
smai
if
more
amounts
common
of
of
highest
marginal
AMOUNT
5
quality;
3Highest
quality n
moderata or greater
amounts
(eg,,
vary
large
boulders
in
deep or fast water,
large
Check
N ,
diameter log
that a stable,
well doveloped rootwad
in steep
/ last
we1r, or deep.
wCll”deFnCA
functional
pools.
C)
EXTENSIVE >75%
[III
UNDERCUT
BANKS [13
*POOLS
> 70cm
12]
—
OXBOWS,
BACKWATERS [1]
C)
MODERATE
25.75%
[7]
* OVERHANGING
VEGETATION
[1]
ROOTWADS [1]
*AQUATIC
MACROPHYTES
[1]
C
SPARSE
&e25%
(3]
—
SHALLOWS (IN SLOW
WATER) [1]
BOULDERS
[1]
LOGS OR WOODY DEBR1S
[‘II
C
NEARLY
ABSENT
‘5%
[1]
ROOTMATS [1]
Cover
Comments
Maximum
20.
3]
CHANNEL
MORPHOLOGY
Check
ONE
in
each category
(Cr2
& average)
SNUOSITY
DEVELOPMENT
flANNEL]ZATION
C
oti
[41
C
EXCELLENT
(7]
C
NONE
16]
C
MODERATE
[31
C
GOOD
[5]
C
RECOVERED
143
C
LOW
[23
C
FAIR
13]
C
RECOVERING
13]
NONE
11]
,Ø
POOR [1]
C
RECENT OR
140 RECOVERY
(1]
Comments
4] BANK
EROSION AND
RIPARIAN
ZONE
Check
ONE
in each
category
for
EACH
BANK
(Cr2 per
bank &
average)
RIPARIAN
WIDTH
p
FLOOD PLAiN QUALITY
p
EROSION
O
D
WIDE>
SUm
14]
ó
C
FOREST,
SWAMP [33
C
C
CONSERVATION
TILLACEt
[‘I]
C]
C
NONE!
LITTLE
13]
C
C
MODERATE
lO..SOrn
(3]
C
C
SHRUB
OR OLD FIELD f2]
C C
URBAN OR
IHDUSTRIAL
10)
C C
MODERATE [2]
C C
NARROW
6-lOm
12]
C C
RESIDENTIAL,
PARK,
NEW FIELD fi]
C
C MINING
I
CONSTRUCTION
[0]
C C
HEAVY! SEVERE
11]
C
C
VERY
NARROW
<Ste
[1]
C
C
FENCED
PASTURE
[I]
C C
NONE
[03
C
C
OPEN PASTURE,
ROWCROP
(03
Si
POOL
/
GLIDE
AND RIFFLE /RUN
QUALITY
MAXIMUM DEPTH
CHANNEL
WIDTH
Chack ONE
(ONLY!)
Check
ONE (Or 2
& ovemqe)
,,j
Ire
16]
C
POOL WIDTH> RIFFLE
WIDTH
121
C
0,7-wire
14]
C
POOL
WIDTH RIFFLE
WIDTH
[11
C
0,4’<O.Tm
[21
C
POOL
WIDTH
<RIFFLEWIOTH
101
C
02-<0.4re[1]
C
<02m
[0]
Comments
Indicate
pmdOrnirtCn
land use(s
.
pea!
lOOm dpsrhsn.
RiparThn
.
Marimurrr
7
10
PooI,f
Cun’e(
IvraxrrrvI,rr
rO
]ndicate
for
fUnCtiOnal riffles;
Best
areas
must
be
large
enough
to
support
a popu!atiort
.,
of
r]ffle..obligate
specIes:
Check
ONE (Cr24
average).
CW)
IFI’Lc,,
trna,.rr
RIFFLE
DEPTH
RUN DEPTH
RIFFLE
I
RUN
SUBSTRATE
RIFFLE
I
RUN
EMBEDDEDNESS
C
BEST AREAS’
10am
121
C
MAXIMUM
a 60cm
[ C
STAPA,E
(e.g., Cobble,
Boulder3
[3J
C
NONE
121
CEESTAREAS5-iOCrnLI]
CMAXI6IUM<SOCrn(’t]
Cb100.SThBLE(e,g.,LargeGravai3[1]
CLOW[1]
C
BEST AREAS
<
5cgr
.
C
UNSTABLE
(e.g.,
Fine Gravel,
Sand) [0]
C
MODERATE [0]
RrrY!e/
irnetrrcOj
Comments
C
EXTENS1VE
(.‘tl
saextnrt
..
“
co
6]GPaDIENT(__
%GL
DEE
DRAINAGE
AREA
C
MODERATE
13.10]
‘=<
5tt’r
C
HIGH
VERY HIGH
[i06]
%RUN:_%RIFFLE:tJ
:..
.
.,
EPA 4520
2Lil/03
j’i1
)Irnpounded
[‘.1j
Strearn &
Location:
QHE1
Score:
Substrate
;1
I
&iaxrrflLJrr?
STABIUTY
HIGH
[33
C
MODERATE
[2]
C
LOW
(1]
Comments
CharmeL[
Mastnwm
20
\:
CURRENT VELOCITY
Check
ALL that apply
C
TORRENTIAL
[-I]
SLOW
[1]
C
VERY
FAST
[1]
C INTEP,STITIAL
[-1]
C
FAST
[1]
C
INTERMITTENT
[-2]
2
MODERATE [1]
g
BODIES
[1]
Indicate
fr
reach
poo
t
s
and dlftes.
Recreation Potential
t
Primafy
Contact
Secondary
Contact
(arcS, :ecs’.’,t aamcwnr o.r saw,]
‘1.
‘‘
Electronic Filing - Received, Clerk's Office, September 8, 2008
Stream
&
LrcaIon:
—
Pate:
t;iJ
/12/
(J8
—_____________
___Seorers
Fui
NBrnS &
AffiIR3tIOfl
%
/
_u!_
18_
—
1]
SUBSTRATE
ChsckONLYTwoiuhstmw:
PLBOXES:
estImate
%
or
note
ev€ny
IVO€,
mesent
Ctmcc
ONE
(Di
25
average)
ST ThPES
POOL RIFFLE
OThE TYPS
POOL
RIFFLE
ORIGIN
QUAUTY
DC]
BLOR I.SLABS (10]_
C] C]
HAROPAN
[61
El
liMESTONE
[1)
El
HEAVY
[-2)
El
El
BOULDER 9]
—
C]]
C]
DETRITUS
[31
El
TILLS
SILT
El
MODERATE
(4]
El
El
COBBLE [8]
C] C]
MUCK
[21
El
WETLANDS
[0]
El
NORMAL
[0]
DC]
GRAVEL
[Yj
—_
C]
[]SILT
[2)
* C]
HARDPAN(0]
El
FREE
(J
El
C]
BNt
—
1]
C]
ART1FICIAL [(1]
*
El
SANDSTONE
[0]
D
EXTENSIVE
[4]
El
El
BEDROCK
[5]
**
iScoro
natural
substrates; kmore
El
RIP/RAP
[0]
04
C]
MODERATE [4]
NUMBER
OF
BEST
TYPES:
Li
4 or more
[2]
ekidgo
from
reed-sources
El
LACUSTRINE
10]
‘D
NORMAL
[0]
C]
3
or
El
SHALE [-4]
El
NONE
11]
Comnente
El
COAL
FiNES
[-2]
2] INS
TREAM COVER
quatt’;
Indicate
2—Moderate
presiirwe
0
amouns,
m
3: 0-Absent;but
riot
i-Very
of
highest
smallqualIty
amounts
or in
or(f
small
more
amounts
commonof
olmargiriathighest
AMOUNT
q
lIM
S
t
r
I
ri
r
i
r
j
ur
t
h— lo-
cer r fast
to1’r
h
g
Ch’ri Dl’ Qi
10
diameter
leo
that
is
stable,
welt
developed
rocaweo 0
clasp
I
fast water,
rdeep. wdll-dafined, functional
pools.
L
EXTENSIVE
>75%
[11]
UNDERCUT
BANKS
II]
POOLS
a 70cm
(2’]
—
OXBOWS. BACKWATERS
[-1]
El
MODERATE
25J5%
(2]
OVERHAIsGINb
VEGETATION
Il
ROOTWADS
I
]
AQUATIL
MAGROPHY
PBS
[lj
C]
SPAPSE
6<25%
]
—
SHALLOWS (IN SLOW
WATER]
[1)
BOULDERS
[1]
—
LOGS OR
WOODY DEBRIS [1]
El
NEARLY
ABSENT
<5%
[1)
—
ROOTNIATS (1]
Cover
3/,,
Comments
Maximum
‘to
?‘5’
3]
CHANNEL
MORPHOLOGY
ChtL
ONE.
in
each
category
(Or
2 5 average)
SINUOSITY
DEVELOPMENT
CHANNELIZATION
El
HIGH
14]
C]
EXCELLENT
(71
C]
NONE
(6]
O
MODERATE
[3]
El
GOOD(S)
C]
RECOVERED
[4J
El LOW
(2]
0
FAIR
[3]
C]
RECCVER1NG
(3]
NONE
[1]
POOR (i]
El
RECENT OR NO
RECOVERY
fi]
Comments
‘a
“C]J
$
BANK
EROSION AND
RIPARIAN
ZONE
Check
ONE in each category
for
EACH BANK (Or
2gw bank &
average]
RNr riit
klCwiar
,. RIPARIAN
WIDTH
FLOOD
PLAIN OUAL!TY
EROSION
Q Q
WIDE
5-
SCm f4]
D 0
FOREST,
SWAMP
[3]
ü l1
CONSERVATION
TILLAGE
[1]
C] C]
NONE I LITTLE
[3]
C]
C]
MODERATE 1040m
(3]
C]
El
$t-1Ft1313
OR OLD FIELD
[2]
El
LI URBAN
OR
INDUSTRIAL
(0)
O C]
MODERPJE
[2]
C]
El
NARROW 5-1Cm
[2]
El El
RESIDENTIAL,
PARK, NEW
FIELD
[1]
El
El
MINING!
CONSTRUCTION
[0]
Li 0
HEAVY!
SEVERE
11]
El El
VERY
NARROW
<Sm (1]
El El
FENCED PASTURE
(I]
El El
NONE [0]
El El
OPEN PASTURE,
ROUt/CROP [0]
5]
POOL?
GLIDE
AND RIFFLE
/ RUN
QUALITY
MAXIMUM
DEPTH
CHANNEL
WIDTH
Check
ONE
(ONIY1)
Check
ONE (Cr2
&
overegei
Irin [6]
C]
POOL
WIDTH
a RIFFLE WIDTH
(2]
C]
ILT-el
m
(41
El
POOL
WIDTH = RIFFLE
WIDTH
[11
C]
CA—<OJm
[2]
C]
POOL
WIDTH
< RIFFLE
WIDTH
10]
C]
C2atQAm(1]
C]
C 02m [0]
Comments
Indicate pieriorninaid
land USC(S)
v
pasl
lOOm rtparian.
T4lparian
3
-.
!tiax/rnurml
-‘‘)‘
Pool!, -,
Current
I,’jCi0n;,ri
12
IndIcate
for
funct(onal riff(es; Best
areas must
be large
enough
to support
a
population --
of r]ffb-oiI]gate
speoms:
Chack
ONE (0r2
5
average),
LJNO
RtFrc<
tmetnc”m
RIFFLE DEPTH
RUN
DEPTH
RiFFLE
I
RUN
SUBSTRATE
RIFFLE I
RUN
EMBEDDEDNE3S
C)
BEST AREAS>
10am
(2]
C]
MAXIMUM> 58cm
[21
C]
STABLE
(a,g, Cobble,
Boulder)
12]
El
NONE
[2)
EIBEST
iPF6S-1ciri1t]
Elhh’.4’
‘Vi1
’]
cc
1
LJv
STABLE
eg ougeC
eJo
1
Itl]
fls,00
li]
C],
BEST AREAS
< Sam
C]
UN’STABLE
(a,,, Elm Gravel,
Sand]
(01
El
MODERATE
(0]
Rime
[molricasl
,
C]
EXTENSIVE 1-i),,
Comments
8]
GRADIENT
1
______
Unit>
C]
VERY
LOW - LOW ‘2]
%PDOL’
%(2l
(DE:(i
Gradient
DRA]NAGE
AREA
C]
UDDER/CS (S10]
‘
:
(
m
C]
HIGH
VEYrltOqt0€)
rRUN
C’D%RIFFLE
(
-
,,,_,fl,
EPA
agog
gtpipog
P21J]i
M)3T
MDiFIED
tt:tI,’5f’t3/5f
-iab]ta.t
Evalluatk,n ndex
an
Use Assessment
Fed Sheet
QHEE
Score:
,
Substrate
]‘
c-:]
Marimwa
20
STABILITY
HiGH
[3]
El
MODERATE
(2]
,E1
LOW [I]
Comments
Channel’
iteaai,,tun’i
/
‘I
C
RENT VELOCITY
Check ALL
that
apply
LI
TORRENTIAL
[-1]
SLOW
[1]
C] VERY
FAST
[11
El
INTERSTITIAL [-1]
C]
FAST
(1]
El
INTERMITTENT
[-2]
El MODERATE
[1]
C]
EDDIES
[1]
lndicrsme (or
,each-
poo/s-
arid n/flee’
RecreatiOrI Potential
Primary Contact
Secondary
Contact
un
‘:
:,
‘‘‘.i
Electronic Filing - Received, Clerk's Office, September 8, 2008
al.;.:
Stream
&
Location:
Riter
Code:
STORET
#:
11
SUSSTRATE
Check
DNLYTWS suhckete IYPE
COXES;
cetmete
%
or note every
type preCent
BEST
POOL
RWFLE
OTHER
POOL RIFFLE
EDO
BLDR/SLABS[I0
__
DQHARDPANE4I
ED
Q
BOULDER
[9]
—
[T
Q
DETRITUS
[3]
**
EDO
COFiRLE![3J
QQMUCI%[2]
—*
ED ED
GRAVEL
[7)
—
—
Li
E]
SILT
[2]
——
C]
0
SAND
[6]
*
CD
C
AR11FICIAL [.O] —
—
ED Li
BEDROCK
[5J
(Scors
naturel substrates;
ipeons
NUMBER OF BEST
TYPES;
0
4 or more
[21
etUdgo from point-sources)
Comments
0
3 or less
[0]
RM:
1
O
Date:
CZ/
I
L/
08
Is
—
Qifios
Yerffi5d_,
location
Li
Check
ONE Or
2 &
averape)
OR1OIN
QUALITY
ED
tJMESTONE
[1]
0
HEAVY
[-2]
ED
TILLS [1]
T
ED
MODERATE
[-1]
E]
WETLANDS
[01
SIL
NORMAL
[0]
O
HAROPAN
[0]
0
FREE
1)
ED
SANDSTONE
£01
EXTENS1VE
[2J
C]
RIPIRAP [0]
DE
MODERATE
[-1]
0
LACIJSTRINE
[0]
El
NORMAL [0]
C]
SHALE
E-11
Li NONE
[1]
ED
COAL
FINES
[-21
STABiliTY
HIGH
13]
ED
MODERATE
[2]
ED
LOW[1]
CURRENT
VELOCITY
Check
ALL that
apply
Li
TORRENTIAL
E-11
SIOW
1]
O VERY FAST
[1]
ED INTERSTITIAL
[-13
O
FAST
[1]
ED
INTERMITTENT
[-2]
MODERATE
[1]
EDDIES [1]
Indicate for
reach
pools arid
iiffle.a.
Recreation Potential
Primaiy
Contact
Secondaty
Contact
{
ew’t’
c wctr
:MBI
MODIFIED
Qualltatve
Habitat
Evauaton
hidex
•..)
and
Use
Assessment Fied
Sheet
.Scorm
Full
Name
&
AffIliation:
Let]
Lonq,:
—
—
Srthsfrete
I
Maximum
20
2] INS
TREAM
COVER
quaiity;
Indicate
2—Moderate
presence
0
to
omounis,
3: 0-Absent:hut
not
1-Very
of
highest
small
qtiality
amounts
or in
or
small
if more
amounts
common
ofofhighest
msrginral
AMOUNT
e
h
y
yy
-r
a
pr
a m
s
p
ir
nrc hnul
Lr, dae
Qrfaat v rlei I rg
hk
ON
Or
diameter lop
thati stable, well
developed
rotwad
in
deep!
fast
water,
or deep. well-defined,
functional pools.
ED
EXTENSIVE
>75%
111]
UNDERCUT
RANKS
[1]
*
POOLS
> 79cm [2]
—
OXBOWS,
BACKWATERS [1]
ED
MODERATE
2575%
[7]
OVERHANGING
VEGETATION
CI] .
ROOTWADS
[1]
—
AQUATIC
MACROPHYTES
[11
El
SPARSE
S-<25%
[3]
—
SHALLOWS
(IN SLOW
WATER)
[1]
_BOULDERS
[‘i]
*
LOGS
OR WOODY DEBR1S [1]
ED
NEARLY ABSENT
<5% [13
* ROOTMATS
11]
Cover
Comments
Msximu,rr
1
20
3]
CHANNEL MORPHOLOOV
Check
ONE
in
each
category
(Or
2 &
average)
SINUOSrrY
DEVELOPMENT
CHANNELIZATION
0 HIGH
141
0
EXCELLENT
[7]
ED
NONE
[61
O
MODERATE
£31
0
GOOD
[5I
ED
RECOVERED
£43
ED
LOW
[2]
ED
FAIR
13]
ED
RECOVERING
[3]
_NONE [1]
]‘
POOR
[1]
0
RECENT
OR NO RECOVERY
[13
Comments
:
Chenne1
t4axjmwrt
]
41
BANK
EROSION AND
RIPARIAN
ZONE
hedk
ONE
in
each
category
for $AH SANK (0r2 per
bank& average)
Rl rlir
looses
dowosiaom
RIPARIAN WIDTH
,.
FLOOD
PLAIN
QUALITY
p
EROSION
I
WIDE a 5Dm [4]
0 El
FOREST, SWAMP
[3]
ED
0
CONSERVAI1ON
TILLAGE
[1]
ED ED
NONE!
LrrTLE [3]
0 ED
MODERATE
10-SlIm
[R
0
0
SHRUB
OR
OLD FIELD
[21
ED ID URBAN
OR
INDUSTRIAL
£01
C ED
MODERATE [2]
0 LI
NARROW 5.1Gm
[2]
0 L]
RESIDENTIAL,
PARK, NEW
FIELD
[I]
C]
ED MINING
CONSTRUCTION
[0]
CD ED
HEAVY!
SEVERE
[1]
ED Li
VERY NARROW
c
5rn
Li]
ID
ED FENCED
PASTURE
[1]
fridic&e predominant
land use(s)
C] Li
NONE
101
ID
0
OPEN PASTURE,
ROWCROP
[0]
past
lOOm
dparian.
Riparian
Maximum
I
9
POOL
I GLIDE
AND RIFFLE
I
RUN QUALITY
M,XIMUM
DEPTH
CHANNEL
WIDTH
Check
ONE
(OWLY
Check
ONE IOn’ 2
&
Cv&raoej
ira
f6]
ED
POOL WIDTH >RIFFLE
W1DTH
[7J
Li
0,7-Mm
[4]
0
POOL
WIDTH RIFFLE
WIDTH [1]
0
0,4.o0,7m
£23
ED
POOL
WIDTH <RIFFLE
WIDTH
£03
ED
0,2-<0,4m
[13
ED
<0,2m [0]
4
impounded
[-1]
Comments
Current
Po!/
f’’
‘‘
Mximruiri
Indicate
of riffleubllgate
for functtonai
species:
riffles; Best areas
Check
must
ONE
be
large
0r2&averager.
enough
to
support a population
fl
NJ
°IFFLE
[mem—
“
RIFFLE
DEPTH
IIN
DEPTH
RIFFLE
I
RUN
SUBSTRATE
RIFFLE
(RUN
EMBEDDEDNES
0
BESTAREAS>
10cm
[2]
L]MAXIMUM>
00cm
[2J
LI
SThRLE
(mg,
Cobble,
Bomiier)[2]
0
NONE
[2]
RESTPREASI
lOom
L
Lii
iAXifU
r4
< 1f-r
1I(
Ci
MOD STABLE
(ep
19
ge Cia
mi)
f
3
C]
LOW
iij
ED
BEST AREAS
<Scm
ED
UNSTABLE
e,q,.
Fine
Gravel,
Send) [03
ID
MODERATE
E03
?OO I.,
fmetric9]
ED
EXTENSIVE [-11
Comments
6] GRADIENT
1
Q
VERY LOW-
LOW [2’6)
DRAINAGE
AREA
ED
MODERATE
CS-ia]
(mi
2
)
ED
HIGH
VRY
HiGH
(10’61
%POOL:C_Z
%GLIDE()
Gradkrt
%RdFa
C%PIFrLE
()
oX
Electronic Filing - Received, Clerk's Office, September 8, 2008
MBI
MoDIFIED
Quallitive
labitat Evaluation
index
‘i
and lisa
Assessment
Fed Sheet
Stream &
RM;
Dete:
c.1
/n/
08
Full Name &
Affiliation:
/•
River
Cocie:
sroIr
#
Lat.! Lonq:
Ia
Qfl7reI/er04
—
-.
11
SUBSTRATE
Check
ONLYTwo
cube!
rMe TYPE
COXES:
esumMe
% or
riofe
ery
fvp pr—r•
Check
ONE
fOr
24 ‘elope)
POOL
RIFFLE
OTHER TYPES
ORGN
DCI
BLOB
(SLABS
[10]
CI
CI
HAROPAN [4]
CI
LIMESTONE [1]
HEAVY
(2]
DCI
BOULDEP.ro]
CI
DDETPJrUSI3I
CITLLS[i]
SILT
DMODERATE&13
DCI
COBBLE (5]
—
CI
CI
MUCK
[El
—
—
CI
WETLANDS
[03
CI
NORMAL
[0]
DCI
GRAVEL[7]
_..._ []DSILT[2}
CIHARDPANEO]
DFREEIIJ
CI
CI
SAND
16]
CI CI
ARPIFfCIAL
[0) —
—
CI
SAND
STONE
(03
OEXTESVE
[2]
DCI
BEDROCK
[
—
Iscore
naturrrt
substrates;
roars
CI
FUPJRAP
[0)
004
CI
MODERATE
[1)
NUMBER
OF BEST
TYPES:
U
4 or
noTe
[23
1OE1 TIOm
pOfltSOOt5Sj
CI
LACUSTPJNE
[0]
‘CI
NORMAL
10]
3
or
less
[01
CI
SHALE
Ml
CI
NONE
[1]
ommen
CI
GOAL FINES
[2]
Sbstrafa
.1
Msxirrium
20
2]
INSTREAM
COVER
qualify:
Indicate
2$jirxferste
presence 0 toCrnounts,
3:
OAbscrit;
but
not
1Verv
of
hfgtrost
smelloualitv
amounts
or
or
in small
f
morerirnounts
common
of
of
hidhest.,
marginal
AMOUNT
qua
y
3
jhc.t
cli
y
o t
101
“
p
n l
p
it
Cii
‘DNF (C 2 &
C
dNmeter
rig
that
is
stable, well
cMveloped roofwau
in
deep!
fast water
or deep
welkdsrfinod,
functional
pools,
CI
EXTENSIVE
>75%
[11)
—
UNDERCUT
BANKS
[13
POOLS
> 70cm
121
——
OXEOWS. BACKWATERS
El]
CI
MODERA’E
2S75%
E71
* OVERHACG!NG
VEGETAtION
11] *ROO’rWADS
(1]
—
AQUATIC MACROPHYTES [1]
CI
SPARSE
5-e25% [3]
SHALLOWS
(IN
SLOW
WATER!
[1]
EfOULOERS
[1]
LOSS
OR WOODY DEBRIS El]
CI
NEARLY
ABSENT
5%
[1)
—
ROOTMATS
[13
Cover
Comments
Mao,nu,n
30
STABIUTY
J
HIGH
[31
CI
MODERATE
[2]
CI
LOWEll
3]
cHANNEL MORPHOLOGY
Check ONE
in
each caragury (Or
2 4
average)
SINUOSITY
DEVELOPMENT
CHANNEUZATION
CI
HIGH [4]
CI
EXCELLENT
[7]
CI
NONE
[6]
CI
MODERATE
[31
CI
GOOD
[5]
CI
RECOVERED
[4]
CI LOW [2]
CI
FAIR
[33
CI
RECOVERING
[3]
, NONE [1)
POOR
[13
CI
RECENT
OR
NO
RECOVERY
(13
Comments
7
Irnpormctedf-1]’
Chann0i
Maxr,rurrr
4] BANK
EROSION
AND RIPARIAN ZONE Check
ONE in
each category
for EACH
BANKC
r2psrda,rk
&
average!
Rive iii
5rO5In dve
, RIPARIAN
WIDTH
FLOOD
PLAIN
QUALiTY
1
f
EROSION
CI
WIQE >5001(4]
D
FOREST,
SWAMP
[1
CI CONS1IRVAI1ON
TILLAGE
(11
3 CI
NONE
I LITTLE
[5]
CI
CI.
MODERATE
1060m
[5!
CI
CI
SHRUB
OR OLD FIELD (23
CI
CI
URBAN
OR INDUSTRIAL [0]
CI
C
MODERAIE [2]
CI
CI
NARROW 510m
[2]
CI CI
RESIDENTIAL,
PARK, NEW
FIELD
CI CI MINING
(CONSTRUCTION
(0]
CI CI
HEAVY! SEVERE [13
CI
CI
VERY NARROW’c
50!
[1]
CI
CI
FENCED PASTURE
[1]
lnd!cate
oredomirsfint land
use(s)
..r’
CI
CI
NONE
[03
CI CI
OPEN
PASTURE, ROWCROP
[01
pest
lOOm iipatlarr.
Riparian
tm77Crf
“
5] POOL I GLIDE
AND
RIFFLE?
RUN
QUALITY
MAXIMUM
DEPTH
CHANNEL
WIDTH
Check ONE
(COPY!)
Check ONE (Or 2
4
ave
,‘a
I in
[63
CI
POOL WIDTH>
RIFFLE WIDTH
123
CI
0,T”<lrn
(4)
CI.
POOL
WIDTH RlFFLE
WIDTH
(13
CI
0,4.’rO.Ths
[23
Cl
POOL
WIDTH <RIFFLE
WIDTH
[0]
CI
0,2.c0,4m
[1]
-
CI’-02n[0I
r
Irn)oLrIiJeci[lJ
Comments
CURRENT
VELOCITY
Check AU..
that apply
LI
TORRENTIAL
P4]
SLOW
[1]
CI
VERY
FAST [11
CI
INTERSTITIAL [11
CI
FAST
[11
CI iNTERMITTENT
[“2]
CI
MODERATE
[13
CI
EDDIES [1]
!nd!cafs
for
reach
poots
and riffles.
ationPot1}
:1
Primary
Contact
Secondary
Contact
PooIIi,
Crsrreof
4
i;
Maximum
:e
inthcate
for funCtiona[
rffies;
Best areas
must be Iaroe
enough to supoort
a
popu3aton
of r[ffIeobiigate
Species:
.
Chsck ONE
(Cr2
&avarepe).
‘
CINO
RIPrLc
imezric0
RIFF’-LE
DEPTH
L!EP
[4
RIFFLE
I
RUN
SUBSTATE
RIFFLE I
RUN
ElEDL
CI
BESTAREAS>
lOom [23
QMAN!MUM> 60cm
12]
CI
STABLE
(a,g,,
Cobble,
Boeider3
121
CI
NONE [2)
CI
SESi
AREASc
los
1
Li
FiT
A
tin
e&.m(m1
“
13)02
e?taB
i
it
ssqe C
Sves)
[1]
,,j
LOW
CII
BEST
AREAS
C
Scm
F]
UNSTABLE
(eg,. Fine Gravel,
Sand)
(01
CI
MODERATE
-li
°“'
[me
rrc0]
CI
E”TEiJSlttCf
ii
P
in
Comments
.
.
M5XiOivfl./
6] GRADIENT
(:mn
CI
vsi
LOW LOW [2$]
%POOLITh
%G(iDE:C
GradMrP:j
APES
i3DEflE
m’
0)
“i
I
CI
HIGH
VERY
HIGH [10-5)
%RUN: %RIFFLE:
—.,,&,
II--)
Electronic Filing - Received, Clerk's Office, September 8, 2008
M3T
IVTOT)TFIEJ)
htatve Habtat kiaton
hidex
r..
QriI
Score:
Scorers Full Name
&
Affiliation:
1r
tJA
LatJ
Lona:
Off#ce Hnad
1 SUBSTRATE
Cheef
OIdLY Two
s bsh>te TYPE
BOXES:
estimate
% or
nrds every
tyspreserE
Check
ONE
(Or
2 &
averaqe}
BEST
TYPES
POOL
RIFFLE
OTHER
TYPES
POOL R1FFLE
ORIGIN
DC
SLOE
1SLASS [10]
DDHAROPAN
[4]
C
LIMESTONE 11
C
HEAVY
[-2]
DC
BOULDER [91
D D
DETRITUS
3]
—
C
TILLS [I]
T
MODERATE
(-1]
CC
CO BLE
E]
—
D
DMUCRp]
Ds[o]
SIL
DNORMAL(0]
CC
GRAVEL
171
C
CSILT[2]
—
DHARDPAN[0]
DFREE
[1)
CC
sc
sj
[9
C
APT1FICIAL5(
CSANDSrONE
[0]
LI
EXTENSIVE
[2]
CC
BEDROCK
[5]
]Scoe
natur( substetes;
ignore
C
RIPIRAP
[0]
OEOA
C
MODERATE
[1)
NUMBER
OF BEST TYPES:
C
4 or
more
[21
siudge
Irorn
point-sources)
D
LACUSTRINE oj
C
NORMAL
tO]
C
3or
fees
101
USHALE[-1]
C
NONE1]
mmens
COAL FINES
t.2j
STAB ILITY
C
HIGN
[5]
C
MODERATE
£21
C
LOW [1]
Maximum
20
!
•
Stream
&
Location.
River
Code:
Substrate
/1
t
H—
20
21
INSTRE4M COVER
owifitv;
Indicate
2—Moderate
presence P
amounts,
ix
3:
0-Absent:
huE not
1-Veryof
highest
smafl
oua5ty
amounts
or
or
in
smell
if
more
amounts
common
of
of
higl’uast
marginal
AMOUNT
hJfiu
S H
01mm
ouau
t
r
rv I
c-rirs c
aim u
I
e hoJoem
it’ oecp
ot
I
waler Ia
c_bnc(
oNr uOr2
S enge)
diameter Ioihat
stable. well
developed
rooiwcl
in
deep
/
Mel water, or
deep. well-defined, Emotional pools.
C
EXTENSIVE
>75%
[11]
—
UNDERCUT
BANKS [1]
POOLS>
75cm
[2] —
OXBOWS, BACKWATERS [1]
C
MODERATE
2545%
[7]
OVERI-IANGING
VEGETATiON
[1]
——
ROOT
WADS [1]
—
AQUATIC MACROPHYTES
[1]
C
SPARSE
5-<25%
t31
—
SHALLOWS IN
SLOW WATER) [1]
BOULDERS
[1]
LOGS OR WOODY DEBRIS
[1]
C
NEARLY
ABSENT
<5% [1]
ROOTMATS [1]
—
Cover
Comments
Maxlrnwn
J
L
33 CHANNEL
MORPHOLOGY
Check ONE in each
category
(Or 2 & verge)
SNUOSITY
DEVELOPMENT
CHANNELIZATION
C
HIGH
E41
C
EXCELLENT [73
C
NONE
19
C
MODERATE
(31
C
GOOD
[I]]
C
RECOVERED
[4]
C
LOW
[2]
C
FAIR
(3]
C
RECOVERING (3]
C
NONE
[1]
C
POOR [13
C
RECENT
OR NO RECOVERY (1]
Comments
lnprLndcI[1]
43
BANK
EROSION
AND RIPARIAN
ZONE
ONE in uach
ca
ego
for EAcH BANK
(Oi Poo
bank &
aruqe)
5,vrrii,itkhu
umwnmroa’
, RPARIAN
WIDTH
FLOOD
PLAIN
QUALITY
EROSION
C
D
WIDE>
BOrn
41
C 0
FOREST,
SWAMP
[31
LI O
CONSERVATION TILLAGE
[1]
C
(]
NONE! LITTLE
[1
C C
MODERATE
0-5Om
13]
C
C
SHRUB
OR OLD
FIELD
(2]
C C URBAN
OR
INDUSTRIAL
[03
C C
MODERATE [2]
C C
NARROW 5-tOrn [2]
C C
RESIDENTIAL, PARK, NEW
FIELD [1]
C C
MINING!
CONSTRUCTION
(0]
C C
HEAVY! SEVERE
11]
C
C
VERY NARROW < Em (1]
C
C
FENCED
PASTURE [1]
/ndicate
predominant land
use(s)
v
C C
NONE
[9
C
C
OPEN
PASTURE,
ROWCROP
(01
pest
10Dm
,lper’len.
Riparfan
Comments
.
Maximum
53 POOL
IGUDEAND
RIFFLE/RUN
QUALITY
MAXIMUM
DEPTH
CHANNEL
WIDTH
Checf
ONE
IONLY/)
Check
ONE
[Or
25
average)
C>
Im [6]
C
POOL WIDTH>
RIFFLE WIDTH
[2]
C
07-<lm 14]
[9POOL
WIDTH
RIFFLE WIDTH [11
C
{S.4-<O.Trn
[2]
C
POOL
WiDTH
RIFFLE
WiDTH [0]
C
0.2-eOArn (1]
.
C<O2rn[01
Li
1PounoedL-1II
Comments
CU
RENT VELOCITY
Check ALL that
apply
C TORRENTIAL
t-13
C SLOW
(1]
C
VERY
FAST [1]
C
INTERSTITIAL
[-1]
C
FAST [1]
C INTERMITTENT [-2]
C
MODERATE [1]
C EDDIES [1]
Indicate
Sir
reach - pools
and ritWes.
Recreation
PotenUal
Prin7aty Oontact
Secondary
Contact
1.
Crrnnt
:
Mmdrnurn:t
“j’
/2
Indicate
for
functional
riffles; Best areas
must be
large enough to support
a
population
of
riffle-obligate
species:
coack
ONE
(OrZ
CNO
RIFF
RIFFL
DEPTH
RUN DEPTH
PLE
I
,
$TRATE
IIFFLE1 RUN EMBEPNESS
C
BEST AREAS>
10cm
(23
C
MAXIMUM>
BOom
[2)
C
STABLE
(mg..
Cobble,
Boulder)
[2j
C
NONE
i21
C
BESTAREAS
5-lOom
i
C
MAXIMUM
050cm
(13
C
MOD.
STABLE (eçj, Large
Grvel (1]
C
LOW
[1]
-
C
BEST AREAS
Born
,
C
UNSTABLE(mg, Fl
Greval Sand) [59
C
MODERATE
10]
R,ftle,
(rnetncedl
C
EXTENSIVE
[‘-1] ,, ,,,‘
Comments
5uasvu,,
63
GRIDEN
if
mr
[9
IePY
LOW JOB!
(2-4
DRAINAGE AREA
C
MODERATE [6-10]
C
HIGH
- VERY
HIGH [10-6]
EPA 4520
POOL:cD
%GLIDE:(’)
Grad!ant
%RIJN:
CD%RlFFLE(
)
Mao
Electronic Filing - Received, Clerk's Office, September 8, 2008
MEl
MODIFIED
Quafltative
and Use
Assessment
Habitat
Evaluation
Fi&d Sheet
IndeX
El S
core.
Stream&Locat!on:
:i’>
(
4
cJ,rr
%je1
—
r
Date:r/rro/
08
Scorers Full Name
&
Affiliation:
:<
...
:/
RverCode::STORET#:
-. -
- 18.
-
1] SUBSTRATE
Check ONLY
Two
substrate
TYPE
BOXES;
estimate
%
or note every
ipe
present
.
Cteck ONE (Cr2
rwcragc)
BEST
TYPES
POOL RIFFLE
OTHER TYPES
POOL RIFFLE
ORIGIN
QUALITY
a]
BLDR IS LABS [10]
[j
NAROPAN
t4]
—
a]
LIMESTONE
[1)
0
HEAVY
[2]
D
a]
BOULDER (9]
—
Q a]
DETRITUS
(3] *
a]
T1LtS
[1]
a]
MODERATE [-13
a] a
COBBLE
(8]
*
——
a] 1J
MUCK [23.
*
a]
WETL NOS [0]
SILT
NORMAL [0]
a a
GRAVEL
[7]
—
a
a
SILT
[2]
C]
HAROPAN [03
C]
FREEJ,J
ai
a
SAND]
—
—
a a
ARTIFICIAL
(03 —
—
C]
SANDSTONE
(01
t’1EXTENSWE
[-2]
a a
ROCK
(9
—
—
(Boom
nahir
aritatrates: tnor
C]
RPIRAP
[0]
oUEb,
a
MODERATE
[1)
NUMBER OF BEST
TYPES:
04 or
more (2]
SNdQS from
po(nt-sourcas)
C]
LACIJSTRINE [a]
0
NORMAL [0]
D3orless(0J
DSHALE[-1]
ONONE(11
omments
.
a]
COAL FINES [-2]
2] INs TREAM COVER
nualtty;
2-Moderate
presence
I) to
amounts,
3: 0-Absent;
bul not1-Very
of
hkthest
smalloualfty
amounts
or in
or
smallmoreamounts
common
of
01
higtrestmarginal
,.
AMOUNT
ua!ry 3-Higt 6.
qu
Itv
rrodernbe crg eater
n ii . s.
y
lare
boulder
m ‘leep or
last
water rje
Cuek CHIc
6Cr 2 ‘
ace
rilametar
log thmt is stable. welt
developed rootwad in
deep!
fast water. or deep. well-defined, functional
pools.
C]
EXTENSIVE
>759,
(113
UNDERCUT
BANKS
[1]
*POOLS > 71km
(2] *OXEOWS, BACKWATERS
(1]
a]
MODERATE
25-75%
[7]
—
OVERHANGING
VEGETATION [1]
—
ROOTWADS
[1]
—
AQUATIC MACROPHYTES
(1]
a]
SPARSE 5.<25% (33
—
SHALLOWS
(IN SLOW WATER)
(1]
BOULDERS
(1]
LOGS OR
WOODY DEBRiS [ij
a
NEARLY
ABSENT
<5% [1]
ROOTMATS
(‘fl
—
*
Cover
Comments
Maximum
20
L
3] CHANNEL MQRPHOLOGY
Check
ONE
in
each category fOr 2
&
average)
SINUOSITY
DEVELOPMENT
CHANNELIZATION
a]
HIGH
14]
0
EXCELLENT
[7]
a
NONE (6]
a
MODERATE [3]
0
GOOD
[5)
0
RECOVERED
(4]
a] LOW [23
0
FAIR
[23
a
RECOVERING
133
]1
NONE
[1]
a
POOR [1]
a
RECENTORNO RECOVERY
[11
Comments
[
JmpOUndEd
4]
BANK EROSION
AND RIPARIAW
ZONE
Check ONE in osci’.
category
for
EACH BANK (Or2por
bank
&
average)
RIPARIAN
WIDTH
.,
FLOOD PLAIN
QUALITY
EROSION
D
C]
WIDE> 5Gm
I4]
0
D
FOREST SWAMP.[3]
ó D
CONSERVATION
TILLAGE(1]
C] a
NONE
I.LITTLE[3]
a]
C]
MODERATE
45
[3]
a a
SHRUB
R
OLD
FIELD
[2]
a]
a]
URBAN
OR
INDUSTRIAL
[0]
a a
MODERATE
[2]
C]
NARROW
510m
[21
a a
RESIDENTIAL, PARK, NEW FIELD (1]
a a]
MINING! CONSTRUCTION
[0]
a]
0
HEAVY
I.SEVEREI’t3
a] C]
VERY NARROW
C Sm [1]
a a
FENCED PASTURE [1]
ai C]
NONE [0]
a a
OPEN PASTURE, ROWCROP
(01
5] POOL /
GLIDE AND
RiFFLE/RUN
QUALITY
MAXiMUM
DEPTH
CHANNEL
WIDTH
Check
ONE IONLY!}
Check
ONE (Or 2
&
average)
a]
> lm [63
a]
POOL
WIDTH> RIFFLE WIDTH
[2]
O
&7-<fm
t4]
a]
POOL WIDTH
=
RIFFLE WIDTH [13
a]
04-<0.Tm (2]
[3
POOL WIDTH
<RIFFLE WIDTH
[03
a]
02-<OAm
[1]
a]-c
0,2m [0]
Comments
Indicate
predominant land uses
past
born ,!panamr
Riperian .
flI,sxrmijrn
-.
10
Pool?
Current
Maximum
Indicate for functional
riffles; Best
areas must be large enough to support a population
of
riffle-obligate
species:
Check ONE (Or
2 &
average).
[Jl’tO
RIFFLE
[me.rn.-0]
RIFFLE
DEPTH
RUN
DEPTH
RIFFLE
I RUN SUBSTRATE RIFFLE I
RUN
EMBEDDEDNESS
a]
BESTAREAS>
lGcmf2]
a]MAXIMUM >
50cm
[2]
a]
STABLE
(e.g.,
CobbIe, Boulder)
[23
[3
NONE
[2]
a]
BEST AREAS
540cm
1’]
a]
MAXIMUM
50cm [1]
a]
MOD. ST.4LE
(e.g.,
Large Gravel)
[1]
a
LOW [1]
,
I]
BEST
AREAS<
Scgi
a].
UNSTABLE
(e.g.. nine Gravel.
Sanci)[0I
a]
MODERATE
[03
Rmft(e/1
, .
ImetrU3
a]
EXTENSIVEj-1]
Comments
?
61
GRAOIEWT___ftImI)
[3
VERY
LOW
- LOW
[24]
%POOL
%GLIDE(J
c-raaient1,
DRAINAGE
AREA
a]
MODERATE [5-10]
(
mt
2)
[3
HIGH-VERY
HIGH [1043
%RUN:
%RIFFLE
“‘iö%,J
EP!, 4520
C
Substrate
I
Piaxirnurn
20
STABILITY
O
HIGH (3]
O
MODERATE [2]
a
LOW[1]
Comments
Channel
(
Maxunurn20
)
CURRENT VELOCITY
Check ALL that
apoty
D
TORRENTIAL f-I) a] SLOW [13
a]
VERY FAST (1]
0 INTERSTITIAL [-1]
a]
FAST [1]
0 INTERMITTENT
(-2]
O
MODERATE [1]
0
EDDIES
[1]
Indicate
for
reach
- pools and
n7flas.
Recreation
Potential
Primary
Contact
Secondary Contact
cIen1wtobmC6Jj
vA?;
iJ/
/
‘/
Gt
i
UtVliiUS
Electronic Filing - Received, Clerk's Office, September 8, 2008
Qualitative
Habitat Evaluation
•
Index
QHEi.Score:5.
..
.. ..
and
Use Assessment
Field Sheet
I?1zJr
-
ci’i3
RM:2.€’Date:0I/)
108
Scorers
Full Name
&
Affiliation:
3’
-“L
f74
‘‘Q>
Lat./
Long.:
4
I
ii
9
Office verified
..._iNAO83.decIm19_J_
“_
J.2_
locationl]
Substrate
0
Maximum
20
Cover
MaxImumØ
Channel
Maximum
predominant
land ue(s)
past lOOm
nparian
Rlparlan
S
Maximum
5] POOL
/
GLIDE AND
RIFFLE
/
RUN
QUALITY
MAiMUbE
Fm
CHANNEL.WIbTH
CURRENT..VELOCITY
Recreation Potential
Check
ONE
(ONLY’)
Check ONE
(Or
2
&
average)
Check
ALL
that
apply
Primary Contact
D9m
[4L
EJ?OOLWIDTHRIFFLEW1DTH
[21
D
VERYFS[I
EJ
INER1TIAL
[4]
(circle
Secondary
onaand cominenton
Contact
back)
D[2]
D
POWlDTHRIFFLEWiDTH
[OJ
DjiJE4rp$
D
E1*
Pool/(
Indicate for
reach
7
poosand
riffles.
Current
Comments
Ma5nrnum_J
Indicate
fOr fuñctiónal
riffles; Best
areas
must
be
largeenough
to support
a
population ,
of
riffle obligate species
Check
ONE
(Or2
& average)
e’O
RIFFLE [metric—Ol
RIFFLE
DEPTH
RUN
bERTH
RIFFLE I RUN SIJRSTPATE
Stream
&
Location
River
C -
1]
SUBSTRI
STORET
#:
teTYPE
BOXES;
O9kFFLE
Check
ONE (Or 2 &
s
POOL
RIFFLE
-
I substrates;
ignore
e from
point-sources)
EJ
U
EJ
D
D
e.Qto3OAbsent.i-Vc-ysrnaHanr-”
3.
I
i
r
small
if more
amounts
commonofofhighest
marginal
AMOUNT
‘‘e
Check ONE (0r2
& average)
J
N[V
I
:i
I
r.-.
I
.i
Q sup
1-
‘-\€.c-
6cc.
Ow
Check ONE
in eacfrcatE ory:
(0r2
&
average).
L-a
“(Or2perbank &
average)
ITYE5II
DD
Electronic Filing - Received, Clerk's Office, September 8, 2008
Qtat Habitat
Evauafion ndex
-
and
Use
Assessment
Fie’d Sheet
QHEI
Stream
&
Location:
Vi.
P/.L’’€—
0
RM:
ate:t
11
/3I
08
ft
7o
i
vet/r’t,/
Scorers Full Name
& Affiliation:
River
Code:
—
- — — —- —
—
STORET#:
ji
L/
3
I8
11
1
SUBSTRATE
Check
ONLYTwo substrate TYPE BOXES;
atimate
%
or note every type present
Check
ONE
(Or 2
& average)
BEST TYPES
POOL
RIFFLE
OTHER TYPES
POOL
RIFFLE
ORIGIN
QUALITY
_
D
D
BLDR
ISLABS
L10L_..
—
Q
Q
HARDPAN
L41 __
—
D
LIMESTONE
1]
ZHEAVYE-21
EJ
D
BOULDER [9]
—
—
Q
Q
DETRITUS
[3]
V
—
ILLS
Eli
-
-
SILT
YMODERATE
r-lJ
Substrate
‘D
COBBLE
LBj-
—
fl
MUCK [2]
—
D
WETLANDS
[0]
D
NOMALoJ
D
GRAVEL7]
..._._. —
2DSILT2i
-.._
—
HARPPAN.L01
0
SAND
.
—
Q Q
ARTIFICIAL
L0]_
—
0
SANDSTONE
(01
EXrENSIVE
-2J
00
BEDOcK
15]
—
—
(Score
natural si:bstrates;
ignore
C
RIP/RAP
101
DEb
gM0DERATE
[-11
A
NUMBER
OF
BEST TYPES:
1
’
or
more [2]
sliidgo
from
point-sources)
C
LACUSTRINE
[01
NORMAL
[0]
20
Comments
0
3 or less
[0]
(!2
,.—
-.-‘
CC
SHALECOAL
FINES
E-1]
:
[-2] ,-‘
C
NONE
Eli
—,
,t,.
-
.,;
. I
,
,;,
k
,•
,•
2]
INSTREAM COVER
quality:
Indicate
2-11oderate
presence
0
amounis,
to 3: 0-Absent;
hut
not
1-Vary
of highest
smal:quality
amounts
or in
orsmall
if
more
amounts
common
of
olhighest
marginal
AMOUNT
auality;
3-Higiost quality in
moderate or
greater amounts
(e.g., very large
boulders in
deep
or fast water, large
CheOft
ONE
(0r2 &
aerege)
oometer
log that is
stable, well developed
rootwad in
deep
/
fast
water,
or dee, well-defined,
functional
pools.
Q
EXTENSIVE >75%
LII]
—
UNDRUT BANKS
[I]
.
._..._L POOLS
>70cm [2]
.__2_
OXBOWS,-BACKWATERS
[I]
Q
MODERATE
25-75% [7]
—
OVERHANGING
VEGETATION
LI]
—
ROOTWADS
Li]
_L
AQUA11C
MACROPHYES.FII
SPARSE
5.25%
131
—
SHALLOWS(IN SLOW
WATER)
[1]
F
BOULDERS
[1]
—
LOGS OR
WOODY-DEBRIS
I)
Q
NEARLY
ABSENT
<5%
I]
—
RObTMATS [1]
Cover
Comments
-
-
Maximum
3]
CHANNEL MORPHOLOGY
Check ONE in
:h
cLegory
(0r2
& average)
SINUOSITY
DEVELOPMENT
CHANNELIZATION
STABILITY
O
HIGH
E4]
Q
EXCELLENT
Lu
[]
NONE
[6]. .
...
..
HIGH
[3].
0
MODERATE
131
Q GOOD.L5]
C
REcOVERED
L41
:,
.-..,.
Q
MODEATE
121
C
LOW
2]..
C
FAIR
L31
.
C
RECOVERING
L3]
:. -.
,‘ LbW
LIF
jNONE.r1J
,,POOR
El]
REENT
OR
NO RECOVERY
LII
Channel
Comments
Maximum
4J BANK
EROSION AND
RIPAR1AN ZONE
Check ONE
in each c
‘for EACH
TANK
(Or 2 per bank
&
average)
River rljht bobbin downitro.im
RIPARIAN WIDTH
Fl
‘IA I r
EROSION
Q Q
WIDE > 50m
4I
.
C
- C .cONSEVATION
TILLAGE [1]
NONE fLITTLE
L3]
C
C.MOPERATE.I0-50m
[31
C
C URBAN.OR INDUSTRIAI
0i
C
0
MODERATE [2]
.
0 0
NARROW
5-lOin
[2]
.
C
U MINNGI
CONSTRUcTION
101
0 0
HEAVY
I
SEVERE
LI]
C C
VERY NARROW
< 5m
LI]
C
land use(s,)
NONE
LQ1
C
past
par/an.
Rlparlan
Commonts
Maximum
3
10
5]
POOL
/
GLIDE
AND RIFFLE/RUN
QUALITY
MAXIMUM DEPTH
CHANNEL
WIDTH
CURRENT
VELOCITY
Recreation
Potential
Check
ONE (ONLY!)
Check ONE
(Or
2 & average)
Check
ALL that apply
Primary Contact
21>
Im
[61
0
POQçlI1DiH?RIFILE
WIDTH
[21
C
TO1RENT1ALLU
LOW[Ii
Ser’o,,clari
Contact
EJ
07
1 in 4]
TfLE
JIDTH
[1]
0
VYASf
11
(circle one and comment
on back)
CO
4-<0 7m [2]
C
POOL
WiDTH
5RIFFLE
WIDTH
[0
C
S[)4f,
C4TERI1I1EçJ
CO
2-<0 4m [1]
C
MbbTE C Eth1T
Pool!
0<
02m [0]
I,ididte foieach
-pñdiffie
Current
Comments
Maximum
Indicate
for
functional
riffles; Best
areas must
be large
enough
to support
a population
,
of
riffle-obligate
species:
Check ONE
(0r2 & averag).,
rO
RIFFLE [metrIc—O
•
RIELEDEPTH
. RUNDEPTH...
.• RlFFLE!RUNSUBSTRATE...
RIFFLE
I
RUN
EMBEDDEDNESS
CEtB4TI
CAXI°UM9m
[2]
0
t
çb&Woii14r)
[2]
DbE
[2i7
C
[1]
C
MALMUPI
50cn[1]
C
MOD
SJABLE
(eaW%GI4
C
C
BEARS <5bm
t
C
UNSTABLE
101
C
OIFTE
Riffle
I
Lf1
C
EXTENS1E
[1]
Maximum
6] GRADIENT
(
<
ftlmi)
C
%POOL:
%GLIDE:C
)
Gradient
DRAINAGE
AREA
2
m1)
C
%RUN
(
D%RIFFLE
C
ZD
Maximum
i
EPA
4520
>
I,
co
?
/
((,(i
Y
06/11108
Electronic Filing - Received, Clerk's Office, September 8, 2008
Stream
&Location:
V
P/l?r
/t’i’>e,.-
—
‘/
1eft
4
Tcr
RM:
.,?
7Date:
7:1 .?J
08
Full Name &Affiliat(on:
C1€
1,t4r
ifr
River
Code:_-___STORET#:
LatJLoni.:
18_
Offlceverlfled1
1]
SUBSTRATE
Check
ONLYTw0
substrate 7YPE BOXES;
estimate
%
or
note every type presertt
Check ONE (0r2
&
average)
BEST TYPES
POOl.
RIFFLE
OTHER TYPES
POOL RIFFLE
ORIGIN
QUALITY
‘i
DO
BLDRISLABS[10L..,.
—
0
DHARDPAN[41
—
DLIMESTONE[1J
.F4EAVY[2]
O
Q
BOULDER
[91
—
Q
0
DETRITUS [3]
-
—
TILLS
[1]
SILT
0
MODERATE
[1]
Substrate
,1D
COBBLE[8]
—
0
DMUCKL2]
7
—
DWETLANDS[0]
...2NORMALLO1
DO
GRAVELL7J
___
—
‘DSILT[2J
jr.. —
AtHARDPAN[0J
DFREE[,13
-
O
0
SAND [6]
—
0 0
ARTIFICIAL [0] —
—
0
SANDSTONE
tO]
EXTENSIVE
[2]
LJ
O
0
BEDROCK [5]
—
—
Scrre
wituri .,ubstrates ignore
0
RIIIRAP
EOj
4
DE
EJ
MODERATE
[11
ii,n
NUMBER OF
BEST
TYPES
2
or more
[21
sluclje from pomt sources)
0
LACUSTRINE [0] ‘
‘NORMAL
[01
20
-
0
3or
less
[01
/
D.SHALEH];.c.:
—.,
0
NONE
[11
Comments
s—--
‘—
DcALFIES[-2j:c
t/
.‘
‘hs1
ej
— .—J
‘
21
INSTREAM
COVER
quality;
Indicate
2-Moderate
presence
iS
amounts,
to 3: 0-Ahent;
but
not
1-Very
of highest
sms!l
quality
amounts
or in
or
small
if more
amounts
commonofof
highest
marginal
AMOUNT
quality; 3-Highest quality in
moderate
or
greater amounts
(e.g.,
very large
boulders in deep orfast water, large
Check ONE
(0r2 &
average.,
diameter log that
is stable,
well
developed rootwad in deep
/
fast water,
or deep, well-defined, functional pools.
o
EXTEJS!VE.>75%.[11J
—
UNDERCUT
BANKS
[1]
.__L_..
POOLS 70cm [2]
—
OXBOWS
BACKWATERS [1]
a
MODERATE 2575%
[71
—
OVERHANGING
VEGETATION
[I]
ROOTWADS
[I]
__ AQUATIC MACROPHYTES
‘SPARSE 5-<25% [3]
—
SHALLOWS (IN
SLOW
WATER) [I]
BOULDERS [13
‘
LOGS OR WOODY DEBRIS
[1]
EJ
NEARLY ABSENT <5% [1]
—
ROOTMATS
ti]
comments
3] CHANNEL
MORPHOLOGY
Check ONE in each category (Or
2 &
average)
SINUOSITY
DEVELOPMENT
O
HIGH [4]
0
EXCELLENT
[7]
.a’
O
MODERATE [3]
0
GOOD
[51
0
O
LOW
L2]
0
FAIR
[3]
0
NONELIJ
POOR
Lii
0
Comments
predominant
land
use(s)
past lOOm
riparian.
Riparian
Maximum
10
)
Qualitative
Habitat Evaluation Index
and Ue Assessment
Field Sheet
QHEI
Score
CHANNELIZATION
NONE
(61
.RECOVERED
[4]
RECOVERING
j -
RECENT
OR
NO RECOVERY
Lii
Cover
MaxImum
/0
20
\J
STABILITY
Mp’tL2ii
•
1’ZONECIieck ONE in each cat
,tdEACHBAE(Or2perbank&
average)
‘TY
Channel
Maximum
LJL
)
RIFFLEIRLJN.QUALITY
CHANNEL WIDTH
Check
ONE (Or2
&
average)
,,r
CURRENT VELOCITY
Recreation
Potential
Check
ALL thàtáppl
Primary
Contact
[11
0
VEFAST[If%
DERSTITJ*JtL
11
(clrclo one
andcommenton back)
I
C
POOL1DTH<RIFFLEWID1H
[0J
OL1f
DItrENT
[J
DMoEAtE4J.
DDDIEJM
Pool!
Cunntl
g
Comments
‘
Maximum
Indicate for functional
riffles;
Best areas must
be large
enough to support
a
populatIon •
-
of
riff!e-obligate species:
Check
ONE (0r2 &average).
ORiFFLE [metrlc-0J
RIFFLE
DEPTH
RUN
DEPTH
RIFFLE
I RUN SUBSTRATE
RIFFLE
I
RUN
EMBEDDEDNESS
•
DiMPQ[2i
DMp4tO];
icugel
4tmetrlcO1
OFEISWEEII
Ufl
Comments
-
Maximum
6]
GRADIENT(
O,1
fflmi)
0
%POOL:C__)
%GLIDE:()
GradIent(
DRAINAGE
AREA
0
MQERL0]f&
Maximum
it ‘
m12)
C
tI9]
%RUN
C
)%RIFFLE
ZZ
10
EPA
4520
‘
I((!o’
06/11/08
Electronic Filing - Received, Clerk's Office, September 8, 2008
RM:23DateCI2/!
08
Scorers Full
Name
&
Affiliation:
3
J,’cr4,
f4
Lat./Long.:q
Office verified
IMAfl
1
R
I.!1
iocationLi
ROOTWADS[iJ
L
BOULDERS1II.
Channel
3r2
per bank &
average)
Maximum
J
r1i
Li
L*4
Indicate
predominant
land use(s)
past
loom
ilparian.
Riparlan
Maximum
10
Qualitative
Habitat
Evaluation
Index
and Use
Assessment
Field Sheet
QHEI
Score
Stream
&:Löàation:
P/wt—er
,‘(jvs,—
.3’
/?.f
River
Code:
-
-
—
STORET#:
-
1] SUBSTRATE
Check
ONLYTwo
substrata
TYPE
BOXES;
estimate
%
or
note every type present
Check ONE (Or 2 &
average)
BEST
TYPES
POOL
RIFFLE
OTHER
TYPES
POOL RIFFLE
oRIGIN
QUALITY
--
LID
BLDRISLABSLIOI_
—
LI
LIHARPPAN4I
—
LILIMESWNE
LI]
LIHEAf[-2J..
Li Li
BOULDER [9]
—
LI
Q
DETRITUS
[3] •‘
—
...11LLS
[I]
SILT
1iODERATE [1]
Substrate
LI Li
COBBLE
[8]
__
I] ]
MUCK
[2]
—
—
Li
WETLANDS
[0]
., NORMAL [0]
l
I2’
GRAVEL
[71
J_...
—
[J LI
SILT
[21
_......
LI
HARDPAN
[0]
Li
FREE (1)
II
,q
II
LI Li
SANb [6]
..j........
LI
LiARTh9CIAL [0] —
—
Li
SANDSTONE
[01
fl
ExTENSIVE
[.2]
U U
BEoocc
i:
—
—
(Score natural substrates;
ignore
Li:IiRAP;[O1..
f
t
%_MO.DE!TE.:L13
Maximum
NUMBER OF
BEST
TYPES:
U
4 or morà [2j
slUdge
from Point-sources)
LIc!roj:
,.NRMALL0J
20.
Comments
3 or less
[0]
LI
Li
SHALE
coiNES-21
[1J:
.;
Li
NONE
[1]
:
2] INSTREAM COVER
quality;
Indicate
2-Moderateproserice
0
amounts,
to 3:
0-Absent;but
not
1-VerV
of
highest
small
quality
amounts
or in
or
small
Wrnore
amounts
common
of
of
highest
marginal
AMOUNT
quality; 3-Highest
quafty in
moderate or
greater
amounts (e.g., very
large boulders in deep
or
last
water, large
Check
ONE (Or 2 &
average)
diamntnr Ioq that is
stable,
well
developed rootwain
deep
/
fast water,
or deep, well-defined, functional
po;s.
Li
:XTE
VE?75%
1111
—
UNDERCUT
BANKS
[1]
POOLS
> 70cm [2]
—
OXBOWS
BACKWATERS
[1]
Li
MODERATE 25
75
[71
U
Cover
—
Comments
Maximum
3] CHANNEL
MORPHOLOGY
Checi
ONE
in each category
(Or 2
&
average)
:SlNUSIIIW. .DE’JELOPMENT
LIjJ
.
EXCEILENT[7j U
LI
M
ATE[3]
LI
P99[5]W
E
LI
j$jj’
LI
L31I
£
E[lJj4
-rooi1
LI
Comments
4]1
hékONE1neachci
.•R
-
Comments
5] POOL / GLIDE
AND RIFFLE /
RUN
QUALITY
MAXIMUM DEPTH
CHANNEL
WIDTH
CURRENT VELOCITY
Recreation
Potential
Check ONE (ONLY!)
Check ONE (Or 2 & average)
Check ALL that
apply
Primary
Contact
Im
61
LI
POOL WIDTH
> RIFFLE
WiDTH
[2]
Li
TORRENTIAL
-i
1gSLOW [1]
cecondary
Contact
LI
0.7-<.1
in [4]
.
POOL
WIDTH = RIFFLE WIDTH
[11 LI
VERY
FAST
LI]
LI INTERSTITIAL
[.1]
I
tclrclaoneand
comrnanton back)
LI
o.4<o:7m.[2]
LI
POOL WIDTh
<RIFFLE
WIDTH
[0]
Li
FAST
W
LI
INTERMITTENT
[-2]
LI
0.2-’cO.4rn
[1]
LI
MODERATE
[I]
LIEDDIE [1].
Pool?
LI
<0.2m
oj
thdlcate fo,recii
- pools and riffles.
CWTent
Comments
Maximum •.
Indicate
for
functional
riffles;
Best
areas
must
be large
enough
to support a population
r
of riffle-obligate
species:
Check
ONE
(Or 2 & average).
RIFFLE [metrIc—a]
RIFFLE
DEPTH
RUN
DEPTH
RIFFLE
I RUN
SUBSTRATE RIFFLE l.RUNEMBEDDED.NESS
LI
BESTAPEAS
‘IOc [2’
LI
IAYIMIJIR
> 50cr [2’
LI
S’ABLE
(a
g
Cobb’c Bou
1
d.)
[2
Li
Li
BEST
APEAS 510cm
[1]
LI
MAXIMUrI
<
‘Wem
[11
C
CD
STABLE
(e
g
L’rge
C
avol)
[1]
LiW[11
k.
—
LI
BEST
AREAS
< 5cm
LI
UNSTABLE
(e
g
Fine Gravel
Sand)
[0]
Li
IRAfEI0I
EI
( —
[rietrlco3
Comments
.
Li
EX
. -
ENSII
[I]M
axiniurn
&
6]
GRADIENT
(
<
if/mi)
Li
VERY
LOW
LOWf4I
%POOL
%GLIDE
( )
Gradient(
DRAINAGEEA
m12)
Li
h4HRYH
%RUN
C
J%RIFFLE
c::
MaxImurn3
EPA4520
‘,
i,
(C
06/11/08
Electronic Filing - Received, Clerk's Office, September 8, 2008
QuaNtative
Habftat Eva’uation
Index
and
Use
Assessment
Field
Sheet
QHEI
Score
Stream
&
Location:
ic P7Ibt4T
,Our
2
‘‘/Lj
....,
RM:
Date:F/,’/
08
wi
Scorers Full Name
&
Affiliation:
4s_
t4 t,teidj
River Code:-_._STORET#:
f2
I8.
12
Office
verifledQ
11
SUBSTRATE
Check
ONLYTw0 substrate PIPE BOXES;
estimate
%
or note every type
present
Check
ONE (Cr2 &
average)
BESTTYPES
POOLRIFFLE
OTHERTYPESPOOLRIFFLE
—••-I
ITY
D D
BLDR:,sL
BS
L10_ —
Q Q
HARDPAN
4I
—
D D
BOULDER.[9]
—
D
EJ
DETRITUS
L31
—
I
Substrate
D.cOBBLE:j;
—
Q
QMUcKj2j:
—
[
GRAVEL
[7]
......!...
—
D
DSILT[2]
—
D D
SAND
[6]
—
Q
D
ARTIFICIAL 0]
—
[
D D
BEDROCK
L5J
—
.
(Score
natural subsates;
Ignore
[
3
Am
NUMBER
oF
BEST TYPES:
ormoreL23
sludge
from
point-sources)
[
20
Comments
or less
[0]..
.
.
2] INSTREAM COVER
quality;
Indicate
2-Moderate
presence
0
amounts,
to
3: 0-Absent;but
not
1-Very
of
highest
small
quality
amounts
or
or
in
small
if
more
amounts
common
of
of
highestmargiral
AMOUNT
quality;
3-Highest quality
in
moderate
or greater amounts
very large
boulders
in
deep
orfast water, large
Check
ONE (Cr2 &
eragc
diameter
log
that is
stable.
well developed
rootwad in
deep
I
fast
water,
or
deep,
well-defined,
functional
pools.
Q
EXTENSIVE
>75%1i11
—
UNDERCUT BANKS
[1]
._L. POOLS
a
70cm [2]
—
OXBOWS
BACKWATERS
[I]
JWODERATE
25 75% [7)
—
OVERHANGING
VEGETATION
[1]
—
ROOTWADS
Li]
...2
AQUATIC
MACROPIIYTES
[1)
Q
SPARSE
6-25%
[3]
—
SHALLOWS (IN
SLOW WATER)
LII
—
BOULDERS
[1]
1
LOGS
OR WOODY DEBRIS
[1)
Q
NEARLY
ABSENT
<5%
[1)
_.ROOTMATS.[II.
... .
.
.
-.,-.
Cover
Comments
‘.—,.
(i.’
Maximum
I
33 cHA
NNEL
MORPHOLOGY
Check
ONE in eoch
caiegorj (0r2&
average)
SINUOSITY
DEVELOPMENT
CHANNELIZATION
STABILITY
O
HIGH
[4]
0
EXCELLENT
L7]
0
NONE
[6]
Q
HIGH [3]
0
MODERATE [33
0
GOOD
[5]
0
RECOVERED
[4]
‘M0DERATE [2]
0
LOW
[2]
0
FAIR
[3)
‘ RECOVERING
[3]
Q
LOW
[I]
ZNONE [1]
,J’
POOR
[13
0
RECENT
OR NO
RECOVERY
[I]
Channel
Comments
Maximum
4]
BANK EROSION
AND
RIPARIAN
ZONE
Check
ONE
in
each category
for EACH BANK
(Or
2 per bank &
average)
Rivnrrhihookngdowiistrc.un
RIPARIAN
WIDTH
FLOOD PLAIN
QUALITY
EROSION
Ô
WIDE
DrnL4]*
.:ii
F.oj;
iiI::
i:S
0
NONE!
LITTLE [3]
Q 0
MODERATE
10 5Oin
[3]
0
0
SHRUB OR
OLD
FIELD
[2]
- 0 0 URBAN OR
INDUSTRIAL
[0)
O 0
MODERATE
[2]
Q Q
NARROW
5 lOm [2]
0 0
RESIDENTIAL,
PARK
NEW
FIELD [I]
0 0
MINING! CONSTRUCTION
[0]
0 0
HEAVY
I
SEVERE [I]
Q
Q
VERY NARROW
‘C
5m
[I]
0 0
FENCED
PASTURE
[I]
Indicate
predominn
land use(s)
.
0 0
NONE
[0]
EJ
EJ
OPEN PASTURE
ROWCROP
[0]
past lOom
ripanan
Riparlan
Comments
-.
_--,
Maximum
10
53
POOL
/
GLIDEAND RIFFLE/RUN
QUALITY
MAXIMUM
DEPTH
CHANNEL
WIDTH
VELOCITY
Recreation
Potential
Chek ONE (ONLY!
Check ONE
(0r2 & average)
Primary Contact
Im
[6]
0
POOL
WIDTH>
RIFFLE
WIDTH
[23
. Secondary
Contact
0.7-’C1m.L41
.2fPOOL
WIDTH
RIFFLE
WIDTH
[11
cIrdaonoandcommentonback
O.o.40.7ni2j
0
POOL
WIDTH<RIFFLE
WIbTHL0j
I]
02<0.4m [1]
Pool/1t
Q.<
0.2m
[Oi
.-
Current
Comments
Maximum
Indicate for
functional
riffles; Best
areas
must be large
enough
to support
a
population
,
of riffle-obligate
species:
Check
ONE (Cr2 & average)
RIFFLE
DEPTH
RUN DEPTH
RIFFLE
I RUN
SUBSTRATE
RIFFLE
I
RUN
EMBEDDEDNESS
C
BESTREAS’ 1
0ciii
Q
A”I
‘U 50cr’
L21
0
STBLE
(e
g cobIe
Bou.der
2j
0
i4OiE
BEST
APES 55 10cm
El]
0
MAXIMUM
‘C 50cr”
ri1
0
‘OD STABLE
o
q
La ge Grate’)
[9
0
LOW
L
41
0
BEsT
AREAs.<:5cm
0
UNSTABLE
e.g., FIne iravel,
Sand)
[0]
0
MÔDERATE[0]
Riffle!
EmetrIcOj
.
i-I’
Ufl
Comments
.
.
-
Maximum
6]
GRADIENT
(
(Jr
ftlml)
0
%POOL:Q
%GLIDE:C__D
Gradientr
%RUN:
F%RIFFLE:1
)
MaxImum$)
EPA
4520
V2-
7/(
(o
06111/08
Electronic Filing - Received, Clerk's Office, September 8, 2008
Qualitative
Habitat Evaluation
Index
and
Use
Assessment Field
Sheet
HEI
‘
sC
ore
7
5
Stream
&
Location
s
P/i
M-
— i
s3
RM
2
Date
f1
LI_i
08
Full Name
& Affiliation:
ic
fJJ,d4-
*
141i
River
Code:
- — —- —
—
STORET#:
-fIJL.
U/vi3
i8.
iza
Office
v9rffledLI
11
SUBSTRATE
Check
ONLYTw0
substrate
PIPE BOXES;
estimate
%
or note
every
trpe present
Check
ONE (Or 2 &
average)
BEST TYPES
POOL
RIFFLE
OTHER
TYPES
POOL
RIFFLE
ORIGIN
QUALITY
—
LID
BLDRISLABS[10]__._
—
LI
DHARDPAN[4]
—
—
DLIMESTONE[1]
E]HEAVY[-2]
LI LI
BOULDER
(9)
...............
—
fl
LI
DETRITUS
[3]
—
ILLS
[i]:
SILT
2MODERATE
[-1]
Substrate
LID COBBLE[81
—
LI
LIMUCK[2J
—
—
LIWETLANPs.[o]-.
..BNORMAL[OJ
2LI
GRAVEL
[7]
—
LI
LISILT[2]
_
—
LI.P[0,.
DJJ
j
/j
J3 LI
SAND
[61
—
LI
I]
ARTIF!CIAI
[0] —
—
LI
SADSTONE[OJ
[1 ECrENSIYE
[2]
LI
I]
BEDROCK [5]
—
(Score
natural
sibsfrates; ignore
LI
RIPiRAI
[0j
,
E%
‘MQDERATE[-l]
NUMBER OF
BEST TYPES:
LI
4 or more
[21
sludge
from
point-sources)
LI
LACUSTRINE-lOl
‘
NPRMAL[P1
20
or
less [0)
LI
SHALE [.1]
LI NONE [l].
Comments
6?
C
cbAES
[1
2]
INS
TREAM
COVER
quality;
lndicte
2-Moderate
presence
0
amounts,
to 3: 0-Absent;
buL notI-Very
of
h;ghest
smallquality
amounts
or
in
or
small
if more
amounts
commonofof
highest
marginal
-
AMOUNT
quality;
3-Highest
quality in
moderate
or greater
amounts
(e.g., very
large boulders in
deep or
fast water,
Iaie
(iie
Oi’
r
- average
diameter
log that is
stable, well
developed rootwad
in
deep I fast
water, or deep, well-defined,
functional
pools.
LI
EXTENSIVE
>75%’[ll]
—
UNDEGUTS BANKS
LI].
_L.POOLS
> 70cm
L21
__L.. OXBQWS
1
’
BAGWATERSF1J
LI
MODERATE.25J5%
171
.LibVERHANGING
VEGETATION
LI]
—
RO0TWADS
LI]
AQUATIC
MACRfrHYTES
[]
,SPARSE
5-<25% [3]
—
SHALLOWS
(IN
SLOW
WATER)
(1]
—
BOULDERS
ti]
-
LOGS OR WOOYDEBRIS
ill
LI
NARLY ABSENT <5%
LII
—
ROOTMATS [1]
7
,_,
.-.
Cover
Comments
I
(5.)
(
Maximum
I
—“
20
r5i
- -.
3] CHANNEL
MORPHOLOGY
Chock ONE in
each
category
(Oi2 & aiuryu)
SINUOSITY
DEVELOPMENT
CHANNELIZATION
STABILITY
LI
HIGH [4].
LI
EXCELLENT [7]
LI
NONE[6]
LI
iIIGH
[3]
LI
MODERATE.[3]
LI
GOOD.[5]
LI
RECOVERED
[4]
•.
WMODERTE
[]
LILÔW[2]
:.
LI
FAIR [3]
1RECÔVERING,[3]
-
- LI
LOWlj
,NONE
iJ
-,
Z
POOR [lj.
J
WEcENT
OR NO
R
OVERY
E1
Channel
Comments
,
MaxlmurnJ
4]
BANK
EROSION
AND
RIPARIAN
ZONE
Check
ONE in each
category for EACH
BANK (Or
2 per
bank &
average)
RNarriqhtlookTnfldowncrcnrn
, RIPARIAN
WIDTH
FLOOD
PLAIN
QUALITY
F-
EROSION
Q
WIDE >50rn [4] -
C
fFOREST,.SWAMP
-
C I ÔONSERVATION.TILLAGE
[I]
i::i
[‘NONE
I
LITTLE
[3]
LI LI
MODERATE 10 50m
[3]
LI LI
SHRUB OR
OLD FIELD
[21
LI LJRBAN
OR
INDUSTRIAL
(0]
LI LI
MODERATE
[2]
LI LI
NARROW 5 lOm [2]
LI
LI
RESIDENTIAL
1
PARK
NEWFIELD
[1]
LI LI
MINING I
CONSTRUCTION [0]
LI
LI
HEAVY
I
SEVERE
[1]
LI LI
VERY NARROW
< 5m [1)
LI
LI
FENCED
PASTURE
[1]
Indicate
predominant
land u,o(s)
LI
J’NONE [0]
LI LI
OPEN
PASTURE,
ROWCRO?
roj:.
past
lOOm
riparian.
Riparlan
Comments
.-.
-—.
,.------,
Maximum
C
(3
10
5] POOL
/
GLIDE AND RIFFLE /
RUN
QUALITY
MAXIMUM DEPTH
CHANNEL
WIDTH
CURRENT
VELOCITY
Check ONE (ONLY!)
Check ONE
(Or 2 &
overage)
CheckALL
tht
apply
Primary Contact
I
in
[6]
LI
POOL WIDTH
> RIFFLE
WIDTH
[2]
D
TORRENTIAL
[-1]
IS
LOW
11
-.
Secondary
Contact
LI
(L7<1
m [4]
A’POOL
WIDTH = RIFFLE
WIDTH
[1]
U
VERY
FAST-[1J.
LI
INTERSTITIAL
[-1]
(ciràte
oneandcommentcn
back)
LI
O.4-<0.7m [2]
LI
POOL WIDTH <RIFFLE
WIDTH
[0]
LI
FAST[1]
-
DINTERMIV[ENTC.2]
LI
0.2-c0.4m
[1]
LI
MODERATE
LI]
LI
EDDIES
[1]
Pool!
LI
<0.2m [0]
IndIcate
forrech
- pols a,d ,irnè.
Current
Comments
Maximum
Indicate
for
functional
riffles; Best
areas
must be large
enough
to support
a population
,‘p
of riffle-obligate
species:
Check
ONE (Or 2 &
average).
RIFFLE
rmetrlc-O]
RIFFLE
DEPTH
RUN
DEPTH
RIFFLE
I
RUN
SUBSTRATE
RIFFLE
I
RUNEMBEDDEDNESS
LI
BEST I
PES
‘ 1
Ocm [2]
El
MêXIMUM
>
S0t’r
T9
LI
STABLE (e
g
Cobbla,
Bod’dor)
[2’
LI
D
BEST
AREAS 5
10cm
ri]
LI
MAXIMUM <50cm
i’l
LI
MOD STABLE
(e
g
Lrge
GraueI)
[ii
LI
LI
BEST AREAS
< 5cm
-
LI MÔDJRTE
rot
rclFfie,
Comments
[metrmc=O]
I
‘0
8
‘—,------
6]
GRADIENT
Q,j’
ft’mi)
LI
VERY
LOW -LOW
L241
%POOL:
%GLIDE(
J
Gradientj1
DRAINAGE
AREA
-
LI
MODERATE
[6-10j
-
Maximum
mi
2)
LI
HIGH
VERY
HIGH [106]
%RUN.
C
)%RIFFLEC
D
10
EPA
.520
I,5l•
‘)cg
1
7f
(o
p
06!11/08
Recreation
Potential
Electronic Filing - Received, Clerk's Office, September 8, 2008
Check
ONE
(Cr2
&
average)
iN
QUALITY
D
HEAVY
[-21
2’
M0DERATE•[-1]
Substrate
SiLT
,NbRMAL[O]
1
D
rYEXTENSIVE
FEE
[IJi
21
.
1/2
f
I
)
aMTE-1I
2’NqRMALro1:
20
DNONEI1T
STABILITY
•lD
D1
Cover
Maximum
20L
Ii
Io
UNCNF.[21
DMODERATE
oj.
RlrnefØ
DEXTENSIVE
Maximum
Gradient]
Maximum____
?/
(7
(OJ
06/11/08
Stream
&
Location:
De<
I
2
/J..’rs-
43
and
Qualitative
Use
Assessment
Habitat
Evaluation
Field.
Sheet
Index
HEI
W
core.
-
-
STORET#:
RM:21fDate:O1i
/
I
OL
orers
Full
Name
&
Affiliation:
— —
(NAD
LatfLoni(.:qj
5 - dar,Im
ig.
±.L!1
Office
iocationD
verffierl
________________
River
Code:
1] SUBSTRATE
Check
ONLYTw0
substrate
TYPE
BOXES;
estimate
%
or
note every
type present
BEST
TYPES
POOL
RIFFLE
OTHER
TYPES
POOL
RIFFLE
I]
EJ
BLDR ISLABS
[1O]_
HARDPAN
[4] —
—
[
GD
BOULDER.91.
—
—
Q Q
DETRITUS
3J
._f
—
GD
COBBLE
[8]
—
—
G
Q
MUCK
[2]
L
D
GRAVELL7I
.. ,.......
—
Q
QSILTI2
E
ZD
SAND[6].
iL.
—
D
DMTIFICIM[0]_
—
-
GD
BEDROCK.[5]
:.
—
(Score
natural
substrates;
Ignore
0
NUMBER
OF
BEST
TYPES:
D
4 or more
[21
sludge
from point-sources)
0
Comments
or less o]
c
Comments
2] INSTREAM
COVER
quality;
lndieae
2-ModN
presence
rate
to
amounts,
3: 0-Absent;
but not
1-Very
of
highest
small
quatty
amounts
or in
or
small amountse
common
ofof
highest
marginal
AMOUNT
—
quality;
3-Highest
quality in
moderate
or greater
amounts
(e.g.,
very large
boulders
in deep
or fast water,
larqe
Check
PNt
0r2&
average)
diameter
loqthat
is stable,
well
developed
rootwad
in
deep
I
fast water,
or
deep,
well-defined,
functional
pools.
D
EtNSiYE>7.5%:W1
:
UNDERCUT
BANKS
[1]
.._.L...
POOLS
>70cm
[2]
—
OXBOWS
BACKWATERS
[I]
MODERATE 2575
[7)
OVERHANGING
VEGETATION
[1]
—
ROOTWADS
[1]
..2z.
AQUATIC
MACROPHYFES
EJ
SPARSE
5<25%
[3]
—
SHALLOWS
(IN
SLOW
WATER)
[1]
BOULDERS
[1]
LOGS
OR WOODY
DEBRIS
[1]
D
NEARLY
ABSENT
<5% [1]
:ROOTMATS:[1]
..
3] CHANNEL
MORPHOLOGY
Check ONE
in each
category
(0r2
& average)
SINUOSITY
DEVELOPMENT
c
D
HIGH
[4]
D
EXCELLENT
[71
fl I
D
MQDERATE[3i
D
t]
D
FAll
[3]”
.Np.NEE.1’.
p.POOR
El]
D
I
Comments
Channel
Maximum
4]
BANK
EROSION
AND
RIPARIAN
ZONE
Check
ONE
In
each category
for
EACH BANK(Or
2 per bank
&
average)
RIvorrightIookin
0
downtream
RIPARIAN
WIDTH
FLOOD
PLAIN
QUALITY
.
EROSION
iif:i
WIDE
> 50m (4]
fEu
FOREST
SWAMP
[31
C
CONSERVATION
TILLAGE
[1]
ZEI
NONEI
LITTLE
13]
D
D
MODERATE
10 5Dm
[3]
D
D
SHRUB OR
OLD
FIELD
[2]
D 0 URBAN
OR
INDUSTRIAL
[0]
D D
MODERATE
[2]
ID
D
NARROW’S
1Dm
[21
D
D
RESIDENTIAi!.
PARK
NEW FIELD
[I]
D D
MINING
ICONSTRUCTION
(0]
D D
HEAVY!
SEVERE
[1]
D D
VERY
NARROW
< 5m
LI]
D D
FENCED PASTURE
[1]
indicate
pmdcirinant
!ind usc(s)
LI D
NONE
[0]
LI D
OPEN PASTURE
ROWCROP
[0]
‘ past lOOm
Ipdrldn
Rlparlan
Comments
.—‘
Maximum
10
10
5]
POOL/GLIDEAND RIFFLE/RUN
QUALITY
—
MAXIMUM
DEPTH
CHANNEL
WIDTH
CURRENT
VELOCITY
Recreation
Potential
Check
ONE
(ONLY!
Check
ONE
(Cr2
& average)
Check
ALL
that apply
Primary
Contact
.‘>
DO
7-<lm
1fl
[6]
[4]
..,2rPOOLVv1DTHLI
POOL
WIDTH>
=RJFFLEWIDTH[1j
RIFFLE
WIDTH
12] 0
U
VERYFAST
TORRENTIAL
[11
C
11.Z%LOW
0 INTERSTITIAL[
[11
1]
(clrdeoneandcammantonback)
Secondary
Contact
DO
4-<O
7m [2]
LI
POOL WiDTH
<RIFFLE
WIDTH
[0]
LI
FAST [1]
D INTERMITTENT
[2]
DO
2-cO
4m
[1]
LI
MODERATE
[1]
LI
EDDIES
(1]
Pool?
/
LI.<
0.2tii.[O]
Indicate
forreaóI,
-
ooth &d
rift7i.
Current
Comments
Maximum
Indicate
for
functional
riffles;
Best areas
must
be
large
enough
to support
a
population
of
riffle-obligate
species:
Check
ONE
(0r2
&
average).
RIFFLE
t I 0
iiO
RIFFLE
DEPTH
RUN DEPTH
RIFFLE
I RUN
SUBSTRATE
RIFFLE
I
RUN
EMBEDDEDNESS
LI
BEST
APE.S
>10cm [2]
0
MAXIMUM>
50cm
12]
0
STaBLE
(o
g
cobble,
So
ildar
1
[2
D
BEST
AREAS
5 10cm
11]
D
MPXIMUM
<50cm
Lii
LI
10D
STABLE
(e g Large
GravI)
1J
Li
LII..SJ I ?%I’LLJO
—
ID
UNSTABLE.(e.g..
FIné.Gravel,
Sand) [0]
[nietric0]
Comments
GRADIEN
Oil
ftlmi)
D
VERY
LOW
- LOW
[2-4]
DRAINAGE
AREA
D
MODERATE
[6-10]
(Oml2)
LI
HIGH
-VERY
HIGH [10-6]
EPA
4520
%POOL:(
%GLIDE:C
%RUN:
C_)%RIFFLE:C
Electronic Filing - Received, Clerk's Office, September 8, 2008
Qualitative
Habitat
Evaluation Index
and Use
Assessment Field Sheet
HEI
Scoiw
V3
//ki
fn1r
4’
RM:-.Date57--ILiI
08
Full Name &
Afflliation:cJoe
C1.
I8Z.Jfl
o
m
ceverlflbdQ
11
SUBSTRATE
•
Check
estimate
ONLYTwo
%
or
note
substrate
every pe
Th’PE
present
BOXES;
Check ONE (Or
2
&
average)
BEST
TYPES
POOL
RIFFLE
OTHER
TYPES
POOL RIFFLE
ORIGIN
QUALITY
,
DC BLDRISLABSLIOJ_
—
Q Q
HARDPAN
4i —
—
DI4ISTONE11%
IEAfJ
C
C
BOULDER
L9].
—
—
Q Q
DETRITUS
£31
.
—
SILT
Substrate
C EJ
COBBLE [8J
— —
C C
MUCK
121
—
EJ0
2LTpJ
-iI
C
C
GRAVEL [7]
—
C C
SILT [2]
....
DfREJti
02!
SAND
[6]
C C
ARTIFICIAL [0] —
—
STO
0]
C C
BEDROCK
[5]
—
—
(Score notural
si.b,trates
ignore
DL0
DEO
4
DLI
NUMBER OF
BEST TYPES
C
4 or more [2]
sludao
from point sources)
Dj[1
20
Comments
less [0]
9iki
—f
2] INSTREAM COVER
Indicte prosonce 0 to 3: 0•Absent;
1-Very small amounts orTioe common of
marginal
AMOUNT
quality; 2-Moderate amounts,
but not of highest cuality or in small amounts of
highest
ciulity;
3-Highect
quality in
modera’e or
greater smoints
e.g., very large
botilders in
deep
or fast
water,
large
Check
ONE
(0r2 & average)
diirrroter
log
that is
stoble,
well
developed rootwad in
deep
/
fast water, or
deep,
well-defined,
functional pools.
Q
EXTENSIVE
>75%
Liii
—
UNI5ERëUT
BANKS [1].
.....L...
PPOLS:?
70cm
121
—
CXBØWS,BACKWTERS
[ii.
Q
MODERATE 25-75% [7]
—
OVERHANGING
VEGETATION
Lii —
ROOTWAD’L1i
...Z_..
AQUATiC MAGROPHTES-[1J.
SPARSE 525%
43]
—
SI
ALLOWS (IN
SLOW
WATER)
El]
—
BOULDERS
[11
—
LOGS
OR
WOODY DEBRiS
LI]
ONE in
each catØgory (0r2
& average)
SINUOSITY
DEVELOPMENT
CHANNELIZATION
STABILITY
I1I
—
r,,m
Comments
TW1
—
L2
Cover
Maximum
)r 2perbank
&
average)
-—I
1Q
Dj
Indicate
predominant
land use(s)
past
lOOm
riparian.
Rlparian
(,..
Maximum
10
Recreation Potential
I
CheàWøEONLY!)
Check ALL thatapply
Primary
Contact
Ti
C
IIA1j4%
Secondary Contact
Qoi[4]
$OLDIEMDTH[
C
aYAr4i
C1INE
R[ 1J
(circle
one
and
comment
on
back)
C’o7Ni4
C
POOLflDTHt RHFLE(REH
EQ
ClIT1iji
C[i
[]r1J
Pool!
C0
2m[0I
Indicate forreach
pools and nfules
Current
Comments
Maximum
Indicate.för
functional
riffles; Best
areas must
be large
enough to support
a
population
of
riffle
obligate
species
Check ONE
(0r2 & average)
NO RIFFLE
[metric 0]
RIFFLE
DEPTH
RUN DEPTH
RIFFLE!
RUN SUBSTRATE
RIFFLE
I
RUN
EMBEDDEDNESS
DSrL4
C
MgXOM
5c[1]
DOLLavI)[
C
UtONE[2].
•••
•
1m1
j’
C
EXTENSIVE
11
iifaximurn_j
IJ
Stream
&
Location
River
Code:
-
-
STORET#:
LJ•IJU_
L:’i:
DcöAL..FINEs[..2].
CömEèh.ts •
Chanhel
..
Maximum
5].P.JØL!DEAND
RIFFLEIRUA.
QUALITY
MAIMUMbEPTH
CHANNEL WIDTH
Check ONE (0r2
& average)
CURRENT VELOCITY
C
BESTAREAS
<-Scni
[metrico]
Comments
6] GRADIENT
(
O’
I
- ft/mi)
C
DRAINAGE
AREA
C
MODERATE [q10
(->-aqemi2)
CIqiy
VHL4[10
61
EPA
4520
K
7!
(
1
oJY
%POOL:Co)
%GLIDE:(___D
%RUN:
C
)%RIFFLE:C
D
06/11108
Electronic Filing - Received, Clerk's Office, September 8, 2008
:
•
••
Qualitative
and
Use Assessment
Habftat
EvaluationField
Sheet
Index
‘
HEI
Score
Stream
&
Location
/
2
es /c).cs’
/Cf.iv
/ft3
RM
Z7
LDate
c1—i
L
!
08
Full Name
& Affiliation:
River
Code:
-
-
STORET#:
IJL
±i
I
I8’.
afIvceveFrnedQ
1]
SUBSTRATECheGk
ONLYTw0
substrate TYPE
BOXES;
..
estiinte %
or
note every
type
present
Check ONE
(Or 2 &
average)
BESTTYPES
POOL
RIFFLE
OTHER
TYPES
PL RIFFLE
ORIGIN
D
D
L7ABTf1OJ_
Q
DN0PA[4i
DJ.IMESTONE
[i
DD
Wof
Q Q
DEtR
3]
—
tJ
—
D
—
C
DD
U
—
WIP
AND1
i.-’
—
I]
Dj
[O1_
—
C
(Score
ñátüral
substrates; ignore
NUMBER
OF
BEST
sludge
from
point sources)
2] INS
TREAM
COVER
quality
Indicate
2
presence
Moderate
0
amounts
to
3 0 Absent
but
not
I
of
Very
highest
smallquality
amountsor
In
or
small
if more
amounts
commonofof
highest
marginal
AMOUNT
quality
3 Highest
quality
in
moderate
or greater
amounts
(e
g very
large
boulders
in
deep
or fast
water
large
aae
diameter
l6that
is
stable
well
developed rooad
in deep!
fast water or
deep
well-defined
functional
pools
0
(I
4fi4j
E1LI
I
Cover
Comments
Maximum
3]
CHANNEL MORPHOLOGY
Check
ONE in each
category
(Or
2 & average)
SINUOSITi
DEVELOPMENT
CHANNELIZATION
STABILITY
—
hannel
Comments
Maximum
4] BANK
EROSION
AND
RIPARIAN
ZONE
Check ONE
In each category
for
EACH BAWK(Or2perbank
&
average)
RIverrightiookingdownsirem
RIPARIAN
WIDTH
FLOOD
PLAIN
QUALITY
O 0
YJSJRtIJ
Q
DIRjN$
JJ2J]
0
Indicate
predominant
land
use(s)
-
0
DNL0I
C
OppN
tu
past lOOm
riparlan
Riparlan
Comments
Maximum
‘0
5]:POOL
/GLJDEAND
RIFFLE/RUNQUALITY
MAX
.M.EpTH
CHANNEL
wibTH
CURRENT
VELOCITY
Recreation Potential
ChkbNE
ONLY!)
Check
ONE (0r2
& average)
.
Check ALL that
apply
Primary
Contact
• %mf6j
D4iJ1
COEN
Scondary
Contact
fO4
LIJ
DWALM
(circle
one
and comment on back)
O07$j[4
D;
WkIIO1
0
1
F
DNTERMnENI2]
Pool!
r
Comments
Oçjr
Indicate
for
reach - pools and
nifies.
Maximum
Current
If
g
UI
Indicate
for
functional
riffles;
Best areas
must
be large
enough,
to support
a
population
-
of riffle
obligate
species
Check ONE (Or
2 & average)
RIFFLE
[metric-U]
RIFFLE
DEPTH
RUN
DEPTH
RIFFLE
1
RUN
SUBSTRATE
RIFFLE
I
RUN
EMBEDDEDNESS
O
O
MPJCIMUM
qocm[2]
JjESTAREAS54bcfii11I
OMAXIMUMC5OñW]
OMTA1av1
DLo
-
OBS5r
- 0
Dó[oJ
Rime
I1r
Corns
0
rENIVj-I]
Maxim:rnlJ
6]
GRADIENT
<
I
ft/mi)
C E3QL
IWJ4J
%POOL
( )
%GLIDE
()
Grathent(
DRAINAGE
AREA
C
MOg[6-10j
Maximum
II
‘
I
(1mi2)
O
HIGI4
YHGH[I06j
%RUN
C
)%RIFFLE
( j
EPA4520
)l,fo2..
—//o
2’
06/11/08
Electronic Filing - Received, Clerk's Office, September 8, 2008
Quabtative
Habitat
Evaluation
Index
HE!
s
____
and
Use
Assessment
Field
Sheet
core
____
Stream
& Location:
Pec-
P/c4
5
-/
RM:7-.fDate:ILIO8
9o_+
eii
77d
J:
‘
Scorers
Full
Name
&
Affiliation:
%
River
Code:
—
- —
—
—-
—
—
#:4’
Jonqj
±.
1111
/82.
L
7
i
1]
SUBSTRATE.Check
ONLYTwo
substrate
7YPEBOXES;
I.
q
j
7
q
àstimate
%
or
note
every
type
present
Check
ONE (Cr2
&
verageJ
BEST.TYPES
POOL
RIFFLE
OTHER
TYPES
POOL
RIFFLE
ORIGIN
QUALITY
orzi
BLba1oI.
C
D
—
DLIMEsjpNEjIf
DHE11
GD
BtDL1
—
—
SILT
Ô
LE[U
Substrate
—
—
O1I
CD
—
CC
—
DJpNEjOJ
C C
ROj
[5]
—
(Sore
natural
substrates
ignore
DAJI
4°4
Aum
NUMBERbF
BEST
TYPES:W4
*?[?I
sludge
from
point-sources)
DSIt
E[OJ
20
Comments
Cfies[o1
DA
d
2]iNsTRAM:covER
quahtyIndicate
2
presence
Moderate
0
amounts
to
3:
0-Absent;
but
not
1-Very
of
highest
small
quality
amounts
or in
or
small
if
more
amounts
common
of
of
highest
marginal
AMOUNT
quality
3—Highest
quality
in
moderate
or greater
amounts
(e
g
very
large boulders
in
deep
or
fast water
large
Check
ONE
(Cr2
& average)
diameter
log
that
is
stable
well
developed
rootwad
in deep
/
fast water
or
deep
well
defined
functional
pools
C
uij
Lo2
ORHAFjGIN V
t3ELTIqN
L’L.
zjIri
—
RoQTw4D.sr[1]4
IC’MACOPIj
2ARSE
[3J.
/
BZE1
/
OG
OLEiL1I
C
Cover
Cömmehts
.
Maximum
II
I
I
I
20
3].CI34rVNELMORPHQLOGY
Check
ONE
in
each
category
(0r2
&
average)
SINUOSITY
DEVELOPMENT
C’
—
-
— -
C
C
LrP]
El
Cömmént
4] BANK
EROSION
AND
RIPARIAN
ZONE
Check
ONE in
each
category
for E.4cH
ANK
(Or
2 per bank
&
average)
Rivarrlghtlooklng
downstream
RIPARIAN
WIDTH
FLOOD
PLAIN
QUALITY
- -
r
EROSION
Zfl3
WIDE
>0ni
(4]
kii
FOREST
SWAMP
(3]
‘
-
C
C
CONSERVATION
TILLAGE
[1]
ti
NONE!
LITTLE
L3]
D
C
MODERATE
10
50m
[3]
D
SHRUB
OR OLD
IlELD
[2]
C
C
URBAN
OR INDUSTRIAL [0]
C C
MODERATE
[21
C C
NARROWS
lOm
[21
.
C C
RESIDENTIAL
PARK
NEW
FIELD [1]
C C
MINING
I
CONSTRUCTION
[0]
C
C
HEAVY
I
SEVERE
ti]
C C
VERY
NARROW
Sm
[1)
C C
FENCED
PASTURE
[1]
Indicate
predominant
lsnd
use(s)
C C
NONE
[0]. -
-
-:
C C
OPEN.PASTURE,R0WCRdP[0]
-
-. past
lOOm
riparian.
Rlparian
Comments
Maximum
5]
POOL/GLIDEAND
RIFFLE/RUN
QUALITY
MAXIMUM
Chéôk
ONE (ONLY!)
DEPTH
Check
CHANNEL
ONE
(Cr2WIDTH
& average)
CURRENT
Check
ALL
VELOCITY
that
RecreatIon Potential
I
ay
Primary
Contact
I
DÔREA
0
Secoda’y
Contac
CO
7.<ig4J-
iIJ
C
t
E
4ST1I14
(circle
one
and comment
on
back)
I
C
0440
7ñJ
COoLMOTH
<FE
WD!H101
CASTf4
C
lrEMIfrT44
____
Co[1l
1tD5RkEj
C’DS
PooI/
C
o2m[oJ
Indicate
forreach
pools
and riffles
Current
Comments
Maximum
12
UI
‘_-
Indicate
for
functional
riffles;
Best
areas
must
be
large
enough
to support
a
population
-
of riffle.obligate species:
Check
ONE
(Cr2
& average).
,O
RIFFLE
metrIc—0]
RIFFLE
DEPTH
RUN
DEPTH
RIFFLE!
RUN
SUBSTRATE
RIFFLE!
RUN.
EMBEDDEDNESS
C
BEST
AES>
10cm
t21
C
.IaAIrIJILI>
0ci
L2j
C
STABLE
e
g
oobIe,
BouIaer
L
2
J
C
Nt2f
C
BESTAPEftS
5 10cm
1j
C
X’MUM
<50c’i
[9
C
MOD
STABLE
te
g
Large
Gravefl
.1
C
Lv
C
BEST AREAS
<Scm
-
C
UNSTABLE
(e.g.,
Fine
Gravel,
Sand)
[0]
CØER[0E
RiffleI
(.‘))
Comments
ImetrIc0J
CENR,EMaxim::
I
6]
GRADIENT
(
0.1
ftImi)
C
VERY
LOW
- LOW.[2.4]
%POOL:Qa
)
%GLIDE:Ct’_)
GradientI’%
DRAINAGE
AREA
C
MODERATE[6-10l.
m
MaximumJ
mi2)
C
HIGH
VERY
HIGH [1O-6J
%RUN:
(
D%RIFFLE:CJ
‘a
_____
-
-
.
.
06/11/08
STABILITY
Channel
Maximum
20
.
EPA4520
C.(
)
(1
(0
-
Electronic Filing - Received, Clerk's Office, September 8, 2008
Qualitative
Habitat
Evaluation
Index
‘
1
HEI
s
____
and
Use
Assessment
Field
Sheet
core
____
Stream
&
Location
Dc
Pfz,is
‘
cfos-
7d
/-,.-f
‘4
cL-J
RM
249jDate
fr,!
08
Full Name
&
Affiliation:
je
L.J,tdAC
cft1-
River
Code:
-
-
STORET
#:
(
f4Jj
J
18Z
L
L
j
1] SUBSTRATE
Check
ONLYtwo
substrate
TYPE
BOXES;
estimate
%
or
note
every
type
present
Check ONE
(0r2
&
average)
POOL
RIFFLE
OTHER
TYPES
POOL RIFFLE
ORIGIN
QUALITY
D
C
HNE41_
—
DIMESTONEJ11
I]
QtbJ
Substrate
SILT
[J
(]4RtjFIC)AL[oJ.....
—
ØANDSTQI*[OJ
EXTENSIVEL21
L,J
(Score
natural
substrates
ignore
iPDE04,
C
iW’i
lium
r
TvPES
LJ2j
sludge
from
point sources)
20
STABILITY
5iPQbL/GLIDEAND
RIFFLE/RUN
QUALITY
MAXIMUM
:D.EPTH
CHANNEL
WIDTH
CURRENT
VELOCITY
Recreation
Potential
Check
cNE.(ONLY!)
Check
ONE (0r2
&
average)
Check
ALLthata
iy
Primary
Contact
Secondary
Contact
C
O7$t4J
9QTHJJWIDTH41J
C
VJST
L11D
I(circie
on
andcommQnton
back)
C
O4O72J
C
POOL
DThFF
1H
£01
C
___
C23
CTE
PooI/
om[OJ.
Indicate
for
reach
- pools and
riffles.
Current
Comments
Maximum
Indicate
for
functional
riffles;
Best
areas
must
be large
enough
to support
a population
of
riffle-obligate
species:
Chek
ONE
(0r2
&
average).
•
RIFFLE
[me r
c—al
-
RIFFLE
flEPTH.
.RUND.EPTH
RIF
IRUNSUBSTRATE.RIFFLE
I
RUN
EMBEDDEDNESS
CJ
LP
C
tiTt
)UM
5Ocpf
C
C
C
MI
AIiLÔ]
Riffle
/
Coin
L0
6]
GRADIENT(
-.(
ft/mi)
C
9.
%POOL:(/tr)
%GLIDE:
1
Gra
client
DRAINAGE
AREA
C
>‘
Maximum
____
(-ml2)
C
IGHVER’HIGH
[1O
%RUN
J%RIFFLE
10
EPA 4520
>
t S
-.
A4fir7--I
2
’
ji’
,_-
06111108
/
__(7
‘—-“--ate
‘‘;.2-Moderate
presence
0
amounts,
to 3:
0-Absent;but
not
1-Veryof
highest
small
quality
amouni&
or
in small
if
more
amounts
common
ofof
highest
marginal
AÔÜNT
amounfs
(e
g very
large boulders
in
deep or fast
water large
Check
ONE
(Or
2!era)
rootwad in
deep/fast
water
or deep
well-defined
functional
pools
—
, fÔG
C
Cover
Maximum
•
2]I
C.
C
‘P
LiLt
Comh7.ent
I
I.
)
L-I
.if-L
-L
‘
J
/J4
OLOGY
dheck ONE
in
each
category
(0r2 &
average)
T
C
‘ ONE
In each
cat
•‘.V
‘IBA
NK
(Or2per
bank
& average)
F!
Channel
Maximum
L
Li
md/cat
‘ada
minant
land use(s)
it1pai1an.
Riparian.
2-
Maximum
10
Electronic Filing - Received, Clerk's Office, September 8, 2008
BI
MoDIFIED
Ouahtaflve
Habitat Evahiaton
ndex
and
Use Assessment
R&d
Sheet
SfreamSLocetian:
.
/
/L
RN:
3JJ
Cute: o7/
1/08
Full
Name
S Affilitin:
j .
-,
-
11 SUBSTRATE
CIieOK
OtLYTro
substrate
PESOXES:
estimate %
o
note every
tape
present
Check
ONE (Or 2 &
average)
BEST
TYPES
POOL RIFFLE
Q]
TYPES
OGIN
QUII
Li
Li
sLOR
istss [10]
—
HARDPAN
(4]
Li
LiMESTONE
(13
Li
HEAW
[-23
Li
Li
BODER(51
Li
Q
DETRITUS
Li]
—
Q
TILLS
[1]
5.1
T
Li
MODERATE [-1]
Li
Li
COBBLE
8]
Li
Li
MUCK
[2]
Li
WETLANDS
[0]
Li
NORMAL
[03
[]C
GRAVEL
[7]
[JO
SIUf
(2]
[3
HAROPAN
[01
DJL.
Li C
SAND
[03
LiD
ARTIFICIAL
[01
*
Li
SANDSTONE
101
[D
EXTENSIVE [2}
Li
Li
BEDROCK
[5)
(Score naiurrd
substrates: ignore
Li
RIP/RAP [0]
LIMODERATE
1.1]
NUMBER OF BEST
PES:
Li
or
slvqe
front
point-sources)
Li
LACUSTRINE (0]
(
Li
NORMAL
10]
O3oriessfOJ
[J$HALE[1)
LINONE[1]
ommeits
C]
COAL
PINES (-2]
STABiLiTY
2
HIGH
[33
[3MODERATE [23
Li
LOW [13
Substrate
MilLer?
20
21
INS
3REAM
COVER
o 0
2
presence
c- Ia
p
.
i
0Absent;
I
n
1-Ver
of big
small
as ojat
amounts
1 ci
or
it
n
f more
ll
et
common
uui t of
of
highest
marginal
AMOUNT
uala
3H at
uuI
r’ a r
e
er
roe
.1ncs
w doep
m
las
a er Iaqe
Ohr ONU
0 / Sc
er’gp
diameter logIhat
a
stable,
sell
devtoped repOsed
in
cesrp
INLet
w)4ep’or
deep,
welleia6nett.
tuncUonal
poiils.
[3
EXTENSIVE
>75%
[11]
*
UNDERCUT BANKS [1]
POOLS> 70cm
1
2]
OXBQWS,
BACKWATERS [13
QMODERATE
2575%
[7]
OVERHANGING
VEGETATION
i]
ROOTWADS
[1]
AQUATIC
MACROPHYTES [13
LI
SPARSE
5<25%
[31
—
SHALLOWS
(IN
SLOW
WATER) [1)
*BOULDERS
[11
LOGS OR WOODY DEBRIS
Q
NEARLY
ASSENT
s5%
[1]
ROOTMATS [1]
*
Cover
Comments
Maximum
I
20&
3)
CHANNEL MORPHOLOGY
Cheoc
ONE in
each cetporv
(Or
2 4
SIN
UOSITY
DEVELOPMENT
CHANNELIZATION
Li
HIGH [4]
[3
EXCELLENT
[7]
Li
NONE
[tt]
LI
MODEItASE [3)
LI
GOOD [6]
Li
RECOVERED
[4]
Li
LOW
[2]
Li
FAIR
(31
Li
RECOVERING
[3]
)2J
NONE
11]
POOR [1)
Li
RECENT
OR NO RECOVERY
[13
Comments
irpiite
[-i]
cit
Maximum
20).
41
BANK
EROSION
AND
PIPA
IAN ZONE Oh”
I ONE n ooch
rate
rory
for EACH BANK
iOr
F pa Synk
6
,rr or
iq
rht
ke5dnti
dtwv
:,
RIPARIAN
WIDTH
FLOOD
PLAIN
QUALITY
EROSION
Li O
WIDE>
SUm
[4]
ii LI
FOREST,
SWAMP(S)
Cl
CONSERVATION
TILLAGE
[1]
Li C]
NONE!
LITTLE
IS)
C)
C
MODERATE
50ar
(TI
[3 Li
SHRUB
OR OLD FIELD [2]
C]
Li
URBAN
OR
INDUSTRIAL
(0]
Li Li
MODERATE
[23
Li
Li
NARROW
5-1 Urn
(23
Li
Li
RESIDENTIAL,
PARK,
NEW
FIELD
[1]
C] LI MINING I
CONSTRUCTION
[01
LI
LI
HEAVY
I
SEVERE [1)
Li
Li
VERY
NARROW
C
Sm [1)
Li
LI
FENCED PASTURE
[1]
indiCate
prcrdoseinenr
land
use(s)
Li LI
NONE
[0]
Li LI
OPEN
PASTURE,
ROWCROP
(0)
past
lOOm
r(padari.
mpsrianf. ,
Comments
Mxmum
)‘/“
51
POOL!
GLIDE
AND RIFFLE
/
RUN
QUALITY
MAXIMUM
DEPTH
CHANNEL
WIDTH
Check ONE (ONLYi
Check ONE
(Oi
24
everager
,> ‘Im
16]
Li
POOL
WIDTH>
RIFFLE WIDTH
[2)
[3
0,7-elm
[4]
Li
POOL WIDTH
‘ RIFFLE WIDTH
[1]
Qo.4eo.7m
[21
Li
POOL
WIDTH RIFFLE
WIDTH
[0]
Li
0.2e0.4m[1)
LIc6,2m [0]
Comments
CURRENT
VELOCITY
Check
ALL that
apply
Li
TORRENTIAL F-I)
M’SLOW
[1]
LI
VERY FAST
[13
LI INTERSTITIAL
[-1]
Li
PAST (1)
Li INTERMITTENT
[-2]
Li
MODERATE
(1]
Li EDDIES
[13
indicate fOr
reach - poois and riFles.
Recreation
Potential
Primary
Contact
Secondwy
Contact
1)11
il
mnmlrt ‘II
Poe/I
Current
12
indicatti
for functional
riffles; Best areas
must
be
large
enough to
support
a
population
RIFl
F
Nt—P
of
riffleobIigate
species:
Cheek
ONE
(Or 24
arrerrrgs),
Li’
i-
.. line
RIFFLE
DEPTH
RUN DEPTH
RIFFLE
I RUN SUBSTRATE
RIFFLE
I RUN
EMBEDDEDNESS
[BEST
AREAS>
10cm 2j
[JMAXINIUM> 50cm
[2)
DSTABLE (..Cobble.
Boulder) [2]
Li
NONE (23
ODES
f
AREAb S
5
0c
a I
Li
MA>
a
to
Rho
if
ii
[JIsOri
ST4BLE
(e
Large Gro
eI}
[1
[JLOW
[1]
C]
BEST
AREAS
<Scm
C]
UNSTABLE
(e,r’,
Fine
Gravel.
Senrli rot
[3
MODERATE
[01
Rite,
)matrio0]
‘
‘
LIEXTENSIVE[-I]
Hurt
17)
Cwnments
viaxunu,n
C
0)
0155
101001111
(
L
VEY
LOW
- LOW f24]
DRAINAGE
ARE/k
[JMODERATE
[5-10]
[3
HIGH VERY HIGH
(ID’S]
/—Th
).‘
5
POOL:
,)
%GLIDE:(
)
%PJfc,
(JD%DIFFLE
(
)
/:
I
/‘—i)
‘
Gradianf
/
Maxnrlum
Electronic Filing - Received, Clerk's Office, September 8, 2008
MUl
MODIFIED
Quahtatñve
riabftet
Evaituatbn kadex
I.LJflI.
and
Use Assessment
Fäelld Sheet
PM
-;Oatc
2i±9J08
Full Name A
AffIlIation:
:..;
2
RnerCodeSTOPET#
I
1] SUBSTRATE
Check
ONLYTwo substrate
l’VPPBOXftS
estimate
Lo note every
type
present
P!T
TYR!
POOL
RIFFLE
OTHER
TYPES
POOL RIFFLE
00
BLDRISLAES
(103_.
—
0 0
HARDPAN
(43 ——
o
0
BOULDER (93
0
0
DETRITUS [31 —
OOCDBBLE(83
OOMUCK[23
00
GRAVEL[73
——
—
OOS1LT(23
—
00
SAND
[63
—
0
OARTIFICIAL[OL__
O 0
BEDROCK (53
(Score natural
sunslratea:
ignore
NUMBER OF
BEST TYPES:
0
4
or
more
[2]
sludge
born
pcrnt-soumes}
0
3 or
tess [03
Chece
ONE (Ci-?
&
avemga)
ORK3!N
QUALITX
0
LIMESTONE
[1]
0
HEteJY
[-21
0
TILLS [13
D
MODERATE
[-13
O
WETLANDS
[0]
0
NORMAL
[0]
O
HARDPAN
03
0
FREE
[1] - -
O
SANDSTONE
(0]
U
EXTENSIVE
[-4
O
RIPIRAP [03
0
MODERATE
f-i]
O
LACUSTRINE
[0]
0
NORMAL
[03
Li
SHALE
[-11]
0
NONE (1]
1.9
COAL fiNES [-23
21
—
INSTREAN
COVER
lndicete
tuafltv:
2—Moderate
presence it
amounts,
(oat
C-Absent
hut noti-Very
or
htghsst
email
nudity
amounts
or
or
n
small
ii
more
amounts
comnnton
otofhiohest
ntsrginal
AMOUNT
oMit7 Shgwsto
cli
ede
Lomb
cc
nau eg
si
fi r
Let
ems tMpor
a &ker
In
a
(n
cONE
Or 5
isnm
diameter
tog
that
a
stable,
well
developed rootws.o
a
deer!
fast v,steoor
deep
well-defined,
functional is,
6
po
0
EXTENSIVE
>75%
(113
UNDERCUT
SANKS [1]
—-
POOLS
a 70cm (23
OXBOW&
BACKWATERS
(13
0
MODERATE
25’JS%
[7]
OVERHANGING
VEGETATION
[‘13
ROOTWADS
[1]
—
AOUAF1C
MACRO PHYTES
[1]
0
SPARSE
5-c26%
[3]
—
SHALLOWS (IN
SLOW
INATER)
313
BOULDERS
[13
LOGS OR
WOODY
DEBRIS
ri
0
NEARLY
ABSENT
<5%
[i]
—
ROOTMATS
31]
Cover
I
Comn’srants
Max/mum
.
2O
33 CHANNEL
MORPHOLOGY
Check
ONE in
each
category
(Or 2
&
avsmsget
SINUOSITY
DEVELOPMENT
CHANNELLEATION
O
HIGH
4]
0
EXCELLENT [73
0
NONE [6]
O
MODERATE
(33
0
GOOD (5]
.
0
RECOVERED
[4]
O
LOW
[7]
0
FAiR
(3]
0
RECOVERING
[3]
fZNONE
[1]
$
POOR
[1]
0
RECENT OR NO RECOVERY
[I]
Comments
1
Impounded
1]
q BANK
EROSION
AND
RIPARIAN
ZONE
Check
ONE
in each category for
EACH BANK (Cr2 per-dank
&
eversgs)
River
nest
taskice
dowestresm
-. RIPA.R(AN
WIDTH
-
FLOOD
PLAIN
QUALiTY
±
s
EROSION
O O
WIDE>
SUm
633
O
O FOREST,
SWAMP [3]
0 b
CONSERVATION
TILLAGE
[i]
O 0
NONE
F
LITTLE
(33
0 0
MODERATE 10-SCm
(33
0
0 SHRUB
OR OLD
FIELD
(2]
0 0
URBAN OR
INDUSTRIAL [03
o o
MODERATE
(4
0
0
NARROW
5-lOin
(2]
0
0
RESIDENTiAL,
PARK. NEW FIELD
[1]
0 0
MINING!
CONSTRUCTION
[0]
o o
HEAVY
(SEVERE
[1]
o
0
VERY NARROW
< Sm [1]
0 0
FENCED
PASTURE
[1]
0
0
NONE
[0]
0
0
OPEN
PASTURE, RCWCROP 0]
51
POOL /GLI’DEAND
RIFFLE/RUN
QUALITY
MAXIMUM
DEPTH
CHANNEL
WIDTH
Check ONE
(ON/Y!t
Check ONE
(Or? & eversga(
,,Ø’>
im [6]
0
POOL
WIDTH> RIFFLE WIDTH
(2]
0
02-elm
63]
0
POOL WIDTH
= RIFFLE WIDTH
(13
0
&4-<OYtn
[2]
0
POOL WIDTH
<R/FFLE
WIDTH
(0]
O
02-efL4m
[‘I]
.,,,
—--.---
—--
0
2m
[0]
4
kt
tti
n
]--rJ
[13
Comments
hid/cafe
predominant
land ueo(al i-r.a
r:.rcy.
pest
bUnt
rioeren.
Riper/an
1; .
—
Maximum
if)
-- -
PoofJ,y
Current)
/
Maxanuro
]ndkate
for
fUnCtiOnal rWf]es:
Best
areas
must be
large
enough
to support
a
population
‘-1-to
RIFFL
(r
of
riffle-obligate
speCieS:
Check
ONE
(Om 2
& average).
Li
5
..
RIFFLE
DEPTH
RUN
DEPTH
RIFFLE
I RUN
SUBSTRATE
RIFFLEIRUNEMBEDDEDNESS
o
BESTAREASa
10cm
[23
QMAXIMUM
> 50cm
j2]
0
STABLE
(e,9,.
Cobble. Eottlderj
[2]
0
NONE [2]
O
REST
AR!AS S
tOont ‘i1
Ulitr(
I
Li-/I ‘- itt
l1
DM00 STABLE (c
j
Large
Gravel) ii]
020W
(IJ
O
BEST
AREAS
<Scm
0
UNSTABLE
(e,g,±
Fine f3revet,
Sand) [0]
0
MODERATE
(03
ur/e
fniotdcwo]
.
0
EXTENSiVE
fri]
, ±.on
Comments
e’racr’nc.cn;.’
Stream
&
Location:
La
rJrat/ff
5z±,,i
‘,,i—-,±’
4tersrcL
‘ii. ‘i,—
.
‘__.
Comments
SILT
Sobs/mar/e
/.baxhnunr
20
STABILITY
HIGN [33
0
MODERATE
[2]
Z
LOW[r/
Comments
Channel
!
Mas/mnwn)
4
CURRENT
VELOCITY
Check
ALL th
at
apply
o TORRENTIAL
f-i] WSLOW
[1]
O
VERY
FAST [1]
0
INTERSTITIAL [-1]
o FAST
[1]
0
INTERMITTENT
[-23
o
MODERATE
[1]
0 EDDIES [I]
InN/celia fUr reach
— roots end riffles
‘ReCreation Potential
1
Primary Contact
Secondary Contact.
3
Nests
sire
aid
seereesfcsJss3rjj
6]
GRADIENT
itimi;
C)
VERY LOt/L-
LOW (2-43
DEAptAOE
&EA,
c
55(fl9;5jt
if)
mitt
ii
FtlGt’i - VERY
HIGH
31it6]
%POOL:Q)
%GLIDECJ’
5
AR]JN’
()%R]FFLECJD
4
.--
(2rem/!en//
/
tq,e,o;nttot
i-
/
EPA 4520
OF/I/Ott
Electronic Filing - Received, Clerk's Office, September 8, 2008
MEl MODIFIED
cuutive
Habitat Evahiatbn
ndex
‘
and
Use
Assessment Fed Sheet
_f”
Scorers Full
Name
& Afflliatioc:
River Code:
STORET#:
LaLI Long.:
18
Oft
1] SUBSTRATE
Check
OWLYTWo substrate
TW’E BOXES:
%
O
555 55y
IP5
i5fli
CIIek
ONE
(0’
2
& enge)
BEST
TYPES
POOL
RIFFLE
POOLRWFLE
GRIN
QUA-1T!
o
Q
SLOP /SLABS
[1
O
Q Q
HAROPAN
4] —
—
Q
UMESTONE
[1J
U
HEAVY
[2
00
BOULDER
[91
*
c
DETRITUS [3] *
* [3
TELLS
[11
UMODERATE
[1]
[3D
COI3i3LE[9]
—
[3fl
MUCK
[23
—
—
U
WETLANDS OJ
I
NORMAL
[0]
[3D
GRAVELf7]
_._,. [][JSILT[23
DHARDPAN[]
DFREEII)
[3
SAND [S
__.
[.3
ARTB9CIAL
10]
[1
SANDSTONE
[01
(2
EXTENSIVE
[2]
C]
C
BEDROCK [5]
(Score
puratouhs1rates
Iqnorv.
[3
RP1RAP
[0]
)DEOF!
[3
MODERATE
[-II
NUMBER
OF
BEST
TYPES:
[3
4 or more j
sludpe (rem poitsourves)
DLACUSTRNE
to]
C
NORMAL fO]
C]
or ieee
O]
[3SHALE [-1]
UNONE
[1]
ommen s
[.3COAL 9NES
[2]
2]
INSTREAM
COVER
Indiceto
nuot
5$
presence
oeerai
Cite
en
3:
ii
RAbsent
is
b
a r-
a
i-Vera
o Ii 3hesl
srnafl amounts
iaht oi in
or
esrell
if
more
ar
common
ojn ci
of gInaI
AMOUNT
he
.
i
n mo.L
.. or
,io
i
ii
S
a
t.c
v
hro
k. a
toep r
foal
.dat Iare
Chad ONI
O
2 & lIOJ
i
diameter ra that
is
stable,
well
dOvelopad rocawad
in
deep
/
(eec
wttec’or deep.
welt-defined,
funtionai pools,
[3
EXTENSIVE
>75%
iii]
UNDERCUT BANKS
[1)
—
POOLS> 70cm
[23
OXBOWS, BACKWATERS
[1]
[3MODERATE
2545% f7]
OVERHANGING
VEGETATION
[13
*ROOTWADS
[1]
*AQUATIC
MACROPHYTES
i]
[3SPARSE
5s25%
P1
_SHALLOWS (iN
SLOW
WATER)
(13
*BOULDERS
[1]
—
LOGS OR WOODY DEBRIS [j]
QNEARLY
ABSENT
<5%
[13
—
ROOTMATS
[13
Cover
Comments
Maximum
3
ij
2O
‘‘
3] CHANNEL
MORPHOLOGY
Check ONE in each
category
(Or
2 A average)
SINUOSITY
DEVELOPMENT
CHANNELIZATION
O
HIGH [4]
[3
EXCELLENT [1]
[3
NONE
o
MODERATE
I1
C]
GOOD
[53
0
RECOVERED
f4]
o
LOW
f2]
0
FAIR
J
0
RECOVERING [3]
NONE [1]
1
POOR [1]
C
RECENT
OR
NO RECOVERY
[13
Comments
7r
4]
BANK
EROSION
AND RIPARIAN
ZONE
Check ONE in eech category
for EACH
BANK
(Or2parhank & average)
Riw
cast
otdn
. RIPARIAN
WIDTH
FLOOD
PLAIN
QUALITY
EROSION
C] C
WIDE SOre
E4]
C]
0
FOREST, SWAMP [3]
C
CONSERVATION
TILLAGE
[13
0 C)
NONE! LITTLE
[3)
C]
C]
MODERATE ‘ID-SOre
(31
0 C
SHRUB OR OLD FIELD
E23
C] [3
URBAN OR
INDUSTRIAL
(0)
U [
MODERATE [2]
QQ
NARROW S.40m
E]
C [3
RESIDENTIAL,
PARK, NEW FIELD
[13
[3 0 MINING!
CONSTRUCTION
[03
Q[3
HEAVY! SEVERE [13
Q[3
VERY NARROW
SIn [1]
00
FENCED PASTURE [1]
indIcate
preaominuanl land use(s)
0
[3
NONE [0]
0
DOPEN PASTURE,
ROWCROP [0]
past
lOOm
ruoadan.
Fii
par/Cc
Comments
Mx,mum
5] POOL /GLIDE
AND
RIFFLE/RUN
QUALITY
MAXIMUM
DEPTH
CHANNEL
WIDTH
Check ONE
(ONLY!)
Check
ONE (Or
2 & everago)
Ire
E51
POOL WIDTH> RIFFLE
WIDTH [2]
C]
0,7-elm
(41
C]
POOL
WIOTHRIFFLE
WIDTH [1]
o
0,4a07m
[2]
0
POOL
WTDTH a RIFFLE
WiDTH
I]
O
0.2-aO.4m
[1]
[3-c
L2m [0]
:ImpOUned[’i],
Comments
Herd?
Current
Llaxtrraurn
12
IndiCate
for functional riffles Best areas
must be
large enough to
support
a
population
r
H
RRFL
‘t”
of riffle-obligate
SpeCICS
Otack
ONE (Cr2
A
average),
.
C5
RIFFLE
DEPTh
RUi] DEPTh
RIFFLE
I
RUN SUBSTRATE
RIFFLE
I
RUN
EMBEDECNS
C]
SESTAREAS a lOom [2]
0
MAXIMUM> 50cm
[23
0
STABLE
(eg,, Cobble, Boulder) [23
[]
NONE
[2]
C
BESTAREAS
SdlOcm
El]
C]
MAXIMUM a 50cm
(I]
C
MOD.
STABLE
(e.g,
Large c-ravel)
[1]
0
LOW [13
,
C]
LES”
°CAS 5’
C]
dNSTSLE
10
9,,
Ree (-“a
c
1
C
)
‘9
C]
MQDen4ru er
[matrIod)
•0
EXTENSIVE (-1],
-,
Comments
l
GRAO!ENT(
C]
IERiLOOr
LOW”2-4u
iPOOL
““ %GUDE
(““')
r’juraVt
DRAINAGE
AREA
C
MODERATE
[SW]
.
Mec”wc
‘
u
iDkHHfi09____
%PUN_j%RD-F-LE
=—=
.
.
‘:
‘
.‘(‘
2131)10!!
EPA
4522
,.
Stream & Location:
Substrate
!I4ac!rnuuru
20
STABILITY
O
NIGH
[3]
o
MODEIATE [23
3’LOW[1]
Channel
.1
Mttx)murn
n... •
20 ,
CU
RRENT vELocrrl
Check
ALL
thai apply
o
TORRENTIAL Ml
.ISLOW
[1]
O
VERY
FAST (1)
0 INTERSTITIAL
[-1)
O
FAST [1]
C INTERMITTENT
[-2]
O
MODERATE [1]
0
EDDIES
[1]
In cl/cafe
for
15Cc!?
- pools
and riffles.
Recreation
Potential
Primary
Contact
I
Secondary
ContCct)
Icirule
aria
.AJ
‘‘.7
1:
Electronic Filing - Received, Clerk's Office, September 8, 2008
iviooi
FlED
cce
Eviaton
kidex
ii
kssesment
Fed
Sheet
.Dato:
J
i
C8
_Scorers
Full
Narr,e
&
I4fFiliation:
1’
_____
*
—
—
—
—
STORE7
—
LeL / Long
/8
ñ
*__=
U
crL)
—_--==——
—
— —
Ii SUBSTRATE
Cher
ONLY
Thm
mibsmfc
Th’PE
3:X7S;
et’etr-
%
or
onto
every
ty
resertt
ChecR
ONE
tOr 2 &
everege)
2
P0OIRFFLE
ORG1N
QuALrry
LiD
SLD°’
S
i-’E
[101
Li
r
RO°A\
[]
LI
MESTONE
[1]
U
HEAVY
2]
1J
[1
BOULDER
[51
EJ
Li
LW
RLLUS
—
DrILLS
[1]
Li
ODLRALE
0
C]
COBBLE
[8)
C]
(
MUCK
[2]
——
Li
WETLANDS
[0)
Li
NORMAL
(0)
[ID
GRM’EL[7
*
Li
DSILTr2)
[]HARDPAN[03
DFREE[1J
—
Li LI
SAND
S)
fl
PTWICAL
[0]
D
SANDSTONE
[0]
Li
EX
EENSIVE
2]
CI
C]
BEDROCK
5)
,,..
tScoe
nafrerd
subehatne;
iqnore
Li
RIPIRAP
[03
0%
Li
MODERATE
[-1]
NUMBER
OF BEST
TYPES:
Li
4
or mars
[2]
shJcNe
from
porosources)
CLACUSTRINE[0]
‘3D
NORMAL
[0]
—u
3oricss[0]
DSHALE[41
LiNONE1]
Li
COAL
FINES
[.2]
Strsam
&
Lactioz:
Shstrete
isximum
20
2] INS
TREAM
COVER
hd;cete
presenco
C
to
3: 0-Absent;
1Vary
smell amounts
or ii
more common
N
marginal
AMOUNT
i
i.
i n I gh-l
..uh
o ii n
iN
-sir inn a a
h
vhas
r&
\
34ghatt
4LI
tV
(€iO
t5OLJ..
ery
lerge
hovers
dei
or
fr
water
ls
._,ck
I
..
dtarnaler
Ice
that s stable.
w5Ii
O5dOpe)
rocCwen O
OE5P
/
feat water.
or
doeu,
wcll-defined.
ftincironal
pools.
Li
EXTENSiVE
>75%
111]
UNOERCUT
BANKS
[t]
POOLS>
70cm
[21
OXBOWS,
BACKWATERS
[1]
Li
MODERATE
25-75%
[71
OVERHANGING
ECEIA11ON
OOTeVADS
IJ
——
AQUATIC
MACROHYTES
[Ij
Li
SPARSI-
S
25t
0]
*
SHALLOWS
(IN
SLOW
WATER)
[1]
-—
BOULDERS
[ii
—
LOGS
OR
WOODY
DEBRIS
r
Li
NEARLY
ABSENT
e5%
[1)
ROOTMATS
[1)
Cover
Max/mum
1
20
STABILITY
2!
HIGH
[3]
Li
MOI3ERATE
[2]
Li
LOW
[1]
3]
cHANNEL
MORPHOLOGY
Cheok ONE
I:
eech
category
(Cr2
&
average)
SINUOSITY
DEVELOPMENT
CHANNEUZATION
Li
HiGH
[4]
C
EXCELLENT
[7]
Li
NONE
163
Li
MODERATE
[3j
C
GOOD
[5]
Li
RECOVERED
[4]
Li
LOW
[21
Li
FAIR
[3)
Li
RECOVERING
[3]
NONE [1)
POOR
[1]
Li
RECENT
OR
NO
RECOVERY
[1)
omrnents
lnipounded
[1][
Chanril
M>xrrnen
3;
20
sl
St
IJe
EPOSION
MID
P!PA PlAN
ZONE
Ch’ce
ONE n
each
a
eory
or EACH
BANK
0
2 no DCI
& C
erie)
bks
RIPARIAN
W!DTH
FLOOD
PLAIN
QUALITY
EROSION
C]
[]WIIOE
> 50m
(4]
t]
Li
FOREST,
SWAMP
]3]
Li
CONSERVATION
TILL/tOE
[1]
C]
C)
NONE [LITTLE
[M
C)
C)
MOOERATE
305Cm
[1
[LI
[LI
SNRUB
OR OLD
FIELD [23
0 Li URBAN
OR INDUSTRIAL
[2]
Li Li
MODERATE
[2]
El
C
NARROW
5-IOn,
[2]
[LI Li
RESIDENT1AL,
PARK
NEW FIELD
[11
Li Cl
MINING!
CONSTRUCTION
[01
Li Cl
HEAVY
I
SEVERE
[1)
Li C
VERY
NARROW
< 5fl (1)
C Li
FENCED
PASTURE
[13
Indicate
proclominare
land use(s
Li Li
NONE
[0]
El
C]
OPEN
PASTURE,
ROWCROP
[01
pest
lOOm riper/an.
Ripar!an
I!
-
Maximum
10
k
9
POOL
/ GLIDE
AND
RIFFLE!
RUN
QUALITY
MAXIMUNI
DEPTH
CHANNEL
WIDTH
Check
ONE
(ONLY!)
Check
ONE (O
2
& avcraoe)
N>
3m
[03
0
FOOL
WiDTH>
RIFFLE
WIDTH
12]
C]
0Je1m
141
C]
POOL
WIDTH
RIFFLE WIDTH
[11
Li
5.4-e0.7m
[2)
Li
POOL WIDTH
C
RIFFLE
WIDTH [0]
Li
0.2-eiL4m
[jm
Li
0,2m
[0]
Comments
CURRENT
VELOCITY
Check
ALL
)bel
apply
Li TORRENTIAL
[-1] LOW
[1]
CI
VERY
FAST
[1]
Li
INTERSTITIAL
[-1]
O
FAST [13
Li
INTERMITTENT
1-21
Li
MODERATE
[1)
Li
EODIES
[1]
md/oNe
fo, reach
POOlS
and tIff/es
RecreatIon
PotentIal
I:
Priiriary
Contact
i
S000ndamy
Contact
Po?i
flax/mu
of
indicate
liffle-Obilgate
for
functional
species:
riffles;
Best ara-s
Check
must
ONE
be
Or
iarge
2 &
average).
enoUgh
to
support
a
popuiation
Li
-- NO
l
RiFFLE
DEPTH
RUN
DEPTH
RIFFLE
I RUN SUBSTRATE
RIFFLE
I
RUN
EMSEDDEDFESS
El
EE5TAREAS>
10cm
[2]
C]
MAXIMUM
> 50cm
[2]
Li
STABLE
(e.cj.
Cobbla,
Boulder)
[2]
Li
NONE
[2]
-i
EES AREAS
[I
m,!I
U
3lrm
C]
nOD
STA3Lr
p
j
LorDe
Oravei)
1
[I
Ost
j]
EE
‘A
— 5cm
U
UNST
L.E
e Gnav,
So,
dl 15]
CI
1ODELA’T
C,
[metric0)
-
-
C]
EXTENSiVE
[1]
.,
Comments
9
GRADIENT
(MN)
Li
VERY LOW
- LOW
12-4)
C]
r1ODC’TC
[a
01
L__mi
2
)
Li
HIGH
- VERY
HiGH [10-6)
EPA
4523
%POOL_j
%GLIOE:C
j
Gradient
%RUN:
(
%R!FFLE(ZDt
sIc
oven
Electronic Filing - Received, Clerk's Office, September 8, 2008
MEl
MODIFIED
etream
&
Location:
&tqsK/a&ryc
River
Code:
STORET
A:
I]
SUBSTRATE
Check
ONLYTwo
substrate
no’s
EOYES:
estimate % or
note
every
type
present
BEST
TYPES
POOL RIFFLE
OTHER
TYPES
POOL RIFFLE
DO
BLDR
ISLABS [10J.
C
C
HAROPAN
14)
—
—
o
C
BOULDER
fP3
—
—,
C Q
OETRITIJS
[3] -—
—
CD
COBBLE[0]
—
C
EIMUCK[2)
—
—
000HAVEL[YI
ODSILT[2]
CE]
SANO[9
——
El DARTIFICIALM_
—
DC
BEDROCK
[5]
—
—
(Score
natural
substrates;
tçnore
NUMBER OF BEST
TYPES:
C
4
or more
t:
sludge
from point-sources)
ments
‘
0
3 or lees [0]
Check ONE (Cr2
&
average)
ORIGIN
QUAUTY
C
LIMESTONE
[1]
C
HEAVY [-2j
C
TILLS
[‘I]
SILT
MODERATE
1-i)
o
WETLANDS
10)
C
NORMAL
[0)
o
I4ARDPAN
[0]
0
FREEJI]
- -
o
SANDSTONE
10)
EK#NSWE’P2]
0
R1PJRAP
[0)
0
t0DE%
0
MODERATE
[-1]
C
LACUSTRINE
[0]
tO
Q
NORMAL
[0]
o
SHALE [-1]
NONE
p3
C
COAL
FINES
f-2]
21
MIS
TRPAM
COVER
Indicate
gush
y
2
presence
ivlcderi
3,
0 to
or
3;
a
0-Absent:e
out rot
i-Very
o
feghest
small
guilty
amounts
or in
or
small
if
moreancommon
ounle
o
of
highaet
maiVinal
AMOUNT
quality:
3-Highest quality in moderate
orgreater
amounts
(eg,,
vary
large
boulders
in deep or feel
water, large
i
r r
-
diameter
log that
is stable.
well
developed
rot
twed
in
deep!
rest water, or
deep,
well-defined, functional
pools.
C
EXTENSIUL
>76%
[Ii]
UNDERCUT
BANKS
ii]
—
POOLS>
70cm
[21
—
OXBOWS,
BACKWATERS [‘I)
Q
MODERATE
2545% [7)
OVERHANGING
VEGETATiON
[1]
—
ROOTWADS
[1]
—
AQUATIC
MACROPHYTES
11]
0
SPARSE 5-<25%
[3)
—
SHALLOWS
(IN SLOW
WATER)
[1)
—
BOULDERS
[1]
—
LOGS OR WOODY
DEBRIS [1)
[]NEARLY
ABSENT
<5%
[1]
—
ROOTMATS
[1)
Cover
I
Comments
Mqhuin
I
20k
3] CHANNEL MORPHOLOGY
Check
ONE in
each
category fOrk
&
average)
SINUOSITY
DEVELOPMENT
CHANNELIZATION
C
NIGH
1]
C
EXCELLENT
[7J
C
NONE
5]
CI MODERATE [3)
C
GOOD
[5]
El
RECOVERED
[41
o LOW
[2]
0
FAIR
[3)
0
RECOVERING
15]
$NONE
(1)
POOR
[‘I)
C
RECENT
OR
NO RECOVERY
[1]
Comments
$
4]
BANK
EROSION AND
RIPARIAN
ZONE Check ONE in each
category
for EACH
BANK
(Cr2 per bank &
overage)
River
tNeteeenretovmrflern
RIPARIAN WIDTH
FLOOD
PLAIN
QUALITY
ROS1ON
U
WIDE>
SCm
f4]
O C
FOREST
SWAMP
[3)
U
U
cONSERVATION
TILLAGE [1)
0
0
NONE! LITTLE
[3]
[9 0
MODERATE
10-5Gm
[3)
C C
SHRUB
OR
OLD
FIELD [2]
C C
URBAN OR
INDUSTRIAL
[0)
LI
Cd
MODERATE
0
C
NARROW
5-1Gm
121
C
C
RESIDENTIAL,
PARK, NEW FIELD
[1]
C
C MINING 1
CONSTRUTIDN
[0]
o 0
HEAVY!
SEVERE
U]
0
0
VERY NARROW
<Sm
[1)
1] 0
FENCED
PASTURE
[1)
C C
NONE [0]
C
C
OPEN
PASTURE,
ROWCROP
103
5]
POOL
J
GLIDE
AND
RIFFLE
/ RUN QUALITY
MAX1MUM DEPTH
CHANNEL
WIDTH
Check
ONE (ONLY0
Check
ONE (Cr2
& avenegot
Im
16j
0
POOL WIDTH>
RIFFLE WIDTH
121
o
0,7<l in
It]
C
POOL WIDTH
RIFFLE
WIDTH
[1)
o
OA-c07m
[2]
0
POOL WIDTH
<RIFFLE
WIDTH
[01
C]
0,2-4r,4m
[1]
C
<0.2rn
[0]
Comments
ludicete
prer/omioanl
ten
ci
use(sI
pest
10003 r!perieri.
Riparfen ti
,-
.—
Maximum
I
C
PoolI
,te:
Current.,
.kloxvrttim
‘2
indicate
for functional riffles;
Best areas
must
be large
enough to support
a
population
rINC
PT’
9
of
riffIeobligate
species:
Chock
ONE (0r2
& evemge).
.2
”
t
t[.4’rS
RIFFLE DEPTH
RUN
DEPTH
RIFFLE! RUN
SUBSTRATE
RIFFLE I RUN
EMBEDDEDNESS
C
BESTAREAS> 10cm
12]
C
MAXIMUM> 50cm [2[
C
STABLE
(e,g.,
Cobble,
Boulder)
[21..
Oh
ONE [2]
C
BESTAREAS 5-lOcn3
[‘I)
C
MAXIMUM <60cm [1)
C
MOD,
STABLE
(e,q., Large
Gravel] [1)
C
LOW1)
ED
BEST
AREAS
<
Scm
C
UNSTABLE
[e,g,,
Fine Gravel,
Sand)
101
C
MODERATE
15]
Rr4.
netrtc%
w
0
EXTENSIVE
(‘1
.,,. .
V.,..
çt.
Comments
v,ax1121t0,
r
0
Mextoatm
GradIent
‘
/
ärçre.....eeeea
0t3’iVCk
V
. .1
K
‘
7.4,?
O;uaitbtive
Habitat Evaktation
llndex
‘ü
and
Use Assessment
Held
-
Sheet
Qrin
COsG.
RM:fl3
Oate:c7//
jf/O8
Scorers Full Name
&
Affiliation:
“ice
(A.
vr%c<rlo,
e’4I’v.”’
LaLI
Los .:
emnce venartd,
recess-three 0,,..,..
— ,_
—
._
.,,_ —
— —
. .
!PPt!ltm ‘-.
Ssrhs
irate
Maxirnrnn
STABILITY
C
HIGH [3]
C
MODERATE
[2)
LOW[1)
Comments-
Channel
Maximum
J
it) v.
CURRENT
VELOCITY
Check ALL that
apply
O
TORRENTIAL
-l)
WSLOW
[1]
o
VERY
FAST [1)
0
INTERSTITIAL
I-il
o
FAST [1]
C INTERMITTENT
[r
21
o
MODERATE
[1)
C
EDDIES [1]
Indicate for reach
- pouts and riffles.
I
Recreation
Potential
I
Primary
Contact
Secondary
Contact
j
trirdr
err
end re’rmrttt
tee trrrt0 4
1
GRADIENT
tgmi)
C
VERY LOW - LOW
1241
DRAINAGE
AREA
0
MODERATE
16-10)
mlt)
C
HIGH
- VERY
HlGH
[105]
EPA
4520
iy.000L:C’)
%GLIDEQ_J
%RUN:
CZD%RIFFLE:C
0
Electronic Filing - Received, Clerk's Office, September 8, 2008
3]
CHANNEL
MORPHOLOGY
Check
ONE
ch
cete[lorv
(Or
2 &
everape)
S[NUOSITY
DEVELOPIENT
CHANNELIZAIION
C
[4]
C
EXCELLENT
[1
C
NONE
[6
C
MODERATE
[3]
C
GOOD
[5]
C
RECOVERED
L41
C
LOW [2]
C
FAIR [3]
C
RECOVERING
[31
NONE[1]
]2
POOR
[1]
C]
RECENT
OR
NC)
RECOVERY
[11
Comments
RM:JCDetO:fl
/]O
Scorers
Full
Name
& Affiliation:
J1r
Lati
Long:
4]
RANK
EROSION
AND
RLARIAN
ZONE
Check
ONE
in
eecl,
ca:egory
for
EACH
SANK
(0r2
per heck &
aveiepej
RIPARIAN
WIDTH
FLOOD
PLAIN
QUALJTY
ROSION
H
WIDE>
SOni
[4]
]J
FORESt
SWAMP
[3]
0
CONSERVATiON
TILLASE
[1]
C]
Ci
c
L1TLE
[3]
Ci
MODERATE
t5fl
131
C
C
SHRUE
OR OLD
FIELD
[2]
C
C
UREAN Q
INDUSTRIAL
tO]
C C
MODERATE
[2]
C C
NARROW
5-lOm
2j
C Ci
RESIDENTIAL,
PARK,
NEW
FIELD
[1]
0
Cl
MINING I
CONSTRUCTION
[0]
C
C
HEAVY I
SEVERE
[1]
C
C
VERY
NARROW
5m
[1]
0 0
FENCED
PASTURE
[1]
Irdicete
pedomifl31N
lOch
u$O(S,)
,
C
C]
NONE
[0]
C
0
OPEN
PASTURE,
ROWCROP
[0]
pest
lOOm
ripetien,
Comments
Maximum
:.
/
ii)
5]
POOL
I GLIDE
AND
RIFFLE
/ RUN
OU4UTY
**
MAXIMUM
DEPTH
CHANNEL
W]DTH
Check
ONE
Cis)tY’
Check
ONE Or
24
ZT>
im [Sj
C
POOL
WIDTH
> R1FFLE
WIDTH
C]
0,T’c1m
(4]
C
POOL WIDTH
RiFFLE WIDTH
[11
C
0AeU7w
2]
C
POOL
WIDTH
< RIFFLE
W[DTH [01
C
fL2-0,4m
1]
C<alm[G]
Ccmments
POOl!;’
Mdic3te
fer
funcUon&
riffles;
Best are&s
must
be ]aroe
enough
to
support
s poputation
,.,.
ofrifflobiiate species:
CheckONE(Or2&eveogs).
DEi4
uEOT’j
FFLE
‘RUfl SUBS
rPE
RIILE!
Je
ERi
cc
Ci
SESTAREAR>
10cm [21
[C
MAXIMUM
>
SOon
L2]
C
STABLE
(eq
Cobb[e l3oulder
[7]
C
NONE
(2]
Li
rpep.
iuc’[
1
j
Ii
3
1t
—
i I
i400 STAS
e
j
arçje
C
C.ie)ti1
P3
LOW
t
EJEESTAREAS<Scm
CUNSTABLE(en,Pinraeeodi[31
CMODERATEtU]
jme
r &
E”9’lSu/F
,
Comments
MBI
TYJQDIFIED
p3
f:stt
aijuto
[idGX
,,,
:‘ ci
se
1o3sesernent
FBd
Sheet
‘
‘2rp
Code:
STORET#:
18
.,‘t, —
lBSI
TE
‘l
C C
isr,4
“
C
21510
or roko
every
type niesent
Check
ONE
(Or
2
&
average)
BEST
TX
POOL
RIFFLE
TYPES
POOL
RIFFLE
QRIGIN
QUALITY
[CC
BLDR
P -t%S
10
F
E1°4PDPAN[9
—
L]LIAESTONE[]
CHEAVI
]-2]
Li
Li
BOULDER
[9]
—
C
C
DETRITUS
[3]
**
CTILLS[i1
T
C
MODERATE
1-1]
C C
COBBLE
[0j
—
C
0
MUCK
[23
—
C
WETLANDS
[01
C
NORMAL
[OJ
C
C
GRAVEL
(7]
C
C
SiLT
[33
—
C
NAROPAN
O1
-
C
FREE
SAND
(61
—
—
C
AR
FICJAL fOl
—
C
SANDSTONE
[0]
C]
EXTENSIVE
(2]
C] Cl
BEDROCK
[5]
..,_
(Score
nekorel
substrates;
ignore
C
RIPIRAP
[UI
o0
0
%,
C
MODERATE
[-1]
NUMBER
OF
BEST
TYPES:
ii
4
or
more
[2]
SkIdrie
irom
pots-sources)
C
LACUSTRINEIO]
NORMAL
(0)
C
Cor tees
[0!
-
CSHALE(-i]
CNONE]1I
CCOALFINES[-21
Substrate
2
20
C] MIS
rERAN
COVER
!nric5to
2-
presence
0
In
2:
0-Absimi;
i-Very
stitcH amounts
or if more
common
of marginal
AMOUNT
i
ii
y’j
— hi
I
o
n
gnesl cii 4
u
or
In
mcIl en oui,
a
o
Nc
1
-‘
-l
r
L
Ii
C
I
J
Cr
t
arci
bjutor-
It oee orbs
Jtr
I1
ONE
iQ
2
-
r
e
ioct fltCi
is
amble. ocli
devabe
rorryved
in dee;
[lest
wtrCir deep,
well-deSned.
functional
pools.
C]
EXTENSIVE
>75%
[11]
UNOERCUT
BANKS
[1]
_
POOLB>
70cm
[23
_
OXSOWS,
SACEWATERS
[1]
C
MODERATE
25-75%
[73
OVERHANGING
VEGETATION
(4]
ROOTWADS
[1]
AQUATIC
MACROPHYTES
[1]
C
SPARSE
S-e29%
(3]
—
DNA Lt,.OV’9
-4 S
CW
SA
fDPI
0]
BOULDERS
(13
—
LOGS
SR WOODY
DEDRtS
[P
[C
NEARLY
iSSEN
5% [lj
ROOTMATSFI]
Cover
(
‘]
Comments
Maxinur
3:
20
3,
STABIL]TY
HIGH
[3]
C
MODERATE
[23
C
LOW[-1]
Cbemasl.
Maximum
203
CURRENT
VELOCITY
Check
ALL thaj
apply
C TORRENTIAL
-1] E1SLOW
[I)
C
VERY
FAST
[1]
0 INTERSTIT1AL
f1]
C
FAST
[1]
C
INTERMWTENT
[-2]
C
MODERATE
[1]
C EDDIES
Ii]
indicate
1o
rscti
-
P1S
and riffles.
Recreation
Potentia[
,r7j
Contact
GRADIENT
(tsai)
C
VERY
LOW
- LOW
(24]
ORA[N
AGE
APEA
C
MODERATE
[fliO]
miX
C
HIGH-VERY
NtGH
[1O-63
%POOL:(j
%GL]DE:(
)
ora-’jisot
%FUN
DRLEi
)
Electronic Filing - Received, Clerk's Office, September 8, 2008
Stream
esa
&
Location:
- tb
,
;;•
a.
2
River Code:
- STORET
#:
1] SUBSTRATE
Check
ONLY Two
substrate
TYPE
SOXES;
eslirriale
%
or
nole every type
present
BEST
i-ypg
POOL RIFFLE
OTHER
TYPES
POOL
RIFFLE
o 0
flDR
ISLABS
[10
.
—
Q
C]
HARDPAN.f4] —
—
D.Q
BOULDER
193
—_
C] UI
DETRITUS
03 ——
o o
COBBLE [B]
C]
C]
MUCK
[2]
—
00
GRAVEL7]
—
ODSILTIZ]
—
—
O 0
SAND [6]
—
—
0 0
ARTIFICIAL
103_ —
O 0
BEDROCK [53
(Score
nalurel
substrates, ignore
NUMBER
OF BEST
TYPES:
0
4
or
more
skidge
from point-sources)
comments
0
3 or
tess o]
Check
ONE (0r2 &
average)
ORIGIN
QUALIT!
0
LIMESTONE
[1]
Li
HEAVY (.23
0
TILLS
[1]
SiT
0
MODERATE
F-I)
0
WETLANDS
[03
0
NORMAL
[03
o
HARDPAN
[03
0
FREE
I3
o
SANDSTONE (03
ETE5&EFiSPJE
[-23
0RIP!RAP[0]
tDEO÷
0
MODERATE
1-i]
o
LACUSTPJNE (0]
%0
NORMAL
(0]
1]
SHALE
-1]
C
NONE [13
0
COAL FiNES
[-2]
23 iNS TREAM
COVER
quality;
Indicate
2—Moderate
preeenco
0
amounts,
to 3:
0-Absent;
hut not
1-Very
of
highest
smallquality
emounts
or
in
or
small
if
more
amounts
common
of
ofhif4hesl
marginal
AMOUNT
‘-- r
-
-
quality;
3-Highest
quality
in
moderate
or
greateramouote
(e.g.. very large
boulders in
deep or
fast
water, large
Chec
<.m
diameter log
that
is
stable,
well developed roolwad
in
deep! fast
waler, or deep,
well-defined,
functional
pools.
C]
EXTENSIVE >75%
[11]
UNDERCUT
BANKS
[13
.
—
POOLS>
70cm
(2] —
OXBOWS, BACKWATERS
[13
C]
MODERATE
25-75% [73
OVERHANGING
VEGETATiON [I]
—
ROOTWADS
[1]
AQUATIC
MACROPHYTES
(13
C]
SPARSE
5-<25%
(33
SHALLOWS
(IN
SLOW
WATER)
[13
BOULDERS
(13
—
LOGS OR
WOODY
OEBR1S [‘I)
C]
NEARLY
ABSENT <5%
(13
ROOTMATS
[1]
*
Cover
Comments
Machumor
3] Cf-iA
WNEL MORPHOLOGY
Check ONE in
each
category (Or
24
atwrage)
SINUOSITY
DEVELOPMENT
CHAN’NELIZATION
STABILITY
0
HIGH
H]
0
EXCELLENT
[7]
0
NONE
[6]
HIGH [33
0
MODERATE
(5]
0
GOOD [53
0
RECOVERED
H]
C
MODERATE [2]
C] LOW
[2]
0
FAIR [33
0
RECOVER1NG
123
LOW
[I]
YNONE
[1]
E’
POOR [13
RECENT
OR NO RECOVERY
(1]
Charmes
Comments
I
,h!p9pd
,,,;
Macunion
t-
4] BANK
EROSION AND
RIPAR1AN ZONE
Check ONE in each
category
for
EACH BANK
(0r2 per
hank &
evorogo)
Rw2rn5tit
oeidn drwnsmrrn
r’
RIPARIAN
WIDTH
,..
FLOOD
PLAIN
QUALITY
r
o
EROSION
C]
WIDE>
5Dm
H]
C]
U
FOREST,
SWAMP
[3]
C] C] CONSERVATION
TILLAGE [13
C] b
NONE!
LITTLE
[3]
0 C]
MODERATE 105gm
[3]
0 0
SHRUB OR OLD FIELD
[23
0 0
URBAN
OR iNDUSTRIAL
(0)
O C]
MODERATE.
[23
0
C]
NARROW
5-1Gm
(2]
Cl
0
RESIDENTIAL,
PARK, NEW
FIELD
[1]
0 0 MINING!
CONSTRUCTION
[0]
0 0
HEAVY! SEVERE
(13
C] C]
VERY
NARROW
<Sm
[I]
C]
0 FENCED
PASTURE
tl]
ind!catspredorninenr
land
wme(ty
Comments
C]
0
NONE
[D]
0 0
OPEN
PASTURE,
ROWCROP (0]
past
lOOm n’pad-an
e4aximm,rm
Riparian
3
/
r
10
5]
POOL
/ GLIDE
AND
RIFFLE /
RUN
QUALITY
MAXIMUM
DEPTH
CHANNEL
WIDTH
Check ONE
(ONLYh
Check
ONE (Or 2 & average)
J5f’>
tm
HI
C]
POOL
WIDTH> RIFFLE WiDTH
[2]
O
0,Te1m
14)
0
POOL WIDTH
=
RIFFLE
WIDTH
(I]
C]0,4-coJm[23
CPOOLWIDTH<RIFFLEWIOTH[0j
C]
0,2-<0,4m
[1]
—,
m—’——-——----’-------,
.
poot
o
<02m
[0]
‘4
(lnv?oundodj-1]
Currant
Comments
Maximum
mdioa(< for
frncbonal
riffles
Best areas
must
be
large enoUgh
to suppot
a
,aopalafto;’
,
r
ofr]ffie-obl]gatespecies;
CheckONElOr2&averege).
Ci”
I
rne*&.r
R]FFLE
DEPTH
RUN
DEPTH
RIFFLE
I RUN SUBSTRATE
RIFFLE I RU
EMBEDDEDNESS
0
BEST AREAS>
10cm
[71
C]
MAXIMUM >50cm
[2]
0
STABLE (e.g..
Cobble,
Boulder)
[23
0
HONE
(21
0
BEST
AREAS
310cm
[1) C]
MAXIMUM
<30cm
[1]
C]
MOD.
STABLE
(e.g.,
Large Gravel)
[1]
0
LOW (1]
‘lE<STPPB
S°5m’
C]t
cp
E(og
tncC.
a Sl,[7i
C]’
oDE’sr’F’e
(matncmt3
Comments
C!
EXTENSIVE
(-IL.
9.
V
-:
cm,, .,
cm
.*-. *
%POOL;ç,,,,,,,
J
te(atJDtc;L.,,
)
Graoreotm
/
“‘ /
r
%RUN:
L
_,)%R]FFLE:(,,
*OO***.
;;
-
MBI MODIFIED
Quallftative Habitat
Evalluationbidex
OHEI
SCare:
*
and Use
Assessment
Fleha
Sheet
**
RM:.[:,,cDafa’/’,47/fi
08
Scorers Pull
Name
&
Affiliation:
*r
.‘ ,
.
/4
*
Lat./Lon
.:
in
oharemreriflsm,r,
t
9
.e
9
ttNAP55t’P’t.t”
---- ,,, Y—L,,--
— ..LkStitfri’
C
Suhsfrsta
!,_!axknumn
20
CURRENT
VELOCITY
Check ALL
that
apoly
O TORRENTIAL
-1]
SLOW
[1]
C]
VERY FAST
[1]
0
INTERSTITIAL [-1]
0
FAST [1]
0
INTERMITTENT [-2]
C]
MODERATE
[‘I]
C] EDDIES [1]
Indicate
for
react, - pooh; and riffles,
Recreation PotentiaL:
Primary Contact
Secondary
Contact’
3
tmrmte
rae
are Cai’ime’i’m
<9
e]
GRADEI)
;nr
mm
U
V1SR,
uOn
,OtJt2
DRAINAGE
AREA
0
MODERATE
[5-103
mlt)
0
HiGH - VERY HIGH
[10-03
EMit 4520
CIA
,.,(
:4r
00111/00
i/L*t4.
Electronic Filing - Received, Clerk's Office, September 8, 2008
MEl MODIFIED
Quafliadve
Habftat Evalluadon
ndex
“r
$
si-sd
Use
Assessment FieM
Sheet
$nhi SOD 0
—
RrtflS&.:Date:o7J
:0/08
__Scor.ers
Full
Name
&
Affiliation:
0o
V*c
ofi
Pwt
Cjde:
STOREF#
rtdIVJJ_z_rrraJ!ar
!1 SUBSTRATE
Check
ONLY
Two
substrate
TYPE
IOOXE3;
estimeie
V. or note every
type present
BEST
TYPES
POOL
R1FFLE
OTHER
1PES
POOL RWFLE
EEl
BLORJSLAES[10]_.
[]HARDPAN[4]
El El
BOULDER
[0)
El El
DETRIFUS
[3] —
—
o
El
COBBLE [3]
—
El El
MUCK [2]
—
——
006RAVEL[29
——
OOSILT[2)
——
El El
SAN
13
[5]
—.
El El
ARTIFICIAL
[0]_ —
El El
BEDROCK
[SJ
,_
(Scoe
natural
substrates;
ipnore
NUMBER OF
BEST
TYPES:
CI
4
or
more
[2]
studge Soot
poke-sources)
El
$
or less
[0)
Check ONE
(Or 2 &
average)
ORiGIN
QUALITY
El
LIMESTONE
[1]
El
HEAVY
[-21
El
TILLS
[1]
El
MODERATE [41
El
WETLANDS
[0]
El
NORMAL
[0]
El
HARDPAN
[0]
El
FRE
(J)
El
SANDSTONE [0]
CThITENSIVE
[-2]
DRIP/RAP
[0]
thtDDEO%
El
MODERATE
f-I]
El
LACUSTRINE [0]
ff
‘qj
El
NORMAL [0]
ElSIIALE[-1]
El
NONE
[1]
El
COAL
FINES
[41
21
INSTREAM COVER
Indicate
sit
2
presence
1
LuraL
ft to
v no
3:
0-Absent;
I S
not
1-Very
o ft
smell
ouch
emounts
y
or
or
to em
if
more
tfl
at
common
minis
ofof
lvohe
msrgtnel
AMOUNT
vt
3
lth a
ci
liv
0
nc
.
rjo
10
e 07
o
Icm
LoIrk. wd<cporfes
clot
to
Ci
30
OiIFtO
o
27
diem&ter log:
thet N
staRe,
well developed
rooiwad
in
deep [feet
weteflor
deep,
well-defined,
functional
pools.
El
EXTENSIVE
>75% [11]
UNDERCUT
BANKS [I]
—
POOLS
a 70cm
[2]
OXSOWS,
BACKWATERS
[1]
El
MODERATE
2545%
[7]
OVERHANGING
VEGETATION
Ii)
—
ROOTWADS
[1]
—
AQUATIC
MACROPNYTES
[1]
El
SPARSE
5-<25%
[3]
SHALLOWS
(IN
SLOW
WXFER) [1]
—-
BOULDERS
[1]
—
LOGS OR
WOODY
DEBRIS fI]
El
NEARLY ASSENT <5% [1]
ROOTMATS
[1]
Covor
(
Comments
Mexknwn
:
0
20
3)
CHANNEL MORPHOLOGY
Check
ONE in each
cetegory
(Or 2
5
overage)
SINUOSi-rY
DEVELOPMENT
CHANNELIZATION
El
HIGH [4]
El
EXCELLENT
[7)
El
NONE
[6]
El
MODERATE
(3]
El
GOOD
[5]
El
RECOVERED
[4]
El LOW
[2]
El
FAIR
[3]
El
RECOVERING
[3]
2
NONE [1]
ETPOOR
[1)
El
RECENT
OR
NO RECOVERY [1]
Comments
4] BANK EROS/ON
AND
RIPARIAN
ZONE
Check ONE in
each cete,qory for
EACH
SANK
(Or
2per
bank
& evecege)
Riwrdcibt
oke
thswnsvewn
p
RIPARIAN
WIDTH
p
FLOOD
PLAIN QUALITY
EROSION
Q
C
WIDE> SOre
4]
El
C
FOREST, SWAMP
[3]
C
El
CONSERVATION
TILLAGE
[1]
o
El
NONE
/
LITTLE
(31
El
El
MODERATE
10-SOm
[3)
El El
SHRUB
OR OLD FIELD
[2]
El
El URBAN OR
INDUSTRIAL
[0]
U
U
MODERATE
[2]
El El
NARROW
540m [2]
El
El
RESIDENTIAL,
PARK, NEW
FIELD
[1]
El
El
MINING
I
CONSTRUCTION [0]
El
0
NEAVY ‘SEVERE [1]
El El
VERY
NARROW
<Sm [I]
El
El
FENCED
PASTURE
[1]
El El
NONE
[0]
El
El
OPEN PASTURE,
ROWCROP
[01
5) POOL!
GLIDE
AND RIFFLE!
RUN
QUALITY
MAXIMUM DEPTH
CHANNEL
WIpT[’j
Check
ONE
(ONLY/i
Check ONE (Or
2 & everceyc)
,$a
Im
[l
El
POOL
WIDTl4> RIFFLE
WiDTH
[2]
o
0.7’cl m [4]
El
POOL WIDTH
RIFFLE
WIDTh
[‘I]
El
&4.<0Jm
[2]
El
POOL
WIDTH
<RIFFLE
WIDTH [0]
El0.2-chAm[1]
.j.—--’--—-.---
El
<0.2m [0)
20
Comments
/ndicate
predominant
land
use(sl
,‘:::
peel
lOOm
riysedon.
mpensn!’
Maximum
:
“4
3
tO
Poo/!:
Currtcnf
Max/inure
Indicate
for funotional
riffles;
Best areas
must
be large
enough to support
a pDpulatlon
r- ‘
PrY’
c:
of
riffle-obligate
speCIes;
Check
ONE
(0r2
&
everage).
r
RIFFLE
DEPTH
RUN
DEPTH
RIFFLE
I
RUN SUBSTRATE
RIFFLE I RUN
EMBEDDED[LESS
El
BEST AREAS> 10cm
]
El
MAX1MUM
> 50cm
[2]
0
STABLE
(e.g., Cobble,
Boulder)
[2]
0
NONE
12)
Li
EESTAREAS 540cm [I]
Elf!iAXIS1UM
<
SCoot
[I]
DM00, SThSLE
(e.g., Large Grevei)[I]
GLOW
[1]
0
BEST AREAS
C Scm
13.
UNSTABLE
{e,c’,, Fine Gravel,
Send] ff11
0
MODERATE tO)
Nirle
r
(‘nutr cY/
El
CXTE
‘1St
YE
t
I
yr
COmOIEfItS
- ,,‘,e:crnum.
7
6) GRADIENT
(hj’mi]
(3
VERY
LOW
- LOW
[2-4]
%POOL-C
%OL[DE:fl’)
Gredrent.
JP2INAC3LLFET
‘nOOERATEC
0’
r
N
v
I
reP)
El
HIGH
-VERY HIGH
[i0-S]
%RUSL
ç,,J%Rl°FLE7,,
3’
EFV4520
351/Ct/i
Stream &
Location:
Comments
SILT
Szthstro/e
115
1
Me’r/,ntu,,
20
STABILITY
HiGH
[3]
El
MODERATE
[2)
J3
LOW[1]
Comments
Cbenne/u,
,Vaxitr,v,rt
Ct
20
CURRENT
VELOCITY
Check
ALL thai apply
El
TORRENTIAL
[4]SLOW
[1]
El
VERY
FAST
[‘I]
0
INTERSTITIAL
14]
El
FAST
[1]
0
iNTERMITTENT [4]
El
MODERATE
[1]
0 EODIES
[I]
lnd/cete
for
reach -
poo/s and r/O/as.
Primary Contact
Secondary
Contac
(ci’cRc eat
a,,teo,e,,,mL
a,,
:/.
Electronic Filing - Received, Clerk's Office, September 8, 2008
Stream
&
Location:
je
--
i’
River
Code:
-
STORET#:
-
1]
SUBSTRATE
Check
ONLYTwo
suostrate
TYPESQXES;
estimate
%
or
note
every
type
present
BEST
TYPES
POOL
RIFFLE
OTHER
TYPES
POOL
RIFFLE
a
a
BLOR ISt.ABS
[103
—*
Q
Q
HAROPAN
(43
—
aa
SOULDERIS]
—
—
DDDETRITUSL3I
*
a a
COBBLE
[3
—
Q
MUCK
t21
—
a
a
GRAVEL
£71
—
—
a a
SILT
[21
—
a
a
SAND
[61
—
—
0
Q
ARTIFICIAL
[0]
—
a a
BEDROCK
t5]
—
—
(Scom
natural
substrates;
ignore
NUMBER
OF
BEST
TYPES:
0
4
or
more
(2]
sludge
frCini
ponisGutces)
Comments
0
3 or
Ios
0]
Check
ONE
tOr2
&everaqo)
ORIGIN
QUALITY
0
LIMESTONE
(1]
a
HEAVV
1-21
0
TILLS [1]
SI
MODERATE
[-1]
0
WETLANDS
[0]
a
NORMAL
[0]
DHARDPAN[o]
0
FREE
113
0
SANDSTONE
[01
DEXTENSIVEt.z1
C
RIPIRAP
Oj
a
MODERATE
f-il
C
LACUSTRINE
[0]
a
NORMAL
[0]
0
SHALE
[-1]
0
NONE
ri
0
COAL FINES
[-2]
2]
INSTREAM
COVER
tfcate
presence
1) to
3: 0-Absent:
i-Very
small
amounts
or
ii
more
common
of
marginel
AMOUNT
quality:
2-Moderate
emoults,
but
not
of
highest
auelity
or in
small
amounts
of
highest
quality;
3-HigheSt
quality
in
moderate
or
greater
amounts
(e.g.,
very
large
botilders
in
deep
or
fast
water,
large
Check
ONE Or
2 &
average)
diameter
log that
a
tsble.
‘ell
dvelopsd
roolwd
in deep
/ fast
water,
or deep,
well-defined,
functional
pools.
EXTENSIVE
>75%
[111
UNDERCUT
BANKS
[1]
—
POOLS
>70cm
[2]
OXBOWS,
BACKWATERS
(i]
a
MODERATE
26-75%
[7]
—
OVERHANGING
VEGETATION
[13
—
ROOTWADS
[1]
AOUAT1C
MACROPI-FYTES tii
a
SPARSE
5-<25%
[3]
SHALLOWS
(IN
SLOW
WATER)
[1]
—
BOULDERS [1]
LOGS
OR
WOODY
DEBRIS
[11
0
NEARLY
ABSENT
<5%
[1]
—
ROOTMATS
[1]
—
Cover
Comments
Marimurn!
20t.
/ /
31
CHANNEL
MORPHOLOGY
Check
ONE in
each
category
(Or
2 &
average3
SINUOSITY
DEVELOPMENT
CHANNELIZATION
a
HIGH
[4]
0
EXCELLENT
UI
a
NONE
[6]
a
MODERATE
£]
a
GOOD
[5]
a
RECOVERED
4J
a
LOW
[21
0
FAIR
[3]
a
RECOVERING
[33
?NONE[1]
POOR
[1]
a
RECENT
OR NO
RECOVERY
[1]
Comments
L____,_.i
4]
EANK
EROSION
AND
RIPA
AlA
N ZONE
Check
ONE
in each
category
for EACK
BANK(Oi
2
ncr
hank
& average)
Rir
d5h
ik
1
m
downstrrn
,
RIPARIAN
WLOTH
..
FLOOD
PLAIN
QUALITY
EROSION
O
0
WIDE>
50m
14]
a a
FOREST,
SWAMP
(3]
a a
NONE
I LITTLE
[31
a a
MODERATE
10—SUm
[31
a
a
SHRUB
OR
OLD FIELD
£21
a
a
MODERATE
[2]
a
a
NARROW
5-lOm
[21
a a
RESIDENTiAL,
PARK,
NEW FIELD
[1)
a a
HEAVY
I SEVERE
[1]
a a
VERY
NARROW
<Sm [1]
a a
FENCED
PASTURE
[1]
a
a
NONE
(0]
a
a
OPEN
PASTURE,
ROWCROP
(0]
Comments
6]
POOL
/
GLIDE
AND
RIFFLE!
RUN
QUALIPI
MAXiMUM
DEPTH
CHANNEL
WIDTH
Chack
ONE
(ONLYIt
Check
ONE
(Or
2
& everaoei
a
im [6]
a
POOL
WIDTH>
RIFFLE
WIDTH
(23
a
0.7-<lm
(4]
apooLwIDm=RIFFLEwom[1]
a
0.$-’0.7m
[2]
0
POOL.
W1DTI-{
<RIFFLE
WIDTH
[0]
0
0.2.<OAm
[1]
a
<0.2m
[0]
Comments
Pool!
Current
Vaufmurn
IV-’
indicate
for
functional
riffles;
Best
areas
must be
large enough
to support
a population
RI’
-
of
riffle-obligate
species:
Check
ONE
(Cr2
& averagel.
D
‘
—c
RIFFLE
DEP
RUN
DEPTH
RIFFLE
I
RUN SUBSTRATE
RiFFLE
/
RUN
EP1BEDDEDNESS
SEST
AREAS>
10cm
[2]
a
MAXIMUM>
50cm 12]
0
STABLE
(e.g..
Cobble,
Boulde,’)
(2]
a
NONE
[2]
a
BESTAP.EAS
5-lUcmTiJ
aMAXIS1UM
C 50cm
[1]
MOD.
STABLE
<e.g.,
Large
Gravel)
[1)
0
LOW
[1]
V
V
E
cEA
AREAS
‘- flcn
0
UN>TASLS,”
q
ine GrvI
Sand)
10]
a
MOOEcATE
i]
tmatrc01
a
EXTENSiVE
r.i1
.,
Q2
Comments
6]
GRADIENT
idrnfl
f
VERY
LOW
- LOW
(2-41
%POOL:(
%GLIDE(Grecfient,
oRAlAGE
AREA
a
MODERATE
[6-10]
t______
nP)
0
HIGH-VERY
Hb3H[10-6J
%RUN:
(
)
-,-.
pu
52
5fl
9
ç,
‘f
)lmpounded[-1]
MBI
MODIFIED
Qua!tative Habitat
Evahiation
hidex
V__V
ana
Use
Assessment
FIed
Sheet
AM:
Date:1
I//
05
,Scorers
Full
Name
& Affiliation:
7<
i’
LatiLonci.:
so
010CC
‘dlierl,—
IocadoniJ
Substrate
t.JV
Maximum
20
STABILITY
O
HIGH
(3]
C]
MODERATE
[2]
LOW[1]
ChanneIi’
Mxcnom
it
vrL,.
20
C
C
CONSERVATION
TILLAGE
[‘I]
a 0
URBAN
OR
INDUSTRIAL
[01
C]
C]
MINING
I
CONSTRUCTION
(0]
Indicate
predominant
f-and
OSC(s(
,r-’-’,
past
lOOm
rfprian.
Ripariwa
-
Maxsmum
/.
ii)
CURRENT
VELOCITY
Check
ALL
that apply
C] TORRENTIAL
[-1]
.SLOW
[1]
0
VERY
FAST
[1]
0
INTERSTITIAL
[-1]
0
FAST
(1]
iNTERMITTENT
(-2]
C]
MODERATE
[1]
0
EDDIES
[1]
On’
cats
fr
reach
- poo/s
end
rifllos.
Recreation
Potential
Prirnasy
Contact
Secondaty
Contact
CiVC!
or
rnd
co,r,rn,,rr
er,act)
Electronic Filing - Received, Clerk's Office, September 8, 2008
Full
Name &
Affiliation:
Yr
L
4
sp-u
-
,‘
River
Code’
..
Lat./
Lana.:
Office
verifIed
.
1]
SUgSTRATE
Check
ONLYTwO
substrate
TYPE
BOXES:
eshmata
or
note every
type
present
Check
ONE
Or
2
&
average)
BEST
TYPES
POOL
RIFFLE
OTHER
TYPES
POOL
RIFFLE
ORIGIN
QUAUTY
DC
ELOR
ISLABS
[i03_
Q
Q
I-IARDPAN
[4]
—
tJ
LiMESTONE
[1]
C
HEAVY
[.2]
DC
BOULDER
[9]
—
—
Q
C
DETRITUS
[31
—
C
TILLS
[1]
C
MODERATE
[-1)
CD
COBBLE
[83
—
Q
MUCK
[2]
—
C
WETLANDS
(0]
SILT
NORMAL
£0!
DC
GRAVEL
t1
—
C
C
SILT
£2]
—
—
C
HARDPAN
[0]
[]RE
[1]
C C
SAND
(6]
—
—
Q C
ARTiFICIAL
(0]
C
SANDSTONE
[0]
EXTENSIVE(:2j
CC
BEDROCK
[5]
—
(Score
nakiral
substrates:
ignore
C
RIPIRAP
[0]
Eb
4
C
MODERATE
[.11
NUMBER
OF
BEST
TYPES:
C
4
or
more
[21
Sludge
from
point-sources)
C
LACUSTRINE
[01
“
i
C
NORMAL
101
C
3or
loss
[0]
DSHALEt-I1
DNONE[11
,..ommenL.
C
COAL.
FINES
[-23
CURRENT
VELOCITY
Check
ALL that
apply
C
TORRENTIAL
[-1]
SLOW
[1]
C
VERY
FAST [1)
C
INTERSTITIAL
[-it
C
FAST
[1]
C
INTERMITTENT
[-2]
C
MODERATE
[1]
C EDDIES
[1]
Indicate
for reach
pools
-3nC1 rifi7e.s.
Stream
&
Location:
MBI
MODIFIED
Quatiftative
Habitat
Evaluation
hidex
and
Use
Assessment Field
Sheet
STORET
#:
Subsiratra
bteximwrr
20
2]
INS
TREAM
COVER
Indicate
presence
C to
3:
0-Absent:
1Very
small amounts
or
if
more
common
of
marginal
AMOUNT
quality:
2-Medarate
amounta,
but
riot of
highest
quality
or
in entail
amounts
of
highest
quality:
3-Highest
quality
in
modr5ta
or
greater amounts
(eg..
sery
large
boulders in
deep
or
fast water,
large
Check
ONc
(0:
2
&
aei
dirneter
tog
that
is
stable,
well
developed
rootwad
in
deep
I
fast
water,
or deep,
well-defined,
functional
pools.
C
EXTENSIVE
>75%
[11]
—
UNDERCUT
BANKS
1]
POOLS>
70cm [2]
OXBOWS,
BACKWATERS
[1]
C
MODERATE
25-75%
[7]
—
OVERHANGING
VEGETATION
[1]
ROOTWADS
[]
AQUATIC
MACROPHYTES
[1]
C
SPARSE
5.c25%
[3]
—
SHALLOWS
(IN
SLOW
WATER)
[1]
BOULDERS
[‘I]
LOGS
OR WOODY
DEBRIS
[1]
C
NEARLY
ABSENT
6%
[1]
—
ROOTMATS
[1]
—
Cover
Comments
Mximwn
i
f
If
20
3]
CHANNEL
MO1PHOLOGY
Check ONE
in
each
category
(Or
2 &
average)
SINIJOS1TY
DEVELOPMENT
CHANNELIZATION
STABILITY
C
HIGH
[4)
C
EXCELLENT
C
C
NONE
[61
C
HIGH
[3]
C
MODERATE
[4
Q
GOOD
[5]
C
RECOVERED
[4]
C
MODERATE
[2]
C
LOW
[2]
C
FAIR
[3]
C
RECOVERING
[31
,j
LOW [1]
NONE[1]
‘POOR[i]
C
RECENTORNORECOVERYf’t]
7
Comments
-_
[ipouned
I-ill
Channel
M-iinurri
4]
BANK
EROS1ON
AND
RIPARIAN
ZONE
Check
ONE
in
each
categoryfor
EACH
BANK
(Or
2
per
bank
4 evoroge)
ivra9nt
RIPARIAN
WIDTH
:.
FLOOD
PLAIN
QUALITY
R
EROSION
fl C
WIDE
050m
(4]
0
0
FOREST,
SWAMP
[3]
0
CONSERVA11ON
TILLAGE
[1]
C
C
NONE
I LITTLE
[I
C
C
MODERATE
104Cm
[3]
0
C
SHRUB
OR
OLD
FIELD
[23
C
C
URBAN OR
INDUSTRIAL
fO]
C C
MODERATE
[2]
C C
NARROW
5-lOm
f2]
C
C
RESIDENTIAL,
PARK.
NEW
FIELD
tl]
C C
MINING
I
CONSTRUCTION
[0]
C C
HEAt/V
I
SEVERE [1]
C C
VERY
NARROW
e
Sm
[1)
LI
C
FENCED
PASTURE
[1]
Irtcficata pro
dominant
land
usa(s)
C
C
NONE
[0]
U
C
OPEN
PASTURE.
ROWCROP
[0)
pasf
lOOm oparran.
Riparian
e
Comments
Maximum
5]
POOL/GLIQEAND
RIFFLE/RUN
QUALiTY
MAXIMUM
DEPTH
CHANNEL
WIDTH
Check
ONE
(Of’ILYIt
Check
ONE (Or2
&
evaraoe)
S>
tm
[6]
C
POOL WIDTH>
RIFFLE
WIDTH
£21
C
0.7-elm
[4]
C
POOL WIDTH
RIFFLE WIDTH
[I]
C
O.4cO.7m
(2)
C
POOL
WIDTH
C
RIFFLE
WIDTH [0]
C
n.a.eo.sm
[1]
C
0.2
in
[U)
Comments
Recreation
Potential
Primary
COntact
Pool!
CurrCnI
Indicate
for
functional
riffles;
Best
areas must
be
large enough
to
support
a
population
,
of
riffle-obligate
species:
Check
ONE
(Or?
&
averaget.
C
i
Rh-r-Lc
[m.-,t
RIFFLE
DEPTH
RUN
DEPTH
RIFFLE
I RUN SUBSTRATE RIFFLE
I
RUN
EIv1BEDDEDNESS
C
BEST
AREAS>
10cm
[2i
C
MAXtMUM
>60cm
(2]
C
STABLE
(e.g.,
Cobble, Boulder)
[2]
C
NONE
(2]
C
BESTAREAS
8.10cmi]
C
MAXIMUM
50cm
[1]
DM00.
STABLE
(e.g., Lara
Gravel)
[1]
C
LOW [1)
C
BEST
AREAS
5cm
ii
UNSTABLE
(e.g.,
Fine
Gravel Sand)
£01
C
MODERATE
M
Po
[metrcO1
CEXTENSIVEI-1I
...
Comment-s
-
-
°
GP,DtE
f
FP LOVi
L04 r”-4
q-
\
c;
F
:ODT
i
10]
________nil
2
)
C
HIGH
VERY
HIGH
[10-6]
EPA.
4520
%PCOL:i,
J
%GLIDE:(
)
Gradisrrr.
%PUN:
(,
t%RIFFLE:(
)
Electronic Filing - Received, Clerk's Office, September 8, 2008
MBI
MODIFIED
Quatatve Habitat
Euahiaton
hidex
-.
c
I4c
(k’
5Date:J
//J
93
Full Name & Affiliation:
se
(A’Ju.
er
Cede:STORET#:
-
_J.°D
ij
SUBSTRATE
Check
ONLY Two subskite
TYPE
BOXES:
estimate
% or
note
every
type present
Check ONE (Or
2
&
average)
BEST
TYPES
POOL RIFFLE
OTHER
TYPES
POOL RIFFLE
ORIGIN
QUALITY
O 0
BLDR
1SLABS
[101
Q
HAROPAN
[4] —
—
Q
LIMESTONE
[1]
LI
HEAVY [-2]
DO
BOULDER[9)
—
—
Q
QDETRITUS(3] —
—
DTILLS[1]
SILT
LIMODERATEIIt
C C
COBBLE
[3
C 0
MUCK
12]
—
0
WETLANDS
[01
LI
NORMAL
EO]
CC
GRAVEL [7]
Q
SILT [23
—
—
Li
H
ROPAN
[0]
LIFREE(1J
C
C
SAND
[6)
—
C C
ARTiFICIAL
—
*
C]
SANDSTONE
(0]
Ci
EXTENSIVE
[2j
Q
C
BEDROCK(S)
—
(Sco-e natural substrates;
ignore
Li
pjpjp,a.p
€.ODCOA
LI
MODERATE [-1]
NUMBER
OF
BEST TYPES:
Li
4 or more [2]
sludge from
point-sources)
LI
LACUSTRINE [0]
0
NORMAL
[0]
-
C
3orless(0)
DSHALEI-1]
LINONE[1]
comments
Li
COAL
FINES
(-23
2]
INSTREAM
COVER
quo
lndtcata
fry:
2-Modareta
presence
0
amounts,
to 3:
0-Absent;
bul not
1-Veryoi
highest
smallquality
amountsor
in
or
smelt
if
more
amounts
common
of
of
highest
marginal
AMOUNT
quolity:
3-Highest
quality
in moderate
or greater
amounts
(e.g.,
very
large boulders
in
deep or
last
waler,
large
(.hec<
ONE (Or 2 &
averago)
diameter log that
is stable,
well
developed
roob4ad
in
deep
I
fast
water,
or deep.
well-defined,
functional
pools.
Q
EXTENSiVE
>75%
[Ii]
UNDERCUT
BANKS
[1]
—
POOLS>
lOom
[2]
*OXEOWS,
BACKWATERS
III
Li
MODERATE
25.75%
f73
OVERHANGING
VEGETATION
(1]
ROOTWADS
[1]
*AQUATIC
MACROPHYTES
(11
Li
SPARSE 5-<25% [3]
—
SHALLOWS (IN
SLOW WATER)
[13
—
BOULDERS
[1)
LOGS OR WOODY DEBRIS
[1]
0
NEARLY
ABSENT
<5% [1]
——
ROOTMATS
(1]
—
Cover
Comments
Ma)rhn
]
CHANNEL
MORPHOLOGY
Chacic ONE
in each
category
(Or
2
&
average)
SIN
UOSITY
DEVELOPMENT
CHANNEUZATION
C
HIGH
(6]
C
EXCELLENT
0
U]
NONE
[63
C]
MODERATE
[3]
El
GOOD
(5]
LI
RECOVERED
[41
0
LOW (2]
0
FAIR [33
LI
RECOVERING(S)
NONE [1]
3’PoOR
[i
LI
RECENT
OR
NO
RECOVERY[1]
Comments
4]
BANK
EROSION
AND
RIPARIAN
ZONE
Check ONE in
each category for EACH
BA NK (Or
2 per
bank &
average)
Rie
rhjht !oøk
RIPARIAN
WIDTH
FLOOD PLAIN
QUALITY
EROSION
Q C
WIDE > SUm
[4]
Cl
C
FOREST, SWAMP [3]
Li
CONSERVATION
TILI,,AGE
[‘13
O C
NONE I LITTLE
l3
C
C
MODERATE
‘1050m
[3)
0
0
SHRUB
OR
OLD
FIELD (2]
0 C
URBAN OR
INDUSTRIAL
[0]
C 0
MODERATE [2]
C Li
NARROW
5-lOm
[2]
0
LI
RESIDENTIAL, PARK, NEW
FIELD [13
0 C MINING
I
CONSTRUCTION [03
C C
HEAVY I SEVERE
[1]
C U]
VERY
NARROW
<
5m
[1]
0 0
FENCED PASTURE
[1]
C Li
NONE [0]
0 0
OPEN
PASTURE, ROWCROP [03
Fri
dicate
predominant land
past
lOOm npenan.
Ripe
nan
Mmrimum
‘)
10
PooI/
p
impounded
1-11.
Current
Comments
Indicate
for functional
riffles; Best areas
must be large
enough
to support
a
population
-.
.,. ,.
of riffle-obligate
species:
checK
ONE
(Or
2
&
average).
Cr3u
Rtr,
Lc
taa-
I
RIFFLE
DEPTH
RUN DEPTH
WFLE!
UN
SUBSTRATE
RIFFLE I
RUN
EMBEDDEDNESS
O
BEST AREAS>
10cm
(2]
C
MAXIMUM
> 50cm
[21
C
STABLE
(e.e,
Cobble,
Boulder)
[2]
C
NONE
(23
C
BESTAREAS
5-10cm
[I]
C
MAXIMUM < 50cm
(1 0
MOD.
STABLE
(eg,
Large
Gravel) [1]
C
LOW 1]
O
BEST AREAS
< Scm
-
C
UNSTABLE
(e.g.
Fine
Gravel
Send)
103
C
MODERATE
tO)
R,tfle/ ,
LmstrIcu1
C
EXTENSiVE
[_‘1
“‘
:
(/
Commenis
r,e>nn,m
V
V
EPi4520
L)V
V.
Stream
& Location:
Substrata
1fJ
Maximum
20
STABILITY
0
HIGH
[3]
C]
MODERATE
[2]
FLOW [1]
Comments
ChanaIf’
Maximnm
V;_,_
eQ
5] POOL
/ GLIDE
AND
RIFFLE
/
RUN
QUALITY
MAXIMUM
DEPTH
CHANNEL
WIDTH
Check ONE
(ONLY!)
Check ONE (Or2
& average)
Im
[1
Q
POOL
WIDTH>
RIFFLE
WIDTH
(2]
O
0.7-<im
t1
[]POOL
WIDTH
RIFFLE
WIDTH
(1]
C
0.4-<OJrn
(2]
U
POOL
WIDTH <RIFFLE
WIDTH [0]
O
0.2-<0.4m
[1)
C
‘ 0,2m [0]
BRENT
VELOCiTY
Check
ALL
that
apply
C
TORRENTIAL [-1)
SLOW
(1]
C
VERY FAST
[1]
C INTERSTITIAL
[-1]
C
FAST
(1]
0
INTERMITTENT
(-2]
C
MODERAtE
[‘1]
0 EDDIES
[1]
Indicate
for reach
pools
and
nthes.
ReCreation
PotentiI
V
Primary
Contact
Secondmy Contact
ra
,ne
,,eew,L
‘nlv’ct’.u
61
GRADIENT
1
kirnhi
C
VERY
LOW - LOW
[2.4)
DRAINAGE
AREA
C
MODERATE
(6-103
mi°f
0
HIGH -VERYHiGH
[10’S)
%POOL:cD
%GLIDE;()
%RUN:
t,ZD%RlFFLE:,,j
(VVV
Ore chair’!
Electronic Filing - Received, Clerk's Office, September 8, 2008
iiL
MODIFIFt)
Substrate
1
ii
Mactrier
20
23
INSTREAM
COVER
indicate
2
presence
qOC
it
C
u 3
j
b-Ahaene i-Lore
small
amounts
ant
more common
of
margtnal
AMOUNT
‘
a
h
m
cli
em nnI
t
onlcm
Ct
htyiact
&
3-HiclaC
ib
ioJ
r
ettrtn
a
,leee
tNt
Jerte
rdLr d_
Cc
O[I
Dr
or
—
dtamerer
ice
that is
stable well
rteseiopen
reowcu
ri
dean
/
(ear
water,
or
deep.
raell.deftnad,
(uricuanal
paNs.
EXTENSIVE
>75%
[ii]
—-
UNDERCUT
BANKS
[1]
POOLS
>70cm
[2)
—
OXBOWS,
BACKWATERS
)i]
[9
MODERATE
2545%
[73
OVERHANGING
VEGETATiON
[1]
,,
ROOTWADS
[fi
—
AQUATIC
MACROPHYTES
[1]
[3
SPARSE
5-e25%
[3]
__SHALLOWS
(IN
SLOW
WA’tPr
1) ——
4CL_OtRS
113
—
LOGS
OR
WOOD
DEBRIS
[11
[9I4IEAPLI
vçO
&,
[Ij
—
ROOTMATS
[fi
Cover
Convnents
ialaxirmear
3
20
>1,,
3]
CHANNEL
MORPHOLOGY
Check
ONE
in
each
cakeqary
(Or
2
4
nvemqe)
!NPQS1TY
DEVELOPMENT
CHANNELiZATION
0
NIGH
[4)
Li
EXCELLENT
[7)
Li
NONE [II]
O
MODERATE
[3]
Li
GOOD
[5]
Li
RECOVERED
[4]
U
LOW
[23
0
FAIR
[21
Li
RECOVERiNG
[3]
2
NONE
(1]
,[?YPOOR
[13
Li
RECENT
OR NO
RECOVERY
1]
Comments
4]
BANK
EROSION
AN!)
RIPARIAN
ZONE
Check ONE
in each
caiaqoiv
(or
BAtH SANK
(Or
2
per
banir4escarnqe)
—
River
rest
Ieoidee
dewestroem
RIPAR!AN
WIDTh
FLOOD
PLAIN
QUALITY
EROSION
Li
1]
WIOS
> SUm
[4]
LI C
FOREST,
SWAMP
[3]
Li
C
CONSERVATION TILLAGE
[1]
Li
Li
NONE!
UTILE
131
Li LI
MODERATE
1cr50c.
[2)
Li Li
SHRUB
OR OLD
FIELD
[2)
Li Li
URSAN
OR
INDUSTRtAL
(03
Li
U
MODERATE
[2]
Li Li
NARROW
5-i Urn [2]
Li
Li
RESIDENTIAL,
PARK,
NEW FIELD
[1]
Li Li
MINING!
CONSTRUCTION
[0]
Li
Li
HEAVY!
SEVERE
[1)
Li
Li
VERY
NARROW
C
Sm
[1]
Li Li
FENCED
PASTURE
[1]
Li
Li
NONE
[0]
Li
Li
OPEN
PASTURE.
ROWCROP
[0]
6]
POOL/OLIDEAND RIFFLE/RUN
QUALITY
MAXIMUM
DEPTH
CHANNEL
WIDTH
Chock
ONE
(ONLY!)
Check
ONE
(Cr2
&
eueraoe)
,‘
irn[6]
[9
POOL WIDTH>
RIFFLE
WIDTH
[2)
Li
0.7-cim
)fI)
Li
POOL
WIDTI-Cr
RIFFLE
WIDTH (11
Li
0,4—cO.7m
[2)
Li
POOL
WIDTH
RIFFLE
WIOTH
[4]
Li
IL2c0Am[’I]
Li
%2m
[0]
Comments
Indicate
raedomkiert/
lend
use
153
peat
iliUm
riparieu.
Ripaflan
/
Meairrterrt
‘to
Pool//’’
A,tTeflt
4cx/muc;ti,
4,’
indiCate
for
functiona)
riffles;
ScsI areas
must
be large
enOUgh
to
supporl
a
popu)ation
“• ;-,
of
rifflEobHgato
species:
Check
ONE
(Cr2
&
overeqe].
Ic
-
eeIPFcE
0679
RI/ti
-ETh
PIFVZLEI
RUnS
SUBSTRATE
fl
LE
I
PIJ\
Ci2flio
m
t
Li
BESTAREAS
e
10cm
[2]
Li
MAXIE1UM>
50cm [2)
Li
STABLE
(e,g.,
Cobble,
Boulder)
[2]
Li
NONE
[2)
“
CESIA”EO5
i
,
JET
Vt4,1j
-
.
Lir
1
or
STe,St.Lw
j
Leige
0 ase4
Lia_tt/r’[tl
L
3E°
\TEaS
Sc
Li’s
1
rPPLE
“nO cvi
5ord,10
LJVjCZsET
i_lu
[
mU
P
41
FXir—s
epic
—t
Comments
,etctX,’rflifl.
u- -
e/POOLç
C/fl
051,,,
CraWicn
-r
‘vv’c
43,.
./
- -
elSie’-
‘n
>5
-
cr11
1D2L;eIfl((3t5e
e’n
‘-‘-r
--
co-S
4S3e2o-rnert
eFsid
Siee
‘_‘
-
Stream
SLoccI/op:
‘
c
1-.
RN:
;?j
30a/;e4::1//
:4(05
—______
Fuji
Name
&
Affiliation:
dc-c
‘
sc,-
,‘
_____
01501
Code
S1OE3
La /cong
/8
——
ctñr
conic
r
1]
SUBSTRATE
Chech
CNLY’IWO
substrate
fl
t
PBOXE,S
estknate 3-
or
note every
type oresent
Check
ONE (Cr2
A
seerege)
BEST
TYPES
POOL
RIFFLE
OTHER
TYPES
POOL
RIFFLE
ORIGIN
QUALIIY
LiLi
SLD>!&ABS[tO],
—
fl[3UMftDCAII[6)
—
—
UL11IeESTONE[l]
UmuAV°
[2’
Li
Li
BOULDER
[9]
-—
—
Li
Li
DETRITUS
[33
—
—
LiTILLS[1]
‘I””
LiMODERATE[-’/)
O
Li
COBBLE
[8]
—
Li
Li’
MUCK
[2]
—
—
Li
WETLANDS
[0]
ci
Li
NORMAL
[0]
LiLi
GRAVEL[7]
—
._
LiLiSILT[21
,_,,,,,_
,,_,_
OHARDPAN[0)
LiFREEII]
-
Li
Li
SAND
[6]
—
—
Li Li
ARTIFICIAL
[0]_
—
Li
SANDSTONE
[0]
ElcIEl-IVE-t)
0
Li
BEDROCK
[5]
(Score
natural
eubalretaa;
Snore
Li
RIP/RAP
[0]
O0t1
43-
Li
MODERATE
[-1]
NUMBER
OF
BEST
TYP
ES:
Li
don more
[2]
sludge
(rem
pon.:-aodlces
Li
LACUSTRINE[0]
‘Li
NORMAL
[0]
rn’
-
‘Li
son Ieee
pi’i
OSHALE[-1]
LiN0HE[1]
Li
COAL
FINES
[-2]
STABIUTY
Li
HIGH
[3]
Li
MODERATE
[2]
WLoWlli
Comments
Channe/
/‘
-
Maxeuum
‘:
d
lmpounrierl
[c
1
]
CURRENT
VELOCITY
Check
ALL
theJ apply
Li
TORRENTIAL
[-1]Z’SLOW
[1]
Li
VERY
FAST
[1)
Li INTERSTITIAL
[-1)
O
FAST [1]
Li INTERMITTENT
[-2]
O
MODERATE
[13
Li
EDDIES [1]
Indicate
for
reach
- poole
and
oh7er
:1
Reoreaoon
Porentiai).
Primary
Contact
i
Secondary
Contacti.
i LCtror
attn
rail
-etittieti
at
5]
GRADIENTt
it/ml)
Li
VERY
LOW-LOW[%-41
DRAINAGE
7Fsr
C]
MODERATE
[6-10]
I/____,_nti
2
)
Li
HIGH
- LEA’!
HiGH
[10-6]
Electronic Filing - Received, Clerk's Office, September 8, 2008
MBJ.
MODIFIED
Stream
S
Locajion:
f
7
/;i.?ç/:
id_—
/E3
iver
Code:
STORET#:
1(
SUBSTRATE
Chest
ONLY
Iwo
sufetmie
7YPE
BOXES;
eshmale
% or
note
every
type present
POOL
RIFFLE
?POOL
RIFFLE
GD
SLOP
!SLABS
[10
_..
Li
DNAROPAN.14]
*
—
C C
BOULDER
[91
—
Li
DETRITUS
13)
—
El
Li
COBBLE
oi
—
Li Q
MUCK
[2]
—
GD
GRAVEL[71
—
DDS1LT[2]
——
—
Li
C
sw
——
Li Li
ARTIFICIAL
[0]
-—
C
C
BEDROCK
[5]
(Score
natural
substrates;
ignore
NUMBER
OF
BEST
TYPES:
U
4 or more
[2J
sludga
from
point-sources)
-
D3orlessrf)1
Lommems
Check
ONE
(0r 2
average)
QUALITY
Li
LIMESTONE
[1]
Li
HEAVY
[2J
Li
TILLS
SLT
Li
MODERATE
(‘11
DWETLANDS [0]
Li
NORMAL
10]
Li
HARD
PAN
[0]
Li
FREEJJ.
Li
SANDSTONE
[0]
““
[]
TENSIVE
F-i
LiRIP!RAPtOI
4e.
DMODERATS
(-Ii
Li
LACUSTRINE
[0]
Li
NORMAL
(0]
Li
SHALE [.1]
Li
NONE
[fi
Li
COAL
FINES
[..2]
21
INSTREAM
COVER
Indicate
presence
0 to 3:
0-Absent;
1Vry
smallamounts
or
if more common
olmarginal
AMOUNT
u
vrb 2
otL
tr.
a
rou-i a
o
Nj ec
J21LIy
or n s-
afl
mom
L
of
gi
eat
,.
au”
o” do
o
jt1?Or
amnui
6 c
p
ci I?
95
oulder 0
deep
c
tea
a
er
I5C)C
CNn
0?
2
diemetor
bc that
5
stable.
wIl dovIo
ed rootwan
in
deep
I
fast
waler, or
deep,
well-defined,
functional
ponis,
Li
EXTENSI\iE
>ic%
[Iii
UNDERCUT
BANKS
[‘1]
—
POOLS>
70cm
[2]
OXBOWS,
BACKWATERS
[1]
Li
Ii100EPA’rE
25-75%
[71
OVERHANGING
VEGETArIaN
[1]
ROOTWADS
[1]
—
ACIUAT)C
MACROPHYTES
[1]
Li
SPARSE
5--c25%
[3]
SHALLOWS
(iN
SLOW
WATER)
[]
BOUtDERS
[1]
—
LOGS
OR
WOODY
DEBRIS
[‘I]
Li
NEARLY
ASSENT
<5%
11]
—
ROOTMATS
[11
Cvar
Ceraments
Maxftruiri
20
1
CHANNEL
MORPHOLOGY
Check ONE
in
esh
catoocty
(Cr2
&
eiwraga)
SINUOSITY
DEVELOPMENT
CHANNEUZATfON
El
waH
[41
Li
EXCELLENT
[7]
Li
NONE
[5]
Li
MODERATE
Li
GOOD
[5]
Li
RECOVERED
[4]
Li
LOW [2]
Li
FAIR
[1
Li
RECOVERING
[3]
,NONE
[1]
,[‘POOR
[1)
Li
RECENT
OR
NO RECOVERY
tI]
Comments
84Nr(
EPOSION
ArID
%P
IAN
ZOuifE
C ,.c
1
O’lE
in each :a
eqory
for
EACH
BAN!’
Or
2
,.ei
bnr
L -t
iq
Rvor riwit
R1PARIAN
WIDTH
FLOOD
PLAIN
QUALITY
EROSION
C
C
WiDE> SOre
(4]
Li C FOREST,
SWAMP
13]
b
C CONSERVATION
TILLAGE
[Ii
C. Li
NONE!
LITTLE
(3
C
Li
MOOBRATE
10-SOre
[3)
Li
Li
SHRUB
OR
OLD
FIELD
[2)
Li
Li URBAN
OR
INDUSTRIAL
(0)
Li
Li
MODERArE
[2)
1]
Li
NARROW
5-lOre
[2]
Li Li
RESIDENTIAL,
PARK,
NEW FIELD
[11
Li
Li
MINING!
CONSTRUCTION
[0]
Li
C]
HEAVY!
SEVERE
[‘I]
Li
Li
VERY NARROW
<Sm
[1]
Li
Li
FENCED
PASTURE
[1]
IndIcate
predominant
land useryl
Li Li
NONE
[0]
Li Li
OPEN PASTURE,
ROWGROP
[0]
past
lOOm
rpa4an.
P.iparian
omments
Maximum
10
(
%---.-
5]
POOL
IGLIDE
AND
RIFFLE/RUN
QUALITY
MAXIMUM
DEPTH
CHANNEL
WIDTH
Check
ONE
iONLYi)
Check
ONE
(Cr2 It
rrvensqel
Wa
im
[6]
Li
POOL
WIDTH>
RIFFLE
WIDTH
[2]
Li
ti,7-<lm
[4]
Li
POOL
WIDTH
RIFFLE
WIDTH
[1]
___________
Li
G,4-c0.7m
[21
Li
POOL
WIDTH
<RIFFLE
WIDTH
[0]
Li
0,2-<%4rn[1J
PolI
Li
— a
(01
rn
)or
CCC,
ji
ran
Y
‘
4’
t
tridIcae
13(
TUb
E’IOfla rrftes,
Bes 9ICTS
mUst
oe
large
enougI
to sippo
a
DOp.RI!Ct
of
riffle-obligate
species:
Check
ONE
(Cr2
&
averepe).
LI?
D
.
RIFFLE
DEPTH
RUN
DEPTH
R[FFLE/
RUN
SUBSTRATE
RIFFLE
I
RUN
EMBEDDEDNESS
CEESTAREAS>
111cm
12] Li
MAXIMUM>
50cm
[2]
Li
STABLE
(e,g,.
Cobhte?
BouIcler)2
DNONE[2]
D
BFA6EAS
3-
1
dcn
H]
flPr’/tIUw
50cr
I Li
P409
SIreBLE
(s
Lorgc
GtaseI}’Ij
Li
LDV’
!i
Li
BEST
AREAS
<Scm
Li
UNSTABLE
(e,e. Fina
Gravel.
Sand)
flit
Li
MODERATE
lOt
RIMe
(metricO1
-
‘
Li
EXTENSIVE
(—ii
tI
Comments
‘““
0
%°OOL
(
J
%‘3LdDE
(,
,}
i?
0
QuaItath!e
Habitat
Evalluatan
8ndex
S
and
Use
Assessment
R&d
Sheet
QHEI
cca-’g-:
RIM:
2
Daie;t7/
//1013
,,Scorers
Full
Name &
AffiWatian:
Jst
-<
- ‘:%
d
f;
Lat/
Long,:
ía
——
OOiIS
ssIir(ad
,.-—--.-.--—--.---
loCsaon?_.’
Substrate
STABILITY
Li
HIGH
[3]
Li
MODERATE
(2]
LOW
[1)
Chref[f
i’,iaxrrnuni
20
‘i.
CURRENT
VELOCITY
Check
ALL that
apply
Li TORRENTIAL
t-l]
%SLOW
[1]
Li
VERY FAST
[1]
Li
INTERSTiTIAL
[1]
Li
FAST [I]
Li
INTERMITTENT
[-2]
Li
MODERATE
[‘I]
Li EDDIES
[1]
IrvyicatC
!or
reach
- pools
arid rifles.
etioPo
Primary
Contact
Secandaty
Contact
Icirtkct
>?d
GRADIENT
(ñ’it
Li VERY
LOW -
LOW f.24]
CRAINAOE
AREA
Li
MODERATE
(3-10]
reP)
Li
HIGH
- VERY HIGH
[‘IG’6)
Electronic Filing - Received, Clerk's Office, September 8, 2008
:I’Th3:I
MODIFIED
no:
Us
Assessmeit
Hec
Sheet
PM:
2
-:
1
108
Full NnI€
&
ffillation
_.:
PWer
Cede:
STOPET#:
LaL/Long:
——
— —
—
2]
SUBSTRATE
Lho.
ONLYTW
biS
“/PII
OOjXE.S.
ocrasrar
o-
ChGc
ONE
(Or
2
4
!I
TPES
POOL
RWFLE
POOL
RIFFLE
-
U
U
&0P 1SLAB
O]_
[]Q
4sR0PAN
[41
ii
LA4ESTONE
[1J
Ci
HE
[2]
CE]
BOULDER
[E[
—
C]
C]
DETRITUS
[31
—
—
[]TILLS
[1]
C]
MODERATE
[‘3] Subseae
[3D
COBBLE[S]
—
DC]MUCH[2
—
—
C]WETLANDS[O]
C]NORMAL[0]
[IC]
GRAVEL
[7]
C]C]SILT[2}
—
C]HARDPAN[6]
7/
JU
S’4U0[C]
—
Li
[IARPFICkLIC1_
—
C]SANDSTONE[O]
[1EXTE[2]
CC
EEOROCK[3]
—
ScziatrI
isr-n,
crr.
DRIP!RAP[Q1
E%
Cr1
RATE[
l
BEN
OF BEST
TYPES:
C]
4
or more
(21
skuipe
ocw2-sources)
C]
LACUSTRINE
[0)
C]
NORMAL
[0]
F]
3
-
rn1
C]sHALE[..i]
C]
NONEr]
fl7OflS
—
DGOALFINES[-2]
-
STABUTY
C]
HIGH
[3]
C]
MODERATE
[2]
LOW[I)
Chmne
VV
MitCsniim
20
7VVVVV•
Primary
oetae(
Secondary
Oontactl
(rnrct,
cftd
coflfl’Itü
Gn itelt
.31
1 STREAM
ØV5p
ndLoiin
pi snri
0 c
3- 0-Absenk
i-.Ver’,
small amounts
or if more
common
omargaial
AMOUNT
9
1
2
It
t
hj
“
o h
1heI
luMt
or
in naIl
i 1.jne
ot
3r
i
n
1
IL
-
S
a
rIr-
o
r
eorfes’
ler
ldg
----‘-
V
lmnmLlr
pe Oat
is
O,
eeIt
om’eiop0c
SOtWaCI
in
rla
oOJ
feat werer,
or
dope.
well-defined.
furiclional
pools.
C]
EXTENSIVE
>75%
[1 Ij
UNOEROUT
RANKS
[tJ
POOLS
>
Thom {23
—
OXBOWS,
BACKWATERS
[1]
C]
MODERATE
2570%
Ci]
OVER94
NGHC.V
“EG
i%FiOF’
*
ROOTIIADS
[13
—
AQUATIL
MACROPVTES [13
U
SPARSE
c
-26
A
13]
HLi
OWS ‘IN
Si
ON
WER11IJ
——
cxI.
DERS
[11
—
LOGS
OR
WOODY
DEBRIS
111
[I
NEARI YABSFU
<5
ROOTMATS
[13
Cover
Comments
20
31
N
4MJP3
MORPBOf
OGV
Check
ONE
ri
sack
category
br
2 f
average]
SINUOSITY
DEVELOPMENT
CHANNELIZATION
C]
HIGH
14]
C
EXCELLENT
173
C]
NONE
[6]
C
MODERATE
[3]
C]
GOOD
[5]
C]
RECOVERED
[41
C] LOW
[2]
C]
FAIR
[3]
C]
RECOVERING
[3]
Ci’NDNE
11]
POOR
[11
C]
RECENT
OR NO
RECOVERY
fI]
Cosrmens
lmpottnoerl
13
41
!3Afill<
EROS!
ON
AND
RIPARIAN
ZONE
Chock
ONE
ri
each catpeoty
for
EACH BANJ<
(Or 2
per
honlr
& -riverrigo3
RIPARIAN
WIDTH
,
FLOOD
PLMN
QUAL1TY
-.
EROSION
[]C]
WIDE>
50m
f4]
C] Li
FOREST,
SWAMP
[3}
D
CONSERVATION
TILLAGE
[I]
C
C]
NONE!
liTTLE
[3]
C]
C]
MOOBRATE
IGSOm[3]
C]
C] SHRUB
OR
OLD
FIELD
C] C]
URBAN
OR
INDUSTRtAL
[01
CC]
MODERATE
[2]
[3 C]
NARROW
5-lOin [2]
1]
Ci
RESIDENTIAL,
PARK,
NEW
FIELD
(ii
C]
LI
MIN1NG
I
CONSTRUCTION
[0]
[3 C]
HEAVY/SEVERE
[I]
[]
C]
VERY
NARROW
Sm
[1]
C]
C]
FENCED
PASTURE
[1]
IoU/caM
prndornin,vO
lerid
use/st
- -.
C
C]
NONE
[0]
C]
C]
OPEN
PASTURE,
ROWCROP
[0]
past lOOm
npCrPm.
Riparian
2
Comments
Mrcthnurn
9
POOL
/GLIDEAND
RIFFIEIRUN
UA!JTY
MAXIMUM
DEPTH
CHANNEL
WIDTH
Oheck
ONE
(ONLY!,
C’hecir
ONE
]Oi-
2 &
evsrraqo)
?>
Im
F]
C]
POOL ‘440TH
>
RIFFLE
WIDTH
[2]
[3iJ,7-lrn
143
C]
POOL WIDTH
= RIFFLE
WIDTH
[11
C
04.-cOjm
[23
Ci
POOL
WIDTH
e
RIPPLE
WEITH
101
—V
C]
°CL2m [0]
,,l1flP0l.iflCk5CJ[-lJ
Comments
CURRENT
VELOCITY
Check
ALL
that apply
C]
TORRENTIAL
[-13
J’SLOW
111
C]
VERY
FAST
[‘1]
C]
INTERSTmAL[-’lI
C]
FAST
[1]
C]
iNTERMITTENT
[21
C]
MODERATE
[13
C] EDDIES
(1]
iridrmfe
for reach
— gooN
arid
.tWies.
Pø/!
-
Current
V
-
[ndica[e
for functicnai
riffles;
Best areas
must be
iarge enough
to
support
a pop
at
4
ofrifPe-obUgate
species:
CheciONE(Or2&sveragst.
r
_V-V
--
VVV]
Rt°
]SPTrI
RIFLm
RUik
SJBSTRA7E
RIFFVVE/
RU1
E,
tCZD:,
BESTAREAS>
lOom
(2]
1]
MAXIMUM>
50cm [2]
C]
STABLE
(is.g., Cobble,
l3oulder)
[23
[[NONE
[21
C
TEST
peEA°
4VV10
IC
J
M./
MLlif
‘-. its’
Ut
oOD
STABLE
j
.a-’ge (3
evet) 111
[3L’1II
N
C]
BEST
AREAS
<SCm
C]
UNSTABLE
leg., Fine Gravel,
SCOU)
101
MODERATE
RNLS
1
[metrIo0]
-
C]
EXTENSIVE
{i1
‘°2
C
Ccmmenrs
V.VV
i•
-
1
GRADIENT
(
_fL/irii]
C]
VERY LOW
- LOW
[2-43
AREA
C]
MODERATE
[040]
%pQ[’
“—‘
%GVL1E]E:
)
•.‘C
,-nr.I
EIO9
ENIGH[104I
%RUN
%[EL8
VVV.V.VV3V.
-
1
1)
-
.S.i
Electronic Filing - Received, Clerk's Office, September 8, 2008
MBI
MODIFIED
QuaUtatWe
Habftat
Ev&uation
ndex
and
Use
Assessment
FMd
-
Sheet
‘
,L___.
PM
v5, Date
jVcorers Full
Name &
Affiliation:
River
_____
Code:
STOREr
#:
Let] Lon:
/8
1]
SUBSTRATE
Check
ONLYTwo substrate
TYPE
BOXES;
estirneN’
U or
note every
type present
Check
ONE
(Or
2 &
average)
BEST
TYPES
POOL
RIFFLE
Q.TY
POOL
RIFFIE
.PRMN
Q4IiI
CD
BLUR /SLABS [lD]__,,,
C C
HARDPAN
f4] —
—
C
LIMESTONE
[1]
C
HEAVY [-2)
CC
BOULDER(S)
C
CDETRITUSP]
,
—
CTILLS[1]
<‘r
CMODERATE
CC
COBBLE
15]
—
—
C
C
MUCK
[2]
—
—
C
WETLANDS
[01
IL.
C
NORMAL
E0]
[]Q
GRAVEL[7]
—
.
C
CSILT[2]
CNAROPAN[03
CFREE
[1]
o C
SAND [5J
—
—
C C
ARTIFICIAL
ES)
—.
C
SANDSTONE
ID]
‘
ET1E1TE1SIVE
[.23
C C
BEDROCK
[5)
.,,
,.,.
(Score
natural
substrates;
ignore
C
RIPIRAP
0J
€ODb%
C
MODERATE
V3
NUMBER OF BEST TYPES:
C
4ormore-[2j
sludge t-on
poina-sourtes)
CLACUSTRINE[O]
‘CNORMAL[0I
C
3 or less
[0]
C
SHALE [4]
C
NONE [I]
onimems
COAL
FINES (-2]
2]
qualityl
FNSTREAM
34$ighest
COVER
quality in moderate
Indicatequelky:
2—Moderate
presenceor
greater
0
amountsamounts,
to
3:
0-Absent;(e.g.,but
not
very
1-Veryof
large
highest
small
boulders
quality
emounta
in
or
deep
in
or
small
if
moreor
feet
amounts
commonwaten
oflarge
of
highest
marginal
,,
.na< N;
AMOUNT
--
(ii
,
—
,
C
<
chiC.
dtameter
log that is
stable.
welt
developed rootwed
in
deep
I
fast water,
or
deep, well-defined,
functional
pools,
C
EXTENSIVE
>7o%[l’l]
—
UNDERCUT BANKS [1]
—
POOLS>
70cm [2]
—
OXBOWS, BACKWATERS
[1]
C
MODERATE
25-75%
[7)
—
OVERHANGING
VEGETATiON
£1]
—
ROOTWADS
[1]
—
AQUATIC MACROPHYTES
[1]
C
SPARSE
5.’cZS%
13)
—
SHALLOWS
[IN
SLOW WATER)
El] —
BOULDERS
El]
——
LOGS
OR WOODY
DEBRIS
[I]
C
NEARLY
ASSENT
<5% (1]
—
ROOTMATS [1]
CoverS
Comments
Mkvlmurn
20
33 HAMNEL MORPI-IDLOGY
Check ONE in each
category (Or
24 average)
SINUOSITY
DEVELOPMENT
CHANNEUZATION
C
NIGH
E4
-
C
EXCELLENT
[7]
C
NONE(S)
-,
C
MODERATE
[3]
C
GOOD [5]
C
RECOVERED
[4]
C
LOW
[2
C
FAIR
[23
C
RECOVERING
[2J
‘NONE [1]
7
POOR
[I]
C
RECENT
OR NO RECOVERY
[I]
Comments
*
ii
iiiPT
43 BANK EROSION
AND RIPARIAN ZONE Check
ONE
In each category
for EACH
SANK
(0r2
per bank &
average) -
Rivr,c die tmkin dQwnMmern
,, RIPARIAN
WIDTH
FLOOD
PLAIN
QUALITY
-
EROSION
C
Q
WIDE>
SUm
C
O
FOREST, SWAMP
[3]
C C CONSERVA’IION
TILLAOE [I]
C C
NONES
LITTLE 13)
C C
MOOERATE
ID-SUm
[3]
C
C
SHRUB OR OLD FIELD
[2]
C
C
URBAN OR
INDUSTRIAL
[0]
C C
MODERATE
[2]
C
C
NARROW
S-tOm
[2]
C C
RESIDENTIAL,
PARK, NEW FIELD
[I]
C C
MINING
I CONSTRUCTION
[0]
C C
HEAVY
I
SEVERE
[I]
C
C
VERY
NARROW<
Sm [1]
C C
FENCED PASTURE
[1]
C
C
NONE [U]
C C
OPEN PASTURE, ROWCROP
[0]
5] POOL / GLIDE
AND
RIFFLE
/ RUN
QUALITY
MAXIMUM
DEPTH
CHANNEL
WIPTH
Check ONE
(CNLYr;
Check ONE
(Cr2 & average)
Im [63
C
POOL WiDTH>
RIFFLE WiDTH
[2]
C
0,7-clm
4,)
C
POOL
Wi,OTHtRIFFLE
WIDTH [I)
C
OA-40.ita
[2]
C
POOL
WIDTH
<RIFFLE
WIDTH
(03
C
0.2-c0,4m [I]
C
fL2m [0)
Comments
tridloate
paLdonaoent
land
Lee(s) ,
pest
loOn,
ifosrian,
mpanan
1,
r
‘
Maxenuni
Pooli -.
Cnri’ent
Mavkuum
12
indicate
for
functional riffles; Best
areas
must
be
large
enough
to support e population
,-,
-
of riffIeobligate
SpecieS
Check
ONE (Cr2 &
average),
CiNL’
RI
lP1flc*.,
RIFFLE DEPTH
RUN DEPTH
RIFFLE
I RUN SUBSTRATE
RIFFLE
I
RUN
EMBEDDEDNESS
C
SESTAREAS>
10cm [23
0
MAXIMUM
50cm
[2]
0
STABLE
(e.g., Cobble4Boulder)
[2
C
NONE
E2)
C
BEST AREAS
5-lOcmnE’l]
C
MAXIMUM C 50cm
[1]
C
MOD4
STASt.E(e,g,,
Large
Greveifll]
C
LOW
[1]
C
ET
orAS
-‘ m
C
UThBuE
m
g
‘ne
Orcu
SanJ
2
OOER
—
-
[motrichi)]
fl
EXTENSiVE
4]
s,,,,,,
Ron
,.,
Comments
,1,C.F,C,
1
.
ts
13]
GRADiENT
L,Pmi) C
VERY
LOW
- LOW[2.43
%POOL:Lj
%GLflE;l
)
Grarllonr
/ -
Do” ItvAOE
P!It
C
NOOE0AmE
(6
-J
r-
)“‘-
-<
-
imCHIGhERYkhGHfiG%RU_j%%RFLEit
-
1’
,
.
.
.
.
ERA 4520
-
062t1101’
/1,
‘
hwoudndt13,
Stream
es
& Location:
QHEI
ScCn:
:
:151cc
vsm’irtac/
r
iocatian
i.—’
Sirbstra-ra
7,.,
20
STABILITY
C
HIGH (3]
C
MODERATE
[2]
.2?
LOW[1]
Comments
Channel.
-,
-
tiaxrmum,,
-
20
.:
.,.
CURRENT
VELOCITY
Check ALL that
sppiy
C
TORRENTIAL
[-1],ZS
LOW
[I]
C
VERY
PAST
(1)
C
INTERSTITIAL
[-1]
C
FAST
[I]
C
INTERMITTENT
[-2]
C
MODERATE
[1]
C EDDIES
[1]
Indicate for
mcccli - pools
end riffles.
Recreation
Potential .
Secondaiy
Primary
ConfeCt
Contact[
i
Electronic Filing - Received, Clerk's Office, September 8, 2008
MBI
MODIFIED
Quaiitative
Habitat
Evaluation Index
,,
.
<.
and
Use
Assessment Field Sheet
QdtI
Stream
&
Locat/on:
.
1.8’>
1
LB
FM:
:21
/)Pate:
cYT/
‘I 08
-
_$corere
Fall i4axme
&
Afnhatzon
j
C
Vol Code
STORET
Lee
/
Lonq
18
0
Ire el7w
i
Si/JSSTPATE
Chec2
ONLYTWo substrate
TYPESOXES
o no
v
r rmnescnt
01w” ONE
“
2Cc
a $30)
BEST
TYPES
POOL
RIFFLE
OTHER
TYPES
POOL RIFFLE
OR1GN
QUALITY
DO
BLDRISLABS[10)_,,.,,,>,,,,,,,.
Q
QHARDPAN4)
LJL1MESTONE[I]
DHEAVY[-23
GD
BOULOER 193
,,>, 3 0
DETRITUS
[33 —
—,
OTILLSW
iLT
0
MODERATE
[-I]
GD
COBBLE
[83
—
_, 0
0
MUCK
12]
—
——
0
WETLANDS
10]
“
0
NORMAL (0)
00
GRIeVEL[7]
,.,,-
OOSILT2I
ONARDEANjO]
GD
SAND [5)
00
ARTIFICIAL
10]__
—
DSANPSTONE
10]
EYEXTENSIVE
[-2)
O 0
BEDROCK(S)
—
(Score natural subslratas; ignore
0
RIP/RAP [0]
ç,cIDE%
0
MODERATE
[01)
NUMBEP OF
BEST TVP80
4IUC%O
on
1)0
‘c.,t’,5)
OLACUSTRINE
10]
D
NORMCL (0]
Comments
0
COAL
FINES
f-2]
2)
lit/STREAM COVER
lndtoate presence 0 to 3; 0-Absent; I-Very ernat amounts
or
If
more
common of marginal
AMOUNT
di
2
IN
A
ni
‘ hut it
I
ghe’I q,klitl
or i
“mall
arm
oun of I igh s
,
S
qh
t
‘it it
ir C
or3m
or
snouns
e
J
em>’
srq boulders
in
&itorfasti
ator
i’ll)
iek c
N
41
P
diemeter tog that
to stable, well
developed
niototad in
deep
/ fast
water, or deep. well-defined, functional pools.
Q
EXTENSIVE
>75% [II)
BANKS [1)
—
POOLS>
70cm
[23
OXBOWS, BACKWATERS
[1)
Q
MODERATE
25>75% [7]
OVERHANGING
VEGETATION
[1]
ROOTWADS [1]
—
AQUATIC MACROPHYTES
[I)
13
SPARSE
5-<25% [3)
SH3LOWS
tIN
ml
OW WATER) [1
COtuLDERS
01)
LOGS OR WOODY DEBRIS
[1]
0
NEAPLI
AbSeNt 5%
[1]
COO)
MATS
LI)
—
—
Cove”
r
Comments
/Jfa’mirnwn
5?”
3] CHANNEL MORPHOLOGY
Chock ONE in
each category
(Or
2 &
avereee)
SINUOSITY
DEVELOPMENT
CHANNELIZATION
O
HIGH
FI
0
EXCELLENT
17)
0
NONE
16]
O
MODERATE [3]
0
GOOD fSJ
0
RECOVERED
[3J
$‘LOW
[2]
0
FAIR (3]
0
RECOVERING
[3]
0
NONE
[1)
,WPOOR
[1)
0
RECENT OR NO RECOVERY (I]
Comments
‘8
A]
BA/t/IC EROS/ON
AND F/PAR/AN ZONE
CheckONEineachcategomyforEACffSAN/C(Or2perbank&evenigs)
Rirtrrihite5ina
do,,strent
,
RIPARI.ANW!DTH
$
FLOOD PLAIN
QUALITY
.
EROSION
13 Q
WIDE> 5Dm [43
13 O
FOREST.
SWAMP [$3
O 13
CONSERVATION
T1LLAGE
[I)
0 0
NONE
1
LITTLE
[3]
Q 0
MODERATE
104Dm
[3]
0
0
SHRUB OR OLD
FIELD
[2)
0 0
URBAN CR
INDUSTRIAL
[0]
O Li
MODERATE
[2]
U U
NARROW
54Gm
[2]
13
0
RESIDENTIAL, PARK, NEW FIELD
II]
0 0
MINING
/
CONSTRUCTION
f93
U 0
HEAVY
/
SEVERE [1)
0
0
VERY NARROW <Sni
[1]
0 0
FENCED
PASTURE [I]
/ndicate
predominant
lend
oae%t
0 0
NONE
103
0 0
OPEN PASTURE,
ROWCROP [03
past
It/Urn
r/pathan.
Riper/an
Coniments
/Aoximum
4
1’
O
5]
POOL/GL/DE AND
RIFFLE/RUN
QUALITY
MAXIMUM DEPTH
CHANNEL
WIDTH
Check
ONE
tONL’I
Check ONE (Or
28
average)
7>
‘mi
0
PooL.
WIDTH>
RIFFLE
WiDTH
[2)
0
O.T-<Im
14]
0
POOL WIDTH RIFFLE WIDTH
[I)
o
0.4-cO.Tm
14
0
POOL
WIDTH
a RiFFLE
WIDTH
93]
0
0.2-aDAm
[1)
0<
0>2m [0)
/;
,Impounde.cI
1-h
Commamtts
Corranf 2
Mai Onion
indicate
for furtctiona!
riffles;
Best arees
mUSt
be large enoUgh
to
support a population
QHO
P’I’ZFU:
of
riffie-obltgate
species:
Check
ONE (Or
28
averagc.
‘
0’ -
RIFFLE DEPTH
RUN DEPTH
RIFFLE / RUN SUBSTRATE
RIFFLE
I
RUN
EMBEDDEDNEIT
0
SESTAREAS> 10cm
12]
QMAXIM UM > 50cm [2)
0
STABLE
(a>g>,
Cobble,
Boulder)
[2]
0
NONE
[2]
L
aE
°C/’S t1
cm”
mi]
3F4p.’ip1f’m
%
,m 01
01100
STCSLC
1>’
g
Lcre C ‘ &)
m
1i
LLOW
Lt]
l>’IIOISflDLE(ce
FnoGrs N Szi )[0I
D,IODEVflEOi
IIiilc
Cua,fleflts
tmomnc”'uJ
(‘3
EXTENSIVE
[-I],
I
0
4
Smmbstra/c
‘1’
.i
C>
/
/,‘iaxunomn
STABILITY
0
HIGH
13]
O
MODERATE [23
LOW [I]
C1;annai
4
‘c”>’
Maximum
1
—3
CURRENT
VELOCITY
Check ALL that aoply
0 TORRENTIAL
14]
,LOW [I]
0 VERY
FAST (1]
0 INTERSTITIAL [-1]
0
FAST
[‘1]
0
INTERM1TTENT
[-2]
0
MODERATE
[1]
0 EDDIES
[1]
/nd/cate forreach
-pools and riffles.
Recreatton Potential
Pr/mary Contact
.
Seciondary
Contaott
6] GRADIENT
.
ft/nit)
fl
VERY LOW - LOW
[2’C]
DRAINAGE
AREA
OMODERATE
[8-10]
[3
N1GH
-VERY
HtGH
[10-5]
EPA4520
‘1?/1/47>
‘.1
‘.
/
1
PDOL
>4
,,,, udn
/“\
ro_;>>,>’,
3
%RUN: 4,,_j%RlFFLE:[_J
Electronic Filing - Received, Clerk's Office, September 8, 2008
MEl
MODIFIED
raana
Qudiltative Habftat Evaluation indeY
‘;m
J’
ndiJsa
Assessment R&d
Sheet
Snnrere Full
Name
&
AfFiffation;...
jI,
4i -
‘
River Code:
-
STORET
#:
Is
1
SUBSTRATE
Check
ONLY
Two substrate TYPE
BOXES:
-
estimate % or
note every
type present
Chect
ONe (Cr2
o
average)
BEST
TYPES
POOL RIFFLE
TYPES
POOL
RIFFLE
PR&GW
QUALITY
00
BLDR
(SLABS
[10]__
,
0 C]
HARDPAN
[4] —
—
0
LIMESTONE [1]
Li
HEAVY [-2]
O
C
BOULDER
[9]
—
[3
0
DETRITUS
(3]
,
0
TILLS [1]
0
MODERATE
(-1]
o
0
COBBLE
[0]
—
—
0 0
MUCK
[2]
—
—
0
WETLANDS
[OJ
‘
C]
NORMAL
[0]
00
GRAVEL [7]
—
——
[3D
SILT
[2]
—
0
t-IARDPAN [0)
OFREE[3]
00
SAND 0J
—
—
C] 0
ARTIFICIAL
[01
—
0
SANDSTONE 0[
—
C
EXTENSIVE
[-2]
00
BEOROCK
(3]
(Score
natural substrates; ignore
DRIP/RAP
[0]
4
AO%
U
MODERATE
[-1]
NUMBER
OF
BEST
TYPES:
0
4 or more
[2]
sludge frmn
point-sources]
C]
LACUSTRINE fO]
0j
0
NORMAL [0]
D3oriass[o]
DSHALE[4)
ONONEFI]
Comments
0
COAL FINES -2]
2] INSTREAM
COVER
Indicate
presence
0 to 3: 0-Absent;
i-Very
smell amounts or it more common
of marginal
AMOUNT
q
oh
y
2 elooo iw
moa r but
not o h
Meal
ovali
ir
m
smell
a i-our a
t
hig
r—’i
,
quelty: 3-Highest
quatly
in
moderate or greater amounts
(eg.. very
large boulders s
deep
or
test
water, large
2 s’ at
acm-st
diameter
log that is stable,
well
devetopeu
rootwag rn
deep
/feet
water. or
deep, welt-defined,
tunotional
pools.
C]
EXTENSIVE >75%
(‘II]
UNDERCUT
BANKS [1]
POOLS > 70cm
[2] _. OXBOWS, BACKWATERS
[1]
C]
MODERATE
25J5%
(7]
OVERHANGING
VEGETATION [1]
—
ROOTWADS
[1]
AQUATIC MACROPHYTES
]
C]
SPARSE
0-e25%
(3]
SHALLOWS (IN
SLOW
WATER)
[1]
BOULDERS
(3]
—
LOGS OR WOODY
DEBRIS [1]
C]
NEARLY
ABSENT
xS%
[1)
—
RODTMATS
[1]
Cover
Comments
Max/mum
‘j4
20
3j CHANNEL MORPHOLOGY
Chock ONE in
each category (Or
2 & average)
SINUOSITY
DEVELOPMENT
CHANNELIZATION
o
HIGH
t]
0
EXCELLENT [7]
0
NONE
£6]
o
MODERATE
[31
1]
GOOD
[9
0
RECOVERED
o
LOW [2]
C]
FAIR
(3]
0
RECOVERING
[3]
JZNONE
(3]
WPOOR
[1]
0
RECENT
OR NO
RECOVERY [1]
Comments
4] BANK
EROSION AND RIPARIAN
ZONE
Check
ONE In each category
for EACH BANK
(0r2
per bank &
overage)
RrvGrnqhttQkin
5
dovmsermam ,
,, RIPARIA.N WIDTH
..
FLOOD PLAIN
QUALITY
EROSION
O
O
WICE >5Gm 4]
C C
FOREST,
SWAMP
(3]
C
C]
CONSERVATION
TILLAGE
[1]
O
0
NONE/LITTLE [3]
C]
[]MODERATE
itt—SOre
[3]
0
0
SHRUB
OR
OLD FIELD
[2]
0
0
URBAN OR
INDUSTRIAL
(01.
o o
MODERATE
[2]
0
ONARROW
S-i0m
[3]
0
0
RESIDENTtAL, PARK, NEW
FIELD (1]
0 0
MINING
(CONSTRUCTION
(31
o 0
HEAVY! SEVERE
[1]
0
OVERY
NARROW-c
Sm [1)
0
0
FENCED
PASTURE
[I]
0 0
NONE
0 0
OPEN
PASTURE,
ROWCROP
[0]
51
POOL! GLIDE
AND
RIFFLE!
RUN
QUALITY
MAXIMUM
DEPTH
CHANNEL
WIDTH
Check
ONE (CNLTh
Check ONE (Cr2 &
averaae;
$t>
im
[63
0
POOL
W(DTH a RIFFLE WIDTH
[2]
o
0j-cim
[4]
0
POOL WIDTH RiFFLE
WIDTH
[-I]
O
OA-<OJm
(23
DROOL WIDTH
C
RIFFLE
WIDTH
(33
O
0.2—’0.4nt [I]
0<
RAm
[0]
Comments
(nd/cafe predoor/nant
/and uaa(a;
.1
peat
10Dm
r4oar/an.
Riperlan
4c
/
Maximum
6
Pool)..
Current
Maximum
,,
‘12
Indicate for
funCtional
riffles; Best
areas must
be
large
enough
to aupoort
a
ponulation
,
- -
-
of
r]fflo-obl]gate
species:
Check
ONE (Cr2 Leverage).
- UNO
RIFeLt Lrnetrroatcl
RIFFLE
DEPTH
RUN DEPTH
RIFFLE
I RUN SUBSTRATE
RIFFLE
I
RUN
EMBEDDEDNESS
C
SESTAREAS
a 10cm [2]
QMAXtNIUMa
50cm
[2]
0
STABLE
(ag,, Cobble, Boulder) [2]
0
NONE (2]
0
0
BESt
BEST
APEPS
AREAS
S 10cmit-nt i1
Ct
alSiUto
— COon
v] 0
OU
PlODDTAtA.L
S AELt
Is, u
ry
FrntGiamat
j
i_argo Graveti
Sand
tl[
3rc
Or
0
OJCP
OW
C
‘a
r
‘
e
[metrrcO]
C
E”rNstvErvit
Pt-n--
,,
Comments
,
—
Mexcxnurrr
Stream & Location:
£
/4rixa
d1
-‘ 28/-
A8
RM:LLDStS:C7./
/
1/
05.
QHEI
4
Stocn’e
Suhstrrw.e
Aiax/;nrsn’c
2.0
STABILITY
0
NIGH [3]
0
MODERATE
[2]
LOW
[1]
Comments
C/raona/
-
Max/mute
4 n-..,
jd
CURRENT
VELOCITY
Cheek ALL that
apply
o
TORRENTIAL [-1] FSLOW
[I]
O
VERY FAST [1)
0
INTERSTITIAL
[-ii
O
PAST [1]
0
INTERMITTENT [-2]
o
MODERATE
[1]
0
EDDIES
[1]
/nd/cate ibm roach - poo/s and
N/ties.
Recreation
Potenda[!
Primary
Contact
Secondary Contact
-6]
GRADIENT
l_W’mt)
C]
VERY
LOW
- LOW
(2-41
DRAiNAGE
AREA
C]
MODERATE
[4-ID]
nil
2)
C]
HIGH VERYHIGH [‘1D9
tEPA4520
‘
.
(i-47u/
:j
- 7_-.\
%POOL:(.,_j
%C-LIDE:(__)
Gradient:,
%RUN
CD%rtE
7
Th
2
/
Electronic Filing - Received, Clerk's Office, September 8, 2008
MEl MODIFIED
cfl.tHI
Stream
&
Location;:
J/s
fYec
AXe,
28/i 3
AD
River
Code:
‘
STORET#:
11
SUBSTRATE
Check
CRC/Two
substrate TYPEBOXES;
sebmata %
or
note every
type present
BEST
TYPES
POOL
RIFFLE
OTHER
TYPES
POOL RIFFLE
[DC
BLDR/SLASS(10_
E]C]HARDPAN(4]
o
0
BOULDER
[N
—
DQ
DETRITUS
131
—
CO
COBBLE[8]
——
OEJMUCK[2]
—
—
00
GRAVEL[fl
—
C
DSILTI2]
—
—
00
SAND
[6]
—
0
0
ARTIFiCIAL
(0]_
C]
C]
BEDROCK
t5]
—
(Scam natural
substrates; ignore
NUMBER OF
BEST
TYPES:
C]
4cr
more f2]
sludge
Iron
point-sou.rces)
Comments
—
LI
3
or
less [0]
Check ONE
(Or
2
&
overage)
ORIGIN
QUALITY
Ci.
LIMESTONE
[
C
HEAVY [-2]
C
TILLS
L
MODERATE [-11
C
WETLANDS 0J
SI
C]
NORMAL
[0]
O
HARDPAN [0]
DJiL.,
o
SANDSTONE [0]
0
EXTENSIVE
[-21
ORIPIRAP
[03
eODE%
C
MODERATE
UI]
O
LACUSTRINE
[0]
C
NORMAL
(01
0.
SHALE i-I]
C
NONE
CI]
0
COAL
FINES [-2]
23 INS TREAM
COVER
indicate
;u
4
l 2
presence
r’dmolo
0 to
nu
3:
0-Absent;
Ha
I
ci
o
I-Very
of
ho
small
car
puehljamounts
or
or
n
sm-HI
if
more
ante
common
a
15w
of
Not
marginal
sal
AMOUNT
quafly; 3—Highest
nudity
in moderate
or
greater
amounts
(eg,.
very
large boulders
in deep or
fast water, large
LneJc
ONE
a’
2 r
t
diameter
log that
is stable, well
developed
rooiwad
in
deep
I
fast
water,
or
deep,
well-delined,
functional
pools.
fl
EXTENSiVE >75%
[II]
UNDERCUT BANKS
[I]
POOLS>
70cm
(2]
—,
OXBOWS,
BACKWATERS
[1]
C
MODERATE
25J5% (73
—
OVERHANGING
VEGETATION
III
ROOTWADS
[‘I]
AQUATIC MACROPHYTES [‘I]
0
SPARSE 5-°26%
13]
SHALLOWS
(IN
SLOW
WATER) [I]
—
BOULDERS
[1]
—
LOGS ORW000YDEERIS[1]
Q
NEARLY
ASSENT <5%[l]
—
ROOTMATS [1]
Comments
Uotirn
ç
0
H.
2f
2
3
33
CHANNEL MORPHOLOGY
Check ONE in each
category (Or
2 3
averege)
SIN UOSITY
DEVELOPMENT
CHANNELIZATION
C]
HIGH
141
C
EXCELLENT
[7]
0
NONE
[63
0
MODERATE
[3]
C
GOOD
[5]
C
RECOVERED
J
,2’LOW
[23
C
FAIR
[3]
C
RECOVERING
(3]
o
NONE
[1]
0
POOR
[1]
0
RECENT OR
NO RECOVERY
[I]
Comments
;T
43
BANK
EROSION
AND RIPARIAN
ZONE
Check ONE
in
each category for
EAOH
SANI< [Or2perbenk &
average)
RNwnehUoGkIne
downryern
RIPARIAN
WIDTH
p
FLOOD PLAIN QUALITY
,
EROSION
0
0
WIDE>
SUm
1]
ED
ED
FOREST.
SWAMP
[31
C CONSERVATION
TILLAGE
(3]
C]
C]
NONE
2
LITTLE
[33
C 0
MODERATE
10-5Gm
[3)
0 C] SHRUB
OR OLD F1ELD
[2]
C
C
URBAN
OR
INDUSTRIAL
[0]
C Li
MODERATE
12]
0 0
NARROW
5-’iOm [2]
C U
RESIDENTIAL,
PARK,
NEW FIELD [1]
0
C MINING!
CONSTRUCTION [0]
O 0
HEAVY! SEVERE
[1]
C
0
VERY NARROW
<Sm
[1]
C
C
FENCED
PASTURE
[1]
C C
NONE
[9
C C
OPEN
PASTURE. ROWCROP
[0]
5]
POOL/QLIOEAND
RIFFLE/RUN
QUALITY
MAXIMUM
DEPTH
CHANNEL
WIDTH
Check ONE (ONLYI’I
Check
ONE (Or 2 &
average)
Ira
[01
0
POOL WIDTH>
RiFFLE
WIDTH
[2J
C
0,7-elm
1]
Q
POOL
WIDTNRIFFLE
WIDTH
[I]
O
0J,’-tO,7m
121
0
POOL WIDTH
<RIFFLE
WIDTH
101
o
0,2-eOAm
[I]
C
< 0,2m
[0]
Commenis
/ndice!e
preriooiioeo!
lend
rrse(s
pest
lOOm
oper;ao.
Riperien
(
(H
Iviessrnwe
.
H
1
Current
indicate
of riffle-obligate
for
functional
species:
riffles;
Best areas
Check
must
ONE
be
(Or
large
2 &
everege).
enough to support
a
popuiatiom
C]
,
oir
,
r,,,Z
— l•--’
RIFFLE
DEPTH
RUN DEPTH
RIFFLE
/
RUN
SUBSTRATE
RIFFLE
I
RUN
EMBEDDEONESS
0
SESTAREAS> 10cm
i2
C
MAXIMUM> 90cm [2]
C
STABLE
(e.g.,
Cobble,
Boulder)
[21
C
NONE
[2]
[D
BEST
AREAS
5-10cm [1]
0
MAXiMUM
e 50cm [1]
C
MOD. STABLE
[eg,,
Large
Grave])
[1]
ED
LOW 11]
[D2Er
PS<Sm’r
m’l1rrS.flBC/(eg
rrc
rr
Sand)t0t
1nDE”E
lmehicaO;
D
EXTENSWE
Comments
QuaLtative
Habätat
Evalluatbn fridex
ntq:t’
dfrarrra
arid
Use
Assessment
FMd
Sheet
‘
, -
RM:2(HfYDate;OX/
t/p
,Scerers
Full
Name
&
Affiliation:
:%
4o(H
-
-
LaL/ Loin:
014cr vrvmvv’
.-
,
-,,_
locaaor
Suhsfmare
(-(H)
Mae—nun
20
STABILITY
o
HIGH [3]
0
MODERATE
123
a
LOW
[1]
Comments
Channelc
Aldairnuo:
2f2.
Tn’lpDurVYtl[l]
CURRENT VELOCITY
Check ALL
that
apple
O
TORRENTIAL
El]
2’%LOW
II]
C
VERY
FAST
(1]
C
INTERSTITIAL [-1]
O
FAST
[1]
-
C
INTERMITTENT
[-2]
C
MODERATE
[1]
C
EDDIES
[1]
Indicate ter
reach
- pools cod
riffles.
i
Recreation
Potential
i
Primary
Contao1
L
Seoondaty
Contact
itcdrcts
record
crmmero cc wee
6]
GRADIENT
fl/mi)
C]
VERY LOW
- LOW
[2-43
DRA3NAGE
AREA
C
MODERATE
15-10]
(mi
2
)
0
HIGH - VERY HIGH
[10’S]
EPA4S2O
)‘:;.
(-/
- .
%POOLç,J
%GL1DE:ç,,
3
%RUN:
CED%RIFFLE:CZZ)
G7adiacl’
,-
-,
t$cvrr.
crr3?
-
r”>
It)
Electronic Filing - Received, Clerk's Office, September 8, 2008
QUALI1Y
El
HEAVY
[23
r
fV100ERATE
(fli]
El
NORMAL
(03
- -
El
FREE
[1]
C
EXTENSIVE
[.2]
O4I,
El
MODERATE
(.41
jD
NORMAL
[0]
C
NONE
1]
21
-STREAM
c/1?
qslity;
hdicat
2-Llodemte
presence
Ii
amounts.
to
3:
04bseni;l-Varv
hut
not ot
highest
small
quality
amounts
or in
or
small
ii moreamountScommonol
ot
highest
marginal
AMOUNT
-.
1
Ned
err
u
Ii
r
rroJr
.
or
0
0
0
1
0 0
(0
Lro
oul
1te
oee
o
f’tr
aim
Lrgs
v’*
CNL
Cr
0
dmmdtar
00
that
is siSbiC.
woll
4ev
opari roulwad
in
<isep
/
iset
water,
or
deep,
wli-ddllnd,
funciloord
pools.
fl
EIENSIVE
>75%
(ii]
_UNDERCUT
BANKS
113
——
POOLS>
70cm
[21
—
OXEUWS.
BACKWATERS
[it
fl
MODERATE
25-ThY
17]
OVERHANGING
VEGETATiON
[11
—
£11
—
AQUATIC
MACROPHYTES
£13
El
SPARSE
S-c25%
[3]
SHALLOWS
(IN
SLOW
WATER)
[1]
BOULDERS
[1]
—
LOGS
OR
WOODY
Q
NEARLY
ABSENT
<5%
(11
—
ROOTMATS
[1]
Coeer
Ccrrrnents
Maunnurn
1
2G
3] HAFINEL
MORPHOLOGY
Chock
ONE
in
cock category
(Or 2
&
svrorya)
SINUOSITY
DEVELOPMENT
CHANNEUZATION
El
HiGH
4i
EXCELLENT
[7]
El
NONE[6]
El
MODERATE
(3J
El
GOOD
15]
El
RECoVERED
[4]
ZLOW
[23
Cl
FAIR
[3]
El
RECOVERiNG
[33
[3
NONE
(1]
.]POOR
[11
[3
RECENT
OR
NO
RECOVERY [1]
Comments
iEiJf1
41
SANK
EROSION
AND
RIPARIAN
ZONE
Chock
ONE
in
each category
for EACH
BANK
Or2
per
book
&
average)
Pv
0qht1d
es1r
RWARIAN
W{DTh
FLOOD
PLAIN
QUALITY
EROSION
D
C
WIDE>
50m
[4]
C]
C
FOREST,
SWAMP
[3]
C C] C0NSEP.VAIION TILLAGE
[1]
El
C]
NONE
1
LITTLE
1
C]
[3’VIOIYERATE
1i1..50m
El C]
SHPUE
OP
OLD
FIELD
[21
0
0
URBPN
OR INDUSTRIAL
[0]
El El
MODERATE
(2]
Q
El
NARROW
5.4Dm
(2]
El
El
RESIDENTIAL,
PARK.
NEW
FIELD
[1]
C
C] MINING
I
CONSTRUCTION
(01
C]
ElHEAVY!SEVERE(13
Cl
ElVERYNARROWc5m(1l
El El
FENCED
PASTURE
[1]
C]
El
NONE
[0]
El
C
OPEN PASTURE,
ROWCROP
[0]
51
POOL!
GLIDE
AND
RIFFLE!
RUN
QUALITY
MAXI[UM
DEPTH
CHANNEL
WIDTH
Chace
ONE
ONLY?)
Check
ONE
(Or
2
4
o
Ire
[8]
Cl
POOL
WIDTH>
RIFFLE
WIDTH
12]
0,7-elm
[4]
El
POOL
WIDTH
RIFFLE
WIDTH
[1]
El
(L4-cO.7m
[23
El
POOL
WIDTH<
RIFFLE
WiDTH
[0]
El
oa.eo.4m
[1]
El
<0.2m
[01
Comments
lre1iats
pradorrthtanf
land
use(s)
.
past lOOm
rirerdan.
Riparien
r(
Maximum)
-‘
Pool!-
Current
Moar;nrjm
•2
Indicate
for
functional
riffles;
Best
areas
must
be
large enough
to
support
a population
. -
...,
•,.
of
riffie-obligato species
Coach
ONE
(Dc 26
avaragai.
tirIO
RI.
RIFFLE
DEPTH
RUN
DEPTH
RIFFLE!
RUN
SUBSTRATE
RIFFLE
I
RUN
EN1BEDDEDNESS
El
BESTAREAS
>10cm
(2]
r
3MAXIMUMa
50cm
[2]
El
STABLE
(e.g.
Cobble,
Boulder3
£21
*
[3
NONE
[23
El
$ESFAPF
sS”
ucv[r
flt,
50ct
tOO
STAfIt
E (a
o
Lam—
GraveI)tl]
ElLO4
1’
C
OEC’
“ROS
—
,.
4 TC..E
g
e
Sriito
Sottu)
01
JMOJERVC
tOt
tmotrt
cmi]
C]
E)(TENSiVS
(-1] ..
-. -
oomments
,-r-.
.
.
.
“7
Of’7”’JT
—.
.
.
-
—
,.—,
t’
.O
[
2
—i
.
..
—- .‘- -
‘‘
%X
L
C
-
‘TO
-,
-
)rsO
14
_t
— I
/
Th
t
mP
El
HIGH-VERY
H1GH
110-6]
%RUN:
(
J%RIFFLE:(
-.
:
--,==_
:
I
..
ER
4520
;
crr
5
“:
Sfream
&
Location:
!1t—7
1’TQDTFTTT)
ta
S-
s
and
Use
Assessment
F&d
Sheet
.J;w
.t’Cf5
i!ir
;2L
Full
Name
&
Affiliation:
;
2.14
RII€ICOc
3
e
STOPE?
4
—
/8
11
SUBSTRATE
Check
ONLt’Two
SuhOirete
TYPE
BOXES.
-
esimate
% or note
every
type
ptSCI11
BEST
TYPES
POOL
RIFFLE
flI.R
POOL
RIFFLE
ORIGIN
_______
DEl
BLDRISLABS
[10}
,,..._
QC]
HARD?AN
£4]
—
—
El
LIMESTONE
[i]
[ID
BOULDER(S)
*
,,__,
CDOETRITUStS]
—
—
DTILLS[1J
C] El
COBBLE
[51
—
—
C
El
MUCK
[2]
—
—
C]
WETLANDS
[0]
DC]
GRAVEL
[7]
El
[ISiur
[23
—
—
C]IIARDPAN[o1
CC
SAND
E
.
El
El
ARTIFICIAL
(0],
C]
SANDSTONE
[0]
El El
BEDROCK
[51
_.
...,,,,
(Score
natural
substrates:
ignore
C
RIP/RAP
[01
NUMBER
OF
BEST
TYPES;
El
4
or more
[2J
sittcig
hoot
point-sources)
C]
LACUSTRINE
[03
C
S
or
less
£03
C
SHALE
[-1]
cosninents
.
C
COAL
FINES
[-2]
Cirs-crs
ONE
tOr 2 6
storage)
C
a:
STABILITY
C]
NIGH
[3J
MODERATE
[2]
LOW(1]
Comments
Clronno!
ae)rrnum
20
cURRENT
VELOCITY
Check
At L that
apply
El
TORRENTIAL
[-1] SLOW
[I]
C]
VERY
FAST
[13
DINTERSTIT1AL
[1T
C
FAST
[1)
DINTERMITTENT
[-21
O
MODERATE
[1]
C]
EDDIES
[1]
Indicate
for,osch
- pools
and
riffles.
I
Recreation
Potential
Primary
Contac
Secondary
Cantacti
vS O3TtO,.tti
Vt
os_It
I
(4
:.>1LJ
Electronic Filing - Received, Clerk's Office, September 8, 2008
MBI MODIFIED
_t
aV?
iauatOr
Ek
and
Use
Assessment
R&d
Sheet
SeaitiOs
/mnr
ij
/!3
__&orBrSFullNSme&AfluIktion1
.A
r•
I?
r
Code
STOPET
Lat
ILong
J!QL
i
—
—
——-—
—
l
J33Dn.
O’L-
ocs
LW flutES
EIVSW?
type
LWESSe2Ri
Cnek
OtOr
3EST
rIP
ES
oo
i
OTHER
TIPES
ORGN
-
9
B_Do
SA[
[9 Q-IAPDPAts]
*
—
LILII1ESTONCII)
3D
BOULOEF
19]
—
——
Li
‘i
LID
COBBLE
[6]
LI LI
MUCK
[2]
—
LIWETLANDS
[01
LI
NORMAL
[03
LID
GRAVEL[7
—
,.
LILIsn.x[2
—
LIHARDPAN[{I]
1FREE(13,,
U Ci
SAND
[6]
*
—
LI
LI
4RTI9C[AL
[0]
LI
SANDSTONE
101
Li
ry
roisivE
r
23
Li
LI
BEDROCK
5]
—
Score
natural
euhetratus;
cjnore
LI
I1JP11JP
[j]
4]3O%
Li
MODERATE
i1
NUMBER
OF
3EST
TYPES:
LI
4cr
moro [2]
Audge
trom
p
kCouLces]
LI
LACUSTRNE
10]
‘
‘LJ
NORNIAL
10
LI
a
crIses
10]
Li
SHALE
[-1]
C]
NONE
13
LI
COAL
FINES
[2]
21
INSTREAM COVER
P°°°°
0 tu
3
0-Absent:
1-Very
small
amounts
or
i
moe
common
of
4m[I
2
am
mrpir
AMOUNT
etenmcie
but
s
u
h3TmeD
m’lm\o
Ims’melllrraunso
hr’e,
<--a
-n
s
-
a
‘
i
rI
ma
a
L
mr
o
r
na
stur
r
11
damrnster
log
that
a
cAsIo
well
davotoped
rotuwed
fl rasp
/ mast mator
or
Ltmsep.
well-defined,
funotmommal
pools;.
[9
EXTENSIVE
>75%
[It]
UNDERCUT
BANKS
ti
—
POOLS
a 70cm
2]
—
OXBOWS,
BACKWATERS
[1]
9
MODERATE
25-75%
ITt
OVERHANG1NG
VEGETATION
[1]
ROOTWADS
[I]
*
AQIJA11C
MACRGPHYTES
[I]
LI
SPARSE
dr25%
fl
*
SHALLOWS (IN
SLOW
WATER3
[1]
BOULDERS
(1]
LOGS
OR
WOODY
DEBRIS
[1]
LI
NEARLY
ABSENT
cSIk
—
ROOTMATS
[I]
*
—
Comments
21
CHANNEL
fIOLOOY
Cneck
ONE
n
esch
ceiegcnj
iOr2
7 arsaaqo)
SINUOSiTY
DEVELOPMENT
CHANNEIJZAI1ON
STABILITY
LI
HIGH
14]
LI
EXCELLENT
17]
LI
NONE
[6]
LI
NIGH [3)
LI
MODERATE
[3:
LI
GOOD
[5]
LI
RECOVERED
[4]
2’MODBRATE
[2]
Li
LOW
[2]
LI
FAIR
[3]
LI
RECOVERING
[3]
9
LOW
[1]
)2NONE
[I]
(2PODR
[1)
LI
RECENT
OR
NO
RECOVERY
[1]
Comments
a
4
[Irnpounda11J
4
BANK
EROSION
AND
R,/PARIAN
ZONE
Check
ONE
in
each
catecory
for EACH
BANK
(Or
2pihsmnlm
2
o
RIPARIAN
WiDTh
:
FLOOD
PLAIN
QUALITY
EROSION
0
L
WIDE>
LOm
[4]
1]
0
FOREST,
SWAMP
[3]
LI
D
CONSERVATION
1ILLAGE
[-I]
LI
LI
NONE
!LIT7LE
(3]
LI
LI
MODFR4/112
IltuSfim
13)
LI
Li
SHRUB
OR
OLD FiELD
12]
U LI
URBAN
OP
IDUST!715L
[Cm
Li
LI
MODERATE
(2]
Li LI
NARROW
5-lOrn
[2]
Li
LI
RESIDENTIAL,
PARK,
NEW
FIELD
[1]
LI
LI MINING!
CONSTRUCTION
[01
LI
LI
HEAVY!
SEVERE
[‘I]
LI LI
VERY
NARROW
< sm
LI LI
FENCED
PASTURE
[1]
LI
C
NONE
[0]
LI
LI
OPEN
PASTURE,
ROWOROP
[0]
indicate
prer/oinmnanm
(anrf
if
eels!
peel
lOOm
s/par/an
Riparlaa
Mroh;muin
5
ifldcate
for
functional riffles;
Best
areas
must
he (arge
enough
to
support
a
popuiation
of
r
p[•p
a
riffleobiiate
species;
Check
ONE.
(Or?
&w1a>e)
5i)
..
(Oi:
R(EFLE
DEPTH
RUN
DEPTH
RiFFLE
/
RUN
SUBSTRATE
RFLEIRUNEMBEDDEI-l[JESS
LI
BESTAREAS>
16cm [2
C
MAXIMUM>
50cm
2[
LI
STABLE
(eg.,
Cobble,
Boulder)
[2]
[9
NOLt[[
[21
F’
B:s
eES
9
IOD STkBLE
o
Large
C
CV
1
F’
)‘
t
FE5c
‘lf5,BL{r
6—
.
3
o:r-’
f-
JE/’S2m
cOfl?ifle1IdS
E
1
(201.
13/PelT.
...
.
-
—
w
/‘____.
rPt
LOS
2
E
0
4]
.:SQr;%_
3Lm
/
-
r]
]
mODEP4IE[6 IOu
>-=----
)
(j[/j4ijr.3
Comreu
.
20
5]
POOL
/
GLIDE
AND
RIFFLE
IRUN
QuALITY
MAXIMUM
DEPTH
CHANNEL
WIDTH
Chock
ONE
(OWLY[
ChccJ<
ONE
(Or
2
&oVsraciEr/
lm [6]
9
POOL
WIDTH
a
RIFFLE
W1DTH
[2]
[Em
0,7-rIm
(4]
LI
POOL
WIDTH
mFFLE
WIDTH
(1]
LI
(t.6-<0.im
[2]
LI
POOL
[R1IDTh
r
RIFFLE
WIDTH
(0]
LI
1T2-’40.4rml[Ij
LI
rtL2m
[0]
/
1mpOdfldeC-1
1
,
Comments
CURRENT
VELOCITY
Check
ALL that
apply
LI
IORRENTIAL
[4]Z5LOW
[1]
LI
VERY
FAST
[1]
C
INTERS11TIAL
(I]
LI
FAST
[1]
LI
INTERMITTENT
(‘.2]
LI
MODERATE
[1)
DEDDIES [I]
md/cab
(or teach
—
pola ssnd
riNse
:1
Recreation_PotentiN
Prinwiy
Coisshrsct
Seconcimy
Co/lIner!
Pooi/.
Electronic Filing - Received, Clerk's Office, September 8, 2008
Stream
&
LoCation:__/14jjj_YJ’o3LE
River
Co
STORET
#:
estimate
%
or
note
every type
present
BEST
TYPES
POOL
RIFFLE
OTHER
TYP$
POOL
RIFFLE
C C
SLDR
1SLABS
[10]_
Q Q
HARDPAN
[4]
—
C C
BOULDER
[9
—
Q
DETRITUS
[3]
—
—
CC
COBBLE
[B]
—
0
QMUCK[23
—
CO
GRAVELI7]
—
OflSILT[2]
—
—
C C
SAND [6]
0
{]
ARTiFICIAL
[U]
——
0 0
BEDROCK
15]
—
(Scow
natural
substrates;
ignore
NUMBER
OF
BEST
TYPES:
0
4
or
more
123
sludge
from
point-sources)
Comments
C
S
or teas
[0]
Check
ONE
(Or
24
onn’ege)
ORIGIN
QUAUTY
o
LIMESTONE
[1J
C
HEAVY
[-2)
OTILLS[1J
SILt
CMODER4TEVi)
C
WETLANDS
[0]
C
NORMAL
[0]
OI-IARDPANI9
OFREEII]
o
SANDSTONE
W]
LJEIfENSIVE
[-2)
o
RIPIRAP
[0]
gpDEo
4
0
MODERATE
[-1)
o
LACUSTRINE
[0)
C
NORMAL
itt)
o
SHALE
[-1]
C NONE
:‘]
o
COAL
FINES
[-2]
2]
INSTREAM
COVER
Indicate
presence
I)
to
& 0-Absent
1-Very
small
amounts
or if
more
common
of
marginal
AMOUNT
quality;
2—Moderate
a;oounls,
but not
of highest
quality
or
In smel
amounts
of highest
,.
ml
S I—
tjhnl
it;
r’
eoo;
to 0;
gr<n;er coo
a
K
te
p
<
iipe
bojoers
in
hap
r
tact
a’e
Is
ge
Co
0;
P 0”z e
die;neler log
that
is
stable,
well
developed
rootweri
in
deep I
fast water,
or
deep,
walt-definer],
functional
pools.
EXTENSIVE
>75%
[11]
—
UNDERCUT
BANKS
[1]
—
POOLS>
70cm
[33
—
OXBOWS,
BACKWATERS
[13
MODERATE
2544%
(7)
OVERHANGING
VEGETATION
[1]
—
ROOTWADS
[13
—
AQUATIC
MACROPHYTES
[1]
C
SPARSE
5-’c25%
[3]
—
SHALLOWS
(IN
SLOW
WATER)
[I]
—
BOULDERS
[1]
LOGS OR
WOODY
DEBRIS
[1]
C
NEARLY
ABSENT
<5% (1]
—
ROOTMATS
[1]
Cover
.‘‘-,
Comments
aloafrowe
5]
CHANNEL
MORPHOLOGY
Check
ONE
reach
category
(Cr2
&
average)
SINUOSITY
DEVELOPMENT
CHANNELIZATION
o
HIGH
14]
C
EXCELLENT
[7]
[J
NONE
[61
C
MODERATE
[31
Q
GOOD
[5]
0
RECOVERED
[43
o
LOW
[33
C
FAIR
[3]
0
RECOVERING
11
NONE
[-I]
POOR
[13
0
RECENT
OR NO
RECOVERY
[1]
Comments
‘ Impounded
[-1]1
4] BANK
EROSION
AND
RIPARIAN
ZONE
Check
ONE in
each
category
for
EACH
BANK
(Or2per
hank &
a;’e;apc)
n5H
hoidog
doenseoarn,
r;;
RIPAR1AN
WIDTH
,
FLOOD
PLAIN
QUALITY
,
ROSION
0 0
WIDE
> 5Cm
143
h
FOREST,
SWAMP
[3]
0
0
CONSERVATION
TILLAGE
[1]
o C
NONE!
LITTLE
[3]
C 0
MODERATE
10-SCm
[3]
0
0
SHRUB OR
OLD
FIELD
12]
C C
URBAN
OR
INDUSTRIAL
if]
o o
MODERATE
12]
C
C
NARROW
5-1cm
[2]
C C
RESIDENTIAL,
PARK,
NEW
FIELD
[1.]
C
C
MINING!
CONSTRUCTION
[0]
o C
HW1SEVERE
[1]
C
C
VERY
NARROW
< Bin
[1]
C
0
FENCED
PASTURE
[I]
0
0
NONE
[C]
C C
OPEN
PASTURE.
ROWCRDP
[0]
9
POOL!
GLIDE
AND
RIFFLE!
RUN
QUALITY
MAXIMUM
DEPTH
CHANNEL
WIDTH
Check
ONE
(Ci’JLY!)
Check
ONE
(Or
2 &
everage)
1 m
[5]
C
POOL
WIDTH
> RiFFLE
WIDTH
(2$
C
C,T-<lm
]
0
POOL
WIDTH
=
R(FFLE
WIDTH
[I]
C
OA-’M.7;n
(2]
C
POOL
WIDTH
<RIFFLE
WIDTH
0]
C
tL2c0.4m
[1]
C
<C.2m
[0]
Comments
!nchorcfe
predominant
tariff
usda)
past
100;”:
rtueneo.
Riper!an
Msxeoron
Poof/,’
Current
Maxunu;o
:2
Indicate
for
functional
riffles;
Best
arees
must
be large
enough
to support
a
populatIon
;“.
pc-i
c’
of
riffle-obligate
species:
Check
ONE
(Or?
&
average),
t-J
K.’ I
‘-‘_
RIFFE
DEATh
RUN
DETn
RIFFLE!
RUN
SUBSTRATE
RIFFuE
I
RJK EMS
EDDEDt
1t35
C
BEST
AREAS>
10cm
[2]
I::MAXMIIM>
60cm
12]
C
STABLE
(e.g., Cobble,
Boutderfl2]
—
0
NONE
[2]
-
ThSESTAPCMS
IOcmlt]
DMAA
flU
Cc,[t]
Disco ST.OBLE(Og
LargoGrrvr)l[I]
EJLO’
it
C
BEST
AREAS
‘c
Scm.
C
UNSTABLE
[a,g,, Fine
Grevel,
Send)
[51]
C
MODERATE
(01
fhk:o
/
[nctr
Oj
,,
1
rc.
tDomments
-
‘
,nax:ni,:,a
$1
GR4DIENT
(
kIroi)
C
VEFt’(
LOW
- LOW
04)
%POOL:CTh
%GLIDE;(
GtedS’;nt
Lt)TA3tA-)IE
pjgsp
C
MODERATE
0-101
t
nit
2
)
C
t-IIGH-VERYtIIt-H.[10-0)
%RUN:
(
j%R3FFLE:
3
‘‘‘““
EPn452G
f
Imkce.ndcJlfl
MBI
MODIFIED
Quaitative
Habitst
Evakiadon
hidex
—
and
Use
Assessment
R&d
Sheet
CHEF’
Scc’c
RN:
z,’t>-,
Date:
i
Senses
Full
Name
&
Affiliation:
“J>r
/“
Lat.!Long.:
to
fl*ic€v045e$r..
Subs
iretc
‘to
STABILITY
C
HIGH [3]
C
MODERATE
[21
Z’LOW
[1]
Comments
Channel
Mexircu;o
çpRRENT
VELOCITY
Check
ALL
t
apply
C
TORRENTIAL
1-’]
TSLOW
[1]
C
VERY
FAST
jp
C
INTERSTiTIAL
I-I]
O
FAST
[1]
C
INTERMITTENT
62]
C
MODERATE
[1]
0 EDDIES
[1]
Indicate
for
;wach
- pools
eriC!
riNse
I
Recreation
Potemtiai]
Primary
COnCOCt
SeCOndary
Contact
ftr_eueSc>Mea0o’.:oStj
::.-‘
I—”,
C
.‘-C
.“
Electronic Filing - Received, Clerk's Office, September 8, 2008
MEl
MODIFIED
Quaaitatve
Habftat
Evauaflon
tndex
fY.1F
‘
J1
and
Use
Assessment
FleW
Sheet
Z’?e,
ç9%,>
fl’:ry
2CG
,c73
—
RM:2.klDatE:oHijJ
08
Scorevs
Full Name
&
Affiliation:
Zr
7
L
Lat.JLonct:
—
craevcrsrkwr
River Code:
STORET4:
IS
raeetrorrLJ
11
SUBSTRATE
Cheek
ONLY
Two
sirbatreta
TYPE
BOXES
-
estrorcie
%
or
°ote every
type orasenl
Check
ONE
(0:2 & ae’raqo)
ri
TfPES
POOL
RIFFLE
QThR
TYPS
POOL
R1FFLE
ORIGIN
QUALITY
C]fl
BLDR
(SLABS
[10t..
C] C]
HAROPAN
14] —
—
C]LIMESTONE[1]
C]
HEAVY
[-21
DC]
BOULOER[S]
—
—
C]
C]OETPSTUS[3]
—
—
C]T1LLS[1]
L
[]MODERKIE[-1]
o
C]
COBBLE
[SI
—
—
C] C]
MUCK
[21
—
C]
WETLANDS
[01
°
C]
NORMAL
[0]
C]C]
GRAVEL[73
—
C]
C]SILT[2]
—
—
C]HARDPAN[0]
DFREEII]
O
C]
SAUD
fol
C]
C]
APW
CI,L
oj —
C]
SANDSTONE
[0]
fl
EXTENSIVE
I 2
O
C]
BEDROCK
151
—
(Score
nalural
substrates;
kjnwe
DRIP/RAP
[03
C]
MODERATE
[-I]
NJMBER
or BEST
TYPES
U
:
ohoe
Rfl ov
d
o
aces;
C]
LACUSTRINE
0]
cC]
NOPIrIIAL
[0]
Comments
-
C]
COAL
FINES
‘2]
2]
INS TRE/4M
COVER
lndicvon presence
0
to 3:
0-Absont: 1-Very
ernst
I
amounts or
it
more
common
of
marginal
AMOU
NT
I
ii
U
a “ode
ate
a
nou
tO
Cut
c
a
h
c
eat
ouolrU
or n
5 eat anrounts
of nro’re I
S
C ott’
rorw
w
or rnter
enouno
(
ct
van
Is
go boulders
in deep
r (s t Her
hr
fe
C c
Or ir 0
&
)wrC
dizrrneter log
that
is stable.
wet
daucrioped
roo%Jad
in
deep I
fast
water, or deep, well-defined,
funclional
pools.
C]
EXTENSiVE
>75%
[11]
UNDERCUT
BANKS
[1]
—
POOLS>
70cm
U3 —
OXBOWS,
BACIOATERS
[1]
C]
MODERATE
2545%
U)
OVERHANGING
VEGETATION
[1)
—
ROOTWADS
[1]
—
AOUAT!C
MACROPHYTES
[1]
C]
SPARSE
5,c25%
[3]
SHALLOWS
(IN
SLOW
WATER)
[1]
BOULDERS
[1]
LOGS
OR WOODY DEBRIS
[13
C]
NEARLY
ASSENT
55%
[1)
ROOTMATS
[I]
—
—
Cov
Continents
Maxrrrrrrm
&
3]
CHANNEL
MORPHOLOGY
Check
ONE
in
aech
category
(Or
2
&
average)
SINUOSITY
DEVELCtPMIENT
CHANNEUZATION
C]
hUGH
[41
C]
EXCELLENT
[7]
C]
NONE
[6]
—
C]
MODERATE
[31
C]
GOOD [5]
C]
RECOVERED
[4]
C] LOW
[2]
C]
FAIR [3]
C]
RECOVERING
[2]
ta-NONE
[I]
‘
POOR
[1)
C]
RECENT
OR
NO
RECOVERY
[1]
Comments
y’
!ned bill
I
BANK
EROSION
AND RIPARIAN
ZONE
Cheek
ONE
in each
category tar
EACH
BANK (0r2
per bank &
average)
RivrriUbr
Ioerdr,q
dawowcrem
RIPARIAN
WIDTH
..
FLOOD
PLAIN QUALITY
-r
EROSION
b
WIDE> SOm
4]
O C FOREST,
SWAMP
[33
fl C CONSERVATION
TILLAGE
[1]
Li
C]
NONE!
LITtLE
131
fl
C]
rSOOERATE
10—SOre [2]
C]
C]
SHRUB
OR
OLD
FIELD
[2t
C] C]
URBAN
OR
INDUSTRiAL
10]
LI
C]
MODERATE
[2]
C] C]
NARROW 5-lOre
[2]
C] C]
RESIDENTIAL,
PARK,
NEW FIELD
[1]
C]
C] MINING I
CONSTRUCTION
[(1]
Li
C]
HEAVY (SEVERE
CI]
C] C]
VERY
NARROW
Sm
[1]
C] C]
FENCED PASTURE
[1]
C]
C]
NONE
[0]
C]
C]
OPEN
PASTURE,
ROWCROP
[0]
5]
POOL
/
GLIDE
AND
RIFFLE/RUN
QUALITY
tRAXMUM
DEPTH
CPANNEL
WIDTH
Cheek
ONE
(ONLY/i
Check ONE
(Or
2 & average)
2!>
Im
[63
C]
POOL
WIDTH> RIFFLE
WIDTH
U]
C]
OT-clm
4]
C]
POOL
WIDTH = RIFFLE
WIDTH
[1]
C]
o-4c0-Tm
32]
C]
POOL
WiDTH
a
RIFFLE
WIDTI-l
[0]
C]
02-’4L4m [1]
C]
‘C
0,2n: [0)
Comments
(nd/tate
pnldomrrront
land
use(s)
peril
loom
rIper/en,
Riparian
Maxknurrr
(
C
—1
roo(/;
)lmpouncled
:Th
Cornet
:r’raxrrnrjrrr
ni oak icr
rURO
tonal
nff’es, 3es’
meas
must cc
large
ertougn
to suppo—s
a noo
I
\
0
‘rF
F
ci
riffle-obligate
species;
Check
ONE (0:28
average).
Jr.-
‘.1 - .-
RIcFLEDEFH
RI/N
CErn
RIFLEJ°Uj$
oBSTR,cTE
RICI
5;
RN
1
!D:2-E
C]
BEST AREAS’
lOom
[3]
LCMAXII’JIUM
>60cm
C]
C]
STABLE
ie.g, Cobble, Boulder)
[2]
0
NONE
C]
C’
FESi
A”2I-P lhcrot
2
r
rlU r -s°0o
r—
C]
e,IABLL’o
o
Li gaGr-vci
Or_Ot
rrS
r:S-;c,
UrLr—DLE(e,
Fr
ers
S&,)t,
C]
1e’2-T
49,,
—1tI
DE
TEn
‘CI
I
“
S
Comments
StrEam
&
Location:
Sobs/rate
Mexirnuc
20
STABILITY
2
HIGH
[3]
C]
MODERATE
[2]
LOW
[1]
Comments
Chance/h’
,vraer,rtrrr,
20
CURRENT
VELOCITY
Check ALL that
apply
C]
TORRENTIAL
[4] PSLOW
[1]
C]
VERY
FAST [1]
C]
INTERSTITIAL
[-1]
C]
FAST
[-I]
C] INTERMITTENT
[-‘2]
C]
MODERATE
(1]
C]
EDDIES
[I]
lnri(cete
for
reach - OOi5 and
riffles.
I
RecreatIon
Potentia)
I
Primary
Contact
Secondthy
Conta
cr:
l
kircb
irrrs
o,-J
sorr,nrerrr
orr
‘21
“raP
nscarr,
rrrror;
‘ I
York Luw-oOae
fri-nj
DRAINAGE
AREA
C’ MODERATE
[640]
mi
1
)
C]
HIGH - VERY HIGH
[10’0]
EPA
4520
5:
°°
1
LJ
%GLIDE:LJ
A————’
‘9
%RUN;
(
J%RWFLE;(
Electronic Filing - Received, Clerk's Office, September 8, 2008
Stream
&
Location:
t.s
/Iicir:
f’asY
,13j,
I,
i
CHANNEL
MORPHOLOGY
Check
ONE Yeach
category (Or
25 eenage)
SINUOSITY
DEVELOPMENT
cfAr*1EuzATIoN
o HIGH
14]
0
EXCELLENT [7]
Q
NONE
EN
o
MODERATE
[I
0
GOOD
[9]
0
RECOVERED
[4!
0
LOW
[2]
0
FAIR
[3]
0
RECOVERING
[3]
NONE
[1]
POOR [1]
0
RECENT
OR NO RECOVERY(1]
Comments
A
IrnAET&iTiT
5]
POOL I GLIDE
AND
RIFFLE! RUN
QUALITY
MPXIMUM
DEPTH
CHANNEL
YV!DT.H
Check ONE
(ONLY’)
Check ONE (Cr2 &
£vereos)
m
IN
0
POOL WIDTH>
RIFFLE WIDTH
12!
0
0Th<lm
I]
SPOOL
WIDTH
= RIFFLE
WIDTH [1]
0
0.4<0Jni
12!
0
POOL WIDTH
C
RIFFLE
WIDTH
1]
0
0;2..<OAm
[1]
0
< 02wr
[0]
Impounded
Comments
STAB[UTY
o
HIGH [3]
0
MODERATE [2]
J’LOW[1]
MBI MODIFIED
GuafltatNe
Habftat
EvaAuaton ktdex
and
Use
Assessment
R&d Sheet
RN:,
Date:J1:ojOis
Scorers Rail Name
& Affiliation:
.1b
:6••\.
‘
LLP
1] SUBSTRATE
Check
ONLY Two suhsirata
TYPE
BOXES;
estimate
5,
or note every type
presenl
Check ONE
(Or
2
e
average)
BEST
‘‘
POOL RIFFLE
OTHER
TYPES
POOL RIFFLE
ORIGIN
QUALITY
00
BLDR
!SLABS [i0__
,
0 0
HAROPAN
14] —
—
0
LIMESTONE
(1]
0
HEAVY
&2j
0 0
BOULDER
[!
—
—
0
0
DETRITUS
[3!
0
TILLS
[1]
BItT
0
MODERATE
[4]
Substrata
00
COBBLE
[5!
,,
—
0 0
MUCK
[2]
—
0
WETLANDS [0]
0
NORMAL (0]
‘
00
GRAVEL
f7J
—
——
0
0
SILT
[3]
—
0
HARDPAN
0J
0
0
BAND
[6]
_,.
0 0
ARTIFICIAL
10]
0
SANDSTONE [0]
.
0
EXTENSIVE
[‘2]
U
U
BEDPOCI(
[9]
— —
——
tSco
a narural -, ibclsmea jnnre
0
RIP/RAP
fO]
e04c
U’
MODERAI E[ P
NUMBER OF
BEST
TYPES:
0
4 or more
[2]
sludge
from
potnAsources)
0
LACUSTRINE [0]
NORMAL (0]
ri
3 or face
[01
0
SHALE [4]
0
NONE [‘11
Comments
.
0
COAL FINES [-2]
2]
INS
TREAM
COVER
Indicate
preaonca
0
to 3:
U-Absent
IA/amy
small amounts or if more common
of
marginal
AMOUNT
q.
l
‘ 2 U
rleror,
a-taunt
butt a o t
rjhest
ouaItt
or to err
dl aeeun’s 0
htghs
n
—
—
-
quality;
3-Highest quality
it maderate
or greeter
amounts
(e.g..
very
large boulders
in
deep
or
fast water, large
.hek
tiNe (Ct 2
c
diameter
log that
is
stable,
well
developed moiwad in
deep
/
fast. waler, or
deep, well-defined,
funcltonal
pools.
Q
EXTENSIVE >T5%
[II]
UNDERCUT
BANKS
[1]
_.., POOLS
a TOom
[2] ——
OXBOWS,
BACKWATERS
[1]
0
MODERATE
2645%
[71
——
OVERHANGING
VEGETATION
I]
ROOTWADS
[I]
—
AQUATIC
MACROPHYTES
0
SPARSE 5-<25%
(3]
—
SHALLOWS
(IN
SLOW
WATER) [‘I]
BOULDERS ti]
LOGS OR
WOODY DEBRIS
[1]
5
NEARLY
ABSENT <5% [1]
—
ROOTMATS [I]
Cover
Comments
Mavimnurr
203 “
Channe/
( -.
Mardotttm
iv.—.
20
4]
BANK EROSION
AND
RIPARIAN
ZONE Check ONE in
each category
for
EACH BANK (Cr2 per
bane
&
average)
hint nght1ootdndnastrnrn
RIPARIRN
WIDTH
,,
FLOOD
PLAIN
QUALITY
EROSION
5 U
WIDE> SOm 4]
U
0
FOREST,
SWAMP
[3]
0 0
CONSERVATION TILLAGE
[I]
0
0
NONE! LITTLE
13]
0
C]
MODERATE
I0S0m
[3]
0
0
SHRUB
OR
OLD FIELD
[2]
U U URBAN OR
INDUSTRIAL [Li]
0 0
MODERATE [2]
0 0
NARROW
6”IOm
[2]
0 0
RESIDENTIAL,
PARK, NEW
FIELD [1]
0 0 MINING!
CONSTRUCTION [0]
O 0
HEAVY
ISEVERE[i]
0 0
VERY
NARROW<Sni
[I]
0
0
FENCED PASTURE
[1]
atr//ce/eprsr/om/oaof/andoaa(e/
crrr
0 0
NONE
[0]
0
0 OPEN
PASTURE.
ROWCROP
1J
past boot
n’pemian.
Riper/an
1
.- r
Comments
Max/mum
CURRENT
VELOCITY
Check ALL that
apply
C.
TORRENTIAL [-I] WSLOW
[1]
0
VERY FAST
[1]
0
INTERSTITIAL [-I]
o
FAST [1]
0
INTERMITTENT
[‘2]
0
MODERATE
[1]
0 EDDIES [I]
/nd/cate for
reach
— poo/s and rift/es
.1 Recreation Potential’.
I
Primaiy Contact
I
Secondary
Contact
kttrtrrcnr
rr*mn,a,t
,,ntart,i
Poo/!
Ctrrrant
;
/
t-iavLatt’ot
IndiCate for
functional riffles;
Best areas
must be
large enough
to support
a
population
OIFC
of riffle-obligate
species:
Chack
ONE (Cr2
&
average),
RIFFLE
DEP1 9
RUH
DE°TH
RIFFLE
I
P04 SUBSTRATE
RIFFLE
I
RuN_EMBFDDcJr.IOSS
0
BEST
AREAS>IOcm
17]
0
MAX]MUM a 50cm
[2]
0
STABLE
(a.g.. Cobble.
Boulder)
12]
0
NONE [2]
C]
BES - PEAS 5
lOon
t’
C]
Mevw
St.IM
20
u
3
0
EtOD STeELe [a
g
rarqa Crated)
[r,
C]
LOW
I
It
C
err
-rta-o
5-—
C]
tf;c’A&c
r,
“ no C .wa Sand
i9
2
‘ OOEF/T
90
I’ta
rIaO]
C]
E”T2NSI
it:
0
a,,
Cramrnients
rria>itttttt;
24
a
a.enrtr-na
—-- --. .
,t—_-
r’N
t.tv’
Li
rttrP -O’/a
‘- ‘It—”
%POOL
L_J
VOCL”DEI
Go ‘en
CFAtN,
OtZJ5RFc
C]
n,yIp/q-4J
.—----%
‘==Y.
2—
VRUN(_J%RIFFLE(J’”
EPA 4520
j’r
Electronic Filing - Received, Clerk's Office, September 8, 2008
MBI
MODIFIED
QuaUtaSve
Habftat EvaRuatkn
ndex
I
and
Use
Assessment
Fi&d
Sheet
—________
Full
Name &
AffIllallon: ThY
Th
-
S”OREr
i/ta
tO ta
4
C,
Let/Lana
-Th
r,,
iocetson
,,,—-—.——.....
-
1]
SUBSTRATE
Check ONLY Two substrate TYPE
BOXES;
.
estmalt
35 or
note every
type
present
Checa
ONE
tOt
2
e
evemye)
BEST
POOL RIFFLE
OTHER
TYPES
POOL RIFFLE
QL
GUALETY
C
C
BLOR
[SLABS [l11]_,,
——
C C
HARDPAN [4] —
—
C
LIMESTONE
[1]
U
HEAVY
[—2]
CC
BOULDER fBI
—
—
C
CDETR1TUS[3]
CTIILS[I]
SILT
CMODERATEE—-i]
CC
COBBLE [B]
—
,
C
C
MUCK [2]
—
—
C
WETLANDS
[Oj
C
NORMAL
[0]
C
C
GRAVEL
[7]
—
—
C
C
SLIT
£21
—
—
C
HARDPAN
[01
- -
C
FREE
C C
SAND
[6]
—
C
C
ARTIFICIAL [tt]
—
C
SANDSTONE
[0]
C
EXTENSIVE
[—2]
C
C
BEDROCK [5]
_,_
—
[Score
nature! substrates;
ignore
C
RIP)RAP
[i
ODEO%
C
MODERATE
t1]
NUMBER
OF
BEST
TYPES:
C
4
or more
[2J
sludge from
point—sources)
C
LACUSTRINE
10]
C
NORMAL
[ti]
—
C
3
or
less [0]
L
SHALE [4]
C
NONE [I]
Comments
C
COAL
FINES
1-2]
2] INS TREAM
COVER
qu-rta
Indicate
2—Ncdc
presence
f
I)
doad
to
3:
0-Absent;
N but r
l—Venj
to
h ghest
smell
queLl,
emounle
or
or
to smell
if moreomotcommon
n e
ANg
of marginal‘net
AMOUNT
—
quality;
3-htghest
quetity
in rnoderete
orgreeier
amounts
(e.g., very
large
boulders
in
deep or
feet
weleic large
t,hvcnr
A’ t
C
tt
dierneter
log
thetis
stable,
well
developed
rootweu in
deep/Met
weteq or deep. well-delined,
functional
pools,
C
EXTENSIVE
>75% [ii]
UNDERCUT
BANKS [‘Ii
POOLS
>70cm
£2]
—
OXBOWS,
BACKWATERS
El]
C
MODERATE
2545%
[7]
OVERHANGING
VEGETATION
[I]
—
ROOTWADS [I]
—
AQUATIC MACROPHYTES
El]
C
SPARSE
35<25%
£]
SHALLOWS
(IN
SLOW
WATER)
El]
BOULDERS
[I]
LOGS OR WOODY
DEBRIS
[I]
C
NEARLY
ASSENT
<5%
[1)
—
ROOTMATS [I]
—.
Comments
nfn’nrflJflt
3] CHANNEL
MORPHOLOGY
Cneck
ONE in-
each
category
tOn
2
&
average)
SINUOSITY
DEVELOPMENT
CHANNELIZATION
C
HIGH
E4]
C
EXCELLENT
ft]
C
NONE
£]
C
MODERATE
13]
C
GOOD
[1
C
RECOVERED
E4
C
LOW
[2]
C
FAIR [3]
C RECOVERING
D]
C
NONE
£1]
POOR
El]
C
RECENT
OR
NO
RECOVERY [1]
Comments
rt
q BANK
EROSION
AND
RIPARIAN
ZONE Check
ONE in
each
category
for EACH BANK
(Or2
per
bank &
average)
av-rrita
tr,’tun
Cownstr,m
, RIPARIAN
WIDTH
•
FLOOD
PLMN
QUALITY
,
tROSON
C C
WIDE>
5Dm
£4
C b
FOREST,
SWAMP [3]
C C
CONSERVATION
TILLAGE
[‘I]
Li
C
NONE)
LITTLE [3]
C C
MODERATE
10-SCm
[31
C C
SHRUB
OR
OLD
FIELD
[2]
C
C URBAN OR
I3IDL’STRIAL
[0]
C
C
MODERATE [2]
C C
NARROW
5.1Dm
[2]
C
C
RESIDENTIAL,
PARK, NEW FIELD
[I]
C C MINING
I
CONSTRUCTION
[0]
C C
HEAVY! SEVERE
[I]
C
C
VERY
NARROW
C Sm [1]
C
C
FENCED PASTURE
11]
inrlica,Iepredomihan
land rreotqt
C C
NONE 0J
C
C
OPEN
PASTURE, ROWCROP
[0]
pest
loOm
ripaden.
Riperlarr
Maxirnron
9
POOL/GLIDEAND RIFFLE/RUN
QUALITY
--v-----zv-———
MAXIMUM:
DEPTH
CHANNEL
WIDTH
Check
ONE
(ONLY!)
Check
ONE (Or
2
S average)
$‘a
Im
£6]
C
POOL W!DTH
> RtFFLE WIDTH
[2]
C
0,7—elm
£]
C
POOL WIDTH = RIFFLE
WIDTH [1]
C
OA—rO,irn
12]
C
POOL
WIDTH <RIFFLE
WIDTH
10]
C
g,2”04m
11]
Pool!,.
‘•‘ -
C
<
0.2m [11]
Cun,orrr:
Comments
!vlwnn’e;nj
.,•
.1.’.
indicate for
functional riffles;
Best
areas
must be large enough
to support
a
population
nt
n
n
tnt - ,-_
—
of
riffle—obligate
species:
Check
ONE
br
2
&
average),
Li
.‘t l’
., ti
RIFFLE
DEPTH
RUN
DEPTH
RIFFLE! RUN SUBSTRATE
RIFFLE
I RUN
EMBEDDEDNESS
C
BEST,4REAS>
10cm
[2] CMAXINUM>
Stictn
[2]
C
STABLE
[e,g, Cobble,
Bouidarl
£2]
r:
NONE
[2]
C
SES’ThRbaS
5
lucn 11
Ct$XtNd — 5&’n
LI]
C
wOO
STYBLE
eg
terr
Gre
e rI]
C
LOS
ECb
‘n5r\5
- e’a
CØ!CSLE
N
p..
t e!3
Lie’ <ci)
111
J
1tOCE<C
-
[metricolf)
C
EXTENStVE
v
.
ivy
Comments
-
- ,wea’nt’fl
6]
*Dlwrt
non
C
kERr
fttv cD/
t2—r
-.
ç
JOt
ç
,
C’eo
DRJNAGE AREA
C
MODERATE
[s—kg]
t
mP;
U
VFR/PlGH[l[tA
%RUN
t_
C”Thr,
JIOR)F
DI
,...E
t
)
Slream
&
Location:
QI’;iESi
SCorn,:
•:
Th-.
Subs
h-eta
H
L!extrpu;
:
STABHJTY
C
I’IIGH
13]
C
MODERATE
[2]
WLOW
[I]
Comments
Chanoef
H —‘
!Asxtrnu-r
xc’
7’.
CURRENT
VELOCITY
Check ALL
the! apply
C
TORRENTIAL
[-1]
SLOW
£1]
C
VERY FAST
[1]
C
INTERSTITIAL [-1]
C
FAST [1]
C INTERMITTENT
[4]
C
MODERATE
[1]
C
EDDIES
[1]
!ndk;ete
for reach - poole
end r/ffles.
‘Recreation_Potential]
Primary Contact
I
SecondarvContactj
tctds
Qr,-
mt
comme,,t
etvr1O
EPA -4621;
r
,v
‘
Electronic Filing - Received, Clerk's Office, September 8, 2008
MELT
MODIFIED
Quai]IItati
4
ve
Habrtat
!EvaRuatbn
hidex
a>
0>
• J
441i
S4111fl
ancs
Use
AssessmenL
ead
Sneet
‘ose
,r,nfl
4
_._
r4rJ
it’iy
J:cJ
t
—
HAl;
2C
%
Veto:
011,11
08
ers
Fail flame
&
Affi’,atwn
River
Code;
STORET#:
LoLl Long.:
/8
oThrevc
—
—
—
54
0
decImal
—
—
—
0
—JOfl
1] SUBSTRATE
Check
OItLY%vc
substrate,
TYPE
SOXE.S:
esttmate tk or
I
cia.
every
type
macant
Check ONE
(Or
2
&
overage)
BEST
TYPES
POOL
RIFFLE
OTHER
TYPES
POOL
RIFFLE
ORIGIN
QUAUTY
20
&OP’SLAVS[10
——
OOItPDPAII[3
——
JHMESTOHE[1]
9HEM[2]
00
EOULDFt9i
f
ODCTRflJSP
—
JTILLSII]
OMODEPATE[
00
COBBLE
[SE
——
0
Q
PlUCK
[2]
—
——
0
WETLANDS [0]
-
0
NORMAL
103
00
GRAVEL
IT]
.
.
0
0
SILT
12]
0
HAROPAN
[03
0
FREE
[11 - -
00
so
rs
C
OAR
(I
0
ICIML
[0]
—
Li
SANDSTONE
10]
O
EXTENSiVE PC)
o o
BEDROCK
[51
,,..
(Score
natural suhs
t
rstes:
korrore
CRIF/RAPfD)
4
tEn
5
C
MOOERAIE
Ni]
NUMBER
OF
BEST
TYPES:
04cr
more [‘2]
aluege corn
pcrut-eoJrces)
0
LACUSTRINE
fO]
NORMAL
[0]
-.-
O3ortass[’6]
OSHALE[-1]
ON0NEII]
o.cjflhlflOflS
0
COAL
FINES [-2]
21
INSTREAM
COVER
Indicate
presence
0 to 3:
0-Absent; I-Very
small
areounfa
or
if
more
common
of marginal
AMOUNT
goal
1
2
I
ci
ml—
coon
a b
crc
V
mgi-cs
uelrI
or
ri arnoll emu cr6
a
I
gi
t
p
3 ii
yh_sr
oel
y
m_Jr
men
crane
ins
(>7
r
I—
j
1
In
Lbe0>
OHC rO 2
diameter log
that is
stable.
well
devcrtoped
rootwad
in
deep
/ fast water
or deep,
well-4efined, functional
pools.
Q
EXTENSI’JE
>75%
[11]
——
UNDERCUT BANKS
[1]
—
POOLS>
70cm
12]
—
OXSOWS,
BACKWATERS
[1]
0
MODERATE
2545%
[7]
OVERHANGING
VEGETATION
II]
ROOTWAOS
[1]
AOUAT1C
MACROPHYTES
[1]
0
SPARSE
5-c25%
[3]
—
SHALLOWS
(IN
SLOW WATER)
[1]
—
BOULDERS
1:1]
LOGS
OR WOODY
DEBRIS [II
0
NEARLY
ABSENT
sS%
[1]
—
ROOTMATS
[1]
—
Cover
Comments
Maximum
[
/ S
20
‘
3] CHANNEL
MORPHOLOGY
Check ONE
in
each
category
(Or
2
&
enrage)
SINUOSITY
DEVELOPMENT
CHANNELIZATION
O
HIGH
14]
0
EXCELLENT [7]
0
NONE
[61
O
MODERATE
[5]
0
GOOD
[SJ
0
RECOVERED
[43
O
LOW
[2]
0
FAtR
[3]
0
RECOVERING
[3]
‘NONE [‘I]
POOR [1]
0
RECENT
OR
NO
RECOVERY
11]
Comments
;4
pmded1]:
41
BANK
EROSION
AND
RIPARIAN
ZQI’SE Chectr
ONE in, each
category for
BAtH BANK
(Or2perbaniz
&
overage)
——
i’Oer
Sear
leokina
RIPARIAN
WIDTH
.
FLOOD
PLAIN
QUALITY
EROSiON
0
0
WIDE> SUm
[4]
0
0
FOREST,
SWAMP
[3]
0 0
CONSERVATiON
TILLAGE[i]
0 0
NONE!
LITTLE
[3)
00
MODERATE
10-SCm [31
0 0
SHRUB
OR OLD FIELD
[2]
0
0 URBAN OP.
INDUSTRIAL
[C]
LI 0
MOOERATE
[2]
0 0
NARROW
5.1Gm [2]
0
0
RES1OENTIAL,
PARK,
NEW FIELD
11]
0
0
MINING I
CONSTRUCTION
[03
O LI
HEAVY!
SEVERE
[1]
0 0
VERY NARROW
<Sin [1]
0 0
FENCED
PASTURE
[1]
0
0
NONE
[0]
0 0
OPEN
PASTURE, ROWCROP
[0]
9
POOL /
GLIDE
AND
PIFrLE
/
RUN QUALITY
IVJM1MVM
DEPTH
CHANNEL
WIDTH
Check ONE
(ONLVi)
Chaiar
ONE
(Or
2
& average)
>
ire [6]
0
POOL
WIDTH> RIFFLE
WIOTH
[2]
19 Qt<lna
[4]
0
POOL
WIDTH
=
RIFFLE
VgIDTH
[1]
0
Q,4-c0.Trn
[23
0
POOL
WIDTH
<RIFFLE
WIDTH
10]
0
0.2-cL4m[i]
0
<0,2m [0]
COIThTIO1ItS
/ndicate
prrrrlnrn/nrrrrr
/and
rraa(,sj
- .
past lOom
nP4ma’r
Riparien
j
Idea/mum
‘O,N
‘(0
5
Pool
I
Currant
/
Macintern
I
indicate
for
functional
riffles; Best
areas
must
be
large
enough to support
a
popuiatiott
r-—
er’cc c
ci
riffle-obligate
species
Chace
ONE
(Or 2 & average).
‘,
-
--0
FFLE
DEPTh
Li’) D2°T—i
R1LE
I kur
SU3STRCE
RIrLE
I
RUe]
Eie3BEDD°zDUESS
0
BTTTAREAS>
10cm
12]
0
MAXIMUM>
50cm
[23
0
STABLE
trng,.
Cobble.
Boulder) [2]
0
NONE [2]
flSES7A>Er
Sn-10Tr
1]
Cr
rr L”
SOc
r
OMOC
STs
5
SLEIeg
LalgeC
a;&)r
Oi..O
1
-
F
FS
eAT>
Sri-,
.r
t”
>FeEr Era
ci
c
110
.
1
-iveL
Sana’
rflr
]
OCERATE
C
-
cnrO1
:]E>TE
s
pcr
1
rYrrpmemts
.
“a nrftflfCrirr
-
/‘,
0
r’-
VEPr_Ci
Cr
2ee
°iPOO$J
o.n__L
Cc>r-.
r
—--
ia,Oertrt
,
Ci
-
I
Cd
[I%
%RUN%FLEJ
45,
4520
../
,r.
:43111953
;t
[mpoundecl[t1],
Stream
&
Location;
Srtha fcc/c
t-irnr/rr;o:r,
20
STABILITY
C
HIGH
[3]
o
MODERATE
[2]
SLOW
[1]
Cotmnnents
Channels
AIax/rrrurn
S
0
CURRENT
VELOCITY
Check
ALL
that
apnly
0
TORRENTIAL
[-I]%SLOW
[1]
C] VERY
FAST [1]
0 INTERSTITIAL
I—li
O FAST
[1]
.0
INTERMITTENT
[.73
o
MODERATE
[1]
0
EDDIES
[I]
inc//caL’ for
reprc/r
- poois
ant!
r/ffles.
Rooroation
Potential
I
:1
Primaty
Contact
[
Socondacy
Contact
rrr.rrerocrrr
5
cr
55
rentresst’
1
‘cc
Electronic Filing - Received, Clerk's Office, September 8, 2008
MBI
MODIFIED
2&o.o
Pt(3
R%i:2t.
•aC
____Scorer’s
Full Name &
Affiliation:______
-
STORET#
_nhr
11
SUBSTRATE
Check
OJiLY Two
substrata
TY’PEI3OXES:
estimate
% or note
every
type
present
Check ONE
Or
2
d
averejet
BEST TYPES
POOL
RIFFLE
2IER
yPg
POOL RIFFLE
OGIN
QUALiTY
DC]
BLDRISLASS[1D]_,
—
C]
C]HARDPANJ —
—
C]LIMESTONE(1)
EJHEAVYE-2]
DC]
EOULDER[t)]
—
—
C]
C]DETRITUS[3!
—
C]TILLS[I]
C]M0DERATEMI
C]C]
COBBLE
[5]
—
C] C]
MUCK
[2]
—
C]WETLANDS
[0]
“
C]
NORMAL
tO]
C]C]
C-RAVEL(T)
—
—
C]
C]SILT[2]
C]HAROPAN[U]
OFREErI]
o
C]
SAND
(SI
—
C]
C]
ARTIFICIAL
[0]_
—
C]
SANDSTONE
[U]
E]EXTE(4SfVE
(2]
C] C]
BEDROCK [5]
(Score natural
aubafrakas;
lonore
C]
RIP1RAP [U]
4904k
C]
MODERATE
f’tI
NUMBER
OF BEST
TYPES:
C]
4
or
more
[2]
sludge from point-sources)
C]
LACUSTRINE
O]
‘
,C]
NORMAL [0]
c
C]
Sor[e’asp]
C]SNALE[-1]
C]NONE:1]
ommens
C]
COAL FINES
[-2]
21
1NSTREAM
COVER
Indicate presence 0 to
3:
0-Absont;
1-Very small amounts
or
if
more common of
merginsi
AMOUNT
qrl 1
2 kodst e r,u’ge
but c
ot
ragc est uusltty or n
stall
amounts
°sjw:
,,
qifr
3 rgt s
yi odu ate, rorstc a nwnts ej
nlo
gebod
n m h
kO IF i
diemelor
log
that
is stable,
well developed
rootwad
in
deep I
fast
water, or deep, well-defined, functional pools.
C]
EXTENSIVE
-‘T5%
l’i]
UNDERCUT BANKS
(1]
POOLS
a
70cm (2]
OXBOWS,
BACKWATERS (1]
C]
MODERATE
25-75%
f
— OVERHANt1NC
VEI3E1
ATION
(1]
POOTWADS
[1]
AOUAftL
MACROPNVTES
[i]
I
SeAPSE
c25°,
‘a,
—
SHALLOWS (lN
SLOW
WATER)
(‘1’)
—
BOULDERS
(‘1]
LOGS OR WOODY DEBRIS
(‘1]
C]
NEARLY
AESEN
s5%
(‘i]
ROOTMATS
(1]
Comments
3) CHANNEL
MORPHOLOGY
Chock
ONE in each category
(Or 2 S average)
SIN UOSITY
DEVELOPMENT
cHANNELIZATION
STABIUTY
C]
HIGH
4j
‘
C]
EXCELLENT
U]
C]
NONE
[5]
S
HIGH
[3]
C]
MODERATE [5]
0
GOOD (5]
C]
RECOVERED (6]
C]
MODERATE
[21
C]
LOW
(2]
C]
FAiR
[3]
C]
RECOVERING
[3]
5
LOW (1]
—.
NONEp]
WPOOR(1J
C]
RECENTORNORECOVERY[1]
Lnenr,eC,
Commerts
O’
lmnpoundetj(ij’
41
BANK EROSION
AND RIPARIAN ZONE
Check ONE in each cstogory for BAtH
BANK (Or
2per
hank
&
everepc)
mverrwnaaee
ewnsrrn,
,, RIPARIAN WIDTH
FLOOD
PLAIN QUALITY
EROSION
C]
a
WIDE>
SUm
I4]
b U FOREST, SWAMP
[SI
C] C]
CONSERVATION
TILLAGE
(1]
C] C]
NONE!
LITTLE [3]
C]
C]
MODERATE 10-SUm
[3]
C]
C]
SHRUB
OR
OLD
FIELD (2]
C] C]
URBAN
OR
INDUSTRIAL
IT]
C] C]
MODERATE [2]
C] C]
NARROW
5-tOrn [2]
C] C]
RESIDENTIAL.
PARK,
NEW FIELD [1]
C] C] MINING)
CONSTRUCtION
(II]
C] C]
HEAVY (SEVERE
[1]
C]
C]
VERY
NARROW < Sm
(1]
C] C]
FENCED
PASTURE [‘I]
btdicaie
predominant (curl use(s)
C] C]
NONE [0]
C]
C]
OPEN PASTURE, ROWCROP [U]
past
WOrn
dporlou.
Ripartan:’
Comments
Meirinrom
/,
(i
31
POOL/GLiDE
4ND Re°FLE/RUN
OU4LTY
MAX IUM
DEPTH
C•1ANNYVIDTH
QØ.RRENT VELOCITY
Reereabon Potentwt
Check ONE
(ONLY’)
Check
ONE
(Cr2 & sverage;
Check
ALL
that
apply
Primer],
Con(aor
1 m
[Si
C]
POOL WIDTH> RIFFLE W1OTH
[2]
C] TORRENTIAL
E1]JBLOW
1]
‘ SBCOIUIPLy
Con
tact
C]
fLY-elm (4]
C]
POOL WIDTH RIFFLE
WIDTH
[I]
C]
VERY
FAST (1]
0 INTERSTITIAL Ml
;,
evrt
me cat
r mtmeee bra;
C]
D,4-<&7m (2]
C]
POOL WIDTH <RIFFLE
WIDTH (I)]
C]
FAST
(‘1)
C]
INTERNITTENT
[-2]
C]0,2-c0,4m(1]
t;”’”,
C]MODERATE(1] C]EDrNES(l]
PooW:’
C]
‘-0
2’n
10]
In1pourdcd[_’l’I,
t
civ
do
fot
pails
,o
nOtes
C
srr’oi
Comments
irI
sate for
UnCtIonaIt
offies Bess a
eas lmst be
Inrge
maough to suppor o noou,at
r
of
i
(iDe-obligate
SpeCies:
Check ONE
(Or
2
&
averagej,
Li’
“
RWFE
DEPTH
,PUNE,EDTp
RIFFLE’ RUN
SUBSTRATE
RIP-
EIRUt_LUBeOAEiT3,,2
C]
SESTAREAS
>10cm 2]
C]MAXINUM> 50cm (2]
C]
STABLE
(ag,,
Cobble,
Boulderl
[51
C]
NONE (2]
C]
SESTARE’AS
540cm (1]
C]
MAXI$UM <50cm (1]
C]
MOD, STABLE
(ag, Large Gravel)
(1]
C]
LOW (.1)
,,.
‘1
$3’r
C
3 sS < 5-n-
C]
sn’S”
E,E
e
9n
C
Sandt
r3]
C]
1CDE°”
(molrio’O)
C]
EXTENSIVE (-‘I]
‘
t’:
i/i
Continents
,,CCX,fl’ .‘,
Stream
& Location:
QuaHtative Habitat Evaluation index
r)Ci:
aim
Use Assessment
Fi&d Sheet
Suiseirero
Ike:: i’ner
20
Cover
ikexurmrmr
2(1
,
‘
.
6
GRA.DIEHT
I,
,_ftimi)
C]VERY
LOW
- LOW [5-41
DRAINAGE
AREA
C]
NOOERATE 6$0]
ml’)
C]
HIGH - VERY
HiGH [i0-Sj
EPA 4520
ft
%POOL:L,_,)
%GL4DE:L,
,J
Gradient.
/
j’%PIFuLE
L_j
2
1)
56”; 110’?
Electronic Filing - Received, Clerk's Office, September 8, 2008
MDI MODIFIED
Qu•aDftatve
Hahñtat
Evakiatbn
ndex
and Use
Assessment
R&d Sheet
f’
Date:
t7’i
LJ
08
__Scorers Full
Name & Affiliation:
CJ1e
bry&
)4
2
’N
LO’1’J
1 #1
*
Offtceverffle’J —
eUverCoae:
oIORlc?
A:
a.
0:11
;
it
iocct!onU
11
SUBS7’PATF
Check
ONLY
‘two sobstrete
TYPE/3OXES
askriete %
or note
every type
present
Check
ONE (Or 2 &
ecerege)
BEST
TYPS
POOL
RIFFLE
OTHR
TiRE?
POOL RFFLE
ORiGIN
QUALITY
00
BLDR/SLABS[10_,,
QQNARDPAN] —
DLIMESTONE[1]
DHEAV’[-2j
00
BOULDER
lEt
,,,
—-
Q
fj
DETRITUS
[3]
——
DTILLS[1]
SILT
MODERATE
1-1]
o 0
COBBLE
[51
0
0
MUCK
[2]
—
El
WETLANDS
O3
El
NORMAL
[0]
o 0
GRAVEL
17]
—
0
0
SILT [2]
—
—
El
HARDPAN
[01
o o
SAND
(6]
,,
0
0
ARTIFICIAL fO]
—
El
SANDSTONE
[0]
LI
EXTENSIVE
[-2]
DEl
BEDROCK
151
—
(Score
natu’srl
substrates:
tonore
El RIP/RAP [0]
qt0%
El
MODERATE
[I
NUMBER
OF
BEST
TYPES:
P
skiope
imm point-sources)
ELACUSTRINE[O]
El
NORMAL [0]
Comments
El
COAL
FINES [-2]
21
iNS
TREAM
COVER
indtcsto
2
presenceSr1,
cct eric
to 3:
c u
0-Absent
it
Lu no
1-Very
oth
obest
small
uat4
amounts
or
or
in
am
if
more
d
eric
common
inN
n
of
niohest
marginal
AMOUNT
3
L
hss
o
c
r
iror or
on ts
c
j
vr
6rcc boue in deep
or
fee waler
t
0
-q
Chock
ONE
Or
&
tNt
diamete
log that
is
6
ste
le.
well
clevetopao.
rootwad
in
deep! faslwdter,”or
deep,
well-defined,
functional pools.
El
EXTENS1VE
>75% [11]
UNDERCUT
BANKS
11]
POOLS
> 70cm
(21
—
OXEOWS,
BACKWATERS
[1]
El
MODERATE
2575%
[7]
—
OVERHANO1NG
VEGETATION [1]
,,ROOTWADS
[1]
—
AQUATIC MACROPHYTES
[1]
El
SPARSE
5-<25%
[3]
SHALLOWS (IN
SLOW WATER)
[1]:
BOULDERS
[1]
—
LOGS
OR WOODY
DEBRIS
[‘t]
El
NEARLYASSENT
<5% [4]
_ROOTMATS[’I]
.
Cover
U!’
Comments
Maxmnrc,rn
d
J,_
POt.
3j CHANNEL
MORPHOLOGY
Check
ONE
icr
cccli
category
(Or
2&
everege)
SIN UOSITY
DEVELOPMENT
CHANNELIZATION
El
HIGH
H]
El
EXCELLENT
[7]
0
NONE
[6]
El
MODERATE
[6]
El
GOOD
[5]
El
RECOVERED
[4]
El
LOW
[23
El
FAIR
[3]
0
RECOVERING
[3]
NONE (1]
POOR
[1]
0
RECENT
OR NO
RECOVERY [1]
Comments
j
p
i
BANK
CNnr riahi
EROSION
baking
downniconrn
AND RIPARIA.N
RIPARIAN
ZONE
WIDTH
Check
ONE in each
FLOOD
category
for
PLAiN
EACH BANK
QUALITY
(Or 2per’henk &
everoge)
EROSION
d LI
WIDE> 50m
N]
D O FOREST,
SWAMP [3]
6 C CONSERVATION
TILLAGE
[‘I]
El P
NONE! LITTLE
(3]
Q Q
MOOERATE
10-SUm
[3]
El El
SHRUB
OR OLD FIELD [23
El
El
URBAN
OR
INDUSTRtAL
[0]
o
u
MODERATE [2]
El El
NARROW 5-lOm
[2]
El El
RESIDENTIAL.
PARK,
NEW
FIELD
[1]
El
El
MINING
I CONSTRUCTION
[0]
LI
0
HEAVY
I
SEVERE
[1]
El El
VERY
NARROW
‘C
Sm
[1]
El
El
FENCED
PASTURE
[1]
tndicoie
pradom/oanf
lend
tree(s)
El El
NONE
10]
El El
OPEN
PASTURE,
ROWCROP [0]
pa-cl 10Dm
rfoedan.
iparianK0
P
Comments
Max/morn
i
/;
,5
0
-
51
POOL/GUDEANO
RIFFLE/RUN
QUALITY
MAXIMUM
DEPTH
CHANNEL
WIDIH
CURRENT
VELQCITY
cnatIon
Potential
Check
ONE (ONL’r’it
Check
ONE
(Or2 & er-anige)
Check ALL
that
sooty
Primary Contact
W’
‘tm
163
0
POOL
WIDTH > RIFF LE
WIDTH
123
El TORRENTIAL
-I1,WSLOW [1)
1 Secondary
Contact
El
0,7-cl m [4]
El
POOL WIDTH RIFFLE
WIDTH
[‘I]
El
VERY
FAST
[1]
El INTERSTITIAL
[‘1]
1
tcrcn-ensecamnce’r
El
0A-c&Tm (23
0
POOL
WIDTH <RIFFLE
WIDTH
103 El
FAST [1]
El
INTERMITTENT
[-2]
°
‘fl...
El
0,2c0,4m[lj
4p—---—-—-—------r
MODERATE[1]
El
EDDIES
[1]
Poo/!
£
-
El
<Dim [0]
1i
t!PElL11115±iJi
Ind/cate for
reach
-poo/s arid
riffles,
Cirenirif
Comments
.
MsXirno;tr
IndiCate for rurtctional
riffles
Best
aces
must
be
latge enough to
supporr
-t
poor,ttat
o
of
riffleobIigate
speCies:
Check
ONE (0r2
&
ac-crepe).
LJ’<
YFF
,
L
rnrt
RIFFLE
DEPTH
RUN
DEPTH
RIFFLE
I RUN
SUBSTRATE
RIFFLE
I
RUN
EMBEDSS
0
BEST AREAS>
411cm 3
El
MAXIMUM
0
50cm
21
El
STABLE (a,g,
CoMAe, Boulder)
[2]
0
NONE [2]
0
BES AREAS5
4
0crn
0
wY’i rUtS — SOer
Lit
ElraOD
SThBLEIL
p
Lorqa
Crovel3
[1]
0
cOL
(l
F
EB”
wRAS
5cnt
El
*JNCTA&C
o
Fins
Once
Scnot
it
El
JIODERATE
tO]
Comments
(motrico]
-
. -
-
UEXTENSIVE
[-‘i(
c4eL--.t..
-:ny’n
, 4/’
1%
,
Stream
& LoCation;
“S
/;.
,‘
.‘
5-,
kern
i”r,”-
r-/4’/
4
QHE1
Score:
Sobsfrrrte
‘4
4
19
1’
Sr
455
!r4ecinronr
20
STABILITY
, HIGH
[3]
El
MODERATE
[2]
El
LOW[1]
Channel
&lesenorrr
‘-4
20 ‘
$] GRADIEPJTt
lImit)
0
VERy LOW
- LOW [24]
DRAiNAGE
AR,EA
0
MOOERATE (6-10)
El
HIGH - VERY HtGH
[10-6]
t-FA
‘1520
4
%POOL:LJ
%C-LIDE:ç_,_j
Credlerrt
5-
I
/
CED%RIFFLE
CZ’D
r
r —
DtP:’tl!OS
Electronic Filing - Received, Clerk's Office, September 8, 2008
Stream
&
River Code:
STORET
#:
1]
SUBSTRATE
Check
ONLYTwo
eubstoste
TiPS
BOXES’
estimate
%
or note every
type
present
BEST TYPES
POOL RIFFLE
OTHER TYPES
POOL
RIFFLE
CC)
SLOR ISLASS
[i_
——
C] [3
HARDPAN
(4]
C C
BOULDER
(9]
,
C] [3
DETRITUS
[3] —
—
[]DCOSBLE[S]
QDMUCK(2]
CL]
GRAVEL[7]
,,
,__,
E]DSILT(2]
—
—
C]
El
SAND [6]
—
—
El
C
ARTIFICIAL
[0]
, —
C
El
BEDROCK
[9
,
(Score
natural sobstatee, iorrorrr
NUMBER OF BEST
TYPES:
9
or
caere
[2]
sludge
from point-sources)
Ôomrren.ts
C]
3 or
lees [0]
Check ONE tOr
24
everege)
ORIGIN
QUALITY
o
LIMESTONE
(1]
C
HEAVY
[-7]
o
TILLS [‘I]
-
C
MODERATE
14]
El
WETLANDS
fO]
wLc
C
NORMAL fOj
C
HARDPAN (0]
- DFREEM)
C
SANDSTONE
N]
C
EXTENSIVE
[-2]
o
RIPIRAP
Ni
pDE4
4
f
El
MODERATE
[4]
o
LACUSTRINE
[
C
NORMAL
N]
o
SHALE (4]
0
NONE (1]
0
COAL FINES [-2]
21
INS
TREAM COVER
nuehr;
Indicete
P
presence)
lv odor c
r
to
a
3:
,ut
D-Abcent:
h
ri
cc
4-Very
o h cot
en, ill
go
amounts
Mv
c
a
or
emaf
if
more
ancommon
o
a4c
O
of marginal
AMOUNT
1r
i—lcd I
II
glal qoolh
in
r ‘ r
c
<n
rco
enijunre
0
v
r
to
io
to Ncr in nep
0
f
i
4
or
In
1 JhL
rvrn
.
,
.ii
fl
(C
rliameter
log
that is stable, well
developed roorweri in
deep
/
feet
water,
or deep,
well-defined, functional
poole.
C
EXTENSIVE
>75% [Ii]
UNDERCUT
BANKS
(1]
—
POOLS
>
70cm
[2]
OXSOWS,
BACKWATERS
[1]
C
MODERATE
25-76% (7)
—-
OVERHANGING
VEGETATION
[‘Ii
ROOTWADS
(1]
-—
AOU?T1C
MACROPHYTES
(1]
C
SPARSE 5-<2S%
fS]
—
SHALLOWS (IN SLOW
WATER) ci
——
NOULDEPS
(1)
LOGS OR
VOOD7
DEBRIS
(I]
1
NEARLY!
BEnlT
.55
(]
ROOTNIATS
[1]
Cover /
Comments
M.oxiocom.’
6
“0
. 7
3]
CHANNEL MORPHOLOGY
Check
ONE in
each
category
(Or
24 everepe)
SINUOS1TY
DEVELOPMENT
CHANNELIZATION
o
HIGH
N]
C
EXCELLENT (7]
0
NONE
(6]
El
MODERATE [3]
C
GOOD [5]
0
RECOVERED
f4]
0 LOW
[7]
C
FAIR
(3]
0
RECOVERING
(3]
,WNONE
[I]
gPOOR
[1]
0
RECENT OR
NO RECOVERY
(1]
Comments
/
lmpcrin
4]
SANK EROSiON
AND RIPARIAN
ZONE
Check
ONE in cccl,
category for
EAOHBANff (Or2oorfcenk
4.e’wmoe)
—
reer deec
tooldoc
doosoottoa,o
,,, RIPARIAN
WIDTH
FLOOD
PLAIN
QUALITY
OSION
0 0
WIDE
a
SUm
14]
—
C 0
FOREST,
SWAMP
(3]
0
O
CONSERVATION
TILLAGE
(1]
C
C
NONE I LI’CLE
131
1]
9MODERATE
10-SUm
[3]
C
C
SHRUB
OR
OLD
FIELD
[2]
0 C
URBAN
OR
INDUSTRIAL
[7]
C
[3MODERATE
[2]
0 C
NARROW
S4Oni
12]
C
C
RESIDENTIAL,
PARK, NEW
FIELD
[I]
C
C MINING!
CONSTRUCTION (U]
C C
HEAVY! SEVERE
11]
C C
VERY
NARROW
<Soc (1]
C
El
FENCED
PASTURE
(1]
C El
NONE
(0]
C
El
OPEN
PASTURE,
ROWCROP
(0]
5] POOL/GLIDE
AND RIFFLE/RUN
QUALITY
MAXIMUM DEPTH
CHANNEL
W]DTH
Check
ONE
(DM0101
Check
ONE
(Or
24
average)
M>
Im
17]
C
POOL
WIDTH>
RIFFLE WIDTH
[2]
C
0J-<lm
H]
C
POOL
WIDTH
RIFFLE
WIDTH
11]
C
U.4c0.Tm
p]
C
POOL WIDTH
<RIFFLE
WIDTH (0]
C
U,2-<0.4m
(1]
C
<0.2m [U]
Comments
!rcdflcele
pradomiriani (soil use(s)
pest (Corn
n4ariarr.
Ripar!sn
2
Masirnom
Li
‘0
Poor /
lmpouncltsd
l-1]
Crrrren(
Maiiirnom
‘12
‘.1’
IndiCate for
funotionci riffles;
Best areas
must
be
iat-ge enouti
to support
a population
— r
‘‘
of riffle-obligate
species:
Check
ONE (0r2
& average).
‘J1’ r,crr...c ,nrsr.
c—0
RIFFLE
DEPTH
RUN
DEPTH
RIFFLE
I
RUN
SUBSTRATE
RIFFLE
(RUN
EMBEODEDNESS
C
BEST
AREAS
>10cm [2]
C)
MAXIMUM
> 50cm
(7]
C
STABLE
1mg,,
Cobble,
BouIder
(2]
C
NONE [27
C
EES”
p05755
‘fc
,L’r
0’
ASK
cii
4
0
SOc
f’I
C
S’SLC(r
g
Lcrgo
Scawe9 [1]
U
LOW
c1
1
C
BEST AREAS
< 5c
C
UNSTABLE
(e.g.. Firm C-ravel,
Send) [0]
C]
MODERATC
[0)
Pi’ox
[acernc”uj
a’
Comments
.
(]EXTENSIVE
31]
..,
‘:t
v:
B]GPAD/EW
Mat
:‘
PacCcr
WVr24I
%POOL°
r
GLDB(
- “Th
Cs/s ‘°
R/’N4GEAPE
El
ccODEPrEIS4O
>0—-
c
/ I
fm)
5
)
C
HIGH
-VERY
HIGH
(10-9
%RUN:
L_J%RIFFLE:L,,_.,
“‘“
MB i
MOD
I F
I ED
‘Lta]ibtVfe
Habitat
E,valluadon
index
:%%L
%CACrBi:
,,
and
Use
Assessment
n&d heet
.,
¶
RIM:
9
lDa/ot:.J-fl
/ ‘608
Boaters Full
Name
&
Affiliation:
/1
(x.
..
Lat,/ Lang.:
Office
vere’(ocr
1
,tllCPflartr,ctrcel7t — .-
,.,-..—
.—
‘,—.
...
Msotn,n
Srrbsfrr,fe
)Aeznrr’.rr;i
20
STABILITY
,2’I-lIGH
(7]
C
MODERATE
(2]
U
LOW (1]
Ccimments
clca.nrre/
7
Mexercoin
.20/,
6
CURRENT
VELOCITY
Check ALL (hat apply
0
TORRENTIAL
1-i]
SB%LOW
(1]
C
VERY
FAST [Ii
El INTERSTITIAL
[-1]
0
FAST
[1]
D1NTERNITTENT
(-2]
9—MODERATE
[‘I] 2EDD1ES
[1]
)rtd/cofe
for reach
- pools
sod riffles.
ReCreation
Potential
Primary
Contecf
Secondary
Contact
7
lCwOc
0011000 oo’0050’ so
.vwi
EPA
4520
17
r7
,,
0: /
‘
.
(/
1’
/
r
:,
/
4,
Electronic Filing - Received, Clerk's Office, September 8, 2008
MBI
MODIFIED
QuatatNe
Habftat
Ev1uaton
index
,
and
Use
Assessment
FIed
Sheet
1
&
Oi
* i T
5
L?
——
.
5D- OffC
B
Full
Name & AffihiaioI:
tr
RWor
Code:
STORET#:
LCL/Lon.q.:
od
—
..
.>
..—
... ._
trt—_i
Q..4t.eluJ
—.
—‘——
UESTRATE
Check
ONLYf\-’o
cube
IYPE
BOXES:
esbmste
%
or
ute
every
type
preseq
Check
ONE
(Or
2
&
auer&)
BEPES
POOL
RIFFLE
2IItE
POOL RIFFLE
ORIGIN
QUALITY
C].
ELOR ISLAB$
[101
0
C]
HAROPAN
4)
C]
LIMESTONE
[1]
Li
HEAVY
[-2]
C] C]
BOULDER
S)
...
C] C]
DETRITUS
[3)
—
C
TILLS
S LT
MODERATE
[-1]
U C
COBBLE
[Sj
—
C]
C
MUCK
[21
—
—
C
WETLANDS
[0
C
NORMAL [0]
U CI
GRAVEL
171
——
C] C]
SILT
t2}
—
—
C
HAROPAN
[]
DFREEJIJ
C
LI
SAND
[61
—
C] C]
ARTIFICIAL
[0]_
—
C
SANDSTONE
[0]
- C]
EXTENSIVE
1-2]
C
C]
EEDROCK
[SC
(Score
natund
substrates;
ignore
C
RIP1RAP
101
C
MODERATE
MI
NUMBER
OF
EEST
TYPES:
C
4
or
mor2]
from
point-sOurce)
C]
LACUSTRINE0)
NORMAL
10]
C]
3 or
5s5
[OT
C]
SHALE
[41
C
NONE [1)
:omn7erns
C
COAL
FINES
1-2)
RIXBUOH
PotentiBi
P4maiy
Contact
Secondary
Contact
trs
>ai
>nri
Ce
Strera,n
&
Location:
21
IAISTREAM
COVER
I
licare
presence
0 to 3: 0-Absent:
l-Vry
small amounts
or
if
more common
of
marginal
AMOUNT
-
quality.
2-filode,ai.e amounts,
but not of
higneal
quality
or
in small
amounts of highest
r
r
rr.ctity.
lighest
qoef iV
0
moderate or greeter
amounts
(e.g..
vary
large
boulders
in deep
orfeet
water, large
.heck
ON: (Or 2
em
eut
dimeier
log
that
is stable. welt
developed
rootwad in
deep
I
feet water om
deep,
well-defined,
functional
pools.
C]
EXTENSIVE
>75%
[11]
UNDERCUT
BANKS
[1]
POOLS>
70cm
[21
*
OXBOWS,
BACKWATERS
[1]
C]
MODERATE 25-75%
[1
,
OVERHANGING
VEGETATION
[1]
ROOTWADS
[1]
,,_ AQUATIC
MAGROPHYTES
i)
C]
SPARSE
S-s25% [3]
SHALLOWS
(IN
SLOW
WATER)
[1]
BOULDERS
[1)
LOSS OR WOODY
DEBR1S [1)
C]
NEARLY
ASSENT
S% [1]
ROOTMATS
[C]
Cover
Comments
Maxirrmurn
20
$ cHANNEL
MORPHOLOGY
Check ONE ci cacti
cateDory
(Cr2
&
maccage)
SINUOSTY
DEVELOPMENT
CI-IANNELIZATION
STABILITY
C]
HIGH
[4]
C
EXCELLENT
[7)
C]
NONE
[GJ
$
HIGH
[3]
C]
MODERATE
[31
C]
C-GOD [5]
C
RECOVERED
[4]
C
MODERATE
[ZI
C
LOW
[2)
C]
FAIR [3]
C
RECOVERING
[3]
C
10W [1)
£NONE
[1]
POSR
[1]
C
RECENT
OR NO RECOVERY
[1)
mnenr,e
Cmts
41
SANK
EROSION
AND RIPARIAN
ZONE
ChecL
ONE km
each category
for
EACH BANK
((Cr2 per benk
&
average)
RPARIAN
WIDTH
FLOOD
PLAIN
QUALiTY
EROSION
0
0
WIDE>
SUm
[41
ó C
FOREST,
SWAMP
[3]
0 C
CONSERVATION
TILLAGE
[1)
C.) C!
NONE
F LITTLE
[3)
ØEI
MODERATE
SOm
[33
C]
C]
SHRL1E
OR OLD FIELD
[2]
C] C]
URBAN
OR
INDU-ST!k!AL
[0]
C C]
MODERATE
[2)
C
C
NARROW
5-1Cm [2]
0 C
RESH3ENTIAL,
PARK,
NEW
FIELD
[11
C C
MINING!
CONSTRUCTION
[9]
C]
Li
HEAVY
I
SEVERE
[1)
C C
VERY
NARROW
< Sm
[1]
C C
FENCED
PASTURE
111
fndIcate
pradornirmcn(
lend
use(s
C]
C
NONE [0]
C
C] OPEN
PASTURE,
RCWCROP
[0]
pest
loOm rjoarjase,
Riperian
-
Maximum
I
to
51 POOL/GLIDE
AND
RiFFLE/RUN
QUALITY
MAXIMUM
DEPTH
CHANNEL
WIDTH
Check
ONE
(OWLYF
Check
ONE
((Cr2
& average)
>
Im
[3
C]
POOL
WIDTH>
RIFFLE
WIDTH [2]
tJ
0,7-elm
hi)
C
POOL
WIDTH
RIFFLE
WIDTH
[1)
Li
0.4-0-7m
[21
C
POOL
WIDTh
e
RIFFLE
WIDTH
[0)
o
02-<0.4m [11
C
<
0.2m
101
impoundd[’-i],
Comments
CURRENT
VELOCITY
Check ALL
that
apply
C]
TORRENTIAL
[-1)
‘SLOW
[1]
C
VERY
FAST
[1]
C
INTERST1TIAL
(-1]
C
FAST [1]
C]
INTERMITTENT
[-2]
MODERATE
11)
C EDDIES [1]
Indlt fr
rcl’, - pools
arid
riffles.
Pool!,.
Current
Mmmxsm,rn
indicate
for
funcUots
rittles; Best
areas
mUst
be
large
CIZGUcJh
to support
a
popu[at)on
“
of riffIe-obHate
spec]es:
Cnet
ONE (Or
2
& average).
Li
.O
[i.
R;rL
Lnl
ijTh
RIF_E
I RUN
SUBSTRATE
RIFLEiRJi\EE,.iCEC’
C]
BEST AREAS>
10cm
12]
QMAXh1UM>
50cm
[2)
C]
STABLE
(e.g.,
Cobble,
Boulder)
t2j —
C
NONE
[2]
C]
BEST AREAS
S-loom
[1]
0
MAXThCLI2I
C
60cm
[1]
C]
MOD. STA-3LE
(e.g.,
Large
Gravai[1)
C]
LOW [1]
U
0.1307
AREAS
m
Scm
C
UNSTABLE
teo..
Fine GraveL
5end) 101
C]
MODERATE
)0
wetr c
1
C]
EfTNBICP
Comments
t3RAhtENT(fthntl
C]miEf-7rLOWLOW[24]
DRAiNAcE
AREA
Cl
OCODERATE
6C0)
C
HIGH - VERY
HIGH
[10-61
%POGL:()
GL1DE:[,,
,J
Gradient’
%RUN;
(
%R]FFLE:cE)
.ev’m’vc-
“
k”
Electronic Filing - Received, Clerk's Office, September 8, 2008
!O3E MODIFIED
Qua[iitLathe
Habtat Era1uafian
ndex
ana tke
Assessment heRe
Sheet
Stream&Location:
fh,cic
/1.mo’
74I jZf3
__Seom,s Full Nenie & Affillaticm:JJot_vsj4i±ca’
1 +11
Offtowvaflflar1
rOver
Code:
te..
SlORtt
r:
•
nLtStLj..t,n..tr
Cfl..
.e..r
lb
.
toccriontJ
ii
SURSTR4TE
Cheet:
ONLYTvao uobsf?ata TYPE ROXES;
-.
eat
n
v
epro..n
Cnsc<UNcL 34
C
cog
BEST
TYPES
poot.
ptr°LE
QIC4ITVPES
POOl. RIFFaF
ORGN
QUAUT
UO
BLOR
/51405 [10........
.._.... LI
C
HARDPAN
143
0
LIMESTONE
[I]
o
HEAVY
1-23
90
BOULDER
9
0 C
OFTEn/S
[3]
—
0T1119 fl
C
eIODE°tTEt
1
SfJb$ba a
DO
COBBLE
[83
C
0
MUCK [2)
—
—
0
WETLANDS [9)
0
NORMAL [9]
j
CD
GRAVEL
171
—
—
C
CSILT2]
—
—
DHARDPAN[O]
2o LI
u
LI SAND
rSJ
—
r
[1
aI9 IFK’ 141
[01
—
0
SANDSTONE [0]
0
EXTCKSIVE
[23
.
Ofl BEDROCk
(9
—
at
ccl
uns9ates
v te
0
RIP/PAP
(0]
é°v
Li
MODE$AIh
(II
NUMBER OF
BEST
TYPES:
0
4
or more
[0]
sludge
from
point-sources)
C
LACUSTRINE
t]
%C
NORMAL
10]
20
Q
Sortess
10]
QSHAl(-I]
CNONEN
Comments
Q
OOAL
FINES
1-2]
V
INS TREAM COVER
lrtdtoeto
prvsenca
0 to 3:
C4cbsent:
IA/cry
small amounts or if mom
common
of
marginal
AMOUNT
quolitr
2$/ocisrate
amounts, but not of hiohast
gustO’
or in
amA
amounts of
highest
1
2
nhsl
LII
1
..
ct
0
n
C
rotouIoersi
tdeenortstooter tat
ciockONCtO
25
w
‘0 ,
diammar log that a oatite.
welt
dcweioped rootwad
fr
deep
/
fast waten or
clasp. welt-defined, funoltonal
pools.
Q
EXTENSIVE >75%
[11]
UNDEROUT BANKS
[I]
POOLS> 70cm
[2]
OXBOWS, BACKWATERS [I]
[“MODERATE
2845%
[7]
OVERHANGING
VEGETATION
(I]
ROOTWADS
[I]
AOUATIC
MACROPHYTES (1]
0
SPARSE 5-e25%
[3]
SHALLOWS (IN
SLOW
WATER) [I]
—
BOULDERS [I]
—
LOGS OR WOODY DEBRIS [I]
LI
NEARlY
ASSENT <5% [f]
——
ROOTMATS
[I]
Cower
Comments
Max/mum
201
¶0
3] CHANNEL
MORPHOLOGY
Check ONE in
each
cacegory
(Or 2
&
swempa]
S[NUOSITY
DEVELOPMENT
CHANNEL)ZATION
LI
NIGH
13
C
EXCELLENT
[7]
Q
NONE
16]
O
MODERATE [3)
0
GOOD
1]
LI
RECOVERED
143
GLOW
12]
C
FAIR
pq
LI
REOOVERIN.G
[3]
NONE [I]
2’
POOR
[1]
C
RECENT
OR
NO
RECOVERY [I]
Comments
r
1II21D1
4] BANK
EROSION
AND RIPA PlAN ZONE
Check ONE in
each
category
for EAOH
BANK
(0r2
per
ban/c &
overage)
P%vcr ngtO
ootant
dcwnstroan,
RIPARIAN
WIDTH
>
FLOOD
PLAIN
OUAUTY
EROSION
j
h
WiDE > BOrn
(43
0 0 FOREST,
SWAMP [8]
b CONSERVATION
TILLAGE
[1]
17)
NONE/LITTLE
[3]
Q
MODERATE
19-RIm [3)
0
[]
SHRUB
OR
OLD
FIELO[23
LI C
URBAN OR
INDUSTRIAL
[(t]
Li LI
MODERATE [2)
0
0
NARROW 54Gm
[2)
0 Li
RESIDENTIAL,
PARK,
NEW FIELD
LII
0
0 MINING)
CONSTRUCTION
103
C Li
HE/cOY
/
SEVERE [I]
Q
LI
VERY
NARROW
<Sm [1]
LI
0
FENCED PASTURE
[1]
/u,fice/e preriom/nant
(and use(s)
LI
C
NONE [0]
LI
0
OPEN
PASTURE,
ROWOROP
[0)
ocat
/Oom
r/oa,Ian.
R/par/an
I:
Has/mum
/
U
5] POOL! GLIDE
AND RIFFLE / RUN
QUALITY
Zr:
MAXIMUM
DEPTH
CHANNEL WIDTH
Check ONE IONLY’t
Check ONE (Or
2 & atoursos)
im [6]
C
POOL WIDTH> RIFFLE
WIDTH
(2]
C
0.7-elm
E3
C
POOL WIDTH = RIFFLE
W1OTH (1)
O
94a03tn
(3]
C
POOL WIDTH
e
RIFFLE
WIDTH [0]
O
0.ZwtL$m
[I]
.
Pooh
,
0
<0,211
Corrsnf
Comments
flthu:cctuot
—
indicate for
functional
riffles;
Best at”ees must
be [erge enough
to SUppOrt a
population
—“ ao
-‘ F
of
riffle-obligate
species:
Check
ONE (Or
2
&
swamps).
LJ
‘J
....
V’
RIFFLE
DEPTH
RUN DEPTH
RIFFLE
I RUN SUBSTRATE RIFFLE /
RUN
EMBEODEDLtESS
‘J
BERt” 9E0S>
10cm 12’
1:1
MA <IOu A> Men
j2]
Li
STBLE
(e
p
Cobble Boulde
)
(23
—
0
NONE [21
I]
SfAREAS
S
IOcrr
t
Ct
1w/ic/ate 20cm
ft1
DM00
STOBI
E og Large” Gramp I]
CI
OW n
Li
BEST AREAS
< Sent
C
UNSTABLE (eo., Fine Gravel,
Sand)
[01
C
MOOERATE
P70/S
:
[matrtce0l
.
-
CEXTENSlVE
“4)
rcon
Comments
tSOo
own
STABILITY
3141G1-I
[33
O
MODERATE
[2)
LI
LOW(i]
Comments
chaone/::
/Aaxtmuut
20*
A
Impounded
[4]!.
cM!3RENT
VELOCITY
Chack ALL [hal
app/s
C TORRENTIAL
(-I]
WSLOW
[1]
O
VERY FAST
(1]
‘LI INTERSTITiAL [-I]
O
FAST
[I)
0 INTERMITTENT
1-23
0
MODERATE
[1]
0
EDDIES
[I]
Inc//cafe
for reach
- p00/s
ancf
Nfl/es.
R
ecmatio
nPotential[
Primary
Contact
Secondary
Contact
i
,tatcbanaA7d
te’coM
sO
LuLL’
6]
GRADIENT
(f/mi)
C
VERY tOl
- LOW
[241
DRAtNAGE
AFEA
C:
MODERATE
[540)
C
:
HIGH
VERY
HIGH
(10-0)
EPa. 452ff
%POOLKJ
%GUDE:J
%RUN:
CED%R!IFFLE:CED.
Grad/ecU
Mertn:tnt
(>
if)
“Z
/1
f:
00711/Cf
j//,,r:
/
¶0
t
Electronic Filing - Received, Clerk's Office, September 8, 2008
MF3I
MODIFIED
QuaNtadve
Habkat
Ev&uadon Index
and
Use
Assessment
fleW
Sheet
/
Stream
&
Location:
Vn
eOn
tn&L
x1vaIc4_y1c4
f:iDa2s:
‘j!
era
Fall
Name &
A ffthaaon
-
Lati
Lone.:
050cc
vsrItlsO
ri
21
INSTREAM
COVER
Indicate
presence
0 to 3:
0-Absent:
1-Very
small amounts
or if
more common
of
marginal
AMOUNT
duality;
2—kiodemte
amounts,
but not
of highest
quality
or in smell
amounts
of highest.
-
;—
qrl
i
4 1
hgh V
udl
in ircne”n
e
org
e
amoun
$
itt
g
sort
org ooukfr rs ir
ooc or
ml
watr
tugs
‘i
k
CN
0d
/
Of
diameter
log
that
5 stable,
well
developed
rootwad in
deep
/
feet water,
or
deep,
well-defined,
functional
pools.
ID
EXTENS1VE
>75%
(11]
——
UNDERCUT
BANKS [13
POOLS>
70cm
(23 —
OXBOWS, BACKWATERS
113
MODERATE
25.75%
(7)
OVERHANGING
VEGETATfON
(13
ROOTWAOS
13
—
AQUATIC
MACROPHYTES
rh
(9
SPARSE
5-c25%
(33
—
SHALLOWS (IN
SLOW WATER)
(13
BOULDERS
(13
LOGS OR WOODY DEBRIS
(1]
(9NEARLY
ABSENT
<5%
(IT
—
ROOTMATS (13
—
Cover
Comments
Modicum
1’
i-I
20
-‘
3] CHANNEL
MORPHOLOGY
Check ONE
in each
category
(Or
2
8
essoage)
SINUOSITY
DEVELOPMENT
0
WMNELIZATION
o
HIGH
143
ID
EXCELLENT
173
ID
NONE
(9
ID
MODERATE
Di
(9GOOD
(53
ID
RECOVEftED
(61
ID
LOW [23
ID
FAIR
[3]
0
RECOVERING
[3]
NONE
(13
POOR
(1]
0
RECENT
OR NO
RECOVERY [1]
Comments
ziI!pji
$3
BANK EROSION
PIPA
RIAN
ZONE Ctcck ONEn
eec catsgo-y
ror EACH BANK 1
OrA
/30!
001
2
&
irn,.
rsvsr Oght
took
edowozirosm
RIPARIAN
WIDTH
FL000 PLAIN
QUALITY
o
EROSION
Cl O
WIDE>
SUm
[4]
0
ID
FOREST, SWAMP
p3
b C
CONSERVATION TILLAGE
[I]
ID ID
NONE?
LITTLE (3)
ID ID
NOOERATE 10-SUm
(33
ID
ID
SHRUB OR OLD FIELD
[23
ID ID URBAN
OR
INDUSTRiAL
(03
ID ID
MODERATE
(2]
ID ID
NARROW 5-lOm
(23
ID ID
RESIDENTIAL,
PARK, NEW FIELD
(13
ID ID
MINING
I
CONSTRUCTION [0)
ID ID
HEAVY
/SEVERE
(13
ID ID
VERY NARROW
<Sin
1.13 ID ID
FENCED
PASTURE
[13
ID
ID
NONE
[U]
ID
ID
OPEN
PASTURE,
ROWCROP
[03
53 POOL
/GLIDE
AND RIFFLE/RUN
QUALITY
MAXIMUM DEPTH
CHANNEL
WIDTH
Check ONE
tONLY7,
Check ONE (Or 2 &
average)
7>1 m
[43
ID
POOL WIDTH>
RIFFLE WIDTN
123
ID
0,T-<lm
[43
ID
POOL
WIDTH
=
RIFFLE
WIDTH (1]
ID
tL4-<tL7m
123
ID
POOL WIDTH <RIFFLE
WIDTH (03
ID
0.2-4L4m
ri
ID
<0.2m [03
Comments
Indicate
predominant /and use(s)
,.
past
Worn
riper/an.
taper/en
Maemurn
4
10
‘r
Pool!
Current.
Maxicntwi
12
ofindicate
riffle-obligate
for
functional
species:
riffles;
Best ‘areas
Check
must
ONE
be
(Or2
large
&
avenage).
enough
to support
a
population
LtNJ
— r
r,c
Fl-S
(ma/n-)
RIFFLE
DEPTH
RUN
DEPTH
RIFFLE
I RUN
SIJBSTRATE
RIFFLE
I RUN
EMBEDflNE
ID
BESTAREAS
>10cm
(23
QMAXIMUM
>50cm [23
ID
STABLE
(e.g..
Cobble,
Boulder)
[23
ID
NONE (2]
ID
BErA0EAC
01cm hI]
UnlAcE
n.el SOcir
ri
ID
POD
S FABLE
te
j
orge
Gravcil
ui
ID
LOar
(4]
fl3CST
cREwS < Sc,
ID
UNSTASLowo
En e Grave, Sc, d1
r,
ID
-PCOER-TC
0
motnc3I
-
ID
FXTENSIVF
lIt
5-i n
i.
Comments
‘
M5Xifl1!!fl3.,
Rlvor Code:
STORET#:
I] SUSSTRATE
Check
ONLY
Two
substrate
TYPE
BCXE$
estimate
%
ornate
avery
type
present
BEST TYPES
POOL
RIFFLE
OTHER
TYPES
POOL
RIFFLE
[JO
I3LDR /SLABS (10]
—-
ID
ID
HARDPAN
(4]
—
—
00
BOULDER
[9
—
—
ID ID
DETRITUS
(33 —
—
ID
ID
COBBLE
[83
,_
—
ID ID
MUCK
[23
—
—
IDOGRAVELD!
0.IDSILT[23
——
o 0
SAND [6]
——
—
ID ID
ARTIFICiAL [03
—
—
ID 0
BEDROCK
[53
—
(Score
natural subsbales;
ignore
NUMBER
OF BEST
TYPES:
0
4 or
more
[23
sludge
from
point-sources)
Comments
ID
3 or less
[03
Check ONE
iO
24
everegei
ORIGIN
QUALITY
ID
LIMESTONE
[13
ID
HEAVY (-23
ID
TILLS [1]
‘ltT
ID
MODERATE
(-1]
ID
WETLANDS
[03
0
‘
NORMAL (0)
o
HARDPAN
103
ID
SANDSTONE
103
-
0
EXTENSIVE (-23
ID
RIPIRAP [0]
ODEO
4
o
MODERATE
(-1)
ID
LACUSTRINE
[0]
iF
ID
NORMAL
(03
IDSHALE[-13
‘0
NONE [13
[9
COAL
FINES
f-23
Substrate
STABIUTY
ID
NIGH (3]
a
MODERATE [2)
ID
LOW [13
Comments
Channel
-r
- -.
tie/acorn
t
3
bmpounded
[-131
CURRENT
VELOCITY
Check ALL
thai apply
ID
TORRENTIAL
1-1]
Z’SLOW
113
0
VERY
FAST (13
0 INTERSTITIAL -1j
ID
FAST
[1.]
0
INTERMITTENT
[-23
ID
MODERATE [I]
ID
EDDIES
(1]
Thdfcots
for reach
- pools
sari riffles.
ri;on
Potentiall
- Primaty
Contact
Secondary
ContaCt)
1504*
cr,a
s-C
oeesemu.ewgj
6]
GRADIENT
L_Jlimi)
ID
VERY
LOW - LOW
(2-43
DRAINAGE
AREA
ID
MODERATE
[4,403
ni
2)
ID
HIGH -VERY HIGH (1043
EPA 4520
- /
.75
1/
3
r
-I4
%POOL:L_,J
%GL3:DE:L_j
%RUN:
(J%RIFFLE:(
Gradie;ii*:
kfaxirnirrn;
50
k.n-.’
Electronic Filing - Received, Clerk's Office, September 8, 2008
MBI
MODIFIED
QuaNtative
Habftat
Ev&uation ndex
. aibJfl
and
Use Assessment Fi&d
Sheet
i)s(4&
ttiEr
379J
t6
RM:29JDate:Efi4/Q8
Scorers
Full Name
&
Affiliation:
C$r ...
__________
River
Code:
STORET#:
LatJLonq.:
tj’
—
Office
vefltt;k
—
—.
4NADfl4.skn,.
,.,a- —
—
r’,
‘i
SUBSTRATE
Check
ONLY
TWo
substrate
TYPESOXES;
estimate
%
or note every type present
Check ONE
tO:
2
&
esempet
BEST
TYPES
POOL
RIFFLE
OTHER TYPES
POOL R1FFLE
ORI1N
QUAliTY
CC
ELDR !SLABS
[iO]_
____ C
C
HARDPAN
4J
C
LIMESTONE
[1]
C
HEAVY
[-2]
C
C
BOULDER
[SI
__ C C
DETRITUS
[3] —
—
C
TILLS [1]
,
C
MODERATE
[-1]
CC COBBLE
]
—
C C
MUCK [2J
—
C
WETLANDS [0]
ILi
C
NORMAL
[0J
C
C
GRAVEL
17]
,,
C C
SILT
[7)
—
—
C
HARDPAN [0]
0
FREE
JI]
C C
SAND [6]
—
C C
ARTIFICIAL
D_ —
C
SANDSTONE0]
“‘
0
EXTENSIVE
1-21
C C
BEDROCK [5]
—
,,,,,.,,
tScotw natural aubslrsuea;
ignore
C
RIPIRAP [0,]
tODt4k
C
MODERATE
[i]
NUMBER
OF
BEST
TYPES:
C
4 or more [2]
sludge from poNt-sources)
C
LACUSTRINE [0]
%C
NORMAL
tO]
C
3 or
tens [0]
C
SHALE 4]
C
NONE
‘l]
.Drnhene
C
COAL FINES 1-2]
2]
IiitSTRFAM
COVER
Indicate
presence
U to 3: 0-Absent; 1-Very small amounts or
if
more common of
marginal
AMOUNT
cii is
y
2 k oderet..
you-a bA n-i htghe”t
ttt
oua
ot in
small at
cites uf
tag te,t
—
r
‘1
alt
a H cliet at eta,
coa e
or gr fr r
am Is
te
3
cry Inige
LoWers
in duep ur eat water
g
hew’
Of
3m
2
cc
i
dietnater
log
that is stable,
well
developed
rootwed in
deep 1 fast water,
or
deep,
wai-defined,
functional pools.
C
EXTENSIVE
>7a%
[II]
—.
UNDERCUT
BANKS
[1]
POOLS a 70cm
[7]
—
OXBOWS,
BACKWATERS
[1]
C
MODERATE
2545%
[7]
OVERHANGING
VEGETATION
[1]
—
ROOTWAOS [1]
,
AOUATIC
MACROPHYTES
[1]
C
SPARSE
5-<25%
[3]
SHALLOWS
(IN
SLOW
WATER) [1)
—
BOULDERS
[1]
—
LOGS
OR
WOODY DEBRIS
[1]
C
NEARLY
ABSENT <5% (1]
ROOTMATS [I]
Cover
:7
Corn
nzents
Maxhnurn20’.
/ /
3] CHANNEL
MORPHOLOGY
Check
ONE
in each
category
(Or
2
&
ct-crepe)
SINUOS[TY
DEVELOPM,NT
CHANNELIZATION
C NIGH
f4,]
C
EXCELLENT
(7]
C
NONE
[0]
C
MODERATE [3]
C
GOOD
[5)
C
RECOVERED
f4]
C
LOW
[2]
C
FAIR
[7]
C
RECOVERING
[7]
,,ZIIONE
[1]
F
POOR
[1)
C
RECENT
OR NO RECOVERY [1]
Comments
‘hnpounded[-I]t
4
BANK
EROSION
AND
RIPARIAN ZONE
Check
ONE in each category for EACH BANK (Or2pe:
bank &
ct-crepe)
t5ier
neat
iQcein5
eoanacream
RIPARIAN
WIDTH
.
FLOOD PLAIN QUALiTY
EROSION
if
WIDE
a
SCm
t4]
U U
FOREST,
SWAMP
[3,]
U U
CONSERVATION
TILLAGE [1]
C
C
NONE)
LITTLE [3]
C C
MODERATE 10-SUm [3]
C Li
SHRUB OR OLD FIELD
(2,]
C
C URBAI7
OR
INDUSTRtAI. 103
U
C
MODERATE’[7]
C C
NARROW S-lOre
[2]
C C
RESIDENTIAL,
PARK, NEW FIELD [1]
C C
MINING!
CONSTRUCTIDN
0t
Li
C
HEAVY’
SEVERE
[1]
C C
VERY NARROW < Sm
[1]
C C
FENCED PASTURE
1]
C C
NONE [0,]
C C
OPEN PASTURE,
ROWCROP [0]
5]
POOL!
GLIDE
AND
RIFFLE
!RUN
QUALITY
AXiMUM
DEPTH
CHANNEL WIDTH
Check ONE
(ONL%3
Check ONE
(0:2
& averege)
lm
[7]
C
POOL bOOTH >RIFFLE WIDTH
[21
‘C
0,7-elm 14]
C
POOL
WlDTH RIFFLE’WIDTH
DI
C
04-c0.7m
[23
C
POOL WIDTH <RIFFLE
WIDTH
[0]
C
02-coAta
[1]
Cs0.2m[0I
Comments
Indicate
predom/nate
lend
recta)
Ac..
past
l00n
r/per/an.
Mex/;nuoi
Ripariafl
2
2
Poo/! a>
Cummon?
t,4amjmnr,ot
InthCaIC
5Cr
fUNCtIOnal rrrleS
Bst meas
must be large enough
SUOIY
000UtCt1OP
r
Ri’
a’
o
of
riffle-obligate
speces:
Check ONE (13:2
&
at-crepe],
“ “ ‘‘“
nrFLE DEPTH
RUN
DEPTH
RIPCLE:
RUN
SUBSTRAg
R!FFL
I
RUN
EilBE$fNaj
13t
BESTAREASa 10cm
[7]
CMAXIMUM
a 50cm
[2,]
C
STABLE
(e.g., Cobble, Boulder)
[2,]
C
NONE
[2)
r
DES” AItE4,S ‘1
Ocn [t]
El
8
AX ret) ftc accin
1
C
P100 STr BLC
te
0
Large
Crass-f’
I
C
,,,otv
, ,1
,
“ STTfRZsS X-tn
CJ13TAB(
ui
Gras
SuainrD
E]tclCDrAfc
[metsico]
-
‘
j
EXTENSIVE
[-‘I]
2’
Comments
“a’,’.’
I
4:
mc-
nc:;t,’ncchir
“ —
‘‘“
‘“‘-“‘
/“n,
,c—.,
“
(tdmt)
U
Vhe/Y’LOWcOraft24]
%POOL:L,,, ,,)
%GL(DEA
GradhutL’
/
DRAINAGE
ARISE
C
NODERATE
[040]
-‘
-n=c/’
mm”1
rai’c’
tm
CHGfrnVEPt?tCND0o9%RUNC)%0ttFCEC_,
.
./ ‘
Etc-A
4520
‘.
/
;lmpotinded
!/i]/
Stream
&
Looation:
(#IB
Score:’
Subafc’arc
i1T
Mcxtm,s.
20
STABilITY
HIGH [3]
C
MODERATE [2]
C
LOW[1]
COmmentS
Chanr;e/t<’
Maxirnun’i ,
30
$
CURRENT VELOCITY
Check ALL
IbM
apply
C
TORRENTIAL 4]
SLOW (1]
C VERY FAST
[1]
C
INTERSTITIAL
[-13
C FAST [I]
C INTERMITTENT
[-2]
MOOERATE(l] C
EDDIES
[1]
lnd/c$e
for
ranch
- pools end
r/ffles.
i
ReCreation
Potential
I
Prirnauy
Contaoi:’
1
SeCondary
Contaot
iarmcio
ear asS
oiwrniarrt
yr
/ ,
_
4:
,/‘i,
‘Y”
‘- “
‘‘
3
Electronic Filing - Received, Clerk's Office, September 8, 2008
MB
I
MOE)
I El
EL)
s•.fli
Qualltative
Habitat
Evaluation hdix
4* IbJ*
and
Use Assessment FMd
Sheet
Stream &
Location:
E),ç
/)mn;ir
—
/
4f
tq;
3
?
‘Date;
j<)
/fl
OS
ScorarsFulllVame&Affitiation:
75
Puer
- STOEr
4
- ---rr
1]
SIJBSTRATE
Check
ONLI’TWo
substrate
IYOE
BOXES’
eafirnate
%
or note every
type present
Check ONE jOt
2
&
average)
BEST TYPES
POOL
RIFFLE
OTHER
TYPES
POOL RIFFLE
ORIGIN
QLJAUTY
CC
BLOR
ISLASS [1O3.__
C
[
NAROPAN
[4]
C
LiMESTONE
[1]
C
HEIV [-23
DC BOULOERIP]
. C
COETRITUS[3] —
—
CTILLS[1]
qL
CMO0TEN)
CC
COBBLE
5]
C C
MUCK
[2]
—
—
C
WETLANDS
101
C
NORMAL
]
CC
GRAVEL
[73
—
C
CSILT[2]
—
CHAROPANIO]
CFREEIIJ -
C
C
SANO
[SI
—.
U C
ARTIFICIAL fO]
C
SANDSTONE
10]
fl
ETCN5WE
[
23
C
C
BEOROCK [5]
(Score natural
substrates;
iqnors
C
RIP/RAP [03
DOO4,
C
MODERATE
(4]
NUMBER
OF
BEST
TYPES;
C
4
or more
[23
sludge
from
point-sources)
C
LACUSTRINE [0]
th
C
NORMAL
(0]
C
3 or
lass
10]
C
SHALE
[-1]
C
NONE 1]
womments
C
COAL FINES [4]
Cover
kiaxftnum
:3
1<3
‘
20
\
indicate
predominant
land usa(s3
‘‘
past
lOOm
rarian,
AlgerIan 4
Maximum
$
/0
H
:PotenUaH
Primary Contact
:3
Secondary
Contact
Gradient
H
10
Subs
fiats
U’
m4e;rimunt
20
2]
INSTREAM
Qvp
Indicate presence
0 to
3:
0-Absent; 1-Vary
small
amounts
or
if more common
of
marginal
AMOUNT
qua
2 t
0
atm no Ms
bt note
h
yl
as,
ac,i
v r in
maI
ar wants ol agnest
quality; S-Hghsst quality
in
modarete• or greater amounts
(e.g.. very
large boulders in deep or
fast water, large
Chac
ONE ,Or 2& arc
diameter
log
that
is stable, well
developart rootweo in deep i
fast water, or
deep,
watt—defined,
functional
pools.
C
EXTENSIVE
>7o%
[11)
UNDERCUT BANKS [1]
..._ POOLS>
70cm
[2]
—
OXBOWS, BACKWATERS
[1]
C
MODERATE
2545%
(‘2]
OVERHANGING
VEGETATION
[.1]
., ROOTWADS
[I]
—
AQUATIC
MACROPHYTES
[1]
C
SPARSE
5-c25%
[3]
—
SHALLOWS
(IN SLOW
WATER)
[1]
BOULDERS
[1]
LOGS OR WOODY DEBRIS [1]
C
NEARLY
ASSENT <5%
[1)
—
RODTMATS [13
Comments
Si
CHANNEL
MORPHOLOGY
C
neck
ONE
in
each
category
(Or
2 &
average)
—
——
SINUOSITY
DEVELOPMEF?JT
NNELIZi
ST3kBIUTY
C
HIGH
[4]
C
EXCELLENT
rn
C
NONE
[9
NIGH
[3]
C
MODERATE
[3]
C
GOOD
[43
C
RECOVERED [43
C
MODERATE
[2]
C
LOW
131
C
FAIR
[33
C
RECOVERING
[3]
LOW [1]
ja’NOHE (1)
,2’POOR
[1)
C
RECENT
OR
NO RECOVERY [1]
whannel/
Comments
/
lrnpotinded[
1]
4nmnr
Comments
4J
SANK
EROSION
AND
RIPARIAN
ZONE
Check
ONE in
each
category for FAN BANK (Or2 per
denim &
average)
ewcr
date iookin
5
dw,u,noam
.,
RIPARIAN
WIDTH
FLOOD PLAIN
QUALITY
>
tROS
ION
O S
WIDE>
5Dm
14]
C C
FOREST, SWAMP
1]
fl C
CONSERVATION TILLAGE
[1]
C El
NONE /
LITTLE
13)
C
C
MODERATE
‘tO-SCm [33
C
C
SHRUB OR OLD FIELD
[2]
C C
URBAN OR
INDUSTRIAL
103
C C
MODERATE [2]
C
C
NARROW
5-1Cm
[23
C C
RESIDENTIAL, PARK, NEW FIELD
[I]
C
C
MINING!
CONSTRUCTION
[0]
C C
HEAVY
i SEVERE
[1]
C C
VERY
NARROW
<Sm [1]
C C
FENCED PASTURE
[I]
C C
NONE [0]
C C
OPEN PASTURE, ROWCROP
[0]
$
POOL
/
GLIOE
AND
RIFFLE
/
RUN
QUALITY
MAXIMUM_PEH
CHANNEL WIDTH
Check
ONE
(ONLYt)
Check ONE (Or
2 & everaget
>
Ira
(6]
C
POOL WIDTH > RIFFLE
WIDTH [23
C
0,7-<1m.
[43
C
POOL WlDTH
RIFFLE WIDTH [1]
C
0.4-<o,Tm [2)
C
POOL
WIDTH
e
RIFFLE WIDTH
1$
C
0.2-sCAm
[13
C
<0.2m
[0]
Comments
CURRENT
VELOCITY
Check
ALL that apple
C
TORRENTIAL
1-1]
ZSLOW
[1]
C VERY FAST
[1]
C INTERSTITIAL
0.13
C
FAST
[1)
C INTERMITTENT
[-2]
C
MODERATE [1]
C
BODIES (1]
etdicaie Ibm
reach
- goofs end ditlee
Pool?
‘•‘
H
Conenr
t/eyi;nu.’rr
.
12
Indicate
for
f:LrnCtionai
dRIes; Best areas
ITtust he large
enough to support a
population
-
of
riffle-obiigate
species;
Check ONE
(OrZ&
average).
U”
RIFFLE
DEPTH
RUN
DEPTH
RIFFLE I RUN SUBSTRATE
RIFFLE
LRM1
EMBEDDNESS
(3
BEST
AREAS> lOon
23
C
MAXIMUM> 50cm
[2]
C
STABLE
(e.g.. Cobble, Boulder)
123
C
NONE
123
C
BEST AREAS
5-10cm
(1]
C
MAXIMUM c 50cm
(1]
Li
MOD, STABLE (e.g.. Large
Greval)[1]
CI
LOW [1]
C
BEST AREAS
e
Scm
C
UNSTABLE
(e.g..
Floe Gravel,
Sand)
f0
C
MODERATE
pj
Prfe?:(
Cornmcnts
lncetrtco]
-
),
EXTENSIVE
(4]
rJLfl
‘P
r’r
UI
samtMrr4
s
(
mtt
4
ft
C
VERY LOW
- LOW [24]
tRAINAOE
AREA
C
MODERATE
f6$mj]
(mP)
C
HIGH
- VERY
HtGH
[10.6]
EF’A 4520
1
i’
r
i
0
PO..rL:çJ
-/esetDç,,,
%RUN:
(JD%RIFFLE:CJ
3*21
‘1.
3’
Electronic Filing - Received, Clerk's Office, September 8, 2008
e
—
utw
ii
MBI
I’4OJDIF1ED
QuaIitatve
Habitat
Ev&Iuatbn
Index’
and
Use Assessment
Fed
Sheet
Stream & Location:
—
_____Srers
Fix/I
Name
&
Añ7Iiatiam_________
STOPET
IS
1] SUBSTRATE
Check
OWLY1\’o
s
5
bstrate
TYPE
BOXES’
hrnale
or
note
every
type present
BEST
TY
POOL
RIFFLE
OTHER
!E
POOL
RIFFLE
DC]
ELOR/SLABS[1UI_
DDHARDPANI4I
C]
C]
BOULDER 191
C] C]
DETRITUS
131
—
DC]
COBBLE[S]
C]
1]
MUCK 12]
—
—
QQSlLTYZ
DC]
siios
—
DEJARTIFICIALtOL
*
U Ci
BEDROCK(S)
(Score
natural subsimlee,
ignore
NUMBER
OF BEST
TYPES:
J
4
more
2]
sawge rrom
po
ni-Sources)
Li
3orHse[0]
ChecR
ONE
crage)
OR[G!N
QUALiTY
o
LIMESTONE
[1]
[3
HEAVY [-2)
C]
TILLS [1]
C]
MODERATE
C]
WETLANDS
[0]
ONORD1AL
[0)
C]
NAROPAN
(01
C]
FREE
111
OSANOSTONEI/il
[EXTm.SIVE
21
[3
RIP/RAP
(0]
;sDDcO
4
0
MODERATE
(1)
C]
LACUSTRII4E
[0]
NORMAL
[O
C]
SHALE
[4]
UNONE
ru
C]
COAL FINES
(2]
21 INS
TR
M
COVER
quality,Indicate
2.Moderateproserice
0
amounts,
to 3:
0-Absent:but
not
i-Very
of highasi
small
qualIty
amounts
or in
or/more
small
amounts
common
of
of
tithes:
rarginal
,
,,,,,,
AMOUNT
I,.
‘s
3
‘rhesl
qt
r u.
to
‘n
‘a
ores
an-ou
s
g
e
hg
<wHas
n deep
or
as)
u ter Ccc
( N.
)
diameter
log that
is stable,
well developed
rootwad
in
deep
I
fast wa/er.
or
deep,
well-defined,
funclionel
nooN.
C]
EXTENSIVE. >75%
[III
** UNDERCUT
BANKS
[1]
POOLS>
70cm
[3)
_,
OXBOWS. BACKWATERS
f’i]
[3
MODERATE
25-73%
ru
OVERRANCING
VFGEfACOIt
(1]
ROOTWADS(1]
—
AQUATIC
MPCROPHYTES
[I]
C]
SPPPSL
9<25/
[‘1
SHALLOWS
(IN
SLOW
WATER)
[1]
BOULDERS
[1]
LOGS
OR
WOODY
DEBRIS
(1]
C]
NEARLY
ABSENT
<5%
[1)
ROOT/OATS
(‘I]
Cover
COmntCntS
34sa1num
‘
] CHANNEL
MORPHOLOGY
Check ONE
in each
category
(Or
2
&
average)
S[NUOSTY
DEVELOPMENT
CHANNEUZAI1ON
DH1GH
[4]
C]
EXCELLENT
[7]
C]
NONE
[9
C
MODERATE(S)
C]
GOOD
[6]
C]
RECOVERED
[41
C]
LOW
[2]
C]
FAIR
[31
C]
RECOVERING
[3]
,,NONE
fI]
,,J
POOR
[11
C]
RECENT
OR
NO RECOVERY
[11
Comments
/
41
BANK
EROSION
AND
RIPARIAN
7ONE
Chad;
ONE
in each catceory
for EACH
SANK (0r2
per bn5
7
Rc wet
wen
5rc
P[PA(AN
WIDTH
,.
FLOOD
PLAIN
QUALITY
EROSION
C
C
WIDE>
SOn (4j
C C
FOREST
SWAMP
[3J
C] C
CONSERVATION
IILLSGE (11
[3
C]
NONE!
LIITIE
131
C)
MODERATE
15-SOon
[7!
C]
C]
SHRUB
OR OLD F1ELD
12]
C] C
URRAU
OFt.
I’1OUSTFt!AL
rp
[3D
MODERATE (2]
C]
QNARROWS.jOm
[2]
C]
U
RESIDENTlALPARK,NEWFlELO(11
C] C] MINING/CONSTRUCTION[0]
C C]
HEAVY
/
SEVERE [1]
C] C
VERY
NARROW
<3m [1]
C] C]
FENCED
PASTURE
[1]
Indicwe
predominant
lard
use(st
C]
C]
NONE
(5]
C]
C]
OPEN
PASTURE,
ROWCROP
(01
past
lOOm
HPeMOV
Riparian’
Comments
MerImurn
V
V
6] POOL/GUDE
AND
RIFFLE/RUN
QUALITY
MAX1MUM
DEPTH
cHANNEL
WiDTH
Check ONE
(ONLYtI
Check
ONE
(Or 24
average)
‘Ion [6]
C]POOL
WIDTH>
RIFFLE
WIDTH (2]
C]
OJ-alm
[4]
C]
POOL WIDTh
= RIFFLE
WIDTH
(1]
O
o4c0Tm
[2]
C]
POOL
WIDTH
<RIFFLE WIDTH
tOl
C]
L2-<0,4m
[1]
C]
< (Urn
[01
Comments
Pool!
VV
C;rrrant
12
thcltcate
for
ftirtctontd
riffles
Best
areas must
be
large
erIOUçIh
to
support
e
posuiatioc
.VVVV
VV
riV
V
of
riffle-obligate
species:
Gnec
ONE (Or
24 avamga).
.J
u.V V’S
u_
V
FLE
DEPTH
RUN
DEPTH
RiFFLE
I
RUN
SUBSTRATE
RIFFLE
RUN’
EidIBEUDECNEES
C]
ISESTAREAS>
10cm (2)
C]1PAXNfiVUM>
30cm
[2!
[3
STABLE
fe,g., Cobble,
Boulder)
[21
CHONE
[3]
cm 1
I
r
C
n
C]
OJ a’oi
o(’c
argcC
-‘ —]
LSI)
o
FF8”
-,S
. Sc
vJETAB8
.
o
F
a
Grade
,
C
U
t’.28F-’
2
-
1
F(
5l
11.
V
V
a’eu’ne;
%FOOLC)
%MUN:
(‘%PFi_E
(/er’:u.u;
V
V
V5
Cox2vtIen
‘/s
SILT
STABILITY
C]
NIGH
[3]
1OODERATE
[21
C]
LOW[1]
C/CrOCI
‘‘
irnoounded
(-1)•
CURRENT
VELOCITY
ChaNt
ALL lhat apply
C]
TORRENTIAL(4J.SLOW(i]
C]
VERY
FAST 11]
C] INTERSTITIAL
(-1]
C]
FAST
[1]
-
C]
INTERMITTEN’I’
[-21
[3
MODERATE
[1]
C] BODIES
1]
/rdc.atrs
for reach - pools
arid
riO/es.
Reoreetion
Potential
PHmwy
Contact
Secondary
Contact
sear
Ct,VVO
3)
GRADIEWT
f/mO
C]
VERY
LOiN
-
yf
[55)
;“
1
i.t
E
‘25:
ntpV
2
C
.2
Cr0)
[3
HiGH
-VERHtoli[10-O
Electronic Filing - Received, Clerk's Office, September 8, 2008
MEl
MODIFIED
Subsfiete
C ‘I
Max/room
20
2]
INSTREAM
COVER
indicate
presence ü to 3:
0Absent: 5-Vary small amounts or
if
more
common
of
marginal
AMOUNT
the 2
o a a
ma
- hr
oot
N gl
test qualil
or tn small a
stounte
at
hthe
r’
3 %*c
r
alt
‘nk a’
ear
t
arnnrnso-i
0.
,iteoo
nuluetstrdmeoor act aei
larac
tIc o a
eqe
dienAter lugthet
is stable,
well developed
routwed
in
deep/last watemor deep, weil-defirod, functional pools,
Q
EXTENSIVE 75%
[i’l]
UNDERCUT
BANKS (11
.,_ POOLS
> 70cm
[2]
—
OXBOWS, BACKWATERS [‘1]
(j
MODERATE
2575% [7]
OVERHANGING
VEGETAT1ON
[1]
ROOTWADS
(1]
—
AQUATIC
MACROPHYTES
pj
0
SPARSE
5-c25%
[3)
SHALLOWS (IN
SLOW
WATER) [1]
—
BOULDERS [‘I]
LOGS OR
WOODY
DEBRIS
[13
0
NEARLY
ABSENT ‘5% (13
—
ROOTMATS [1]
Cover
r
Comments
Maximum
3
In
2
3]
CHANNEL
MORPHOLOGY
Check
ONE
in
each category (Or 20 average)
SINUOSITY
DEVELOPMENT
CHANNELIZATION
O
HIGH
pu
0
EXCELLENT [‘7]
0
NONE
[6]
o
MODERATE
[3]
0
GOOD [53
0
RECOVERED
[43
O
LOW
[2]
0
FAIR
[34
0
RECOVERING rZj
,7’NONE [1)
POOR
[‘1]
0
RECENT OR
NO RECOVERY
[1]
Comments
or
4]
BANK
EROSION AND
RIPARIAN
ZONE
Check
ONE
in
each category for EACH BANK (Or
2perbank&auarage)
RNt
rattoeOnadr,wnsIrcm
RIPARIAN
WIDTH
FLOOD
PLAIN QUALIfY
r
EROSION
b 0
WIDE a SUm
4j
fl
C
FOREST,
SWAMP
1]
C
C
CONSERVATION
TILLAGE [1]
O 0
NONE
/ LITTLE [33
C] 0
MODERATE 104Dm
[3]
0
0
SHRUB
OR OLD FIELD [2]
0 0
URBAN OR
INDUSTRIAL [0)
O 0
MODERATE [2]
0 0
NARROW 54Dm (2]
0 0
RESIDENTIAL, PARK, NEW FIELD [1]
0 0 MINING
I
CONSTRUCTION [0]
O 0
HEAVY/SEVERE I1]
0
OVERT
NARROW
<Sm [13
0 0
FENCED PASTURE
[1]
0
0
NONE [0]
0 0
OPEN
PASTURE. ROWCROP [03
5]
POOL!
GLIDE
AND
RIFFLE!
RUN
QUALITY
MAXIMUM
DEPTH
CHANNEL
WIDTH
Check
ONE (OAILWt
Check ONE /0r2 & c’varaee3
5’
‘im [6)
0
POOL WIDTH> RIFFLE
WIDTH
[33
O
0,7-elm
4)
0
POOL
WIDTH
=
RIFFLE
WIDTH [1]
O
Ooi-’eOJm
23
0
POOL WIDTH <RIFFLE
WIDTH
101
O0,2r0,4m[l]
O
<
02m
[0]
Comments
Indicate
predom/nant
lend
useMJ
past
100mm;
miparian
Riper/en
Maximum
3 1
Pool!
Correni
2
mmdaxmmnm’rn
12
Indicate
for functional
riffles; Best
areas must
he large enough
to
support
a
oopuiation
-,
-
of riffleobligate
speCies
ChaNt ONE
(Or2
&
average).
OMO
eli-
roe
[metrrcr
RIFFLE
DEPTH
RUN DEPTH
RIFFLE
I RUN SUBSTRATE RIFFLE
I
RUN
EMSEDDEDNS
0
BEST
AREAS>
10cm
[23
0
MAXIMUM> 50cm
12]
0
STABLE
(eg,, Cobbia, Boulder)
123
0
NONE
[23
0
BEST AREAS [40cm
11;
OMAXIMUM
c 50cm
[1]
0
MOD,
STABLE
(mg,
Large Graves [1]
0
LOW [13
0
BEST AREAS
0
5cm
0
UNSTABLE a.g,. Flee
Gravel, Sand)
[‘13
0
MODERATE
[(13
‘‘C
(niatnc=u]
]
EXTENSIVE
t41 ,
‘]
(7)
Comments
‘nsaxmnxmnt-
9
GR/3PEIP
1
r
em
Li
sr
SW
ON
‘4
a
1
POOL
_,
%GL]DE
(j
Craumen
2PPNMCE
Et
[1063
%RUN
c3%RtFLE
cE
7
-Strewn &
LoCation:
OuaU7)ve
Habftat
Ewduation
index
jryj,jp
3mm’-
ifl
S
and Use Assessment R&d Sheet
t27)$7)
Jfflr
PA’
c24Dao
‘iJL2JOS
Full
Name &
Affiliation:
17)
L/tn,.kv&j7(’
%vei Coca
ORET4
aaR45sfLe —
— /8__
——
_°‘
:l-:i
ii
SUBSTRATE
Check
ONLY
Two substrato
rvpra
estmmnte
22
or
nato
every
type
present
Check ONE
(Or
2
&
average)
BEST TYPE
POOL RIFFLE
OTHER
TYPES
POOL RIFFLE
ORIGIN
QUALITY
0 0
SLDR
1SLABS
1103 ,. —
0 0
HARDPAN
14) —
—
0
LIMESTONE [13
[‘3
HEAVY
1-2)
00
BOULDER[93
—
0
ODETRITUSP3
OT1LLS[1]
QMODERATE(4]
00
COBBLE
[[I]
,
0
0
MUCK
[2]
[3
WETLANDS
10]
0
NORMAL
[0]
00
GRAVEL
(7]
_,
0
0
SILT
123
—
0
NAROPAN
10]
0
FREE
U)
00
SAND
[63
,
—
0
0
ARTIFICIAL
103 —
—
0
SANDSTONE
[0]
D’iWNSIVE
[-2]
0 0
BEDROCK [53
—
(Score nahiral
suhatmatas;
ignore
0
RIP/RA
[0]
0
MODERATE
[4]
NUMBER
OF
BEST TYPES:
i:i
4 or memo
[2]
sludge i-mn pnint-sotirces)
0
LACUSTRINE [0]
iij,0
NORMAL
[0]
a
Osorlesslo)
OSHALEI4I
QNONE[1]
,ommnnts
0
COAL. FINES
[-2]
STABILITY
0
HIGH
[3]
2
MODERATE [23
0
LOW
[1]
Comments
Channe/
Max/mown 3
205’-’-
iS
cURRENT
VELOCITY
Check ALL [hat apply
0
TORRENTIAL
[-1]
.2%LOW
11]
0
VERY FAST
[13
0 [NTERSTITIAL
[-13
0
FAST
[1]
0
INTERMITTENT
[-2]
0
MODERATE
(1]
0 EDDIES
[I]
Md/cats
for
reaah - poo/s and
muffles
fRecreation
Potentia!]
Priniauy Contact
1 Secondary
Contact
s”tac Cacti;
P
A
[a
CPA 1520
1
-a
-‘-“a-
‘--‘/:atOC-
a
ar.
Electronic Filing - Received, Clerk's Office, September 8, 2008
MEl MODIFIED
OuMitaVve
Habftat Evauatgon !flciS)t’
...
r,rcttrff5w4#r#tflW’fl.
a
IIhSJ&IL
rid
‘—n
Use
Assessment
.,. ,,,,t,tfl$
Flalid
t1 C$n,tW
Shesi
,ztvt’rn’nn”t/’t”t’
‘2
Stteam&Loa
ion
__
Fri
1
JL
r
rrj
Scorers Full
Name &
Affiliation:
AY
- ,.
-:
River Code:
STOREI’#:
Let/Long.;
/3
——w—
1] SUBSTRATE
Check ONLYTwo
subsirafe
TYPE
BOXES;
estimate
U or
OOiC every type
present
Check
ONE
(Or
2
Leverrrr,gei
BEST
TYPES
POOL RIFFLE
OTHER
TYPES
POOL
RIFFLE
QRIGIN
QUAfl
DO
BLDR?SLABS[1OJ,__,_
___
DL]HARDPANI41 —
—
DLIMESTONE[IJ
E]HEAVY[-21
0 0
BOULDER 191
,,__.
,,,,__,
r
Q
DETRItUS 13)
0
TILLS [‘1
1
Fj
MODERATE
(-1]
Svhsfrato
o 0
COBBLE
(
___ 0
0
MUCK
12)
—
——
0
WETLANDS
[01
iJ
I
o
NORMAL
(0)
00
GRAVEL]?]
—_
.,,,_._. 0051LT[2]
—
—
OHARDPAN[0]
OFREEII]
00
SAND [9)
—
[9
flAç139f4[9J ——
—
OSANIJSIONE
[01
DEX1ENSPC
12]
/
o o
BEDROCK
151
__ —
(5r
nit
ml Lain e
nre
0
RIP1PAP [0]
00
q,t
44
Li
eIODE’AfE
[I
NUMBER
OF
BEST
TYPES:
0
4
or more
[21
sludge from point-sources)
0
LACUSTRINE
101
j
‘rQ
NORMAL [0]
20
C
— —D
Sorless[D]
USHALE[-1]
DNONE[’I]
Omnleths
0
COAL FINES [-2]
2
IN-STREAM
COVER
Irritate
presence
U
to
3:
0-Absent;
i-Very
small emounis or if more common
of marginal
AMOUNT
qnl t 2
r0oacrL
ira,
bat o o
htgnesl
qaolrlv ur
‘,mal’ a
ajnt, of
i
Ore
trunlity;
3-N;ghest quelay
in moderate
or
greater
amounts
(e.g.,
very
large boulders
in
deep
or
fast
water, large
.1C,.r,
r.
r
‘<
‘
diemeter
log that
is
stable,
well
developed
rootwad
in deep’
last water, or
deep.
well-defined, furroliorial
pools.
Q
EXTENSIVE
>75%
[‘ii]
,.,__, UNDERCUT BANKS Ti]
,._ POOLS>
70cm [2] —
OXBOWS, BACKWAtERS
[1]
0
MODERATE
2575%
(7)
OVERHANGING
VEGETATtOIrF[iJ
ROOTWADS
[11
—
AQUATIC
MACROPHYTES [1]
Q
SPARSE 5-c29%
P
SHALLOWS [IN
SLOW
WATER) [1]
——
BOULDERS
[i]
LOGS
OR
WOODY DEBRIS [‘I]
0
NEARLY
ABSENT
<5%
(iJ
ROOTMATS [I]
Cover,
Comments
i,rarrrnu;n,.
2Cr
-
3]
CHANNEL
MORPHOLOGY
Check ONE in oech
category (Or
2 &
average)
SINUOSITY
DEVELOPMENT
CHANNELIZATION
STABILITY
0
HIGH
14]
0
EXCELLENT [7]
0
NONE
(6]
0
111014
[3]
0
MODERATE
[31
0
GOOD [5]
0
RECOVERED
14]
MODERATE [2]
0
LOW[2]
0
FAIR
[3]
0
RECOVERING
13]
0
LOW[1]
NONE
[1]
ZPOOR
[1]
0
RECENTORNORECOVERY[1]
CIrrrnne,t:
Comments
‘Uoyrrrum
4] BANK EROSION
AND
RIPARIAN
ZONE
Check ONE in each
cetegoryfor EACH BA MR (Or
2
perhenIr &
average)
Sivcrñgla twdnq
4owIrGw
, RIPARIAN
WIDTH
,.
FLOOD PLAIN
QUALITY
-,
EROSION
ii
b
WIDE>
5Dm
[41
O D
FOREST, SWAMP
[3]
C
CONSERVATION TILLAGE
[1]
o 0
NONE I LITTLE [3]
0 0
MODERATE ‘tD-SOm
[31
0
0
SHRUB
OR OLD FIELD
12]
0
0 URBAN OR
INDUSTRlAL [U)
0 0
MODERATE
12]
Q [3
NARROW
5-lOm [2]
0 0
RESIDEN:TiAL,
PARK, NEW
FIELD [1]
0
0
MINING
I
CONSTRUCTION [0J
0 0
HEAVY ‘SEVERE
[1]
Q
0
VERY NARROW
<Sm
[‘1)
0 0 FENCED
PASTURE [1]
popege
predominanl
Iandrraefs)
0
0
NONE [0]
0 [3
OPEN
PASTURE,
ROWCROP
[0]
nasi
1000?
ripso’an.
Rfparien
,,, :2
Comments
tUax/muur
,
H
10
5]
POOL/GLIDE
AND
RIFFLE/RUN
QUALITY
.
.,
MAXIMUM
DEPTH
CHANNEL
WIDTH
CURRENT VELOCITY
.rRecroation
Potea(:
Check
ONE
(ONLY’)
Check ONE
(Or
2
& avereg’e)
Check
ALL
that
apply
Primary
Contact
> im [6)
0
POOL WIDTH> RIFFLE WIDTh
(2J
0
TORRENTIAL [-I]
9SLOW
[i]
1
Secondary
Contact’
O
0.7—rIm
14)
C,
POOL WIDTH = RIFFLE
WIDTH [1]
0
VERY FAST [1]
0
INTERSTITIAL
UI]
(rie:teerar.rrdrrrrg4wrrmrrlrrai;)
0
0A’0.7m [2]
0
POOL
WIDTH
‘r
RIFFLE WIDTH
101
0 FAST
[1]
0
INTERMITTENT
[-2]
r’rr’
0
U2-<0,4m[l]
,,,- ,-————--—i
0
MODERATE
[I]
0
EDDIES
Ii]
PooIiy>’
[‘3
0 2rn
ID
4r
rlmpoundo’I
[
l]
ThJ1
an re
,clr
p0cc a sdrrfflss
Cu’r”rr
Comraents
Indicate for
functional
riffles; Best
areas must
be large enough to support a population
‘n
of
riffleobIigate
species;
Check
ONE (0r2&
average).
L,J’<-’ “ -
alErLE
DEflh
!.N
DEPTh
RIrFLE
I RJN 3UBSIRITE
qc3J
Ruir 31
tBEDDEi
$055
0
SEAT AREAS
a
10cm [2)
0
MAXiMUM>
MIcro
[2]
0
STABLE
(ag,, Cobble. Boulder)
121
0
1-tONE
[21
1
JJEcCA-tEA’a
lOcn
I
fir”
tn’,
Sb t
t I
C]lJiOU
SU—FLF(Pg
Larg’G’vei)ie]
f’oe’ I
—
‘—
-
r—
—
-,
_,,,.
Lii
BEST
AREAS
[mccnotw,
< arm
J
rn-JoTrBut
tamp
Pine
Graver. Eandr
Ens
Lr
[3
k1ODr,PO
EXTENSIVE
c
(-‘1)U’)
‘
.
4:,H:r
‘
-‘U
-
Comments
.
nwr-n,/n -- -
a’?
f”?an$teflr
‘..-
(—“‘N
(N
-,.‘- -
4
la-cn,,.,n
(
rim t
_
tICK’
LOW
I
LW Or
c
3CPOOL
ç,
itrOc
,L’5!
I
,r
N-
no
ORAtHI
3
L
njc,5,
3
lOOEctAittS
Jr
.tZtri”
““<
r
U
HIGH[IO
%PUN(J/eThF0EE(j,
2PA452U
Electronic Filing - Received, Clerk's Office, September 8, 2008
MEl
MODIFIED
Quahtathre
Habftat
Evaketon
ndex
ac
Use
Assessment
F’eW
Sheet
RM:
2Y
D&t
/
/oI
08
Full
Nerne
Affilietiori:
1t
-
‘W
C
>STP
1
-
’
Check
LYTwubeirste
TYPE
BOXES:
—
estm&e
or
0010 every type
preseni
Check
ONE
(Qi
2 & vorag&)
POOL
RIFFLE
OTHER
TYPES
OOI
RIFFLE
OR1GN
QUA
C
C
SLOR
(SLABS
IIOL_
C Q
HAROPAN
14]
0
LIMESTONE
[1]
Q
HEAVY
[S-2]
C]
C]
BOULDER
19]
_. [J
C]
DETRITUS
[3]
*
—
[]TILLS
1
1LT
MODRATE
[1]
C]
C
COBBLE
[5]
—
—
C C
MUCK [2]
—
C]
WETLANDS
10]
“
C
NORMAL
[0]
CC
C
DsIiT[2
DHARDPAN[O]
DFREErIJ
C] C
SAND
[B)
_
C
C
ARTIF!CIAL [0]
0
SANDSTONE
fO]
L]
EXTENSIVE [2J
L
EEDROCK [51
*
&o
no
10 Cu trts
9norc
C]
RIP/RAP
[01
DEØ
4
]
MODRATE
[
NuMBER
OF
BEST
fl’
F
4
or
mraf2]
ekago
fm pont soJrccs)
C
LACUSTRINE
i1
C
NORMAL
(0]
Comments
C
COAL FINES
[2]
INS
7RFAILq
ndicrLe
presence-
0 to 3:
0-Absent;
1-Vely
small
venounts
or
if
more
common
of marginal
AMOUNT
I
2
s
ode
a%
Co
nts ho rio of hiqust
ouotij
or
ii
small
ou
oou Iso
tI
3
dei
‘
rm’i
I
fe
g very krge
h(
ilr%rs
ri
deep
or at
C
iSSS1
O±
‘0
i
i
duerneter
toil
that
is statue
web developed
rootwad
in deep / fast
water,
or
deep,
welk{ef]ned,
functional
pools.
C]
EXTENSIVE
>75%
(11]
UNDERCUT
BANKS
[1]
—
POOLS
> 70cm
[2]
—
OXBOWS,
BACKWATERS
[13
C
MODERATE
2B75% (73
*
OVERHANGING
VEGETATION
[1]
*
ROOTWADS
[I]
AQUATIC
MACROPHYTES
(1]
C]
SPARSE
5<25% [3]
** SHALLOWS
(IN
SLOW
WATER)
[1]
—
BOULDERS
[1]
—
LOGS OR
WOODY DEBRIS
[‘
C]
NEARLY
ABSENT
<5% [1]
—
ROOTMATS
(I)
Comments
2O
I I
33
CHANNEL
MORPHOLOGY
Check ONE in
each
category
(Or
2
&
suwrsqe)
s]NuosvrY
DEVELOPMENT
CHANNEUZATION
O
H1GH [4]
C
EXCELLENT [7]
C
NONE [6]
C
MODERATE
[3]
C
GOOD
[51
C
RECOVERED
t41
C
LOW
[2]
C]
FAIR
[3]
C]
RECOVERING
[3]
5IONE
[I]
,P0OR [1]
C]
RECENT
OR NO
RECOVERY
[I)
Comments
C
ImPOUnded3-1]1
41
BANI(
EROSION
AND
RIPARIAN
ZONE
Check ONE in each
category
for EACH
SANK(Or 2perbank
& ar’e,vi9o)
RIPARIAN
WIDTH
FLOOD
PLAIN QUALiTY
EROSION
Q
Q
WIDE>
SUm
143
C
D
FOREST
SWAMP [33
0 Ci CONSERVATION
TILLAGE
[1]
C] C
NONE
I
LITTLE
[31
C] C]
MODERATE
10-SUm
[23
C
C
SHRUB
OR
OLD
FIELD
23
fl
C URBAN
OR
INDUSTRIAL
[03
C U
MODERATE
(2]
Ci C
NARROW
54Cm
[2]
C
C
RESIDENTIAL,
PARK, MEW
FIELD [1]
C
C
MINING!
CONSTRUCTION
[U]
C] C
HEAVY!
SEVERE
[13
C] C]
VERY
NARROW
< Sm [I]
C
Li
FENCED
PASTURE
LI]
C
C
NONE
LOI
C
0
OPEN
PASTURE,
ROWCROP
[0]
5] POOL / GLIDE
AND
RIFFLE
/
RUN
QUALITY
AXIMUM
DEPTH
CHANNEL
WIDTH
Chack ONE
(ONlY!)
Chock
ONE
(Or
2
&
overade)
110
161
C
POOL
WIDTH>
RIFFLE
WIDTH
[2]
[C]
07<Im
Pt]
C
POOL
WIDTH RIFFLE
WIDTH
LI]
C
0.4-Oi7rn
[2]
C
POOL
W1DTH <RIFFLE
WIDTH
[0]
C
0,2-e0Am
[1]
Ce
0.2m
[0]
Comments
indicCte p,edomlnar.t
(arid
use/el
post
1
001P
nPaflafl.
R!parian
r
Max/mt
‘
--
Pool!
Current
Max;murk
4
-
Indicate
for
functiorta]
riffies
Best areas
must
be
large
enough
to
sUpport
e
oopu]atkn
,
of
riffie-abiigate
species:
Check ONE (Or
2
5
average).
—
“-‘ ‘ -
RIFFLE
DEPTH
RUN
DEPTH
RIFFLE
/RUN
SUBSTRATE
RIFFLE
I
RUN-
EMBEDDEONESS
C]
BESTAREAS>
10cm
[2]
C
MAXIMUM a 60cm.
[2]
C
STAELE(e,g.,
Cobble,
Boulder)
[21
C
DONE
[2]
C]
ss PEAS
5
t’
I
Lii
‘-‘-
Ii i
C]
MOD
STIt
BLE
Ia
Laiga
Gra,eI, [i]
U
JW
tj
24S1
AREA-Se
Scm
E]UNSTAISlY
(erj,
D’io Grrezei,
Sand)
(01
C
IIIODERATE
MI
-
C
EXTENSIVE
iii
- ‘Ufl
S
iWsOieLiis1s
-
-
‘ t’’-’”
-‘‘‘“
“‘‘‘“
- -
- -
“ J
VEI’(_DV
LJ2.
4
0
OOL
)
%Gi”
y’
‘u
‘l
r
DZE’tAtE5-0i
-‘S
-
]HCVEPP2HI0
%UN(_J%P-L_j
Stream
&
Lecetiori:
Subs/raM
P-Iaxnuwm
20
STABILITY
C]
HIGH
[3]
MODERATE
[2]
C
LOW[II
CharinI
Mxerium
204
s
-
1E’
CURRENT
VELOCITY
Check
ALL that apply
C
TORRENTIAL
[I] 21’SLOW
[13
C] VERY
FAST
[I]
C
INTERSTITIAL
t—i]
O FAST
[1]
C]
INTERMITTENT
[-21
C
MODERATE
LI]
C
EDDIES
[I]
Indicate
for
reach
— pools
and
diScs.
j
Recreattort
PotentIal
Primary
Contact
Secondavy
Contactt
-
.S
Electronic Filing - Received, Clerk's Office, September 8, 2008
ME3I
MODIFIEL)
t4uaiftati?a Habitat
vaiuation
Index
and
Use Assessment
Reid Sheet
-
RM:22jD8re:OHif IDE
Full Name & Affiliation:
H
Vrr.<4_
RiCode
SO°E
‘1] SUBSTRATE
ChaNt
ONLYTw0
substrate
TYPESOXES;
-
a—V
)(tOt
r1
t
ChctkO
rtflt2”
‘rjel
BEST TYPE
POOL
RIFFLE
OTHER
TYPES
POOL
RIFFLE
ORIGIN
QUALITY
o
0
BLOR
(SLABS
[101
, [3
OHAROPAN
N]
—
OLIMESTONE
[1]
[3HEAVY 1-21
00
EOULOER(91
,
0
ODETRIFUS[3] —
DTILLS[i]
st
[JMODERATEVI]
00
COBBLE[5}
—
0
0MUCK[21
—
OWETLANDS[0
ON0RMAL[0]
00
GFzAVEL[7]
,.
0
DSILTI2]
-—
DNARDPAN[C]
DFREEtQ,,
00
SAND [5]
—
—
0
0
ARTIFICIAL
[DJ_
0
SANDSTONE [0]
0
EXTENSIVE
[-2]
O
0
BEDROCK 5]
—
,_
(Score
natural substrates; nears
DRIP/RAP
[0]
t00
U
MODERATE
Ml
NUMBER OF
BEST
TYPES:
C]
4 or more
[2]
stitdae from point’soJLes
0
LACUSTRINE [0J
!JD
NORMAL
[5]
- “D
Sorlass[5i
DSKALE[-’I]
DNONE[]
,,Ommonts
-
0 COAL
FINES
[-2]
21 INS
TREAM COVER
inchoate presence U to 3:
0-Absent;
I-Very small amounts
or if atore common
of marginal
AMOUNT
oltt
2
t,{1_.,
r. io
t
tutto
o
hghestgrlicornnaIlenout (so
ttqr’rct
—‘
quality;
3—Hgtteet quality
n
moderete or
greeter
amounts
(eg.. very
large boulders to deep
or
fast water
large
“°‘‘
“
‘
diameter
log
that-s stable.
well
developed rootwed
in
beep
/
fast
water
or
deep.
wet-defined,
funafonat
pools,
Q
EXTENSIVE
>i5%
[II]
UNDERCUT
BANKS
[‘F]
—
POOLS
70cm [2] —
OXBOWS, BACKWATERS
tI]
C]
MODERATE
25’75%
[7]
OVERHNflNC
VFGL-TATION
1]
—
°OOTWADS
—
AQUATIC
MACROPHYTES
l]
Q
SPARSE 5— 25%
[1]
—
SHALLOWS (IN
SLOW
WATER) [V
BOULDERS
[I]
—
LOGS OP
WOODY
OEBPIS
rt
LI
ARLY
P
BSEt’fl
‘“
N
ROOTM-ATS [1]
Covar
Com,nents
Mosftouor ‘/
4”
3
Cl-I At4NEL
MORPHOLOGY
Check
ONE in
cacti caterer-v (OrE
S average)
SINUOSITY
DEVELOPMENT
CHANNEUZATION
U
HIGH
[4]
0
EXCELLENT
[7]
0
NONE [6]
o
MODERATE [3[
(3
GOOD [5]
0
RECOVERED [4]
o
LOW
[2]
0
FAIR (3]
0
RECOVERING
[3]
2”N-ONE
[1]
WPOOR
[13
0
RECENT OR
NO
RECOVERY
[1]
Comments
Impouncjec’t[l
41 BANK
EROSION
AND
RIPARIAN
ZONE
Chsck ONE in each categoryfor EACH SANK(Or2pareaok &
average)
Rt’rr,r
r{ahttoaktna
downrarr’
r
RIPARIAN
WIDTH
. r
FLOOD PLAIN
QUALITY
EROSION
h
b
WTDE> mm
[5]
b
FOREST SWAMP [3]
0 O
CONSERVATION
TILLAGE
[I]
O [3
NONE
/
LiTTLE
(3]
(3C]
MODERATE 10-50m
[3
0
0
SHRUB OR OLD FIELD (2]
0 0 URBAN
OR
INDUSTRIAL 30]
U
0
MODERATE
[2]
0
[3
NARROW B-SUm
[2]
0
0
RESIDENTIAL, PARK, NEW FIELD
[‘1]
(3
0
MINING!
CONSTRUCTION
C]
CI
HEAVY I
SEVERE [13
(30
VERY NARROW
< Sm [1]
0
0 FENCED PASTURE
[1]
Indicate
ptedorn/nanr
(and use(sj
0 0
NONE [03
0
0
OPEN PASTURE, ROWCROP
[03
pest
/Oottt
r/parfan,
R!peflret ‘
Comments
Maximum
10
5]
POOL/GL1DEAND
RIFFLE/RUN
QUALITY
.
WXM.UM
DEPTH
CHANNEL
WiDTH
CURRENT
VELOCITY
:rteOn
Potent’alI
Check ONE
(0/At.
Yt)
Clack ONE (OrE
&
averaget
Chack ALL that appI
Primary
Contact
,j5S-
Im [6]
0
POOL WIDTH>
RIFFLEWIDTH[21
0
TORRENTIALt-l] MSLOWi1]
Secondary
Contact]
[30
7—tim
4t
C]
POOL W’DTl’9 — R]FFLE
WiDTH (II
0
VERY
FAST
[II
0
INTFPcTmAI
[-1
4 or
rc’mn
0, ‘, 5’
0
0,4-eB7m
16]
OPOOL
WIDTH
C
RIFFLE WIDTH
[0]
0 FAST
[‘1]
0
INTERMITTENT
[-2]
H’’””’”9
0
0.2-cO,4m[1]
---
‘,
r—-
0
MODERATE [1]
0 EDDIES
[1]
Poo!/
(3<
02m [(P3
y’;Impounoed-1j
/nr//cata
for
raacl, -port/s and dfliaa,
Current)
Comments
/viaxittrm
Indicate
for functional
riffles; Best areas must
be large enough to support a
popu]atiott
‘fl
RIt
Ft
F
f’
of
riffle-obligate
species:
ChaekONE(0r2 Saver-age].
,j
.
-—
RIFFLE DEPTH
RUN_DEPTH
RIFFLE! RUN
SUBSTRATE RIFFLE!
RUN
EMBEDDEONESS
C]
BEST AREAS>
10cm [2]
[3MAXIMUM> 50cm [2
0
STABLE
(am,
Cobble, Boulder] 2]
0
NONE [2]
O
BESTAREAS
5-10cm
U]
0
MAXN,IUM
<S0cni
ti]
DM00. STABLE
(ag
Large Gravel)-
[1]
0
LO4V
II]
0
BEST AREAS
<
Scm
CONSTABLE
tag
Fins
GraveL
Sand) (0]
0
MODERATE [03
Ruve,,’
Co-nznientS
[nretnavo]
0
EXTENSIVE
1-1]
‘
,ncnn:
- ,_
“3’
or
e°no-J’nvcrut.
.
,r
,e”
4
— r
Th0’
[31
€r, ttLd
uOtt(
4 Sf
%°OOL
k
--
%EN,,N2E
1
r—
,
OMCOERATE[5
3]
“rrç
c
_ot
[3
HIGH nESt Att3H[l06
C/eRUN
t)%RIFFL
()
-—
/r’
,(
Yr
“t
Otii:H..
Stream
&
Location:
4’,
‘,1
-
fr
r’V
1’-’:
Or
—
r-
‘01.
‘,r
f’.
to
QHEI
SCOre:
Substrate
Ma,rrrorumtt
STABILITY
I]t’IIGH
[3]
a”MODERATE
[2]
O
LOW[1]
Cttsnns4/’
Mexirn tar,
EPA
‘LS1A)
Electronic Filing - Received, Clerk's Office, September 8, 2008
MBI
MODIFIED
Qualitative Habitat
Evaluation Index
sw :ai.
and Use
Assessment Field
Sheet
Stream
&
Location:
ts
f’L
ius
J’
-
%.
q4
ptJi
x Jcbxn
Ciek
RN:
;
;q3eate:
611
108
River Code:
-
STORET
5:
FullLoLl
Name
Long:
S
Afr7llatlon1&
18
1a±,
Office
voriri
—
ii
SUBSTRATE
Check
ONLY Two
substrete TYPE
BOXES;
—
eetunabr
% or nole
Every
type
present
Check ONe. (Or
2 &
evenigv)
BEST TYPES
POOL
RIFFLE
OTHER
TYPES
POOL RIFFLE
ORIGIN
qUAUTY
ED
ED
BLDR ?SLABS
[l0]_,.
[]Q
HARDPAN
[4]
— —
0
LIMESTONE
[I]
ED
HEAVY
[-2]
EDED
BOULDER
[I)]
——
ED [3
DETRITUS
[3] —
—
[3TILLS
11]
9
T
MODERATE
[-13
EDO
COBBLE
[3]
—
ED
ED
MUCK [2]
—
—
[3
WETLANDS [0]
ED
NORMAL
[0]
EDO
GRAVEL[7]
—
ODSILTIZ]
——
DHARDPAN[0]
OFREE[1)
EDO
SAND
[6]
—
—
0
0
ARTIFICIAL
LC]_
—
0
SANDSTONE
[UI
0EXTEJS1V&I-2]
00
BEDROCK
(5]
—
(Score
natural substrates; ignore
U
RIPIRAP [0]
900%.
U
MODERAtE
[.11
NUMBER OF BEST
TYPES:
0
4 or more
[23
sludge
from point-sourcee)
GLACUSTRINE
10]
tD NORMAL
1]
or
lees
[0]
OSHALE&1I
ED
NONE
[1]
omments
[3COAL
FINES
[-2]
23 INS TREAM COVER
quality;
Indicate
2-Moderate
presence Gb
amounts,
3: 0-Absent;
but
not
1-Very
or
highest
smallquality
amounts
or
in
or
sn-all
C more
amounts
common
of
of
highest
marginal
-
AMOUNT
quality;
3—Highest
quality
in
moderate
or greeter
amounts
(e.g,,
very
large boulders
in deep or
Vest
wetet;
large
Checs
jN,_ ;c
. < uvereae
rhacieter
lug
that
5
sleble. well
developed
motwad
in ceep / fast
watec or
deep, welt-defined.
functional
pools.
[3
EXTENSIVE >75%
[Ii]
UNDERCUT
BANKS
[1]
—
POOLS>
70cm
[2.] —
OXBOWS, BACKWATERS
[1]
[3
MOOERATE
2545%
(7]
,
OVERHANGING
VEGETATION
(1]
—
ROOTWADS
[1]
—
AQUATIC
MACRDPI-IVTES
[1]
[3
SPARSE S-c25%
[3]
SHALLOWS (IN
SLOW
WATER]
[1]
BOULDERS
[1]
LOGS OR
WOODY DEBRIS [13
[3
NEARLY
ABSENT <5% (1]
ROOTMATS (1]
Cover
t’
COITUNOnIS
Max/mum
202,
31
CHANNEL
MORPHOLOGY
Check
ONE in
each
category
(Or
2 S
average)
SINUOSITY
DEVELOPMENT
CHANNEUZATION
STABILITY
C
HIGH
13
0
EXCELLENT
[7]
[3
NONE
16]
[3
HIGH [3]
ED
MODERATE
[3)
0
GOOD [5]
0
RECOVERED [4]
‘ MODERATE
[2]
ED LOW [2]
0
FAIR [3]
0
RECOVERING
[3]
U
LOW [1]
J2’NONE [1]
<PDOR [1]
a
RECENT OR NO
RECOVERY [1]
Ohannef,.
Comments
p jTuT-i’fl
Meramu;g
4]
SANk
EROSION
AND
RIPARIAN
ZONE
Check
ONE in each
ceteaory for EACH BANK(Or2
per hank &
everage)
Recr
riie
tecidne
diiwnora>n
, RIPARIAN
WIDTH
FLOOD
PLAIN
QUALITY
r<
EROSION
C
b
WIDE> SUm
[4]
O
ti
FOREST,
SWAMP
[3]
U
CONSERVATION
TILLAGE
[1]
ED ED
NONE!
LITTLE
(3]
ED ED
MODERATE
10-liDre
[31
ED
ED
SHRUB
OR
OLD FIELD
12]
ED ED
URBAN
OR
liNDUSTRIAL
10]
ED ED
MODERATE.
[2]
ED ED
NARROW
5-lOm
[2]
ED U
RESIDENTIAL, PARK, NEW
FIELD [1]
0 0 MINING
I
CONSTRUCTlON
[tt]
ED
ED
HEAVY I
SEVERE
11]
ED
EDVERY
NARROW
< Sm [1]
ED
0
FENCED PASTURE
[1]
ED 1]
NONE [0]
0 0
OPEN PASTURE,
ROWCROP
[01
5] POOL!
GLIDE AND
RIFFLE!
RUN
QUALITY
MAXIMUM
DEPTH
CHANNEL
WIDTH
CURRENT VELOCITY
Check
ONE
(ONLYI
Check ONE
(Or 2
& averoge)
Check ALL that apoly
e
Im
163
0
POOL
WIDTH> RIFFLE
WIDTh
19
ED
TORRENTIAL
-1]Z%LOW
[1]
ED
(t,7-cim
14]
ED
POOL
WIDTH> RIFFLE
WIDTH
[1]
0
VERY FAST
[1]
0
INTERSTITIAL [-i]
ED
&4.-cG.Tm
[2]
ED
POOL
WIDTH < RIFFLE
WIDTH
[0]
ED FAST
[1]
1]
INTERMITTENT
[-2]
ED
02-’cOAm
[1]
.<—--
—-—-
ED
MODERATE
[1]
U
EOD1ES
[1]
ED
< &2m [0]
J)
t!9RE]I]5!5
[1]J
Ind/cate’
for
reach -pools
and riffles.
Comments
ind/cerepredom/nanl
tend use(sJ
,‘-<
pest
lOOm rfoerten.
Riper/ee
Maximunr
to
3ndicate
for
fUnCtiortal riffles;
Best areas
must
be
large
enough
to support a population
iqc
1
-ptcc
‘z -
of
riffle-obligate
species;
Check
ONE (Or
2 &
average),
ED
‘—
[:nr
.—y
RIFFLE
DEPTH
!
DEfTh
RIFFLE
I RUN SUBSTRATE
RIFFLE
I
RUN
EMBEDDEDNESS
ED
BEST
AREAS>bOcm
123 ED
MAXIMUM
> 50cm
[21
ED
STABLE
(e.g., Cobble, Soulder)
[9
ONONE
[2]
ED
BEST AREAS 5-10cm
(1]
EDMAXtMUM
<50cm
[1]
0
MOD. STABLE
(e.g.,
Large Gravel)
[1]
ED
LOTS [1]
it
SETT
?PEA
S Scm
0
bHSV BcE
Ia
ç
Cp
Dm
at
cor
1
n11
9
M0OERCTr
ci
c-omments
[niotnco
ED
EXTENSIVE
[-‘I)
,w,o,,L,,.,,
rc,l’,
,,,
‘,:.
- .
,
,,
-
.
r””Th
:‘
‘u
Li’u
..J
—‘‘
,_,,,j1irnq
tJ
dwrx’r
LOW
- LOg)
[24]
%POOL:t
i
%GLt.DE;t
)
Grad/rot.’
DRAINAGE
AREA
ED
MODEFIATE(5-10]
. Srni
t
,ee.’e<
tji,9)4m,io
mtt)
ED
H]GH-VERYHIGH[10-S]
%RUN;
(‘%RIFF1E:(’)
.x,>t.’’a’
n>’, ‘—“‘
n”,=”=,”>=n>,
QHEI
Score:
t
4
,6;
Substrate
/i/exin21irl
20
Comments
otentia[
Primary Contact
Pool? ‘
Current
i
7
Max/mont
EPA
4623
5ijjiiJ9,
Electronic Filing - Received, Clerk's Office, September 8, 2008
MDI MODIFIED
Wfl..fløflt
fn,g4
a
a
aa.i
a
-
._a--
ana
UBUtBJVe
Use Assessment
Habftat
-rn,c=v4senn
Eva
fleW
fluaton
.
Sheet
ndex
(Jh5
acorn
BOcarr
&
Lur
aNon
s
yg
oDe’s
Qjf/r,
3
Scorers
Full Name & Affiliation:
Jc
t/nJ-6
Cr:c.r.’
River
Code;
STORETS:
LatiLong:
is
OeoevedflerC-
— —
—
Jb6Pr ‘VQM2Jr
CC
tO —
P
SUBSTRATE
Coed.
Of4LYTwo
aubstrete
TYPE
BOXES;
estrnnrts <2
or
note every type pretrent
Chedc
ONE
(Or
2
&
average)
BEST TYPES
POOL
RIFFLE
OTHER TYPES
POOL RIFFLE
ORIGIN
QUALITY
DLI
BLOR /SLABS
[10].
LI
Q
HAROPAN
14]
—
—
ID
LIMESTONE (I]
LINEA’1([’.23
DLI
SOULDER(9]
—
LI
LIDETRITUS[3]
—
-—
LITILLStI]
q
LIMODERATEVII
LID
COBBLER]
LI
LIMUCK(2]
—
LIWETLANDS(O]
S
-
LINORMAL(0]
DLI
GVELP3
LI
LISILT(21
—
—
LIKAROPANfOI
LIFREEII)
LID
SAND
(6]
—
LI LI
ARTIFICIAL
[0]
—
LI
SANDSTONE
(0]
ETE5C?EIISWE
(-2]
LI
LI
BEDROCK [5]
(Score natural substrates;
ignore
LI
RIP/RAP (0]
@DE0A
LI
MODERATE
Vt]
NUMBER
OF BEST
TYPES:
LI
4
or
more
[2]
sludge Fern
point-sources)
LI
LACUSTRINE
(IL]
g
0
NORMAL
(0]
3 or tess
(0]
LI
SHALE [-I]
LI
NONE
(I]
mrnenta
LI
COAL
FINES [-2]
54
no
t)
I’D
Substrate
20
21
iNS
TREAIW
COVER
quality;lrrdtoete
2—Moderate
presence
0
to
amounts,
3;
0-Absent;
hut not
I-Very
of hrghest
small
ouetitv
amounts
or to
or
smell
F more
enounts
cornnron
ofofhighest
marginal
AMOUNT
1
V
-
sY
x
I—
L
c K a noun re
n ernh
pa
‘nuluar
si
dep
or
a
Icr here
Coo K
0kV nc’
&
<-to
I
diarneterloçj’thati
soda.
welt
developed
rootwad
in dsep
/ lest
water: or
deep.
welt-defined, functional
poc1s.
EXTENSIVE
>75%
[11]
—
UNDERCUT
BANKS
(1]
__.
POOLS
>70cm (2]
—
OXSOIN&
BACKWATERS (1]
J
MODERATE
2545%
(7]
OVERHANGING
VEGETATION
(1]
—
ROOTWADS
(I]
-—
AQUATIC MACROPHYTES
(1]
[J
SPARSE
5-<25% (3]
SHALLOWS (IN
SLOW
WATER) (I]
BOULDERS
(I]
—
LOGS OR WOODY DEBRIS
(1]
NEARLY
ASSENT
c5%
(I]
ROOTMATS
[Il
Cover
Comments
Msidrnunr
20’D
I
/
STABILITY
LI’14IGH
(3]
LI
MODERATE
(2]
LOW[1]
3] CHANNEL
MORPHOLOGY
CtwoL ONE
in
each
category (Or 2 & overega]
SINUOSITY
DEVELOPMENT
CHANNELIZATION
LI
HIGH [4]
LI
EXCELLENT
(7]
LI
NONE
(6]
LI
MODERATE [3]
LI
GOOD
(5]
LI
RECOVERED
(4]
LI
LOW (2]
LI
FAiR
(3]
LI
RECOVERING
(3]
$‘NONE
(1]
rPOOR
(I]
LI
RECENT OR
NO RECOVERY (1]
Comments
r
Flmctre&d7iT
Cttennei.;
“tox4nrtrn
‘I
;:‘dr’
43
BAN C
EROSION
AND
PIPARIAPI
ZONE
Chv
v ONE
s oa<k
cetecoi.t<
for EACrf SANK
(Or ope
Let-its swegci
Rrrrrkrt<t rrnkint
sownrtrrafl,
.,
RIPARIAN WIDTH
. t-
FLOOD
PLAIN
QUALITY
EROSION
LI
D
WIDE> SOn,
LI O
FOREST, SWAMP (3]
LI LI CONSERVATION
T1LLAGE [I]
LI
LI
NONE’
LITTLE (3’]
LI LI
MODERATE
10-mm (3]
LI
LI
SHRUB
OR OLD FIELD (2]
LI
LI URBAN
OR
INDUSTRIAL
(0]
LI LI
MODERATE [2]
LI LI
NARROW
5-lOre (2]
LI LI
RESIDENTIAL, PARK, NEW FIELD
(1]
LI
LI
MINING!
CONSTRUCTION
(0]
LI LI
HEAVY! SEVERE
(1]
LI
LI
VERY NARROW
<Sm (1]
LI
LI
FENCED
PASTURE
(1]
Indicate
predominant
lend
use(s)
LI LI
NONE (0]
LI
LI
OPEN
PASTURE, ROWCRQP
[0]
pest
iQQtn
r(oarien.
RNer!en
0
—
Comments
Msxintum
5] POOL / GLIDE
AND
RIFFLE
/ RUN
QUALITY
MAXIMUM
DEPTH
CHANNEL
WIDTH
Check ONE
(ONLY!)
Check ONE (Or
2 & average)
21’>
Im (6]
LI
POOL
WIDTH > RIFFLE
WIDTH
(2]
LI
0-7-elm
(4]
LI
POOL
WIDTH
RIFFLE W1DTH
(1]
LI
E.4-<&Tm (2]
LI
POOL
WIDTH <RIFFLE WIDTH
(0]
LI
0,2-c0,4m
(I]
I-I
LI
<e2m ff1]
<--
Fn.000ndedM].
Comments
cURRNT
VELOCIJY
Check ALL that
apply
LI
TORRENTIAL
(-13$ SLOW (1]
LI VERY
FAST
(1]
LI
INTERSTITIAL
(-1]
LI
FAST (I]
LI INTERMITTENT
(‘-2]
LI
MODERATE (I]
LI EDDIES
(1]
/nd/cate tot-roach
- poo/s
end
dOtes
ReCreatiOn
Potential
Primary
Contact
Secondary Contact
1
:tMrtL
r,wss’to’eee’te<SteSt
5
Pool!:
Current
‘
C
Max/tre’rrr
oi
rfltIICBtC
riffle-obligate
tot furv’nomal
speCies:
utica Best
areas
Che-KONE(0r2&evsrage).
must oe
large
enougI to
Support
C
DO5UIB
On
L<
r
L
ft-
cWt
RI<FLE
DEPTH
RUN
DEP”-°-t
333FF_El
RUN SUBSTRATE
RIOCLE
/ RUts
E%BLDDEtDNtS2
LI
BESTAREAS >10cm (2]
Li
MAXIMUM>
50cm
(2]
LI
STABLE
(eOt,
Cobble,
Boulder)
(2]
LI.
NONE (2]
J
dEe nREAS - 1 len
il
LIt-
11
-A It-at, C ocrt
r
J Li
100 SD-BLE
1
o tog—
Oresotl
(1]
2
LOW
II]
LI
SEST AREAS < Scm
-‘
LI
UNSTABLE
tea.
Fine Greed, Send) [0]
LI
MODERATE
0]
nrme1
j
, -
(metnc’O]
LI
EXTENSIVE
(-1]
‘
Li
Comments
e,en-’tt
!,:<.:..:
C
(3F!]C’E”IT
t.._
ft
n’
LI
FCPY
Lore’
LOW
t
4
4]
D°’ £4wEP’
j
t-iotmnn
0]
LI
HIGH
- VERY
HIGH [10-6]
%POOL:(j
%GUDE:(j
%RUN:
(-%R]FFLE:(
)
EPA 4620
Ii,
-
. ..
J
.,-‘o<
Electronic Filing - Received, Clerk's Office, September 8, 2008
4cf,qL
tiW!°
40!
sant
3]
CHANNEL MORPHOLOGY
Check
ONE
in
eech
category
(Or
2 &
avemge)
SINUOSITY
DEVELOPMENT
CHANNELIZATION
LI
HIGH
4]
LI.
EXCELLENT
[7]
LI
NONE
[6]
LI
MODERATE
[3]
LI
GOOD
[5]
LI
RECOVERED
[4]
LI
LOW
[2]
LI
FAIR [3]
LI
RECOVERING
[3]
NONE[i]
2’POOR[i]
LI
RECENTORNOREC0VERY[13
Comments
/
hTooUndC]
5] POOL
JGLIDEAND
RIFFLE/RUM
QUALITY
IMUM
DEPTH
CHANNEL
WIDTH
Check
ONt•(ONLYfl
Check
ONE
(Or
2 &
everaoe)
]5’>
Im
[6]
LI
POOL
IMDTN>
RIFFLE
WIDTH [2]
LI
0,7c1m
[4]
LI
POOL
WIDTH
RWFLEWDTH
[1]
LI
(L4-eOJm [2]
LI
POOL WIDTH
<RIFFLE
WIDTH [Cl]
LI
02c0Am
[‘1]
LI
< OOni [C;
Ki
Comments
Cover
Mrccrr;irn
20JJ
Sttnm
& LOCJIOfl
/7
f/ç/e
/\fJ*f
MDI
MODIFIED
Qualitative
Habitat Evak’iafion
tadex
c’r
and
Use
Assessment R&d
Sheet
RN:
‘
:oDafe:
1;
‘CN
—
Sco,’ers Full Name
& AffIIiation:jjj/j_>
Ptver
Code
STORET
Let
/ Long
/8
0
i’c /‘(
te,jibMj
,_
—
— —
1]
SUBSTRATE
Check
ONLY Two
substrate TYPE
BOXES;
eshrneie
%
or note
every
lype present
Check
ONE
tOr
2 &
everupr)
BEST TYPES
POOL
RIFFLE
OTHER
TYPES
°OOL
RIFFLE
ORIGIN
QUALIfl
LI LI
SLOE ISLABS
[iG]_
—
LI LI
HARDPAN
[4]
—
—
LI
LIMESTONE
[1]
LI
HEAVY
[2]
LI
LI
BOULDER
[91
—
LI
LIDETRITUS[3]
—
LITILLS[1]
SL’’
LI
MODERATE (Al
Scsbsrnirc
LI LI
COBBLE
[6]
_,
—
LI LI
MUCK
[2)
—
LIWETLANDS[0)
LI
NORMAL
(0]
LILI
GRAVEL[T]
—
LI
LISILT[2]
LIKARDPAN[0]
LIFRE5J3L.
LI LI
SAND
[6]
—
—
LI LI
ARTIFICLAL [0] —
—
LI
SANDSTONE
[0]
‘ ESSIIENSIVE [-2]
LI LI
BEDROCK
[5]
—
(Score
netLtral substrates;
ignore
LI
RIPIRAP
[0]
t0°E04
LI
MODERATE
[“i);/7,
NUMBER
OF
BEST
TYPES;
LI
4
or more
[21
sludge
from
point-sou:ces)
LI
LACUSTRINE
$
LI
NORMAL
[0]
7::—
—
LI
3 or tess
[0]
LI
SHALE
[-1]
Li
NONE
[I]
tCnfl1NB1tS
LI
COAL
FINES
[2]
21
INS
TREAM
COVER
“lnd;cete
t
2—a
recence
edo Me
0
amorm
to 3:
0-Absent;
‘, hut
no
I-Very
rr
h
ghe
small
it
amounts.
ale
or
or
in
smoh
if
more
inn
common
ruts
l
of
sjhA
marginal
AMOUNT
uasl
I
g
n
I qt tI
n
rwi
r
h.
oi ice
air urec
Is
Q
Cr,’
ii
3E. hojous in deep ci 14
vi
ç,ne
‘Hr Or
)
it
I
diameter
log
that s stable,
well
developed
rootwad in
deep
/ fact water, or deep,
well-defined, functional
pools,
LI
EXTENSIVE
>75%
(11]
—
UNDERCUT
BANKS
[‘I]
POOLS>
70cm
[2:
—
OXEOWS,
BACKWATERS [1]
LI
MODERATE
25-75%
[71
OVERHANGING
VEGETAI’ION
[1]
ROOTWADS[1]
—
AQUATIC
MACROPHYTES [1]
LI
SPARSE 5-<25% (3]
SHALLOWS (IN
SLOW WATER) [1]
BOULDERS
[1]
—
LOGS OR WOODY DEBRIS
[1]
LI
NEARLY
ABSENT <5%
(]
ROOTMATS
[1]
Comments
STABILITY
LI
HIGI-l [3]
2MODERATE
[2)
LI
L-OW[i]
Cherrr’e!(
Alexrrnr’rr,
2(1
41
SANK
EROSION
AND
RIPARIAN
ZONE
Check ONE in
each category for EAOH
SANK (Or 2per
bank &
ecwrago]
Seer
fore
lvvkhir
avwnvevr,m
,
RIPARIAN
WIDTH
,
FLOOD PLAIN
QUALITY
,
EROSION
19
O
WIDE
5Gm [4)
LI LI
FOREST,
SWAMP
[3]
LI
LI
CONSERVATION
TtLLAGE
(‘I]
LI
LI
NONE
I
UTTLE [3]
LI
LI
MODERATE 10-SUm
[3)
LI
LI
SHRUB
OR OLD FIELD
[2]
LI LI
URBAN
OR
INDUSTRIAL
[1%
LI LI
MODERATE
[2]
LI
LI
NARROW
5-IOn [2]
LI
LI
RESIDENTIAL
PARK,
NEW
FIELD [1]
LI LI MINING!
CONSTRUCTION
(0)
LI LI
HEAVY!
SEVERE
(1]
LI LI
VERY
NARROW < Sin
[1]
LI LI
FENCED PASTURE
[1]
ftr4!ce
oreriominant
ionc!
use/el
LI LI
NONE [0)
LI
LI
OPEN PASTURE,
ROWCROP
[0]
peel
WOnt riaer!an.
mparmn
Comments
Matcimnum
10
CURRENT
VELOCITY
Check ALL
that app!y
LI
TORRENTIAL
[-I] ZSLOW
[1]
LI
VERY
FAST
pt
LI
INTERSTITIAL
[-I]
LI
FAST
[1]
LI
INTERMITTENT
[-2]
LI
MODERATE
[1]
LI
EDDIES [1]
Indicate for reach
- pcofs
end i/Mac
1
Recreation
Potential]
Primary Contact
i
Secondoiy
Contac(
Pout!.
Current
:
/
‘2
Indicate for funCtional
riffles;
Best
areas
must be large
enough to support a population
of riffle-obligate
species;
Check
ONE (Or
2 &
everegek
LI”t’
<nt LC
av&r’c—’
PIFFLE
DEPTh
UN_DEPTh
RIFFLE I RUN
SUBSTRATE RIFc’,
I
RUH EMEDD,ED
t
E
LI
BEST AREAS a
bern
[2]
LI
MAXIMUM
> 50cm [2]
LI
STABLE
(ag,, Cobble,
Boulder)
[2j
LI
NONE [2]
LI
iSESTAREAS 5-10cm
[1]
r
IMAXIMUM
<50cm
[1]
LI
MOD,
STABLE
(ma,,
Large Graeet)[1]
LI
LOW (‘I)
EAs—,°2
S<--rr
2U’rABLEIe3
aneG”srj
Ss’-J)”,
en
nzEce’Ec
Pr>
t
ne’rrcm’j
“1
EX”ENS
YE r,
1/
Comments
7d7vitft
n>’t1c1
—
u
L
/c
,4 ,Ordten
‘,
POOL
1”
‘v
N
‘
4
$CE
C
4
n’
/
fl,eI/,\CC
Cf/PA
,
000CR%TE’s
10
4
‘u%\
r=_7
a
2)
CH VcR20Gd
f/U
%NWFLEç,
izN%.
<ti?
)
1.7ç
Electronic Filing - Received, Clerk's Office, September 8, 2008
Electronic Filing - Received, Clerk's Office, September 8, 2008
ATTACHMENT 2F
Figures showing QHEI score
distributions
for
the July 2008 study
Electronic Filing - Received, Clerk's Office, September 8, 2008
Figure 2F-1. Narrative Habitat
Classifications for
Upper
Dresden
Pool based on Ohio EPA
QHEI
Scores,
July
2008.
River
Not
Evaluated
2.0%
Mile
I1flJflflflflflllflfl
= Shipping
Channel
47.2%
(RB)
= Excellent
Habitat (QHEIs >=75)
285.
0
2801
.E’
C ..-.
F—
Good Habitat
(QHEIs 60-74)
I
= Fair
Habitat
(QHEIs 45-59)
23.6%
I
6.1%
I
0.0%
I
= PoorNery Poor Habitat (QHEIs <45)
21.2%
I
River
Mile
(LB)
auth
of
Jackson
280
279
278
I
Electronic Filing - Received, Clerk's Office, September 8, 2008
[Muth
of
Jackson
River
Mile
(RB)
=
Shipping
Cr
Figure
2F-2.
Narrative
Habitat
Classifications
for
Upper
Dresden
Pool
based
on
MBI-Modified
QHEI
Scores,
July
2008.
I
Not
Evaluated
2.0%
I
=
Good
Habitat
(QHEIs
60-74)
4.9%J
47.2%
I
Excellent
Habitat
(QHEIS
>=75)
0.0%
I
=
PoorNery
Poor
Habitat
(QHEIs
<
45)
32.3%
=
Fair
Habitat
(QHEIs
45-59)
13.6%
I
River
Mile
(LB)
280
279
Electronic Filing - Received, Clerk's Office, September 8, 2008
Mile
(RB)
—
280[
a’
I.
a’
C
—
..
.
-
a’
—
2T’
278
Figure
2F-3.
Narrative
Habitat/Attainment
Classifications
for
Upper
Dresden
Pool
based
on Ohio
EPA
QHEI
Scores,
July
2008.
River
I
I
= Not
Evaluated
2.0%
-
=
Attainment
Likely
(QHEIs
55-59.5)
9.8%
River
Channel
47.2%
= Attainment
Questionable (QHEIs
50-54.5)
3.8%
IMile
Good/Excellent
habitat
(QHEIs
>=60)
6.1%
=
Attainment
Not
Likely (QHEIs
45-49.5)
10.0%
(LB)
= PoorNery
Poor
Habitat
(QHEIs
< 45)
21.2%
I
Electronic Filing - Received, Clerk's Office, September 8, 2008
Figure
2F-5.
Narrative
Attainment
Classifications for
River
= Not
Evaluated
2.0%
Mile
= Shipping
Channel
47.2°!,
(RB)
]
Poo’
based
on
Ohio
EPA QHEI
Scores,
July 2008.
=
Attainment
Likely
(QHEIs
>= 52.5)
18.1%
I
River
I
= Attainment
Not
Likely
(QHEIs
< 52.5)
32.8%
Mile
(LB)
J
r
Li
Mouth
of
Jackson
I
Electronic Filing - Received, Clerk's Office, September 8, 2008
on
MBI-Modified
QHEI
Scores,
July
2008.
= Attainment
Likely
(OHEIs
>=
52.5)
6.2%
I
River
= Attainment
Not
Likely
(QHEIs
< 52.5)
44.6%
I
Mite
(LB)
1
.
—
2801
C
—
Q
.
0
0•0
2Th
Mouth of
Jackson
Electronic Filing - Received, Clerk's Office, September 8, 2008
ATTACHMENT
3
Santucci, V.J.,
S.R. Gephard,
and S.M.
Pescitelli. 2005.
Effects
of
multiple low-head
dams on fish,
macroinvertebrates,
habitat, and
water
quality
in the Fox River,
Illinois.
North
American
Journal of Fisheries
Management
25:975-992.
Electronic Filing - Received, Clerk's Office, September 8, 2008
North American
Journal
of
Fisheries Management
25:975992, 2005
Copyright by
the
American Fisheries Society 2005
001: 0.1 5771M03-2
16.1
Effects
of
Multiple
Low-Head Darns
on Fish,
Macroiiivertebrates, Habitat,
and Water
Quality hi the Fox River,
Illinois
VICTOR J. SANTUCCI,
JR.*I
Max
McGraw Wildlife Foundation.
Post
Office
Box
9,
Dundee, Illinois
60)18,
USA
STEPHEN
R.
GEPI•IARD
Connecticut
Department
of Enviromnental Protection, Inland Fisheries
Division,
Post
Office
Box
719, Old Lyme, C’onnecticut 06371,
USA
STEPHEN M. PESCITELLI
Illinois Department
of Natural Resources,
5931 Fox River Drive, Piano, Illinois
60545. USA
[Article]
Abstract. We
examined the effects
of low-head dams on aquatic biota, habitat,
and
water quality
in a 171-km
reach of a midwestern waranwater river that was
fragmented by 15 dams into a series
of free-flowing and
impounded
habitats.
Dams impounded
55%
of the river’s
surface area within
the studs’
reach and influenced distributions of3O species offish
by restricting upstream movements.
Values
for the Illinois index of biotic integrity
(WI)
were higher
in free-flowing areas (mean IBI
= 46
out of a
possible
60
at below-dam
and midsegment free-flowing locations)
than impounded
areas (mean
IBI
<
31 for above-damn
and midsegment impounded locations). Likewise, scores
from
a
macroinvertebrate condition index
(MCI)
were higher
at stations in free-flowing reaches
(mean
MCI
>
415 out of a possible 700) than in nearshore areas of
impounded reaches (mean
MCI
<
210). Ponar
dredge samples
taken only from open-water impounded
areas
showed
an
offshore invertebrate community that consisted almost
entirely
of tolerant oligochaetes
and
c.hi
ronomid
larvae. Qualitative habitat evaluation
index (QHEI) scores indicated good-quality habitat
in
free-flowing areas (mean. QHEI
>
70 Out, of a possible 100) and
severely degraded habitat at
impounded
sites (mean QHEI
<
45). In impounded
reaches, dissolved oxygen
and pH
showed
wide daily fluctuations (2.5-18.0 mg/L and
7.0
9.4
units) and often failed
to meet Illinois water
quality standards. In
free-flowing
portions of river, fluctuations in these
parameters were less
extreme and
water quality standards
typically were
met. We found little
evidence of
cumulative
effects of dams; however, our data suggest that low-head
dams
adversely
affect warmwater stream
fish and
macroinvertebrate communities
by
degrading habitat
and water quality and fragmenting
the
river landscape. These
results
should aid
river
managers and stalceholders
in
determining
appropriate
restoration practices (i.e.,
dam
removal versus
fish passage structures) for warmwatcr
rivets and streams that contain low-head darns.
Free-flowing rivers have
been characterized
as
having a
gradient of physical
conditions that elicit
gradual
changes in hiotic
communities
from head-
waters to
the river mouth
(river continuum
con
cept:
Vannote et al. 1980). Due to disruptions in
natural flow
caused
by
dams and their associated
impoundments,
few
U.S.
rivers
remain free flow
ing
throughout
their lengths (Ward and Stanford
*
Corresponding author:
vsantucci@dnrmaiI.state.il.us
Present address: Illinois
Department of Natural Re
sources,
$916
Wilmot Road, Spring Grove, Illinois
6008i. USA.
Received
November
7,
2003; accepted Deceml,er 27, 2004
Published online
July
20, 2005
1983). Past ecological research related to darns has
focused on lotic reaches directly below dams
(Ward
and Stanford
1979:
Bain et al. 1988; Ligon
et al.
1995; De Merona arid Albert 1999), main-
stern reservoirs directly
above
dams (Ellis 1941;
Hall 1971; Hall and
Van Den
Avyle 1986), fish
communities upstream of impoundments
(Marti
nez
et al. 1994), fish and invertebrate
migration
(Clay 1995; Benstead et
al. 1999;
Pringie et al.
2000), and environmental impacts from hydro
electric development
(Efford 1.975;
Baxter 1977).
From this large
body
of work,
we lcnow
that
dams
can have dramatic effects on rivers and aquatic
biota
by
altering
water
quality
and
habitat,
dis
rupting nutrient cycling
and
sediment transport,
and blocking fish and invertebrate
movements.
975
Electronic Filing - Received, Clerk's Office, September 8, 2008
976
SANTUCCI ET
AL.
However,
past studies
have typically
examined
large darns
and impoundments
on large riverine
ecosystems that often
supported coldwater
sal
monid species.
Whereas the
general
effects of
dams
may remain the same
for rivers of
different
sizes
(i.e., conversion
of lotic
habitat
to lentic hab
itat and the
blocking of migration),
the magnitude
of
the effect and the degree
to
which
biotic com
munities
are
impacted may
change with river size
and temperature regime
(Ward
and Stanford
1983)
or with
dam size
and
function
(Poff and Hart
2002).
The
ecological
consequences
of low-head dams
(<15
m) are poorly understood
(Benstead
et al.
1999),
and
few studies
have examined
their
effects
on
smaller
warrmvater rivers and
streams. Singh
et
al. (1995) found that
high phytoplarikton hio
mass
and
sediment
oxygen
demand in an
impound
ed
reach of a
warrnwater
river
produced substan
dard
dissolved oxygen (DO)
levels and may
have
reduced
the river’s
natural waste
assinilation ca
pacity.
Filter-feeding niacroinvertebrates
are
abun
dant
directly below surface-discharging
darns
in
warmwater
streams (Spen.ce and Hynes
1
971
a;
Parker
and
Vosheil 1983), and
these abundant
in
vertebrates may influence
food
resources available
to
downstream
communities (Parker
and Voshell
1983).
Darns may influence
warmwater stream
fishes
by
restricting
movements
(Porto
et al. 1999),
altering
assemblages
in
impoundments
and lotic
reaches
above impoundments
(Spence and
Hynes
1971b),
and causing extirpation
of species from
the
watershed upstream
of dams (Winston et al.
1991).
Although
important,
these studies
were lim
ited
to evaluations
of single dams and
one or
two
ecological
parameters (i.e.,
fish, invertebrates,
habitat,
or water
quality). Evaluation
of
multiple
dams and
parameters concurrently
within
a
river
system
may
lead
to additional
understanding of
the
cumulative
effects
of
darns
and
the
dynamics
of
directional
transport in rivers
and
streams
(‘vVard
and
Stanford
1983).
Like
other temperate-zone
locales (Dynesius
and
Nilsson
1994), northeastern Illinois
contains
flowing waters
where dams
are prevalent; many of
these
darns
are
remnant
or rebuilt milidams
from
the
1 800s.
Safety concerns and
old
age
(many
dams
arc
>
50
years
old) are driving
a
need
for
structural
improvements
at many
dams in
the
re
gion.
Howevet;
most darns lack
a
present-day func
tion, and
those with a practical purpose
(e.g.,
hy
droelectric
generation
and drinking water
supply)
need
functional
fish passage facilities
(Santucci
and
Gephard 2003).
To make informed decisions
regarding
the repair,
removal, or modification
of
darns
that
are publicly
owned
like many
of
those
in northeastern
Illinois, river
managers
and
public
stakeholders require
information
on
the
effects that
these structures
may have
on
river
ecosystems
(Smith
et a]. 2000).
We
investigated
the effects
of
15 low-head dams
on several
biotic and
abiotic components
of the
Fox
River, a sixth-order
warmwater
river that
drains
portions
of Wisconsin
and Illinois. Fish,
macroinvertebrates,
and habitat quality
were sam
pled concurrently
at 40 stations
located in free-
flowing
areas
directly
below
darns,
impounded
ar
eas directly above
dams,
and free-flowing
or im
pounded
rnidsegment
areas between dams. Water
quality
was
monitored at a
subset of
22 biota—
habitat
stations.
We compared
water quality
var
iables
among stations
from free-flowing
and im
pounded habitats
and
across the
upstream—down
stream
gradient to identify effects
of low-head
darns
and assess whether
effects
of
multiple
dams
were cumulative.
Historic and current
fisheries
survey data
also were
examined
to evaluate the
effects
of river
fragmentation
by
dams on
fish dis
tribution
patterns.
Based on our
results, we high
light
the need :for and
benefits
of potential dam—
i-elated
river restoration
practices to
assist man
agers and
stakeholders
faced
with darn repair,
re
moval,
or modification
decisions.
Study
Area
The
Fox
River flows
in a
southwestern
direction
for 298
km
from its
source
near Waulcesha,
Wis
consin, to its
confluence with
the Illinois
River at
Ottawa,
Illinois.
It drains about 2,435
1cm
2 in
southeastern
Wisconsin and 4,453
km
2 in north
eastern
Illinois.
The study
area included
171 river
kilometers (rkm)
and IS dams between
the Chain
of Lakes and
Dayton, Illinois
(Figure 1).
Agri
cultural
land
(66%).
urban
or
residential
land
(18%), woodlands
(9.2%),
wetlands
(4.5%),
and
lakes
and
streams (2.3%)
were
the predominant
land
cover
types in the
Illinois
portion
of
the wa
tershed
(IDNR 1998).
The central
region
(Elgin
to
Montgomery)
had
the
highest concentration
of ur
banlresidential
land, whereas
row crops and rural
grasslands predominated
in the more
northerly and
southerly areas.
The river
gradient is flat from
Chain
o:f Lakes
to Algonquin (average slope
0.06
m/km),
steepest between
St. Charles and
Yorkville
(0.85 m/km),
and
moderate
from Algon
quin to St.
Charles
(0.38 mikrn)
and downstream
of
Yorkville
(0.51
m/km). Recent average
daily
flow
(1980—2000)
at Dayton, Illinois,
ranged from
Electronic Filing - Received, Clerk's Office, September 8, 2008
LOW-HEAT)
DAM EFFECTS
ON A WARMWATER
RTVER
Stoip Island
Dam
977
FIGURE 1.—Map
of
the
Fox
River watershed,
Illinois, showing tile locations
of major tributaries
(drainage area
>
50
),
2
km
main—stem and selected
tributary
dams
(squares), and numbered
stations
that were
sampled for fish,
macroinvertebrates,
and habitat
during
summer
and fall 2000.
Stations marked
by
asterisks were sampled for
water
quality
during
summer and titll 2001.
5.9
to 1,319
/s
3
m (USGS
2001).
River hydrology
is
typically
dominated
by winter snowfall
and
summer
rajntali,
but
summer low flows are
main
tained by
the
controlled
release of
2.7
m
3
/s
of
water
from the
Chain of Lakes (Stratton
Dam) and dis
charges of
processed groundwater
from numerous
municipal wastewater
treatment facilities (IDNR.
1998).
Al I dams were
run-of-ri vet; low-h cad structures
located in tile main
stem between
9.2 km
(Dayton
Darn) and
159.1 km (Stratton
Darn)
above the river
mouth (Figure
1). Darns
ranged
from 44 to 183 m
long and
from
0.8 to
9.0
m
high and
impounded
47%
of
tile
river’s length
and 55%
of its
surface
area within the
study reach (Santucci
and
Gephard
2003).
Impounded
areas formed upstream
of darns
Stratton Dam
7
/
IIIinois(—S
St. Charles Dam
North Batavia Darn.
Souih Batavia Dam
Elgin Dam
Geneva
Dam
Montgomery
Darn
Yorkville
Dam
10
0
10
Kilometers
Dayton Dam
Electronic Filing - Received, Clerk's Office, September 8, 2008
978
SANTUCCT
lET AL.
were
small (2—346
ha),
narrow (76—189
rn; less
than
twice
the
width of adjacent free-flowing
ar
eas), and shallow
(mean
depths
<
2.1 m), and
their
storage
vol
lime,
turnover rate,
and morphology
were more similar to
a
those
of a
low-velocity
canal than to
those of a
natural
lake or
large res
ervoir.
Methods
Fish, niacroinverrebrates,
and habitat
quality.——
We sampled
fish and
macroinvertebrate
cornnru
nities
and
evaluated habitat
quality at 40 stations
from mid-July through
early
September
2000
(Fig
ure 1).
Rita and
habitat were
sampled concur
rently at each. station, and
stations
were visited in
consecutive
order
beginning
with
station
I . All
stations
were
about 0.8 km in length
and
encom
passed the
entire width of the
river and
adjacent
riparian
areas.
Thirty
stations were located
within
1 km of Fox
River dams; 15 of these
stations
were
sited upstream
of
darns
in impounded
areas, and
15
were sited
downstream of darns in
free-flowing
areas. Safety
considerations
precluded sampling
within
1
00
m of each
dam. Ten additional stations
were located in
middle reaches
of five
between-
dam
river segments (two
additional
stations
per
segment).
Midsegment
stations were
located
at
about 30%
and
60%
of
total
segment length
in
either
free-flowing
or impounded
habitat.
Fish
were
sampled
with
a
pulsed-DC
boat elec
troshockei a
generator-powered
backpack
dee
troshocker,
and a 3.2-mm-mesh
bag seine
(30.5 rn
long
X
1.8 m
deep). Boat electrofishing
runs began
at
upstream boundaries of
each
station
and
pro
ceeded
downstream
for
30
mm along
each
bank
of
the river
(total time
I
h/station).
We targeted
wadabie habitat (riffles,
runs,
and
shoreline areas)
with the backpack
electroshocker
and
sampled
these
habitats in relative proportion
to their abun
dance at
each station
for a total of 30 mm/station.
Seining took
place at three locations
within
each
station and sampled
habitats
of
wadable
depth with
silt, sand,
or
gravel
substrates.
The seine was de
ployed
in
a single
30.5-rn arc along tire riverbank
before being
retrieved to shore. All
fish larger
than
200
mm
total length (TL)
were identified
to spe
cies,
measured
(nearest mm TL), weighed
(nearest
g),
and examined
for anomalies
in
the fi.eld.
Small
er fish
were
preserved
in
10% buffered
formalin
and were
returned to the laboratory
for processing.
We characterized
fish
communities
based
on bi
ological
integrity and
harvestable—sized
sport fish
abundance. Community
integrity was estimated
for each station
with
aversion of
the
index ofbiotic
integrity
(IBI) developed
for
warmwater
streams
and
rivers in Illinois
(Karr .1981;
Bertrand et al.
1996). The lBi
has been shown
to accurately
re
flect the
biological integrity
and ecological health
of stream
ecosystems
(Fausch et at. 1990).
Values
for the
TBI range from 12
to 60;
higher scores
indicate
better biotic
integrity.
Illinois uses
the IBI
to classify
stream segments into
A
(IBI scores
51—60),
B (41—50),
C (31—40). D
(21—30),
and
E
(12—20) categories
that represent
unique,
highly
valued,
moderate, limited,
and
restricted aquatic
resources,
respectively
(Bertrand
et
al. 1996).
To
provi.de
a measure o:C the relative
availability
of
sport
fish
species to
anglers,
we
estimated sport
fish abundance
for each station
by
summing
boat
electrofishing
catch rates for
all
sport species larg
er
than designated
harvestable-size
length
minima
(Bertrand et al
..l
996).
The index
included top
predators
(percids
Sander
spp.,
yellow perch Perca
jiavescens, pilces
Esox spp., black basses
ii4icrop-
terzis spp.,
flathead
catfish
Pylodictis olivaris, cat-
fishes
Ictalurus
spp.,
rock basses Ambioplites
spp.,
crappies .Pomoxis
spp., and temperate
basses
Mo
rone
spp.), surifishes
Lepomis
spp., bullheads
Arneturns
spp.,
buffalo
Ictiobus
spp.,
redhorses
Moxostoina
spp.,
common
carp
Cyprinus
carpio,
and
freshwater
drum
Aplodinotus grunniens.
Data from the
present
study
and 14 other fish
community surveys
conducted between
1980
and
1999 were
used
to examine
whether dams affected
fish distributions
by acting as barriers
to upstream
movement.
Previous
studies
included periodic
whole-basin
surveys
and bi-annual sampling
of the
river
main
stein
by
the
Illinois Department
of Nat
ural Resources (IDNR;
Bertrand
et
al. 1982; Sallee
and Bergmann
1986;
Day
et al. 1992;
Pescitelli
and
Rung,
unpublished data)
and site-specific re
search efforts
(Heidinger
1
993;
Santucci
1994).
Combined data from
112
Fox River
main-stern and
tributary
sampling
stations
were used in the anal
ysis. To identify
species with distributions
limited
by
dams,
we first determined
presence of
species
within
each
between-darn
river
segment
(including
tributaries)
and then visually
examined
distribu
tion patterns for
the entire
study
area.
Macroinvertebrates
were
sampled
from
wad able
habitats
by
kick-netting
and
hand
picking
for .1
collector-hour
at each station.
Kick
nets were 250-
mm
><
457-mm rectangular
steel frames fitted with
1.5-rn handles
and 500-p.m-mesh bags.
Nets were
used
to
sample
small
substrates
(silt,
sand, and
gravel),
the water
surface,
and the
water column.
Forceps
were used when
picking
invertel,rates
from arbitrarily
selected submerged
rocks and
Electronic Filing - Received, Clerk's Office, September 8, 2008
LOW-HEAD
DAM
EFFECTS ON
A
WARMWATER
RIVER
979
TABLE
1 .—Macroinvertehrate
community
index (MCI: maximum
score
=
700) and component
metric
scores
(hr
downstream
free-flowing,
midsegment
free-flowing.
midsegment
impounded,
and
upstream
impounded
stations
on
the
Fox
River between
McHcnry
and Dayton,
Illinois.
Macroinvertebrates
were
sampled
by
kick-netting
and hand picking
at
40
stations
during
July—September
2000.
The MCI
was
developed with
Fox
River
data based
on USEPA rapid
bioassessment
procedures (Barbour
et
a!. 1999). Values
are means
(SEs).
For each
comparison,
ANOVA
F-statistics
and P-values
are shown (df
= 3, 36
lbr
all
tests).
Different
letters
designate
sienificant
differences
among
station types
for each metric
(Tukey’s
multiple
comparison
test: P
<
0.05).
Station
type
Downstream
1\.lidsegment
Midsegment
Upstream
Index and metrics
free-flowing
flee-flowing
impounded
impounded
F
P
MCI
417.5
(28.6) z
473.5
(41.1) z
205.8
(42.5)
y
203.0
(157)
y
21.95
0.001
Richness measures
(N)
Taxa richness
27.7
(1.0)
33.0
(2.5)
25.5
(3.0)
25.8
(1.6)
2.86
(1.05
EPT tax&’
6.4(0.7)z
9.2
(l.3)z
2
.
2
(l.
3
)y
3.1
(0.6)y
(1.36
0.001
Composition measures
(%)
EPT
individuals’
44.2
(5.5)
z
37.9 (4.6)
a
3.6
(2.3)
y
3.8
(1.0)
y
2528
0.001
Chironomidac
19.6
(3.8)
7.0
(3.0)
19.7
(4.5
20.5
(3.3)
0.24
0.87
Tolerance
measures
Intolerant
taxa
(N)
5.5 (0.3)
y
8.7 (1.3)
a
3.0 (0.9)
y
3.0
(0.4)
y
14.81
0.001
Macroinvertebrute
biotic
index
6.3 (0.2)
z
5.9
(0.2)
z
6.7
(0.41
yz
7.3
(0.2)
y
7.45
0.001
Habit
measures
(%)
Clinger
organisms
46.8
(5.8)
z
42M
(6.2) z
5.7
(0.9)
y
4.3 (0.9)
y
24.11
0001
Ephomeroptcrs,
Plccoptera,
and Trichoptera.
woody
debris
pulled
from
the water.
We allocated
sampling
time
to
various
macrohabitats
(i.e., rif
fles.
runs,
and shoreline
areas) based
cm
visual
estimates
of
the
aerial
coverage
of these
habitats
within a station
(except impounded
stations).
Be
cause
wading was
limited
to nearshore
areas
of
impoundments,
we
sampled deepet
offshore
1mb-
itat at most
impoundment
stations
(N = 16)
with
a petite
ponar
dredge
(152-mm
X
152-mm
open
ing) deployed
from
a canoe.
Three impoundment
stations were
excluded
from offshore
sampling
be
cause
they had large
gravel
and cobble
substrates
that
were not
sampled
effectively
with
the ponar
dredge.
Five
substrate
grabs
were
taken
along one
upstream
and one
downstream
transect
at each
sta
tion (iv
= 10
grabs/station).
Transects
ran perpen
dicular
to
the
river’s thaiweg
in
water
over
1
.5 m
deep. Grab
contents
were
combined and
washed
through
a
sieve with
a mesh size of
500
tam.
Samples
from
wadable and
open-water habitats
were
preserved
in
5%
solutions
of
buffered
for
maim
and were
returned
to the
laboratory, where
all
organisms
were sorted from
sediments
and de
bt-is
prior to
enumeration
and identification.
We
identified
all
individuals
in each
sample
(typically
to
genus)
except
for chironomid
larvae
(Diptera)
which
were
subsampled
for identification.
We
identified
a
minimum
of one—third
of the chiron—
omids in samples
with more
than
1 5 individuals
and
all
ebironomids
from
samples
containing
15
or fewer larvae
by
examining
mouth
parts aud
oth
er
body
parts with
a compound
microscope.
Iden
tities
were assigned
to all
chirononiids
in
a sample
based
on the
taxa
proportions
in
the
corresponding
identified
subsample.
A multitnetric
macroinvertebrate
community
in
dex
(MCI)
was used
to
characterize
macroinver
tebrate
communities
sampled
from wadable
hab
itats.
Illinois
does not
have a standardized
com
munity
index
for macroinvertebrates
(a statewide
index
is currently
in development),
so we devel
oped
a seven-metric
MCI
for the Fox River
based
on Environmental
Protection
Agency
(USEPA,)
rapid
bioassessment
protocols
(J3arbour
et
al.
1999;
see Table
I for
a
list of metrics).
The in
toleran.t
taxa
metric
was made
up of organisms
with
a tolerance
rating of
4
or less (range
0—
II) based
on the latest
Illinois macroinvertebrate
tolerance
list (Hite
and Brockamp
1992).
The
Ii
linois
MBI,
a version
of the
Hilsenhoffbiotic
index
(Hilsenhoff
1987),
provided
an overall community
tolerance
rating
based
on
the ineasi
of tolerance
values
weighted
by organism
abundance
(Hite
and
Brockanip
1992).
Values
of MEl
greater
than
or
equal to 7.5
represent
limited or
restricted
aquatic
resources
and a henthic
community
with limited
diversity, few
intolerant
forms,
and
a predomi
nance of
tolerant
organisms (Bertrand
et al.
1996).
Clinger
organisms
were
filter-feeding
insects per
snanently
attached
to substrates
and were consid
Electronic Filing - Received, Clerk's Office, September 8, 2008
980
SANTUCCI
ET
AL.
TAttLE
2...-.—Qualitative habitat evaluation
index (QHEI; maximum score = 100) and component metnc scores for
downstream
free-flowing, midseginent free-flowing, midsegment impounded,
and upstream impounded stations on the
Fox River
between McHenry and Dayton, Illinois. Habitat was evaluated
at 40 stations during July—September 2000.
Values are
means
(SEs).
For each comparison.
ANOVA
F-statistics
and P-values are shown
(df
3, 36 for all tests).
Different letters desigiiate significant differences among station types
for
each metric
(Tukey’s
multiple
comparison
test:
P < 0.05).
Station type
Downstream
Midsegment
Midseginent
Upstream
Index and 1-nettles
tree-flowing
free-flowing
impounded
impounded
F
P
QHEI
71.9 (2.9) z
76.0 (4.1)
z
42.9 (3.9)
y
35.8
(2.1)
y
45.92
0.001
Habitat rating
Good quality
Good
quality
Severely
degraded
Severely degraded
Component
me.tric.s’
Substrate (20)
16.9 (0.4) z
15.8 (0.6)
zx
11.8
(1.4) yx
9.1 (0.8)
y
28.82
0.001
Instream
cover (20)
13.5 (0.9) zx
16.2 (0.9) z
10.8 (0.8)
yx
8.8 (0.8)
y
10.77
0.001
Channel morphology
11.3
(0.9)
xx
13.3 (1.2)
z
7.2 (0.6)
yx
5.4 (0.4)
y
17.21
0.001
(20)
Riparian zone and
bank
4.2 (0.5)
6.4
(0.7)
4.4 (0.9)
4.7 (0.5)
1.74
0.18
erosion (10)
Pool—glide
quality
(12)
9.9 (0.4)
z
9.5
(1.2)z
1.8 (0.2)
y
1.6 (0.4) y
74.66
0.001
Riffle—run quality (8)
6.3
(0.5)
z
4.8 (1.0) z
0.0
y
0.0
y
49.04
0.001
Gradient (10)
9.7 (0.3)
z
10.0 (0.0) z
7.0 (1.0)
y
6.1 (0.1)
y
48.69
0.001
Maximum
scores.
ered intolerant
of poor water quality conditions
(Merritt
and
Cunimins 1996; Harbour et
al.
1999).
Tl.xe range of
values
for
the
MCI
was
0—700,
wherein
higher scores indicated
a
higher-quality
rnacroinvertebrate
community.
The
MCI
was not
appropriate for making
comparisons to
other stud
ies or gauging
ecological health relative
to
other
rivers because
only Fox Rivet- data were used in
its development.
However,
the index
provided
a
useful
measure for documenting relative differ
ences in
macroinvertebrate communities among
Fox
River
sample stations. The MCI scores also
were positively
correlated with.
IBI scores (Pear
son’s
product-moment colTelation: r
= 0.83,
P =
0.001).
We assessed
habitat quality with
the
qualitative
habitat evaluation index (QHEI), a visual obser
vation
habitat index designed to provide empirical,
quantified
evaluations
of lotic
macrohabitat
char
acteristics important to fish conirnunities (OEPA
1989). The
QHEI includes seven principal metrics
(see
Table
2)
and a number of metric components,
and
it has been shown to
generate scores
that
are
strongly correlated
with
fisheries assessment
data
(Rankin 1989). We used
the
QHEI to
evaluate hab
itat
quality in impounded as well as free-flowing
areas
because impounded areas retained charac
teristics
of
a
slow-flowing
river,
habitat indices are
not yet
available
for irnpoundnients, and
free-
flowing
conditions will be restored i:f darn
removal
is selected as
a river restoration alternative.
To enhance
accuracy and precision,
two
crew-
members completed
a i -d
QHFJ
training course
before
fieldwork
began and followed developed
protocols
when
evaluating
habitat during the study
(OEPA 1989).
Each station was surveyed twice by
canoeing
or
wading, first
to
draw a map of ma
crohabitat
features
and then to score individual
metric
components.
Index scores greater than 60
(maximum score
= 1 00) indicate good-quality
habitat that typically
supports diverse fish com
munities,
whereas
scores less than
46 indicate
se
verely
degraded habitat
that typically supports
poor-quality fish
communities (E.
Rankin,
Ohio
EPA,
personal communication). Scores between
46 and
60 indicate degraded habitat that
may or
may
not meet warmwater criteria
for
supporting
aquatic life.
I’Vater
qualiiy.—We
used
continuous, point, and
grab sampling
to monitor water quality at
ii
downsti-earn
free-flowing stations and Ii upstream
impounded
stations
(Figure 1).
Sampling
took
place
during August
6—17, 2001, when
water tem
peratures were high (>20CC)
and
flow
rates
were
low
(<20
/s
3
rn
at Algonquin). Continuous sam
pling with
Hydrolab Datasonde water
quality
mon
itors measured
temperature, DO,
and
pH every 1 5
mm for
40 h at each station. Monitoring began at
1600
hours on the first day and concluded at about
0800
hours
on the third
day.
Datasonde monitot-s
were calibrated
and deployed
midchannel
at depths
ranging
from
30 to 60 cm above the
river bottom.
During
evening
and early-morning extremes in
the
die]
oxygen cycle
(1800—2000
and 0600—0800
Electronic Filing - Received, Clerk's Office, September 8, 2008
LOW-HEAT) DAM EFFECTS
ON A WARMWATER RIVER
981
hours), we took
point
measurements with
a
cali
brated
Datasonde
monitor from
the surface, mid—
depth,
and
near—bottom
depth at midchannel (same
as
deployed
Datasoude
locations), left—of—center,
and right-of-center sites along
a
cross-channel
transect that bisected each station.
Point measure
ments also were niade at Datasonde
monitoring
depths when units were set and retrieved
to assess
instrument drift (none occurred)
and at grab-
sample
depths to provide
precise measures of tem
perature,
DO,
and pH for comparison
with water
chemistry data.
Grab
samples (N
44;
one morning and
one
evening sample
per station) were
collected at each
midchannel site and were analyzed
for
turbidity,
total
phosphorus
(TP), total nitrogen
(TN), and
chlorophyll a. Two clean, I .9-L plastic
bottles
were
filled with water from a depth of
30 cm and
placed on ice in a dark cooler.
Within
30 mm
of
collection, water samples either were processed
in
the field (turbidity
and
chlorophyll a) or were
transferred
to
clean, pre-labeled
polyethylene bot
tles
and preserved for later laboratory analysis
(TP
and
TN).
Turbidity was measured in the field with
a portable turbidimeter. Chlorophyll-ci samples
were filtered through glass microfiber filters that
were wrapped in
aluminum
foil, labeled, and fro
zen before being
transferred
to
the
Illinois EPA
laboratory
for analysis. The USEPA Region
5 Cen
tral
Regional Laboratory analyzed nutrient
sam
ples.
Effects of dams and impoundments were
as
sessed by
comparing individual water quality var
iables
between free-flowing and impounded areas
within river
segments, across
time periods, and
among vertical and horizontal sample locations
(temperature, DO, and pH only). Because
we
sam
pled 4—6 stations at
one time,
above—below darn
comparisons were made for four dams (Algonquin,
Elgin,
North Aurora, and Yorkvilie) to assess the
direct
effects of these structures on
river
DO lev
els. In
addition, we compared measured variables
to
accepted Illinois EPA ambient water standards
(temperature, DO, and pH) or recommended
guidelines (TP, TN, chlorophyll a, and turbidity;
USEPA
2000; Robertson et al. 2001) for mid
western rivers and streams (see Table
3).
Statistical
analyses.
—-We
compared fish (IBI
and
harvestable-size sport fish abundance), mac
roinvertebrate
(MCI),
and habitat (QHEI) indices
and
individual metric scores
among station types
(i.e.,
downstream
free-flowing, midsegment free-
flowing,
midsegrnent impounded, and upstream
impounded)
with one-way analysis
of
variance
(ANOVA)
and Tukey’s multiple
comparison test.
An arcsine
transformation
was used
on percent
ages
to
normalize
the variance before statistical
analysis (Steel and
Torrie 1
980).
Pearson’s product—
moment
correlation analysis
was used
to
assess the
relation
between fish and
macroinvertebrate com
munities and habitat
quality. Repeated-measures
ANOVA
was used to
compare water quality pa
rameters
between
habitat
types (free-flowing ver
sus impounded) and
among vertical (surface.
mid-
depth,
and bottom)
and horizontal (left, mid-,
and
right channel)
sample locations.
The model in
cluded habitat type
(or location)
and
sample
tin.e
period as main effects
and
a
habitat
type
(or
lo
cation)
X
time period
interaction term. To
assess
whether dfeets of multiple
dams
were
cumulative,
we
used
linear
regression
to examine the relation
between
upstream—downstream
distance (repre
senting
increasing numbers
of
dams)
and
several
measured variables
(IBI, MCI,
QHEI,
TP, TN, and
chlorophyll
a).
A statistical
significance level a of
0.05 was used for all
analyses.
Fish
Comm unities
Results
The quality of the
fish community as determined
by
IBI score
was higher in
free-flowing reaches
of
river
than in
impounded
areas above darns (Table
4), but communities
did
not differ within free-
flowing (Tukey’s
multiple
comparison test: P
0.98) or impounded
habitats
(P
= 0.96).
On av
erage, free-flowing
reaches
were characterized as
highly valued
B-quality streams
and impounded
reaches were characterized
as
limited-value,
D
quality streams. Mean
catch rates
of harvestable-
sized
sport fish also
were
higher
at
downstream
free-flowing
and midsegment
free-flowing
stations
than at midsegment
impounded and
upstream im
pounded stations (Table
4), and catches
were
sim
ilar within free-flowing
(P
= 0.40) and impounded
areas (P = 0.48).
Relative to
impoundments, free-
flowing areas had
higher species
richness,
sub
stantially higher
overall
and harvestable-sized
sport
fish abundance, and
more sucker species and
intolerant
fish species
(Table 4). Samples from
free-flowing
areas also contained a
higher per
centage
of insectivorous
minnows, such as spotlIn
shiners
Clprinella
spiloptera and
sand shiners No—
tropis
strainineus. in contrast,
stations in impound
ed areas had
a predominance
of tolerant and om
nivorous species,
such as the
common carp,
blunt-
nose minnow
Pimephales noatus, quiliback car
piodes cyprinus.
and
green
sunfish.
Electronic Filing - Received, Clerk's Office, September 8, 2008
92
SANTUCCI
ET AL.
Tusiit
3.
Water
quality parameter means
ISEs) and
results
of repeated-measures
ANOVA
(df
= 1, 20 for all
tests;
= 0.05)
examining
the effects of habitat type,
time period, and
habitat
X
time
interactions
on water quality in
the
Fox
River between
McHenry and Dayton, Illinois.
Water
samples were
collected during
August 6—17, 2001, in free-
flowing
and
impounded
habitats during morning
(0600—0800
hours)
and evening
(1800—2000
hours) time
periods.
Illinois
Environmental
Protection
Agency ambient
water quality standards
exist
for temperature,
dissolved oxygen, and
p1-I, whereas guidelines
have
been
developed
[hr
total
P and total N (Robertson
et
al. 2001)
and
for
chlorophyll a and
turbidity (USEPA
2000).
Habitat
type
Standard
or
Parameter
guideline
Free-flowing
lnipouuded
F
P
Temperature (°C)
33.7
26.2
(0.6)
26.2
(0.6)
0.01
0.98
Dissolved oxygen mg/L)
5.0
7.4
(0.3)
8.0
(0.8)
0.75
0.40
p11
(units)
6.5—9.0
8.6 (0.1)
8.7 (0.1)
0.39
0.54
Turbidity
NTU)
9.9
43.2 (1,5)
40.5 (1.7)
1.14
0.30
Chlorophyll
a (rgIL)
7.3
136.0
[9.0)
t48.1
(9.7)
0.75
0.40
Total P
(mg!L)
0.1 1
0.42 (0.03)
0.42 (0.03)
0.01
0.96
Total N (mgfL)
1.75
2.83
(0.12)
2.74
(0.12)
0.16
0.69
‘
Nephelonietric
turbidity
units.
Darns appeared to
have
altered
distributions of
nearly one-third
of Fox
River
fishes by acting
as
baiTiers
to
upstream
movement. Fifteen
species
had truncated
distributions, and
another 15 species
had discontinuous
distributions
(Figure
2). Species
with
truncated
distributions were found
only in the
lower
portions
of the river.
Ten species
were
not
found
above
the
lowermost
darn
in
Dayton, Illi
urns, whereas
five additional species,
including
the
river
redb
orse .4’Joxosiorna
carna1uni (listed
as
threatened
by
the state of Illinois), had
populations
that
persisted
above
the Dayton
Darn but were lim
ited
to the lower Fox
River
in Illinois. Species
with
discontinuous
distributions
were
found in the tip
per and
lower river, but
only
occasionally
or not
at all in the
central region
between the
St. Charles
and
Montgomery
dams. This highly urbanized
see-
hon
of river has a high density
of dams (eight darn.s
in 22 rkrn)
compared
to other parts of the Fox
River
in
Illinois (one
darn every 15.3
rktn).
Macroinvertebrale
Communjties
Free-flowing
habitat
supported
higher-quality
macroinvertebrate
communities
than did impound
ed
waters
above
dams.
Mean
MCI scores were
similar for
stations within
free-flowing
(Tukey’s
multiple
comparison
test:
P
0.59)
or impounded
habitats (P = 0.84).
but
scores for downstream
free-flowing
and midsegnient
free-flowing stations
were
more than twice as
high
as scores from mid-
segment
in.pounded
and upstream
impounded
sta
tions
(Table
1). Samples
from
the
free-flowing
riv
er had
higher percentages
of Ephemeroptera—
Plecoptera—Trichoptera
(EPT)
individuals
and
clinger
organisms
and
higher
EPT
taxa
richness
than the
wadable
portions
of impounded
areas.
Overall taxa richness
and percentages
of chiron
omids
were
similar among
station
types
(Table
1),
whereas
mean siumbers
of
intolerant
taxa were
higher at rnidscgrnent
free-flowing
stations
than at
free-flowing
stations closer
to dams or
at
stations
in
impounded
areas.
Stations below dams
often
contained extremely
high densities
of
filter
feed
ers,
such as certain chironomid
taxa
and
hydrop
sychid caddisflies
(Trichoptera).
Stations
in im
pounded areas
typically
had the highest
MET
scores
(indicating
lower-quality
communities),
and
8 of 15 upstream
impounded
stations had
scores
of 7.5 or greater,
indicating limited or re
stricted
invertebrate
assemblages.
Macroinverte
brates
were
extremely
limited
in
open-water
im
pounded areas.
Ponar samples
showed
an
open-
water
community
consistin.g
of
relatively few
taxa
(N = 34) and a numerical
predominance
(mean ±
SE
= 96.4%
±
0.8%)
of tolerant oligochaetes
and
chironornid
larvae.
Aquatic
Habitat Quality
The
quality of
aquatic habitat available
to
fish
and invertebrate
communities
differed
substan
tially
between
free-flowing
and
impounded por
tions
of
river.
Mean
QHEI
scores
were higher
at
downstream
free-flowing
and midsegmnent
flee-
flowing
stations
than
snidsegment
impounded and
upstream
impounded stations
(Table 2),
but
scores
were
similar
within
free-flowing
(Tukey’s
multiple
comparison
test: .P = 0.74)
and impounded
habi
tats
(P = 0.57). Stations
in free-flowing areas were
characterized
as
having
good
habitat
quality,
whereas
stations
in itripounded areas were
char
acterized
as
severely
degraded. Contributing
to the
severely
degraded
rating
in impoundments was the
Electronic Filing - Received, Clerk's Office, September 8, 2008
LOW-HEAD
DAM
EFFECTS ON A WARMWATER
RIVER
983
TABLE 3.
Extended.
rinse
period
Habitat
X
time interaction
Parameter
Morning
Evening
P
P
F
P
Temperature (“C)
25.3 /0.6)
27.1
(0.6)
75.00
0.001
0.01
0.92
Dissolved oxygen
(mg/L)
5.9 (0.3)
9.4 (0.6)
46.15
0.003
7.24
0.01
p11
(units)
8.5 (0.1)
8.8
(0.1)
70.66
0.003
0.35
0.56
Thrbidily (NTUV
42.4
(1.5)
41.3 (1.8)
0.27
0.61
0.02
0.90
Chlorophyll a (cg/L)
127.5
(6.3)
156.6 (10.9)
6.80
0.02
0.41
0.53
Total P
(mg/L)
0.42
(0.03)
0.41
(0.03)
0.85
0.37
0.97
0.34
Total N (mg/C)
2.86 (0.12)
2.7!
(0.12)
3.26
0.09
3.22
0.09
TABLE
4.—Illinois index of biotic
integrity (IBI; maximum
score = 60), biological
stream characterization,
harvest
able-sized
sport
fish abundance, and IBI component
metric
scores
for downstream
free-flowing,
midsegment free-flow
ing,
midsegrnent
impounded, and upstream impounded
stations on the Fox
River
between
McHenry
and Dayton, Illinois.
Fish
were
sampled
by
boat electrofishing,
backpack electrofishing, and
seining at 40 stations
during July—September
2000.
Values
arc
means
(SEs).
For each comparison, ANOVA
F-statistics
and P-values
are
shown (df = 3, 36 for all
tests).
Different
letters designate
significant differences
among
station types
for each metric
(Tukey’s
multiple
comparison
test:
P < 0.05).
Station
53/he
Downstream
Midsegment
Midsegment
Upstream
Index and
metrics
free-flowing
Eec-flowing
impounded
impounded
F
P
ml
46.1 (1.2) z
46.0
(2.3)
a
29.5 (2.5)
y
30.8 (0.8)
y
41.95
0.001
Biological
stream
B
stream
(highly
13 stream (highly
1) stream (limited
0 sbeam (limited
characterization
valued
re-
valued rc-
rcsouree)
resource)
Source)
source)
Harvestable-sized
86.8 (6.0) z
73.5 (3.1) a
38.8
(4.4)
y
33.3
(3.9)
y
26.26
0.001
sport
fish
abun
dance
(V/h)
1138 component maSt-ks
Fish
species
composition
(N)
All
species
28.9
(0.9) z
25.3 (2.1) z
16.2 (3.5)
y
17.7
(0.9)
y
21.93
0.001
Sucker species
4.5
(0.5) z
4.2
(0.8) a
1.2
(1.0)
y
0.9 (0.2))’
16.74
0.001
Sunfish
species
9
(11.3)
3.0 (0.8)
3.5 (0.6)
:3.3 (1)3)
0.94
0.43
Darter species
3.0
(0.3)
z
2.7
(0.7) z
1.5
(0.6)
zx
0.7
(0.2) a
13.73
0.001
Intolerant
species
7.3 (0.6) z
6.7
(1.1)
z
3.2 (0.6)
y
3.1
(0.3)
y
14.70
0.001
Trophic
composition
(%)
Green
sunlisls’
2.1 (0.3) a
4.0 (3.1) zy
5.5 (2.1)
zy
12.5 (3.3)
y
4.77
0.007
Oninivores
17.8
t2.4)
a
19.7 (3.9) a
45.2
(6.7)
y
25.5 (2.6) a
7.16
0.001
Insectivorous
miii-
37.1)
(4.7) z
43.7
(7.9)
z
3.3 (0.8)
y
10.8
(3.4)
y
14.06
0.001
flows
Top
carnivores
15.0 (2.2)
zy
11.7 (2.5)
a
14.1
(1.8)
zy
22.8
(2.3)
y
3.81
0.001
Fish
condition (%)
Hybrids
0.6
(0.4.1
0.1 (0.1)
0.6
tO.6)
1.3
(0.6)
0.89
0.46
DEI..T
anomaliesb
2.5 (0.5)
zy
1.2
(0.3)
z
4.7
(2.3)
y
1.2
(0.3)z
4.04
0.014
Relative
abundance
(N/h)
All fish
species
821.6
(110.6) z
756.2 (181.2) z
137.0
(41.5)
y
201.2 (26.0)
y
12.28
0.001
Lepomix
cvanIhis.
b
Deformities,
erosions, lesions, and
tumors.
Electronic Filing - Received, Clerk's Office, September 8, 2008
984
SANTUCCI
ET AL.
American
eel
Bigmouth
buffalo
A
Black buffalo
Gizzard
shad
Black
red horse
Hlghfin carpaucker
Longnosegar
Mooneye
River
carpsucker
River redhorse
Sauger
Sliortnosegar
Skipjack herrina
Smallmouth buffalo
Speckled
chub
Black
bullhead
B
I
Black
crappie
I
Blacksldedarter
Goldeye
Grass
pickerel
Muskellunge
Northern
pike
Orangethroatdsrter
Pumpklnseed
Redlin shiner
Rock bass
Shortheadredhorse
Striped shiner
Suckermouthminnow
White crappie
,
I
Upstream
>
Downstream
absence of
important
riffle and run habitat
from
these
areas (Table
2). To account for
the
absence
of
riffles and
runs, we recalculated
the
QHIEJ
with
out the
riffle/run
metric and still found
higher
scores at
downstream free-flowing
(mean ±
SE
=
65.6
±
2.6)
and midsegment
free-flowing
(71.2
±
3.2)
stations
than at
midsegment
impounded (42.9
±
3.9)
al3d
upstream
impounded stations (35.7
±
2.2;
ANOVA:
F3
,
36
38.46, P
0.001).
Good-
quality
instrearn habitat
was typically available
throughout
free-flowing
portions of the
rivet; even
in
downtown areas,
where
banks often were
sta
bilized
with
concrete
and
where
.riparian vegeta
tion was
degraded or absent.
H abitat
quality
was an important factor
affecting
aquatic biota
in the
Fox
River.
A strong
positive
relationship
existed
between QHEI
and IBT scores
(Pearson’s product-moment
correlation:
r = 0.89,
P = 0.001)
and
QHEI
and
MCI scores (r
0.84,
P
= 0.001). These
strong relations
attest to the
usefulness
of QH El
as
a subjective stream habitat
assessment
tool and
underscore the importance
of
habitat quality
to lotic fish
and macroinvertebrate
communities.
Water
Quality
Dissolved
oxygen and
pH
varied
on a daily basis
at all stations,
but the magnitude
of the daily
ox
ygen
fluctuations
was
higher at
stations
in im
pounded
reaches
than
at those in free-flowing
reaches (Figure
3). Dissolved
oxygen
ranged from
2.5
to 18 nig/L
(>200% saturation)
in impounded
areas
and
from
5 to
10
nig/L in
free-flowing
areas.
On average,
DO maxima
were
higher in impound
ed
areas (13.8
±
0.8 mg/L) than in
free-flowing
areas
(9.8
±
0.4 mg/L)
(repeated-measures
—
—
FIGURE 2.—Fox
River
(Illinois) fishes
with (A) truncated
distributions (restricted
to the lower
portion of the
study area), namely
American eel Anguilla
rostrata,
bigmouth
buffalo
Ictiobus
cypri.ne/Itis. black
buffalo 1. niger,
gizzard shad
Dorosorna cepediamon, black
redhorse
Moxostoma
duquesnei,
highfln
carpsucker
C’arpiodes
ve1fer,
longnose gar
i.episosteus osseus,
mooneye
Hioclon tergisus.
river carpsucker
C.
carplo, river redhorse Iv! carinatwn,
sauger Sander canadensis,
shortnose gar
L.
platostomus, skipjack
herring Alosa
chrvsochloris, smallmouth
buffalo
I. huhalus. and specicied
chub Macrhyhopsis aestivalis
and (B) discontinuous
distributions
(typically absent
from
the
middle portion of
the
study
area),
namely, black
bullheadAmeiurus
,neias,
black crappiePonioxisnigrornaculatus.
blackside
darter
Percina
maculate,
goldeye H. alosoides,
grass (redfln)
pickerel
Esox a,ne,-icanus.
muskellunge
E.
masquinongy,
northern pike E. lucius,
orangetbroat
darter
Elheostomc,
spectohile,
punipkinseed
Lepomis gibbosus,
rediin shiner
Lythrurus
unthratilis, rock
bass Ambloplites rupesiris,
shorthead
redhorse Moxostoma macrolepidoluni,
striped shiner Luxilus
chrysocepha/us, suckermouth
minnow Phenacohius
,nirahili,c,
and
white
crappie
Pomoxis
annularis. Data are
fi’om 112 main-stein and tributary
stations sampled
from 1980
through 2000
(Bertrand
et al.
1982; Sallee
and Bes’gmann
1986; Day et al. 1992;
Heidiuger
1993;
Santucci
1994; Pescitelli
and Rung,
unpublished
data:
present
study).
Note that
distances between
dams are not to
scale.
Electronic Filing - Received, Clerk's Office, September 8, 2008
10W-HEAT)
DAM EFFECTS
ON A
WARMWATER
RIVER
985
Cl)
2
8.9
I
-J
a)
0
1600
Hours
FIGURE
3.—Comparison
of
(A)
pH and
(B)
dissolved
oxygen
(DO’)
between
free-flowing
(dotted
lines)
and
impounded
(solid
lines)
areas
of
the
Fox
Rivet
illinois,
from
the
North
Aurora
Dam
to
the Stoip
Island
Darn.
Similar
patterns
in DO and
pH
were observed
between
free-flowing
and
impounded
reaches
of 10
other
between-dam
river segments
monitored
during
the
study.
Variables
were
measured
with
coutmuously
recording
Hydrolab
Datasonde
water
quality
monitors
over
a
40-
li
period
in Augost
2001.
Horizontal
dashed
lines
rep
resent
Illinois
Environmental
Protection
Agency
ambi
ent
water
quality
standards.
ANOVA:
F
26.13,
P
0.001),
and DO
min
ima
were
lower
in
impounded
areas
(4.2
± 0.7 mg/
L)
than
in
free-flowing
areas
(5.7
± 0.7
mg/L;
F
10
= 6.88,
P
=
0.02).
Mean
maximum
pH
also was
higher
in
impounded
areas
(9.0
±
0.08
units)
than
in
free-flowing
areas
(8.8
±
0.07 mgiL)
(F
110
=
7.35.
P
= 0.02),
but
minimum
pH
(F
10
= 0.03,
P
= 0.86),
maximum
temperature
(Fy
10
=
0.40,
P
= 0.54),
and minimum temperature
(F
110
=
3.90,
P
0.54)
were
sitnilar
among
impounded
and
free-flowing locations.
Effects
of
habitat
type,
time period,
and
the hab
itat
X
time
period
interaction
varied
among
water
quality
variables.
Dissolved
oxygen
was
the only
variable
with a
significant
interaction
effect
(Table
3),
which
resulted
because
differences
in
DO
be
tween
mornilig
and
evening
sample
periods
were
greater
for
stations
in impoundments
than
for sta
tions
in
free-flowing
areas.
Mean
DO
also
de
creased
from
sur:face
to
bottom
in
rnpounded
areas
(repeated-measures
ANOVA:
F
220
= 20.71,
P =
0.001)
but
was similar
among
vertical
locations
(surface,
middepth,
and
bottom)
in
free-flowing
areas
(F
2
,
20
= 2.14,
P
= 0.15)
and
among
hori
zontal
locations
(left,
mid-,
and
right
channel)
in
free-flowing
,.F
220
= 1.30.
P
=
0.30)
and
im
pounded
areas
(F
220
=
2.92,
P = 0.08).
Temper
ature,
pH,
and chlorophyll
a
were
higher
in
the
evening
than
during
the
morning,
but none
of
these
variables
showed
significant
habitat
effects
(Table
3). Turbidity,
TP,
and
TN did
not
differ
between
habitat
types
or
sample
periods.
Substandard
water
quality
conditions
were
com
mon
in the
Fox
River
(Table
3).
Total
P and
TN
were elevated
above
recommended
guidelines
at
all but
the
most
upstream
station
(Stratton
Dam),
and TP
was
extremely
high at
all stations
below
Elgin,
Illinois
(>0.4
rng/L).
High
nutrient
con
centrations
led
to the
development
of
excessive
algal
biomass,
as indicated
by
chlorophyll-a
and
turbidity
measures
that
were
elevated
above
rec
ommended
guidelines
(Table
3).
Temperature
did
not
exceed
the
Illinois
water
quality
standard
dur
ing
the
monitoring
period,
hut DO
arid
pH
often
failed
to meet
standards
in
impounded
areas.
Sub
standard
DO
and pH
were
recorded
in
S of
Ii
impounded
areas,
and
these
conditions
often
lasted
for several
hours
in a 24-h
period
(>15
h for
sub
standard
DO
at
two
stations).
In contrast,
DO and
pH
in
free-flowing
areas
failed
to
meet
standards
at
only two
and
one
station,
respectively.
Concurrent
measurements
upstream
and down
stream
of darns
showed
that these
structures mod
erated
extremes
in DO
that developed
in impound
ments
by
the
physical
de-
and
re-aeration
of water
flowing
over
their
spiliways.
Dams
oxygenated
the
river
at
night,
when
DO
was low
in upstream
im
pounded
areas,
but
oxygen
was
released
to
the at
mosphere
during
the day
as
oxygen-supersaturated
waters
from
impoundments
flowed
over
dams.
For
example,
DO decreased
by
about
5
rng/L
each
day
(1600—1800
hours)
amid
increased
by
about
3
mg/
L
each night
(0400--0600
hours)
as
water
flowed
over
the
North
Aurora
Dani
(Figure
4).
The
overall
effect
of
water
flowing
over
danis
during
a 24-h
period
was
a
net
reduction
in DO
from
the
river
and a
loss of
surplus
oxygen
produced
by
daytime
algal
photosynthesis
that
then was
unavailable
to
respiring
algae
at
night.
Cumulative
Effects
of
Dams
Patterns
in biotic
and
habitat
indices
along
the
upstream—down
stream
gradient
were
examined
9.1
8.7
8.5
Electronic Filing - Received, Clerk's Office, September 8, 2008
986
SANTUCCI
ET
AL.
-J
0,
2
0
Hours
FIGURE
4.—Dissolved
oxygen (1)0) concentrations
upstream
(solid line)
and downstream
(dotted line) of
the North
Aurora Dam on the Fox River, illinois. Similar
patterns
were observed at three additional darns moni
tored for DO.
Concurrent upstream and downstream
measurements
were
made with continuously recording
Hydrolab
Datasonde
water quality monitors over
a
40-
h period in
August 2001. Data were transformed based
on
point
sampling
to reflect surface concentrations.
separately
for free-flowing and impounded areas
because
means for
these variables varied
between
habitat types
(Tables 1, 2, and
4).
The variables
TP
TN, and
chlorophyll a were similar in free-
flowing and
impounded areas (Table
3), so
we
pooled data
across
habitat
type
for these variables.
Scores
for
the IBI
and
QHEI
did
not vary signif
icantly
with
increasing distance downstream for
free-flowing (linear
regression for IBI: r
0.38,
P 0.17;
QHEI: r
= 0.43,?
0.11)
orimpounded
areas (IBI:
r
0.02, P = 0.93; QHE.I:
1
= 0.15,
P = 0.60;
Figure 5).
The absence of strong patterns
in fish and
habitat measures as
downstream
dis
tance and
numbers of dams increased
indicates that
effects
of
multiple low—head dams were not cu
mulative
for these variables.
The TP (r
= 0.68, P
= 0.001), TN
(r = 0.32, P = 0.03), chlorophyll a
(r
= 0.33,
P = 0.03). and
MCI scores from im
pounded (r
= 0.62, P = 0.01)
and free-flowing
(r
= 0.50,
P
= 0.06) areas showed
positive
corre
lations
with
downstream distance. Although these
positive relations
could reflect the influence of
multiple
dams,
patterns in the data relative to damn
location
and
density (Figure
5)
provided no strong
evidence
that the effects
of dams were cumulative.
Discussion
Our
results
show
that
low-head
dams
adversely
affected
the
hiotic
integrity
of the Fox River on
local and
landscape
scales.
Local effects were
largely
related to the impoundments
that
formed
upstream of each darn, whereas
landscape-level
effects arose from fragmentation of the river basin
and
restricted movements
of
fish. We found
that
the
use of impoundments
by
important
macroin—
vertebrate
and fish taxa was limited by
degraded
habitat
and poor summer water
quality conditions.
Abundance,
richness, and biotic integrity
of fish
and
invertebrate assemblages were
consistently
lower in impoundments than
in
the free-flowing
river.
Degraded habitat, water quality, and biotic
communities were found throughout impound
ments,
not
just in Lhe most impacted areas im
mediately
above dai.rts. Conversely, good habitat
quality,
water quality, macroinvertebrate assem
blages, and
sport fish and nongame fish commu
nities occurred
throughout
free-flowing reaches,
not just in areas immediately
below
darns. Differ
ences in fish and invertebrate assemblages might
be expected between free-flowing and impounded
river reaches, but the
magnitude and
consistency
of differences that we
observed indicate that
even
low-head darns with relatively small impound
ments can have profound detrimental effects
on
the biotic integrity
of
wnrmwater rivers.
By
impounding
water and altering flow patterns,
darns modify
upstream habitats and elicit changes
in the composition
of aquatic biota (Hynes i970;
Baxter 1977). The absence of erosional benthic
invertebrate
taxa and the predominance of tolerant
depositional forms (e.g., oligochaetes and chiron
omids)
in Fox
River
impoundments are typical re
sponses of aquatic invertebrates to impoundment
in temperate rivers (Nursahl 1952; Paterson and
Fernando
1969; Stanley et al. 2002). Fish assem
blages also change with impoundment,
but
unlike
the
Fox River many impoundment fisheries
consist
of abundant lake-adapted species that frequently
produce high fish
yields and
exceptional
sport-
fishing and commercial
fishing (Ellis 1941;
Baxter
1977). Low sport fish
abundance
in impoundments
of the Fox River may
reflect the
quasi-riverine
characteristics of these
areas or
degraded habitat
and water quality conditions.
Although
the
history
of impoundment fisheries
in the
Fox River is
not
known, present degraded conditions suggest that
major habitat restoration
(e.g.,
renovation back
to
free-flowing conditions)
will be necessary if these
impoundments
are to support
high-quality
fish as
semnblages and fishing in the future. Main-stem
impoundments also are known to support large
populations o:f lacuitative riverine species
(e.g.,
gizzard shad Dorosorna cepedianuin, common
carp, and freshwater drum) that invade
tributaries
Electronic Filing - Received, Clerk's Office, September 8, 2008
LOW-HEAD DAM EFFECTS ON
A WARMWATER RIVER
1.0
-J
250
150
160
0
40
80
120
160
Upstream
;
Downstream
Distance (km)
987
FIGURE
5.—Relations
between
upstream—downstream distance
and (A)
index
of biotic integrity (IBJ), (B) mac
roinvertebrate
community
index (MCI),
(C)
qualitative
habitat
evaluation
index
(QHEI), (I))
total
phosphorus
(TP),
(E)
total
nitrogen (TN), and (F)
chlorophyll a (chioro a) for stations
in
free-flowing
(solid circles) and impounded
(open circles)
areas in the Fox
Rivei
Illinois. Biota and habitat were sampled during July—September 2000, and
water quality
was sampled during August 2001.
Values
for
chlorophyll
a, TP, and TN are means
±SEs
of morning
and
evening samples.
Vertical
lines above the x-axis indicate dam locations.
and
upstream
free-flowing reaches
of
rivers during
spriig and
summer (Ellis
1941; Ruhr l956
Rodriguez-Ruiz
and
Granado-Lorencio 1992).
Common
carp and
freshwater drum were abundant
at many
stations in
free—flowing and impounded
reaches of
the Fox
River, possibly reflecting the
abundance
of
impounded habitat created
by
nu
merous
dams.
Habitat
quality appeared to be an
important
var
iable in
explaining differences in faunal
assem
blages
between
free-flowing and impounded
areas.
We
found
strong correlations between
habitat qual
ity and
fish and
invertebrate community
quality,
and
index scores
were consistently highe.r in
free-
flowing
reaches than in impoundments.
Differenc
es
in
habitat quality
reflected differences in
habitat
diversity
between
free-flowing and impounded
ar
eas.
Free-flowing
areas were
made up of a variety
of
physical
features (i.e.,
riffles, runs and
natural
pools) that provided
a wide array
of water depths,
current velocities, substrate
types.
and cover
char
acteristics. in contrast, impoundment habitat was
more homogeneous
and typically consisted of
ex
tensive, deeper
open-water areas; lower and more
uniform current velocities;
and substrates
domi
nated
by
deposited fine
silts and sands.
Habitat
heterogeneity
is important to the conservation of
aquatic biodiversity
in
rivers
and streams because
abundance and distribution of stream fishes (Ra
beni and Jacobson 1993) and benthic
invertebrates
(Rabeni and Miushail
1977; Reice
1980) are
strongly affected by individual or combinations of
microhabitat variables.
By creating impoundments
with limited habitat
heterogeneity.
Fox
River
darns
restricted the distributions of many fish
and in
vertebrate
taxa
to free-flowing areas
during the
important
surnrner—fall
growing
season. By im
pounding nearly half of the Fox River’s length in
48
36
24
0.6
-J
0.4
0
I—
0.2
A
.
C
o
0
0
0
0
00
919%
0
B
Ce
C
9
0
0
0
00
cb
•
0
0
C
o
,
C
9
•
0
9
•
0
0
00
0
cP0000
0
0
0
I
11111111
-S
-J
0)
3.0
E
z
I—
2.0
400
0
(I)
0200
0
a,
1
75
0
C.)
50
25
D
0i
0
E
0
I I
I
11111111
I
0
40
80
120
Upstream
>
Downstream
Distance (km)
Electronic Filing - Received, Clerk's Office, September 8, 2008
988
SANTUCCI
ET AL.
Illinois,
the
1.5 darns likely had a negative effect
on the abundance and diversity of aquatic biota in
the river.
Little published
literature is available
on the
ecological
effects
of
impoundments formed
by
low-head dams, but
there is existing
evidence that
our findings are
not
unique. Habitat quality and
IBI scores were substantially lower in an impound
ment
than
in free-flowing sections of the Milwau
kee River,
Wisconsin (Kanehi et al.
1997). Simi
larly, Stanley et al. (2002) found that macroin
vertebrate communities in impoundments of an
other Wisconsin river were more degraded than
those in
free-flowing reaches. Impoundments
formed by
low-head dams in other northeastern
Illinois
rivers also have been shown to adversely
affect aquatic habitat, fishes, and macroinverte
brates (Pescitelli
and Rung 1998;
Hammer and
Linke 2003).
Studies such as these
indicate that
adverse effects
of low-head dams
and impound
ments may he
common, at least
for moderate-sized
rivers in the Midwest. 1-Iowevei; additional de
scriptive
research and manipulative
studies (e.g.,
dam removal studies) that include sampling over
multiple seasons and
years
are necessary to further
explain potential
variation in the
effects of dams
within and among
river
systems and across seasons
and years.
Impoundments may play an important role in
the
development of degraded water quality in riv
ers with
low-head dams. Others have shown that
algal abundance is
positively
related to TP and TN
in
aquatic systems (Sohalie and Kimmel 1987) and
that impoundments
enhance phytoplankton
devel
opment in
rivers
by
reducing hydraulic flushing
and algal
washout and allowing more
time
for
growth in
suspension (Tailing and
Rzoska 1
967;
Soballe and
K.immel 1987; Lohman and .Jones
1 999).
Phosphorus and nitrogen loading
from
nu
merous
potential sources (e.g., municipal waste—
water
treatment plants, fertile native bed material,
agricultural
fertilizers, and nonpoint
urban runoff)
has
made the Fox River below Elgin, Illinois,
among
the most enriched rivers in the Midwest
(Robertson et
al. 2001). In combination with
the
presence of
numerous impoundments,
high
nutri
ent
input has
created an environment that
supports
excessive
algal growth.
Daily
cycles of photosyn
thesis
and respiration
by
abundant phytopianktonic
algae, in
turn, produced
large
fluctuations in DO
and
pH that
often resulted in substandard water
quality conditions
in impoundments.
Large dams
and impoundments can
have sig
nificant effects on
the flow regime,
geomorphol
ogy,
and
ecology of downstream
reaches
of rivers
(Ward and
Stanford 1979; Ligon et al.
1995;
Poff
et
al.
1997). In some cases, changes in temperature
and transported organic matter below large dams
may reset environmental variables and inverte
brate communities
to conditions
found in upstream
tributaries
or headwaters (Hauer
and Stanford
1982; Soballe
and Bachmann 1984).
Although
smaller
low-head
dams affected downstream areas
in the Fox River
by moderating
the algae-induced
extremes
in DO that developed in impoundments,
we found no evidence of
a
resetting of invertebrate
assemblage structure
to tributary or headwater
conditions. On
the contrary,
small run-of-river
dams contributed
to higher turbidity (i.e., by con
tinually
releasing algae
from upstream impound
ments) and
poorer invertebrate quality in down
stream free-flowing
areas
than were found in free-
flowing reaches
away from dams. Invertebrate
assemblages immediately
below dams were influ
enced
by
high
densities of
a
few tolerant filter-
feeding taxa,
such as the caddisflies cheuinatop
syche and
Iivdropsyche (Gordon and Wallace
1975),
which probably
were thriving
on
abundant
algae and
other
suspended matter
released
from
impoundments
(Spence
and
Hynes
1 971
a;
Parker
and
Voshell 1983).
It has
been suggested that environmental vari
ables respond differently
when multiple dams antI
impoundments
occur
in a river (Ward and Stanford
1983). Because river
transport is largely unidirec
tional, effects
of impoundment
might
be expected
to increase
with downstream
flow past
consecutive
dams. Howeve
we found
no
evidence that mul
tiple
dams had
cumulative effects (good or bad)
on water quality
or the quality of fishes, inverte
brates, and habitat.
In fact, dams affected these
parameters in
a remarkably similar fashion
throughout the river.
Current
dam
theory tells
us
that response among
abiotic and bic>tic parameters
will vary with dam
size and function (storage
ver
sus run-of-river
dams; Poff
and
Hart 2002) and
location within
a river
system
(e.g., low-order
headwaters
versus high-order alluvial river;
Ward
and Stanford
1983). The lack of variation in our
results may
be due
to
the size and function of the
darns examined
(i.e., small run-of-river structures
with
surface spillways
an.d
small, shallow im
poundments) and the
consistent stream order
that
occurred throughout
the study area.
When varia
tion did occur, i.t
appeared
to
be
related
more to
site-specific morphology
and habitat characteris
tics than to downstream
location
within
the
series
of impoundments. For
example,
fish antI inverte
Electronic Filing - Received, Clerk's Office, September 8, 2008
LOW-HEAD DAM EFFECTS
ON A
WARMWATER RIVER
989
brate
assemblages
were
more
similar
upstream
and
downstream
of Stratton Darn, possibly
because it
was
the
only darn in the low—gradient northern
see—
tion
of
river with generally similar habitat
char
acteristics
at
above- and below-darn stations. The
absence of cumulative effects suggests that low-
head dams and
impoundments may
influence
rivers
more as localized
perturbations than
cumulative
disruptors
of
downstream transport processes,
even
when dams
are mimerous and closely spaced.
Although down stream cumulative effects were
lacking,
multiple darns seemed to cause upstream
cumulative effects on fish movement and distri
bLition patterns
within the drainage. E[istorical
fish
eries data indicated
that dams
currently maintain
restricted distributions
for nearly one—third
o:C fish
species known from the Fox
River
basin. Migra
tion routes in the Fox
River
have been blocked for
species including
American
eels Ang-nilla rostra!a,
buffalo,
redhorses, carpsuckers carpiodes
spp.,
and skipjack herring
Alosa
cinysochioris. A num
ber
of
species
have isolated
populations at the
upstream-most
reaches of their distributions
be
cause of dams,
whereas several species
may be
functionally
isolated
by
the long distance and
nu
m erous dams
occurring between ups trean and
downstream
populations. The Dayton Dani has
isolated all
fish populations in
the
Fox River wa
tershed
by
preventing the influx of
new genetic
material from outside sources
(e.g., other
streams
in the
upper Illinois
River watershed).
The
tem
poral and
geographic scales at which genetic iso
lation by
darns
becomes detrimental to fish
pop
ulations
(i.e., through
inbreeding
depression) Cur
rently are not
known, but theoretical population
modeling of
white
sturgeon .Acipenser transmon
tanus suggests
that increased fragmentation
by
dams can
substantially reduce the
likelihocd
of
persistence
and can erode
genetic
diversity within
and among
surviving
populations
(Jager
et at.
2001).
Tn addition, by
acting
as
barriers
to
move
ment.
multiple dams
prevented recolonization
by
fishes and
freshwater mussels
(through
the con
nection
between
fish hosts and
mussel glochidia;
Watters 1992,
1996) to additional habitats that may
allow for
population growth and range expansion
within the
watershed.
Management Comsiderations
There is
extensive
evidence
that fish need to
move among a
wide array of habitats
during
their
life
cycle (Schlosser
1991; Schlosser and Anger
rneier 1995;
Pringle et al. 2000; Fausch et a1.
2002),
and recent
studies suggest that directional
movement
i.s commonplace, even among species
previously
thought to he
nonmigratory (Schmutz
and Jungwirth
1999: Bunt et
al. 2001). In their
natural form, river
ecosystems provide
a spatially
continuous
mosaic of habitats available
to
specific
species and life
stages of fish
and invertebrates
(Fausch
et
al. 2002). The detrimental consequenc
es of
dam blockage of fish
movements
(i.e., risk
of
extinction
and local extirpations) are well doe
umnented for
hundreds of
species
of
obligate nv
erine
fishes
and invertebrates throughout the West
ern
Hemisphere (see individual species accounts
in
Pringle et al. 2000).
ihe widespread
detrimental
effects of
multiple
dams and
impoundments on the Fox River suggest
that the watershed
would benefit from reconnec
tion and
restoration efforts aimed at removing or
modifying
main-stern and
tributary
darns. Options
for reconnecting
the river include
removing
dams
completely, building
rocky ramps at dams, con
structing traditional
fishways (e.g.. Denil fish-
ways), and constructing
more
natural fish
and
ca
noe bypass channels (Santucci and Gephard 2003).
Darn removal is the
best option
when the ecolog
ical
health of
the
river
is of
prime consideration,
because
it will eliminate barriers
to
migratIon for
all
types and life stages offish, restore high-quality
free—flowing
habitat,
and
improve water quality. In
addition, darn removal
is less
expensive
than the
other options presented,
and it reduces safety
risks
(e.g., drownings) and maintenance costs
by
elim
inating the structure (Born et al. 1998). The ramp
ing
of dams provides for reconnection
of the
river
by
allowing
fish to pass
upstream
and dowustreamn,
but
it
does
little
to improve degraded water quality
and habitat
because the impoundment remains.
Fishways
and bypass channels will improve con
nectivity in the river
by allowing many species
and life
stages
of
fish to
navigate over
or around
dams (Bunt et al. 2001).
However, these
options
will do nothing
to
improve habitat and water qual
ity
because, as with rocky
ramps,
the
darn
and
impoundment remain.
Fishways
and
bypass
chan
nels also have associated
operational costs and
maintenance
requirements,
and building
them
is
more expensive
than darn removal (Santucci and
Gephard 2003).
For these reasons,
fishways
and
bypass channels should
be
considered only when
clam removal
is ruled
out as a river restoration
option.
By examining
multiple
low-head dams in the
Fox
River, we have provided
clear
evidence
that
these small
structures may adversely
affect rnany
biotic and
abiotic components of
rivers and
Electronic Filing - Received, Clerk's Office, September 8, 2008
990
SANTUCCT ET
AL.
streams on local and landscape scales.
Decisions
regarding public dams are often complex, involv
ing numerous stakebolder groups and
a
variety
of
economic, social, political, and environmental
is
sues. Our results emphasize the importance of en
vironmental concerns in this decision-making pro
cess
and provide scientific data to river managers
and other stakeholders entrusted with the choice
of repairing,
removing,
or
retrofitting
existing
darns with fish
passage
structures.
Acknowledgnien ts
We would like to acknowledge
the IDNR. C2000
Ecosystem Program for project
funding and the
USEPA for extensive in-kind contributions.
The
Max McGraw Wildlife Foundation provided
ad
ditional funds, and the Fox River Ecosystem
Part
nership lent its support. R. Lee, F. Novak,
B. Rice,
B. Rung, and N. Williamson coordinated activities
with
IDNR. K. Cummings provided historic
fish
data from the
Illinois
Natural History Survey
da
tabase. E.
Hammer coordinated
activities
with
USEPA, and G.
Azevedo,
D. Collins, J. Dorkin,
M. Nord,
‘L
Patterson, N. Thomas, I). Tiilman,
and
the Region
5
Central Regional Laboratory
provid
ed
assistance. The Illinois EPA analyzed
chloro
phyll a samples. J. Gerritson of Tetra Tech offered
advice on development of the MCI.
C.
Battistuzzi,
A. Daigle,
C.
Hohman, M. Mahoney,
J. Miller, B.
Panocha, S. Proboszcz, and M. Wolfe assisted with
field collections and sample identification.
H.
Dodd, D. Wahl. the
Kaskaskia
Biological Station
Study Group,
P. K anehi, and
two anonymous re
viewers
offered
helpful comments on an earlier
draft of this
manuscript.
References
Baja, M.
B,,
.1.
T
Finn, and El. E. Booke.
1988. Stream-
flow regulation and fish community structure.
Ecol
ogy
69:382—392.
Harbour,
M.
T.,
J.
Gcn’itsen,
B.
D. Snyder,
and J. B.
Stribling. 1999. Rapid hioassessment protocols fbr
use in streams and wadable rivers: periphyton,
ben
thic
macroinvertebrates,
and fish, 2nd edition.
U.S.
Environmental Protection
Agency, Office of Water,
EPA 841 -B-99-002, Washington, D.C.
Baxter, R. NI.
1977. Environmental
effects of dams and
impoundments.
Annual Review
of Ecology and
Sys
tematics 8:255—283.
Benstead. J. P., 3. G.
March,
C. M. Pringle, and F. N.
Scatena.
1999 . Effects of
a
low-head
darn and
water
abstraction
on migratory tropical stream biota. Eco
logical
Applications 9:656—668.
Bertrand, W
A., H. Brown, J. Ferencak, and
3.
Langbein.
1982.
1981 electrofishing survey
of
the
Fox
Rivet
Illinois Department of Natura] Resources. Spring
field.
Bertrand,
W. A., R. L. Rite, and
D.
M. Day. 1996.
Bi
ological stream characterization
(BSC): biological
assessment
of Illinois stream quality
through 1993.
illinois Environmental
Protection
Agency, Spring
field.
Born,
S. M., K. D. Genakow,
T. L. Filbert, N. Hernandcz
Mora,
M. L. Keefer, and
K. A. White. 1998.
So
cioeconomic
and institutional dimensions
of dam
removals: the Wisconsin
experience. Environmental
Management
22:359—370.
Bunt,
C. M., B. T.
van
Poorten, and
.L. Wong. 2001.
Dm11 fishway utilization
patterns and
passage of
several warmwater
species relative to seasonal.
thermal,
and hydraulic dynamics. Ecology
ofFrcsh
water
Fish 10:212—219.
Clay,
C. H. 1995. Design
of
fishways
and
other fish
facilities, 2nd
edition.
CRC
Press, Boca Raton,
Flor
ida.
Day,
D. M.,
H.
Brown,
K. Clodfclter,
J.
Fereneak,
3.
Langhein,
and R. Miller.
1992. The Fox River: tem
poral and spatial
relationships in the tish
community
of an
increasingly
urbanized watershed (1978—
1990).
Illinois Department
of Natural Resources,
Springfield.
Dc Merona,
B., and
P. Albert. 1999. Ecological
moni
toring
of fish
assemblages downstream of a hydro
electric
dam
in French Guiana (South America).
Regulated
Rivers: Research
and Management 15:
339—351.
Dynesius, M.,
and
C.
Nilsson. 1994. Fragmentation
and
flow
regulation
of
river
systems in the northern third
of the
world. Science 266:753—762.
Efford,
I. E. 1975.
Assessment of the impact of hydro
dams.
Journal of the Fisheries Research
Board of
Canada
32:196—209.
Ellis,
M.
M.
l94t.
Freshwater impoundments. Tramis—
actions of the
American Fisheries Society 71:80—
93.
Fausch,
K.
D.. J. Lyons, J. R. Kari’, and
P. L. Angermcier.
1990. Fish
communities
as
indicators of environ
mental
degradation.
Pages 123—144 in
S. M. Adams,
editor.
Biological
indicators
of stress in fish. Amer
ican
Fisheries Society,
Symposium 8, Bethesda,
Maryland.
Fausch,
K. D.,
C. F. Torgersen,
C.
V. Baxter. and H.
W.
Li. 2002.
Landscapes to riverscapes:
bridging the
gap
between
research
and conservation
of
stream
fishes. Bioscience
52:483—498.
Gordon,
A. E., and
3. B. Wallace. 1975. Distribution
of
the
family
Hydropsychidae
in
the Savannah River
Basin of North
Carolina, South Carolina, and Geor
gia. H.ydrohiologia
46:405-423.
Hall, G. E., editor.
1971. Reservoir fisheries and lim
nology. American
Fisheries Society, Special Pub
lication
8, Bethesda,
Maryland.
Hall,
G.
E.,
and M. I. Van
Den Avyle,
editors. 1986.
Reservoir
fisheries
management:
strategies for the
80’s. Reservoir
Committee, Southern
Division,
American
Fisheries Society, Bethesda, Maryland.
Hammer,
J.. and R. L.inke.
2003. t)uPage
River fish
passage
feasibility study. Final rcpnrt of The Con-
Electronic Filing - Received, Clerk's Office, September 8, 2008
LOW-HEAT) DAM
EFFECTS ON A WARMWATER RIVER
991
servation Foundation to the Tllrnojs Departrnct
of
Natural
Resources, Springfield.
Hauer. F.
R..
and
J. A. Stanford.
1982. Ecological re
sponses of hydropsychid caddisflies to stream
reg
ulation. Canadian Journal of Fisheries
and Aquatic
Sciences 39:123
1242.
Heidinger,
R.
1993. Aquatic survey
of the Fox River
between Elgin Darn and South
Elgin Dam. Report
of Southern Illinois University at
Carbondale
to Fly
aN Development Corporation. Elgin.
Illinois.
Hilsenhoff,
W.
L. 1987. An improved
biotie index of
organic stream pollution. Great
Lakes Entomologist
20:31—39.
Hite, R. L.. and D. W. Brockamp. 1992. Effects
of live
stock wastes on small
Illinois streams: lower Kas—
kaskia River basin and upper Wabash
River basin.
Illinois Environmental. Protection
Agency, Report
IEPA/WPC/92-114,
Springfield.
Hynes,
H. B.
N. 1970. The ecology
of running waters.
University of’
Toronto Press,
Toronto.
IDNR
(Illinois
Department of Natural
Resources). 1998.
Fox River area assessment, volume
1. Geology; vol
ume 2.
Water
resources;
and
volume
3. Living re
sources. Illinois Department of Natural Resources,
Springfield.
Jager, H
A. Chandler, K . B. Lepia,
and W. Van
Winkle. 2001. A
theoretical study
of river flag
mentation by darns and its effects on white sturgeon
populations. Environinental Biology
of
Fishes 60:
347—361.
Kanehl, PD
1.
Lyons, and I.E. Nelson. 1997.
Changes
in the habitat and
fish community
of the Milwaukee
River; Wisconsin,
following
removal of the Woolen
Mills
Dam. North American .Tournal
of Fisheries
Management
17:387—400.
Karm’.
J.
R. 1981. Assessment of biotic integrity using
fish communities.
Fisheries
6(6):21...27.
Ligon. E K.,
W. E.
Dietrich,
and W.
J.
Trush.
1995.
Downstream
ecological
effects of dams. Bioscience
45:183—192.
Lohman, K., and J. R. Jones. 1999. Nutrient—sestonic
chlorophyll
relationships in northern
Ozark streams.
Canadian Journal of Fisheries and Aquatic Sciences
56:124—130.
Martinez, P.1., T
Chart, lvi.
A.
Trammell, I.
G.
Wullsehleger, and E. P. Bergersen. 1994. Fish spe
cies composition before and after construction
of
a
main-stern reservoir on the White River; Colorado.
Environmental Biology of Fishes 40:227-239.
Merritt,
R.
W.. and K. W. Cummins.
1996. An
intro
duction to the aquatic insects of North America.
Kendall/Hunt Publishing Company,
Dubuqne,
Iowa.
Nursall,
J.
R. 1952. The early development of a bottom
fauna
in
a
new power reservoir in the
Rocky Moun
tains
of Alberta. Canadian Journal of Zoology
30:
3
87—409.
OEPA
(Ohio
Environmental
Protection Agency). 1989.
Biological
criteria for
the
protection of aquatic
life.
volume III.
Standardized
biological
field
sampling
and laboratory
methods
for assessing fish and mac-
roinvertcbrate
communities. Ohio Environmental
Protection Agency,
Columbus.
Parker,
C.
K., and
I. K. Voshell, Jr. 1983. Production of
filter-feeding Trichoptera
in an impounded and free-
flowing river’. Canadian
Journal of Zoology 61:70—
87.
Paterson.
C.
G.,
and
C.
H.
Fernando. 1969. Macrein-
vertebrate
colonization
of the marginal zone of a
small
impoundment in eastern Canada.
Canadian
Journal
of Zoology 47:1229—1238.
Pescitelli,
S.,
and B. Rung.
1998. Effects of Hoffman
Dam
on local fish communities
in the Des
Flames
River.
Illinois Department
of Natural Resources,
Piano.
Poft’
N. L., J. 1). Allen,
M. B. Bain, I. R. .Karr, K. L.
Prestegaard,
B. 1). Richter;
R. E. Sparks, and I.
C.
Stromberg. 1997. The
natural flow regime: a par
adigm for river
conservation and restoration. Bio
science 47:769—784.
Poff,
N. L., and 1). 1).
Hart. 2002. How dams may vary
and
why
it matters
for the emerging science of darn
removal. Bioscience
52:659
668.
Porto, L. M., R.
L. McLaughlin, and 1). L.
0.
Noalces.
1999. Low-head
barrier
dams
restrict
the move
mnents of
fishes in two
Lake
Ontario streams.
North
American
Journal of Fisheries
Management
19:
1028--I
036.
Pringle,
C. M., M.
C.
Freeman,
and B. J. Freeman. 2000.
Regional
effects of
hydrologic alterations on nv
erine
macrobiota in
the
new
world:
tropical....
temperate
comparisons.
Bioscience 50:807823.
Raheni,
C. F,
and
R. B. Jacobson.
1993. The importance
of fluvial
hydraulics to fish-habitat
restoration in
low-gradient alluvial
streams.
Freshwater
Biology
29:211-220.
Rabeni,
C. F., and
0.
W.
Minshali. 1977. Factors
af
fecting
microdistrihution of stream benthic
insects.
Oikos 29:33
43.
Rankin, F. T. 1989.
The qualitative habitat
evaluation
index
(QHET):
rationale,
methods,
and application.
Ohio Environmental
Protection
Agency, Columbus.
Reice,
S. R. 1980. The role
of substrate in hcnthic mac
roinvertebrate
microdistribution and litter
decom
position in
woodland stream. Ecology
61:580 590.
Robertson, D.
M., 1) ..A.
Saad, and A.
lvi.
Wichen. 2001.
An
alternative regionalizatiorm
scheme for defining
nutrient
criteria for rivers
and streams, U.S.
Geo
logical
Survey,
Water Resources Investigatioos
Re
port 01-4073
Middleton, Wisconsin.
Rodriguez-Ruiz,
A., and C. Granado-Lorencio.
1992.
Spawning
period and migration
of three species of
cyprinids
in a stream with Mediterranean
regimen
(SW
Spain). Journal
of Fish Biology 41:545 556.
Ruhr,
C. E. 1956. Effect
of stream impoundment in Ten
nessee on the fish
populations of tributary streams.
Transactions of the
American Fisheries Society
56:
144--157.
Sallee, R. 1)., and H.
W.
Bergmano.
1986. 1982
Fox
River basin fisheries
assessment. Illinois Depart
mnent of Natural
Resources,
Aledo.
Santucci,
V. J., Jr. 1994. Assessment offish populations
in
the Fox River
between
Algonquin and Elgin, TI-
Electronic Filing - Received, Clerk's Office, September 8, 2008
992
SANTUCCI
ET AL.
linois.
iviax
McGraw Wildlife
Foundation,
Fisheries
Research
Report,
Dundee.
Illinois.
Santucci,
V. J.,
Jr., and
S.
R.
Gephard.
2003. Fox
River
fish passage
feasibility
study. Final
Report of
the
Max
McGraw
Wildlife
Foundation
to
the Illinois
Department
of
Natural
Resources,
Springfield.
Scblosser,
1.
J.
1991.
Stream
fish
ecology: a
landscape
perspccti’e.
Bioscience 41:704412.
Sehiosser,
U..
and P.
L. Angermeier.
1995. Spatial
var
iation
in
demographic
processes
of
lotic fishes:
con
ceptual
models,
empirical
evidence,
and
iniplica—
tions
for conservation.
Pages 392—401
in .1. L. Niel
sen,
editor.
Evolution
and the aquatic
ecosystem:
defining
unique
units
in population
conservation.
American
Fisheries
Society,
Bethesda,
Maryland.
Schmutz,
S.,
and M.
Jungwirth.
1999. Fish
as indicators
of
large—river
connectivity:
the Danube
and its trib
utaries.
Archly fUr Hydrohiologia
I
15:329—348.
Singh,
K.
P., T. A.
Butts, H.
V. Knapp, 0.
B. Shackleford,
and
R.
S.
Larson. I 995.
Considerations
in
water
use
planning
for the Fox
River.
Illinois
State
Water
Survey,
Contract
Report
536, Champaign.
Smith,
L.
W.,
F.
Dittn,er,
M. Prevost, and
D. R. Burt.
2000.
Breaching
of
a
small irrigation
dam in
Oregon:
a
case
history.
North American
Journal of
Fisheries
Management
20:205—219.
Soballc, D. M.,
and
R. W. Bachmann.
1984.
Influence
of reservoir
transit
on riverine
algal transport
and
abundance.
Canadian
Journal
of Fisheries
and
Aquatic Sciences
41:1803--I 813.
Soballe, D. M.,
and
B. L. Kimmel.
1987. A large-scale
comparison
of
factors influencing
phytoplankton
abundance
in
rivers, lakes,
and
impoundments.
Ecology
68:1943—1954.
Spence,
J.A..
and N.
B. N. Hynes.
1971a.
Differences
in henthos
upstream and
downstream
of an
im
poundment.
Journal
of the Fisheries
Research Board
of Canada
28:35—43.
Spence,
J. A.,
and
H. B. N. Hynes.
197 lb.
Differences
in
fish
populations
upstream
and downstream
of
a
mainstream
impoundment.
Journal of
the Fisheries
Research
Board of Canada
28:45—46.
Stanley,
F.
H.,
M.
A. Lueblce,
lvi.
W.
Doyle.
and
D. W.
Marshall.
2002.
Short-term
changes
in channel
form and
macroinvertebrate
communities
following
low-head
dam
removal.
Journal of the
North Amer
jean Bcnthologieal
Society
21:172—187.
Steel,
R. G. D.,
and
J. H. Torrie.
1980. Principles
and
procedures
of statistics:
a
biometrical
approach.
McGraw
Hill.
New
York.
TaIling,
J. F.
and
J. Rzoska.
1967.
The development
of
plankton
in relation
to
hydrological
regime
in the
Blue Nile.
Journal
of
Ecology 55:637—662.
USEPA
(U.S.
Enviroumental
Protection
Agency).
2000.
Nutrient
criteria
technical
guidance
manual: rivers
and streams.
U.S.
Environmental
Protection
Agen
cy,
EPA-822-B-00-002,
Washington, D.C.
USGS
(U.S.
Geological
Survey).
2001.
Water resources
data: Illinois
water
year
2000. USGS,
Denver.
USGS
(U.S.
Geological
Survey).
2002. Water
resources
data:
illinois water
year
2001.
USGS,
Denver.
Vannote,
R.
L., G.
XV. Minshall.
K. W.
Cummins.
J.
R.
Sedell,
and
C.
F. Cushing.
1980. The
river
contin
uum
concept.
Canadian
Journal
of Fisheries
and
Aquatic
Sciences
37:130—137.
Ward,
J.
V.,
and J. A. Stanford.
editors.
1979. The ecol
ogy
of regulated
streams.
Plenum, New York.
Ward, J.
V., and
J.
A.
Stanford. 1983.
The serial
dis
continuity
concept
of lotic ecosystems.
Pages
29—
42
in T. D.
Fontain and
S. M.
Bartell,
editors. Dy
namics
of lotie
ecosystems.
Ann Arbor Science,
Ann
Arbor, Michigan.
XVatters,
G.
T. 1992. Unionids,
fishes,
and the
species-
area
curve.
Journal
of Biogeography
19:481—490.
Watters,
G. 1. 1996. Small
dams
as barriers
to freshwater
mussels
(Bivaivia,
Unionida)
and their hosts.
Bio
logical
Conservation
75:79—85.
Winston,
M. F.,
C. M. Taylor,
and
J.
Pigg. 1991.
Up
stream
extirpation
of four
minnow species
due
to
damming
of
a
prairie stream.
Transactions
of the
American
Fisheries
Society
120:98—105.
Electronic Filing - Received, Clerk's Office, September 8, 2008
Electronic Filing - Received, Clerk's Office, September 8, 2008