Worldwide Engineering , Environmental , Construction , and IT Services
Revision 1
Certain figures in this Report contain sensitive, security-
related information protected from public disclosure by
Federal and State law. This Report is suitable for
public disclosure only after these figures are removed.
HYDROGEOLOGIC INVESTIGATION REPORT
FLEETWIDE ASSESSMENT
QUAD CITIES GENERATING STATION
CORDOVA, ILLINOIS
Prepared For:
Exelon Generation Company, LLC
DISCLAIMER:
SOME FORMATTING CHANGES MAY HAVE OCCURRED WHEN
THE ORIGINAL DOCUMENT WAS PRINTED TO PDF; HOWEVER,
THE ORIGINAL CONTENT REMAINS UNCHANGED.
SEPTEMBER 2006
R
EF. NO. 045136 (20)
Prepared by:
Conestoga-Rovers
& Associates
651 Colby Drive
Waterloo, Ontario
Canada N2V 1C2
Office: (519) 884-0510
Fax:
(519) 884-0525
web: http:\\www.CRAworld.com
Revision 1
TABLE OF CONTENTS
Page
EXECUTIVE SUMMARY.................................................................................................................... i
1.0
INTRODUCTION ...................................................................................................................1
2.0
STATION DESCRIPTION .....................................................................................................2
2.1
STATION LOCATION .......................................................................................2
2.2
OVERVIEW OF COOLING WATER OPERATIONS.....................................2
2.3
SURROUNDING LAND USE ...........................................................................3
2.4
STATION SETTING............................................................................................4
2.4.1
TOPOGRAPHY AND SURFACE WATER FEATURES.................................4
2.4.2
GEOLOGY............................................................................................................5
2.4.3
HYDROGEOLOGY .............................................................................................6
2.5
AREA GROUNDWATER USE..........................................................................7
3.0
AREAS FOR FURTHER
EVALUATION.............................................................................9
3.1
SYSTEMS EVALUATIONS................................................................................9
3.2
HISTORICAL RELEASES ................................................................................12
3.3
STATION INVESTIGATIONS.........................................................................12
3.3.1
PRE-OPERATIONAL RADIOLOGICAL ENVIRONMENTAL
MONITORING PROGRAM.............................................................................12
3.3.2
RADIOLOGICAL ENVIRONMENTAL MONITORING PROGRAM ......13
3.3.3
HISTORIC INVESTIGATIONS .......................................................................13
3.3.4
POWER PLANT DOCUMENTS - UFSAR REPORT ....................................14
3.4
IDENTIFIED AREAS OF FURTHER EVALUATION..................................14
4.0
FIELD METHODS.................................................................................................................17
4.1
SURFACE WATER GAUGING POINT INSTALLATION
AND MONITORING........................................................................................17
4.2
GROUNDWATER MONITORING WELL INSTALLATION.....................17
4.3
GROUNDWATER MONITORING WELL DEVELOPMENT ....................19
4.4
SURVEY ..............................................................................................................19
4.5
GROUNDWATER AND SURFACE WATER ELEVATION
MEASUREMENTS
............................................................................................19
4.6
GROUNDWATER AND SURFACE WATER
SAMPLE COLLECTION
..................................................................................20
4.7
DATA QUALITY OBJECTIVES.......................................................................22
4.8
SAMPLE IDENTIFICATION...........................................................................23
4.9
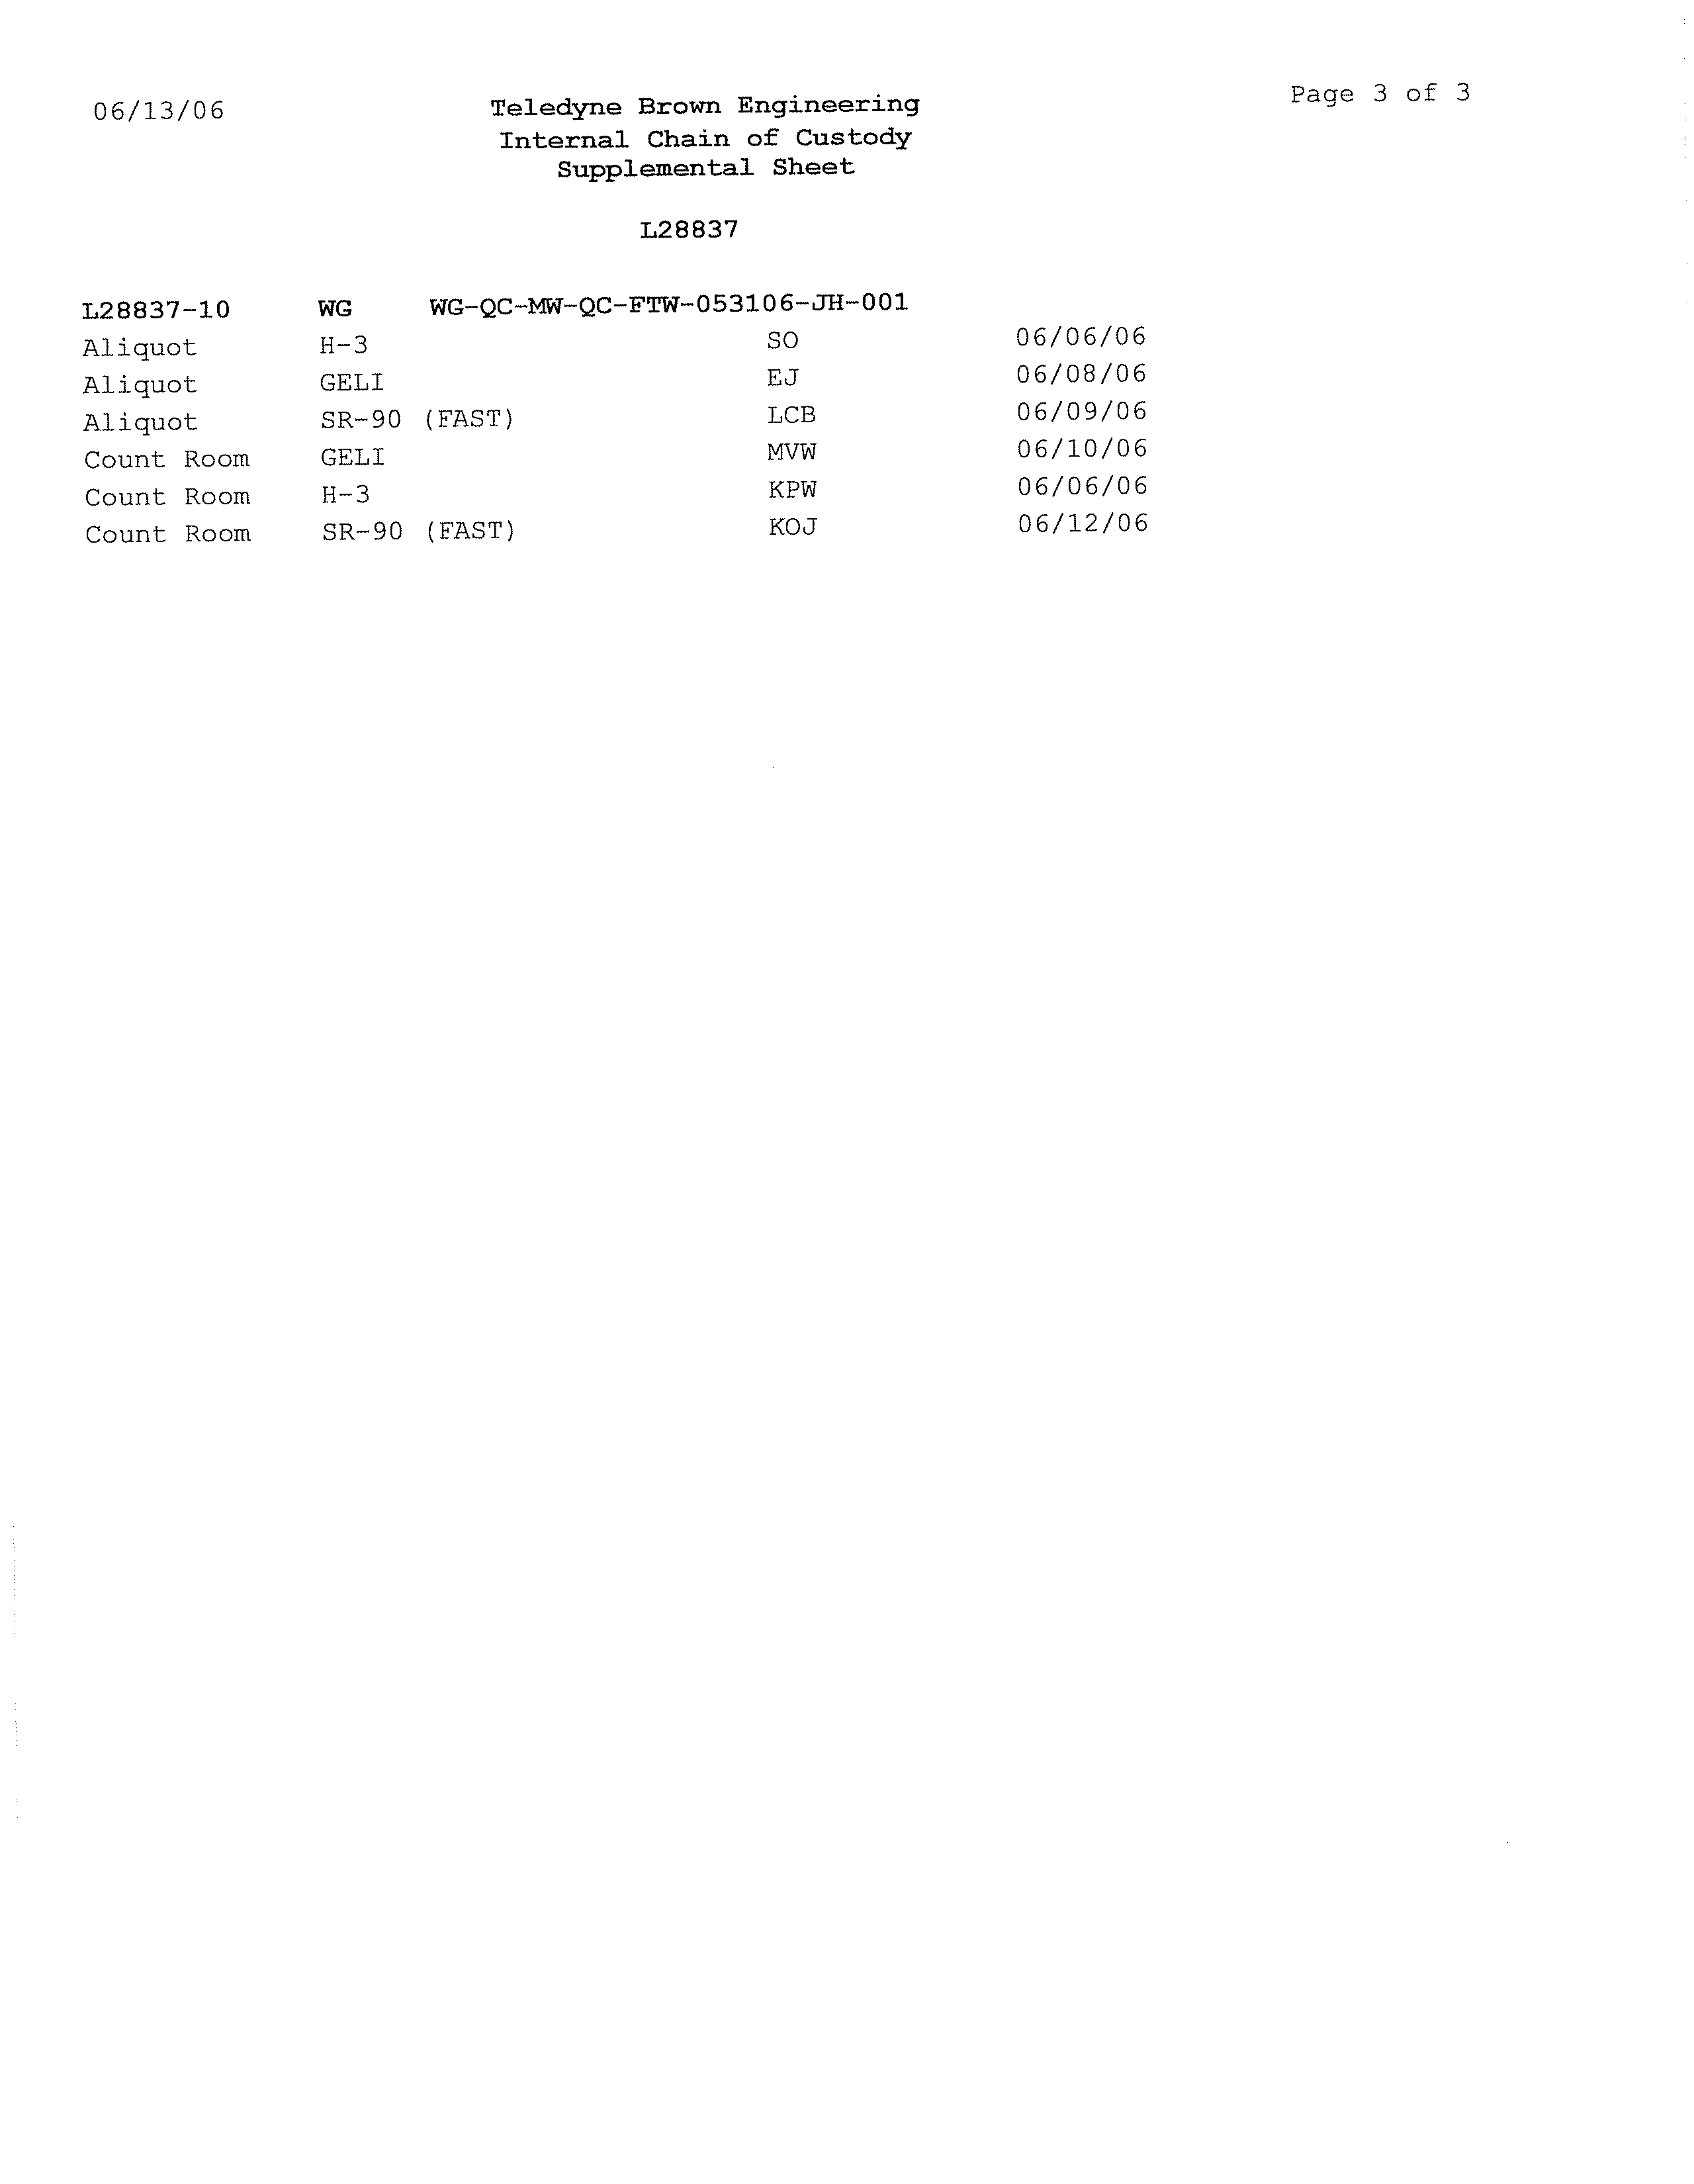
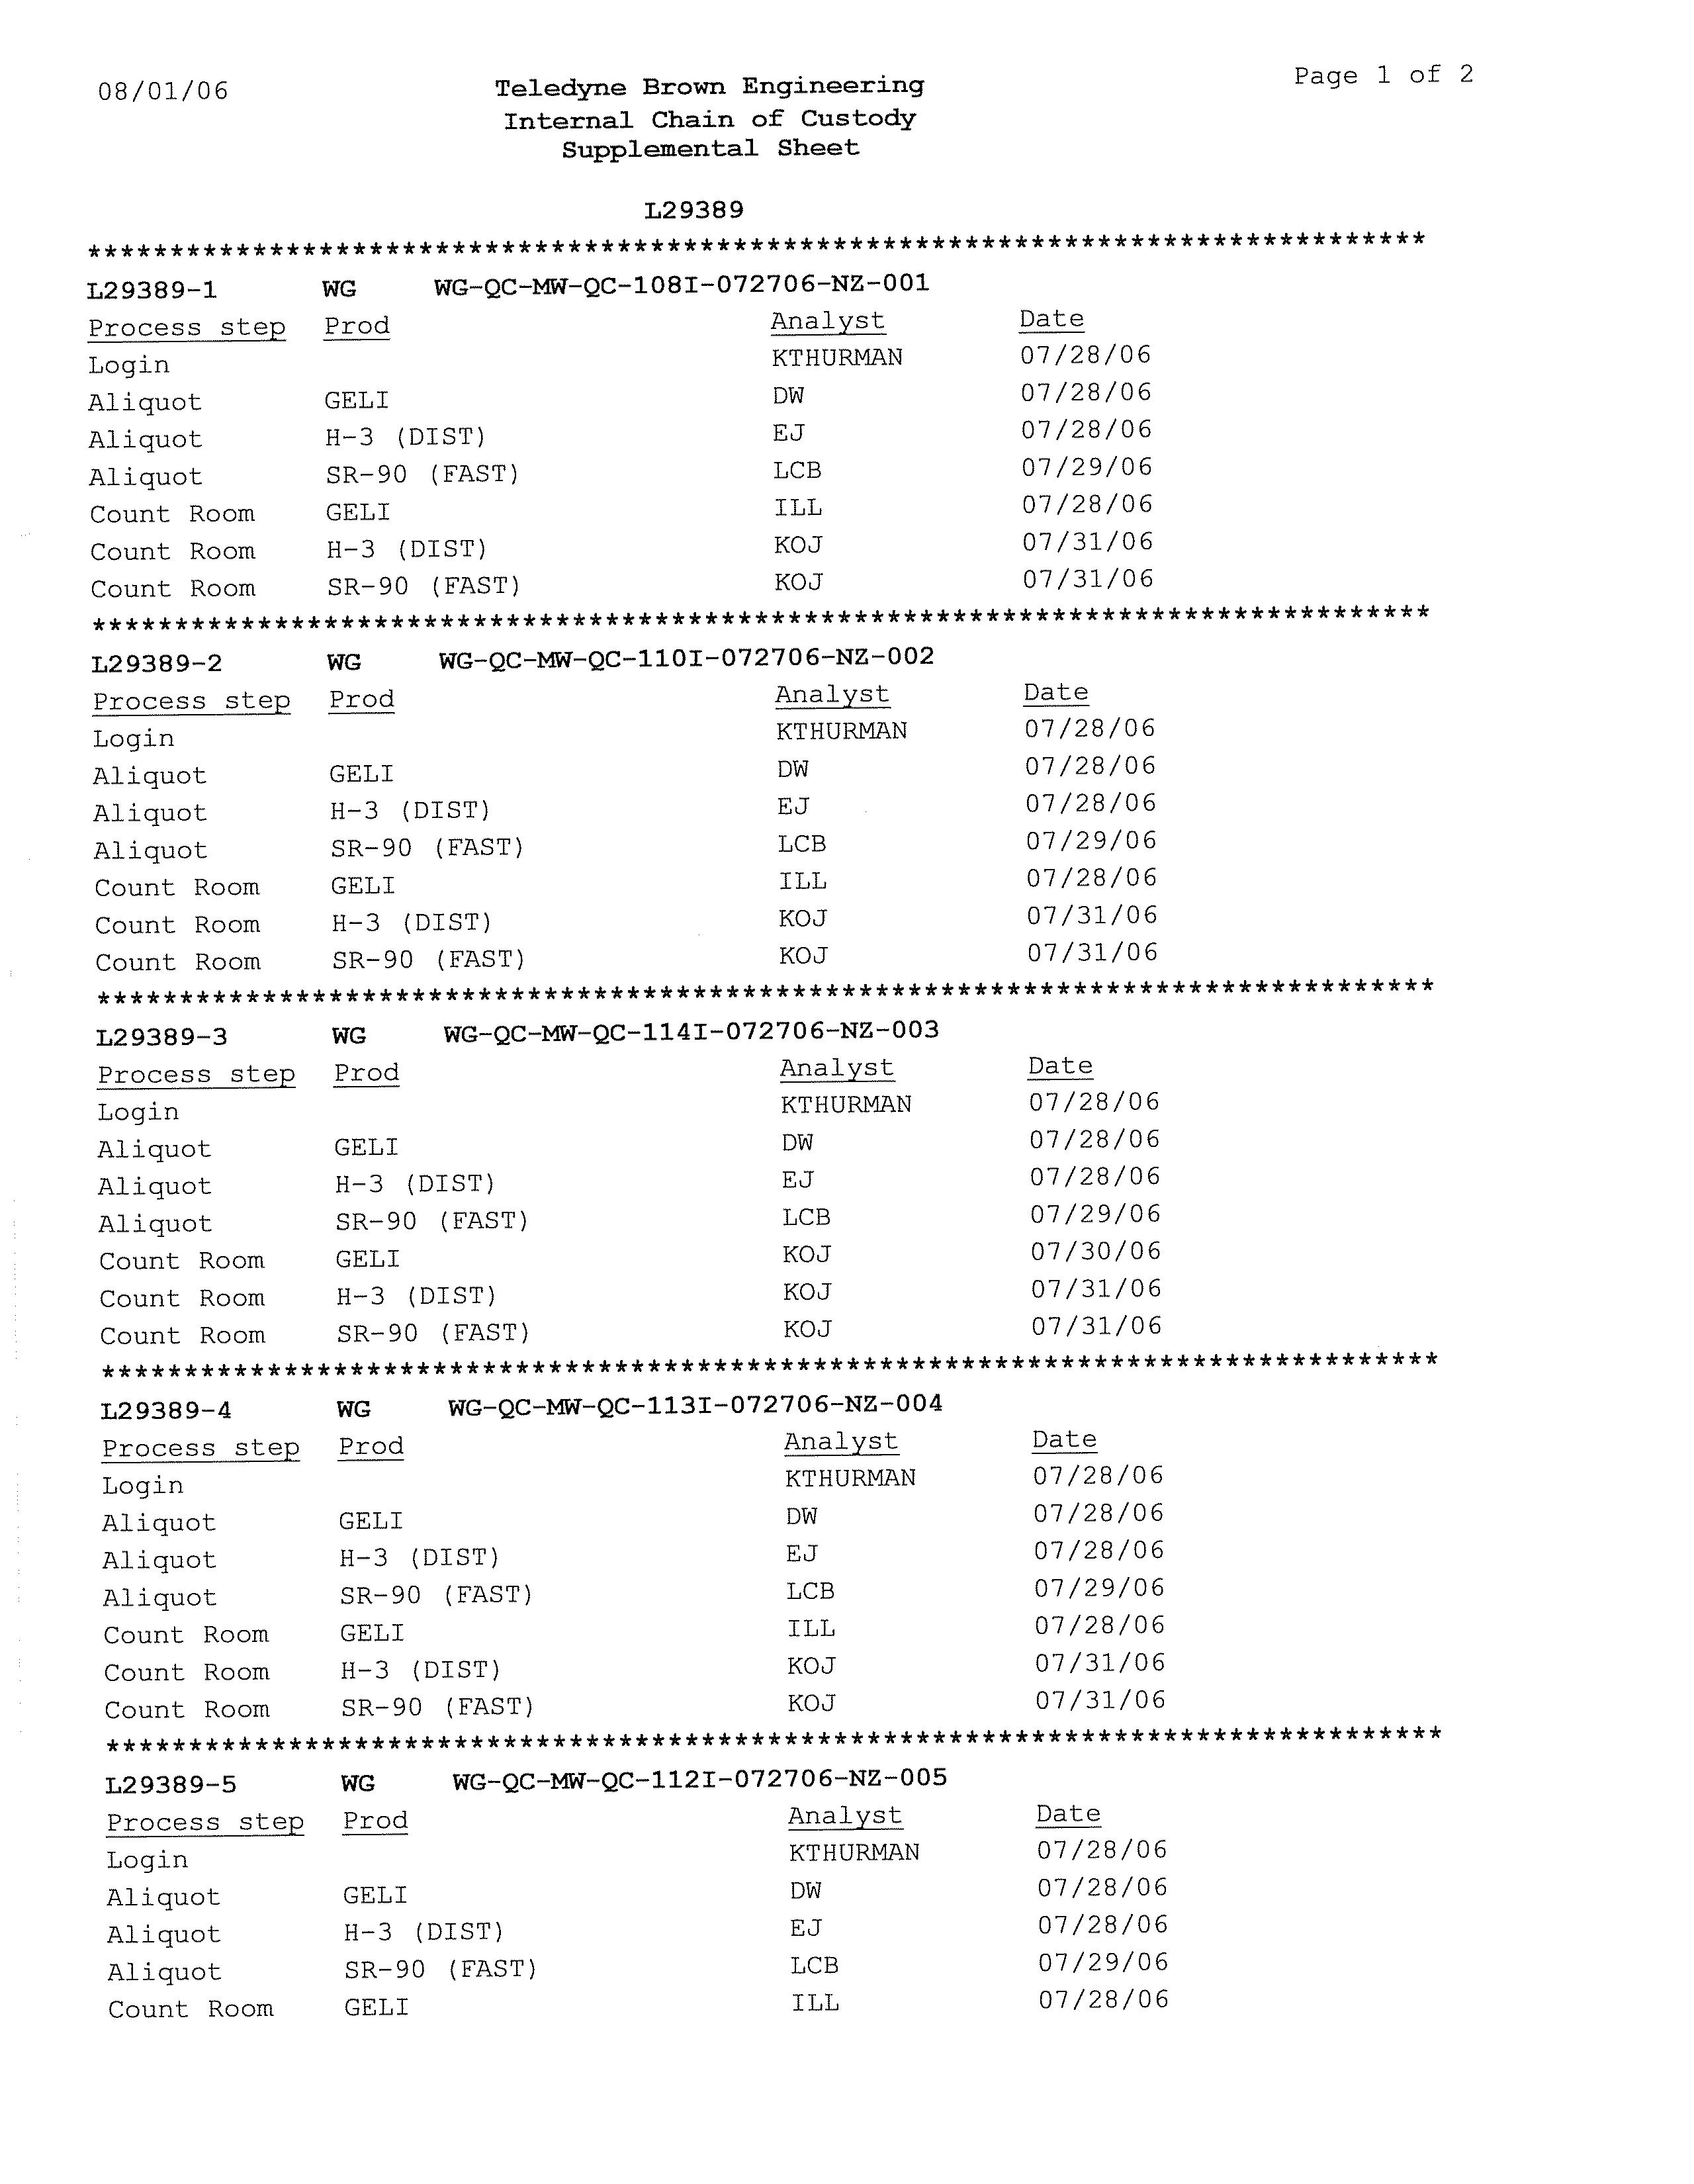
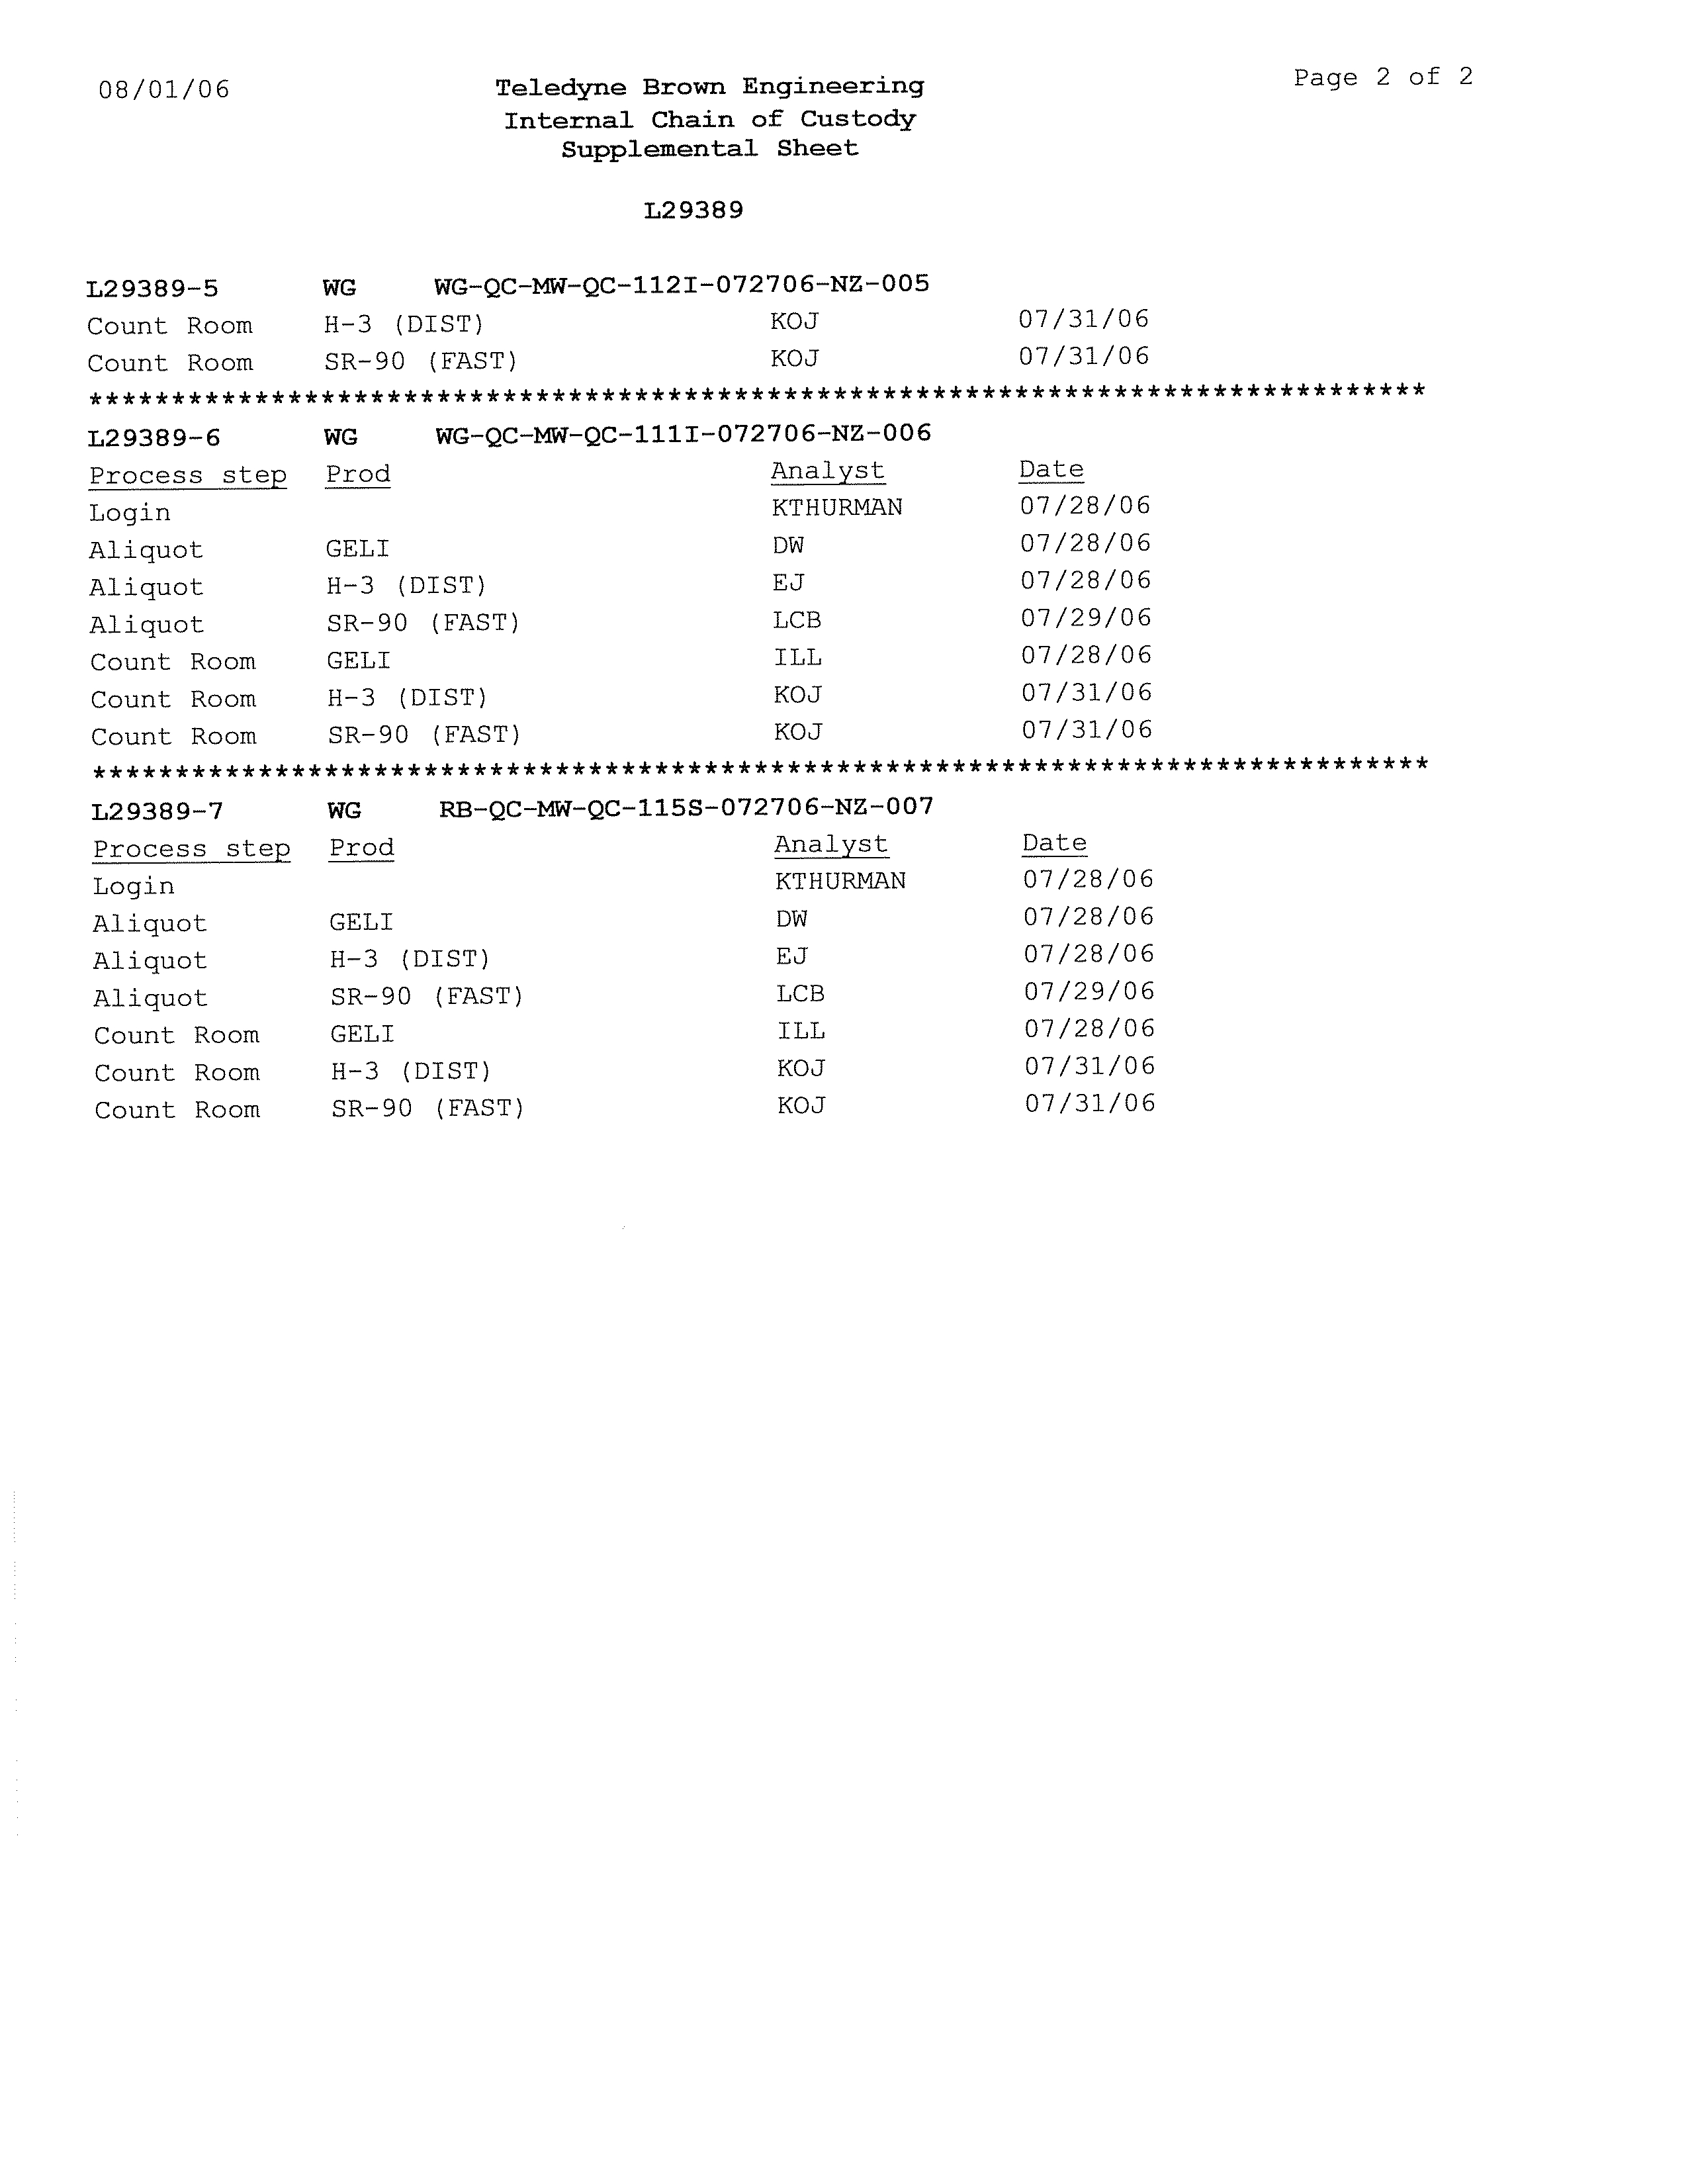
CHAIN-OF-CUSTODY RECORD...................................................................24
4.10
QUALITY CONTROL SAMPLES ...................................................................24
4.11
ANALYSES.........................................................................................................24
045136 (20) Quad Cities Generating Station
CONESTOGA-ROVERS & ASSOCIATES
Revision 1
TABLE OF CONTENTS
Page
5.0
RESULTS SUMMARY..........................................................................................................25
5.1
STATION GEOLOGY .......................................................................................25
5.2
STATION HYDROGEOLOGY ........................................................................27
5.2.1
MAN-MADE INFLUENCES ON GROUNDWATER FLOW .....................27
5.2.2
GROUNDWATER FLOW DIRECTIONS ......................................................29
5.2.3
VERTICAL HYDRAULIC GRADIENTS........................................................30
5.2.4
LATERAL GROUNDWATER FLOW AND VELOCITY.............................30
5.3
GROUNDWATER QUALITY..........................................................................31
5.3.1
SUMMARY OF BETA-EMITTING RADIONUCLIDES
ANALYTICAL RESULTS.................................................................................32
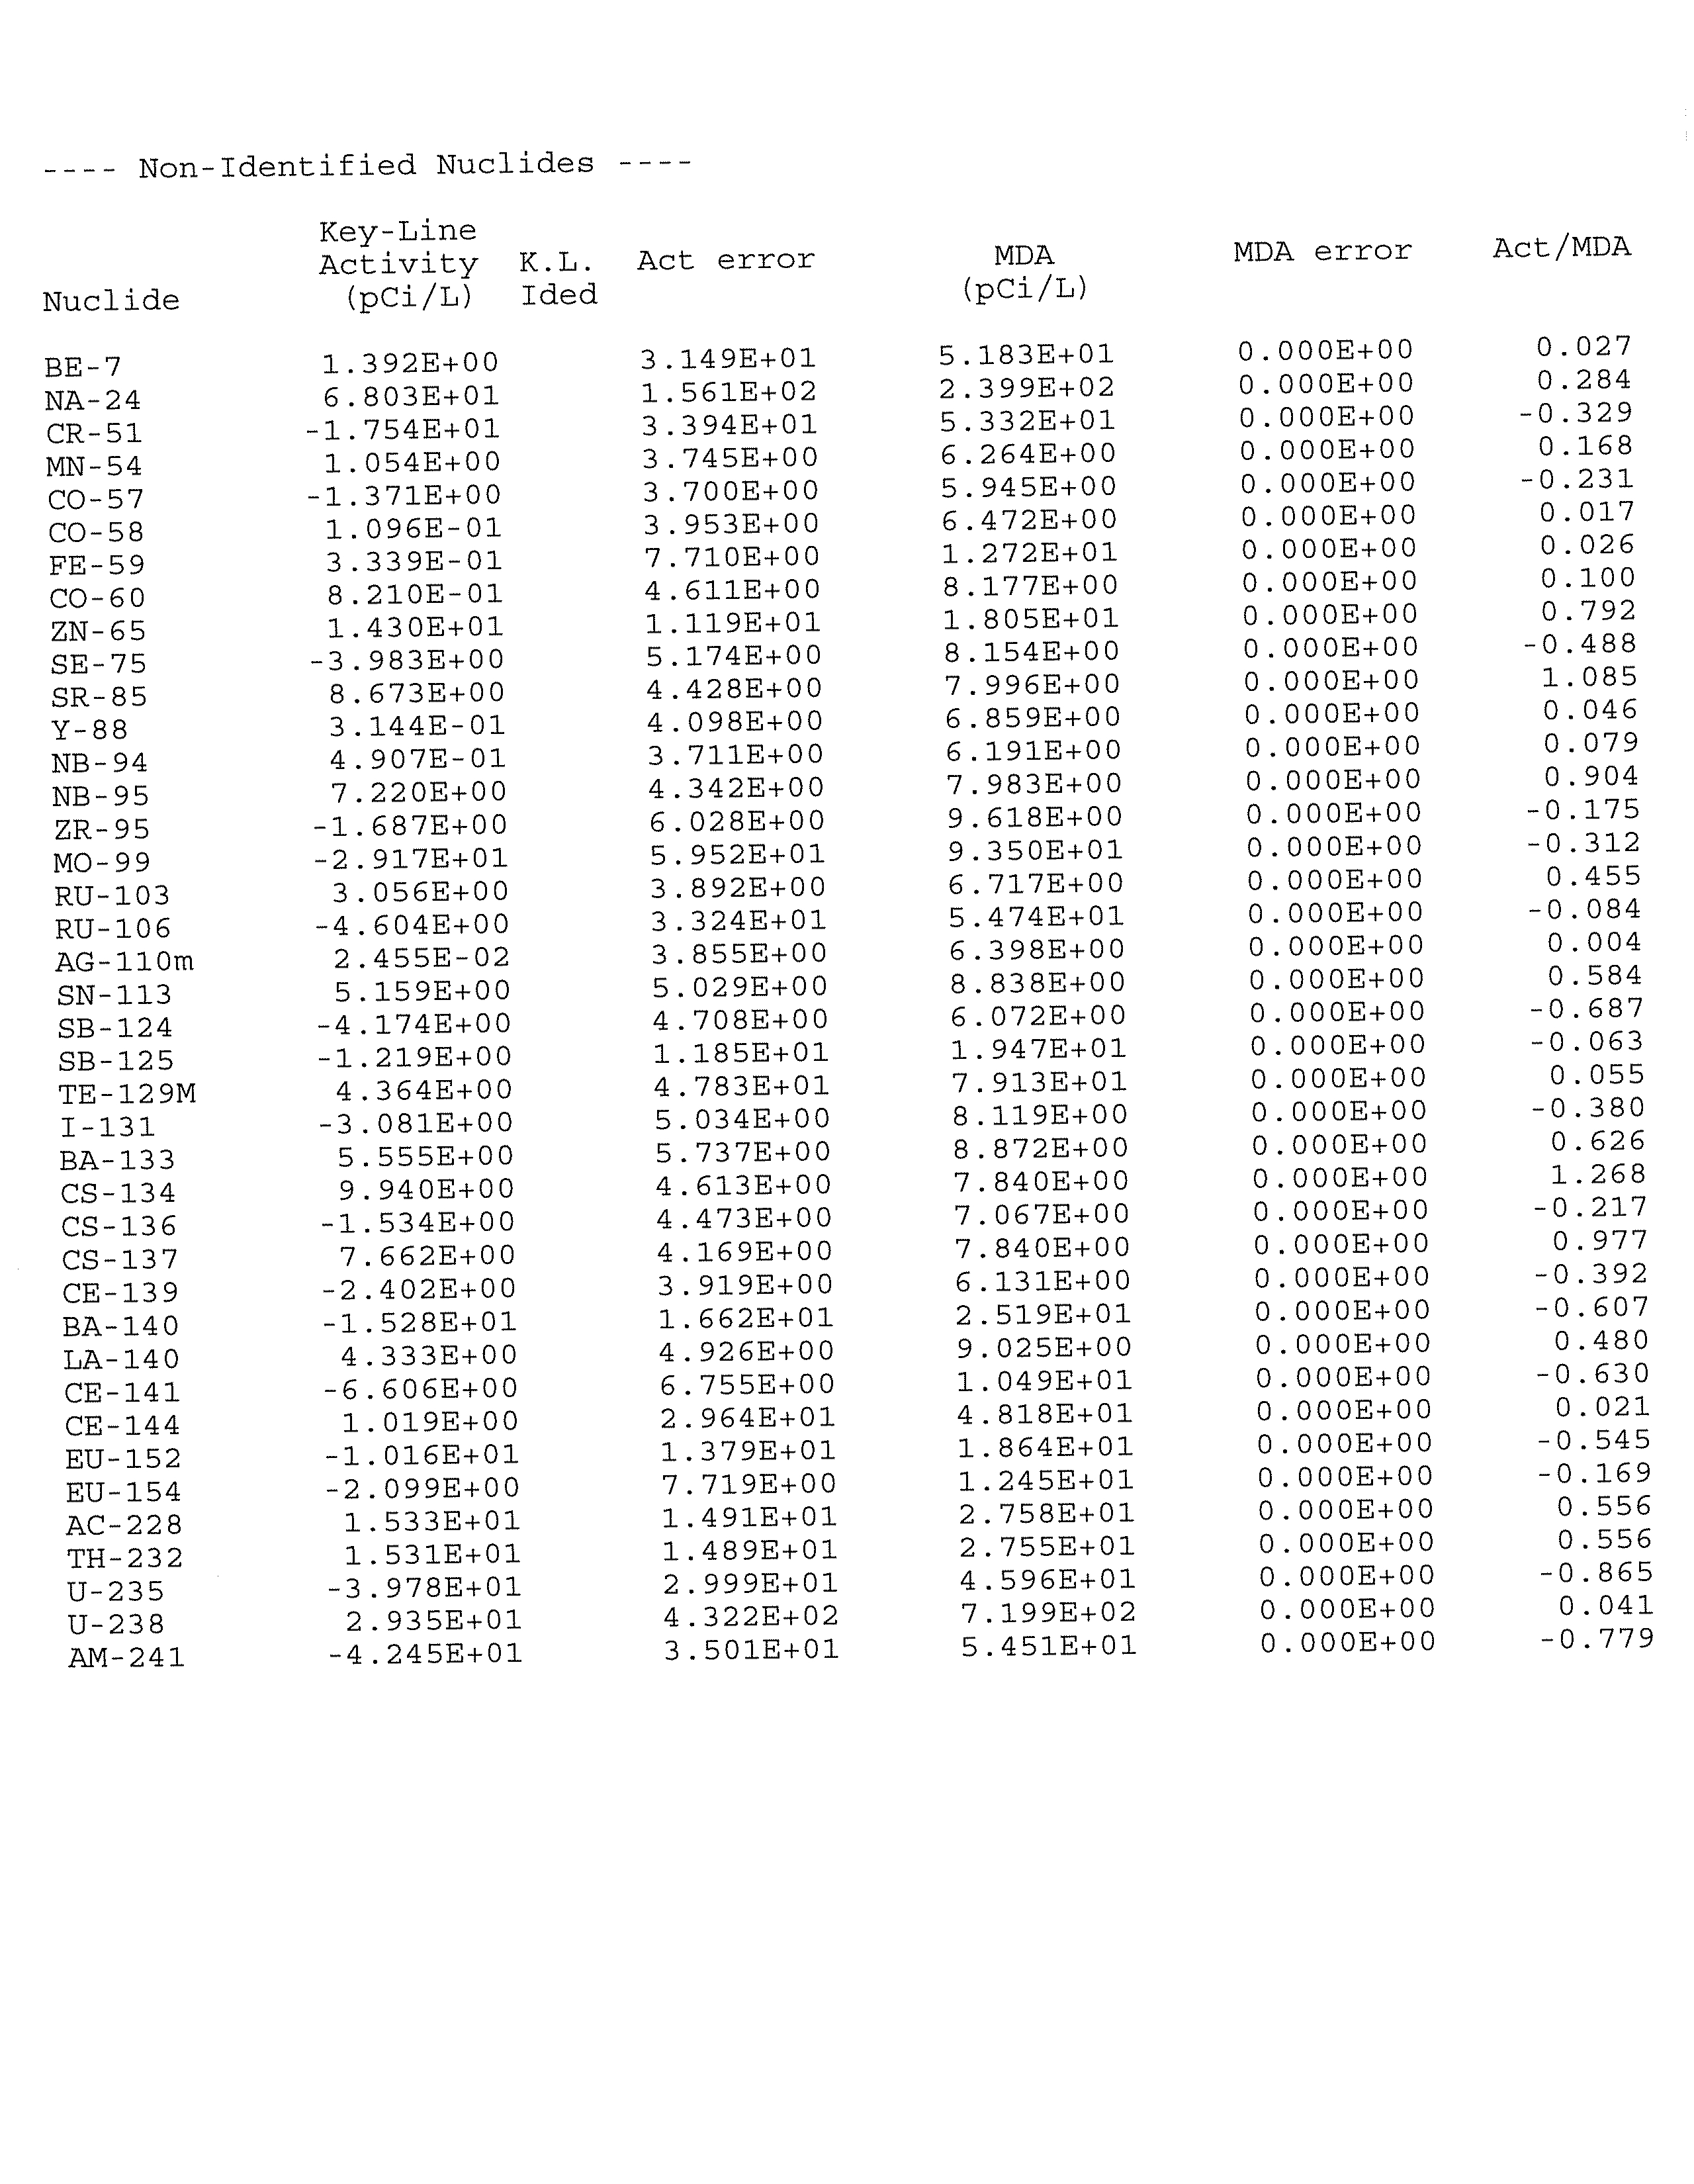
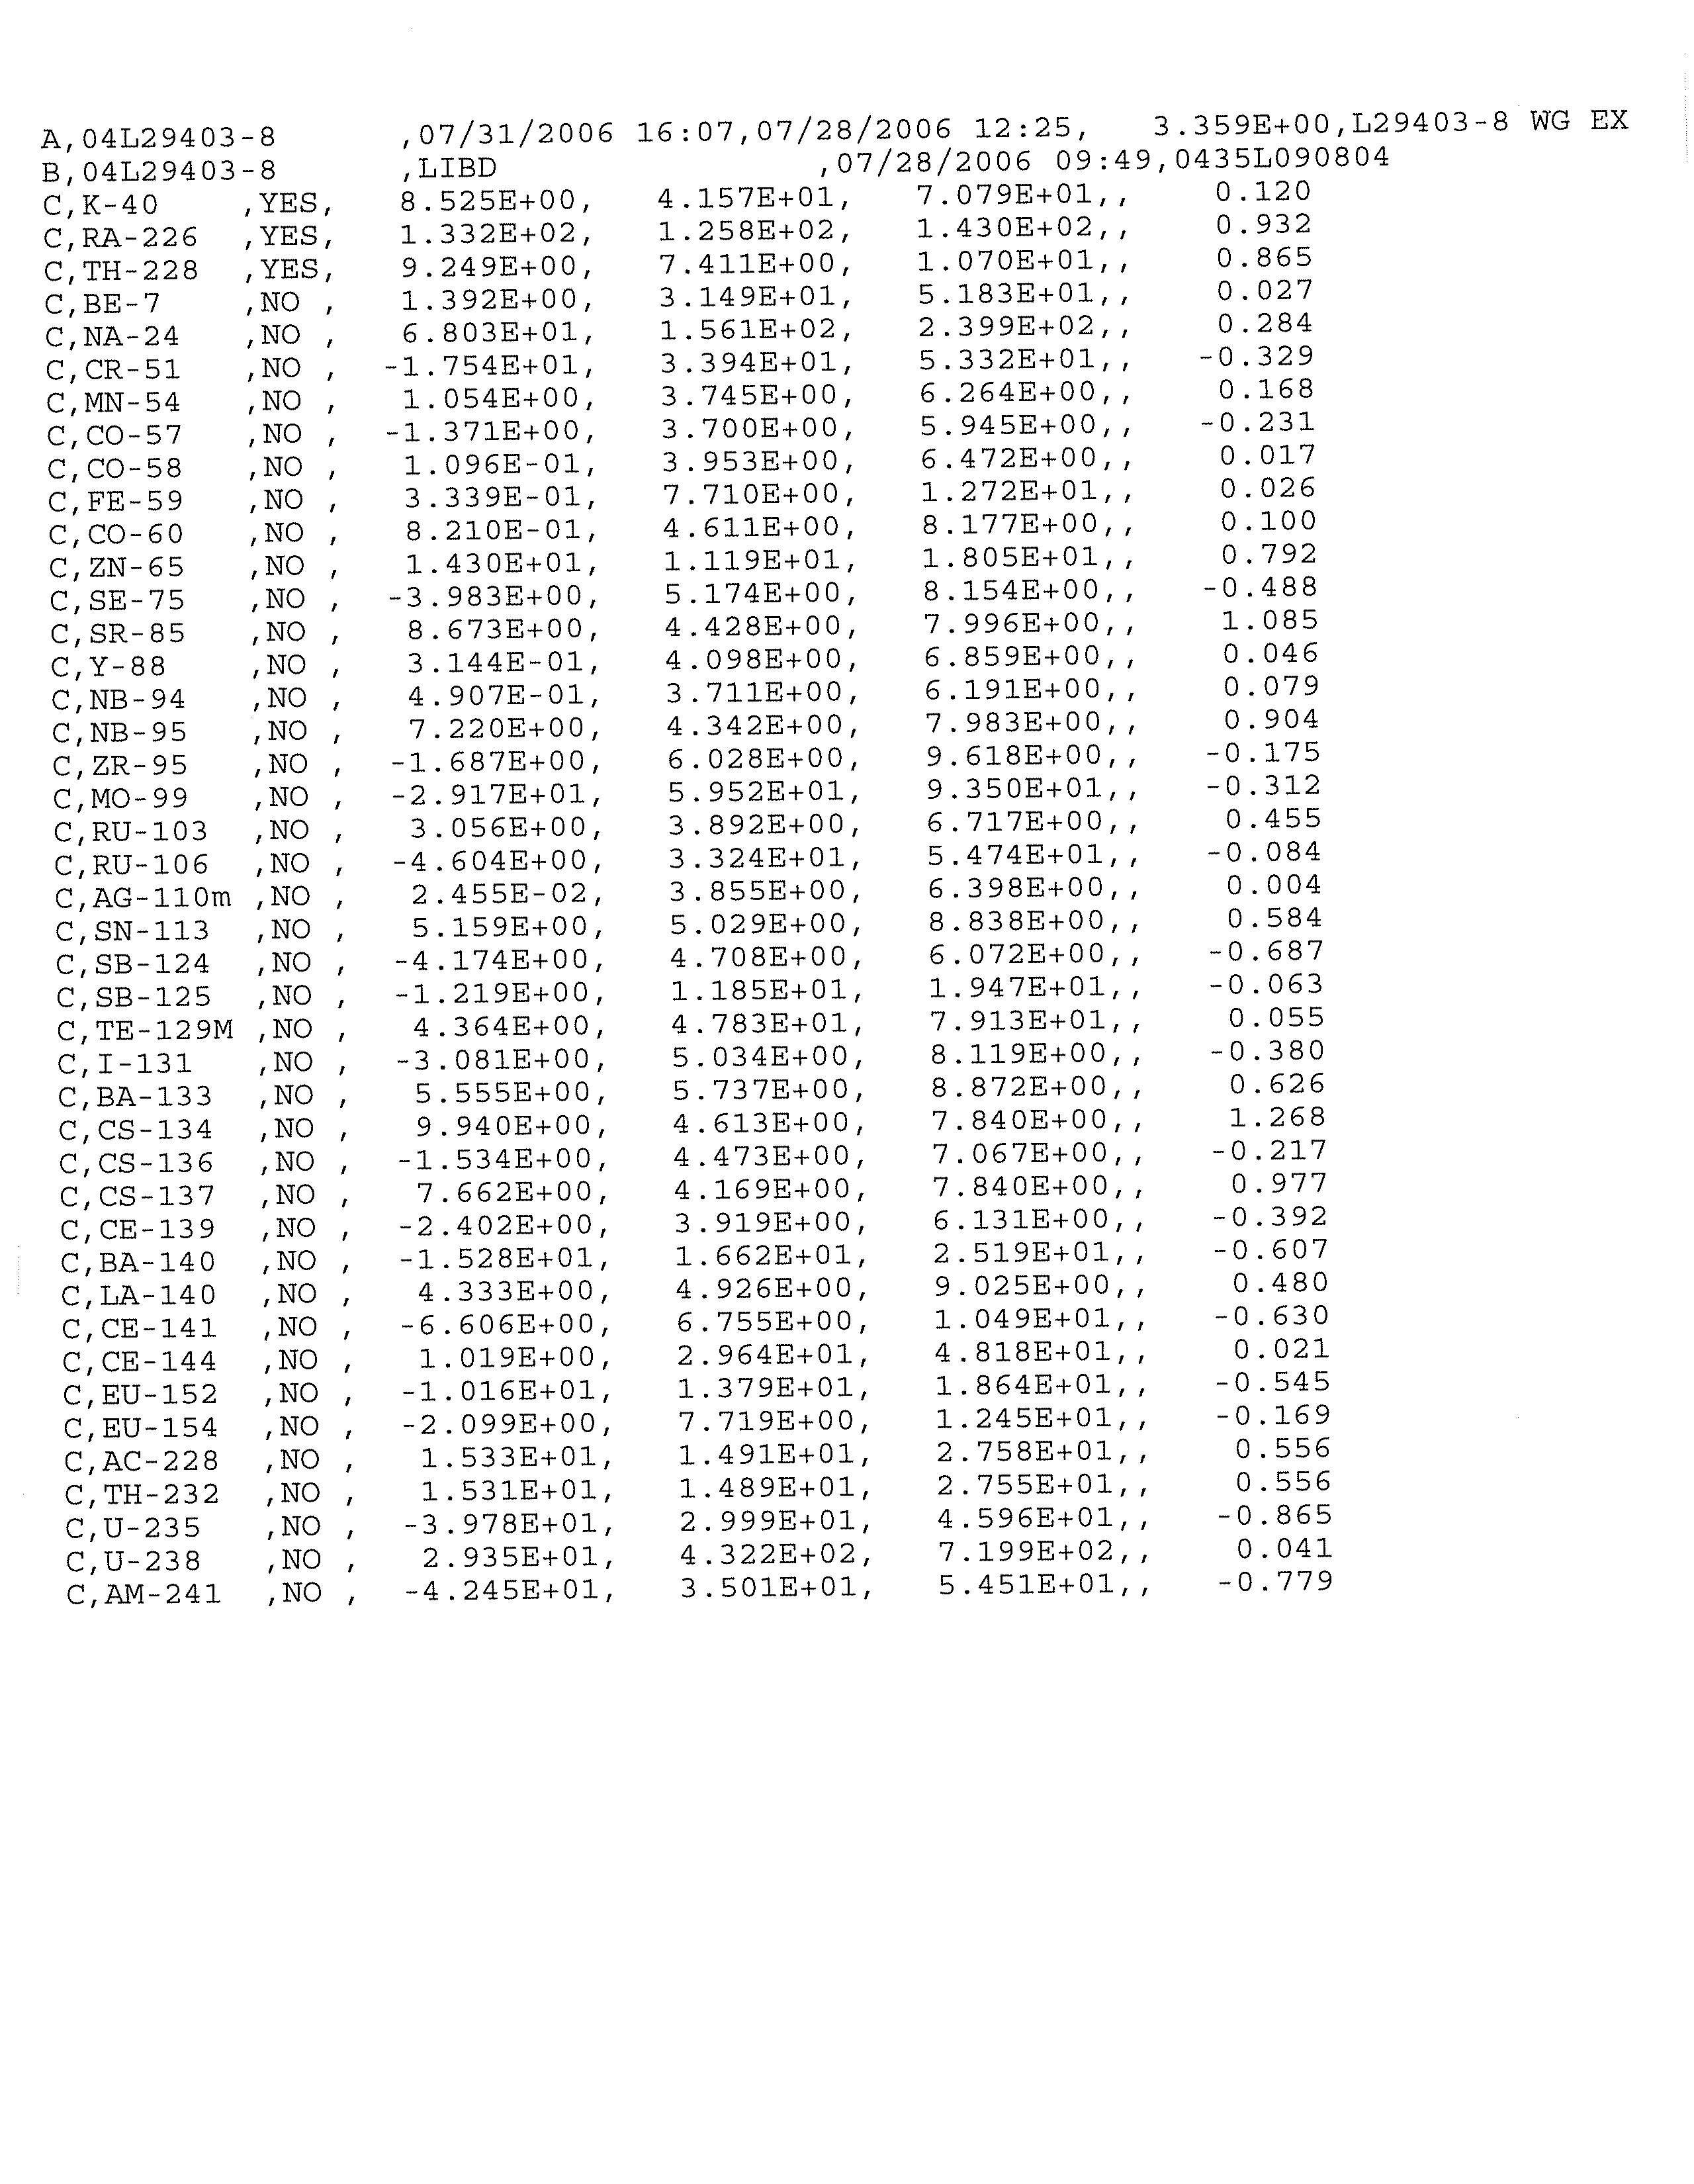
5.3.2
SUMMARY OF GAMMA-EMITTING RADIONUCLIDES
ANALYTICAL
RESULTS.................................................................................32
5.3.3
SUMMARY OF FIELD MEASUREMENTS ...................................................33
5.4
SURFACE WATER QUALITY.........................................................................33
5.4.1
SUMMARY OF BETA-EMITTING RADIONUCLIDE
ANALYTICAL
RESULTS.................................................................................33
5.4.2
SUMMARY OF GAMMA-EMITTING RADIONUCLIDES
ANALYTICAL
RESULTS.................................................................................34
6.0
RADIONUCLIDES OF CONCERN AND SOURCE AREAS .........................................35
6.1
GAMMA-EMITTING RADIONUCLIDES.....................................................35
6.2
BETA-EMITTING RADIONUCLIDES ...........................................................35
6.3
TRITIUM.............................................................................................................35
6.3.1
GENERAL CHARACTERISTICS....................................................................35
6.3.2
DISTRIBUTION IN GROUNDWATER / SURFACE WATER ...................36
6.3.3
CONCEPTUAL MODEL OF TRITIUM RELEASE AND
MIGRATION......................................................................................................39
7.0
EXPOSURE PATHWAY ASSESSMENT............................................................................43
7.1
HEALTH EFFECTS OF TRITIUM...................................................................43
7.2
BACKGROUND CONCENTRATIONS
OF TRITIUM ................................44
7.2.1
GROUNDWATER.............................................................................................44
7.2.2
PRECIPITATION DATA..................................................................................44
7.2.3
SURFACE WATER DATA ...............................................................................45
7.2.4
DRINKING WATER DATA ............................................................................46
7.2.5
EXPECTED TRITIUM BACKGROUND FOR THE STATION ...................47
7.3
IDENTIFICATION OF POTENTIAL EXPOSURE
PATHWAYS AND POTENTIAL RECEPTORS
............................................47
7.3.1
POTENTIAL GROUNDWATER MIGRATION TO DRINKING
WATER
USERS ON AND OFF THE STATION PROPERTY .....................48
7.3.2
GROUNDWATER MIGRATION TO SURFACE WATER
USERS OFF
THE STATION PROPERTY .......................................................48
045136 (20) Quad Cities Generating Station
CONESTOGA-ROVERS & ASSOCIATES
Revision 1
TABLE OF CONTENTS
Page
7.4
SUMMARY OF POTENTIAL TRITIUM
EXPOSURE PATHWAYS ..........49
7.5
OTHER RADIONUCLIDES.............................................................................49
8.0
CONCLUSIONS....................................................................................................................50
9.0
RECOMMENDATIONS.......................................................................................................54
9.1
DATA GAPS ......................................................................................................54
9.2
GROUNDWATER MONITORING ................................................................54
10.0
REFERENCES........................................................................................................................55
045136 (20) Quad Cities Generating Station
CONESTOGA-ROVERS & ASSOCIATES
Revision 1
LIST OF FIGURES
(Following Text)
FIGURE 1.1
STATION LOCATION MAP
FIGURE 1.2
STATION BOUNDARIES AND FEATURES
FIGURE 2.1
STATION BASE MAP
FIGURE 2.2
REGIONAL STRATIGRAPHIC COLUMN
FIGURE 2.3
BEDROCK GEOLOGIC MAP WITH CROSS-SECTION LOCATION
FIGURE 2.4
CROSS-SECTION OF FORMATIONS, BEDROCK SURFACE, AND LAND
SURFACES FROM ABINGDON, KNOX COUNTY, TO NORTHERN ROCK
ISLAND COUNTY
FIGURE 2.5
BEDROCK TOPOGRAPHY OF THE MEREDOSIA CHANNEL AREA
FIGURE 2.6
WATER WELL LOCATIONS
FIGURE 3.1
AREAS FOR FURTHER EVALUATION
FIGURE 3.2
HISTORICAL RELEASE LOCATIONS FOR AFE-QUAD CITIES-2
FIGURE 4.1
GROUNDWATER AND SURFACE WATER MONITORING LOCATIONS
FIGURE 5.1
GEOLOGIC CROSS-SECTION LOCATIONS
FIGURE 5.2
GEOLOGIC CROSS-SECTION A-A'
FIGURE 5.3
GEOLOGIC CROSS-SECTION B-B'
FIGURE 5.4
GEOLOGIC CROSS-SECTION C-C'
FIGURE 5.5
GEOLOGIC CROSS-SECTION D-D'
FIGURE 5.6
POTENTIOMETRIC SURFACE CONTOURS – MAY 2006
FIGURE 5.7
POTENTIOMETRIC SURFACE CONTOURS – JULY 2006
045136 (20) Quad Cities Generating Station
CONESTOGA-ROVERS & ASSOCIATES
Revision 1
LIST OF FIGURES
(Following Text)
FIGURE 5.8
TRITIUM CONCENTRATIONS - GROUNDWATER AND
SURFACE WATER
FIGURE 5.9
RADIONUCLIDE CONCENTRATIONS - GROUNDWATER AND
SURFACE WATER
FIGURE 6.1
TRITIUM PLUME CROSS-SECTION
FIGURE 6.2
TRITIUM PLUME MAP PLAN VIEW
045136 (20) Quad Cities Generating Station
CONESTOGA-ROVERS & ASSOCIATES
Revision 1
LIST OF TABLES
(Following Text)
TABLE 4.1
SUMMARY OF MONITORING WELL INSTALLATION DETAILS
TABLE 4.2
SUMMARY OF MONITORING WELL DEVELOPMENT PARAMETERS
TABLE 4.3
SUMMARY OF GROUNDWATER ELEVATIONS
TABLE 4.4
SUMMARY OF SURFACE WATER ELEVATIONS
TABLE 4.5
SAMPLE KEY
TABLE 4.6
SUMMARY OF MONITORING WELL PURGING PARAMETERS
TABLE 4.7
SUMMARY OF EXISTING SUPPLY WELL PURGING PARAMETERS
TABLE 5.1
SUMMARY OF CALCULATED VERTICAL GRADIENTS
TABLE 5.2
ANALYTICAL RESULTS SUMMARY – TRITIUM IN
GROUNDWATER AND SURFACE WATER
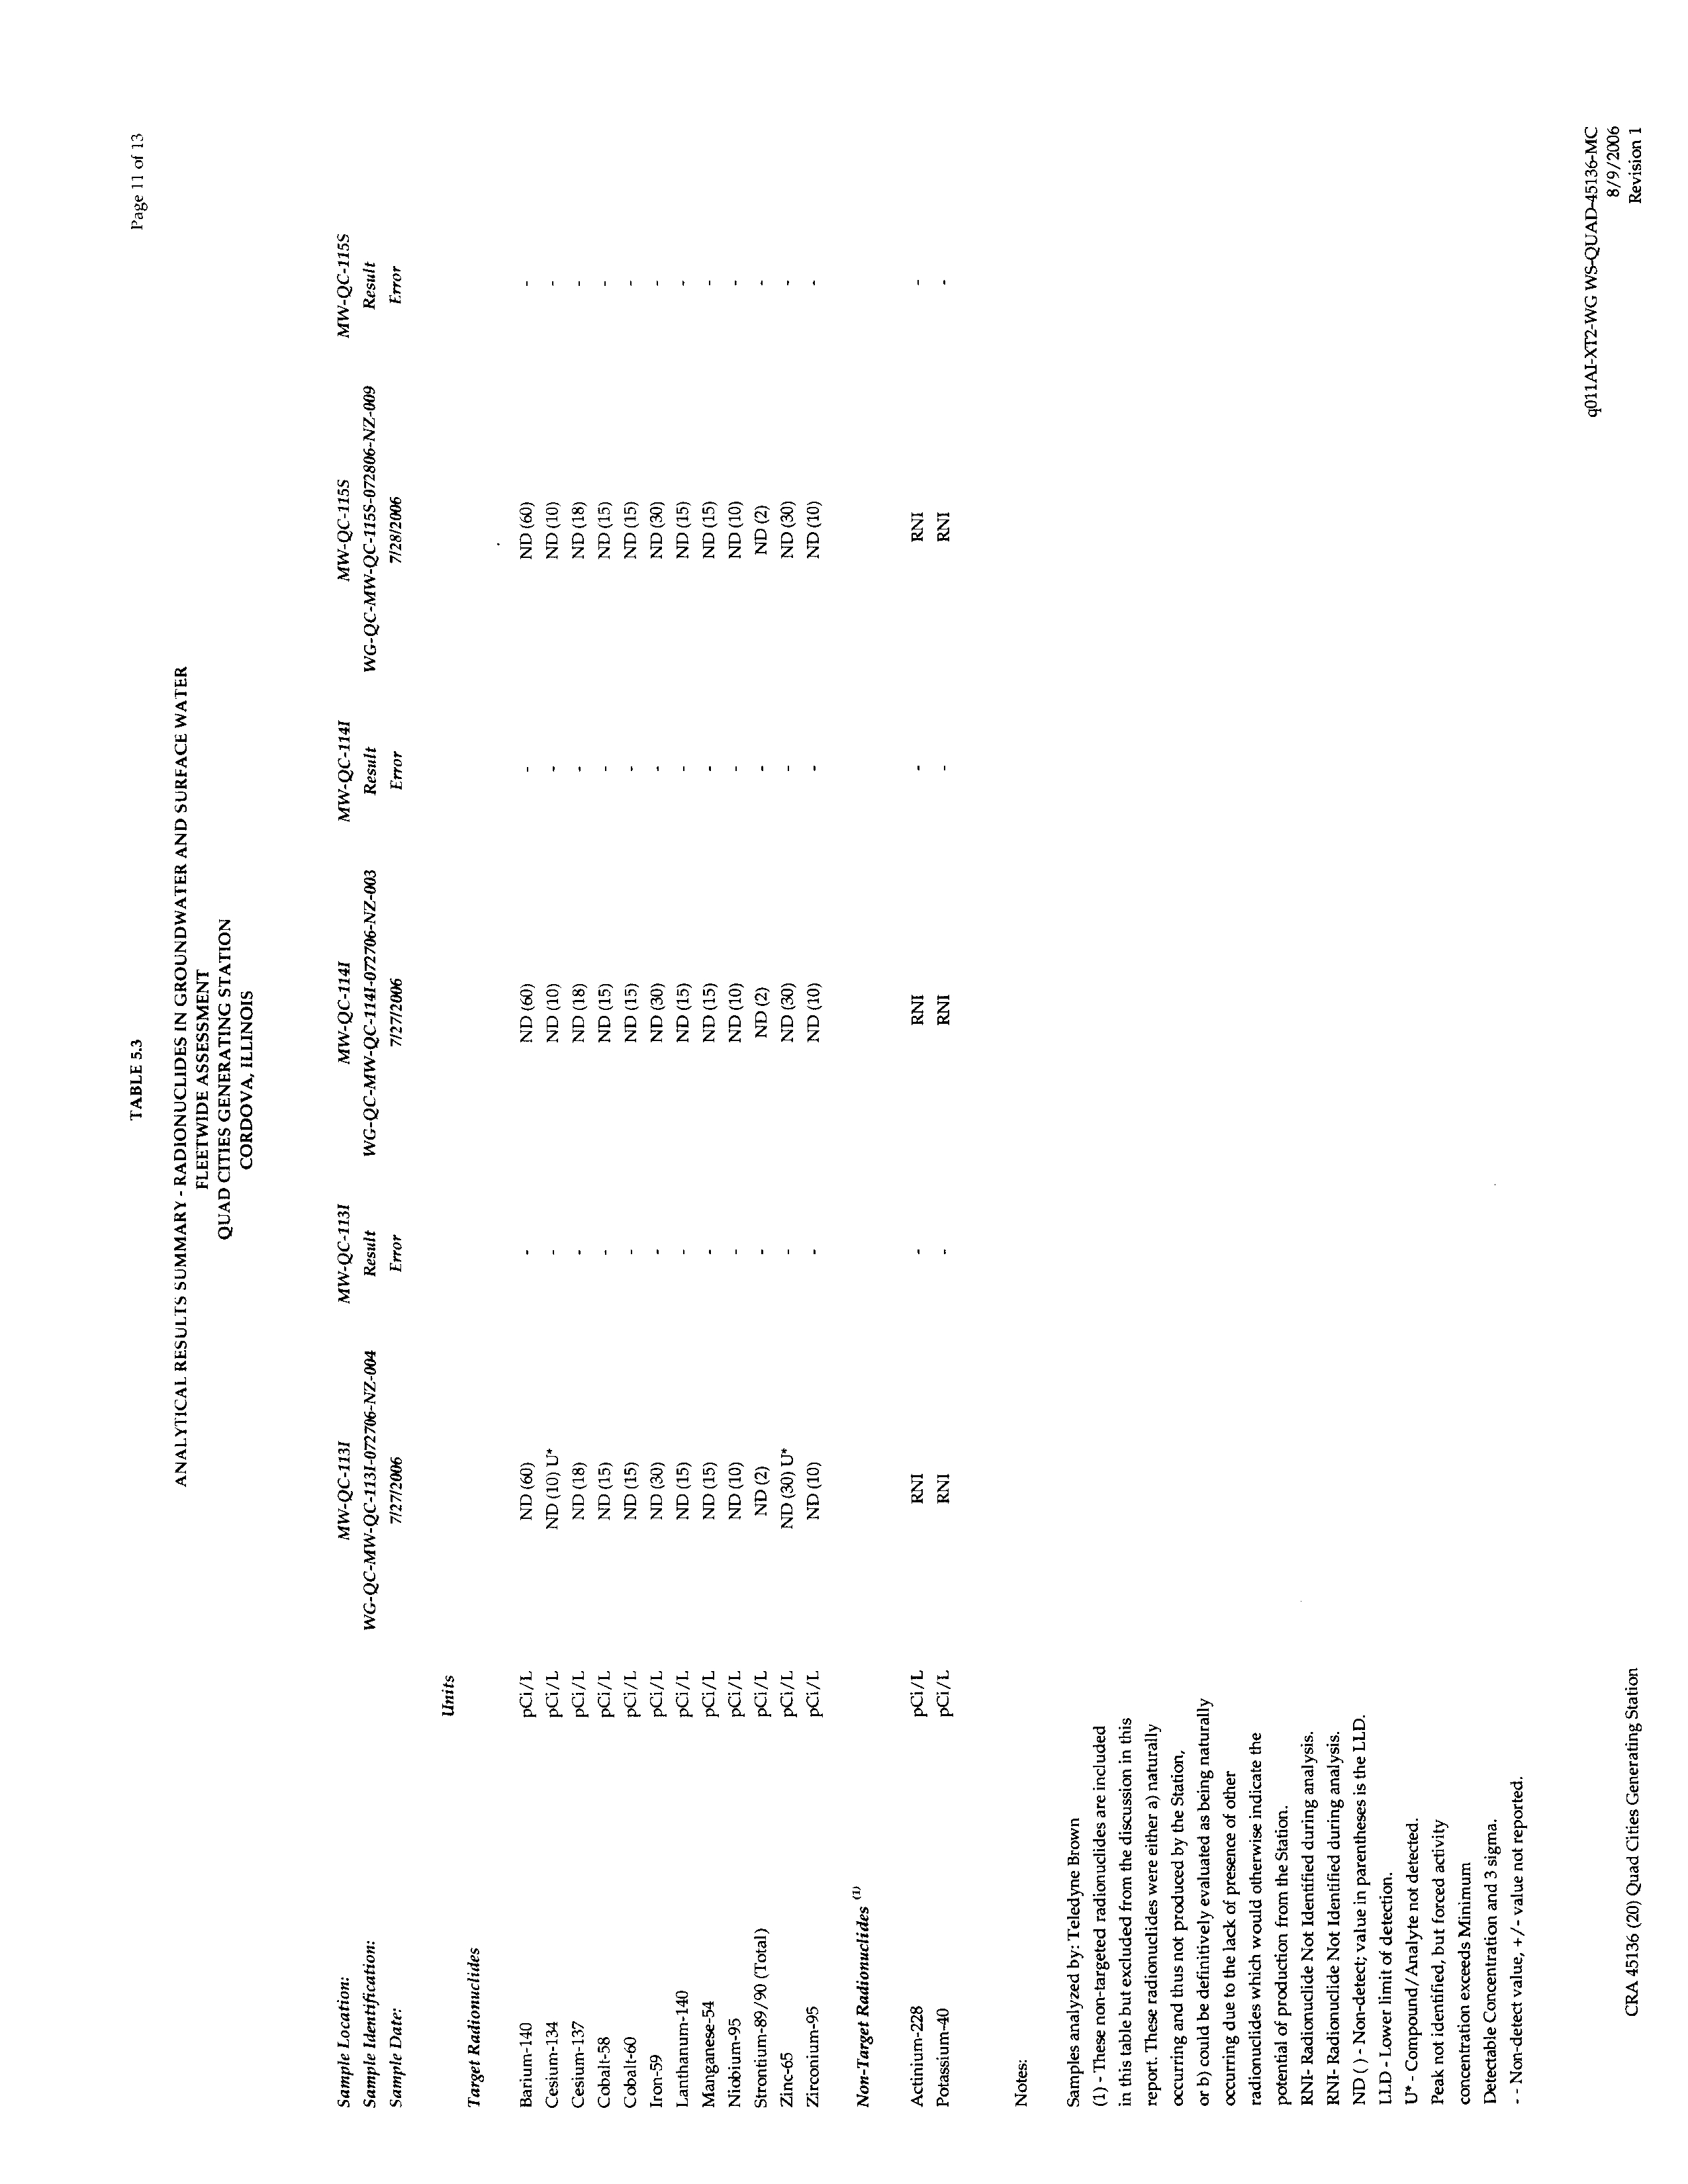
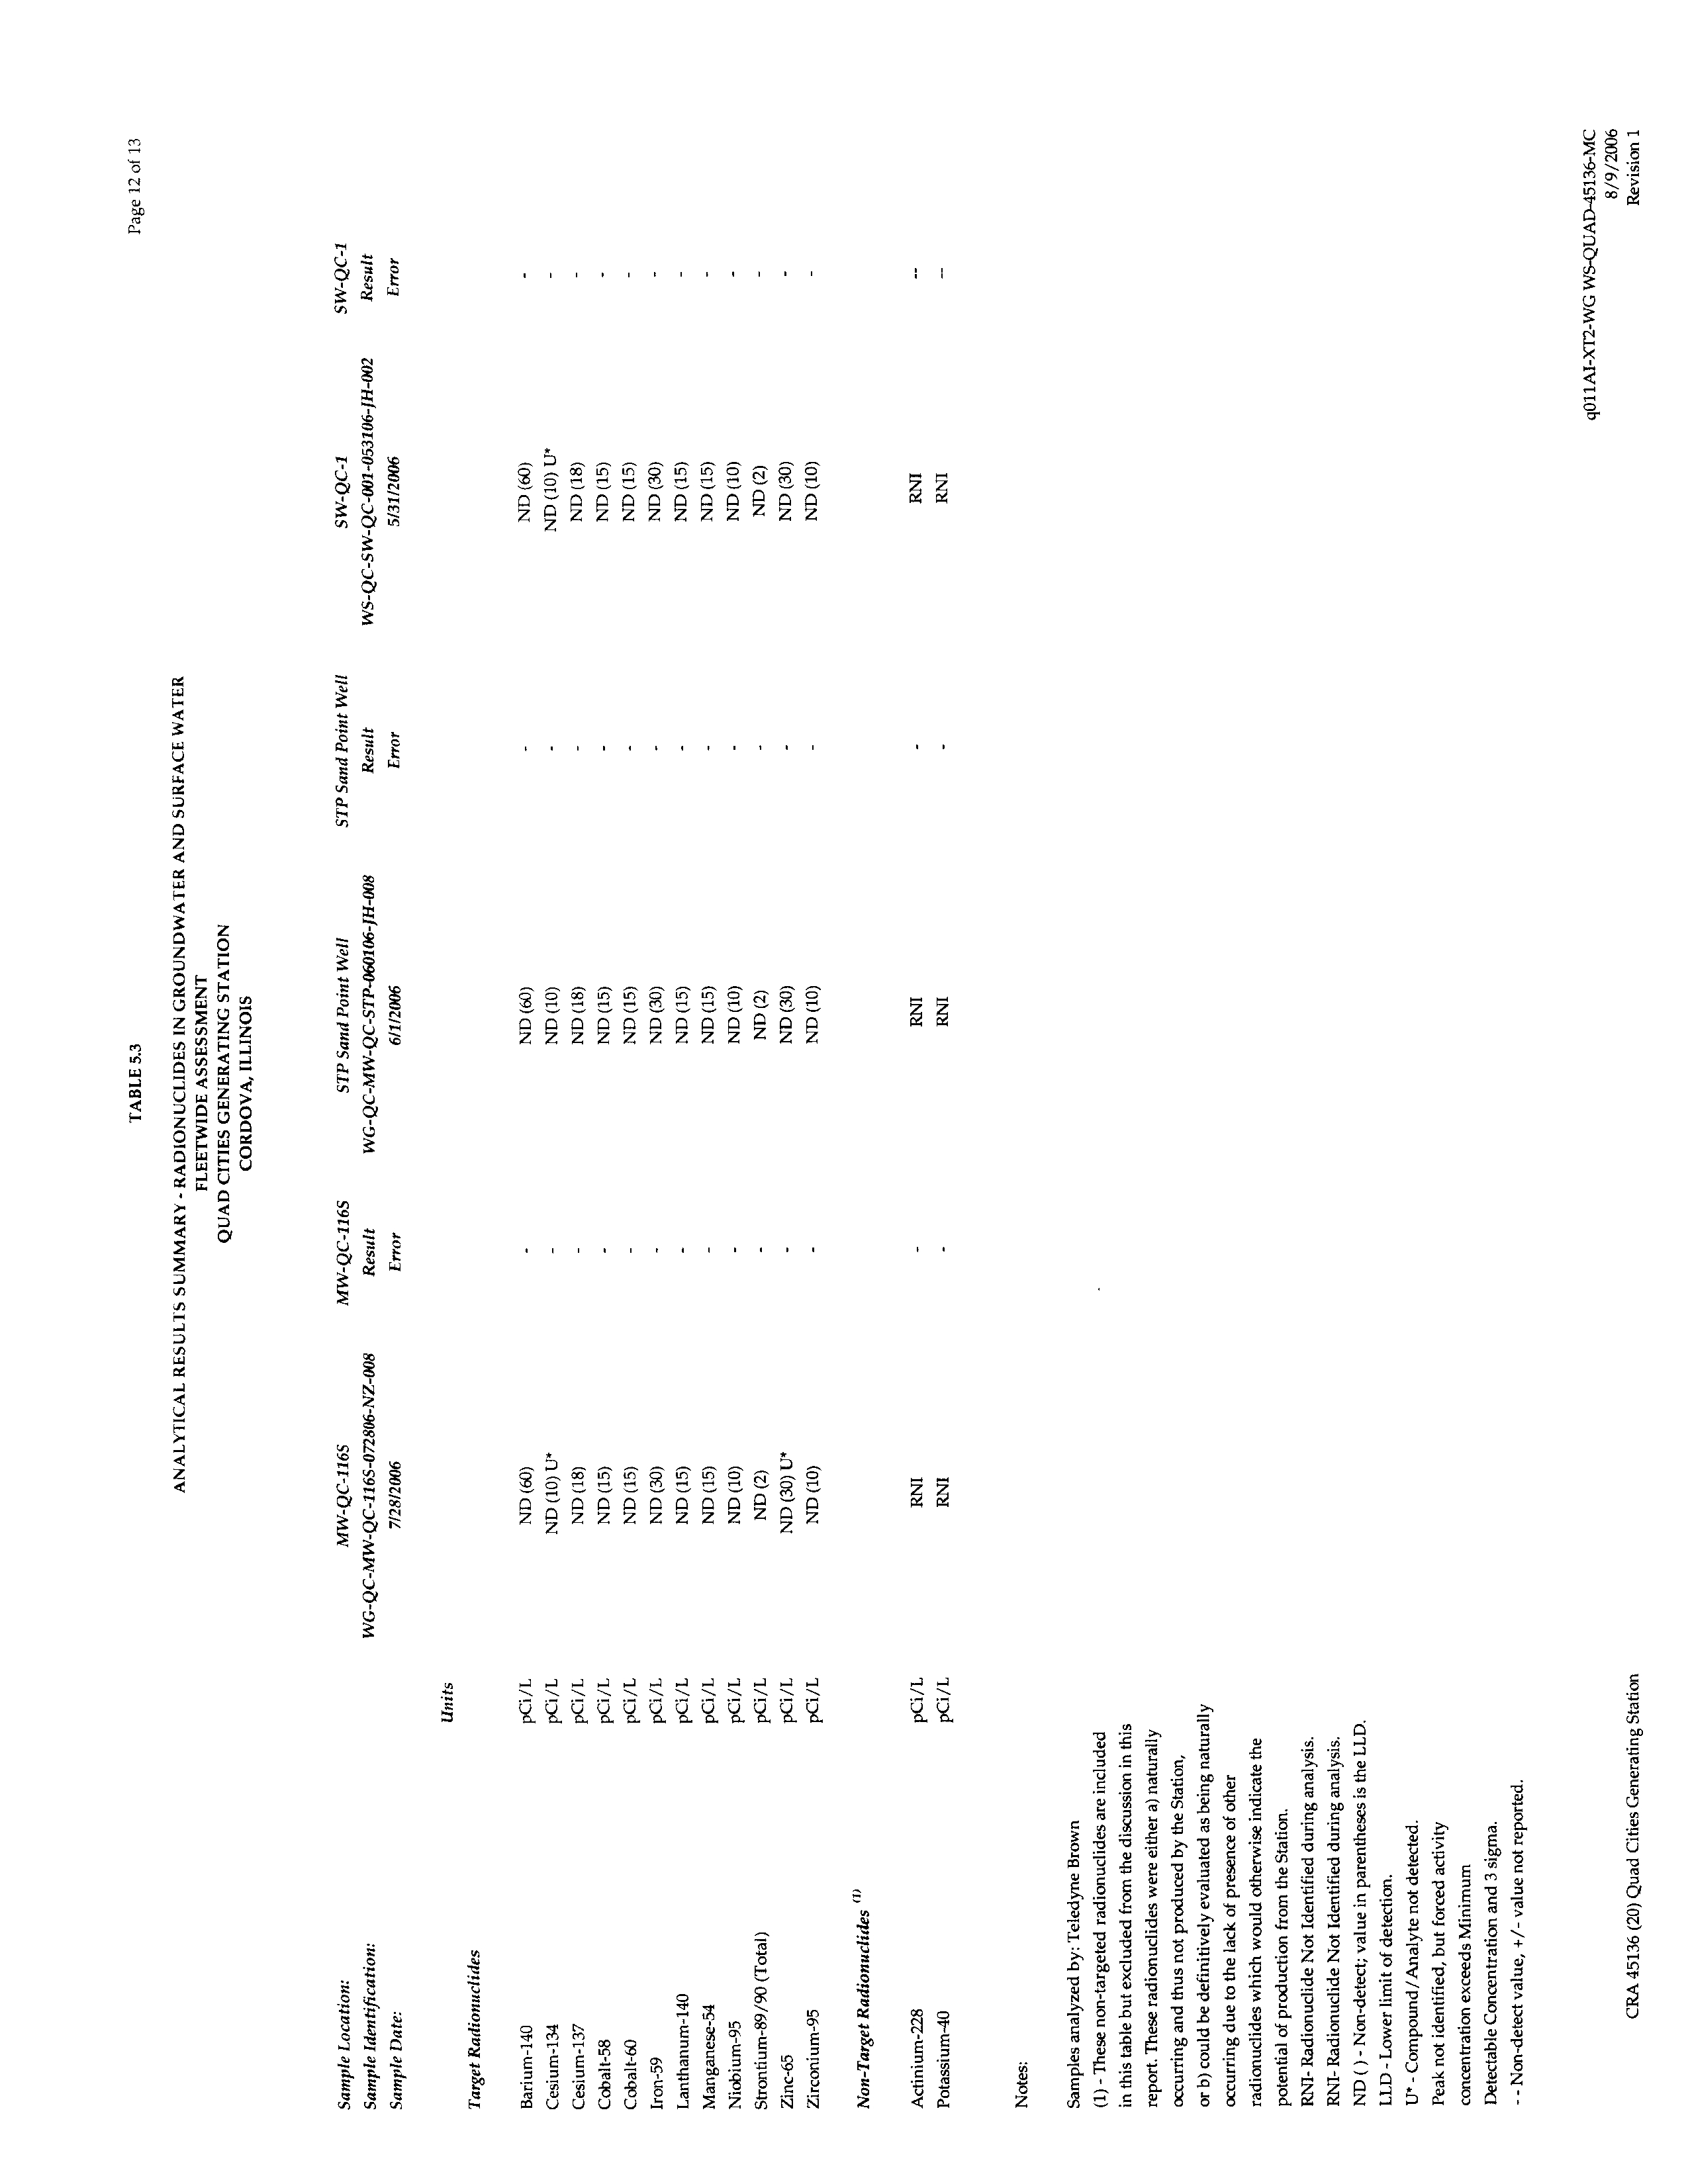
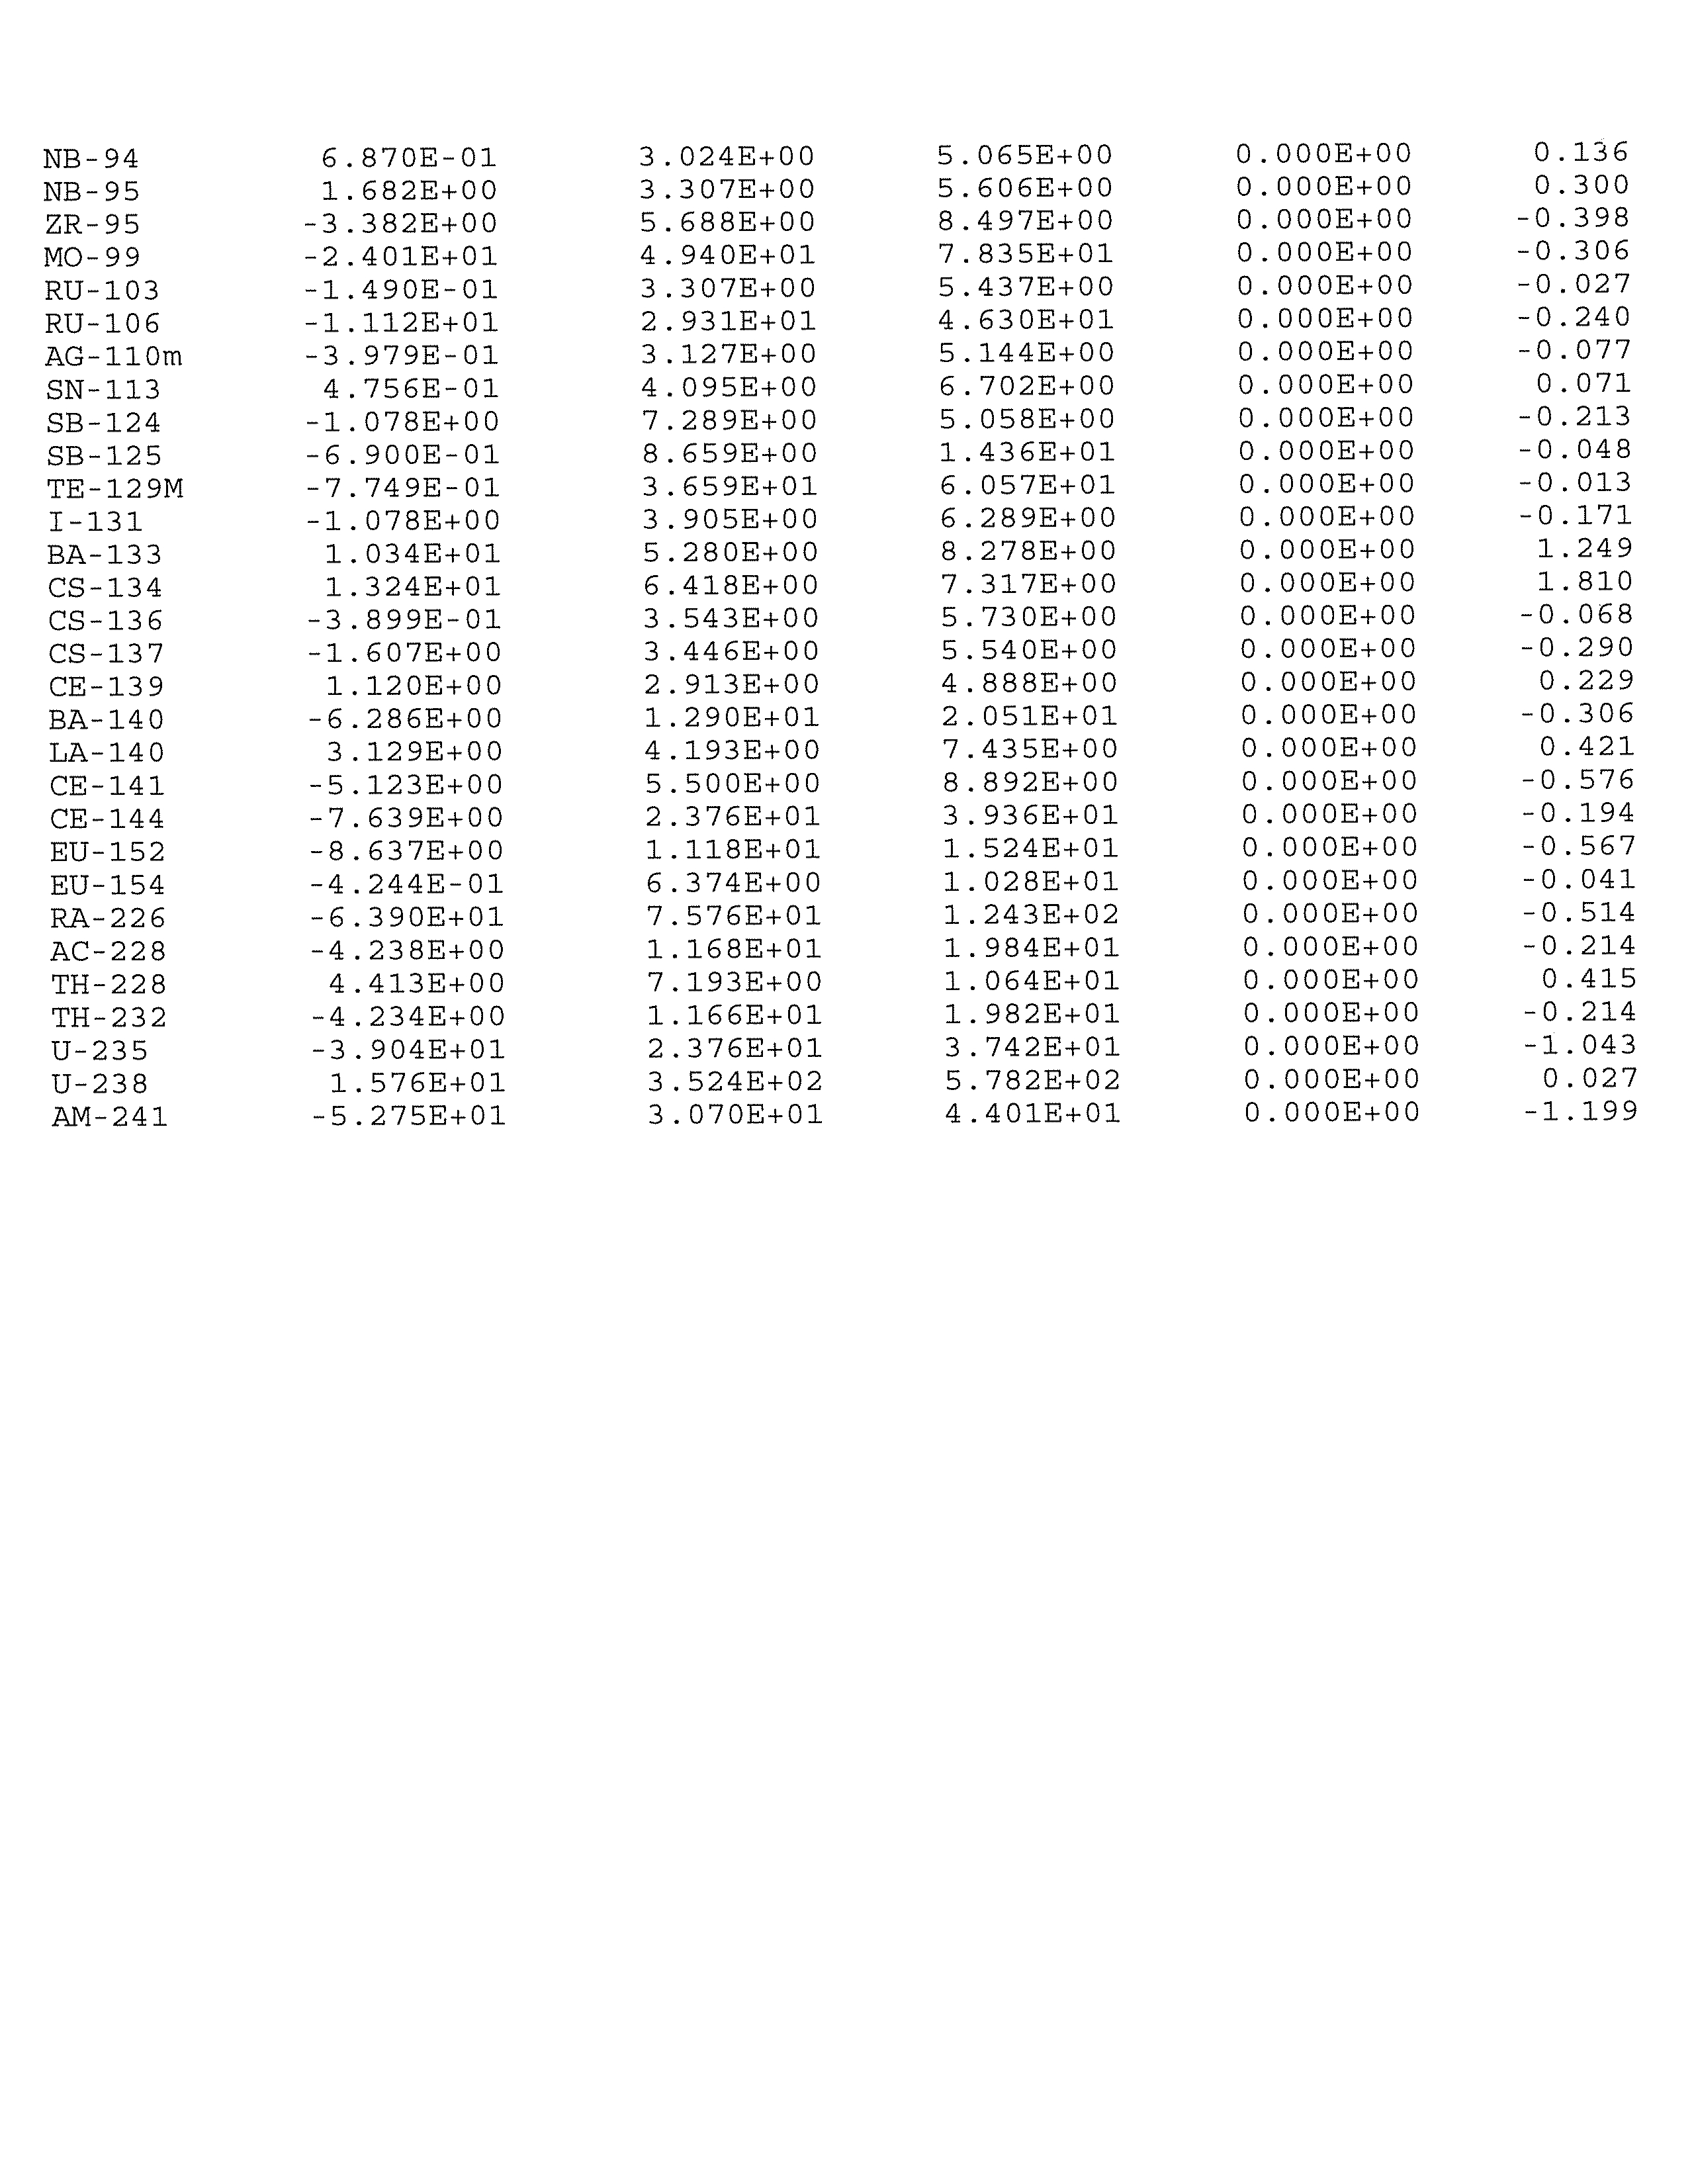
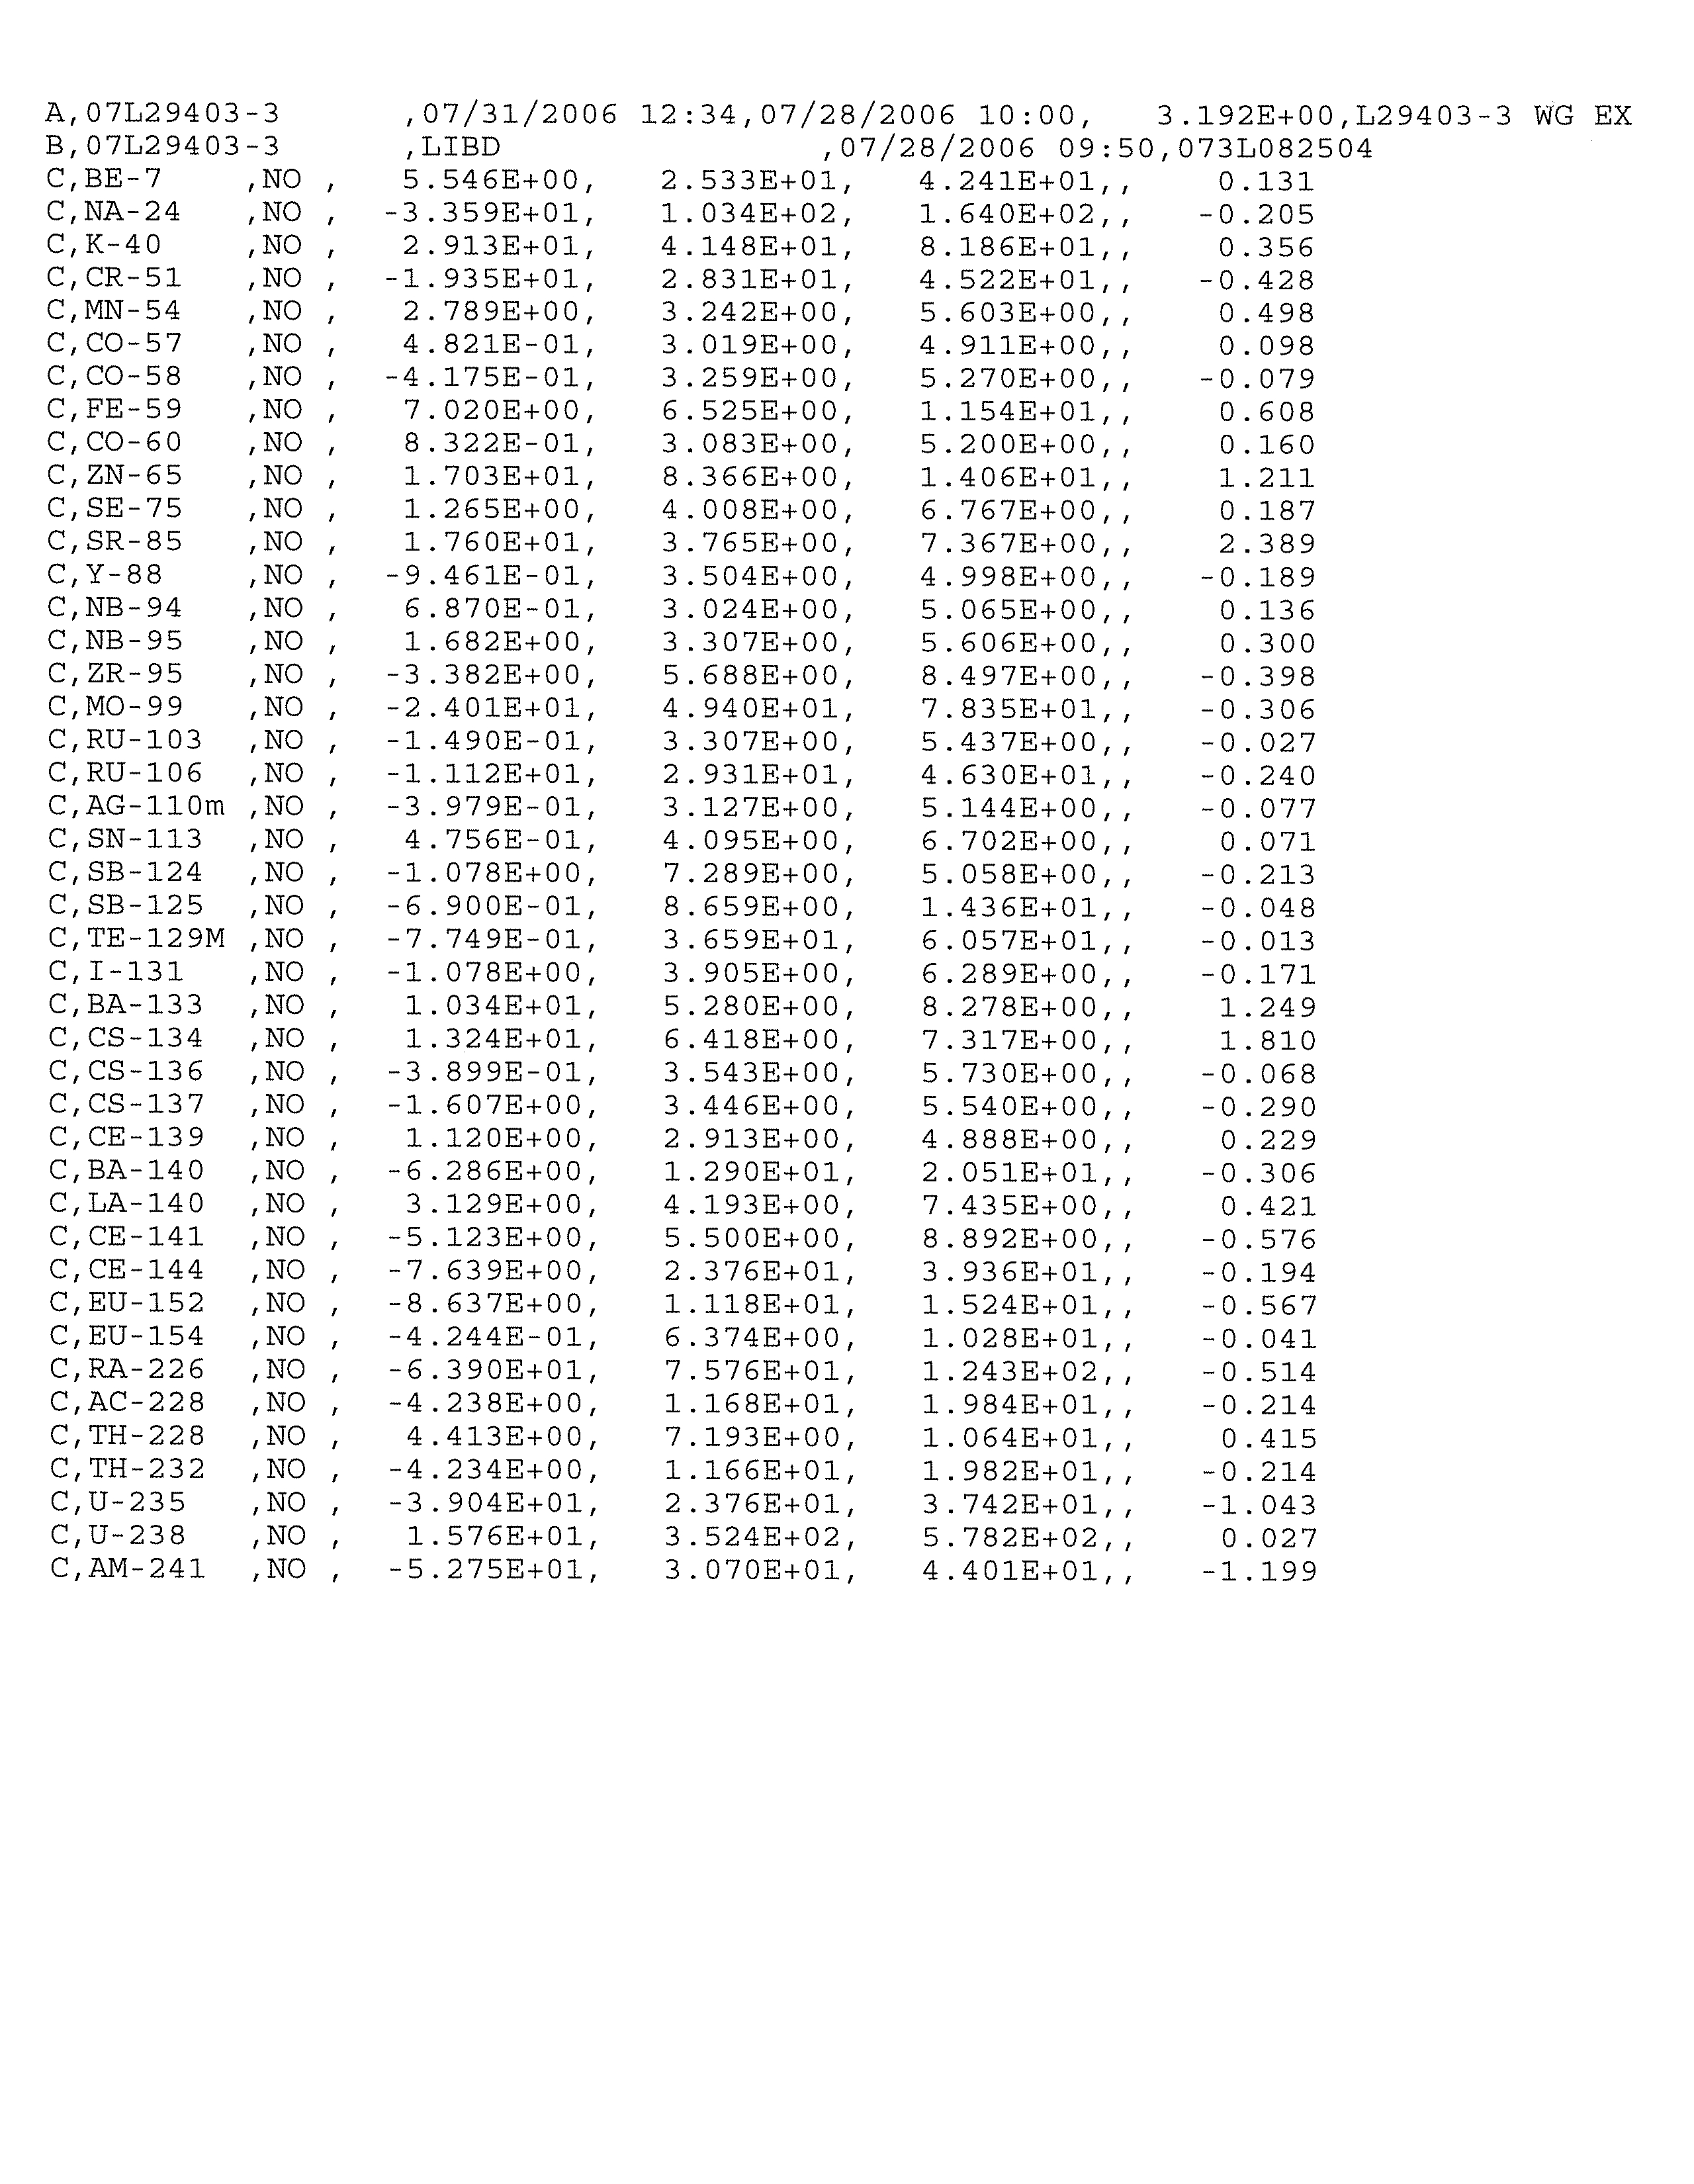
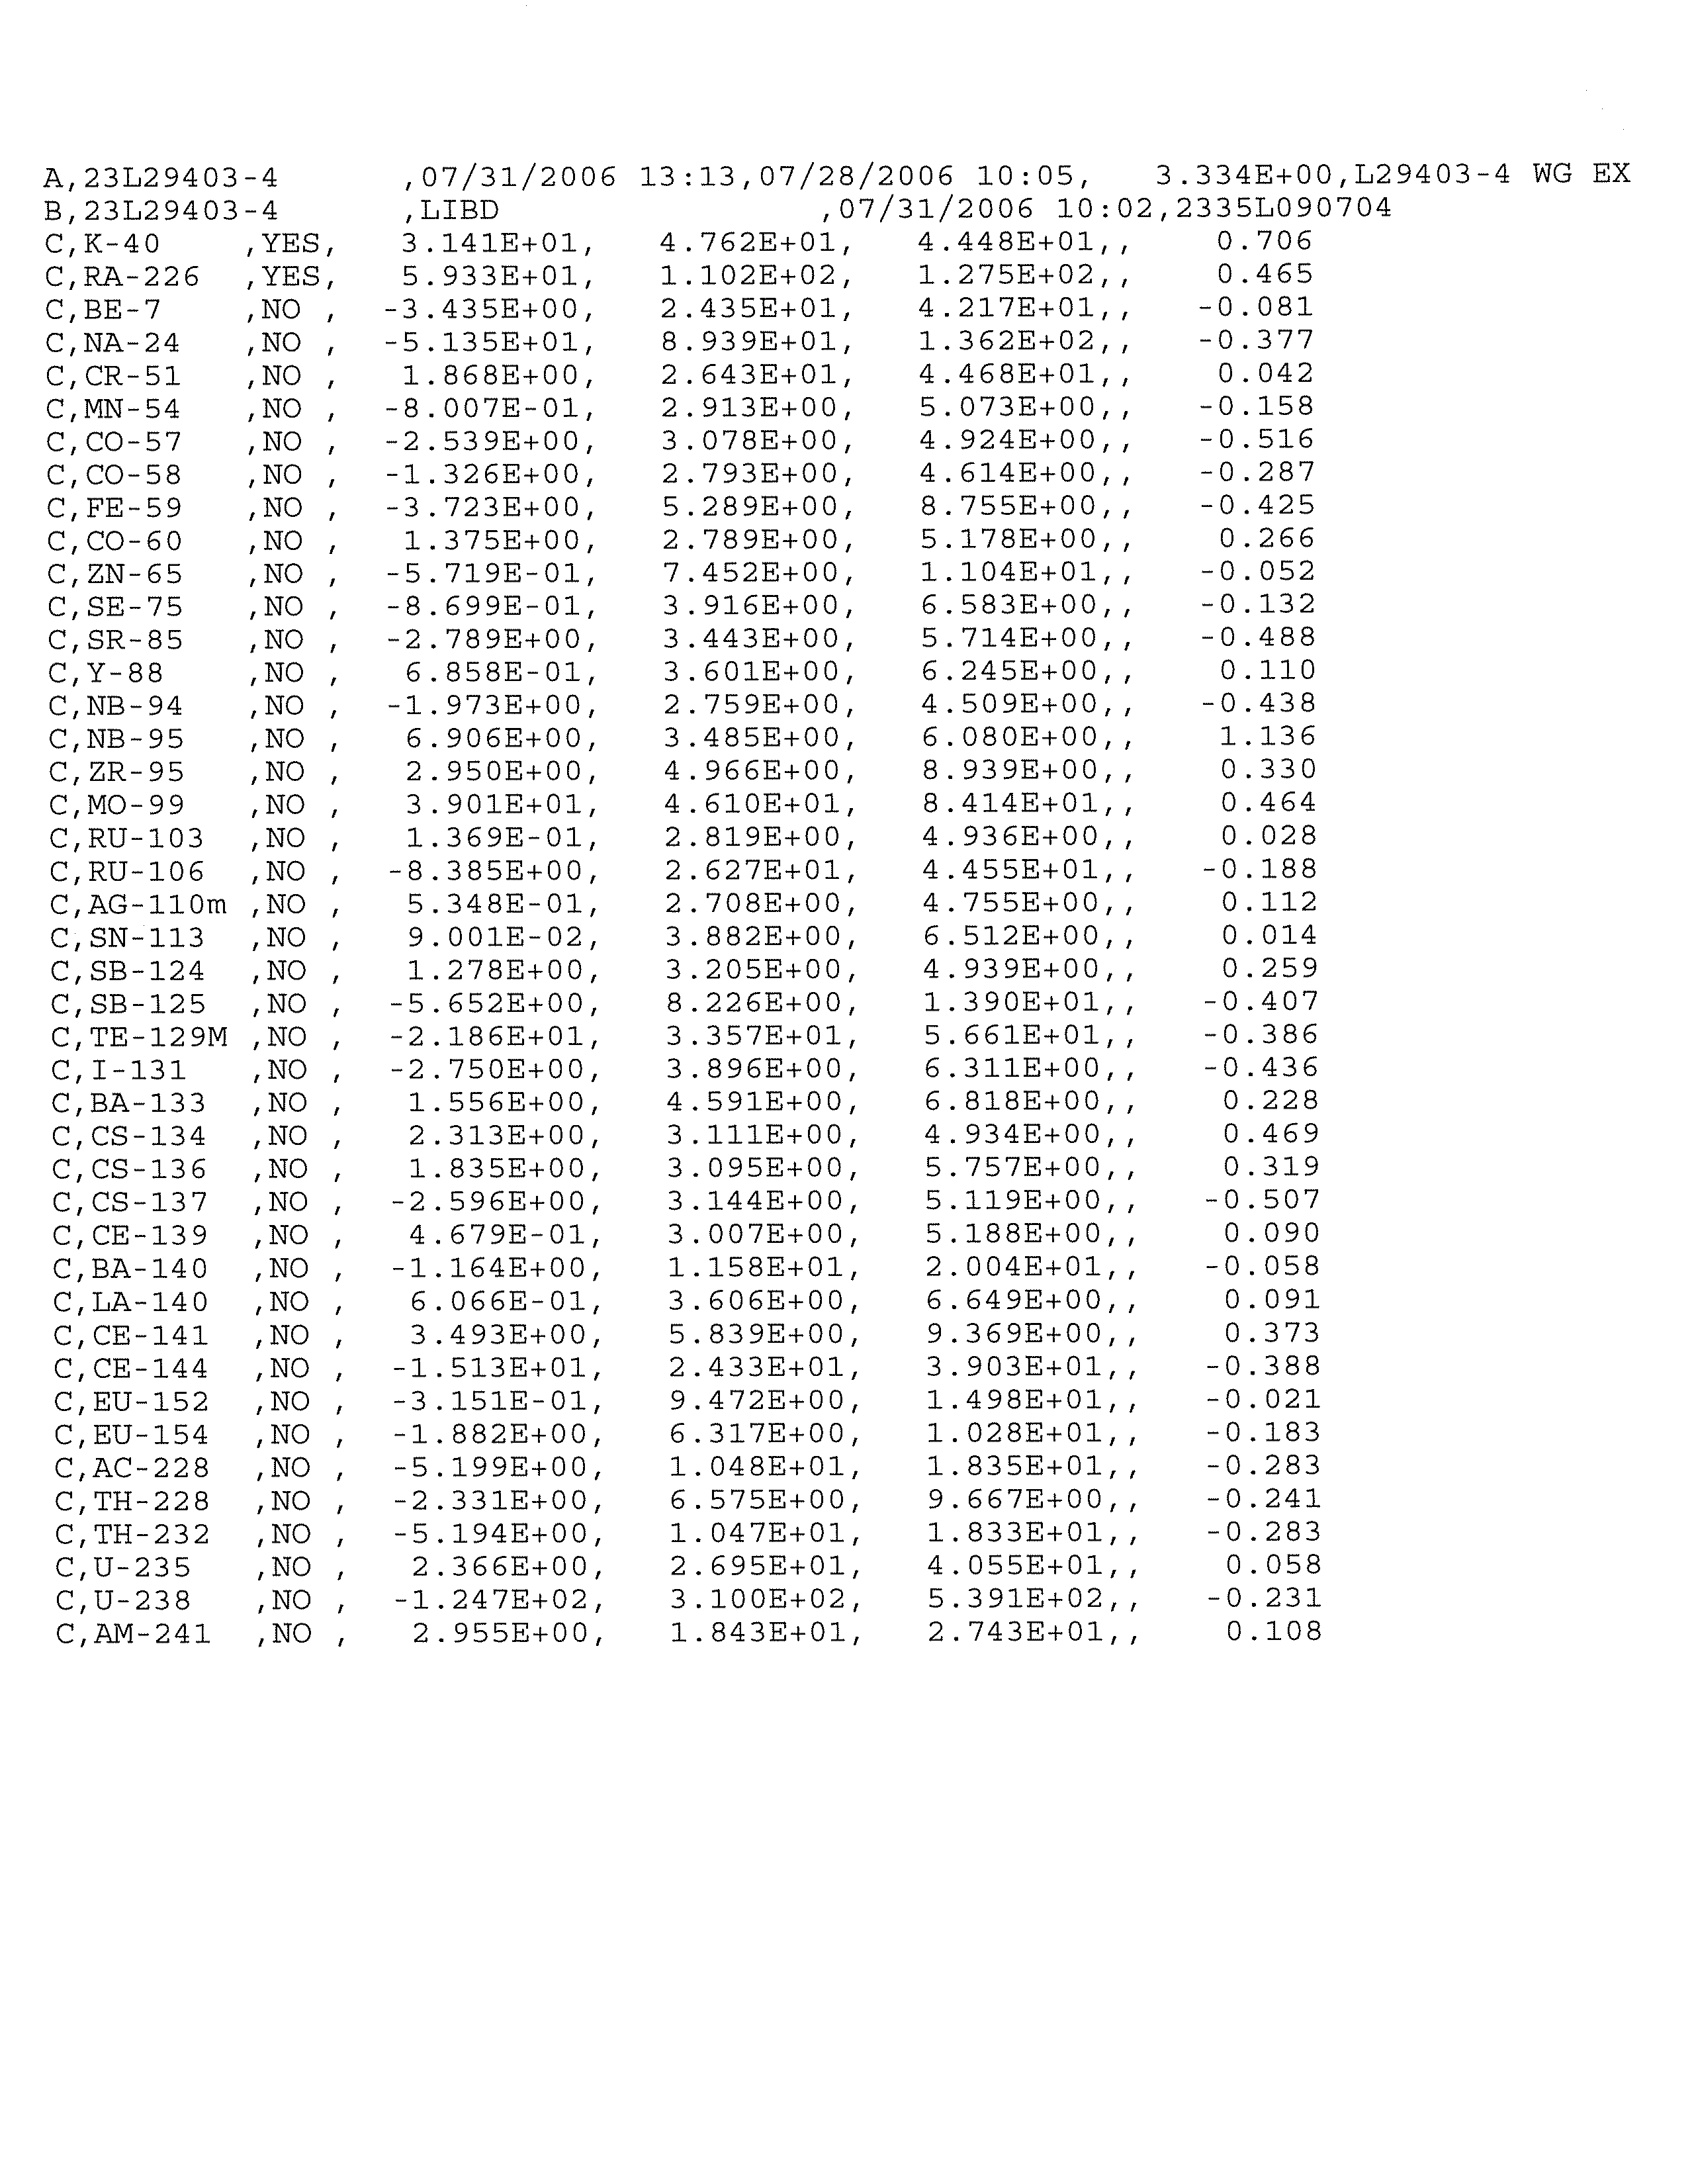
TABLE 5.3
ANALYTICAL RESULTS SUMMARY – RADIONUCLIDES IN
GROUNDWATER AND SURFACE WATER
045136 (20) Quad Cities Generating Station
CONESTOGA-ROVERS & ASSOCIATES
Revision 1
LIST OF APPENDICES
APPENDIX A
WATER SUPPLY WELL INFORMATION
APPENDIX B
MONITORING WELL LOGS
APPENDIX C
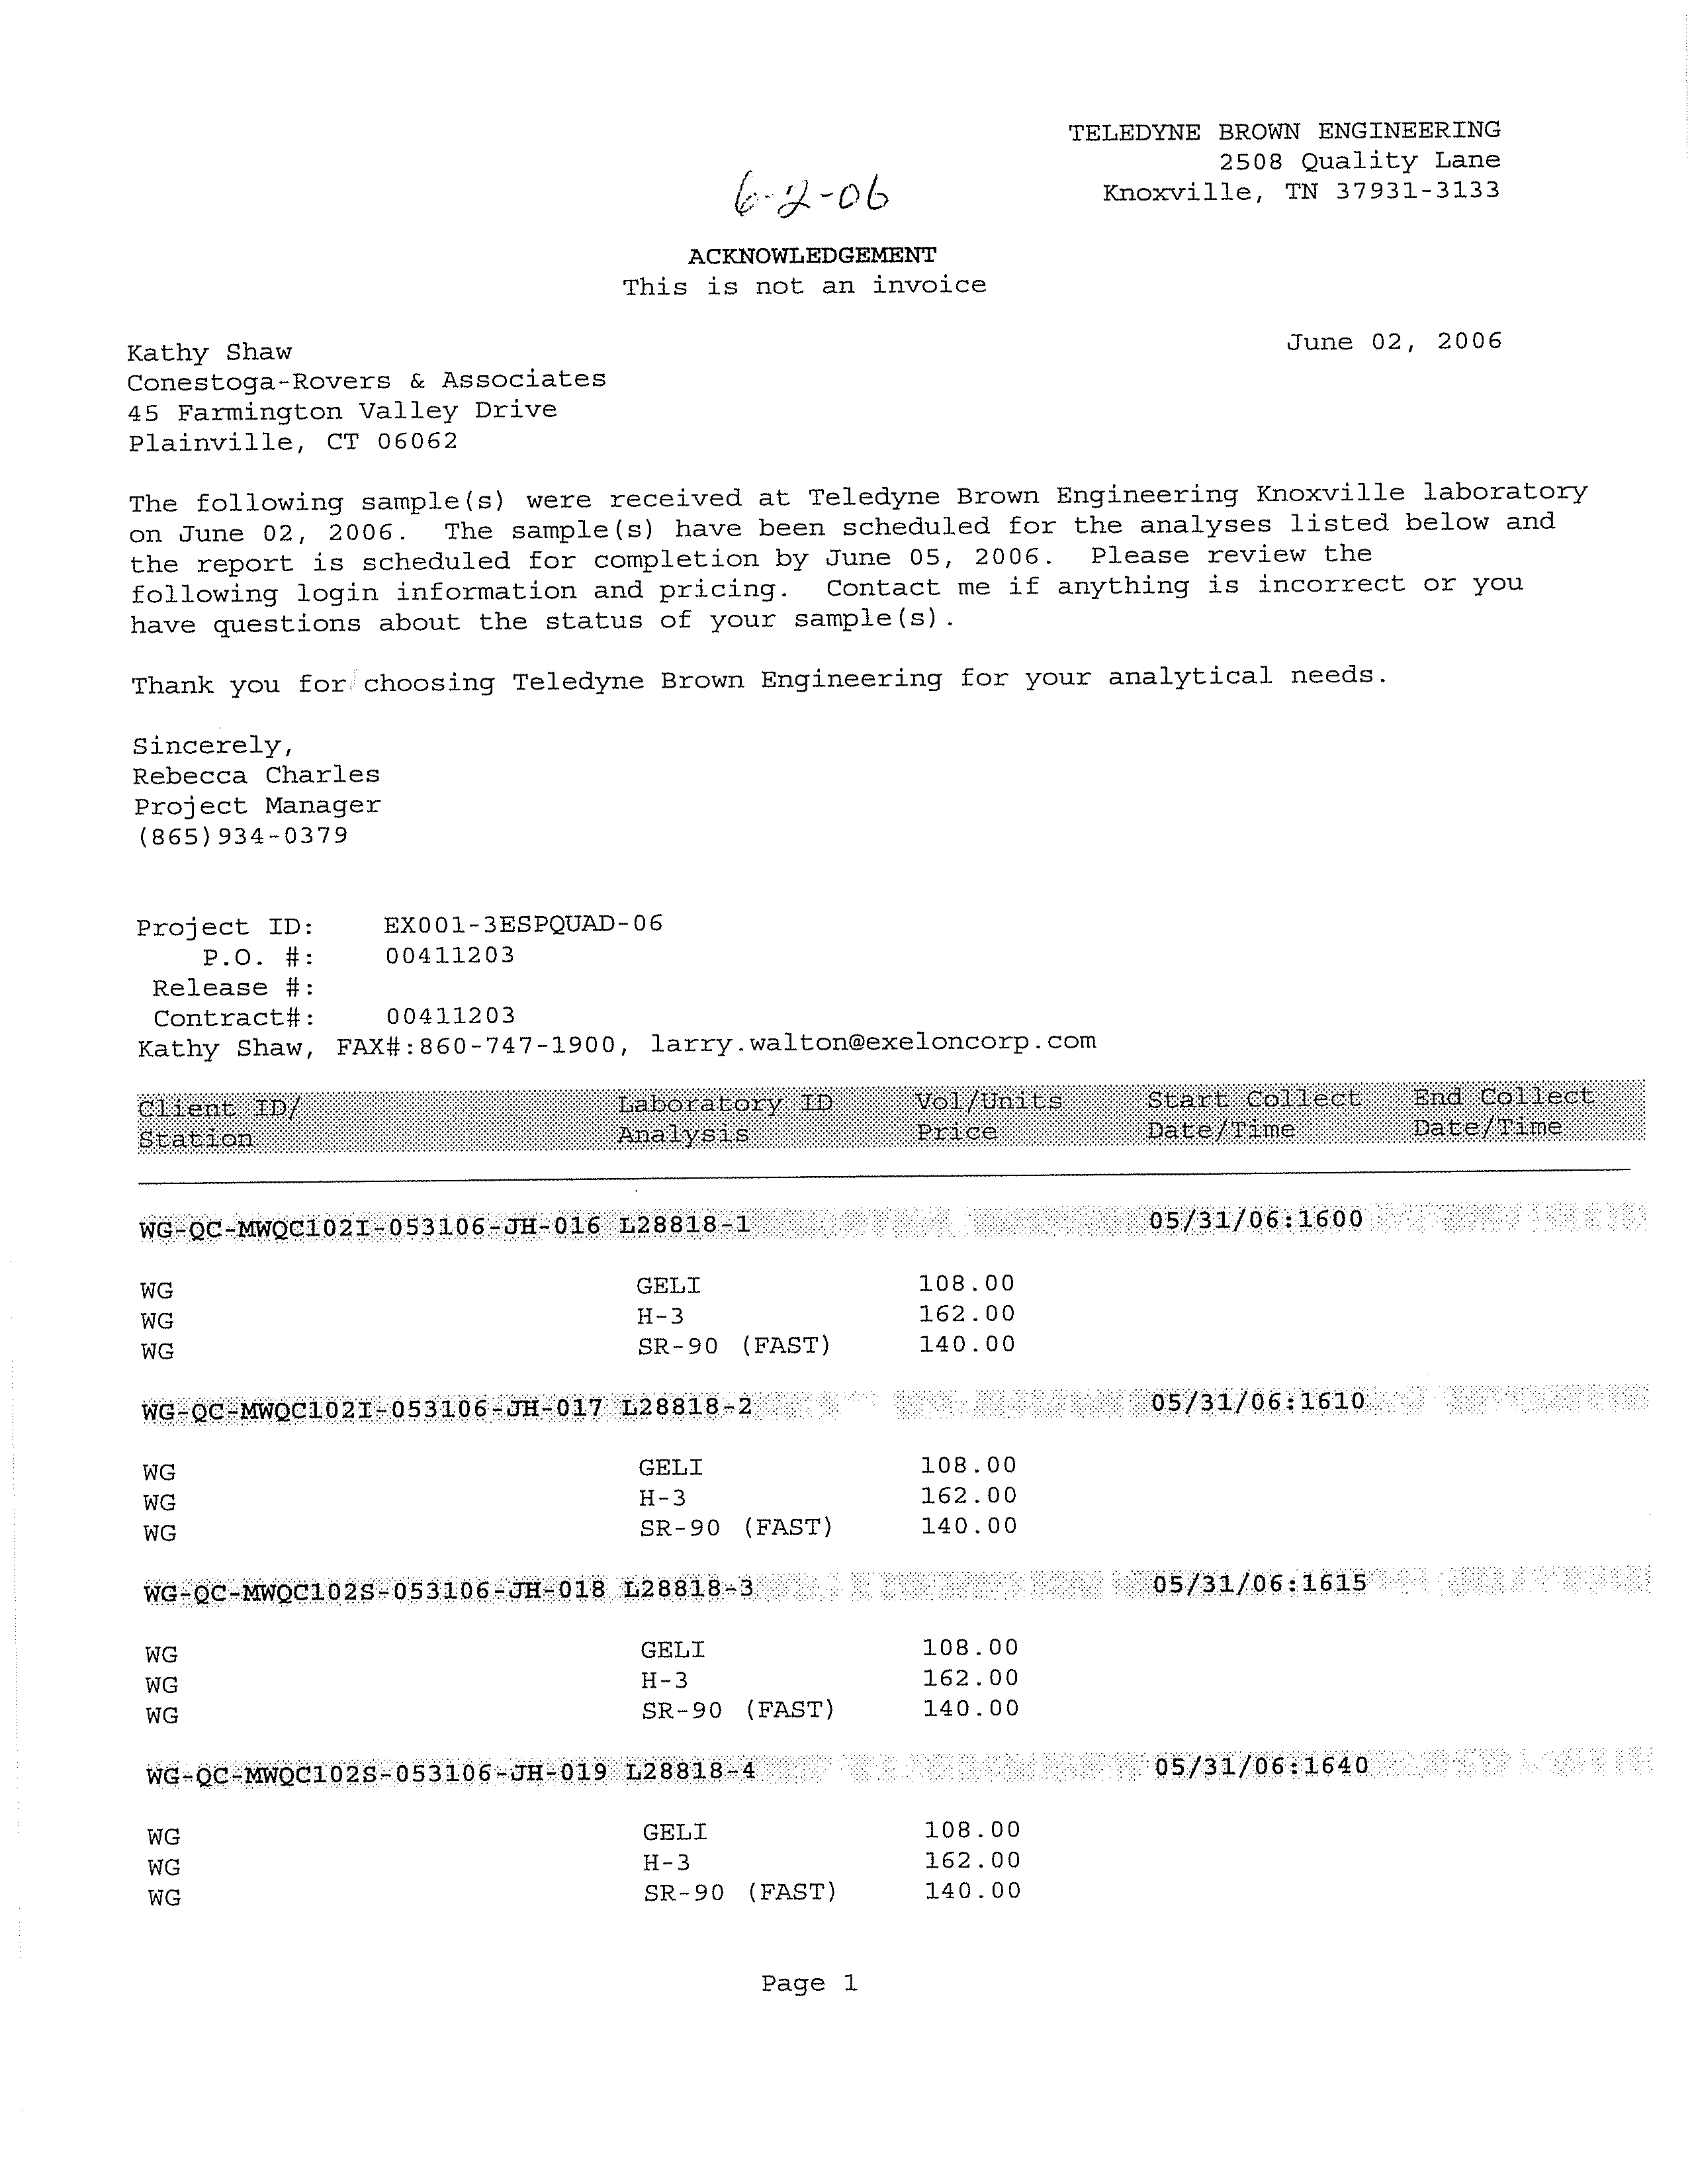
QUALITY ASSURANCE PROGRAM – TELEDYNE BROWN
ENGINEERING, INC.
APPENDIX D
LABORATORY ANALYTICAL REPORTS
APPENDIX E
DATA VALIDATION MEMORANDUM
045136 (20) Quad Cities Generating Station
CONESTOGA-ROVERS & ASSOCIATES
Revision 1
EXECUTIVE SUMMARY
This Hydrogeologic Investigation Report (HIR) documents the results of
Conestoga-Rovers & Associates'
(CRA's) May to July 2006 hydrogeologic investigation
pertaining to the Quad Cities Generating Station in Cordova, Illinois (Station). CRA
prepared this HIR for Exelon Generation Company, LLC (Exelon) as part of its
Fleetwide Program to determine whether groundwater at and in the vicinity of its
nuclear power generating facilities has been adversely impacted by any releases of
radionuclides.
CRA collected and analyzed information on any historical releases, the structures,
components,
and areas of the Station that have the potential to release tritium or other
radioactively contaminated liquids to the environment and past hydrogeologic
investigations at the Station.
CRA used this information, combined with its
understanding of groundwater flow at the Station, to identify Areas for Further
Evaluation (AFEs) and sample locations for the Station.
CRA installed 22 monitoring wells and collected 32 groundwater samples (22 from
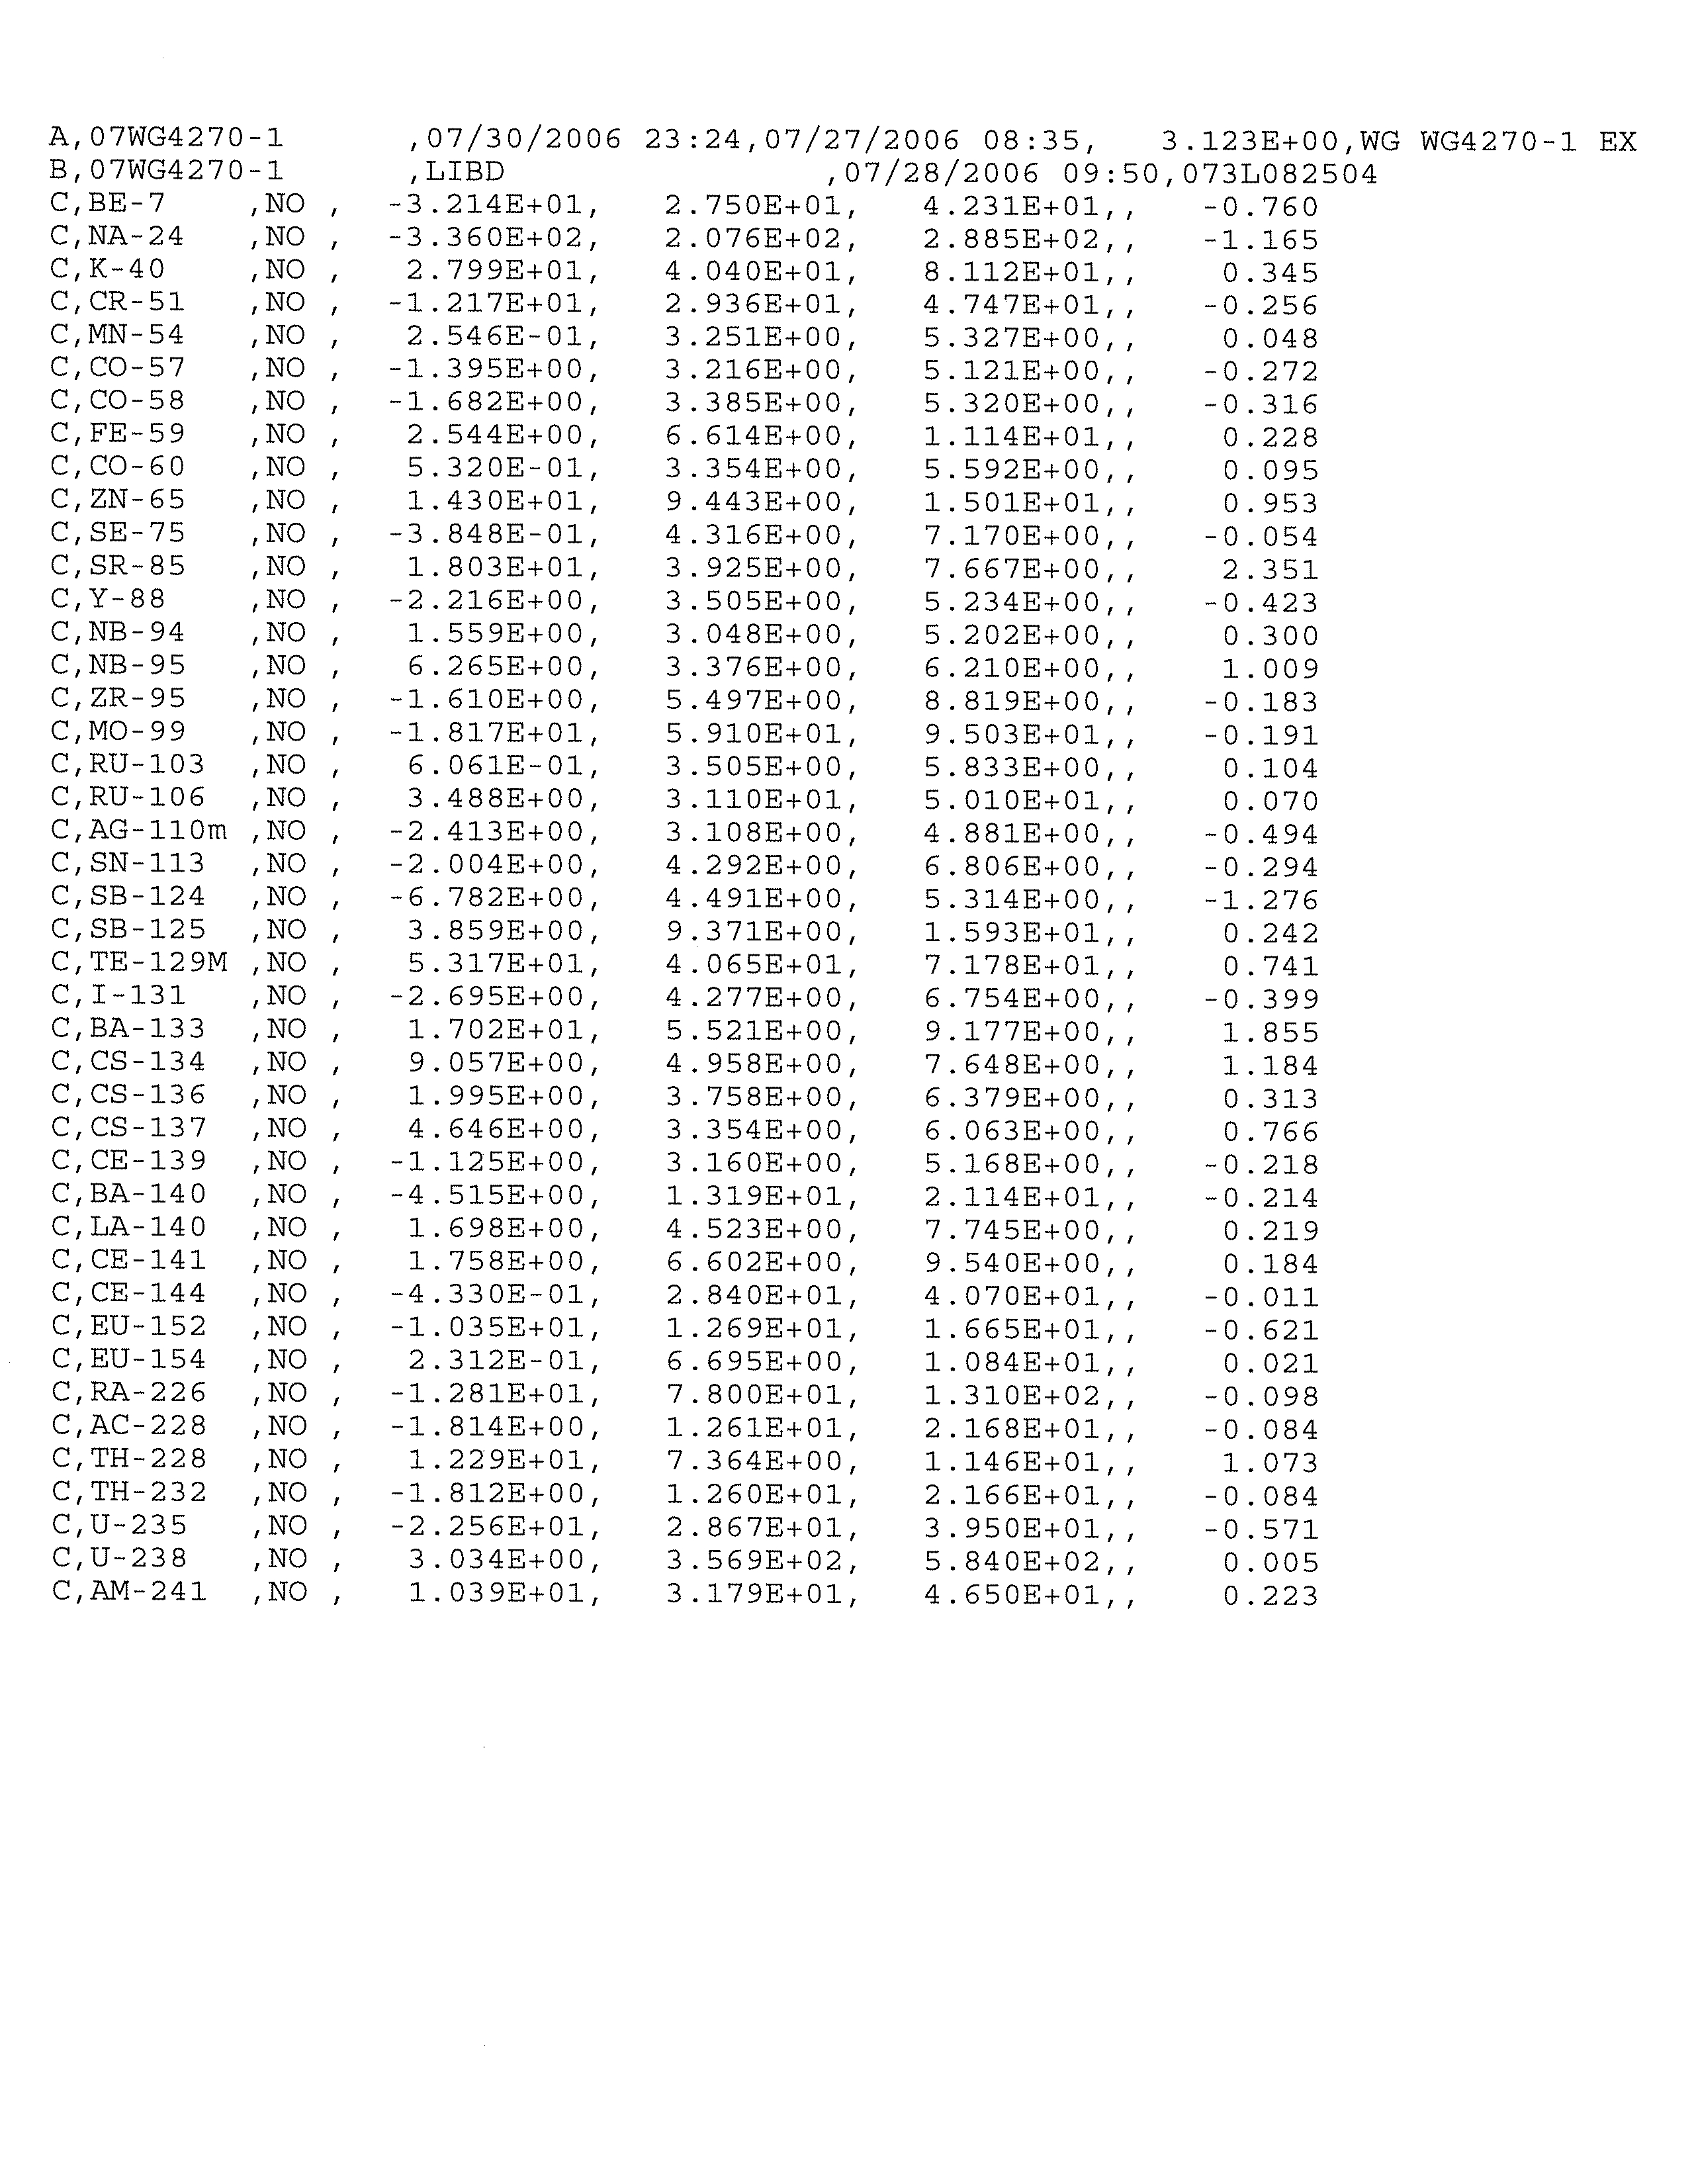
newly installed monitoring wells, two from
existing monitoring wells near the AFEs,
and eight from water supply wells) and two surface water samples at the Station. All
groundwater and surface water samples were analyzed for tritium, strontium-89/90,
and gamma-emitting radionuclides.
The results of the hydrogeologic investigation are:
•
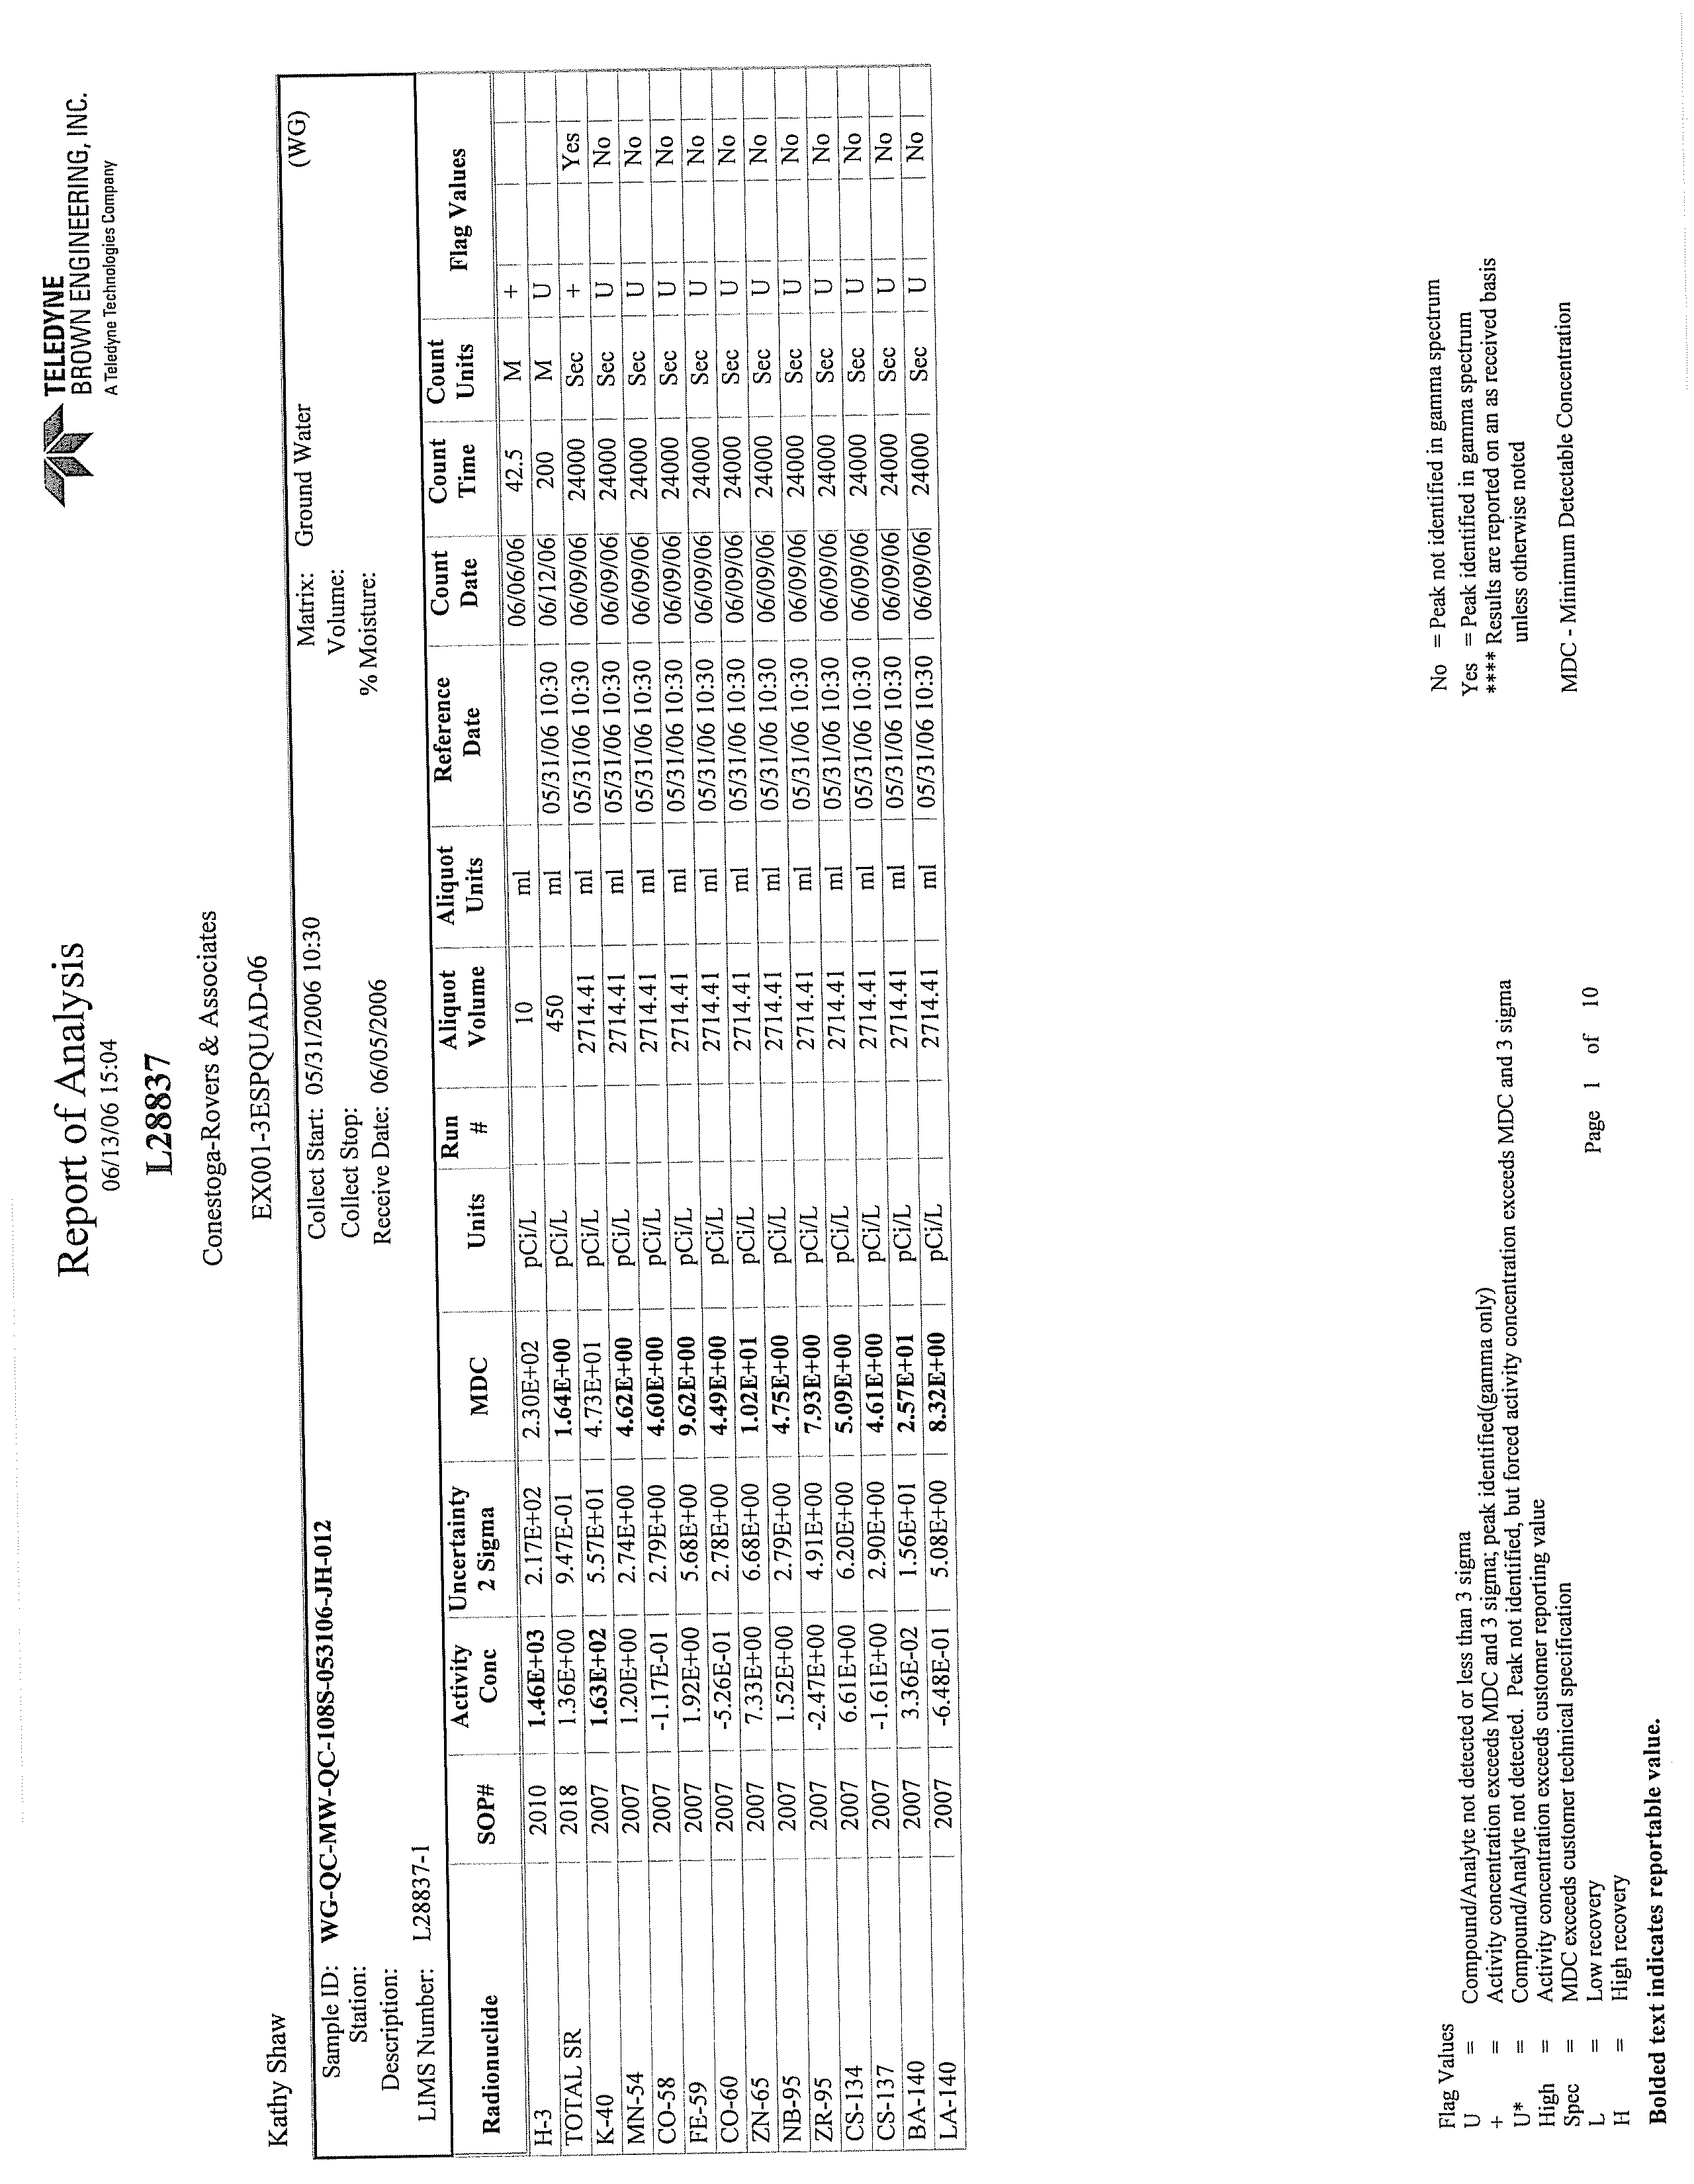
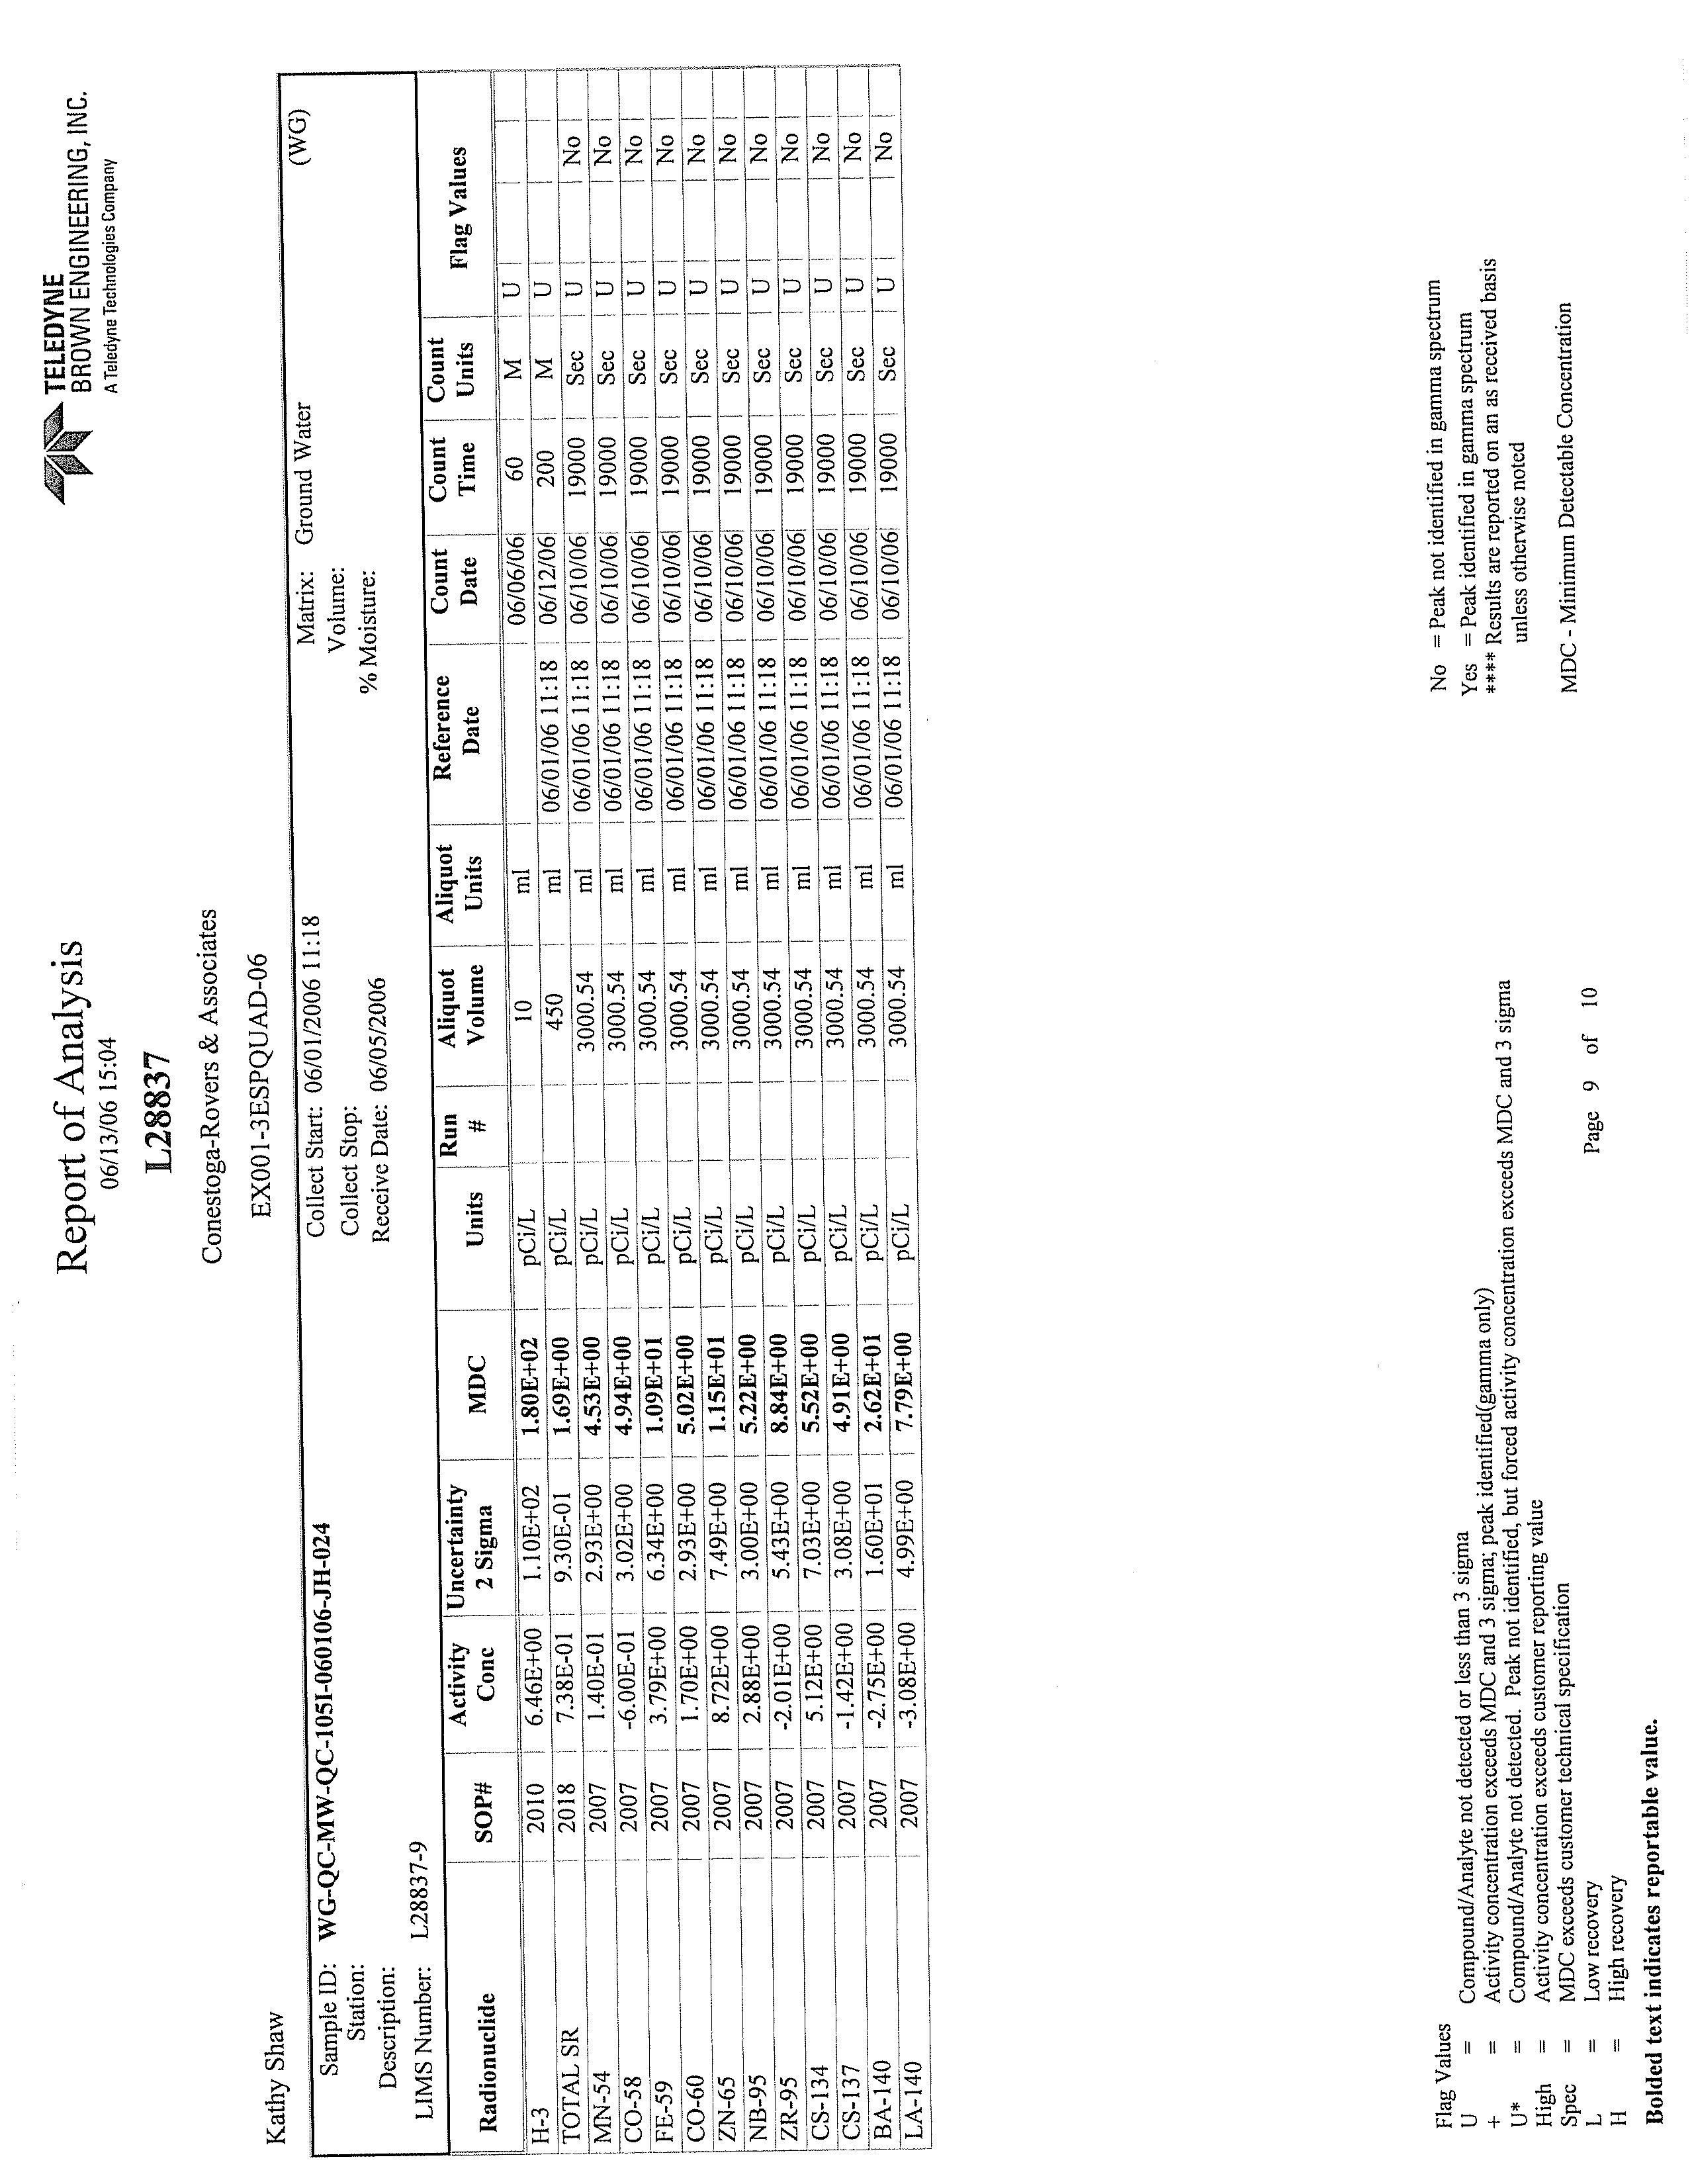
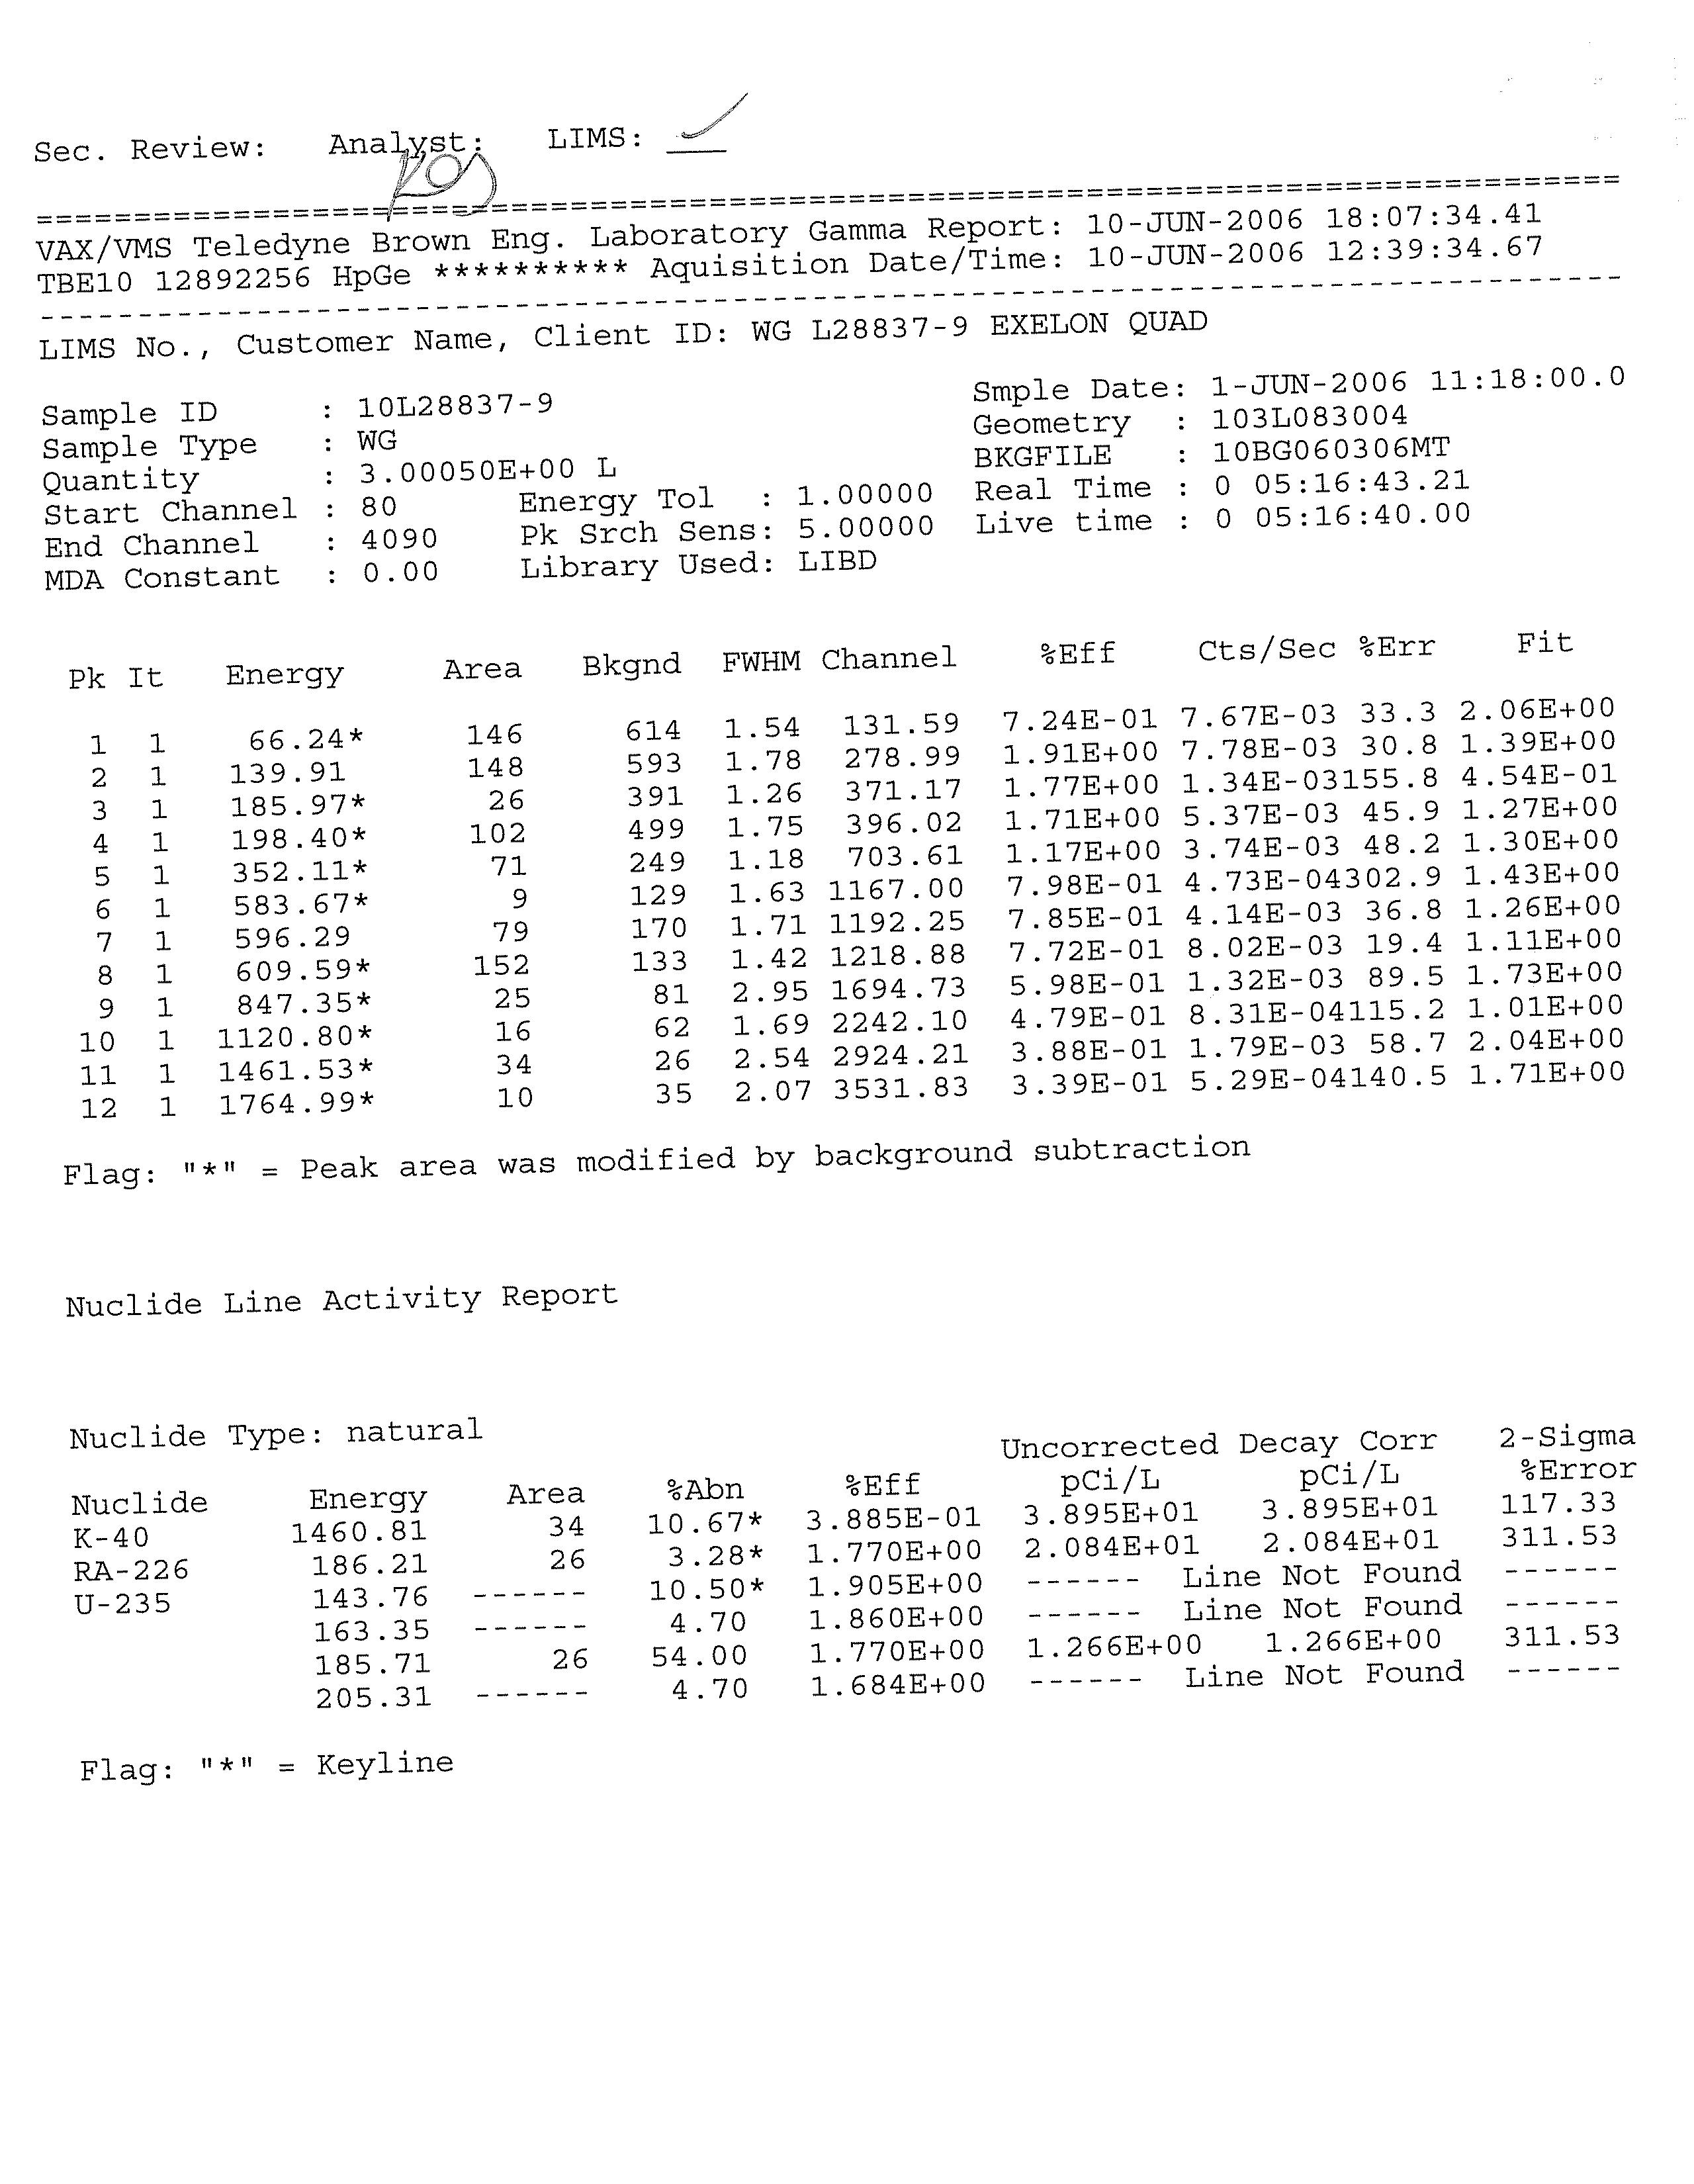
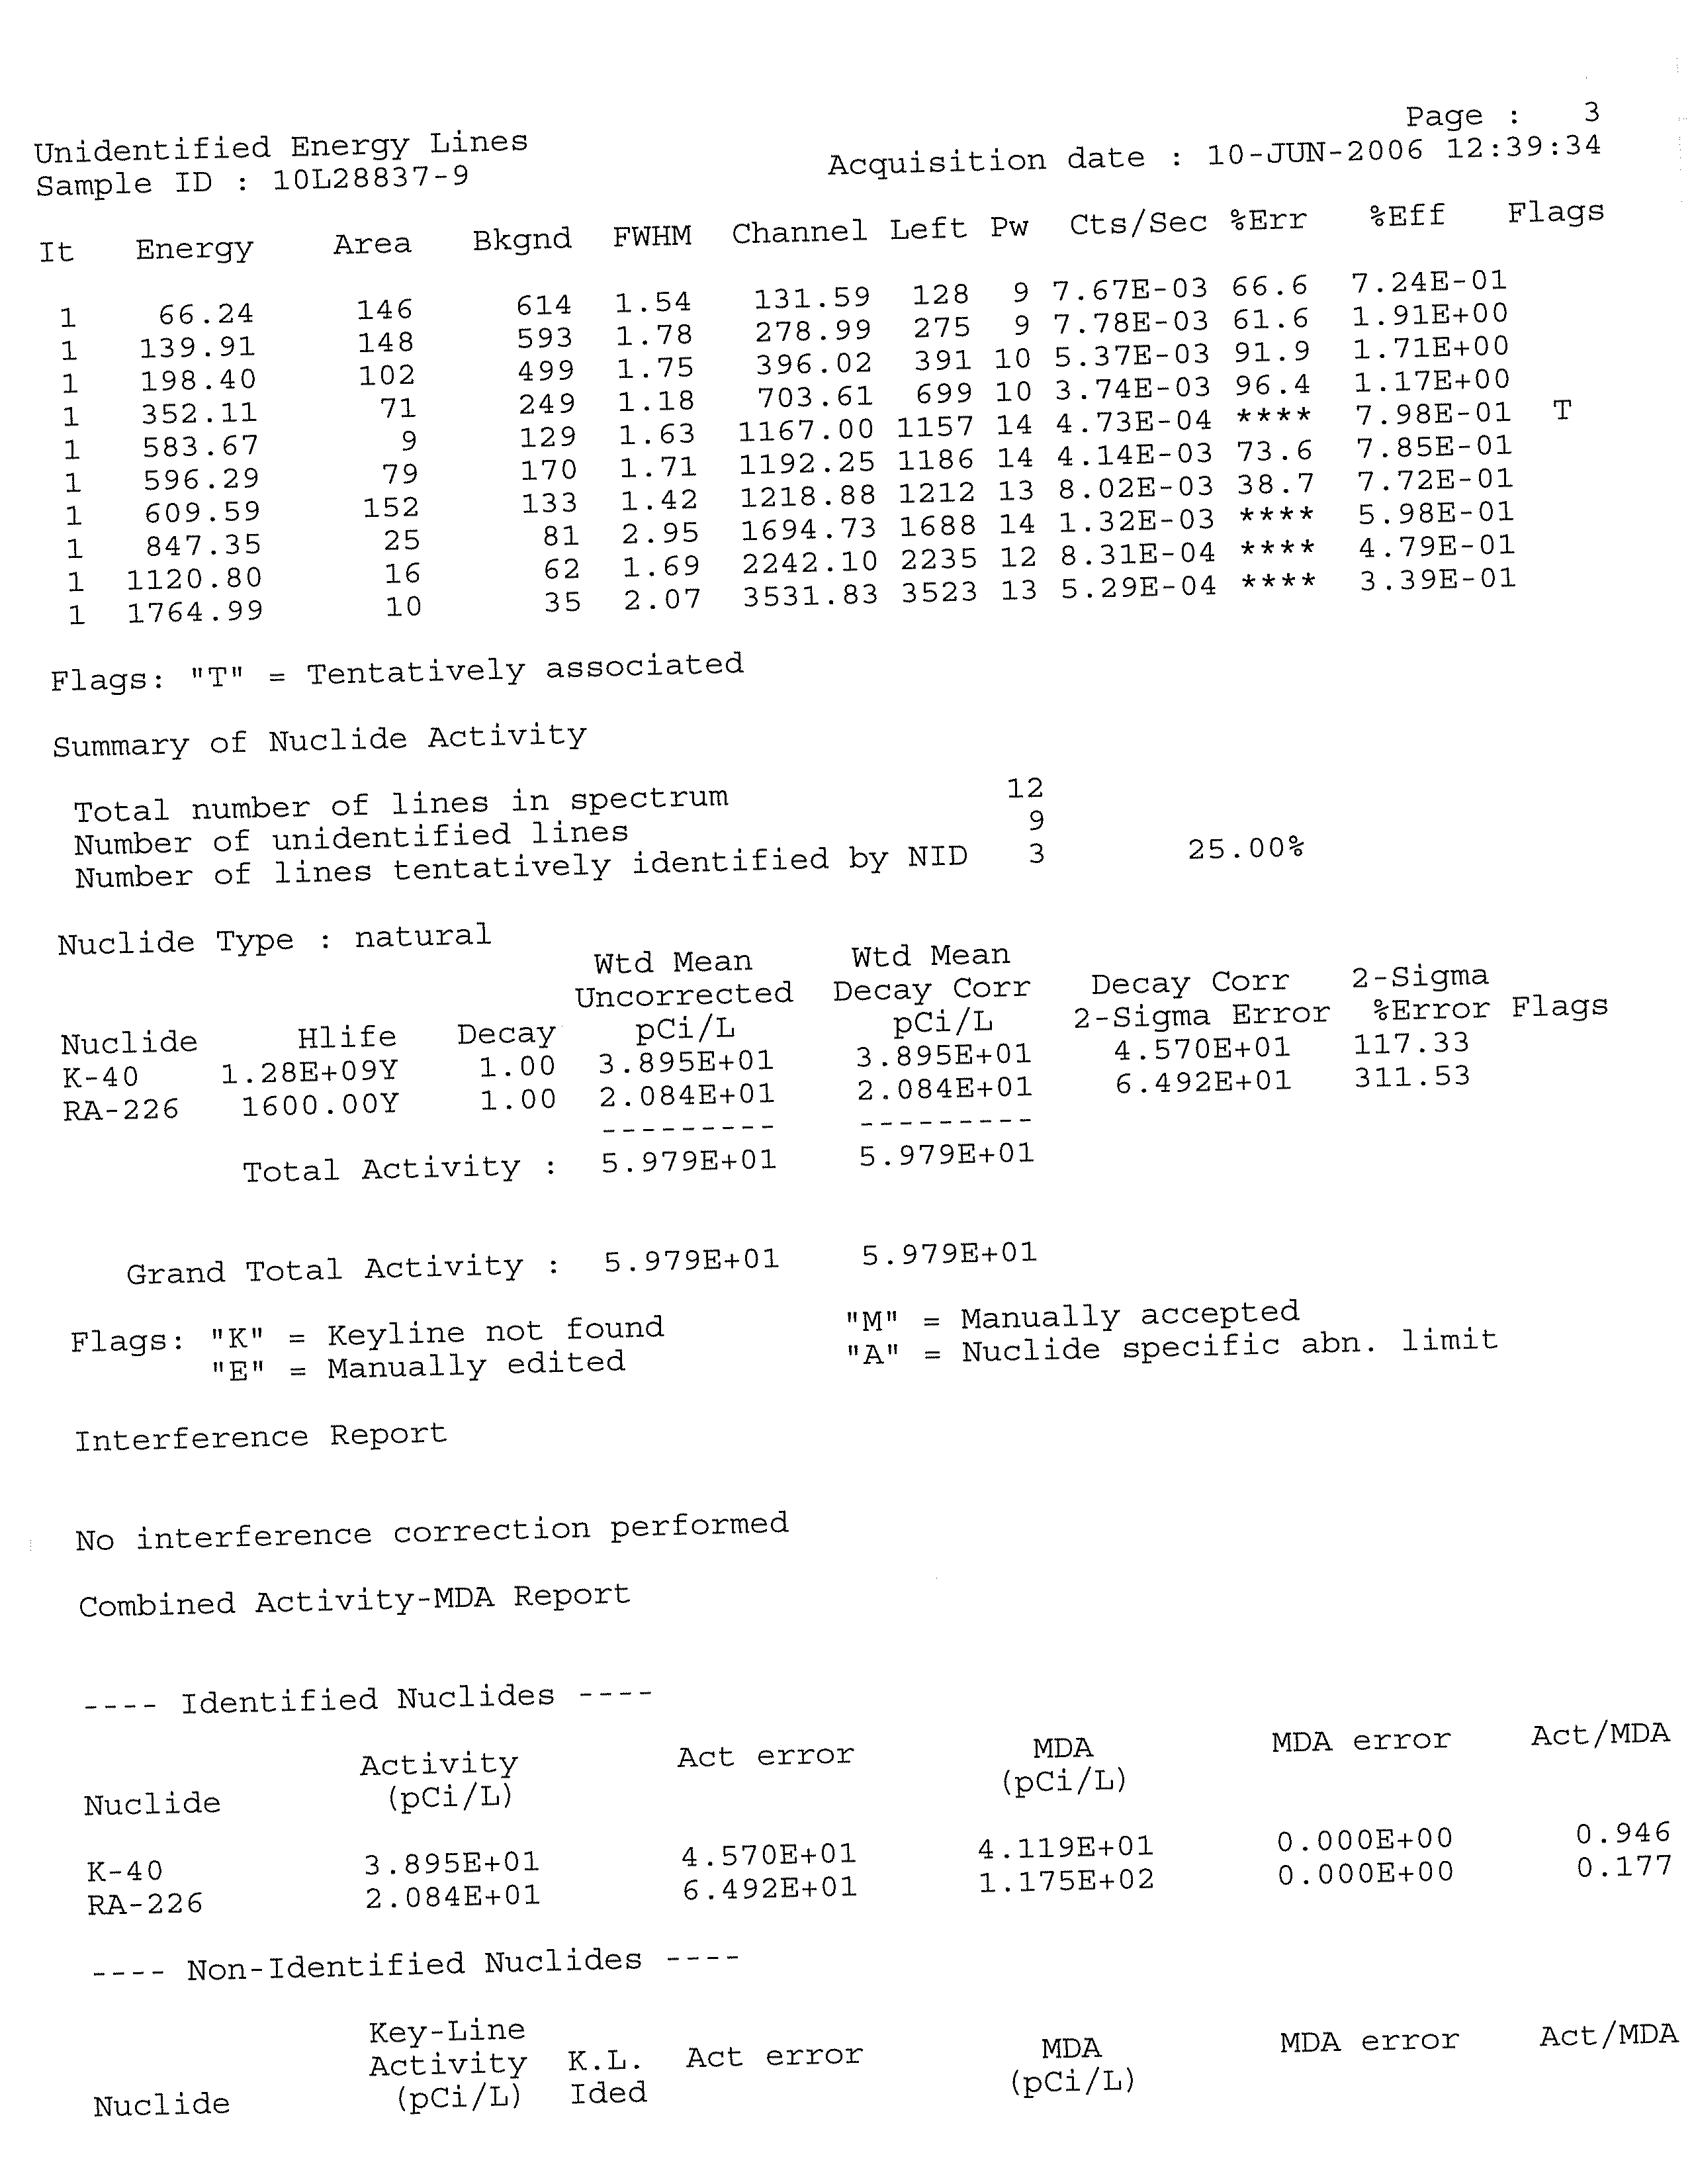
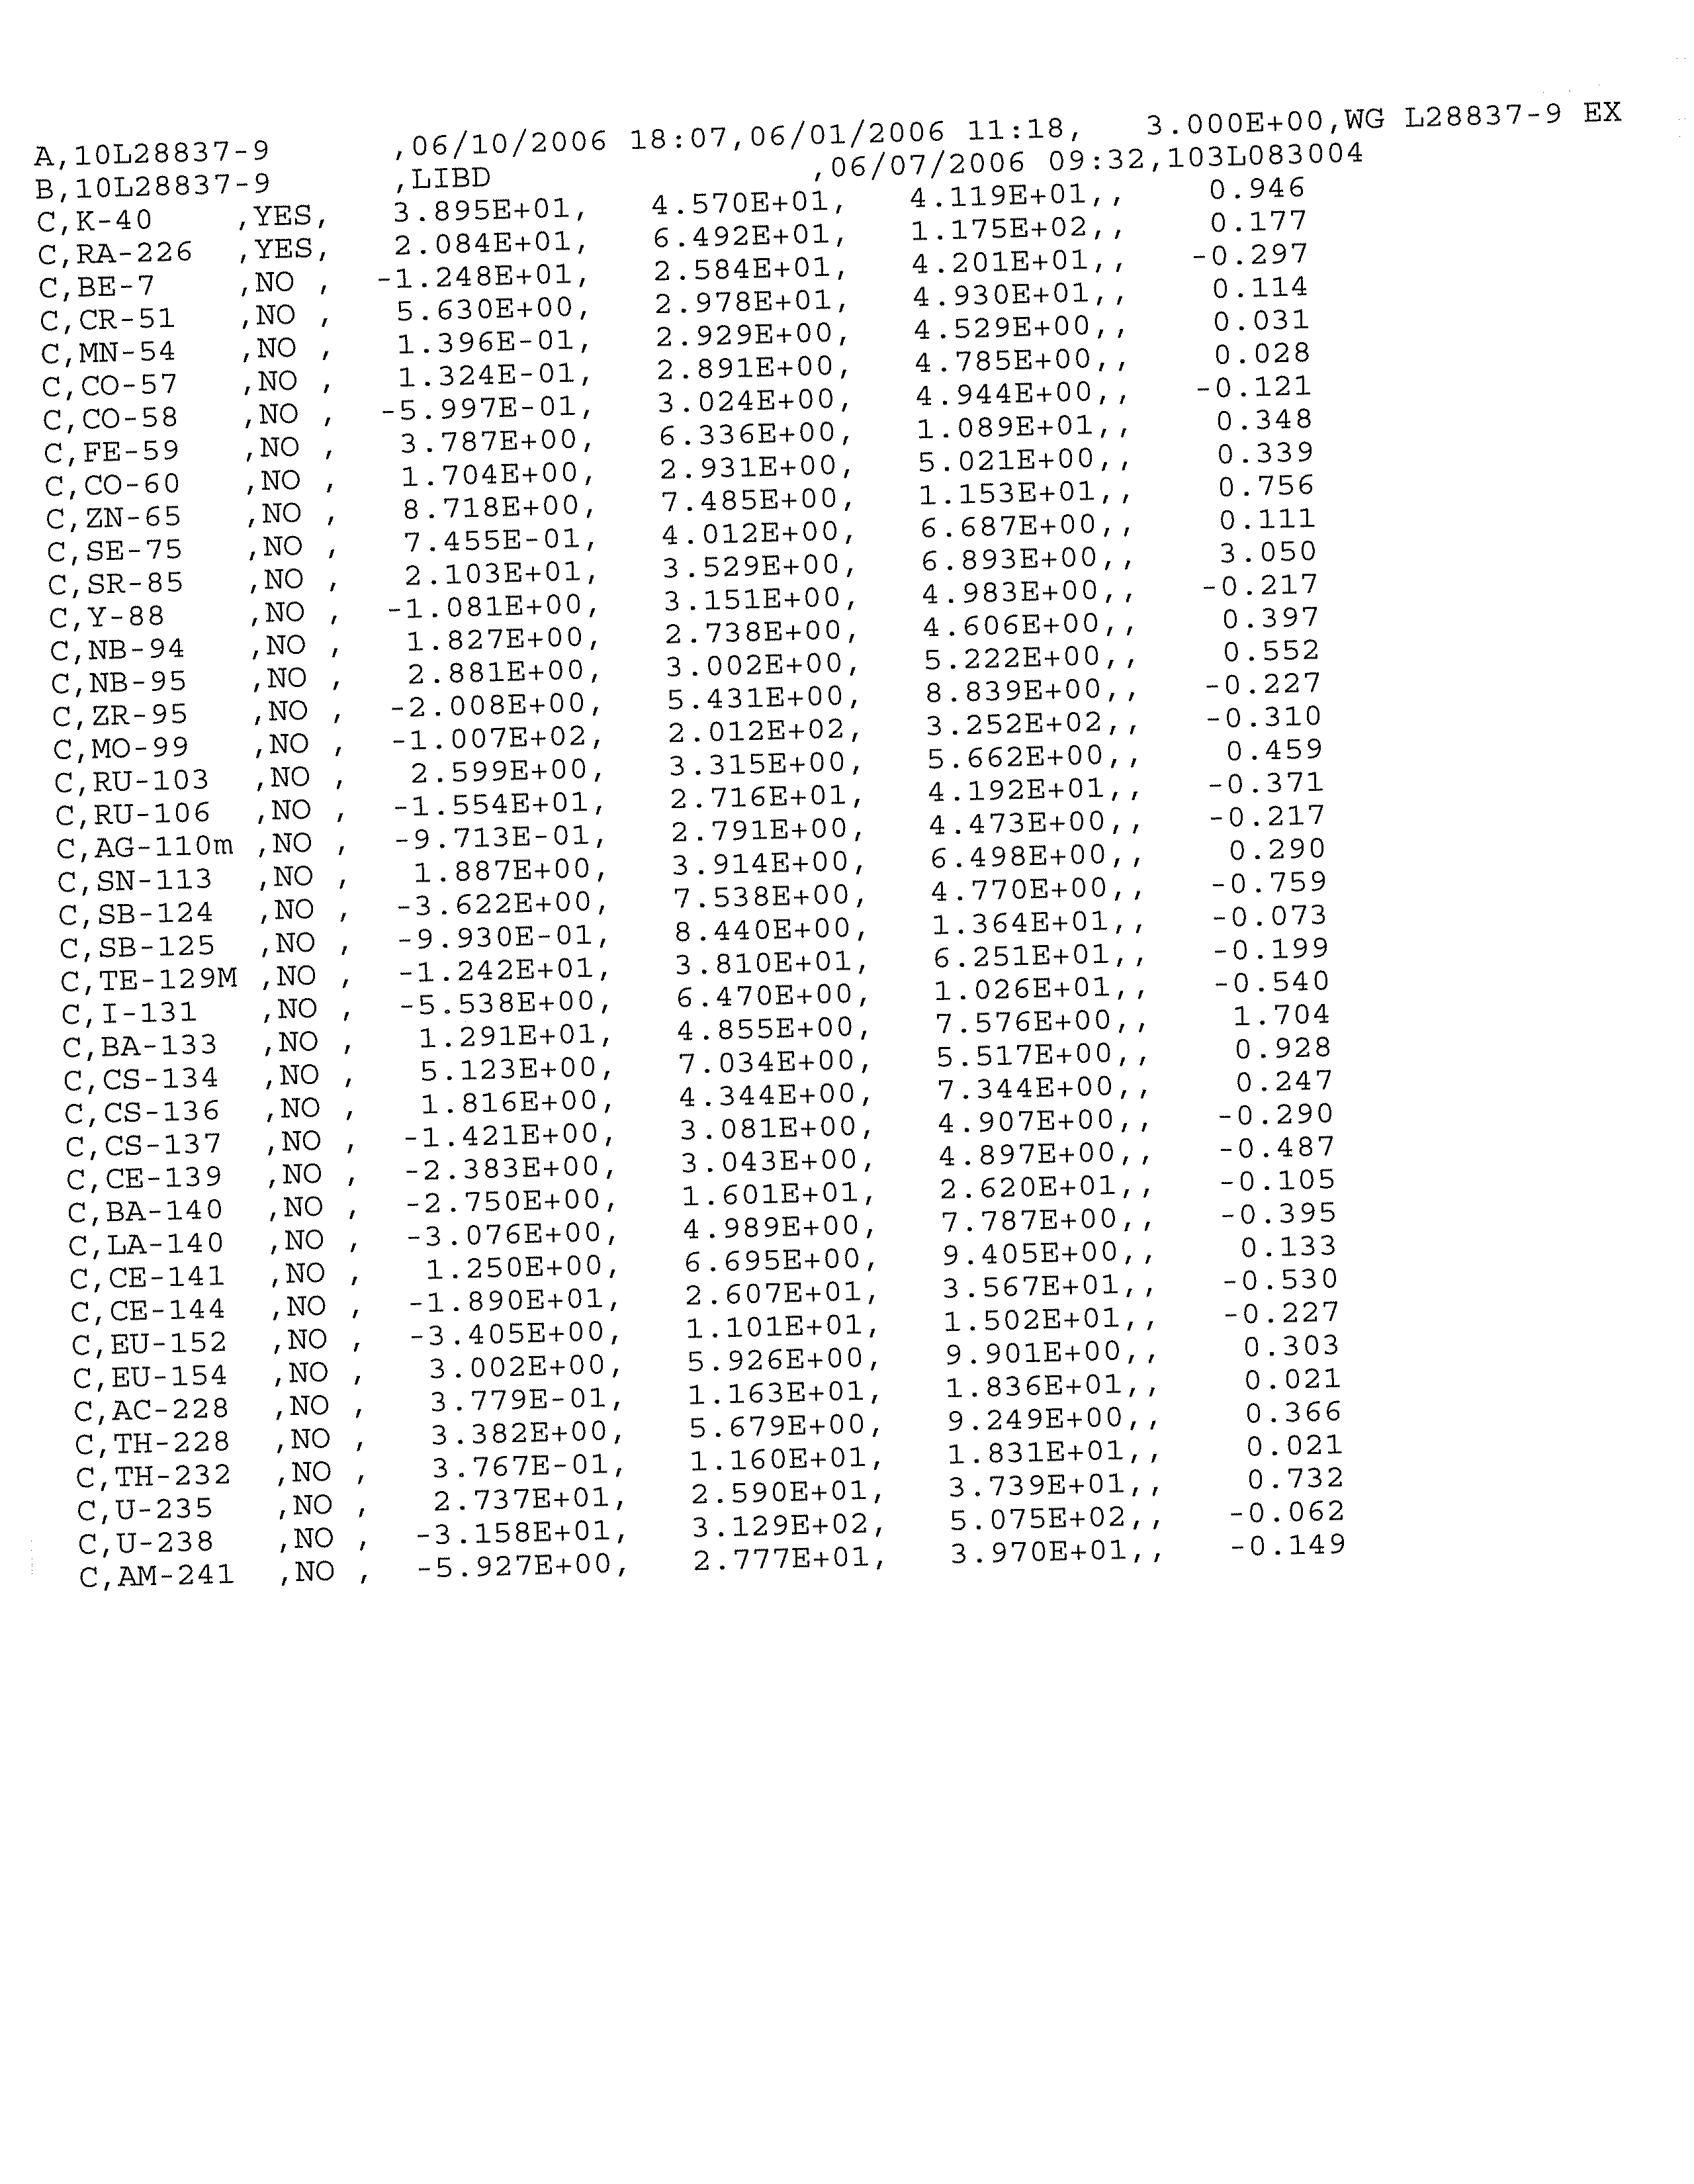
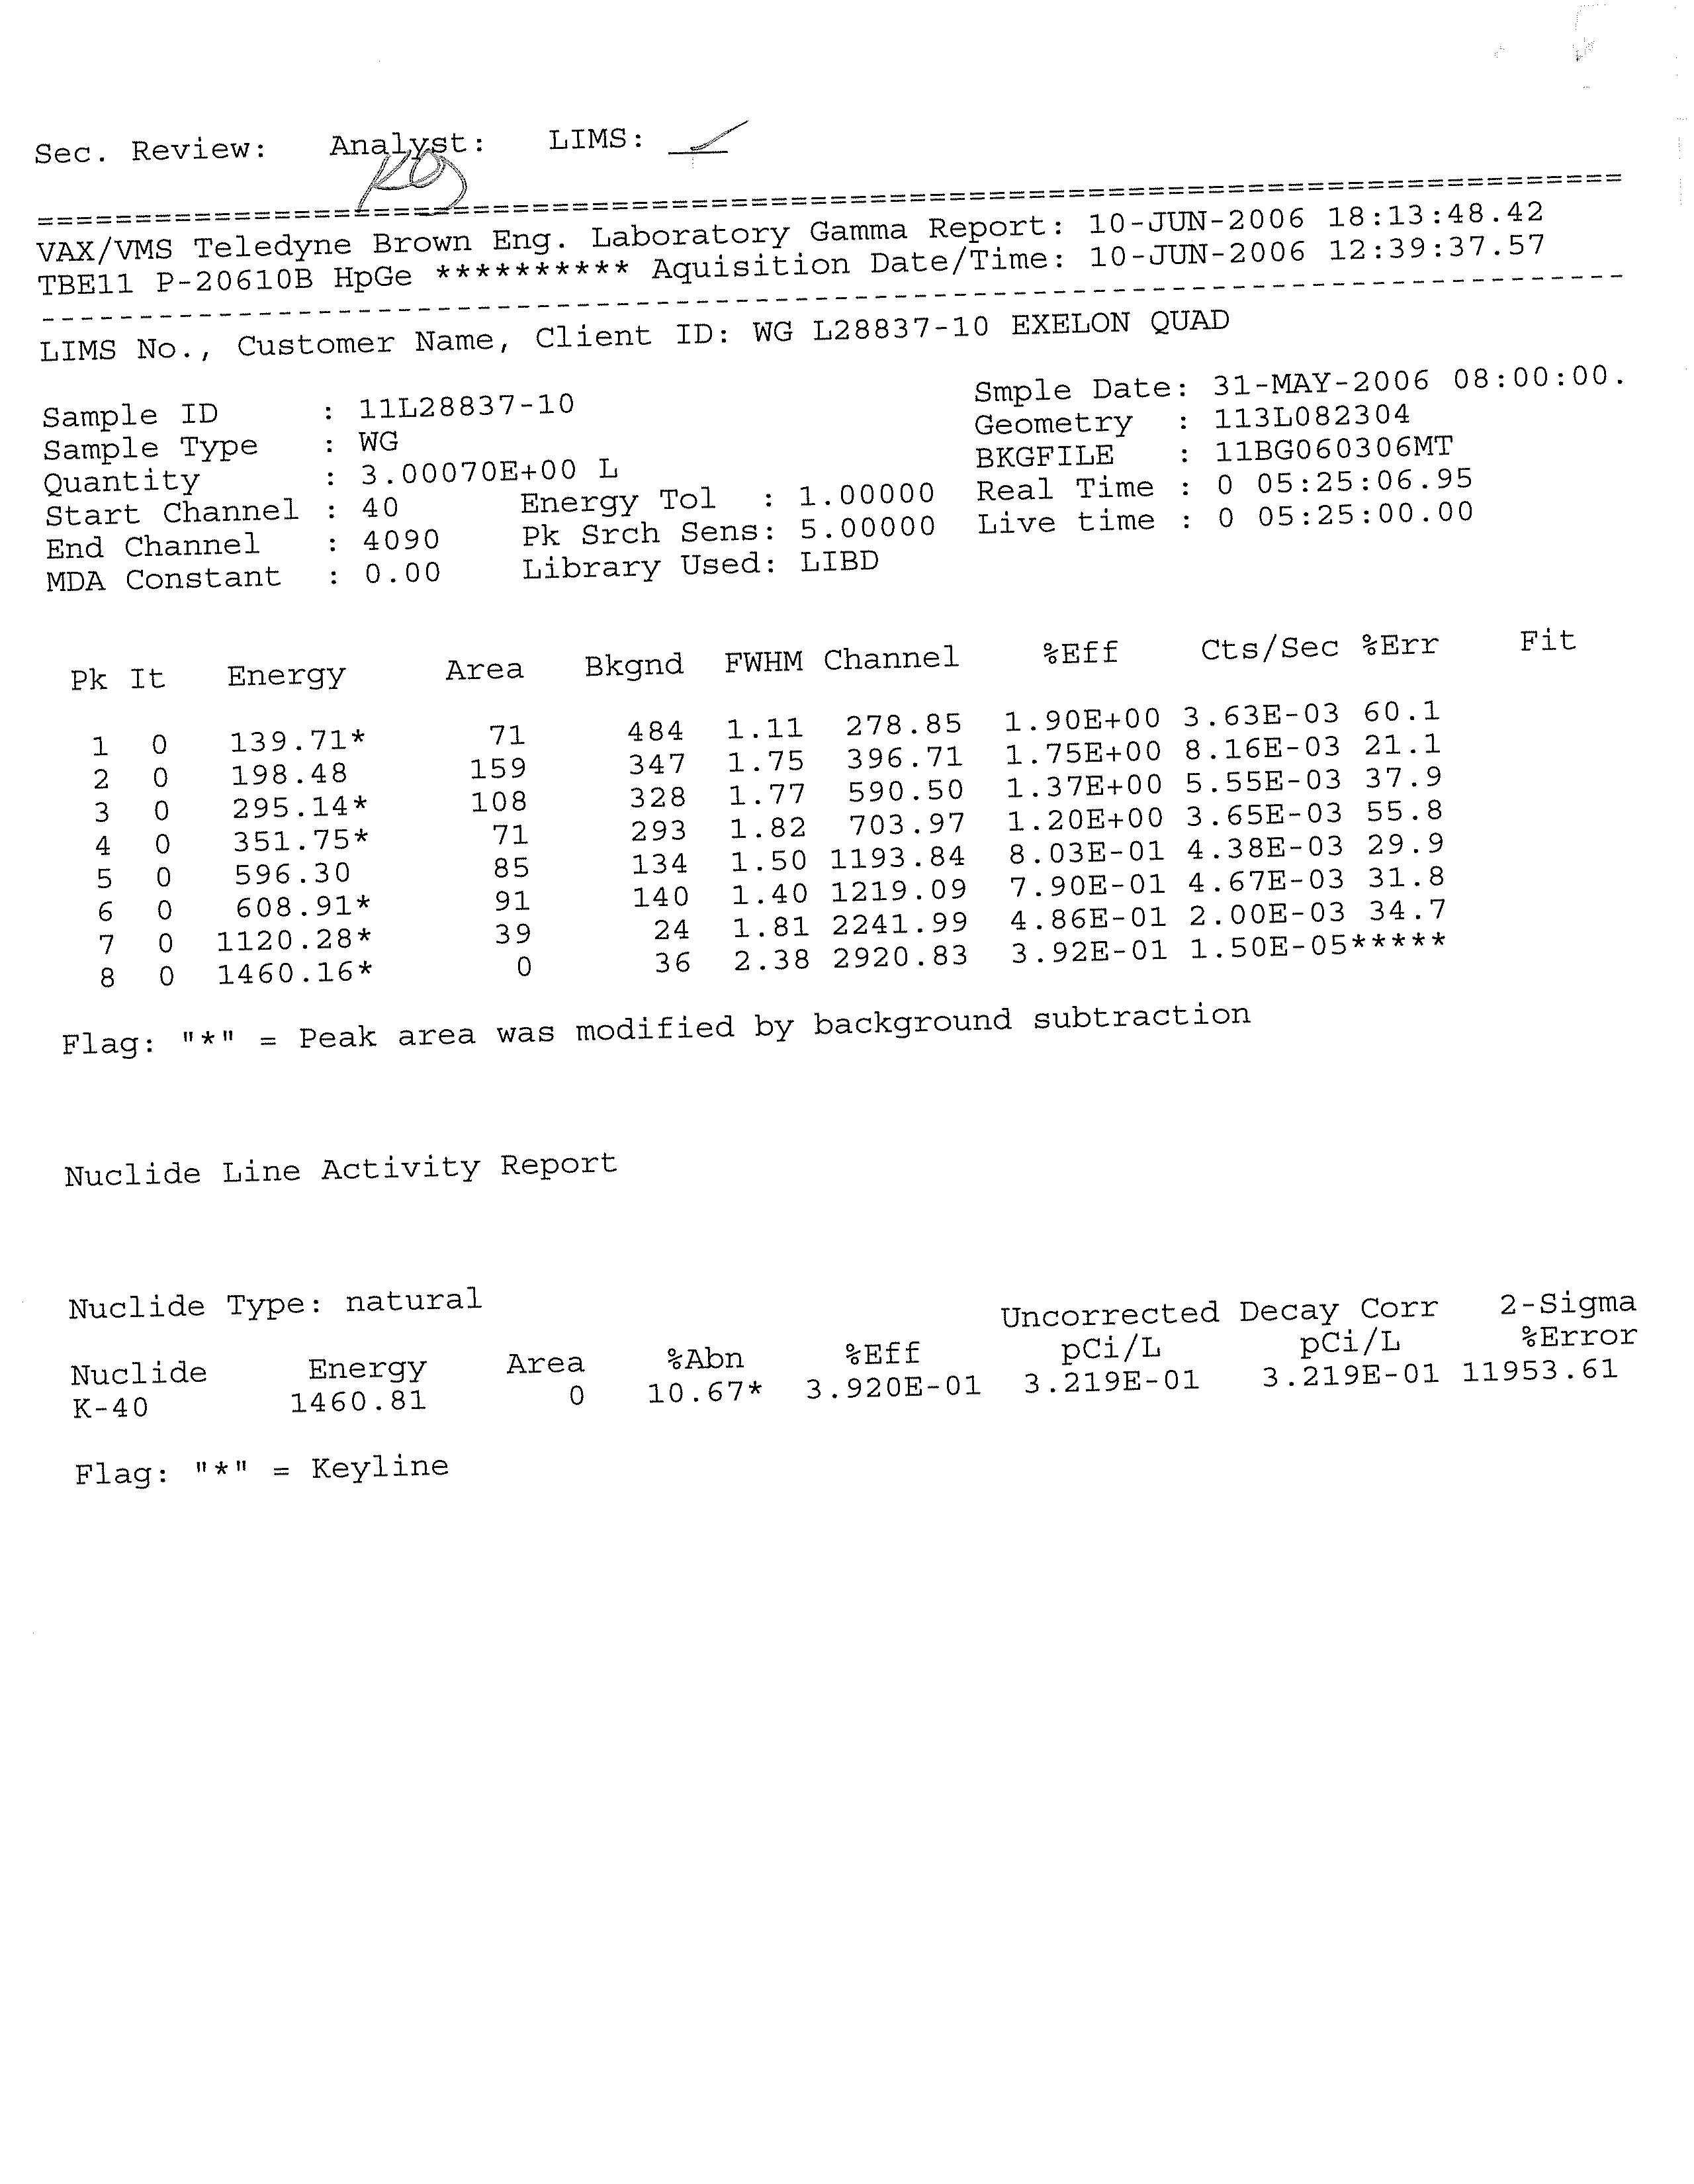
Gamma-emitting radionuclides associated
with licensed plant operations were not
detected at concentrations greater than their respective Lower Limits of Detection
(LLDs) in any of the groundwater or surface water samples obtained and analyzed
during the course of this investigation;
•
Strontium-89/90 was not detected at a concentration greater than the LLD
of
2.0 picoCuries per liter (pCi/L) in any of the groundwater or surface water samples
obtained and analyzed during the course of this investigation;
•
Tritium
was detected at concentrations greater than LLD of 200 pCi/L in
groundwater samples from nine wells in the vicinity of and south/southwest of the
Service and Reactor Buildings, from two wells north/northwest of the Turbine
Building, and in surface water samples collected from the Spray Canal. The
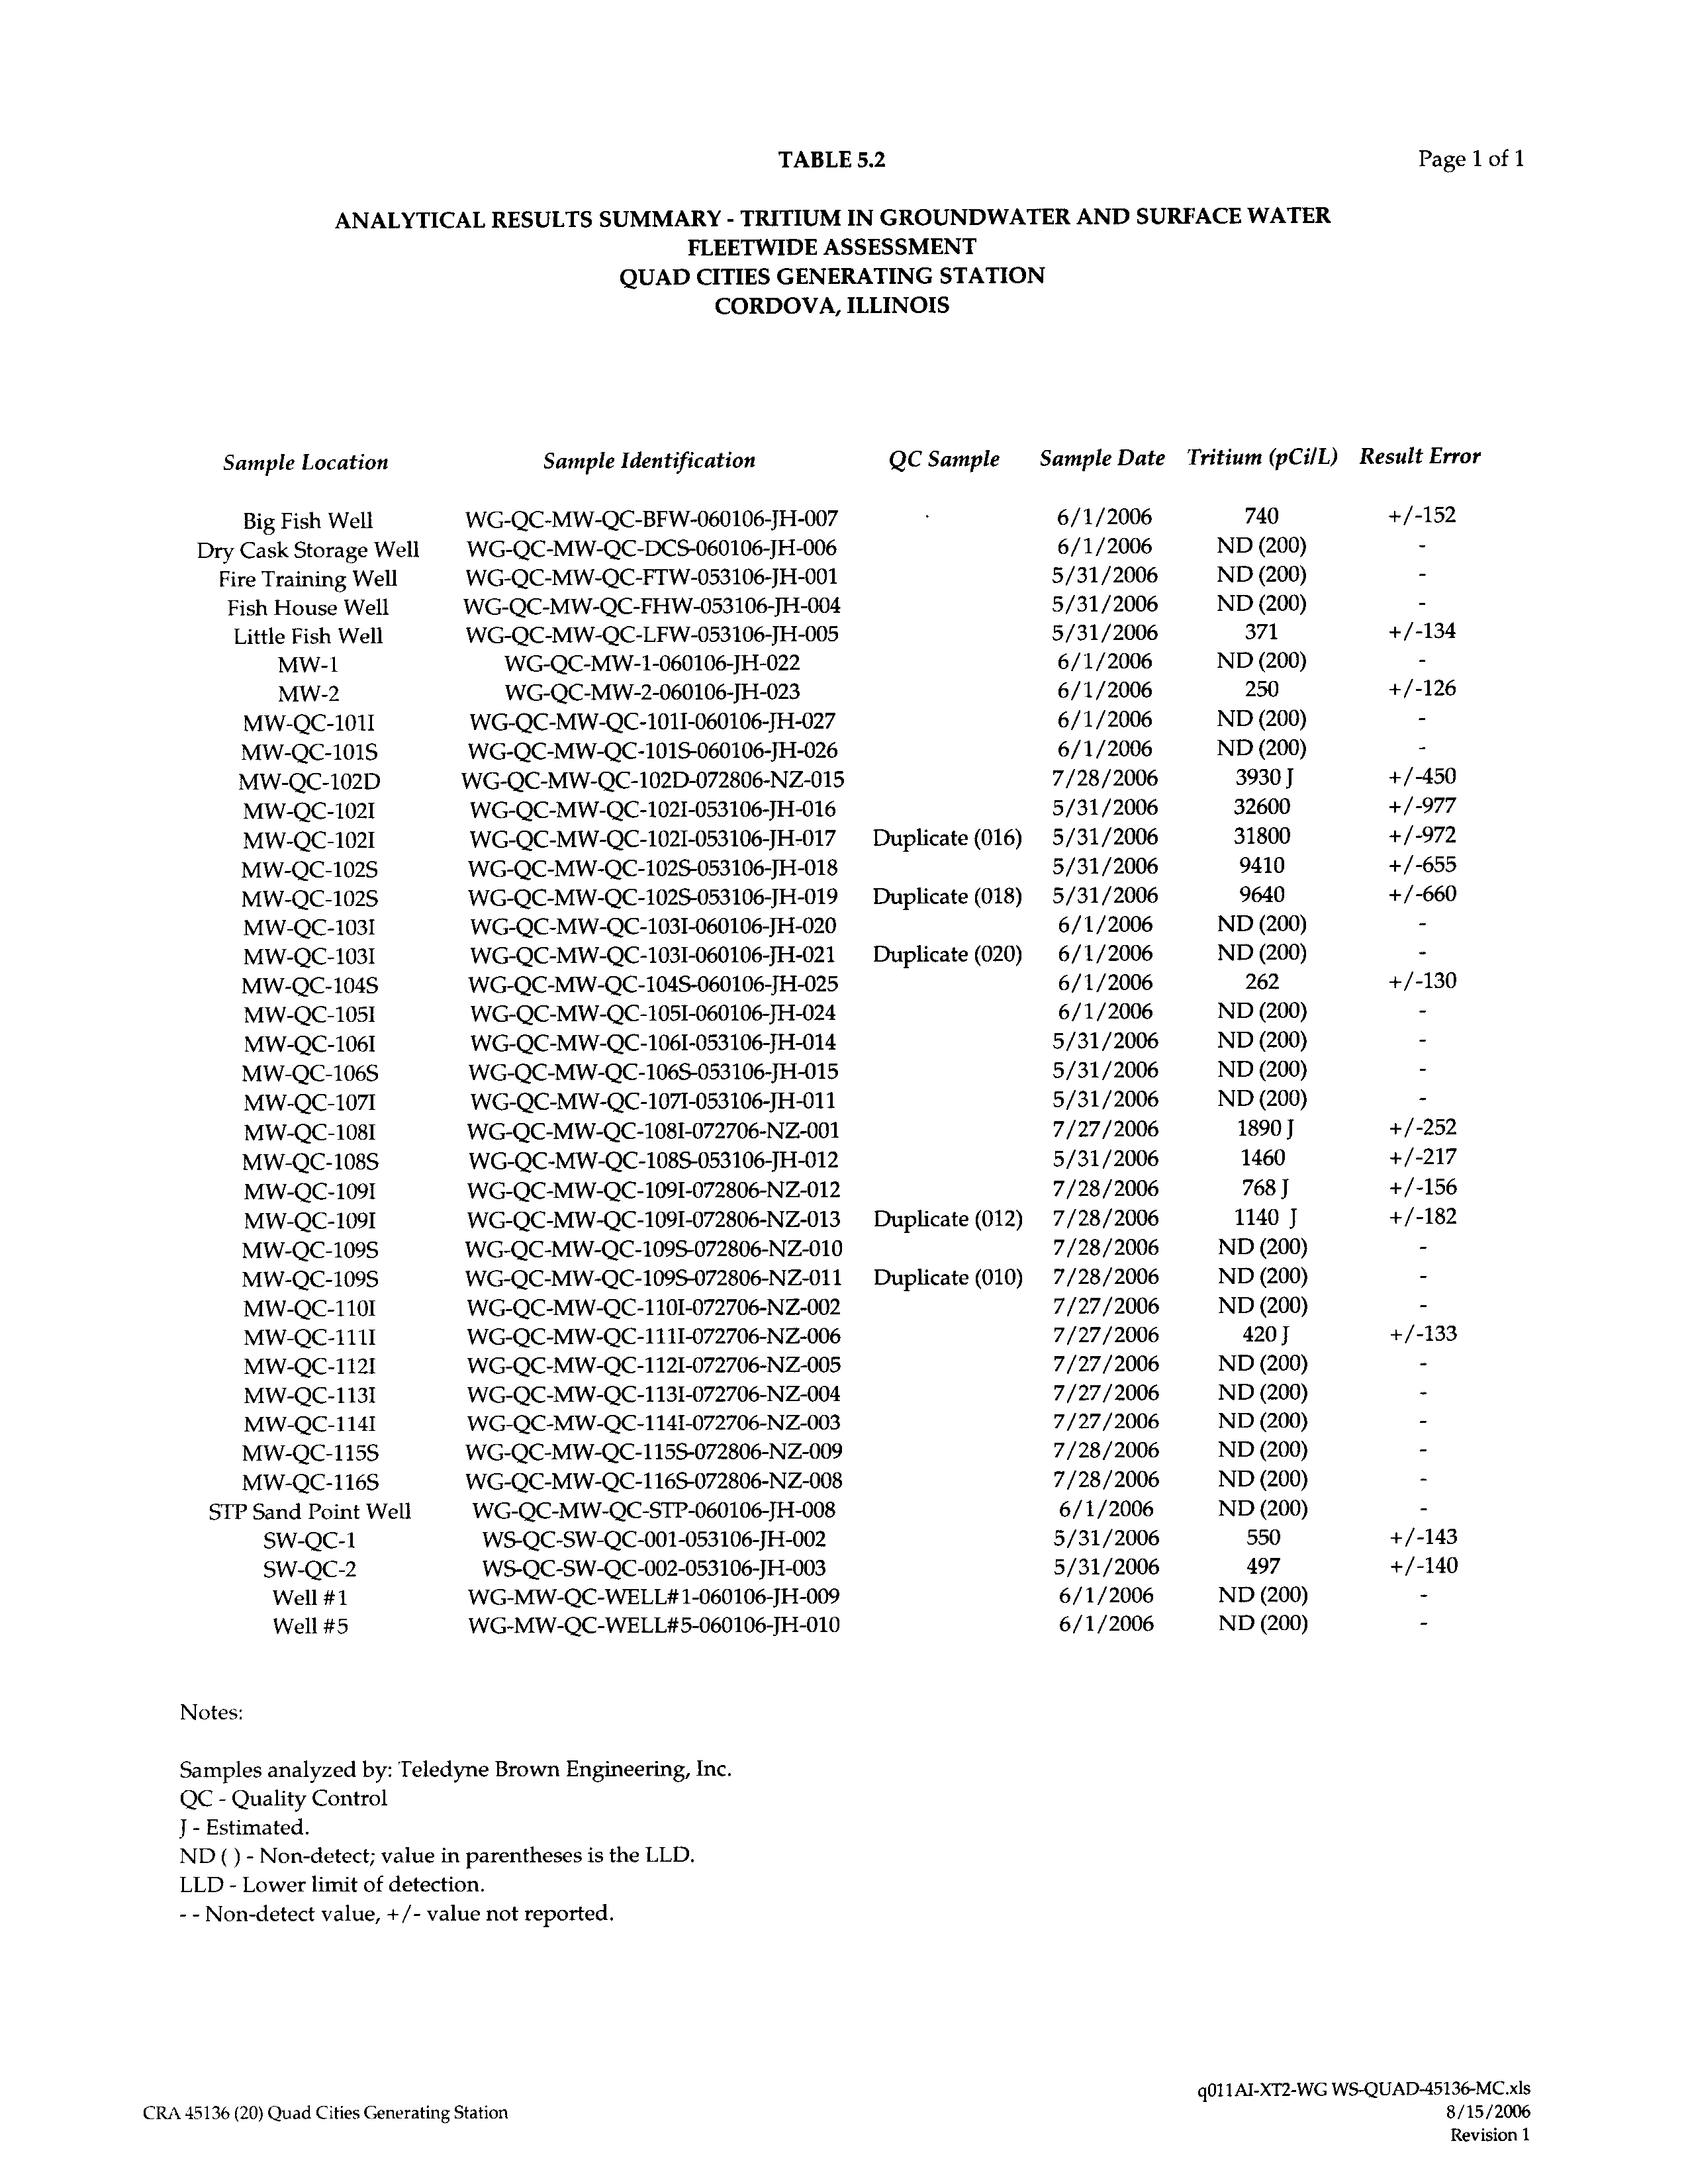
concentrations of tritium in groundwater greater than the LLD of 200 pCi/L ranged
from 250 ± 126 to 9,640 ± 660 pCi/L with the exception of MW-QC-102I at
32,600 ± 977, which is greater than the United States Environmental Protection
045136 (20) Quad Cities Generating Station
i
CONESTOGA-ROVERS & ASSOCIATES
Revision 1
Agency (USEPA) drinking water standard of 20,000 pCi/L. These tritium detections
are likely related to the historical releases;
•
Tritium was detected in the Station's
Spray Canal at 497 ± 140 pCi/L and
550
± 14 pCi/L, which is well below USEPA's drinking water standard of
20,000 pCi/L. The tritium in the Spray Canal is likely associated with the canal's
water supply, the Big Fish Well (740 pCi/L
± 152);
•
Based on the results of this investigation, tritium has not
migrated off site at
detectable concentrations;
•
Based on the results of this investigation, there is no current risk of exposure
to
radionuclides associated with licensed plant operations through any of the potential
exposure pathways; and
•
Based on the results of this investigation, there
are no known active releases into the
groundwater at the Station.
Based upon the information collected to date, CRA recommends that Exelon conduct
periodic monitoring of selected sample locations.
045136 (20) Quad Cities Generating Station
ii
CONESTOGA-ROVERS & ASSOCIATES
Revision 1
1.0
INTRODUCTION
Conestoga-Rovers & Associates (CRA) prepared this Hydrogeologic Investigation
Report (HIR) for Exelon Generation Company, LLC (Exelon) as part of its Fleetwide
Program to determine whether groundwater at and near its nuclear power generating
facilities has been adversely impacted by any releases of radionuclides. This report
documents the results of CRA's May 2006 Hydrogeologic Investigation Work Plan
(Work Plan), as well as several other investigative tasks recommended by CRA during
the course of the investigation. The investigations pertain to Exelon's Quad Cities
Generating Station in Cordova, Illinois (Station) (see Figure 1.1) between May and
July 2006. The Station is defined as all property, structures, systems, and components
owned and operated by Exelon located at 22710 206th Avenue North, Cordova, Illinois.
The approximate property boundaries are depicted on Figure 1.2.
Pursuant to the Work Plan, CRA assessed groundwater quality at the Station in
locations designated as Areas for
Further Evaluation (AFEs). The process by which CRA
identified AFEs is discussed in Section 3.0 of this report.
The objectives of the Work Plan were to:
•
characterize the geologic and hydrogeologic conditions at the Station, including
subsurface soil types, the presence or absence
of confining layers, and the direction
and rate of groundwater flow;
•
characterize the groundwater/surface water interaction at the Station, including a
determination of the surface water flow regime;
•
evaluate groundwater quality
at the Station including the vertical and horizontal
extent, quantity, concentrations and potential sources of tritium and other
radionuclides in the groundwater, if any;
•
define the probable sources of any radionuclides released at the Station;
•
evaluate potential human, ecological, or environmental receptors of any
radionuclides that might have been released to the groundwater; and
•
evaluate whether interim response activities are warranted.
045136 (20) Quad Cities Generating Station
1
CONESTOGA-ROVERS & ASSOCIATES
Revision 1
2.0
STATION DESCRIPTION
This section presents a summary of the Station location and definition, an overview of
Station operations, surrounding land use, and an overview of both regional and
Station-specific topography, surface water features, geology, hydrogeology, and
groundwater flow conditions. This section also presents an overview of groundwater
use in the area.
2.1
STATION LOCATION
The Station is located at 22710 206th Avenue North, Cordova, Illinois (see Figure 1.1).
The Station property consists of approximately
784 acres. The Station is owned by
Exelon Nuclear (75 percent) and MidAmerican Energy (25 percent). Figure 2.1 presents
a Station base map with the Station infrastructure shown.
2.2
OVERVIEW OF COOLING WATER OPERATIONS
The Station consists of two nuclear reactors, associated structures and ancillary
buildings,
a 310-foot main stack, intake and discharge canals, and a former Spray Canal.
The Spray Canal is approximately 3 miles long and was used for condenser cooling
water until 1983, at which time it was changed to a facility to raise game fish for release
into the Mississippi River.
The Station's generating system consists of a two-unit nuclear-powered steam electric
plant. Each unit is a boiling water reactor
(BWR) that produces a net electrical power
output of 930 megawatts. Unit 1 began commercial operation on February 18, 1973, and
Unit 2 began commercial operation on March 10, 1973. The Station currently operates
under the Nuclear Regulatory Commission (NRC) Operating Licenses DPR-29 and
DPR-30 and is permitted to discharge liquid waste to the Mississippi River under its
National Pollutant Discharge Elimination System (NPDES) permit IL0005037.
A BWR plant consists of two separate fluid loops. A separate loop design avoids mixing
the fluids of one loop with the fluids of the other. The loops are called
the primary loop
and the cooling loop.
The main purpose of the primary loop is to transfer the energy generated from fission in
the fuel to the turbine generator. It is a closed
loop system. Nuclear fission creates heat
in the fuel. This heat produces steam, which is passed through a steam dryer and
045136 (20) Quad Cities Generating Station
2
CONESTOGA-ROVERS & ASSOCIATES
Revision 1
moisture separator. The steam turns the turbine generator, which makes electricity. The
unused steam is exhausted to the condenser where it is condensed into water. The
resulting water is pumped out of the condenser with a series of pumps, reheated, and
pumped back to the reactor vessel.
The main purpose of the cooling loop is to use cooler river water to condense the steam
in
the condenser and transfer the heat to the environment. This loop is a single pass
process. The cooling water is pumped to the discharge bay and then discharged back to
the Mississippi River.
The total flow of river water through Units 1 and
2 for condenser circulating water and
service water is approximately 970,000 gallons per minute (gpm). Water is withdrawn
from the river at the intake bay through a canal that is perpendicular to the river flow.
The Station uses a two-pipe diffuser system to discharge cooling water to the Mississippi
River from the discharge bay. The pipes are 16 feet in diameter and lie on the bottom of
the river across the main river flow. Water is discharged into the deepest part of the
river through regularly spaced jet nozzles in the pipes.
Radioactive liquid wastes (radwastes) are collected in sumps and drain tanks at various
locations at the Station and then transferred to tanks in the
Radwaste Building for
processing, storage, and release. Liquid wastes that can be reused are returned to the
Contaminated Condensate Storage Tanks (CCSTs). Liquid wastes that cannot be reused
are returned to the Radwaste System for reprocessing or discharging to the river
(NRC, 2004). Liquid wastes are discharged via the River Discharge Tank (RDT). Water
from the RDT is pumped out to the diffuser house that empties into the south diffuser
below the water surface. The liquid waste mixes with the effluent from the discharge
bay prior to dispersion out the diffuser pipe.
2.3
SURROUNDING LAND USE
The area surrounding the Station to the north, east, and south is rural farmland and
woods. There is an industrial park 1 mile further to the north, and the Cordova Energy
Center, a gas-fired power plant, is located 1 mile to the southeast.
The Station is located on the east bank of the
Mississippi River opposite the mouth of the
Wapsipinicon River. The Upper Mississippi River National Wildlife and Fish Refuge is
across the river from the Station and also on islands in the river about 2 miles
downstream from the Station.
045136 (20) Quad Cities Generating Station
3
CONESTOGA-ROVERS & ASSOCIATES
Revision 1
2.4
STATION SETTING
The following section presents a general summary of the topography, surface water
features, geology, hydrogeology, and groundwater
flow conditions near the Station.
The information was primarily gathered from Chapter 2.5 of the Quad Cities Station
Updated Final Safety Analysis Report (UFSAR, Revision 8, October 2005). The main
references the UFSAR relies upon are listed in Section 10.0. CRA checked and verified
all UFSAR references that apply to this HIR.
2.4.1
TOPOGRAPHY AND SURFACE WATER FEATURES
The Station is located in Rock Island County, which is within the Galesburg Plain
physiographic subsection of the Till Plains Section of the Central Lowland Province. A
flat to gently rolling topography in the Central Lowland Province characterizes almost
all of Illinois. The Galesburg Plain is level to undulating and is largely an Illinoian stage
glacial drift but only locally is there prominent glacial topography. Much of the surface
topography mimics the underlying bedrock surface.
The Station's natural grade level is at an elevation of 594.5
feet above mean sea level
(AMSL). The Station is on moderately high ground on the east bank of the Mississippi
River. The ground surface rises from the river to form steep bluffs approximately
20 to 40 feet in height. The bluffs are breached in places by gullies extending short
distances inland.
The Station is on the east side of the Mississippi River opposite the mouth of the
Wapsipinicon River. The Upper Mississippi
River near the Station is composed of a
series of slack-water pools during low flow. The pools are formed by navigation dams
located on the river both above and below the Station. The Station is located near
Pool #14; the normal elevation of this pool is 572 feet AMSL (Blume, 1966).
Station surface water bodies include the former Spray Canal, discharge bay, intake bay,
and
dredge ponds. Silt pumped from the intake bay and from the Mississippi River in
front of the intake bay is deposited in the dredge ponds. The dredge ponds contain river
sediment so tritium impact from the Station is not anticipated.
045136 (20) Quad Cities Generating Station
4
CONESTOGA-ROVERS & ASSOCIATES
Revision 1
2.4.2
GEOLOGY
The region is on the extreme northwest flank of the Illinois Basin. The upper bedrock
consists of Paleozoic sedimentary strata that dip gently, at approximately 15 to 20 feet
per mile, to the southeast toward the center of the Illinois Basin. The region is on the
south limb of the Savanna-Sabula Anticline (also known as the Plum River Fault Zone),
which trends east-west through Carroll County, several miles north of the Station. The
Paleozoic sedimentary rocks are of Silurian and older age and are on the order of
3,000 feet thick. They are underlain by Precambrian crystalline rocks (granite and
granodiorite) (Blume, 1966).
Beneath the Station are unconsolidated sediments comprised of clay, silt, sand, and
gravel deposited as glacial till, outwash, and river alluvium deposits.
The
unconsolidated sediments are underlain by bedrock of Silurian (Niagaran/Alexandrian
Dolomite), Ordovician (Maquoketa Shale, Galena - Platteville Dolomite, and Glenwood -
St. Peter Sandstone), and Cambrian age (dolomites, sandstones, and shales)
(Blume, 1966).
The Niagaran Dolomite is fossiliferous and sandy. In an abandoned
Niagaran Dolomite
quarry, which is located approximately 1 mile south of Cordova, there is a high degree
of fracturing in the dolomite, and the dolomite was weather-stained along fractures but
was a hard competent crystalline rock. Exploration test borings indicate that the upper
bedrock surface is weathered to varying depths. Deep borings indicate that the Silurian
Dolomite (Niagaran and Alexandrian Formations) is approximately 250 to 300 feet thick
(Blume, 1966).
Figure 2.2 presents the stratigraphic column for
the Rock Island area and the area to the
south and southeast. Although the stratigraphic column shows the Pennsylvanian,
Mississippian, and Devonian systems, these systems are not present in northern Rock
Island County, where the first bedrock encountered beneath the overburden is Silurian
Dolomite. Figure 2.3 presents a bedrock geologic map with a cross-section location. The
Station is adjacent to the northern portion of the cross-section and is underlain by
Silurian Dolomite. The cross-section in Figure 2.4 shows the sequence and structure of
the bedrock in the Station area (J.E. Bruckmann and R.E. Bergstrom, 1968).
The dolomite bedrock surface in northern Rock Island County has been eroded by the
ancient Mississippi drainage system. The Meredosia Channel, the upper portion of
the
Princeton Bedrock Valley system, is drift-filled lowland connecting the present
Mississippi River Valley and the Green River Lowland to the east. The mean elevation
of the bedrock surface in the channel is approximately 450 feet AMSL. However, a
045136 (20) Quad Cities Generating Station
5
CONESTOGA-ROVERS & ASSOCIATES
Revision 1
glacially scoured groove more than 100 feet deep, nearly 4 miles long, and 3,000 feet
wide is present along a portion of the south wall of the channel. It is thought that the
Meredosia Channel was entered at least once by glaciers during each of the four major
glaciations, with the glaciers entering first from the west and later from the east (L.D.
McGinnis and P.C. Heigold).
The channel has been filled with unconsolidated
sediments.
The Station is on a rock hill that was left as an erosional remnant between channels
(Blume,
1966), as is shown on Figure 2.5. The depth to bedrock beneath the Station is
approximately 50 feet. South of the Station, the thickness of the sand and gravel
increases greatly, to as much as 300 feet, due to the presence of the buried Meredosia
Channel that cuts into the dolomite bedrock (Blume, 1966). Figure 2.6 shows the
approximate northern extent of the Meredosia Channel.
2.4.3
HYDROGEOLOGY
Groundwater can be obtained from three aquifer systems:
•
unconsolidated alluvial and outwash sand and
gravel deposits, 40 to 60 feet thick in
the vicinity of the Station;
•
shallow Silurian dolomitic formations, approximately
200 to 250 feet thick; and
•
artesian sandstone aquifers
of Cambrian-Ordovician age.
The potential yield from the upper unconsolidated aquifer
is unknown because of lack
of local pumping data. But in other parts of the Mississippi Valley, this aquifer is
generally capable of yielding large quantities of water on a long-term basis. The
groundwater elevation in the unconsolidated aquifer ranged between 17 and 21 feet
below ground surface (bgs) on the Station. The groundwater flow direction in this unit
was anticipated in a westerly direction toward the Mississippi River. However, as noted
in Section 2.4.2, the Station sits on bedrock high with buried bedrock valleys of the
Meredosia Channel to the north and south (see Figure 2.5). These buried channels
contain thick (greater than 200 feet) deposits of sand and gravel. The buried channels
will likely affect the groundwater flow in the upper consolidated aquifer beneath the
Station. It is also likely that the groundwater table will undergo seasonal fluctuations
and that a temporary reversal of groundwater flow direction may occur from the
Mississippi River (Blume, 1966). Based on published records, it is known that the Army
Corps of Engineers maintains the water level in the Mississippi River adjacent to the
Station at an elevation of 572 feet AMSL.
045136 (20) Quad Cities Generating Station
6
CONESTOGA-ROVERS & ASSOCIATES
Revision 1
In addition to these natural effects, the groundwater flow direction may be affected
locally by structure basements and foundations, and by sheet piles beneath the Station to
a depth of 36 feet bgs at the river along the discharge bay and the inlet to the Spray
Canal (sheet pile locations are illustrated on Figure 2.6)
The Silurian Dolomite formations yield moderate to high quantities of water,
particularly in areas where unconsolidated sand and gravel sediments are present.
Dolomite aquifers immediately below the alluvium and outwash deposits are slowly
recharged from water in these deposits. Wells in the Cambrian-Ordovician sandstone
artesian aquifers produce large quantities of water. Groundwater in the deep artesian
aquifers is independent of the shallow near surface aquifers (Blume, 1966).
2.5
AREA GROUNDWATER USE
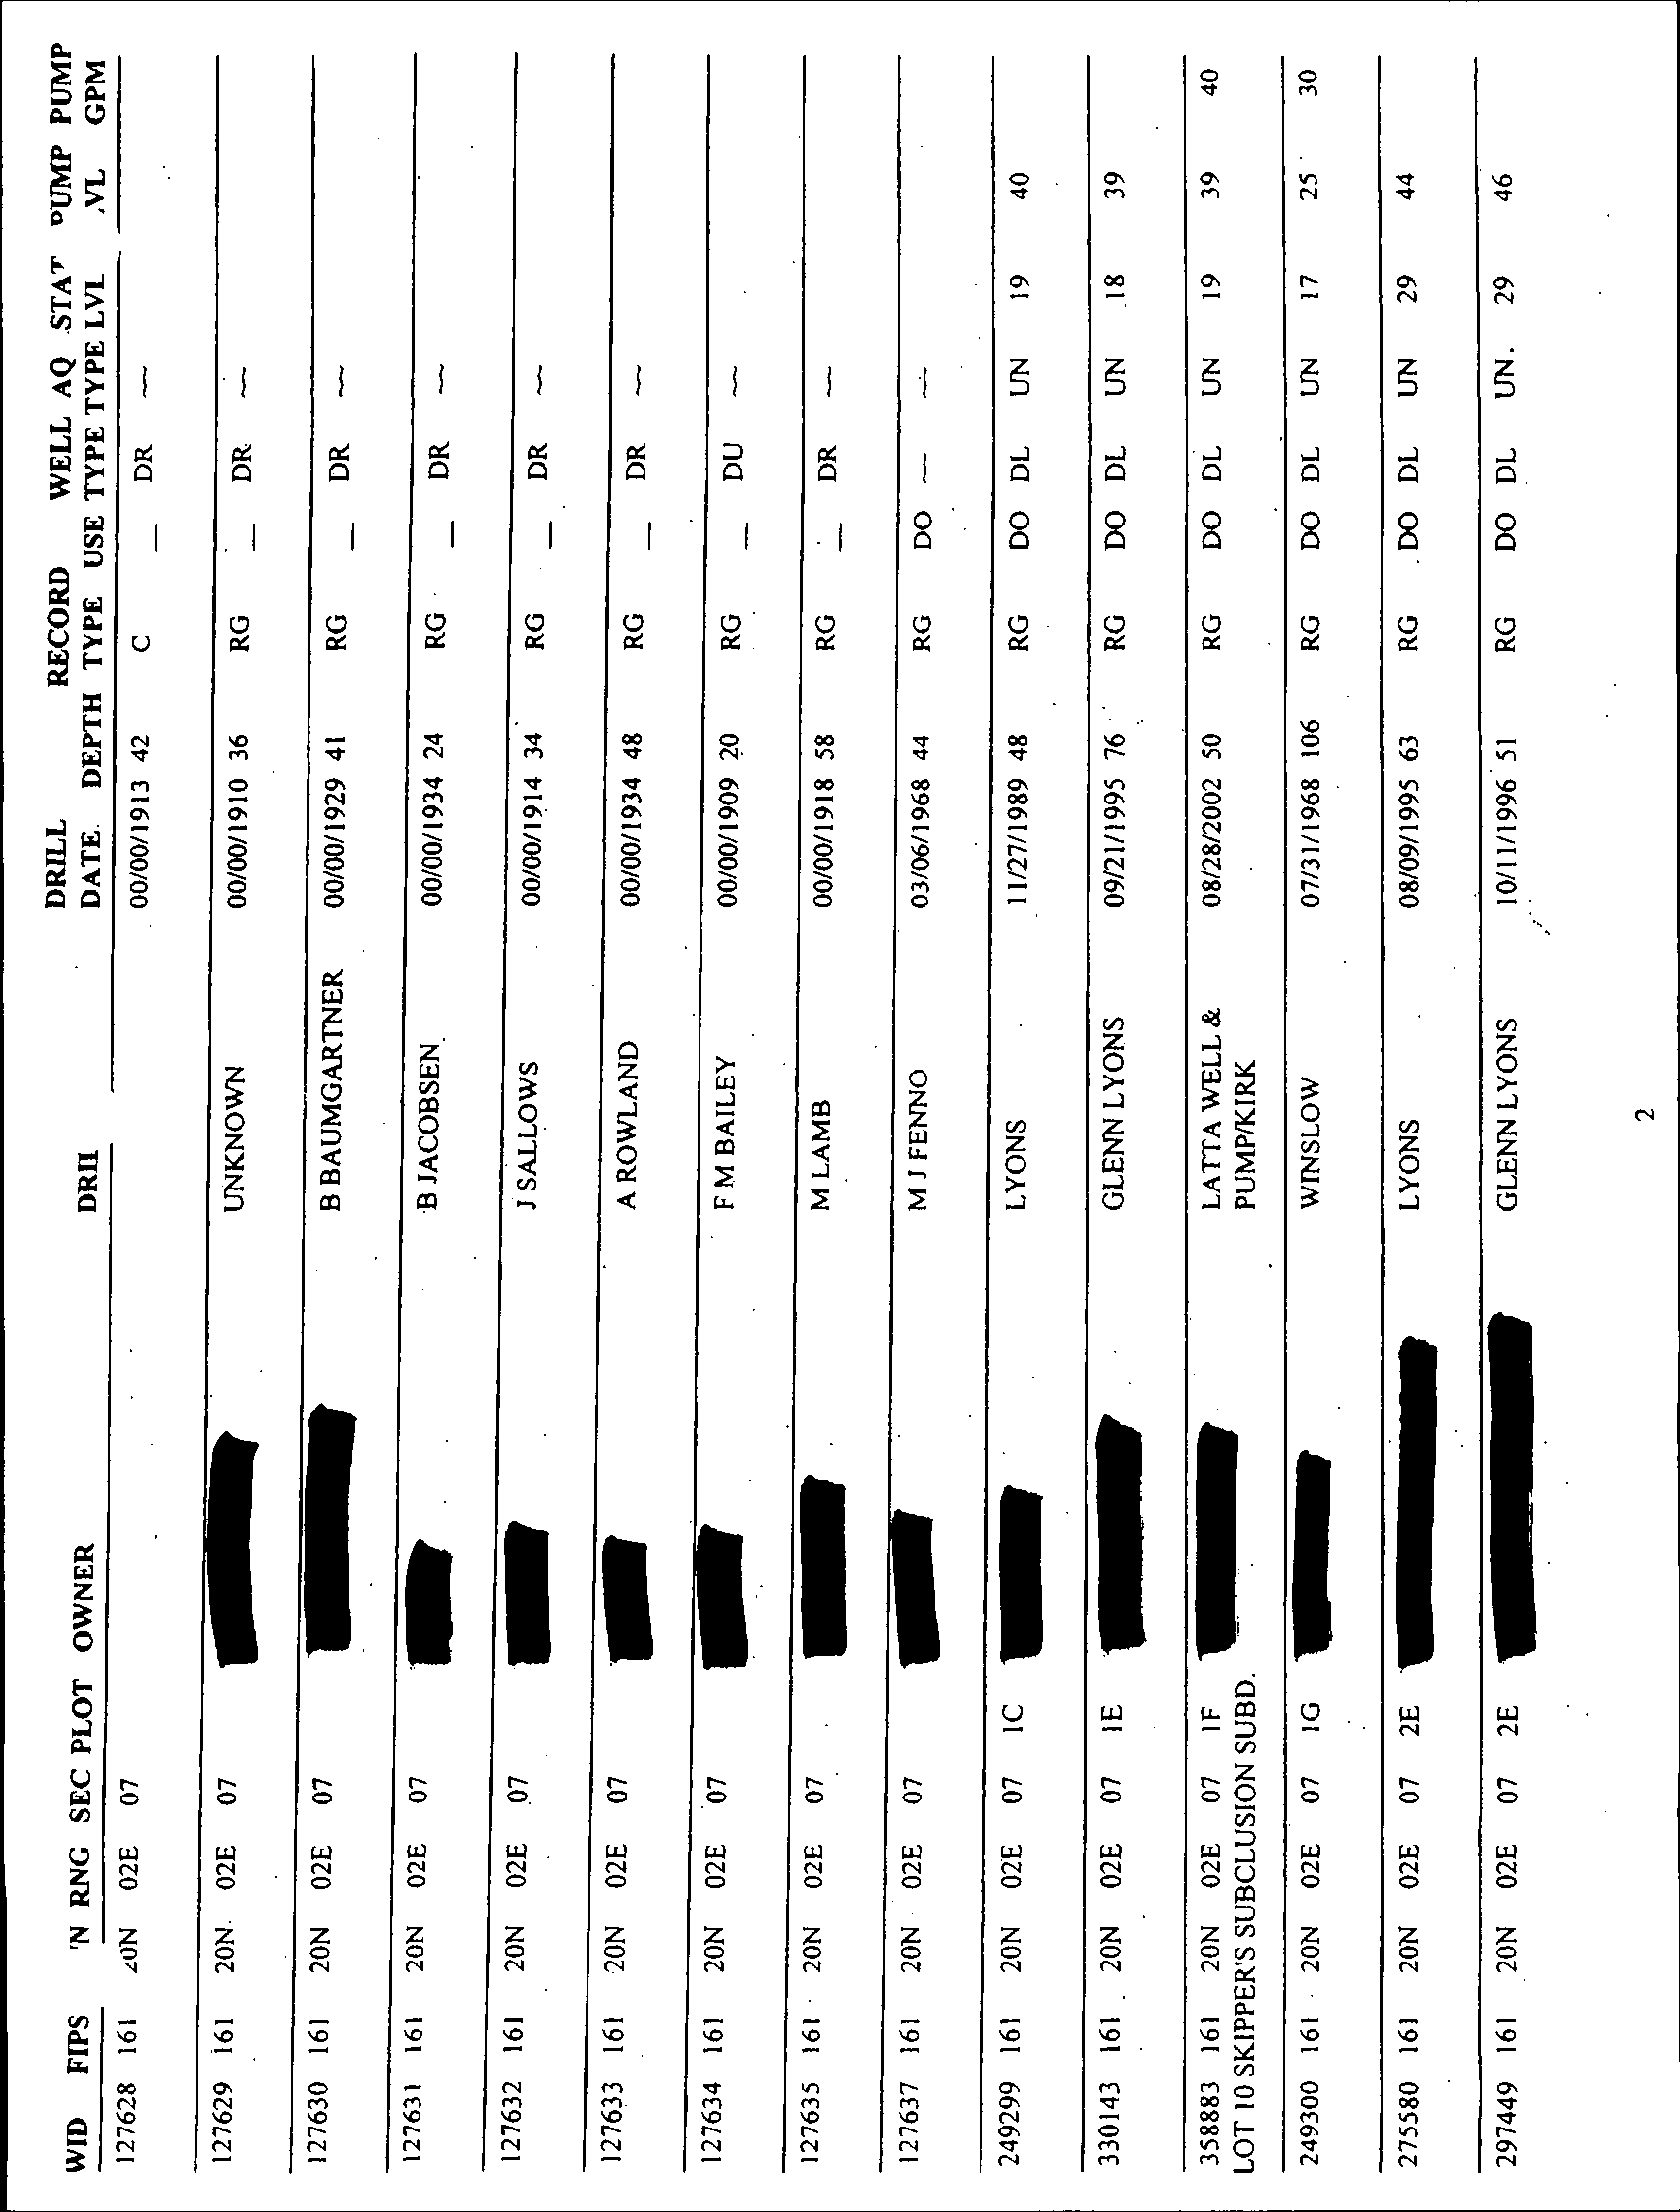
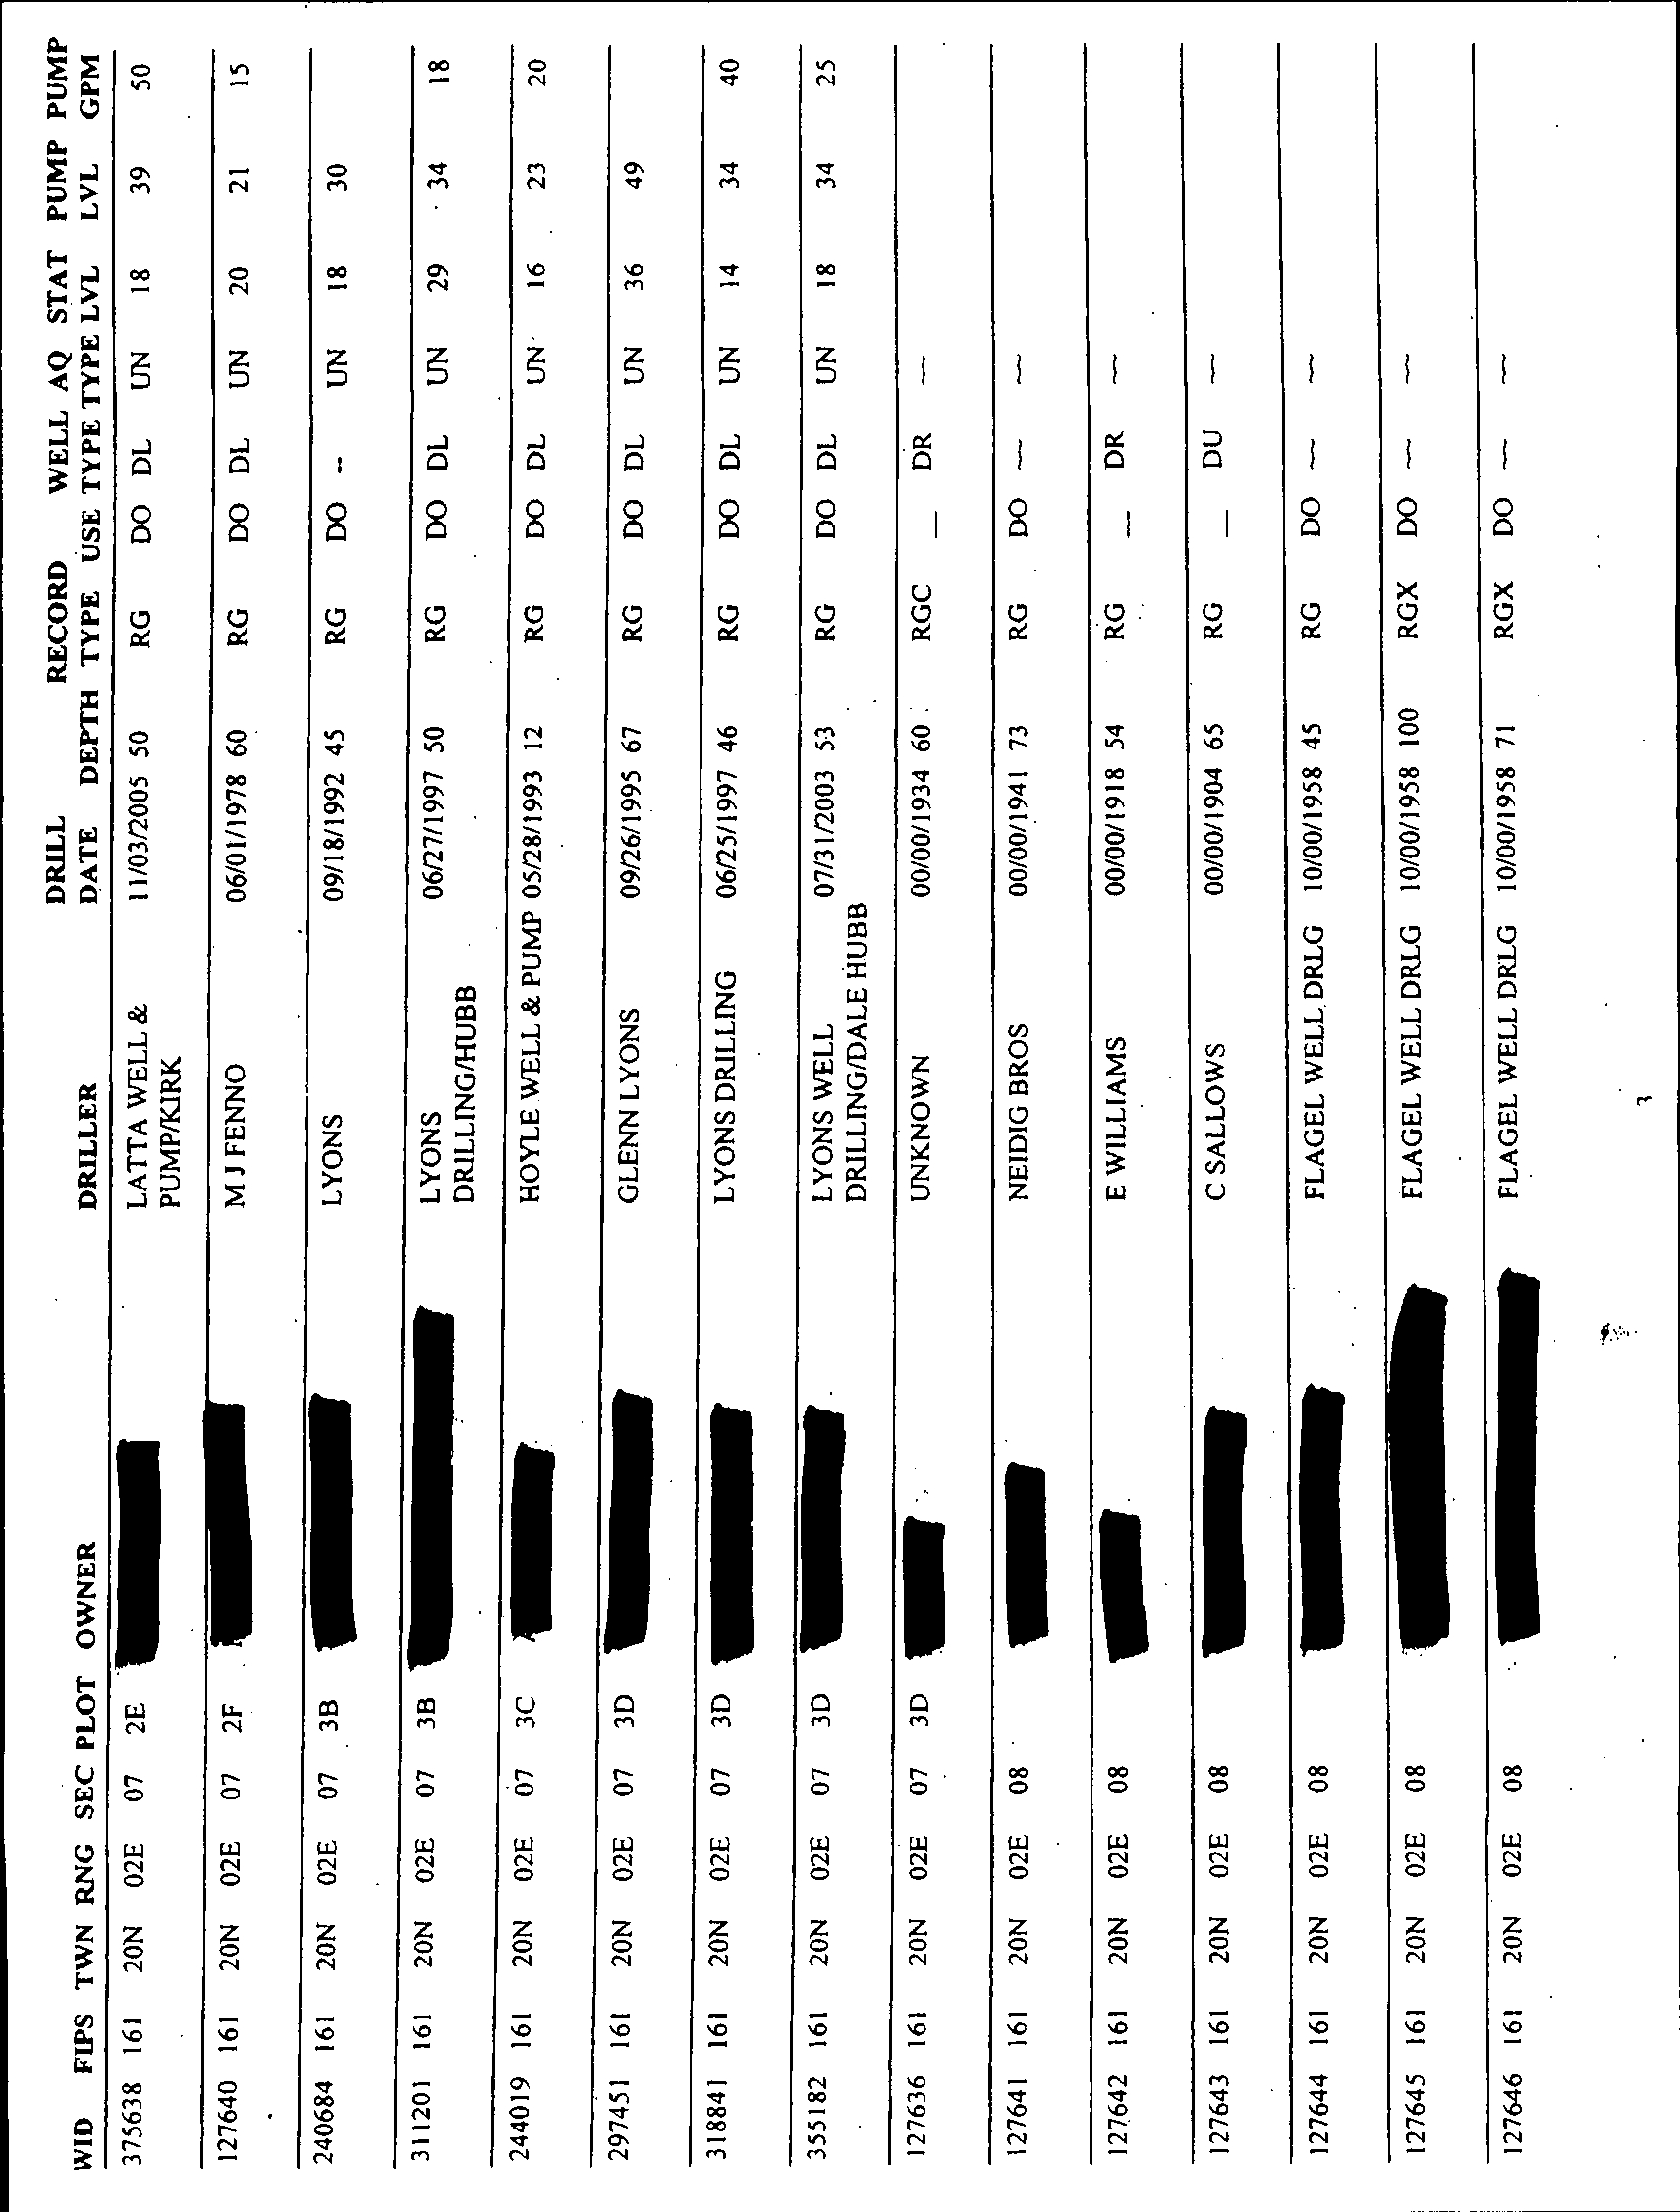
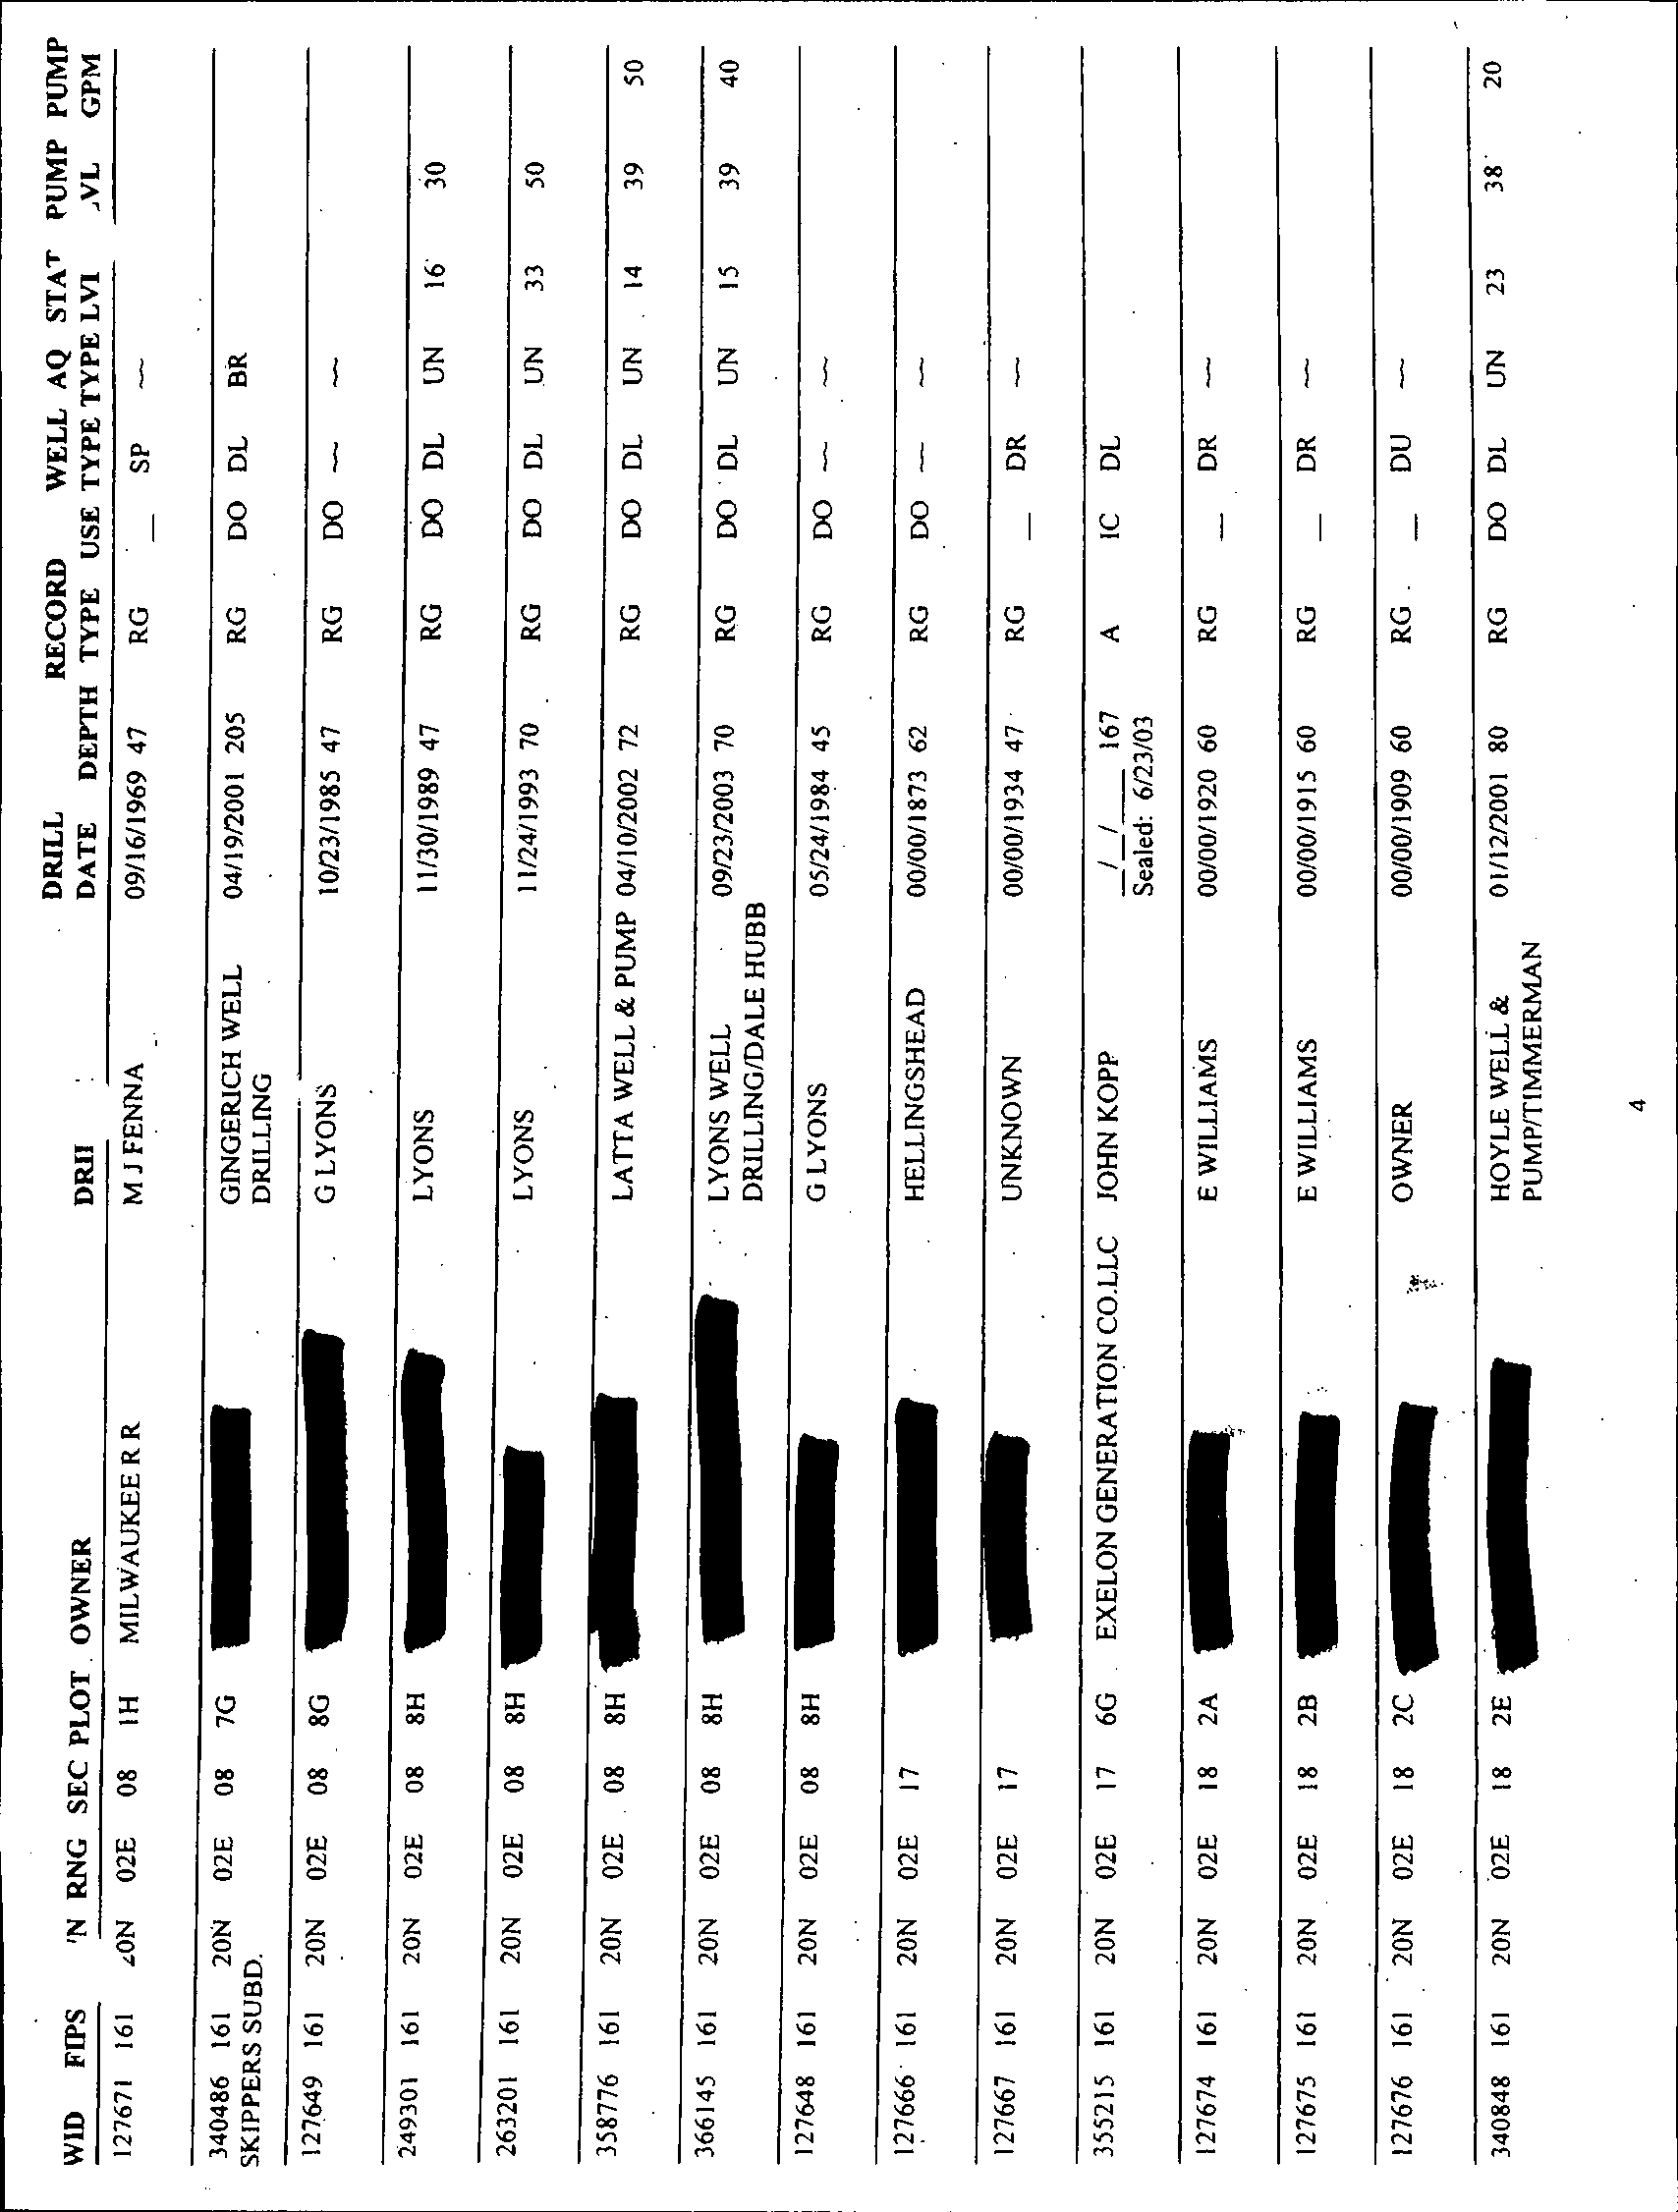
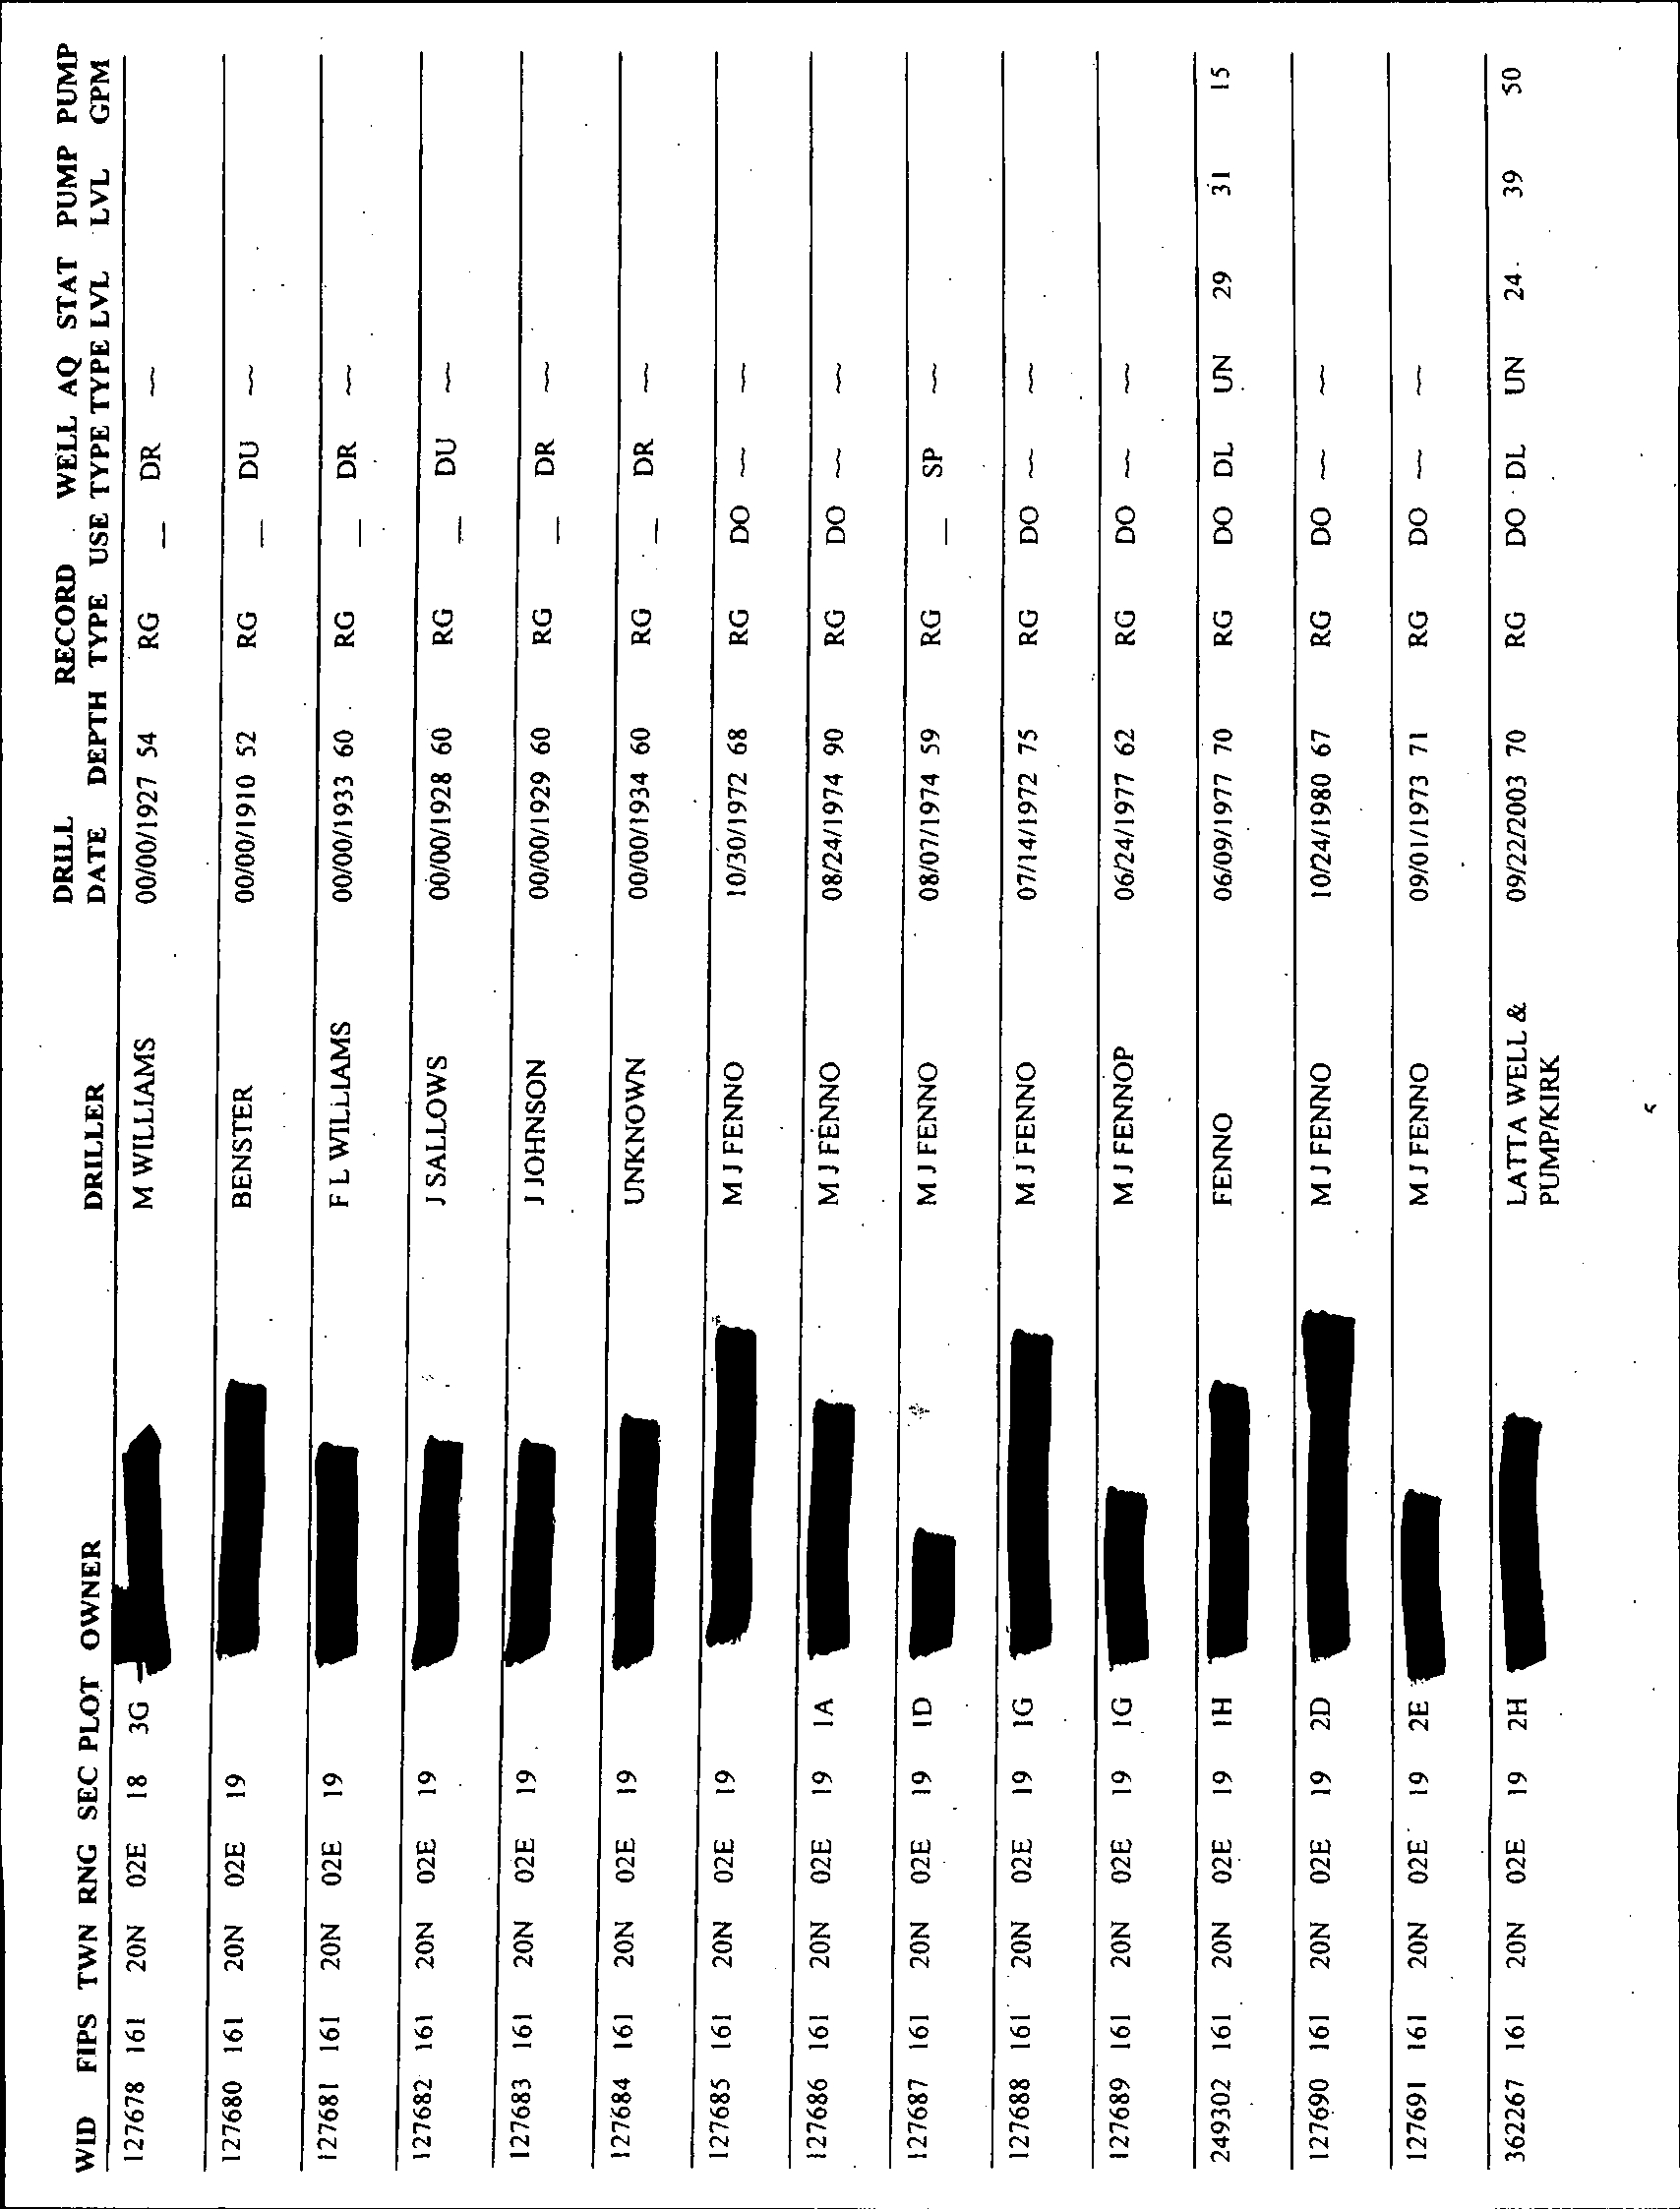
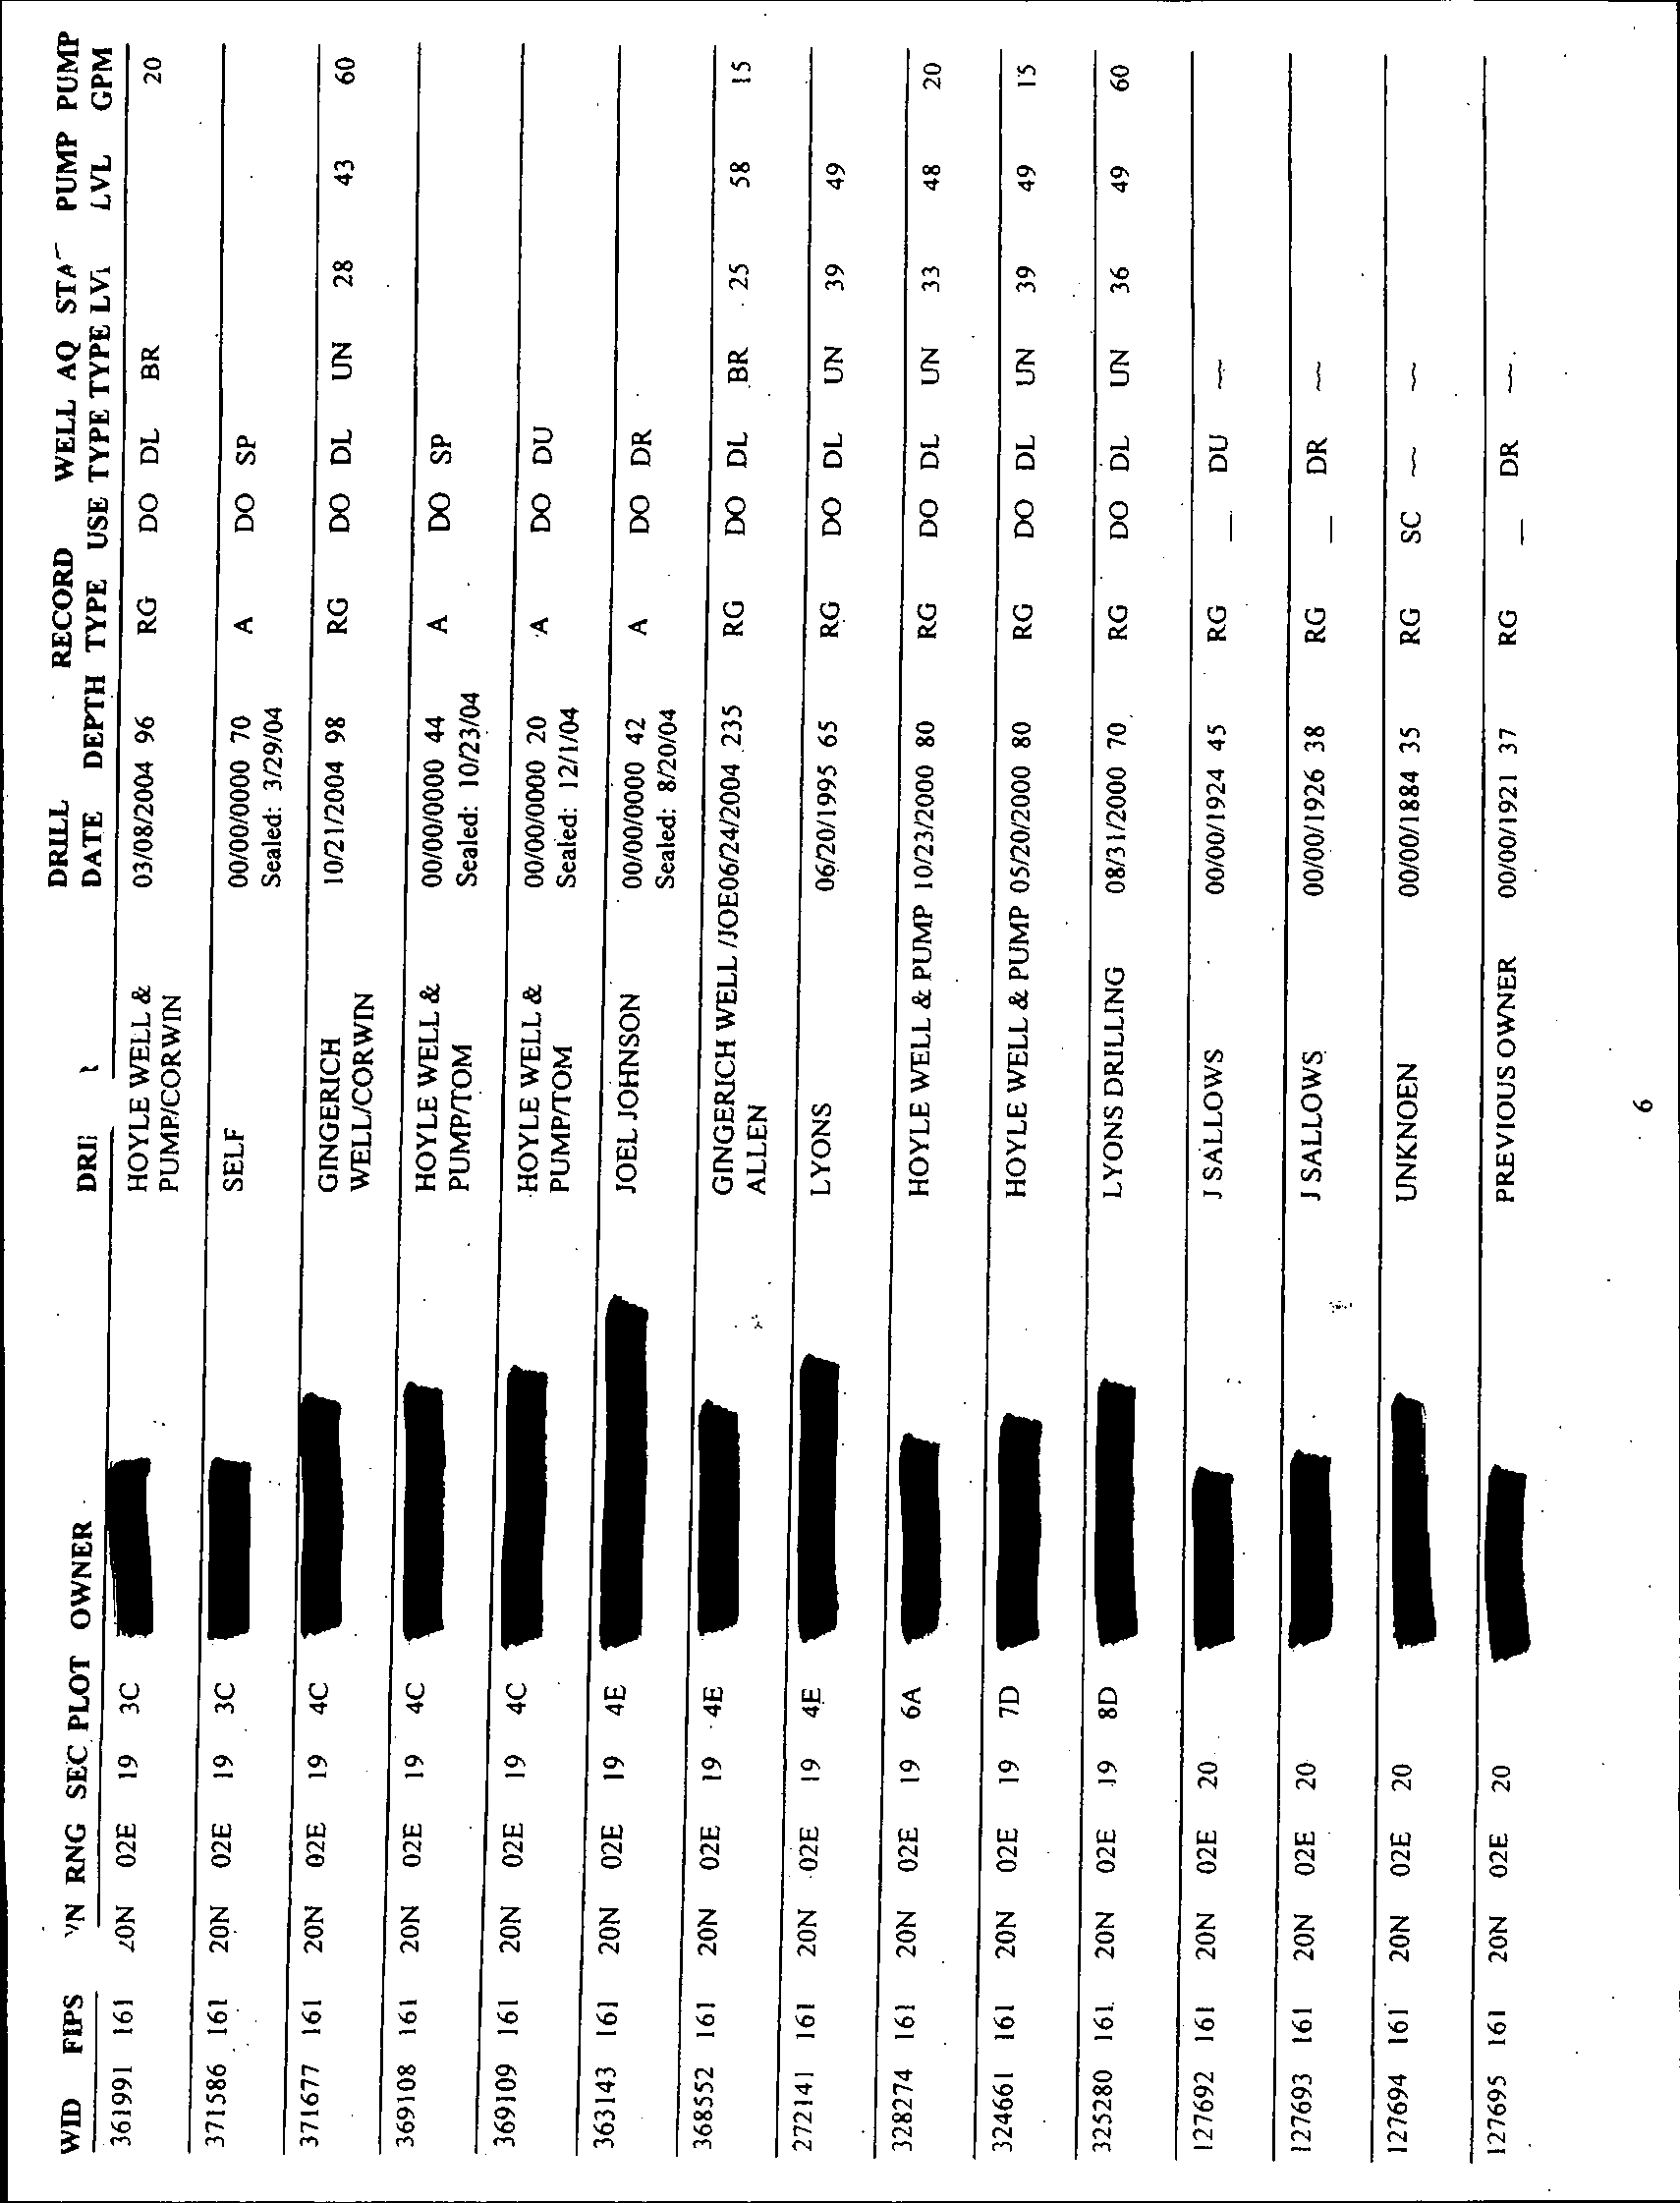
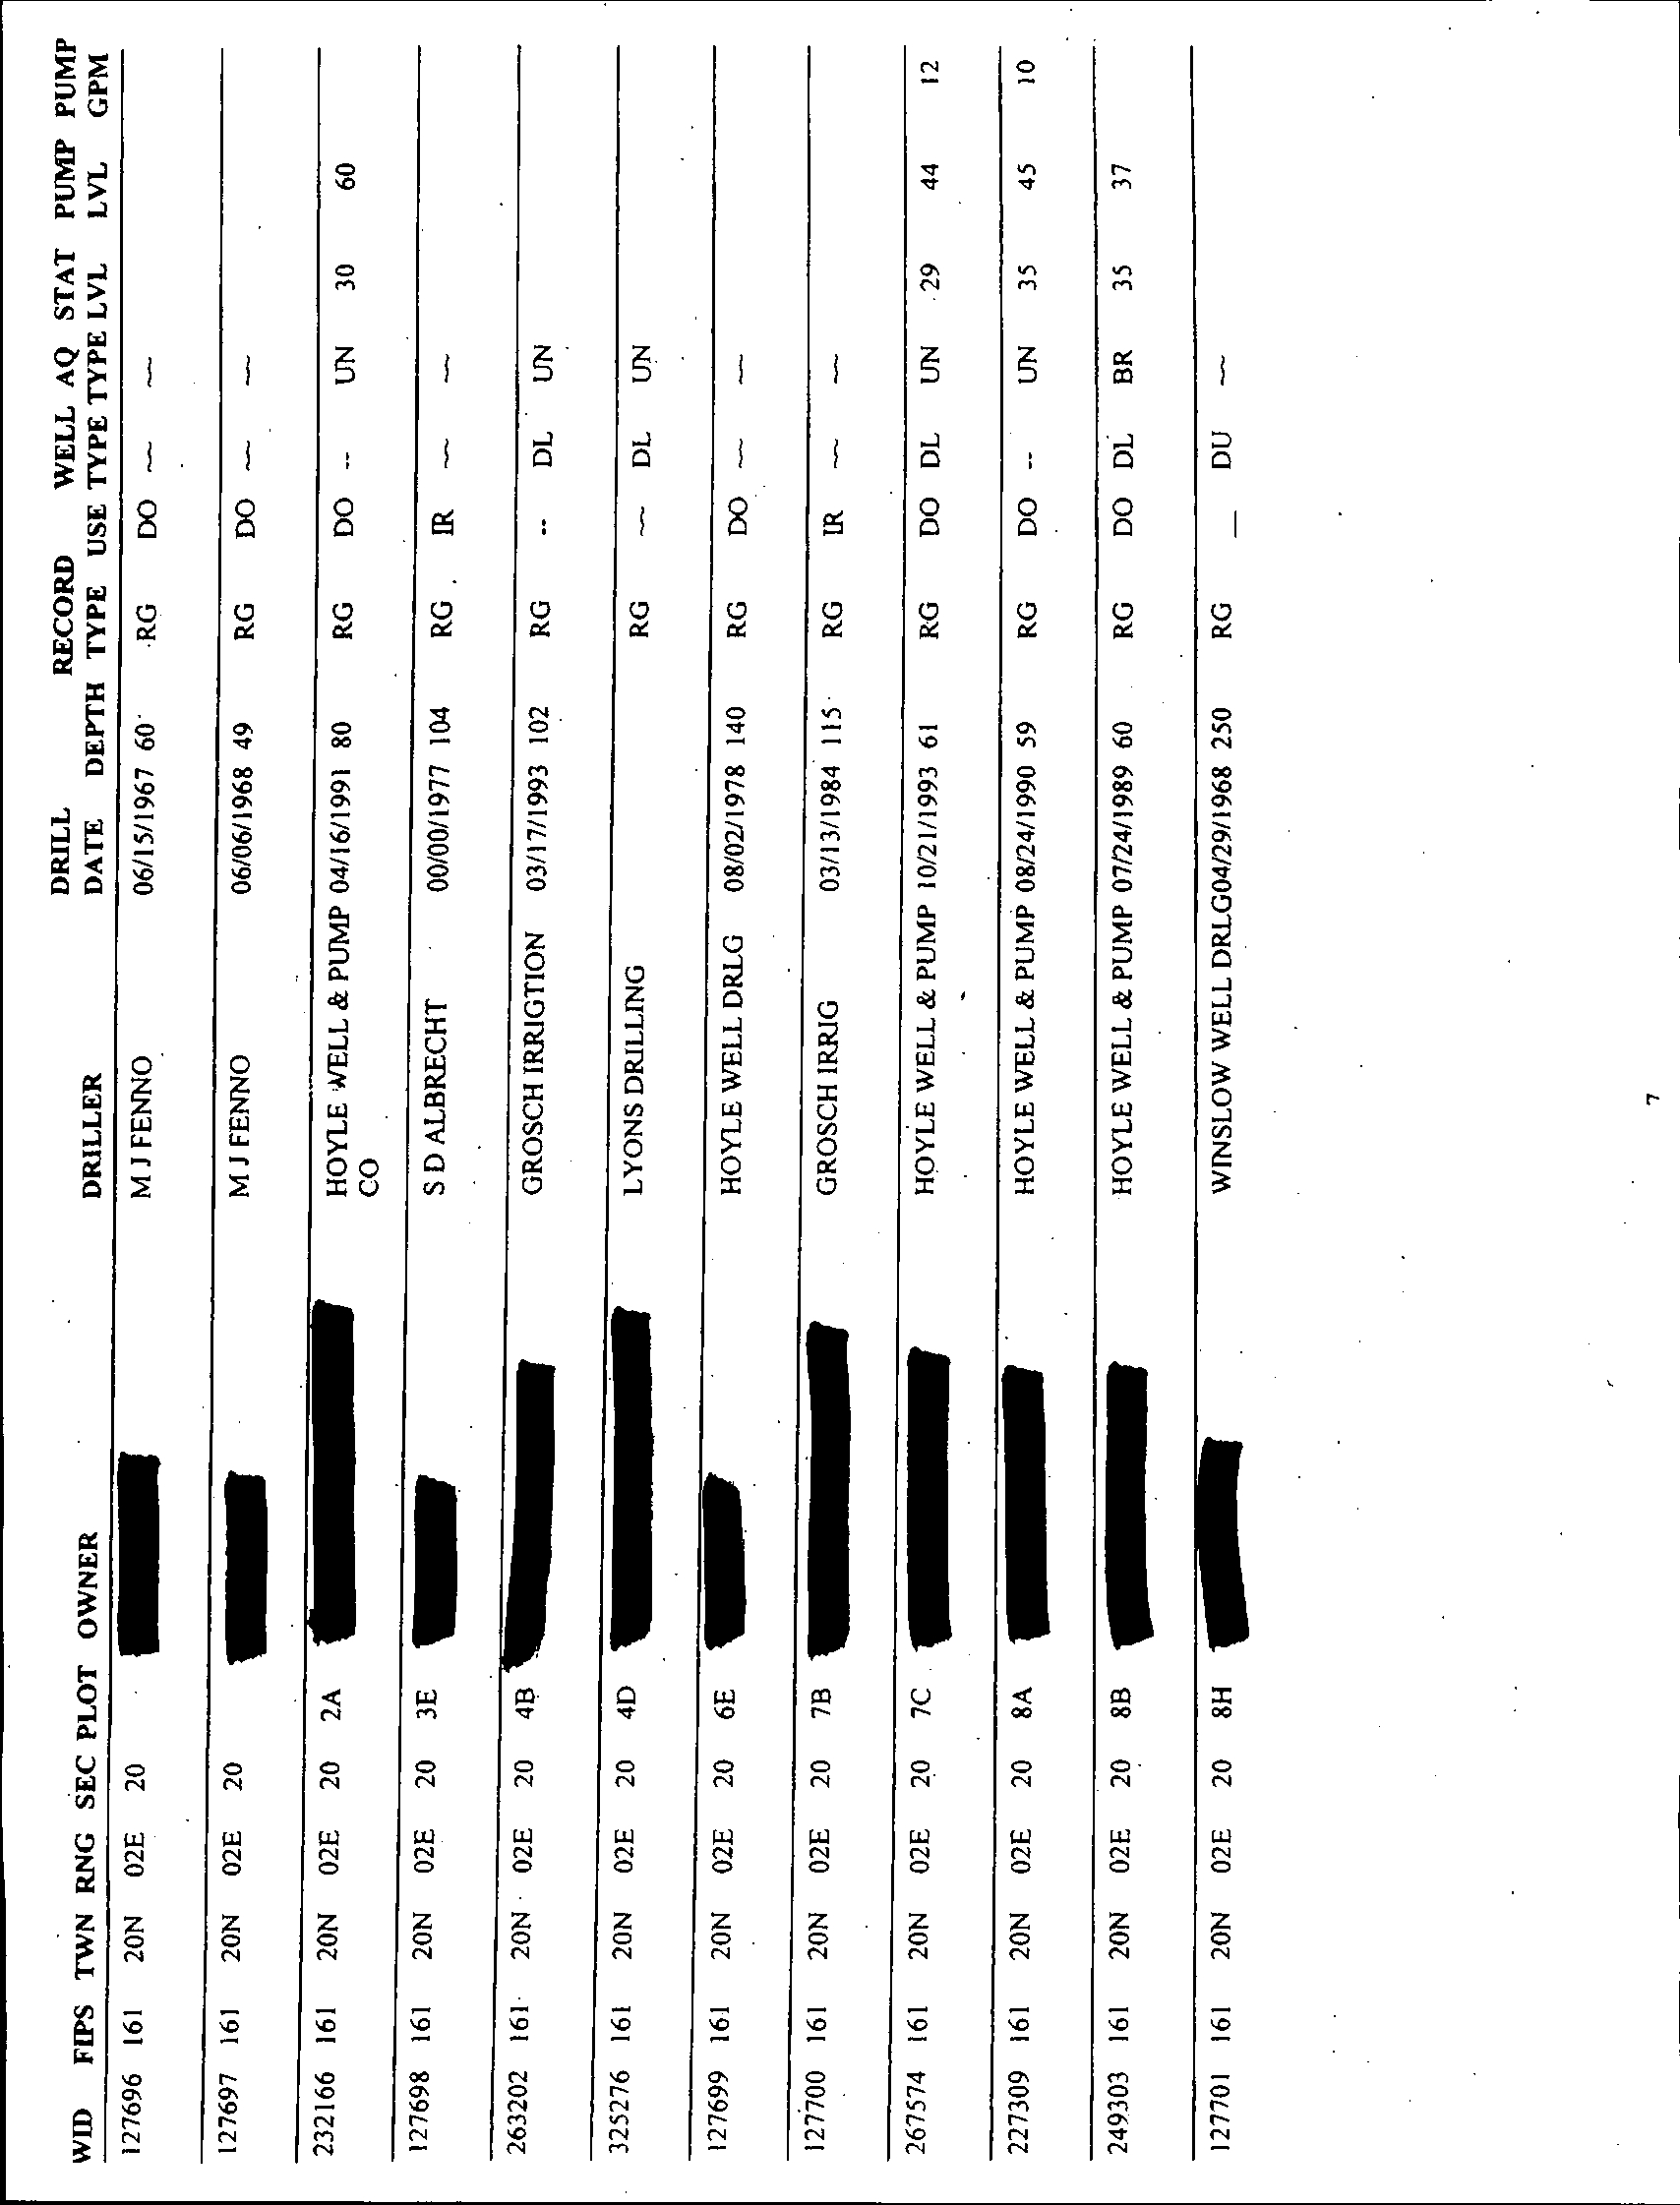
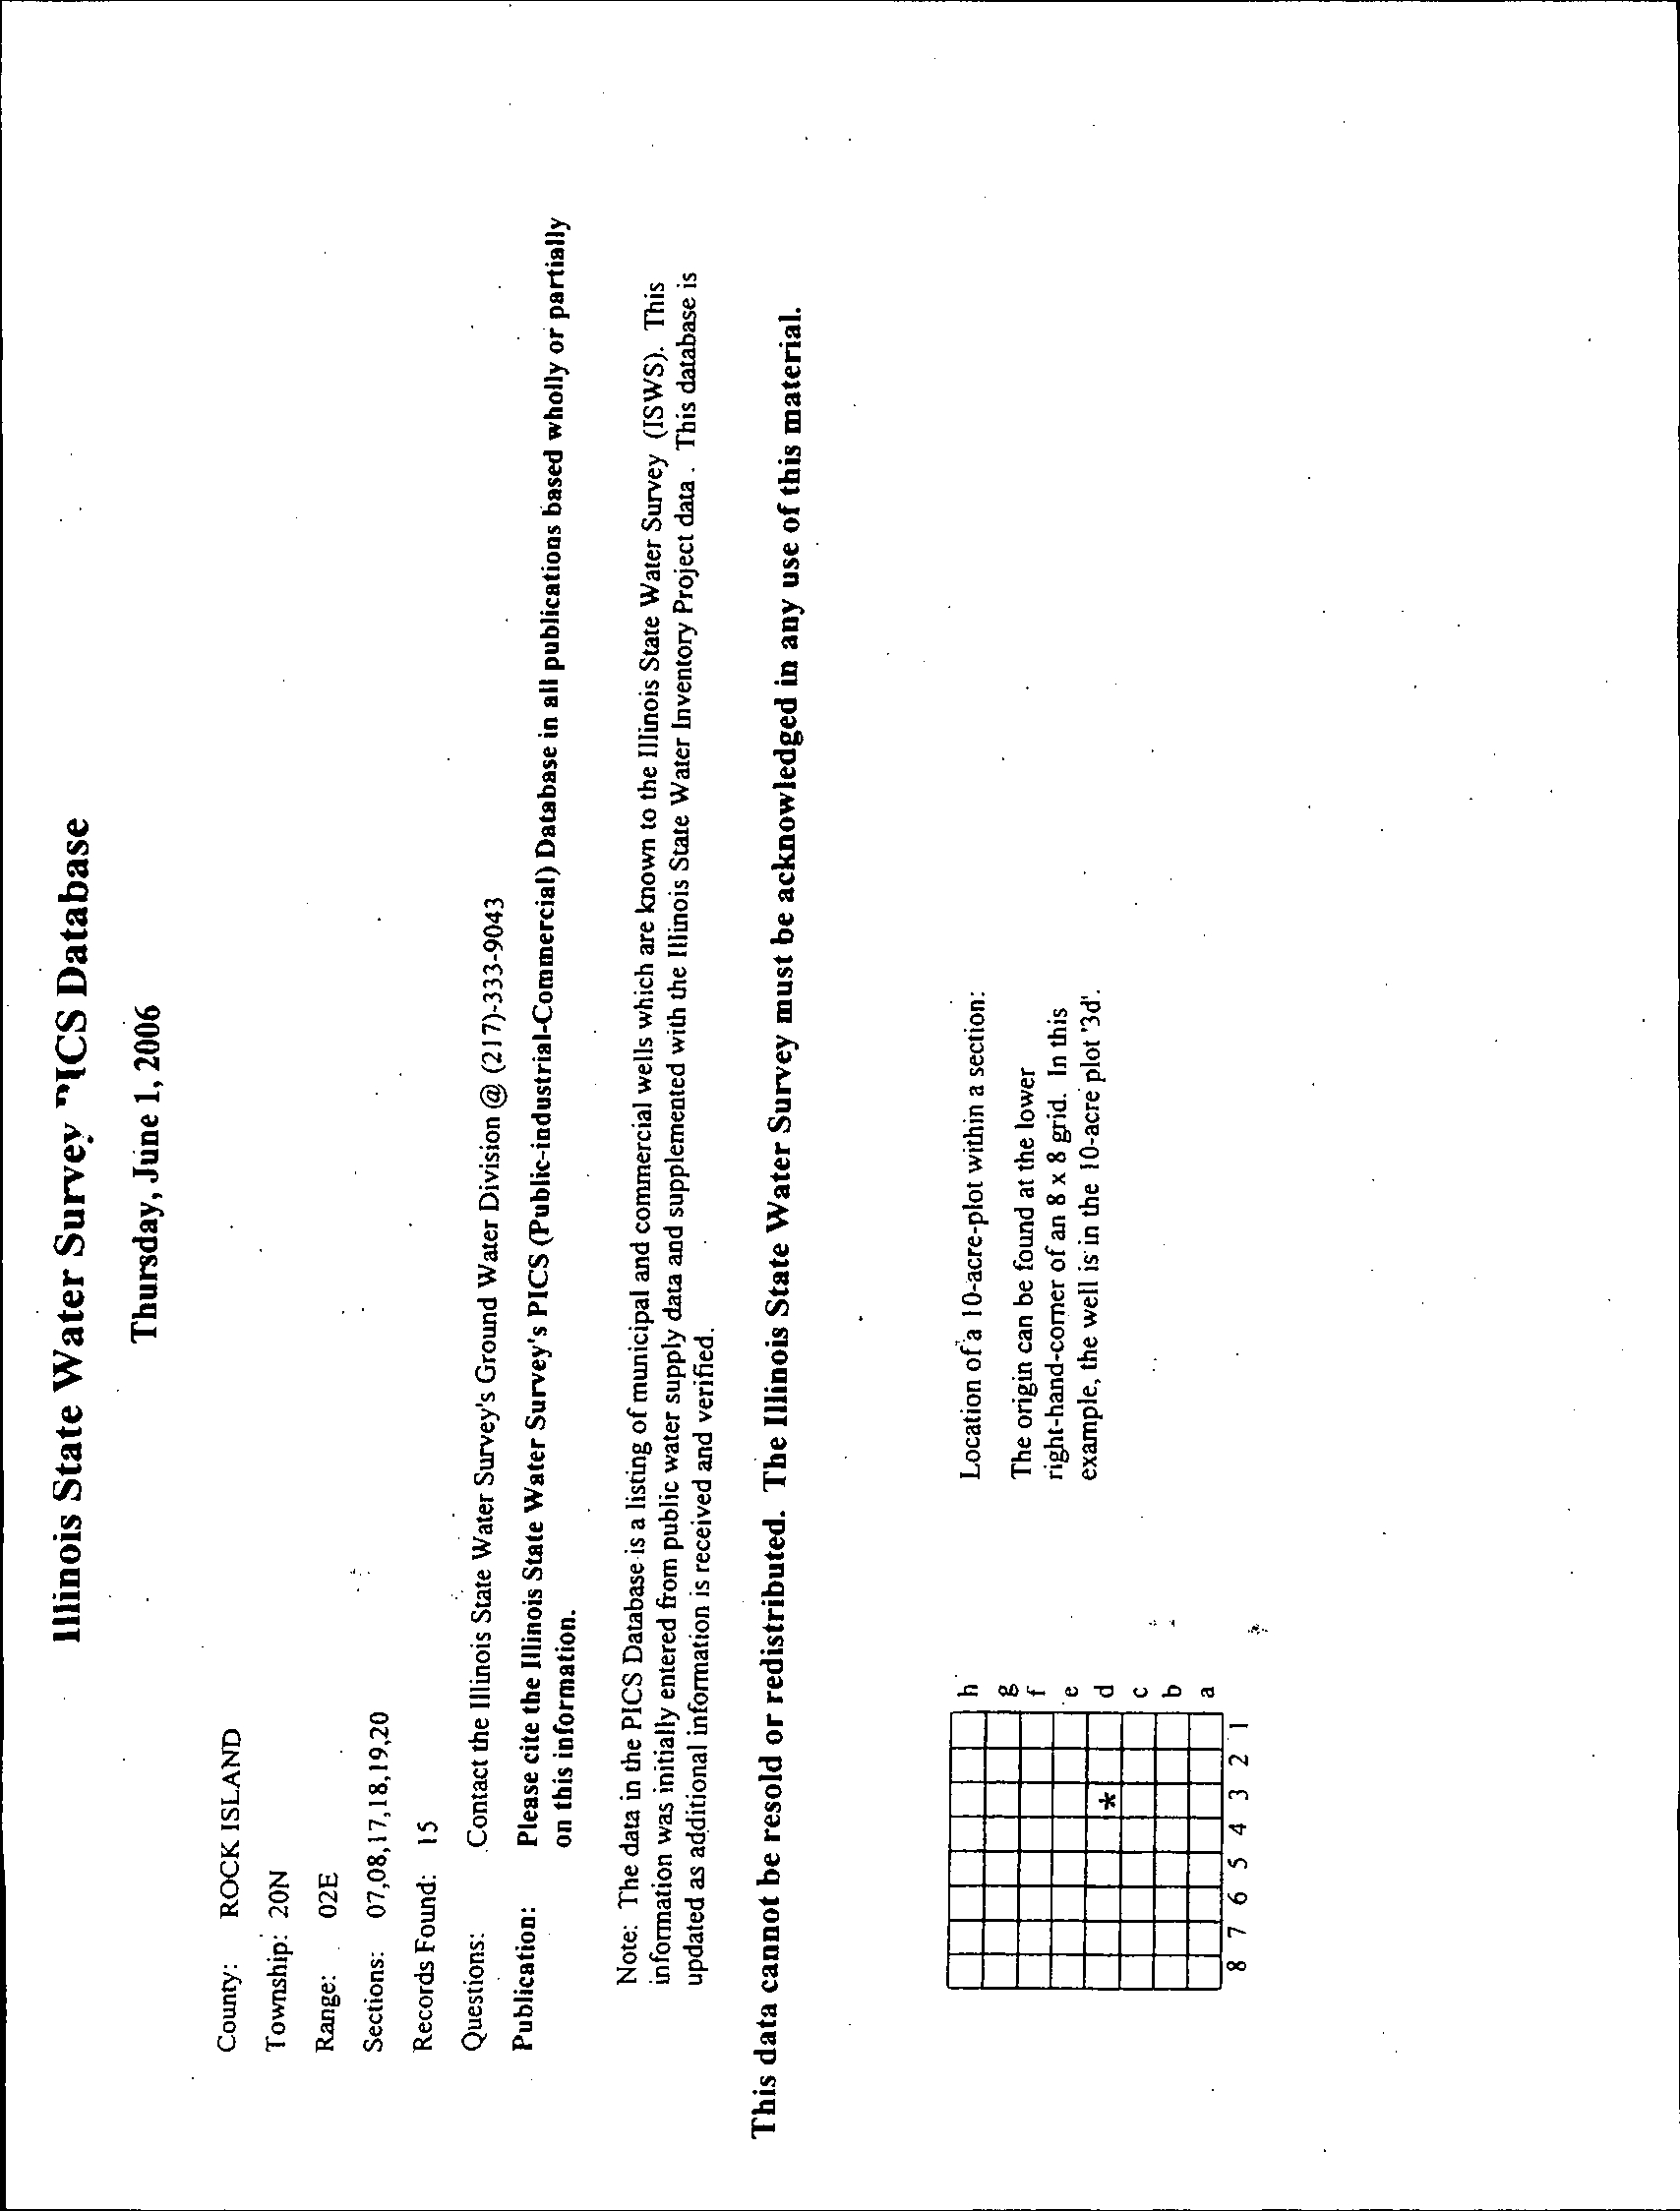
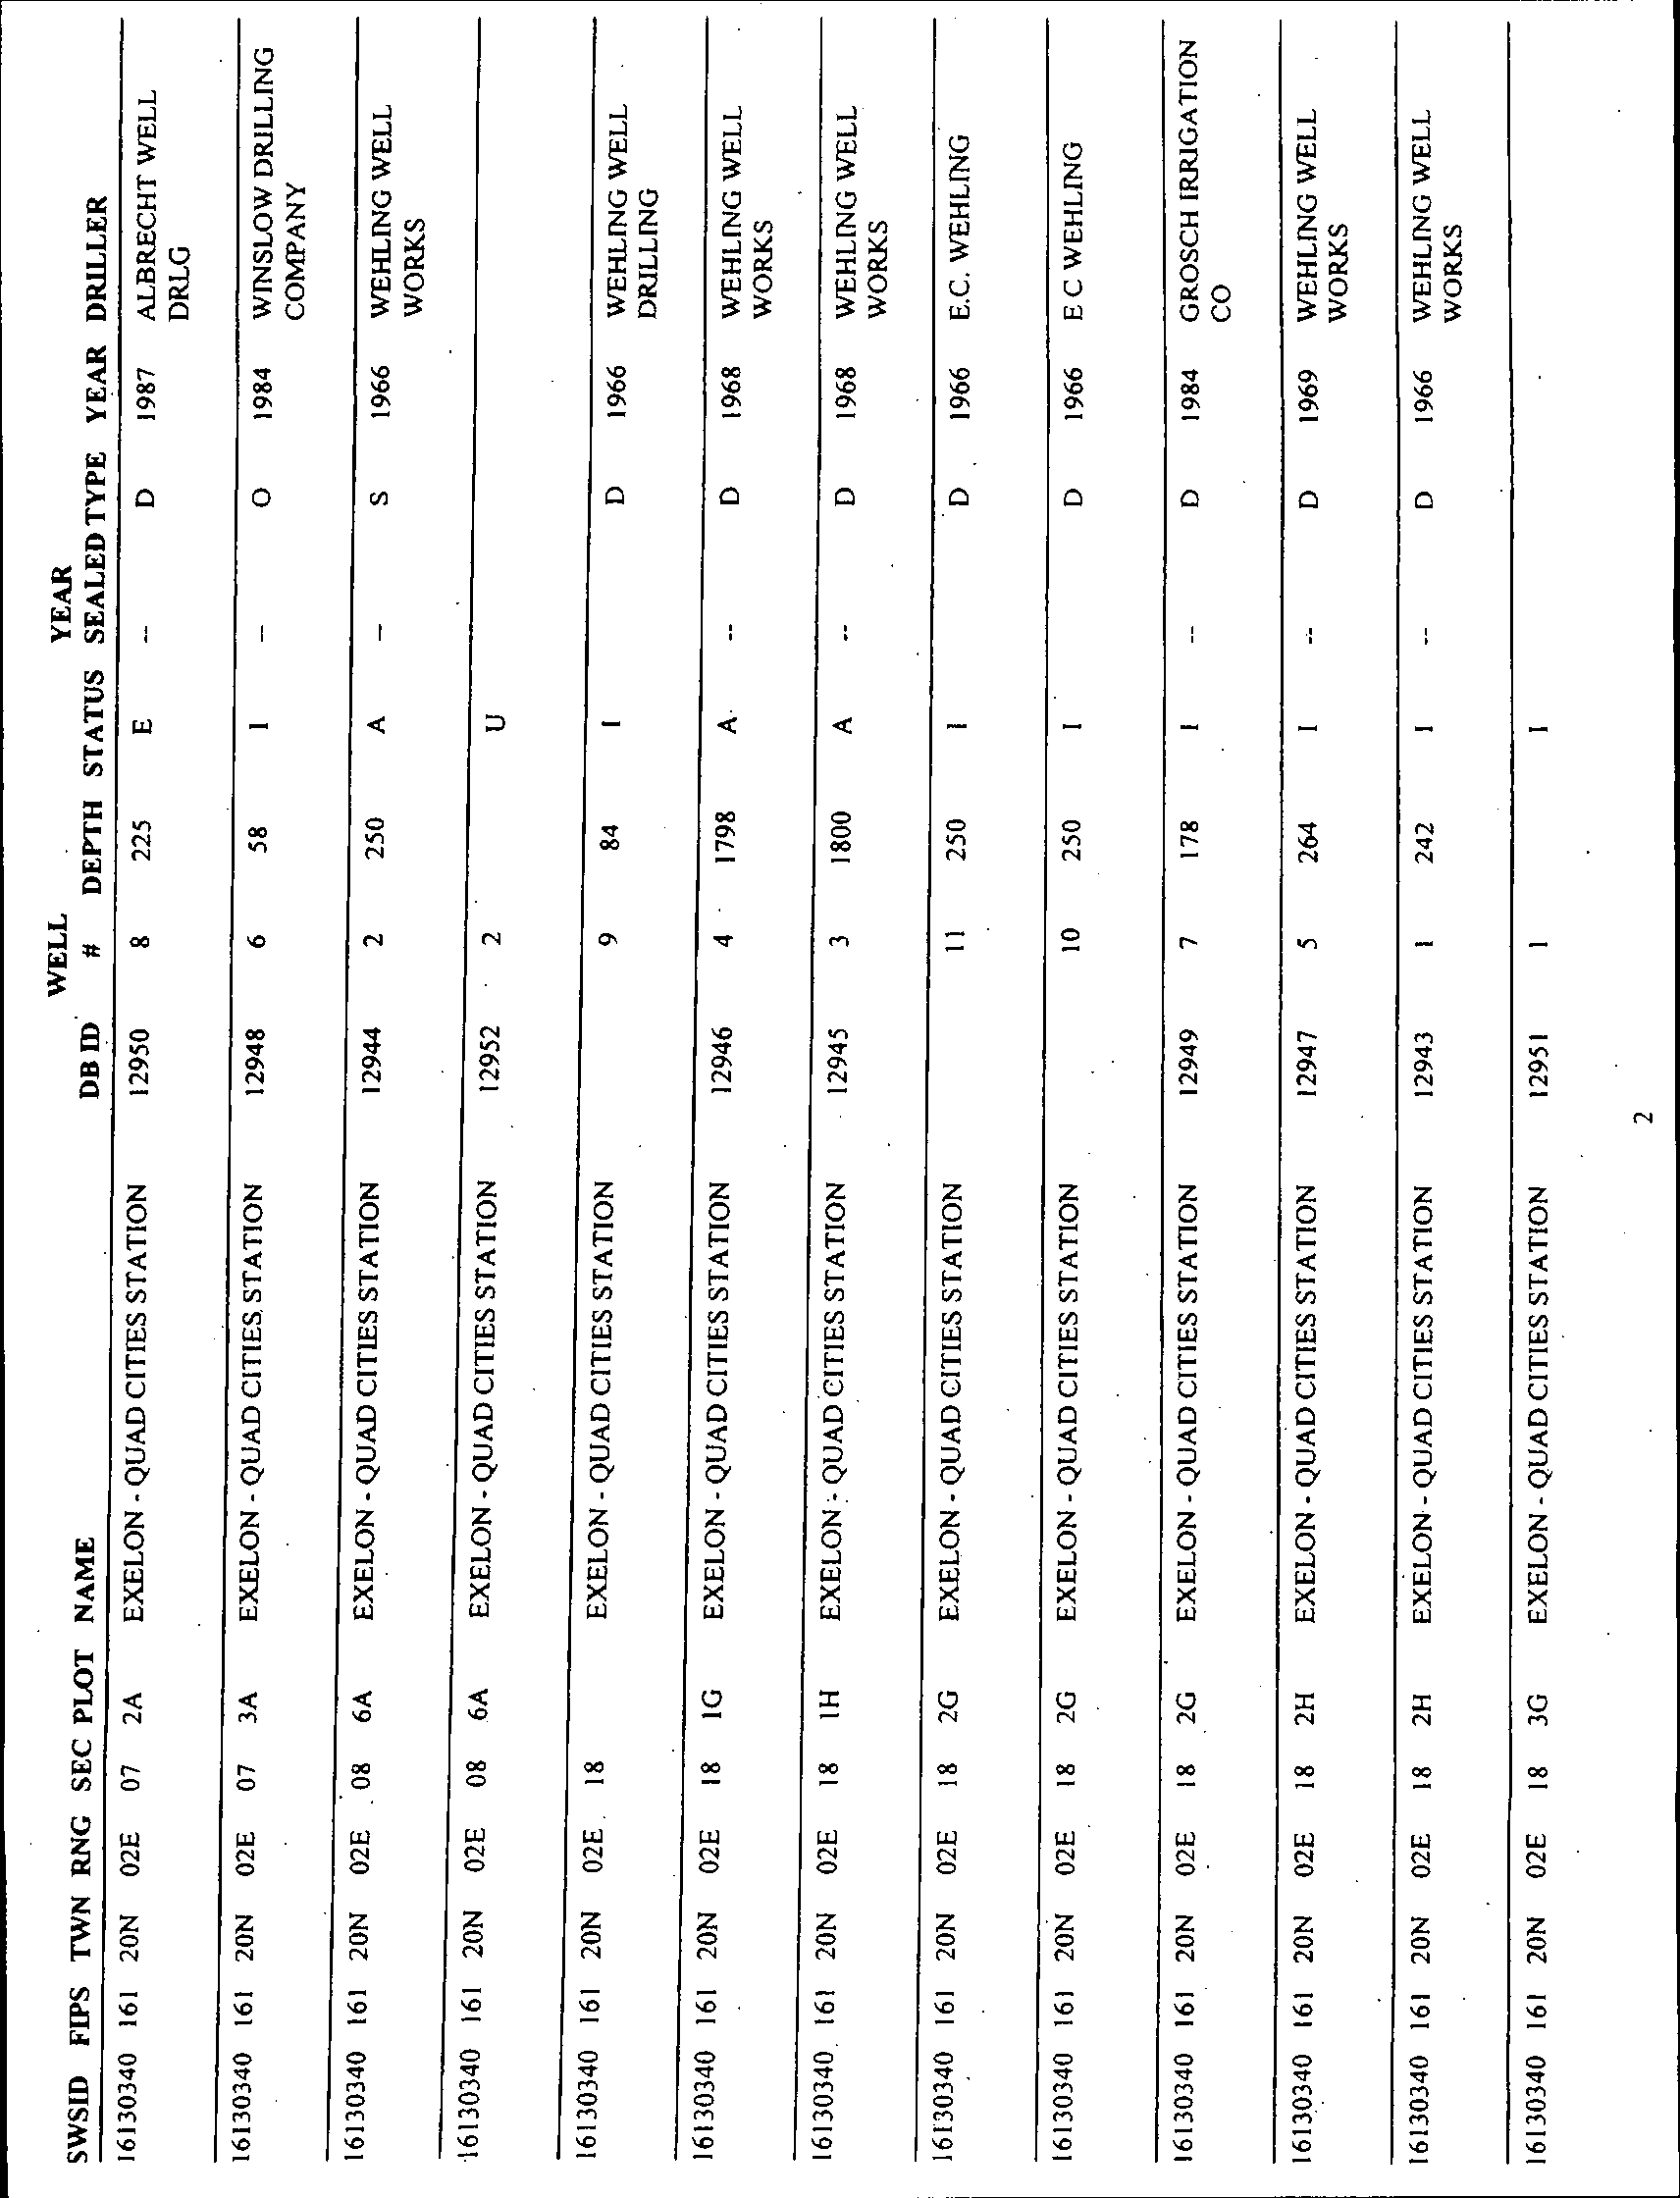
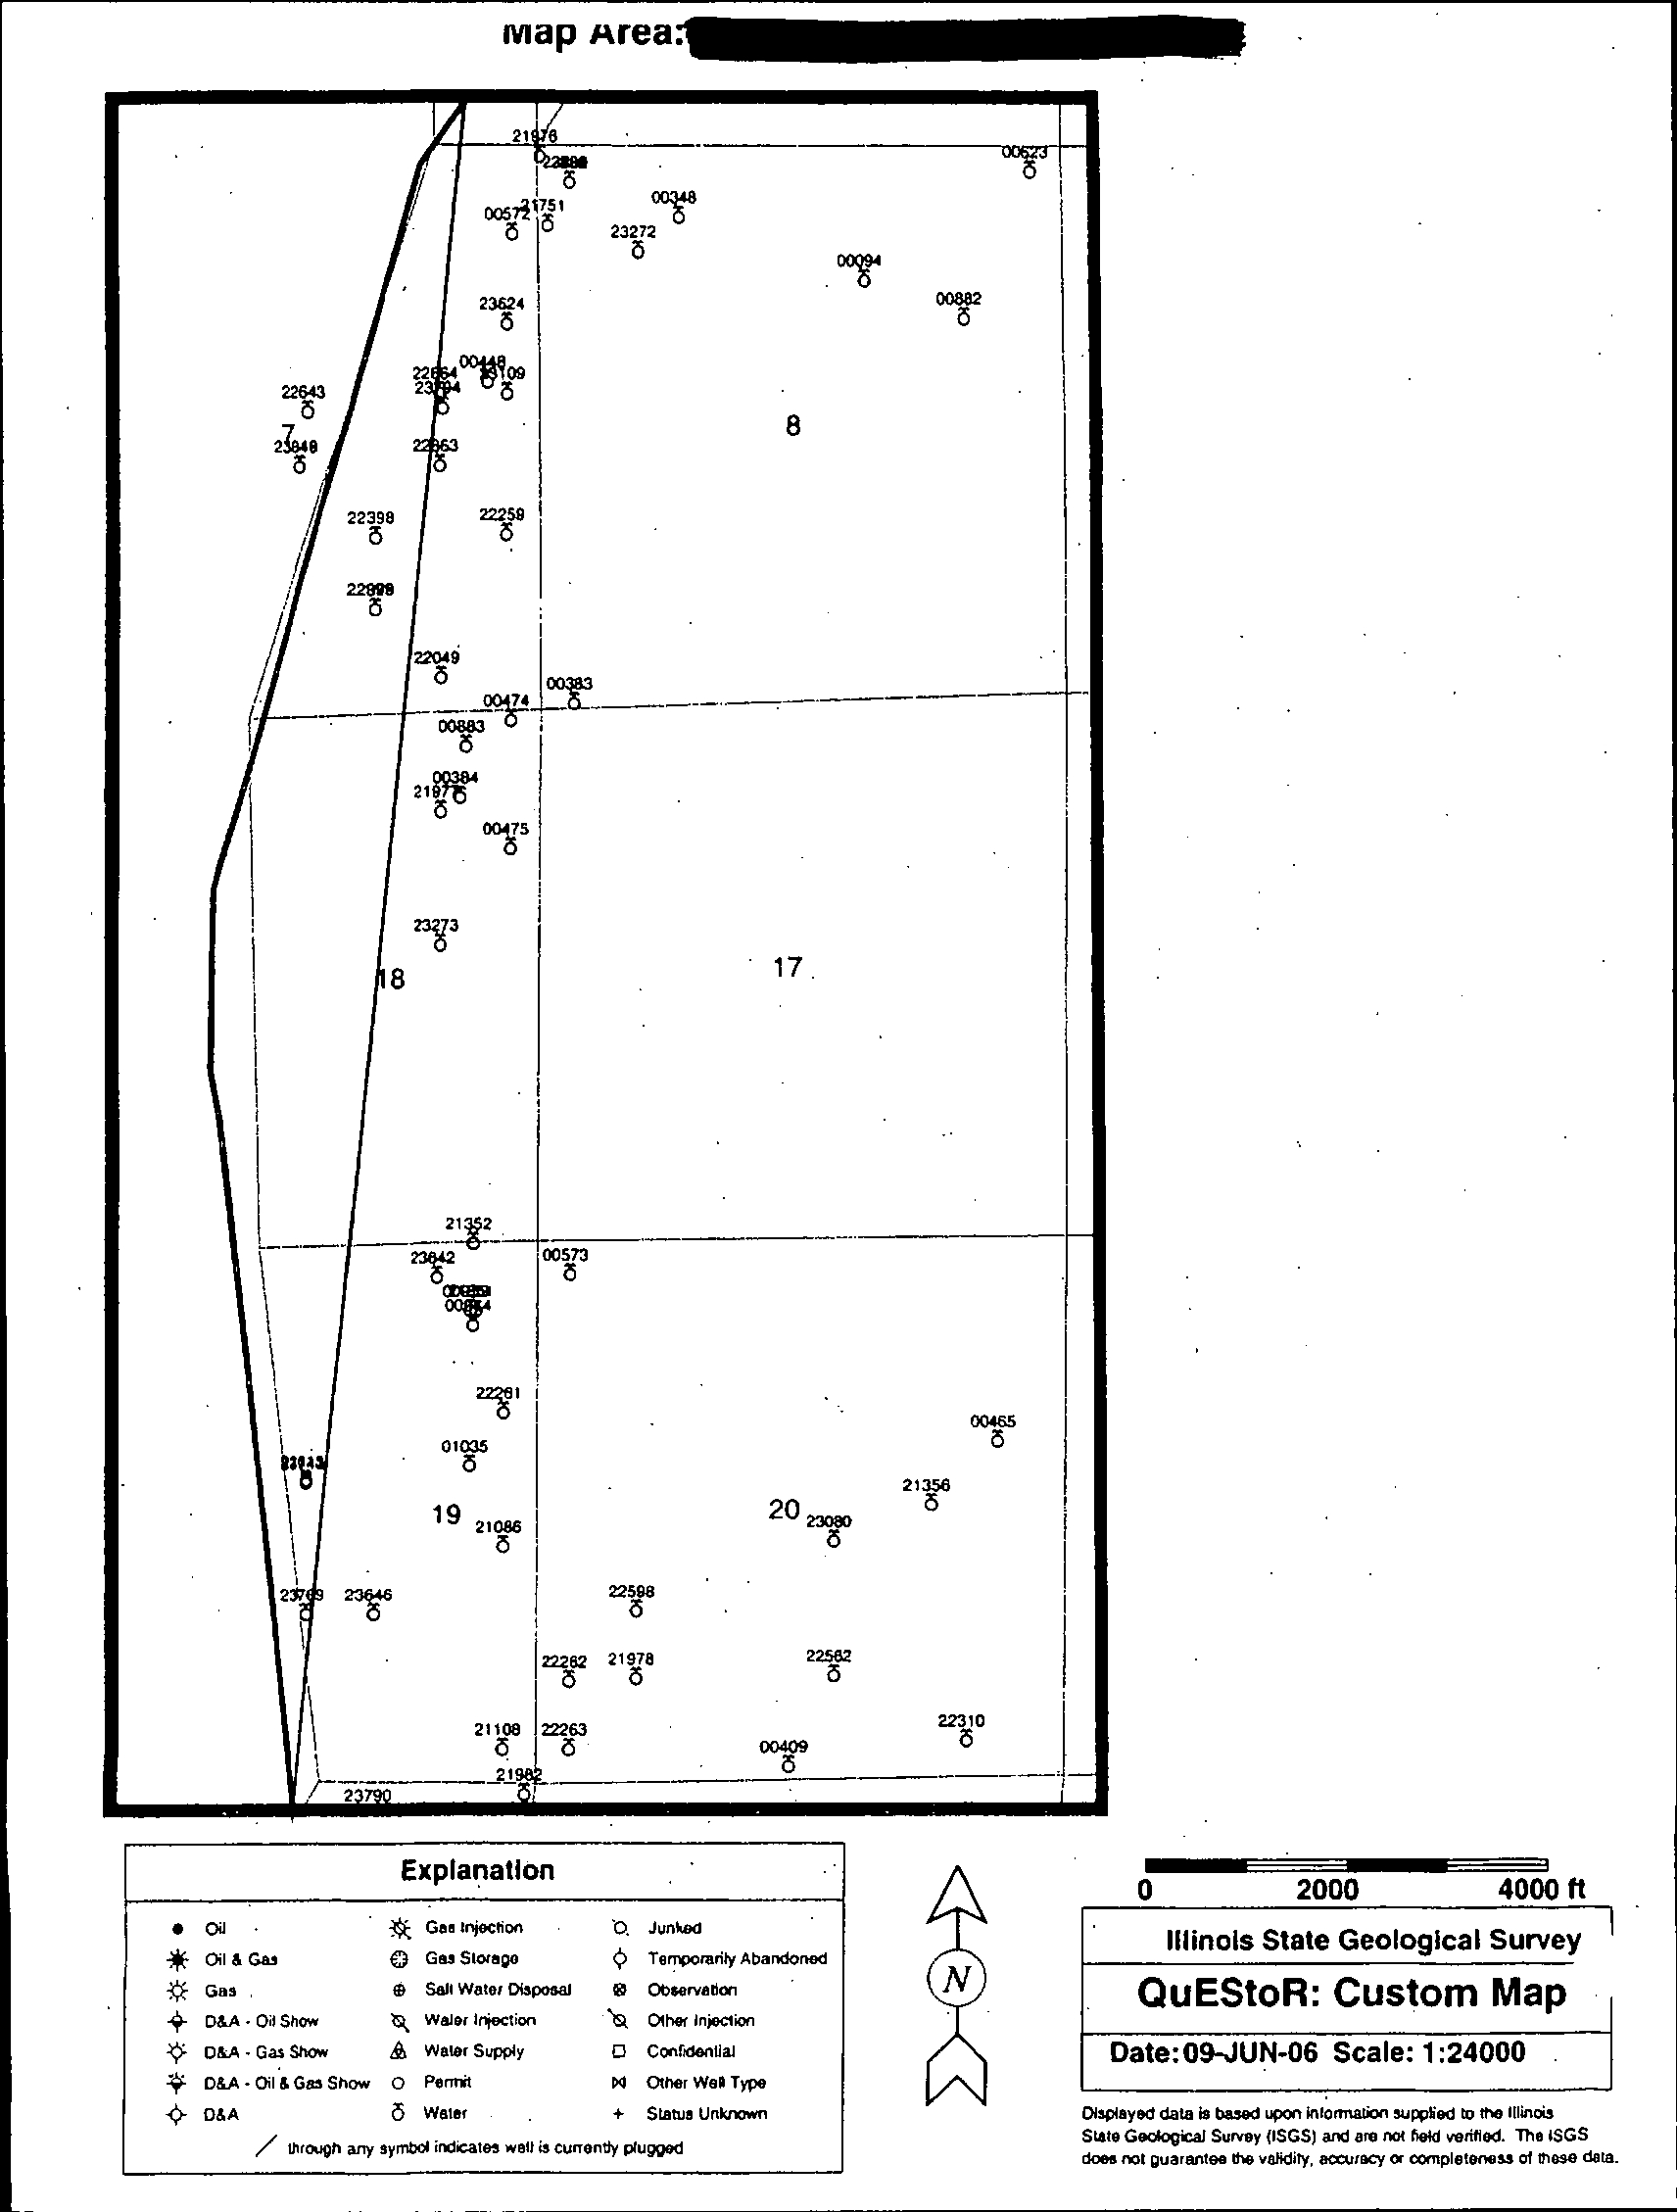
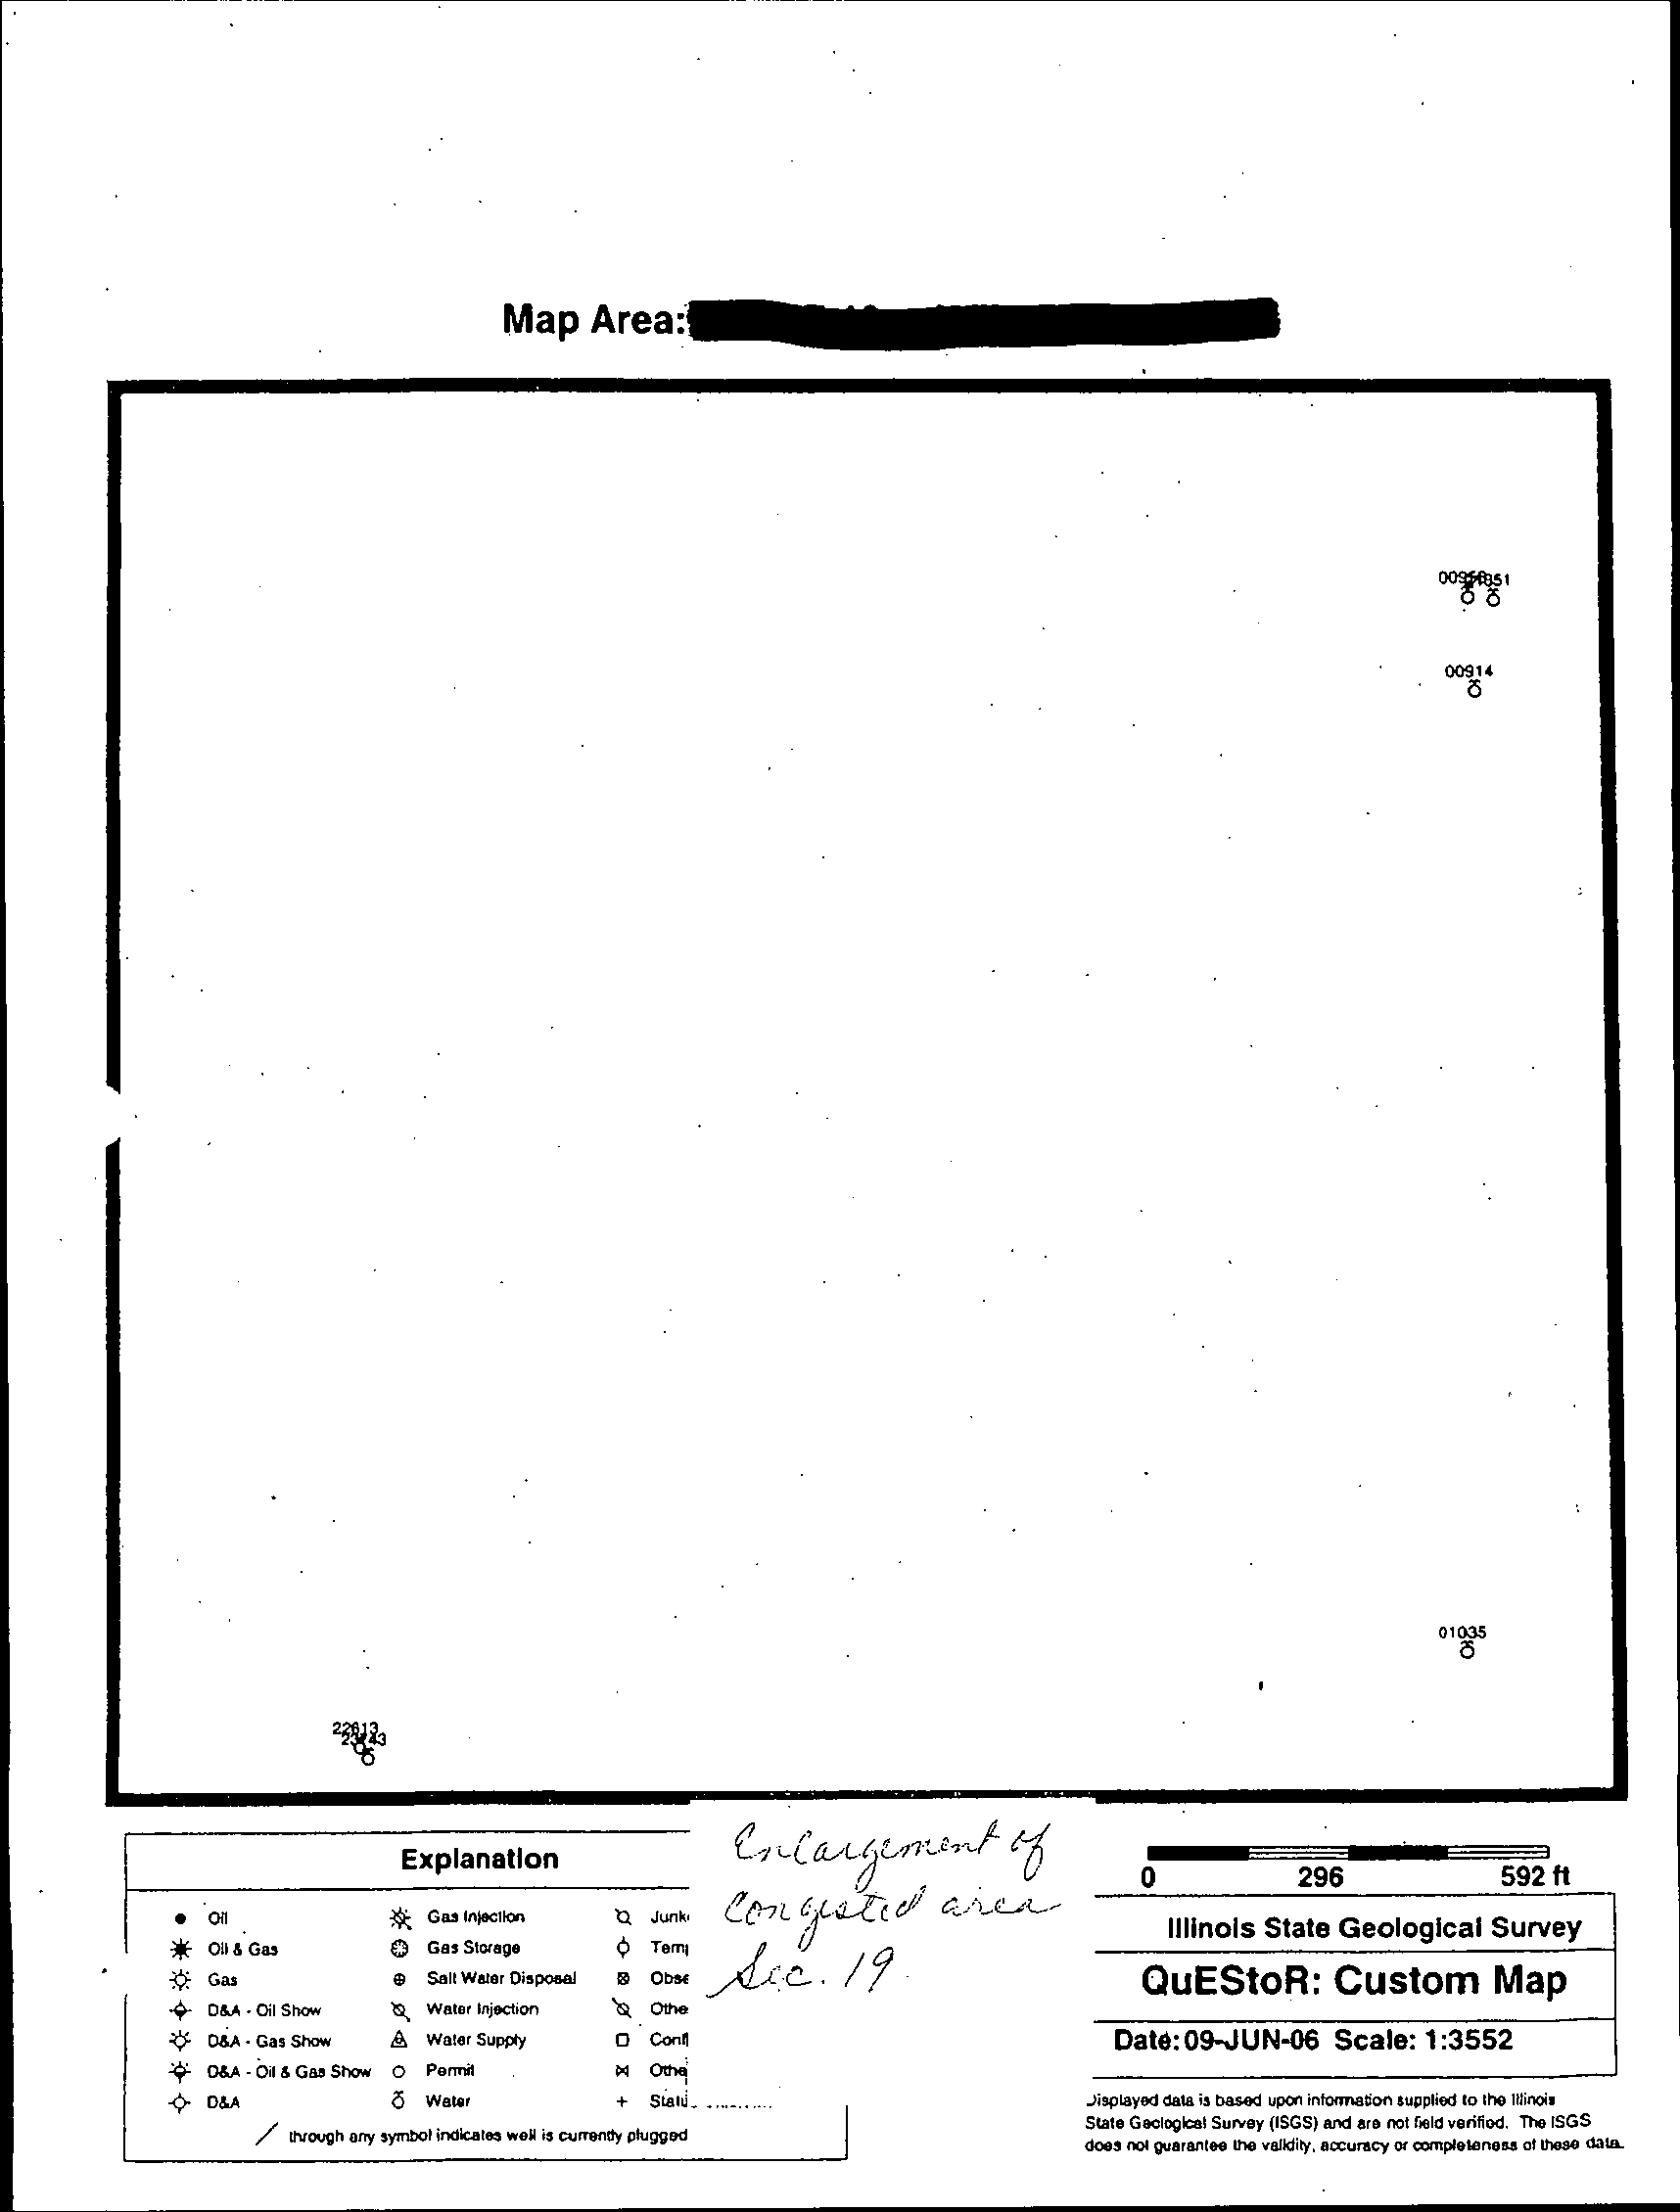
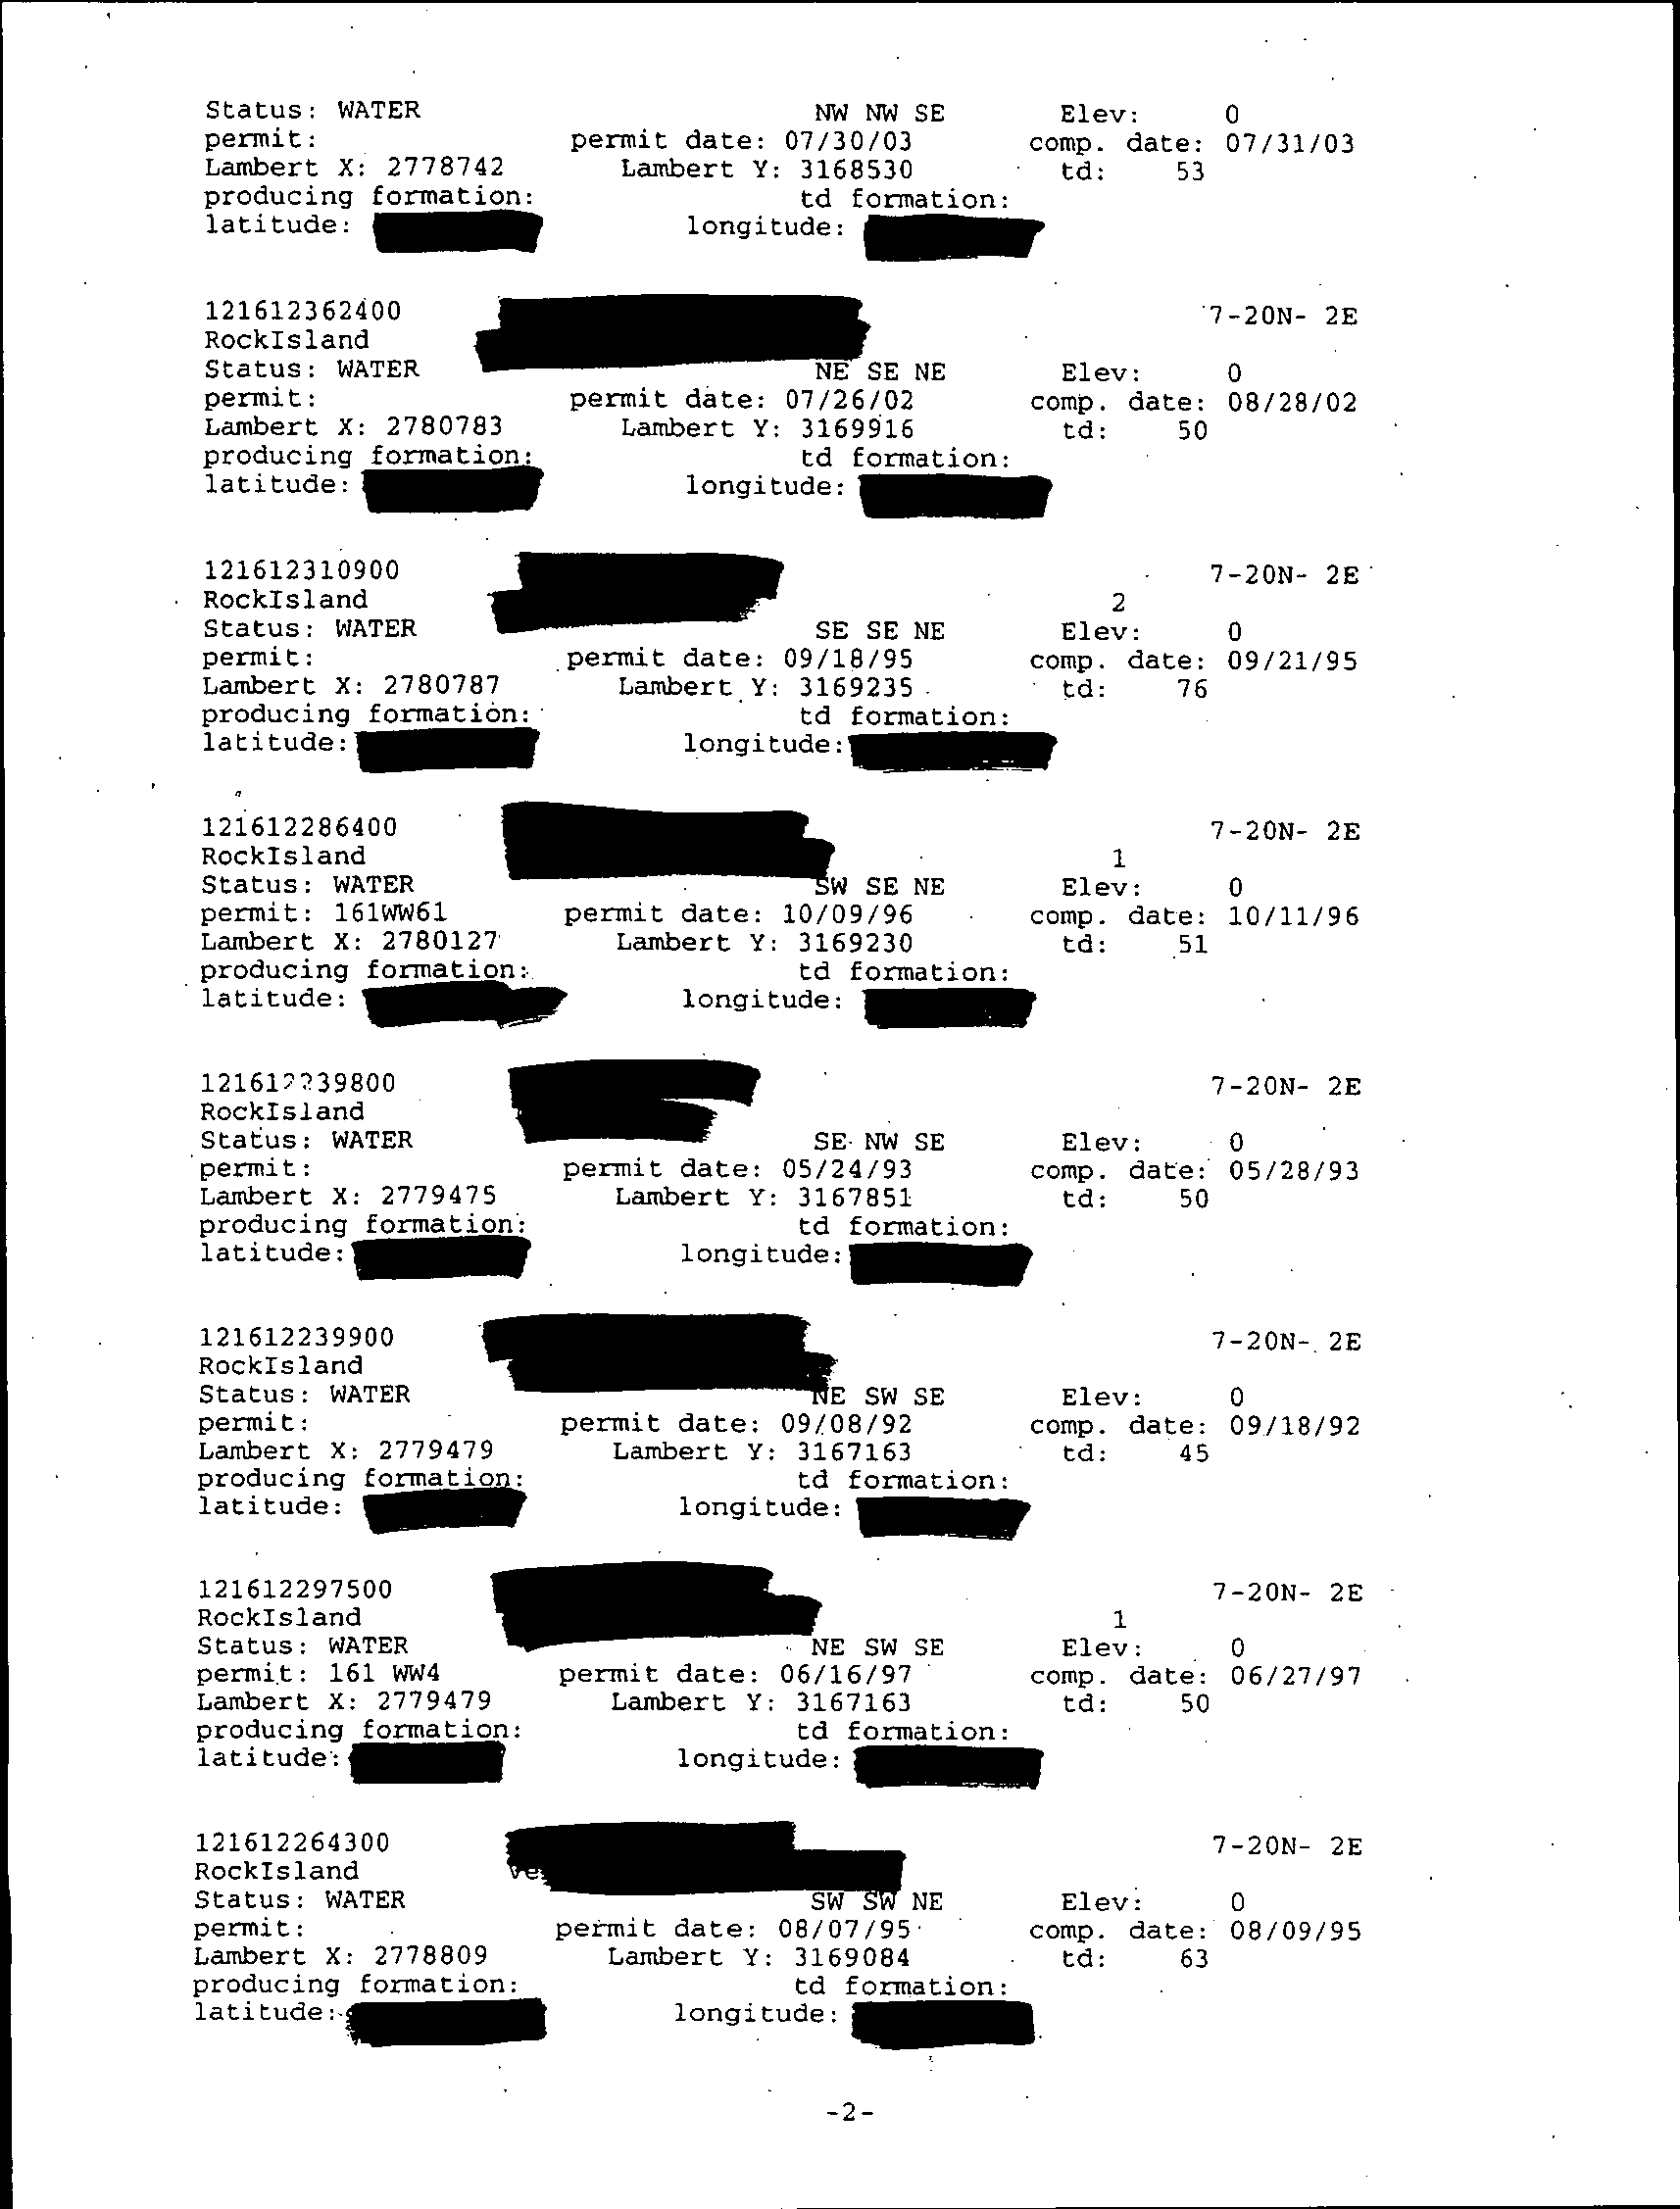
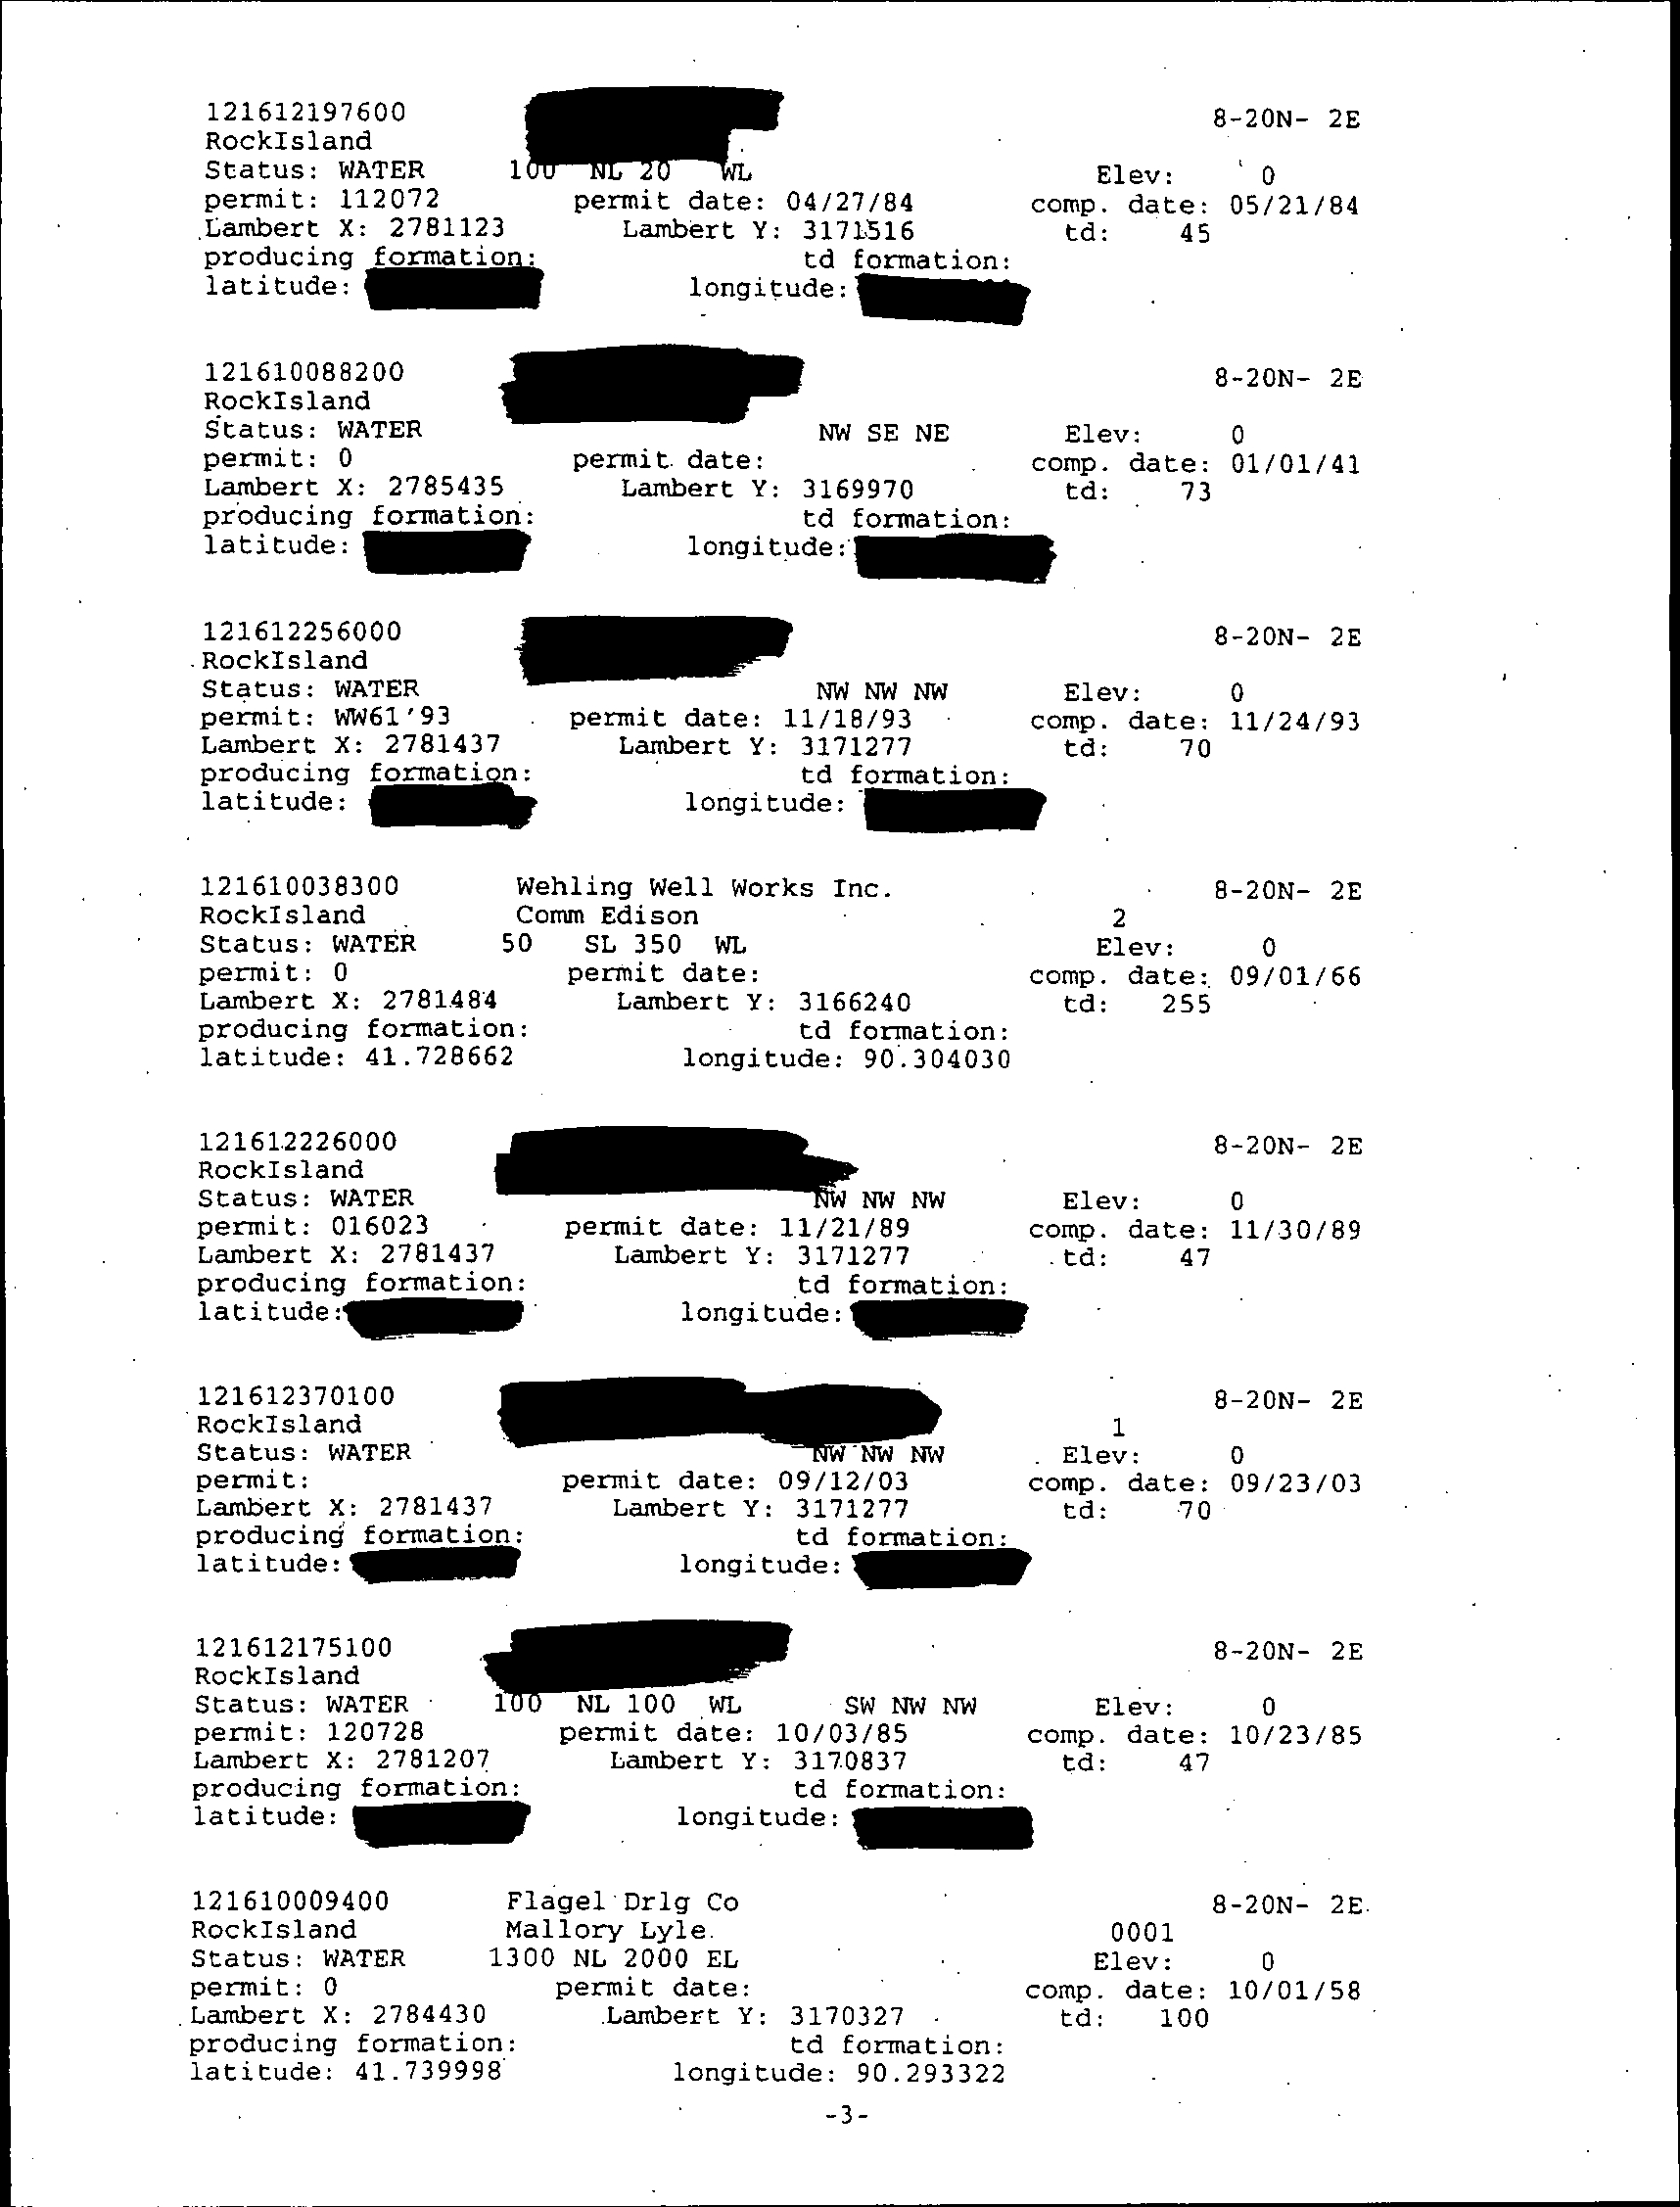
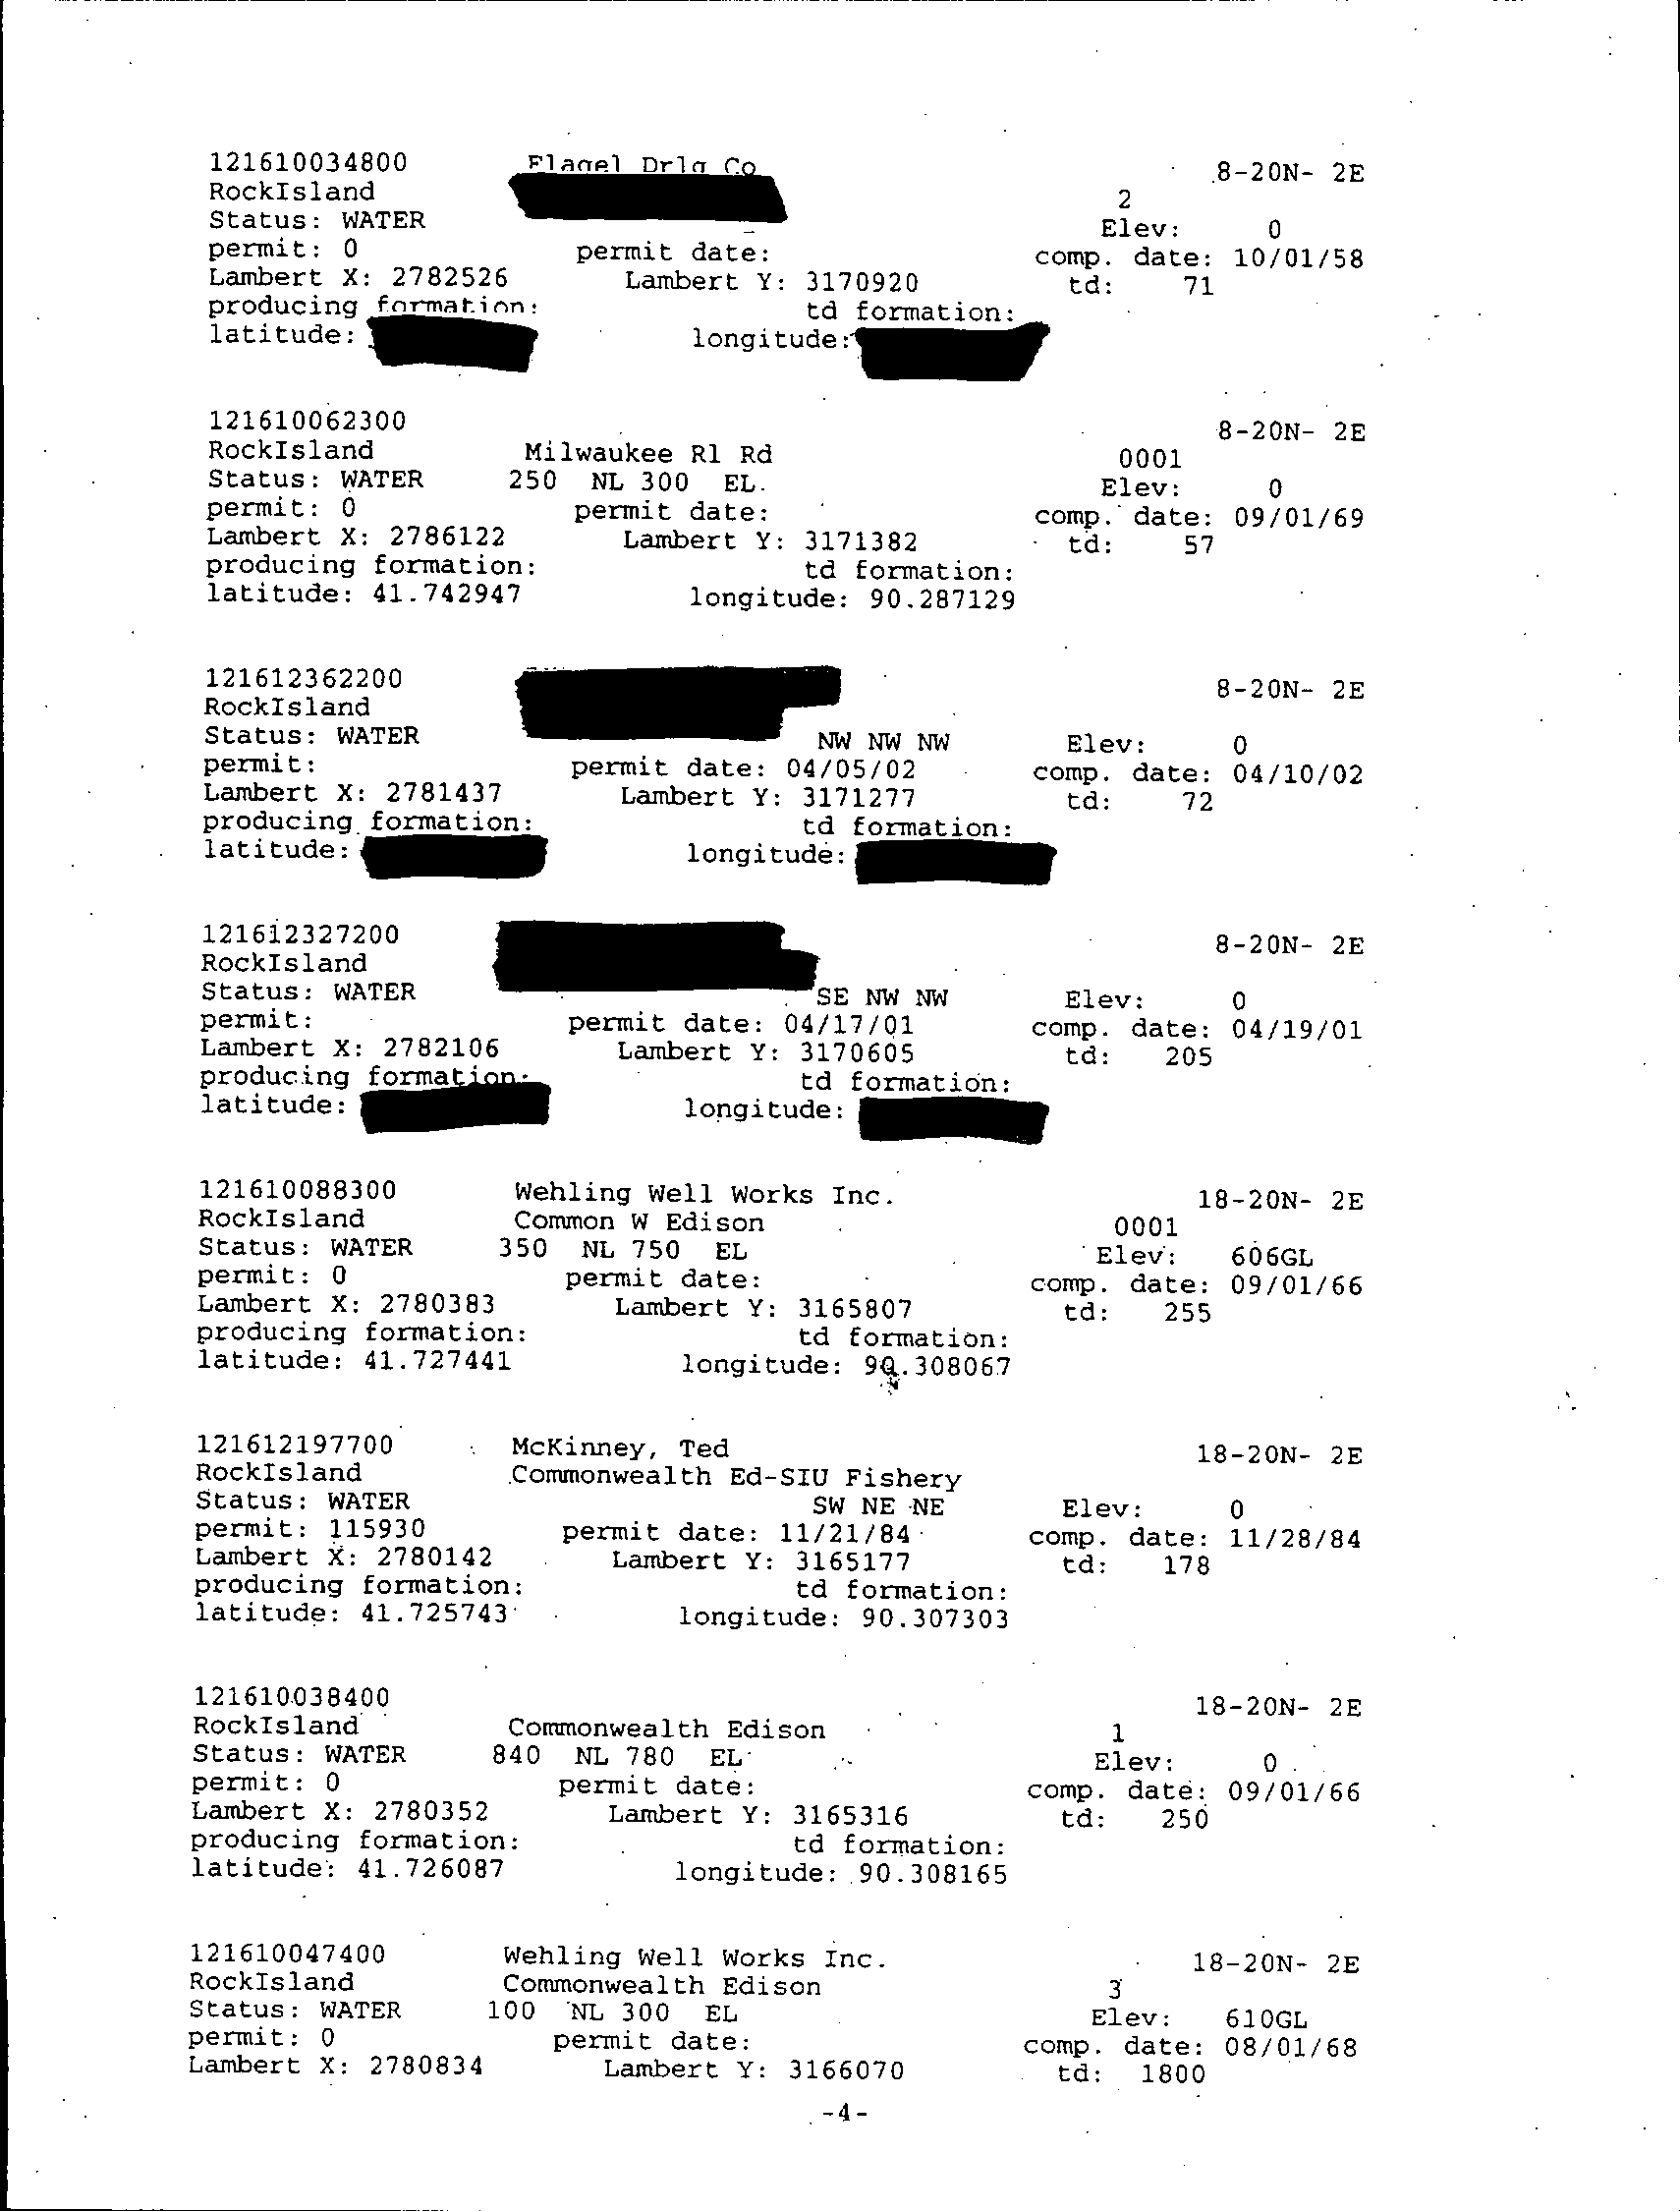
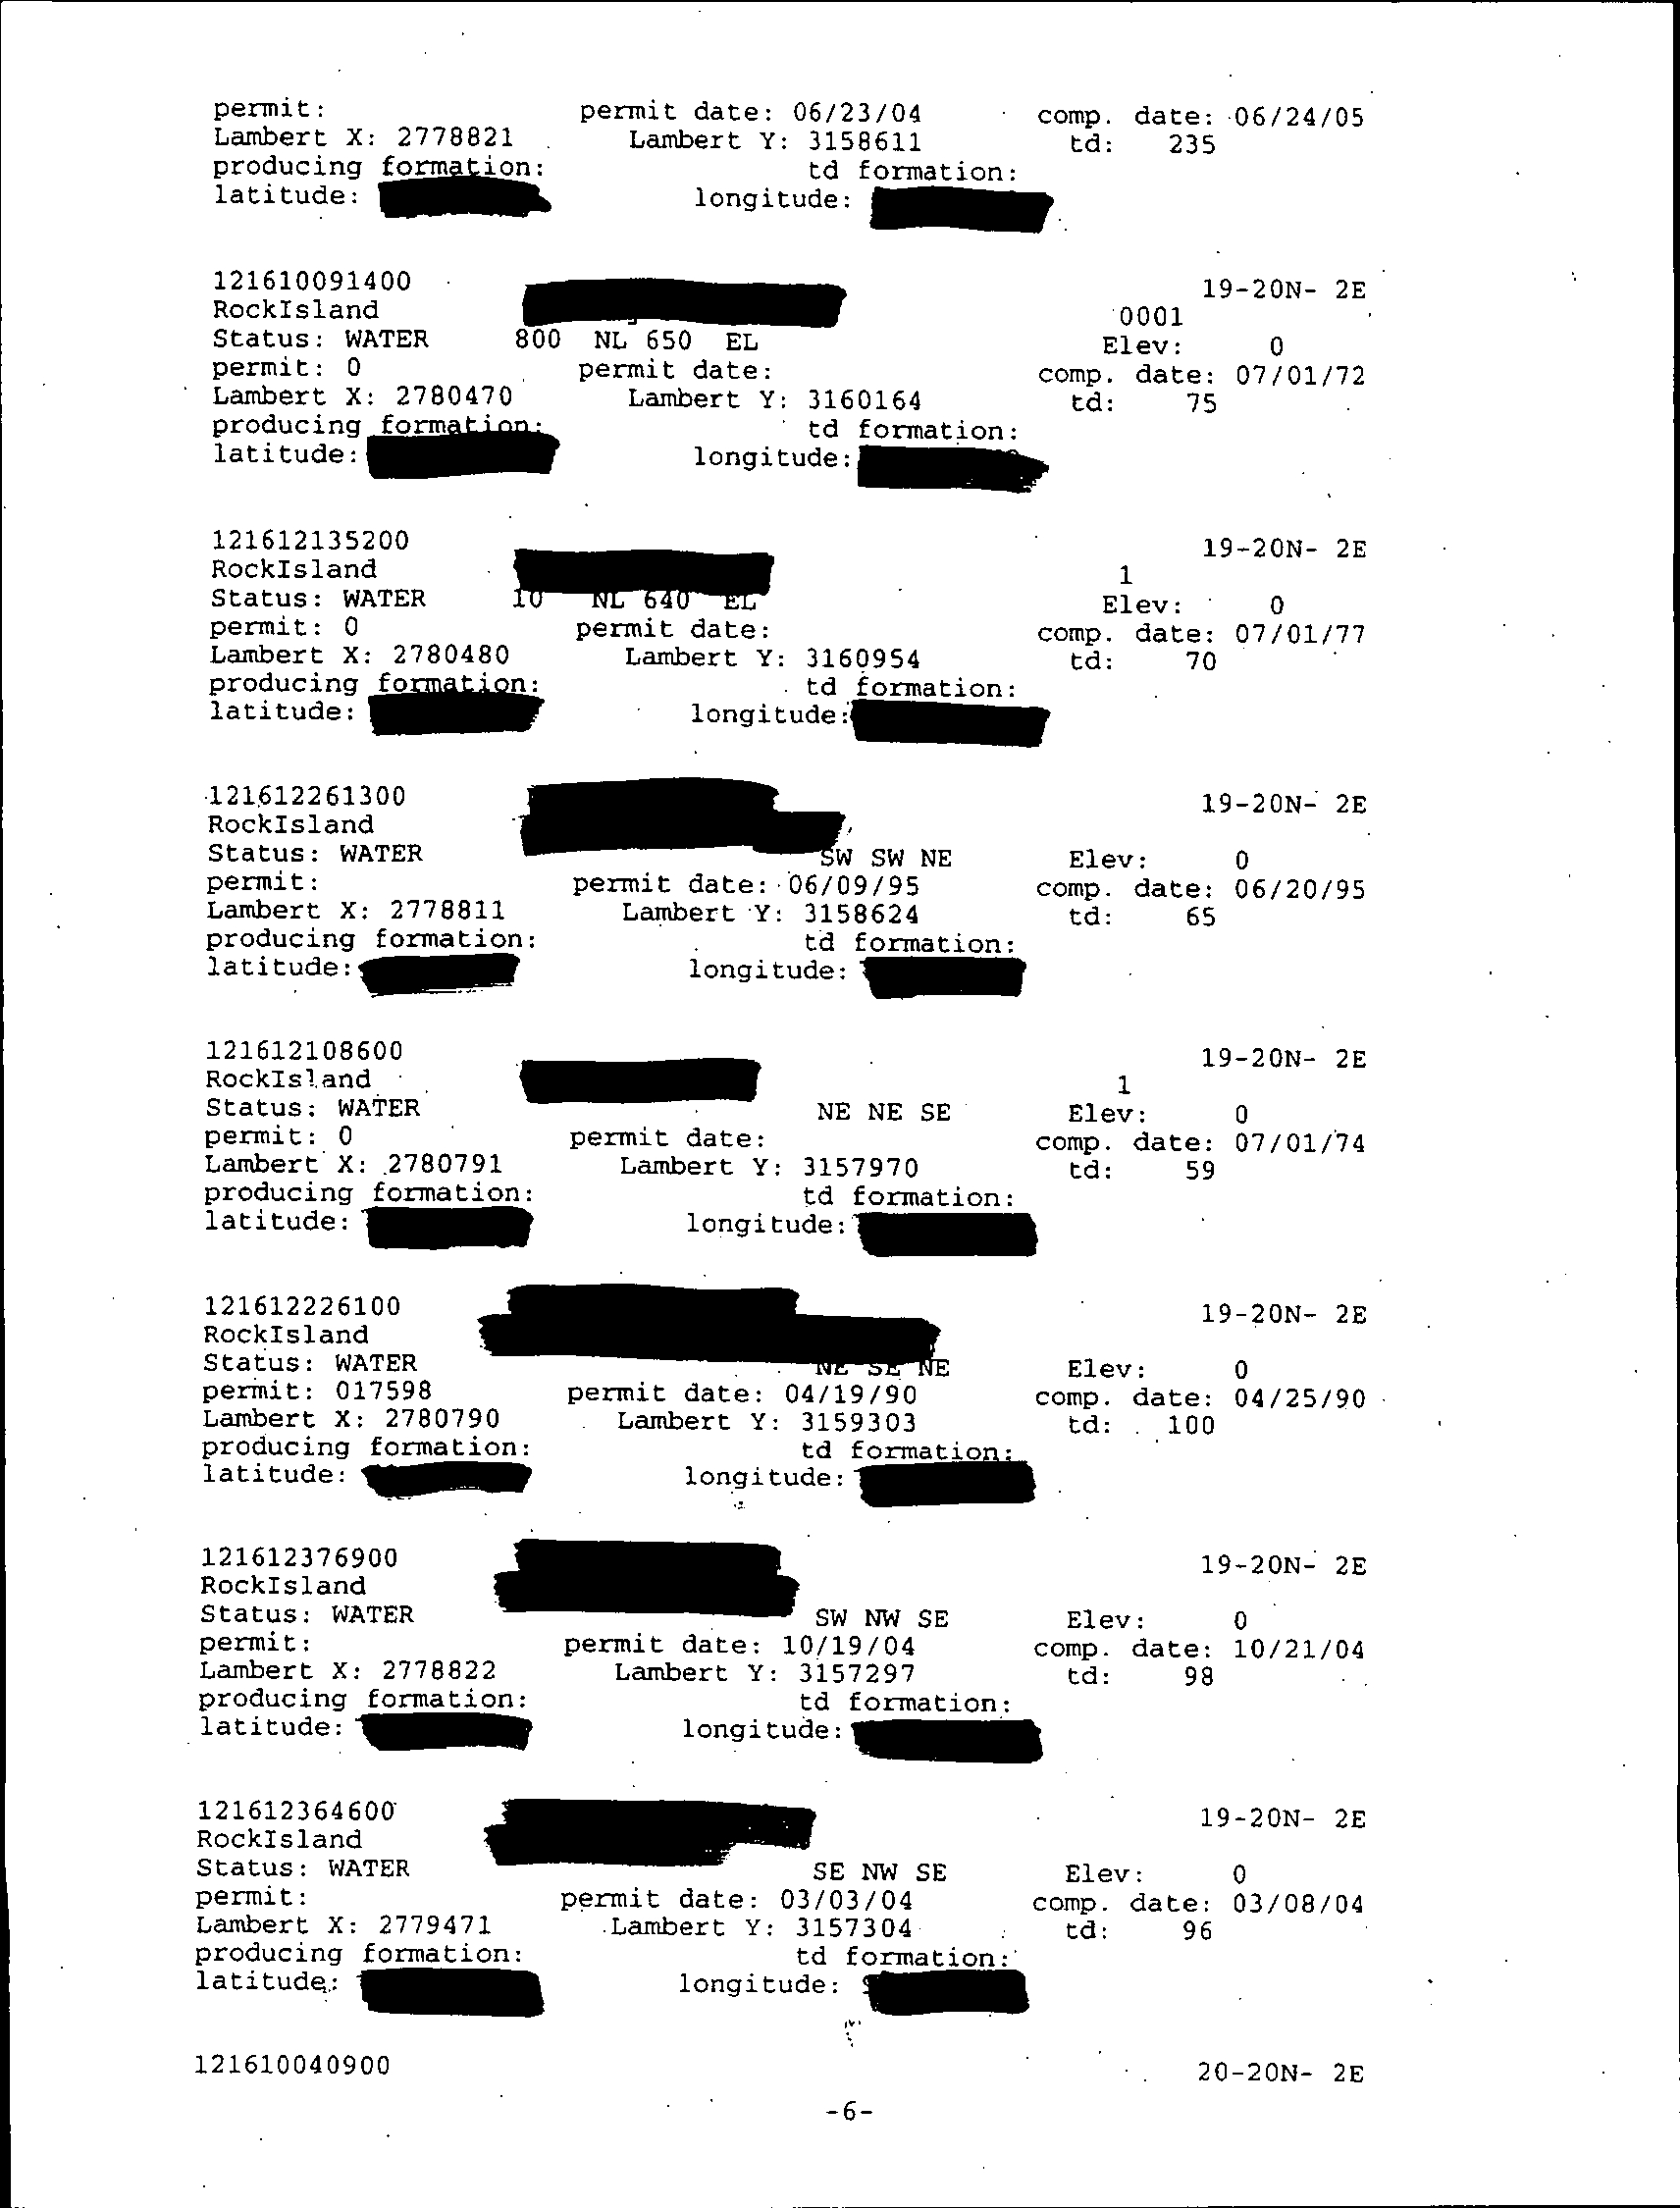
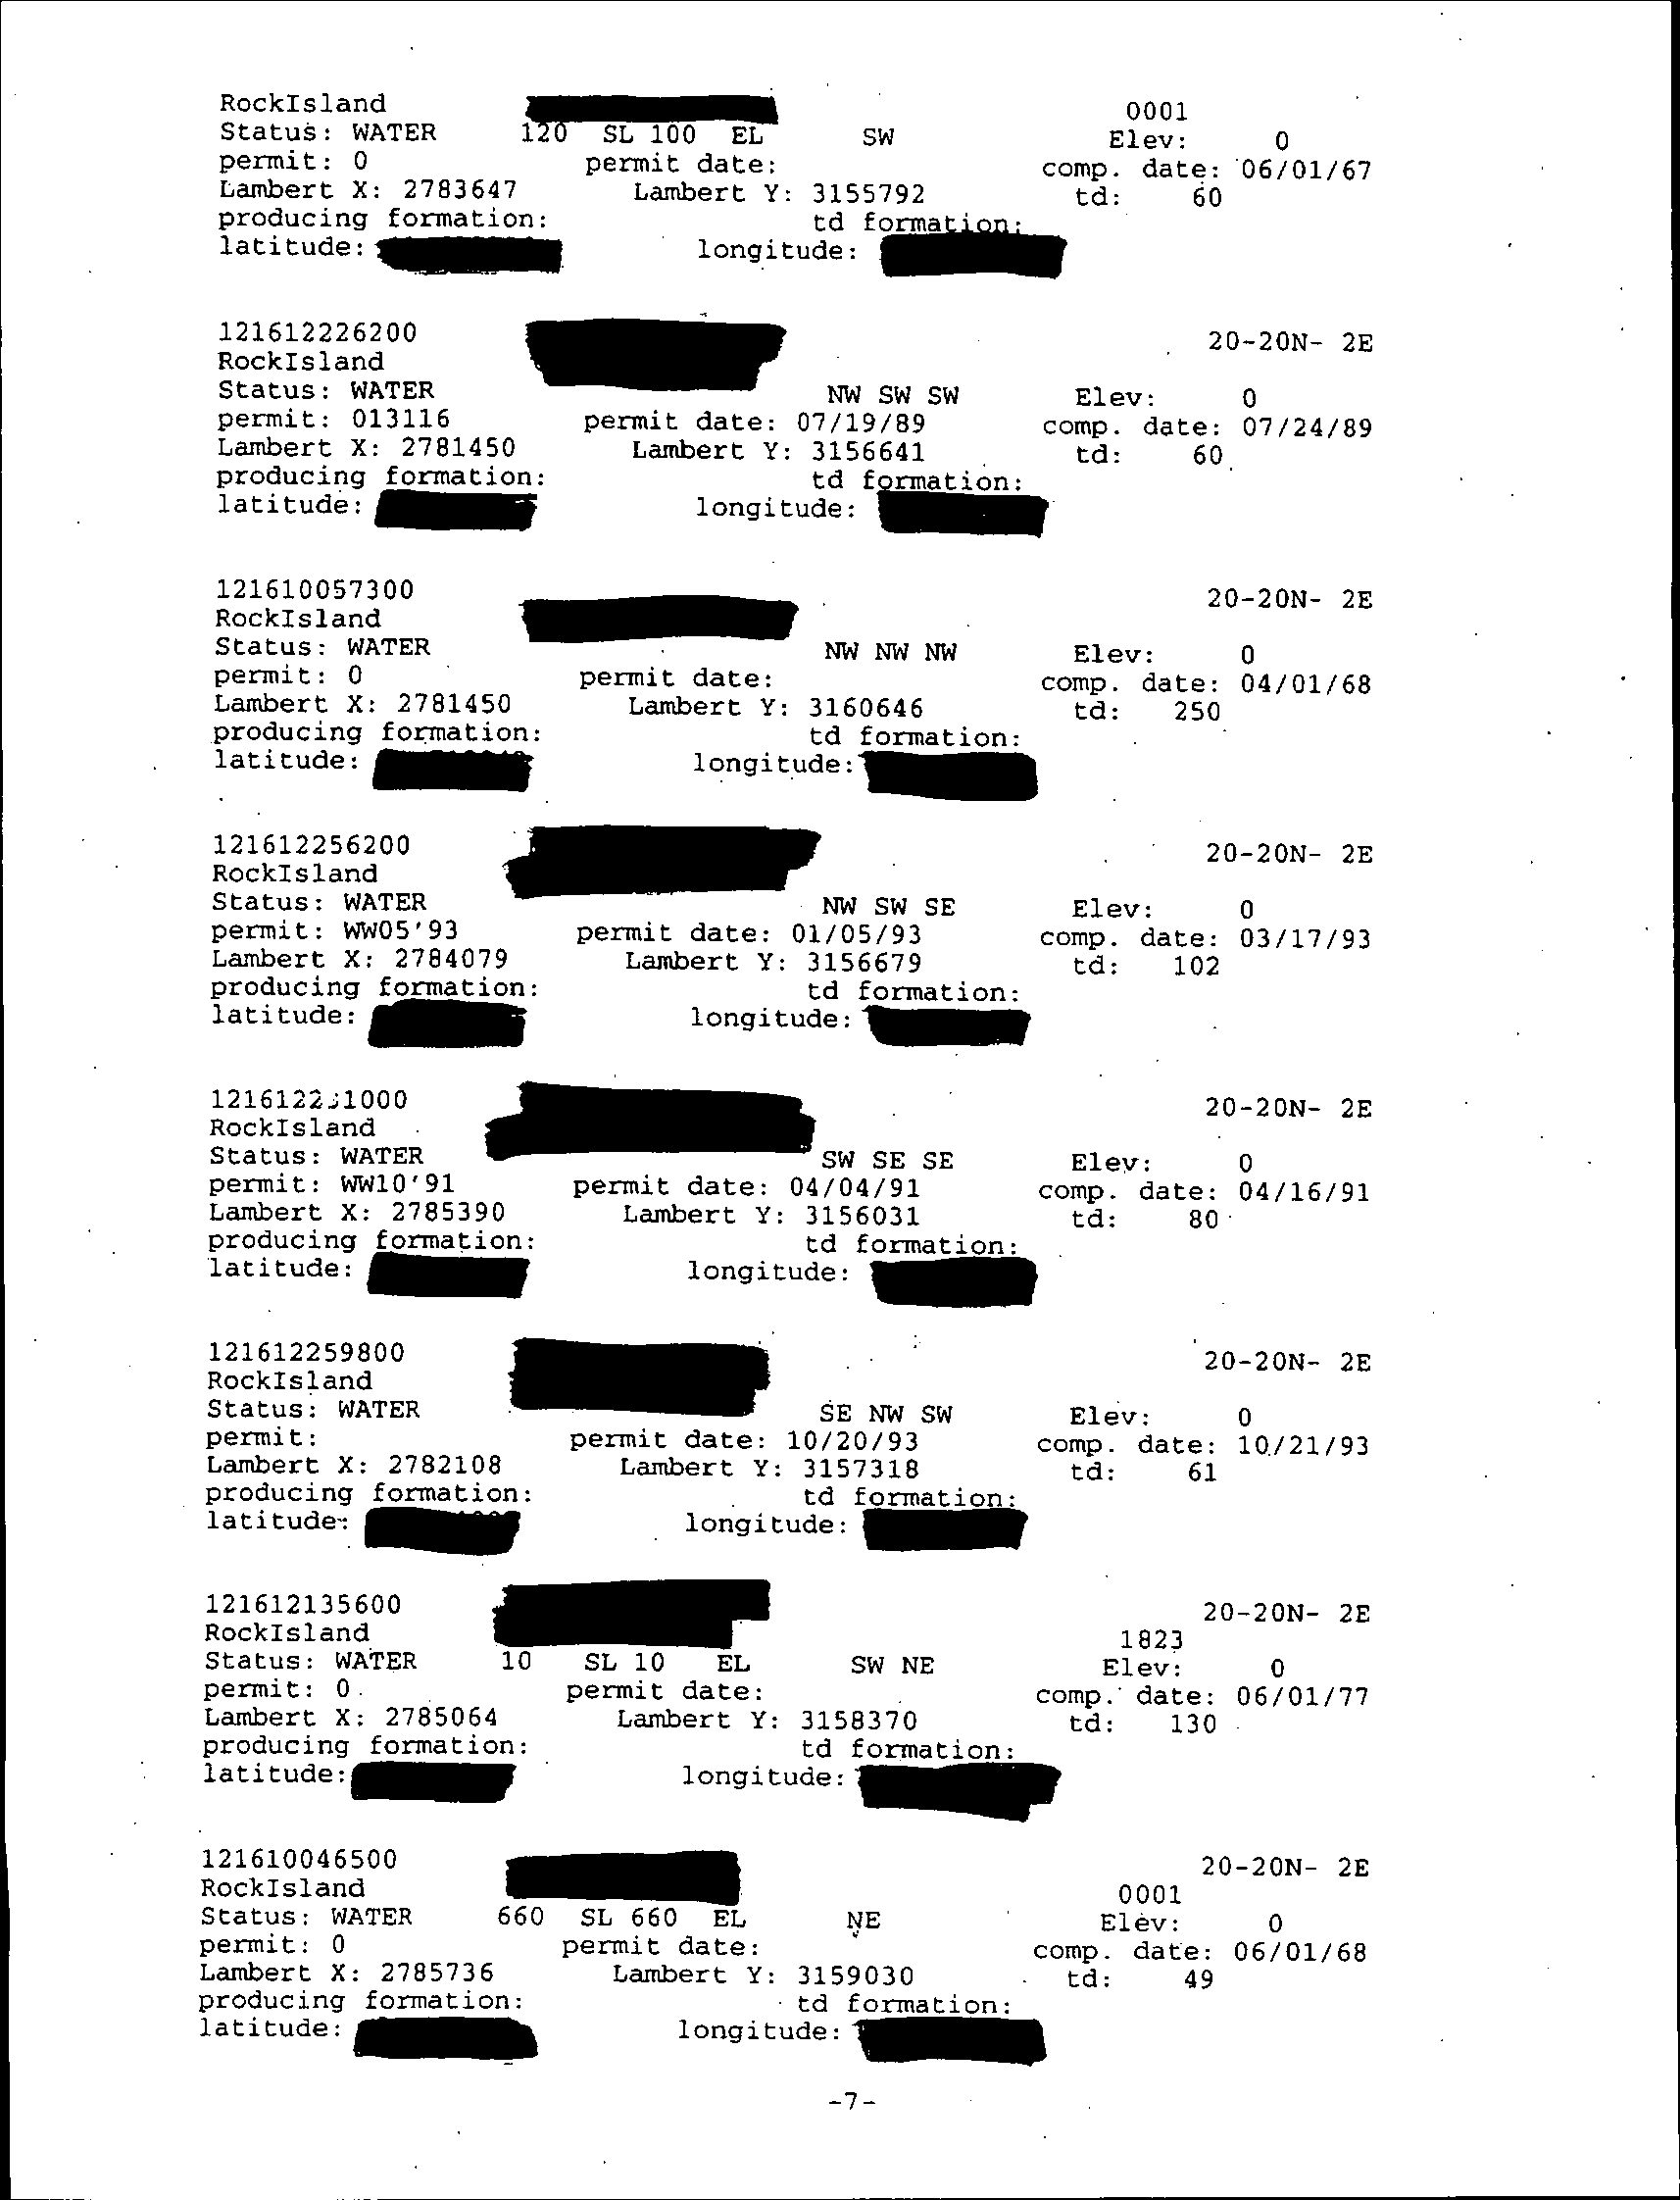
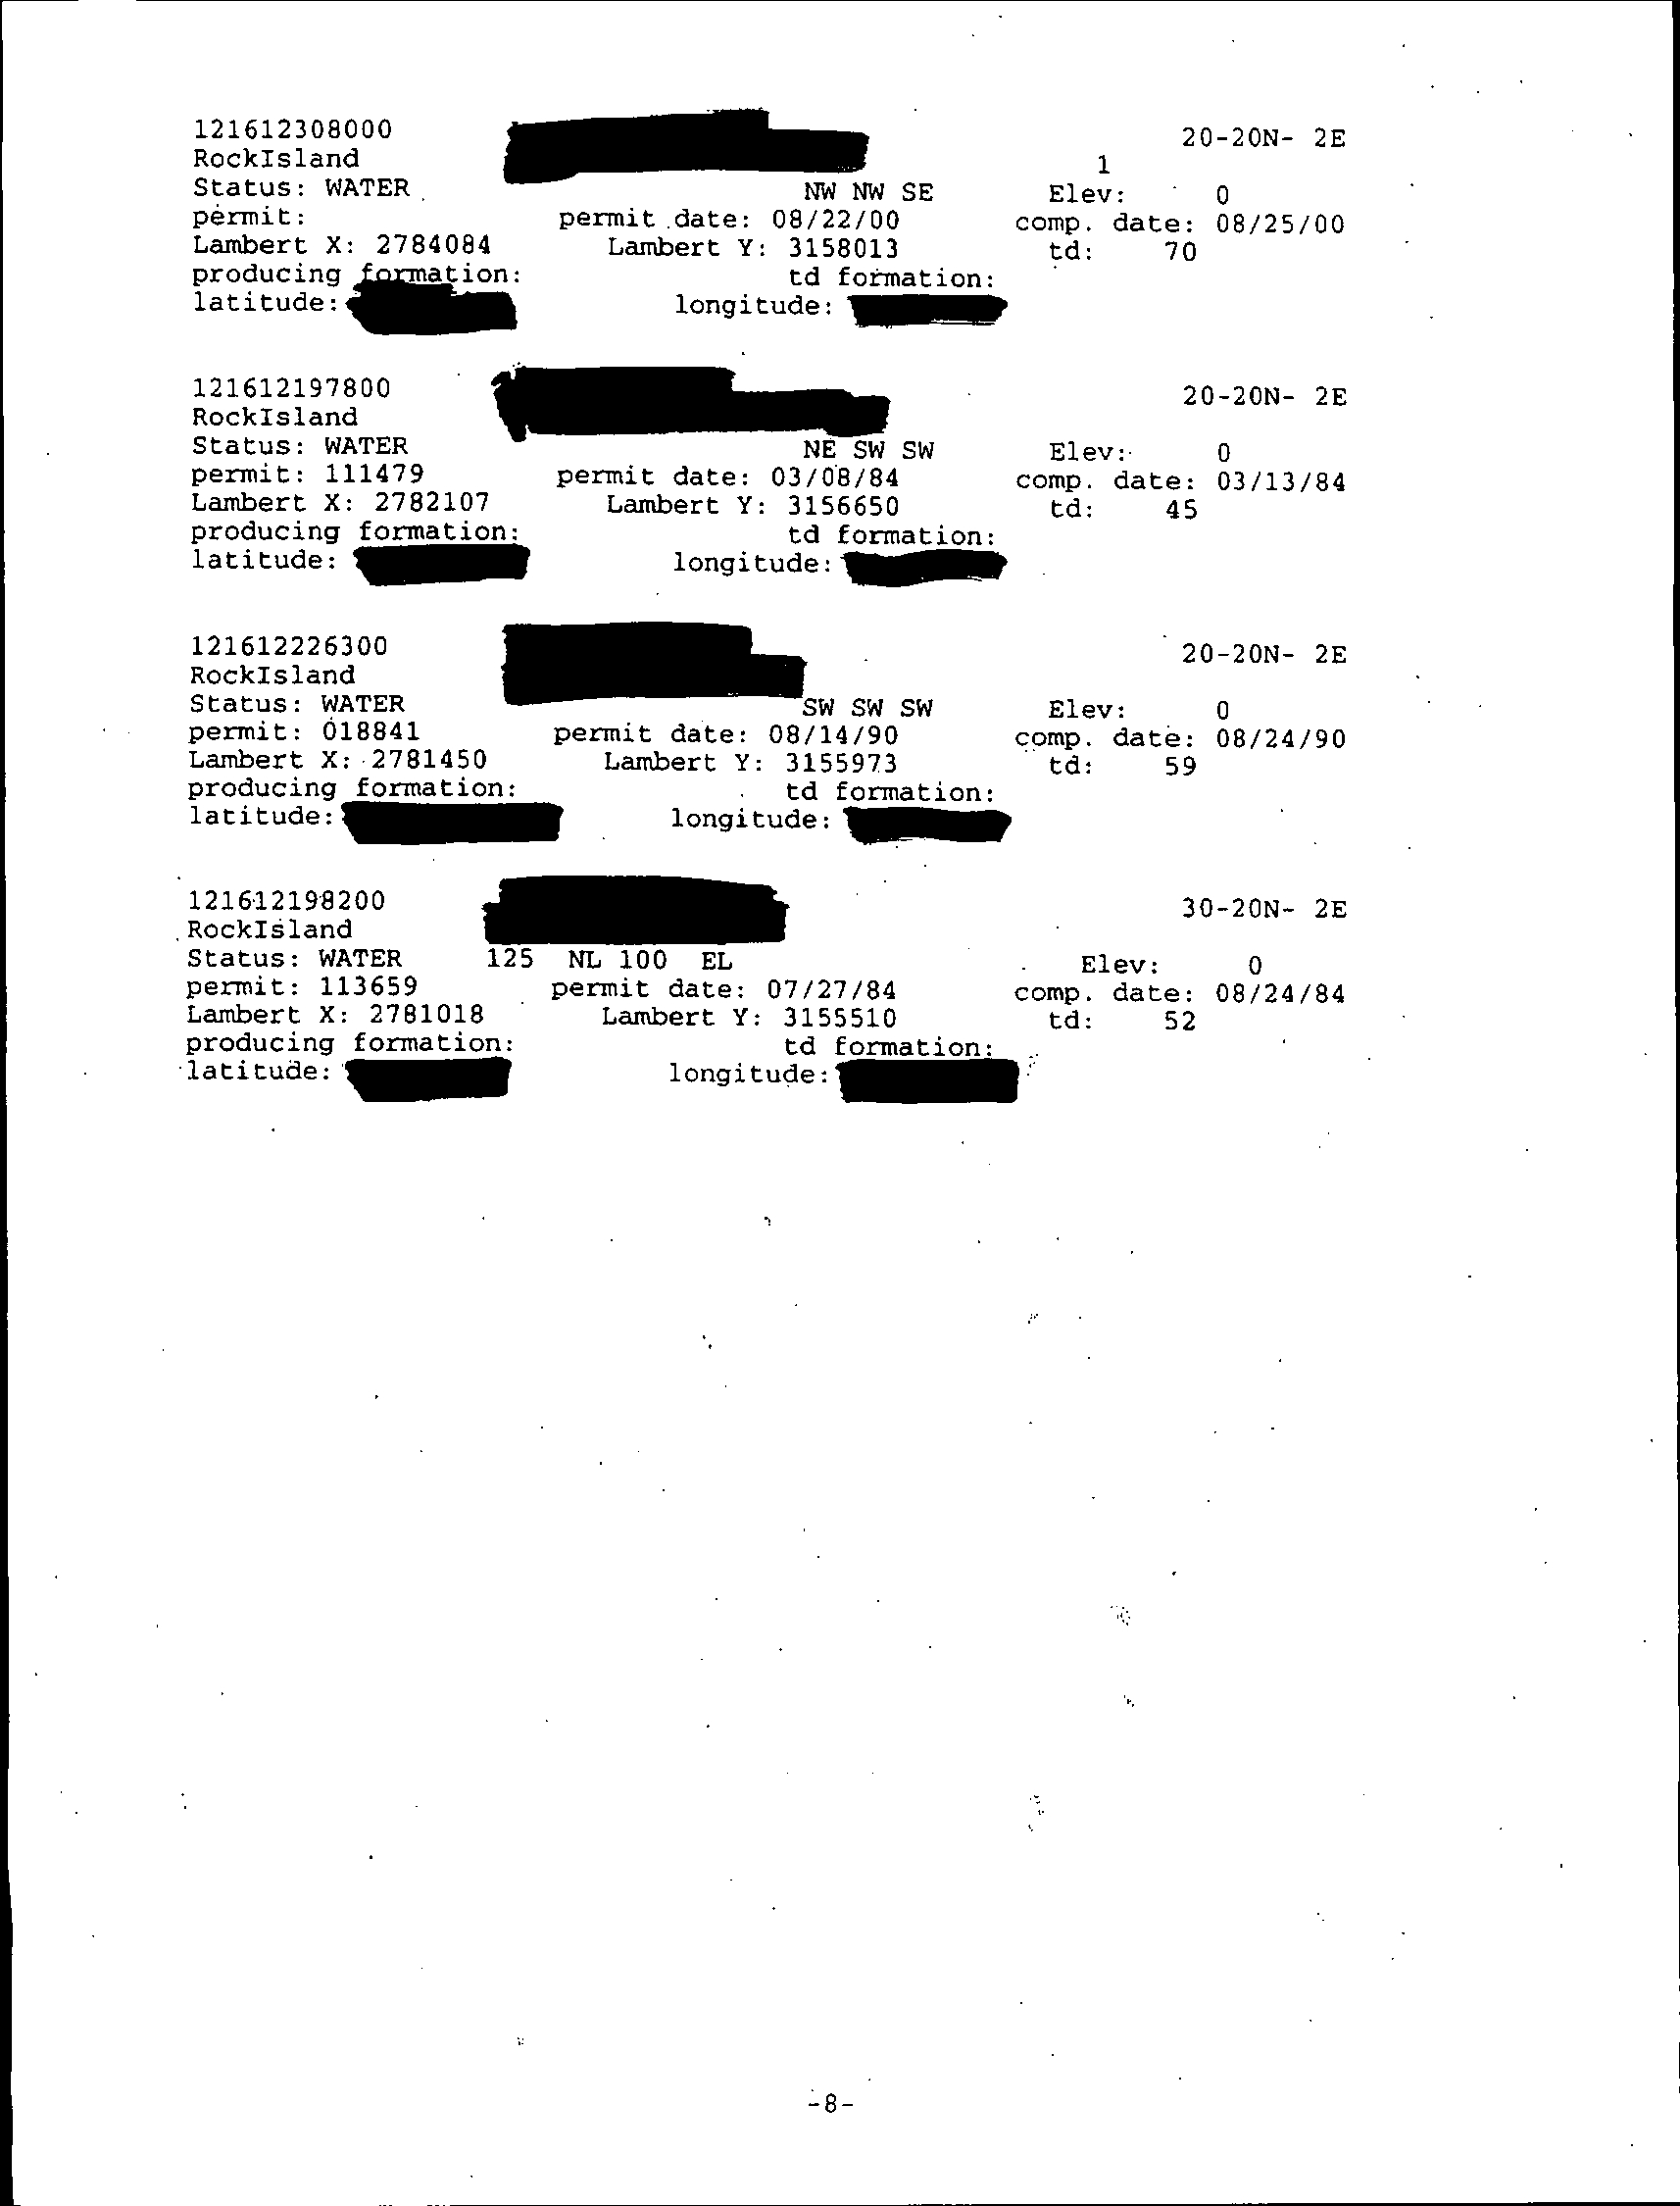
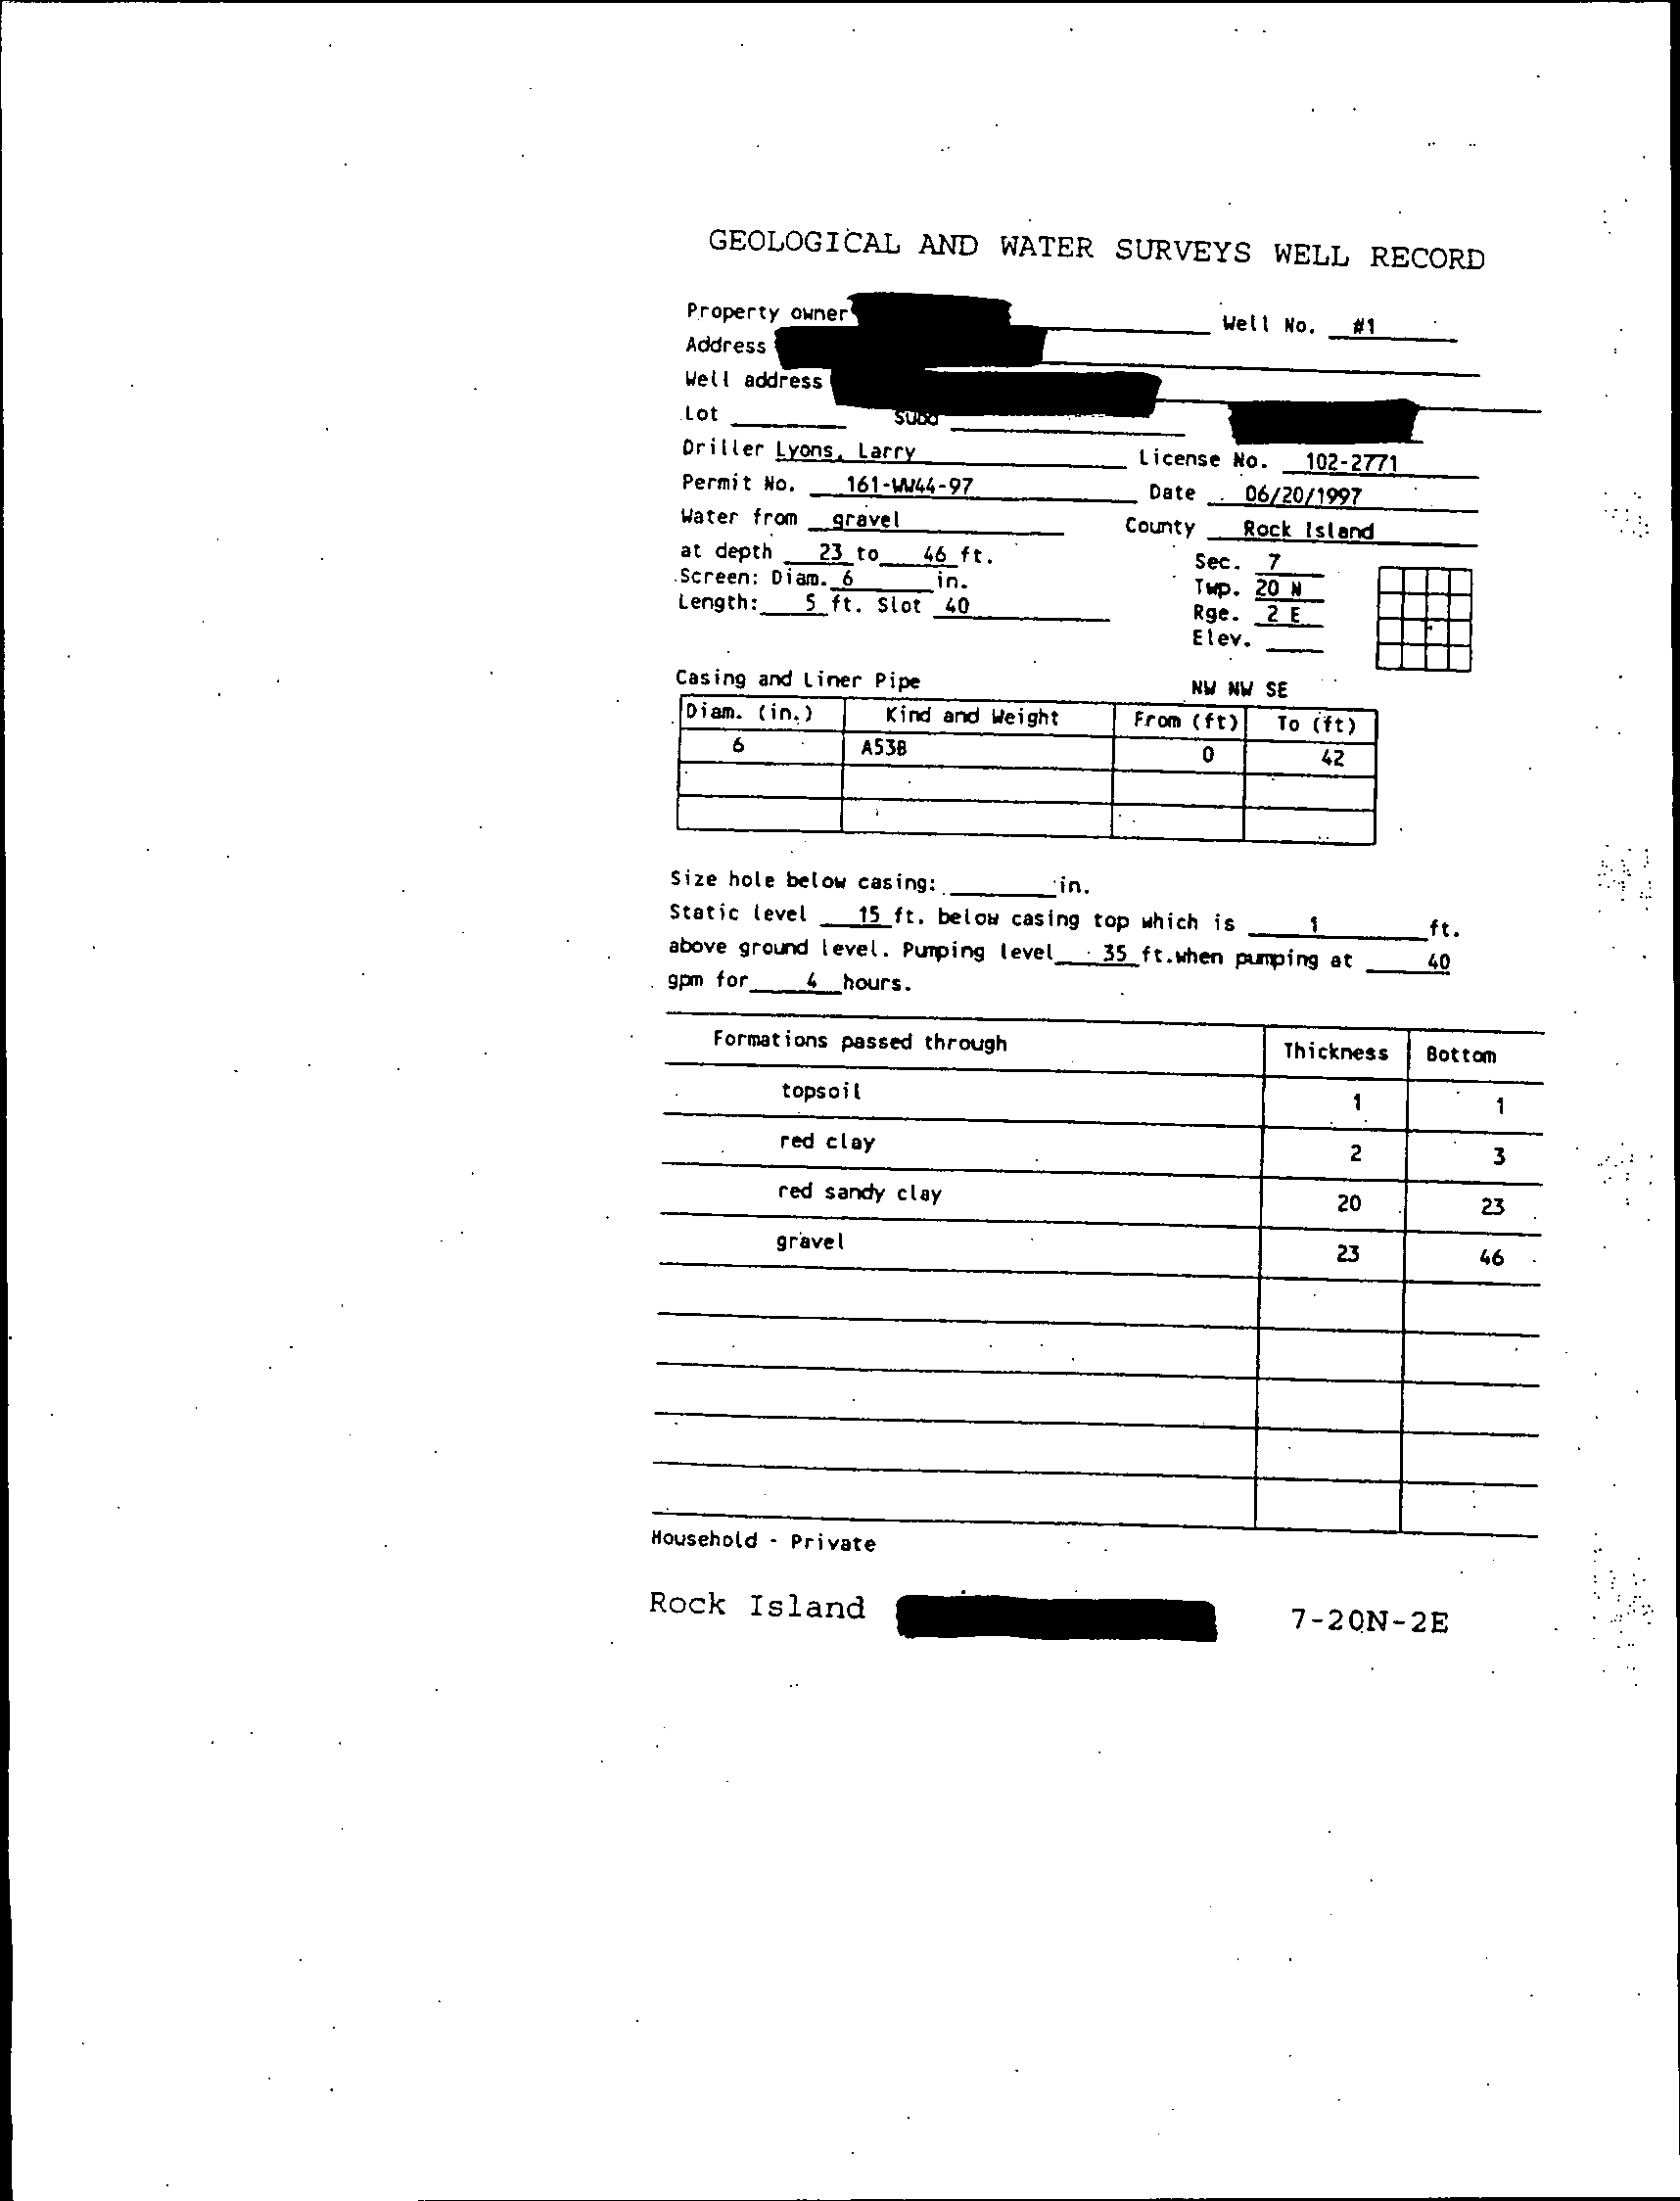
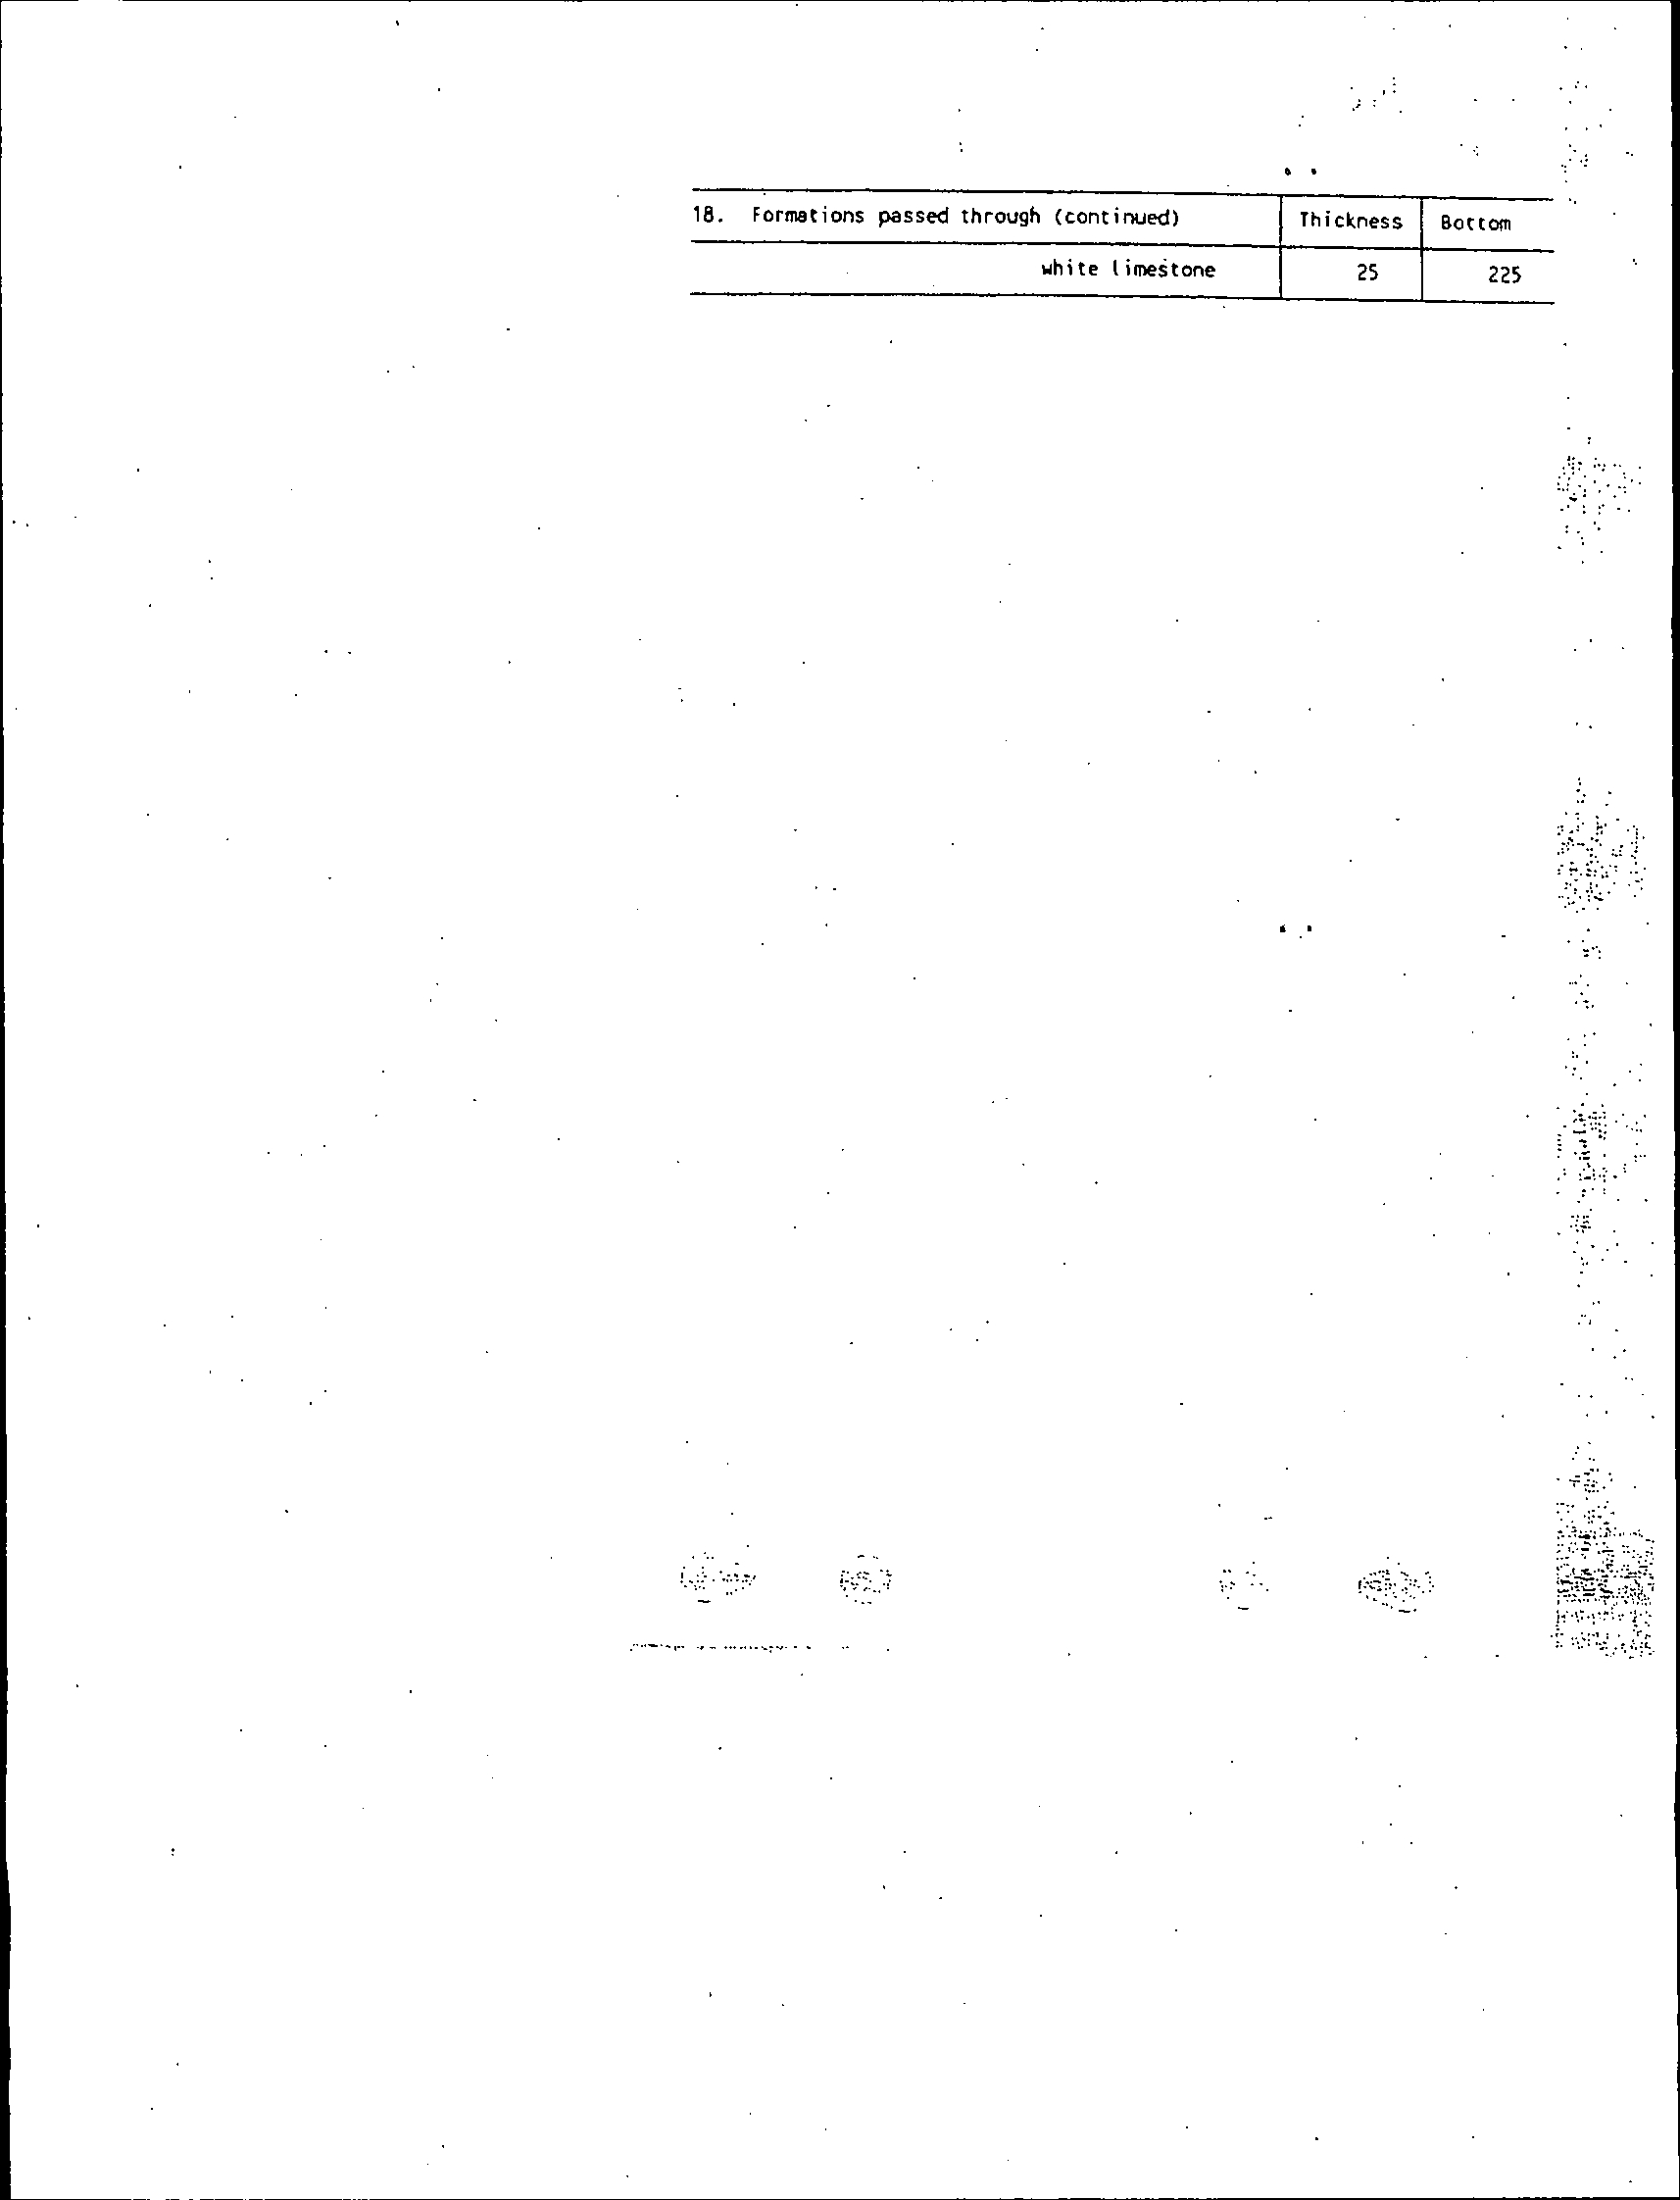
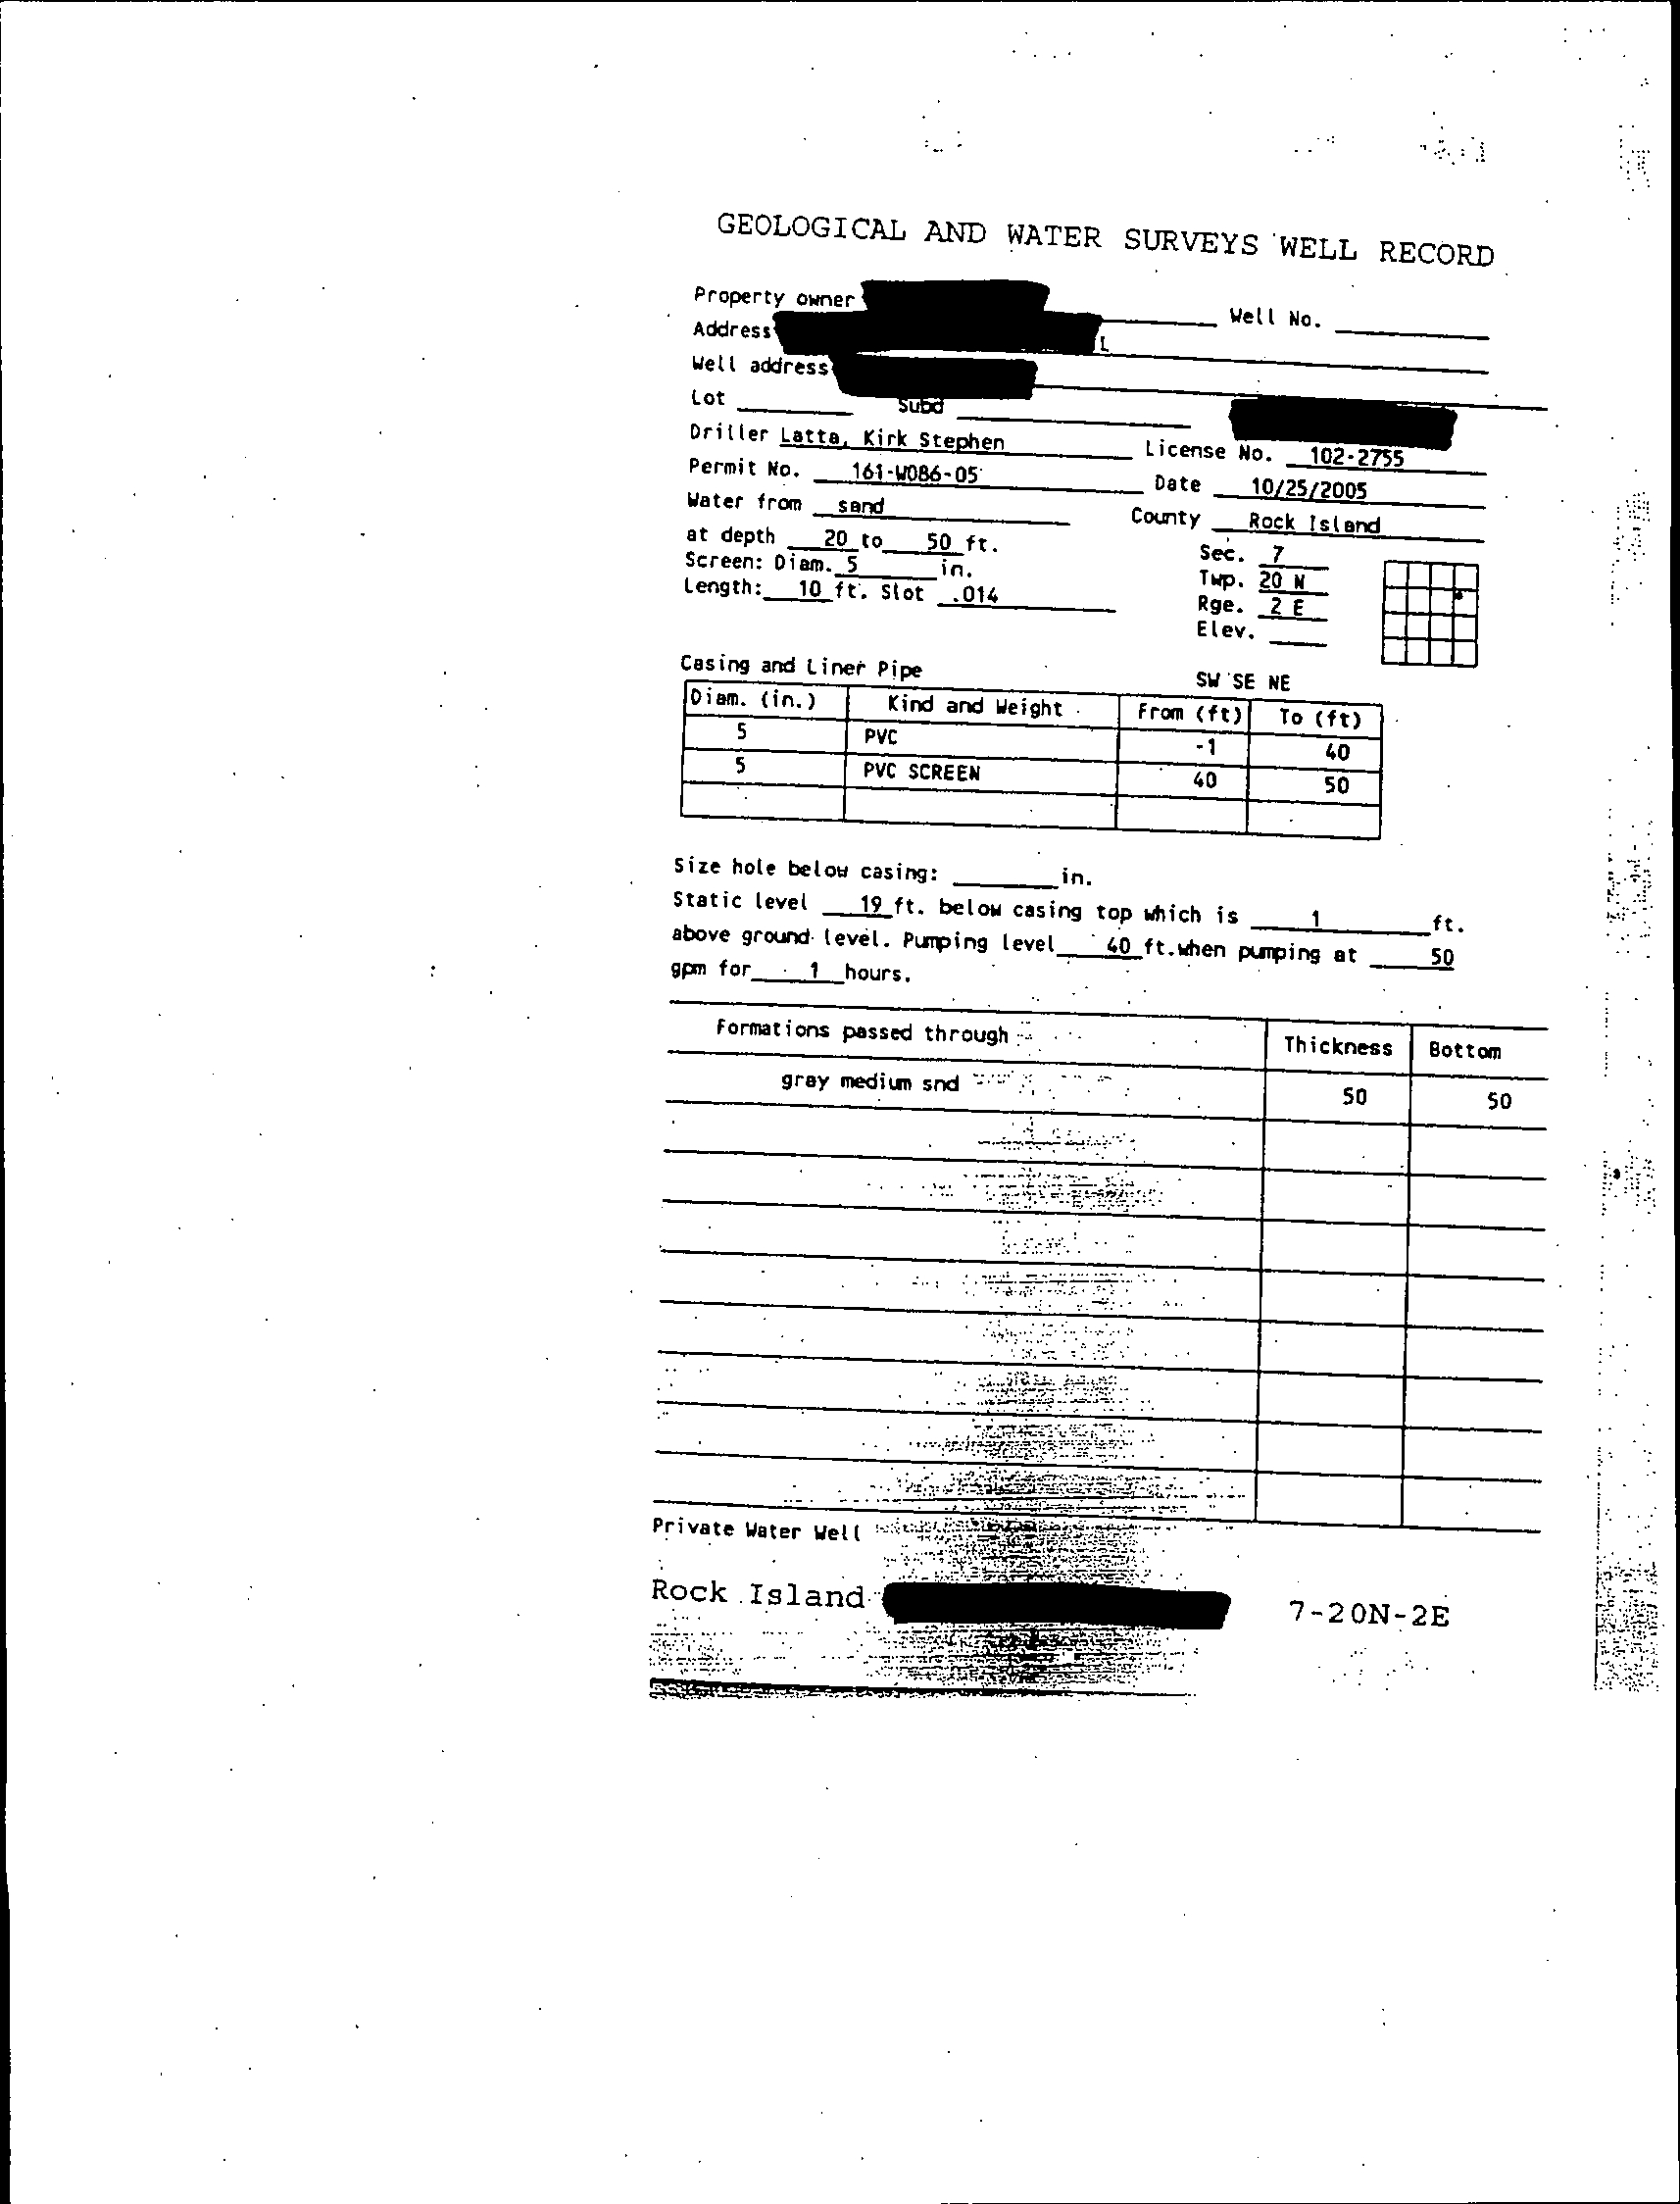
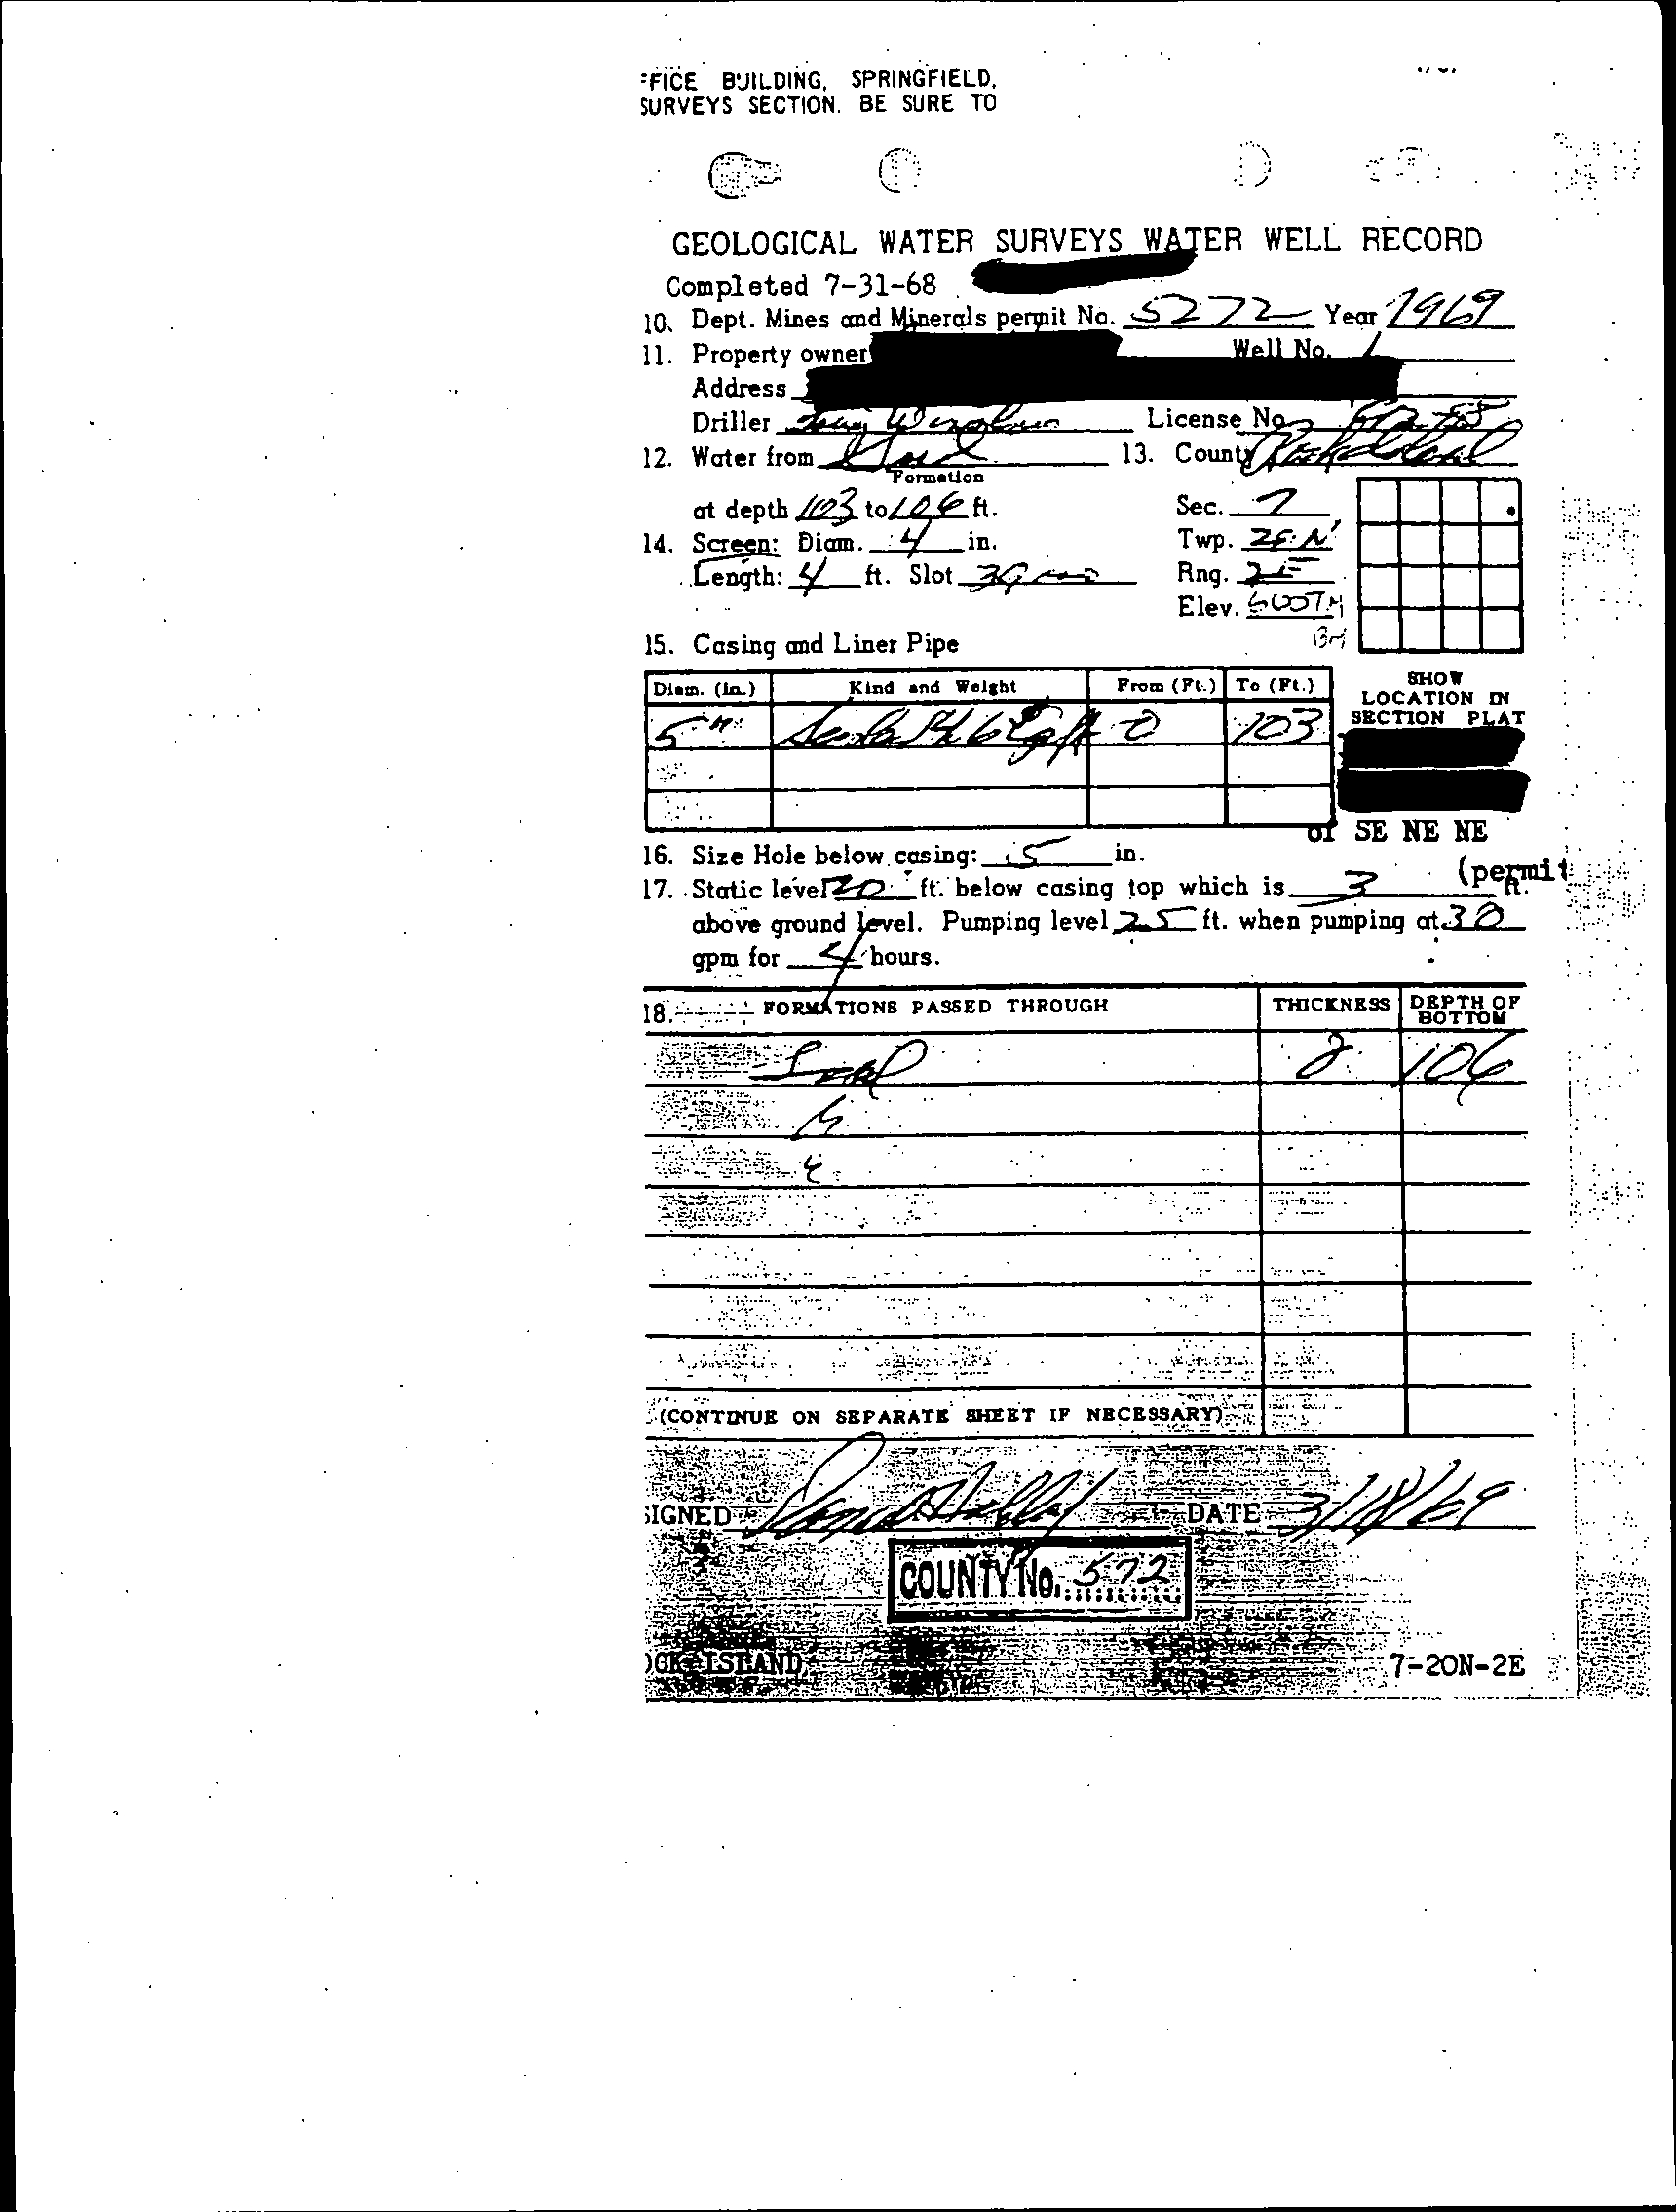
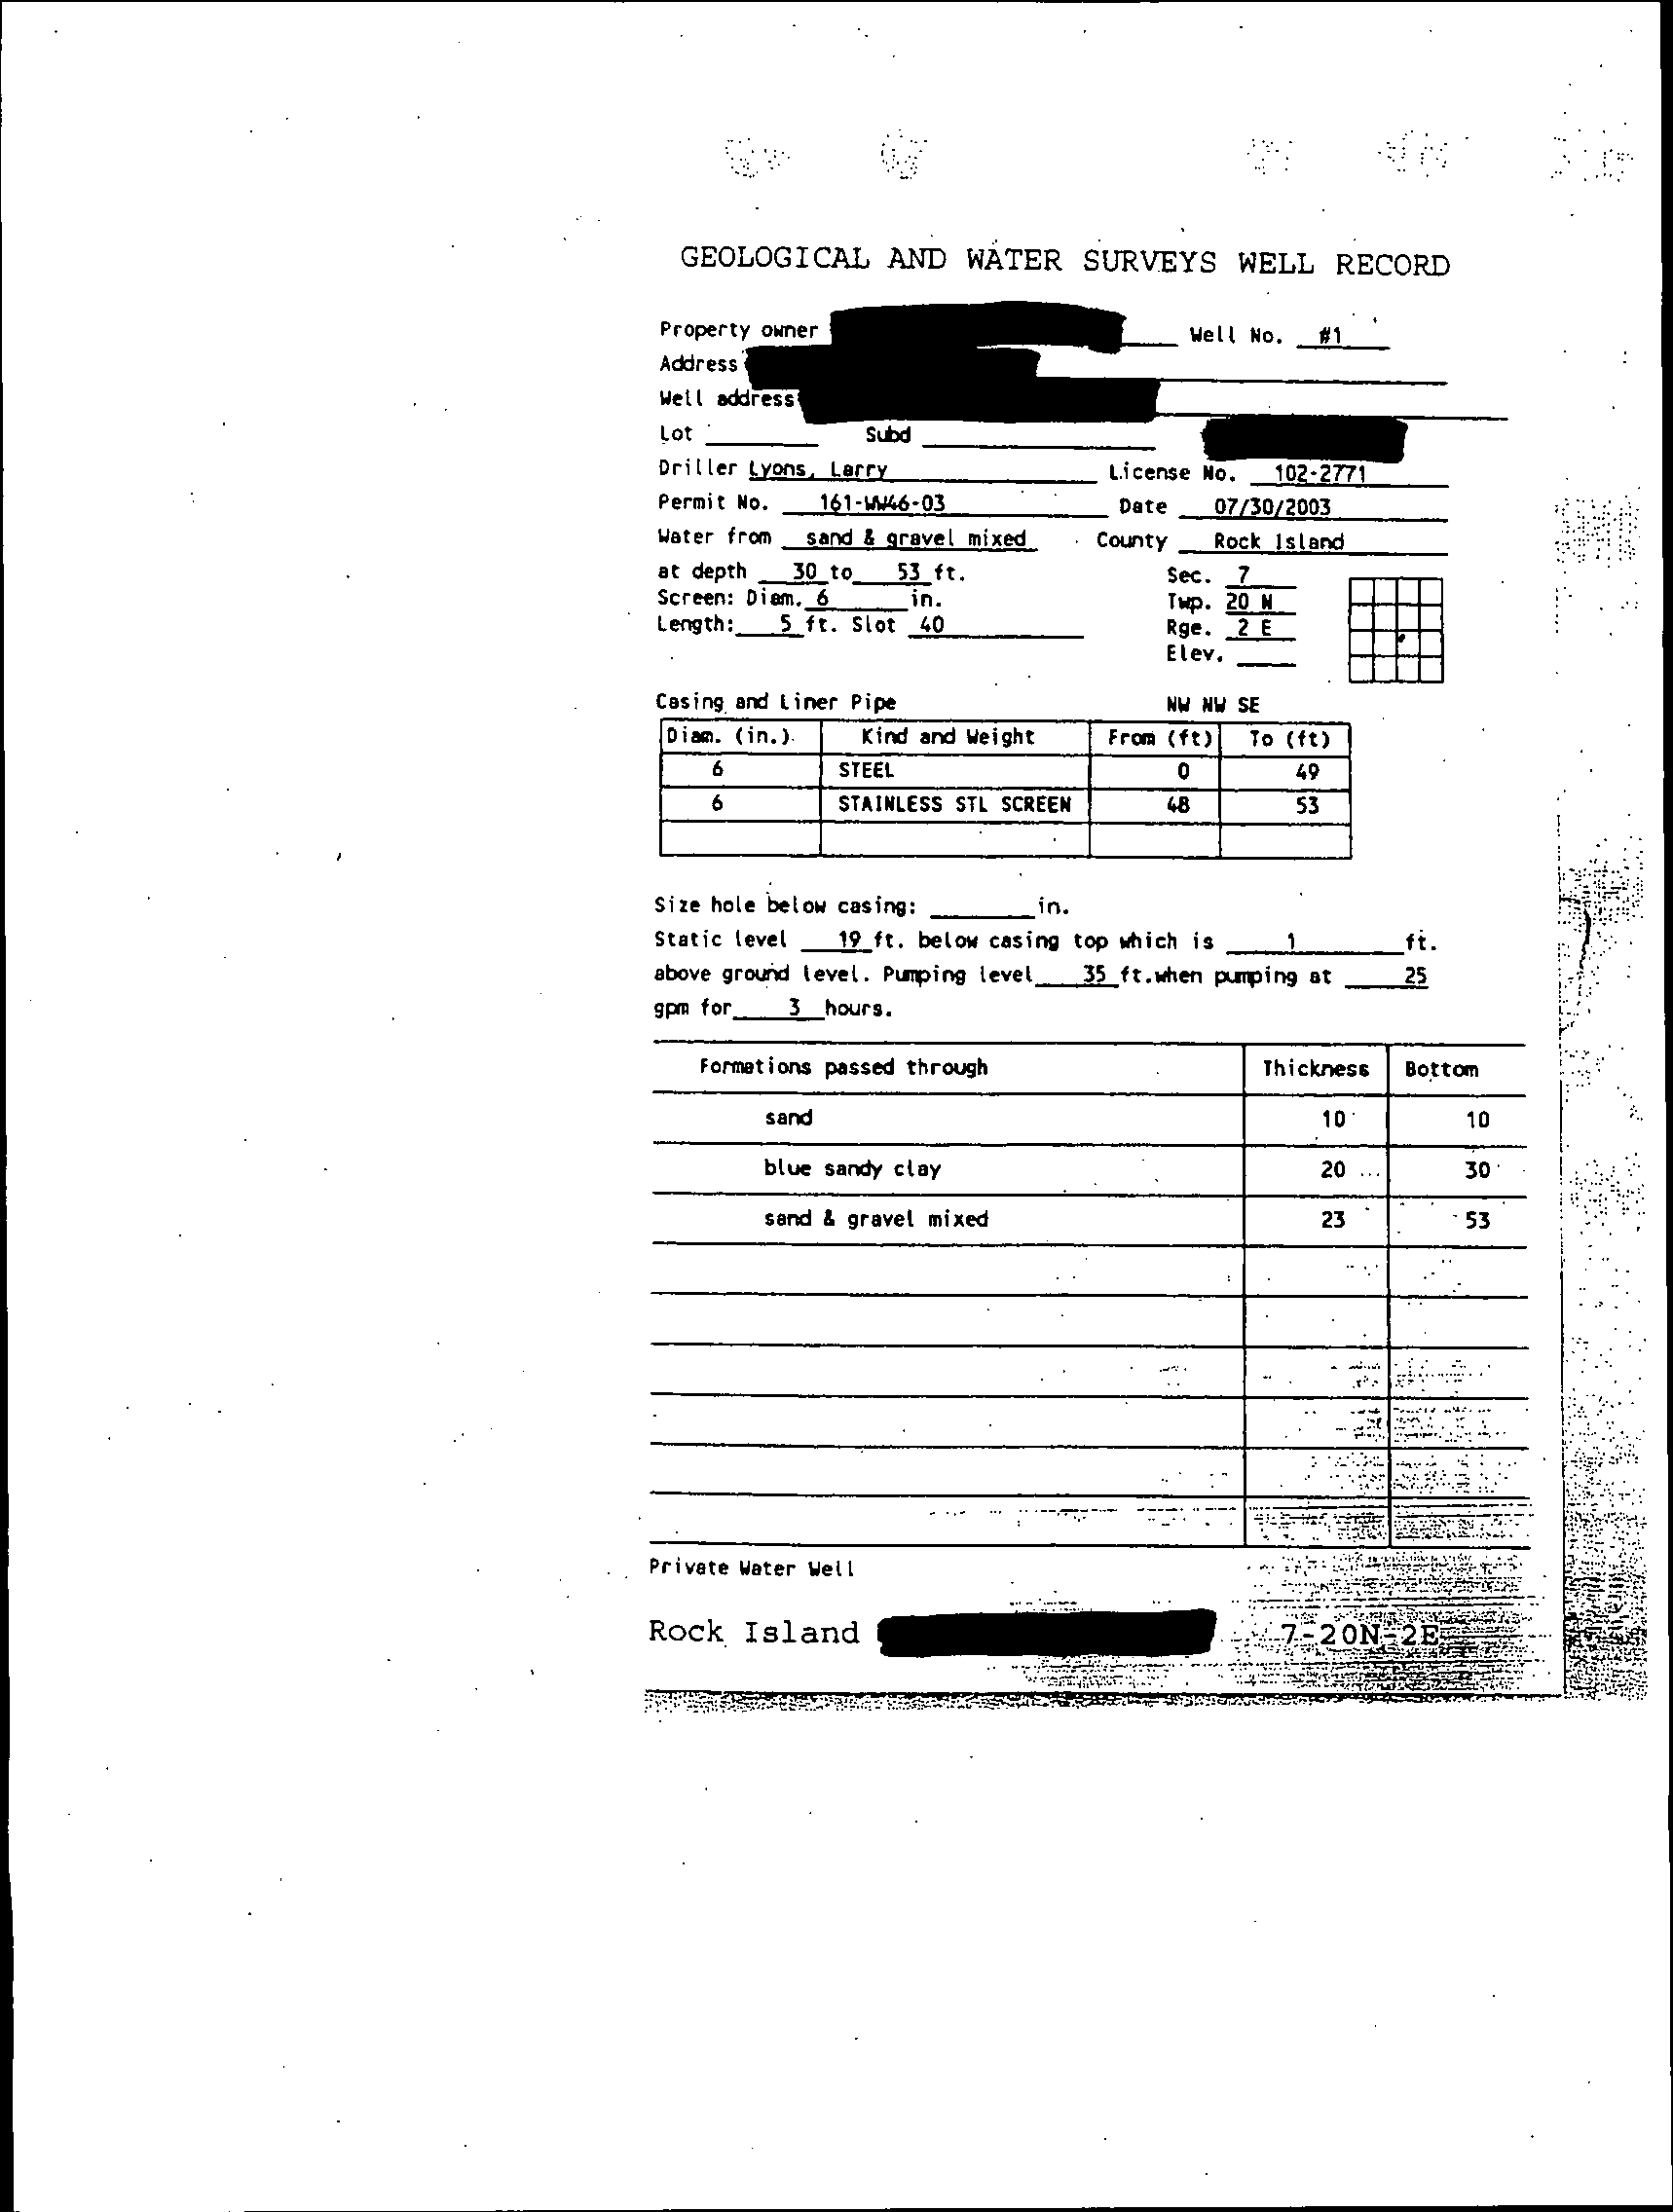
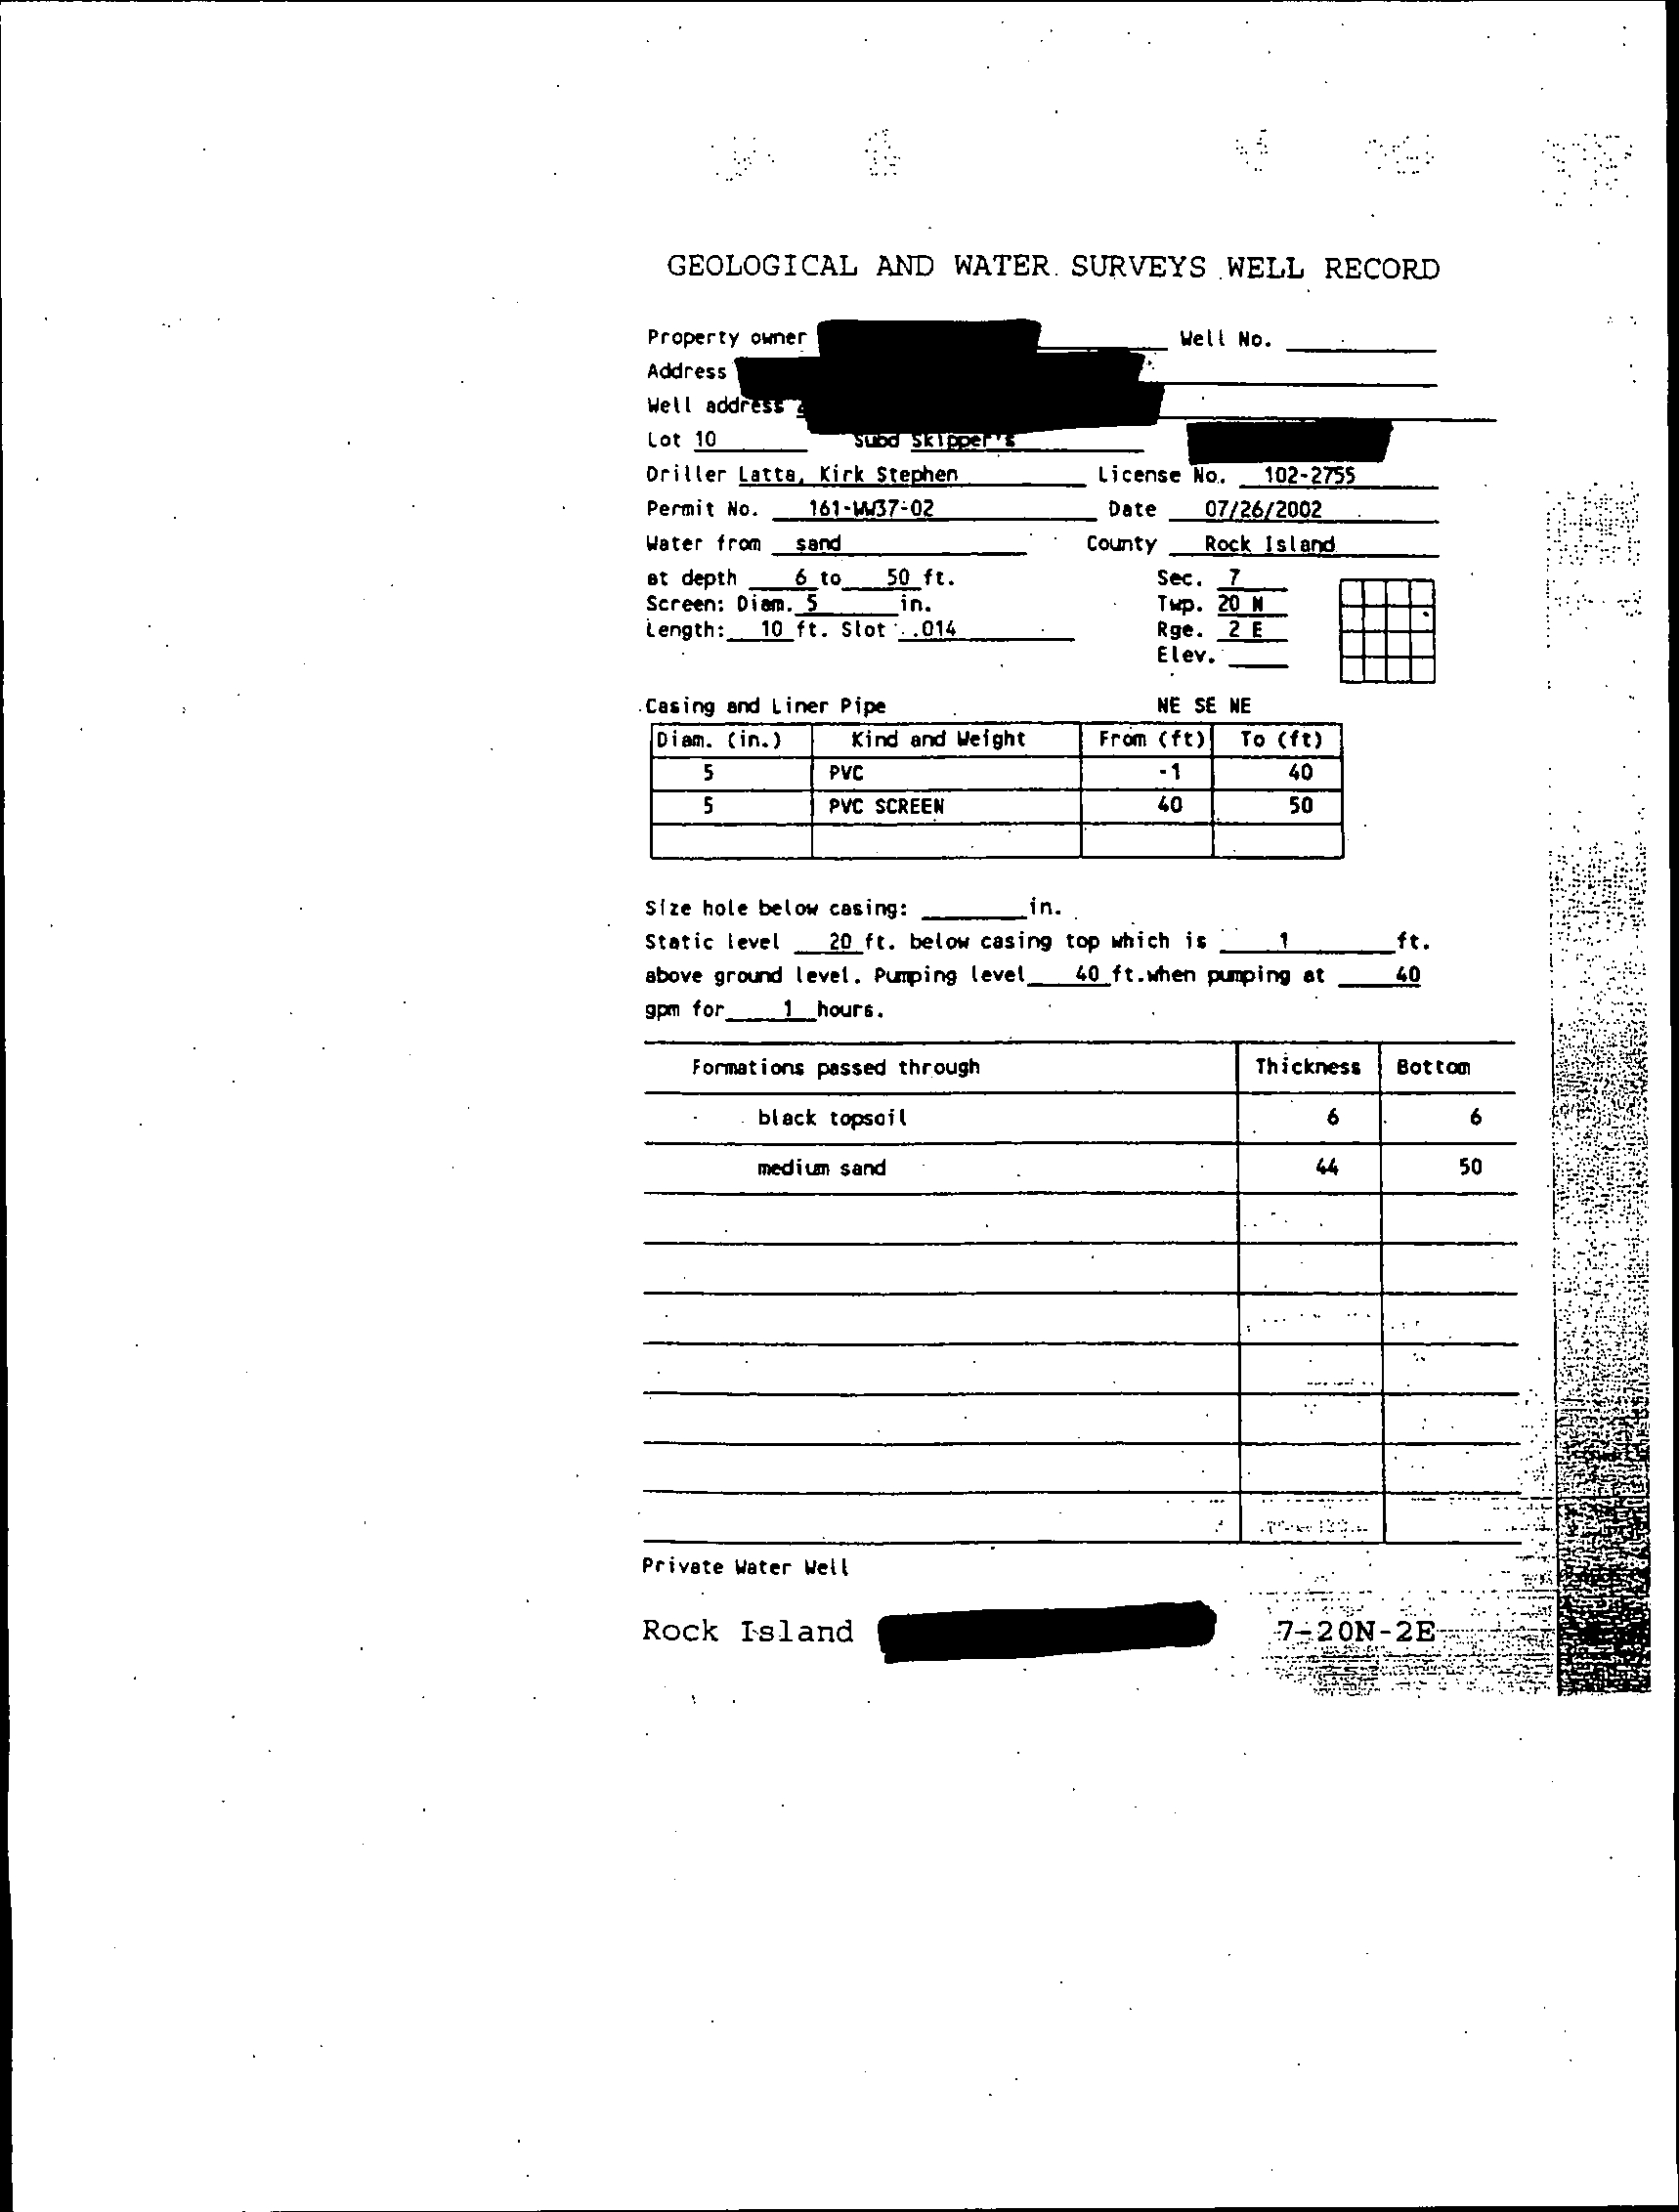
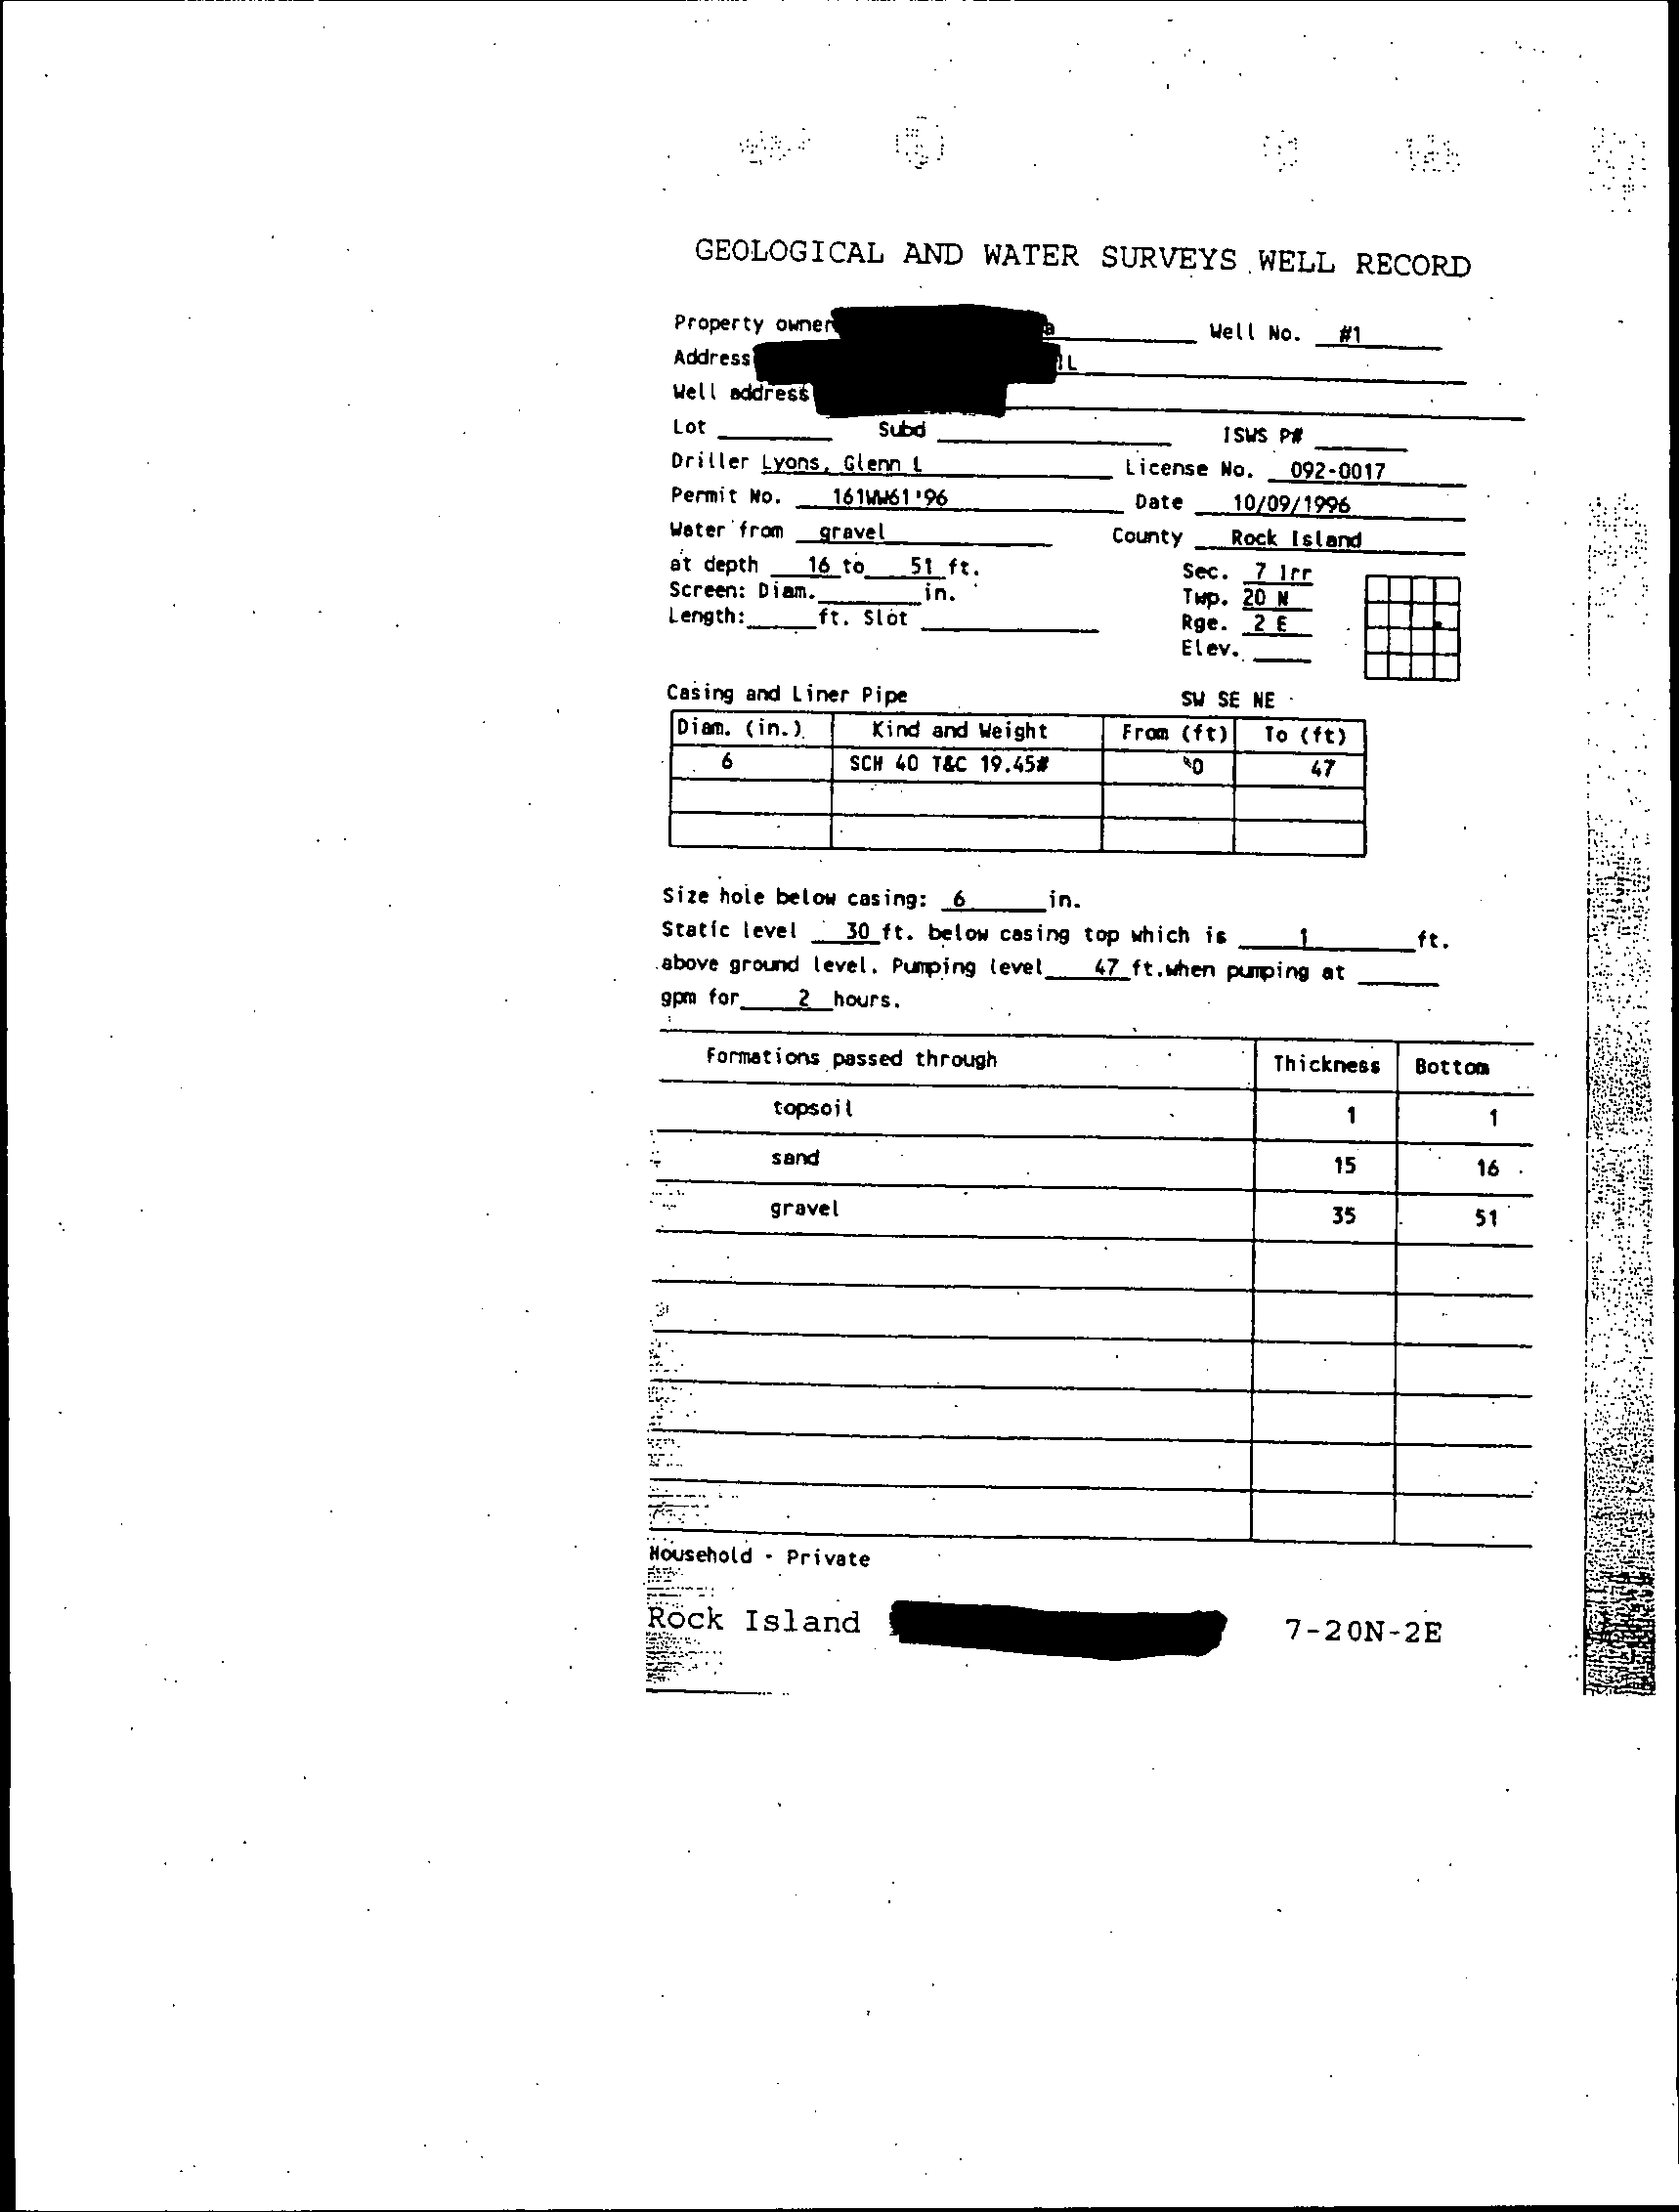
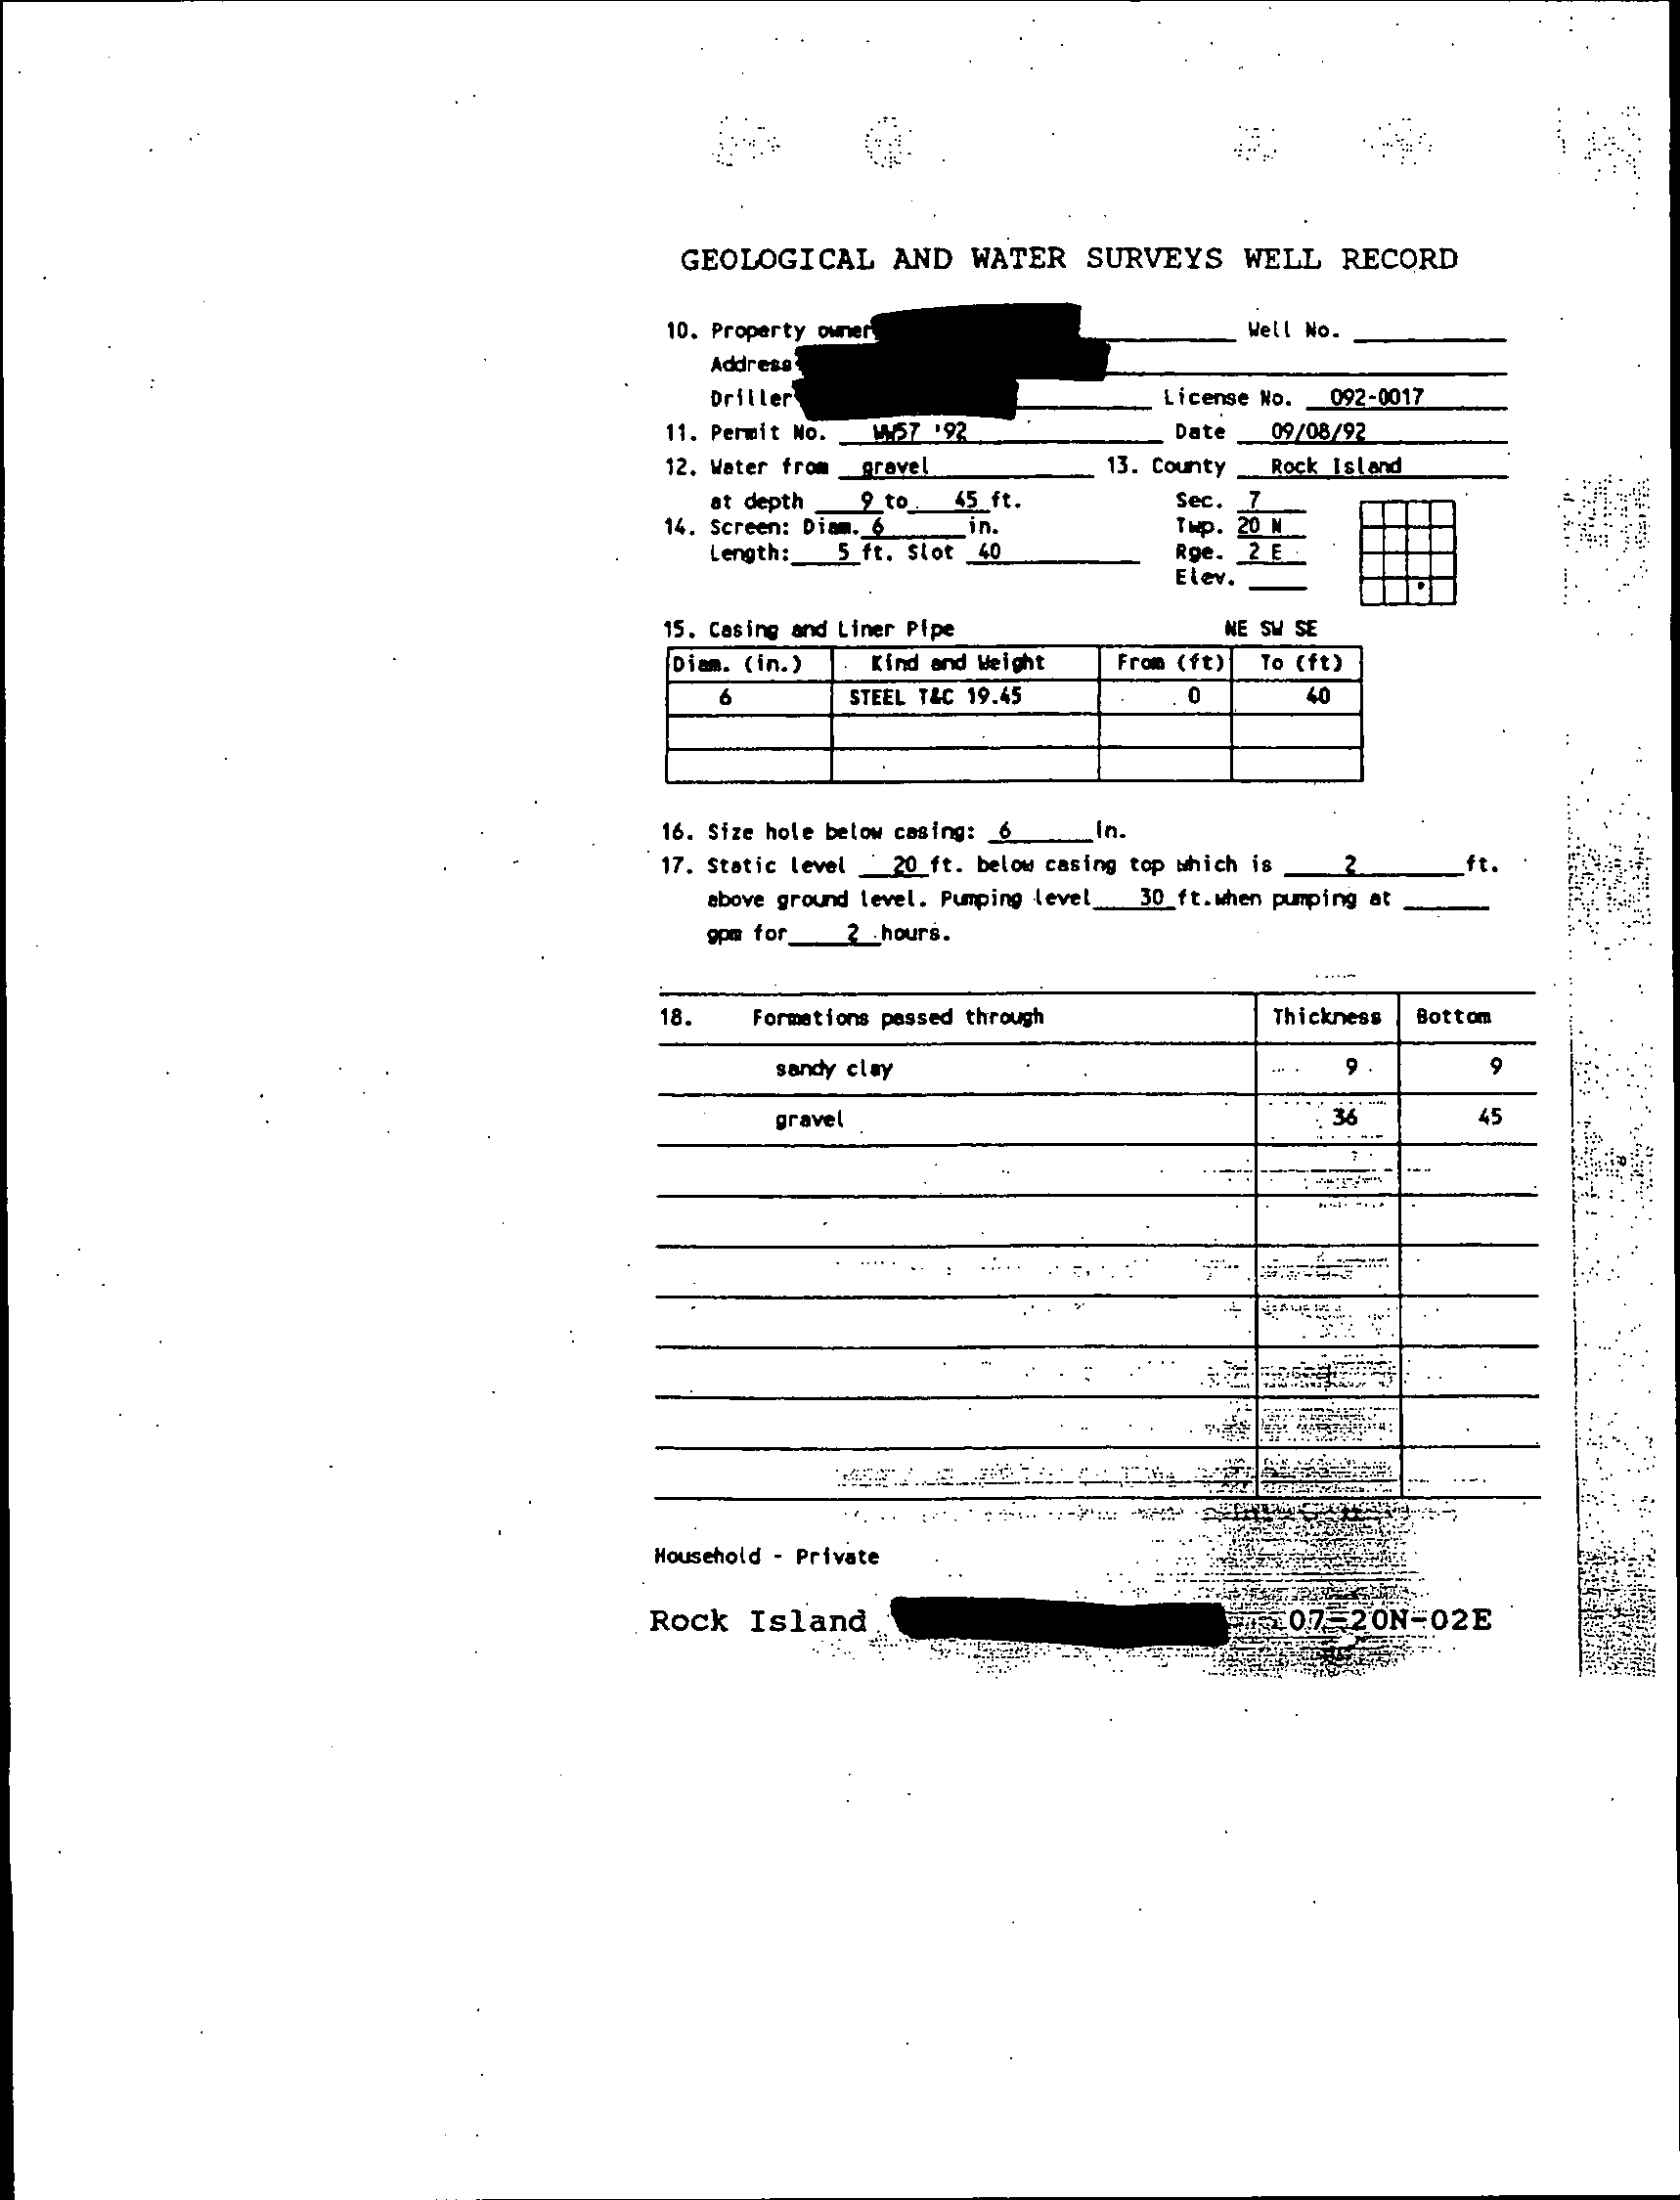
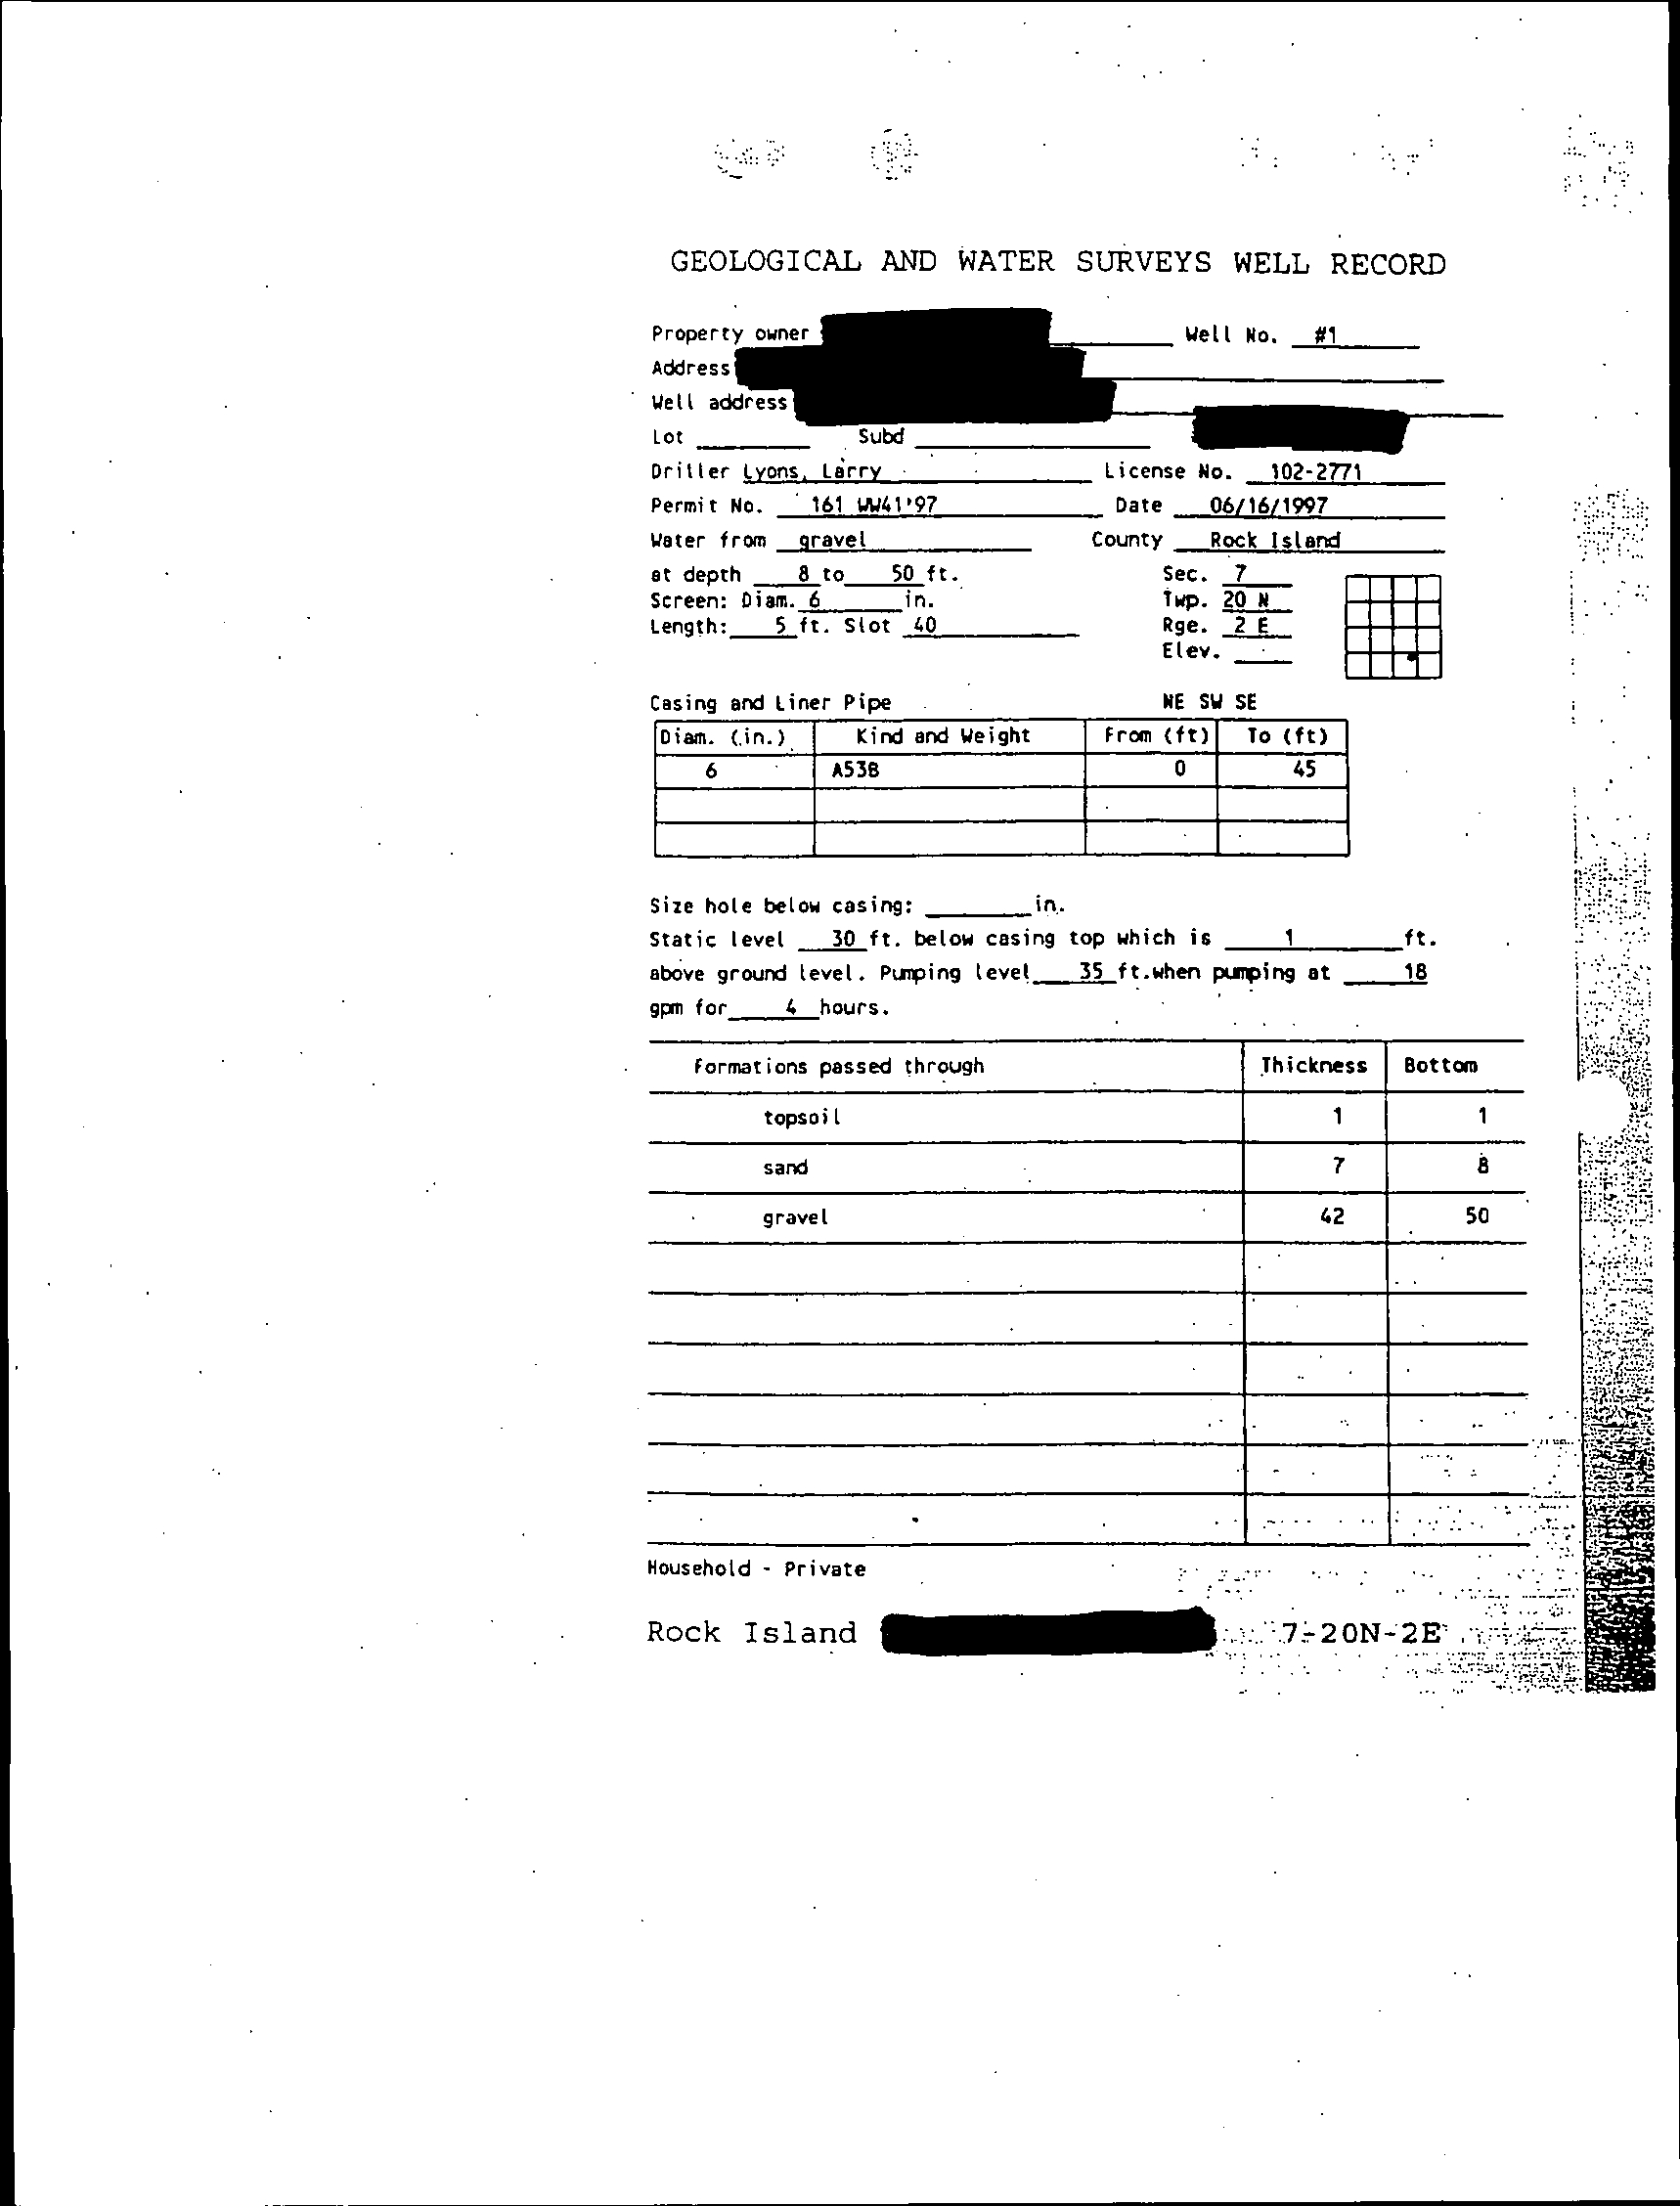
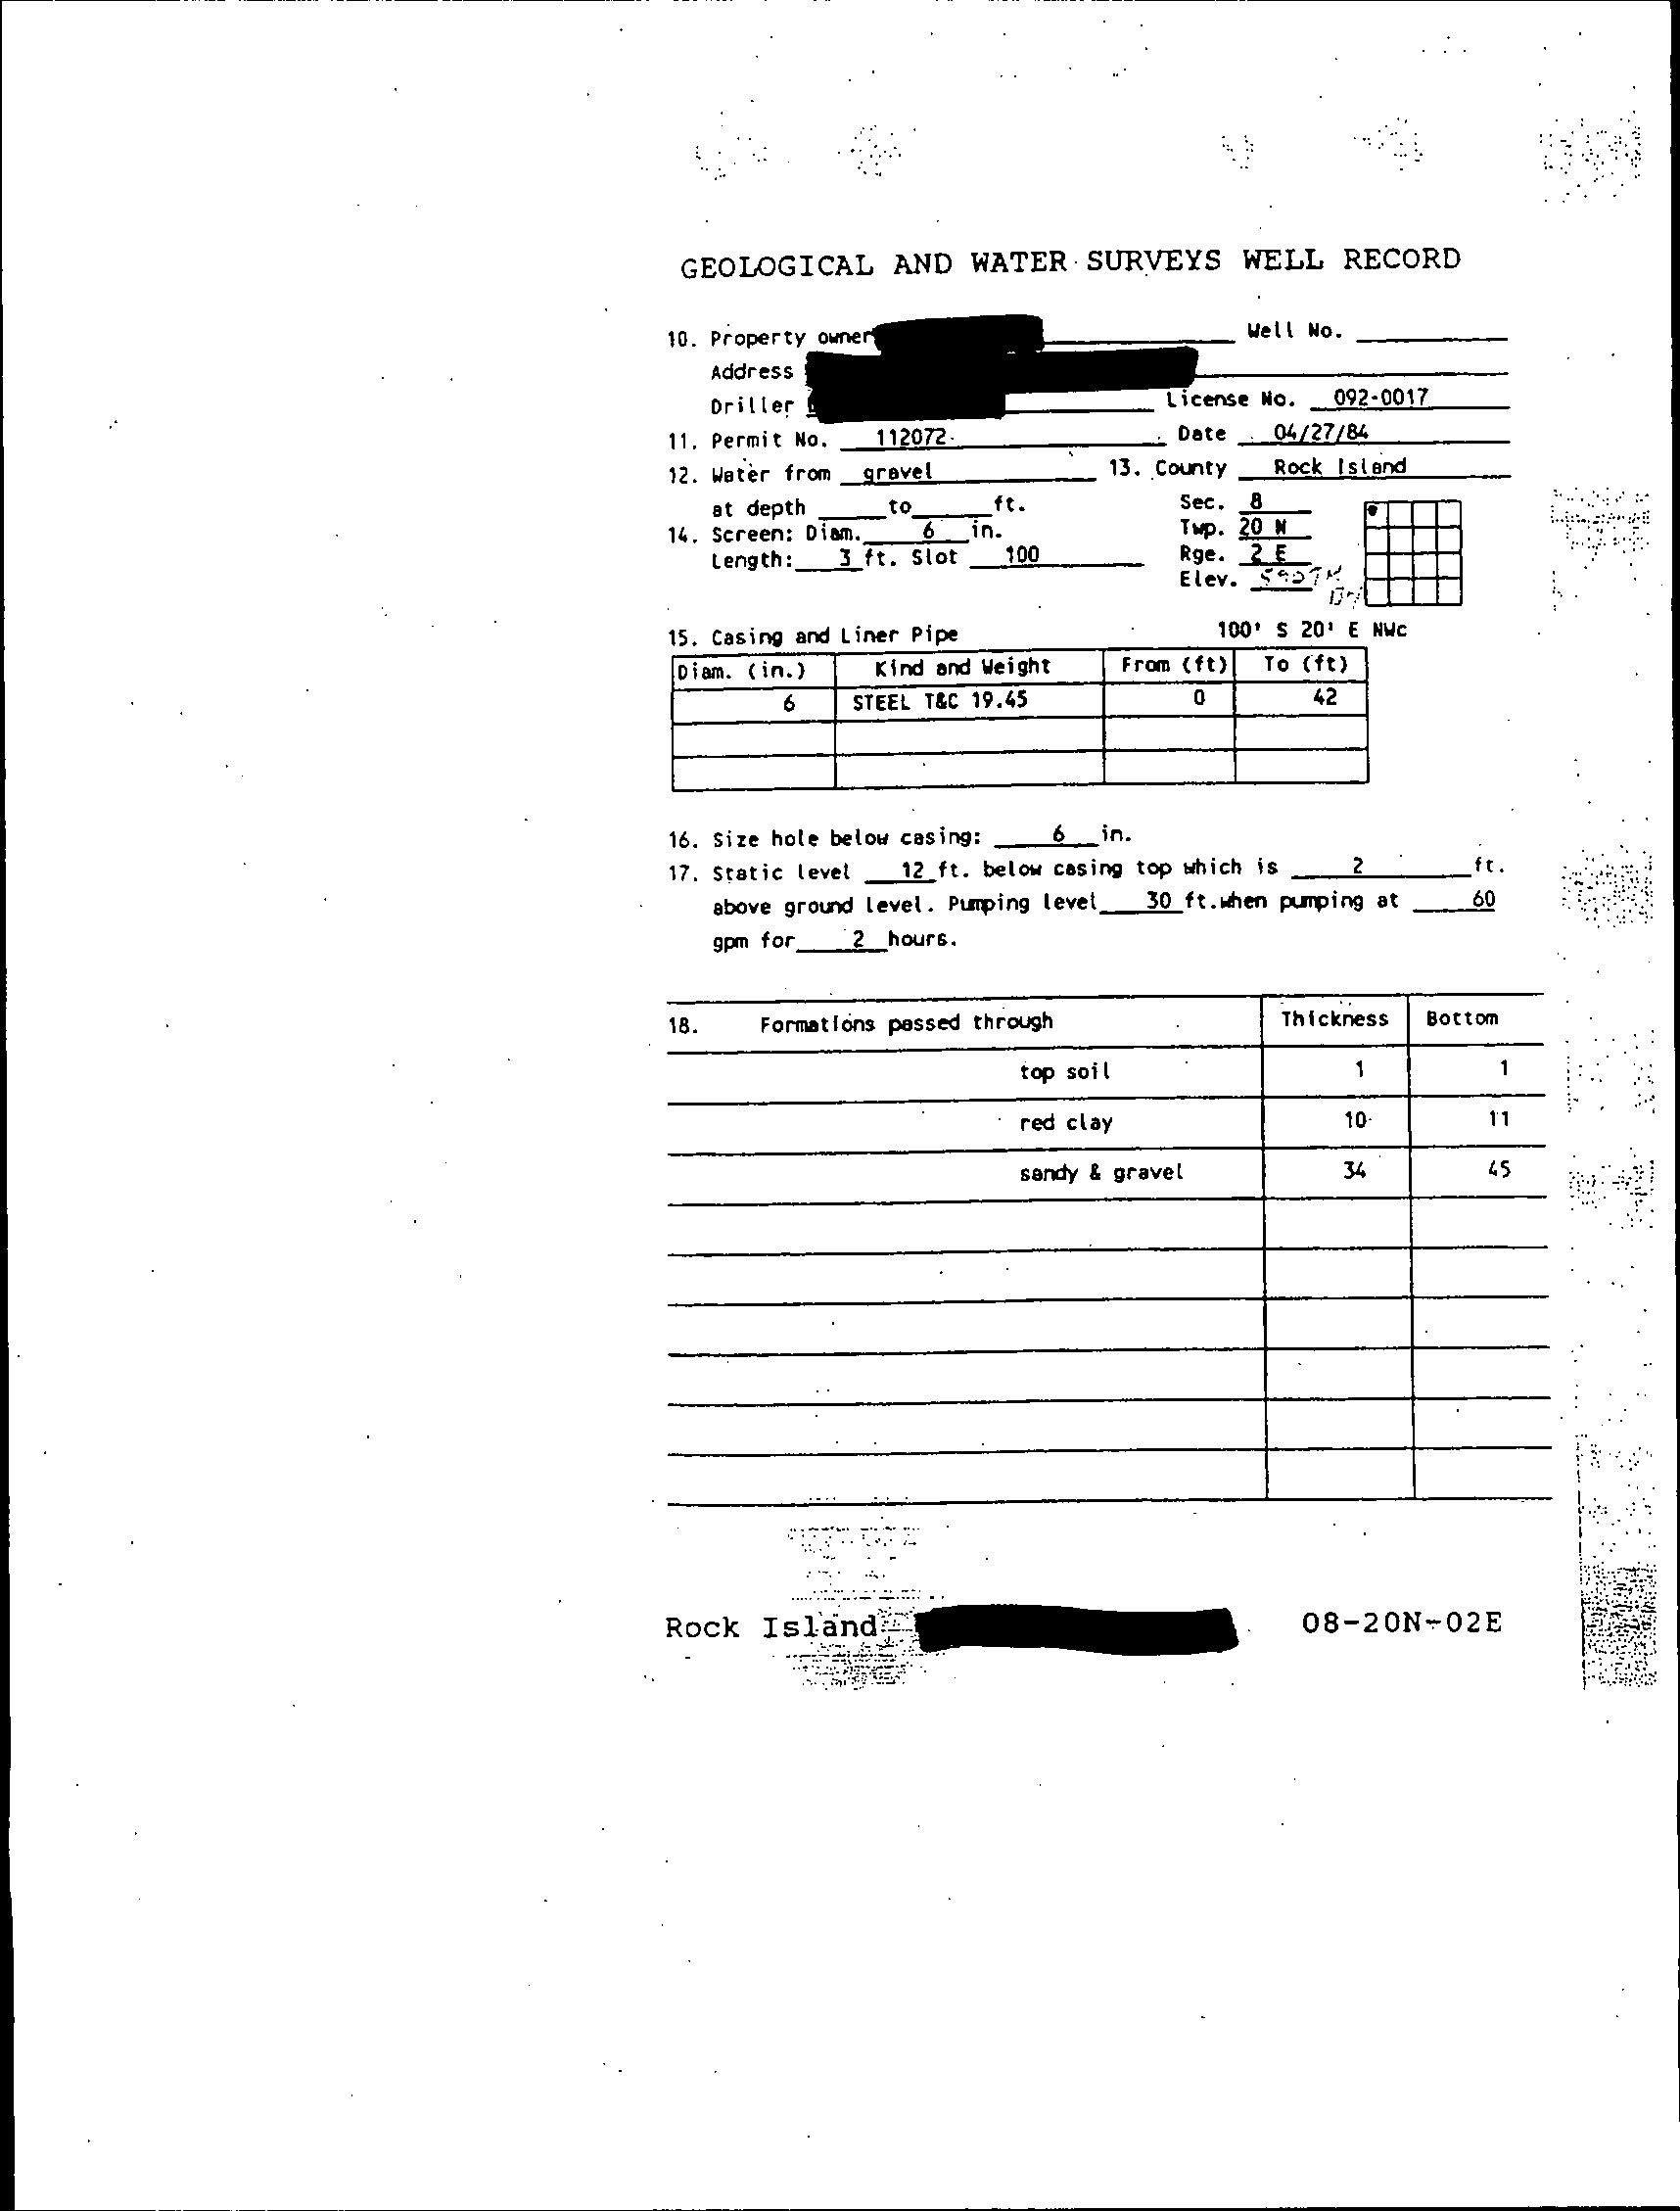
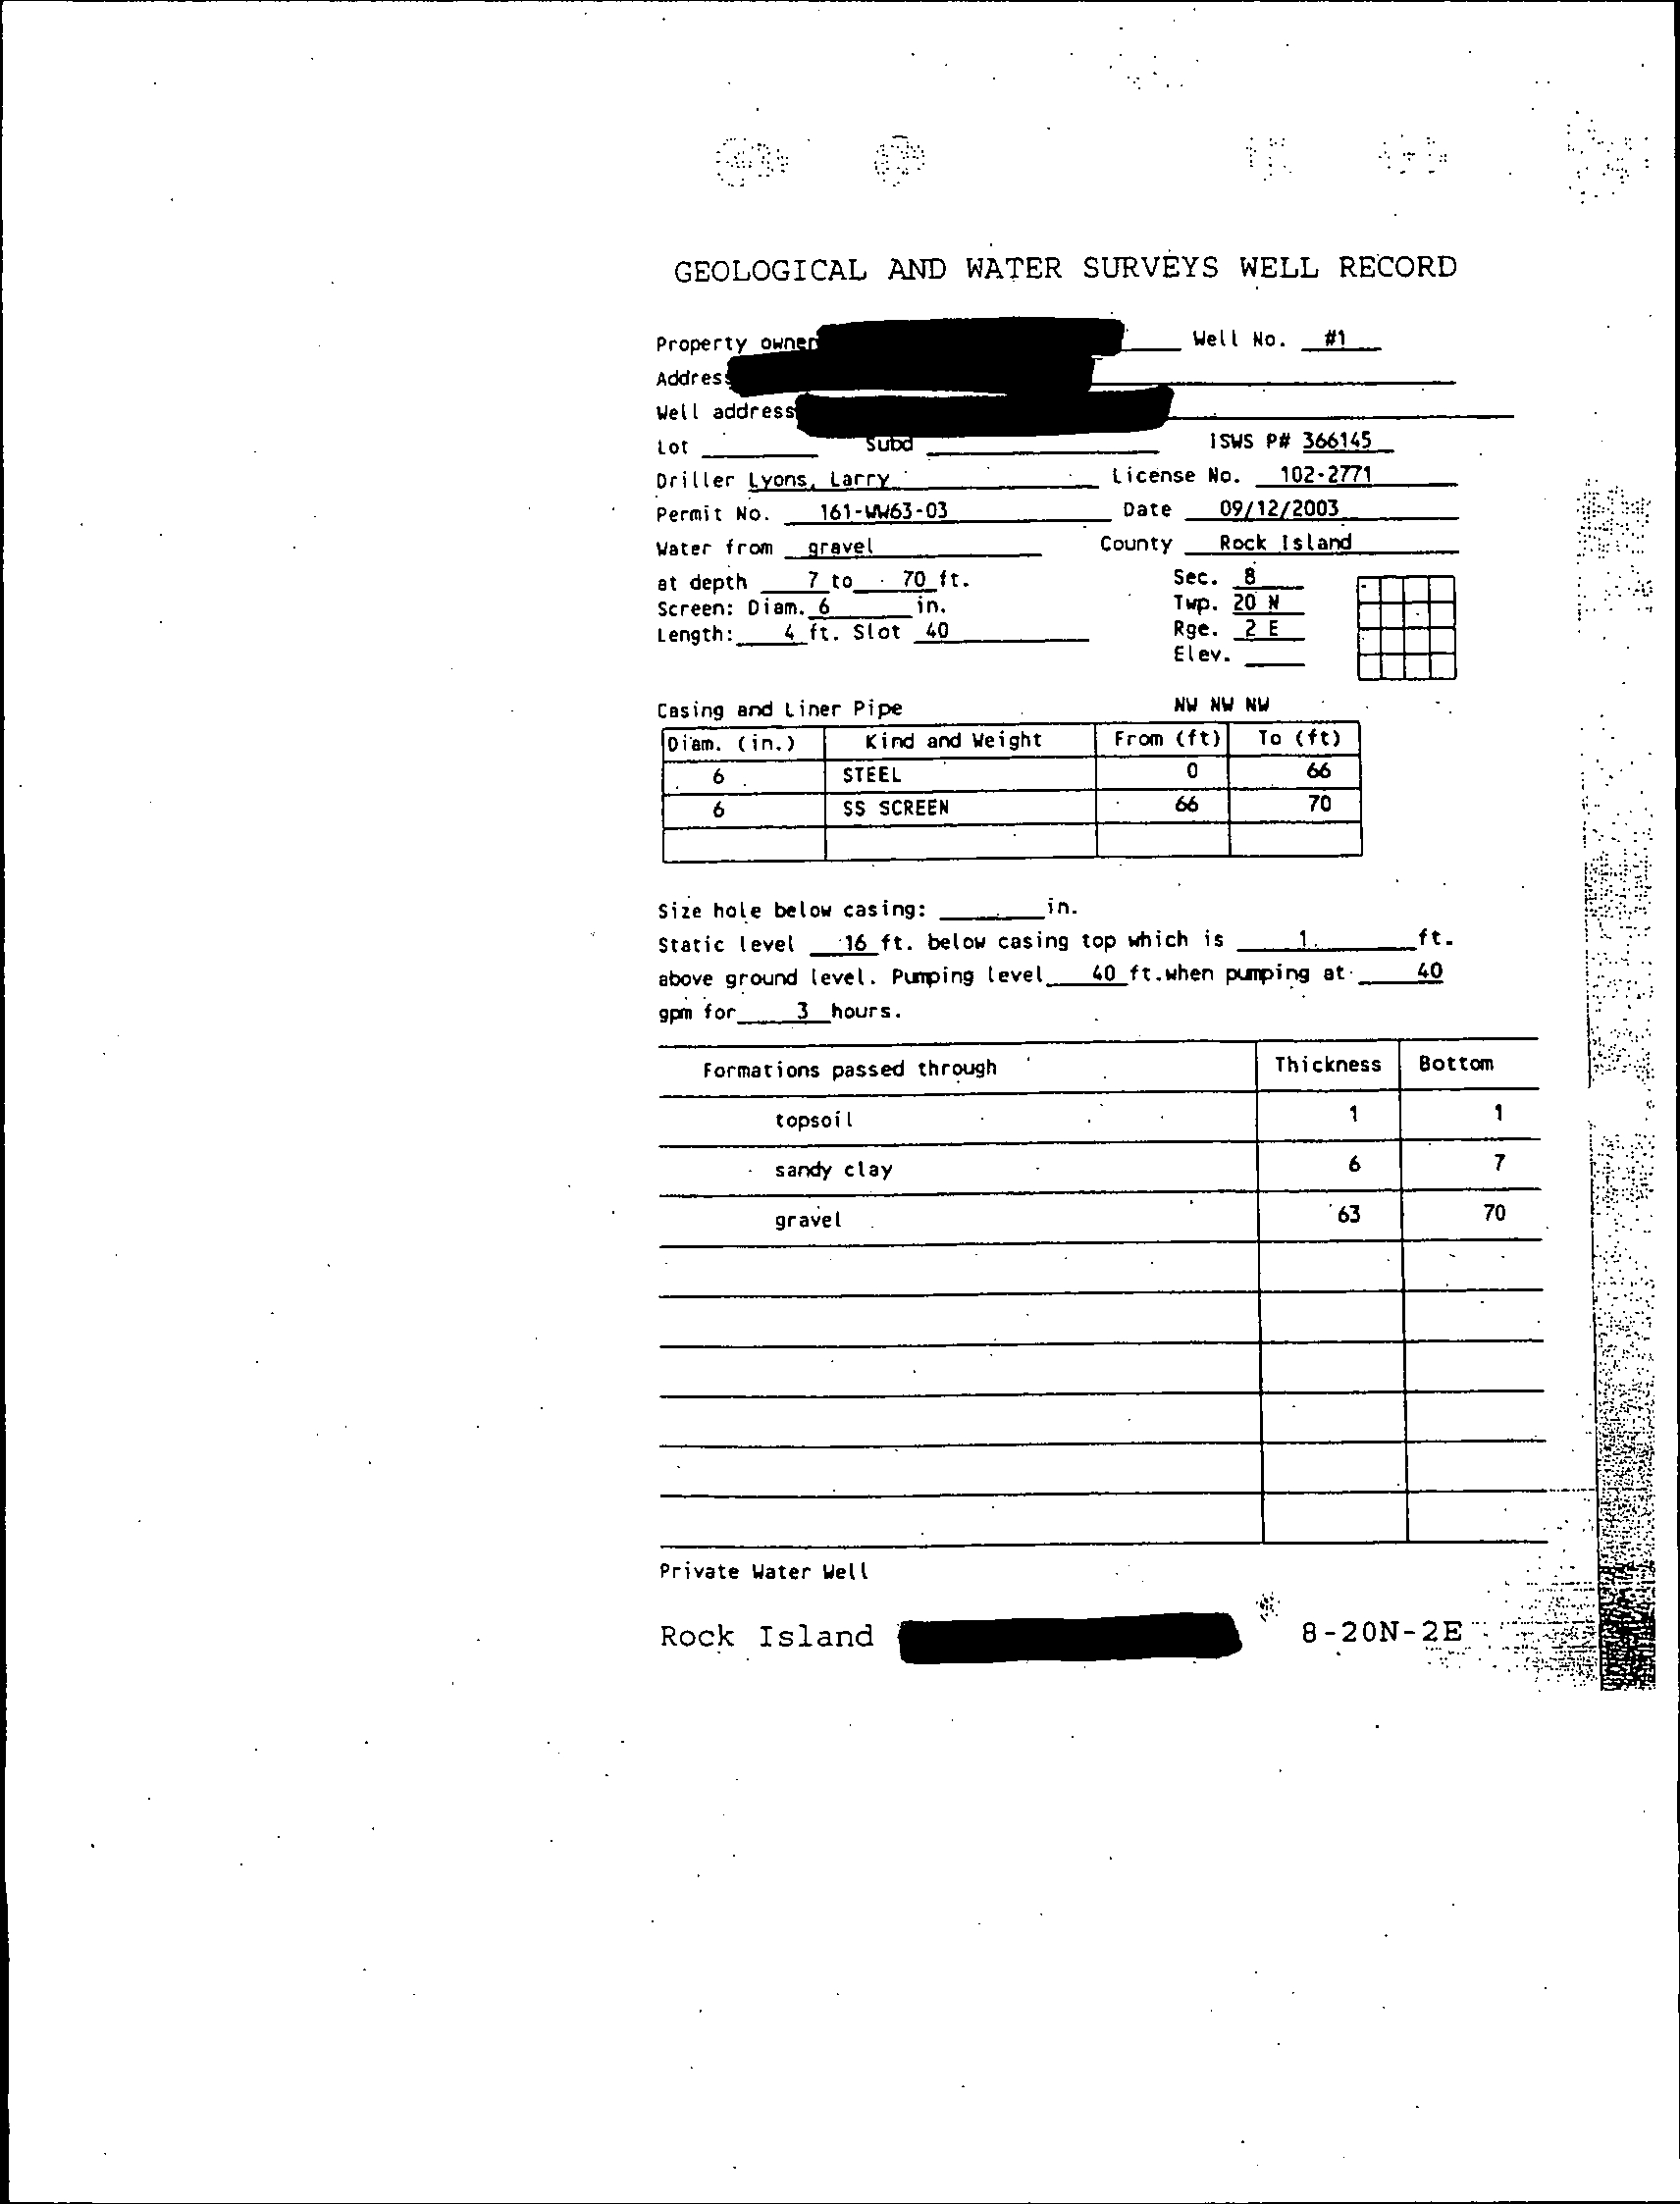
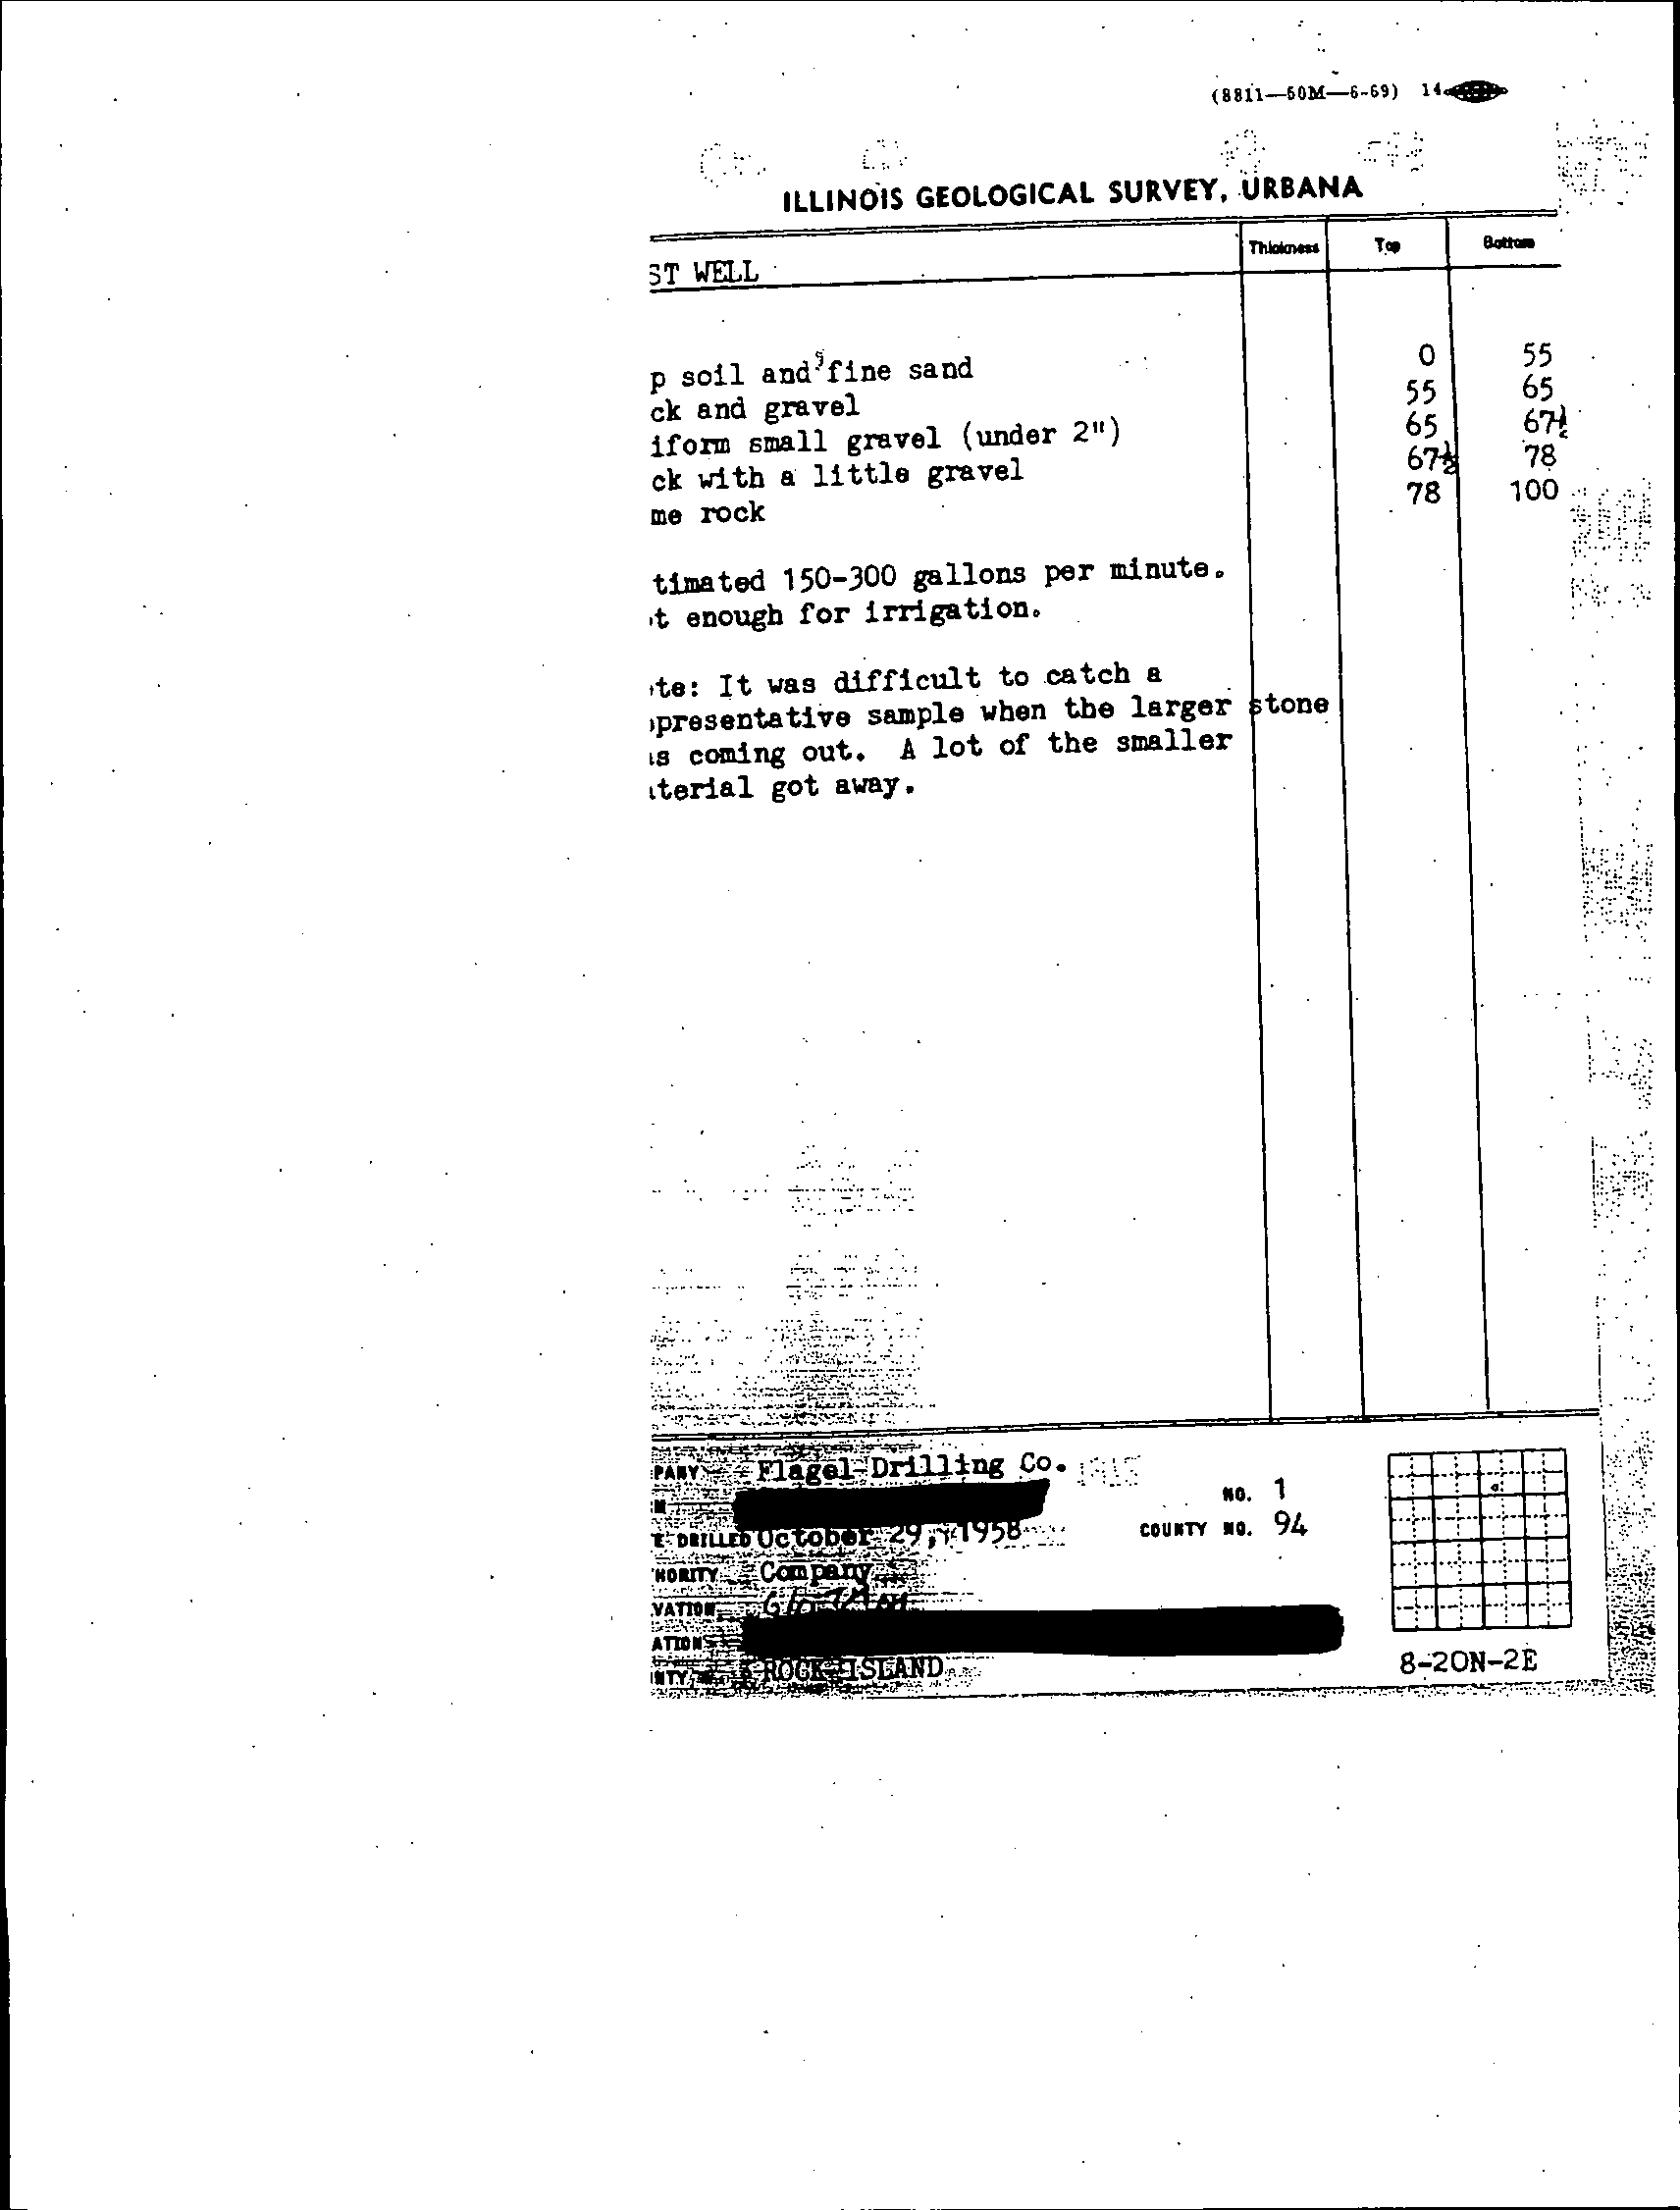
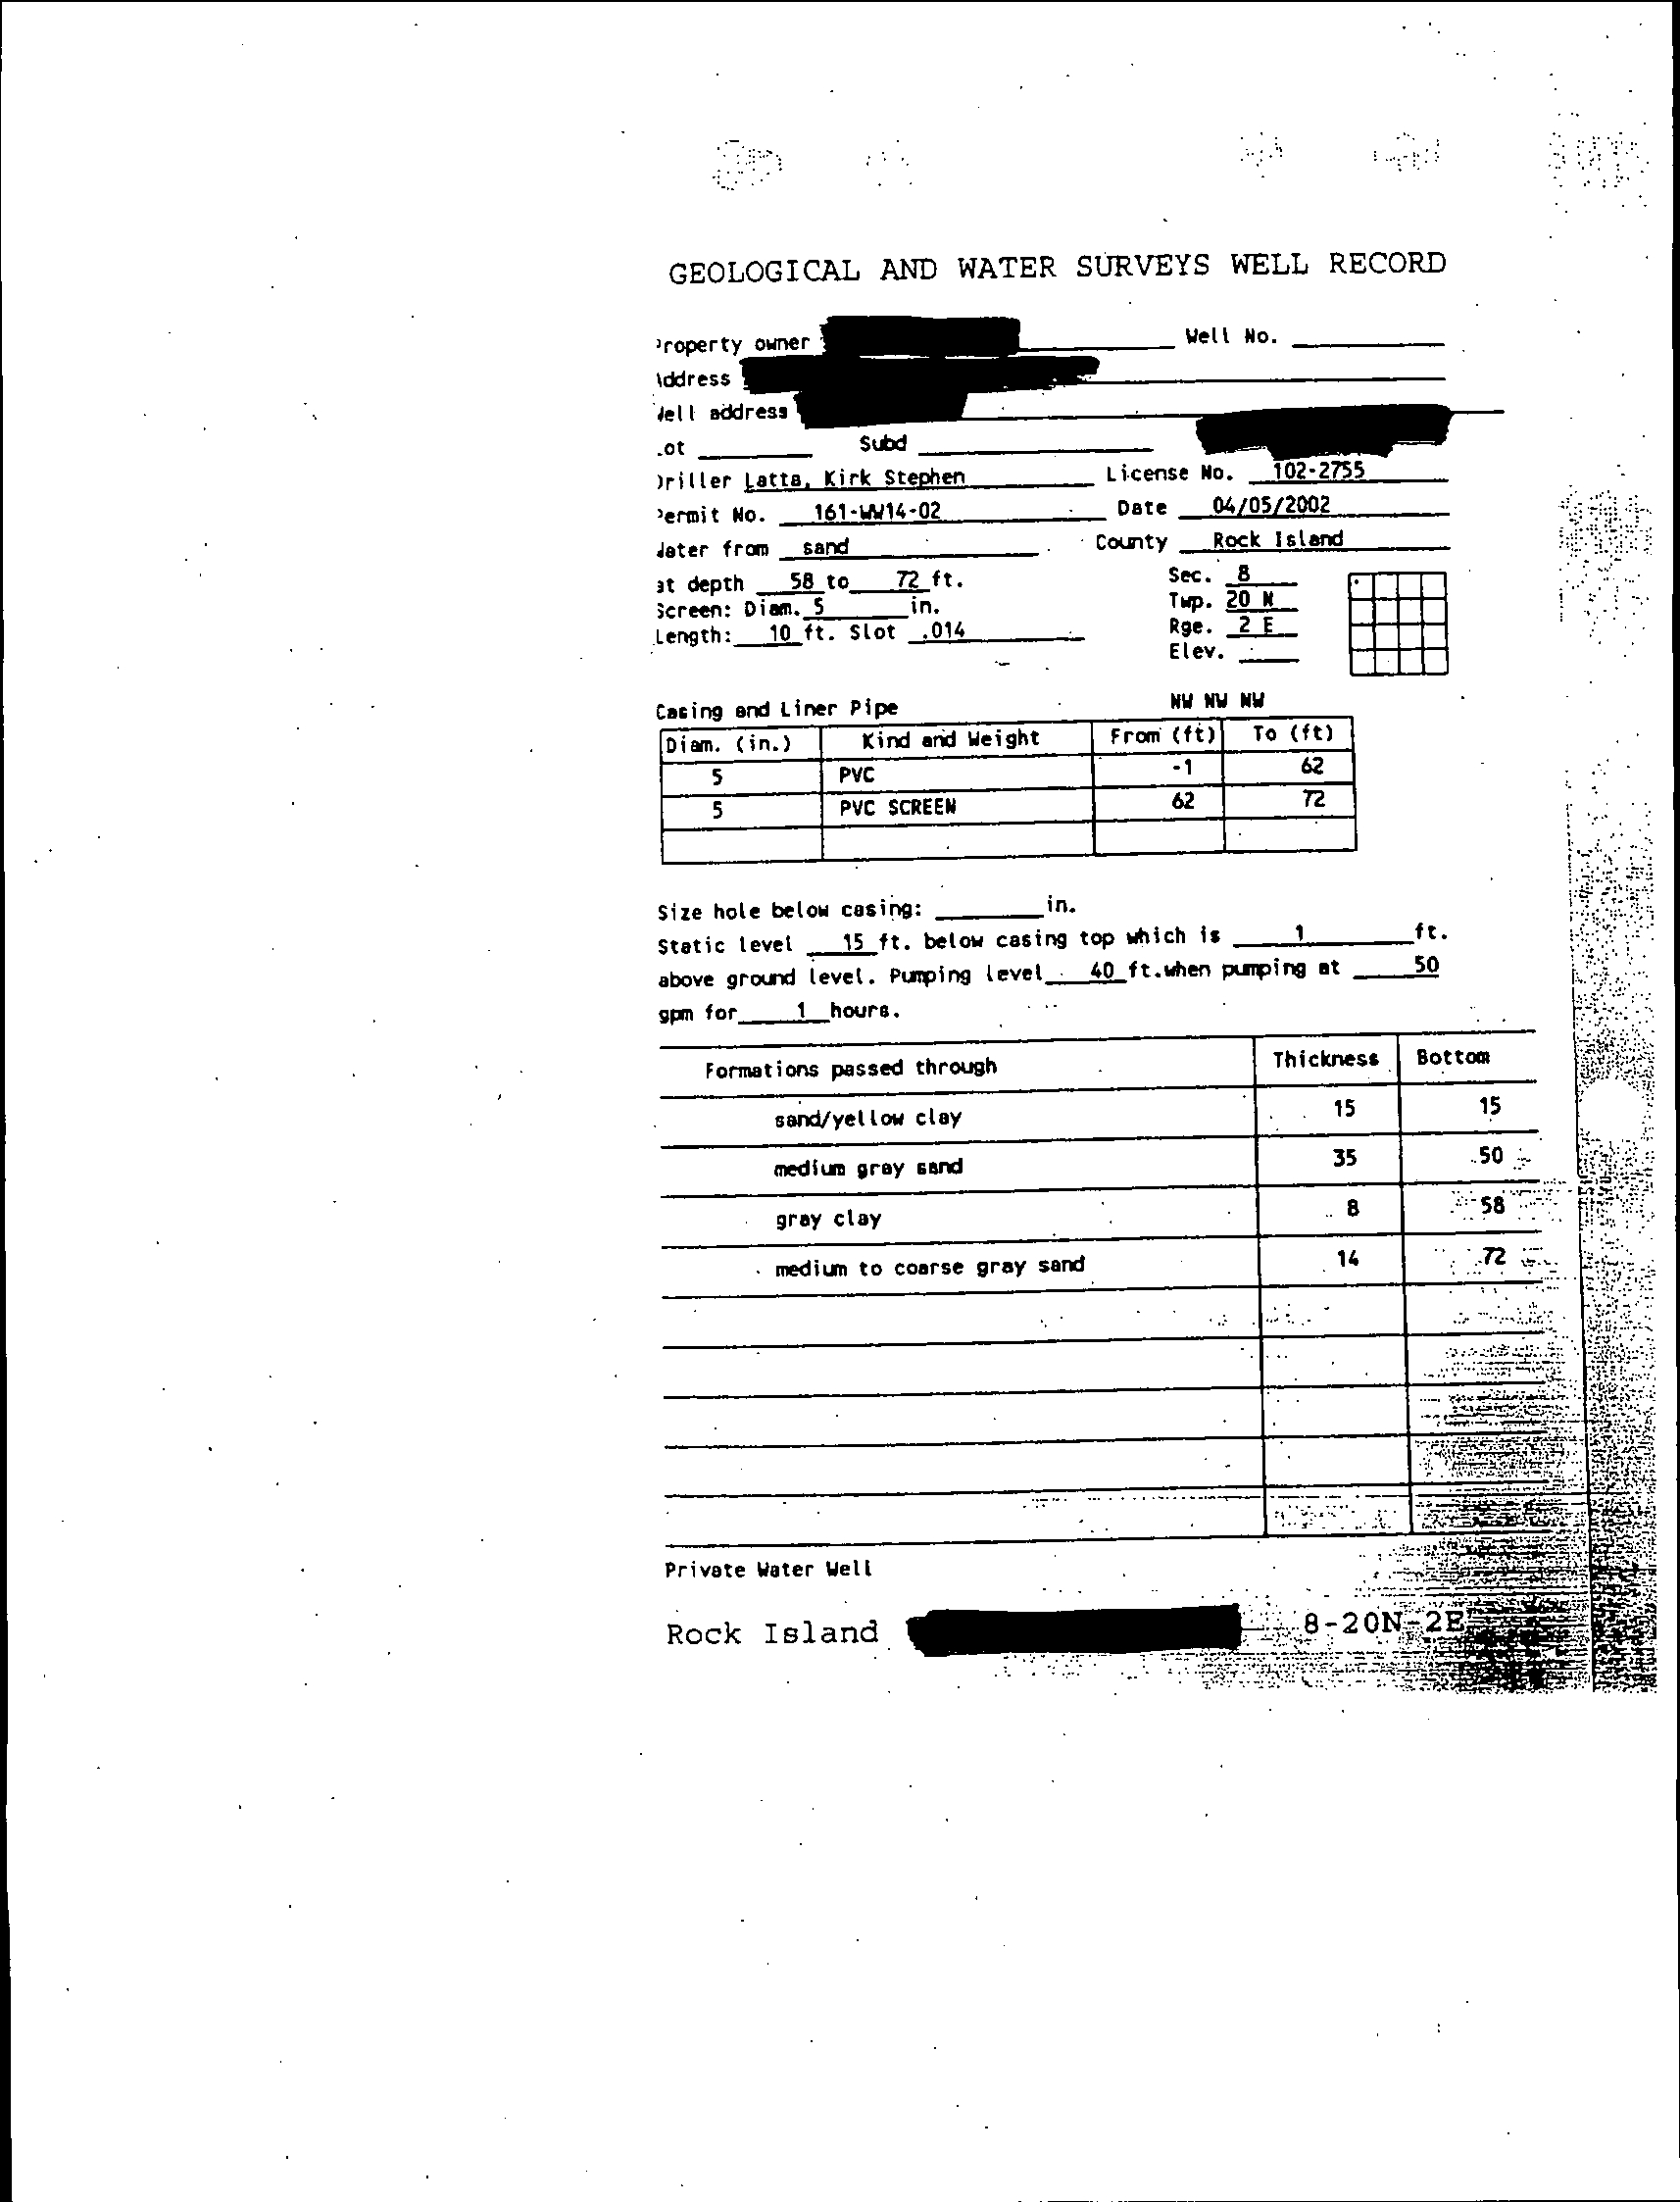
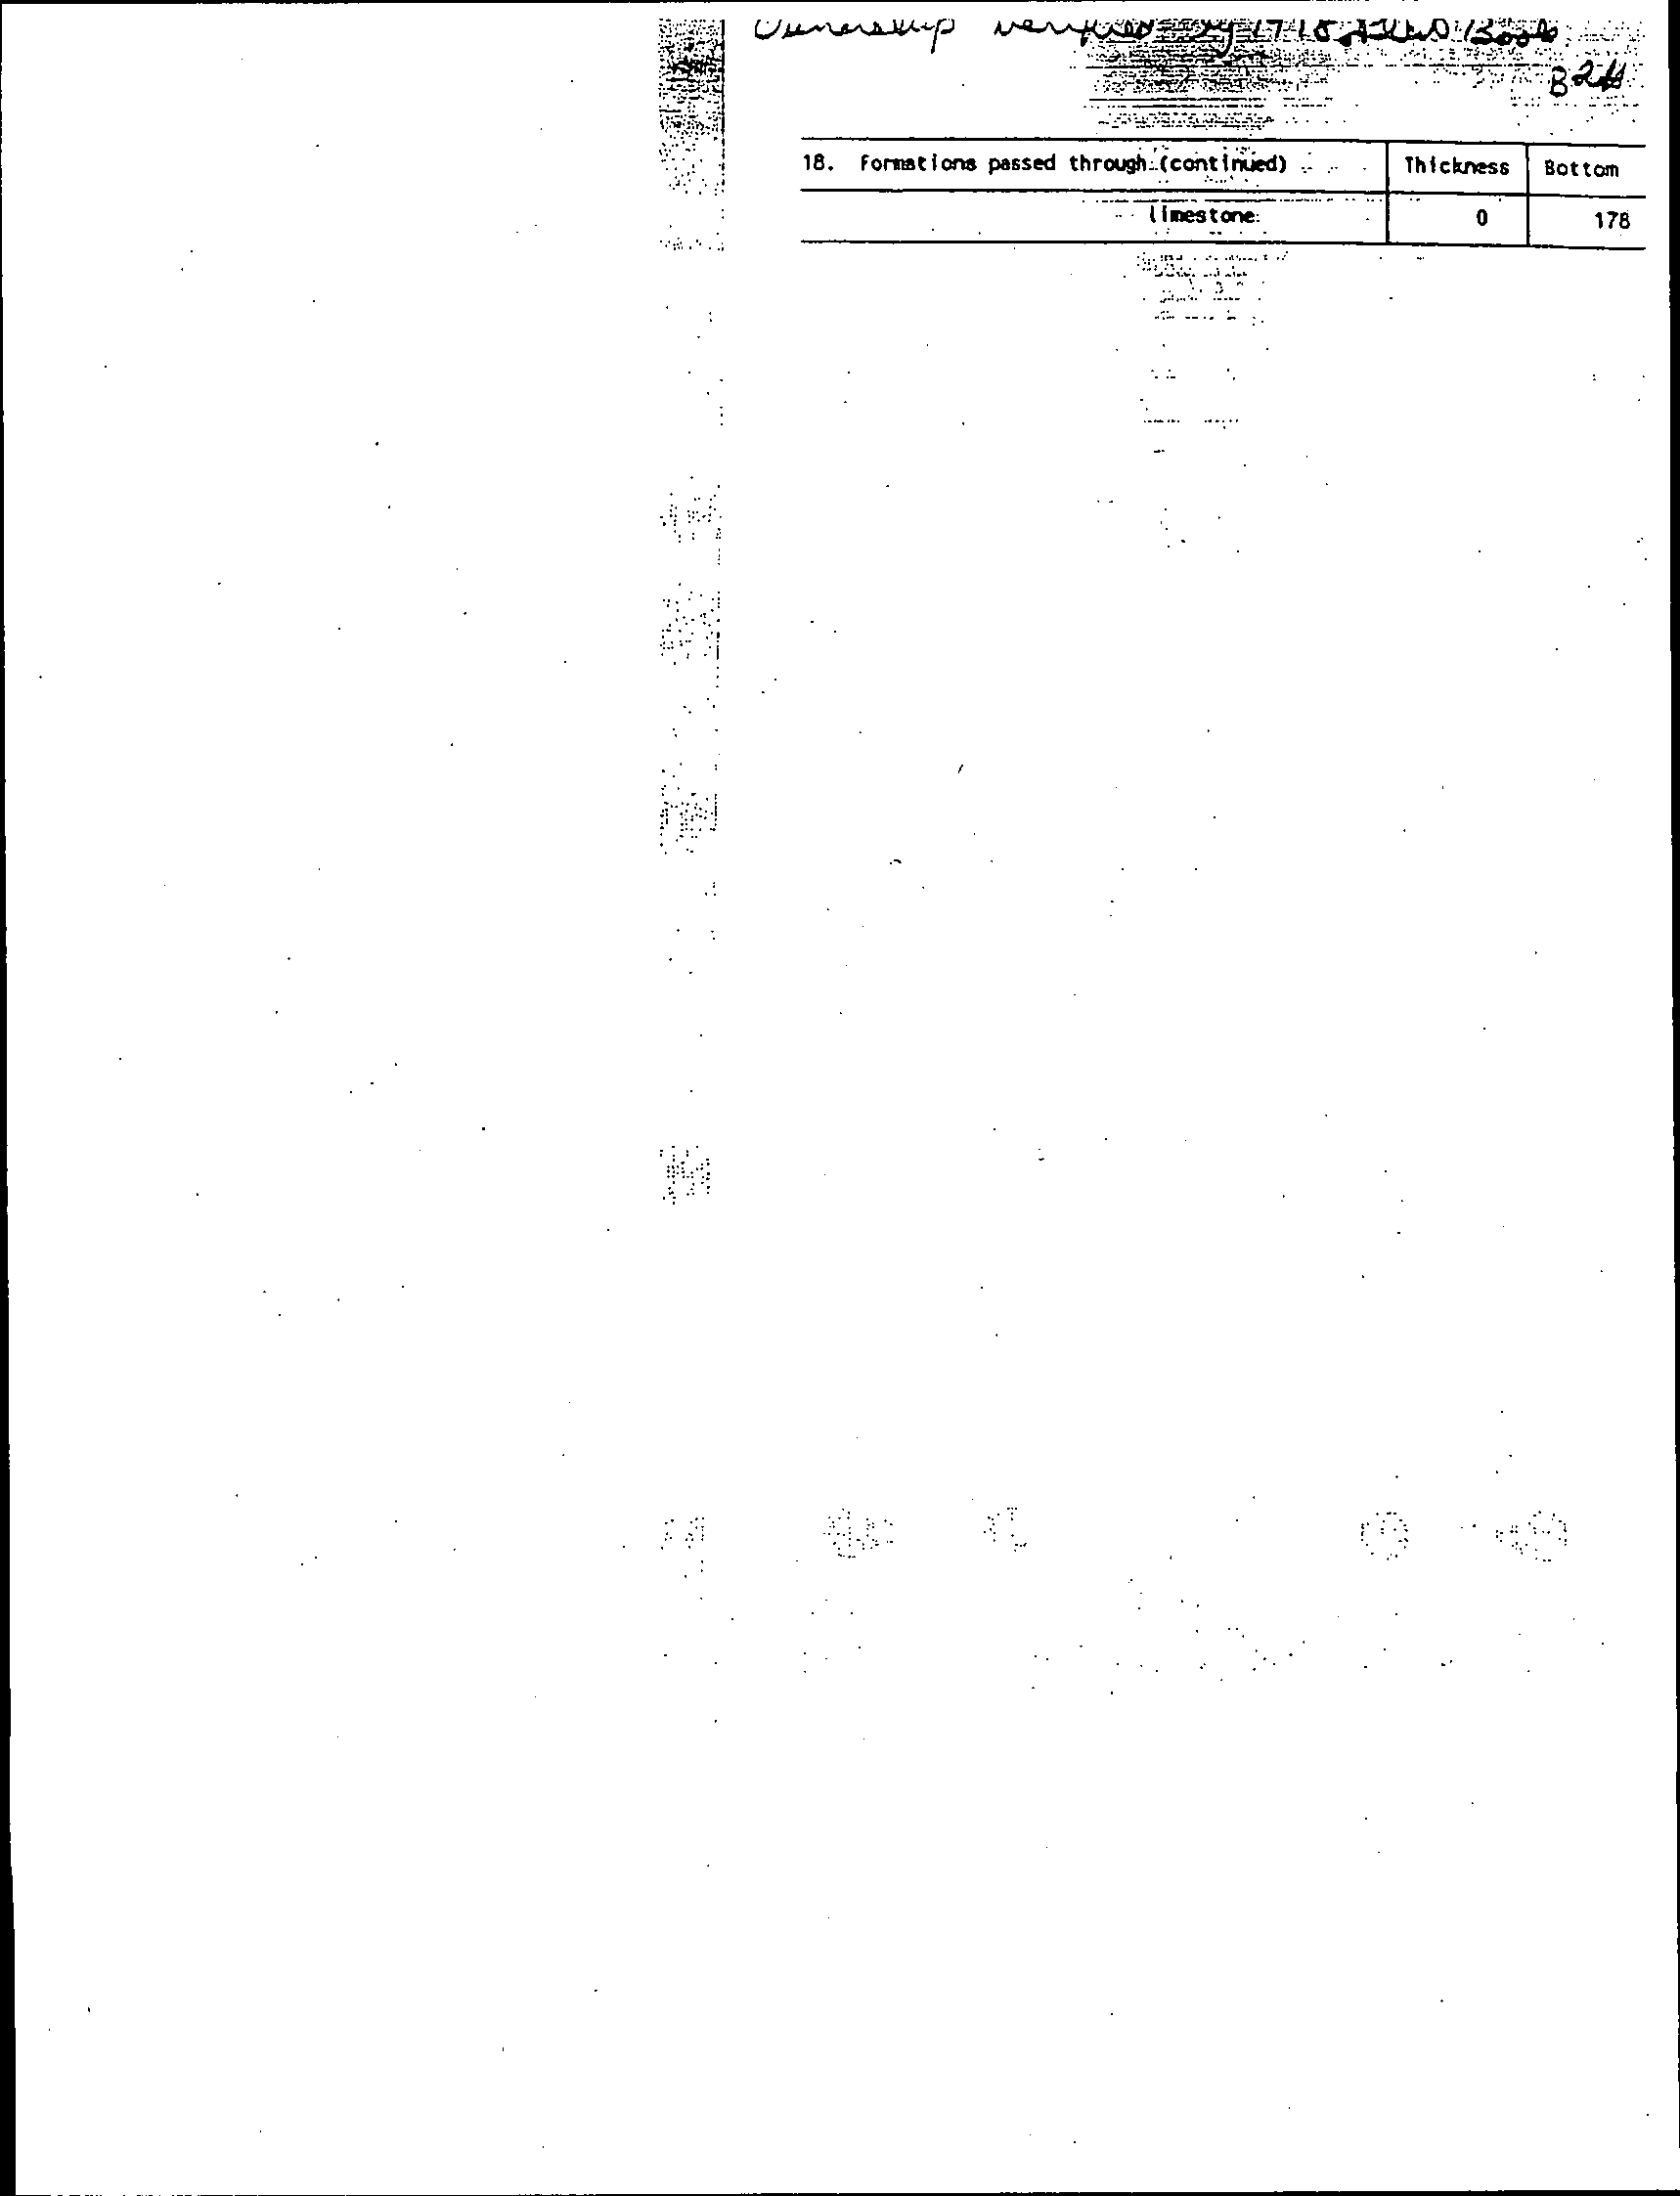
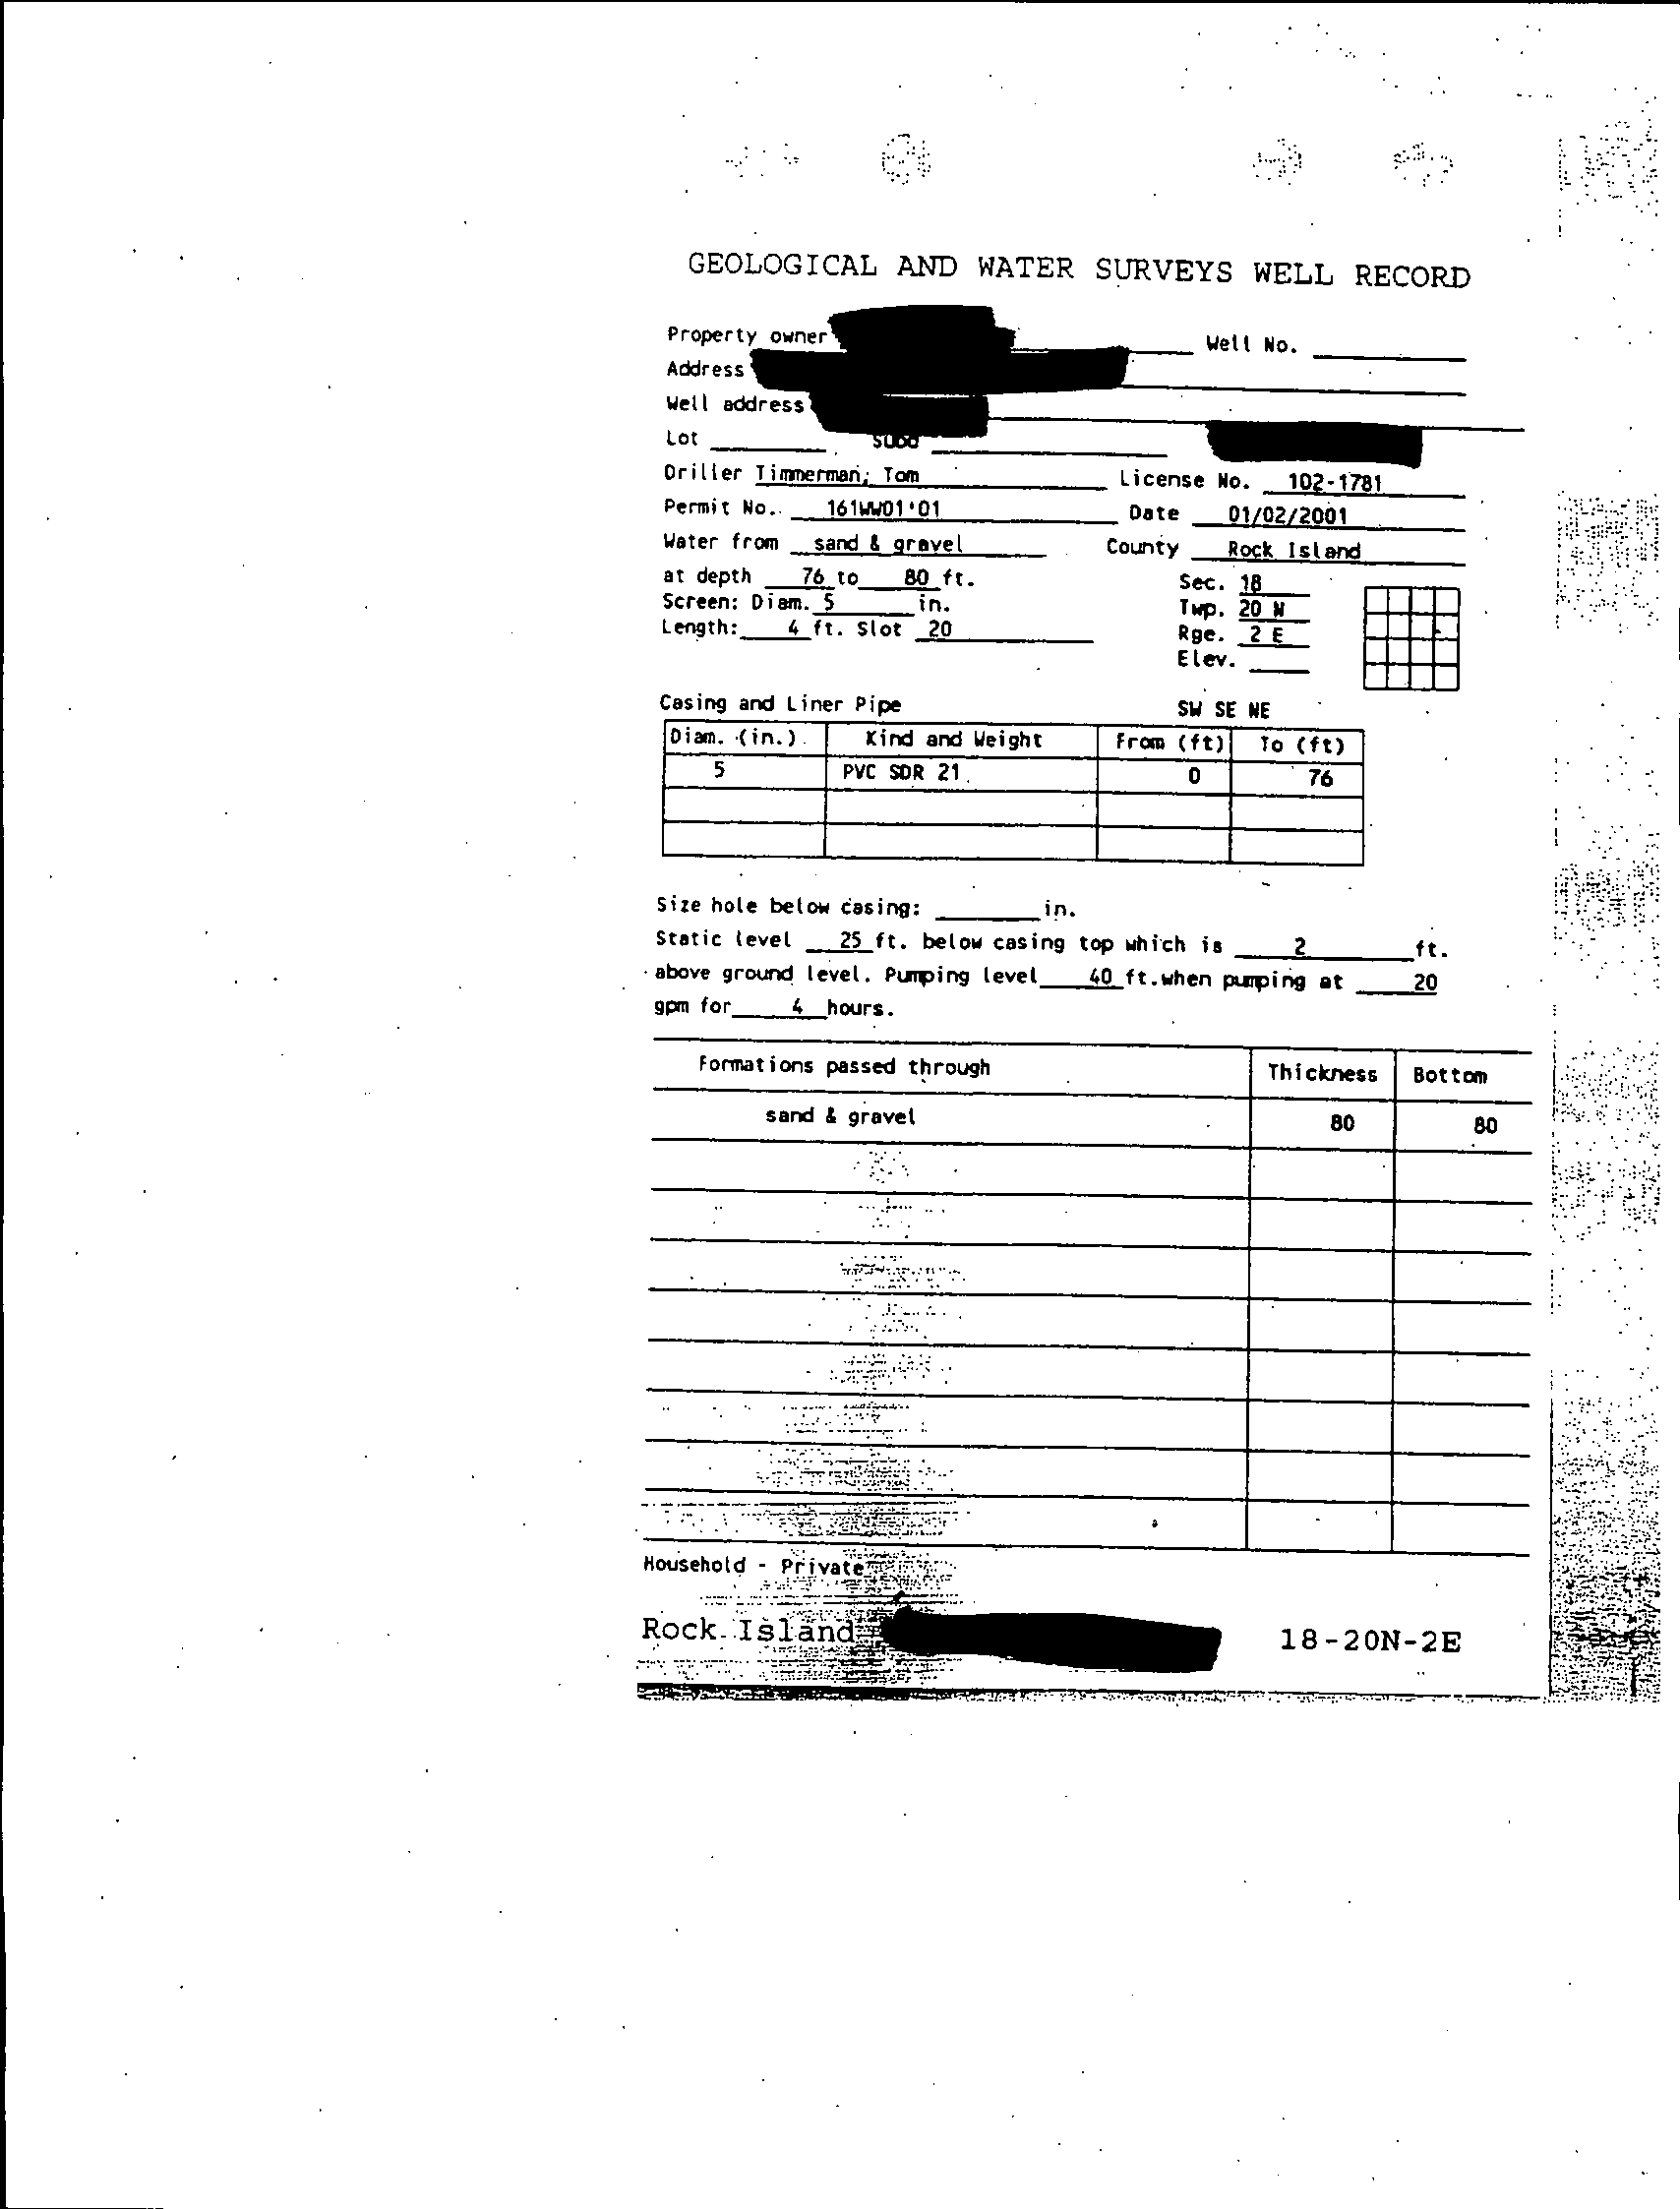
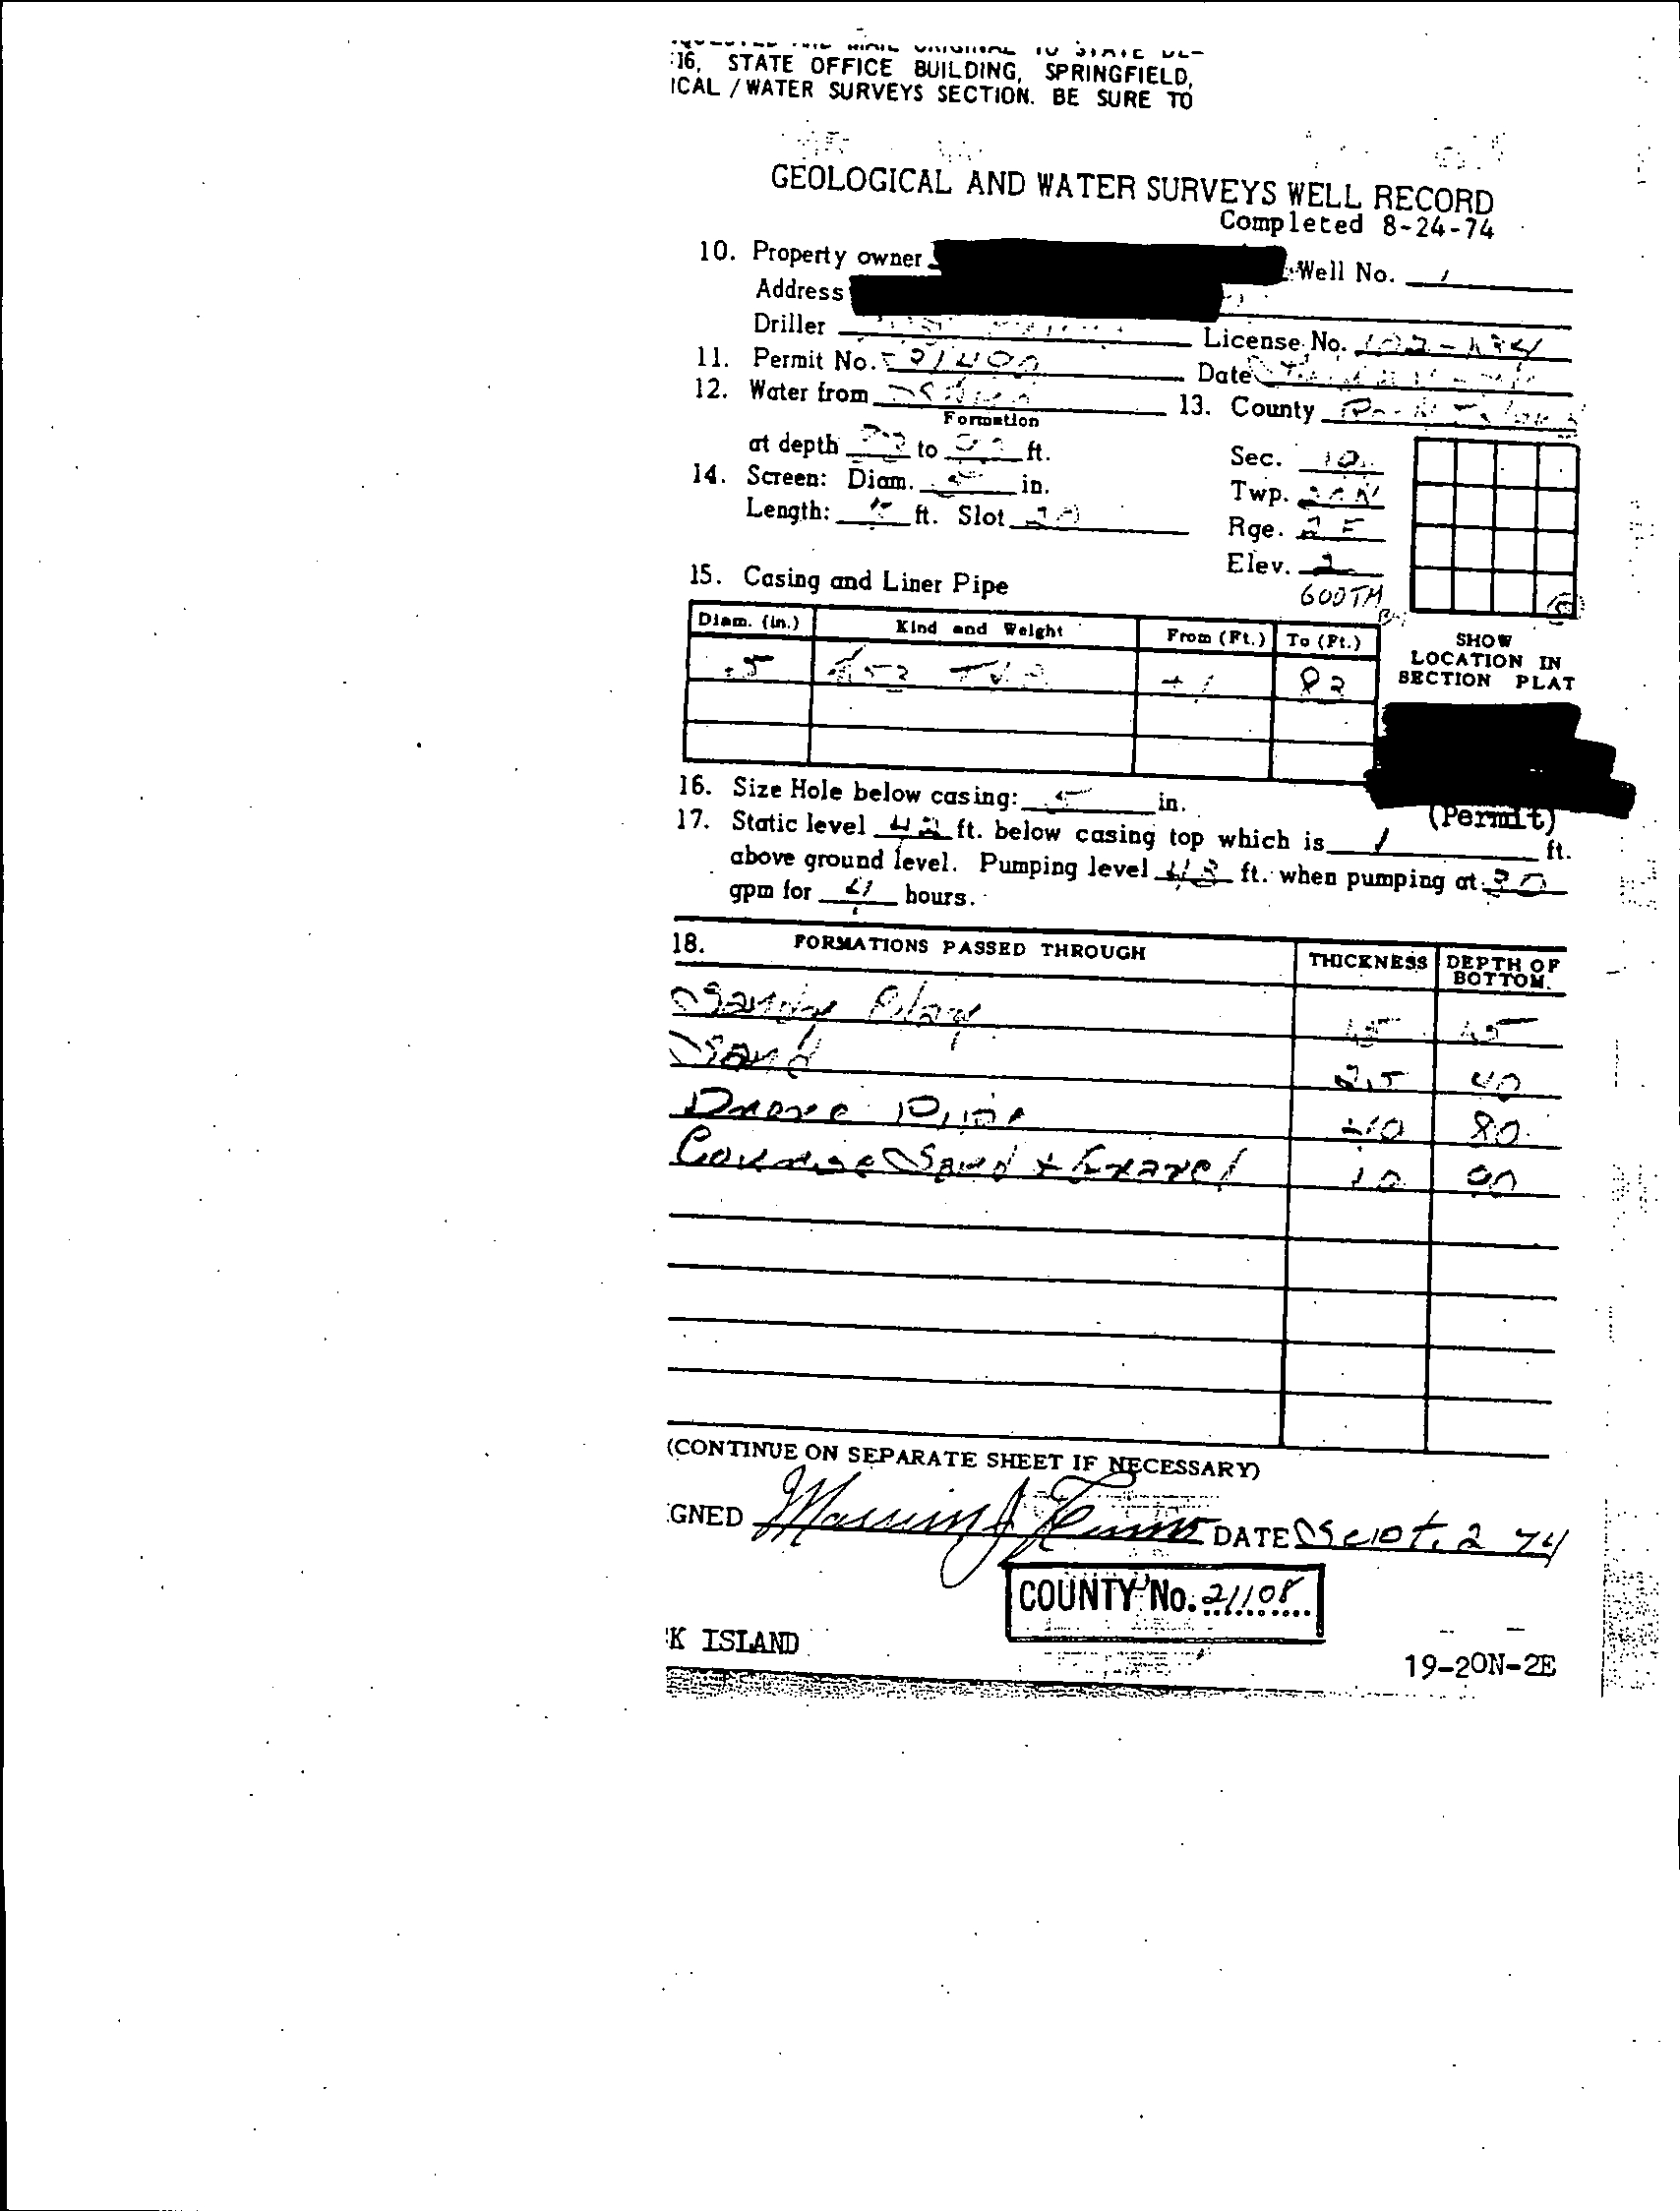
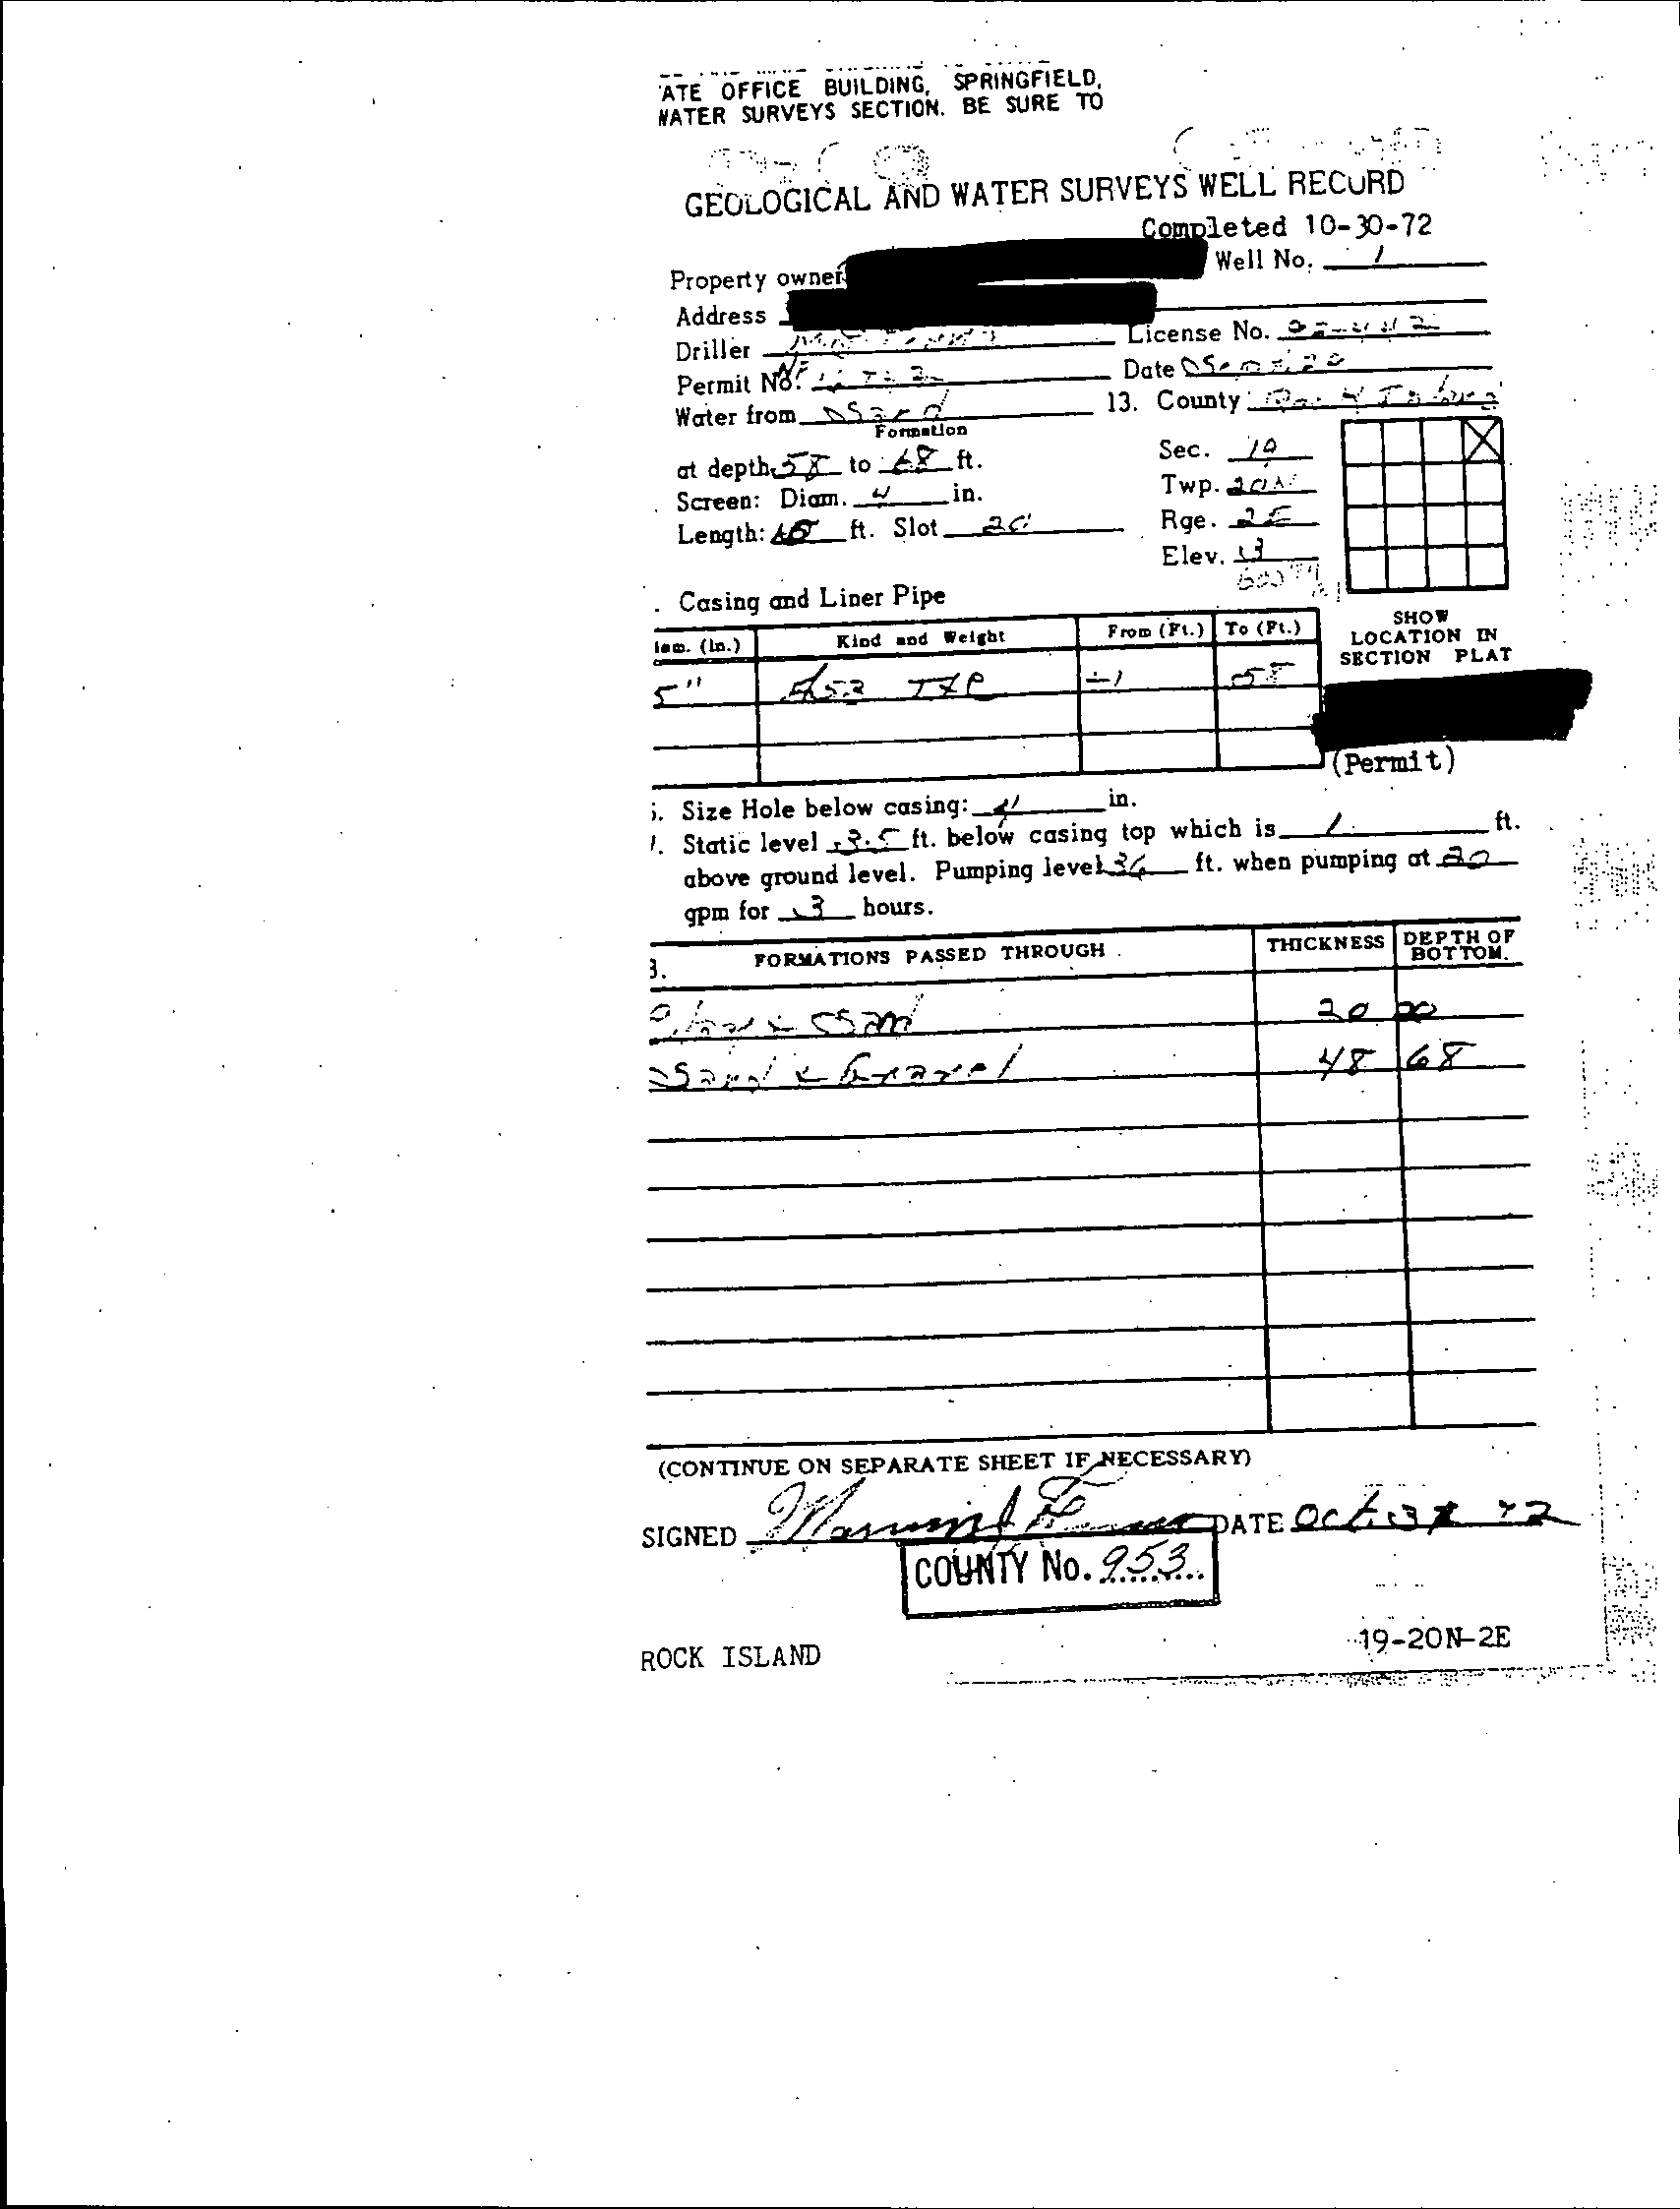
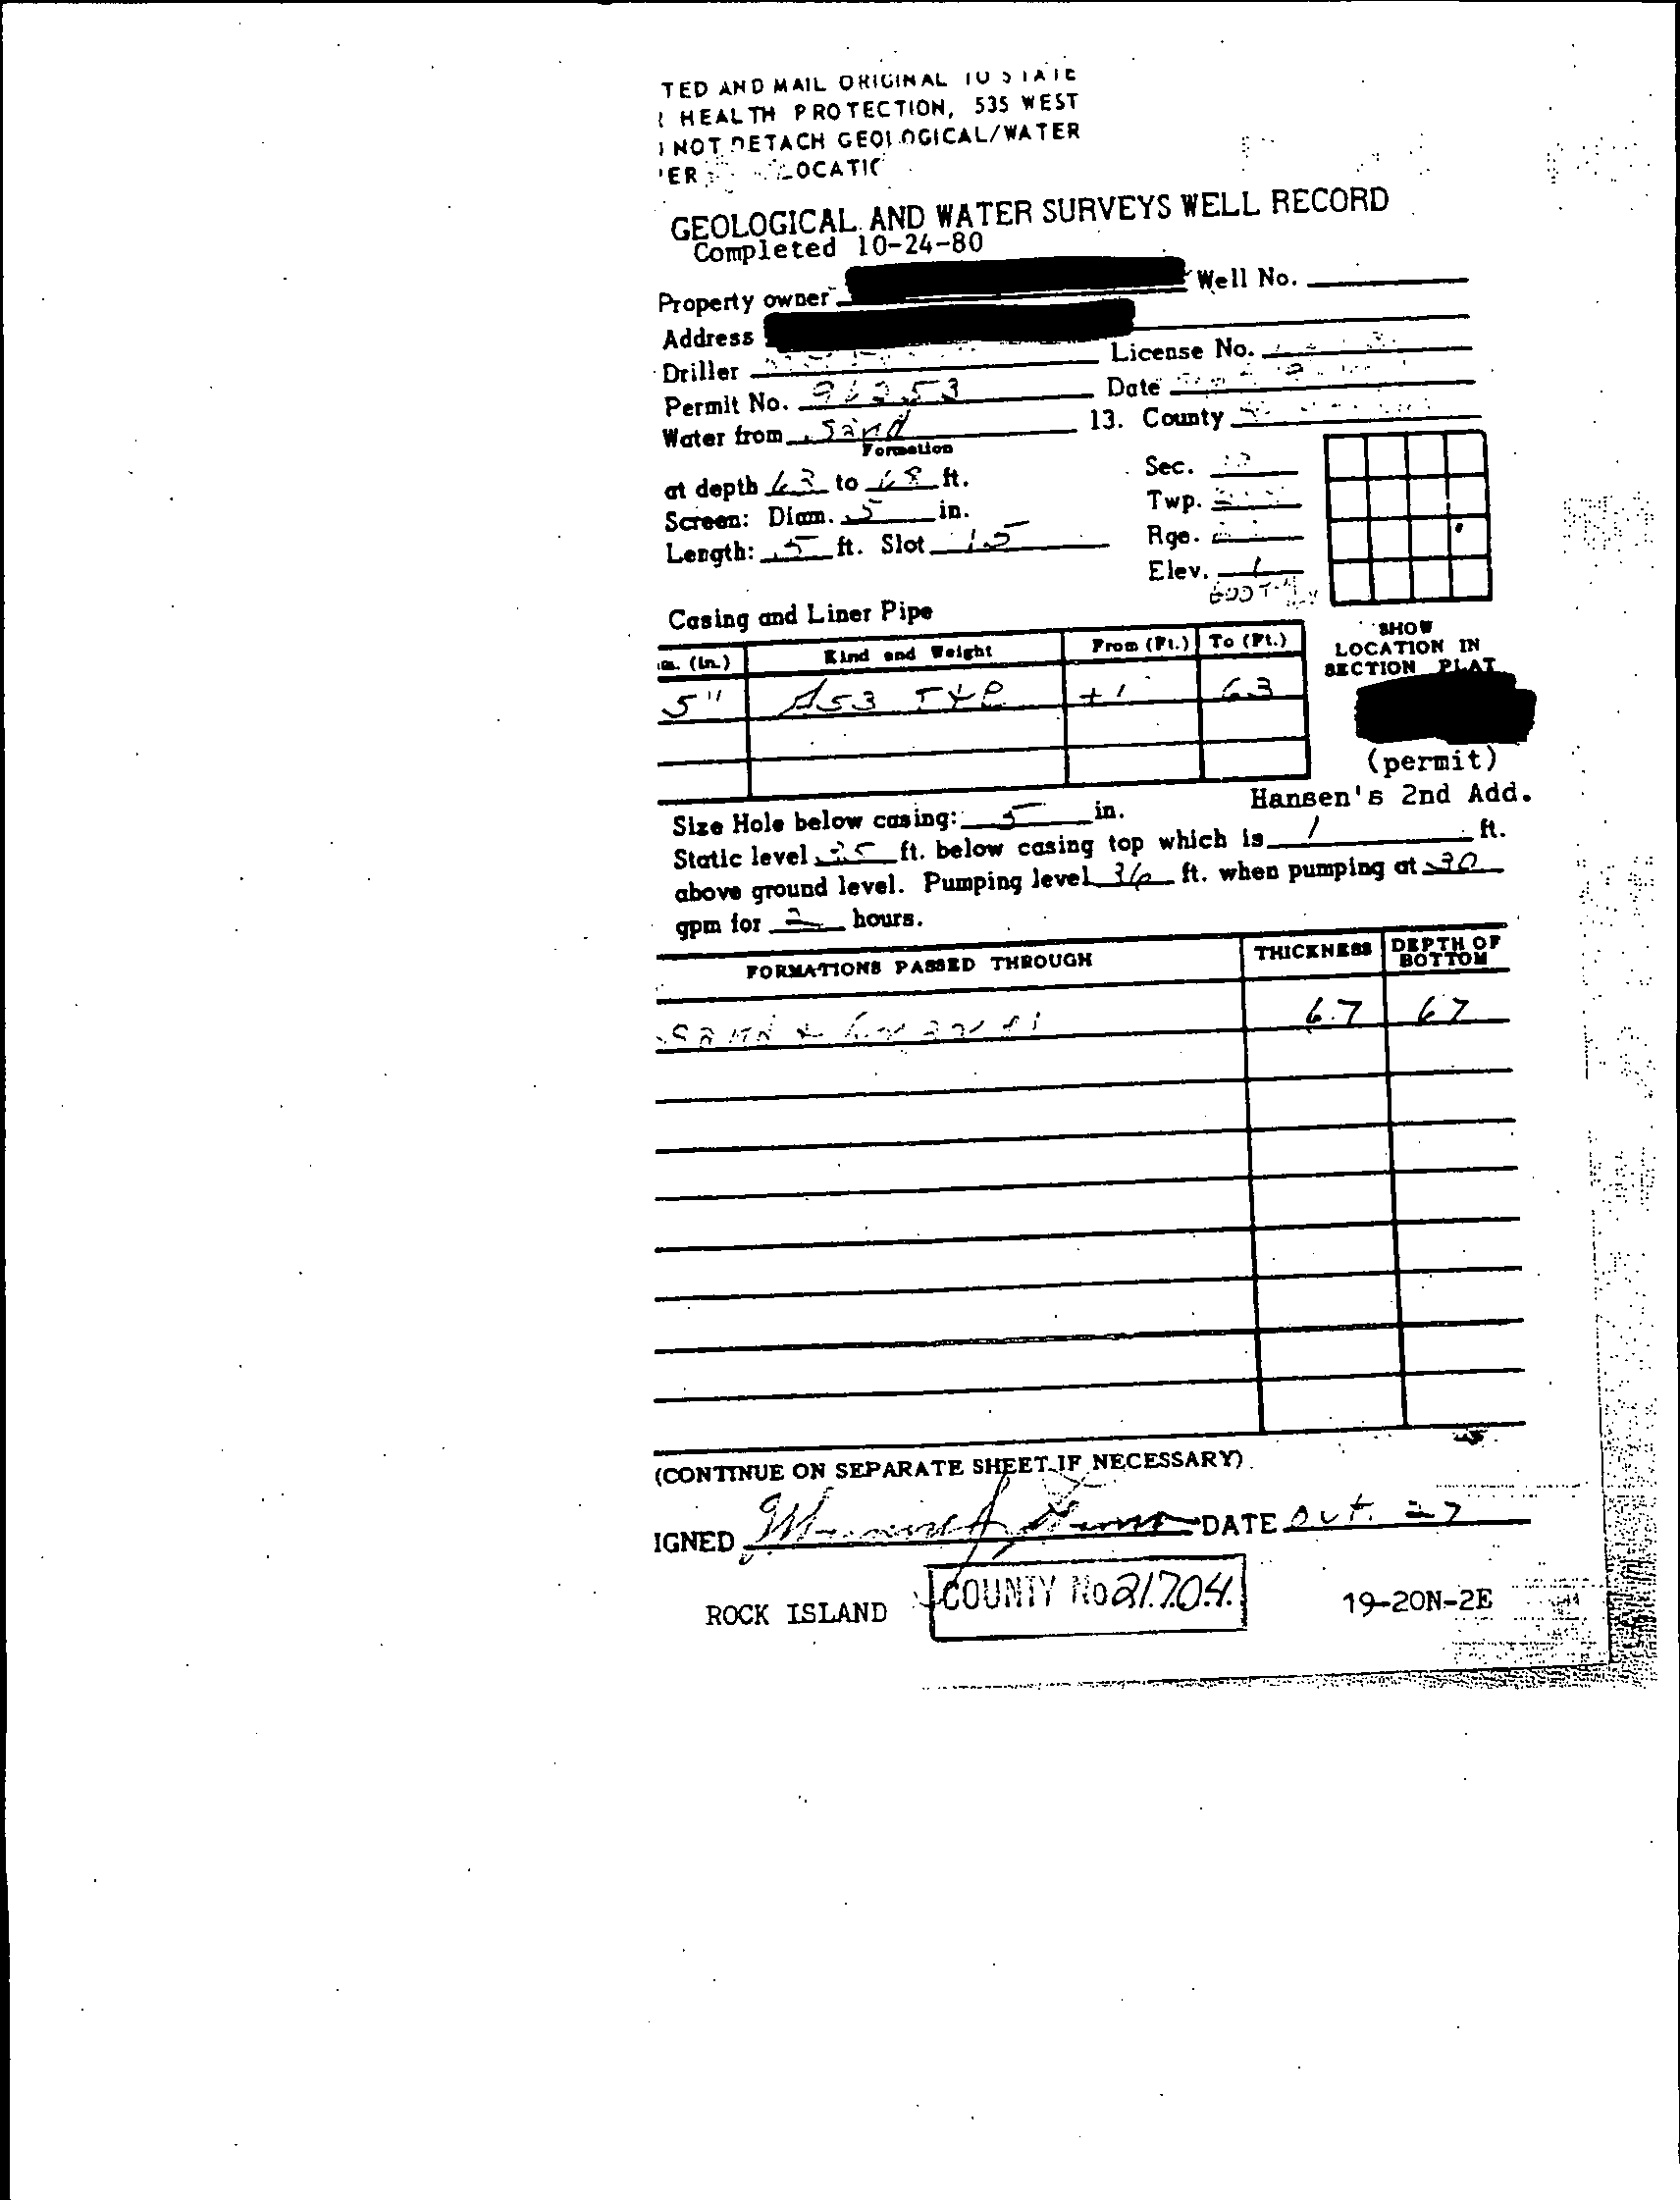
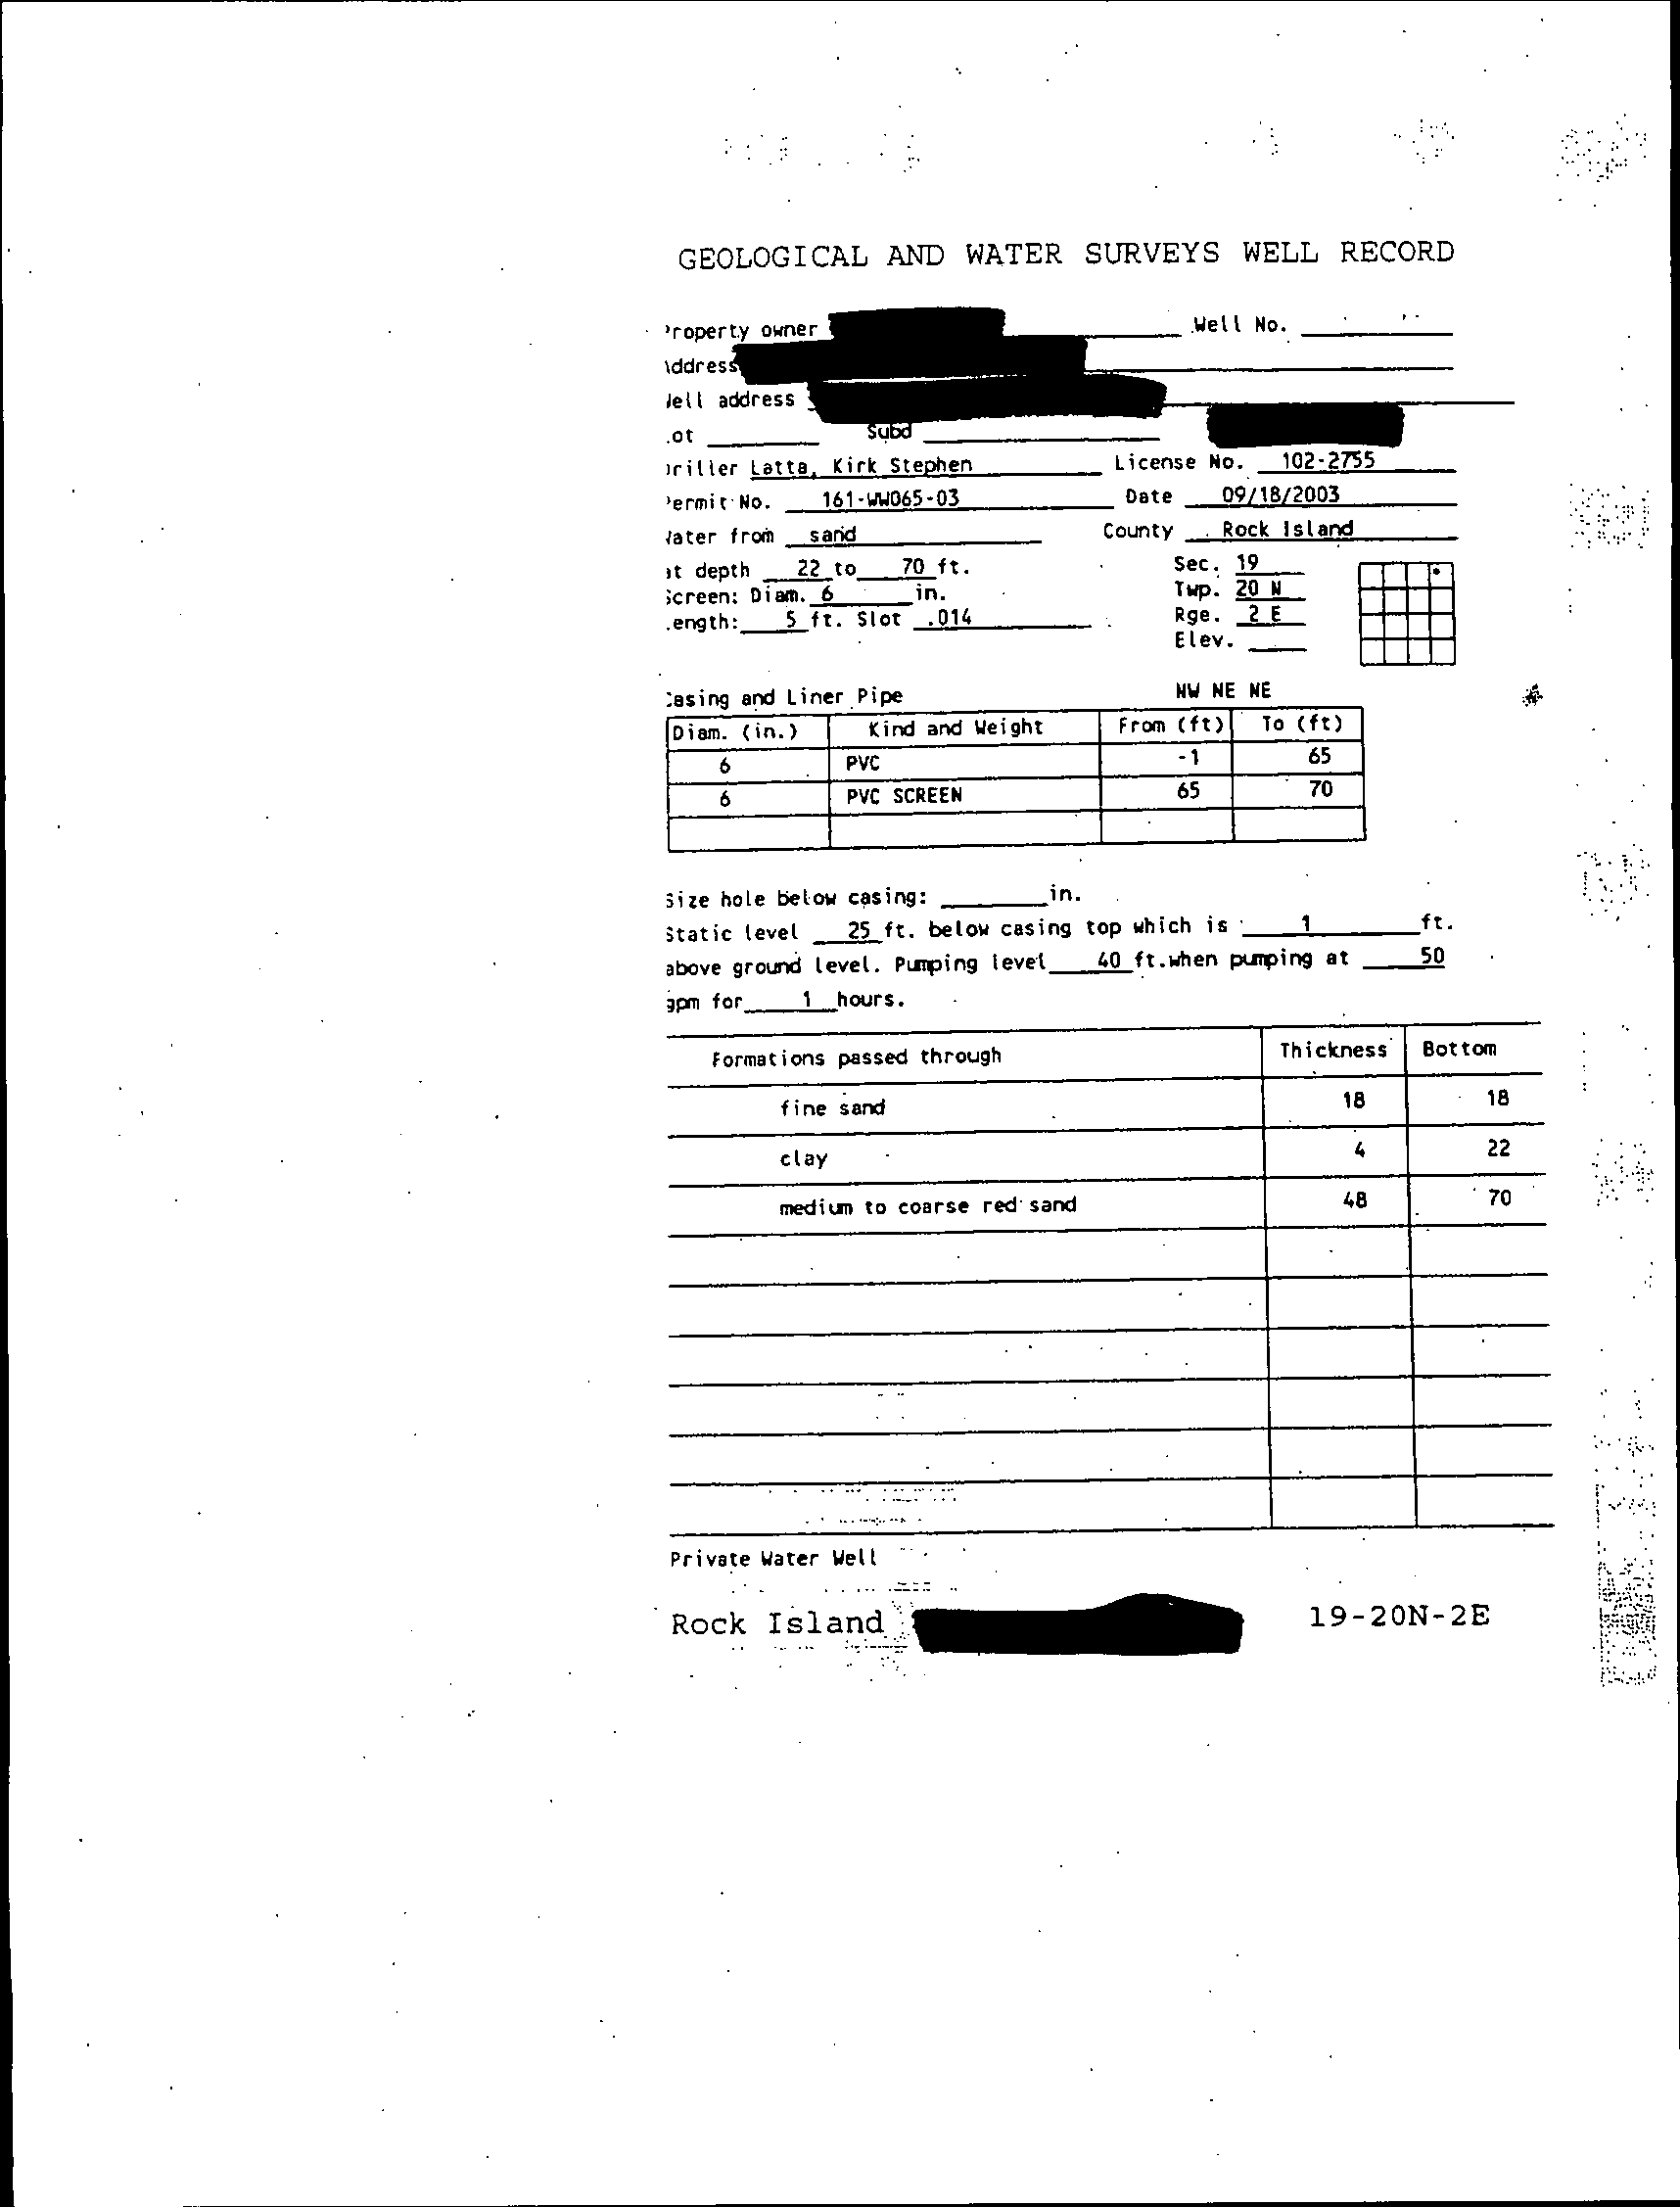
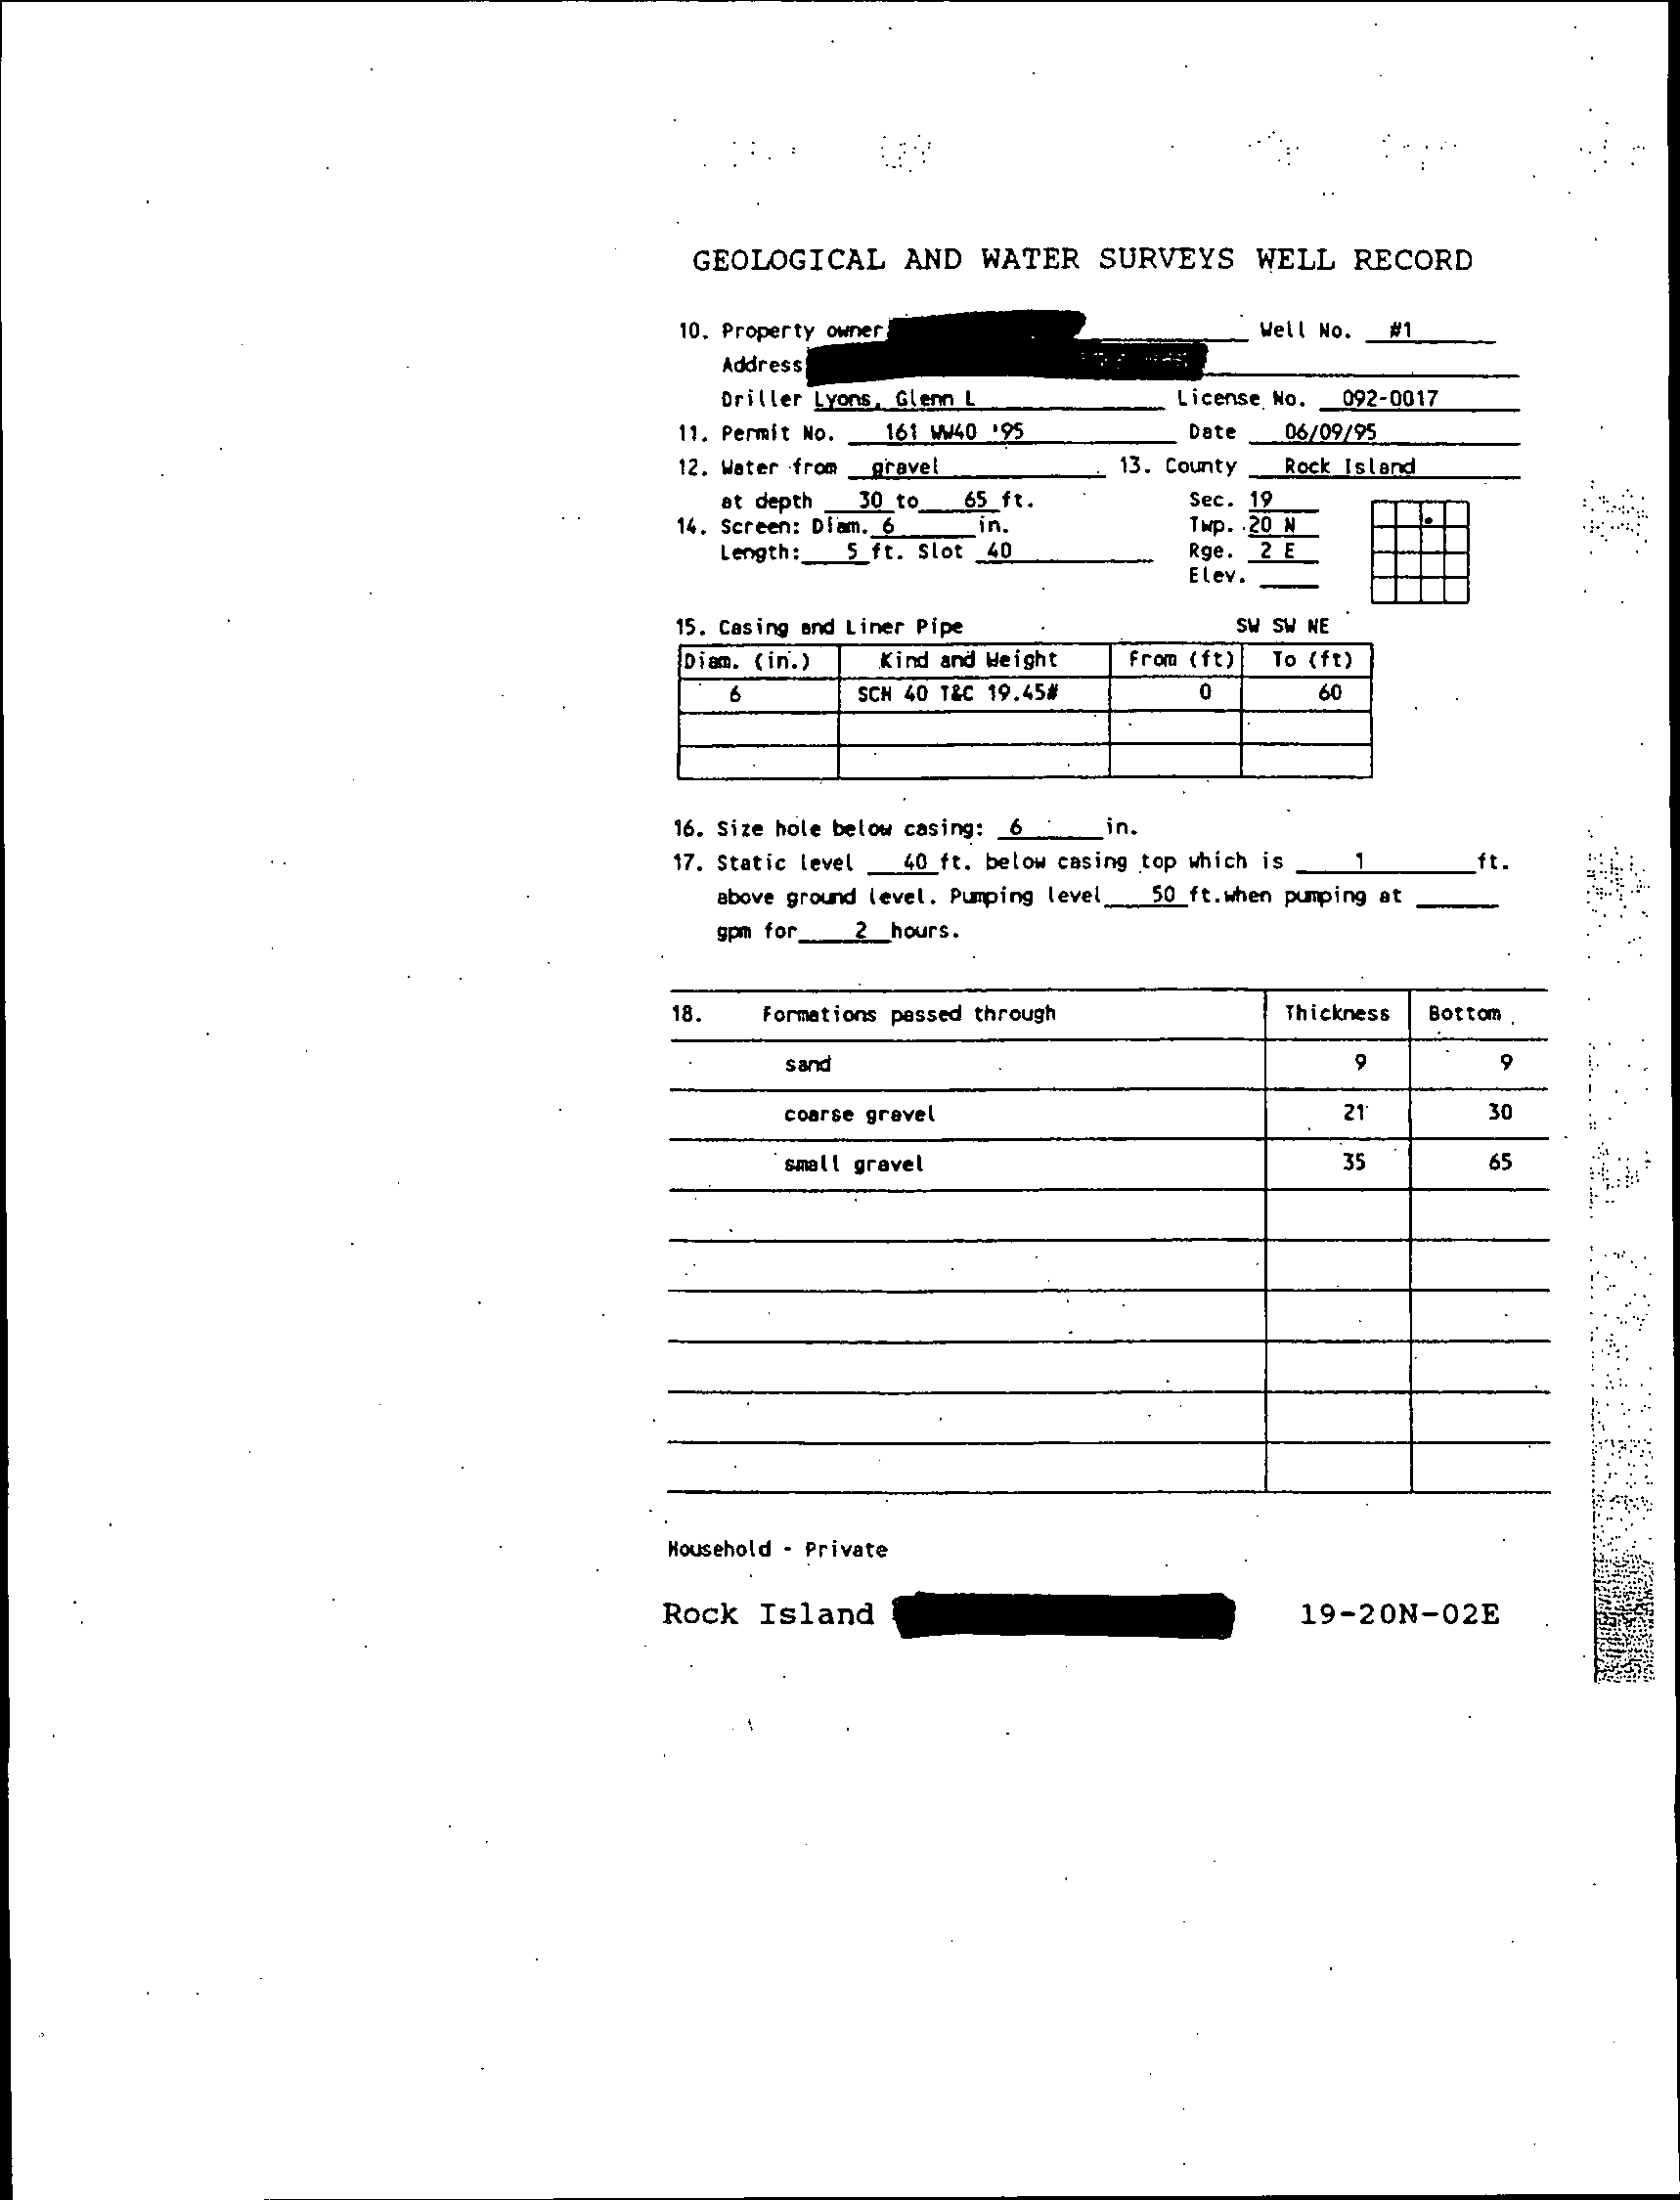
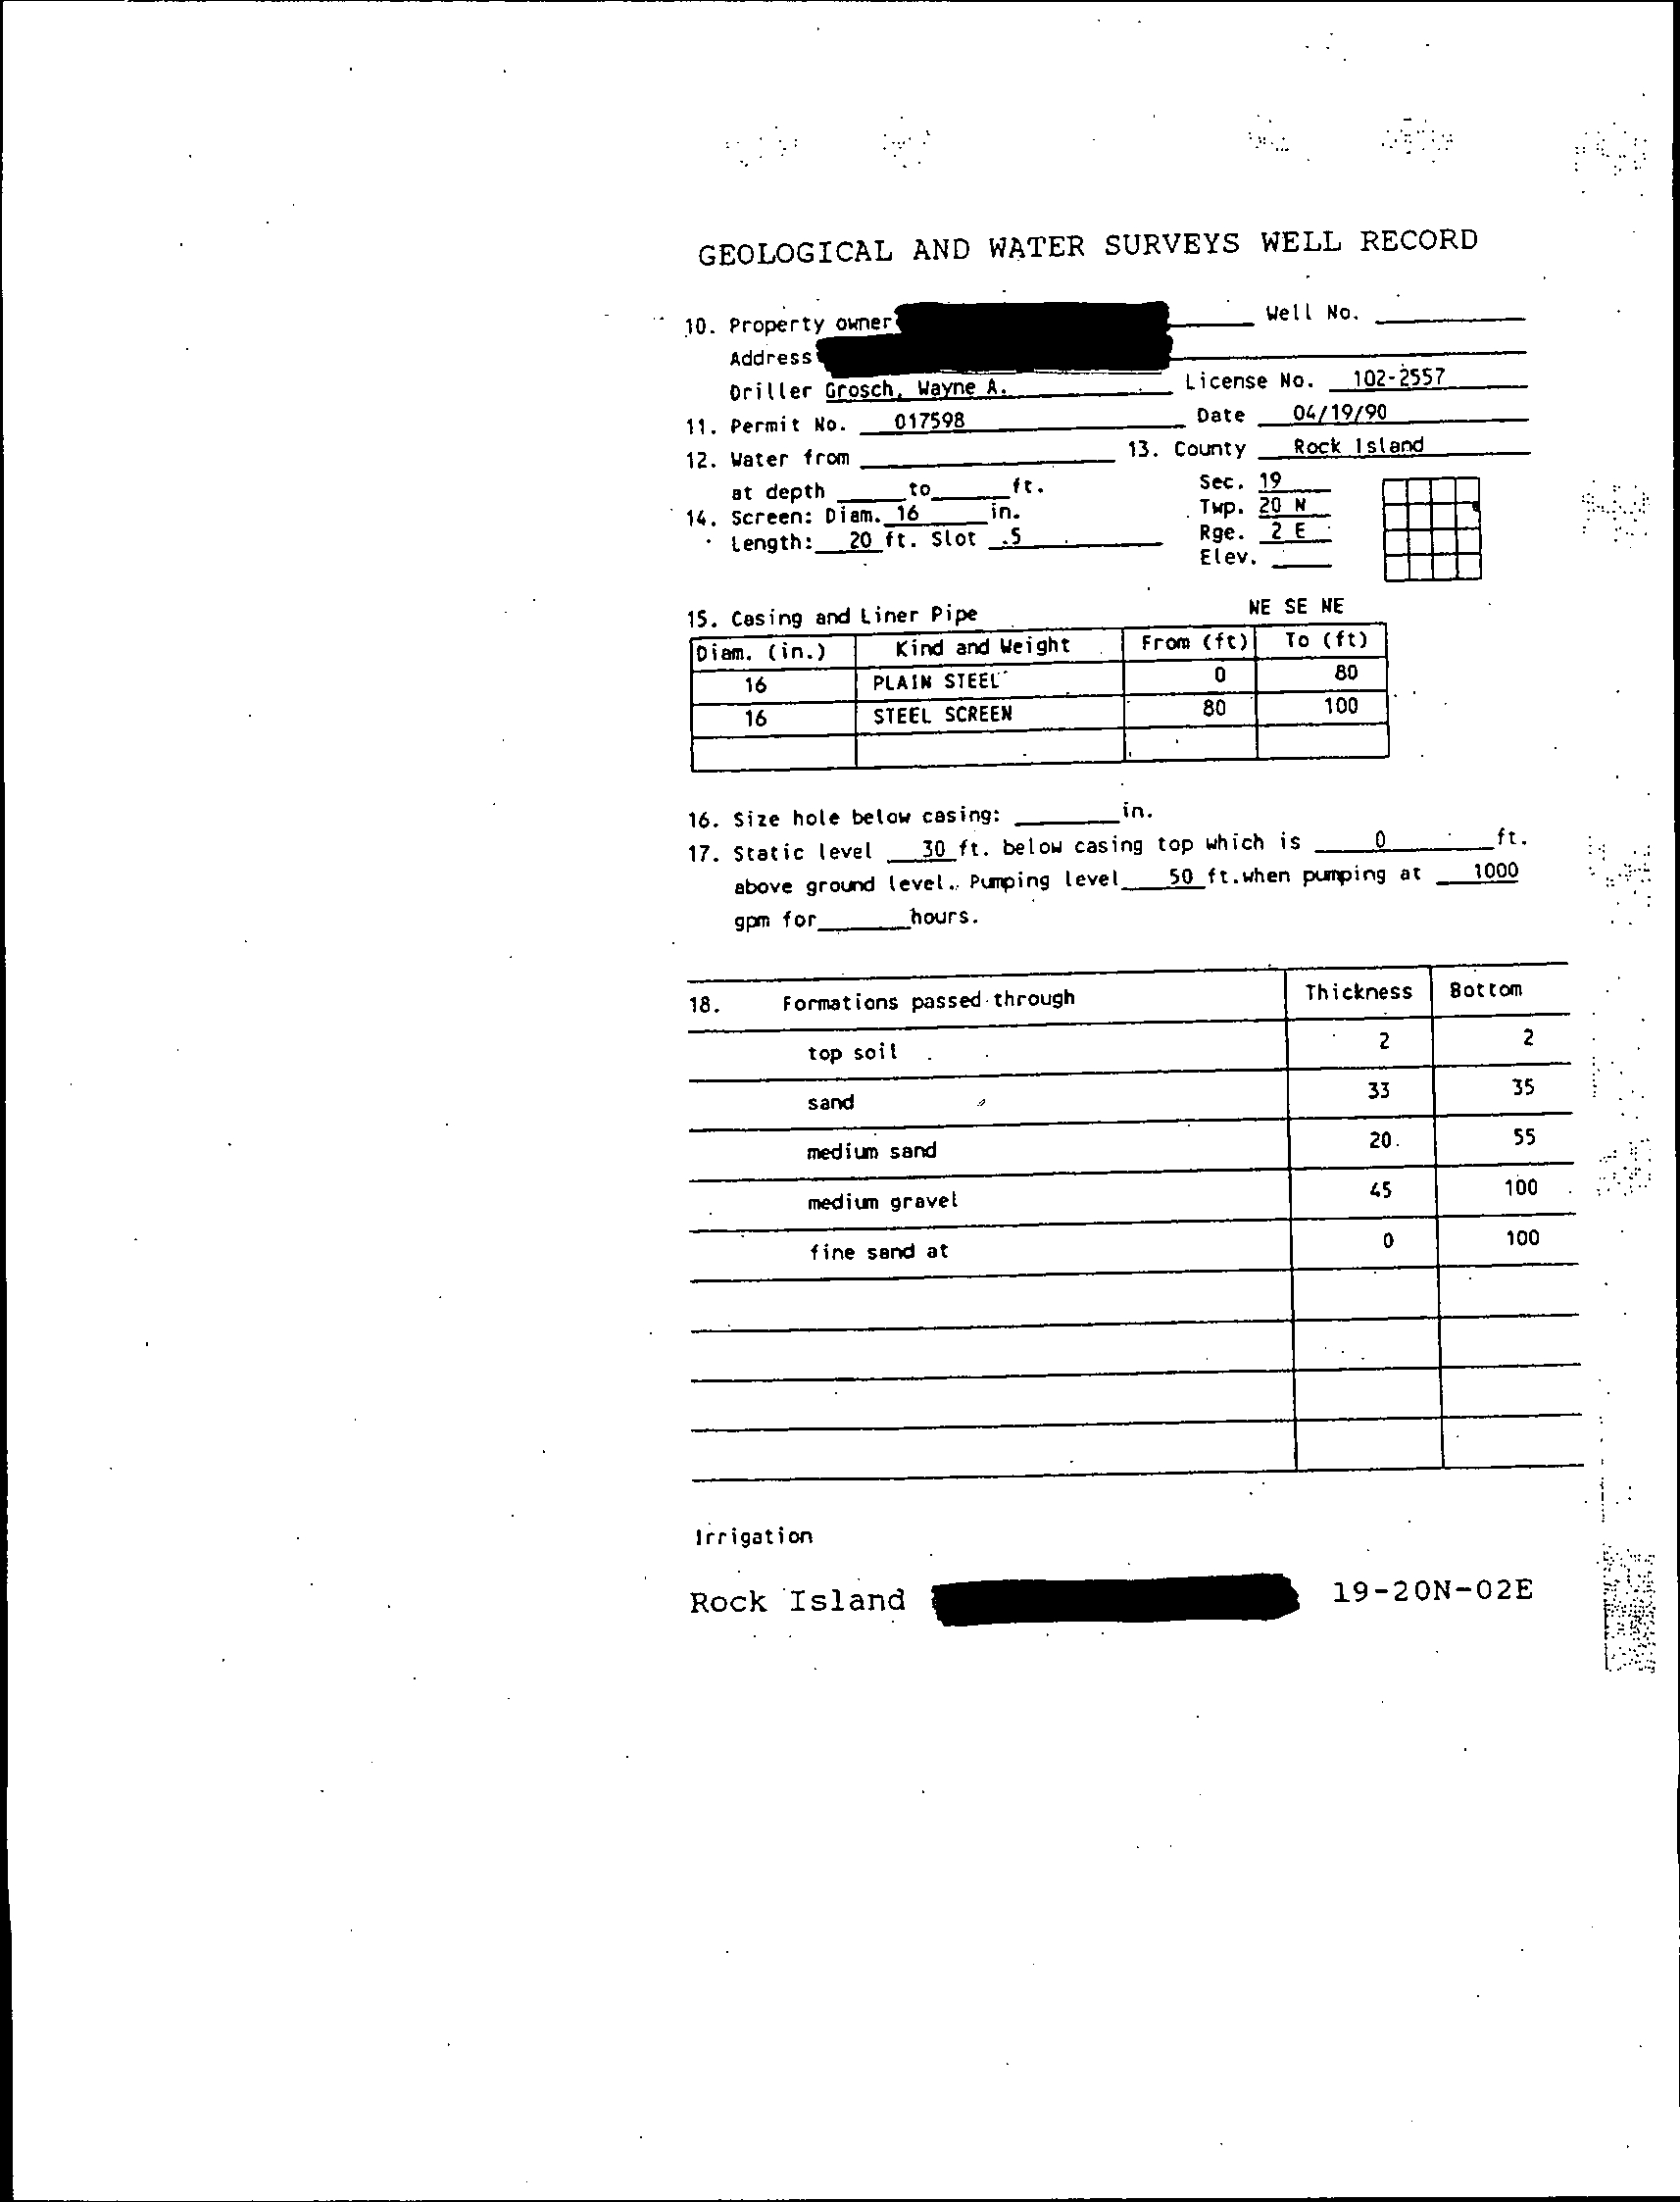
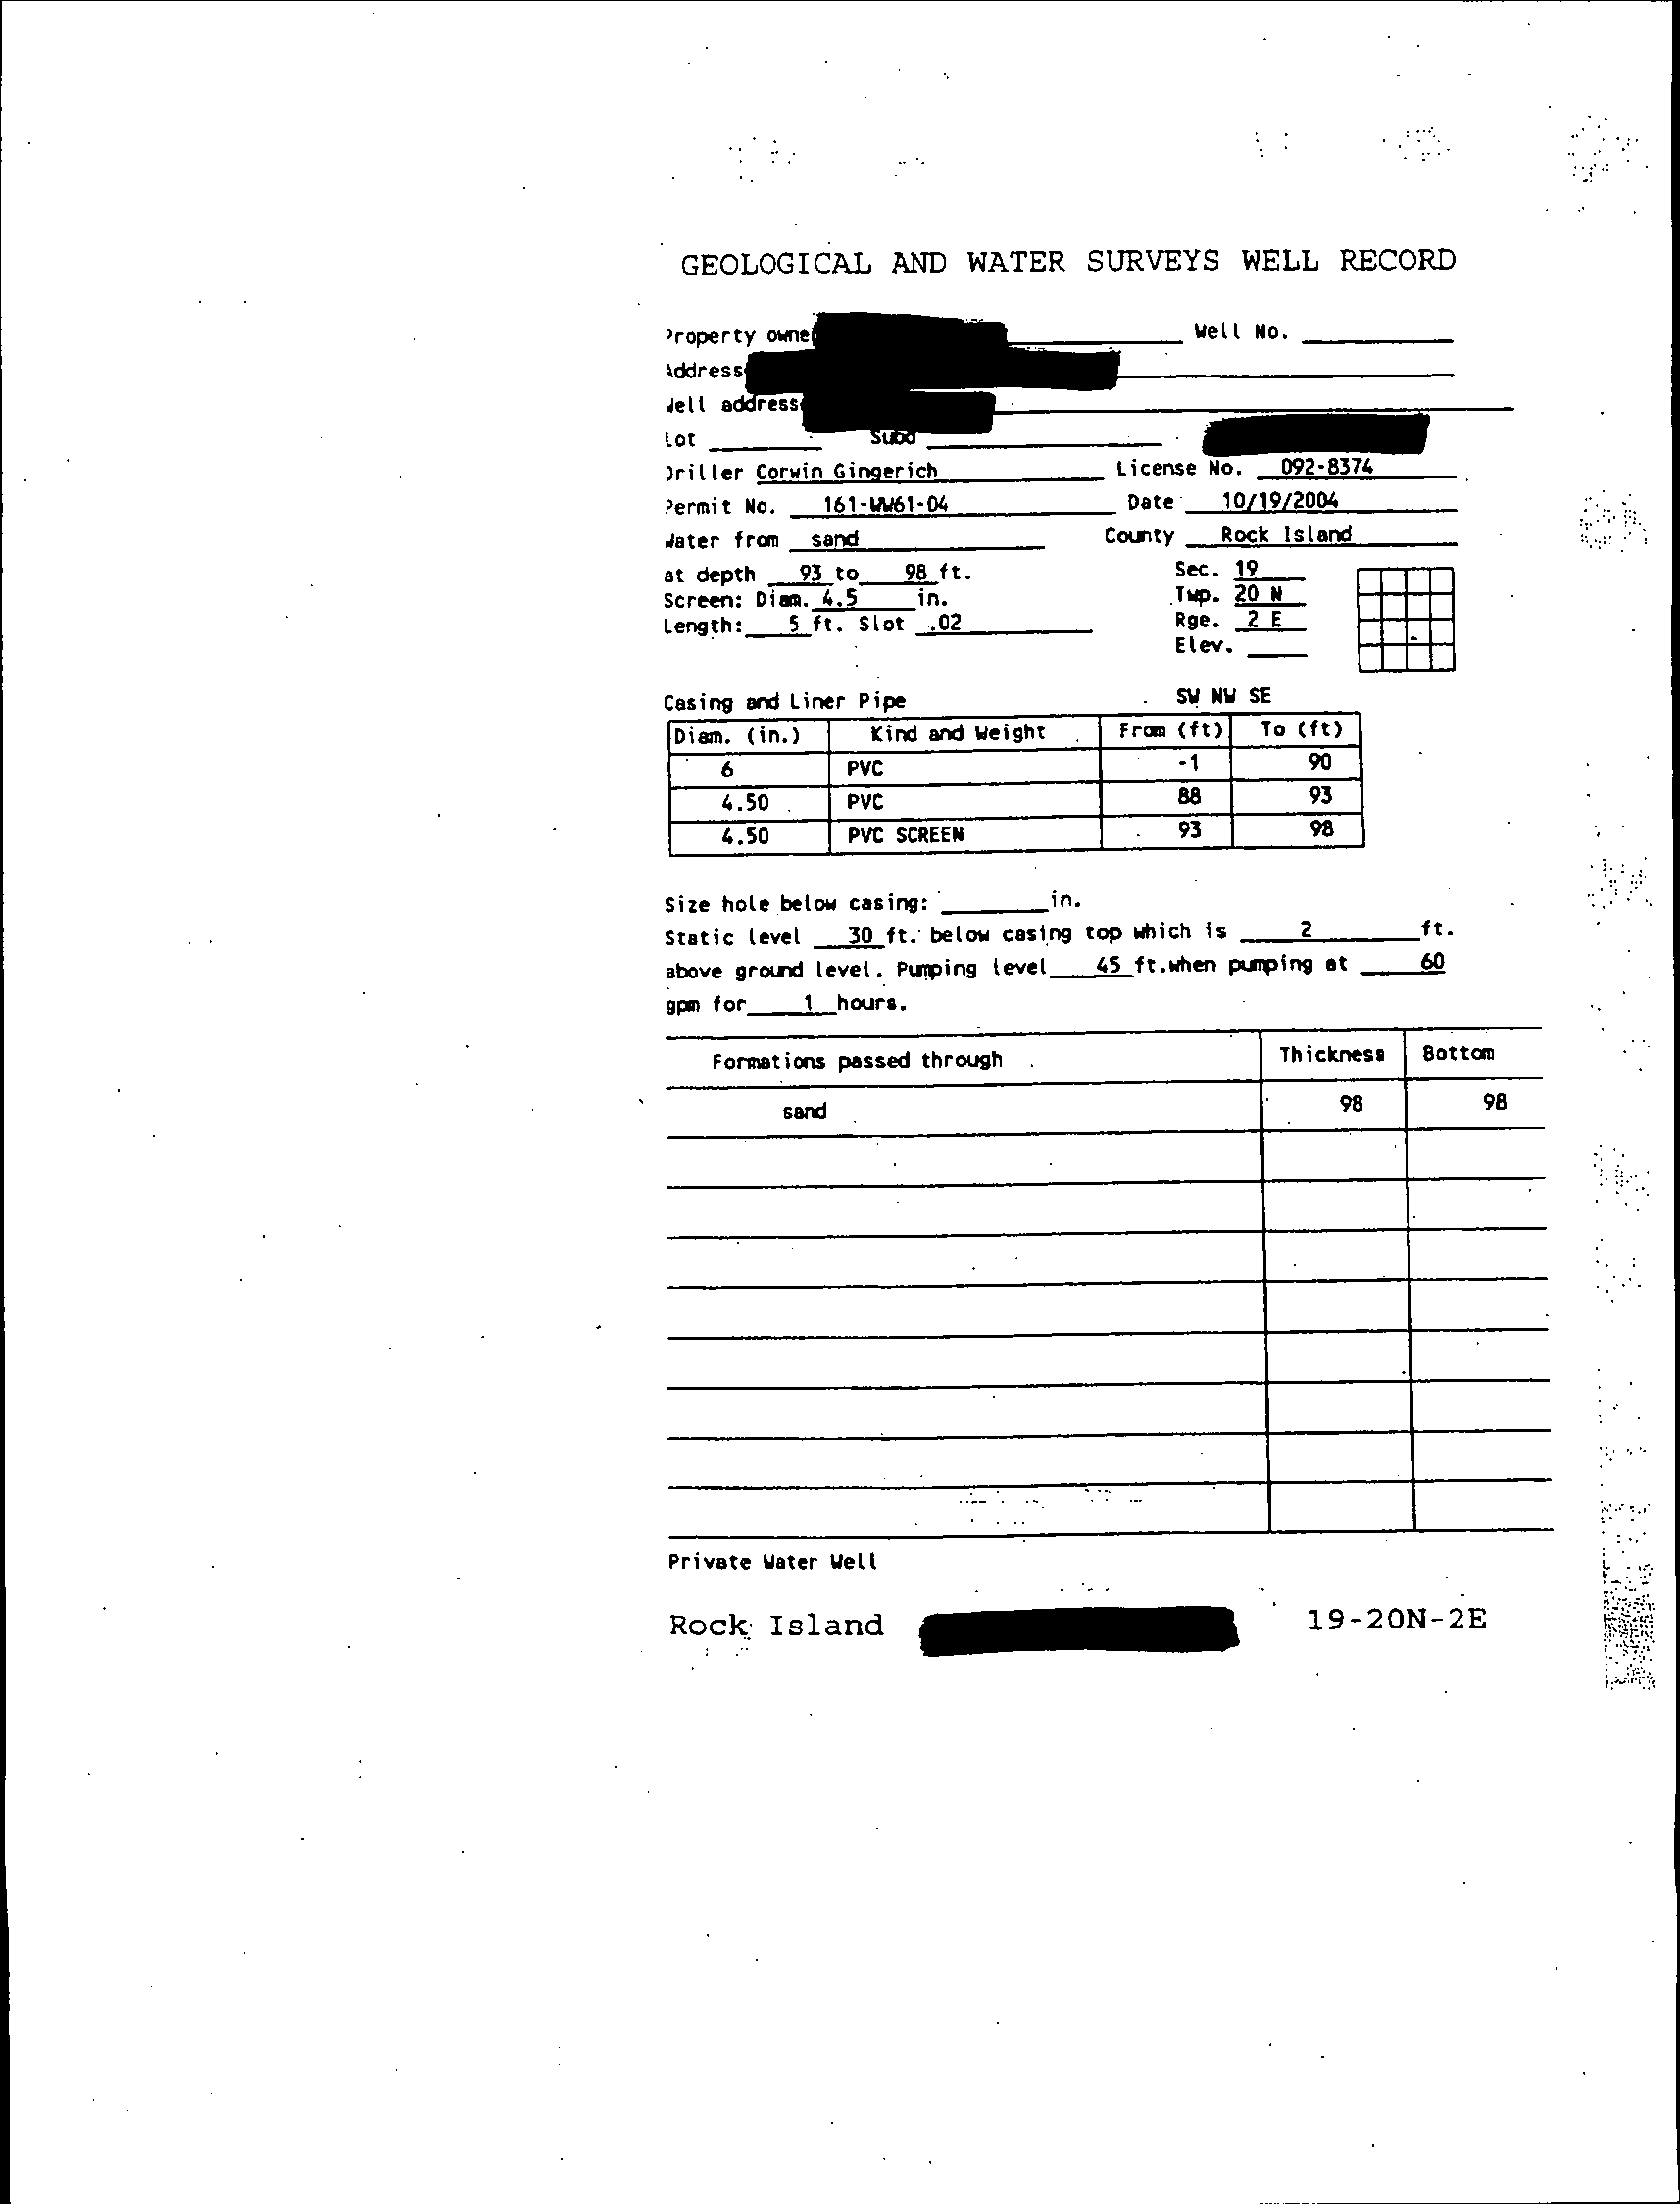
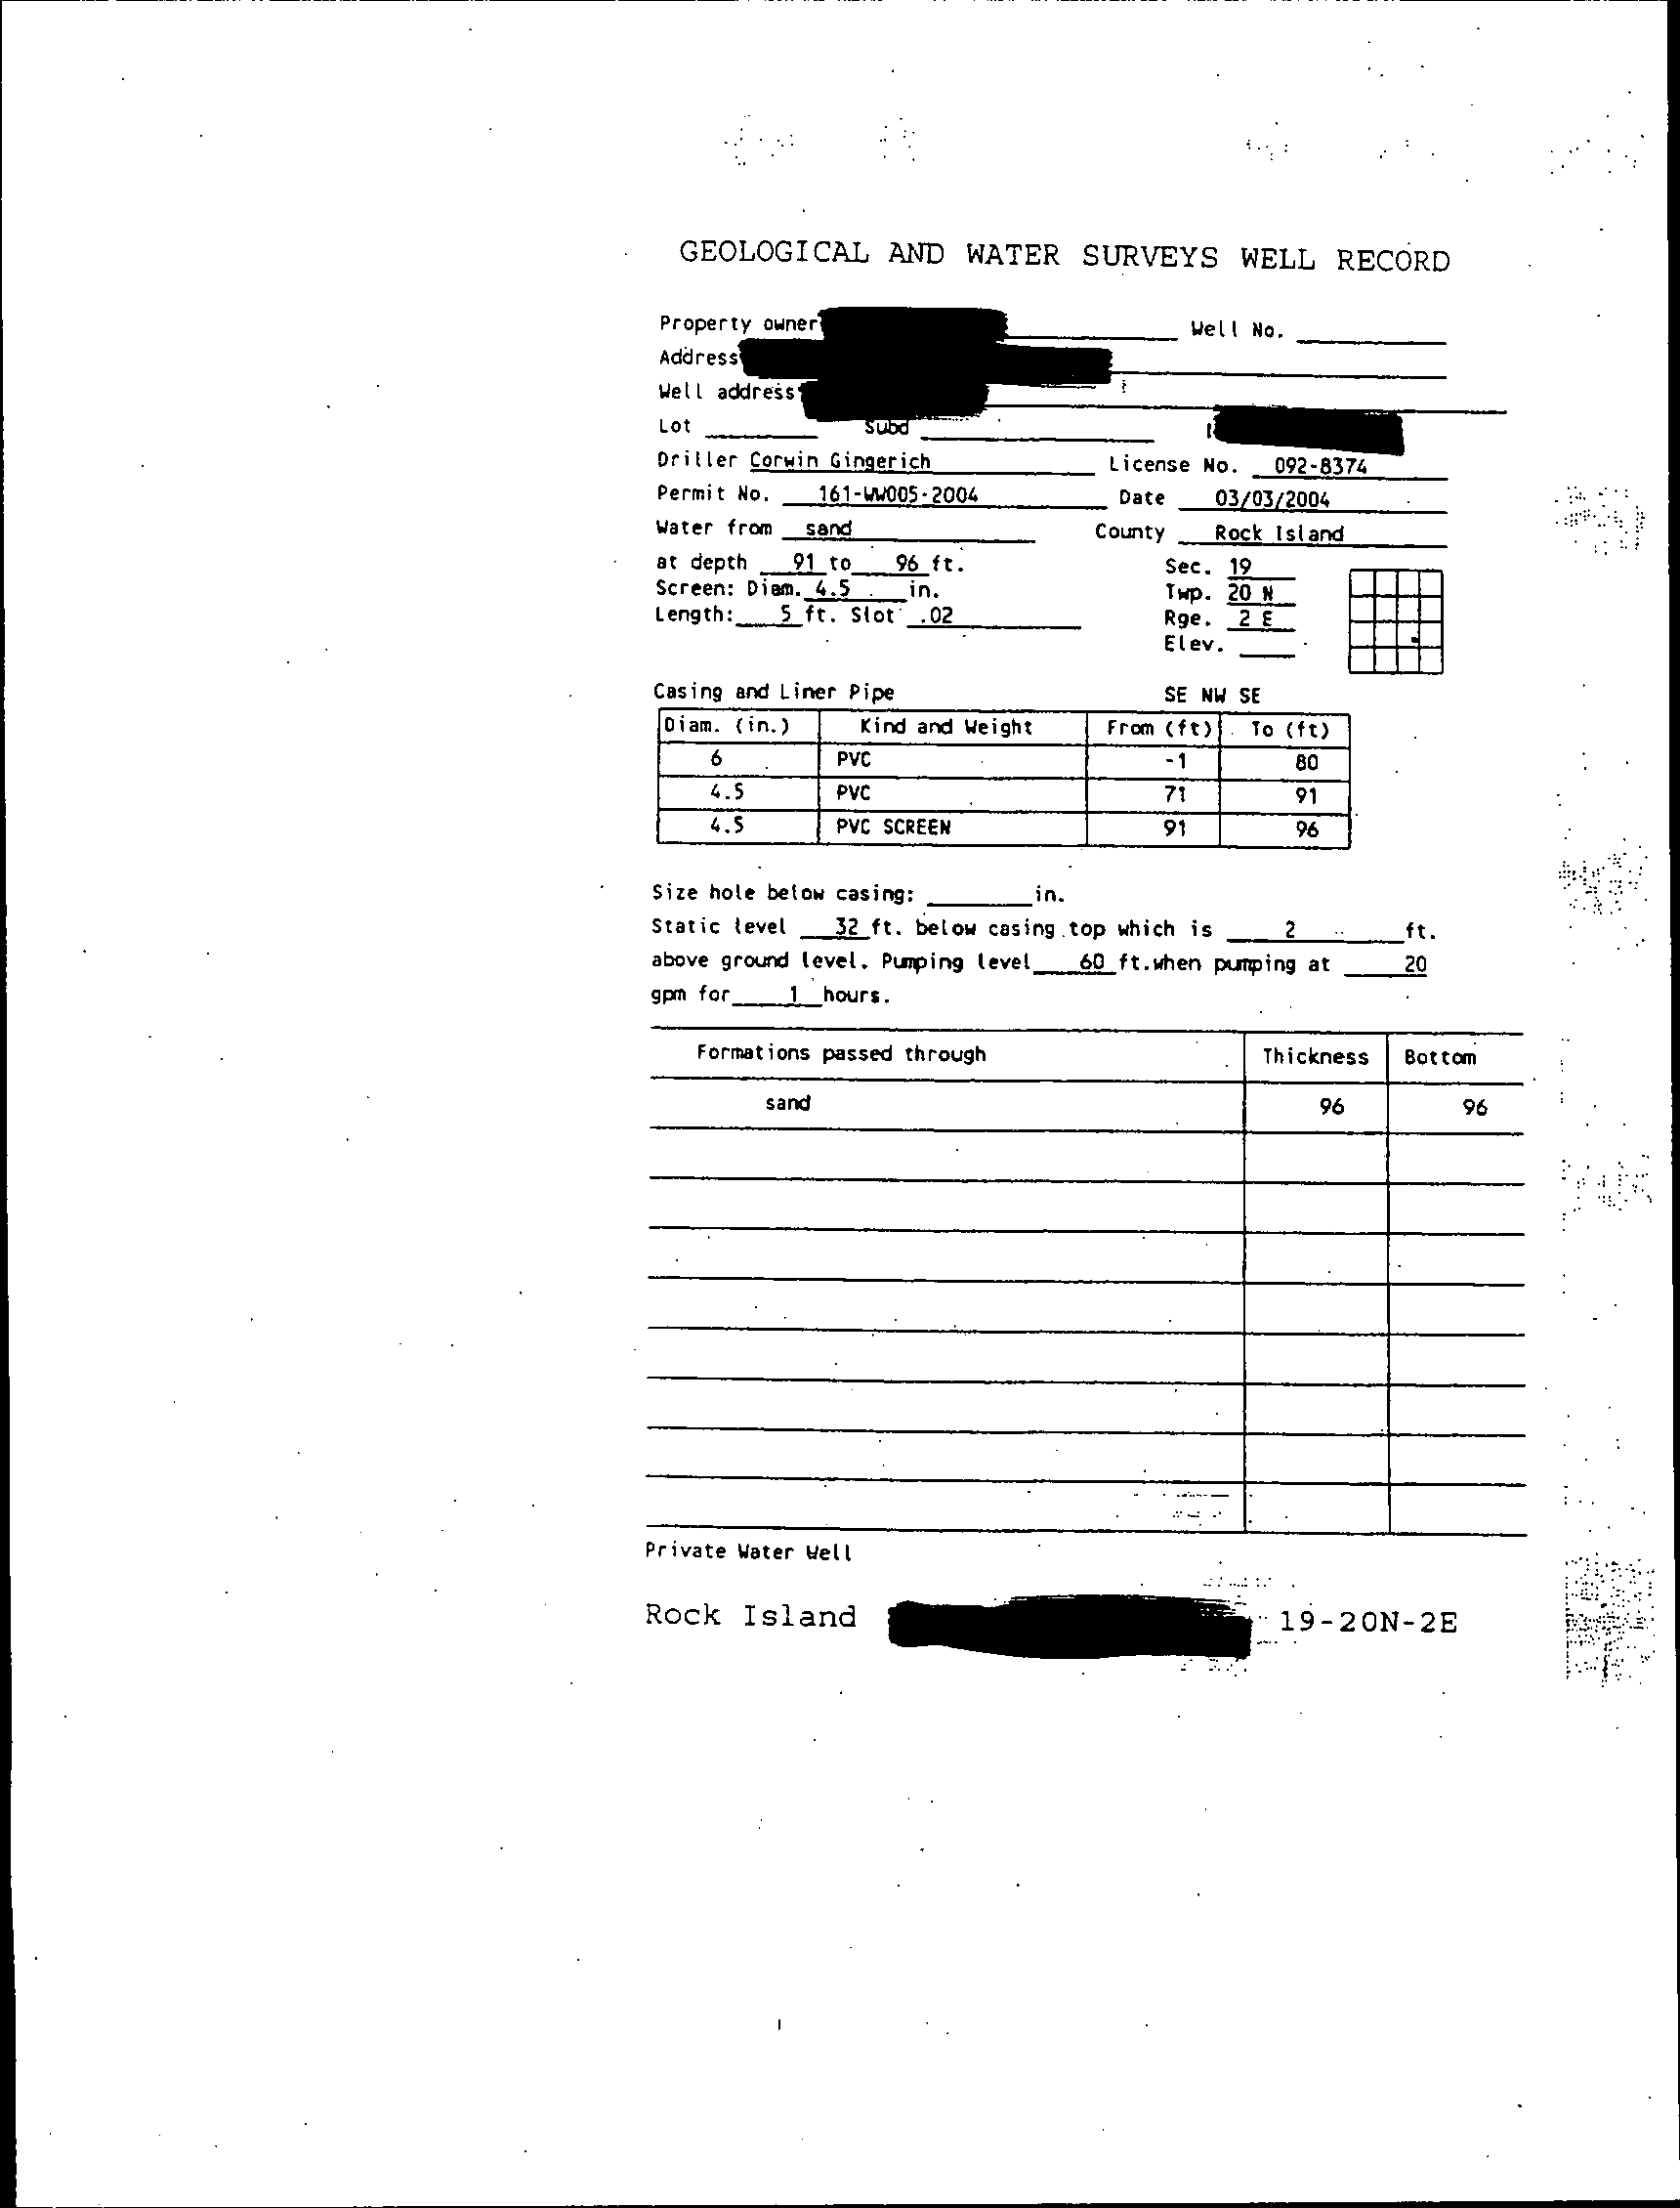
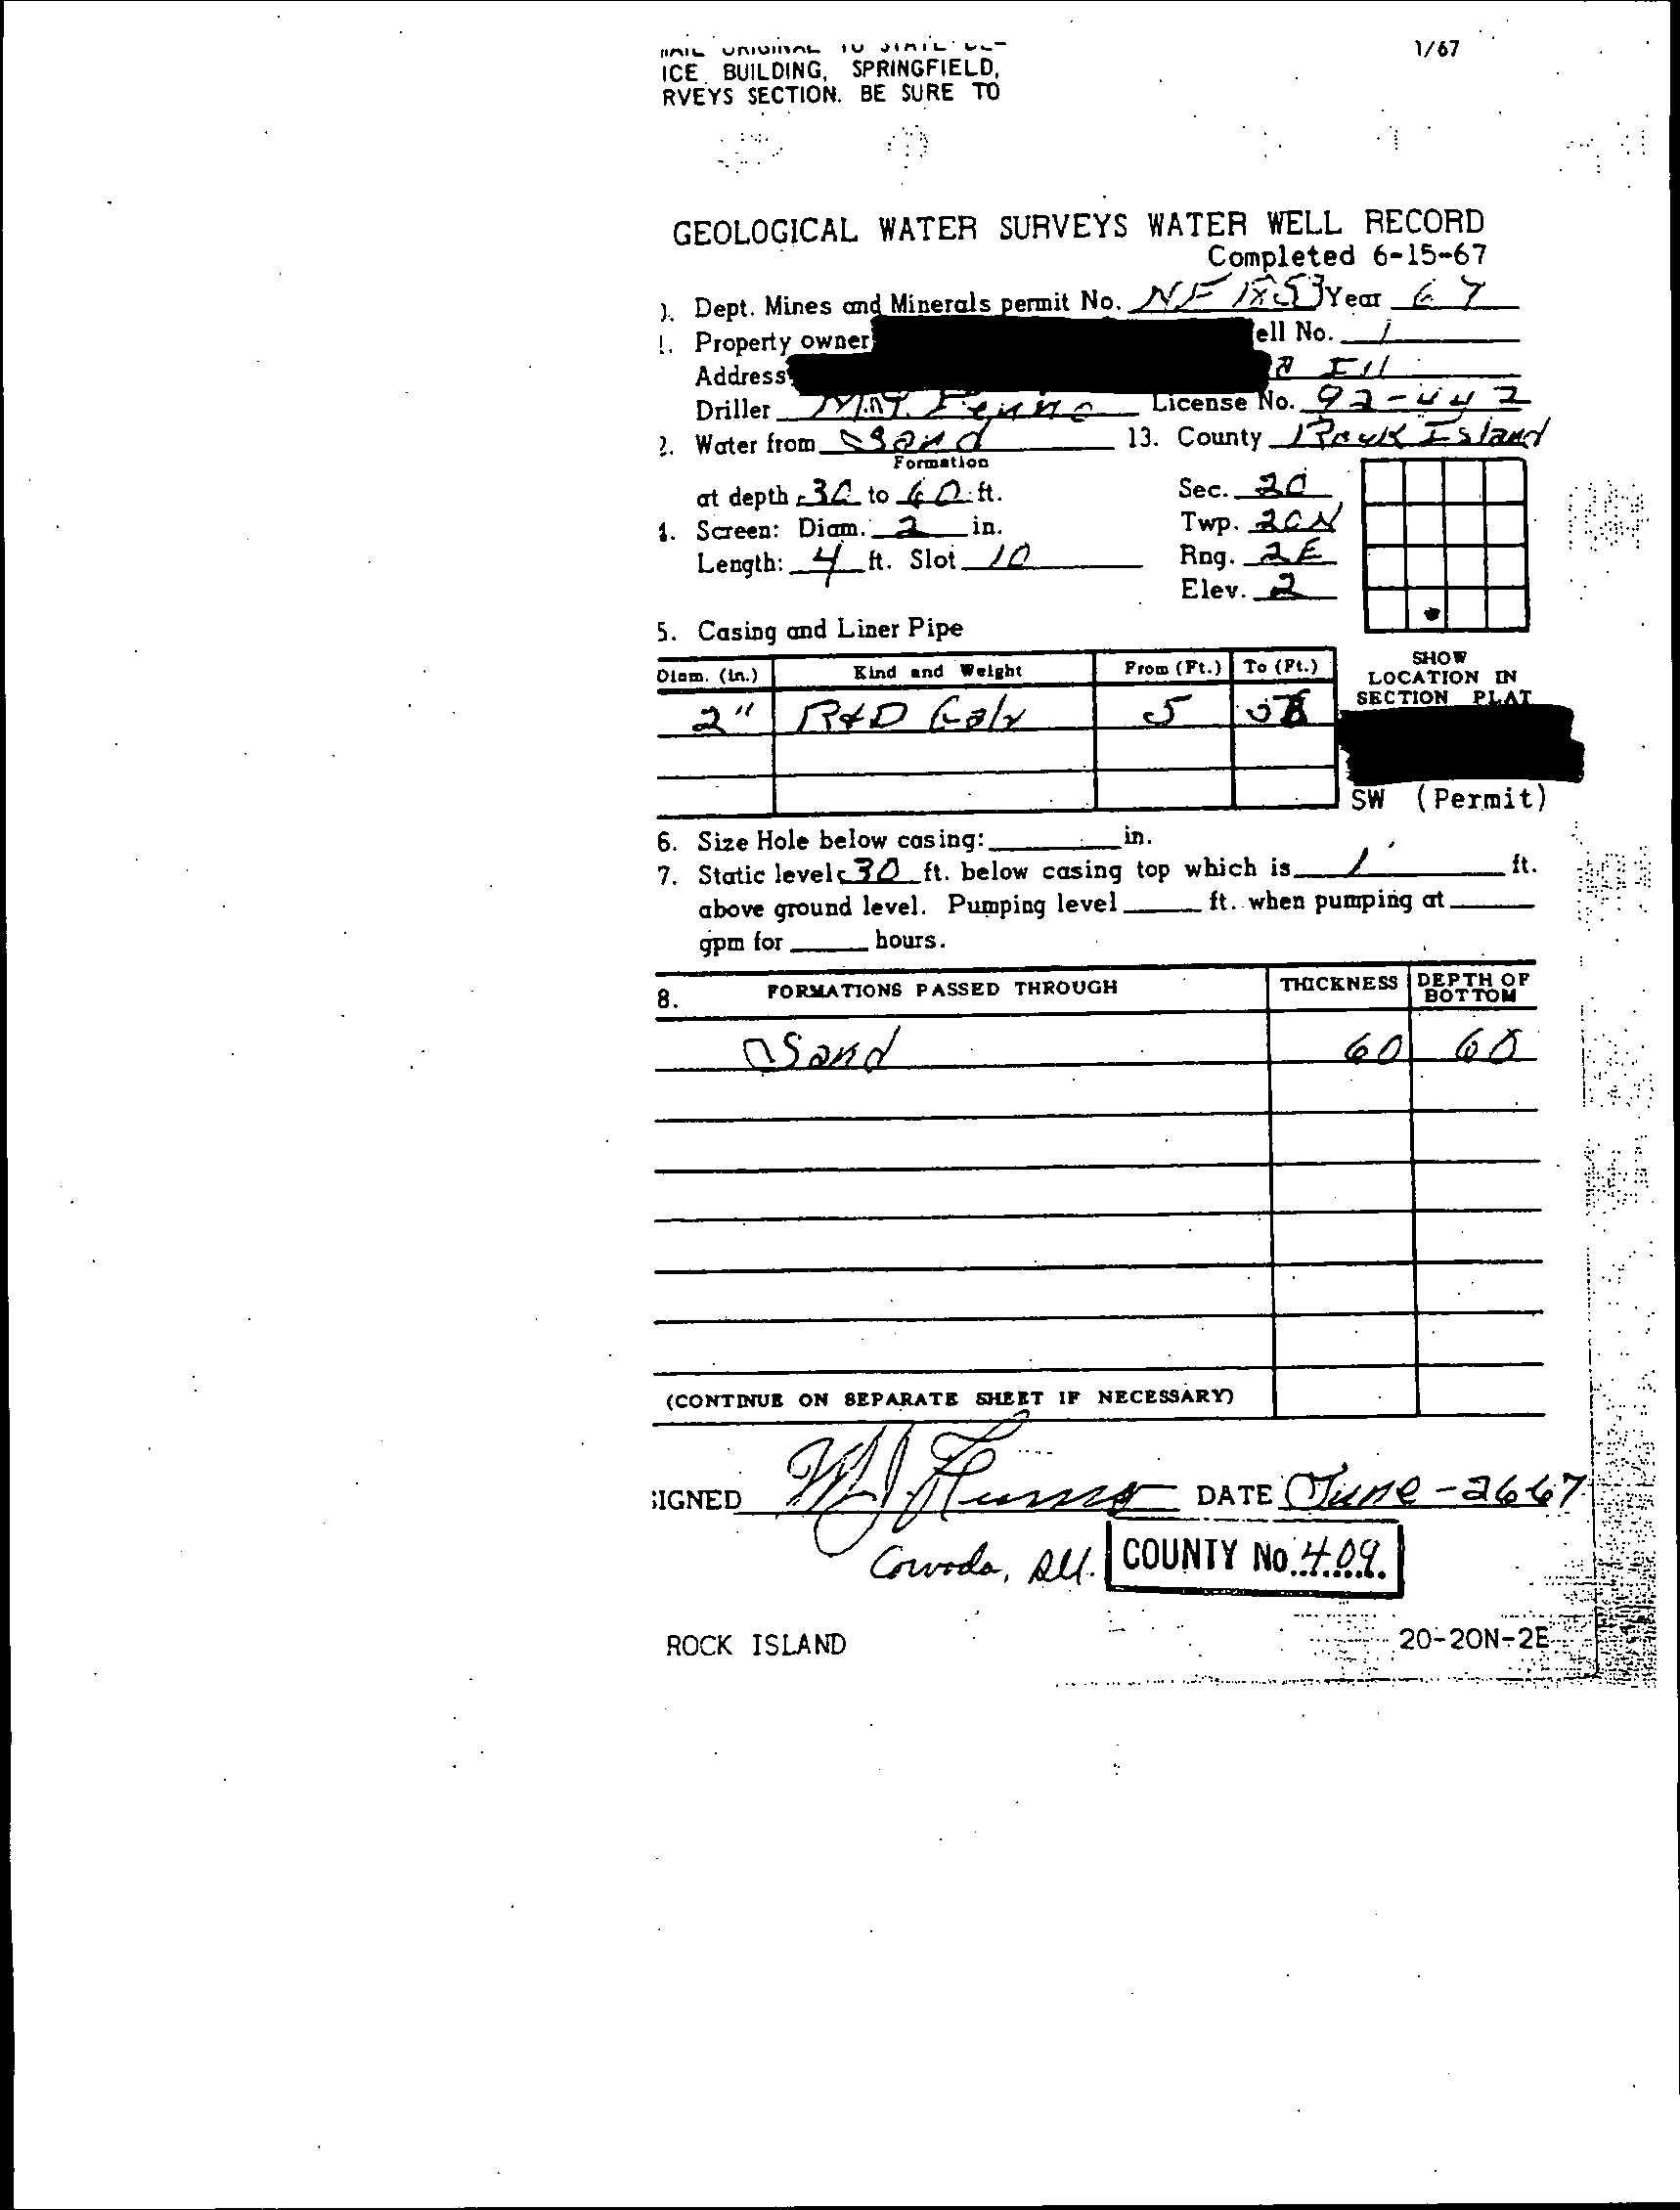
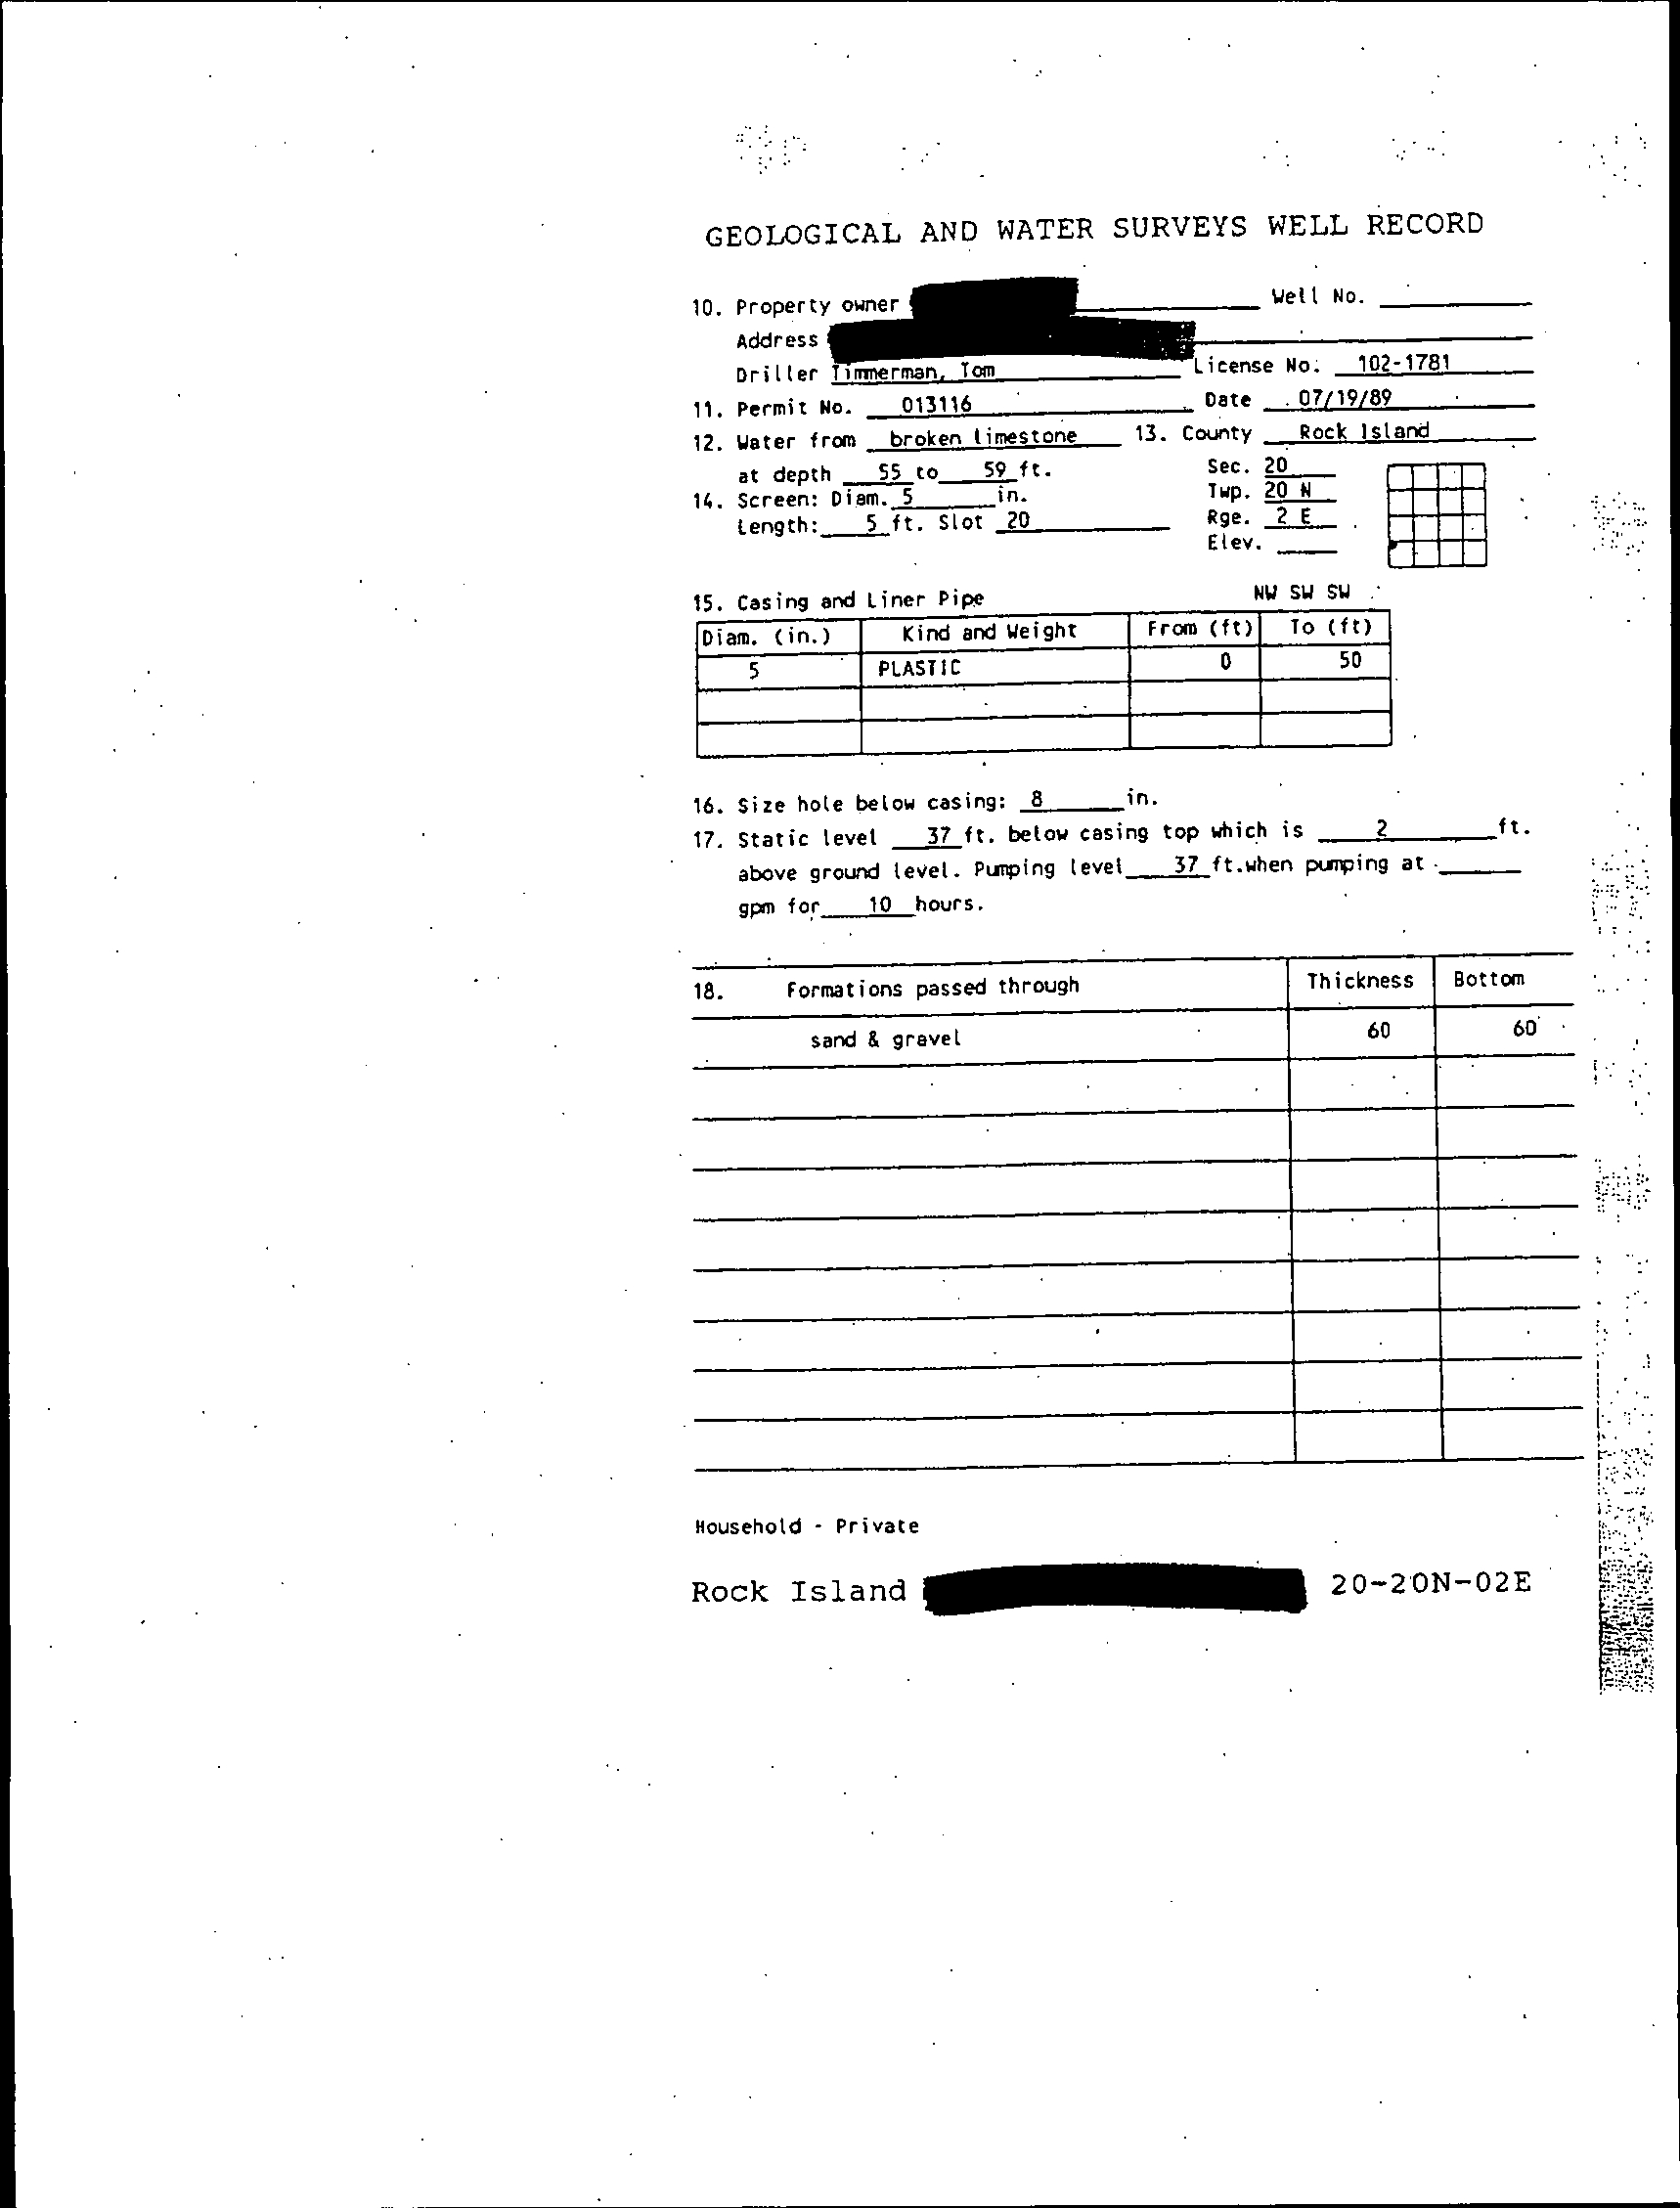
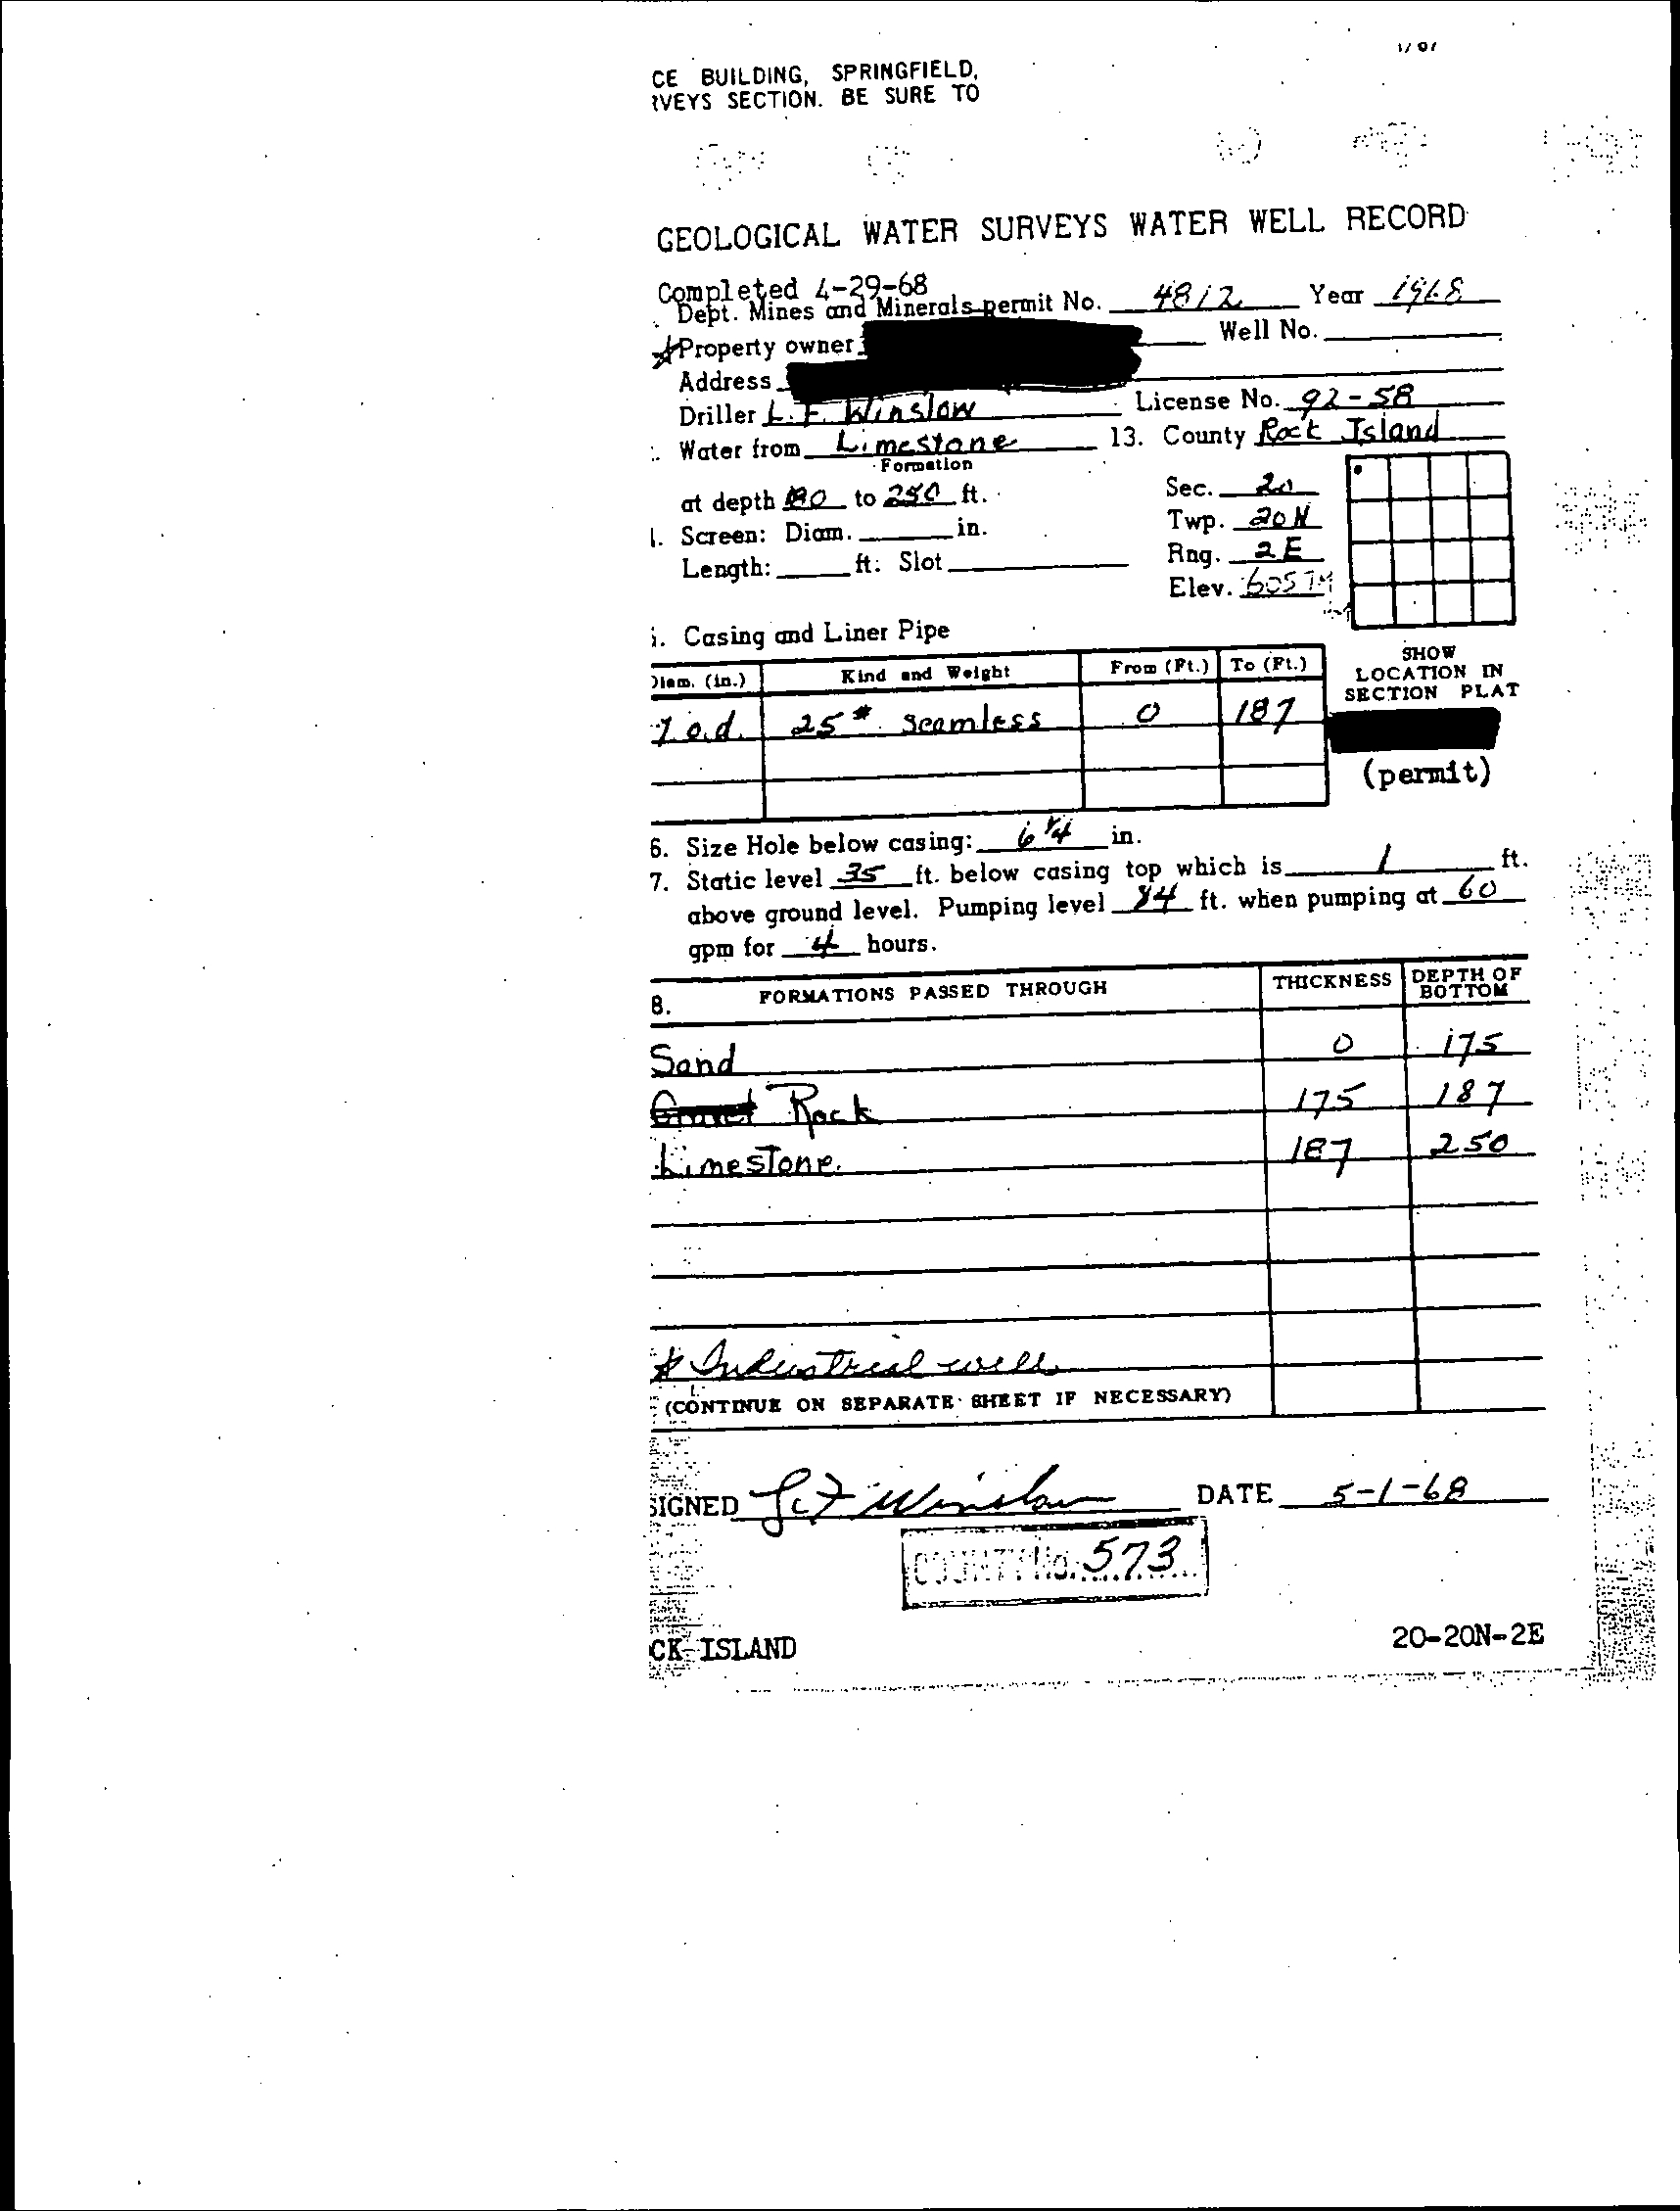
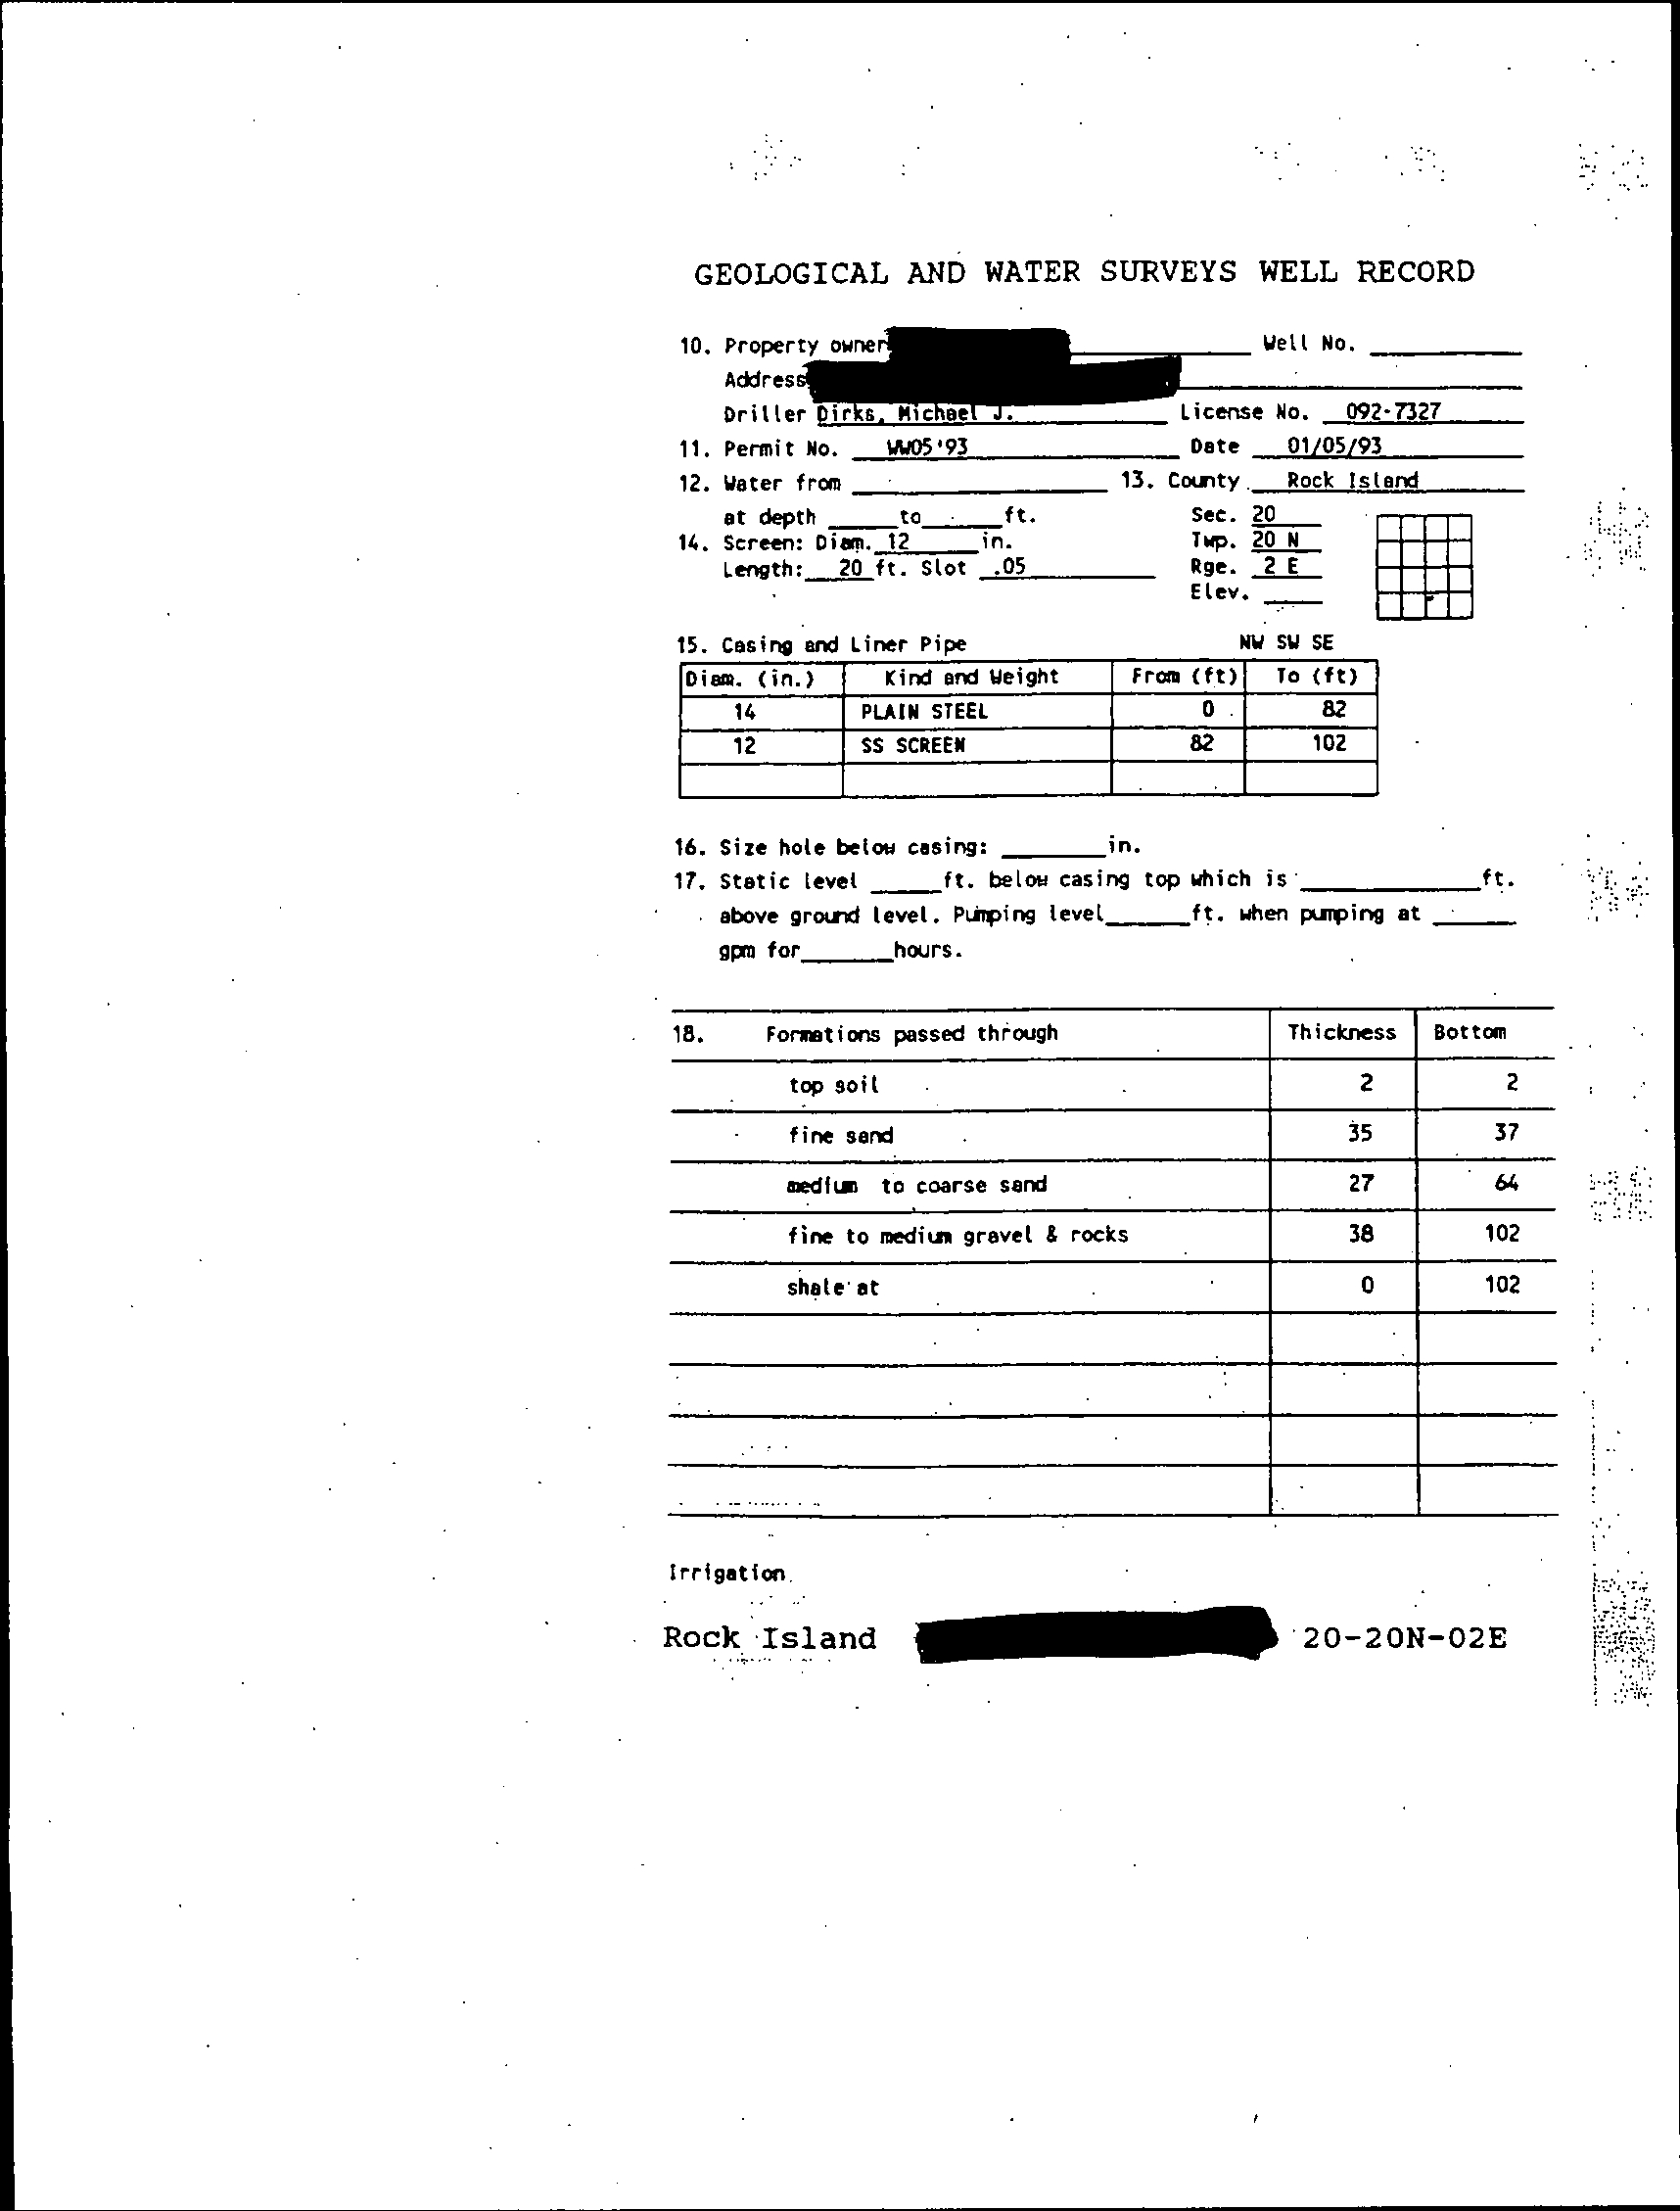
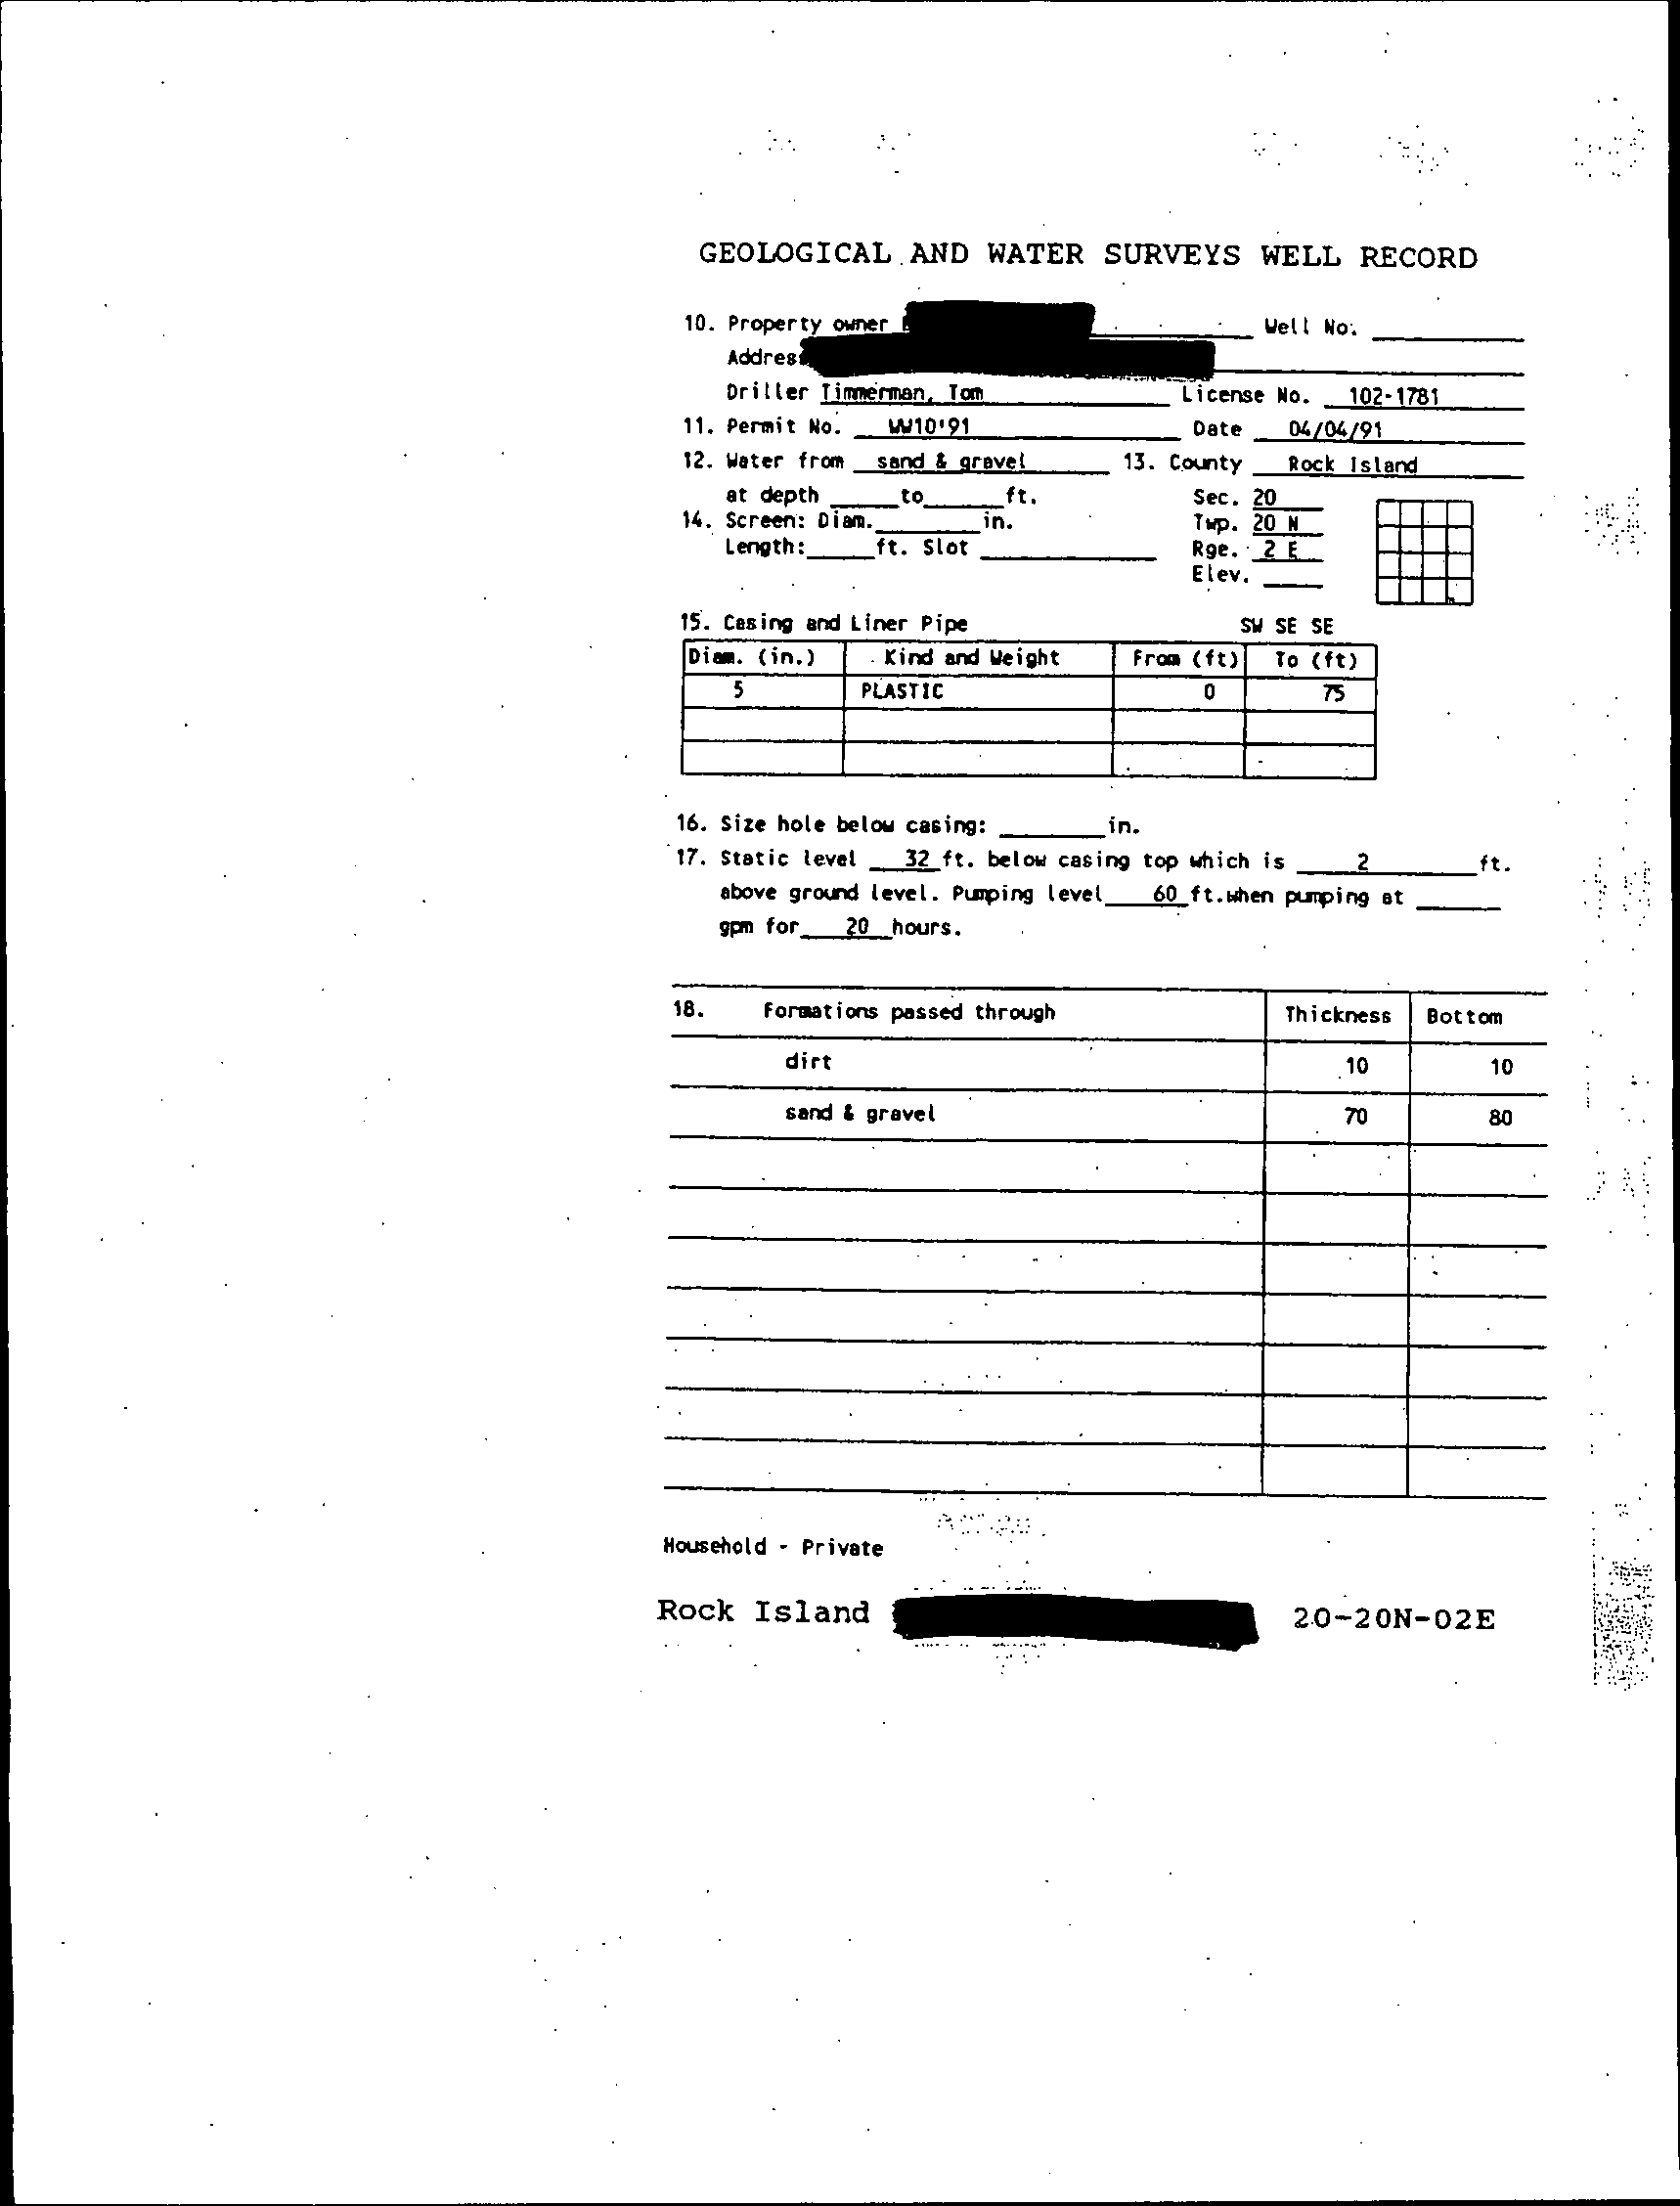
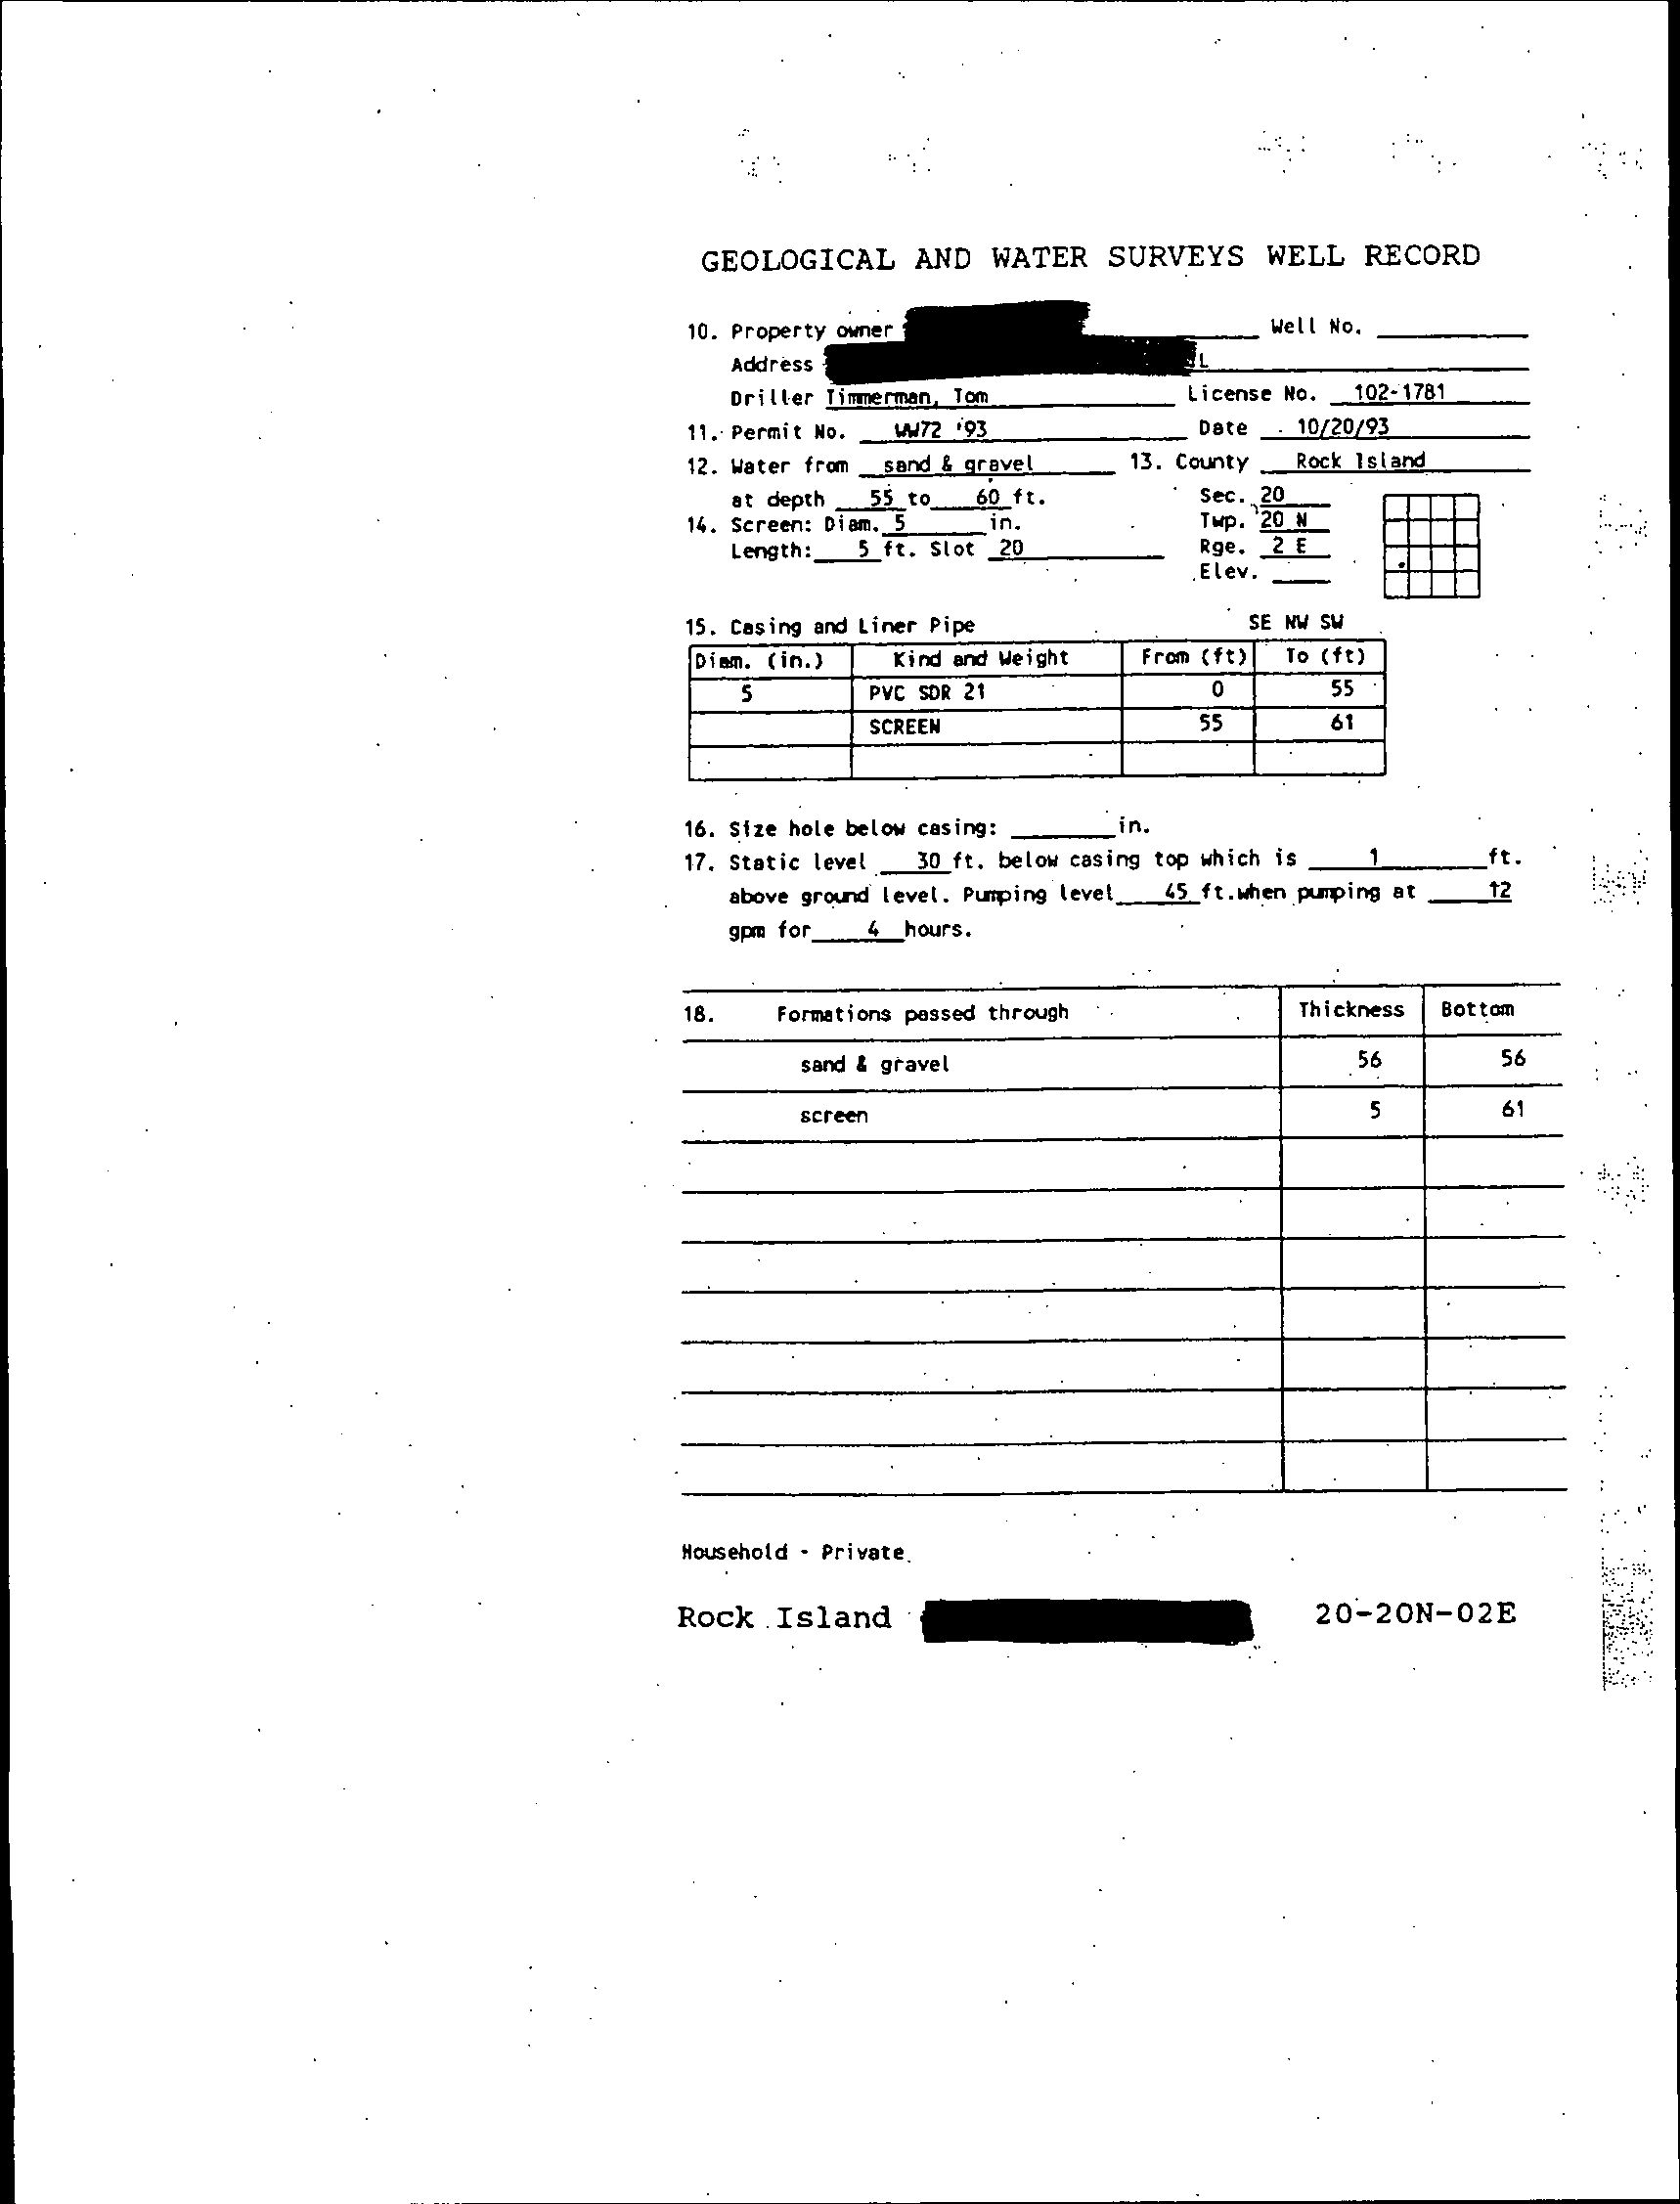
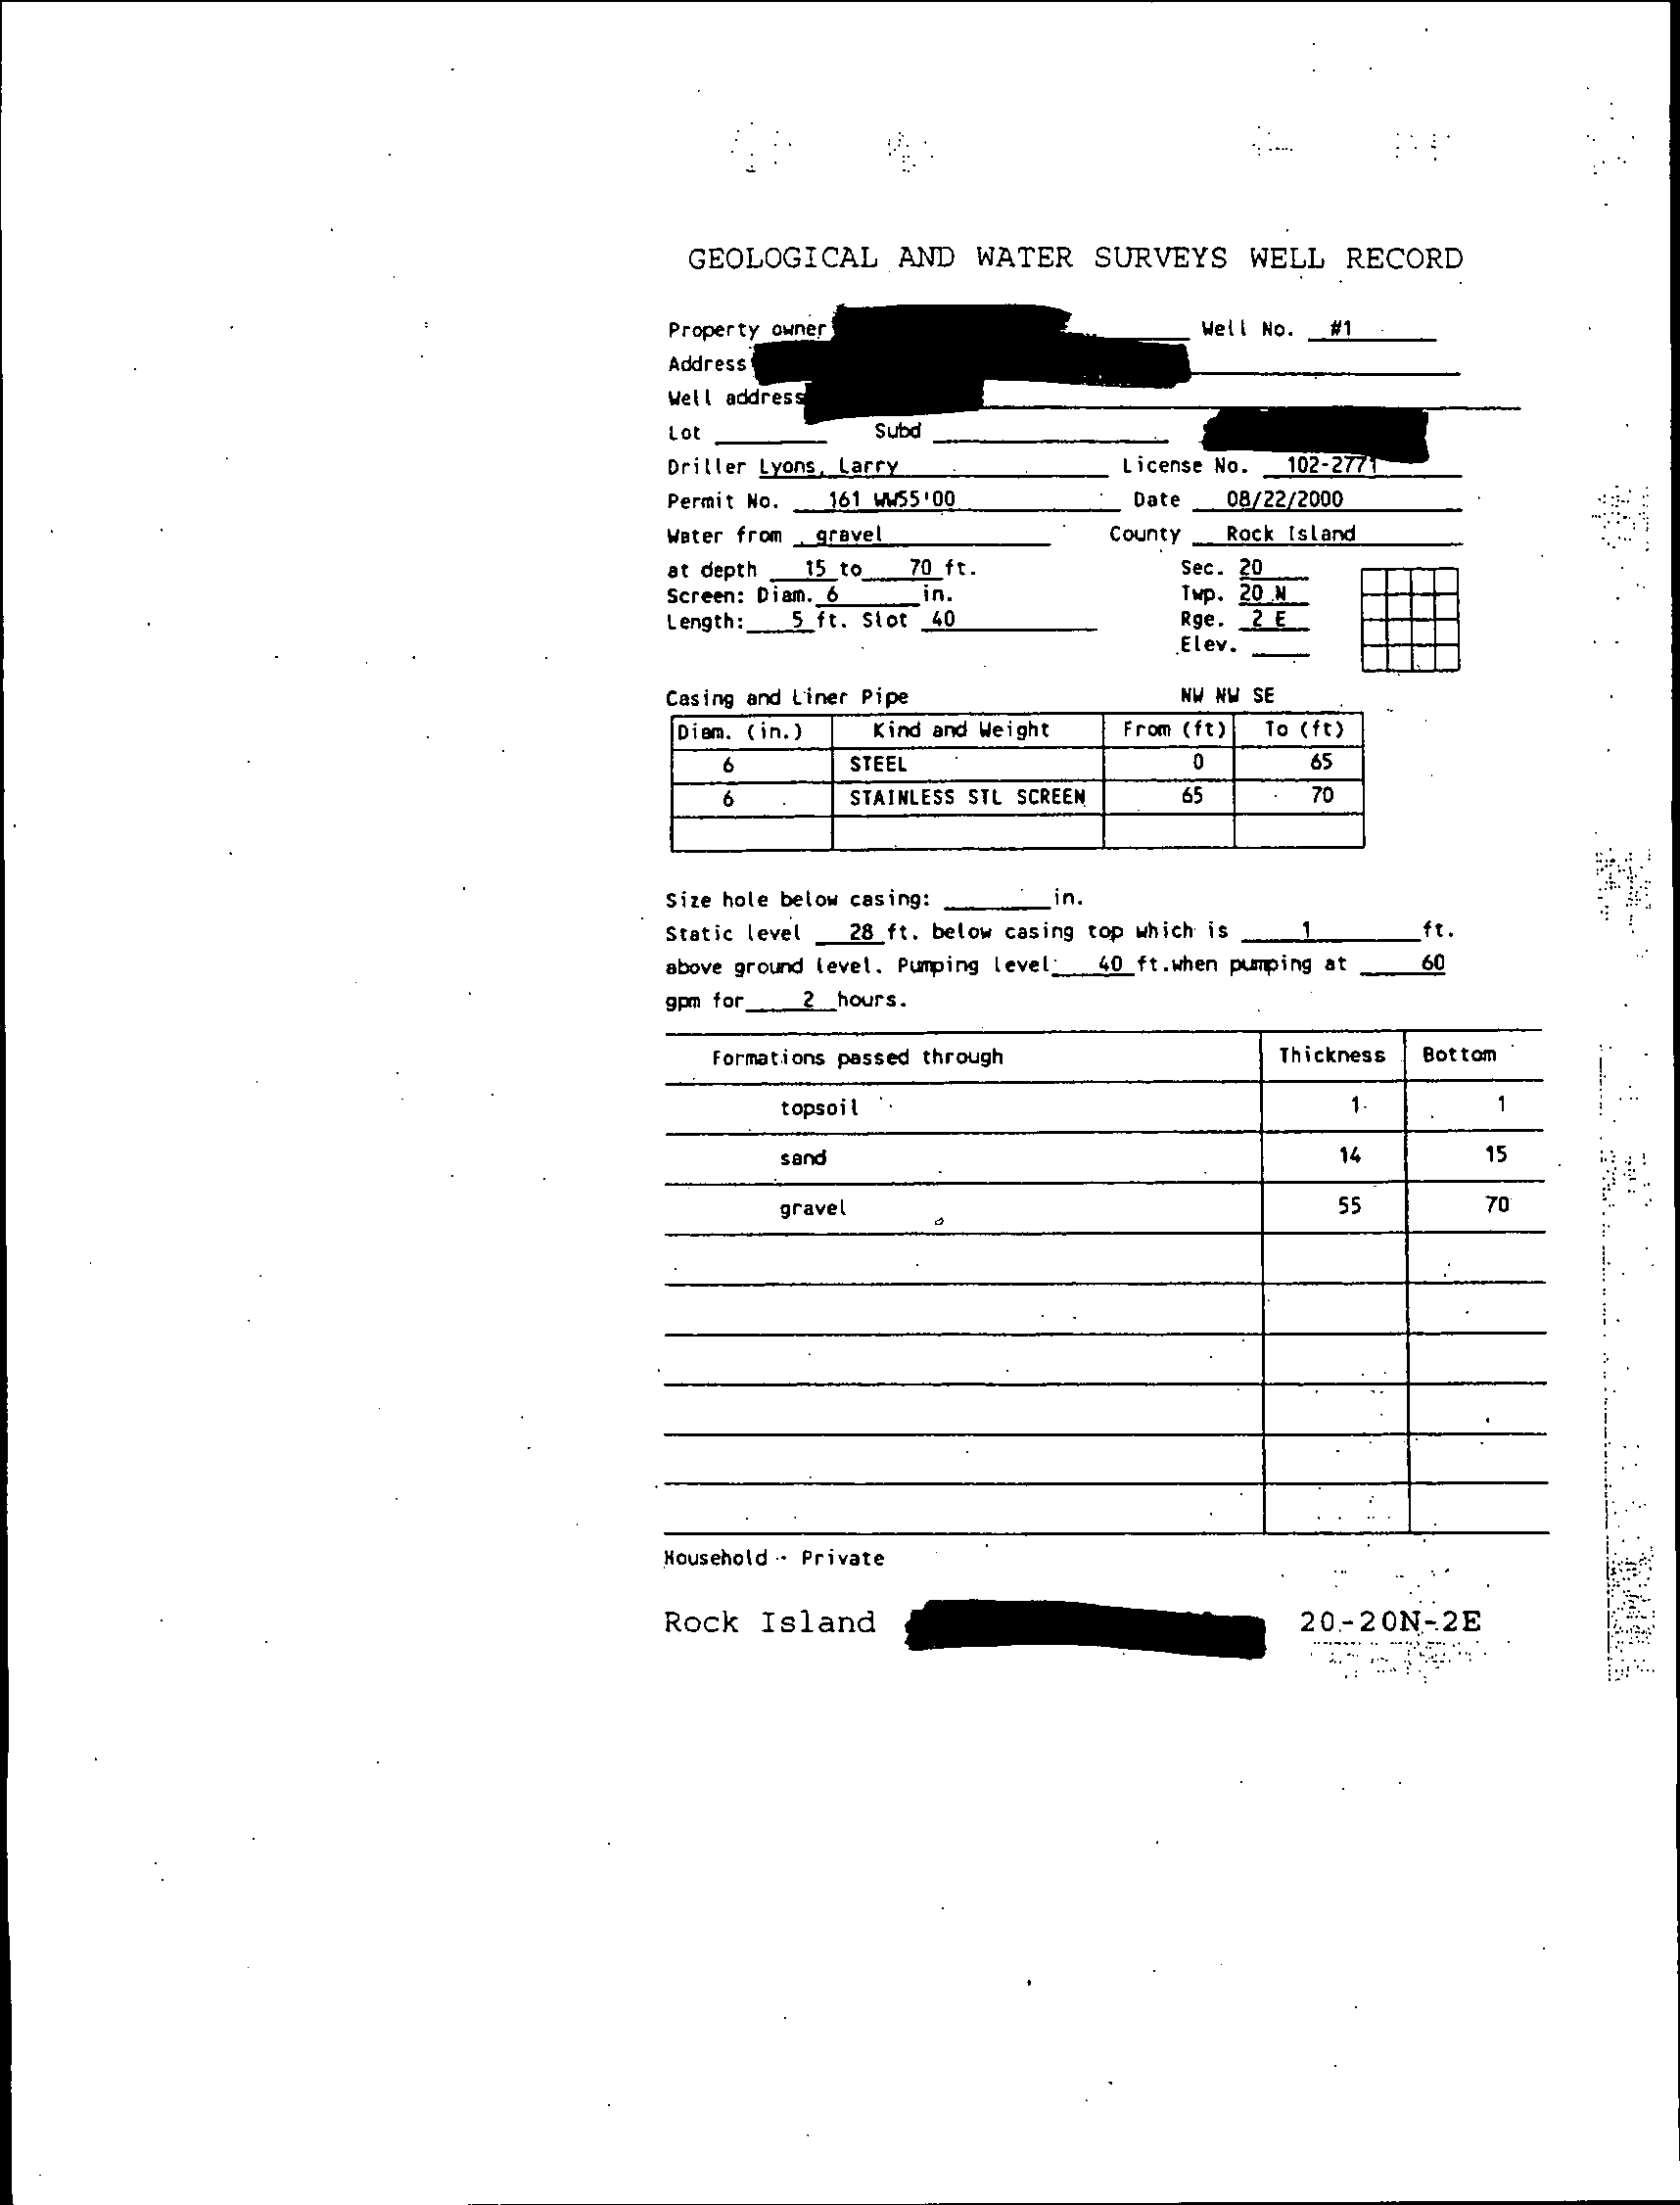
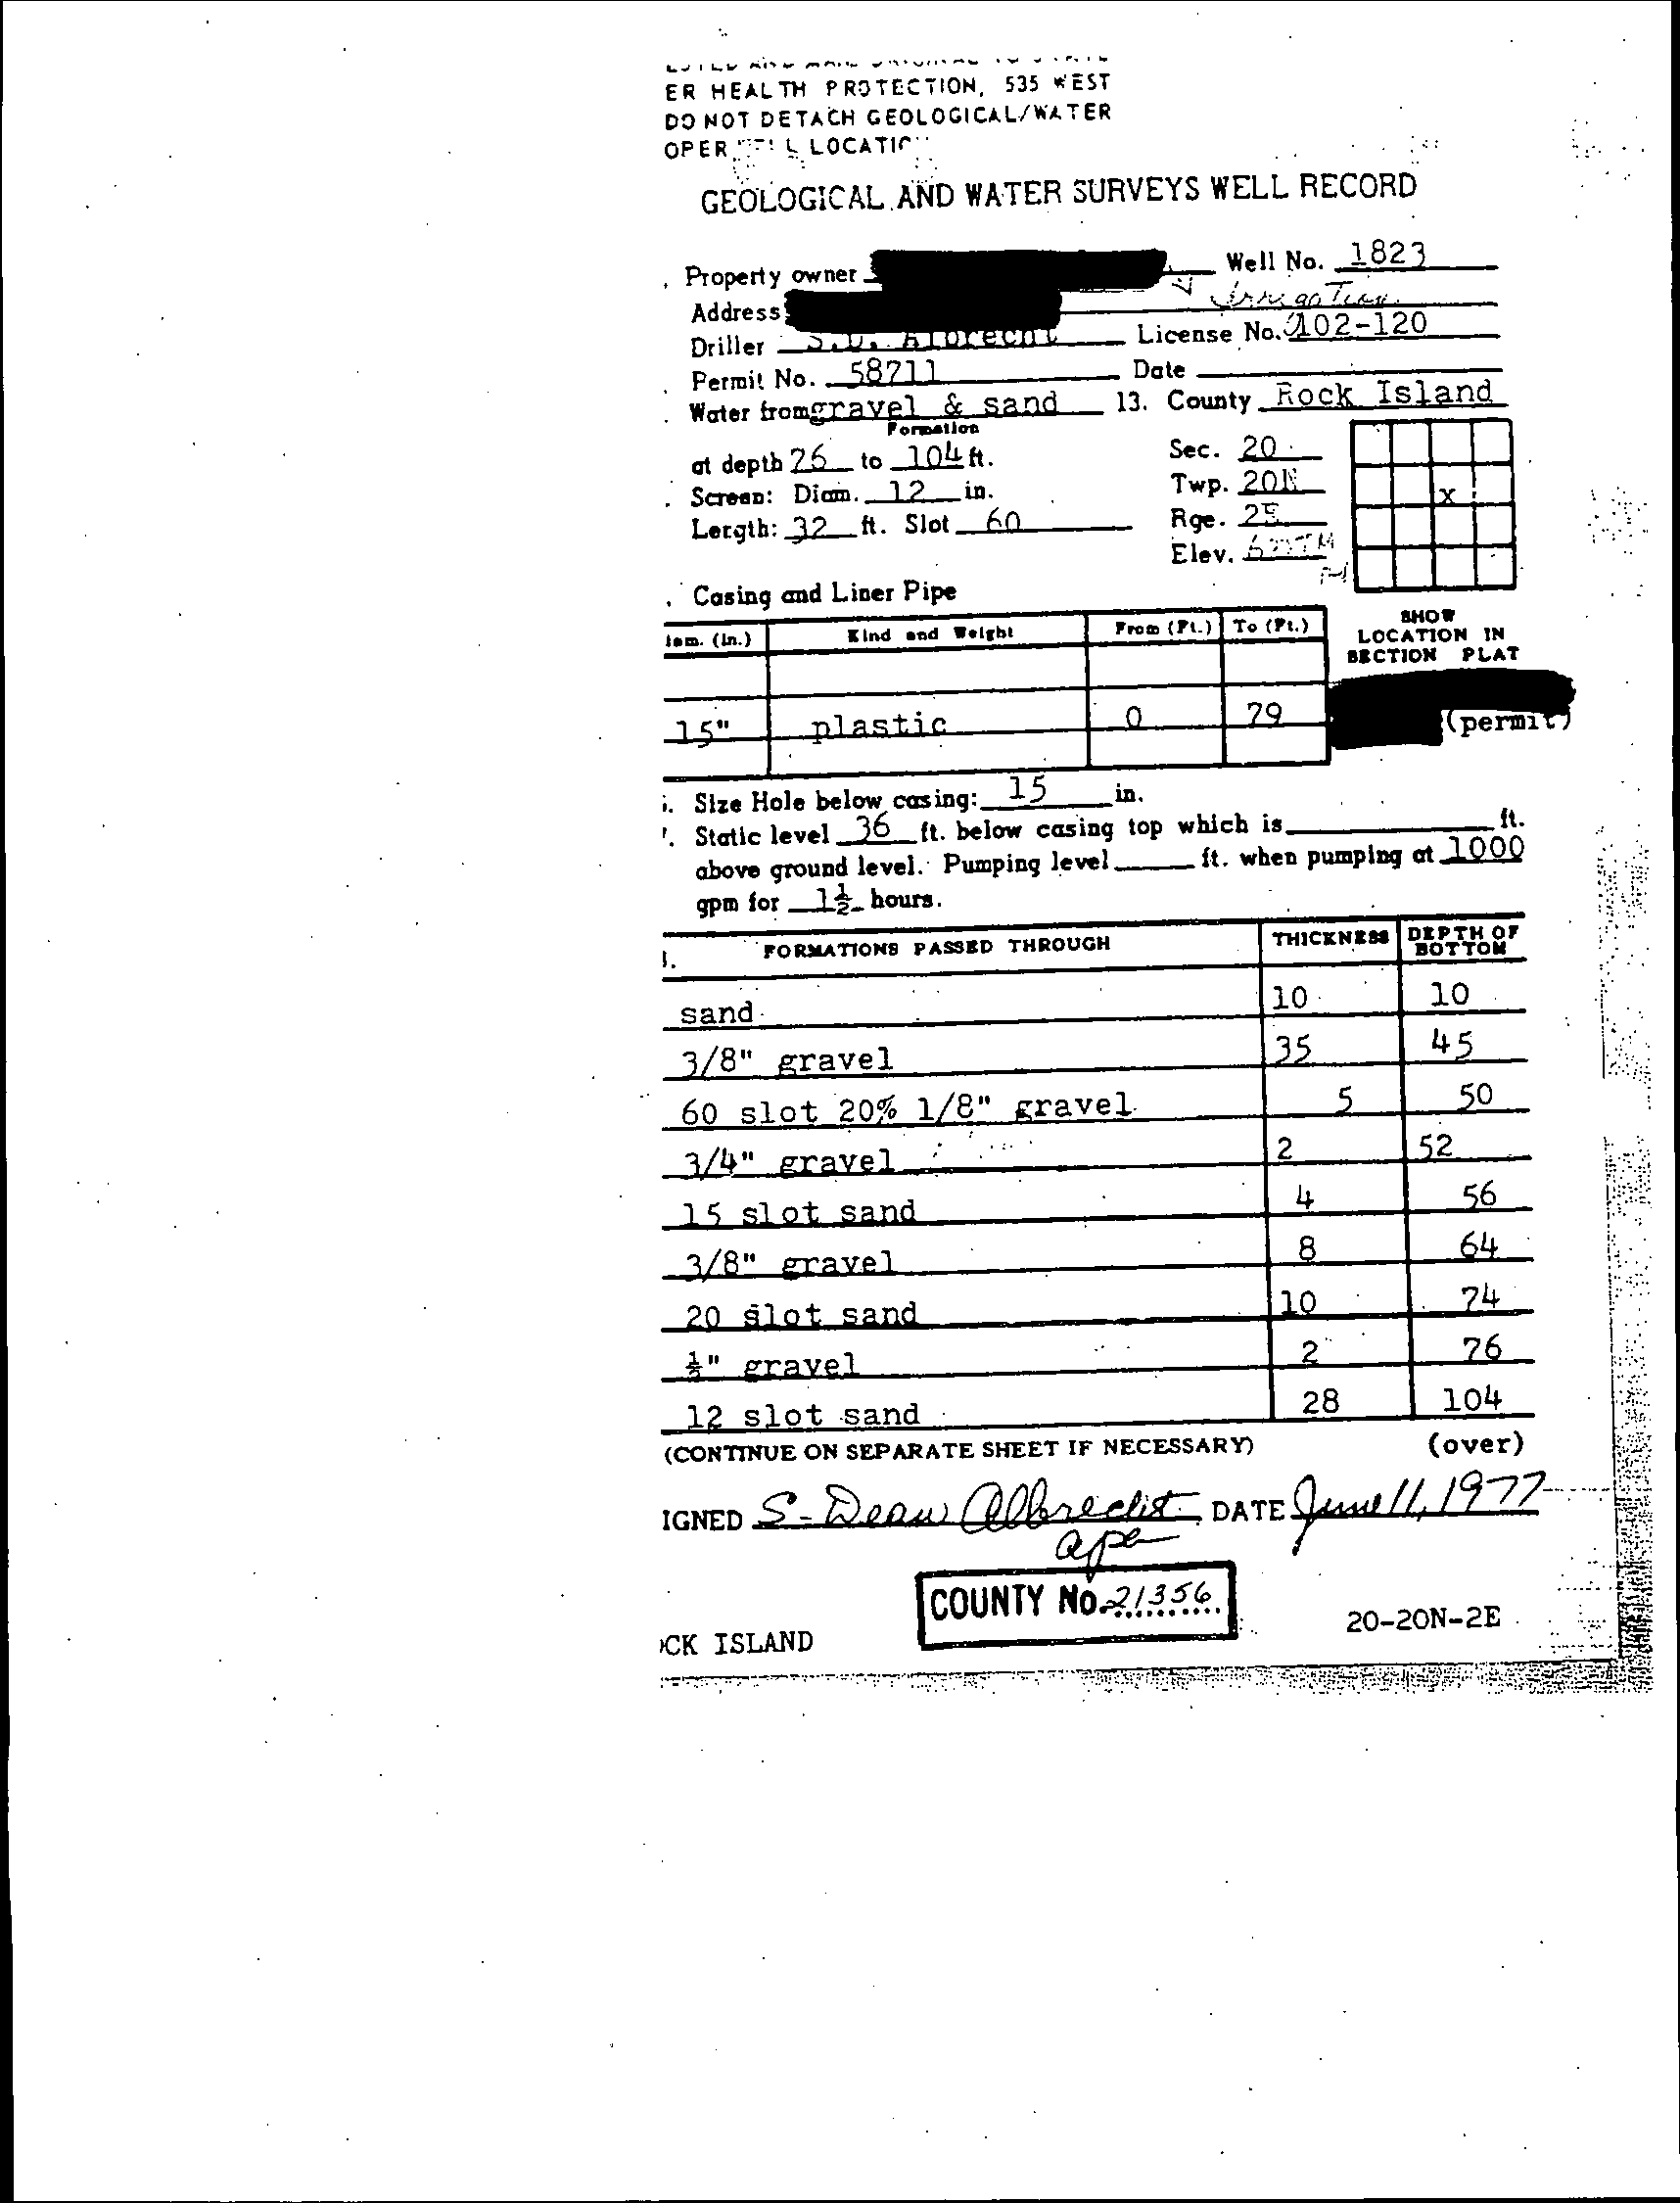
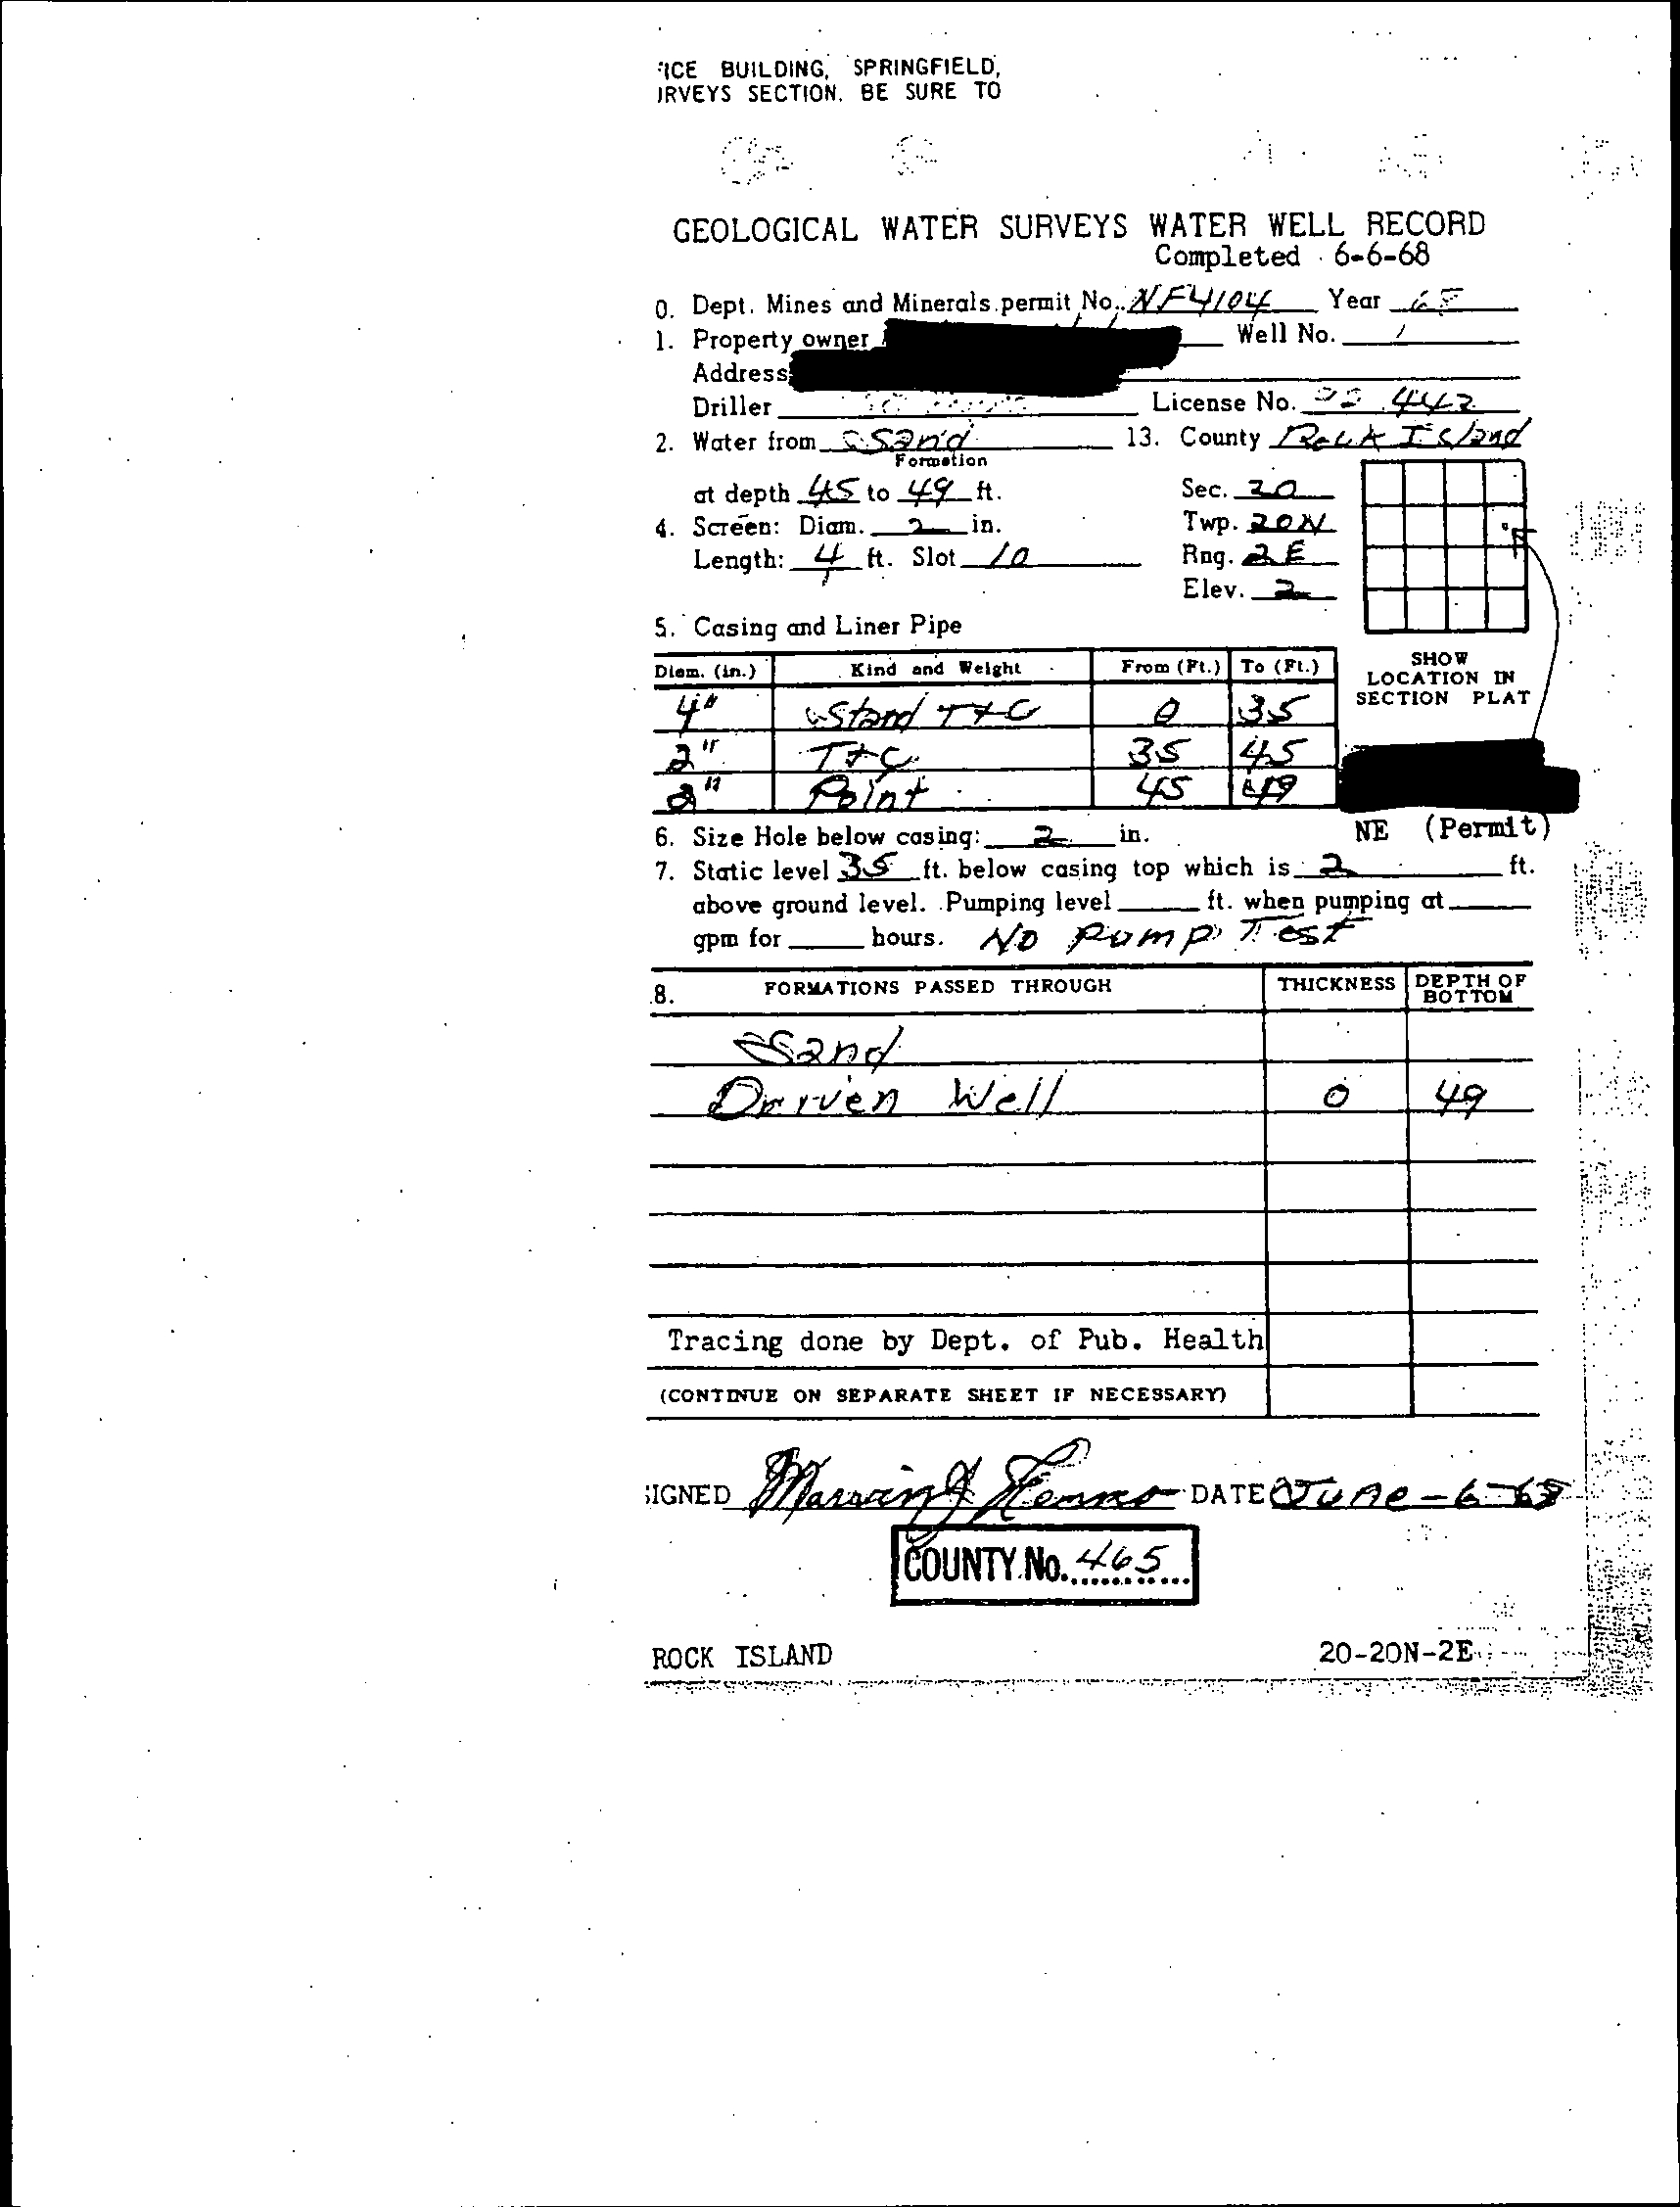
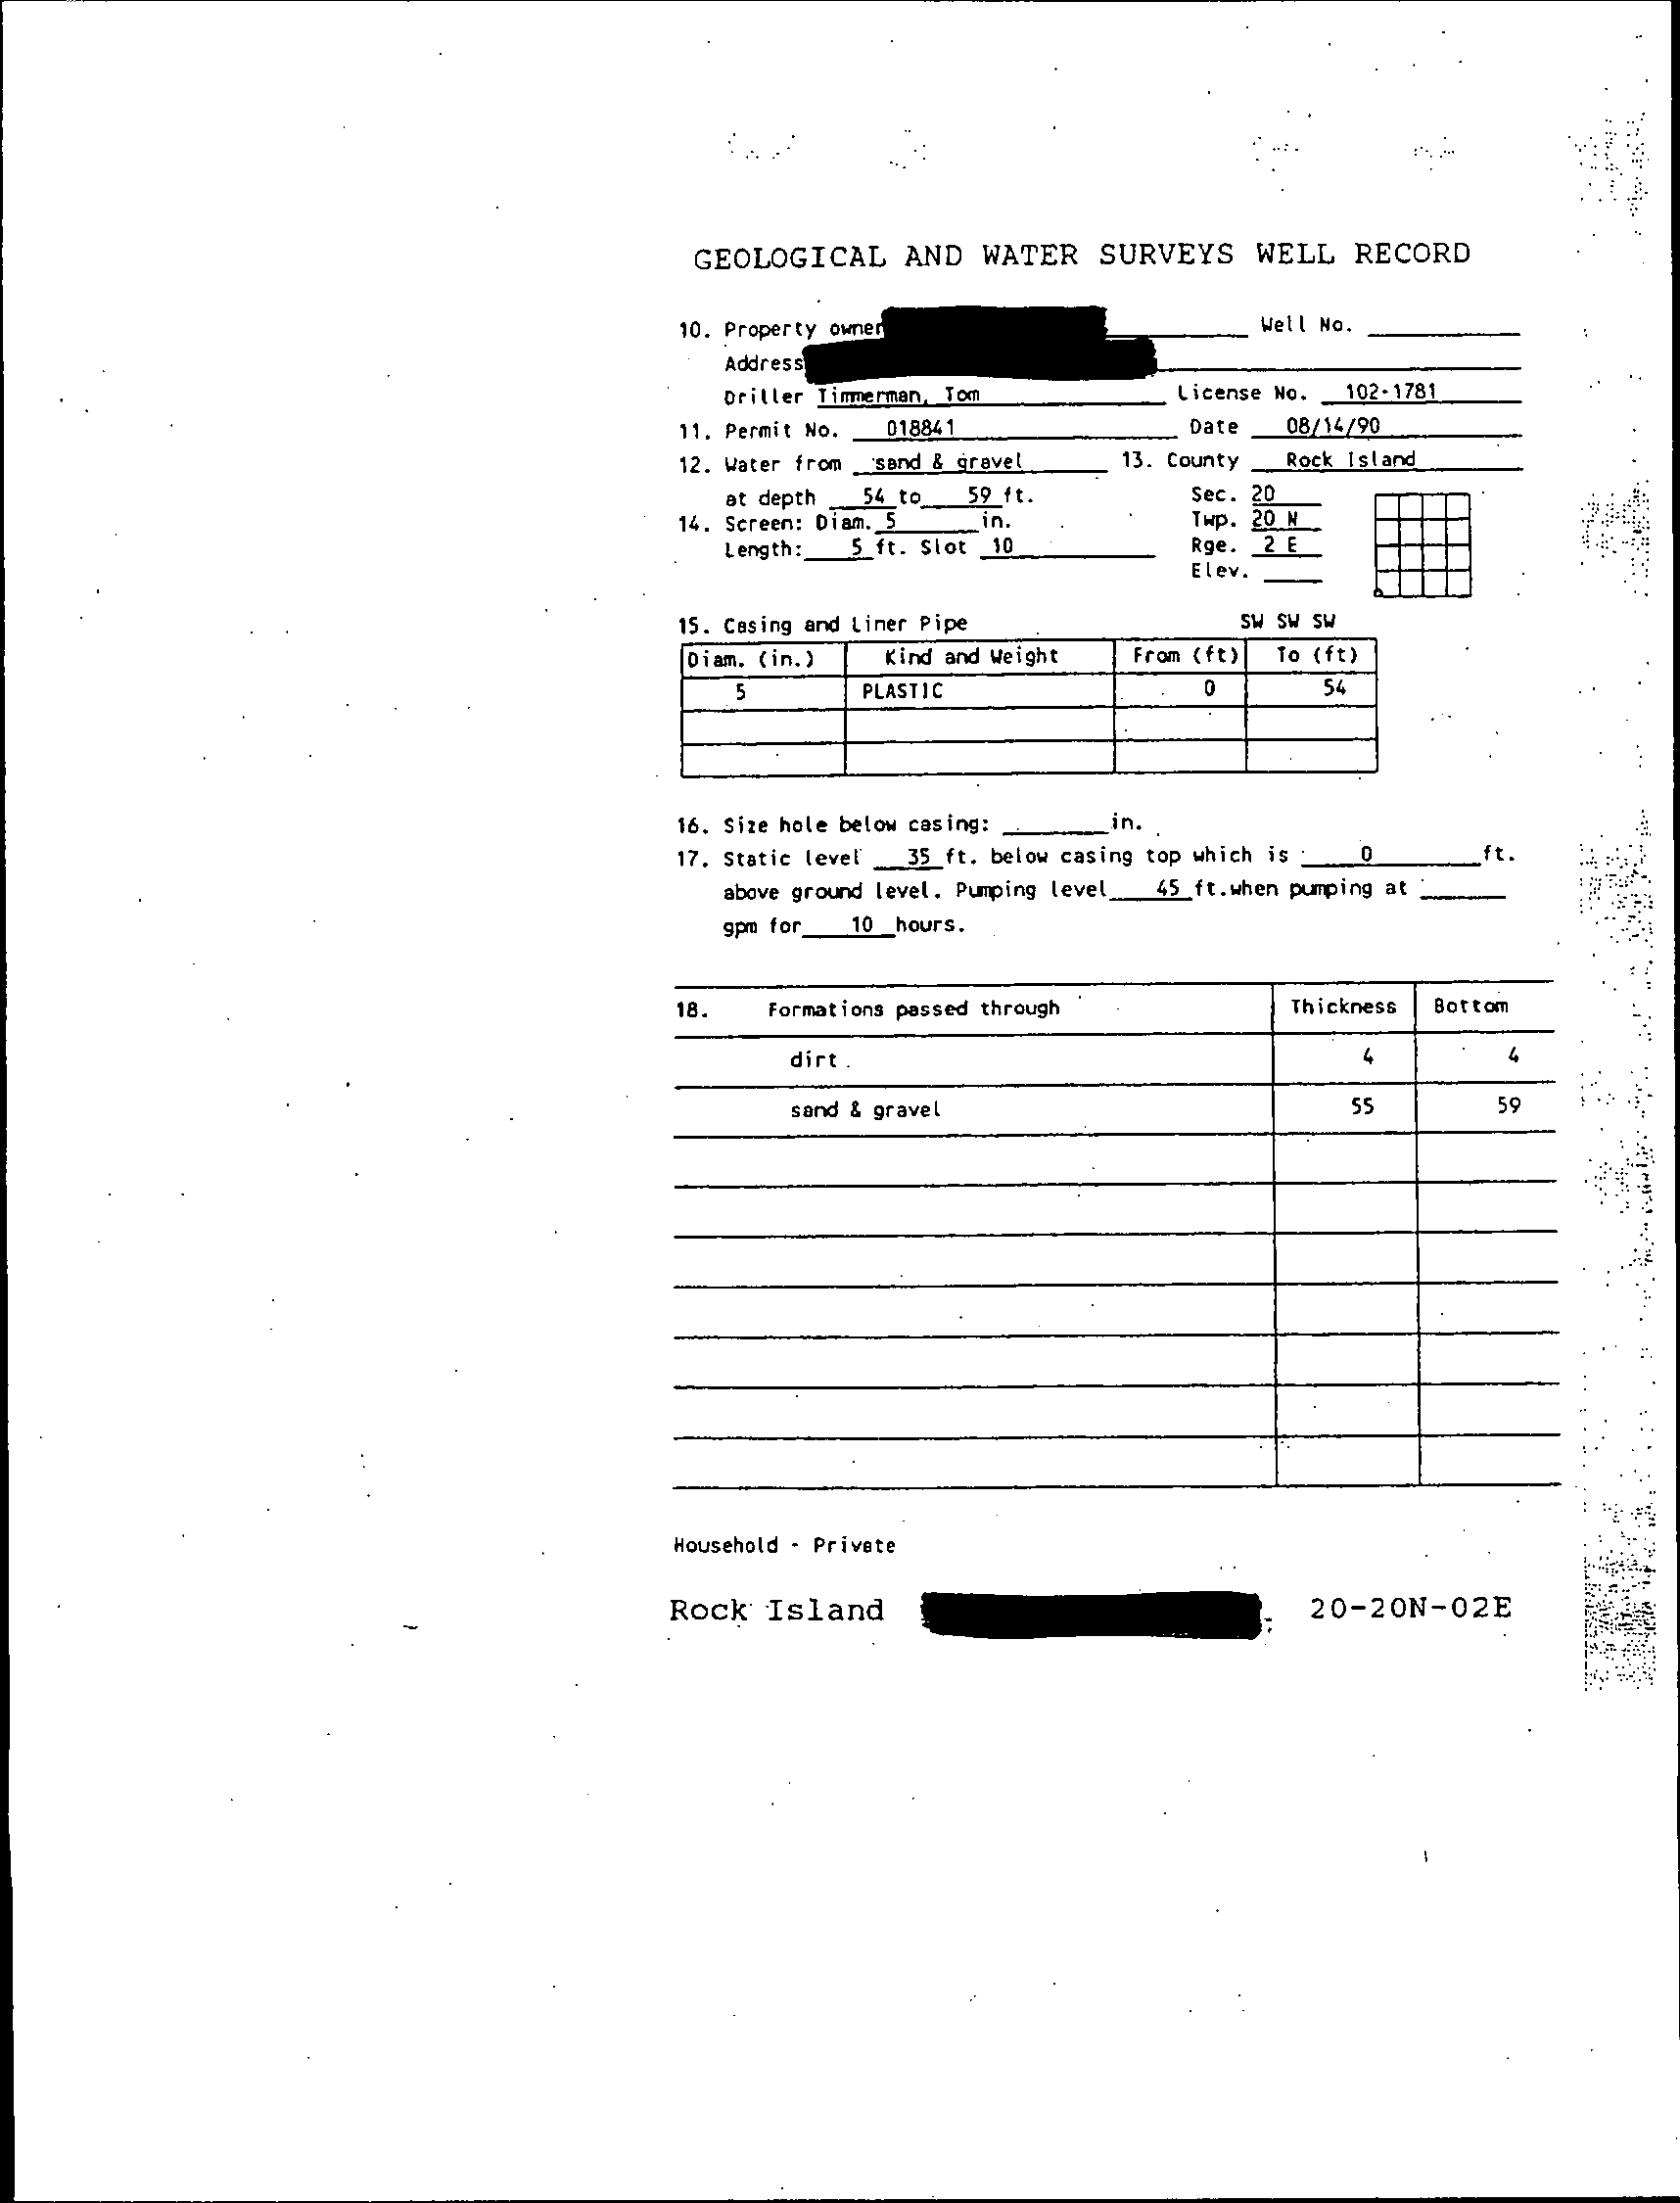
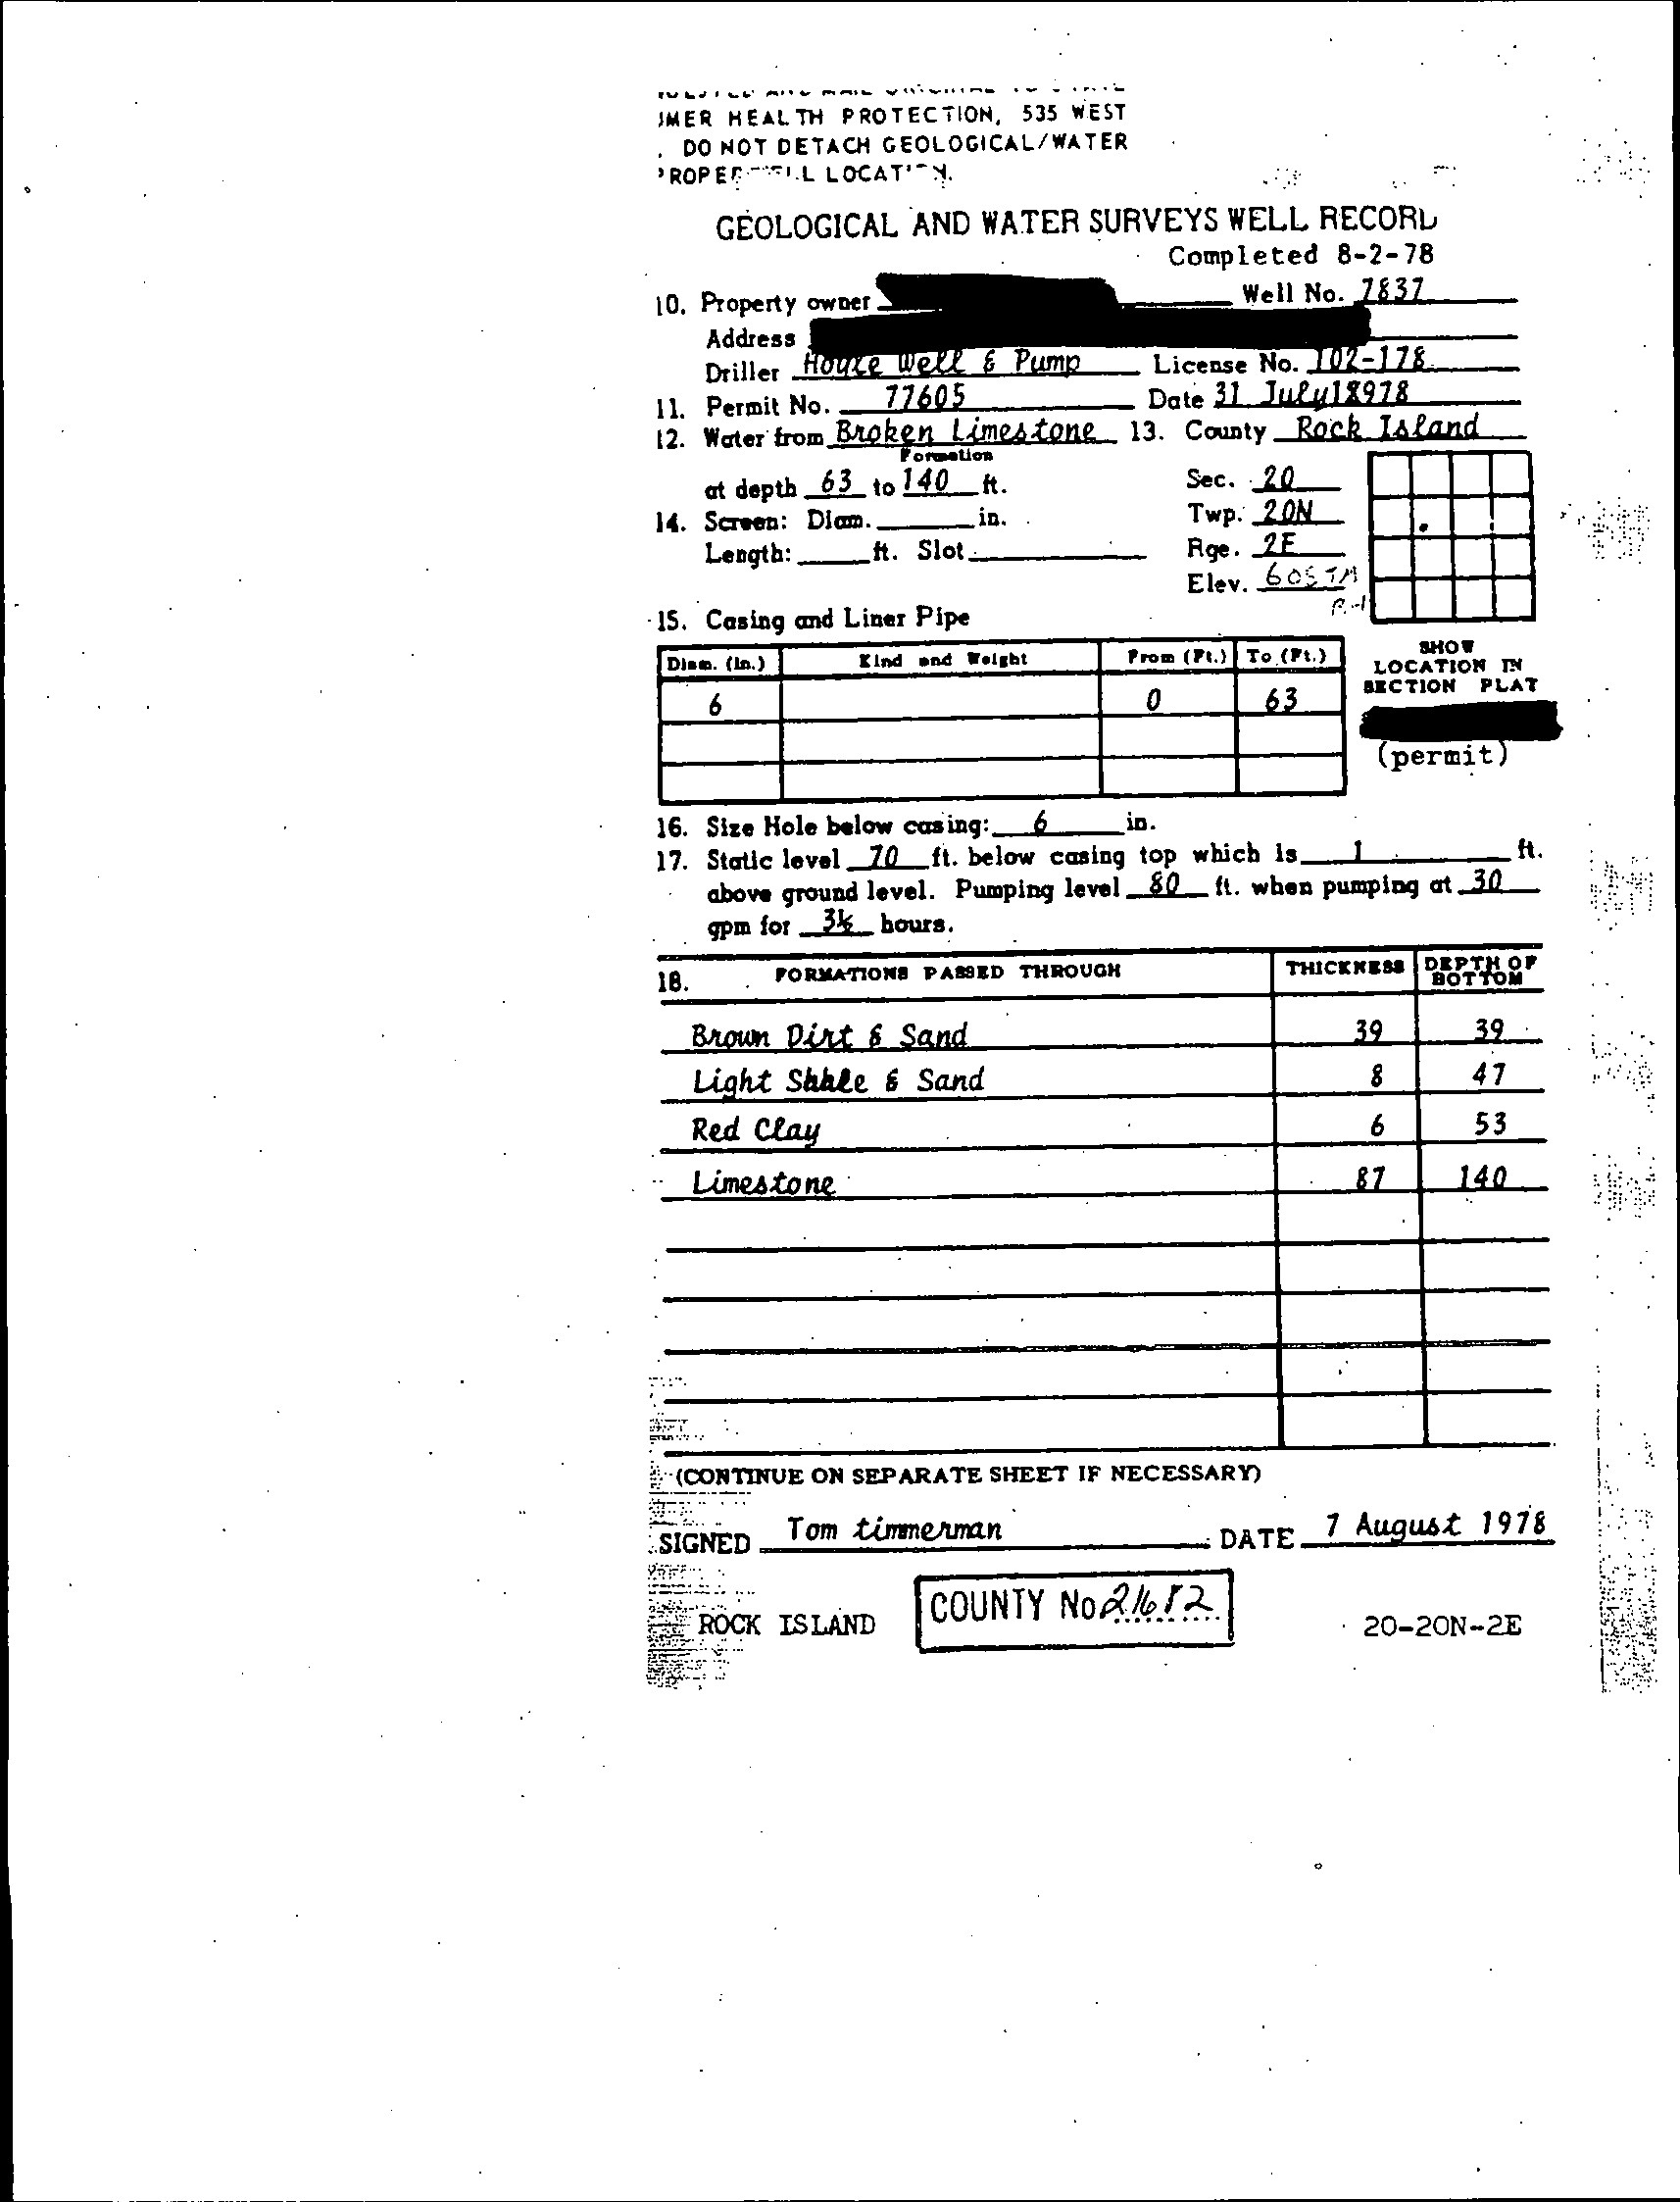
CRA performed a comprehensive private well survey in the vicinity of the
Station. CRA
obtained water well information from the Illinois State Geological Survey and the
Illinois State Water Survey. Eighty-seven private wells were identified as potentially
within 1 mile of the Station. CRA notes that the Illinois State Geological Survey and the
Illinois State Water Survey data sources are not updated with abandoned or closed well
information and distances from a referenced point may not be accurately reported. The
private wells range in depth between 20 and 250 feet bgs with the oldest private well
dating back to 1909 and the most recent private well being installed on November 3,
2005. Fifteen public, industrial, and commercial wells were identified as potentially
within 1 mile of the Station. The public, industrial, and commercial wells range in depth
from 58 to 1,800 feet bgs with the oldest well dating back to 1966 and the most recent
well being installed in 2004. Thirteen of the public, industrial, and commercial wells are
listed as being located at the Station. The remaining two public, industrial, and
commercial wells list the owner as "Saddle Club Farms", a horse farm/dinner club no
longer in operation that was located over 1 mile from the Station. Copies of the well
logs obtained are provided in Appendix A.
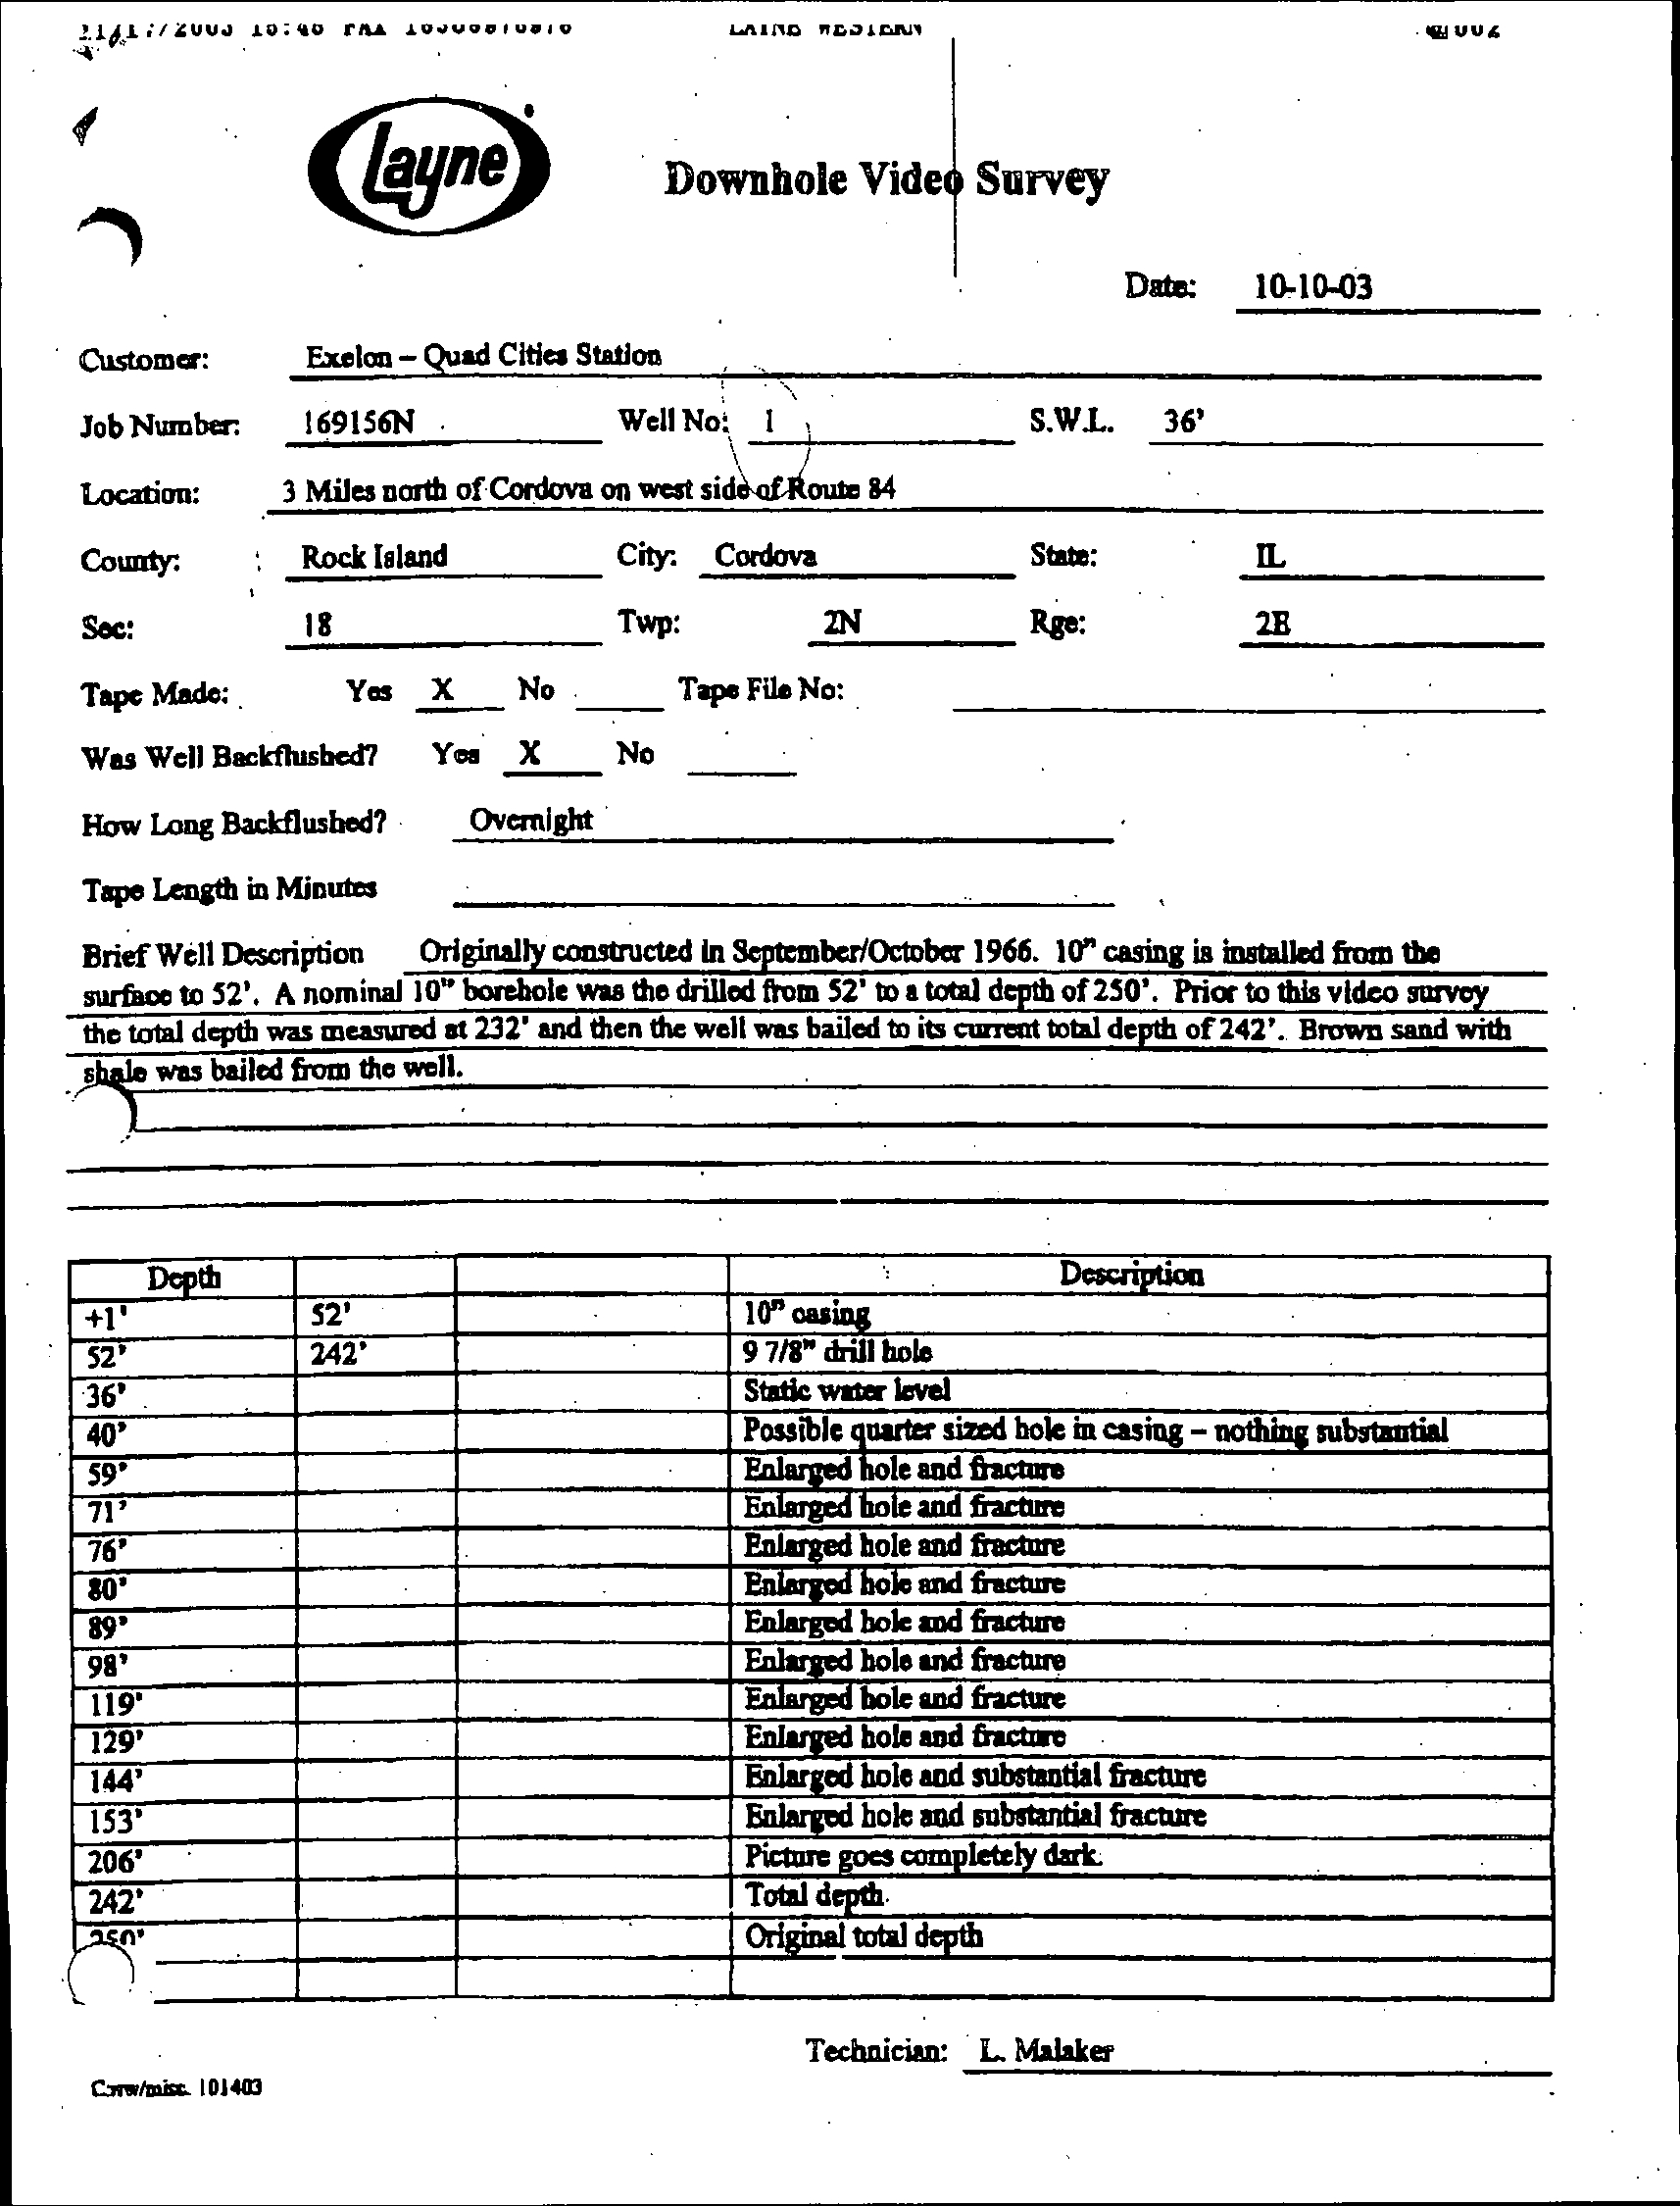
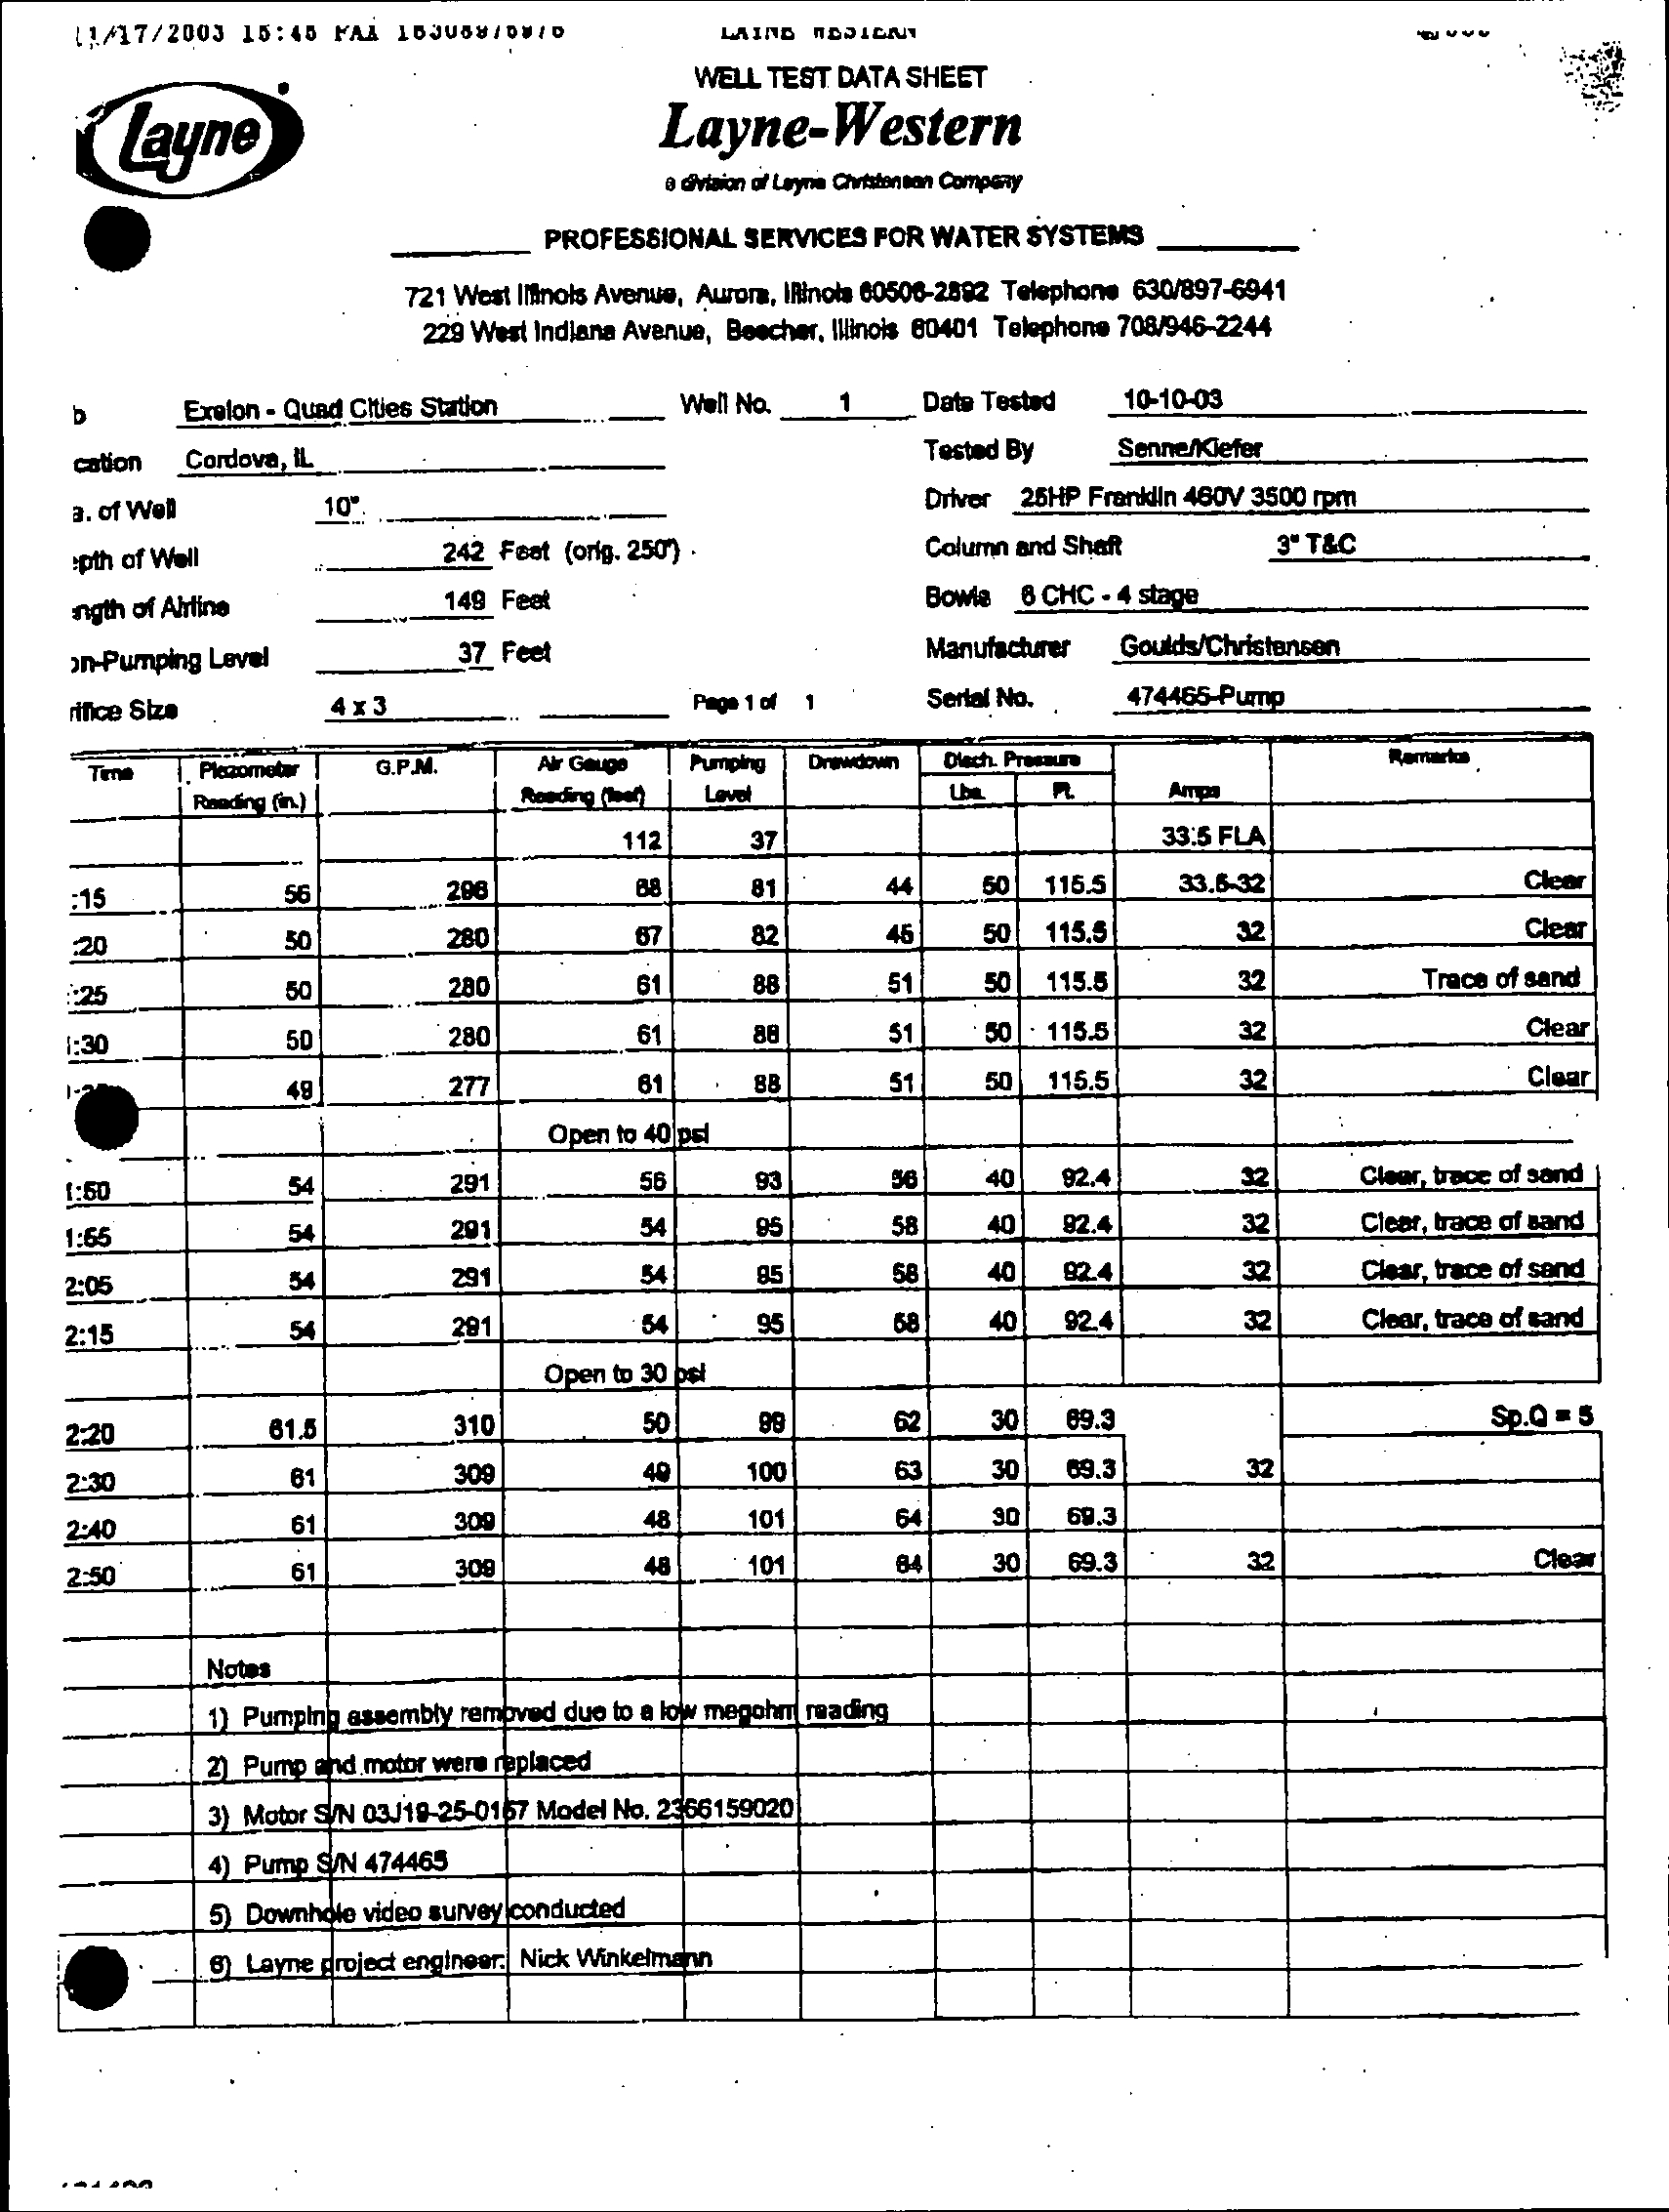
The Station receives potable water from three wells:
•
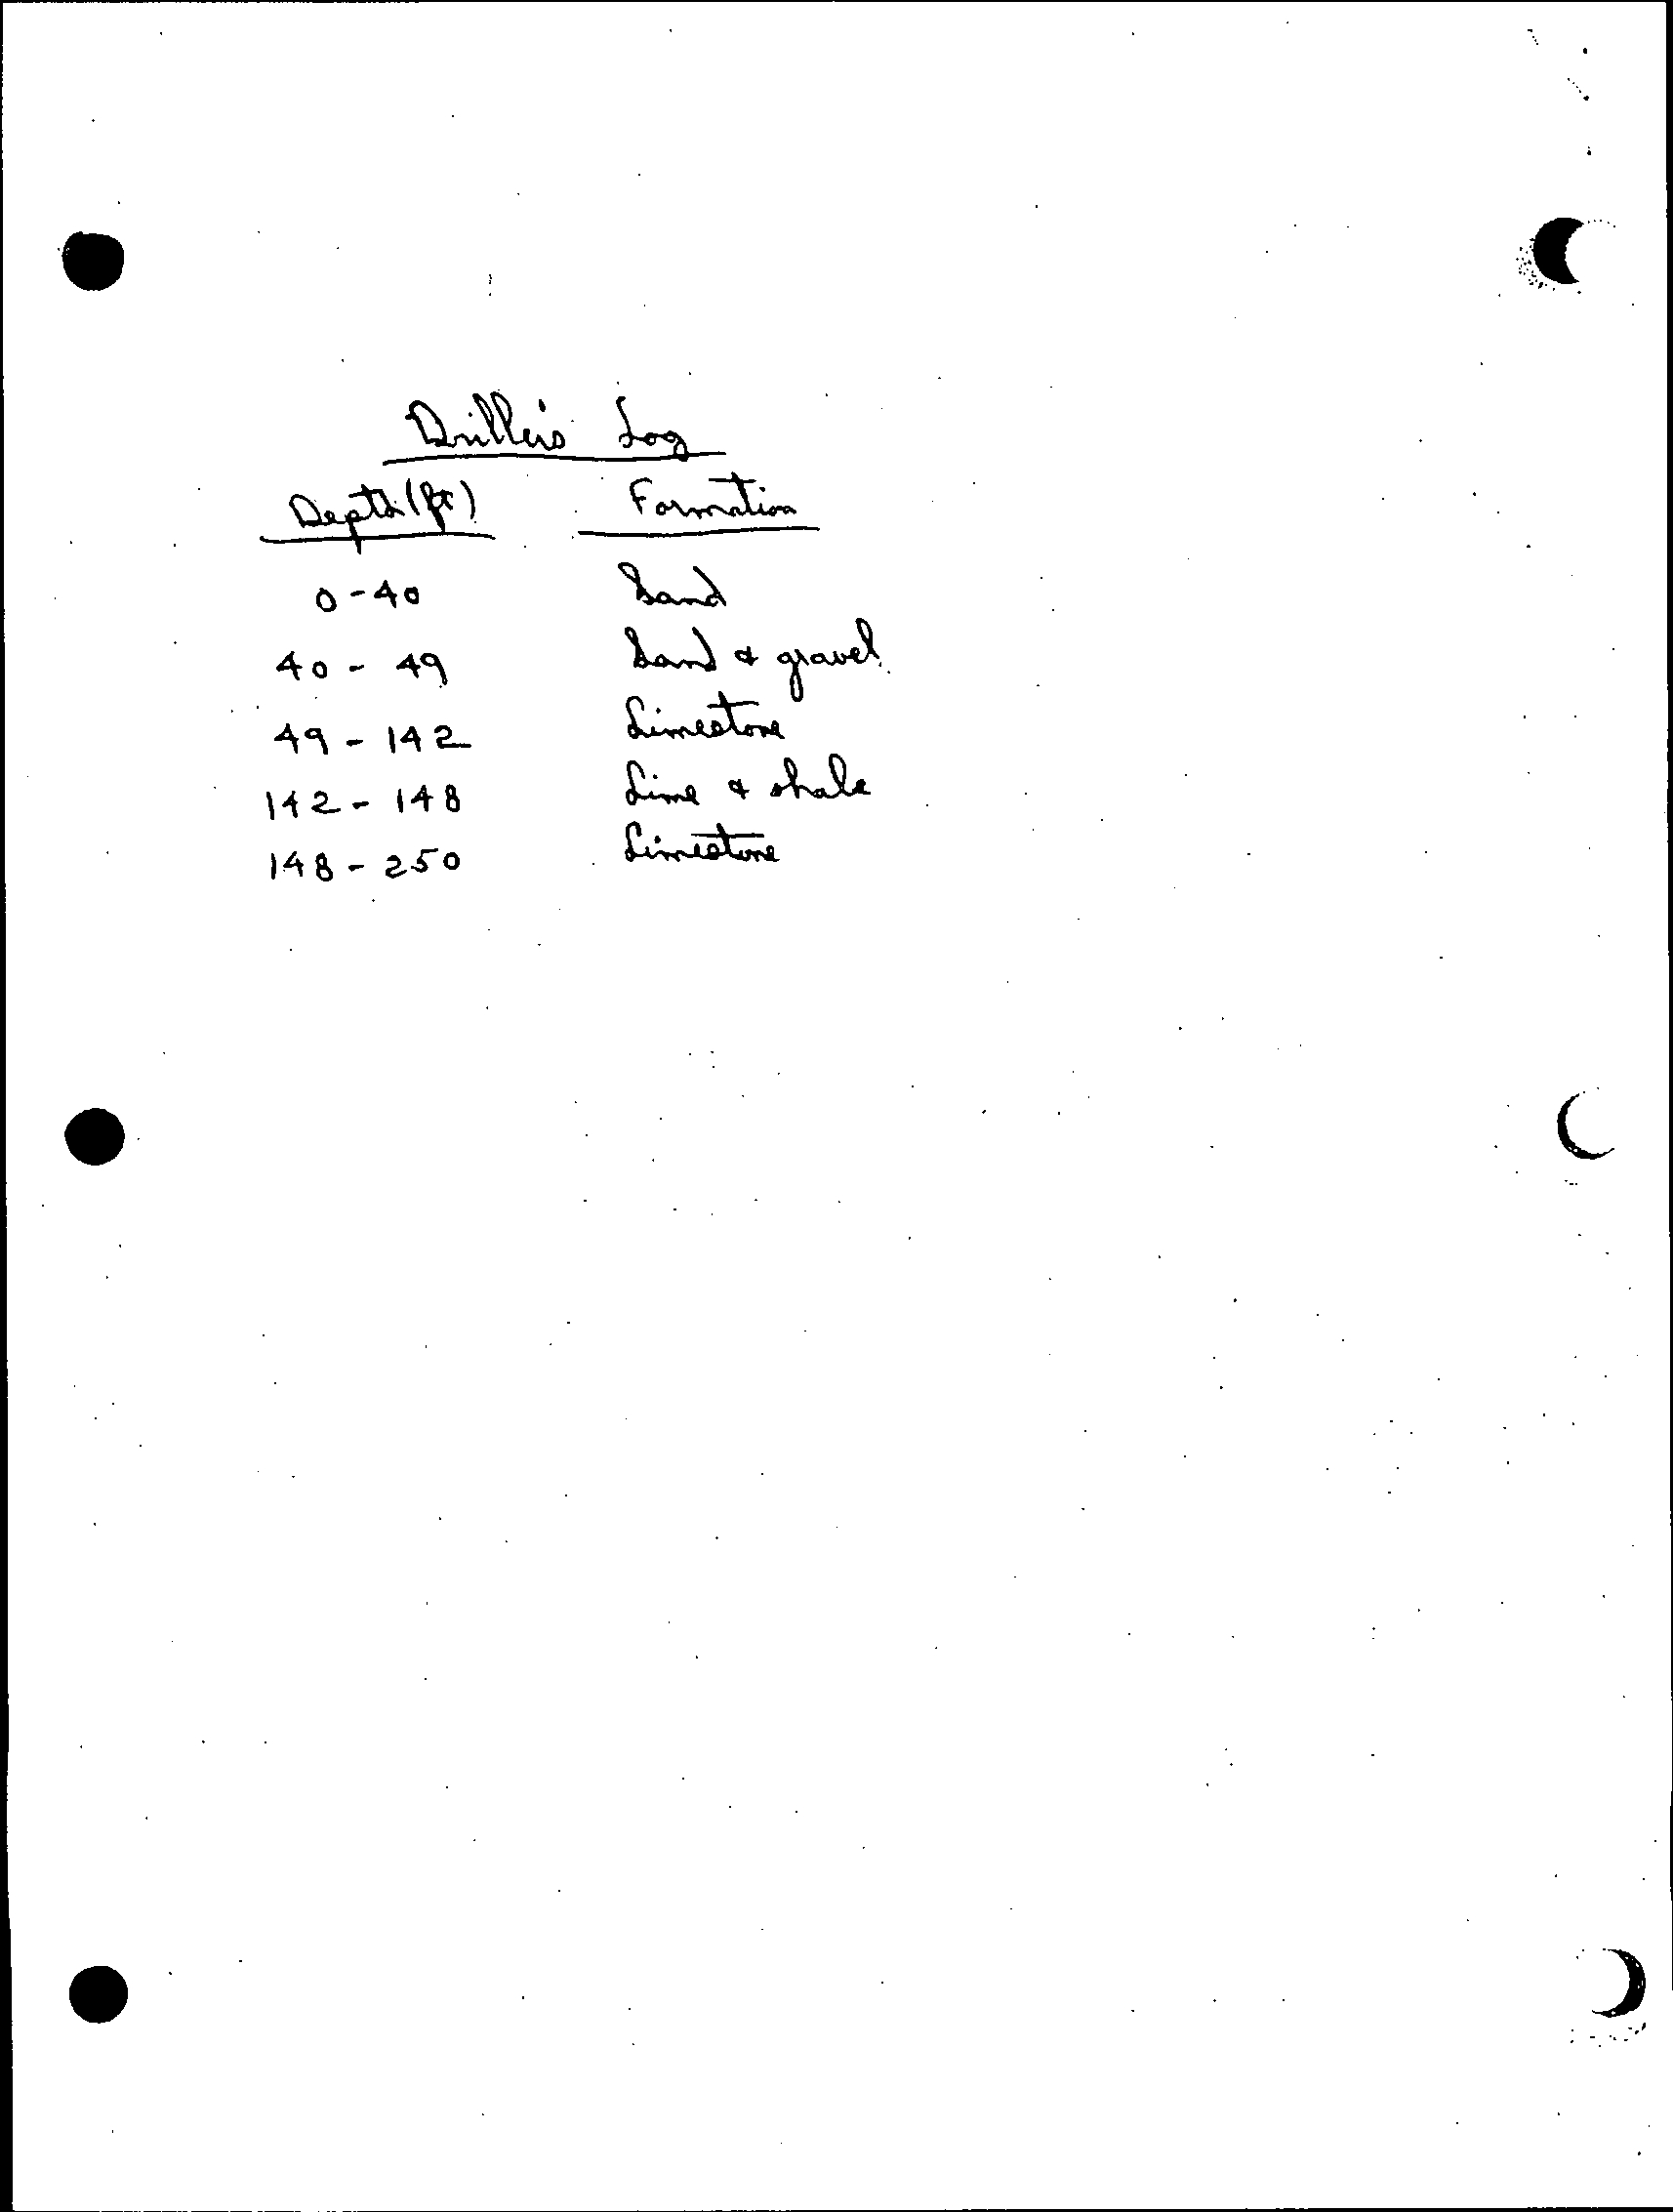
Well #1 (drilled 1966, 242 feet deep, cased to 52 feet bgs);
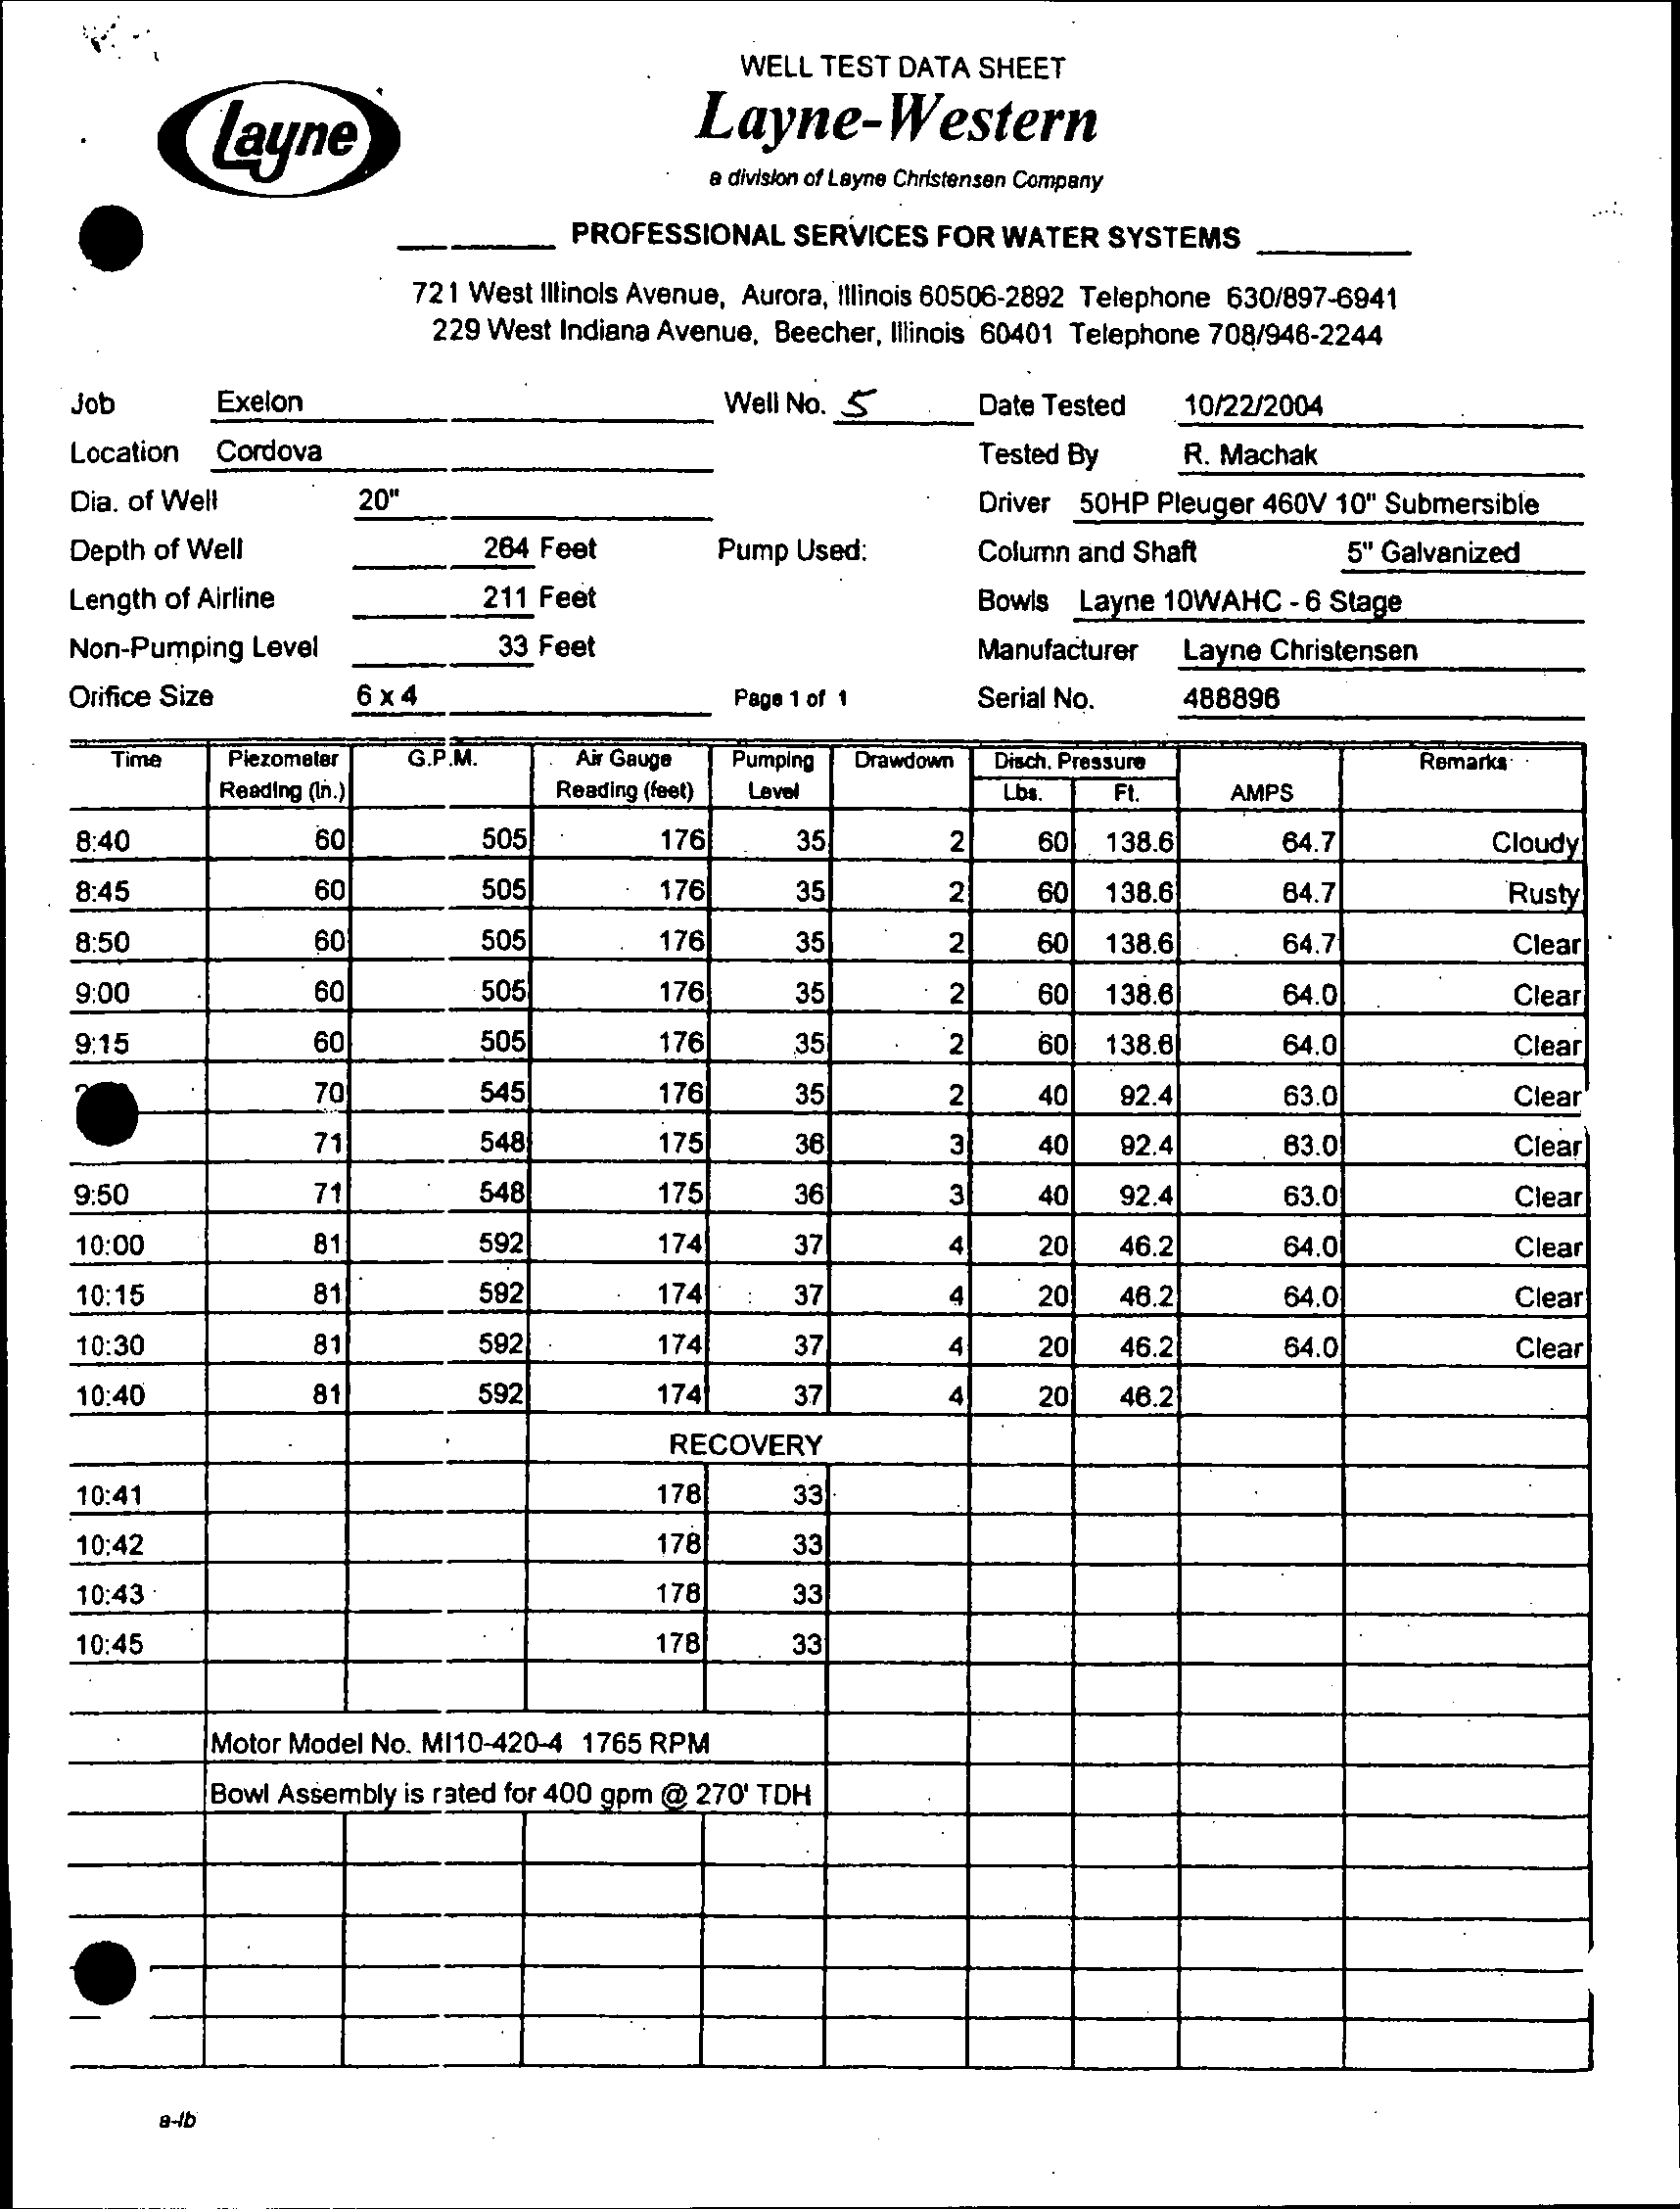
•
Well #5 (drilled 1969, 264 feet deep, cased to 59 feet bgs); and
•
Fish House Well #10 (drilled 2004, 135 feet deep).
045136 (20) Quad Cities Generating Station
7
CONESTOGA-ROVERS & ASSOCIATES
Revision 1
None of these wells are of a suitable depth or construction to use for determining
groundwater contours. The well locations are shown on Figure 2.6 (see Appendix A for
well information).
The following water supply wells are also located at the Station:
•
Fire Training Well (drilled 1987, 225 feet deep);
•
Big Fish Well (drilled 1984, 175 feet deep);
•
Little Fish Well (drilled 1986, 60 feet deep);
•
Dry Cask Storage Well (also know as East Well, drilled approximately
1960, 84 feet
deep); and
•
Sewage Treatment Plant (STP) Sand Point Well (drilled 1985, 30 feet deep).
045136 (20) Quad Cities Generating Station
8
CONESTOGA-ROVERS & ASSOCIATES
Revision 1
3.0
AREAS FOR FURTHER EVALUATION
CRA considered all Station operations in assessing groundwater quality
at the Station.
During this process, CRA identified areas at the Station that warranted further
evaluation or "AFEs". This section discusses the process by which AFEs were selected at
the Station.
CRA's identification of AFEs involved the following components:
•
Station inspection on March 22, 2006 accompanied by Station personnel;
•
interviews with Station personnel;
•
evaluation of Station systems;
•
investigation of confirmed and unconfirmed releases of radionuclides; and
•
review of previous Station investigations.
CRA analyzed the information collected from these components combined with
information obtained from CRA's study of hydrogeologic conditions at the
Station to
identify those areas where groundwater potentially could be impacted from operations
at the Station.
CRA then designed an investigation to determine whether any confirmed or potential
releases
or any other release of radionuclides adversely affected groundwater. This
entailed evaluating whether existing Station groundwater monitoring systems were
sufficient to assess the groundwater quality at the AFEs. If the systems were not
sufficient to adequately investigate groundwater quality associated with any AFE, CRA
installed additional monitoring wells.
The following sections describe the above considerations and the identification of AFEs.
The results of CRA's investigation are discussed in Section 5.0.
3.1
SYSTEMS EVALUATIONS
Exelon launched an initiative to systematically
assess the structures, systems, and
components that store, use, or convey potentially radioactively contaminated liquid.
Maps depicting each of these systems were developed and provided to CRA for review.
The locations of some of these systems are presented on Figure 3.1. The Station
identified a total of 16 systems that contain or could contain potentially radioactively
contaminated liquid. The following presents a list of these systems.
045136 (20) Quad Cities Generating Station
9
CONESTOGA-ROVERS & ASSOCIATES
Revision 1
System Identification
Description
1000
Residual Heat Removal (RHR)/RHR Service Water
1300
Reactor Core Isolation Cooling
1400
Core Spray
2000
Radwaste includes Reactor Building Equipment
and Floor Drains
2300
High Pressure Coolant Injection
2600
Sewage Treatment Plant
2600
Wastewater Treatment Plant
3000
Main Steam
3300
Condensate Transfer
4400
Circulating Water System
4900
Turbine Building Floor Drains
5400/9300
Off Gas
5650
Electro Hydraulic Control (EHC)
5700
Heating System/Heating Ventilation and Air
Conditioning
5773
Heating Boilers
8900
High Rad Sample System (HRSS)
After these systems were identified, Exelon developed a list of the various structures,
components, and areas of the systems
(e.g., piping, tanks, and process equipment) that
handle or could potentially handle radioactively contaminated liquid. The structures,
components, and areas may include:
•
aboveground storage tanks;
•
condensate vents;
•
areas
where confirmed or potential historical releases, spills, or accidental discharges
may have occurred;
•
pipes;
•
pools;
•
sumps;
•
surface water bodies (i.e., basins, pits, ponds, or lagoons);
•
trenches;
•
underground storage tanks; and
•
vaults.
045136 (20) Quad Cities Generating Station
10
CONESTOGA-ROVERS & ASSOCIATES
Revision 1
The Station then individually evaluated the various system components to determine
the potential for any release of radioactively contaminated liquid to enter the
environment.
Each structure or identified component was evaluated against the
following seven primary criteria:
•
location of the component (i.e., basement or second floor of building);
•
component construction material (i.e., stainless steel or steel tanks);
•
construction methodologies (i.e., welded or mechanical pipe joints);
•
concentration of radiological contaminated liquid stored or conveyed;
•
amount of radiological contaminated
liquid stored or conveyed;
•
existing
controls (i.e., containment and detection); and
•
maintenance history.
System components, which were located inside a building or otherwise had some form
of secondary containment, such that a release of radioactively contaminated
liquid
would not be discharged directly to the environment, were eliminated from further
evaluation. System components that are not located within buildings or did not have
some other form of secondary containment were retained for further qualitative
evaluation of the risk of a release of radioactively contaminated liquid to the
environment and the potential magnitude of any release.
Exelon's risk evaluation took into consideration factors such as:
•
the potential concentration of radionuclides;
•
the volume of liquid
stored or managed;
•
the
probabilities of the systems actually containing radioactive contaminated liquid;
and
•
the potential for a release of radioactively contaminated liquid from the system
component.
These factors were then used to rank the systems and system components as to the risk
for a potential release of a radioactively contaminated
liquid to the environment. The
evaluation process resulted in the identification of structures, components, and areas to
be considered for further evaluation.
045136 (20) Quad Cities Generating Station
11
CONESTOGA-ROVERS & ASSOCIATES
Revision 1
3.2
HISTORICAL RELEASES
CRA reviewed information concerning confirmed or potential historical releases of
radionuclides at the Station, including reports and documentation previously prepared
by Exelon and compiled for CRA's review.
CRA evaluated this information in
identifying AFEs. Any historical releases identified during the course of this assessment
that may have a current impact on Station conditions are further discussed in
Section 3.4.
3.3
STATION INVESTIGATIONS
CRA also considered previous Station investigations in the process of selecting the AFEs
for the Station. This section presents a summary of the pre-operational Radiological
Environmental
Monitoring
Program
(pre-operational
REMP),
past
Station
investigations, and the Radiological Environmental Monitoring Program (REMP).
3.3.1
PRE-OPERATIONAL RADIOLOGICAL ENVIRONMENTAL
MONITORING PROGRAM
The pre-operational REMP report was conducted to establish background radioactivity
levels prior to operation of the Station. The program was completed in December 1971
by Eberline Instrument Corporation for the Commonwealth Edison Company. The
pre-operational REMP report included monitoring for atmospheric radiation, fall-out,
domestic water, surface water, marine life, and foodstuffs.
Atmospheric radiation monitoring consisted of gas and air particulate radioactivity
measurements; fall-out monitoring consisted of radioactivity measurements of soil,
vegetation,
and rain water; domestic water monitoring consisted of well water sample
analysis; surface water samples were collected from the Mississippi River near the
Station, the Davenport Water Works, and the East Moline Water Works; and foodstuffs
monitoring included samples of milk.
The pre-operational REMP surface water tritium analytical results ranged from non
detect at an unspecified Lower Limit of
Detection (LLD) to 1,590 ± 850 picoCuries/liter
(pCi/L).
Gross alpha groundwater analytical
results ranged from non detect at unspecified LLDs
to a maximum detected activity of 2.00
± 0.9 pCi/L. Gross beta groundwater analytical
045136 (20) Quad Cities Generating Station
12
CONESTOGA-ROVERS & ASSOCIATES
Revision 1
results (including tritium) ranged from non detect at unspecified LLDs to a maximum
detected activity of 34.2
± 2.3 pCi/L.
3.3.2
RADIOLOGICAL ENVIRONMENTAL MONITORING PROGRAM
The REMP was initiated at the Station in 1968. The REMP includes the collection of
multi-media samples including air, surface water, groundwater, fish, clams, crabs,
sediment, and vegetation. The samples are analyzed for beta and gamma-emitting
radionuclides, tritium, iodine-131, and/or strontium as established in the procedures
developed for the REMP. The samples are collected at established locations, identified
as stations, so that trends in the data can be monitored. An annual report is prepared
providing a description of the activities performed and the results of the analysis of the
samples collected from the various media.
As part of REMP, surface water samples are collected at two locations and groundwater
samples are collected at
two locations. The Station collects quarterly groundwater
samples from two off-site wells (sample locations Q-35 and Q-36) and analyzes the
samples for tritium. Quarterly composites of weekly samples of Mississippi River water
collected upstream (Q-34) and downstream (Q-33) from the Station are analyzed for
tritium. The REMP reports for 2001 through 2004 state that tritium concentrations
remained below the LLD of 200 pCi/L in all of the groundwater and river water
samples. According to the Station, tritium concentrations in the well water and river
water samples have remained less than the LLD of 200 pCi/L since this testing was first
initiated.
The report reviewed by CRA was prepared by Station personnel and is entitled “Annual
Radiological Environmental Operating Report for the Quad Cities Nuclear Power
Station, dated May
2005”. This report concluded that the operation of the Quad Cities
Station had no adverse radiological impacts on the environment.
3.3.3
HISTORIC INVESTIGATIONS
No historic investigations related to radionuclides impact to groundwater were
completed at the Station.
045136 (20) Quad Cities Generating Station
13
CONESTOGA-ROVERS & ASSOCIATES
Revision 1
3.3.4
POWER PLANT DOCUMENTS - UFSAR REPORT
During the construction of the Station, a series of comprehensive investigations of
regional and local geology, surface water, and groundwater conditions were conducted.
These studies are documented in UFSAR Revision 8, October 2005.
3.4
IDENTIFIED AREAS OF FURTHER EVALUATION
CRA used the information presented in the above sections along with its understanding
of the hydrogeology at the Station to identify AFEs which were a primary consideration
in the development of the scope of work in the Work Plan. The establishment of AFEs is
a standard planning practice in hydrogeologic investigations to focus the investigation
activities at areas where there is the greatest potential for impact to groundwater.
Specifically, AFEs were identified based on these six considerations:
•
systems evaluations;
•
risk evaluations;
•
review of confirmed and/or potential releases;
•
review of documents;
•
review of the hydrogeologic conditions; and
•
Station inspection completed on March 22, 2006.
Prior to CRA completing its analysis and determination of AFEs, Station personnel
completed an exhaustive
review of all historic and current management of systems that
may contain potentially radioactively contaminated liquids.
CRA reviewed the systems identified by the Station that have the potential for the
release of radioactively contaminated liquid
to the environment and groundwater flow
at the Station. This evaluation allowed CRA to become familiar with Station operations
and potential systems that may impact groundwater. CRA then evaluated information
concerning historic releases as provided by the Station. This information, along with a
review of the results from historic Station investigations, was used to refine CRA's
understanding of areas likely to have the highest possibility of impacting groundwater.
Where at risk systems or identified historical releases were located in close proximity or
were located in areas which could not be evaluated separately, the systems and
historical releases were combined into a single AFE. At times, during the Station
045136 (20) Quad Cities Generating Station
14
CONESTOGA-ROVERS & ASSOCIATES
Revision 1
investigation, separate AFEs were combined into one or were otherwise altered based on
additional information and consideration. This HIR details the AFEs investigated.
Finally, CRA used its understanding of known hydrogeologic conditions (prior to this
investigation)
to identify AFEs. Groundwater flow was an important factor in deciding
whether to combine systems or historical releases into a single AFE or create separate
AFEs.
For example, groundwater flow beneath several systems that contain
radioactively contaminated liquid that flows toward a common discharge point were
likely combined into a single AFE.
The AFEs were created based on known
groundwater flow conditions prior to the work completed during this investigation.
Based upon its review of information concerning
confirmed or potential historical
releases, historic investigations, and the systems at the Station that have the potential for
release of radioactively contaminated liquids to the environment combined with its
understanding of groundwater flow at the Station, CRA identified five AFEs (see
Figure 3.1).
AFE-Quad Cities-1 - Piping West of Radwaste Building/Floor Drain Surge Tank
This area was identified as an AFE due to its
proximity to buried piping west of the
Radwaste Building where historic releases have occurred and due to its proximity to the
Floor Drain Surge Tank, which conveys waste and liquids potentially containing tritium.
AFE-Quad Cities-2 – Historic Releases Area South of Station Blackout Building (SBO)
This area was identified as an AFE due to its proximity to three reports of historic
releases in this area. Historic
releases related to this AFE occurred on August 17, 1975,
December 10, 1979, and March 21, 1986. The locations of the releases are shown on
Figure 3.2.
•
On August
17, 1975, a Unit 2 feedwater valve leaked, releasing radioactively
contaminated water to the soil east of the Trackway 2 (TW-2) rollup door. The
impacted soil was excavated and shipped off site. Approximately 12,500 gallons of
water were released: 8,500 gallons of feedwater and 4,000 gallons of fire suppression
system water. Approximately 2,570 gallons of water entered the Unit 2 Oil/Water
Separator, which was recovered and released through a permitted discharge point.
Approximately 100 gallons of the water was released to Station surface soils in the
vicinity of the TW-2 rollup door. Tritium was detected in Unit 2 Oil/Water
Separator output at a concentration 97,000 pCi/L.
045136 (20) Quad Cities Generating Station
15
CONESTOGA-ROVERS & ASSOCIATES
Revision 1
•
On December 10, 1979, approximately 4,200 gallons of radioactively contaminated
Residual Heat Removal (RHR) water was spilled into a storm drain system and on
the surrounding blacktop east of the Unit 1 Reactor Building. Water which entered
the Unit 1 Oil/Water Separator was recovered and released through a permitted
discharge point. Based on subsequent sampling of the Unit 1 Oil/Water Separator,
an estimated 25 millicuries were released through the discharge bay, which is a
permitted pathway, and the remaining 12.8 millicuries went into the ground.
•
On March
21, 1986, approximately 10 to 25 gallons of reactor water that contained
tritium and radionuclides leaked onto the asphalt east of the Unit 1 Reactor Building
from the Integrated Leak Rate Compressor. A small area of contaminated asphalt
was removed. None of the water entered the storm drain.
All three of these historic releases occurred east of the Reactor Building, with the 1975
release occurring near the northeast corner of the Reactor Building and the 1979
and
1986 releases occurring at the current location of the Station Blackout Building (SBO).
AFE-Quad Cities-3 - CCSTs and Ancillary Piping
This area was identified as an AFE due to its proximity to the CCSTs and associated
piping, which are not provided with
secondary containment. Any historic releases from
this storage system could potentially impact groundwater downgradient of the CCSTs.
AFE-Quad Cities-4 - Unit 1 Oil/Water Separator
This area was identified as an AFE as potential
releases from the CCSTs and the south
side of the plant would discharge to the Unit 1 Oil/Water Separator.
AFE-Quad Cities-5 - Unit 2 Oil/Water Separator
This area was identified as an AFE as potential releases from the north
side of the plant
would discharge to the Unit 2 Oil/Water Separator.
045136 (20) Quad Cities Generating Station
16
CONESTOGA-ROVERS & ASSOCIATES
Revision 1
4.0
FIELD METHODS
The field investigations for this HIR were completed from May through July
2006. The
initial field investigations completed for this HIR in May and June 2006 were focused
near the five AFEs identified for the Station. Additional field investigations were
completed in June and July 2006 to determine the vertical and lateral extent of tritium in
groundwater. CRA supervised the installation of monitoring wells at the Station and
collected samples from the newly installed monitoring wells, the existing monitoring
wells, and the existing water supply wells, as well as from surface water locations. The
field investigations were completed in accordance with the methodologies presented in
the Work Plan (CRA 2006).
In 2002, CRA installed three monitoring wells (MW-1, MW-2, and MW-3), which were
screened
from 17 to 27 feet bgs and located in the northwest portion of the Protected
Area (PA). CRA collected groundwater samples as part of a separate hydrogeologic
assessment for non-radionuclide parameters. No impacts were detected.
4.1
SURFACE WATER GAUGING POINT INSTALLATION
AND MONITORING
Figure 4.1 presents the location of the three new surface water gauging points installed
as
part of this investigation. SW-QC-1 and SW-QC-2 are located on bridges that cross
the Station Spray Canal. A third surface water gauging point (SW-QC-3) was installed
at the discharge bay near MW-QC-103I. These gauging points were used for surface
water elevation monitoring.
4.2
GROUNDWATER MONITORING WELL INSTALLATION
Twenty-two new monitoring wells were installed at the Station as part of the fleetwide
hydrogeologic investigation. Eleven monitoring wells were installed during the initial
field investigations conducted in May 2006. These locations were selected based on a
review of all data provided, the hydrogeology at the Station, and the current
understanding of identified AFEs. An additional 11 monitoring wells were installed
during the additional field investigations conducted in June and July 2006. These
locations were selected based on a review of the hydrogeology at the Station, the current
understanding of identified AFEs, and the analytical results from groundwater sampling
conducted at the initial 11 monitoring wells and the eight water supply wells.
045136 (20) Quad Cities Generating Station
17
CONESTOGA-ROVERS & ASSOCIATES
Revision 1
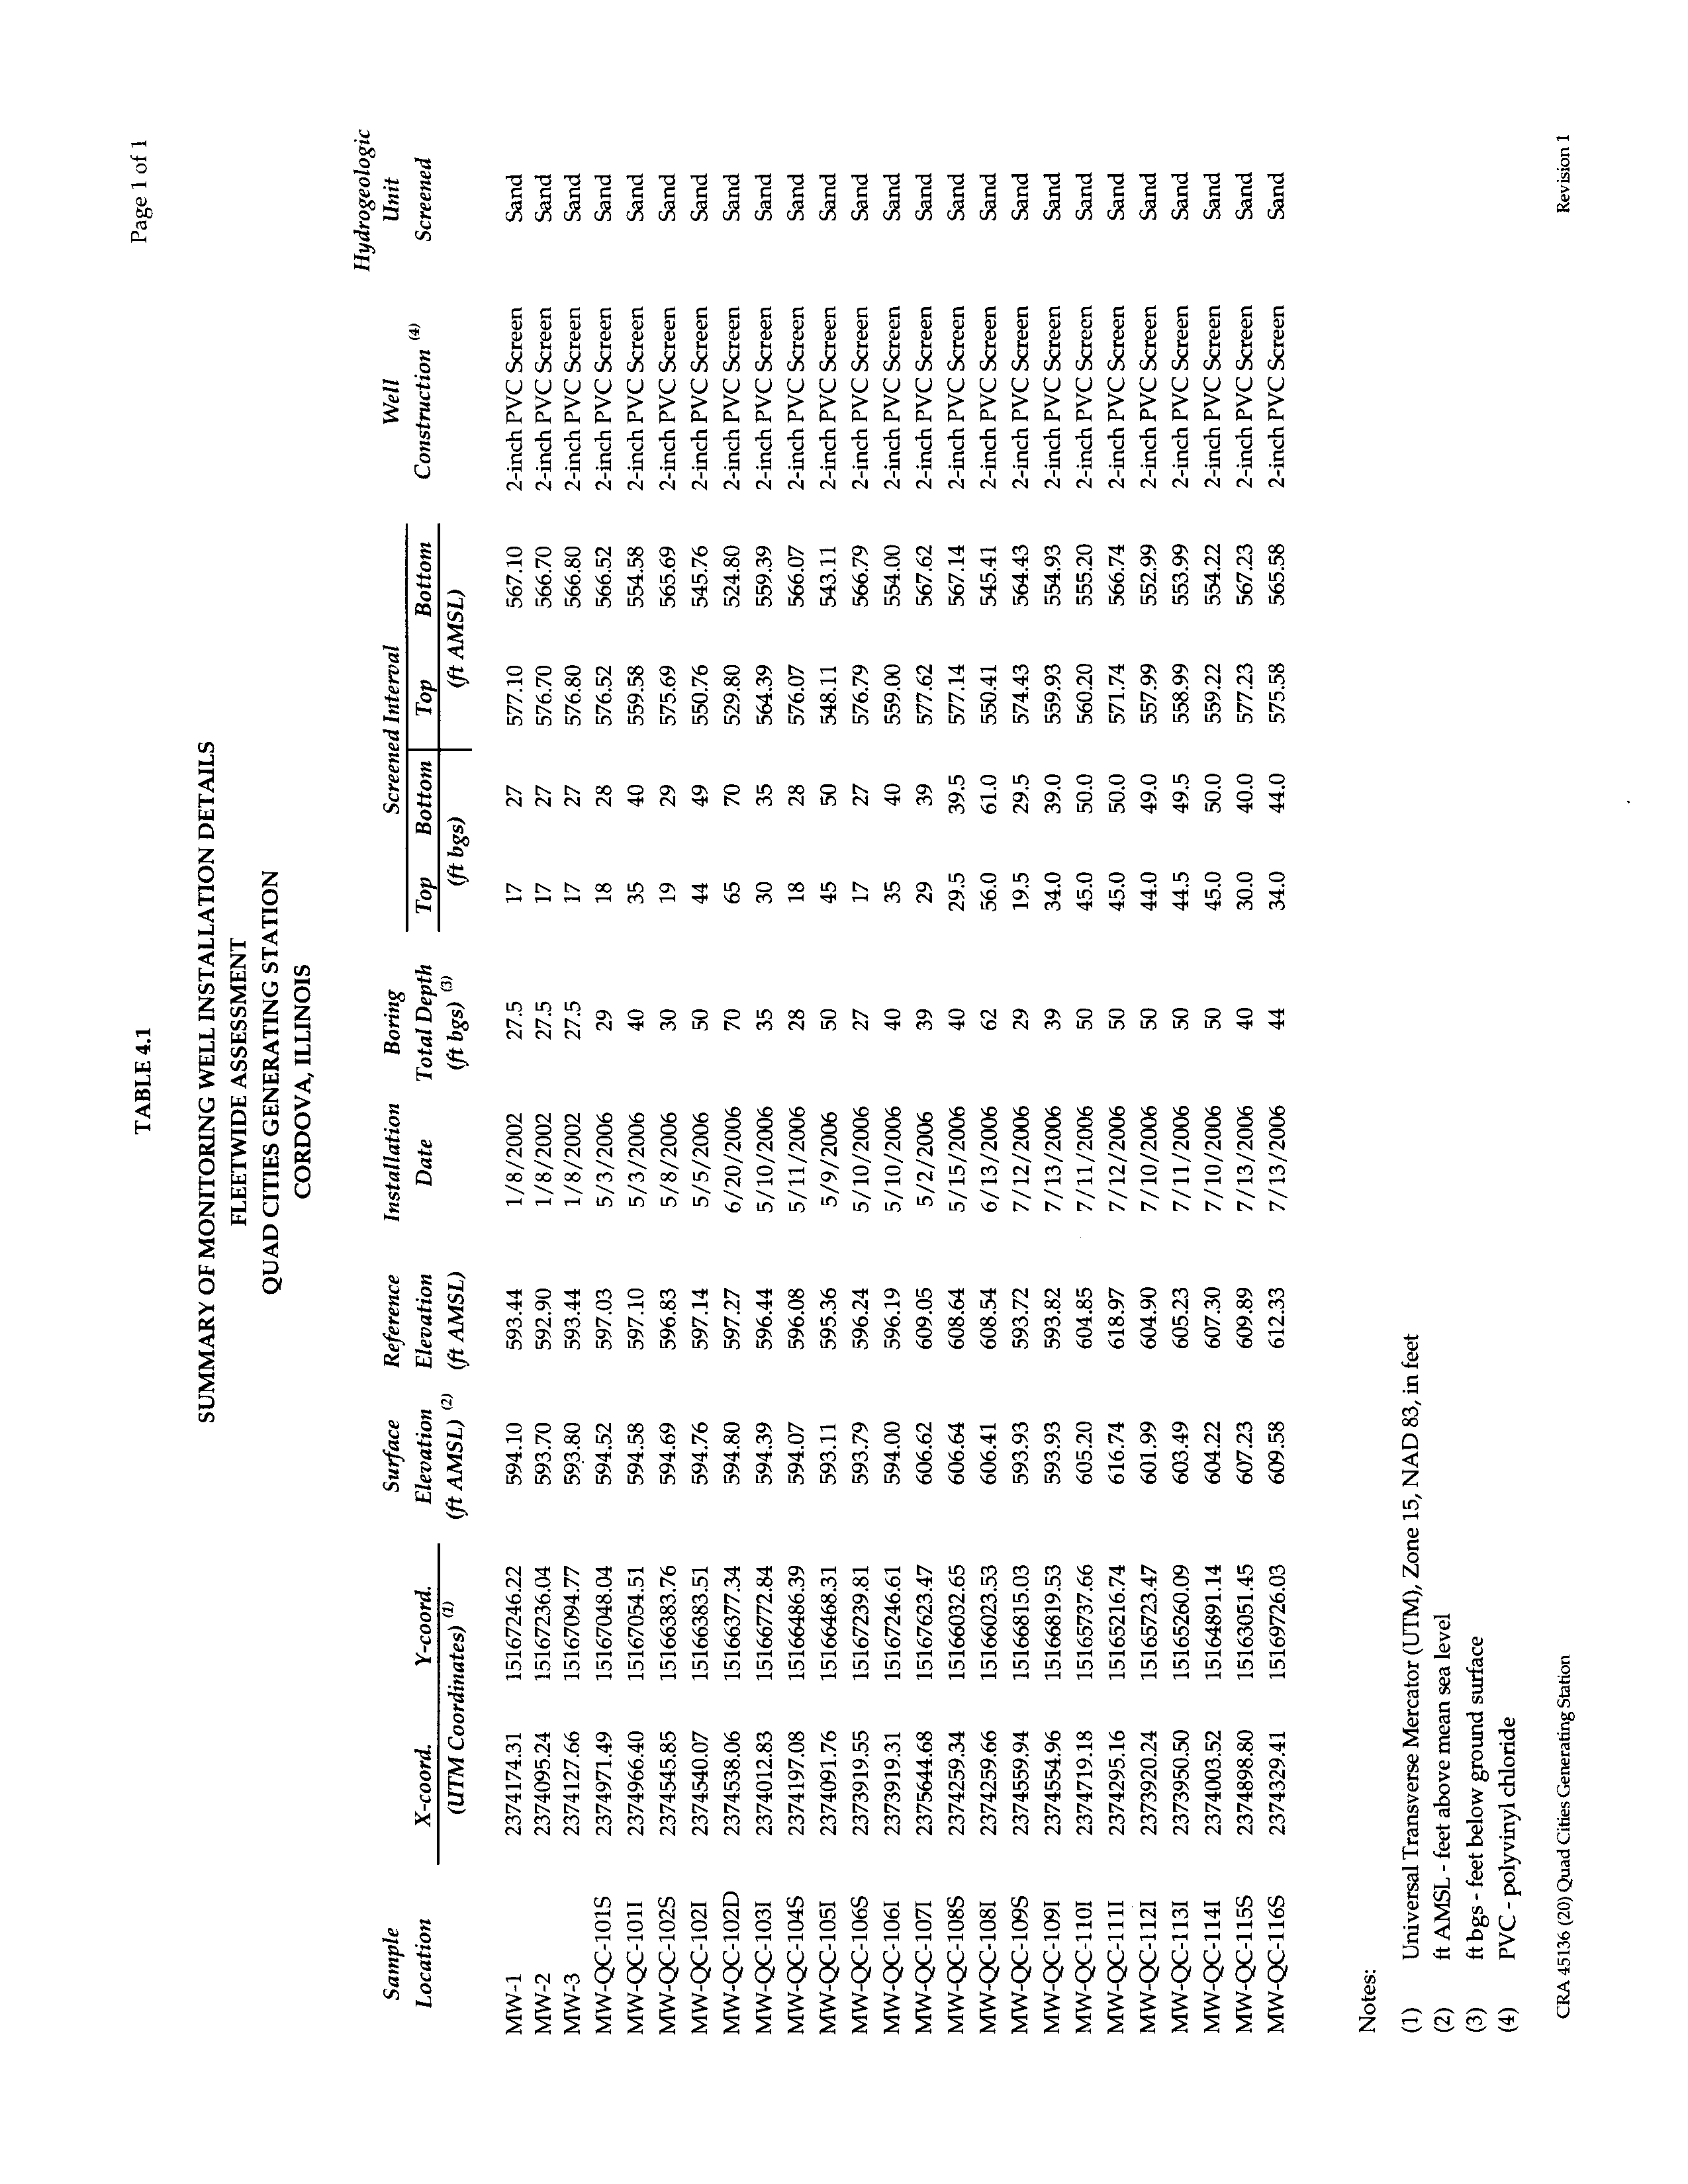
Monitoring well construction logs are provided in Appendix B. Figure 4.1 presents the
location of the 22 new monitoring wells. Table 4.1 summarizes the monitoring well
completion details.
Prior to completing any ground penetration activities, CRA completed subsurface utility
clearance procedures to minimize the potential of injury to
workers and/or damage to
subsurface utility structures.
The subsurface clearance procedures consisted of
completing an electronic survey within a minimum of 10-foot radius of the proposed
location utilizing electromagnetic and ground penetrating radar technology.
Additionally, an air knife was used to verify utilities were not present at the proposed
location to a depth of 10 feet bgs.
Specific installation protocols for the monitoring wells are described below:
•
the borehole was advanced to the target depth using 4.25-inch inside diameter
hollow-stem augers (HSA);
•
a nominal 2-inch diameter (No. 10 slot) PVC screen, 5 or 10 feet in length, attached to
a sufficient length of 2-inch diameter schedule 40 PVC riser pipe to extend to the
surface, was placed into the borehole through the augers;
•
a filter sand pack consisting of silica sand was installed to a minimum height of
2 feet above the top of the screen as the augers were removed;
•
a minimum 2-foot thick seal consisting of 3/8-inch diameter bentonite pellets or
bentonite chips was placed on top of the sand pack and hydrated using potable
water;
•
the remaining borehole annulus was sealed to within 3 feet of the surface using
bentonite grout;
•
the remaining portion of the annulus was filled with concrete and a 6-inch diameter
protective above-grade or flush mount casing. The well head was fitted with a
water-tight, lockable cap; and
•
cement-filled bollard posts were installed around selected monitoring well locations.
The shallow soil borings completed in unconsolidated materials that were to be used for
monitoring well installation were installed using 4.25-inch inside diameter
HSA drilling
techniques. The borehole depths ranged from 29 to 70 feet bgs. During the subsurface
utility clearance activities described above, the borehole was periodically examined and
the soil types documented.
A description was added to each monitoring well
construction log.
The overburden soils were classified using the Unified Soil
Classification System (USCS).
045136 (20) Quad Cities Generating Station
18
CONESTOGA-ROVERS & ASSOCIATES
Revision 1
4.3
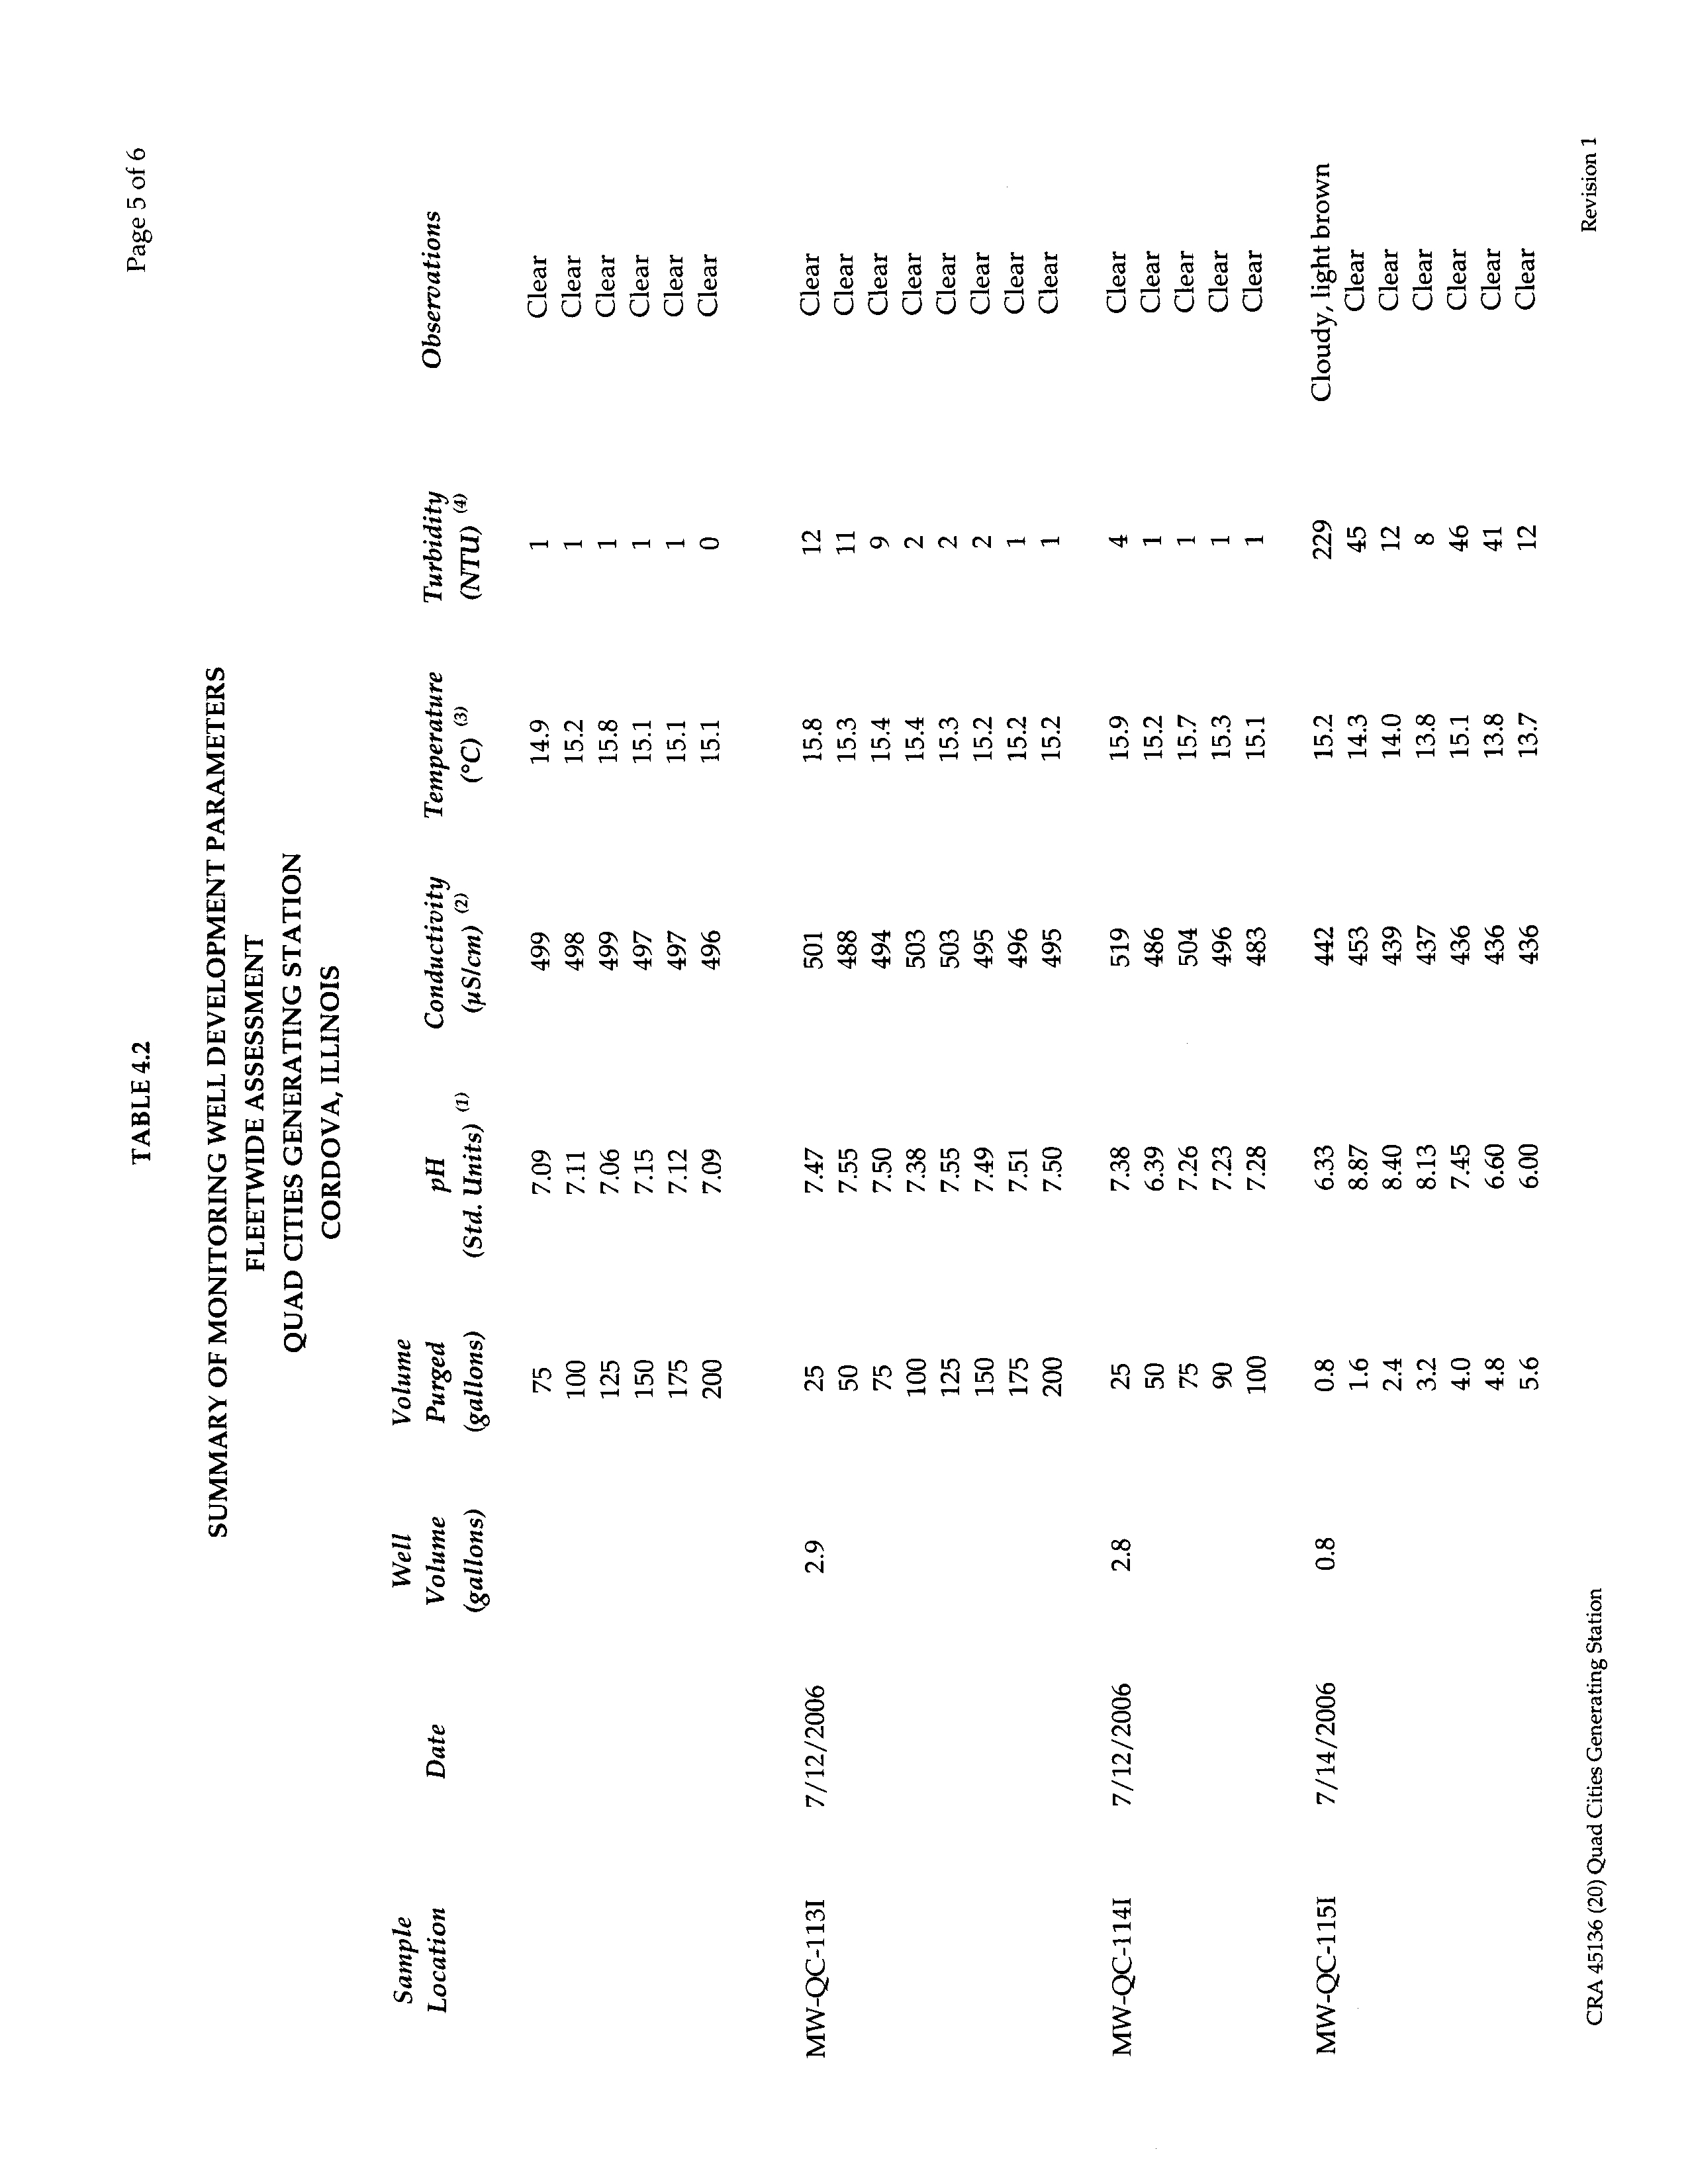
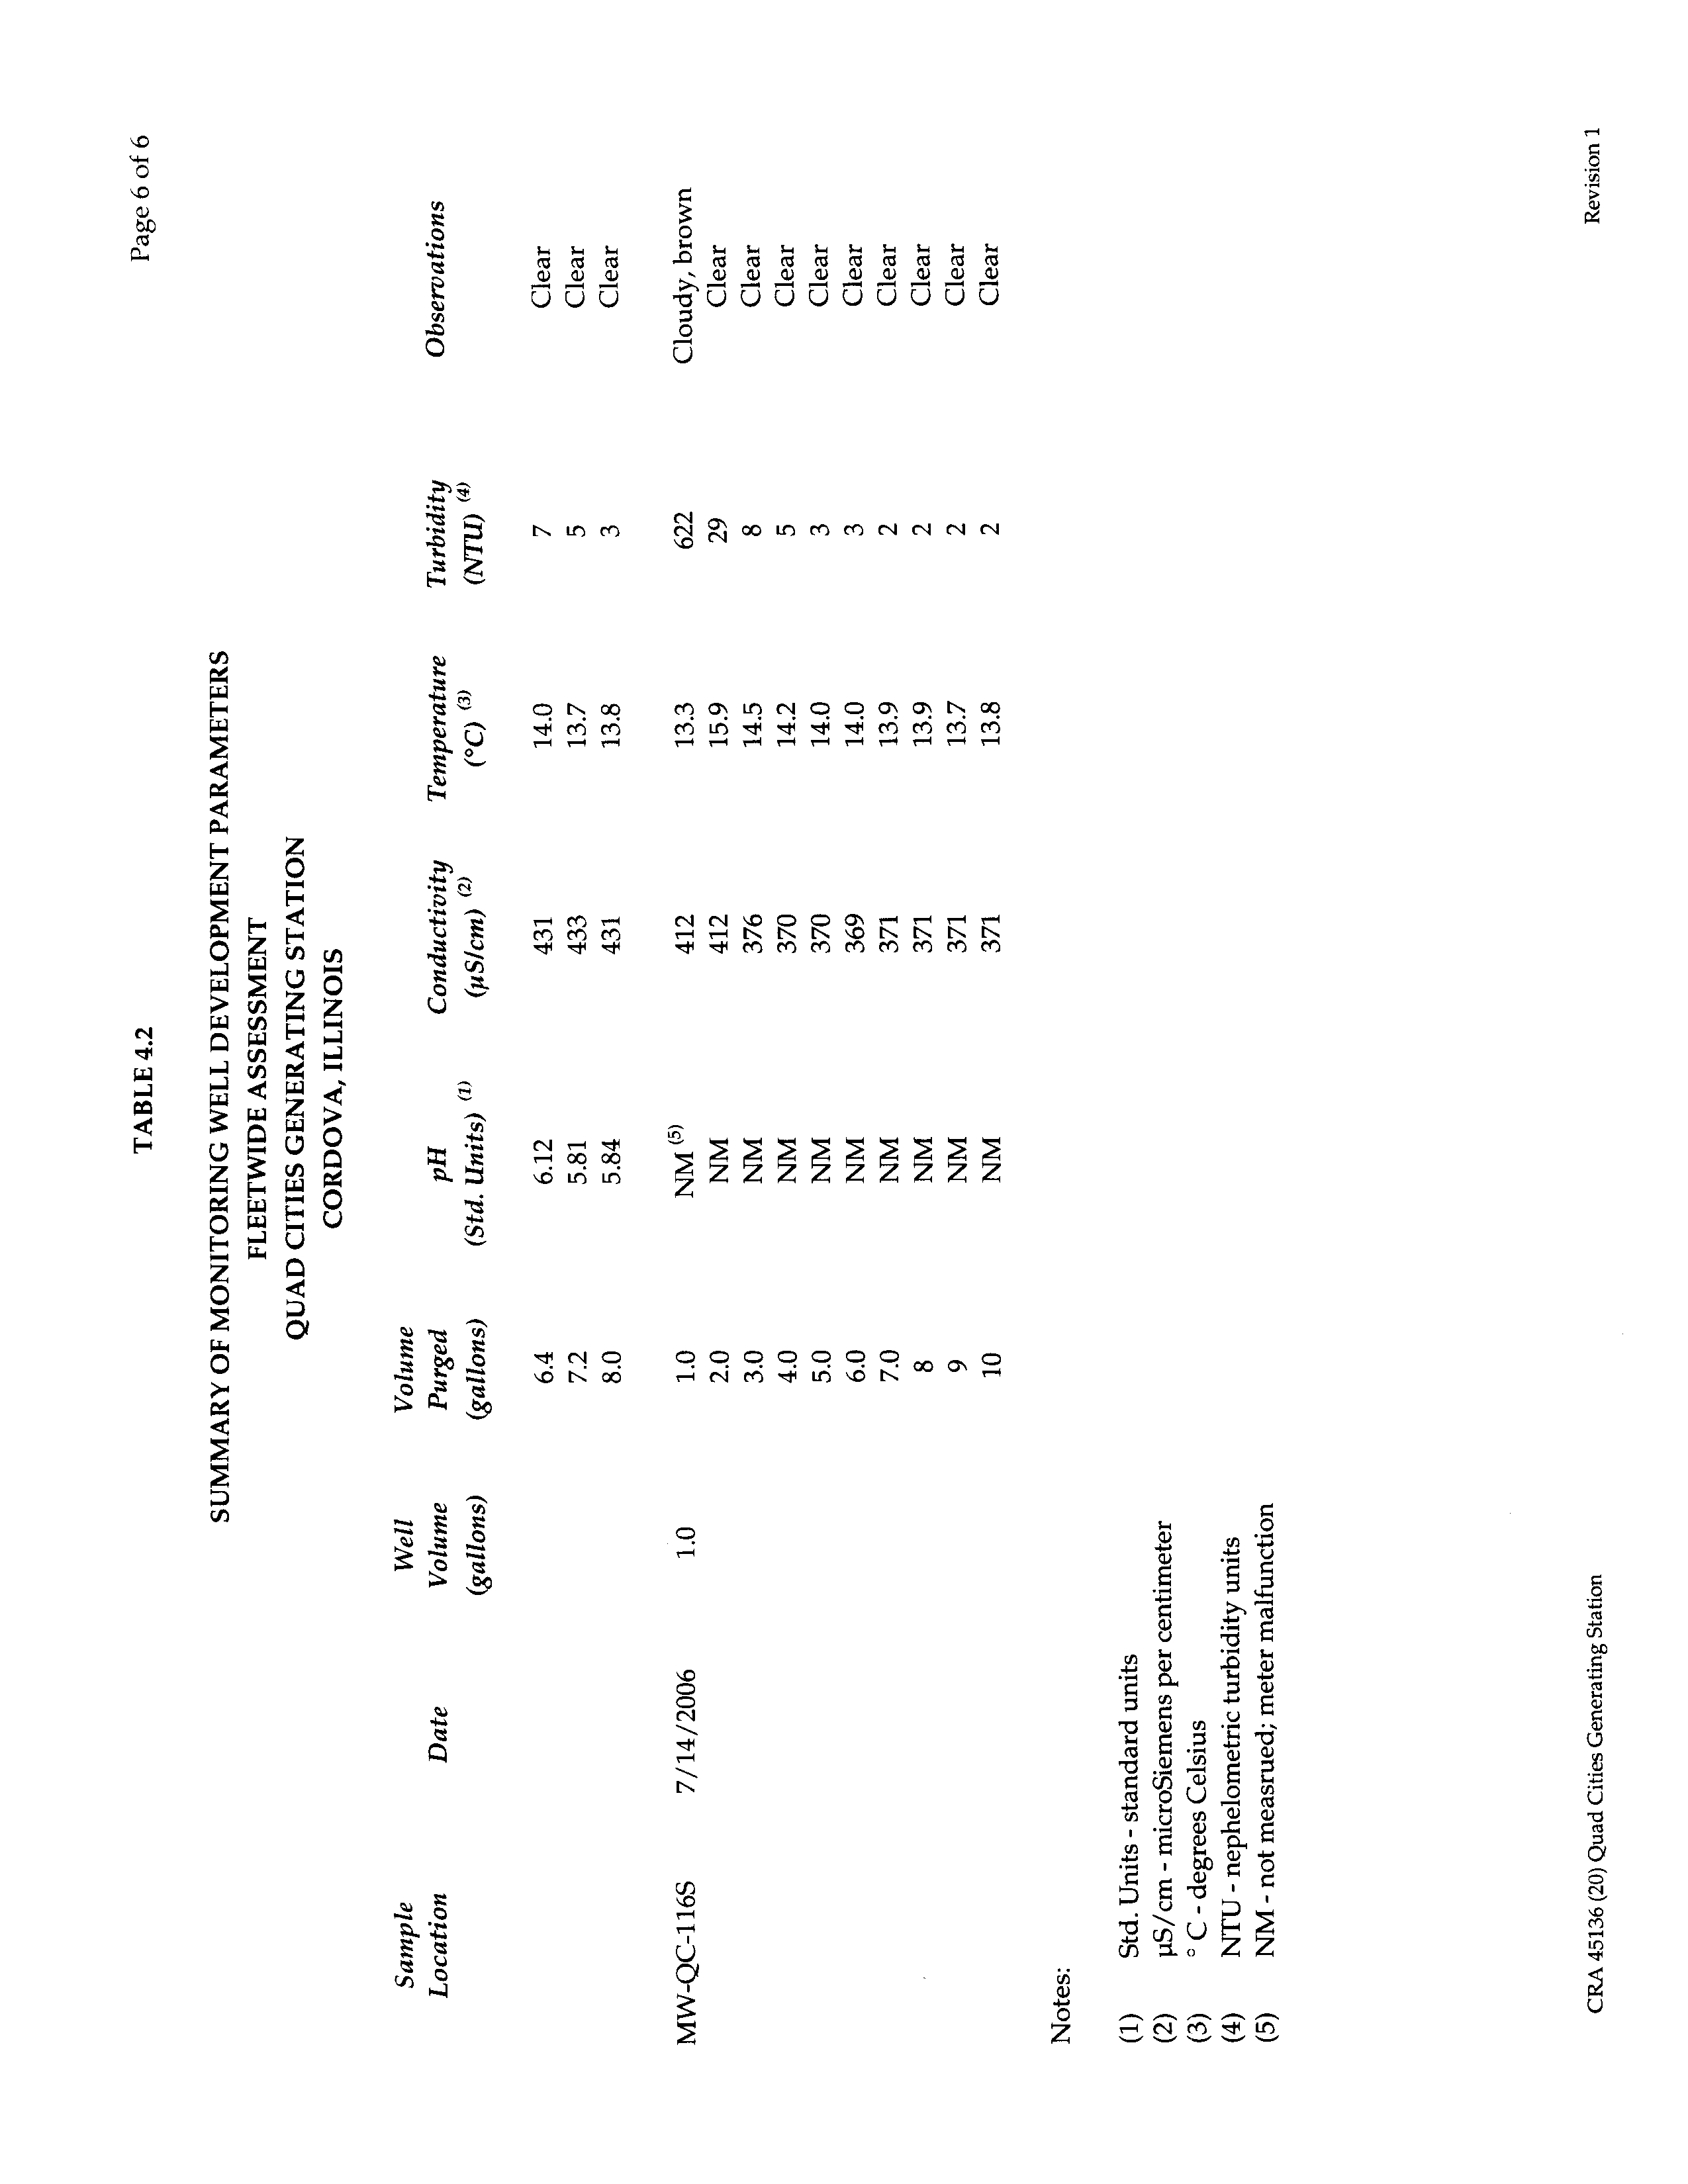
GROUNDWATER MONITORING WELL DEVELOPMENT
To establish good hydraulic communication with the aquifer and to reduce the volume
of sediment in the monitoring well, monitoring well development was conducted in
accordance with this procedure:
•
Monitoring wells were surged using a pre-cleaned surge block for a period of at least
20 minutes.
•
Water was purged from the monitoring well using an electronic submersible pump.
•
Groundwater was collected at regular intervals with the pH, temperature, and
conductivity measured using field instruments. These instruments were calibrated
daily according to the manufacturer's specifications. Additional observations such
as color, odor, and turbidity of the purged water were recorded.
•
Development continued until the turbidity and silt content of the monitoring wells
was significantly reduced and three consistent readings of pH, temperature, and
conductivity were recorded, or a minimum of ten well volumes was purged.
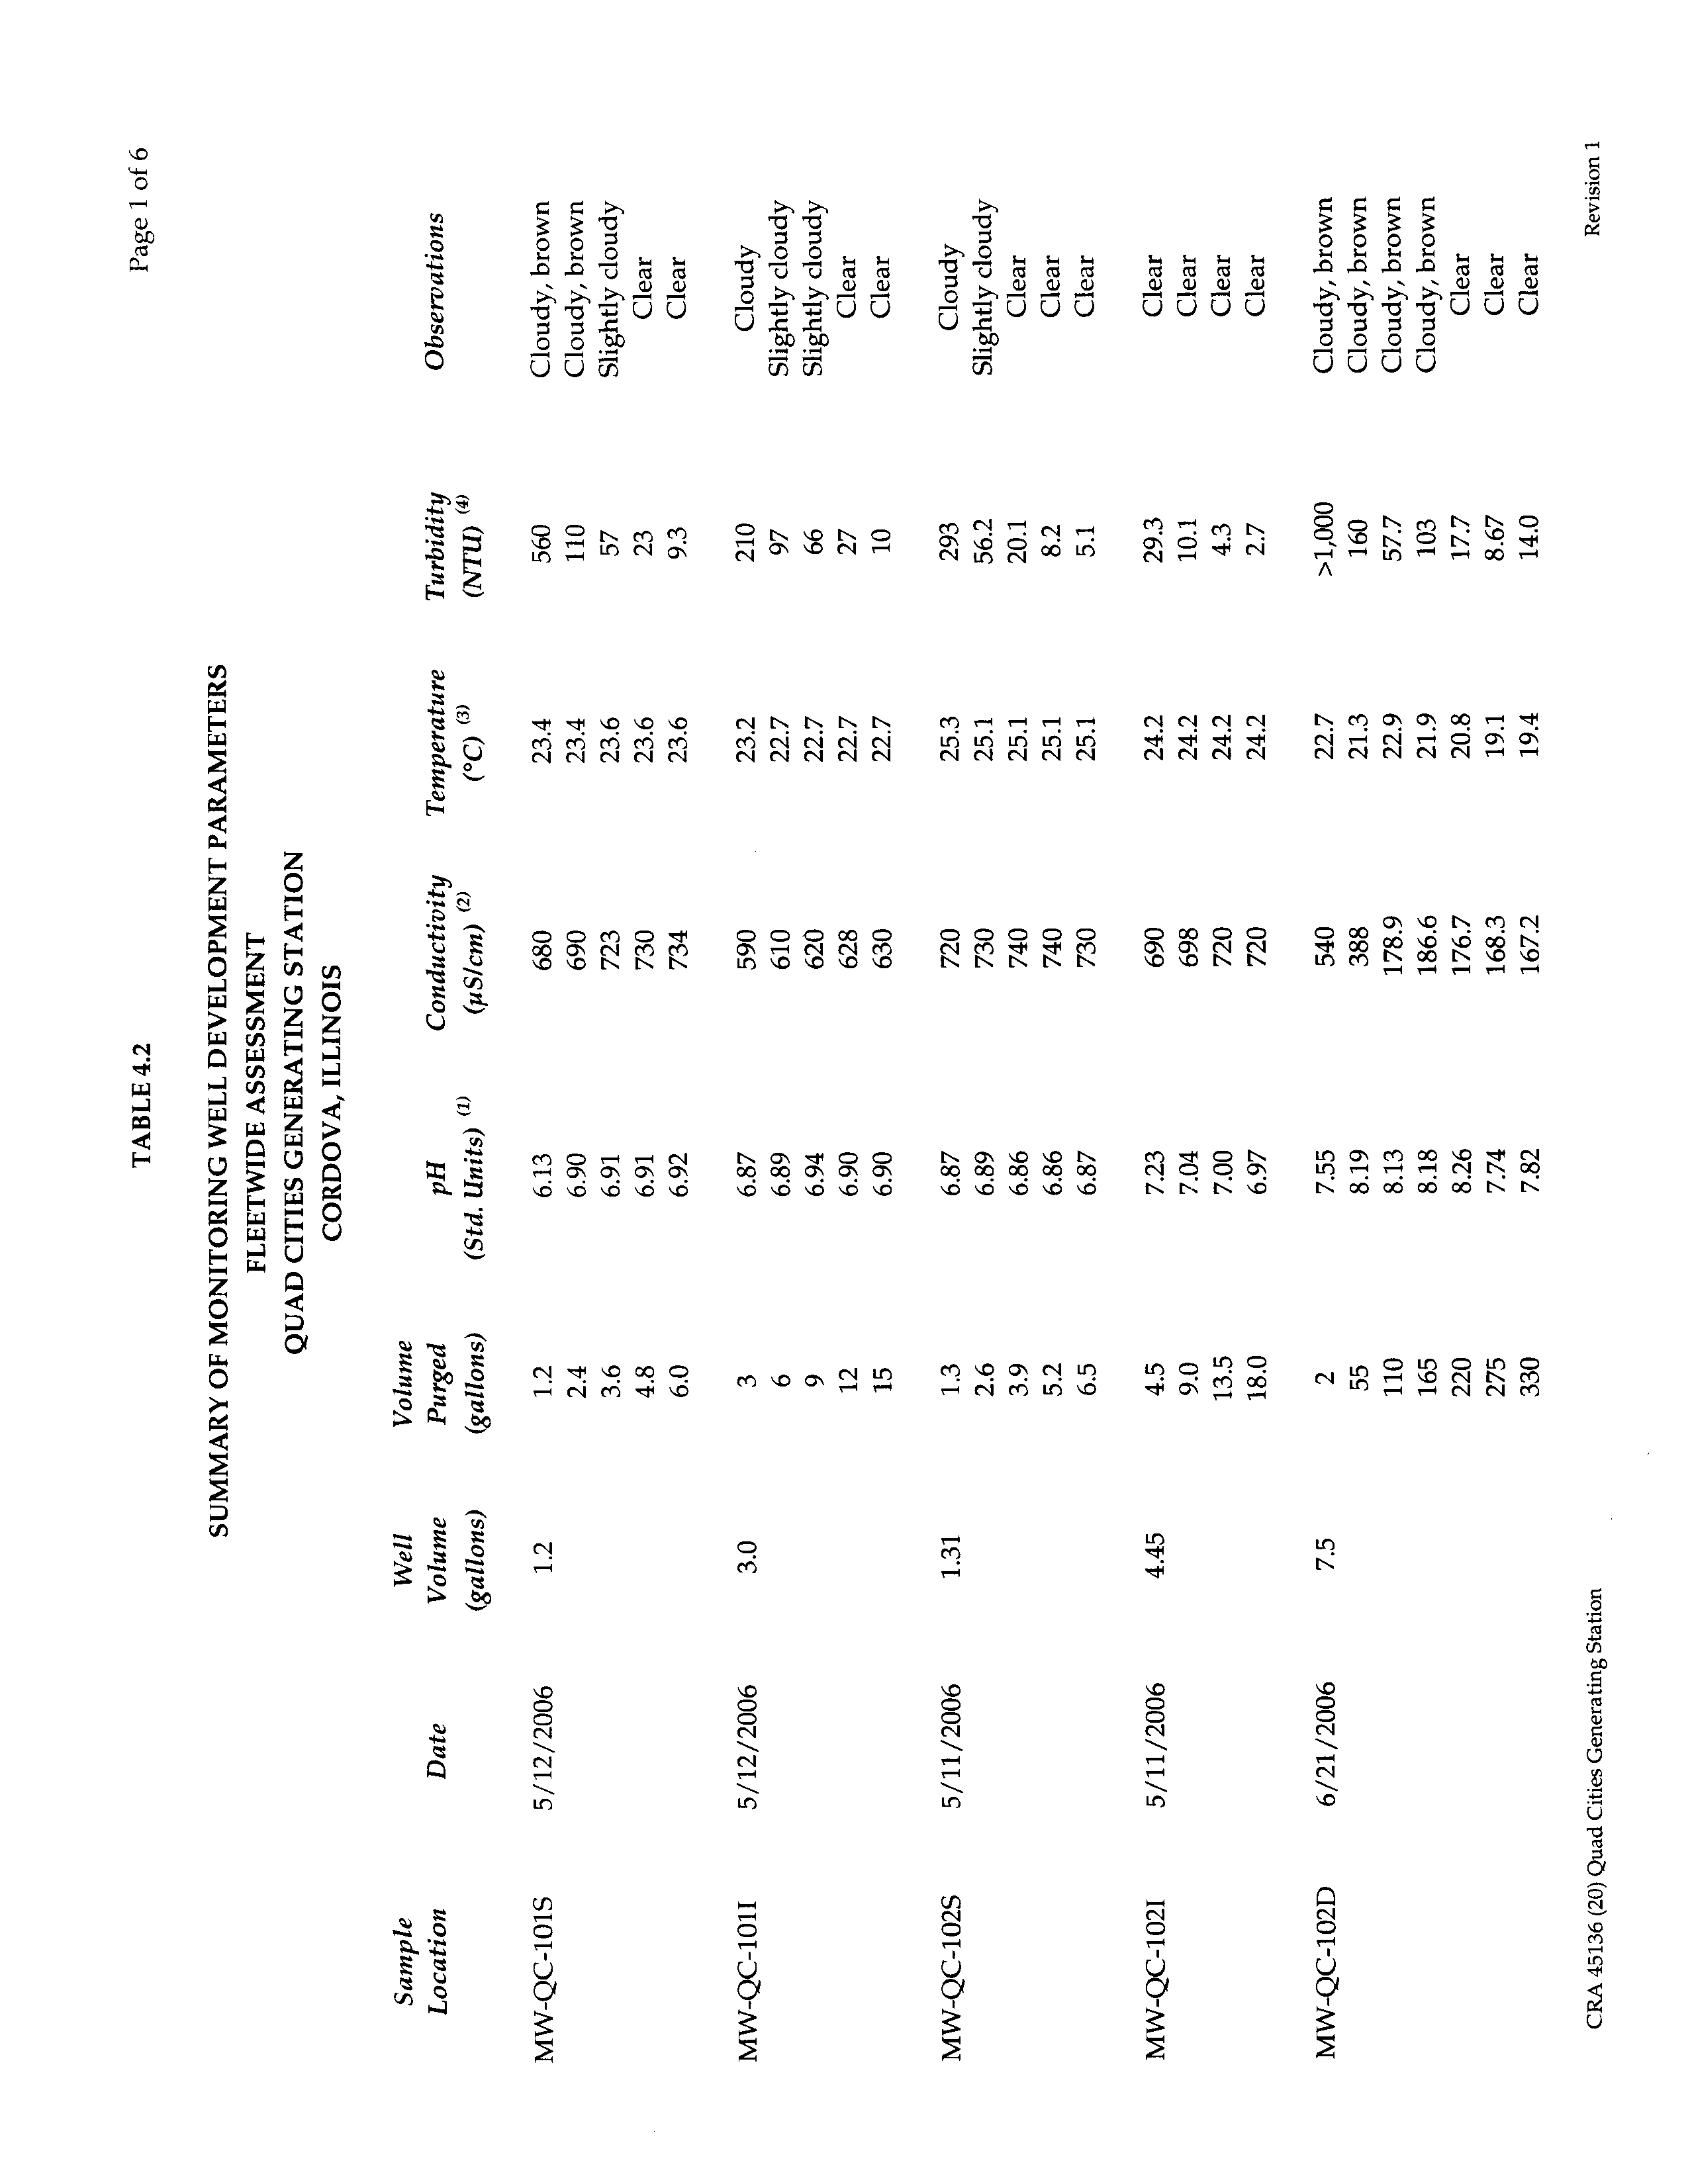
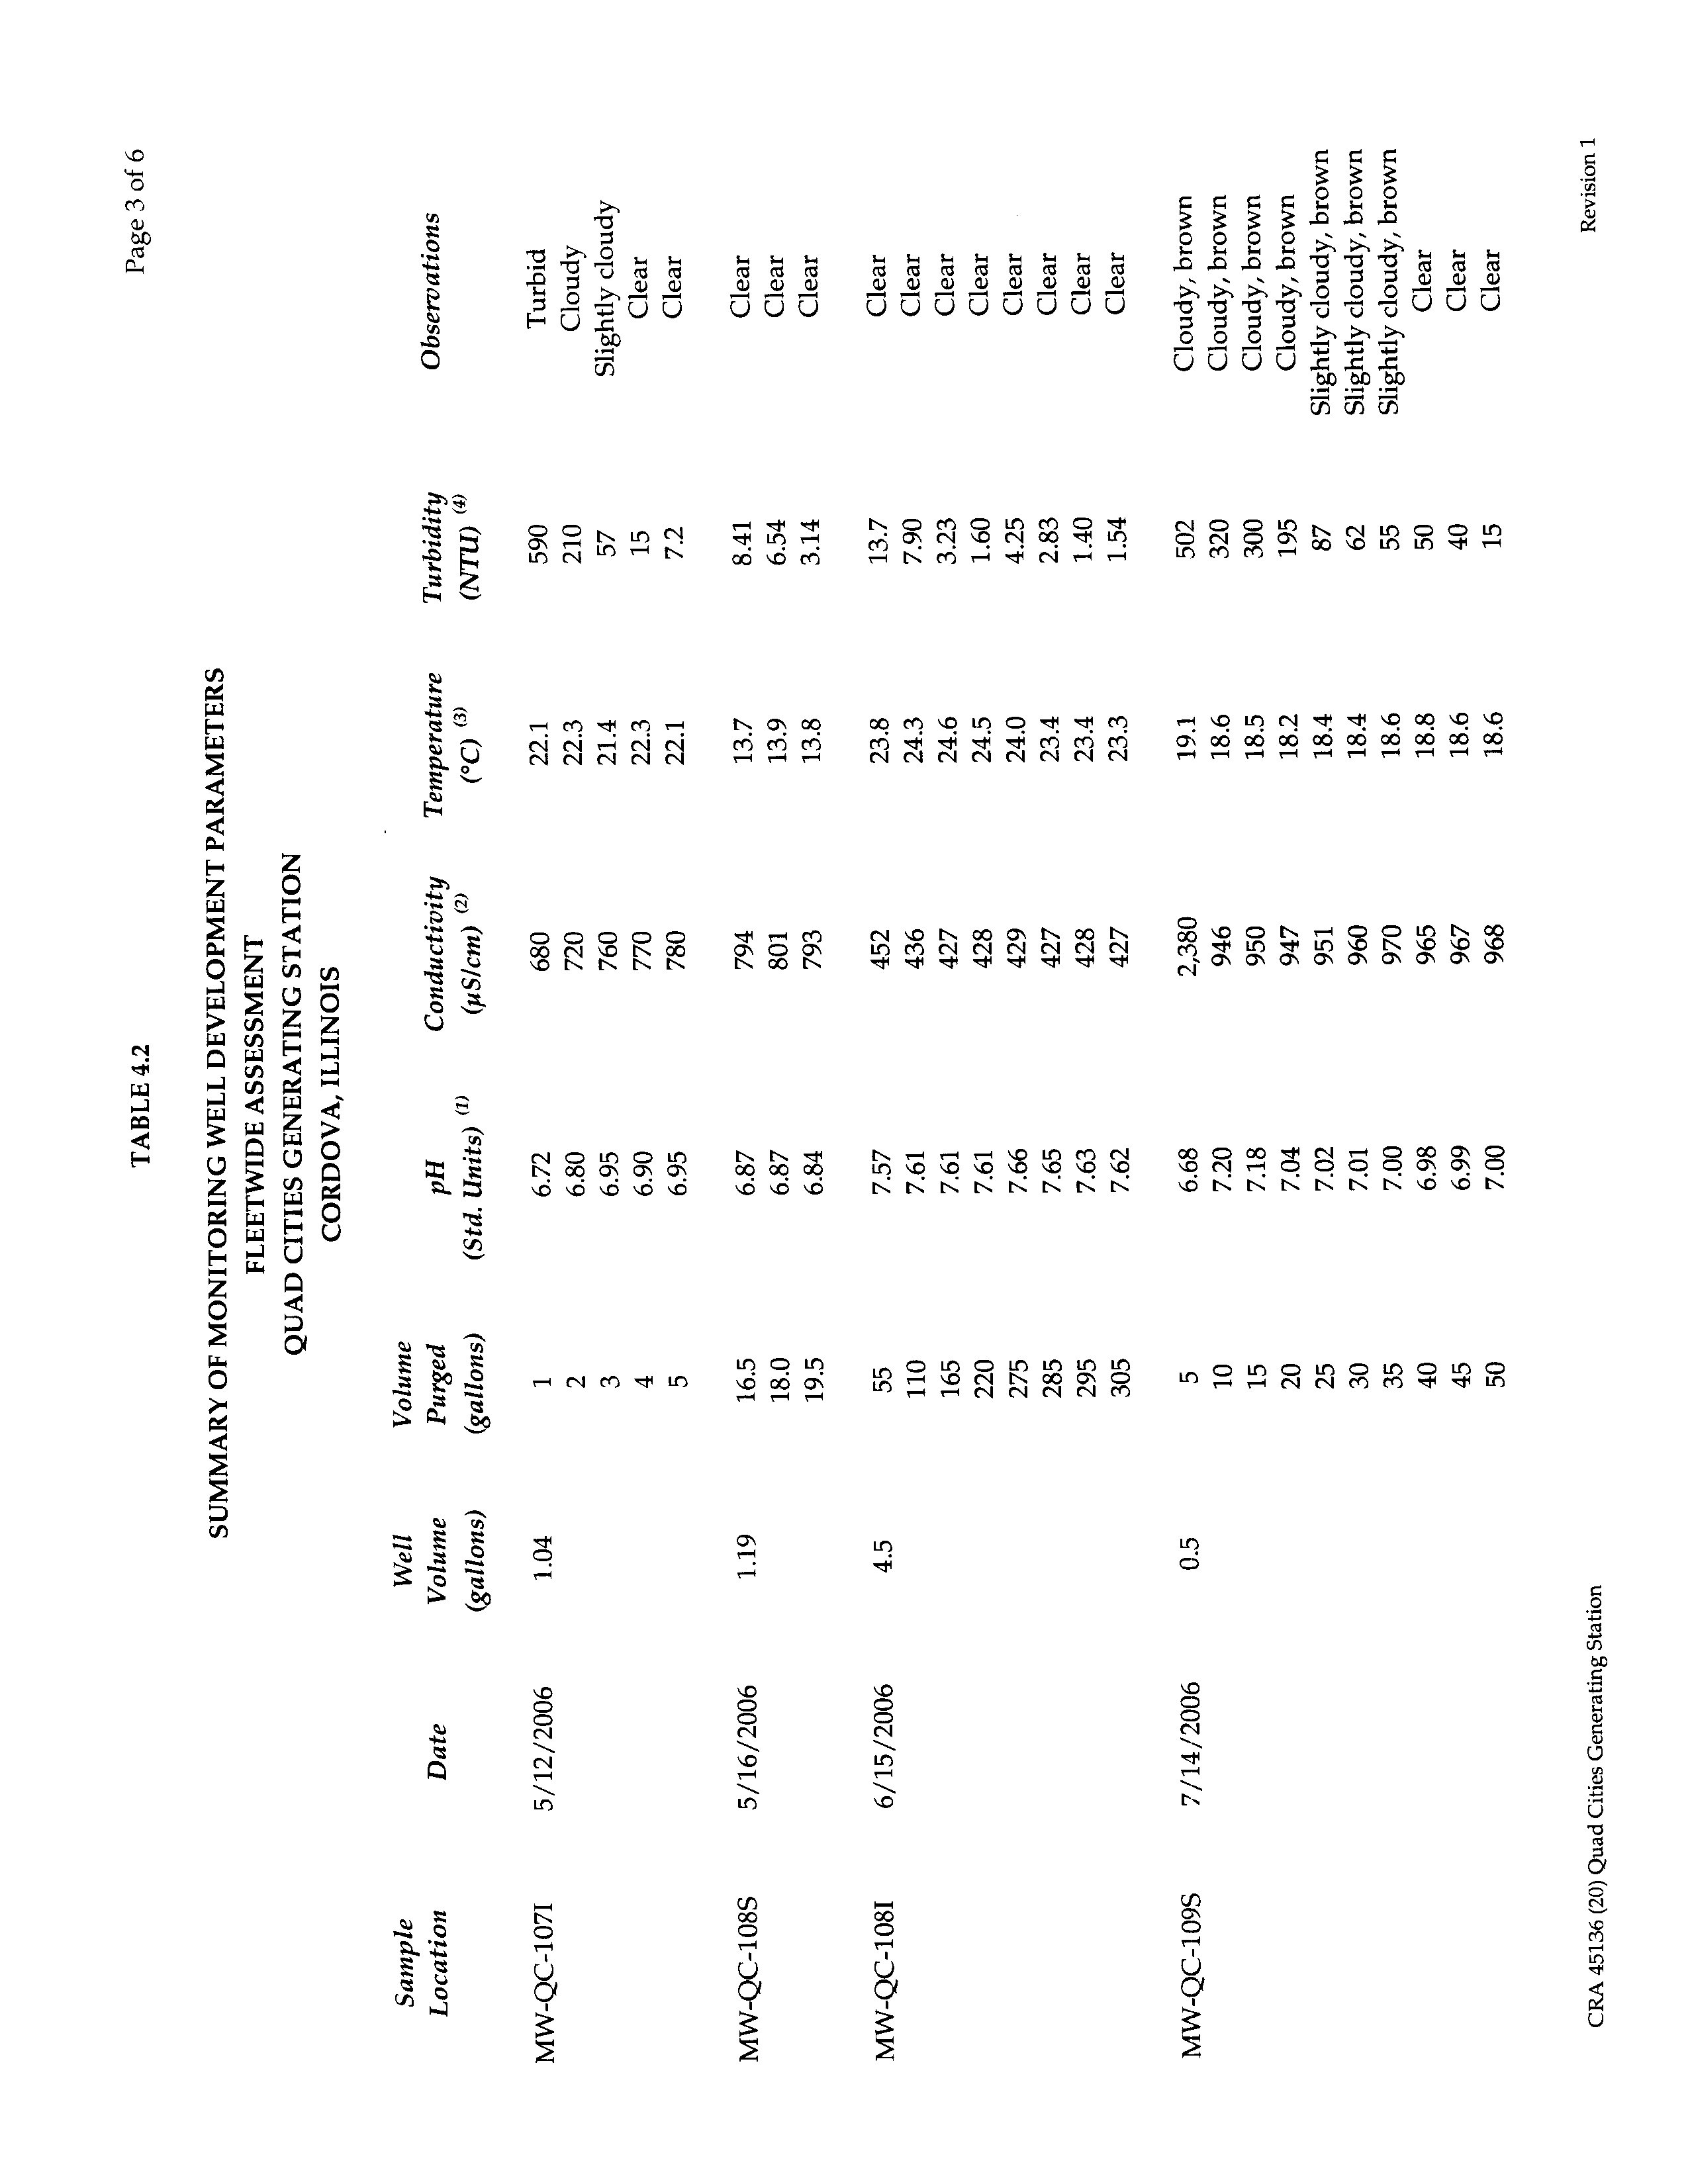
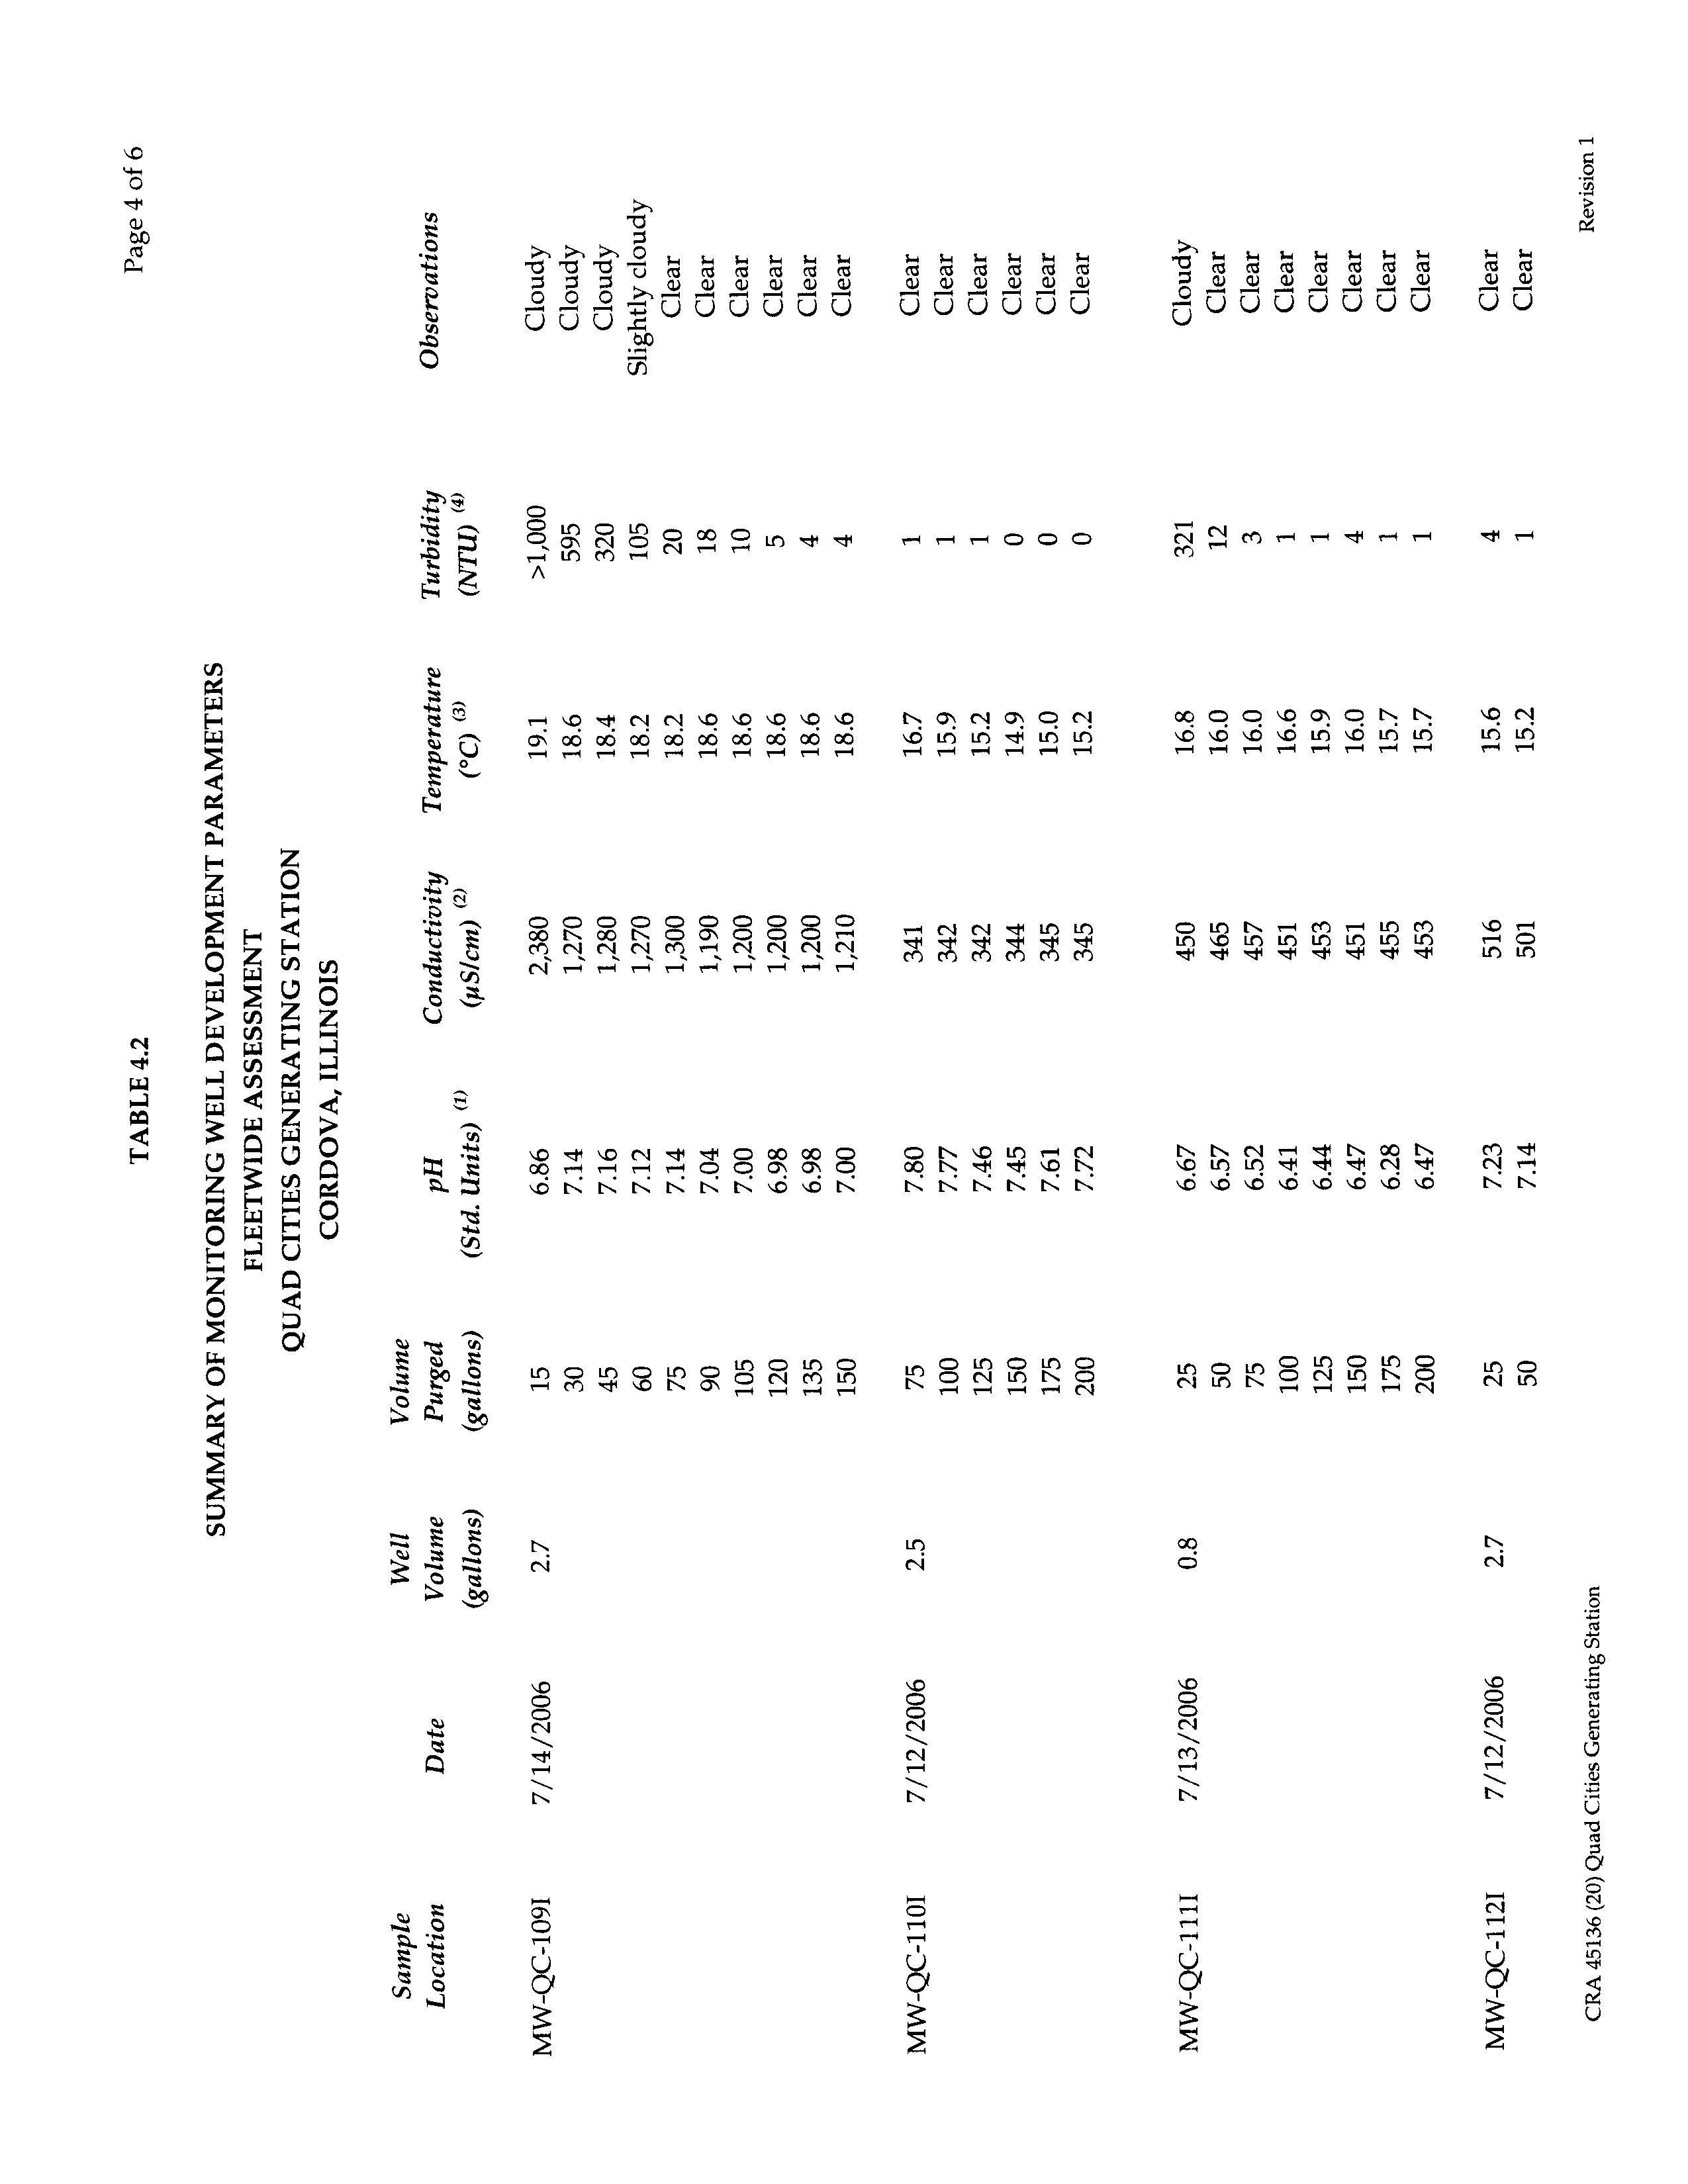
A summary of the well development parameters is provided in Table 4.2.
4.4
SURVEY
The new monitoring wells and surface water gauging points were surveyed to establish
reference elevations relative to mean sea level. The top of each well casing was
surveyed to the nearest 0.01 foot relative to the National Geodetic Vertical Datum
(NGVD), and the survey point was marked on the well casing. The survey included the
ground elevation at each well to the nearest 0.10 foot relative to the NGVD and the well
location to the nearest 1.0 foot. A reference point was also marked at each gauging
point.
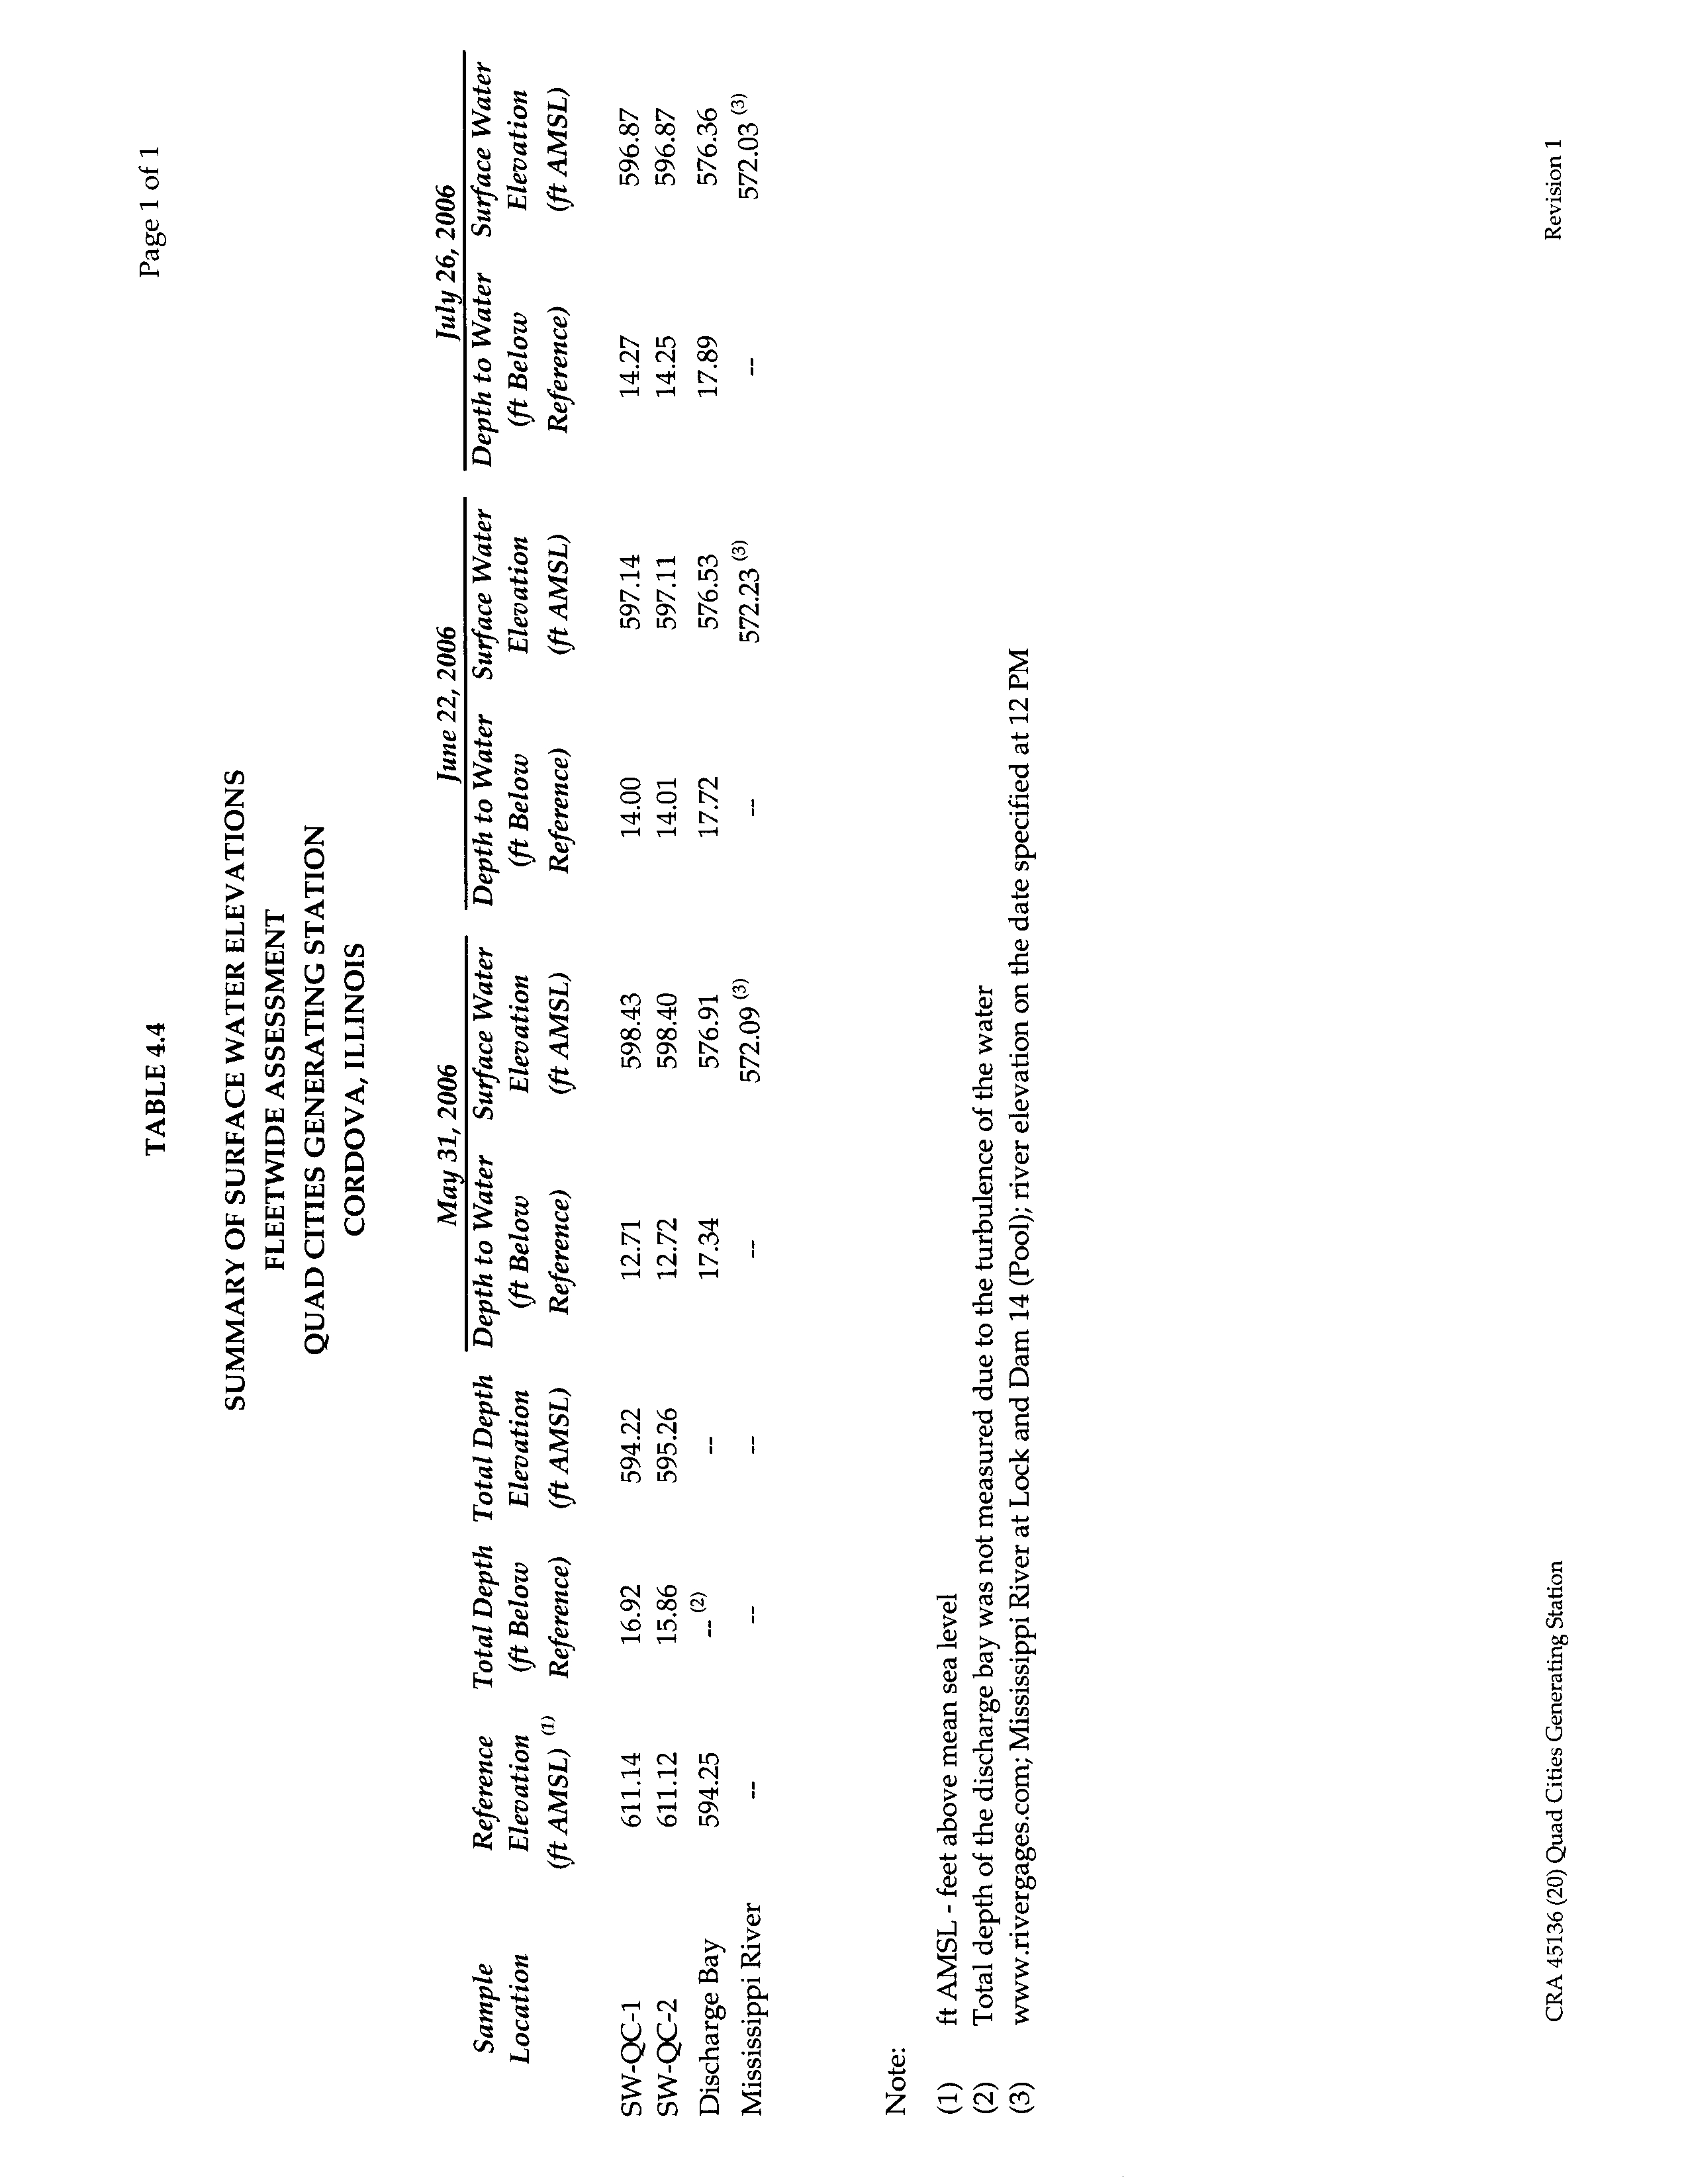
4.5
GROUNDWATER AND SURFACE WATER ELEVATION
MEASUREMENTS
On May 24, 2006 and July 26, 2006, CRA collected water level measurements from new
monitoring wells and surface water gauging points installed in accordance with the
Work Plan and from two existing
monitoring wells. CRA collected additional water
level measurements at the surface water gauging points on June 22, 2006. Based on the
045136 (20) Quad Cities Generating Station
19
CONESTOGA-ROVERS & ASSOCIATES
Revision 1
measured depth to water from the reference point and the surveyed elevation of the
reference point, the groundwater elevation was calculated. A summary of groundwater
elevations is provided in Table 4.3. A summary of surface water elevations is provided
in Table 4.4.
Prior to the water level measurements, the wells were identified and located.
Once the
wells were identified, CRA completed a thorough inspection of each well and noted any
deficiencies.
Water level measurements were collected using an electronic
depth-to-water probe accurate to
± 0.01 foot. The measurements were made from the
designated location on the inner riser or protective casing of each monitoring well.
Surface water measurements were made from the designated location at each surface
water gauging point.
The water level measurements were obtained using the following procedures:
•
the proper elevation of the meter was checked by inserting the tip into water and
noting if the contact was registering correctly;
•
the tip was dried, and then slowly lowered into the well until contact with the water
was indicated;
•
the tip was slowly raised until the light and/or buzzer just began to activate. This
indicated the static water level;
•
the reading at the reference point was noted to the nearest hundredth of a foot;
•
the reading was then re-checked; and
•
the water level was then recorded, and the water level meter decontaminated prior
to use at the next well location.
4.6
GROUNDWATER AND SURFACE WATER
SAMPLE COLLECTION
CRA conducted two rounds of groundwater and surface water sampling during the
completion of the Work Plan for these hydrogeologic investigations. A total of
13 monitoring wells and eight water supply wells were sampled on May 31 and June 1,
2006. An additional 11 monitoring wells were sampled on July 27 and 28, 2006. Of the
24 monitoring wells sampled, 22 were newly installed. The sampling was scheduled to
allow for 2 weeks to elapse between well development and groundwater sample
collection. The two existing wells were selected for inclusion in this monitoring
program based on their proximity to the AFEs. The new wells were installed to
complete the monitoring network in the vicinity of the AFEs.
045136 (20) Quad Cities Generating Station
20
CONESTOGA-ROVERS & ASSOCIATES
Revision 1
At the monitoring well locations, CRA conducted the sampling using dedicated tubing
and a peristaltic pump or a submersible electronic pump, and employed low-flow
purging techniques as described in Puls and Barcelona (1996).
The groundwater in the monitoring wells was sampled by the following
low-flow
procedures:
•
the wells were located and identified;
•
a water level measurement was taken;
•
the well was sounded by carefully lowering the water level tape to the bottom of the
well (so as to minimize penetration and disturbance of the well bottom sediment),
and comparing the sounded depth to the installed depth to assess the presence of
any excess sediment or drill cuttings;
•
the pump or tubing was lowered slowly into the well and fixed into place such that
the intake was located at the mid-point of the well screen, or a minimum of 2 feet
above the well bottom / sediment level;
•
the purging was conducted using a pumping rate between 100 to 500 milliliters per
minute (mL/min). Initial purging began using the lower end of this range. The
groundwater level was monitored to ensure that a drawdown of less than 0.3 foot
occurred. If this criterion was met, the pumping rate was increased dependent on
the behavior of the well. During purging, the pumping rate and groundwater level
were measured and recorded every 5 minutes;
•
the field parameters [pH, temperature, conductivity, oxidation-reduction potential
(ORP), dissolved oxygen (DO), and turbidity] were monitored during the purging to
evaluate the stabilization of the purged groundwater. Stabilization was considered
to be achieved when three consecutive readings for each parameter, taken at
5-minute intervals, were within the following limits:
pH
± 0.1 pH units of the average value of the three readings,
Temperature
± 3 percent of the average value of the three readings,
Conductivity
± 0.005 milliSiemen per centimeter (mS/cm) of the average value
of the three readings for conductivity <1 mS/cm and
± 0.01 mS/cm of the average value of the three readings for
conductivity >1 mS/cm,
ORP
± 10 millivolts (mV) of the average value of the three readings,
DO
± 10 percent of the average value of the three readings, and
Turbidity
± 10 percent of the average value of the three readings, or a final
value of less than 5 nephelometric turbidity units (NTU); and
045136 (20) Quad Cities Generating Station
21
CONESTOGA-ROVERS & ASSOCIATES
Revision 1
•
once purging was complete, the groundwater samples were collected directly from
the pump/tubing directly into the sample containers.
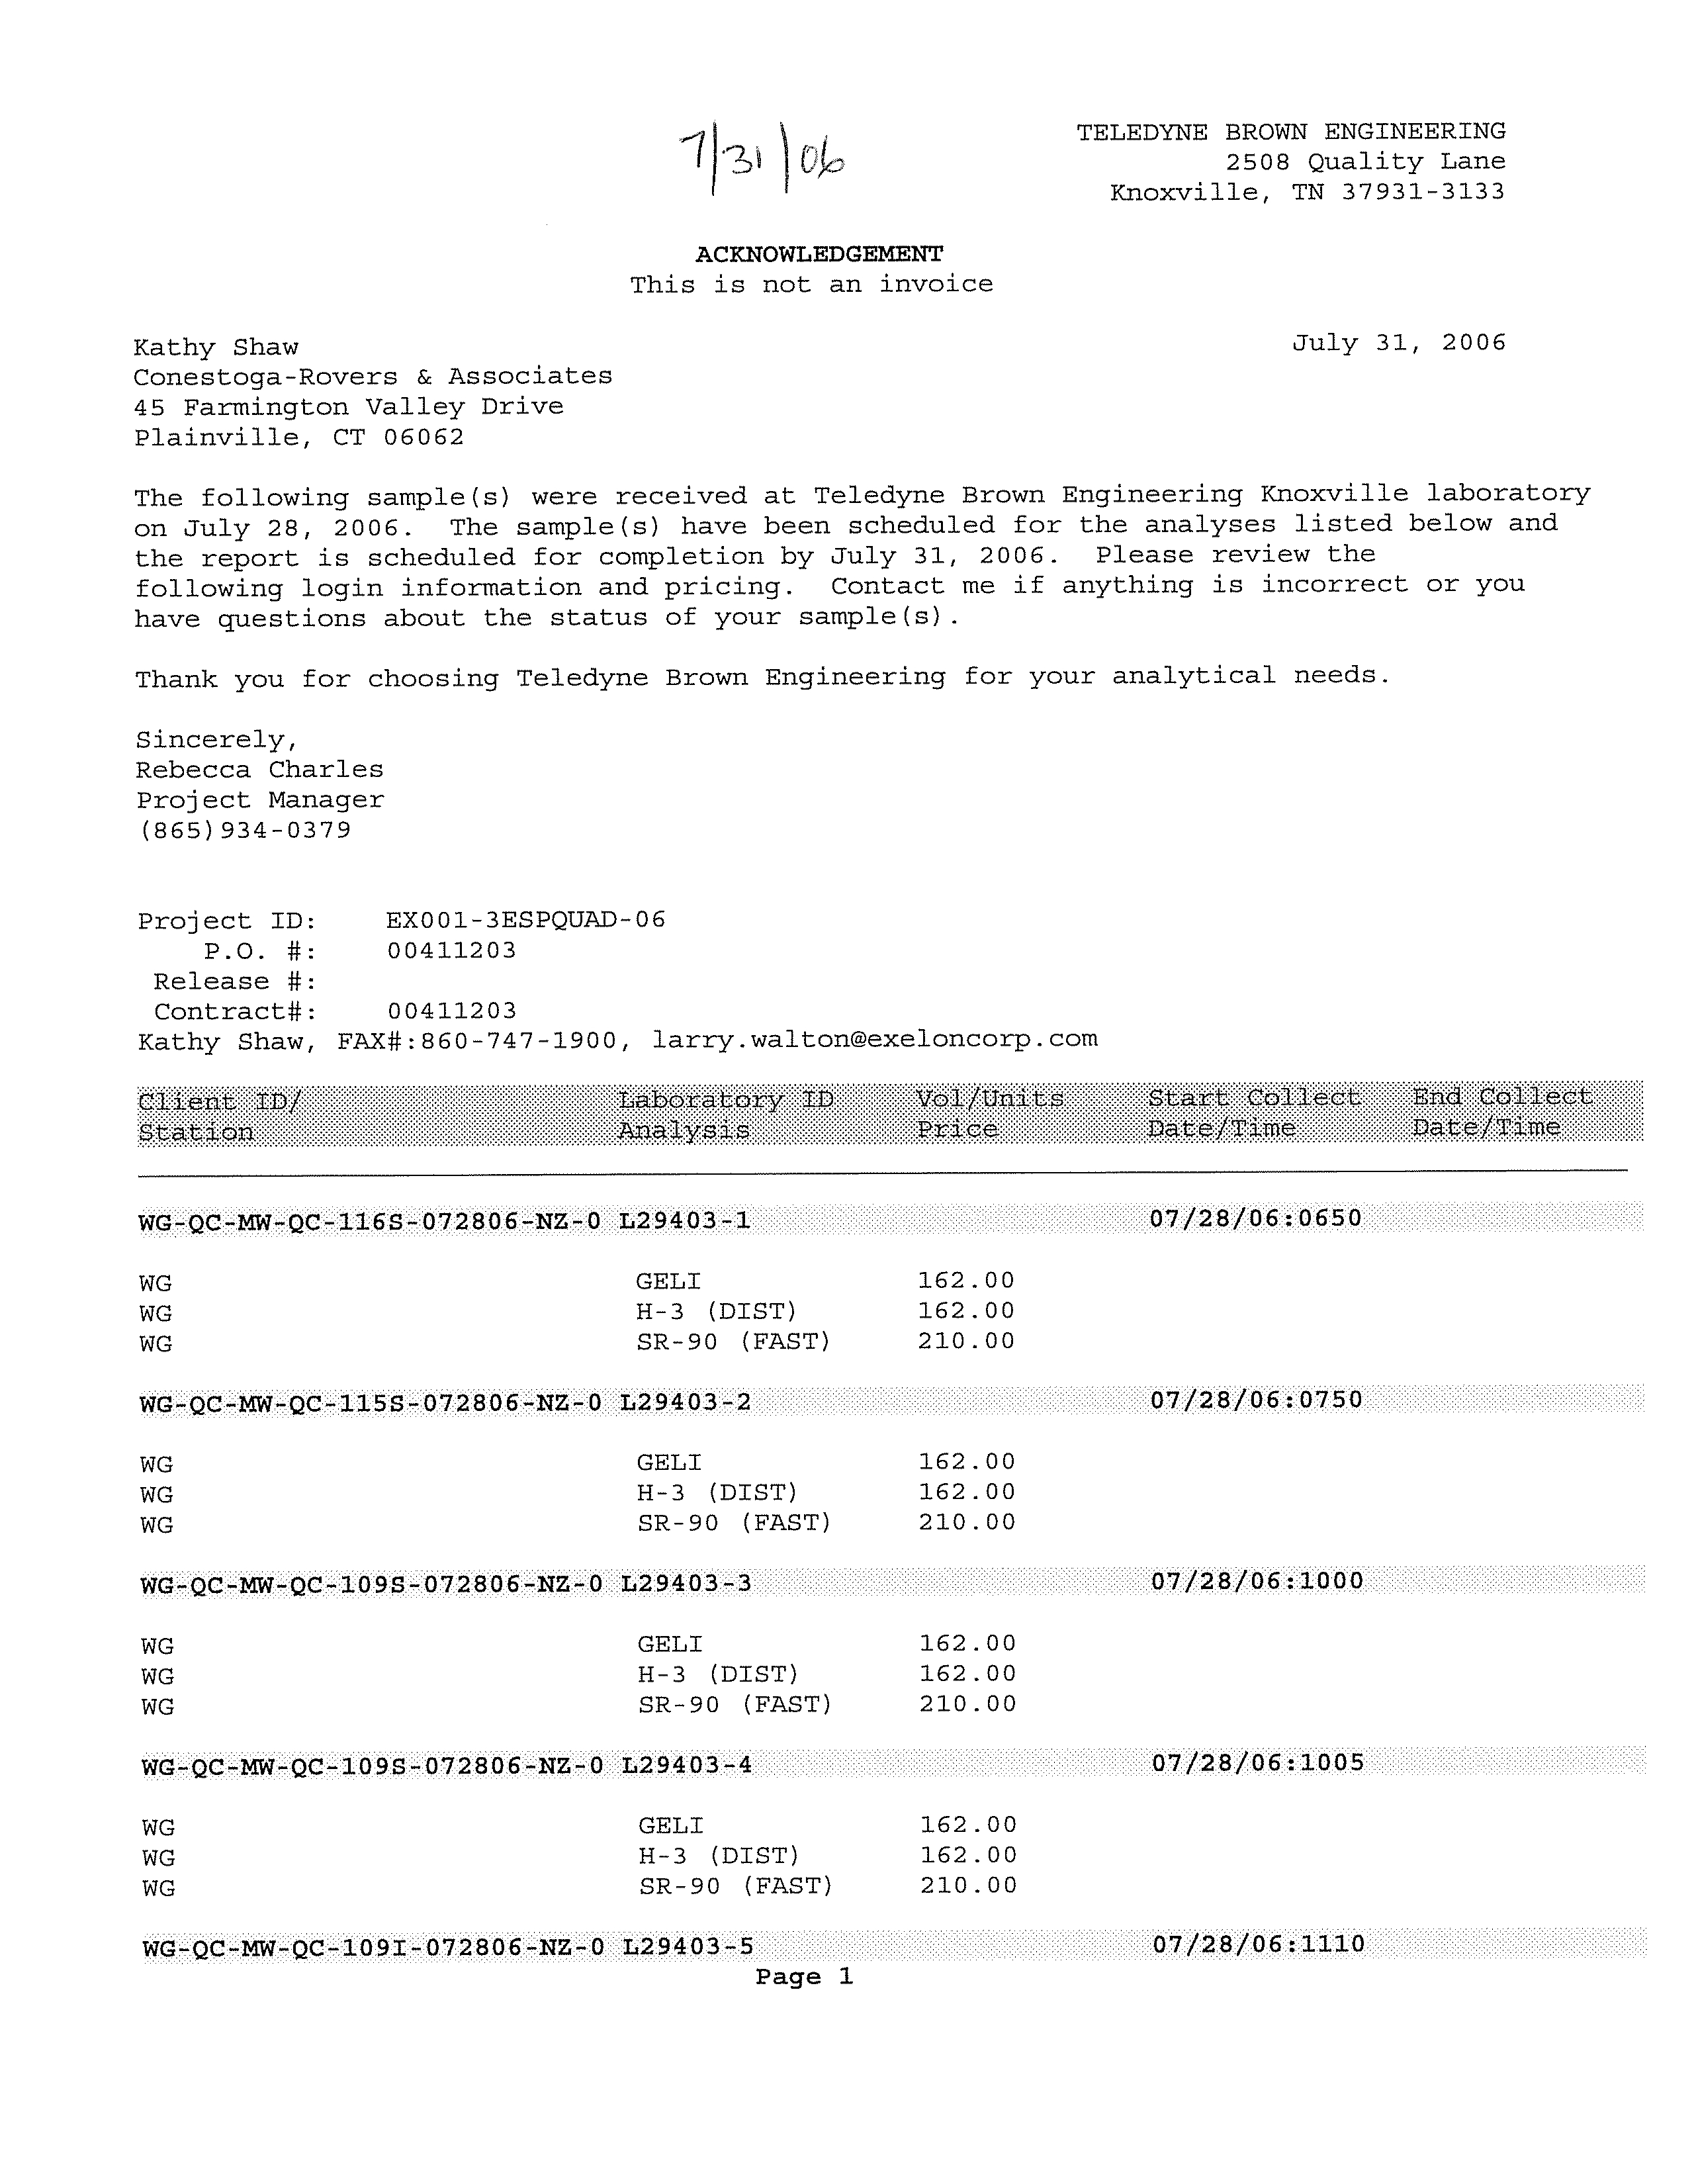
All groundwater samples were labeled with a unique
sample number, the date and time,
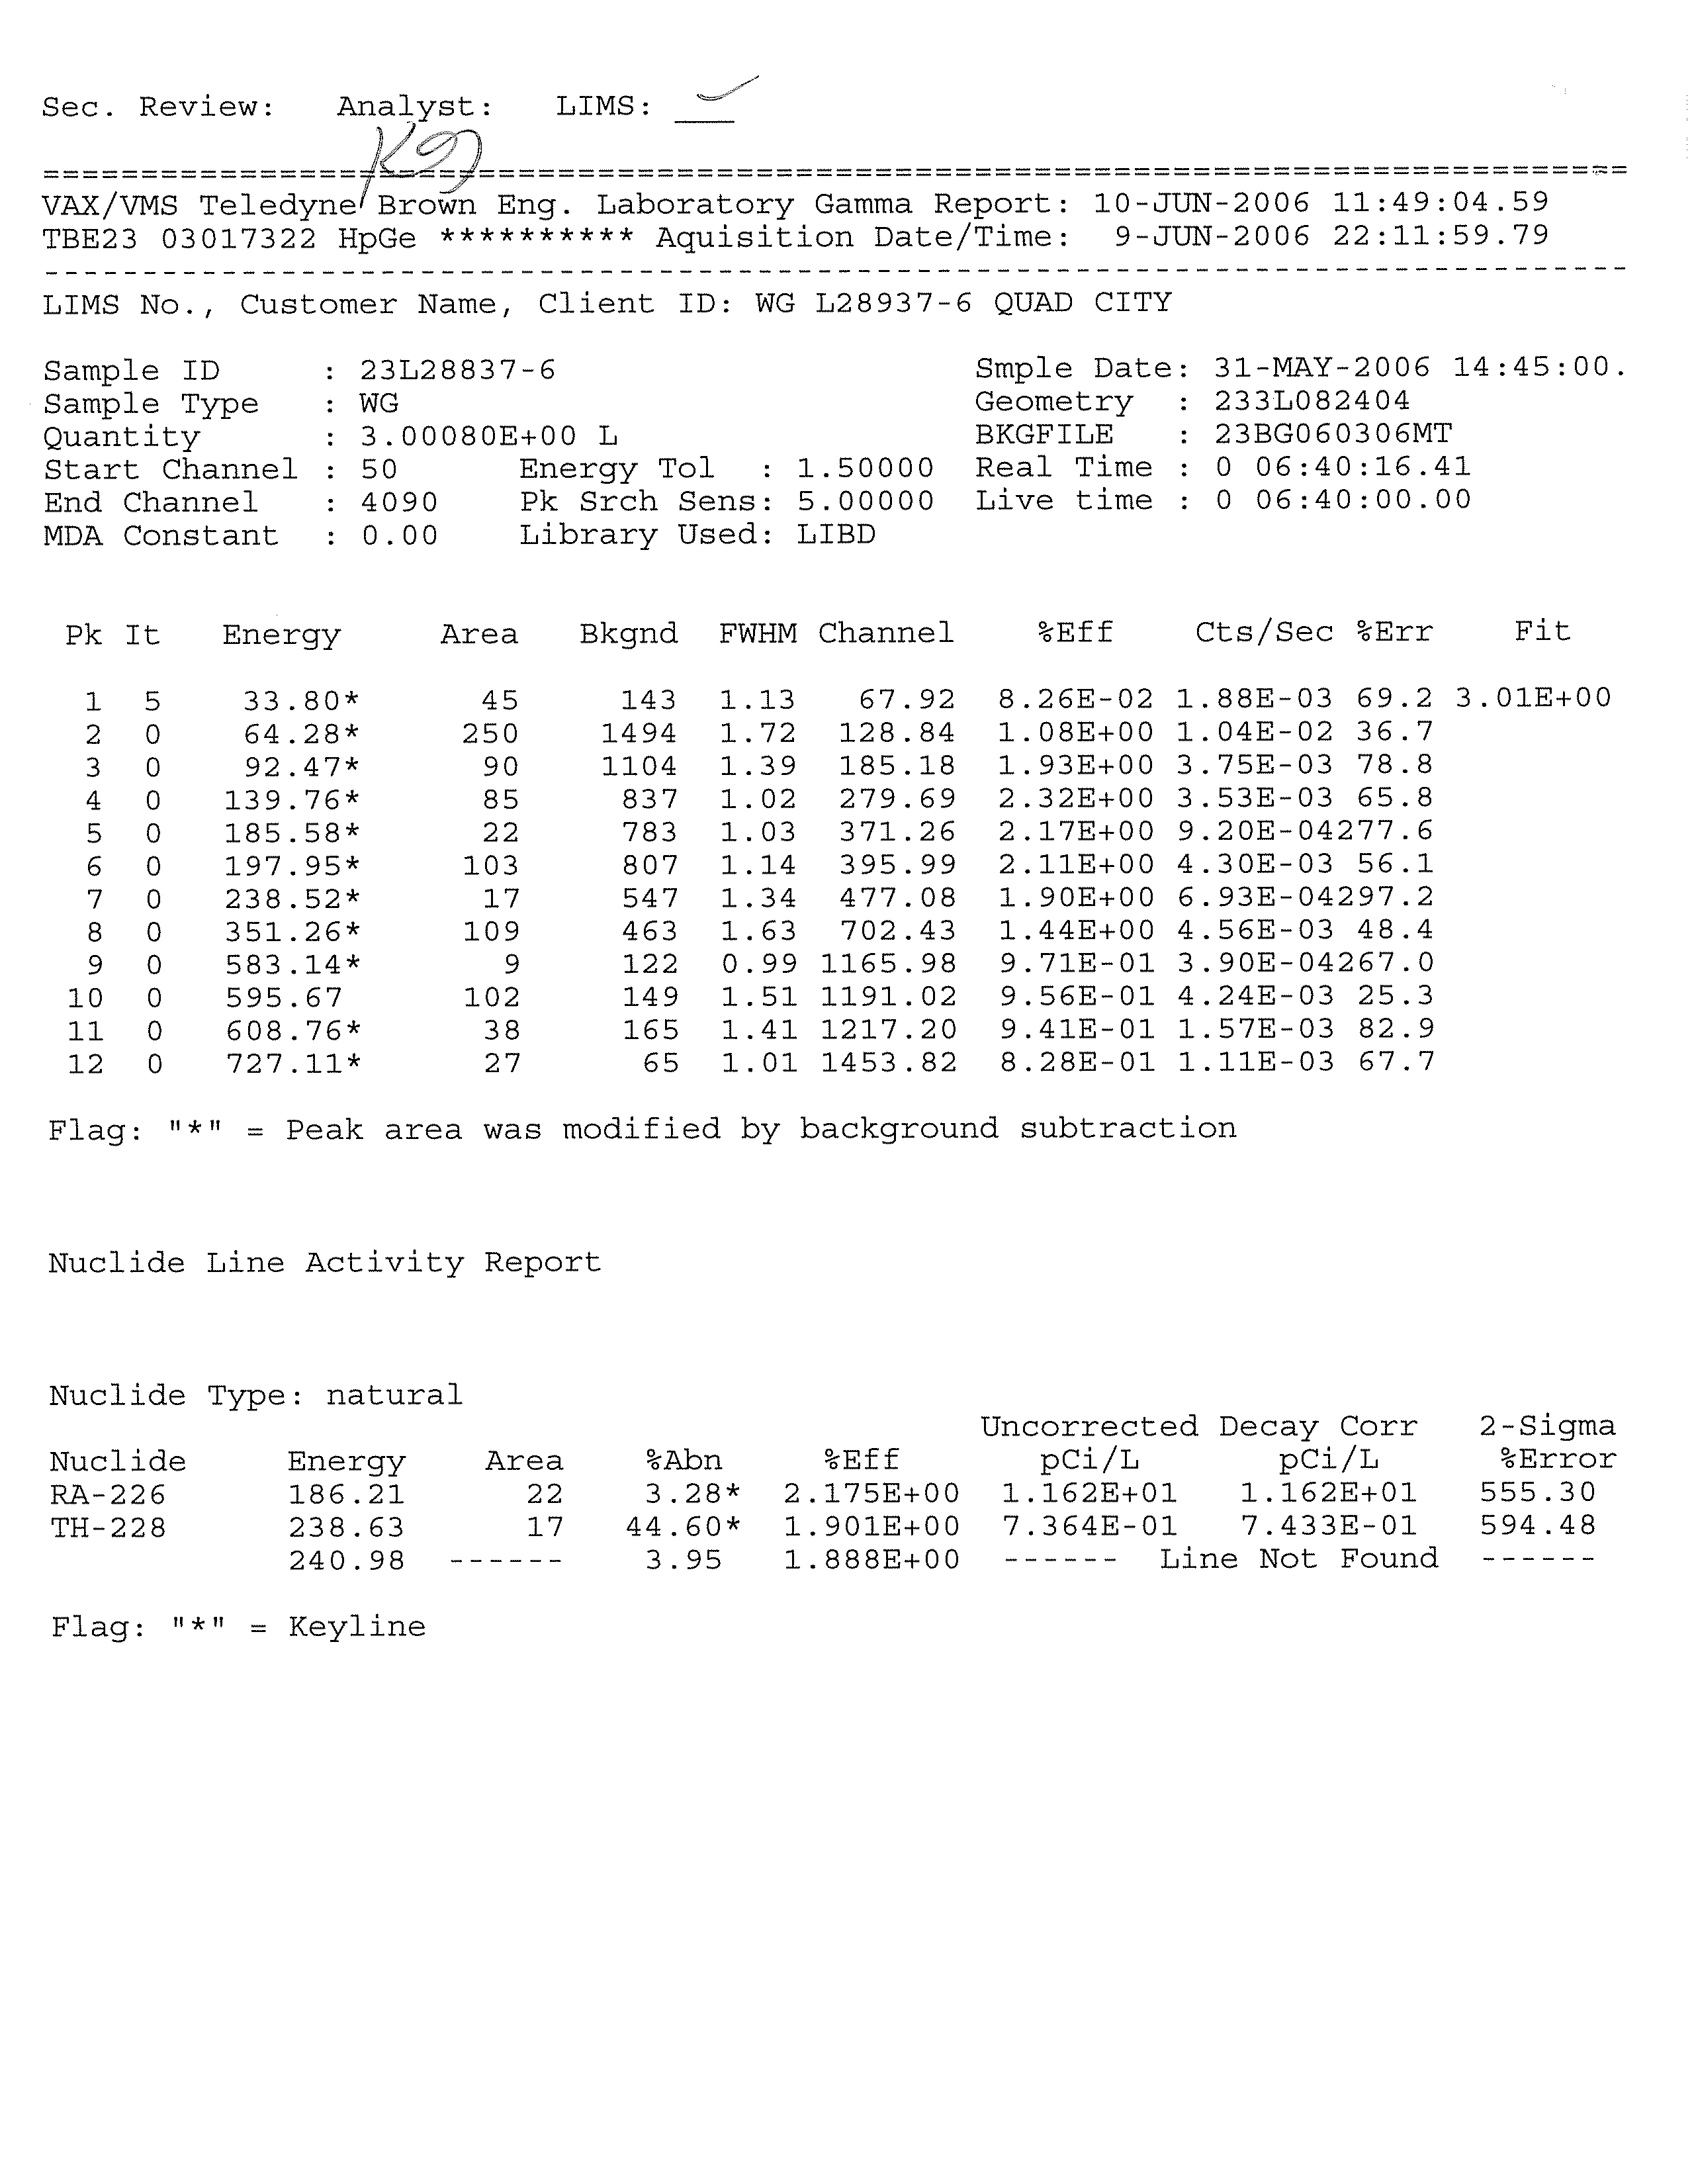
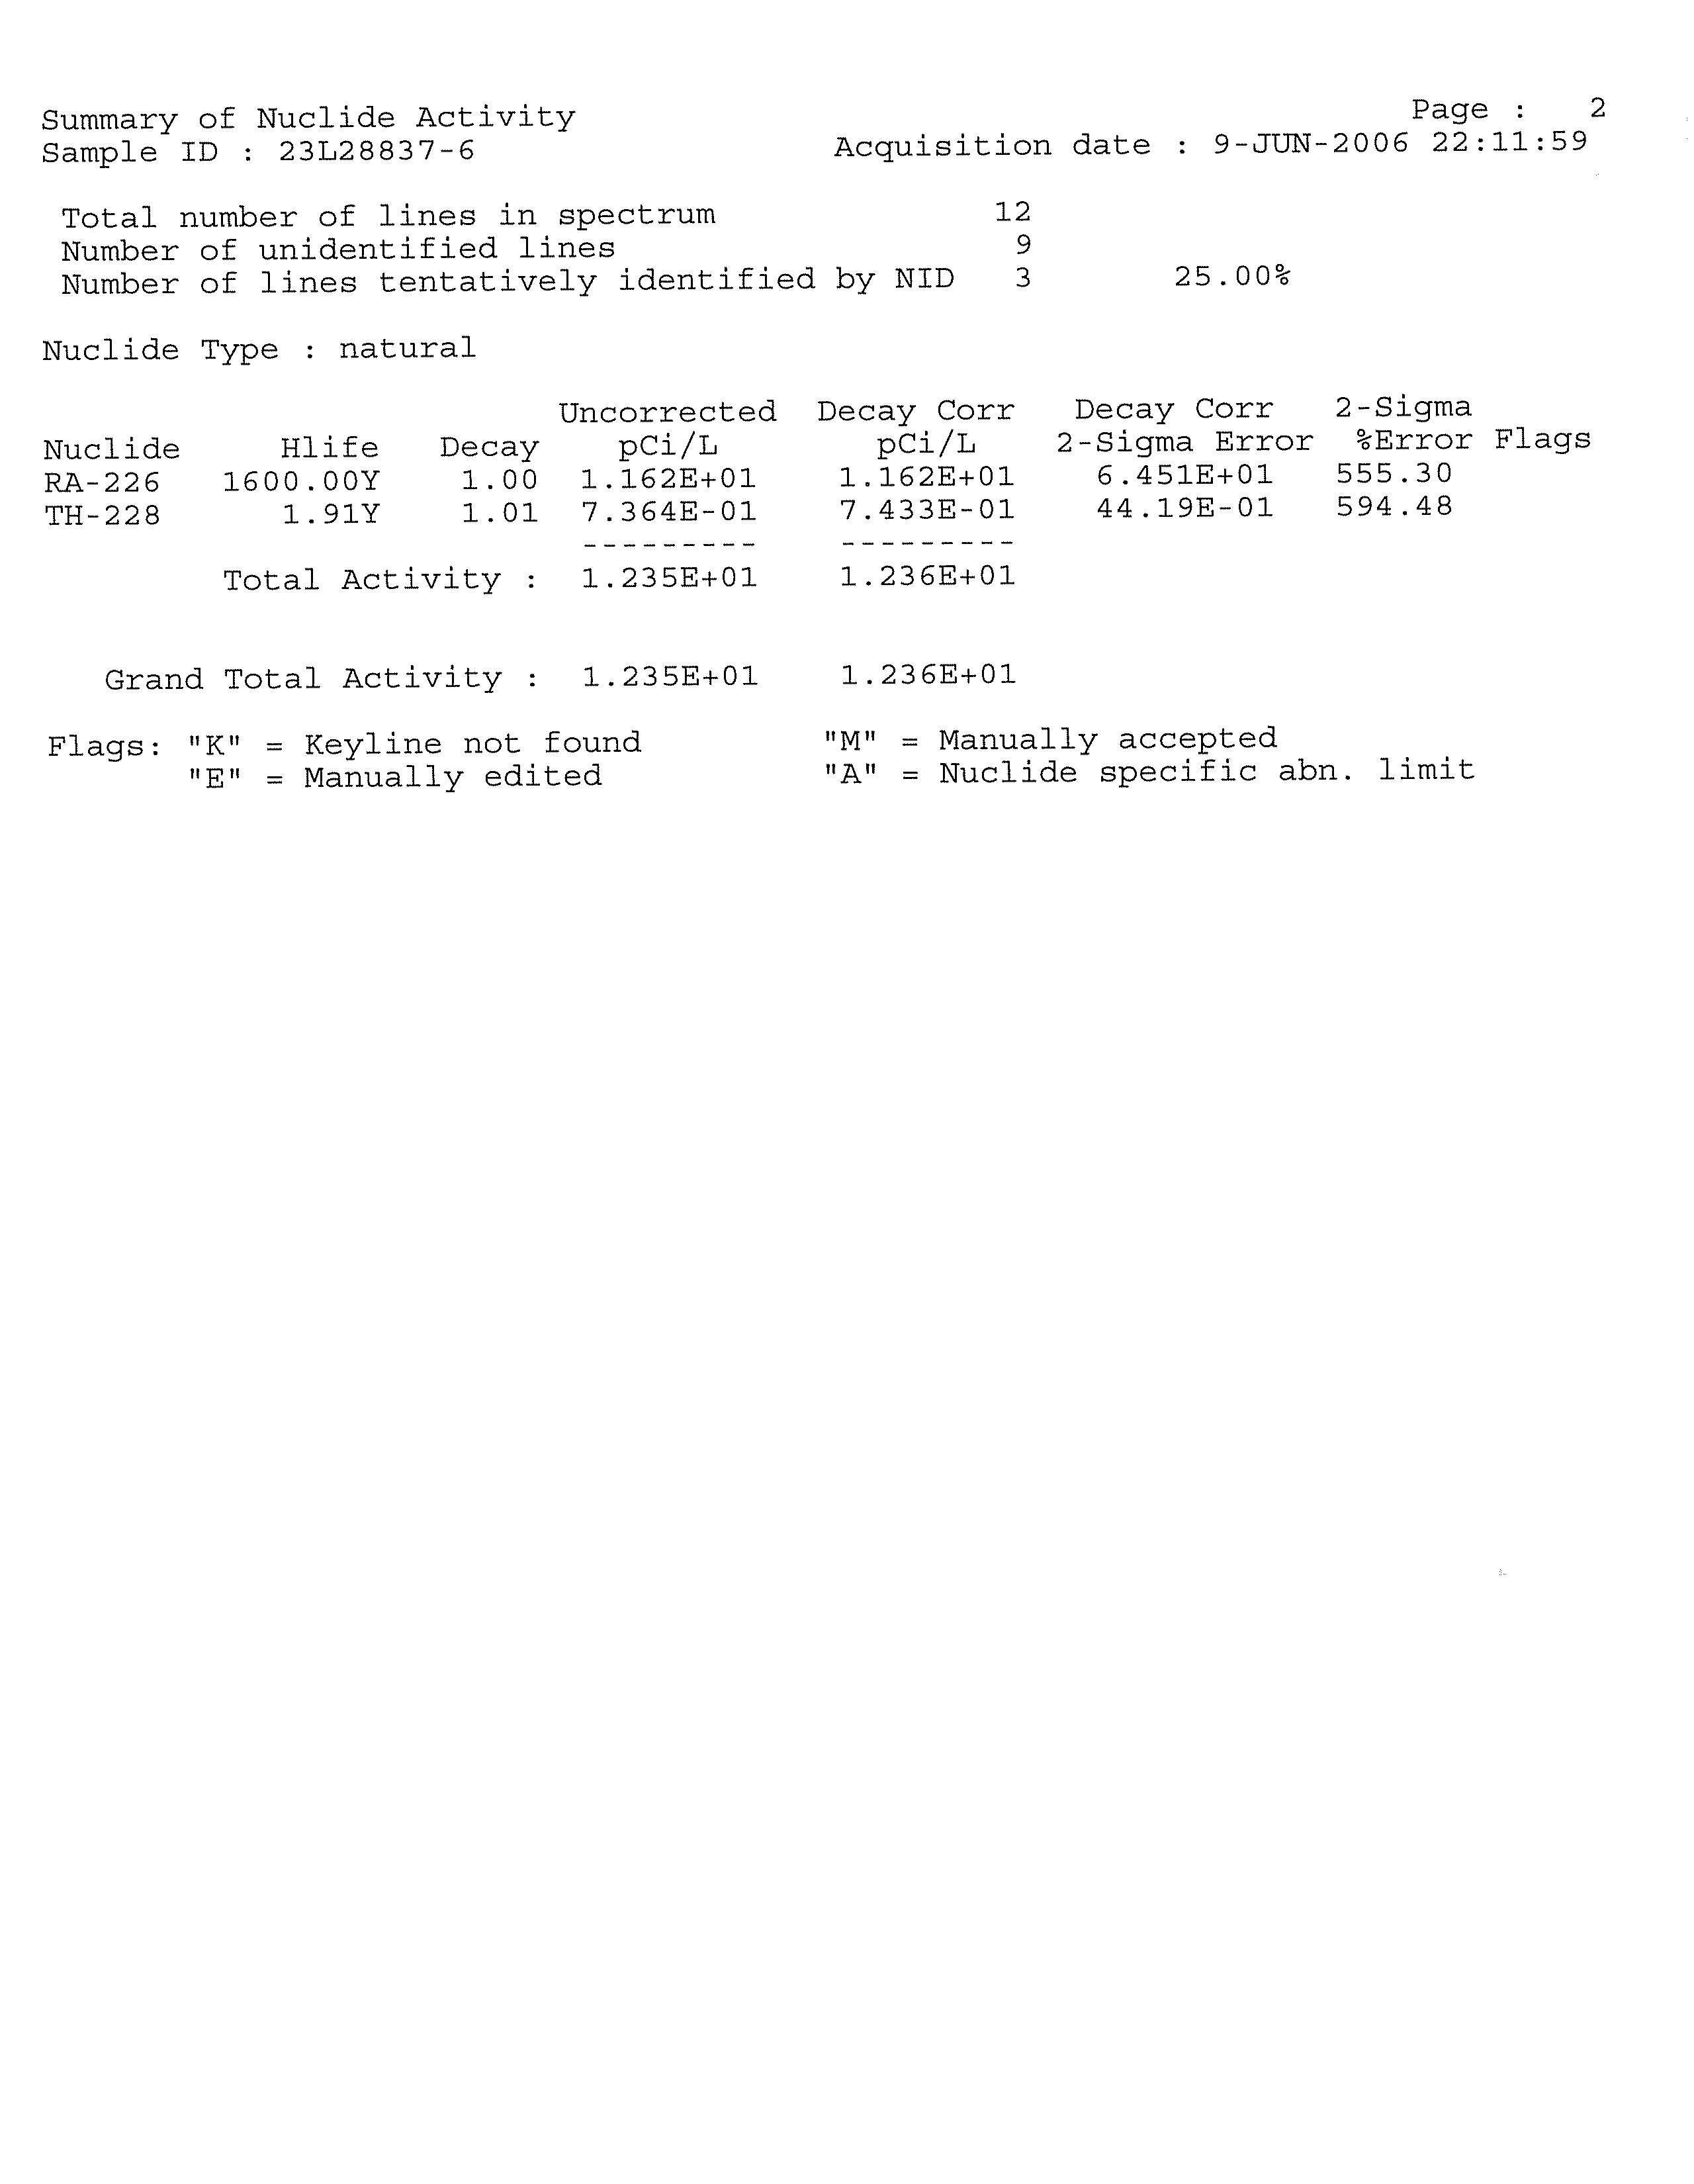
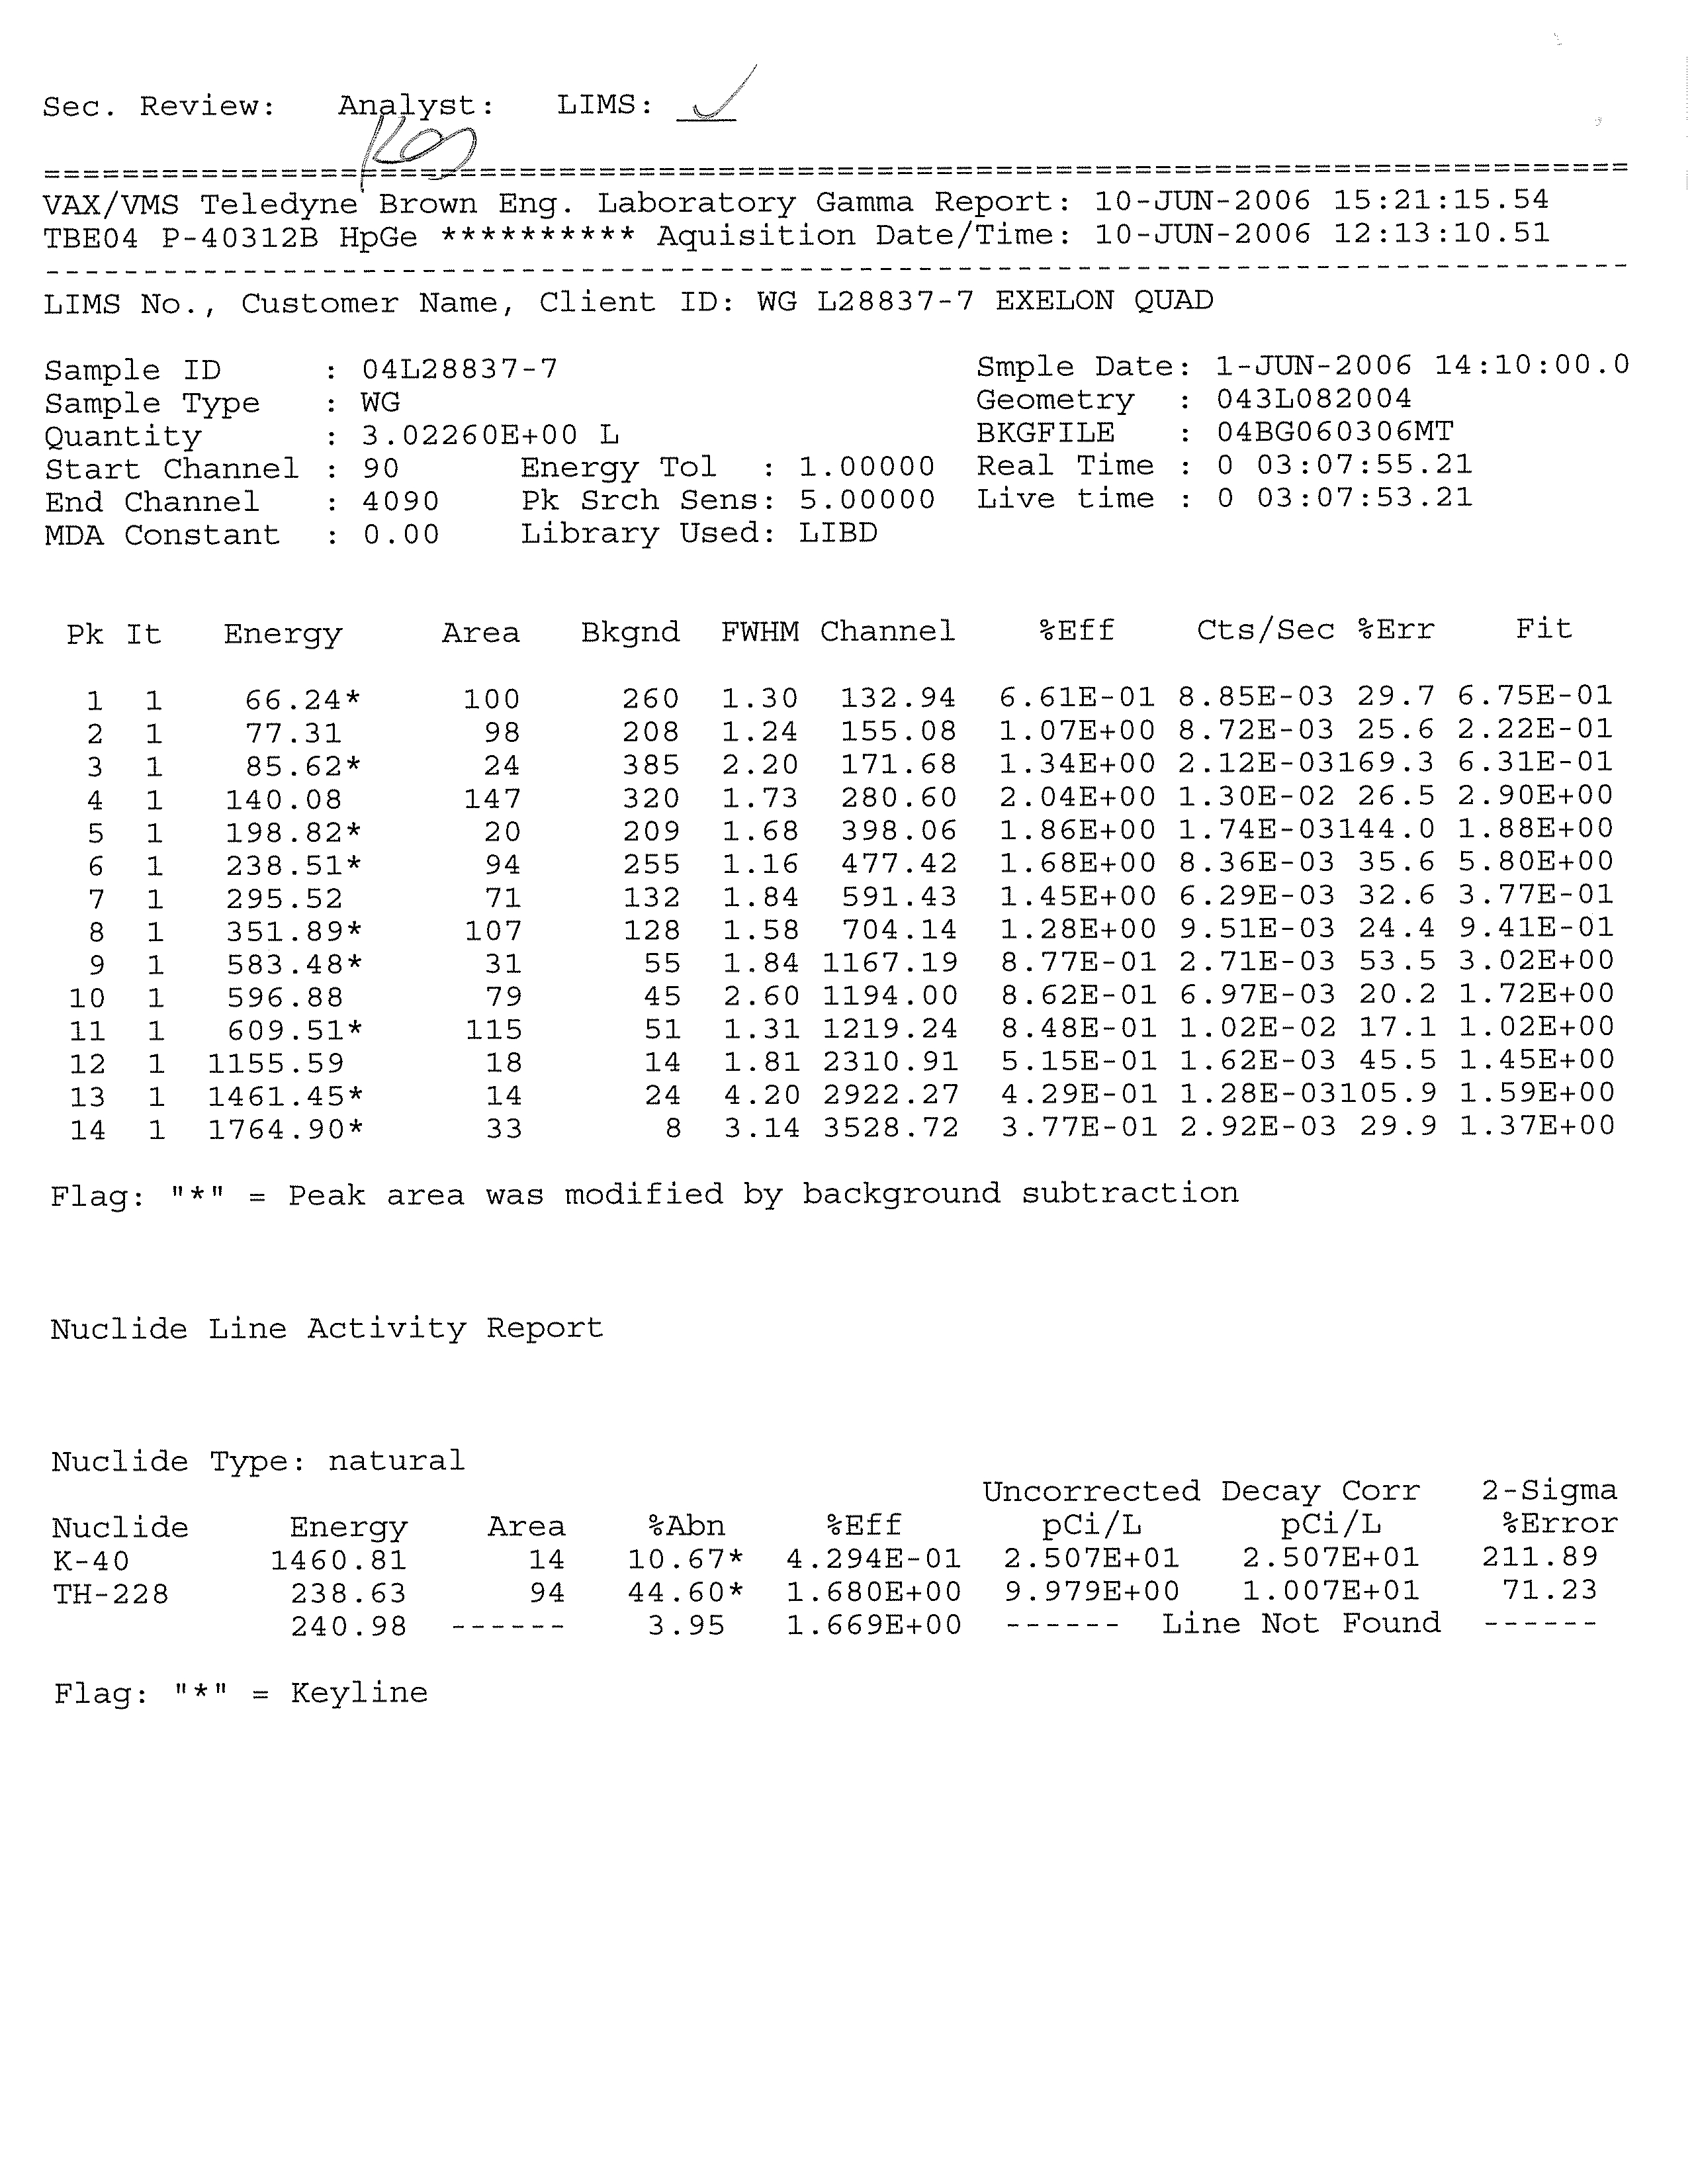
the parameters to be analyzed, the project number, and the sampler's initials. The
samples were screened by the Station for shipment to Teledyne Brown Engineering, Inc.
(Teledyne Brown).
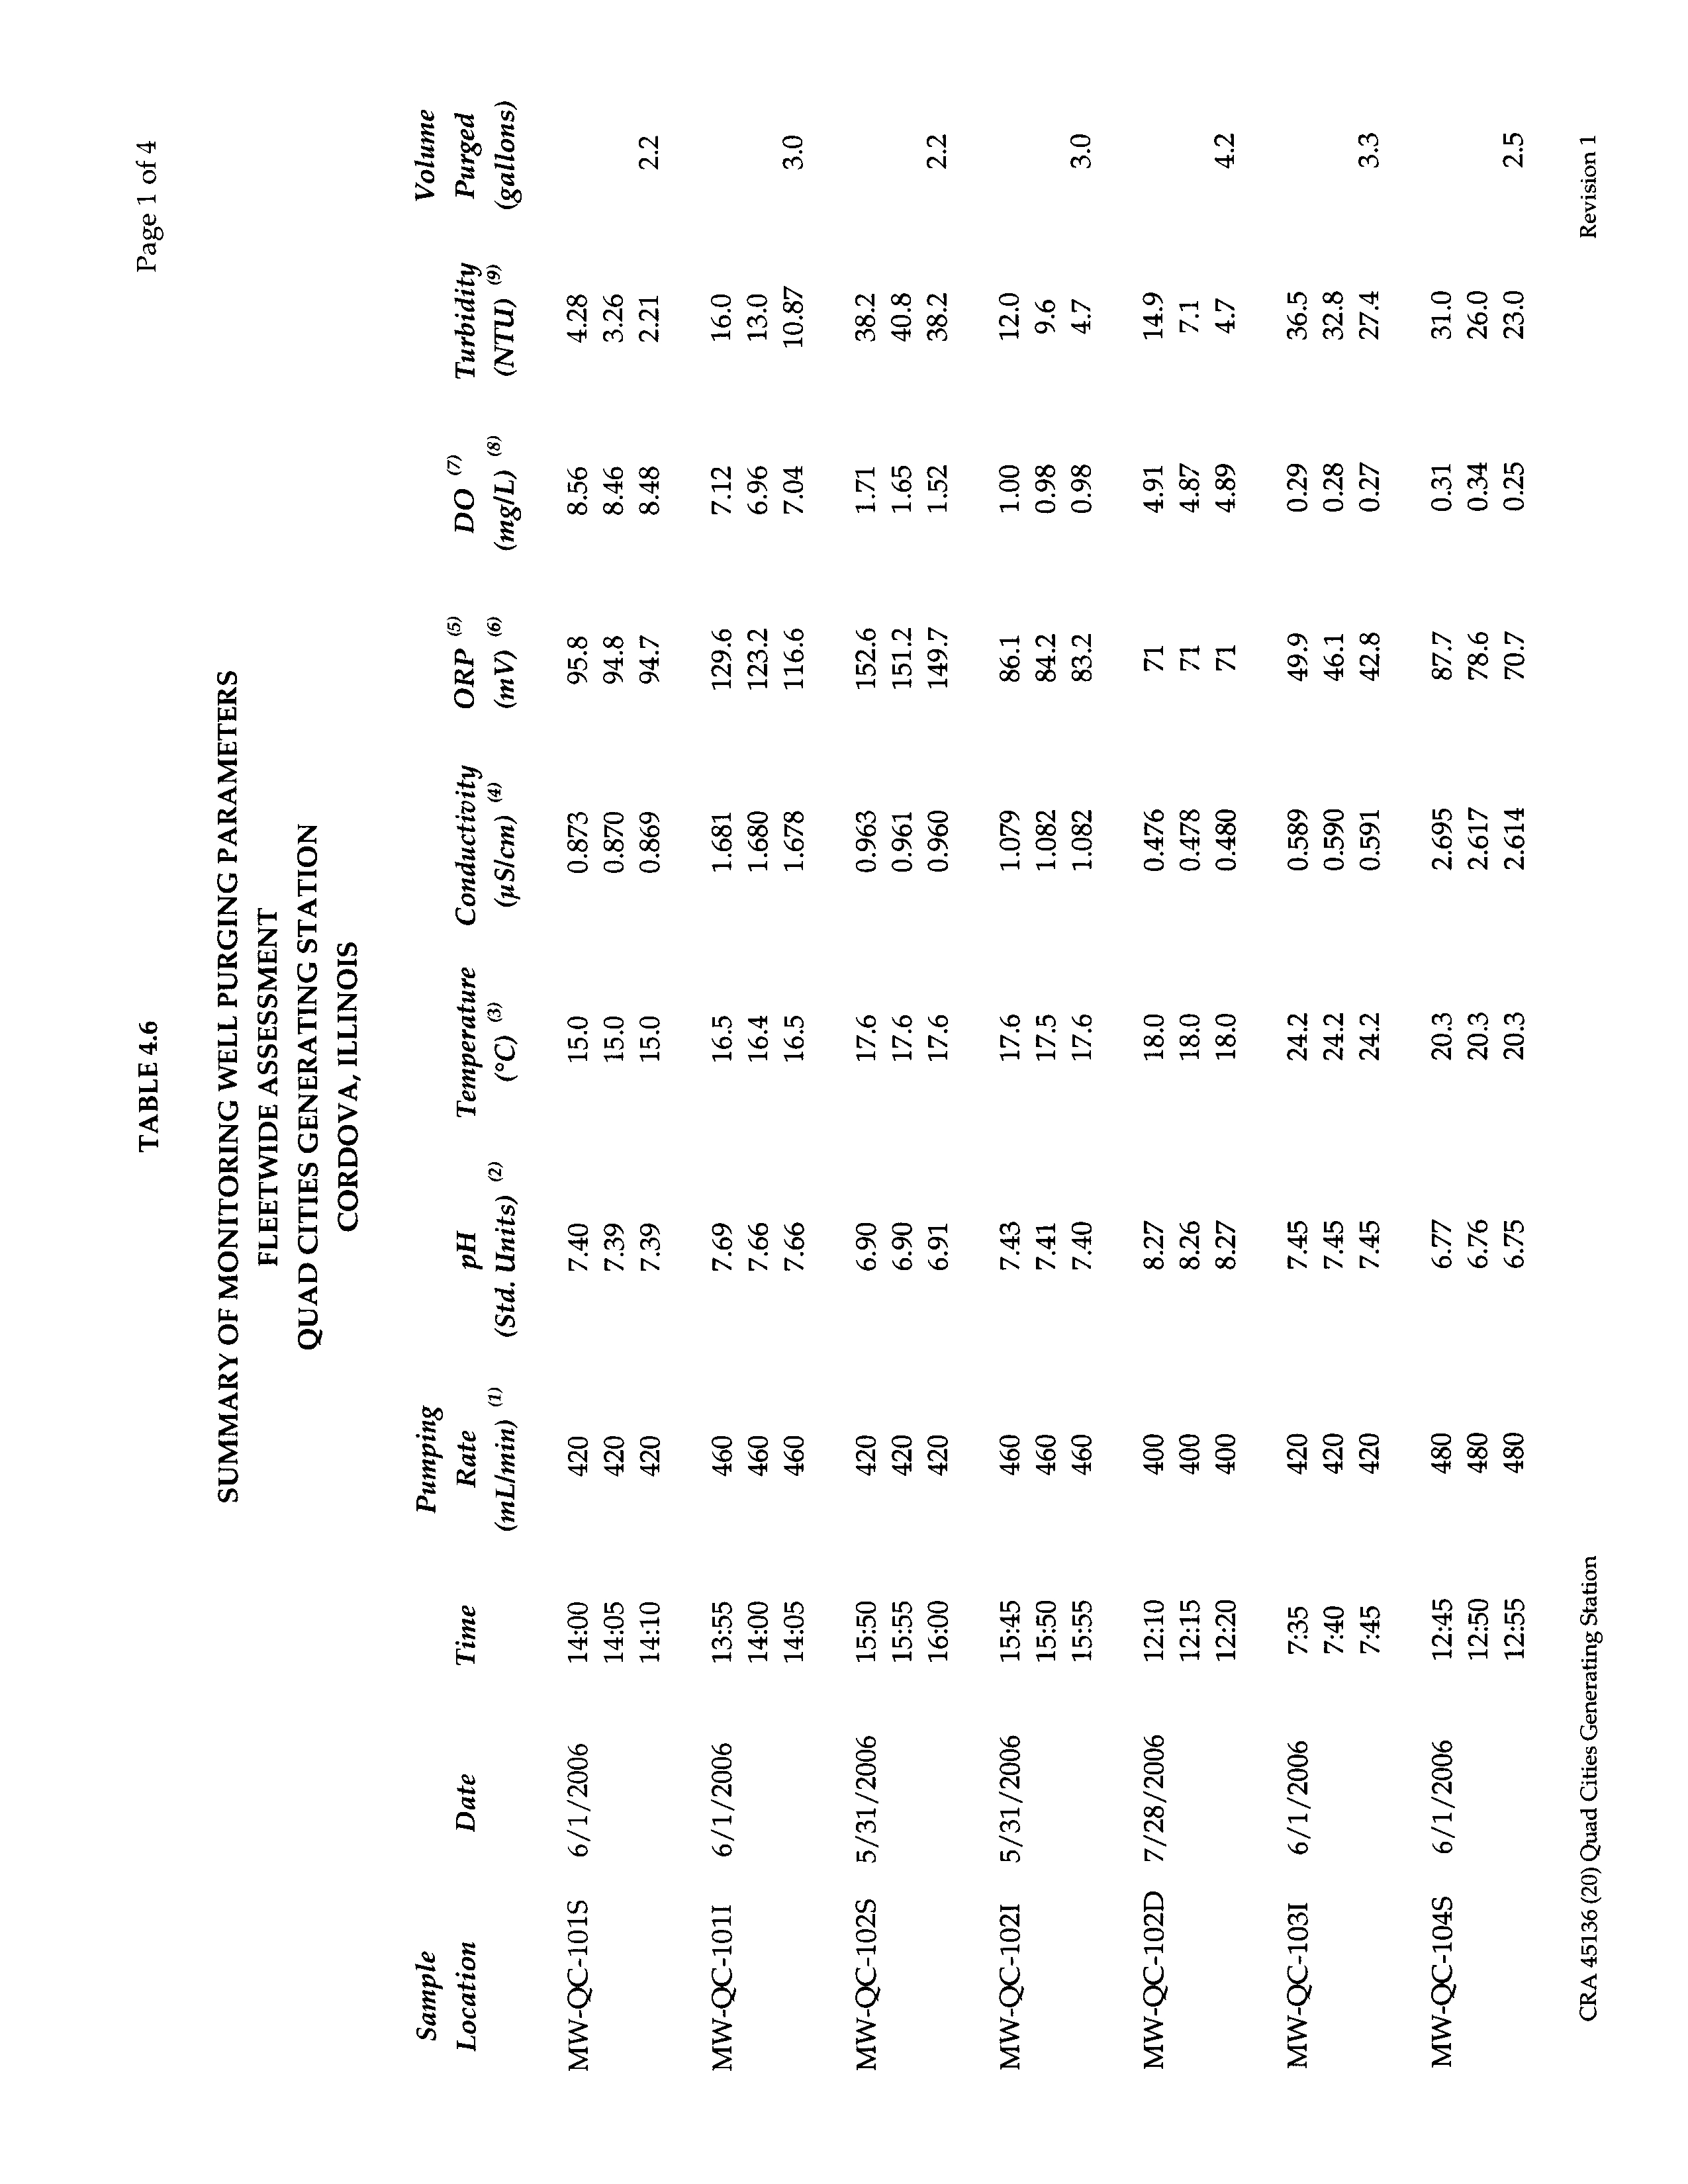
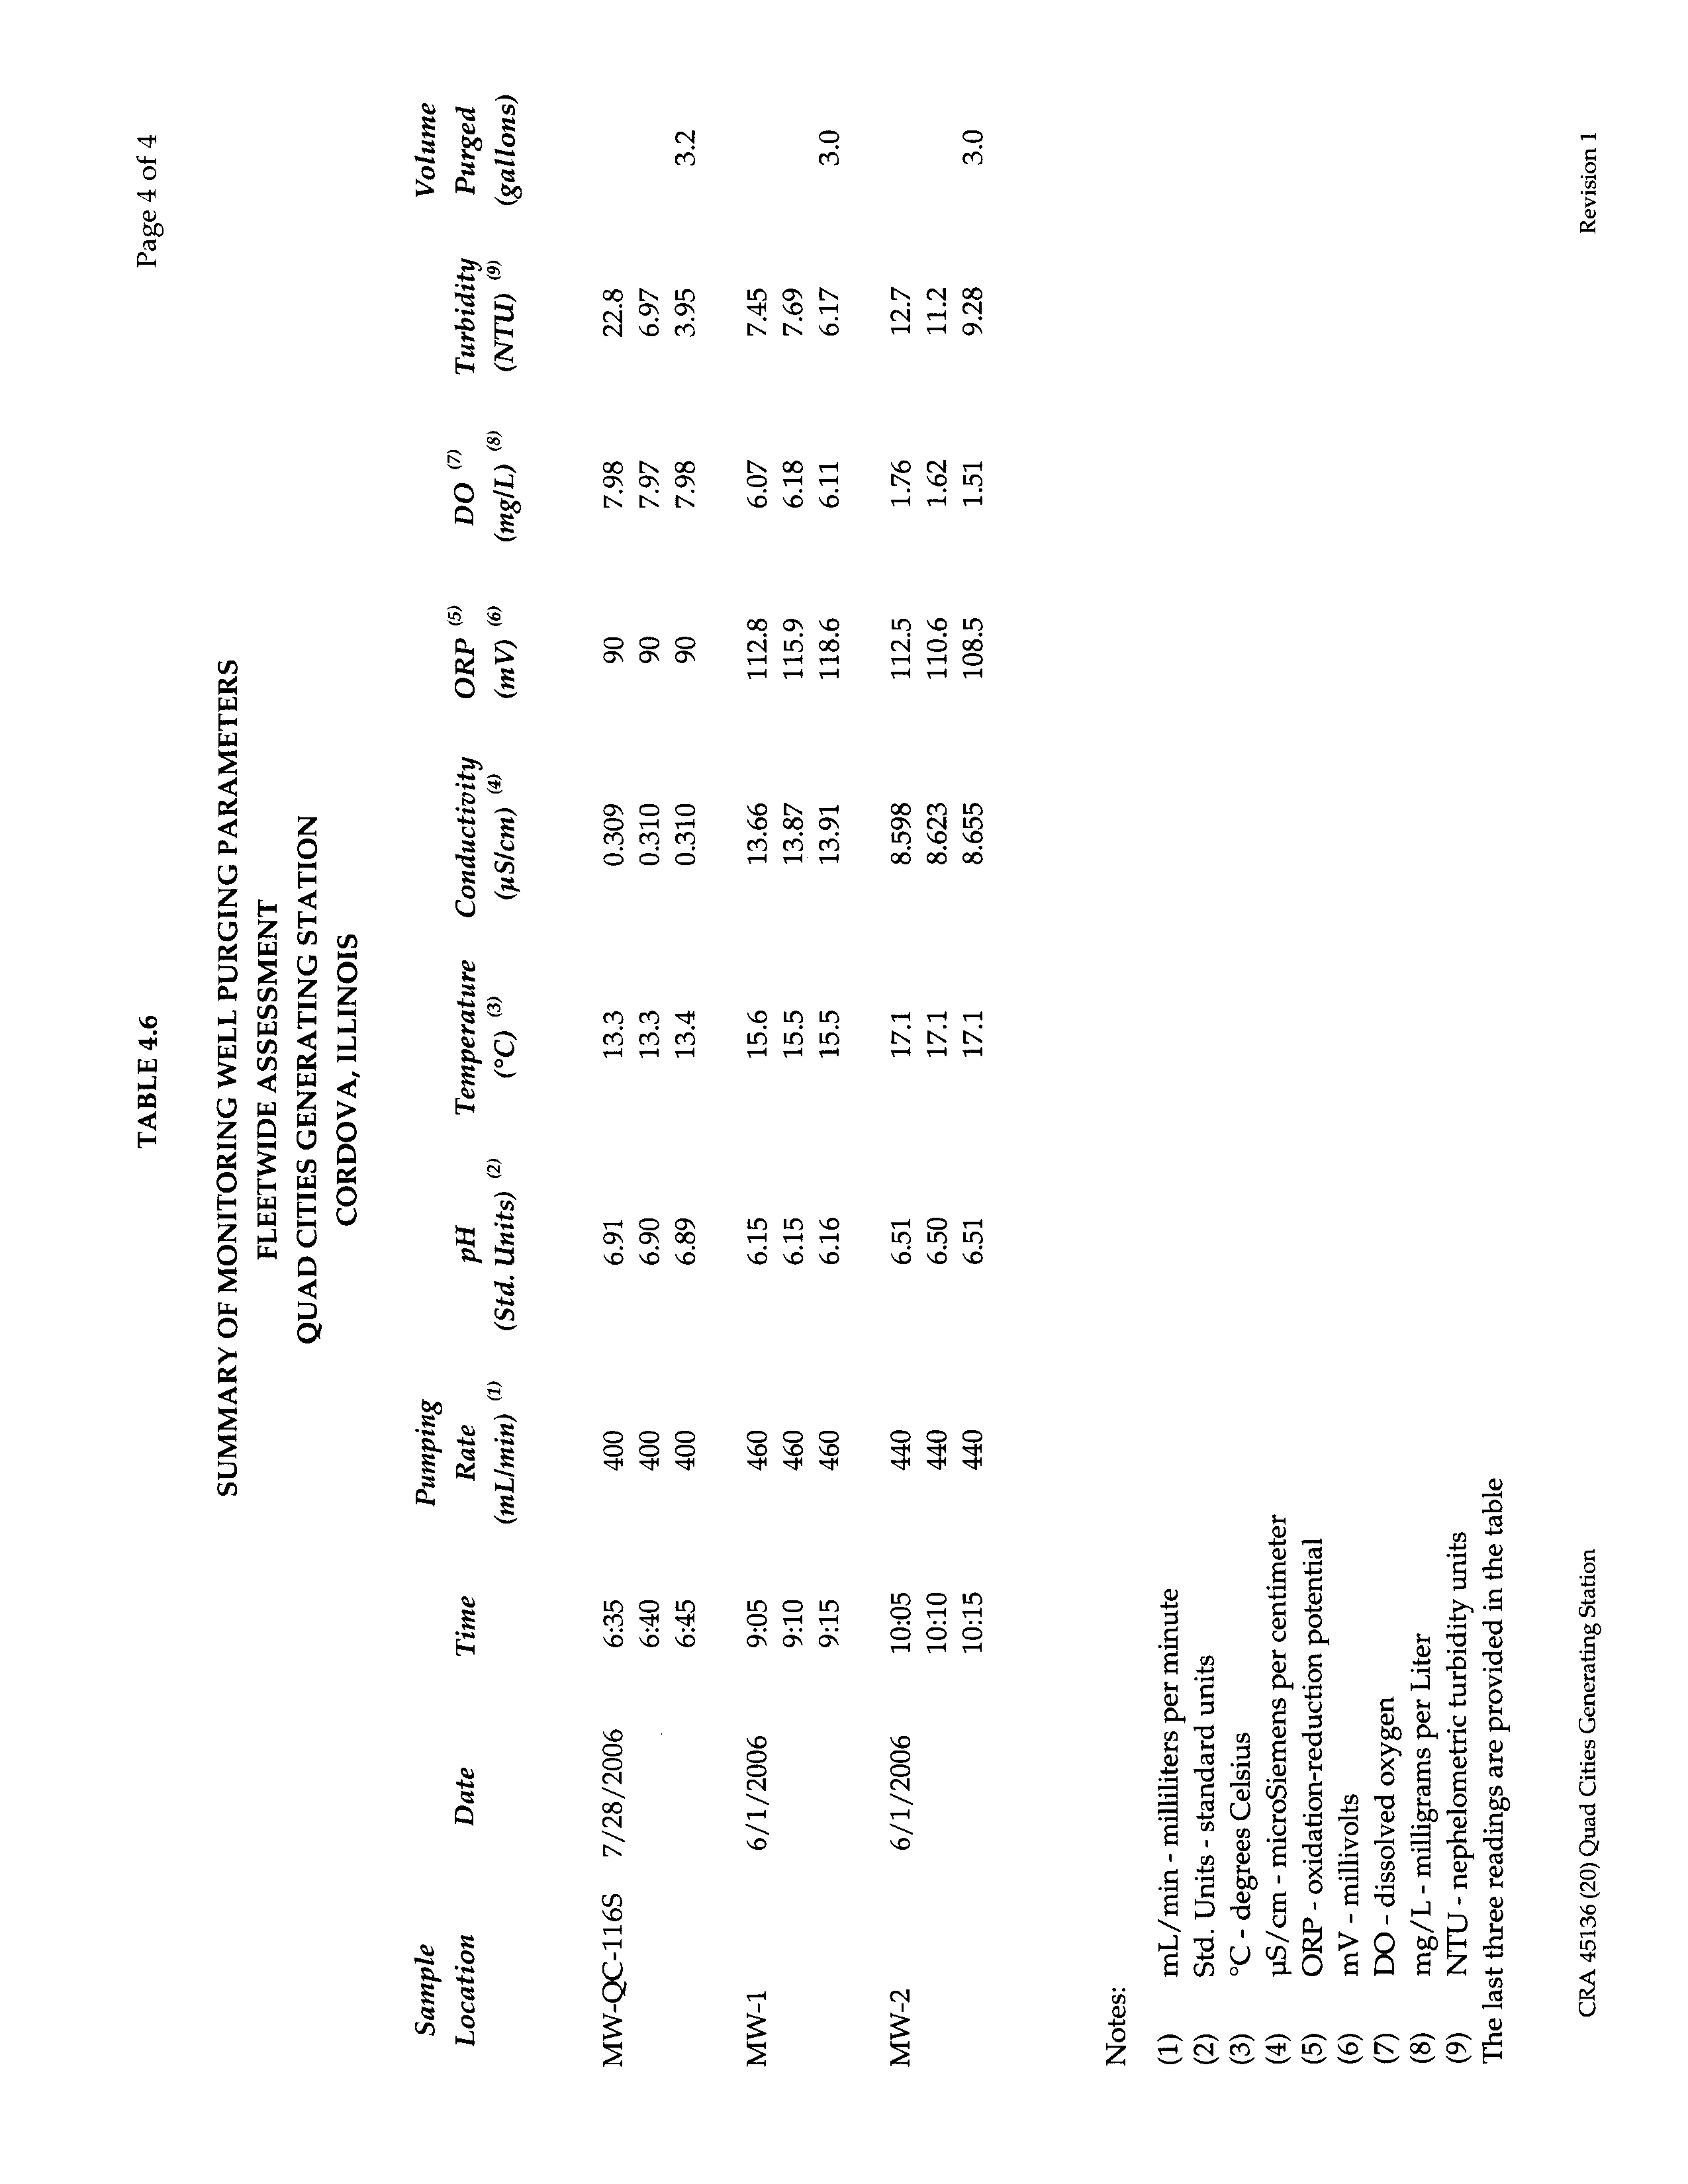
A groundwater sample key is presented in Table
4.5. Purging parameters for the
monitoring wells are presented in Table 4.6.
Water samples collected on May 31 and June 1, 2006 from the existing water supply
wells were collected from existing taps or
spigots on the well pump header or
distribution. Prior to collecting a water sample, the water was allowed to flow from the
tap or spigot for several minutes. Water purging parameters for these supply wells are
presented in Table 4.7.
CRA containerized the water purged from the Station monitoring wells during sampling
as well as water purged from all of the wells during the hydrogeologic
investigation.
The water was placed into 55-gallon drums, which will be processed by the Station in
accordance with its NPDES permit.
Surface water samples were collected on May
31, 2006 at the two gauging points along
the Station Spray Canal. The surface water sampling locations (SW-QC-1 and SW-QC-2)
are presented on Figure 4.1.
The surface water samples were collected by submerging a disposable bailer in the
Spray Canal. The samples were poured directly from the disposable bailer
into the
sample containers. The samples were shipped to Teledyne Brown for analysis.
4.7
DATA QUALITY OBJECTIVES
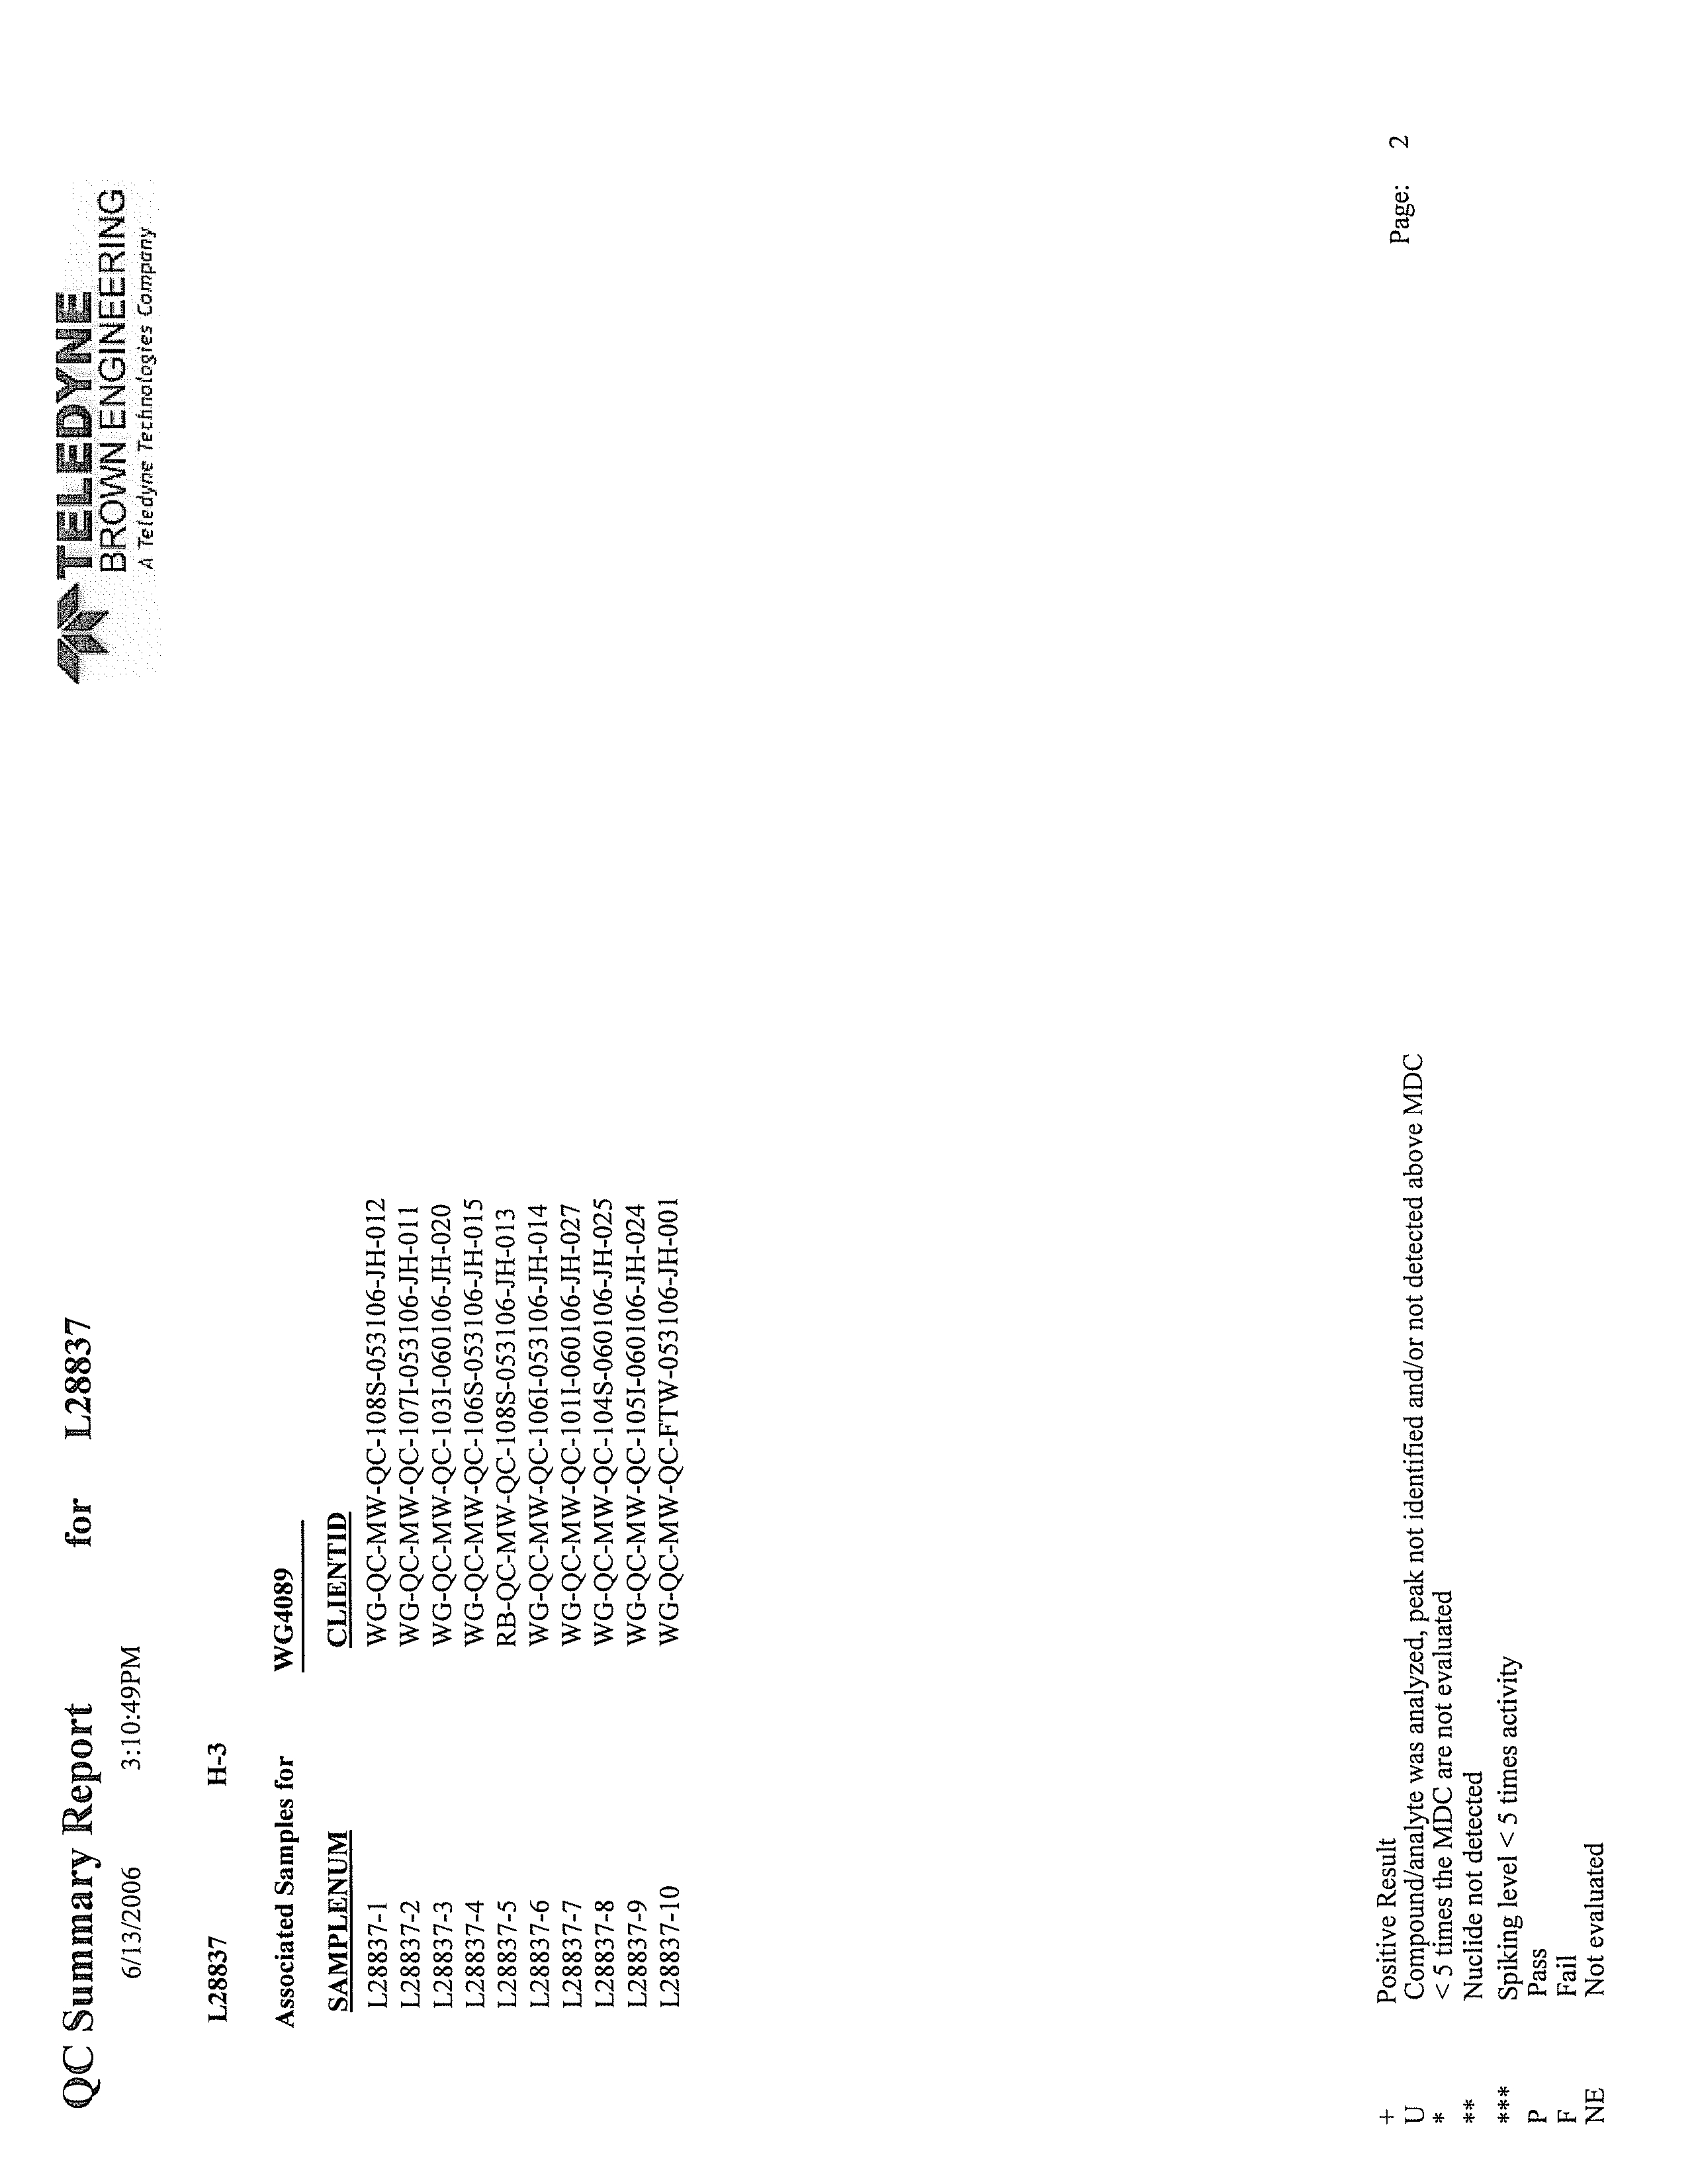
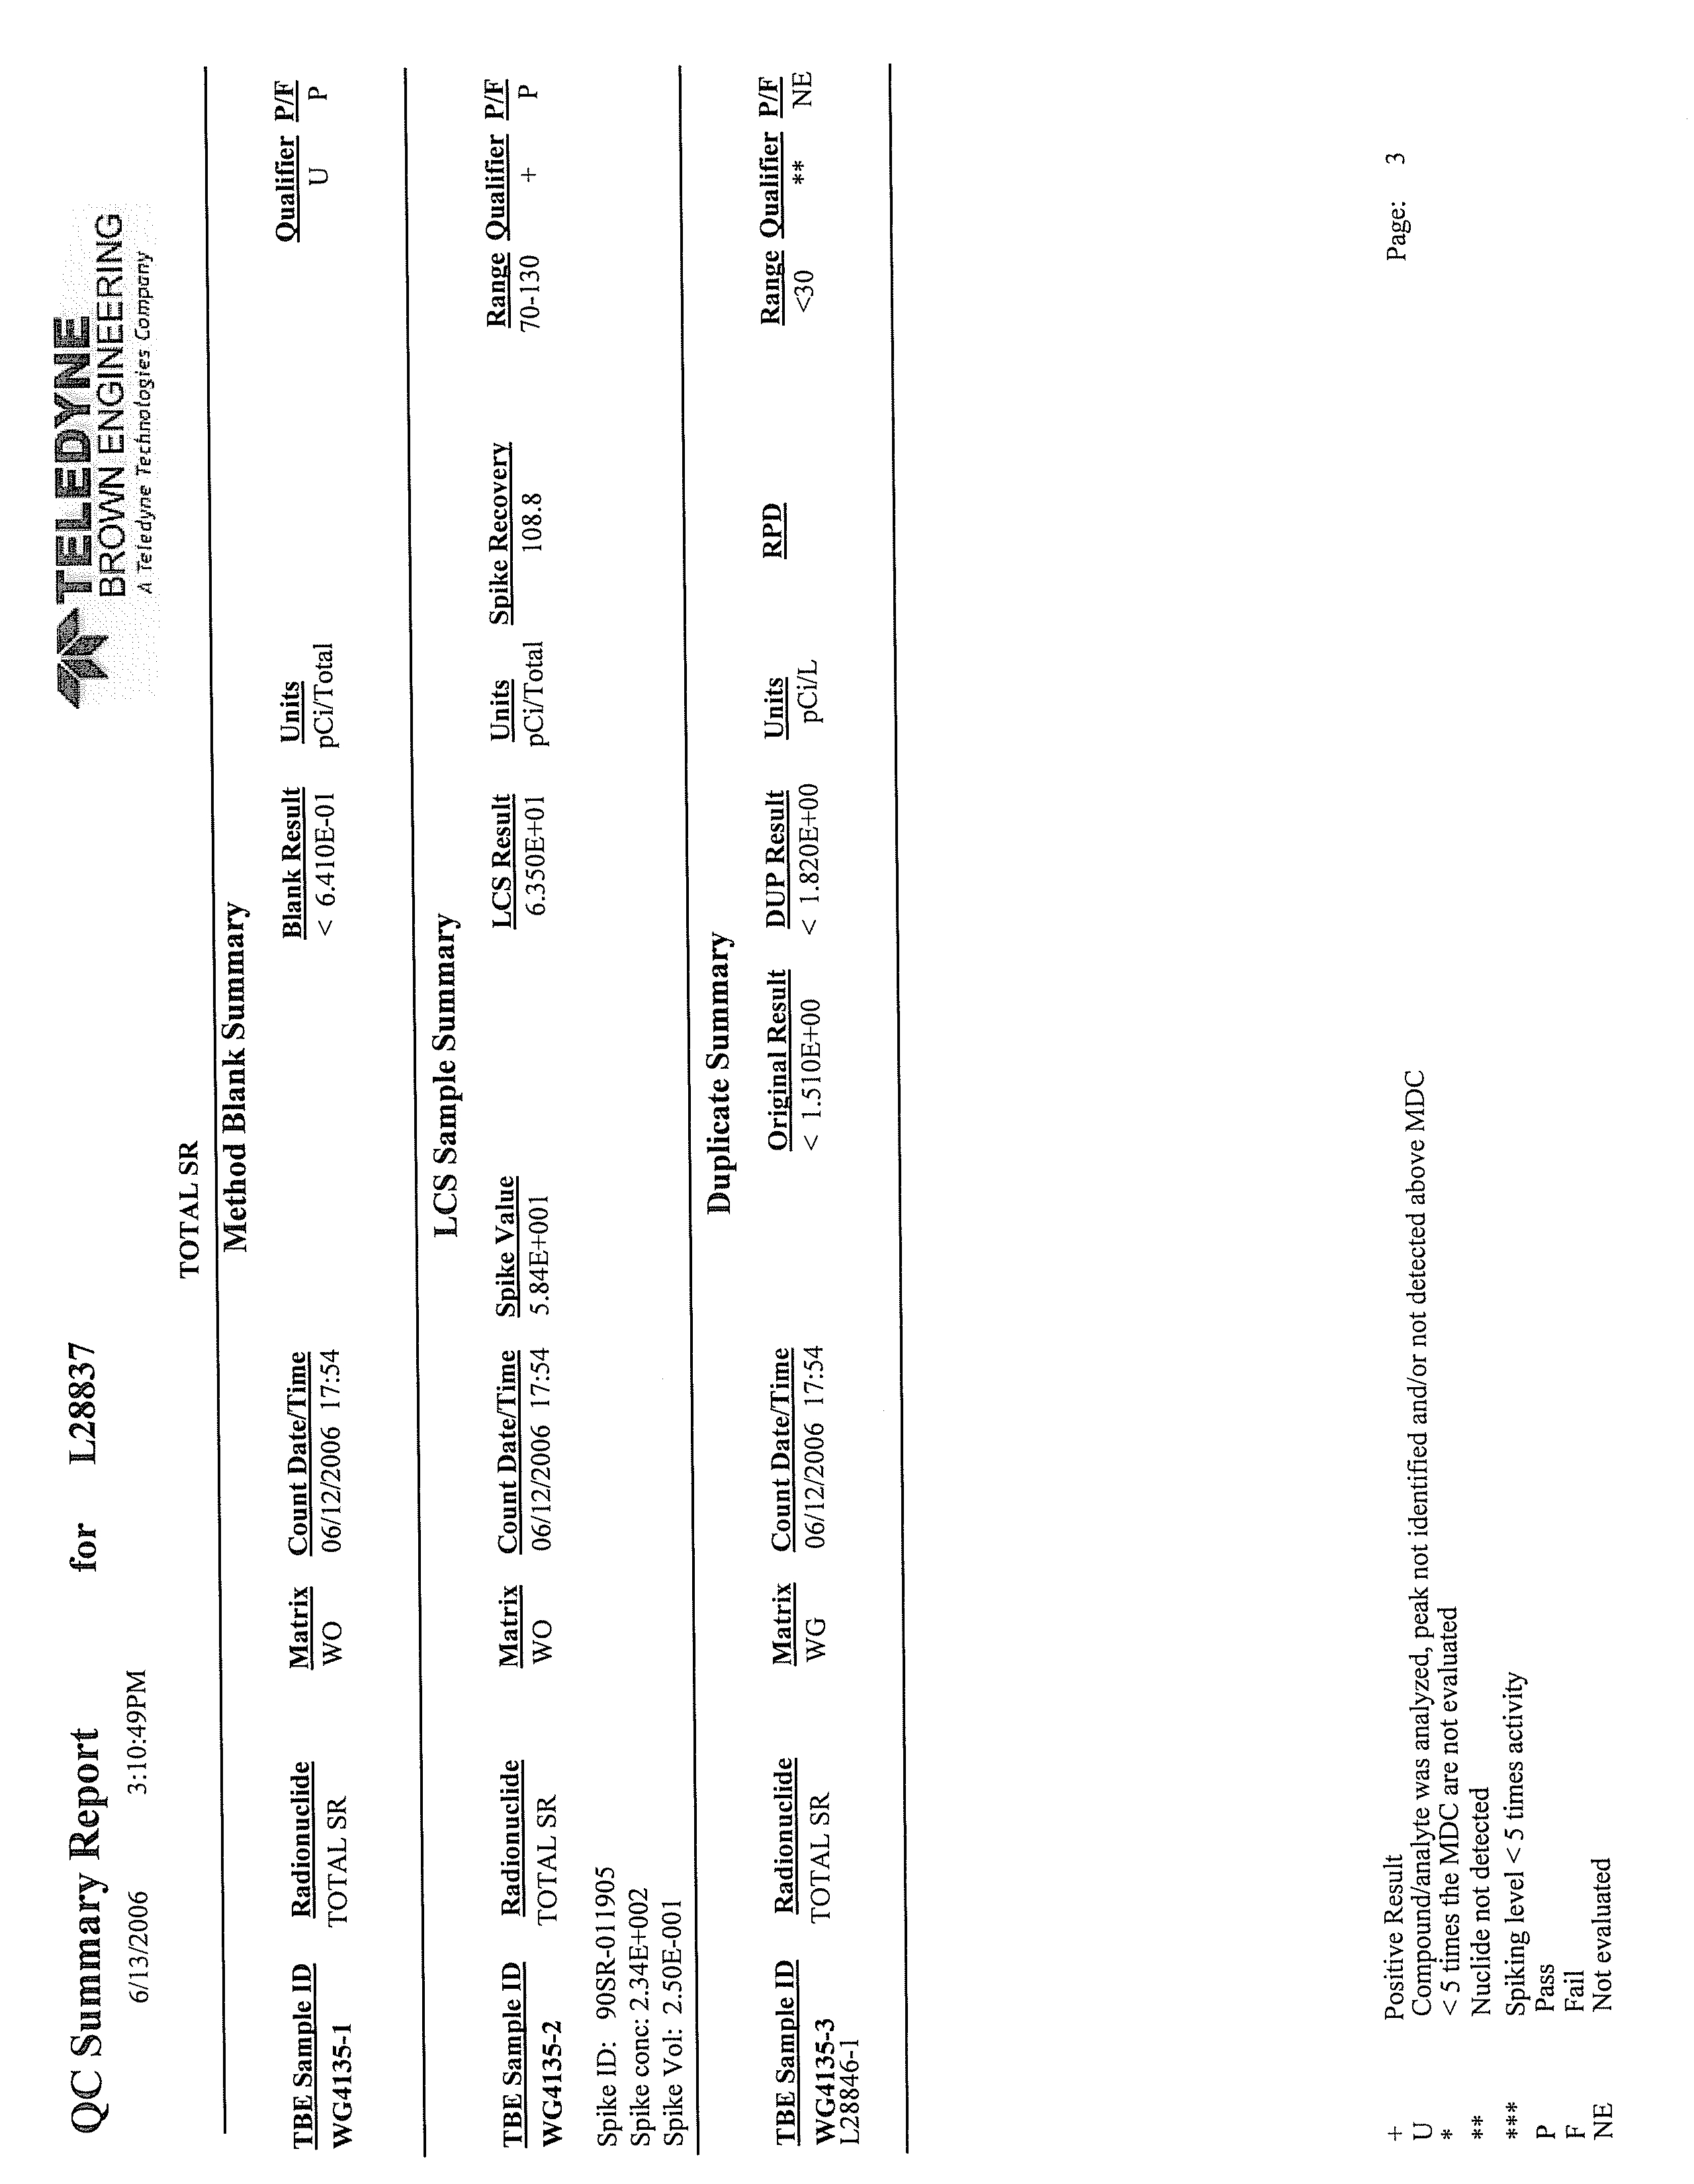
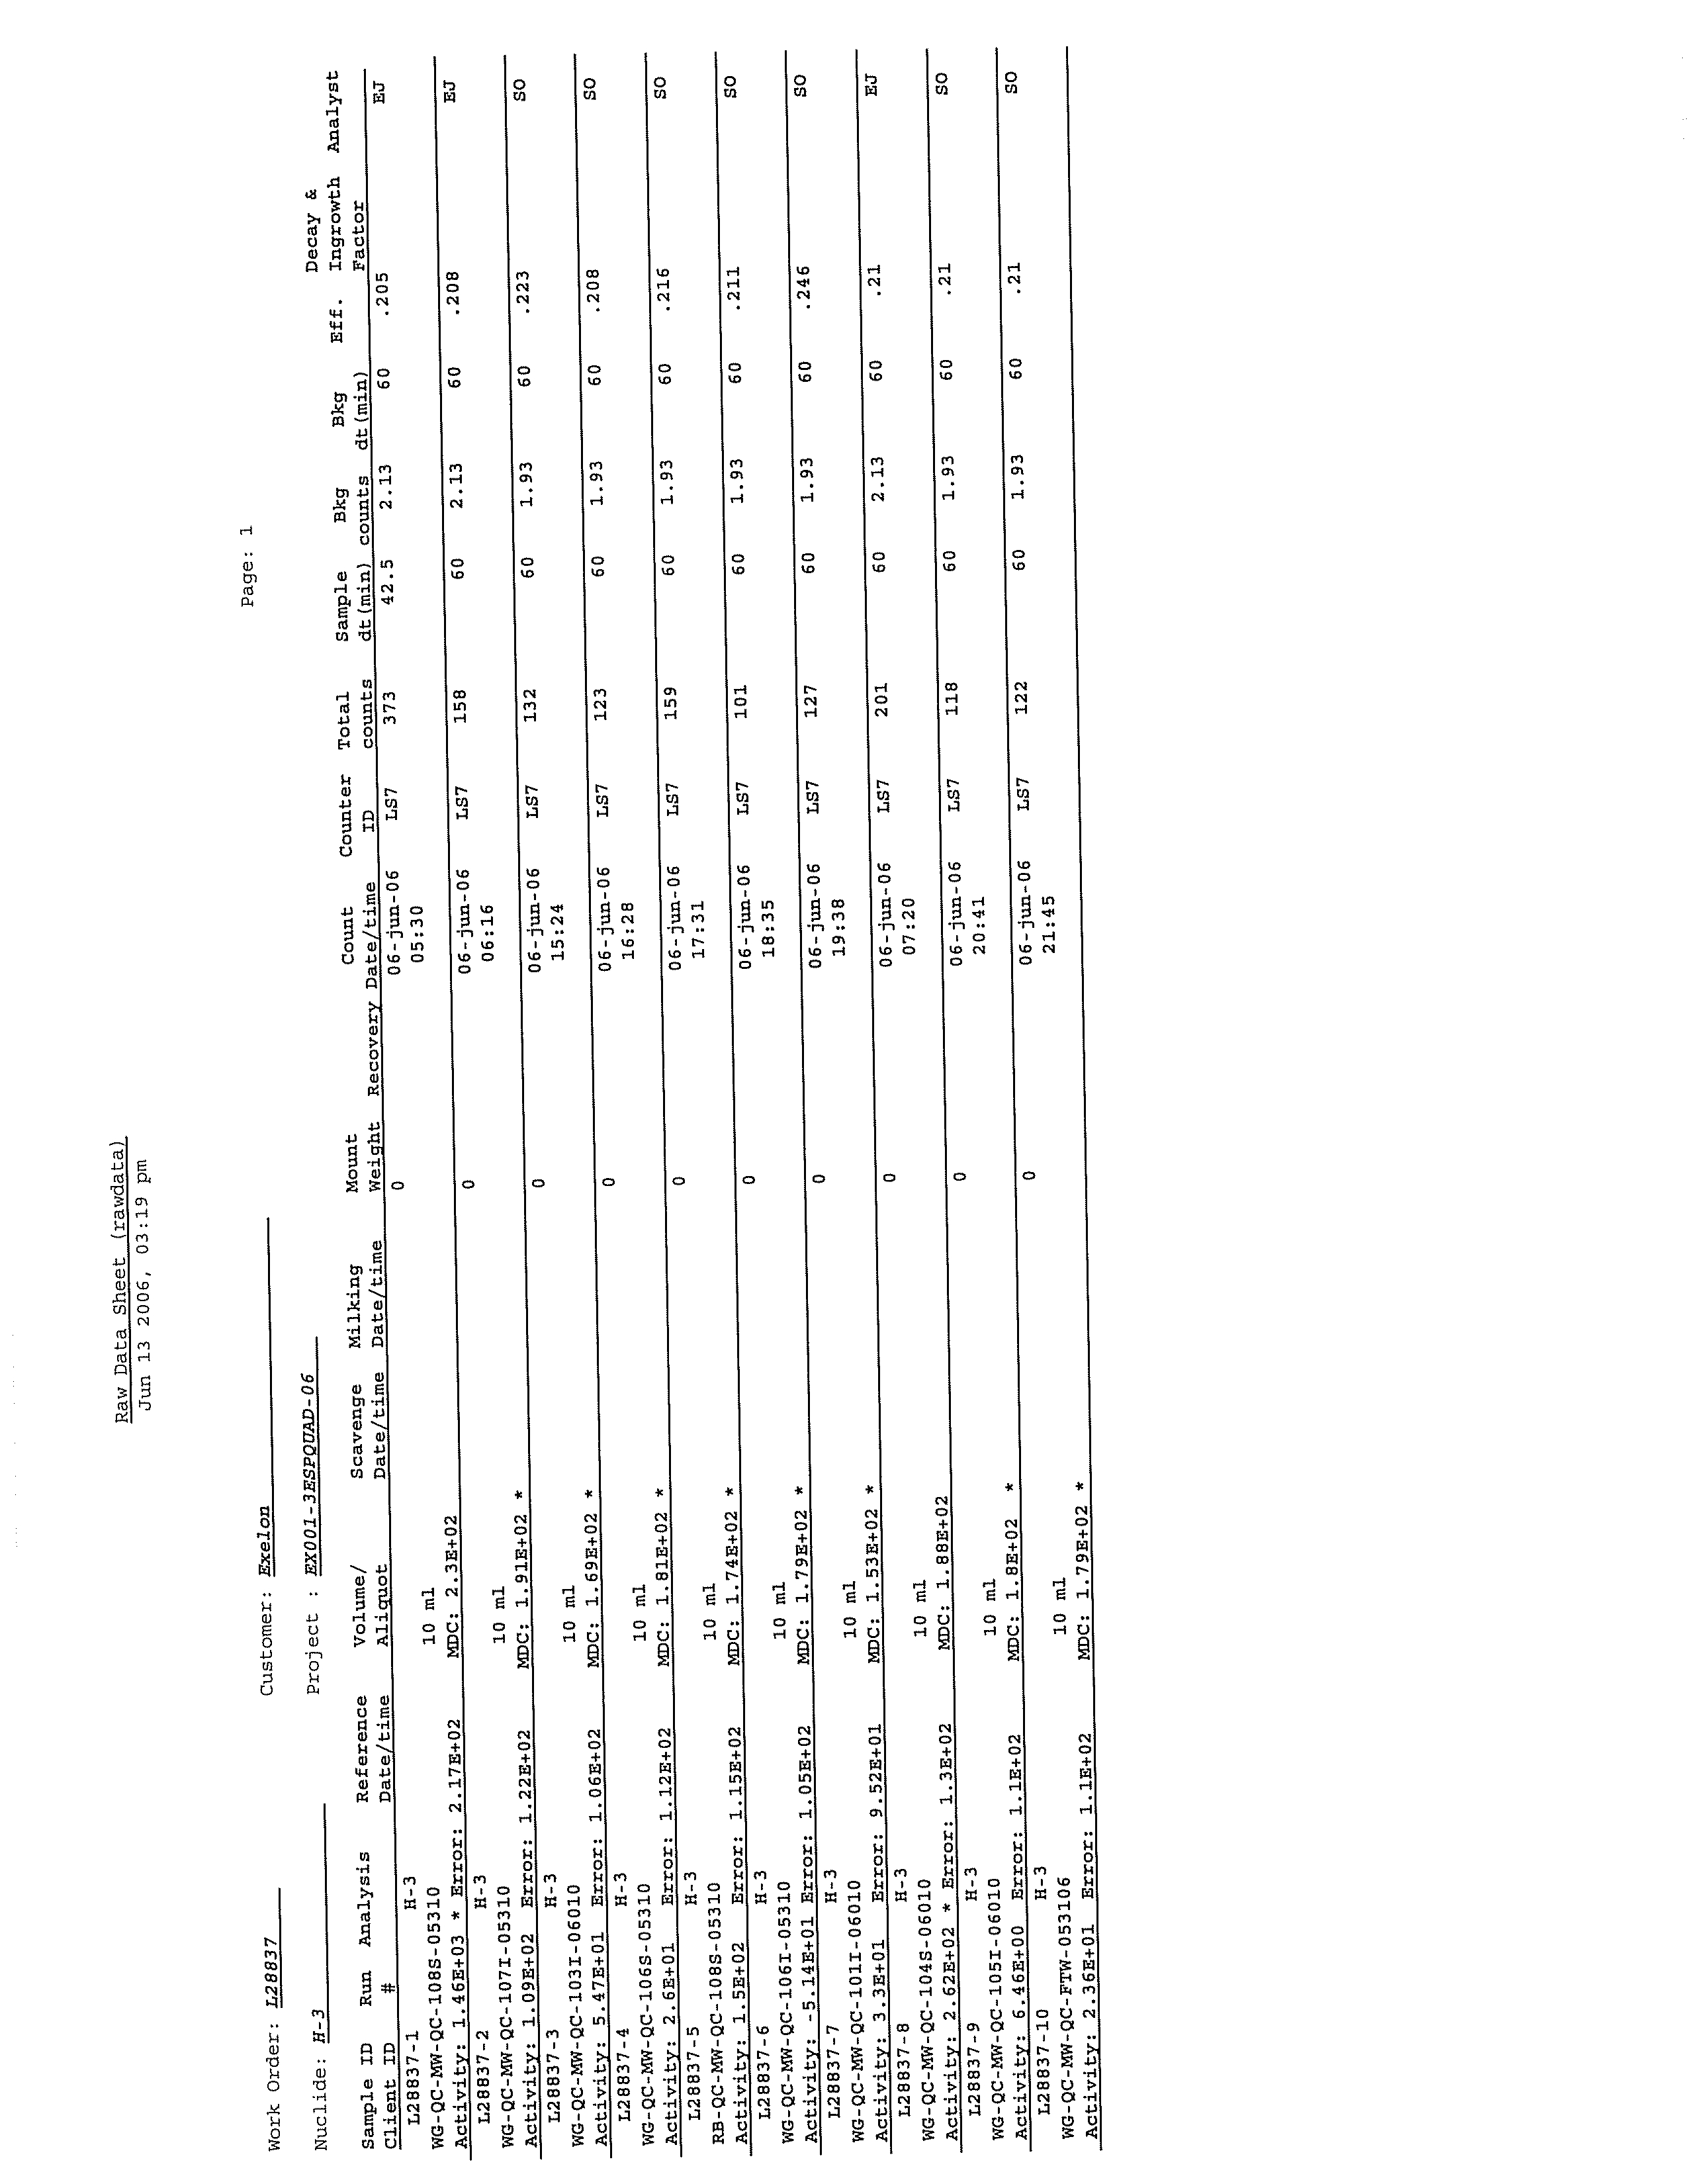
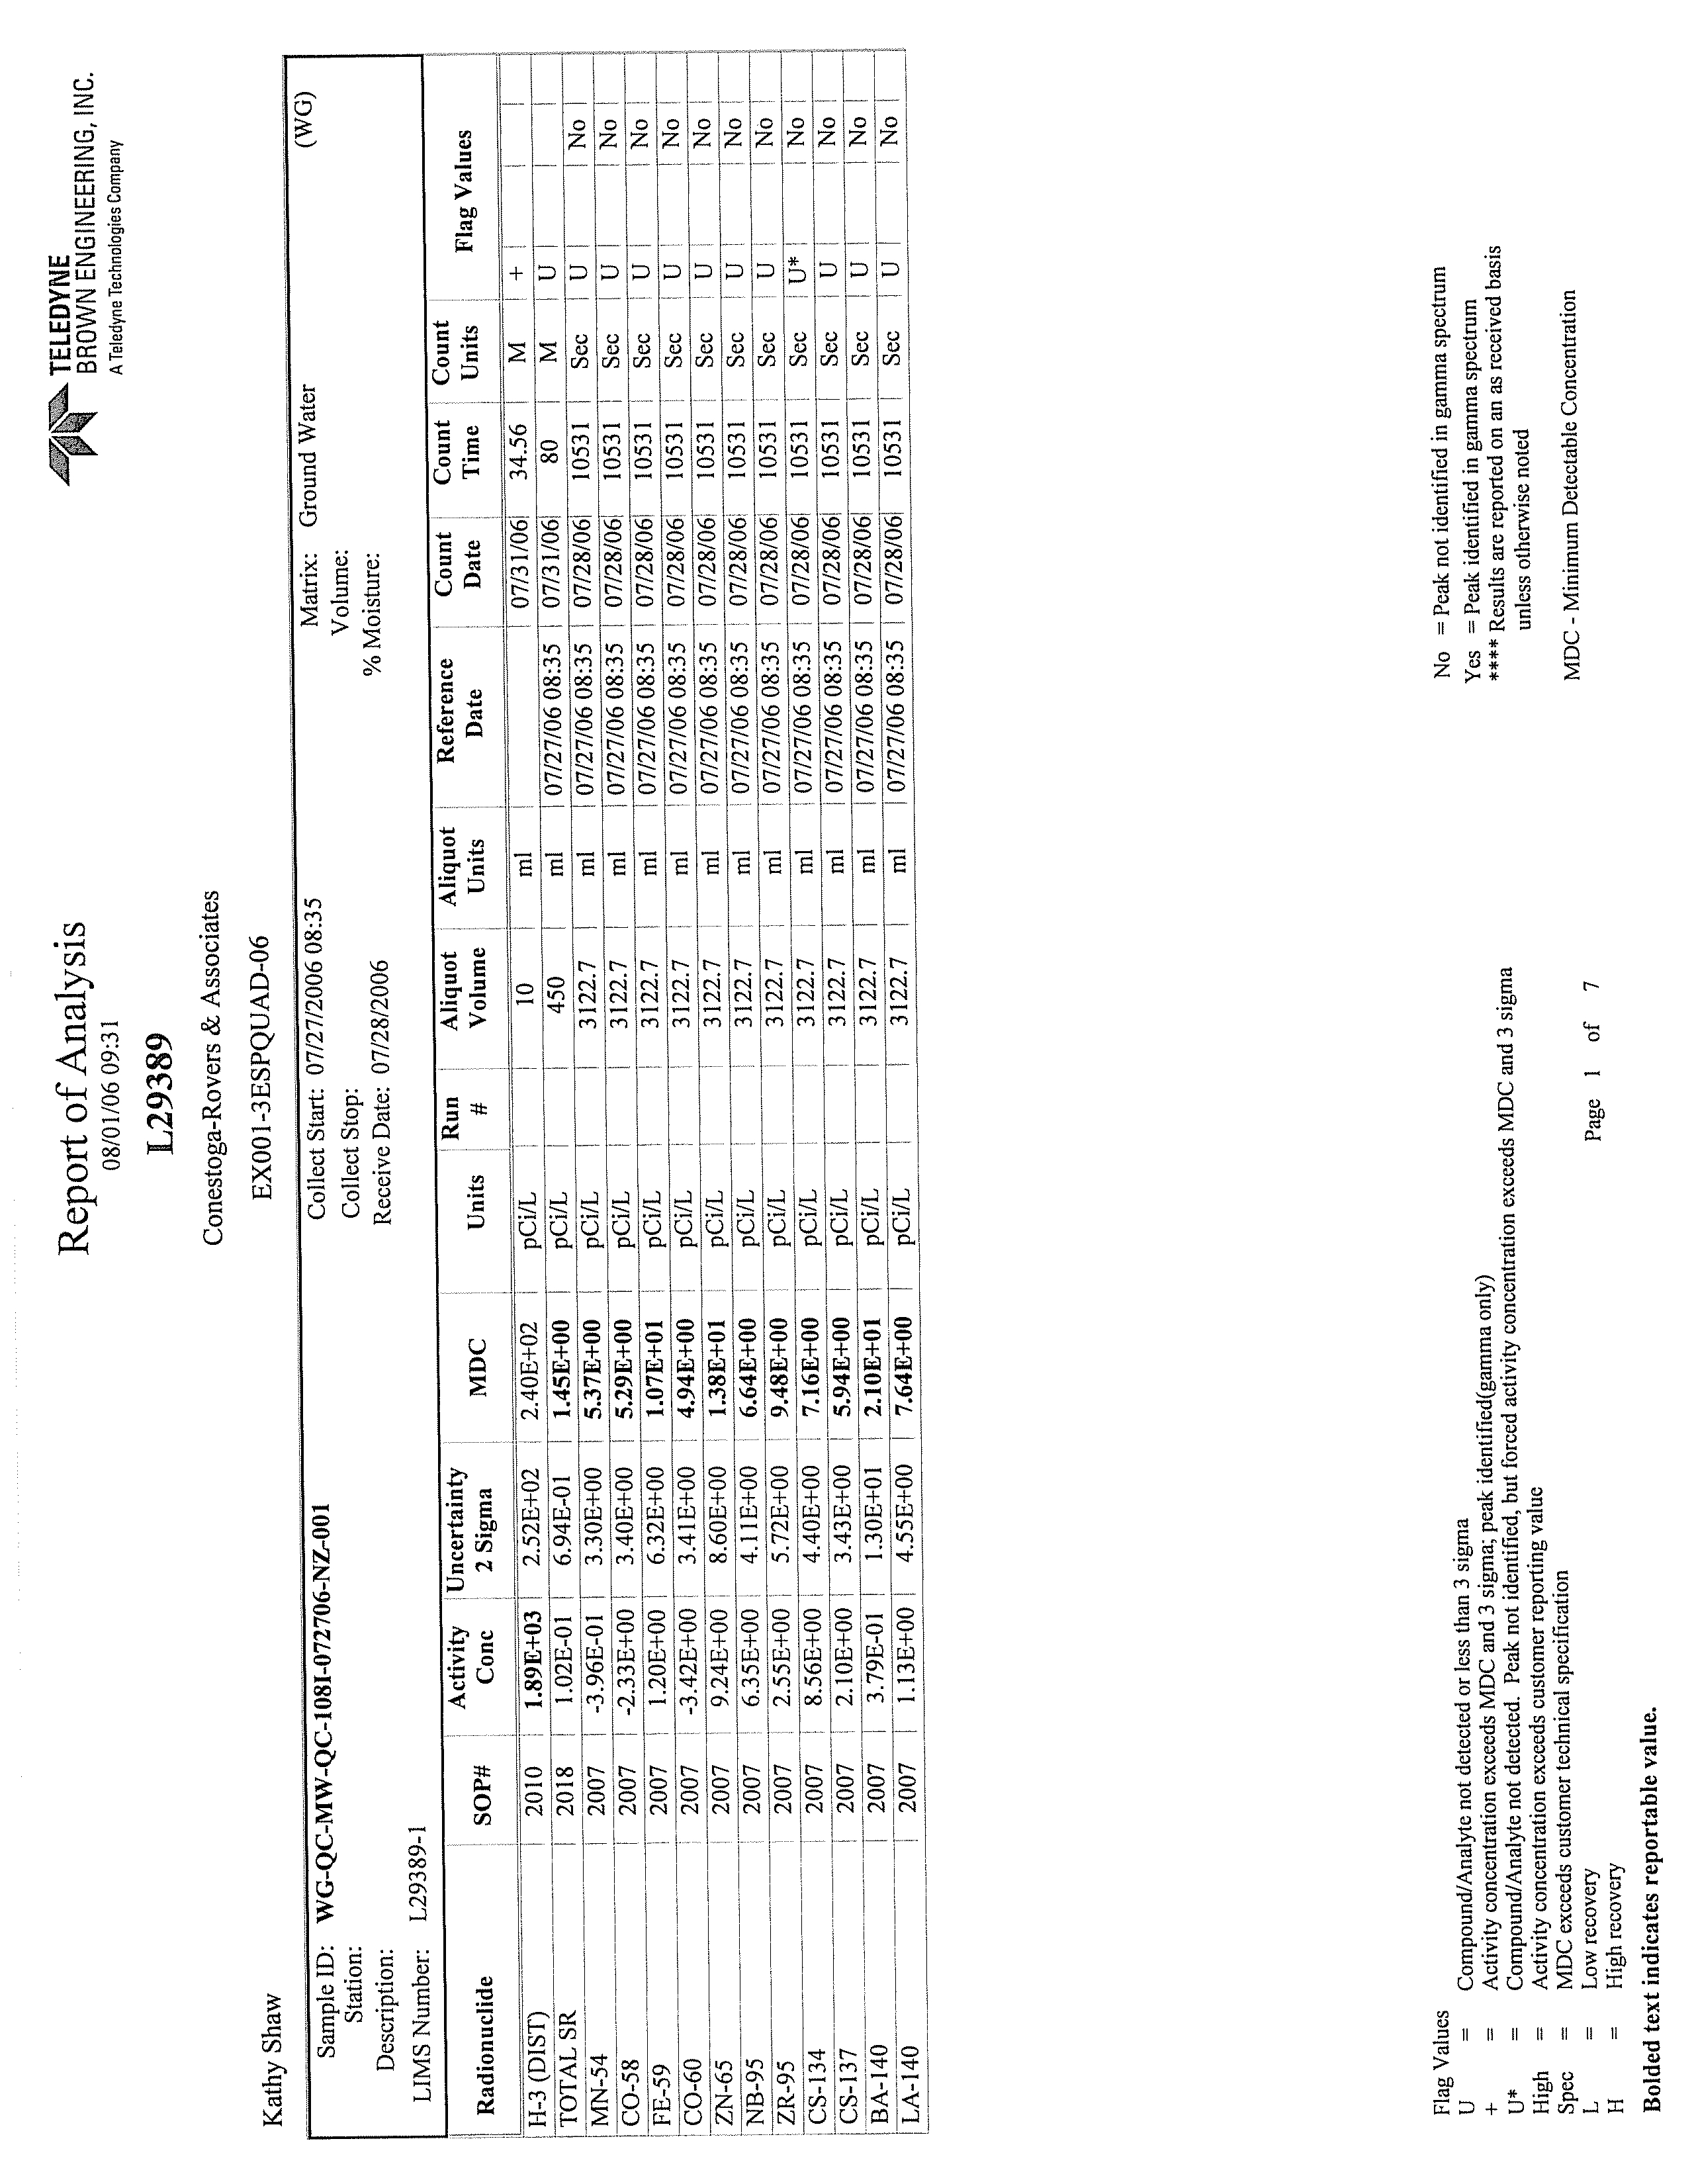
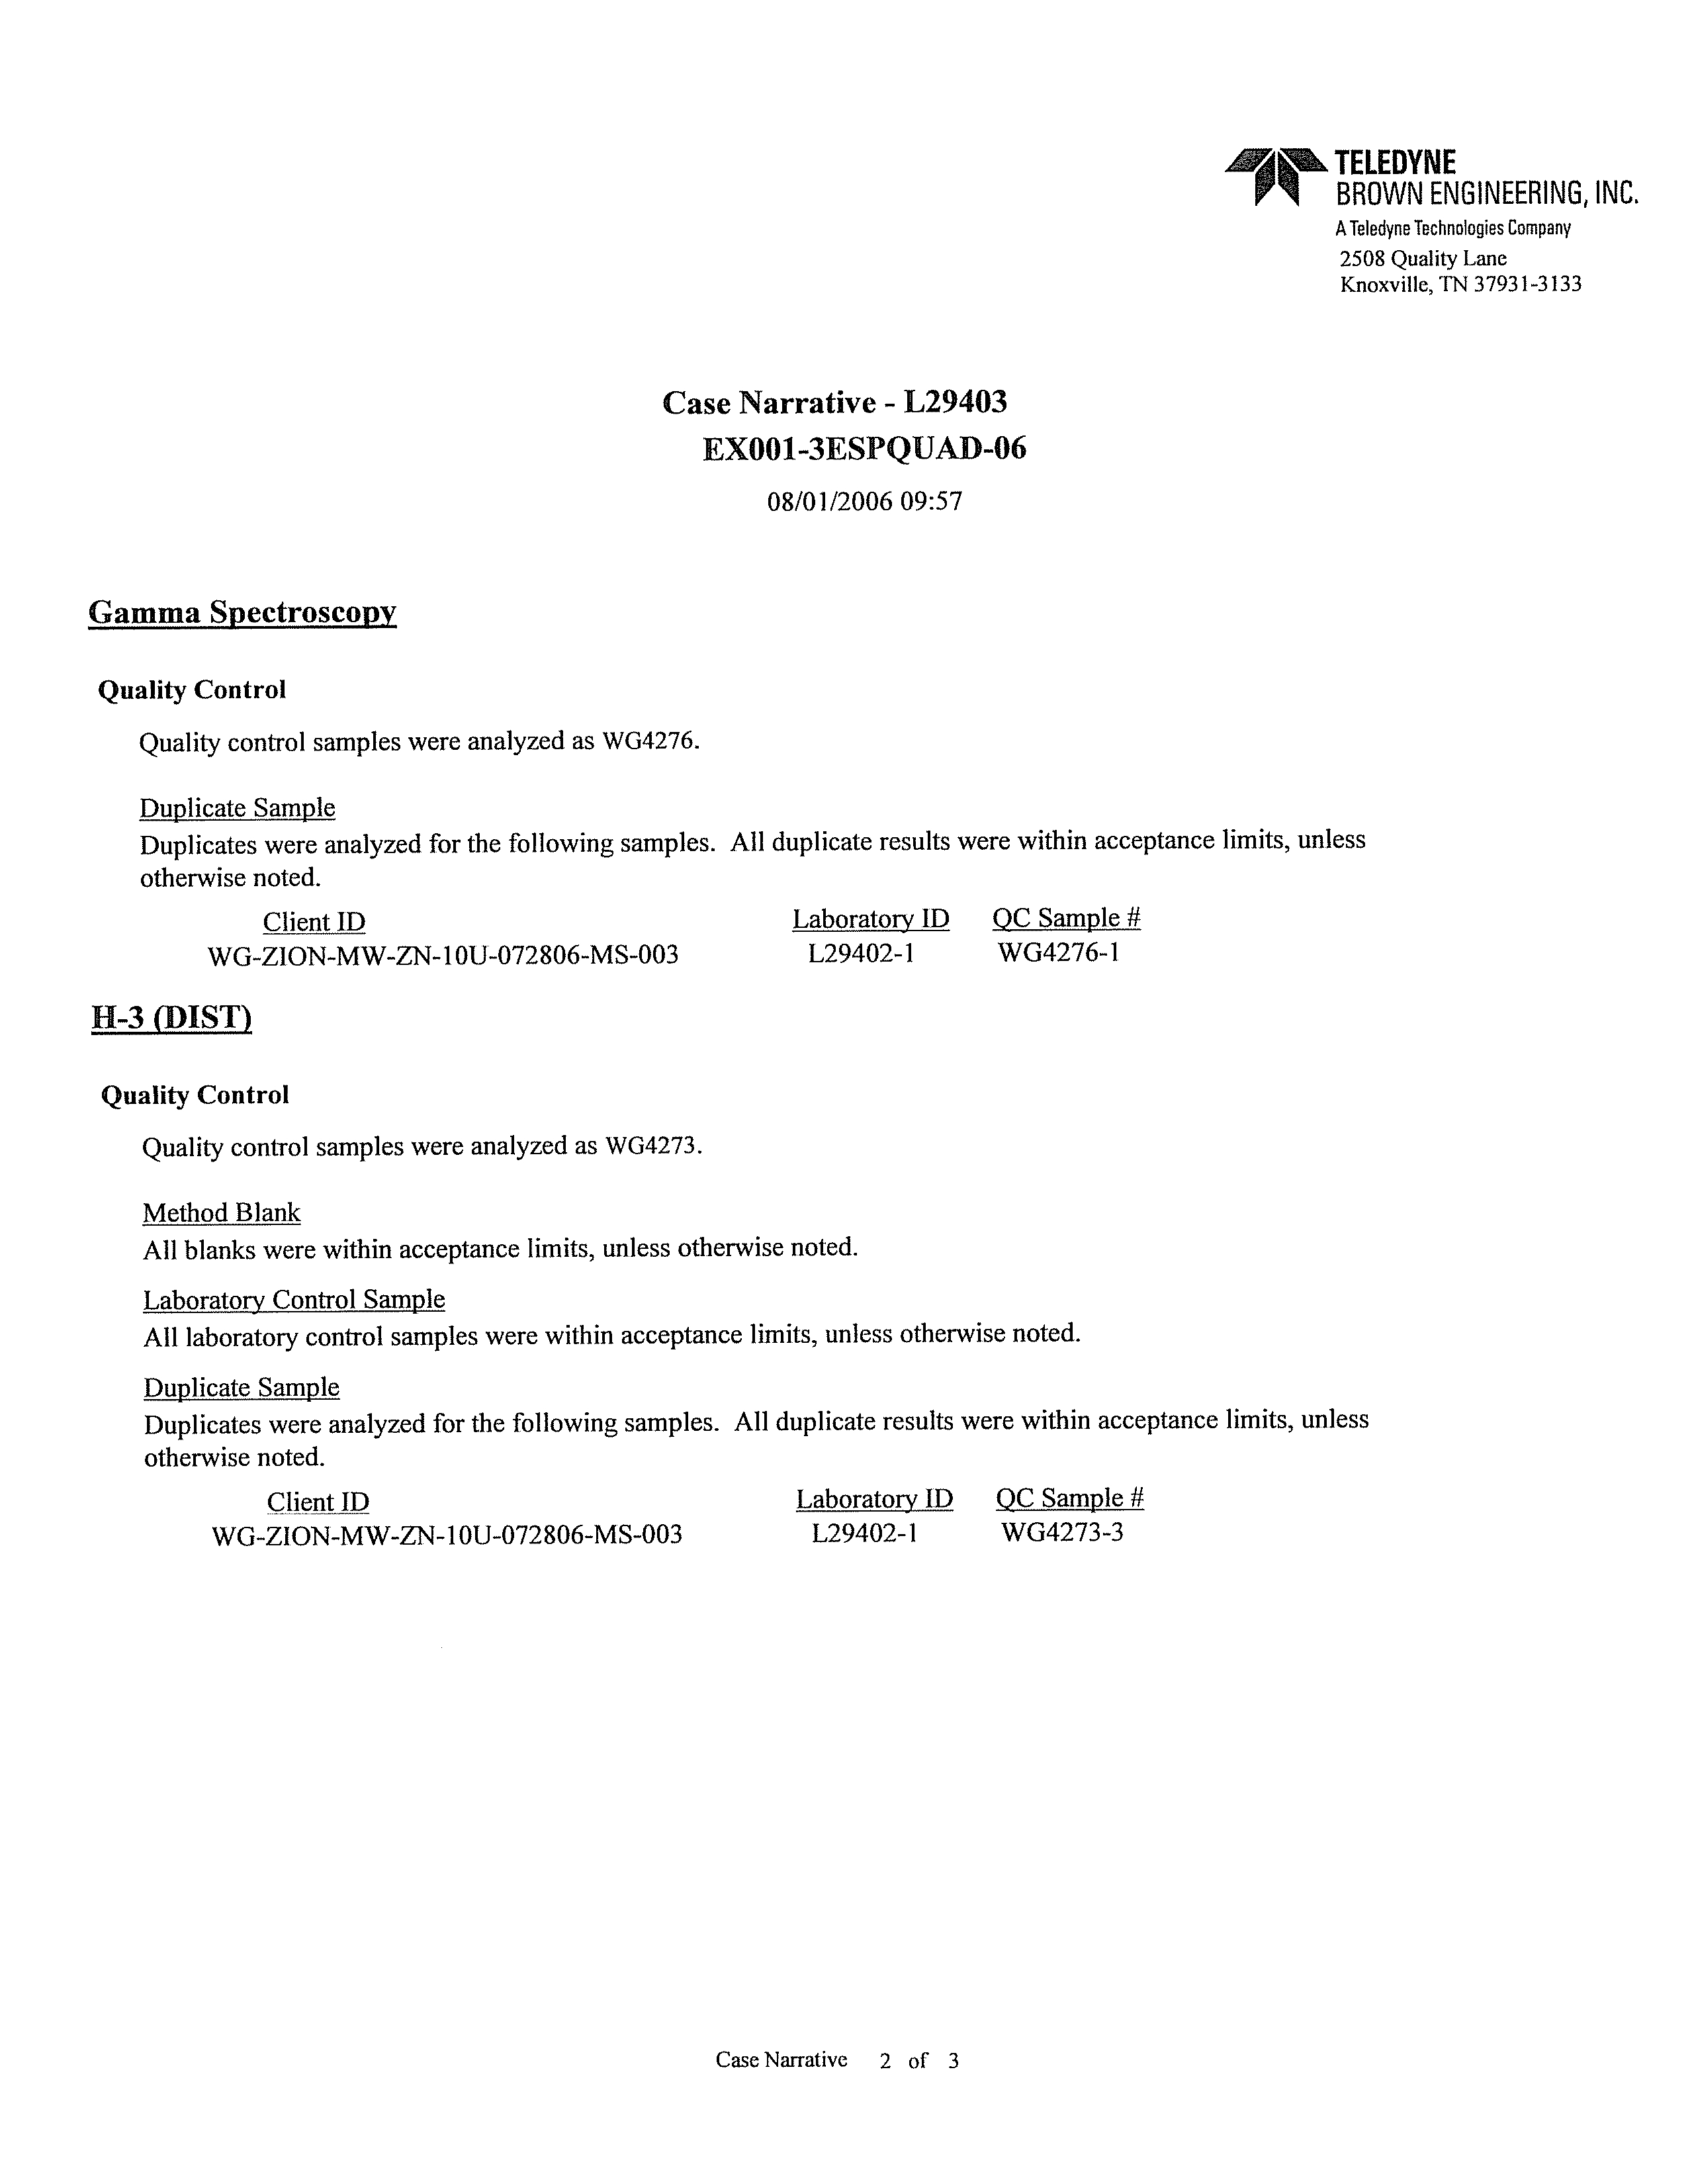
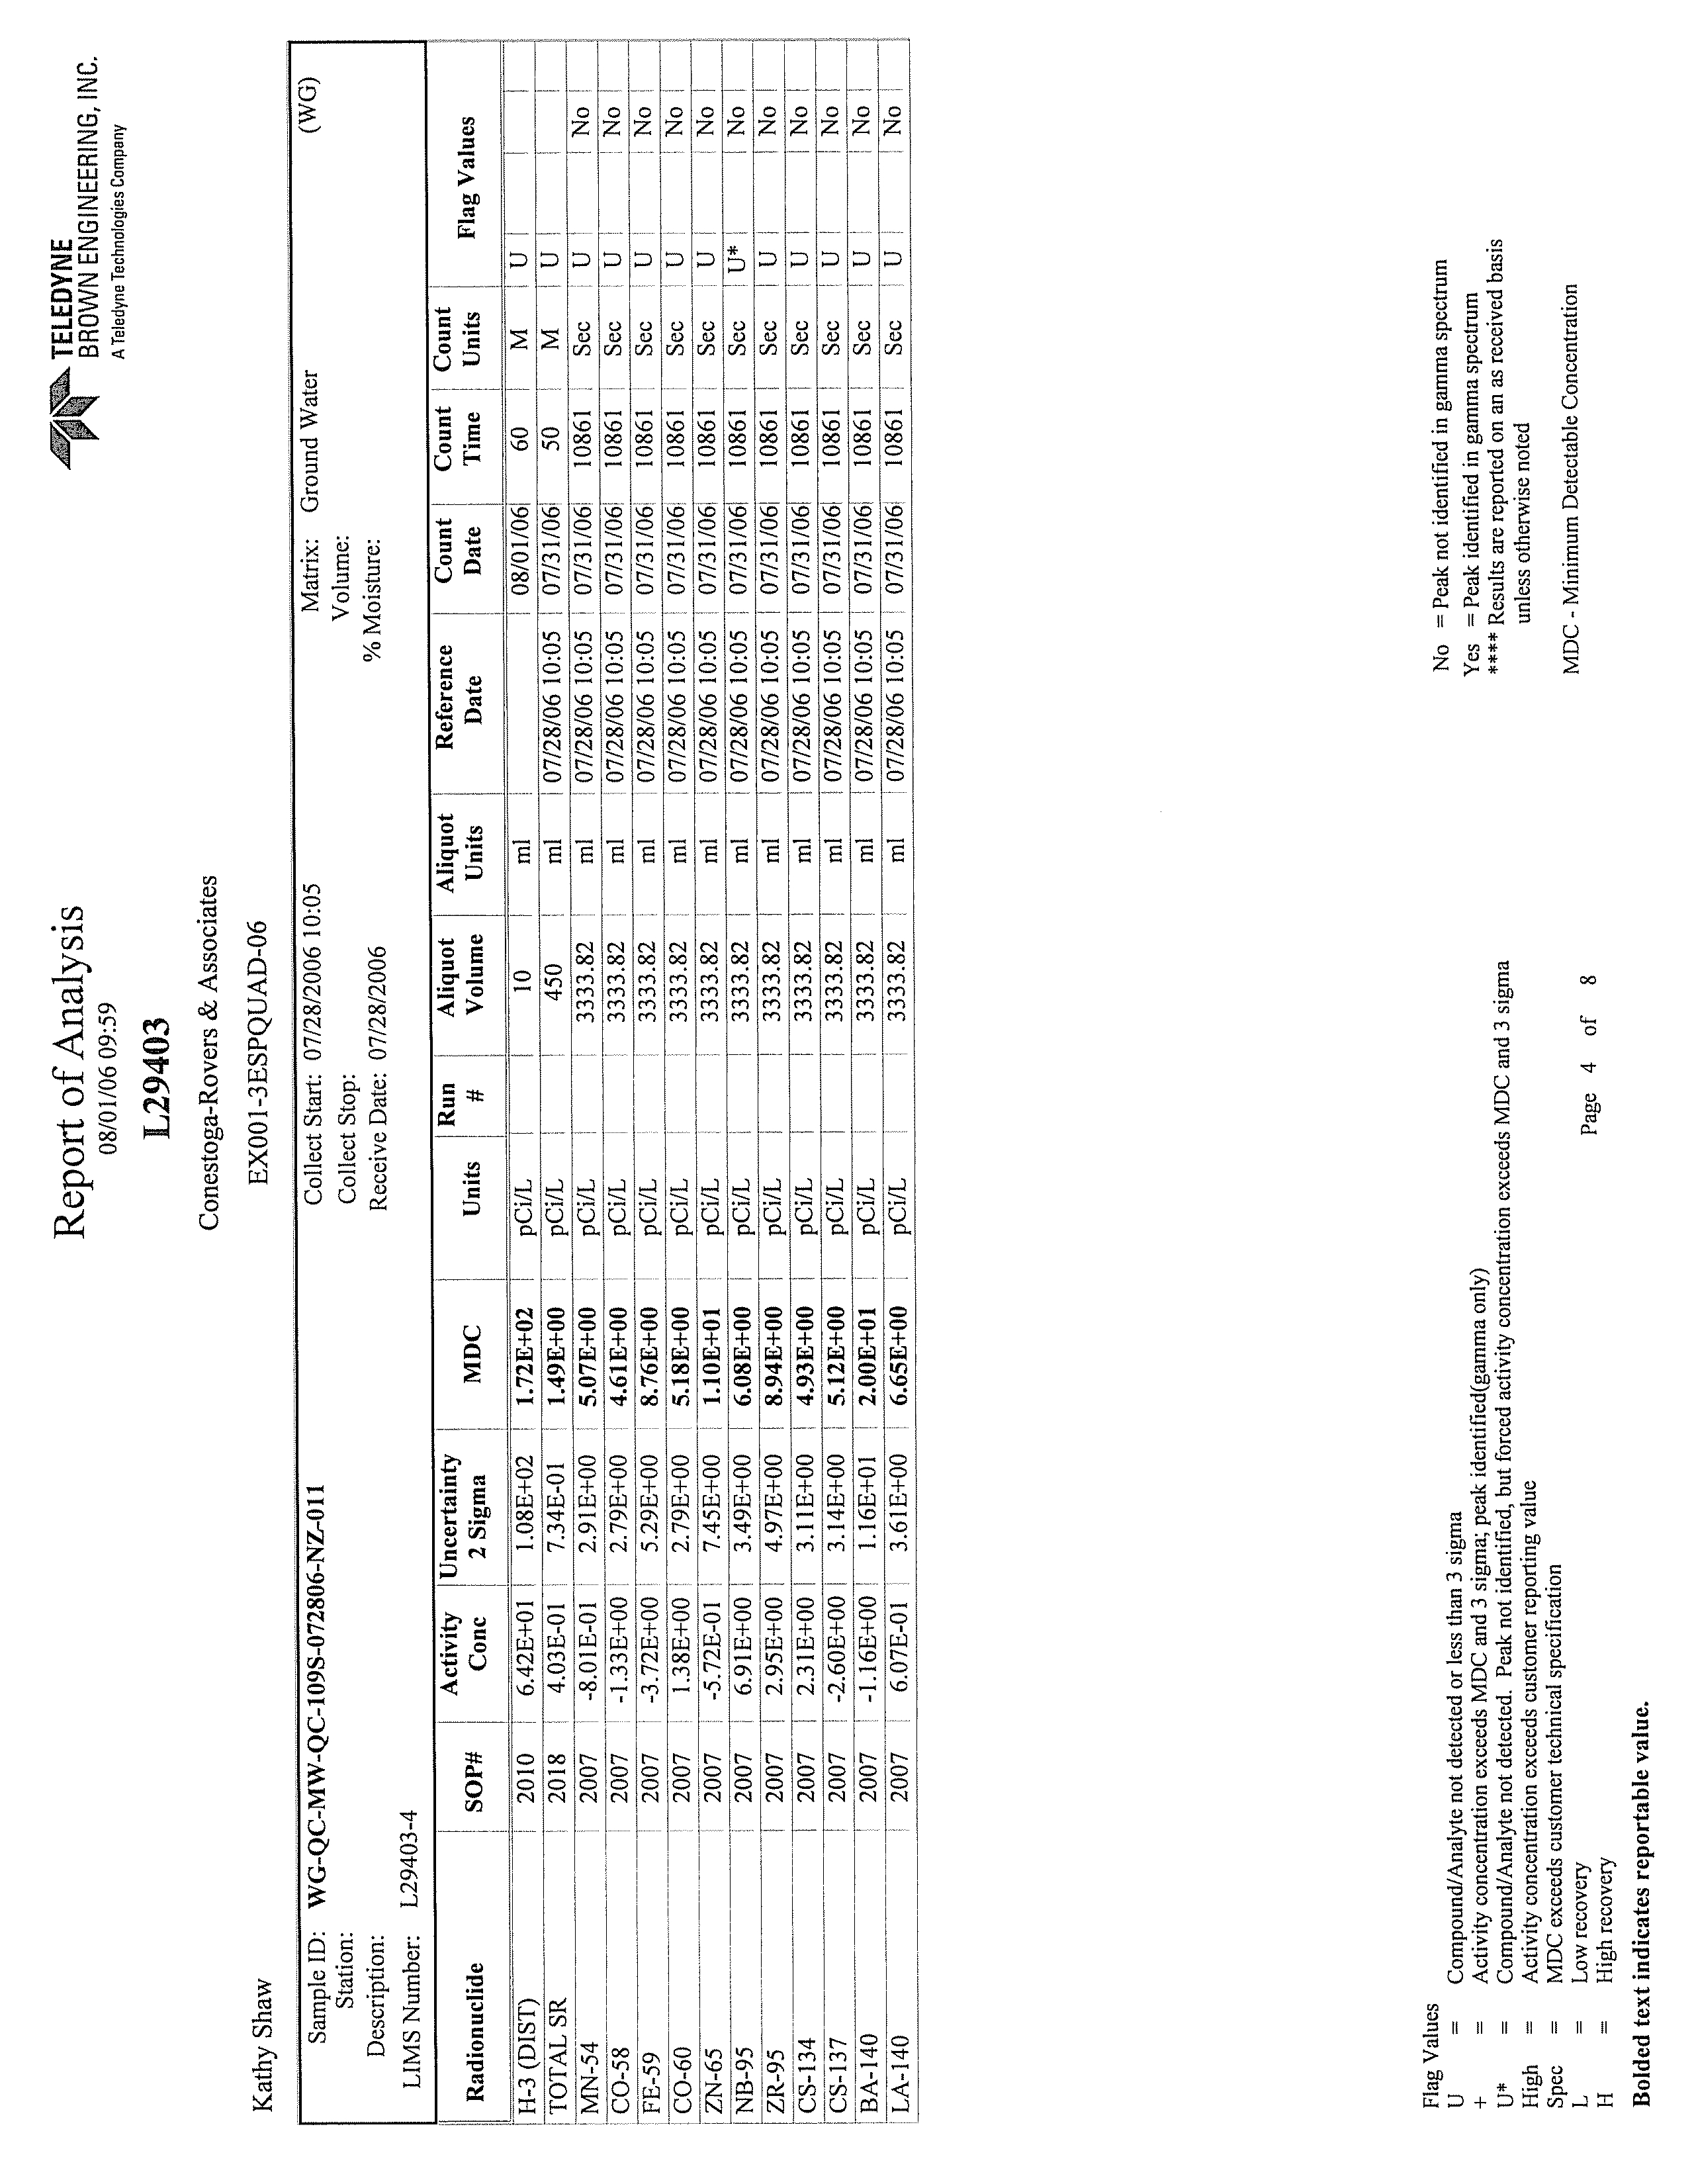
CRA has validated the analytical data to establish the accuracy and completeness of the
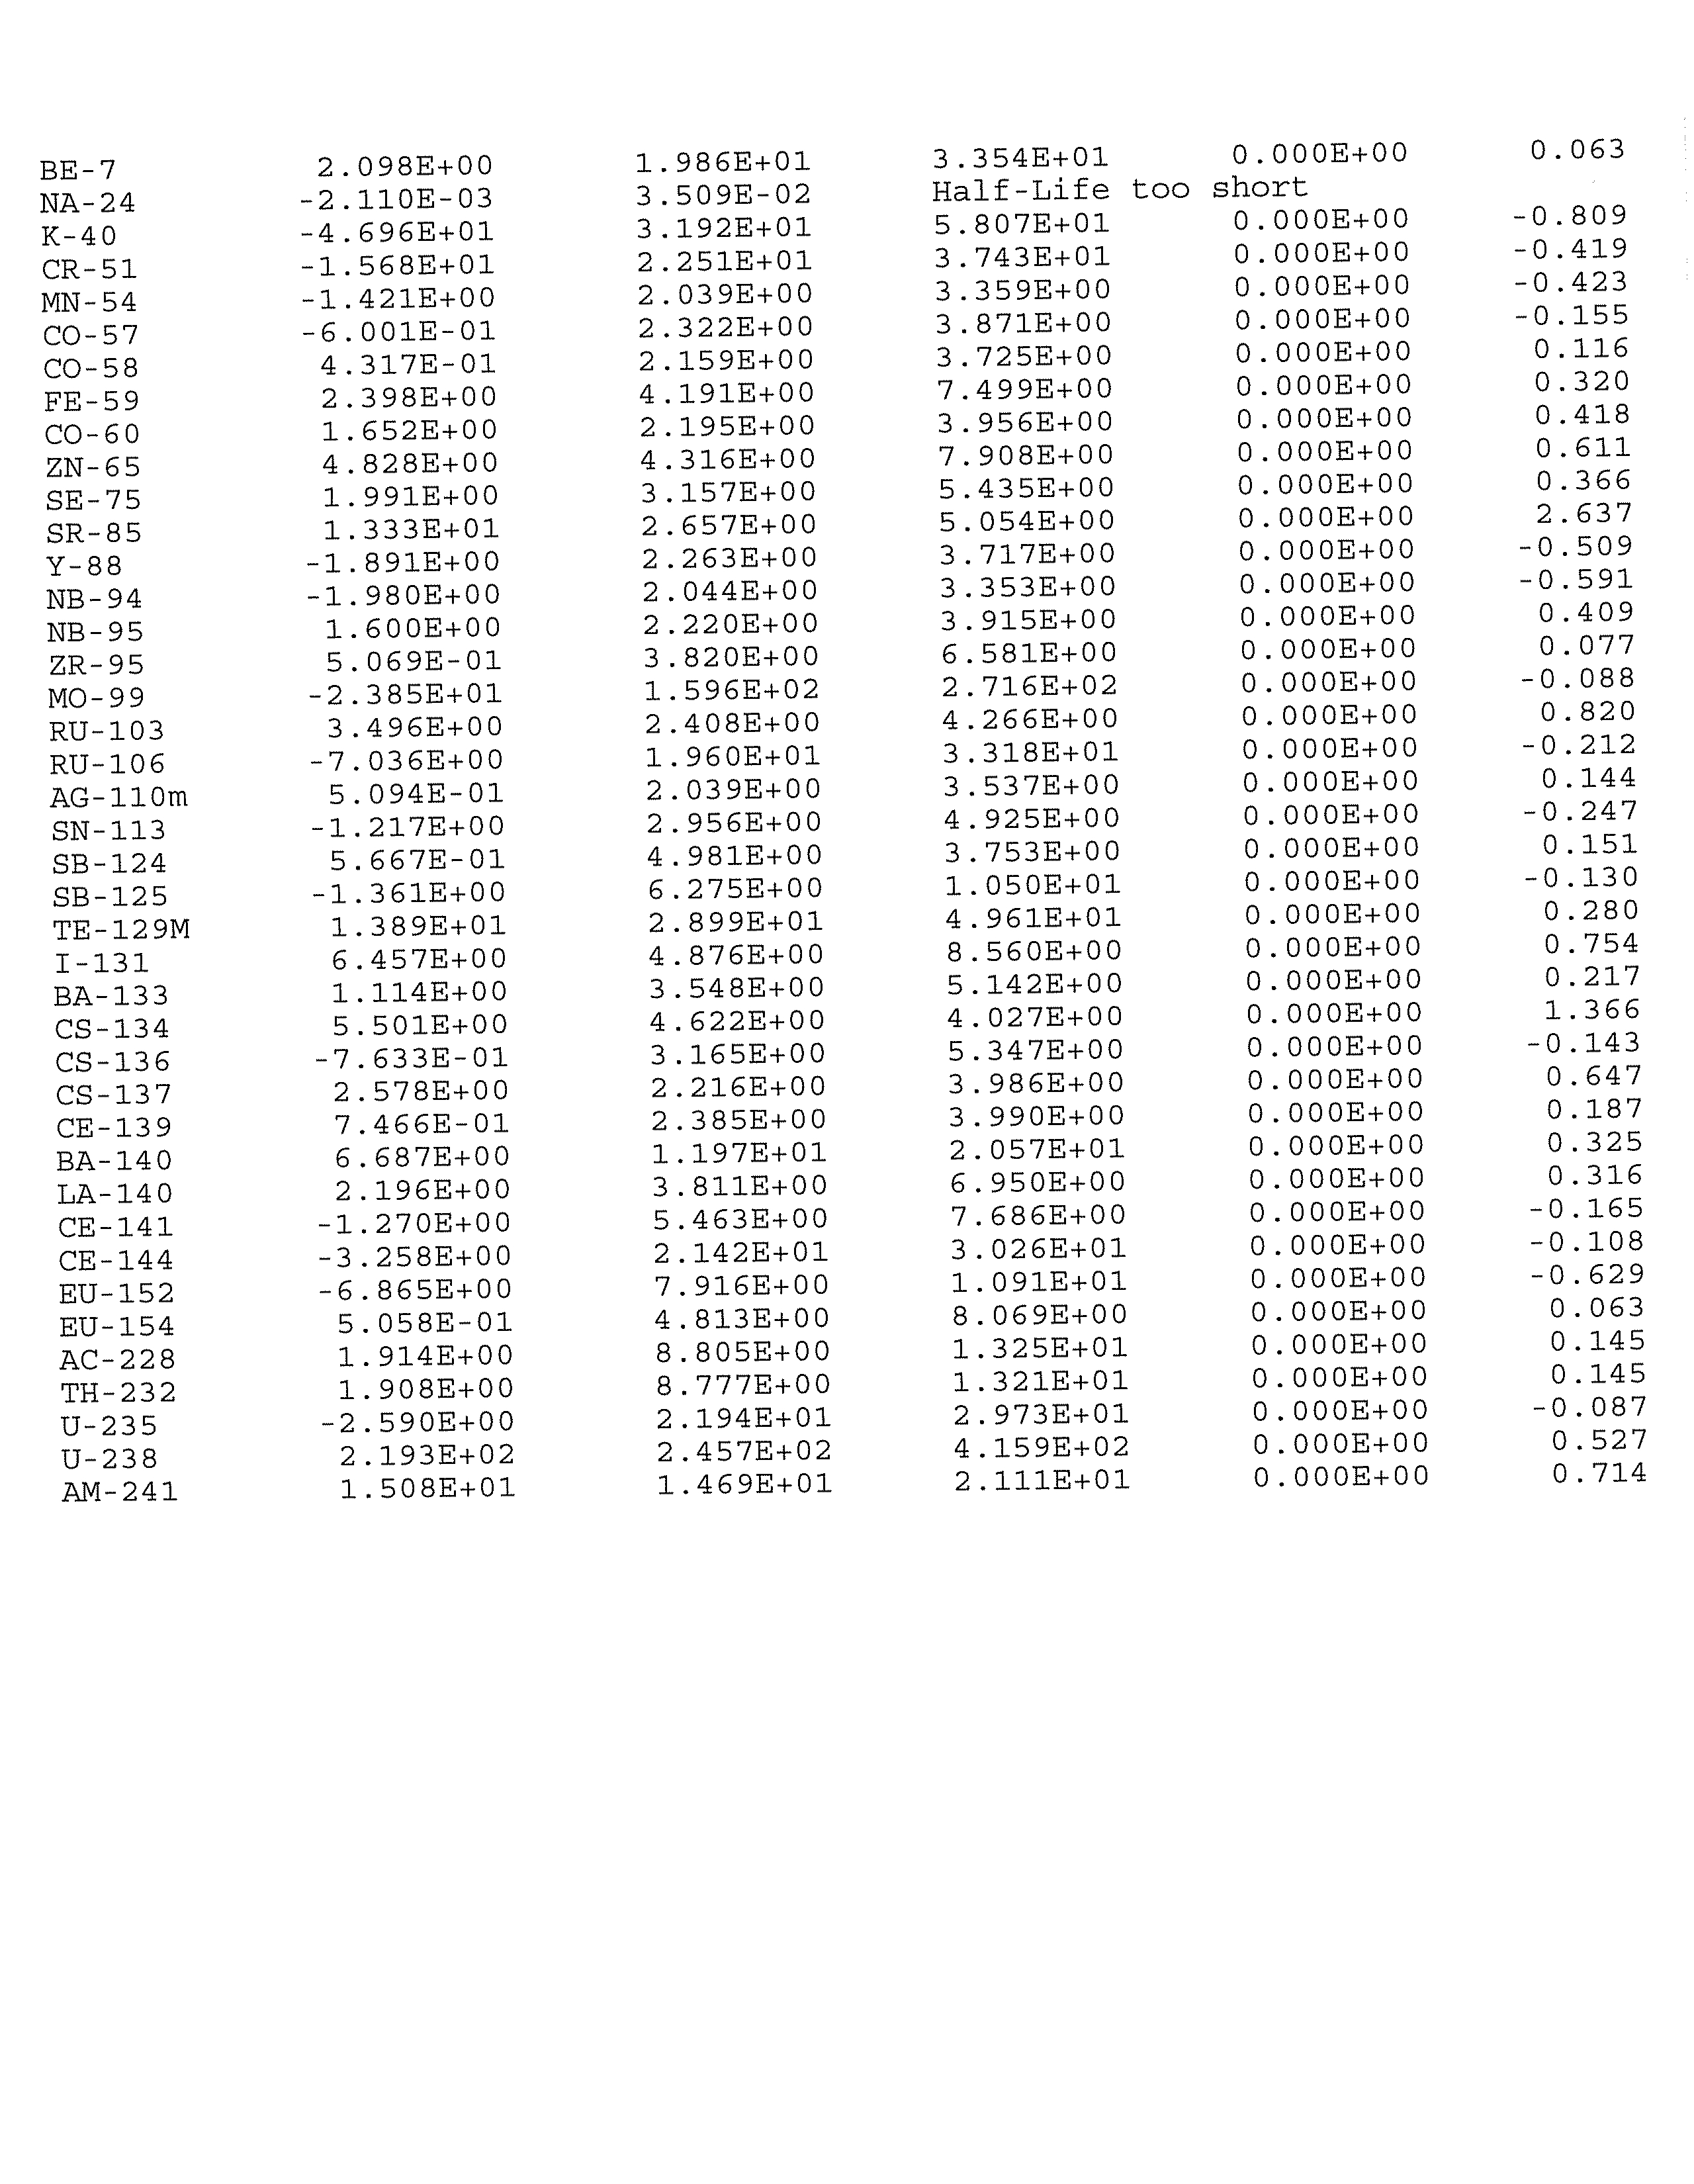
data reported. Teledyne Brown
provided the analytical services. The Quality Assurance
Program for the laboratory is described in Appendix C.
Analytical data for
groundwater and surface water samples collected in accordance with the Work Plan are
presented in Appendix D. Data validation memoranda are presented in Appendix E.
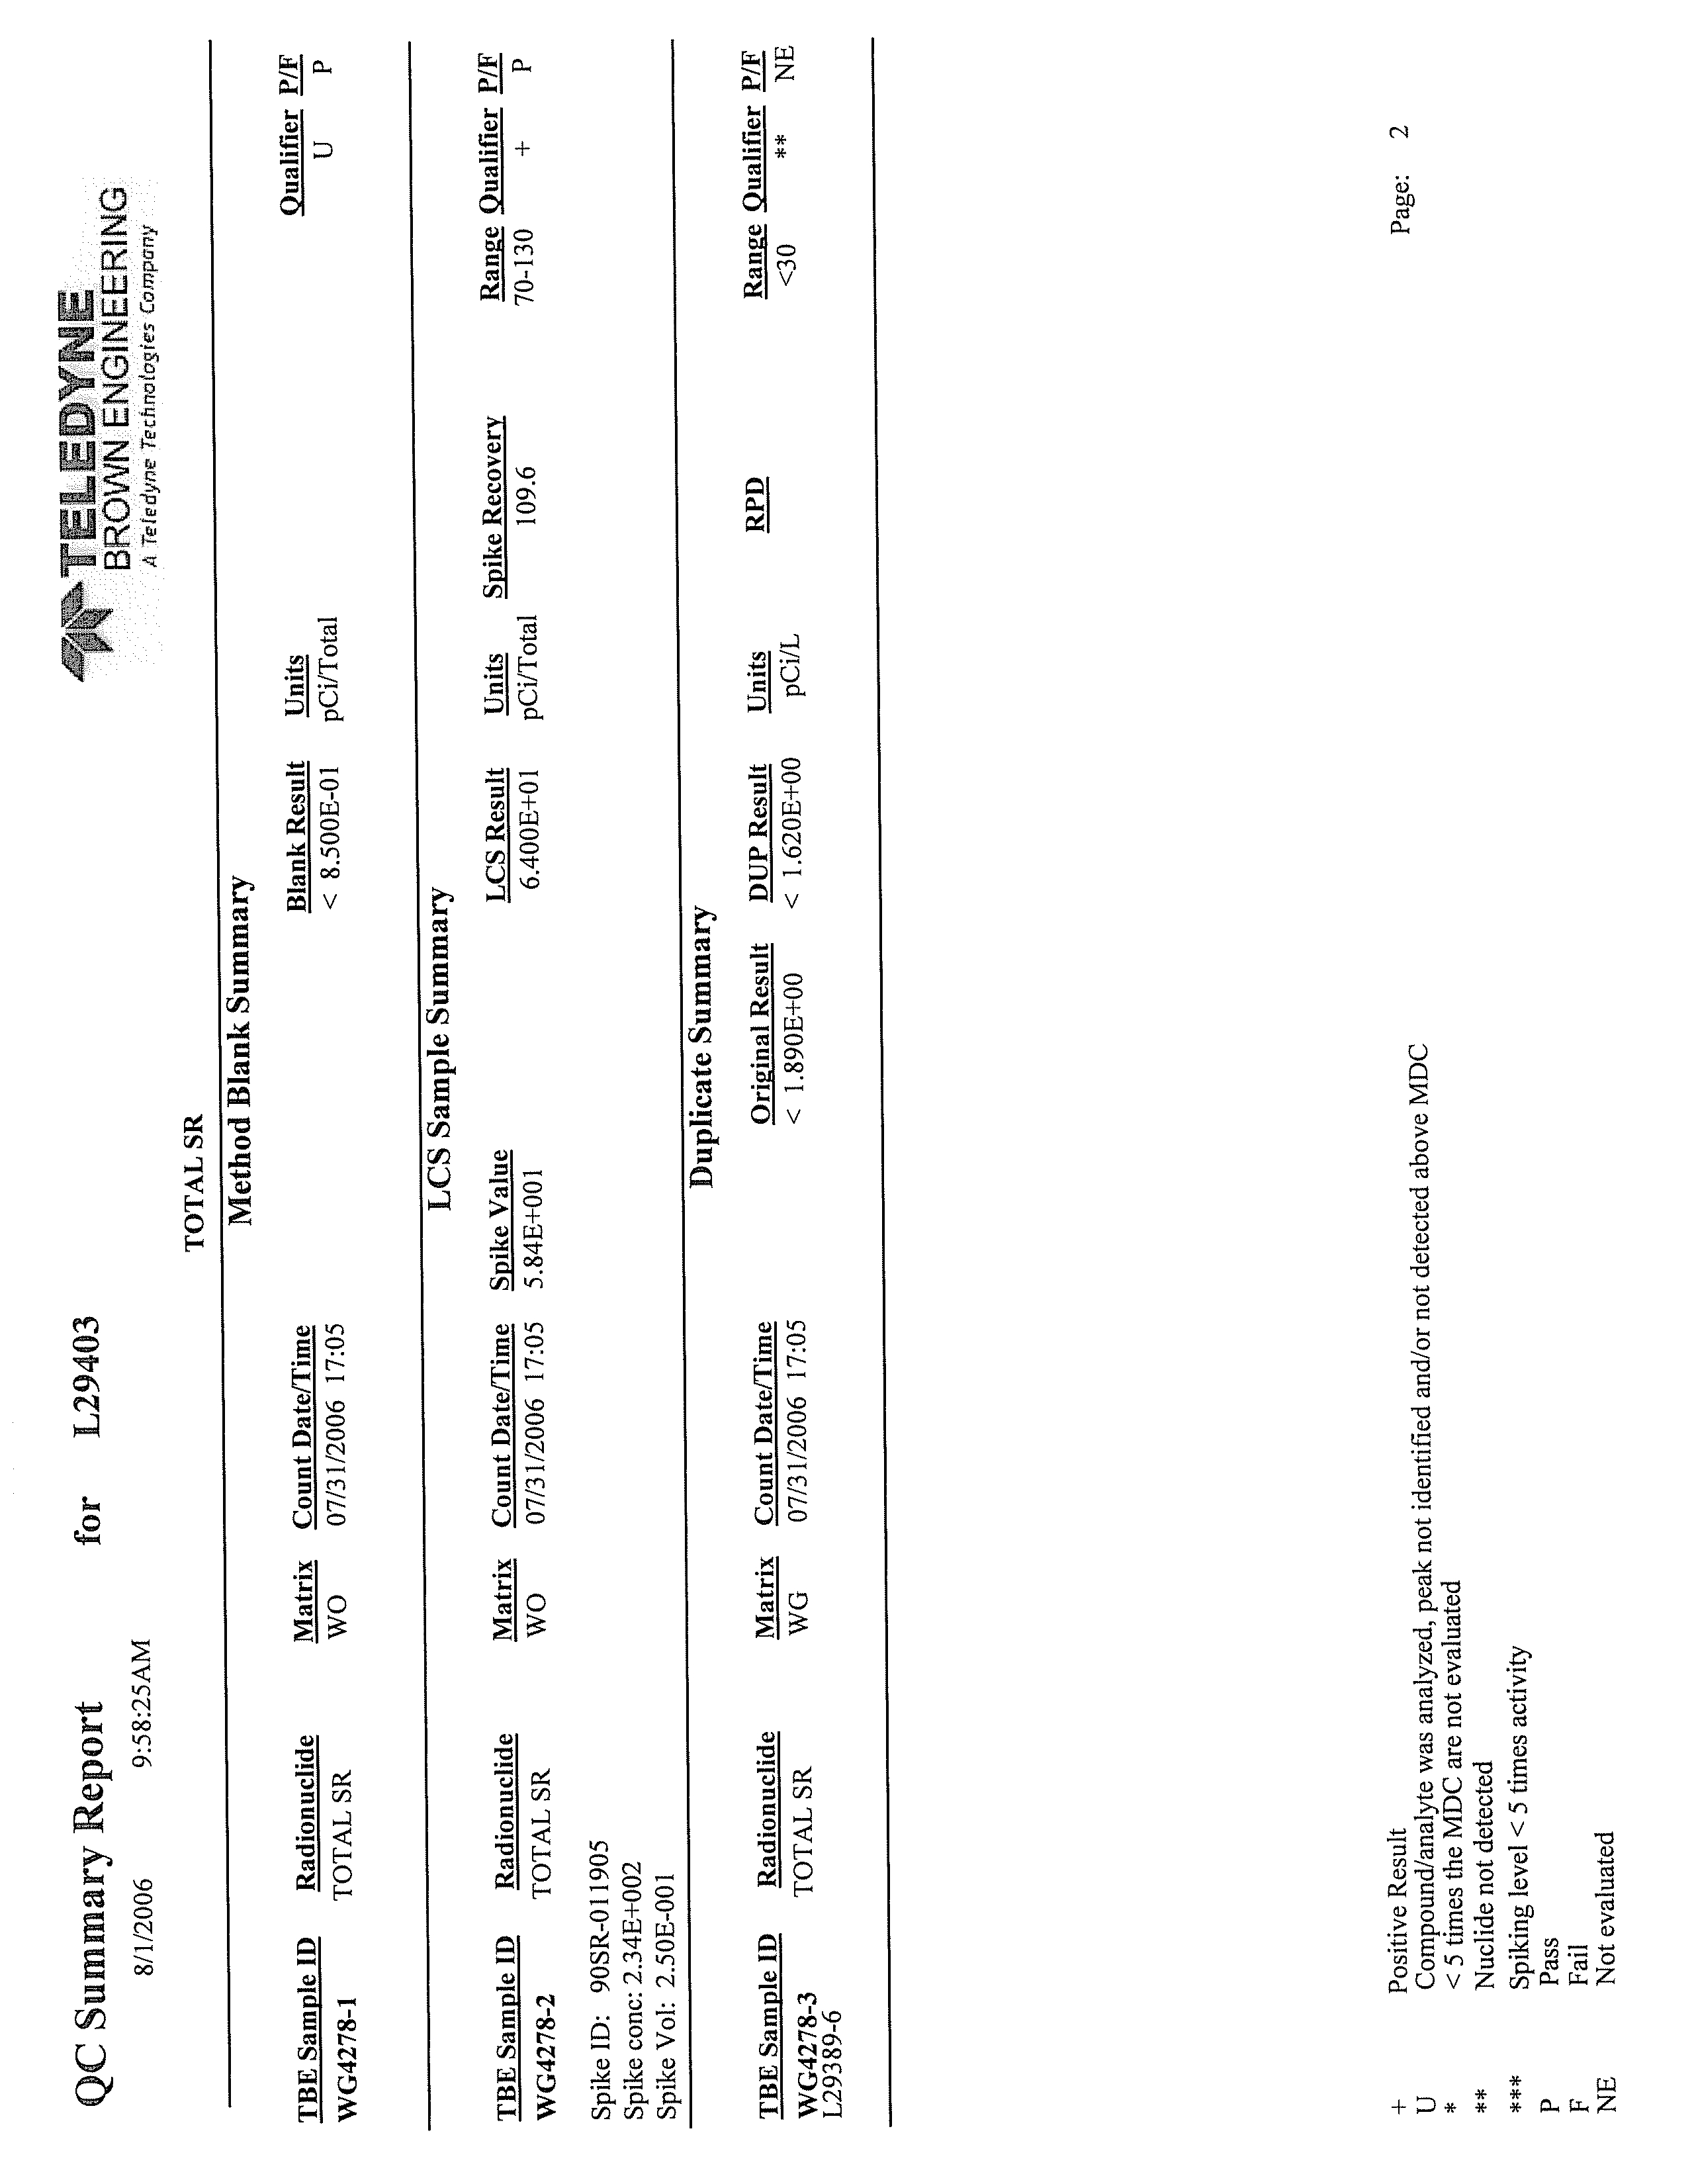
The data validation included the following information and evaluations:
045136 (20) Quad Cities Generating Station
22
CONESTOGA-ROVERS & ASSOCIATES
Revision 1
•
sample preservation;
•
sample holding times;
•
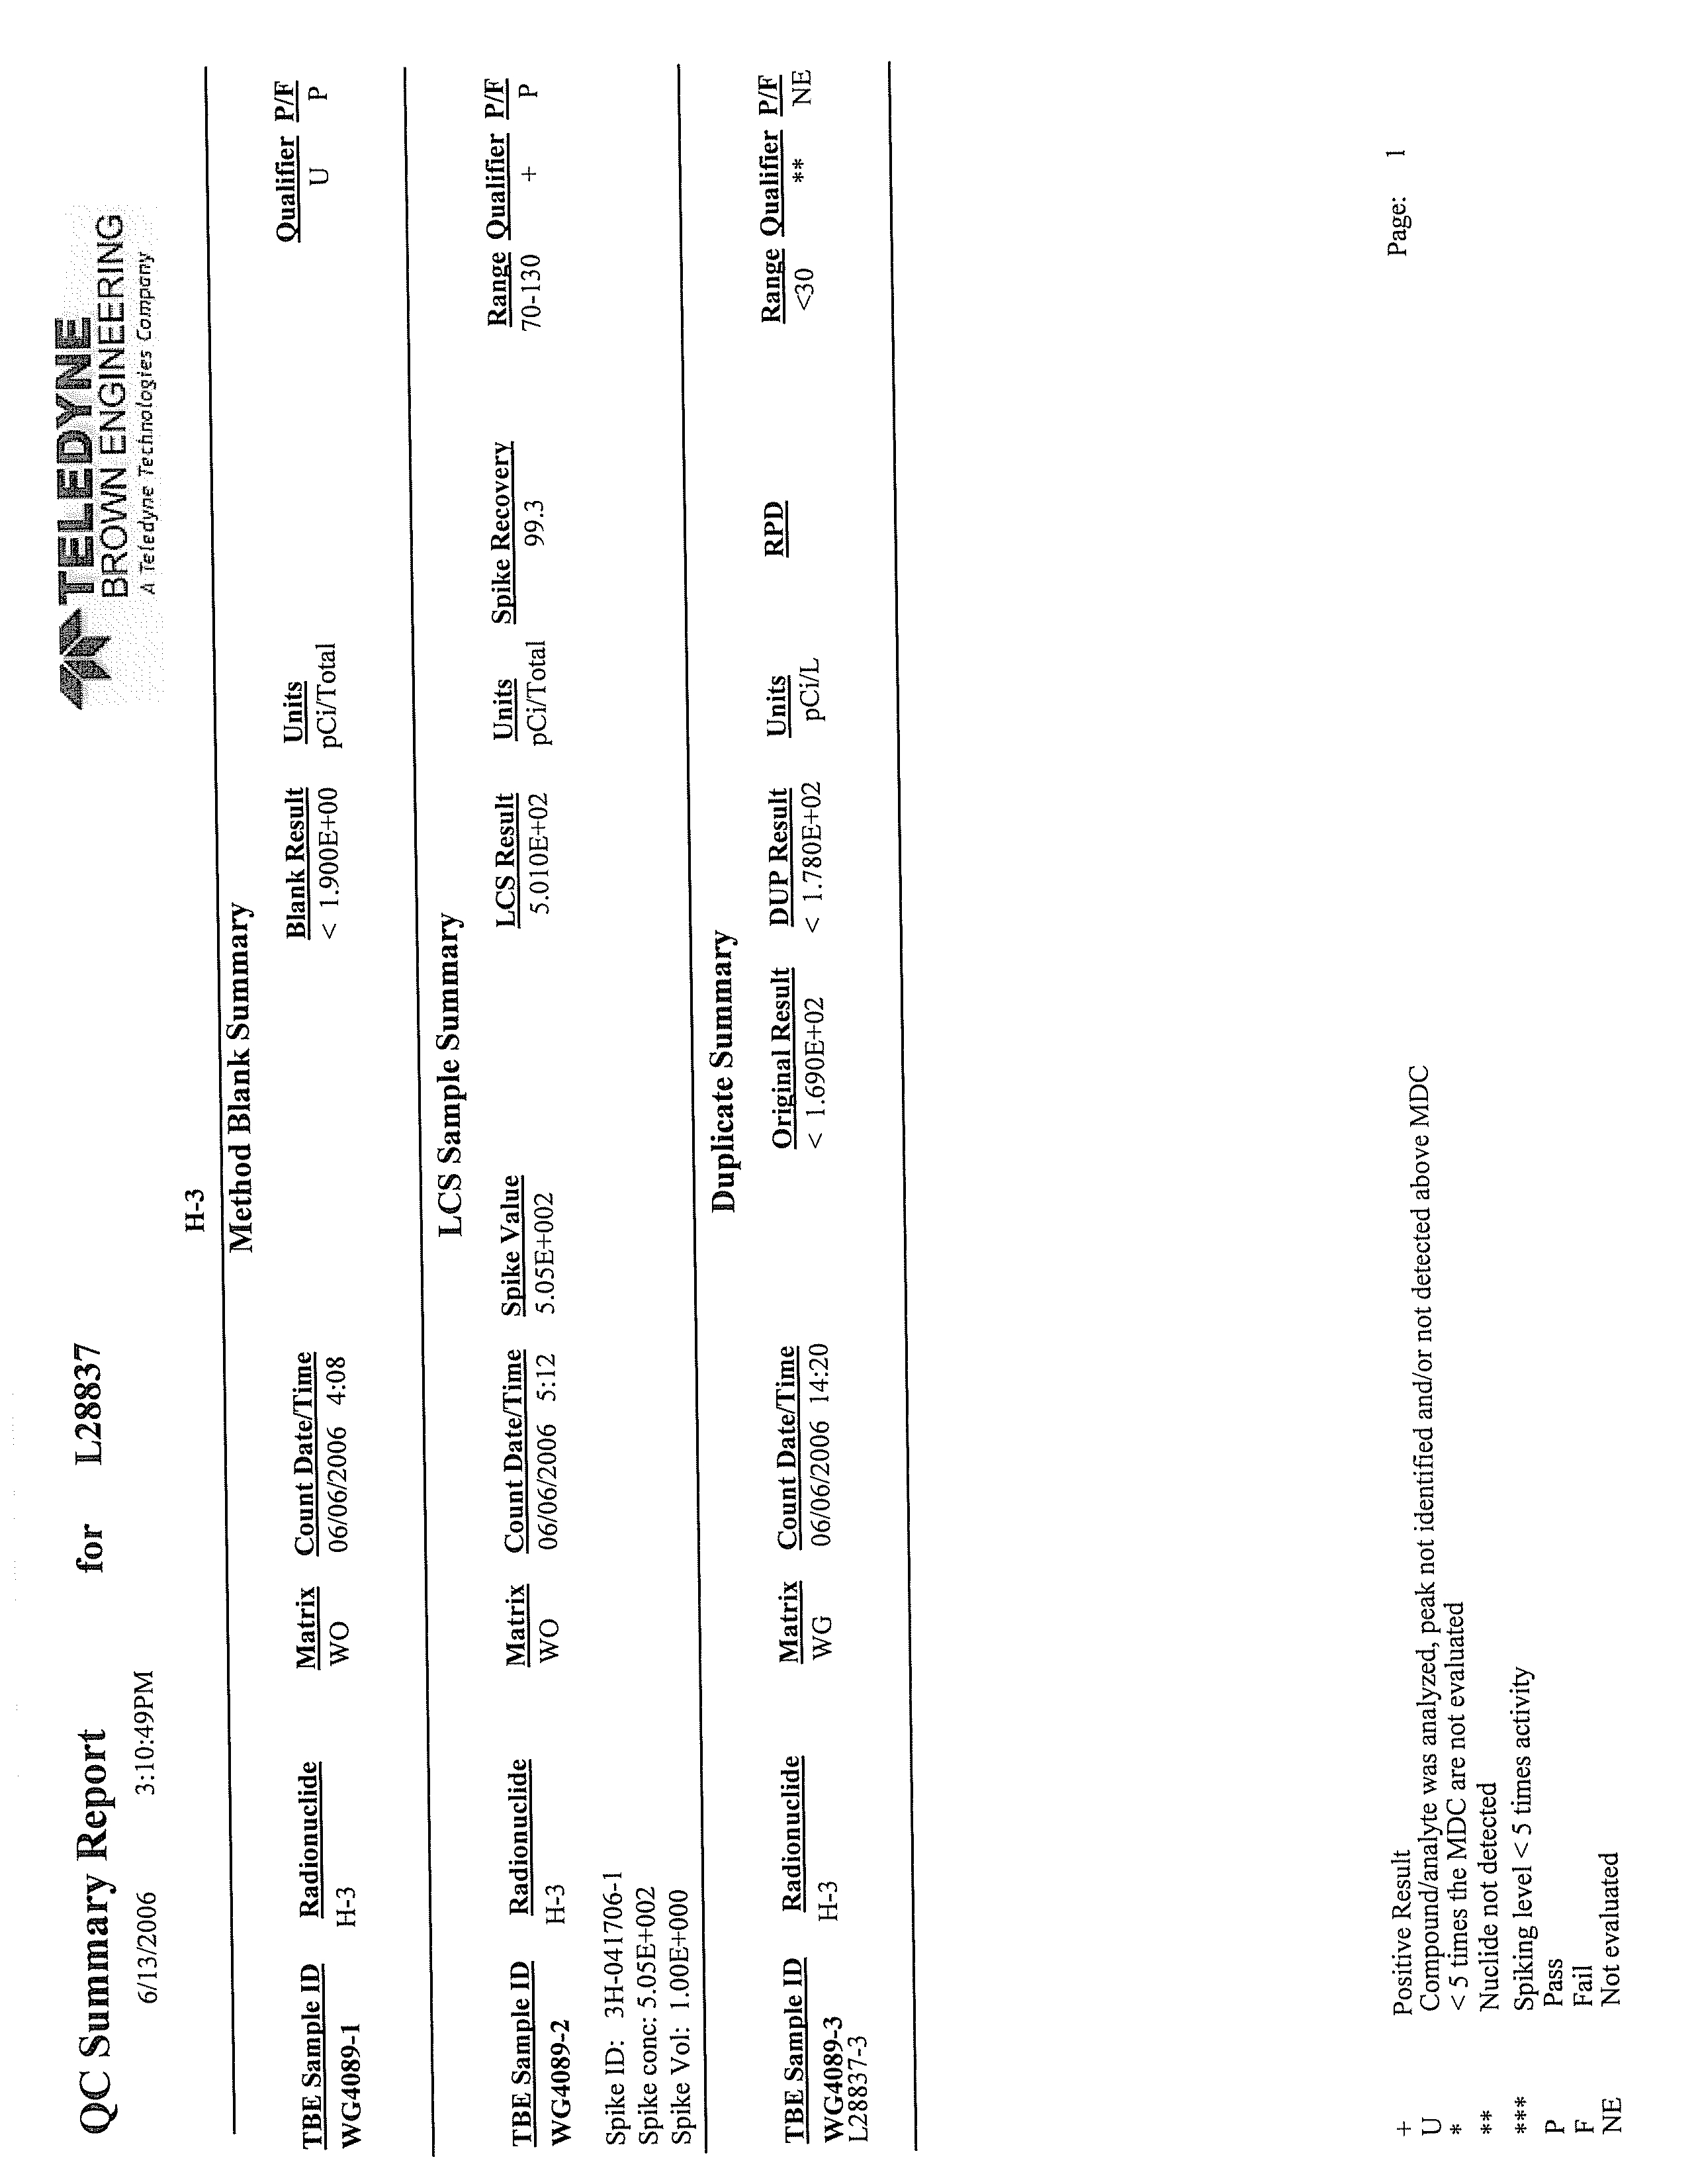
laboratory method blanks;
•
laboratory control samples;
•
laboratory duplicates;
•
verification of laboratory qualifiers; and
•
field quality
control (field blanks and duplicates).
Following the completion of field activities, CRA compiled and reviewed the geologic,
hydrogeologic, and analytical data.
The data were reviewed using the following techniques:
•
data tables and databox figures;
•
hydrogeologic cross-sections; and
•
hydraulic analyses.
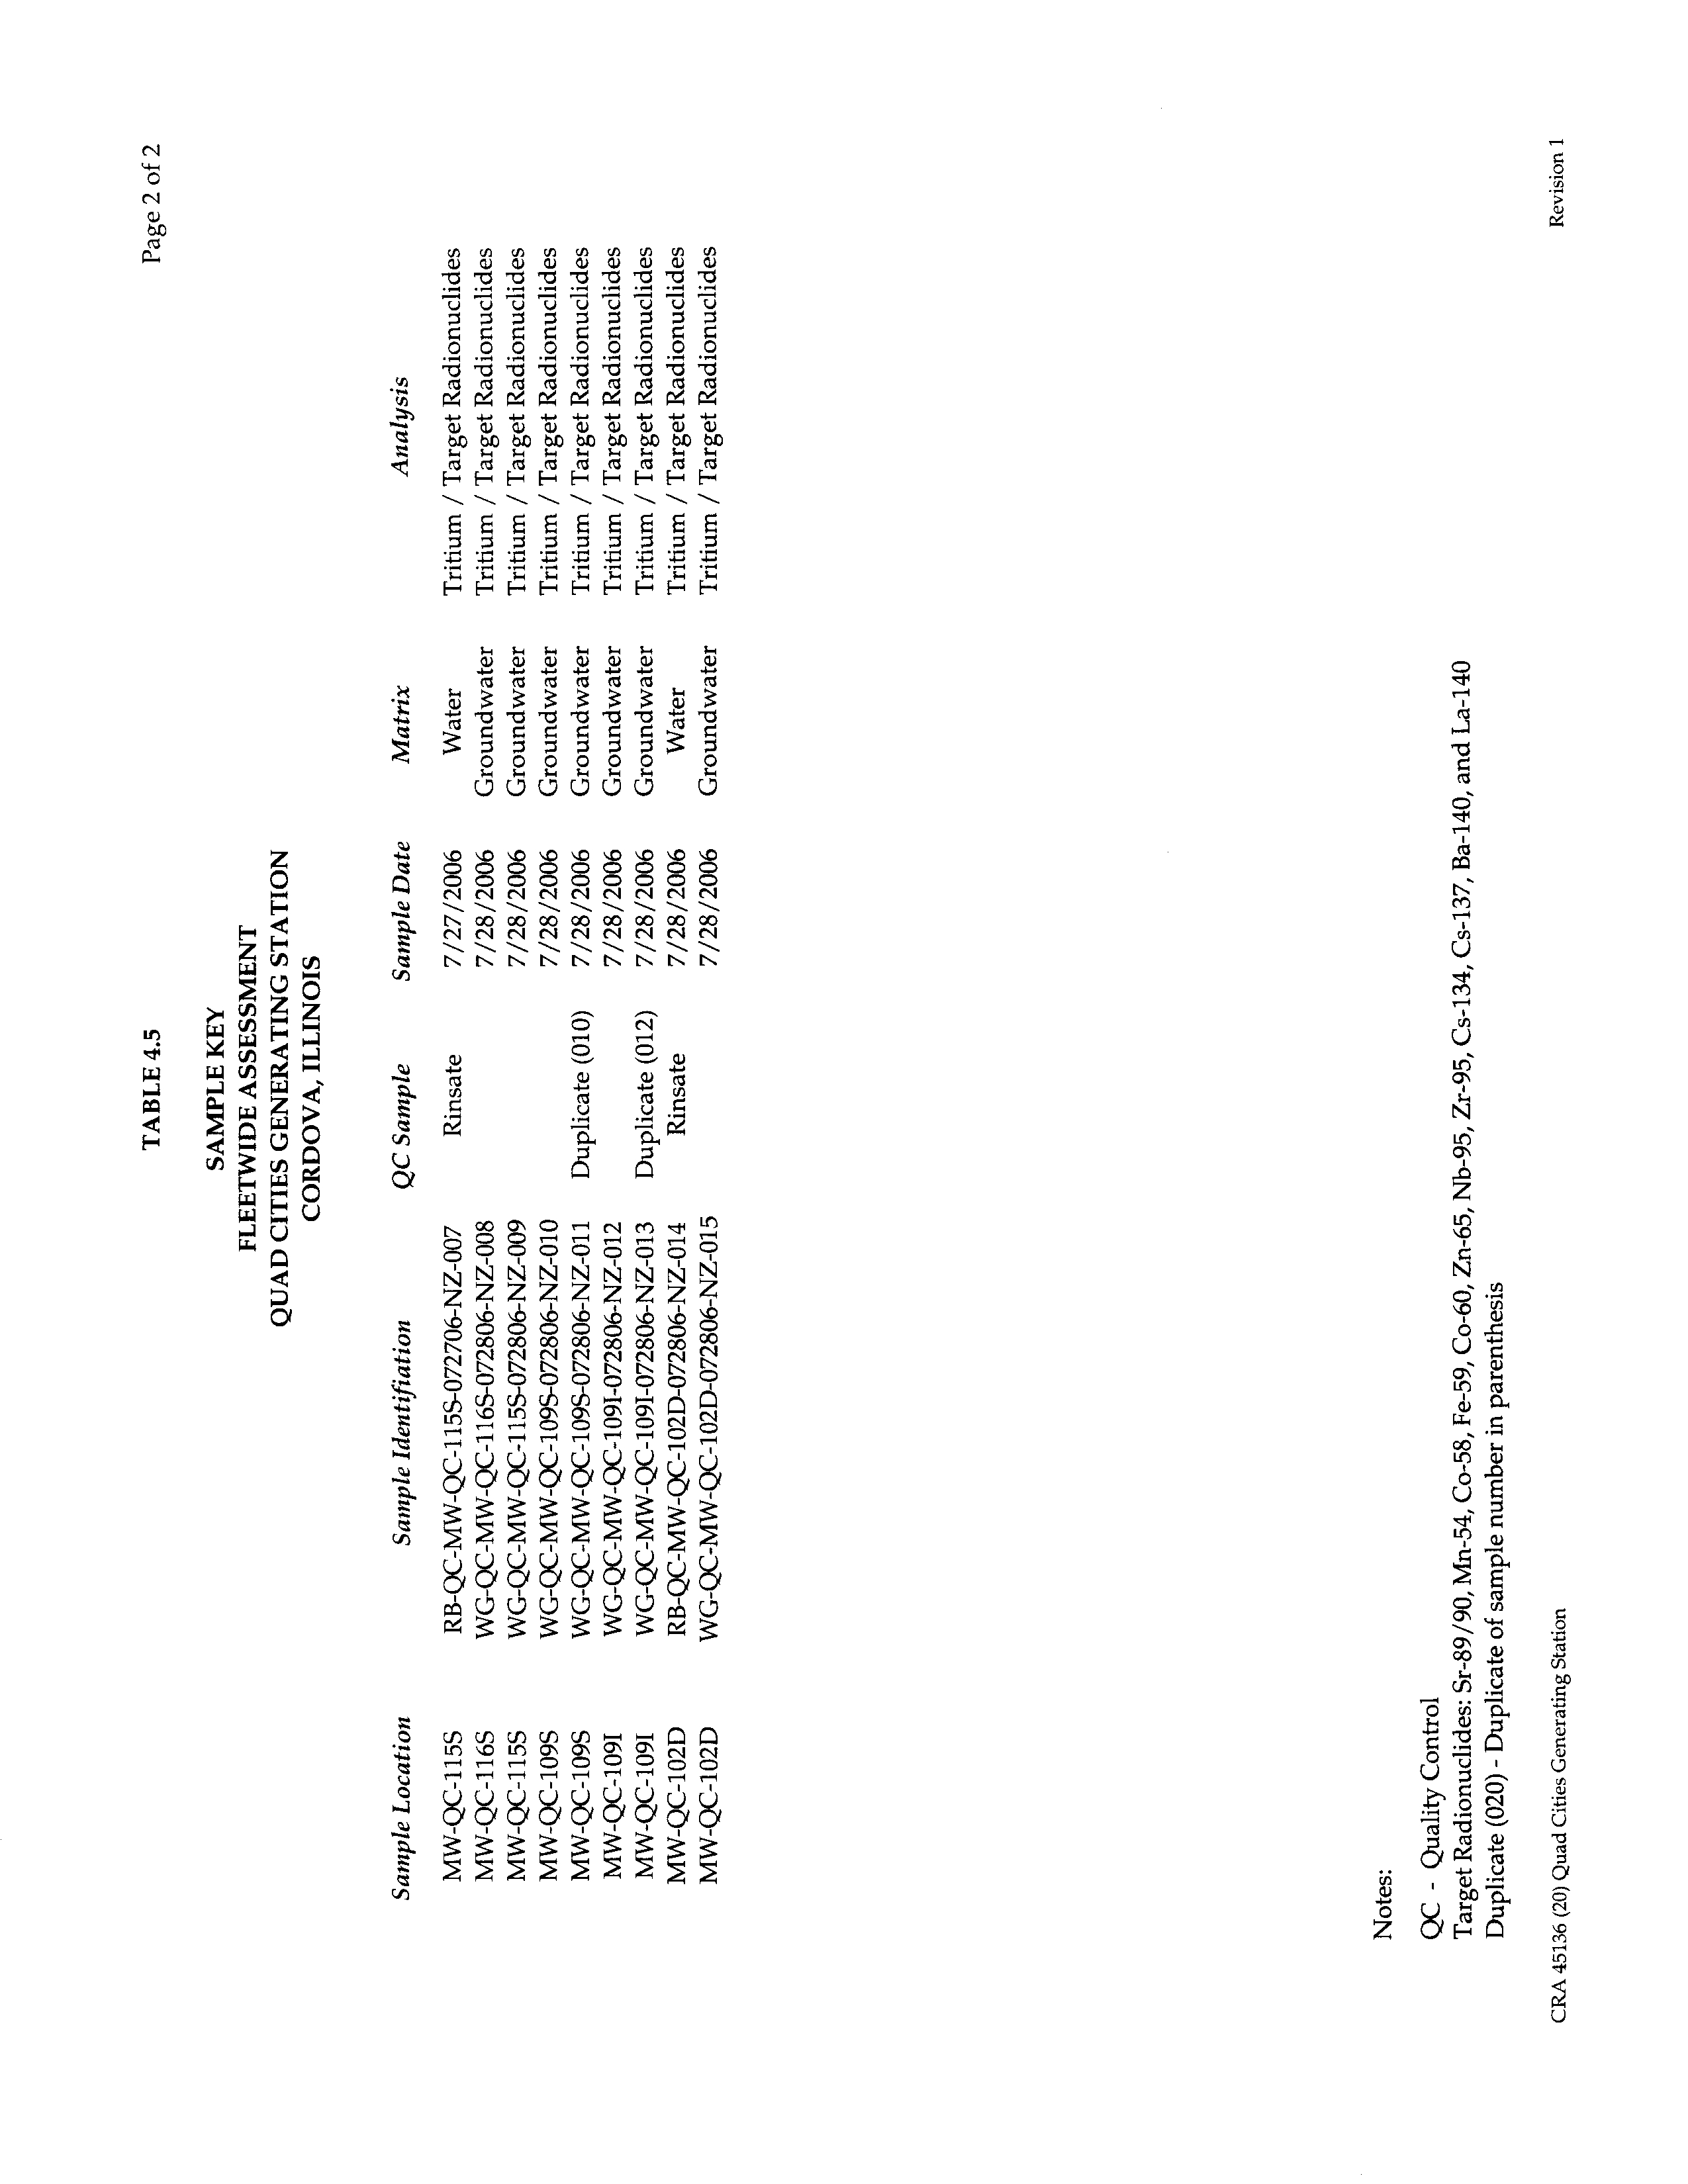
4.8
SAMPLE IDENTIFICATION
Systematic sample identification codes were used to uniquely identify all samples. The
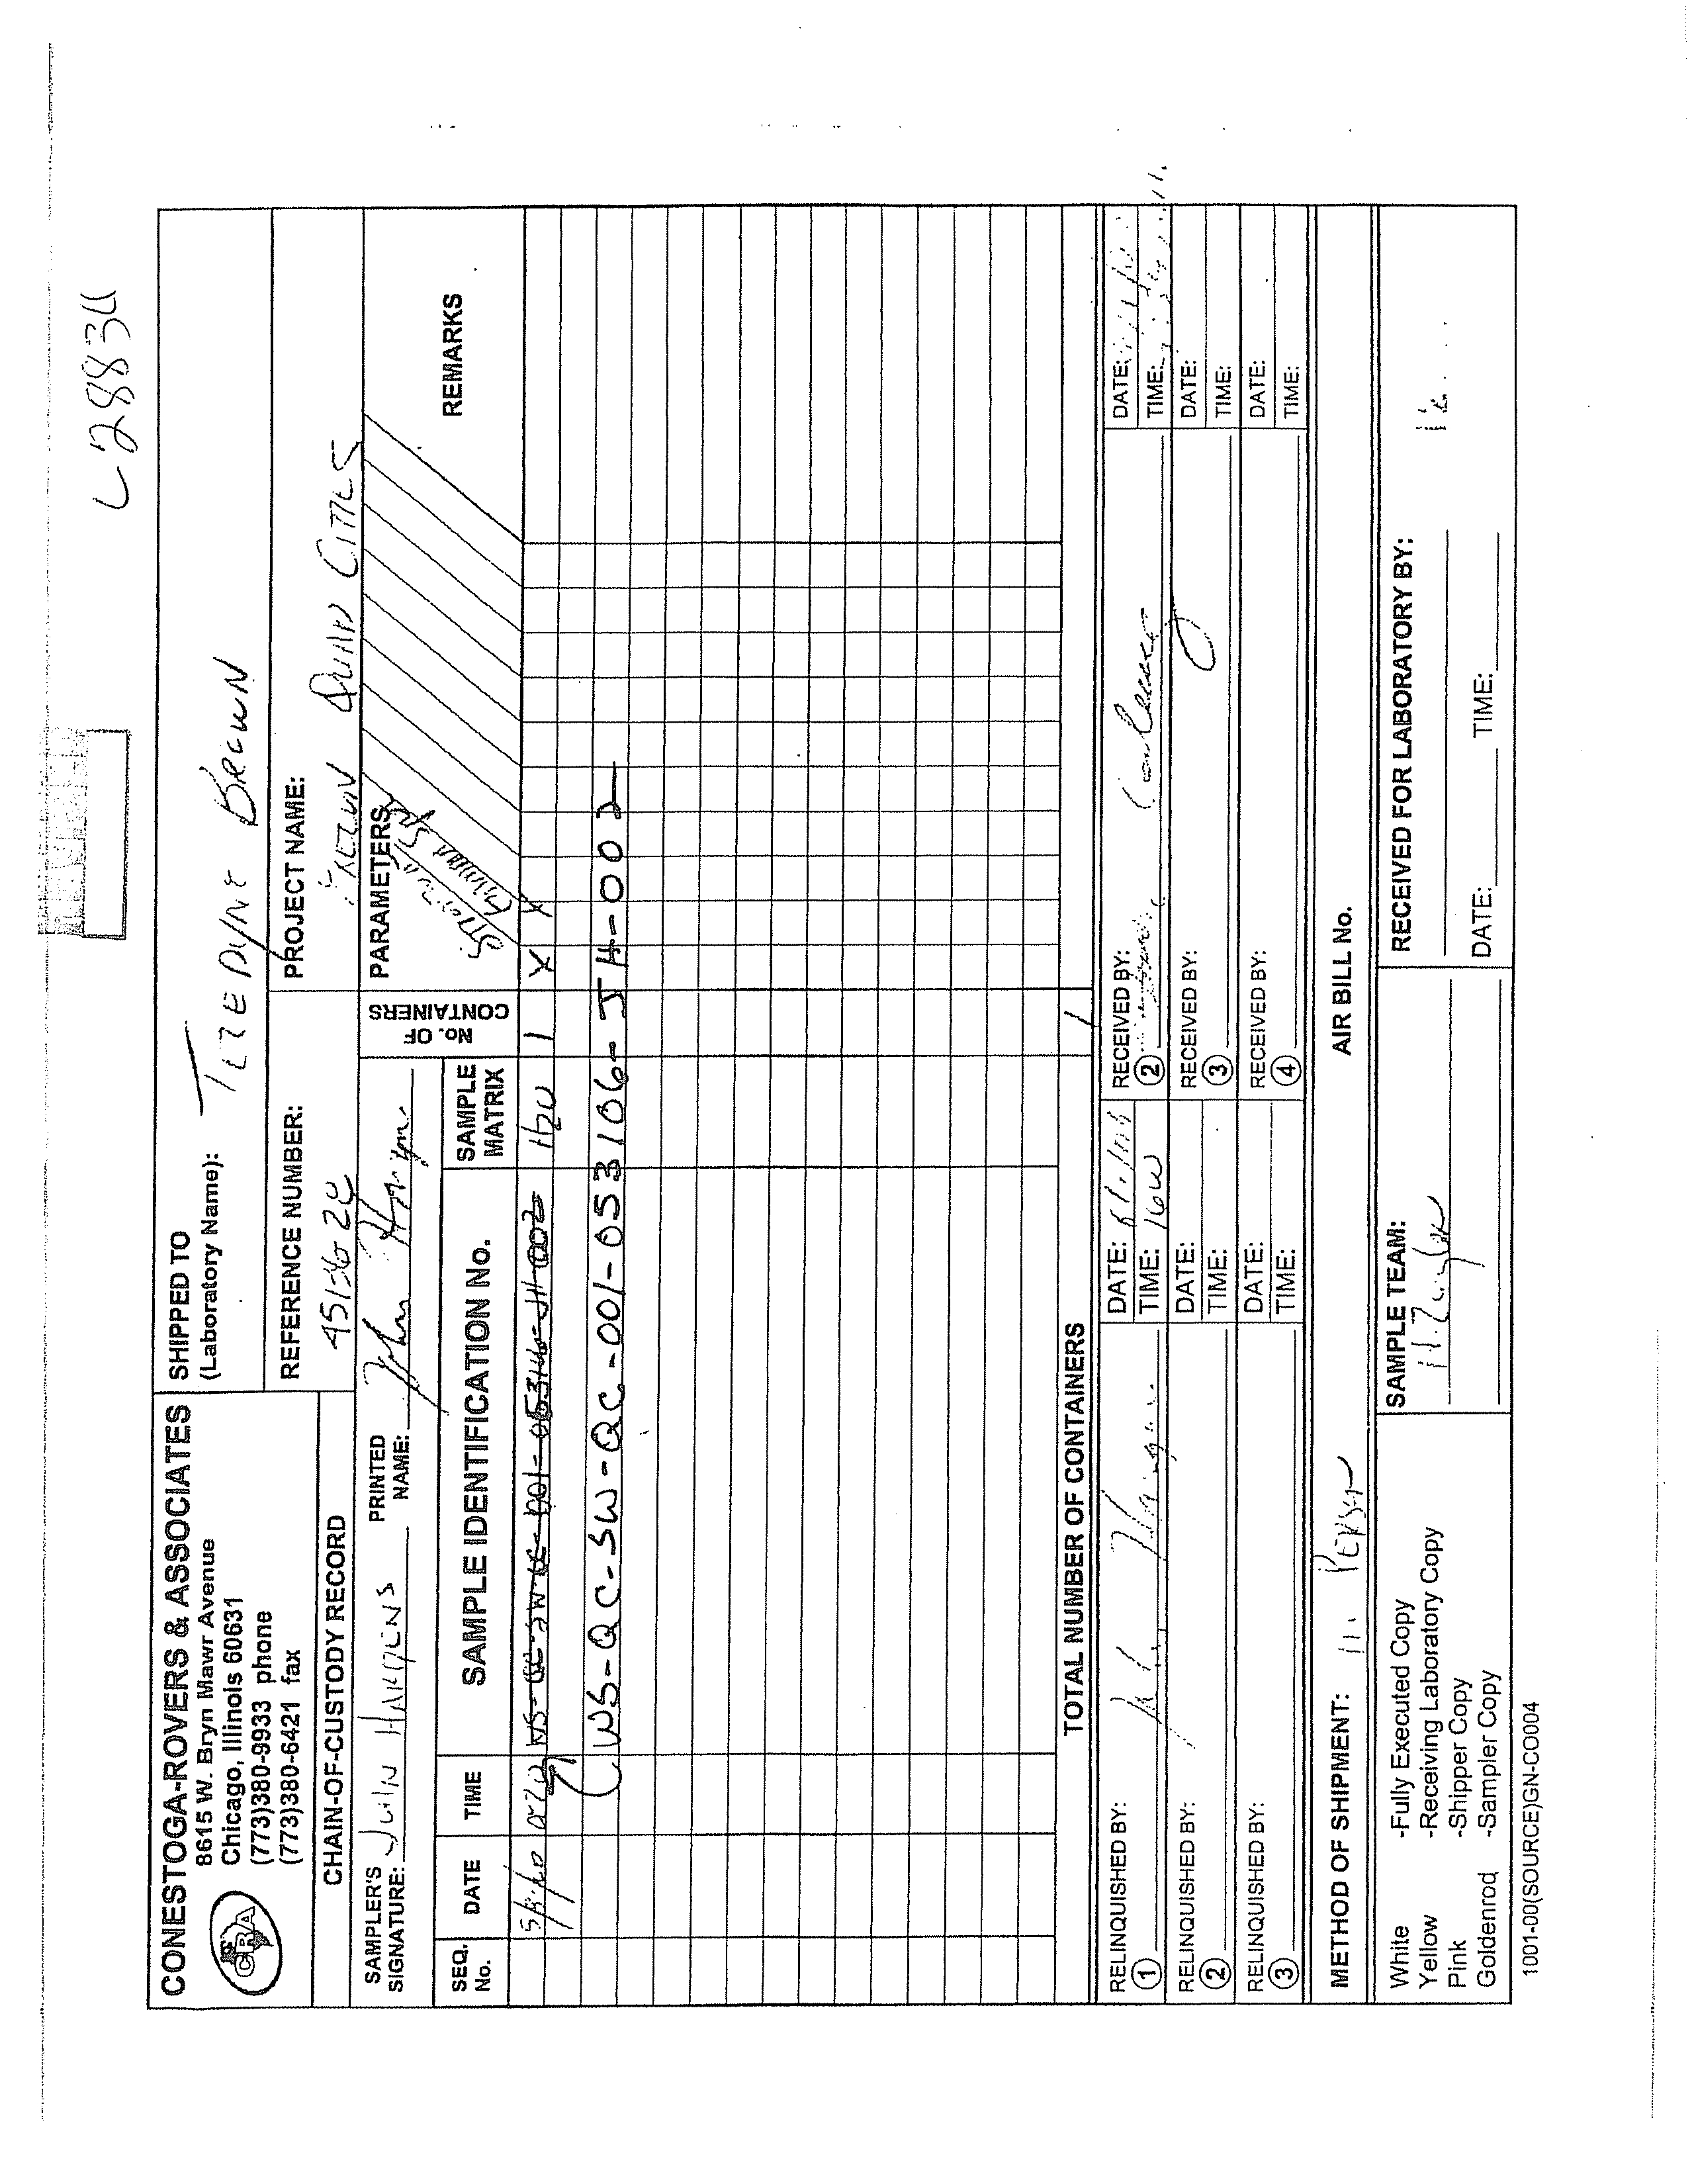
identification code format used in the field was: WG-QC-SW-QC-001-053106-JH-002. A
summary of sample identification numbers is presented in Table 4.5.
WG
-
Sample matrix - groundwater
WS
-
Sample matrix - surface water
RB
-
Sample matrix - rinse blank
QC
-
Station code
SW-QC-001 -
Sample location
053106
-
Date
JH
-
Sampler initial
002
-
Sample number
045136 (20) Quad Cities Generating Station
23
CONESTOGA-ROVERS & ASSOCIATES
Revision 1
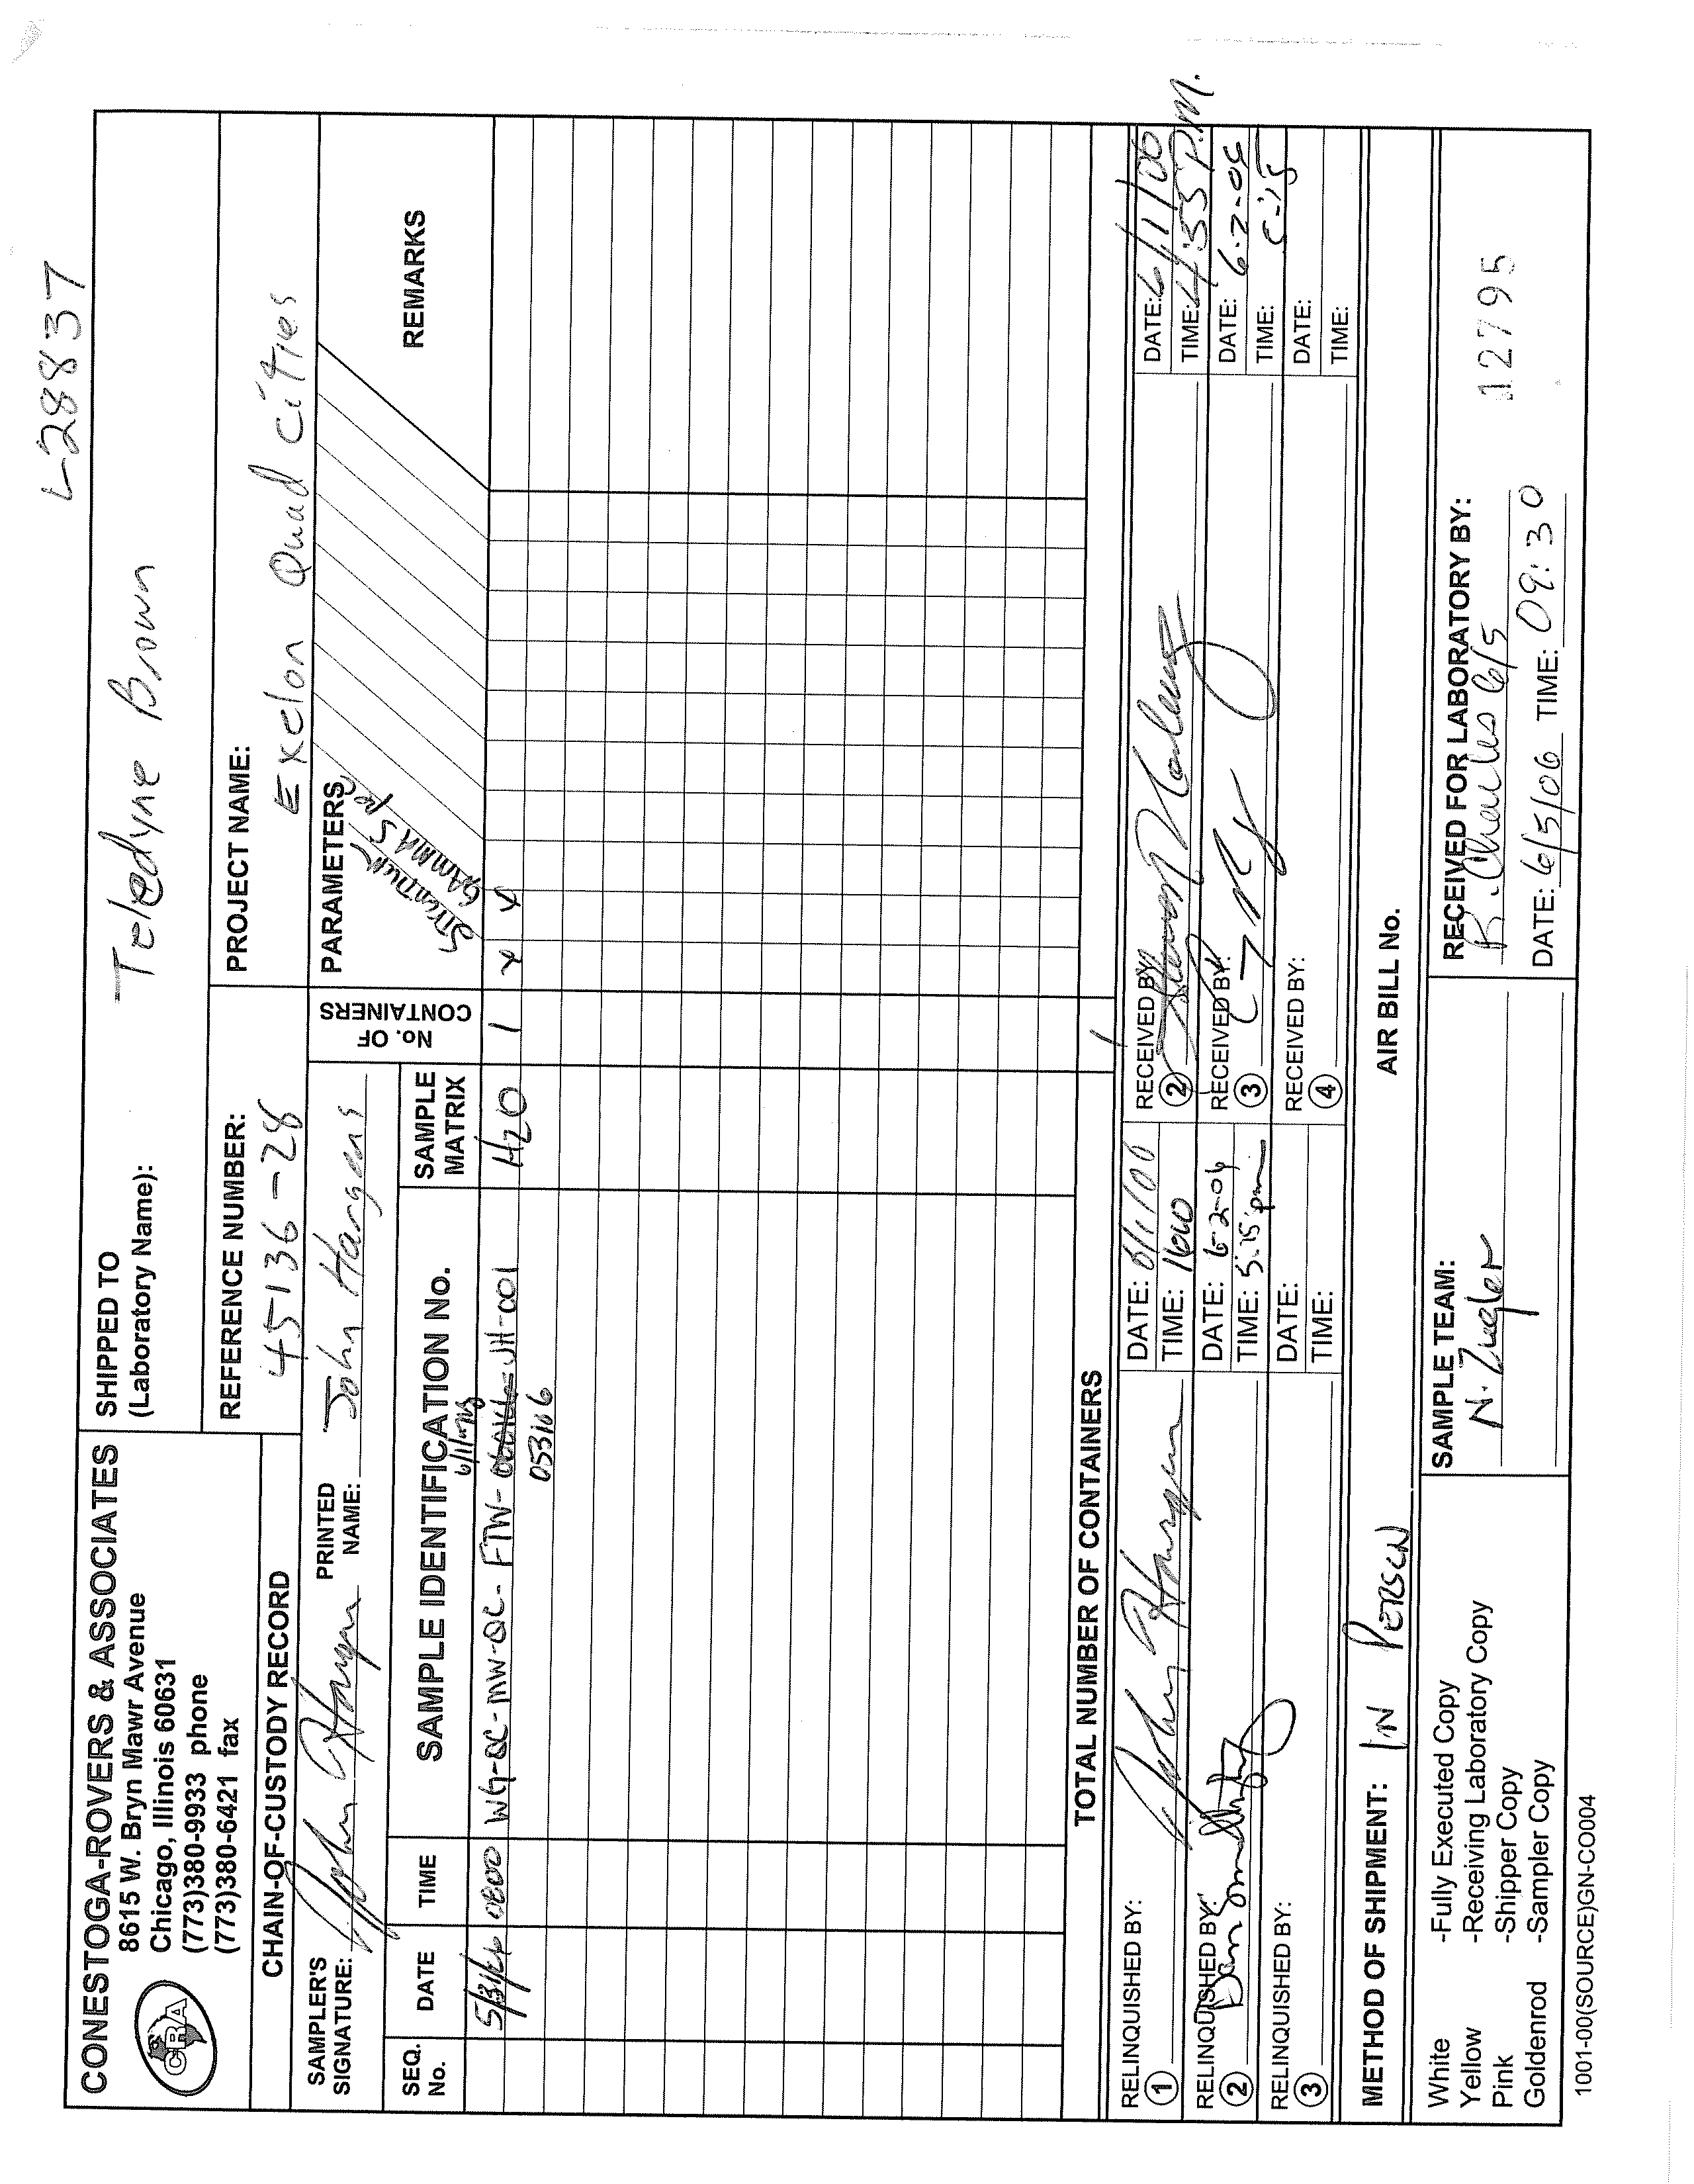
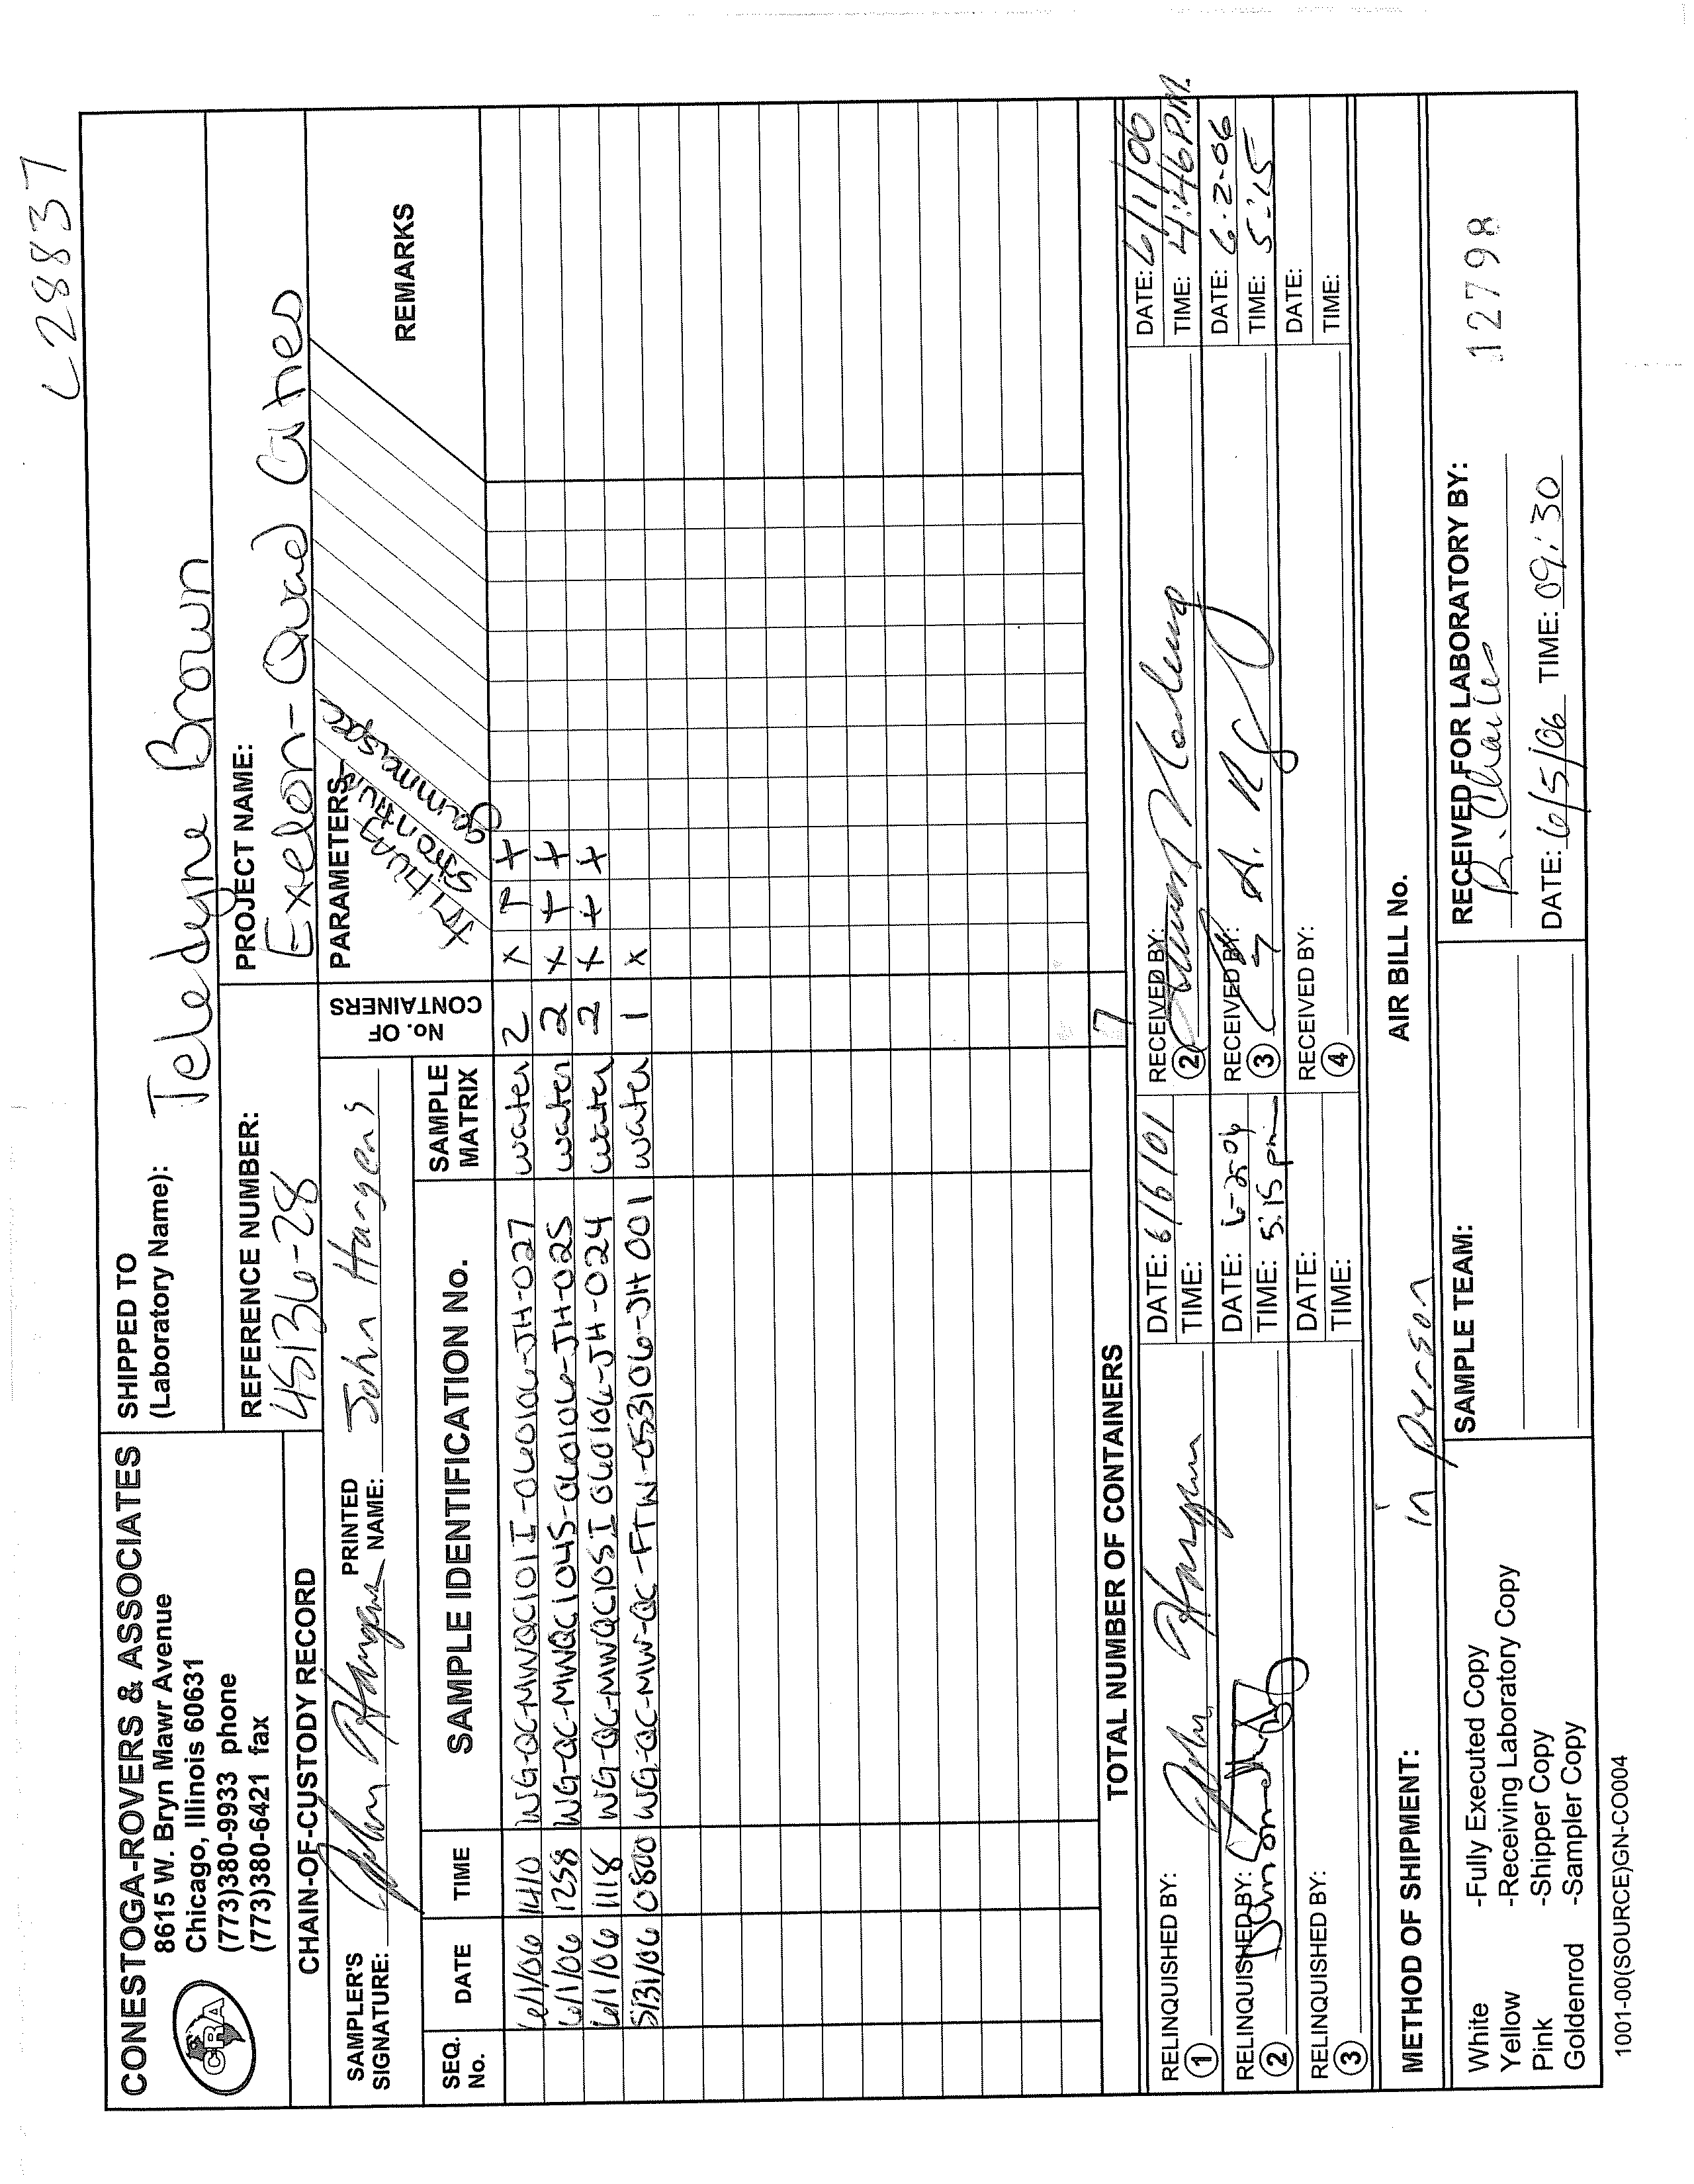
4.9
CHAIN-OF-CUSTODY RECORD
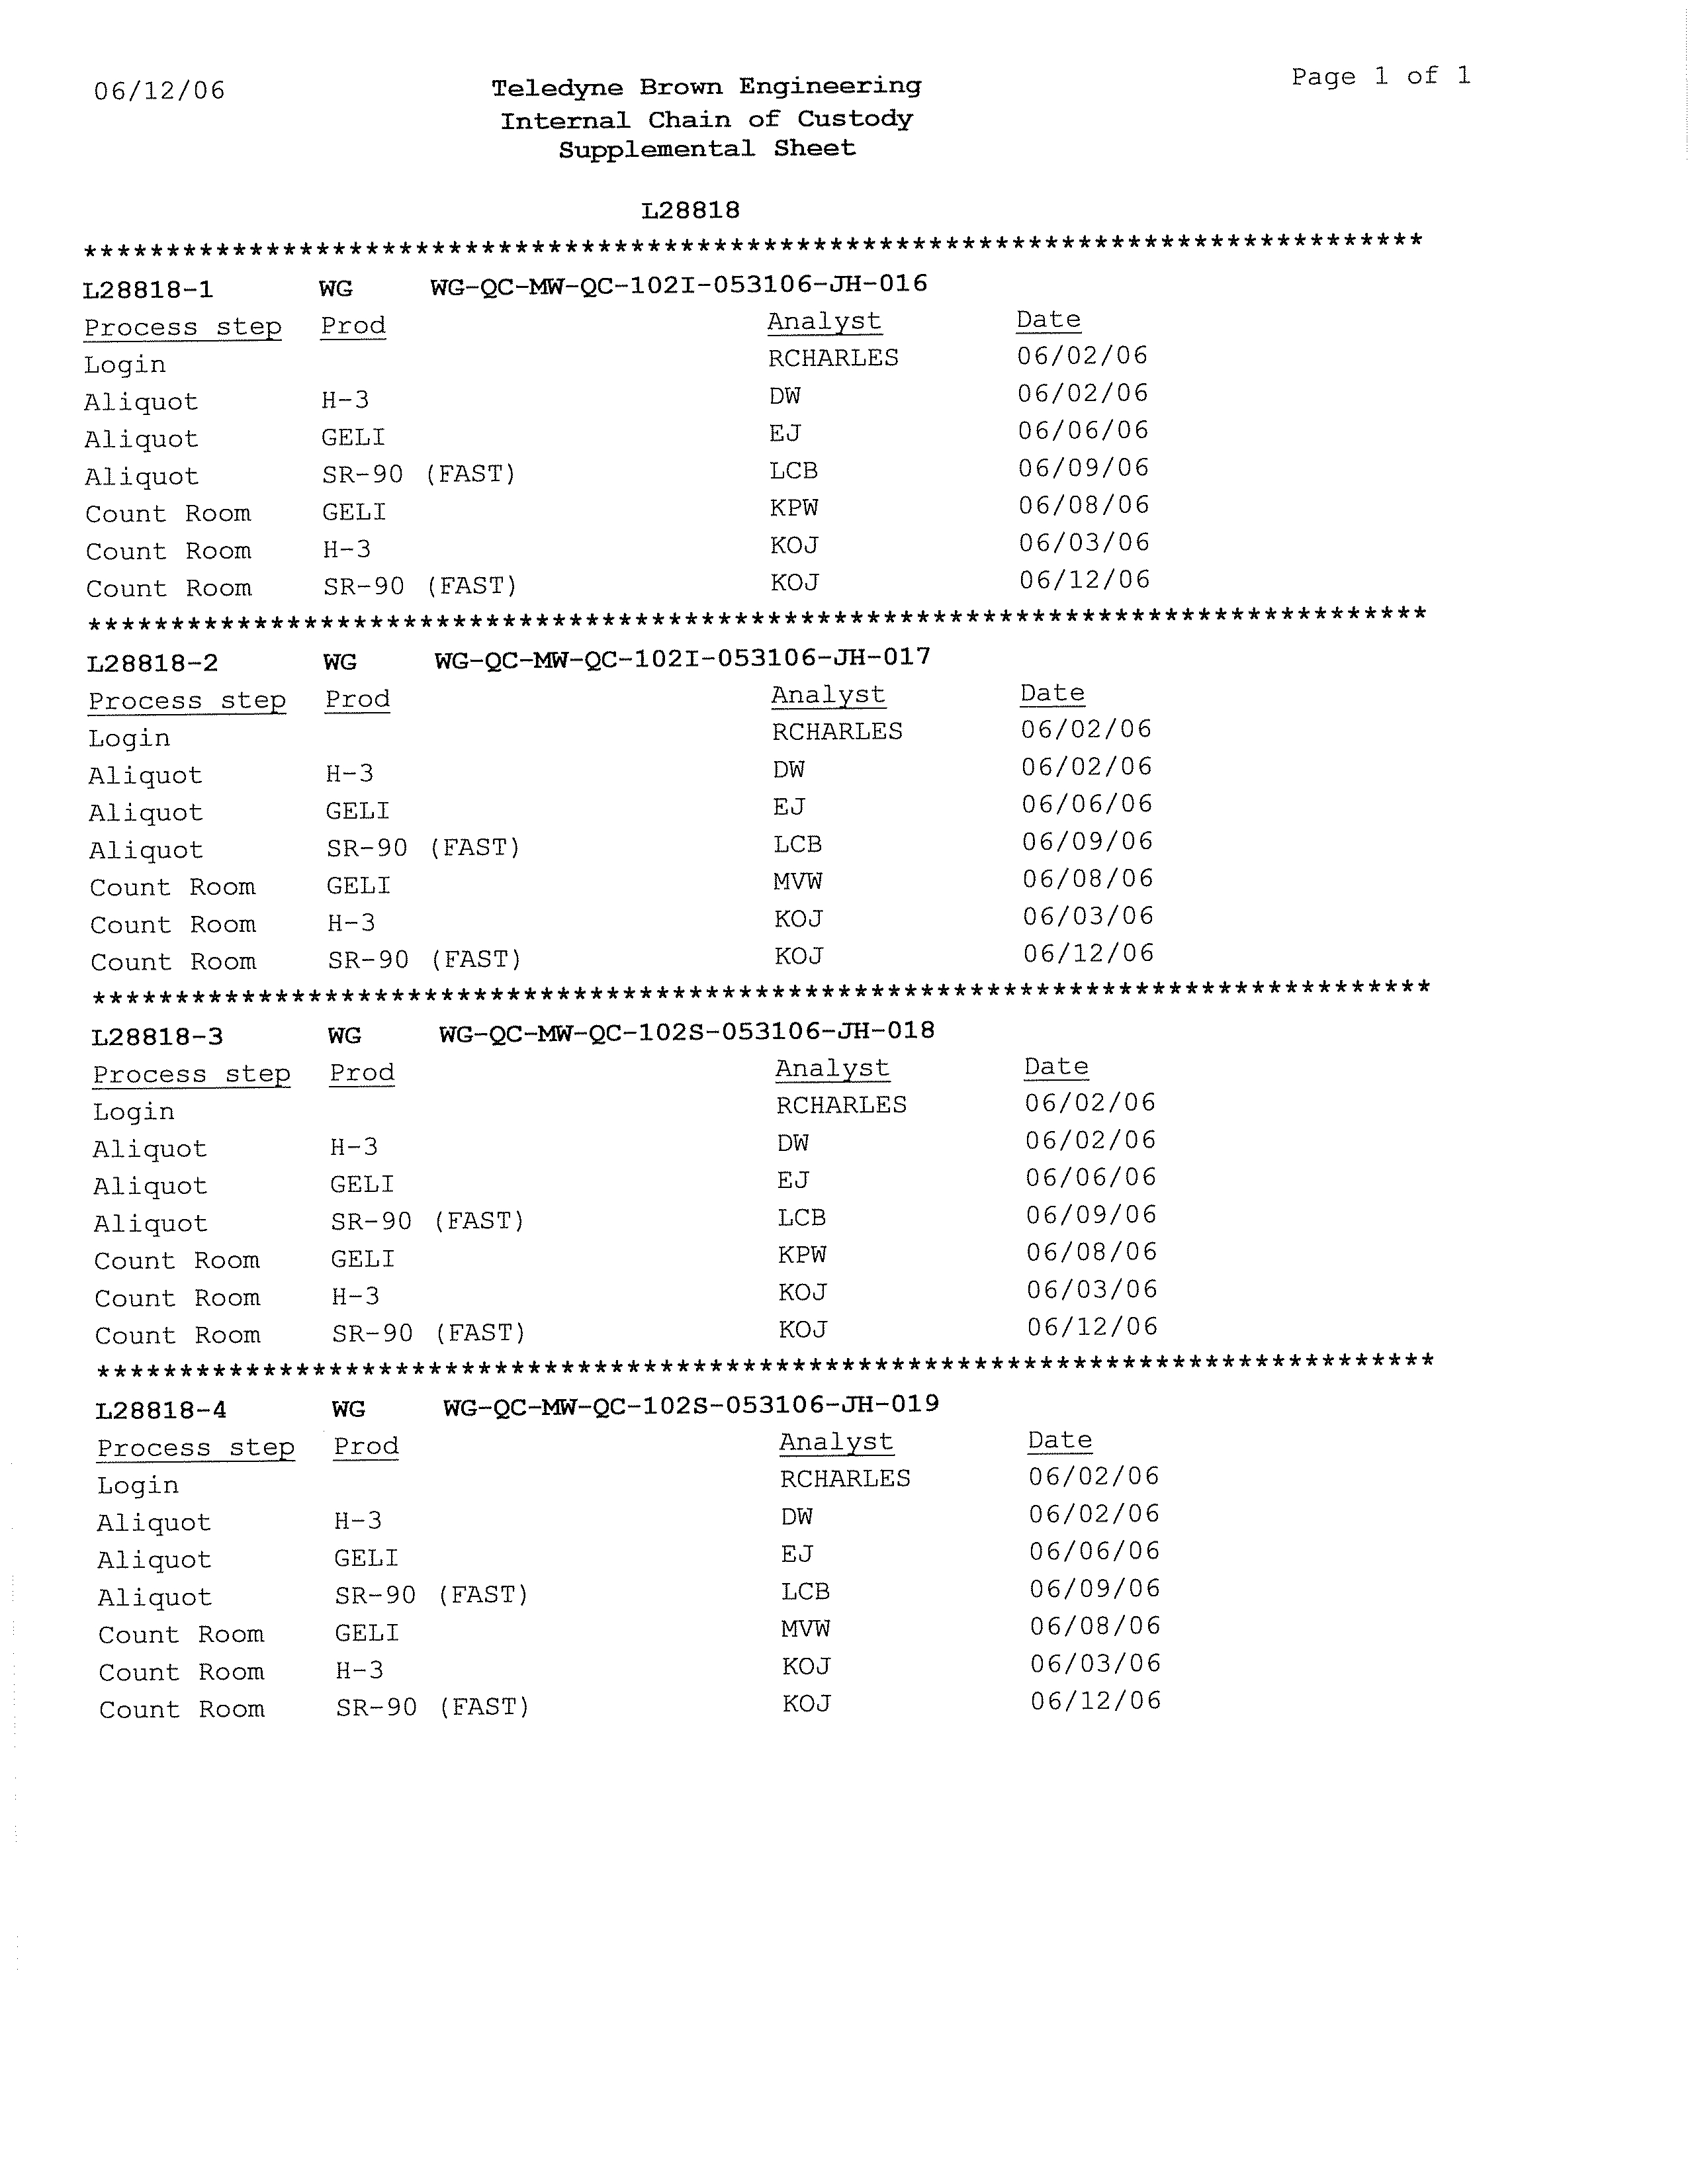
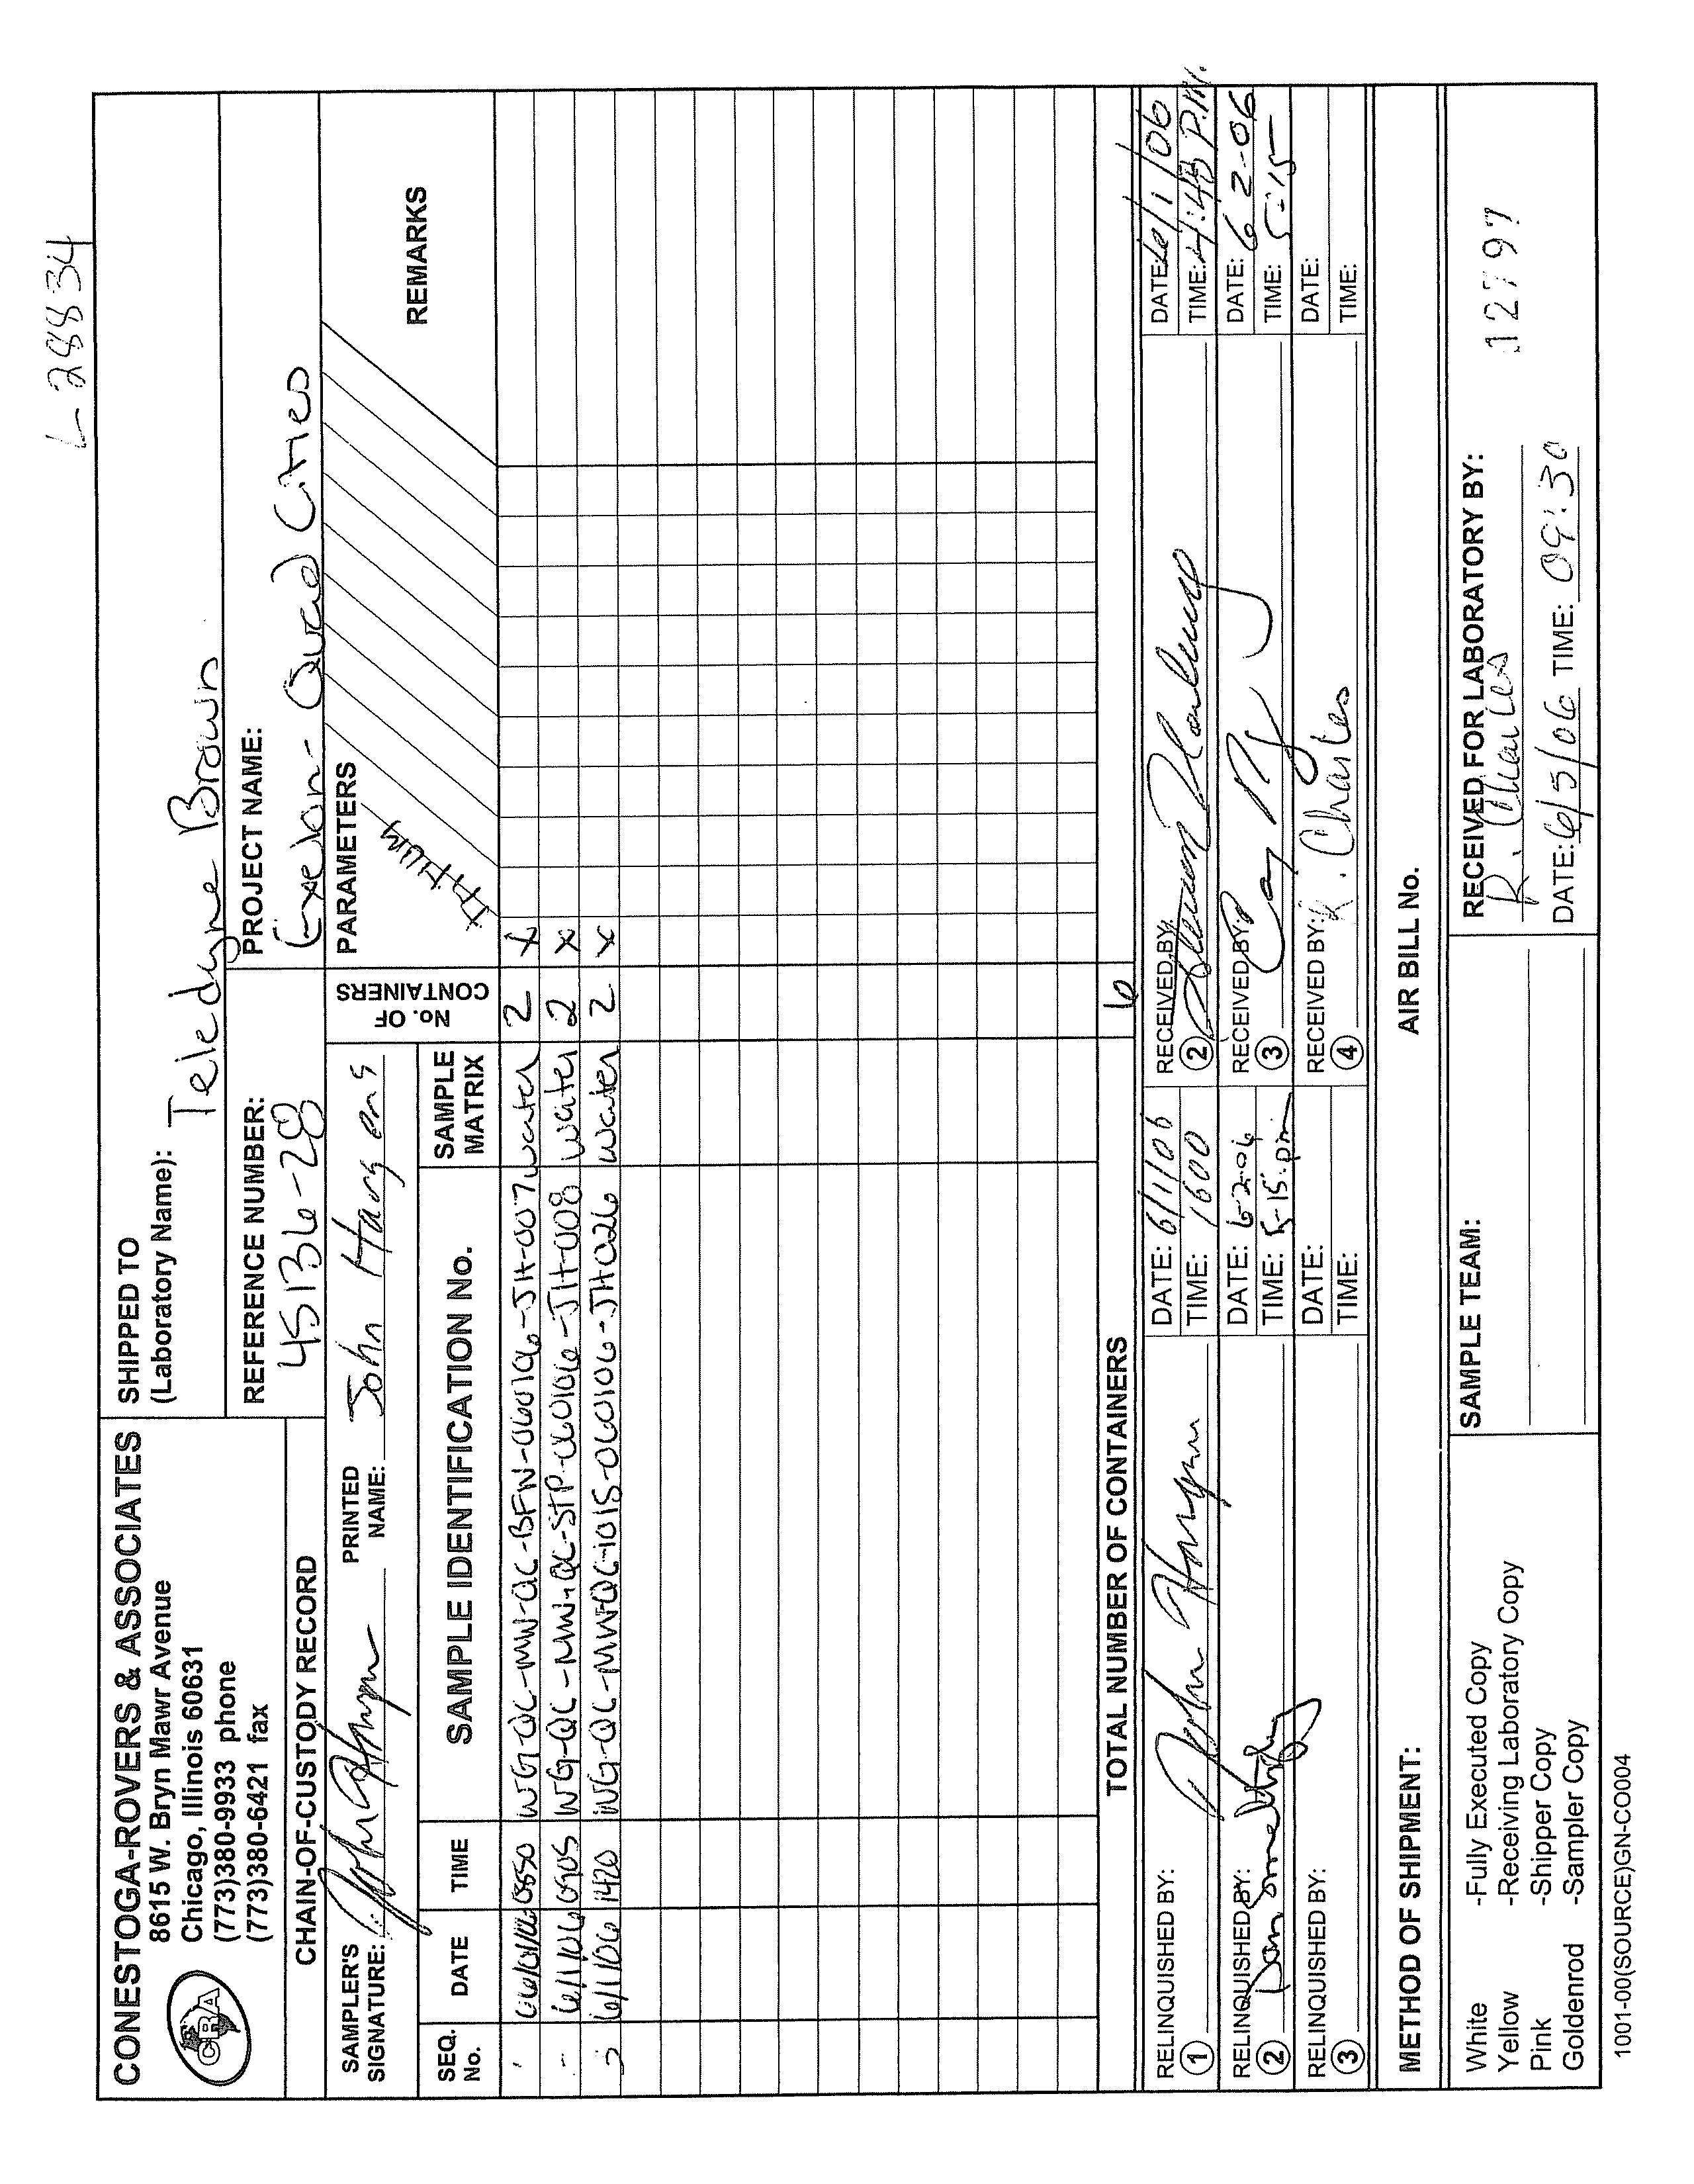
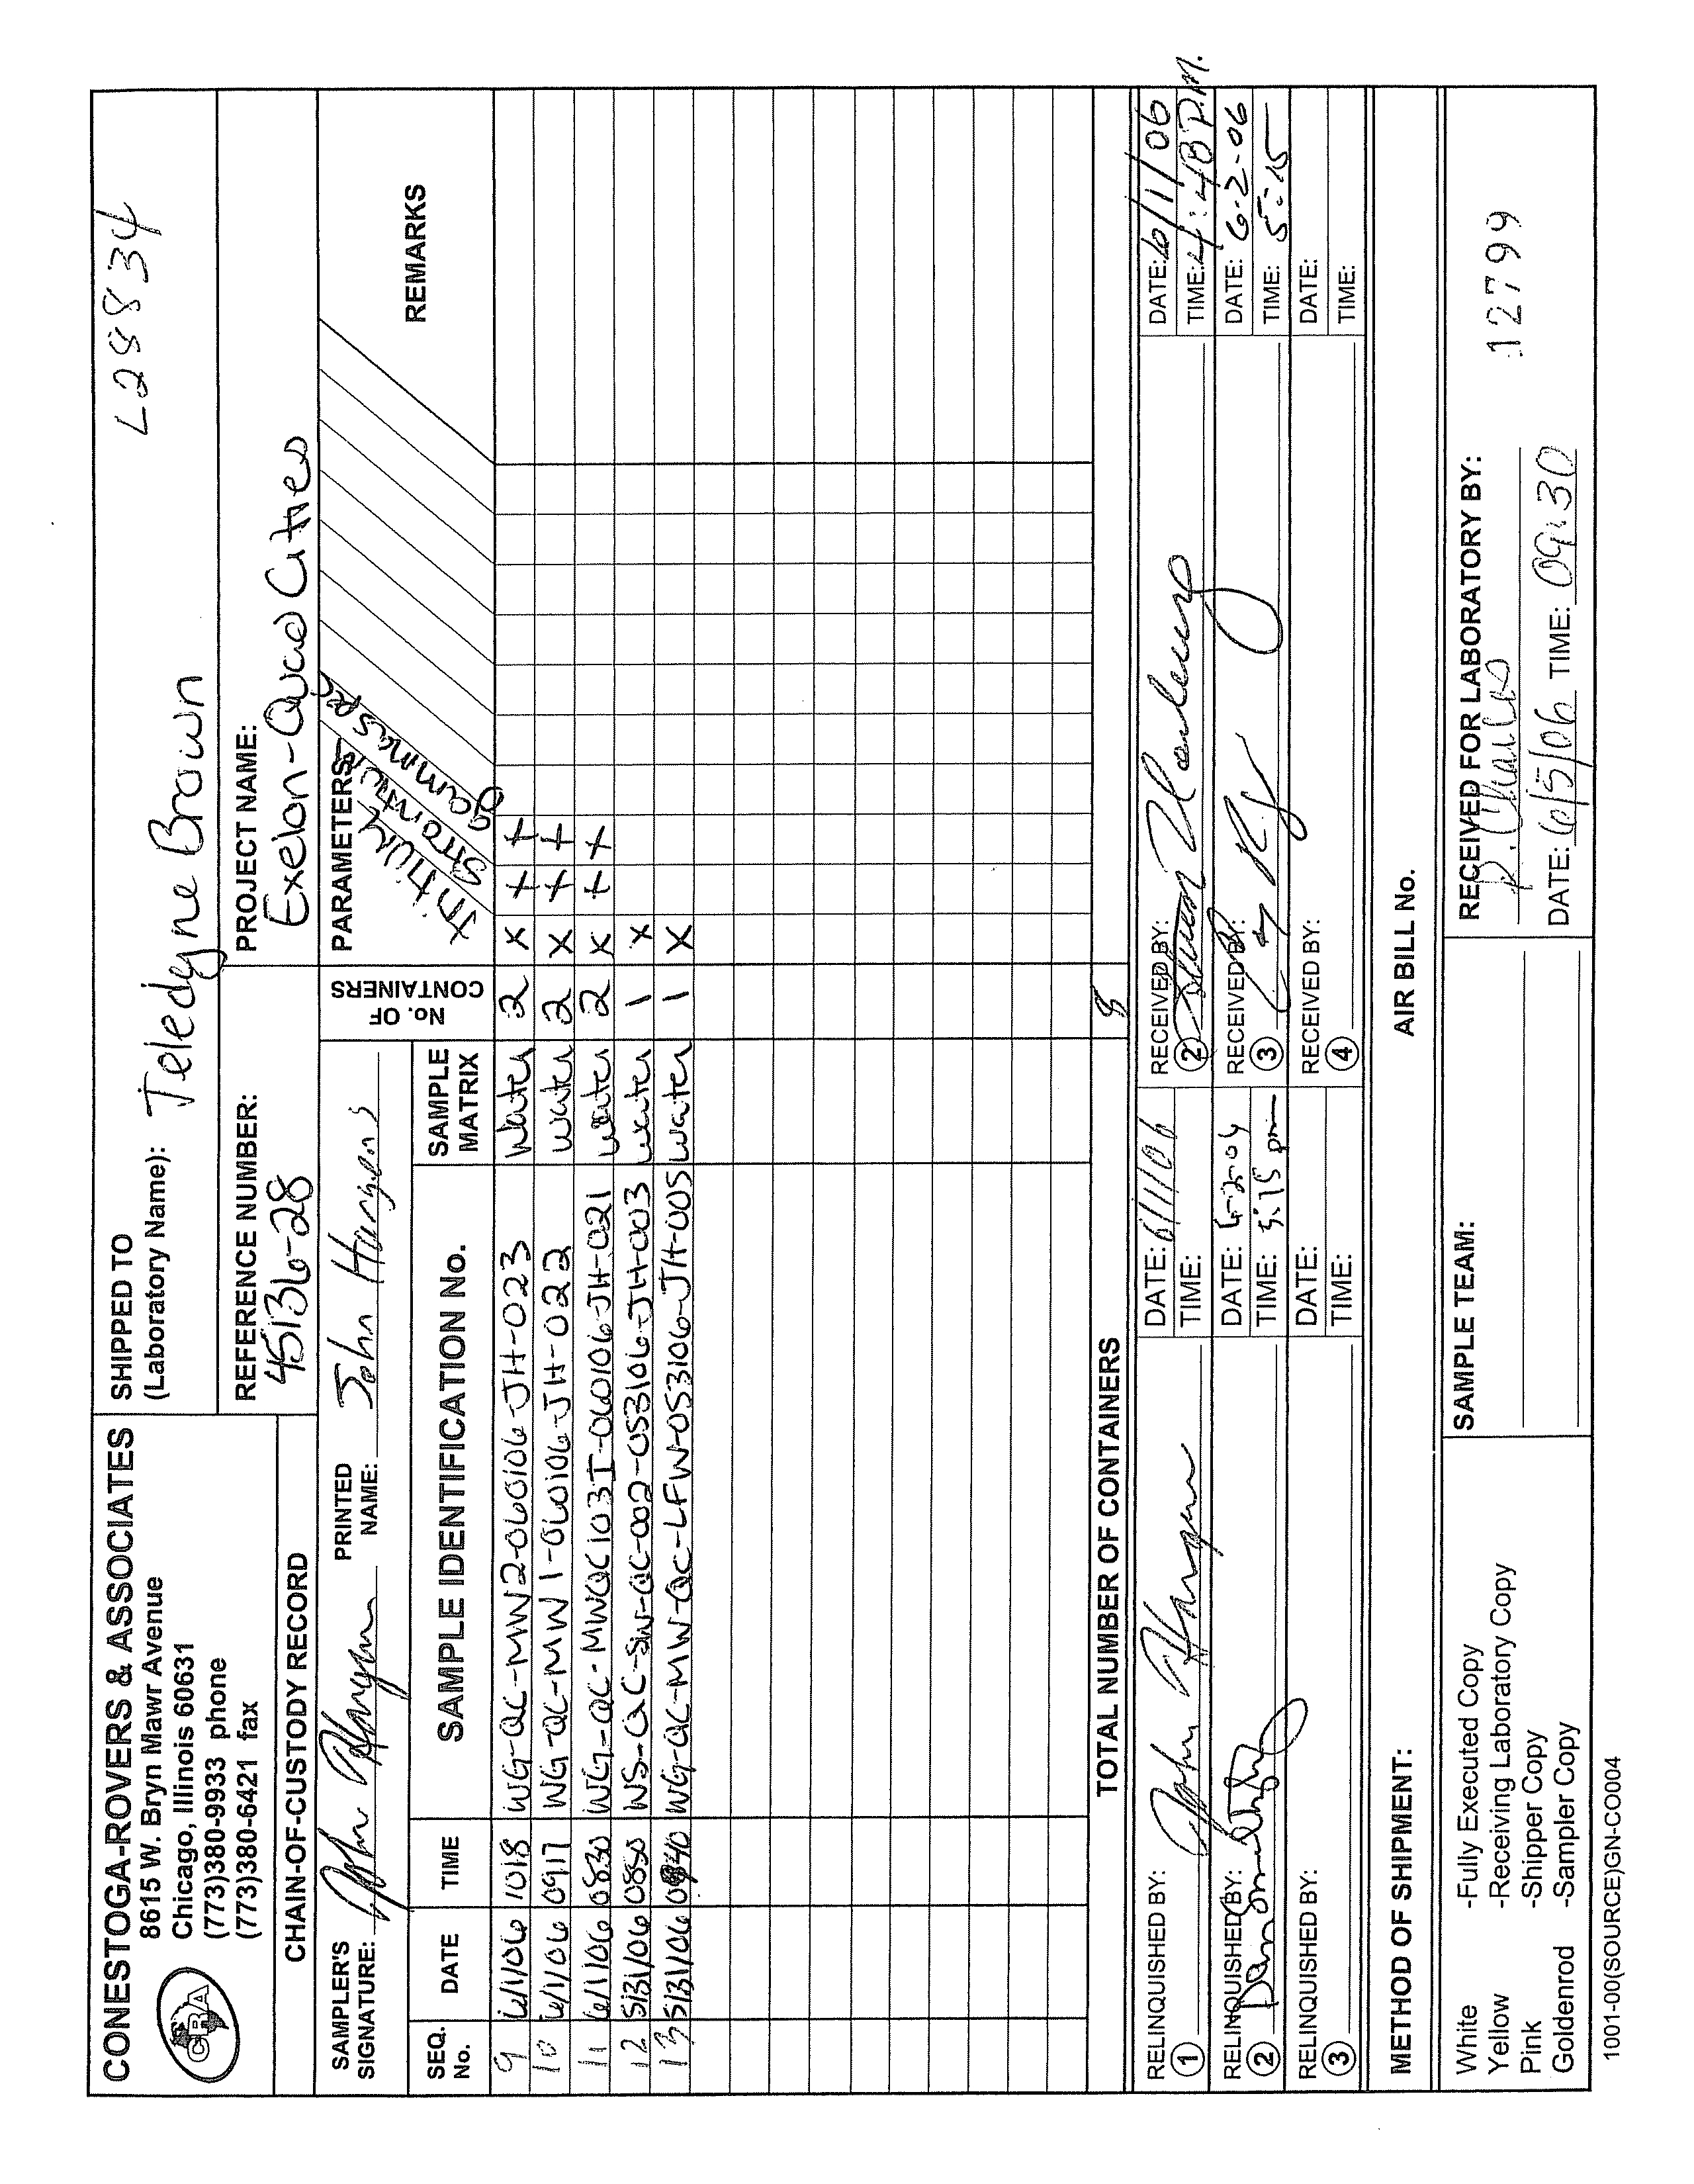
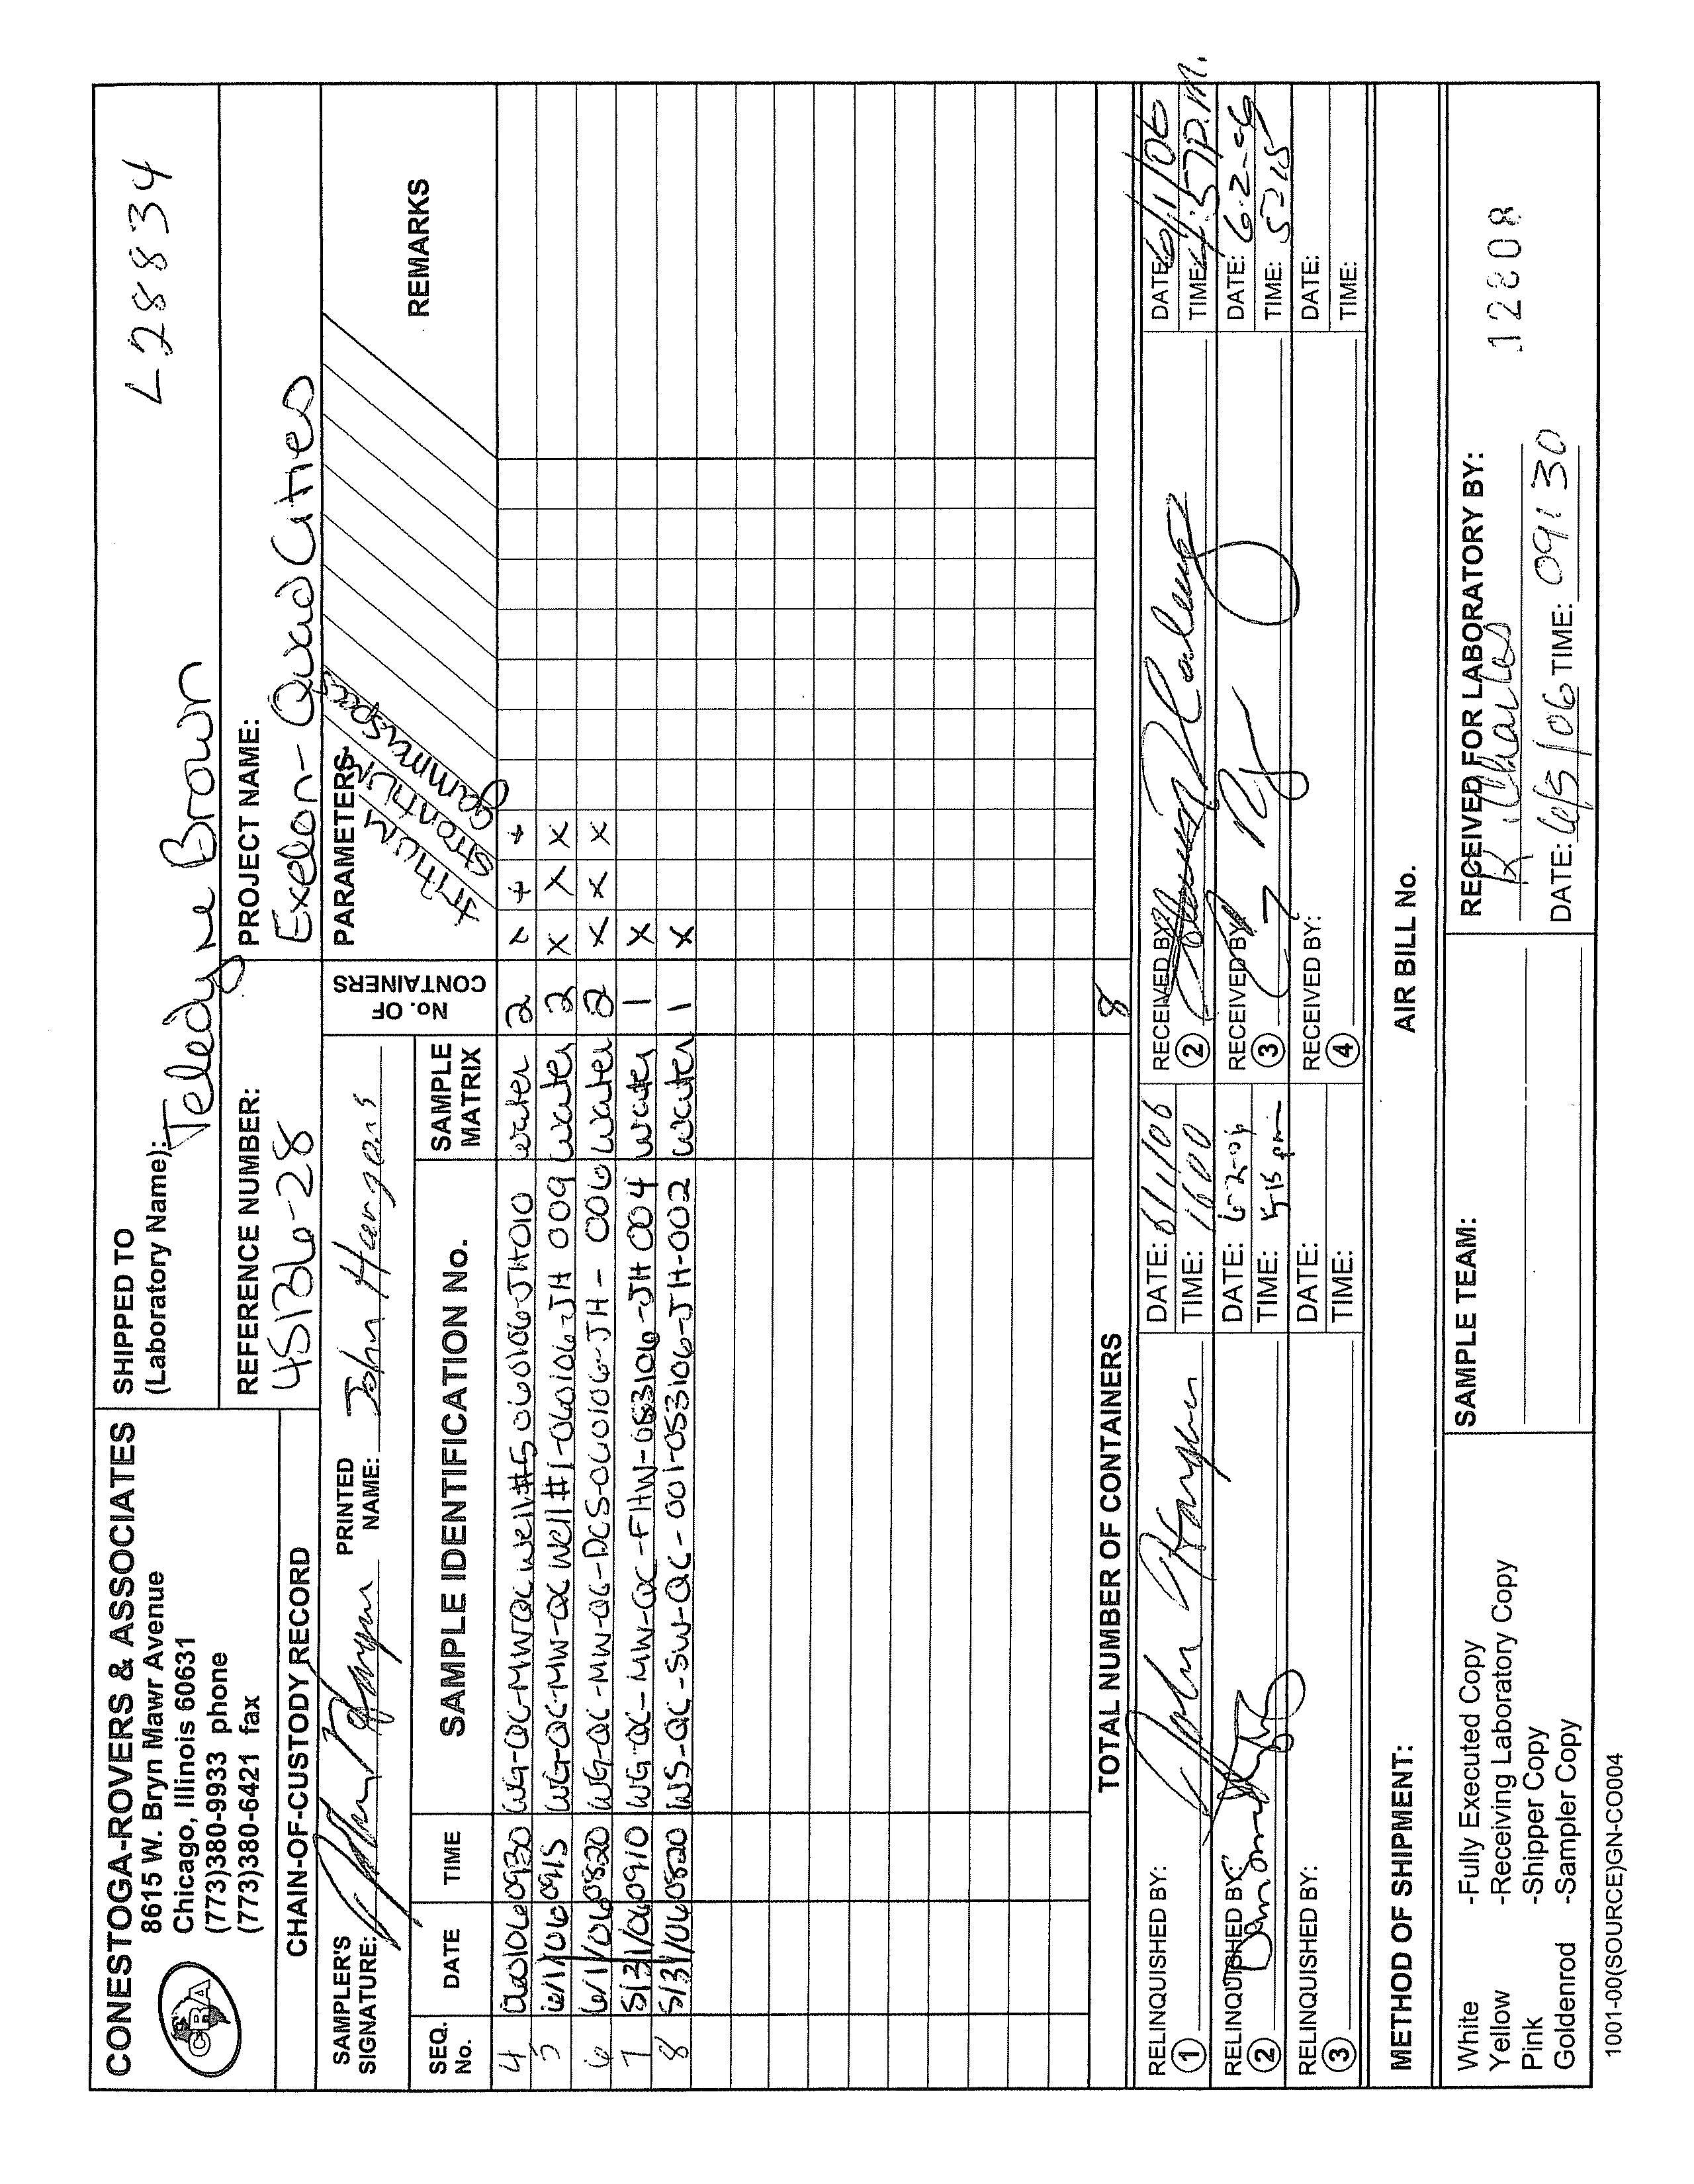
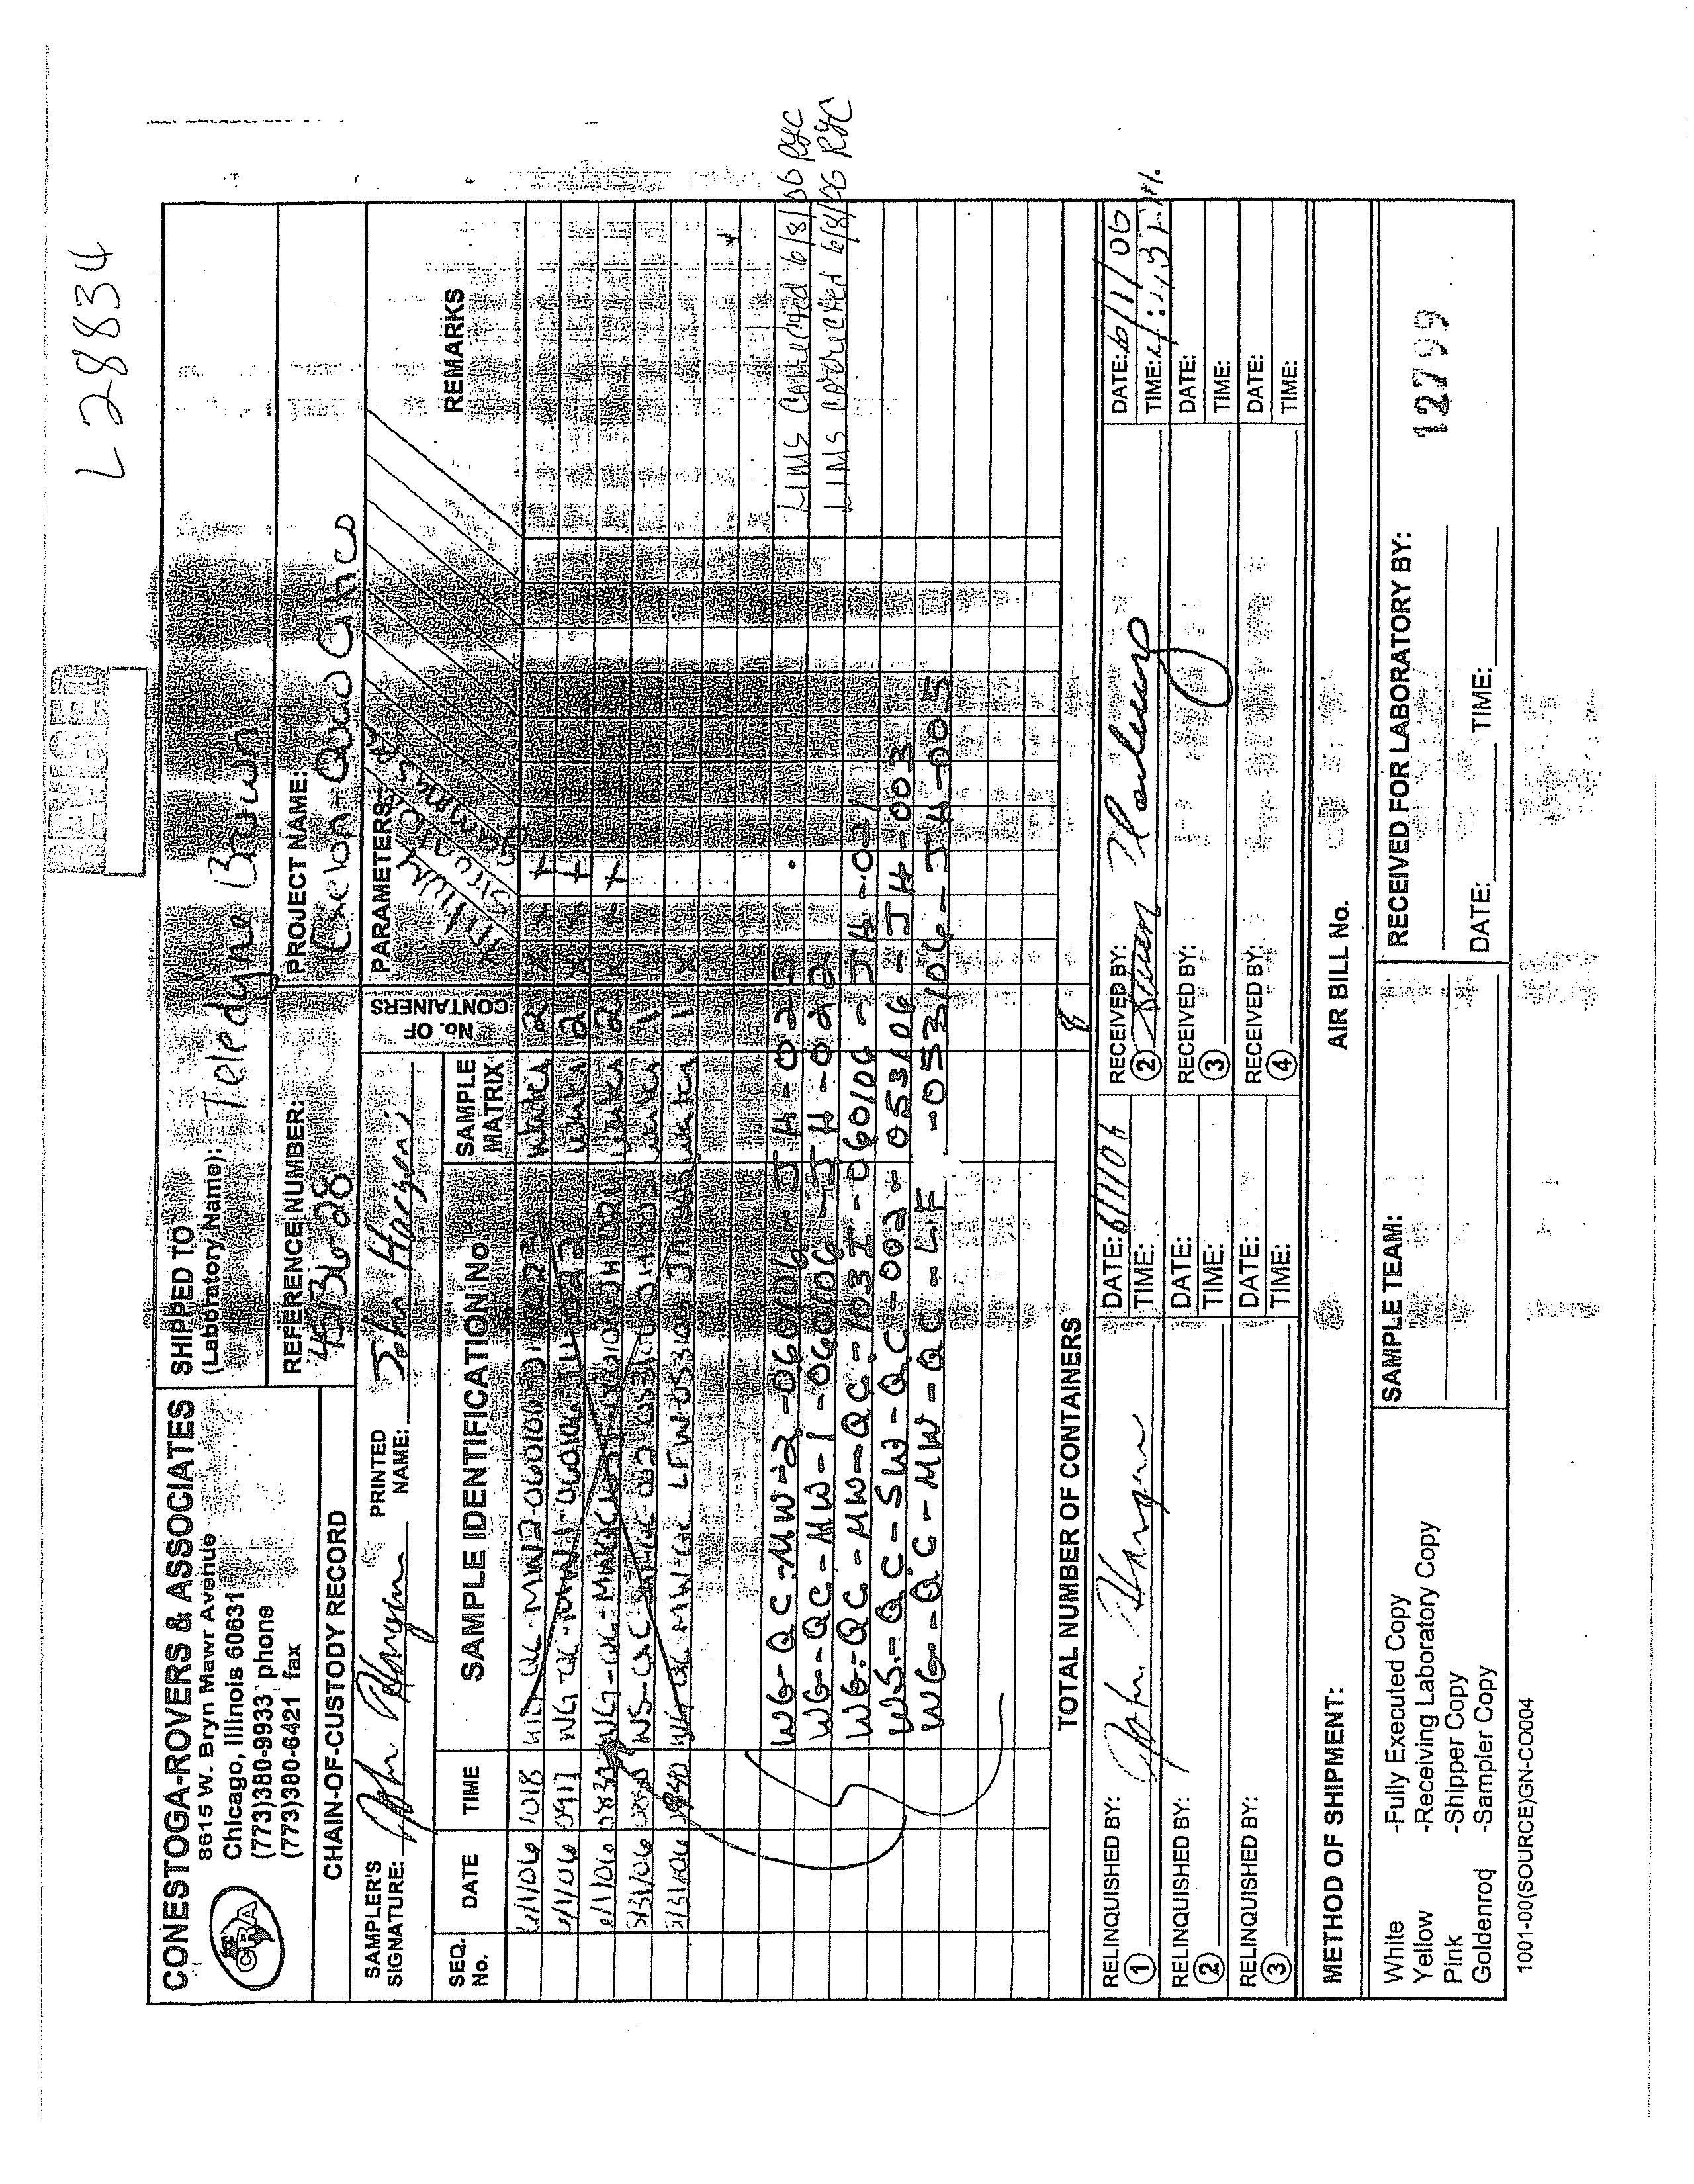
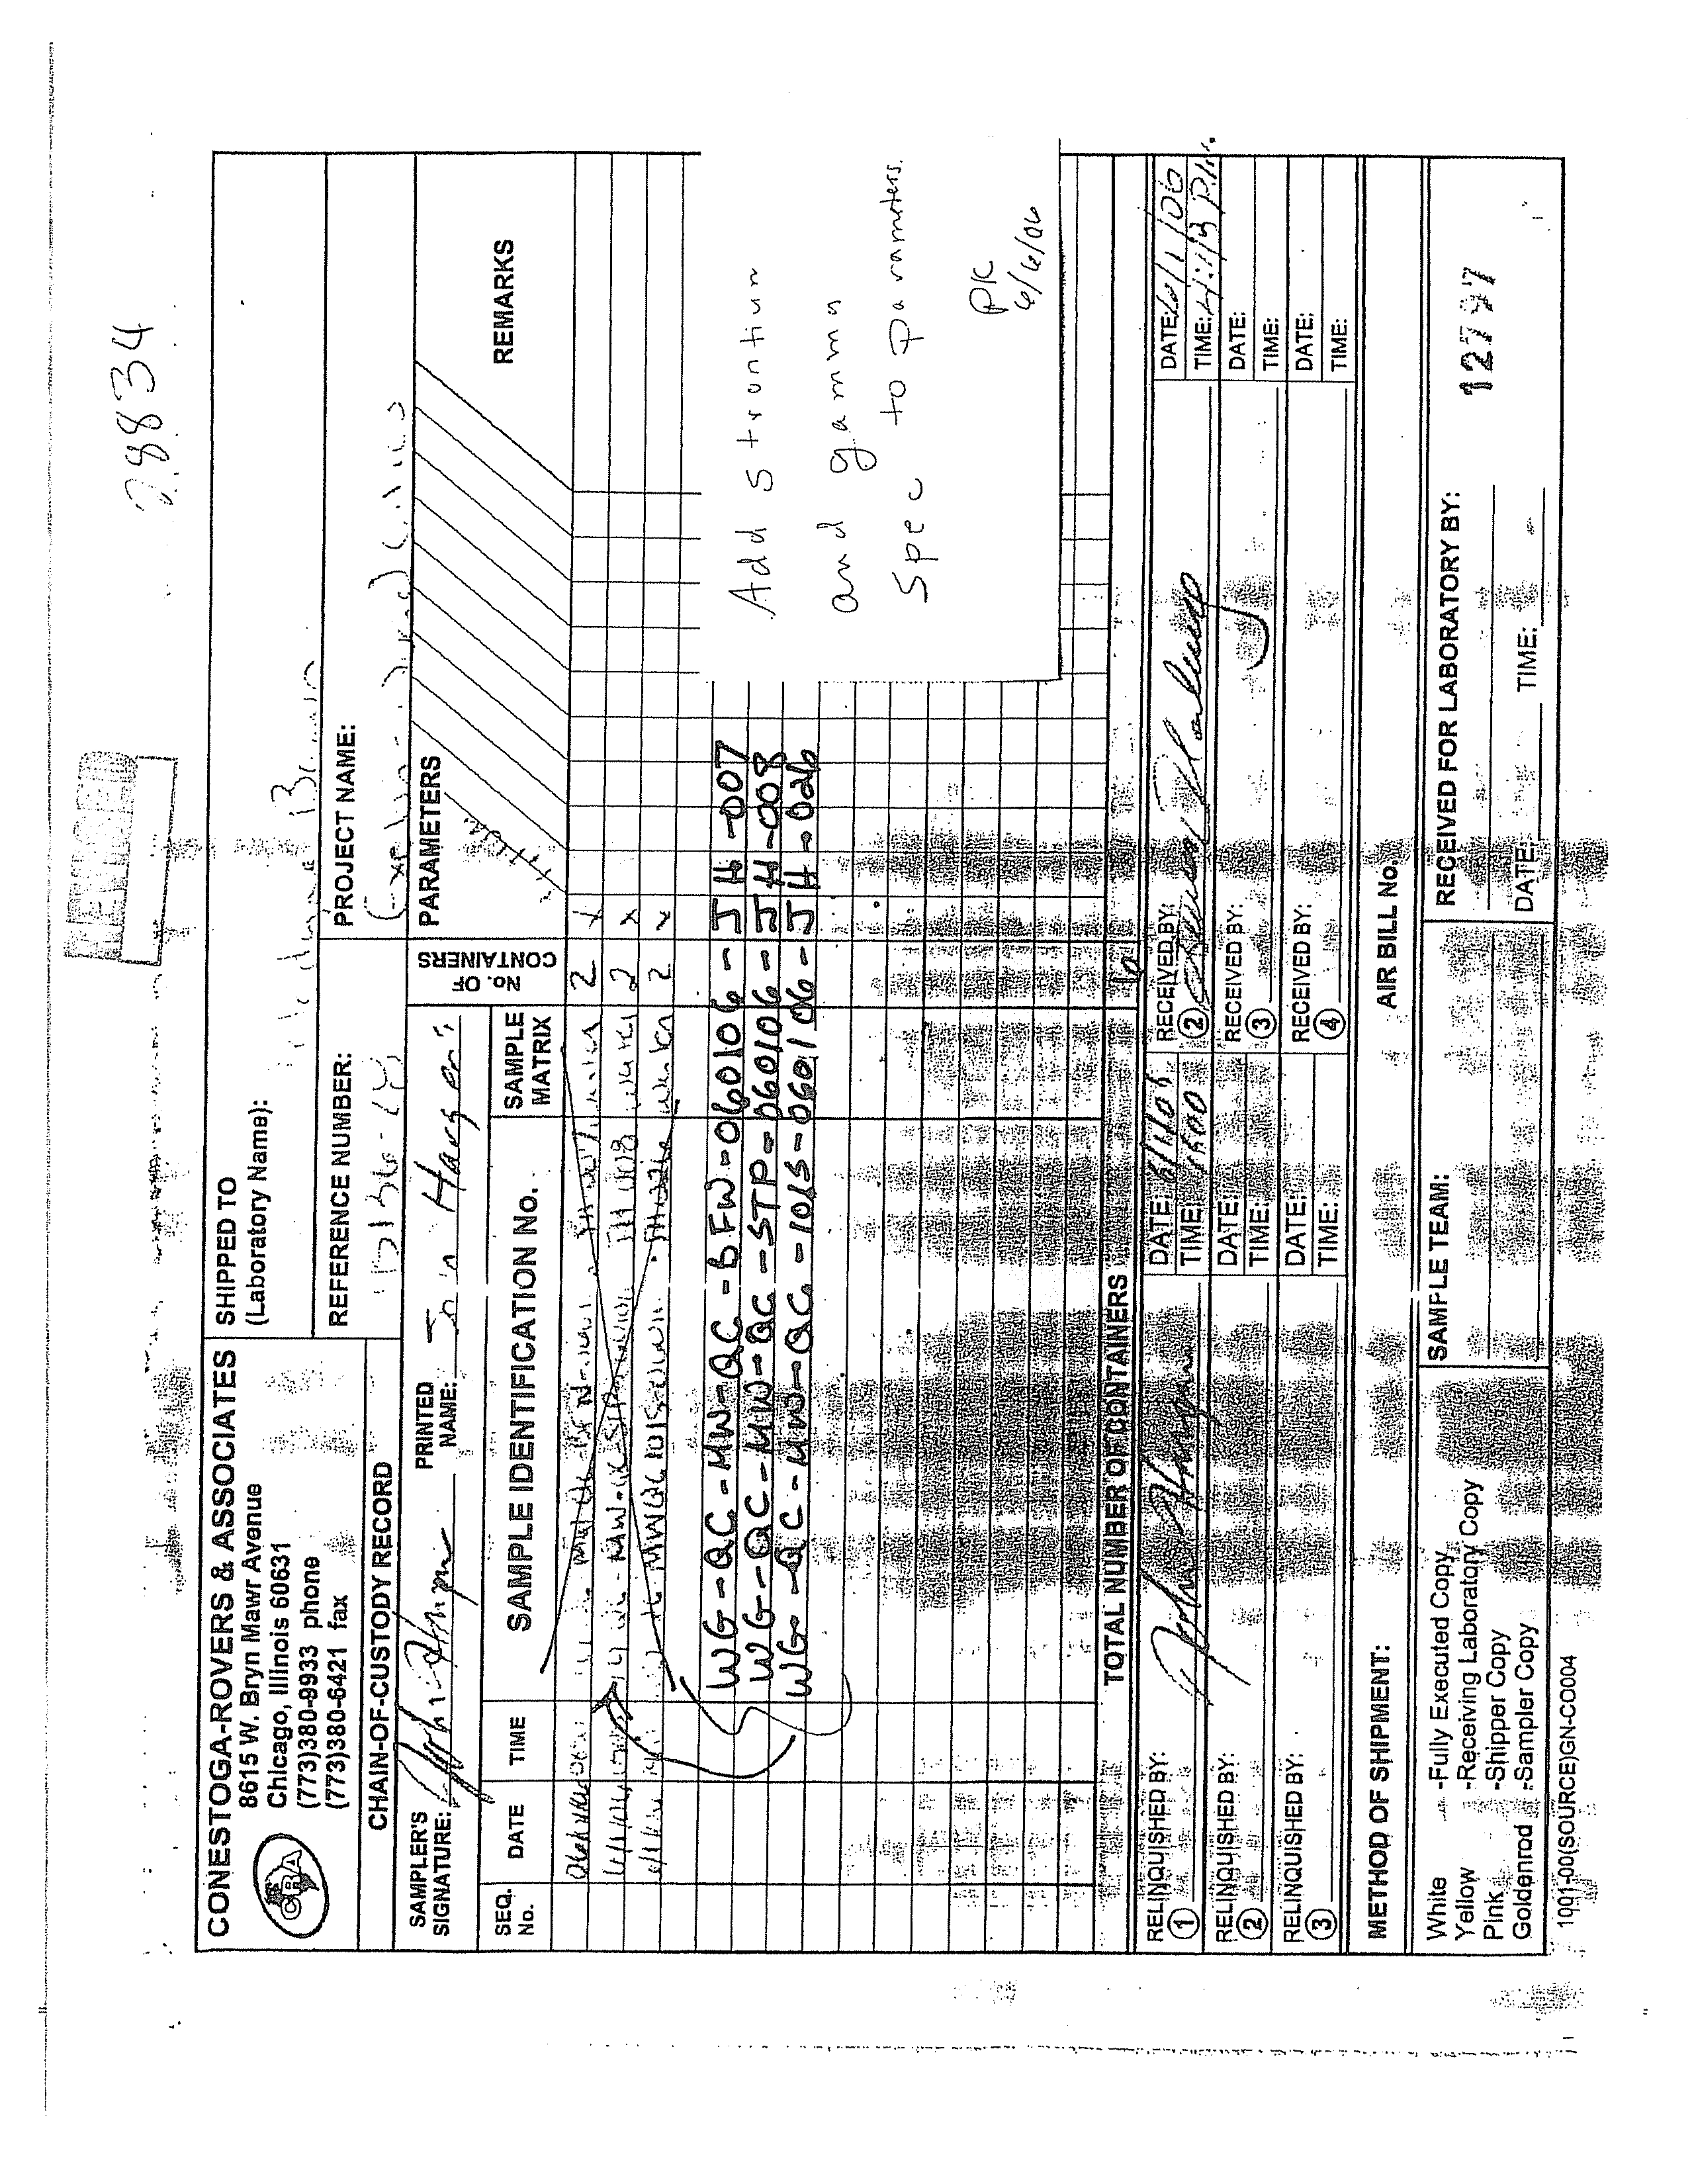
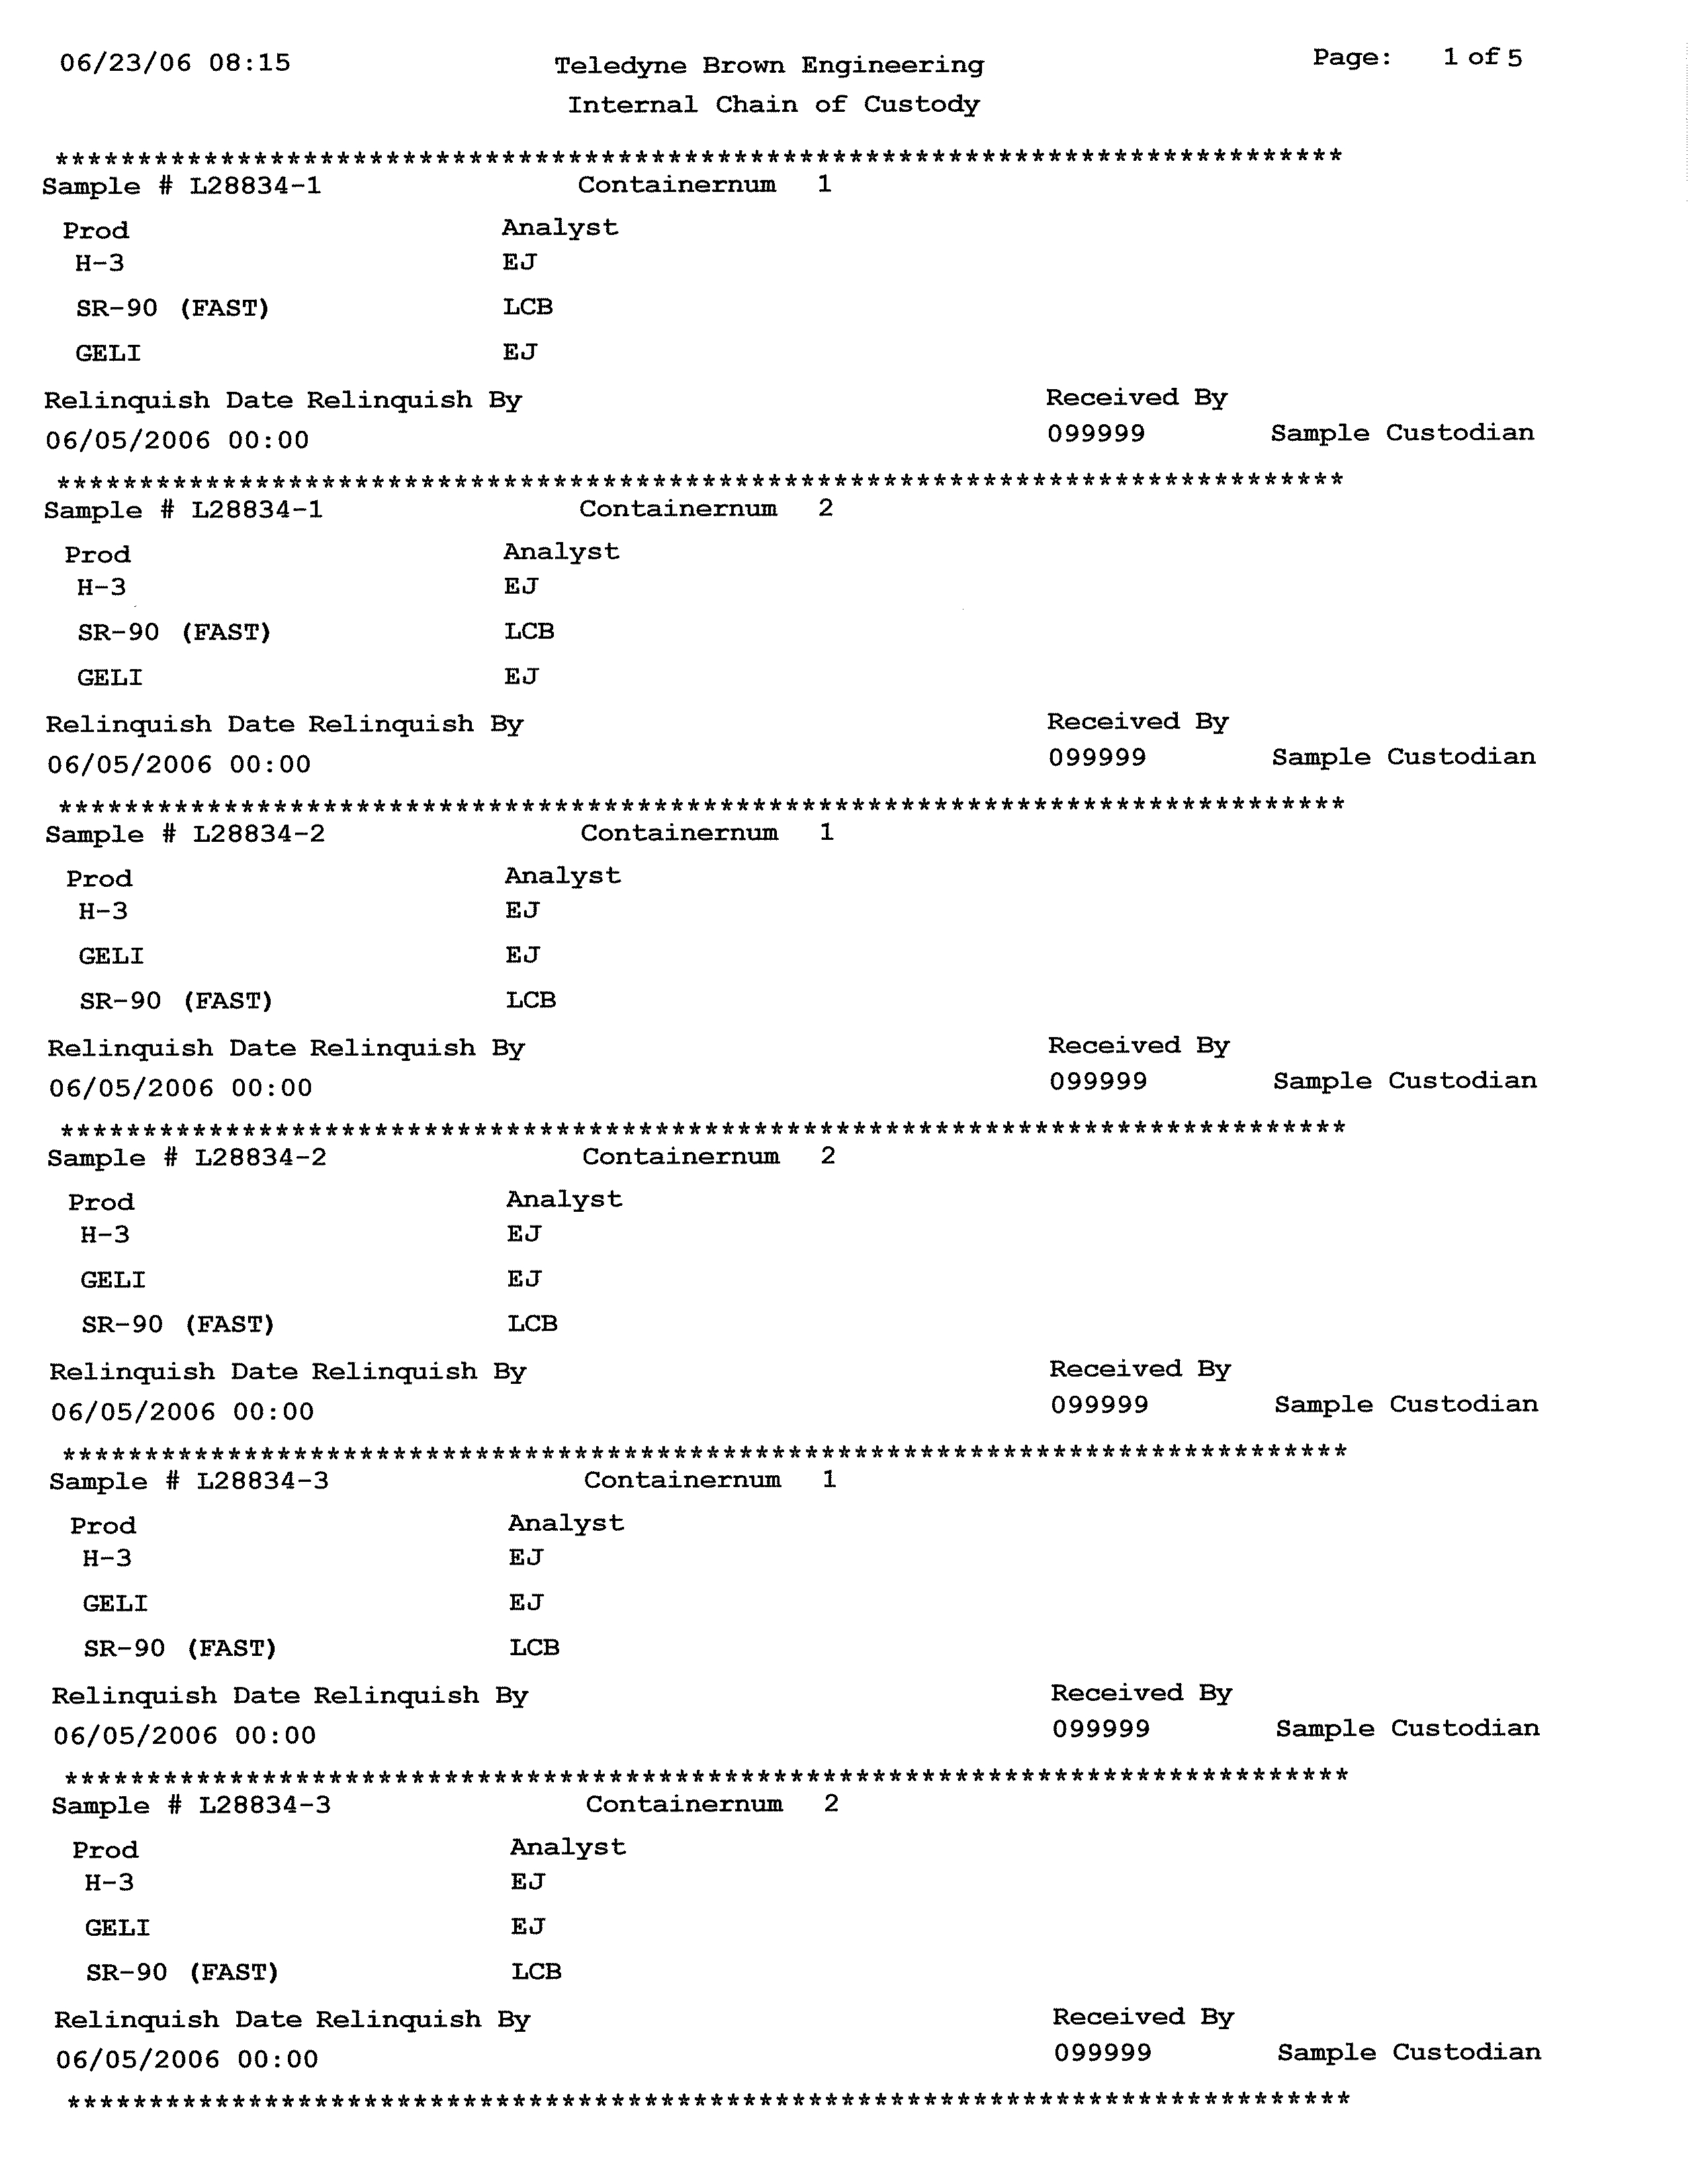
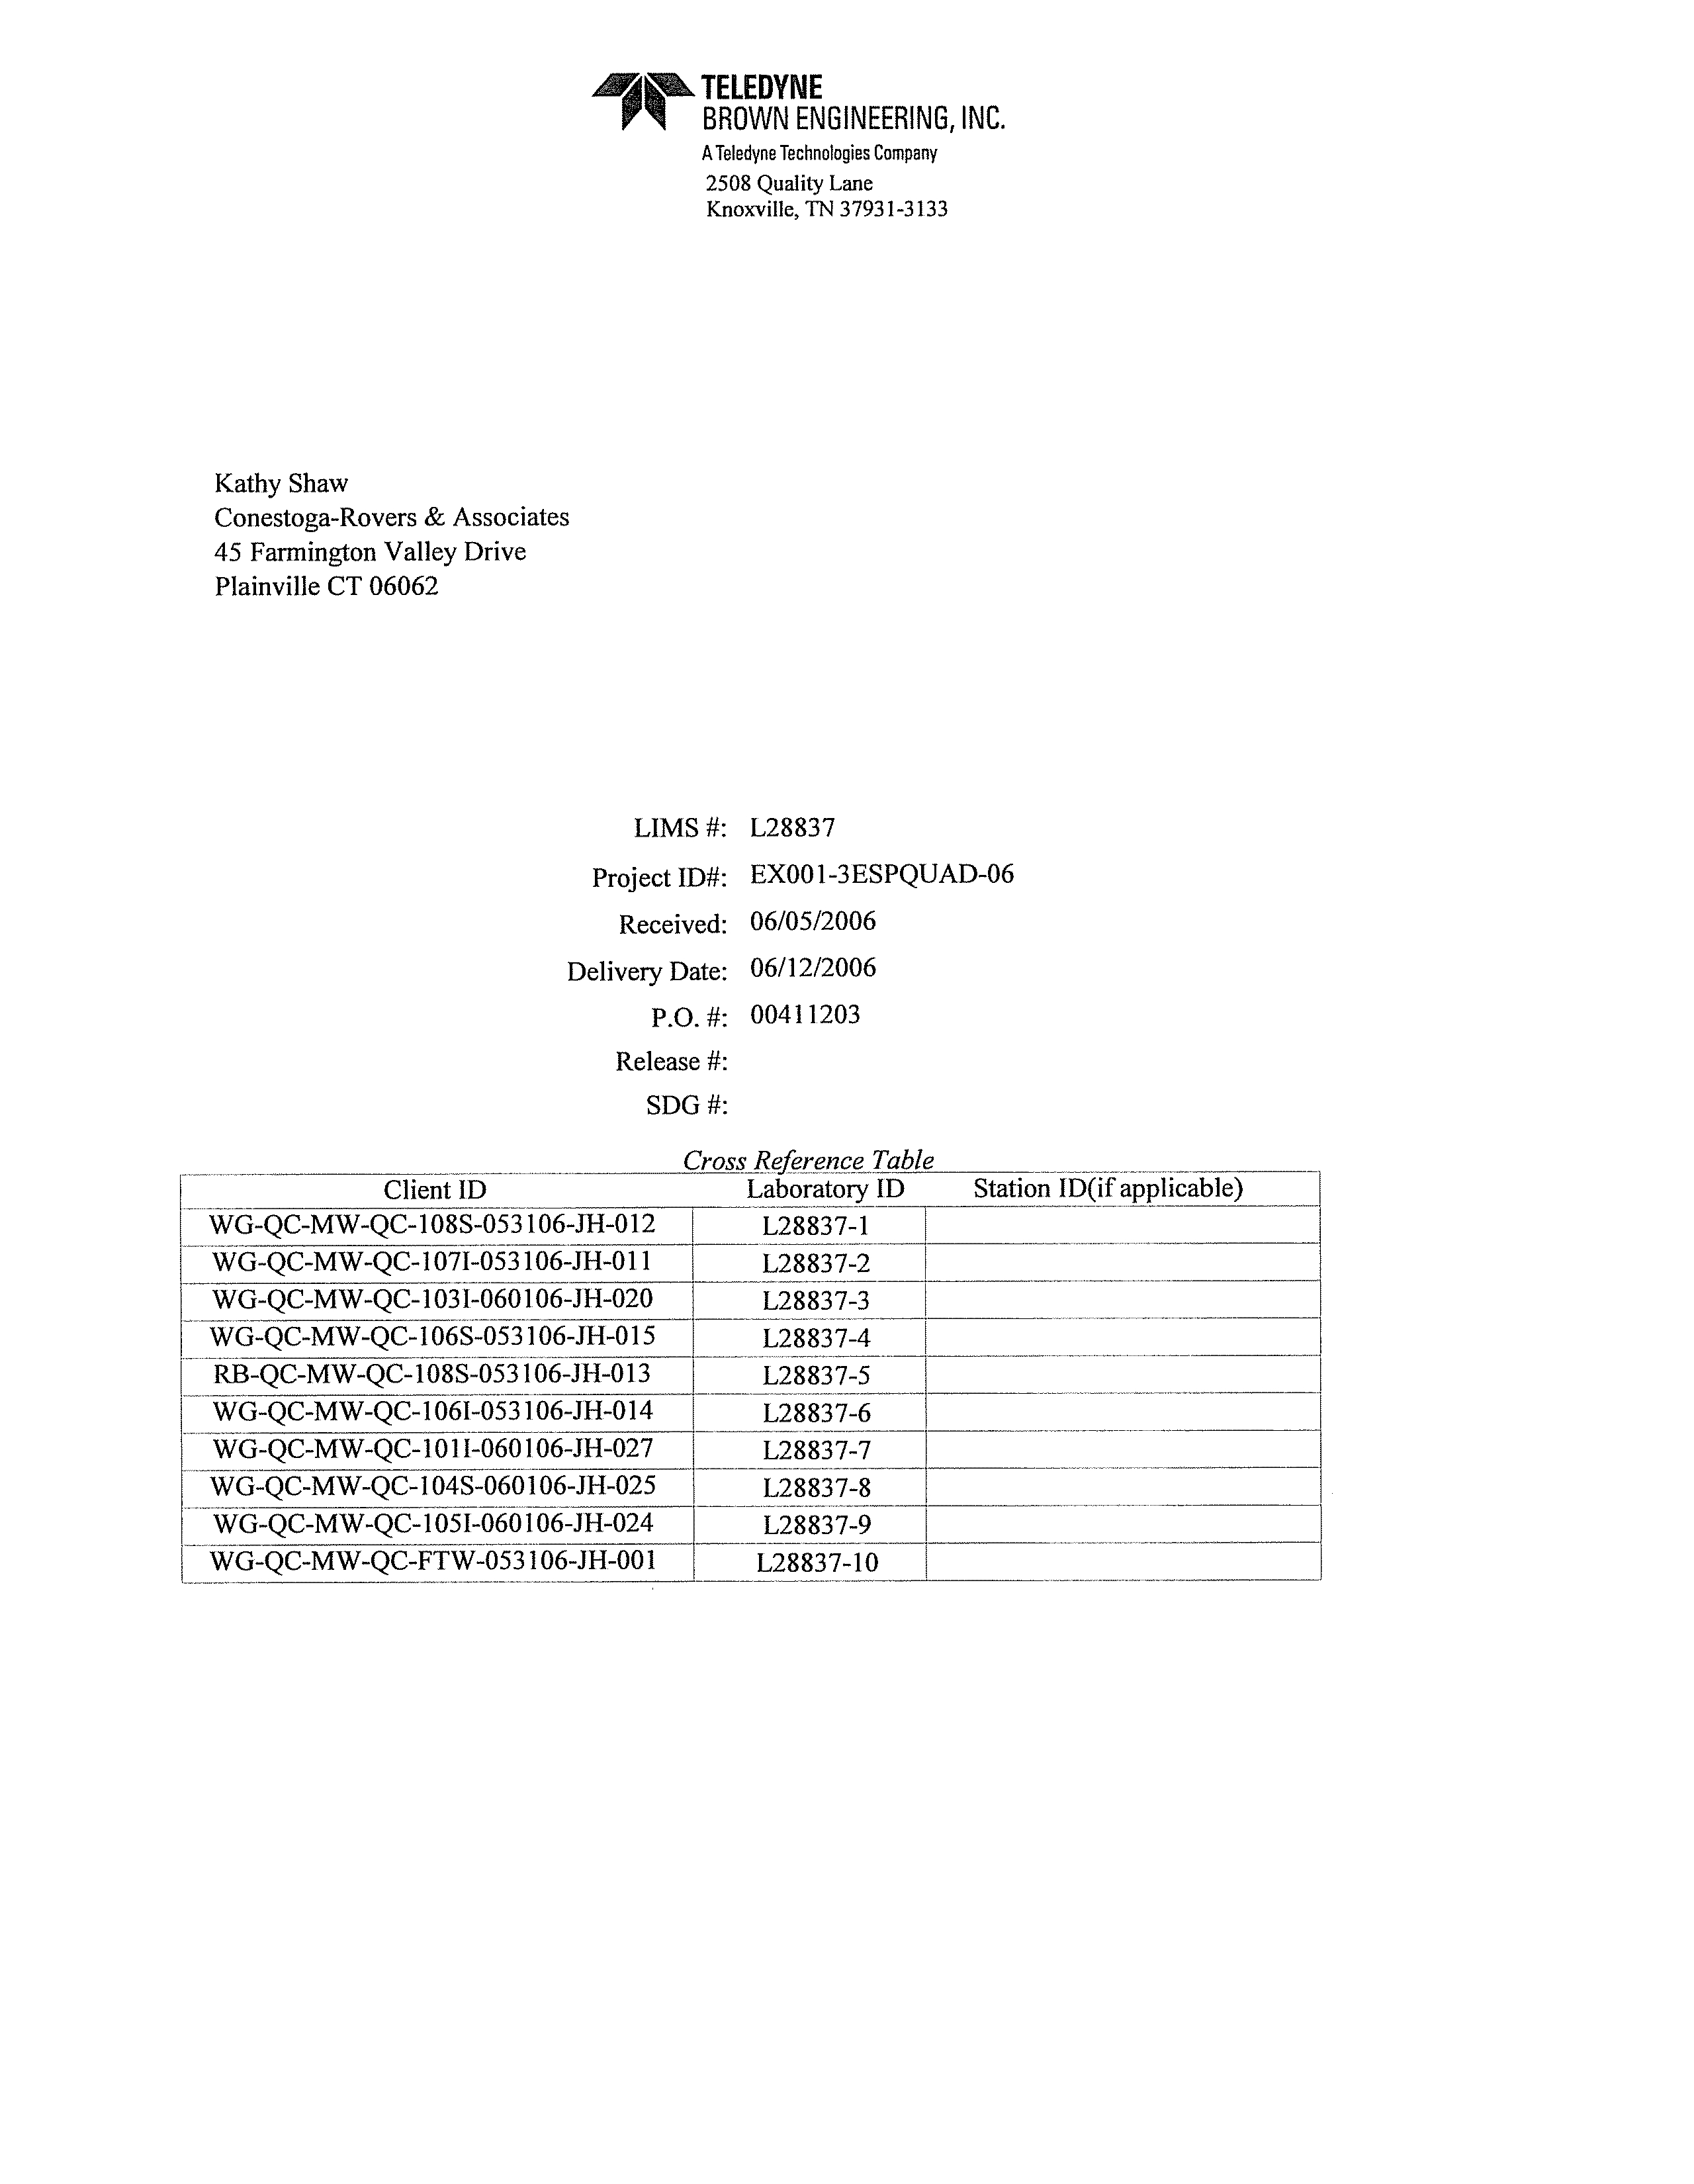
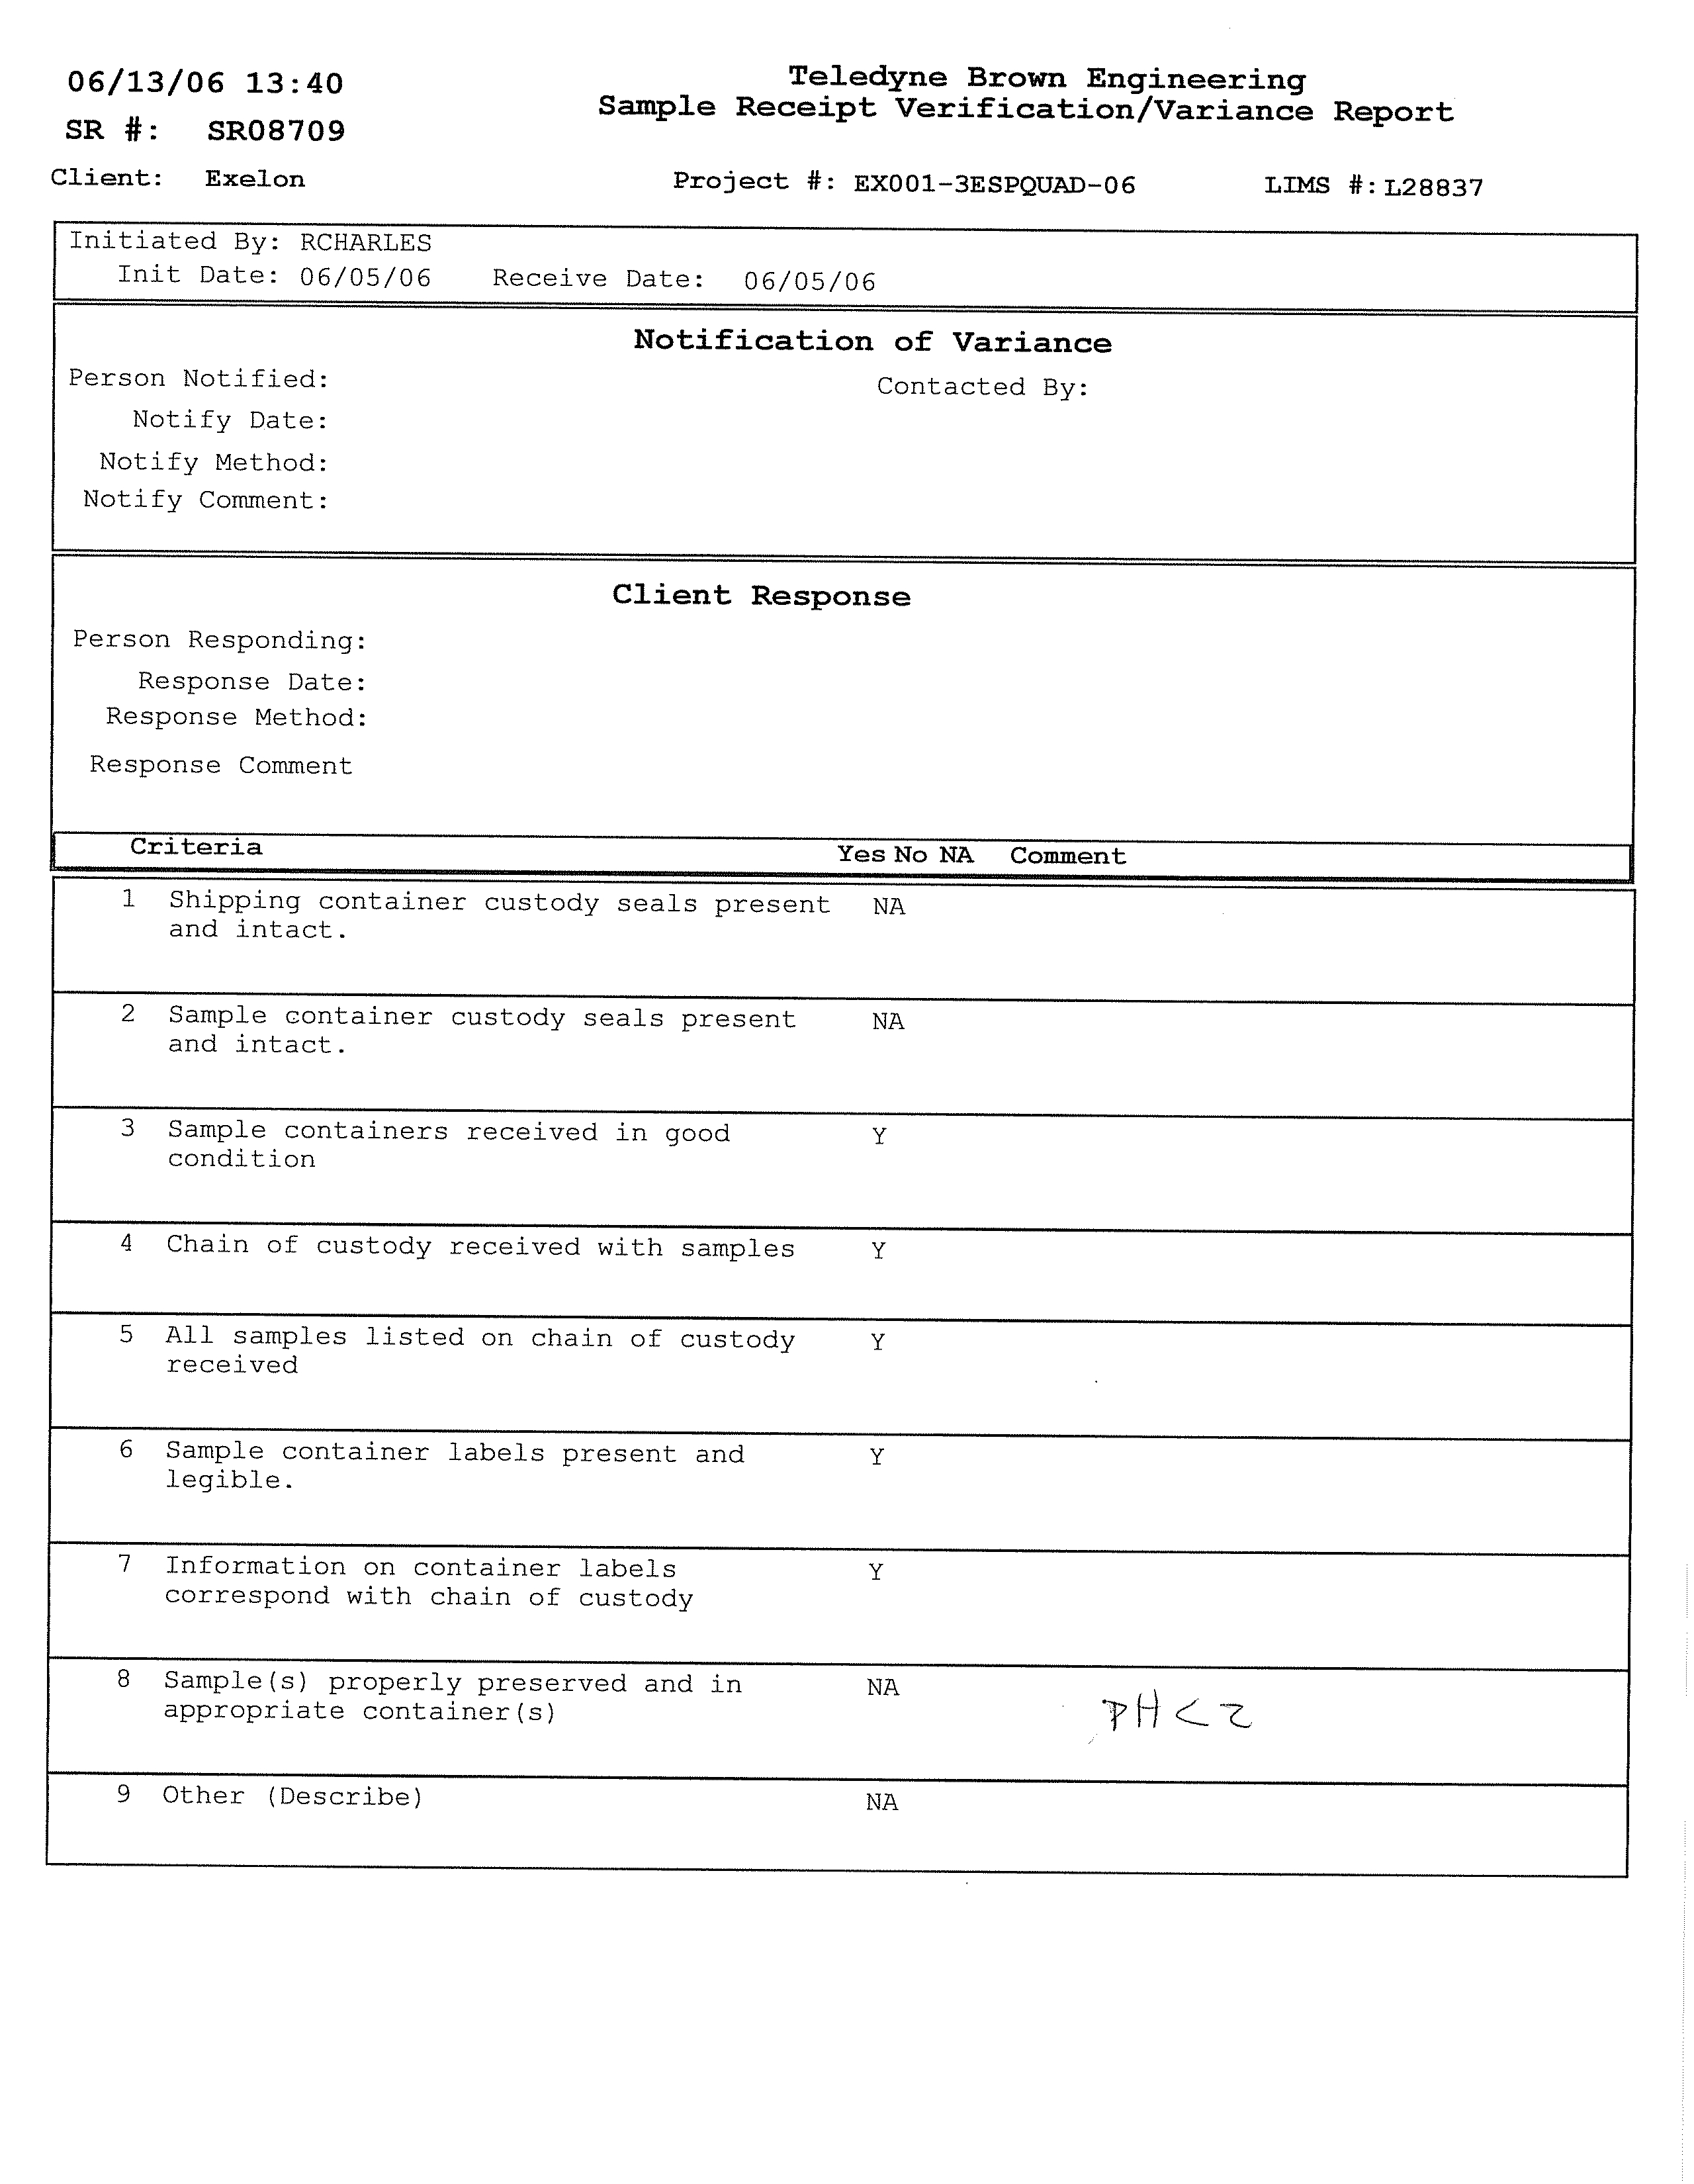
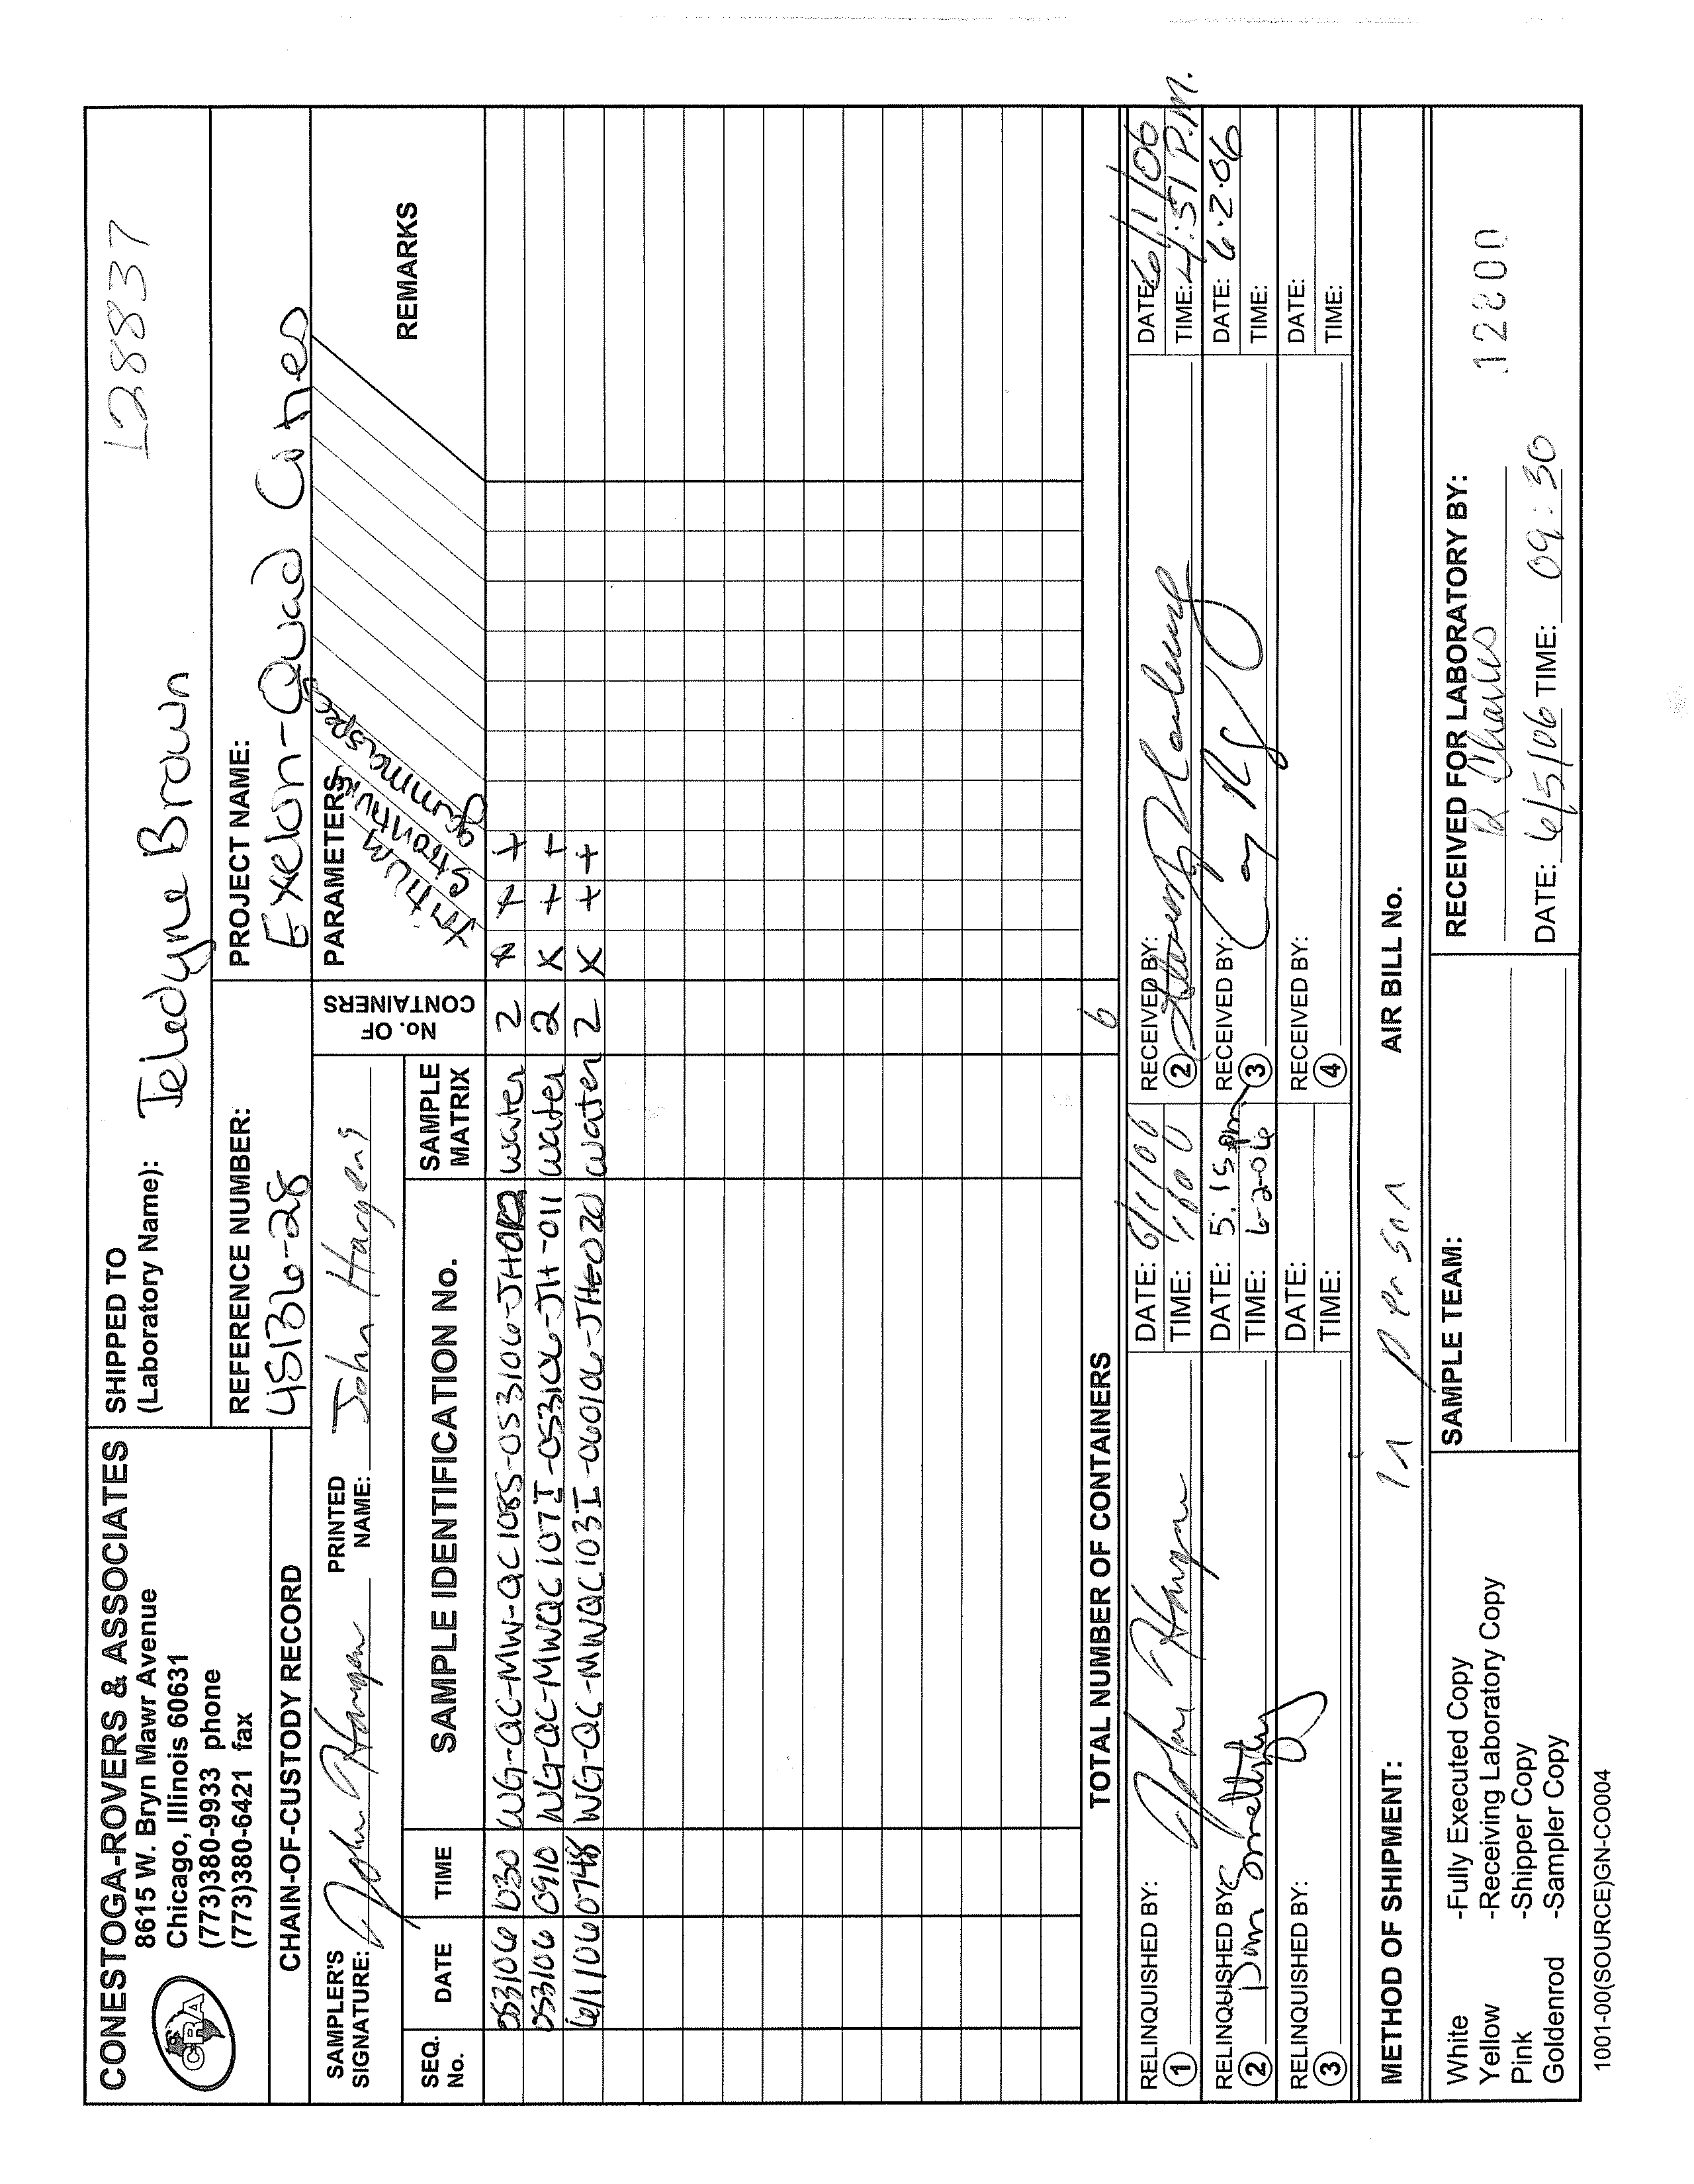
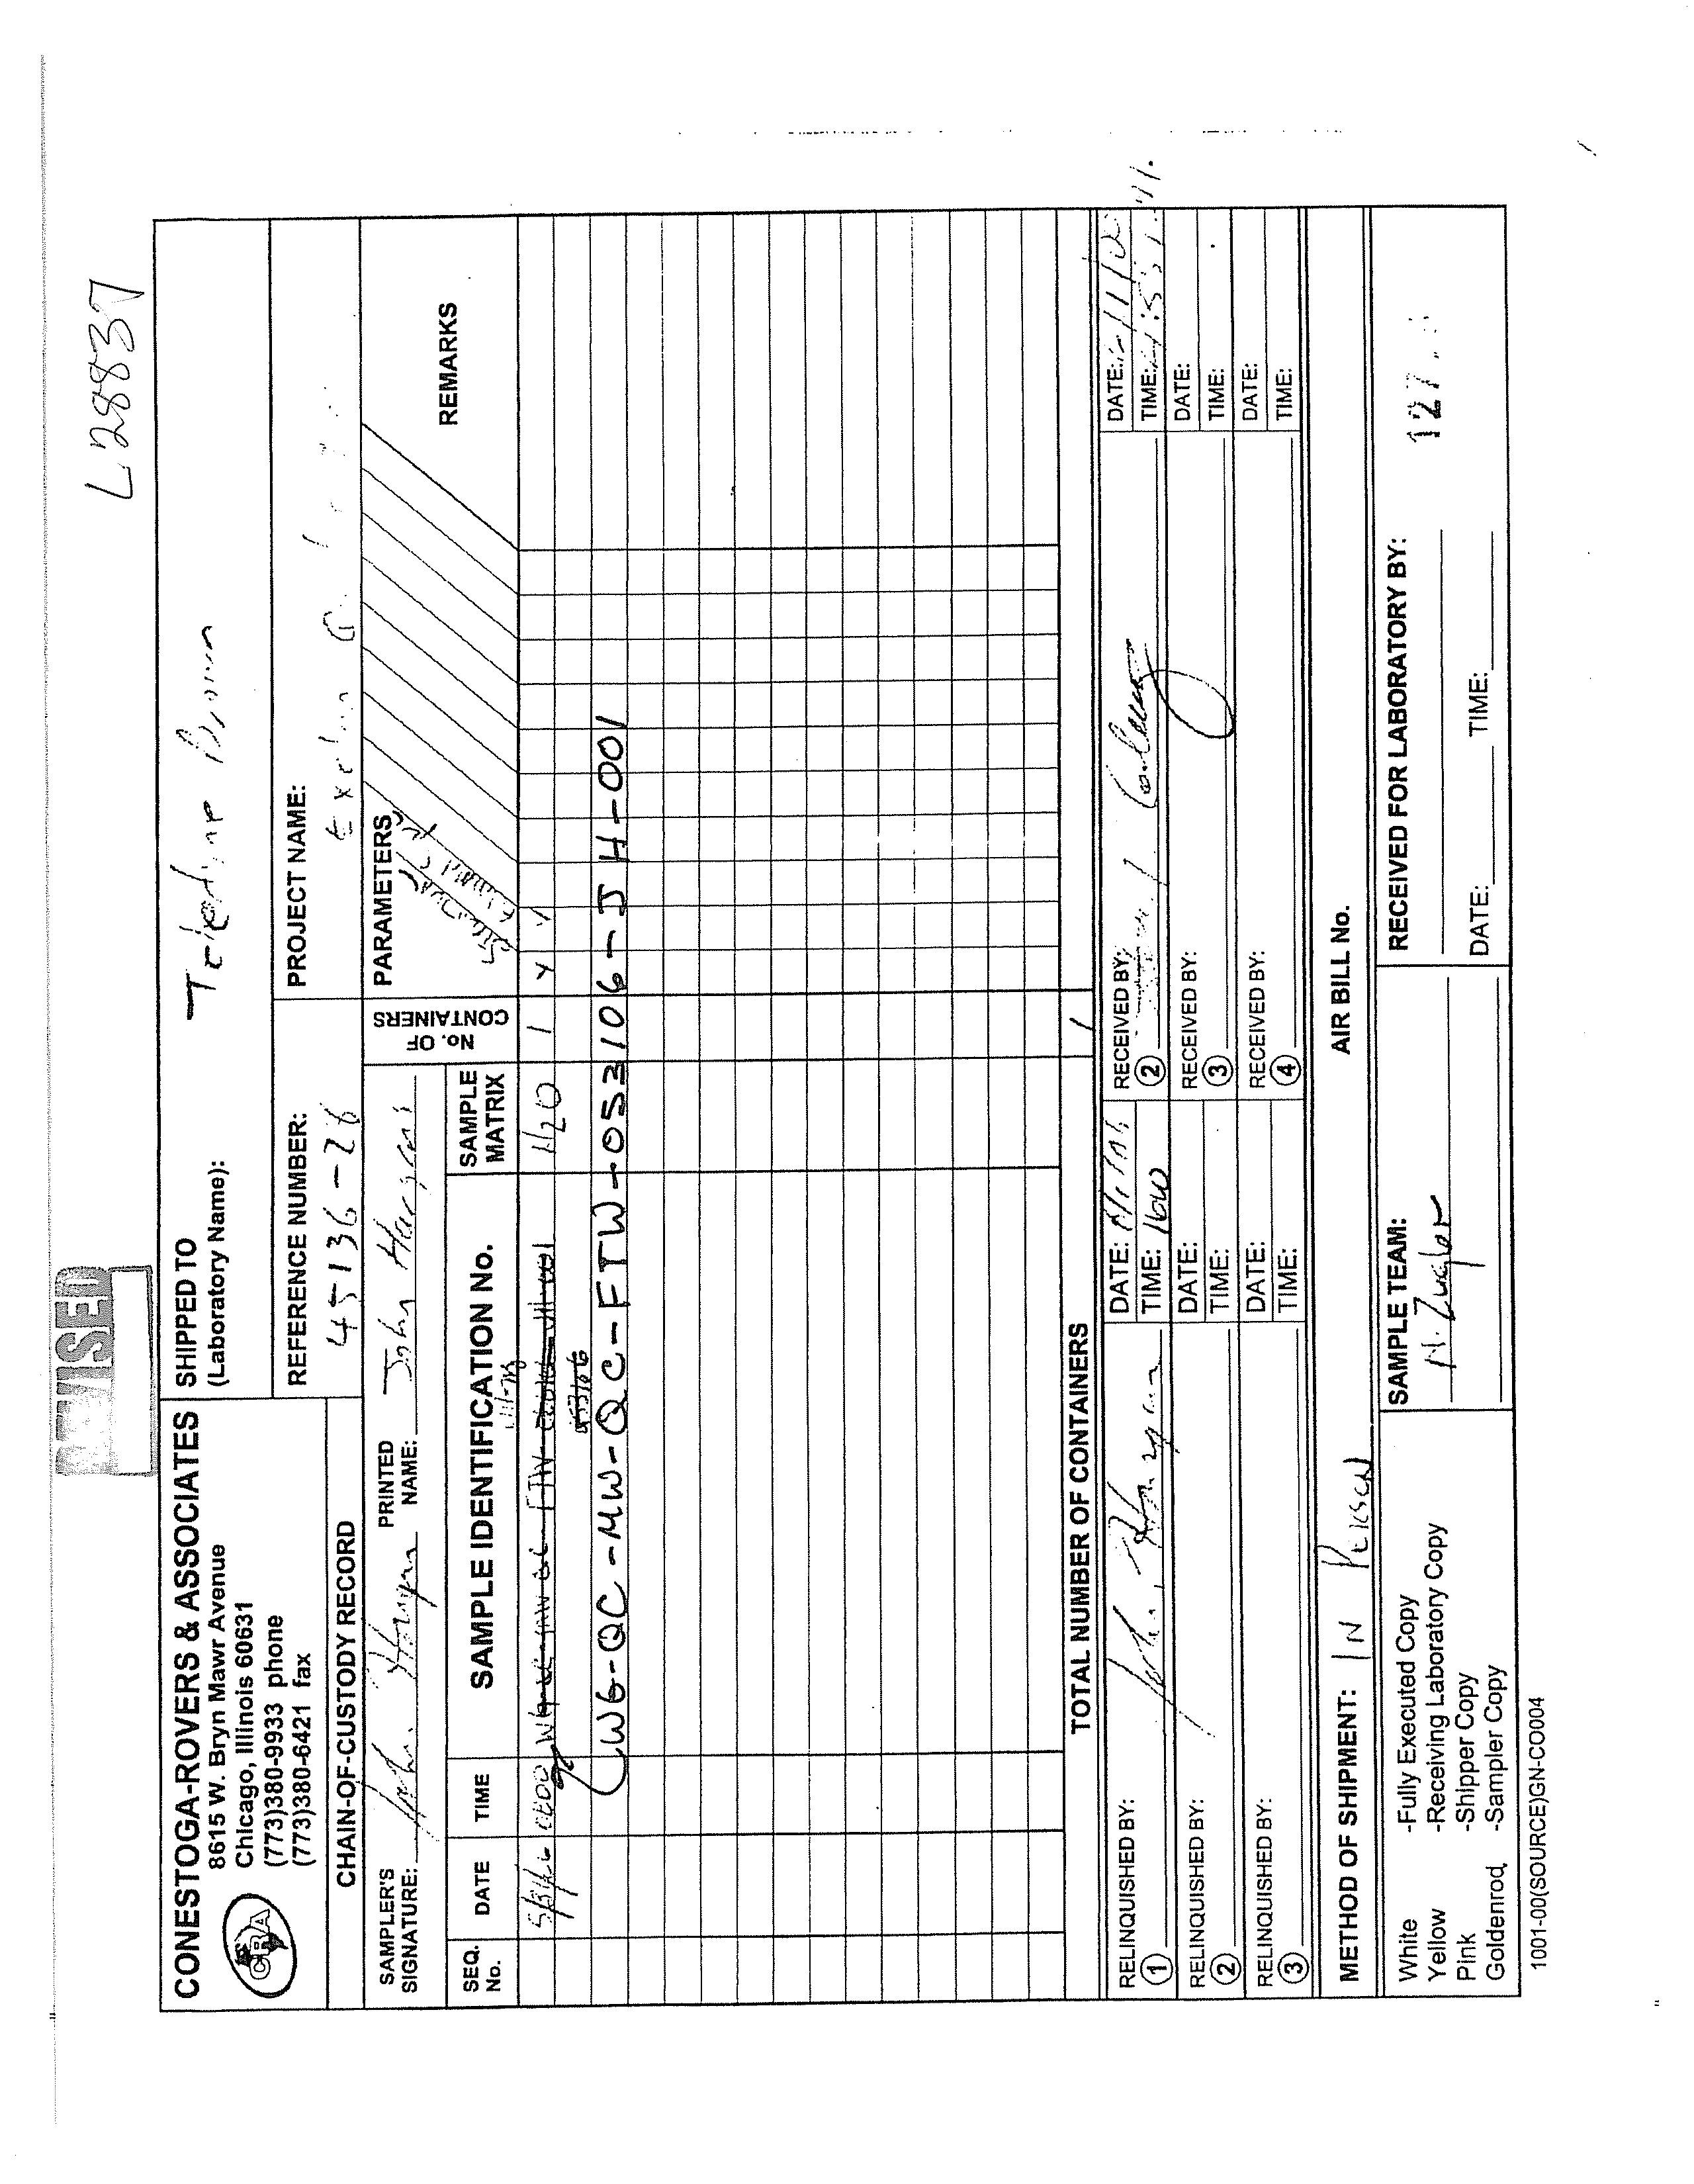
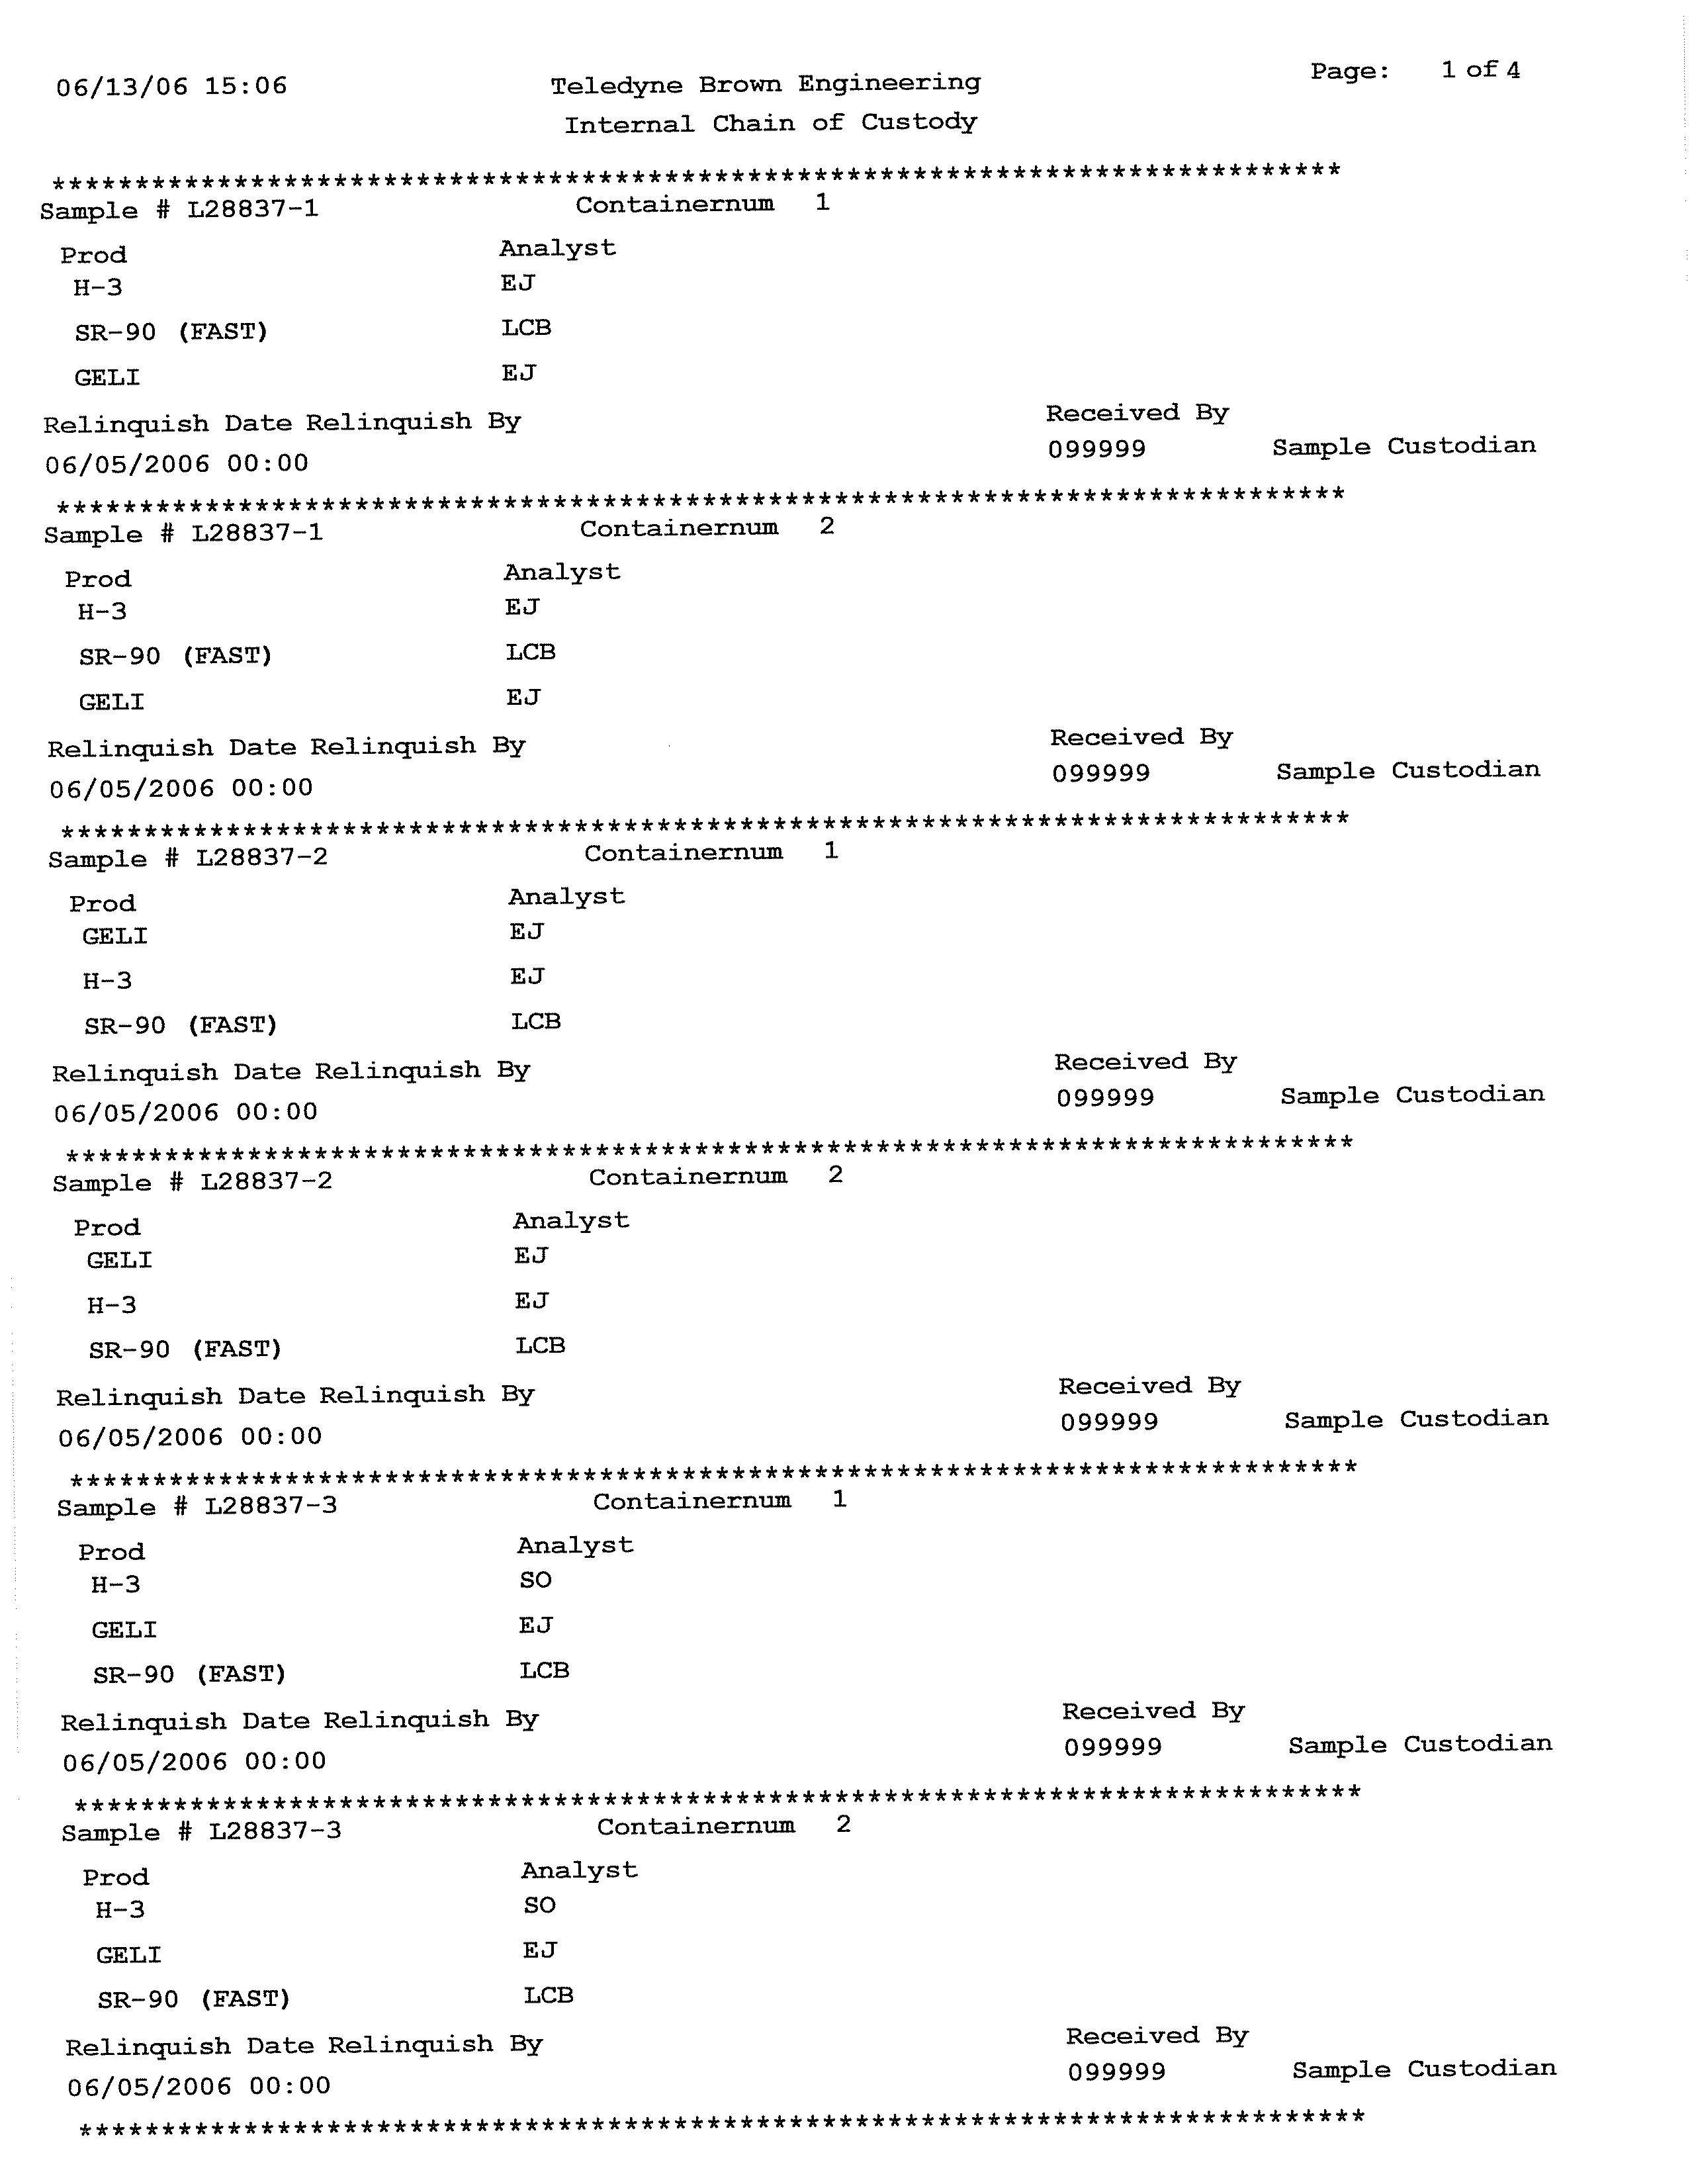
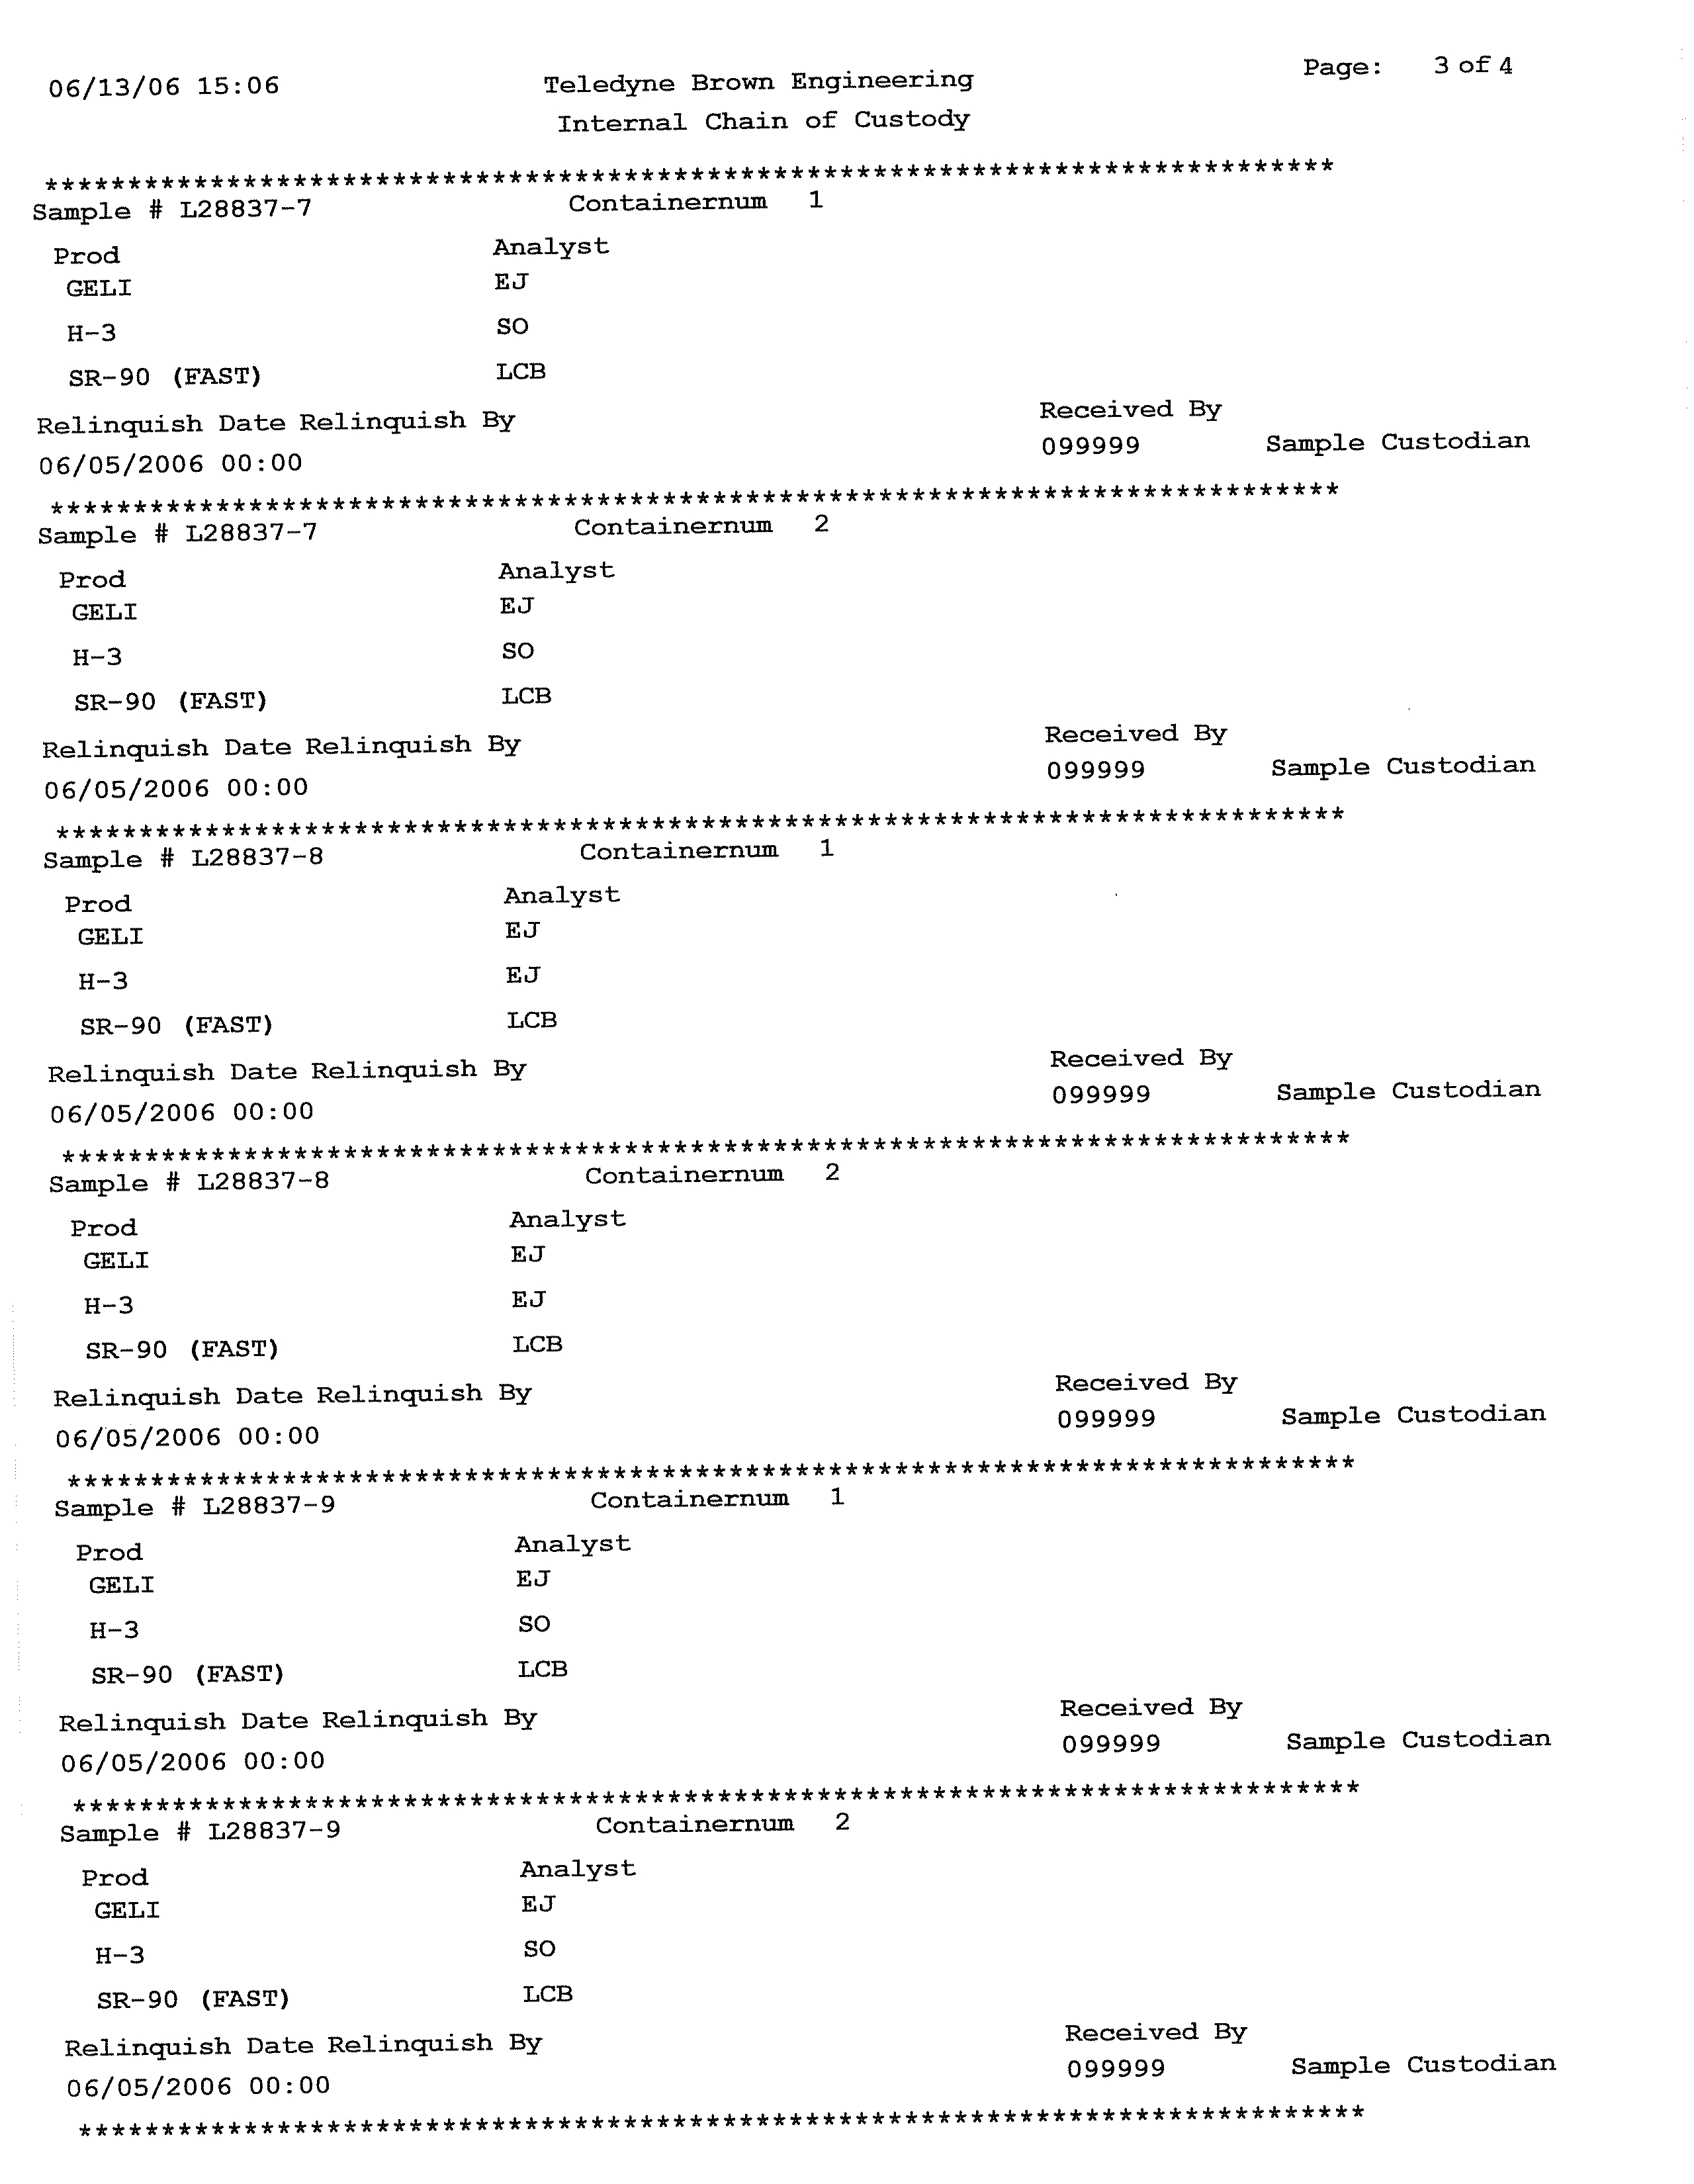
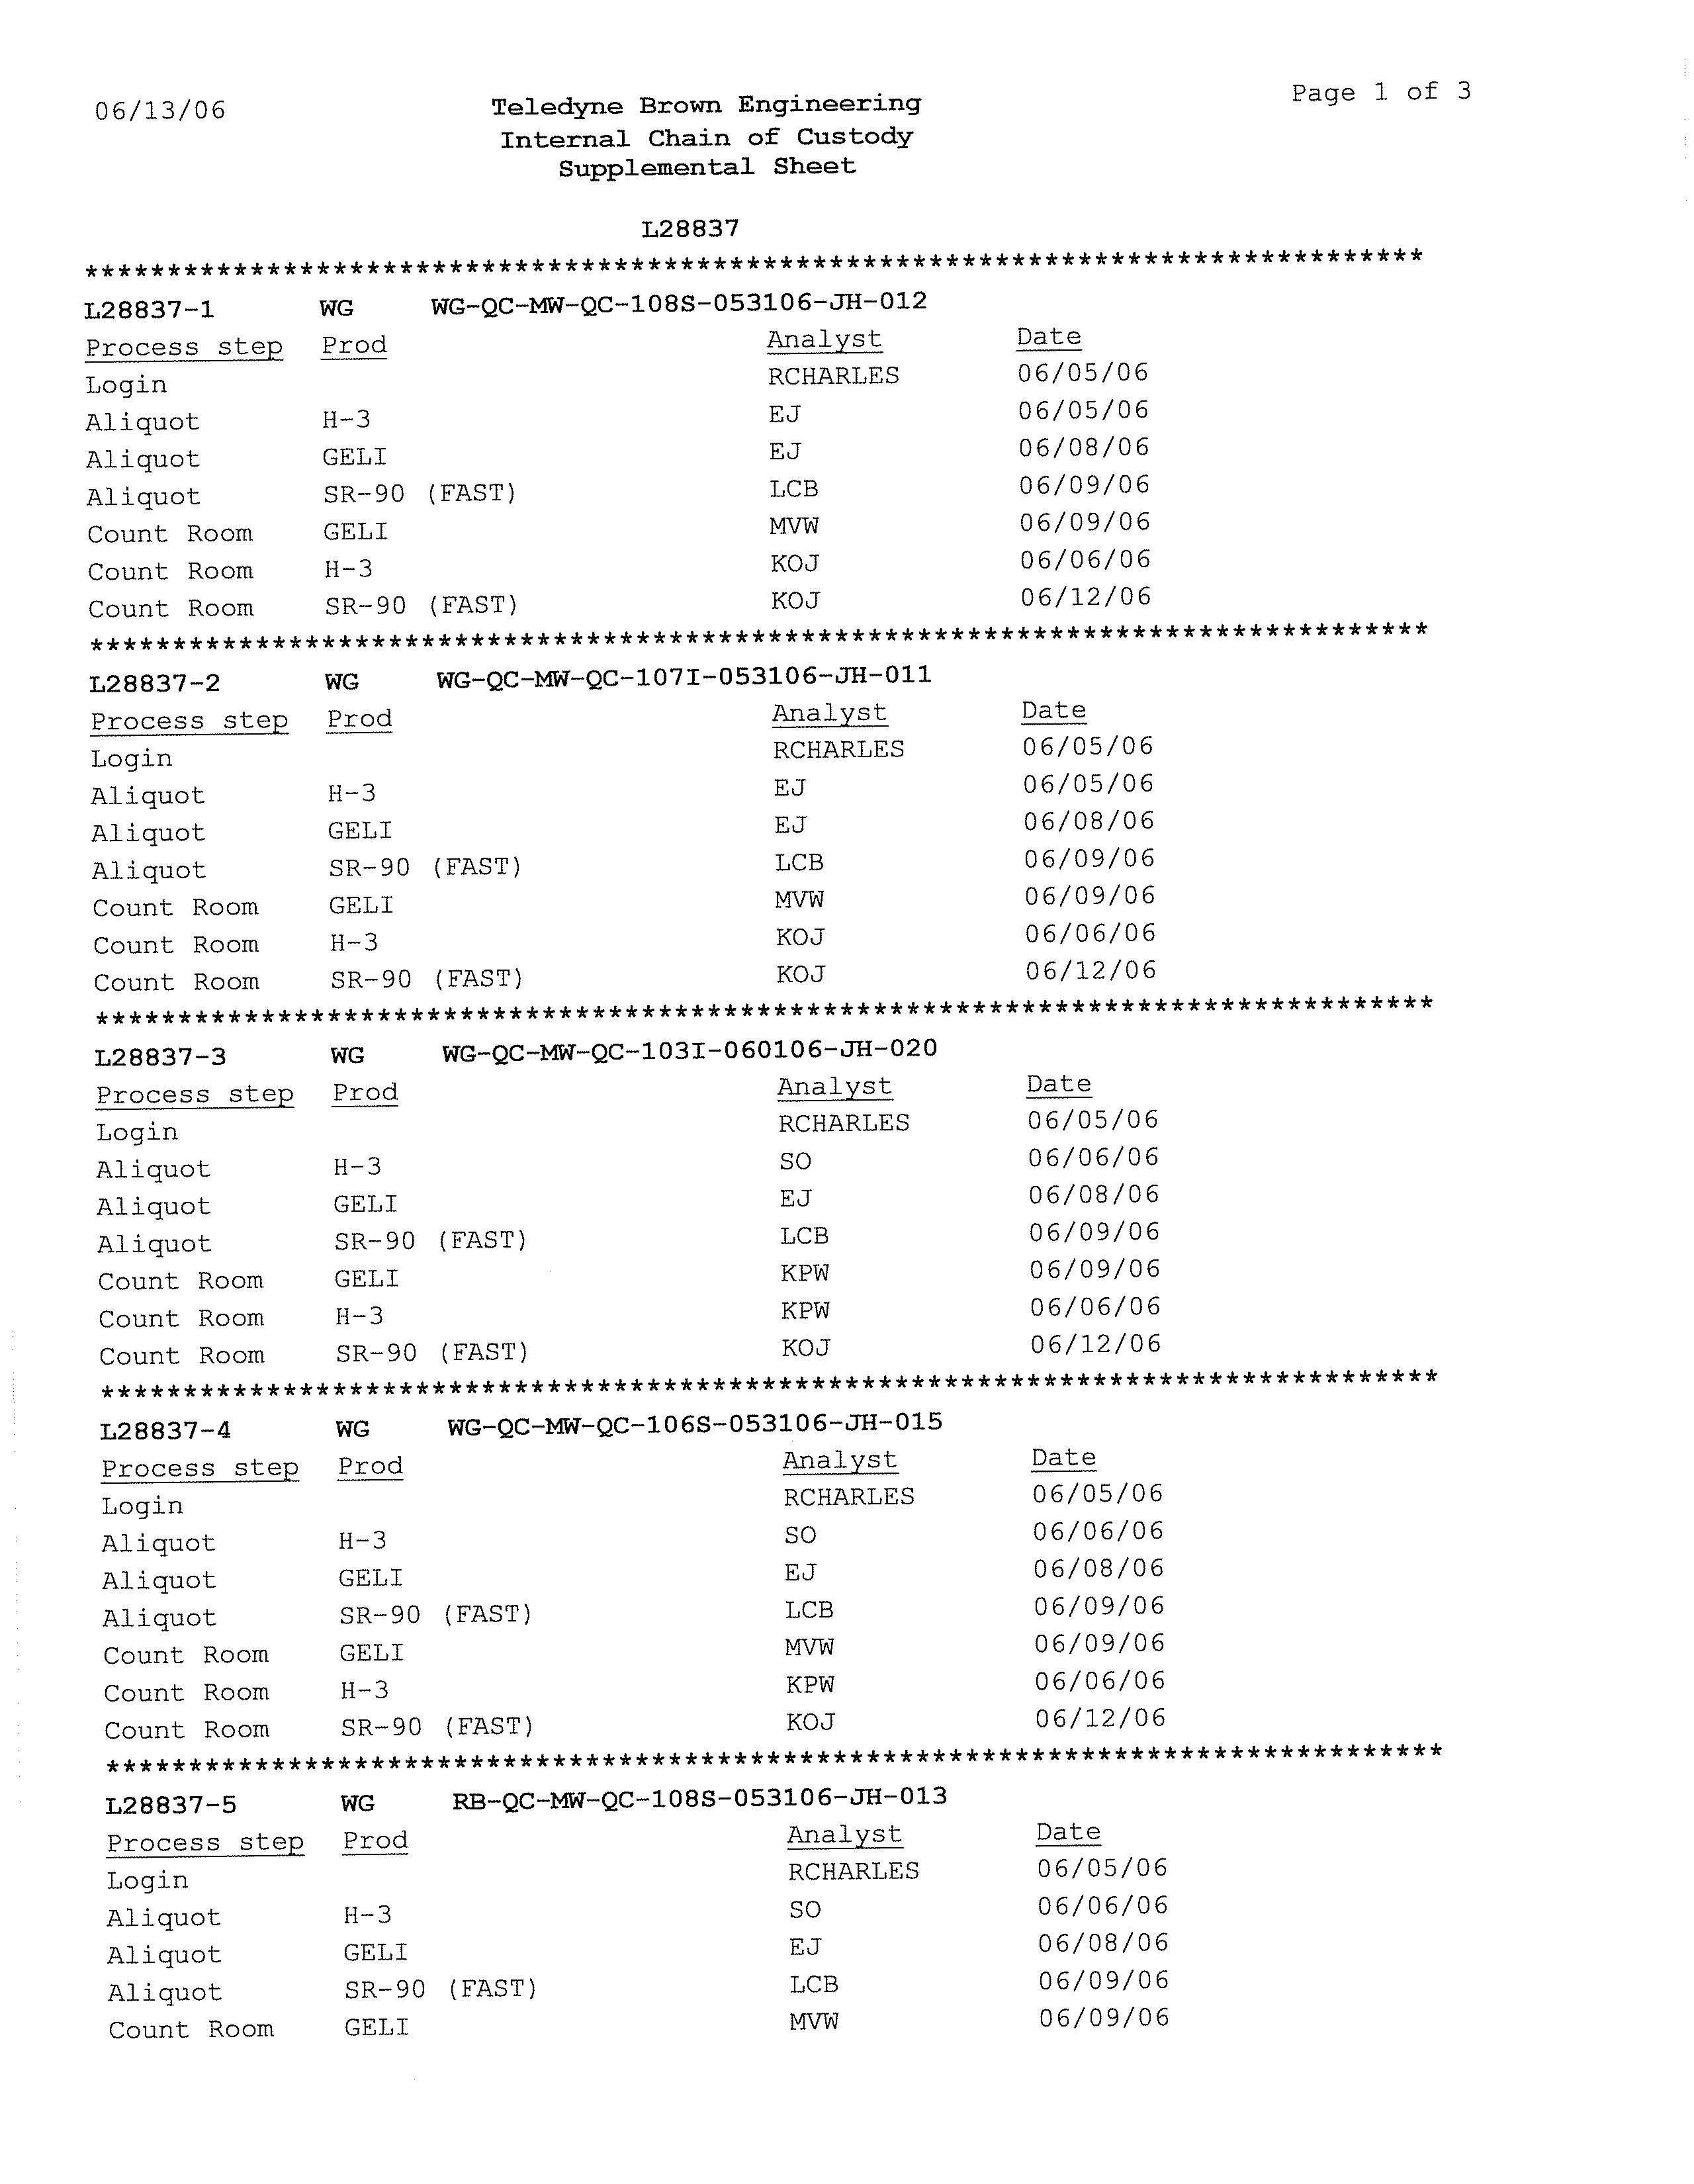
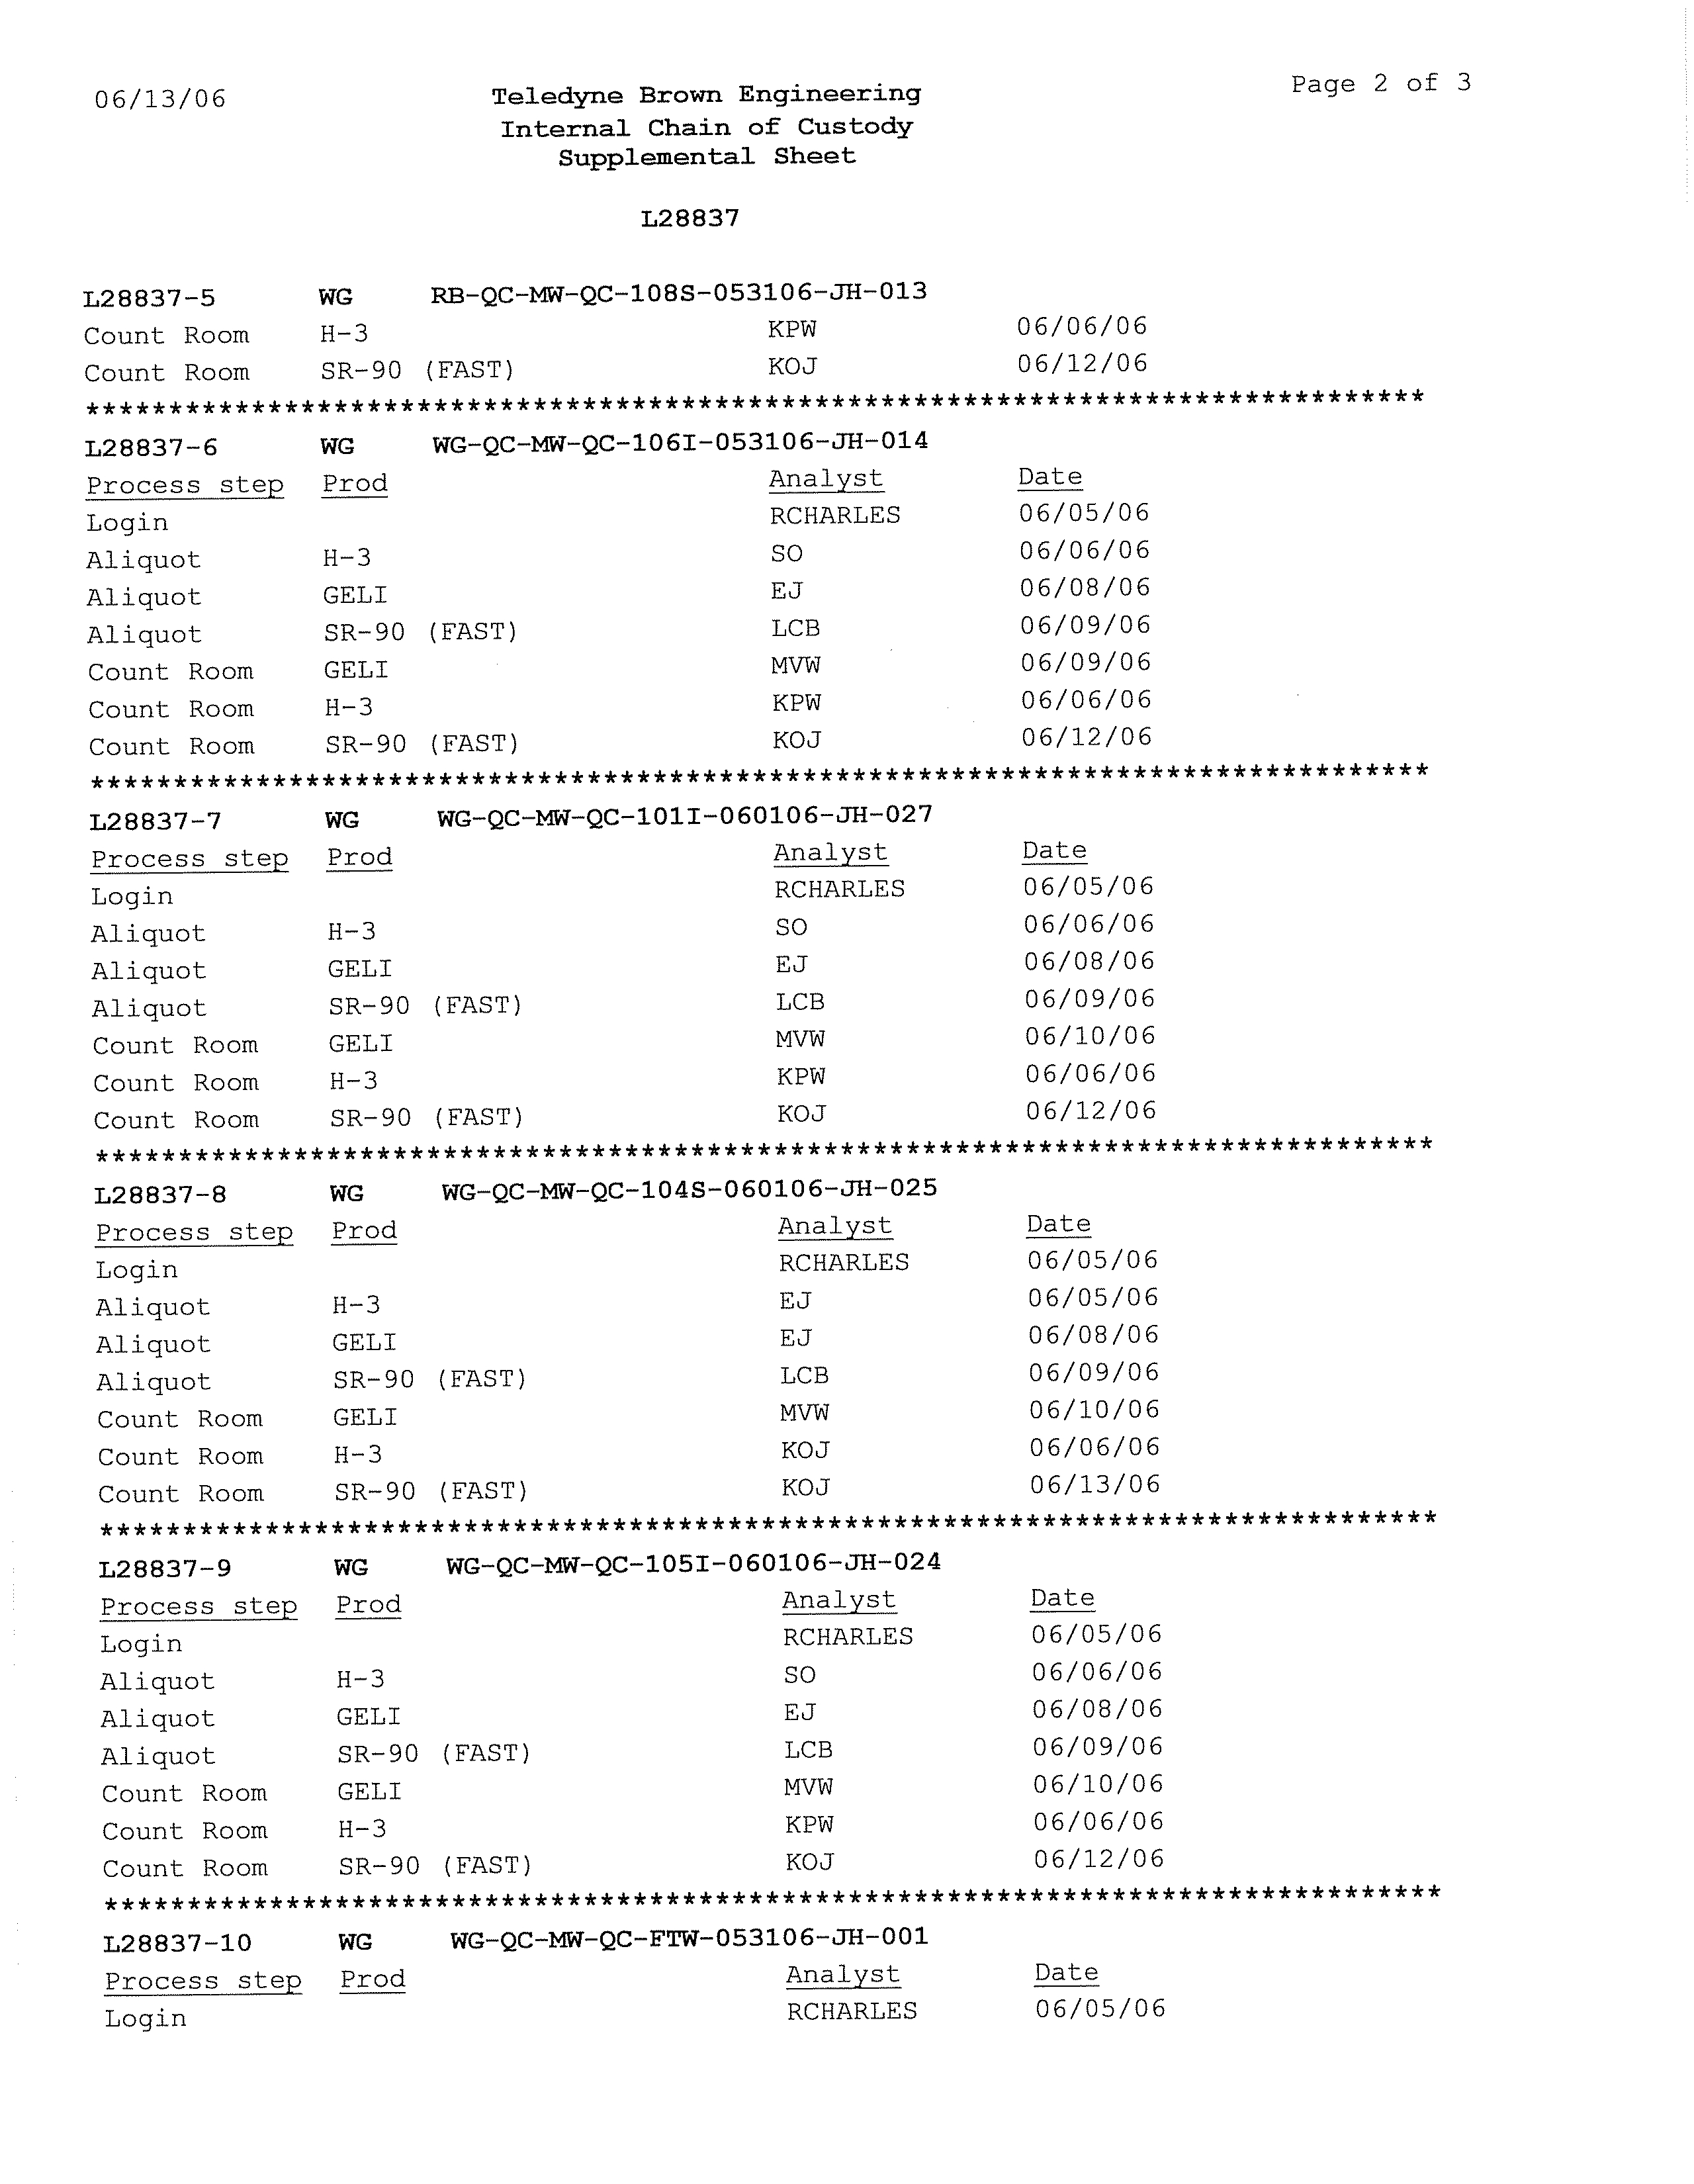
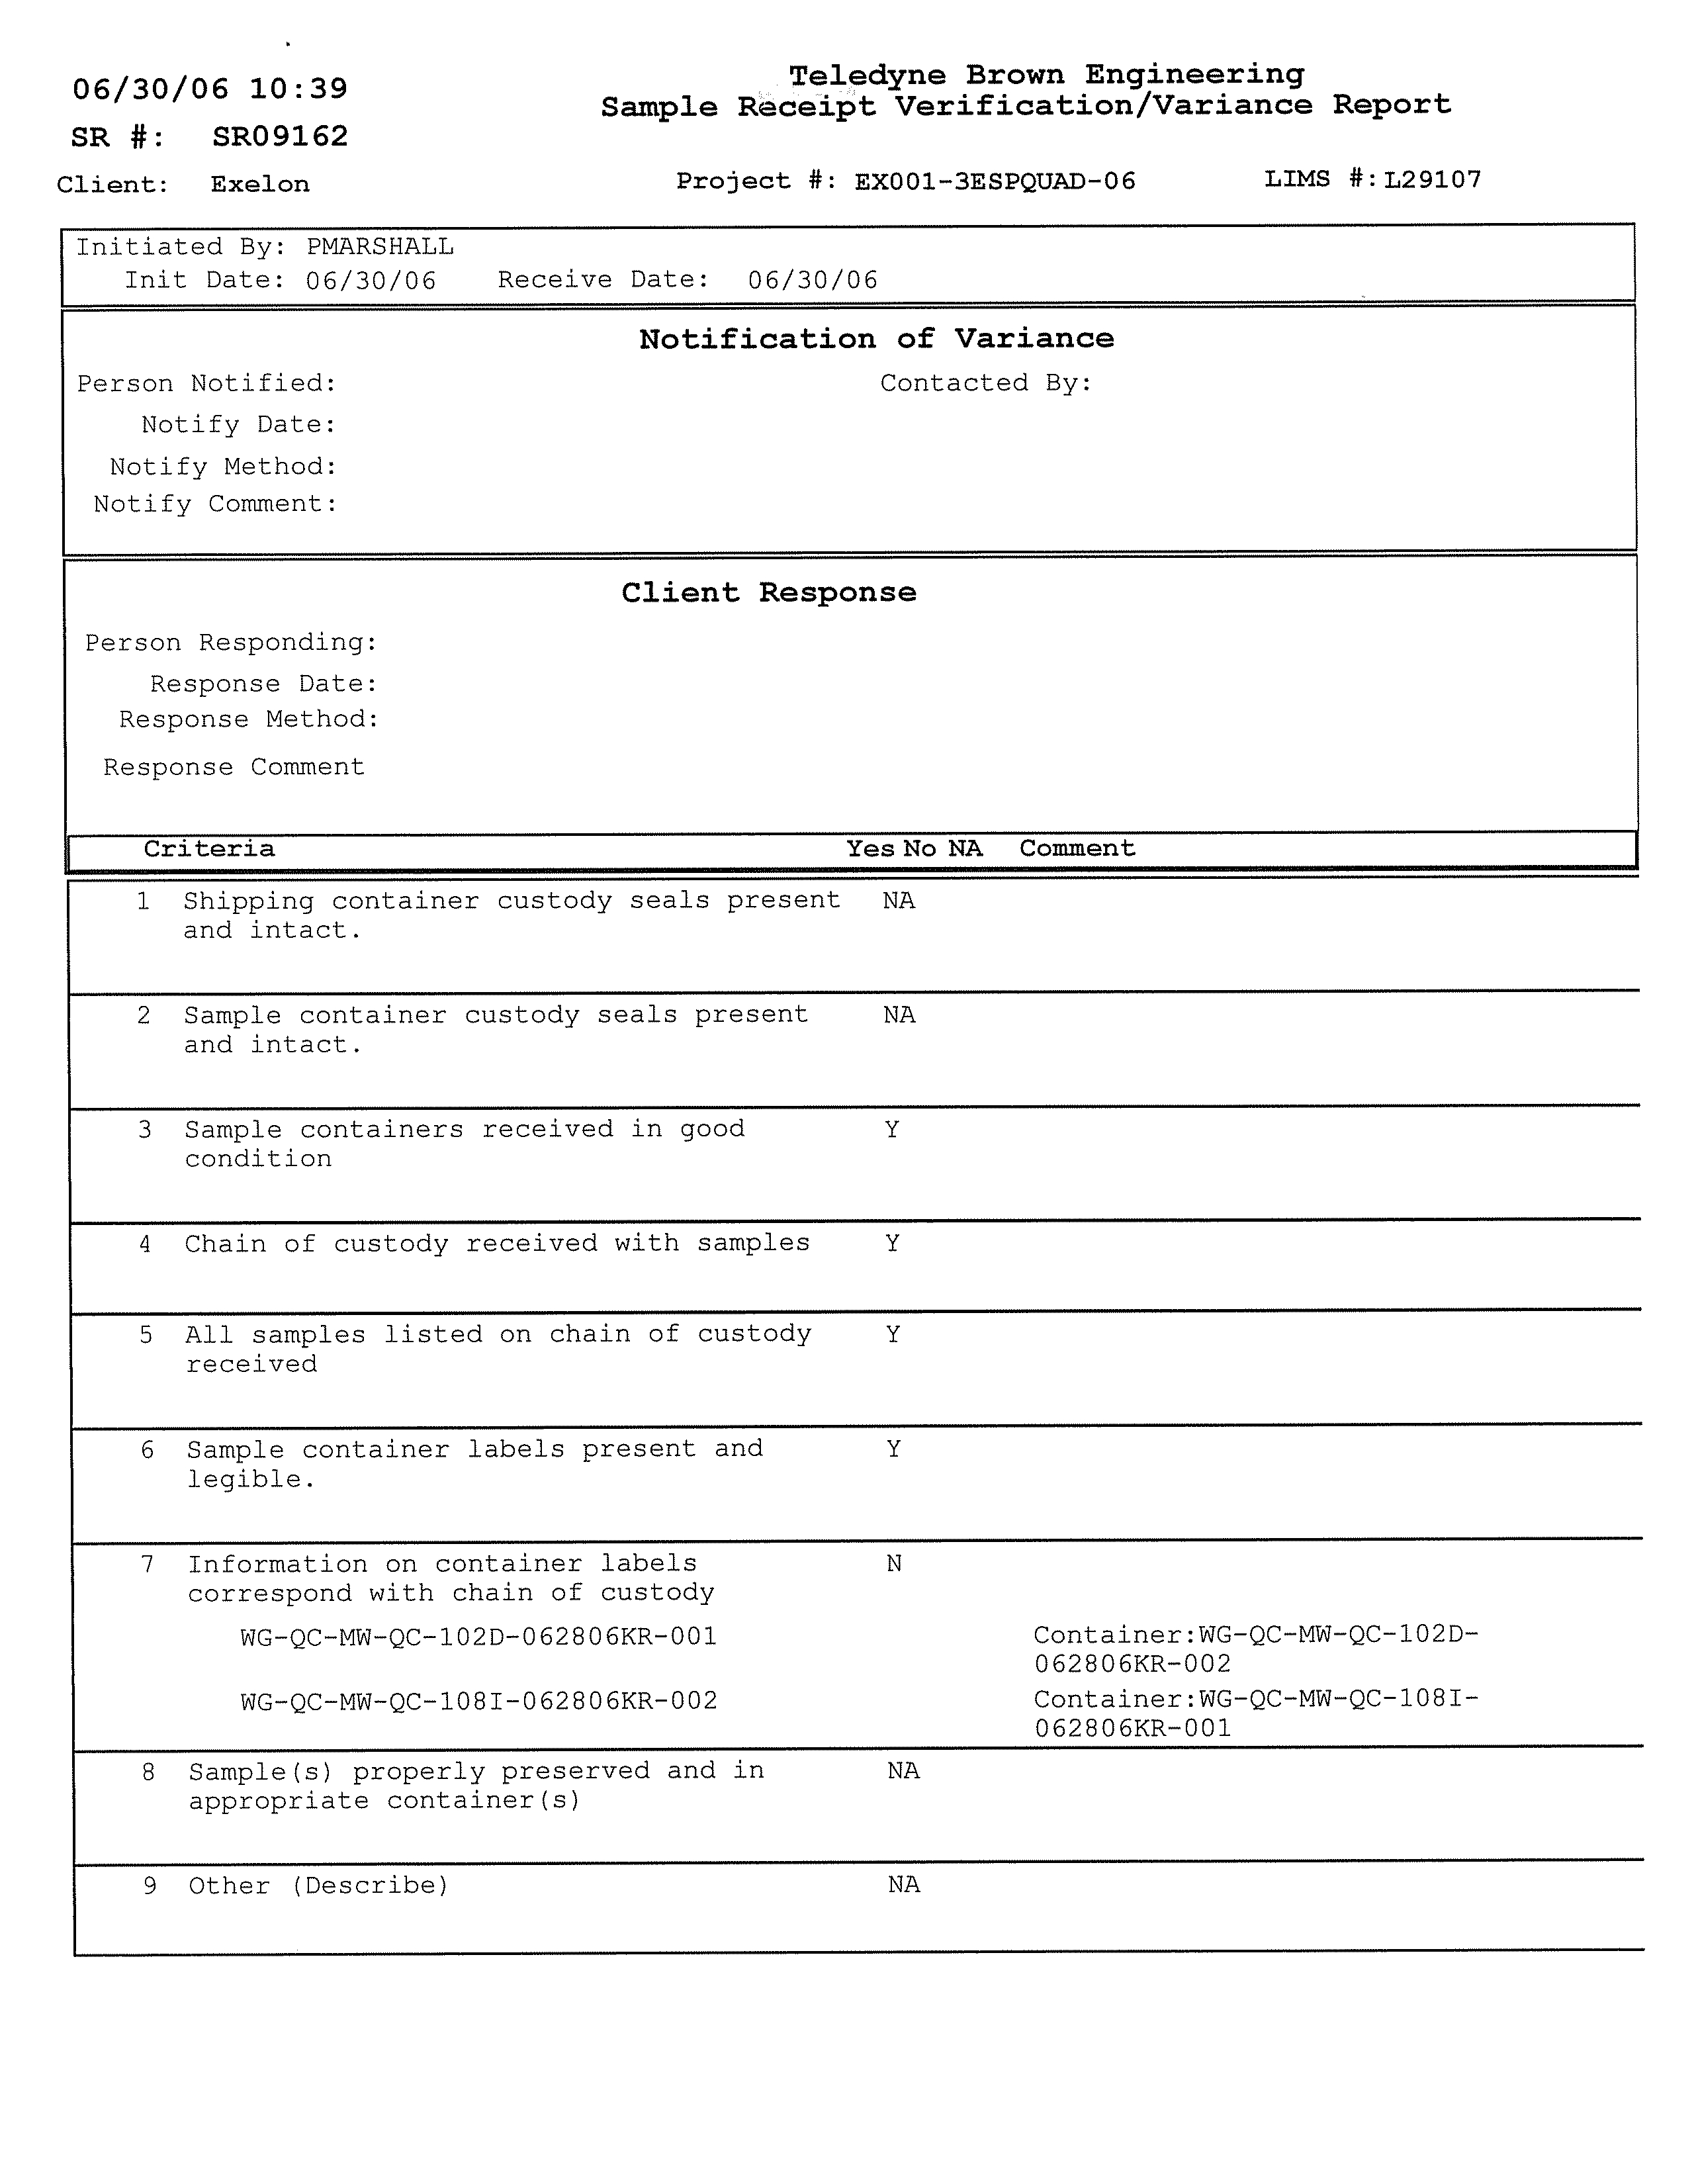
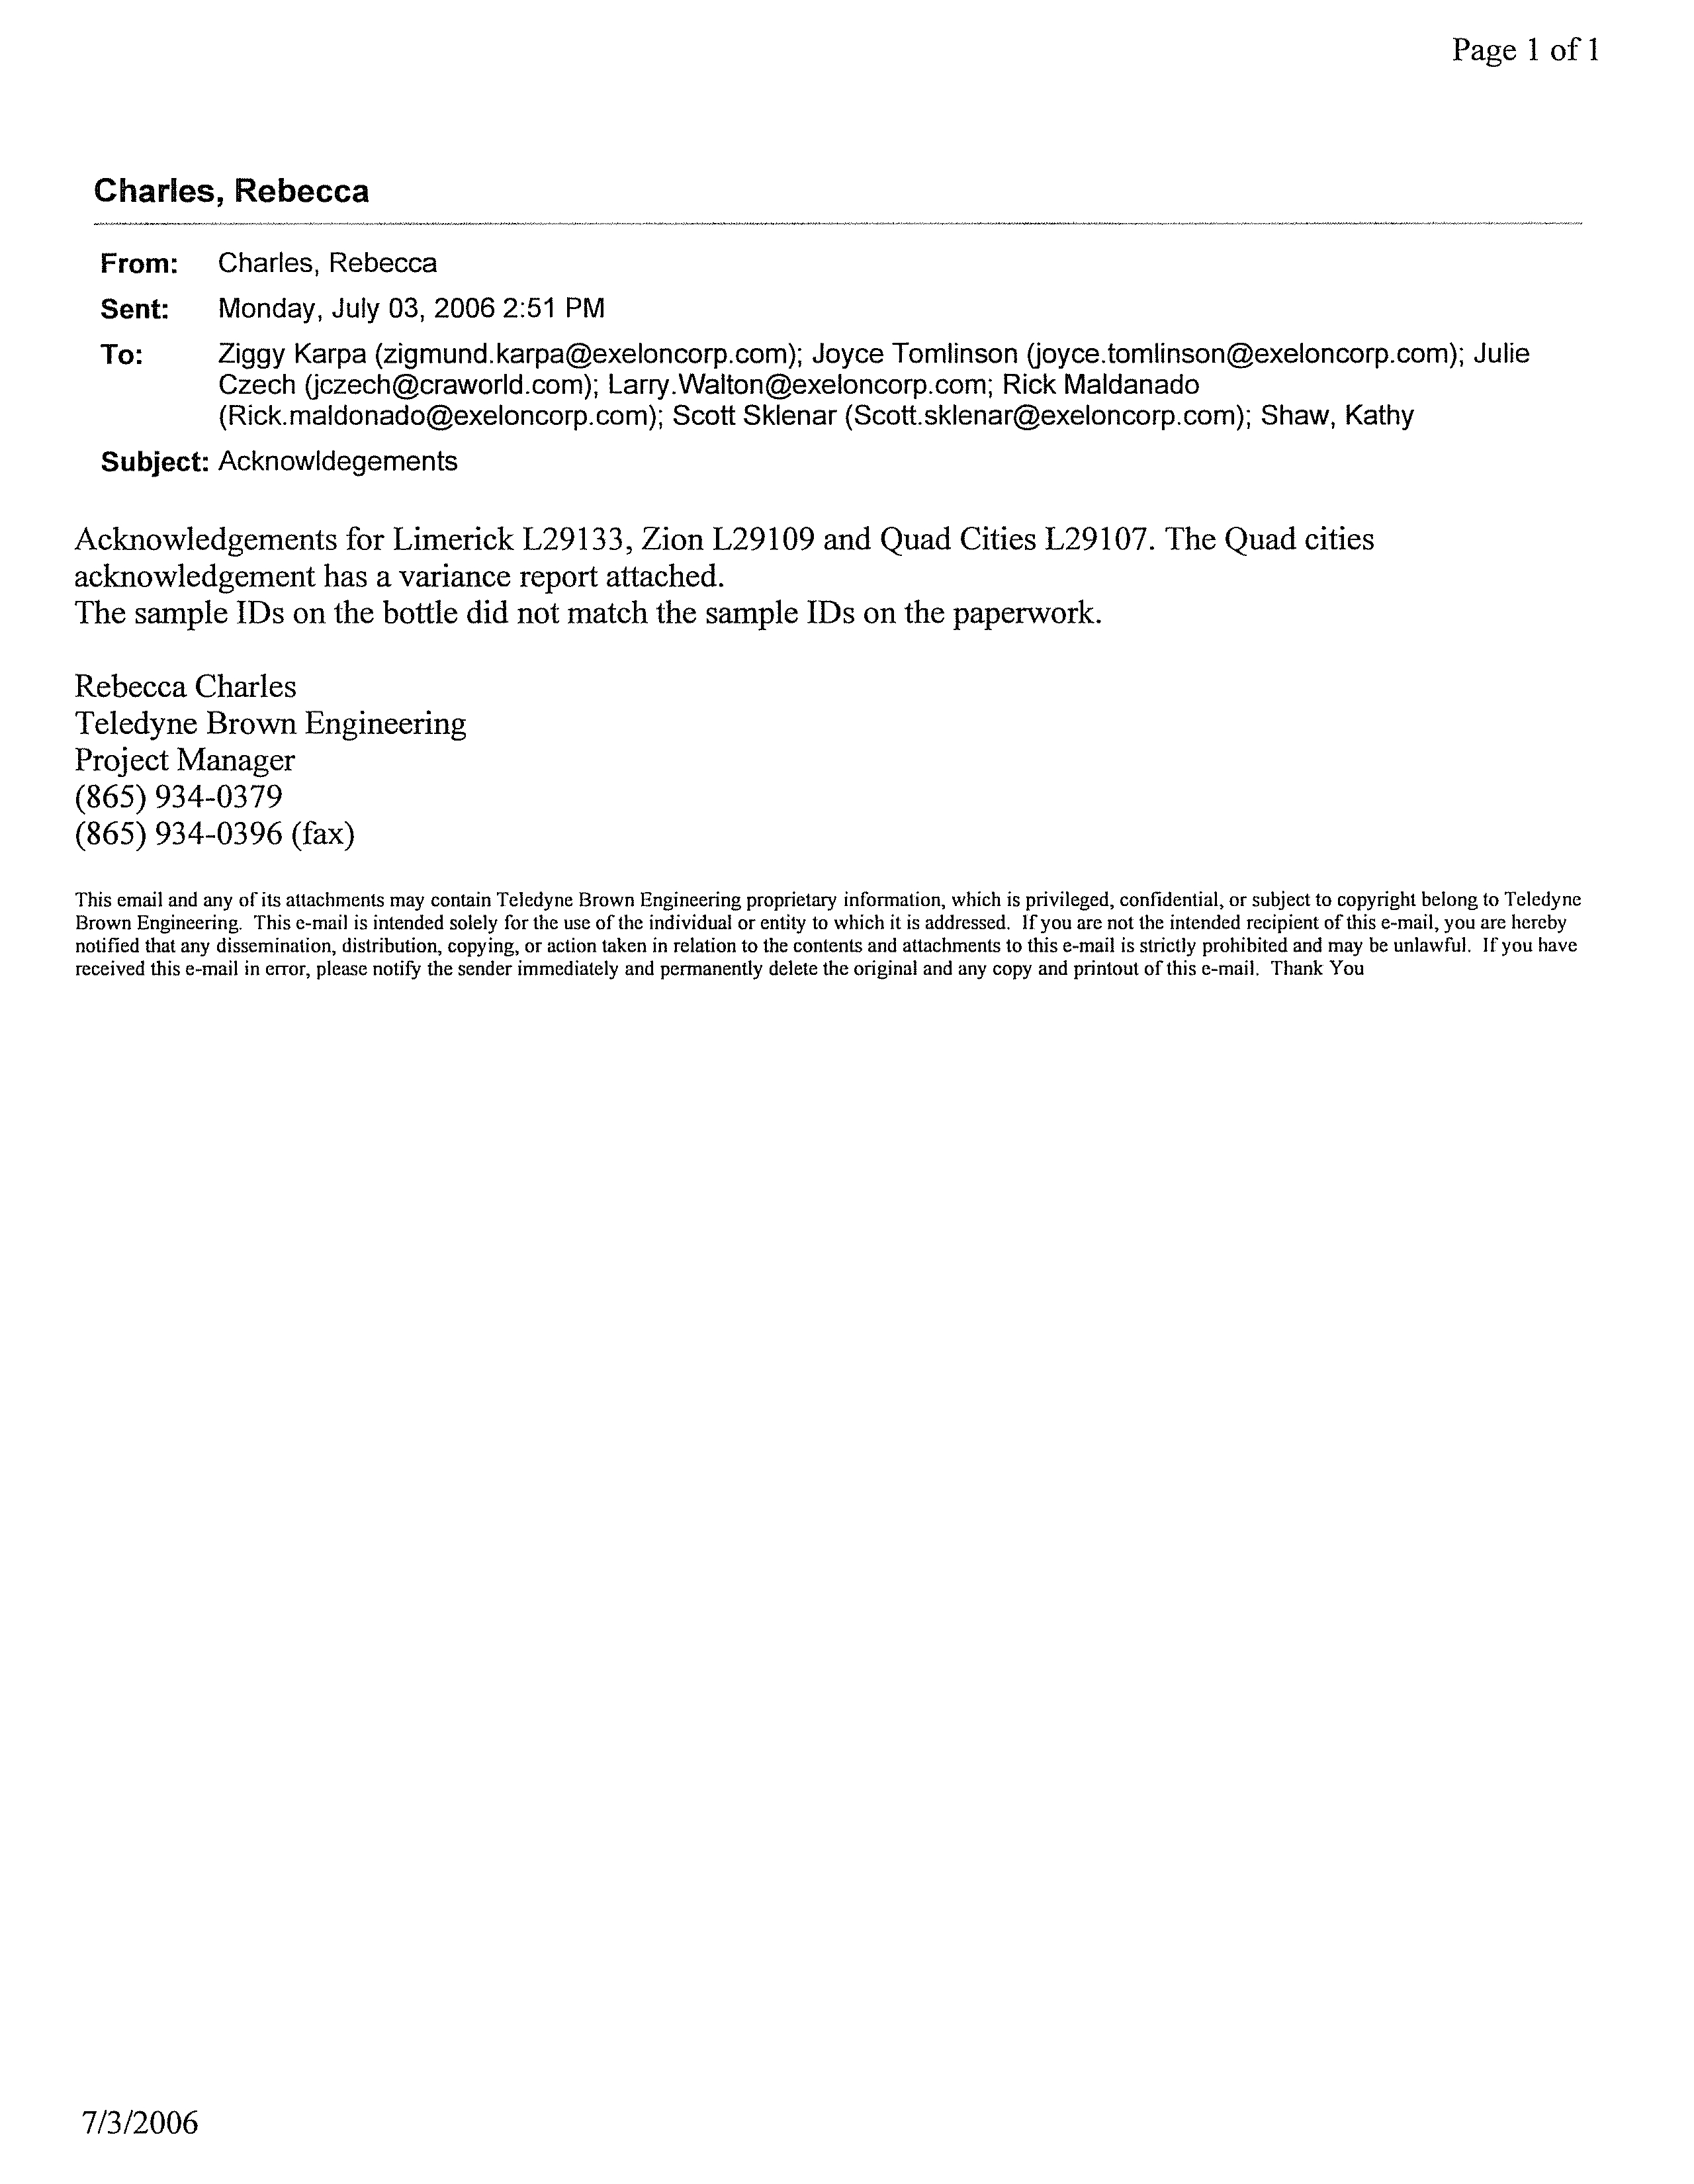
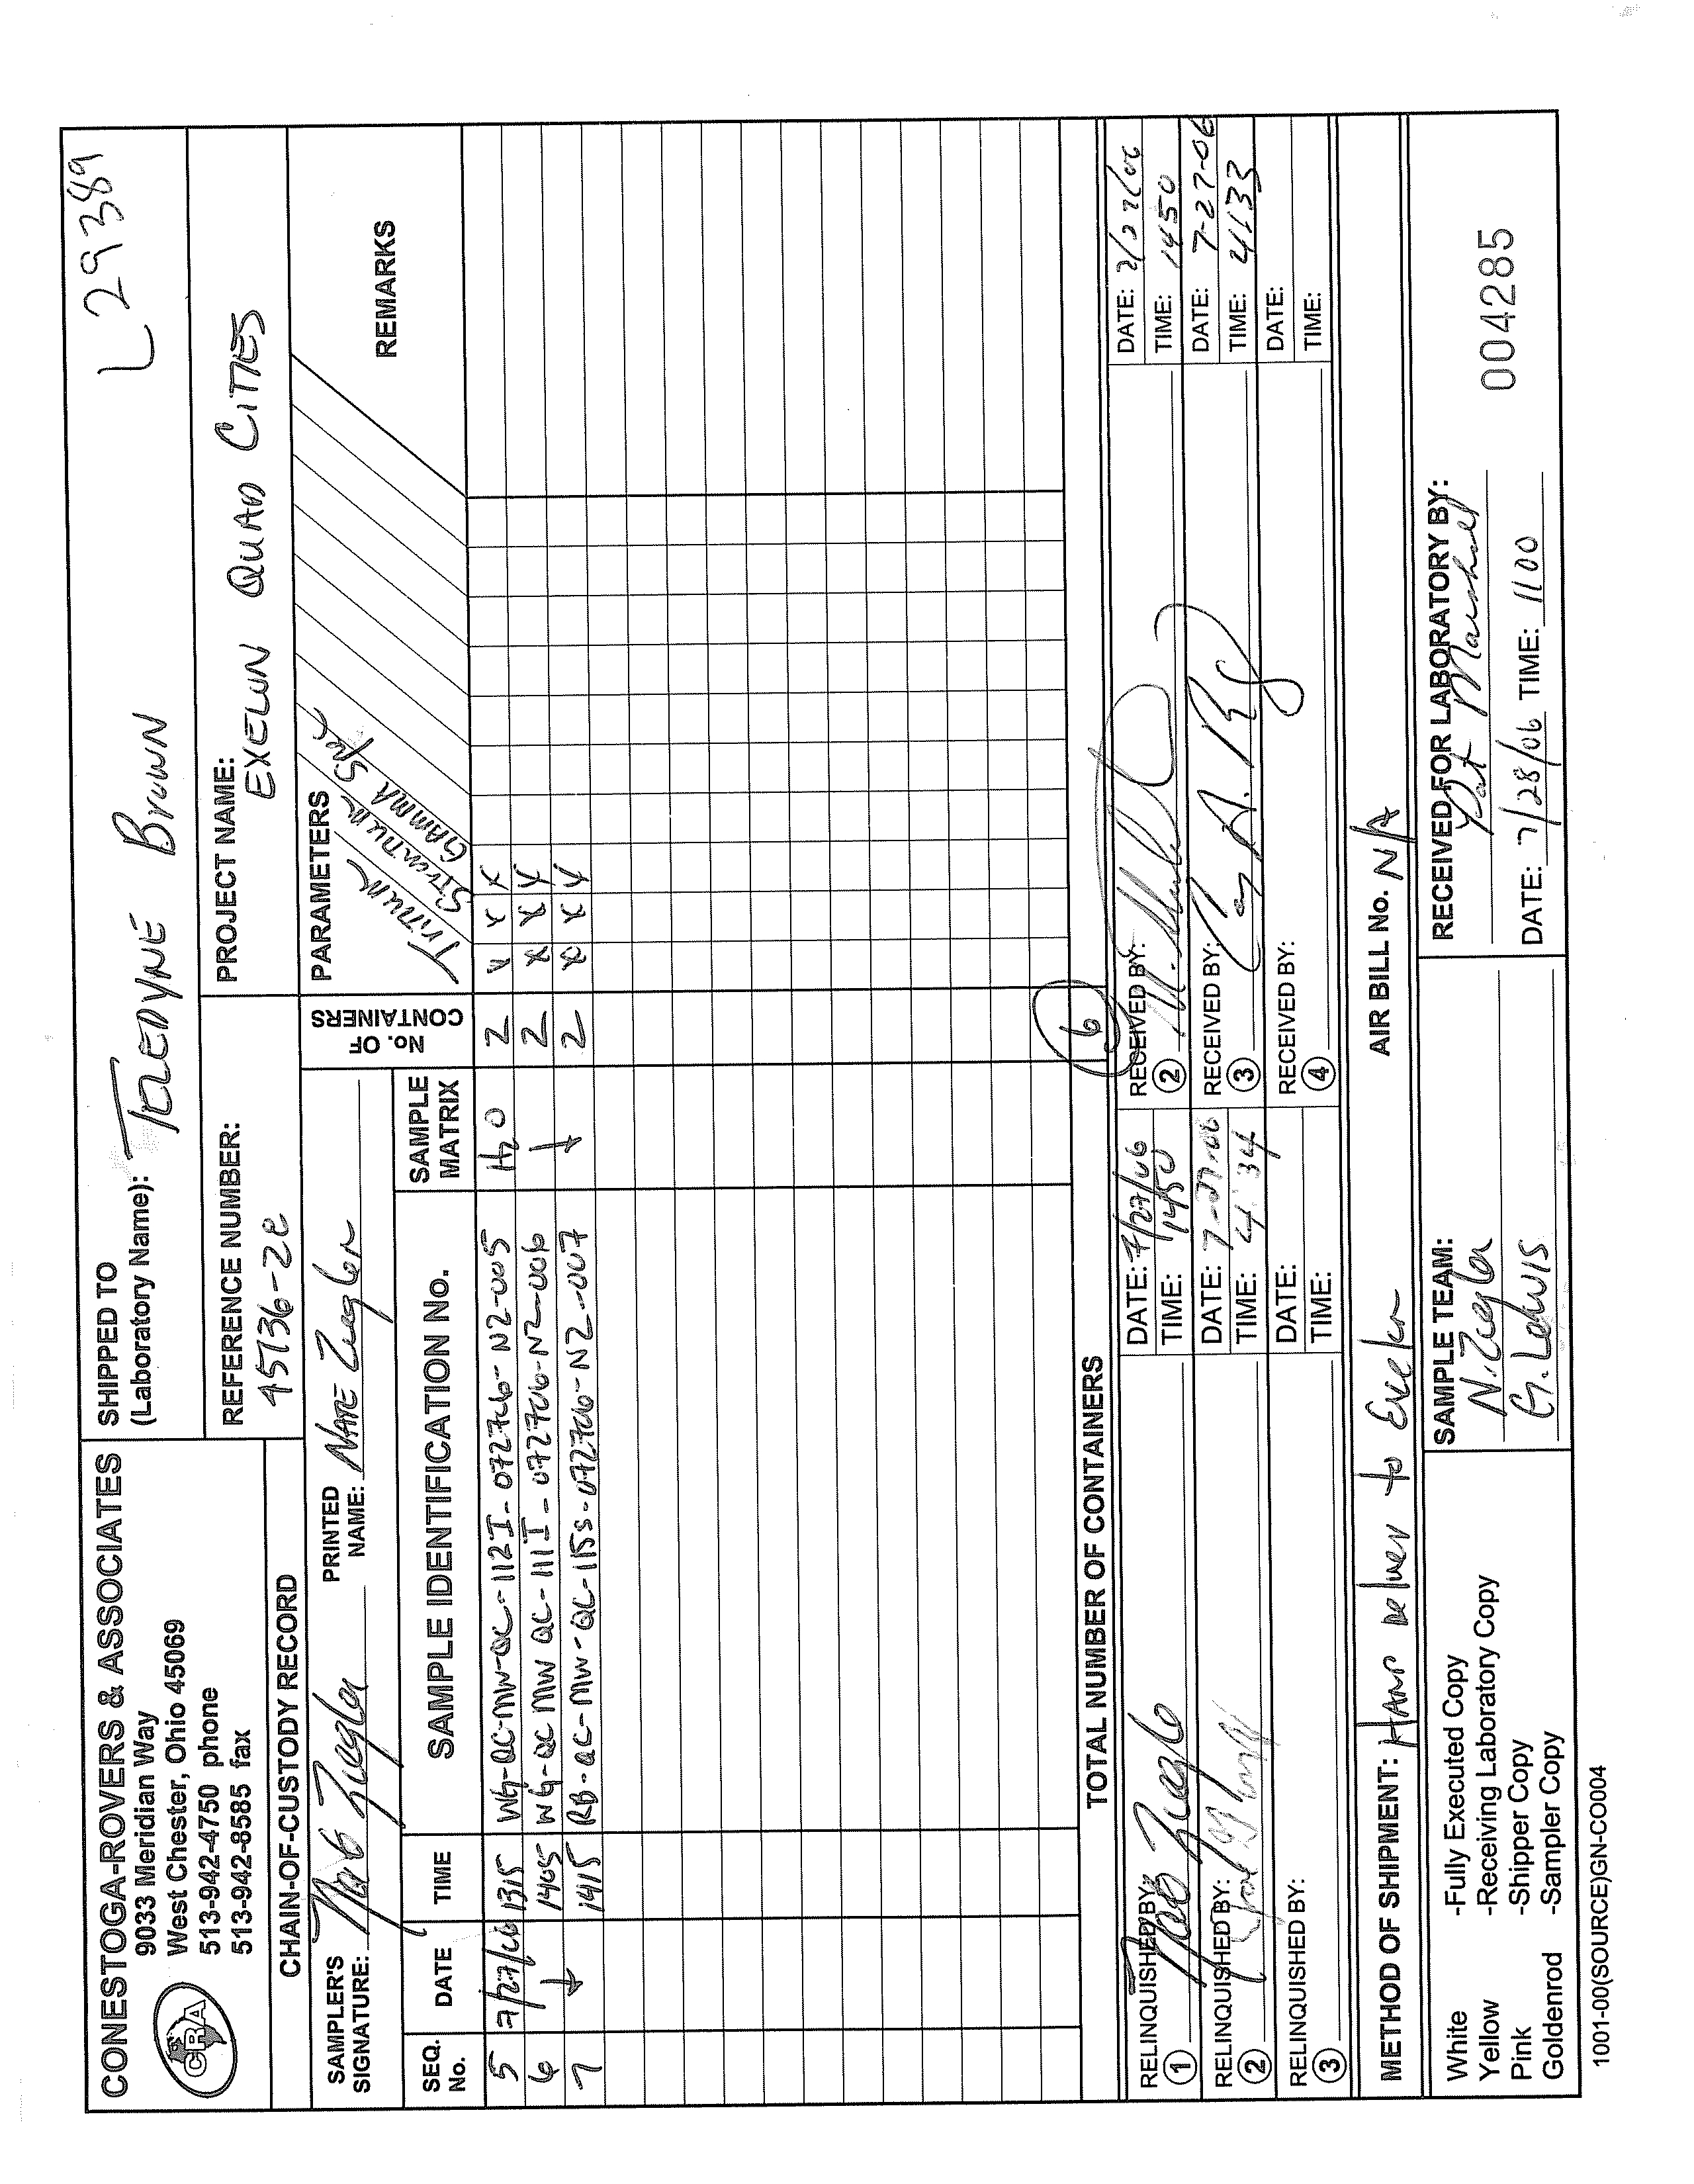
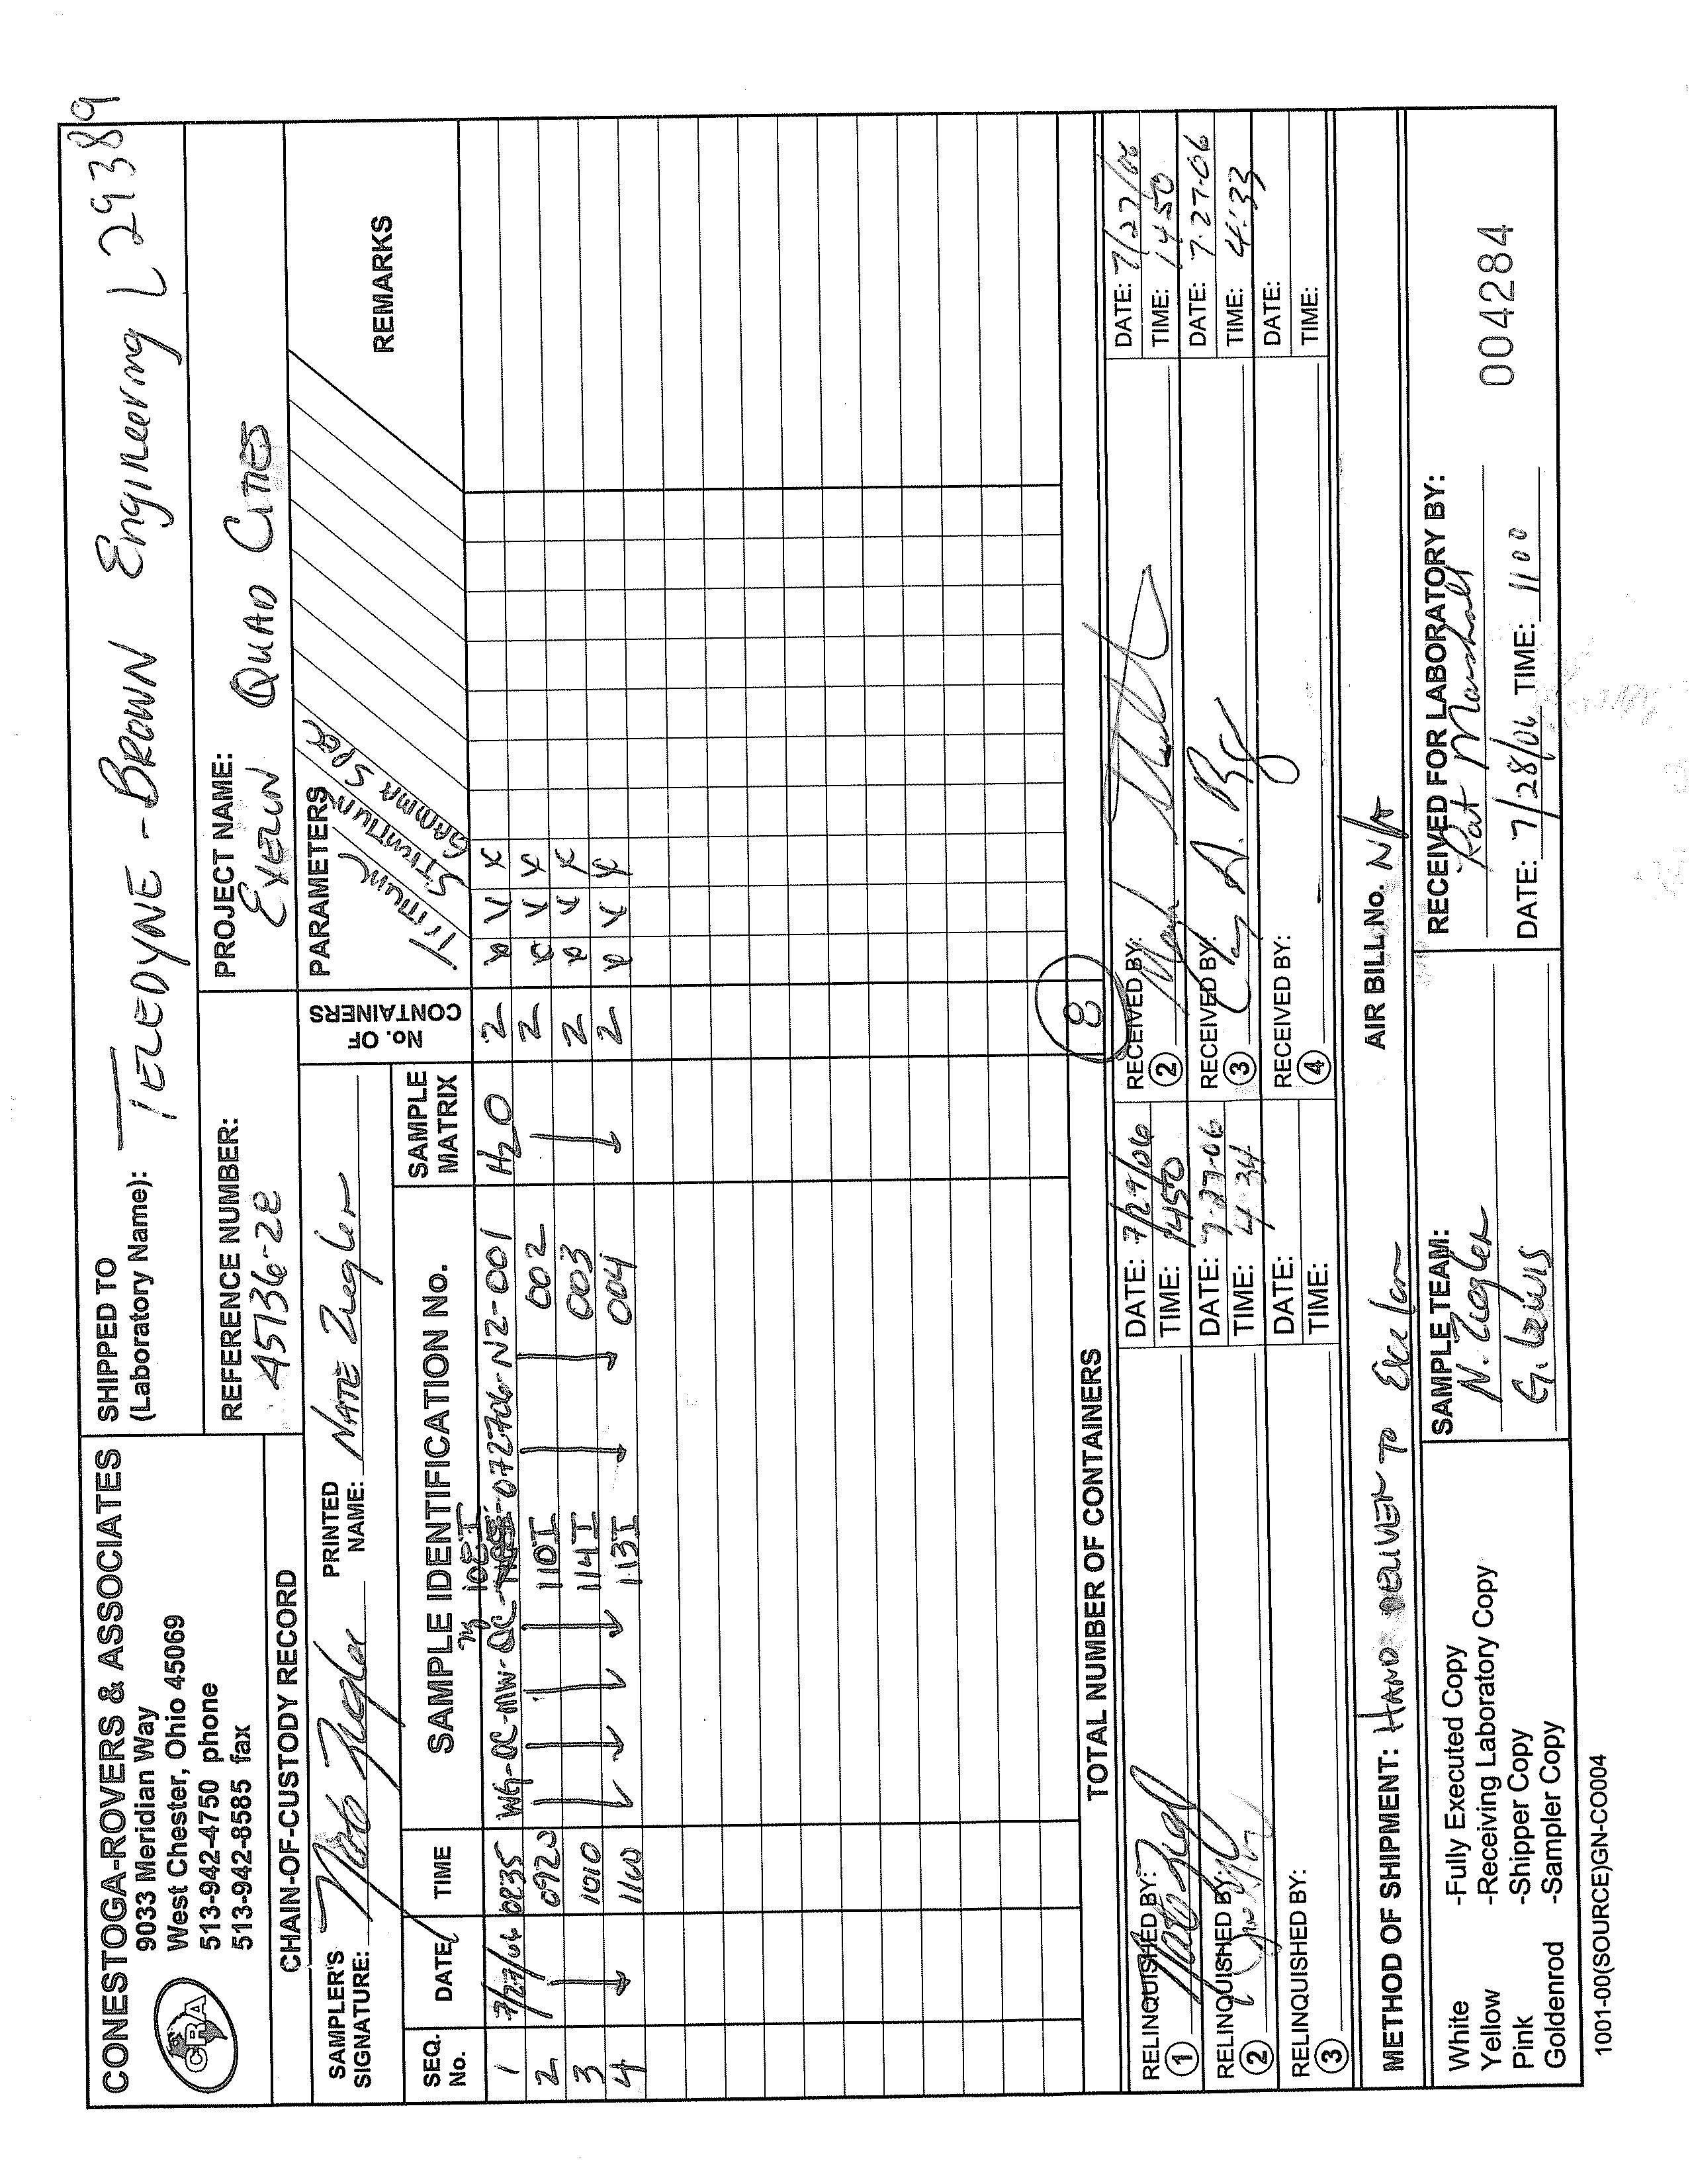
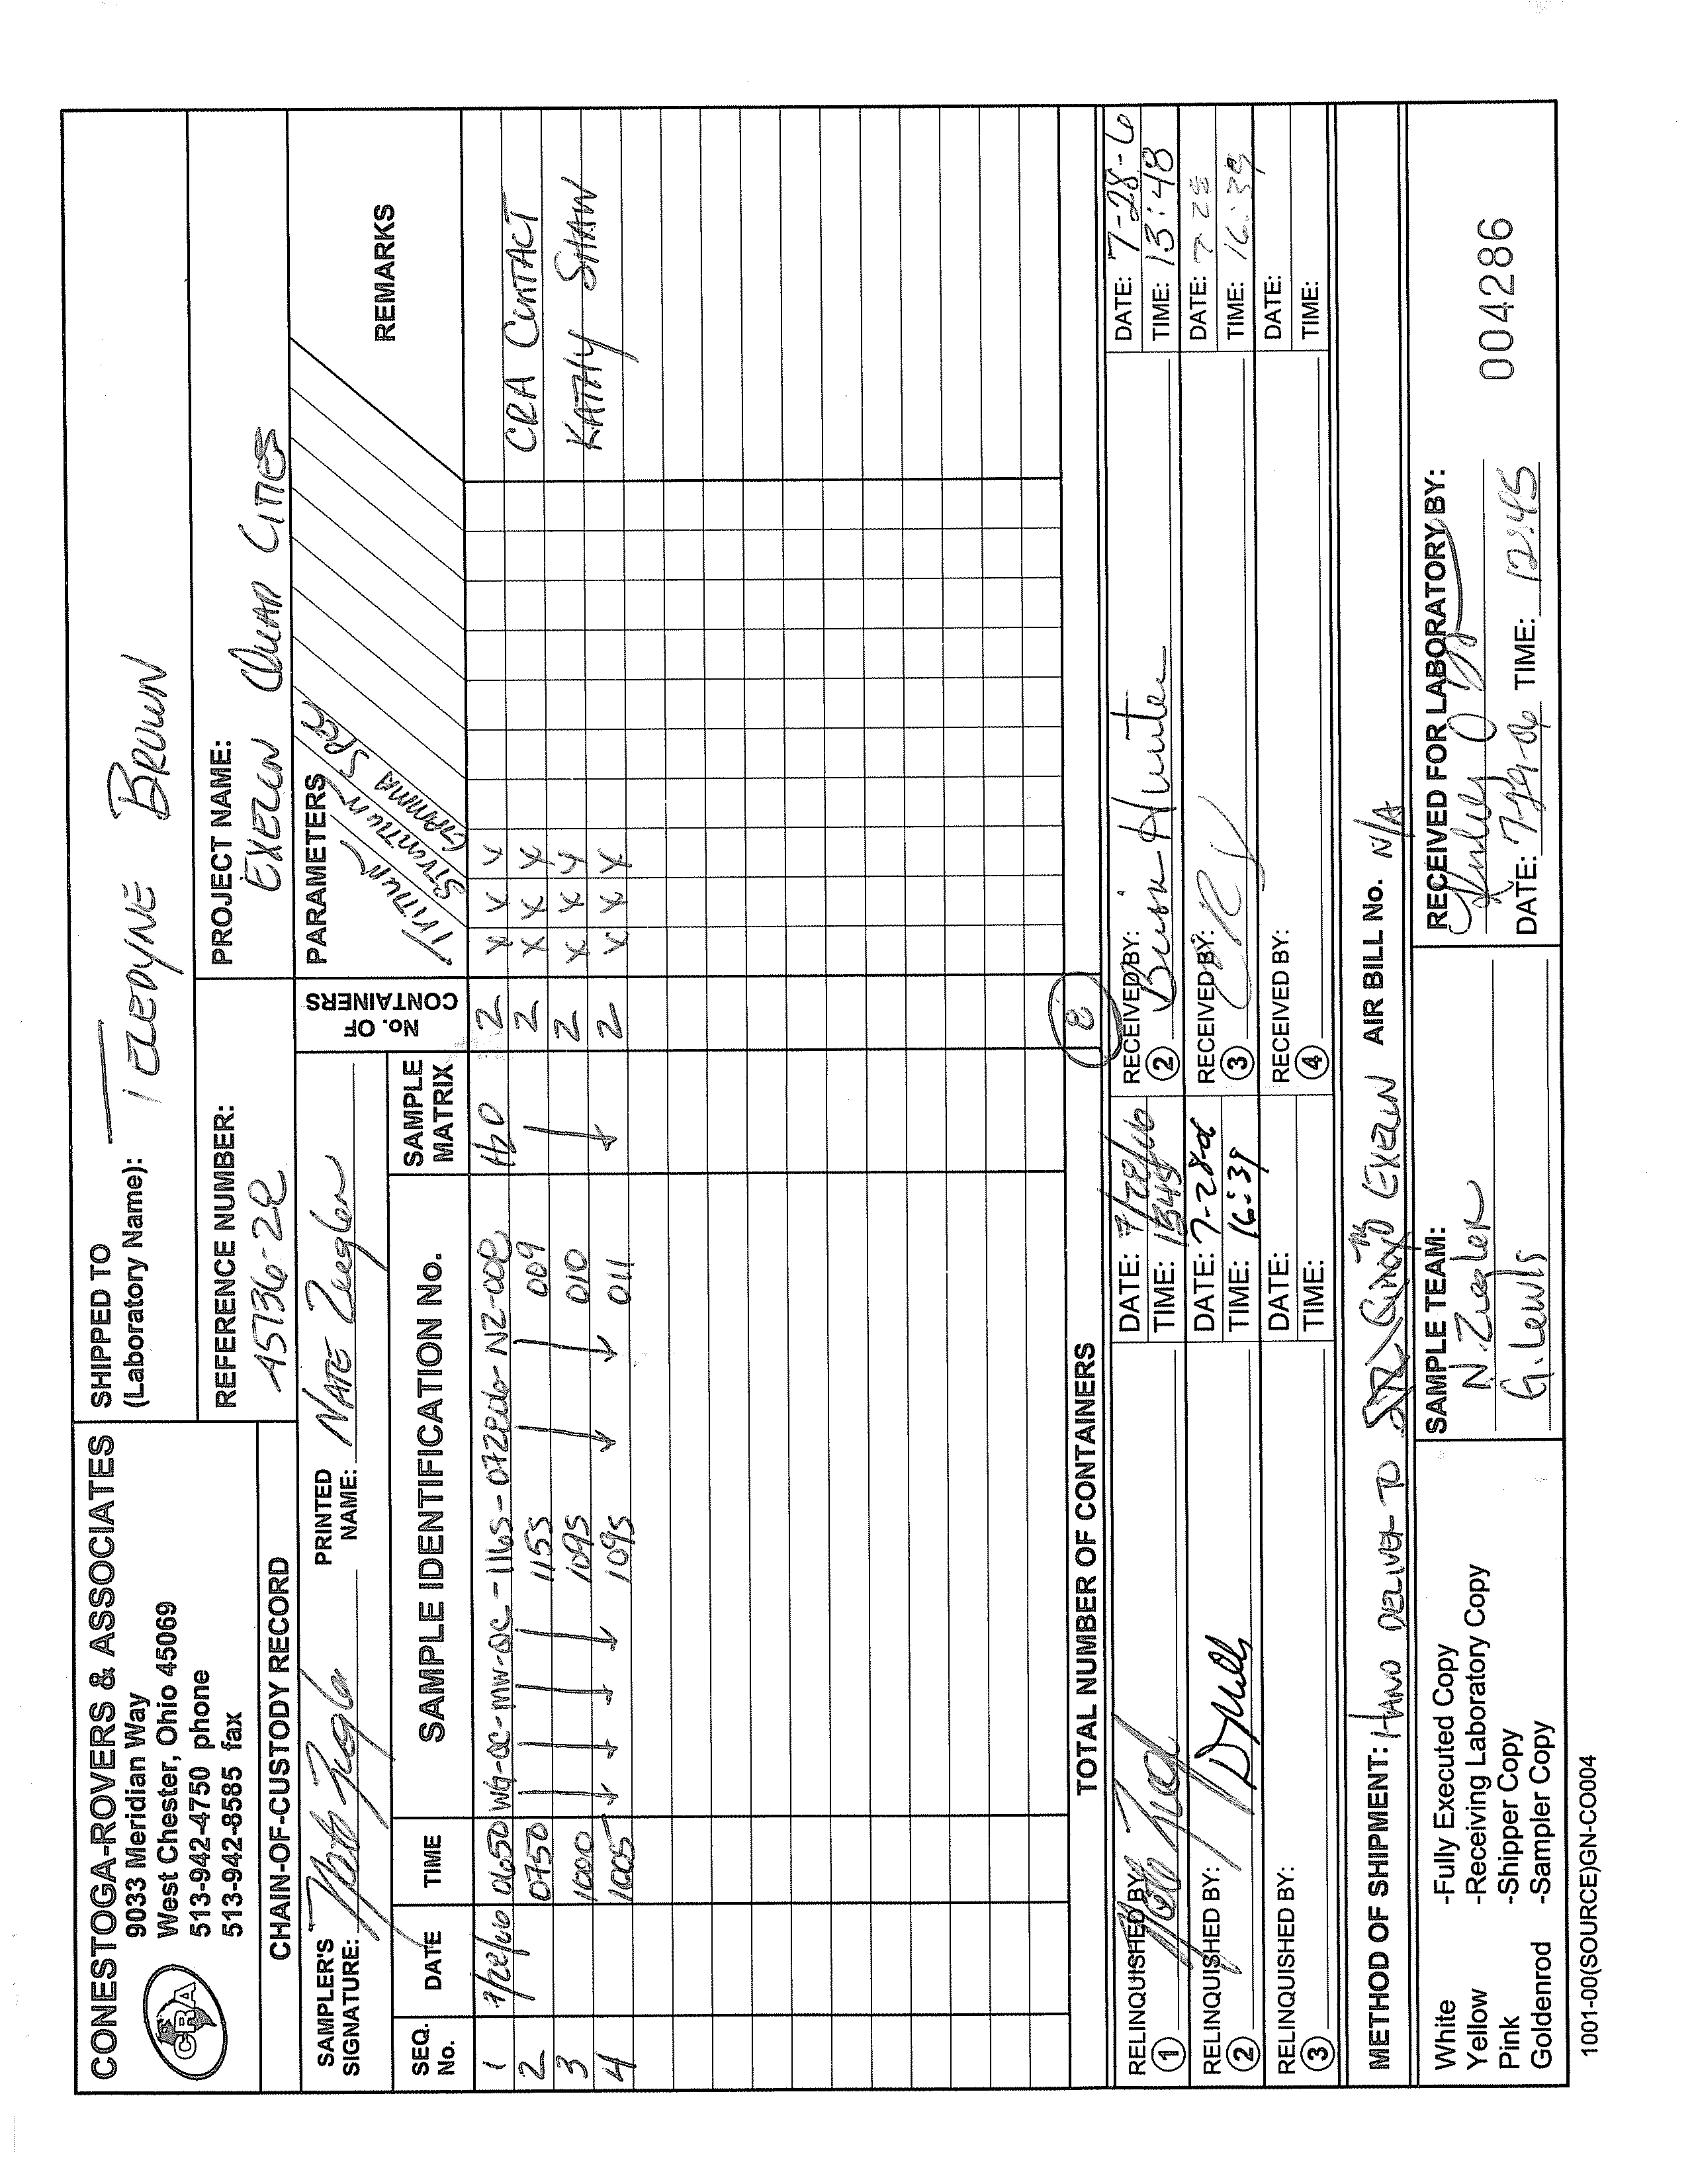
The samples were delivered to Station personnel under chain-of-custody protocol.
Subsequently, the Station shipped the samples under chain-of-custody protocol to
Teledyne Brown for analyses.
4.10
QUALITY CONTROL SAMPLES
Quality control samples were collected to evaluate the sampling and analysis process.
Field Duplicates
Field duplicates were collected to verify the accuracy of the analytical laboratory by
providing two samples collected at the same location
and then comparing the analytical
results for consistency. Field duplicate samples were collected at a frequency of one
duplicate for every ten samples collected. A total of five duplicate samples were
collected. The locations of duplicate samples were selected in the field during the
performance of sample collection activities. The duplicate samples were collected
simultaneously with the actual sample and were analyzed for the same parameters as
the actual samples.
Rinsate Blank Samples
Rinsate blanks were collected to verify that decontamination procedures conducted in
the field were adequate.
Rinsate blanks were collected by routing Station-supplied
demineralized water through decontaminated sampling equipment. Rinsate blanks
were collected at a frequency of one rinsate blank for every day samples were collected
using non-disposable or non-dedicated equipment. Three rinsate blanks were collected.
Split Samples
Split samples were collected by CRA for the NRC for tritium simultaneously with the
actual sample at each sample
location. Split samples were delivered to the Station
personnel and made available to the NRC. In addition, split samples were collected
May 31, 2006 at monitoring wells MW-QC-106I and MW-QC-107I for the NRC and were
given to the NRC representative.
4.11
ANALYSES
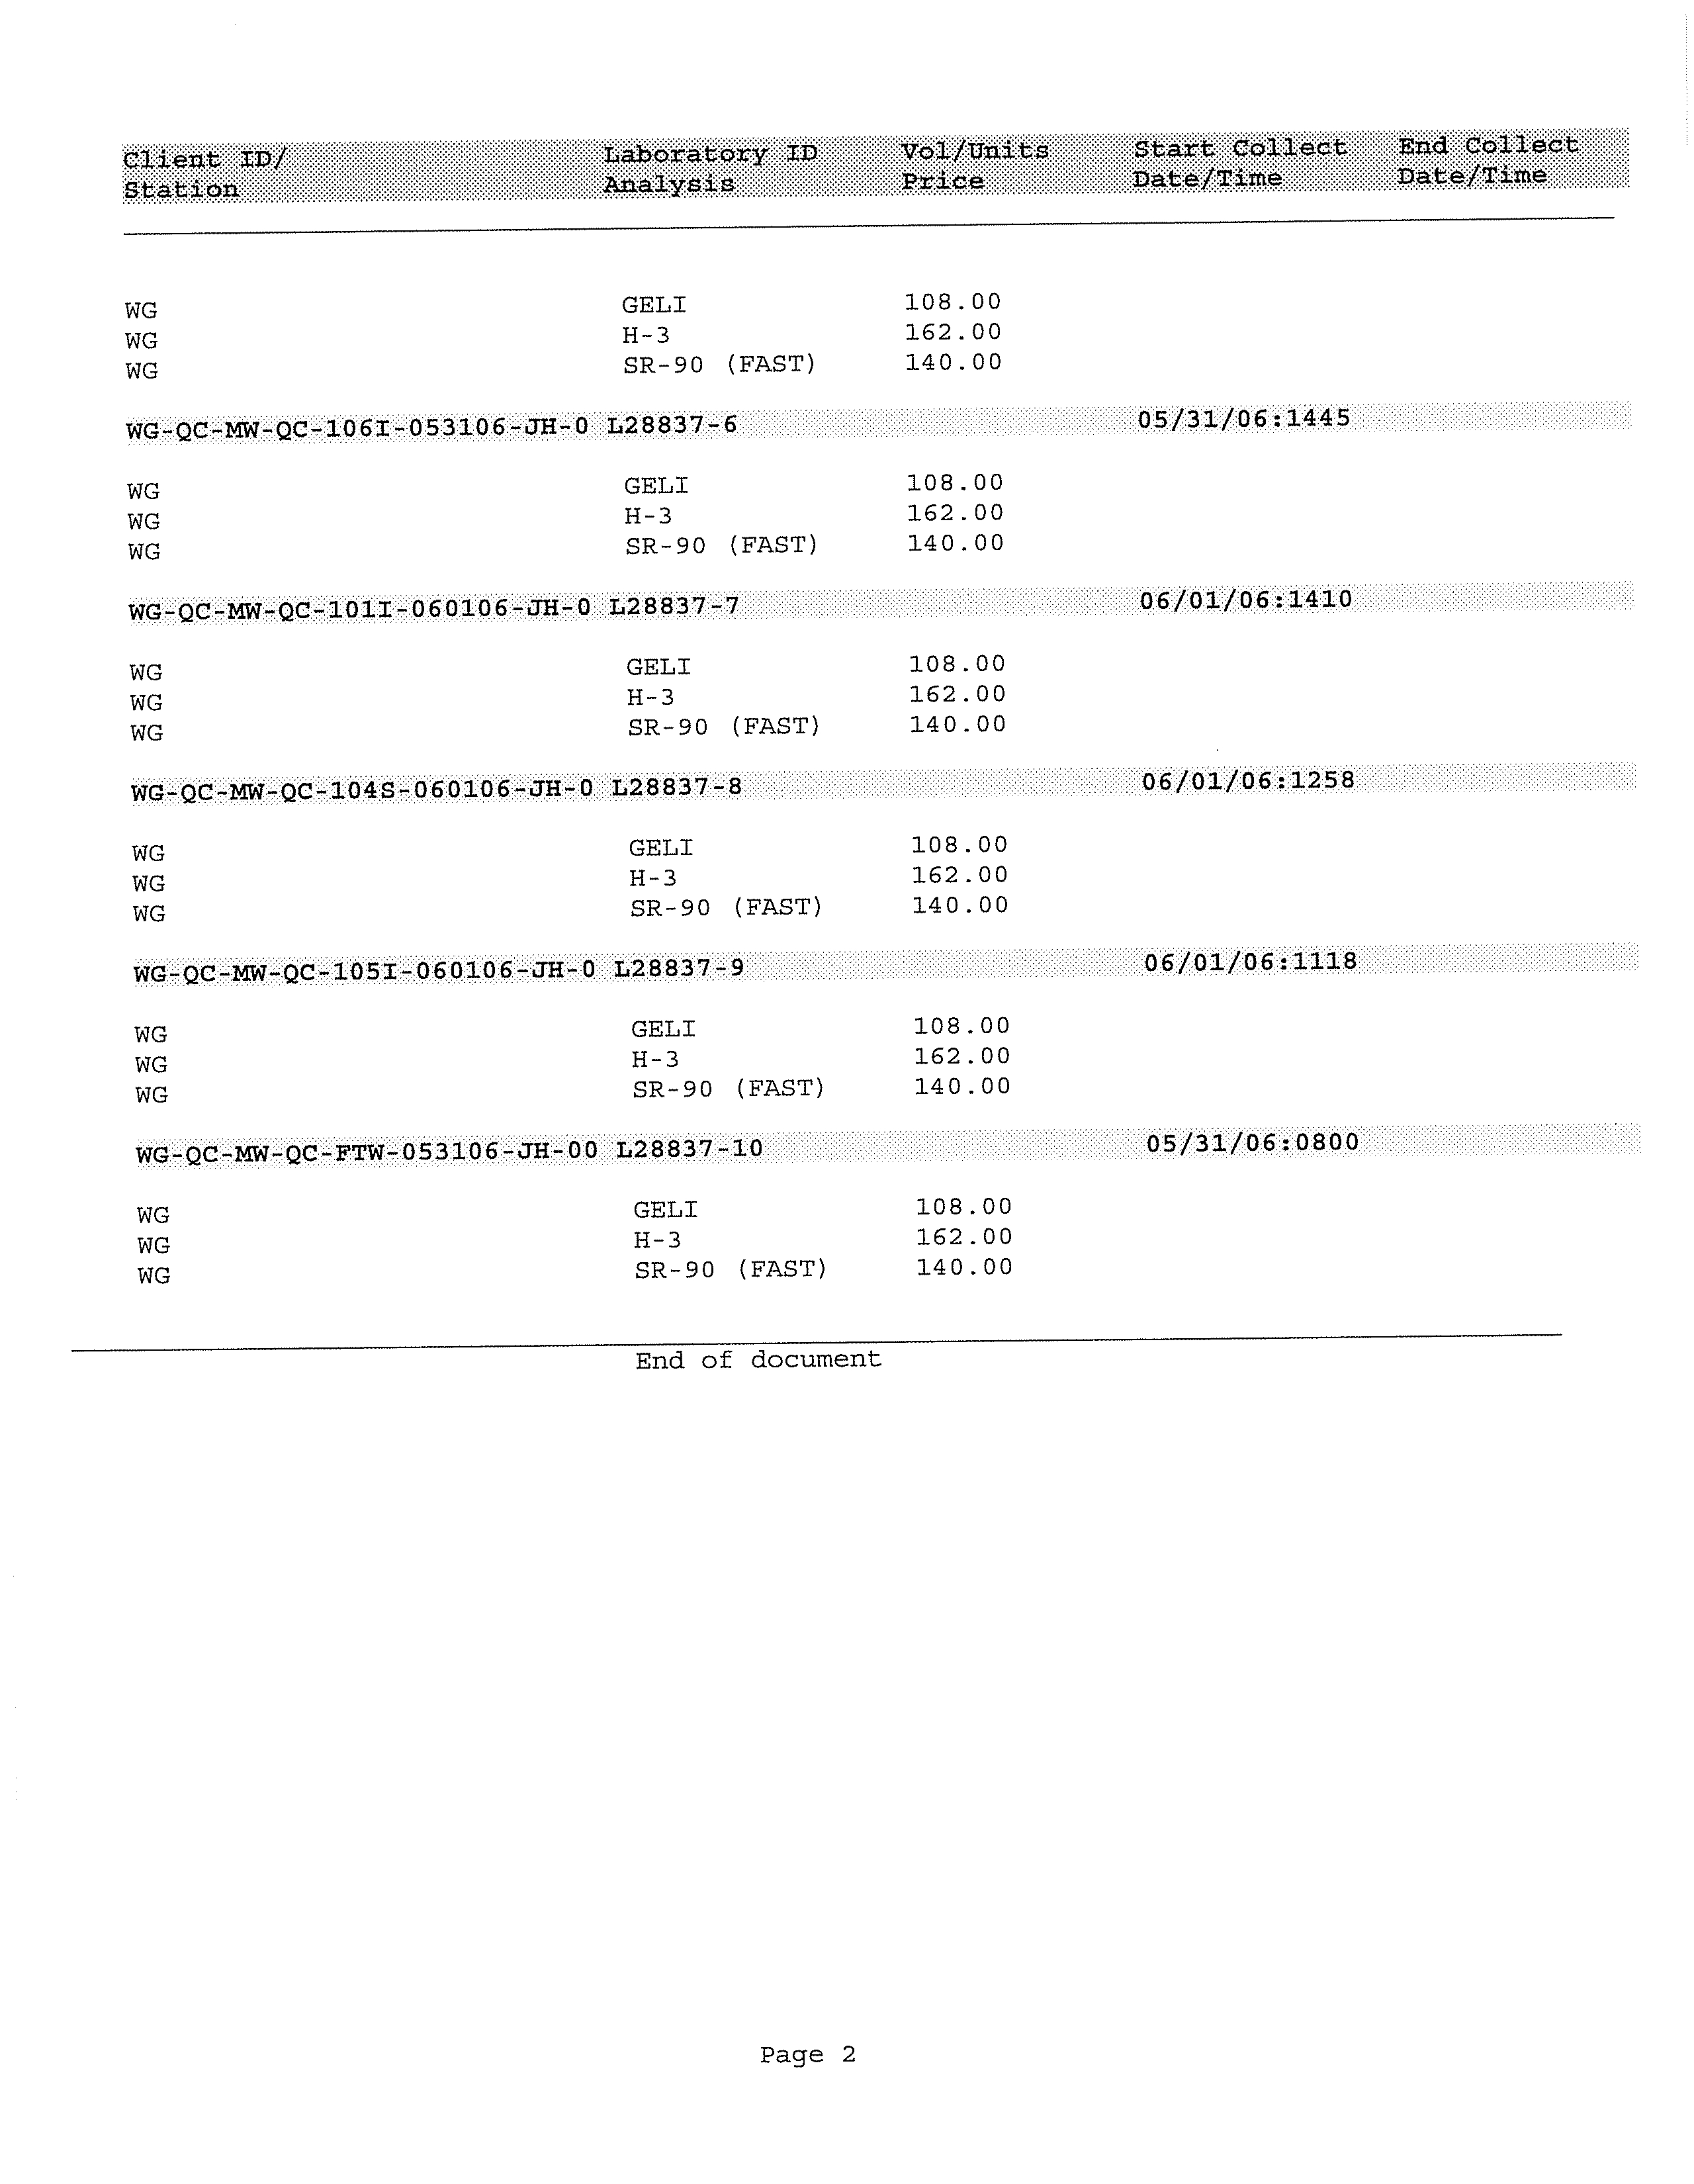
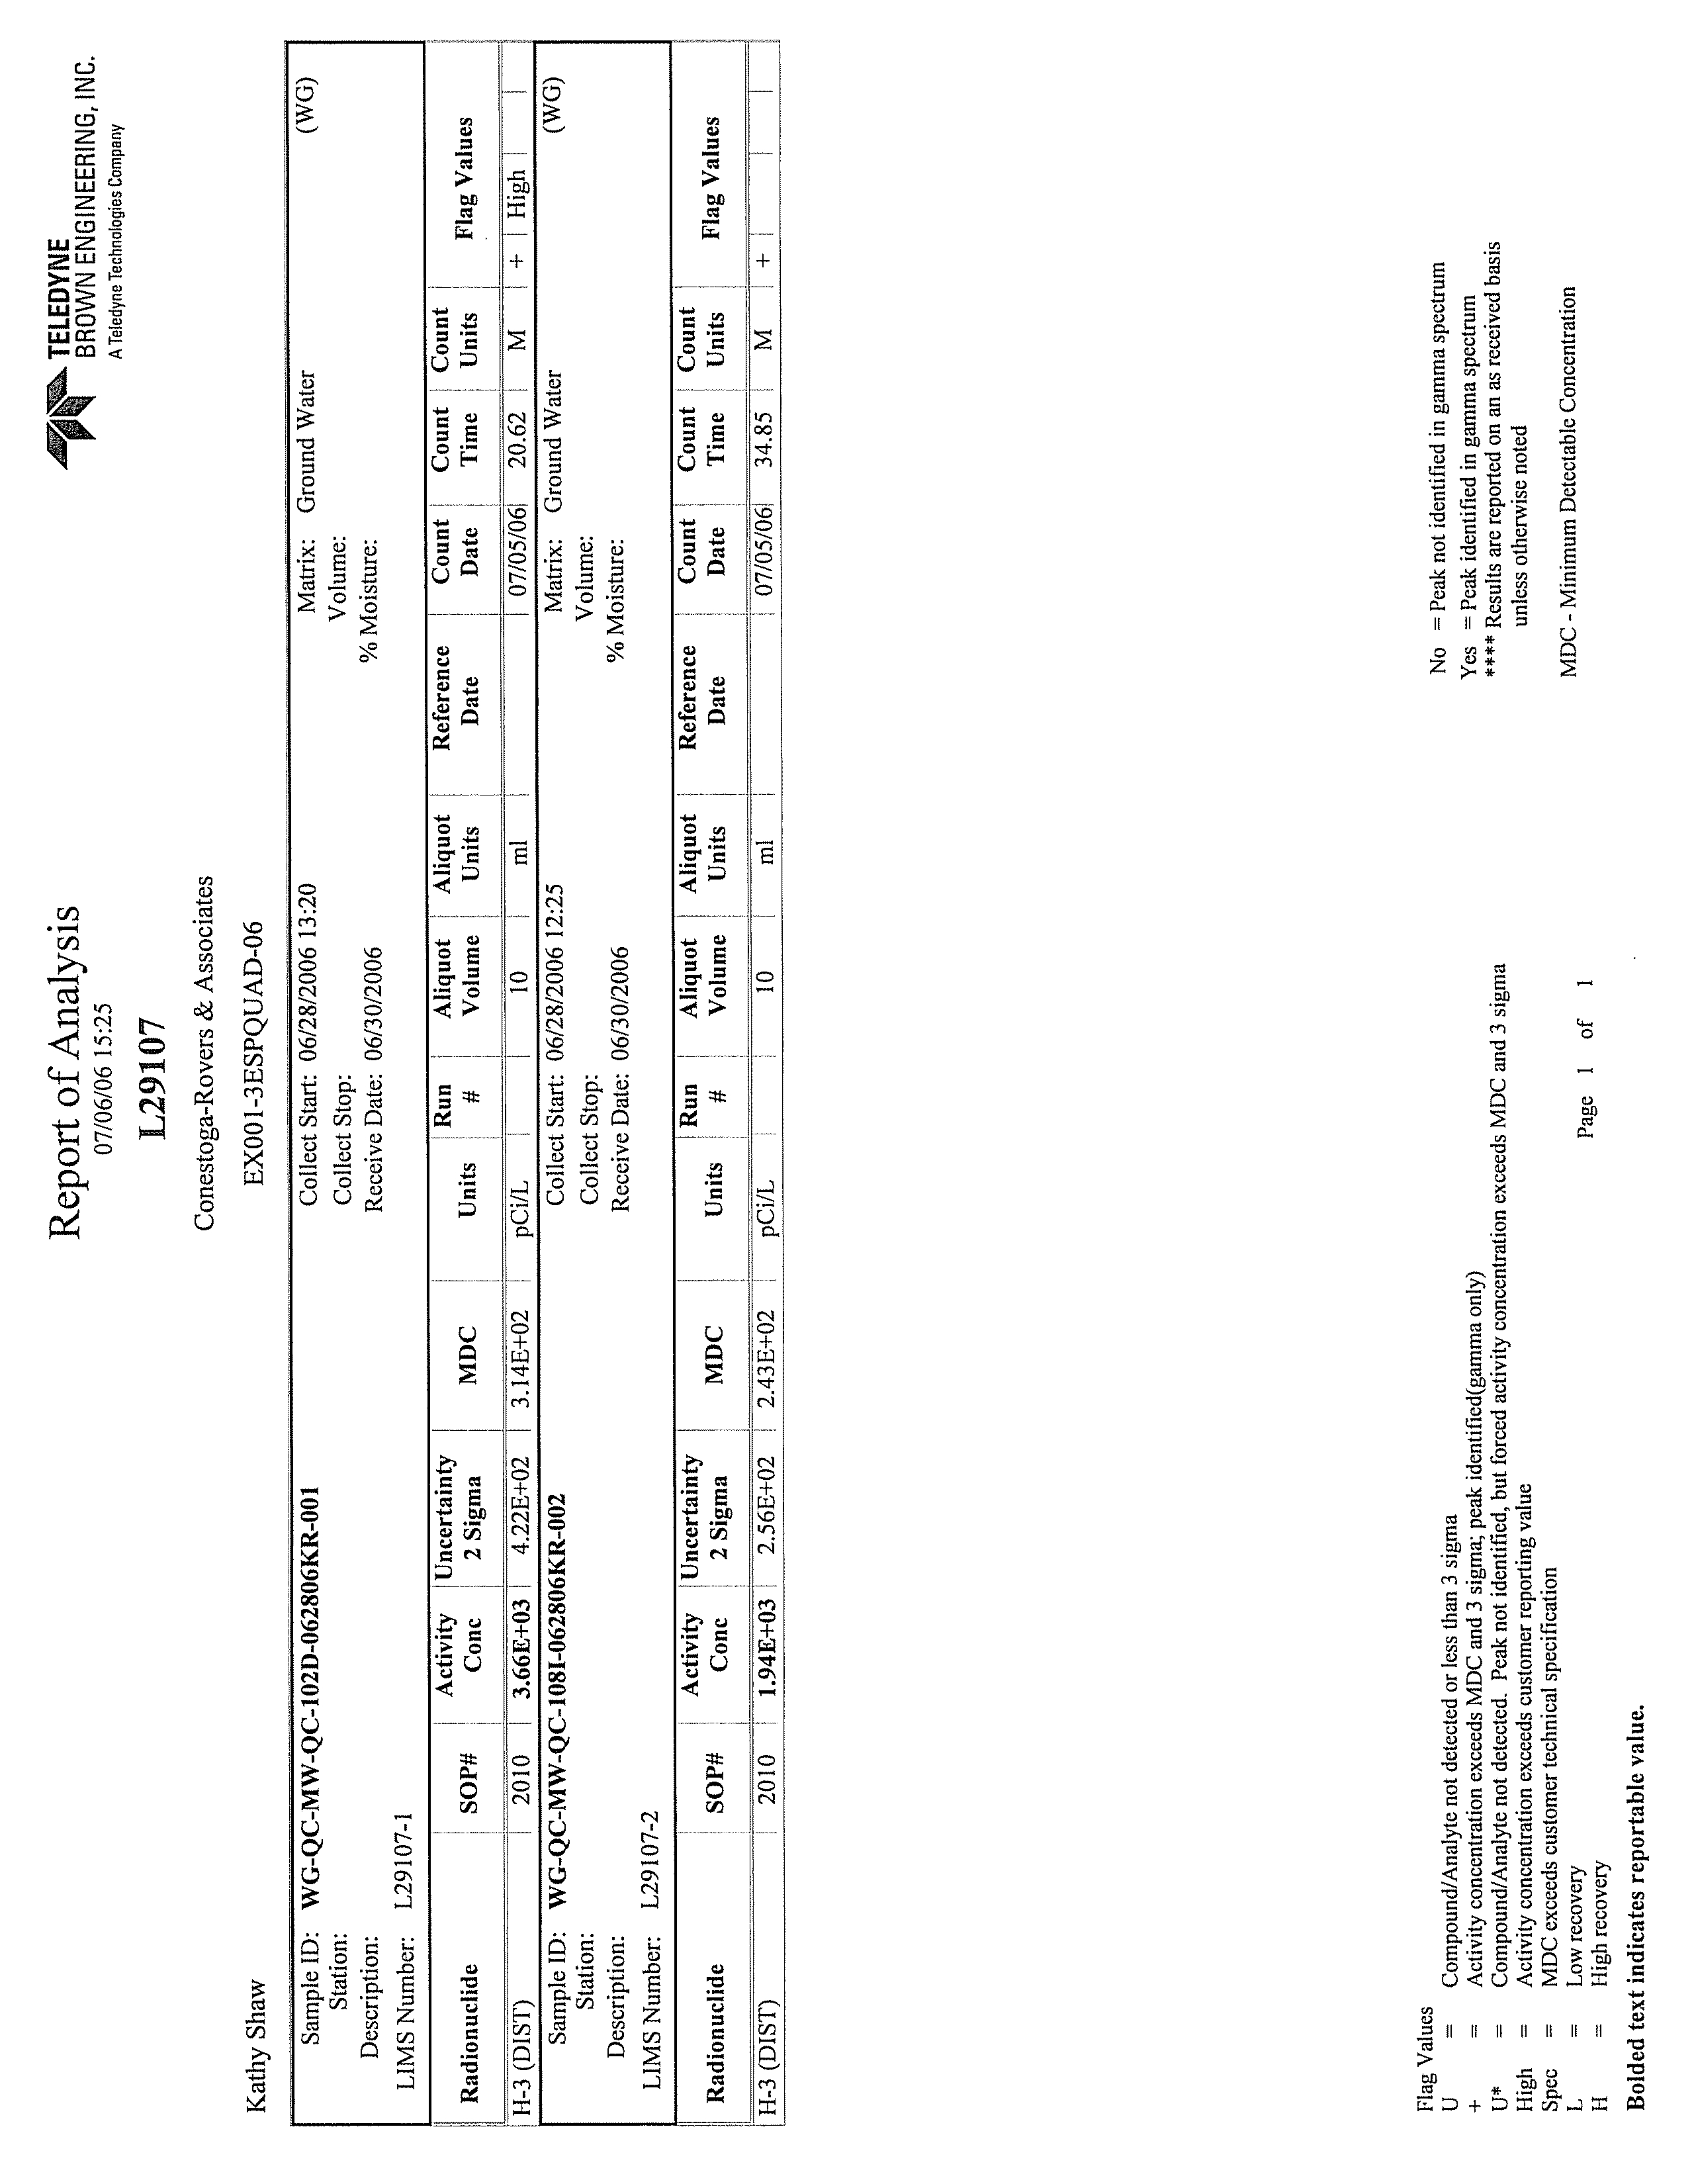
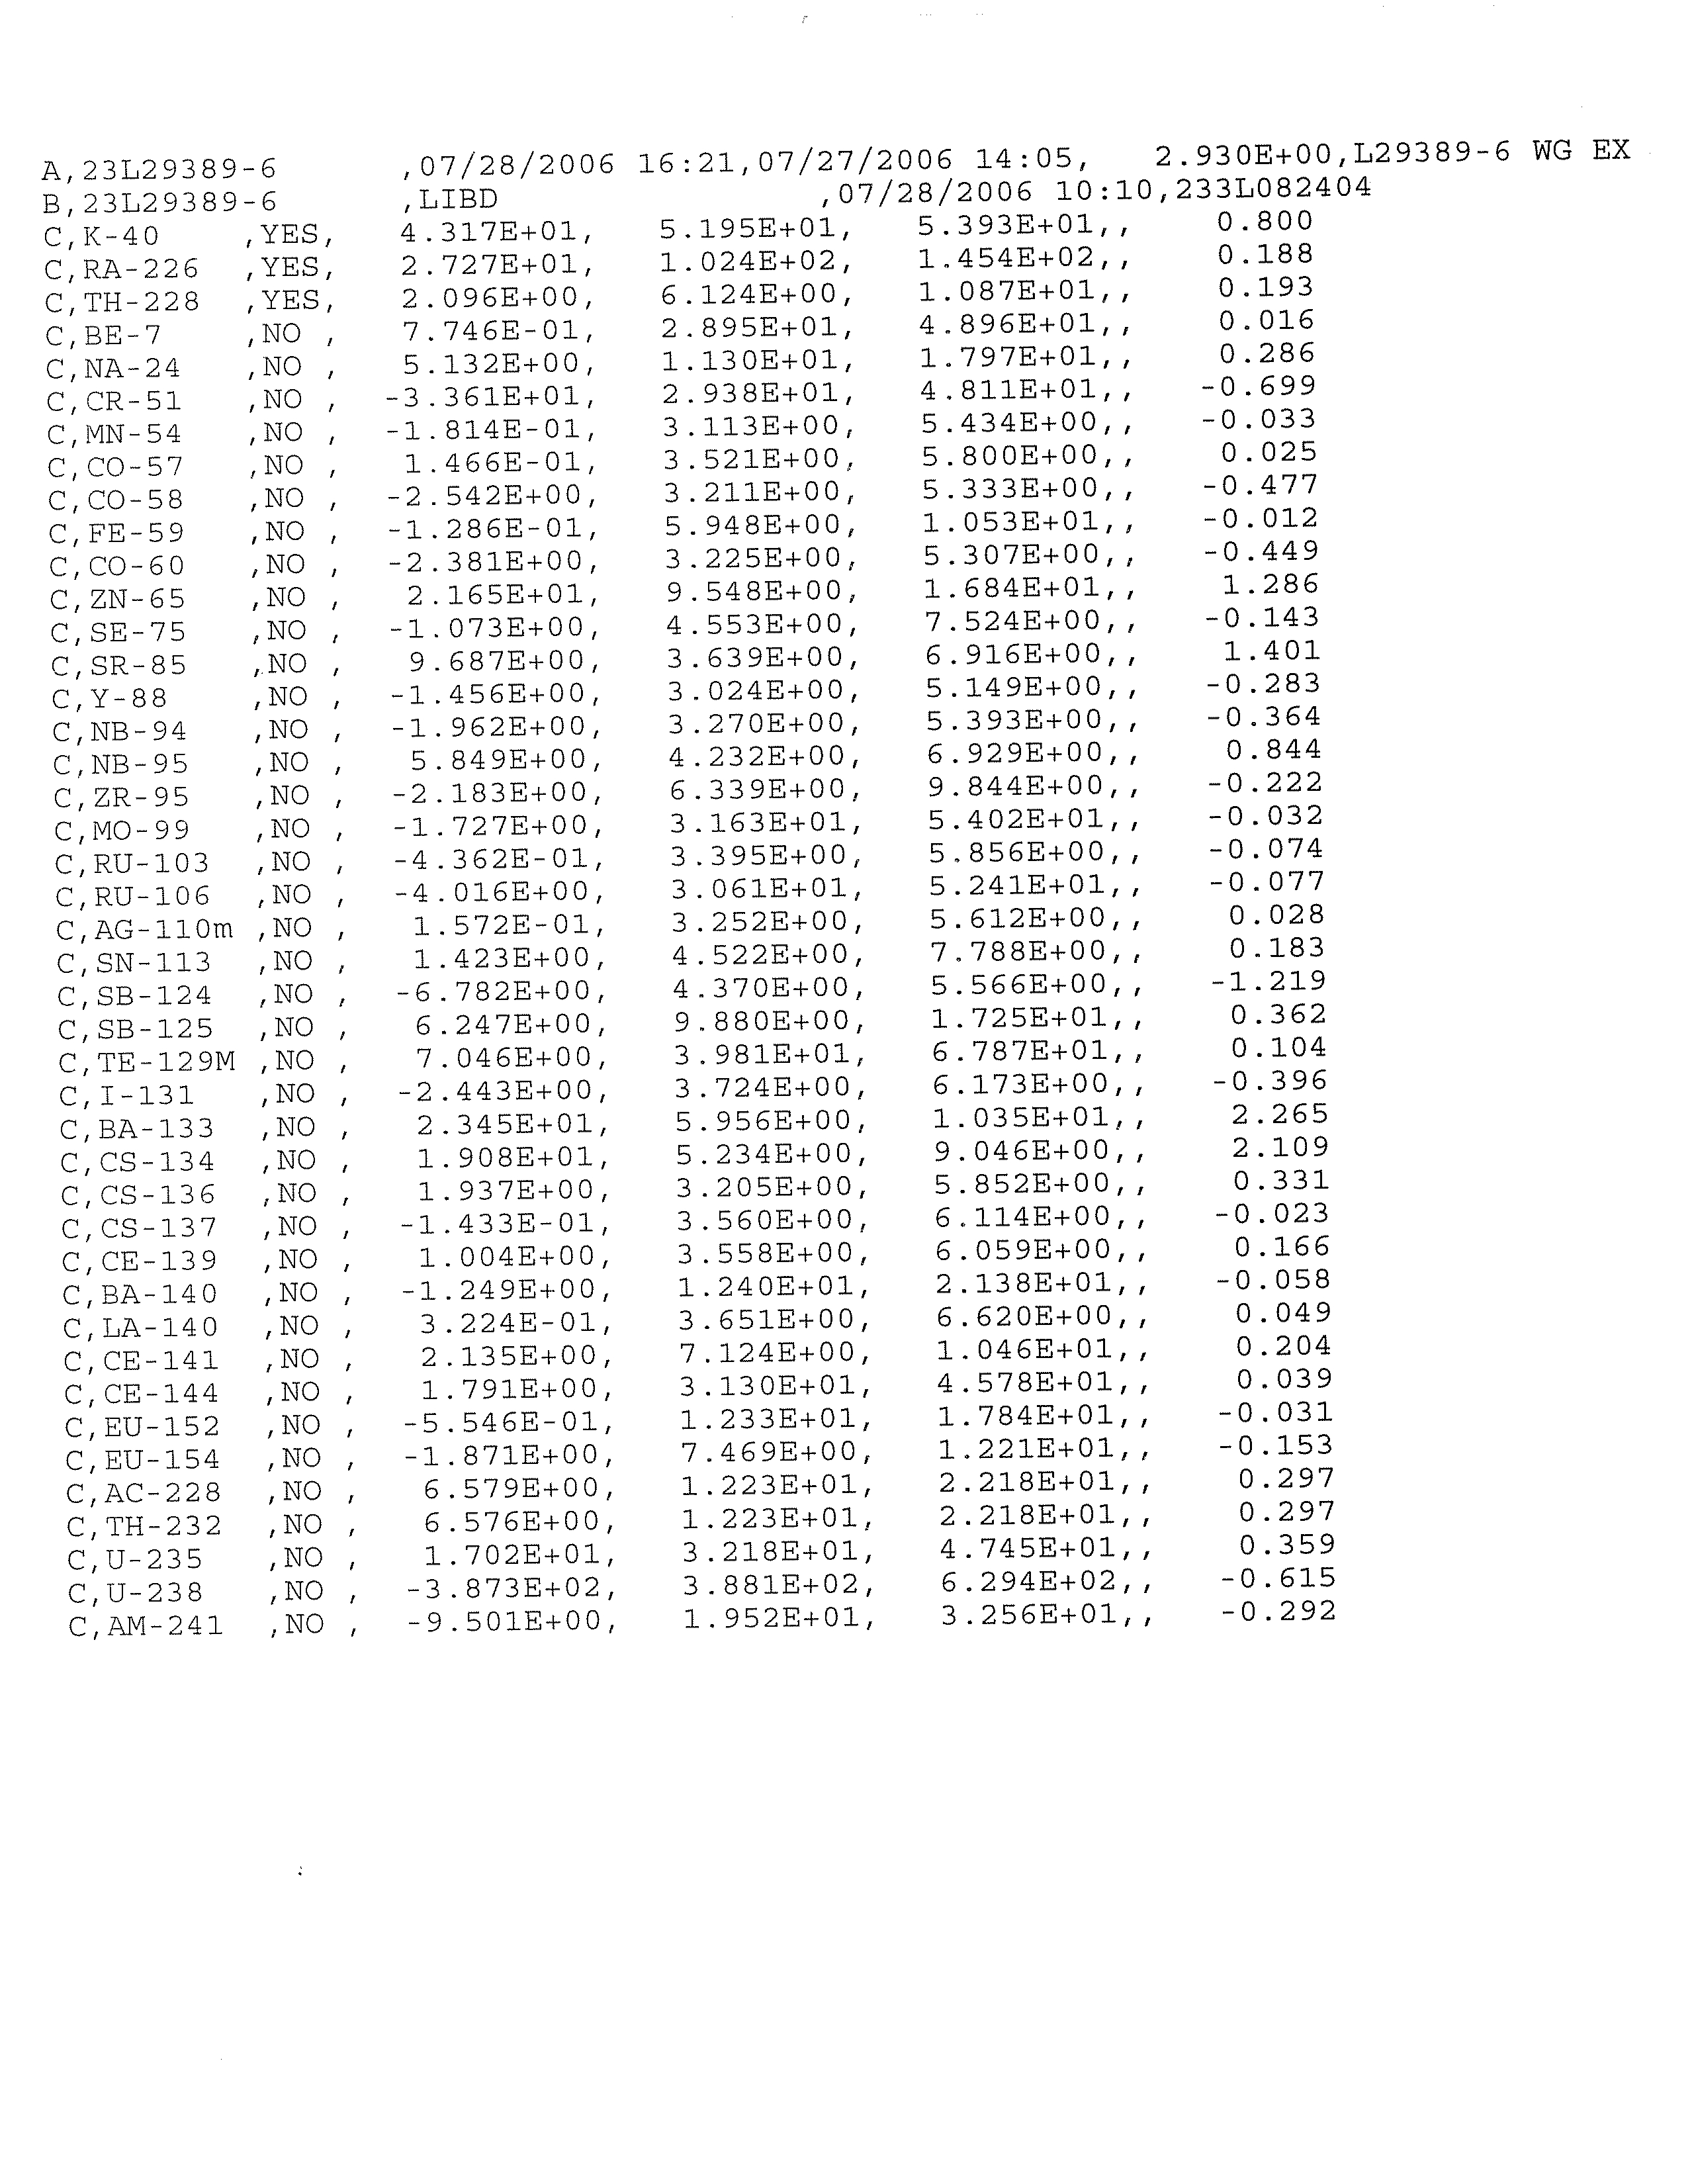
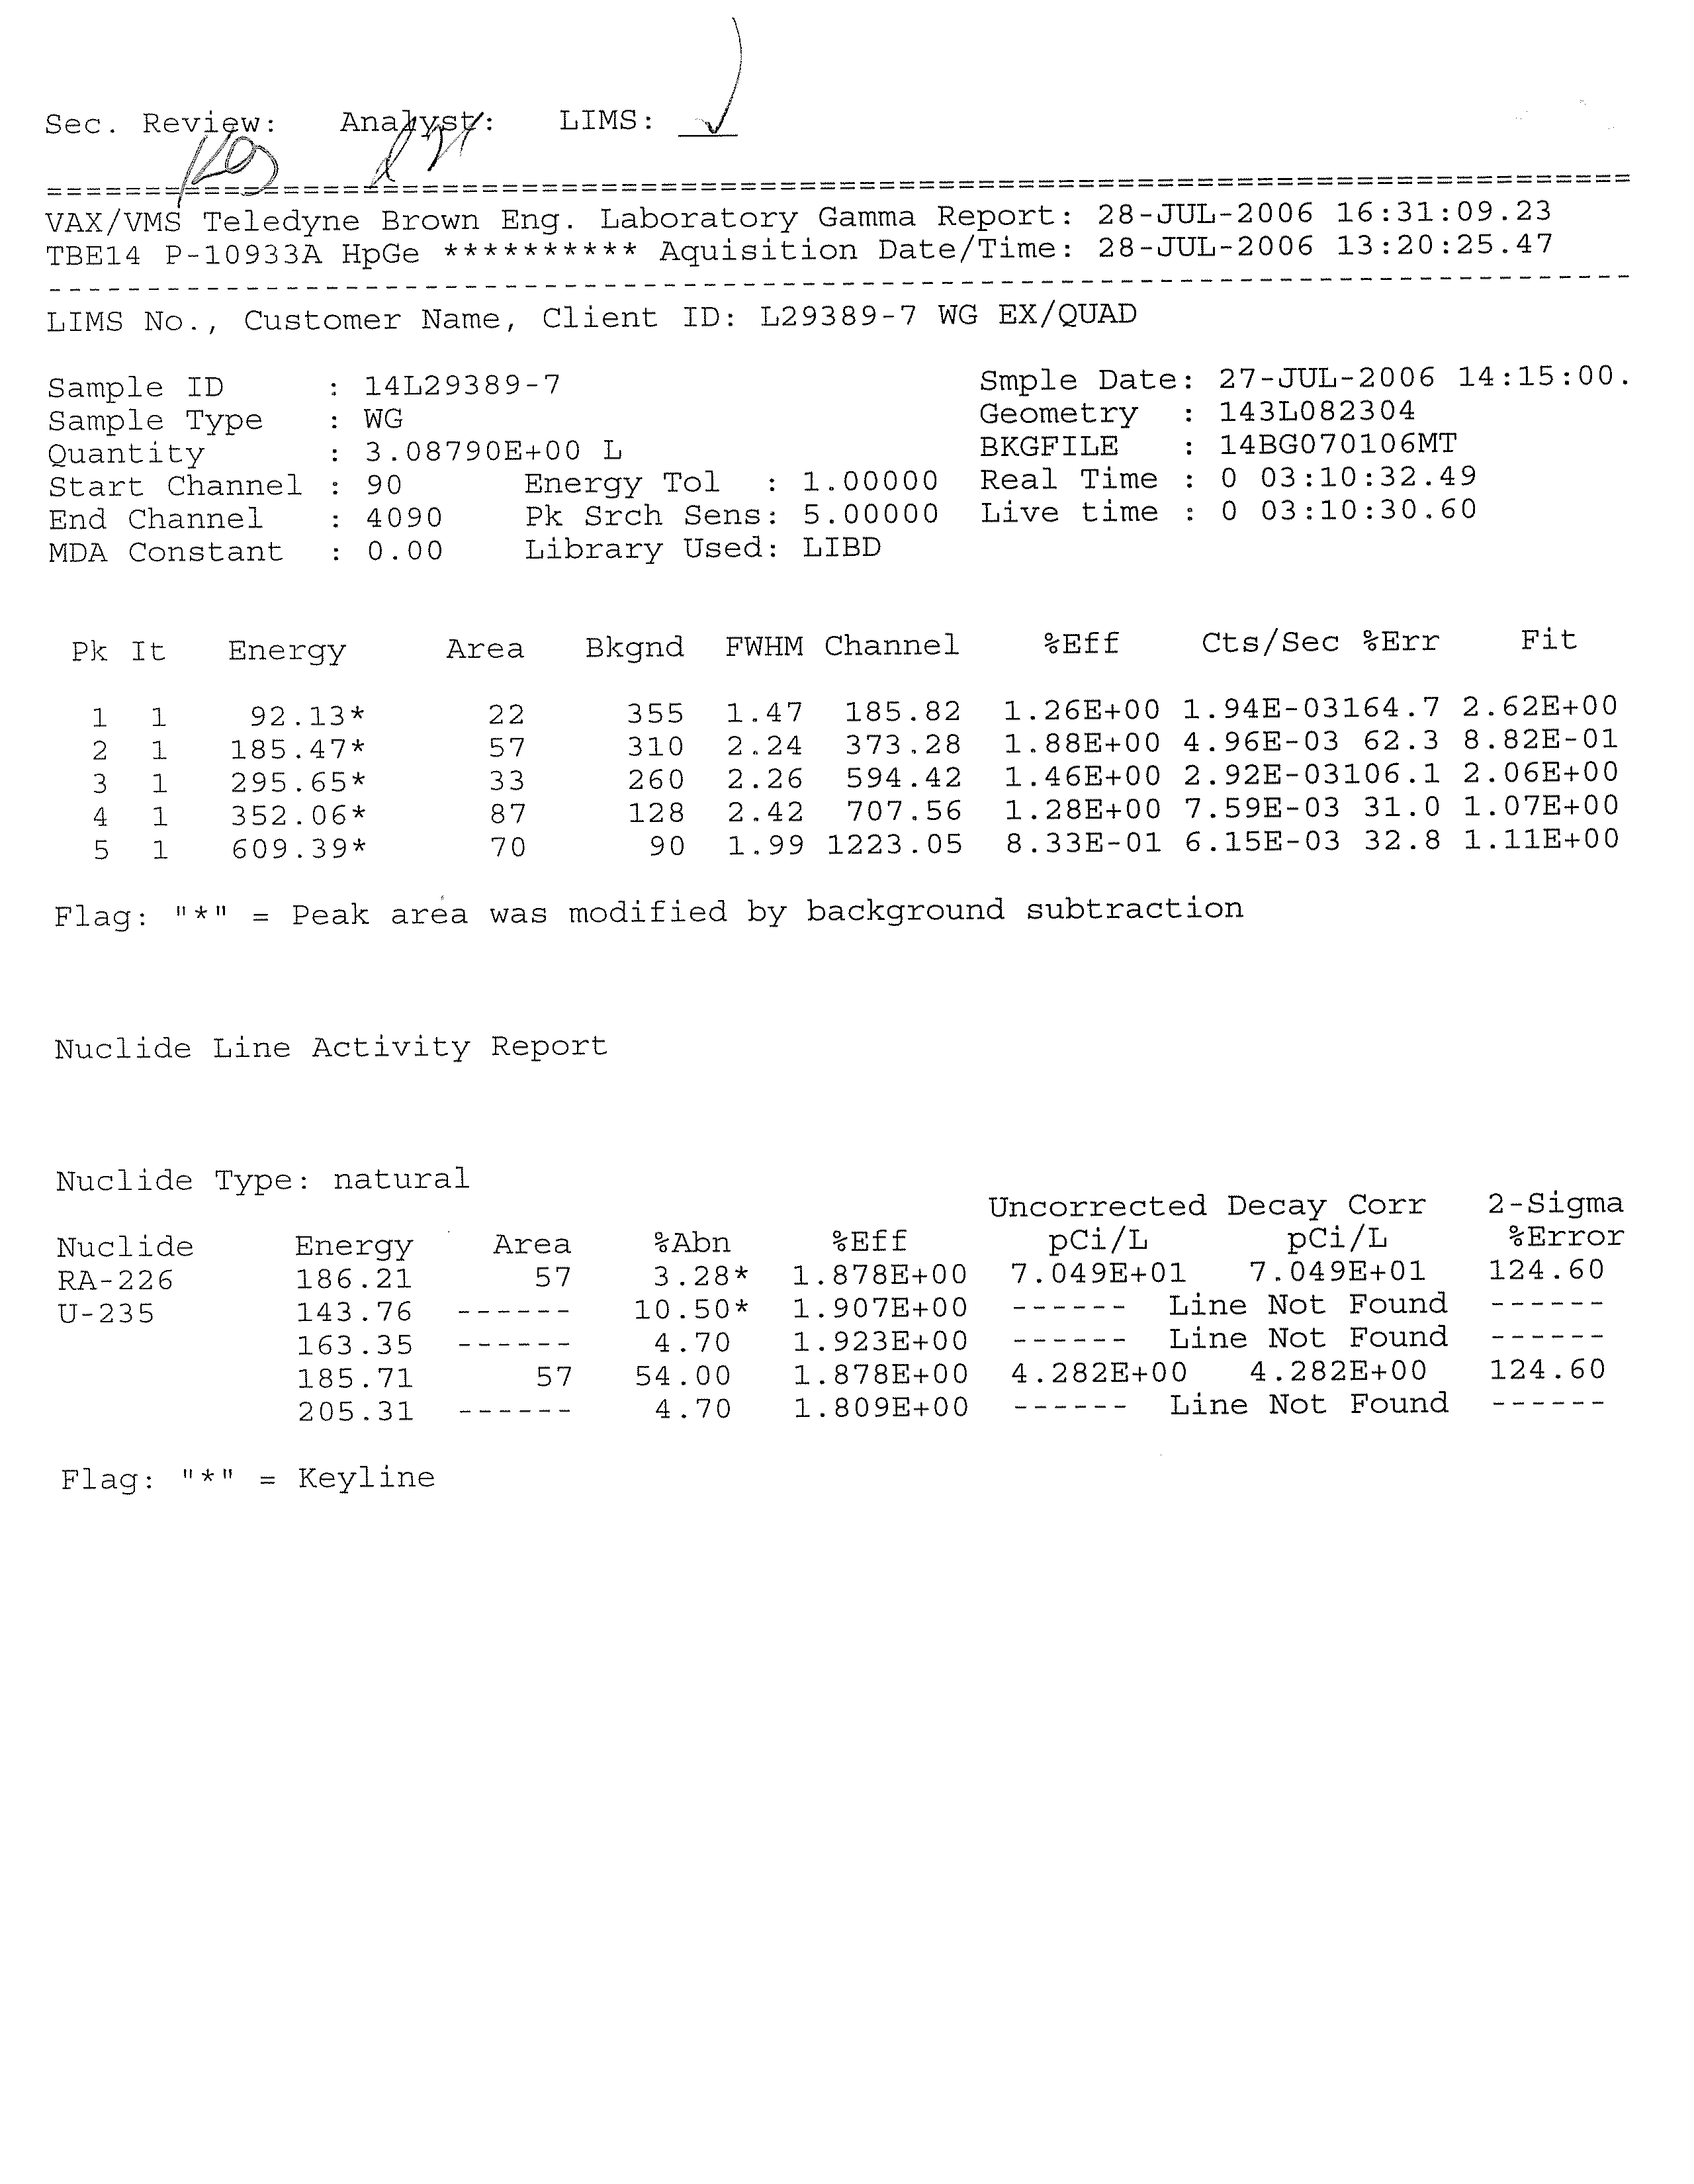
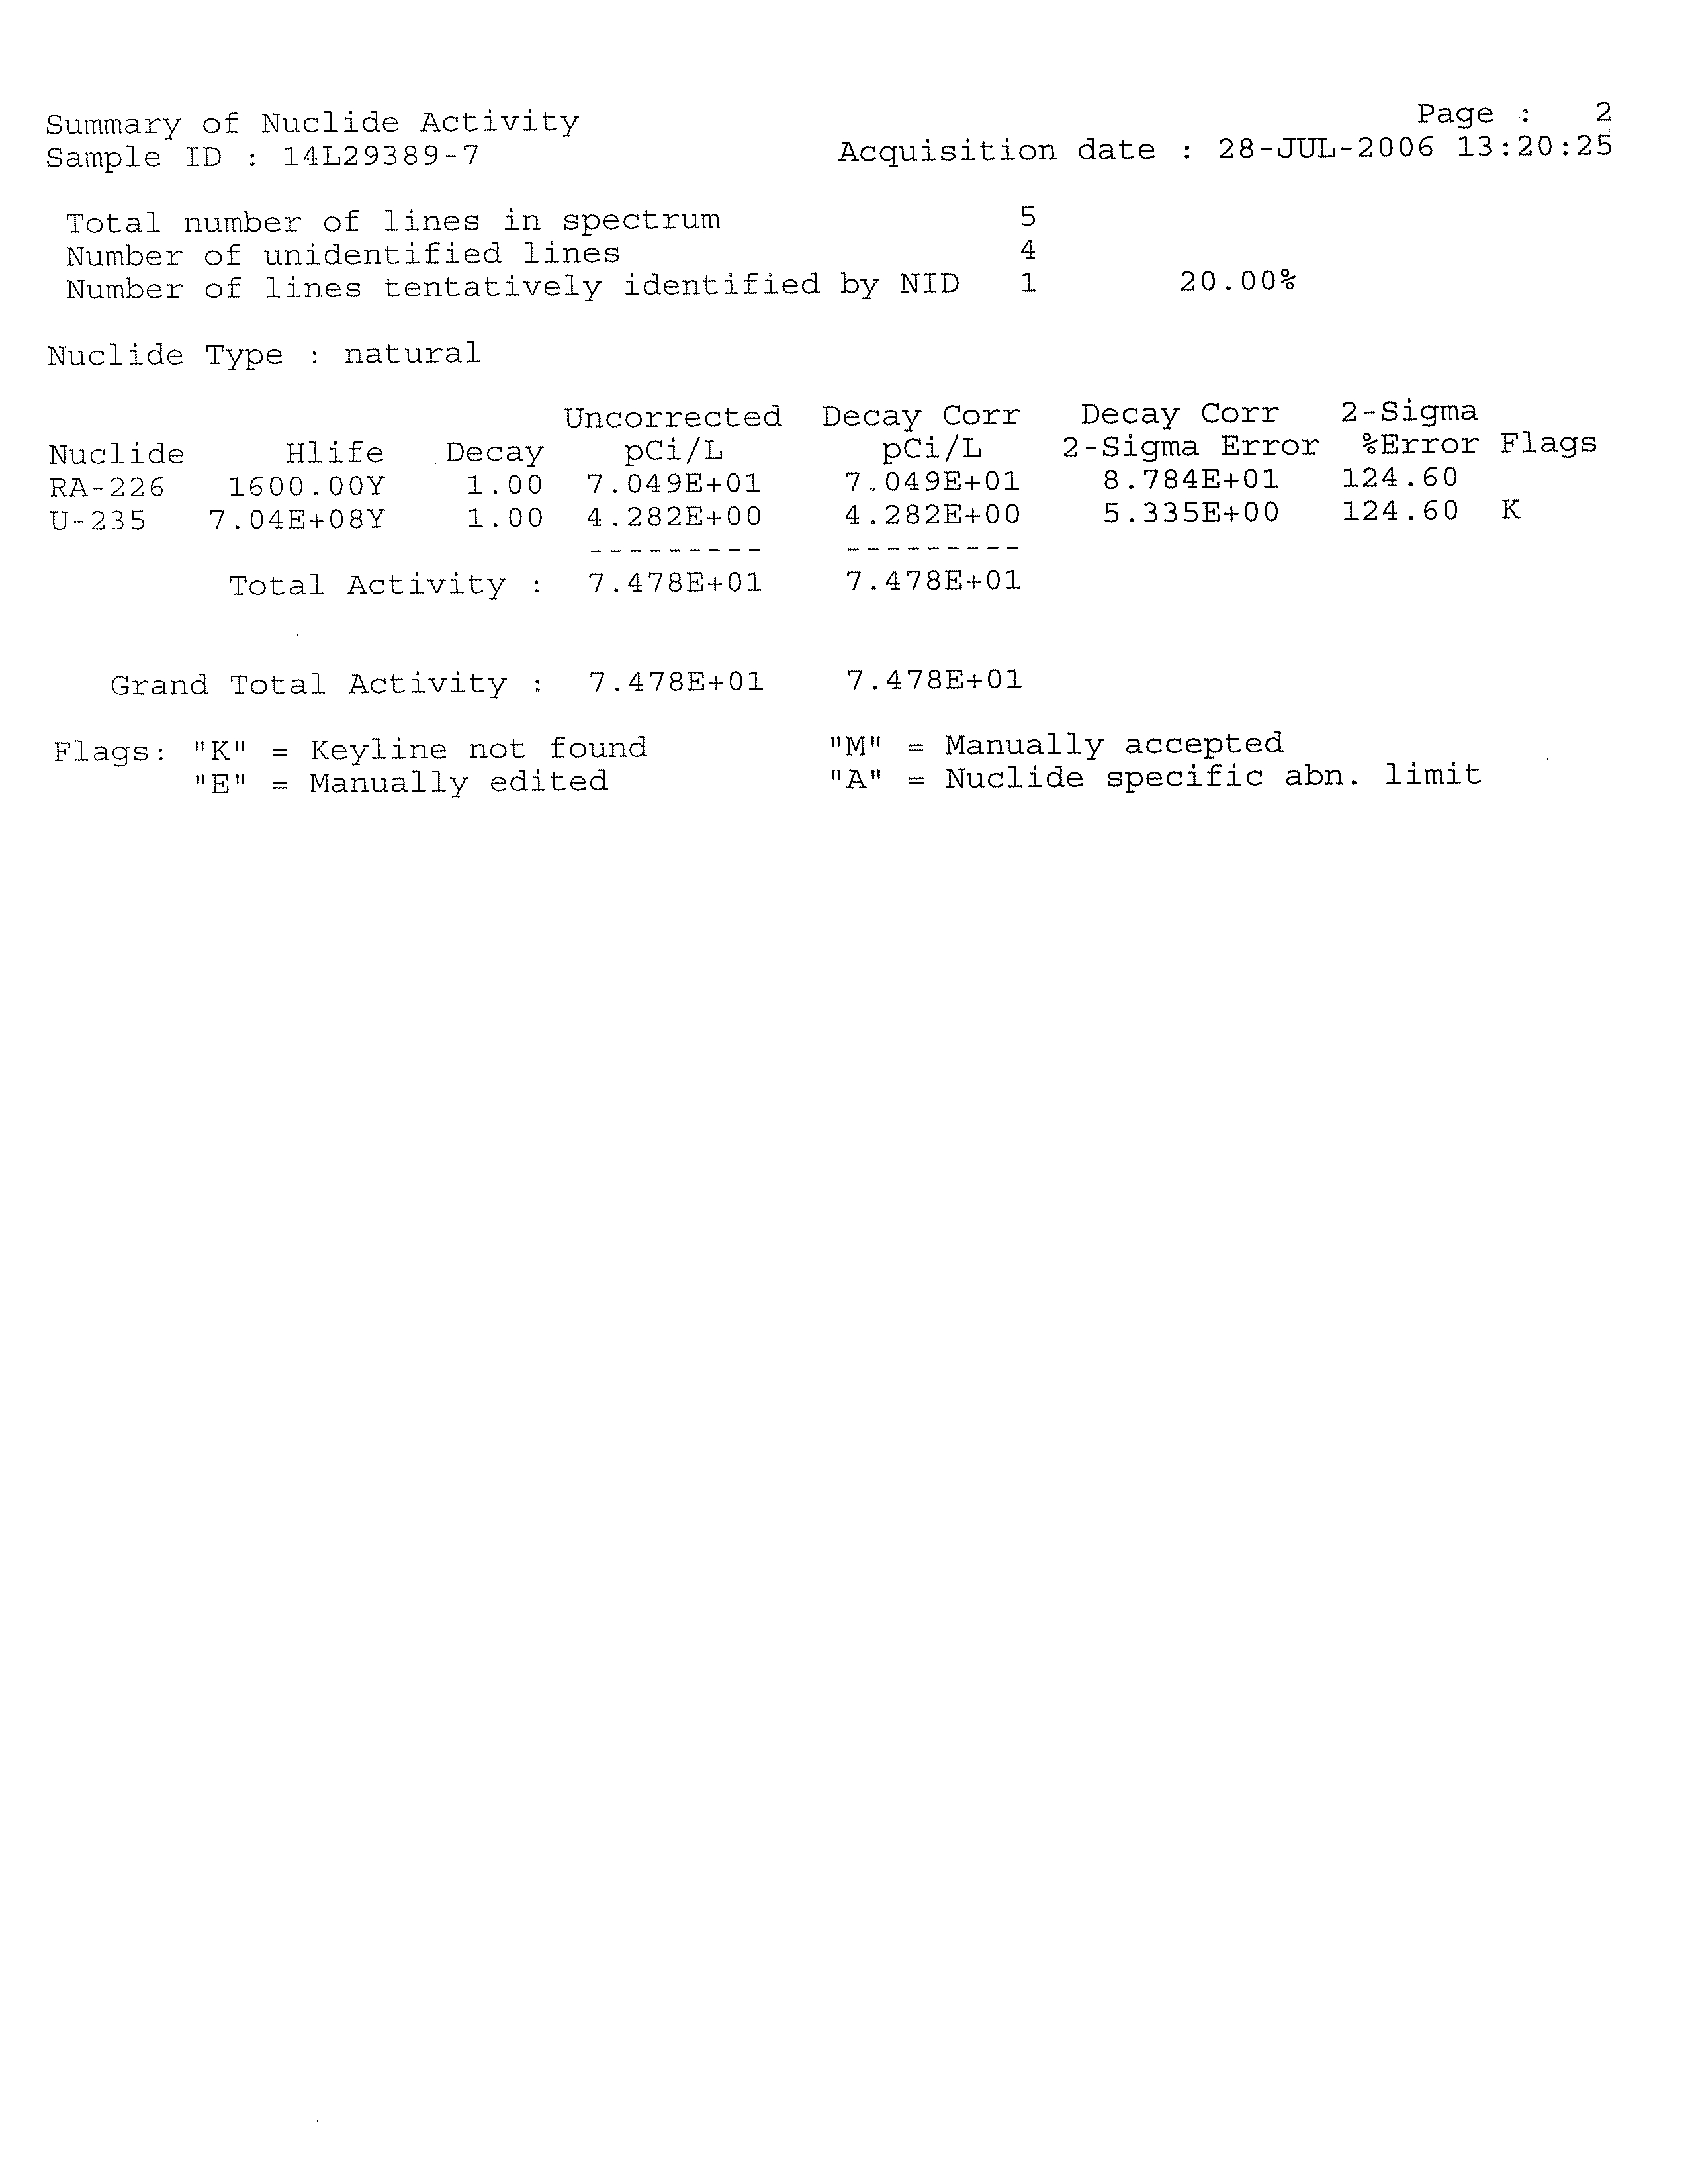
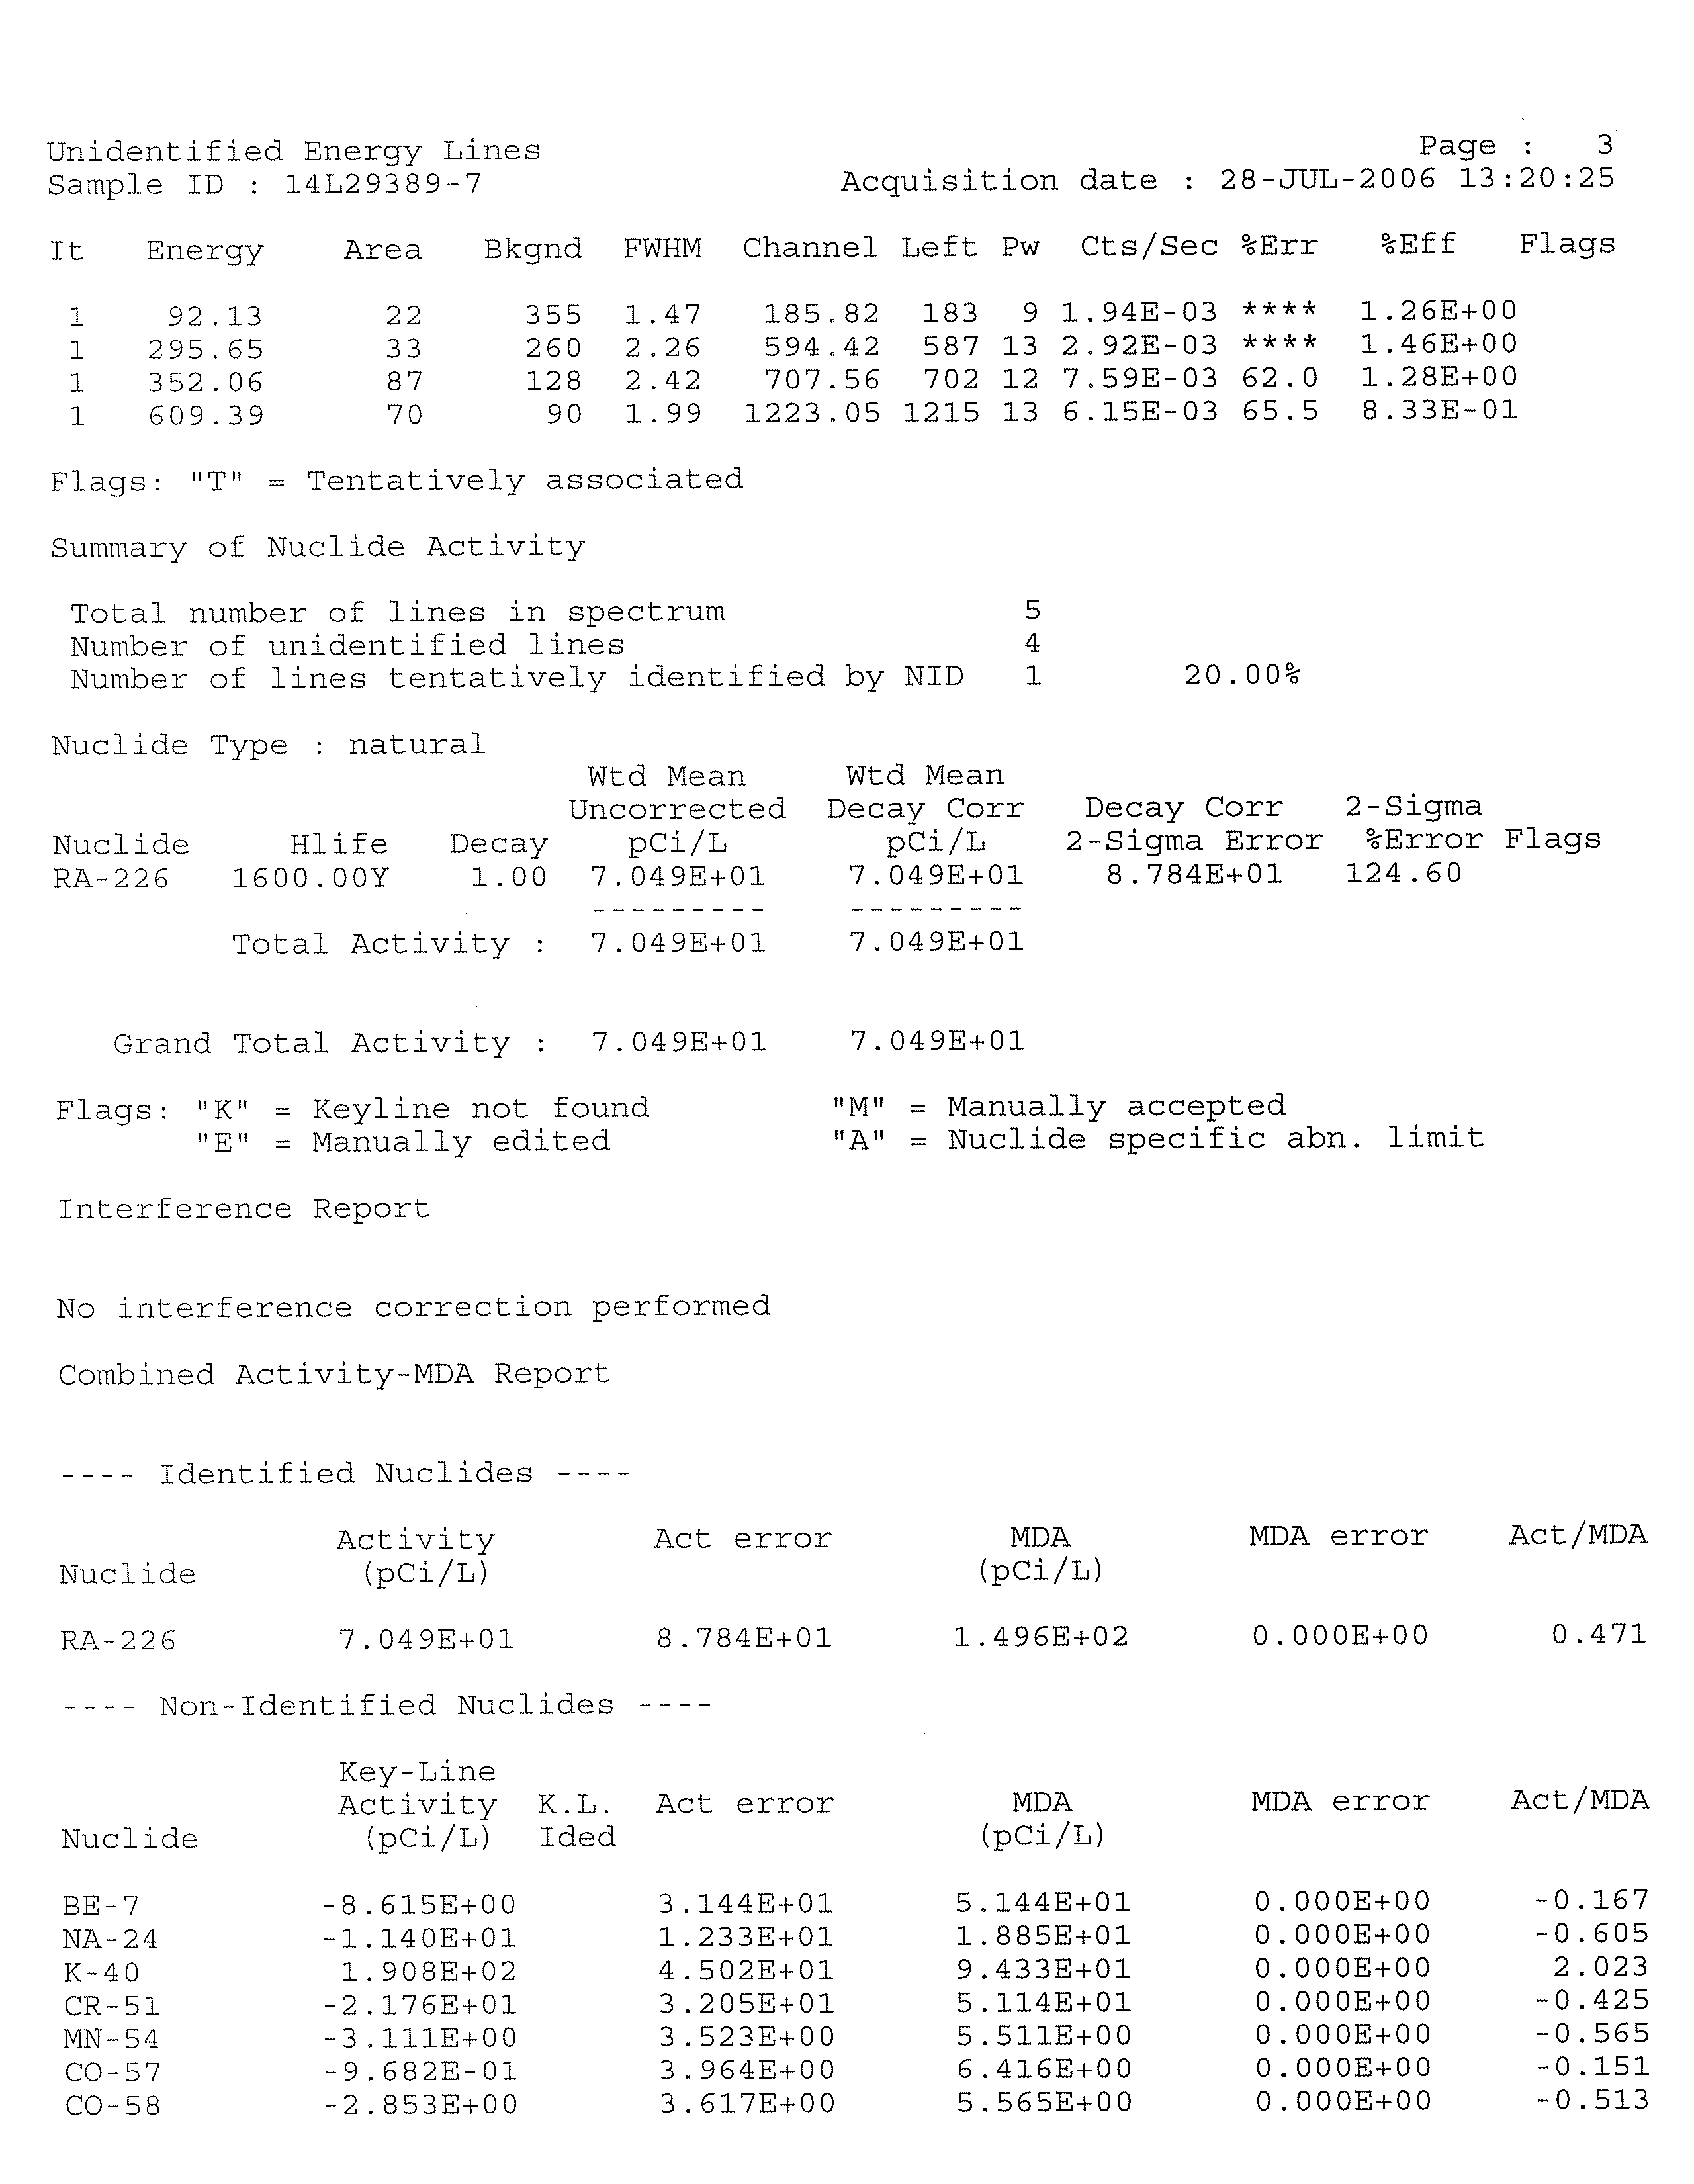
Groundwater and surface water samples were
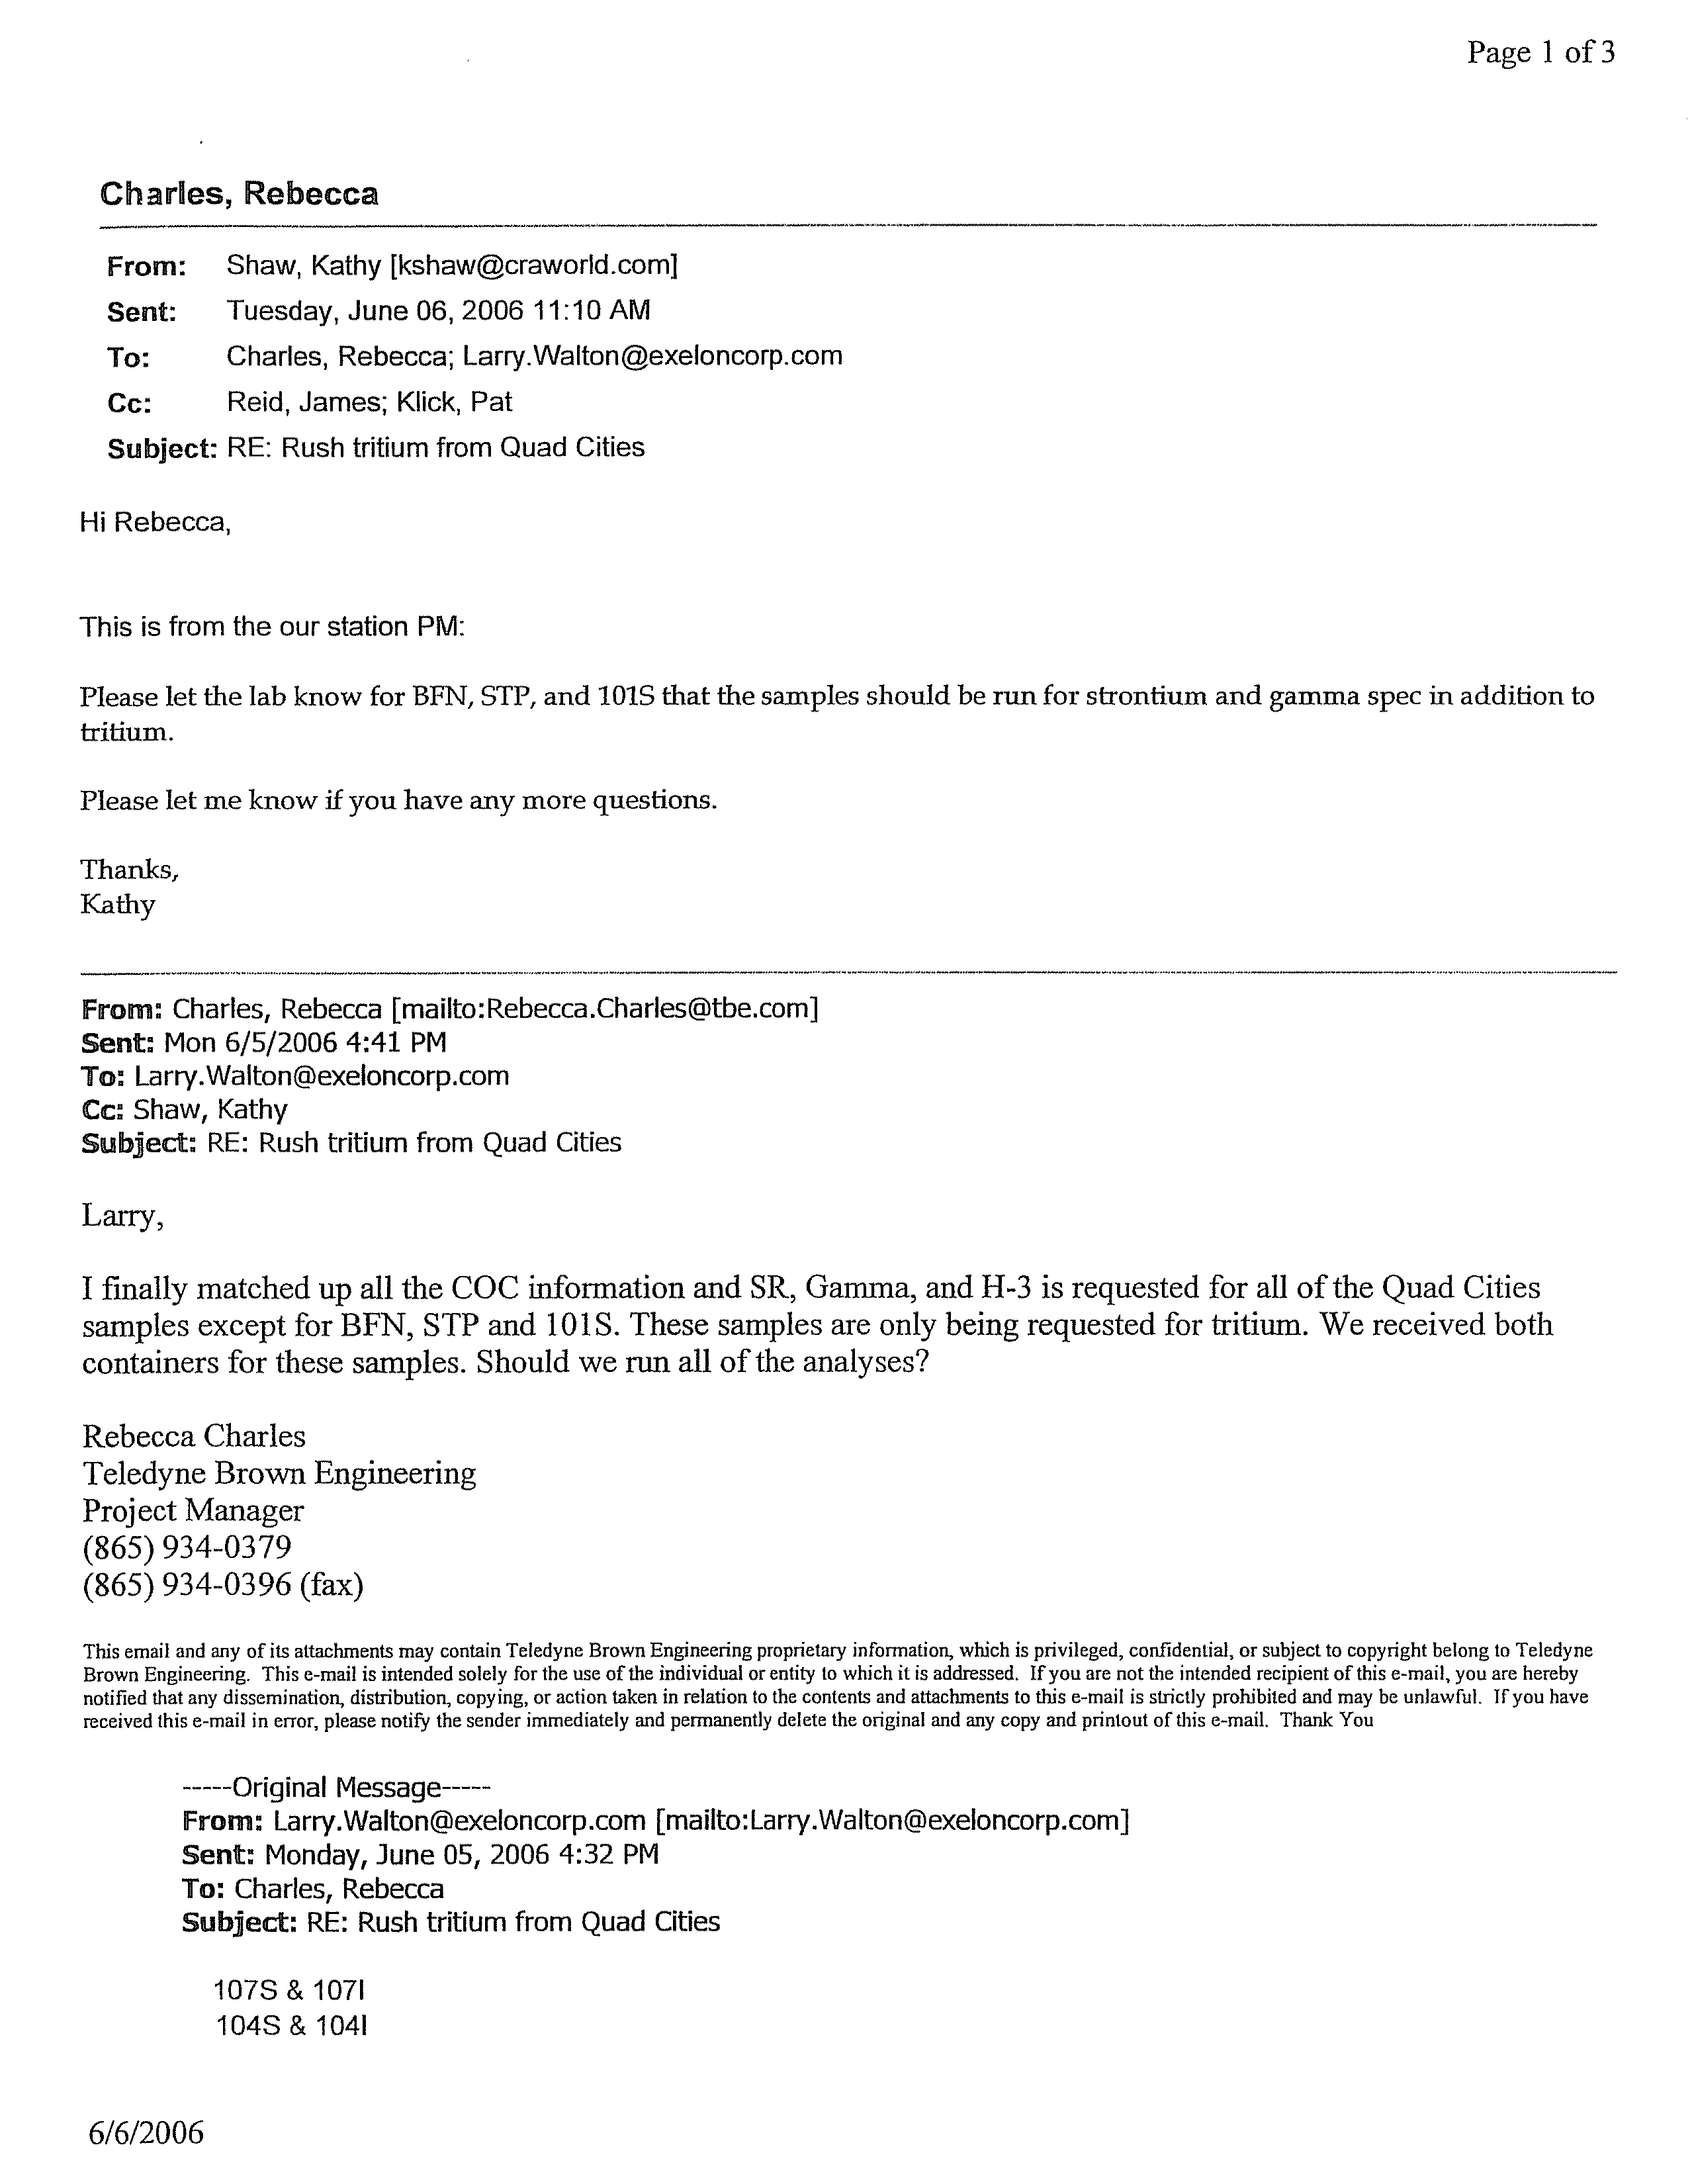
analyzed for tritium and gamma-emitting
radionuclides as listed in NUREG-1302 and strontium-89/90 as listed in 40 CFR 141.25.
045136 (20) Quad Cities Generating Station
24
CONESTOGA-ROVERS & ASSOCIATES
Revision 1
5.0
RESULTS SUMMARY
This section provides a summary of Station geology and hydrogeology, along with a
discussion of hydraulic gradients, groundwater elevations, and flow directions in the
vicinity of the Station. This section also presents and evaluates the analytical results
obtained from activities performed in accordance with the Work Plan.
5.1
STATION GEOLOGY
The geology encountered during monitoring well installation is consistent with the
geology
described in Section 2.4.2.
The geology beneath the Station consists of
unconsolidated sediments comprised of sand and gravel deposited as outwash and river
alluvium deposits. The unconsolidated sediments are underlain by bedrock of Silurian
(Niagaran/Alexandrian Dolomite), Ordovician (Maquoketa Shale, Galena - Platteville
Dolomite, and Glenwood - St. Peter Sandstone), and Cambrian age (dolomites,
sandstones, and shales).
Figure 5.1 displays the locations of the hydrogeologic
cross-sections across the Station.
These hydrogeologic cross-sections are presented on Figures 5.2 to 5.5.
These
cross-section locations were chosen because of their close proximity to the AFEs and
structures potentially influencing groundwater flow patterns.
The new shallow, intermediate, and deep interval wells installed pursuant to the Work
Plan
were installed in the overburden. The Station is underlain by overburden deposits
consisting primarily of unconsolidated sediments comprised of fine- to coarse-grained
sands and trace gravel (see Section 2.4.2). The monitoring well logs are presented in
Appendix B.
Figure 5.2 is a southwest-northeast cross-section (A-A') through the middle of the
Station. It begins near monitoring well MW-QC-114I at the southwestern corner of
the
Station and terminates near the access road in the northeast portion of the Station. This
cross-section also shows the relationship between the groundwater and geology,
excavated areas, and Reactor/Turbine Building foundations that were set on the
bedrock. The Service Building foundation in this area was constructed on concrete piers
within the sand overburden fill to a depth of approximately 589.5 feet AMSL. The
Service Building foundation is not seated in bedrock. Engineered compacted fill was
placed around the foundation of the Service Building to the ground surface. The storm
drain piping along this sectional line is located in the compacted engineered fill. The
northern extent of the buried paleochannel or the Meredosia Channel is located to the
045136 (20) Quad Cities Generating Station
25
CONESTOGA-ROVERS & ASSOCIATES
Revision 1
south of the Service Building.
May 2006 groundwater elevations in the upper
unconsolidated aquifer along this cross-section drop slightly from north (573.85 feet
AMSL at MW-QC-101S) to south (572.51 feet AMSL at MW-QC-108S) due to the
presence of the Meredosia Channel.
Figure 5.3 is a southeast-northwest profile (B-B') that intersects AFE-Quad Cities-2. This
cross-section shows the relationship between the groundwater and geology,
sheet piles,
utilities, and building foundations.
Sheet piles installed as part of the Station
construction are located to the west of the Service Building. The sheet piles were set into
the top of the dolomite bedrock. The discharge bay was also excavated into the top of
dolomite bedrock in this portion of the Station. The northern extent of the buried
paleochannel or the Meredosia Channel is located to the south of the Service Building.
The surface of the dolomite bedrock in this portion of the Station drops approximately
100 feet based on the bedrock topography map (Figure 2.5). May 2006 groundwater
elevations in the upper unconsolidated aquifer along this cross section drop slightly
from northwest (573.09 feet AMSL at MW-QC-103I) to the southeast (572.77 feet AMSL
at MW-QC-102I) due to the competing influence of the Meredosia Channel and the sheet
piles.
Figure 5.4 is an east-west cross-section (C-C') through the Station to the
Mississippi
River. This profile shows the relationship between the groundwater and geology,
excavated areas, building foundations, and the Mississippi River. The Reactor Building,
Turbine Building, and Crib House foundations in this area were constructed to
approximate depths of 548, 542.5, and 545 feet AMSL, respectively. The Reactor
Building, Turbine Building, and Crib House foundations are seated in bedrock.
Engineered compacted fill was placed around these buildings to the ground surface.
The storm drain piping along this sectional line is located in the compacted engineered
fill.
May 2006 groundwater elevations in the fill overburden sand along this
cross-section are relatively flat from east (573.85 feet AMSL at MW-QC-101S) to the west
(573.82 feet AMSL at MW-QC-106S). Groundwater in the overburden flows around the
building foundations to the southwest.
Figure 5.5 is a north-south cross-section (D-D') through the Station. This cross-section
shows the relationship between the groundwater and geology, excavated
areas, and
building foundations. Engineered compacted fill was placed around the foundation of
the Service Building to the ground surface. The storm drain piping along this sectional
line is located in the compacted engineered fill. The northern extent of the buried
Meredosia Channel is located to the south of the Service Building. Dolomite bedrock in
this portion of the Station drops approximately 100 feet. May 2006 groundwater
elevations in the upper unconsolidated aquifer along this cross-section drop from north
045136 (20) Quad Cities Generating Station
26
CONESTOGA-ROVERS & ASSOCIATES
Revision 1
(574.30 feet AMSL at MW-1) to south (572.51 feet AMSL at MW-QC-108S) in response to
the presence of the Meredosia Channel.
5.2
STATION HYDROGEOLOGY
Figure 5.1 presents the monitoring well network in relationship to the hydrogeologic
cross-section locations. Hydrogeologic cross-sections are presented on Figures
5.2 to 5.5.
The cross-sections show the overburden that overlies the dolomite bedrock. In general,
the overburden consists of naturally occurring unconsolidated sand or sand fill (fill is
present where the Station was excavated prior to construction of the buildings).
5.2.1
MAN-MADE INFLUENCES ON GROUNDWATER FLOW
The PA (Figure 1.2) is located at the west area of the Station and is surrounded by the
lined Spray Canal. The Spray Canal was constructed with a polyvinyl chloride (PVC)
liner underlain by 6 inches of sand covered by 1 foot of crushed rock. The polyethylene
sheeting was placed on 1 foot of compacted sand and gravel.
The canal flows counter-clockwise around the Station during the time when
the canal is
being filled with water pumped from the Big Fish water supply well. The Station fills
the canal in the spring for a 3-month period to a depth of approximately 3 feet. The
depth of the water in the Spray Canal during the hydrogeologic investigation ranged
from 4.21 feet at SW-QC-1 on May 31, 2006 to 1.61 feet at SW-QC-2 on July 26, 2006. The
Spray Canal was initially operated as a component of the cooling water operations at the
Station. Cooling water from the condenser was pumped to the Spray Canal to further
reduce the water temperature prior to discharge from the discharge bay. The operation
of the Spray Canal as part of cooling water operations was suspended in 1983. The
Spray Canal was modified for use in fish hatchery operations. The Station fills the canal
as part of a fish hatchery program for the Mississippi River.
When the canal is not being filled, there is no flow; however, there is a residual amount
of water in some parts of the canal. Due to
the higher head in the canal than the
surrounding groundwater elevation (approximately 25 feet of head difference as of
June 2006) there may be some groundwater recharge from the Spray Canal into the
overburden. There is some evidence that seepage through the canal liner exists. Based
on the HIR water level measurements and an understanding of the construction of the
Spray Canal, the water leakage does not appear to have a significant effect on the
groundwater flow direction within the PA.
045136 (20) Quad Cities Generating Station
27
CONESTOGA-ROVERS & ASSOCIATES
Revision 1
During construction of the structures and buildings in the PA, a
dam was constructed to
minimize groundwater infiltration into the excavation and water was pumped from the
excavation. This excavation was greater than 40 feet deep and on top of the underlying
dolomite bedrock formations (UFSAR, 2005). The dam was constructed at the current
location of the inlet bay and was subsequently removed after the completion of plant
construction activities.
Sheet piles were installed around the discharge
bay and the western portion of the Spray
Canal as part of Station construction activities. The discharge bay sheet piles extend
below the water table to an elevation of 535 feet AMSL, but not to the top of competent
bedrock. They are set on crushed stone and rip rap. As such, groundwater flow is
intercepted by the sheet pile walls, but will continue to flow beneath and through the
sheet piles. The sheet piles are shown on Figures 5.3 and 2.6. The foundations or
basements associated with the Reactor Building and the Turbine Building extend to
depths below the water table and are set into the top of competent bedrock (see
Figure 5.4). The total depth of the Reactor Building is 548 to 550 feet AMSL. The total
depth of the majority of the Turbine Building is 542.5 feet AMSL. These basements are
barriers to groundwater flow in the overburden.
The Station structures and utilities were reviewed to assess their impact
on groundwater
flow conditions. All non-process related utilities (e.g., storm drains) are above the
groundwater table and do not appear to impact groundwater flow.
The Station and surrounding land is generally flat and is covered by paved areas,
roadways,
and parking lots. These areas are drained by a storm water system that
drains to the north and south of the Station and passes by the location of MW-QC-102S
(see Figure 3.1). The south storm water system drains to an Oil/Water Separator
(Unit 1) at the south end of the PA whose outfall discharges to the discharge bay. The
north storm water system drains to an Oil/Water Separator (Unit 2) at the north end of
the PA whose outfall discharges to the intake bay.
The water level in the discharge bay fluctuates. The discharge bay water level was
measured
on May 31, 2006 at 576.91 feet AMSL, on June 22, 2006 at 576.53 feet AMSL,
and on July 26, 2006 at 576.36 feet AMSL (see Table 4.4). The discharge bay water level
was approximately 4 feet higher than the water level measured in nearby monitoring
wells MS-QC-103I and MW-QC-105I (see Table 4.3) but does not appear to significantly
affect groundwater flow direction in this area.
045136 (20) Quad Cities Generating Station
28
CONESTOGA-ROVERS & ASSOCIATES
Revision 1
5.2.2
GROUNDWATER FLOW DIRECTIONS
Groundwater level measurements were collected in May and July 2006. Groundwater
contours for the upper unconsolidated aquifer for these dates are presented on
Figures 5.6 and 5.7, respectively. The May 2006 groundwater contour maps are based on
data obtained from 13 wells while the groundwater contour maps from July 2006 are
based on data from 24 monitoring wells.
Examination of Figure 5.6 shows that groundwater
flow in May 2006 is primarily to the
southwest towards the Mississippi River and the southern buried valley of the
Meredosia Channel.
Groundwater levels on the north side of the Station are
approximately 2 feet above the controlled river level elevation. As discussed in the
previous section, the foundations of the Reactor and Turbine Buildings restrict the
groundwater flow, which causes the groundwater to flow around the buildings. The
groundwater flow in the upper unconsolidated aquifer may have been affected by the
pumping of the Big Fish Well to supplement the water level in the Spray Canal.
The Big Fish Well was completed in the upper unconsolidated aquifer
at a depth of
approximately 175 feet bgs.
This well is capable of pumping on the order of
1,800 gallons per minute (gpm). In a typical year, the Big Fish Well is operated for up to
2 weeks in April to fill the Spray Canal. The well is then operated twice a week, running
between 5 to 8 hours during each event through to early August to maintain a minimum
water level in the canal.
Groundwater flow directions for the July 2006 water level monitoring event are shown
on
Figure 5.7. This figure provides a more complete representation of groundwater flow
in the upper unconsolidated aquifer at the Station, given the larger data set and broader
distribution of monitoring wells. In general, groundwater levels are approximately
2 feet lower than those measured in May 2006 (see Table 4.3). This indicates that
seasonal fluctuations in the water table occur. In general, groundwater flows from the
east to the west towards the Mississippi River. However, the groundwater flow
diverges to a southerly and northerly component and flows towards both the buried
valleys of the Meredosia Channel (see Figure 2.5 for Meredosia Channel detail). In
July 2006, the river elevation was higher than all groundwater levels near the river,
indicating that flow from the river to the aquifer is occurring. This will result is
localized reversal in the flow direction. The river recharge also resulted in a much flatter
hydraulic gradient at the Station than that measured in May 2006, when groundwater
discharge to the river occurred. The data also show that basement walls restrict the
groundwater flow, which causes the groundwater to flow around the buildings.
045136 (20) Quad Cities Generating Station
29
CONESTOGA-ROVERS & ASSOCIATES
Revision 1
The water level in the discharge bay will fluctuate. The discharge bay water level was
measured on May 31, 2006 at 576.91 feet AMSL, on June 22, 2006 at 576.53 feet AMSL,
and on July 26, 2006 at 576.36 feet AMSL (see Table 4.4). The discharge bay water level
was approximately 4 feet higher than the water level measured in nearby monitoring
wells MS-QC-103I and MW-QC-105I (see Table 4.3) but does not appear to significantly
affect groundwater flow direction in this area.
A comparison of the water levels in monitoring
wells located on the east side of the
sheet piles with river levels indicates that the sheet piles are not acting as an effective
hydraulic barrier. This is illustrated on the groundwater contour map (Figure 5.6) by the
minimal changes in contour spacing when the river level is compared to groundwater
elevations in adjacent wells. There are no sheet piles along the river bank. The river
bank protection consists of rip-rap (rocks) present to prevent erosion.
5.2.3
VERTICAL HYDRAULIC GRADIENTS
The HIR included the installation of monitoring well clusters in the upper
unconsolidated aquifer to determine not only the vertical distribution of impacted
groundwater (as necessary), but also the vertical hydraulic gradient within the aquifer.
Vertical hydraulic gradients were calculated at the well pairs and are provided in
Table 5.1. Downward vertical hydraulic gradients were calculated for four well pairs:
MW-QC-101 and MW-QC-108, where the vertical hydraulic gradient was very slight,
0.001 feet/foot; MW-QC-106, where the vertical hydraulic gradient was 0.003 feet/foot;
and MW-QC-109, where the vertical hydraulic gradient was 0.006 feet/foot. An upward
vertical gradient was calculated for the remaining well pair, MW-QC-102, where the
vertical hydraulic gradient was -0.003 feet/foot (May 30, 2006) and –0.0004 feet/foot
(July 26, 2006).
The calculated vertical hydraulic gradients at the Station are slight and vary with
proximity
to the canal and Mississippi River. There were no significant vertical
hydraulic gradients observed.
5.2.4
LATERAL GROUNDWATER FLOW AND VELOCITY
The calculated horizontal hydraulic gradient in the upper unconsolidated aquifer along
the east side of the PA based on the May 2006 data is 0.002 feet/foot and based on the
June 2006 data, after the installation of additional monitoring wells, is 0.0004 feet/foot.
The horizontal hydraulic gradient was calculated by dividing the change in
045136 (20) Quad Cities Generating Station
30
CONESTOGA-ROVERS & ASSOCIATES
Revision 1
groundwater elevation along the groundwater flow path by the corresponding distance
along the flow path. The groundwater flow direction in this area is from the northeast to
southwest during both monitoring events.
Figure 5.6 displays the May 2006
groundwater elevation contours and Figure 5.7 displays the July 2006 groundwater
elevation contours.
The calculated horizontal hydraulic gradient in the upper unconsolidated aquifer along
the
west side of the Turbine Building based on the May 2006 data is 0.004 feet/foot and
based in the June 2006 data is 0.003 feet/ foot. The general groundwater flow direction
in this area is from east-northeast to west-southwest (Figure 5.6).
The hydraulic conductivity of the surficial sands is expected
to be approximately 12 feet
per day based on the median measurement from a study conducted at the
Illinois-Indiana border of the shallow aquifer along Lake Michigan (USGS, 1996). The
aquifer
media tested in this study was consistent with unconsolidated aquifer material
at the Station. The velocity of the shallow
groundwater may be roughly approximated
using the Station-specific hydraulic gradient with the literature value for hydraulic
conductivity and a typical value for porosity. The hydraulic gradient range of 0.0004 to
0.004, based on the collected May 2006 and July 2006 data, with a hydraulic conductivity
of 12 feet per day and an assumed porosity of 0.32, yields a velocity of 6 to 54 feet
per year (USEPA, 1996).
The hydraulic gradient and the calculated groundwater
velocity are subject to seasonal fluctuation.
5.3
GROUNDWATER QUALITY
CRA personnel collected 32 groundwater samples from 22 newly installed monitoring
wells, two previously installed groundwater monitoring wells, and eight existing water
supply wells. The samples were analyzed for tritium and additional radionuclides.
Teledyne Brown provided the analytical services. The Quality Assurance Program for
the laboratory is described in Appendix C.
The analytical data reports are in
Appendix D.
The analytical data have been subjected to CRA's data validation process.
CRA has used
the data with appropriate qualifiers where necessary.
The data reported in the figures and tables does not include the results of recounts that
the laboratory completed, except if those results ultimately replaced an initial report.
The tables and figures therefore include only the first analysis reported by the
045136 (20) Quad Cities Generating Station
31
CONESTOGA-ROVERS & ASSOCIATES
Revision 1
laboratory. Where multiple samples were collected over time then the most recent result
has been used in the discussion below.
5.3.1
SUMMARY OF BETA-EMITTING RADIONUCLIDES
ANALYTICAL RESULTS
A summary of the tritium results for the groundwater samples collected during this
investigation is provided in Table 5.2. and shown on Figure 5.8.
The tritium groundwater data have been divided into upper and intermediate intervals
of the upper unconsolidated aquifer. CRA evaluated the groundwater data using upper
and intermediate overburden data sets
to better understand the potential vertical
distribution of tritium in Station groundwater.
Concentrations of tritium in groundwater samples collected south of the Turbine and
Reactor Buildings and in the SBO Area ranged from 262
± 130 pCi/L to
32,600 ± 977 pCi/L. The groundwater sample collected from MW-QC-102I, screened in
the intermediate interval of the upper unconsolidated aquifer, had a tritium
concentration of 32,600 ± 977 pCi/L. The following wells in the upper unconsolidated
aquifer also revealed tritium concentrations greater than the LLD of 200 pCi/L, but less
than 20,000 pCi/L: shallow wells MW-QC-102S, MW-QC-104S, and MW-QC-108S;
intermediate wells MW-QC-108I, MW-QC-109I, and MW-QC-111I; deep well
MW-QC-102D; and the Big Fish Well.
In addition, the following two groundwater samples collected north and northwest of
the Turbine and Reactor Buildings revealed tritium concentrations greater than the LLD
that
ranged from 250 ± 126 pCi/L (shallow overburden monitoring well MW-2) to
371 ± 134 pCi/L (water supply well Little Fish Well).
Strontium-89/90 was not detected at a concentration greater than the LLD of 2.0 pCi/L.
A summary of the strontium-89/90 results for the groundwater samples collected as
part of this HIR is presented in Table 5.3 and shown on Figure 5.9.
5.3.2
SUMMARY OF GAMMA-EMITTING RADIONUCLIDES
ANALYTICAL RESULTS
Gamma-emitting target radionuclides were not detected at concentrations greater than
their respective LLDs. A summary of the gamma-emitting radionuclide results
for the
045136 (20) Quad Cities Generating Station
32
CONESTOGA-ROVERS & ASSOCIATES
Revision 1
groundwater samples collected as part of this investigation that is the subject of this HIR
is provided in Table 5.3 and shown on Figure 5.9.
Other non-targeted radionuclides were also included in the tables but excluded from
discussion in this report.
These radionuclides were either a) naturally occurring and
thus not produced by the Station, or b) could be definitively evaluated as being naturally
occurring due to the lack of presence of other radionuclides which would otherwise
indicate the potential of production from the Station.
5.3.3
SUMMARY OF FIELD MEASUREMENTS
Table 4.6 presents monitoring well purging parameters collected during the well
purging and sampling activities. These field measurements included pH, dissolved
oxygen, ORP, conductivity, turbidity, and temperature. The field parameters were
typical of a shallow sand aquifer with carbonate source rock (i.e., the underlying
limestones and shales). As such, the pH values were found to be approximately 7.0 and
the conductivity was indicative of a shallow water table system subject to surface water
recharge. The conductivity of the water purged from MW-QC-104S was elevated when
compared to the readings from other sampling locations.
5.4
SURFACE WATER QUALITY
Two surface water samples were collected from the two gauging points located at the
Spray Canal shown on Figure 4.1. The samples were analyzed for tritium,
gamma-emitting radionuclides, and strontium-89/90. Teledyne Brown provided the
analytical services. The Quality Assurance Program for the laboratory is described in
Appendix C. The analytical reports are presented in Appendix D.
5.4.1
SUMMARY OF BETA-EMITTING RADIONUCLIDE
ANALYTICAL RESULTS
A summary of the tritium results for the surface water samples collected in this
investigation is provided in Table
5.2 and shown on Figure 5.8. Surface water samples
collected from locations SW-QC-1 and SW-QC-2 contained tritium at concentrations of
550 ± 143 pCi/L and 497 ± 140 pCi/L, respectively.
045136 (20) Quad Cities Generating Station
33
CONESTOGA-ROVERS & ASSOCIATES
Revision 1
Strontium-89/90 was not detected at concentrations that were greater than the LLD of
2.0 pCi/L. A summary of the strontium-89/90 analytical results for surface water
samples collected in this investigation is presented in Table 5.3 and shown on Figure 5.9.
5.4.2
SUMMARY OF GAMMA-EMITTING RADIONUCLIDES
ANALYTICAL RESULTS
Gamma-emitting target radionuclides were not detected at concentrations greater than
their respective LLDs. A summary of the gamma-emitting
radionuclides results for the
surface water samples collected in this investigation is provided in Table 5.3 and shown
on Figure 5.9.
Other non-targeted radionuclides were also included in the tables but excluded from
discussion in this report.
These radionuclides were either a) naturally occurring and
thus not produced by the Station, or b) could be definitively evaluated as being naturally
occurring due to the lack of presence of other radionuclides which would otherwise
indicate the potential of production from the Station.
045136 (20) Quad Cities Generating Station
34
CONESTOGA-ROVERS & ASSOCIATES
Revision 1
6.0
RADIONUCLIDES OF CONCERN AND SOURCE AREAS
This section discusses radionuclides evaluated in
this investigation, potential sources of
the radionuclides detected, and their distribution.
6.1
GAMMA-EMITTING RADIONUCLIDES
Gamma-emitting target radionuclides were not detected at concentrations greater than
their respective LLDs. Other non-targeted radionuclides were also included in the tables
but excluded from discussion in this report.
These radionuclides were either
a) naturally occurring and thus not produced by the Station, or b) could be definitively
evaluated as being naturally occurring due to the lack of presence of other radionuclides
which would otherwise indicate the potential of production from the Station.
6.2
BETA-EMITTING RADIONUCLIDES
Strontium-89/90 was not detected in any of the groundwater samples collected at
concentrations greater than the LLD of 2.0
pCi/L. Tritium was detected in 13 of the
34 total sample locations. Concentrations of tritium ranged between 250 ± 126 pCi/L to
32,600 ± 977 pCi/L.
Since only tritium was detected at concentrations great than the
LLD during the
fleetwide investigation, the following sections focus on tritium, specifically, providing
general characteristics of tritium, potential sources, distribution in groundwater, and a
conceptual model for migration.
6.3
TRITIUM
This section discusses the general characteristics of tritium, the distribution of tritium in
groundwater and surface water, and the conceptual model of tritium release and
migration.
6.3.1
GENERAL CHARACTERISTICS
Tritium (chemical symbol H-3) is a radioactive isotope of hydrogen. The
most common
forms of tritium are tritium gas and tritium oxide, which is also called "tritiated water."
The chemical properties of tritium are essentially those of ordinary hydrogen. Tritiated
045136 (20) Quad Cities Generating Station
35
CONESTOGA-ROVERS & ASSOCIATES
Revision 1
water behaves the same as ordinary water in both the environment and the body.
Tritium can be taken into the body by drinking water, breathing air, eating food, or
absorption through skin. Once tritium enters the body, it disperses quickly and is
uniformly distributed throughout the body. Tritium is excreted from the body primarily
through urine within a month or so after ingestion. Organically bound tritium (tritium
that is incorporated in organic compounds) can remain in the body for a longer period.
Tritium is produced naturally in the upper atmosphere when cosmic rays strike air
molecules.
Tritium is also produced during nuclear weapons explosions,
as a
by-product in reactors producing electricity, and in special production reactors, where
the isotopes lithium-7 and/or boron-10 are bombarded to produce tritium.
Although tritium can be a gas, its most
common form is in water because, like
non-radioactive hydrogen, radioactive tritium reacts with oxygen to form water.
Tritium replaces one of the stable hydrogen atoms in the water molecule and is called
tritiated water. Like normal water, tritiated water is colorless and odorless. Tritiated
water behaves chemically and physically like non-tritiated water in the subsurface, and
therefore tritiated water will travel at the same velocity as the average groundwater
velocity.
Tritium has a half-life of approximately 12.3 years. It decays spontaneously to helium-3
(
3
He). This radioactive decay releases a beta particle (low-energy electron). The
radioactivity of tritium is the source of the risk of exposure.
Tritium is one of the least dangerous radionuclides because it emits
very weak radiation
and leaves the body relatively quickly. Since tritium is almost always found as water, it
goes directly into soft tissues and organs. The associated dose to these tissues is
generally uniform and is dependent on the water content of the specific tissue.
6.3.2
DISTRIBUTION IN GROUNDWATER / SURFACE WATER
This section provides an overview of the lateral and vertical distribution of tritium
detected in groundwater and the distribution of tritium in surface water at the Station.
Tritium has been the only parameter detected in the upper unconsolidated aquifer at a
concentration greater than the LLD of 200 pCi/L. This observation is based upon the
studies recently completed at the Station. Consequently, this section of the report will
focus on the distribution of tritium in the upper and intermediate intervals of the upper
unconsolidated aquifer.
045136 (20) Quad Cities Generating Station
36
CONESTOGA-ROVERS & ASSOCIATES
Revision 1
Tritium concentrations that are greater than the LLD of 200 pCi/L are limited to three
areas at the Station. The first area is located to the north and northwest of the Turbine
Building. The second larger area is located to the south and southwest of the Reactor,
Service, and SBO Buildings. Tritium was also detected in the Spray Canal, the third
area. The tritium detections are summarized in Table 5.2 and shown on Figure 5.8.
North and Northwest of Turbine Building
Tritium was detected at concentrations slightly above the LLD of 200 pCi/L in MW-2,
completed to 27
feet bgs in the upper zone of the upper unconsolidated aquifer, and the
Little Fish Well, completed to 60 feet bgs. Both of these wells are located north and
northwest of the Turbine Building. Groundwater in this area of the Station has been
determined to flow from northeast to southwest towards the Mississippi River based on
the May 2006 groundwater elevations, with a more westerly flow component present
during July 2006.
Historical tritium analytical data for groundwater
samples collected from the Little Fish
Well are available back to 2003. These samples were analyzed in accordance with
NUREG 1302 to an LLD of 3,000 pCi/L (LLD of 200 pCi/L for the five March 10, 2006
samples). Tritium was not detected in any of the samples collected at concentrations
greater than the LLD.
As part of the May 31, 2006 sampling event, tritium was detected in the Little Fish Well
at concentrations of 371
± 134 pCi/L. Tritium was not detected at concentrations greater
than the LLD (200 pCi/L) in the sample from the Fish House Well. The Fish House Well
is screened within the Niagaran Dolomite of the Hunton Megagroup. The driller's well
log shows that competent dolomite begins at 69 feet bgs and that the well was cemented
with bentonite grout to a depth of 71 feet bgs. Therefore, the Fish House Well draws
water from the dolomite aquifer from 71 feet bgs and deeper. Based on the Fish House
Well information, the adjacent 60 foot deep Little Fish Well, screened from 50 to 60 feet
bgs, is screened within the upper unconsolidated aquifer (the sand aquifer above the
dolomite). The Spray Canal is located north and hydraulically upgradient of well MW-2
and the Little Fish Well. Tritium was detected in surface water samples collected from
the Spray Canal. The upper unconsolidated aquifer in this portion of the Station may be
partially recharged from surface water in the Spray Canal at the dam/end of the canal
when it is in use during the spring and summer, as discussed previously in Section 5.2.1.
045136 (20) Quad Cities Generating Station
37
CONESTOGA-ROVERS & ASSOCIATES
Revision 1
South/Southwest of Reactor, Service, and SBO Buildings
Tritium has been detected at concentrations greater than the LLD of 200 pCi/L in the
area
south and southwest of the Reactor, Service, and SBO Buildings. Specifically,
monitoring
wells
MW-QC-102S,
MW-QC-102I,
MW-QC-102D,
MW-QC-104S,
MW-QC-108S, MW-QC-108I, MW-QC-109I, and MW-QC-111I, and the Big Fish Well
contained concentrations of tritium greater than the LLD. Groundwater flow direction
in this area of the Station varies seasonally, and groundwater flows either from
northeast to southwest towards the Mississippi River or from east to west towards the
Mississippi River.
The concentration of tritium in the Big Fish Well, screened at three intervals from 77
feet
to 175 feet in the unconsolidated deposits of the Meredosia Channel, has been reported
as less than the Station LLD of 3,000 pCi/L (2003 through 2006 samples). The new
monitoring wells in this area are screened from 18 to 70 feet bgs within the
unconsolidated aquifer. The highest concentration of tritium, 32,600 ± 977 pCi/L, was
detected in the groundwater sample collected at MW-QC-102I. Tritium was also
detected in the groundwater sample collected from MW-QC-109I at 1,140 ± 182 pCi/L in
the vicinity of historical release referenced in AFE-Quad Cities-2 in Section 3.4. Tritium
was detected as far south as MW-QC-111I at a concentration of 420J ± 133 pCi/L, but
was not detected in either MW-QC-114I or MW-QC-115S, which are located further
south of MW-QC-111I. Tritium detections above the LLD are limited to a localized area
between the Reactor and Service Buildings to the north and the Spray Canal to the
south. Tritium has not been detected above the LLD of 200 pCi/L in wells adjacent to
the Mississippi River (MW-QC-112I, MW-QC-113I, MW-QC-114I, and the STP Sand
Point Well) or beyond the area delineated by the Spray Canal.
Wells with tritium detections greater than the LLD of 200 pCi/L, MW-QC-102S,
MW-QC-102I,
MW-QC-102D, MW-QC-104S, MW-QC-108S, MW-QC-108I, MW-QC-109I,
MW-QC-111I, and the Big Fish Well, are downgradient of the AFE-Quad Cities-2 SBO
Area, which is the likely source of tritium in these wells. Figure 6.1 presents a profile
depicting detected tritium concentrations along cross-section A-A'. Figure 6.2 presents a
plan view depicting detected tritium concentrations.
Surface Water
Tritium was detected in the surface water samples collected from the Spray Canal at
sampling
points SW-QC-1 and SW-QC-2 at concentrations of 550 ± 143 pCi/L and
497 ± 140 pCi/L, respectively. The Spray Canal is filled with water pumped from the
Big Fish Well, which is impacted by tritium.
045136 (20) Quad Cities Generating Station
38
CONESTOGA-ROVERS & ASSOCIATES
Revision 1
6.3.3
CONCEPTUAL MODEL OF TRITIUM RELEASE AND
MIGRATION
This section presents CRA's conceptual model of groundwater and tritium migration at
the Station.
Tritium has not been detected at concentrations greater than the LLD of 200 pCi/L in
samples collected from bedrock potable supply
wells located at the Station (Well #1,
Well #5, and Fish House Well #10). As such, CRA's conceptual hydrogeologic model
focuses on the migration of groundwater and tritium in the upper unconsolidated
aquifer.
Within the upper unconsolidated aquifer, tritium was not detected in monitoring wells
installed adjacent to the Mississippi River (STP Sand Point Well, MW-QC-103I,
MW-QC-105I,
MW-QC-106S,
MW-QC-106I,
MW-QC-112I,
MW-QC-113I,
and
MW-QC-114I). Tritium was also not detected in the monitoring wells installed adjacent
to residential properties (MW-QC-115S and MW-QC-116S). Therefore, the vertical and
horizontal extent of tritium impact to Station groundwater is limited to the Station
property.
The groundwater flow in May within the upper unconsolidated aquifer beneath the
Station is from northeast to southwest, toward the southern buried
valley of the
Meredosia Channel. As shown on Figure 5.6, groundwater flow appears to divide
around the Reactor and Turbine Buildings, as a result of the foundations sitting on
bedrock. Groundwater may also undergo seasonal fluctuations as a result of the filling
of the Spray Canal and water level change within the Mississippi River. CRA observed
seasonal changes in the two rounds of groundwater levels collected. The groundwater
flow in July is, in general, from east to west, but the groundwater flow diverges to a
southerly and northerly component toward the buried valleys of the Meredosia Channel
(see Figure 5.7). There is no indication from this HIR investigation that tritium-impacted
groundwater is migrating off Station.
Hydrogeologic Framework
Groundwater flow within the upper unconsolidated aquifer
at the Station is to the
southwest toward the Mississippi River in May 2006 and generally to the west toward
the Mississippi River in July 2006, with southerly and northerly components present.
045136 (20) Quad Cities Generating Station
39
CONESTOGA-ROVERS & ASSOCIATES
Revision 1
Groundwater moving within the overburden is separated from the deeper regional
bedrock aquifer zones by the upper dolomite. In the vicinity of the Turbine and Reactor
Buildings, groundwater flow in the upper unconsolidated aquifer is affected by the
building foundations, as they extend to the bedrock. This results in a deviation of the
flow around the buildings.
In May 2006, groundwater from the west side of the Turbine Building discharges into
the
intake bay and the Mississippi River to the southwest. The southern component of
flow is also influenced, to some degree, by the pumping of the Big Fish Well and by the
Meredosia Channel. The Big Fish Well was constructed in the Meredosia Channel, an
ancient channel of the Mississippi River that eroded the bedrock. This channel has been
filled over time with unconsolidated sediments ranging from approximately
50 to 300 feet deep (Blume, 1966). The well construction logs indicate that the Big Fish
Well was screened over three intervals (77 to 97, 118 to 148, and 157 to 175 feet bgs) and
has an overall depth of 175 feet. Pumping tests performed on this well indicate that it
can pump at a sustained rate of 1,800 gpm.
In a typical year, the Big Fish Well is operated for up to 2
weeks in April to fill the Spray
Canal. The Big Fish Well is then operated twice a week, running between 5 to 8 hours
during each event through to early August to maintain a minimum water level in the
canal. The canal is used for a fish hatchery. During the time of sustained pump
operation, the water table should draw down around the well. Given the constraints
imposed by the presence of the Turbine/Reactor Building foundation, groundwater will
flow in a north to south direction towards the Big Fish Well, within the capture zone of
the well when the pump is operated. However, given the high rate of hydraulic
conductivity present in the shallow aquifer, the shallow unconsolidated aquifer will
recharge quickly after the pumping has stopped. Pumping of the Big Fish Well draws
water from the upper unconsolidated aquifer. Pumping at this location may draw
surface water from the Mississippi River east towards the southern portion of the
Station.
The northern edge of the Meredosia Channel runs along the southern portion of the
Station as shown on Figure
2.6. This channel eroded the top of the dolomite bedrock in
this portion of the Station and further influences overburden groundwater flow at the
Station to a further southern flow. CRA believes that the location of the channel directs
overburden groundwater flow in a southwest direction.
In July 2006, general groundwater flow in the upper unconsolidated aquifer
is to the
west toward the Mississippi River. However, the groundwater flow diverges to a
southerly and northerly component and flows towards both buried valleys of the
045136 (20) Quad Cities Generating Station
40
CONESTOGA-ROVERS & ASSOCIATES
Revision 1
Meredosia Channel. The southern component of flow is also influenced, to some degree,
by the pumping of the Big Fish Well.
Sources and Migration of Tritium
Tritium was detected above the LLD of 200 pCi/L in three areas at the Station:
•
north and northwest of the Turbine Building;
•
south/southwest of the Reactor, Service, and SBO Buildings; and
•
surface water.
This distribution of tritium (both within the shallow water table zone and within the
deeper portions of the upper
unconsolidated aquifer) is likely related to the following
water release history:
•
historical
releases of tritium to the subsurface that have been documented by the
Station that are associated with AFE-Quad Cities-2; and
•
potential recharge of the upper unconsolidated aquifer
from the Spray Canal.
All tritium detections appear to be related to historical releases at AFE-Quad Cities-2.
The groundwater data suggest that a release of tritium has occurred in AFE-Quad
Cities-2 to the north and upgradient of MW-QC-102S and MW-QC-102I, possibly in the
vicinity of MW-QC-109S and MW-QC-109I. The effect of the periodic operation of the
Big Fish Well pump is to pull the release in the direction of the Big Fish Well. This is
explained by tritium detections in groundwater samples from MW-QC-102S,
MW-QC-102I, MW-QC-102D, MW-QC-108S, MW-QC-108I, MW-QC-111I, and the Big
Fish Well. CRA notes that the historical releases associated with AFE-Quad Cities-2
occurred as long ago as 21 years. The effects of groundwater flow (advection), diffusion,
and dilution have resulted in the current distribution of tritium to the south and west of
AFE-Quad Cities-2.
There is no indication from the HIR investigation that
tritium-impacted groundwater is migrating off the Station property.
In addition, the tritium detected in the Spray Canal is also likely attributable
to historic
releases in the AFE-Quad Cities-2. The Spray Canal is filled from water pumped from
the Big Fish Well. Tritium was detected at a concentration of 740 ± 152 pCi/L in the
groundwater sample collected from the Big Fish Well. The source of tritium detected in
the Spray Canal, therefore, is likely the same as the source of tritium in the Big Fish Well,
which is historic releases from AFE-Quad Cities-2.
045136 (20) Quad Cities Generating Station
41
CONESTOGA-ROVERS & ASSOCIATES
Revision 1
The Spray Canal potentially recharges overburden groundwater downgradient of the
Spray Canal. Water from the Spray Canal enters the upper unconsolidated aquifer in
the northern portion of the Site and water drawn from the Little Fish Well is partially
recharged from the Spray Canal in this area of the Site. Therefore, the source of tritium
detected in the Little Fish Well and MW-2 is also the historic releases associated with
AFE-Quad Cities-2.
Based on the results of the hydrogeologic investigation that is the subject of this HIR,
tritium-impacted groundwater is not migrating off the Station property.
Naturally occurring isotopes not produced by the Station were identified and excluded
from this report.
045136 (20) Quad Cities Generating Station
42
CONESTOGA-ROVERS & ASSOCIATES
Revision 1
7.0
EXPOSURE PATHWAY ASSESSMENT
This section addresses the groundwater impacts from tritium and other radionuclides
at
the Station and potential risks to human health and the environment.
Based upon historical knowledge and data related to the Station operations, and based
upon radionuclide analyses of groundwater samples, the primary constituent of concern
(COC) is tritium. The
discussions that follow are restricted to the exposure pathways
related to tritium.
Teledyne Brown reports all samples to their statistically-derived minimum detectable
concentration (MDC) of approximately
150 to 170 pCi/L, which is associated with
95 percent confidence interval on their hardcopy reports. However, the laboratory uses
99 percent confidence range (± 3 sigma) for determining whether to report the sample
activity concentration as detected or not. This 3-sigma confidence interval typically
equates to 150 (± 135.75) pCi/L.
Exelon has specified an LLD of 200 pCi/L for the Fleetwide Assessment.
Exelon has
also required the laboratory to report related peaks identified at the 95 percent
confidence level (2-sigma).
This HIR, therefore, screens and assesses data using Exelon's
LLD of 200 pCi/L. As is
outlined below, this concentration is also a reasonable approximation of the background
concentration of tritium in groundwater at the Station.
7.1
HEALTH EFFECTS OF TRITIUM
Tritium is a radionuclide that decays by emitting a low-energy beta particle that cannot
penetrate deeply into tissue or travel far in air. A person's exposure to
tritium is
primarily through the ingestion of water (drinking water) or through ingestion of water
bearing food products. Inhalation of tritium requires the water to be in a vapor form
(i.e., through evaporation or vaporization due to heating). Inhalation is a minor
exposure route when compared to direct ingestion or drinking of tritiated water.
Absorption of tritium through skin is possible, but tritium exposure is more limited here
versus direct ingestion or drinking of tritiated water.
045136 (20) Quad Cities Generating Station
43
CONESTOGA-ROVERS & ASSOCIATES
Revision 1
7.2
BACKGROUND CONCENTRATIONS OF TRITIUM
The purpose of the following paragraphs is
to establish a background concentration
through review of various media.
7.2.1
GROUNDWATER
Tritium is created in the environment from naturally occurring cosmic and subterranean
as well as from anthropogenic (i.e., man-made) sources. In the upper atmosphere,
"cosmogenic" tritium is produced from the bombardment of stable nuclides and
combines with oxygen to form tritiated water, which will then enter the hydrologic
cycle. Below ground, "lithogenic" tritium is produced by the bombardment of natural
lithium isotopes
6
Li (92.5 percent abundance)
and
7
Li (7.5 percent abundance)
present in
crystalline rocks by neutrons produced by the radioactive decay of uranium and
thorium. Lithogenic production of tritium is usually negligible compared to other
sources due to the limited abundance of lithium in rock. The lithogenic tritium is
introduced directly to groundwater.
A major anthropogenic source of tritium comes from the former atmospheric testing of
thermonuclear weapons. Concentrations
of tritium in precipitation, increased during
the 1950 and early 1960s, coinciding with the release of significant amounts of tritium to
the atmosphere during nuclear weapons testing prior to the signing of the Limited Test
Ban Treaty in 1963, which prohibited atmospheric nuclear tests.
7.2.2
PRECIPITATION DATA
Precipitation samples are routinely collected at stations around the world for the
analysis of tritium and other radionuclide analyses. Two publicly available databases
that provided tritium concentrations in precipitation are Global Network of Isotopes in
Precipitation (GNIP) and USEPA's RadNet database.
GNIP provides tritium
precipitation concentration data for samples collected worldwide from 1960 to 2006.
RadNet provides tritium precipitation concentration data for samples collected at
stations through the U.S. from 1960 up to and including 2006.
Based on GNIP data for sample stations located in the U.S.
Midwest including Chicago,
St. Louis, and Madison, Wisconsin, as well as Ottawa, Ontario, and data from the
University of Chicago, tritium concentrations peaked around 1963. This peak, which
approached 10,000 pCi/L for some stations, coincided with the atmospheric testing of
045136 (20) Quad Cities Generating Station
44
CONESTOGA-ROVERS & ASSOCIATES
Revision 1
thermonuclear weapons. Tritium concentrations showed a sharp decline until 1975
followed by a gradual decline since that time. Tritium concentrations in Midwest
precipitation have typically been less than 100 pCi/L since around 1980.
The RadNet database for several stations in
the U.S. Midwest (Chicago, Columbus,
Indianapolis, Lansing, Madison, Minneapolis, Painesville, Toledo, and Welsch, MN) did
not show the same trend, which can be attributed to pre-1995 data handling procedures.
The pre-1995 data were rounded to the nearest 100 pCi/L, which damped out variances
in the data. The post-1995 RadNet data, where rounding was not applied, exhibit much
more scatter, and similar to the GNIP data, most of the data were less than 100 pCi/L.
CRA constructed a non-parametric upper tolerance
limit with a confidence of 95 percent
and coverage of 95 percent based on RadNet data for USEPA Region 5 from 2004 to
2005. The resulting upper tolerance limit is 133 pCi/L, which indicates that CRA is
95 percent confident that 95 percent of the ambient precipitation concentration results
are less than 133 pCi/L. The statistical confidence, however, must be compared with the
limitations of the underlying RadNet data, which does not include the minimum
detectable concentration for a majority of the measurements. Some of the RadNet values
less than 200 pCi/L may be approximated.
Nevertheless, these results show a
background contribution for precipitation of up to 133 pCi/L.
7.2.3
SURFACE WATER DATA
Tritium concentrations are routinely measured in large surface water bodies, including
Lake Michigan and the Mississippi River. Surface water data from the RadNet database
for Illinois sampling stations include East Moline (Mississippi River), Moline
(Mississippi River), Marseilles (Illinois River), Morris (Illinois River), Oregon (Rock
River), and Zion (Lake Michigan). As is the case for the RadNet precipitation data, the
pre-September 1995 Illinois surface water data was rounded to the nearest 100 pCi/L,
creating a dampening of variances in the data. The post-1995 Illinois surface water data,
similar to the post-1995 Midwest precipitation data, were less than 100 pCi/L with the
exception of the Moline (Mississippi River) station.
Tritium surface water
concentrations at this location varied between 100 and 800 pCi/L, which may reflect
local natural or anthropogenic inputs.
The USEPA RadNet surface water data typically has a reported ‘Combined Standard
Uncertainty'
of 35 to 50 pCi/L.
According to USEPA, this corresponds to a
± 70 to 100 pCi/L 95 percent confidence bound on each given measurement. Therefore,
045136 (20) Quad Cities Generating Station
45
CONESTOGA-ROVERS & ASSOCIATES
Revision 1
the typical background data provided may be subject to measurement uncertainty of
approximately ± 70 to 100 pCi/L.
Routine surface water measurements for tritium
sampling locations upstream of the
Quad Cities Generating Station show that concentrations in the Mississippi River are
consistently less than 200 pCi/L (Exelon, 2005).
Pre-operational REMP quarterly and semi-annual surface water composite samples
collected
from downstream and on-Station locations were analyzed for tritium. Tritium
was not detected (LLD 1,000 pCi/L) in surface water samples collected from the
Davenport Water Works, the Moline Water Works, and the Inlet Canal for 1969, 1970,
and 1971 (1st quarter).
1971 2nd quarter tritium results were as follows:
•
East Moline Water Treatment Plant –
540 ± 370 pCi/L;
•
Davenport Water Treatment Plant –
540 ± 370 pCi/L; and
•
Intake and Discharge Canal –
180 ± 370 pCi/L.
1971 3rd quarter tritium results were as follows:
•
East Moline Water Treatment Plant –
700 ± 230 pCi/L;
•
Davenport Water Treatment Plant –
730 ± 230 pCi/L; and
•
Intake and Discharge Canal –
590 ± 210 pCi/L.
1971 4th quarter tritium results were as follows:
•
East Moline Water Treatment Plant –
770 ± 200 pCi/L;
•
Davenport Water Treatment Plant –
850 ± 200 pCi/L;
•
Intake Canal –
610 ± 200 pCi/L; and
•
Discharge Canal –
420 ± 200 pCi/L.
7.2.4
DRINKING WATER DATA
Tritium concentrations in drinking water from the RadNet database for three Illinois
sampling stations (Chicago, Morris, and East Chicago) exhibit similar trends as the
precipitation and surface water data. As with the precipitation and surface water data,
045136 (20) Quad Cities Generating Station
46
CONESTOGA-ROVERS & ASSOCIATES
Revision 1
the pre-1995 data has dampened out variances due to rounding the data to the nearest
100 pCi/L. The post-1995 results show tritium concentrations in samples of drinking
water were less than 100 pCi/L and less than the tritium concentrations found in
precipitation and surface water.
7.2.5
EXPECTED TRITIUM BACKGROUND FOR THE STATION
As reported in the GNIP and RadNet databases, tritium concentrations in U.S. Midwest
precipitation have typically been less than 100 pCi/L since 1980. Tritium concentrations
reported in the RadNet database for Illinois surface water and groundwater, at least
since 1995, have typically been less than 100 pCi/L. Based on the USEPA Region 5's
2004 to 2005 RadNet precipitation data, 95 percent of the ambient concentrations of
tritiated water in Illinois are expected to be less than 133 pCi/L, based on a 95 percent
confidence limit. Tritium concentrations in surface water and drinking water are
expected to be comparable or less based on historical data and trends.
Concentrations in groundwater similar to surface water and drinking water are expected
to be less than precipitation values. The lower groundwater concentrations are related
to the age of the groundwater as compared to the half-life of tritium. Deep aquifers near
crystalline basement rock, however, can potentially show elevated concentrations of
tritium due to lithogenic sources.
Based on the evaluation presented above, the background concentration for
tritium at
the Station is reasonably represented by the LLD of 200 pCi/L.
7.3
IDENTIFICATION OF POTENTIAL EXPOSURE
PATHWAYS AND POTENTIAL RECEPTORS
Two potential exposure pathways were considered during the evaluation of tritium in
groundwater:
•
potential groundwater migration on
and off the Station property to private and
public groundwater users; and
•
potential groundwater migration off the Station property to a surface water body.
The following section provides an overview of these two potential exposure pathways
for tritium in groundwater.
045136 (20) Quad Cities Generating Station
47
CONESTOGA-ROVERS & ASSOCIATES
Revision 1
7.3.1
POTENTIAL GROUNDWATER MIGRATION TO DRINKING
WATER USERS ON AND OFF THE STATION PROPERTY
Tritiated groundwater would migrate to the south-southwest and
the north-northwest
with groundwater flow away from the Station towards the Mississippi River.
The Station receives its potable water from the three potable wells on the property
(Well
#1, Well #5, and Fish House Well #10). The three potable wells are cased off
through the upper unconsolidated (sand) aquifer and are screened in the Dolomite
bedrock aquifer beneath the upper unconsolidated aquifer. Well #1 and Well #5 are
upgradient of the source area. Although tritium was detected in the Little Fish Well,
which is near the Fish House Well but screened in the upper unconsolidated aquifer,
tritium was not detected in the deeper Fish House Well; this proves that the Fish House
Well is isolated from the upper unconsolidated aquifer. The potable wells were sampled
as part of the investigation and did not contain tritium or other radionuclides above
background levels.
Although there is a potentially complete exposure pathway to these supply wells, there
is no current risk of exposure associated with groundwater ingestion at the Station.
Residences are present both north and south of the Station. Tritium was not detected in
monitoring
wells installed adjacent to residential properties (MW-QC-115S and
MW-QC-116S).
Although there is a potentially complete exposure pathway to the residential wells,
there is no current risk of exposure associated with groundwater ingestion off
the
Station property.
7.3.2
GROUNDWATER MIGRATION TO SURFACE WATER
USERS OFF THE STATION PROPERTY
Under this potential exposure route groundwater would migrate from the Station
property to the Mississippi River. Potential exposures could occur if the
groundwater
discharge to the surface water body was sufficient to increase tritium levels in the
Mississippi River to detectable levels above background. Based on the results of the
HIR, tritium has not migrated off the Station property at detectable concentrations.
Tritium was not detected in the groundwater samples collected adjacent to the
Mississippi River (STP Sand Point Well, MW-QC-112I, MW-QC-113I, and MW-QC-114I),
which is somewhat indicative of river water quality.
045136 (20) Quad Cities Generating Station
48
CONESTOGA-ROVERS & ASSOCIATES
Revision 1
This exposure pathway is incomplete as tritium was not detected above the LLD of
200 pCi/L in groundwater samples collected from monitoring wells installed adjacent to
the Mississippi River. Therefore, there is no current risk of exposure to surface water
users off the Station property.
7.4
SUMMARY OF POTENTIAL TRITIUM EXPOSURE PATHWAYS
There are two potential exposure pathways for tritium originating in or adjacent to the
Station:
•
potential
groundwater migration off the Station property to private and public
groundwater users; and
•
potential groundwater migration off the Station property to a surface water body.
In summary, based upon the groundwater and surface water data provided and
referenced in this investigation, none of the potential
receptors are at risk of exposure to
concentrations of tritium in excess of USEPA drinking water standards (20,000 pCi/L).
7.5
OTHER RADIONUCLIDES
Target radionuclides were not detected in the groundwater and surface water samples at
concentrations greater than their respective LLDs. Other non-targeted radionuclides
were also included in the tables but excluded from discussion in this report. These
radionuclides were either a) naturally occurring and thus not produced by the Station,
or b) could be definitively evaluated as being naturally occurring due to the lack of
presence of other radionuclides which would otherwise indicate the potential of
production from the Station.
045136 (20) Quad Cities Generating Station
49
CONESTOGA-ROVERS & ASSOCIATES
Revision 1
8.0
CONCLUSIONS
Based on all of the studies completed to date at this Station, CRA concludes:
Groundwater Flow
•
Groundwater flow beneath the Station
fluctuates seasonally. Groundwater was
observed to flow to the south-southwest in May 2006 and toward the west in
July 2006. Station groundwater discharges to the Mississippi River. Groundwater
flows beneath the Station at a rate of approximately 6 to 54 feet per year.
•
Groundwater
flow at the Station is affected by the presence of a natural
paleochannel, the Meredosia Channel. The northern extent of this paleochannel runs
along the southern portion of the Station. The bedrock surface in this portion of the
Station drops more than 100 feet.
•
Groundwater
flow
within
the
PA
is
affected
by
the
construction
(basements/foundations) of the Reactor/Turbine Building structure, which was
constructed into the Niagaran Dolomite. This building is a barrier to local lateral
flow in the upper unconsolidated aquifer.
•
The
deeper bedrock water supply aquifers are not separated from the upper
unconsolidated aquifer.
•
Water from the Spray Canal enters the upper unconsolidated aquifer
in the northern
portion of the Station, and water drawn from the Little Fish Well is partially
recharged from the Spray Canal in this area of the Station.
Groundwater Quality
•
Gamma-emitting radionuclides associated
with licensed plant operations were not
detected at concentrations greater than their respective LLDs in the samples
collected as part of this investigation.
•
Strontium-89/90
was not detected at concentrations greater than the LLD of
2.0 pCi/L in any of the groundwater samples collected as part of this investigation.
•
Tritium
was detected at concentrations greater than the LLD of 200 pCi/L in 11 of
the 32 groundwater samples collected as part of this investigation.
•
Tritium
concentrations were identified in groundwater in two areas at the Station:
wells downgradient of AFE-Quad Cities-2 (including the Big Fish Well) and wells
downgradient of the Spray Canal (MW-2 and Little Fish Well).
045136 (20) Quad Cities Generating Station
50
CONESTOGA-ROVERS & ASSOCIATES
Revision 1
•
All tritium concentrations appear to be related to historical releases at AFE-Quad
Cities-2. Tritium is present in wells south and southwest of AFE-Quad Cities-2,
including the Big Fish Well.
•
Tritium was not detected
in monitoring wells installed adjacent to the Mississippi
River at concentrations greater than the LLD of 200 pCi/L (STP Sand Point Well,
MW-QC-103I,
MW-QC-105I,
MW-QC-106S,
MW-QC-106I,
MW-QC-112I,
MW-QC-113I, and MW-QC-114I).
•
Tritium was not detected in the monitoring wells installed adjacent
to residential
properties at concentrations greater than the LLD of 200 pCi/L (MW-QC-115S and
MW-QC-116S).
Surface Water Quality
•
Gamma-emitting radionuclides associated
with licensed plant operations were not
detected at concentrations greater than their respective LLDs in the two surface
water samples collected as part of this investigation.
•
Strontium-89/90 was not detected at a concentration greater than the LLD
of
2.0 pCi/L in the two surface water samples collected as part of this investigation.
•
Tritium was detected at concentrations greater than the
LLD of 200 pCi/L in two
surface water locations, SW-QC-1 and SW-QC-2, at concentrations of 550
±
143 pCi/L
and 497
±
140 pCi/L, respectively.
•
The likely source of tritium in the
Spray Canal is historic releases associated with
AFE-Quad Cities-2.
AFE-Quad Cities-1 - Piping West of Radwaste Building/Floor Drain Surge Tank
•
Strontium-89/90
was not detected in the groundwater monitoring well at a
concentration greater than the LLD of 2.0 pCi/L in the vicinity of AFE-Quad Cities-1.
•
Gamma-emitting radionuclides associated
with licensed plant operations were not
detected at concentrations greater than their respective LLDs in the groundwater
monitoring well in the vicinity of AFE-Quad Cities-1.
•
Tritium was not detected at a concentration greater than the
LLD (200 pCi/L) in the
groundwater sample collected from new monitoring well MW-QC-103I located to
the southwest of this AFE area.
•
There is no impact to groundwater from AFE-Quad Cities-1.
045136 (20) Quad Cities Generating Station
51
CONESTOGA-ROVERS & ASSOCIATES
Revision 1
AFE-Quad Cities-2 - Historic Releases Area Near Station Blackout Building (SBO)
•
Strontium-89/90 was not detected at a concentration greater than the LLD
of
2.0 pCi/L in the groundwater monitoring wells in the vicinity of AFE-Quad Cities-2.
•
Gamma-emitting radionuclides associated
with licensed plant operations were not
detected in the groundwater monitoring wells at concentrations greater than their
respective LLDs in the vicinity of AFE-Quad Cities-2.
•
Tritium was detected in groundwater
samples from monitoring wells MW-QC-102S
(9,410 ± 655 pCi/L sample and 9,640 ± 660 pCi/L sample duplicate), MW-QC-102I
(32,600 ± 977 pCi/L
sample
and
31,800 ± 972 pCi/L
sample
duplicate),
MW-QC-102D (3,930J ±450 pCi/L), MW-QC-108S (1,460 ± 217 pCi/L), MW-QC-108I
(1,890J ±252 pCi/L),
MW-QC-109I
(768J ±156 pCi/L),
and
MW-QC-111I
(420J ±133 pCi/L); and from water supply well Big Fish Well (740 ± 152 pCi/L).
•
Water from the Big Fish Well fills the Spray Canal. Tritium was detected in Spray
Canal
surface water samples from sampling points SW-QC-1 (550 ± 143 pCi/L) and
SW-QC-2 (497 ± 140 pCi/L).
•
The
Spray Canal potentially recharges overburden groundwater downgradient of
the Spray Canal. Tritium was detected in water supply well Little Fish Well
(371 ± 134 pCi/L) and monitoring well MW-2 (250 ± 126 pCi/L).
•
Additional delineation of tritium in groundwater is not necessary.
•
There have been three historical releases that have influenced the AFE.
AFE-Quad Cities-3 - CCSTs and Ancillary Piping
•
Strontium-89/90
was not detected in the groundwater monitoring well at a
concentration greater than the LLD of 2.0 pCi/L in the vicinity of AFE-Quad Cities-3.
•
Gamma-emitting radionuclides associated
with licensed plant operation were not
detected at concentrations greater than their respective LLDs in the groundwater
monitoring well in the vicinity of AFE-Quad Cities-3.
•
Tritium was detected in the groundwater sample collected from new monitoring
well MW-QC-104S (262
±
130
pCi/L). This value is slightly greater than the LLD of
200 pCi/L.
AFE-Quad Cities-4 - No. 1 Oil/Water Separator
•
Strontium-89/90
was not detected in the groundwater monitoring well at a
concentration greater than the LLD of 2.0 pCi/L in the vicinity of AFE-Quad Cities-4.
045136 (20) Quad Cities Generating Station
52
CONESTOGA-ROVERS & ASSOCIATES
Revision 1
•
Gamma-emitting radionuclides associated with licensed plant operations were not
detected at concentrations greater than their respective LLDs in the groundwater
monitoring well in the vicinity of AFE-Quad Cities-4.
•
Tritium was not detected at a concentration greater than the
LLD (200 pCi/L) in the
groundwater sample collected from new monitoring well MW-QC-105I located
immediately to the northeast of this AFE area.
•
There have been no impacts to groundwater from AFE-Quad Cities-4.
AFE-Quad Cities-5 - No. 2 Oil/Water Separator
•
Strontium-89/90
was not detected in the groundwater monitoring wells at a
concentration greater than the LLD of 2.0 pCi/L in the vicinity of AFE-Quad Cities-5.
•
Gamma-emitting radionuclides associated
with licensed plant operation were not
detected in the groundwater monitoring wells at concentrations greater than their
respective LLDs in the vicinity of AFE-Quad Cities-5.
•
Tritium was not detected at a concentration greater than the
LLD (200 pCi/L) in the
groundwater sample collected from monitoring wells MW-QC-106S and
MW-QC-106I located immediately southwest of this AFE area.
•
There is no impact to groundwater from AFE-Quad Cities-5.
Potential Receptors
•
Based on the results of this investigation, there is no current risk of exposure
to
radionuclides associated with licensed plant operations through any of the potential
exposure pathways.
General Conclusions
•
Based upon the results of this
investigation, there are no known active releases into
the groundwater at the Station.
•
Based on the results of this investigation, tritium
has not migrated off the Station
property at detectable concentrations.
045136 (20) Quad Cities Generating Station
53
CONESTOGA-ROVERS & ASSOCIATES
Revision 1
9.0
RECOMMENDATIONS
The following presents CRA's recommendations for proposed activities to be completed
at the Station.
9.1
DATA GAPS
Based on the results of this hydrogeologic investigation, there are no data gaps
remaining to support CRA’s conclusions regarding the characterization of the
groundwater regime and potential impacts from radionuclides at the Station.
9.2
GROUNDWATER MONITORING
Based upon the information collected to date, CRA recommends that Exelon conduct
periodic monitoring of selected sample locations.
045136 (20) Quad Cities Generating Station
54
CONESTOGA-ROVERS & ASSOCIATES
Revision 1
10.0
REFERENCES
Aker, R., September 2003. Contaminated Soil Volumes for Decommissioning Cost
Estimates - Quad Cities Units 1 and 2.
Anderson, Richard C., 1980. Geology for Planning in Rock Island County, Illinois,
Circular 510, Illinois State Geological Survey, Urbana, Illinois.
Blume, J., 1966. Quad Cites Plant Design Analysis Report, Vol.
1, May 25, 1966, revised
August 18, 1966.
Brueckmann, J.E. and R.E. Bergstrom, 1968. Ground-Water Geology of the Rock Island,
Monmouth, Galesburg, and Kewanee Area, Illinois, Report of Investigations
221,
Illinois State Geological Survey, Champaign, Illinois.
Conestoga-Rovers & Associates, 2002. Site Investigation Report for the Unit No.
2 Main
Power Transformer Oil Spill, Quad Cities Power Generating Station, Cordova,
Illinois, prepared for Exelon Generation Company, LLC.
Conestoga-Rovers & Associates, May 2006. Hydrological
Investigation Work Plan,
Fleetwide Tritium Assessment, Quad Cities Generating Station, Cordova, Illinois,
prepared for Exelon Generation Company, LLC.
Eberline Instrument Corporation, 1968. Commonwealth Edison Company Quad-Cities
Nuclear Power Plant Environmental Monitoring Report, prepared
for
Commonwealth Edison Company.
Exelon, 2002. Quad Cities Nuclear Power Station, 2001 Annual Radiological
Environmental Operating Report.
Exelon, 2003. Quad Cities Nuclear Power Station, 2002 Annual Radiological
Environmental Operating Report.
Exelon, 2004. Quad Cities Nuclear Power Station, 2003 Annual Radiological
Environmental Operating Report.
Exelon, 2005. Quad Cities Generating Station Spill Prevention Control and
Countermeasure Plan (SPCC Plan),
Revision 13, Quad Cities Generating Station,
Cordova, Illinois, Exelon Generation Company, LLC.
Exelon, 2005. Quad Cities Nuclear Power Station, 2004 Annual Radiological
Environmental Operating Report.
McGinnis, L.D. and P.C. Heigold, 1974. A Seismic Refraction Survey of the Meredosia
Channel
Area of Northwestern Illinois, Circular 488, Illinois Geological Survey,
Urbana, Illinois.
045136 (20) Quad Cities Generating Station
55
CONESTOGA-ROVERS & ASSOCIATES
Revision 1
Puls, R.W.
and
M.J. Barcelona,
April 1996. Low-Flow
(Minimal
Drawdown)
Ground-Water
Sampling
Procedures,
EPA
Ground
Water
Issue,
EPA/540/S-92/005, R.S. Kerr Environmental Research Center, United States
Environmental Protection Agency, Ada, Oklahoma.
UFSAR, 2005. Updated Final Safety Analysis Report, Revision 8, Quad Cities
Generating Station, Cordova, Illinois. Chapter 2.0.
USEPA, May 1996. "Soil Screening Guidance Technical Background Document", Office
of Solid Waste and Emergency Response, Washington, DC EPA/540/R95/128.
USGS, 1996. Robert T. Kay, Richard F. Duwelius,
Timothy A. Brown, Frederick A.
Micke, and Carol A. Witt-Smith, Geohydrology, Water Levels and Directions of
Flow, and Occurrence of Light Nonaqueous-Phase Liquids on Ground Water in
Northwestern Indiana and the Lake Calumet Area of Northeastern Illinois,
U.S. Geological Survey, De Kalb, Illinois.
USNRC, 2004. Generic Environmental Impact Statement for License Renewal of
Nuclear
Plants, Supplement 16, Regarding Quad Cities Nuclear Power Station, Units 1
and 2, Final Report, June 2004, by United States Nuclear Regulatory Commission.
Willman, H.B. et al., 1975. Handbook of Illinois Stratigraphy, Bulletin 95, Illinois State
Geological Survey, Champaign, Illinois.
045136 (20) Quad Cities Generating Station
56
CONESTOGA-ROVERS & ASSOCIATES
FIGURE 1.2 STATION BOUNDARIES
AND FEATURES
(Withheld)
FIGURE 2.1 STATION BASE MAP
(Withheld)
FIGURE 2.6 WATER WELL
LOCATIONS
(Withheld)
FIGURE 3.1 AREAS FOR FURTHER
EVALUATION
(Withheld)
FIGURE 3.2 HISTORICAL RELEASE
LOCATIONS FOR AFE QUAD CITIES 2
(Withheld)
FIGURE 4.1 GROUNDWATER AND
SURFACE WATER MONITORING
LOCATIONS
(Withheld)
FIGURE 5.1 GEOLOGIC CROSS-
SECTION LOCATIONS
(Withheld)
FIGURE 5.6 POTENTIOMETRIC
SURFACE CONTOURS – MAY 2006
(Withheld)
FIGURE 5.7 POTENTIOMETRIC
SURFACE CONTOURS – JULY 2006
(Withheld)
FIGURE 5.8 TRITIUM
CONCENTRATIONS -
GROUNDWATER AND SURFACE
WATER
(Withheld)
FIGURE 5.9 RADIONUCLIDE
CONCENTRATIONS -
GROUNDWATER AND SURFACE
WATER
(Withheld)
FIGURE 6.2 TRITIUM PLUME MAP
PLAN VIEW
(Withheld)
Page 1 of 1
Sample
Reference
Total
Depth to
Groundwater
Depth to
Groundwater
Location
Elevation
Depth
Water
Elevation
Water
Elevation
(ft AMSL)
(1)
(ft below Reference) (ft below Reference)
(ft AMSL)
(ft below Reference)
(ft AMSL)
Shallow Wells
MW-QC-101S
597.03
30.65
23.18
573.85
24.93
572.10
MW-QC-102S
596.83
30.92
24.12
572.71
25.04
571.79
MW-QC-104S
596.08
30.15
23.01
573.07
24.07
572.01
MW-QC-106S
596.24
29.87
22.42
573.82
24.50
571.74
MW-QC-108S
608.64
42.31
36.13
572.51
36.90
571.74
MW-QC-109S
593.72
29.45
NI
(2)
--
21.99
571.73
MW-QC-115S
609.89
42.72
NI
--
38.29
571.60
MW-QC-116S
612.33
46.35
NI
--
40.61
571.72
MW-1
593.44
26.61
19.14
574.30
21.29
572.15
MW-2
592.90
26.65
18.84
574.06
20.82
572.08
Intermediate Wells
MW-QC-101I
597.10
42.19
23.26
573.84
25.02
572.08
MW-QC-102I
597.14
51.60
24.37
572.77
25.27
571.87
MW-QC-103I
596.44
37.36
23.35
573.09
24.82
571.62
MW-QC-105I
595.36
52.53
22.43
572.93
23.55
571.81
MW-QC-106I
596.19
41.98
22.42
573.77
24.49
571.70
MW-QC-107I
609.05
41.53
34.94
574.11
36.51
572.54
MW-QC-108I
608.54
64.20
NI
--
36.82
571.72
MW-QC-109I
593.82
39.04
NI
--
22.16
571.66
MW-QC-110I
604.85
49.44
NI
--
33.12
571.73
MW-QC-111I
618.97
52.57
NI
--
47.31
571.66
MW-QC-112I
604.90
50.00
NI
--
32.98
571.92
MW-QC-113I
605.23
52.37
NI
--
34.62
570.61
MW-QC-114I
607.30
52.85
NI
--
35.60
571.70
Deep Wells
MW-QC-102D
597.27
71.81
NI
--
25.48
571.79
Notes:
(1) ft AMSL - feet above mean sea level
(2) NI - not installed
May 30, 2006
July 26, 2006
TABLE 4.3
SUMMARY OF GROUNDWATER ELEVATIONS
FLEETWIDE ASSESSMENT
QUAD CITIES GENERATING STATION
CORDOVA, ILLINOIS
CRA 45136 (20) Quad Cities Generating Station
Revision 1
Revision 0
CRA 45136 (20) Quad Cities Generating Station
APPENDIX A
WATER SUPPLY WELL INFORMATION
Revision 1
CRA 45136 (20) Quad Cities Generating Station
APPENDIX B
MONITORING WELL LOGS
>90
88
74
64
0
0
1.4
0
1SS
2SS
3SS
4SS
not sampled
CL-CLAY, some fine sand, trace fine gravel,
brown, dry
SW-SAND, fine to medium grained, brown,
dry
- damp at 16.0ft BGS
- saturated at 25.0ft BGS
END OF BOREHOLE @ 27.5ft BGS
Concrete
8" Borehole
Bentonite
Chips
2" O / PVC
Well Casing
2" O / PVC
Well Screen
Sand Pack
WELL DETAILS
Screened interval:
577.10 to 567.10ft AMSL
17.00 to 27.00ft BGS
Length: 10ft
Diameter: 2in
Slot Size: 10
Material: PVC
Sand Pack:
579.10 to 566.60ft AMSL
15.00 to 27.50ft BGS
584.10
583.60
566.60
'N' VALUE
PID (PPM)
(OVERBURDEN)
Page 1 of 1
NUMBER
INTERVAL
SAMPLE
REC (%)
MW-1
STRATIGRAPHIC AND INSTRUMENTATION LOG
2
4
6
8
10
12
14
16
18
20
22
24
26
28
30
32
34
36
38
40
42
44
46
48
DEPTH
ft BGS
PROJECT NAME: QUAD CITIES GENERATING STATION
PROJECT NUMBER: 45136-28
CLIENT: EXELON GENERATION COMPANY LLC
LOCATION: CORDOVA, ILLINOIS
HOLE DESIGNATION:
STRATIGRAPHIC DESCRIPTION & REMARKS
NOTES:
MEASURING POINT ELEVATIONS MAY CHANGE; REFER TO CURRENT ELEVATION TABLE
DATE COMPLETED: January 8, 2002
DRILLING METHOD: 4-1/2" HSA
FIELD PERSONNEL: J. HARGENS
OVERBURDEN LOG 45136-28.GPJ CRA_CORP.GDT 6/7/06
MONITORING WELL
GROUND SURFACE
TOP OF RISER
ELEV.
ft
AMSL
594.10
593.44
88
>83
>50
0
0
0
1SS
2SS
3SS
asphalt and gravel
not sampled
SW-SAND, trace fine gravel, fine to medium
grained, brown, dry
- damp at 20.0ft BGS
- gray, wet at 23.0ft BGS
END OF BOREHOLE @ 27.5ft BGS
Concrete
8" Borehole
Bentonite
Chips
2" O / PVC
Well Casing
2" O / PVC
Well Screen
Sand Pack
WELL DETAILS
Screened interval:
576.70 to 566.70ft AMSL
17.00 to 27.00ft BGS
Length: 10ft
Diameter: 2in
Slot Size: 10
Material: PVC
Sand Pack:
578.70 to 566.20ft AMSL
15.00 to 27.50ft BGS
592.70
581.70
566.20
'N' VALUE
PID (PPM)
(OVERBURDEN)
Page 1 of 1
NUMBER
INTERVAL
SAMPLE
REC (%)
MW-2
STRATIGRAPHIC AND INSTRUMENTATION LOG
2
4
6
8
10
12
14
16
18
20
22
24
26
28
30
32
34
36
38
40
42
44
46
48
DEPTH
ft BGS
PROJECT NAME: QUAD CITIES GENERATING STATION
PROJECT NUMBER: 45136-28
CLIENT: EXELON GENERATION COMPANY LLC
LOCATION: CORDOVA, ILLINOIS
HOLE DESIGNATION:
STRATIGRAPHIC DESCRIPTION & REMARKS
NOTES:
MEASURING POINT ELEVATIONS MAY CHANGE; REFER TO CURRENT ELEVATION TABLE
DATE COMPLETED: January 9, 2002
DRILLING METHOD: 4-1/2" HSA
FIELD PERSONNEL: J. HARGENS
OVERBURDEN LOG 45136-28.GPJ CRA_CORP.GDT 6/7/06
MONITORING WELL
GROUND SURFACE
TOP OF RISER
ELEV.
ft
AMSL
593.70
592.90
76
63
40
0.3
0.7
1.1
1SS
2SS
3SS
gravel
not sampled
SW-SAND, fine to medium grained, brown,
dry
- trace fine rounded gravel at 18.0ft BGS
- gray, saturated at 23.0ft BGS
END OF BOREHOLE @ 27.5ft BGS
Concrete
8" Borehole
Bentonite
Chips
2" O / PVC
Well Casing
2" O / PVC
Well Screen
Sand Pack
WELL DETAILS
Screened interval:
576.80 to 566.80ft AMSL
17.00 to 27.00ft BGS
Length: 10ft
Diameter: 2in
Slot Size: 10
Material: PVC
Sand Pack:
578.80 to 566.30ft AMSL
15.00 to 27.50ft BGS
592.80
583.80
566.30
'N' VALUE
PID (PPM)
(OVERBURDEN)
Page 1 of 1
NUMBER
INTERVAL
SAMPLE
REC (%)
MW-3
STRATIGRAPHIC AND INSTRUMENTATION LOG
2
4
6
8
10
12
14
16
18
20
22
24
26
28
30
32
34
36
38
40
42
44
46
48
DEPTH
ft BGS
PROJECT NAME: QUAD CITIES GENERATING STATION
PROJECT NUMBER: 45136-28
CLIENT: EXELON GENERATION COMPANY LLC
LOCATION: CORDOVA, ILLINOIS
HOLE DESIGNATION:
STRATIGRAPHIC DESCRIPTION & REMARKS
NOTES:
MEASURING POINT ELEVATIONS MAY CHANGE; REFER TO CURRENT ELEVATION TABLE
DATE COMPLETED: January 9, 2002
DRILLING METHOD: 4-1/2" HSA
FIELD PERSONNEL: J. HARGENS
OVERBURDEN LOG 45136-28.GPJ CRA_CORP.GDT 6/7/06
MONITORING WELL
GROUND SURFACE
TOP OF RISER
ELEV.
ft
AMSL
593.80
593.44
6
8
8
11
9
7
9
40
10
18
10
18
9
14
78
1SS
2SS
3SS
4SS
5SS
6SS
7SS
8SS
9SS
10SS
11SS
12SS
13SS
14SS
15SS
70
70
75
60
75
65
65
25
50
25
20
35
45
40
20
FILL-coarse gravel
not sampled
SP-SAND, fine grained, loose, brown, slightly
moist
- trace medium and coarse sand and fine
gravel at 17.0ft BGS
- percent of medium and coarse grained sand
and fine gravel decreases at 18.0ft BGS
- saturated at 22.0ft BGS
- dense at 24.0ft BGS
- loose to compact at 26.0ft BGS
DOLOMITE, fractured, clayey, yellow-tan
END OF BOREHOLE @ 40.0ft BGS
Notes:
Auger refusal at 40.0 ft BGS
Concrete
2" O / PVC
Well Casing
Bentonite
Grout
8" Borehole
Bentonite
Chips
2" O / PVC
Well Screen
Sand Pack
594.28
584.58
555.78
554.58
'N' VALUE
(OVERBURDEN)
Page 1 of 2
NUMBER
INTERVAL
SAMPLE
REC (%)
MW-QC-101I
STRATIGRAPHIC AND INSTRUMENTATION LOG
2
4
6
8
10
12
14
16
18
20
22
24
26
28
30
32
34
36
38
40
42
44
46
48
DEPTH
ft BGS
PROJECT NAME: QUAD CITIES GENERATING STATION
PROJECT NUMBER: 45136-28
CLIENT: EXELON GENERATION COMPANY LLC
LOCATION: CORDOVA, ILLINOIS
HOLE DESIGNATION:
STRATIGRAPHIC DESCRIPTION & REMARKS
NOTES:
MEASURING POINT ELEVATIONS MAY CHANGE; REFER TO CURRENT ELEVATION TABLE
DATE COMPLETED: May 3, 2006
DRILLING METHOD: 4-1/2" HSA
FIELD PERSONNEL: P. KLICK
OVERBURDEN LOG 45136-28.GPJ CRA_CORP.GDT 6/7/06
MONITORING WELL
TOP OF RISER
GROUND SURFACE
ELEV.
ft
AMSL
597.10
594.58
WELL DETAILS
Screened interval:
559.58 to 554.58ft AMSL
35.00 to 40.00ft BGS
Length: 5ft
Diameter: 2in
Slot Size: 10
Material: PVC
Sand Pack:
561.58 to 554.58ft AMSL
33.00 to 40.00ft BGS
Material: 20/40 SAND
FILL-coarse gravel
not sampled
SP-SAND, fine grained, loose, brown, slightly
moist
- trace medium and coarse sand and fine
gravel at 17.0ft BGS
- percent of medium and coarse grained sand
and fine gravel decreases at 18.0ft BGS
- saturated at 22.0ft BGS
- dense at 24.0ft BGS
- loose to compact at 26.0ft BGS
END OF BOREHOLE @ 29.0ft BGS
Concrete
Bentonite
Grout
8" Borehole
Bentonite
Chips
2" O / PVC
Well Casing
2" O / PVC
Well Screen
Sand Pack
WELL DETAILS
Screened interval:
576.52 to 566.52ft AMSL
18.00 to 28.00ft BGS
Length: 10ft
Diameter: 2in
Slot Size: 10
Material: PVC
Sand Pack:
579.02 to 565.52ft AMSL
15.50 to 29.00ft BGS
Material: 20/40 SAND
594.22
584.52
565.52
'N' VALUE
(OVERBURDEN)
Page 1 of 1
NUMBER
INTERVAL
SAMPLE
REC (%)
MW-QC-101S
STRATIGRAPHIC AND INSTRUMENTATION LOG
2
4
6
8
10
12
14
16
18
20
22
24
26
28
30
32
34
36
38
40
42
44
46
48
DEPTH
ft BGS
PROJECT NAME: QUAD CITIES GENERATING STATION
PROJECT NUMBER: 45136-28
CLIENT: EXELON GENERATION COMPANY LLC
LOCATION: CORDOVA, ILLINOIS
HOLE DESIGNATION:
STRATIGRAPHIC DESCRIPTION & REMARKS
NOTES:
MEASURING POINT ELEVATIONS MAY CHANGE; REFER TO CURRENT ELEVATION TABLE
DATE COMPLETED: May 3, 2006
DRILLING METHOD: 4-1/2" HSA
FIELD PERSONNEL: P. KLICK
OVERBURDEN LOG 45136-28.GPJ CRA_CORP.GDT 6/7/06
MONITORING WELL
TOP OF RISER
GROUND SURFACE
ELEV.
ft
AMSL
597.03
594.52
39
59
55
>50
>50
34
62
41
16
11
10
13
12
12
8
23
29
23
40
30
0.0
0.0
0.0
0.0
0.0
0.0
0.0
0.0
0.0
0.0
0.0
0.0
0.0
0.0
0.0
0.0
0.0
0.0
0.0
0.0
1SS
2SS
3SS
4SS
5SS
6SS
7SS
8SS
9SS
10SS
11SS
12SS
13SS
14SS
15SS
16SS
17SS
18SS
19SS
20SS
75
100
80
50
50
100
75
50
50
50
25
40
40
0
0
40
60
50
25
50
not sampled
SP-SAND, trace gravel, fine to medium
grained, dense, brown/tan, slightly moist
- very dense, moist at 12.0ft BGS
- trace clay at 14.0ft BGS
- very hard, some dolomite rock at 17.0ft BGS
- dense at 20.0ft BGS
- coarse sand with gravel, very dense,
saturated at 22.0ft BGS
- dense at 24.0ft BGS
- fine to medium grained, compact at 26.0ft
BGS
- coarse sand with gravel at 32.0ft BGS
- no recovery from 36.0 to 38.0ft BGS
- loose, no recovery from 38.0 to 40.0ft BGS
- compact at 40.0ft BGS
- dense, some large rock at 46.0ft BGS
END OF BOREHOLE @ 50.0ft BGS
Concrete
Bentonite
Grout
8" Borehole
Bentonite
Pellets
2" O / PVC
Well Casing
2" O / PVC
Well Screen
Sand Pack
WELL DETAILS
Screened interval:
550.76 to 545.76ft AMSL
44.00 to 49.00ft BGS
Length: 5ft
Diameter: 2in
Slot Size: 10
Material: PVC
Sand Pack:
553.76 to 544.76ft AMSL
41.00 to 50.00ft BGS
Material: 20/40 SAND
584.76
544.76
'N' VALUE
PID (PPM)
(OVERBURDEN)
Page 1 of 1
NUMBER
INTERVAL
SAMPLE
REC (%)
MW-QC-102I
STRATIGRAPHIC AND INSTRUMENTATION LOG
5
10
15
20
25
30
35
40
45
50
55
60
DEPTH
ft BGS
PROJECT NAME: QUAD CITIES GENERATING STATION
PROJECT NUMBER: 45136-28
CLIENT: EXELON GENERATION COMPANY LLC
LOCATION: CORDOVA, ILLINOIS
HOLE DESIGNATION:
STRATIGRAPHIC DESCRIPTION & REMARKS
NOTES:
MEASURING POINT ELEVATIONS MAY CHANGE; REFER TO CURRENT ELEVATION TABLE
WATER FOUND
DATE COMPLETED: May 5, 2006
DRILLING METHOD: 4-1/2" HSA
FIELD PERSONNEL: T. PRANGER
OVERBURDEN LOG 45136-28.GPJ CRA_CORP.GDT 6/7/06
MONITORING WELL
TOP OF RISER
GROUND SURFACE
ELEV.
ft
AMSL
597.14
594.76
not sampled
SP-SAND, trace gravel, fine to medium
grained, dense, brown/tan, slightly moist
- very dense, moist at 12.0ft BGS
- trace clay at 14.0ft BGS
- very hard, some dolomite rock at 17.0ft BGS
- dense at 20.0ft BGS
- coarse sand with gravel, very dense,
saturated at 22.0ft BGS
- dense at 24.0ft BGS
- fine to medium grained, compact at 26.0ft
BGS
END OF BOREHOLE @ 30.0ft BGS
Concrete
Bentonite
Grout
8" Borehole
Bentonite
Pellets
2" O / PVC
Well Casing
2" O / PVC
Well Screen
Sand Pack
WELL DETAILS
Screened interval:
575.69 to 565.69ft AMSL
19.00 to 29.00ft BGS
Length: 10ft
Diameter: 2in
Slot Size: 10
Material: PVC
Sand Pack:
577.69 to 564.69ft AMSL
17.00 to 30.00ft BGS
Material: 20/40 SAND
584.69
564.69
'N' VALUE
(OVERBURDEN)
Page 1 of 1
NUMBER
INTERVAL
SAMPLE
REC (%)
MW-QC-102S
STRATIGRAPHIC AND INSTRUMENTATION LOG
5
10
15
20
25
30
35
40
45
50
DEPTH
ft BGS
PROJECT NAME: QUAD CITIES GENERATING STATION
PROJECT NUMBER: 45136-28
CLIENT: EXELON GENERATION COMPANY LLC
LOCATION: CORDOVA, ILLINOIS
HOLE DESIGNATION:
STRATIGRAPHIC DESCRIPTION & REMARKS
NOTES:
MEASURING POINT ELEVATIONS MAY CHANGE; REFER TO CURRENT ELEVATION TABLE
DATE COMPLETED: May 8, 2006
DRILLING METHOD: 4-1/2" HSA
FIELD PERSONNEL: T. PRANGER
OVERBURDEN LOG 45136-28.GPJ CRA_CORP.GDT 6/7/06
MONITORING WELL
TOP OF RISER
GROUND SURFACE
ELEV.
ft
AMSL
596.83
594.69
not sampled
SP-SAND, trace gravel, fine to medium
grained, dense, brown/tan, slightly moist
- very dense, moist at 12.0ft BGS
- trace clay at 14.0ft BGS
- very hard, some dolomite rock at 17.0ft BGS
- dense at 20.0ft BGS
- coarse sand with gravel, very dense,
saturated at 22.0ft BGS
- dense at 24.0ft BGS
- fine to medium grained, compact at 26.0ft
BGS
- coarse sand with gravel at 32.0ft BGS
- no recovery from 36.0 to 38.0ft BGS
- loose, no recovery from 38.0 to 40.0ft BGS
Concrete
Bentonite
Grout
8" Borehole
584.80
'N' VALUE
PID (PPM)
(OVERBURDEN)
Page 1 of 2
NUMBER
INTERVAL
SAMPLE
REC (%)
MW-QC-102D
STRATIGRAPHIC AND INSTRUMENTATION LOG
2
4
6
8
10
12
14
16
18
20
22
24
26
28
30
32
34
36
38
DEPTH
ft BGS
PROJECT NAME: QUAD CITIES GENERATING STATION
PROJECT NUMBER: 45136-28
CLIENT: EXELON GENERATION COMPANY LLC
LOCATION: CORDOVA, ILLINOIS
HOLE DESIGNATION:
STRATIGRAPHIC DESCRIPTION & REMARKS
NOTES:
MEASURING POINT ELEVATIONS MAY CHANGE; REFER TO CURRENT ELEVATION TABLE
DATE COMPLETED: June 20, 2006
DRILLING METHOD: 4-1/2" HSA
FIELD PERSONNEL: J. HARGENS
OVERBURDEN LOG 45136-28.GPJ CRA_CORP.GDT 8/6/06
MONITORING WELL
TOP OF RISER
GROUND SURFACE
ELEV.
ft
AMSL
597.27
594.80
65
74
111
>100
0.1
0.2
0.1
0.2
1SS
2SS
3SS
4SS
100
100
70
68
- compact at 40.0ft BGS
- dense, some large rock at 46.0ft BGS
SW-SAND, fine to coarse grained, dense, gray
brown, wet
SP-SAND, some fine to coarse gravel, trace
clay, fine to medium grained, brown, wet
END OF BOREHOLE @ 70.0ft BGS
Notes:
Auger refusal at 70.0 ft BGS
2" O / PVC
Well Casing
Bentonite
Pellets
Sand Pack
2" O / PVC
Well Screen
WELL DETAILS
Screened interval:
529.80 to 524.80ft AMSL
65.00 to 70.00ft BGS
Length: 5ft
Diameter: 2in
Slot Size: 10
Material: PVC
Sand Pack:
531.80 to 524.80ft AMSL
63.00 to 70.00ft BGS
Material: NATURAL SAND
541.80
540.80
524.80
'N' VALUE
PID (PPM)
(OVERBURDEN)
Page 2 of 2
NUMBER
INTERVAL
SAMPLE
REC (%)
MW-QC-102D
STRATIGRAPHIC AND INSTRUMENTATION LOG
42
44
46
48
50
52
54
56
58
60
62
64
66
68
70
72
74
76
78
DEPTH
ft BGS
PROJECT NAME: QUAD CITIES GENERATING STATION
PROJECT NUMBER: 45136-28
CLIENT: EXELON GENERATION COMPANY LLC
LOCATION: CORDOVA, ILLINOIS
HOLE DESIGNATION:
STRATIGRAPHIC DESCRIPTION & REMARKS
NOTES:
MEASURING POINT ELEVATIONS MAY CHANGE; REFER TO CURRENT ELEVATION TABLE
DATE COMPLETED: June 20, 2006
DRILLING METHOD: 4-1/2" HSA
FIELD PERSONNEL: J. HARGENS
OVERBURDEN LOG 45136-28.GPJ CRA_CORP.GDT 8/6/06
MONITORING WELL
ELEV.
ft
AMSL
16
12
14
8
8
13
7
3
11
4
6
5
0
0
0
0
0
0
0
0
0
0
0
0
0
1SS
2SS
3SS
4SS
5SS
6SS
7SS
8SS
9SS
10SS
11SS
12SS
13SS
50
50
50
50
50
66
42
50
50
50
50
not sampled
SP-SAND, trace gravel, fine grained,
compact, brown, damp
- loose at 16.0ft BGS
- wet at 20.0ft BGS
END OF BOREHOLE @ 35.0ft BGS
Concrete
8" Borehole
Bentonite
Grout
Bentonite
Pellets
2" O / PVC
Well Casing
2" O / PVC
Well Screen
Sand Pack
WELL DETAILS
Screened interval:
564.39 to 559.39ft AMSL
30.00 to 35.00ft BGS
Length: 5ft
Diameter: 2in
Slot Size: 10
Material: PVC
Sand Pack:
567.39 to 559.39ft AMSL
27.00 to 35.00ft BGS
Material: 20/40 SAND
584.39
559.39
'N' VALUE
PID (PPM)
(OVERBURDEN)
Page 1 of 1
NUMBER
INTERVAL
SAMPLE
REC (%)
MW-QC-103I
STRATIGRAPHIC AND INSTRUMENTATION LOG
2
4
6
8
10
12
14
16
18
20
22
24
26
28
30
32
34
36
38
40
42
44
46
48
DEPTH
ft BGS
PROJECT NAME: QUAD CITIES GENERATING STATION
PROJECT NUMBER: 45136-28
CLIENT: EXELON GENERATION COMPANY LLC
LOCATION: CORDOVA, ILLINOIS
HOLE DESIGNATION:
STRATIGRAPHIC DESCRIPTION & REMARKS
NOTES:
MEASURING POINT ELEVATIONS MAY CHANGE; REFER TO CURRENT ELEVATION TABLE
DATE COMPLETED: May 10, 2006
DRILLING METHOD: 4-1/2" HSA
FIELD PERSONNEL: N. ZIEGLER
OVERBURDEN LOG 45136-28.GPJ CRA_CORP.GDT 6/7/06
MONITORING WELL
TOP OF RISER
GROUND SURFACE
ELEV.
ft
AMSL
596.44
594.39
1SS
2SS
3SS
4SS
5SS
6SS
7SS
8SS
9SS
10SS
50
50
62
50
50
62
62
50
100
50
27
15
22
15
40
26
23
28
55
83
0
0
0
0
0
0
0
0
0
0
not sampled
SW-SAND, trace fine gravel, medium to
coarse grained sand, subangular to
subrounded gravel, compact brown, damp
- wet at 20.0ft BGS
- very dense at 26.0ft BGS
END OF BOREHOLE @ 30.0ft BGS
Concrete
Bentonite
Grout
8" Borehole
Bentonite
Pellets
2" O / PVC
Well Casing
2" O / PVC
Well Screen
Sand Pack
WELL DETAILS
Screened interval:
576.07 to 566.07ft AMSL
18.00 to 28.00ft BGS
Length: 10ft
Diameter: 2in
Slot Size: 10
Material: PVC
Sand Pack:
578.07 to 566.07ft AMSL
16.00 to 28.00ft BGS
Material: 20/40 SAND
584.07
564.07
INTERVAL
SAMPLE
REC (%)
NUMBER
'N' VALUE
PID (PPM)
(OVERBURDEN)
Page 1 of 1
MW-QC-104S
STRATIGRAPHIC AND INSTRUMENTATION LOG
2
4
6
8
10
12
14
16
18
20
22
24
26
28
30
32
34
36
38
40
42
44
46
48
DEPTH
ft BGS
PROJECT NAME: QUAD CITIES GENERATING STATION
PROJECT NUMBER: 45136-28
CLIENT: EXELON GENERATION COMPANY LLC
LOCATION: CORDOVA, ILLINOIS
HOLE DESIGNATION:
STRATIGRAPHIC DESCRIPTION & REMARKS
NOTES:
MEASURING POINT ELEVATIONS MAY CHANGE; REFER TO CURRENT ELEVATION TABLE
DATE COMPLETED: May 11, 2006
DRILLING METHOD: 4-1/2" HSA
FIELD PERSONNEL: N. ZIEGLER
OVERBURDEN LOG 45136-28.GPJ CRA_CORP.GDT 7/11/06
MONITORING WELL
TOP OF RISER
GROUND SURFACE
ELEV.
ft
AMSL
596.08
594.07
4
2
2
8
3
16
30
9
1
11
10
10
8
12
12
8
15
12
19
14
0.0
0.0
0.0
0.0
0.0
0.0
0.0
0.0
0.0
0.0
0.0
0.0
0.0
0.0
0.0
0.0
0.0
0.0
0.0
0.0
1SS
2SS
3SS
4SS
5SS
6SS
7SS
8SS
9SS
10SS
11SS
12SS
13SS
14SS
15SS
16SS
17SS
18SS
19SS
20SS
70
50
50
70
60
50
50
50
40
40
40
25
25
20
50
0
50
8
45
40
not sampled
SP-SAND, fine to medium grained, some
coarse grains, very loose to loose, brown/tan,
moist
- dense from 22.0 to 24.0ft BGS
- compact at 28.0ft BGS
- no recovery from 40.0 to 42.0ft BGS
- large rock at 44.0ft BGS
END OF BOREHOLE @ 50.0ft BGS
Concrete
Bentonite
Grout
8" Borehole
Bentonite
Pellets
2" O / PVC
Well Casing
2" O / PVC
Well Screen
Sand Pack
WELL DETAILS
Screened interval:
548.11 to 543.11ft AMSL
45.00 to 50.00ft BGS
Length: 5ft
Diameter: 2in
Slot Size: 10
Material: PVC
Sand Pack:
551.11 to 543.11ft AMSL
42.00 to 50.00ft BGS
Material: 20/40 SAND
583.11
543.11
'N' VALUE
PID (PPM)
(OVERBURDEN)
Page 1 of 1
NUMBER
INTERVAL
SAMPLE
REC (%)
MW-QC-105I
STRATIGRAPHIC AND INSTRUMENTATION LOG
5
10
15
20
25
30
35
40
45
50
55
60
DEPTH
ft BGS
PROJECT NAME: QUAD CITIES GENERATING STATION
PROJECT NUMBER: 45136-28
CLIENT: EXELON GENERATION COMPANY LLC
LOCATION: CORDOVA, ILLINOIS
HOLE DESIGNATION:
STRATIGRAPHIC DESCRIPTION & REMARKS
NOTES:
MEASURING POINT ELEVATIONS MAY CHANGE; REFER TO CURRENT ELEVATION TABLE
DATE COMPLETED: May 9, 2006
DRILLING METHOD: 4-1/2" HSA
FIELD PERSONNEL: T. PRANGER
OVERBURDEN LOG 45136-28.GPJ CRA_CORP.GDT 6/7/06
MONITORING WELL
TOP OF RISER
GROUND SURFACE
ELEV.
ft
AMSL
595.36
593.11
6
12
8
7
5
4
3
5
6
5
11
6
15
21
>50
0.0
0.0
0.0
0.0
0.0
0.0
0.0
0.0
0.0
0.0
0.0
0.0
0.0
0.0
0.0
1SS
2SS
3SS
4SS
5SS
6SS
7SS
8SS
9SS
10SS
11SS
12SS
13SS
14SS
15SS
50
50
75
75
75
75
40
40
40
40
35
25
30
30
100
not sampled
SP-SAND, very loose to loose, medium
grained, fine to coarse grained, brown/tan,
moist
- saturated at 20.0ft BGS
- loose to compact at 30.0ft BGS
- large rock or bedrock at 39.0ft BGS
END OF BOREHOLE @ 40.0ft BGS
Concrete
2" O / PVC
Well Casing
Bentonite
Grout
8" Borehole
Bentonite
Pellets
2" O / PVC
Well Screen
Sand Pack
WELL DETAILS
Screened interval:
559.00 to 554.00ft AMSL
35.00 to 40.00ft BGS
Length: 5ft
Diameter: 2in
Slot Size: 10
Material: PVC
Sand Pack:
562.00 to 554.00ft AMSL
32.00 to 40.00ft BGS
Material: 20/40 SAND
584.00
554.00
'N' VALUE
PID (PPM)
(OVERBURDEN)
Page 1 of 2
NUMBER
INTERVAL
SAMPLE
REC (%)
MW-QC-106I
STRATIGRAPHIC AND INSTRUMENTATION LOG
2
4
6
8
10
12
14
16
18
20
22
24
26
28
30
32
34
36
38
40
42
44
46
48
DEPTH
ft BGS
PROJECT NAME: QUAD CITIES GENERATING STATION
PROJECT NUMBER: 45136-28
CLIENT: EXELON GENERATION COMPANY LLC
LOCATION: CORDOVA, ILLINOIS
HOLE DESIGNATION:
STRATIGRAPHIC DESCRIPTION & REMARKS
NOTES:
MEASURING POINT ELEVATIONS MAY CHANGE; REFER TO CURRENT ELEVATION TABLE
DATE COMPLETED: May 10, 2006
DRILLING METHOD: 4-1/2" HSA
FIELD PERSONNEL: T. PRANGER
OVERBURDEN LOG 45136-28.GPJ CRA_CORP.GDT 6/7/06
MONITORING WELL
TOP OF RISER
GROUND SURFACE
ELEV.
ft
AMSL
596.19
594.00
not sampled
SP-SAND, very loose to loose, medium
grained, fine to coarse grained, brown/tan,
moist
- saturated at 20.0ft BGS
END OF BOREHOLE @ 27.0ft BGS
Concrete
8" Borehole
Bentonite
Grout
Bentonite
Pellets
2" O / PVC
Well Casing
2" O / PVC
Well Screen
Sand Pack
WELL DETAILS
Screened interval:
576.79 to 566.79ft AMSL
17.00 to 27.00ft BGS
Length: 10ft
Diameter: 2in
Slot Size: 10
Material: PVC
Sand Pack:
578.79 to 566.79ft AMSL
15.00 to 27.00ft BGS
Material: 20/40 SAND
583.79
566.79
'N' VALUE
(OVERBURDEN)
Page 1 of 1
NUMBER
INTERVAL
SAMPLE
REC (%)
MW-QC-106S
STRATIGRAPHIC AND INSTRUMENTATION LOG
2
4
6
8
10
12
14
16
18
20
22
24
26
28
30
32
34
36
38
40
42
44
46
48
DEPTH
ft BGS
PROJECT NAME: QUAD CITIES GENERATING STATION
PROJECT NUMBER: 45136-28
CLIENT: EXELON GENERATION COMPANY LLC
LOCATION: CORDOVA, ILLINOIS
HOLE DESIGNATION:
STRATIGRAPHIC DESCRIPTION & REMARKS
NOTES:
MEASURING POINT ELEVATIONS MAY CHANGE; REFER TO CURRENT ELEVATION TABLE
DATE COMPLETED: May 10, 2006
DRILLING METHOD: 4-1/2" HSA
FIELD PERSONNEL: T. PRANGER
OVERBURDEN LOG 45136-28.GPJ CRA_CORP.GDT 6/7/06
MONITORING WELL
TOP OF RISER
GROUND SURFACE
ELEV.
ft
AMSL
596.24
593.79
6
7
7
11
6
8
10
10
11
13
18
69
66
28
1SS
2SS
3SS
4SS
5SS
6SS
7SS
8SS
9SS
10SS
11SS
12SS
13SS
14SS
65
75
75
60
60
75
65
75
75
70
85
70
70
25
grass and topsoil
not sampled
SP-SAND, fine grained, loose, brown, slightly
moist
SW-SAND, fine to medium grained, trace
coarse grained, brown, moist
SP-SAND, fine grained, loose, brown, moist
- wet at 20.0ft BGS
- compact at 23.0ft BGS
- trace coarse gravel at 27.0ft BGS
- saturated at 31.0ft BGS
- weathered dolomite, tan (2" layer) at 32.8ft
BGS
SW-SAND, fine to coarse grained, brown,
saturated
DOLOMITE, weathered, clayey, gray,
saturated-
tan at 34.6ft BGS
END OF BOREHOLE @ 39.0ft BGS
Notes:
Auger refusal at 39.0 ft BGS
Concrete
2" O / PVC
Well Casing
Bentonite
Grout
8" Borehole
Bentonite
Pellets
2" O / PVC
Well Screen
Sand Pack
WELL DETAILS
Screened interval:
577.62 to 567.62ft AMSL
29.00 to 39.00ft BGS
Length: 10ft
Diameter: 2in
Slot Size: 10
Material: PVC
Sand Pack:
580.62 to 567.62ft AMSL
26.00 to 39.00ft BGS
Material: 20/40 SAND
606.12
595.62
588.62
587.62
573.62
572.42
567.62
'N' VALUE
(OVERBURDEN)
Page 1 of 1
NUMBER
INTERVAL
SAMPLE
REC (%)
MW-QC-107I
STRATIGRAPHIC AND INSTRUMENTATION LOG
2
4
6
8
10
12
14
16
18
20
22
24
26
28
30
32
34
36
38
40
42
44
46
48
DEPTH
ft BGS
PROJECT NAME: QUAD CITIES GENERATING STATION
PROJECT NUMBER: 45136-28
CLIENT: EXELON GENERATION COMPANY LLC
LOCATION: CORDOVA, ILLINOIS
HOLE DESIGNATION:
STRATIGRAPHIC DESCRIPTION & REMARKS
NOTES:
MEASURING POINT ELEVATIONS MAY CHANGE; REFER TO CURRENT ELEVATION TABLE
DATE COMPLETED: May 2, 2006
DRILLING METHOD: 4-1/2" HSA
FIELD PERSONNEL: P. KLICK
OVERBURDEN LOG 45136-28.GPJ CRA_CORP.GDT 6/7/06
MONITORING WELL
TOP OF RISER
GROUND SURFACE
ELEV.
ft
AMSL
609.05
606.62
2
3
1
7
10
10
10
8
14
23
20
15
4
6
11
2.8
2.9
5.5
4.6
4.2
2.1
2.8
4.0
4.2
3.2
4.2
3.1
2.4
3.1
29
1SS
2SS
3SS
4SS
5SS
6SS
7SS
8SS
9SS
10SS
11SS
12SS
13SS
14SS
15SS
75
50
60
60
60
70
75
50
50
50
60
50
75
75
65
not sampled
SP-SAND, fine to medium grained, trace
gravel, very loose, brown, dry
- loose, moist at 16.0ft BGS
- with coarse sand, compact at 18.0ft BGS
- no coarse sand, trace gravel at 20.0ft BGS
- fine grained at 22.0ft BGS
- loose at 24.0ft BGS
- compact at 26.0ft BGS
- trace gravel at 28.0ft BGS
- saturated at 32.0ft BGS
- gravel, coarse sand, loose at 34.0ft BGS
END OF BOREHOLE @ 40.0ft BGS
Concrete
8" Borehole
2" O / PVC
Well Casing
Bentonite
Grout
Bentonite
Pellets
2" O / PVC
Well Screen
Sand Pack
WELL DETAILS
Screened interval:
577.14 to 567.14ft AMSL
29.50 to 39.50ft BGS
Length: 10ft
Diameter: 2in
Slot Size: 10
Material: PVC
Sand Pack:
579.14 to 566.64ft AMSL
27.50 to 40.00ft BGS
Material: 20/40 SAND
596.64
566.64
'N' VALUE
PID (PPM)
(OVERBURDEN)
Page 1 of 2
NUMBER
INTERVAL
SAMPLE
REC (%)
MW-QC-108S
STRATIGRAPHIC AND INSTRUMENTATION LOG
2
4
6
8
10
12
14
16
18
20
22
24
26
28
30
32
34
36
38
40
42
44
46
48
DEPTH
ft BGS
PROJECT NAME: QUAD CITIES GENERATING STATION
PROJECT NUMBER: 45136-28
CLIENT: EXELON GENERATION COMPANY LLC
LOCATION: CORDOVA, ILLINOIS
HOLE DESIGNATION:
STRATIGRAPHIC DESCRIPTION & REMARKS
NOTES:
MEASURING POINT ELEVATIONS MAY CHANGE; REFER TO CURRENT ELEVATION TABLE
DATE COMPLETED: May 15, 2006
DRILLING METHOD: 4-1/2" HSA
FIELD PERSONNEL: T. PRANGER
OVERBURDEN LOG 45136-28.GPJ CRA_CORP.GDT 6/7/06
MONITORING WELL
TOP OF RISER
GROUND SURFACE
ELEV.
ft
AMSL
608.64
606.64
not sampled
SP-SAND, fine to medium grained, trace
gravel, very loose, brown, dry
- loose, moist at 16.0ft BGS
- with coarse sand, compact at 18.0ft BGS
- no coarse sand, trace gravel at 20.0ft BGS
- fine grained at 22.0ft BGS
- loose at 24.0ft BGS
- compact at 26.0ft BGS
- trace gravel at 28.0ft BGS
- saturated at 32.0ft BGS
- gravel, coarse sand, loose at 34.0ft BGS
Concrete
8" Borehole
2" O / PVC
Well Casing
Bentonite
Grout
596.41
'N' VALUE
PID (PPM)
(OVERBURDEN)
Page 1 of 2
NUMBER
INTERVAL
SAMPLE
REC (%)
MW-QC-108I
STRATIGRAPHIC AND INSTRUMENTATION LOG
2
4
6
8
10
12
14
16
18
20
22
24
26
28
30
32
34
36
DEPTH
ft BGS
PROJECT NAME: QUAD CITIES GENERATING STATION
PROJECT NUMBER: 45136-28
CLIENT: EXELON GENERATION COMPANY LLC
LOCATION: CORDOVA, ILLINOIS
HOLE DESIGNATION:
STRATIGRAPHIC DESCRIPTION & REMARKS
NOTES:
MEASURING POINT ELEVATIONS MAY CHANGE; REFER TO CURRENT ELEVATION TABLE
DATE COMPLETED: June 13, 2006
DRILLING METHOD: 4-1/2" HSA
FIELD PERSONNEL: J. HARGENS
OVERBURDEN LOG 45136-28.GPJ CRA_CORP.GDT 8/6/06
MONITORING WELL
TOP OF RISER
GROUND SURFACE
ELEV.
ft
AMSL
608.54
606.41
12
15
15
17
NR
0
0
0.2
1SS
2SS
3SS
4SS
0
80
75
100
SW-SAND, trace medium gravel, fine to
coarse grained, brown, wet
END OF BOREHOLE @ 62.0ft BGS
Bentonite
Pellets
Sand Pack
2" O / PVC
Well Screen
WELL DETAILS
Screened interval:
550.41 to 545.41ft AMSL
56.00 to 61.00ft BGS
Length: 5ft
Diameter: 2in
Slot Size: 10
Material: PVC
Sand Pack:
552.41 to 544.41ft AMSL
54.00 to 62.00ft BGS
Material: NATURAL SAND
566.41
544.41
'N' VALUE
PID (PPM)
(OVERBURDEN)
Page 2 of 2
NUMBER
INTERVAL
SAMPLE
REC (%)
MW-QC-108I
STRATIGRAPHIC AND INSTRUMENTATION LOG
40
42
44
46
48
50
52
54
56
58
60
62
64
66
68
70
72
74
DEPTH
ft BGS
PROJECT NAME: QUAD CITIES GENERATING STATION
PROJECT NUMBER: 45136-28
CLIENT: EXELON GENERATION COMPANY LLC
LOCATION: CORDOVA, ILLINOIS
HOLE DESIGNATION:
STRATIGRAPHIC DESCRIPTION & REMARKS
NOTES:
MEASURING POINT ELEVATIONS MAY CHANGE; REFER TO CURRENT ELEVATION TABLE
DATE COMPLETED: June 13, 2006
DRILLING METHOD: 4-1/2" HSA
FIELD PERSONNEL: J. HARGENS
OVERBURDEN LOG 45136-28.GPJ CRA_CORP.GDT 8/6/06
MONITORING WELL
ELEV.
ft
AMSL
not sampled
END OF BOREHOLE @ 39.0ft BGS
Concrete
8" Borehole
2" O / PVC
Well Casing
Bentonite
Grout
Bentonite
Pellets
2" O / PVC
Well Screen
Sand Pack
(OVERBURDEN)
Page 1 of 2
NUMBER
INTERVAL
SAMPLE
REC (%)
MW-QC-109I
STRATIGRAPHIC AND INSTRUMENTATION LOG
2
4
6
8
10
12
14
16
18
20
22
24
26
28
30
32
34
36
38
DEPTH
ft BGS
PROJECT NAME: QUAD CITIES GENERATING STATION
PROJECT NUMBER: 45136-28
CLIENT: EXELON GENERATION COMPANY LLC
LOCATION: CORDOVA, ILLINOIS
HOLE DESIGNATION:
STRATIGRAPHIC DESCRIPTION & REMARKS
NOTES:
MEASURING POINT ELEVATIONS MAY CHANGE; REFER TO CURRENT ELEVATION TABLE
DATE COMPLETED: July 13, 2006
DRILLING METHOD: 4-1/2" HSA
FIELD PERSONNEL: N. ZIEGLER
OVERBURDEN LOG 45136-28.GPJ CRA_CORP.GDT 8/6/06
MONITORING WELL
GROUND SURFACE
TOP OF RISER
ELEV.
ft
AMSL
593.93
593.82
554.93
'N' VALUE
'N' VALUE
(OVERBURDEN)
Page 2 of 2
NUMBER
INTERVAL
SAMPLE
REC (%)
MW-QC-109I
STRATIGRAPHIC AND INSTRUMENTATION LOG
42
44
46
48
50
52
54
56
58
60
62
64
66
68
70
72
74
76
78
DEPTH
ft BGS
PROJECT NAME: QUAD CITIES GENERATING STATION
PROJECT NUMBER: 45136-28
CLIENT: EXELON GENERATION COMPANY LLC
LOCATION: CORDOVA, ILLINOIS
HOLE DESIGNATION:
STRATIGRAPHIC DESCRIPTION & REMARKS
NOTES:
MEASURING POINT ELEVATIONS MAY CHANGE; REFER TO CURRENT ELEVATION TABLE
DATE COMPLETED: July 13, 2006
DRILLING METHOD: 4-1/2" HSA
FIELD PERSONNEL: N. ZIEGLER
OVERBURDEN LOG 45136-28.GPJ CRA_CORP.GDT 8/6/06
MONITORING WELL
ELEV.
ft
AMSL
WELL DETAILS
Screened interval:
559.93 to 554.93ft AMSL
34.00 to 39.00ft BGS
Length: 5ft
Diameter: 2in
Slot Size: 10
Material: PVC
Sand Pack:
561.93 to 554.93ft AMSL
32.00 to 39.00ft BGS
Material: 20/40 SAND
not sampled
END OF BOREHOLE @ 29.5ft BGS
Concrete
8" Borehole
Bentonite
Grout
2" O / PVC
Well Casing
Bentonite
Pellets
Sand Pack
2" O / PVC
Well Screen
WELL DETAILS
Screened interval:
574.43 to 564.43ft AMSL
19.50 to 29.50ft BGS
Length: 10ft
Diameter: 2in
Slot Size: 10
Material: PVC
Sand Pack:
576.43 to 564.43ft AMSL
17.50 to 29.50ft BGS
Material: 20/40 SAND
564.43
'N' VALUE
(OVERBURDEN)
Page 1 of 1
NUMBER
INTERVAL
SAMPLE
REC (%)
MW-QC-109S
STRATIGRAPHIC AND INSTRUMENTATION LOG
2
4
6
8
10
12
14
16
18
20
22
24
26
28
30
32
34
36
38
DEPTH
ft BGS
PROJECT NAME: QUAD CITIES GENERATING STATION
PROJECT NUMBER: 45136-28
CLIENT: EXELON GENERATION COMPANY LLC
LOCATION: CORDOVA, ILLINOIS
HOLE DESIGNATION:
STRATIGRAPHIC DESCRIPTION & REMARKS
NOTES:
MEASURING POINT ELEVATIONS MAY CHANGE; REFER TO CURRENT ELEVATION TABLE
DATE COMPLETED: July 12, 2006
DRILLING METHOD: 4-1/2" HSA
FIELD PERSONNEL: N. ZIEGLER
OVERBURDEN LOG 45136-28.GPJ CRA_CORP.GDT 8/10/06
MONITORING WELL
GROUND SURFACE
TOP OF RISER
ELEV.
ft
AMSL
593.93
593.72
16
8
20
21
9
0
0
0
0
0
1SS
2SS
3SS
4SS
5SS
50
50
75
75
75
not sampled
SP-SAND, coarse grained, trace medium
grained sand and fine subangular to
subrounded gravel, brown, damp, loose
- wet at 33.0ft BGS
Concrete
8" Borehole
2" O / PVC
Well Casing
Bentonite
Grout
591.20
'N' VALUE
PID (PPM)
(OVERBURDEN)
Page 1 of 2
NUMBER
INTERVAL
SAMPLE
REC (%)
MW-QC-110I
STRATIGRAPHIC AND INSTRUMENTATION LOG
2
4
6
8
10
12
14
16
18
20
22
24
26
28
30
32
34
36
DEPTH
ft BGS
PROJECT NAME: QUAD CITIES GENERATING STATION
PROJECT NUMBER: 45136-28
CLIENT: EXELON GENERATION COMPANY LLC
LOCATION: CORDOVA, ILLINOIS
HOLE DESIGNATION:
STRATIGRAPHIC DESCRIPTION & REMARKS
NOTES:
MEASURING POINT ELEVATIONS MAY CHANGE; REFER TO CURRENT ELEVATION TABLE
DATE COMPLETED: July 11, 2006
DRILLING METHOD: 4-1/2" HSA
FIELD PERSONNEL: N. ZIEGLER
OVERBURDEN LOG 45136-28.GPJ CRA_CORP.GDT 8/10/06
MONITORING WELL
GROUND SURFACE
TOP OF RISER
ELEV.
ft
AMSL
605.20
604.85
12
14
18
0
0
0
6SS
7SS
8SS
75
75
85
- increasing fine gravel at 45.0ft BGS
END OF BOREHOLE @ 50.0ft BGS
Bentonite
Pellets
Sand Pack
2" O / PVC
Well Screen
WELL DETAILS
Screened interval:
560.20 to 555.20ft AMSL
45.00 to 50.00ft BGS
Length: 5ft
Diameter: 2in
Slot Size: 10
Material: PVC
Sand Pack:
563.20 to 555.20ft AMSL
42.00 to 50.00ft BGS
Material: 20/40 SAND
555.20
'N' VALUE
PID (PPM)
(OVERBURDEN)
Page 2 of 2
NUMBER
INTERVAL
SAMPLE
REC (%)
MW-QC-110I
STRATIGRAPHIC AND INSTRUMENTATION LOG
40
42
44
46
48
50
52
54
56
58
60
62
64
66
68
70
72
74
DEPTH
ft BGS
PROJECT NAME: QUAD CITIES GENERATING STATION
PROJECT NUMBER: 45136-28
CLIENT: EXELON GENERATION COMPANY LLC
LOCATION: CORDOVA, ILLINOIS
HOLE DESIGNATION:
STRATIGRAPHIC DESCRIPTION & REMARKS
NOTES:
MEASURING POINT ELEVATIONS MAY CHANGE; REFER TO CURRENT ELEVATION TABLE
DATE COMPLETED: July 11, 2006
DRILLING METHOD: 4-1/2" HSA
FIELD PERSONNEL: N. ZIEGLER
OVERBURDEN LOG 45136-28.GPJ CRA_CORP.GDT 8/10/06
MONITORING WELL
ELEV.
ft
AMSL
12
9
13
11
13
0
0
0
0
0
1SS
2SS
3SS
4SS
5SS
85
85
75
60
50
not sampled
SW-SAND, medium-coarse sand, loose, well
graded, medium-light brown, damp-moist
SP-SAND, medium grained, poorly graded,
loose, light brown, dry
- coarse grained at 25.5ft BGS
- wet at 28.0ft BGS
Concrete
8" Borehole
2" O / PVC
Well Casing
Bentonite
Grout
603.24
601.24
'N' VALUE
PID (PPM)
(OVERBURDEN)
Page 1 of 2
NUMBER
INTERVAL
SAMPLE
REC (%)
MW-QC-111I
STRATIGRAPHIC AND INSTRUMENTATION LOG
2
4
6
8
10
12
14
16
18
20
22
24
26
28
30
32
34
36
DEPTH
ft BGS
PROJECT NAME: QUAD CITIES GENERATING STATION
PROJECT NUMBER: 45136-28
CLIENT: EXELON GENERATION COMPANY LLC
LOCATION: CORDOVA, ILLINOIS
HOLE DESIGNATION:
STRATIGRAPHIC DESCRIPTION & REMARKS
NOTES:
MEASURING POINT ELEVATIONS MAY CHANGE; REFER TO CURRENT ELEVATION TABLE
DATE COMPLETED: July 12, 2006
DRILLING METHOD: 4-1/2" HSA
FIELD PERSONNEL: J. Close
OVERBURDEN LOG 45136-28.GPJ CRA_CORP.GDT 8/10/06
MONITORING WELL
TOP OF RISER
GROUND SURFACE
ELEV.
ft
AMSL
618.97
616.74
17
17
8
0
0
0
6SS
7SS
8SS
55
50
15
- trace fine gravel at 38.5ft BGS
- trace coarse gravel at 45.5ft BGS
END OF BOREHOLE @ 50.0ft BGS
Bentonite
Pellets
Sand Pack
2" O / PVC
Well Screen
WELL DETAILS
Screened interval:
571.74 to 566.74ft AMSL
45.00 to 50.00ft BGS
Length: 5ft
Diameter: 2in
Slot Size: 10
Material: PVC
Sand Pack:
573.74 to 566.74ft AMSL
43.00 to 50.00ft BGS
Material: #7 SAND
566.74
'N' VALUE
PID (PPM)
(OVERBURDEN)
Page 2 of 2
NUMBER
INTERVAL
SAMPLE
REC (%)
MW-QC-111I
STRATIGRAPHIC AND INSTRUMENTATION LOG
40
42
44
46
48
50
52
54
56
58
60
62
64
66
68
70
72
74
DEPTH
ft BGS
PROJECT NAME: QUAD CITIES GENERATING STATION
PROJECT NUMBER: 45136-28
CLIENT: EXELON GENERATION COMPANY LLC
LOCATION: CORDOVA, ILLINOIS
HOLE DESIGNATION:
STRATIGRAPHIC DESCRIPTION & REMARKS
NOTES:
MEASURING POINT ELEVATIONS MAY CHANGE; REFER TO CURRENT ELEVATION TABLE
DATE COMPLETED: July 12, 2006
DRILLING METHOD: 4-1/2" HSA
FIELD PERSONNEL: J. Close
OVERBURDEN LOG 45136-28.GPJ CRA_CORP.GDT 8/10/06
MONITORING WELL
ELEV.
ft
AMSL
7
11
8
12
8
0
0
0
0
NR
1SS
2SS
3SS
4SS
5SS
50
50
65
70
0
not sampled
SP-SAND, loose, poorly graded, medium
grained, slightly moist
- some coarse sand at 15.0ft BGS
- coarse grained at 18.5ft BGS
- wet at 23.5ft BGS
Concrete
8" Borehole
2" O / PVC
Well Casing
Bentonite
Grout
588.49
'N' VALUE
PID (PPM)
(OVERBURDEN)
Page 1 of 2
NUMBER
INTERVAL
SAMPLE
REC (%)
MW-QC-112I
STRATIGRAPHIC AND INSTRUMENTATION LOG
2
4
6
8
10
12
14
16
18
20
22
24
26
28
30
32
34
36
DEPTH
ft BGS
PROJECT NAME: QUAD CITIES GENERATING STATION
PROJECT NUMBER: 45136-28
CLIENT: EXELON GENERATION COMPANY LLC
LOCATION: CORDOVA, ILLINOIS
HOLE DESIGNATION:
STRATIGRAPHIC DESCRIPTION & REMARKS
NOTES:
MEASURING POINT ELEVATIONS MAY CHANGE; REFER TO CURRENT ELEVATION TABLE
DATE COMPLETED: July 10, 2006
DRILLING METHOD: 4-1/2" HSA
FIELD PERSONNEL: J. Close
OVERBURDEN LOG 45136-28.GPJ CRA_CORP.GDT 8/10/06
MONITORING WELL
TOP OF RISER
GROUND SURFACE
ELEV.
ft
AMSL
604.90
601.99
5
9
9
NR
0
0
6SS
7SS
8SS
0
35
25
- trace fine gravel at 38.5ft BGS
END OF BOREHOLE @ 50.0ft BGS
Bentonite
Pellets
Sand Pack
2" O / PVC
Well Screen
WELL DETAILS
Screened interval:
557.99 to 552.99ft AMSL
44.00 to 49.00ft BGS
Length: 5ft
Diameter: 2in
Slot Size: 10
Material: PVC
Sand Pack:
559.99 to 551.99ft AMSL
42.00 to 50.00ft BGS
Material: #7 SAND
551.99
'N' VALUE
PID (PPM)
(OVERBURDEN)
Page 2 of 2
NUMBER
INTERVAL
SAMPLE
REC (%)
MW-QC-112I
STRATIGRAPHIC AND INSTRUMENTATION LOG
40
42
44
46
48
50
52
54
56
58
60
62
64
66
68
70
72
74
DEPTH
ft BGS
PROJECT NAME: QUAD CITIES GENERATING STATION
PROJECT NUMBER: 45136-28
CLIENT: EXELON GENERATION COMPANY LLC
LOCATION: CORDOVA, ILLINOIS
HOLE DESIGNATION:
STRATIGRAPHIC DESCRIPTION & REMARKS
NOTES:
MEASURING POINT ELEVATIONS MAY CHANGE; REFER TO CURRENT ELEVATION TABLE
DATE COMPLETED: July 10, 2006
DRILLING METHOD: 4-1/2" HSA
FIELD PERSONNEL: J. Close
OVERBURDEN LOG 45136-28.GPJ CRA_CORP.GDT 8/10/06
MONITORING WELL
ELEV.
ft
AMSL
6
4
9
11
7
0
0
0
0
0
1SS
2SS
3SS
4SS
5SS
75
70
75
65
35
not sampled
SW-SAND, loose, medium-coarse grained,
well graded, slightly moist
- 1/4" coarse sand layer at 20.0ft BGS
SP-SAND, trace medium sand and fine gravel,
loose, coarse grained, poorly graded, moist
- increase in fine gravel, wet at 33.5ft BGS
Concrete
8" Borehole
2" O / PVC
Well Casing
Bentonite
Grout
589.99
579.99
'N' VALUE
PID (PPM)
(OVERBURDEN)
Page 1 of 2
NUMBER
INTERVAL
SAMPLE
REC (%)
MW-QC-113I
STRATIGRAPHIC AND INSTRUMENTATION LOG
2
4
6
8
10
12
14
16
18
20
22
24
26
28
30
32
34
36
DEPTH
ft BGS
PROJECT NAME: QUAD CITIES GENERATING STATION
PROJECT NUMBER: 45136-28
CLIENT: EXELON GENERATION COMPANY LLC
LOCATION: CORDOVA, ILLINOIS
HOLE DESIGNATION:
STRATIGRAPHIC DESCRIPTION & REMARKS
NOTES:
MEASURING POINT ELEVATIONS MAY CHANGE; REFER TO CURRENT ELEVATION TABLE
DATE COMPLETED: July 11, 2006
DRILLING METHOD: 4-1/2" HSA
FIELD PERSONNEL: J. Close
OVERBURDEN LOG 45136-28.GPJ CRA_CORP.GDT 8/10/06
MONITORING WELL
TOP OF RISER
GROUND SURFACE
ELEV.
ft
AMSL
605.23
603.49
6
7
13
0
0
NR
6SS
7SS
8SS
35
50
0
- layer of fine gravel at 45.5ft BGS
END OF BOREHOLE @ 50.0ft BGS
Bentonite
Pellets
Sand Pack
2" O / PVC
Well Screen
WELL DETAILS
Screened interval:
558.99 to 553.99ft AMSL
44.50 to 49.50ft BGS
Length: 5ft
Diameter: 2in
Slot Size: 10
Material: PVC
Sand Pack:
560.49 to 553.49ft AMSL
43.00 to 50.00ft BGS
Material: #7 SAND
553.49
'N' VALUE
PID (PPM)
(OVERBURDEN)
Page 2 of 2
NUMBER
INTERVAL
SAMPLE
REC (%)
MW-QC-113I
STRATIGRAPHIC AND INSTRUMENTATION LOG
40
42
44
46
48
50
52
54
56
58
60
62
64
66
68
70
72
74
DEPTH
ft BGS
PROJECT NAME: QUAD CITIES GENERATING STATION
PROJECT NUMBER: 45136-28
CLIENT: EXELON GENERATION COMPANY LLC
LOCATION: CORDOVA, ILLINOIS
HOLE DESIGNATION:
STRATIGRAPHIC DESCRIPTION & REMARKS
NOTES:
MEASURING POINT ELEVATIONS MAY CHANGE; REFER TO CURRENT ELEVATION TABLE
DATE COMPLETED: July 11, 2006
DRILLING METHOD: 4-1/2" HSA
FIELD PERSONNEL: J. Close
OVERBURDEN LOG 45136-28.GPJ CRA_CORP.GDT 8/10/06
MONITORING WELL
ELEV.
ft
AMSL
8
6
9
13
14
7
0
0
0
0
0
0
1SS
2SS
3SS
4SS
5SS
6SS
40
85
75
75
70
75
not sampled
FILL, wood, sand, gravel, black coarse sand,
loose, dry
SP-SAND, coarse grained, loose, trace fine
subangular-subrounded gravel, brown, damp
- wet at 32.0ft BGS
Concrete
Concrete
8" Borehole
2" O / PVC
Well Casing
Bentonite
Grout
594.22
592.22
'N' VALUE
PID (PPM)
(OVERBURDEN)
Page 1 of 2
NUMBER
INTERVAL
SAMPLE
REC (%)
MW-QC-114I
STRATIGRAPHIC AND INSTRUMENTATION LOG
2
4
6
8
10
12
14
16
18
20
22
24
26
28
30
32
34
36
38
DEPTH
ft BGS
PROJECT NAME: QUAD CITIES GENERATING STATION
PROJECT NUMBER: 45136-28
CLIENT: EXELON GENERATION COMPANY LLC
LOCATION: CORDOVA, ILLINOIS
HOLE DESIGNATION:
STRATIGRAPHIC DESCRIPTION & REMARKS
NOTES:
MEASURING POINT ELEVATIONS MAY CHANGE; REFER TO CURRENT ELEVATION TABLE
DATE COMPLETED: July 10, 2006
DRILLING METHOD: 4-1/2" HSA
FIELD PERSONNEL: N. ZIEGLER
OVERBURDEN LOG 45136-28.GPJ CRA_CORP.GDT 8/10/06
MONITORING WELL
TOP OF RISER
GROUND SURFACE
ELEV.
ft
AMSL
607.30
604.22
8
5
0
0
7SS
8SS
75
75
END OF BOREHOLE @ 50.0ft BGS
Bentonite
Pellets
Sand Pack
2" O / PVC
Well Screen
WELL DETAILS
Screened interval:
559.22 to 554.22ft AMSL
45.00 to 50.00ft BGS
Length: 5ft
Diameter: 2in
Slot Size: 10
Material: PVC
Sand Pack:
562.22 to 554.22ft AMSL
42.00 to 50.00ft BGS
Material: 20/40 SAND
554.22
'N' VALUE
PID (PPM)
(OVERBURDEN)
Page 2 of 2
NUMBER
INTERVAL
SAMPLE
REC (%)
MW-QC-114I
STRATIGRAPHIC AND INSTRUMENTATION LOG
42
44
46
48
50
52
54
56
58
60
62
64
66
68
70
72
74
76
78
DEPTH
ft BGS
PROJECT NAME: QUAD CITIES GENERATING STATION
PROJECT NUMBER: 45136-28
CLIENT: EXELON GENERATION COMPANY LLC
LOCATION: CORDOVA, ILLINOIS
HOLE DESIGNATION:
STRATIGRAPHIC DESCRIPTION & REMARKS
NOTES:
MEASURING POINT ELEVATIONS MAY CHANGE; REFER TO CURRENT ELEVATION TABLE
DATE COMPLETED: July 10, 2006
DRILLING METHOD: 4-1/2" HSA
FIELD PERSONNEL: N. ZIEGLER
OVERBURDEN LOG 45136-28.GPJ CRA_CORP.GDT 8/10/06
MONITORING WELL
ELEV.
ft
AMSL
9
7
7
9
0
0
0
0
1SS
2SS
3SS
4SS
90
75
80
70
not sampled
SP-SAND, loose, medium grained, poorly
graded, light brown, dry
- trace coarse sand at 20.2ft BGS
SW-SAND, medium-coarse grained, loose,
well graded, brown, dry
Concrete
8" Borehole
2" O / PVC
Well Casing
Bentonite
Grout
Bentonite
Pellets
Sand Pack
593.73
578.73
'N' VALUE
PID (PPM)
(OVERBURDEN)
Page 1 of 2
NUMBER
INTERVAL
SAMPLE
REC (%)
MW-QC-115S
STRATIGRAPHIC AND INSTRUMENTATION LOG
2
4
6
8
10
12
14
16
18
20
22
24
26
28
30
DEPTH
ft BGS
PROJECT NAME: QUAD CITIES GENERATING STATION
PROJECT NUMBER: 45136-28
CLIENT: EXELON GENERATION COMPANY LLC
LOCATION: CORDOVA, ILLINOIS
HOLE DESIGNATION:
STRATIGRAPHIC DESCRIPTION & REMARKS
NOTES:
MEASURING POINT ELEVATIONS MAY CHANGE; REFER TO CURRENT ELEVATION TABLE
DATE COMPLETED: July 13, 2006
DRILLING METHOD: 4-1/2" HSA
FIELD PERSONNEL: J. Close
OVERBURDEN LOG 45136-28.GPJ CRA_CORP.GDT 8/10/06
MONITORING WELL
TOP OF RISER
GROUND SURFACE
ELEV.
ft
AMSL
609.89
607.23
16
7
0
0
5SS
6SS
60
80
- moist at 33.5ft BGS
- wet at 35.0ft BGS
- thin layer of gravel at 37.0ft BGS
END OF BOREHOLE @ 40.0ft BGS
2" O / PVC
Well Screen
WELL DETAILS
Screened interval:
577.23 to 567.23ft AMSL
30.00 to 40.00ft BGS
Length: 10ft
Diameter: 2in
Slot Size: 10
Material: PVC
Sand Pack:
579.23 to 567.23ft AMSL
28.00 to 40.00ft BGS
Material: #7 SAND
567.23
'N' VALUE
PID (PPM)
(OVERBURDEN)
Page 2 of 2
NUMBER
INTERVAL
SAMPLE
REC (%)
MW-QC-115S
STRATIGRAPHIC AND INSTRUMENTATION LOG
34
36
38
40
42
44
46
48
50
52
54
56
58
60
62
DEPTH
ft BGS
PROJECT NAME: QUAD CITIES GENERATING STATION
PROJECT NUMBER: 45136-28
CLIENT: EXELON GENERATION COMPANY LLC
LOCATION: CORDOVA, ILLINOIS
HOLE DESIGNATION:
STRATIGRAPHIC DESCRIPTION & REMARKS
NOTES:
MEASURING POINT ELEVATIONS MAY CHANGE; REFER TO CURRENT ELEVATION TABLE
DATE COMPLETED: July 13, 2006
DRILLING METHOD: 4-1/2" HSA
FIELD PERSONNEL: J. Close
OVERBURDEN LOG 45136-28.GPJ CRA_CORP.GDT 8/10/06
MONITORING WELL
ELEV.
ft
AMSL
5
10
6
10
9
14
11
0
0
0
0
0
0
0
1SS
2SS
3SS
4SS
5SS
6SS
7SS
80
90
75
80
80
90
90
not sampled
SP-SAND, medium grained, poorly graded,
loose, brown, dry
- trace coarse sand at 18.5ft BGS
SW-SAND, medium-coarse grained, loose,
well graded, brown, dry
- trace fine gravel at 33.5ft BGS
- wet at 38.0ft BGS
Concrete
8" Borehole
2" O / PVC
Well Casing
Bentonite
Grout
Bentonite
Pellets
Sand Pack
2" O / PVC
Well Screen
596.08
589.08
'N' VALUE
PID (PPM)
(OVERBURDEN)
Page 1 of 2
NUMBER
INTERVAL
SAMPLE
REC (%)
MW-QC-116S
STRATIGRAPHIC AND INSTRUMENTATION LOG
2
4
6
8
10
12
14
16
18
20
22
24
26
28
30
32
34
36
38
DEPTH
ft BGS
PROJECT NAME: QUAD CITIES GENERATING STATION
PROJECT NUMBER: 45136-28
CLIENT: EXELON GENERATION COMPANY LLC
LOCATION: CORDOVA, ILLINOIS
HOLE DESIGNATION:
STRATIGRAPHIC DESCRIPTION & REMARKS
NOTES:
MEASURING POINT ELEVATIONS MAY CHANGE; REFER TO CURRENT ELEVATION TABLE
DATE COMPLETED: July 13, 2006
DRILLING METHOD: 4-1/2" HSA
FIELD PERSONNEL: J. Close
OVERBURDEN LOG 45136-28.GPJ CRA_CORP.GDT 8/10/06
MONITORING WELL
TOP OF RISER
GROUND SURFACE
ELEV.
ft
AMSL
612.33
609.58
END OF BOREHOLE @ 44.0ft BGS
WELL DETAILS
Screened interval:
575.58 to 565.58ft AMSL
34.00 to 44.00ft BGS
Length: 10ft
Diameter: 2in
Slot Size: 10
Material: PVC
Sand Pack:
577.58 to 565.58ft AMSL
32.00 to 44.00ft BGS
Material: #7 SAND
565.58
'N' VALUE
PID (PPM)
(OVERBURDEN)
Page 2 of 2
NUMBER
INTERVAL
SAMPLE
REC (%)
MW-QC-116S
STRATIGRAPHIC AND INSTRUMENTATION LOG
42
44
46
48
50
52
54
56
58
60
62
64
66
68
70
72
74
76
78
DEPTH
ft BGS
PROJECT NAME: QUAD CITIES GENERATING STATION
PROJECT NUMBER: 45136-28
CLIENT: EXELON GENERATION COMPANY LLC
LOCATION: CORDOVA, ILLINOIS
HOLE DESIGNATION:
STRATIGRAPHIC DESCRIPTION & REMARKS
NOTES:
MEASURING POINT ELEVATIONS MAY CHANGE; REFER TO CURRENT ELEVATION TABLE
DATE COMPLETED: July 13, 2006
DRILLING METHOD: 4-1/2" HSA
FIELD PERSONNEL: J. Close
OVERBURDEN LOG 45136-28.GPJ CRA_CORP.GDT 8/10/06
MONITORING WELL
ELEV.
ft
AMSL
Revision 0
CRA 45136 (20) Quad Cities Generating Station
APPENDIX C
QUALITY ASSURANCE PROGRAM – TELEDYNE BROWN ENGINEERING, INC.
Page 2 of 32
TABLE OF CONTENTS
Section
Title
Page
1.0
KNOXVILLE QAM SECTION INTRODUCTION
7
2.0
QUALITY SYSTEM
10
2.1
Policy
10
2.2
Quality System Structure
10
2.3
Quality System Objectives
10
2.4
Personnel Orientation, Training, and Qualification
11
3.0
ORGANIZATION, AUTHORITY, AND RESPONSIBILITY
12
4.0
PERSONNEL ORIENTATION, DATA INTEGRITY, TRAINING,
AND QUALIFICATION
13
4.1
Orientation
13
4.2
Data Integrity
13
4.3
Training
13
4.4
Qualification
13
4.5
Records
13
5.0
CUSTOMER INTERFACES
14
5.1
Interface Personnel
14
5.2
Bid Requests and Tenders
14
5.3
Contracts
14
5.4
TBE’s Expectation of Customers
14
5.5
Customer Satisfaction
15
5.5.1
Customer Complaints
15
5.5.2
Customer Confidentiality
15
6.0
DOCUMENTATION GENERATION AND CONTROL
16
6.1
General
16
6.2
New Documentation
16
6.3
Documentation Changes
16
Page 3 of 32
TABLE OF CONTENTS - Continued
6.4
Documentation Lists and Distributions
16
6.5
Other Documentation
16
6.6
Documentation Reviews
16
7.0
DESIGN OF LABORATORY CONTROLS
17
7.1
General
17
7.2
Facility
17
7.3
Technical Processes and Methods
17
7.3.1
Operational Flow
17
7.3.2
Methods
18
7.3.3
Data Reduction and Analysis
18
7.4
Verification of Technical Processes, Methods, and Software
18
7.4.1
Operational Flow Verification
18
7.4.2
Method Verifications
18
7.4.3
Data Reduction and Analysis Verification
18
7.5
Design of Quality Controls
18
7.5.1
General
19
7.5.2
Demonstration of Capability (D of C)
19
7.5.3
Process Control Checks
19
7.6
Counting Instrument Controls
20
8.0
PURCHASING AND SUBCONTRACT CONTROLS
21
8.1
General
21
8.2
Source Selection
21
8.3
Procurement of Supplies and Support Services
21
8.3.1
Catalog Supplies
21
8.3.2
Support Services
21
8.3.3
Equipment and Software
22
8.4
Subcontracting of Analytical Services
22
8.5
Acceptance of Items or Services
22
Page 4 of 32
TABLE OF CONTENTS - Continued
9.0
TEST SAMPLE IDENTIFICATION AND CONTROL
23
9.1
Sample Identification
23
9.2
LIMS
23
9.3
Sample Control
23
10.0
SPECIAL PROCESSES, INSPECTION, AND TEST
24
10.1
Special Processes
24
10.2
Inspections and Tests
24
10.2.1 Intra Laboratory Checks (QC Checks)
24
10.2.2 Inter Laboratory Checks
24
10.2.3 Data Reviews
24
10.3
Control of Sampling of Samples
24
10.4
Reference Standards / Material
24
10.4.1 Weights and Temperatures
25
10.4.2 Radioactive Materials
25
11.0
EQUIPMENT MAINTENANCE AND CALIBRATION
26
11.1
General
26
11.2
Support Equipment
26
11.3
Instruments
26
11.4
Nonconformances and Corrective Actions
26
11.5
Records
27
12.0
NONCONFORMANCE CONTROLS
28
12.1
General
28
12.2
Responsibility and Authority
28
12.3
10CFR21 Reporting
28
Page 5 of 32
TABLE OF CONTENTS - Continued
13.0
CORRECTIVE AND PREVENTIVE ACTIONS
29
13.1
General
29
13.2
Corrective Actions
29
13.3
Preventive Actions
29
14.0
RESULTS ANALYSIS AND REPORTING
30
14.1
General
30
14.2
Results Review
30
14.3
Reports
30
15.0
RECORDS
31
15.1
General
31
15.2
Type of Records
31
15.3
Storage and Retention
31
15.4
Destruction or Disposal
31
16.0
ASSESSMENTS
32
16.1
General
32
16.2
Audits
32
16.3
Management Reviews
32
Page 6 of 32
REVISION HISTORY
Revision 7
Complete re-write
January 1, 2005
Bill Meyer
Revision 8
Updated organization
chart, minor change to
1.0, 4.4, 7.5.3.2,
10.2.3, and 12.3
Page 7 of 32
1.0
Knoxville QAM Section Introduction
This Quality Assurance Manual (QAM) and related Procedures describes the
Knoxville Environmental Services Laboratory’s QA system. This system is designed
to meet multiple quality standards imposed by Customers and regulatory agencies
including:
NRC’s 10 CFR 50 Appendix B
NRC’s Regulatory Guide 4.15
DOE’s Order 414.1
DOE’s QSAS
ANSI N 42.23
ANSI N 13.30
NELAC Standard, Chapter 5
The Environmental Services (ES) Laboratory does low level radioactivity
analyses for Power Plants and other customers. It primarily analyzes environmental
samples (natural products from around plants such as milk), in-plant samples (air
filters, waters), bioassay samples from customer’s employees, and waste disposal
samples (liquids and solids).
Potable and non-potable water samples are tested using methods based on
EPA standards as cited in State licenses (see Procedure 4010). The listing [current
as of initial printing of this Manual – see current index for revision status and
additions / deletions] of implementing Procedures (SOPs) covering Administration,
Methods, Counting Instruments, Technical, Miscellaneous, and LIMS is shown in
Table 1-1. Reference to these Procedures by number is made throughout this QAM.
Table 1-1
Number
Title
Part 1
Administrative Procedures
1001
Validation and Verification of Computer Programs for Radiochemistry Data
Reduction
1002
Organization and Responsibility
1003
Control, Retention, and Disposal of Quality Assurance Records
1004
Definitions
1005
Data Integrity
1006
Job Descriptions
1007
Training and Certifications
1008
Procedure and Document Control
1009
Calibration System
1010
Nonconformance Controls
1011
10CFR21 Reporting
1012
Corrective Action and Preventive Action
Page 8 of 32
Number
Title
1013
Internal Audits and Management Reviews
1014
RFP, Contract Review, and Order Entry (formerly 4001)
1015
Procurement Controls
Part 2
Method Procedures
2001
Alpha Isotopic and Plutonium-241
2002
Carbon-14 Activity in Various Matrices
2003
Carbon-14 and Tritium in Soils, Solids, and Biological Samples; Harvey
Oxidizer Method
2004
Cerium-141 and Cerium-144 by Radiochemical Separation
2005
Cesium-137 by Radiochemical Separation
2006
Iron-55 Activity in Various Matrices
2007
Gamma Emitting Radioisotope Analysis
2008
Gross Alpha and/or Gross Beta Activity in Various Matrices
2009
Gross Beta Minus Potassium-40 Activity in Urine and Fecal Samples
2010
Tritium and Carbon-14 Analysis by Liquid Scintillation
2011
Tritium Analysis in Drinking Water by Liquid Scintillation
2012
Radioiodine in Various Matrices
2013
Radionickel Activity in Various Matrices
2014
Phosphorus-32 Activity in Various Matrices
2015
Lead-210 Activity in Various Matrices
2016
Radium-226 Analysis in Various Matrices
2017
Total Radium in Water Samples
2018
Radiostrontium Analysis by Chemical Separation
2019
Radiostrontium Analysis by Ion Exchange
2020
Sulfur-35 Analysis
2021
Technetium-99 Analysis by Eichrom Resin Separation
2022
Total Uranium Analysis by KPA
2023
Compositing of Samples
2024
Dry Ashing of Environmental Samples
2025
Preparation and Standardization of Carrier Solutions
2026
Radioactive Reference Standard Solutions and Records
2027
Glassware Washing and Storage
2028
Moisture Content of Various Matrices
2029
Polonium-210 Activity in Various Matrices
2030
Promethium-147 Analysis
Page 9 of 32
Number
Title
Part 3
Instrument Procedures
3001
Calibration and Control of Gamma-Ray Spectrometers
3002
Calibration of Alpha Spectrometers
3003
Calibration and Control of Alpha and Beta Counting Instruments
3004
Calibration and Control of Liquid Scintillation Counters
3005
Calibration and Operation of pH Meters
3006
Balance Calibration and Check
3008
Negative Results Evaluation Policy
3009
Use and Maintenance of Mechanical Pipettors
3010
Microwave Digestion System Use and Maintenance
Part 4
Technical Procedures
4001
Not Used
4002
QC Checks on Data
4003
Sample Regent and Control
4004
Data Package Preparation and Reporting
4005
Blank, Spike, and Duplicate Controls
4006
Inter-Laboratory Comparison Study Process
4007
Method Basis and Initial Validation Process
4008
Not Used
4009
MDL Controls
4010
State Certification Process
4011
Accuracy, Precision, Efficiency, and Bias Controls and Data Quality Objectives
4012
Not Used
4013
Not Used
4014
Facility Operation and Control
4015
Documentation of Analytical Laboratory Logbooks (formerly 1002)
4016
Total Propagated Uncertainty (formerly 1004)
4017
LIMS Operation
4018
Instrument Calibration System
4019
Radioactive Reference Material Standards
Part 5
Miscellaneous Procedures
5001
Laboratory Hood Operations
5002
Operation and Maintenance of Deionized Water System
5003
Waste Management
5004
Acid Neutralization and Purification System Operation Procedure
Page 10 of 32
Part 6
LIMS
6001
LIMS Raw Data Processing and Reporting
6002
Software Development and/or Pilots of COTS Packages
6003
Software Change and Version Control
6004
Backup of Data and System Files
6005
Disaster Recovery Plan
6006
LIMS Hardware
6007
LIMS User Access
6008
LIMS Training
6009
LIMS Security
2.0
QUALITY SYSTEM
The TBE-ES QA system is designed to comply with multiple customer- and
regulatory agency-imposed specifications related to quality. This quality system
applies to all activities of TBE-ES that affect the quality of analyses performed by the
laboratory.
2.1
Policy
The TBE quality policy, given in Company Policy P-501, is “TBE will
continually improve our processes and effectiveness in providing products and
services that exceed our customer’s expectations.”
This policy is amplified by this Laboratory’s commitment, as attested to by the
title page signatures, to perform all work to good professional practices and to
deliver high quality services to our customers with full data integrity. (See Section
4.0 and Procedure 1005).
2.2
Quality System Structure
The Quality System is operated by the organizations described in Section 3.0
of this Manual. The Quality System is described in this Manual and in the
Procedures Manual, both of which are maintained by the QA Manager. Procedures
are divided into 6 sections – Administrative, Methods, Equipments, Technical,
Miscellaneous, and LIMS. This Manual is structured as shown in the Table of
Contents and refers to Procedures when applicable.
Cross references to the
various imposed quality specifications are contained in Appendices to this Manual.
2.3
Quality System Objectives
The Quality System is established to meet the objective of assuring all
operations are planned and executed in accordance with system requirements. The
Quality System also assures that performance evaluations are performed (see
Procedure 4006), and that appropriate verifications are performed (see Procedures
in the 1000 and 4000 series) to further assure compliance. Verification includes
Page 11 of 32
examination of final reports (prior to submittal to customers) to determine their
quality (see Procedure 4004).
To further these objectives, various in-process assessments of data, as well
as assessments of the system, via internal audits and management reviews, are
performed. Both internal experts and customer / regulatory agencies perform further
assessments of the system and compliance to requirements.
2.4
Personnel Orientation, Training, and Qualification
TBE provides indoctrination and training to employees and performs
proficiency evaluation of technical personnel. This effort is described in Section 4.0.
Page 12 of 32
3.0
ORGANIZATION, AUTHORITY, AND RESPONSIBILITY
TBE has established an effective organization for conducting laboratory
analyses at the Knoxville Environmental Services Laboratory.
The basic
organization is shown in Figure 3-1. Detail organization charts with names,
authorities, and responsibilities are given in Procedure 1002. Job descriptions are
given in Procedure 1006.
This organization provides clearly established Quality Assurance authorities,
duties, and functions. QA has the organizational freedom needed to:
(1)
Identify problems
(2)
Stop nonconforming work
(3)
Initiate investigations
(4)
Recommend corrective and preventive actions
(5)
Provide solutions or recommend solutions
(6)
Verify implementation of actions
All Laboratory personnel have the authority and resources to do their
assigned duties and have the freedom to act on problems. The QA personnel have
direct, independent access to Company management as shown in Figure 3-1.
Figure 3.1. Laboratory Organization
President
VP
Administration & QA
VP
Environmental
Product Assurance
Director
Lab QA Manager
Lab Operations
Manager
Program
Managers
Lab
Supervisor
Administration
Staff
Page 13 of 32
4.0 PERSONNEL ORIENTATION, DATA INTEGRITY, TRAINING, AND
QUALIFICATION
4.1
Orientation
All laboratory personnel must receive orientation to the quality program if their
work can affect quality. Orientation includes a brief review of customer- and
regulatory agency-imposed quality requirements, the structure of the QAM, and the
implementing procedures. The goal of orientation is to cover the nature and goals of
the QA program.
4.2
Data Integrity
The primary output of the Laboratory is data. Special emphasis and training
in data integrity is given to all personnel whose work provides or supports data
delivery. The Laboratory Data Integrity Procedure (Procedure 1005) describes
training, personnel attestations, and monitoring operations. Annual reviews are
required.
4.3
Training
The Quality Assurance Manager (QAM) maintains a training matrix indicating
which laboratory personnel need training in which specific Procedures. This matrix
is updated when personnel change or change assignments. All personnel are
trained per these requirements and procedures. This training program is described
in Procedure 1007. The assigned responsibilities for employees are described in
Procedure 1002 (See Section 3.0) on Organization and in Procedure 1006, Job
Descriptions. Refresher training or re-training is given annually as appropriate.
4.4
Qualification
Personnel are qualified as required by their job description. Management and
non-analysts are evaluated based on past experience, education, and
management’s assessment of their capabilities. Formal qualification is required of
analysts and related technical personnel who perform laboratory functions. Each
applicable person is given training and then formally evaluated by the Operations
Manager (or his designees) and by QA. Each analyst must initially demonstrate
capability to perform each assigned analytical effort. Each year, thereafter, he or
she must perform similar analyses on Interlab Comparison Samples (see Procedure
4006) or on equivalent blanks and spikes samples. Acceptable results extend
qualifications (certification). Unacceptable results require retraining in the subject
method / Procedures. (See Procedure 1007 for added information, records, forms,
etc. used.)
4.5
Records
Records of training subjects, contents, attendees, instructors, and
certifications are maintained by QA.
Page 14 of 32
5.0
CUSTOMER INTERFACES
5.1
Interface Personnel
The Laboratory has designated Program Managers as the primary interface
with all customers. Other interfaces may be the QA Manager or the Lab Operations
Manager.
5.2
Bid Requests and Tenders
The Program Managers respond to customer requests for bids and proposals
per Procedure 1014 for bids, proposals, and contract reviews. They clarify customer
requests so both the customer and the lab staff understand requests. As responses
are developed, internal reviews are conducted to ensure that requirements are
adequately defined and documented and to verify that the Laboratory has adequate
resources in physical capabilities, personal skills, and technical information to
perform the work. Accreditation needs are reviewed. If subcontracts are required to
perform any analysis, the subcontractor is similarly evaluated and the client notified
in writing of the effort. Most qualifications are routine with standard pricing and the
review of these quotes is performed by the Program Manager. Larger or more
complex quotes are reviewed by the Operations Manager and the QA Manager (or
designees). Evidence of review is by initialing and dating applicable papers,
signatures on quotations, or by memo.
5.3
Contracts
The Program Manager’s receive contract awards (oral or written) and
generate the work planning for initiation preparation (charge numbers, data structure
or contents in LIMS, etc.). They review contracts for possible differences from
quotations and, if acceptable, contracts are processed. Documentation of the review
is by initials and date as a minimum. Contract changes receive similar reviews and
planning.
5.4
TBE’s Expectation of Customers
TBE expects customers to provide samples suitable for lab analysis. These
expectations include:
Accurate and unambiguous identification of samples
Proper collection and preservation of samples
Use of appropriate containers free from external and internal
contamination
Integrity preservation during shipment and timely delivery of samples that
are age sensitive
Adequate sized samples that allow for retest, if needed
Specification of unique MOA/MDC requirements
Alerting the lab about abnormal samples (high activity, different chemical
contents, etc.)
Chain of custody initiation, when required.
Page 15 of 32
5.5
Customer Satisfaction
TBE’s quality policy centers on customer satisfaction (See 2.0). TBE will
work to satisfy customers through full compliance with contract requirements,
providing accurate data and properly responding to any questions or complaints.
Customers are provided full cooperation in their monitoring of Laboratory
performance. Customers are notified if any applicable State Accreditation is
withdrawn, revoked, or suspended.
5.5.1 Customer Complaints
Any customer complaints are documented and tracked to closure. Most
complaints concern analysis data and are received by Program Managers. They
log each such complaint, order retests for verification, and provide documented
results to customers. Complaints may also be received by QA or Operations.
If complaints are other than re-test type, the nonconformance and corrective
action systems (Sections 12 and 13) are used to resolve them and record all actions
taken.
5.5.2 Customer Confidentiality
All laboratory personnel maintain confidentiality of customer-unique
information.
Page 16 of 32
6.0
DOCUMENTATION GENERATION & CONTROL
6.1
General
The documentation generation and control system is detailed in Procedure
1008. An overview is given below. The basic quality system documents are
described in Section 2.0.
6.2
New Documentation
Each Procedure and this QAM is written by appropriate personnel, validated if
applicable (see Section 7.0), reviewed for adequacy, completeness, and
correctness, and, if acceptable, accepted by the authorized approver [QA Manager,
Operations Manager (or their designee)]. Both approvals are required if a Procedure
affects both QA and Operations. (See Responsibilities in Section 3.0).
These
procedures control the quality measurements and their accuracy.
Each document carries a unique identification number, a revision level, dates,
page numbers and total page count, and approver identification and sign off. If TBE
writes code for software, the software is version identified and issued after
Verification and Validation per Section 7.0.
6.3
Documentation Changes
Each change is reviewed in the same manner and by the same people as
new documentation. Revision identifications are updated and changes indicated by
side bars, italicized words, or by revision description when practical. Obsolete
revisions are maintained by QA after being identified as obsolete.
6.4
Documentation Lists and Distributions
Computer indexes of documents are maintained by Quality showing the
current authorized revision level of each document. These revisions are placed on
the Laboratory server and obsolete ones are removed so that all personnel have
only the current documents. If hard copies are produced and distributed, separate
distribution lists are maintained indicating who has them and their revision level(s).
Copies downloaded off the server are uncontrolled unless verified by the user (on
the computer) to be the latest revision.
6.5
Other Documentation
In addition to TBE-generated documentation, QA maintains copies of
applicable specifications, regulations, and standard methods.
6.6
Documentation Reviews
Each issued document is reviewed at least every third year by the approving
personnel. This review determines continued suitability for use and compliance with
requirements.
Page 17 of 32
7.0
DESIGN OF LABORATORY CONTROLS
7.1
General
The Laboratory and its operating procedures are designed specifically for low
level (environmental and in-plant) radioactive sample analysis. The various aspects
of the laboratory design include the following which are discussed in subsequent
paragraphs of this Section:
(a) Facility
(b) Technical Processes and Methods
(c) Verification of Design of Processes, Methods, and Software.
(d) Design of Quality Controls
(e) Counting Instrument Controls
7.2
Facility
The facility was designed and built in 2000 to facilitate correct performance of
operations in accordance with good laboratory practices and regulatory
requirements. It provides security for operations and samples. It separates sample
storage areas based on activity levels, separates wet chemistry from counting
instrumentation for contamination control, and provides space and electronic
systems for documentation, analysis, and record storage. Procedure 4014 describes
the facility, room uses, layouts, etc.
7.3
Technical Processes and Methods
7.3.1 Operational Flow
The laboratory design provides for sample receipt and storage (including
special environmental provisions for perishable items) where samples are received
from clients and other labs (see Section 9.0). The samples are logged into the
computer based Laboratory Information Management System (LIMS) and receive
unique identification numbers and bar code labels. (See Procedure 4017 for LIMS
description and user procedures). The Program Managers then plan the work and
assure LIMS contains any special instructions to analysts. Samples then go to
sample preparation, wet chemistry (for chemical separation), and counting based on
the radionuclides. See Procedures in the 2000 and 3000 series. Analysts perform
the required tasks with data being entered into logbooks, LIMS, and counting
equipment data systems as appropriate. Results are collected and reviewed by the
Operations Manager and Program Managers and reports to clients are generated
(See Section 14.0). All records (electronic or hard copy) are maintained in files or in
back-up electronic copies (see Section 15.0). After the required hold periods and
client notification and approval, samples are disposed of in compliance with
regulatory requirements (see Procedures 5003 and 5004).
Page 18 of 32
7.3.2 Methods
The laboratory methods documented in the 2000 and 3000 series of
Procedures were primarily developed by senior TBE laboratory personnel based on
years of experience at our prior facility in New Jersey. They have been improved,
supplemented and implemented here. Where EPA or other accepted national
methods exist (primarily for water analyses under State certification programs - see
Procedure 4010), the TBE methods conform to the imposed requirements or State
accepted alternate requirements. Any method modifications are documented and
described in the Procedure. There are no nationally recognized methods for most
other analysis methods but references to other method documents are noted where
applicable.
7.3.3 Data Reduction and Analysis
Whenever possible automatic data capture and computerized data reduction
programs are used. Calculations are either performed using commercial software
(counting system operating systems) or TBE developed and validated software is
used (see 7.4 below). Analysis of reduced data is performed as described in Section
14.0 and Procedure 4004.
7.4
Verification of Technical Processes, Methods, and Software
7.4.1 Operational Flow Verification
The entire QA Manual and related procedures describe the verification of
elements of the technical process flow and the establishment of quality check points,
reviews, and controls.
7.4.2 Method Verifications
Methods are verified and validated per Procedure 4007 prior to use unless
otherwise agreed to by the client. For most TBE methods initial validation occurred
well in the past. New or significantly revised Methods receive initial validation by
demonstration of their performance using known analytes (NIST traceable) in
appropriate matrices. Sufficient samples are run to obtain statistical data that
provides evidence of process capability and control, establishes detection levels
(see procedure 4009), bias and precision data (see Procedure 4011). All method
procedures and validation data are available to respective clients. Also see Section
7.5 below for the Demonstration of Capability program.
7.4.3 Data Reduction and Analysis Verification
Data reduction and analysis verification is performed by personnel who did
not generate the data. (See Section 14.0).
7.5
Design of Quality Controls
Page 19 of 32
7.5.1 General
There are multiple quality controls designed into the laboratory operations.
Many of these are described elsewhere in this manual and include personnel
qualification (Section 4.0), Document control (6.0), Sample identification and control
(9.0), Use of reference standards (10.0), intra- and inter- laboratory tests (10.0), etc.
This Section describes the basic quality control systems used to verify Method
capability and performance.
7.5.2 Demonstration of Capability (D of C)
The demonstration of capability system verifies and documents that the
method, analyst, and the equipment can perform within acceptable limits. The D of C
is certified for each combination of analyte, method, and instrument type. D of C's
are certified based on objective evidence at least annually. This program is
combined with the analyst D of C program (See Section 4.0). Initial D of C's use the
method validation effort as covered above. Subsequent D of C's use Inter-
Laboratory samples (Procedure 4006) or, if necessary, laboratory generated
samples using NIST traceable standards. If results are outside of control limits, re-
demonstration is required after investigation and corrective action is accomplished
(See Sections 12.0 and 13.0)
7.5.3 Process Control Checks
Process control checks are designed to include Inter-Lab samples, Intra-lab
QC check samples, and customer provided check samples. 10% of laboratory
analysis samples are for process control purposes.
7.5.3.1 Inter- Lab Samples.
Inter-lab samples are procured or
obtained from sources providing analytes of interest in matrices similar to normal
client samples. These samples may be used for Demonstration of Capability of
analyst's, equipment and methods. They also provide for independent insight into
the lab's process capabilities. Any value reported as being in the warning zone (over
2 sigma) is reviewed and improvements taken. Any value failing (over 3 sigma) is
documented on an NCR and formal investigation per Section 12.0 and 13.0 is
performed. If root causes are not clearly understood and fixed, re-tests are required
using lab prepared samples (See Procedure 4006).
7.5.3.2 QC Samples.
QC samples, along with Inter-lab samples and
customer check samples, are 10% of the annual lab workload for the applicable
analyte and method. If batch processing is used, some specifications require specific
checks with each batch or each day rather than as continuous process controls.
(See Procedure 4005)
QC samples consist of multiple types of samples including:
(a) Method blanks
(b) Blank spikes
(c) Matrix spikes
Page 20 of 32
(d) Duplicates
(e) Tracers and carriers
Acceptance limits for these samples are given in Procedures or in lab
standards. The number, frequency, and use of these sample types varies with the
method, matrix, and supplemental requirements. The patterns of use versus method
and the use of the resulting test data is described in Procedure 4005.
7.5.3.3 Customer Provided Check Samples.
Customers may
provide blind check samples and duplicates to aid in their evaluation of the
Laboratory. When the lab is notified that samples are check samples their results are
included in the QC sample percentage counts. Any reported problems are treated as
formal complaints and investigated per Section 5.
7.6
Counting Instrument Controls
The calibration of instruments is their primary control and is described in
Section 11.0. In addition, counting procedures (3000 series) also specify use of
background checks (method blank data is not used for this) to evaluate possible
counting equipment contamination. Instrument calibration checks using a lab
standard from a different source than the one used for calibration are also used.
Background data can be used to adjust client and test data. Checks with lab
standards indicate potential calibration changes.
Page 21 of 32
8.0
PURCHASING AND SUBCONTRACT CONTROLS
8.1
General
Procurement and Subcontracts efforts use the Huntsville-based Cost Point
computer system to process orders.
The Laboratory-generated Purchase
Requisitions are electronically copied into Purchase Orders in Huntsville. The
Laboratory also specifies sources to be used. Procured items and services are
received at the Laboratory where receiving checks and inspections are made.
Laboratory Procedure 1015 provides details on the procurement control system at
the Laboratory and references the Huntsville procedures as applicable.
8.2
Source Selection
Sources for procurements of items and services are evaluated and approved
by QA as described in Procedure 1015. Nationally recognized catalog item sources
are approved by the QA Manager based on reputation. Maintenance services by an
approved distributor or the equipment manufacturing company are pre-approved.
Sources for other services are evaluated by QA, based on service criticality to the
quality system, by phone, mail out, or site visit.
Subcontract sources for laboratory analysis services are only placed with
accredited laboratories (by NELAP, NUPIC, State, Client, etc.) as applicable for the
type of analysis to be performed. QA maintains lists of approved vendors and
records of evaluations performed.
8.3
Procurement of Supplies and Support Services
8.3.1 Catalog Supplies
The Laboratory procures reagents, processing chemicals, laboratory
“glassware,” consumables, and other catalog items from nationally known vendors
and to applicable laboratory grades, purities, concentrations, accuracy levels, etc.
Purchase Requisitions for these items specify catalog numbers or similar call-outs
for these off-the-shelf items. Requisitions are generated by the personnel in the lab
needing the item and are approved by the Operations or Production Manager.
Reagents are analytical reagent grade only.
8.3.2 Support Services
Purchase Requisitions for support services (such as balance
calibration, equipment maintenance, etc.) are processed as in 8.3.1 but technical
requirements are specified and reviewed before approvals are given.
Page 22 of 32
8.3.3 Equipment and Software
Purchase Requisitions for new equipment, software programs, and
major facility modifications affecting the quality system are reviewed and approved
by the Operations Manager and the QA Manager.
8.4
Subcontracting of Analytical Services
When necessary, the Laboratory may subcontract analytical services required
by a client. This may be because of special needs, infrequency of analysis, etc.
Applicable quality and regulatory requirements are imposed in the Purchase
Requisition and undergo a technical review by QA. TBE reserves the right of access
by TBE and our client for verification purposes.
8.5
Acceptance of Items or Services
Items and services affecting the quality system are verified at receipt based
on objective evidence supplied by the vendor. Supply items are reviewed by the
requisitioner and, if acceptable, are accepted via annotation on the vendor packing
list or similar document. Similarly, equipment services are accepted by the
requisitioning lab person. Calibration services are accepted by QA based on
certification reviews. (See Section 11.0.)
Data reports from analytical subcontractors are evaluated by Program
Managers and subsequently by the Operations Manager (or designee) as part of
client report reviews.
Items are not used until accepted and if items or services are rejected, QA is
notified and nonconformance controls per Section 12.0 are followed. Vendors may
be removed from the approved vendor’s list if their performance is unacceptable.
Page 23 of 32
9.0
TEST SAMPLE IDENTIFICATION AND CONTROL
9.1
Sample Identification
Incoming samples are inspected for customer identification, container
condition, chain of custody forms, and radioactivity levels. If acceptable, the sample
information is entered into LIMS which generates bar coded labels for attachment to
the sample(s). The labels are attached and samples stored in the assigned location.
If environmental controls are needed (refrigeration, freezing, etc.), the samples are
placed in these storage locations. If not acceptable, the Program Manager is
notified, the customer contacted, and the problem resolved (return of sample, added
data receipts, etc.). See Procedure 4003 for more information on sample receipt.
9.2
LIMS
The LIMS is used to schedule work, provide special information to analysts,
and record all actions taken on samples. See Procedure 4017 and the 6000 series
of procedures for more information on LIMS operations.
9.3
Sample Control
The sample, with its bar coded label, is logged out to the applicable lab
operation where the sample is processed per the applicable methods (Procedures
2000 and 3000). The LIMS-assigned numbers are used for identification through all
operations to record data. Data is entered into LIMS, log books (kept by the
analysts) or equipment data systems to record data. The combination of LIMS,
logbooks, and equipment data systems provide the Chain of Custody data and
document all actions taken on samples. Unused sample portions are returned to its
storage area for possible verification use. Samples are discarded after required time
limits are passed and after client notification and approval, if required.
Page 24 of 32
10.0 SPECIAL PROCESSES, INSPECTION, AND TEST
10.1 Special Processes
The Laboratory’s special processes are the methods used to analyze a
sample and control equipment. These methods are defined in Procedures in the
2000 and 3000 series. These processes are performed to the qualified methods
(see Section 7.0) by qualified people (see 4.0).
10.2 Inspections and Tests
The quality of the process is monitored by indirect means. This program
involves calibration checks on counting equipments (see Section 11.0), intra-
laboratory checks, and inter-laboratory checks. In addition, some customers submit
quality control check samples (blinds, duplicates, external reference standards). All
generated data gets independent reviews.
10.2.1 Intra Laboratory Checks (QC Checks)
The quantity and types of checks varies with the method, but basic checks
which may include blanks, spiked blanks, matrix spikes, matrix spike duplicates, and
duplicates are used as appropriate for customer samples. This process is described
in Procedure 4005 and in Section 7.0.
10.2.2 Inter Laboratory Checks
TBE participates in Inter-lab performance evaluation (check) programs with
multiple higher level labs. These programs provide blind matrices for the types of
matrix/analyte combinations routinely processed by the Lab, if available. This
program is described in Procedure 4006.
10.2.3 Data Reviews
Raw data and reports are reviewed by the Operations Manager, or
designees.
This review checks for data logic, expected results, procedure
compliance, etc. (See Section 14.0).
10.3 Control of Sampling of Samples
Samples for analysis are supplied by customers preferably in quantities
sufficient to allow re-verification analyses if needed. The samples are prepared for
analysis by analysts and then an aliquot (partial sample extraction) is taken from the
homogeneous customer sample for the initial analysis. Methods specify standard
volumes of sample material required. Sampling data is recorded in LIMS and/or
logbooks.
10.4 Reference Standards / Material
Page 25 of 32
10.4.1 Weights and Temperatures
Reference standards are used by the Laboratory’s calibration vendor to
calibrate the Labs working instruments measuring weights and thermometers.
10.4.2 Radioactive Materials
Reference radioactive standards, traceable to NIST, are procured from higher
level laboratories. These reference materials are maintained in the standards area
and are diluted down for use by laboratory analysts. All original and diluted volumes
are fully traceable to source, procedure, analyst, dilution, and acquisition dates. See
Section 11.0 and Procedure 1009.
Page 26 of 32
11.0 EQUIPMENT MAINTENANCE AND CALIBRATION
11.1 General
There are two types of equipment used by the Laboratory:
support
equipment (scales, glassware, weights, thermometers, etc.) and instruments for
counting. Standards traceable to NIST are used for calibration and are of the
needed accuracy for laboratory operations. Procedures 1009, 4018, and 4019
describe the calibration and maintenance programs.
11.2 Support Equipment
Analytical support equipment is purchased with the necessary accuracies and
appropriate calibration data. If needed, initial calibration by the Laboratory or its
calibration vendor is performed. Recalibration schedules are established and
equipment recalibrated by the scheduled date by a calibration vendor or by
Laboratory personnel. Maintenance is performed, as needed, per manufacturer’s
manuals or lab procedures.
In addition to calibrations and recalibrations, checks are made on the
continued accuracy of items as described in Procedure 1009. Records are
maintained of calibration and specified checks.
11.3 Instruments
Instruments receive initial calibration using radioactive sources traceable to
NIST. The initial calibration establishes statistical limits of variation that are used to
set control limits for future checks and recalibration. This process is described in
Procedure 4018. Instruments are maintained per Instrument Manual requirements.
Recalibrations are performed per the Procedure.
Between calibrations, check sources are used to assure no significant
changes have occurred in the calibration of items. Background checks are
performed to check for possible radioactive contamination. Background values are
used to adjust sample results. Hardware and software are safeguarded from
adjustments that could invalidate calibrations or results.
11.4 Nonconformances and Corrective Actions
If calibrations or checks indicate a problem, the nonconformance system
(Section 12.0) and corrective action system (Section 13.0) are initiated to document
the problem and its resolution. Equipment is promptly removed from service if
questionable.
Page 27 of 32
11.5 Records
Records of calibrations are maintained.
Calibration certificates from
calibration vendors are maintained by QA. Other calibration data and check data is
maintained in log books, LIMS, or instrument software as appropriate and as
described in Procedures 1009, 4018, and 4019.
Page 28 of 32
12.0 NONCONFORMANCE CONTROLS
12.1 General
The nonconformance control system is implemented whenever a
nonconforming condition on any aspect of Laboratory analysis, testing, or results
exist. The system takes graded actions based on the nature and severity of the
nonconformance. Nonconforming items or processes are controlled to prevent
inadvertent use. Nonconformances are documented and dispositioned. Notification
is made to affected organizations, including clients. Procedure 1010 describes the
procedures followed. Sample results are only reported after resolution.
12.2 Responsibility and Authority
Each Laboratory employee has the responsibility to report nonconformances
and the authority to stop performing nonconforming work or using nonconforming
equipment. Laboratory supervision can disposition and take corrective actions on
minor problems.
Any significant problem is documented by QA using the
Laboratory’s NCR system per Procedure 1010. QA conducts or assures the conduct
of cause analyses, disposition of items or data, and initiation of corrective action if
the nonconformance could recur.
12.3 10CFR21 Reporting
The QA Manager reviews NCRs for possible need of customer and/or NRC
notification per the requirements of 10CFR21. Procedure 1011 is followed in this
review and for any required reporting.
Page 29 of 32
13.0 CORRECTIVE AND PREVENTIVE ACTIONS
13.1 General
The Laboratory takes corrective actions on significant nonconformances (see
Section 12.0). It also initiates preventive and improvement actions per the Company
Quality Policy (see Section 2.0). The procedures for Corrective Action/Preventive
Action systems are contained in Procedure 1012.
13.2 Corrective Actions
Corrective actions are taken by Operations and Quality to promptly correct
significant conditions adverse to quality. The condition is identified and cause
analysis is performed to identify root causes. Solutions are evaluated and the
optimum one selected that will prevent recurrence, can be implemented by the
Laboratory, allows the Laboratory to meet its other goals, and is commensurate with
the significance of the problem. All steps are documented, action plans developed
for major efforts, and reports made to Management. QA verifies the implementation
effectiveness. Procedure 1012 provides instructions and designates authorities and
responsibilities.
13.3 Preventive Actions
Preventive actions are improvements intended to reduce the potential for
nonconformances. Possible preventive actions are developed from suggestions
from employees and from analysis of Laboratory technical and quality systems by
management. If preventive actions or improvements are selected for investigation,
the issues, investigation, recommendations, and implementation actions are
documented. Follow up verifies effectiveness.
Page 30 of 32
14.0 RESULTS ANALYSIS AND REPORTING
14.1 General
The Laboratory’s role is to provide measurement-based information to clients
that is technically valid, legally defensible, and of known quality.
14.2 Results Review
The results obtained from analytical efforts are collected and reviewed by the
Operations Manager and the Program Manager.
This review verifies the
reasonableness and consistency of the results. It includes review of sample and the
related QC activity data. Procedure 4002 describes the process. Any deficiencies
are corrected by re-analyses, recalculations, or corrective actions per Sections 12.0
and 13.0. Use of the LIMS with its automatic data loading features (see Procedure
4017) minimizes the possibility of transcription or calculation errors.
14.3 Reports
Reports range from simple results reporting to elaborate analytical reports
based on the client requirements and imposed specifications and standards. (See
Procedure 4004.) Reports present results accurately, clearly, unambiguously,
objectively, and as required by the applicable Method(s).
Reports include
reproduction restrictions, information on any deviations from methods, and any
needed data qualifiers based on QC data. If any data is supplied by analytical
subcontractors (see Section 8.0), it is clearly identified and attributed to that
Laboratory by either name or accreditation number.
If results are faxed or transmitted electronically, confidentiality statements are
included in case of receipt by other than the intended client.
Reports are approved by the Program Manager and Operations Manager and
record copies kept in file (See Section 15.0).
Page 31 of 32
15.0 RECORDS
15.1 General
The Laboratory collects generated data and information related to quality or
technical data and maintains them as records. Records are identified, prepared,
reviewed, placed in storage, and maintained as set forth in Procedure 1003.
15.2 Type of Records
All original observations, calculations, derived data, calibration data, and test
reports are included. In addition QA data such as audits, management reviews,
corrective and preventive actions, manuals, and procedures are included.
15.3 Storage and Retention
Records are stored in files after completion in the lab. Files are in specified
locations and under the control of custodians. Filing systems provide for retrieval.
Electronic files are kept on Company servers (with regular back up) or on media
stored in fireproof file cabinets. Records are kept in Laboratory files for at least 2
years after the last entry and then in Company files for another year as a minimum.
Some customers specify larger periods – up to 7 years – which is also met. Generic
records supporting multiple customers are kept for the longest applicable period.
15.4 Destruction or Disposal
Records may be destroyed after the retention period and after client
notification and acceptance, if required. If the Laboratory closes, records will go in to
company storage in Huntsville unless otherwise directed by customers. If the
Laboratory is sold, either the new owner will accept record ownership or the records
will go into Company storage as stated above.
Page 32 of 32
16.0 ASSESSMENTS
16.1 General
Assessments consist of internal audits and management reviews as set forth
in Procedure 1013.
16.2 Audits
Internal audits are planned, performed at least annually on all areas of the
quality system, and are performed by qualified people who are as independent as
possible from the activity audited.
(The Laboratory’s small size inhibits full
independence in some technical areas.) Audits are coordinated by the Quality
Manager who assures audit plans and checklists are generated and the results
documented. Reports include descriptions of any findings and provide the auditor’s
assessment of the effectiveness of the audited activity. Report data includes
personnel contacted.
Audit findings are reviewed with management and corrective actions agreed
to and scheduled. Follow up is performed by QA to verify accomplishment and
effectiveness of the corrective action.
16.3 Management Reviews
The Annual Quality Assurance Report, prepared for some clients, is the
Management Review vehicle. These reports cover audit results, corrective and
preventive actions, external assessments, and QC and inter-laboratory performance
checks. The report is reviewed with Management by the QA Manager for the
continued suitability of the Quality Program and its effectiveness. Any needed
improvements are defined, documented, and implemented. Follow ups are made to
verify implementation and effectiveness.
Revision 1
CRA 45136 (20) Quad Cities Generating Station
APPENDIX D
LABORATORY ANALYTICAL REPORTS
L28818 1 of 49
L28818 2 of 49
L28818 3 of 49
L28818 4 of 49
L28818 5 of 49
L28818 6 of 49
L28818 7 of 49
L28818 8 of 49
L28818 9 of 49
L28818 10 of 49
L28818 11 of 49
L28818 12 of 49
L28818 13 of 49
L28818 14 of 49
L28818 15 of 49
L28818 16 of 49
L28818 17 of 49
L28818 18 of 49
L28818 19 of 49
L28818 20 of 49
L28818 21 of 49
L28818 22 of 49
L28818 23 of 49
L28818 24 of 49
L28818 25 of 49
L28818 26 of 49
L28818 27 of 49
L28818 28 of 49
L28818 29 of 49
L28818 30 of 49
L28818 31 of 49
L28818 32 of 49
L28818 33 of 49
L28818 34 of 49
L28818 35 of 49
L28818 36 of 49
L28818 37 of 49
L28818 38 of 49
L28818 39 of 49
L28818 40 of 49
L28818 41 of 49
L28818 42 of 49
L28818 43 of 49
L28818 44 of 49
L28818 45 of 49
L28818 46 of 49
L28818 47 of 49
L28818 48 of 49
L28818 49 of 49
L28834 R1 1 of 122
L28834 R1 2 of 122
L28834 R1 3 of 122
L28834 R1 4 of 122
L28834 R1 5 of 122
L28834 R1 6 of 122
L28834 R1 7 of 122
L28834 R1 8 of 122
L28834 R1 9 of 122
L28834 R1 10 of 122
L28834 R1 11 of 122
L28834 R1 12 of 122
L28834 R1 13 of 122
L28834 R1 14 of 122
L28834 R1 15 of 122
L28834 R1 16 of 122
L28834 R1 17 of 122
L28834 R1 18 of 122
L28834 R1 19 of 122
L28834 R1 20 of 122
L28834 R1 21 of 122
L28834 R1 22 of 122
L28834 R1 23 of 122
L28834 R1 24 of 122
L28834 R1 25 of 122
L28834 R1 26 of 122
L28834 R1 27 of 122
L28834 R1 28 of 122
L28834 R1 29 of 122
L28834 R1 30 of 122
L28834 R1 31 of 122
L28834 R1 32 of 122
L28834 R1 33 of 122
L28834 R1 34 of 122
L28834 R1 35 of 122
L28834 R1 36 of 122
L28834 R1 37 of 122
L28834 R1 38 of 122
L28834 R1 39 of 122
L28834 R1 40 of 122
L28834 R1 41 of 122
L28834 R1 42 of 122
L28834 R1 43 of 122
L28834 R1 44 of 122
L28834 R1 45 of 122
L28834 R1 46 of 122
L28834 R1 47 of 122
L28834 R1 48 of 122
L28834 R1 49 of 122
L28834 R1 50 of 122
L28834 R1 51 of 122
L28834 R1 52 of 122
L28834 R1 53 of 122
L28834 R1 54 of 122
L28834 R1 55 of 122
L28834 R1 56 of 122
L28834 R1 57 of 122
L28834 R1 58 of 122
L28834 R1 59 of 122
L28834 R1 60 of 122
L28834 R1 61 of 122
L28834 R1 62 of 122
L28834 R1 63 of 122
L28834 R1 64 of 122
L28834 R1 65 of 122
L28834 R1 66 of 122
L28834 R1 67 of 122
L28834 R1 68 of 122
L28834 R1 69 of 122
L28834 R1 70 of 122
L28834 R1 71 of 122
L28834 R1 72 of 122
L28834 R1 73 of 122
L28834 R1 74 of 122
L28834 R1 75 of 122
L28834 R1 76 of 122
L28834 R1 77 of 122
L28834 R1 78 of 122
L28834 R1 79 of 122
L28834 R1 80 of 122
L28834 R1 81 of 122
L28834 R1 82 of 122
L28834 R1 83 of 122
L28834 R1 84 of 122
L28834 R1 85 of 122
L28834 R1 86 of 122
L28834 R1 87 of 122
L28834 R1 88 of 122
L28834 R1 89 of 122
L28834 R1 90 of 122
L28834 R1 91 of 122
L28834 R1 92 of 122
L28834 R1 93 of 122
L28834 R1 94 of 122
L28834 R1 95 of 122
L28834 R1 96 of 122
L28834 R1 97 of 122
L28834 R1 98 of 122
L28834 R1 99 of 122
L28834 R1 100 of 122
L28834 R1 101 of 122
L28834 R1 102 of 122
L28834 R1 103 of 122
L28834 R1 104 of 122
L28834 R1 105 of 122
L28834 R1 106 of 122
L28834 R1 107 of 122
L28834 R1 108 of 122
L28834 R1 109 of 122
L28834 R1 110 of 122
L28834 R1 111 of 122
L28834 R1 112 of 122
L28834 R1 113 of 122
L28834 R1 114 of 122
L28834 R1 115 of 122
L28834 R1 116 of 122
L28834 R1 117 of 122
L28834 R1 118 of 122
L28834 R1 119 of 122
L28834 R1 120 of 122
L28834 R1 121 of 122
L28834 R1 122 of 122
L28837 1 of 94
L28837 2 of 94
L28837 3 of 94
L28837 4 of 94
L28837 5 of 94
L28837 6 of 94
L28837 7 of 94
L28837 8 of 94
L28837 9 of 94
L28837 10 of 94
L28837 11 of 94
L28837 12 of 94
L28837 13 of 94
L28837 14 of 94
L28837 15 of 94
L28837 16 of 94
L28837 17 of 94
L28837 18 of 94
L28837 19 of 94
L28837 20 of 94
L28837 21 of 94
L28837 22 of 94
L28837 23 of 94
L28837 24 of 94
L28837 25 of 94
L28837 26 of 94
L28837 27 of 94
L28837 28 of 94
L28837 29 of 94
L28837 30 of 94
L28837 31 of 94
L28837 32 of 94
L28837 33 of 94
L28837 34 of 94
L28837 35 of 94
L28837 36 of 94
L28837 37 of 94
L28837 38 of 94
L28837 39 of 94
L28837 40 of 94
L28837 41 of 94
L28837 42 of 94
L28837 43 of 94
L28837 44 of 94
L28837 45 of 94
L28837 46 of 94
L28837 47 of 94
L28837 48 of 94
L28837 49 of 94
L28837 50 of 94
L28837 51 of 94
L28837 52 of 94
L28837 53 of 94
L28837 54 of 94
L28837 55 of 94
L28837 56 of 94
L28837 57 of 94
L28837 58 of 94
L28837 59 of 94
L28837 60 of 94
L28837 61 of 94
L28837 62 of 94
L28837 63 of 94
L28837 64 of 94
L28837 65 of 94
L28837 66 of 94
L28837 67 of 94
L28837 68 of 94
L28837 69 of 94
L28837 70 of 94
L28837 71 of 94
L28837 72 of 94
L28837 73 of 94
L28837 74 of 94
L28837 75 of 94
L28837 76 of 94
L28837 77 of 94
L28837 78 of 94
L28837 79 of 94
L28837 80 of 94
L28837 81 of 94
L28837 82 of 94
L28837 83 of 94
L28837 84 of 94
L28837 85 of 94
L28837 86 of 94
L28837 87 of 94
L28837 88 of 94
L28837 89 of 94
L28837 90 of 94
L28837 91 of 94
L28837 92 of 94
L28837 93 of 94
L28837 94 of 94
L29107 1 of 17
L29107 2 of 17
L29107 3 of 17
L29107 4 of 17
L29107 5 of 17
L29107 6 of 17
L29107 7 of 17
L29107 8 of 17
L29107 9 of 17
L29107 10 of 17
L29107 11 of 17
L29107 12 of 17
L29107 13 of 17
L29107 14 of 17
L29107 15 of 17
L29107 16 of 17
L29107 17 of 17
L29389 1 of 72
L29389 2 of 72
L29389 3 of 72
L29389 4 of 72
L29389 5 of 72
L29389 6 of 72
L29389 7 of 72
L29389 8 of 72
L29389 9 of 72
L29389 10 of 72
L29389 11 of 72
L29389 12 of 72
L29389 13 of 72
L29389 14 of 72
L29389 15 of 72
L29389 16 of 72
L29389 17 of 72
L29389 18 of 72
L29389 19 of 72
L29389 20 of 72
L29389 21 of 72
L29389 22 of 72
L29389 23 of 72
L29389 24 of 72
L29389 25 of 72
L29389 26 of 72
L29389 27 of 72
L29389 28 of 72
L29389 29 of 72
L29389 30 of 72
L29389 31 of 72
L29389 32 of 72
L29389 33 of 72
L29389 34 of 72
L29389 35 of 72
L29389 36 of 72
L29389 37 of 72
L29389 38 of 72
L29389 39 of 72
L29389 40 of 72
L29389 41 of 72
L29389 42 of 72
L29389 43 of 72
L29389 44 of 72
L29389 45 of 72
L29389 46 of 72
L29389 47 of 72
L29389 48 of 72
L29389 49 of 72
L29389 50 of 72
L29389 51 of 72
L29389 52 of 72
L29389 53 of 72
L29389 54 of 72
L29389 55 of 72
L29389 56 of 72
L29389 57 of 72
L29389 58 of 72
L29389 59 of 72
L29389 60 of 72
L29389 61 of 72
L29389 62 of 72
L29389 63 of 72
L29389 64 of 72
L29389 65 of 72
L29389 66 of 72
L29389 67 of 72
L29389 68 of 72
L29389 69 of 72
L29389 70 of 72
L29389 71 of 72
L29389 72 of 72
L29403 1 of 73
L29403 2 of 73
L29403 3 of 73
L29403 4 of 73
L29403 5 of 73
L29403 6 of 73
L29403 7 of 73
L29403 8 of 73
L29403 9 of 73
L29403 10 of 73
L29403 11 of 73
L29403 12 of 73
L29403 13 of 73
L29403 14 of 73
L29403 15 of 73
L29403 16 of 73
L29403 17 of 73
L29403 18 of 73
L29403 19 of 73
L29403 20 of 73
L29403 21 of 73
L29403 22 of 73
L29403 23 of 73
L29403 24 of 73
L29403 25 of 73
L29403 26 of 73
L29403 27 of 73
L29403 28 of 73
L29403 29 of 73
L29403 30 of 73
L29403 31 of 73
L29403 32 of 73
L29403 33 of 73
L29403 34 of 73
L29403 35 of 73
L29403 36 of 73
L29403 37 of 73
L29403 38 of 73
L29403 39 of 73
L29403 40 of 73
L29403 41 of 73
L29403 42 of 73
L29403 43 of 73
L29403 44 of 73
L29403 45 of 73
L29403 46 of 73
L29403 47 of 73
L29403 48 of 73
L29403 49 of 73
L29403 50 of 73
L29403 51 of 73
L29403 52 of 73
L29403 53 of 73
L29403 54 of 73
L29403 55 of 73
L29403 56 of 73
L29403 57 of 73
L29403 58 of 73
L29403 59 of 73
L29403 60 of 73
L29403 61 of 73
L29403 62 of 73
L29403 63 of 73
L29403 64 of 73
L29403 65 of 73
L29403 66 of 73
L29403 67 of 73
L29403 68 of 73
L29403 69 of 73
L29403 70 of 73
L29403 71 of 73
L29403 72 of 73
L29403 73 of 73
Revision 1
CRA 45136 (20) Quad Cities Generating Station
APPENDIX E
DATA VALIDATION MEMORANDUM