Worldwide Engineering , Environmental , Construction , and IT Services
Revision 1
Certain figures in this Report contain sensitive, security-
related information protected from public disclosure by
Federal and State law. This Report is suitable for
public disclosure only after these figures are removed.
HYDROGEOLOGIC INVESTIGATION REPORT
FLEETWIDE ASSESSMENT
BYRON GENERATING STATION
BYRON, ILLINOIS
Prepared For:
Exelon Generation Company, LLC
DISCLAIMER:
SOME FORMATTING CHANGES MAY HAVE OCCURRED WHEN
THE ORIGINAL DOCUMENT WAS PRINTED TO PDF; HOWEVER,
THE ORIGINAL CONTENT REMAINS UNCHANGED.
SEPTEMBER 2006
R
EF. NO. 045136 (13)
Prepared by:
Conestoga-Rovers
& Associates
651 Colby Drive
Waterloo, Ontario
Canada N2V 1C2
Office: (519) 884-0510
Fax:
(519) 884-0525
web: http:\\www.CRAworld.com
Revision 1
TABLE OF CONTENTS
Page
EXECUTIVE SUMMARY.................................................................................................................... i
1.0
INTRODUCTION ...................................................................................................................1
2.0
STATION DESCRIPTION .....................................................................................................2
2.1
STATION LOCATION .......................................................................................2
2.2
OVERVIEW OF COOLING WATER OPERATIONS.....................................2
2.3
SURROUNDING LAND USE ...........................................................................3
2.4
STATION SETTING............................................................................................4
2.4.1
TOPOGRAPHY AND SURFACE WATER FEATURES.................................4
2.4.2
GEOLOGY............................................................................................................5
2.4.3
HYDROGEOLOGY .............................................................................................7
2.4.3.1
EXISTING WELL NETWORK ...........................................................................8
2.4.3.2
GROUNDWATER FLOW ..................................................................................9
2.5
AREA GROUNDWATER USE..........................................................................9
3.0
AREAS FOR FURTHER
EVALUATION...........................................................................11
3.1
SYSTEMS EVALUATIONS..............................................................................11
3.2
HISTORICAL RELEASES ................................................................................14
3.3
STATION INVESTIGATIONS.........................................................................14
3.3.1
PRE-OPERATIONAL RADIOLOGICAL
ENVIRONMENTAL MONITORING PROGRAM
.......................................14
3.3.2
RADIOLOGICAL ENVIRONMENTAL MONITORING
PROGRAM
.........................................................................................................15
3.3.3
HISTORIC INVESTIGATIONS .......................................................................15
3.3.3.1
POWER PLANT DOCUMENTS - UFSAR REPORT ....................................15
3.3.3.2
BLOWDOWN LINE INVESTIGATION.........................................................15
3.4
IDENTIFIED AREAS FOR FURTHER EVALUATION ...............................16
4.0
FIELD METHODS.................................................................................................................19
4.1
BLOWDOWN LINE INVESTIGATION ACTIVITIES .................................19
4.1.1
GROUNDWATER MONITORING WELL INSTALLATION.....................19
4.1.2
GROUNDWATER MONITORING WELL DEVELOPMENT ....................21
4.1.3
SURVEY ..............................................................................................................22
4.1.4
GROUNDWATER ELEVATION MEASUREMENTS..................................22
4.1.5
GROUNDWATER SAMPLE COLLECTION ................................................22
4.2
FLEETWIDE INVESTIGATION ACTIVITIES...............................................23
4.2.1
GROUNDWATER ELEVATION MEASUREMENTS..................................23
4.2.2
GROUNDWATER SAMPLE COLLECTION ................................................24
4.2.3
DATA QUALITY OBJECTIVES.......................................................................26
4.2.4
SAMPLE IDENTIFICATION...........................................................................26
4.2.5
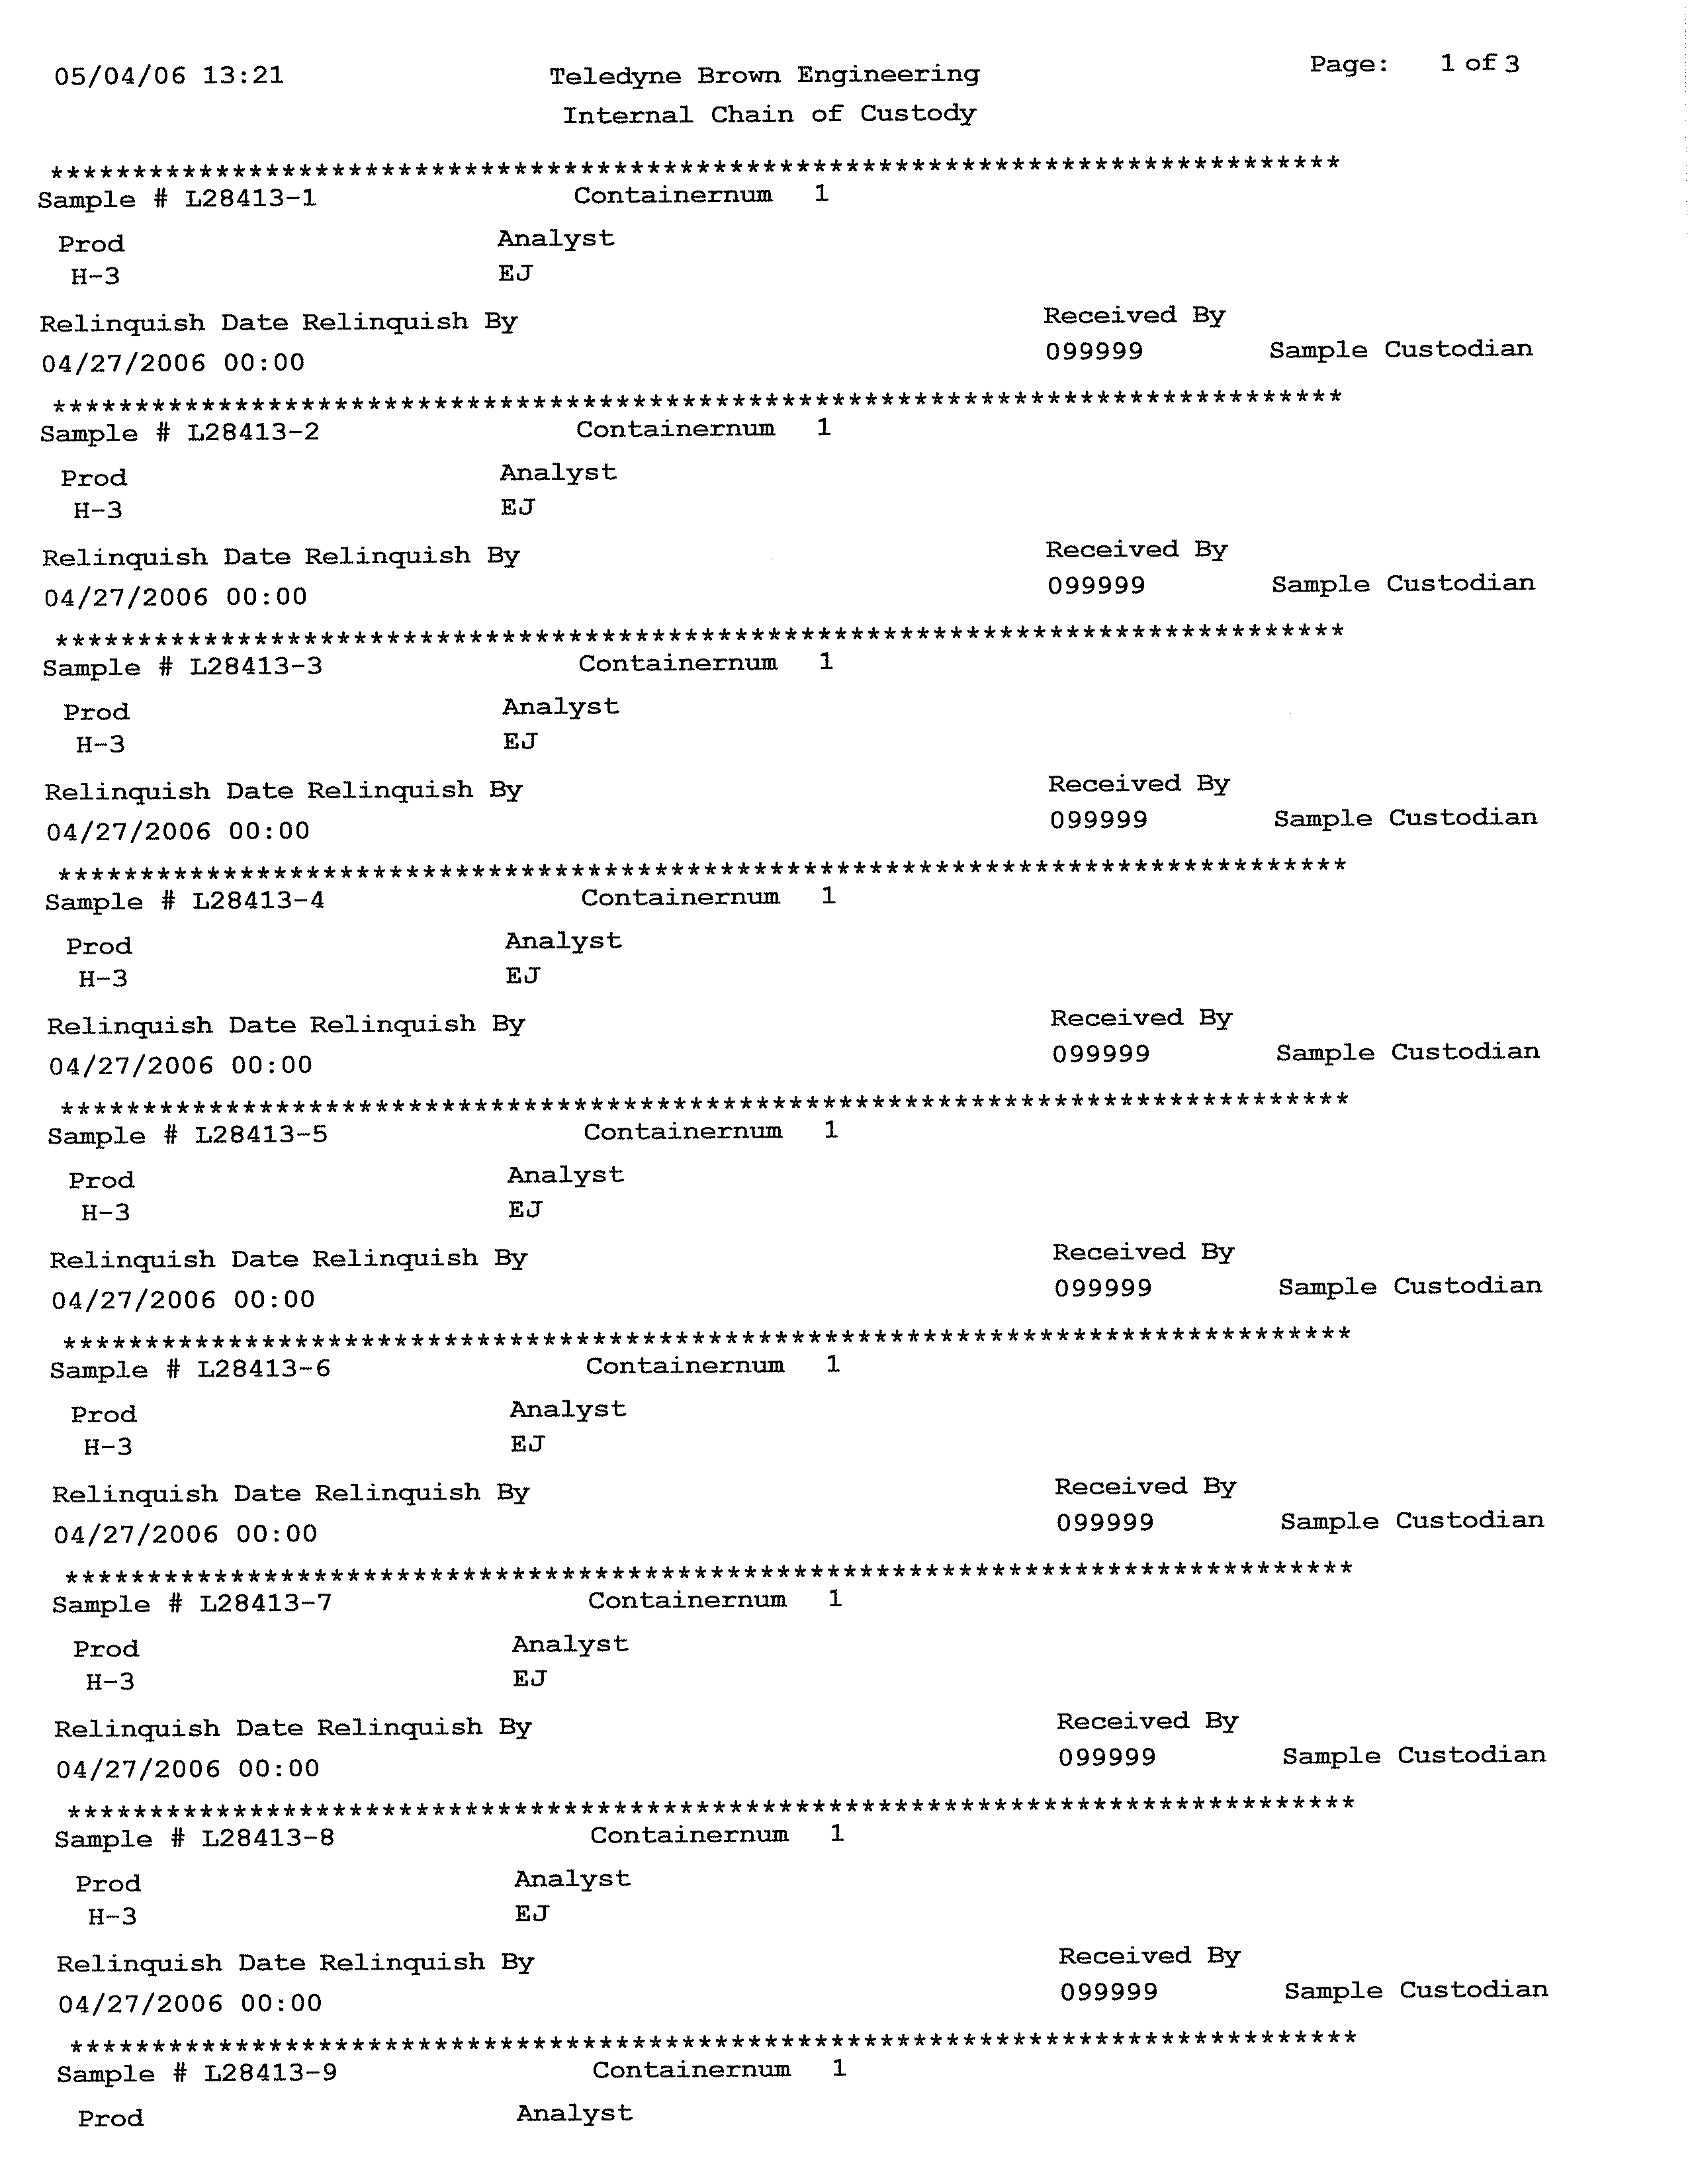
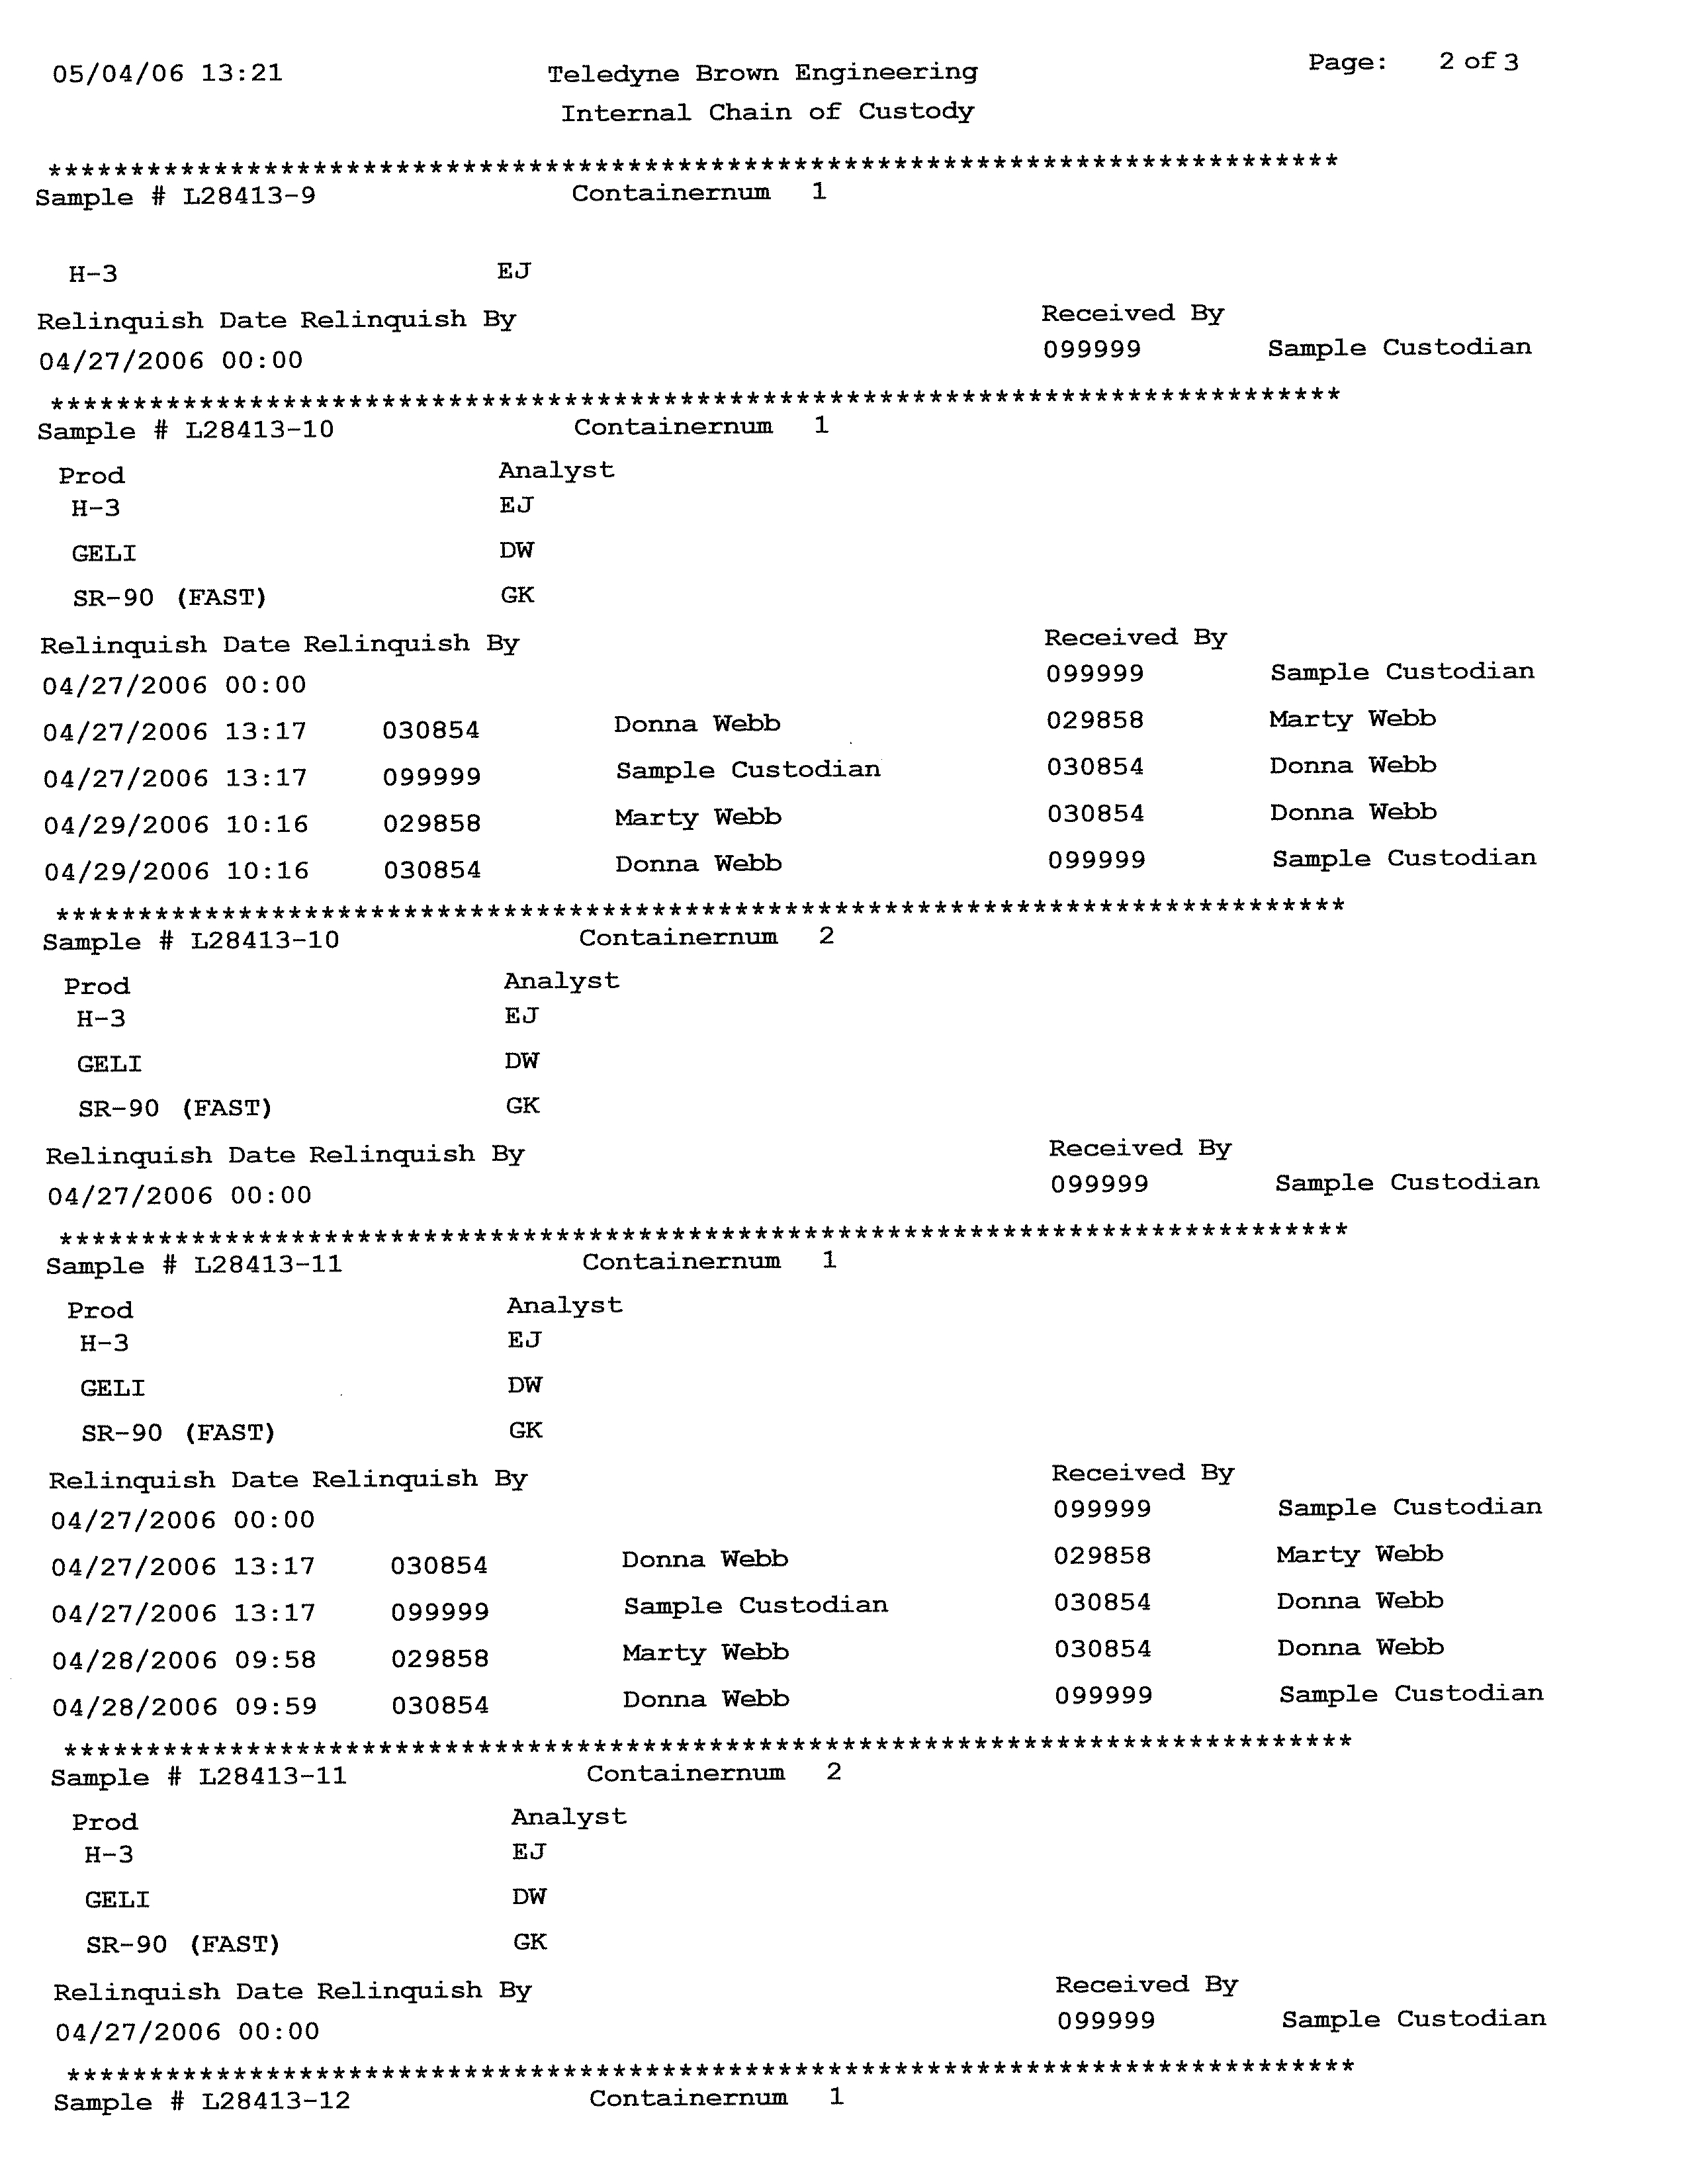
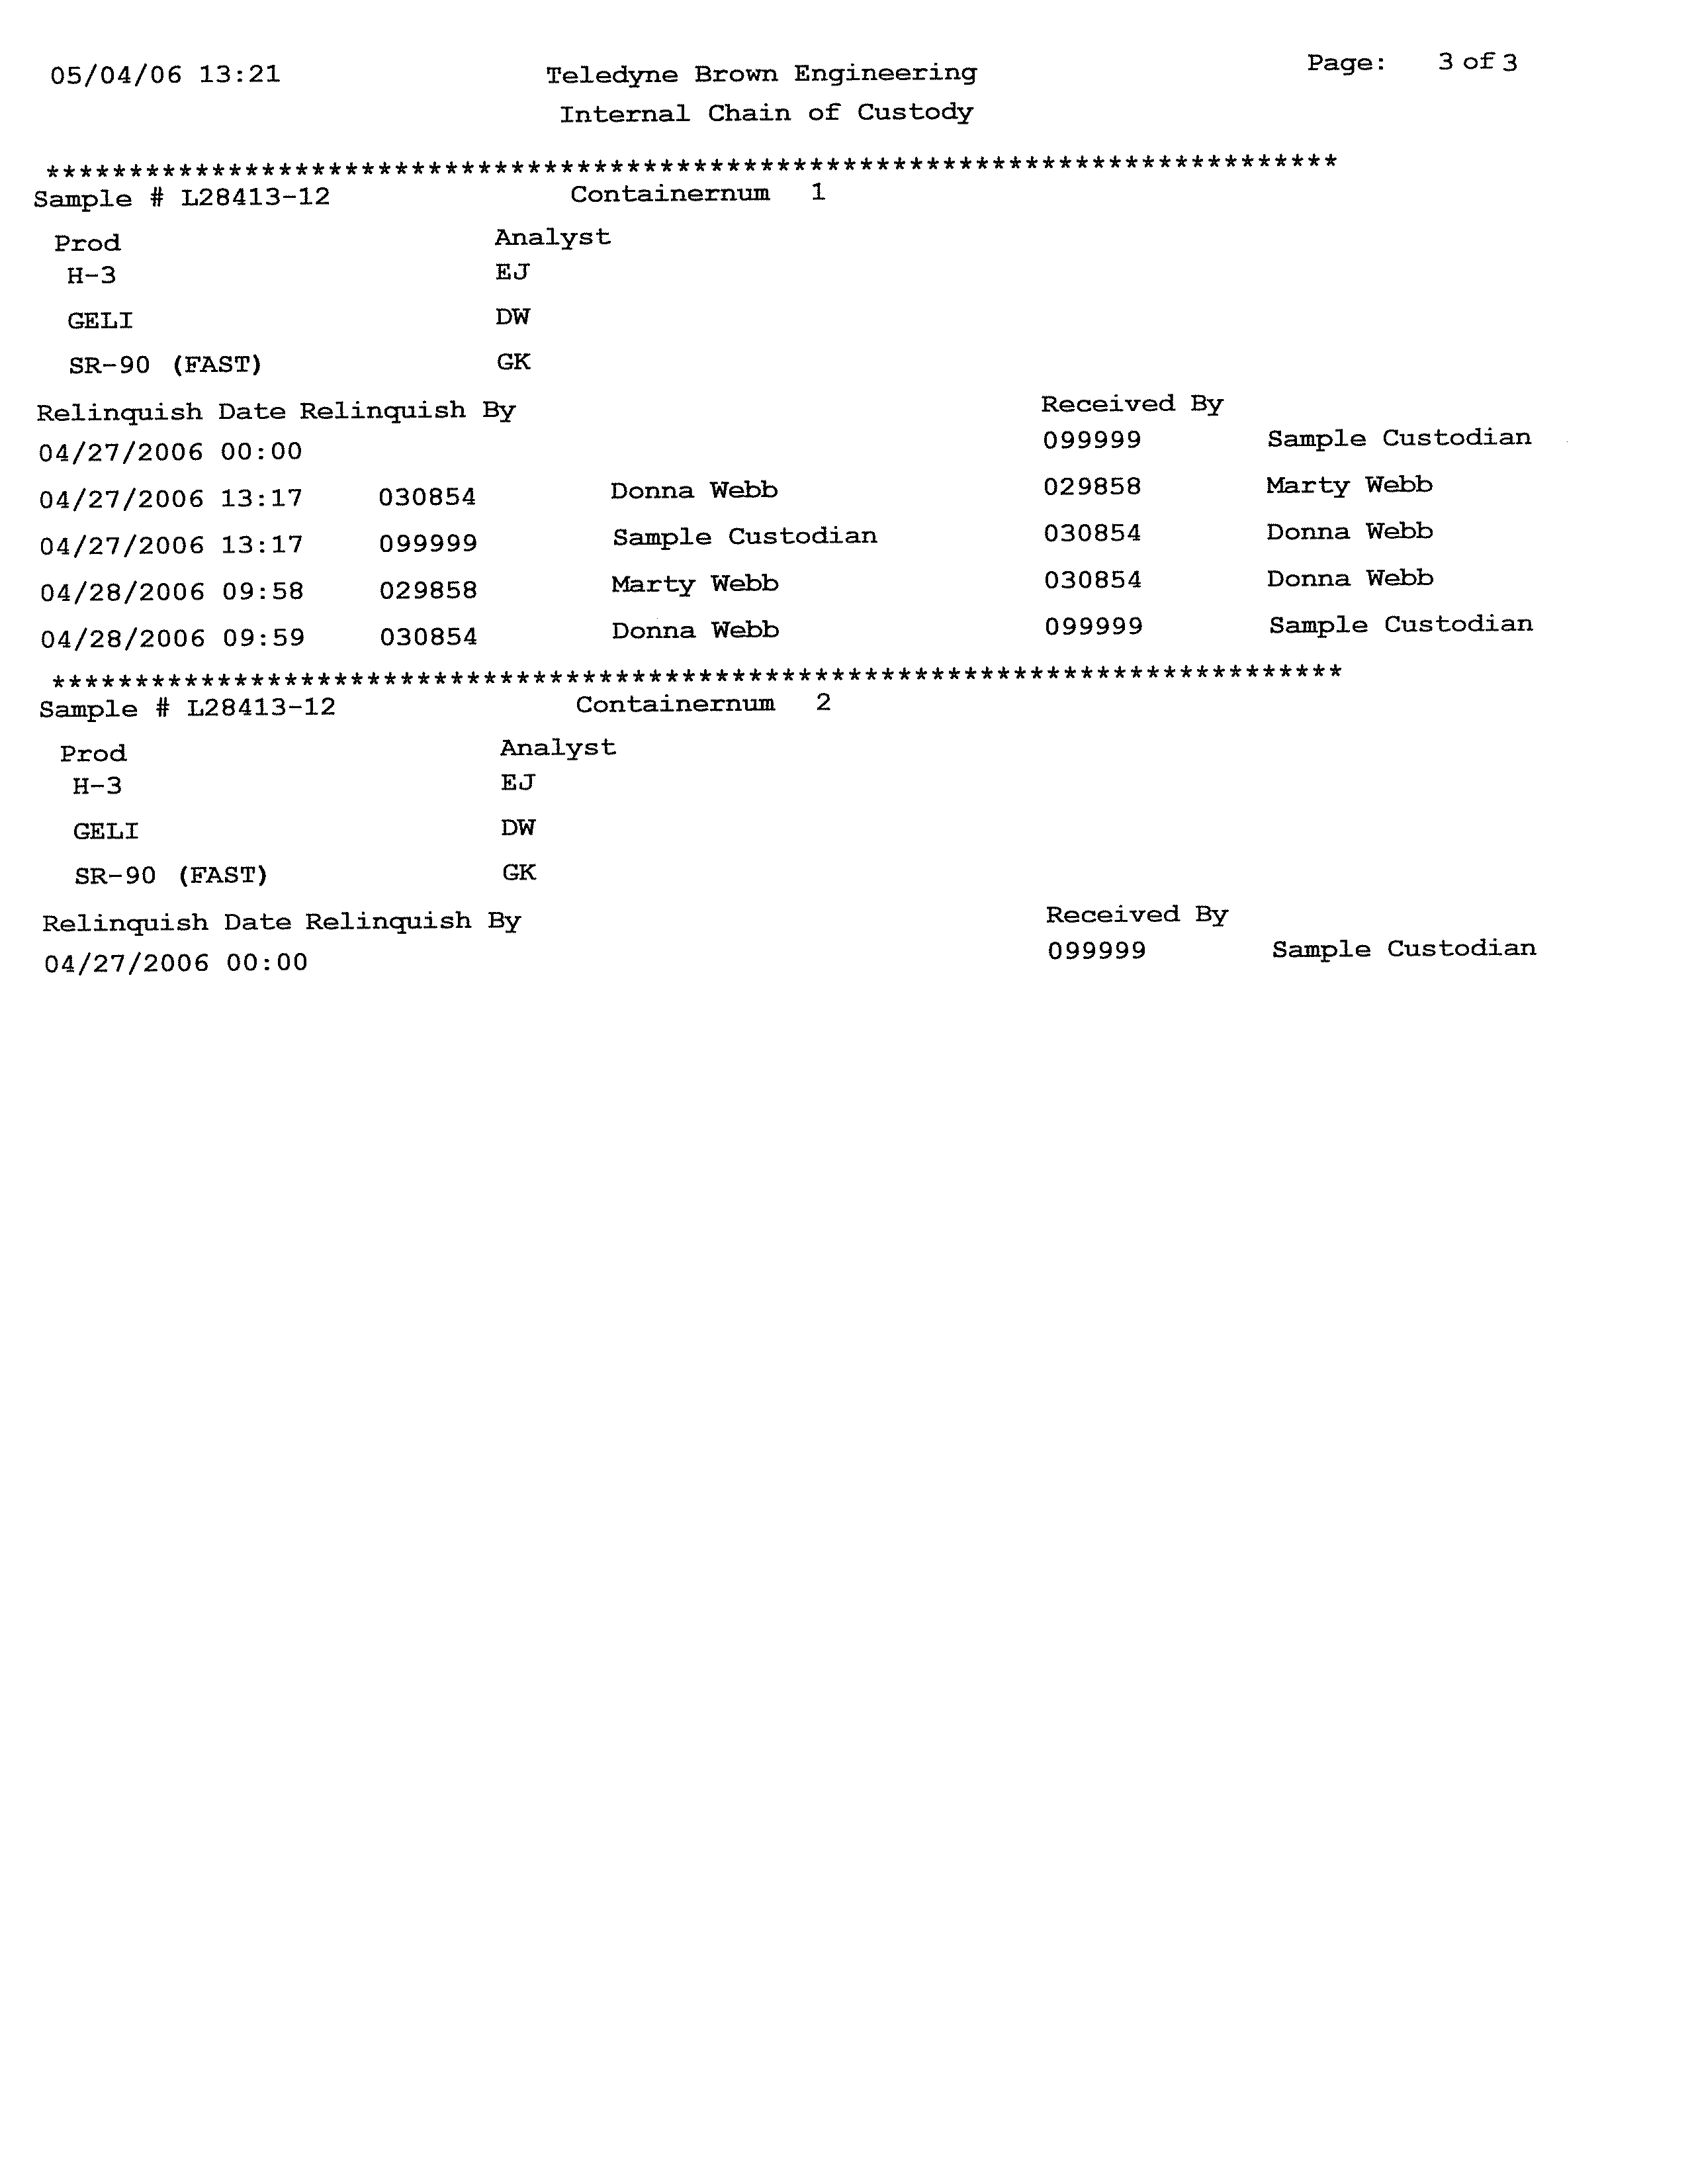
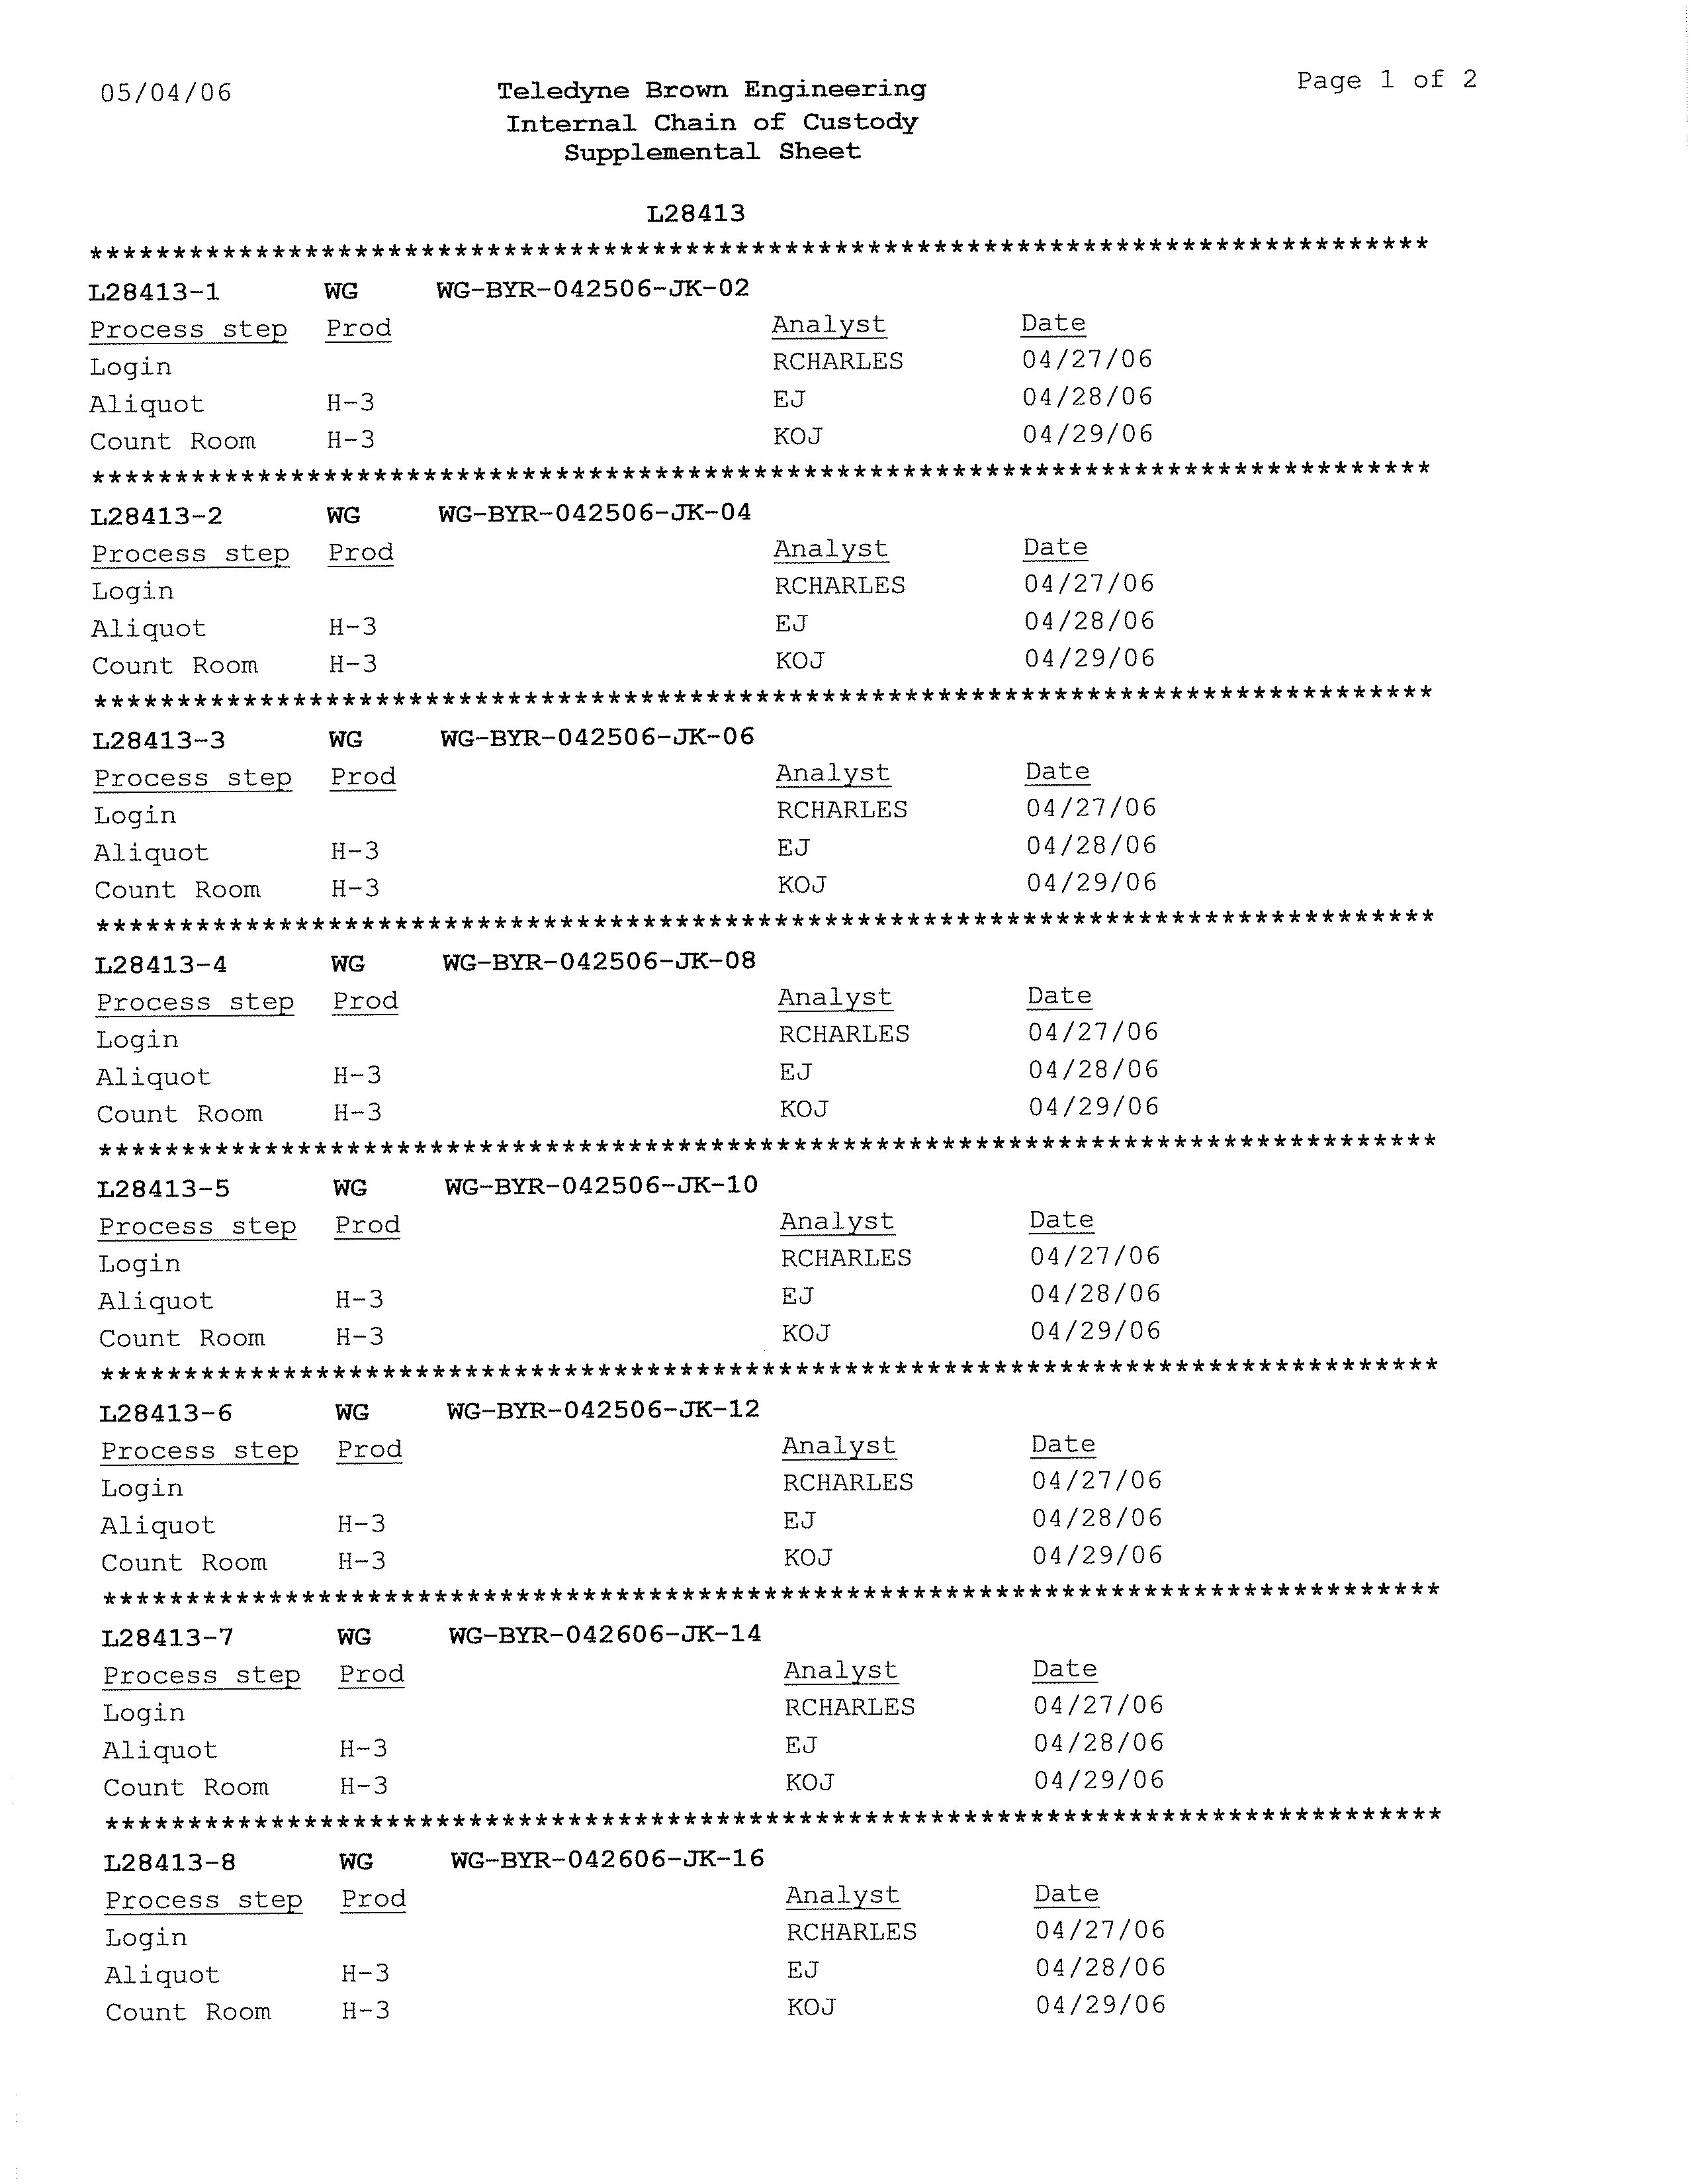
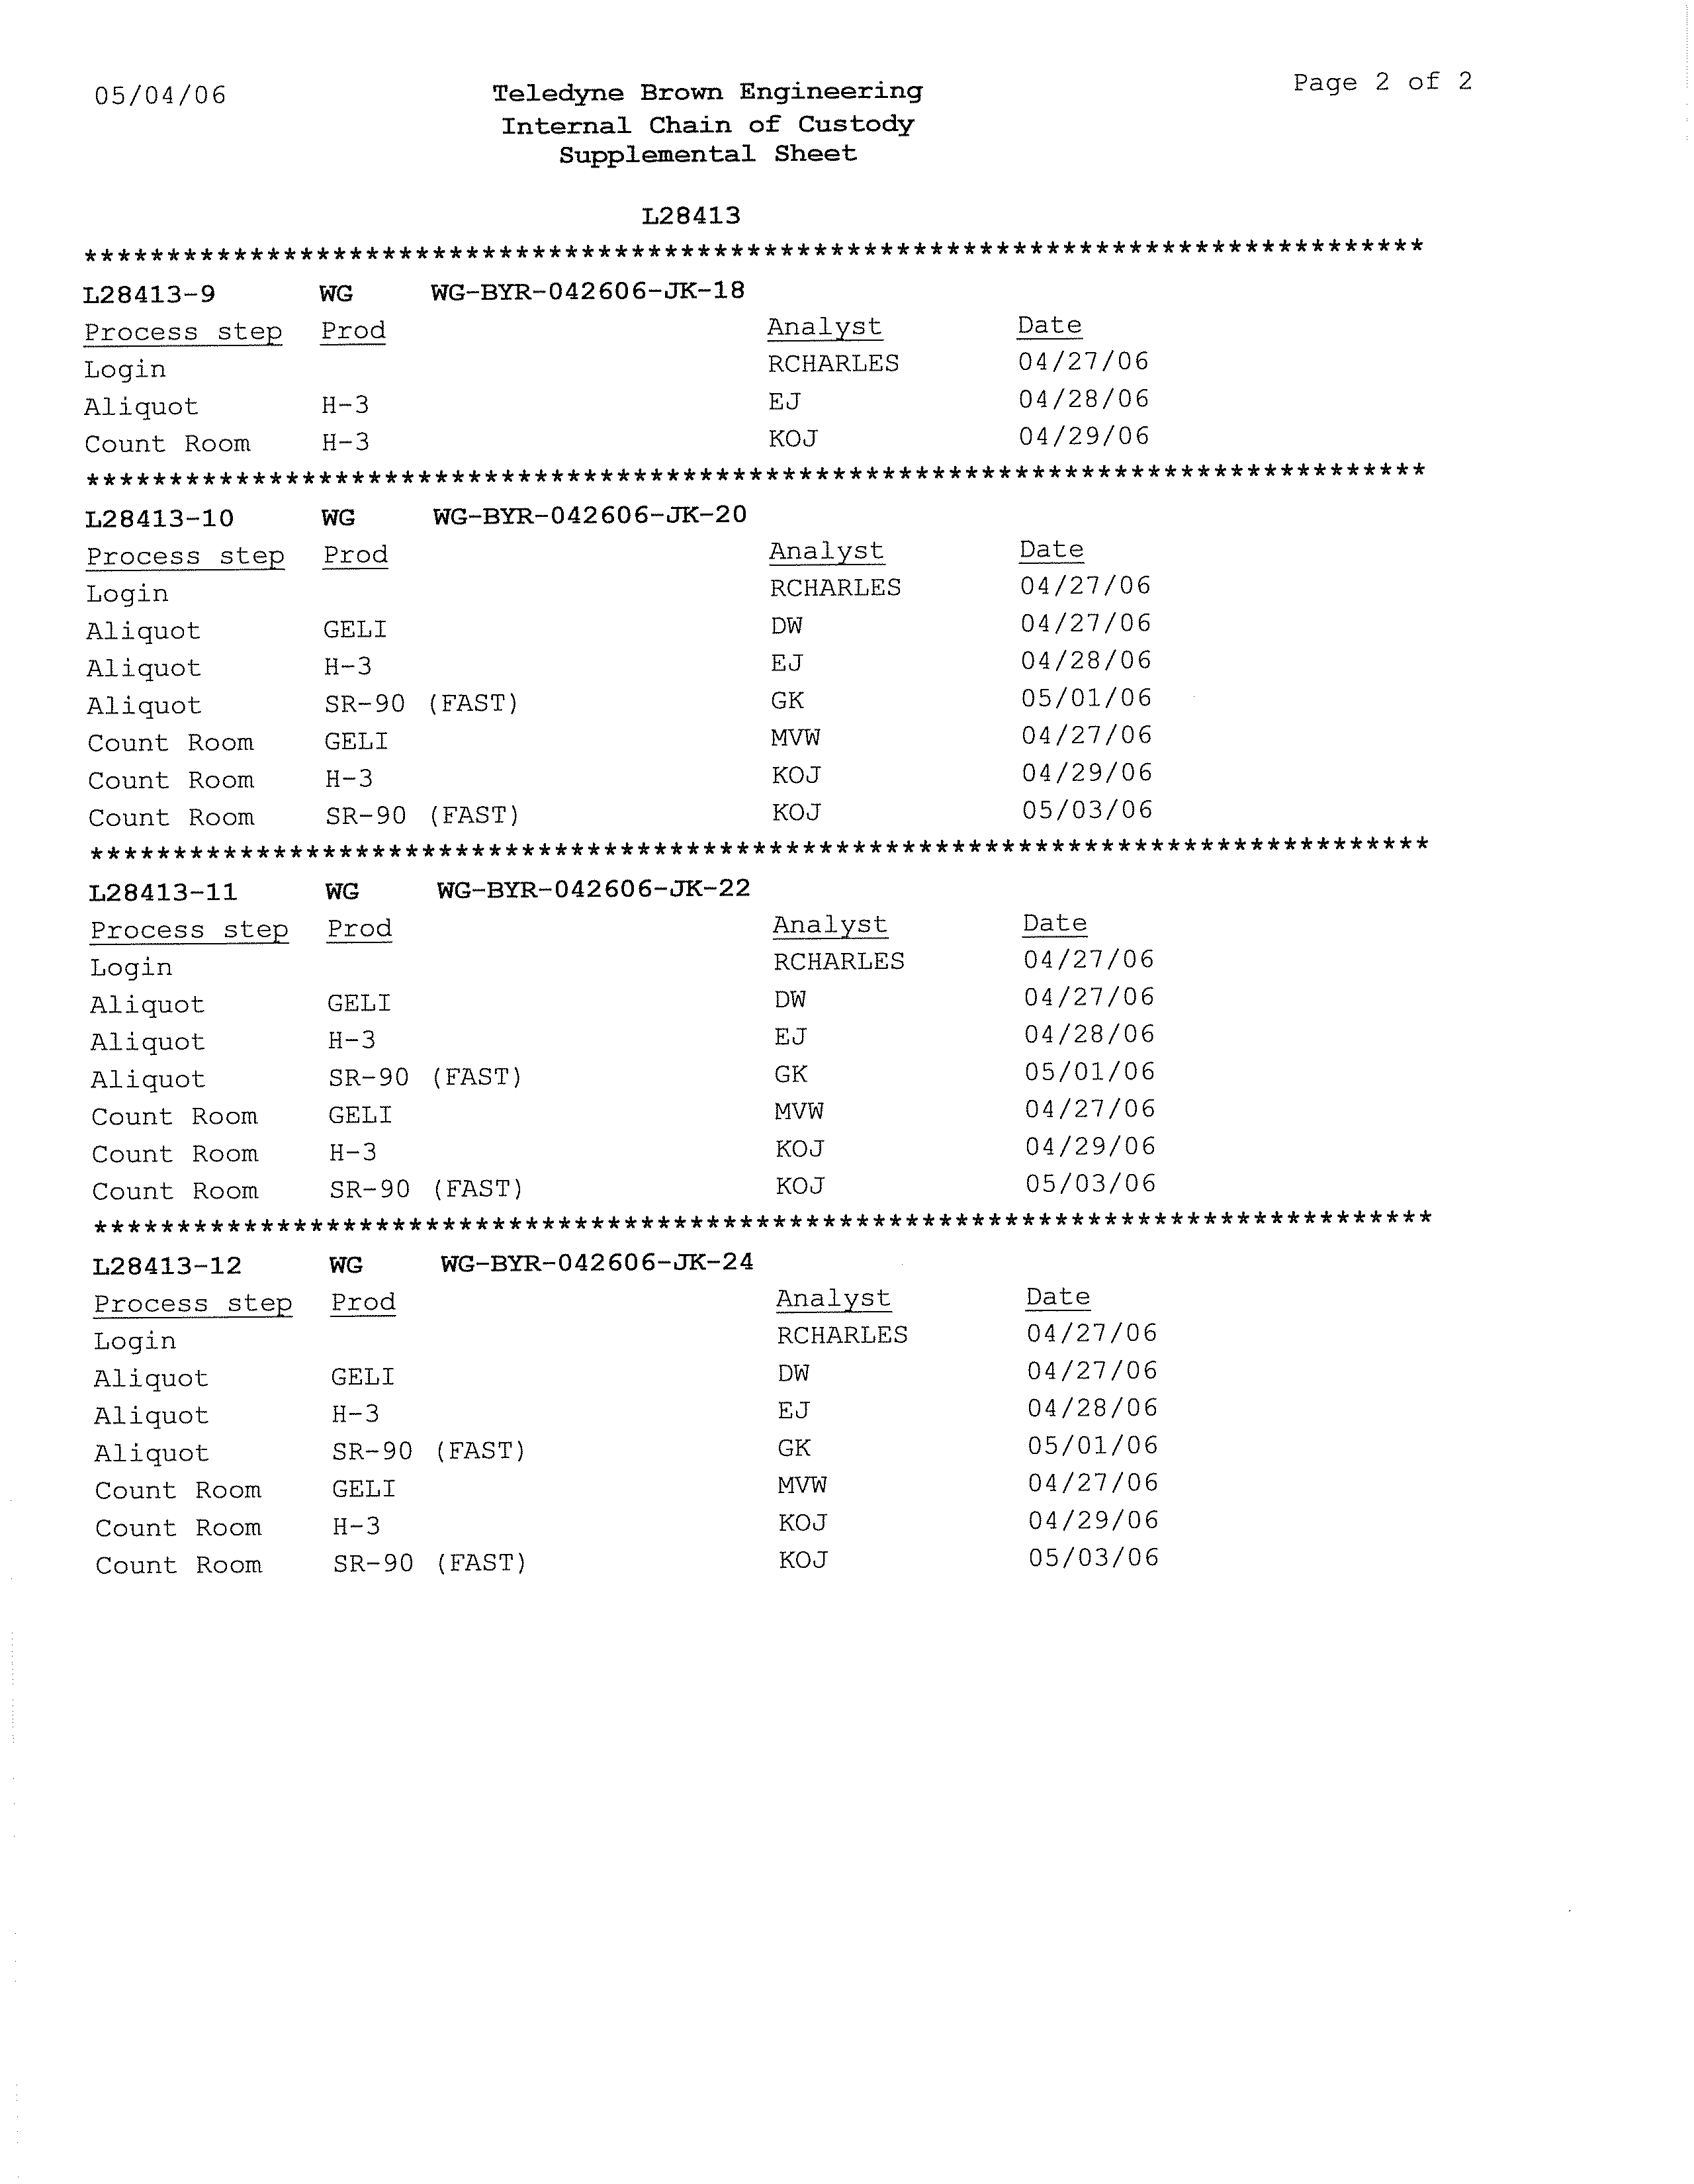
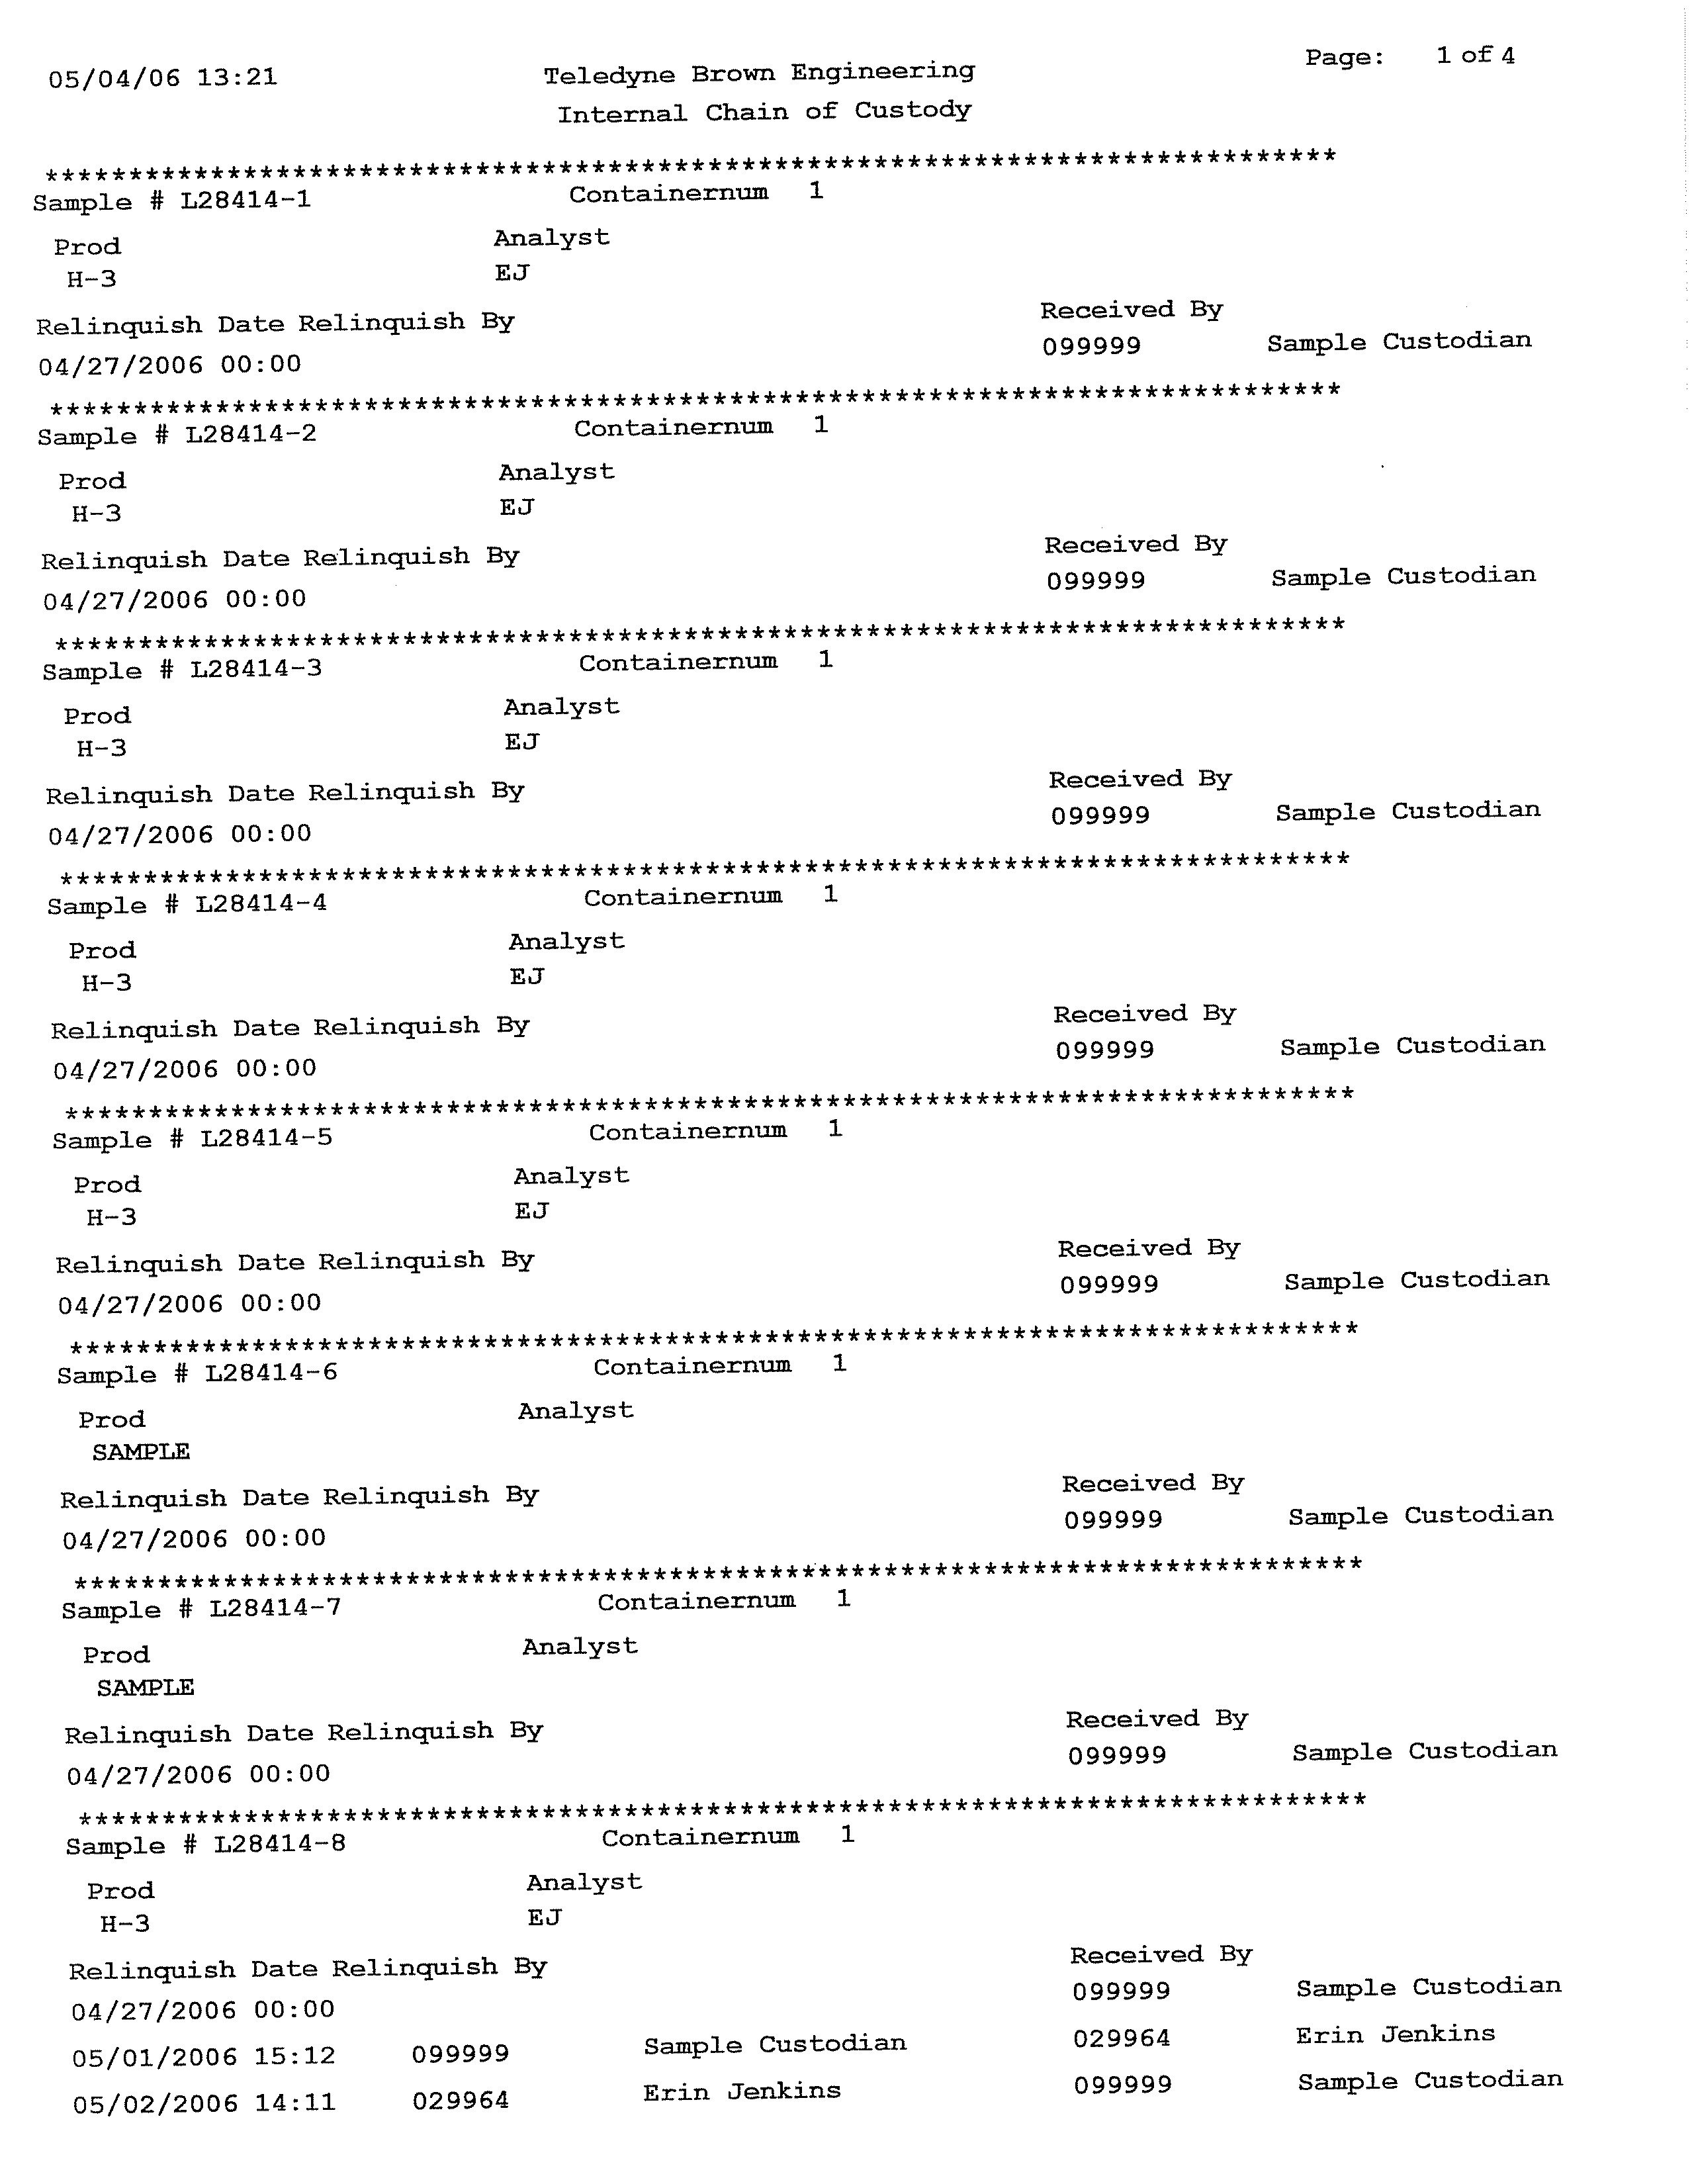
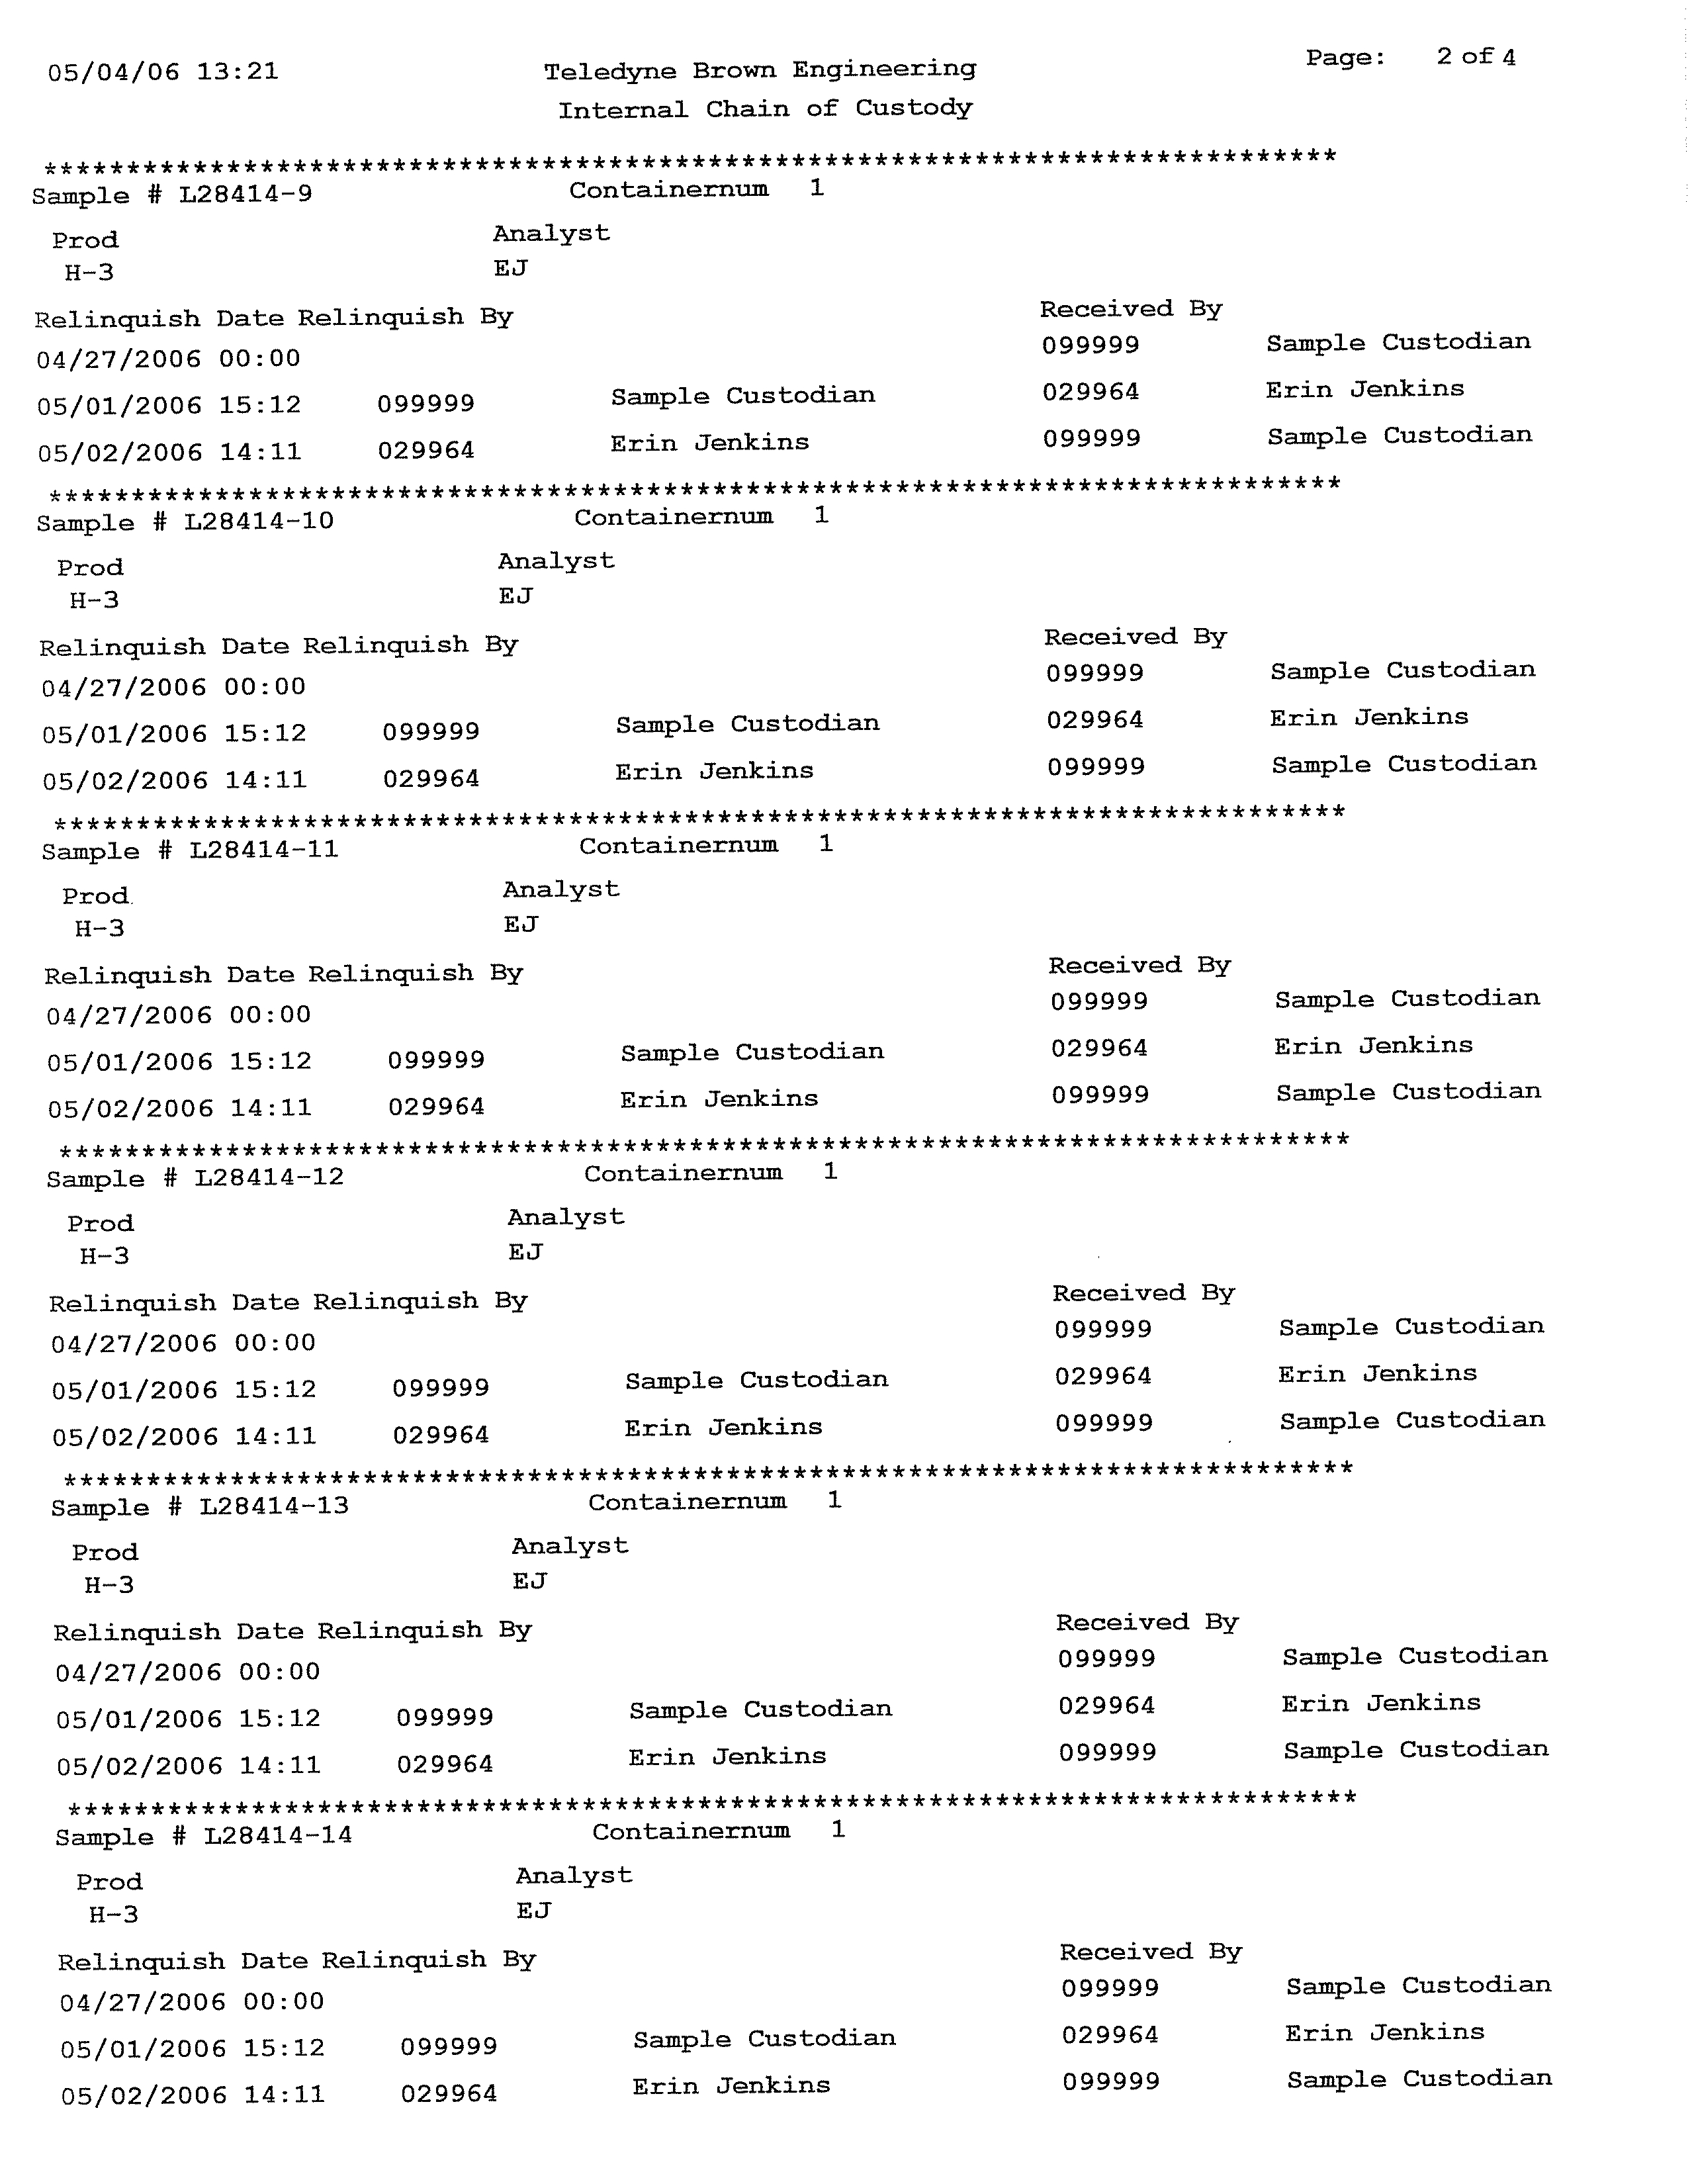
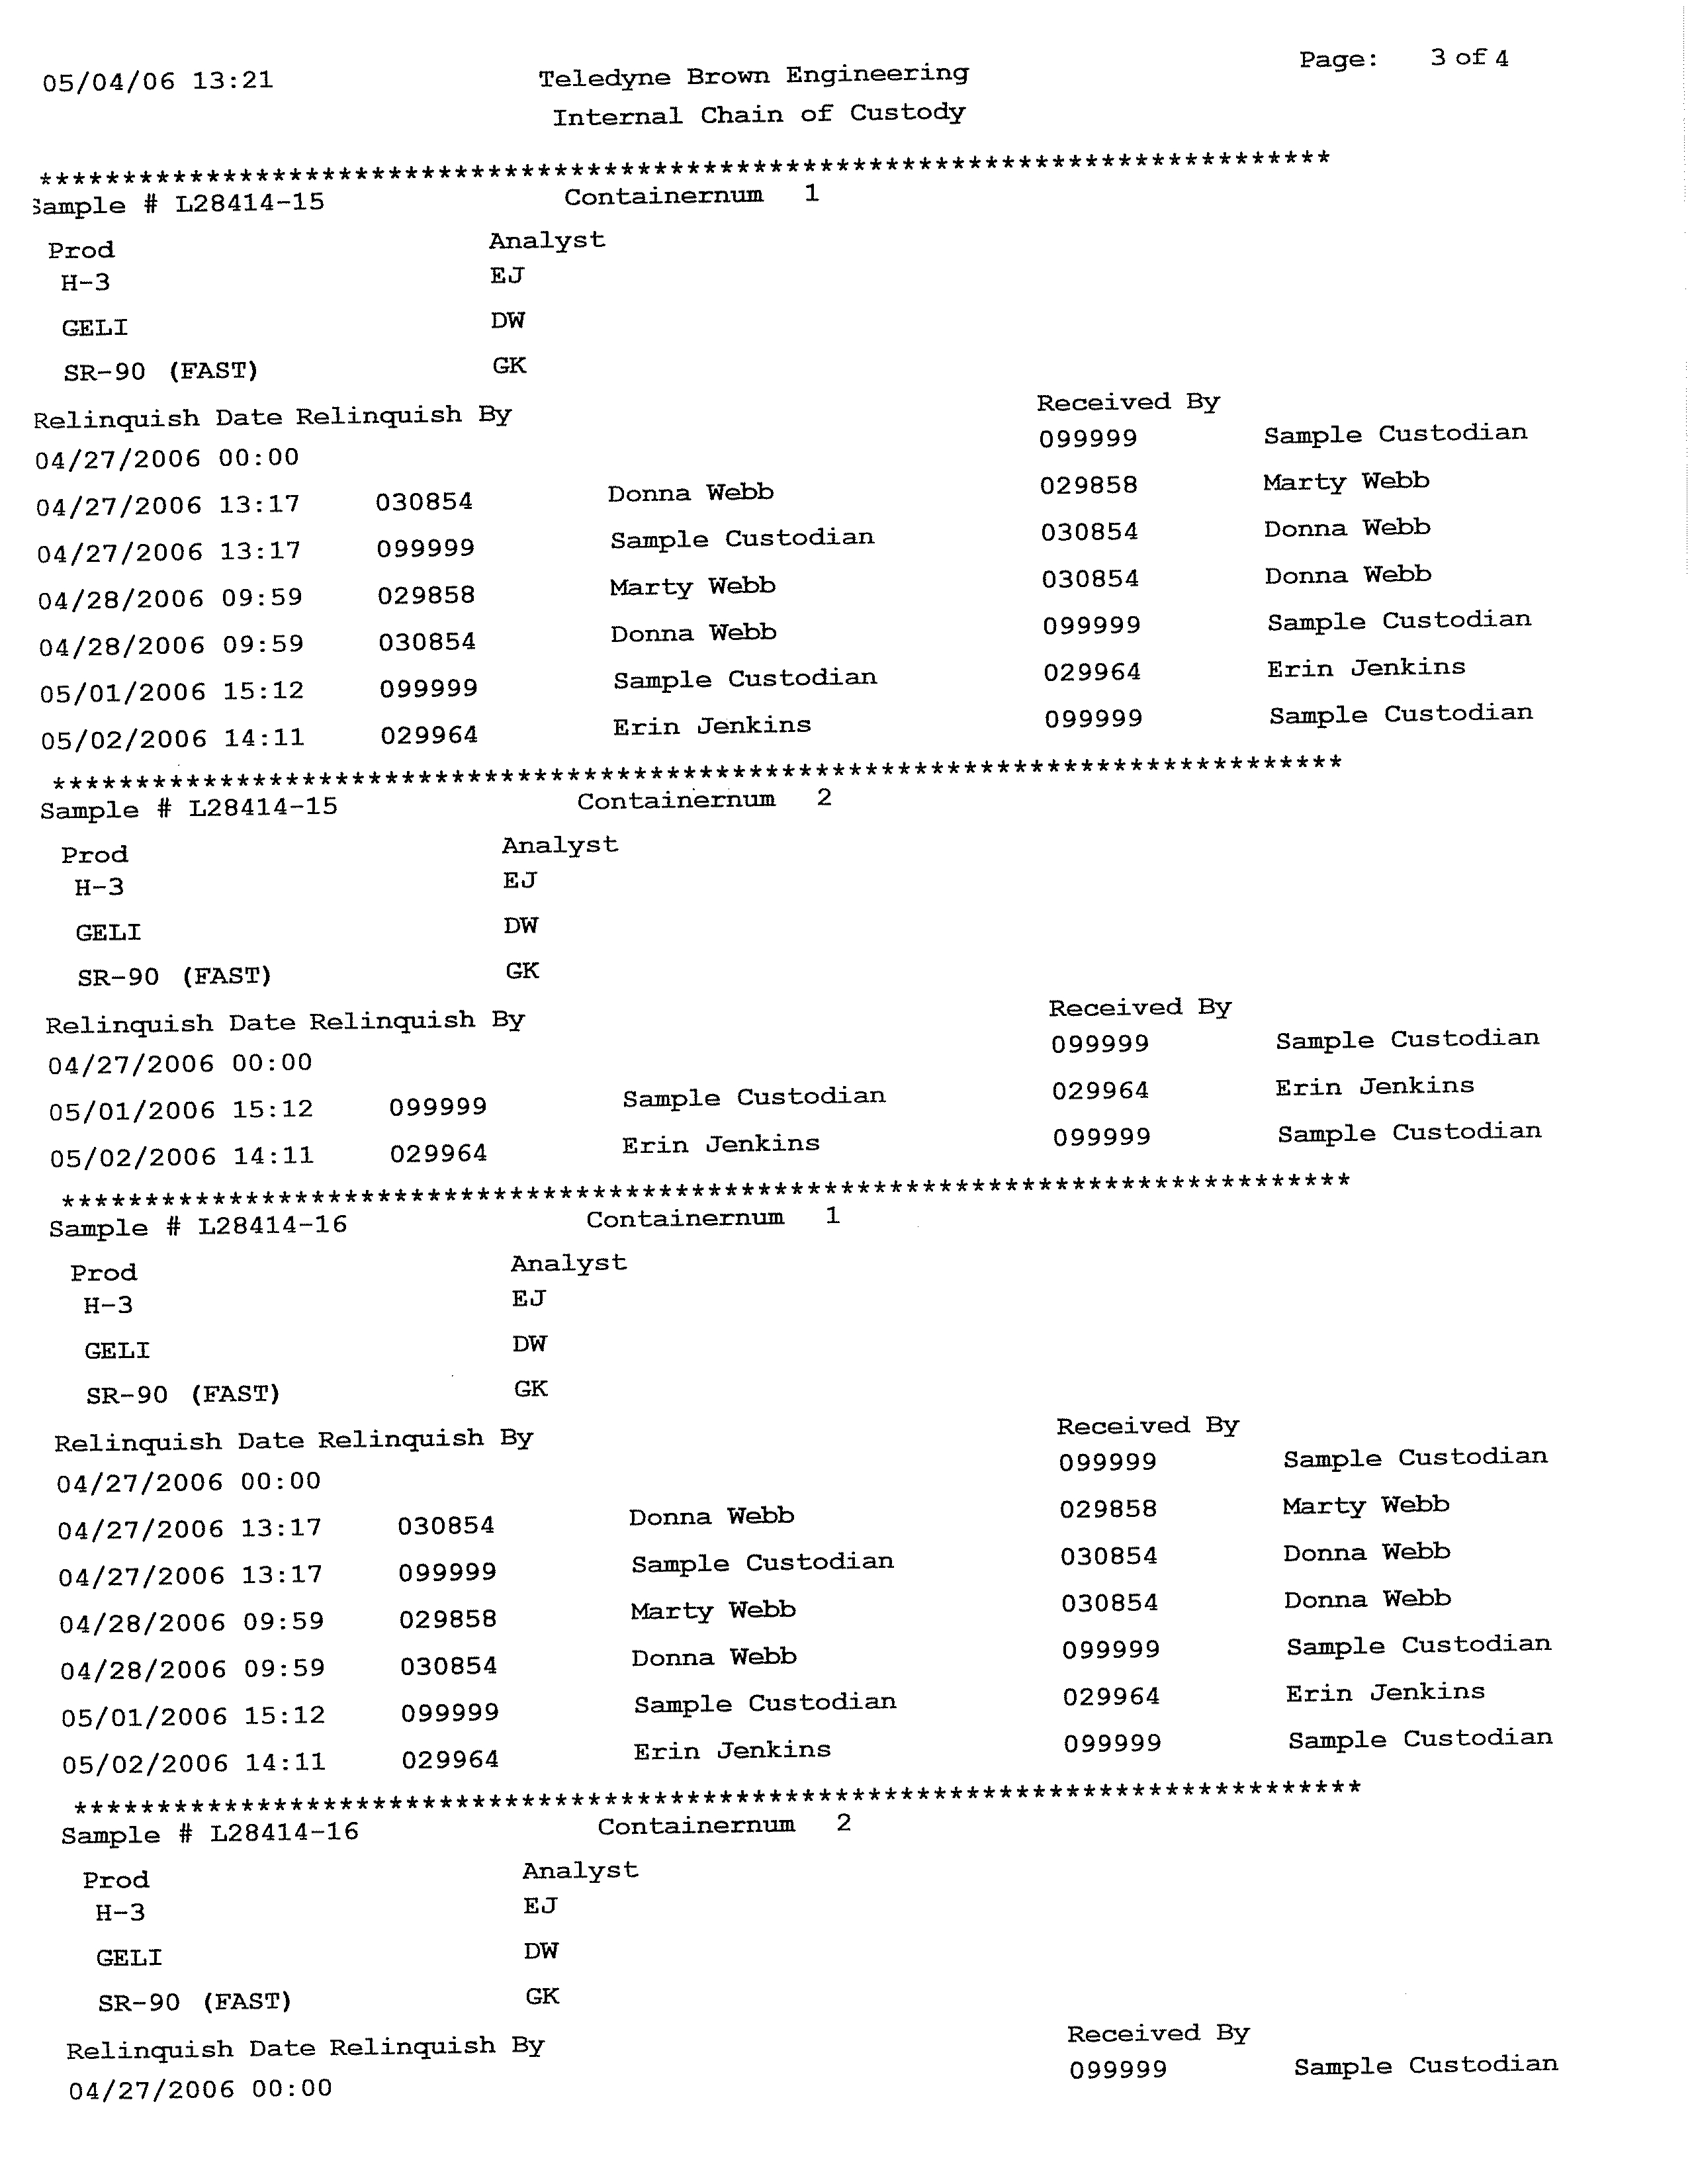
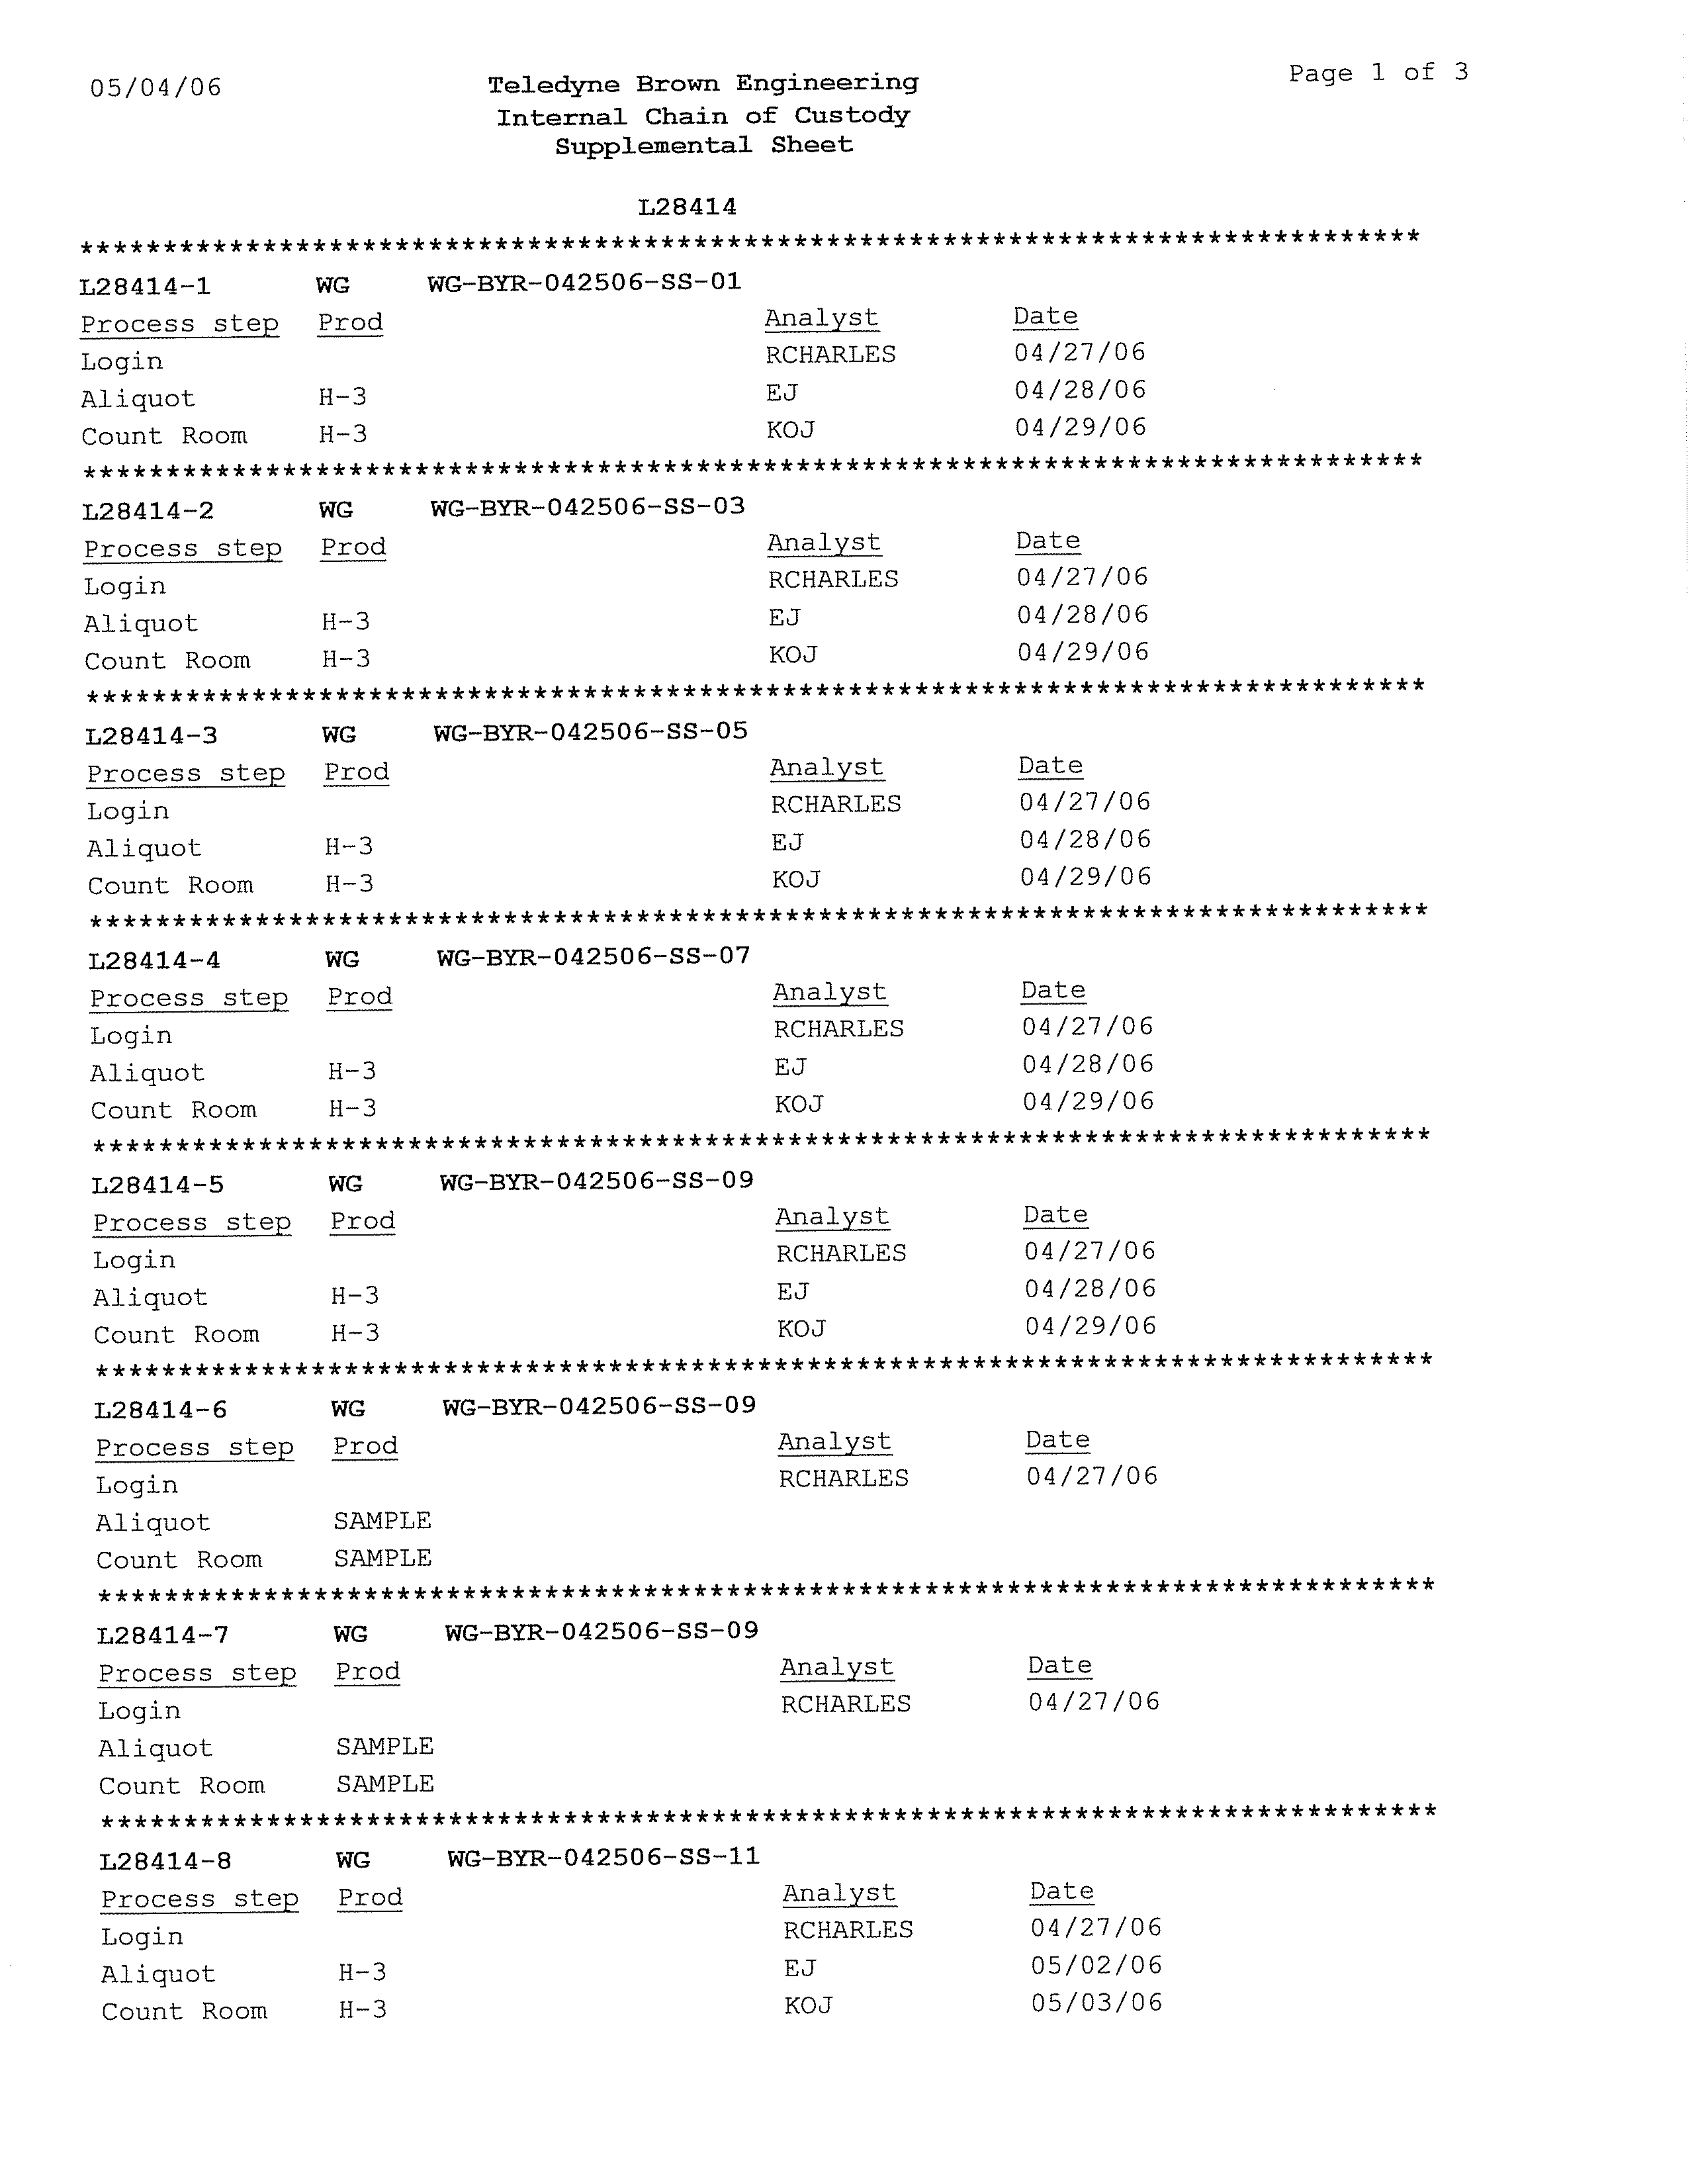
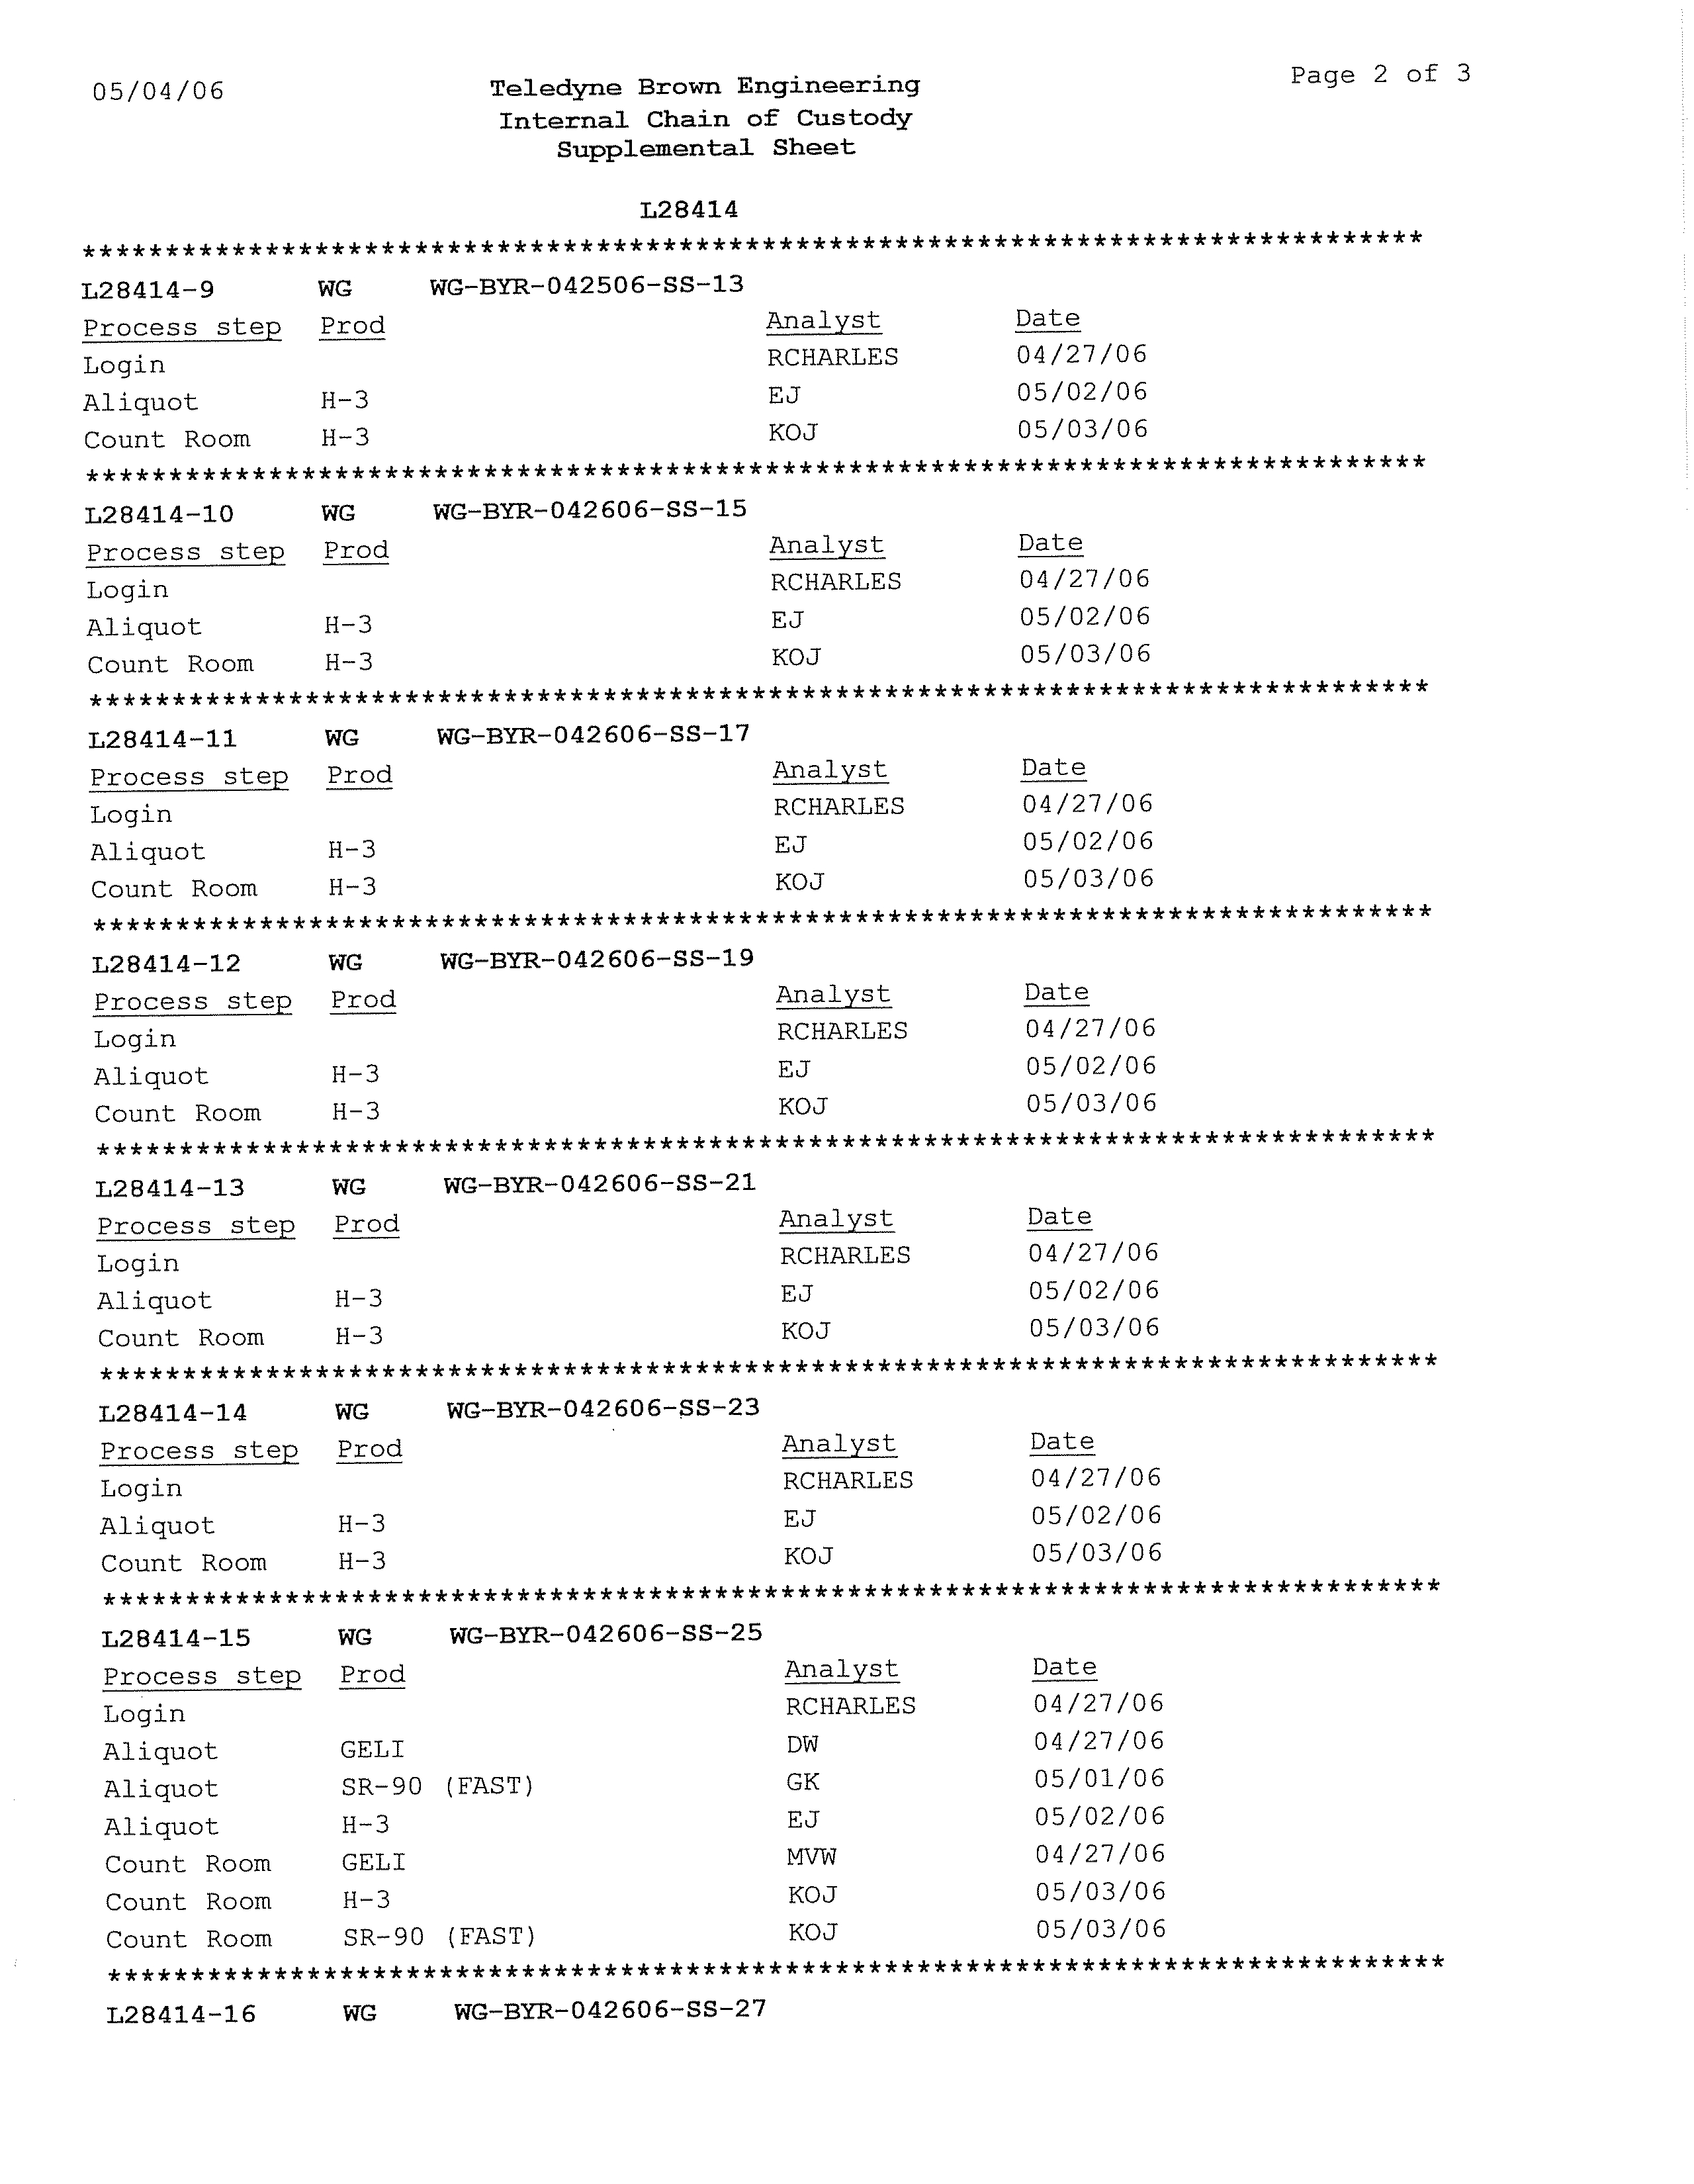
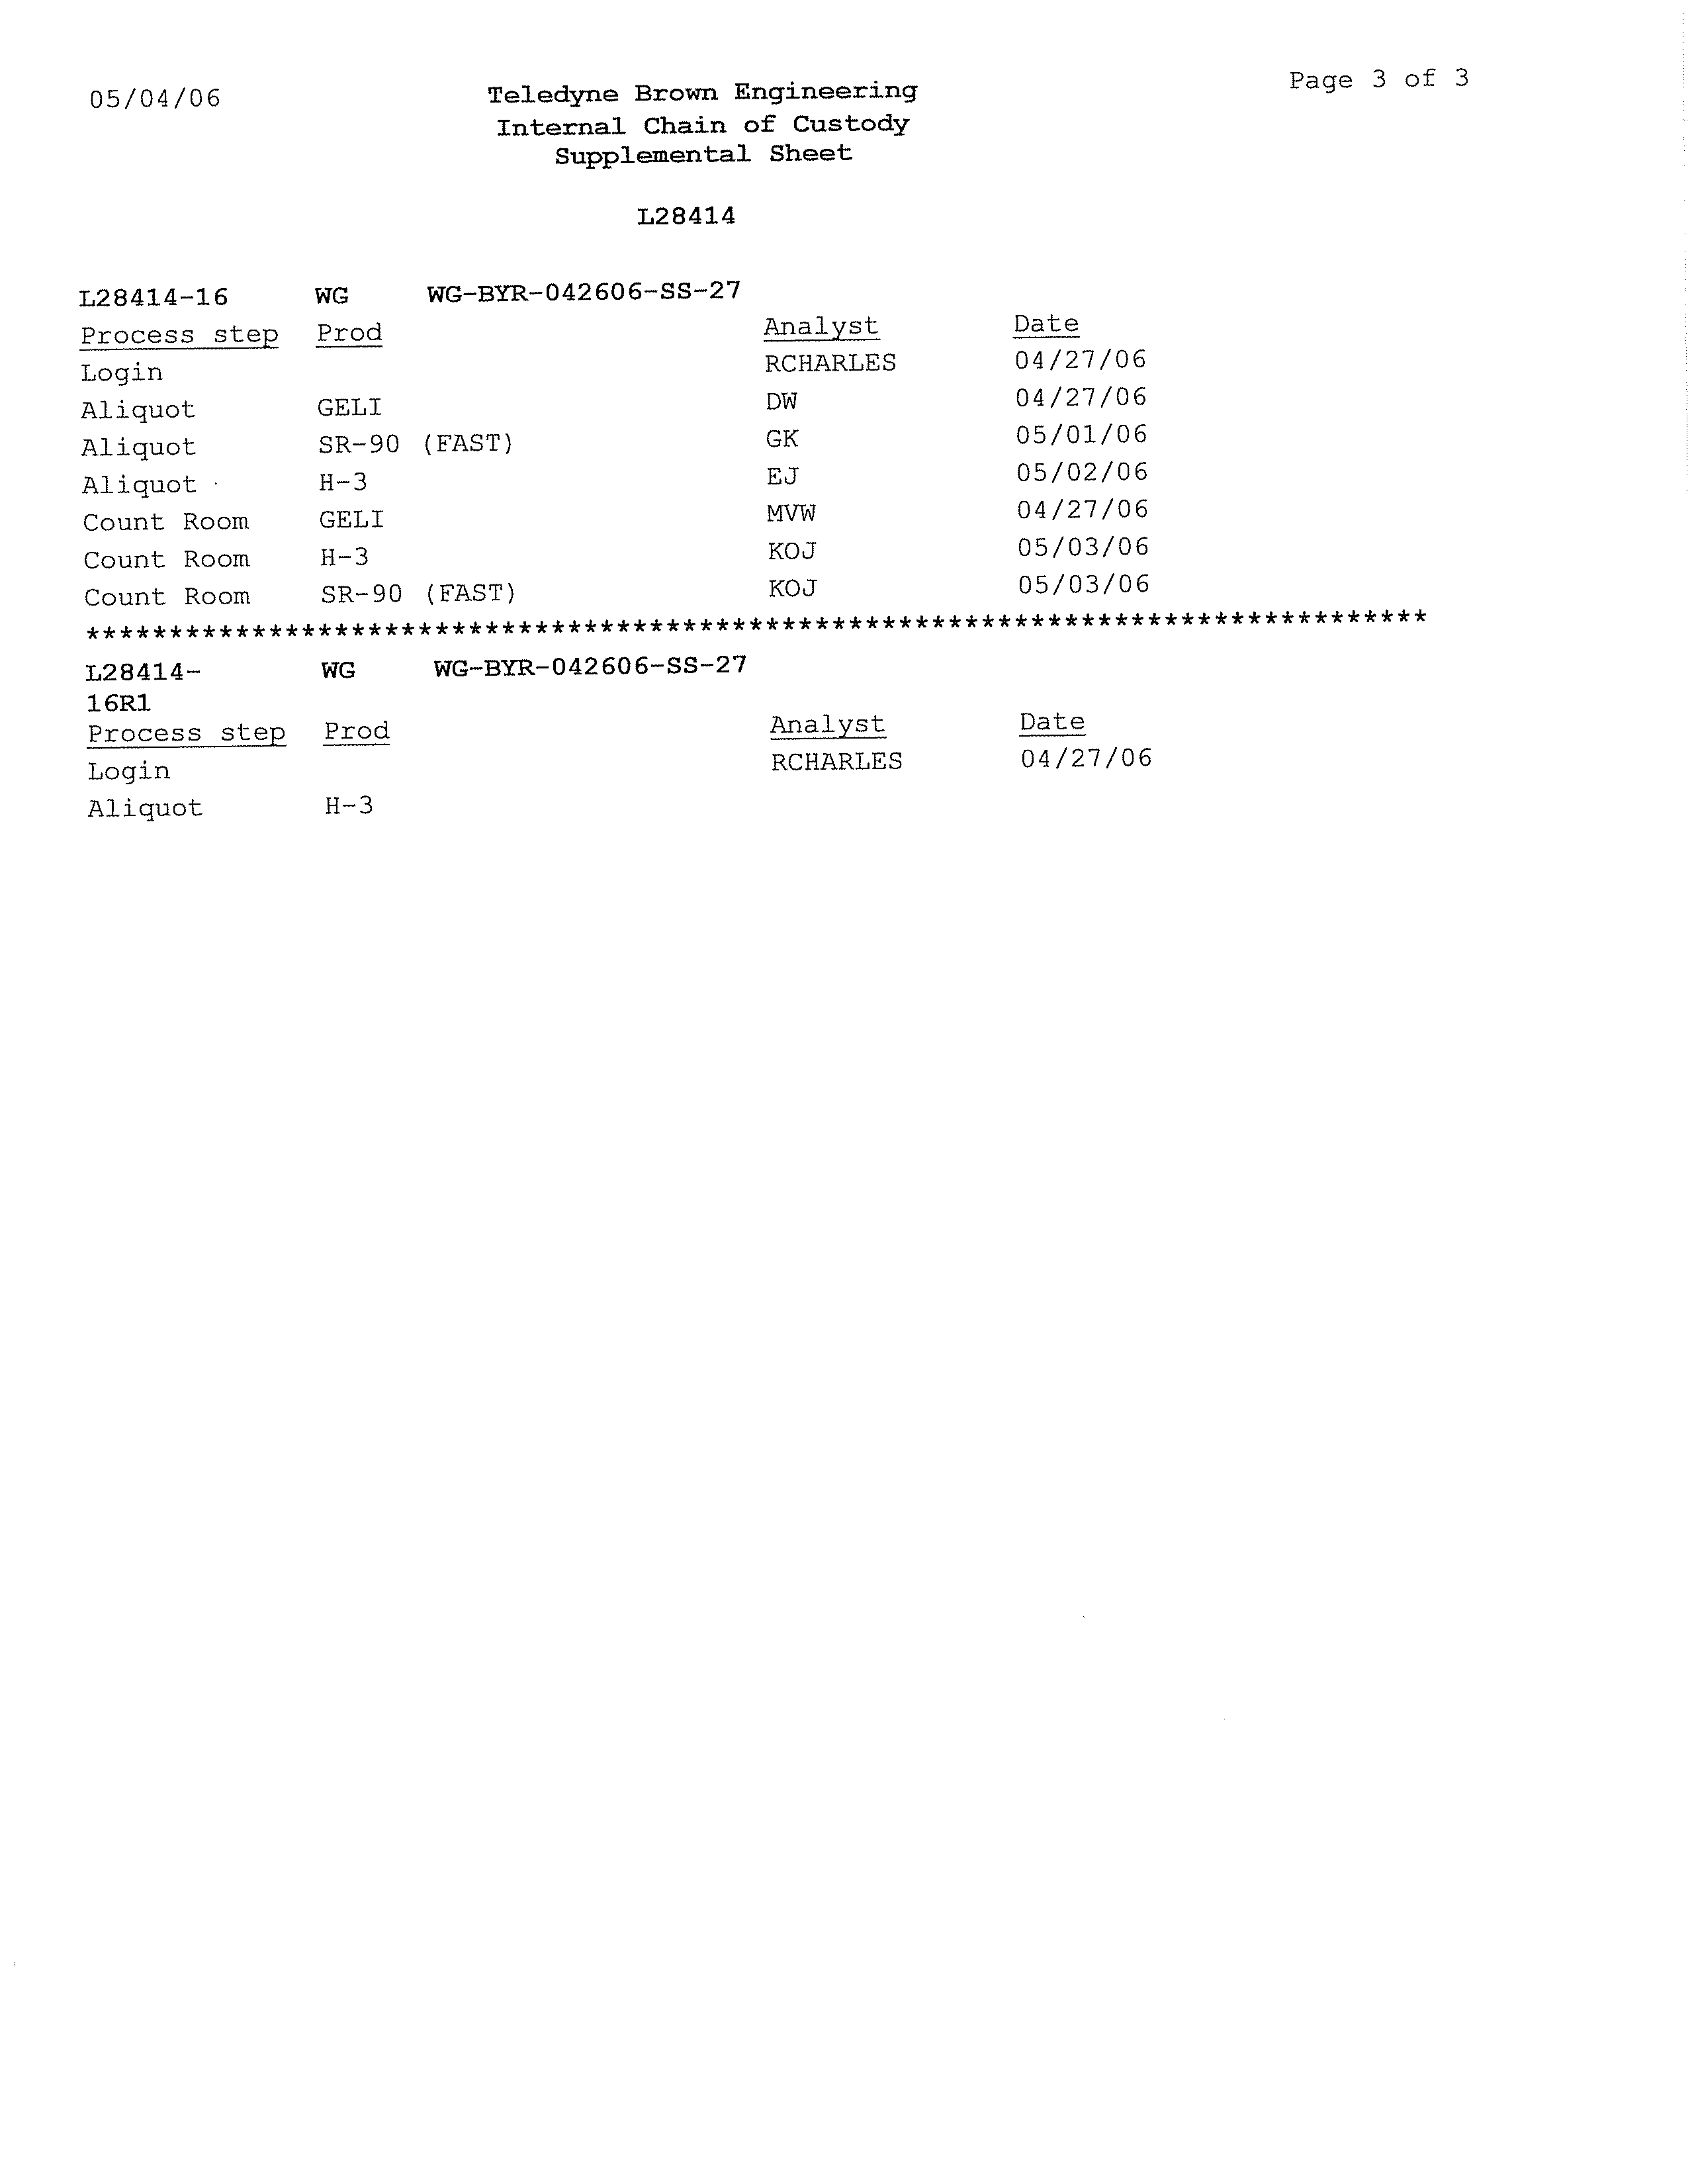
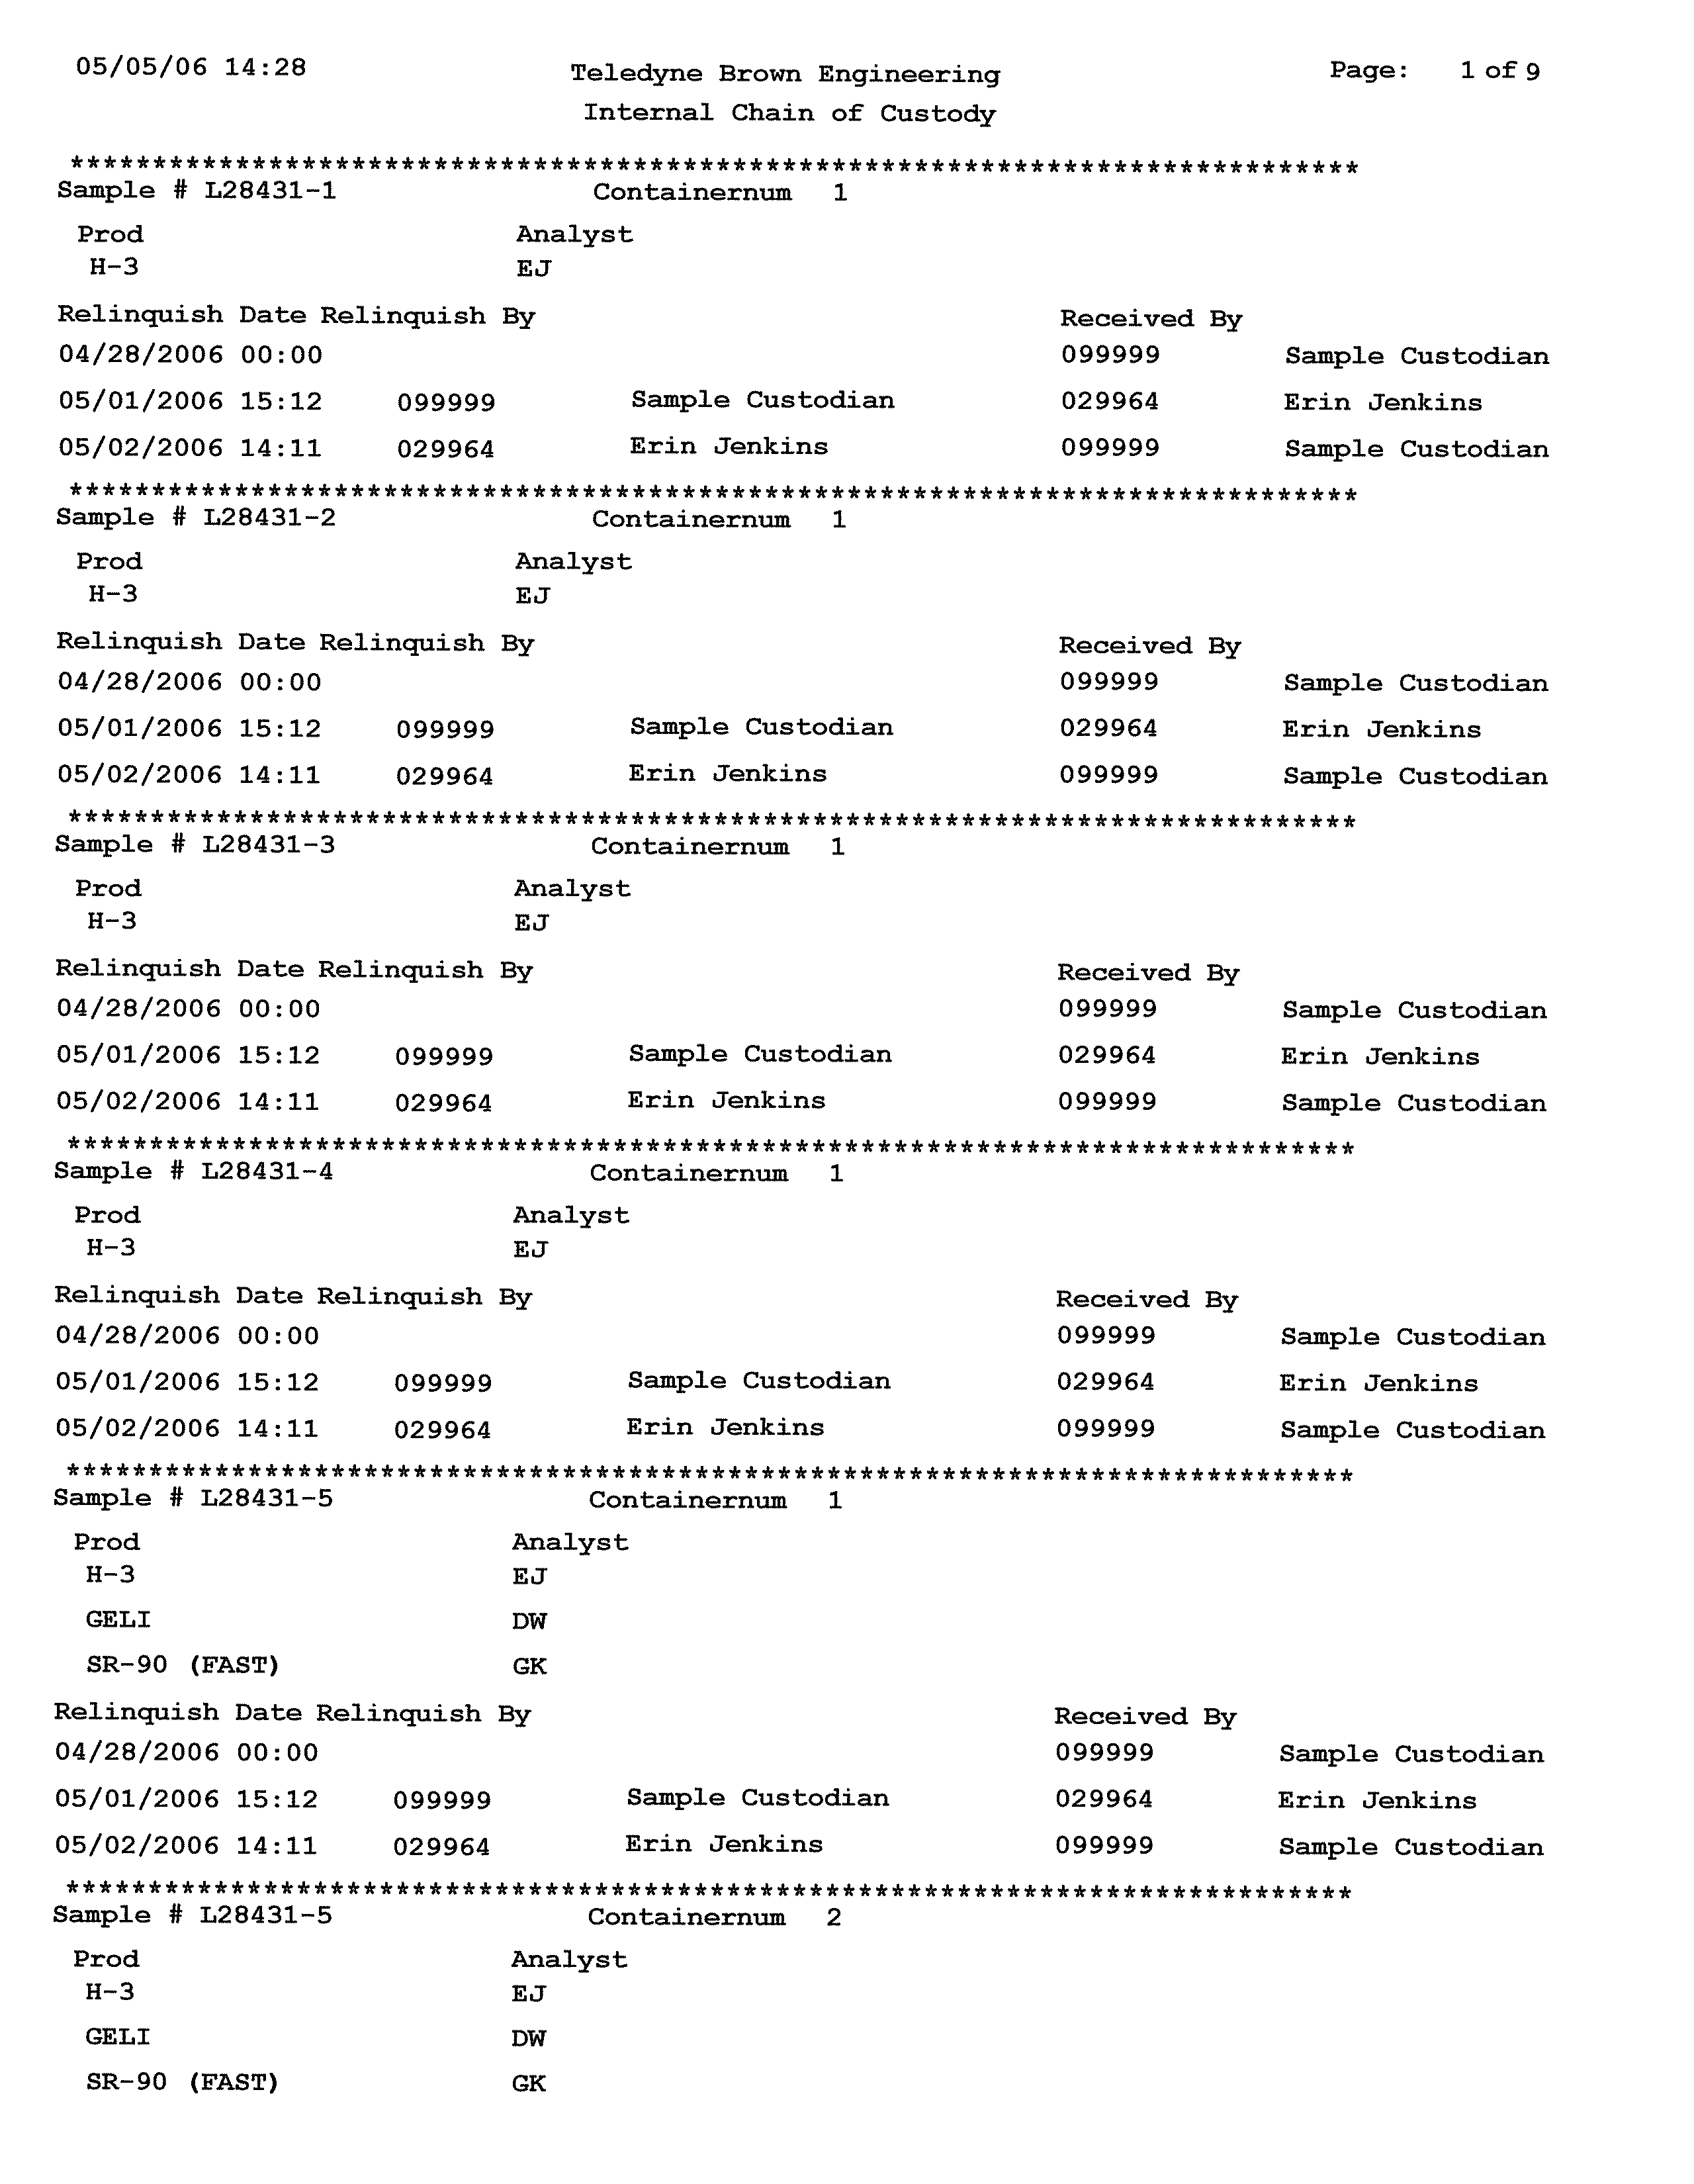
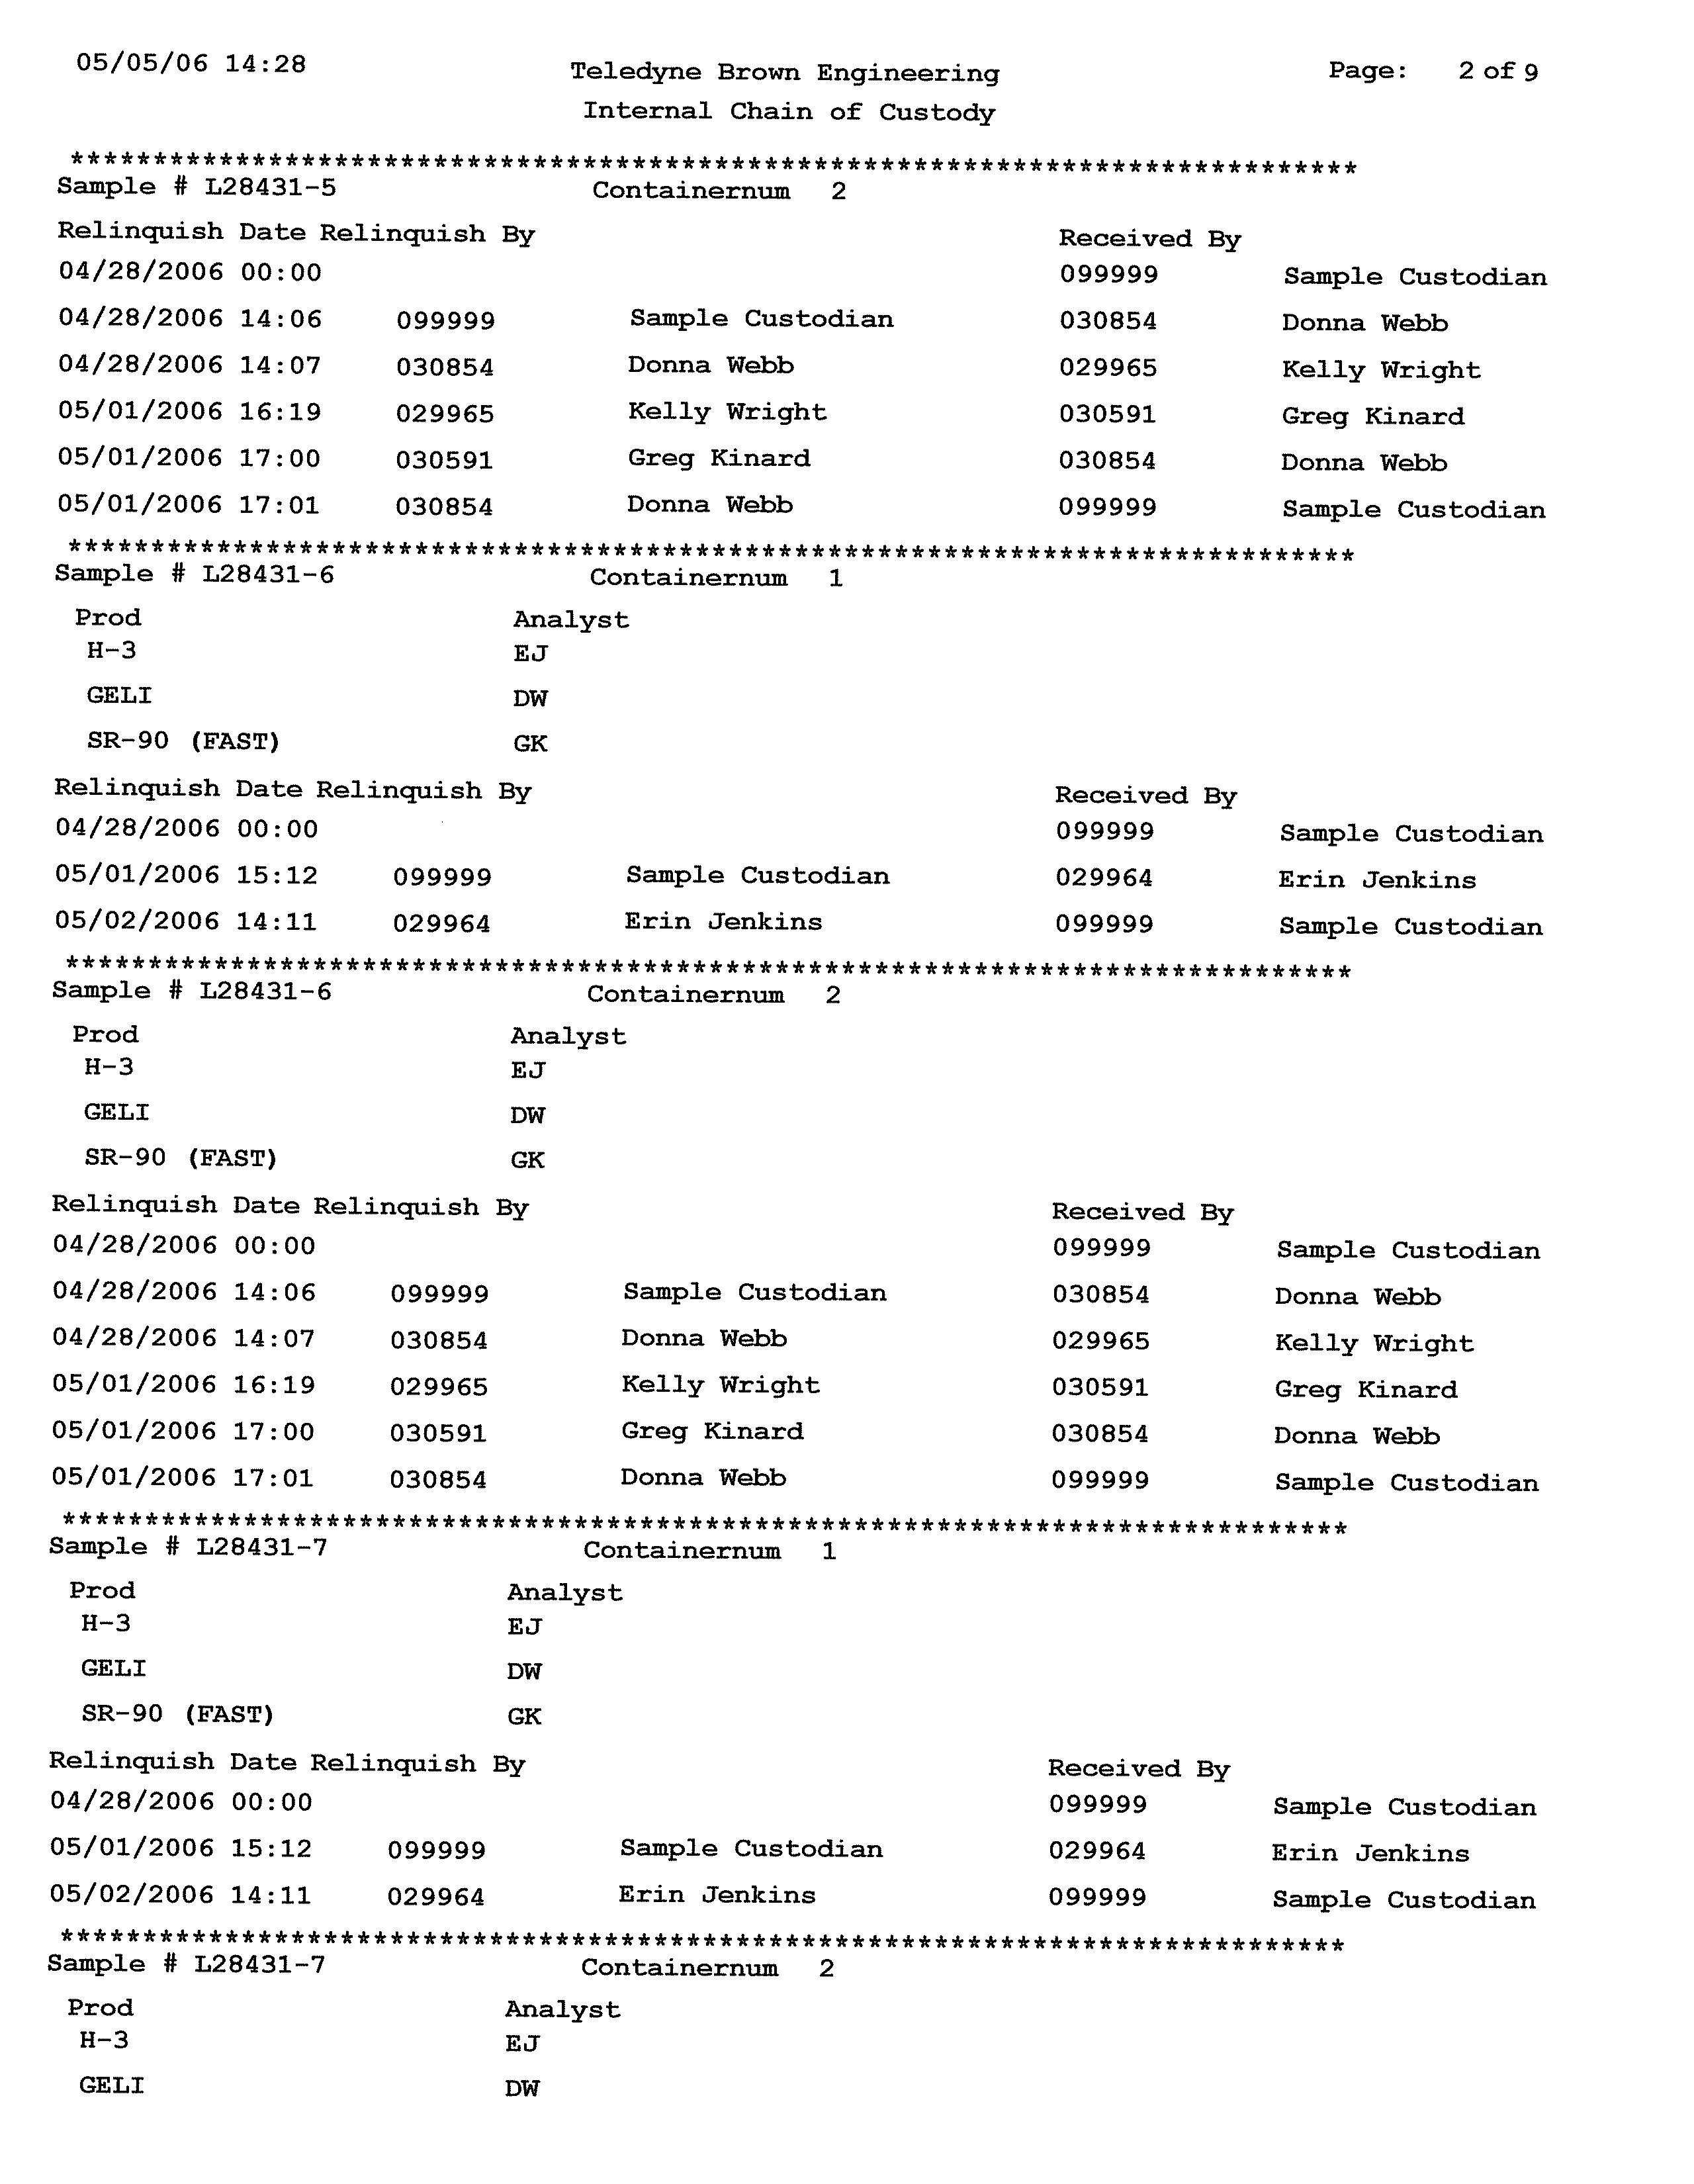
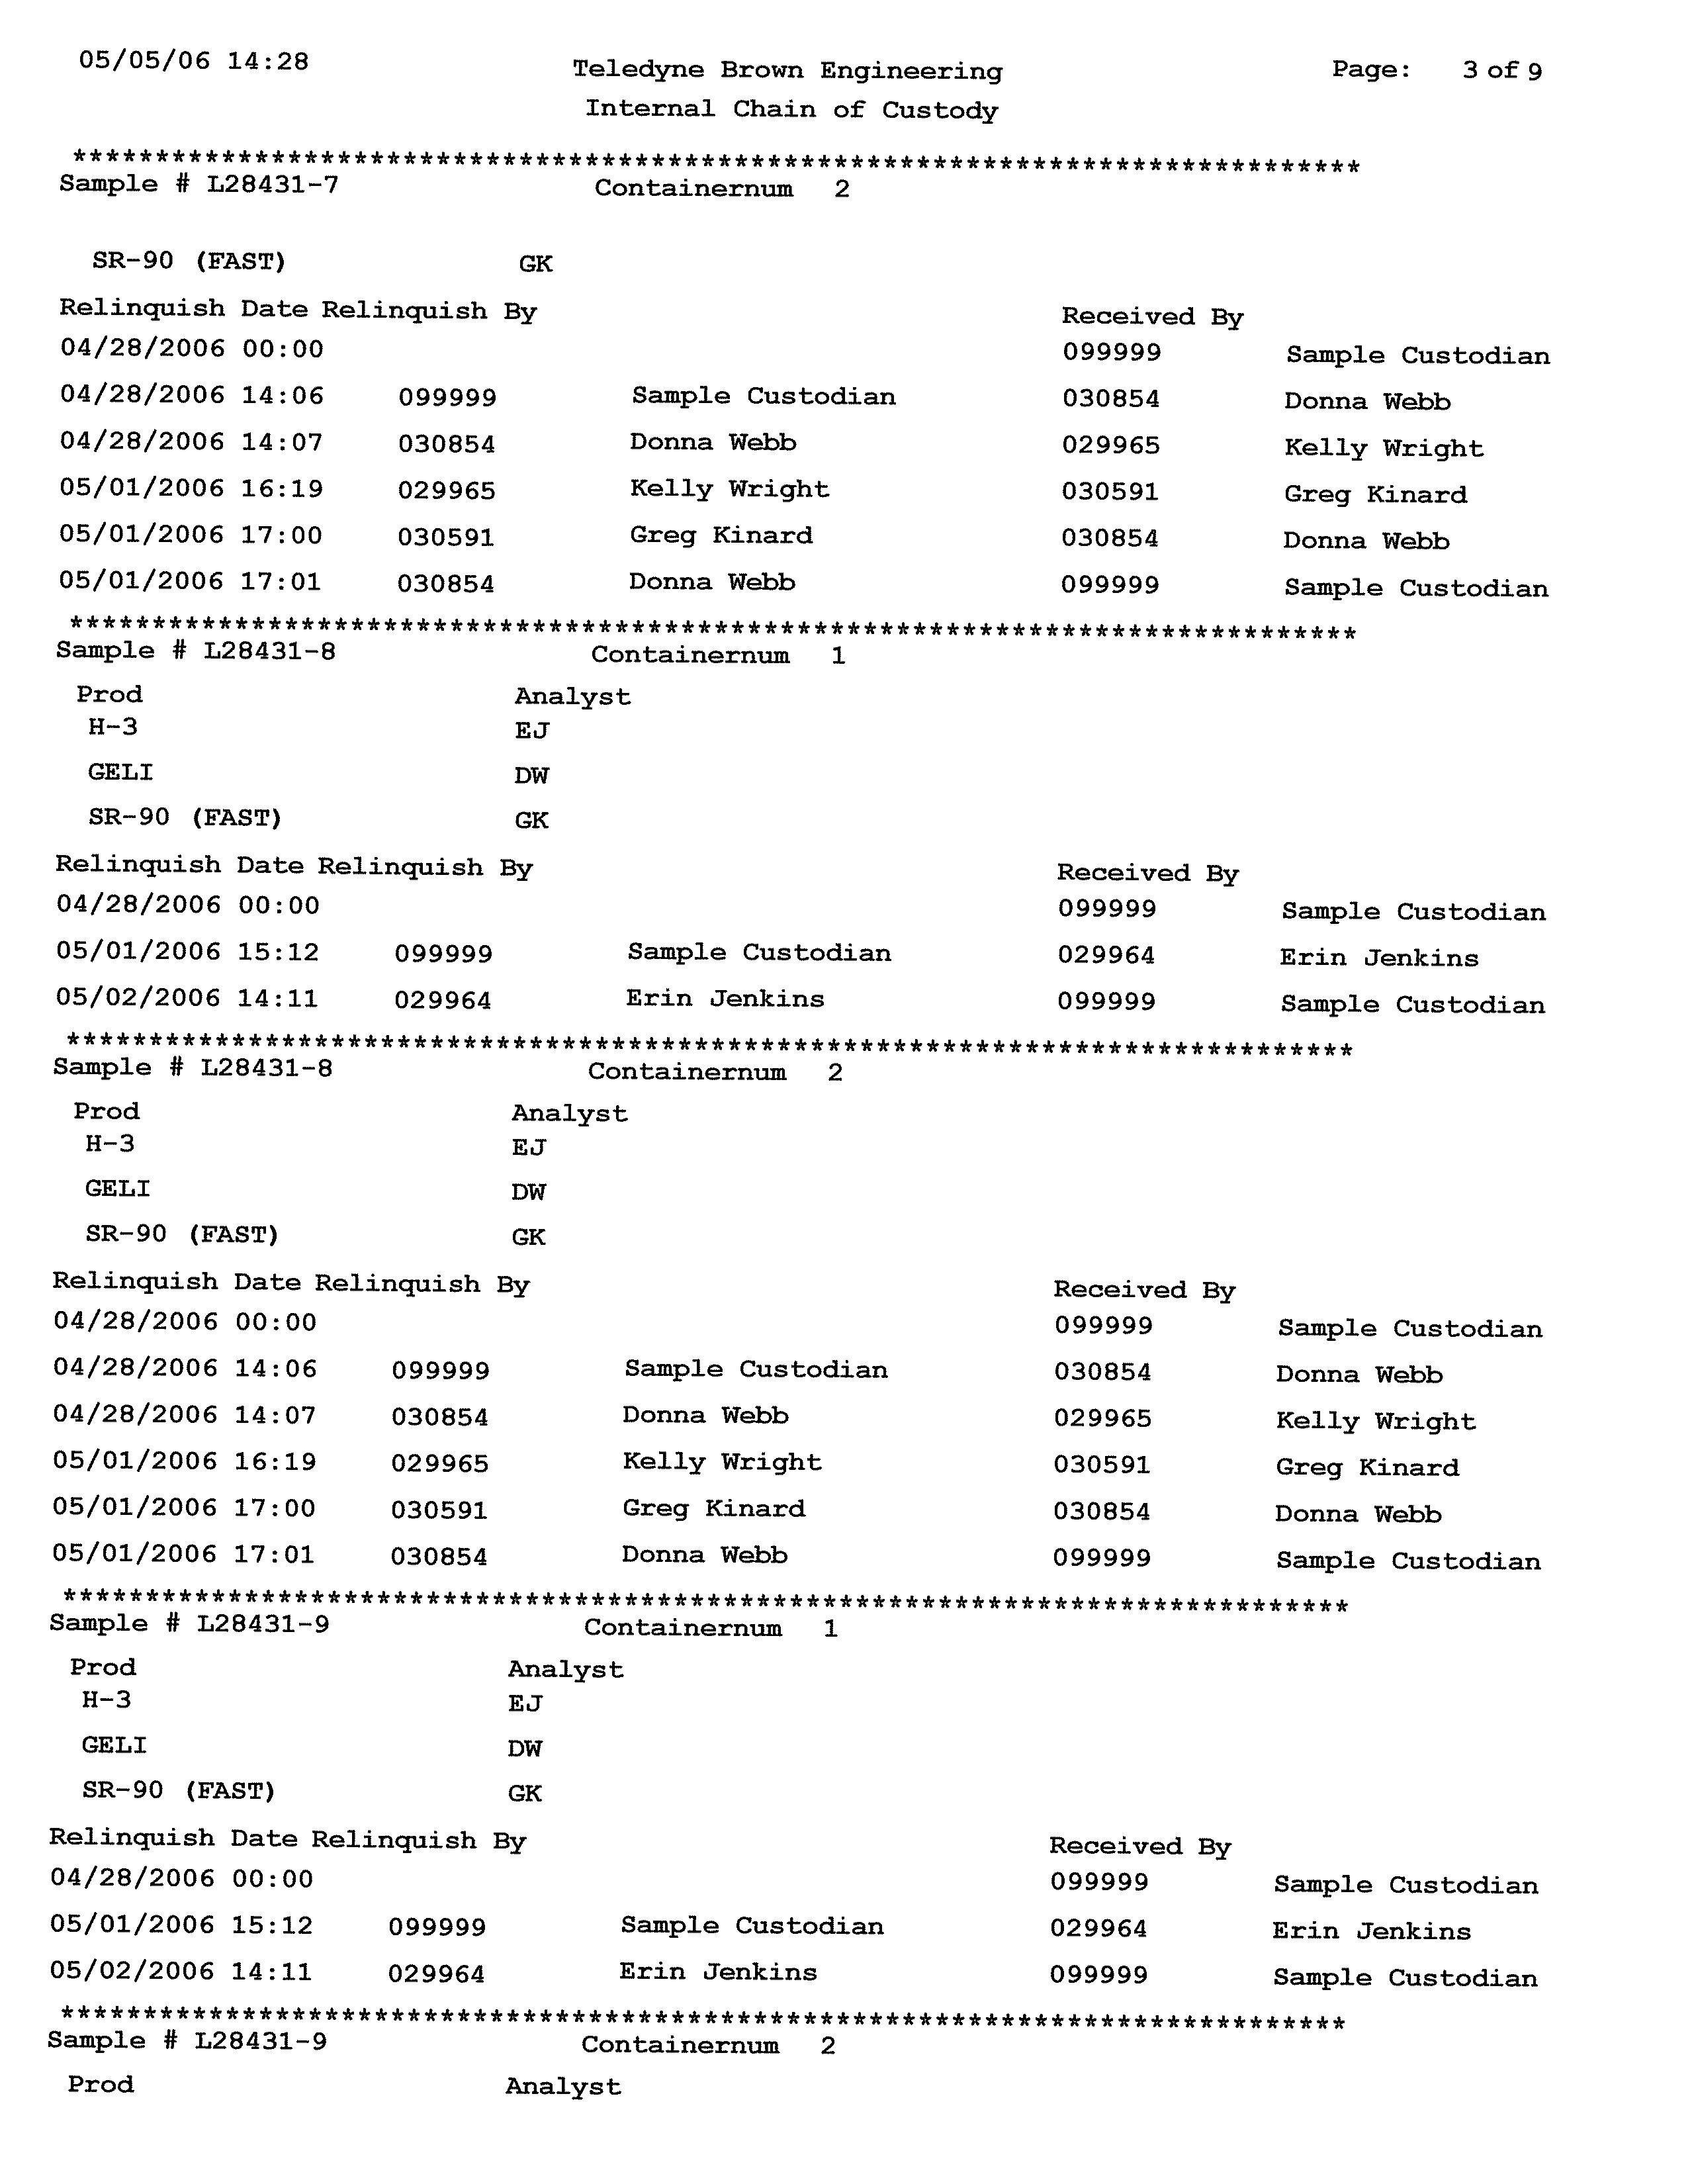
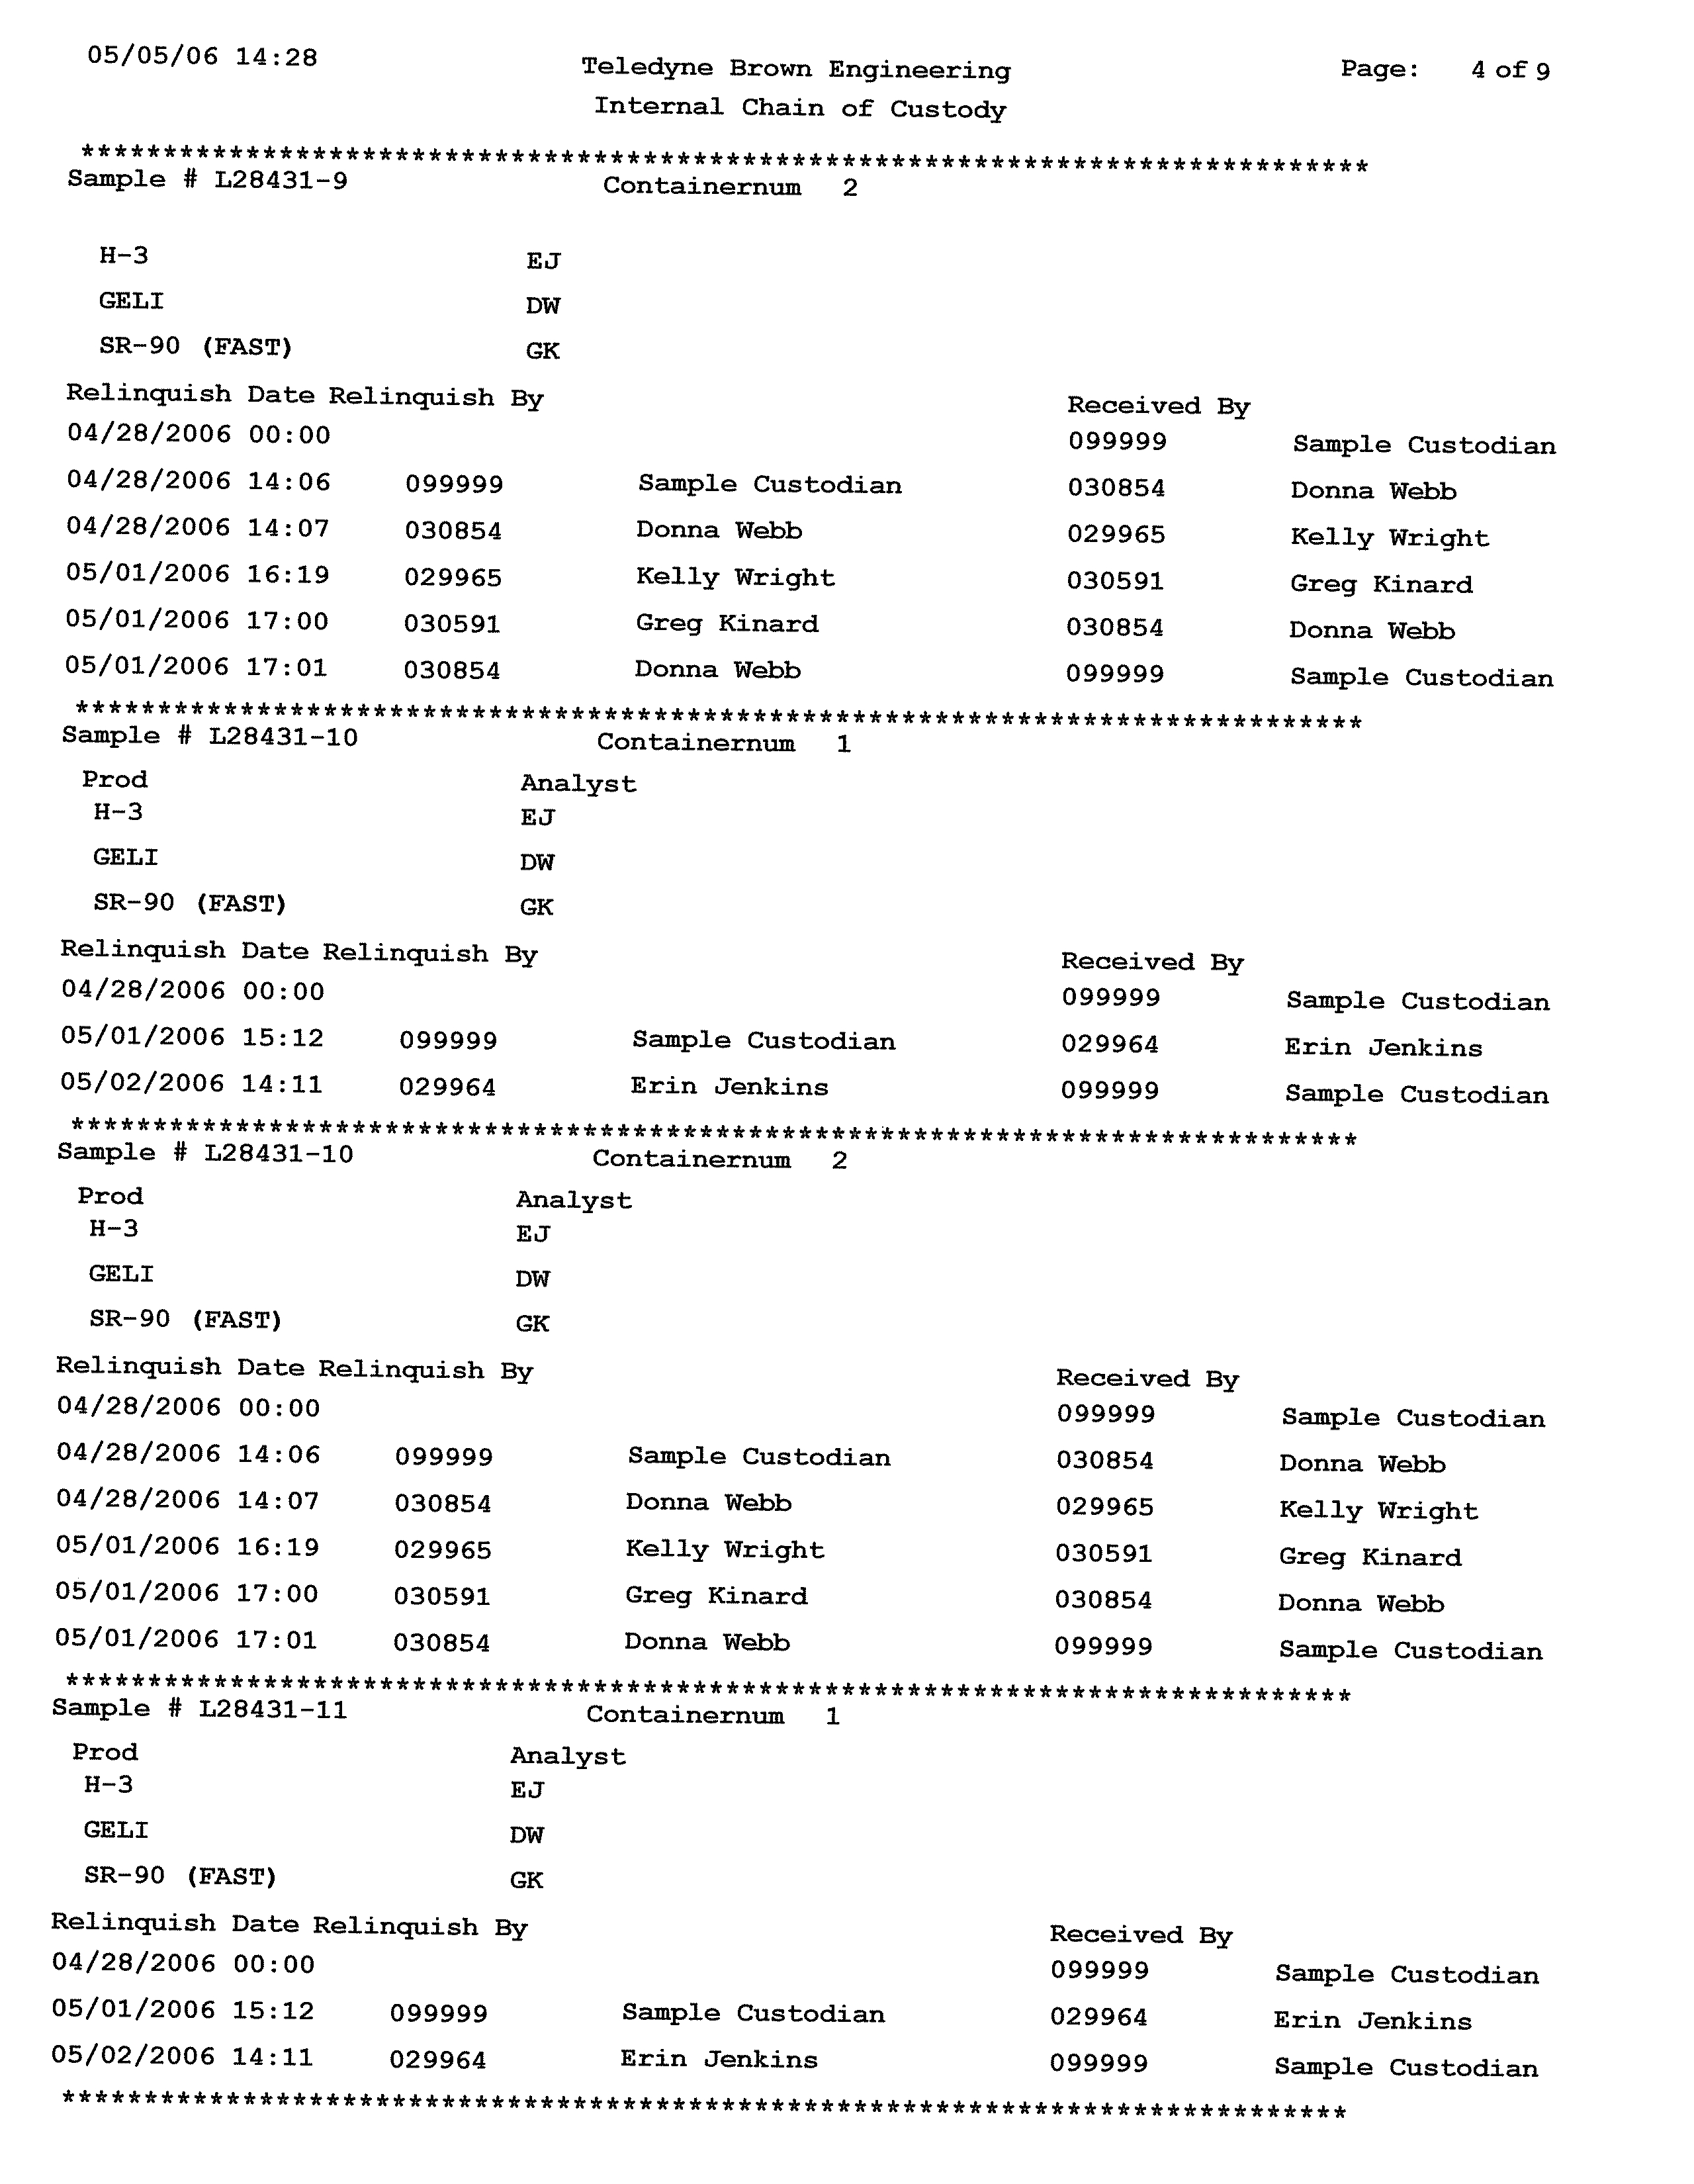
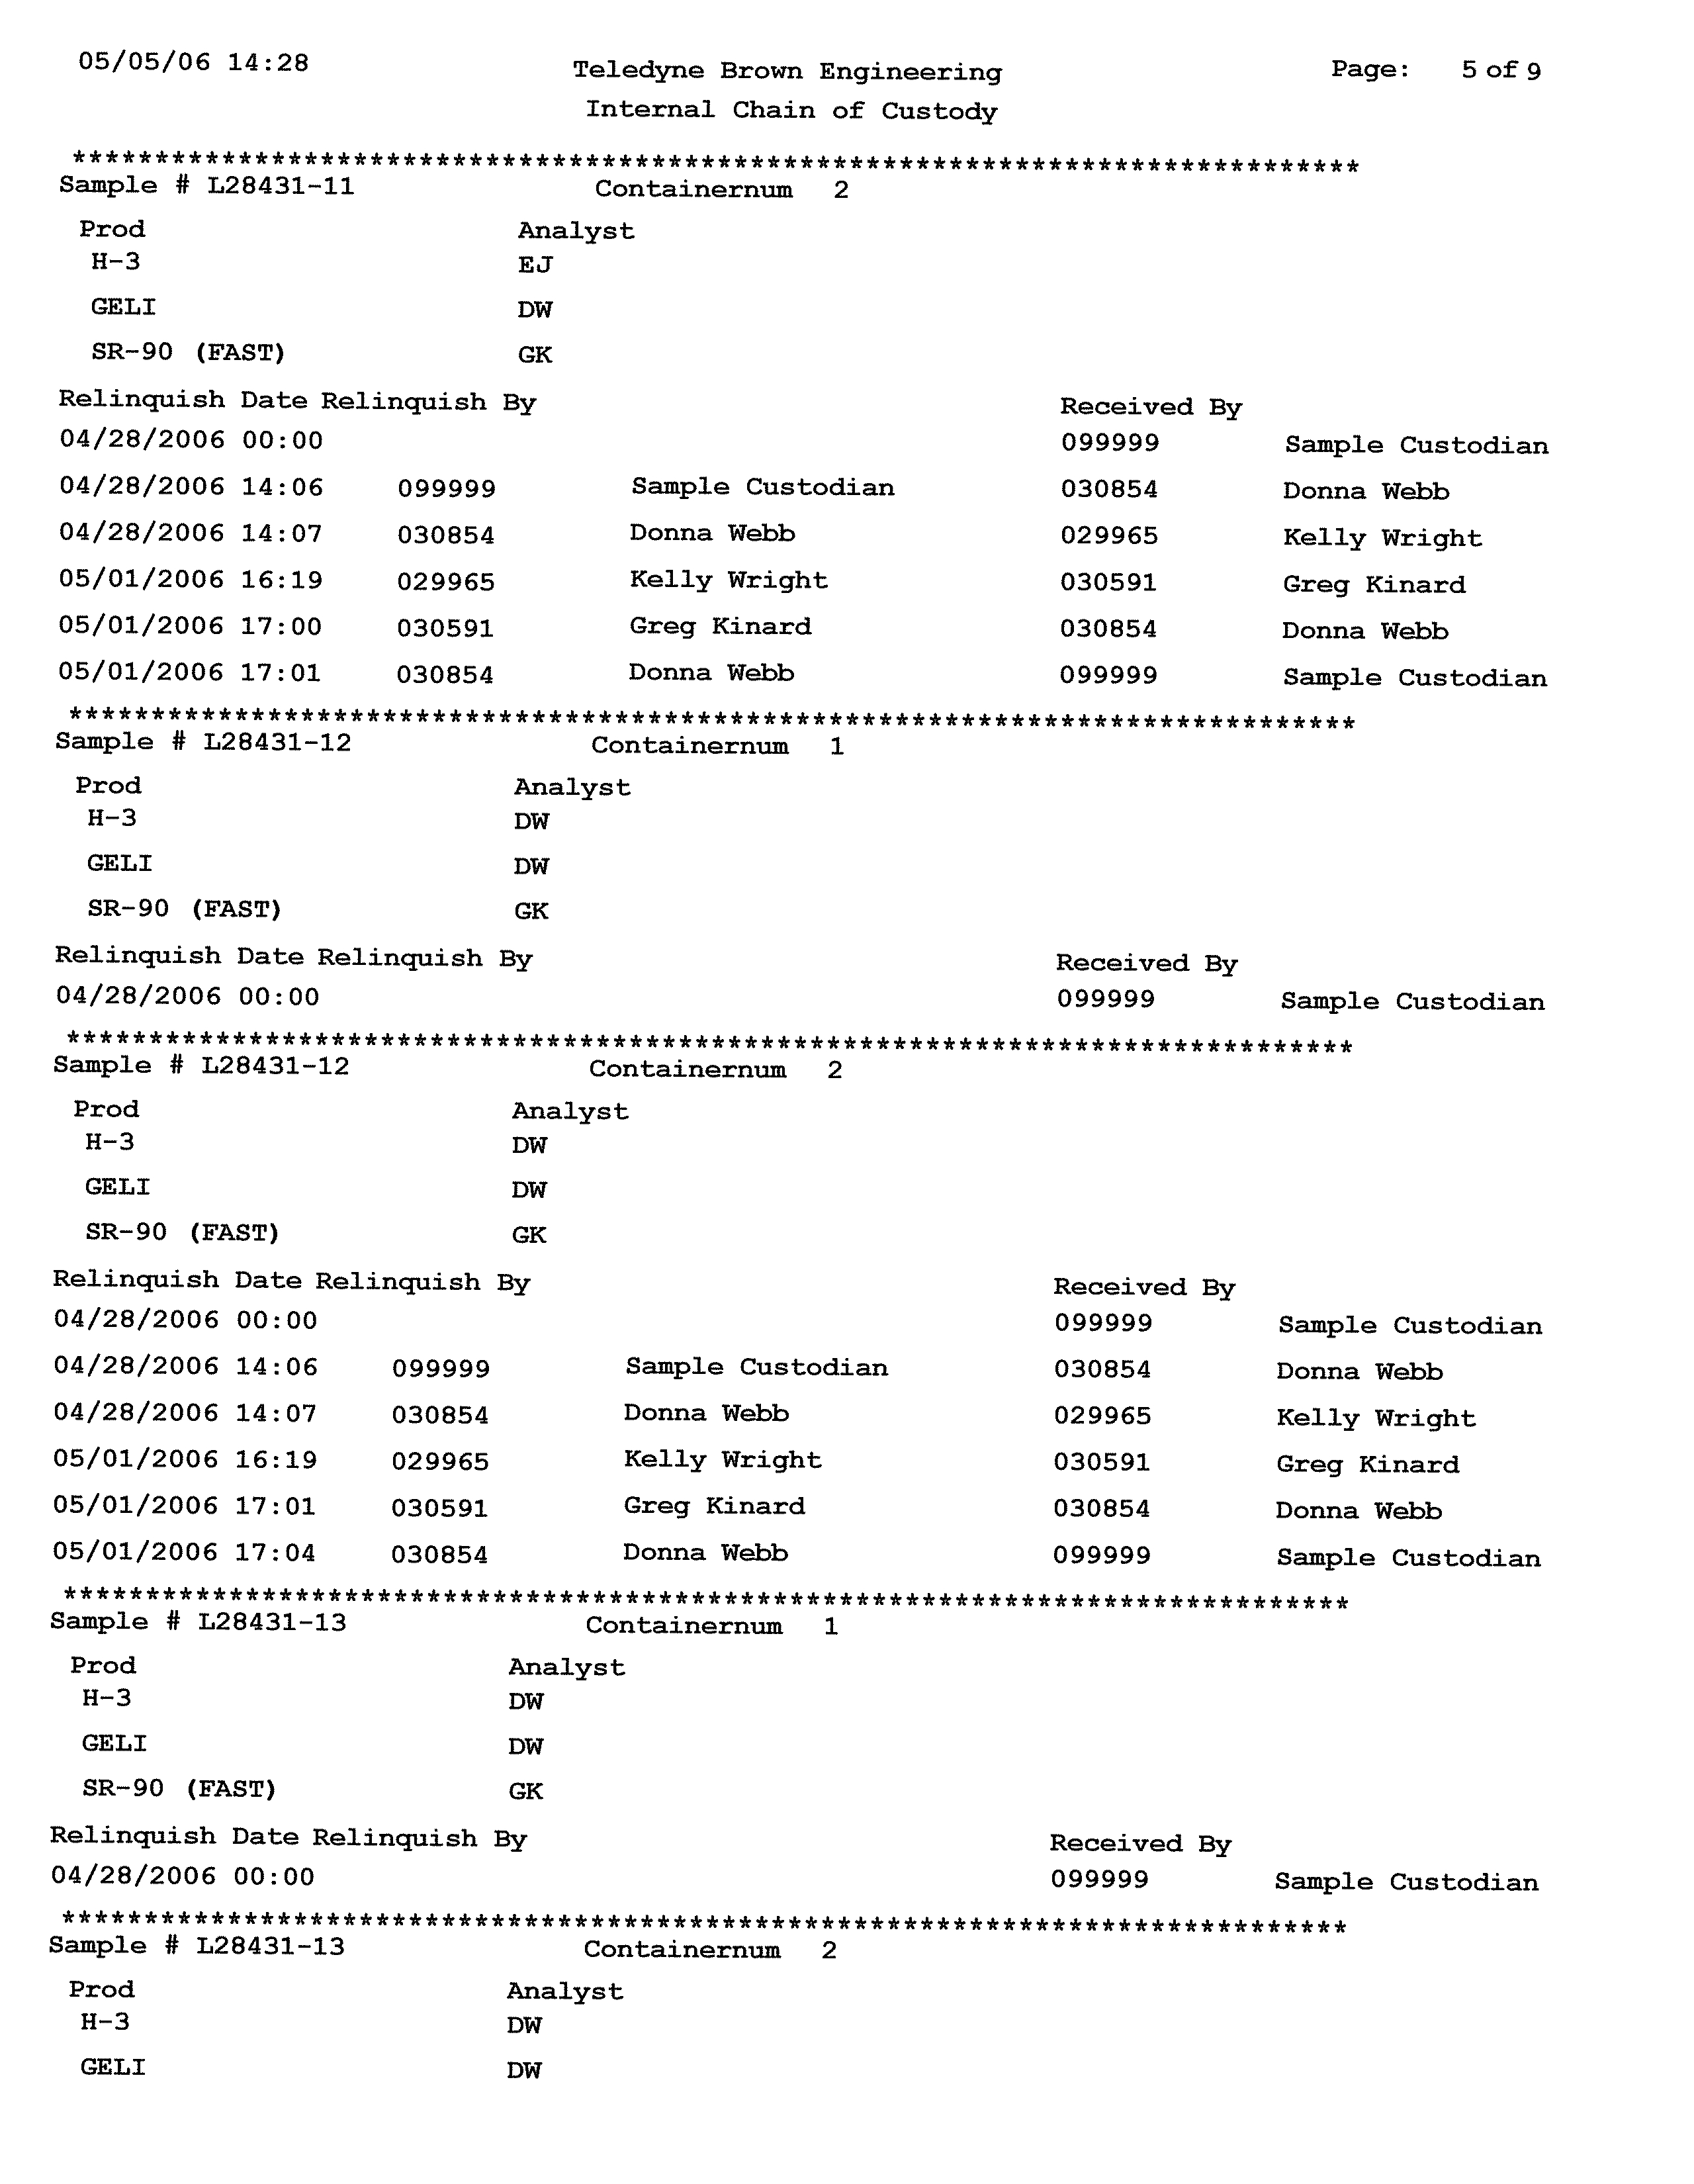
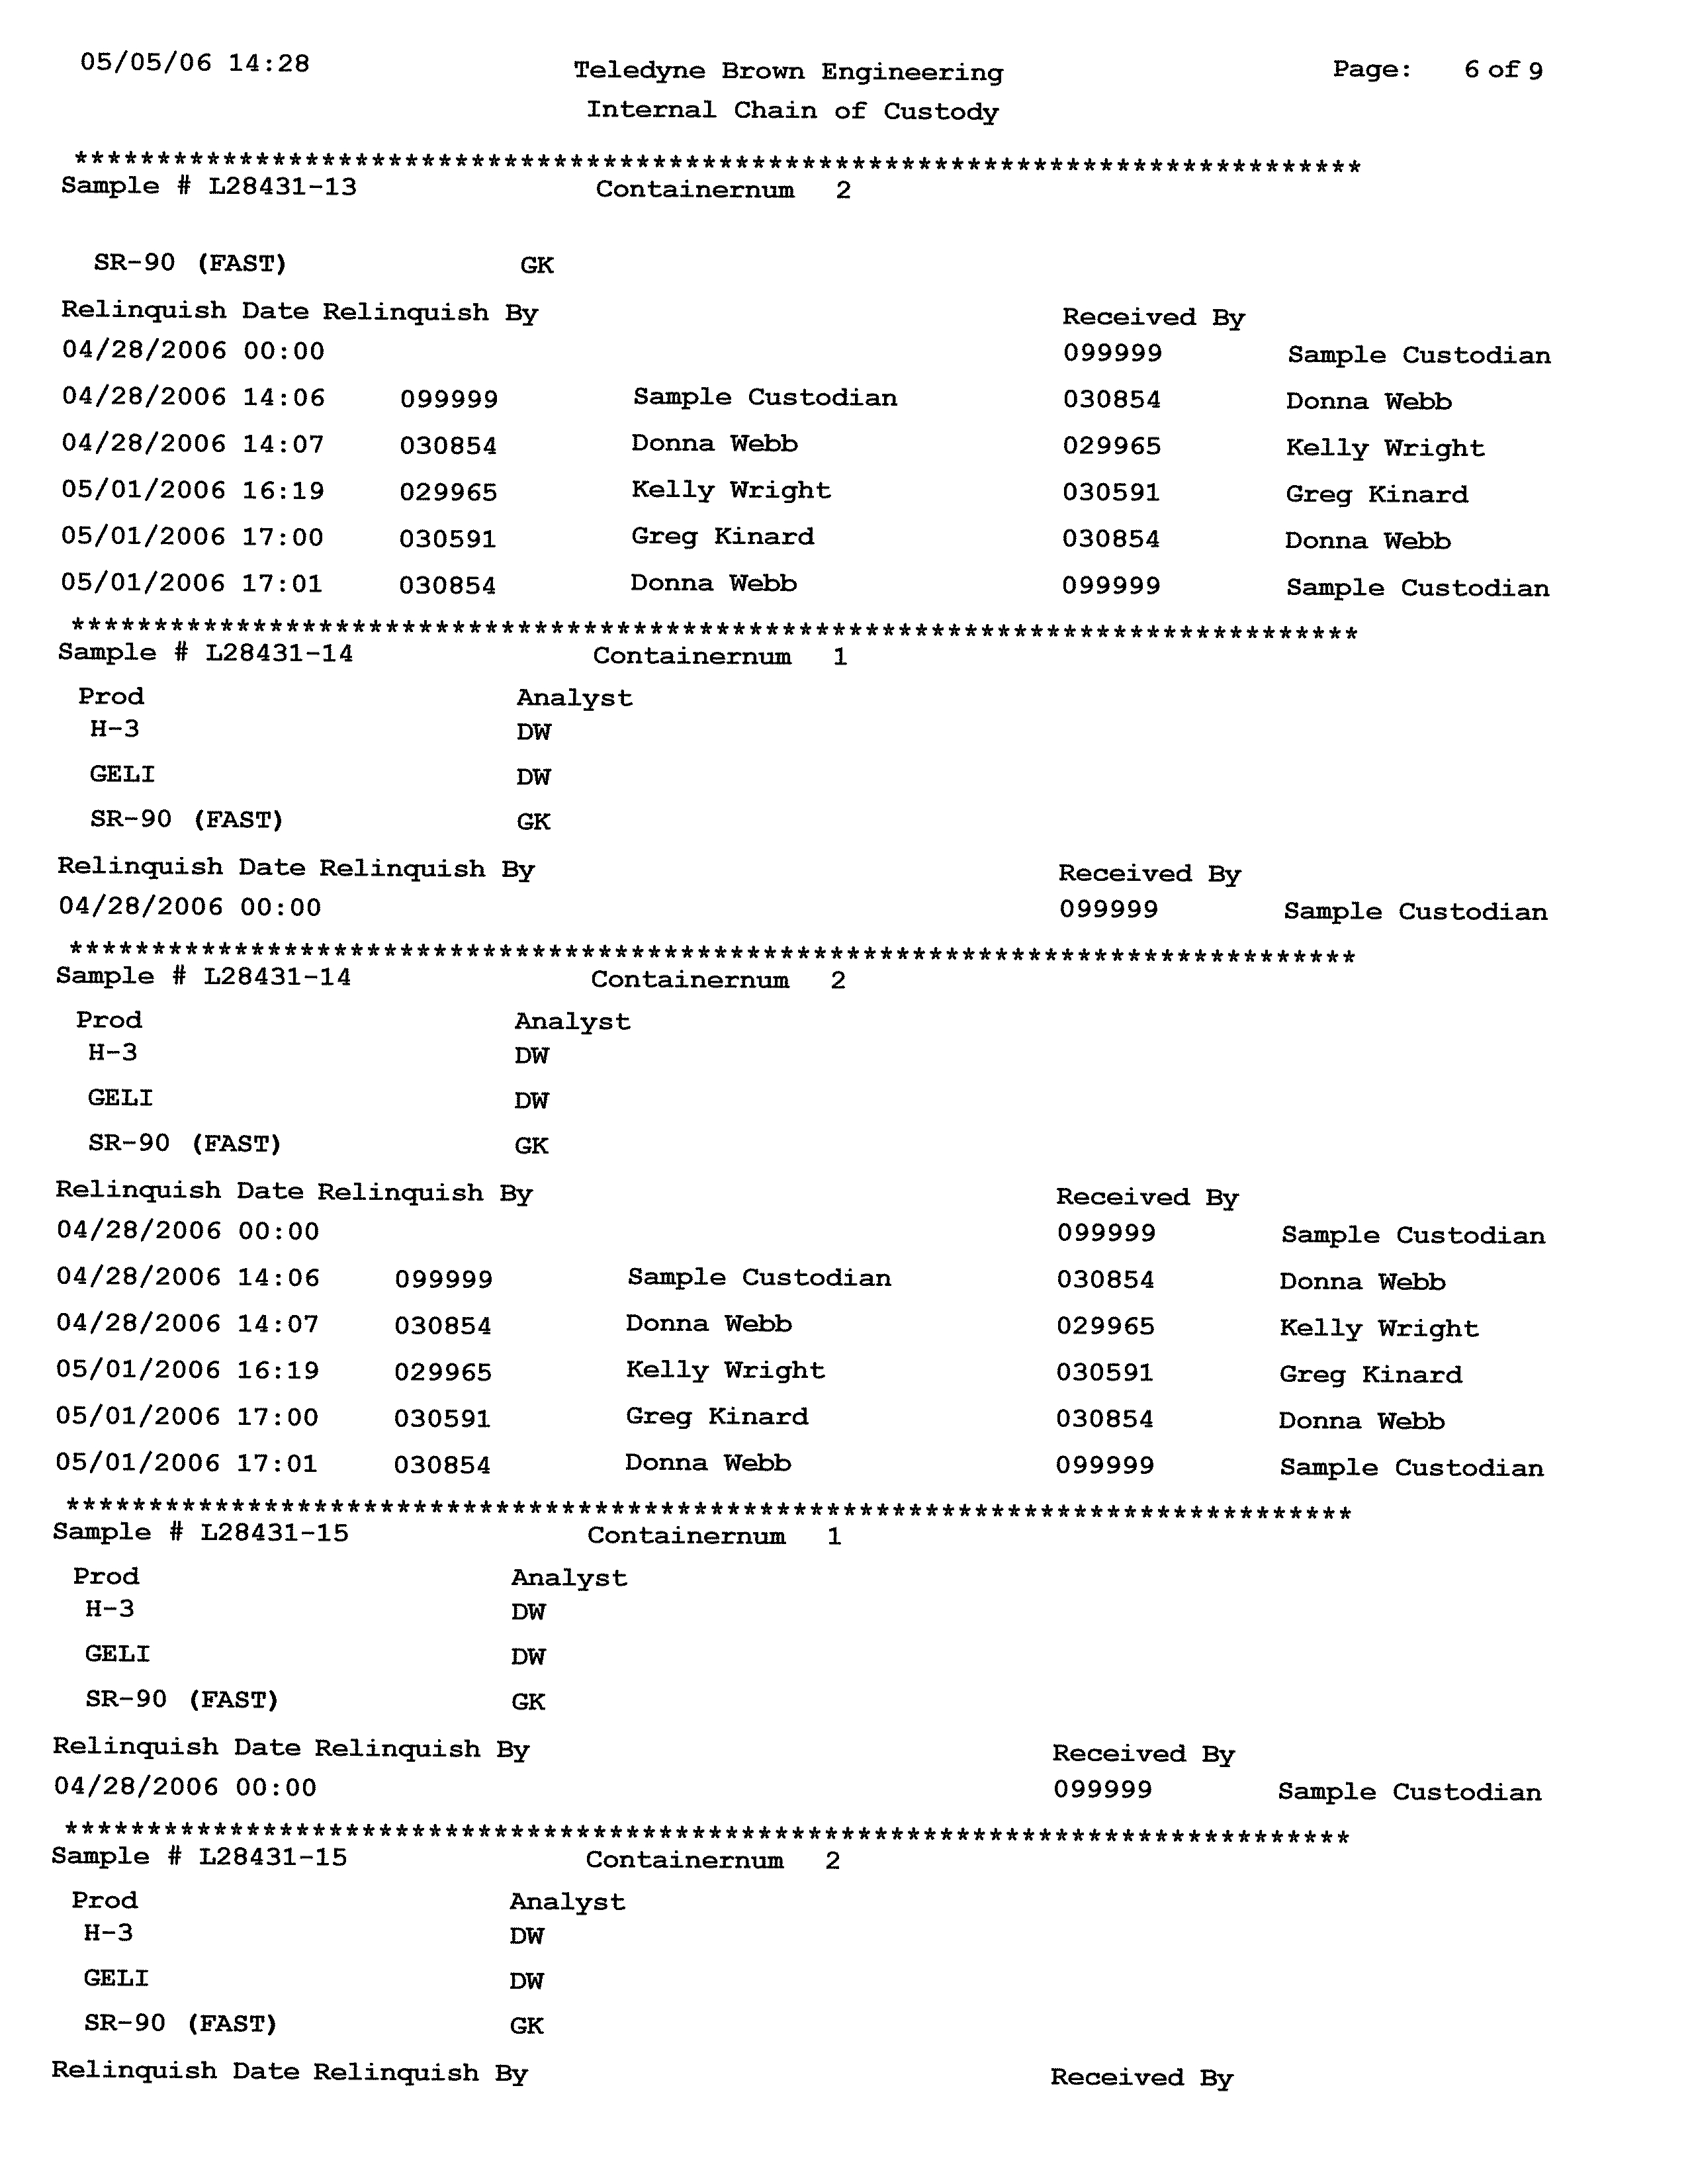
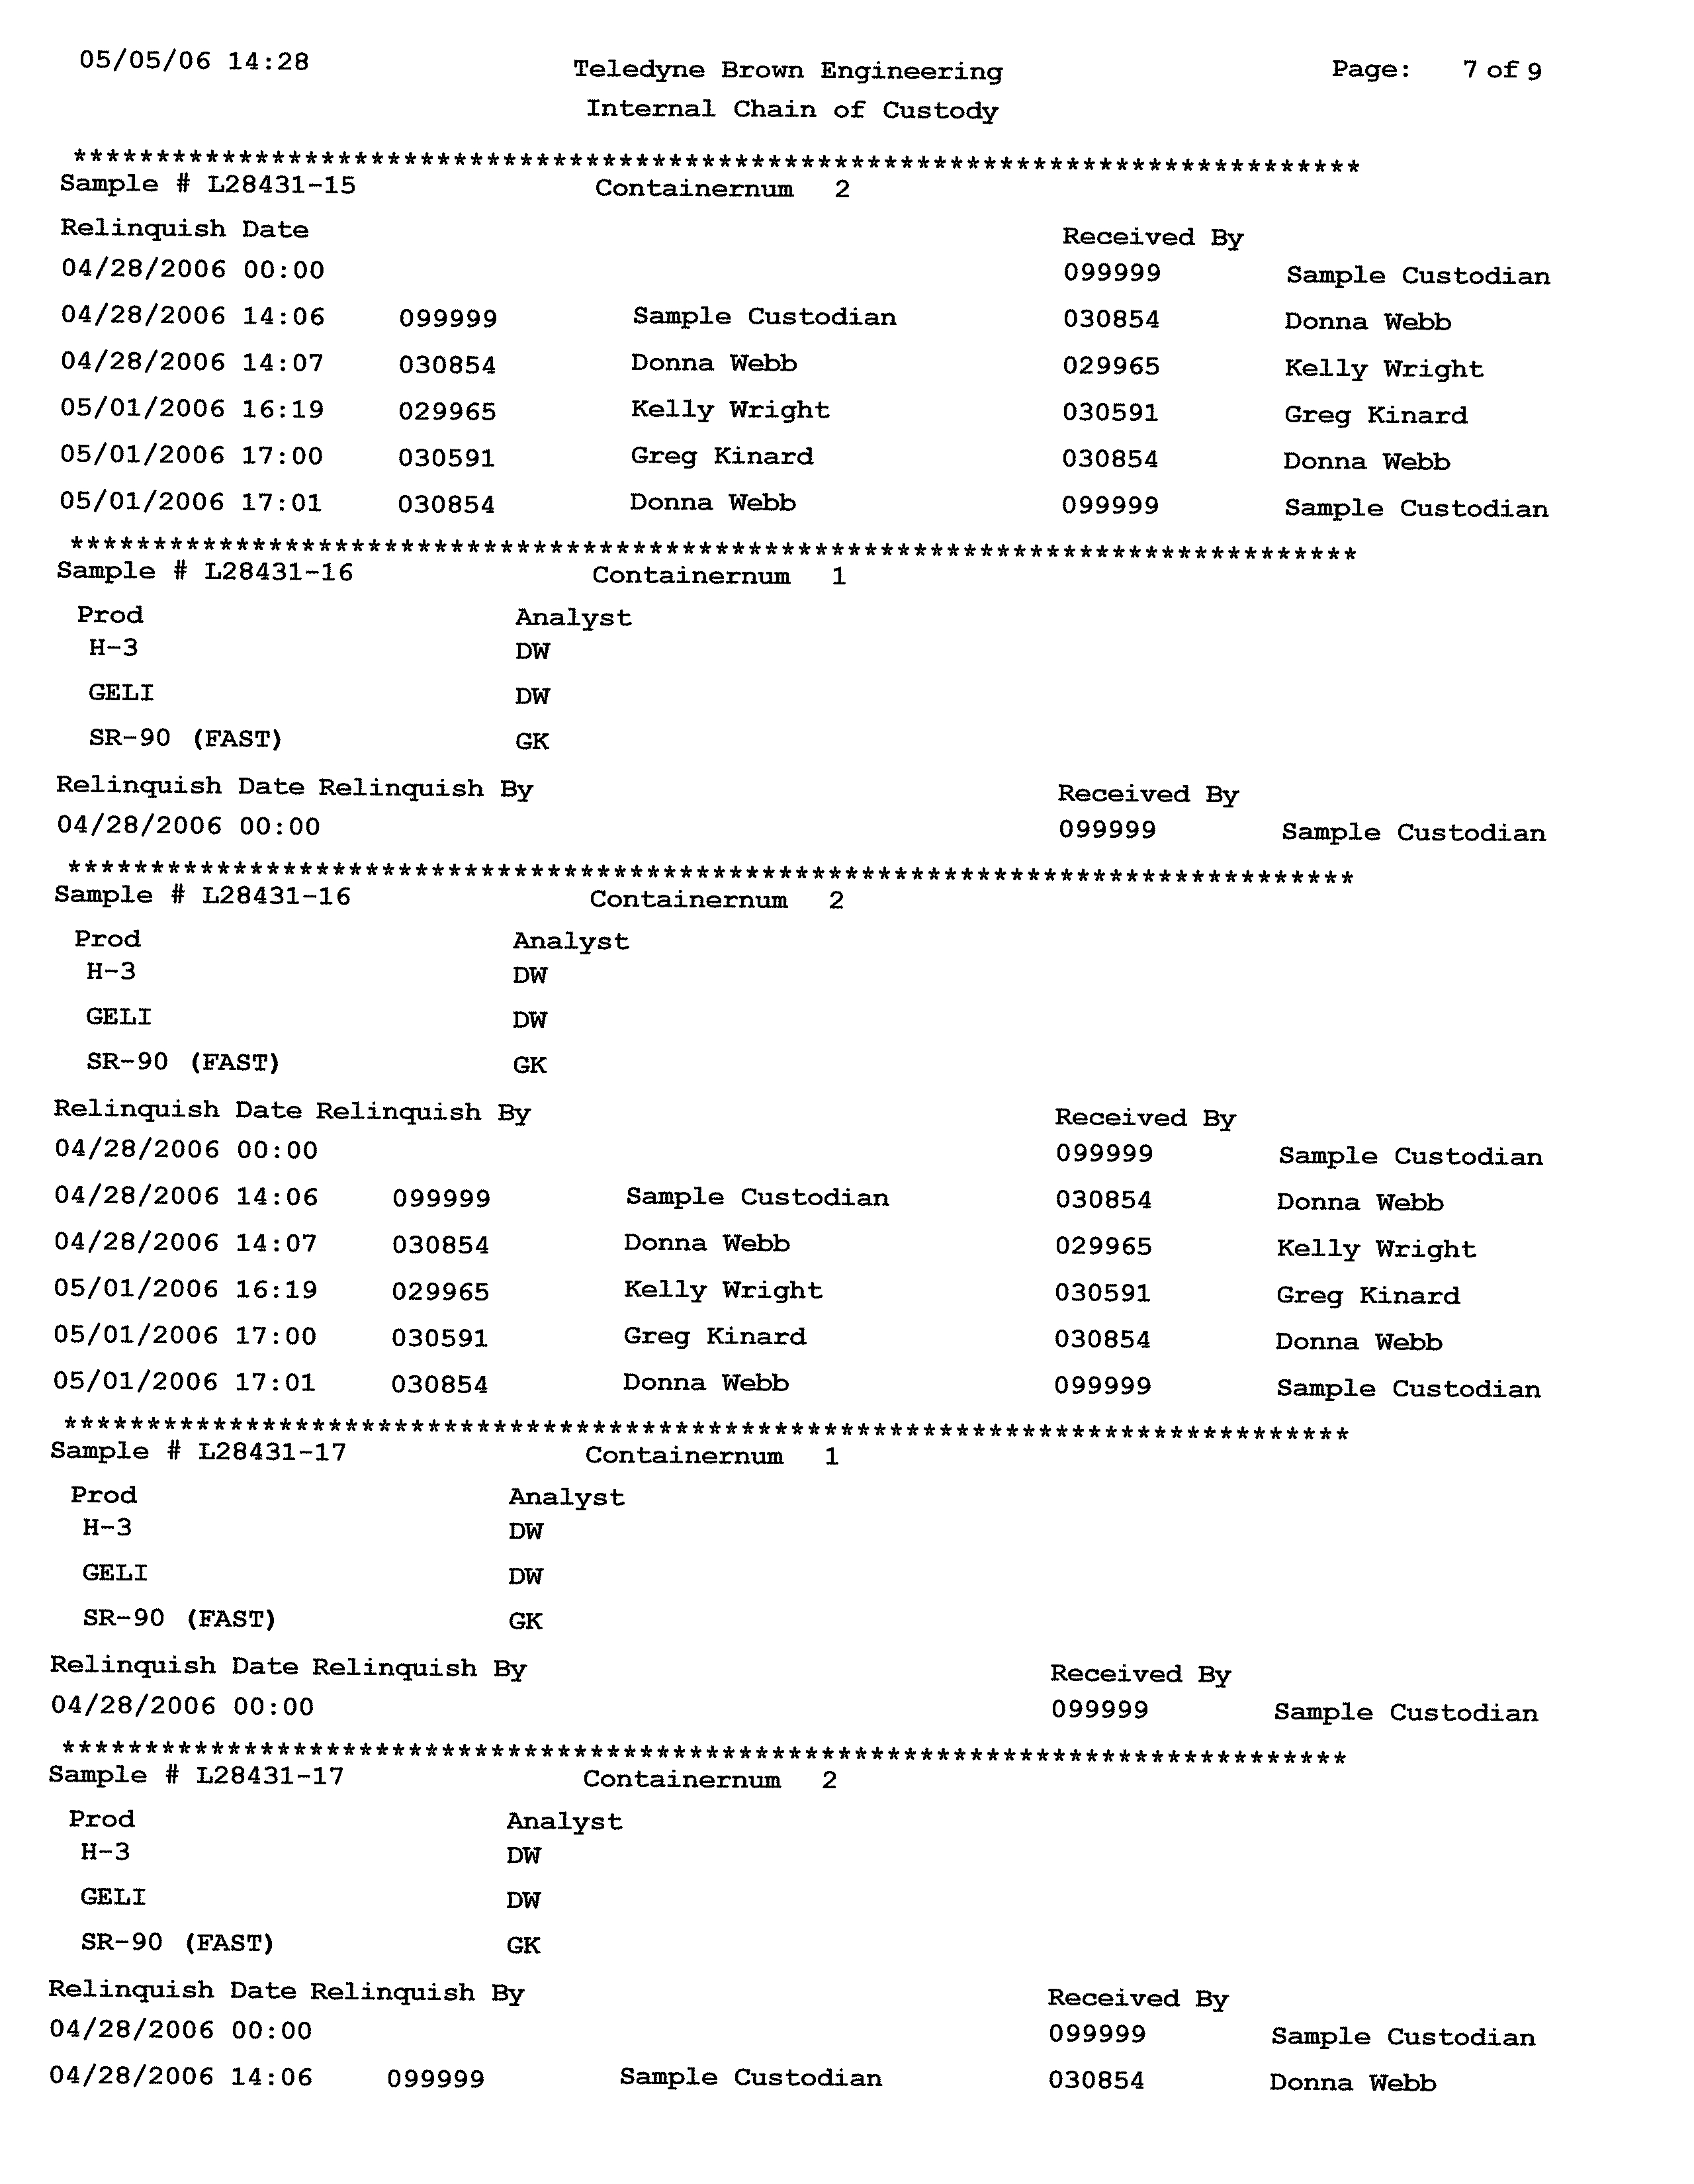
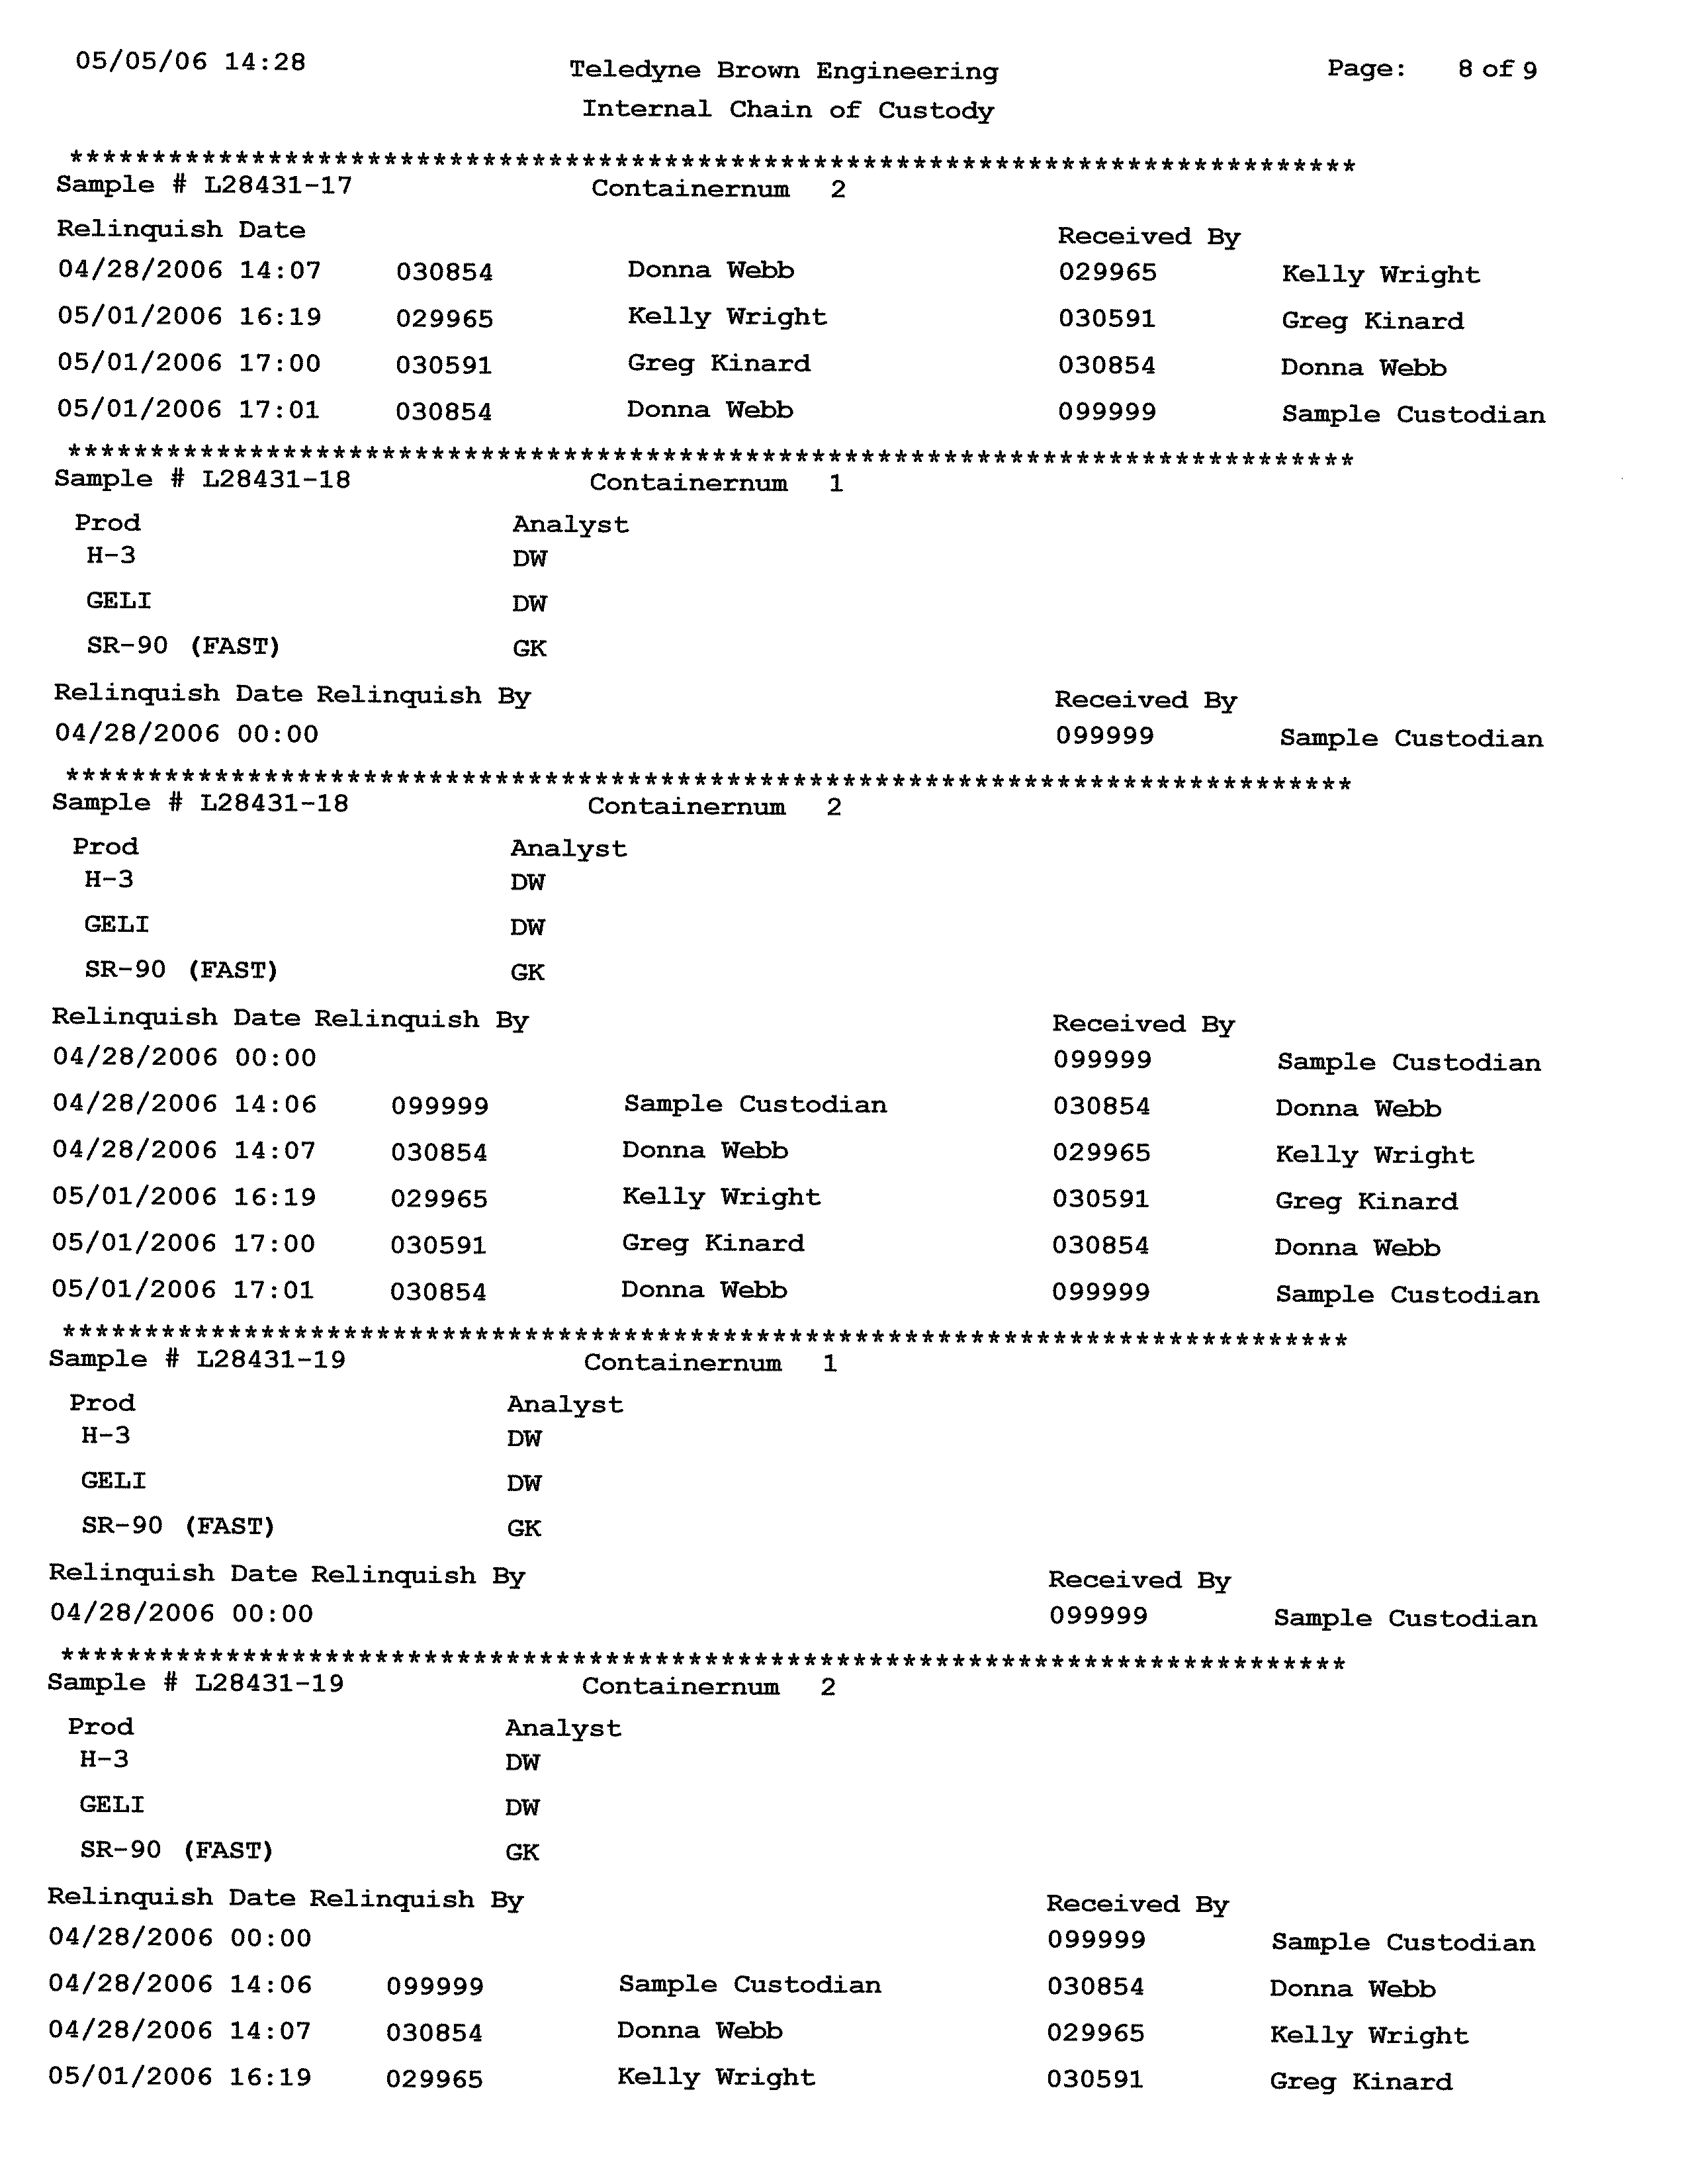
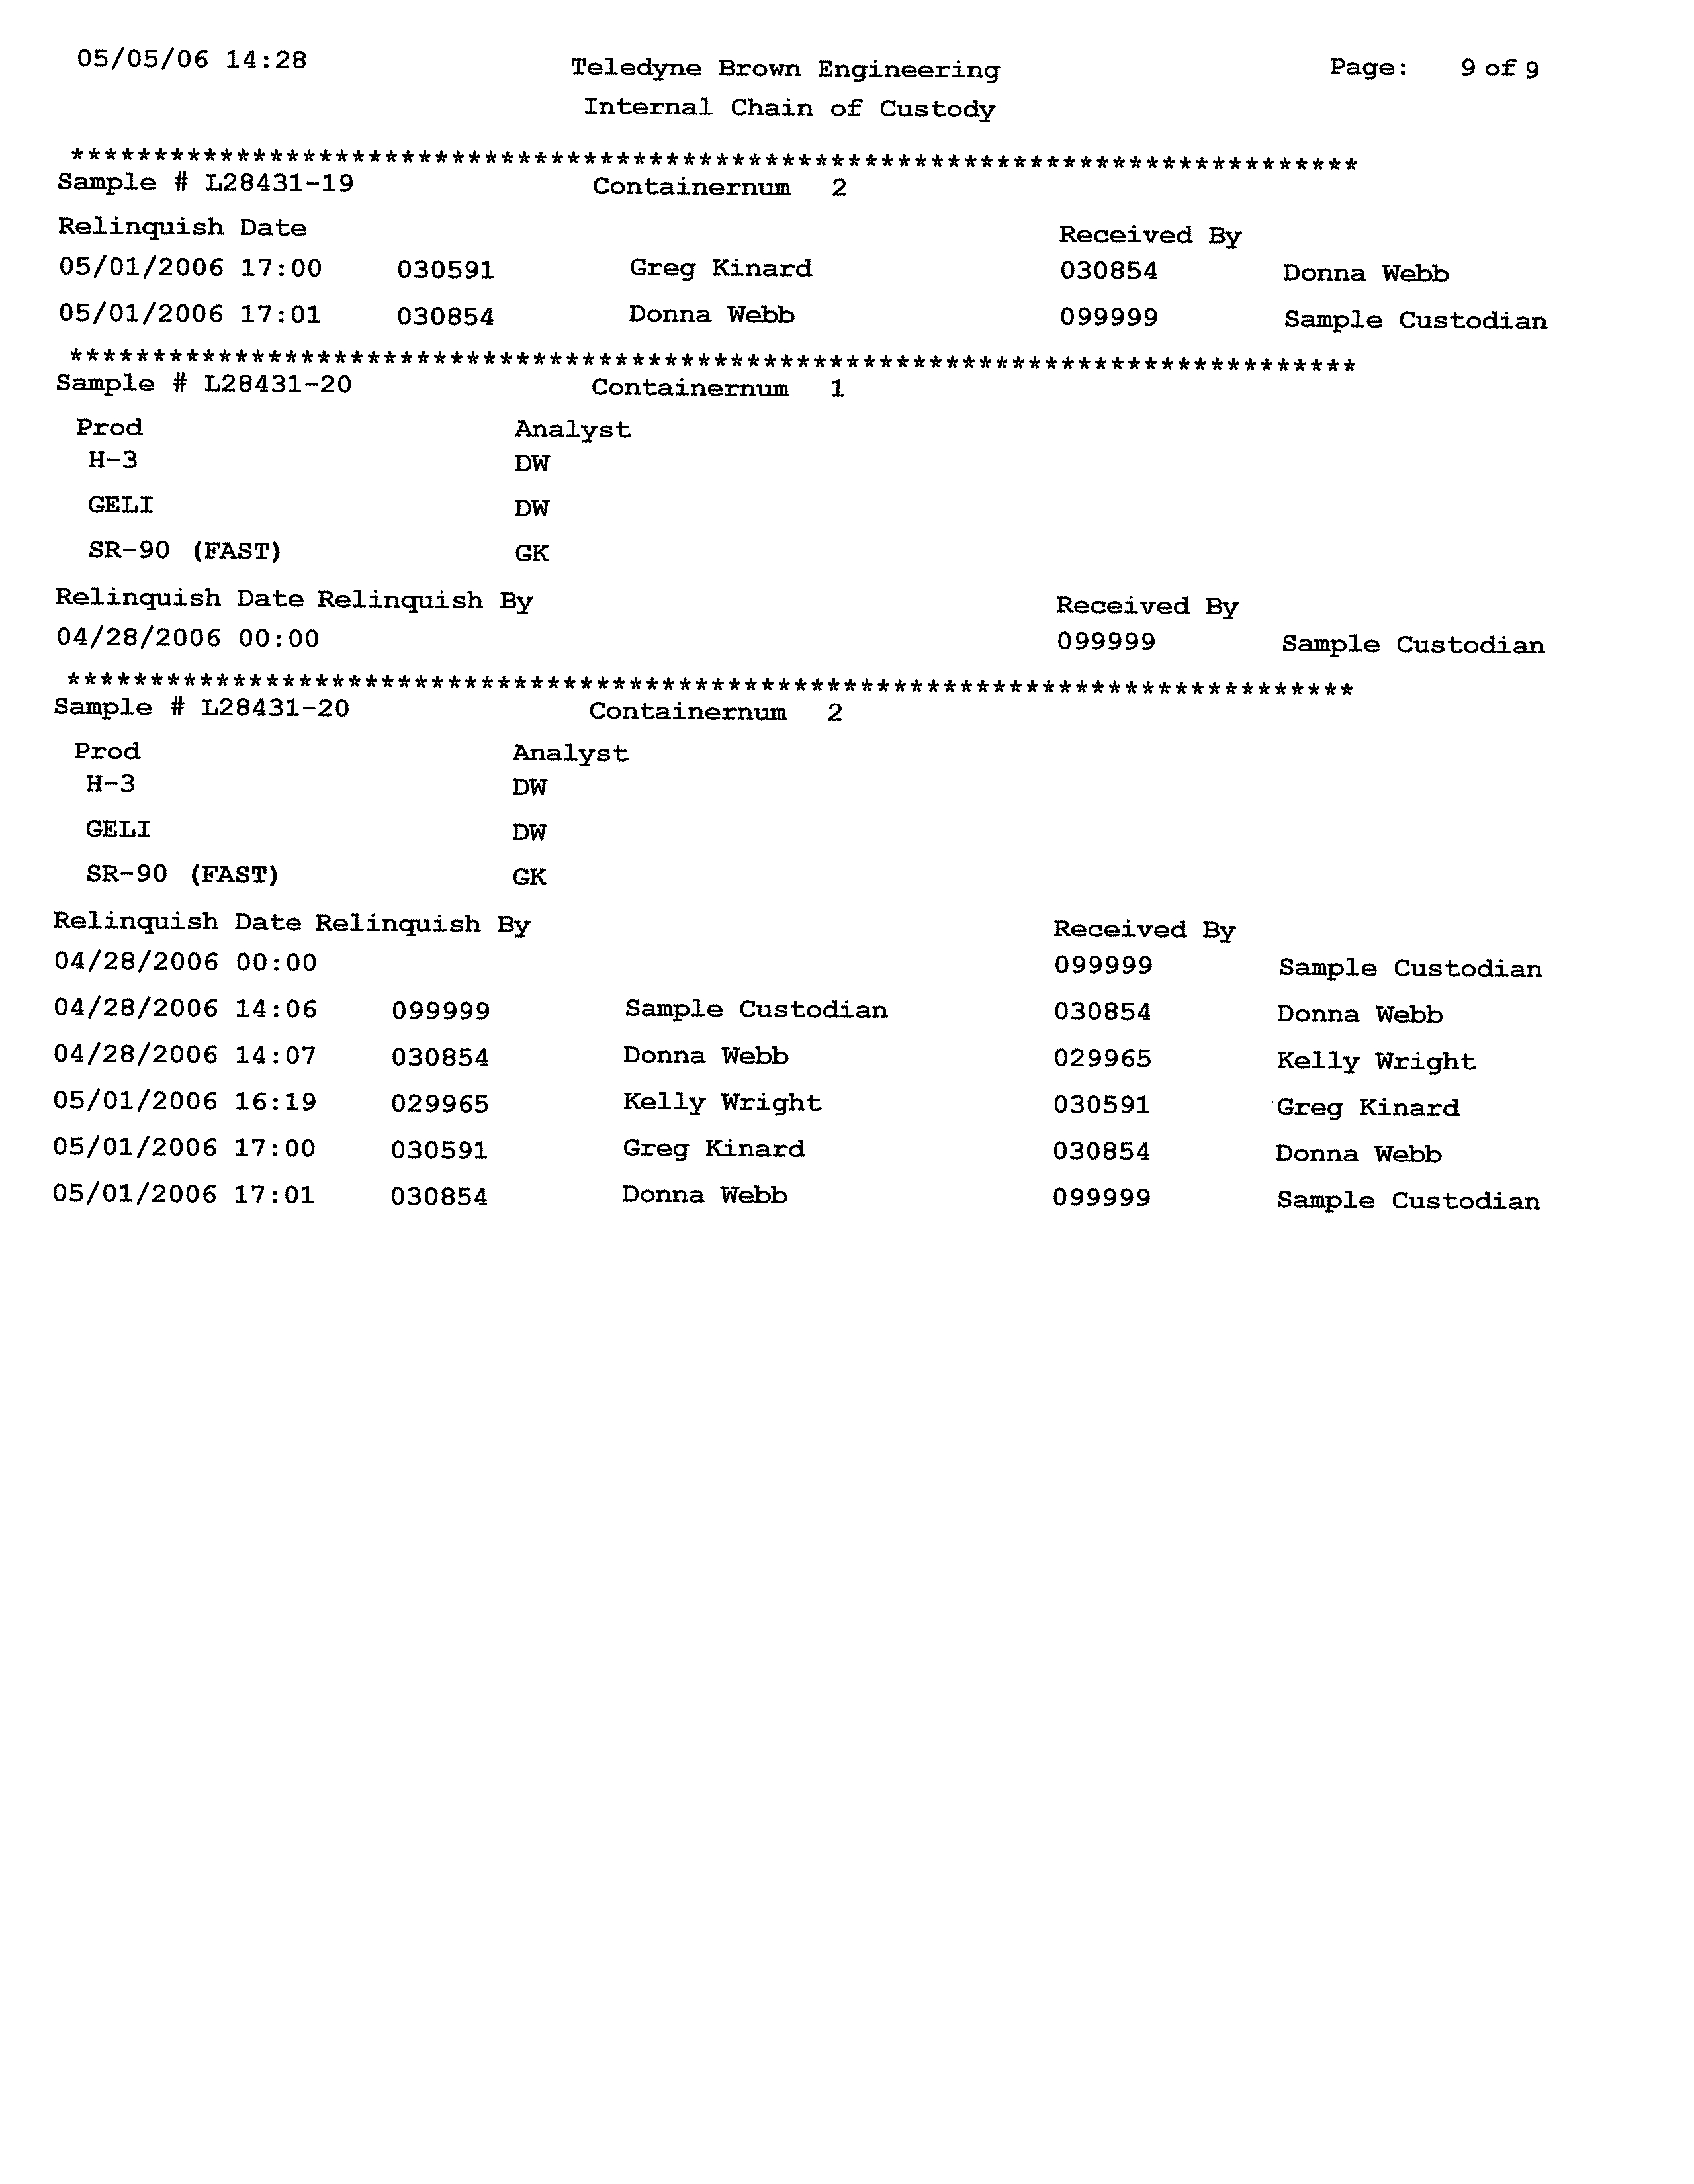
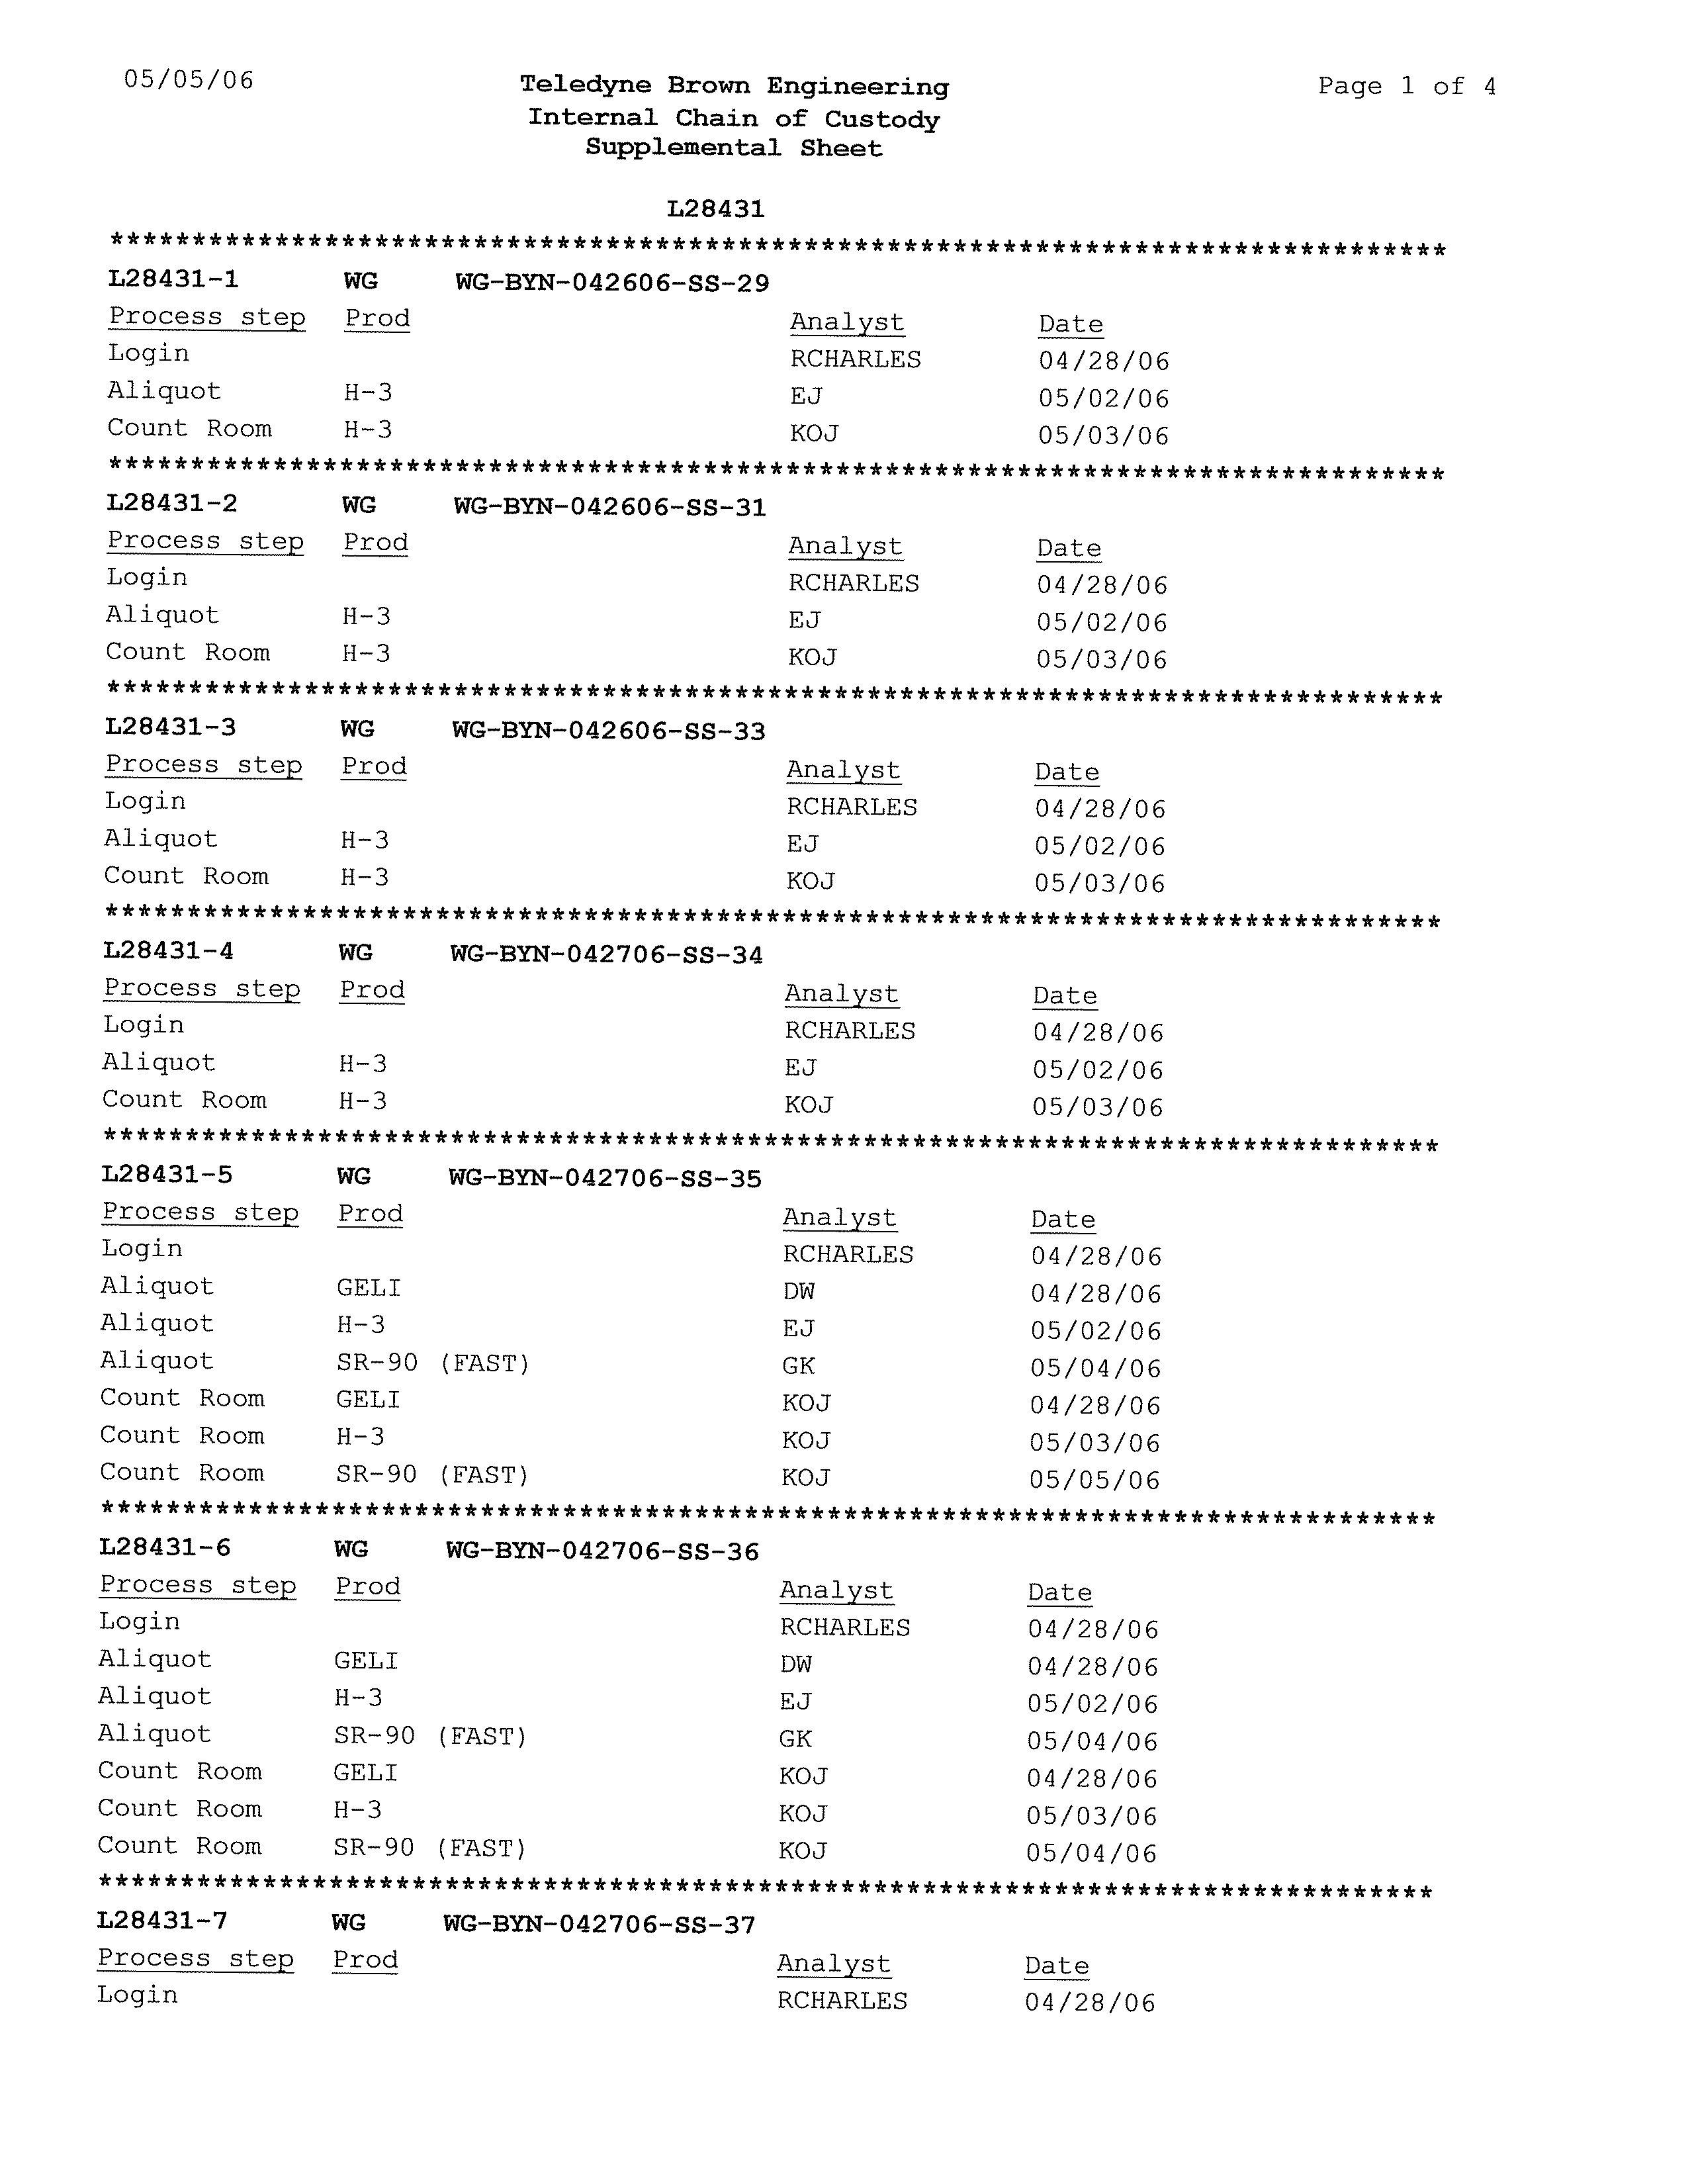
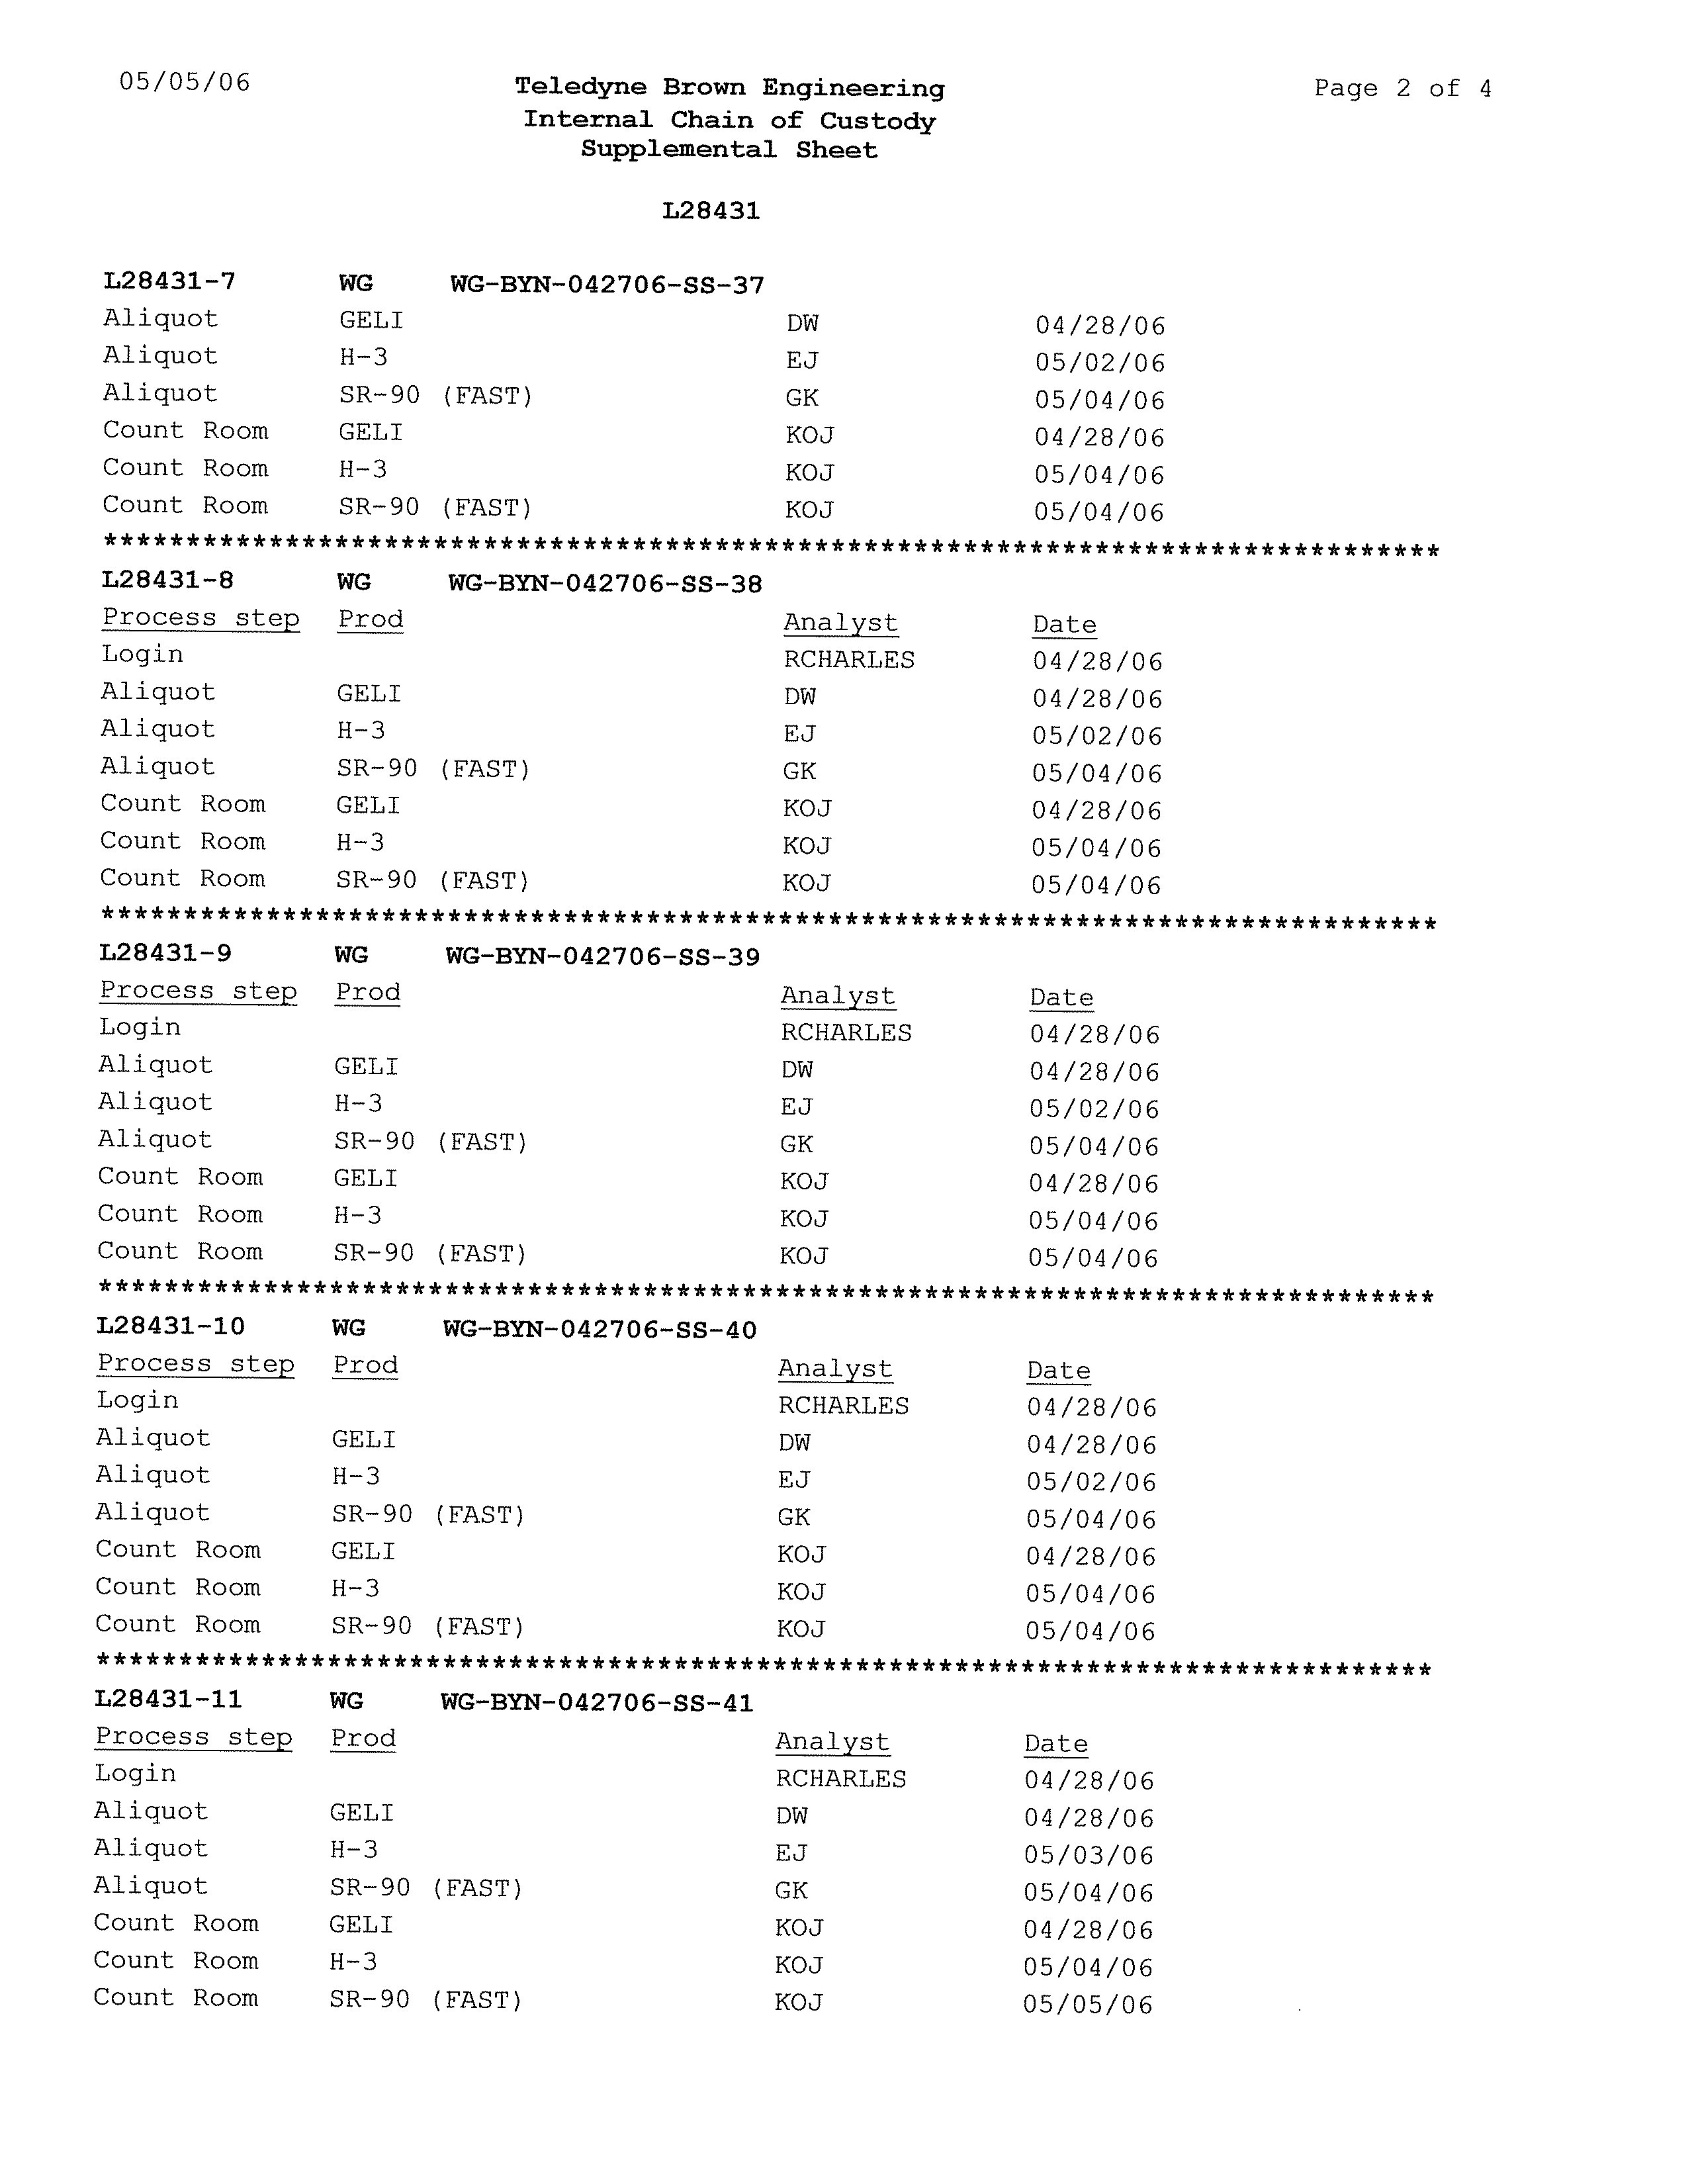
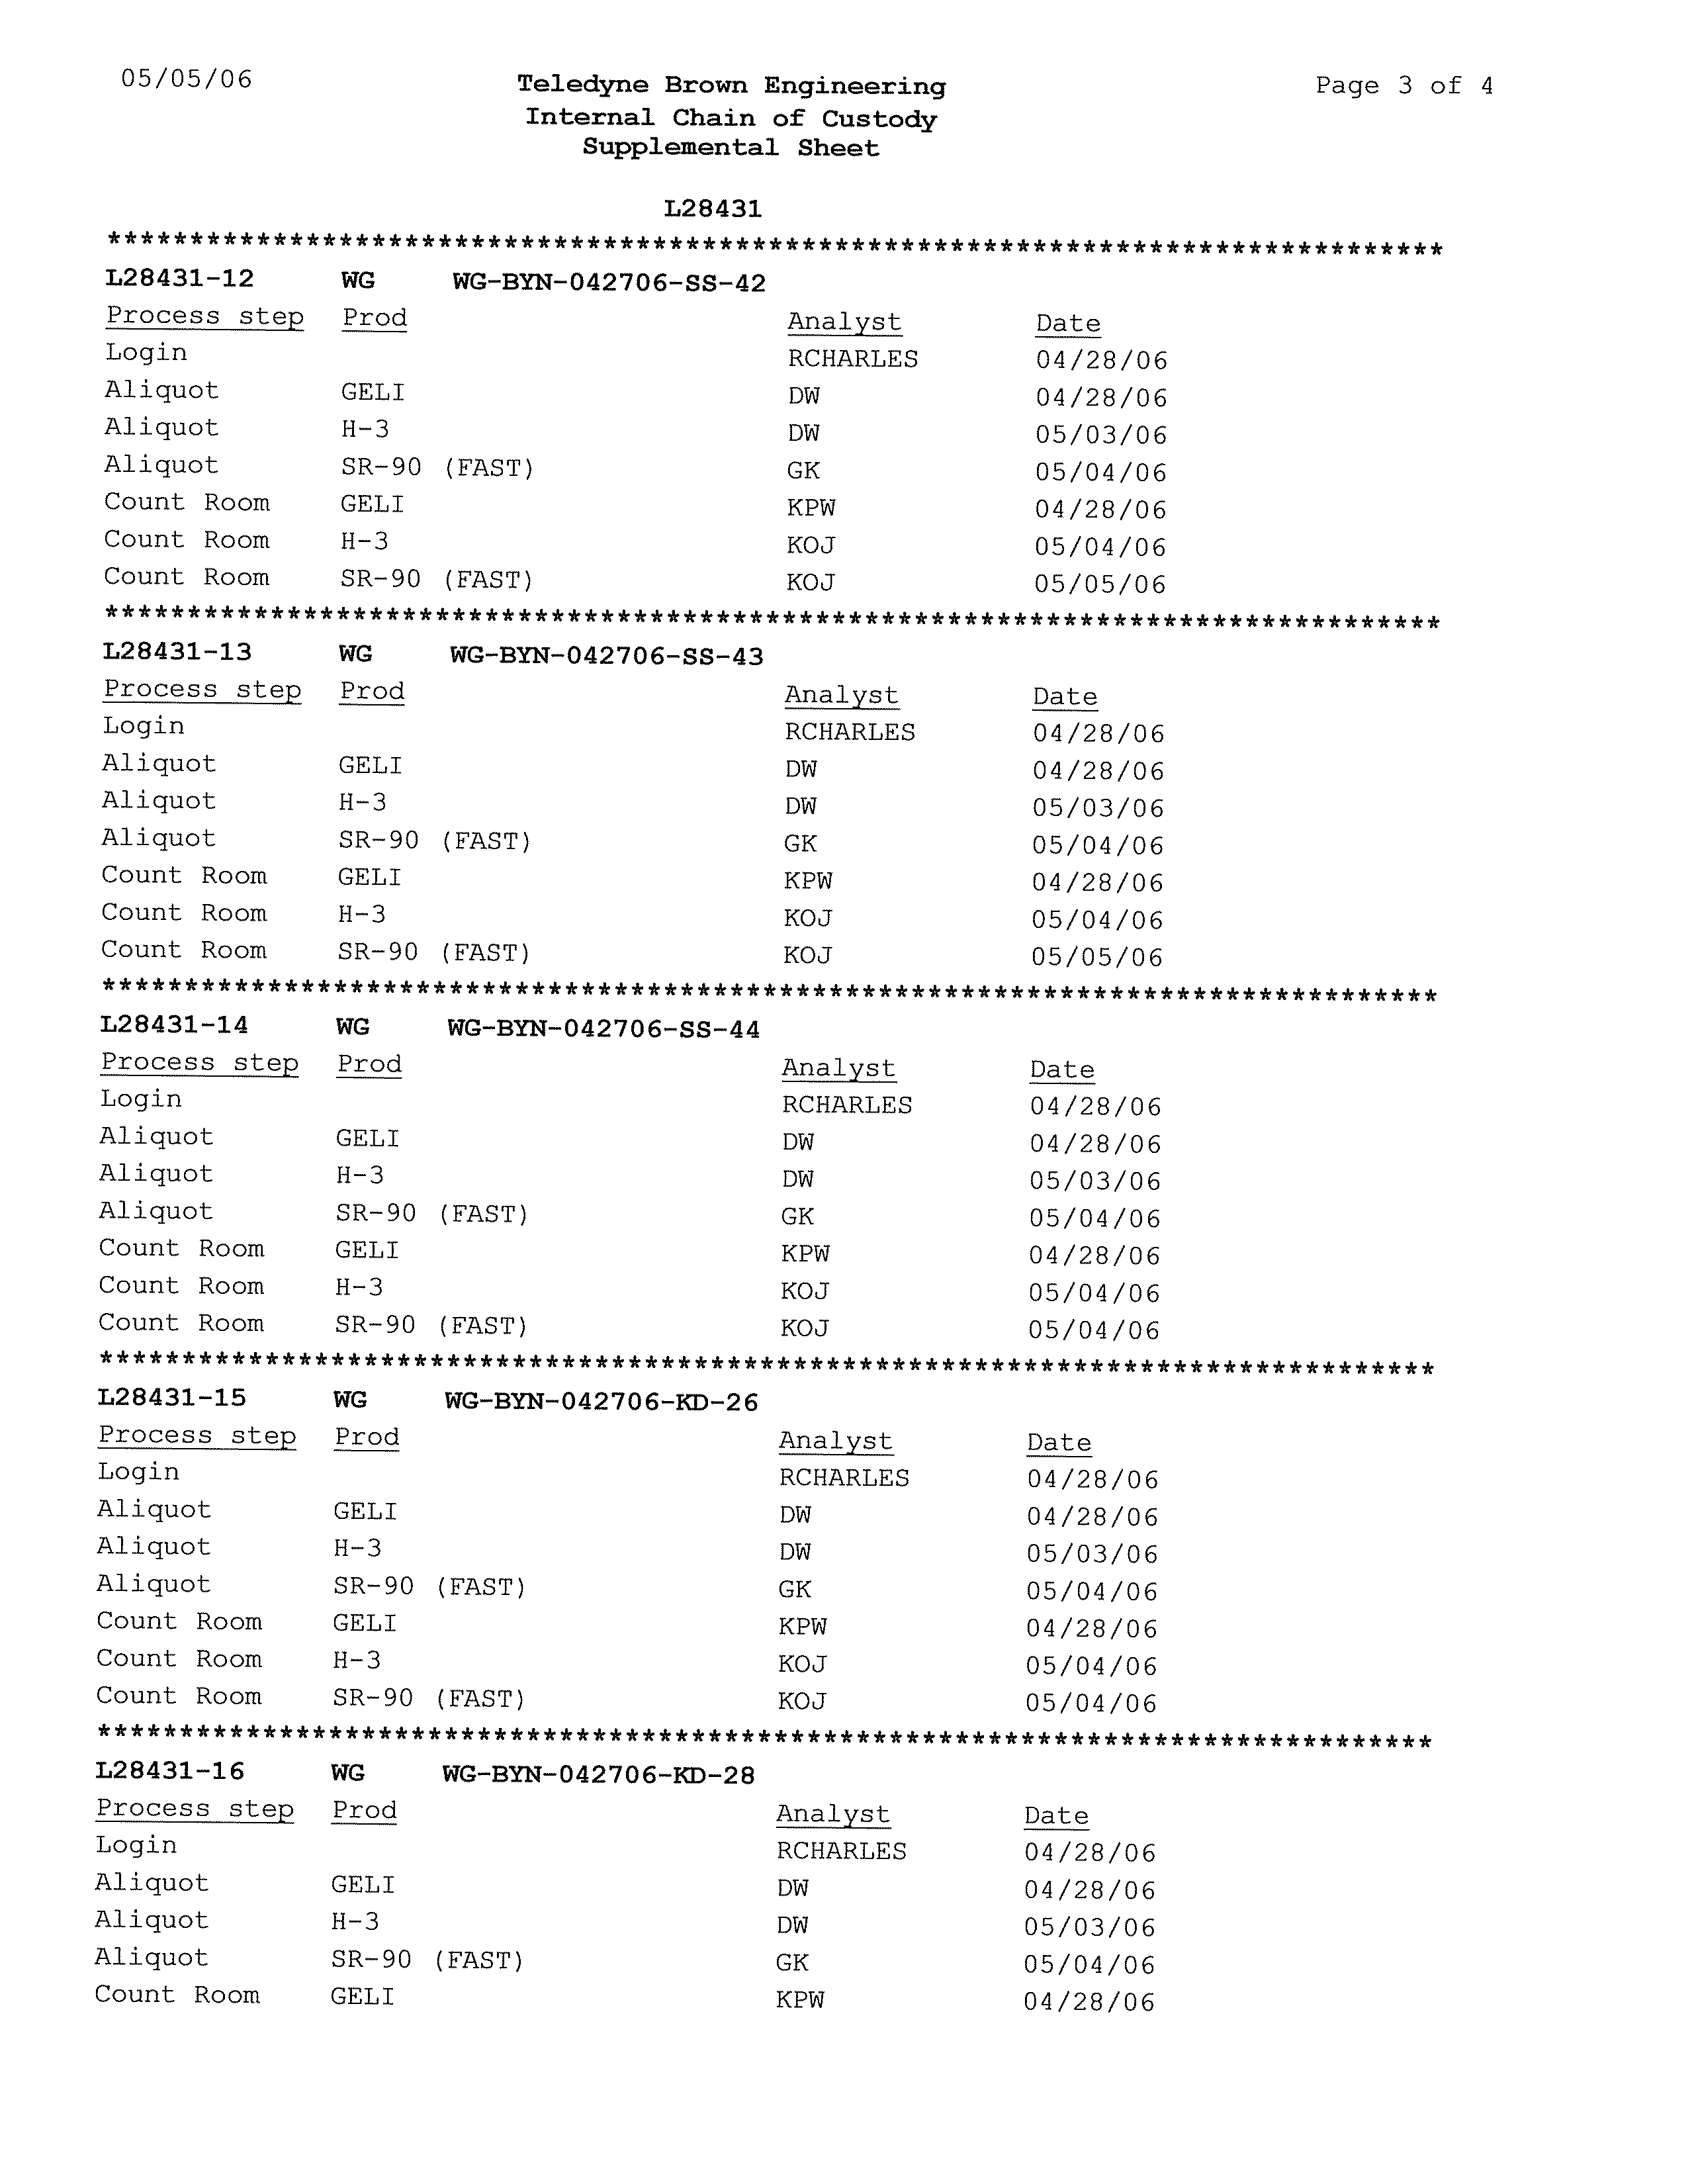
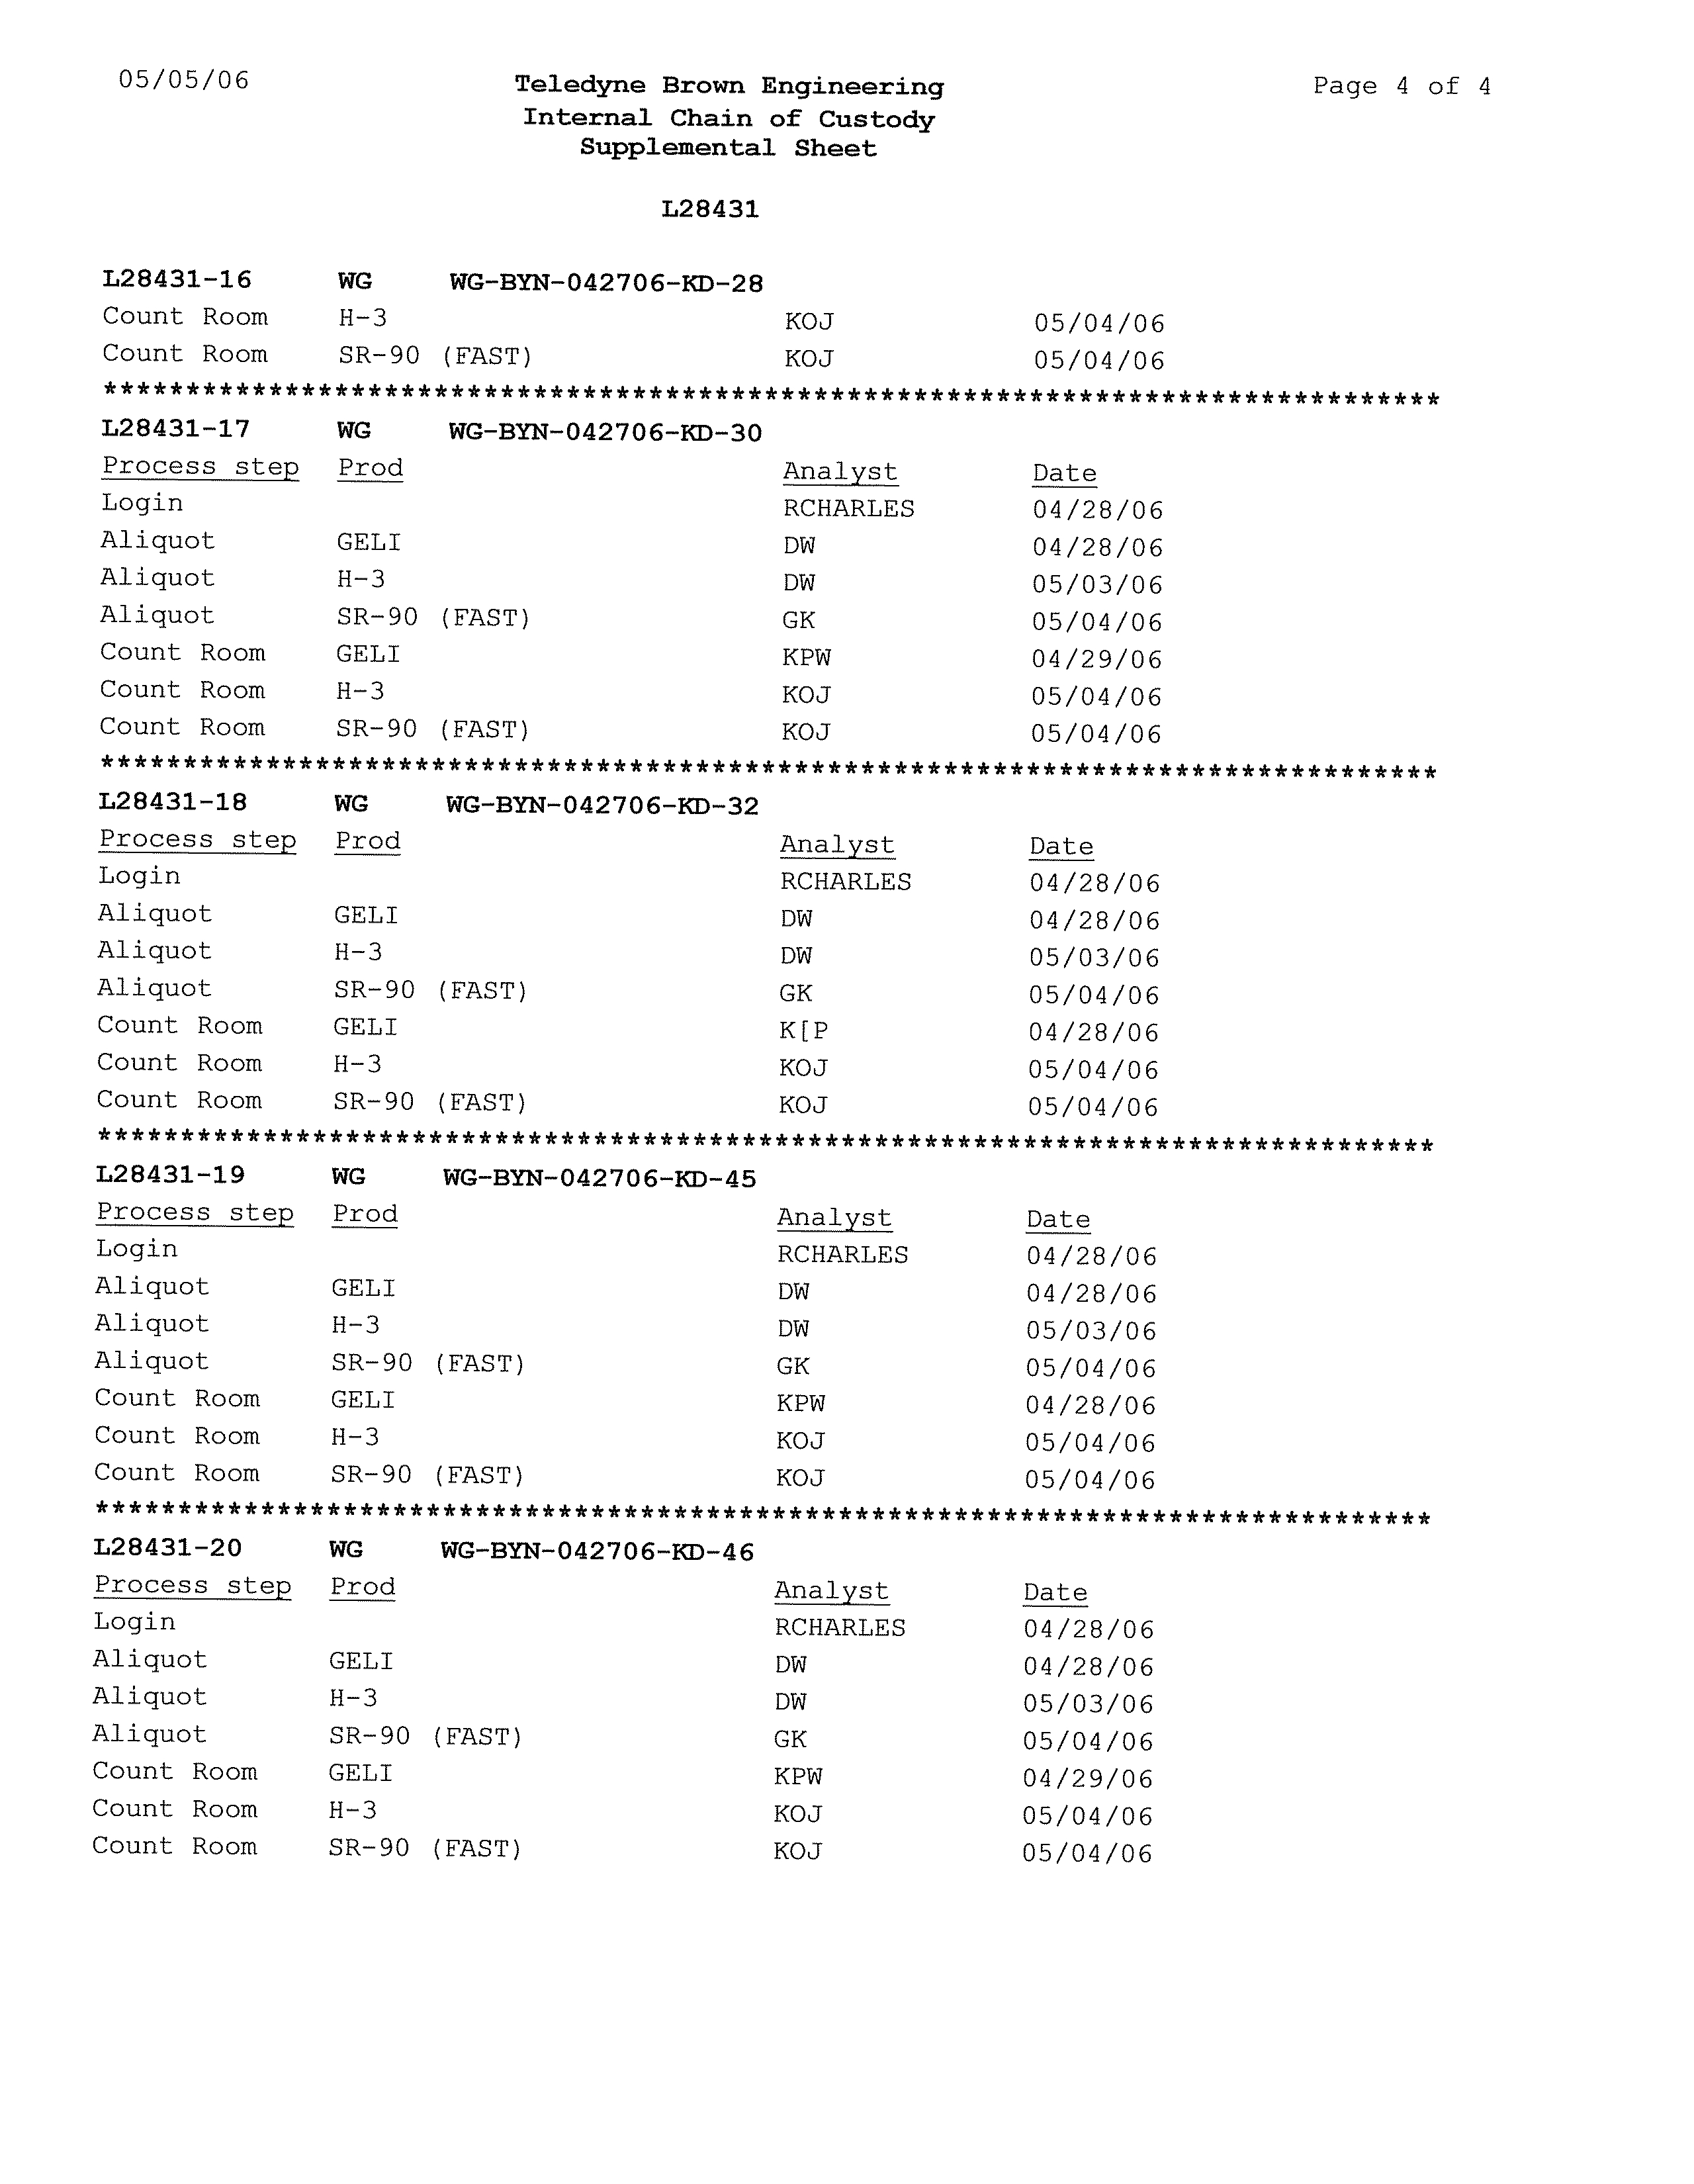
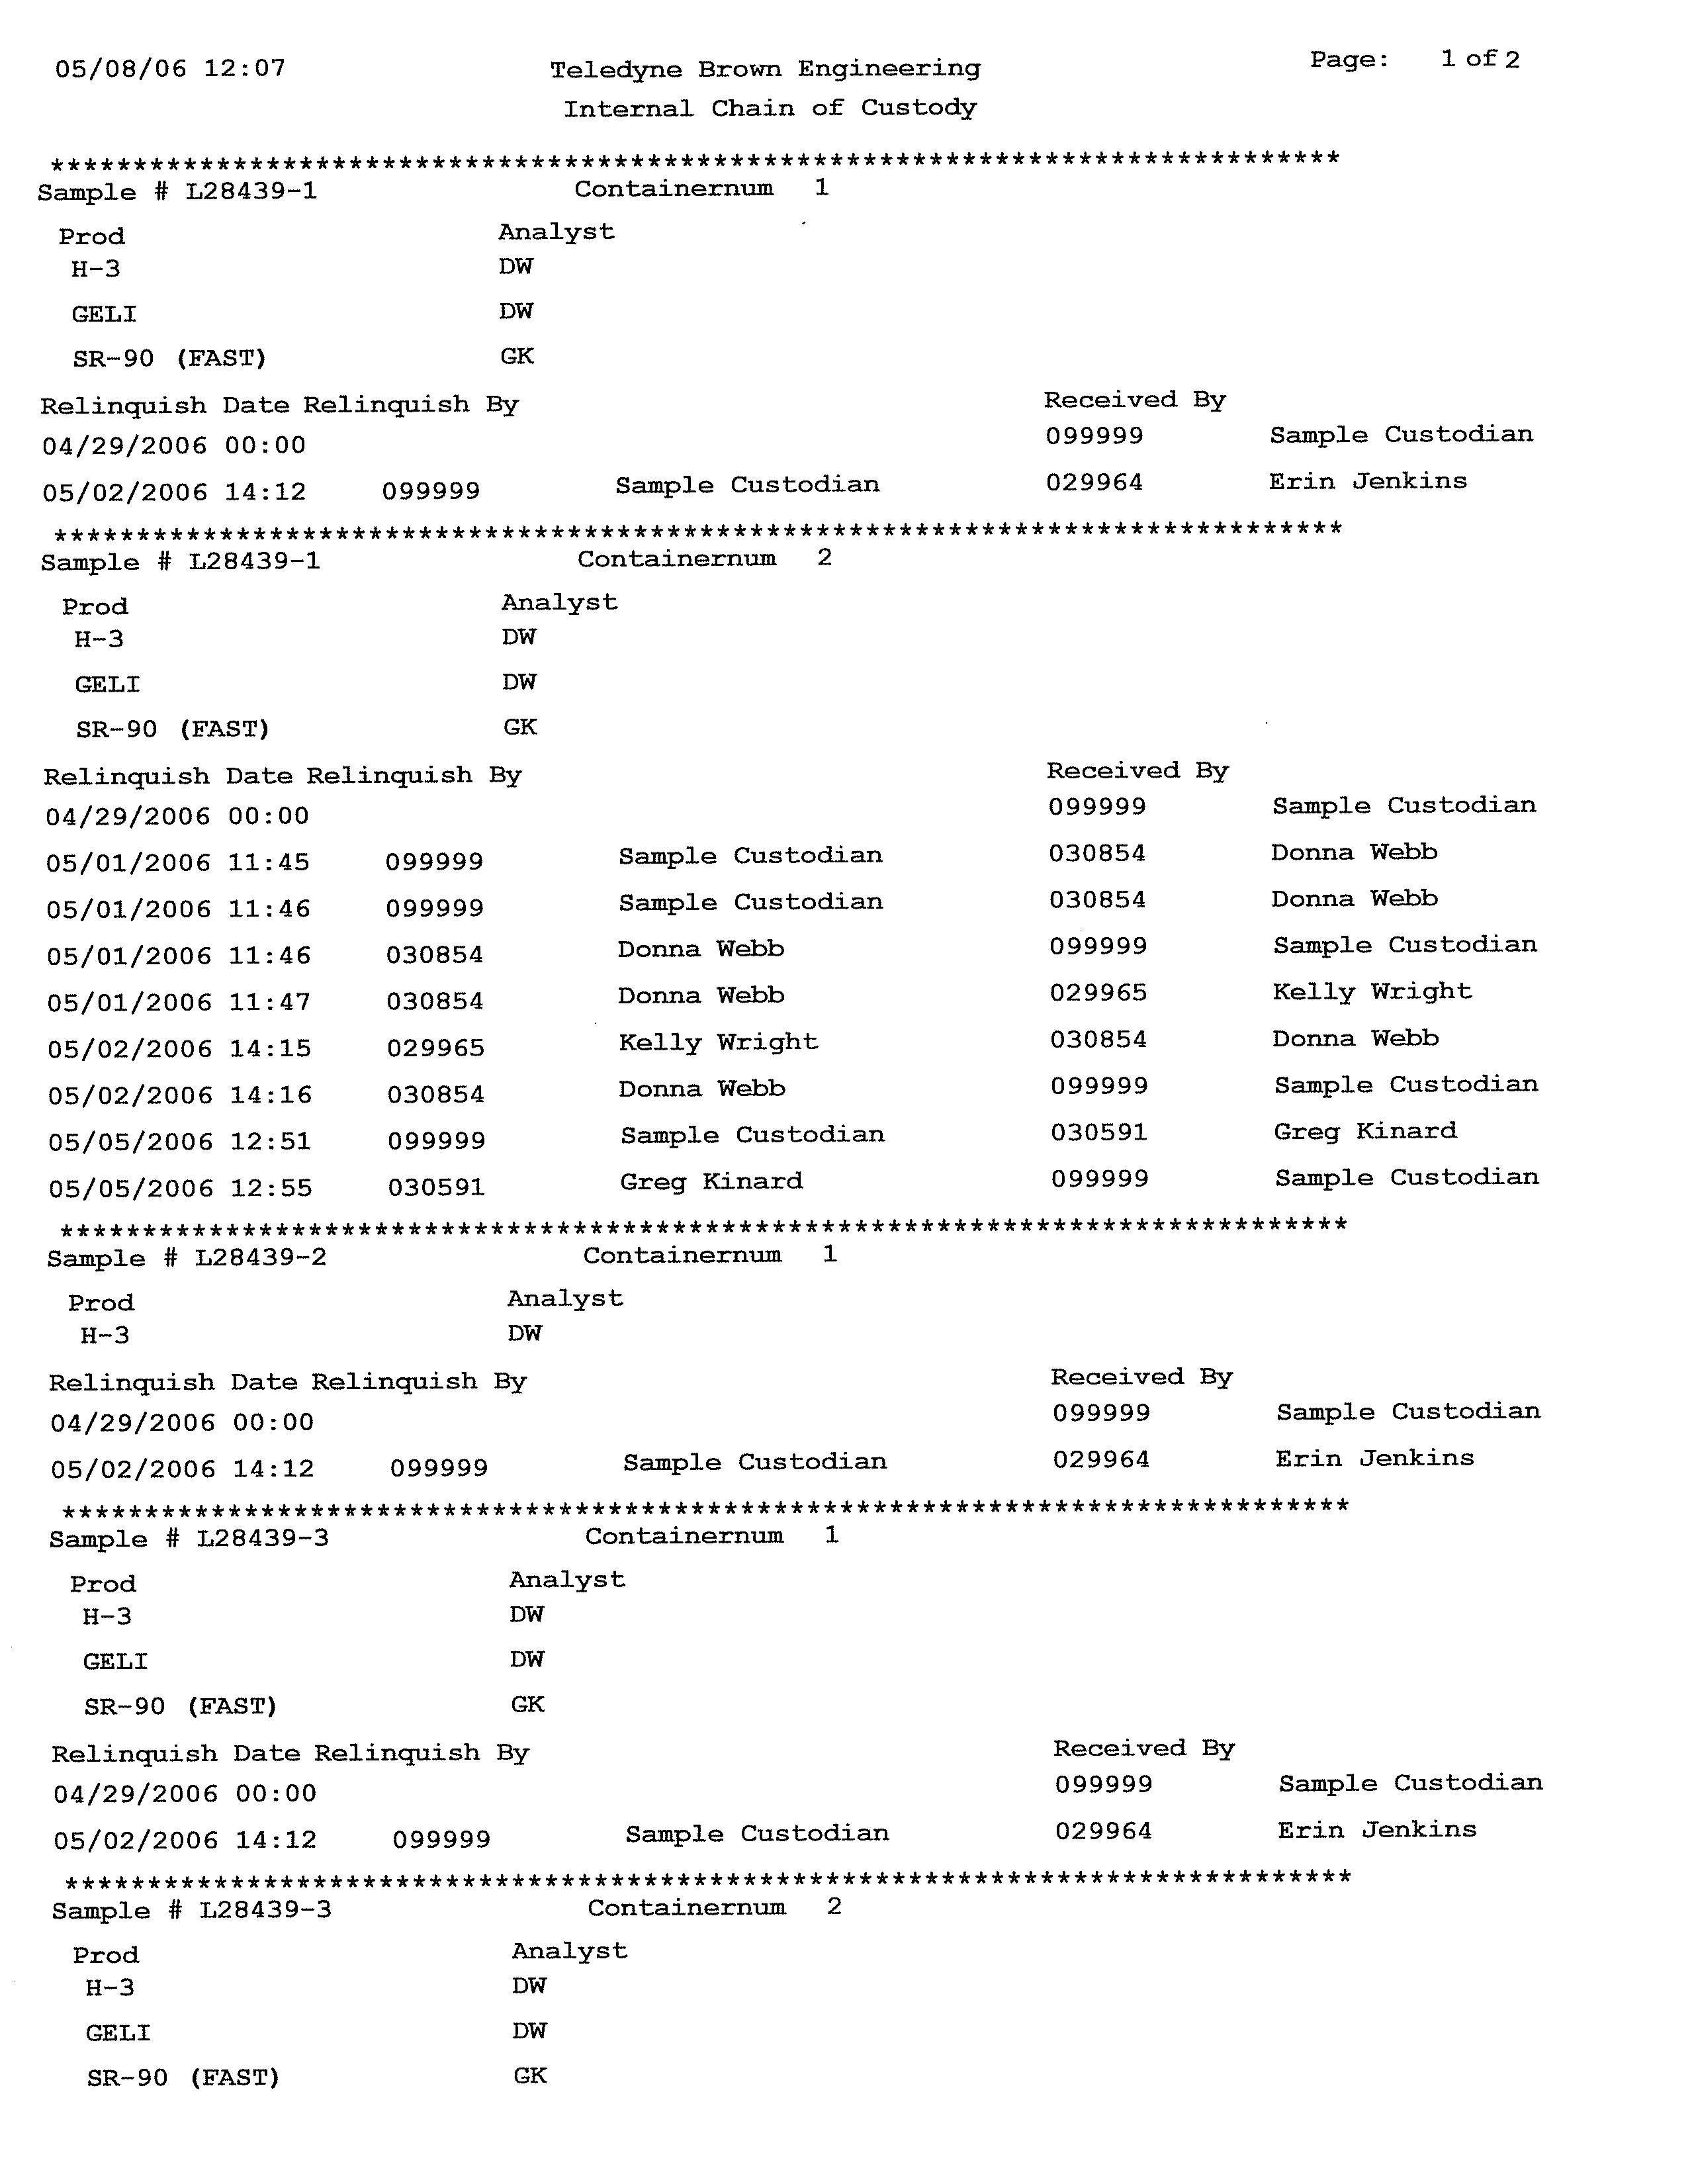
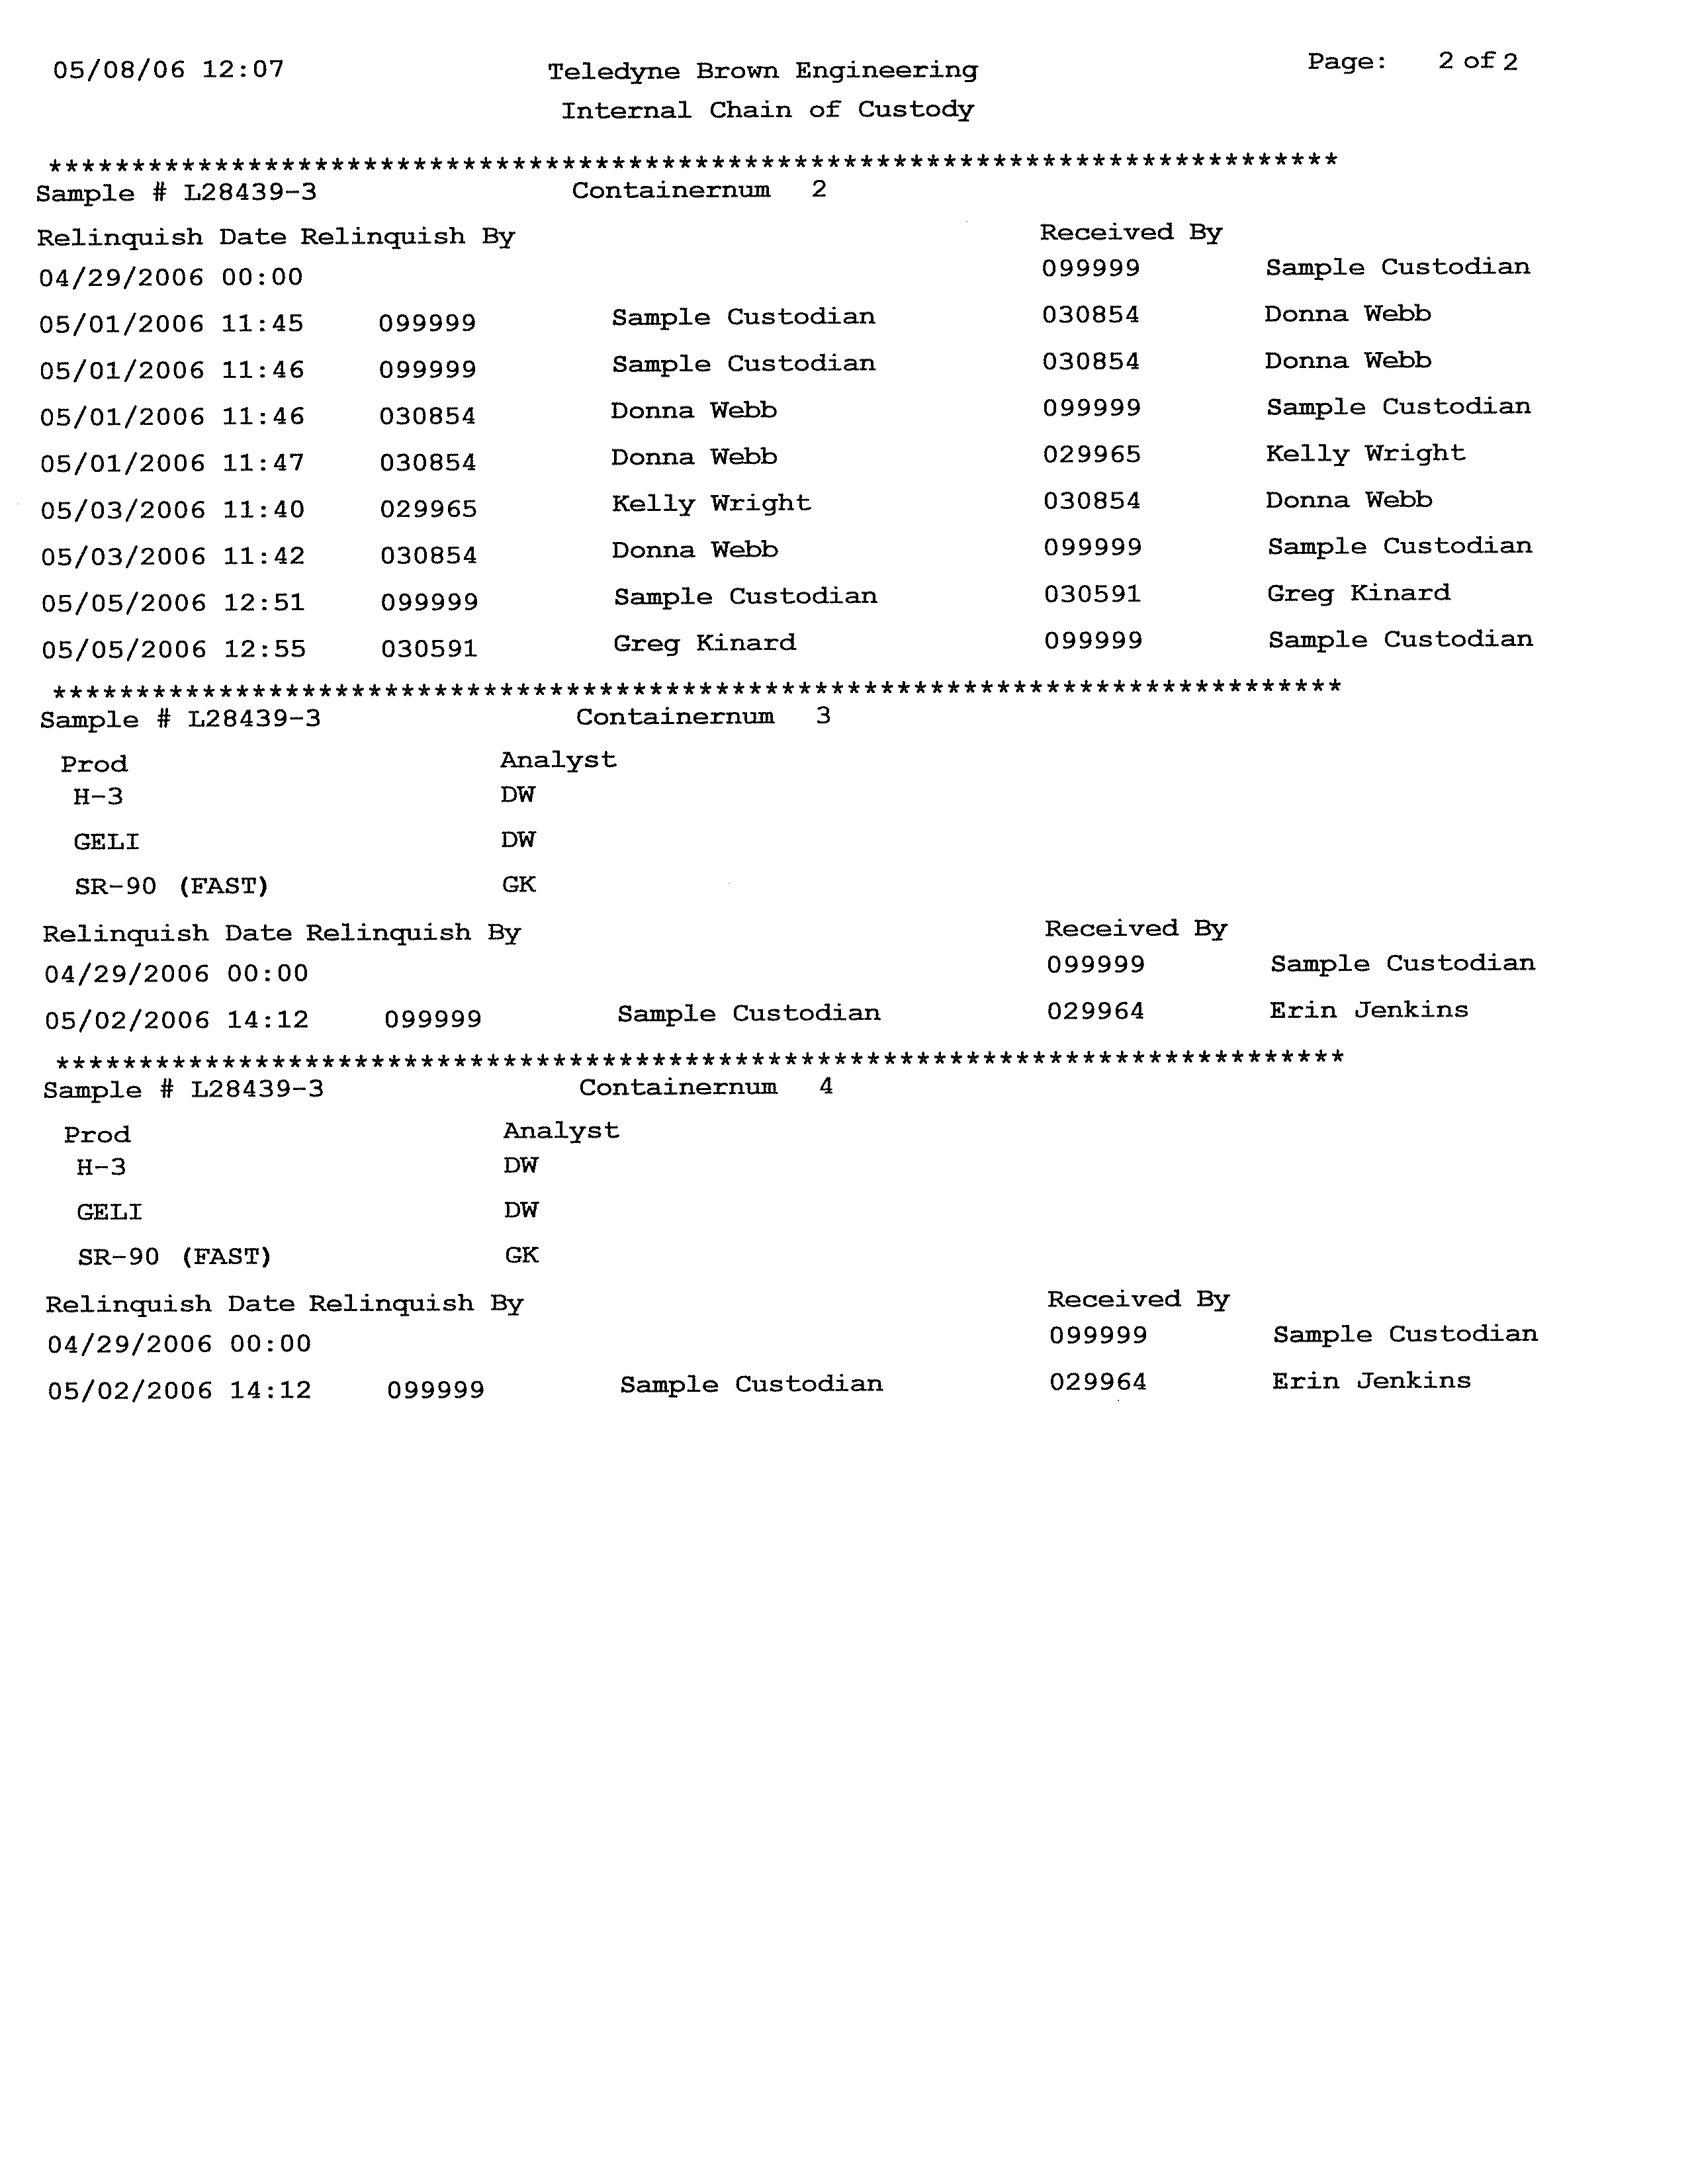
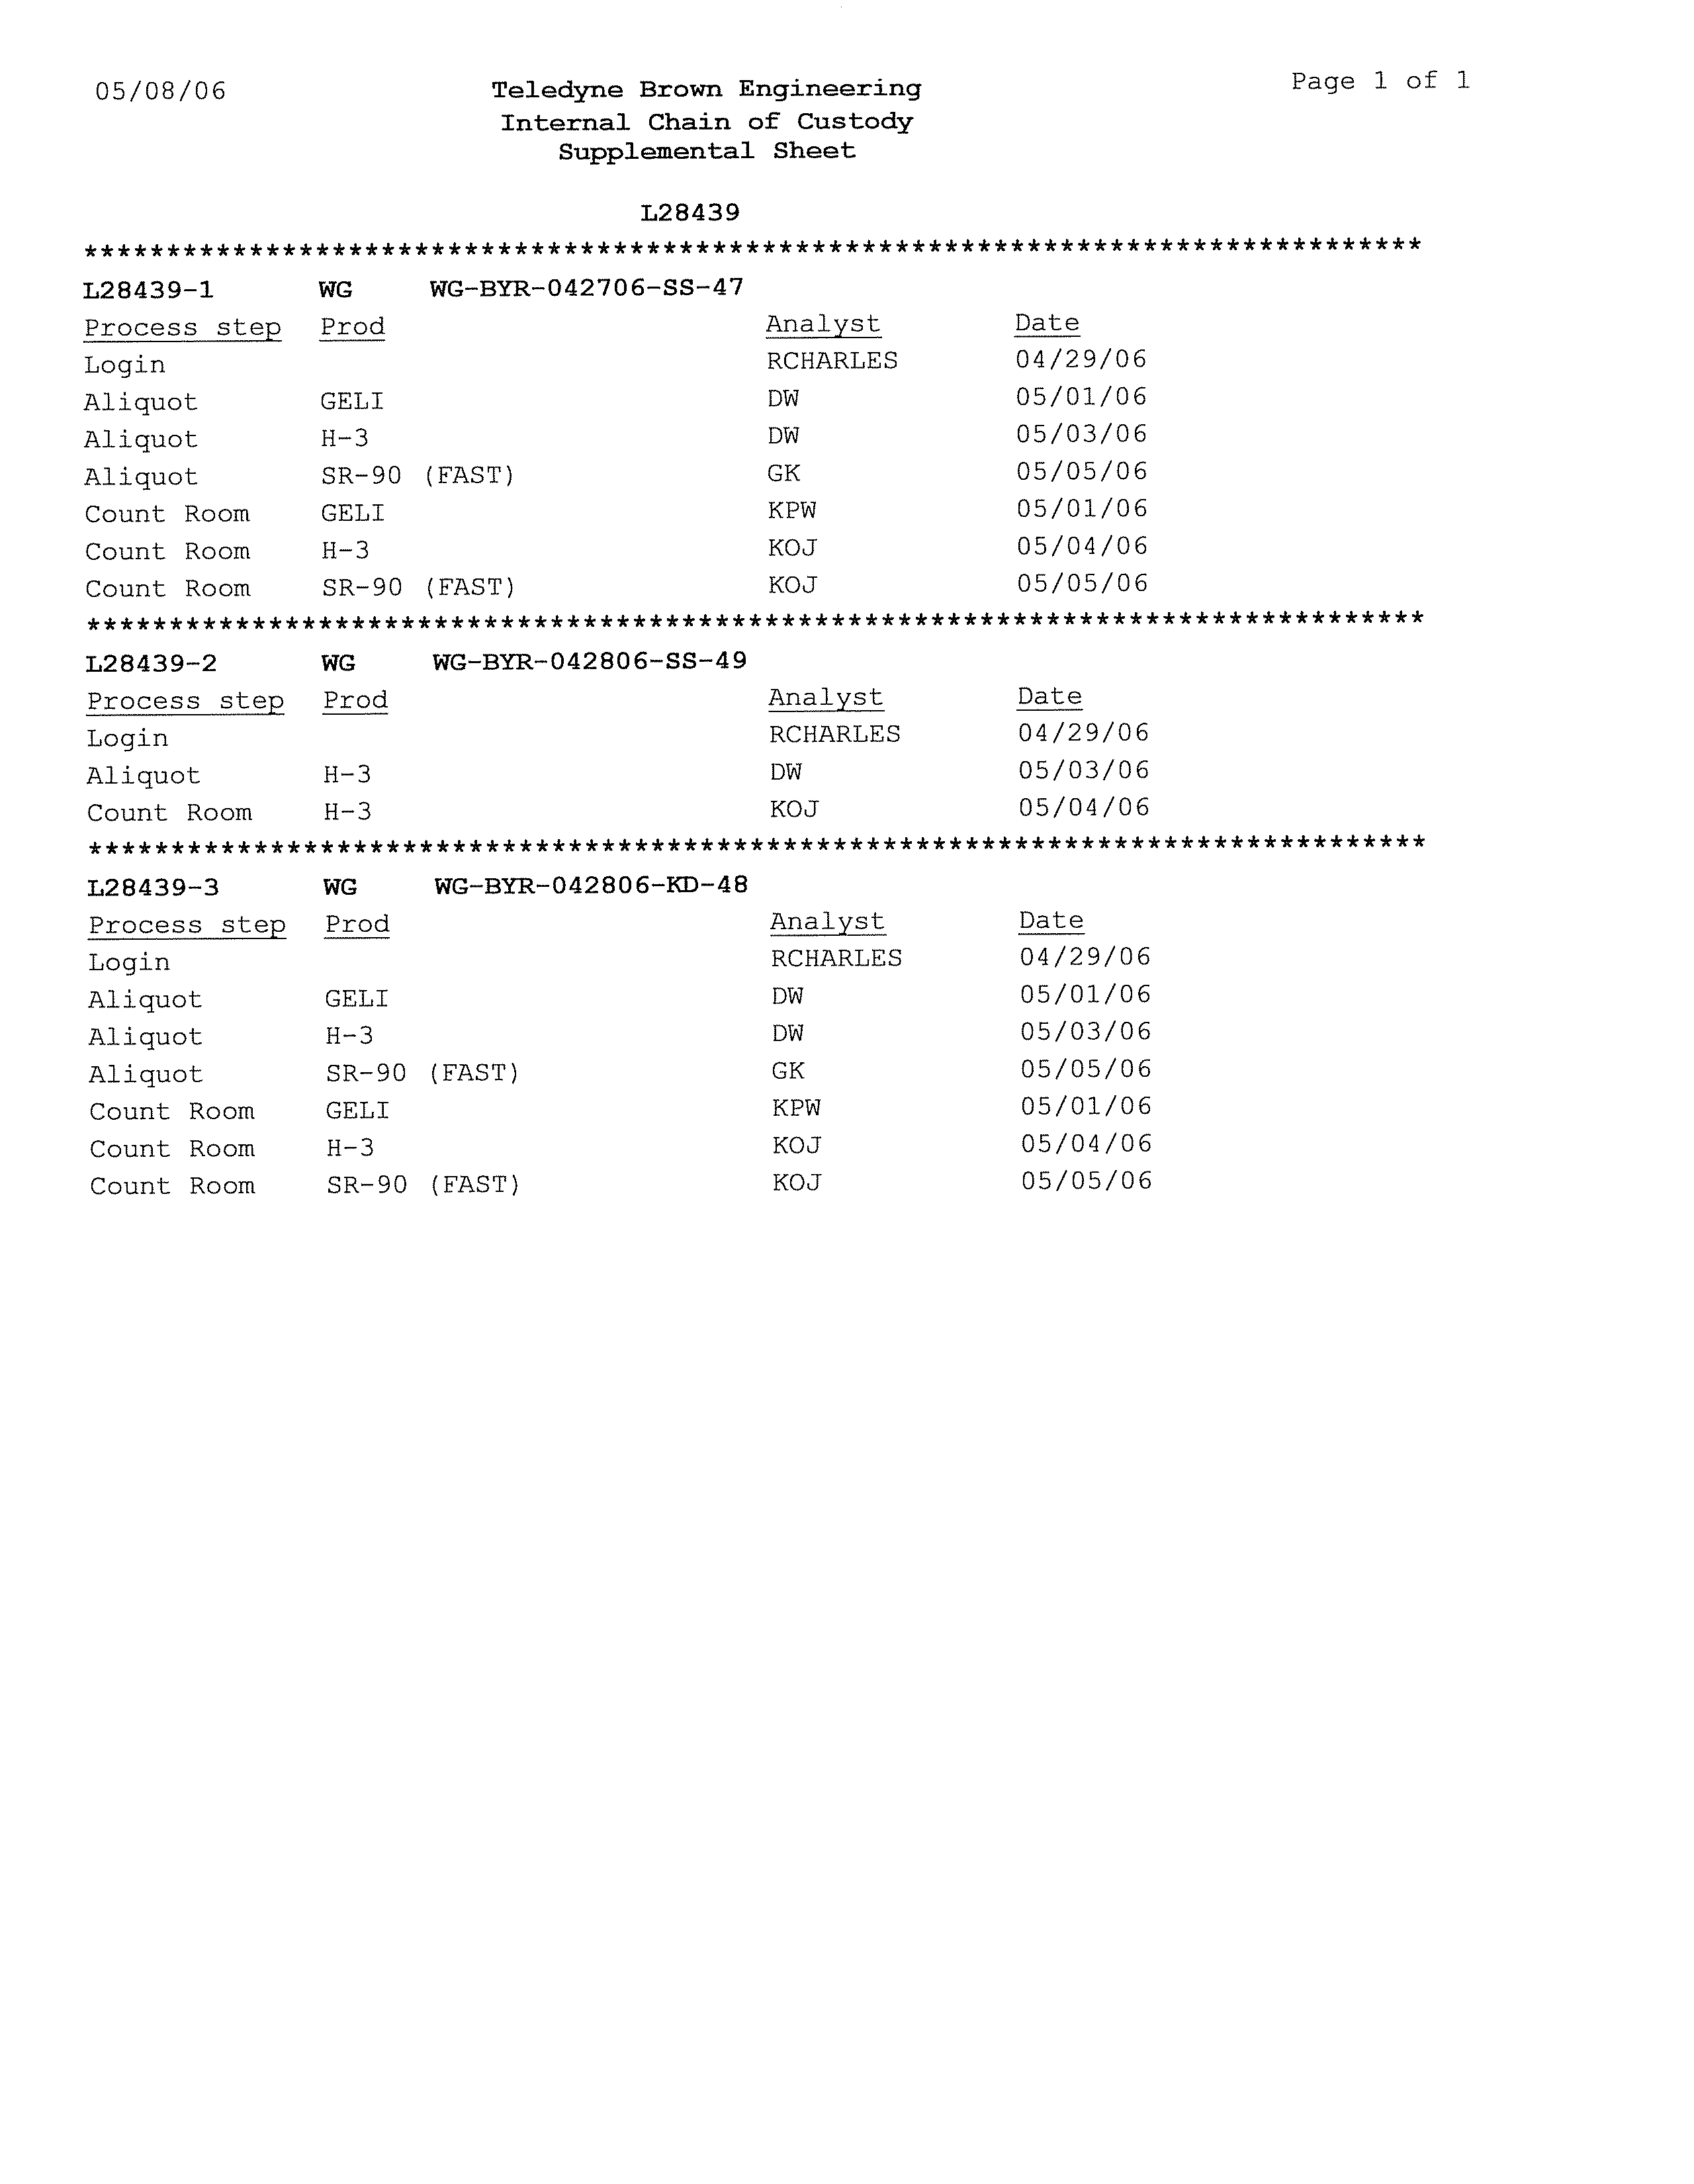
CHAIN-OF-CUSTODY RECORD...................................................................27
045136 (13) Byron Generating Station
CONESTOGA-ROVERS & ASSOCIATES
Revision 1
TABLE OF CONTENTS
Page
4.2.6
QUALITY CONTROL SAMPLES ...................................................................27
4.2.7
ANALYSES.........................................................................................................28
5.0
RESULTS SUMMARY..........................................................................................................29
5.1
STATION GEOLOGY .......................................................................................29
5.2
STATION HYDROGEOLOGY ........................................................................29
5.2.1
GROUNDWATER FLOW DIRECTIONS ......................................................30
5.2.2
MAN-MADE INFLUENCES ON GROUNDWATER FLOW .....................31
5.2.3
VERTICAL HYDRAULIC GRADIENTS........................................................31
5.2.4
LATERAL GROUNDWATER FLOW AND VELOCITY.............................32
5.3
GROUNDWATER QUALITY..........................................................................33
5.3.1
SUMMARY OF BETA-EMITTING RADIONUCLIDES
ANALYTICAL
RESULTS.................................................................................34
5.3.1.1
STATION SAMPLING POINTS......................................................................34
5.3.1.2
GROUNDWATER MONITORING WELL SAMPLES.................................34
5.3.1.3
RESIDENTIAL WATER SUPPLY WELLS .....................................................35
5.3.2
SUMMARY OF GAMMA-EMITTING RADIONUCLIDES
ANALYTICAL
RESULTS.................................................................................36
5.3.3
SUMMARY OF FIELD MEASUREMENTS ...................................................36
5.4
SURFACE WATER QUALITY.........................................................................37
6.0
RADIONUCLIDES OF CONCERN AND SOURCE AREAS .........................................38
6.1
GAMMA-EMITTING RADIONUCLIDES.....................................................38
6.2
BETA-EMITTING RADIONUCLIDES ...........................................................38
6.3
TRITIUM.............................................................................................................38
6.3.1
GENERAL CHARACTERISTICS....................................................................38
6.3.2
DISTRIBUTION IN STATION GROUNDWATER.......................................39
6.3.3
CONCEPTUAL MODEL OF TRITIUM RELEASE AND MIGRATION ...41
7.0
EXPOSURE PATHWAY ASSESSMENT............................................................................43
7.1
HEALTH EFFECTS OF TRITIUM...................................................................43
7.2
BACKGROUND CONCENTRATIONS
OF TRITIUM ................................44
7.2.1
GROUNDWATER.............................................................................................44
7.2.2
PRECIPITATION DATA..................................................................................44
7.2.3
SURFACE WATER DATA ...............................................................................45
7.2.4
DRINKING WATER DATA ............................................................................46
7.2.5
EXPECTED TRITIUM BACKGROUND FOR THE STATION ...................46
7.3
IDENTIFICATION OF POTENTIAL EXPOSURE PATHWAYS AND
POTENTIAL RECEPTORS...............................................................................47
7.3.1
POTENTIAL GROUNDWATER MIGRATION TO DRINKING
WATER
USERS AT THE STATION PROPERTY .........................................47
7.3.2
POTENTIAL GROUNDWATER MIGRATION TO DRINKING
WATER
USERS OFF THE STATION PROPERTY .......................................48
045136 (13) Byron Generating Station
CONESTOGA-ROVERS & ASSOCIATES
Revision 1
TABLE OF CONTENTS
Page
7.3.3
POTENTIAL GROUNDWATER MIGRATION TO
SURFACE
WATER USERS ..............................................................................48
7.4
SUMMARY OF POTENTIAL TRITIUM EXPOSURE
PATHWAYS.......................................................................................................48
7.5
OTHER RADIONUCLIDES.............................................................................49
8.0
CONCLUSIONS....................................................................................................................50
9.0
RECOMMENDATIONS.......................................................................................................54
9.1
DATA GAPS ......................................................................................................54
9.2
GROUNDWATER MONITORING ................................................................54
10.0
REFERENCES........................................................................................................................55
045136 (13) Byron Generating Station
CONESTOGA-ROVERS & ASSOCIATES
Revision 1
LIST OF FIGURES
(Following Text)
FIGURE 1.1
STATION LOCATION MAP
FIGURE 1.2
STATION BOUNDARIES AND FEATURES
FIGURE 2.1
LOCAL GEOLOGIC CROSS-SECTIONS A-A' AND B-B'
FIGURE 2.2
LOCAL GEOLOGIC CROSS-SECTION C-C'
FIGURE 2.3
MONITORING WELL LOCATIONS
FIGURE 2.4
GROUNDWATER CONTOUR MAP - MARCH 2006
FIGURE 3.1
AREA FOR FURTHER EVALUATION – FORMER FIBERGLASS
BLOWDOWN LINE
FIGURE 3.2
AREA FOR FURTHER EVALUATION – BLOWDOWN LINE
FIGURE 3.3
AREA FOR FURTHER EVALUATION –PROTECTED AREA
FIGURE 5.1
HYDROGEOLOGIC CROSS-SECTION LOCATIONS
FIGURE 5.2
HYDROGEOLOGIC CROSS-SECTION X1-X1'
FIGURE 5.3
HYDROGEOLOGIC CROSS-SECTION X2-X2'
FIGURE 5.4
HYDROGEOLOGIC CROSS-SECTIONS X3-X3' AND X3-X3''
FIGURE 5.5
POTENTIOMETRIC SURFACE CONTOURS - APRIL 2006 – UPPER
GALENA-PLATTEVILLE AQUIFER
FIGURE 5.6
POTENTIOMETRIC SURFACE CONTOURS - APRIL 2006 – BOTTOM
OF GALENA-PLATTEVILLE AQUIFER
FIGURE 5.7
POTENTIOMETRIC SURFACE CONTOURS - APRIL 2006 – ST. PETER
SANDSTONE AQUIFER
FIGURE 5.8
TRITIUM CONCENTRATIONS – STATION SAMPLING LOCATIONS
FIGURE 5.9
TRITIUM CONCENTRATIONS – UPPER GALENA-PLATTEVILLE
AQUIFER
045136 (13) Byron Generating Station
CONESTOGA-ROVERS & ASSOCIATES
Revision 1
LIST OF FIGURES
(Following Text)
FIGURE 5.10
TRITIUM CONCENTRATIONS – BOTTOM OF GALENA-PLATTEVILLE
AQUIFER
FIGURE 5.11
TRITIUM CONCENTRATIONS – ST. PETER SANDSTONE AQUIFER
FIGURE 5.12
TRITIUM CONCENTRATIONS – RESIDENTIAL WELL LOCATIONS
FIGURE 5.13
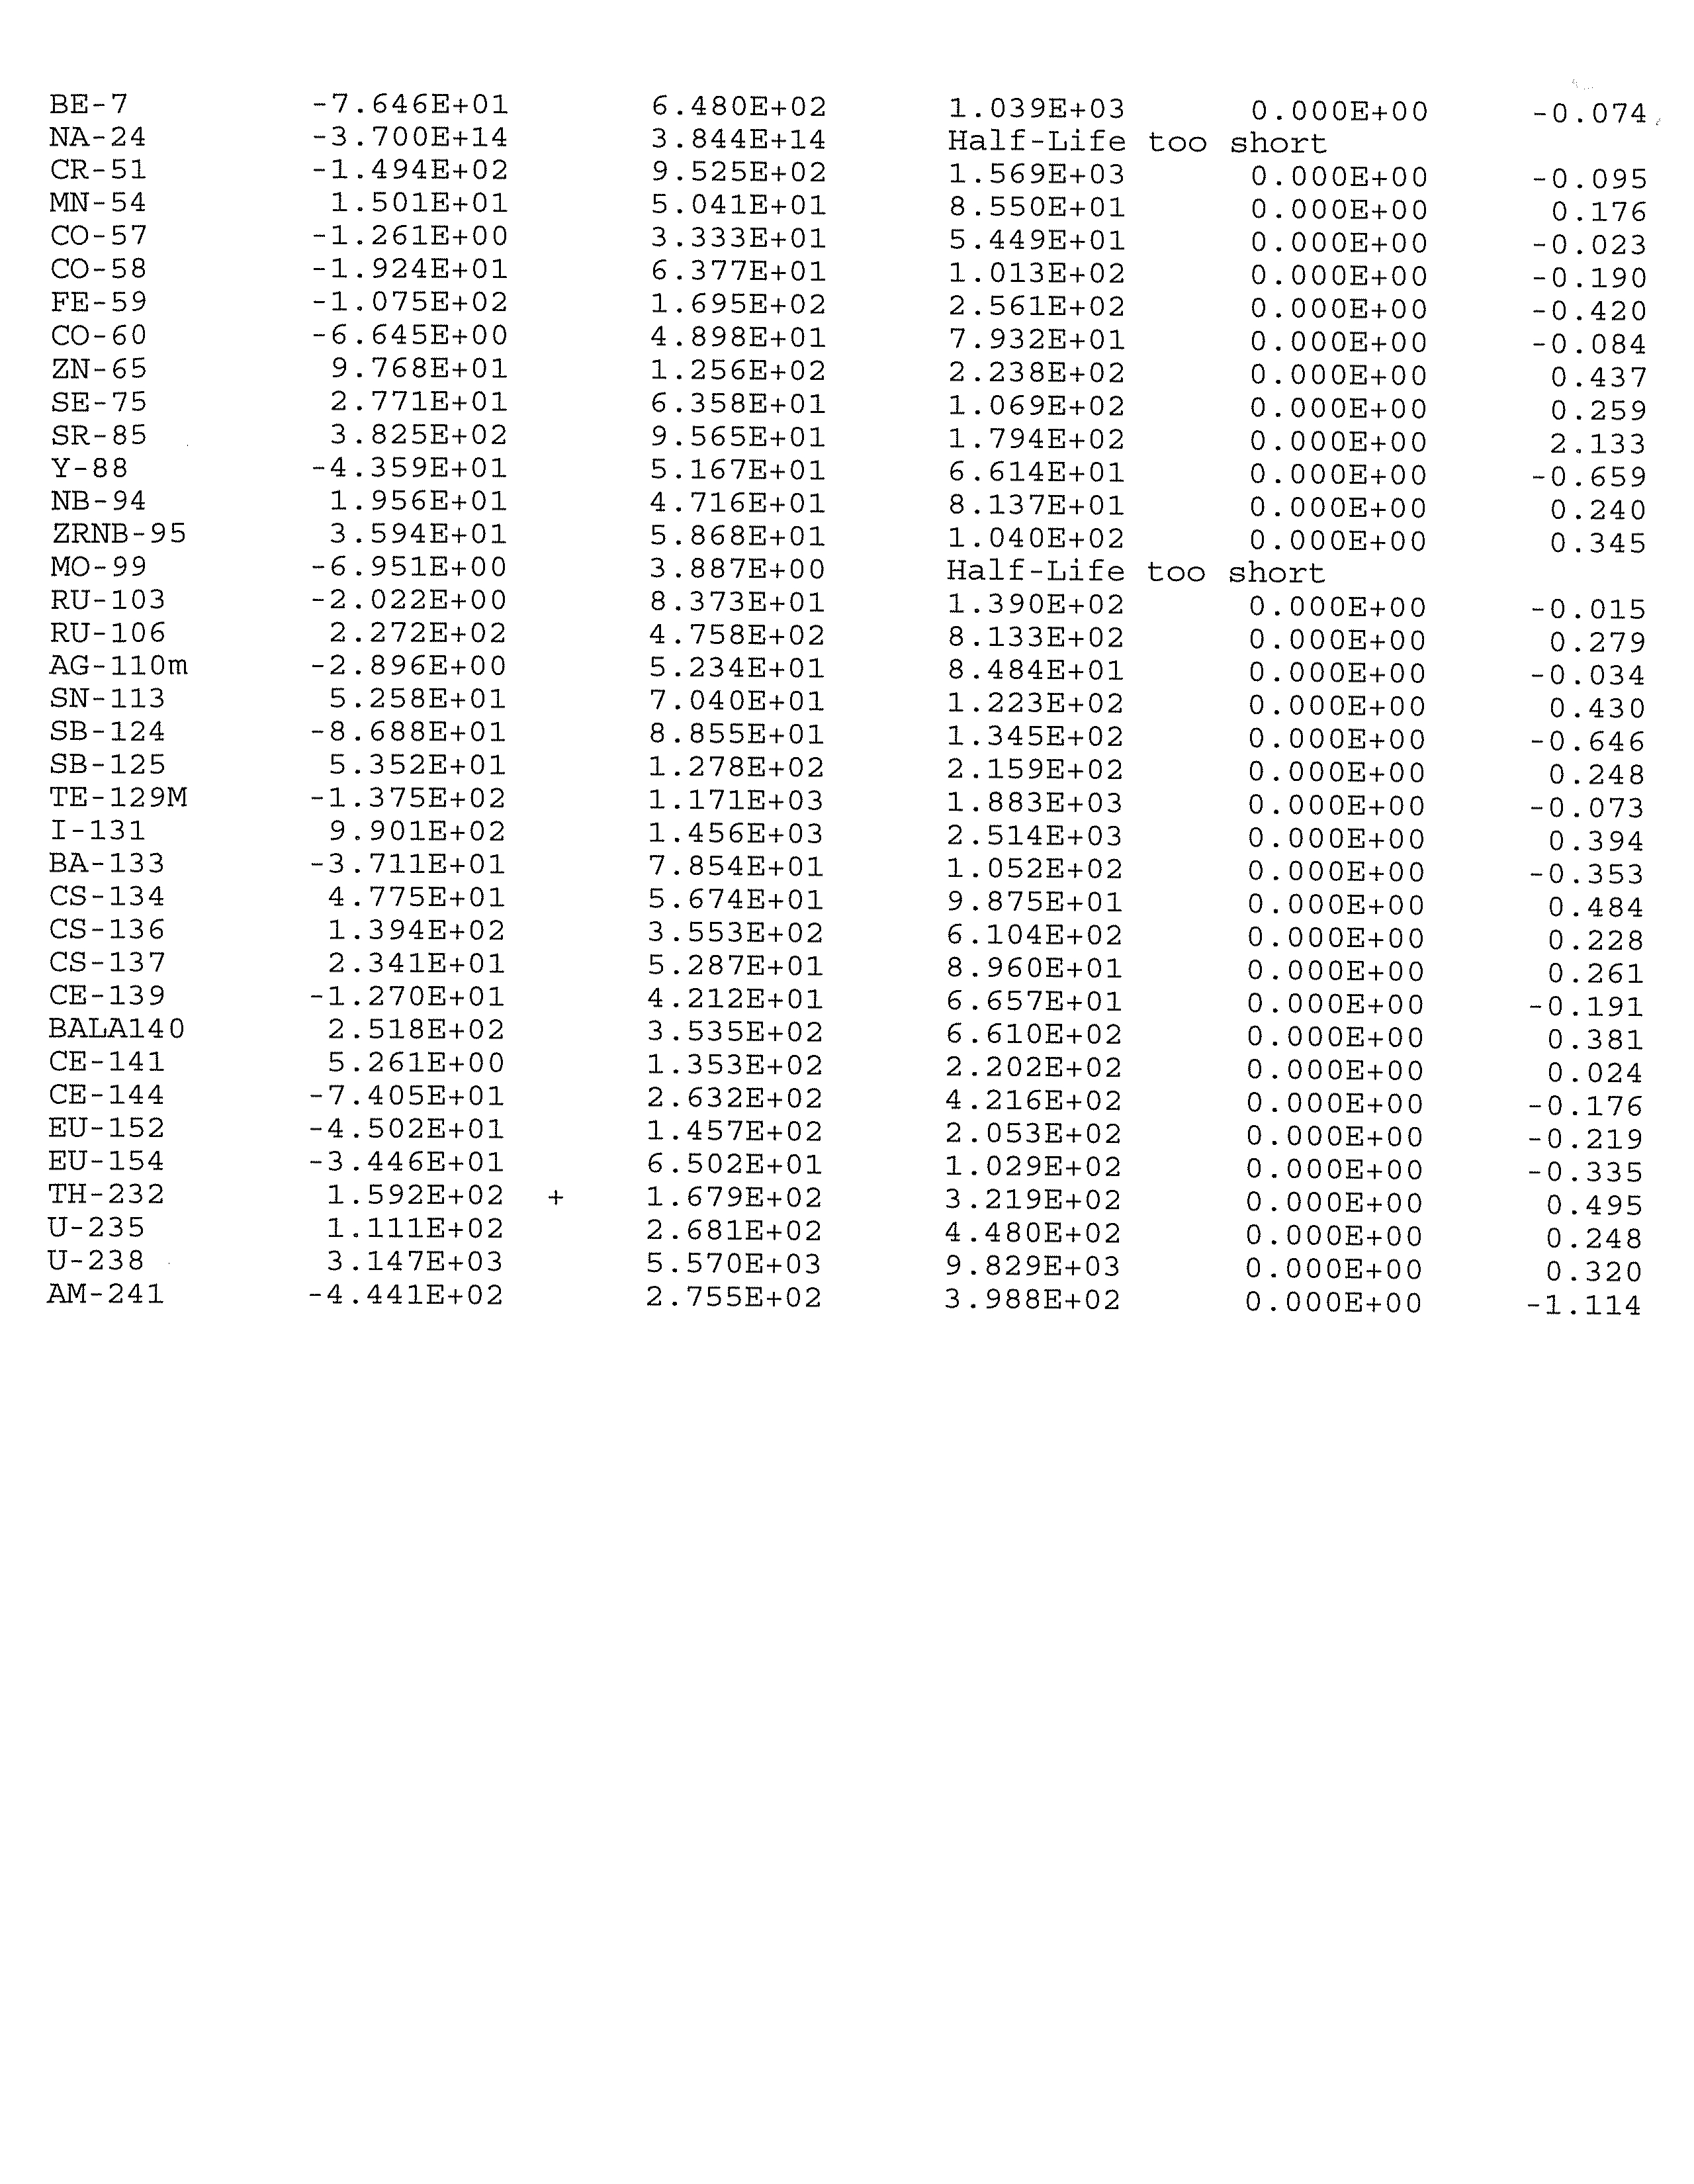
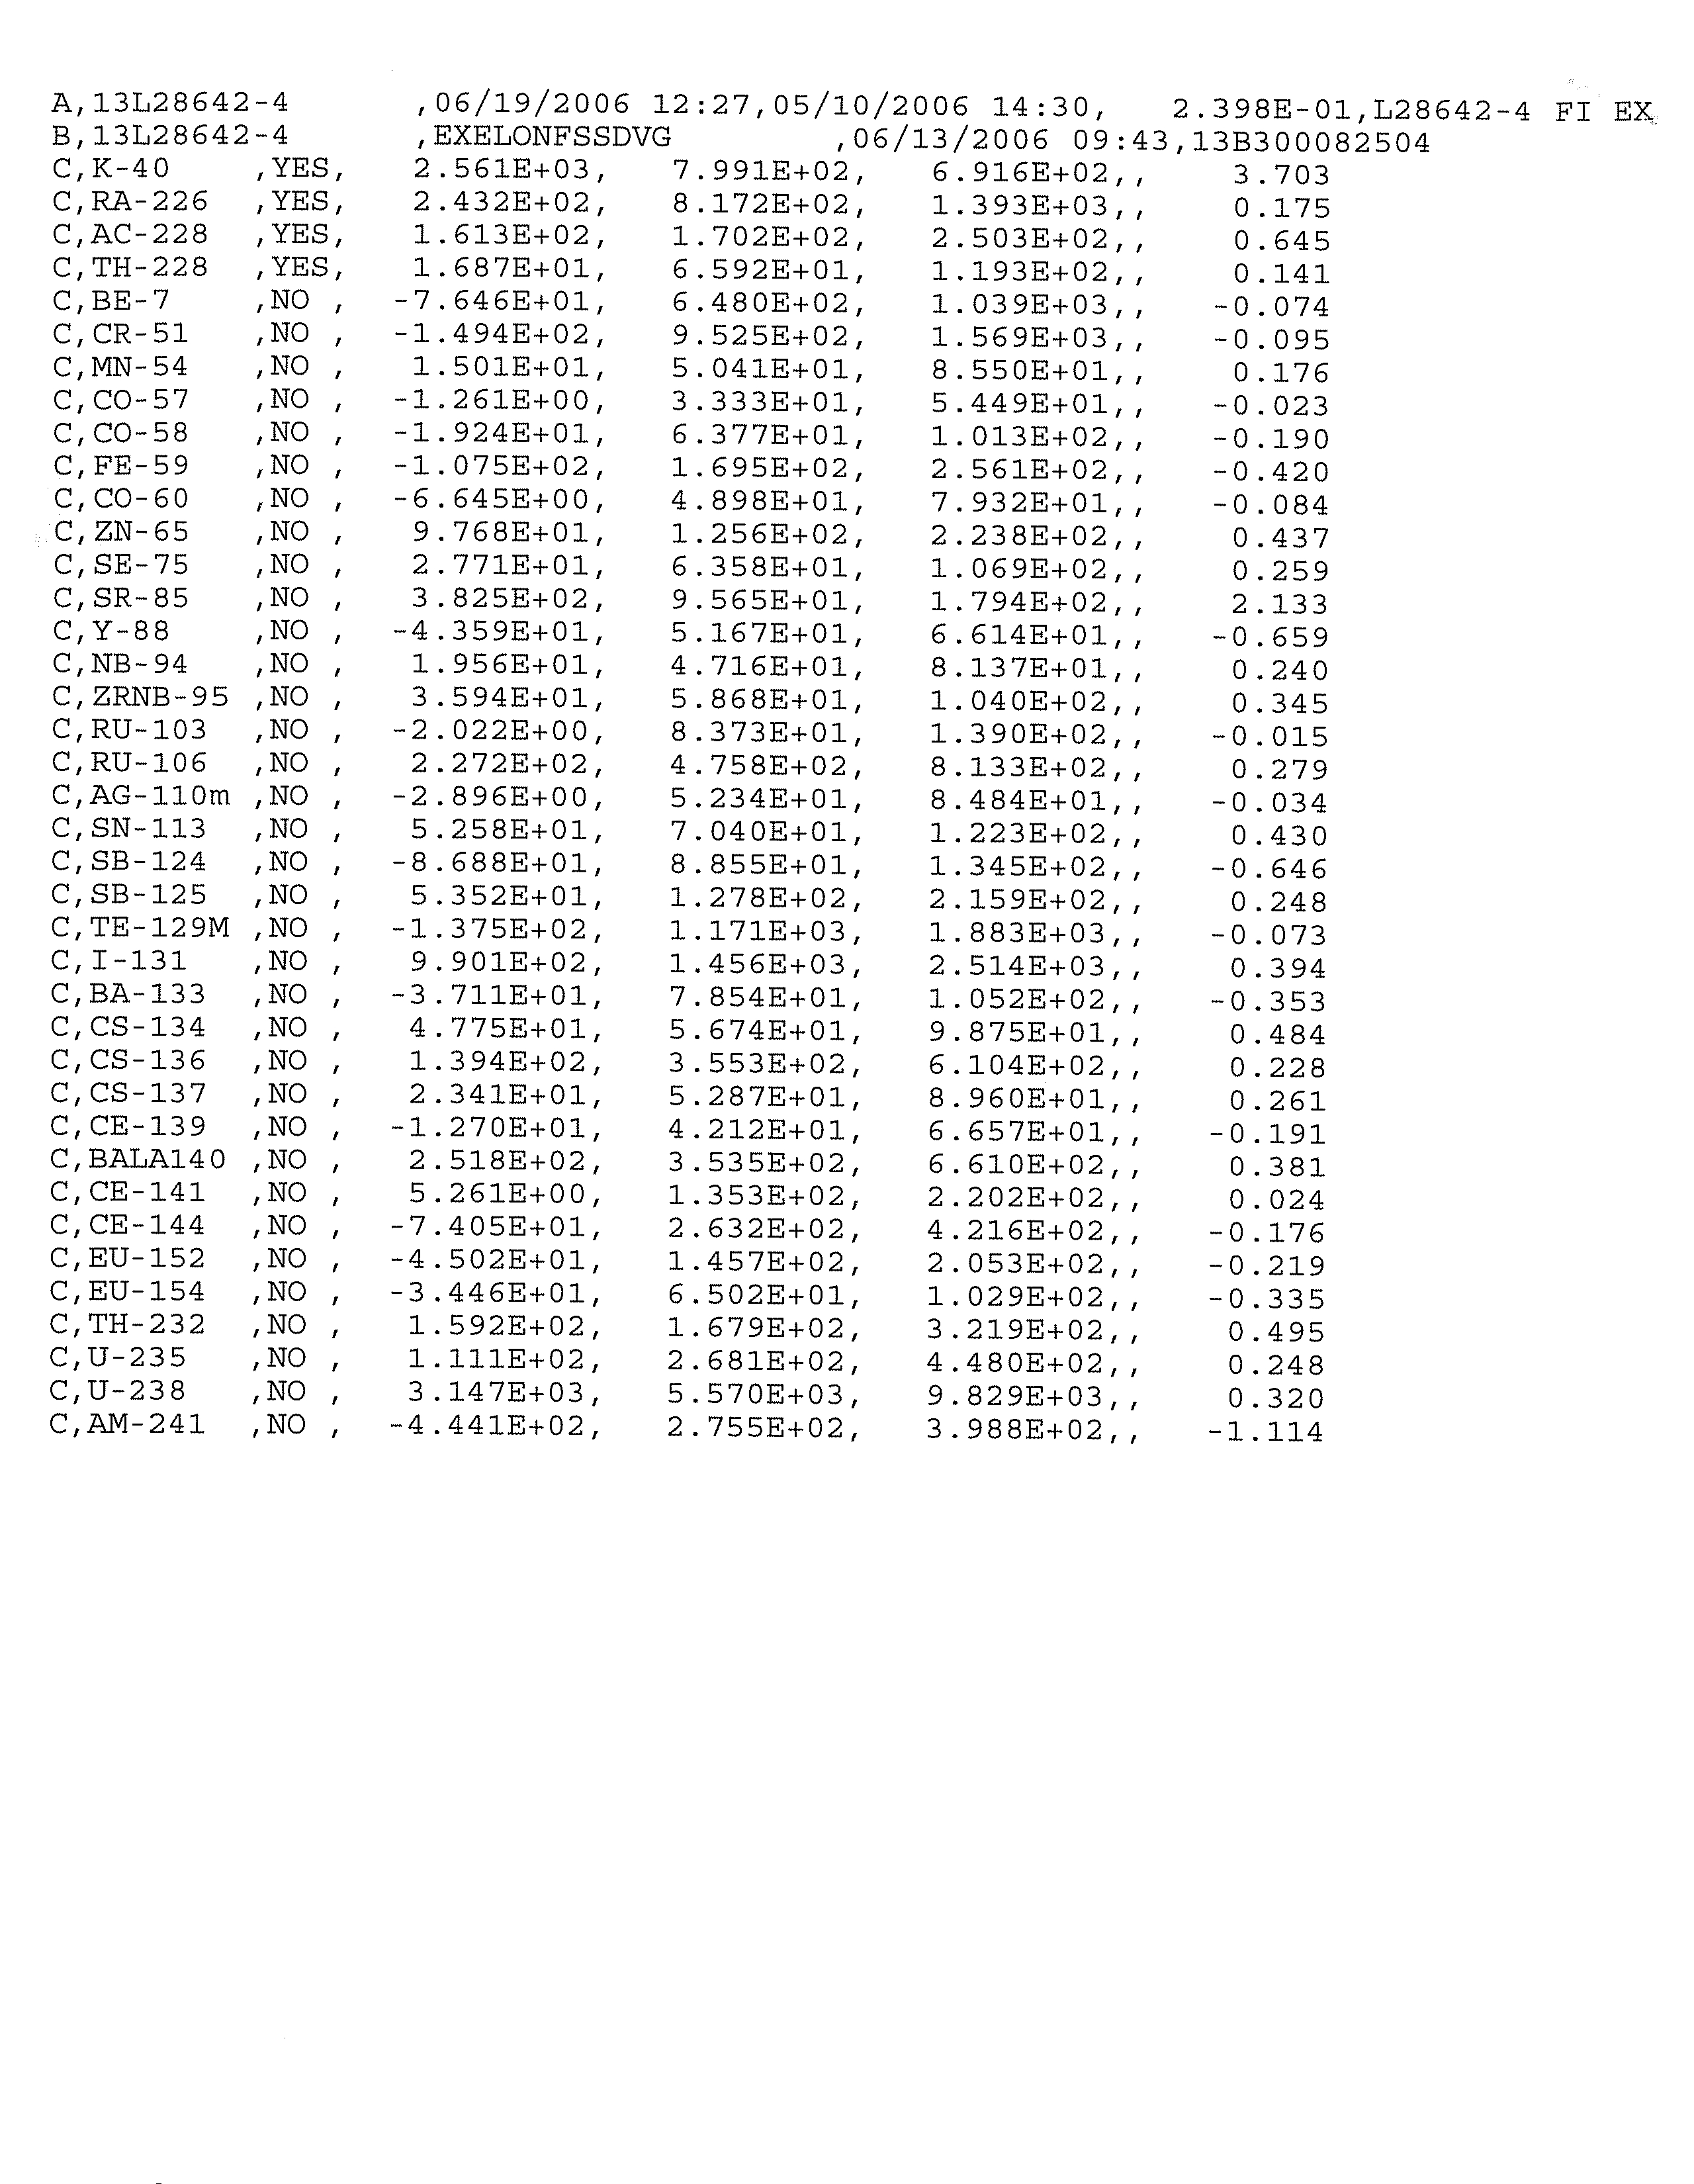
RADIONUCLIDE CONCENTRATIONS
045136 (13) Byron Generating Station
CONESTOGA-ROVERS & ASSOCIATES
Revision 1
LIST OF TABLES
(Following Text)
TABLE 2.1
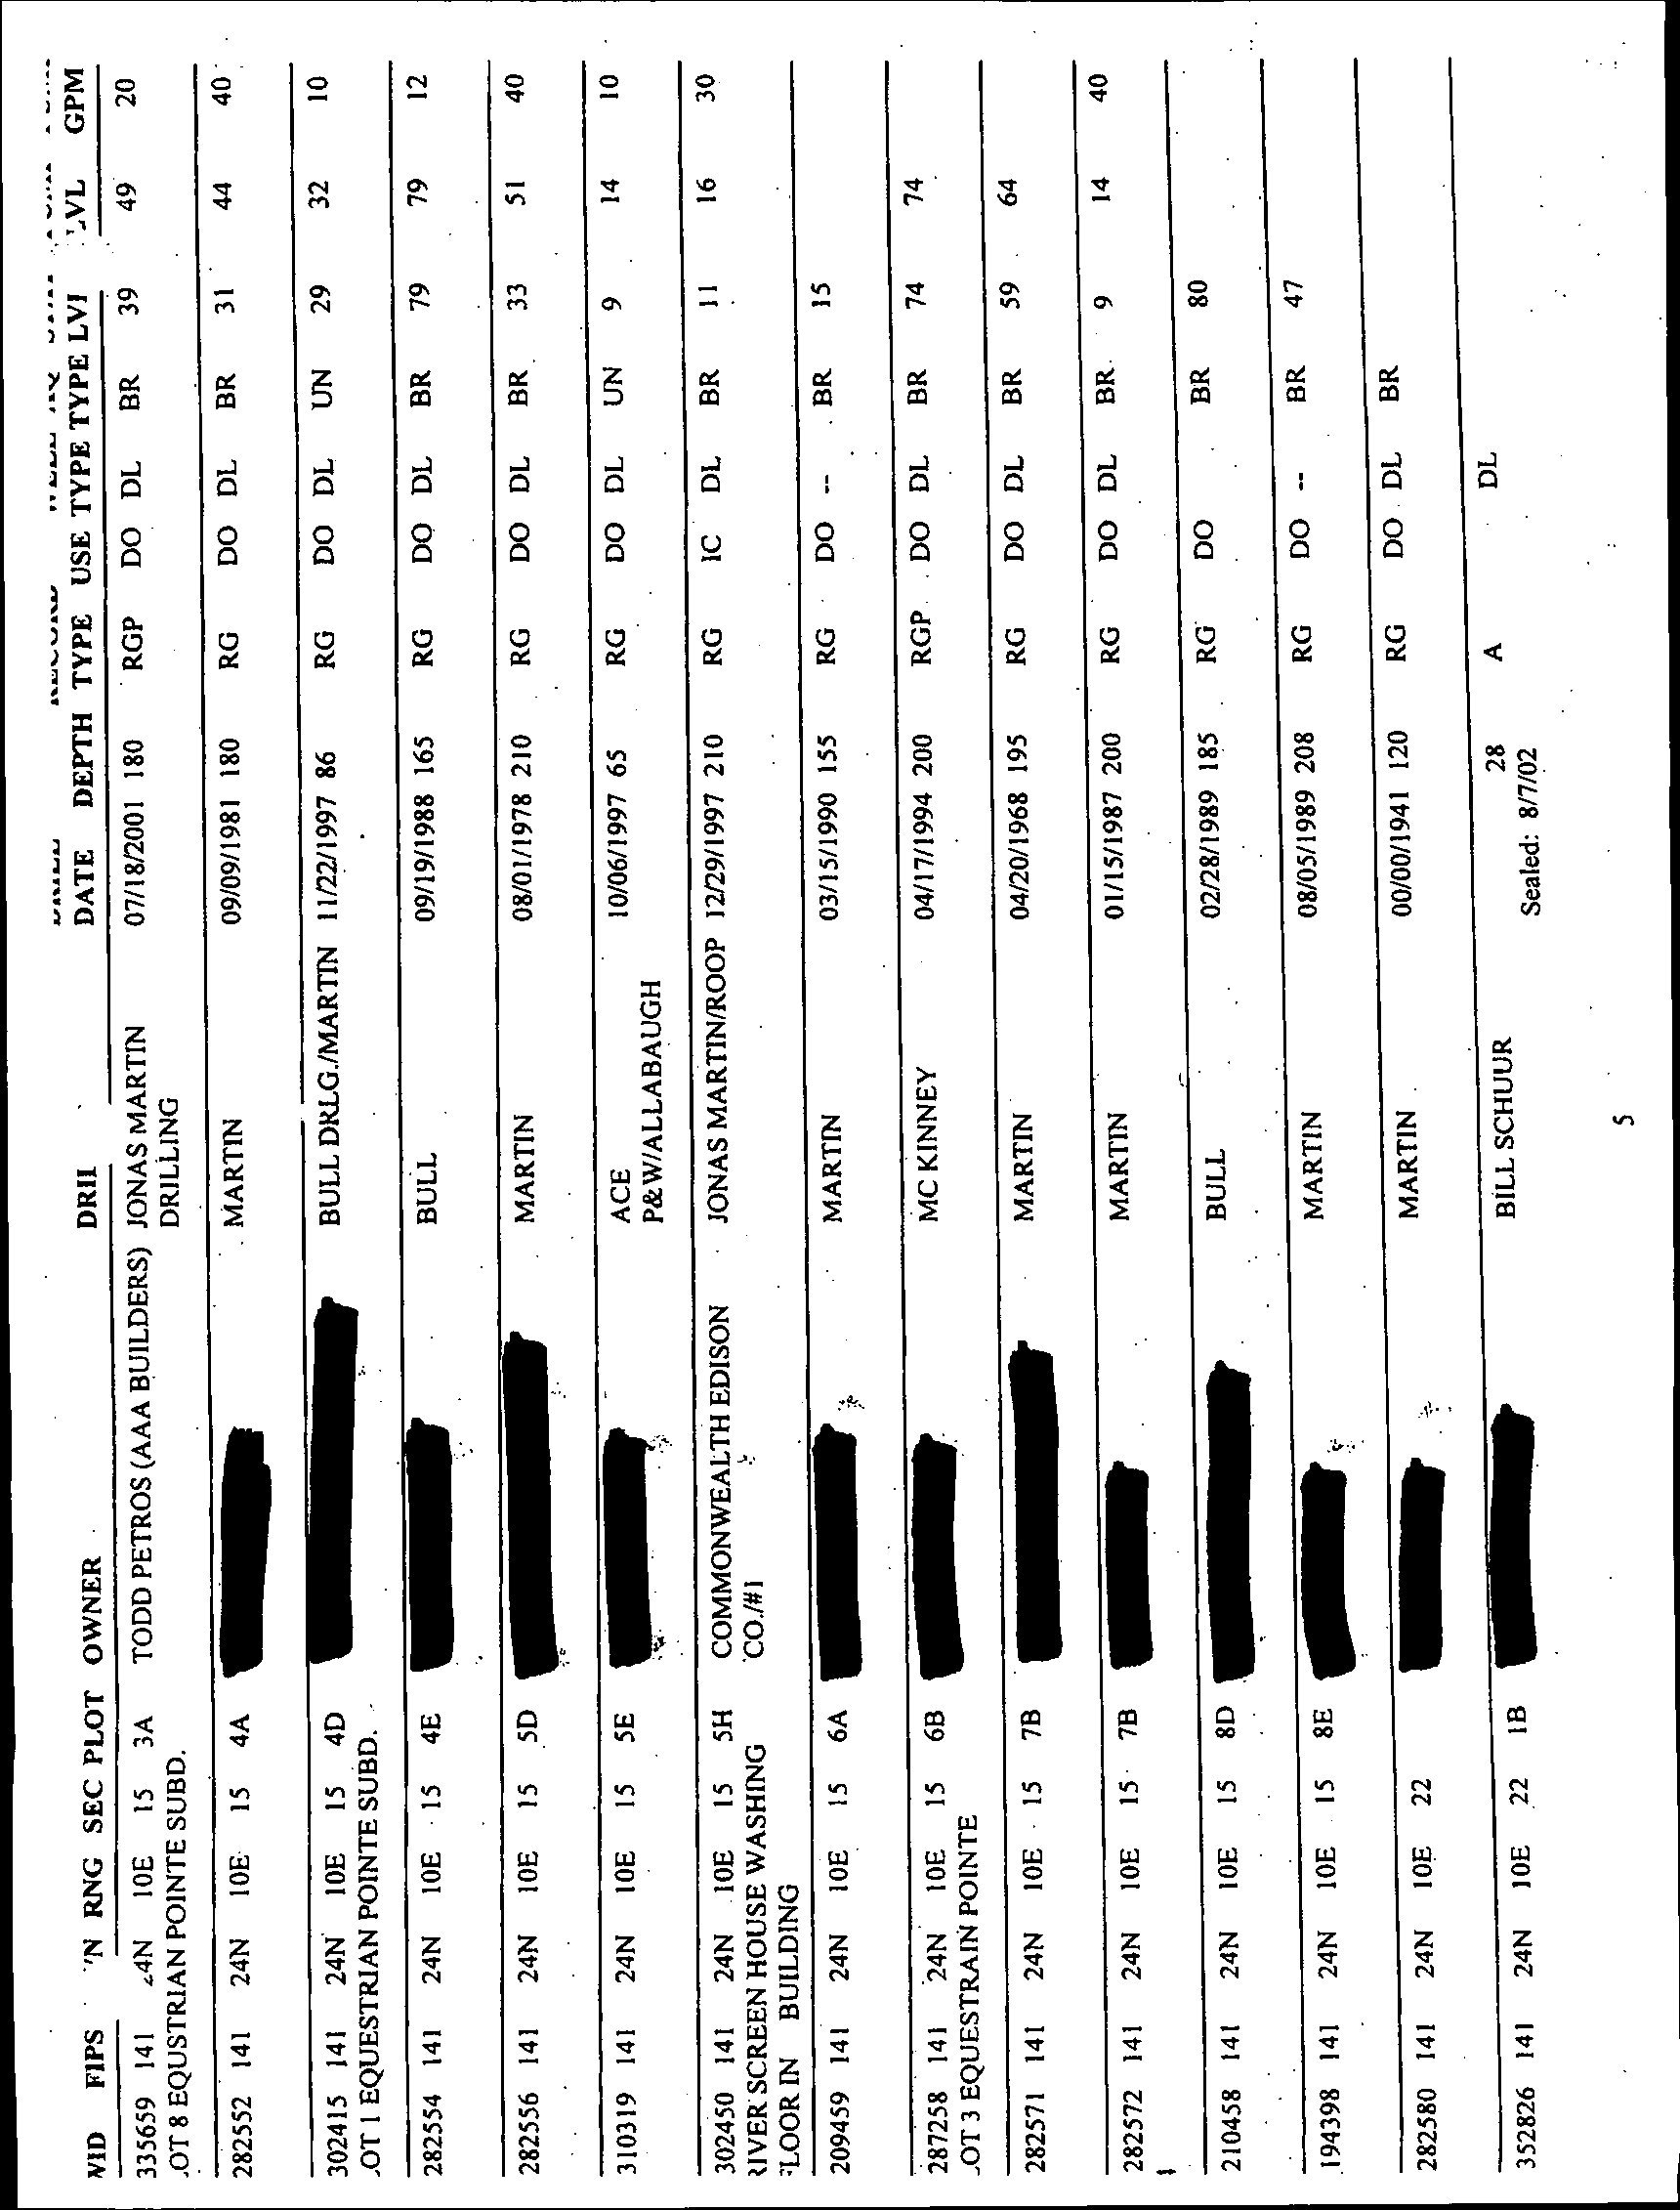
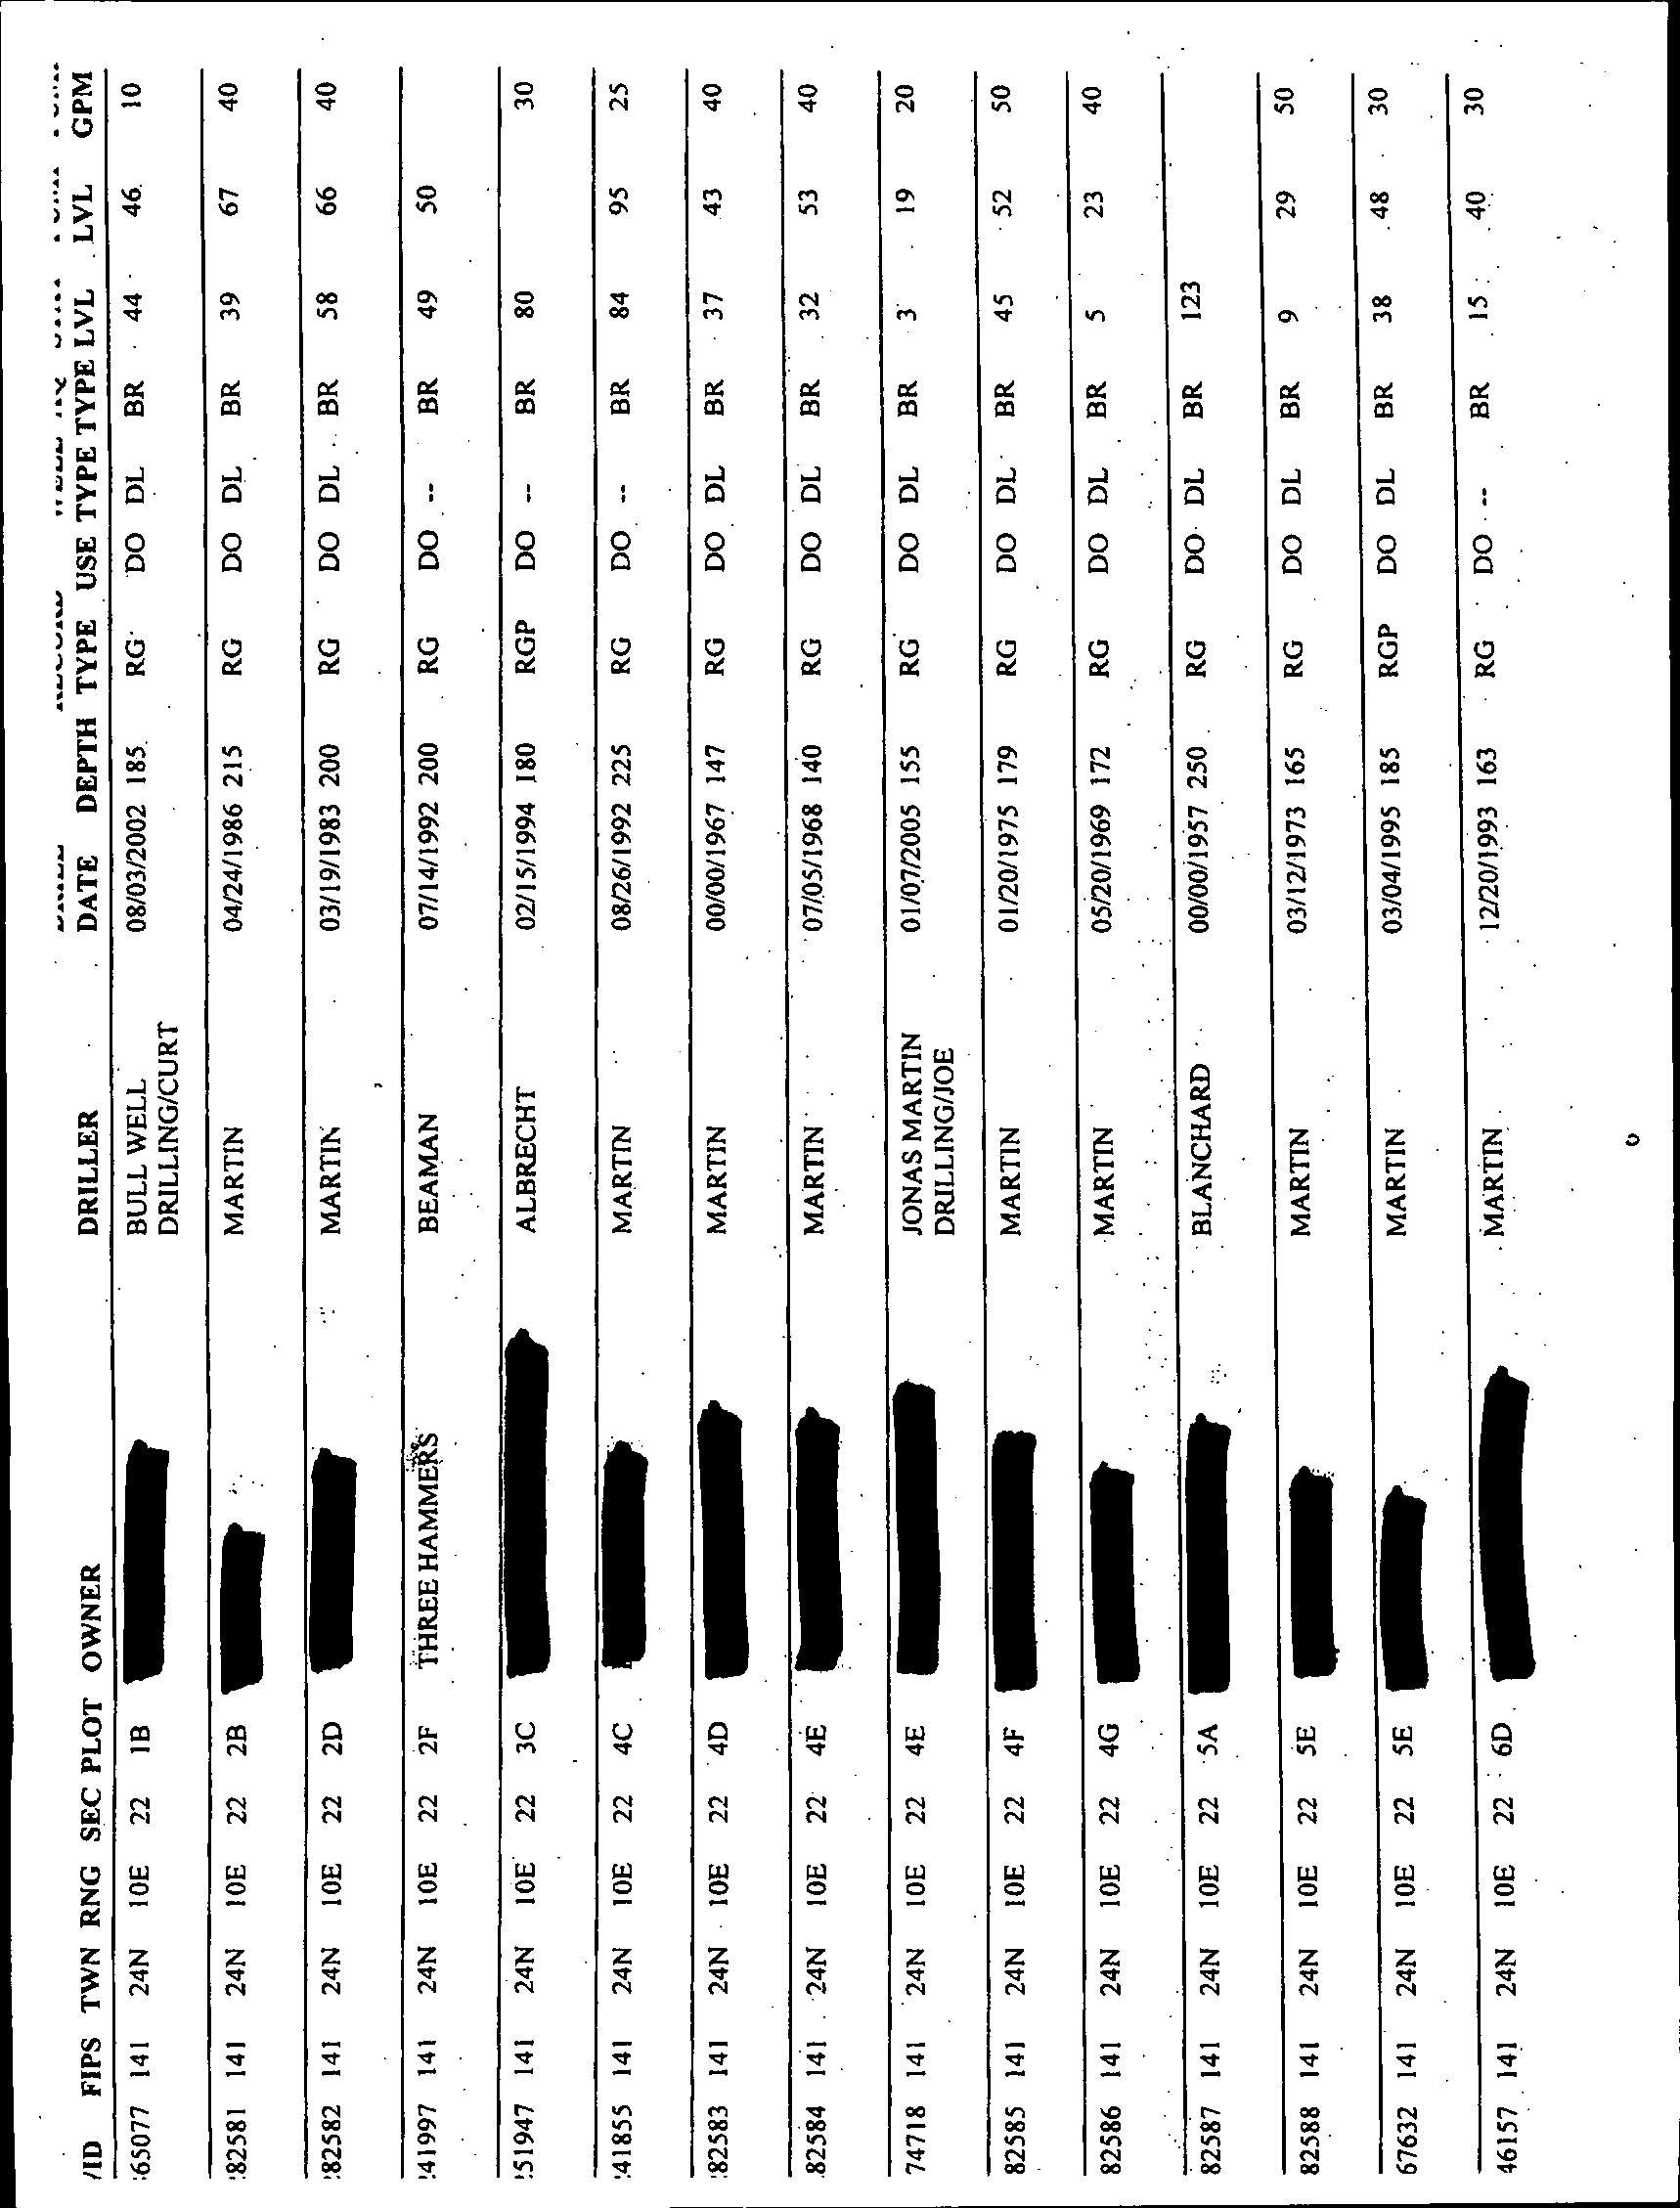
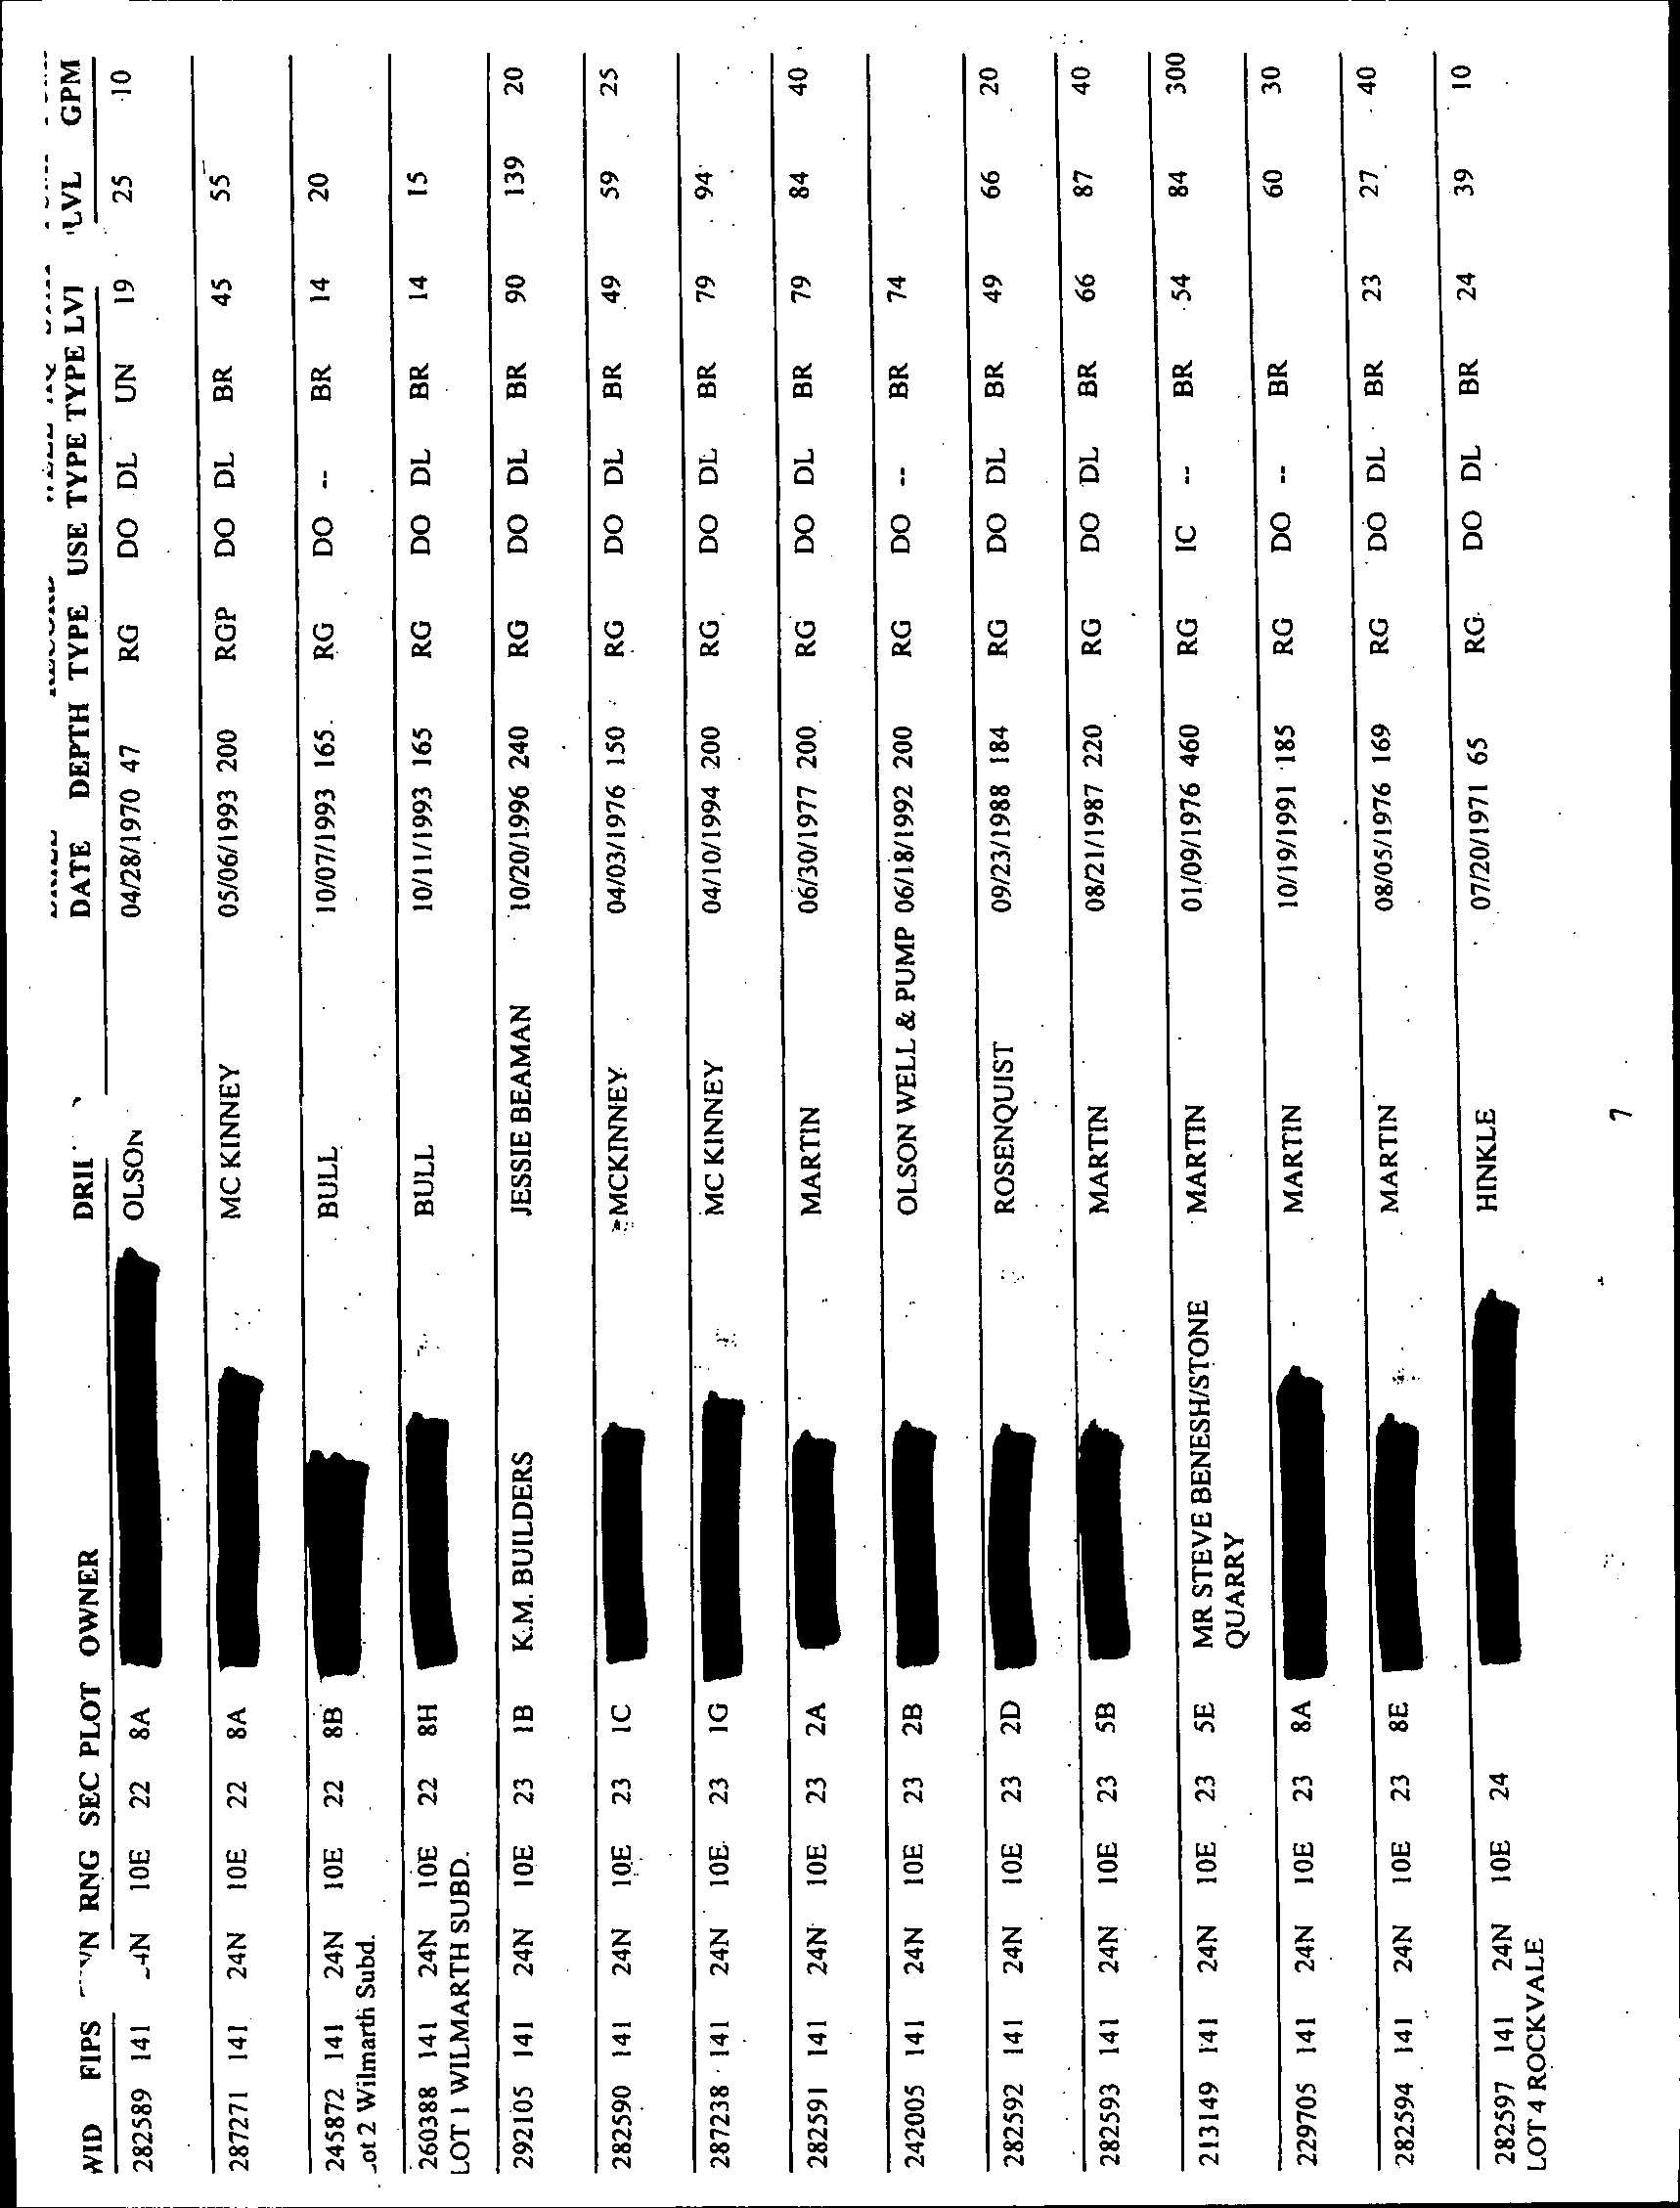
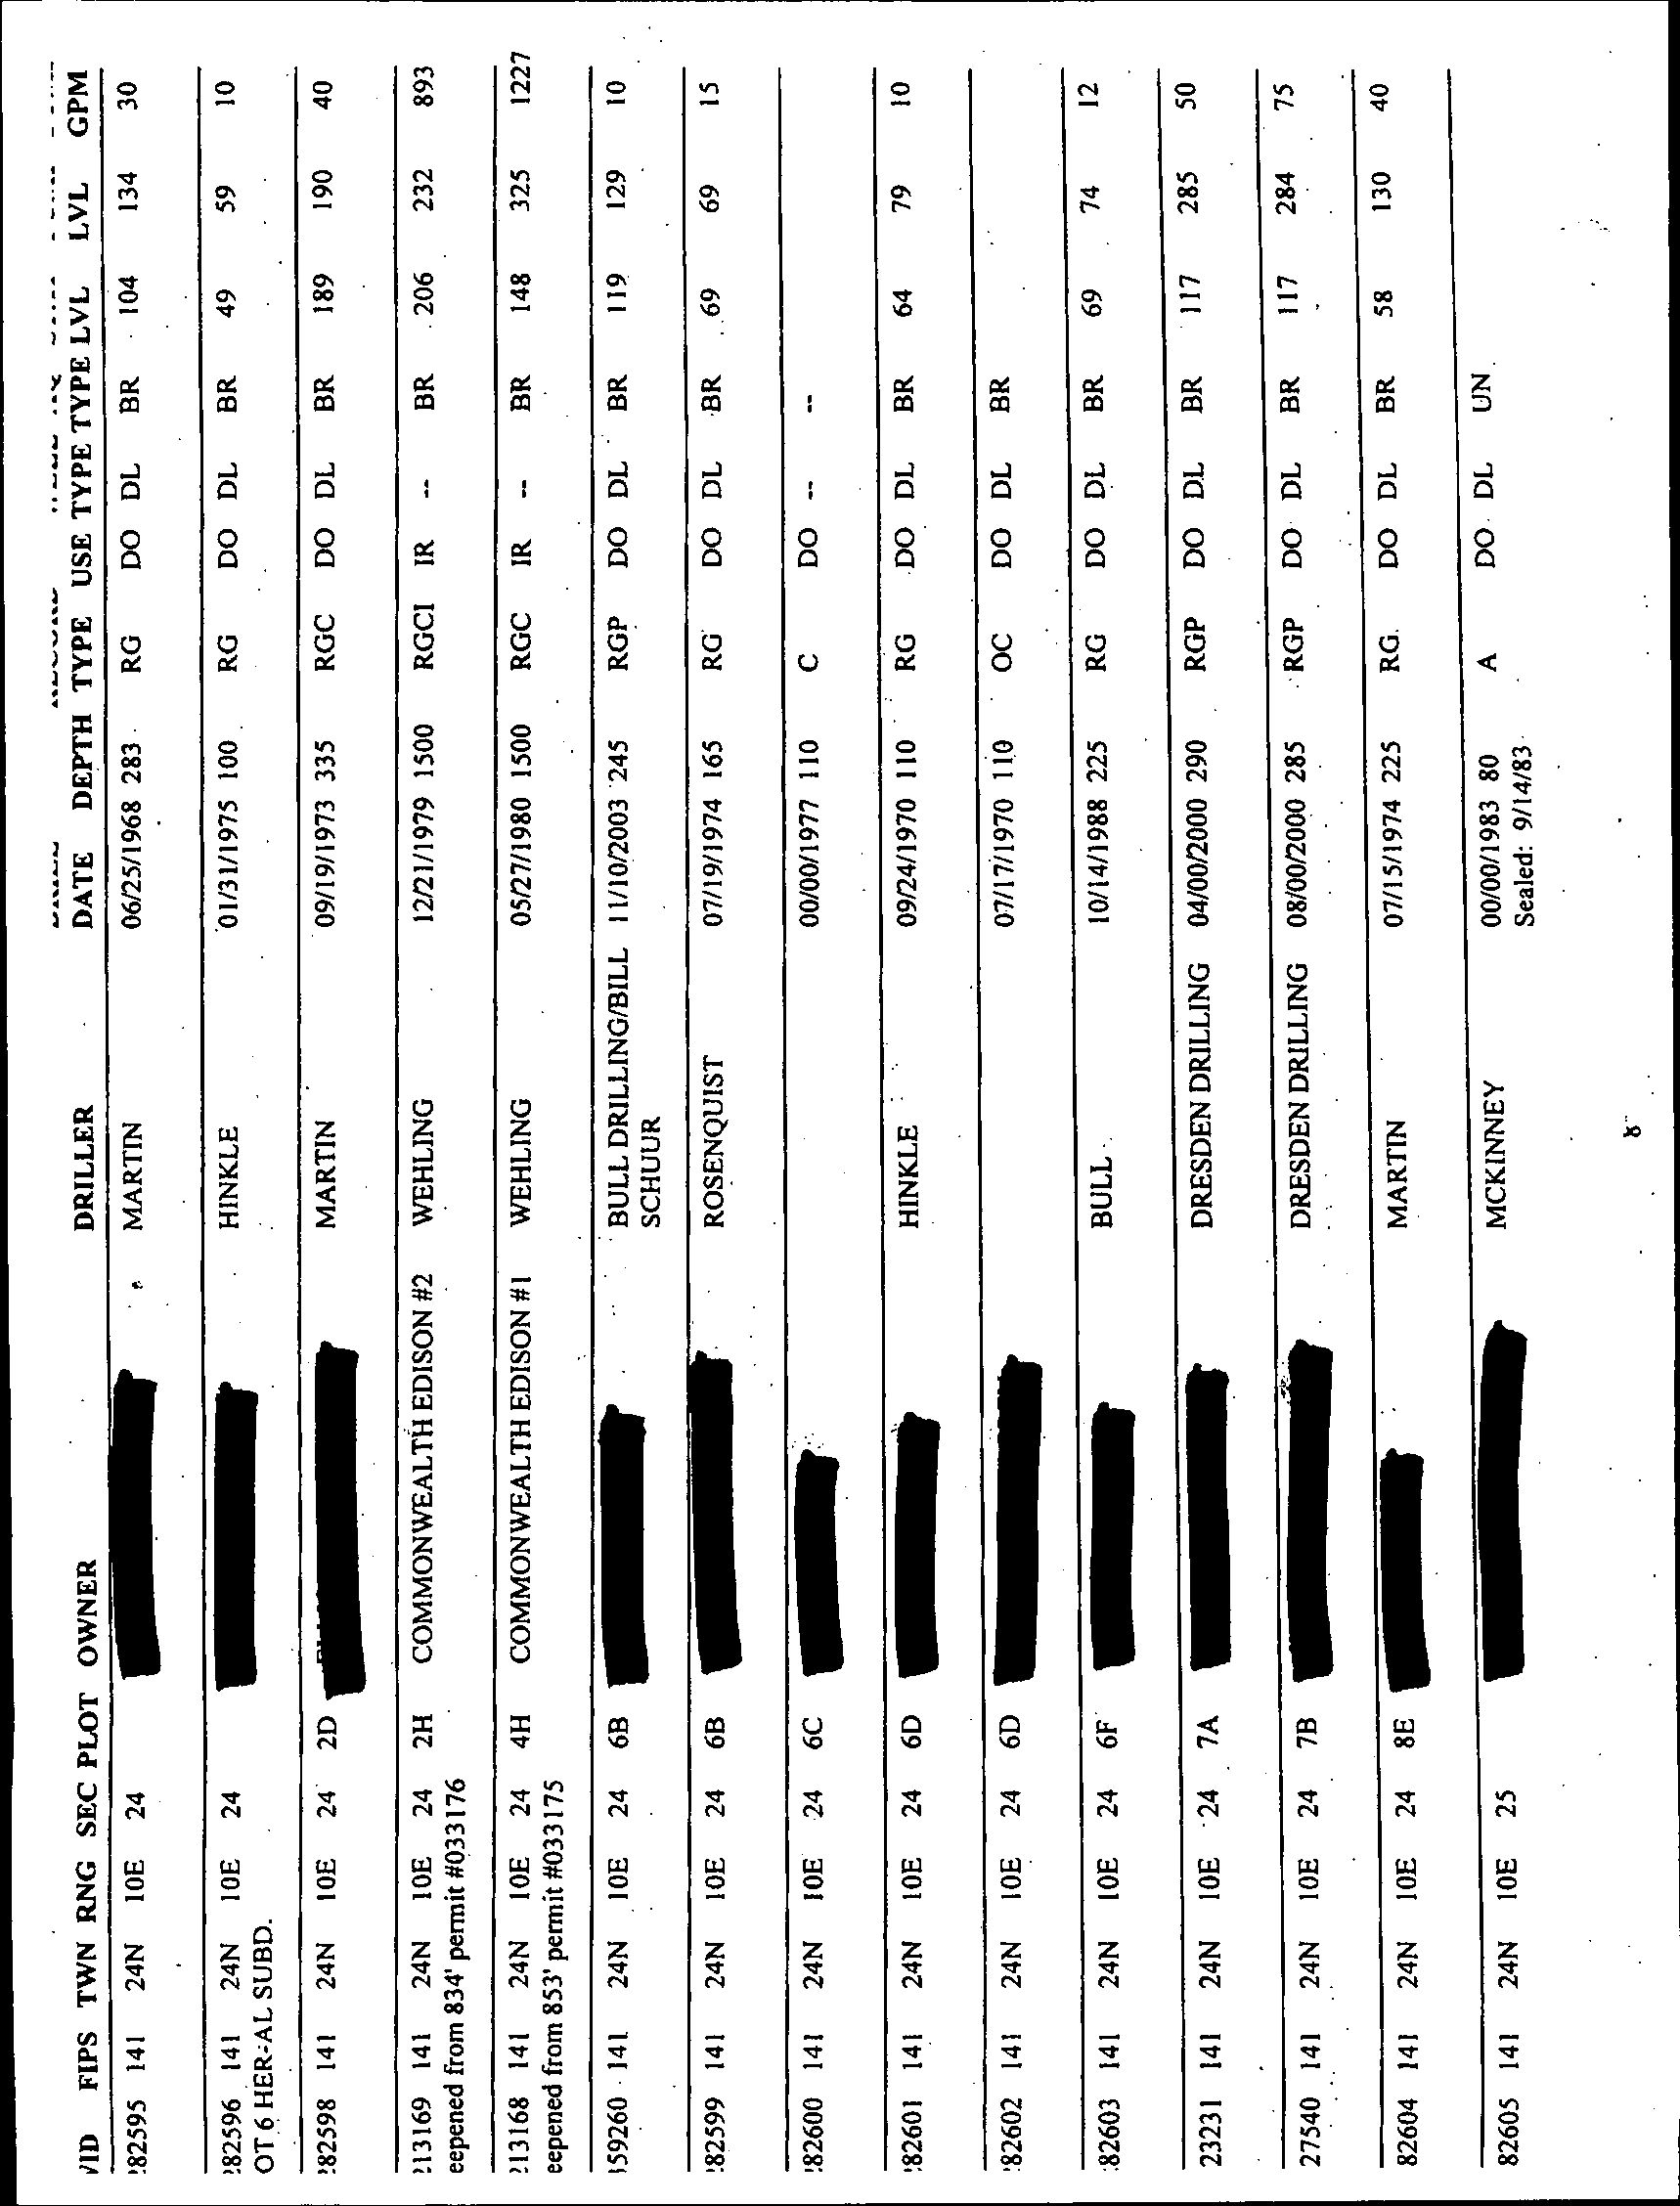
SUMMARY OF EXISTING WELL INFORMATION
TABLE 4.1
SUMMARY OF MONITORING WELL DEVELOPMENT– BLOWDOWN
LINE INVESTIGATION
TABLE 4.2
SUMMARY OF GROUNDWATER ELEVATIONS – MARCH/APRIL 2006
TABLE 4.3
SUMMARY OF MONITORING WELL PURGING PARAMETERS –
MARCH/APRIL 2006
TABLE 4.4
SAMPLE SUMMARY – BLOWDOWN LINE INVESTIGATION
TABLE 4.5
SUMMARY OF GROUNDWATER ELEVATIONS – APRIL 24, 2006
TABLE 4.6
SAMPLE SUMMARY – FLEETWIDE INVESTIGATION
TABLE 4.7
SUMMARY OF MONITORING WELL PURGING PARAMETERS –
FLEETWIDE SAMPLING EVENT
TABLE 5.1
CALCULATED VERTICAL HYDRAULIC GRADIENTS
TABLE 5.2
SUMMARY OF TRITIUM CONCENTRATIONS IN WATER – STATION
SAMPLING LOCATIONS
TABLE 5.3
SUMMARY OF TRITIUM CONCENTRATIONS IN GROUNDWATER -
FEBRUARY-APRIL 2006
TABLE 5.4
SUMMARY OF TRITIUM CONCENTRATIONS IN WATER –
RESIDENTIAL
WATER SUPPLY WELLS
TABLE 5.5
SUMMARY OF RADIONUCLIDE CONCENTRATIONS IN
GROUNDWATER
045136 (13) Byron Generating Station
CONESTOGA-ROVERS & ASSOCIATES
Revision 1
LIST OF APPENDICES
APPENDIX A
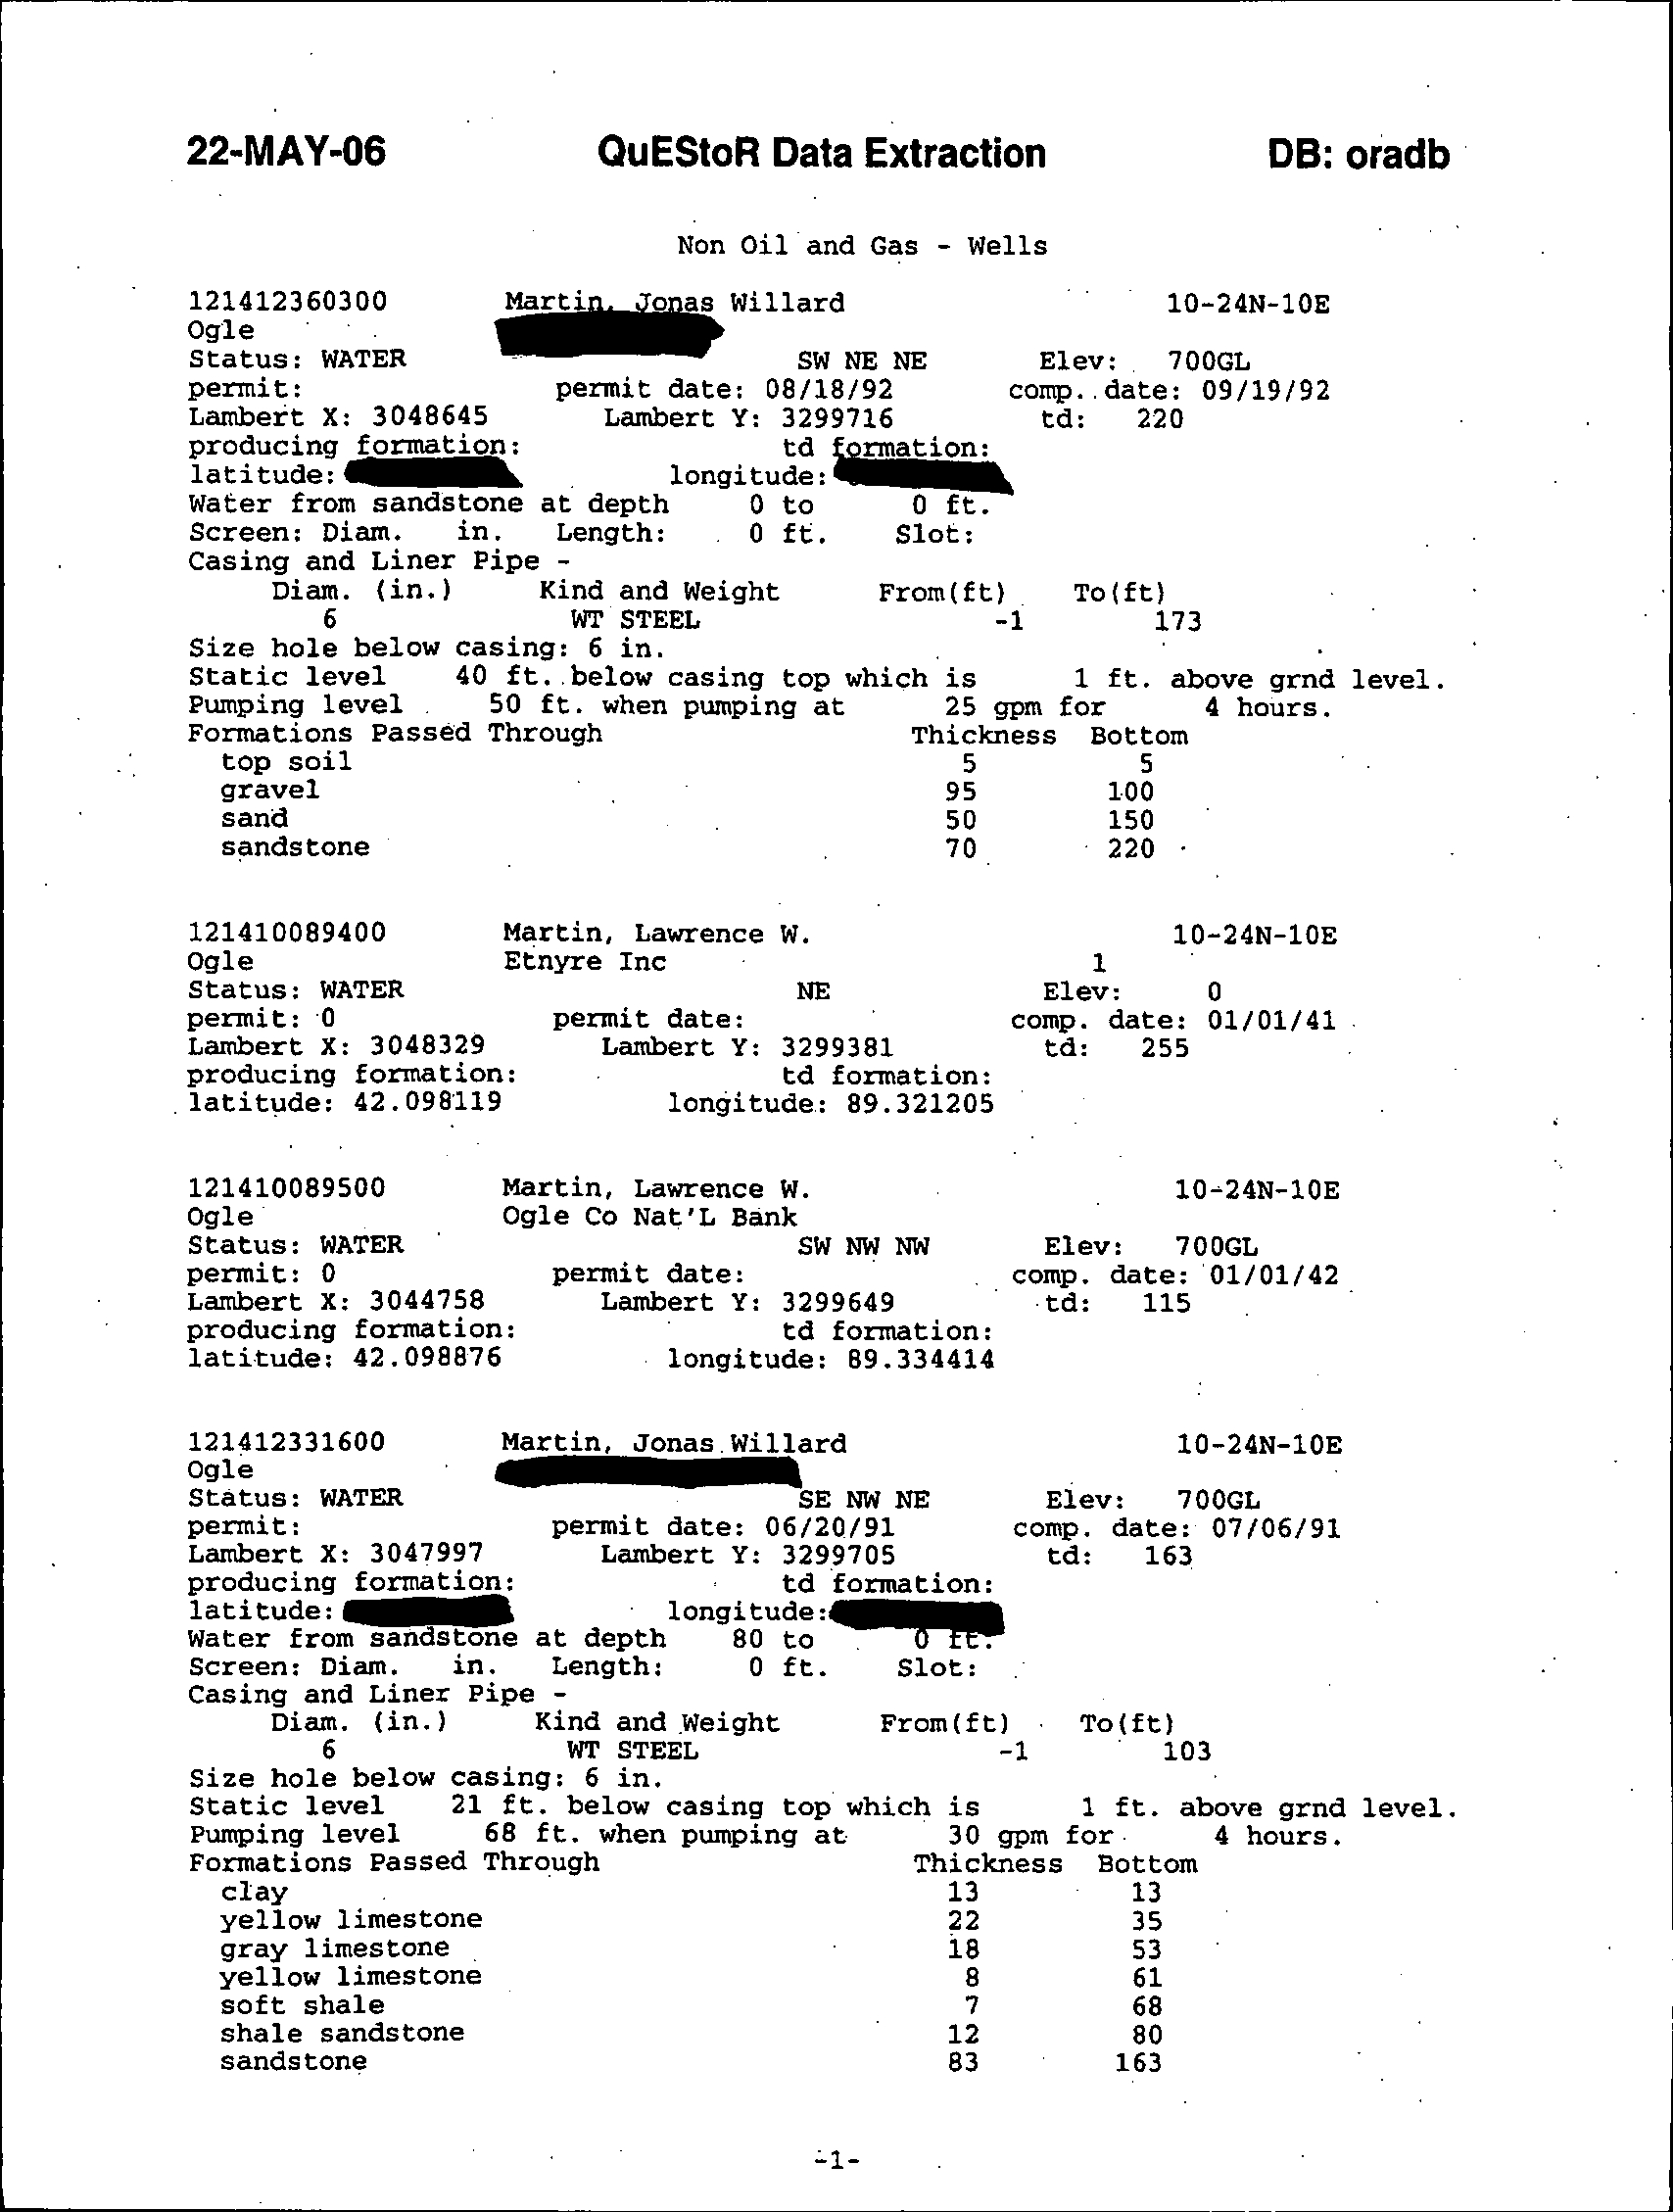
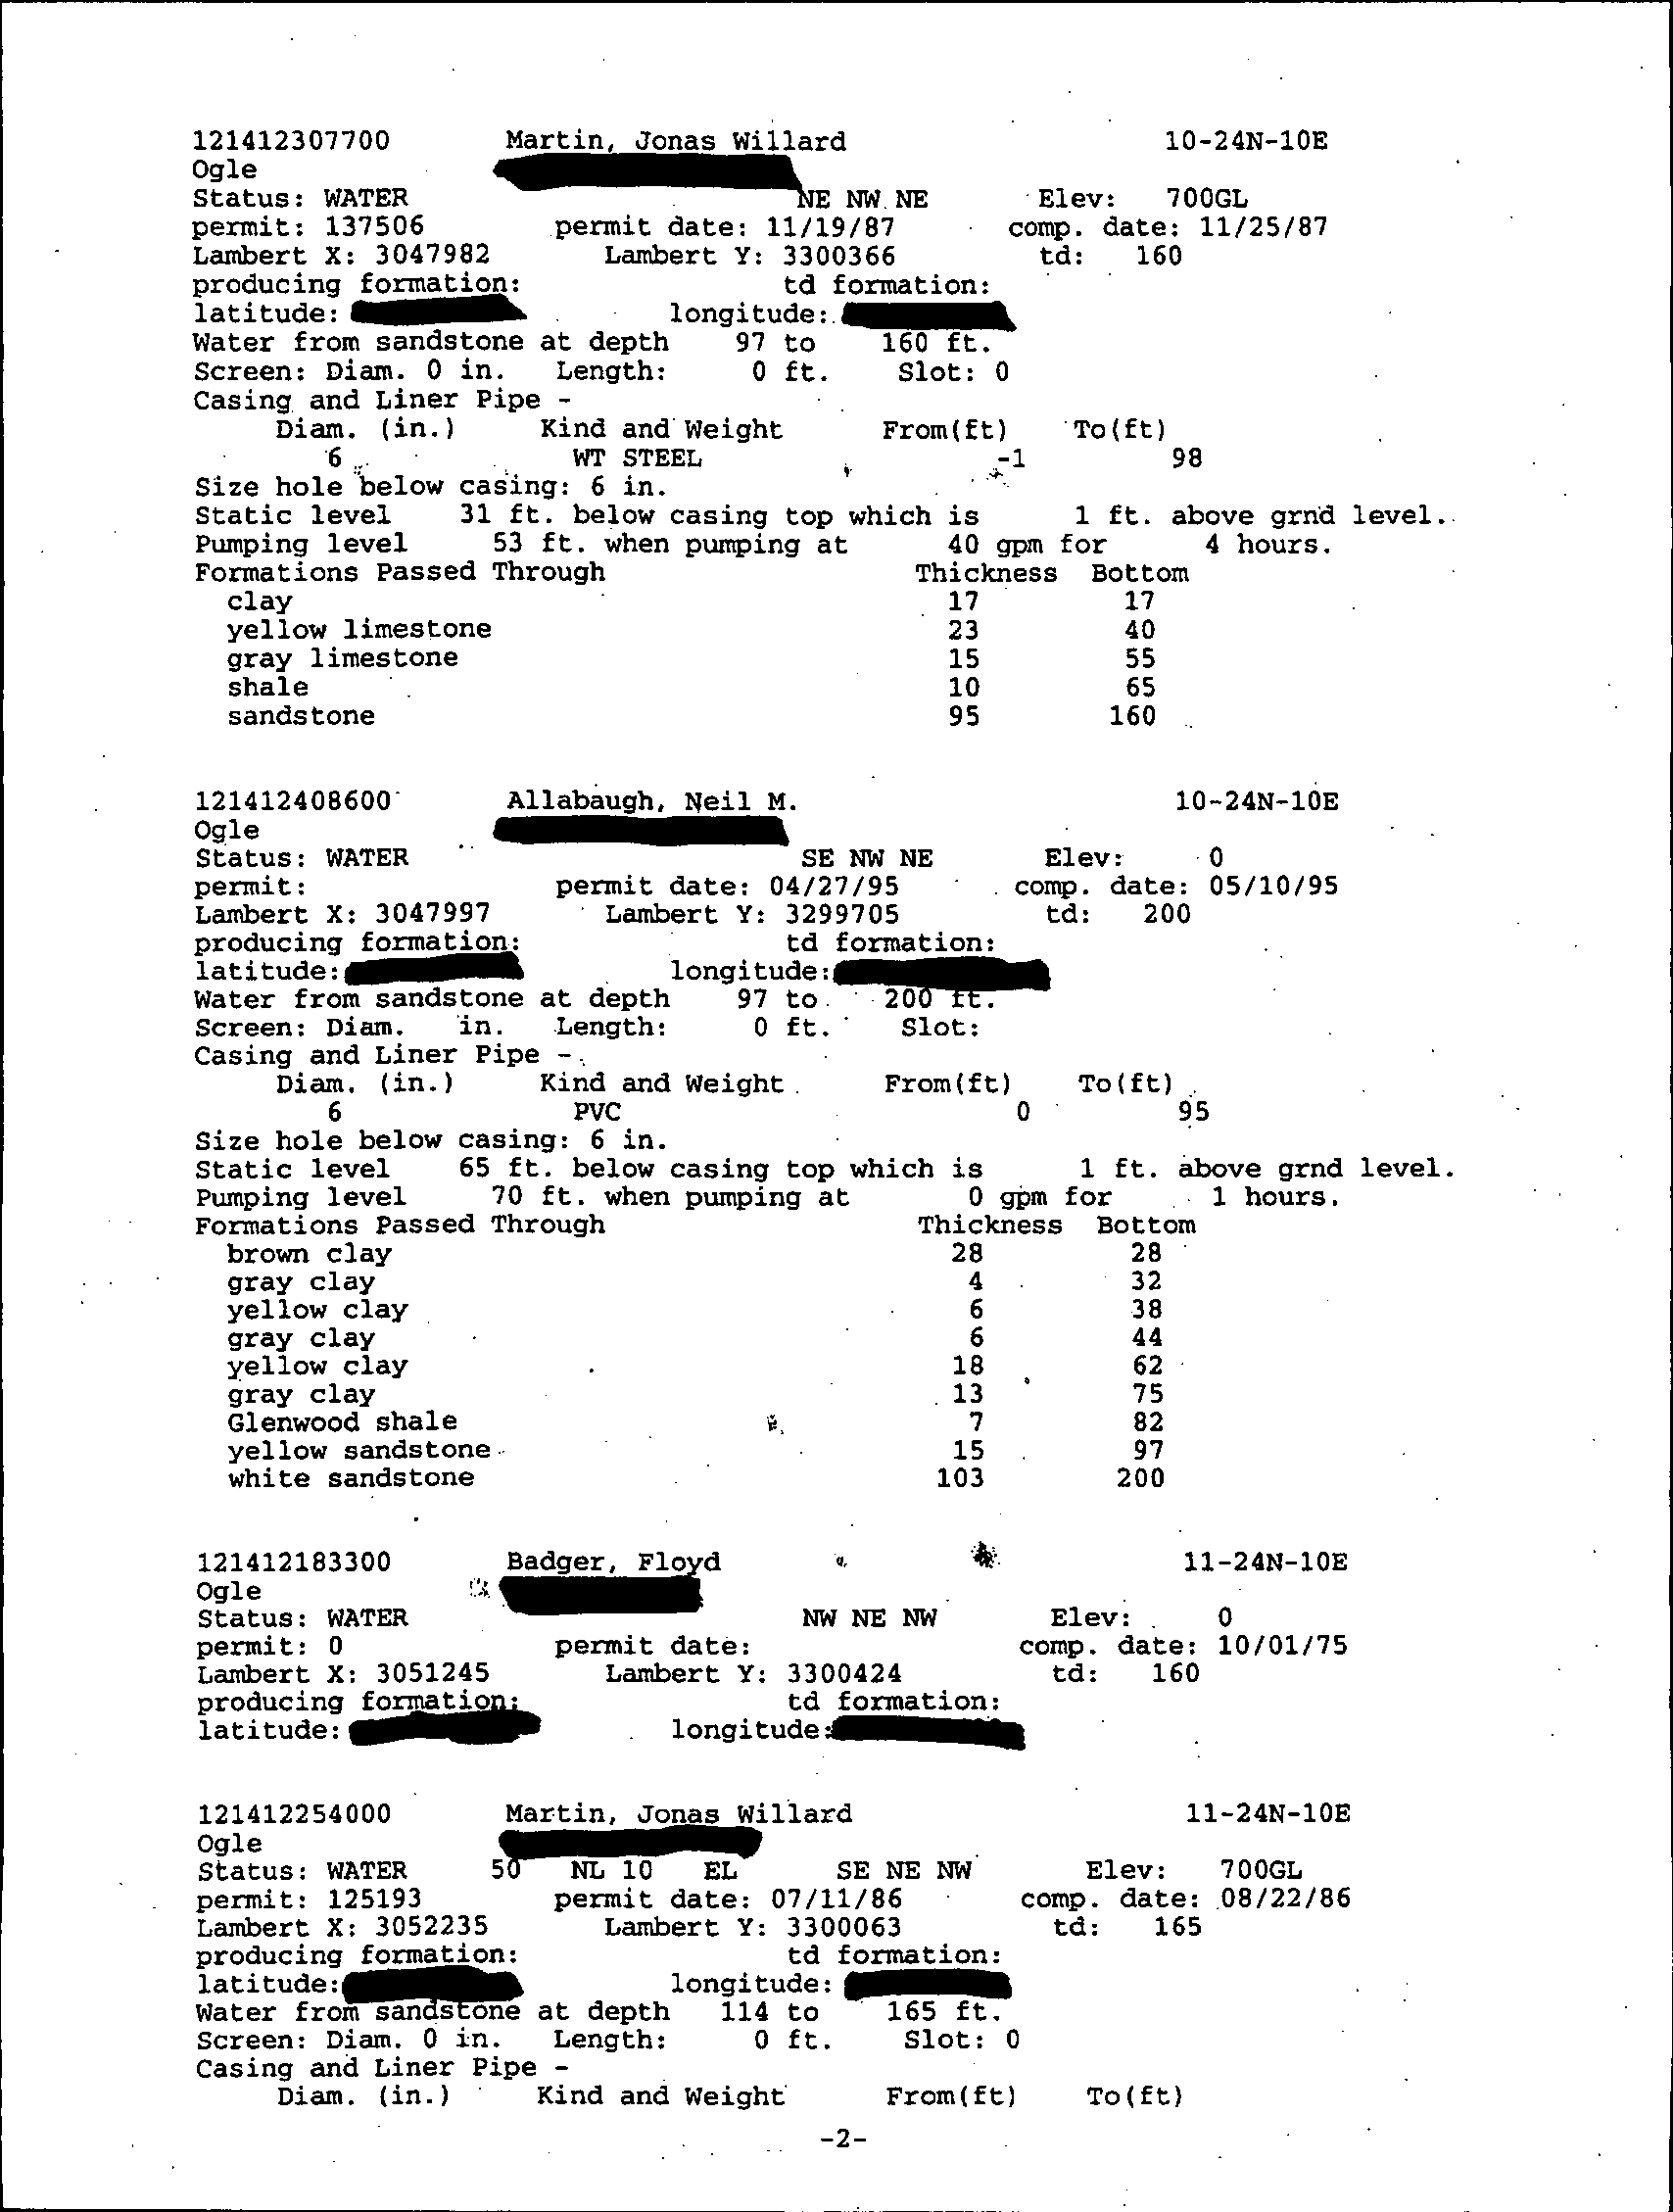
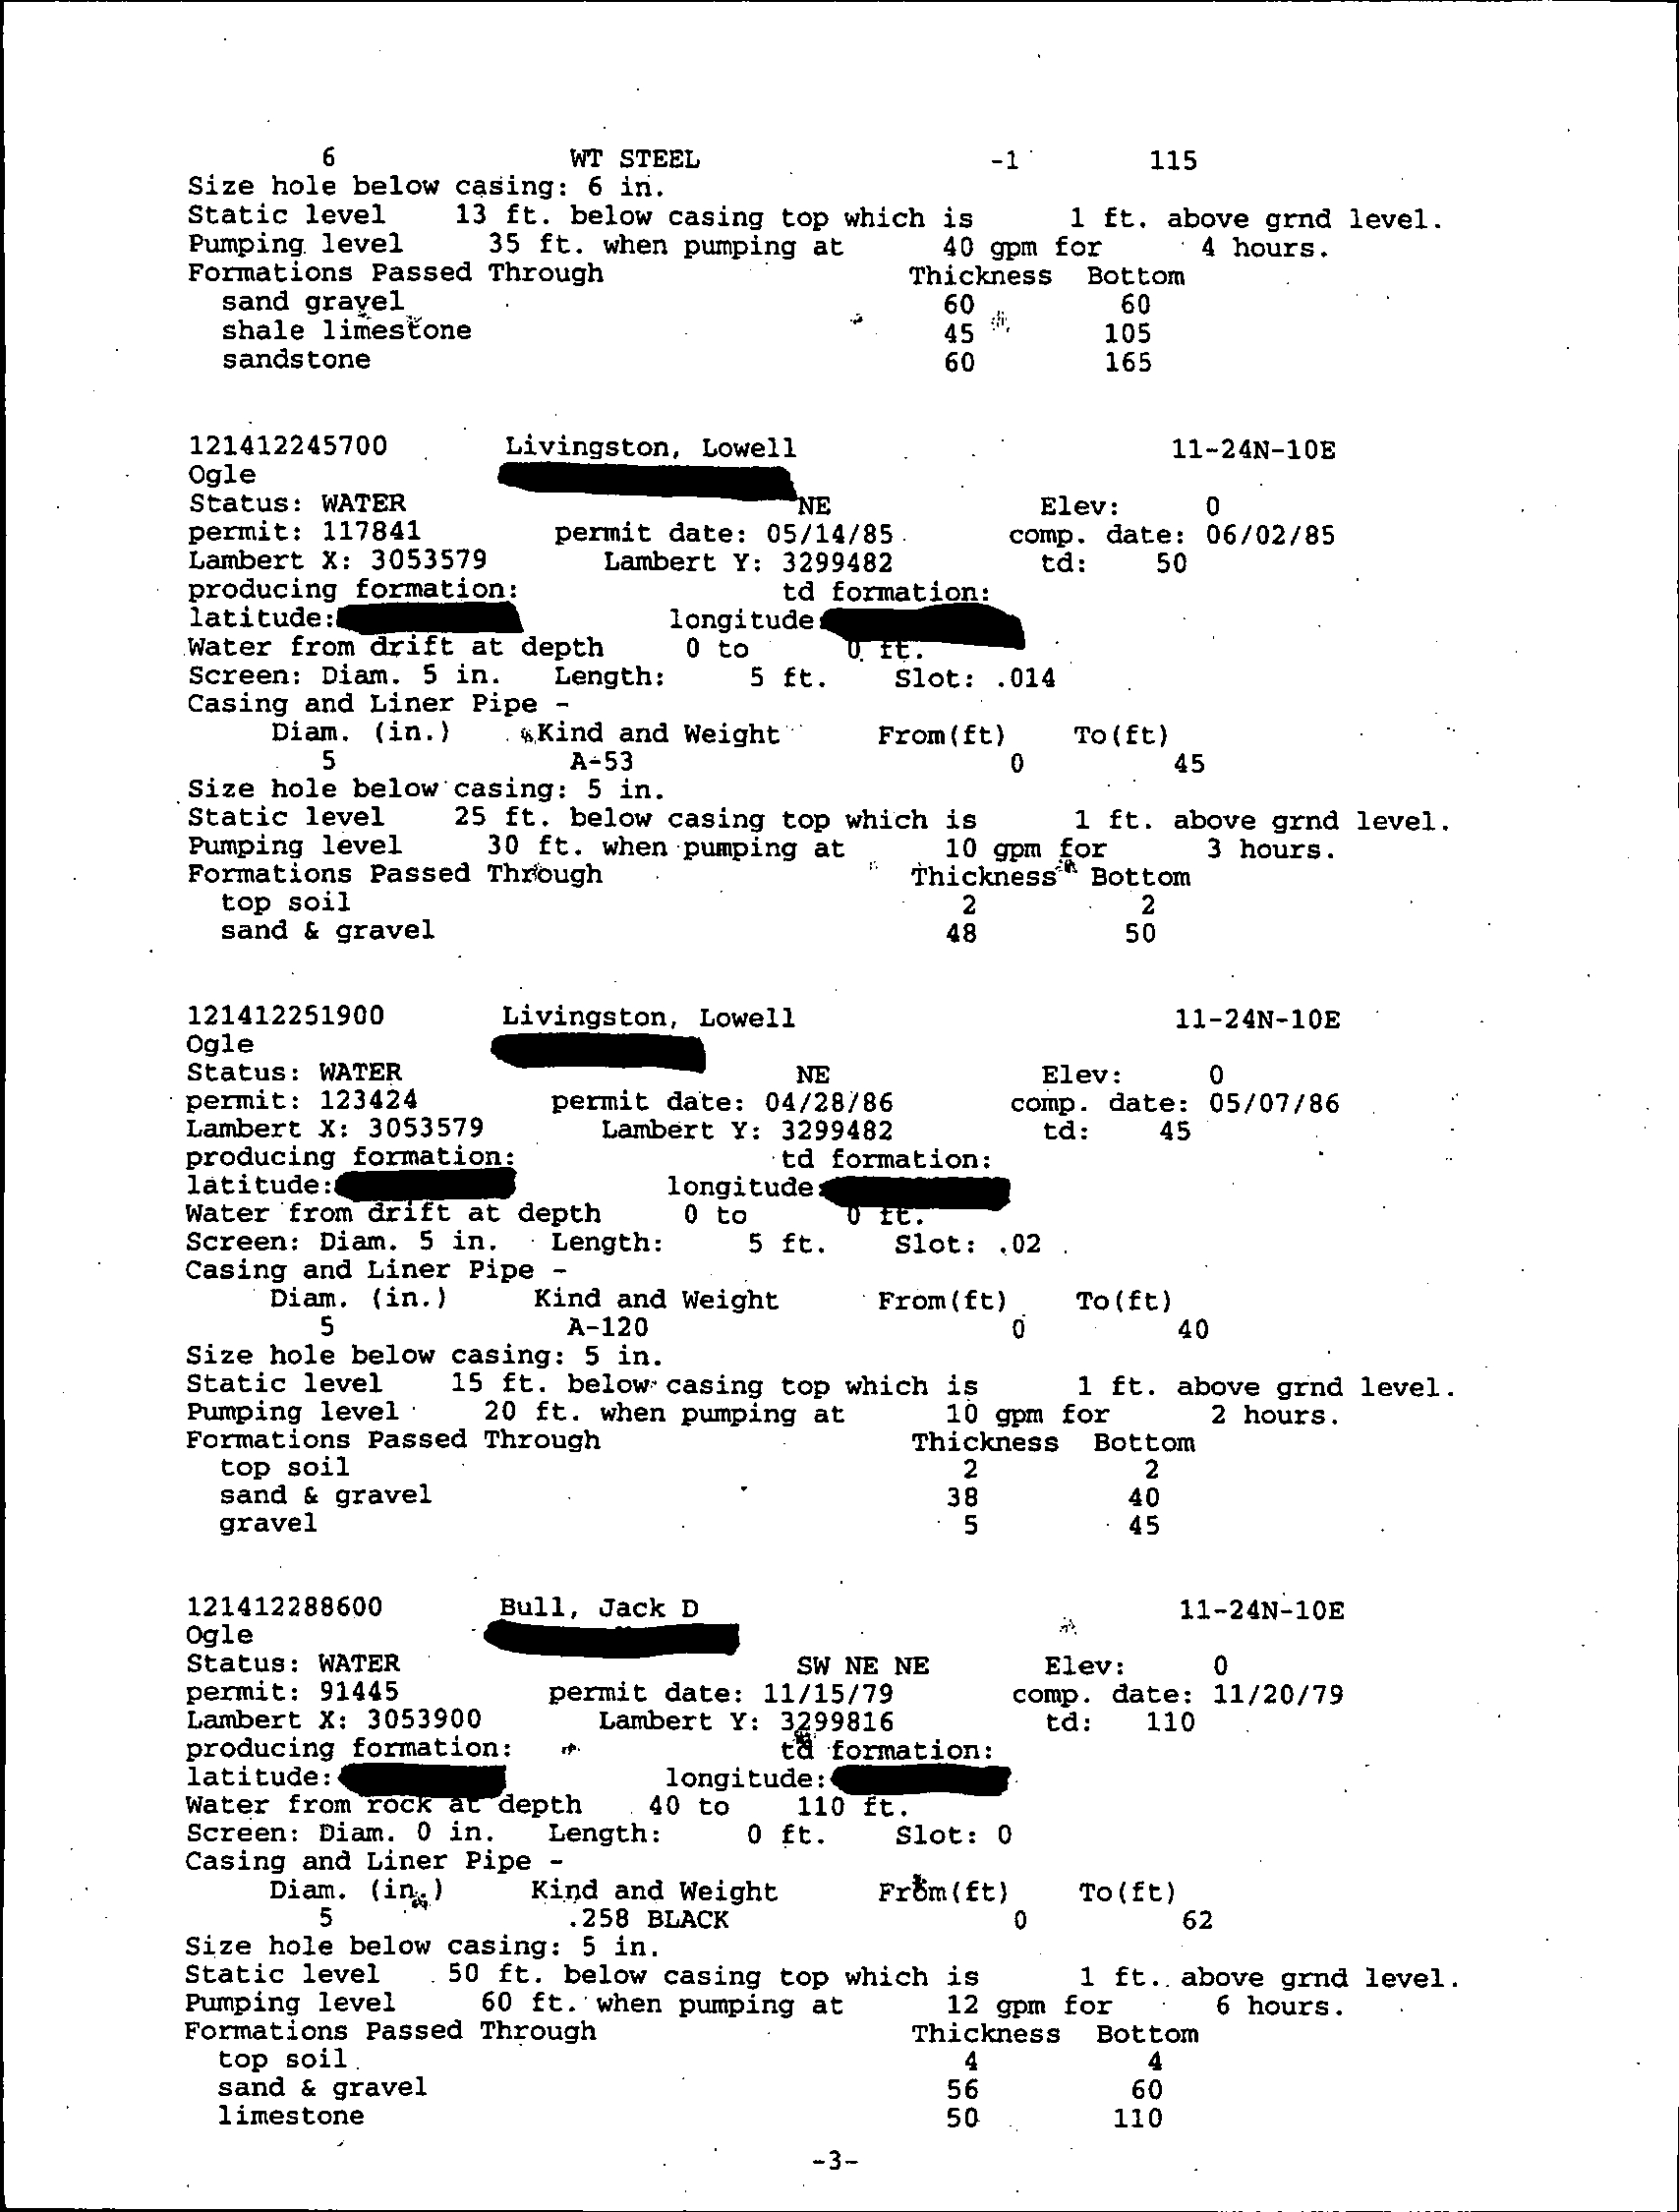
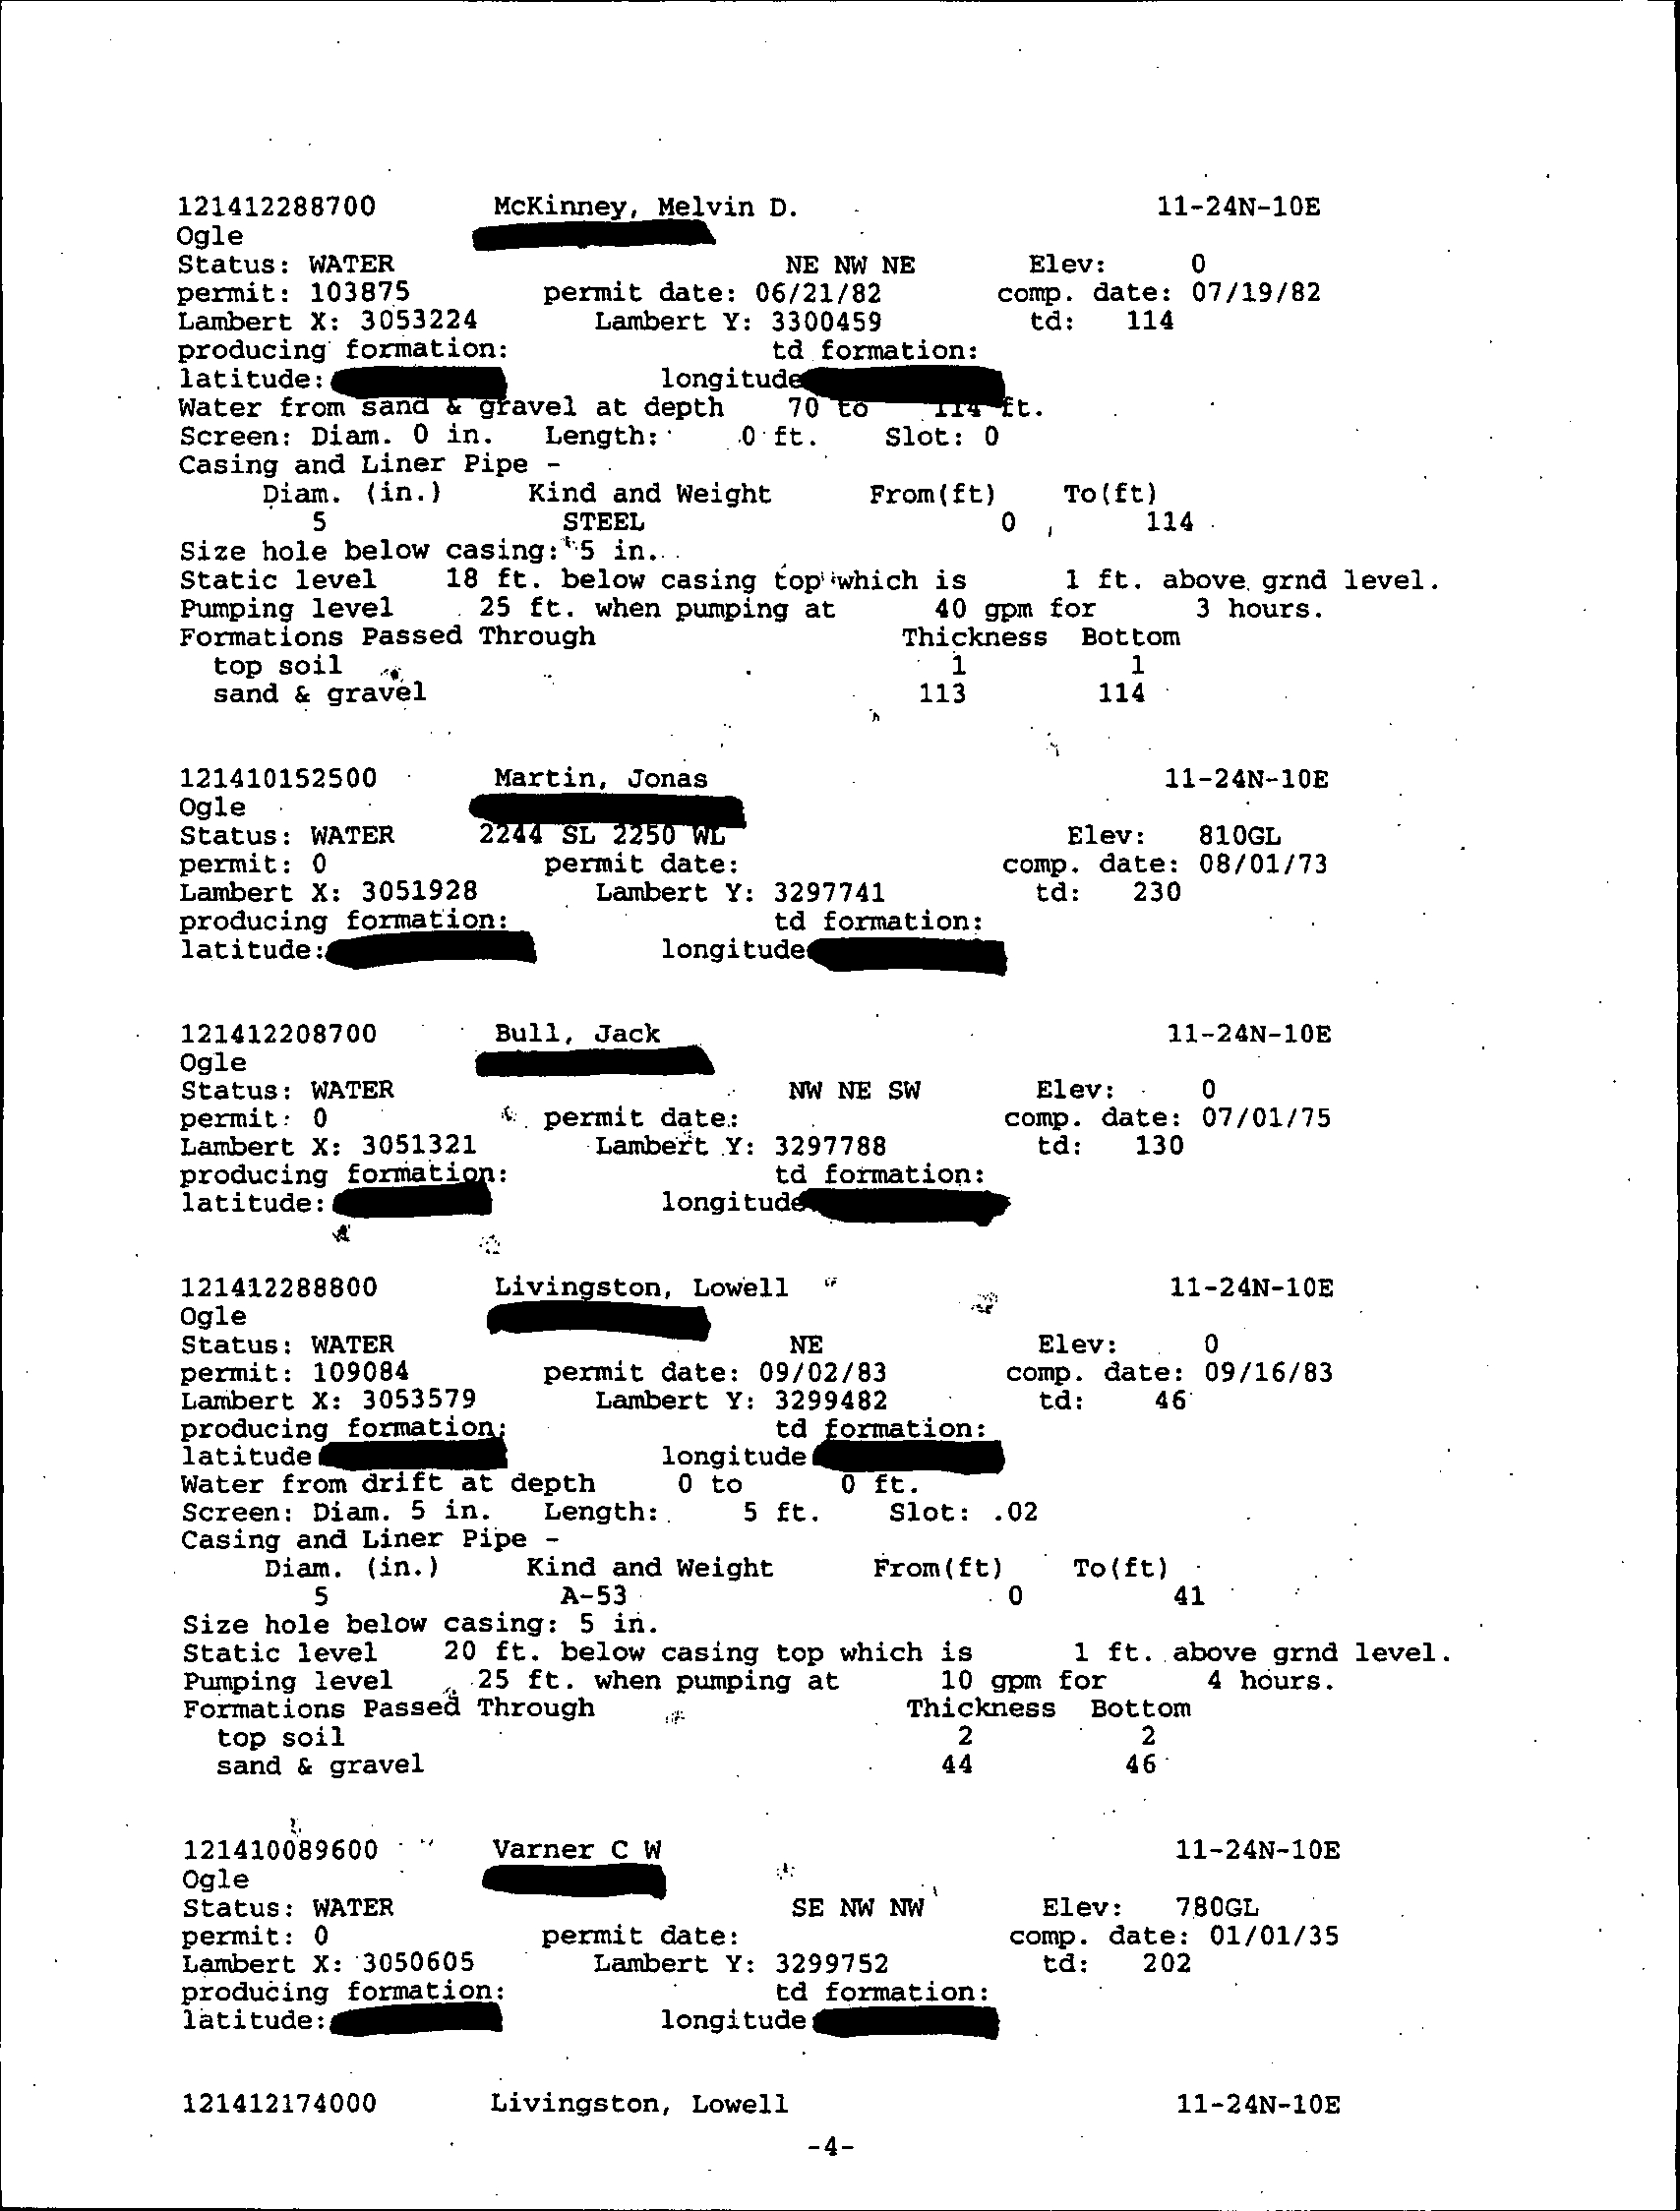
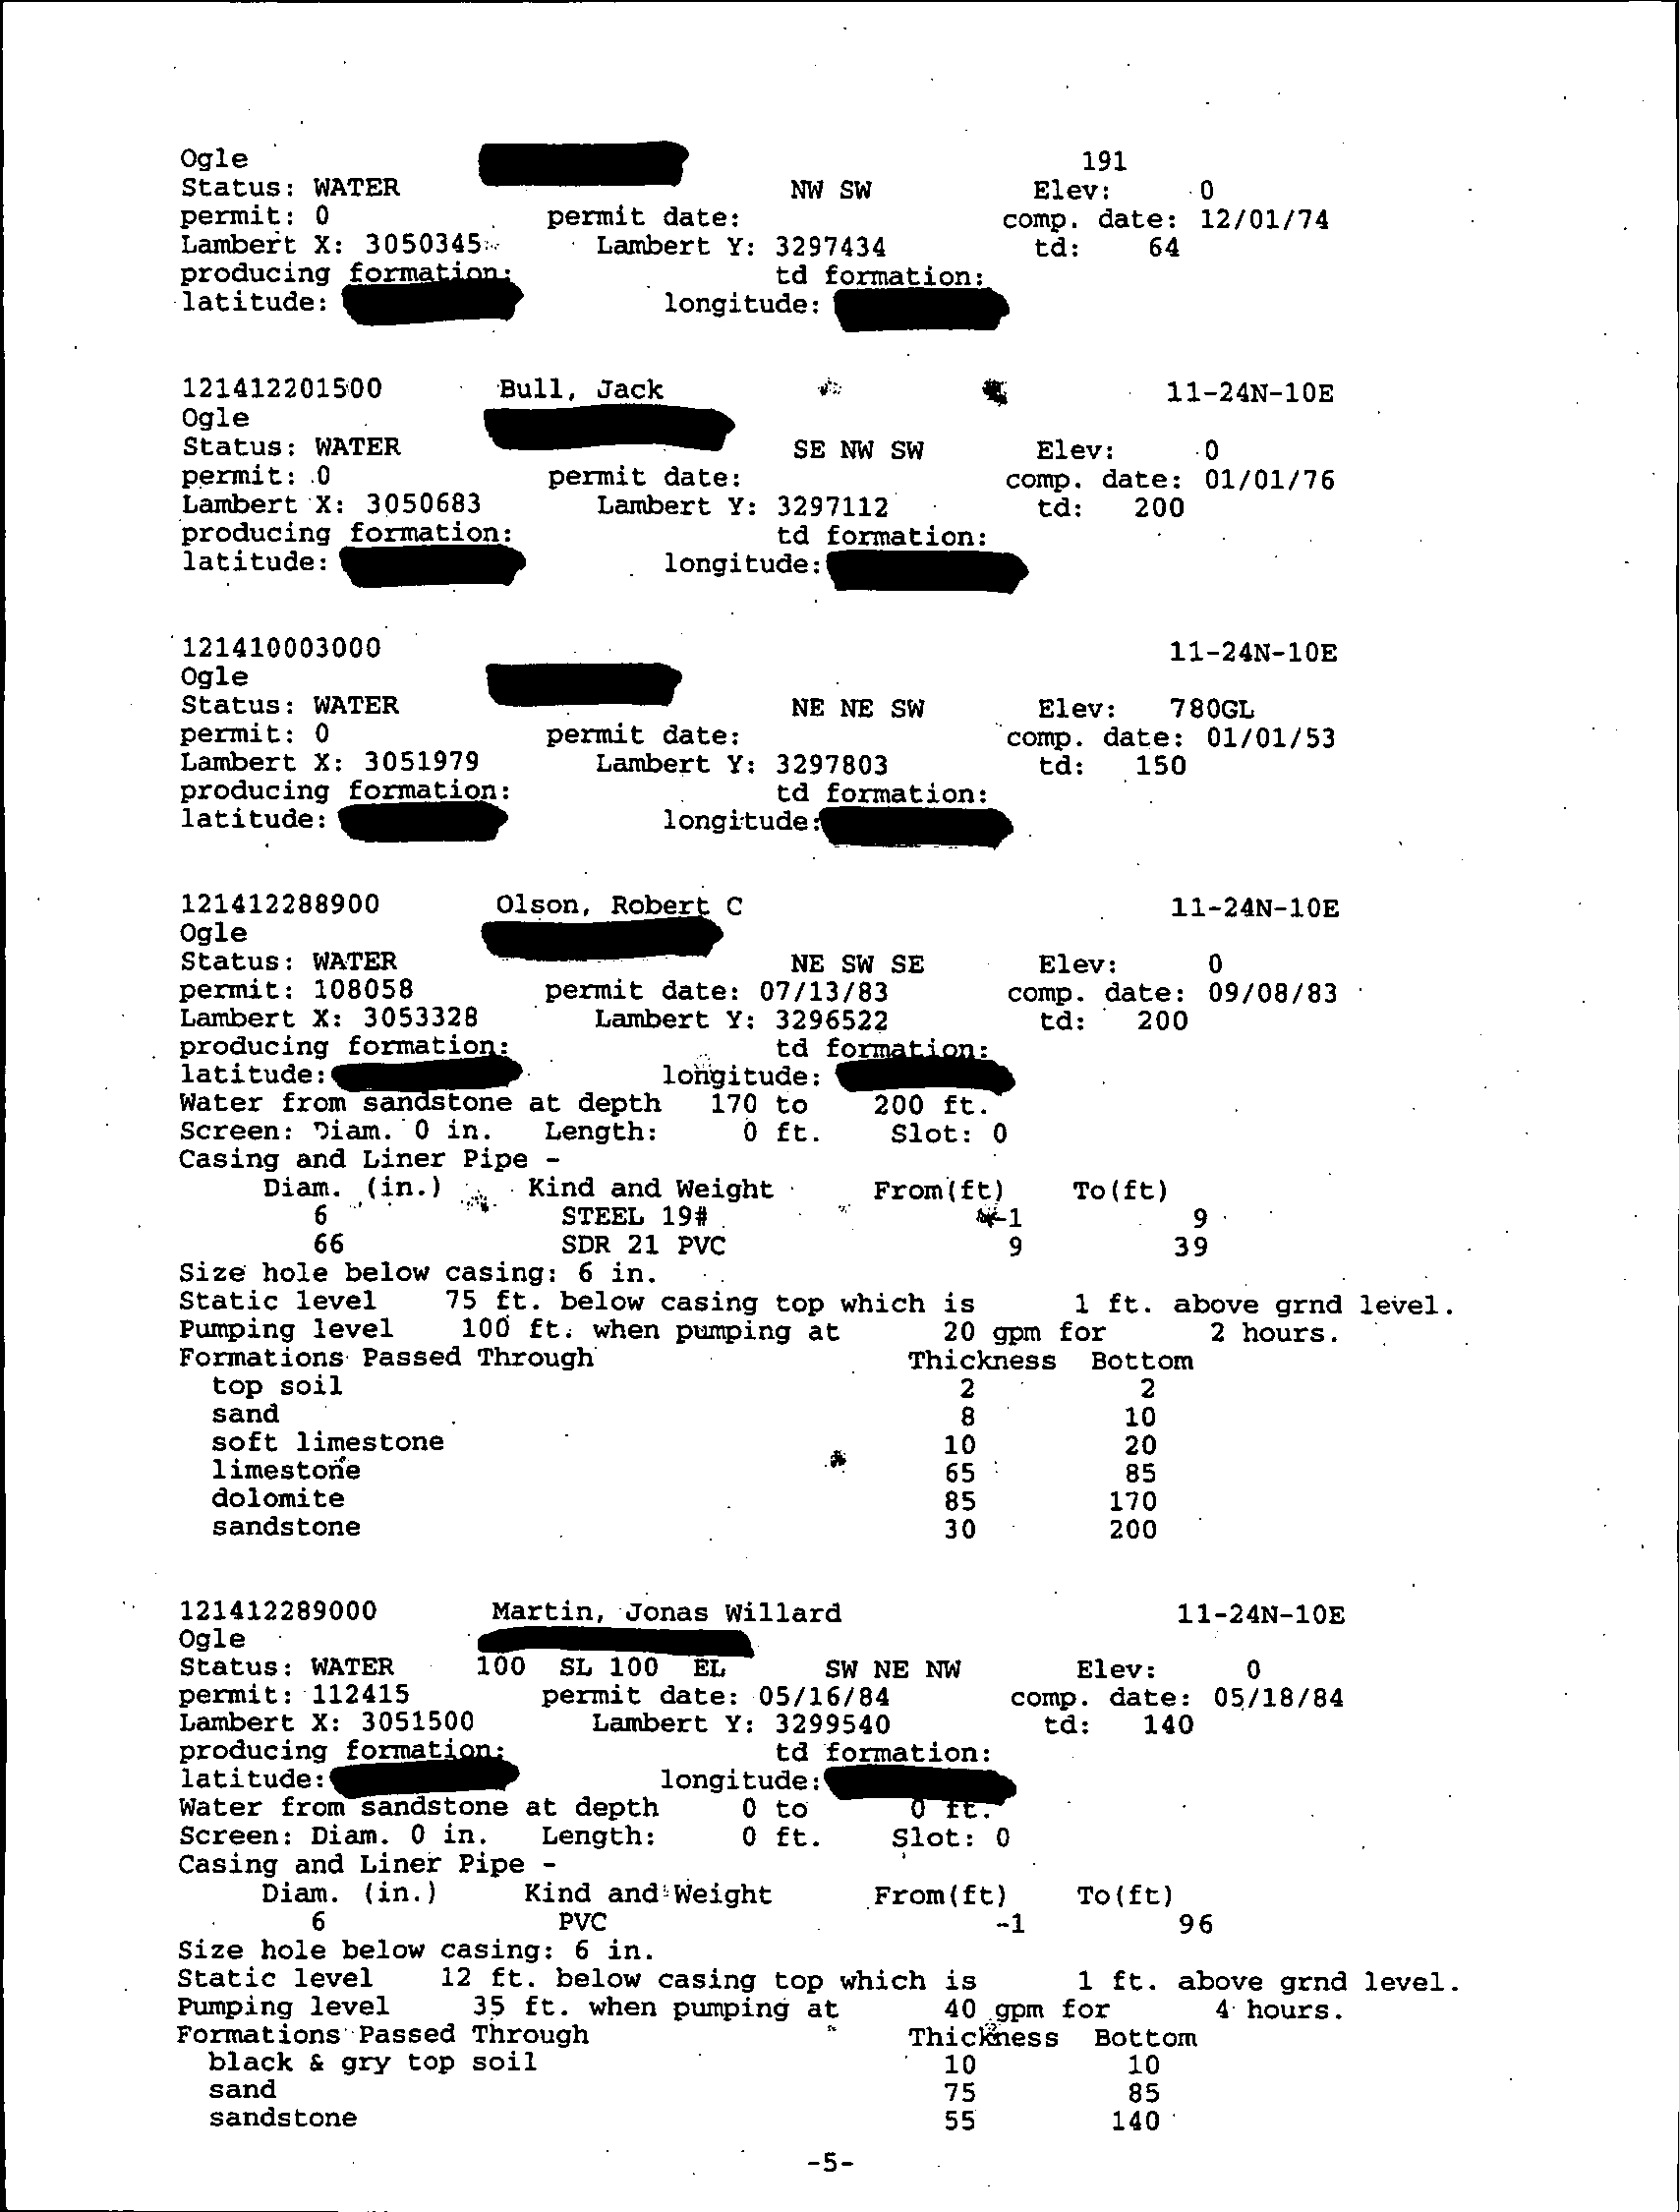
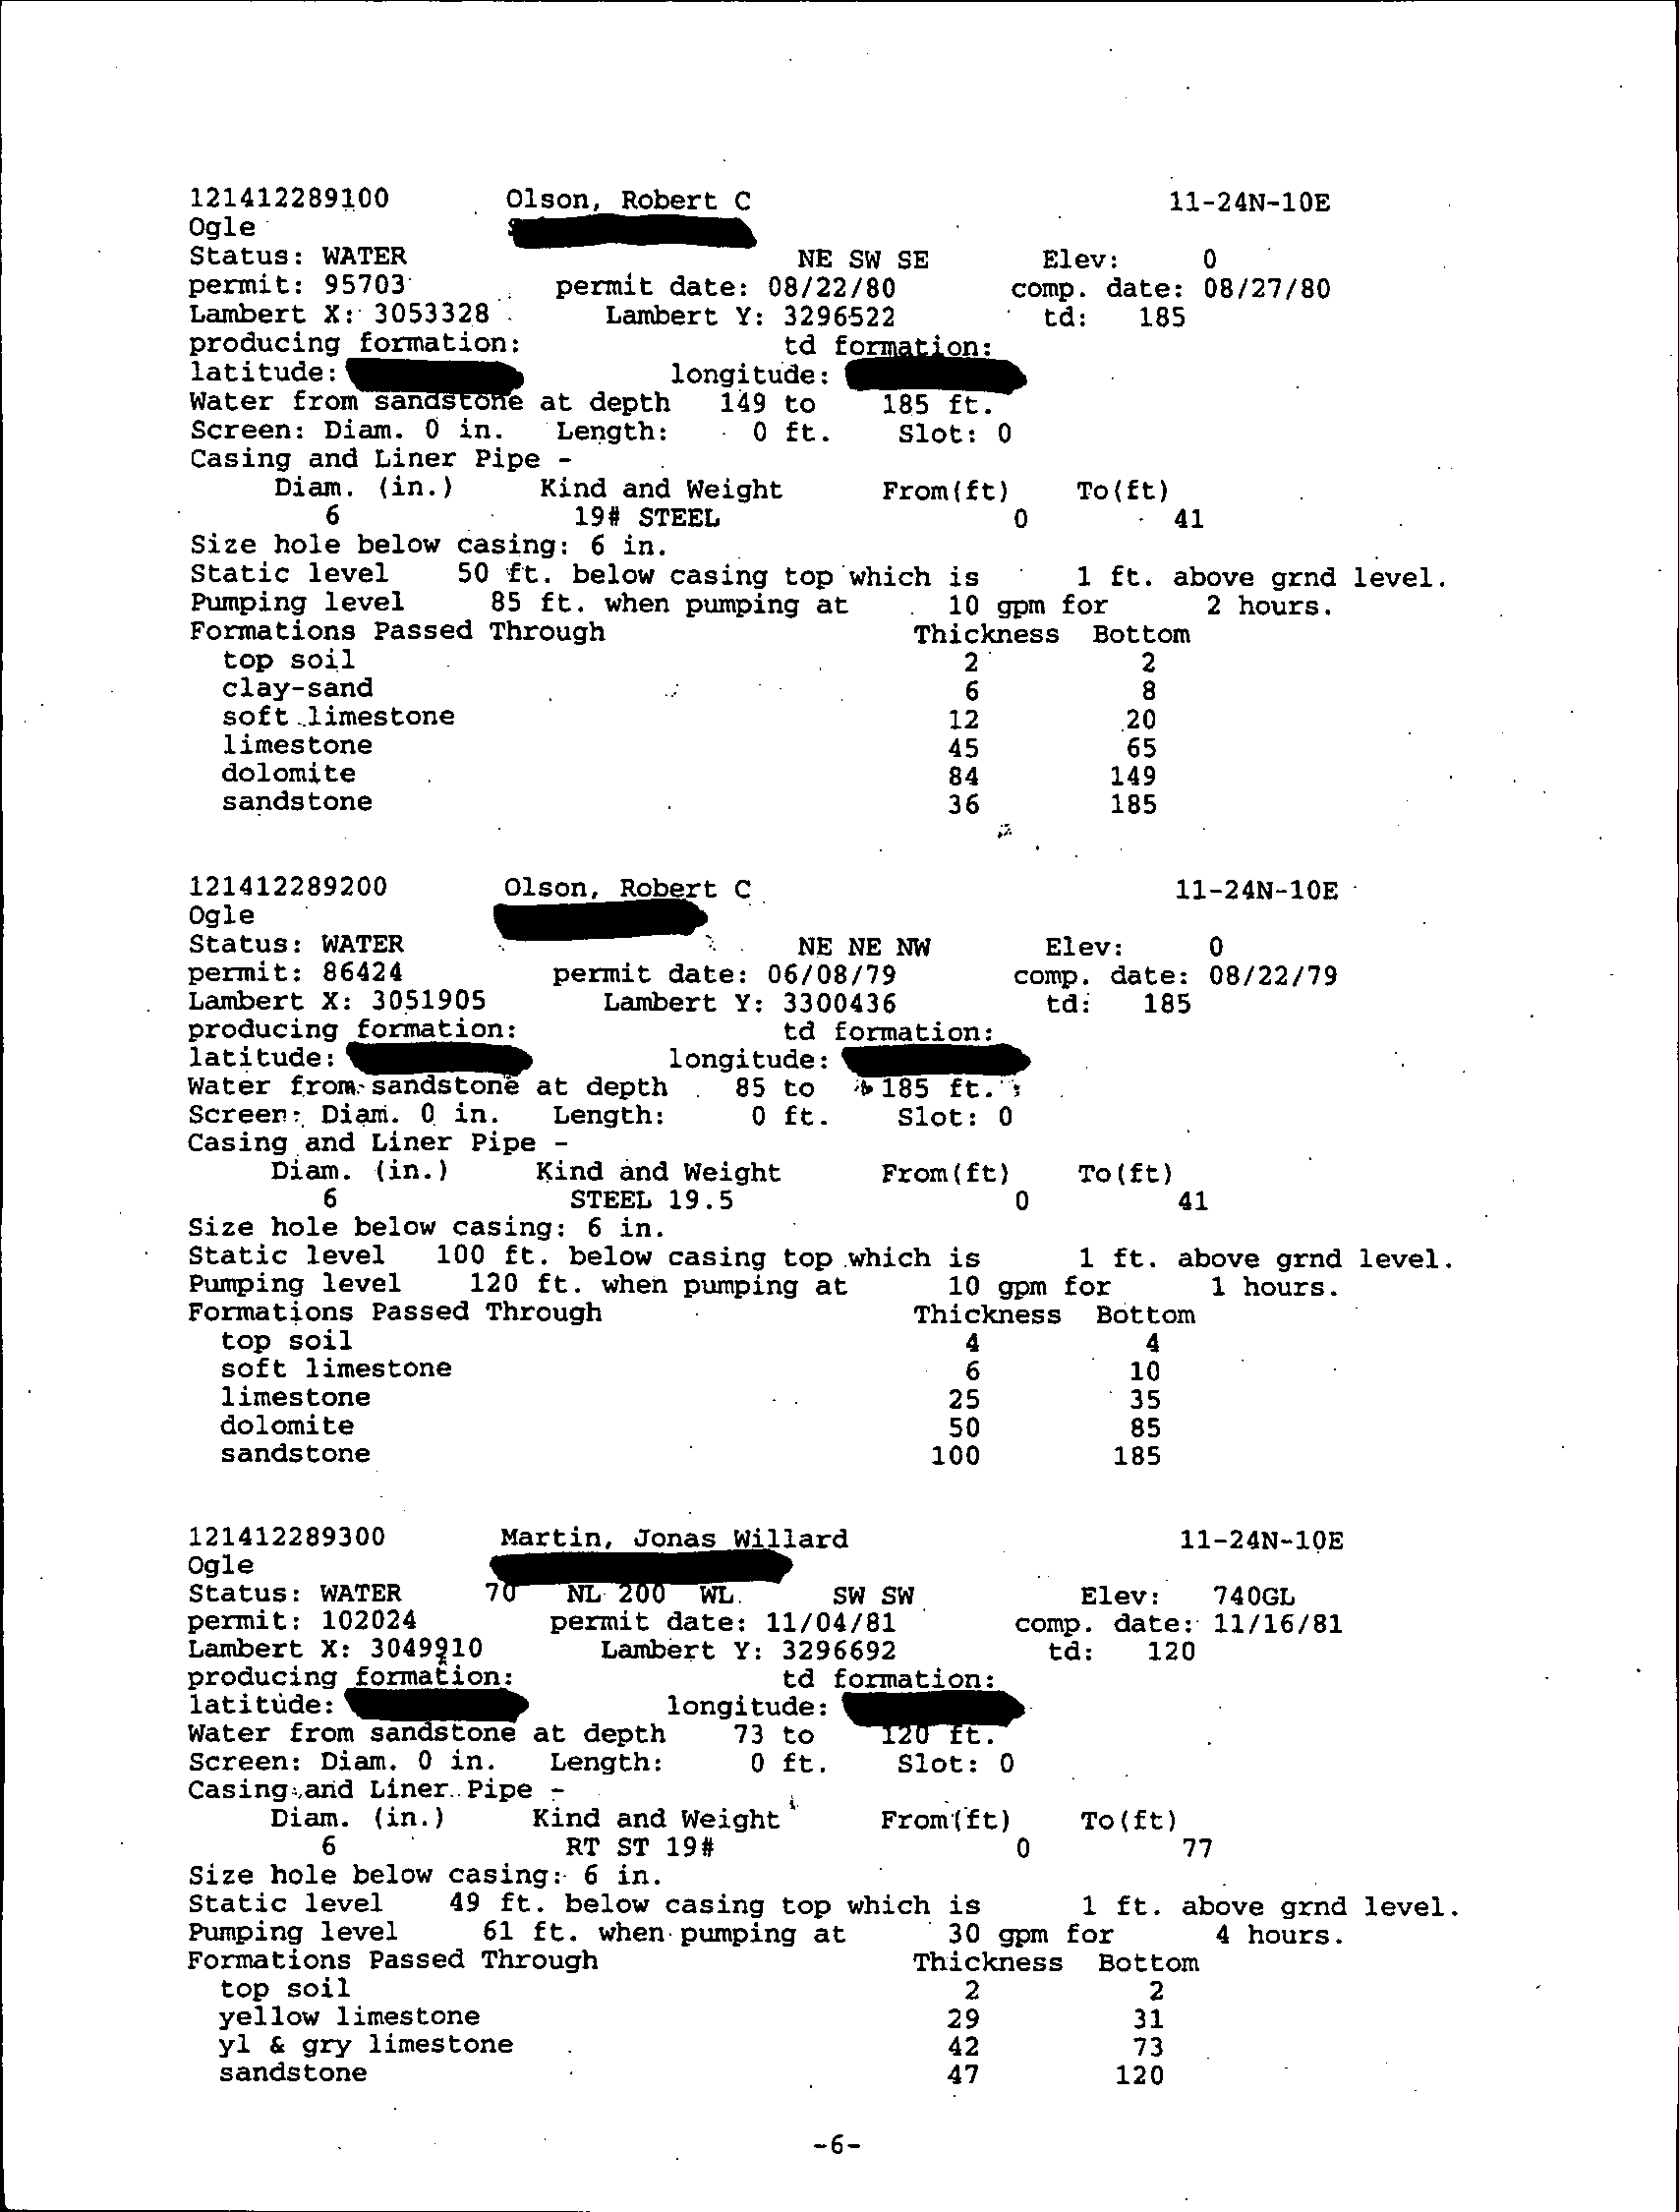
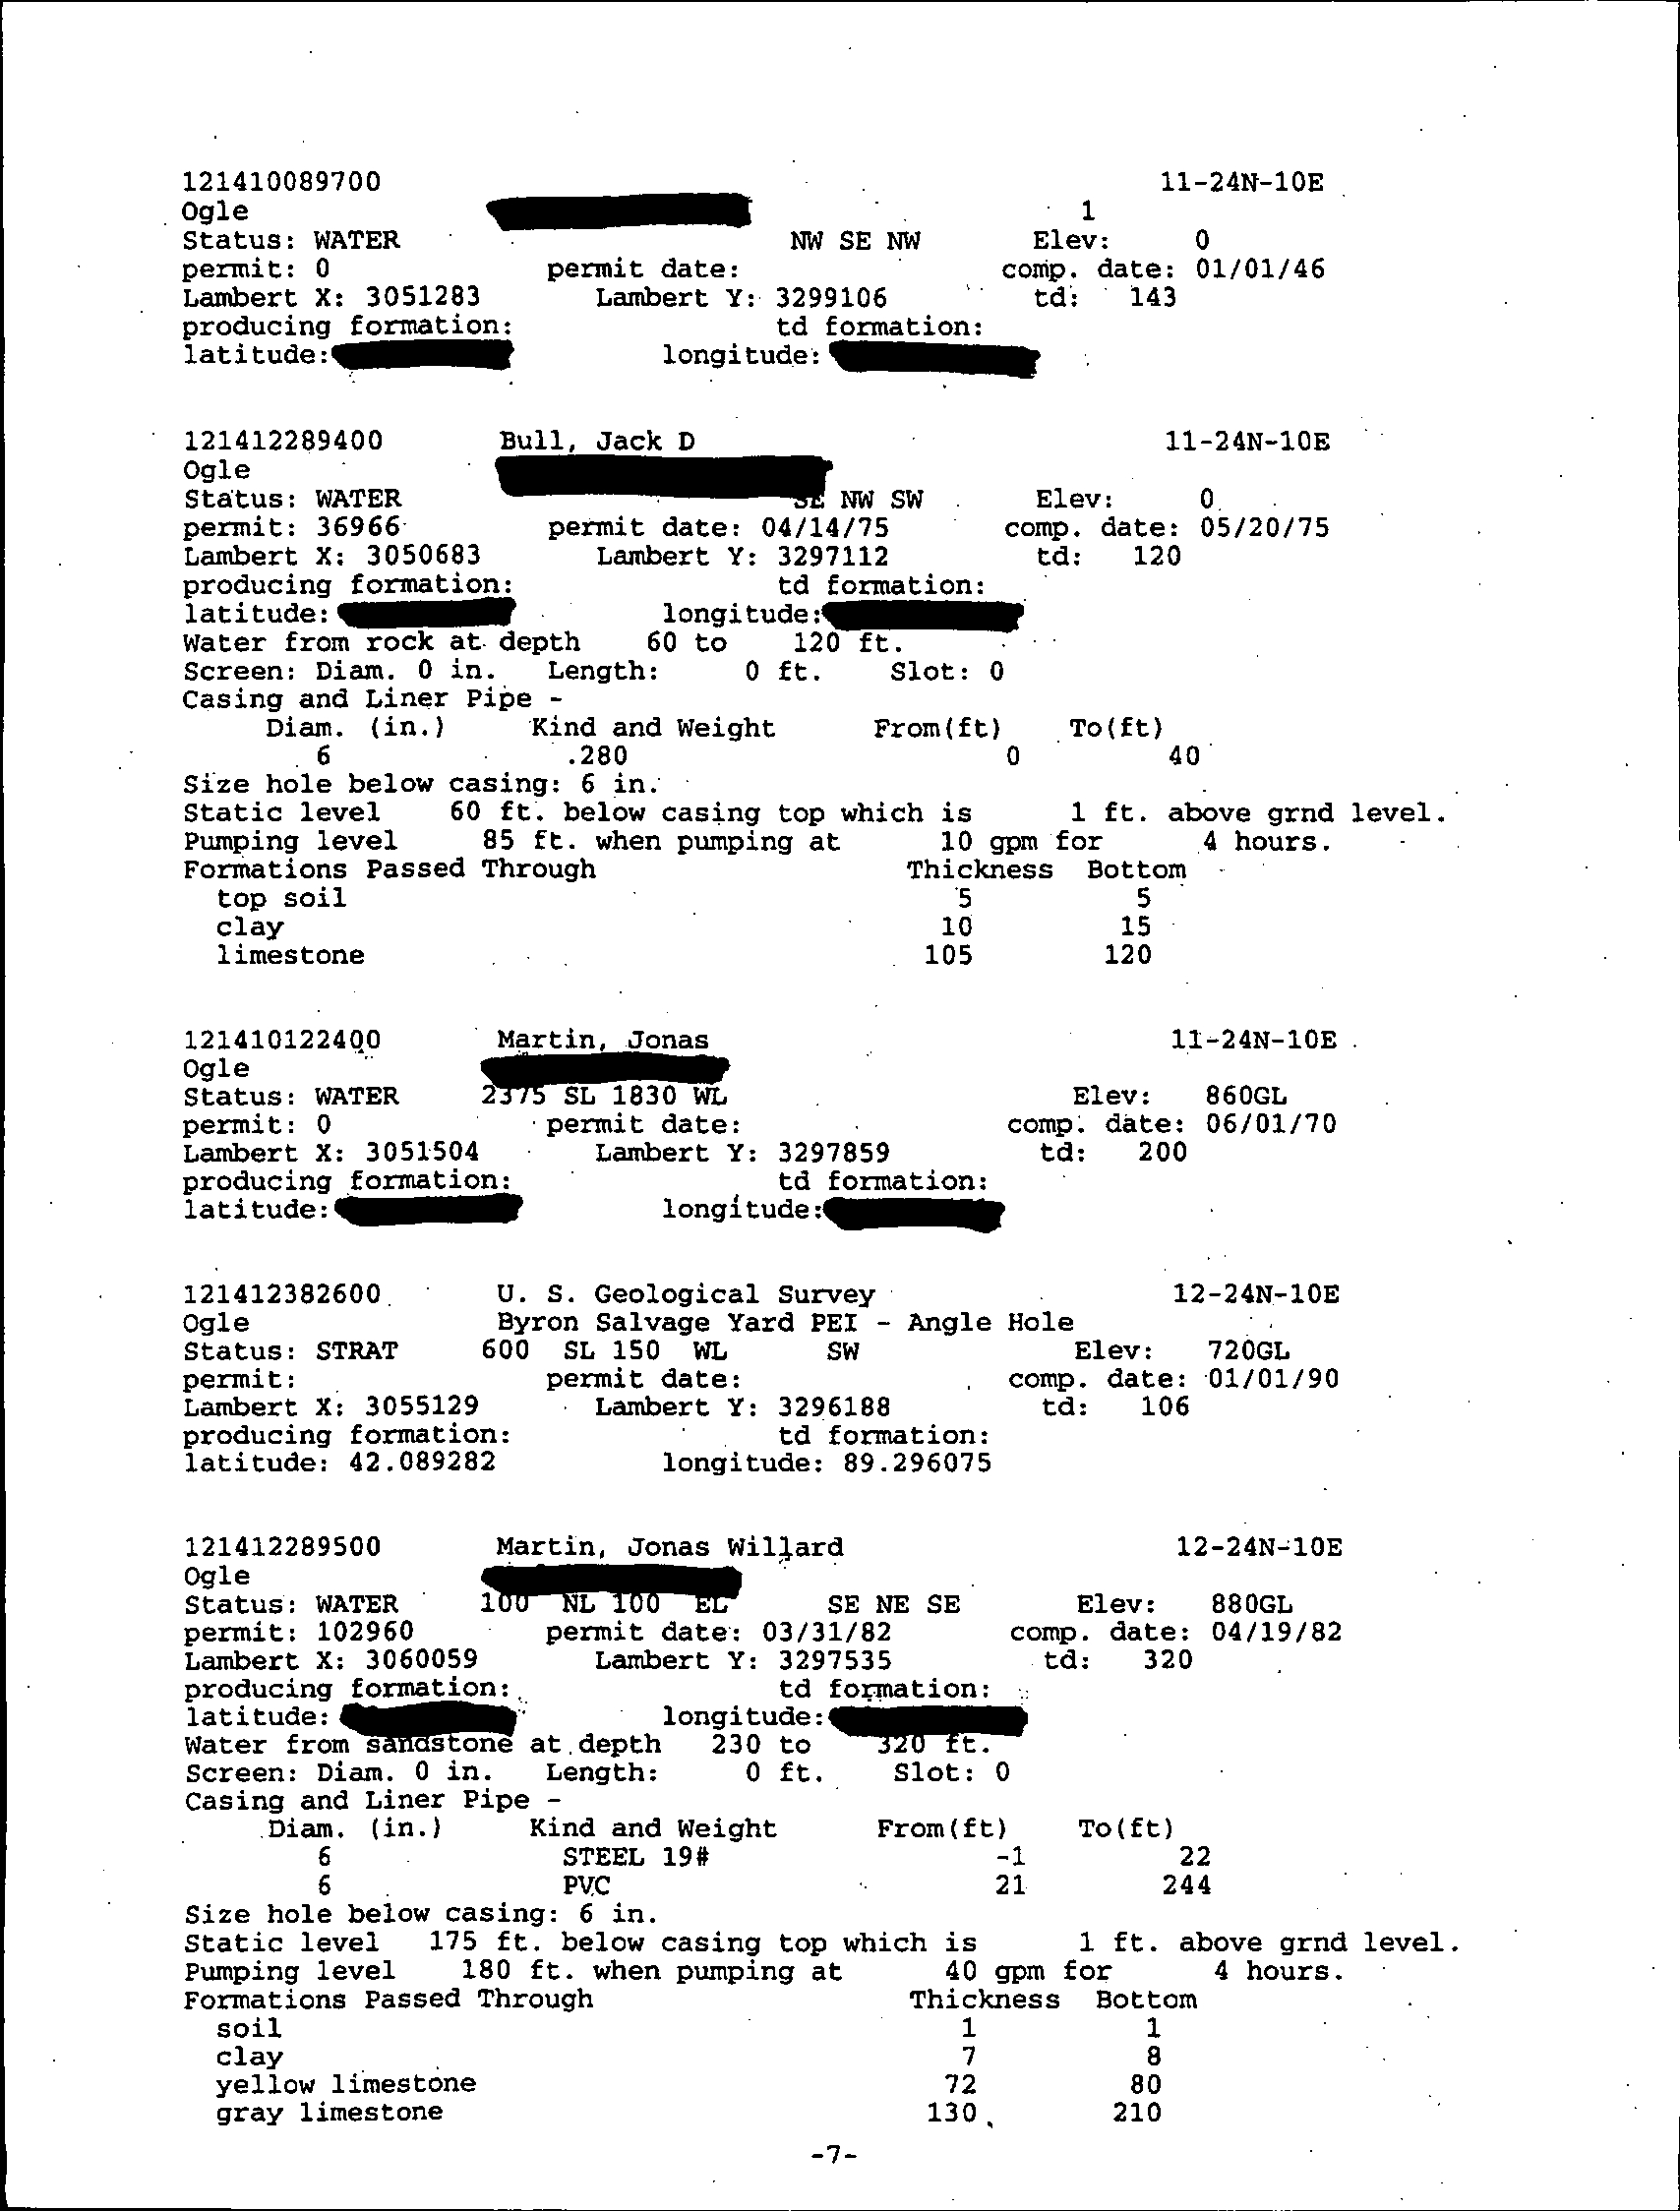
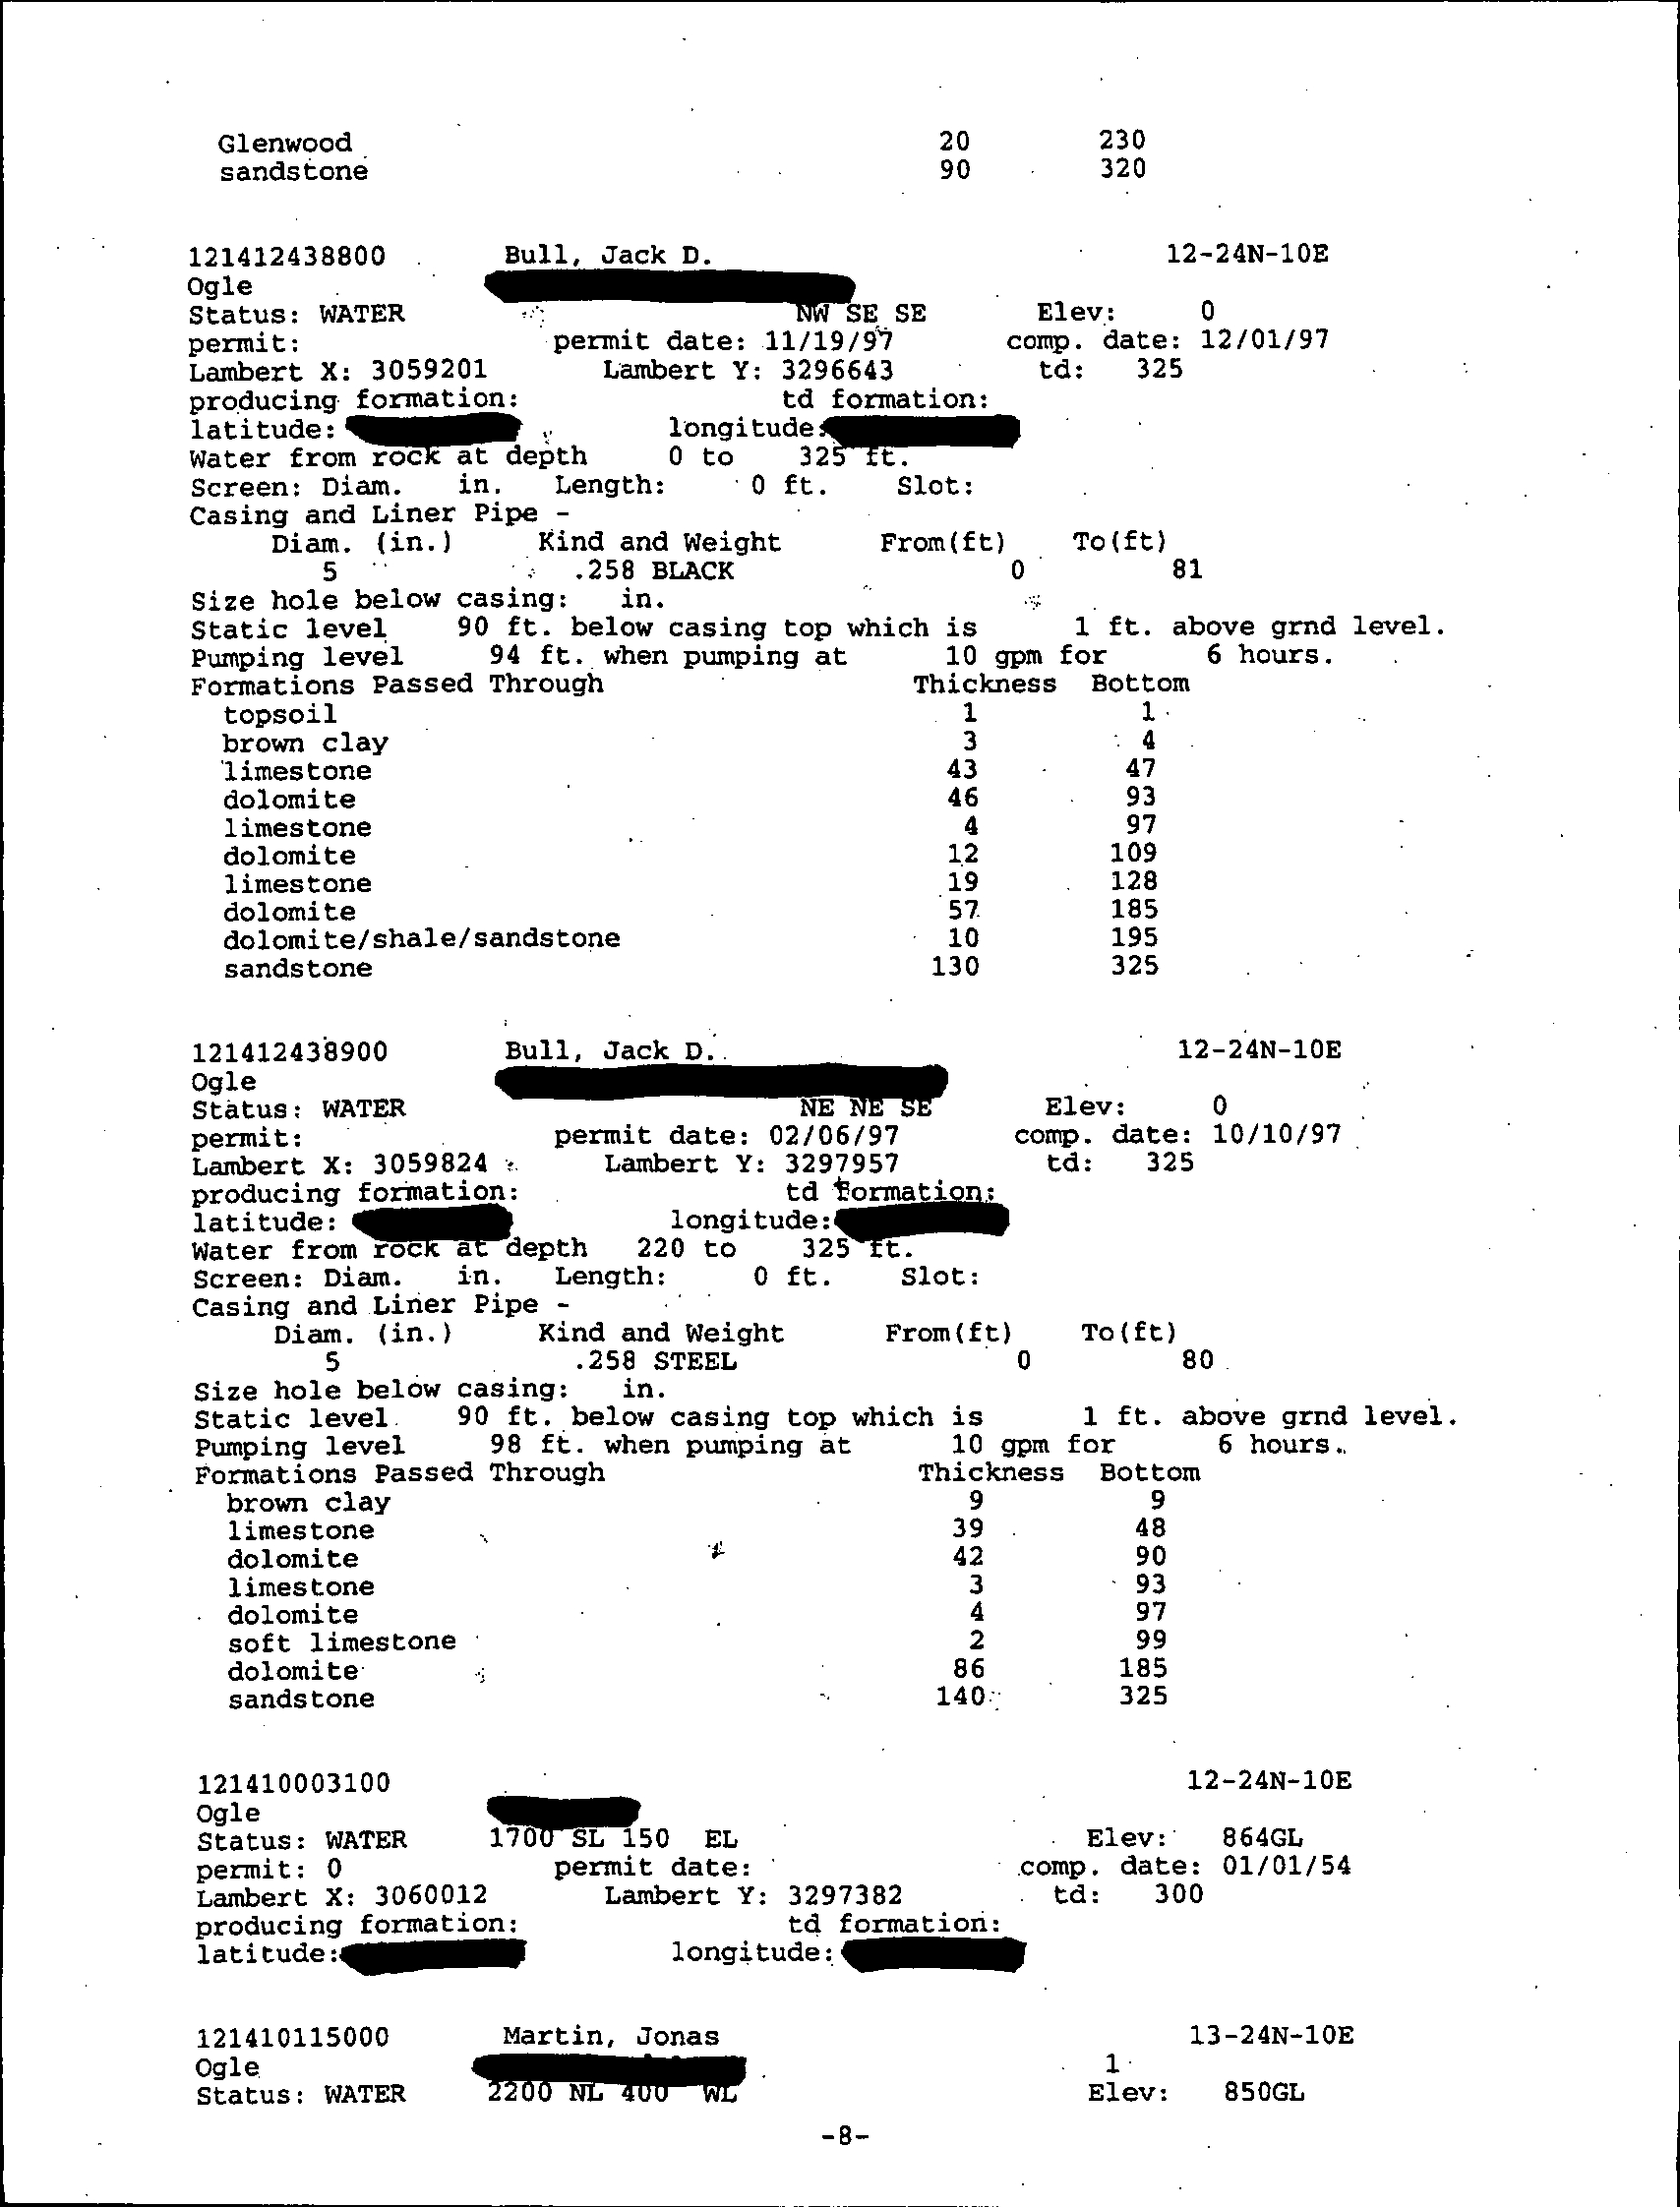
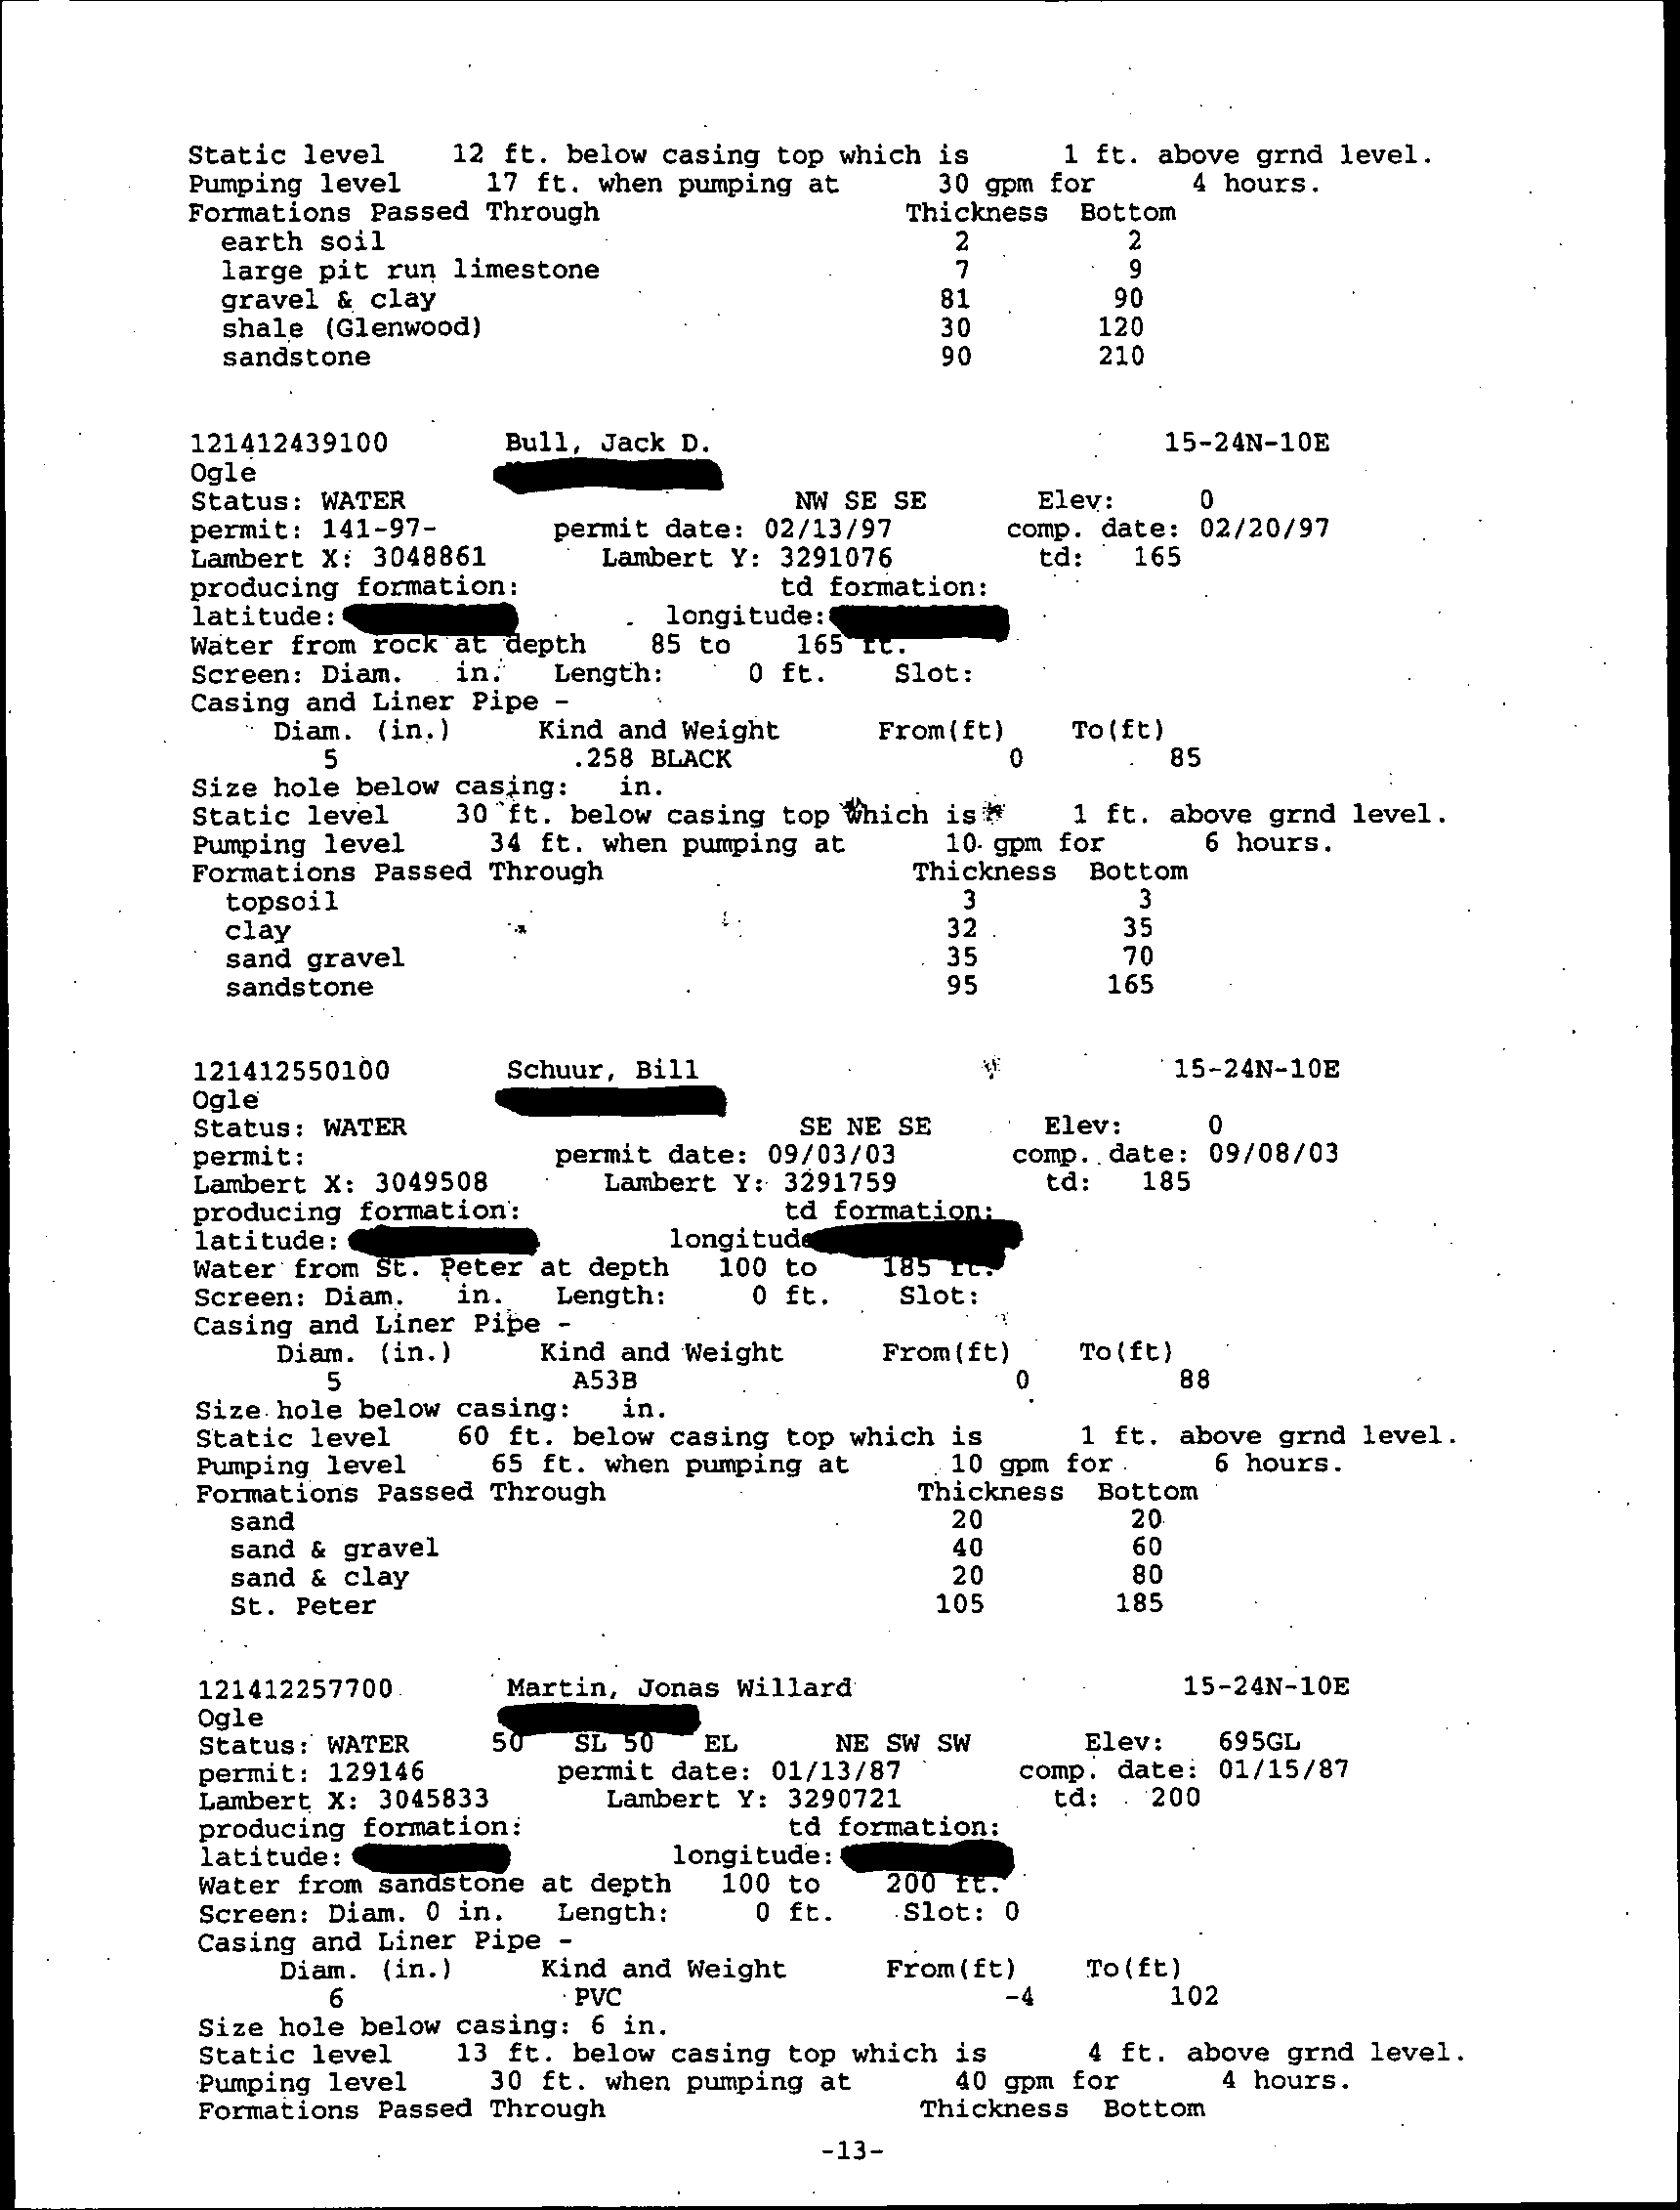
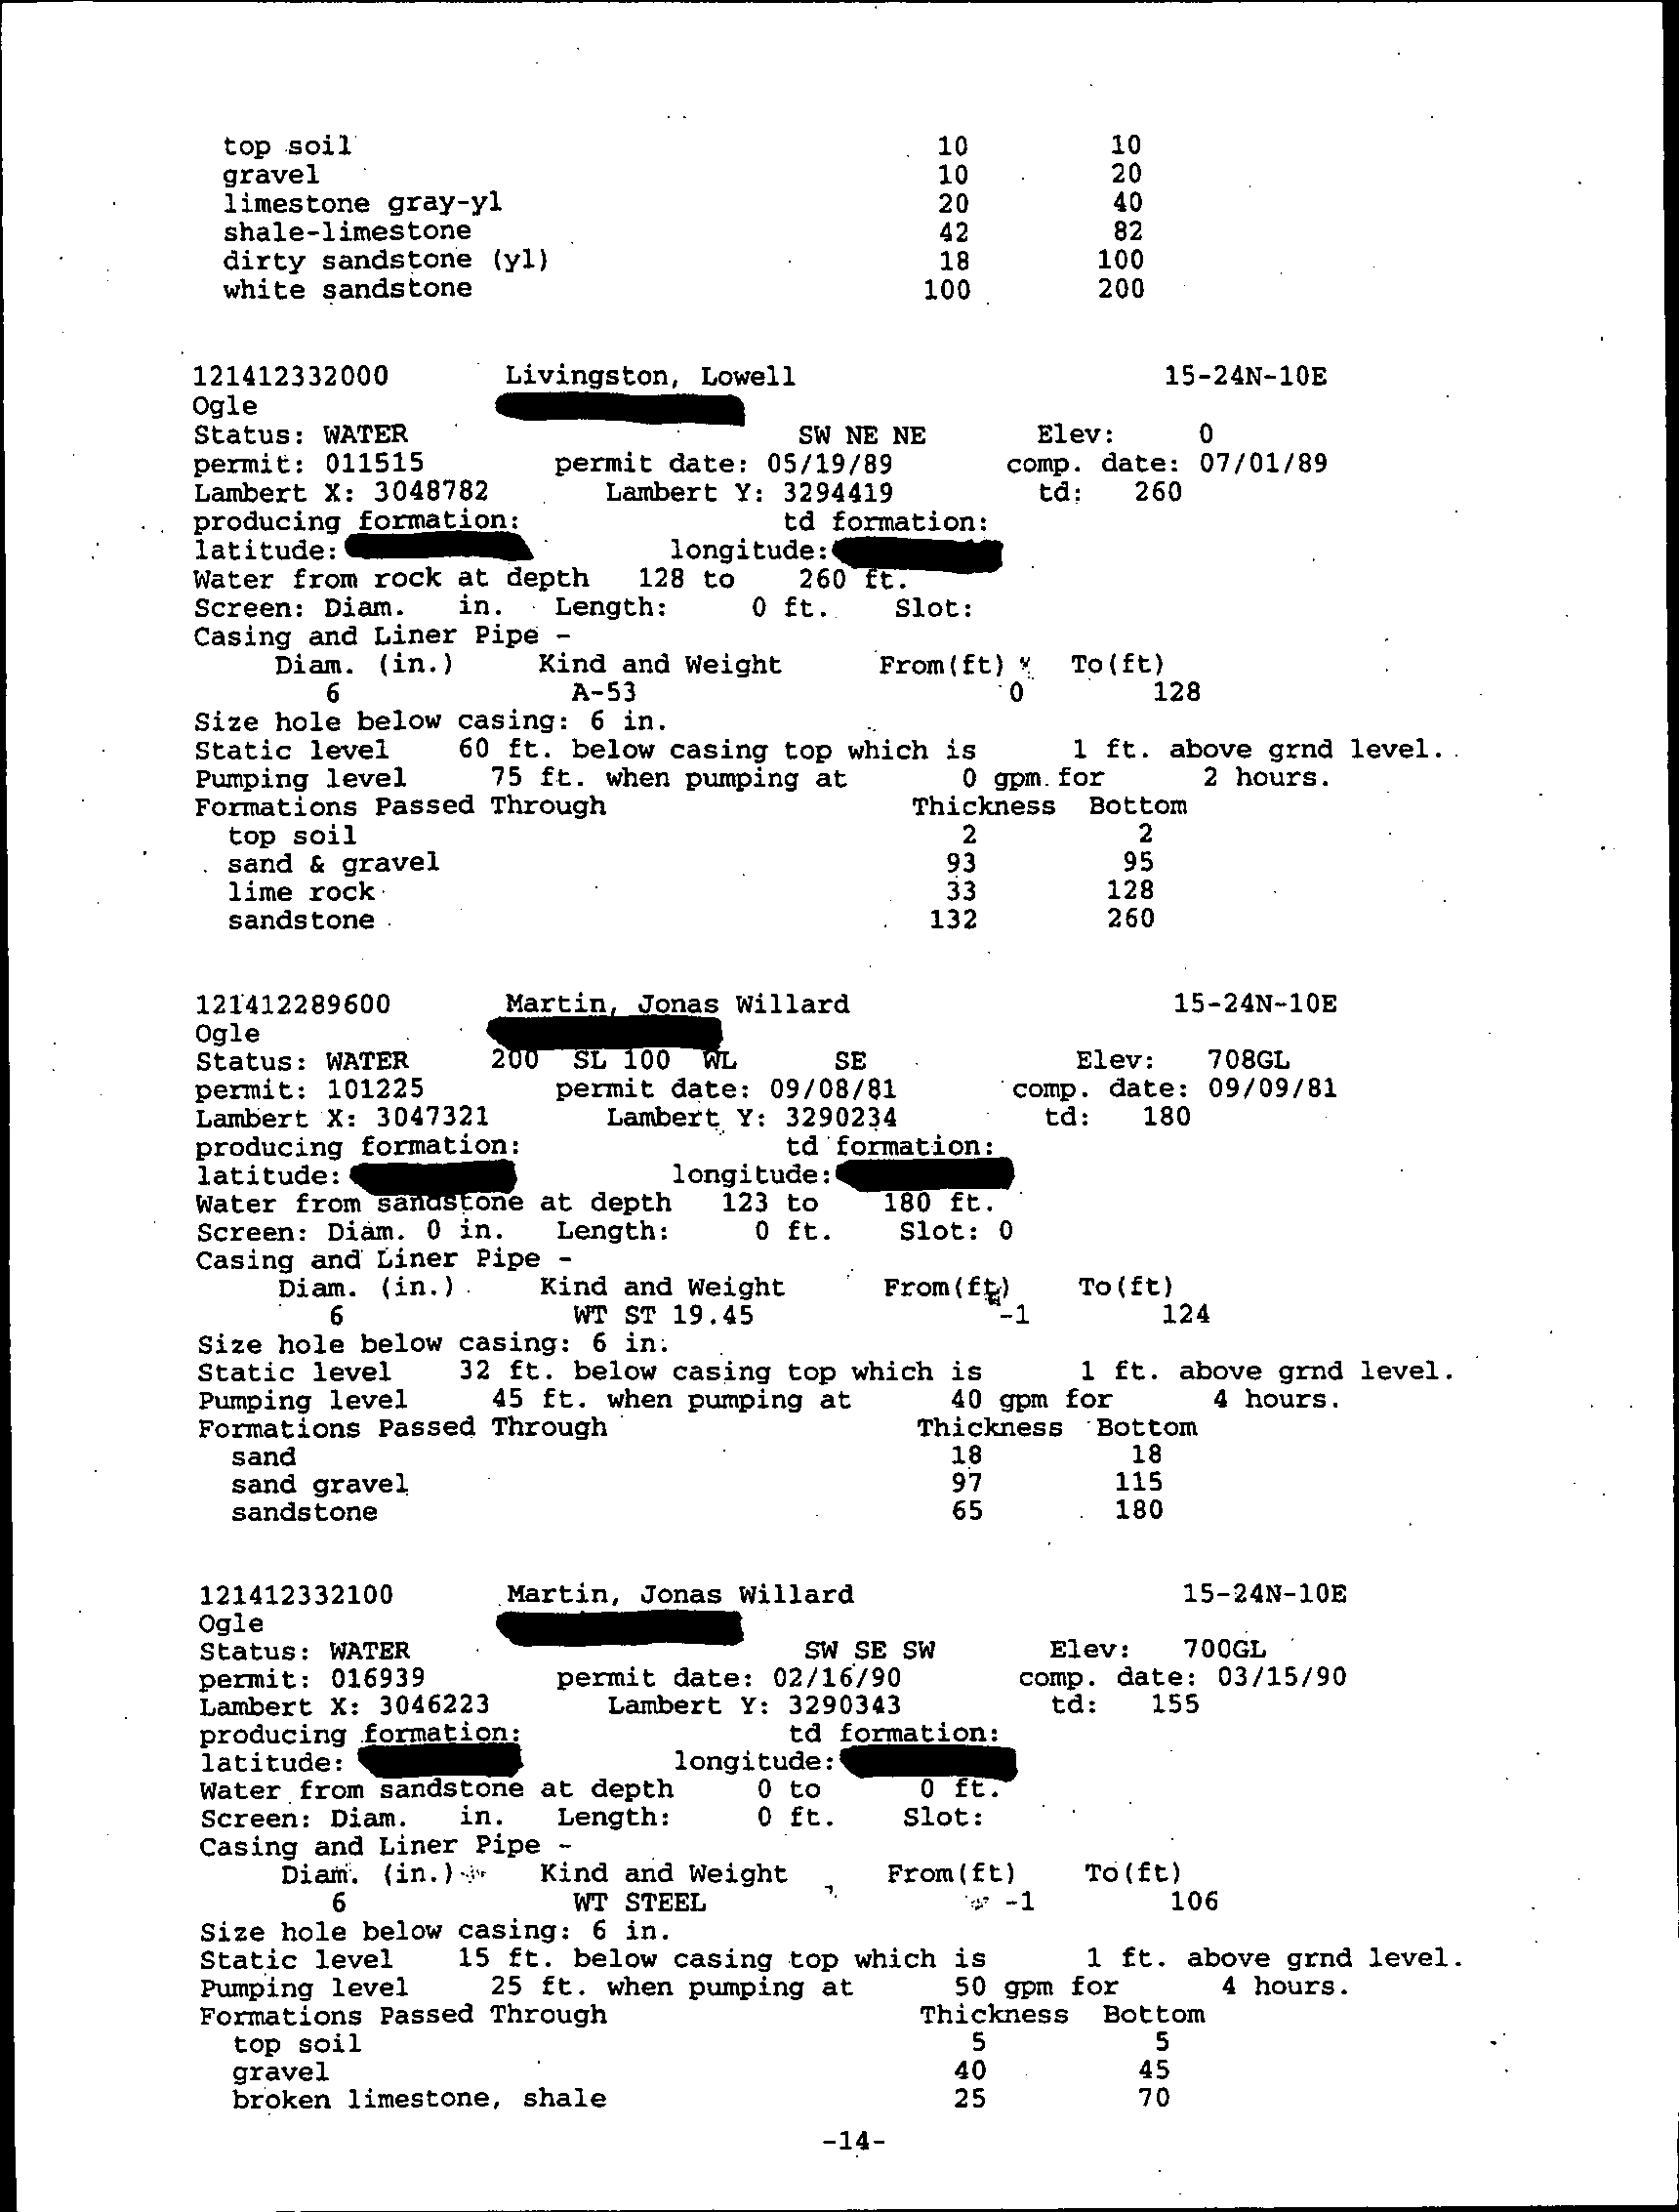
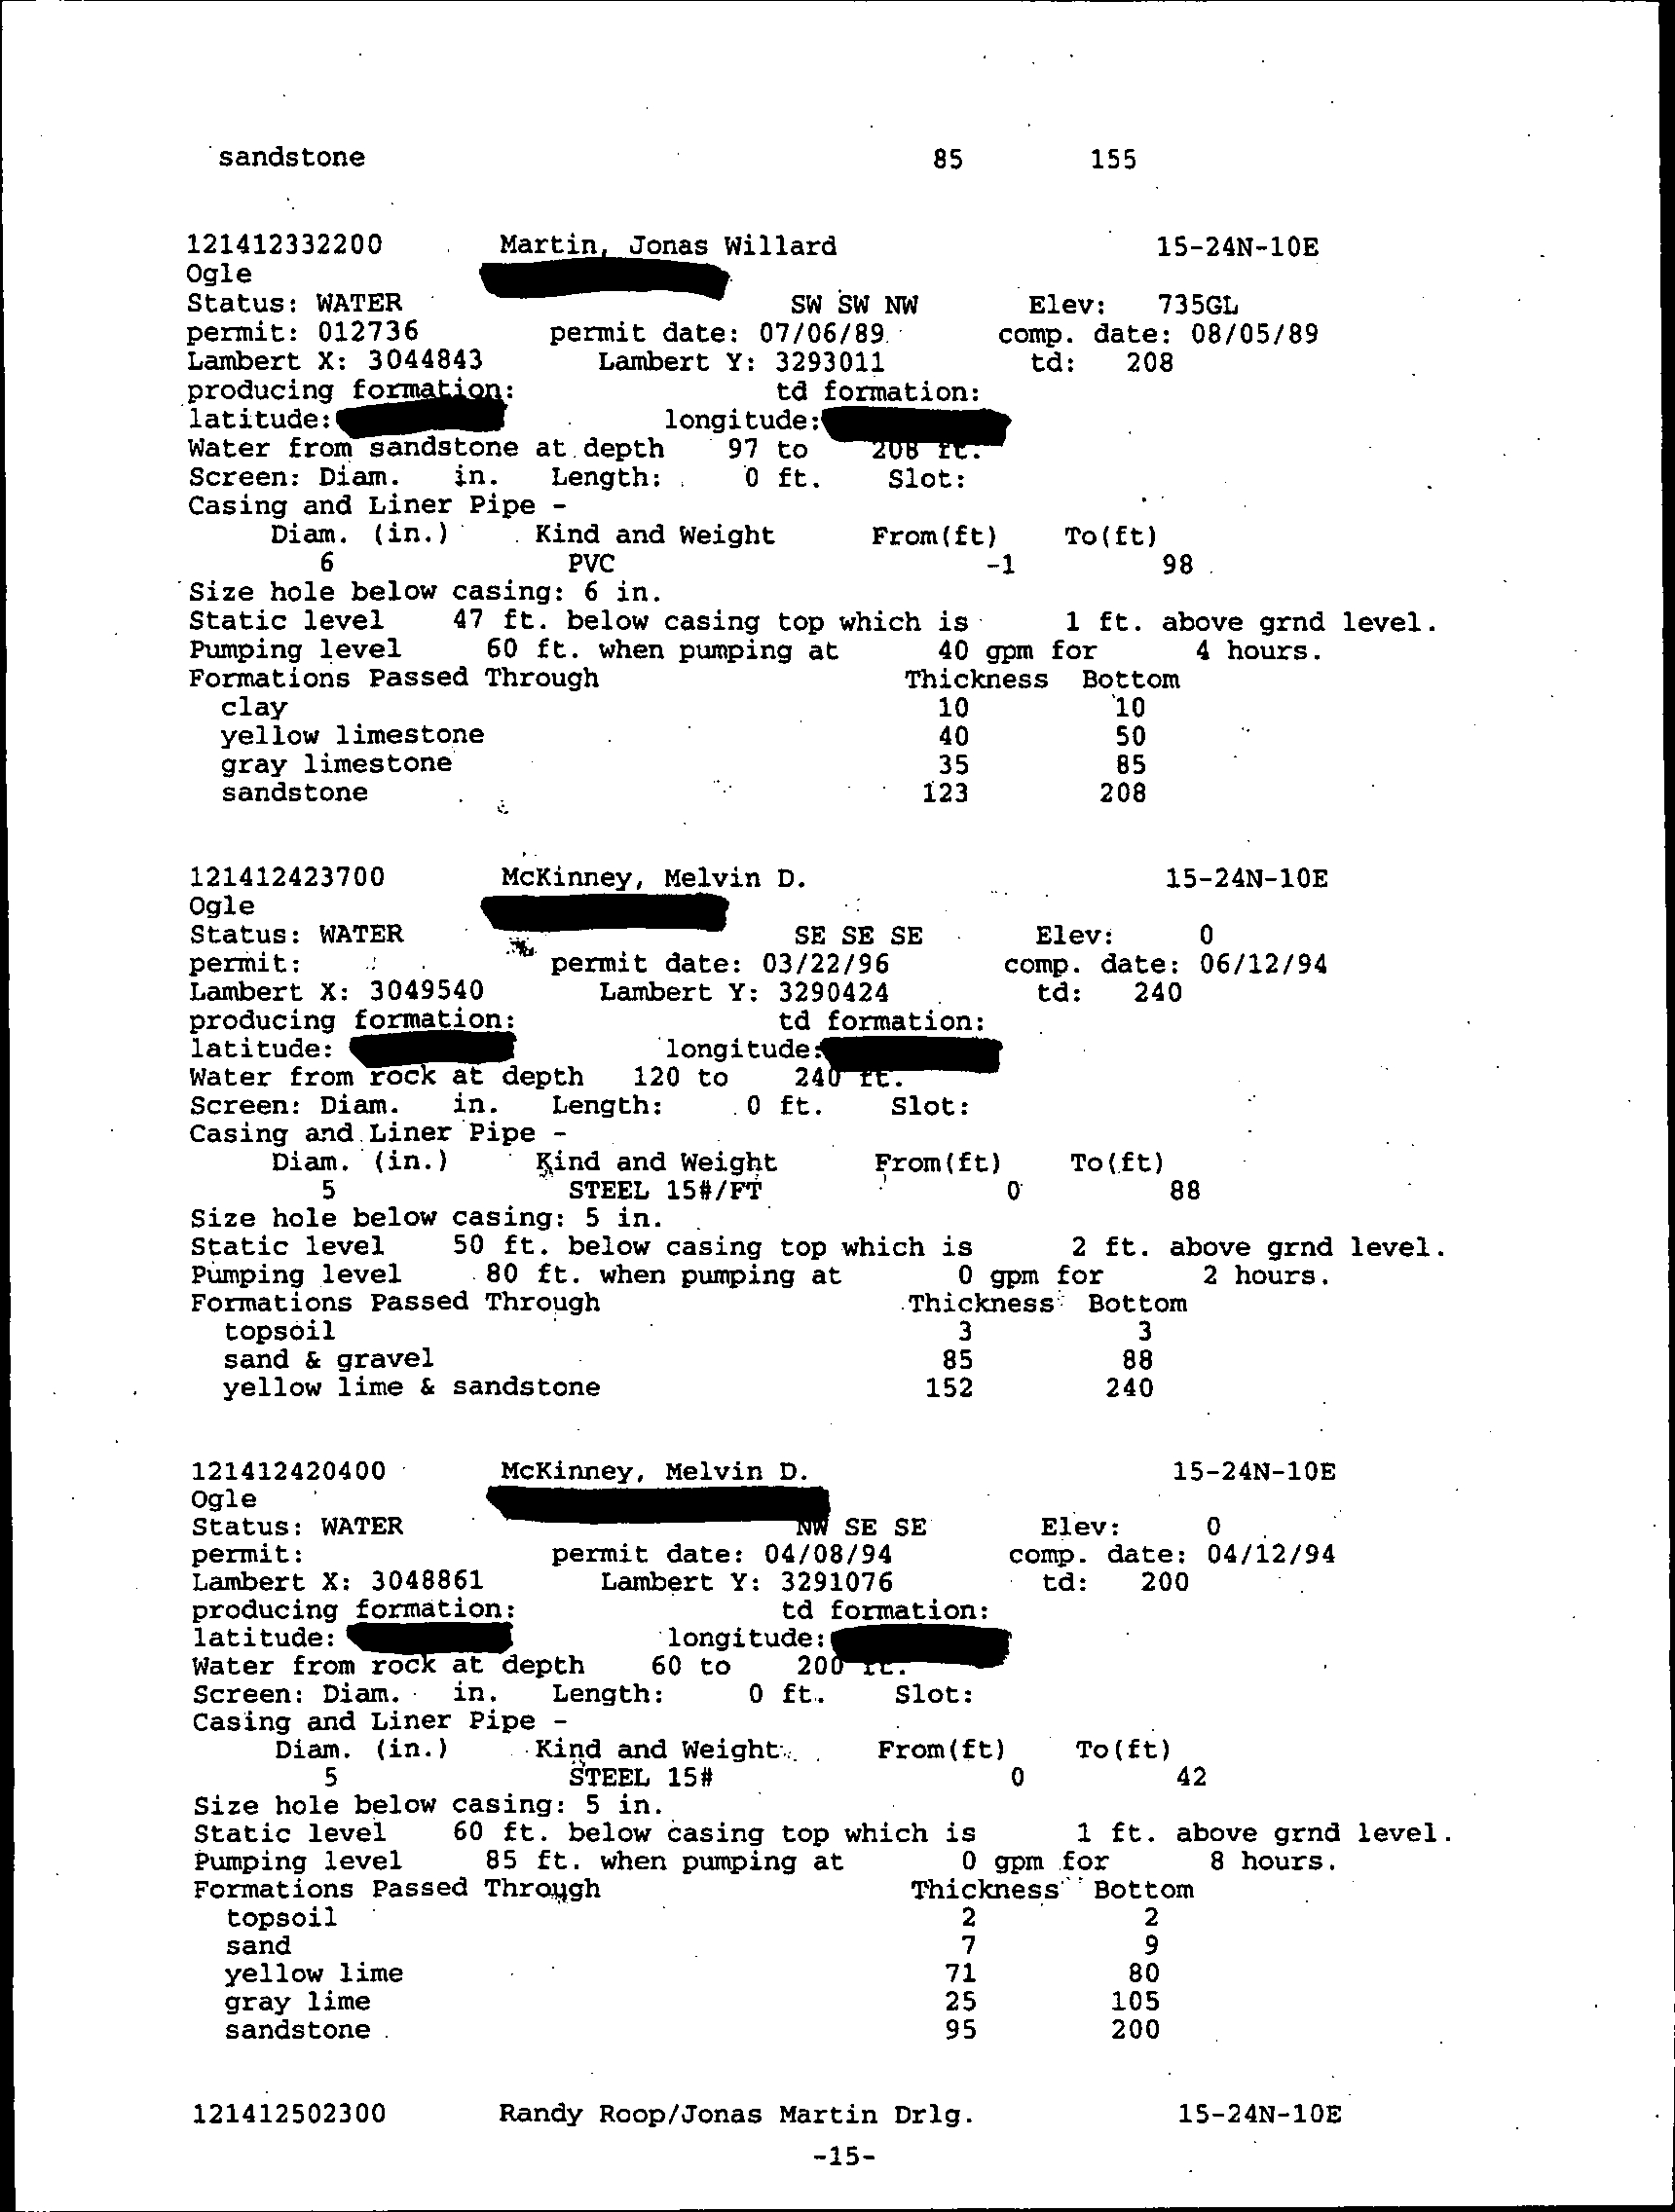
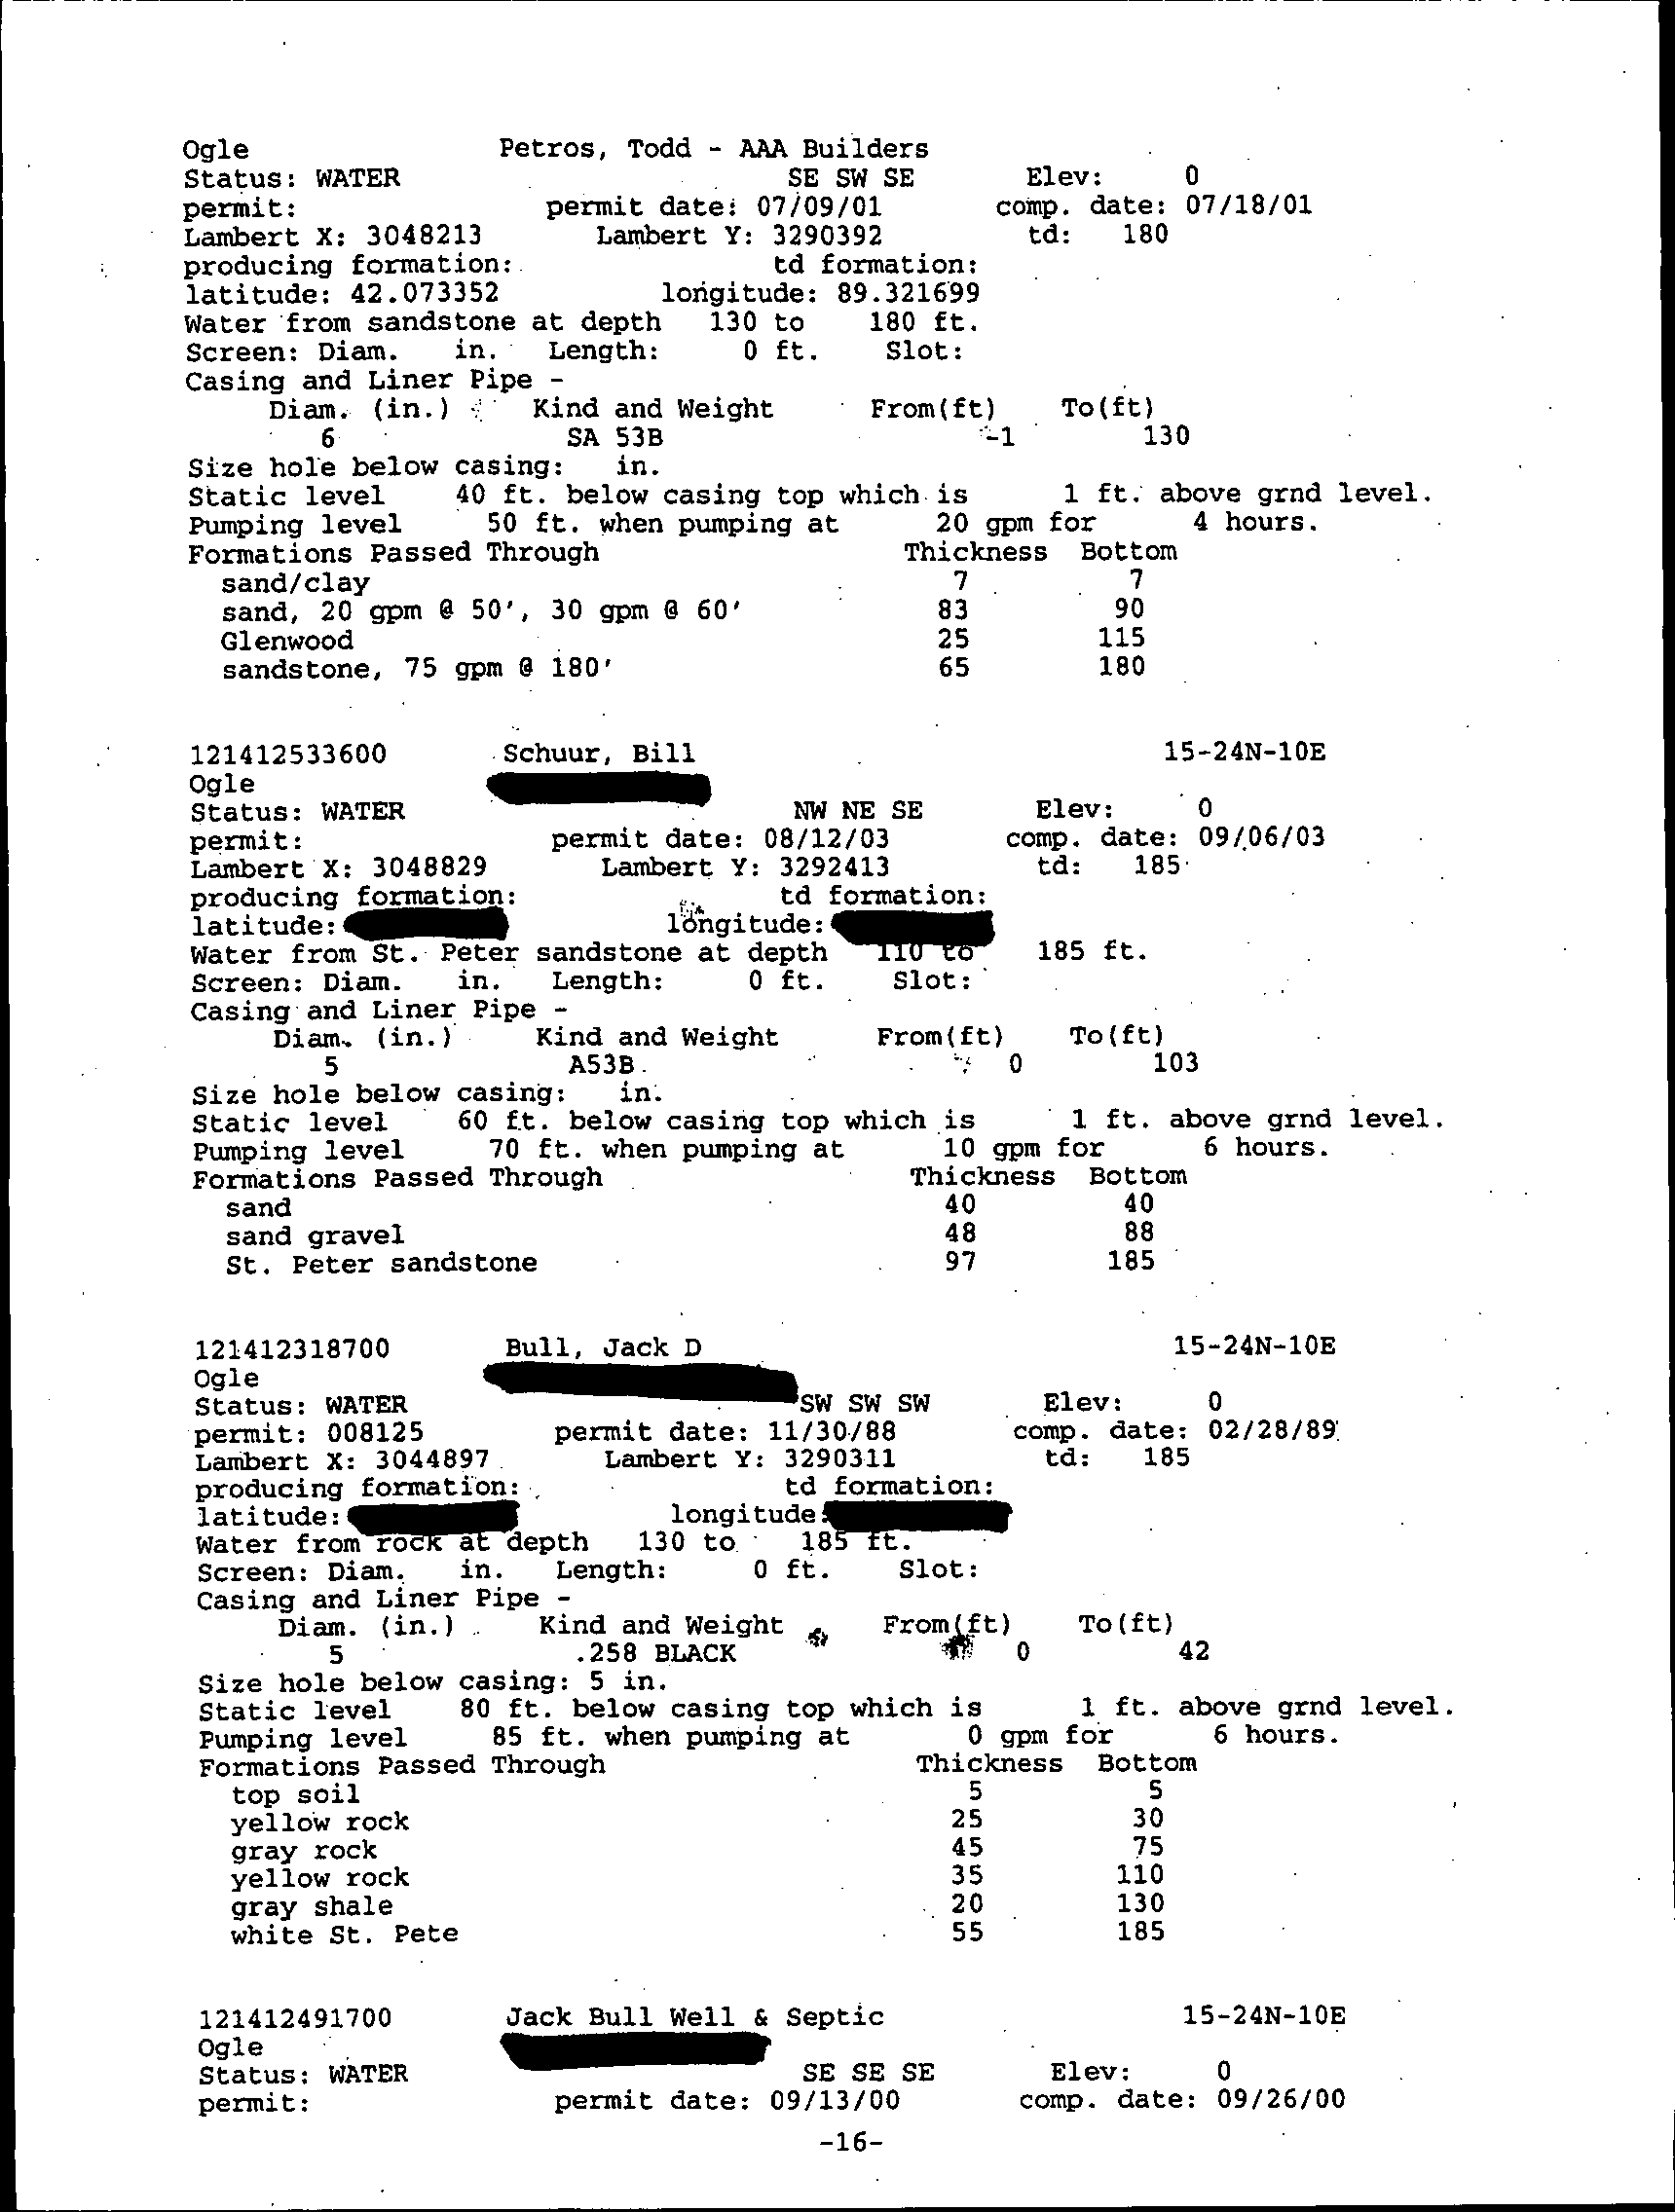
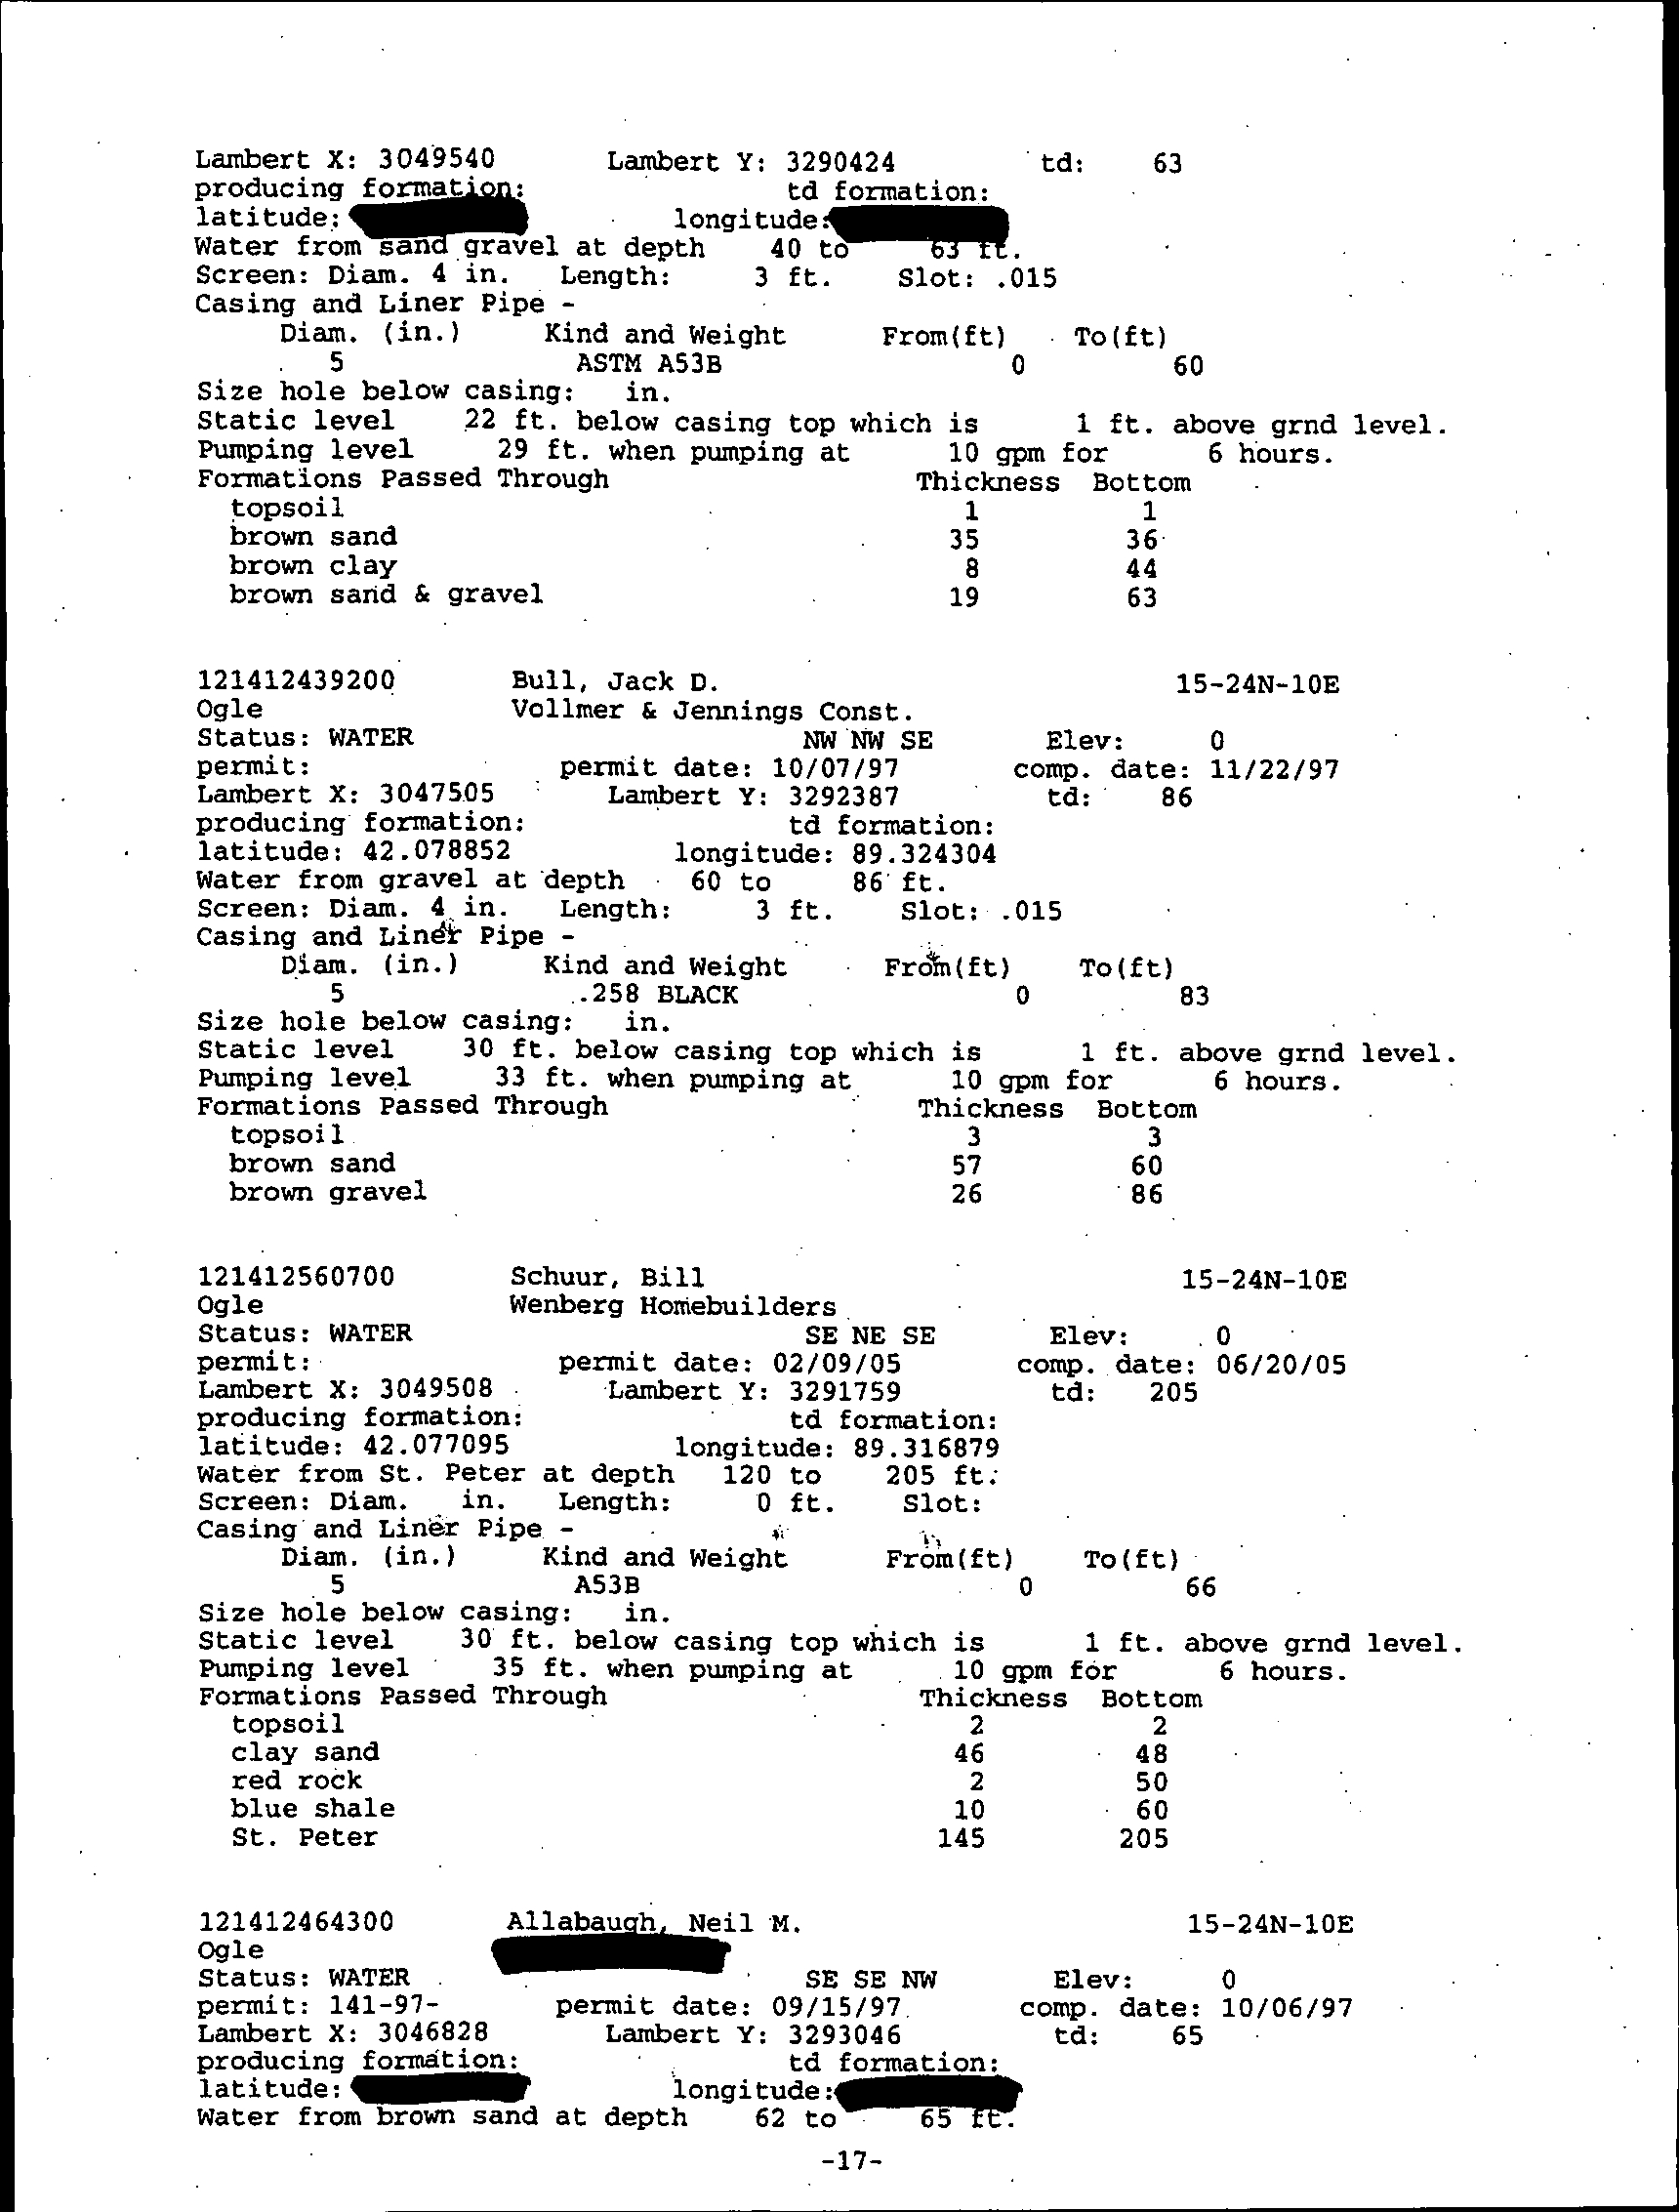
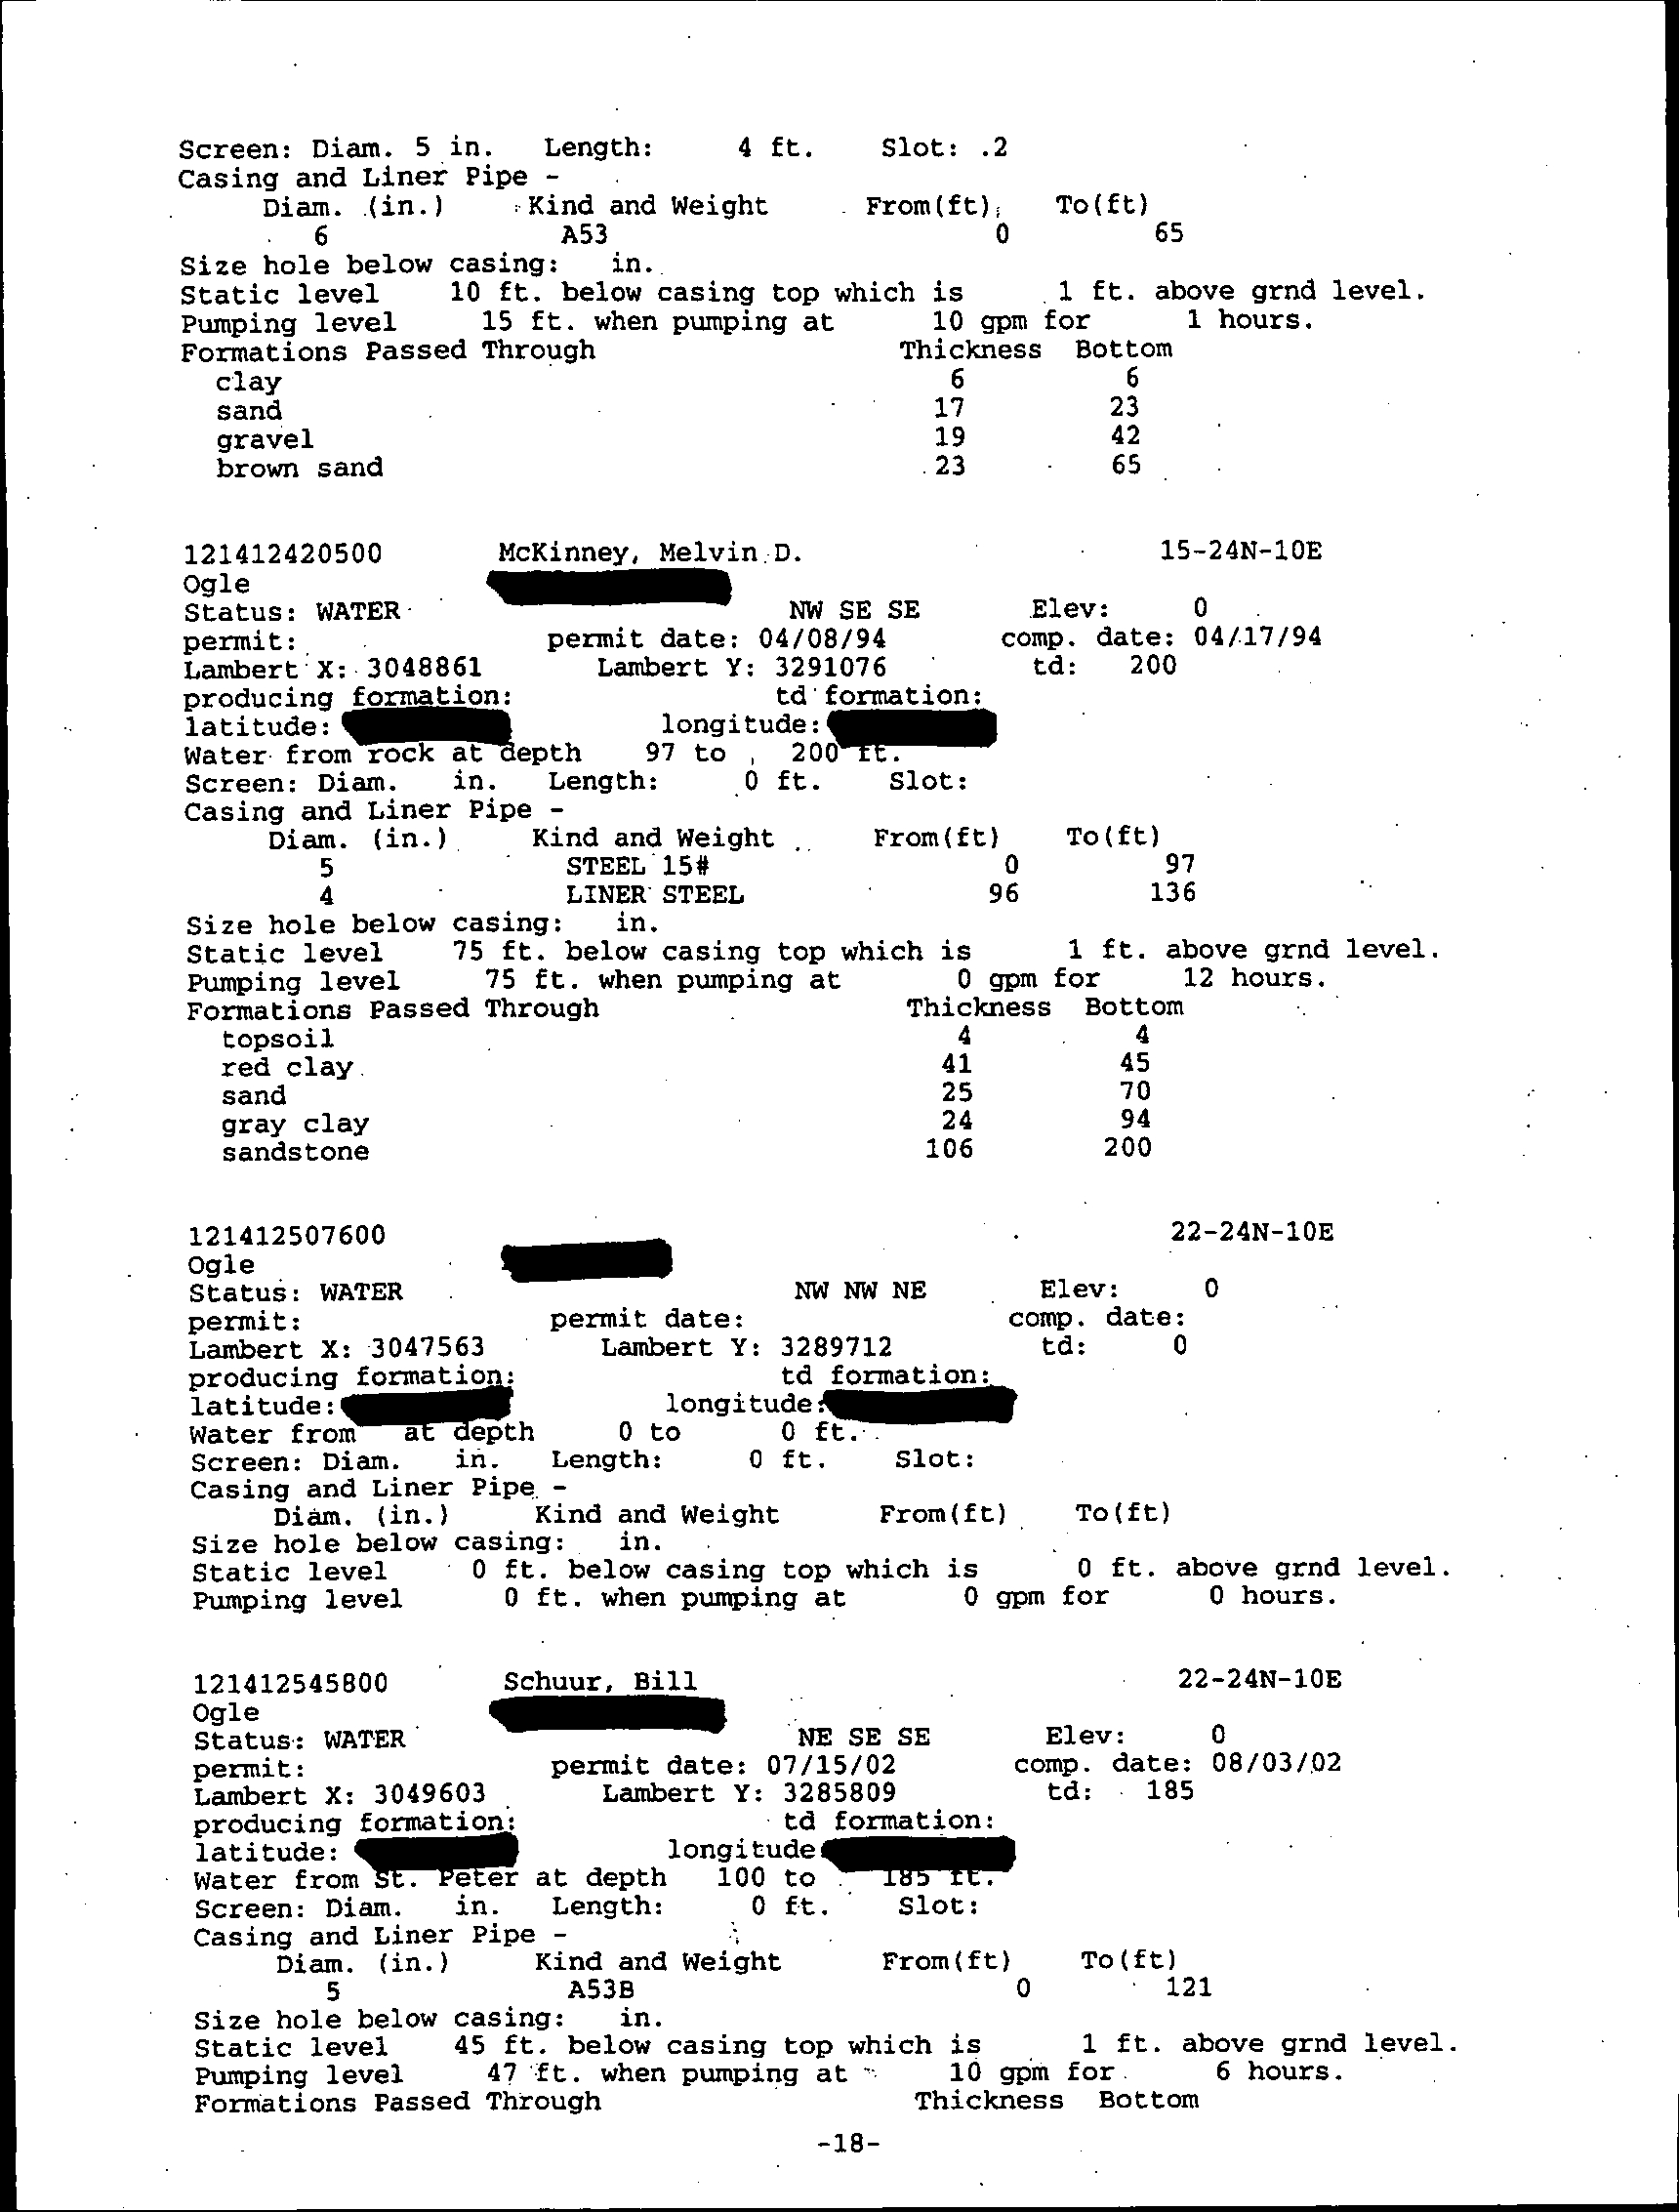
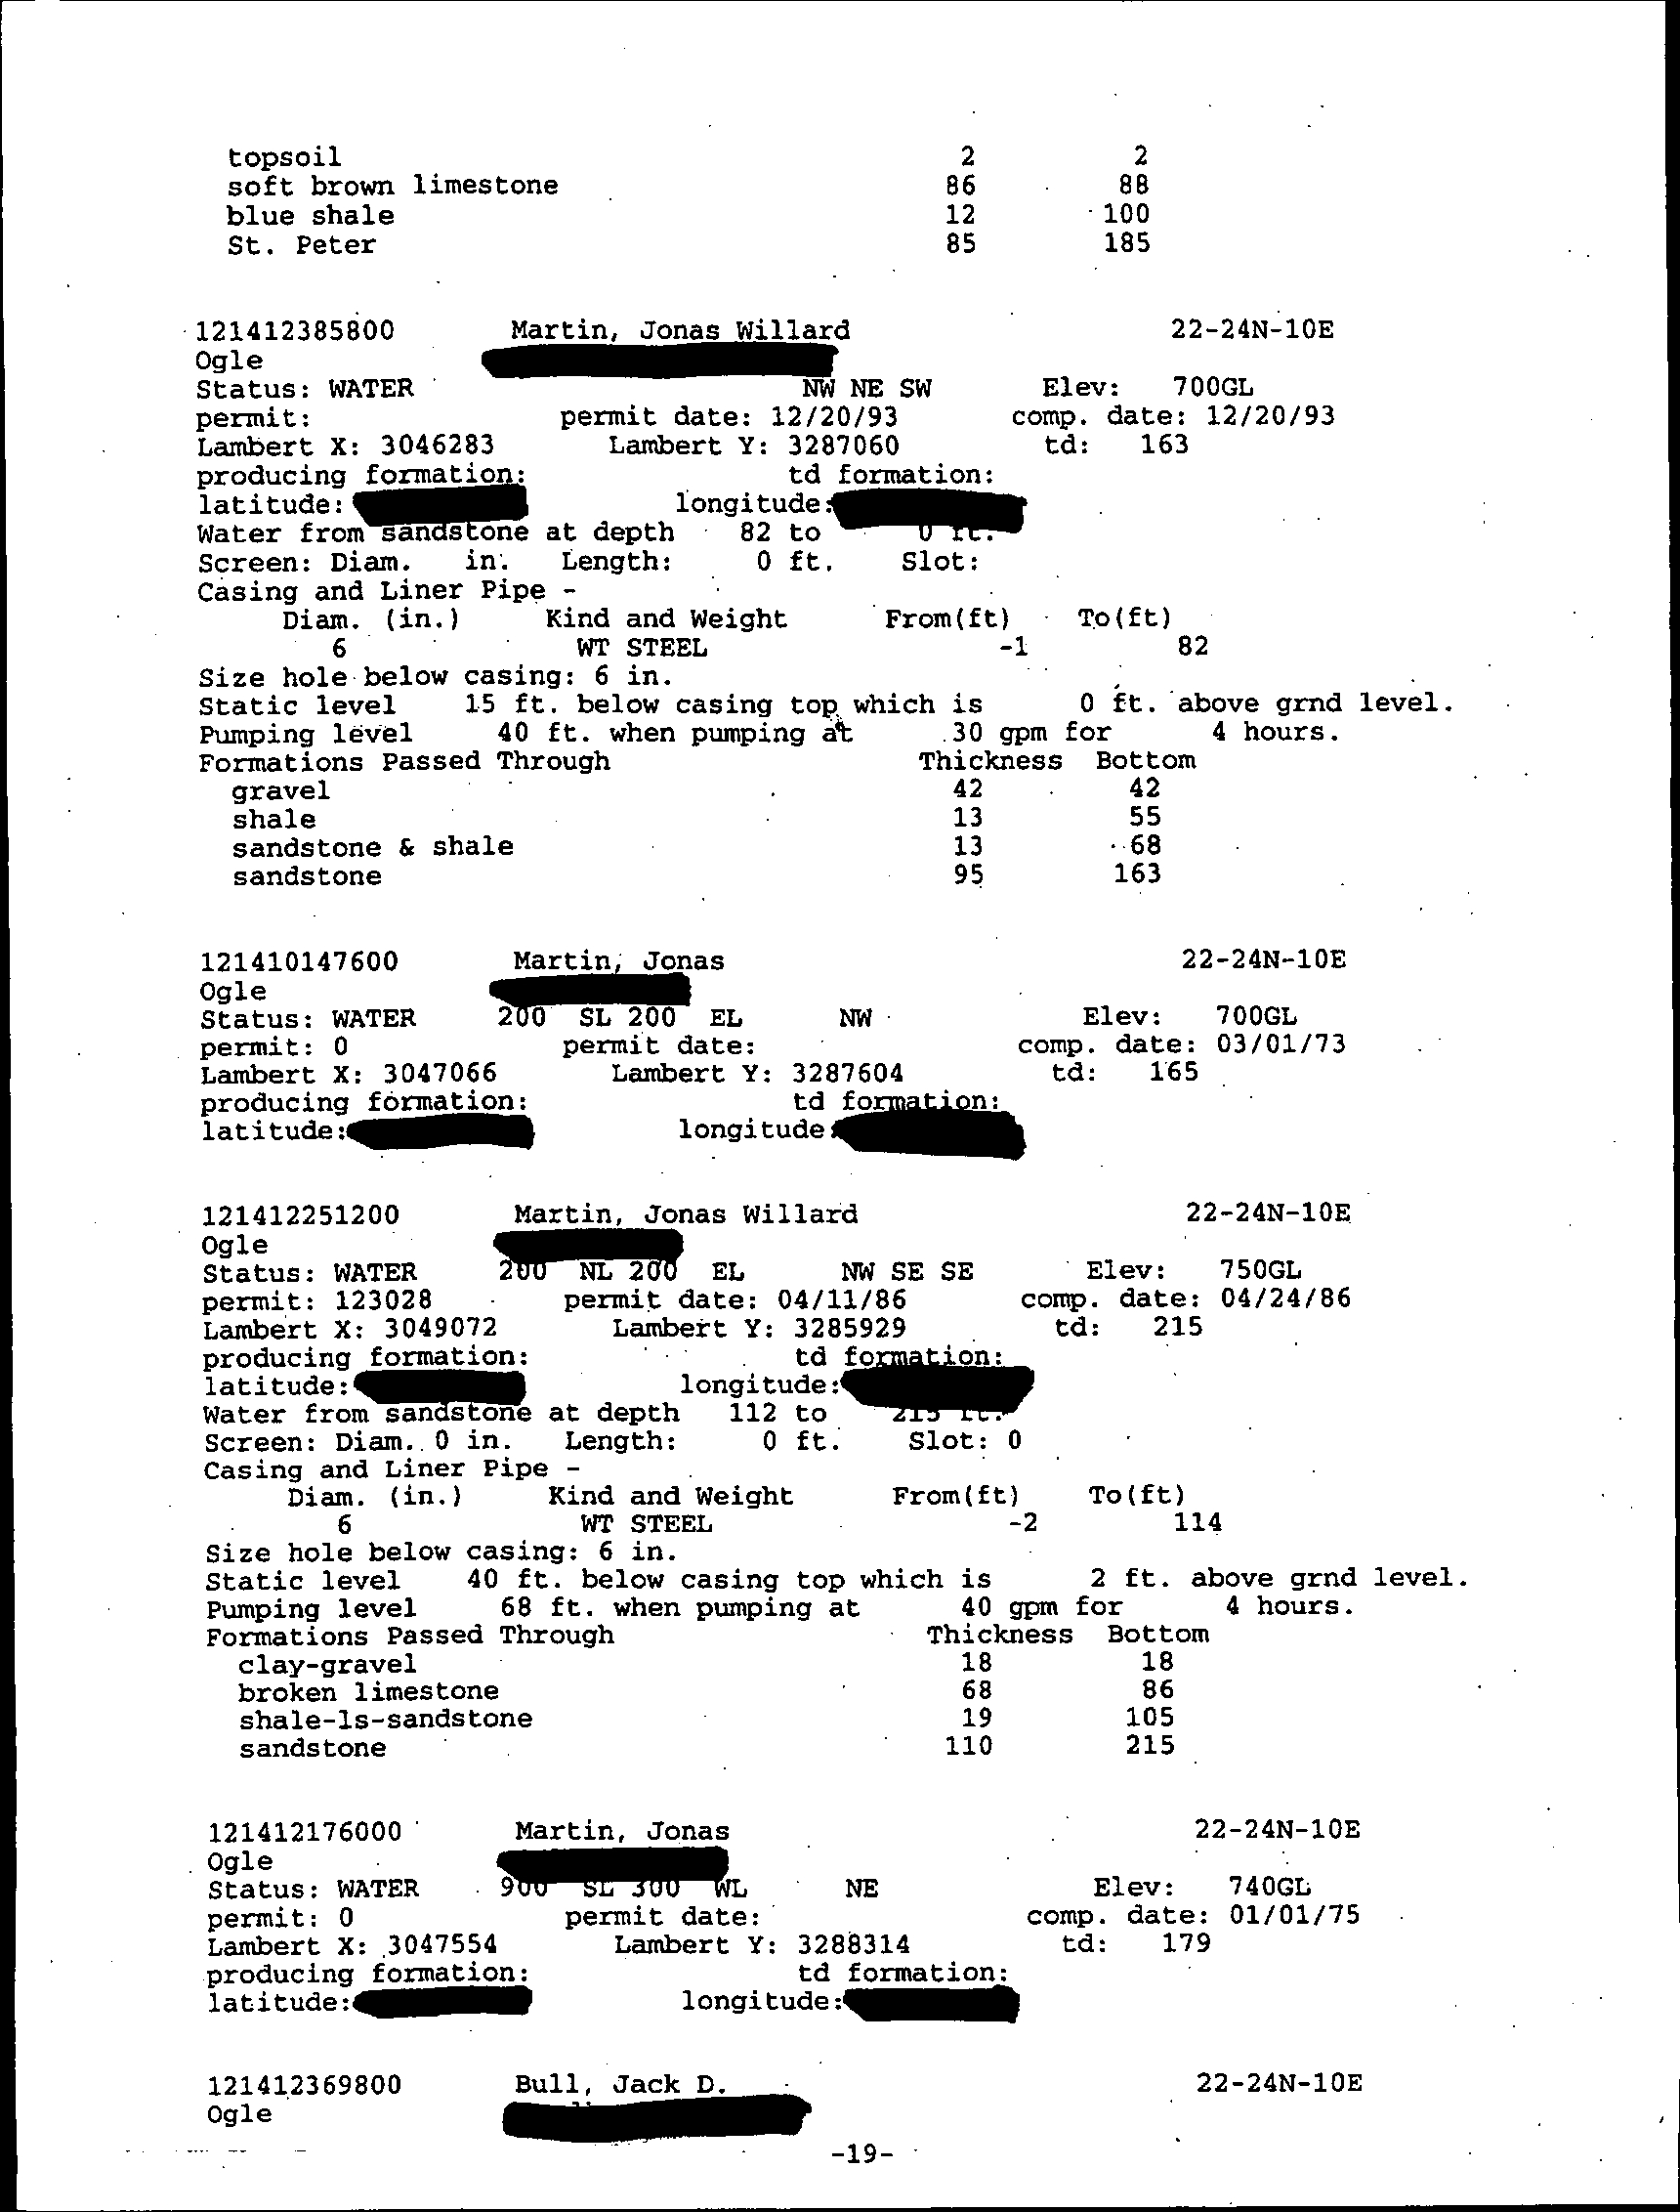
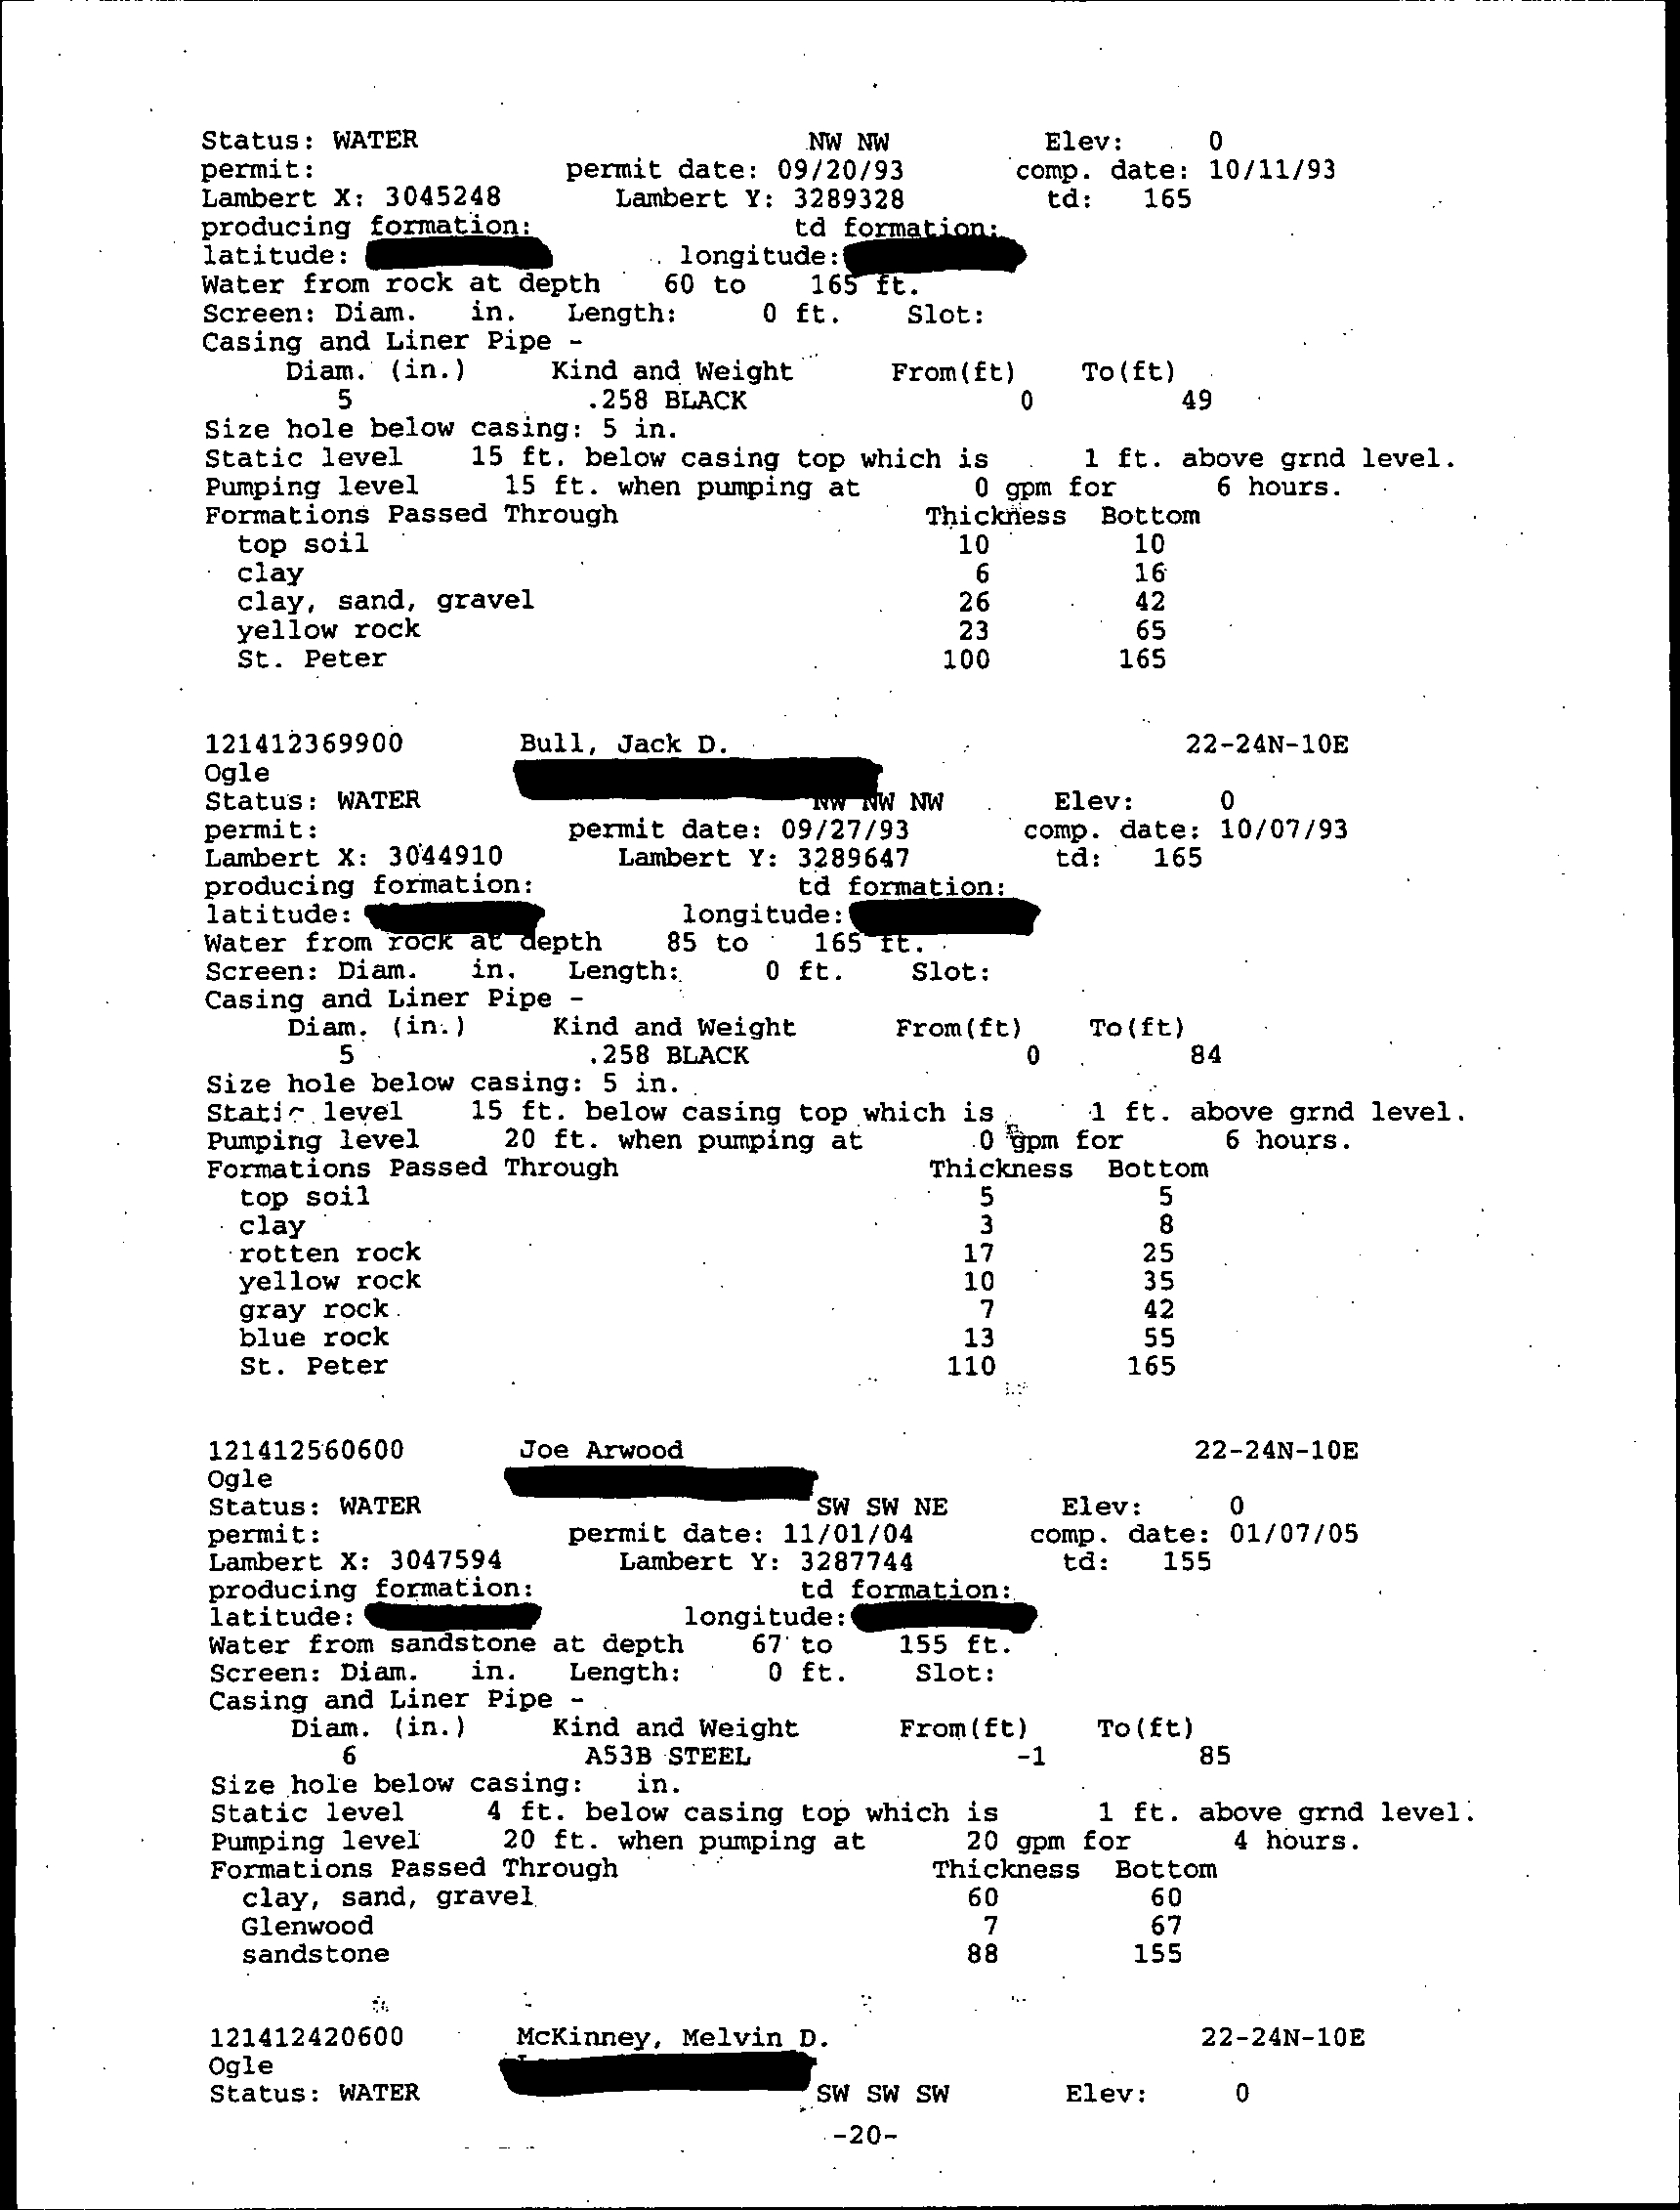
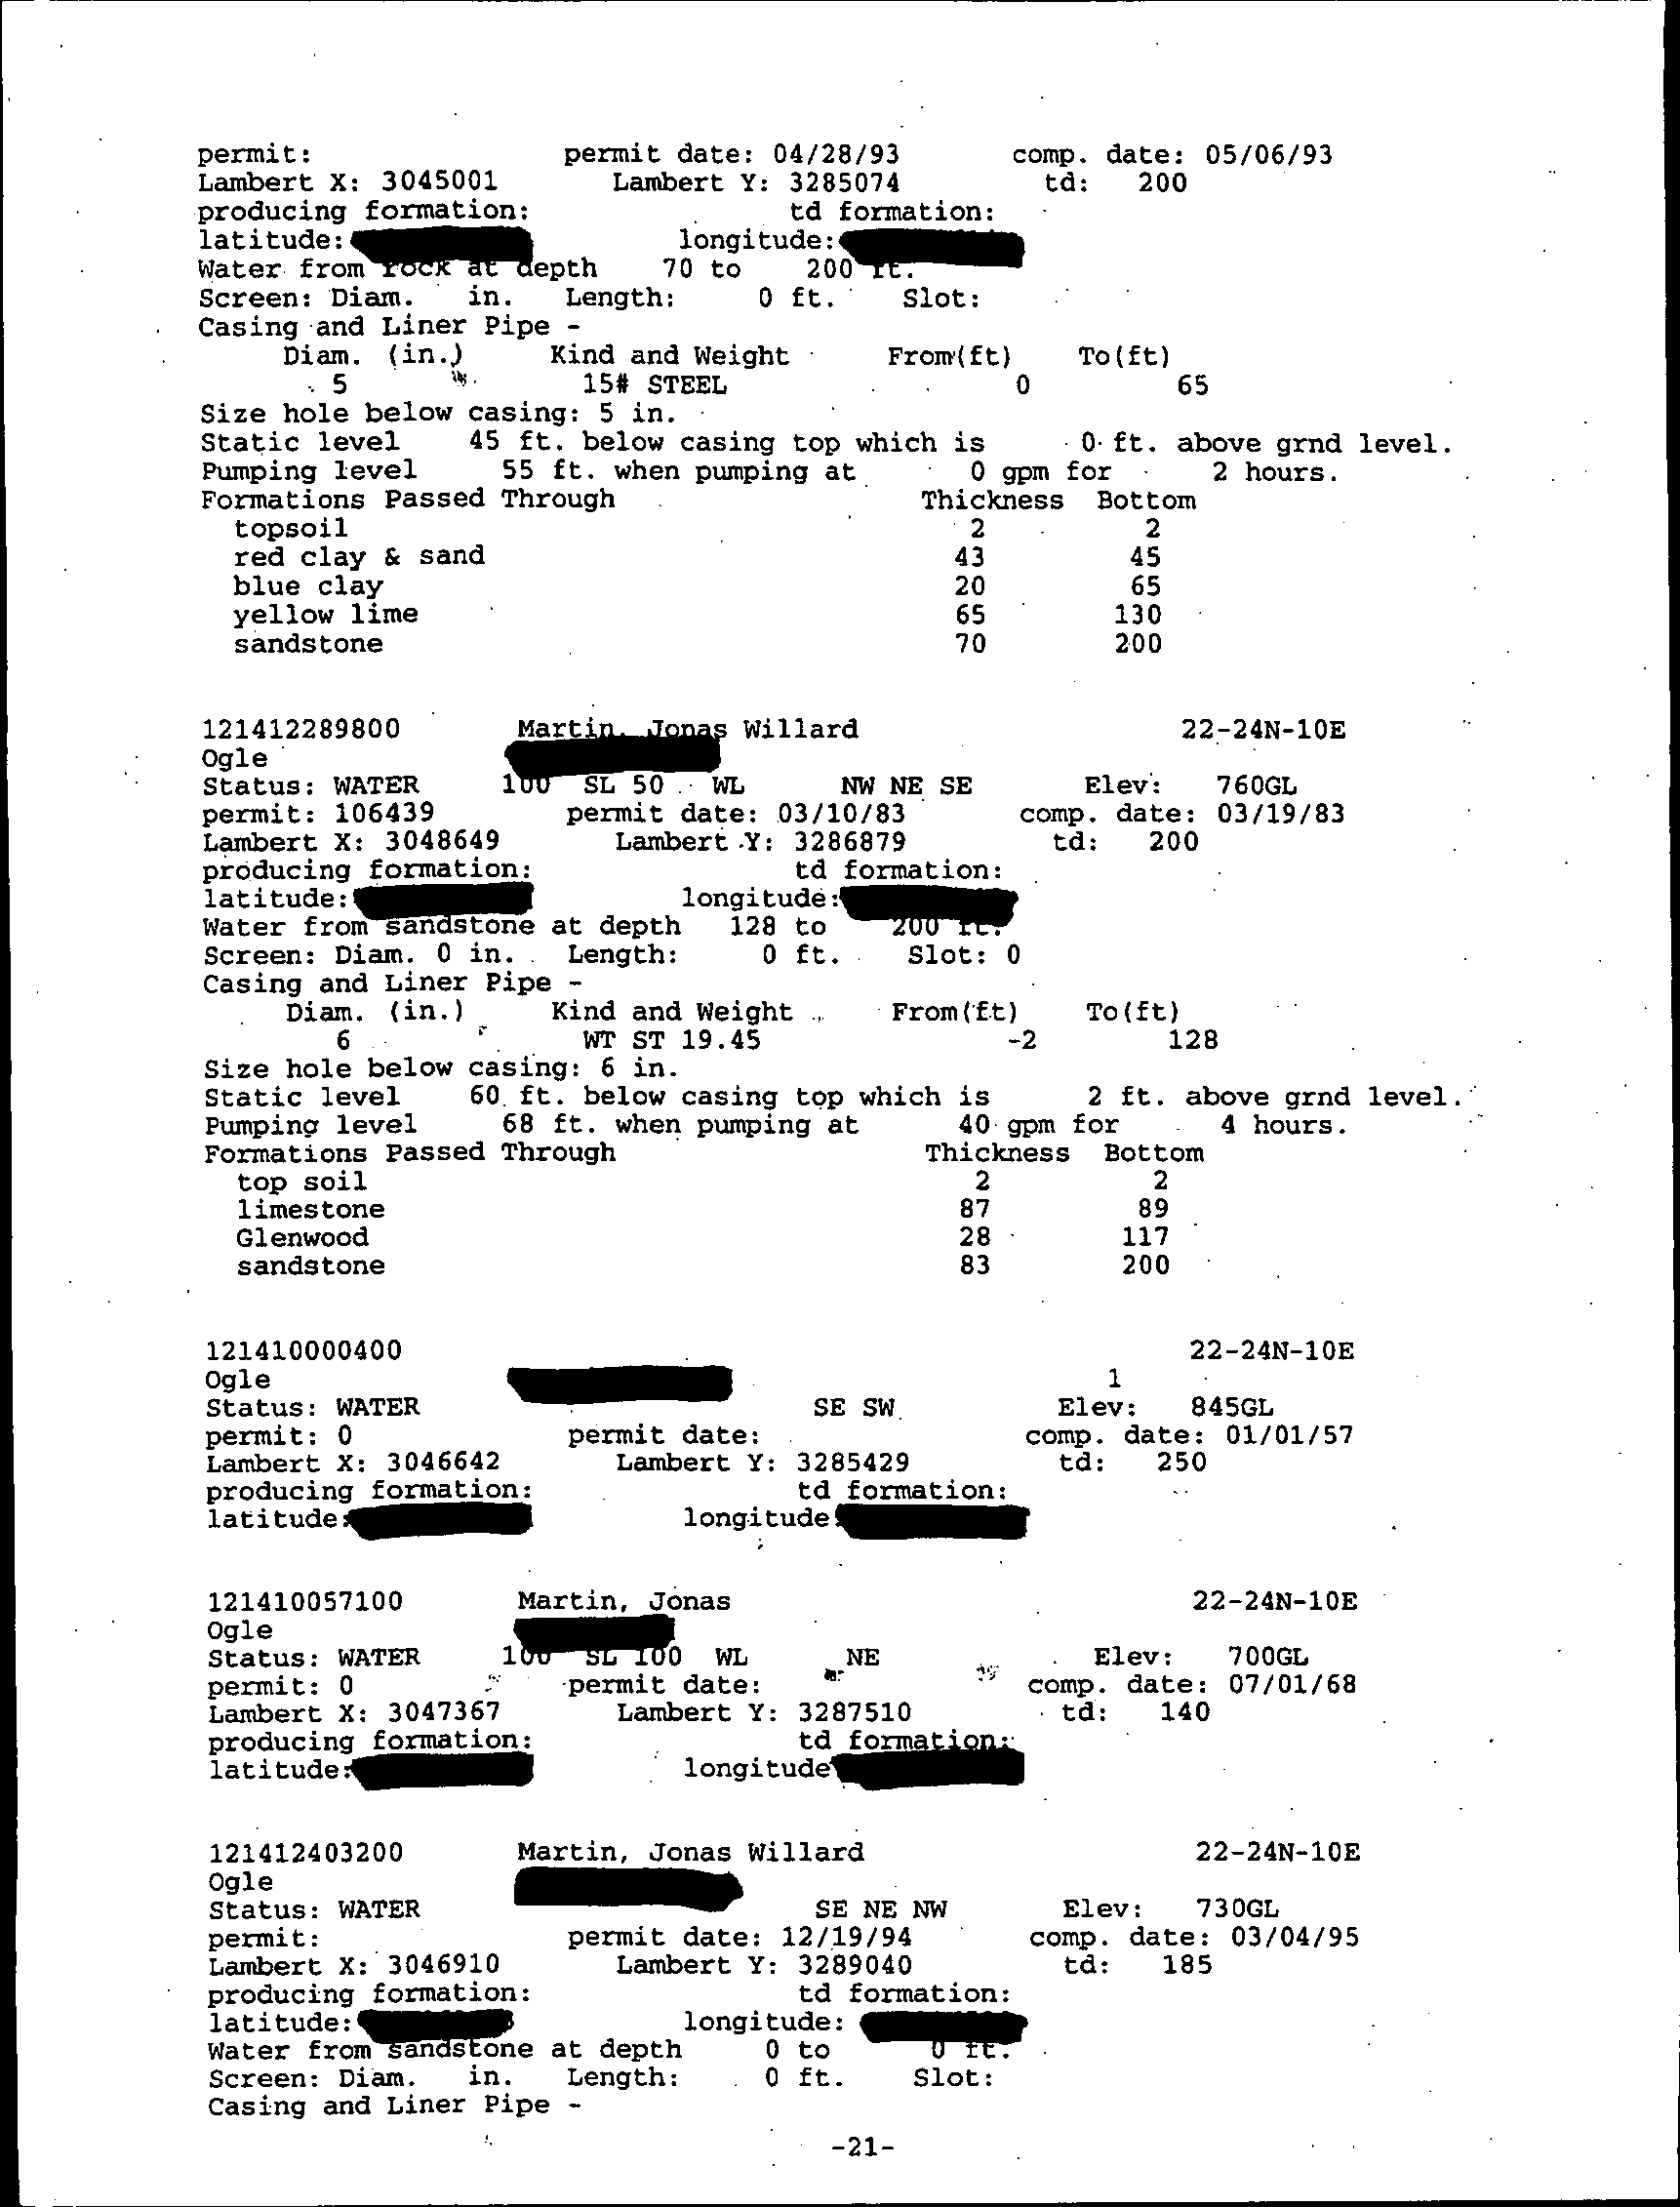
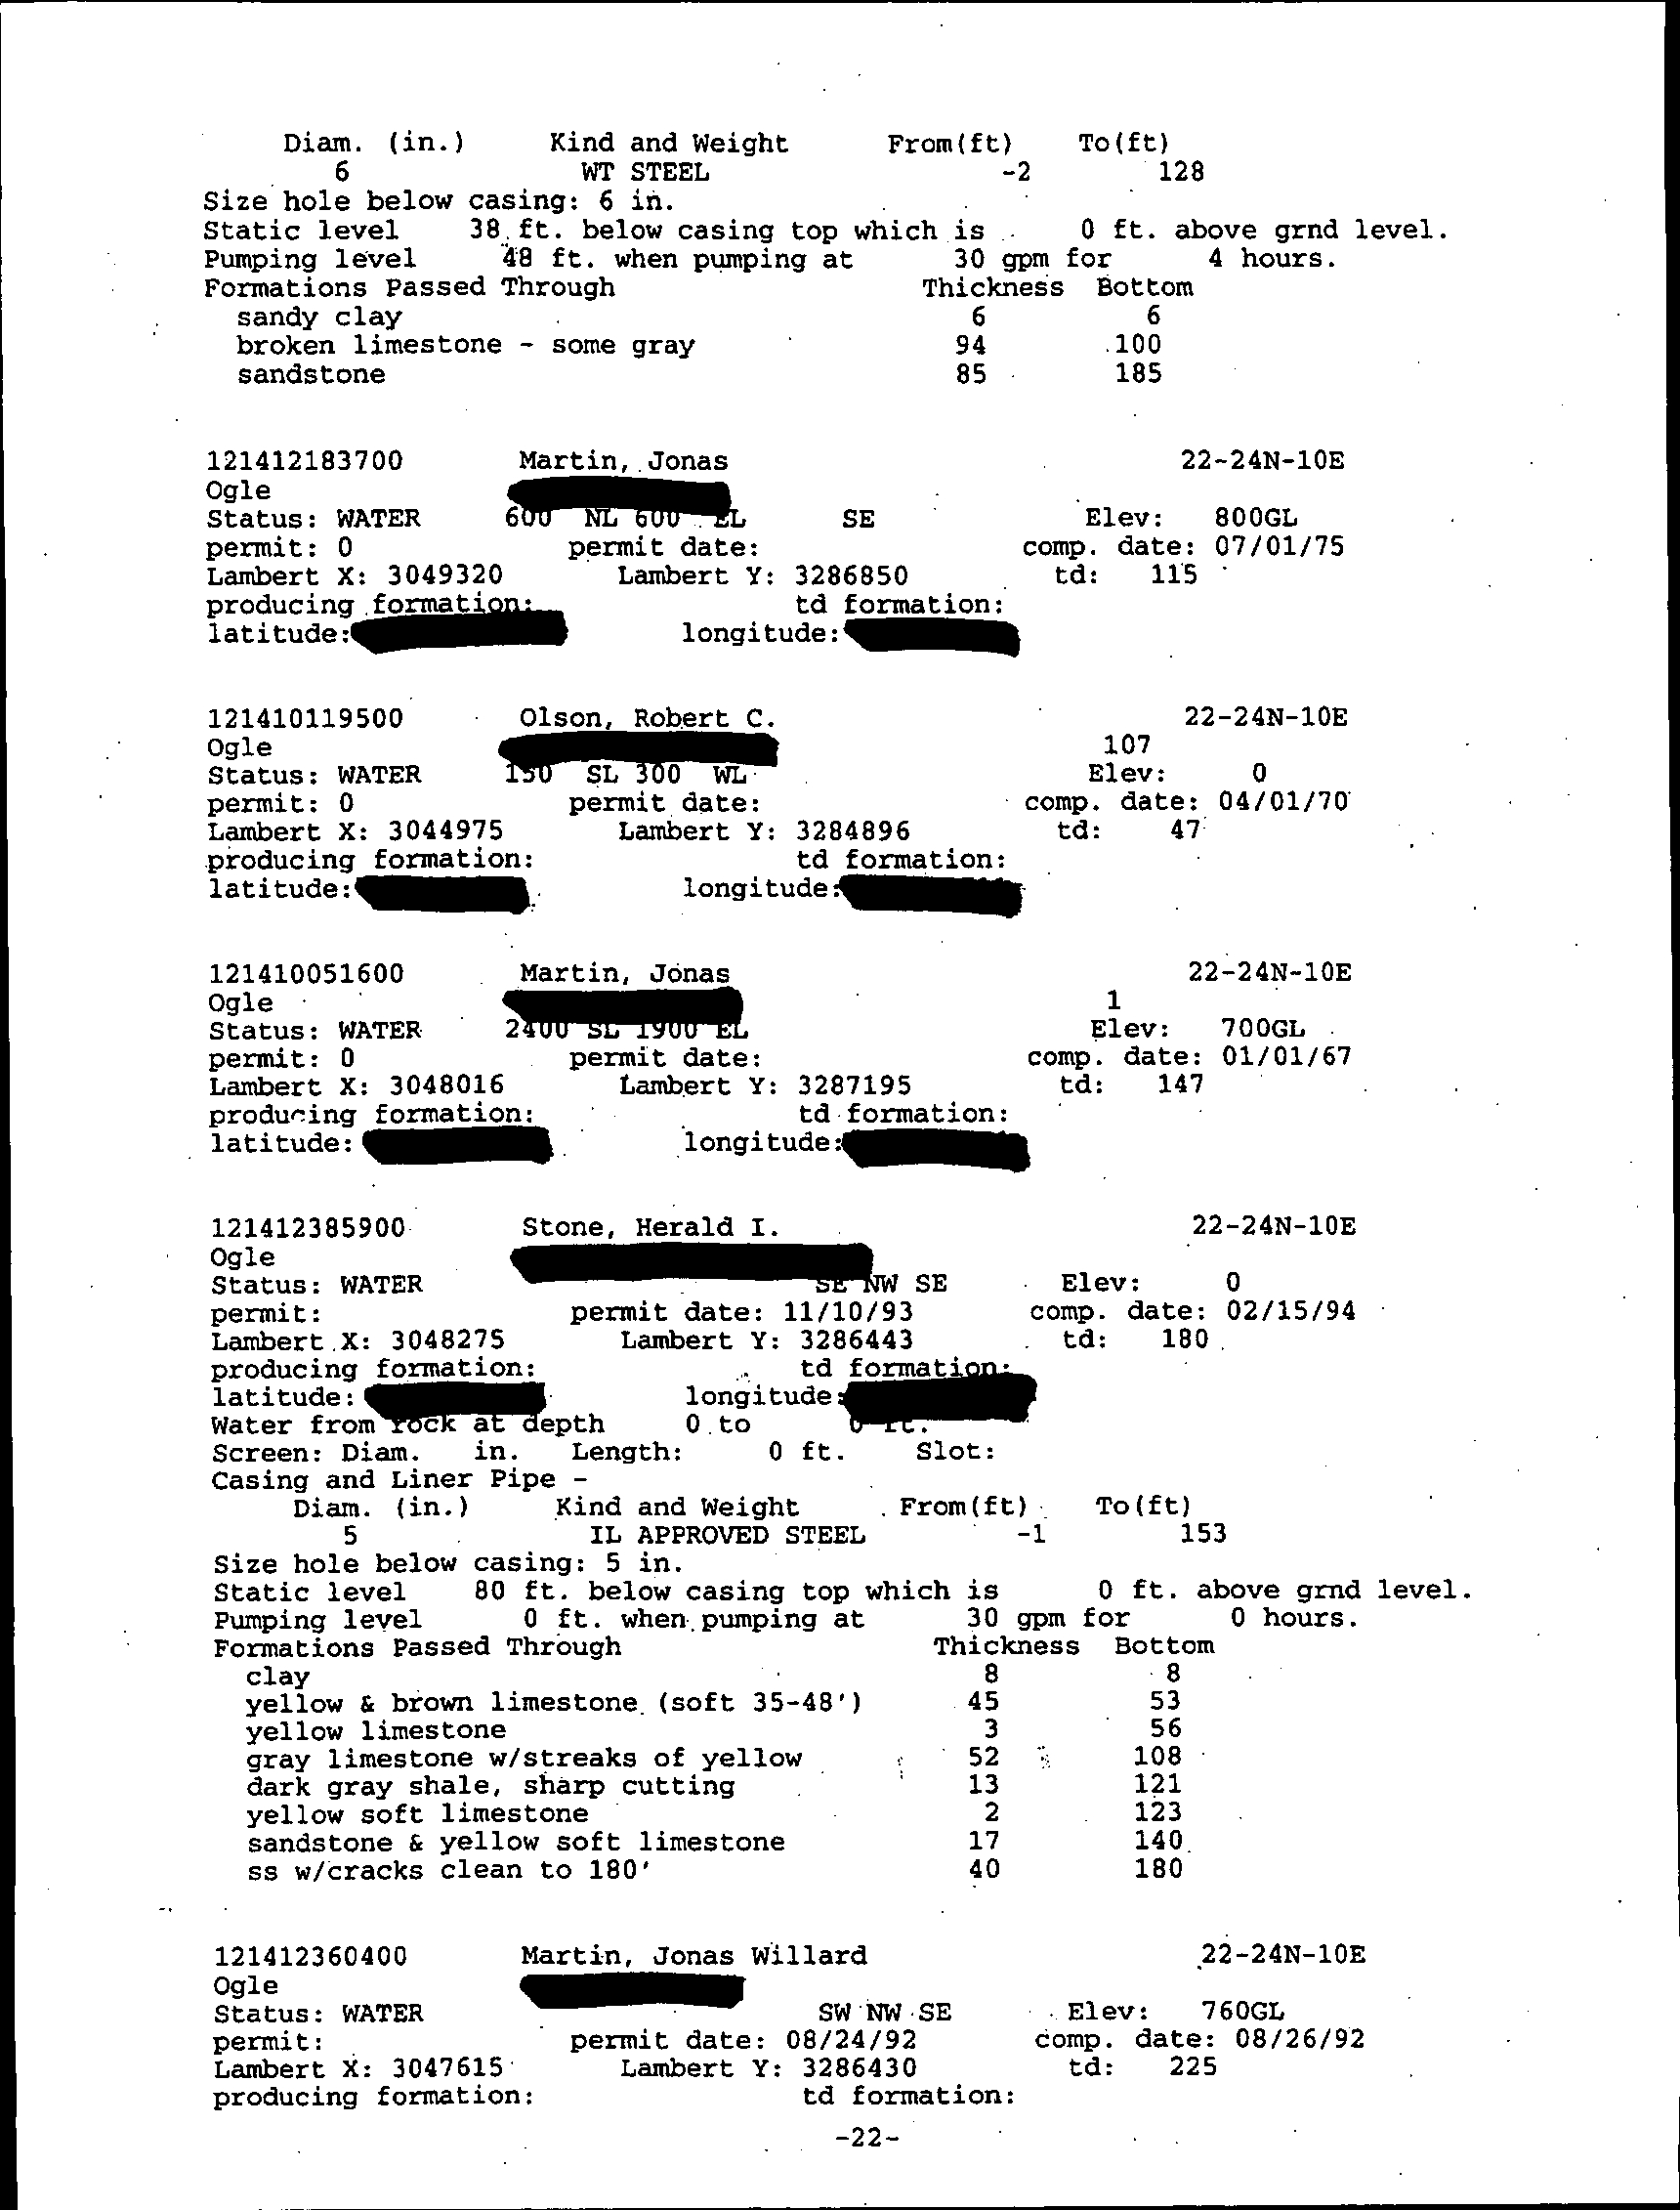
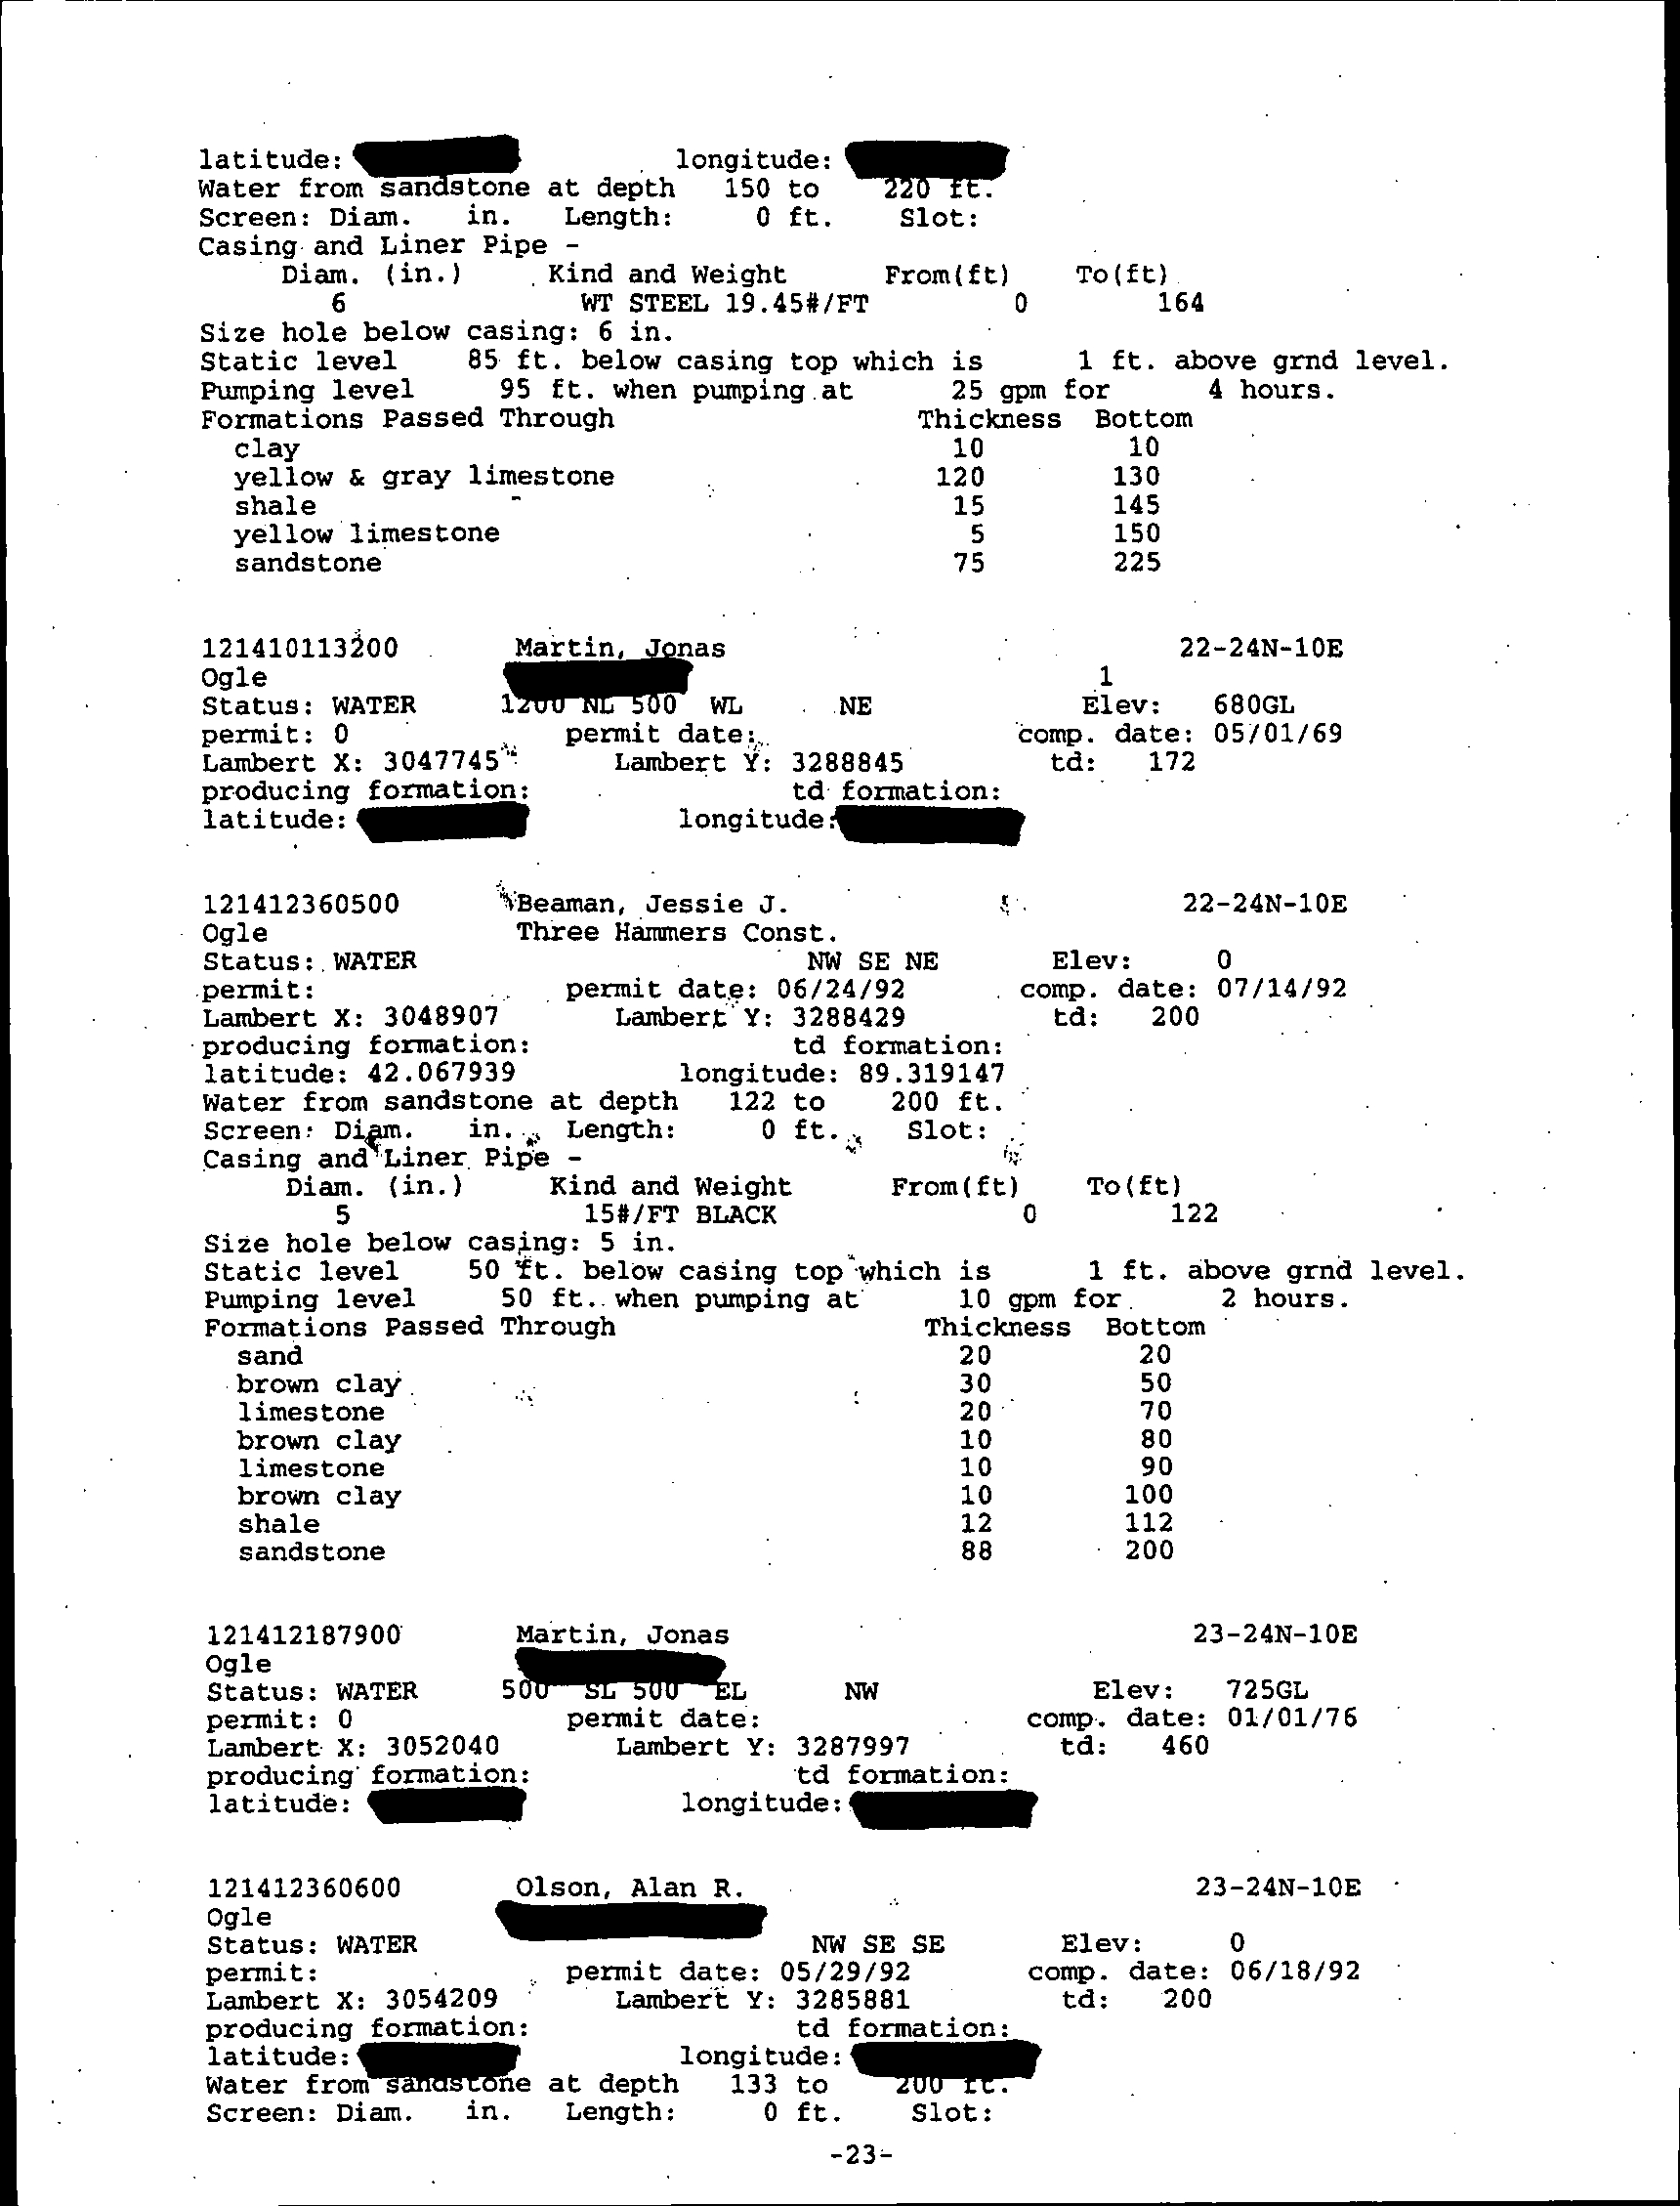
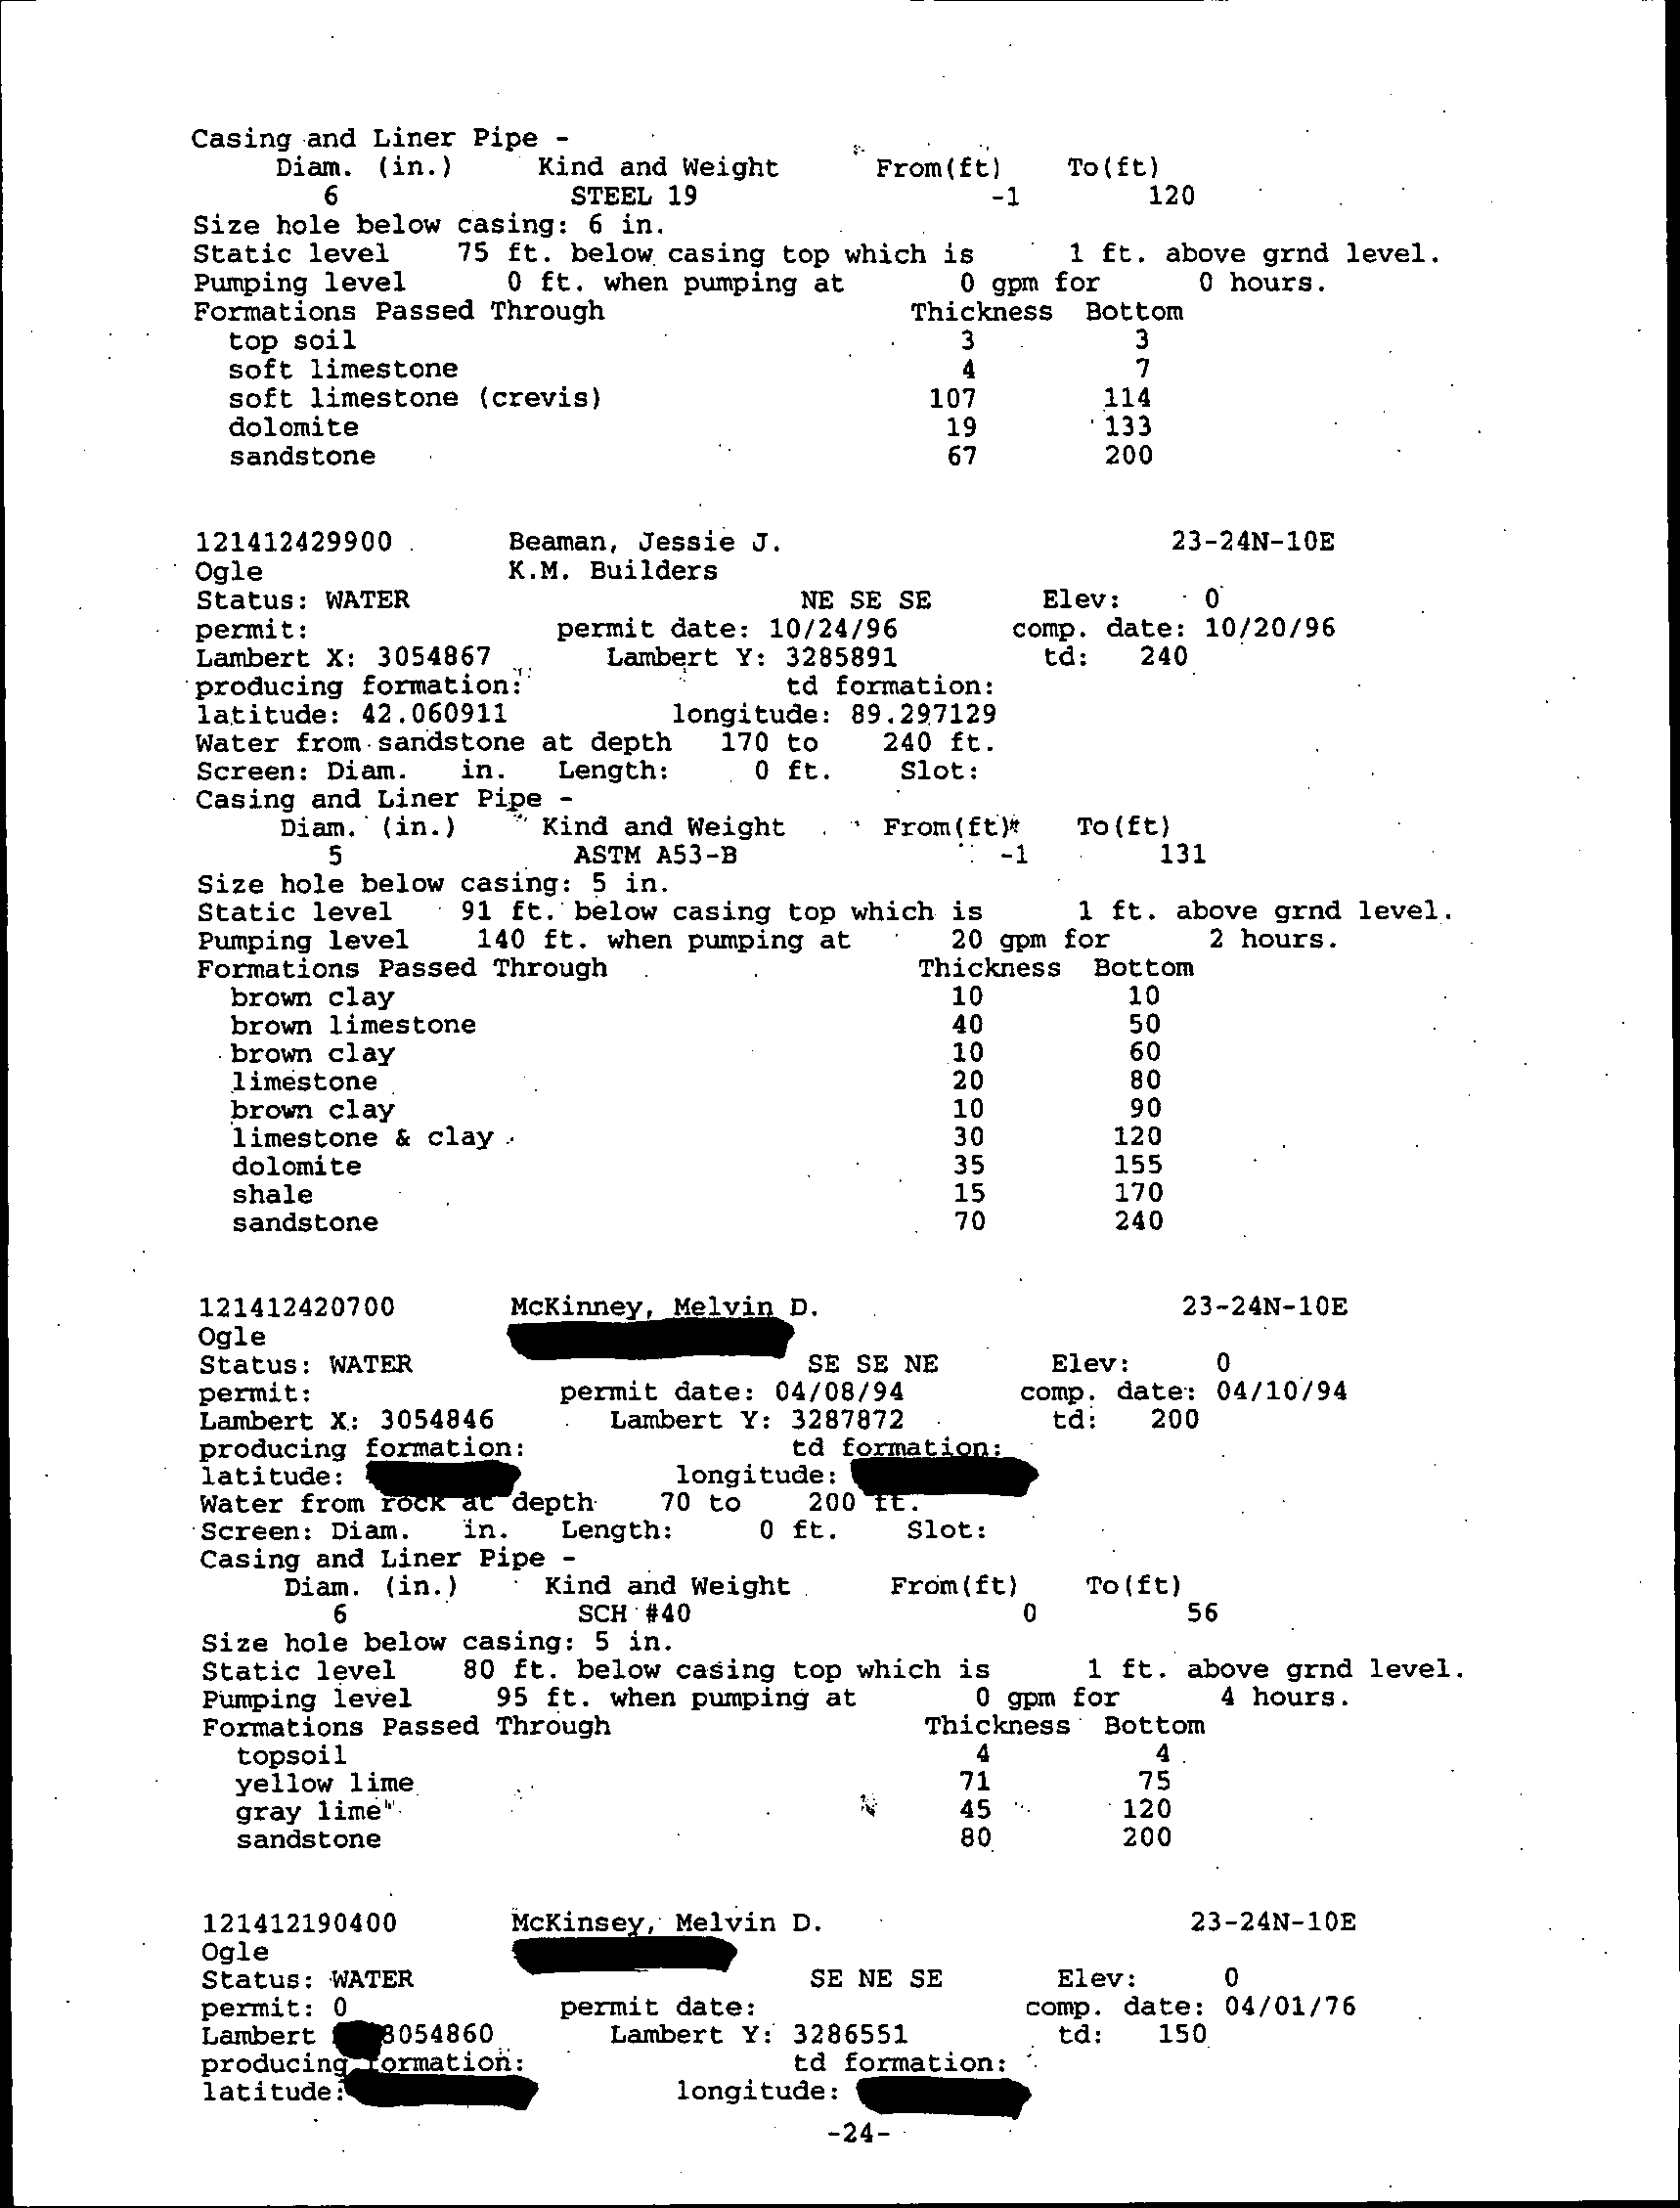
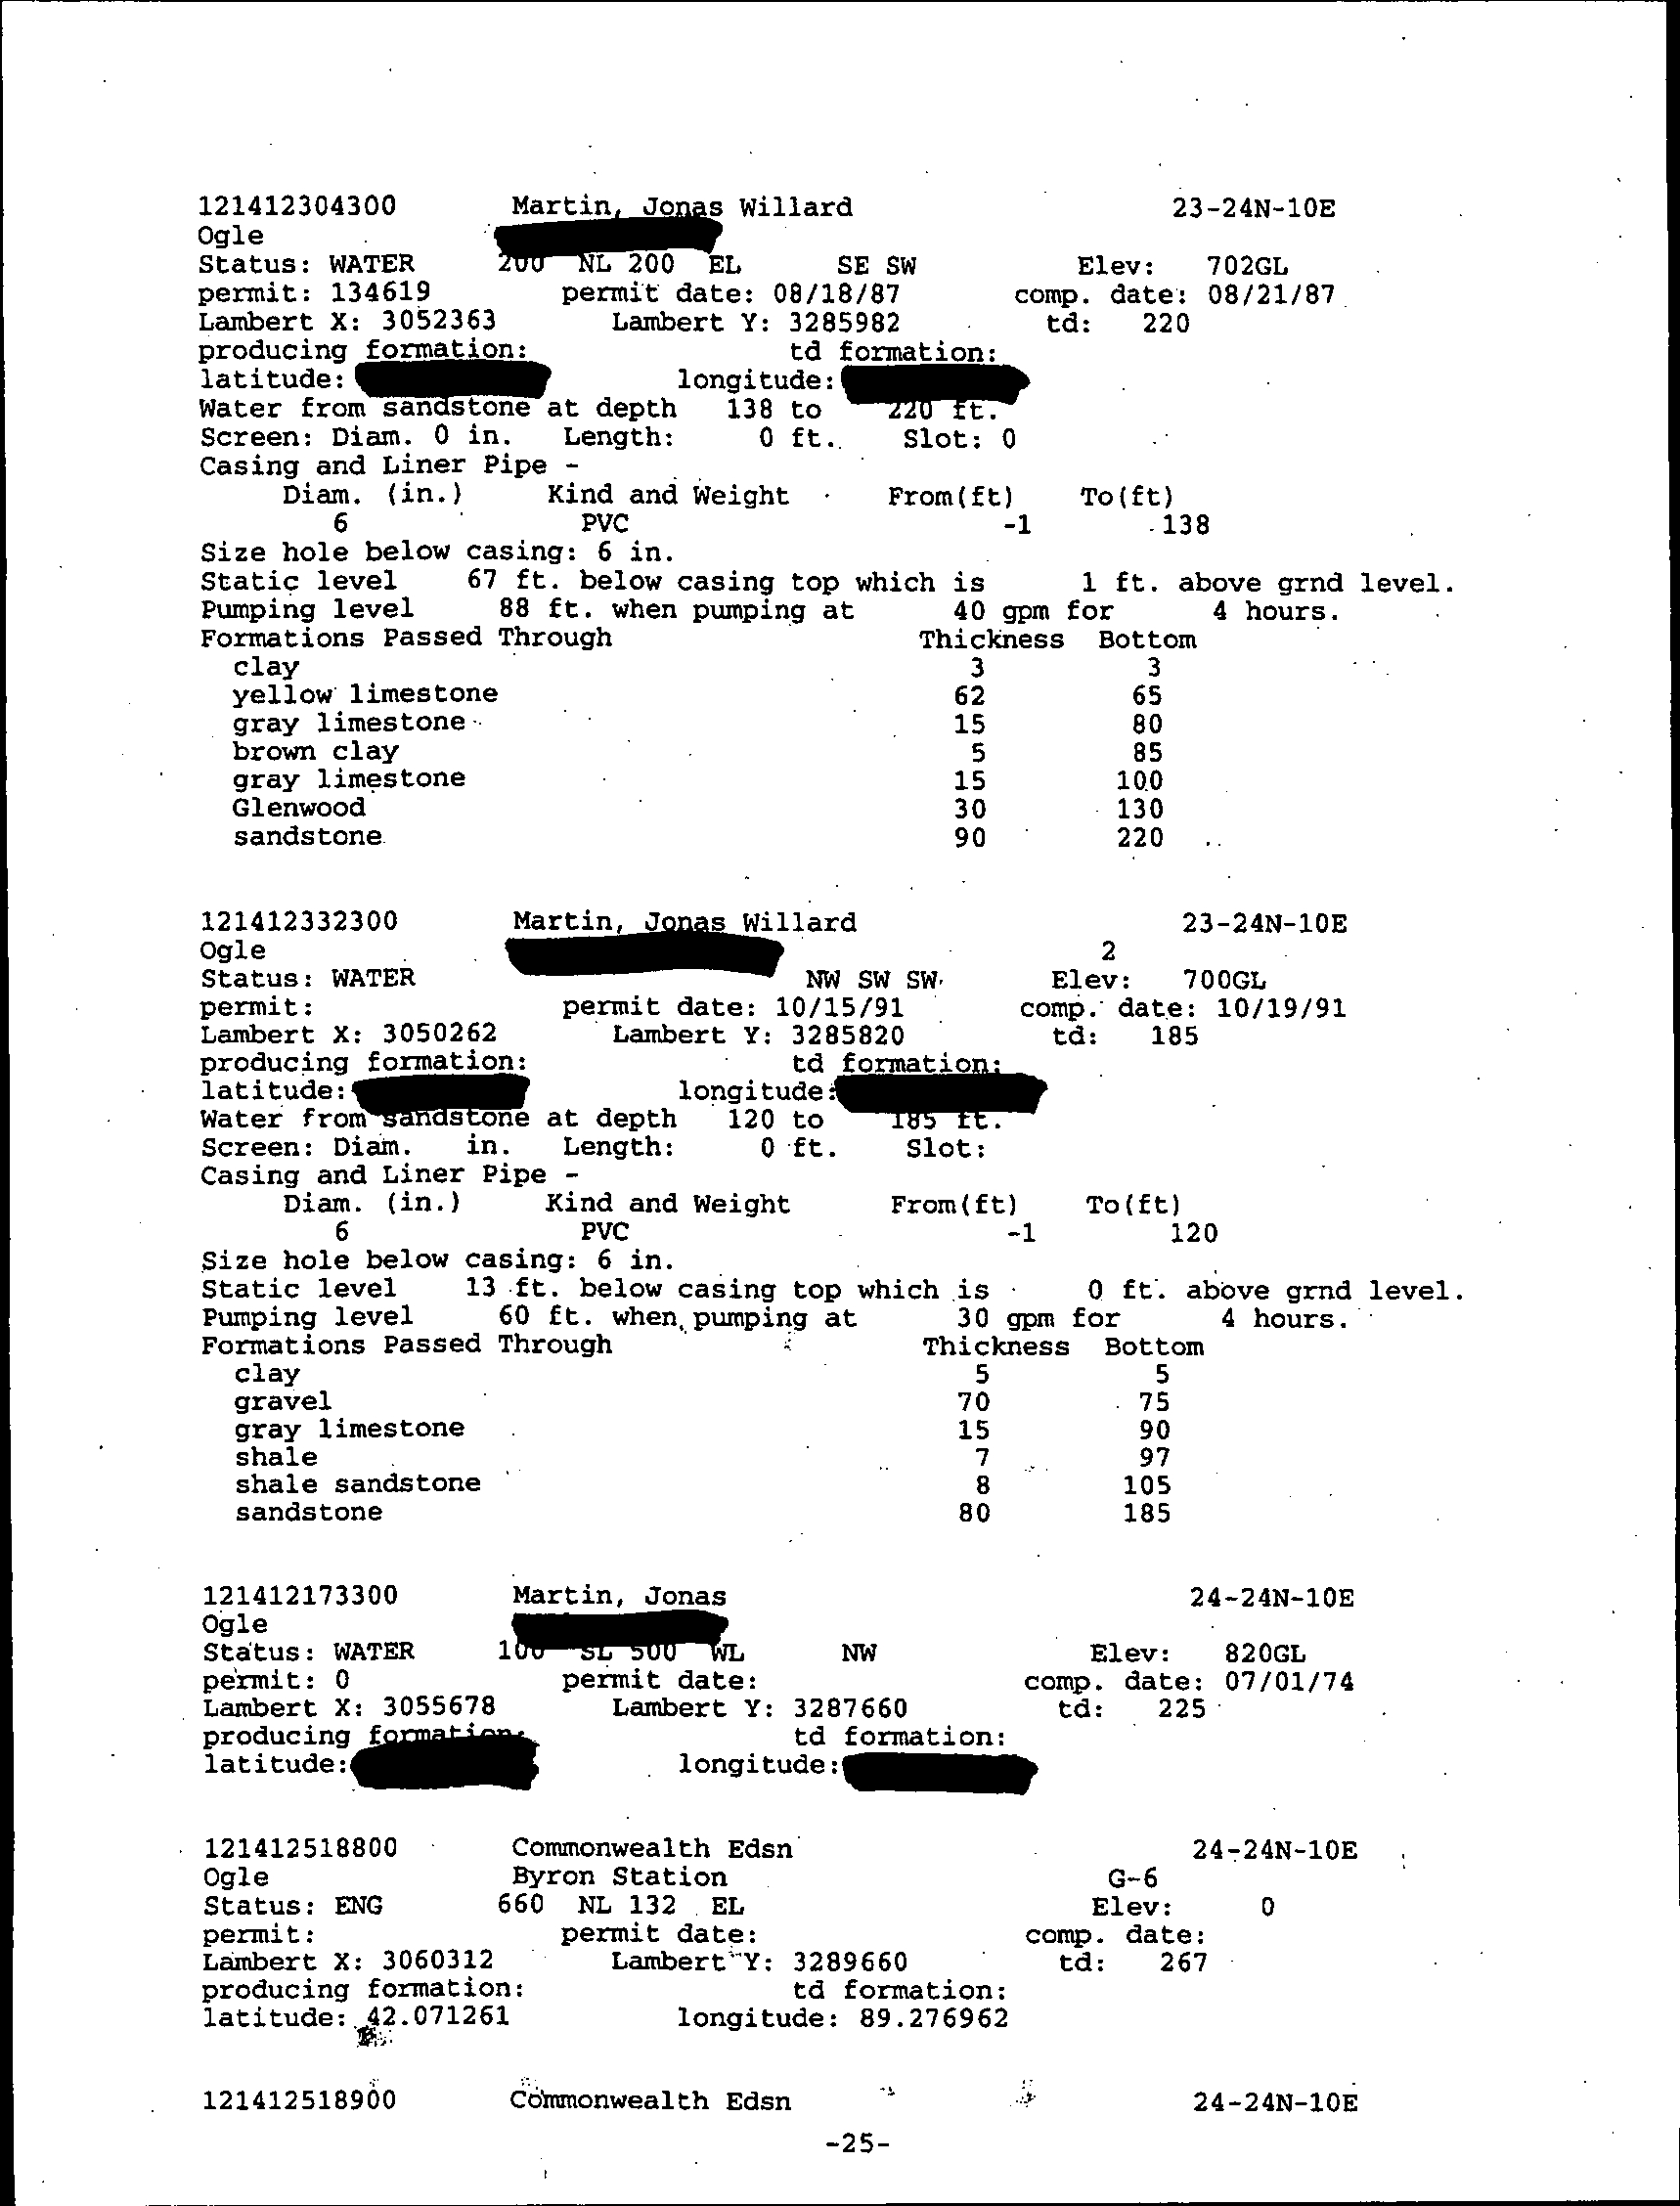
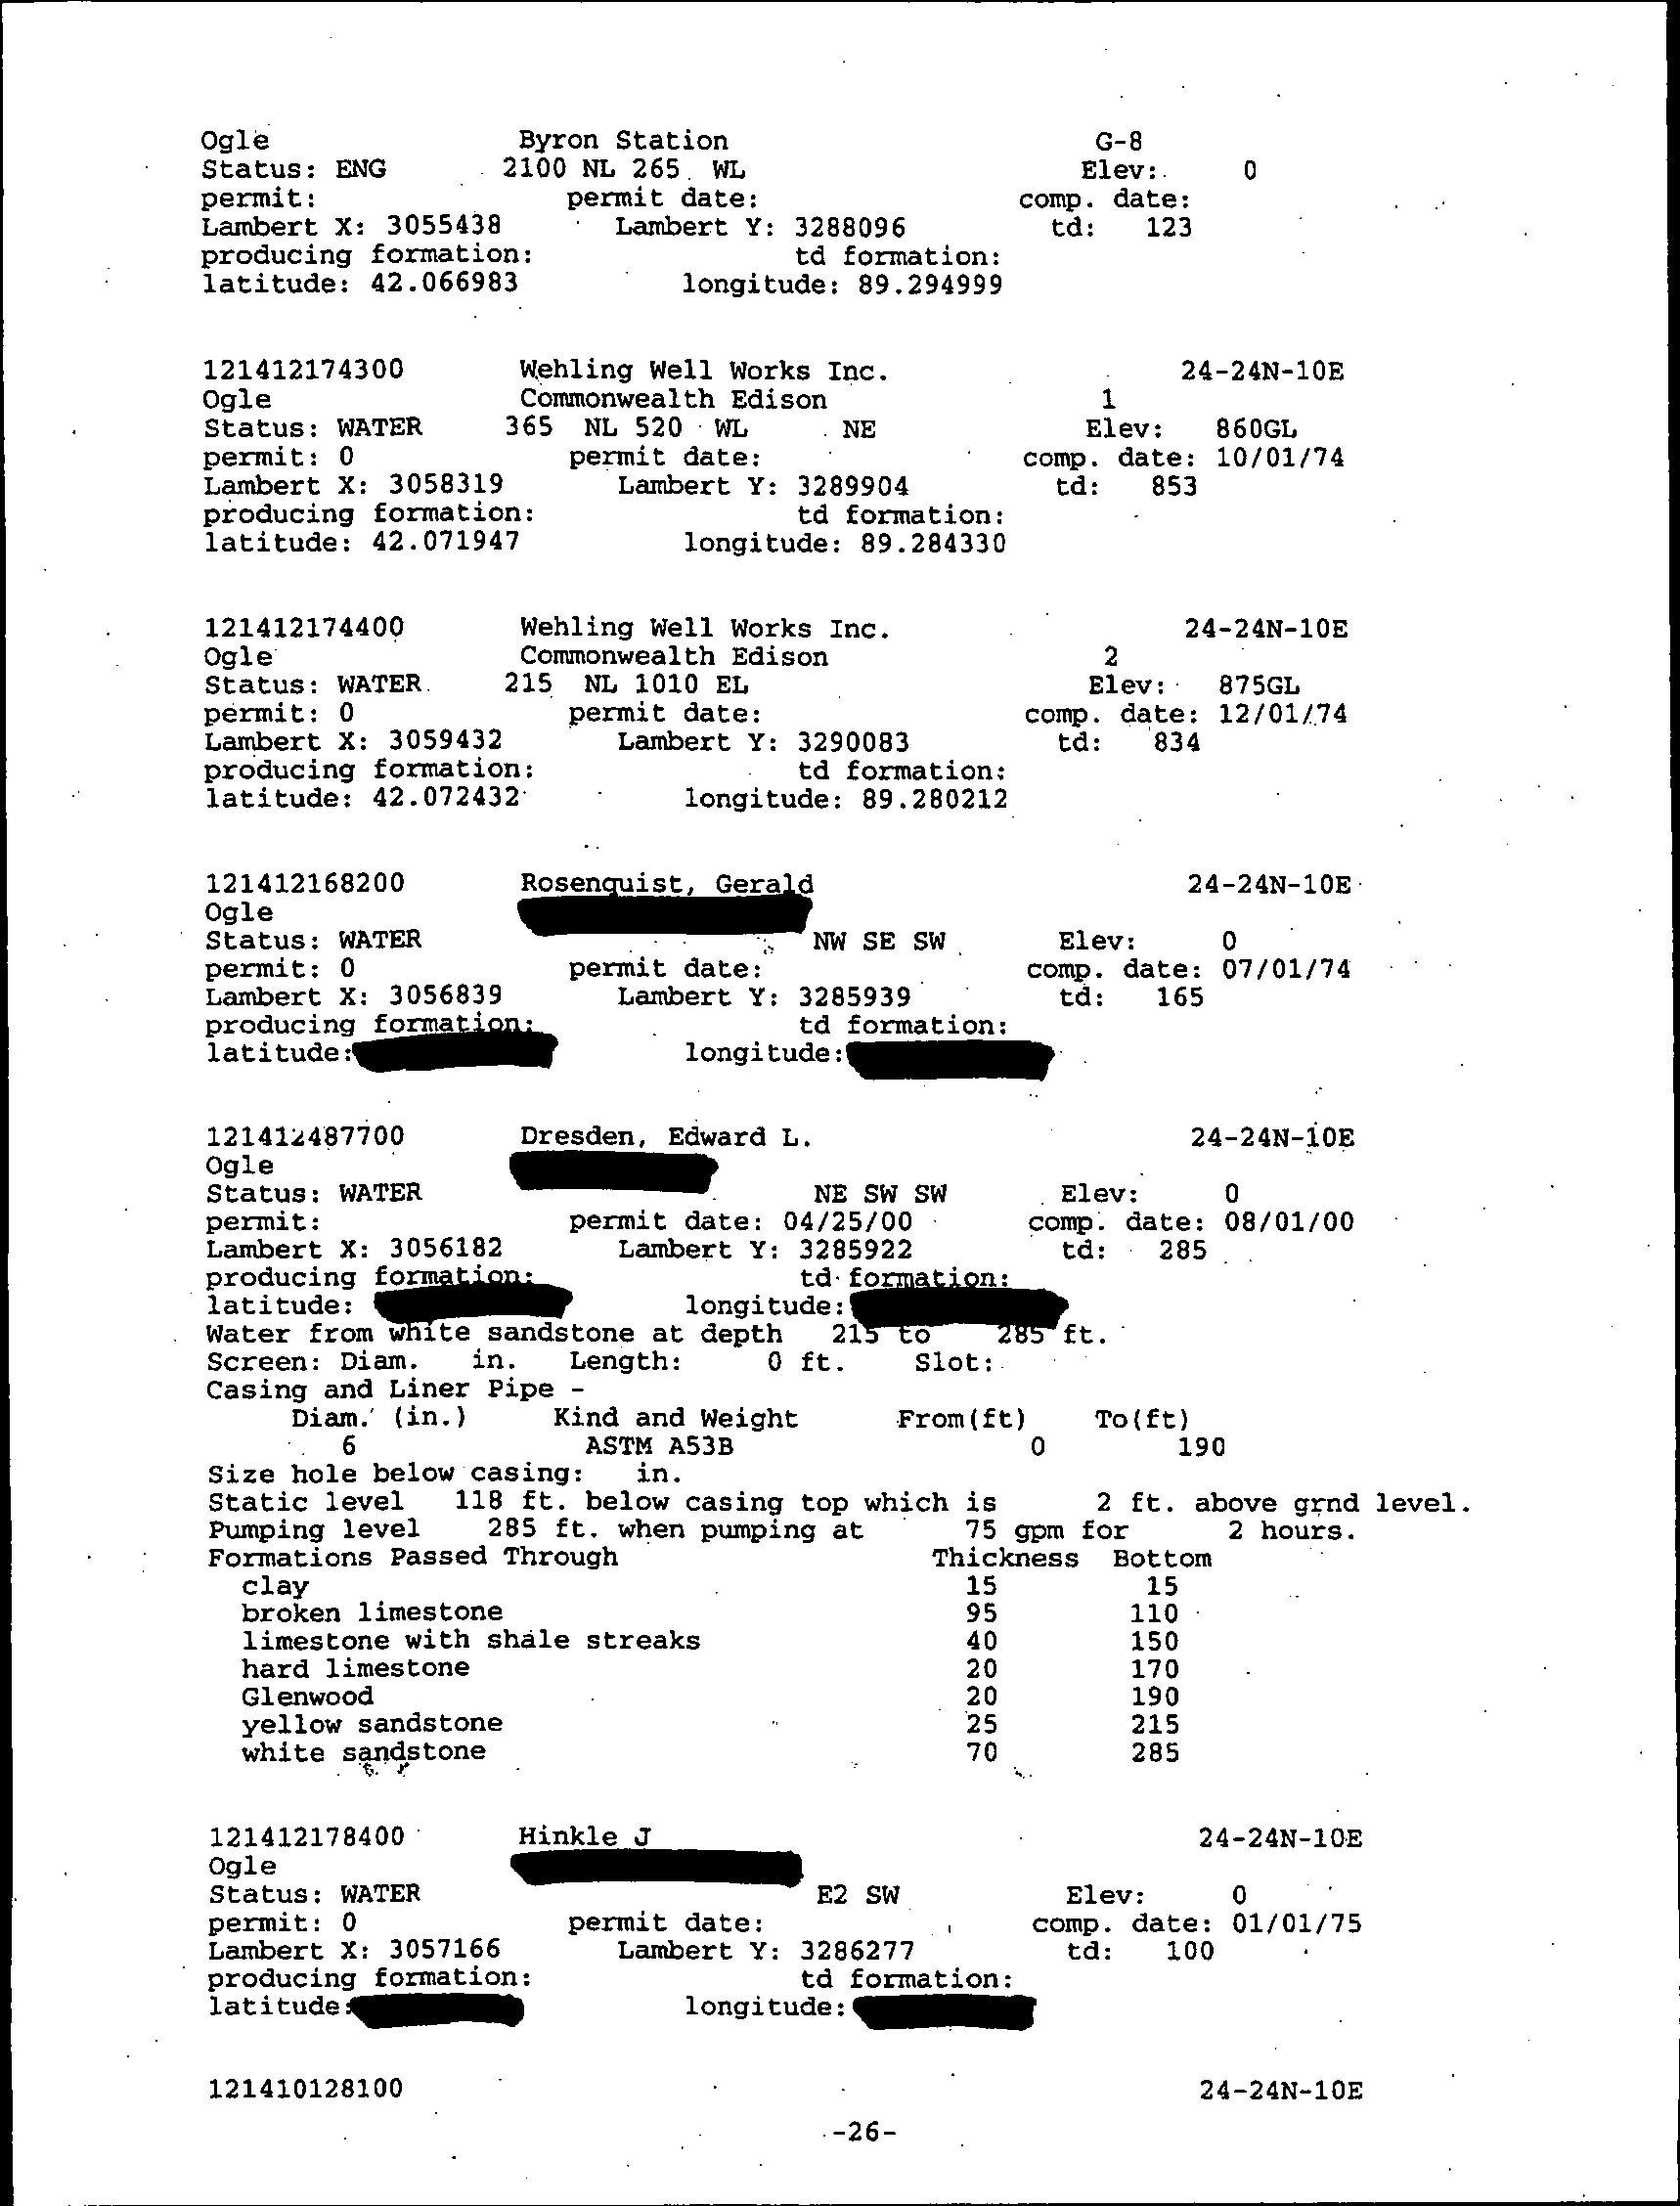
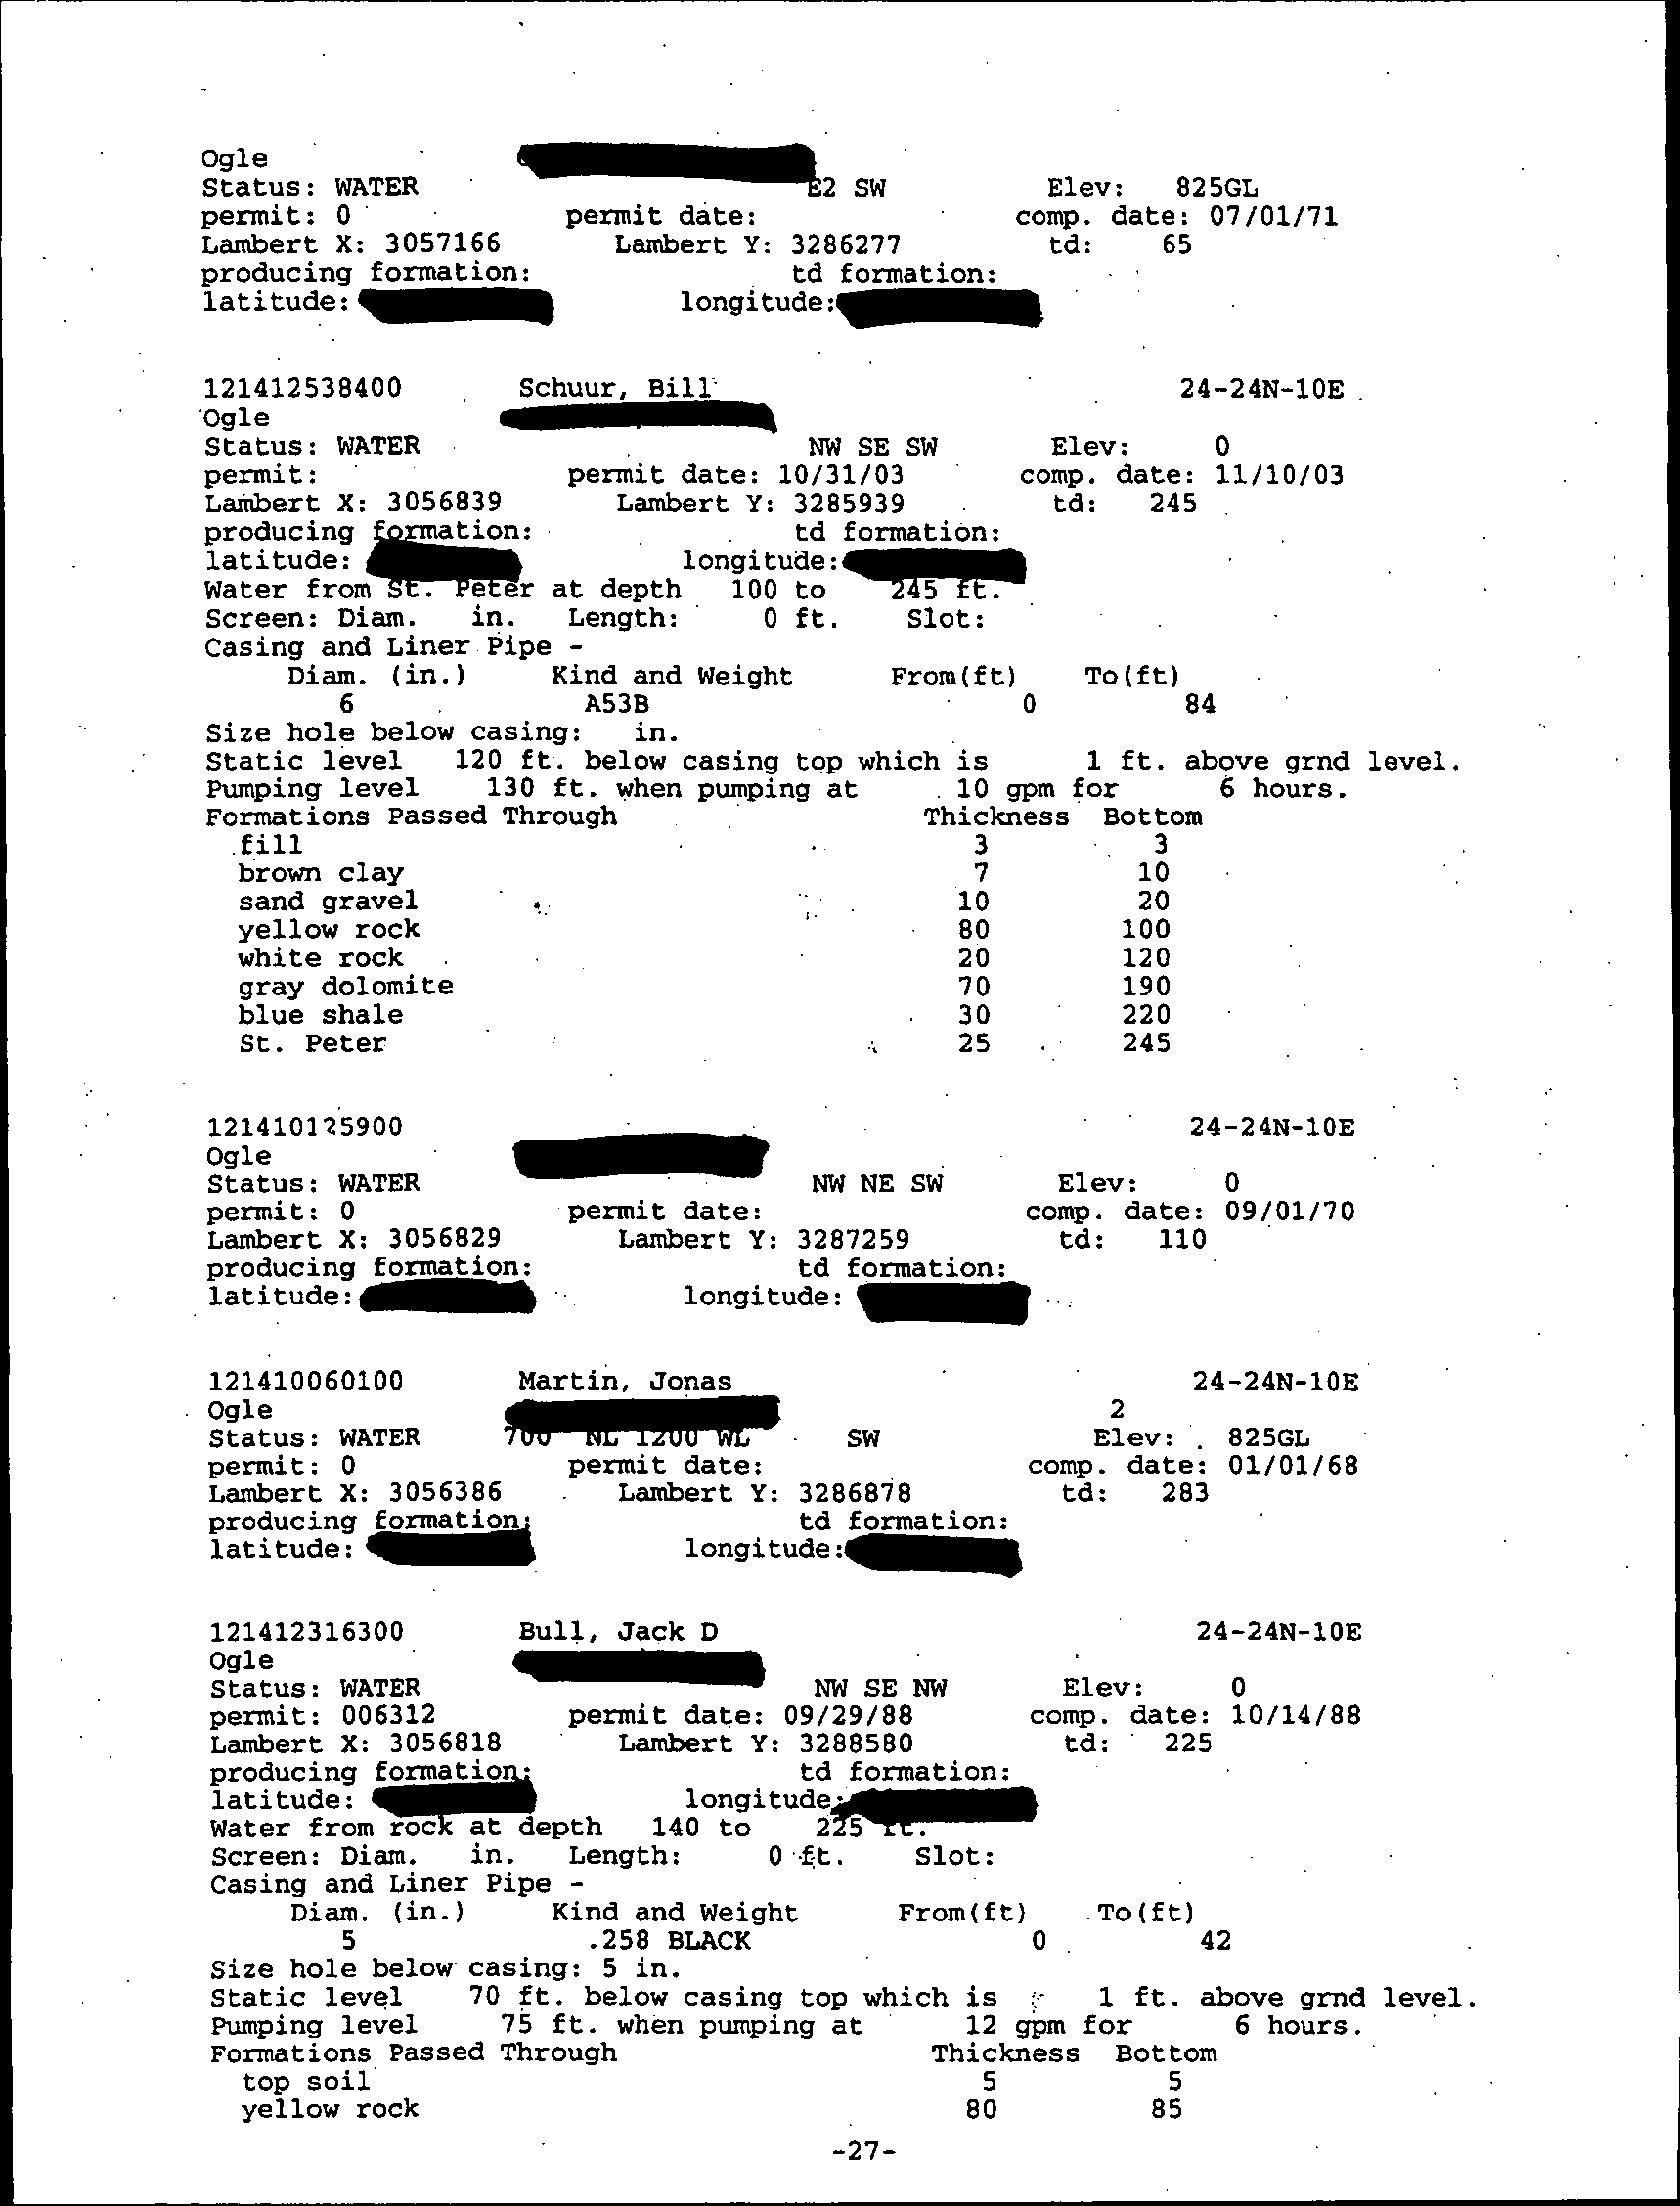
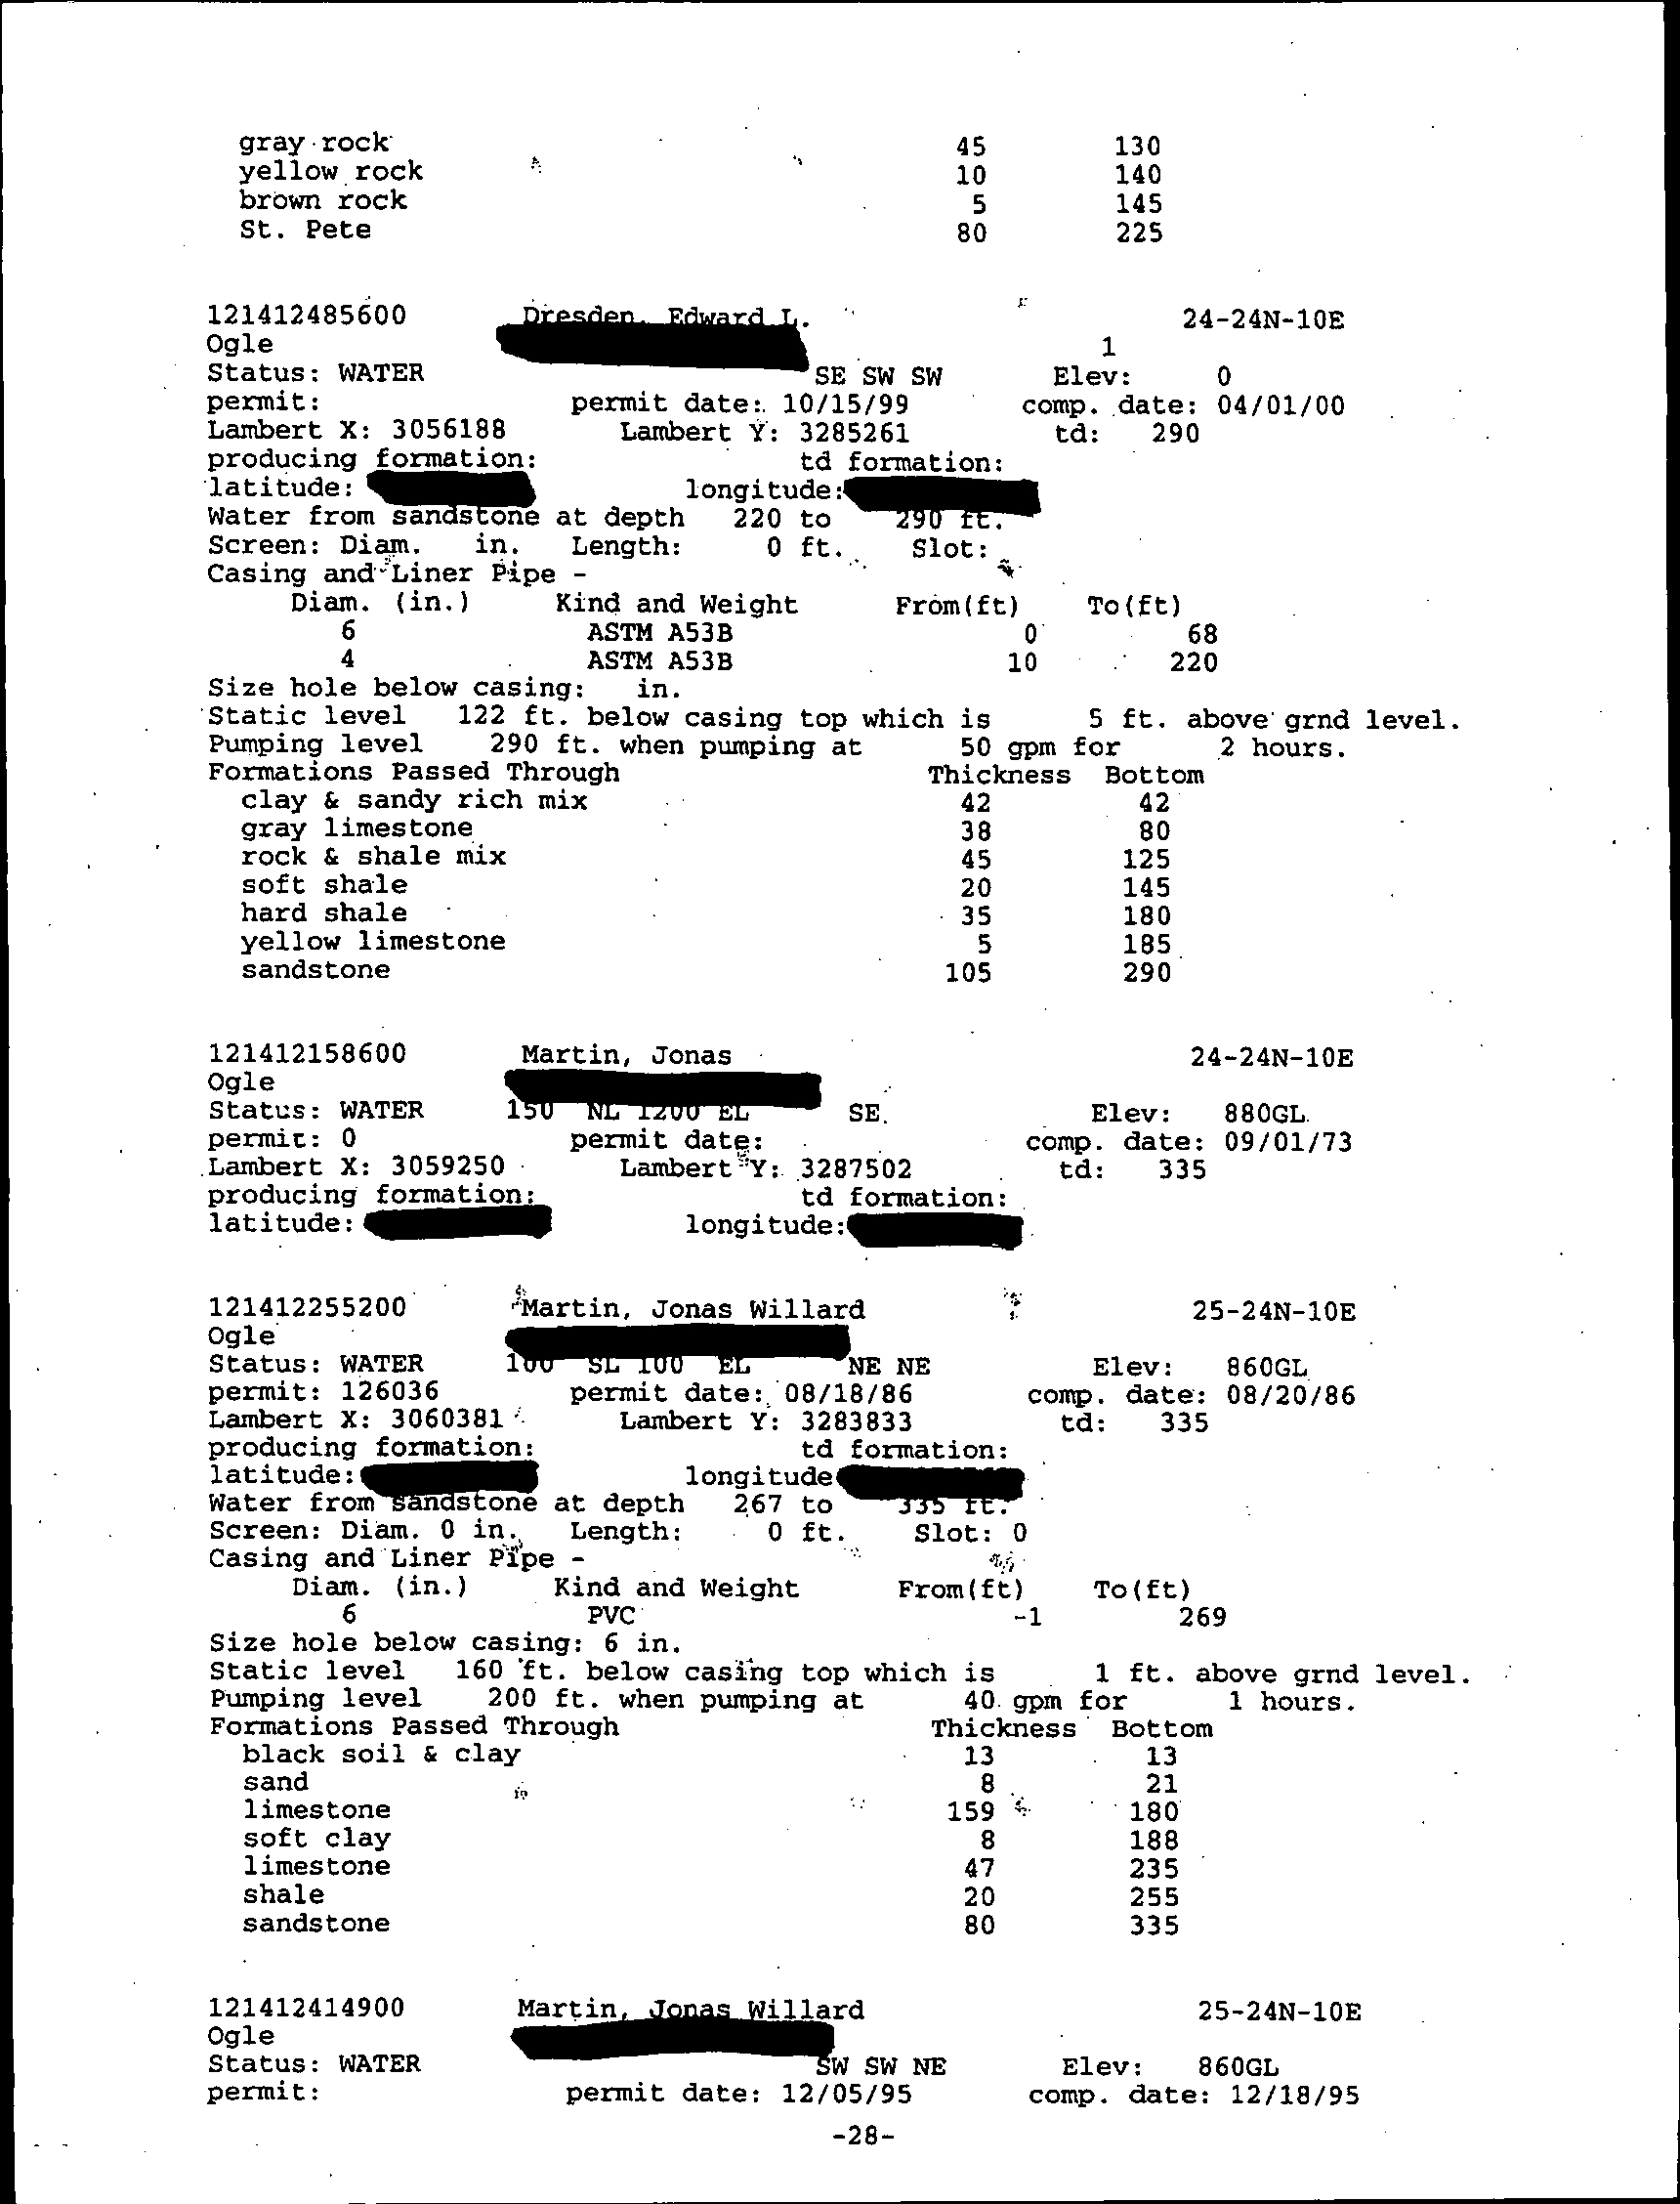
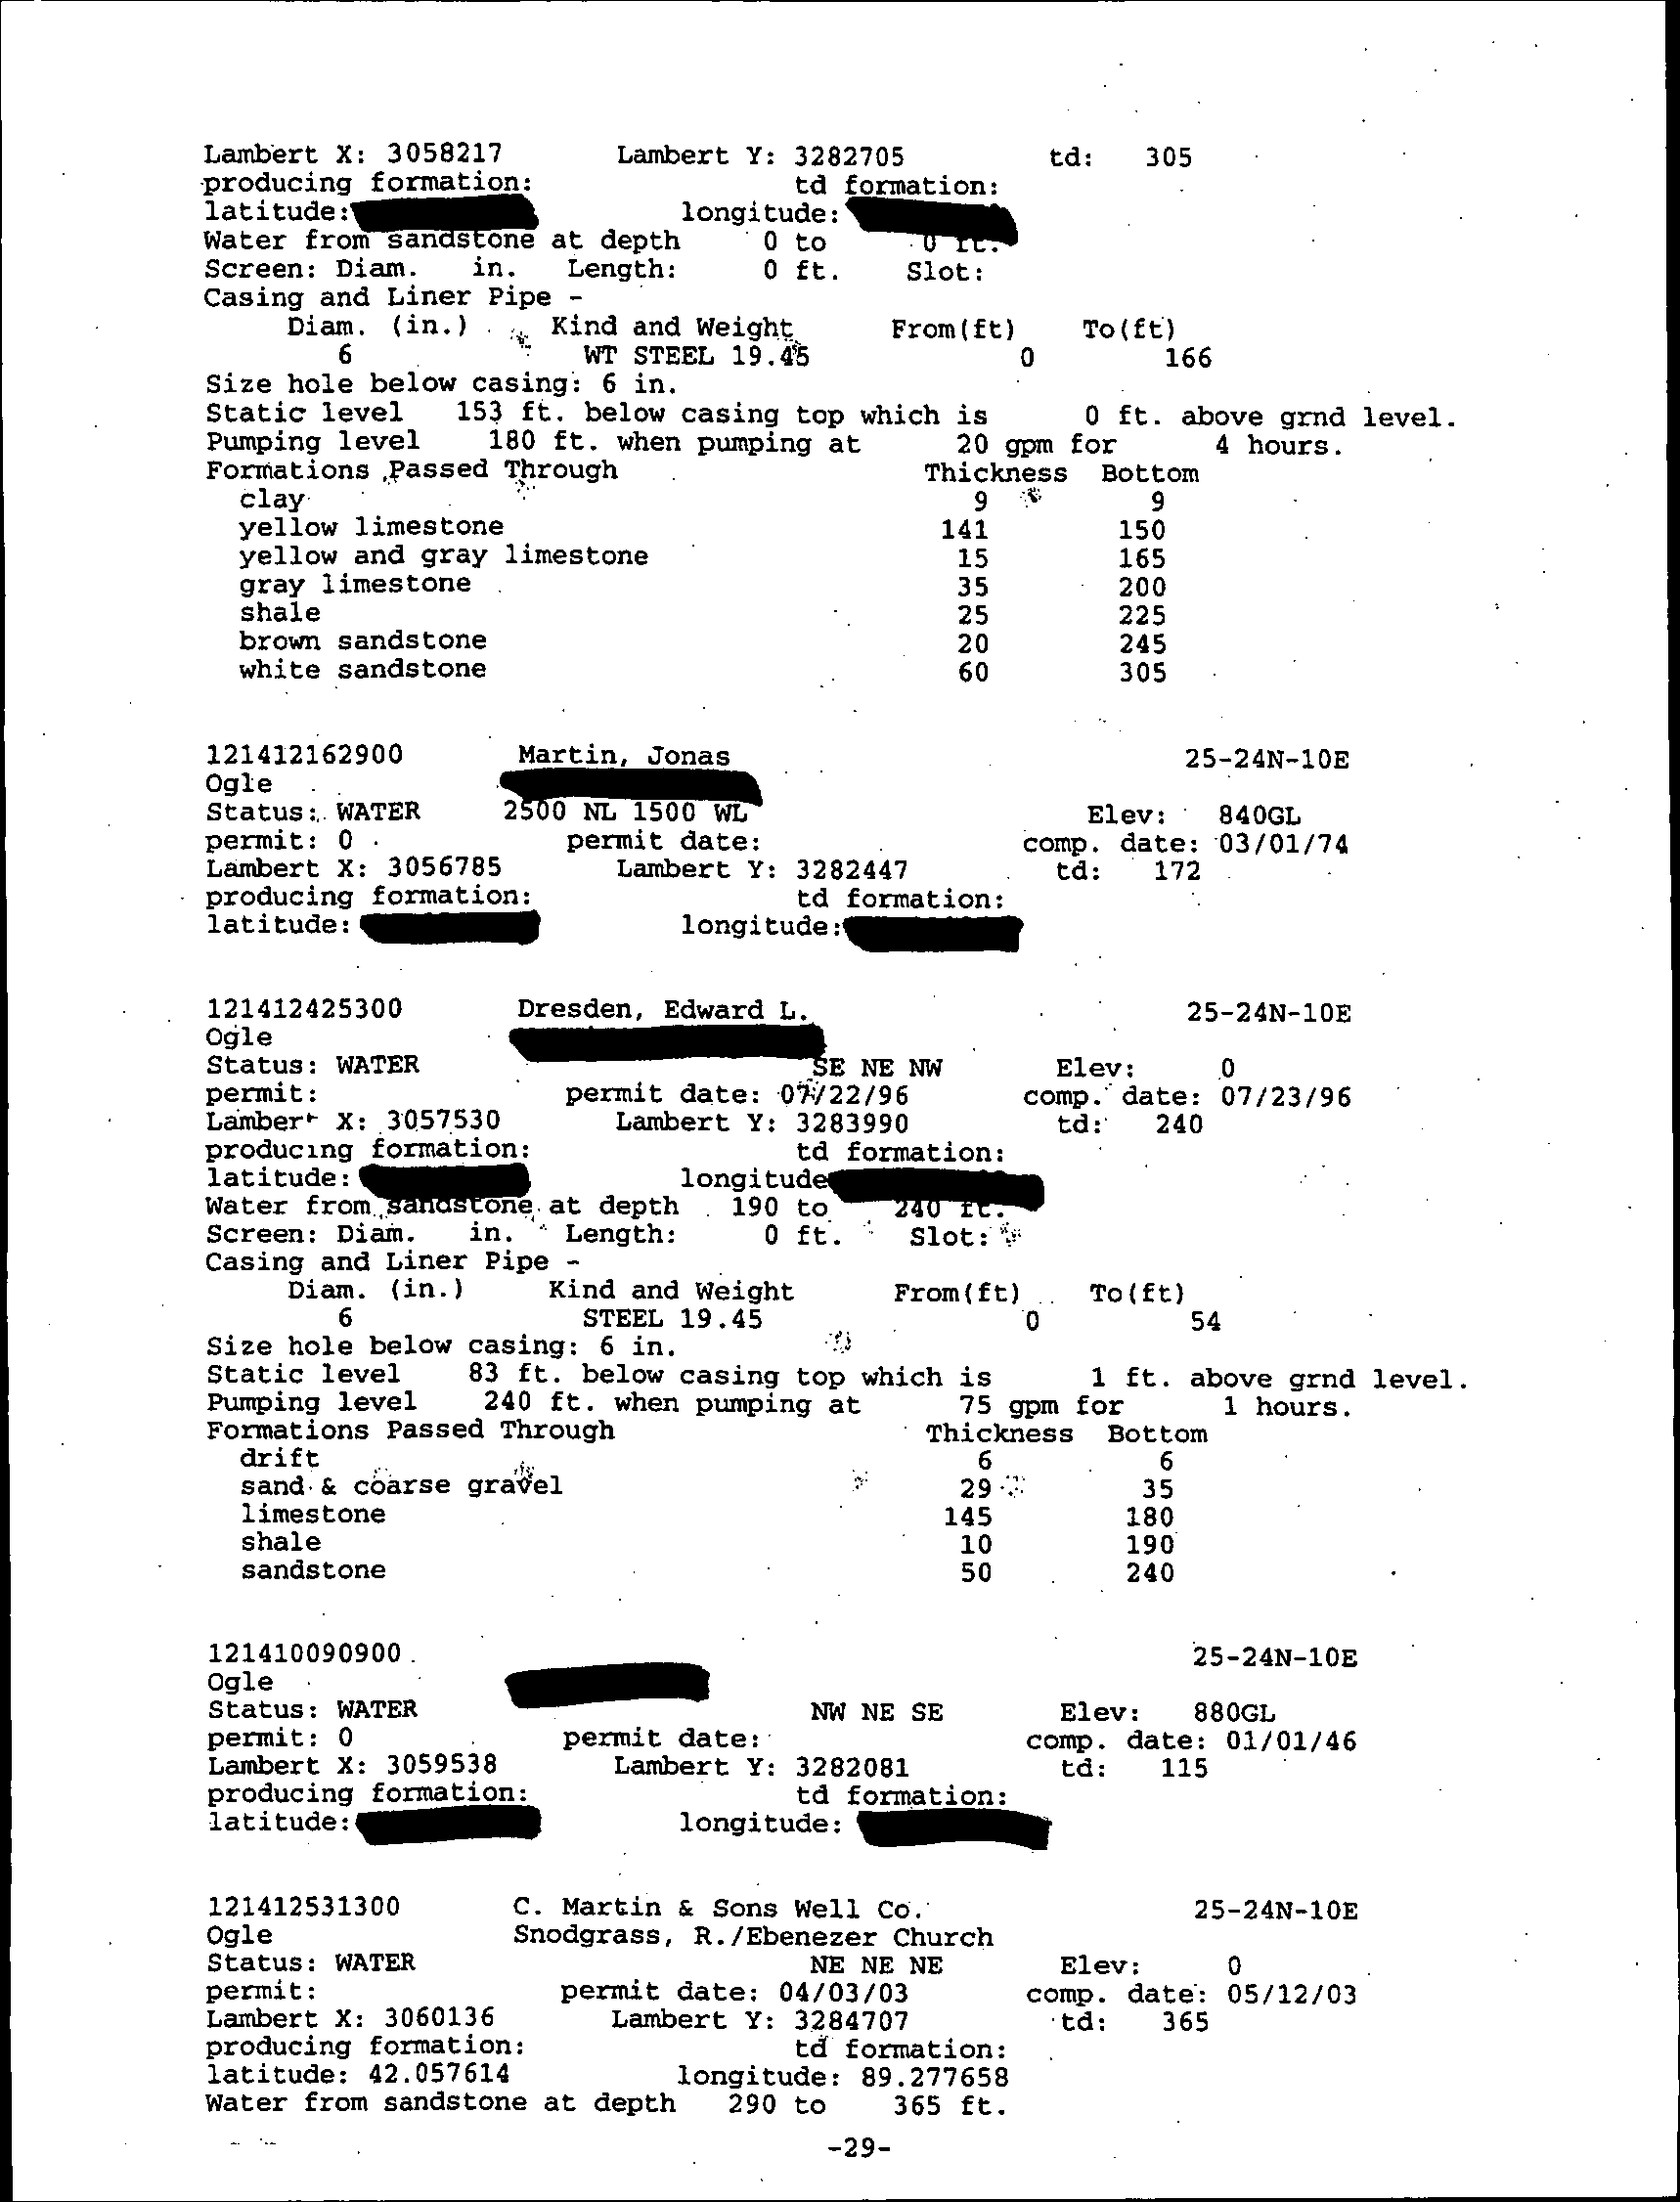
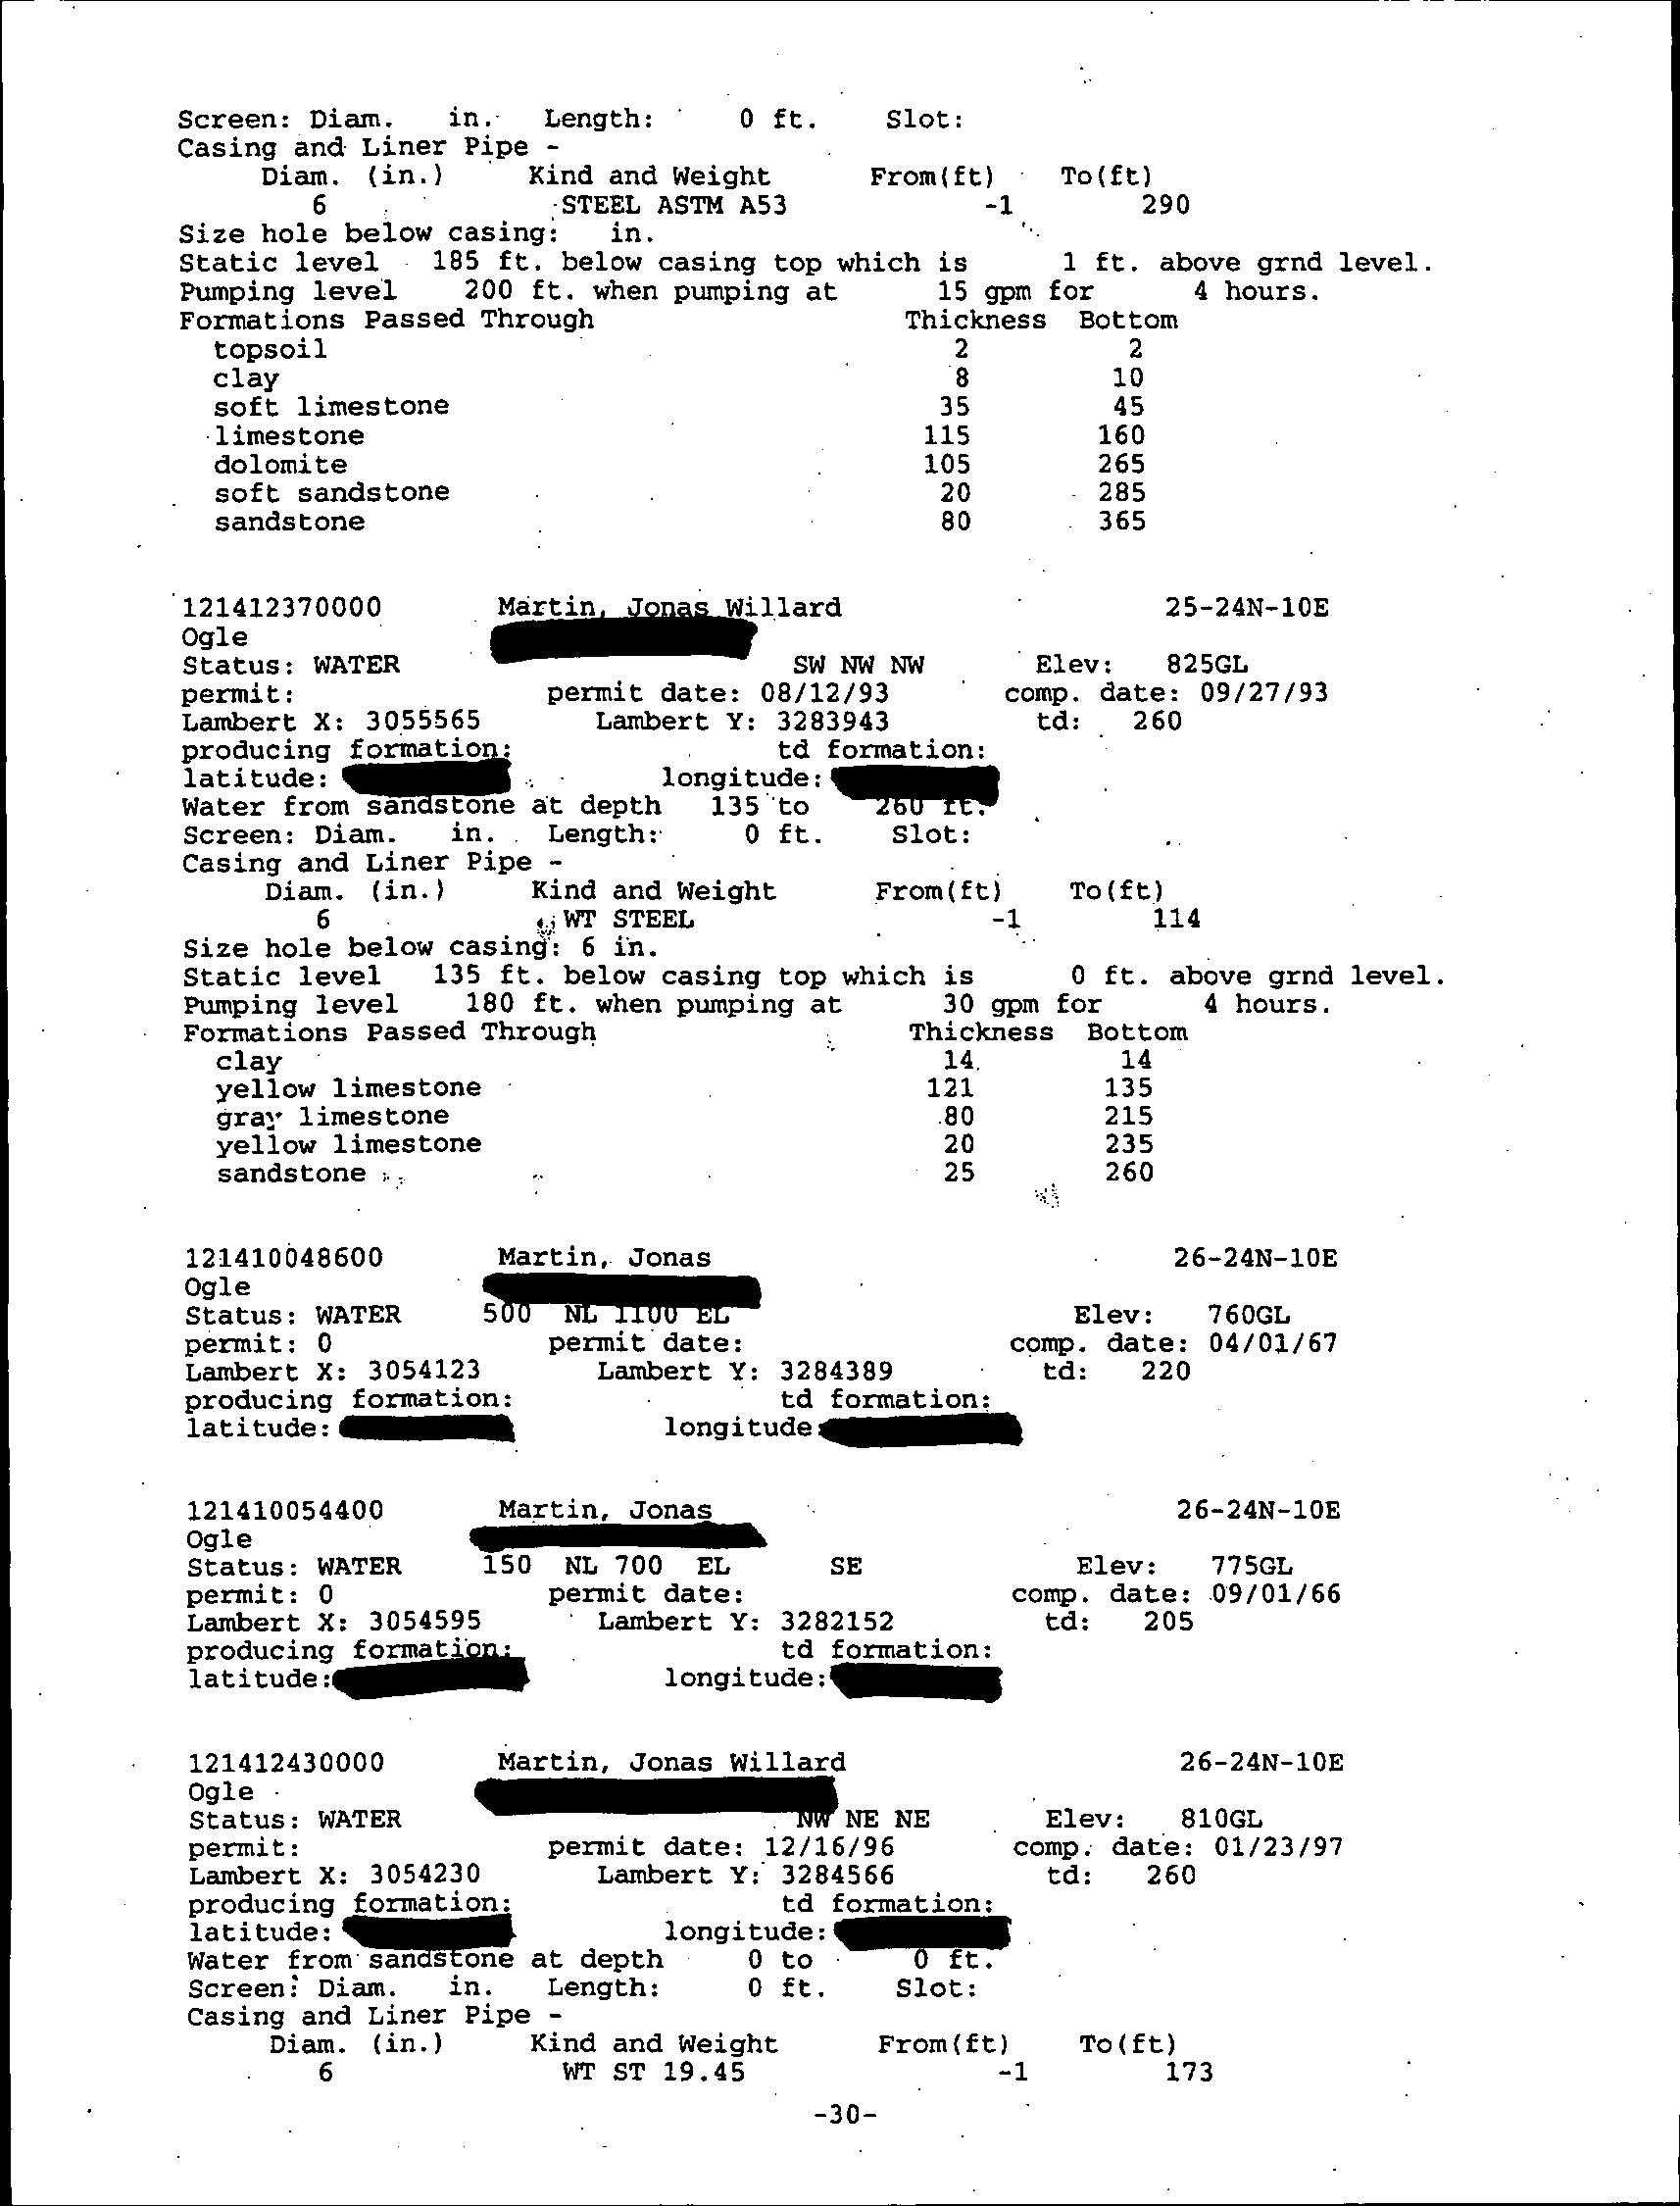
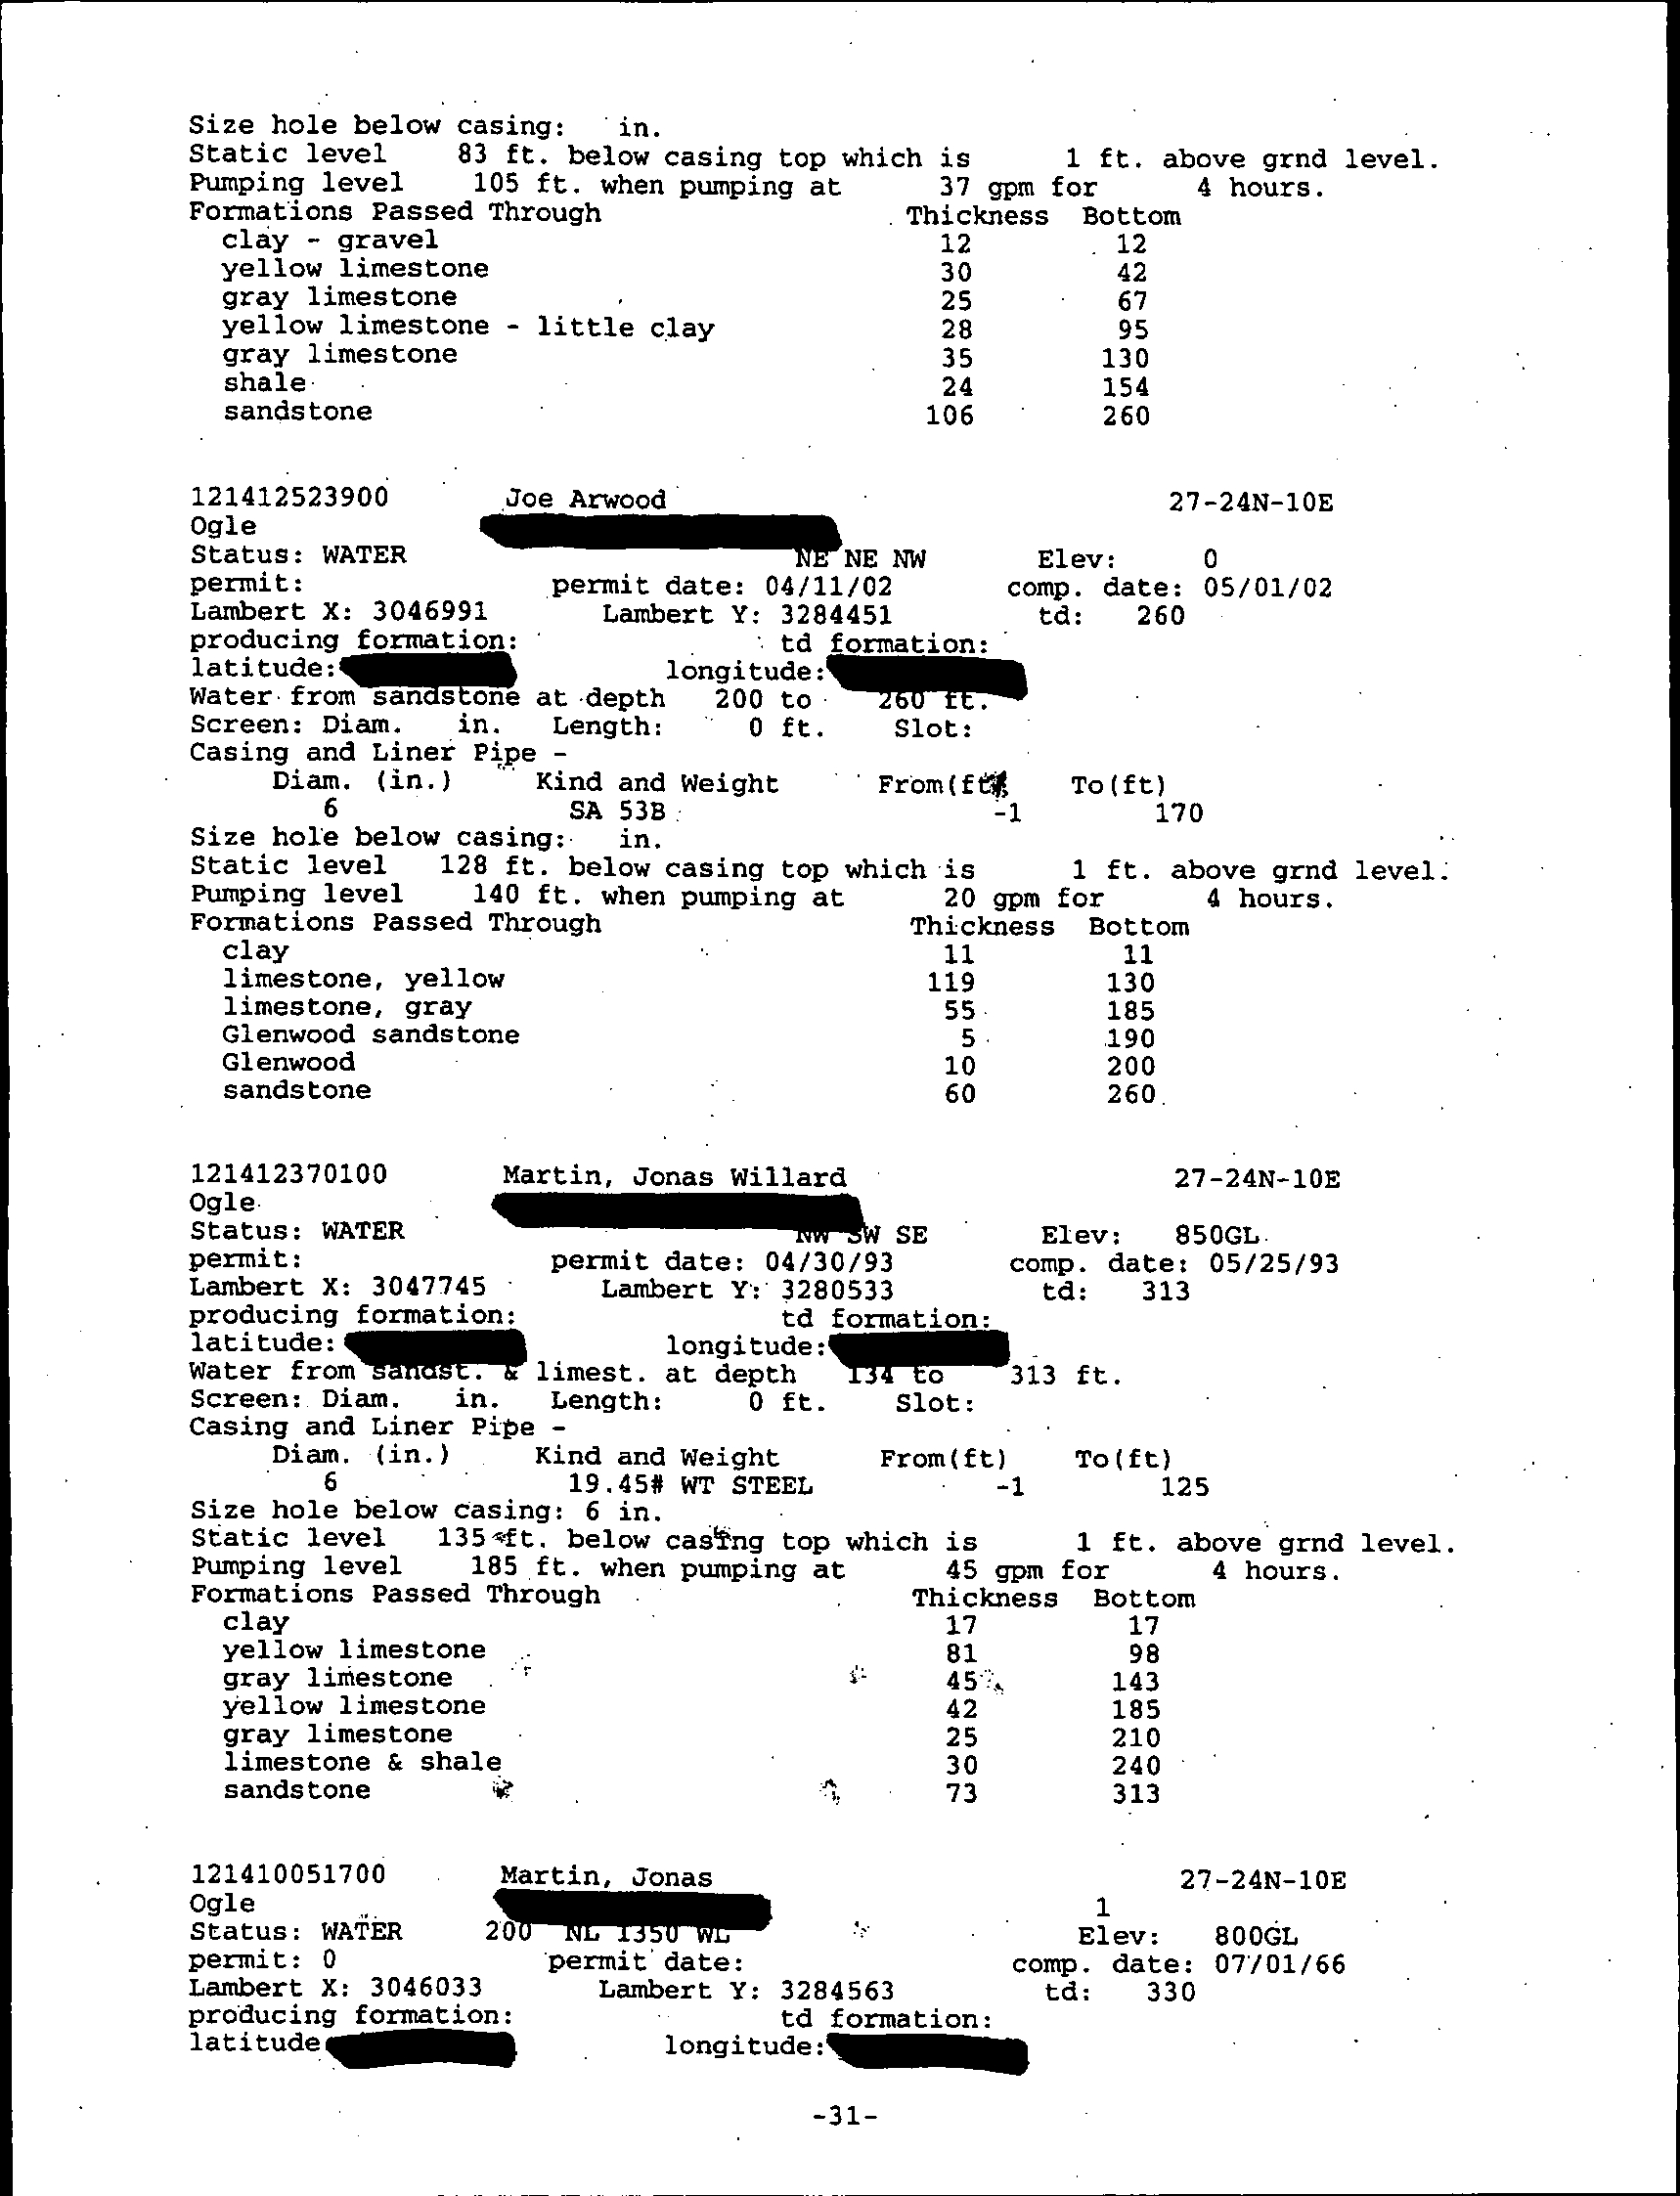
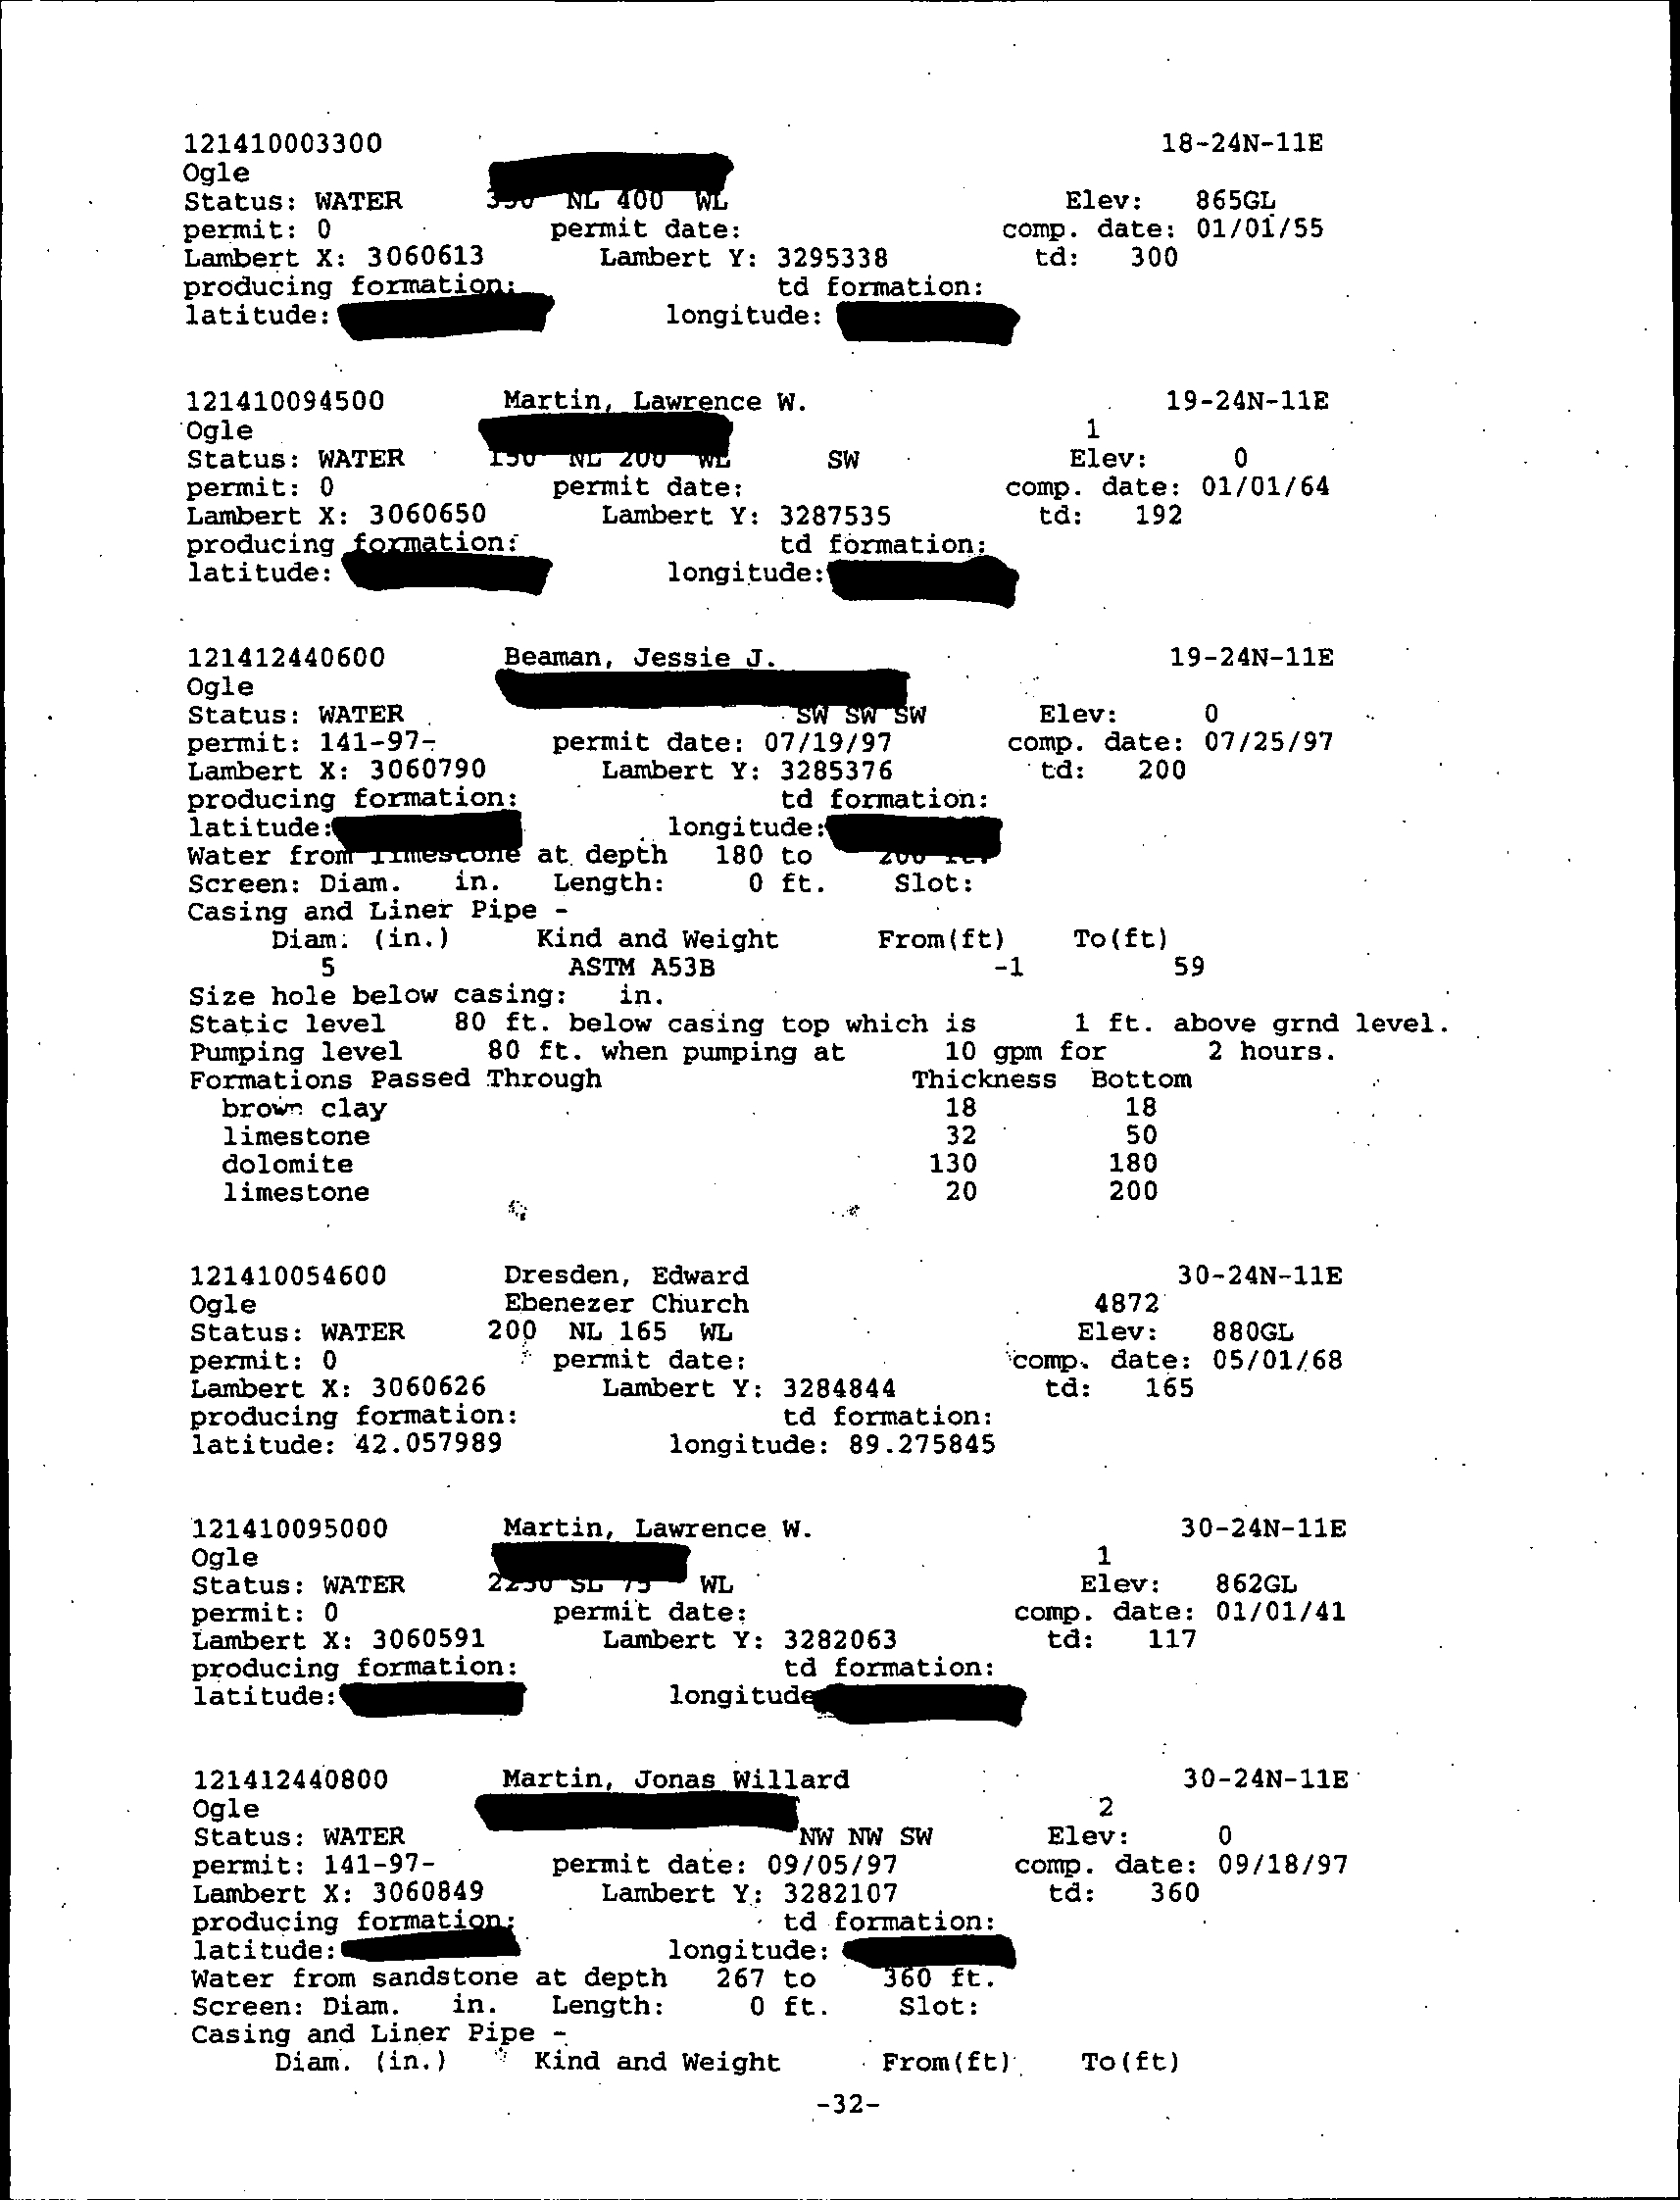
WATER SUPPLY WELL INFORMATION
APPENDIX B
MONITORING WELL STRATIGRAPHIC AND INSTRUMENTATION
LOGS
APPENDIX C
QUALITY ASSURANCE PROGRAM
C.1
ENVIRONMENTAL, INC.
C.2
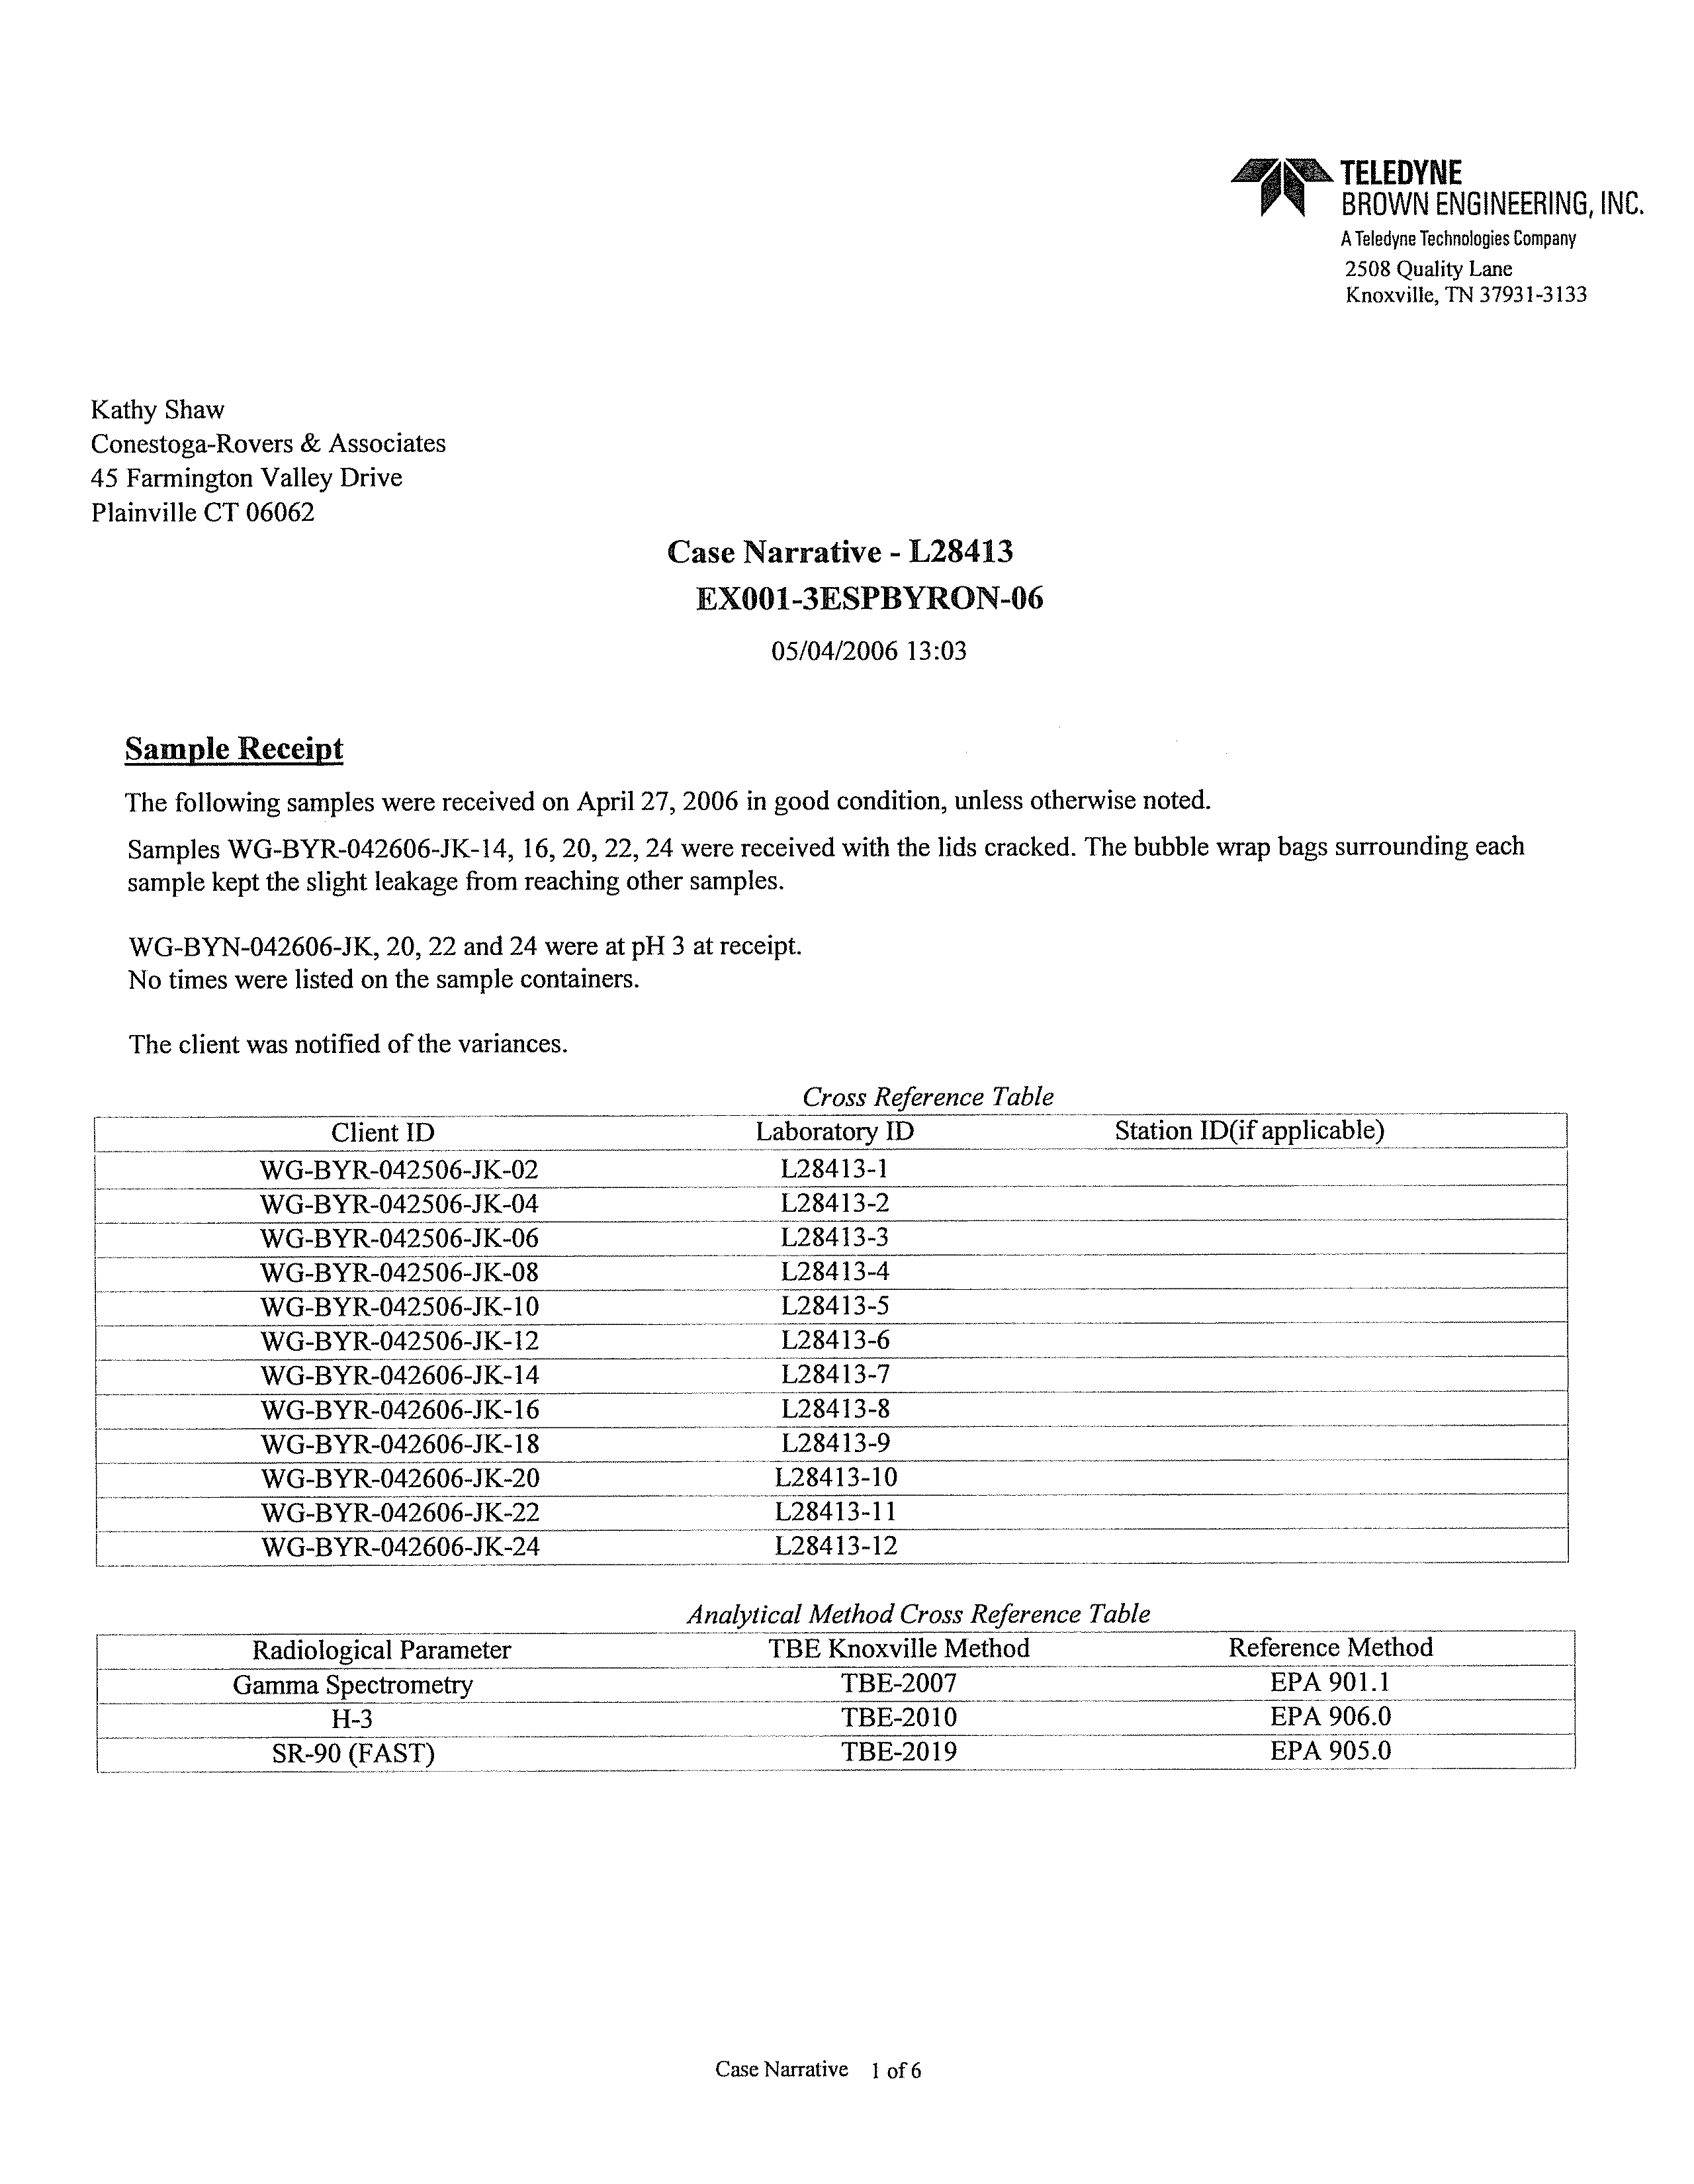
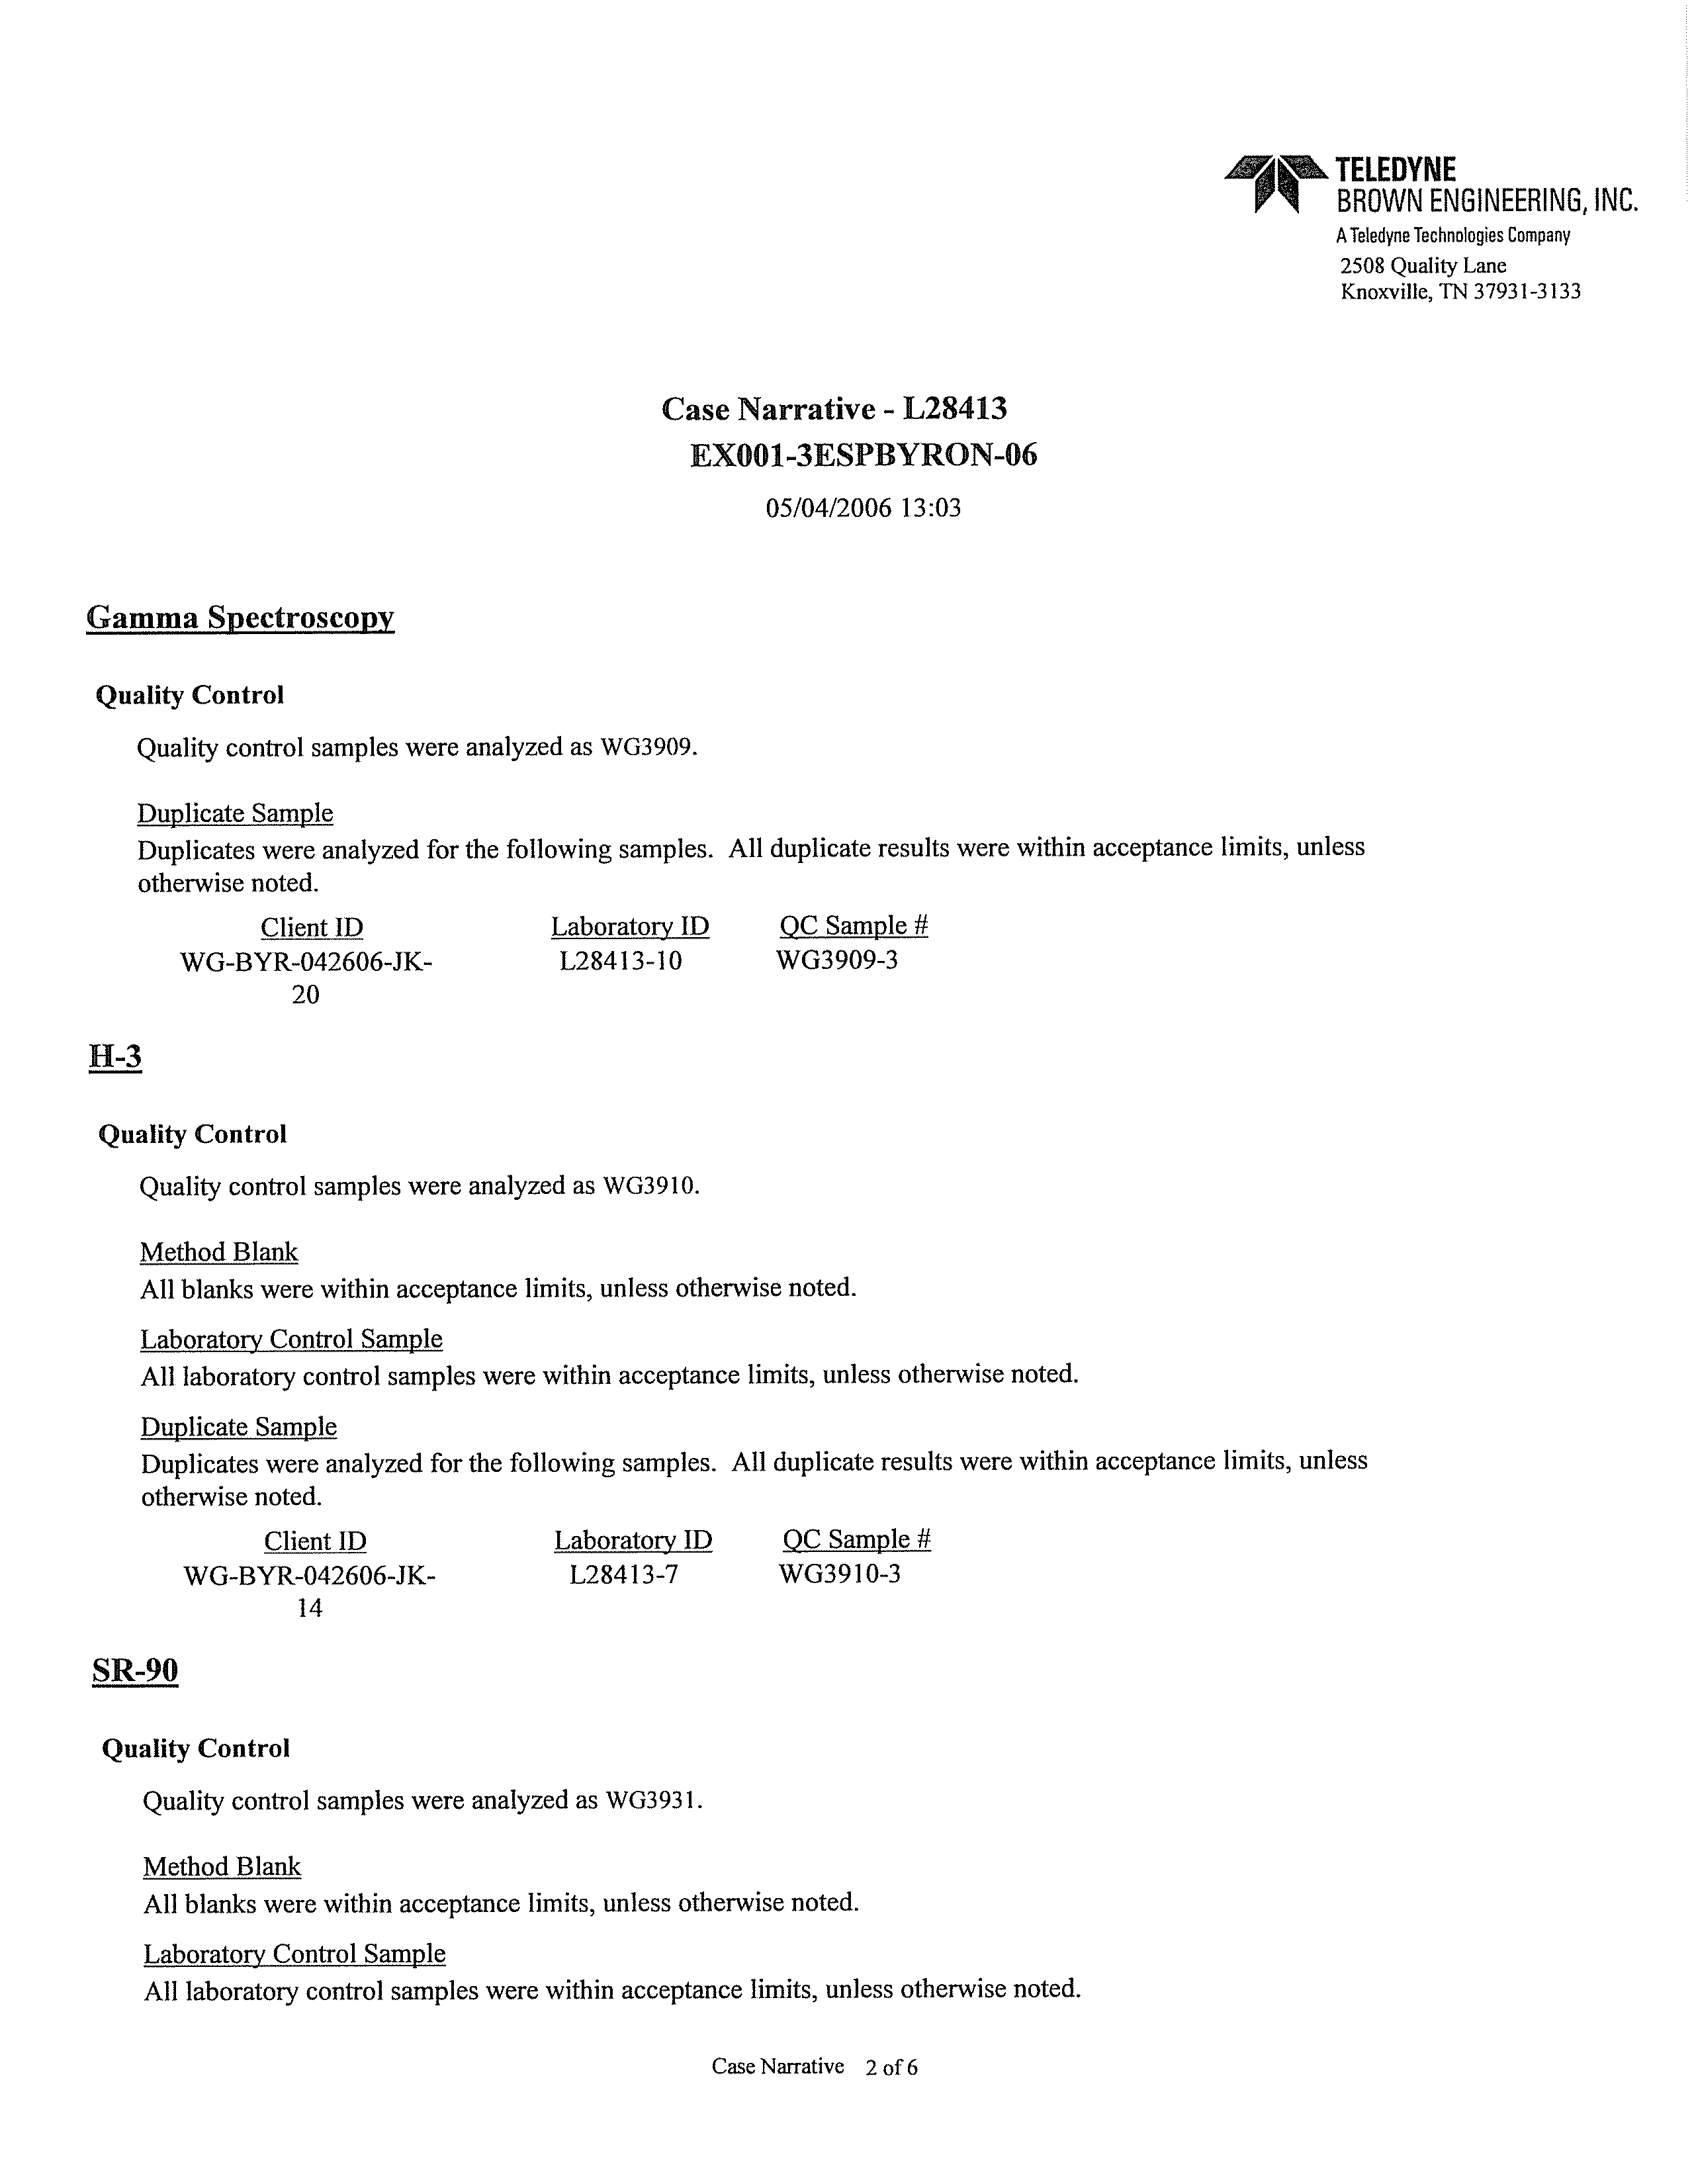
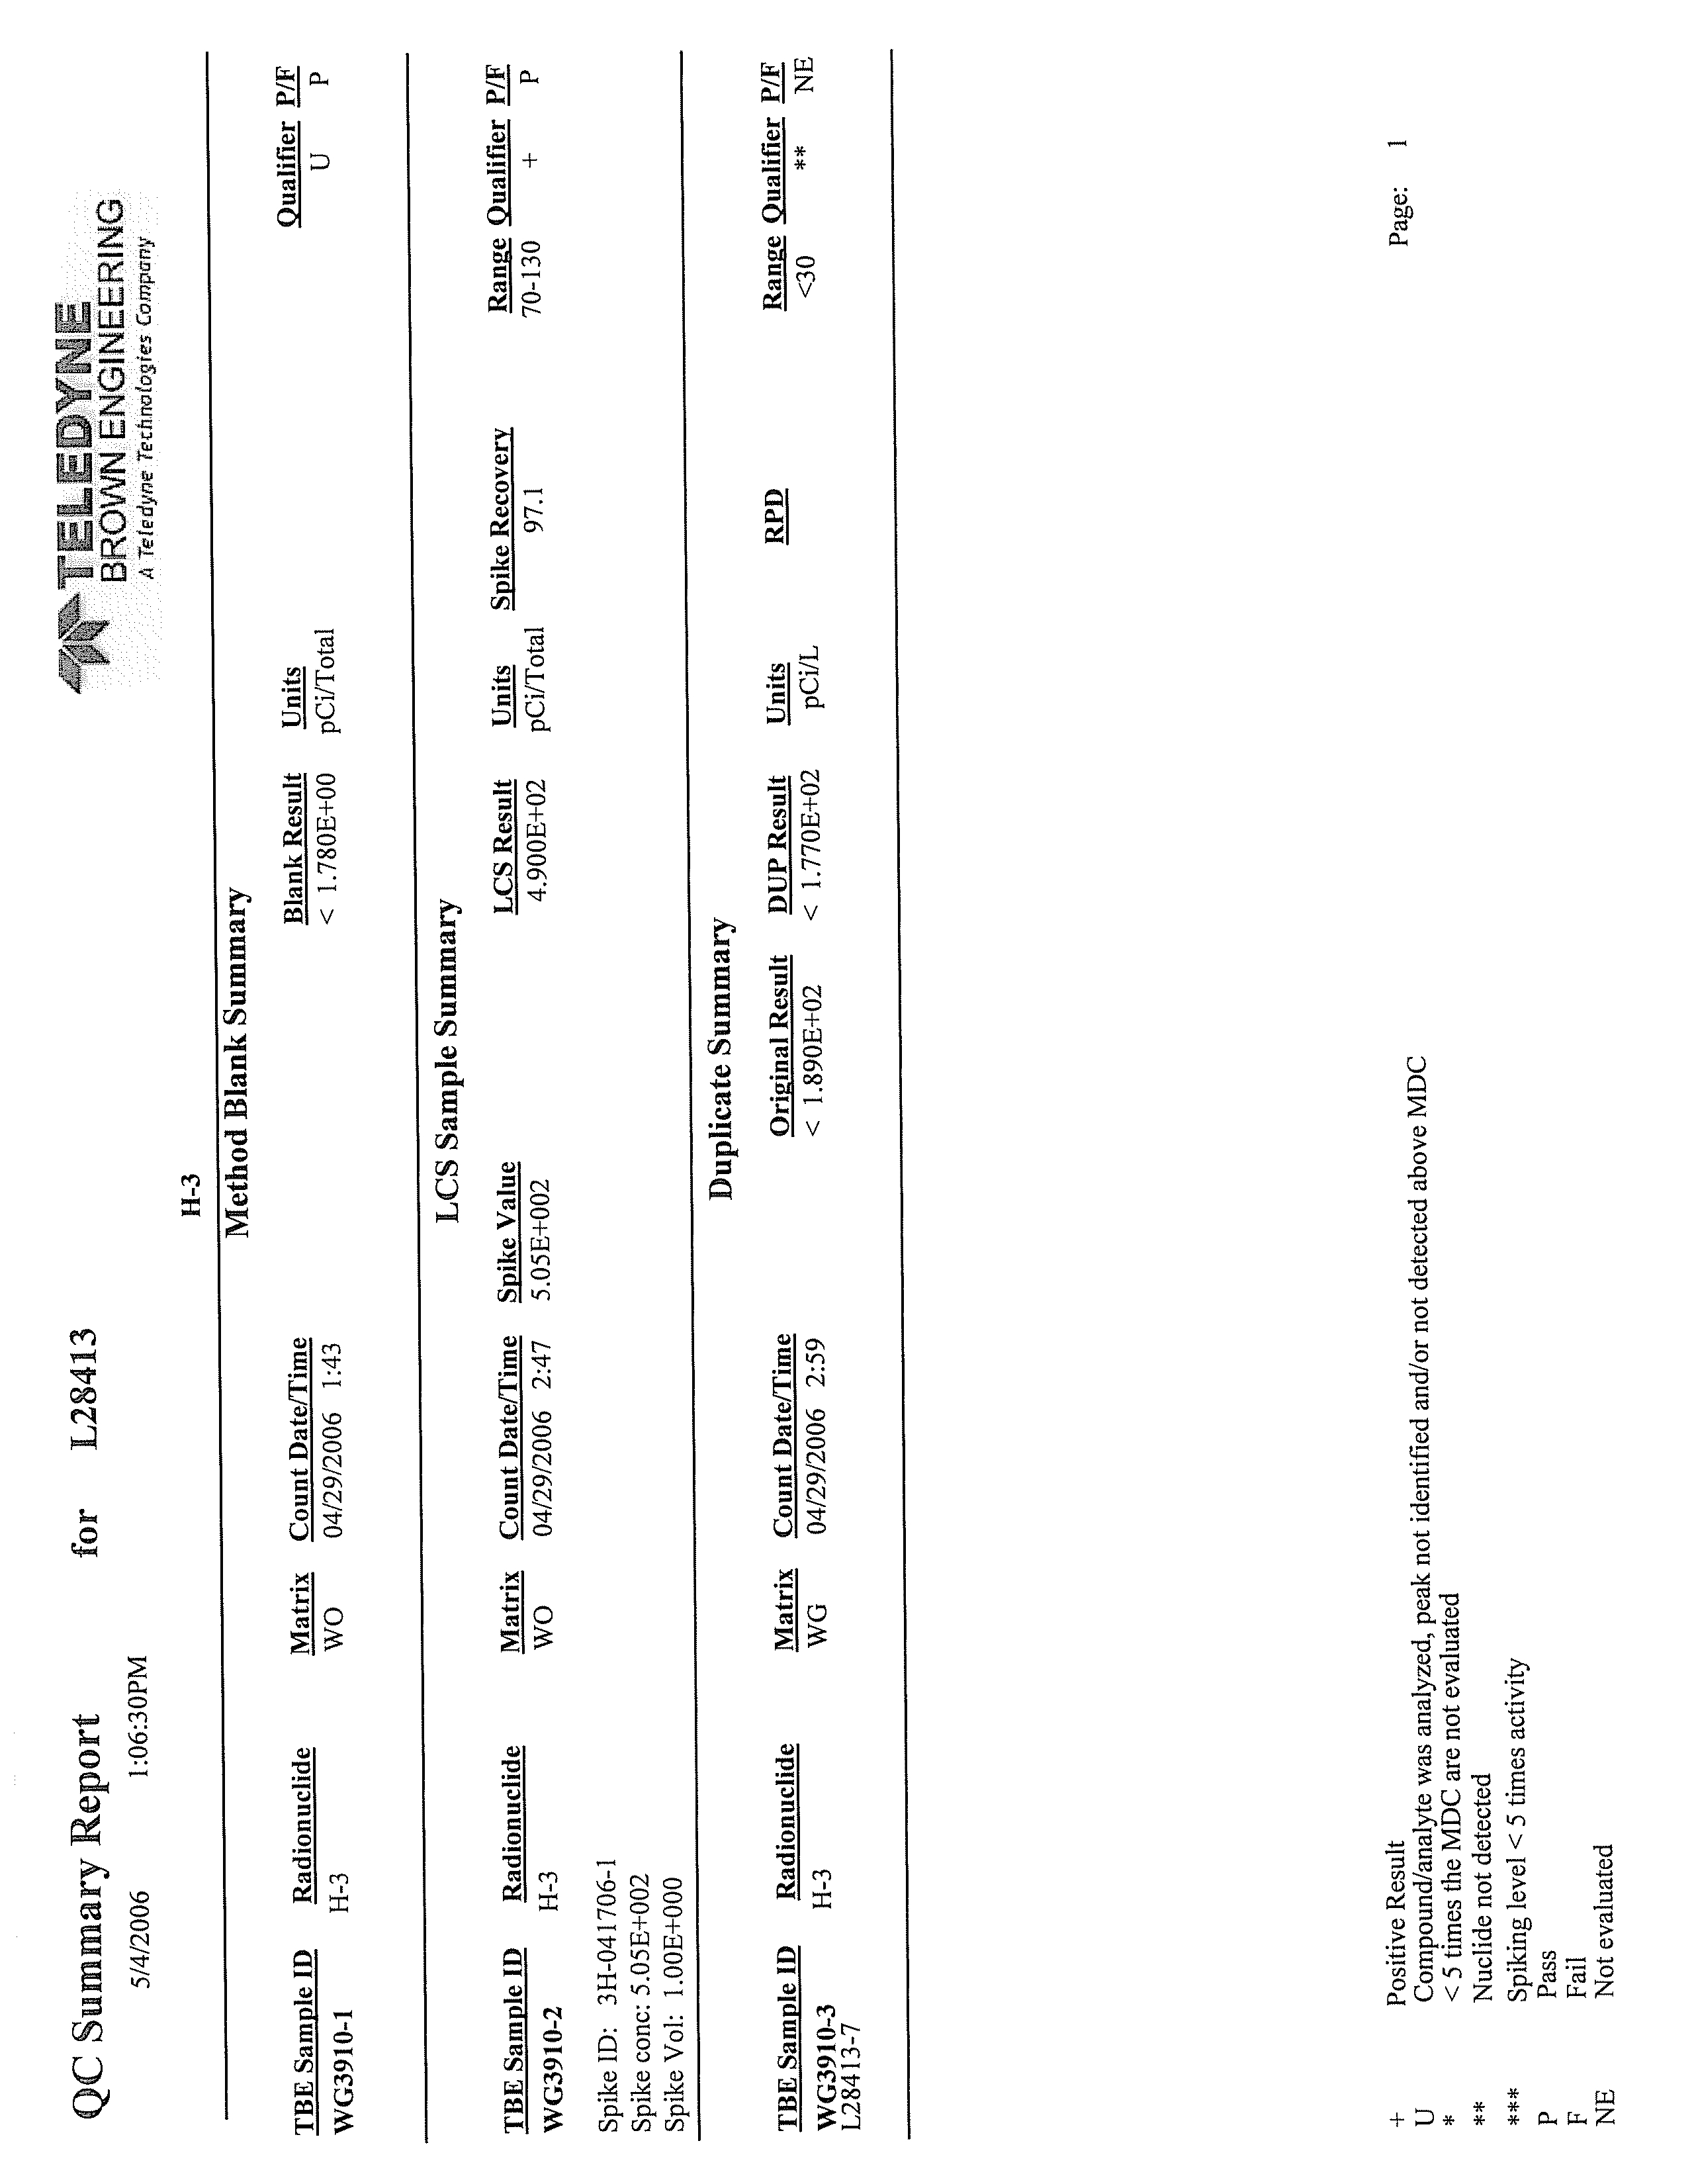
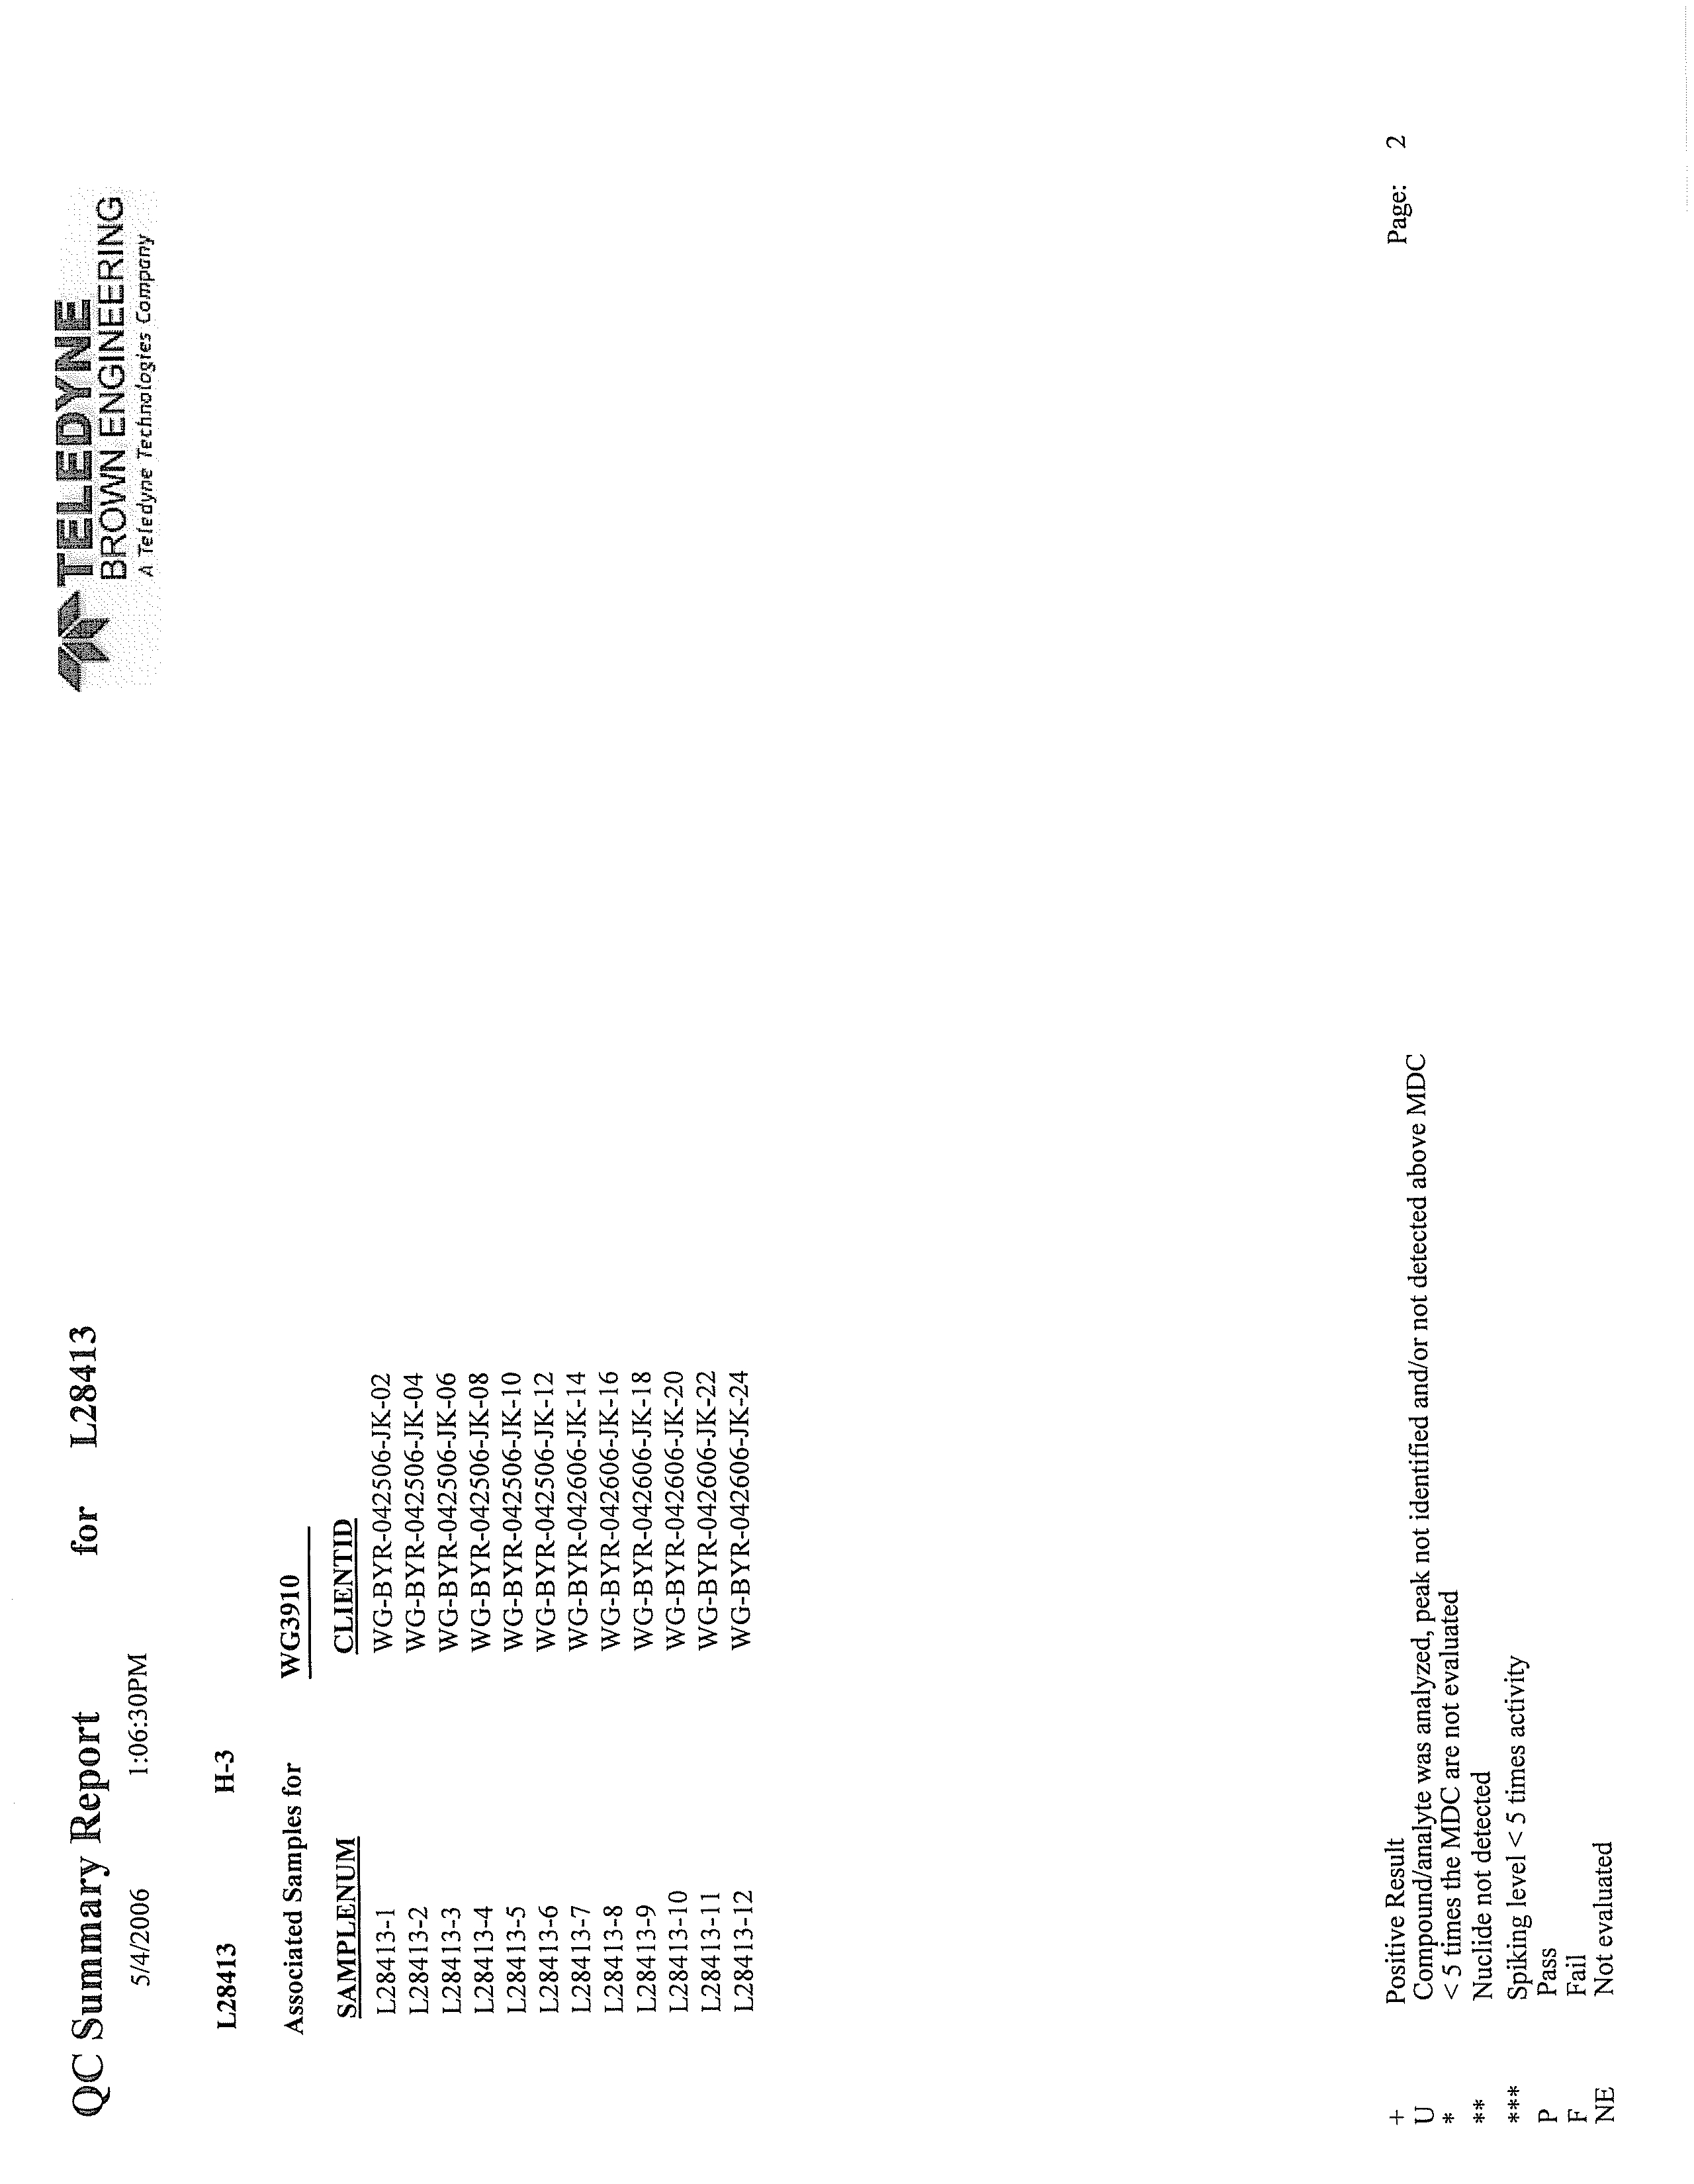
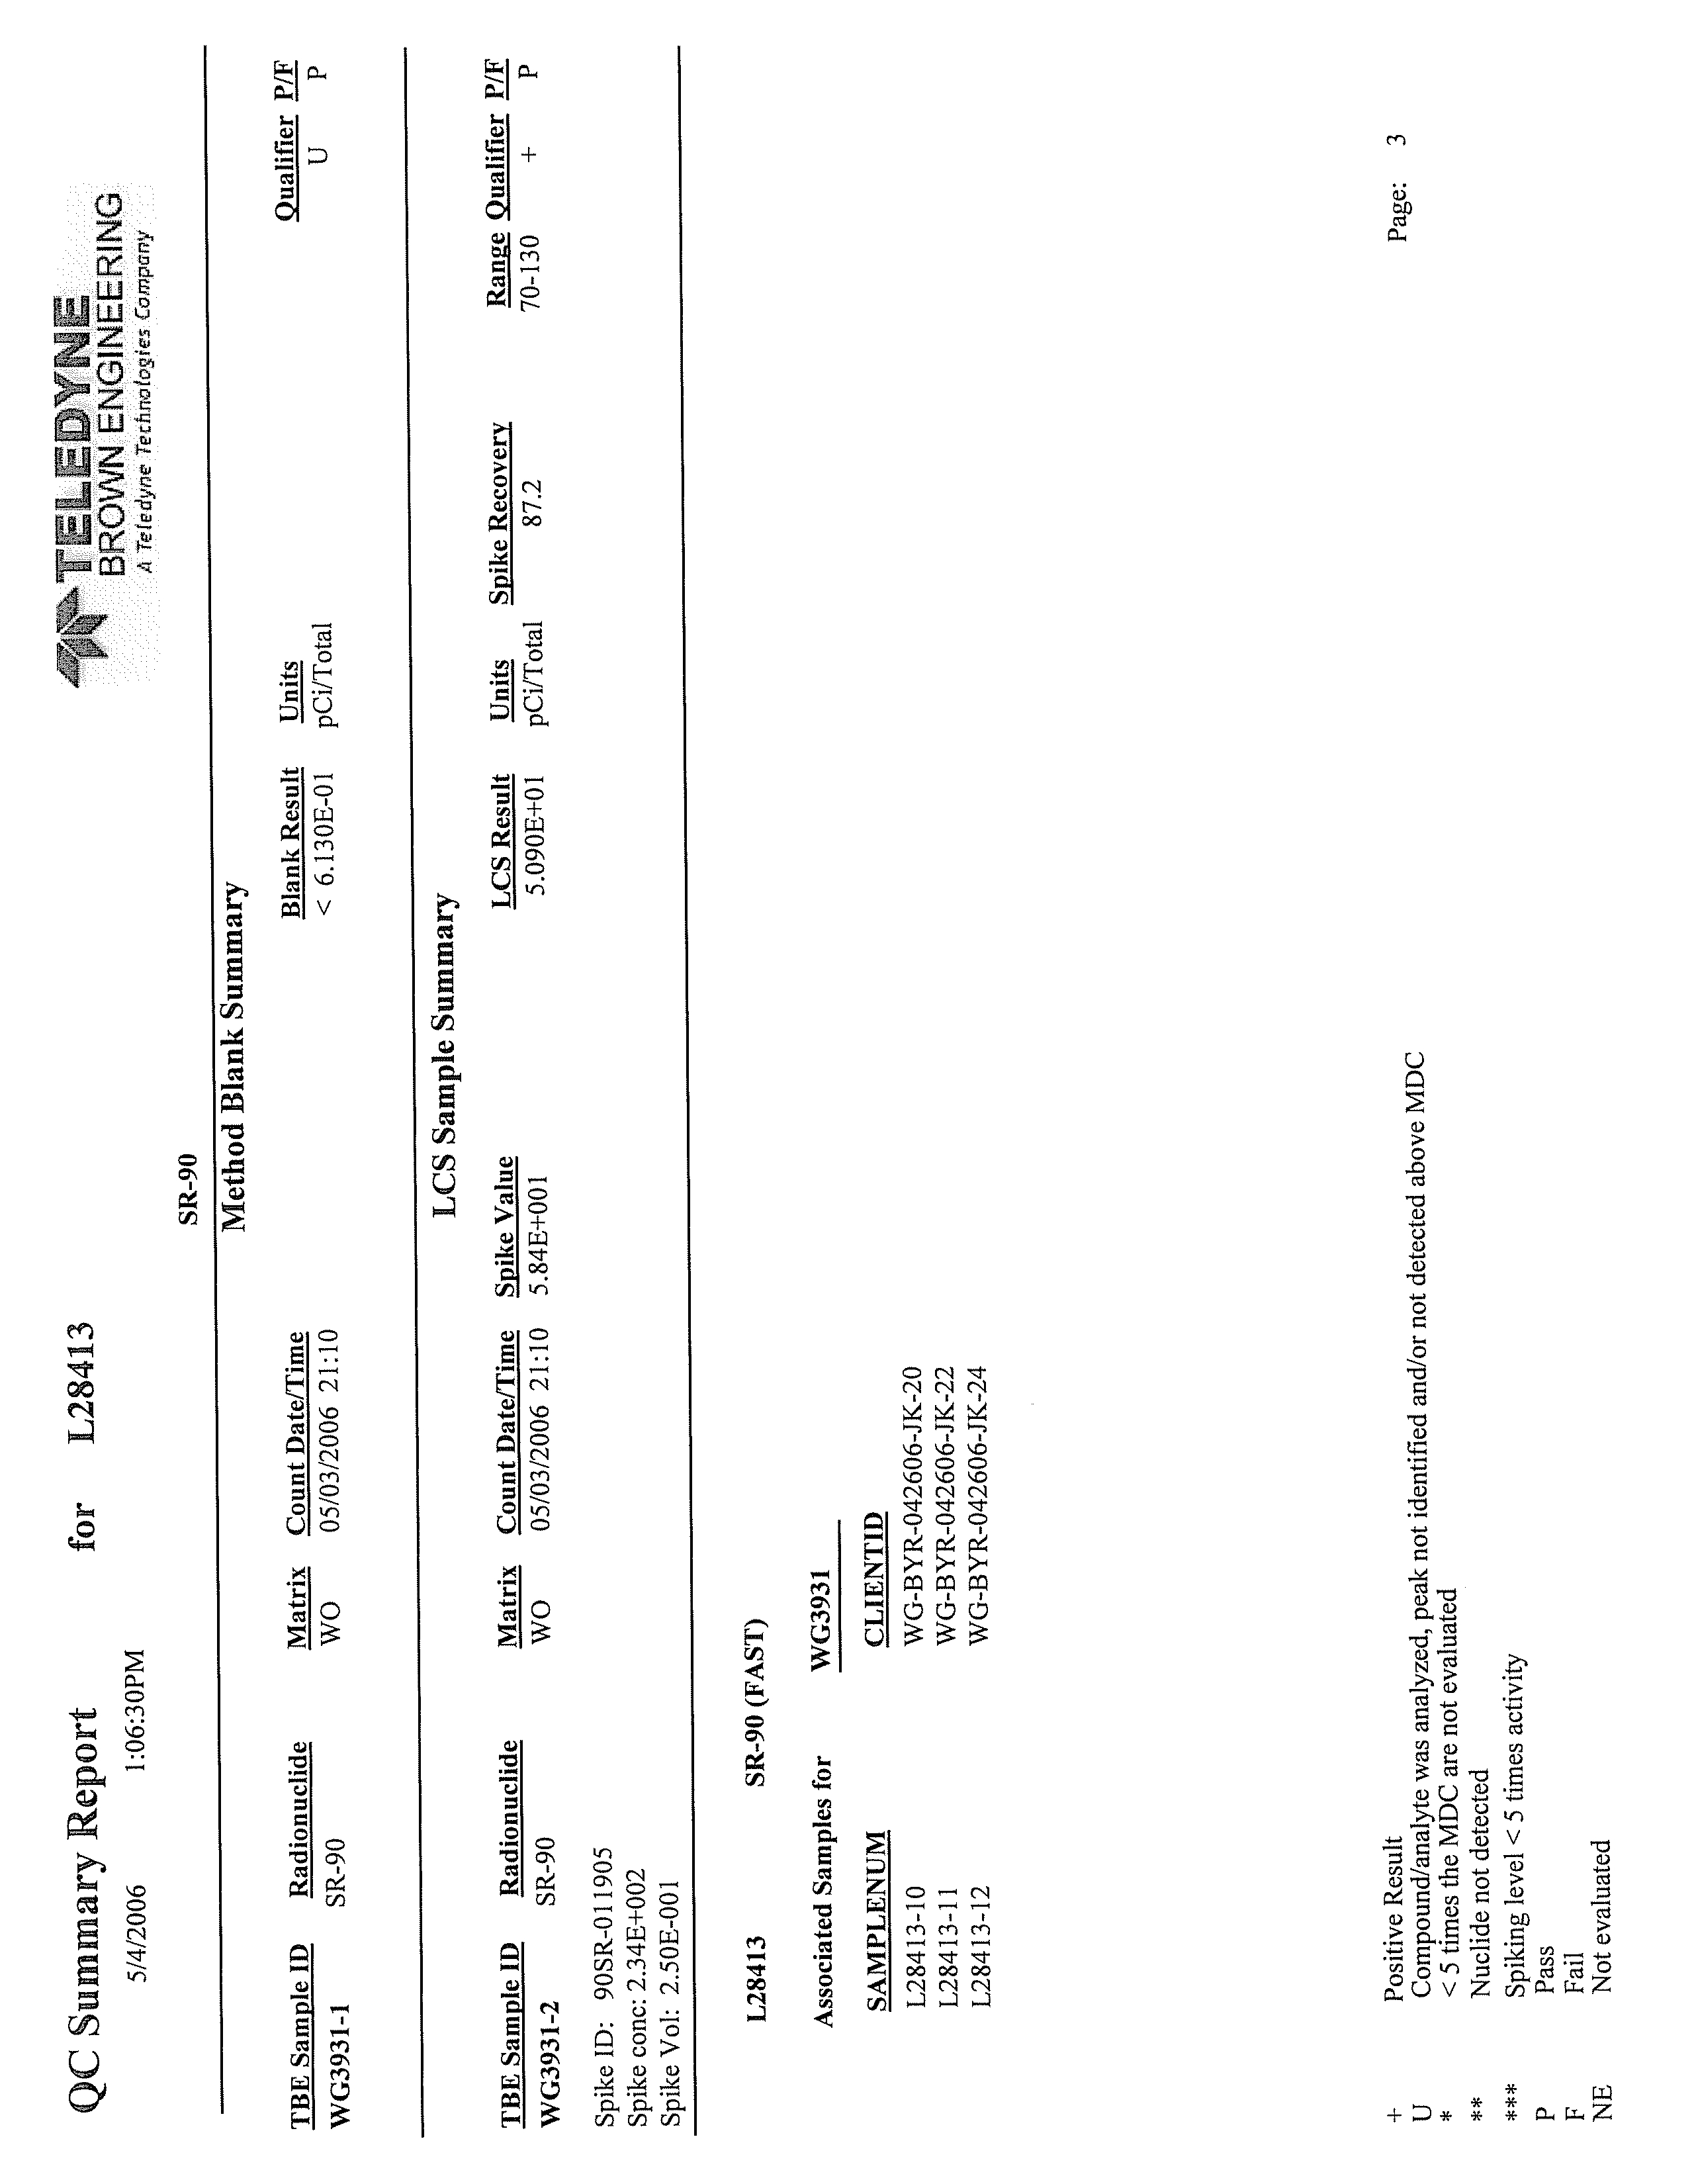
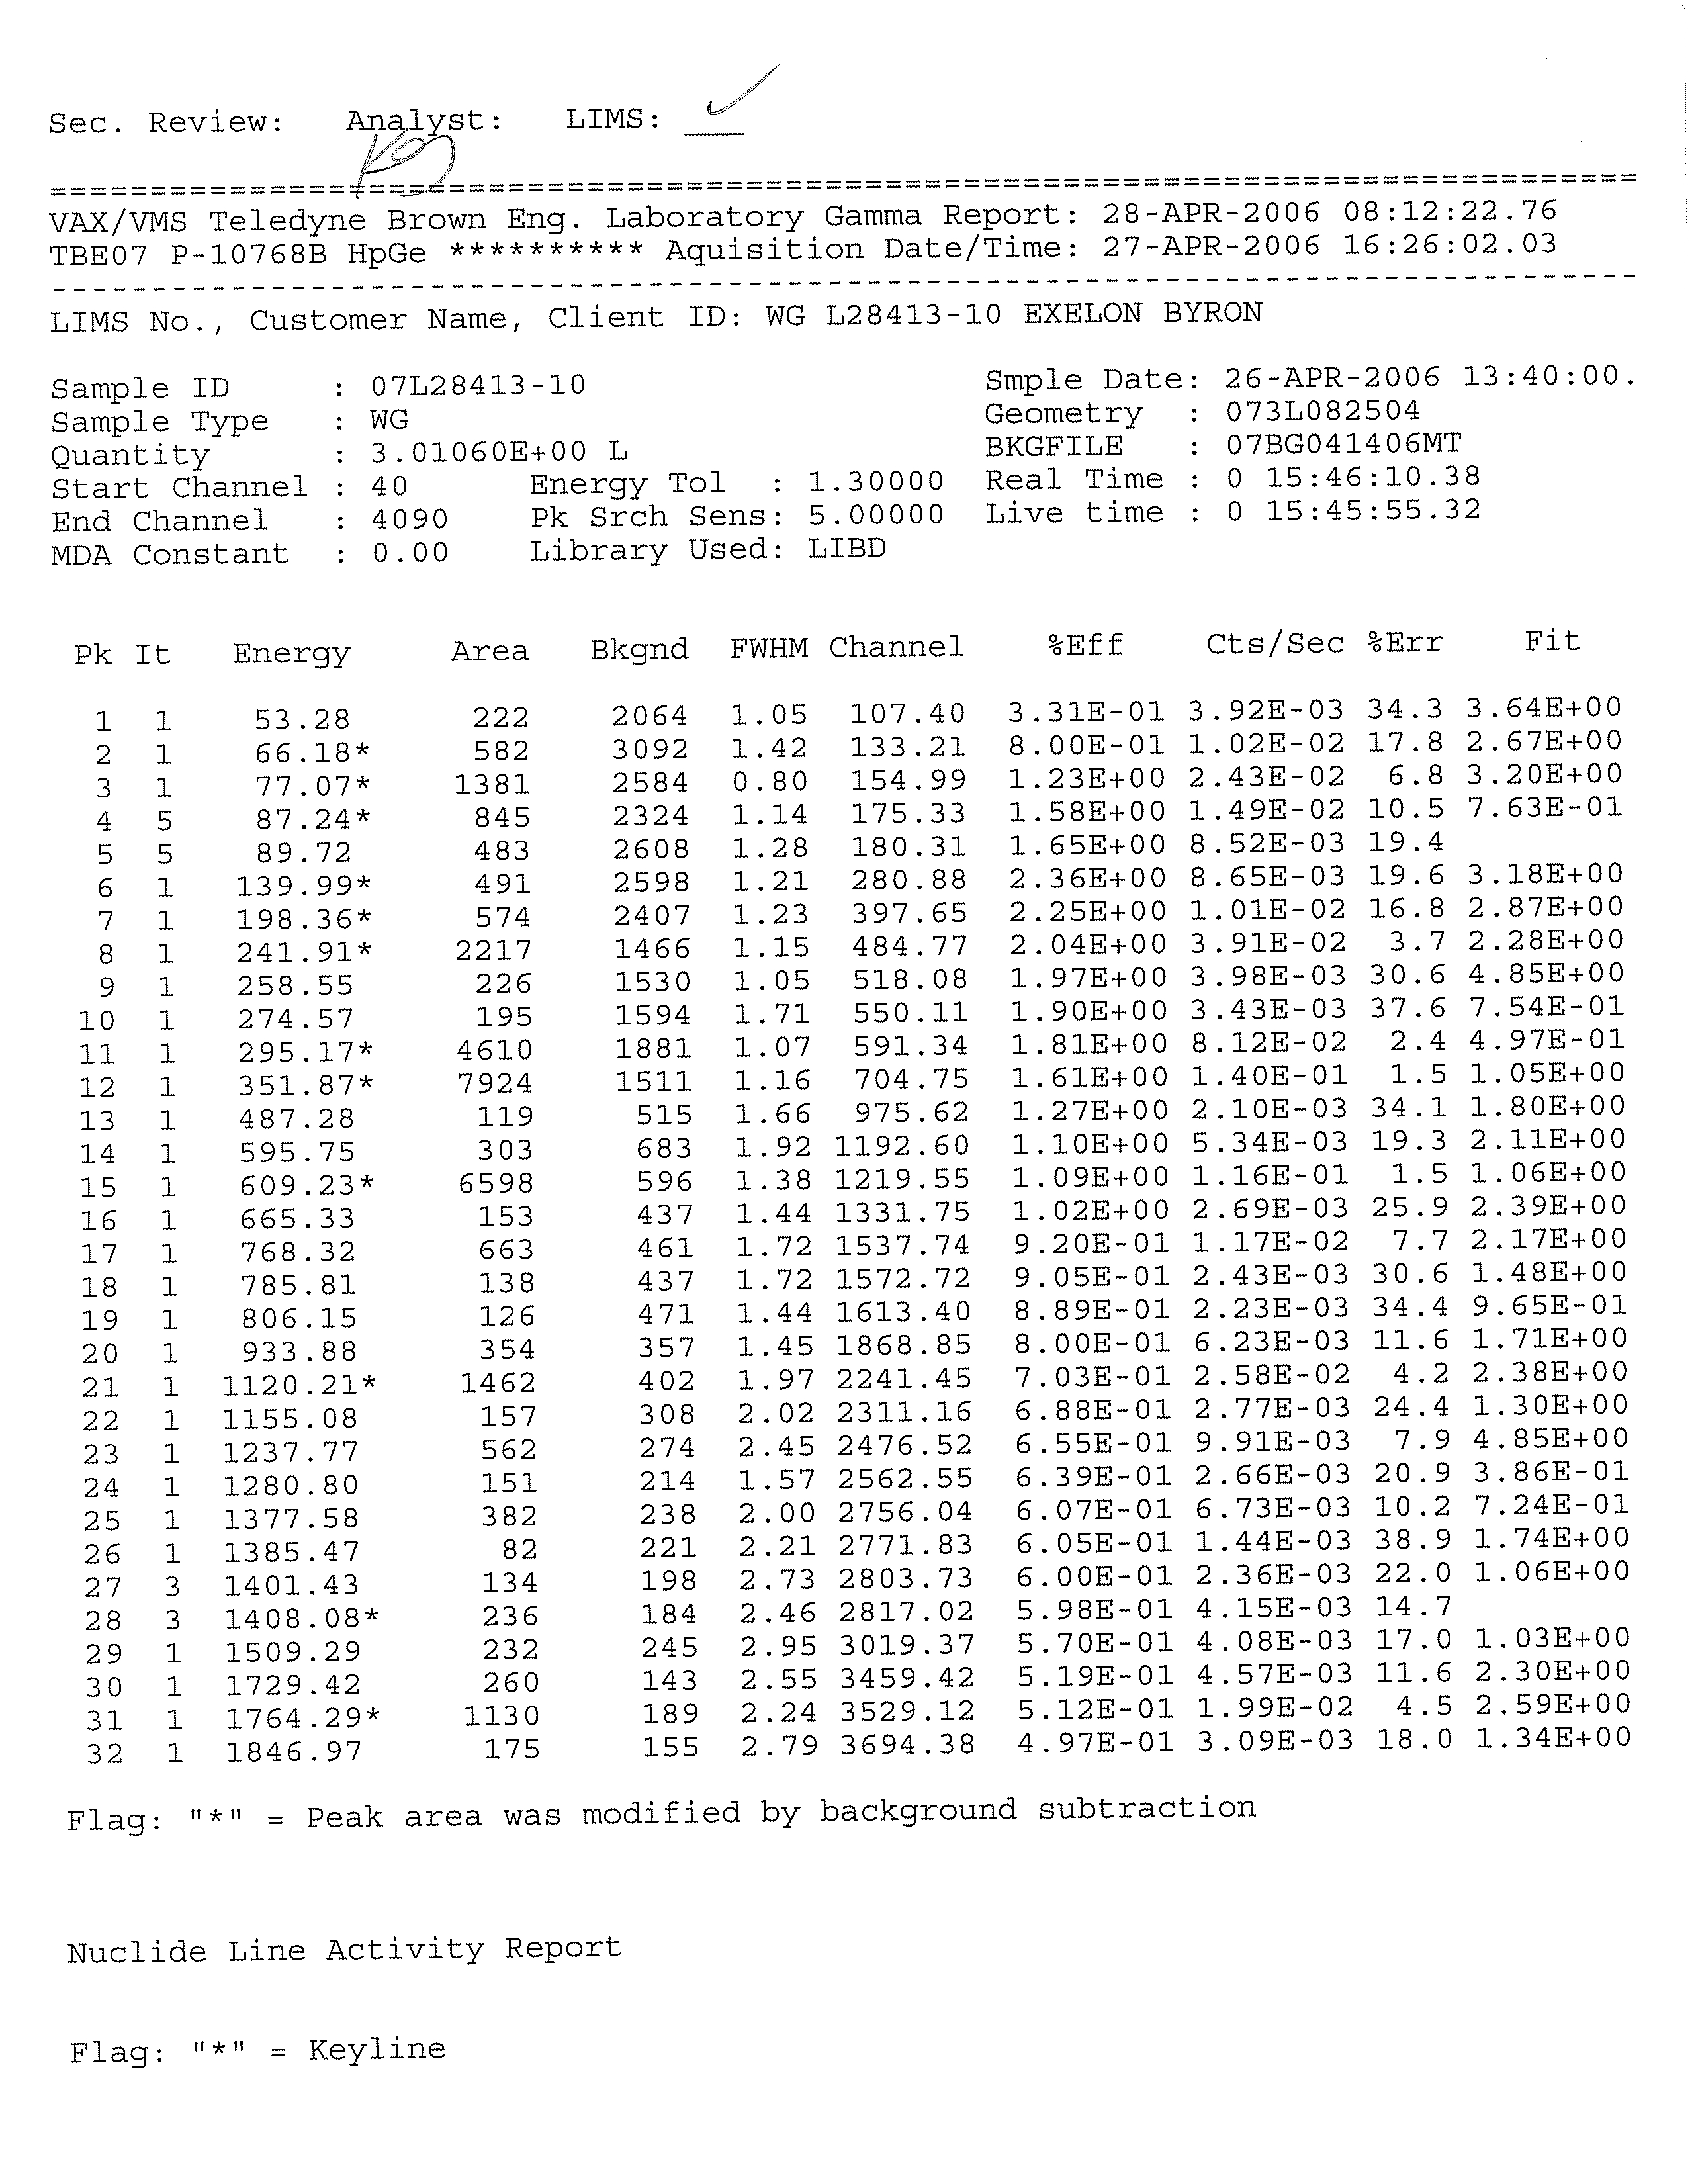
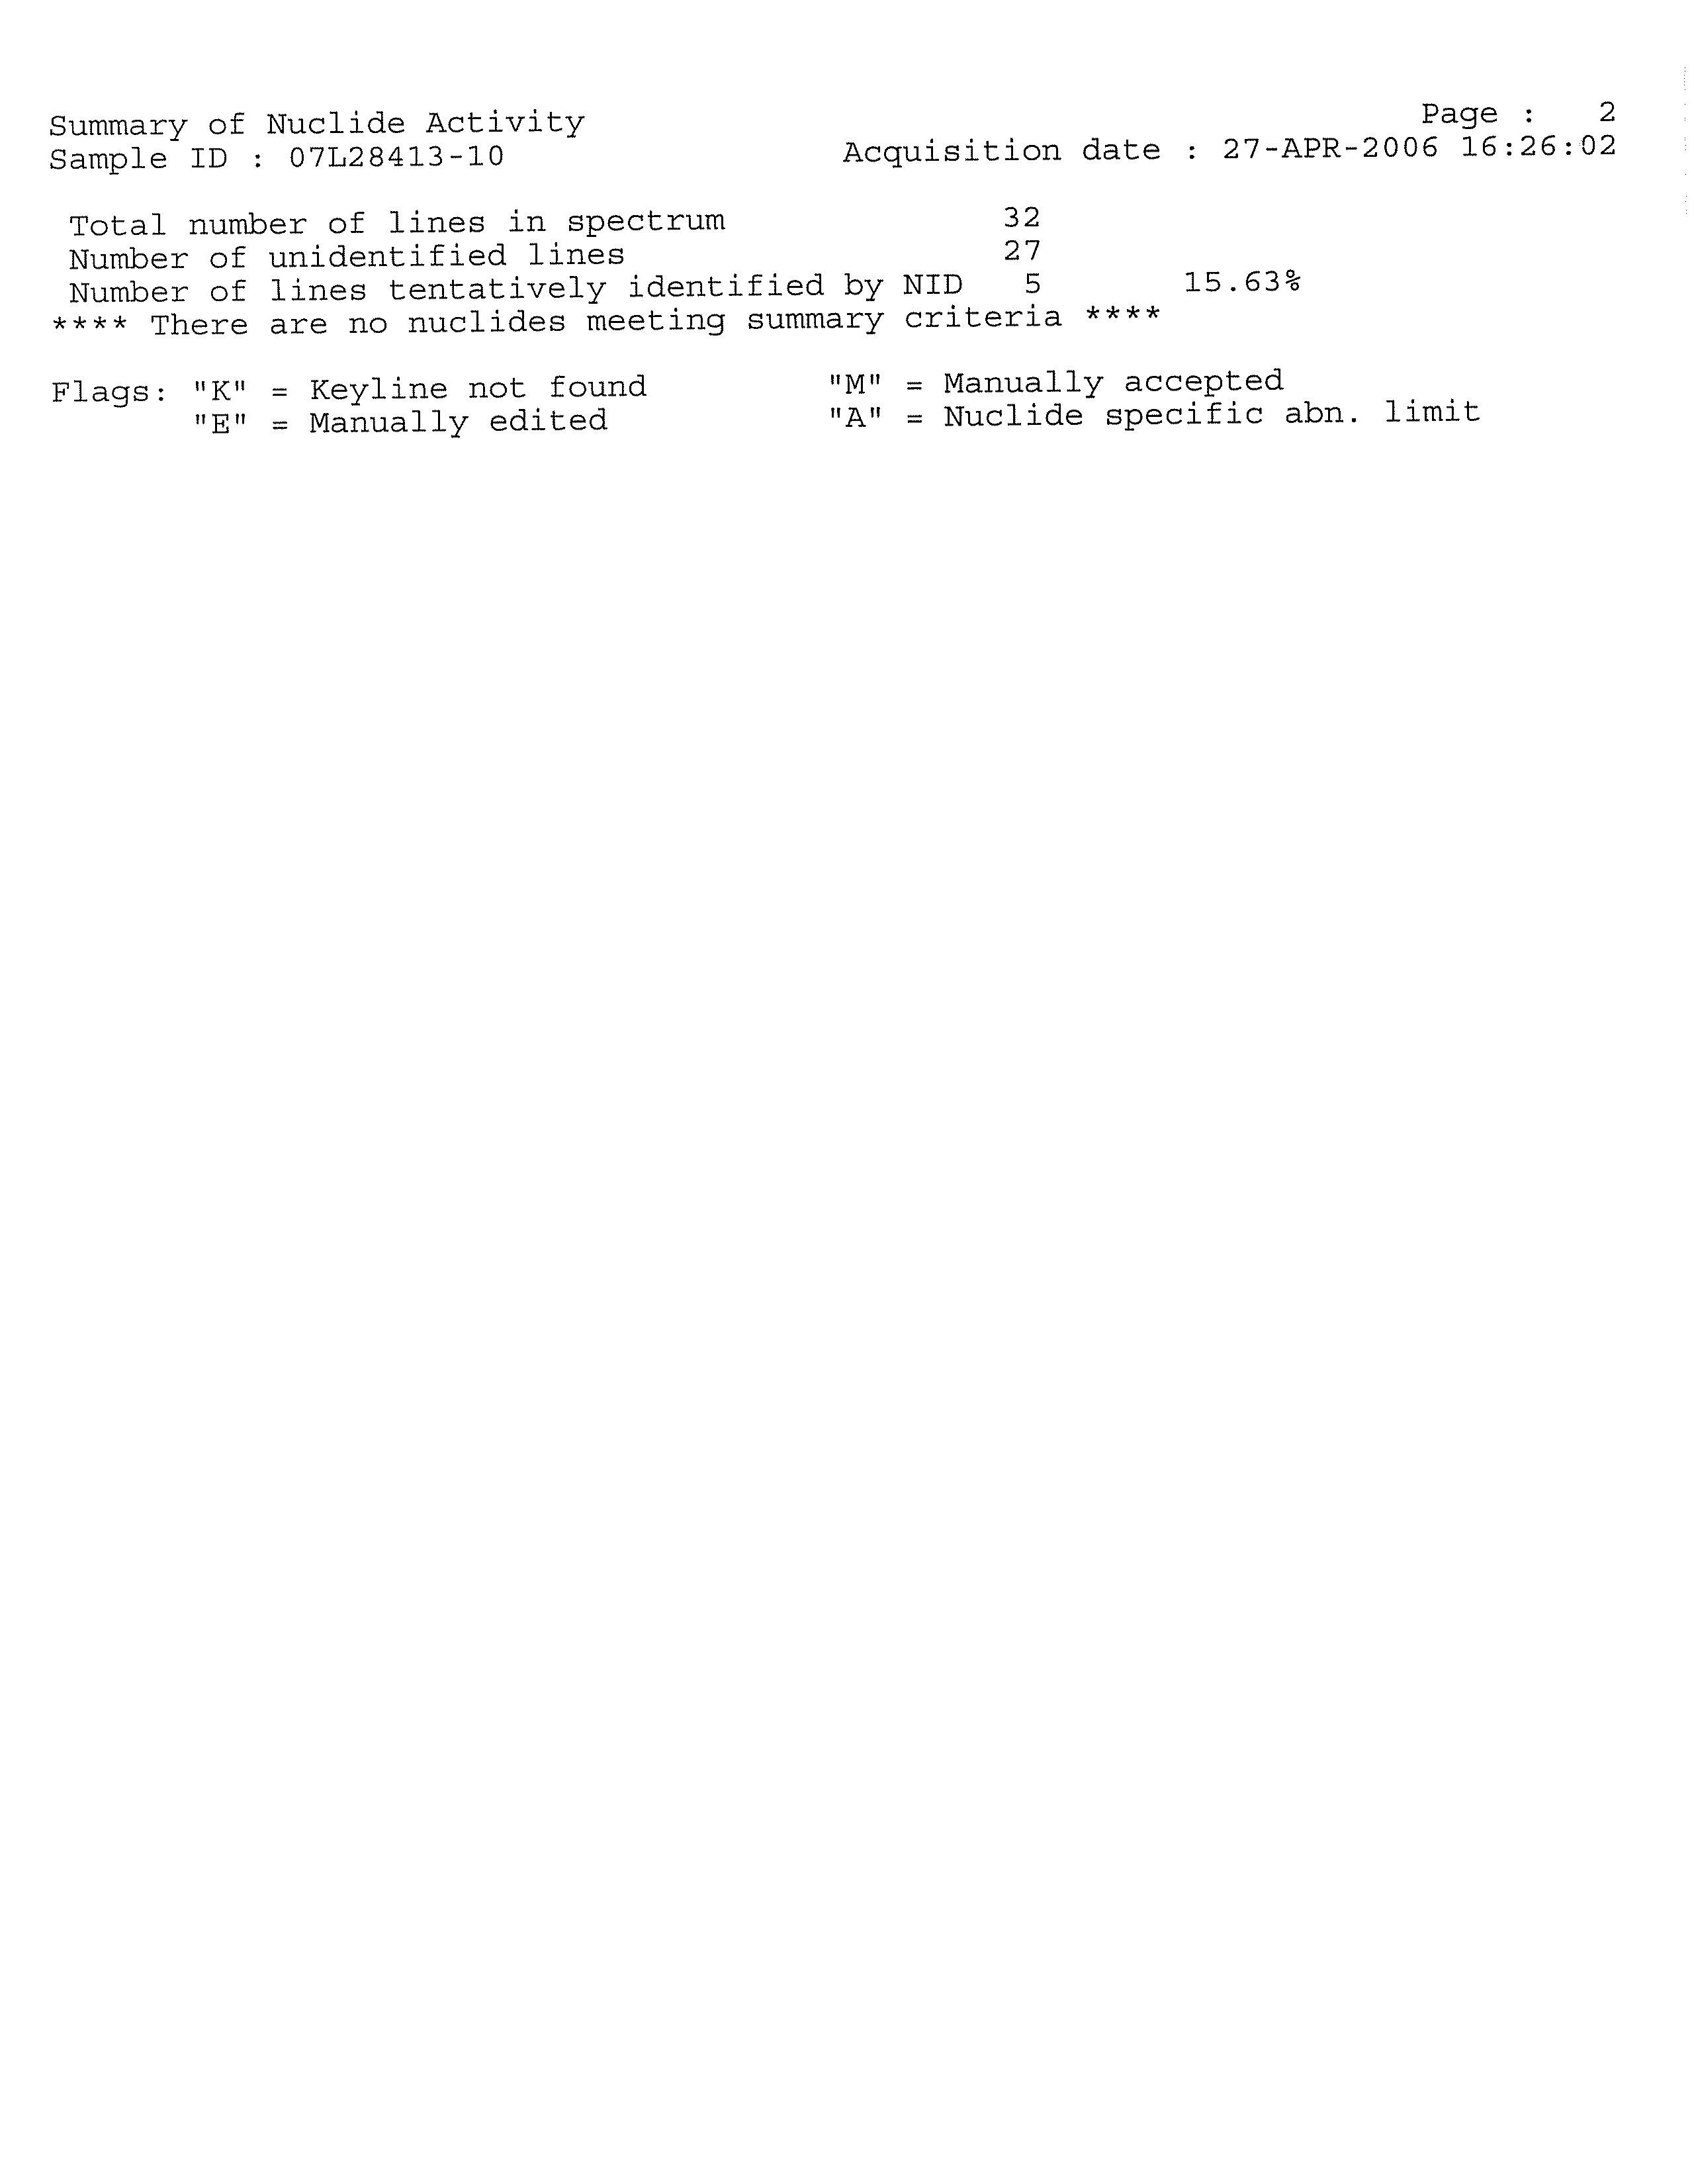
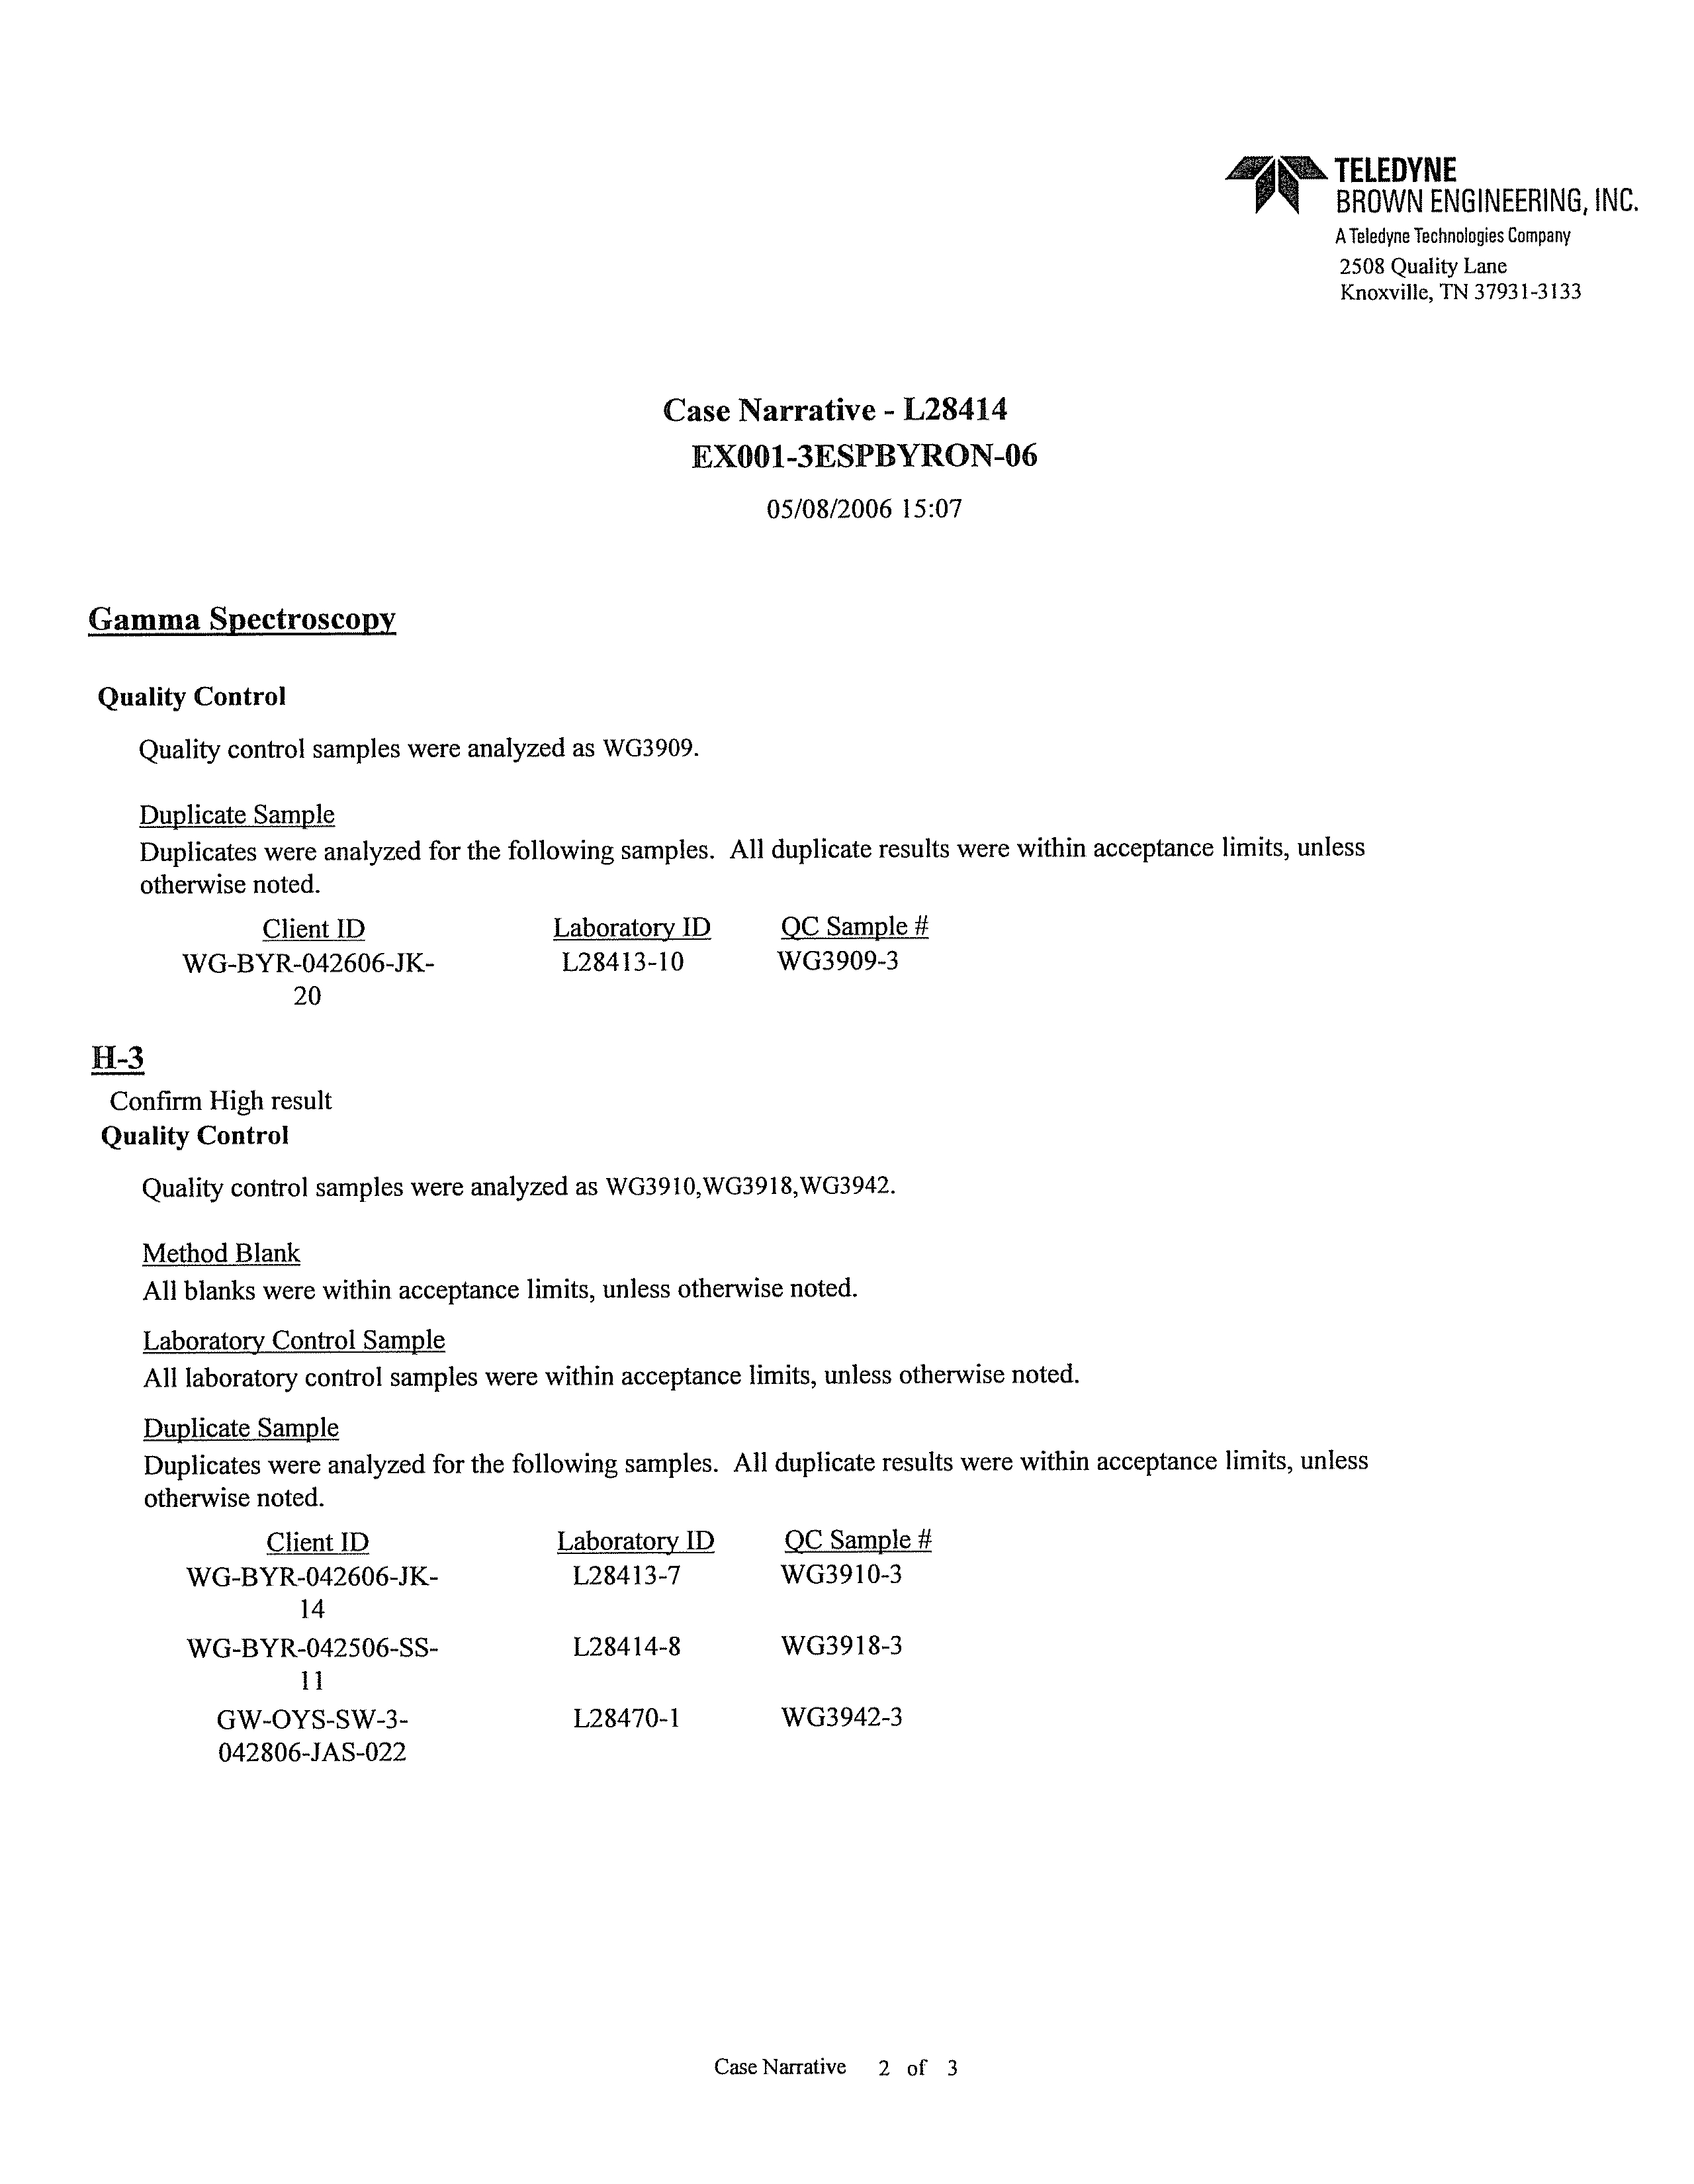
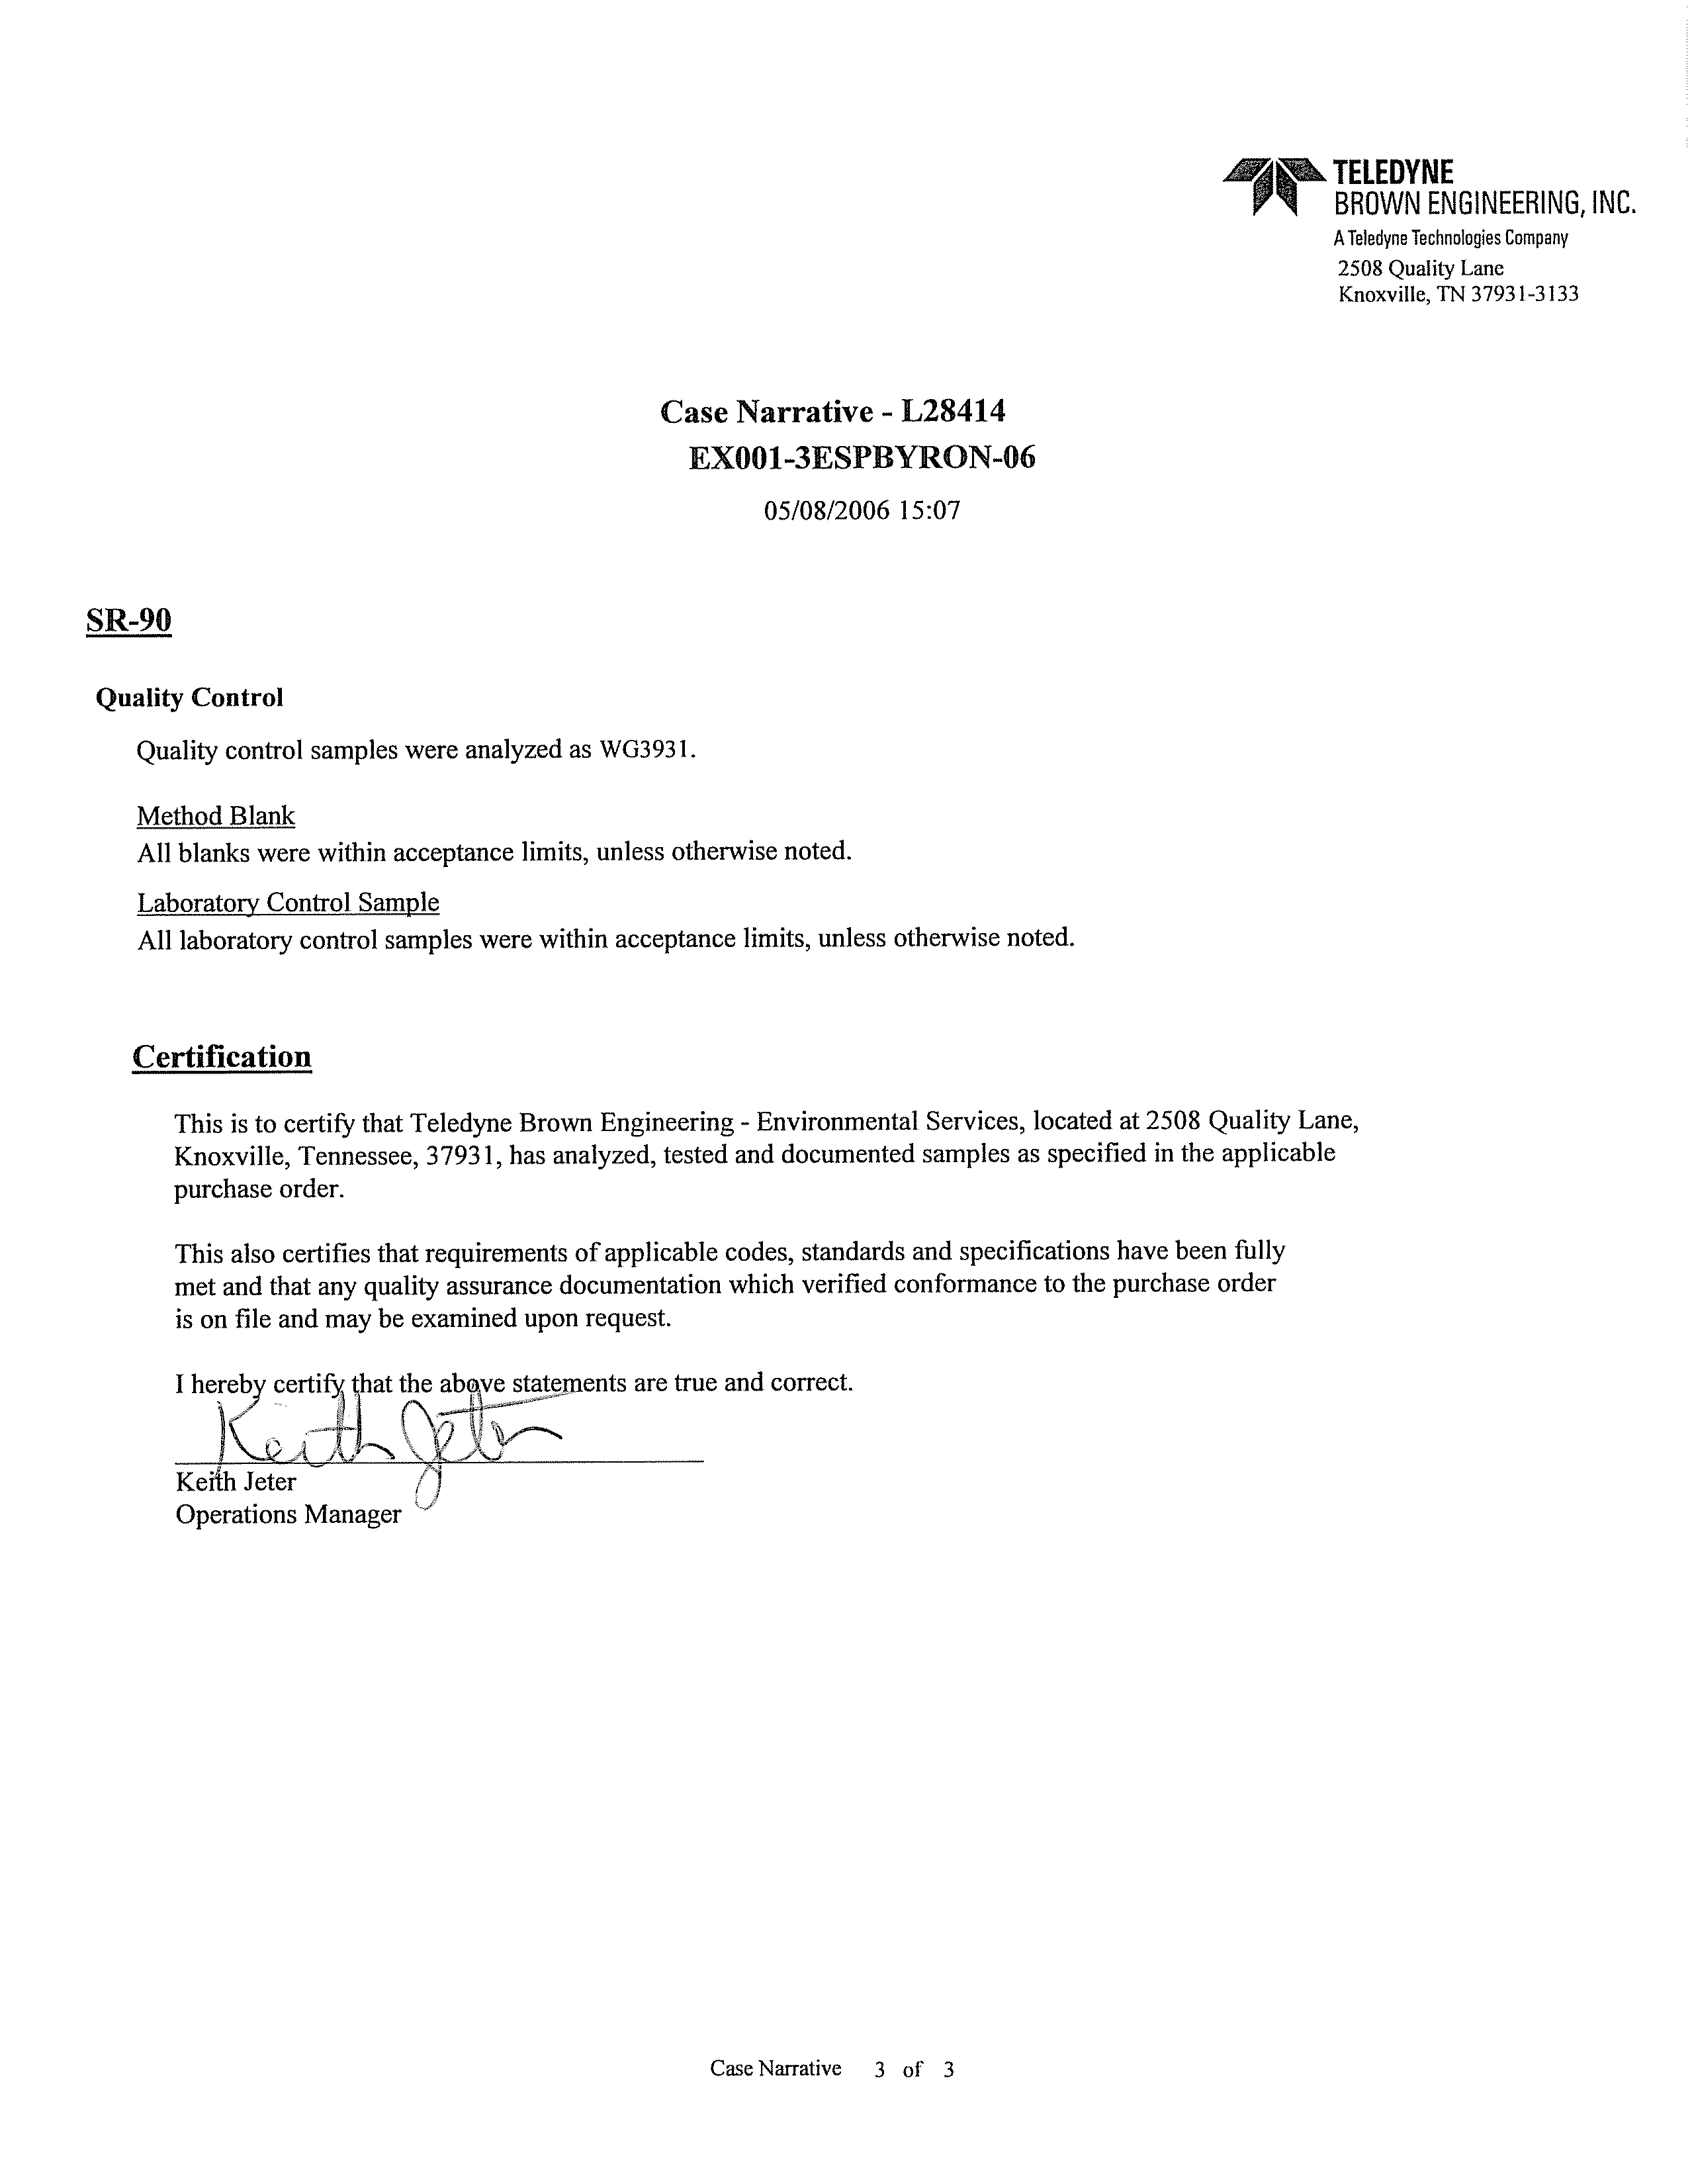
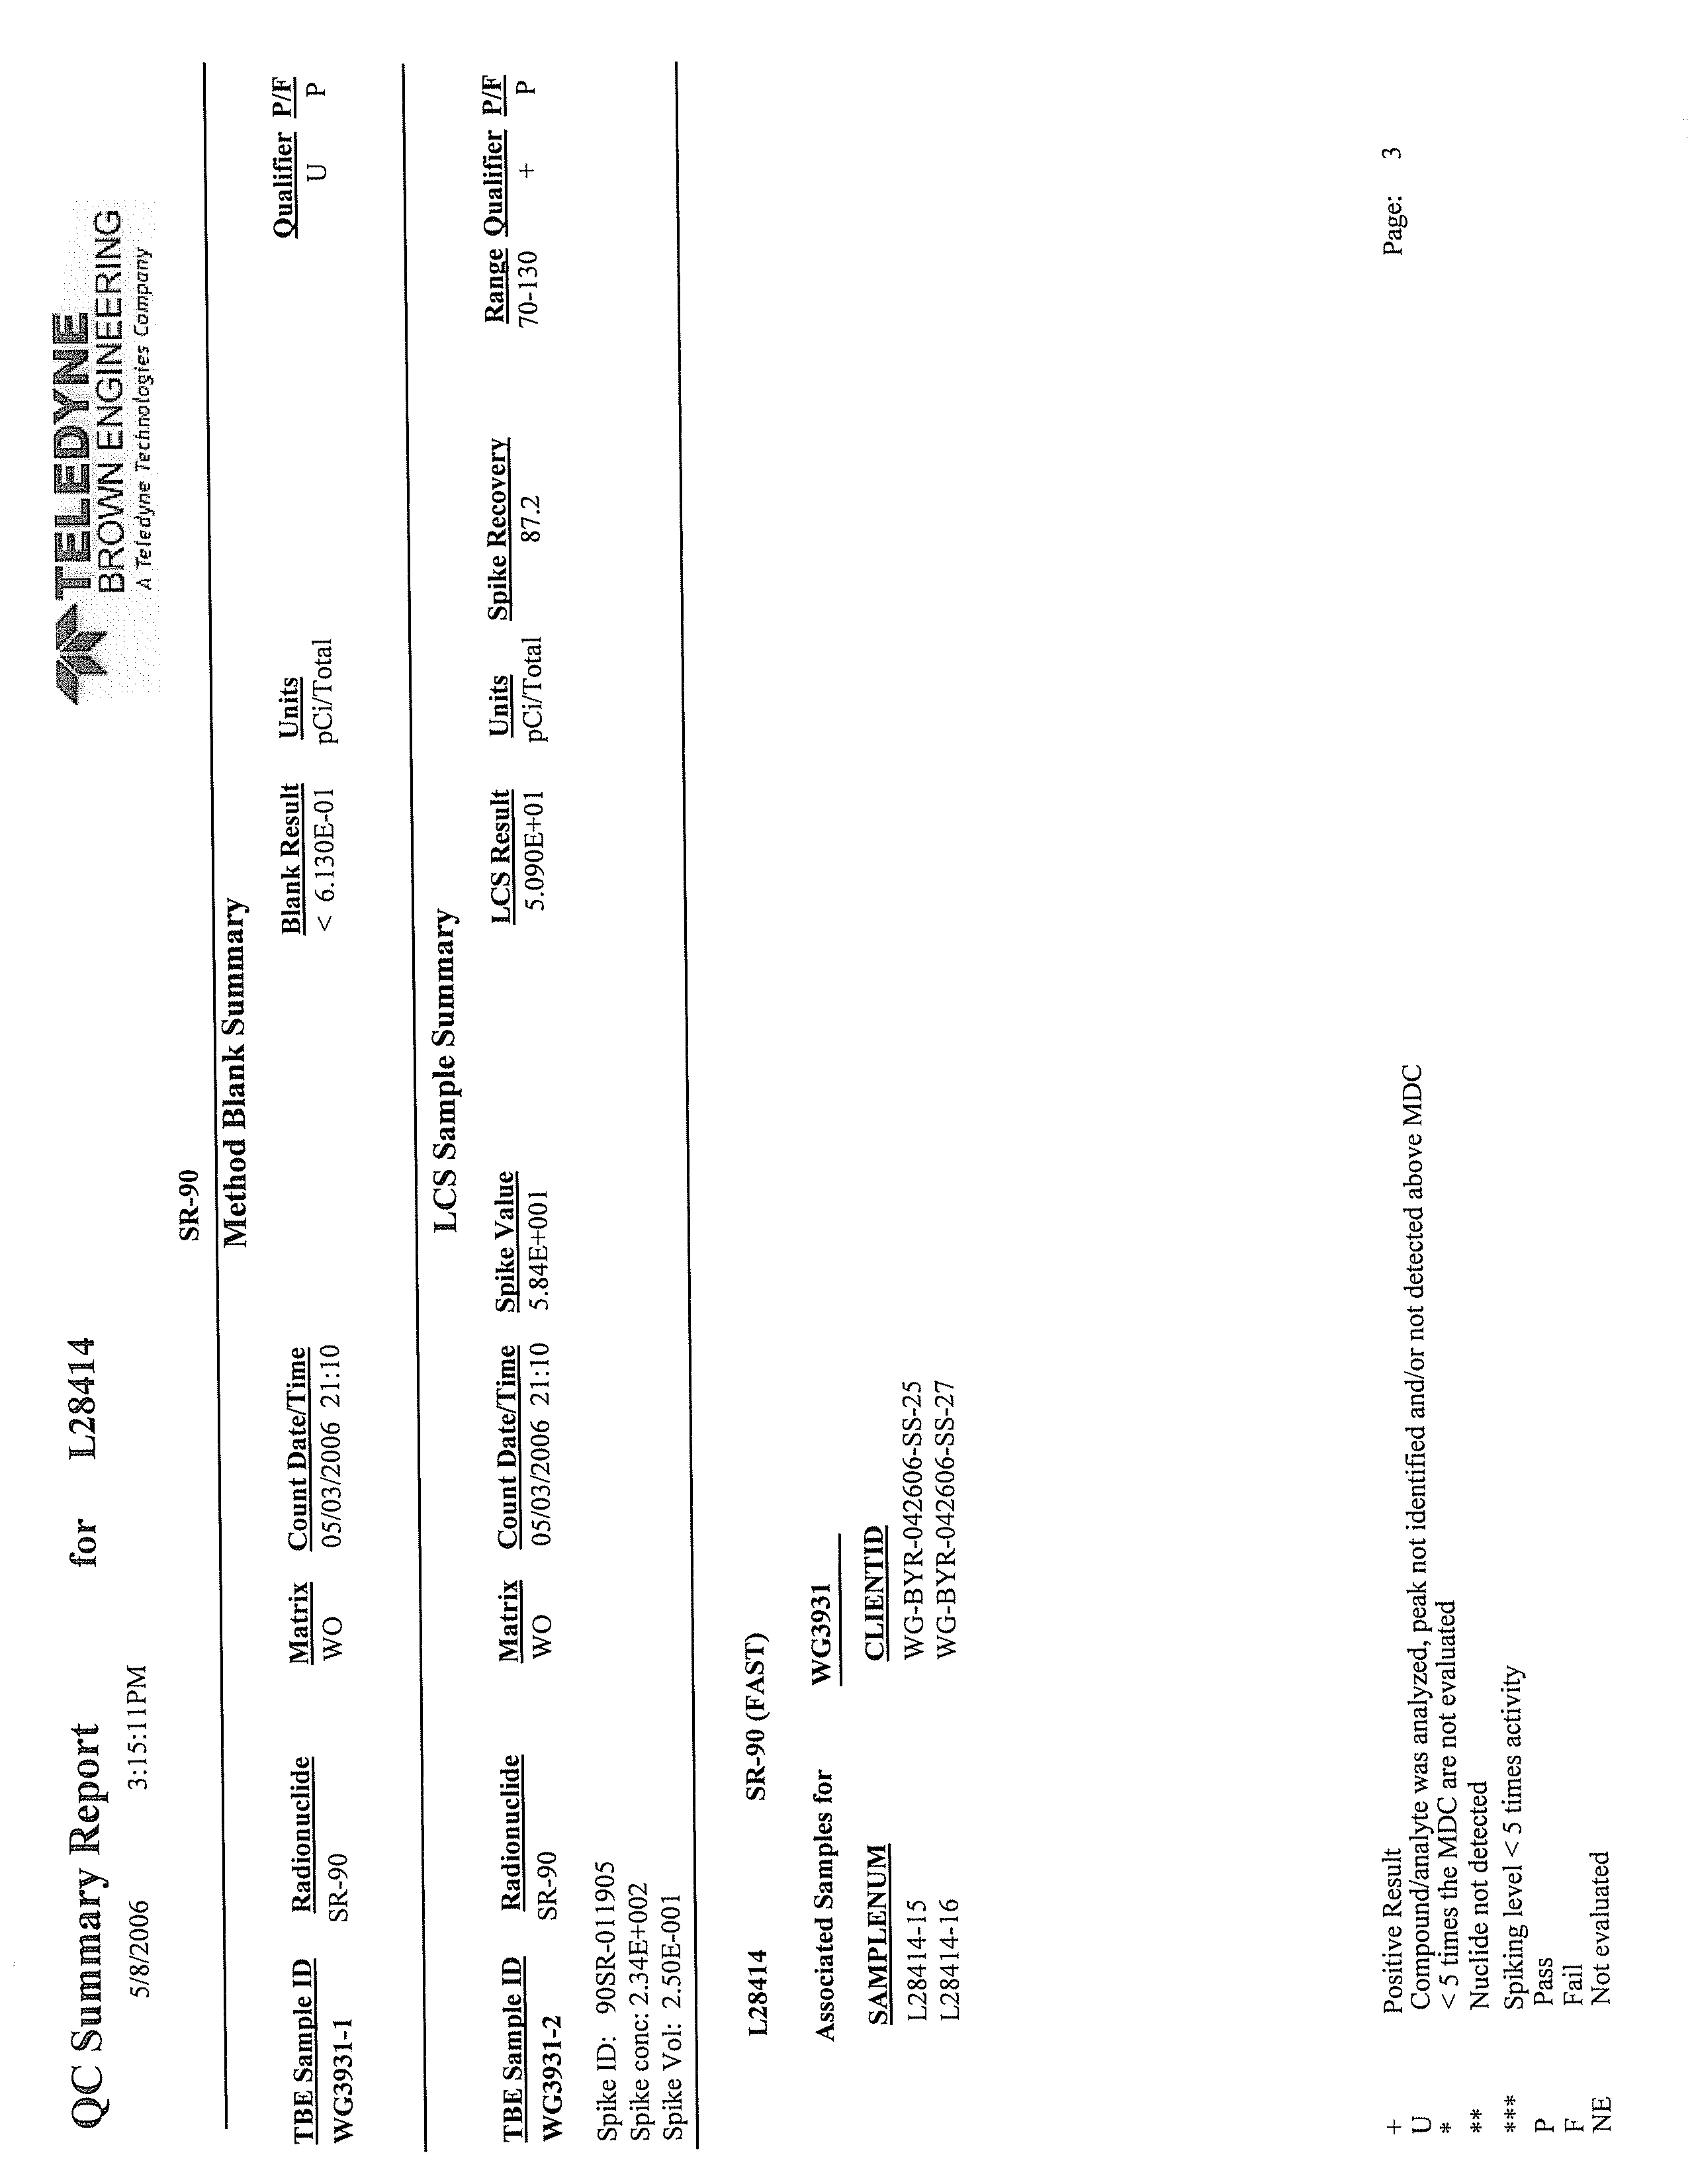
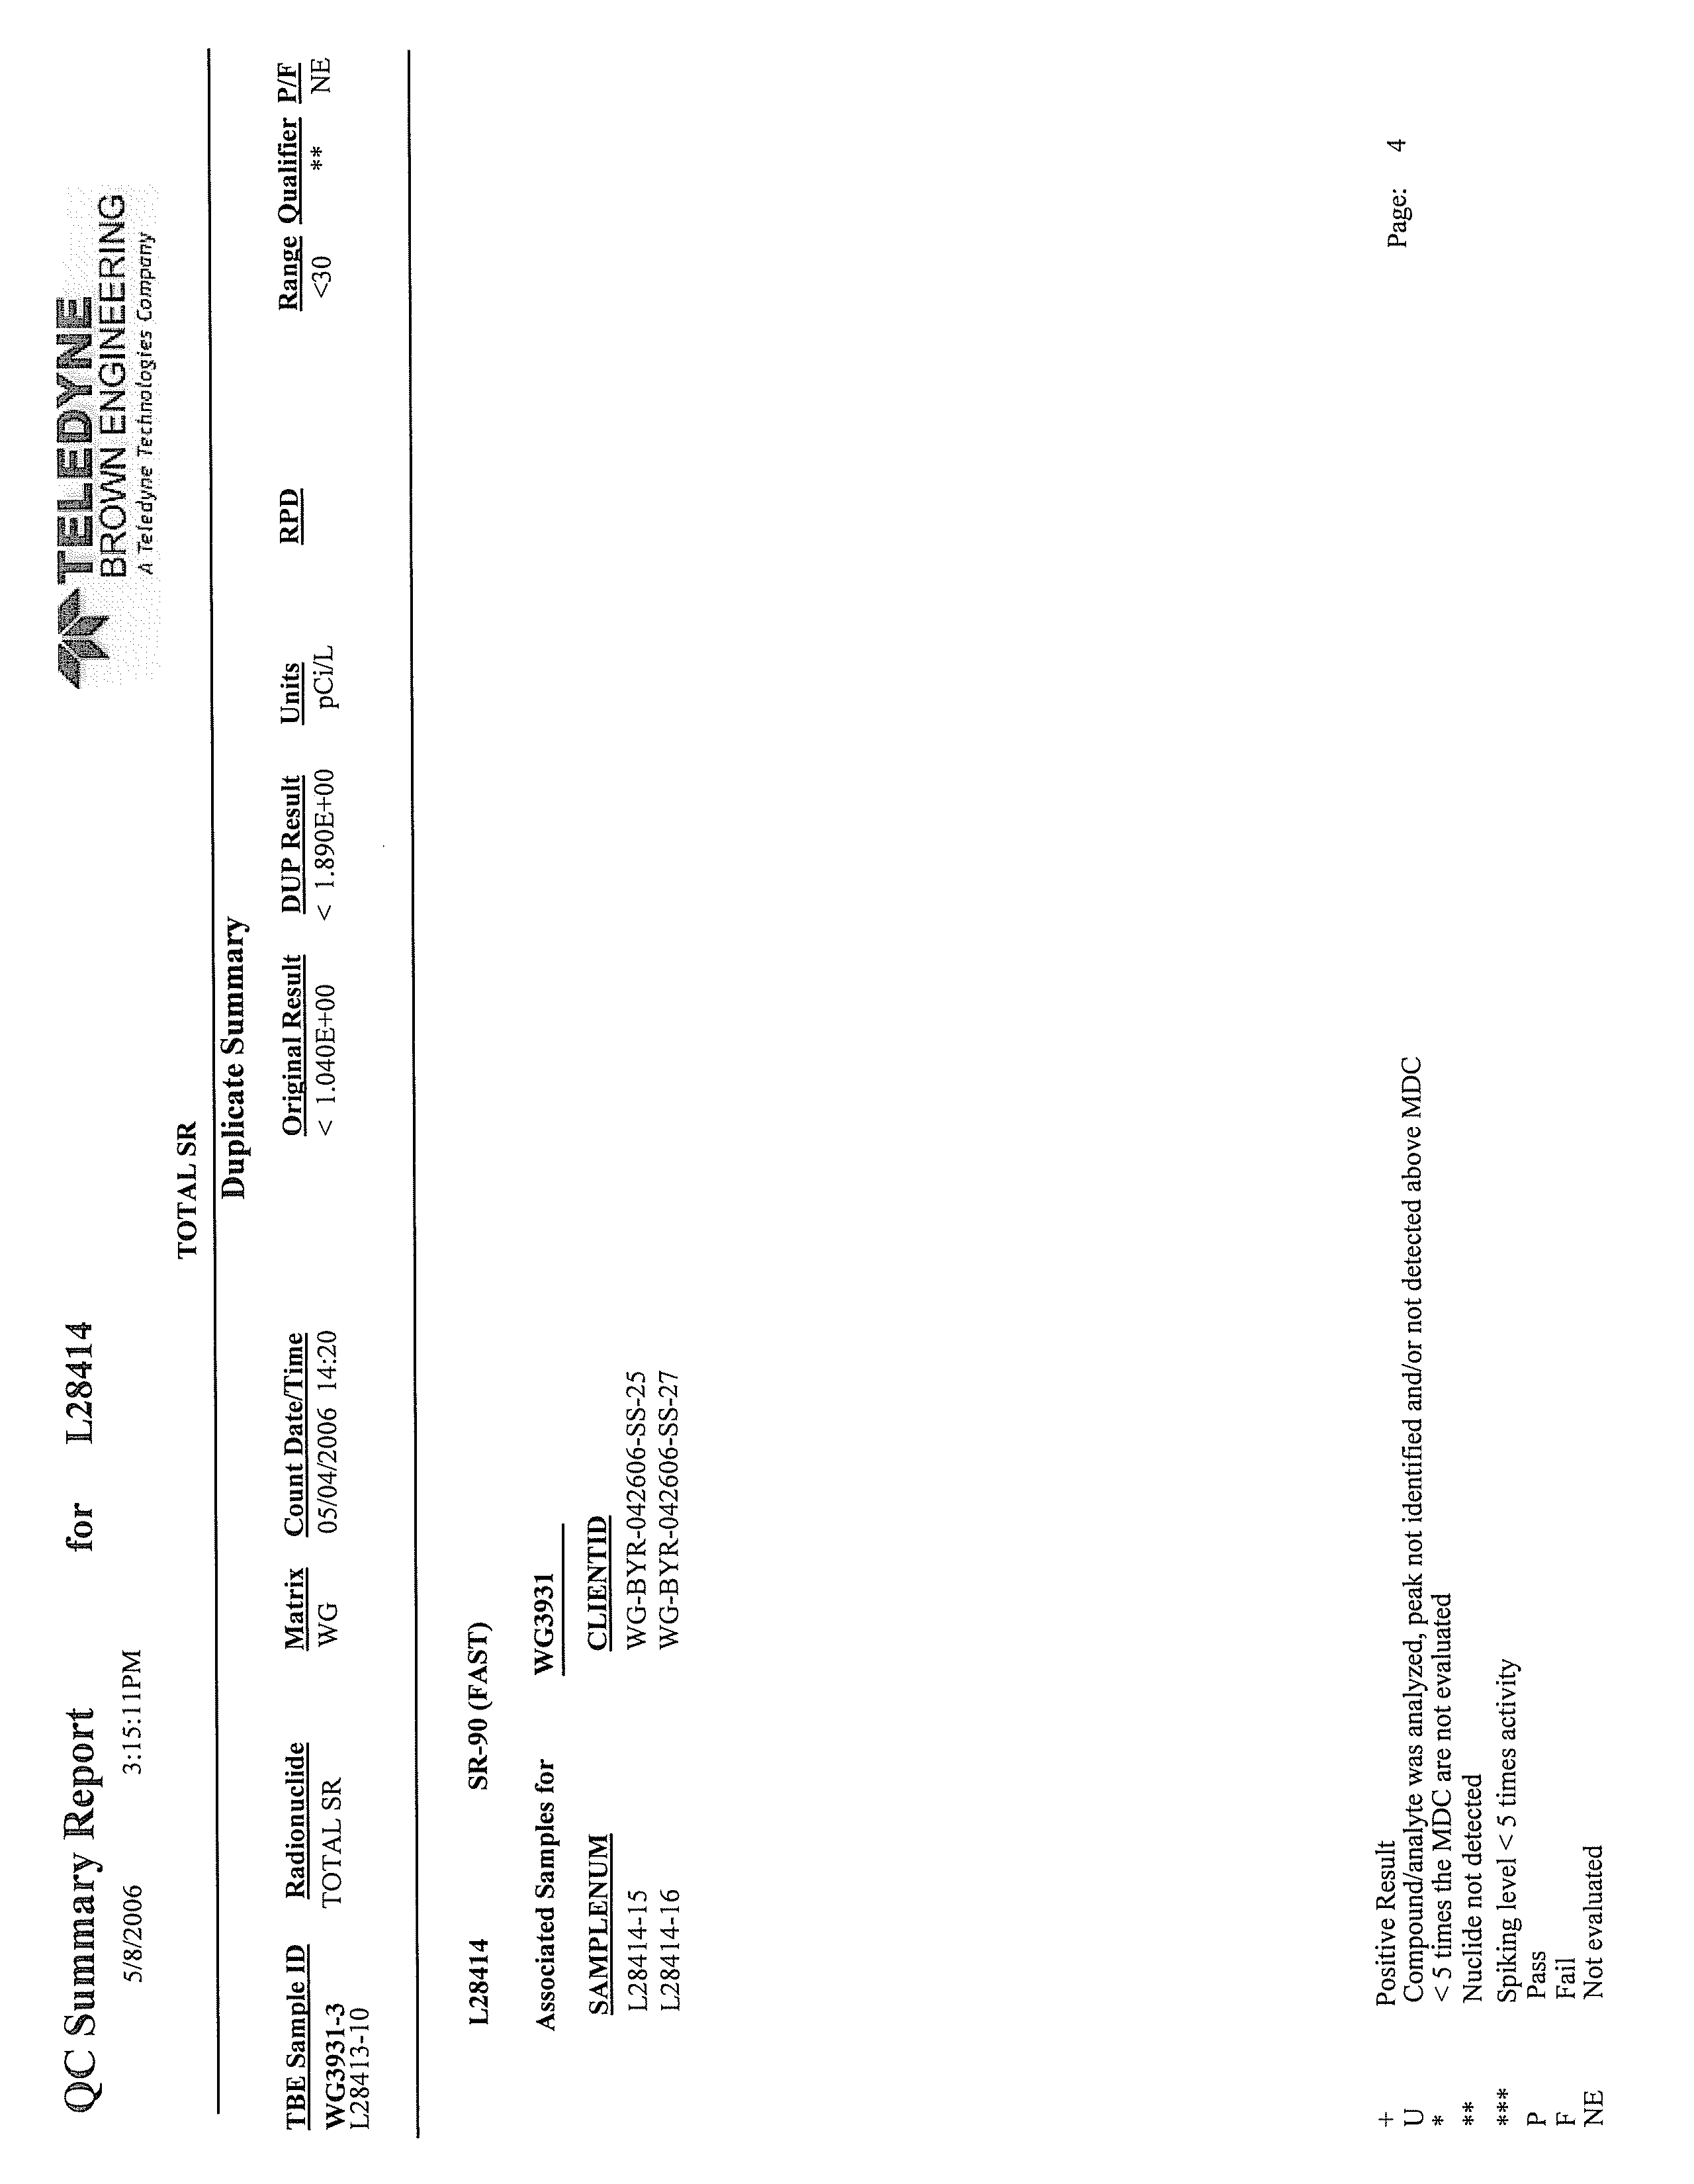
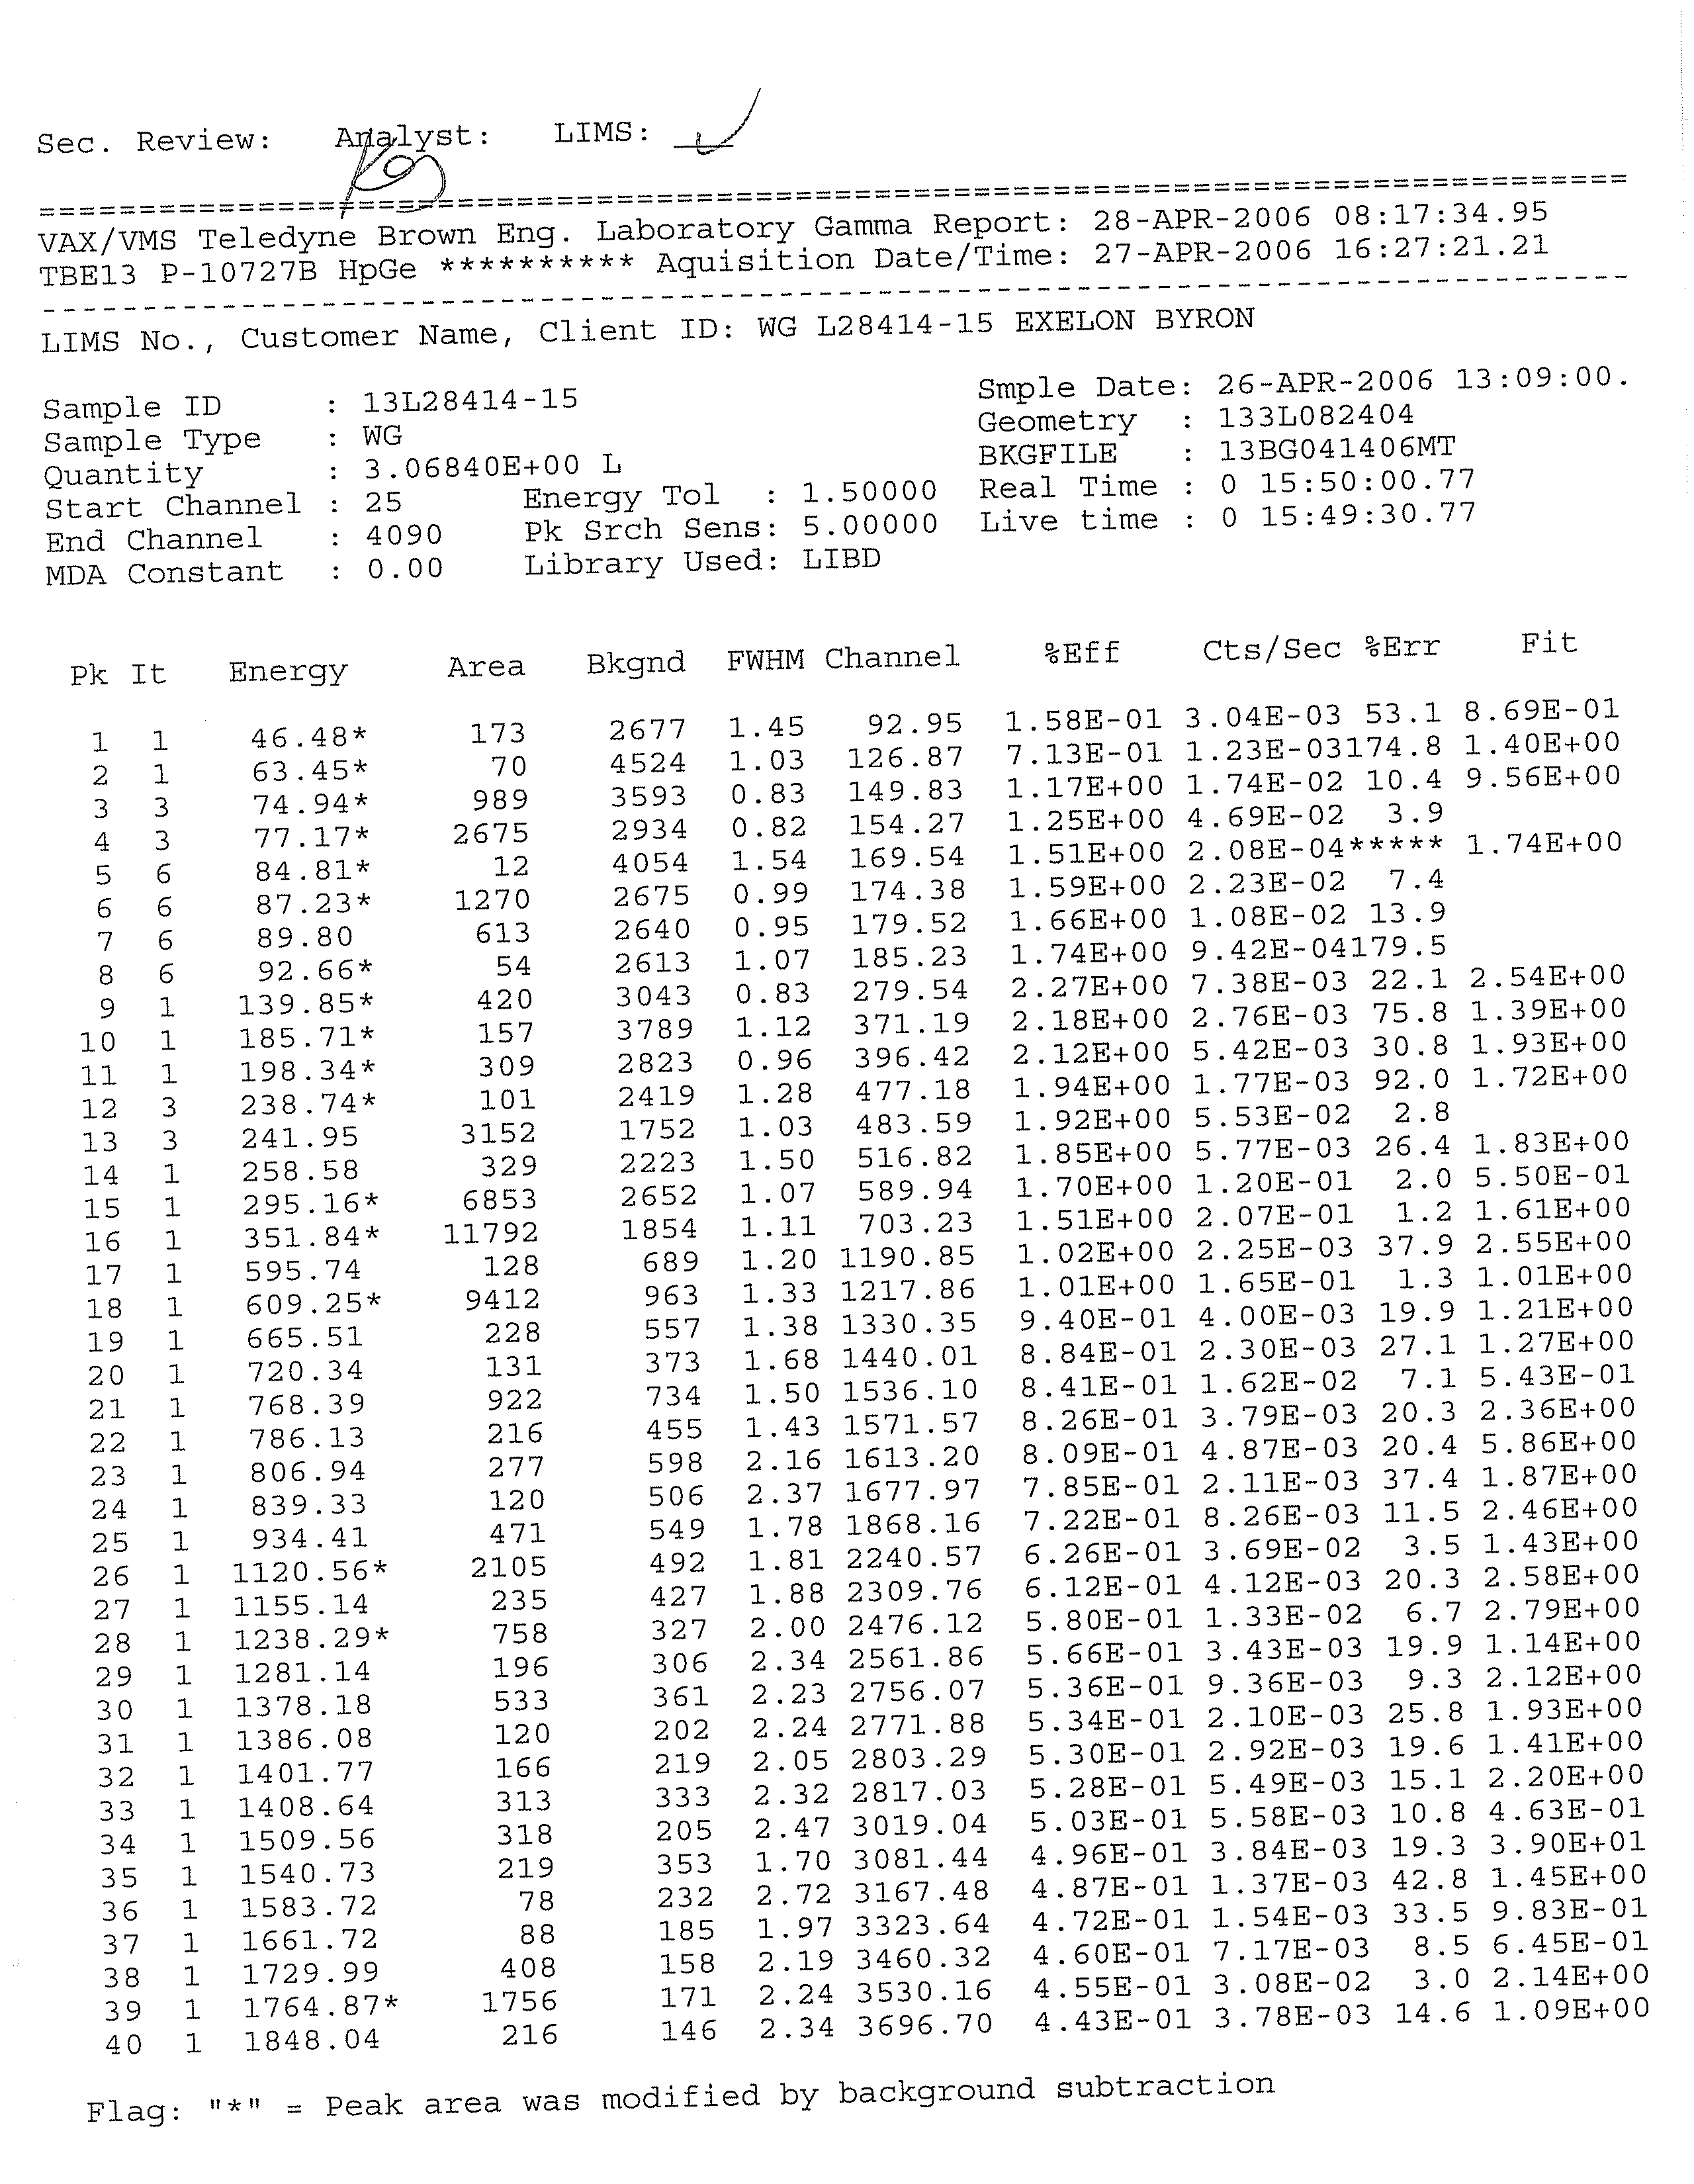
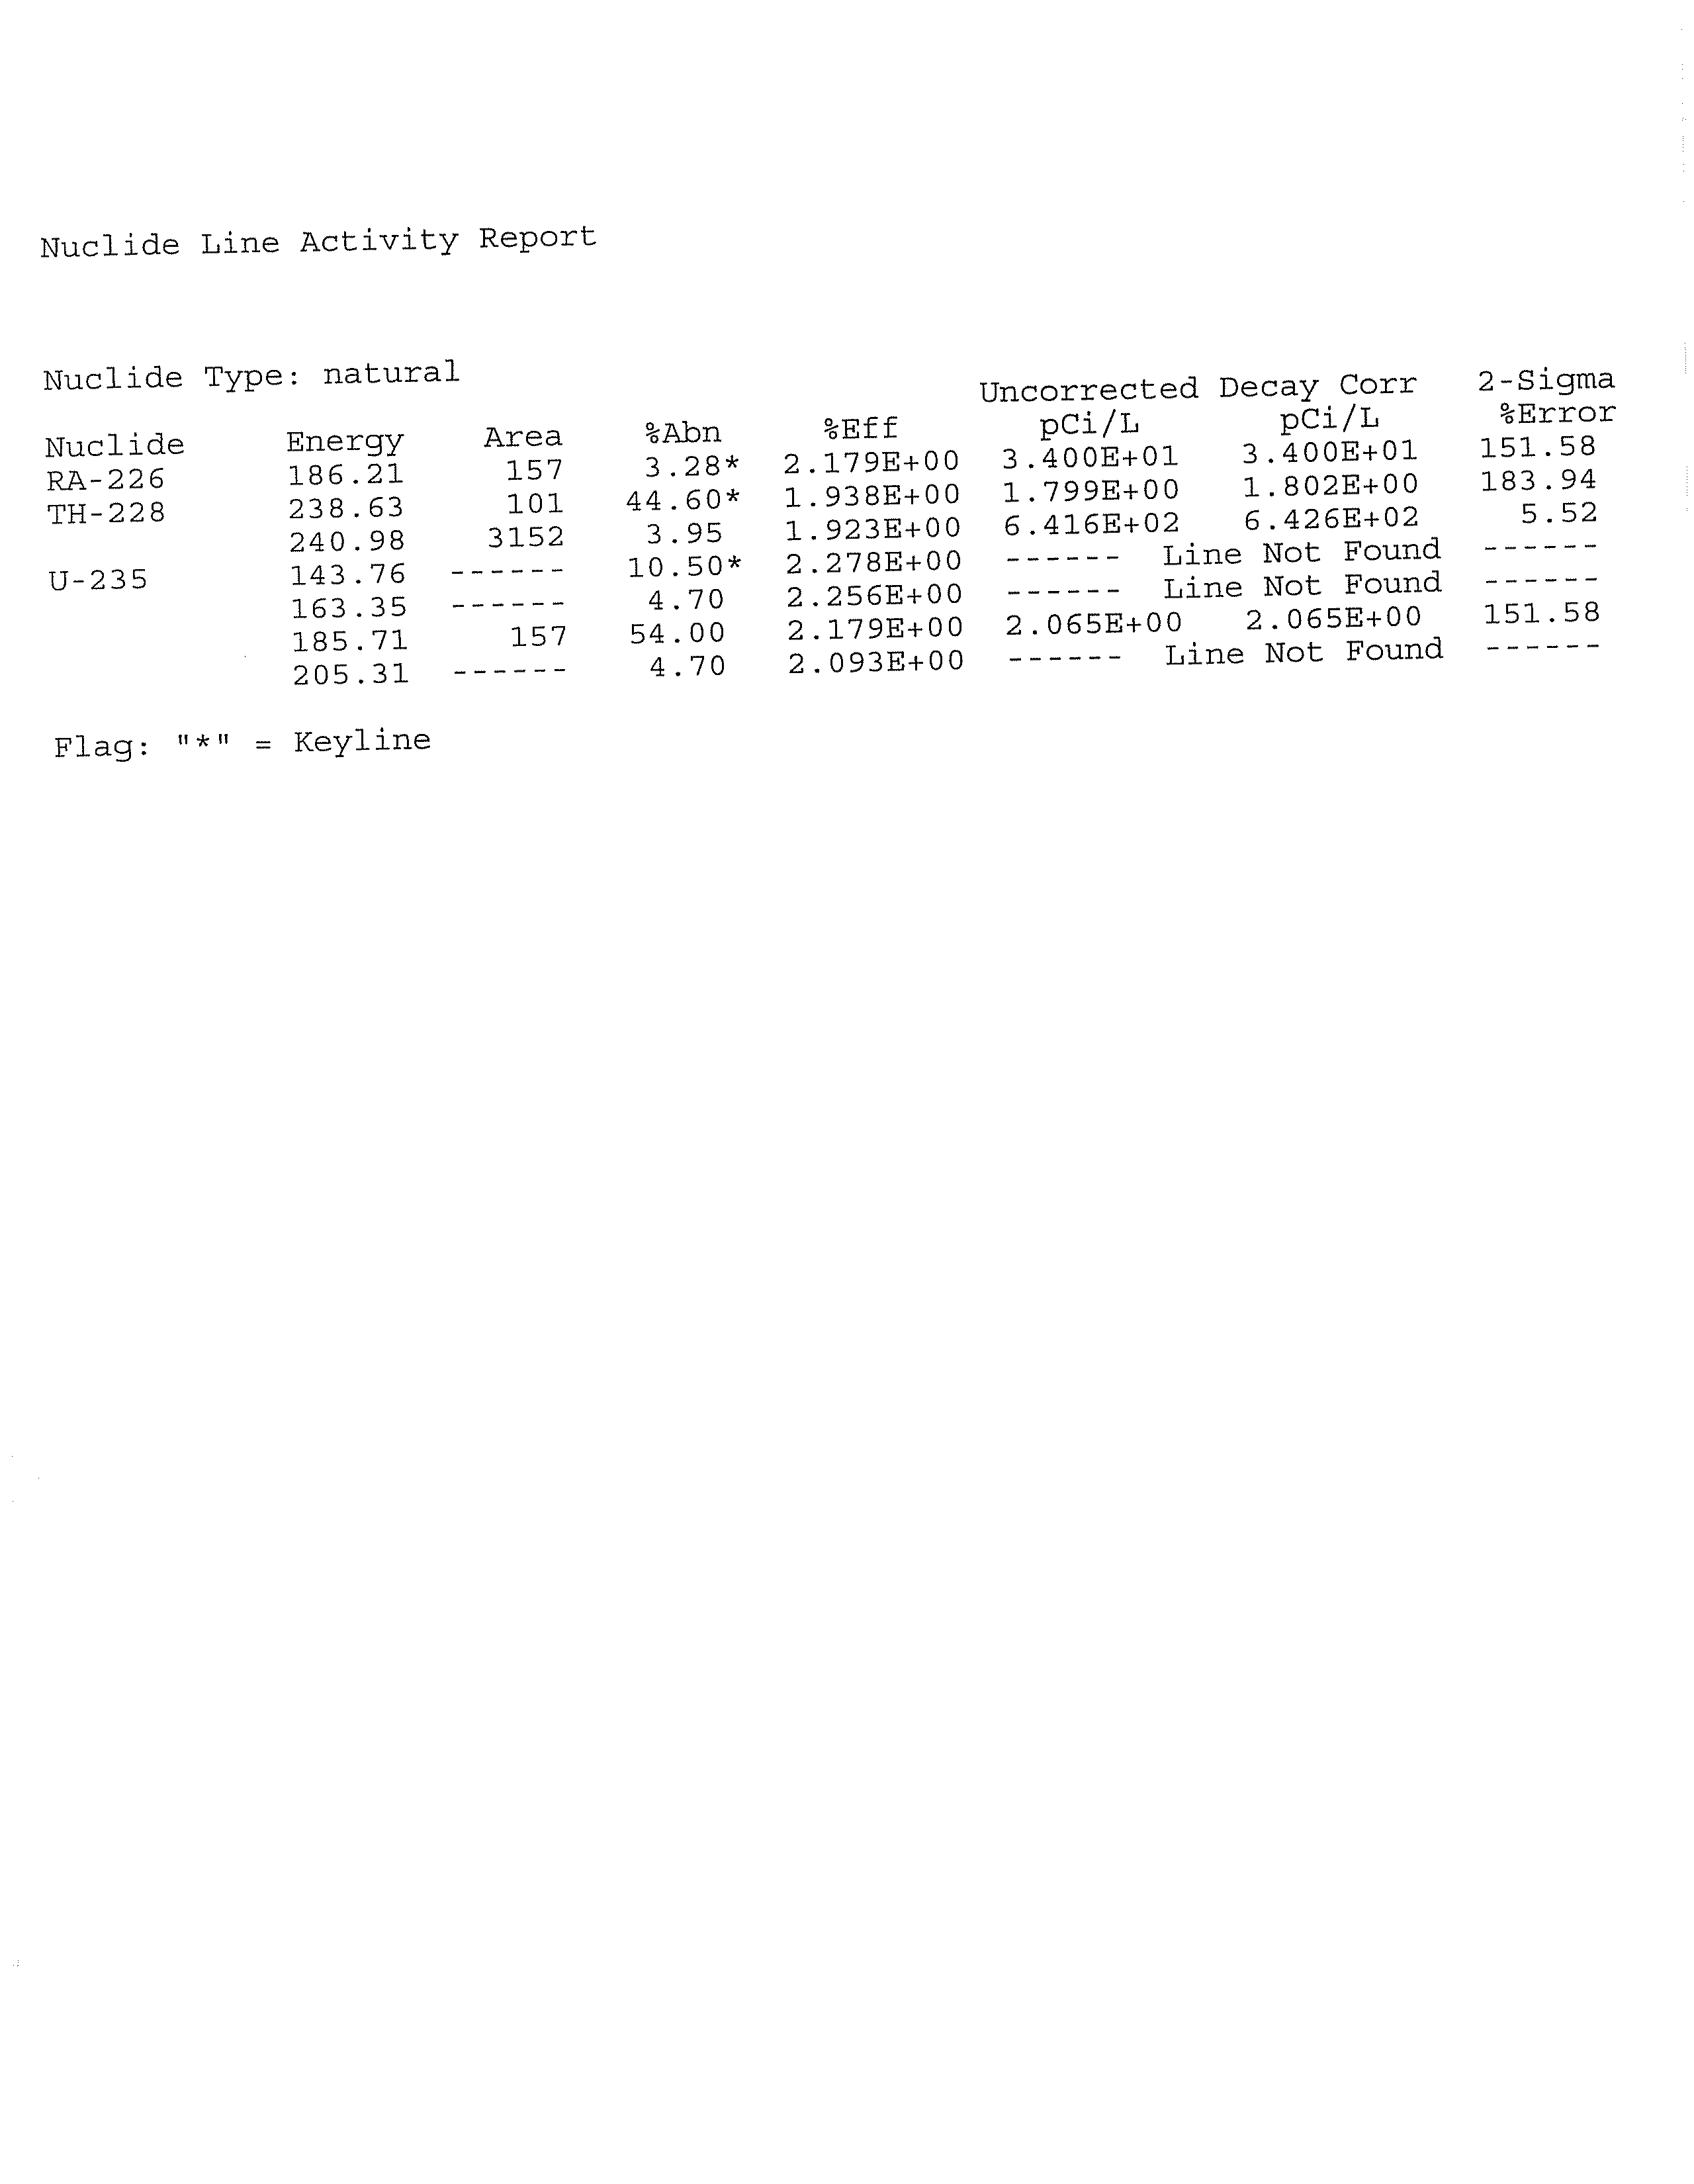
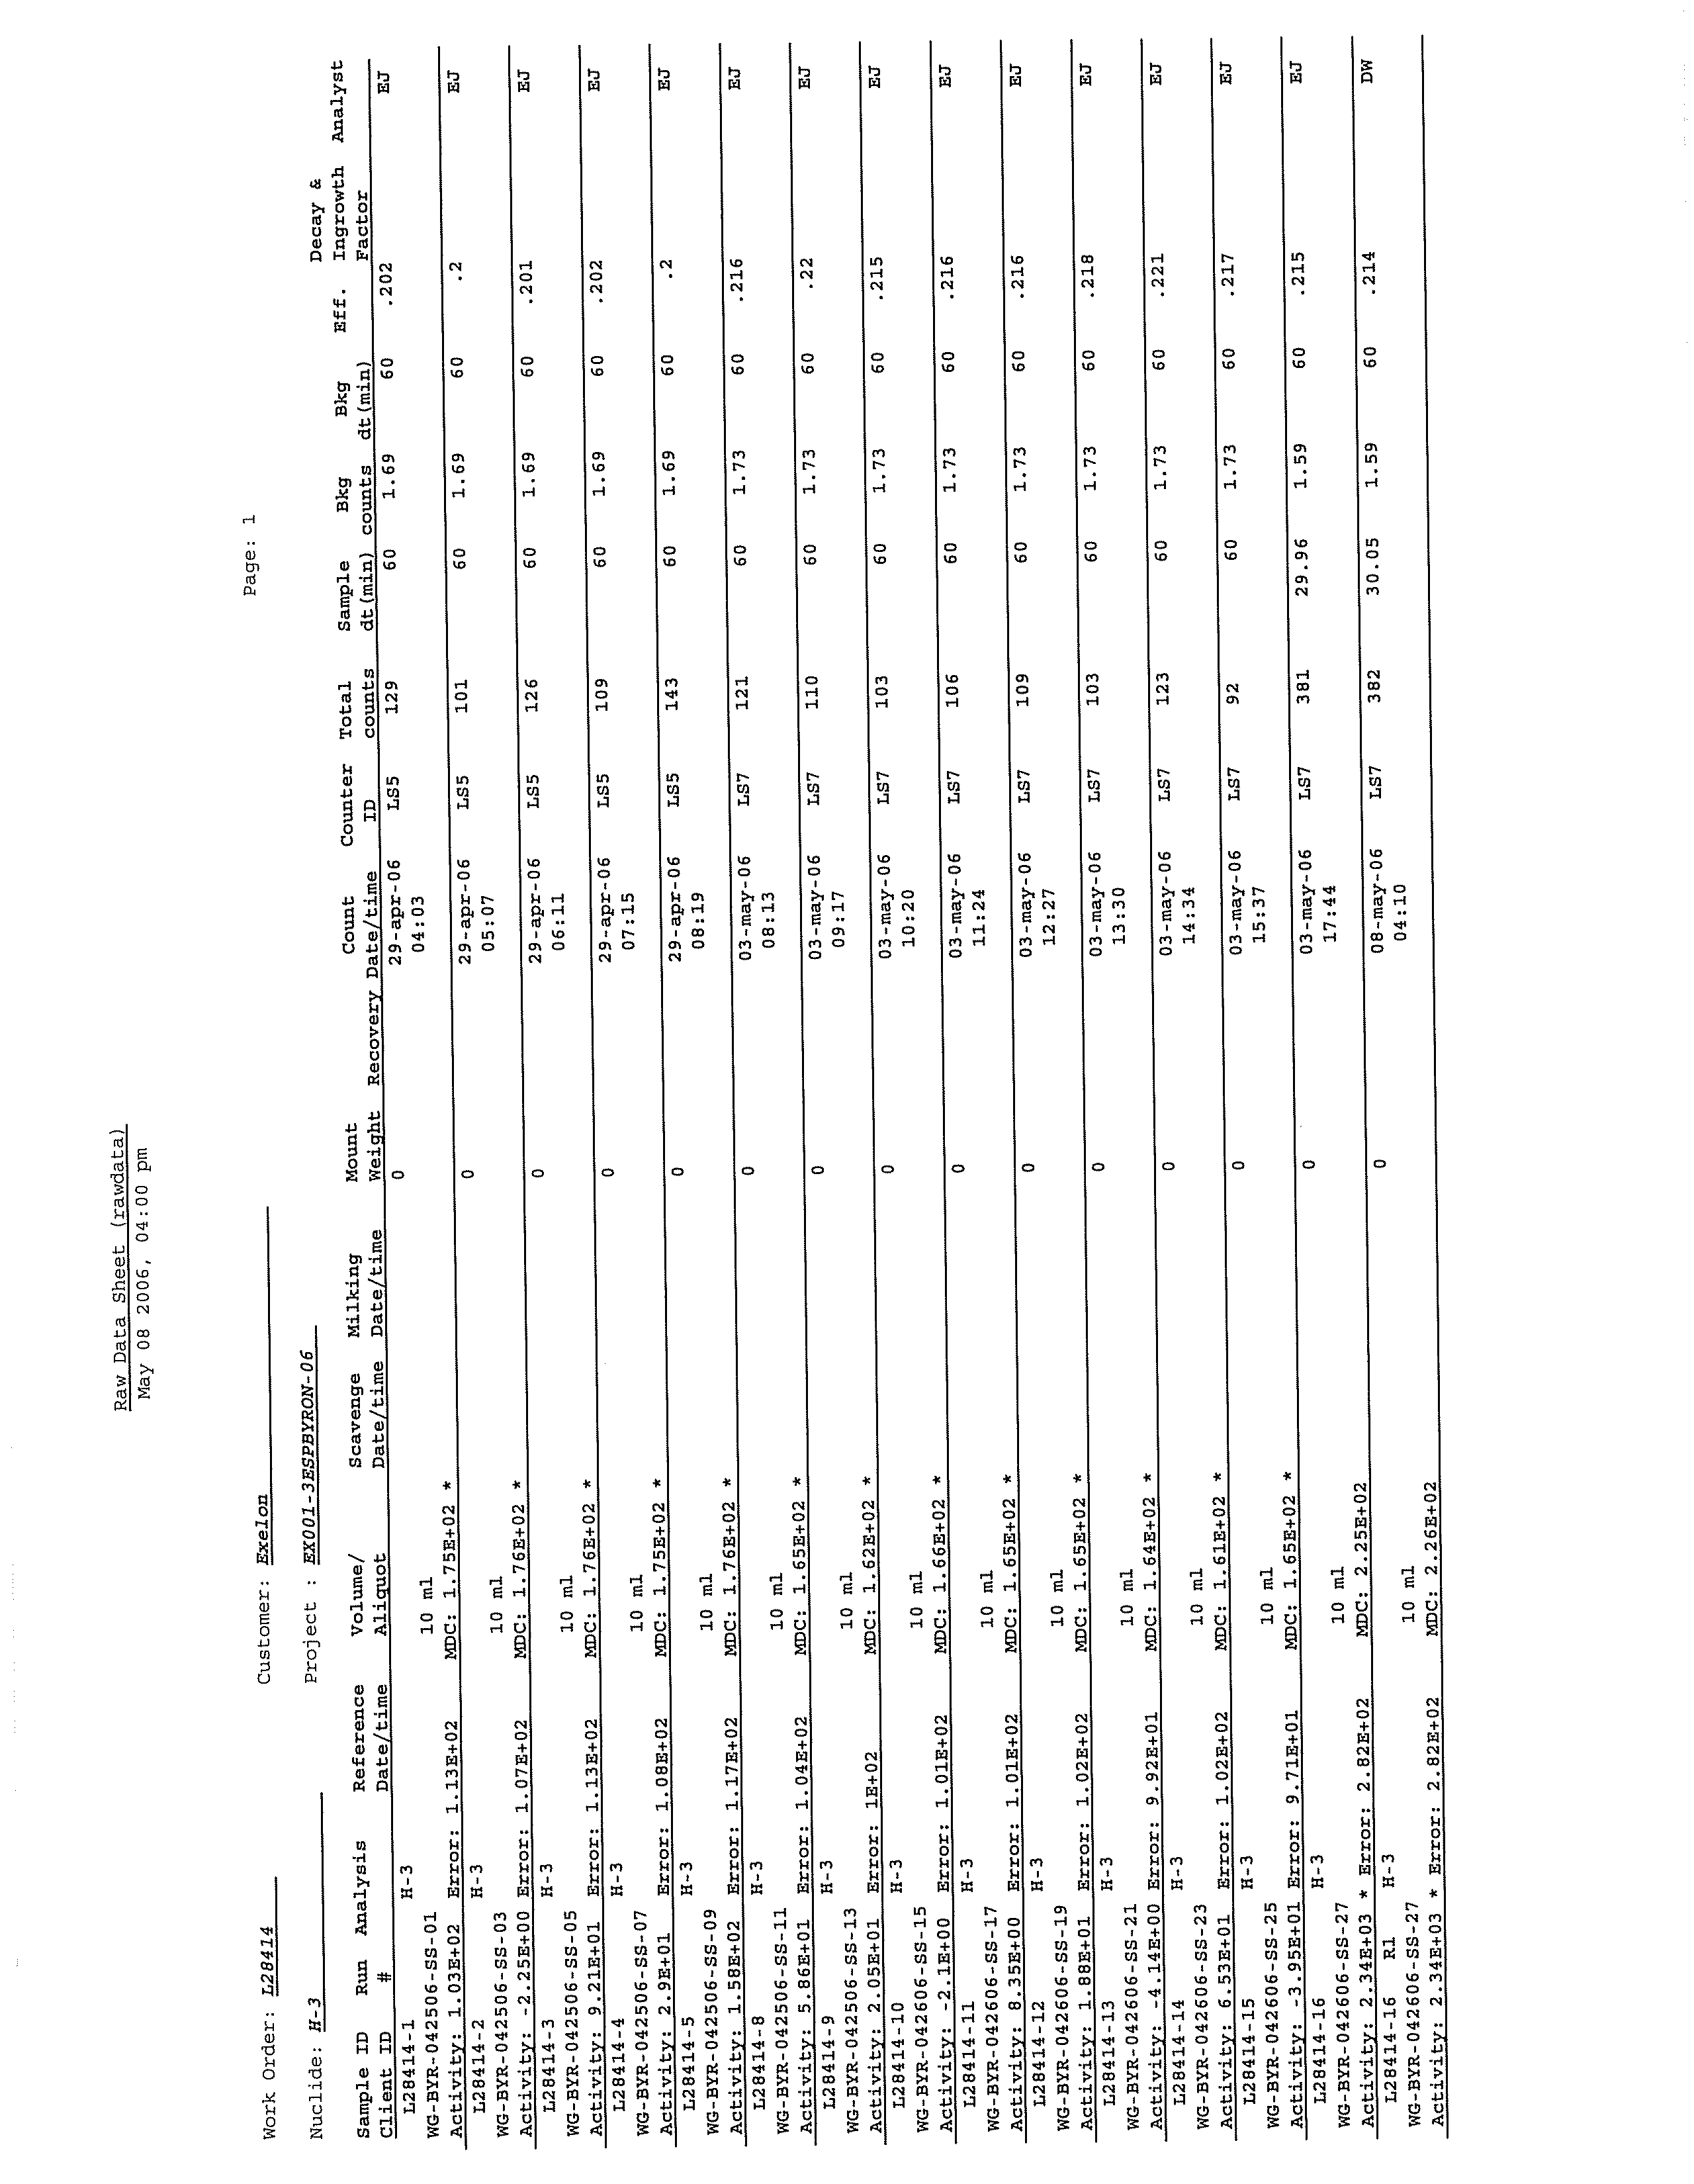
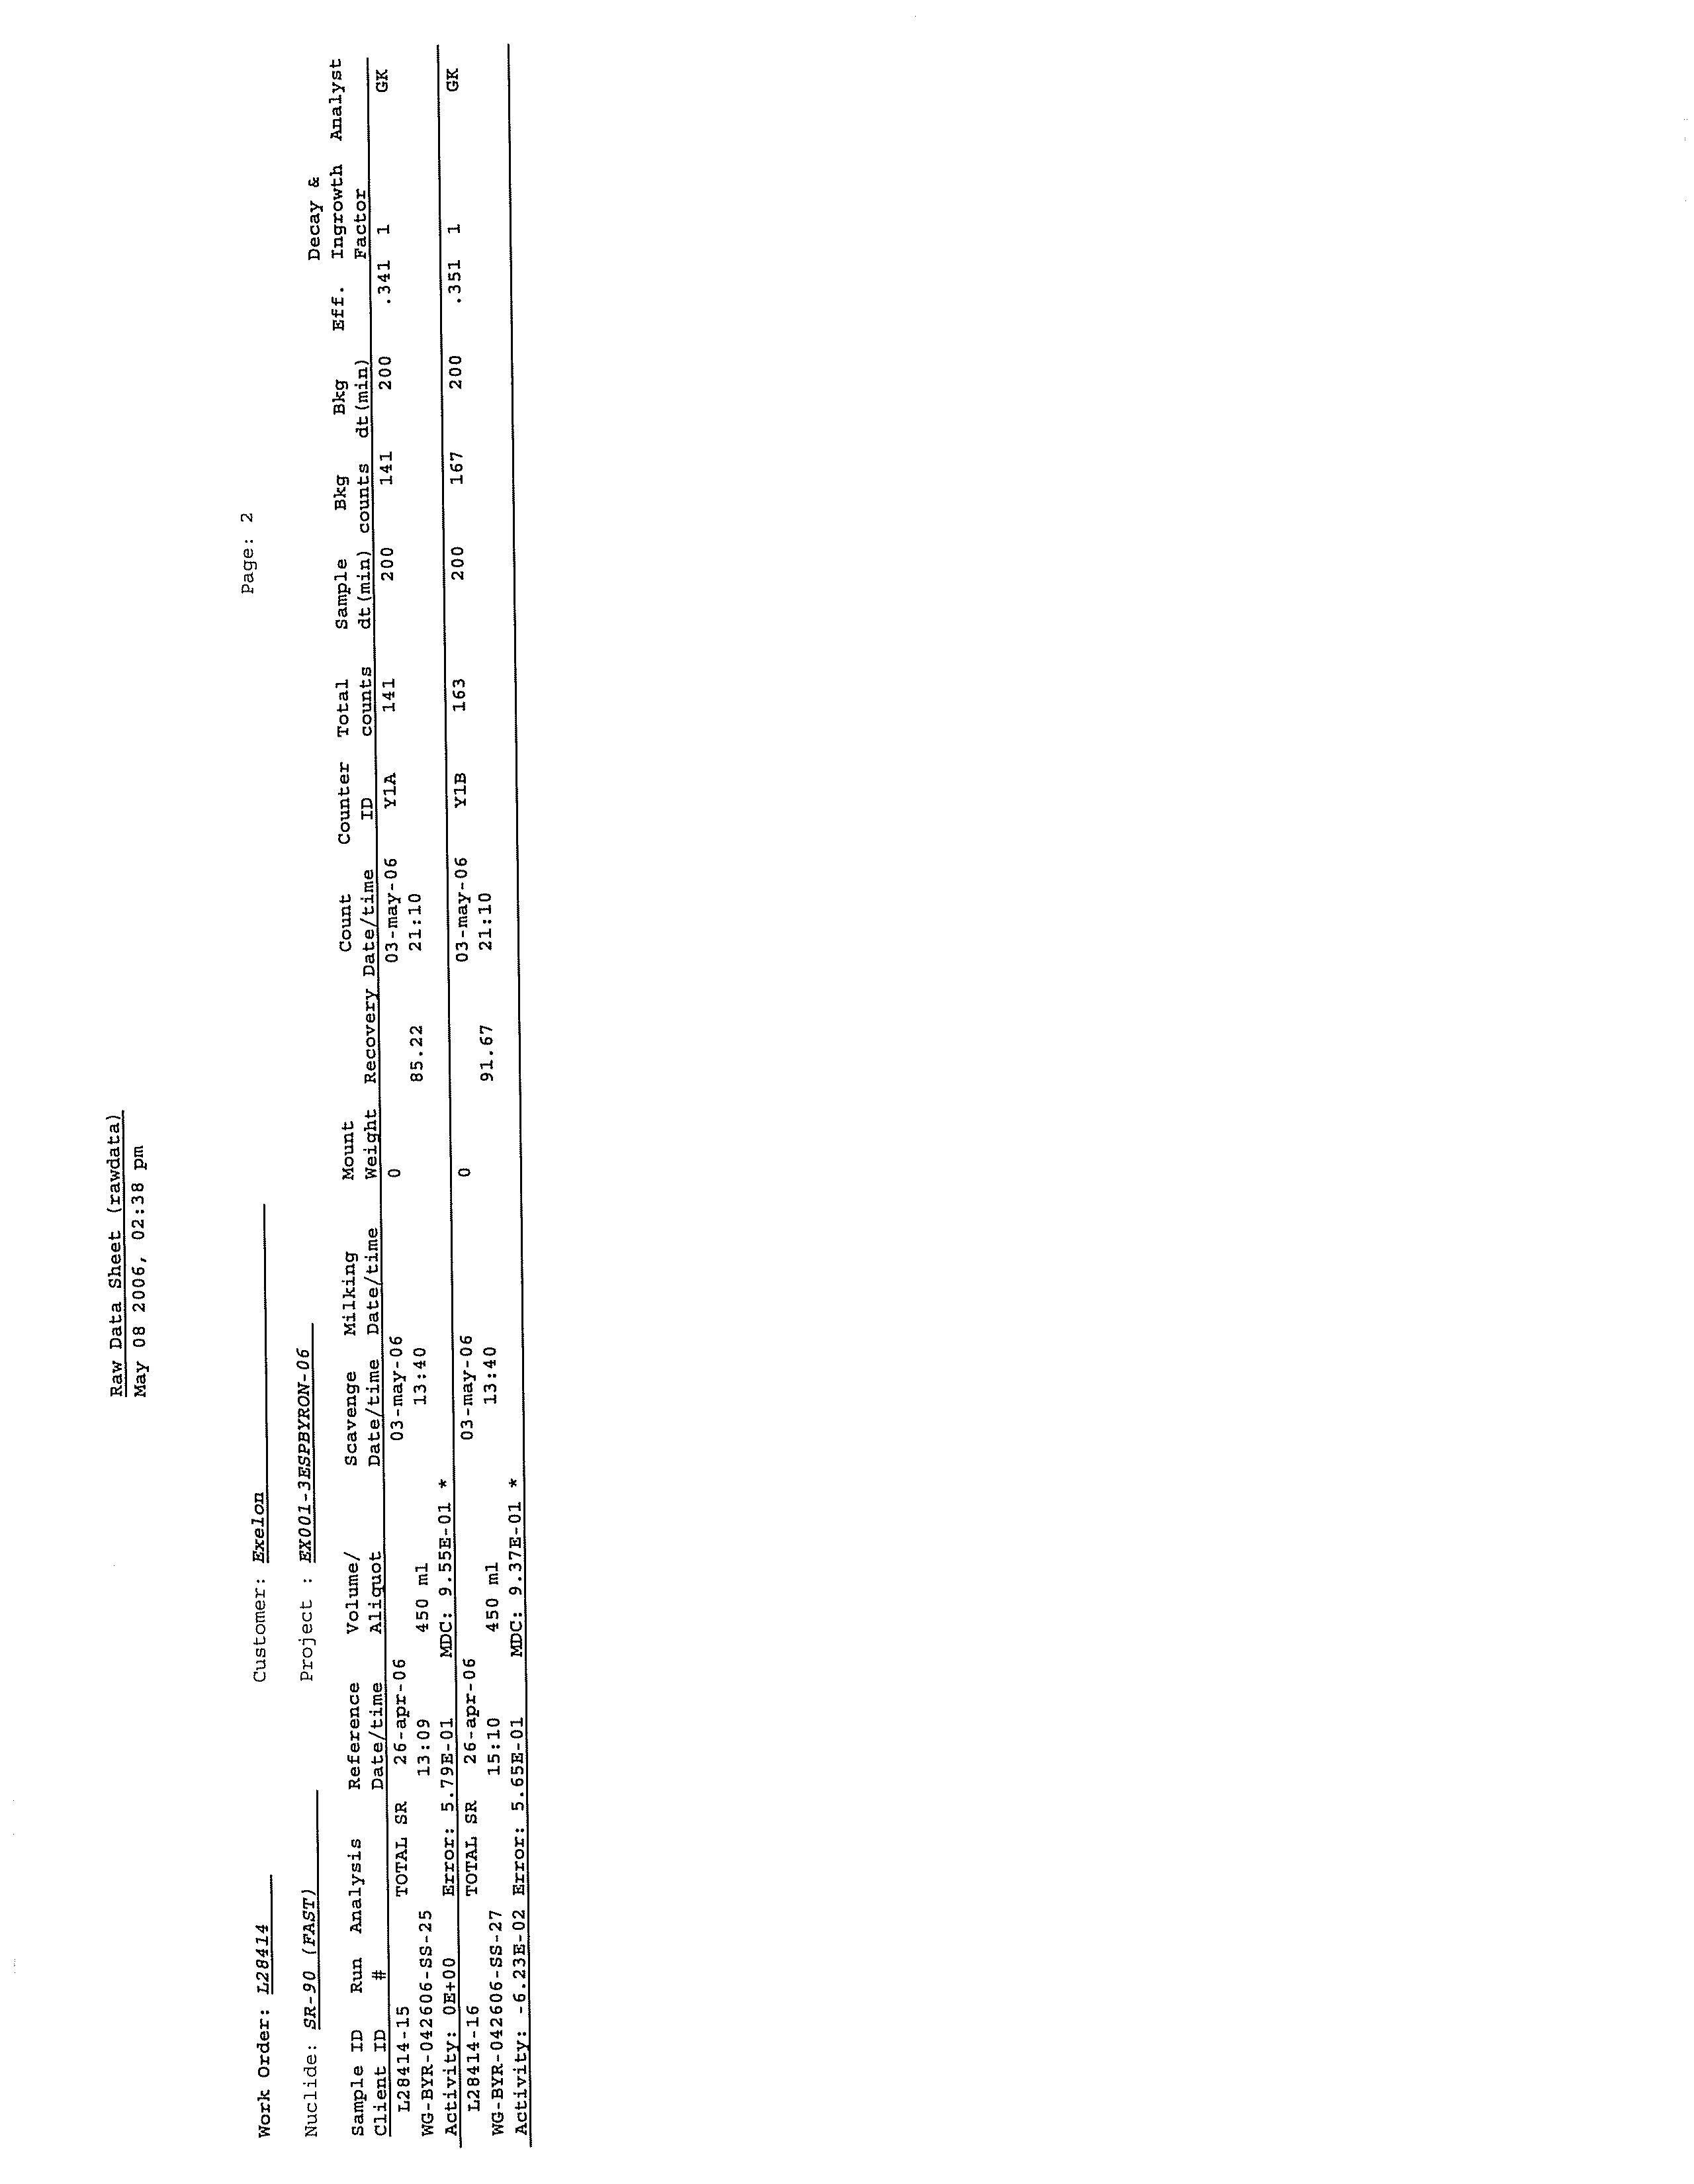
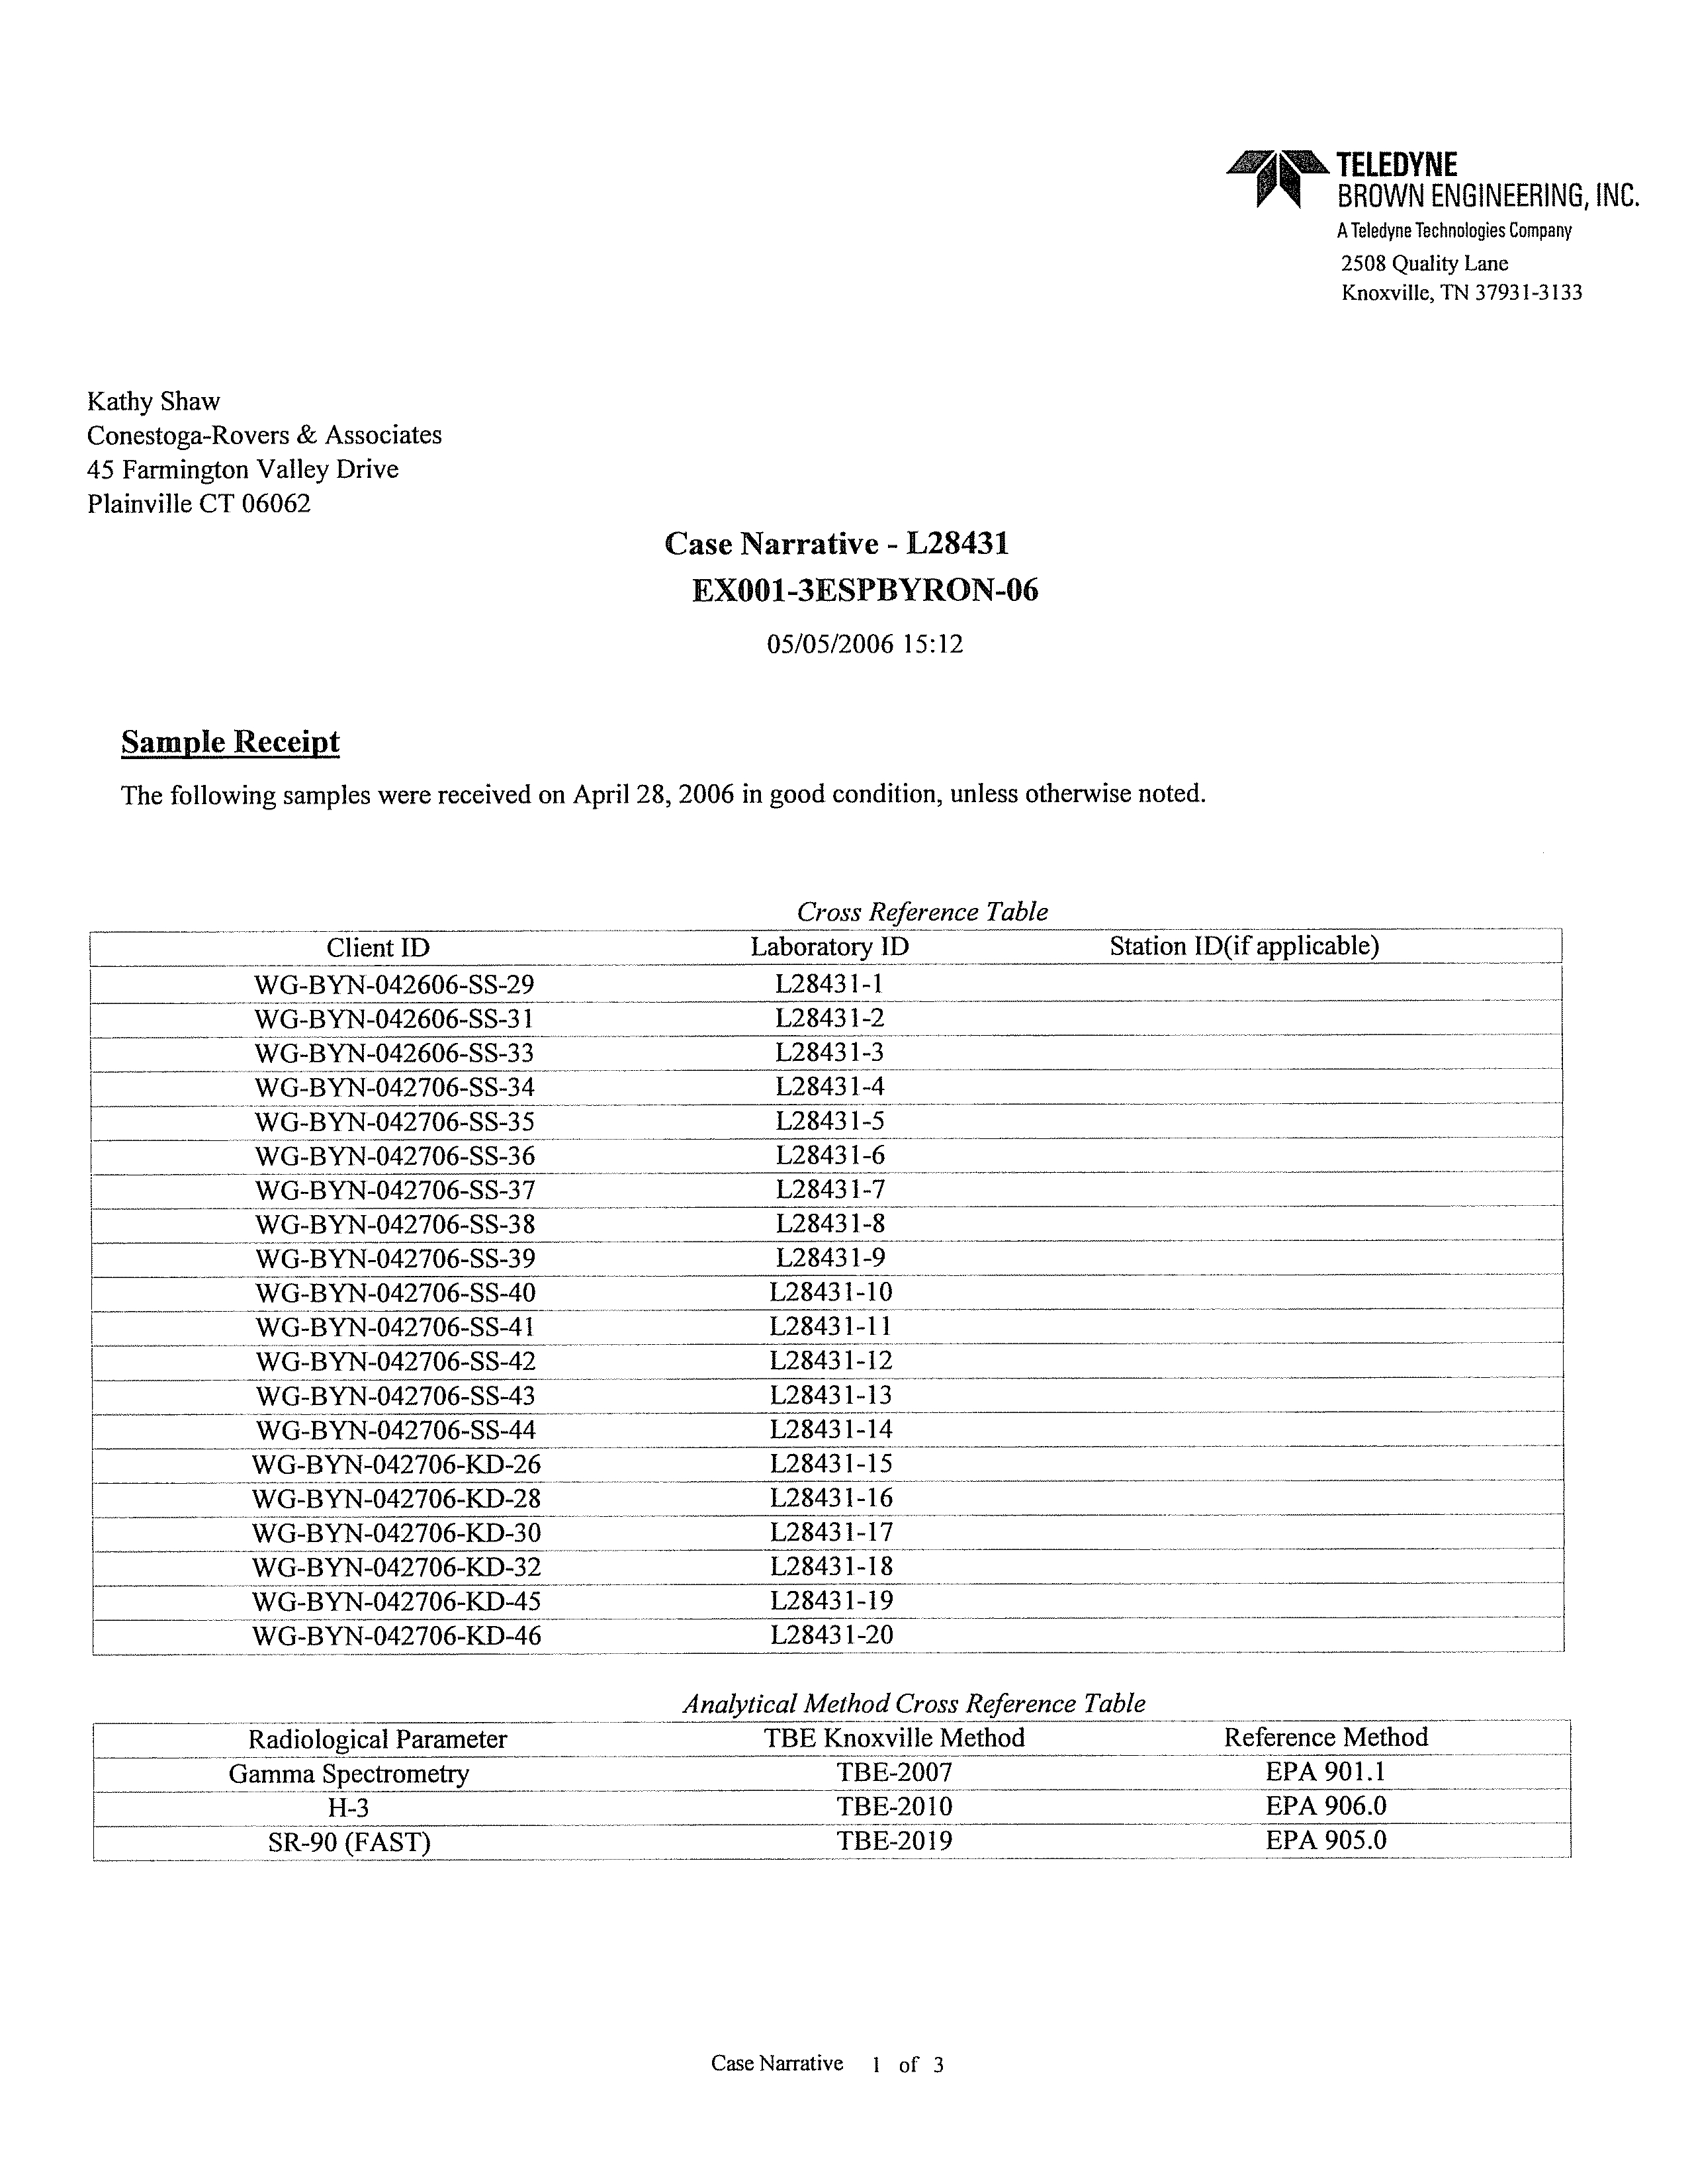
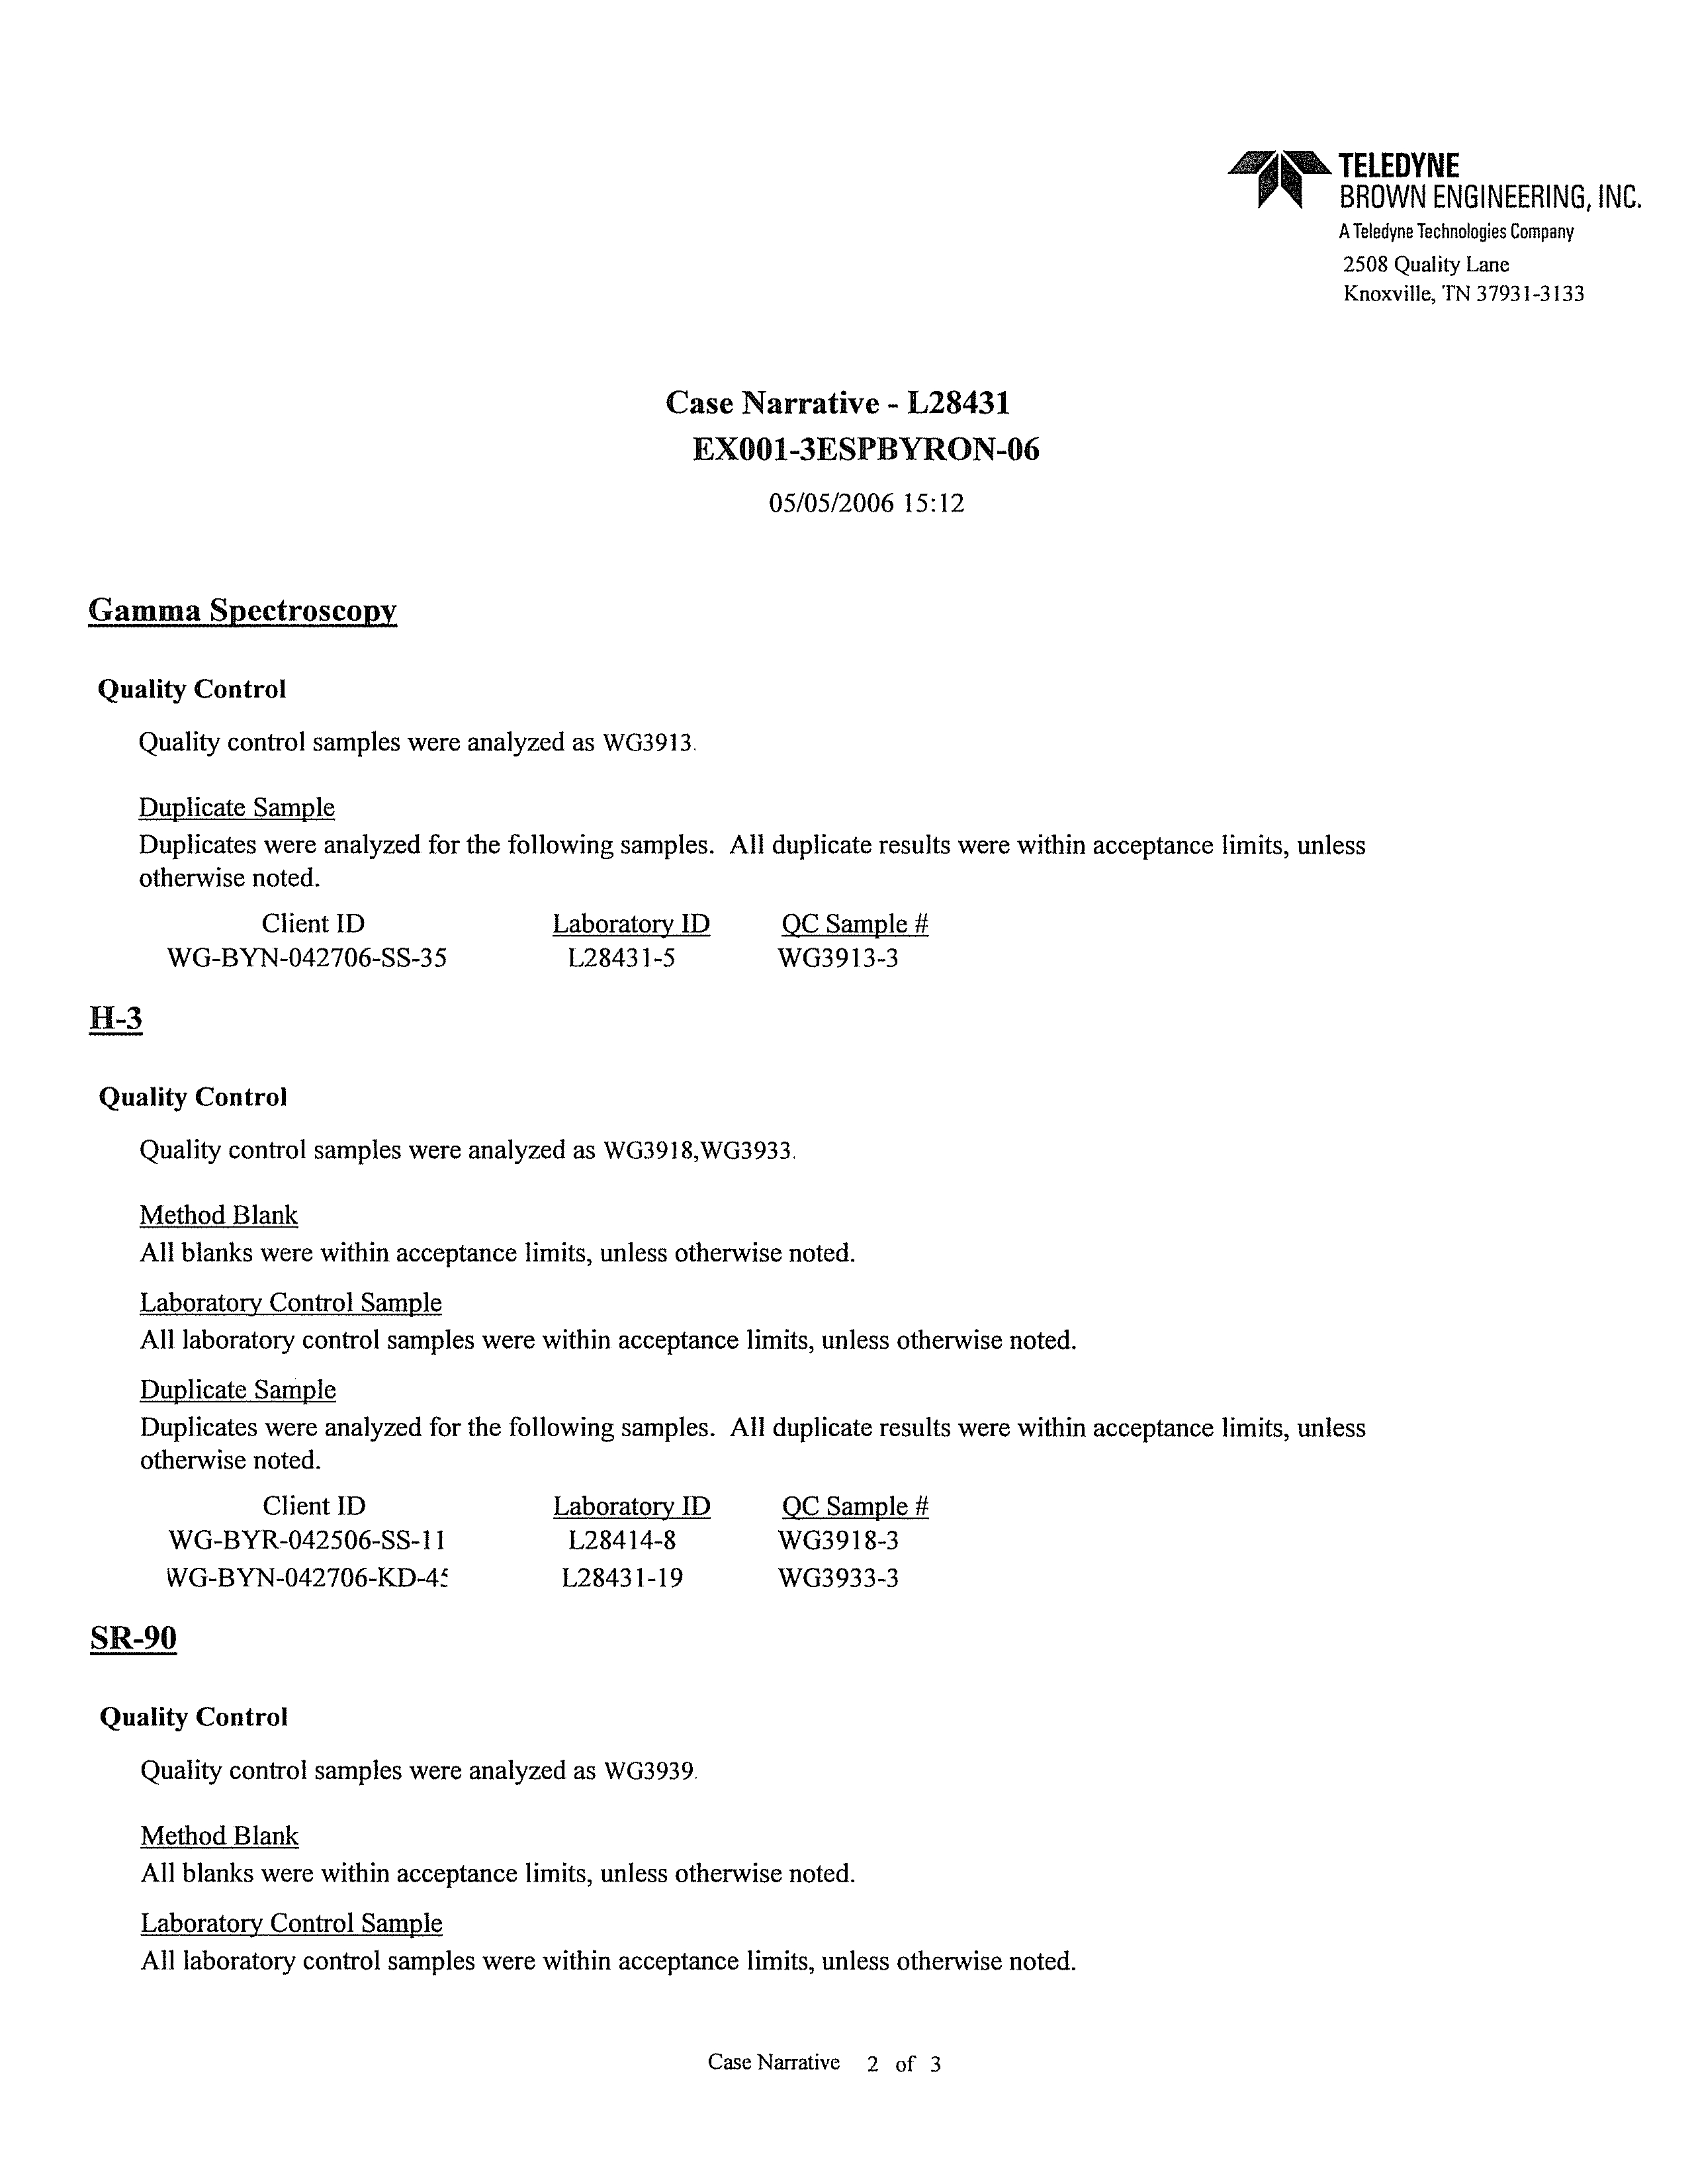
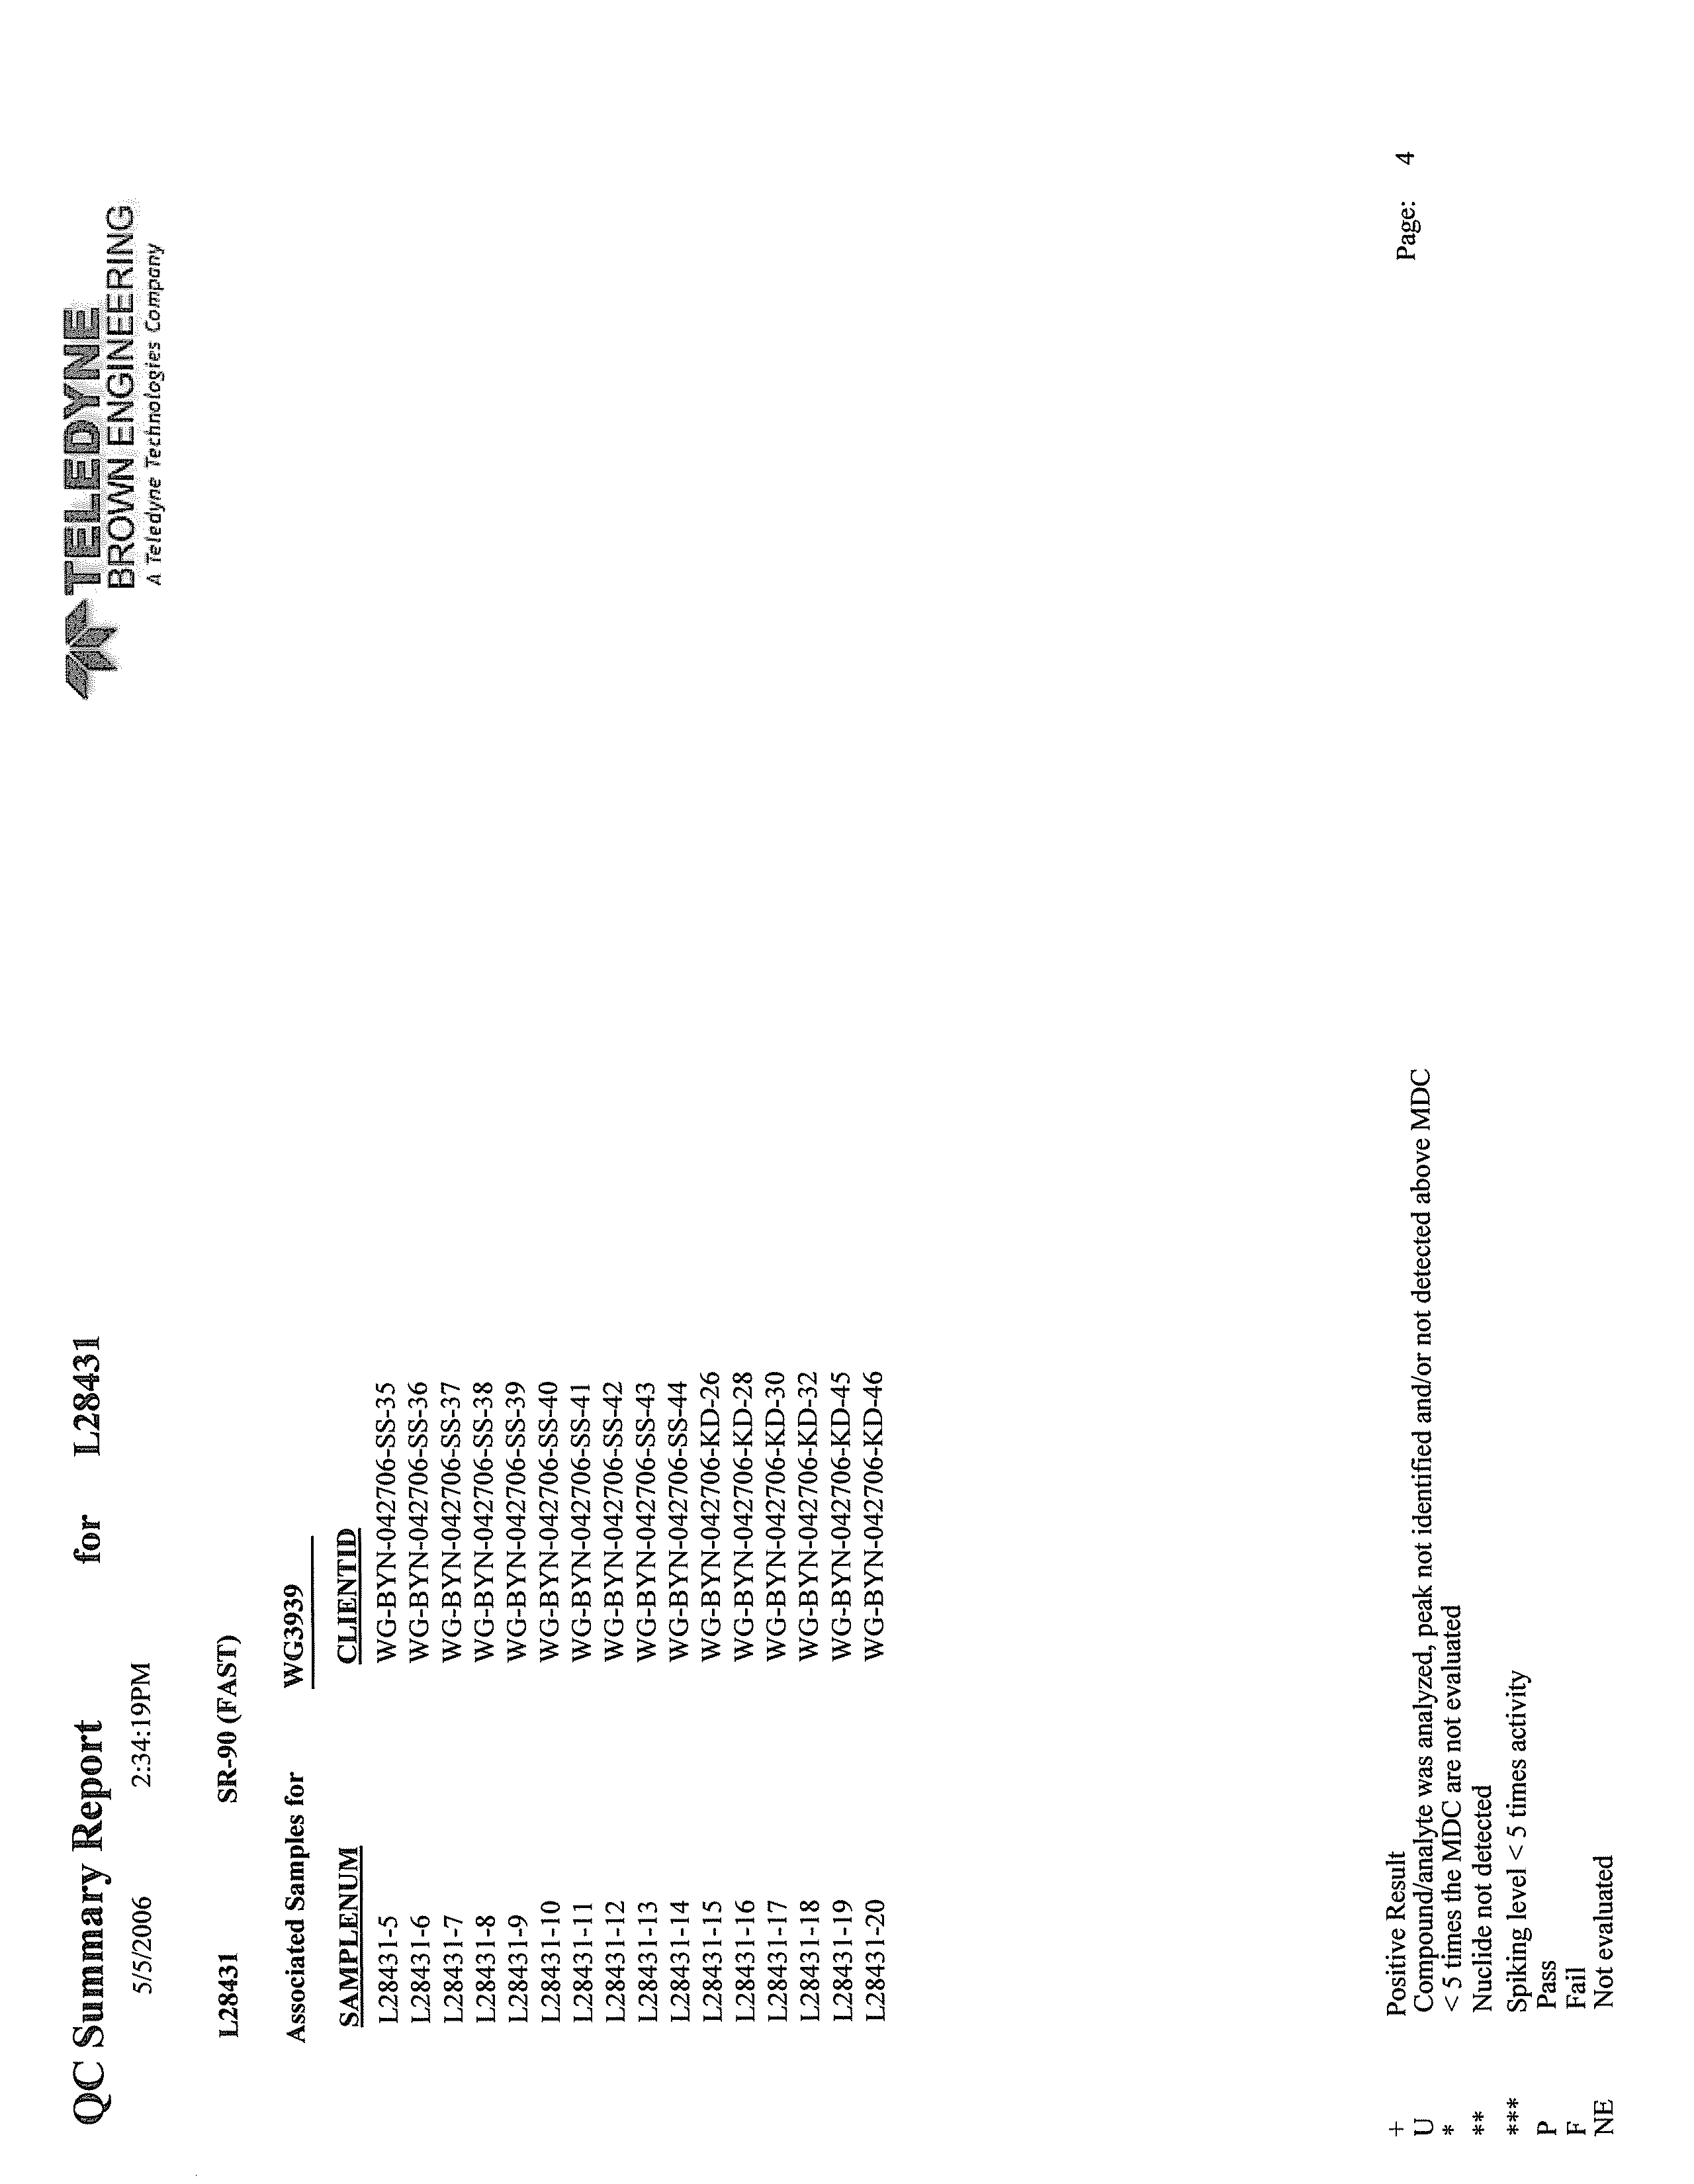
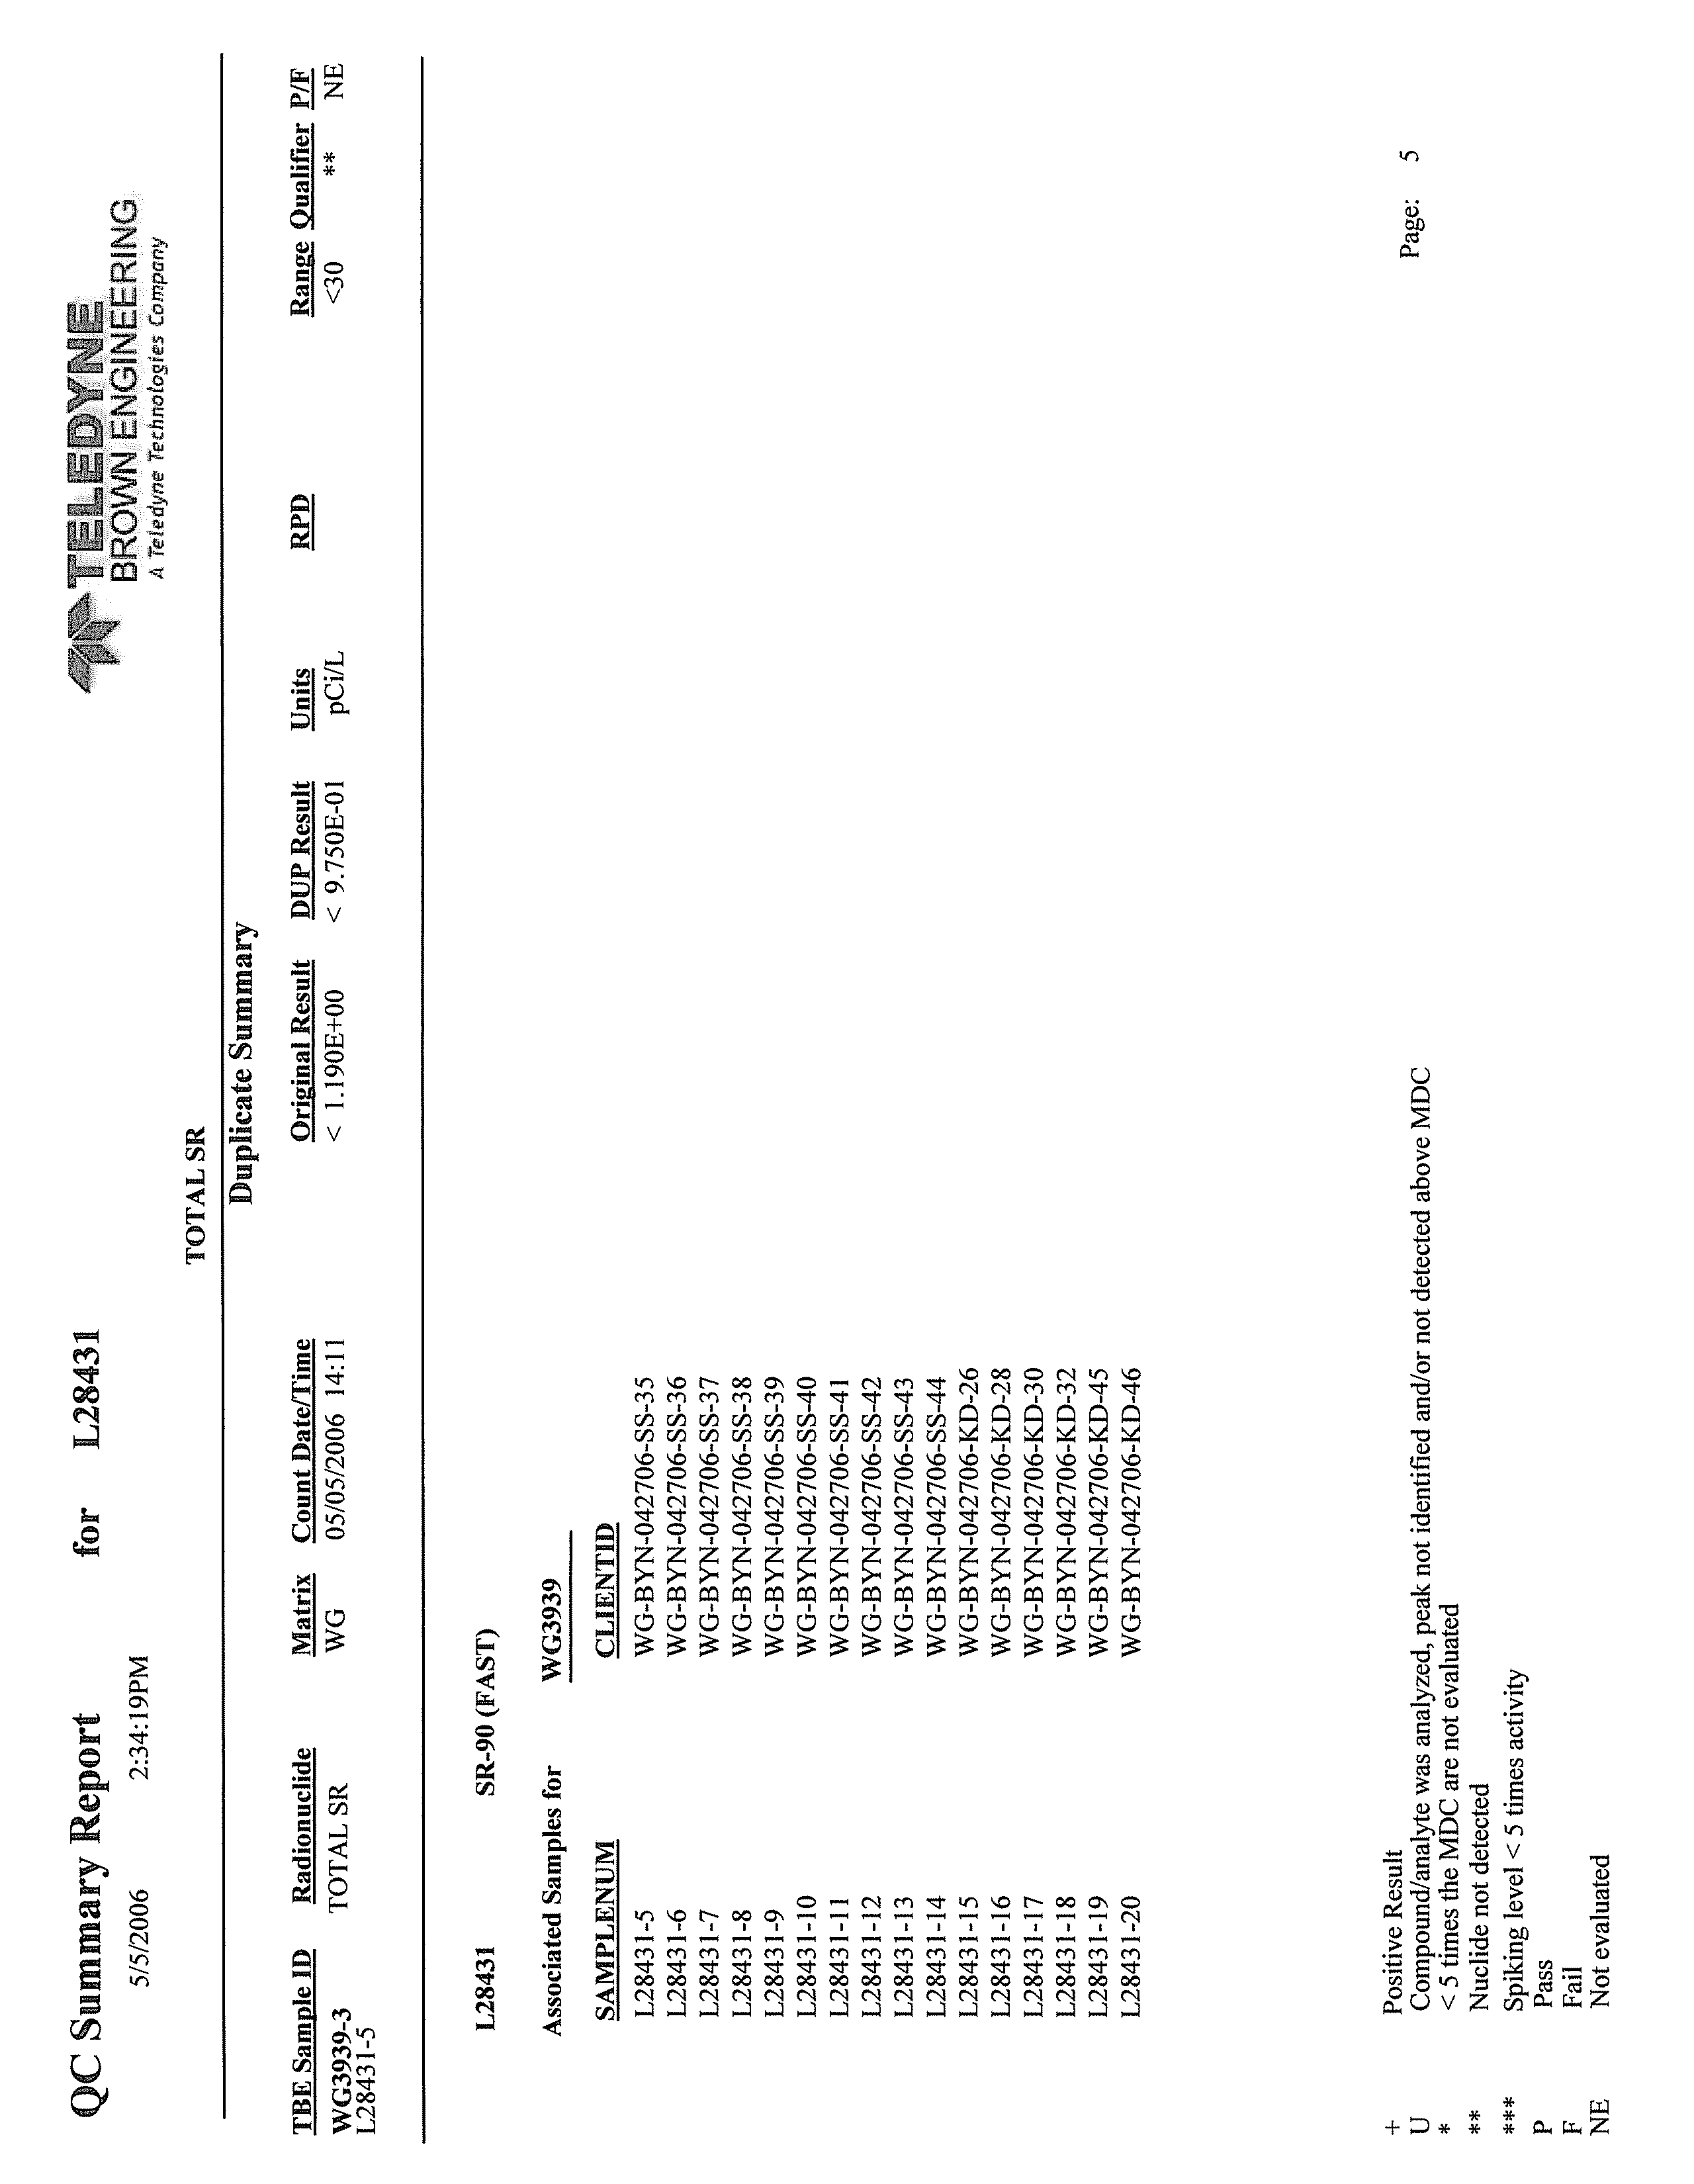
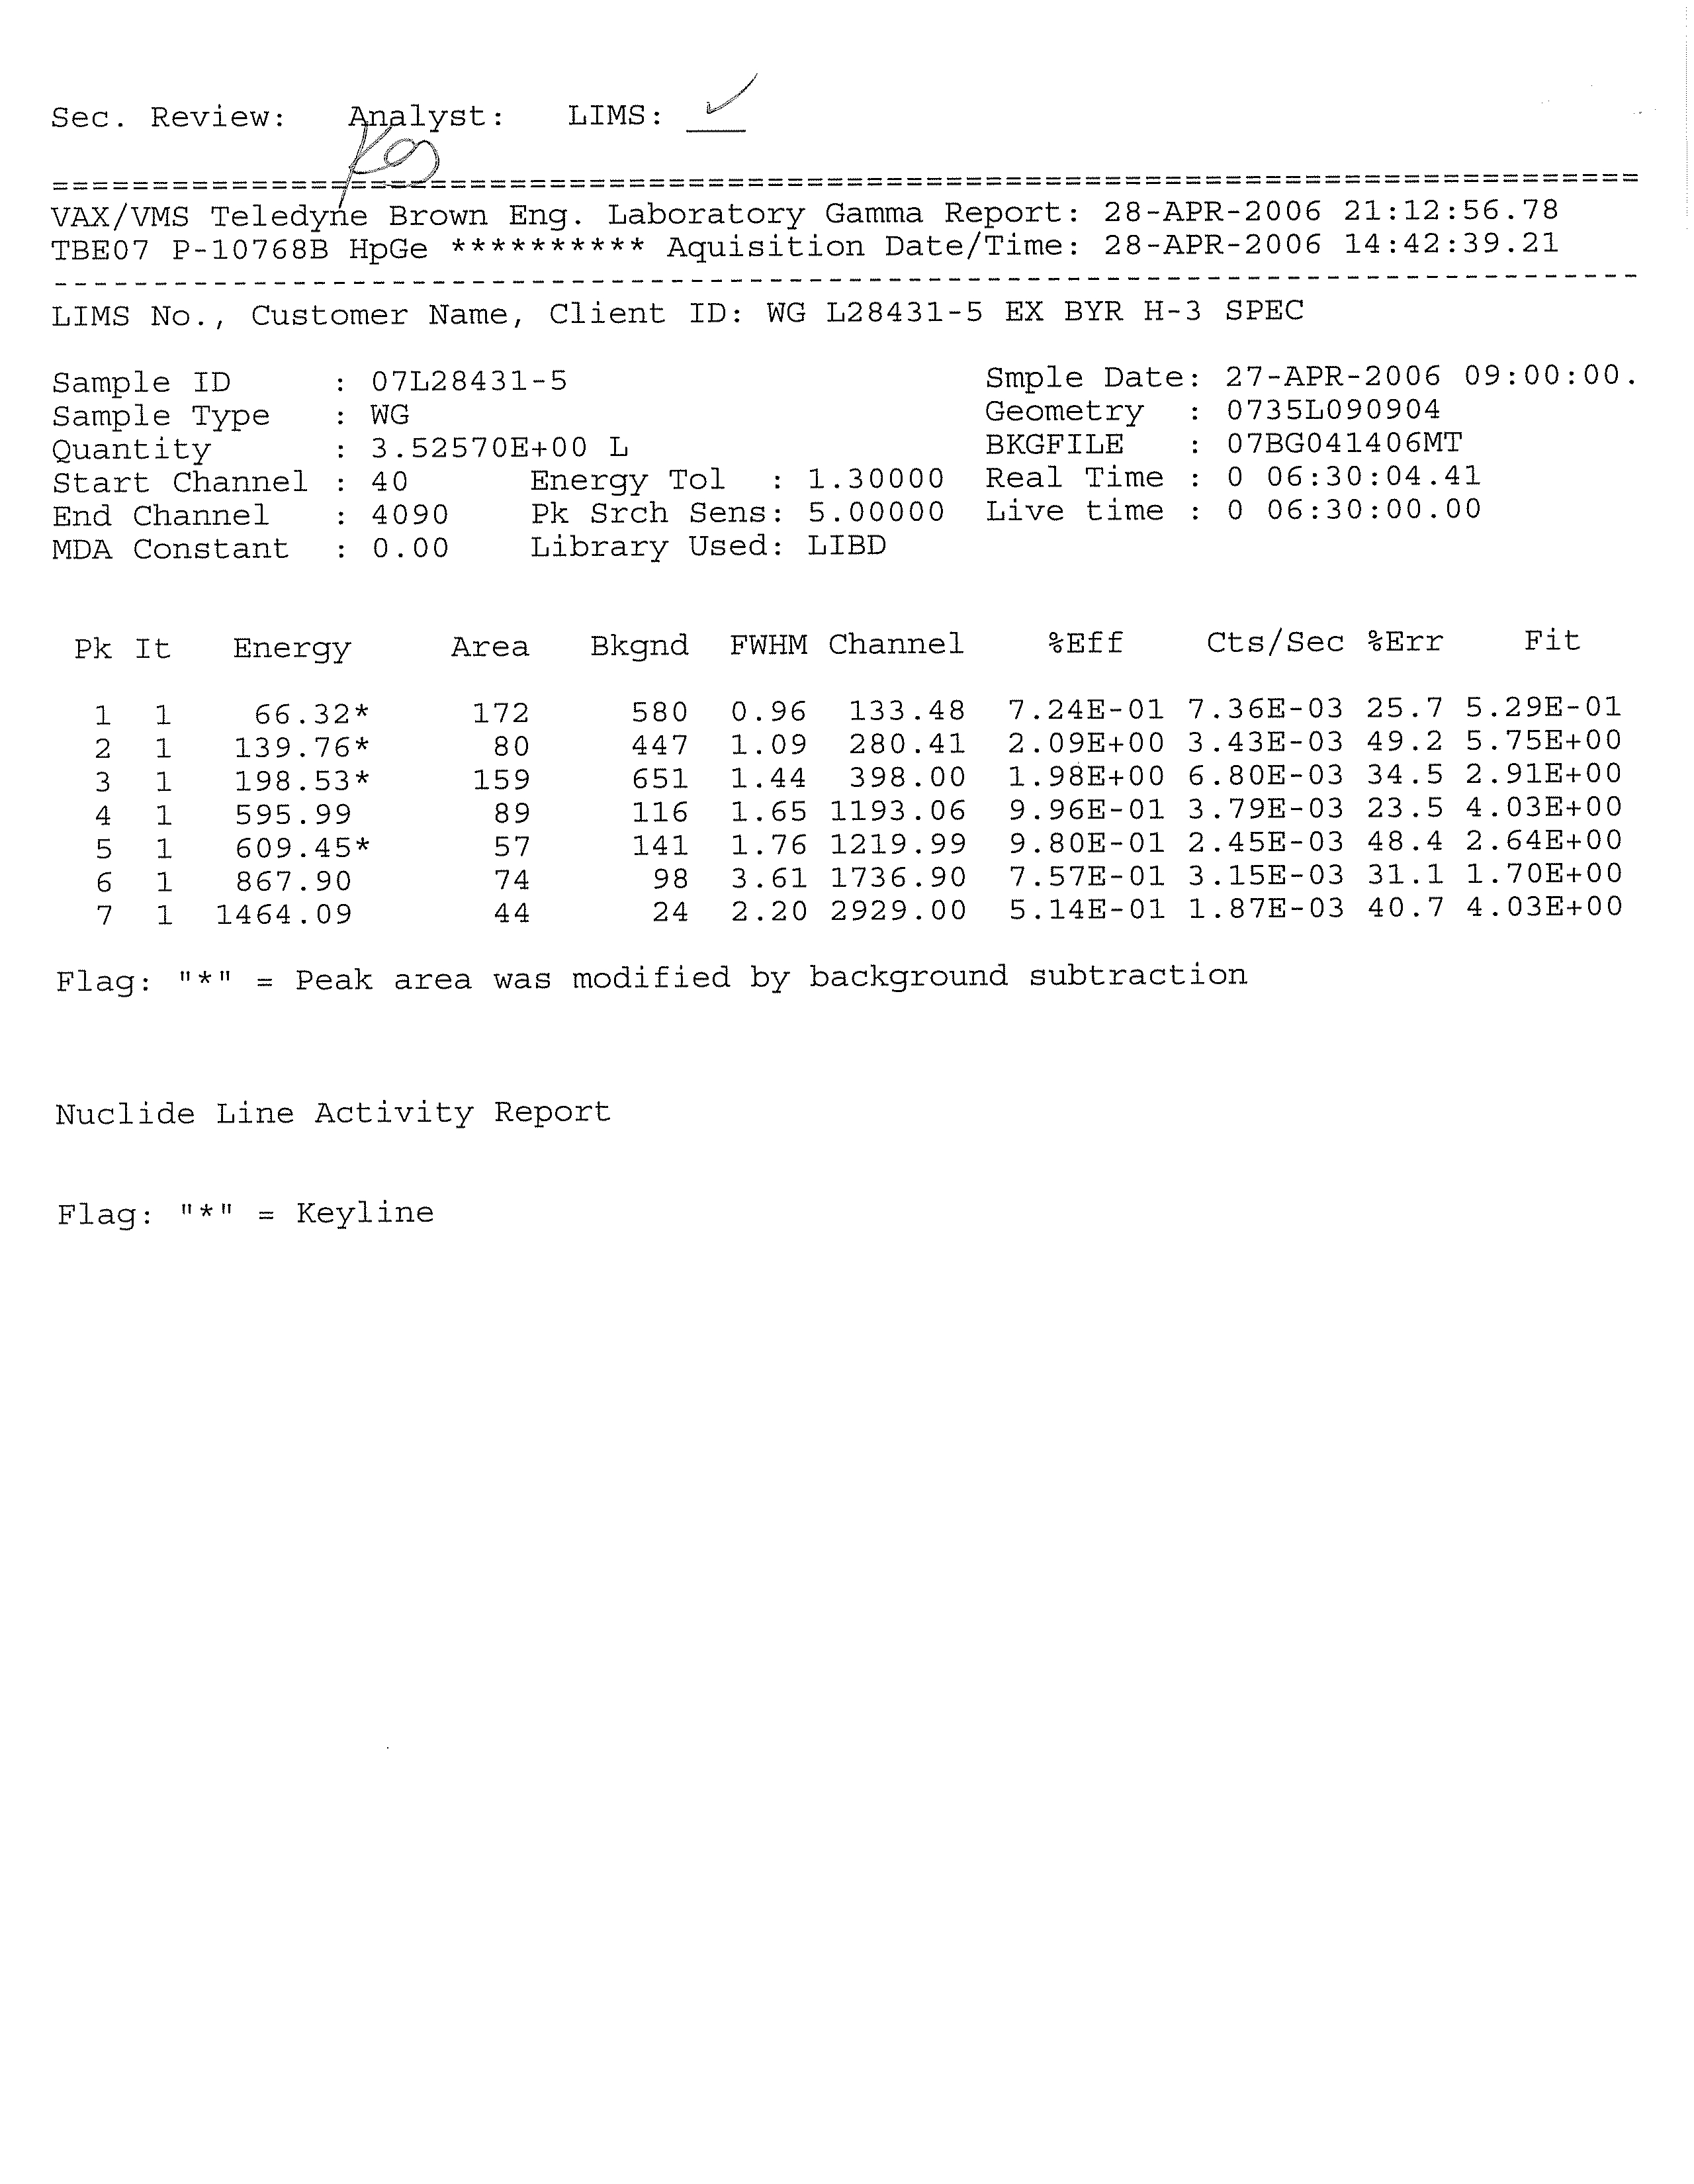
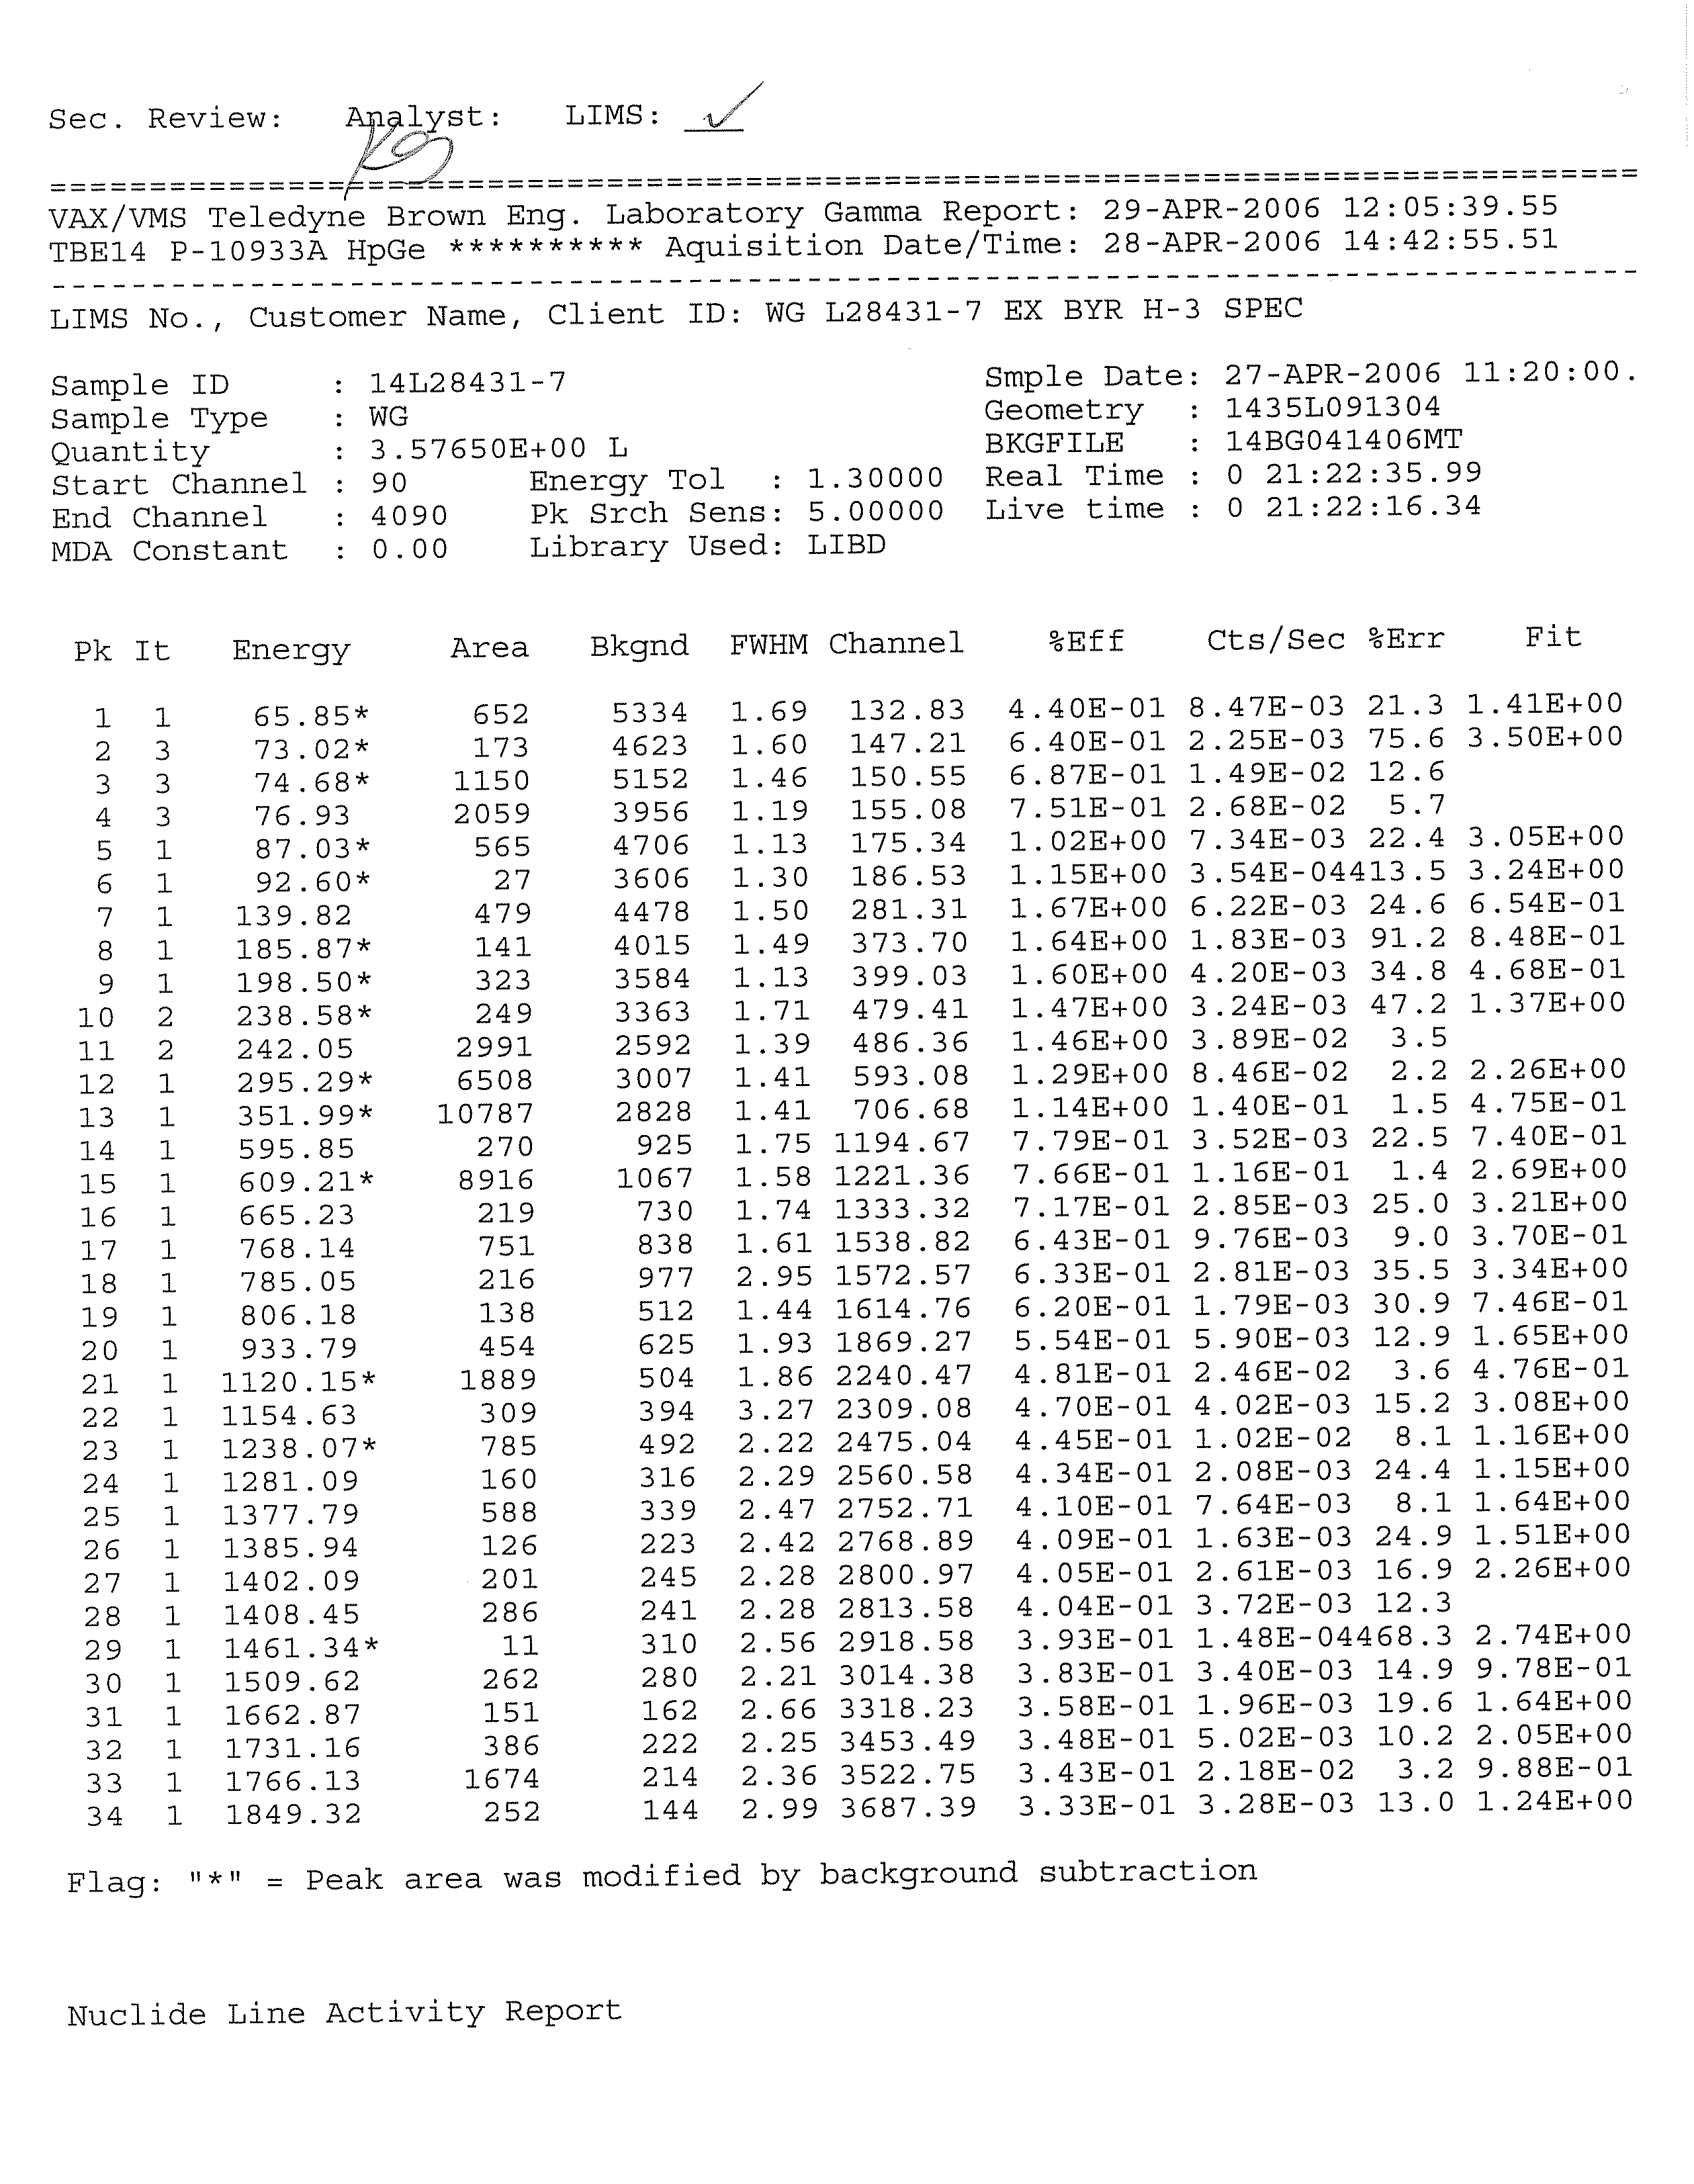
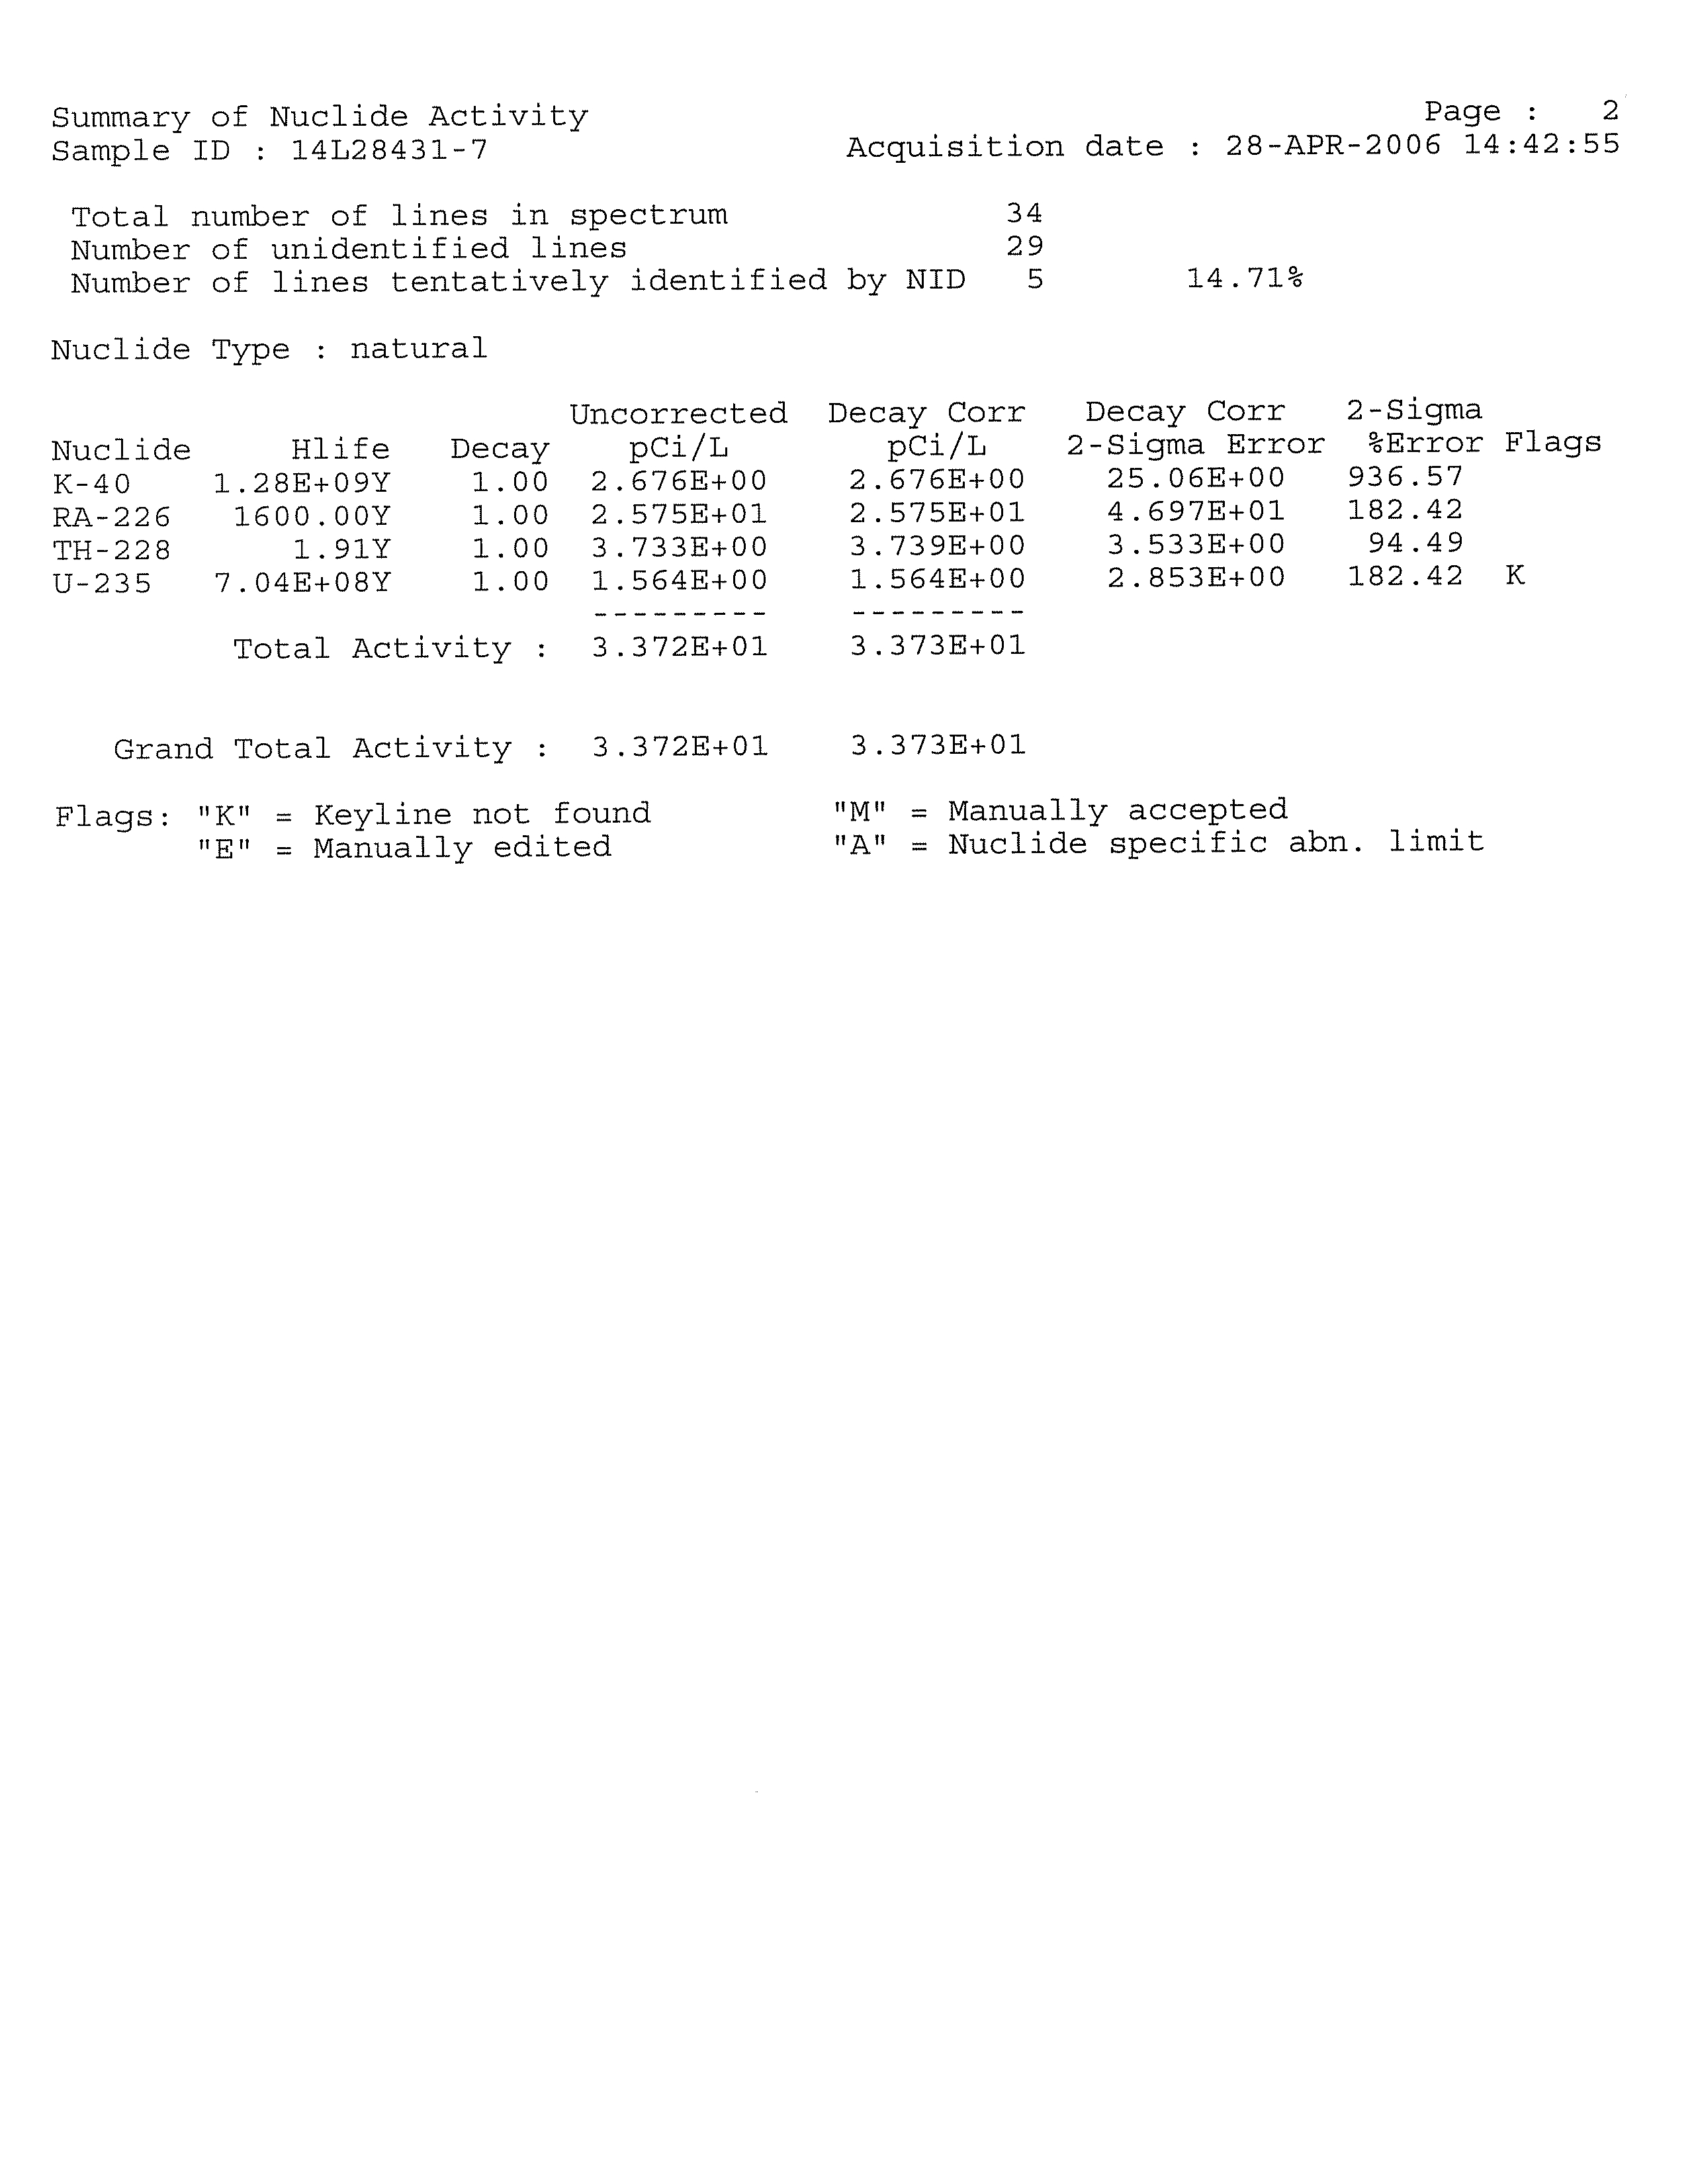
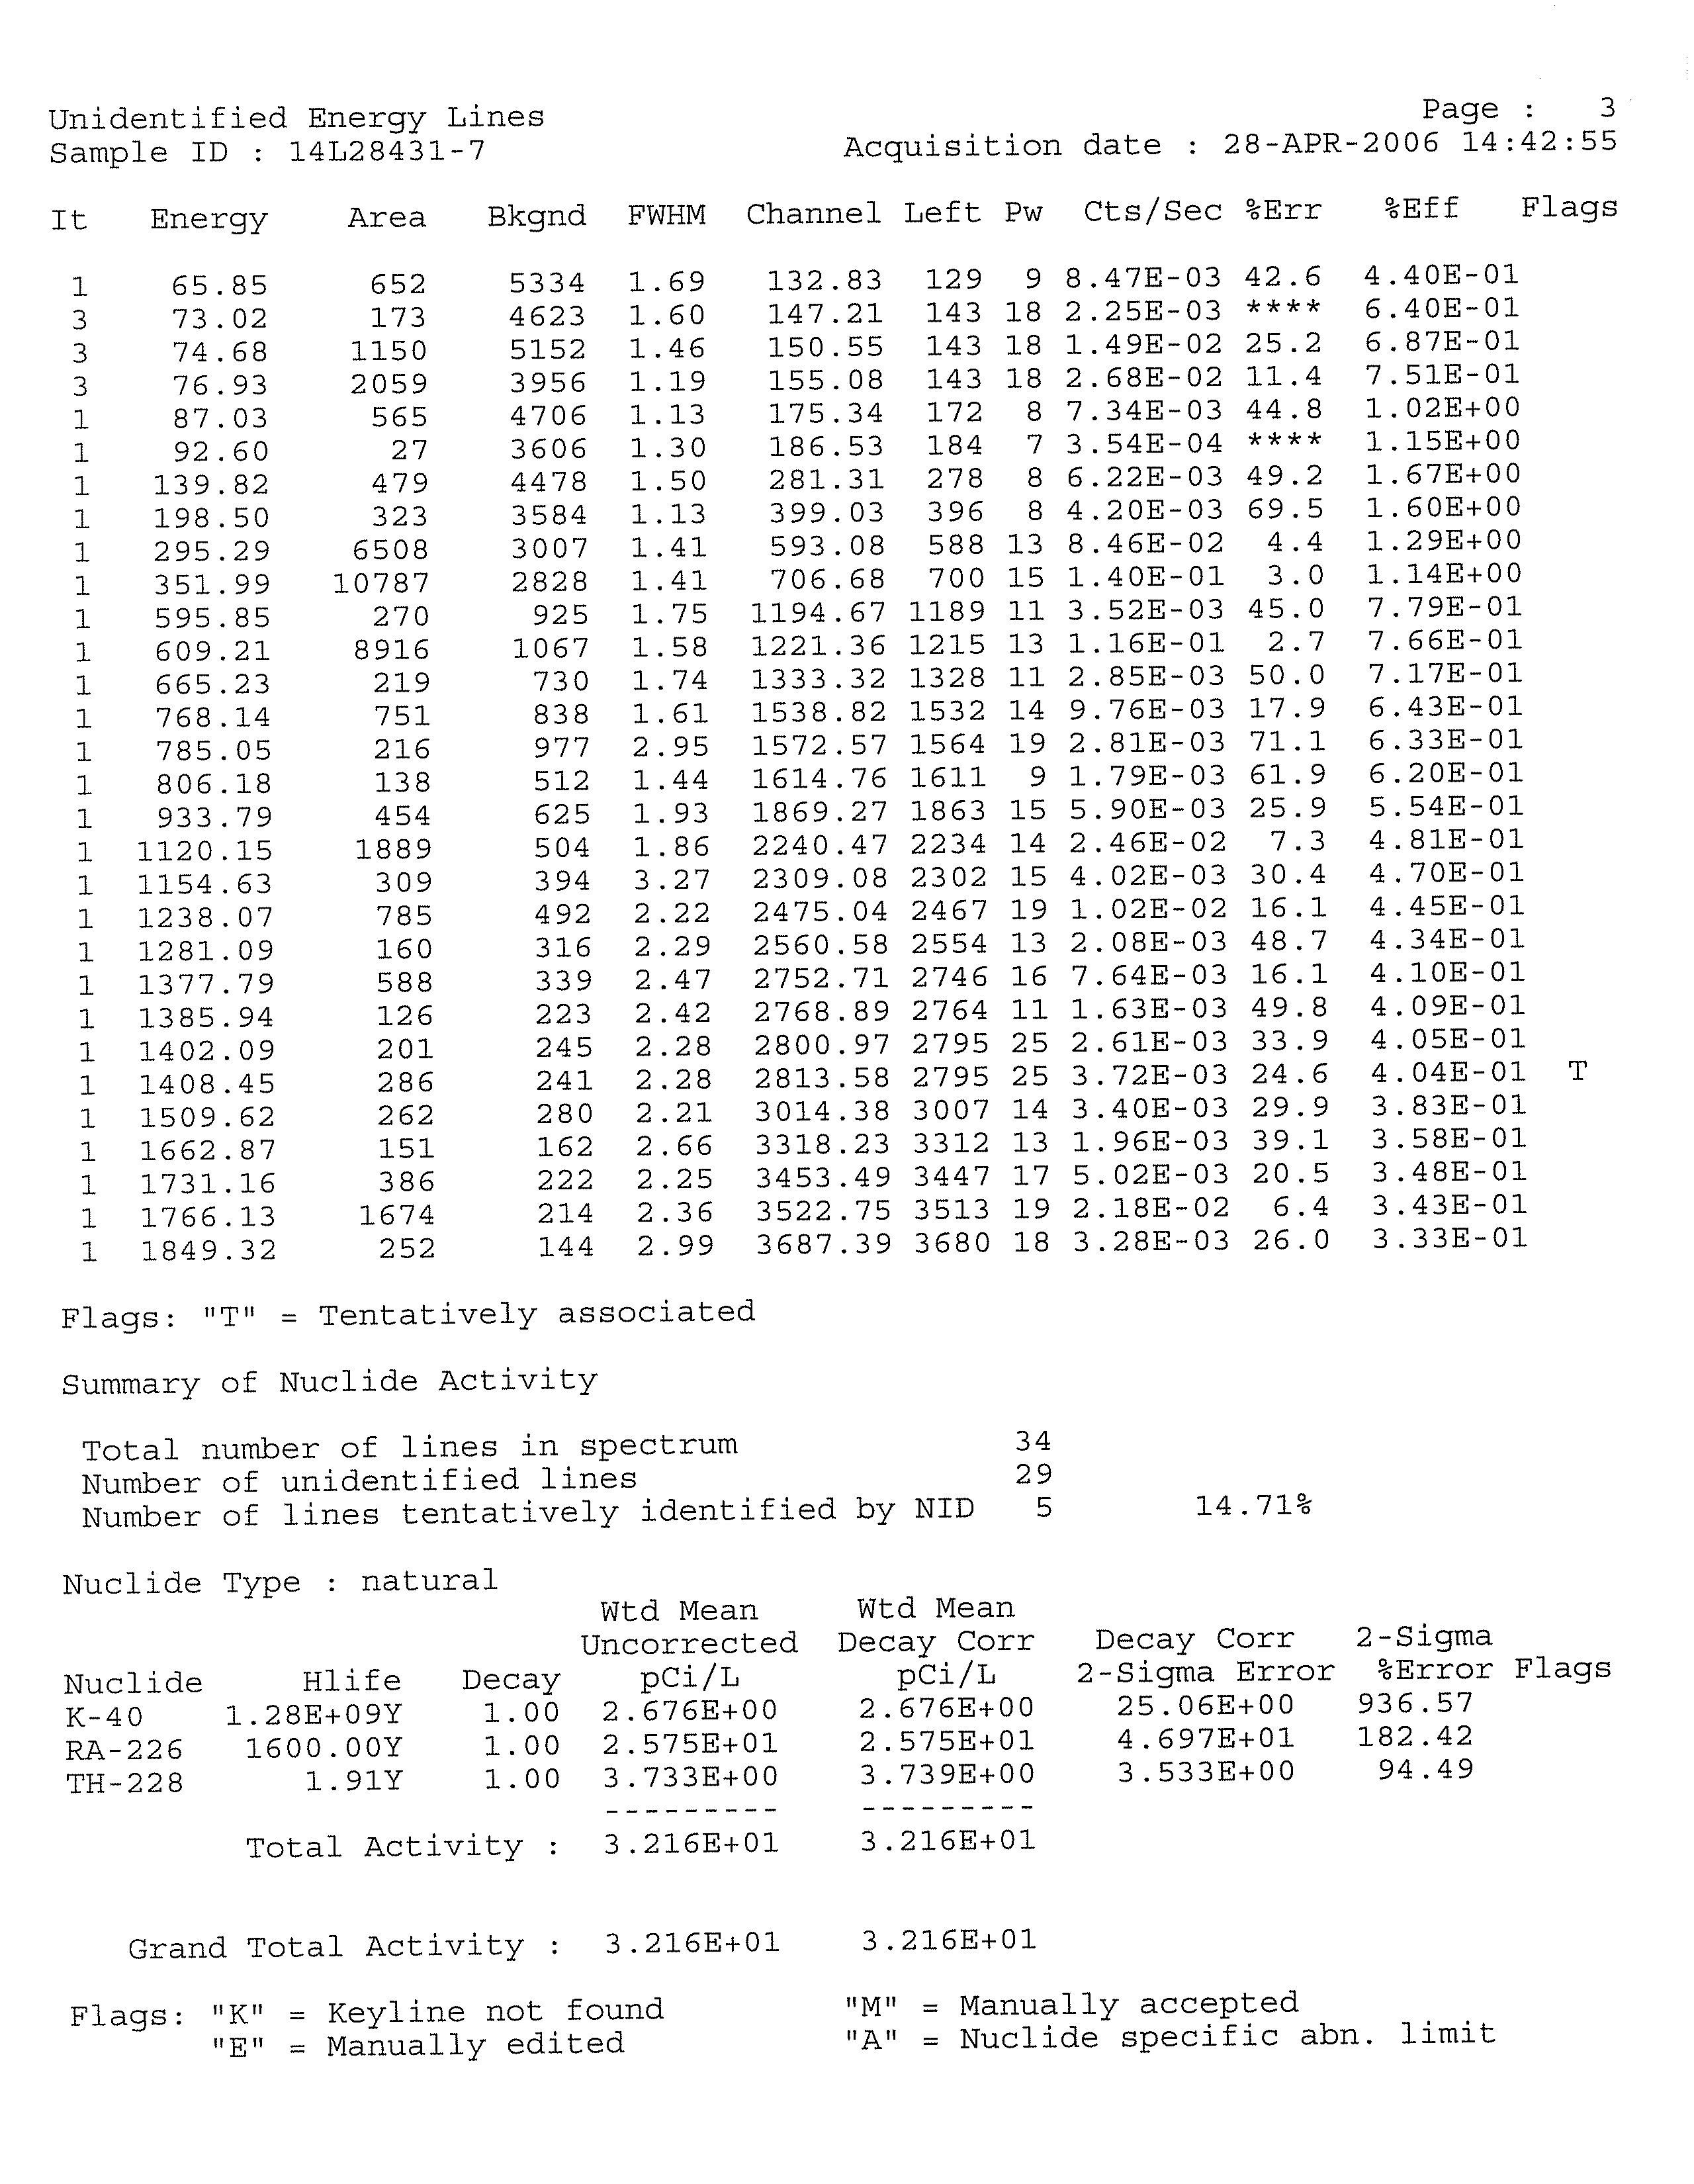
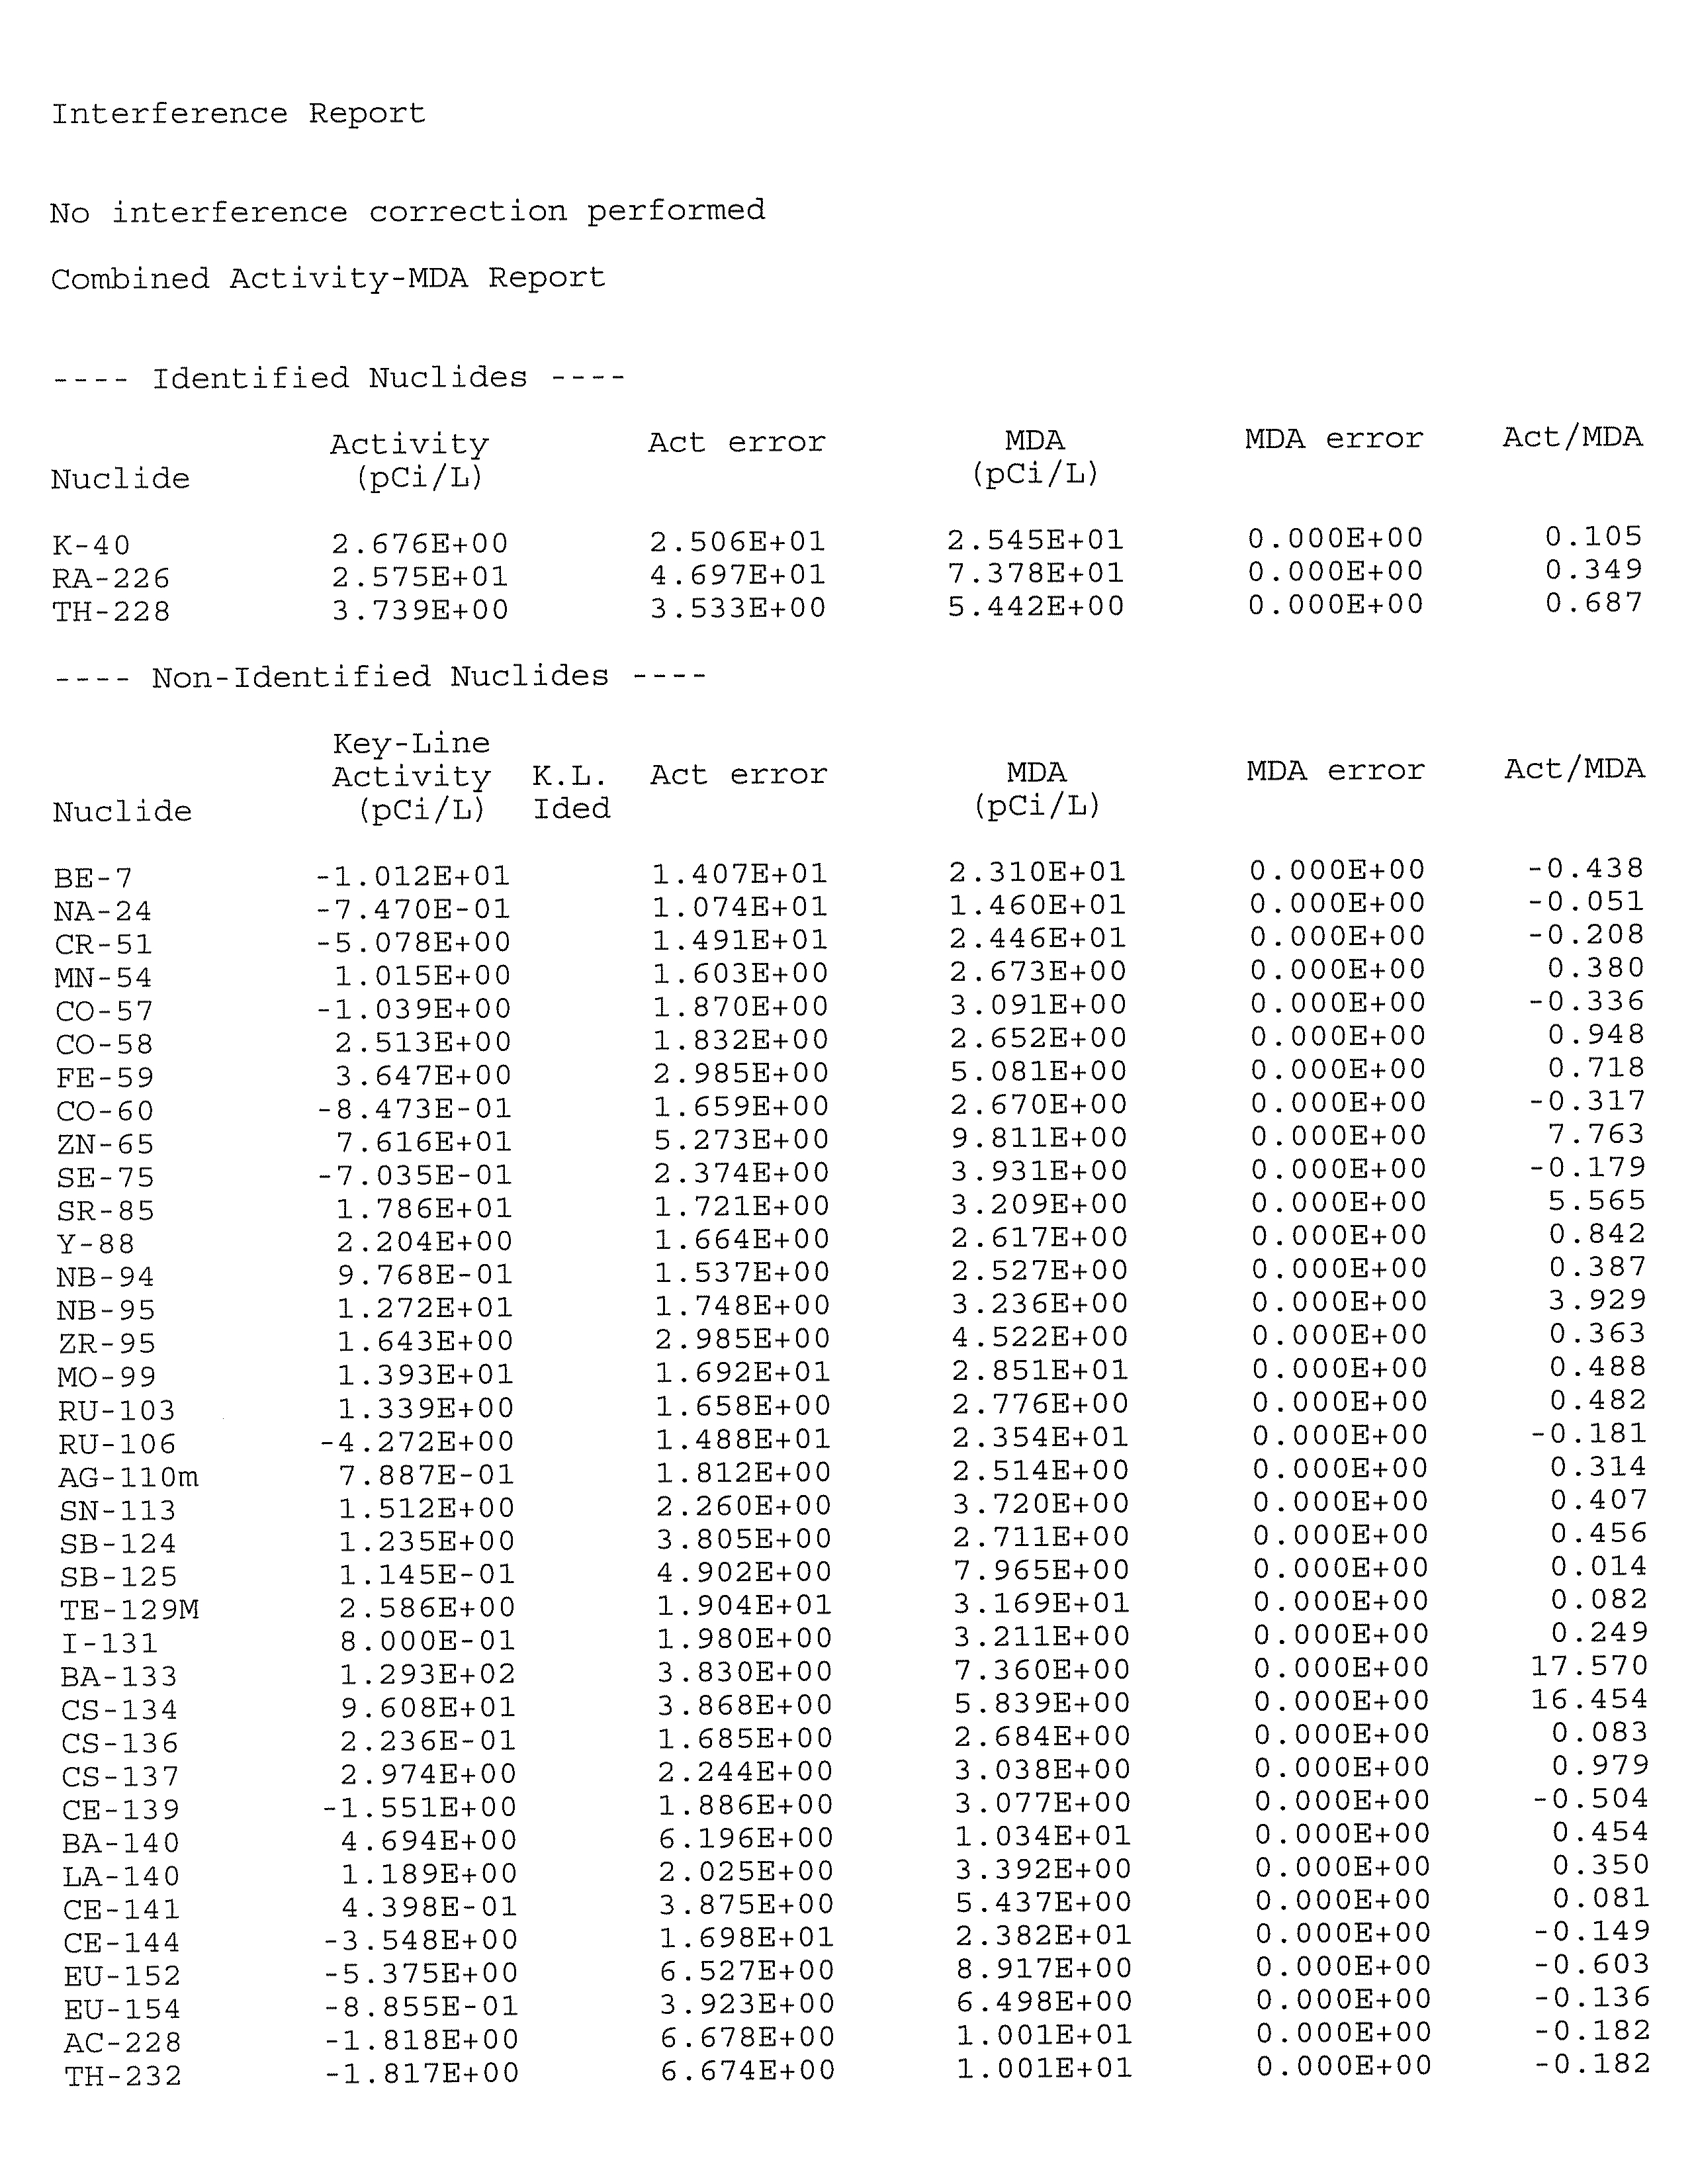
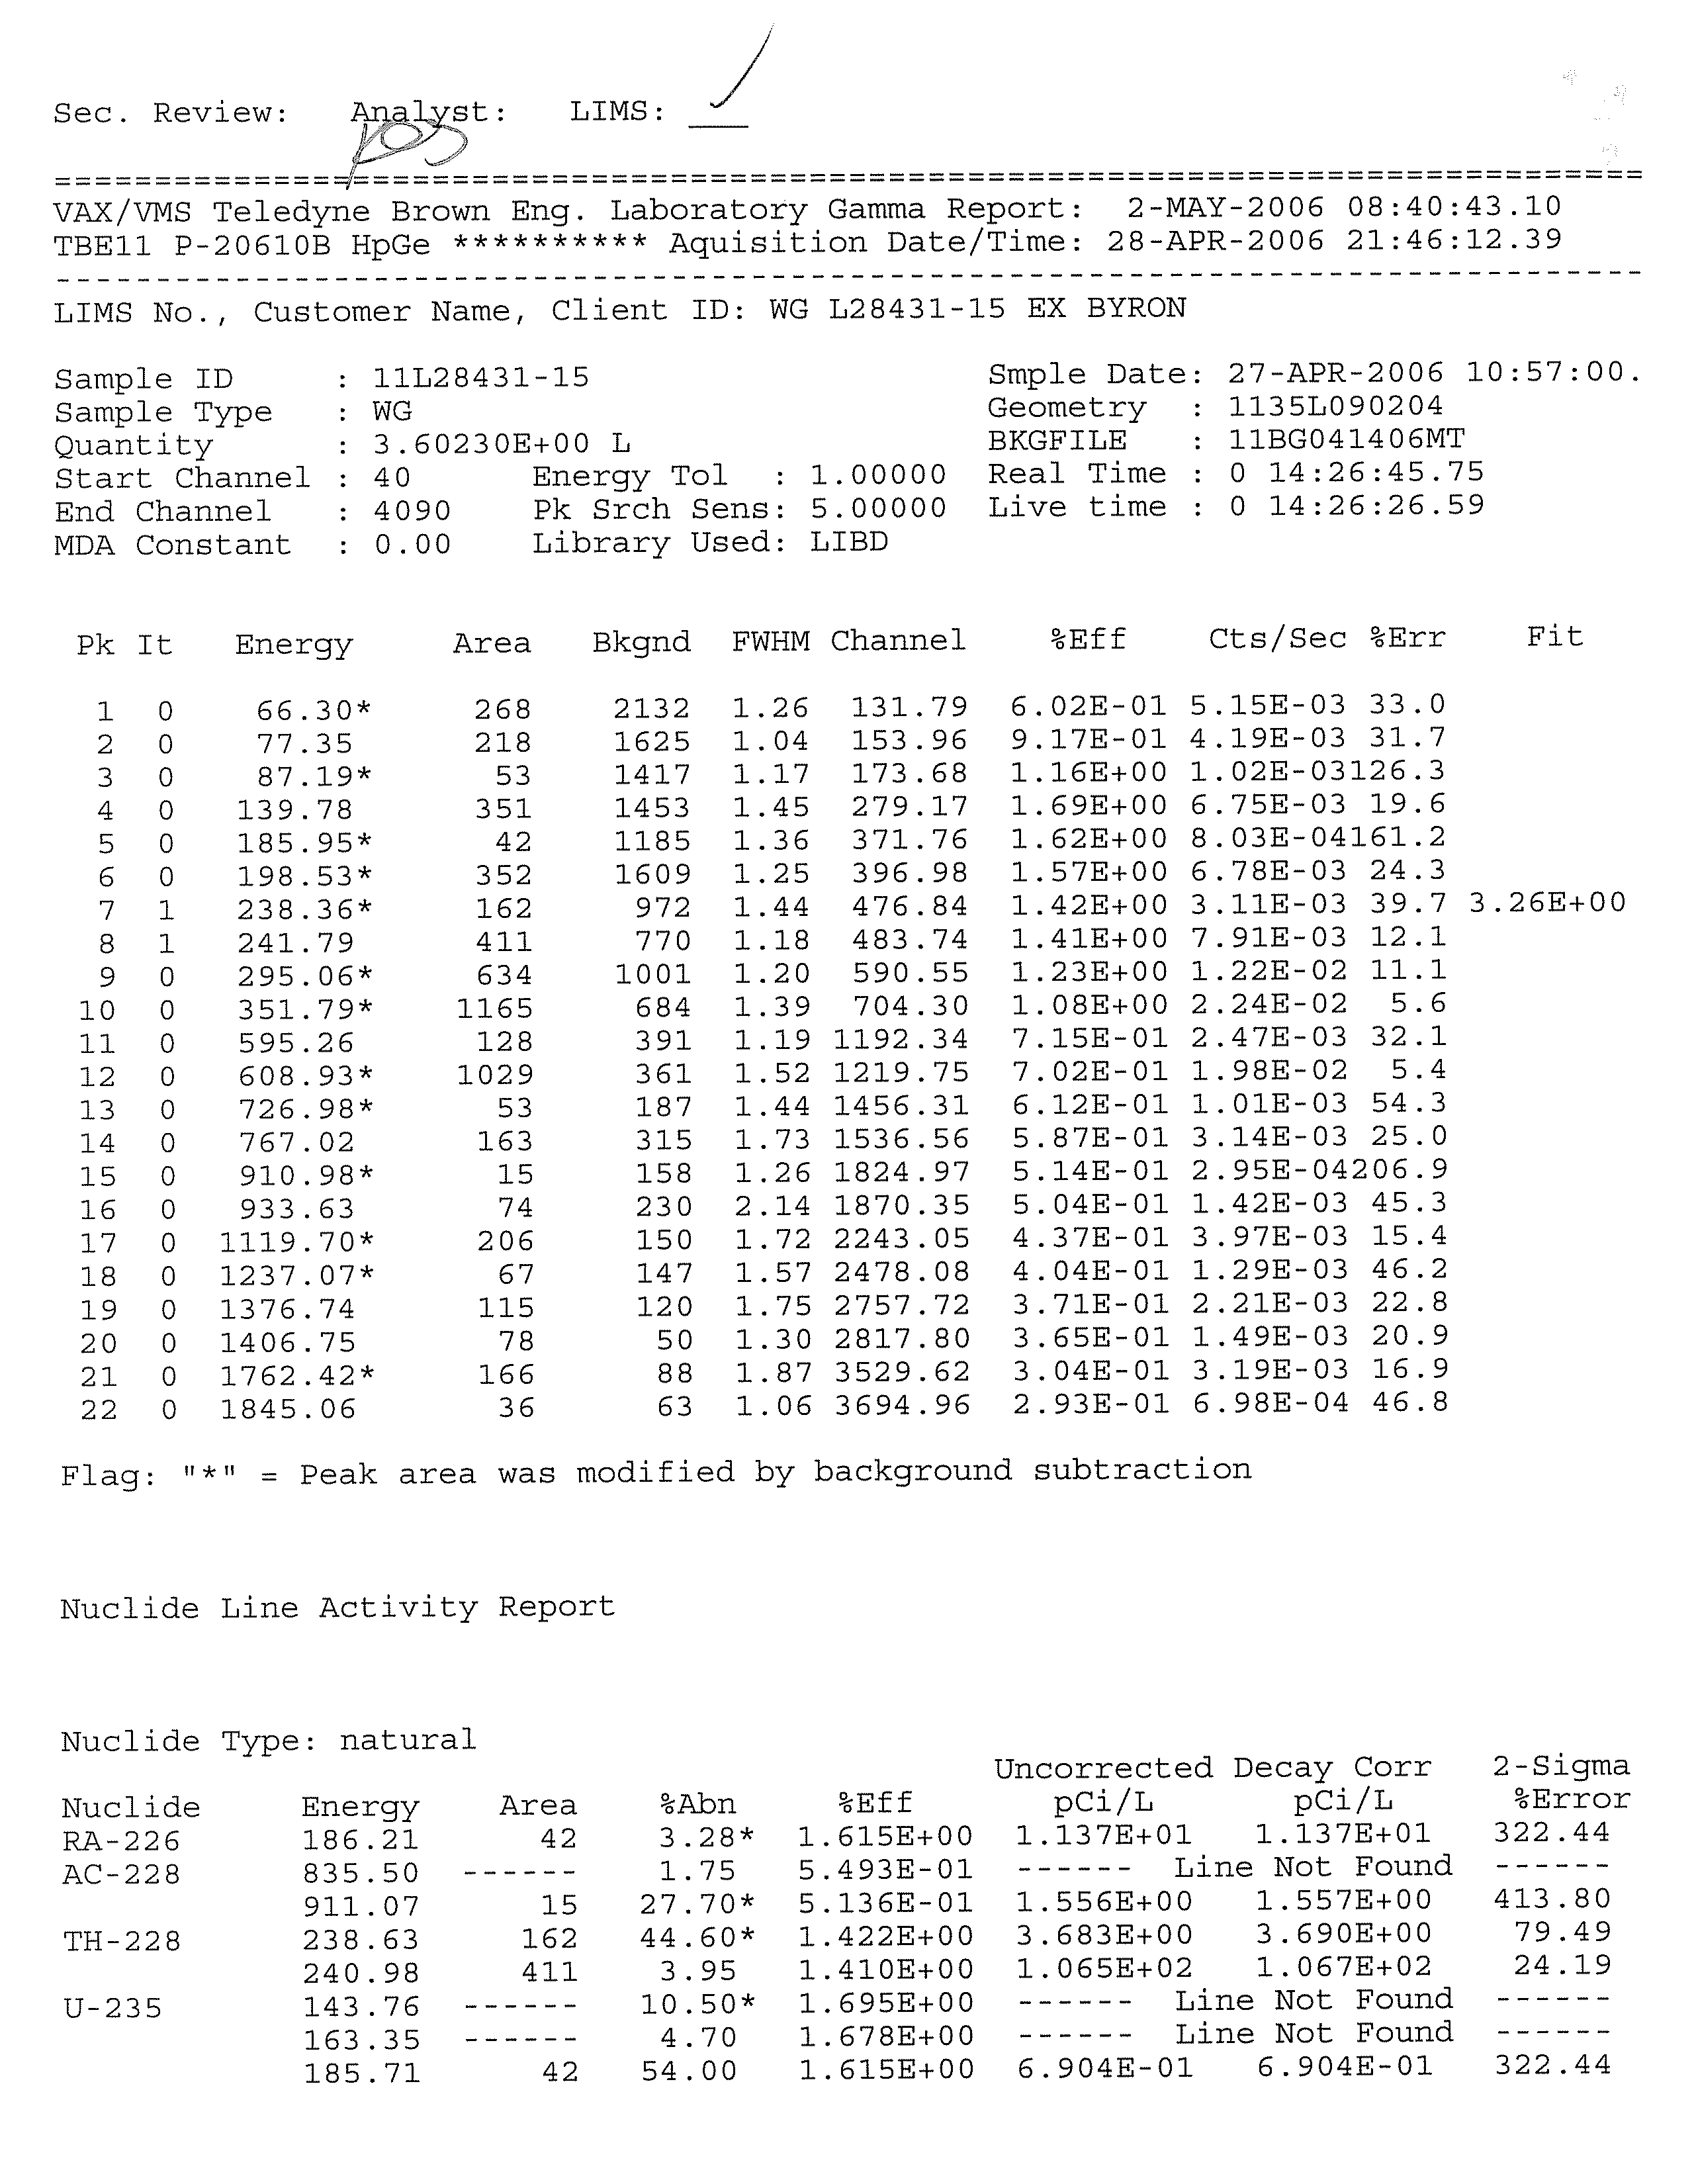
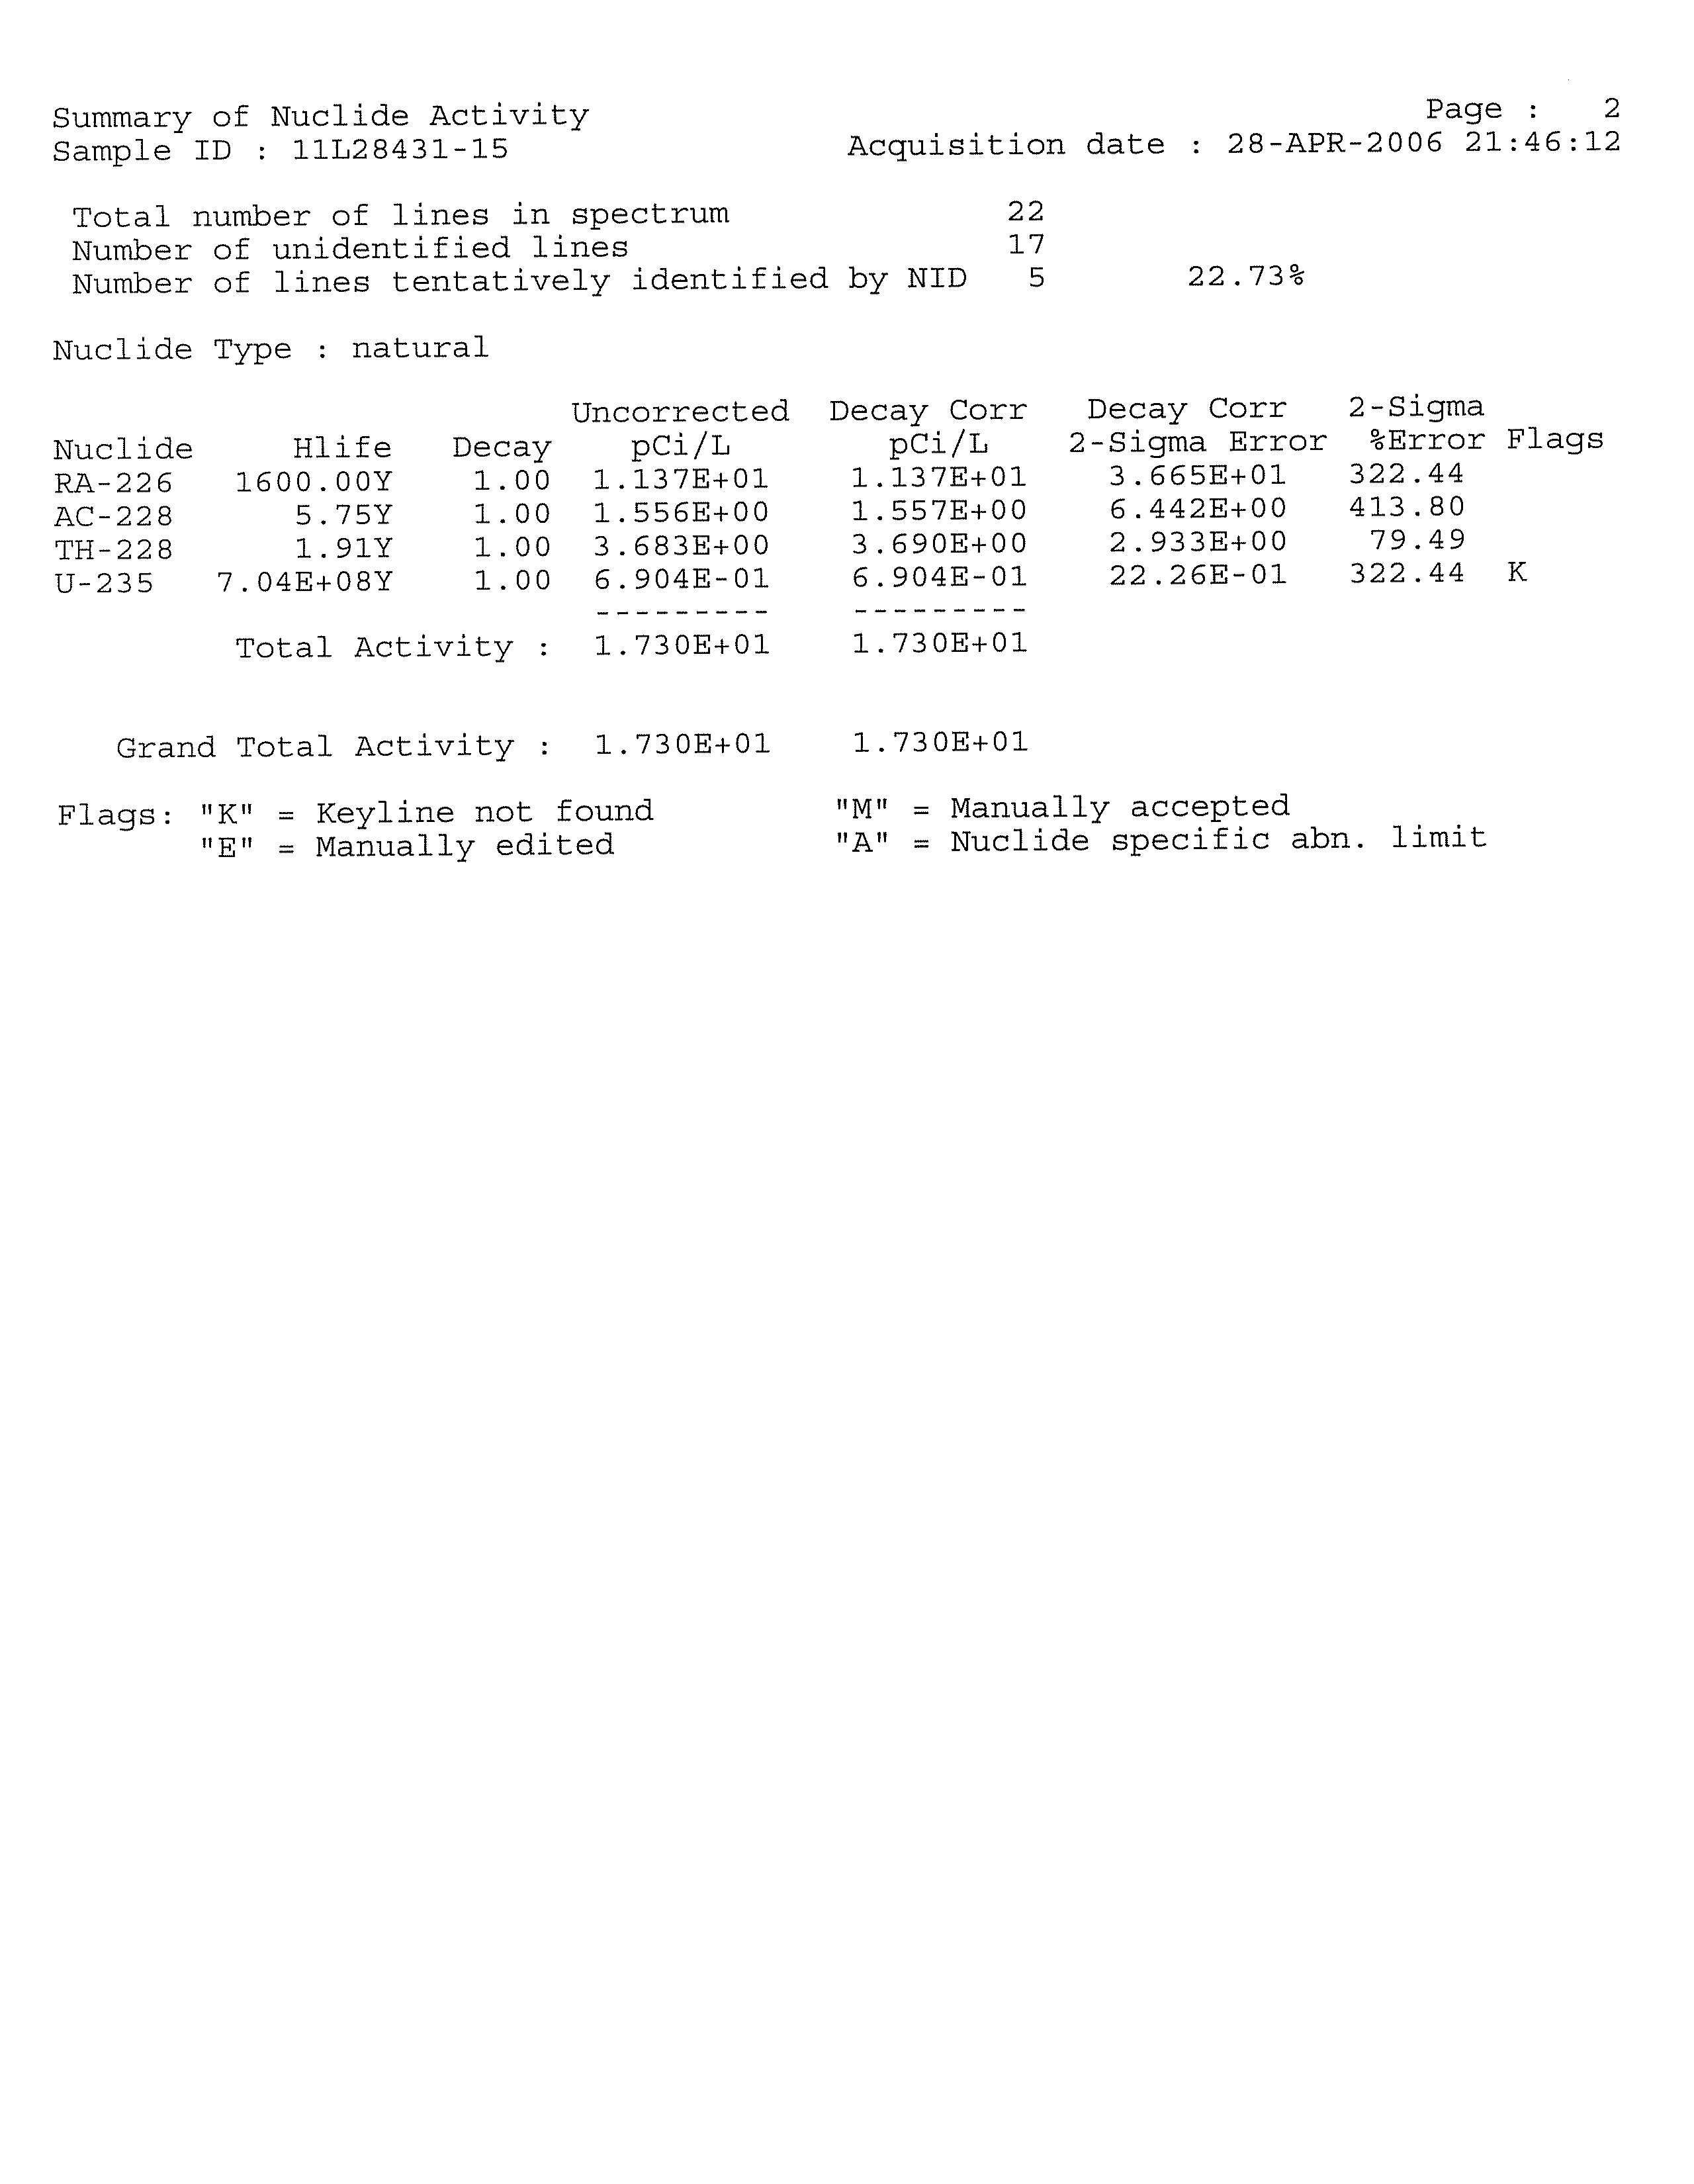
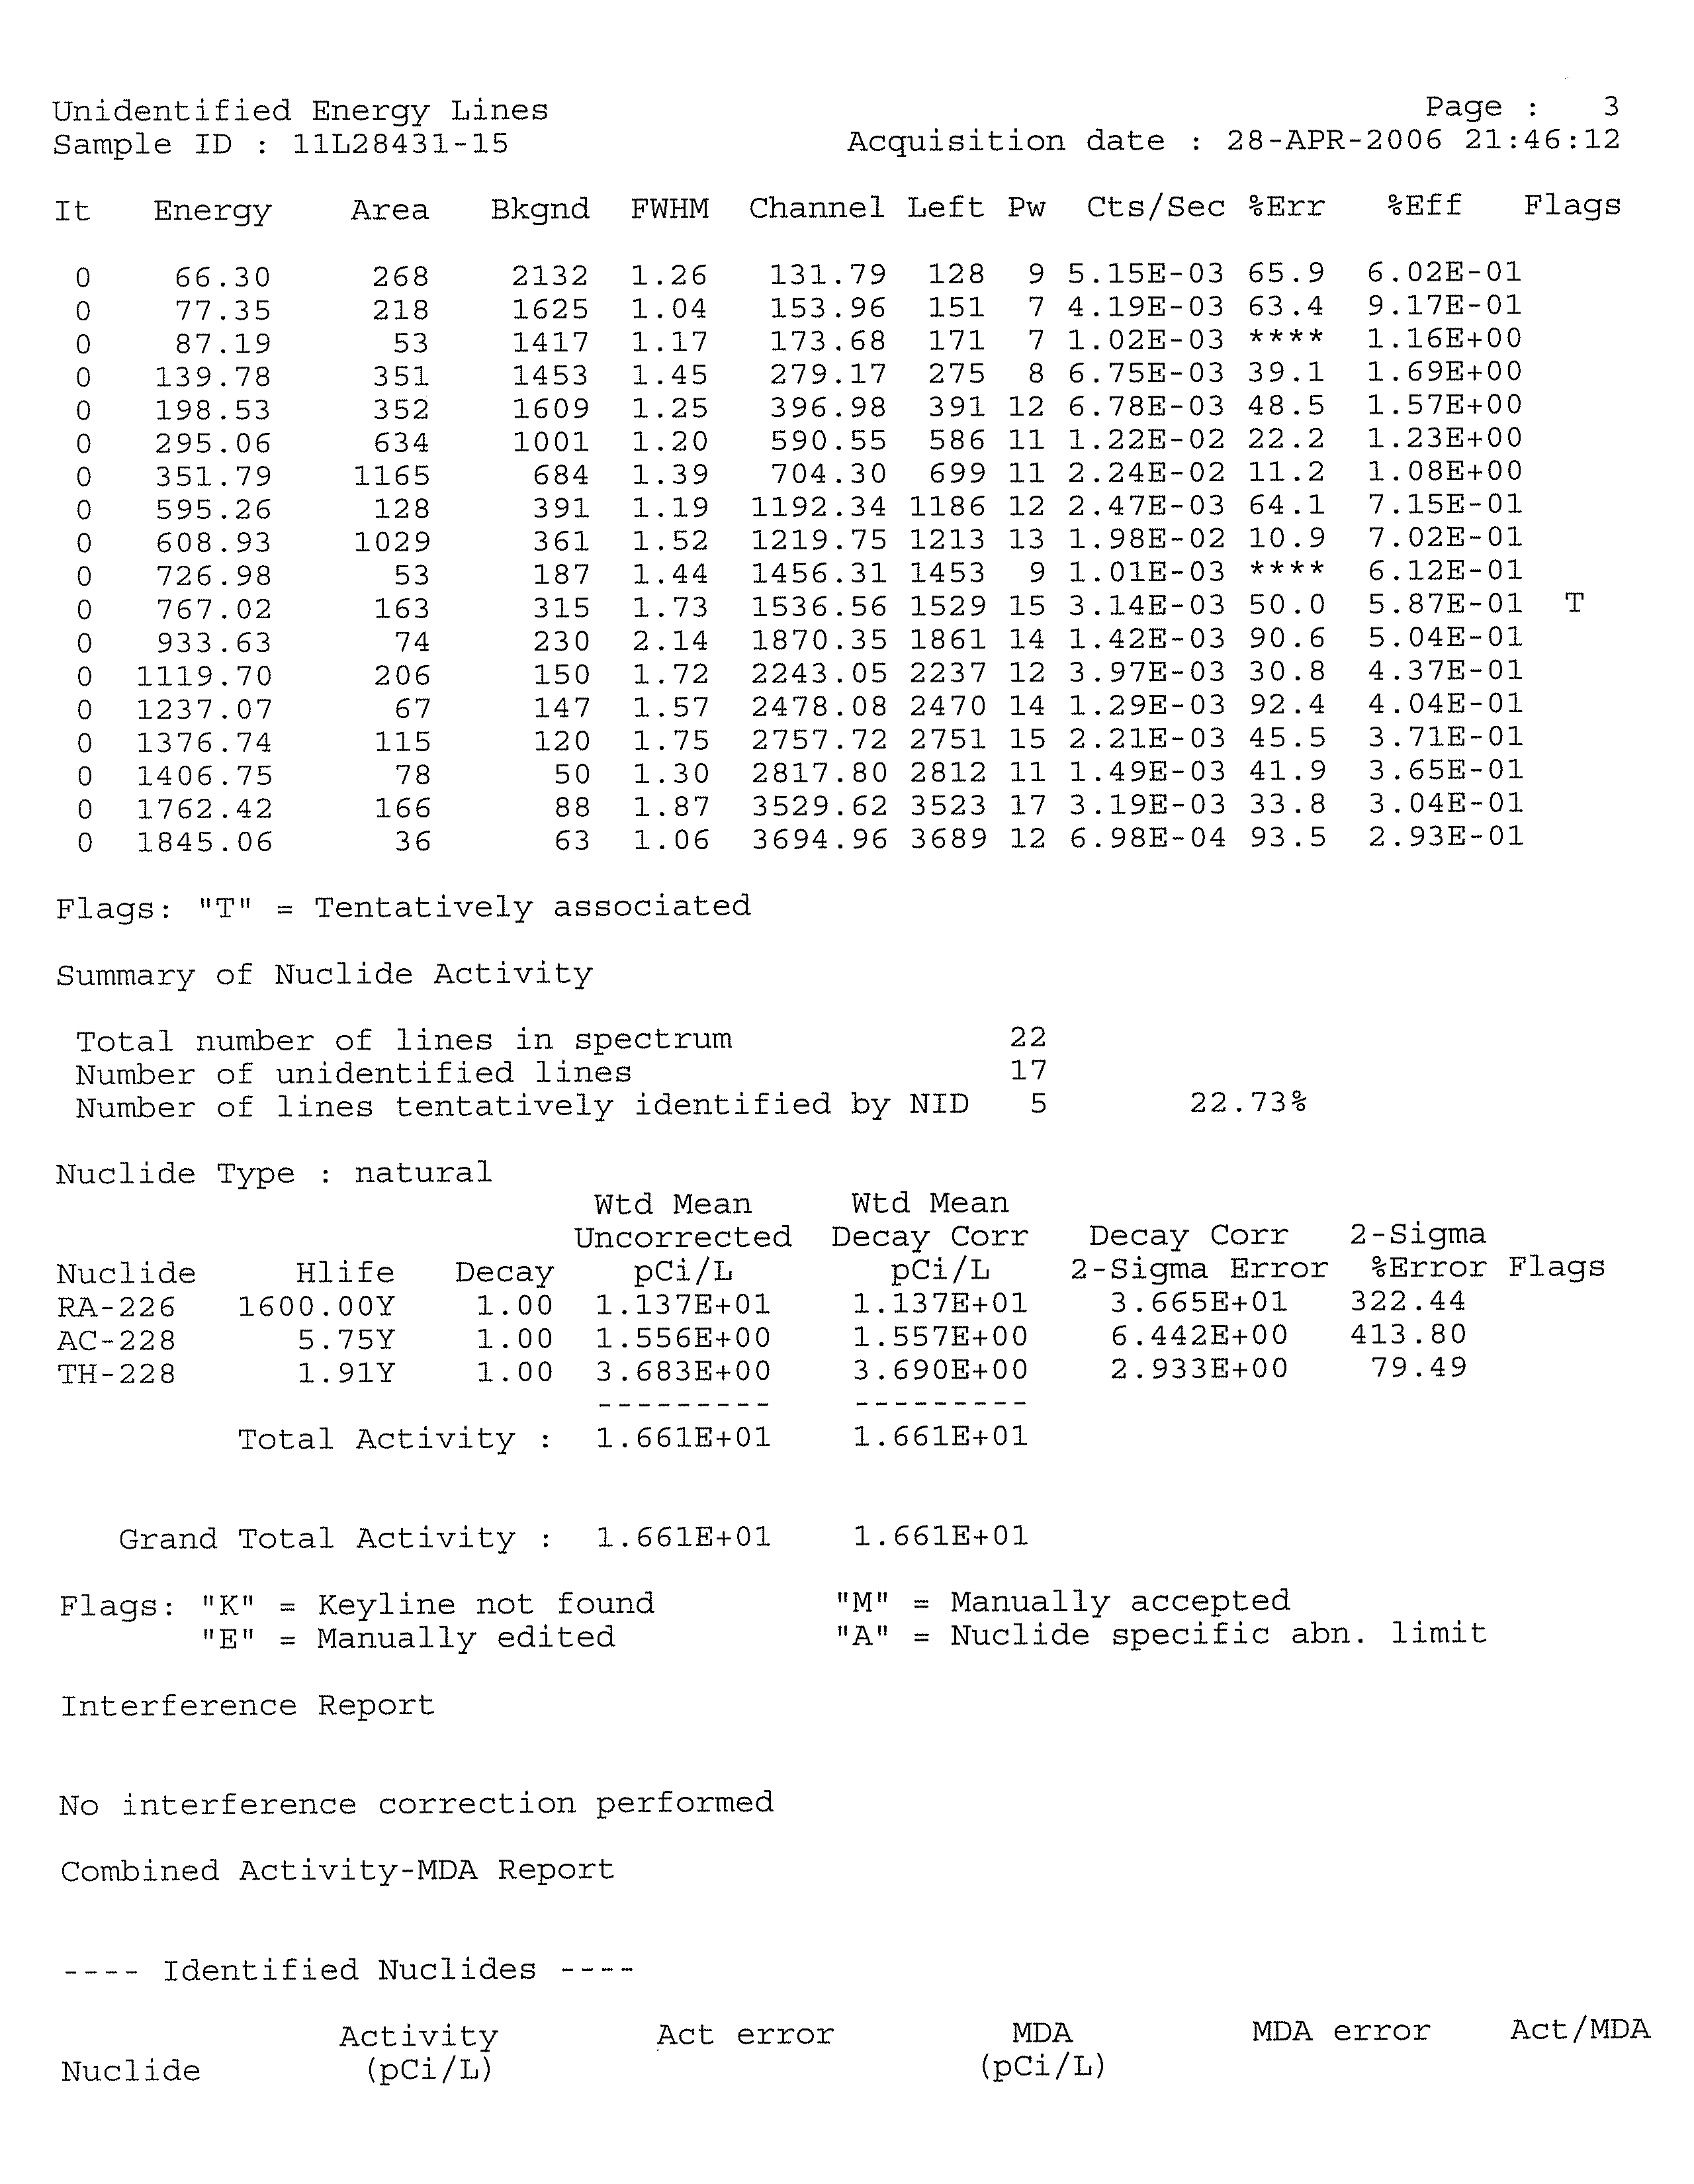
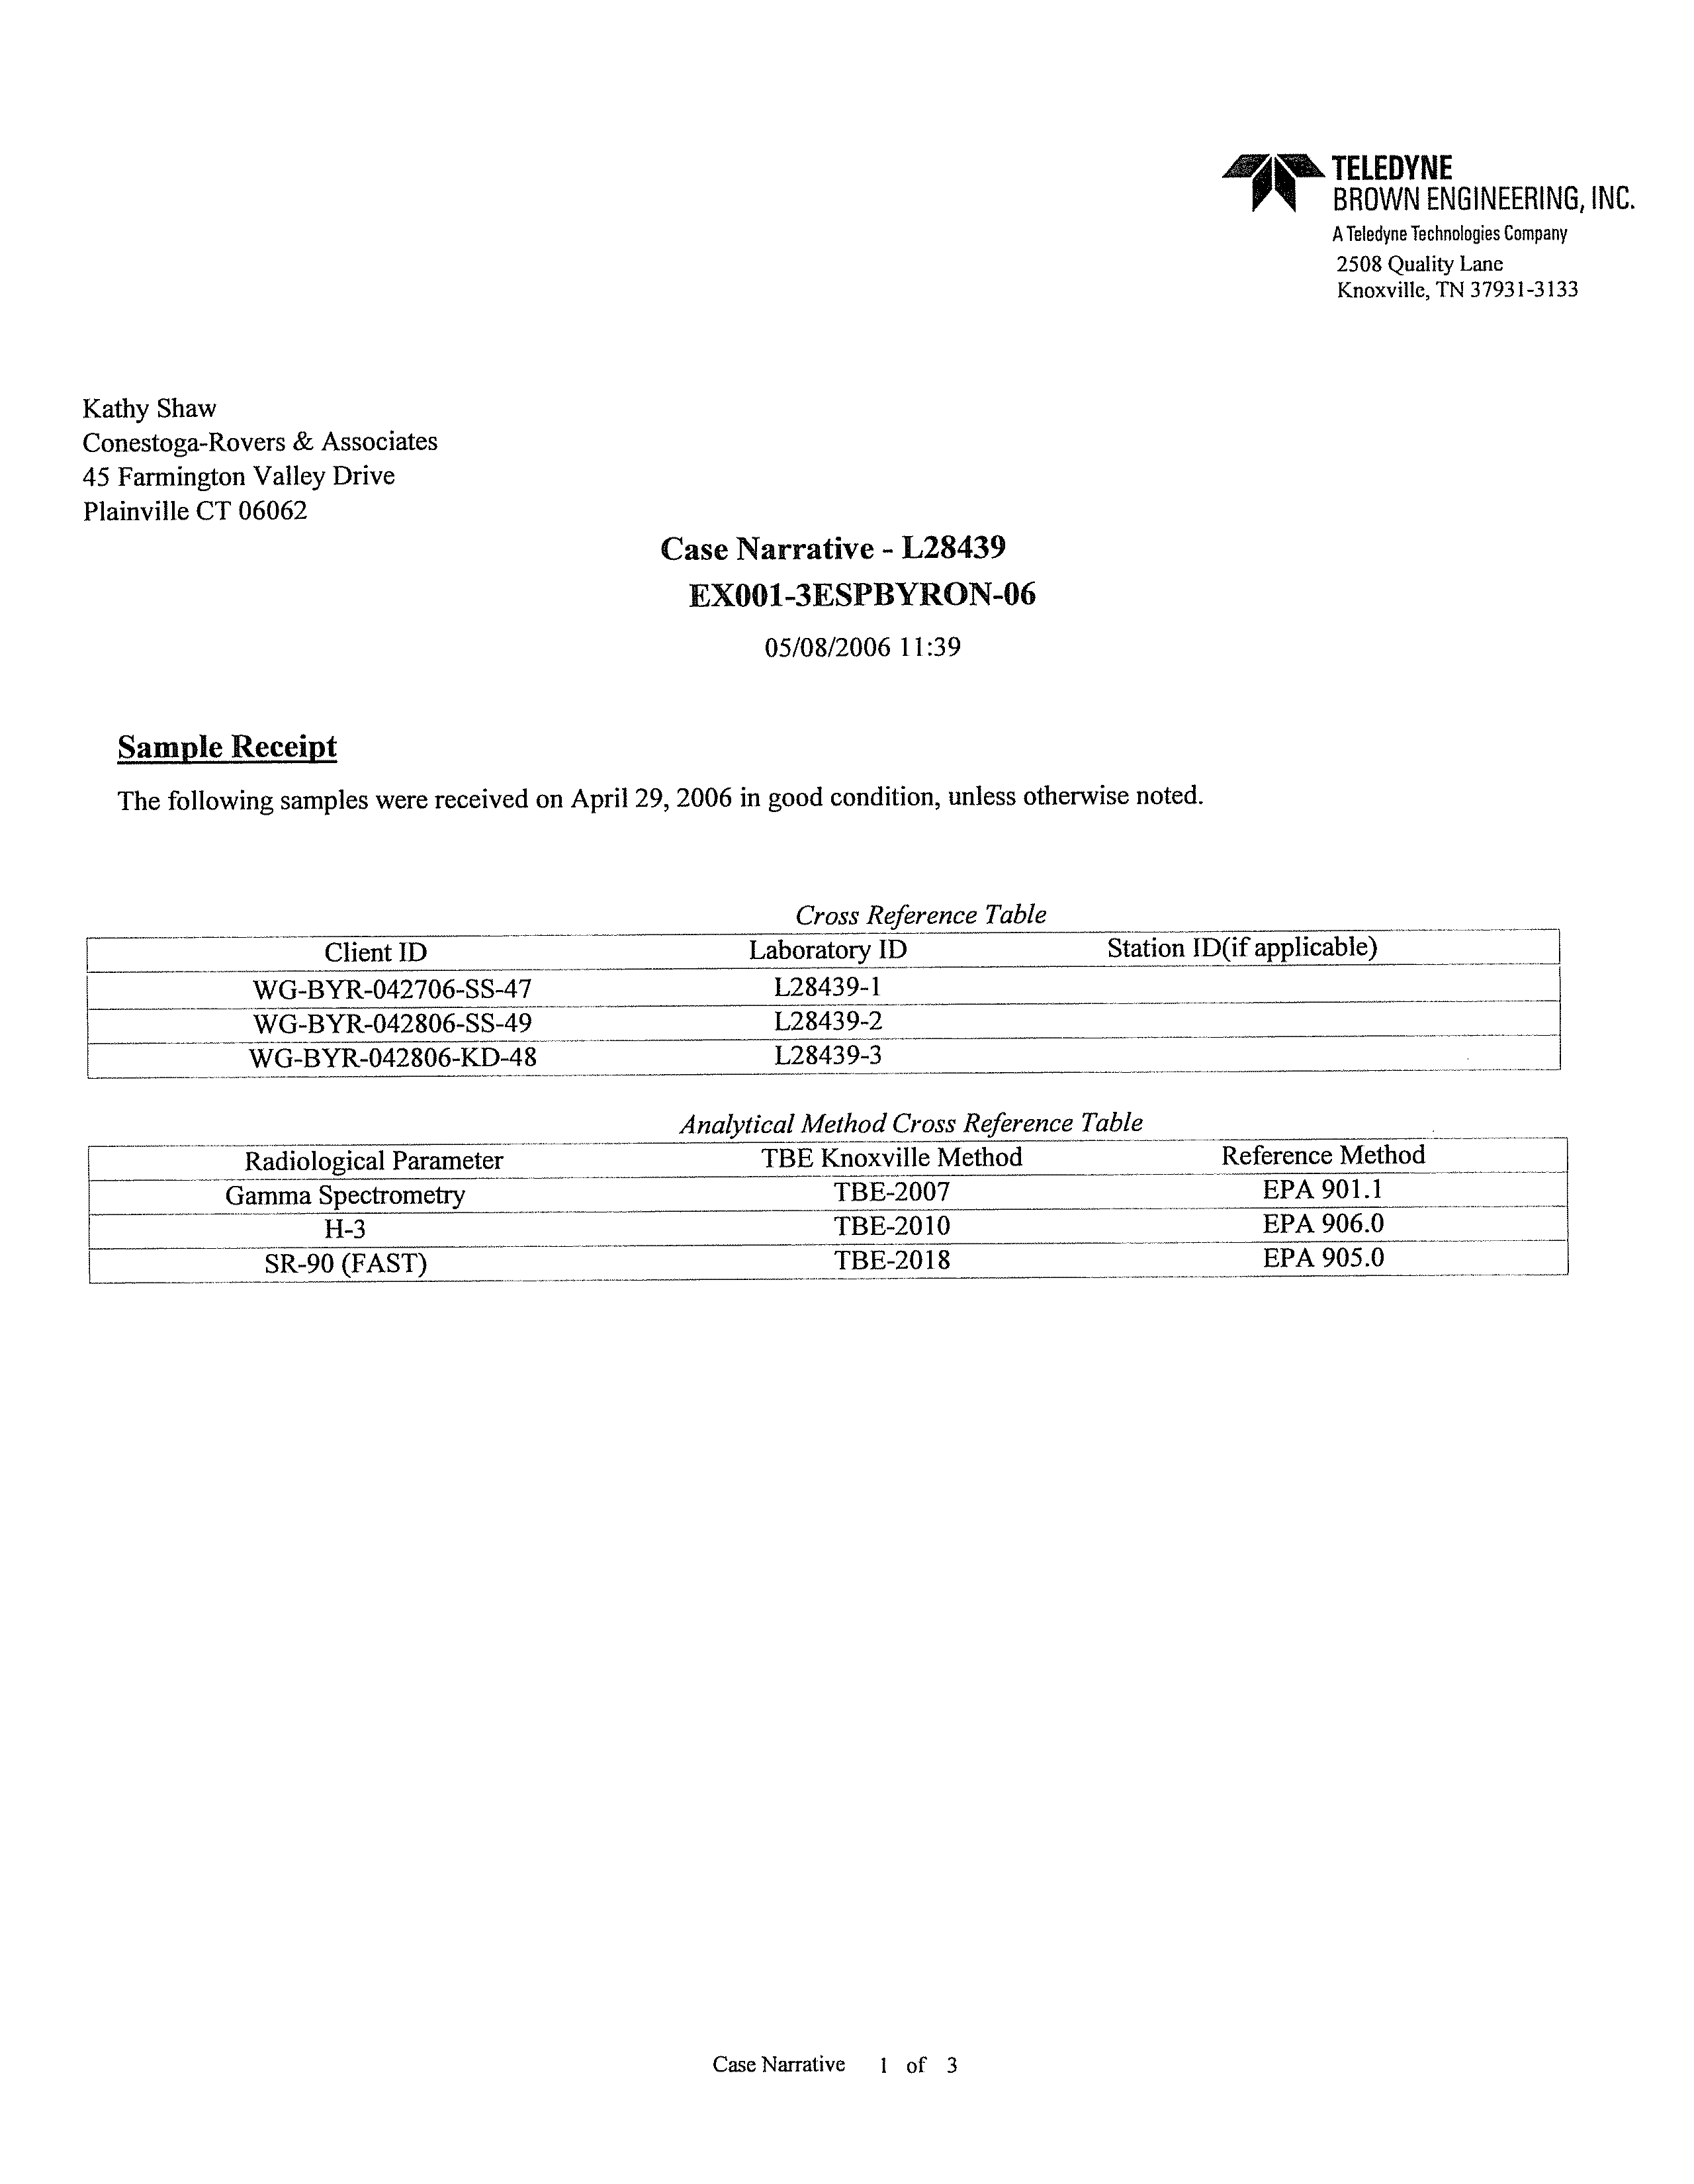
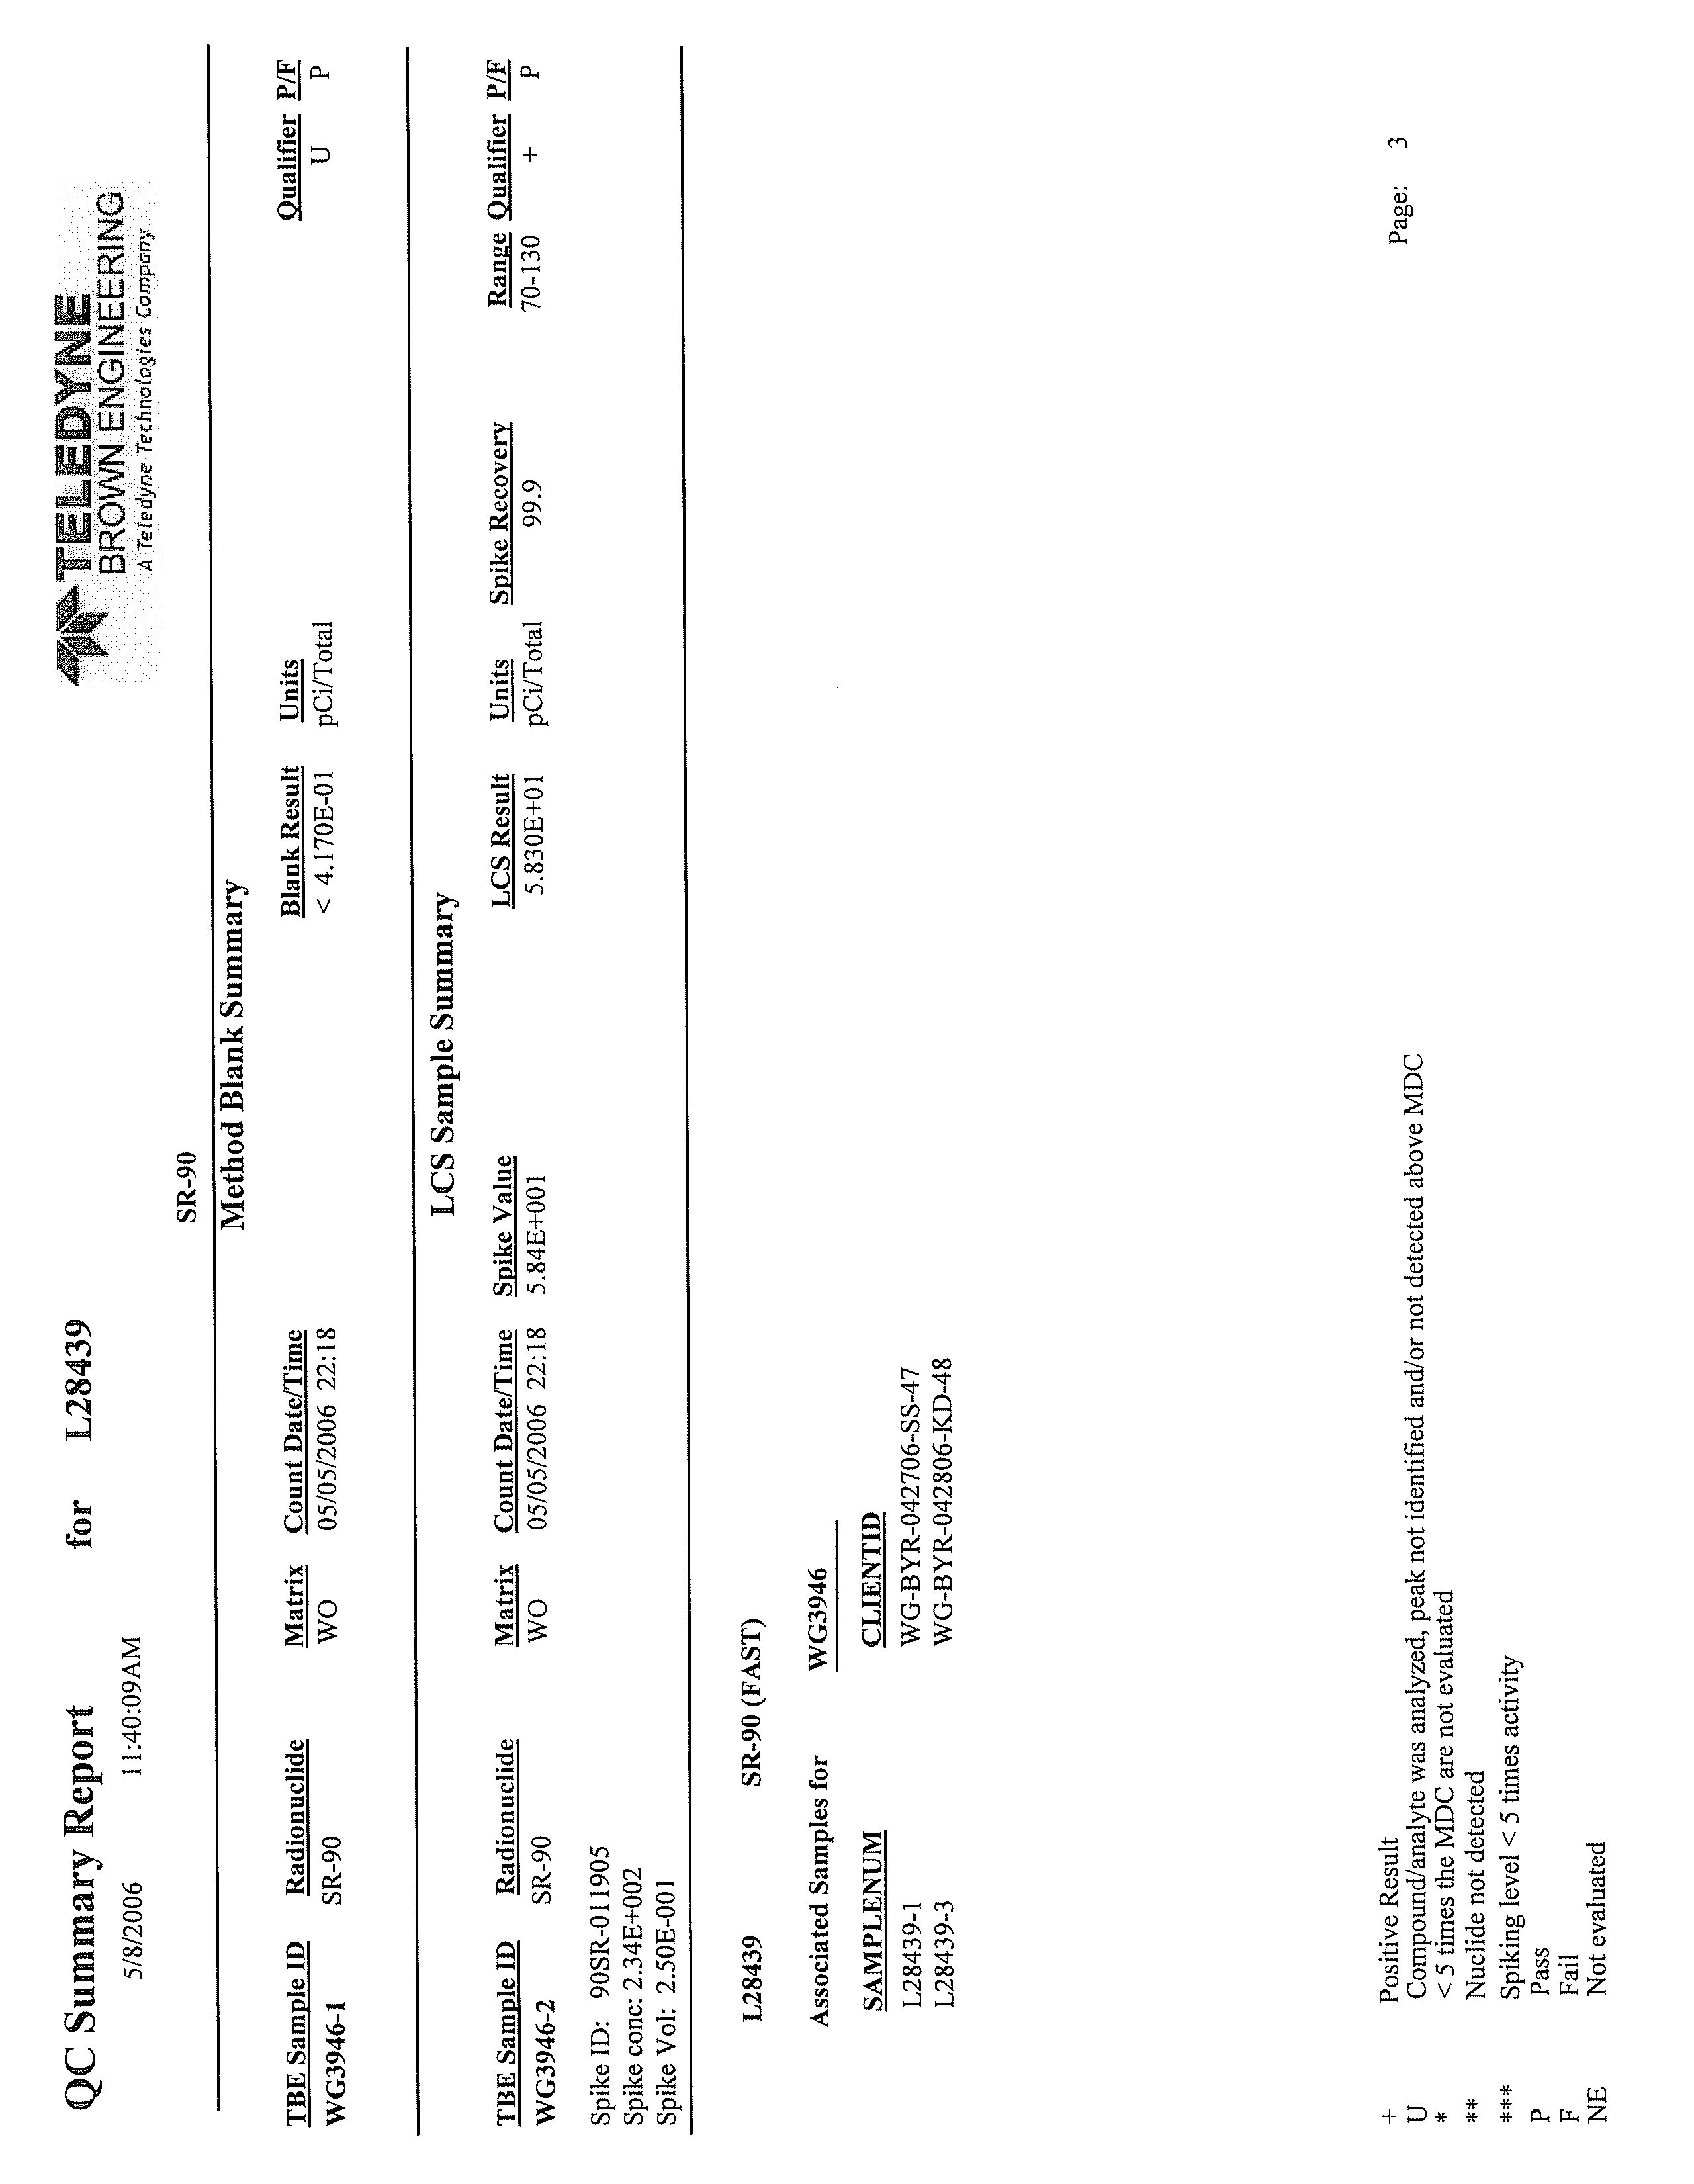
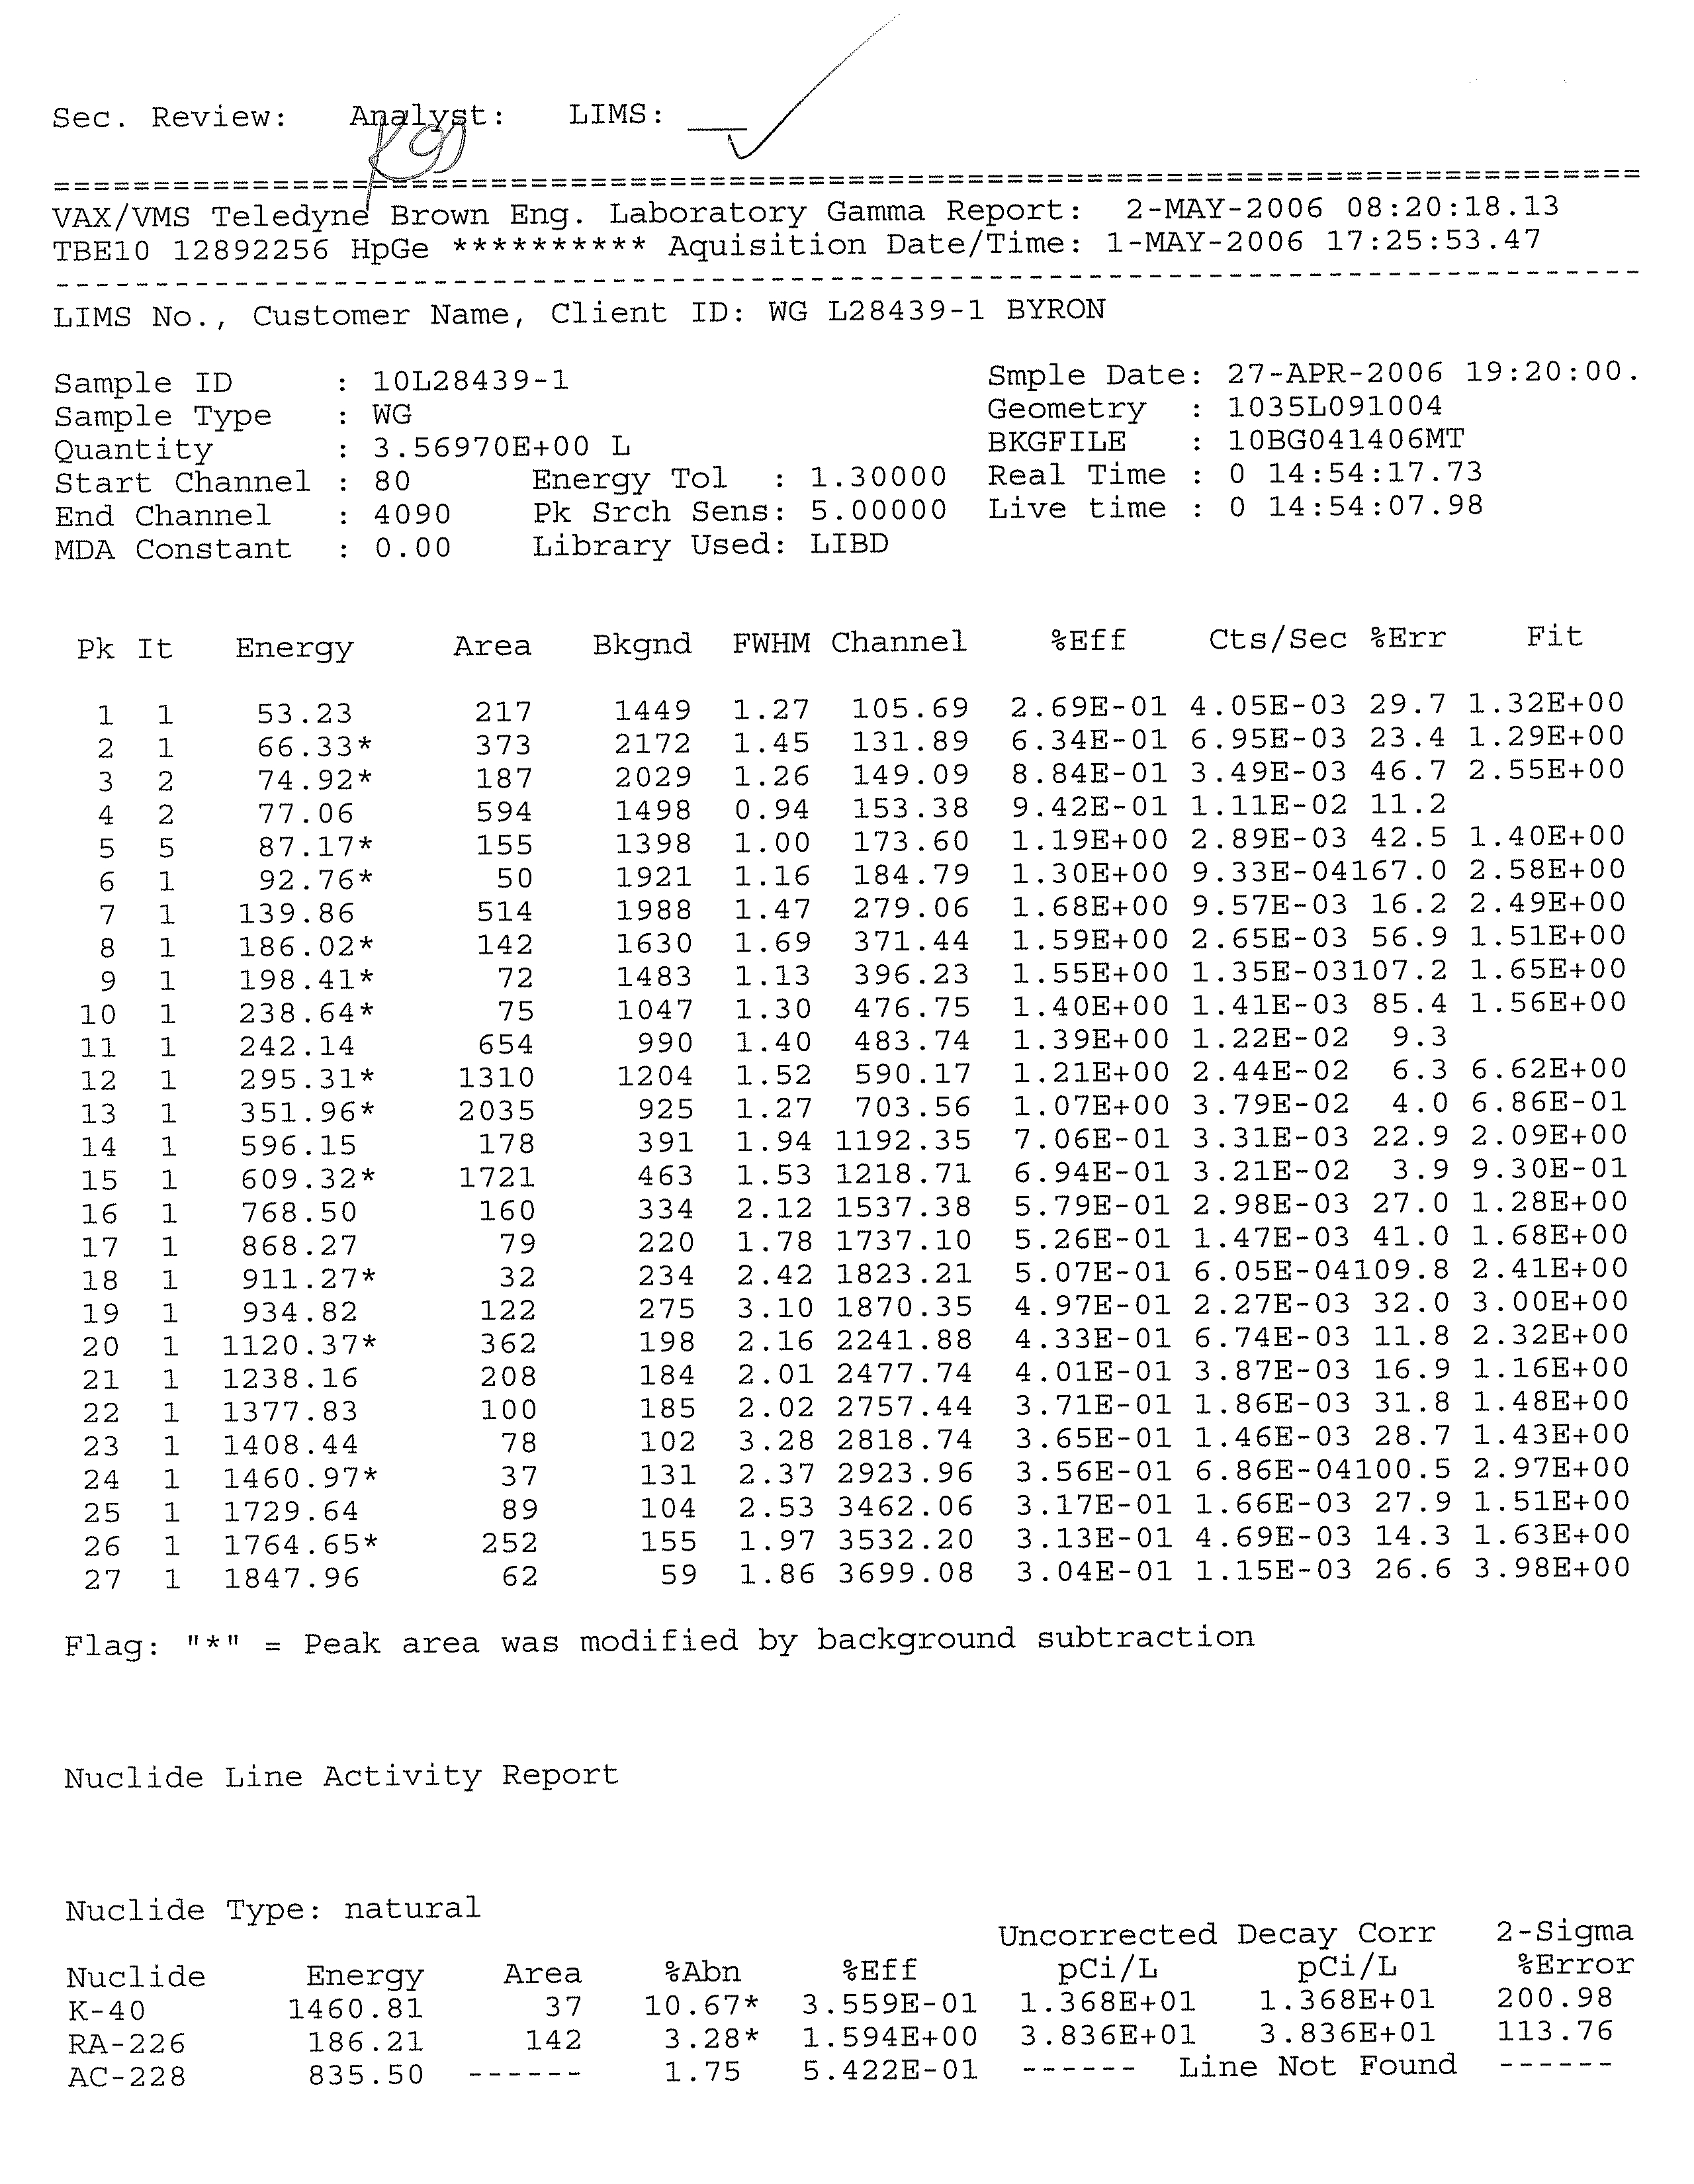
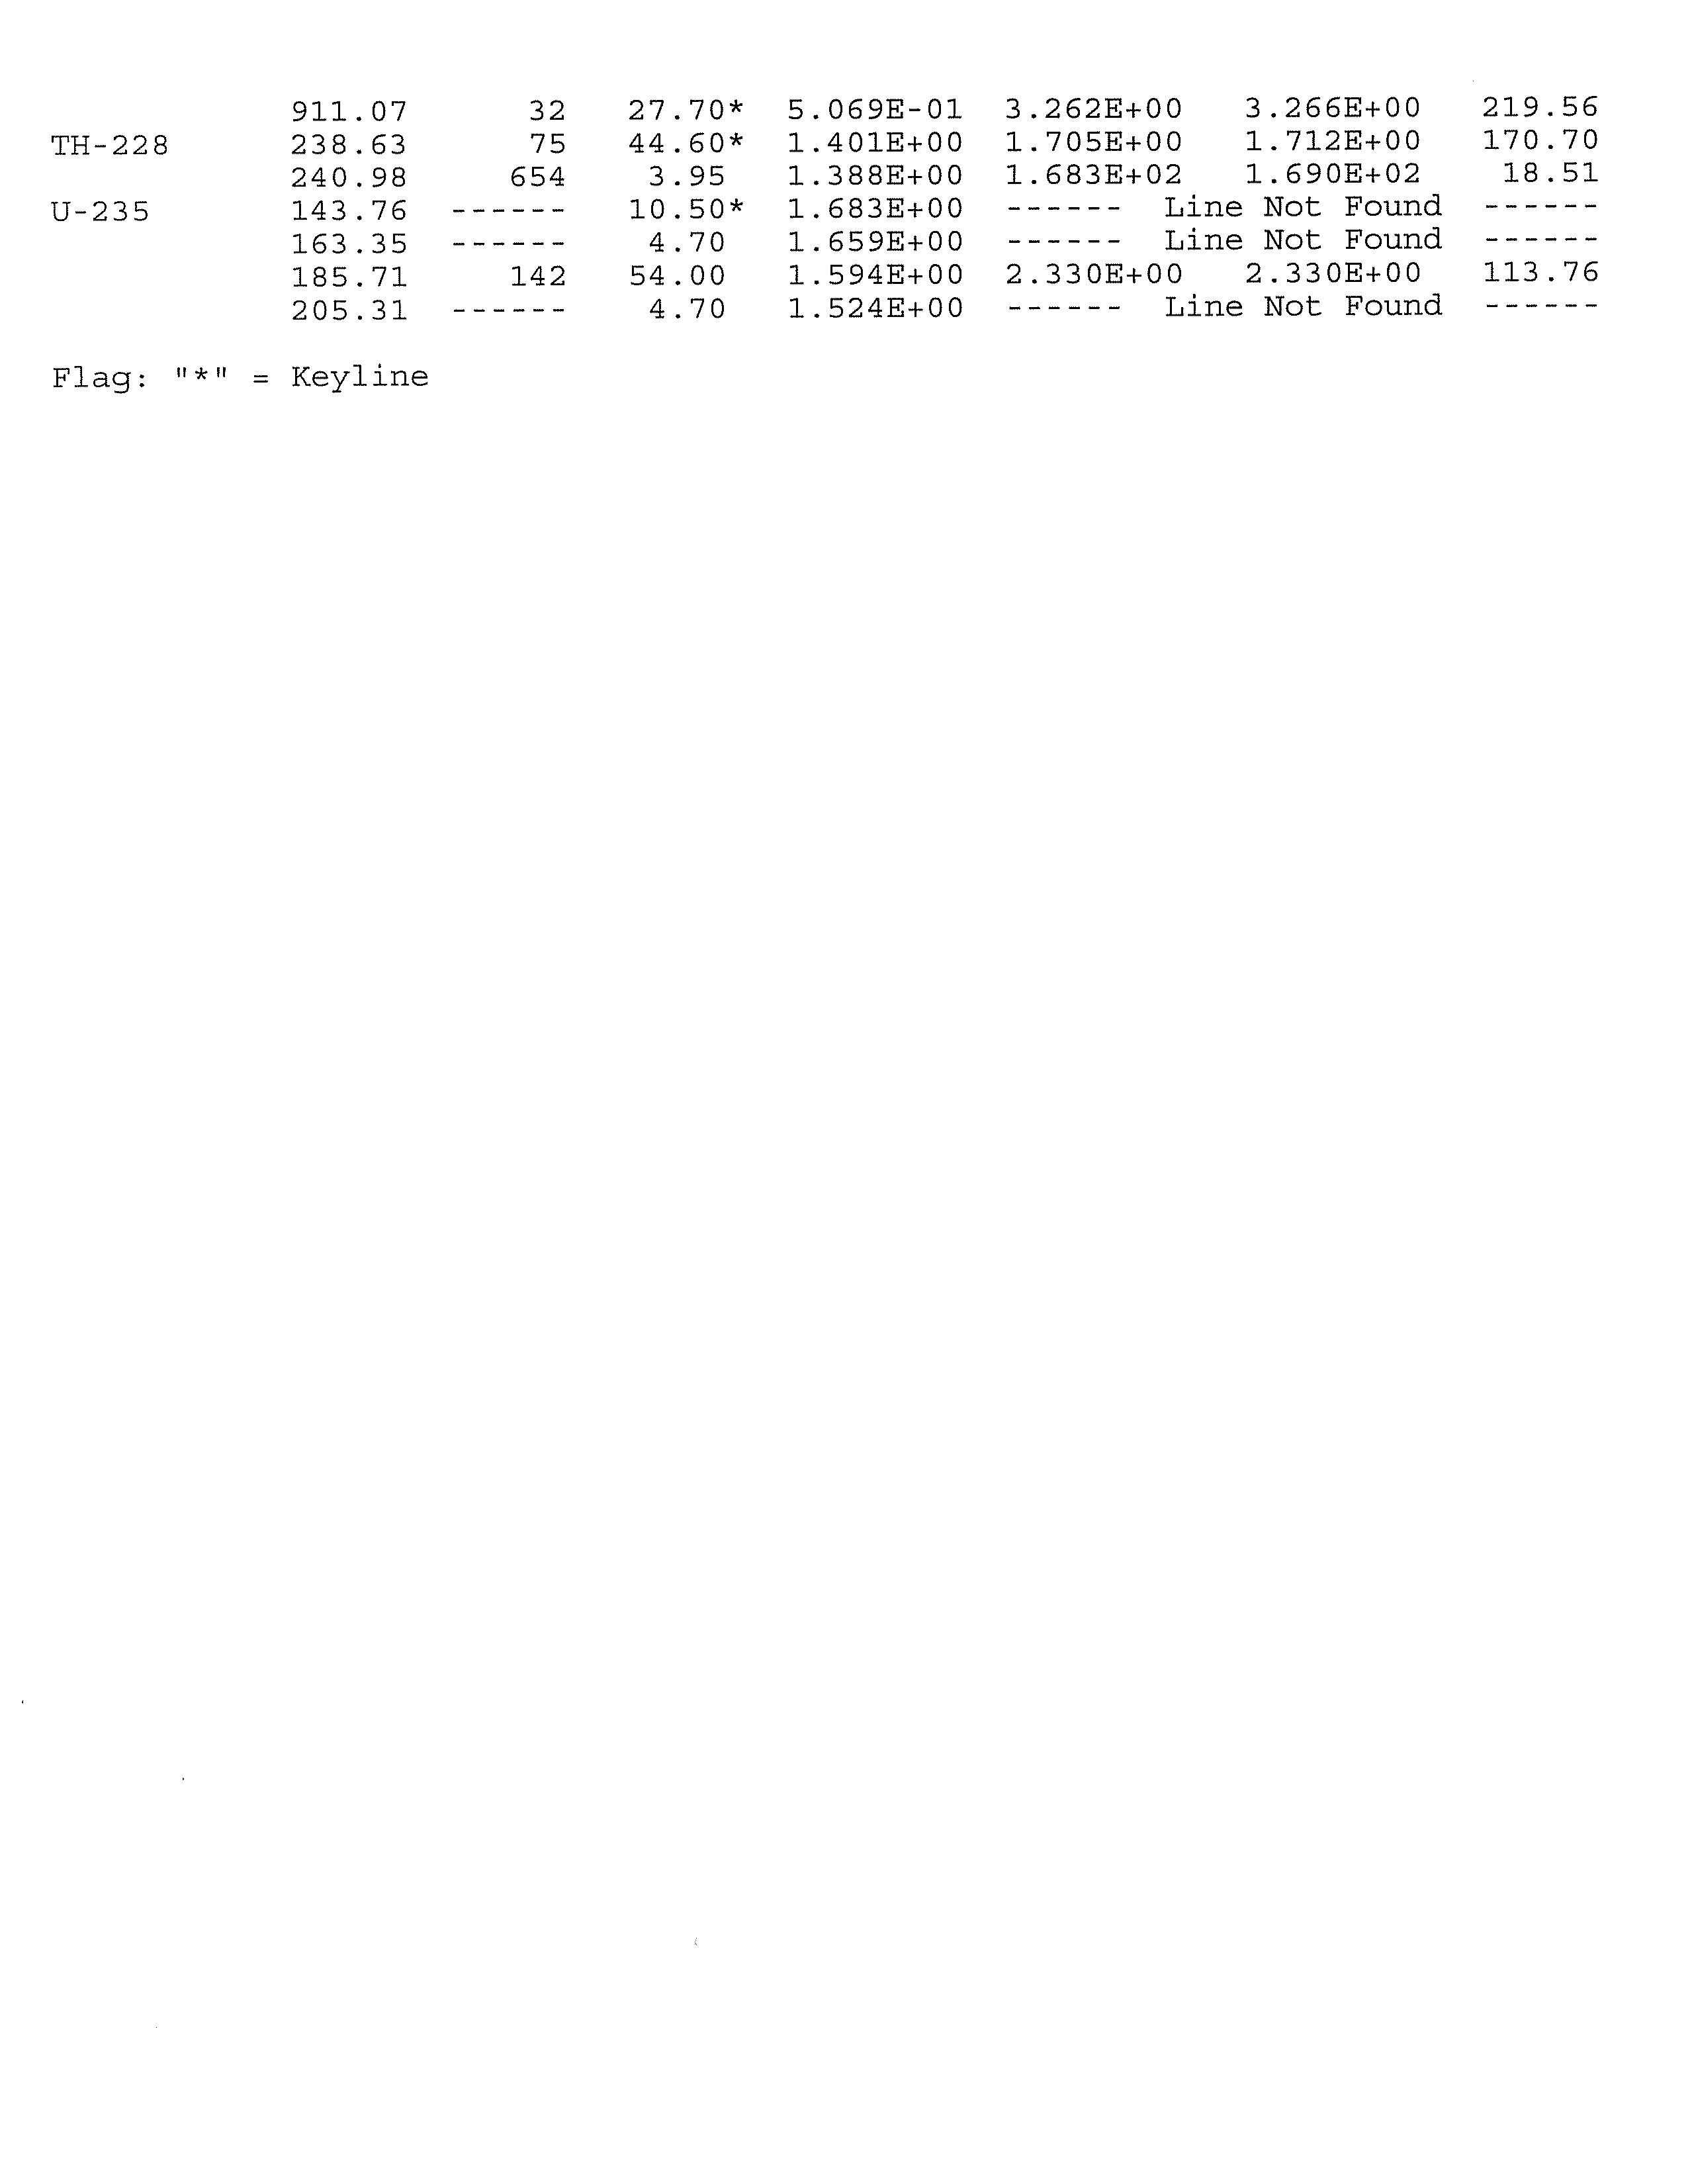
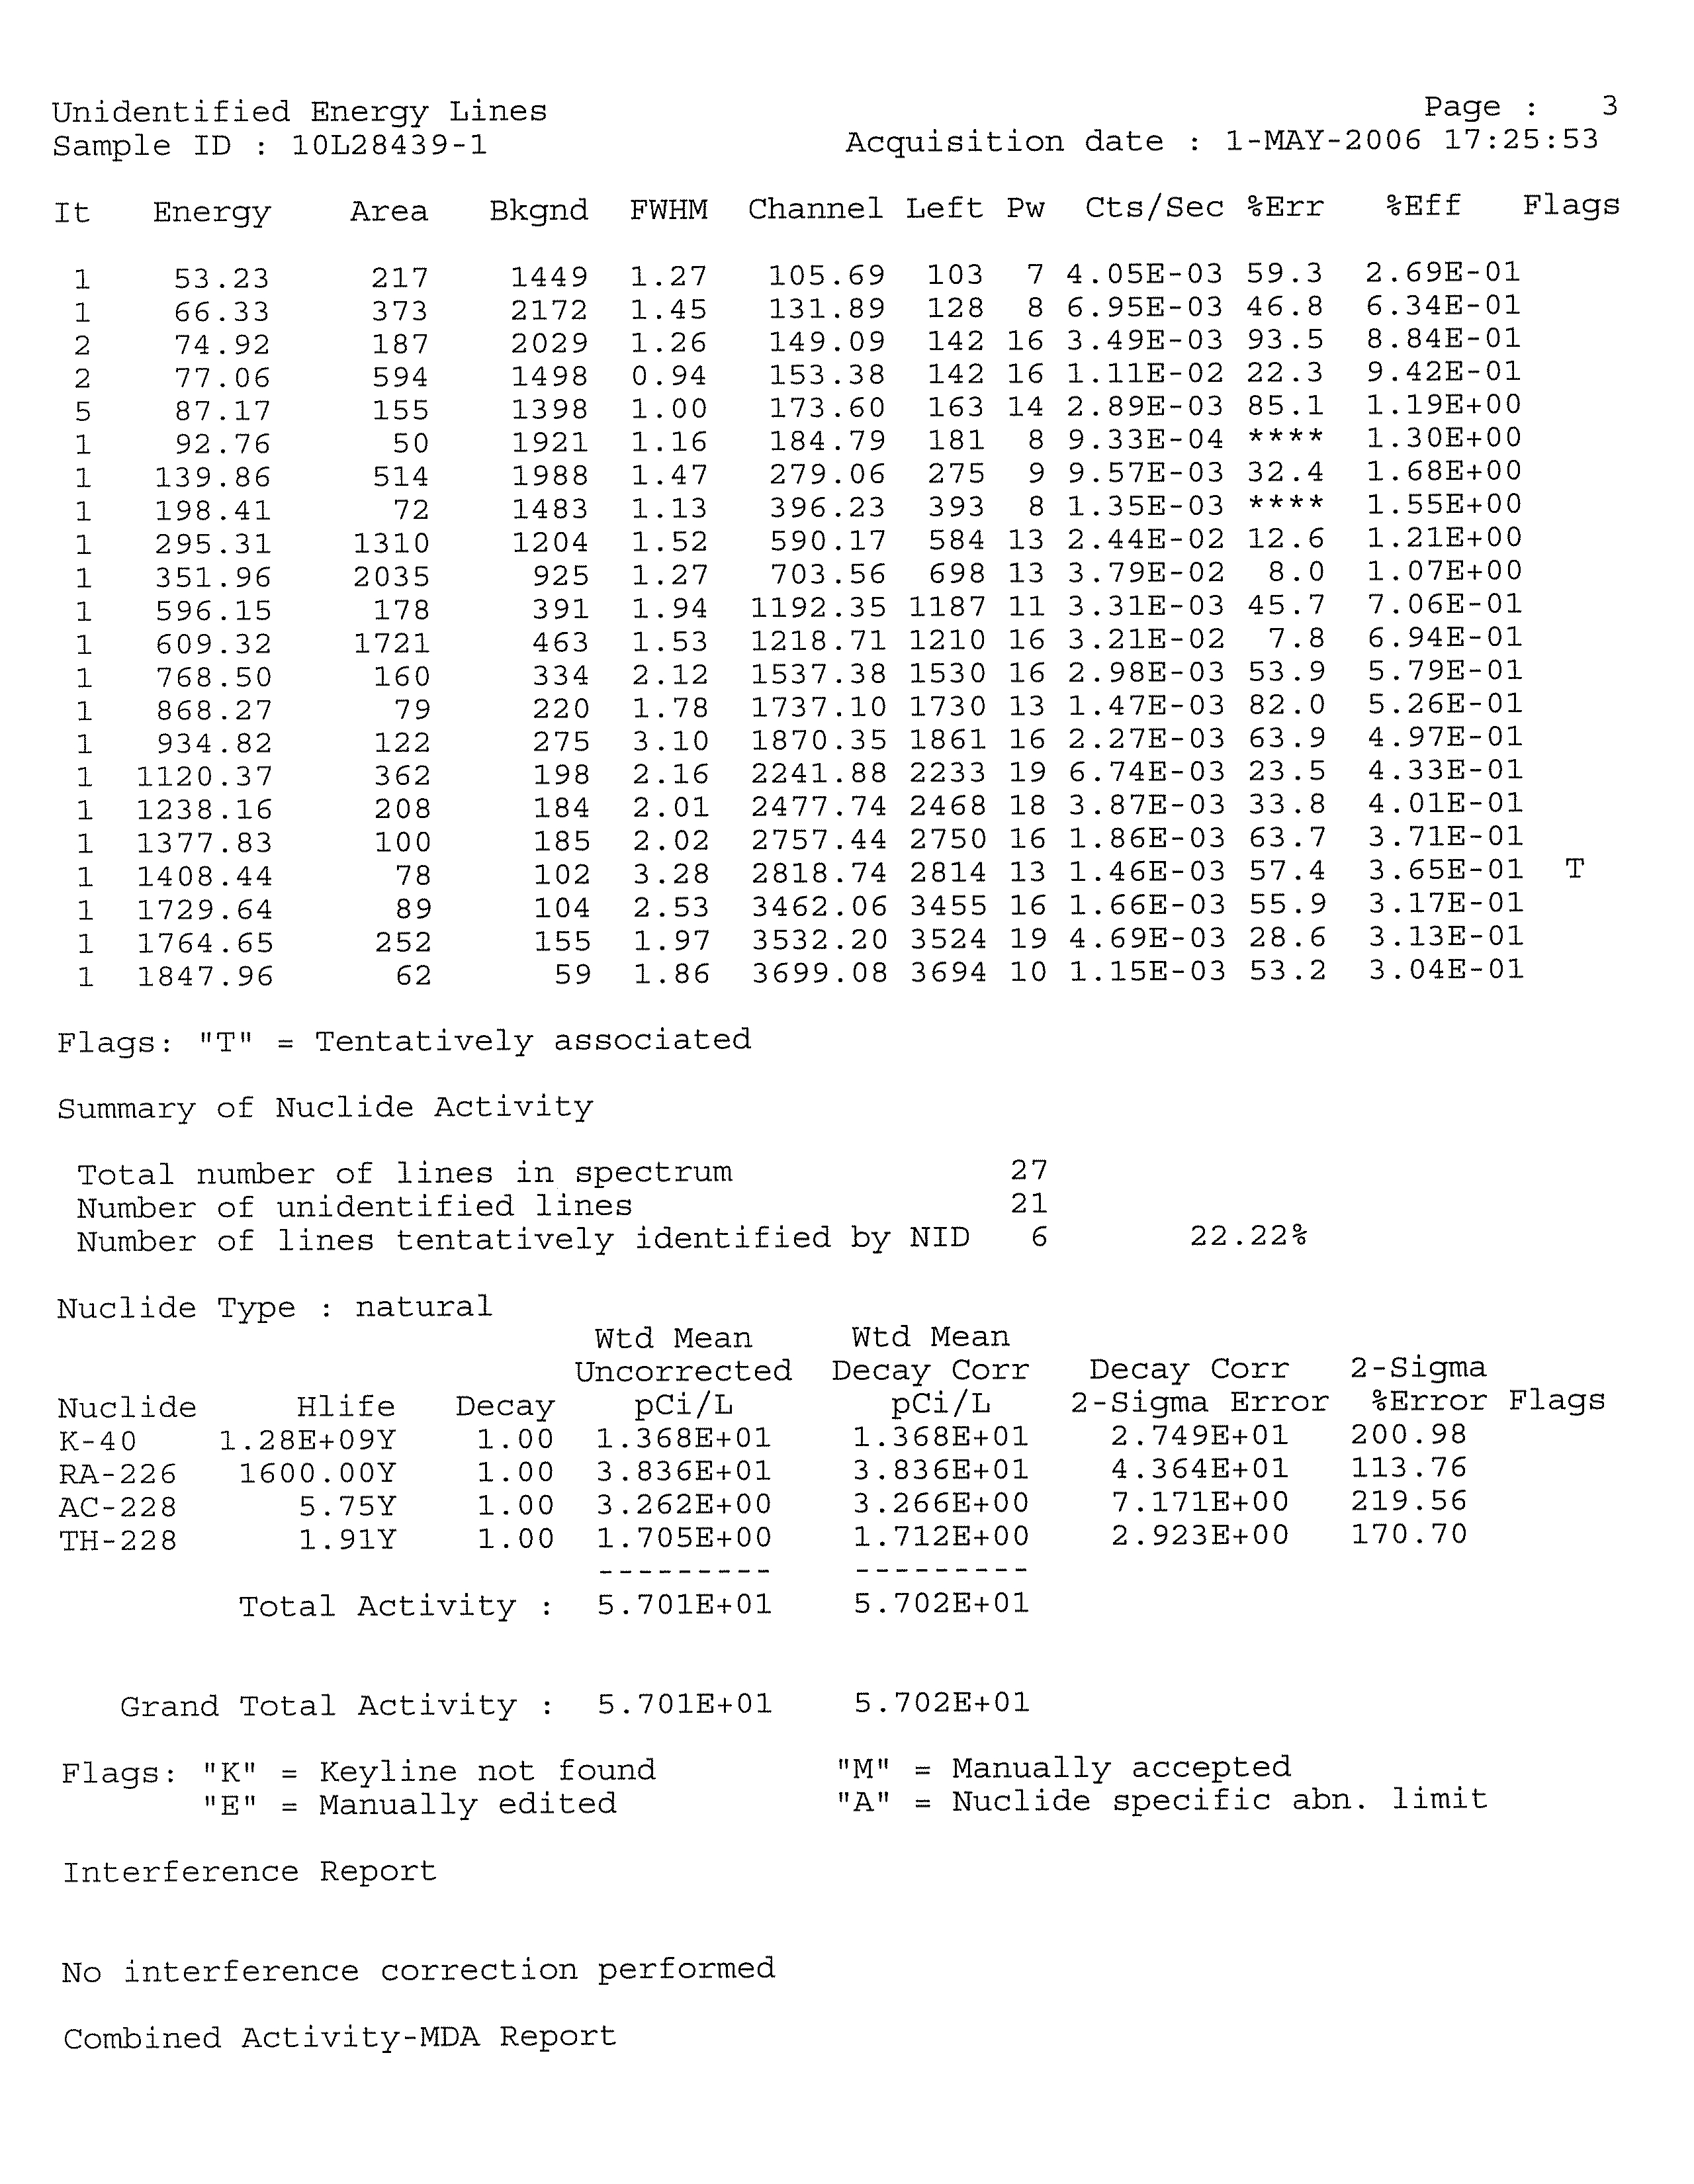
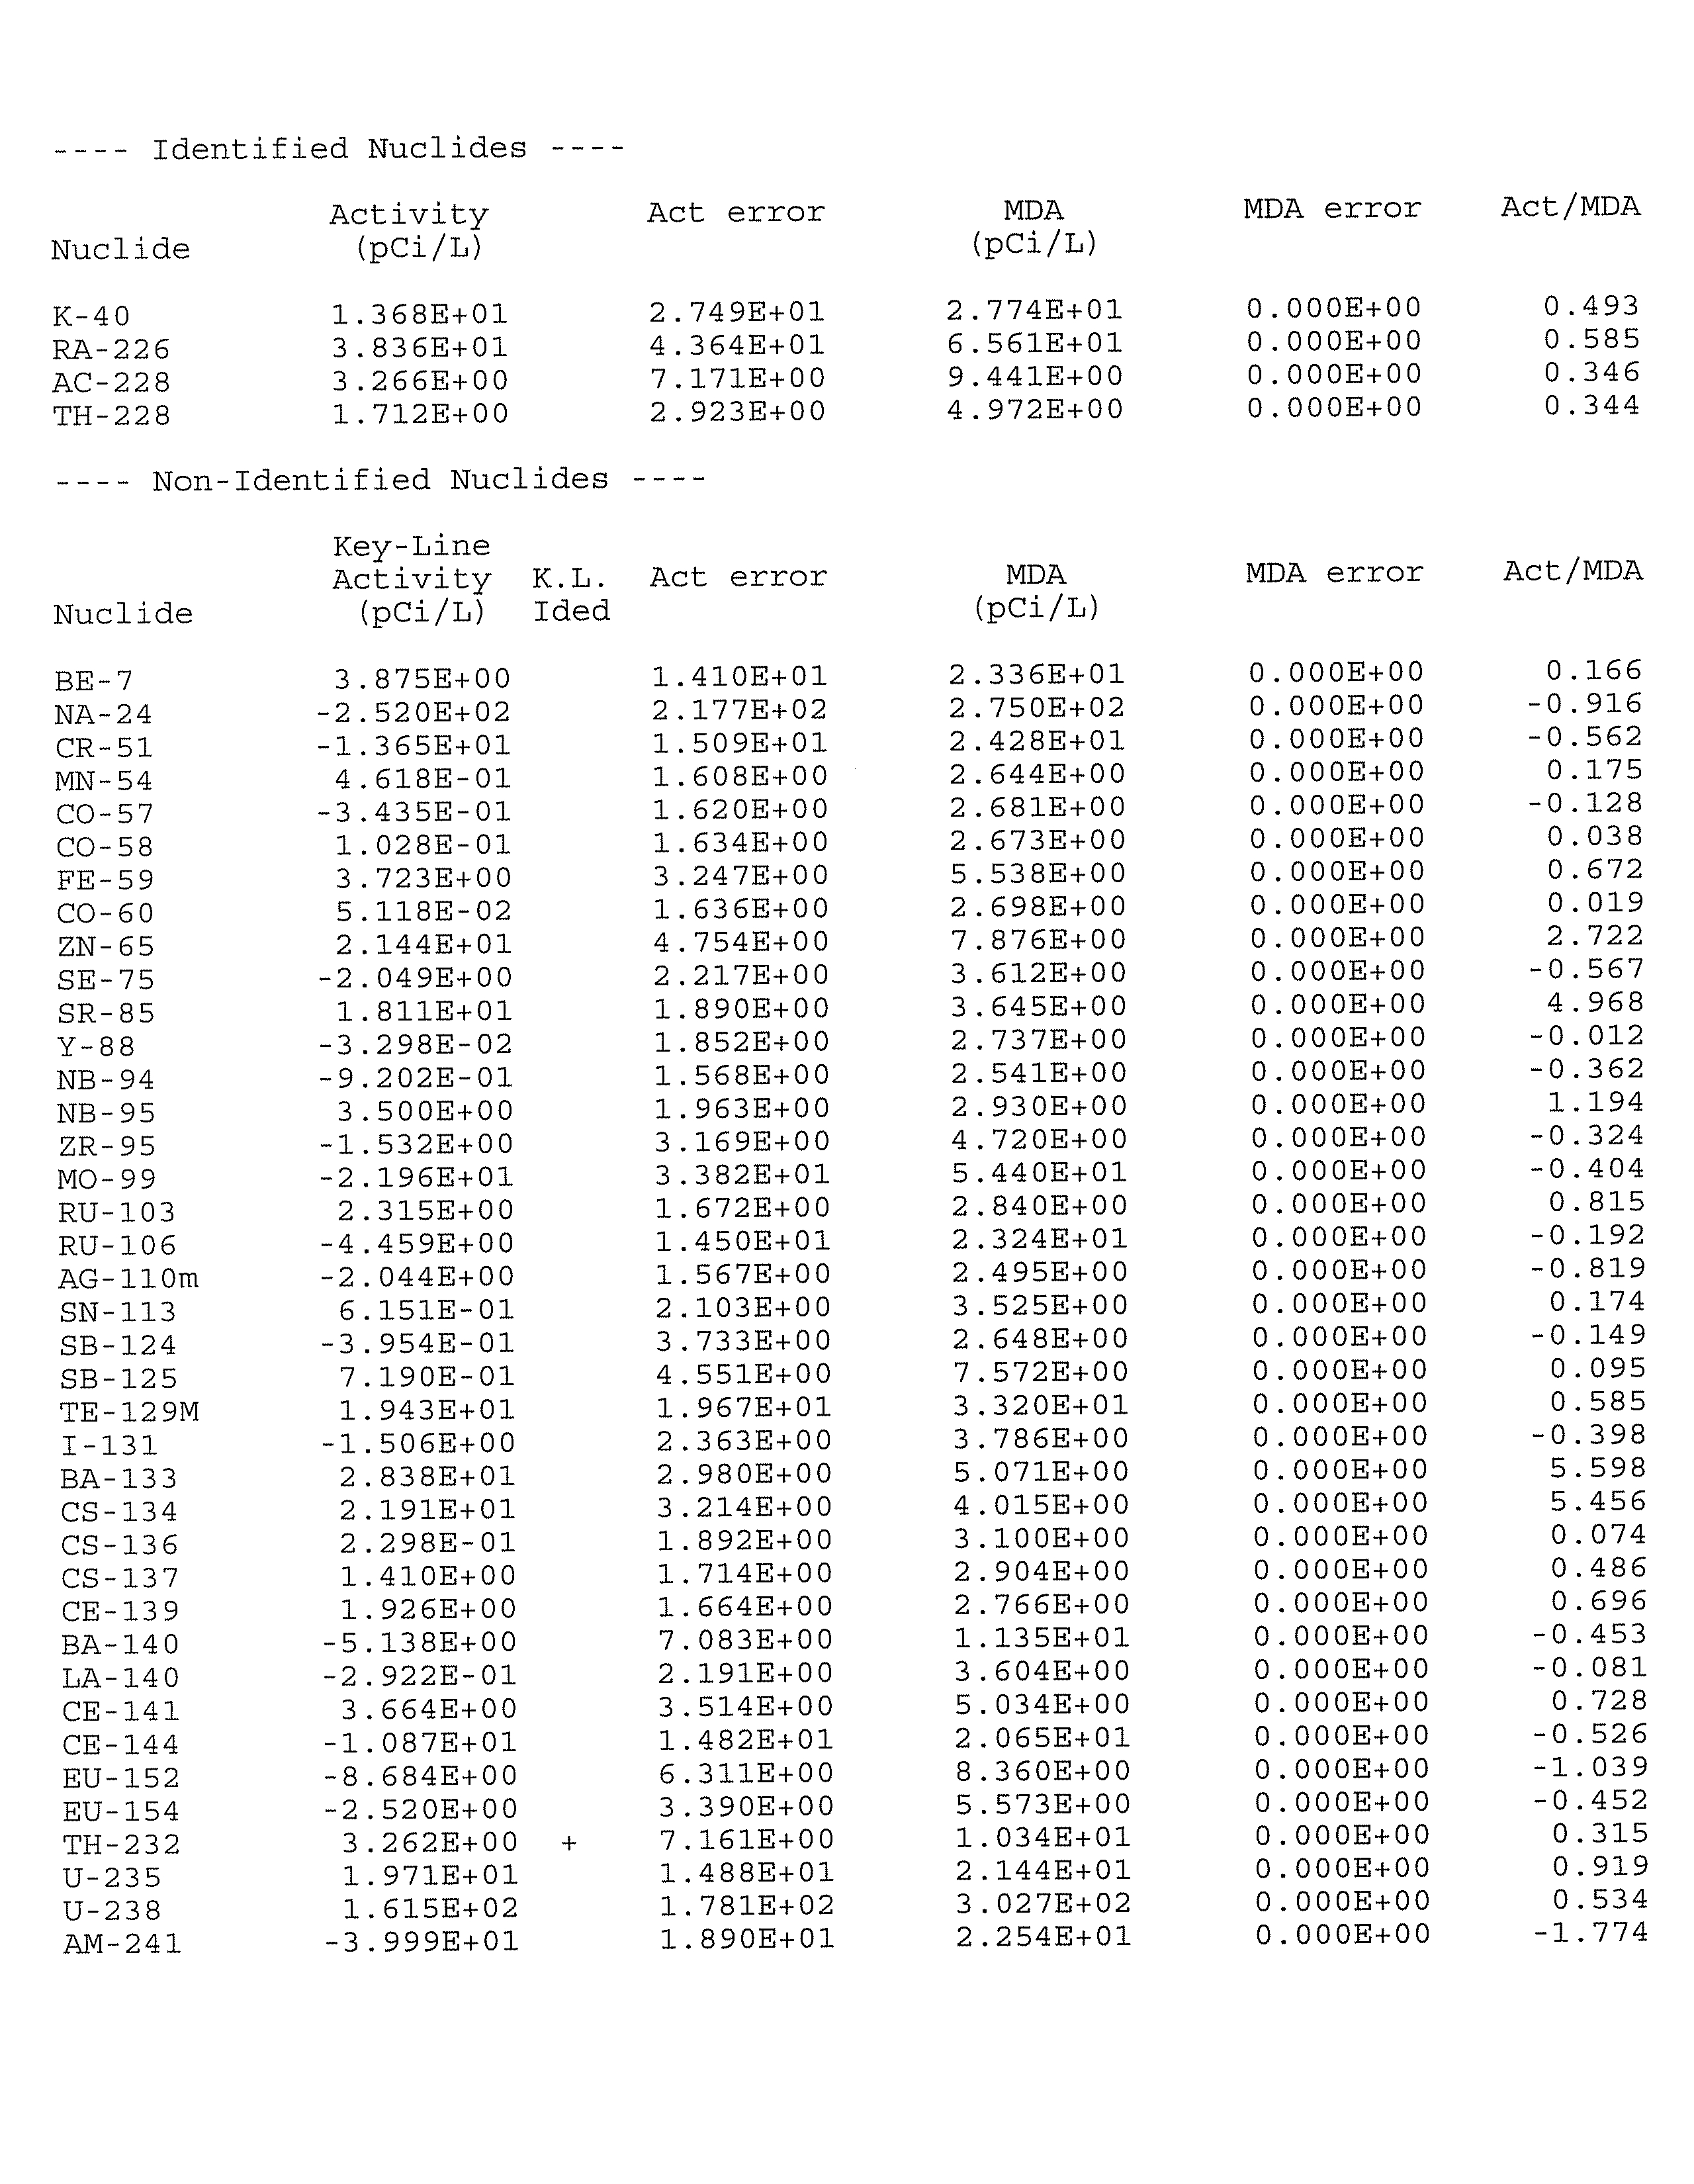
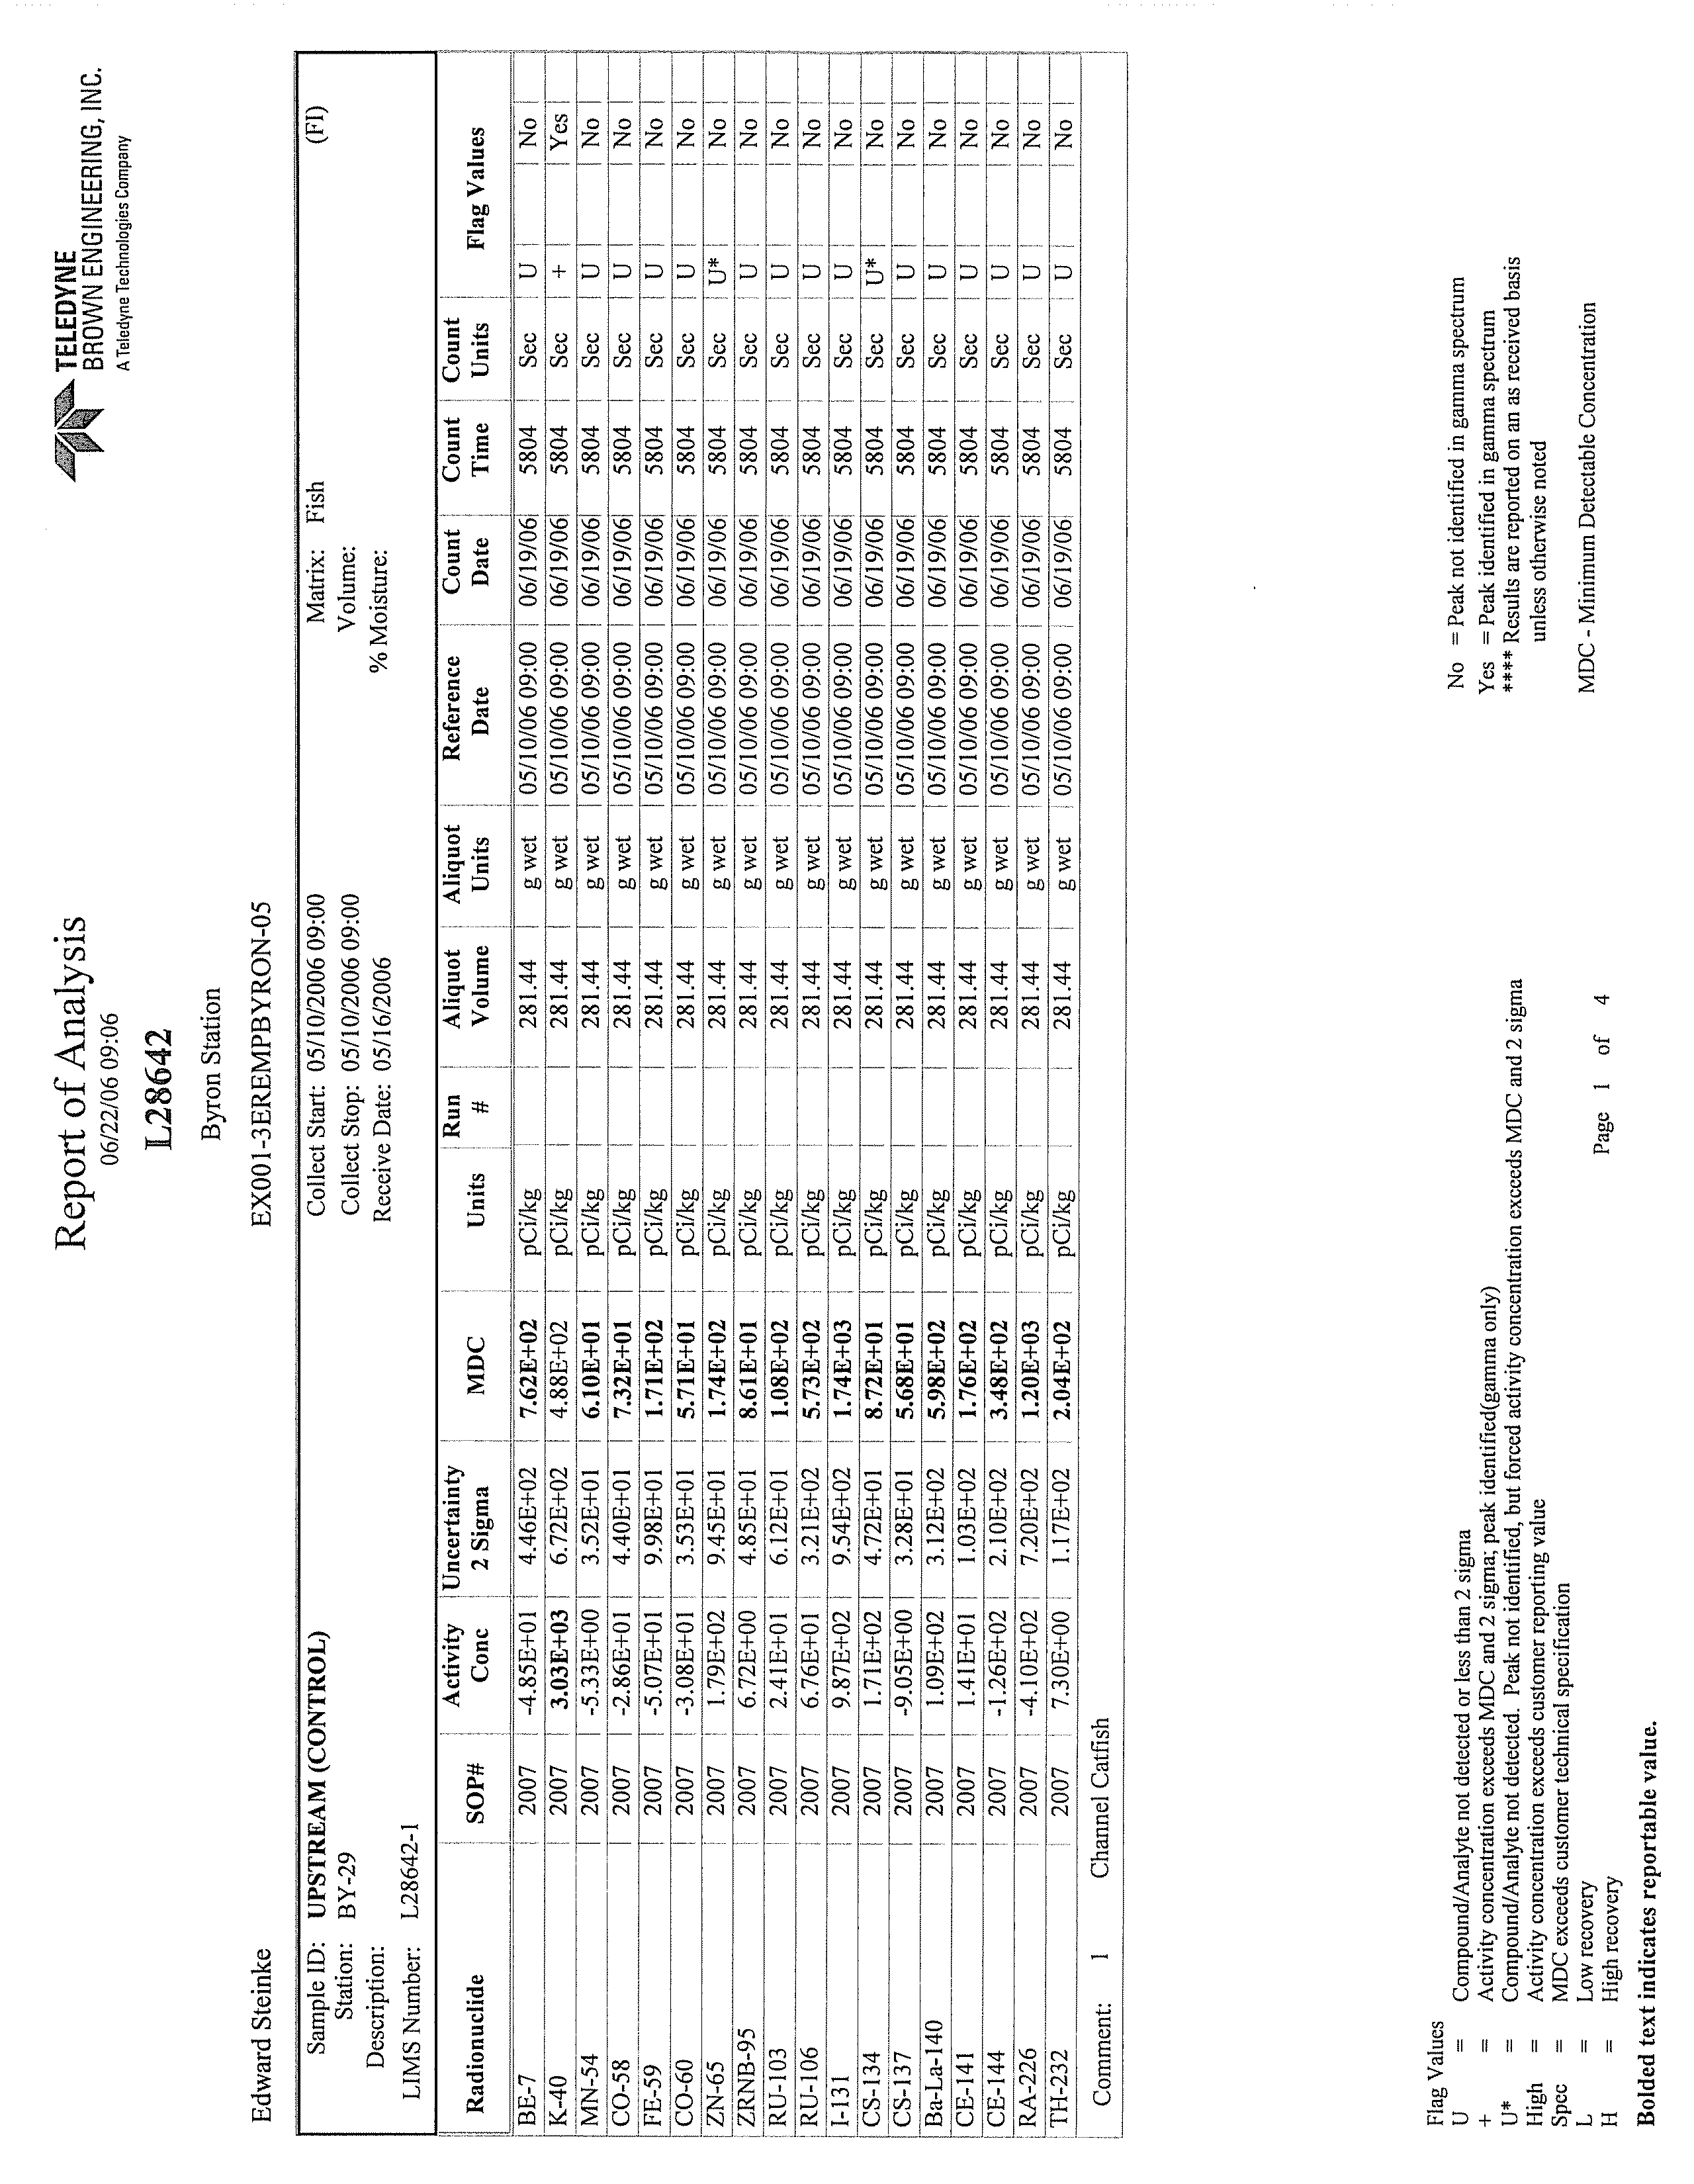
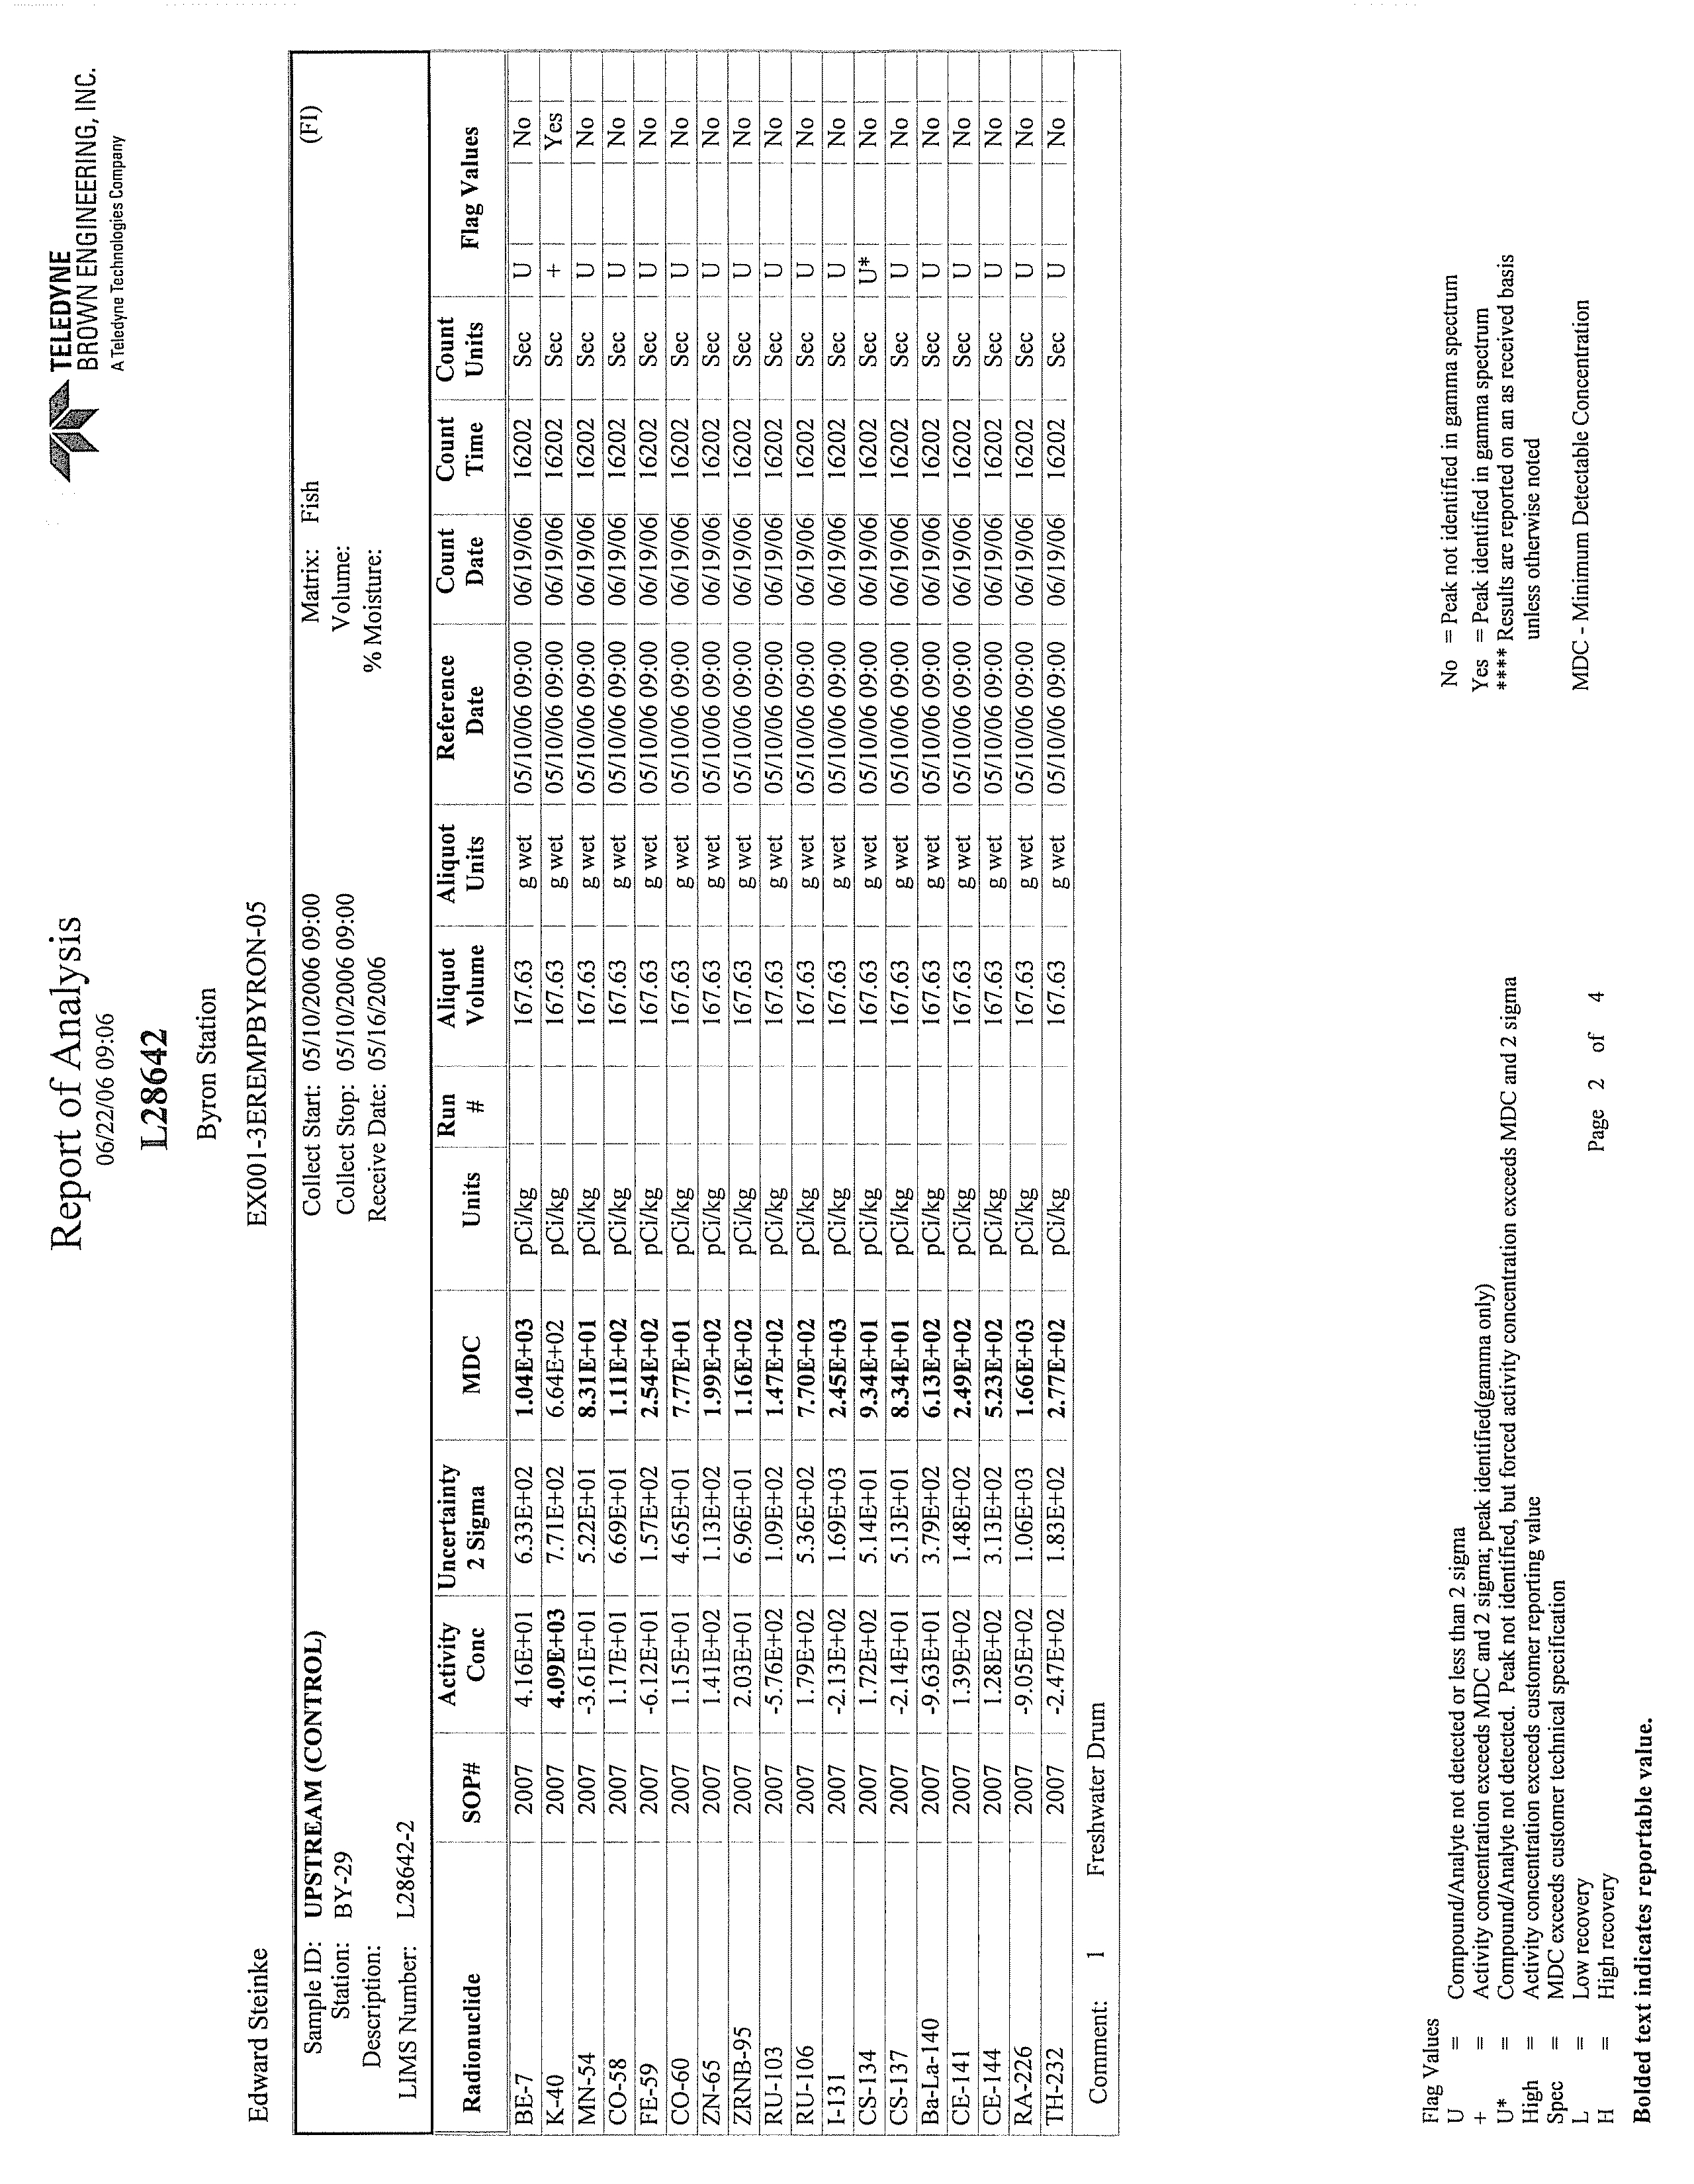
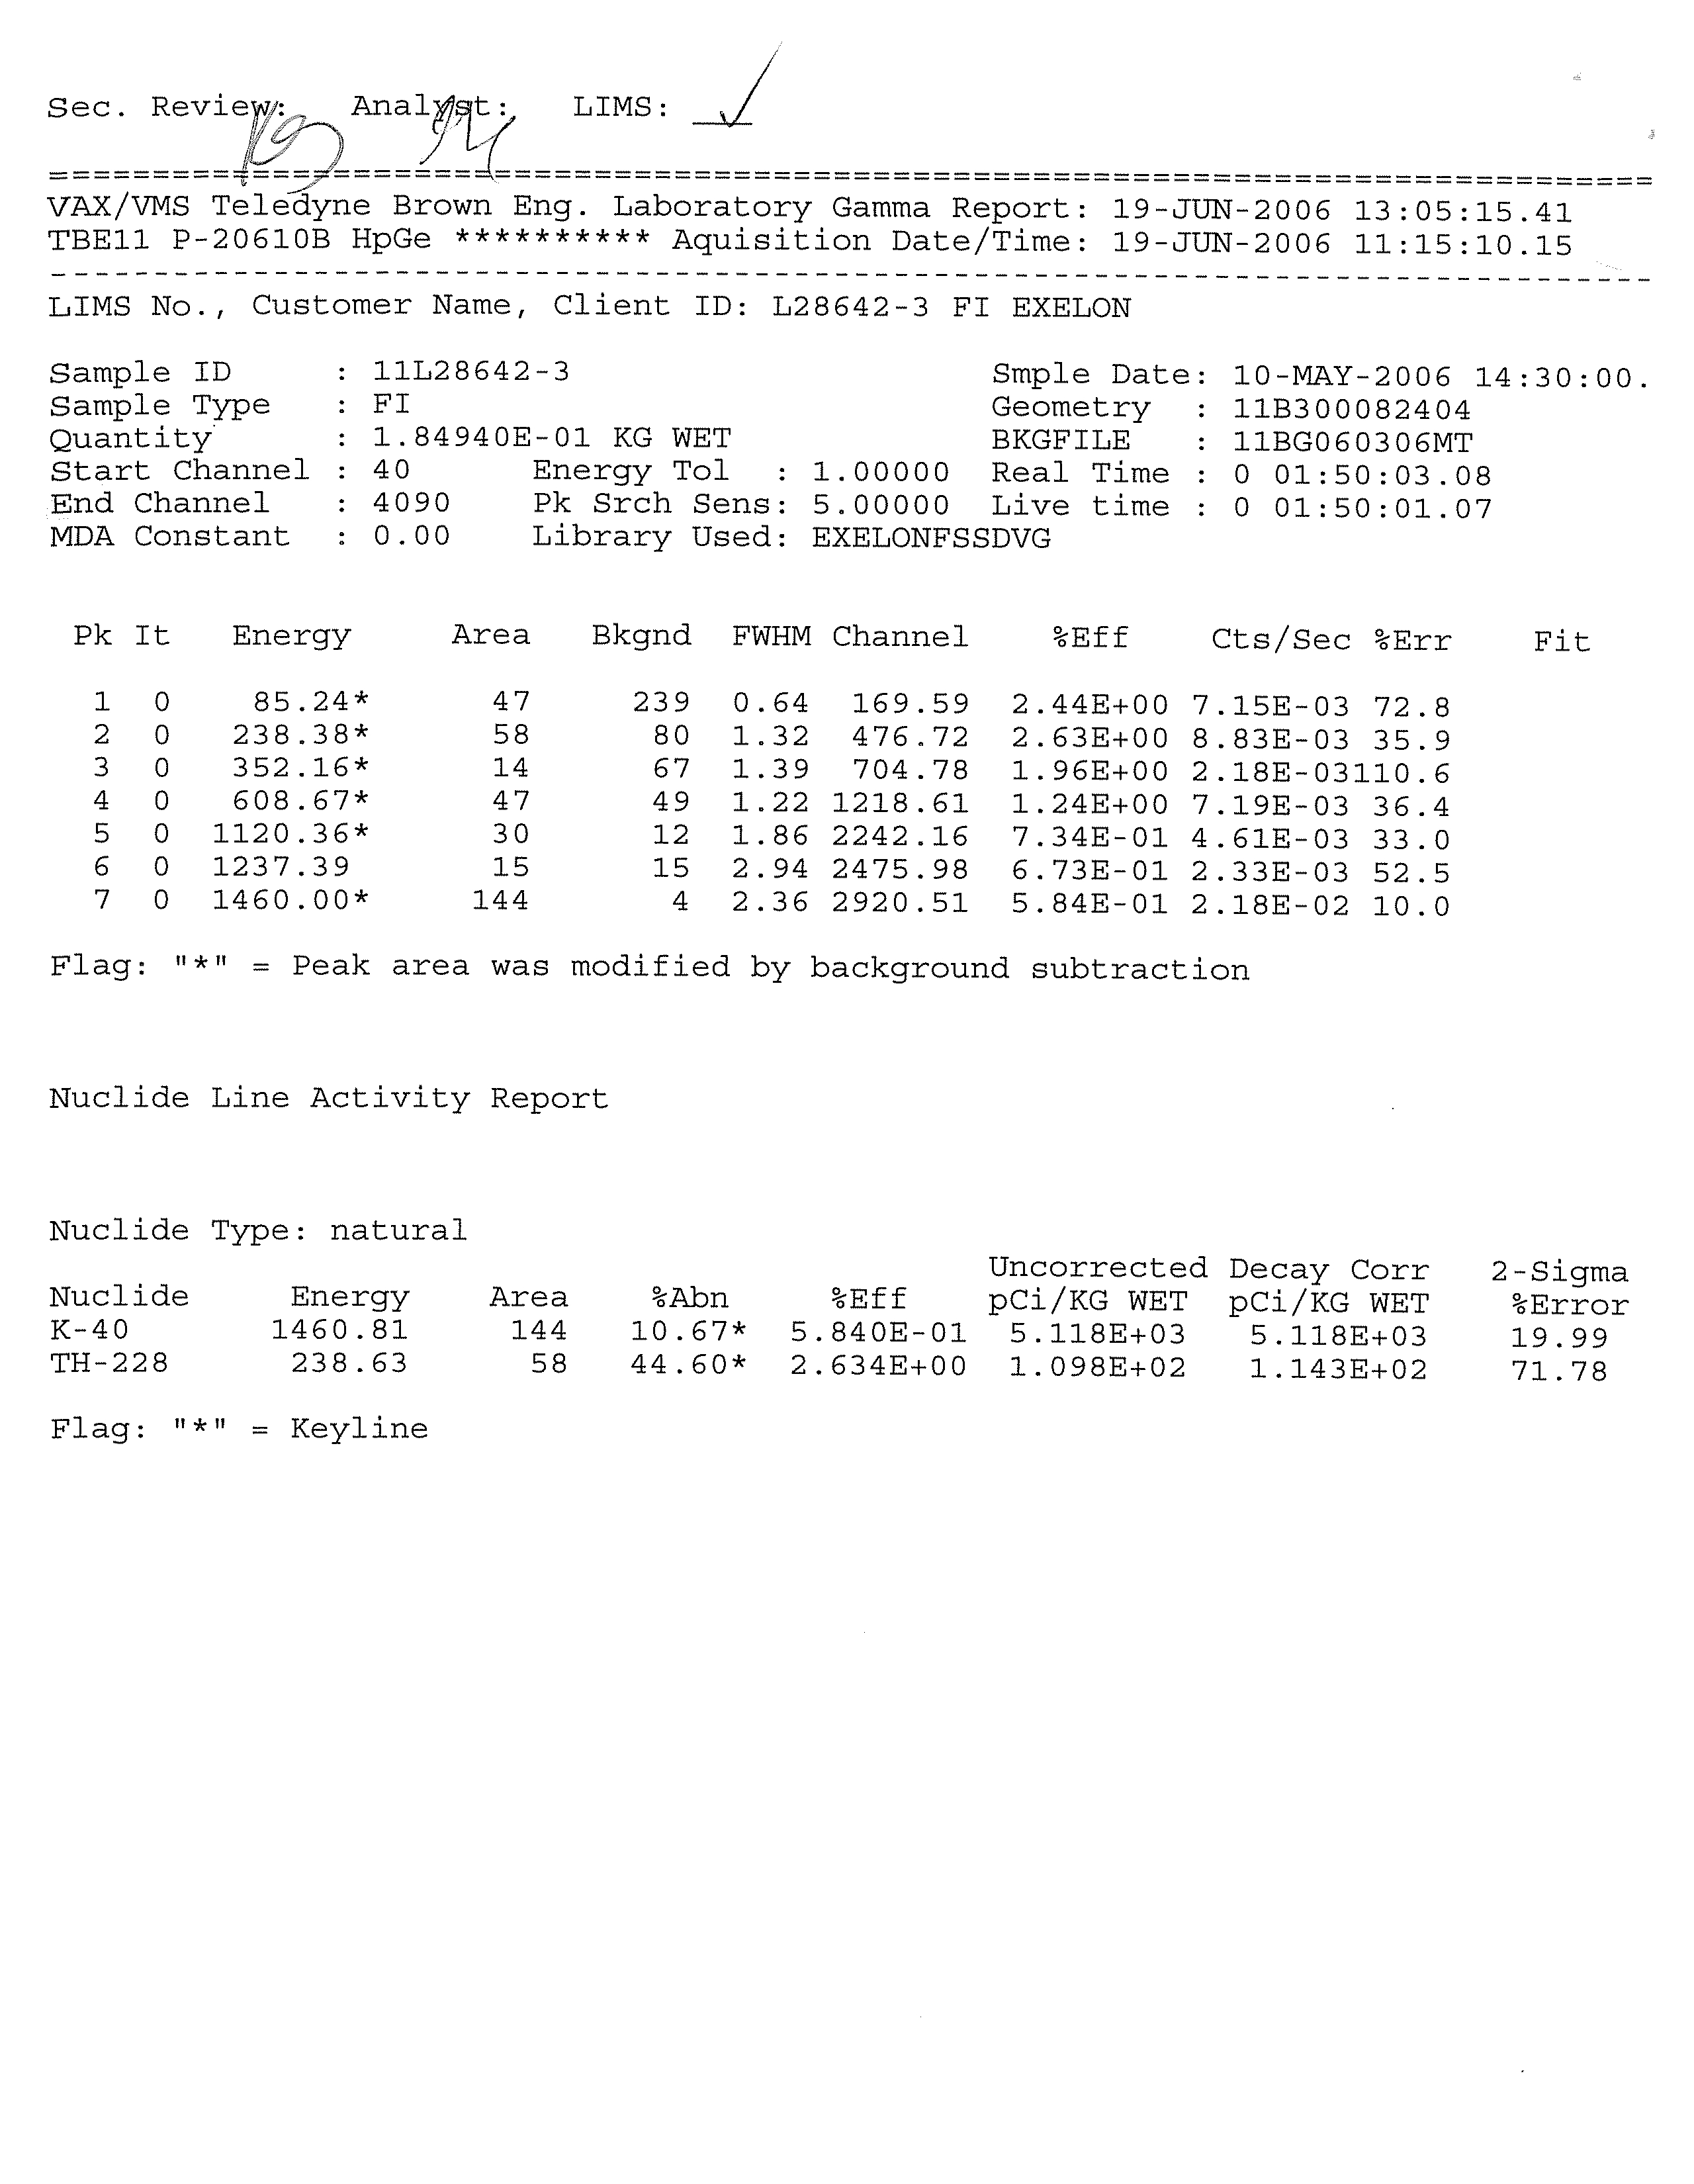
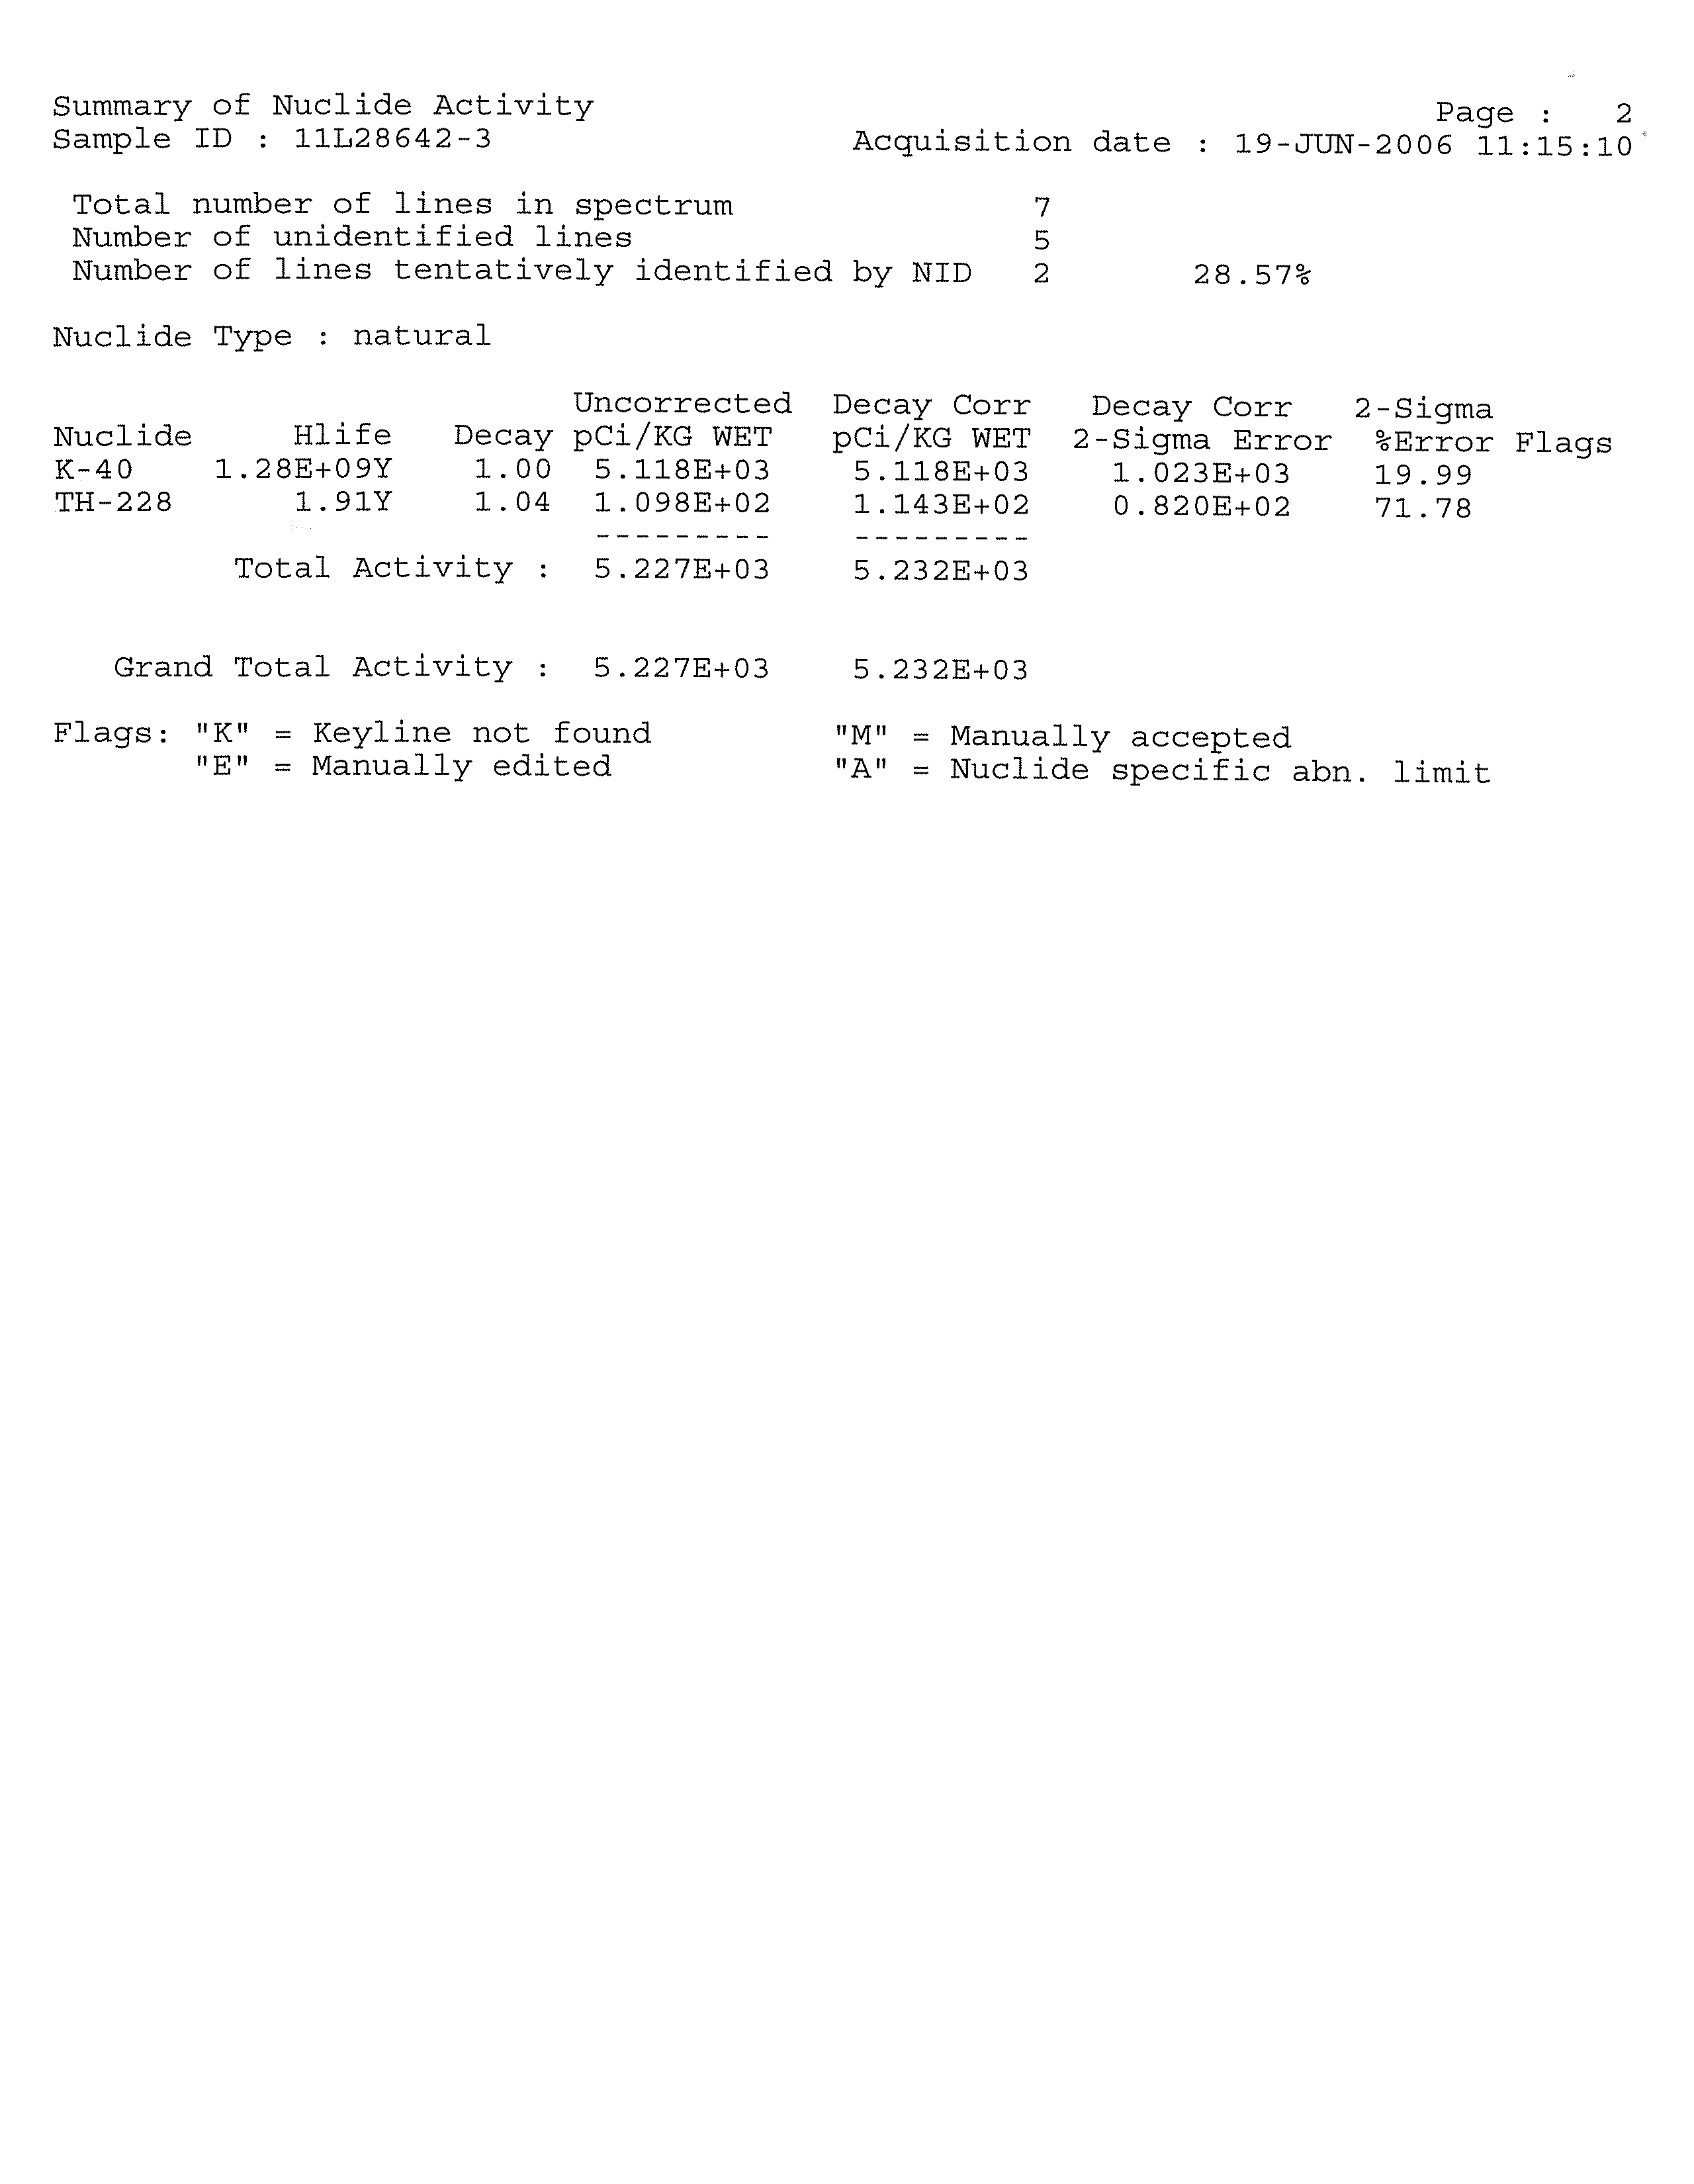
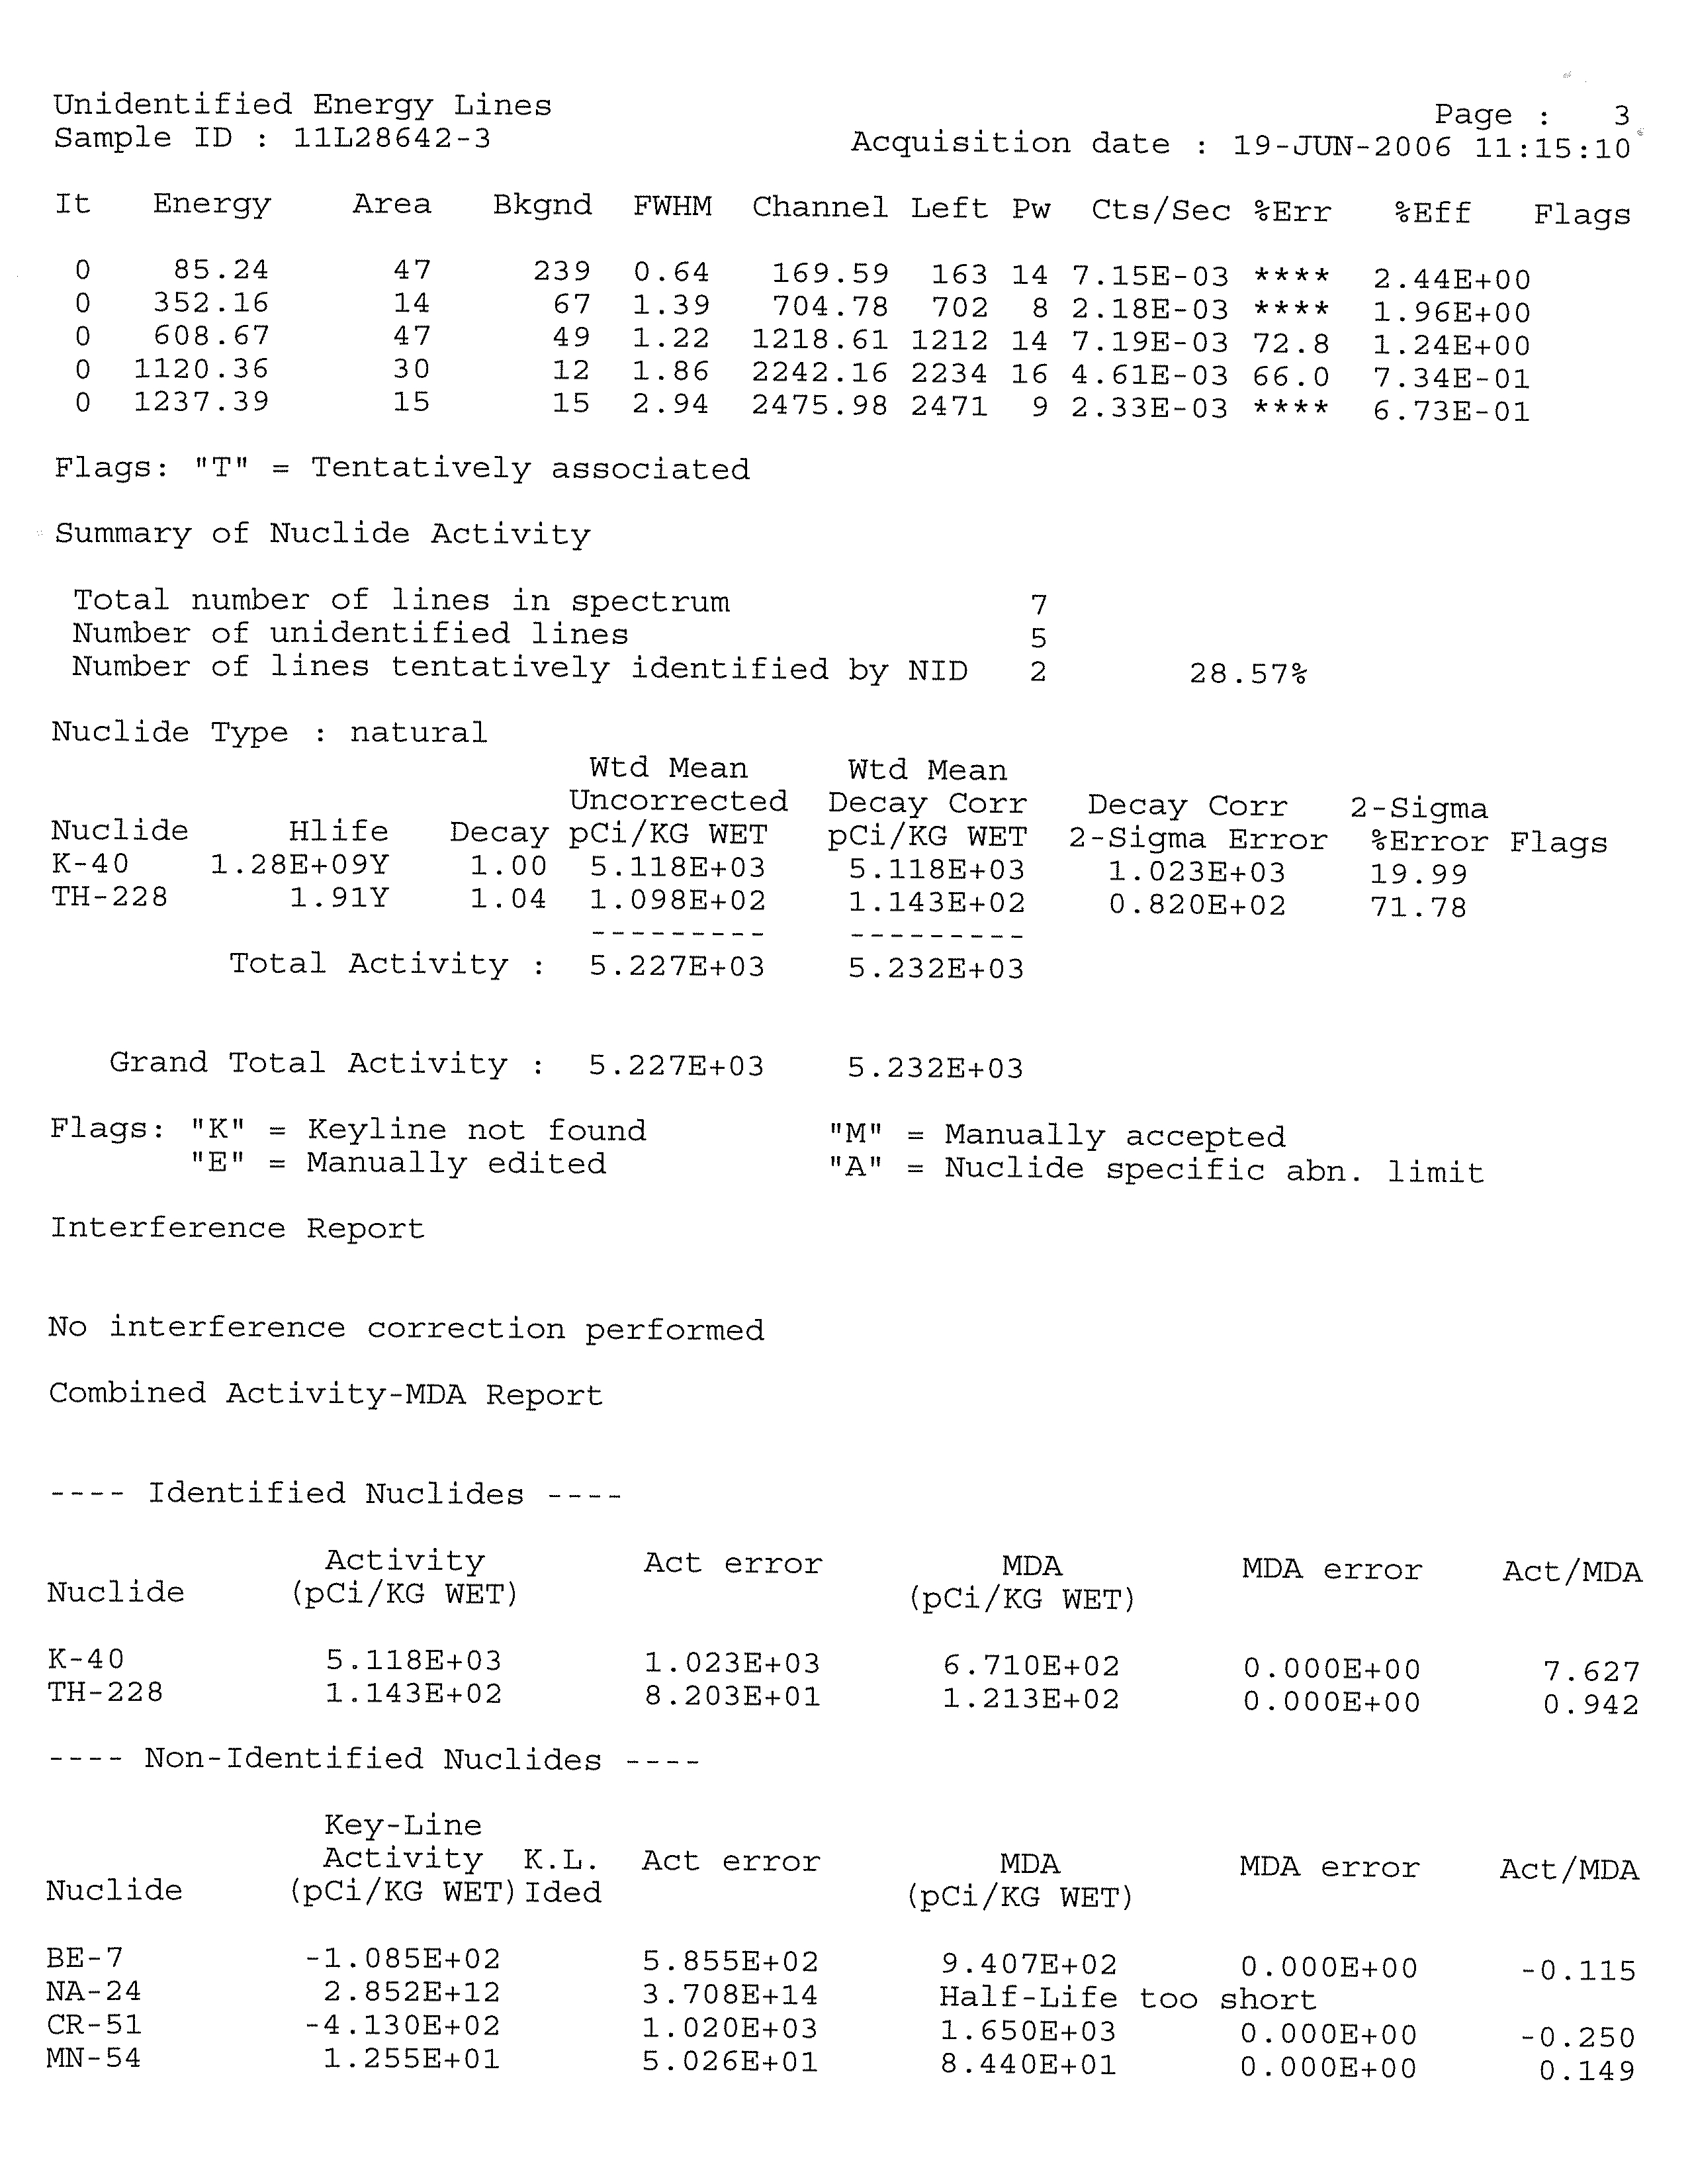
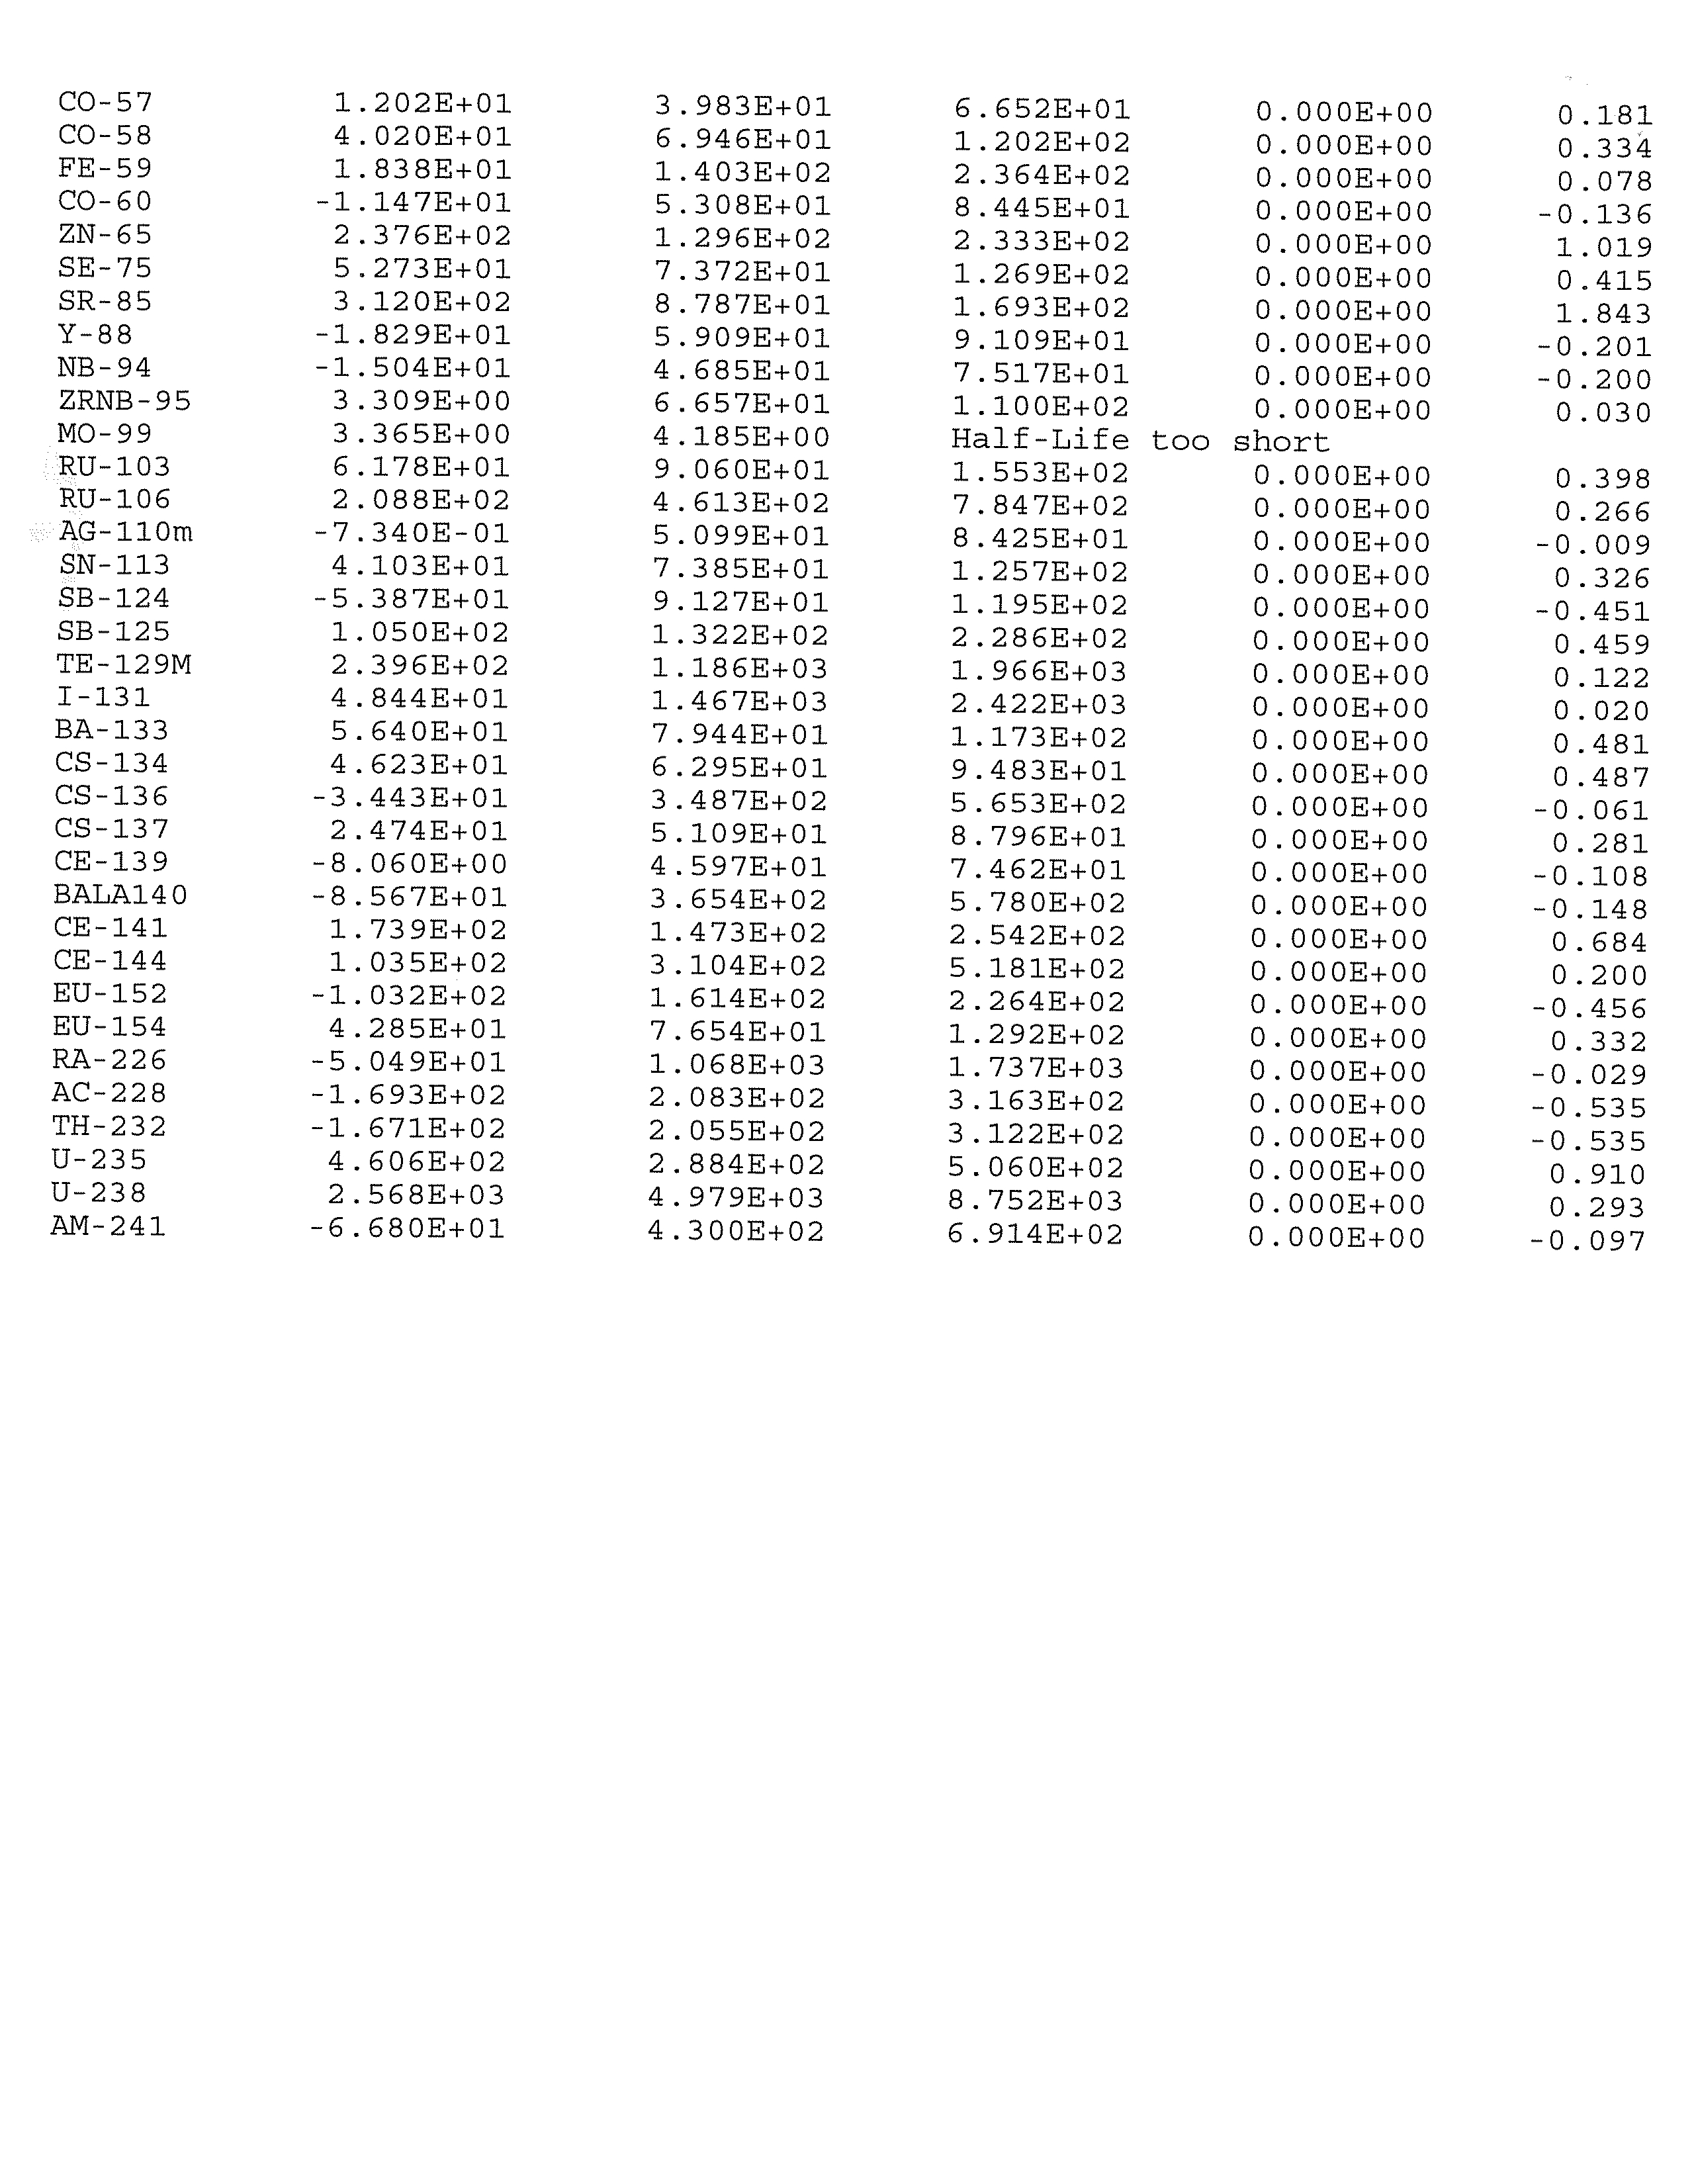
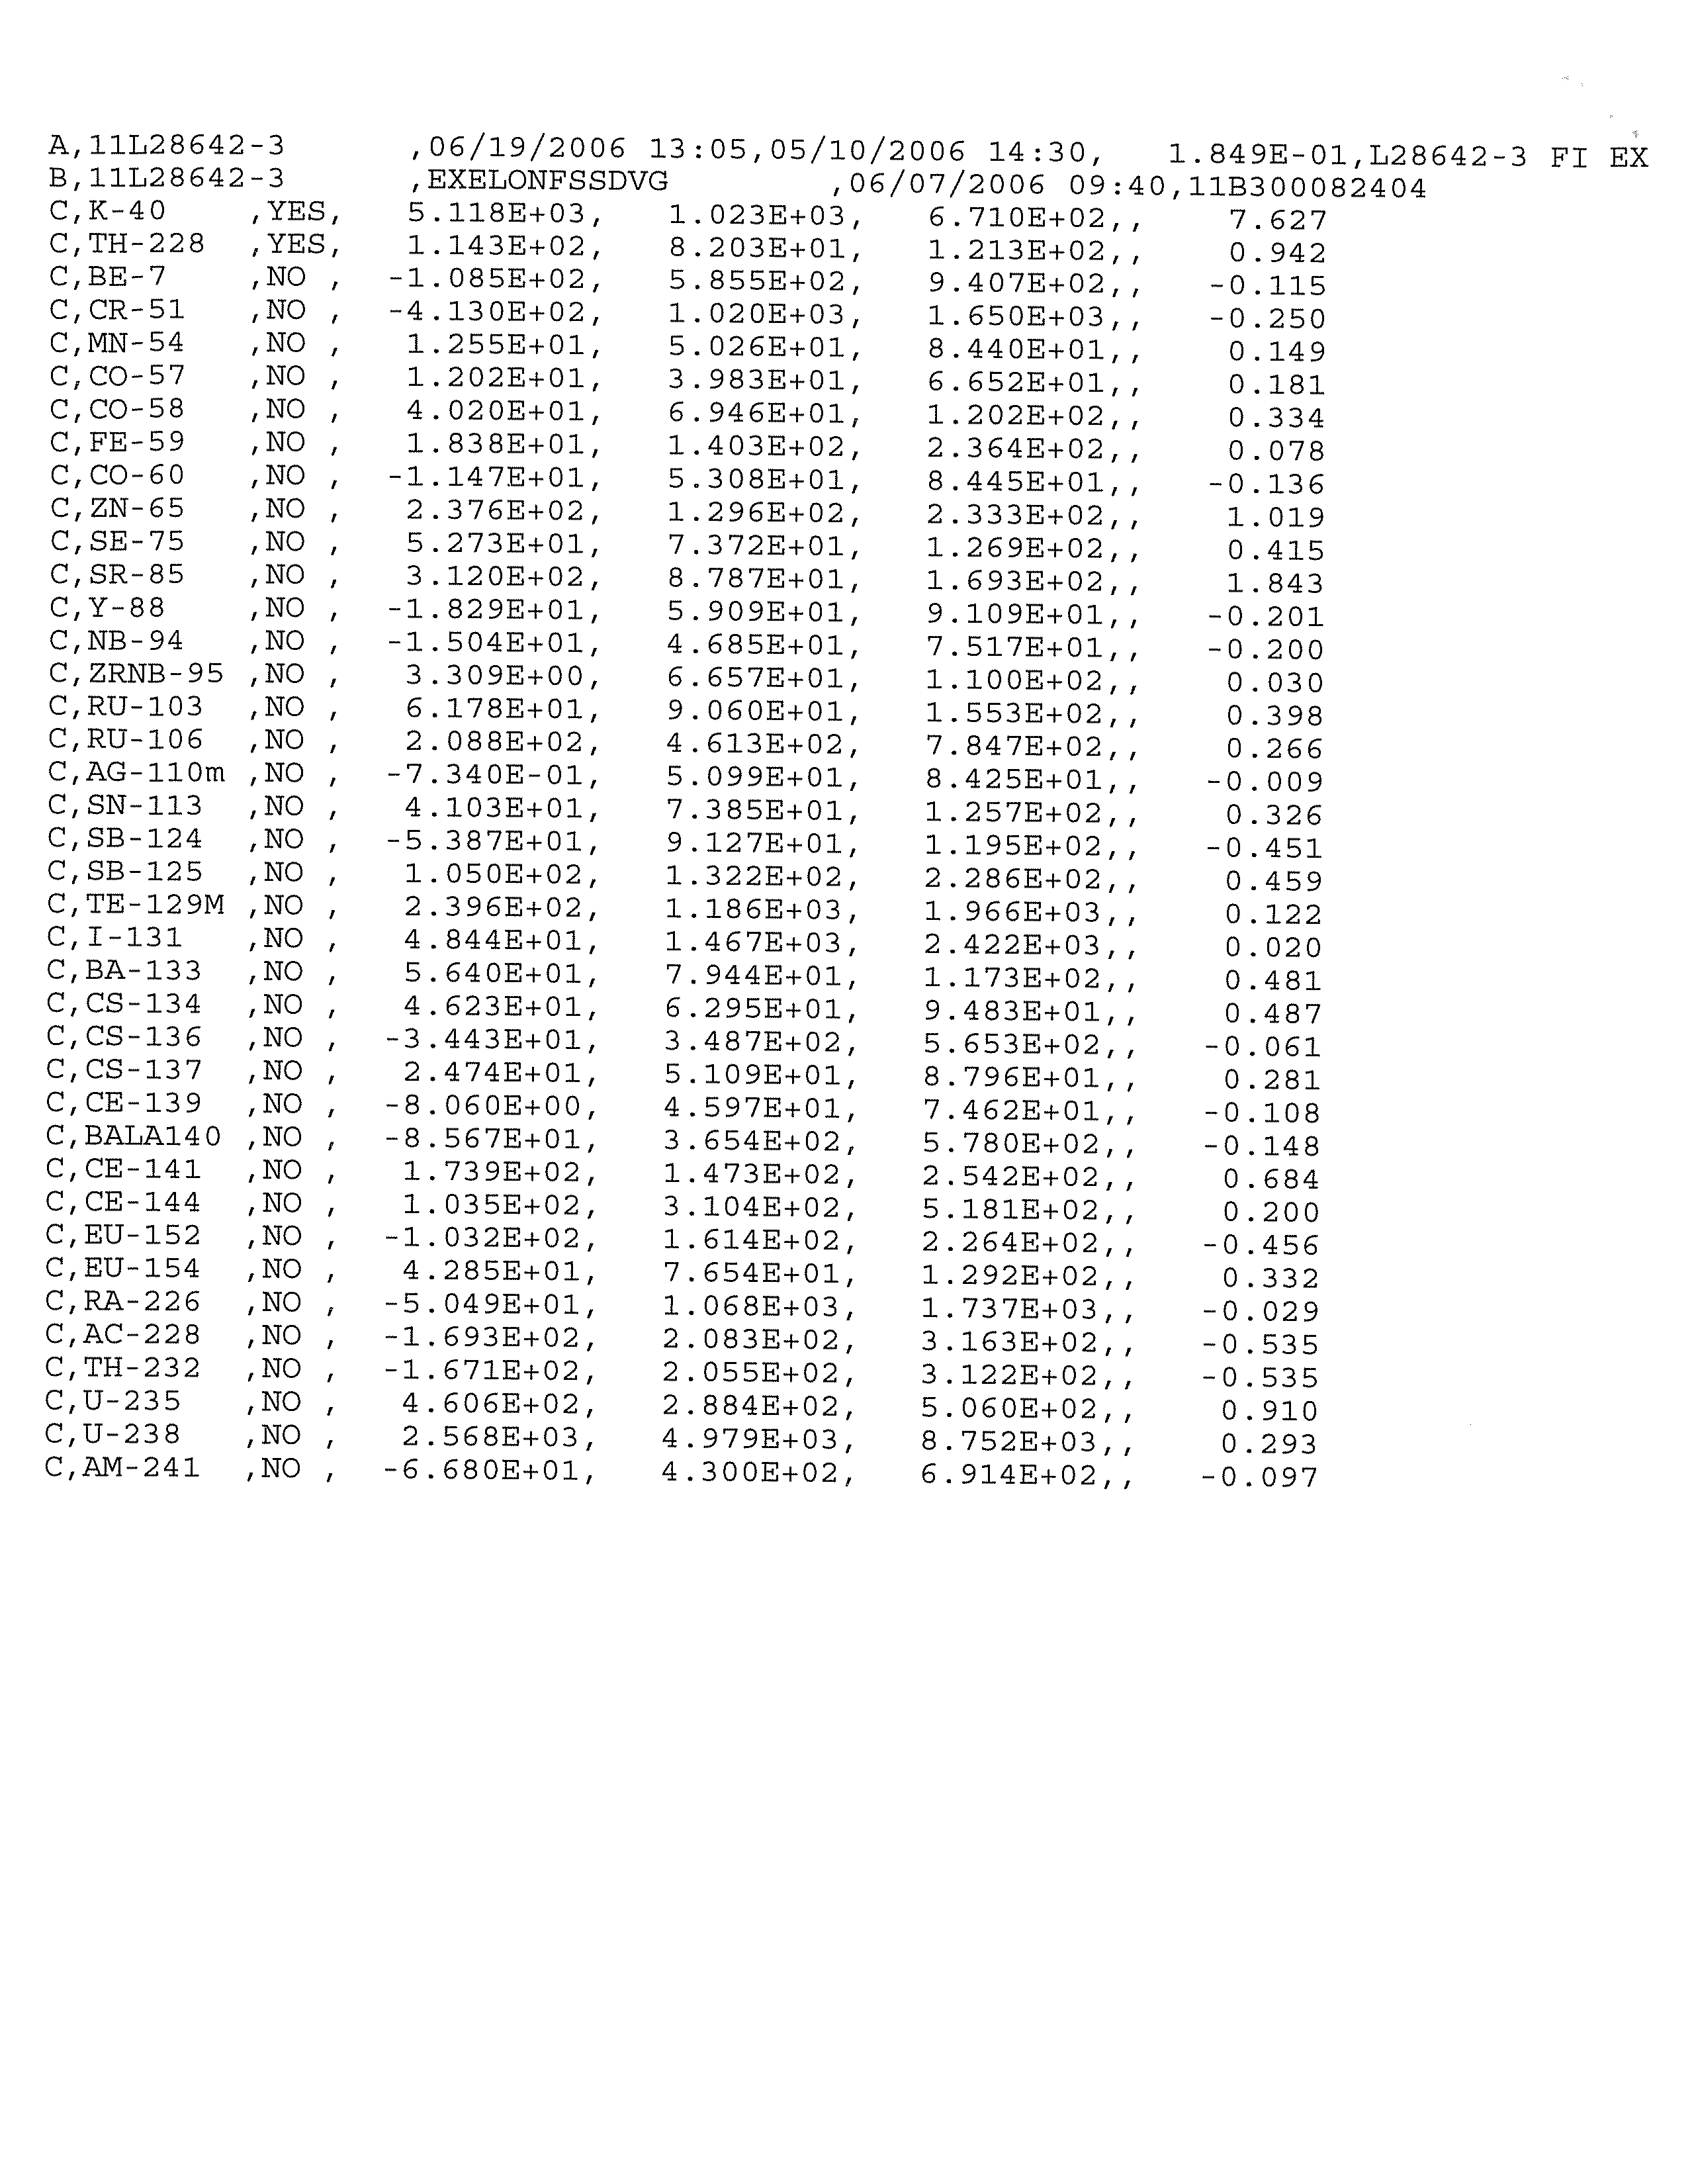
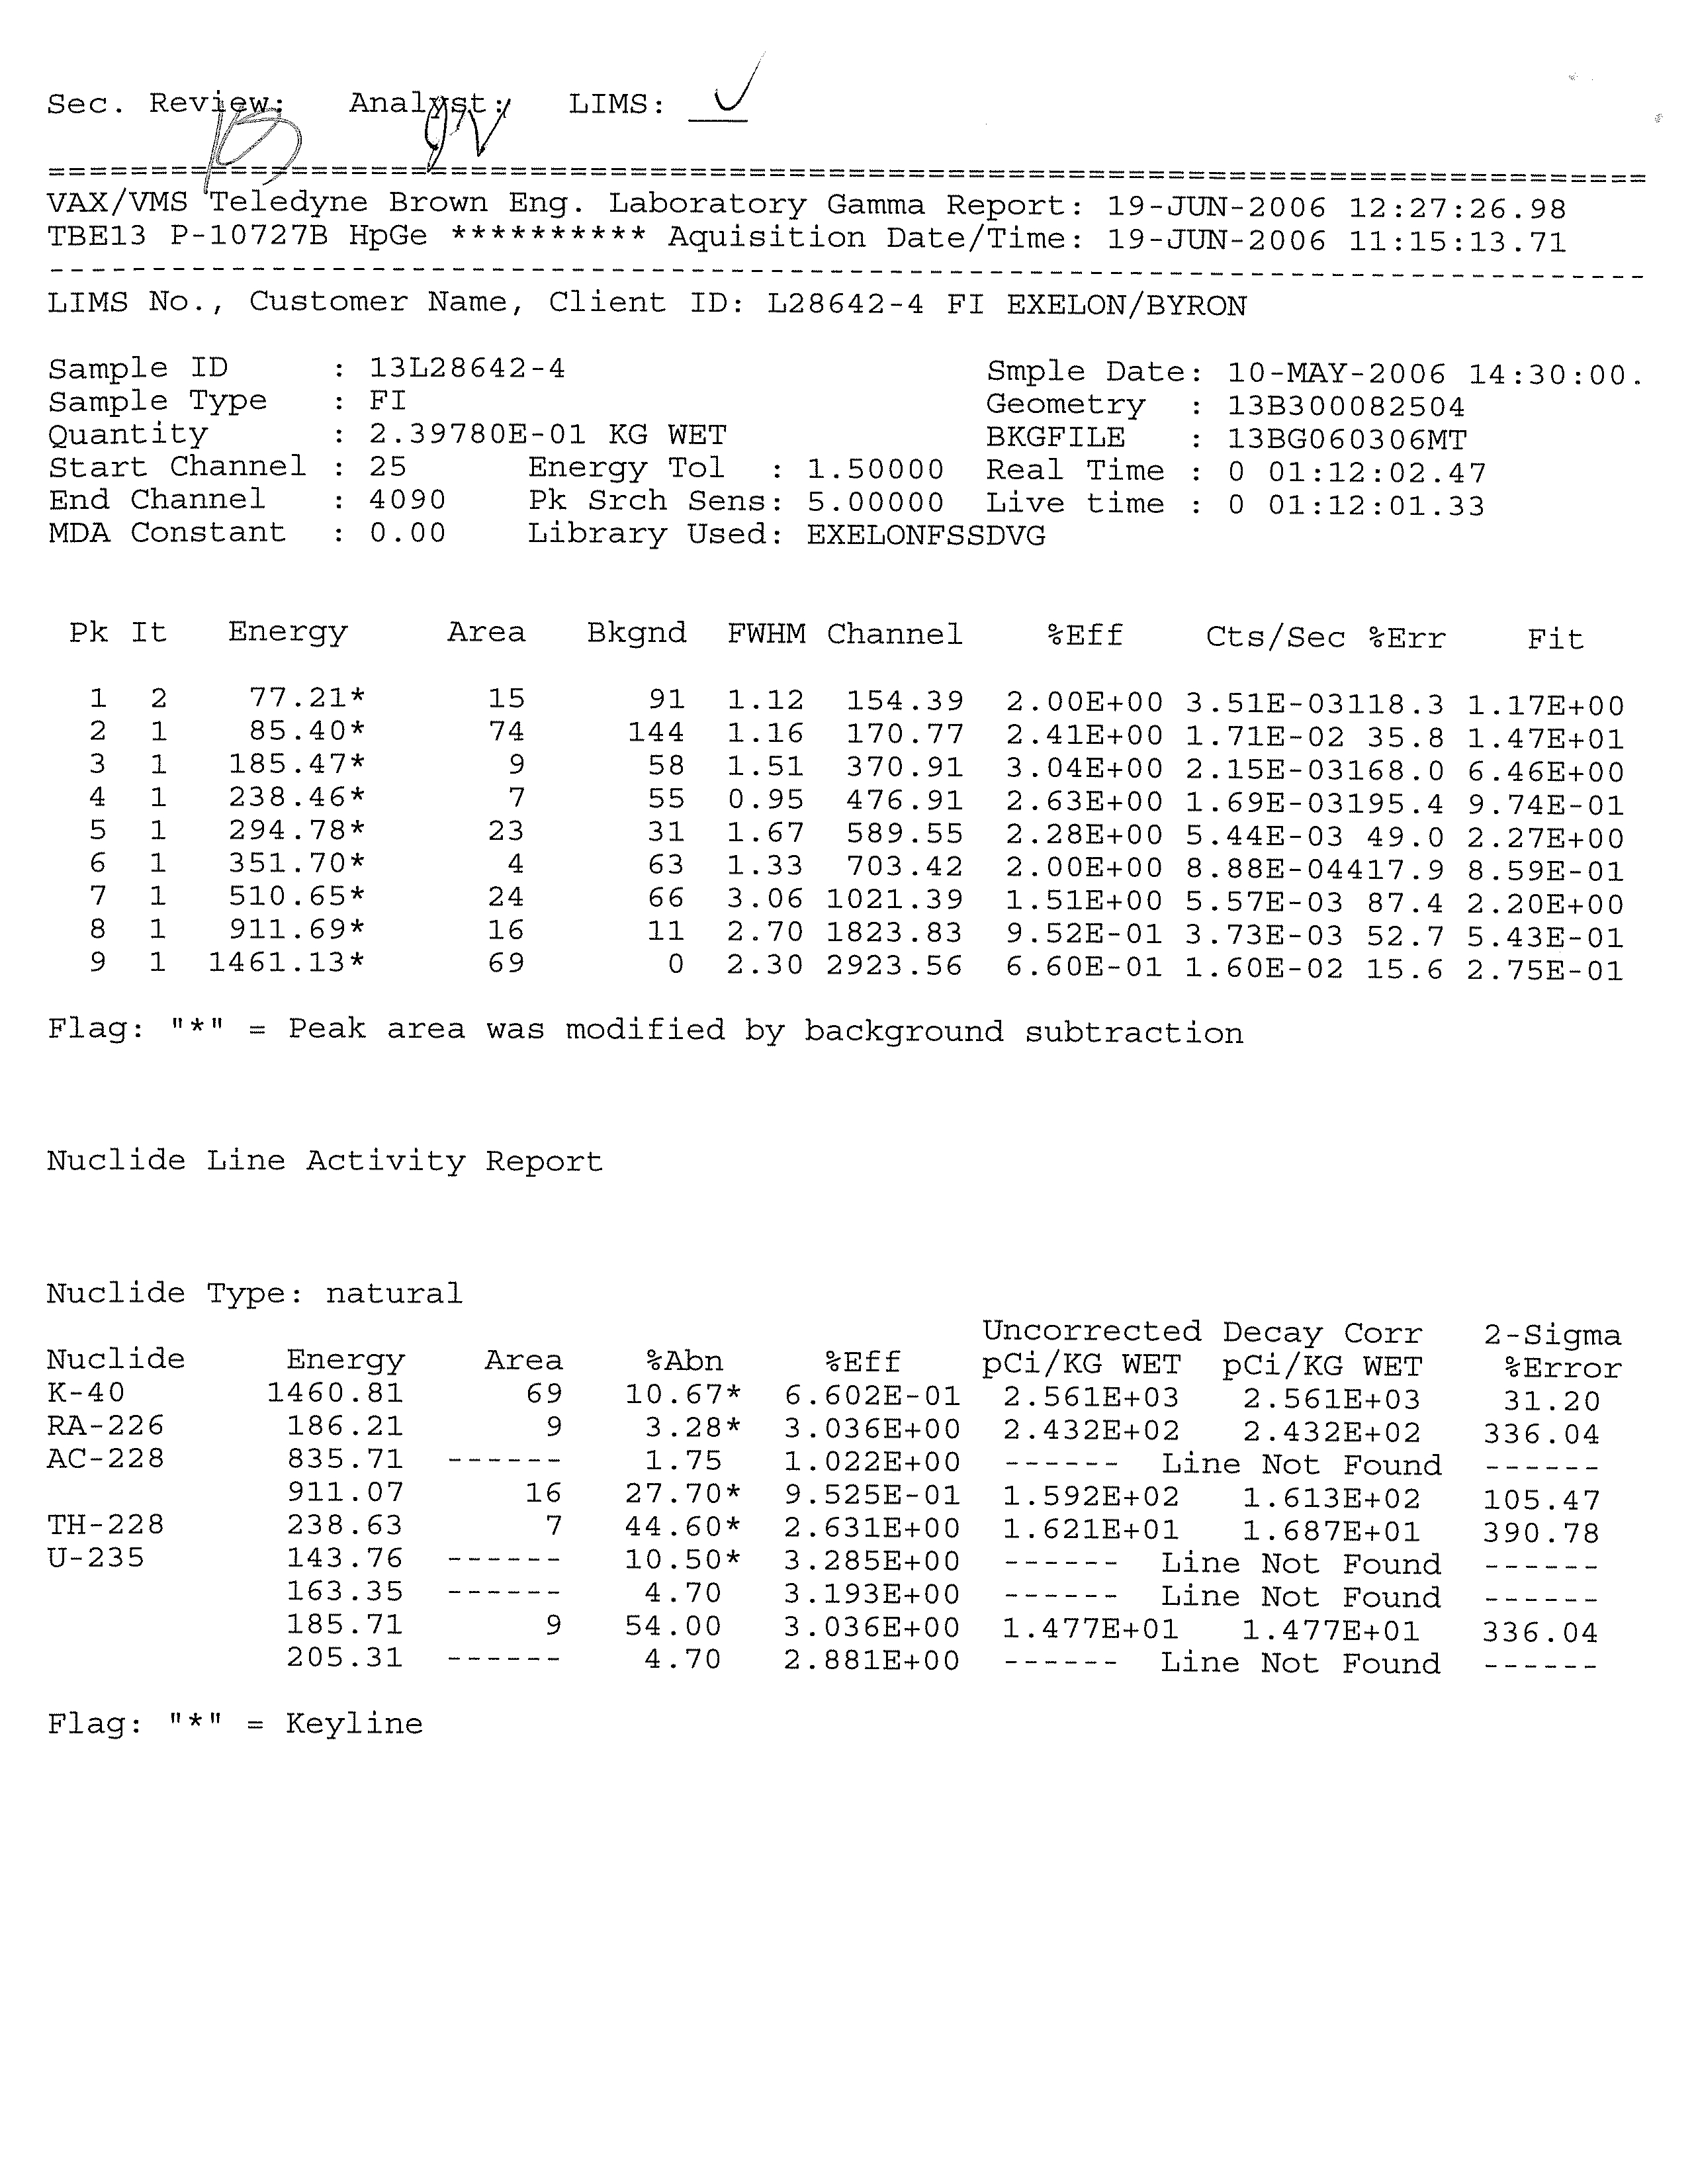
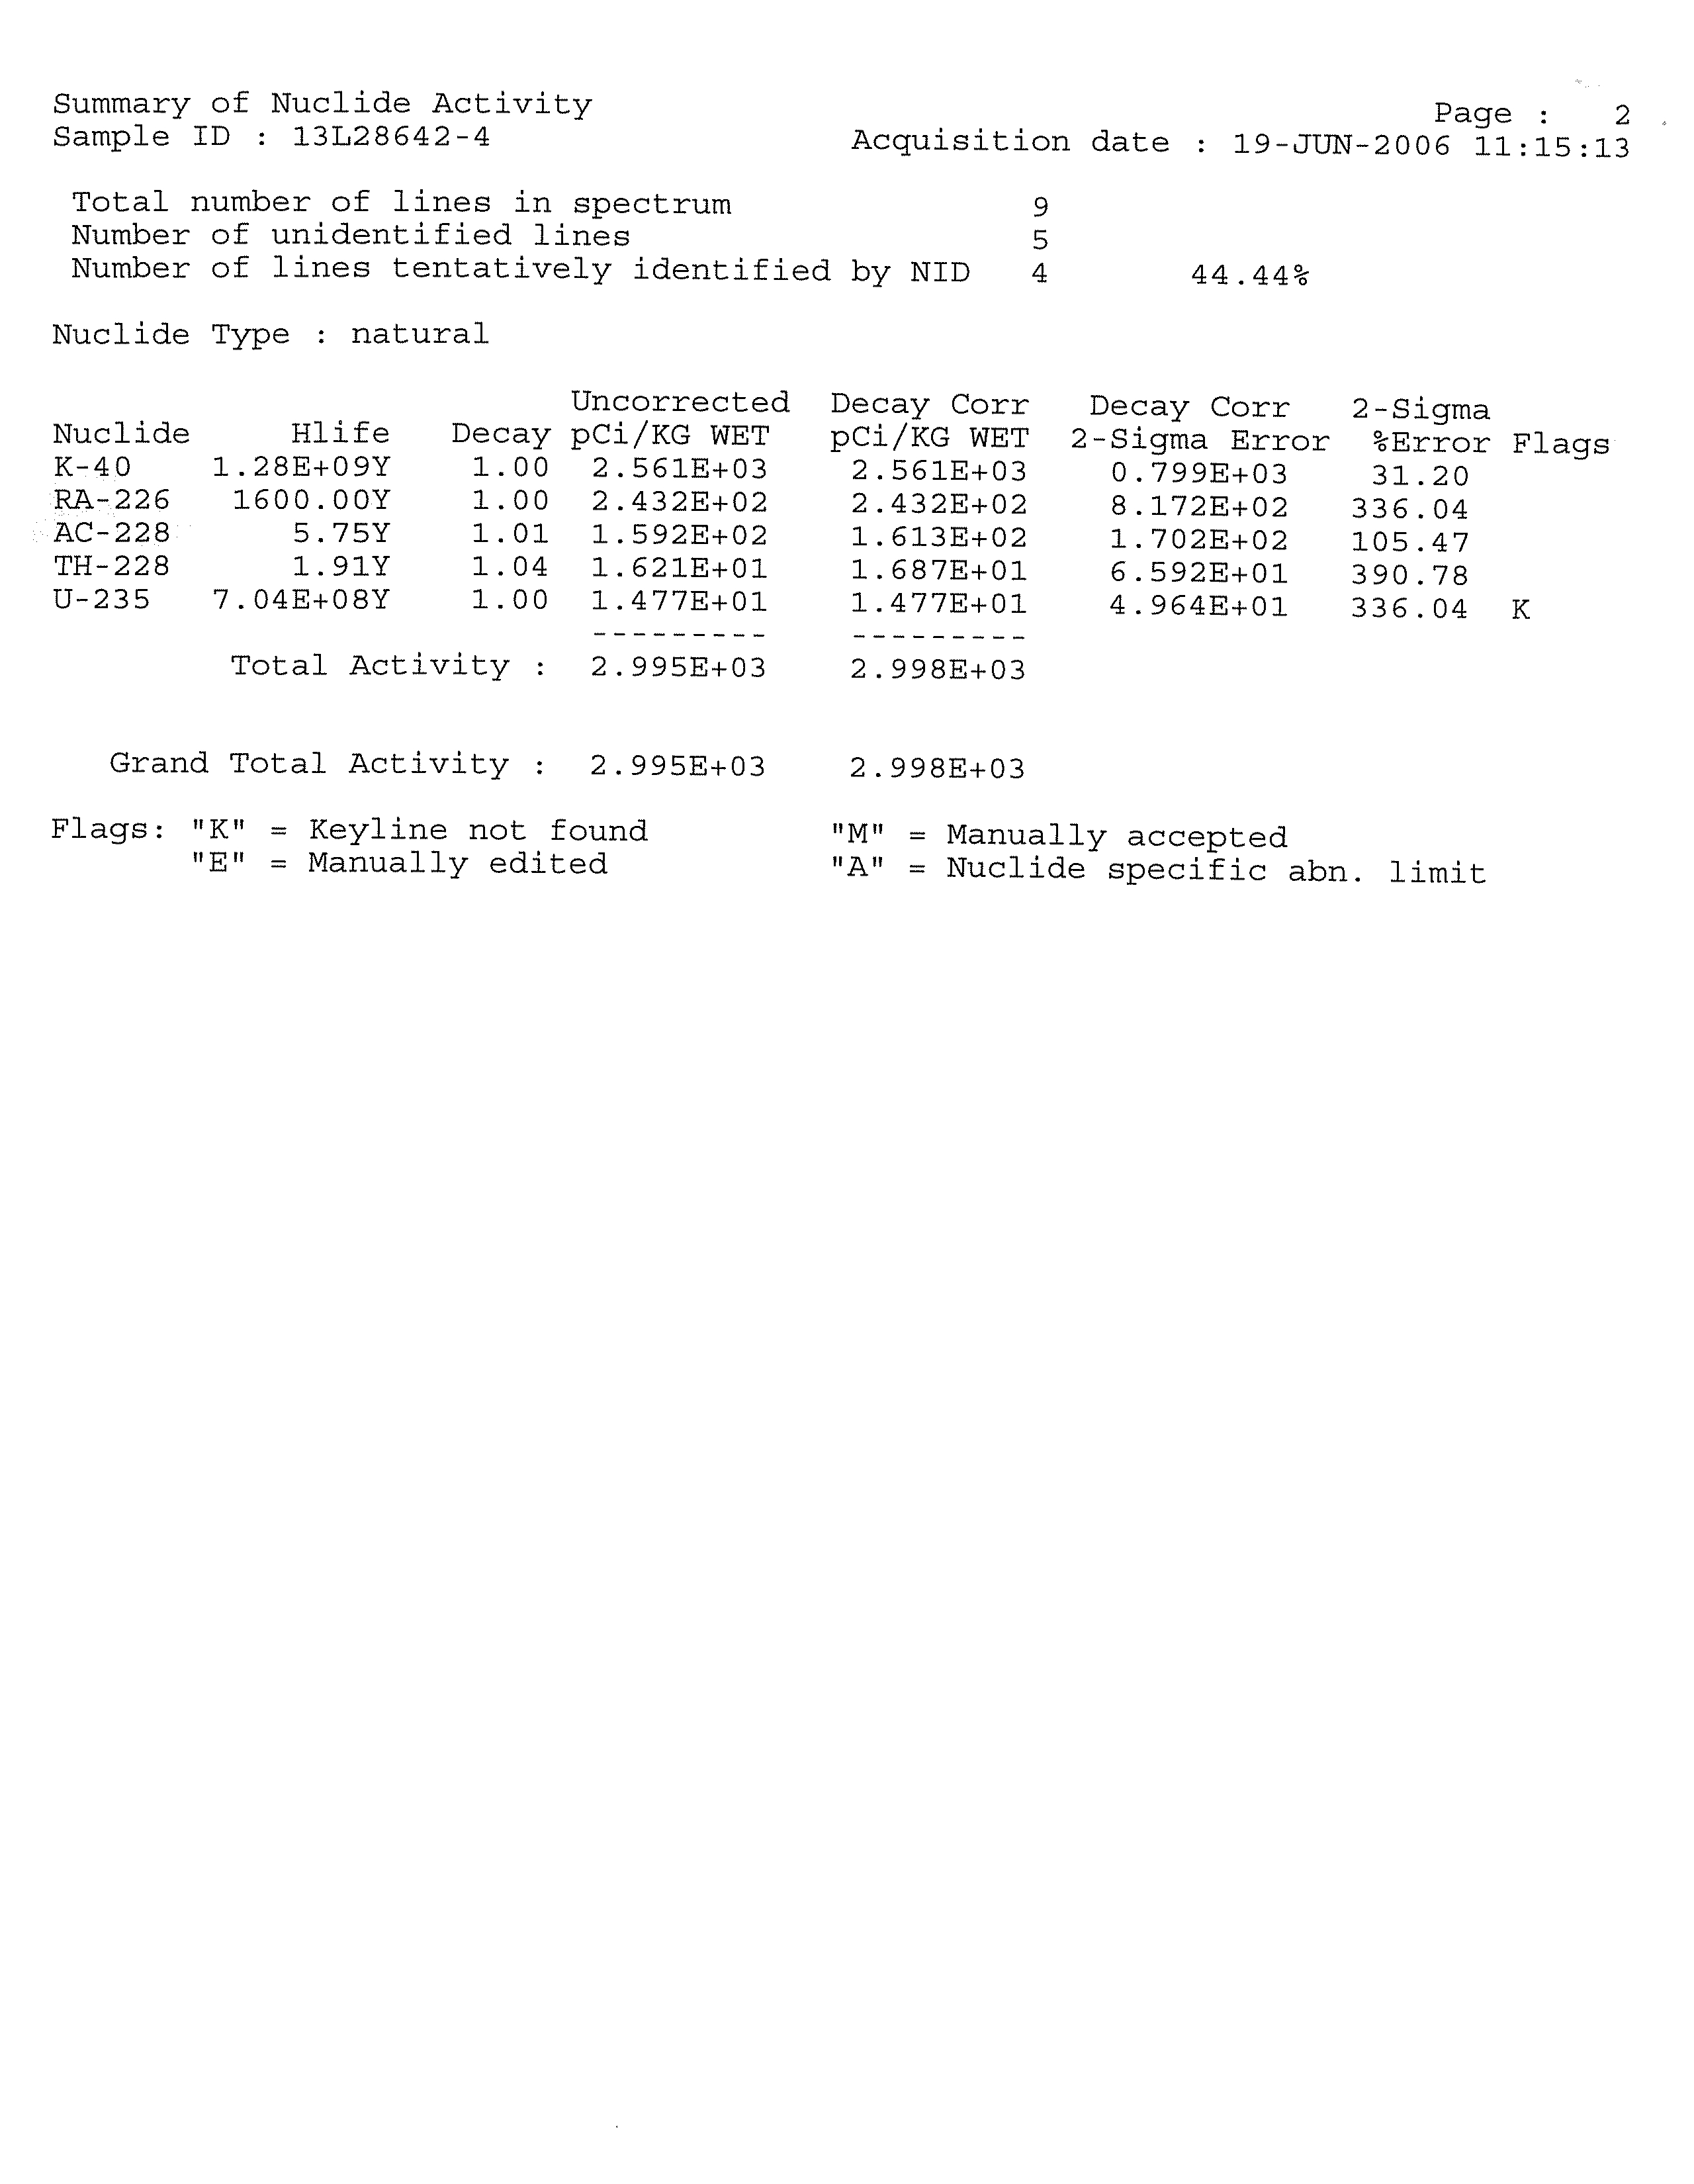
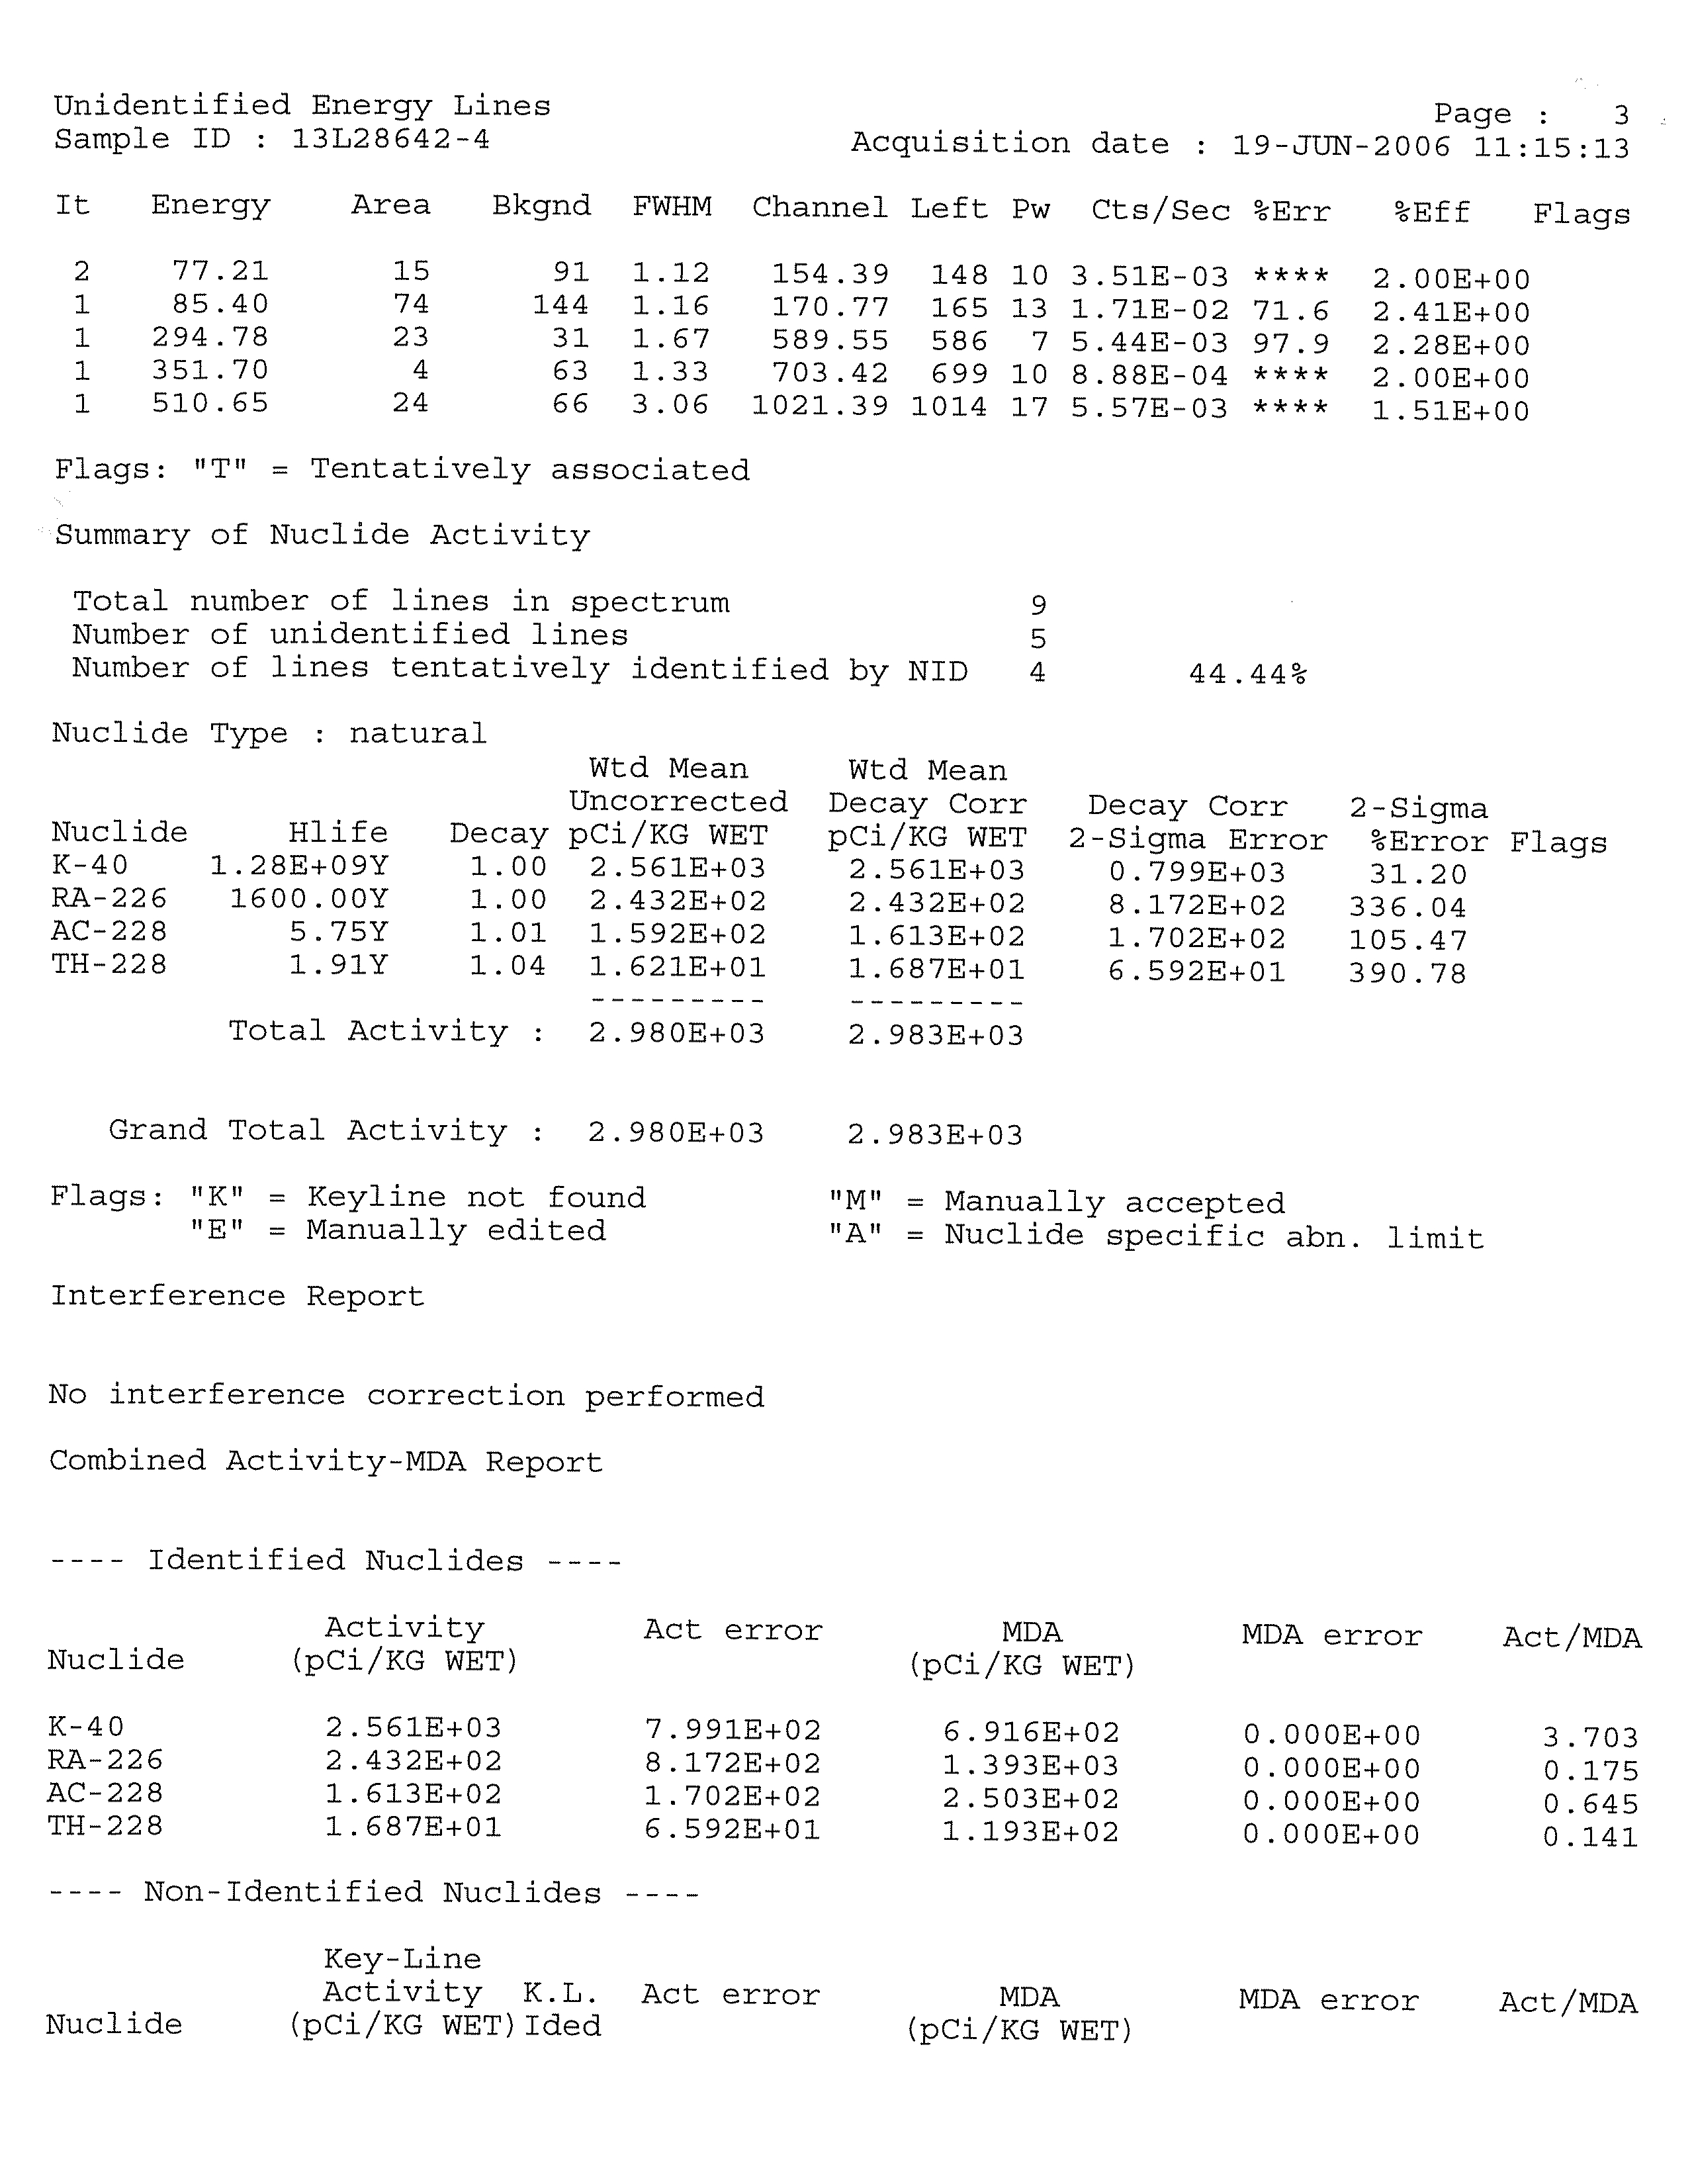
TELEDYNE BROWN ENGINEERING, INC.
APPENDIX D
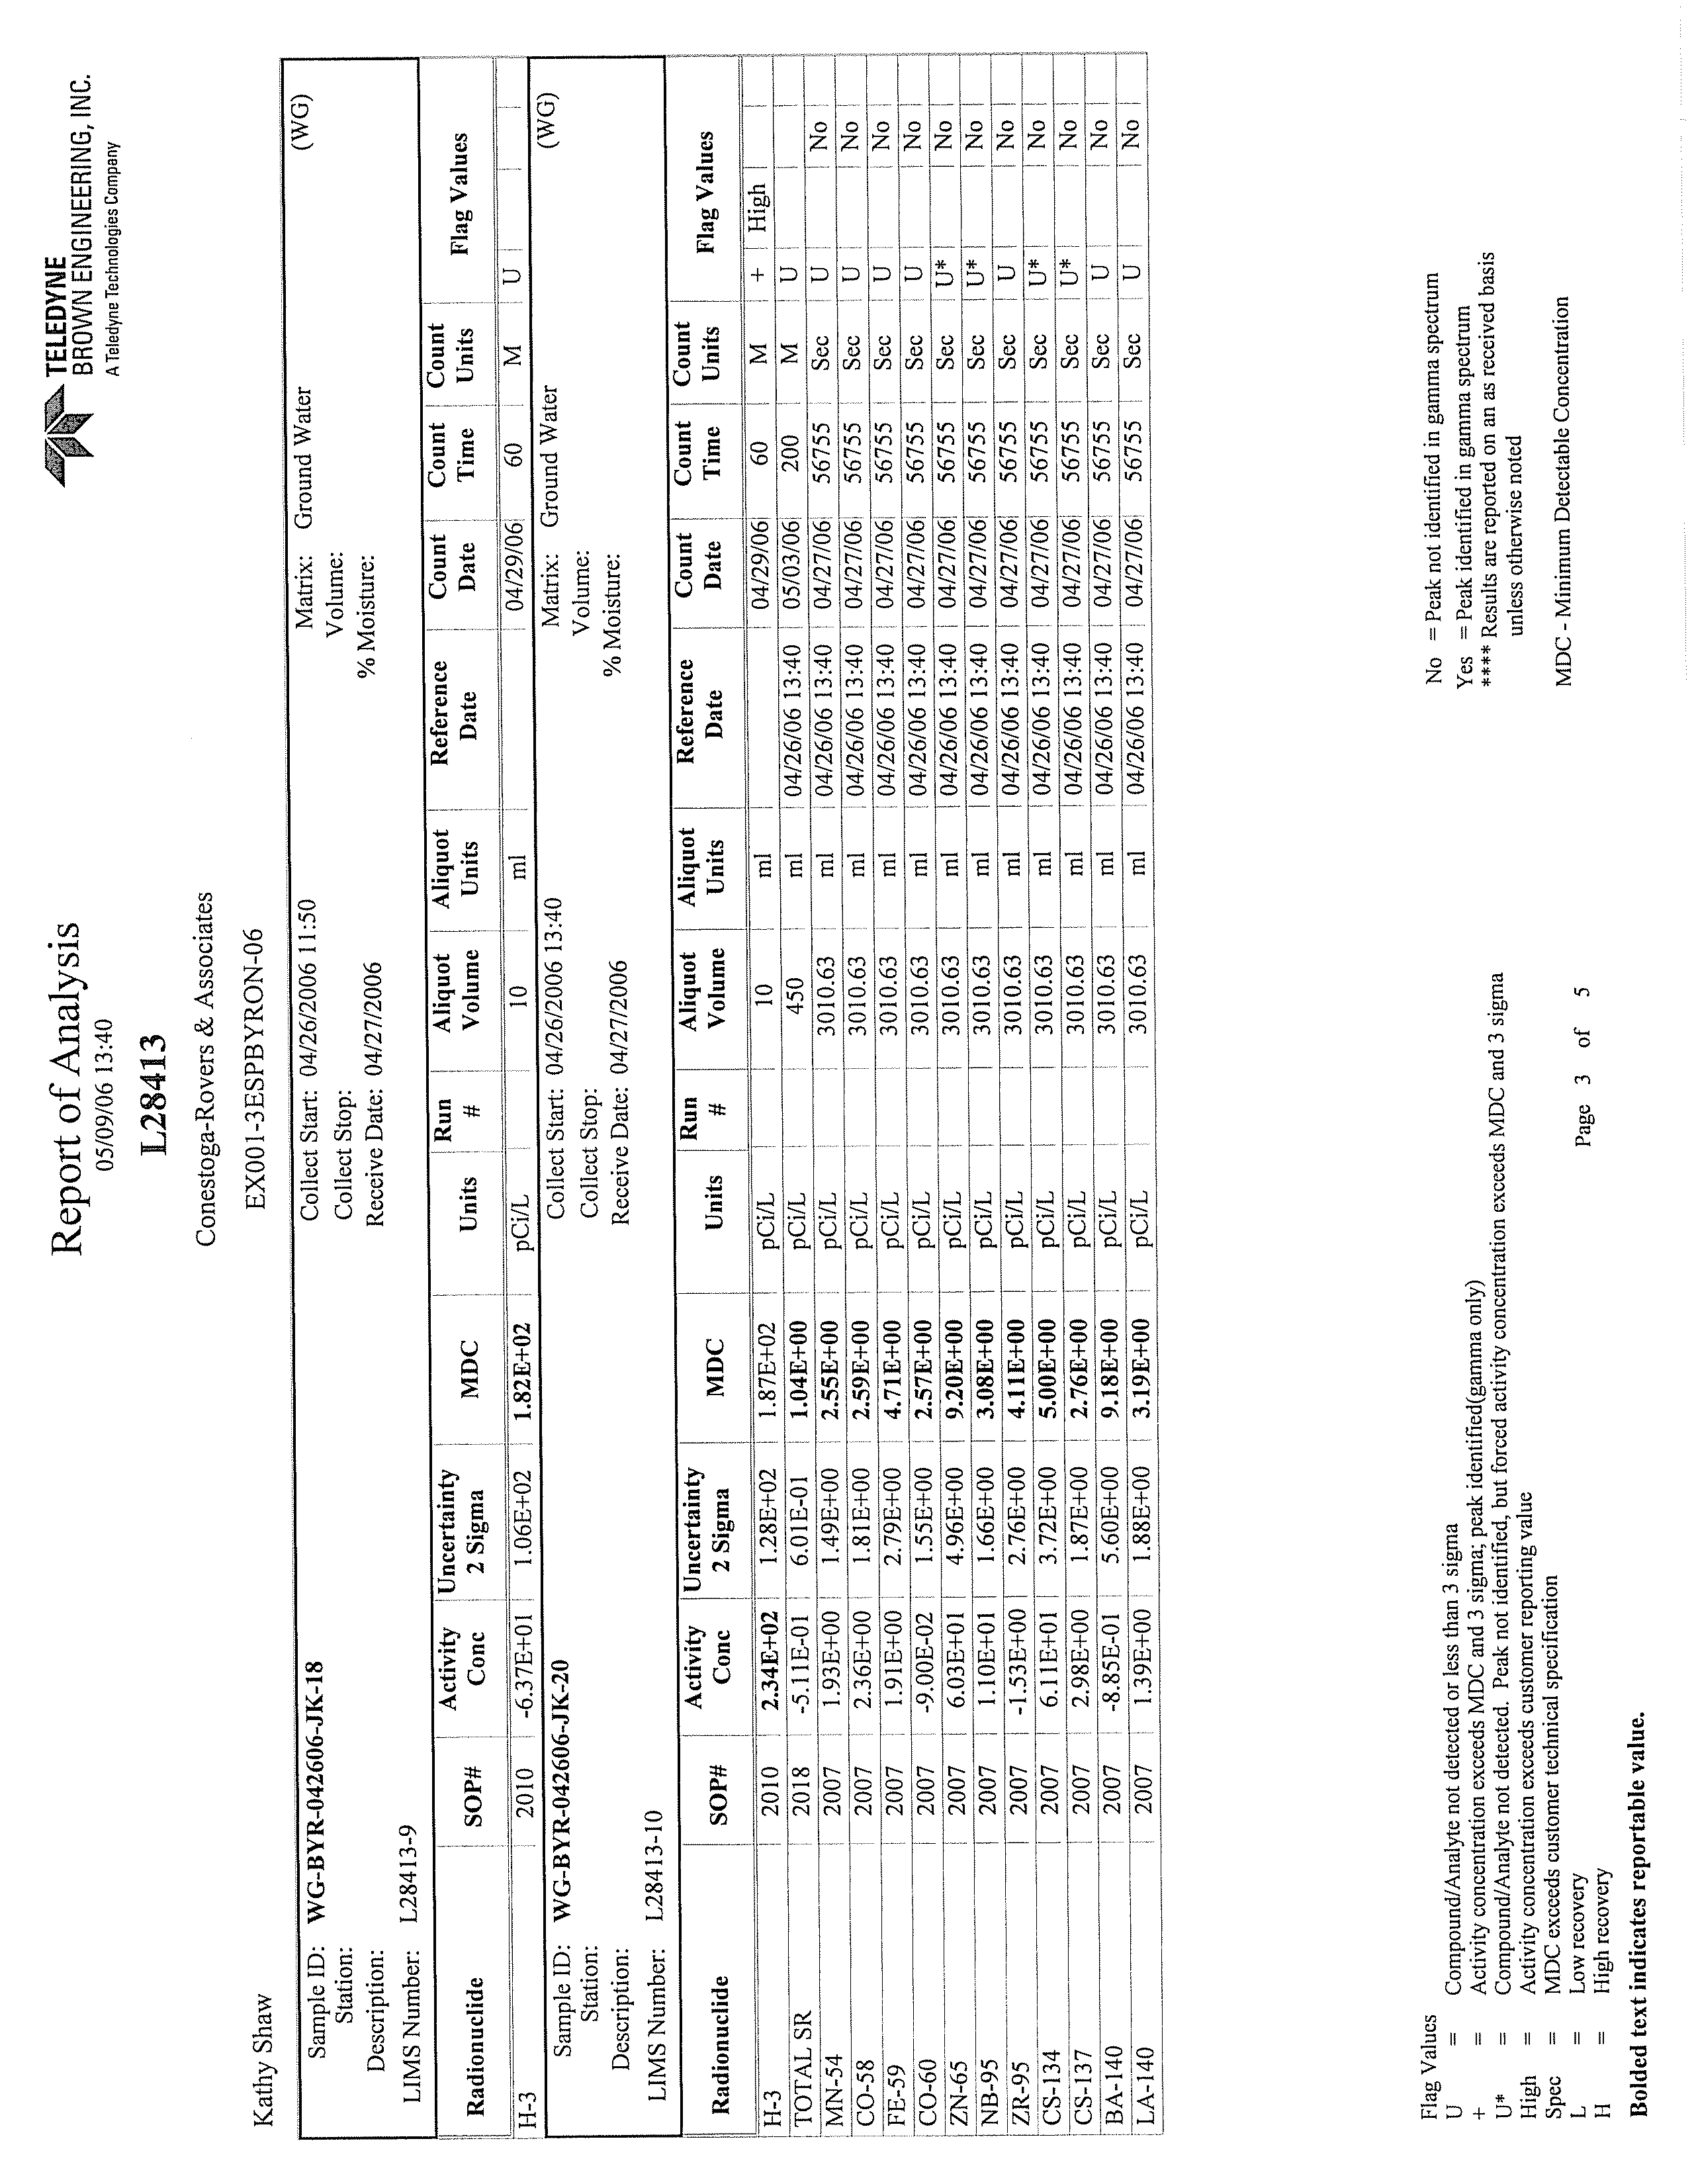
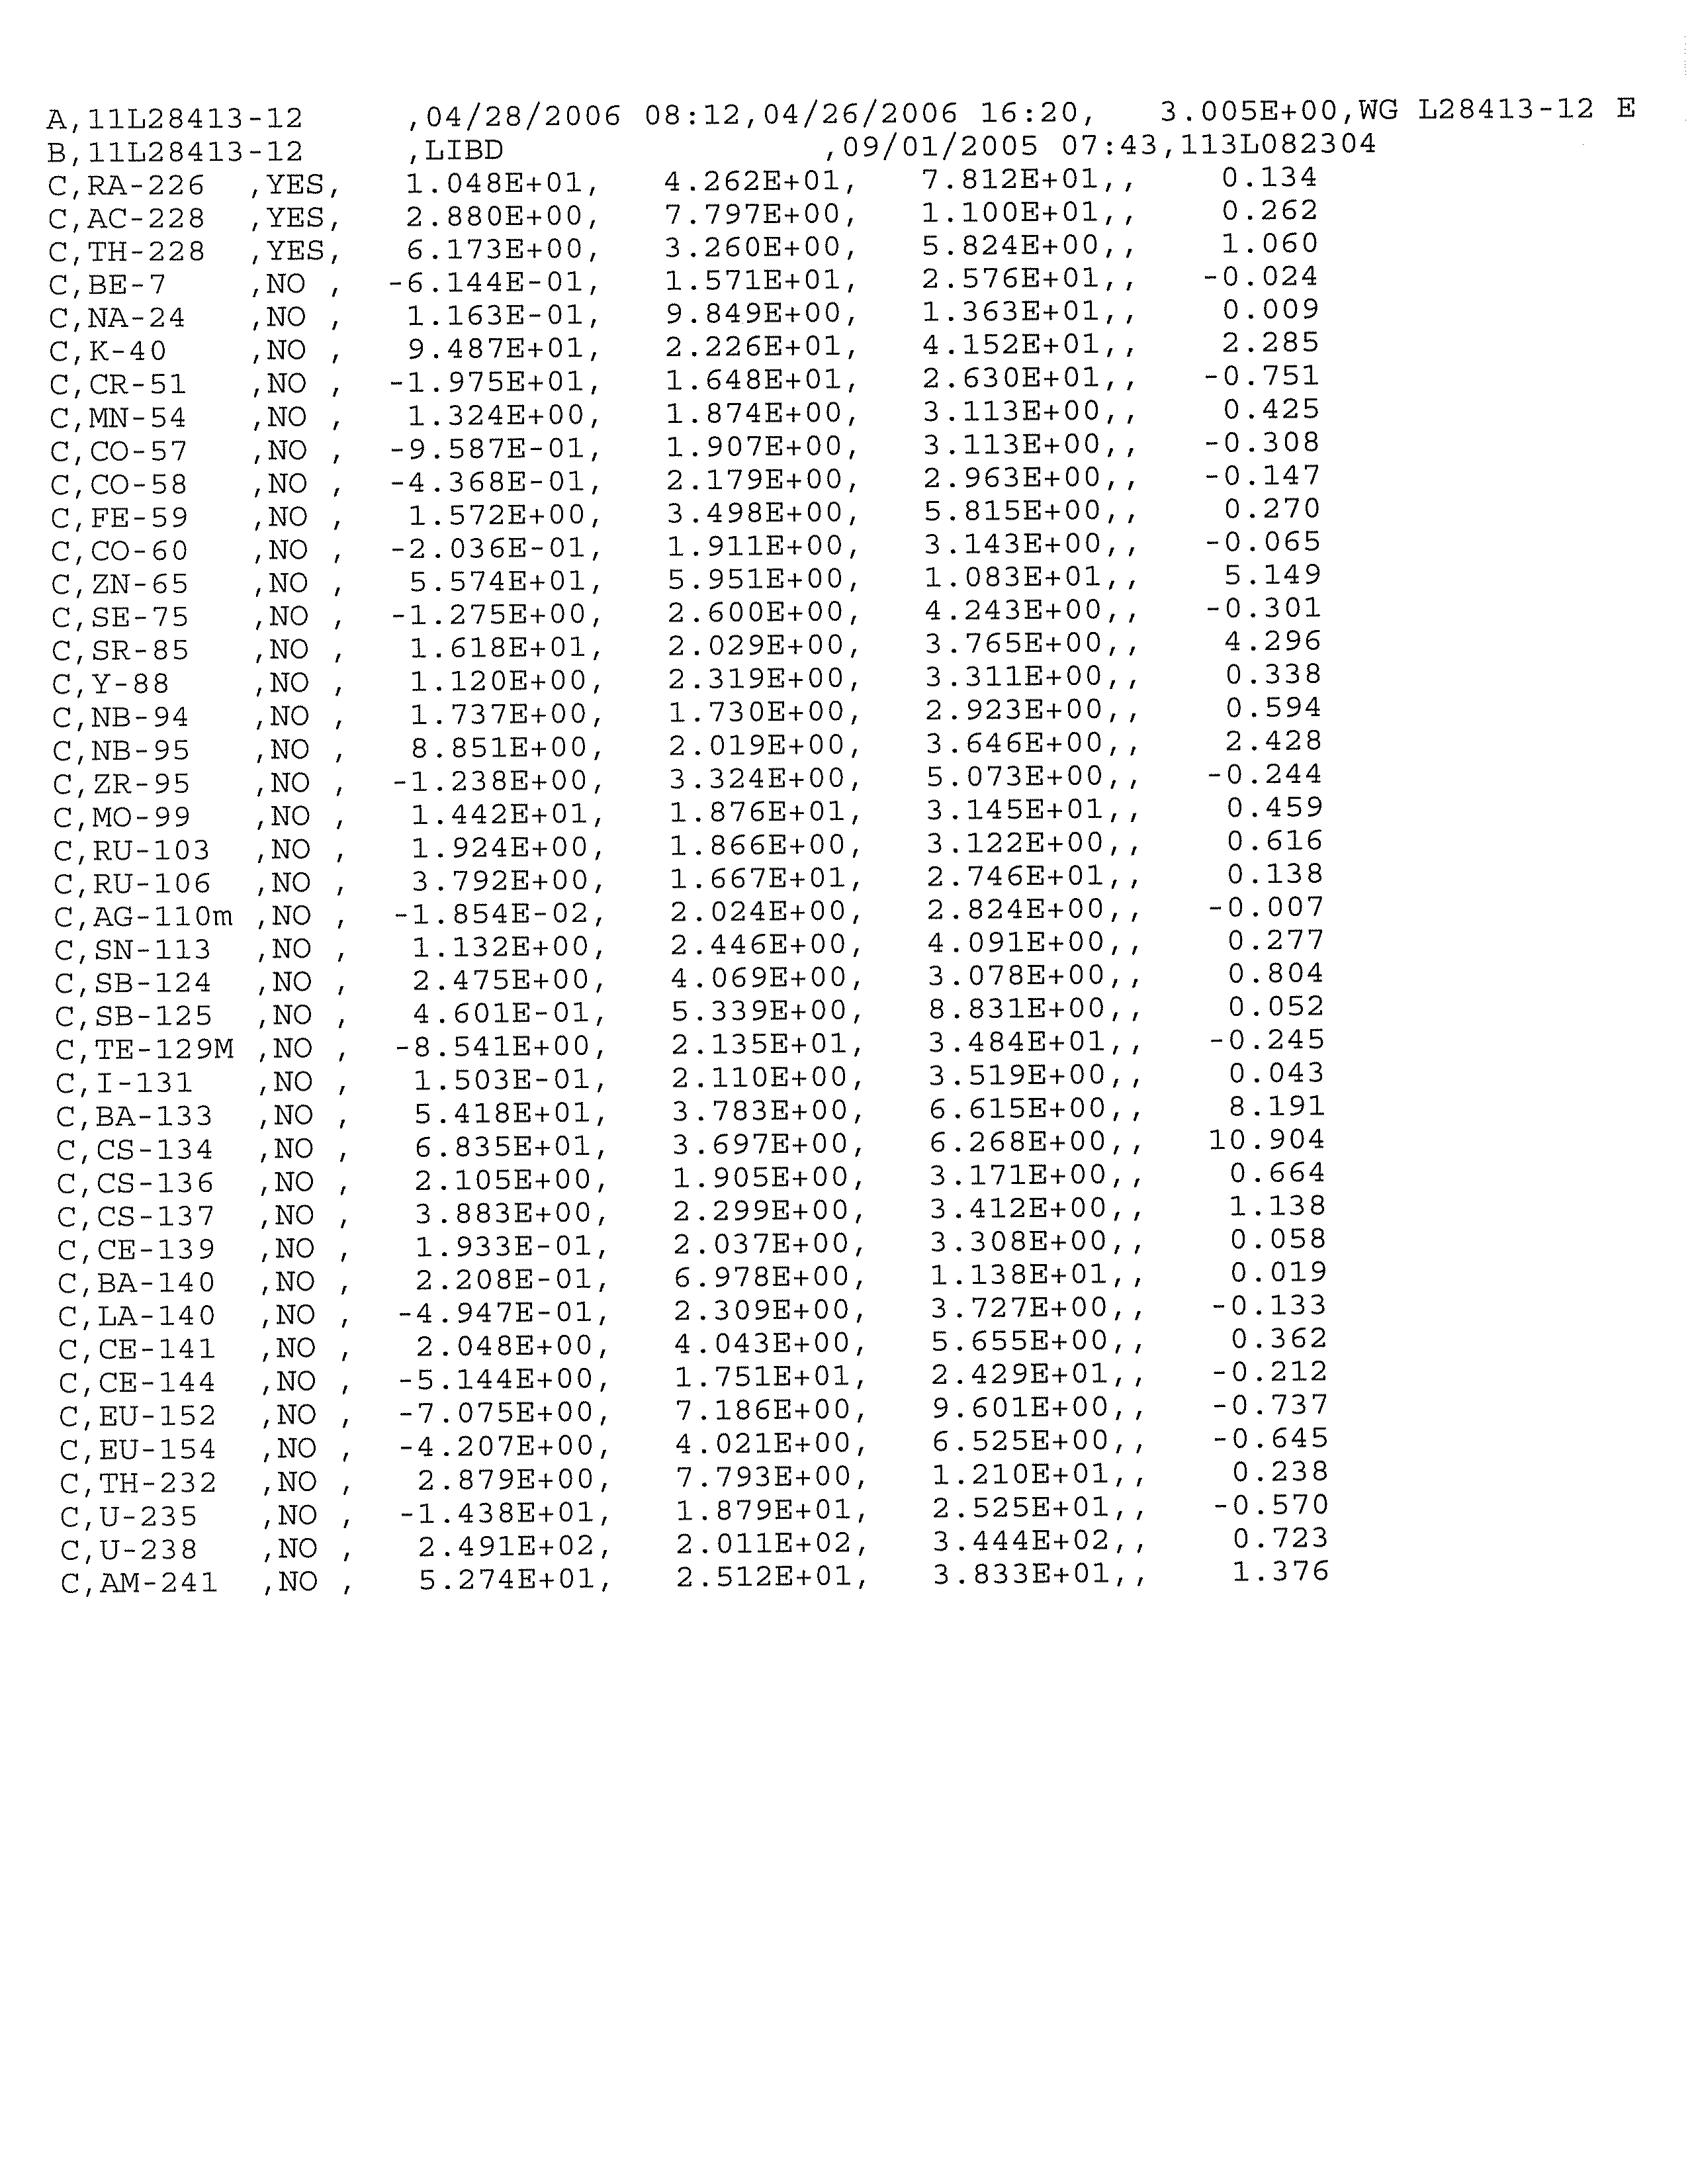
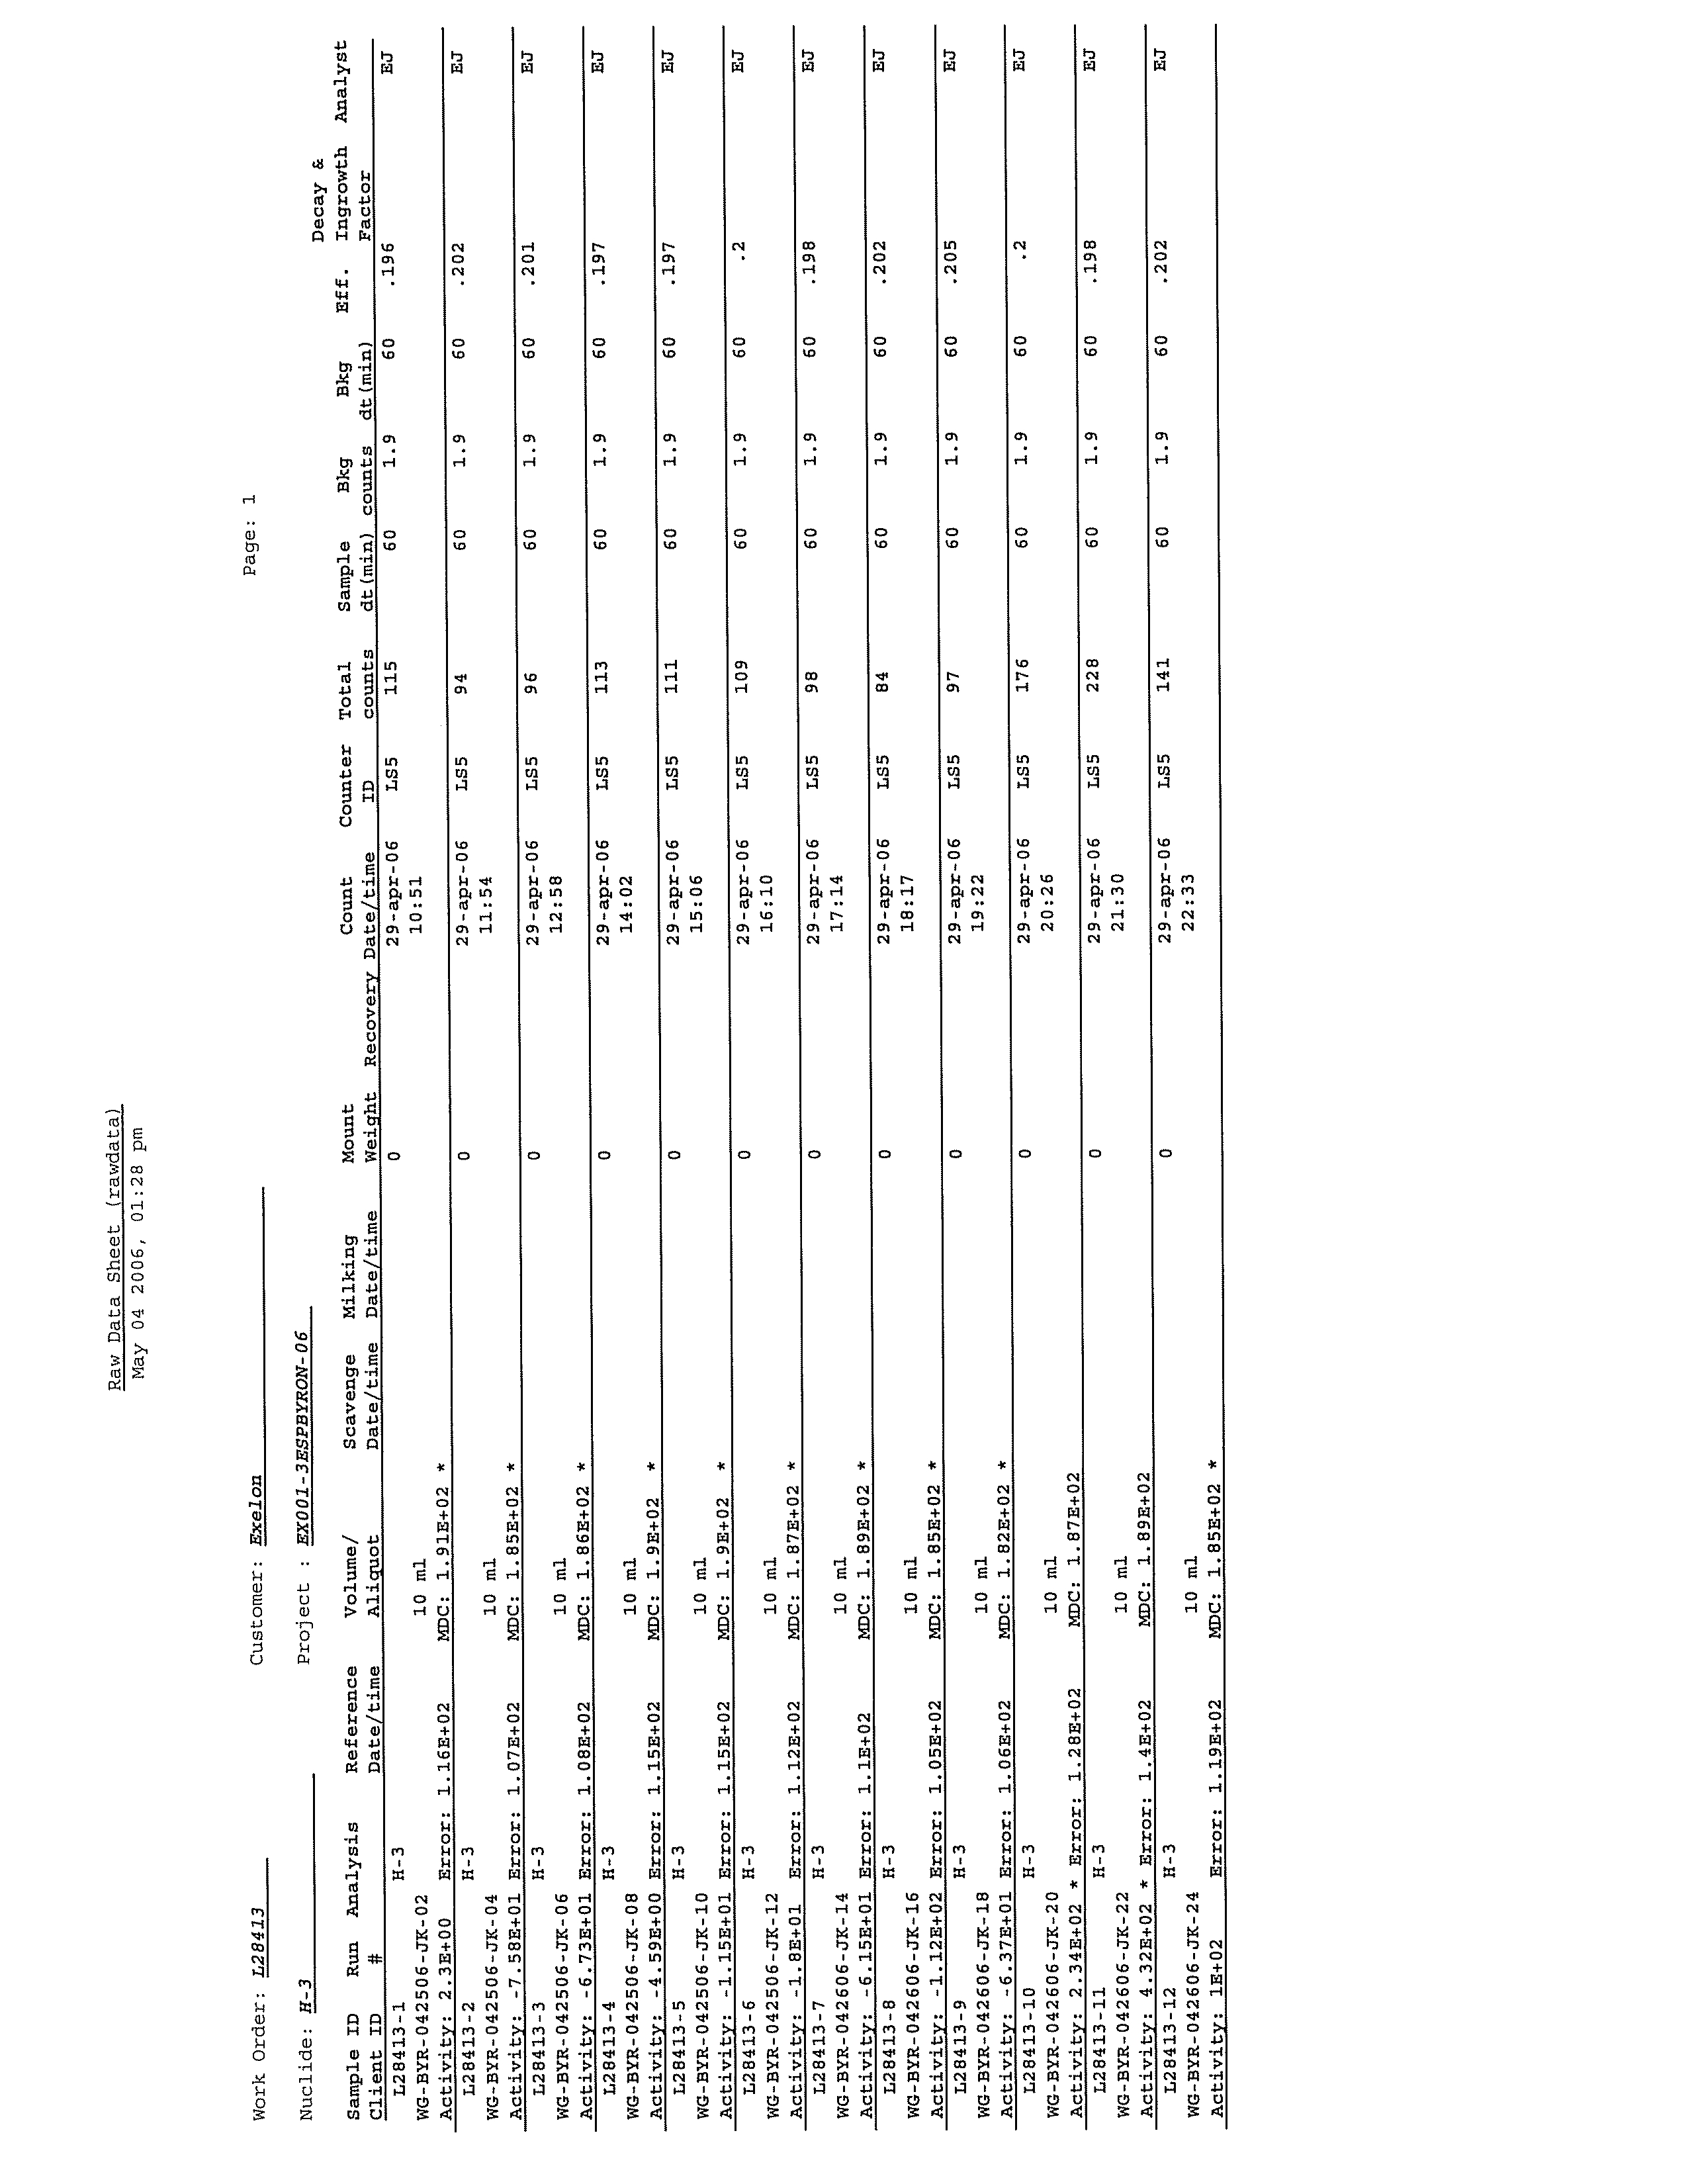
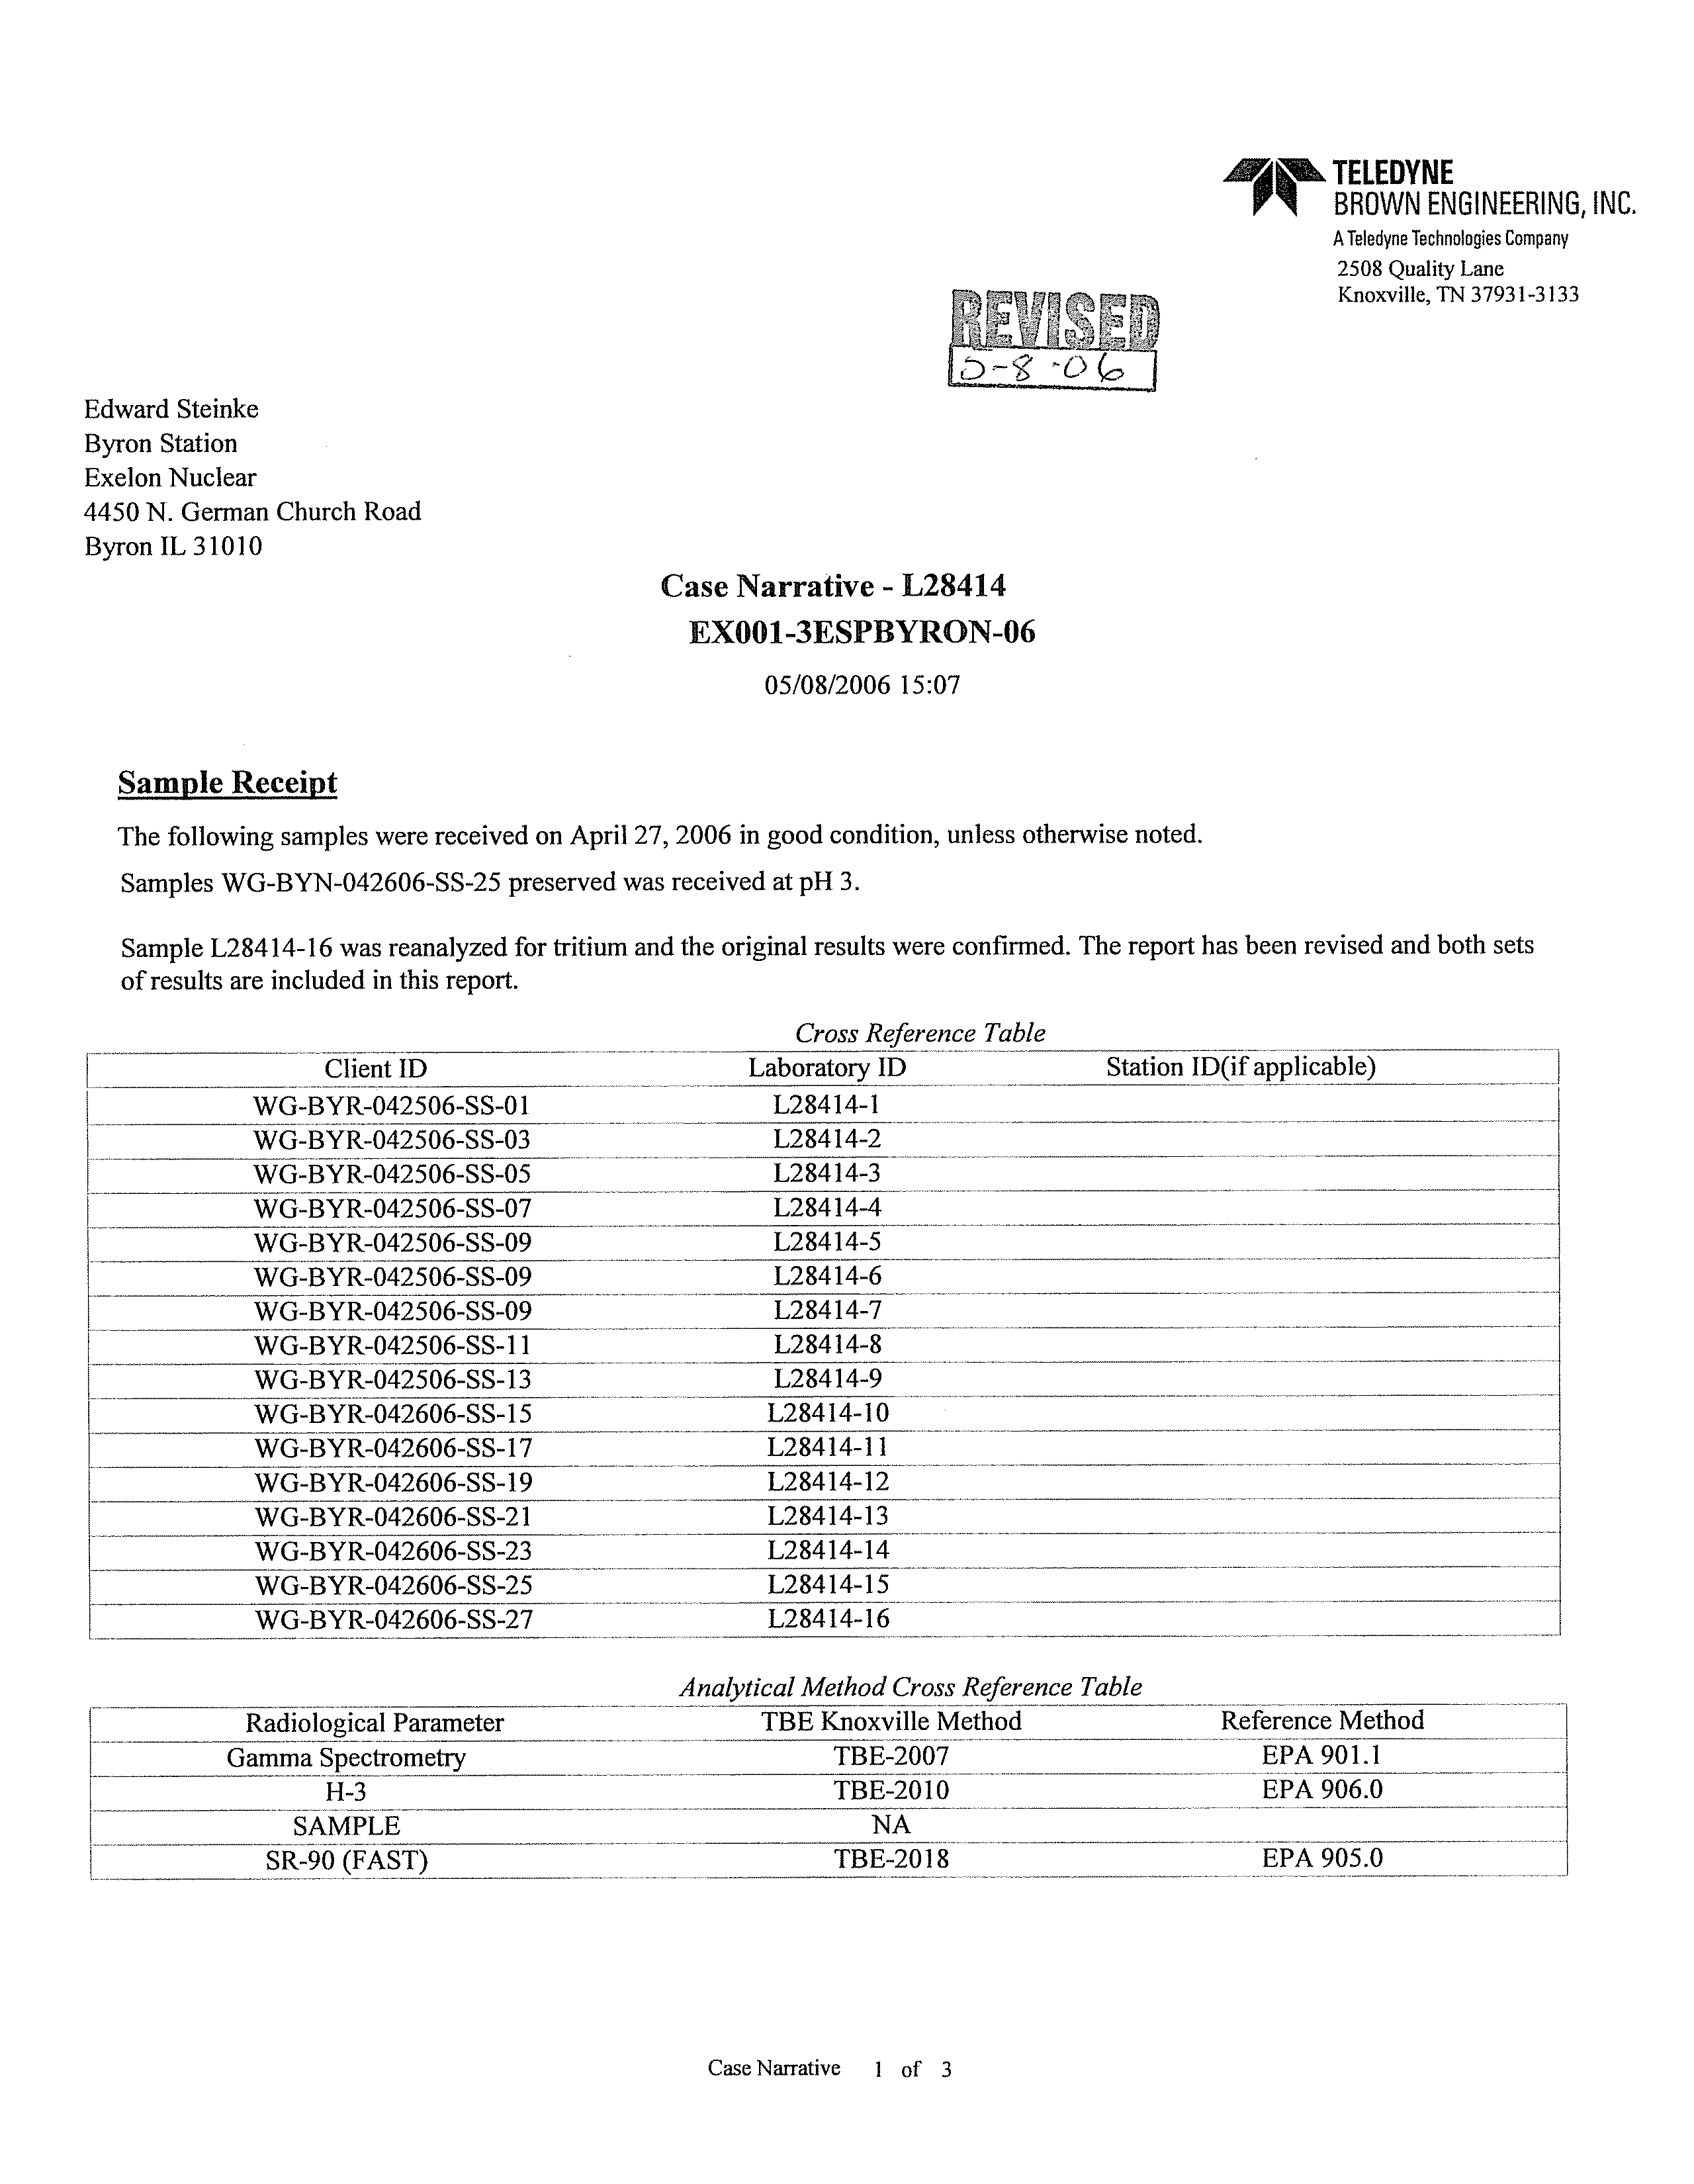
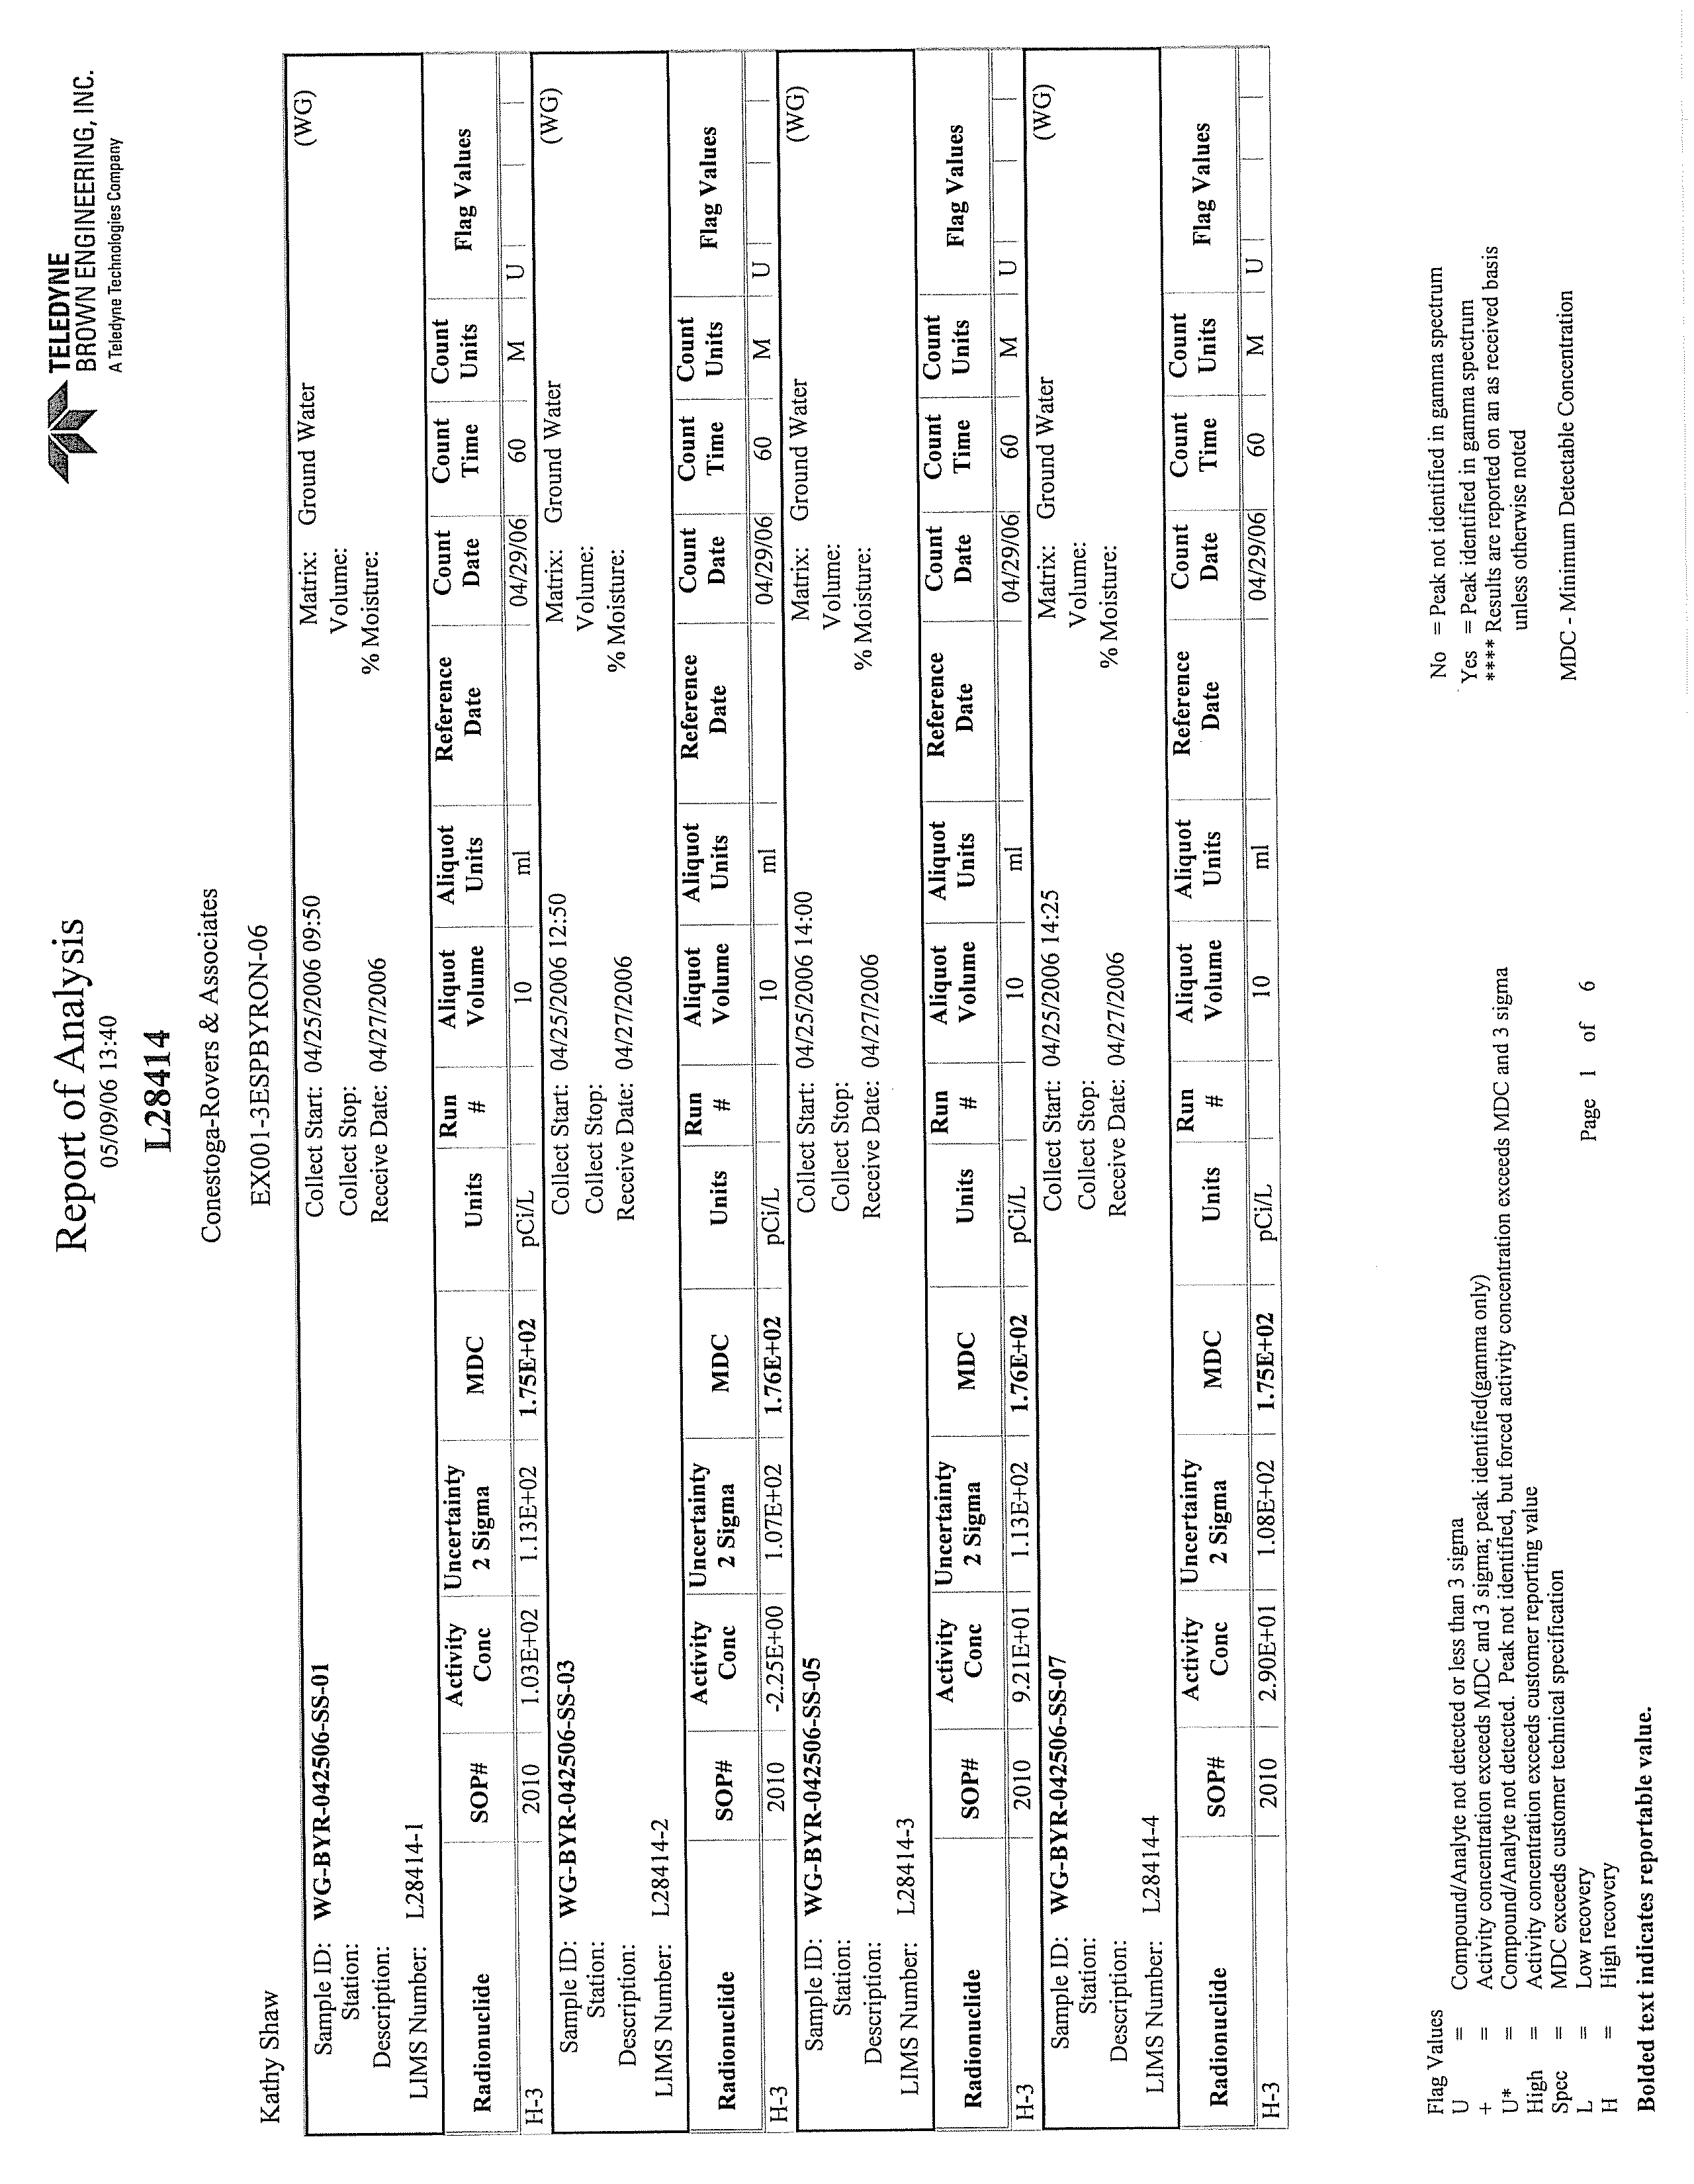
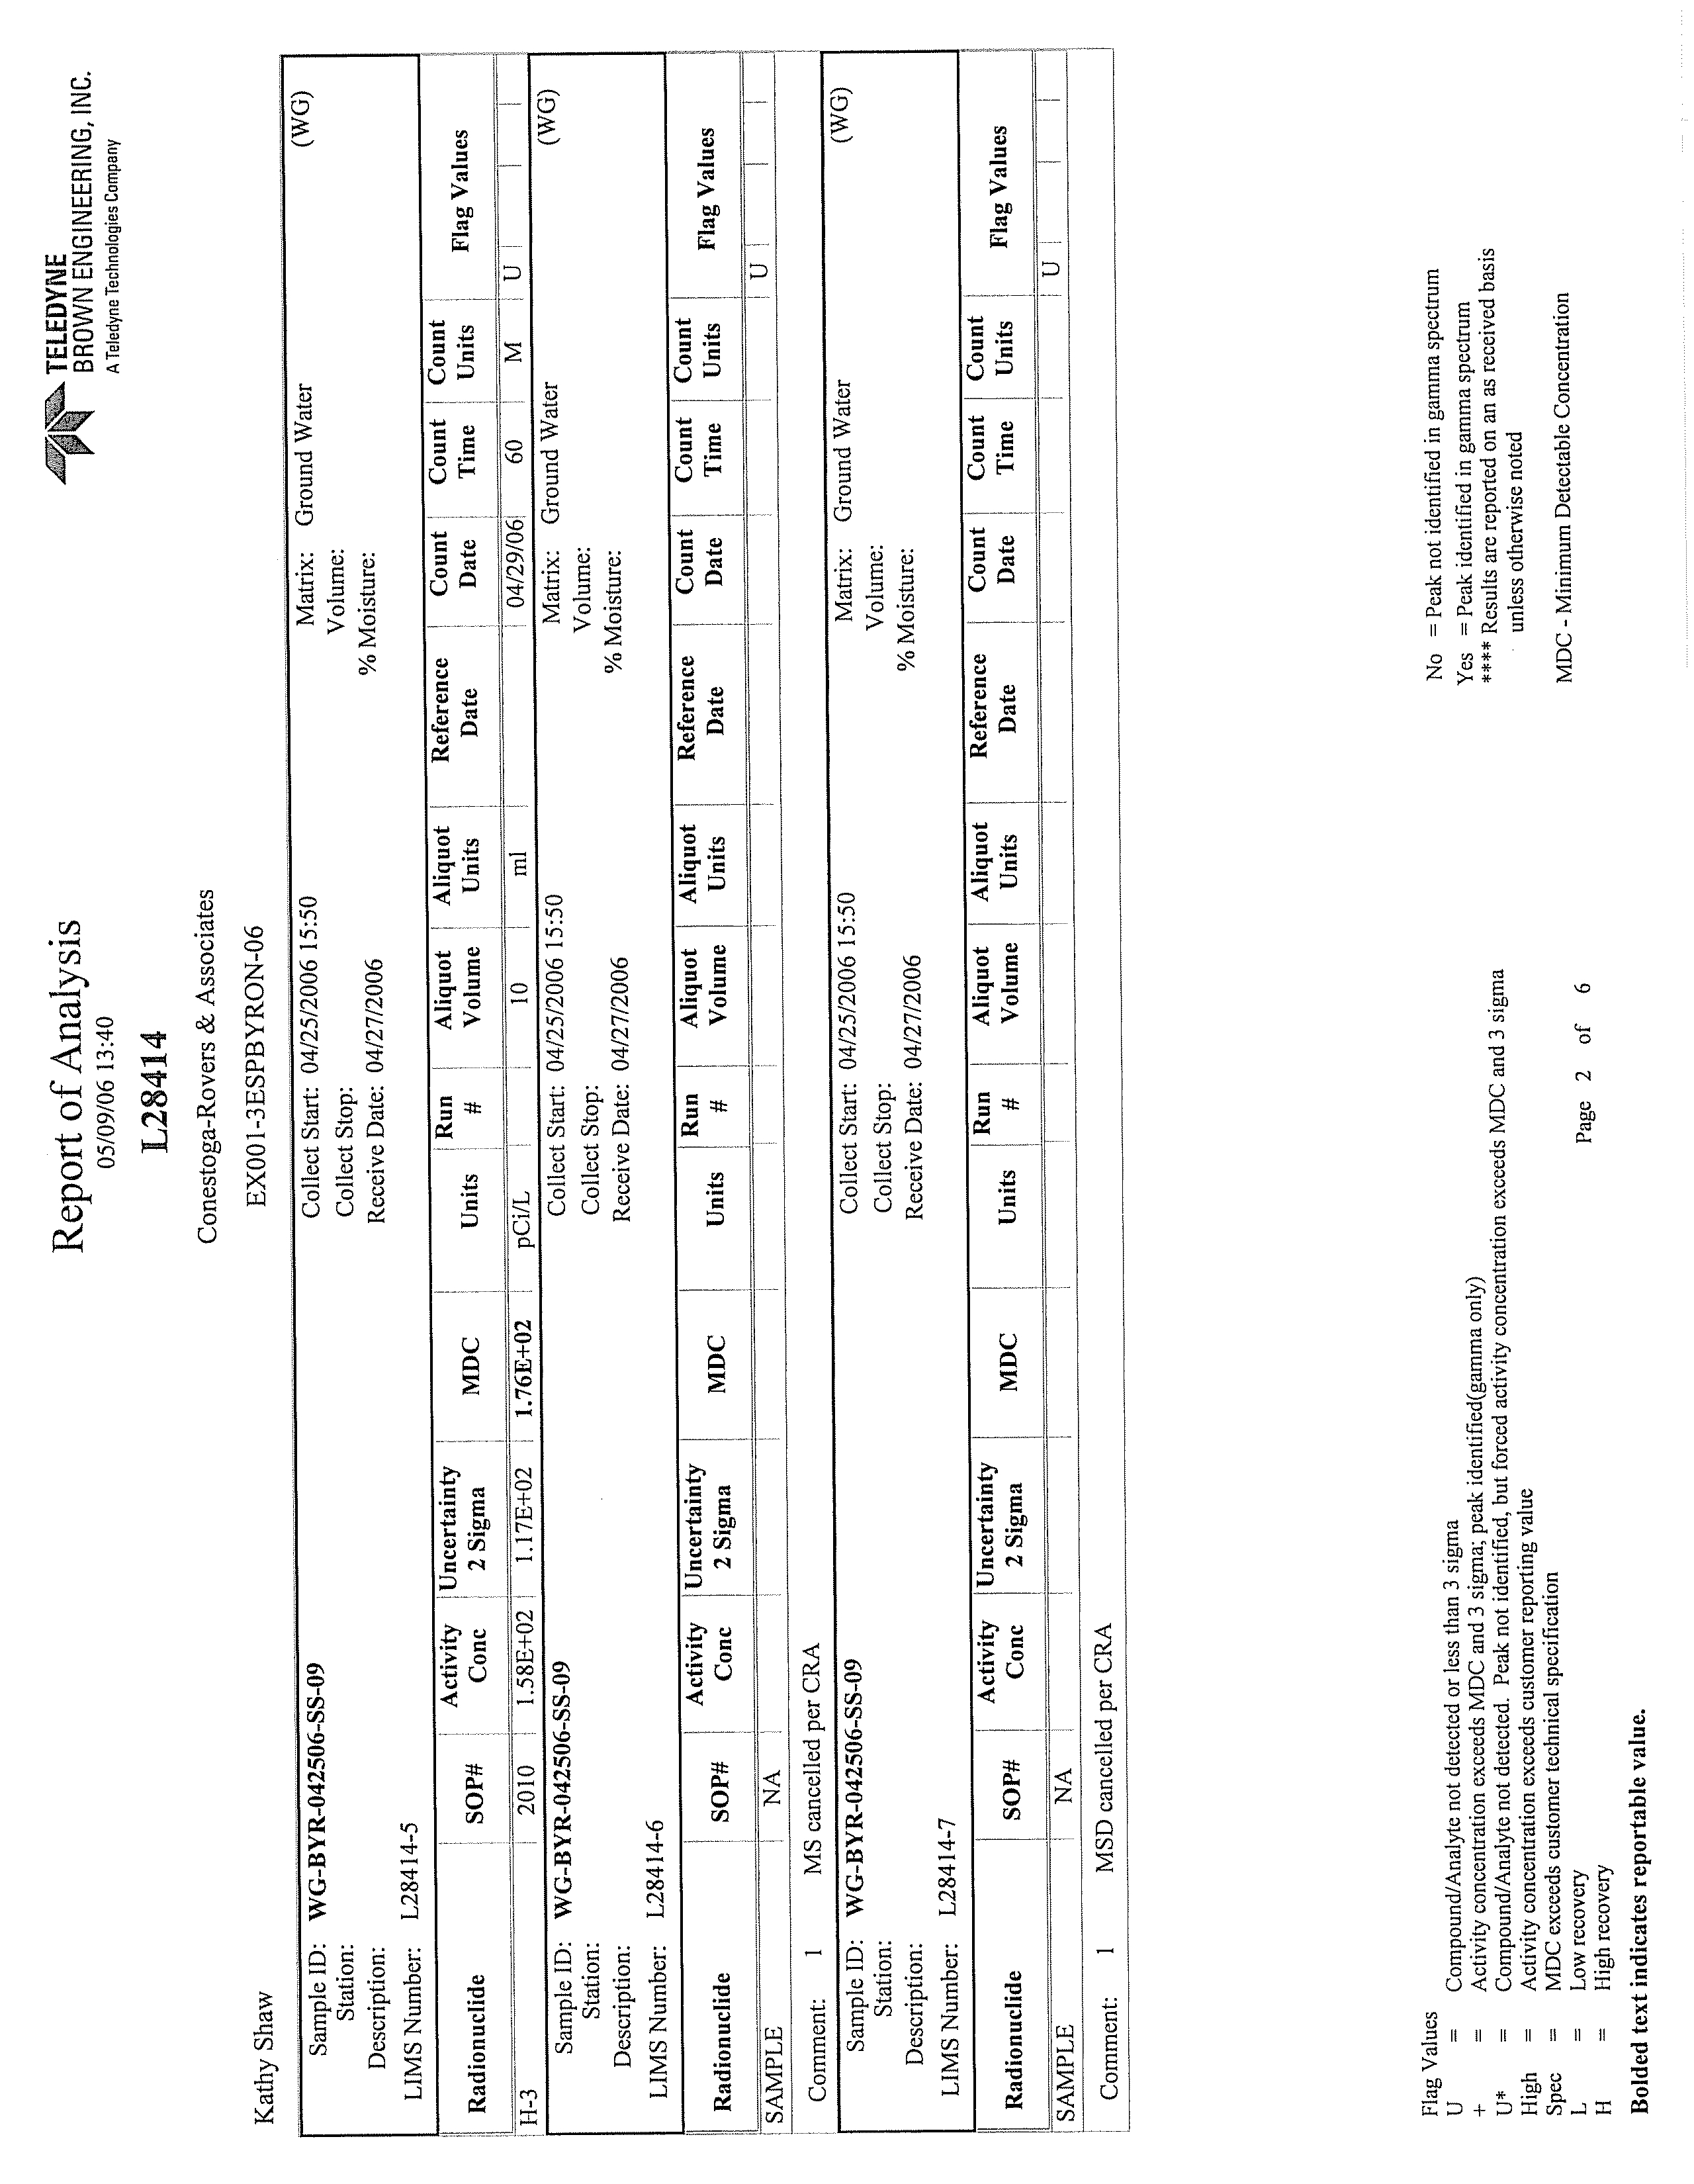
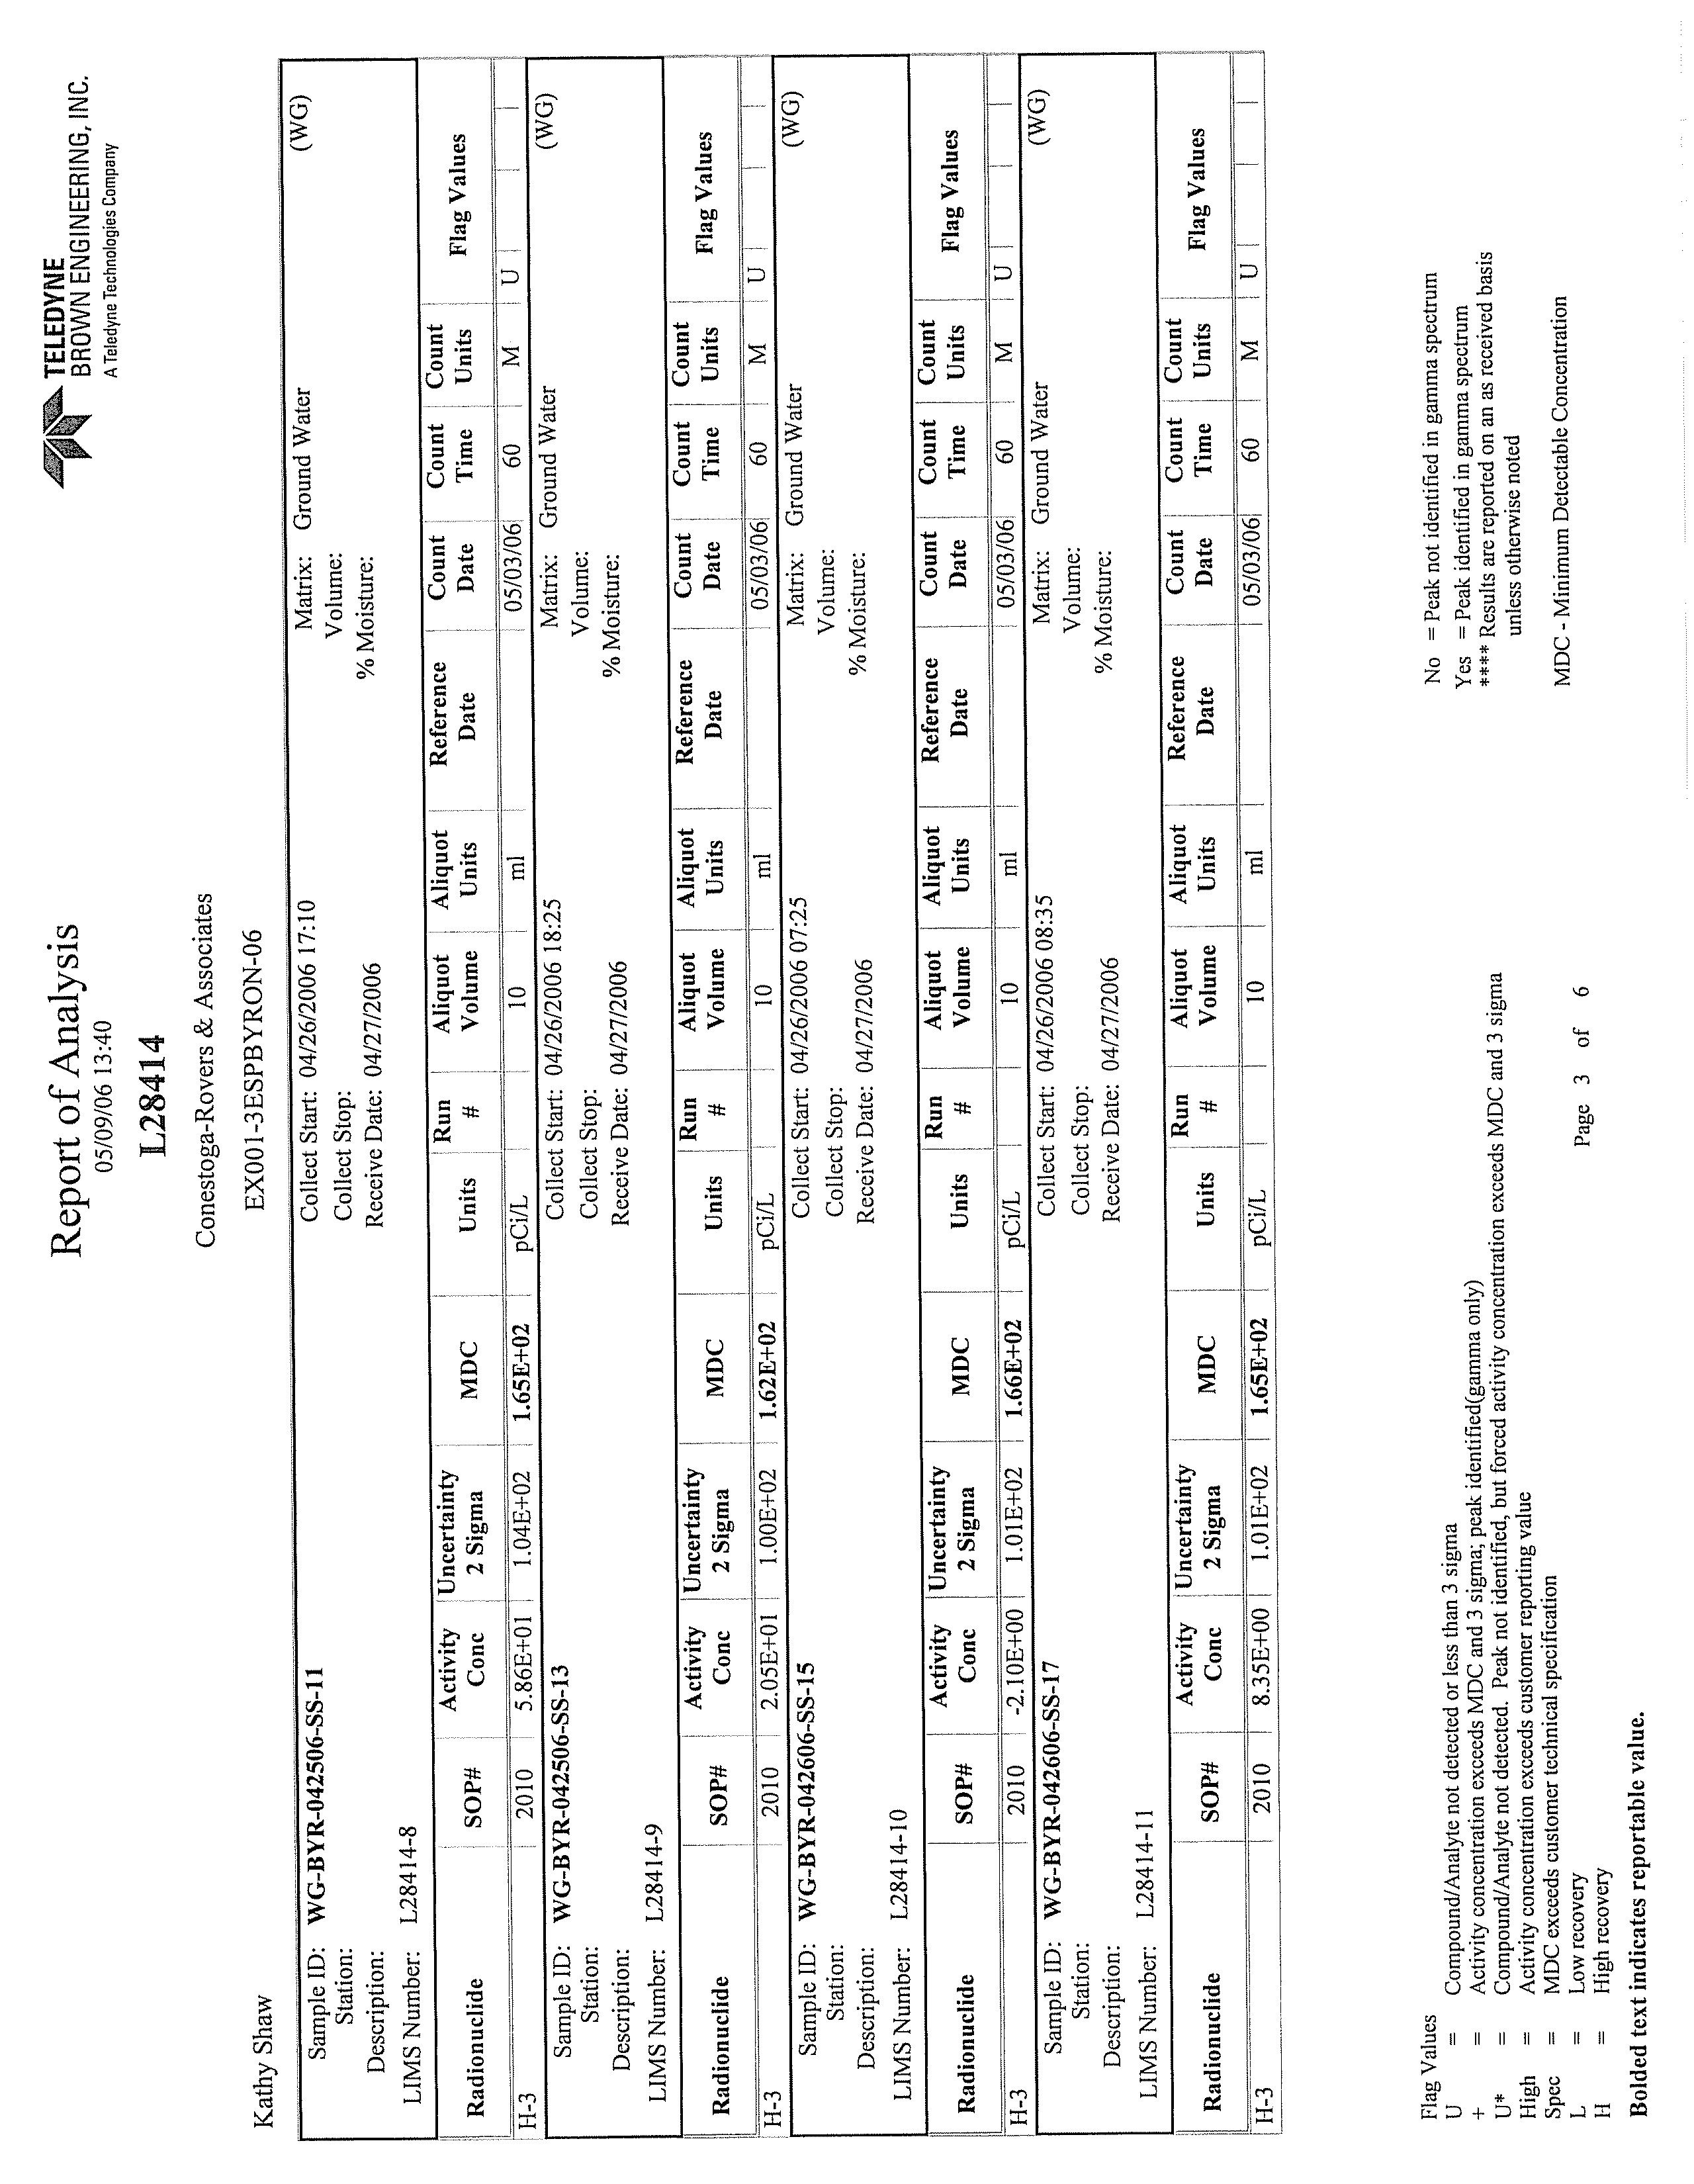
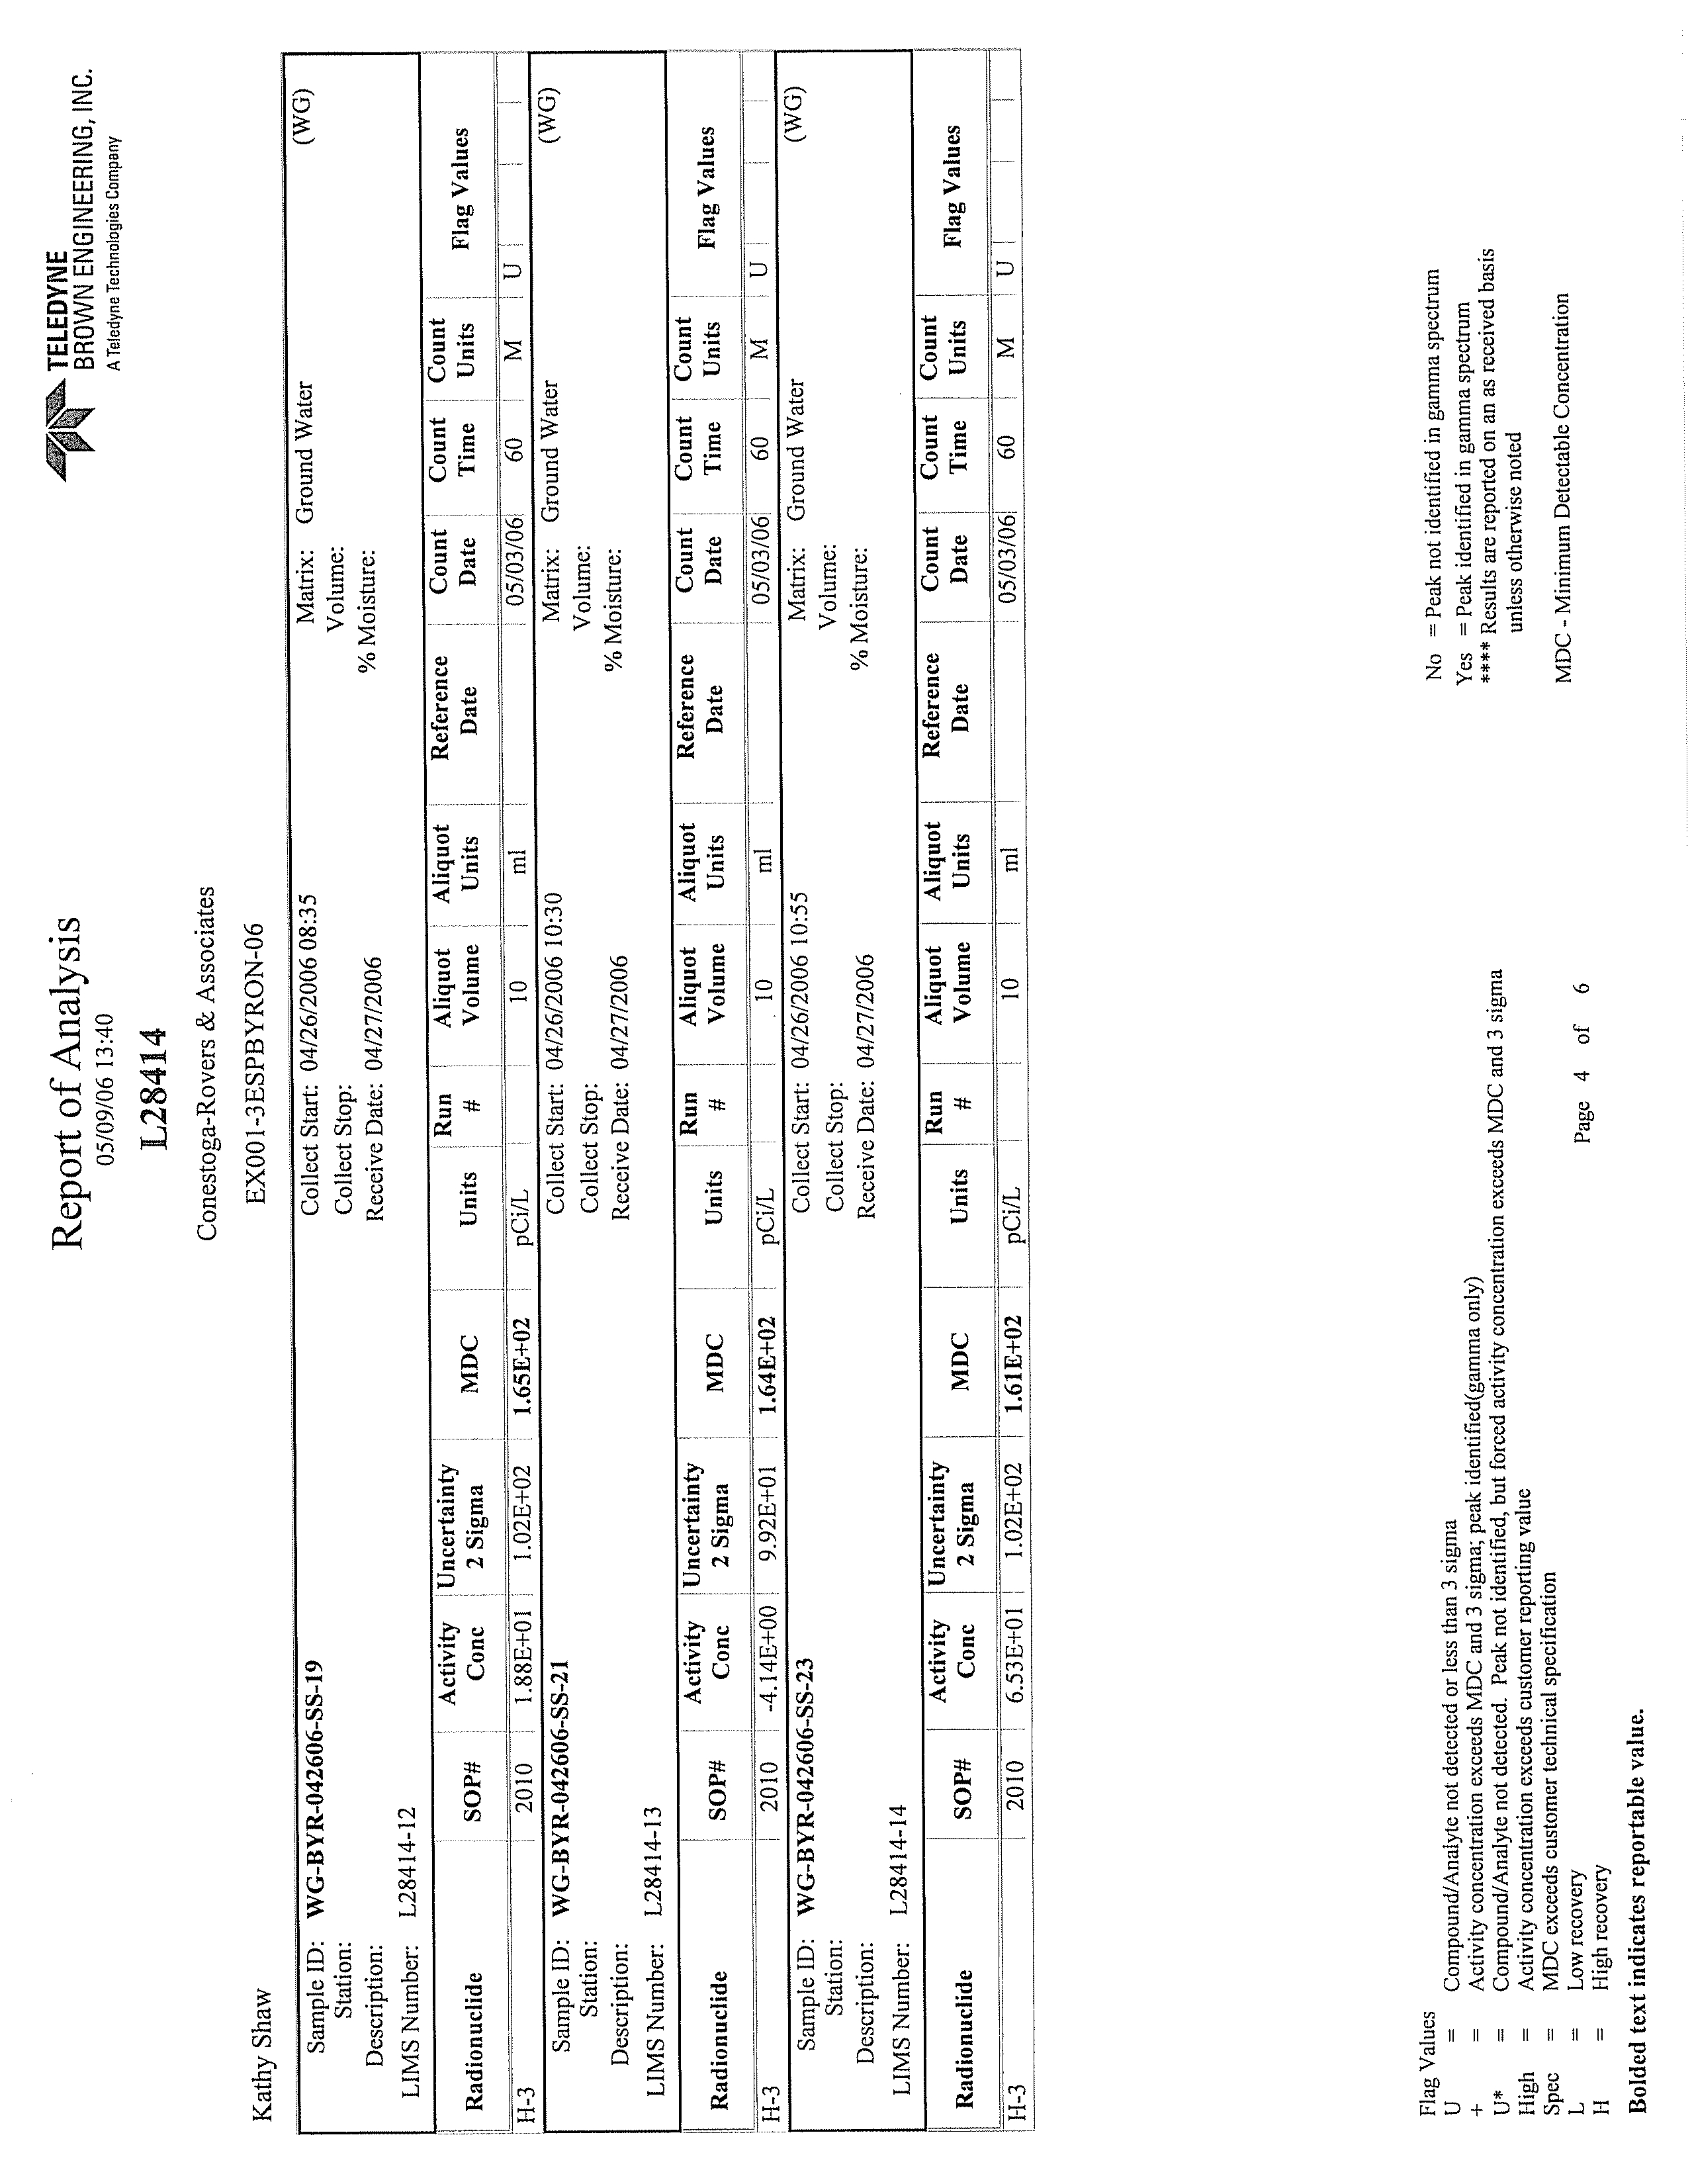
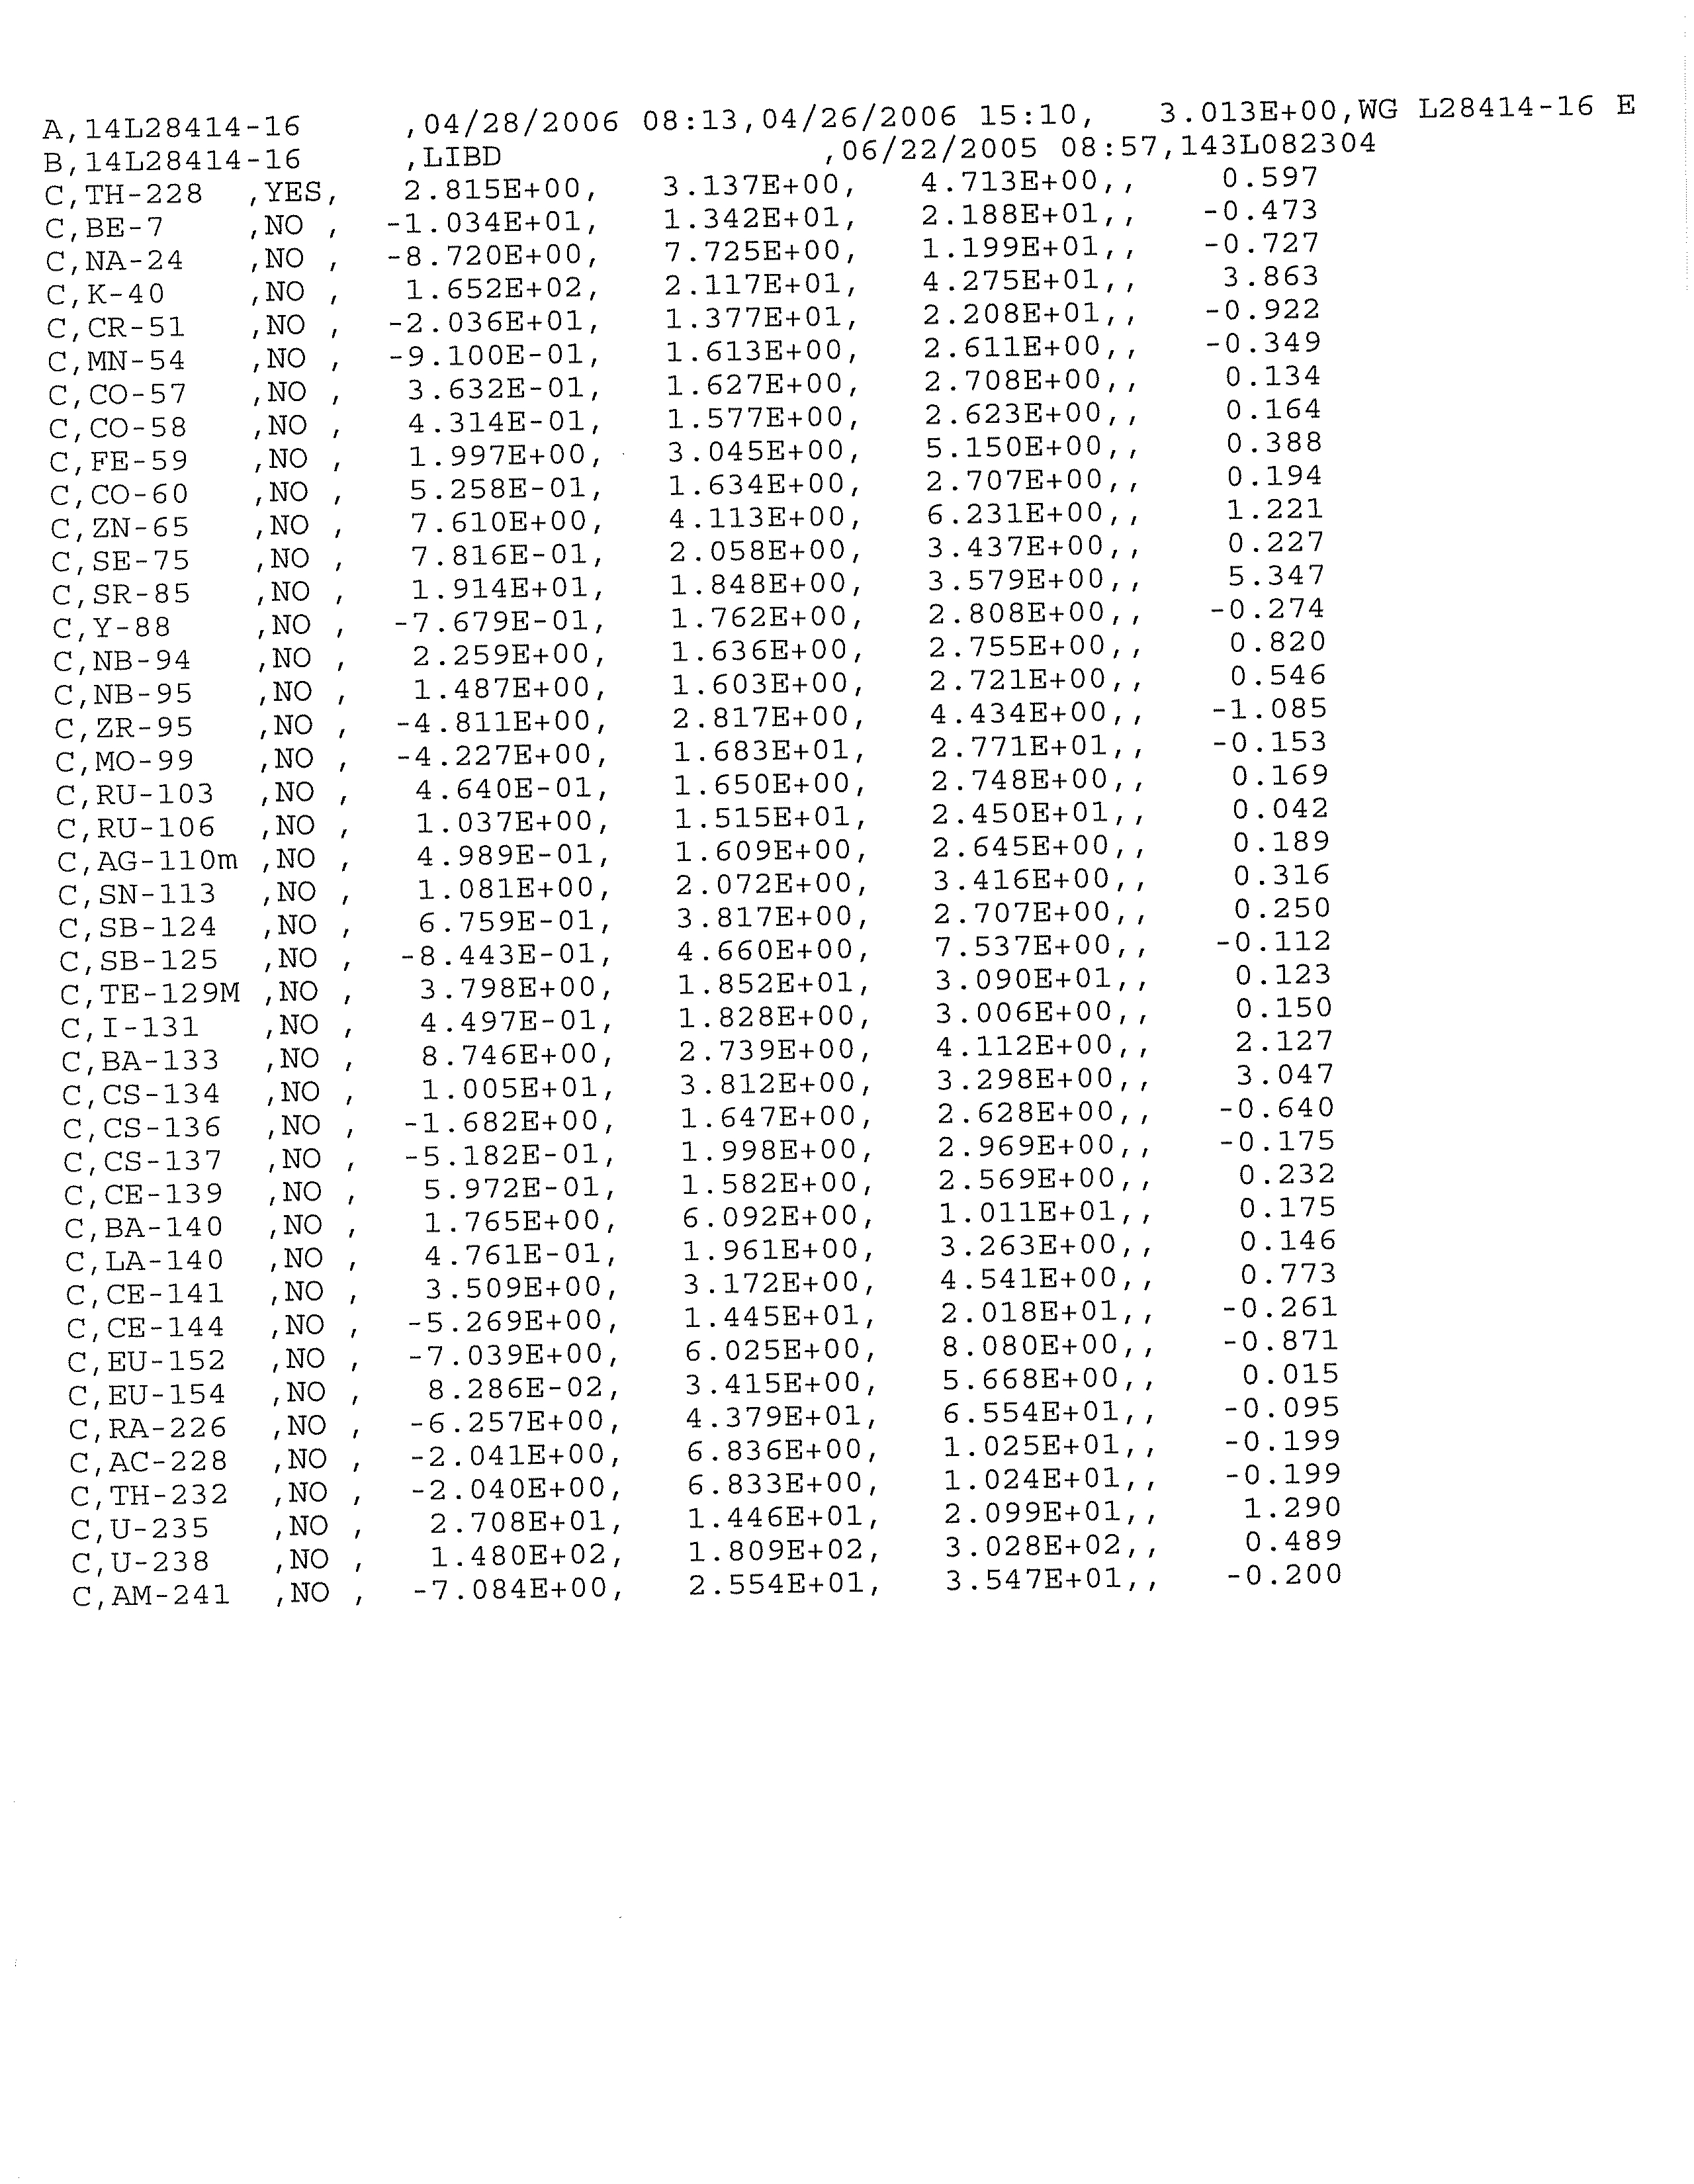
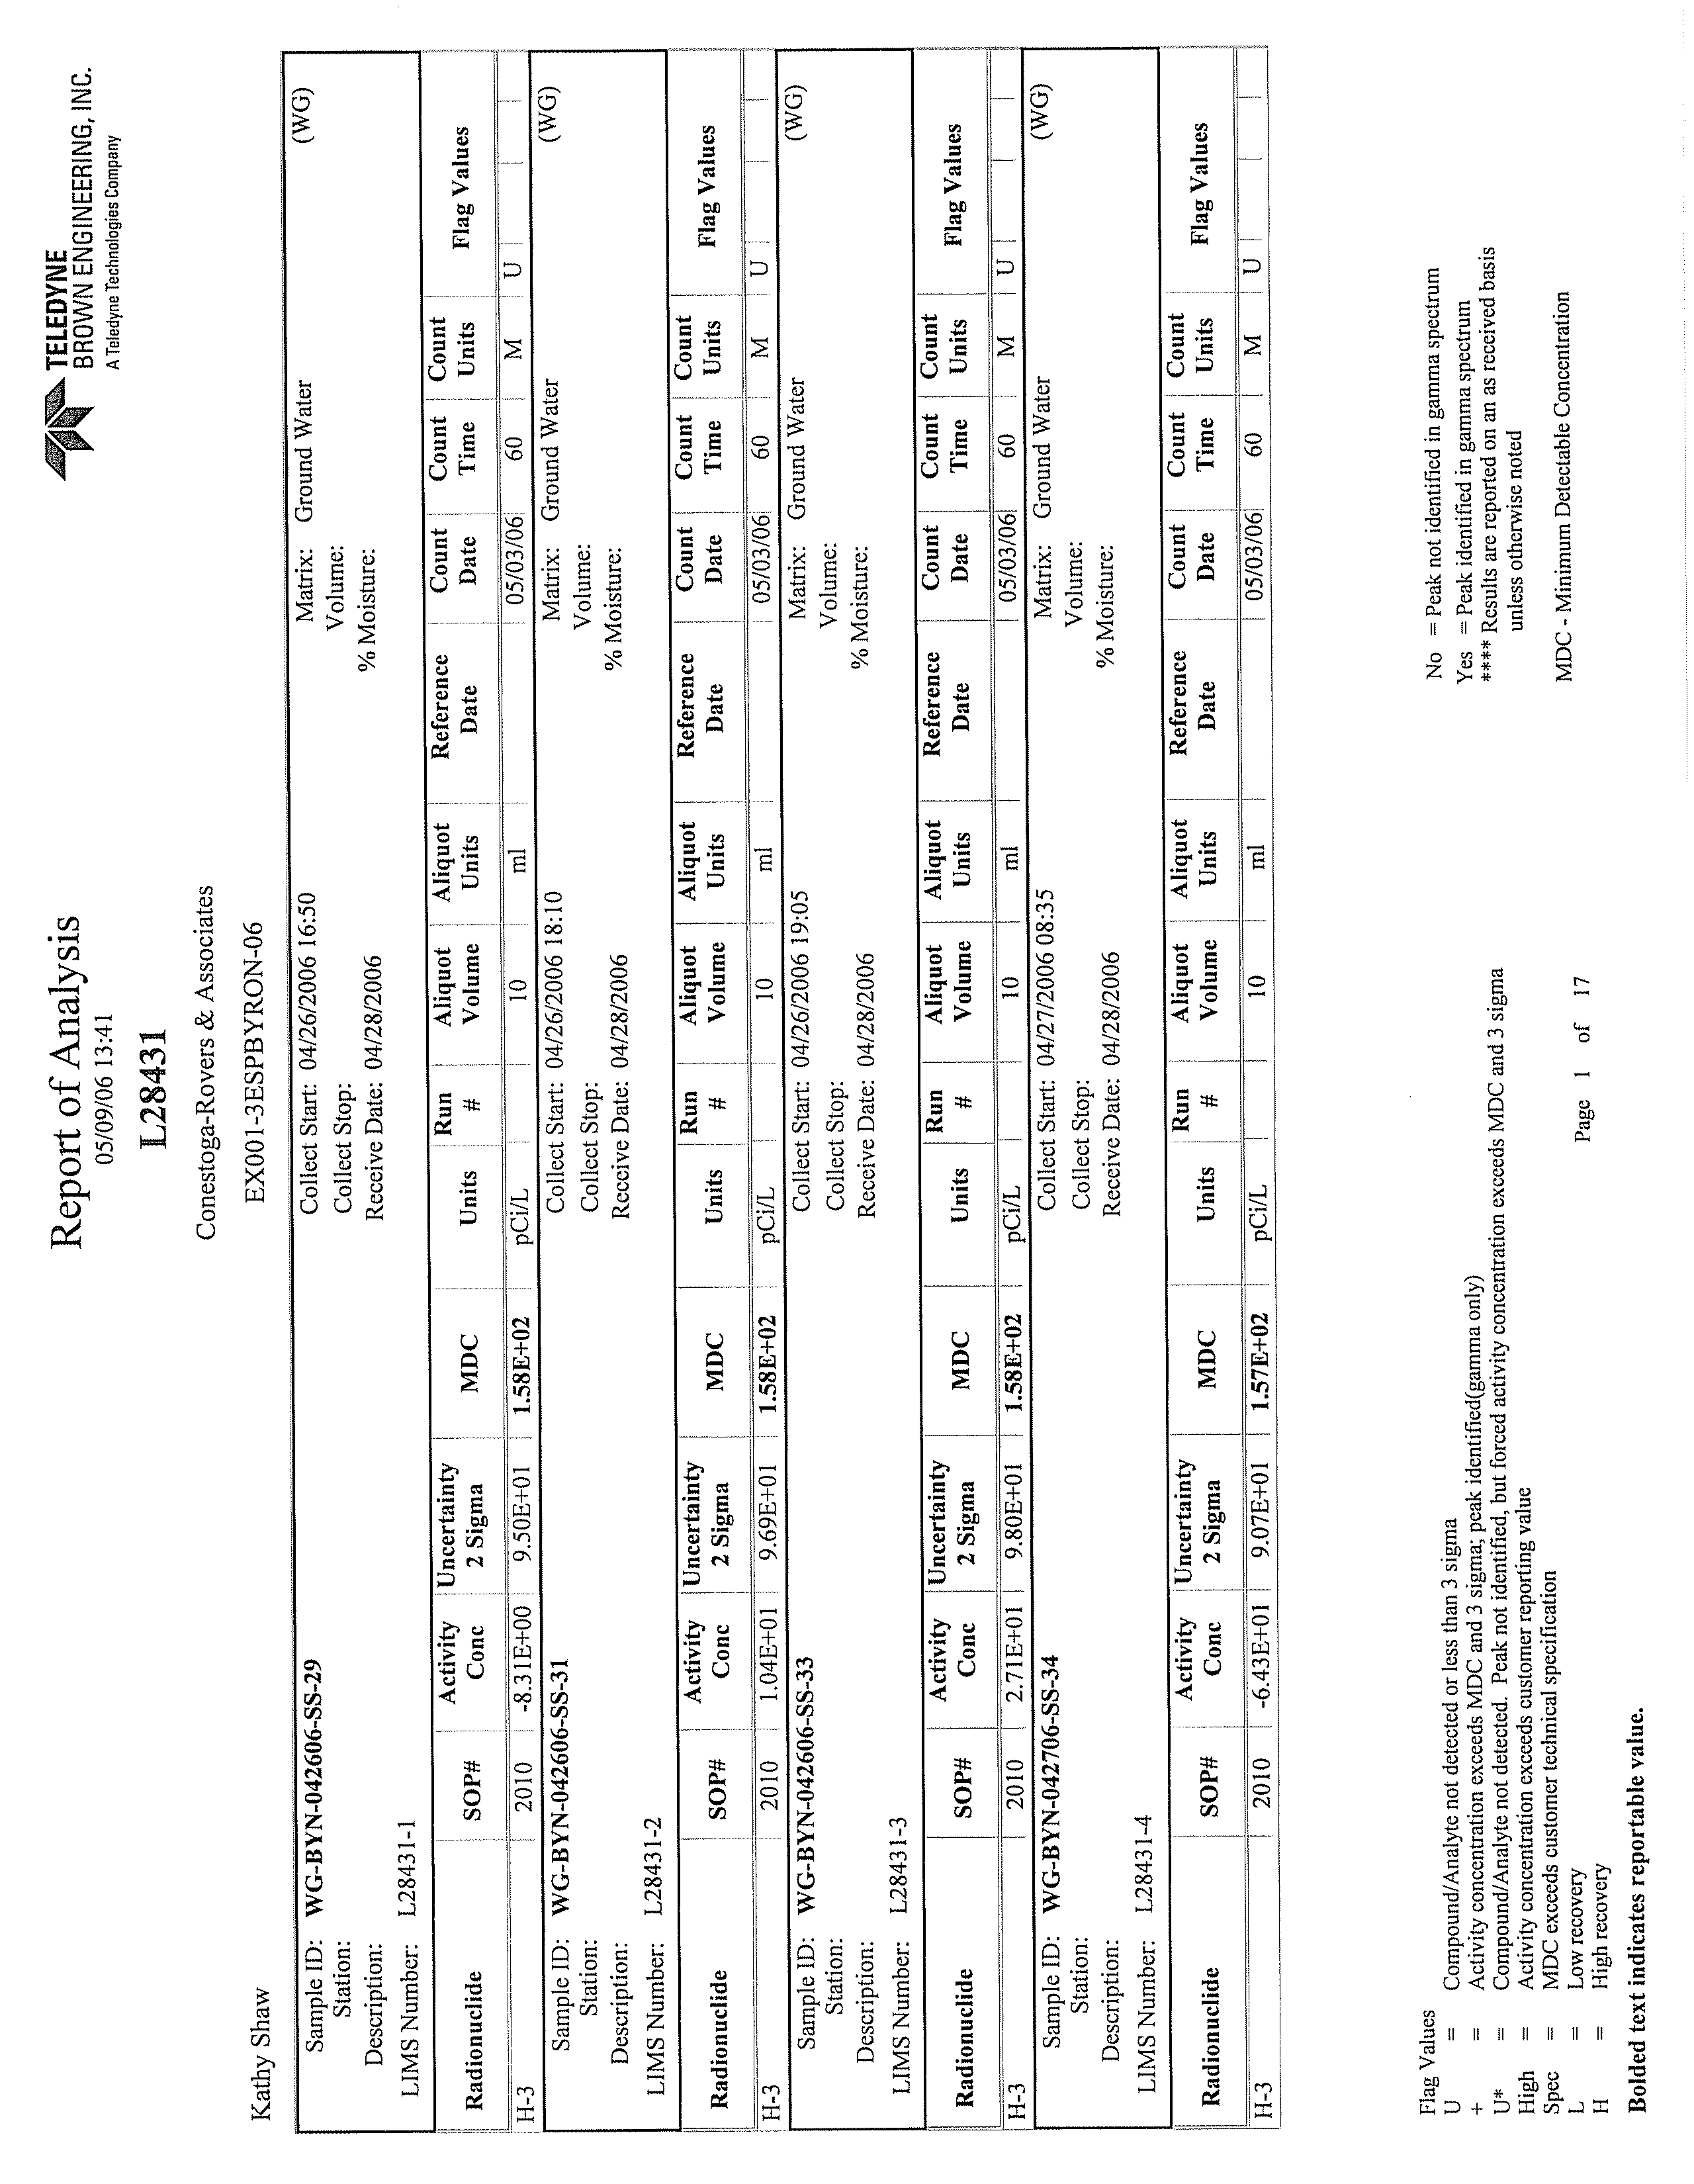
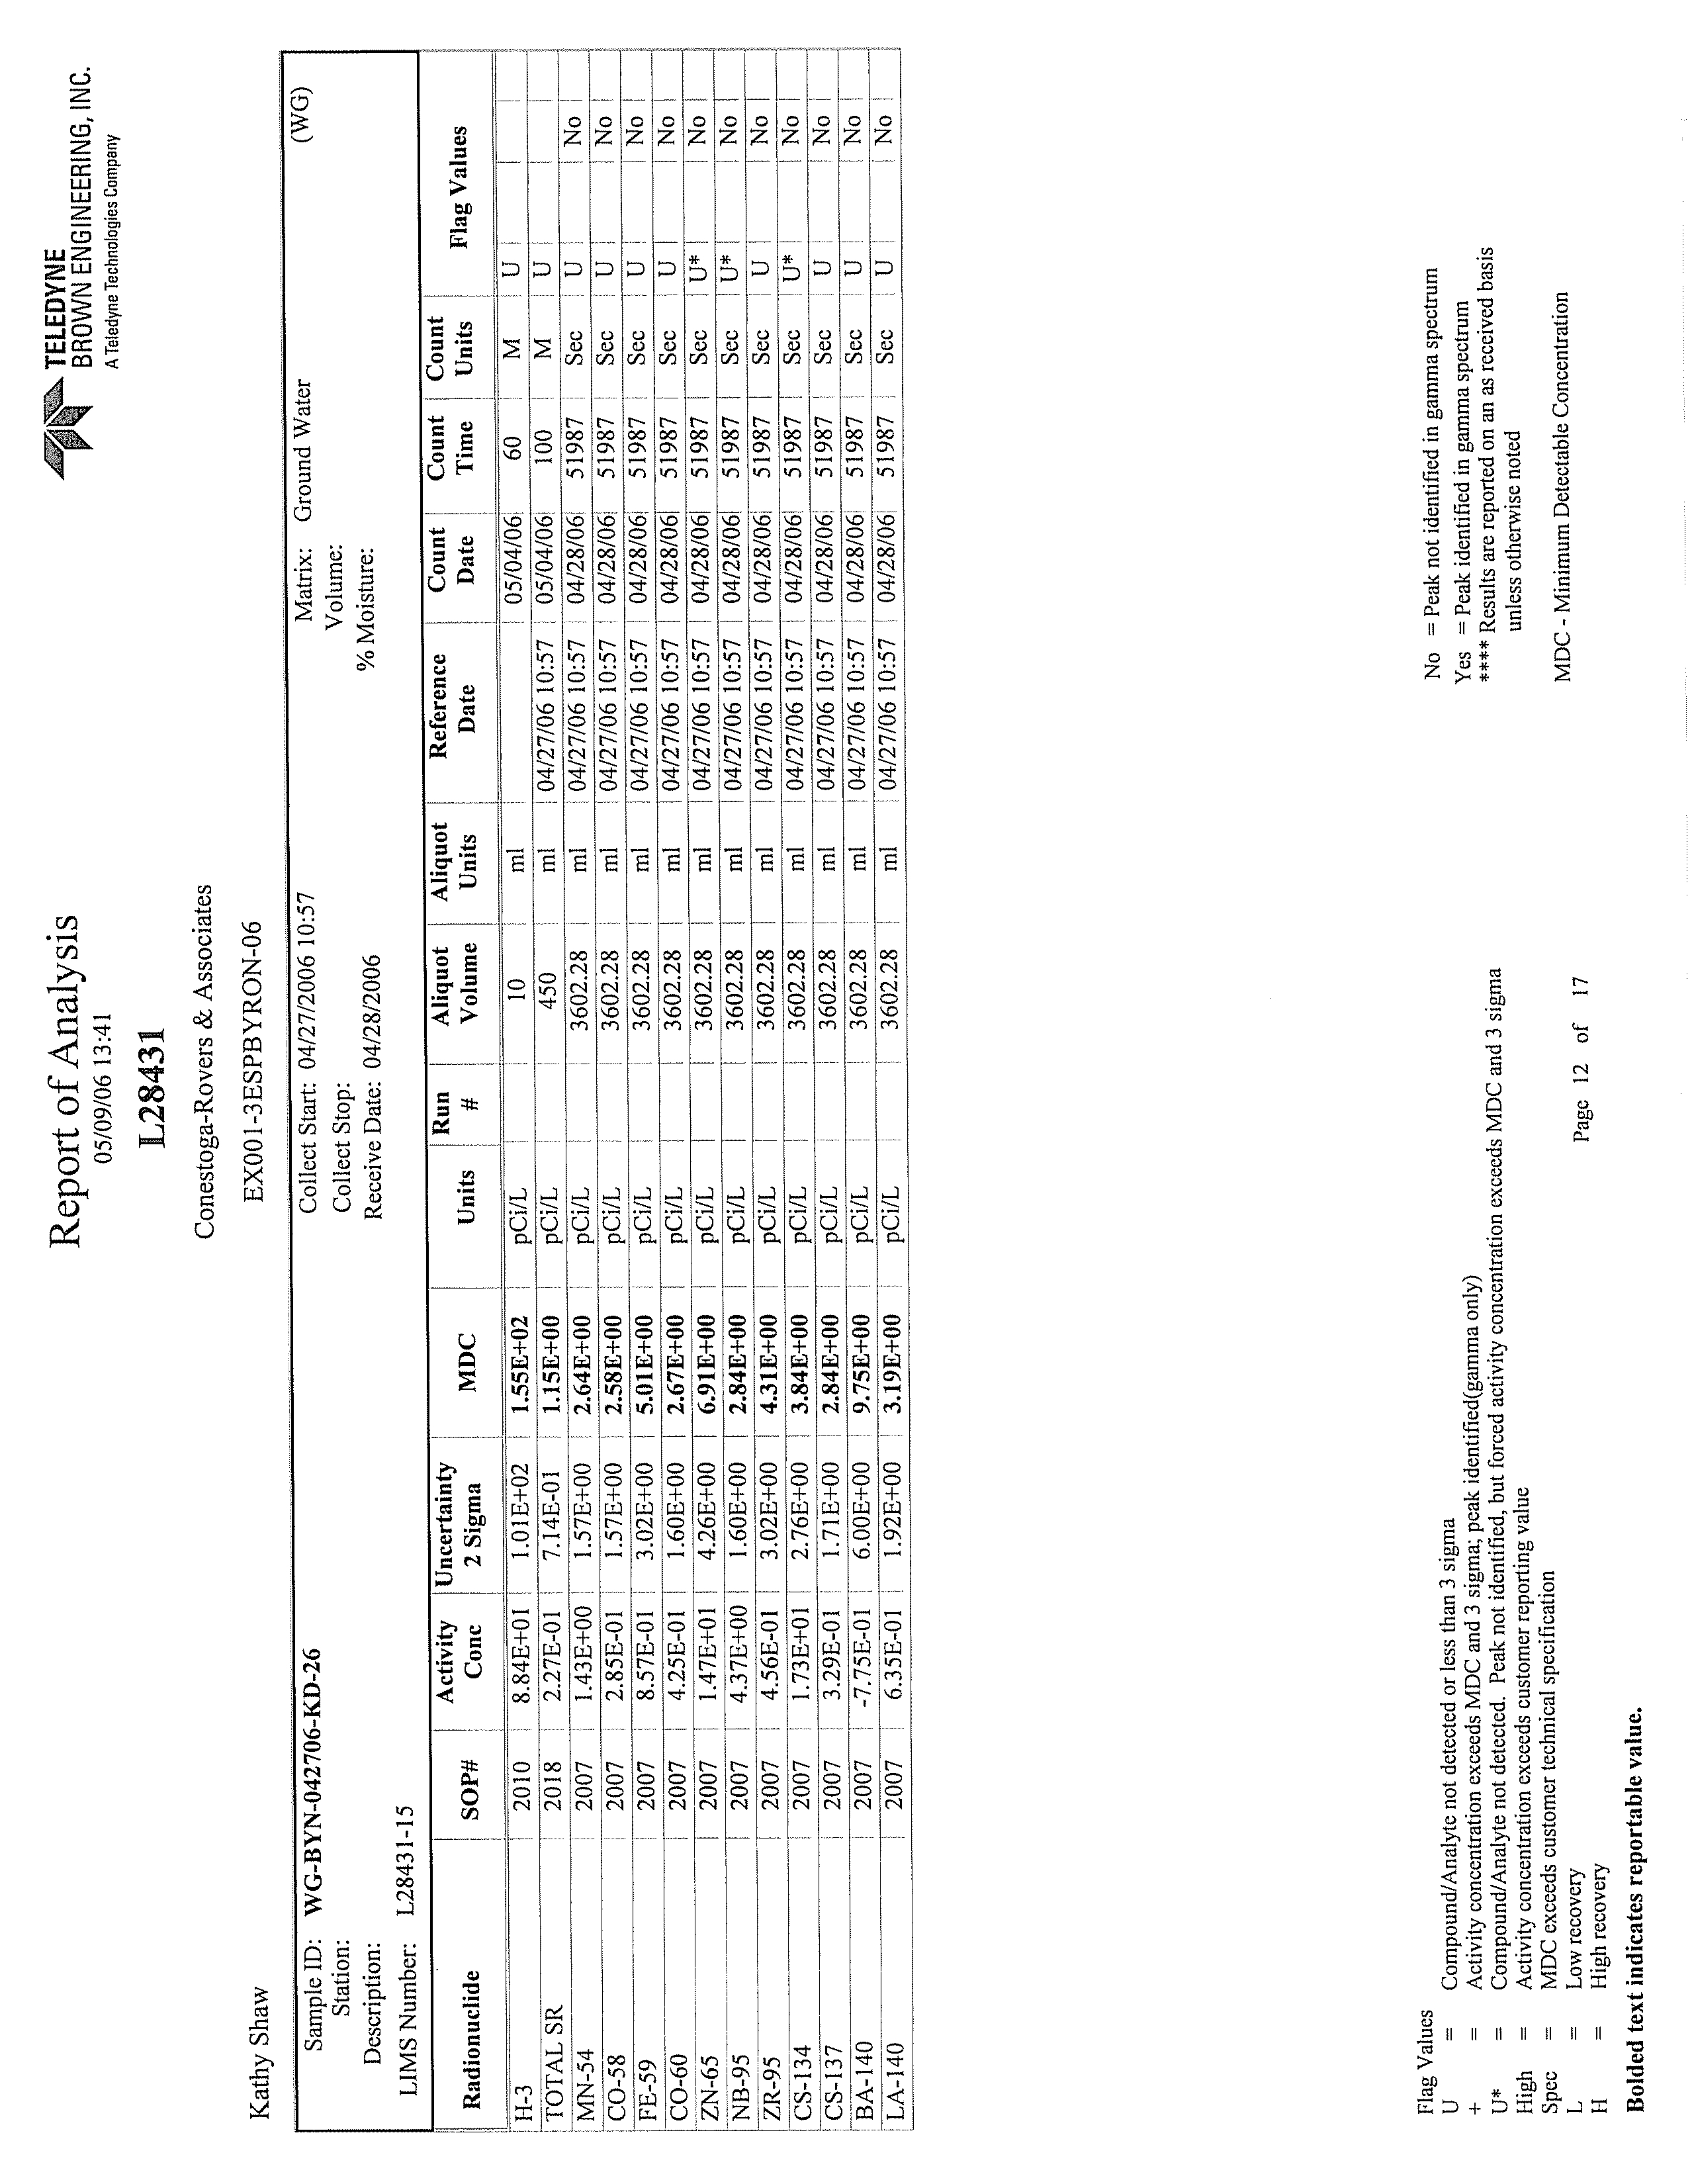
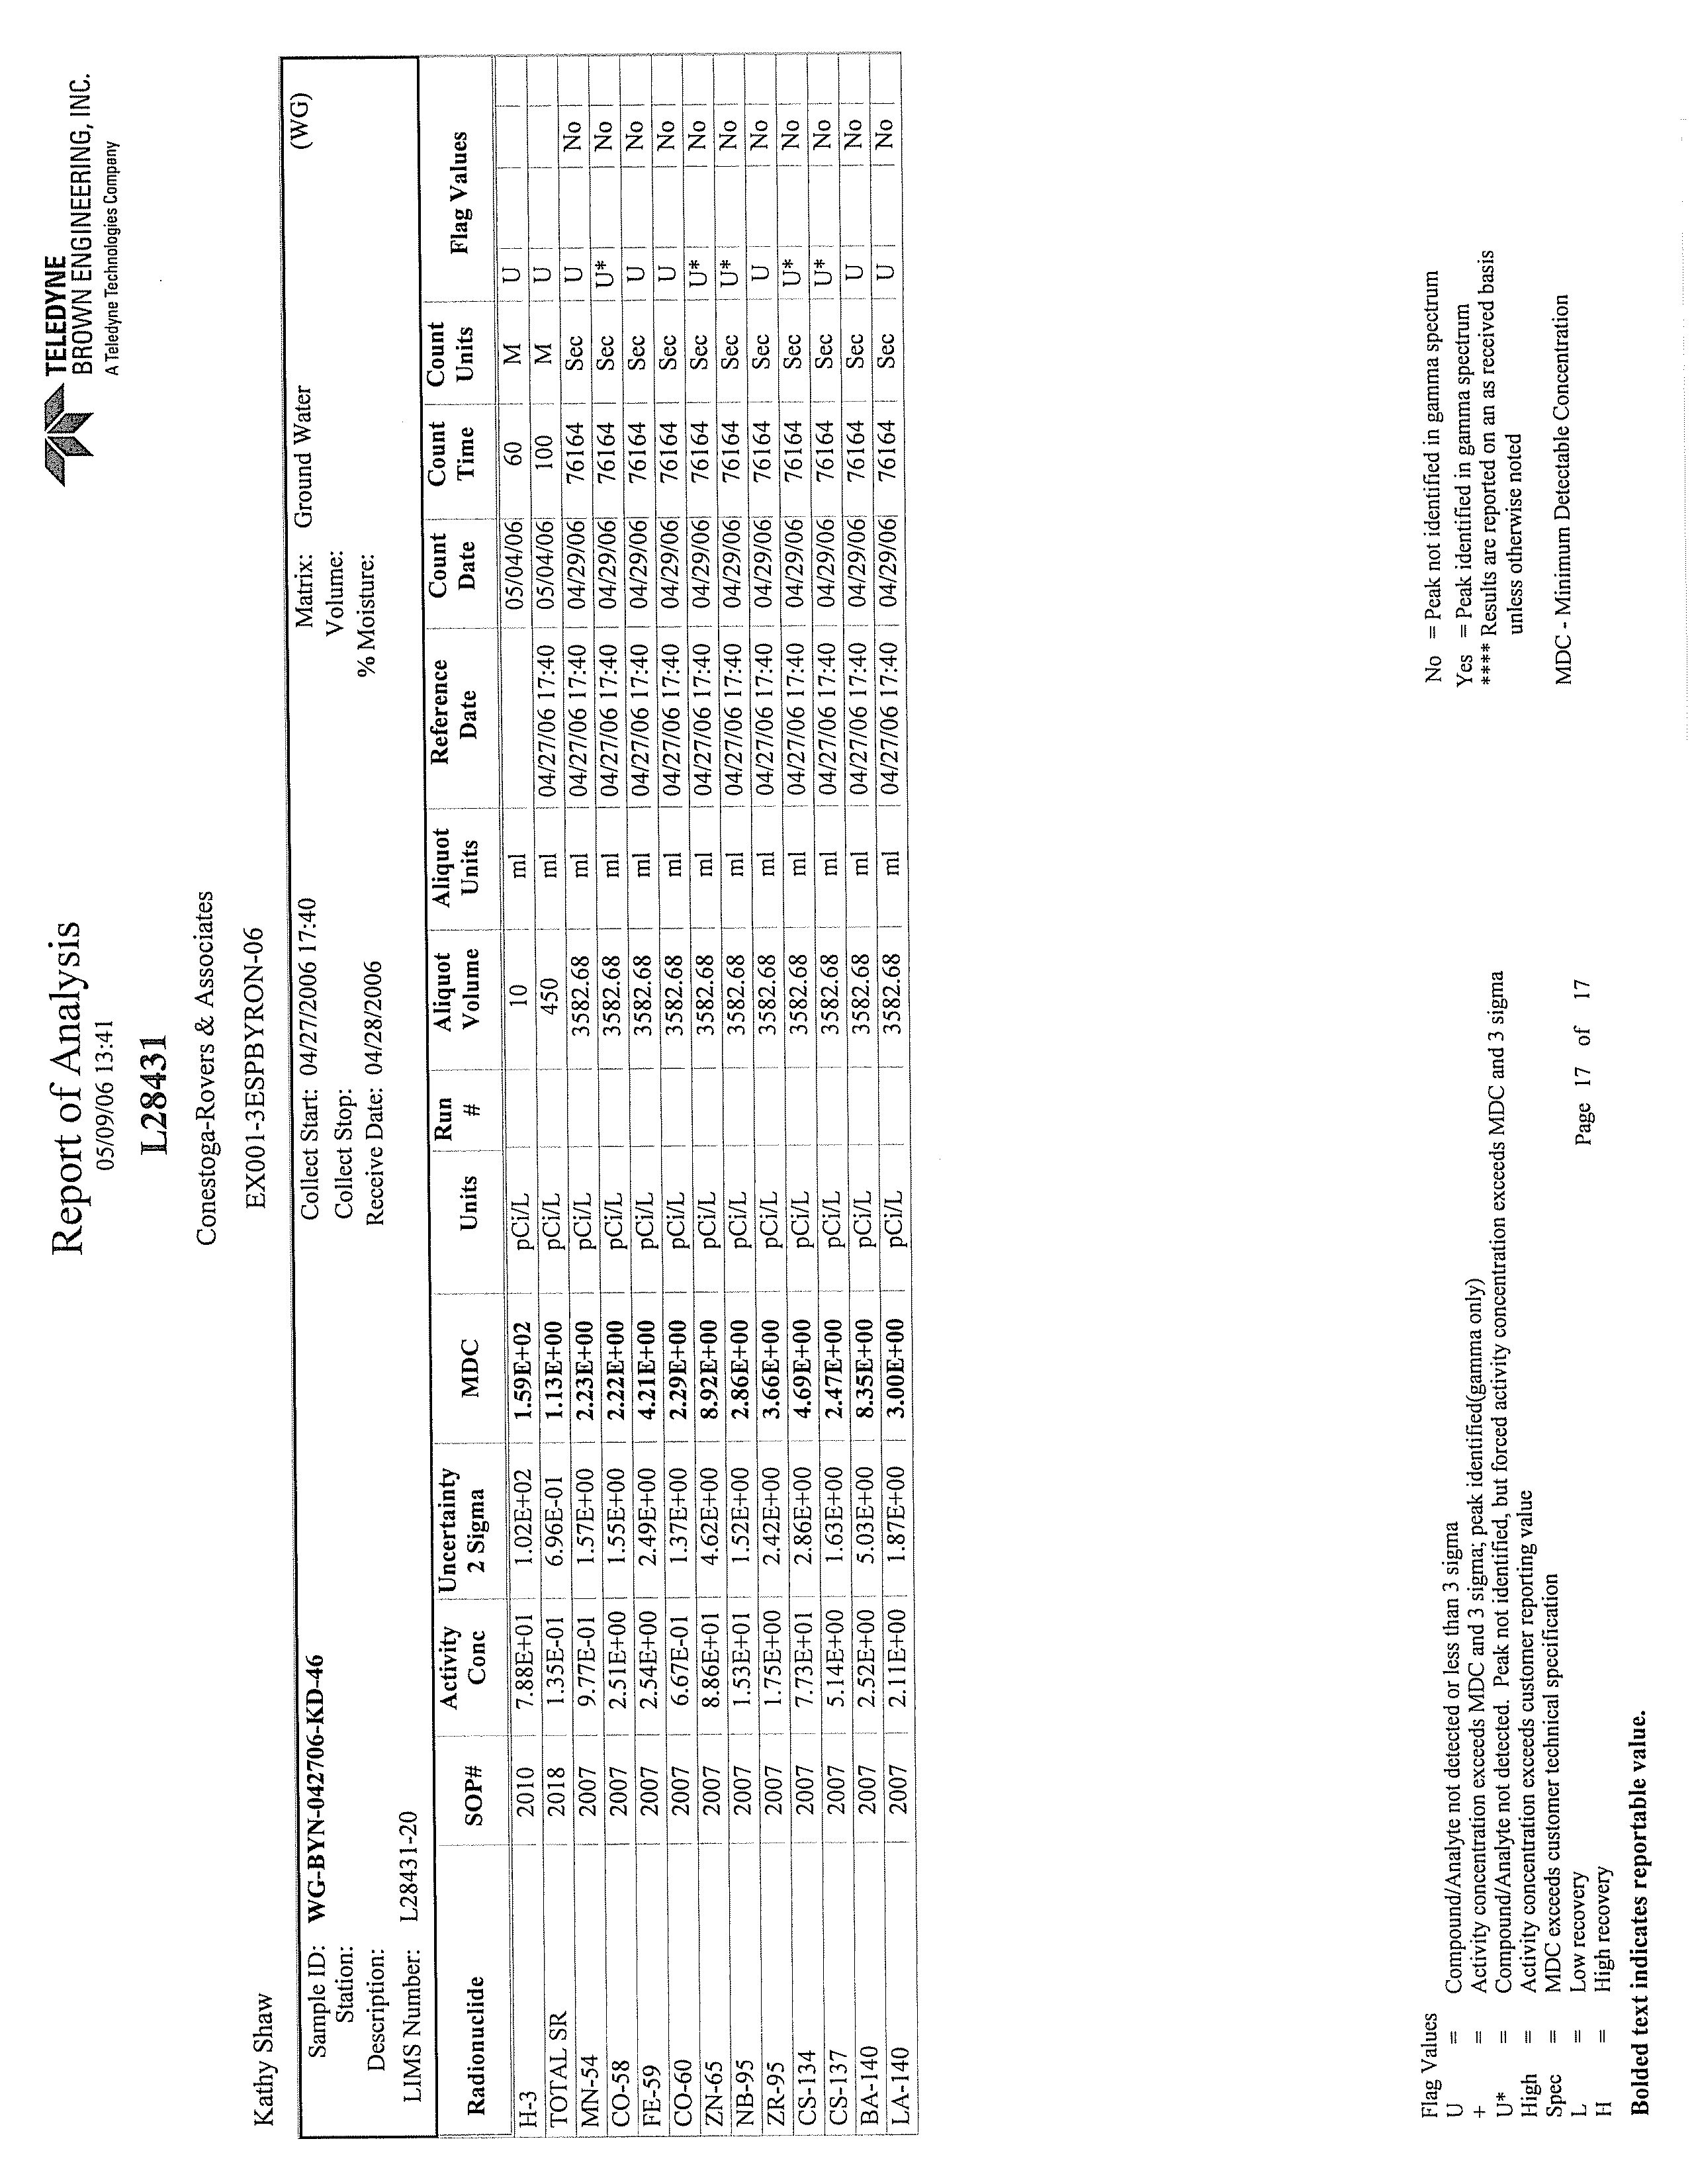
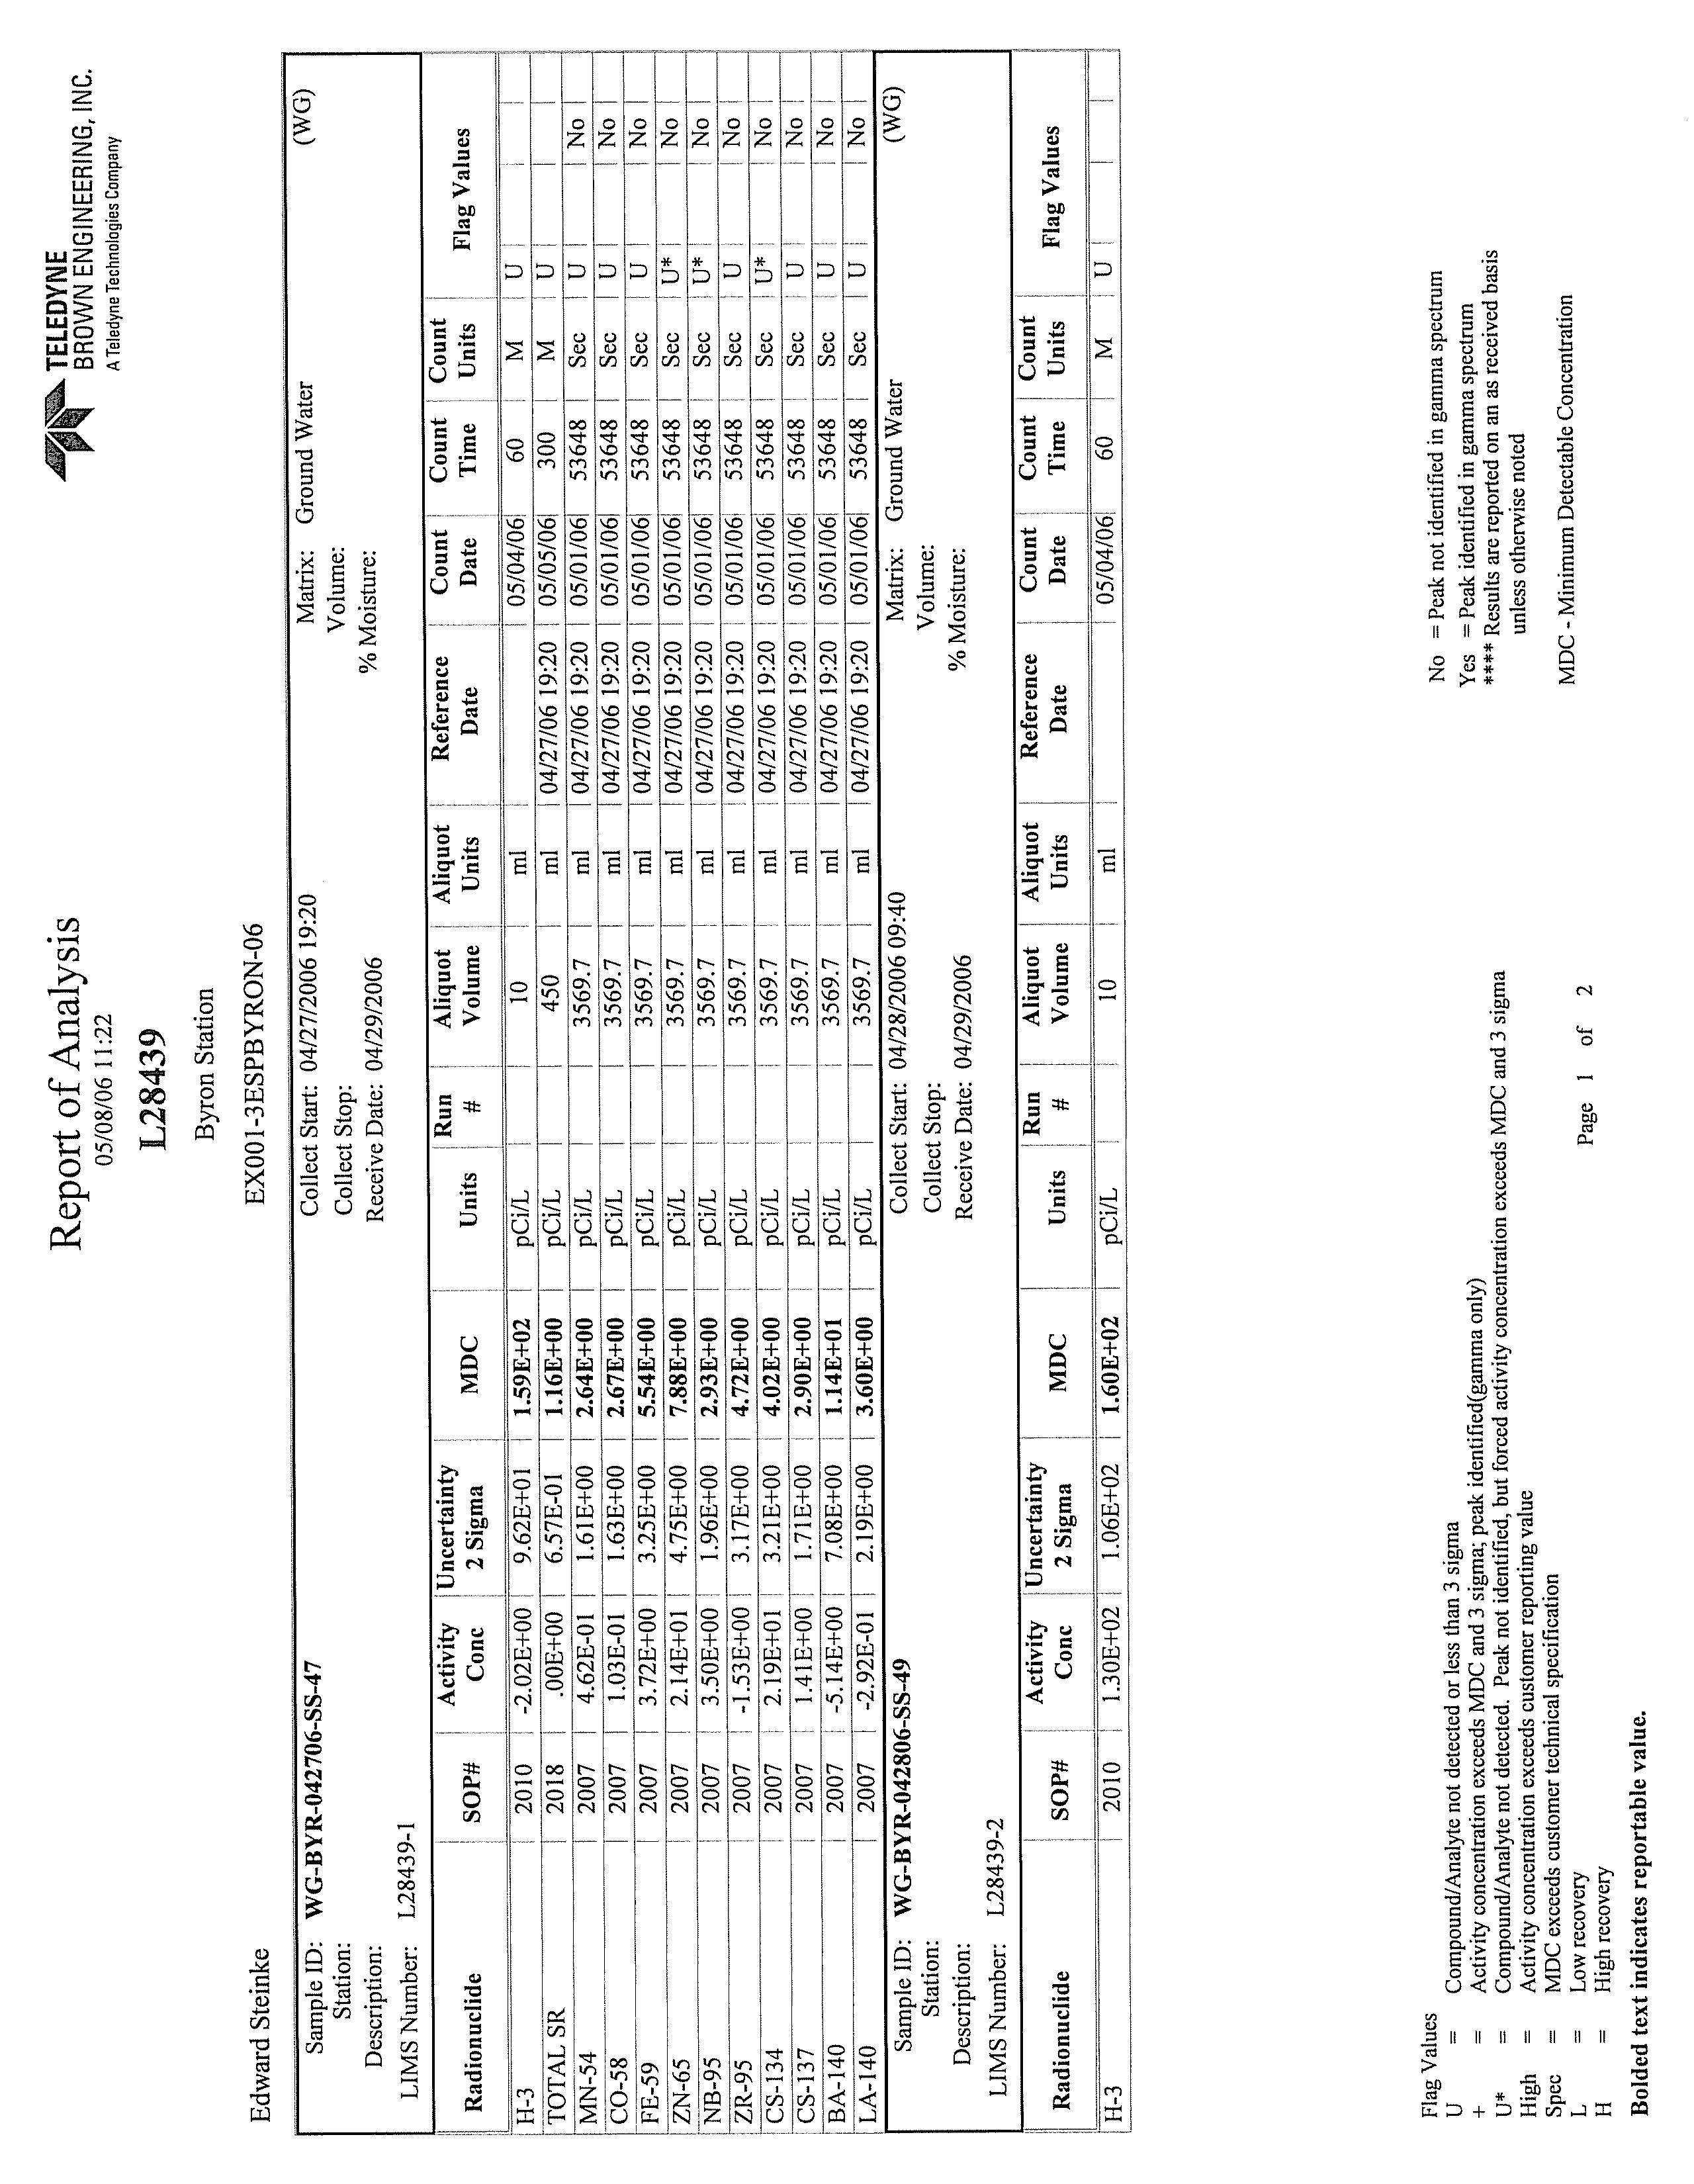
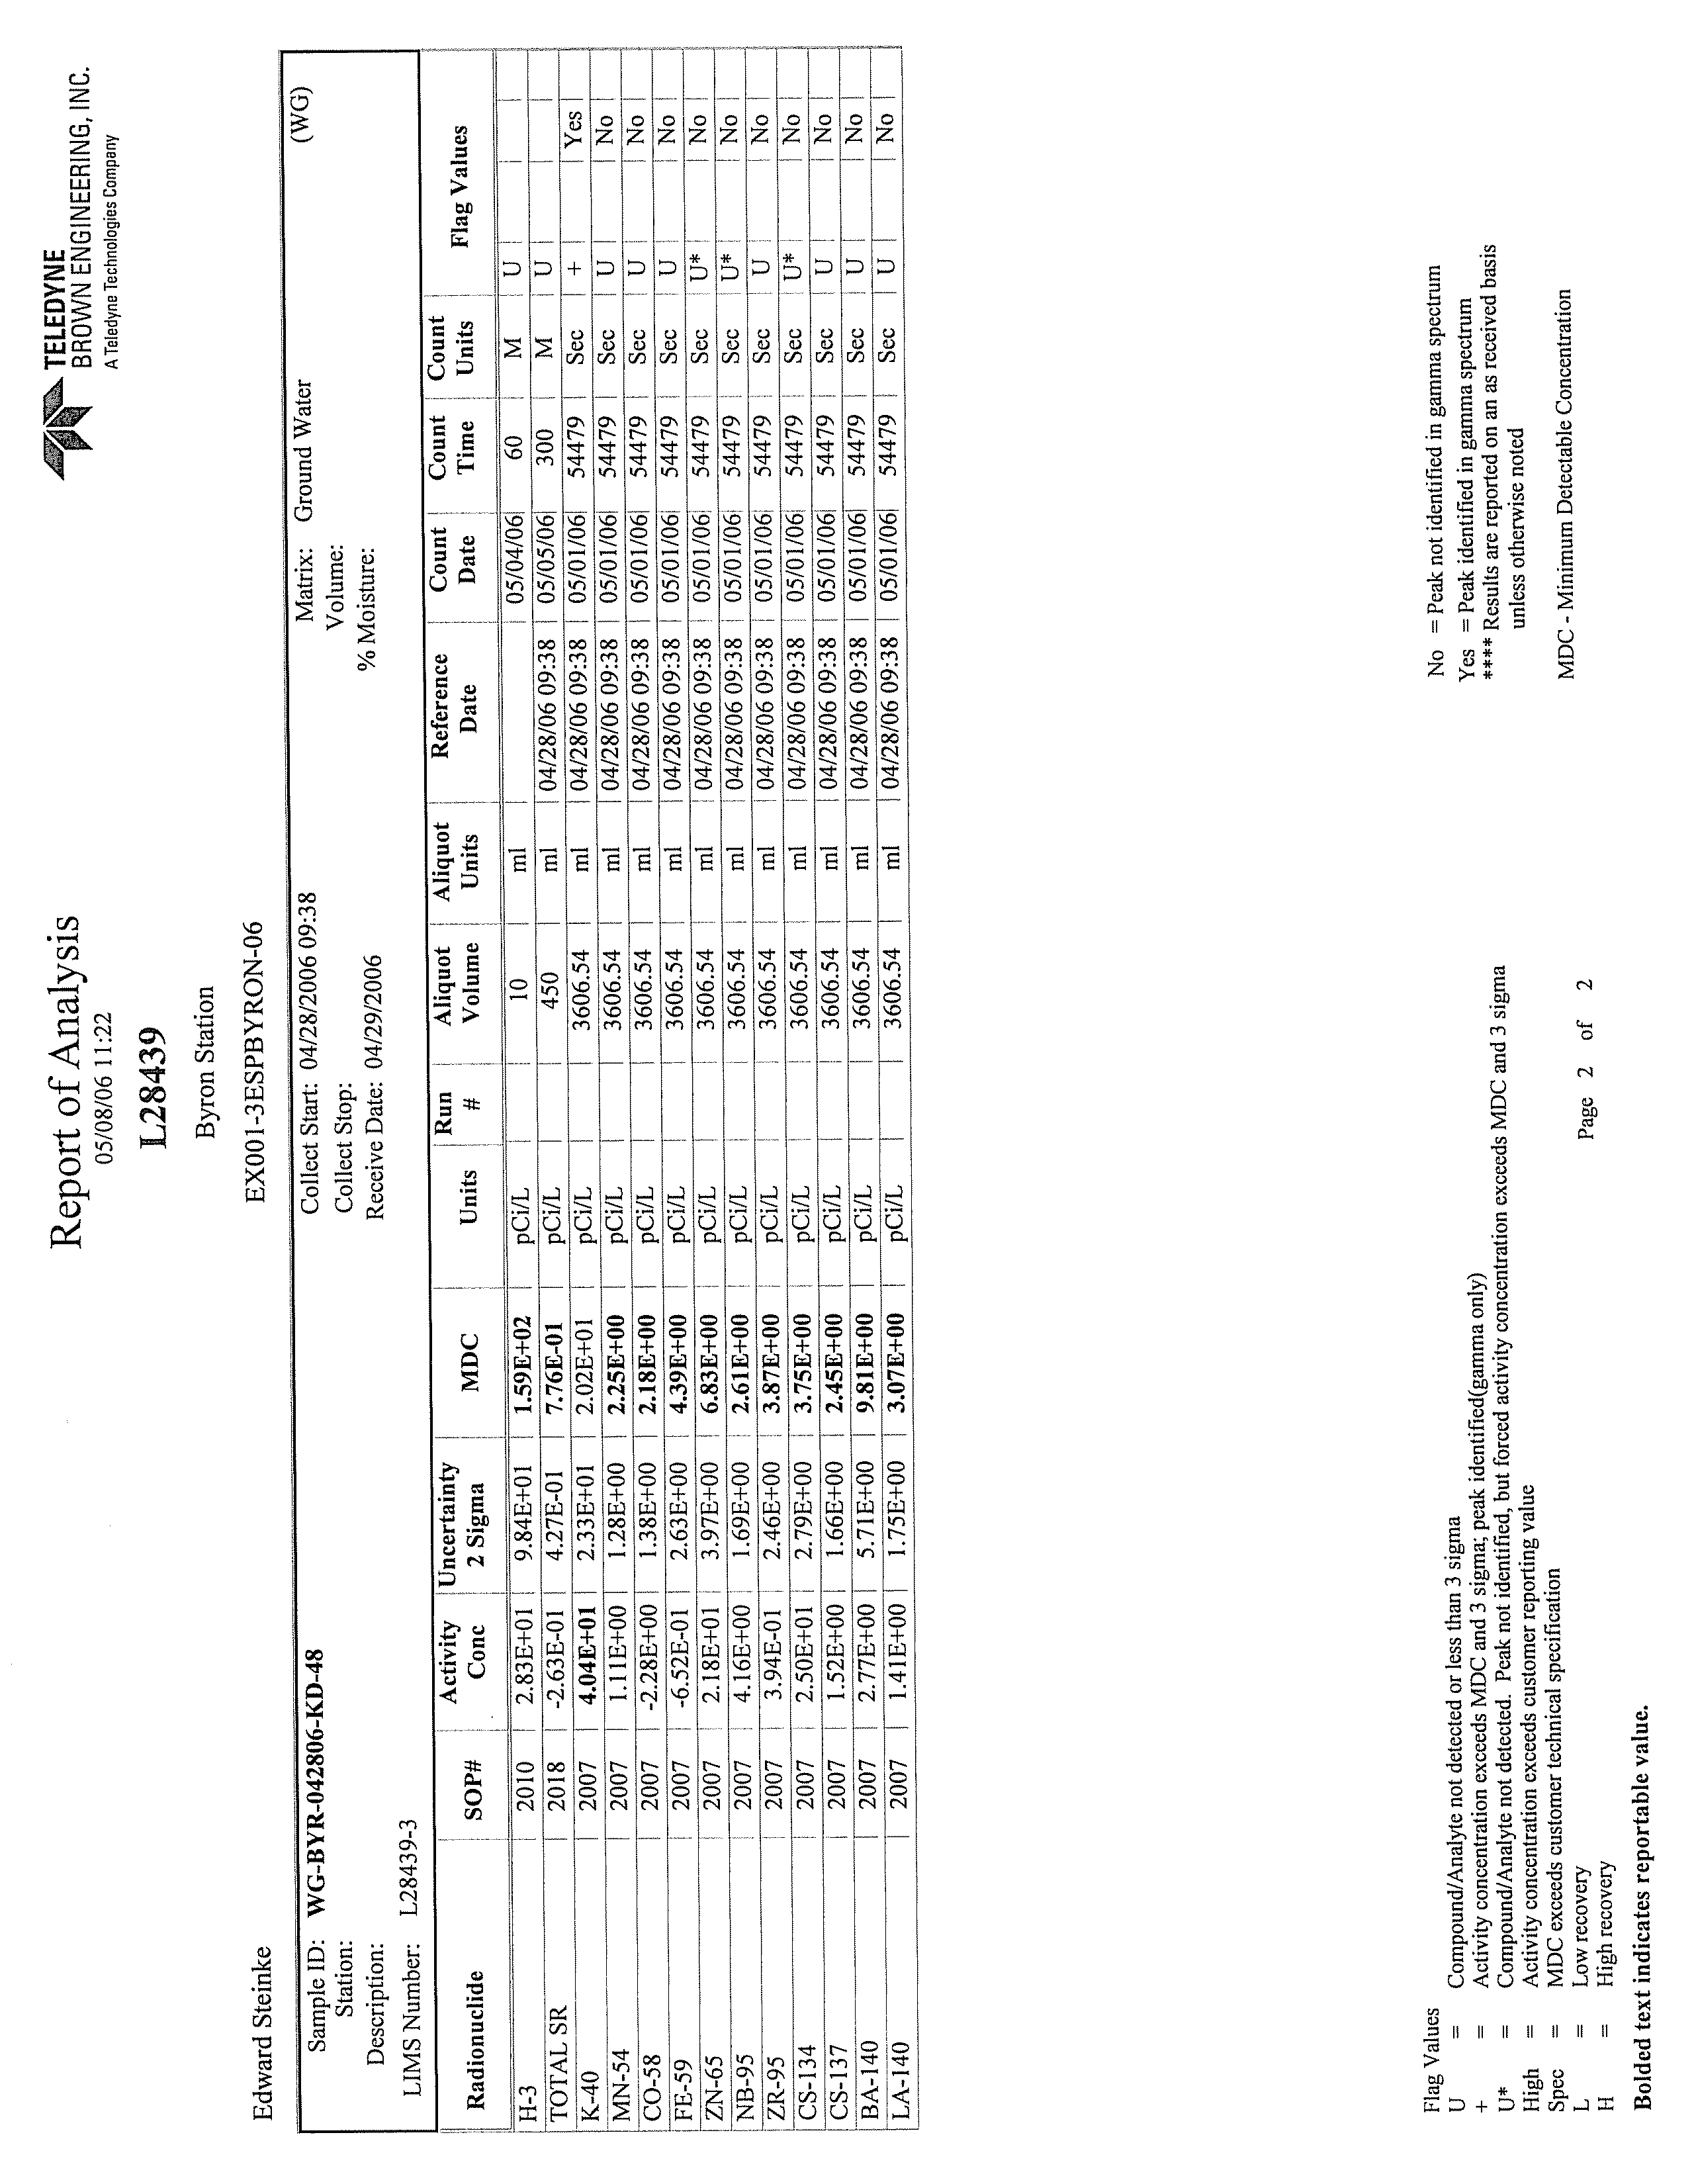
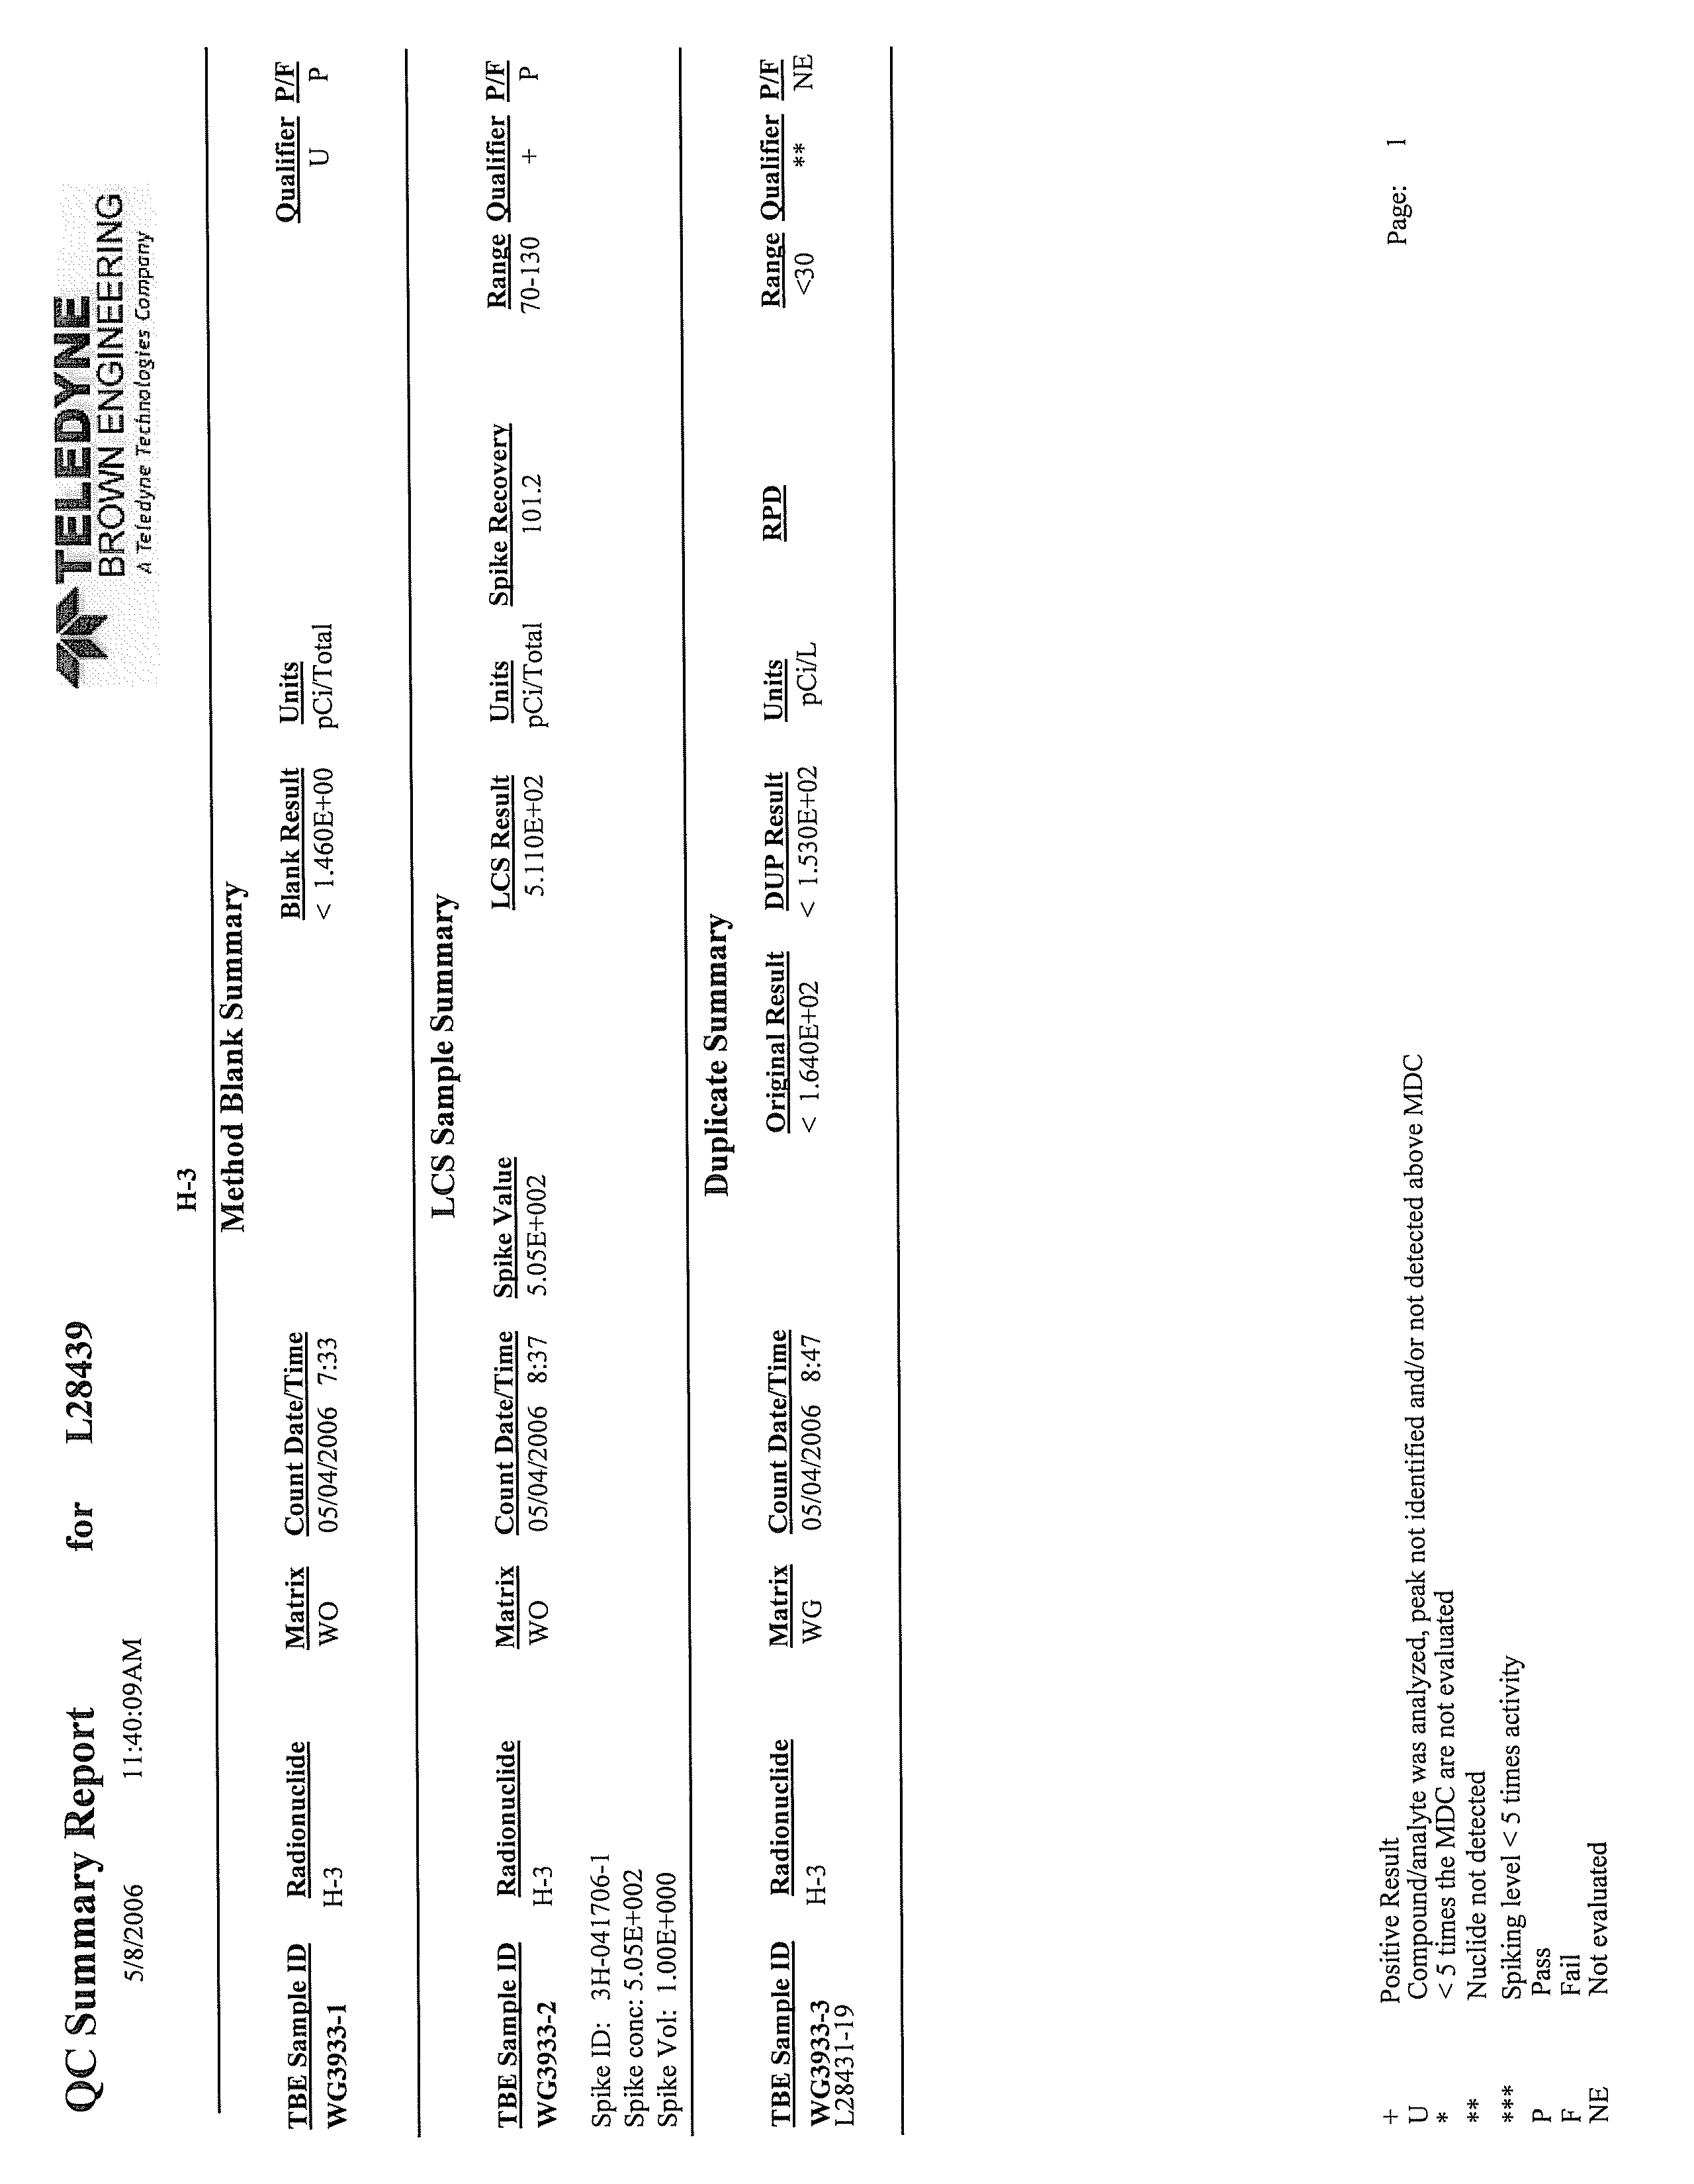
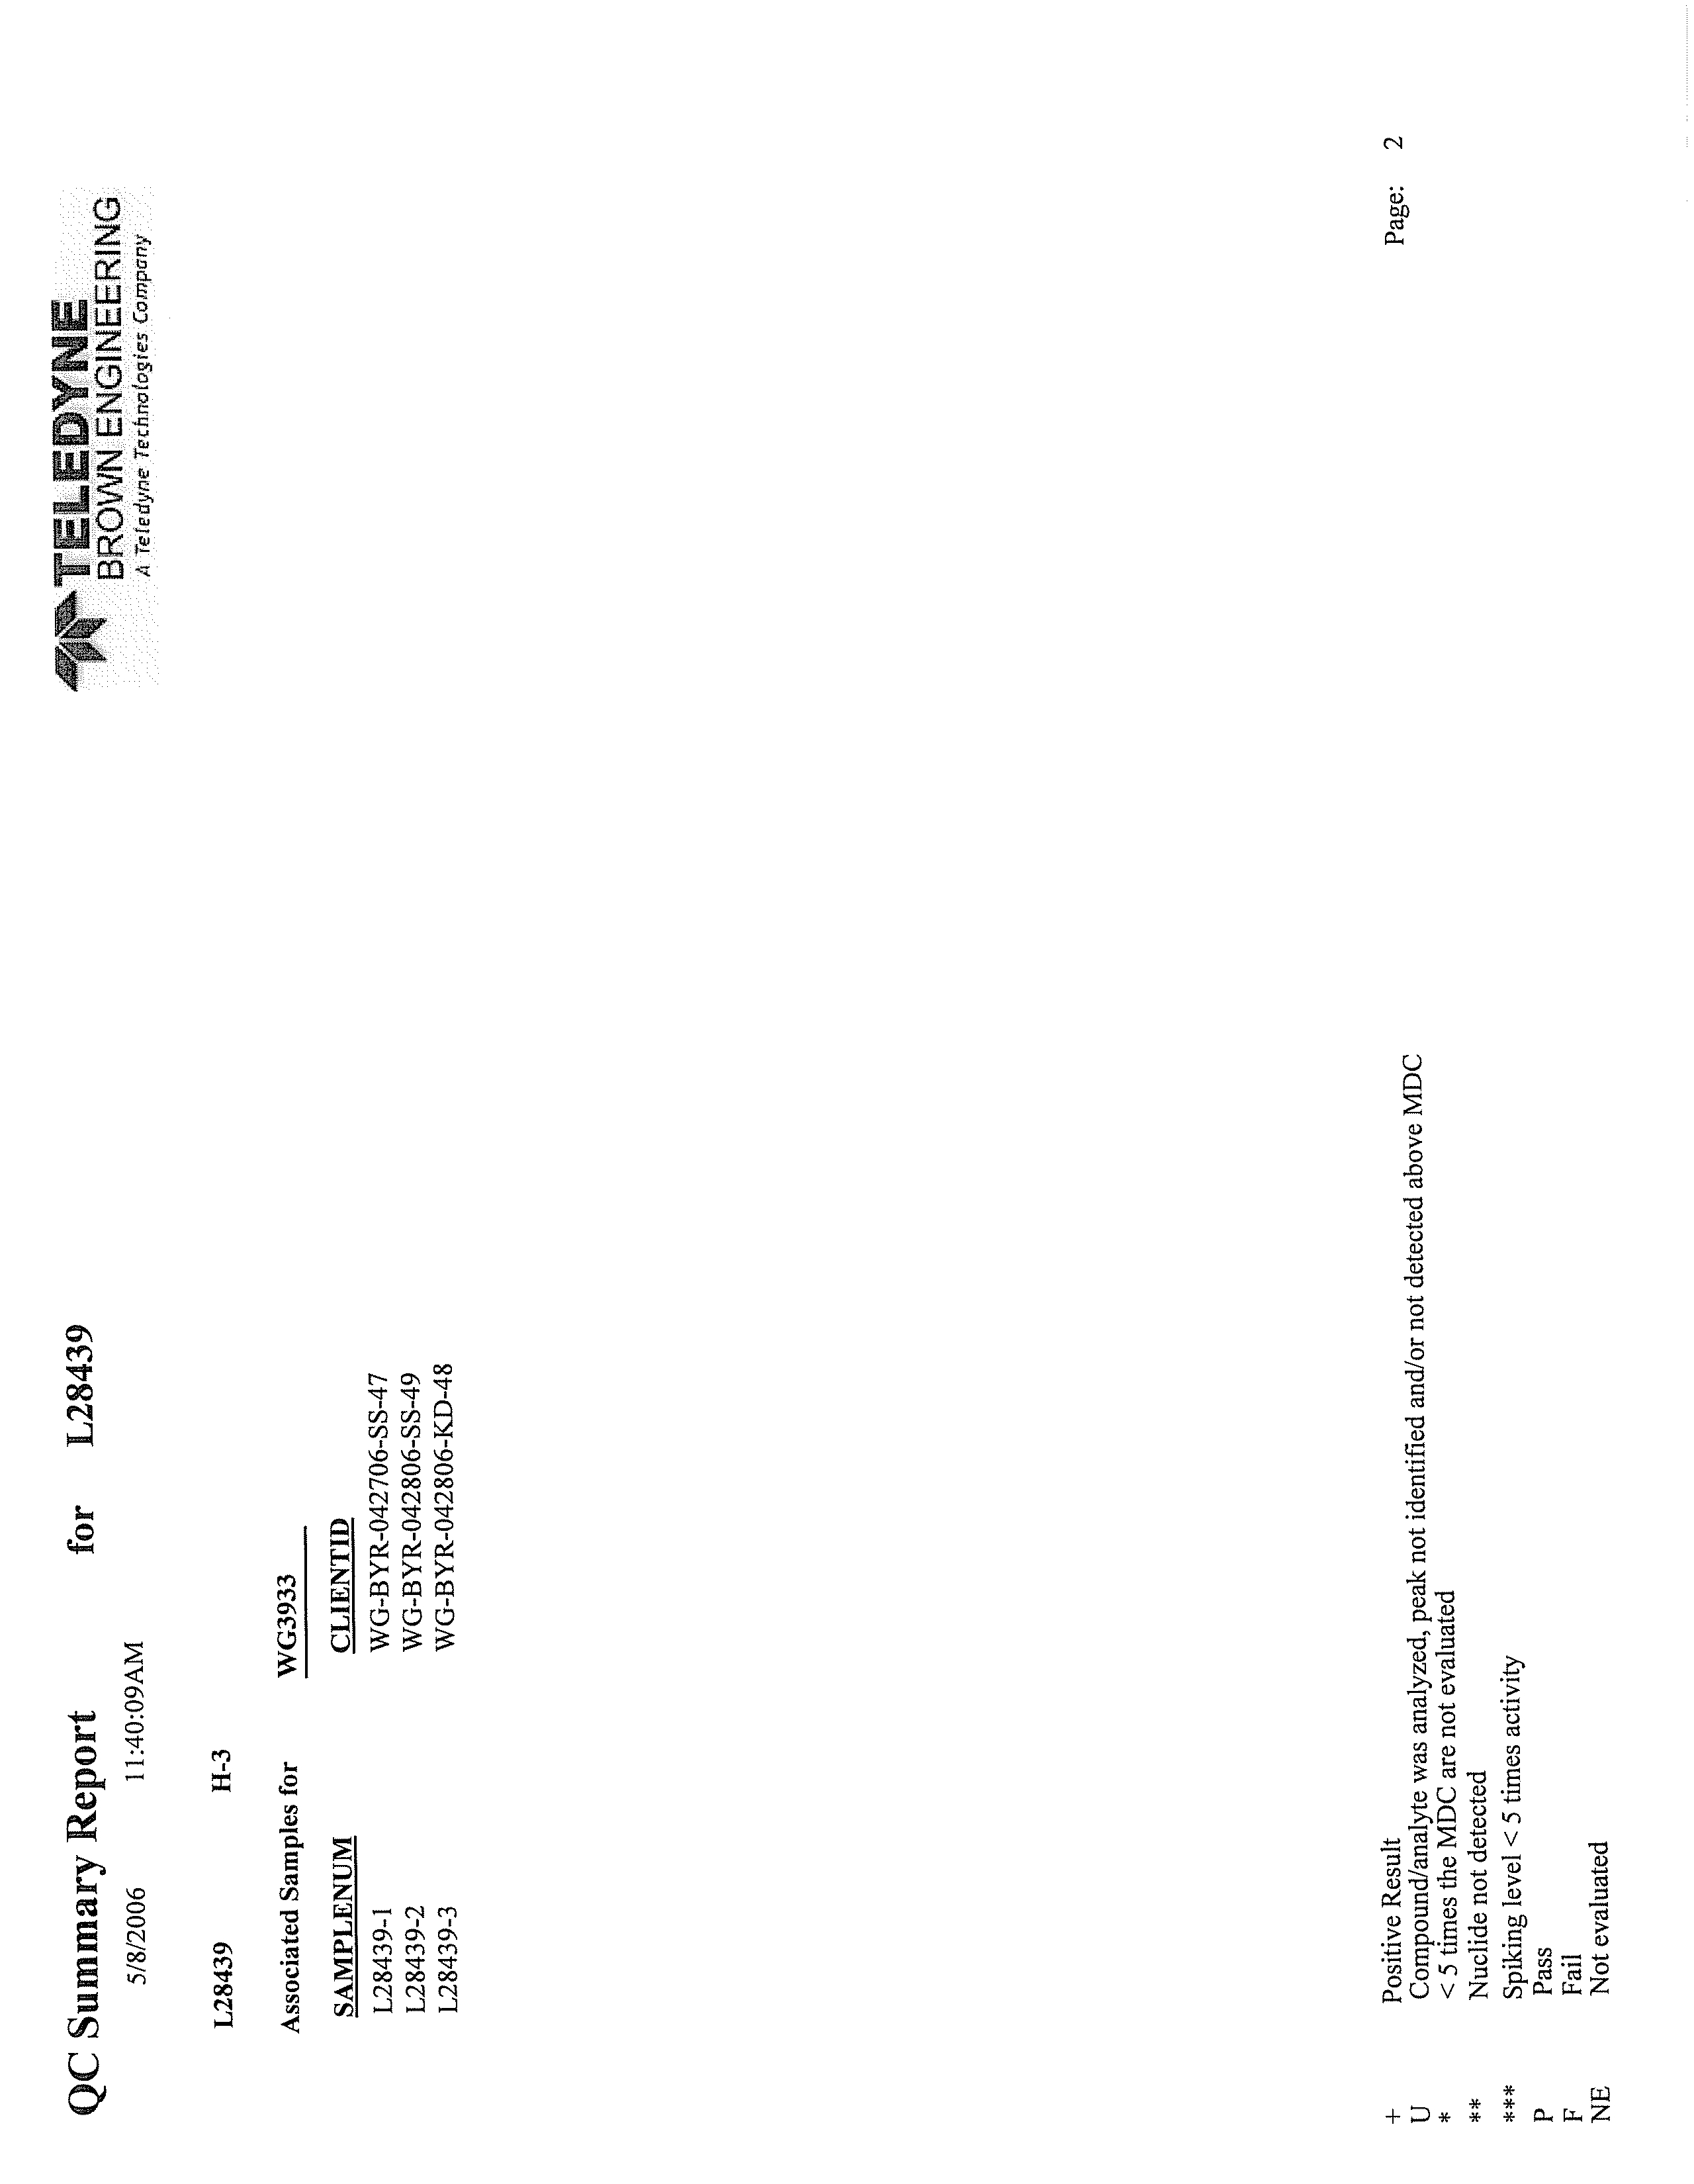
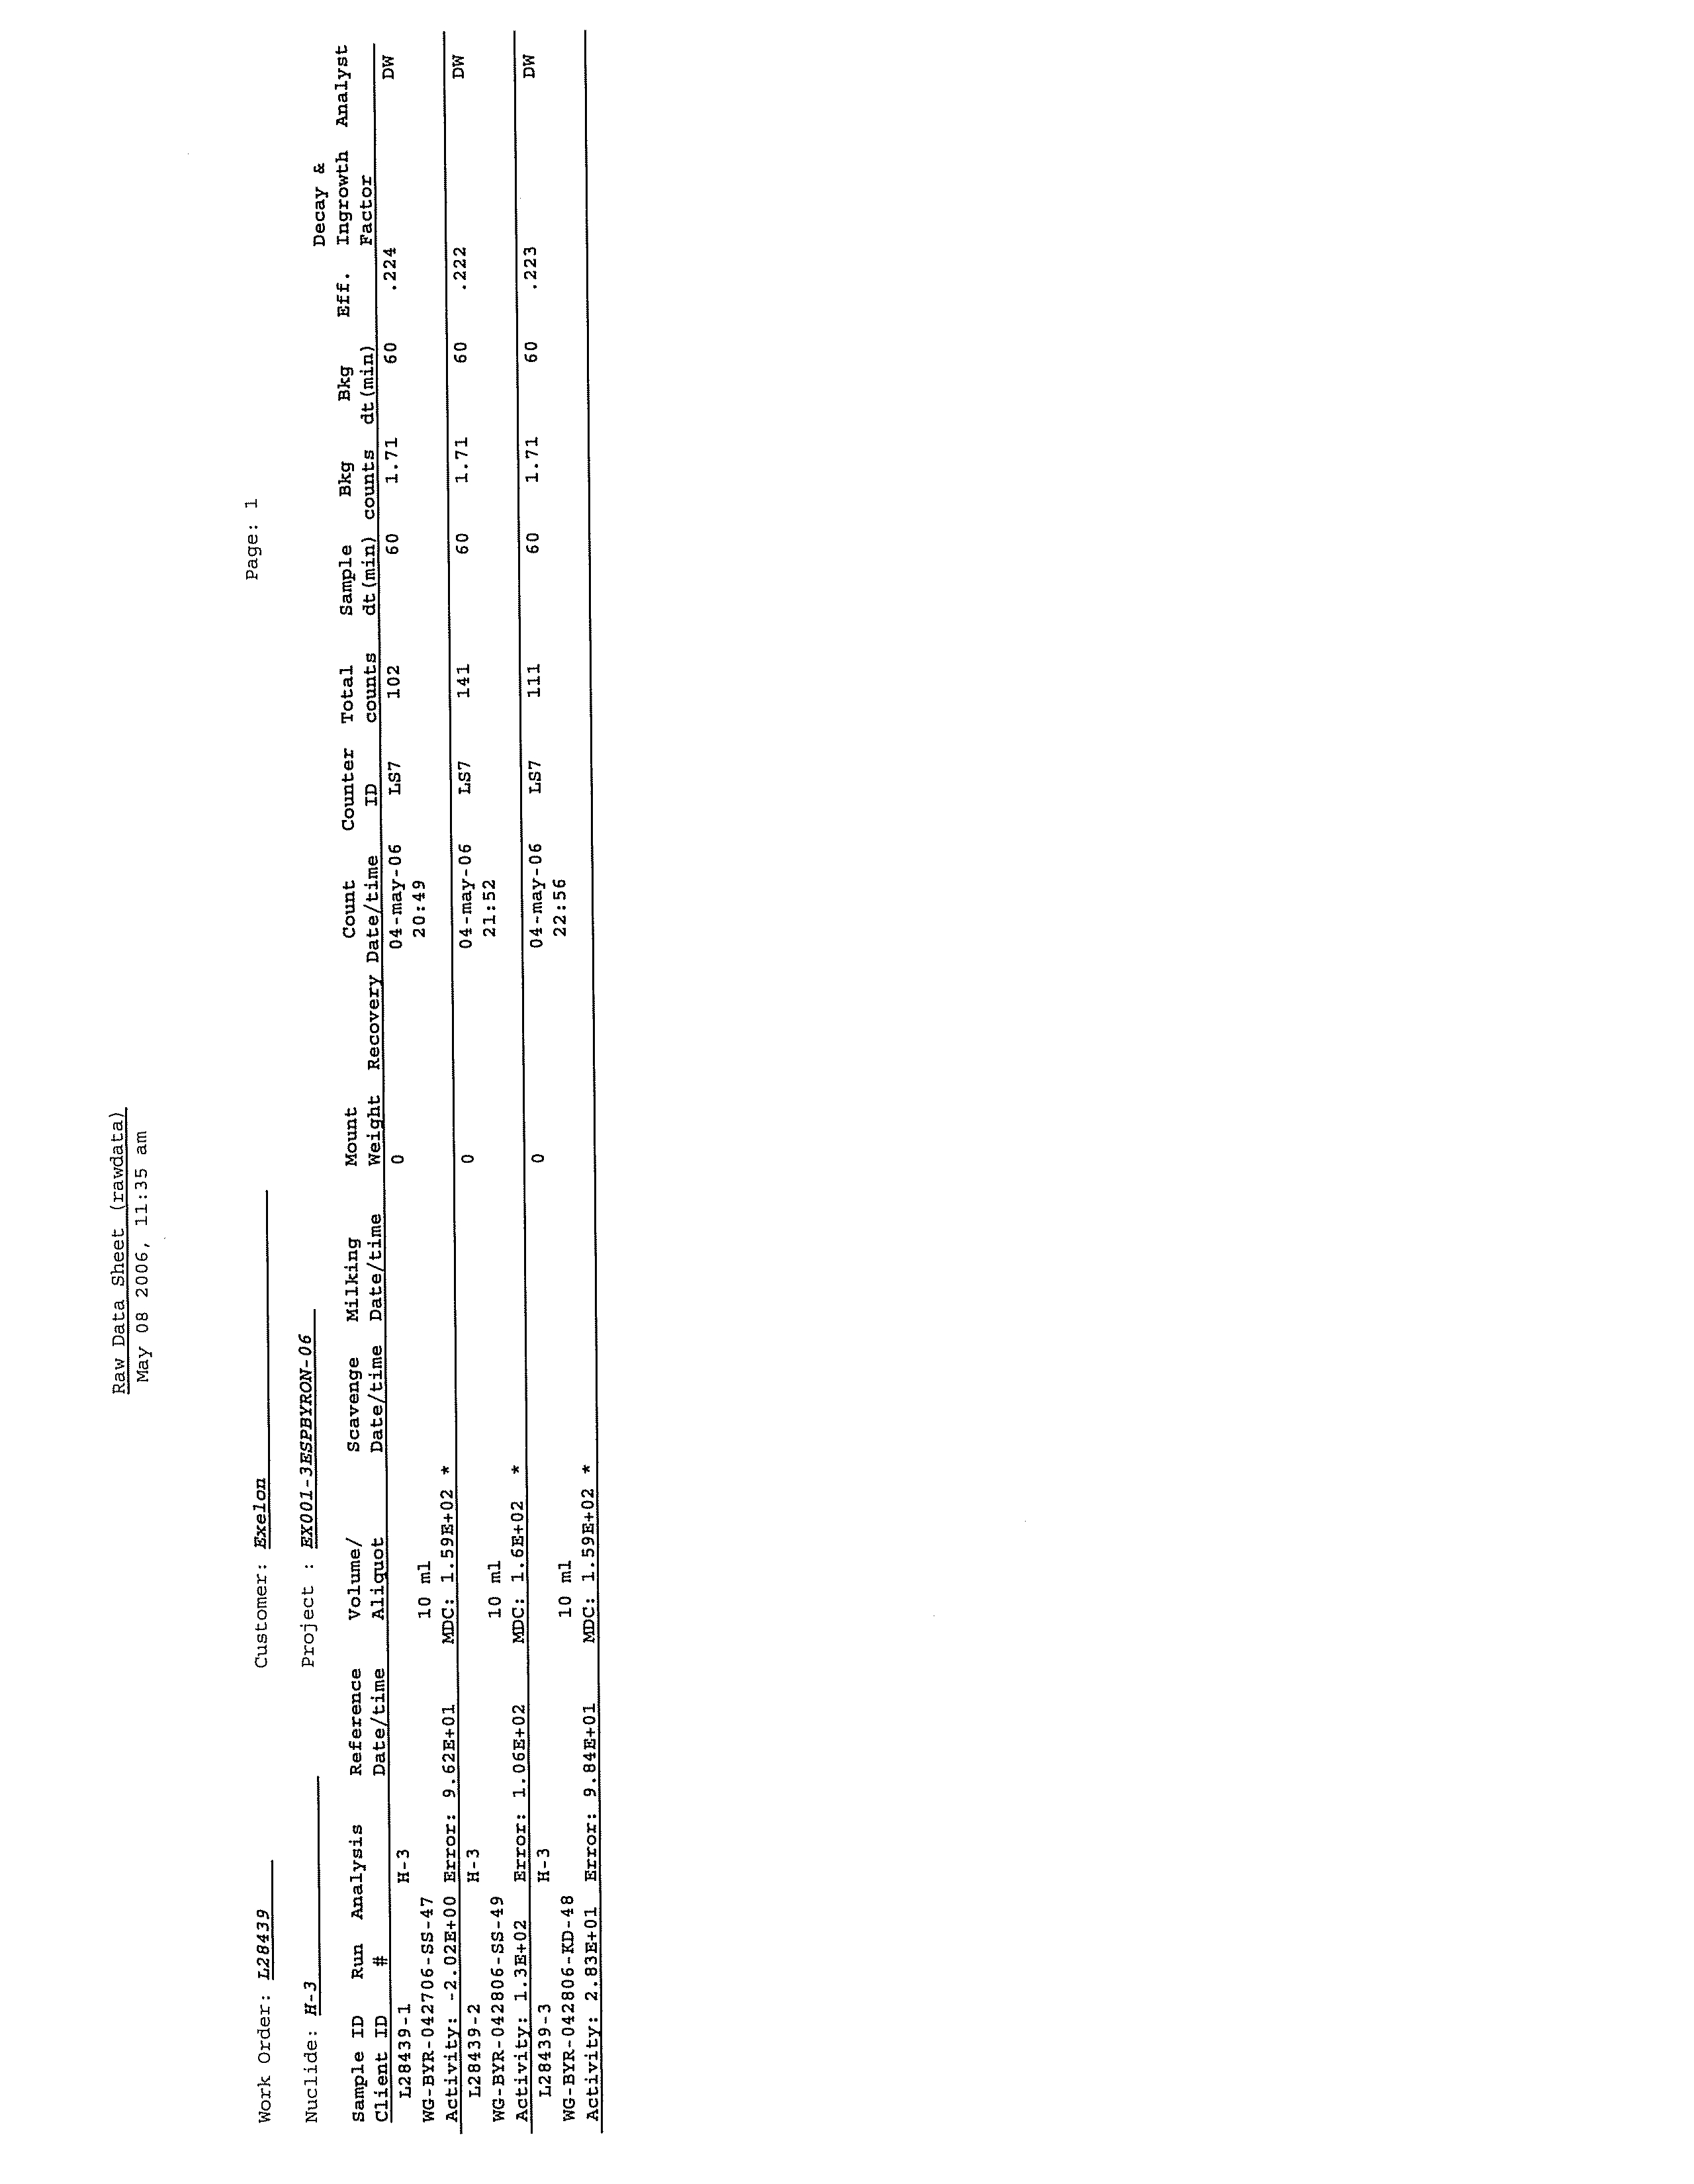
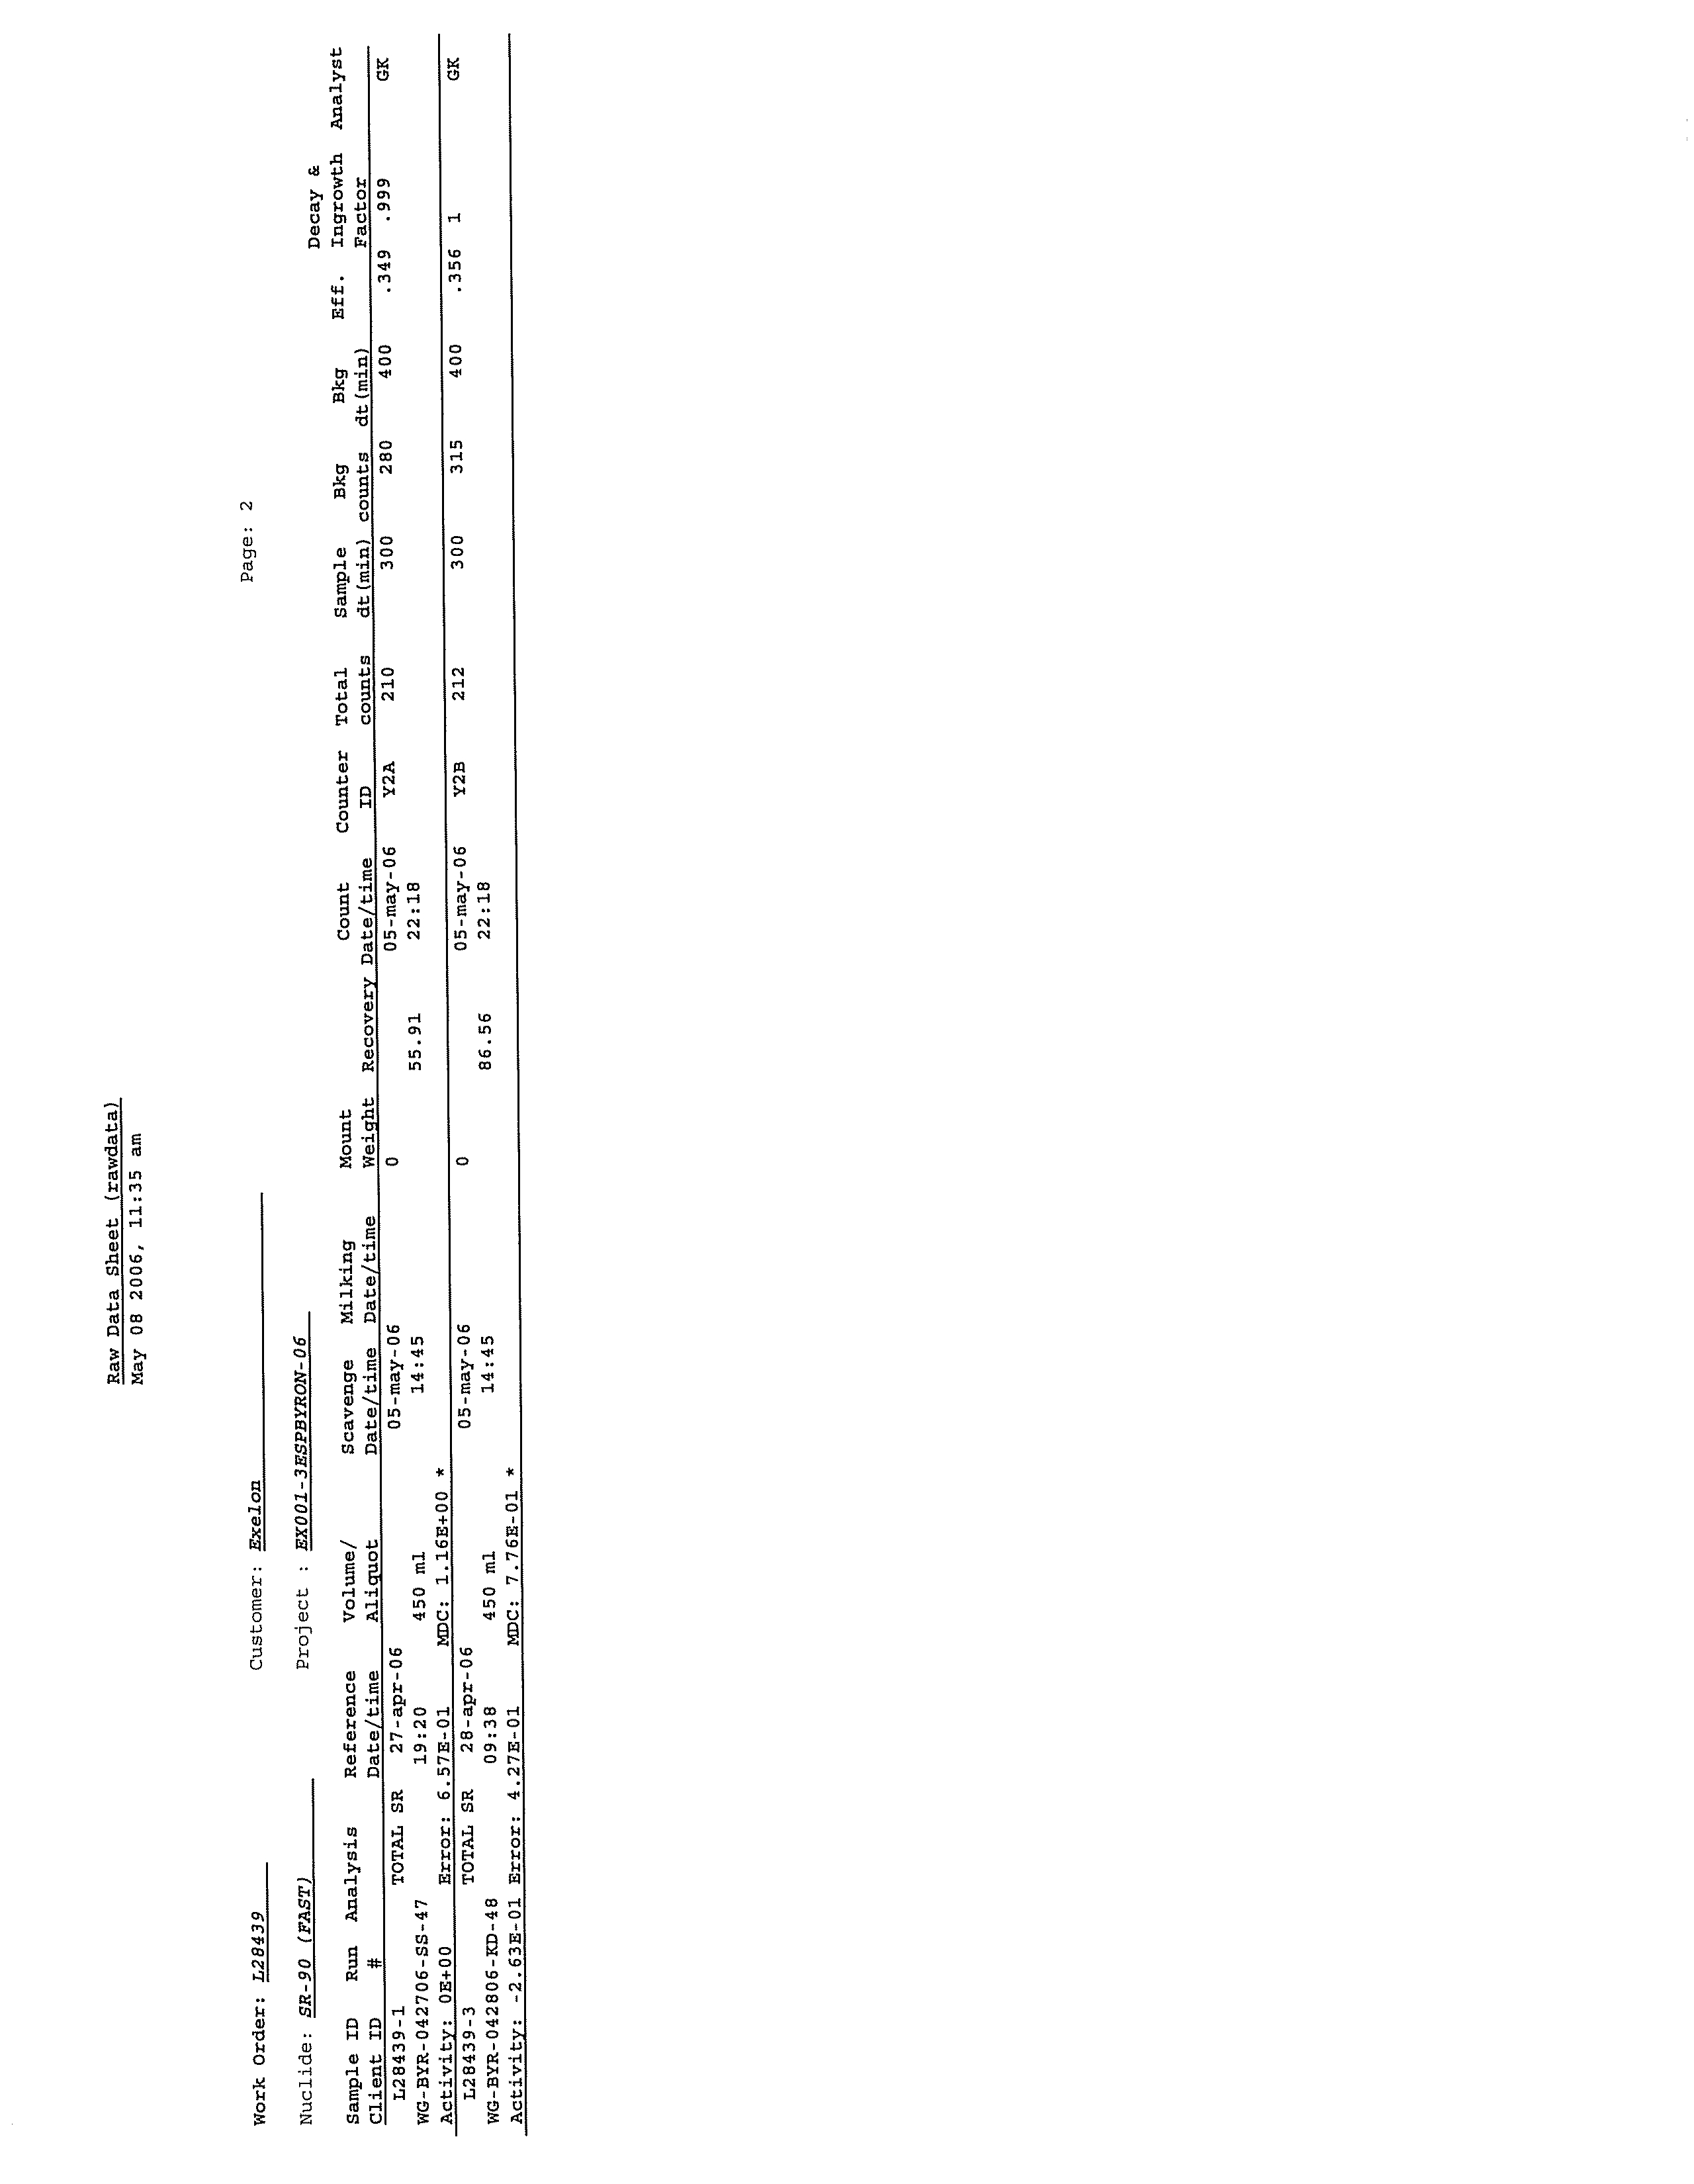
LABORATORY ANALYTICAL REPORTS
D.1
ENVIRONMENTAL, INC.
D.2
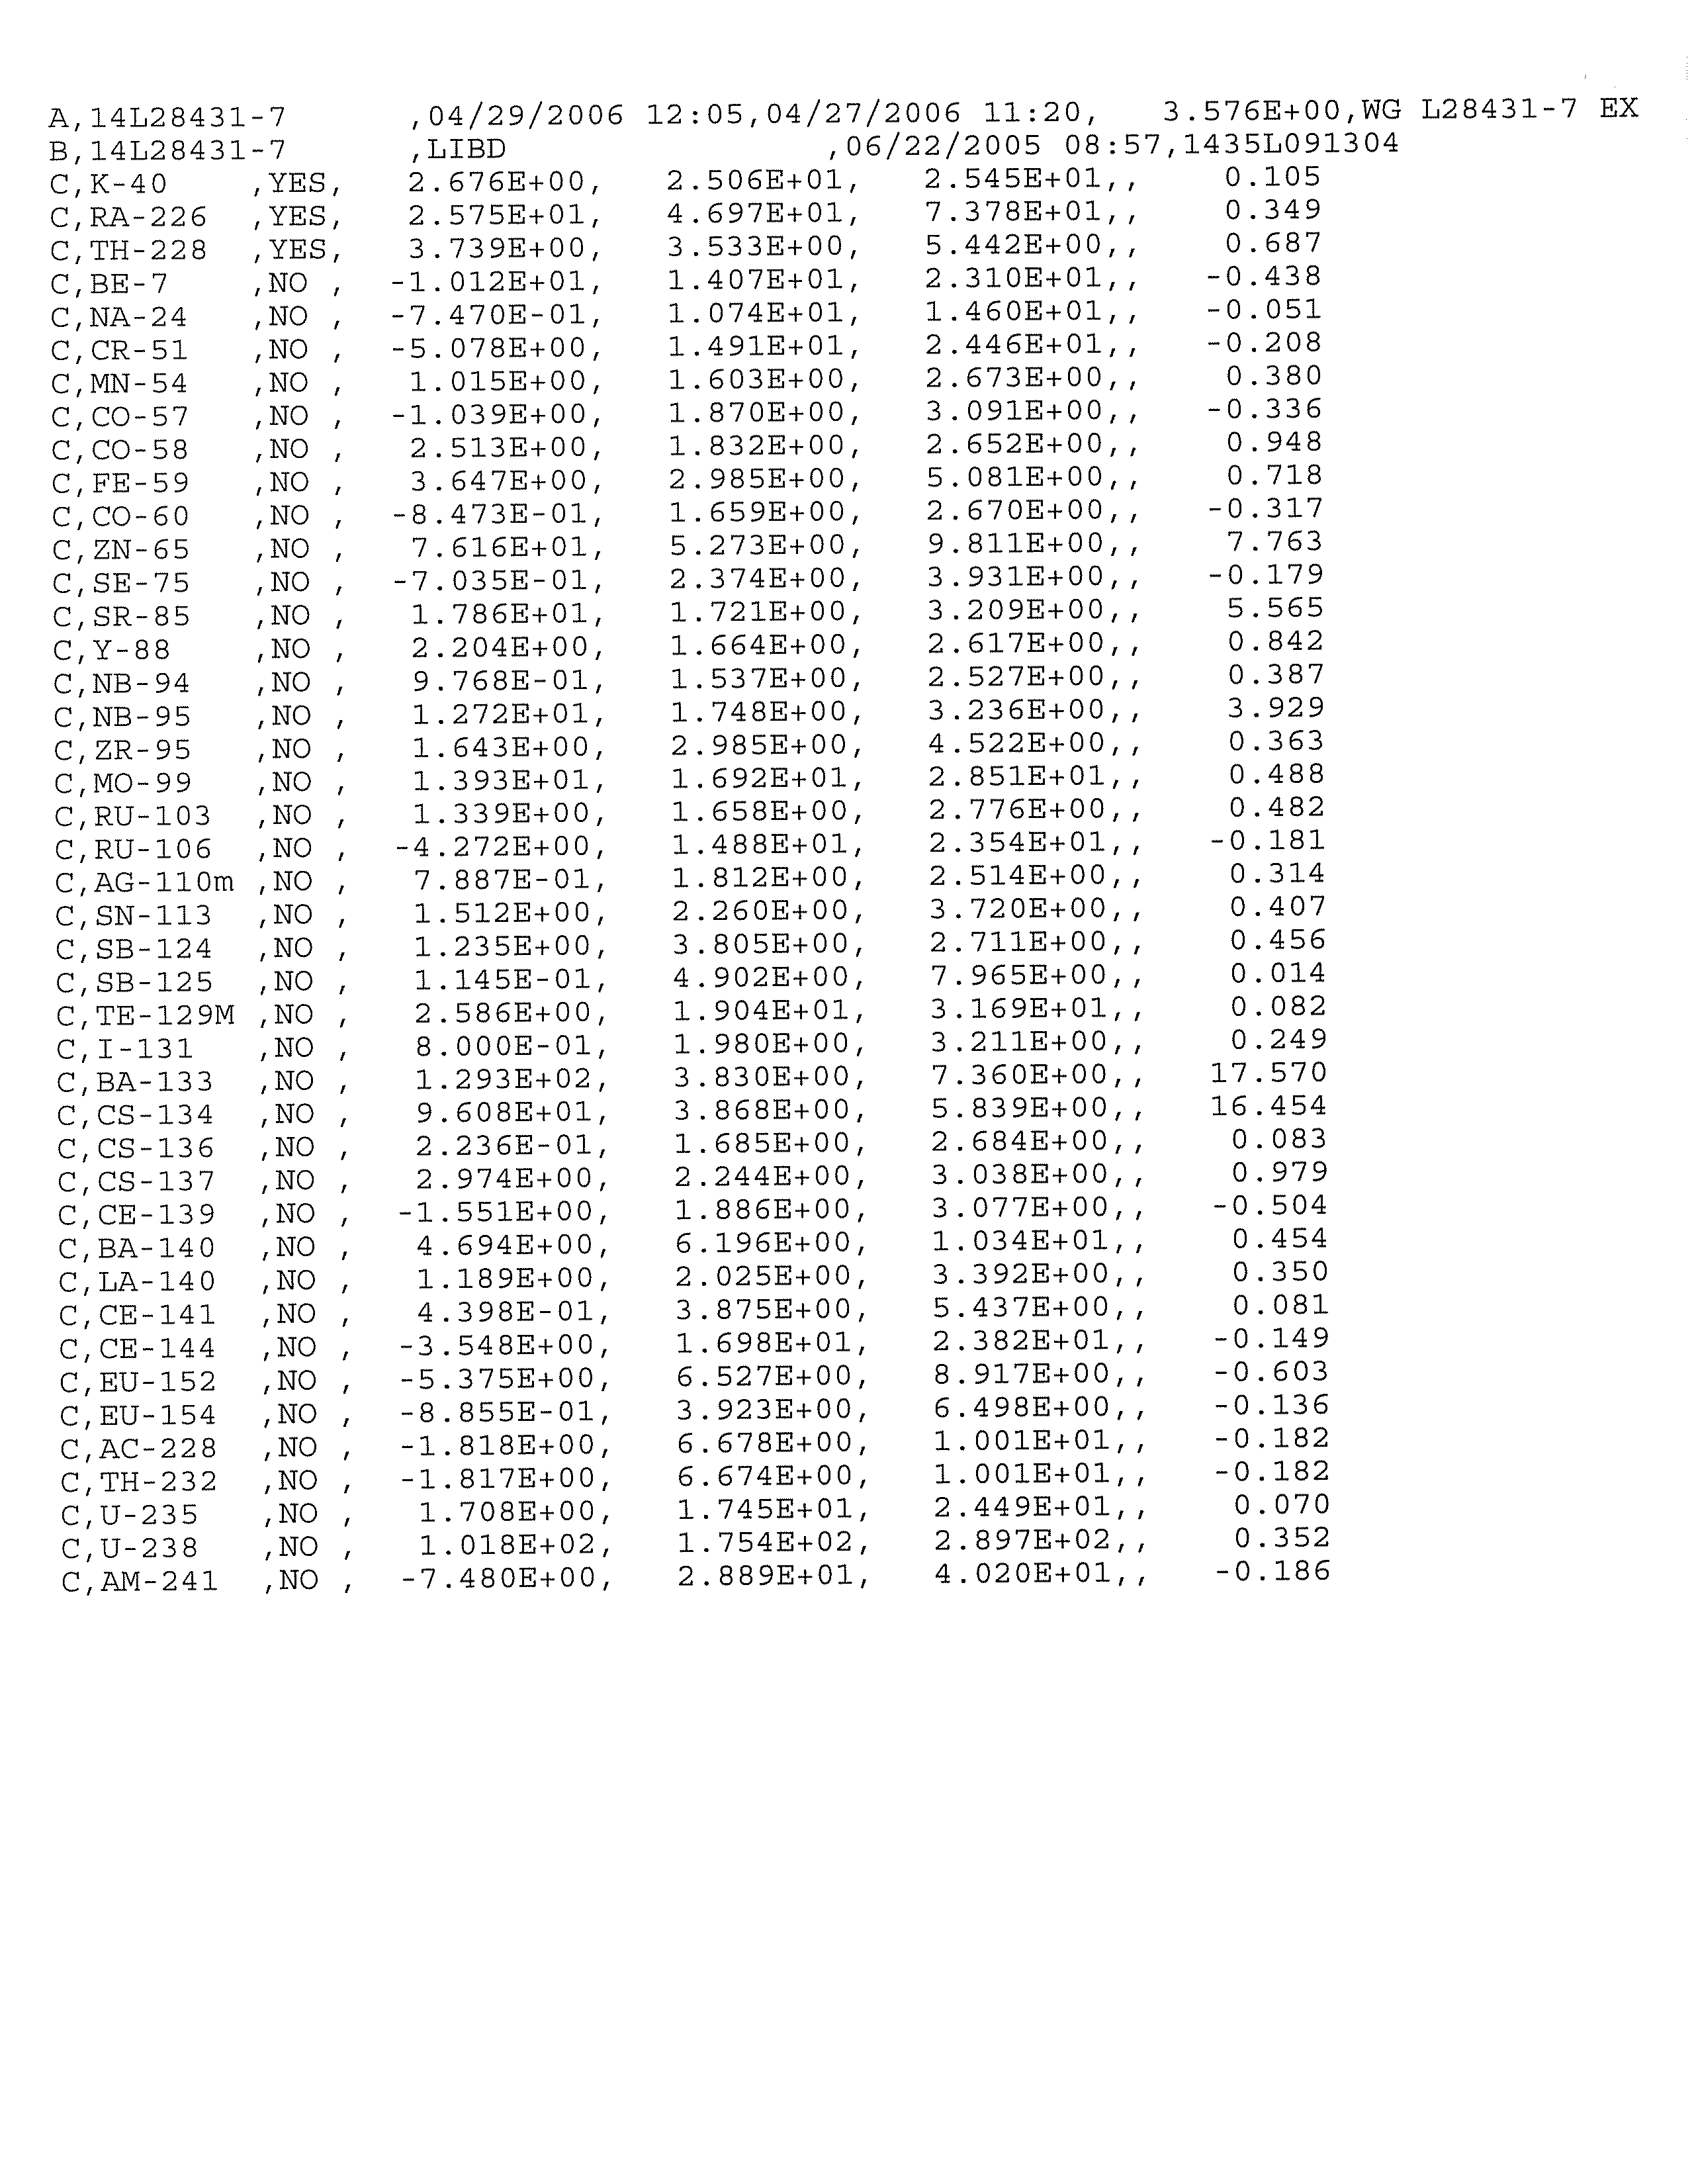
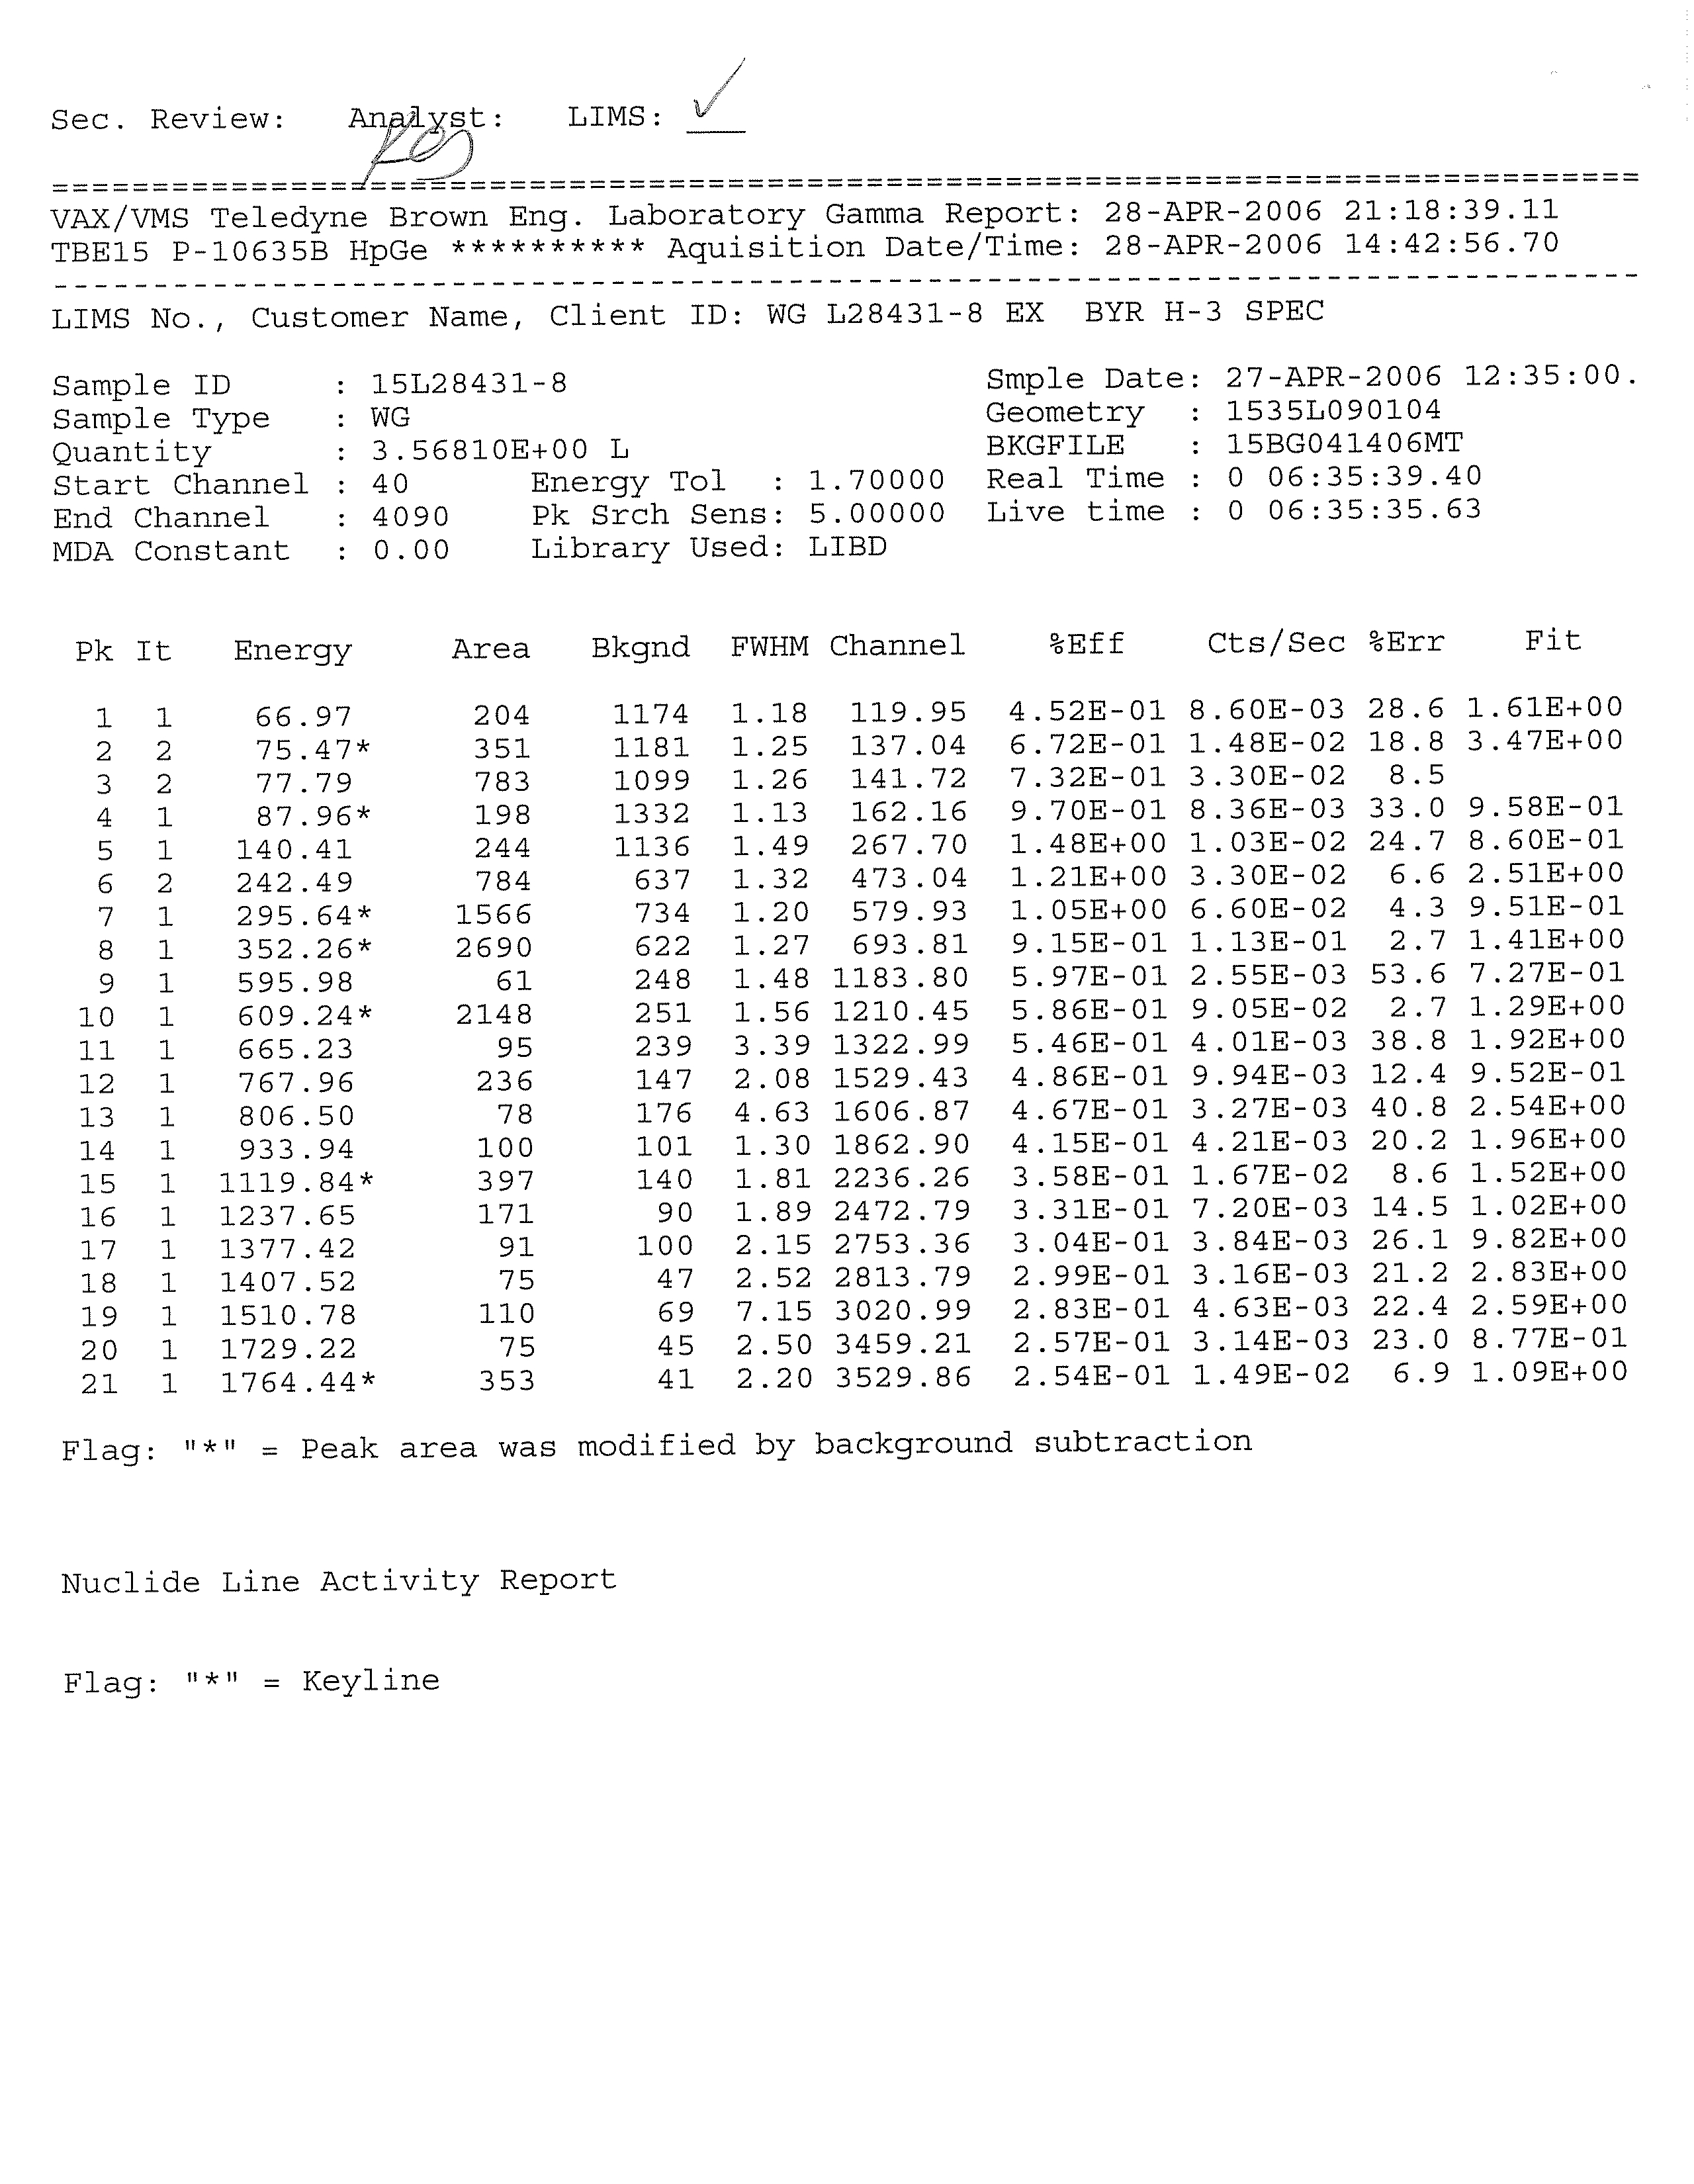
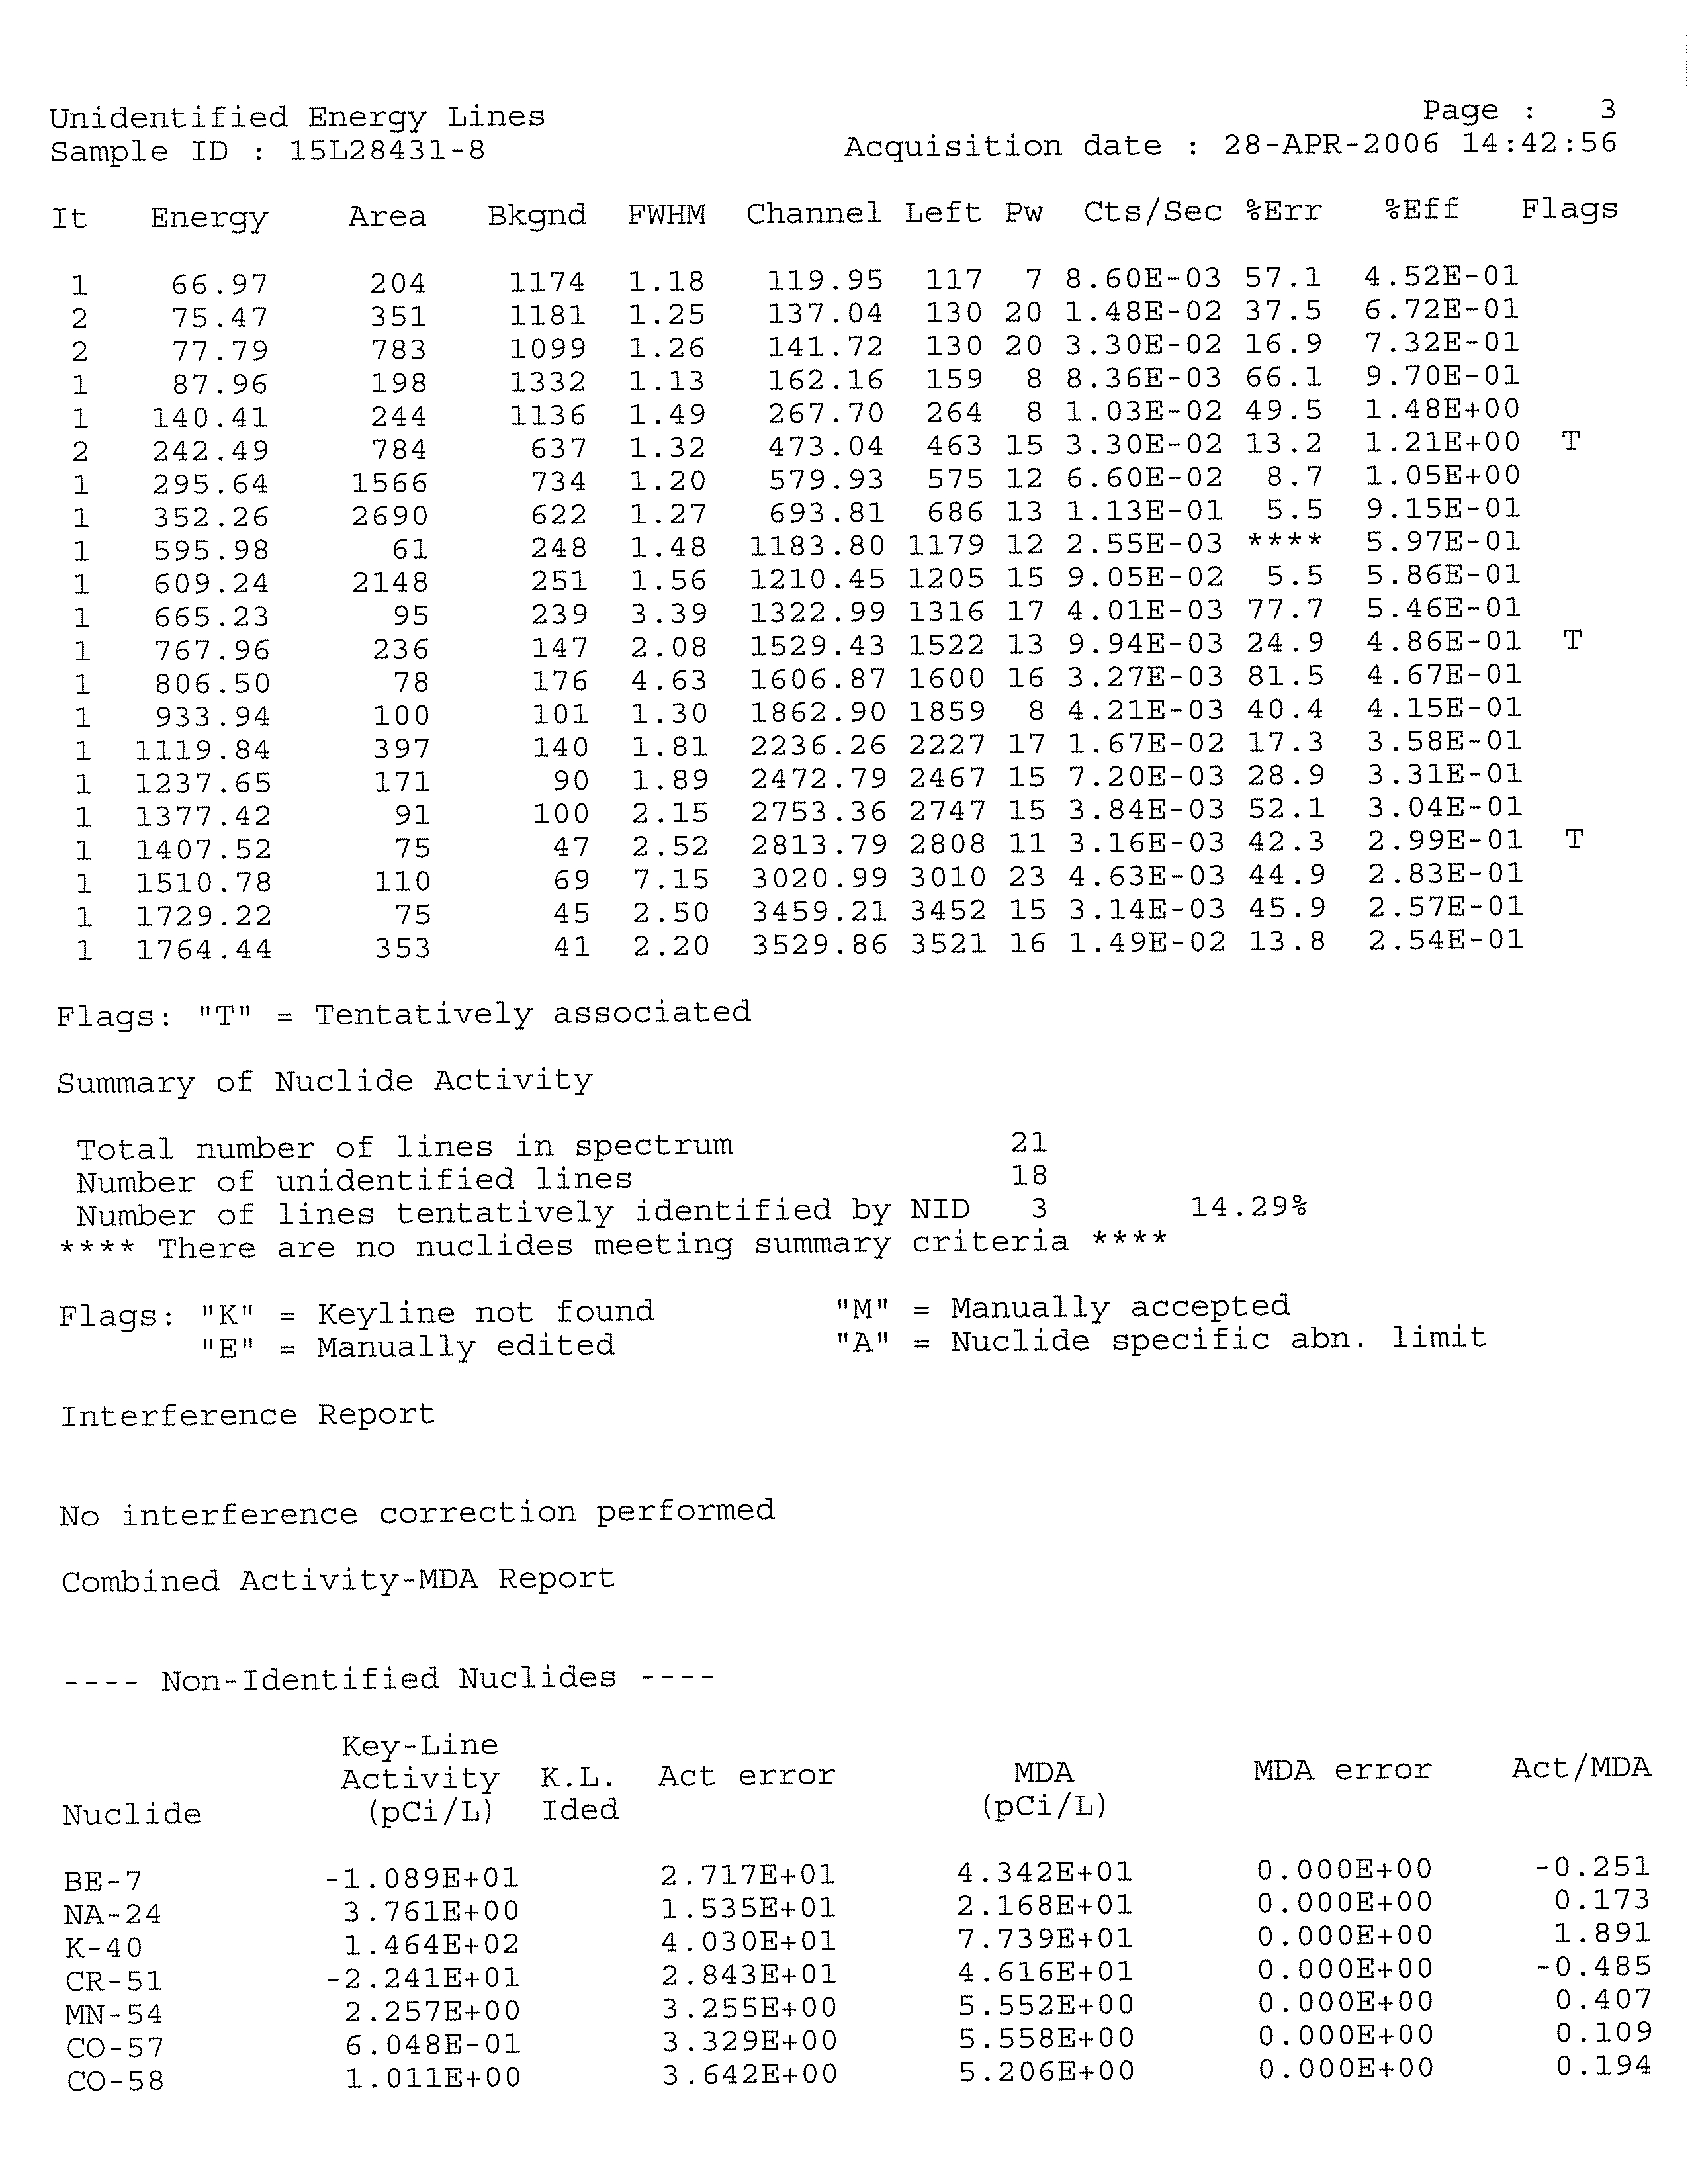
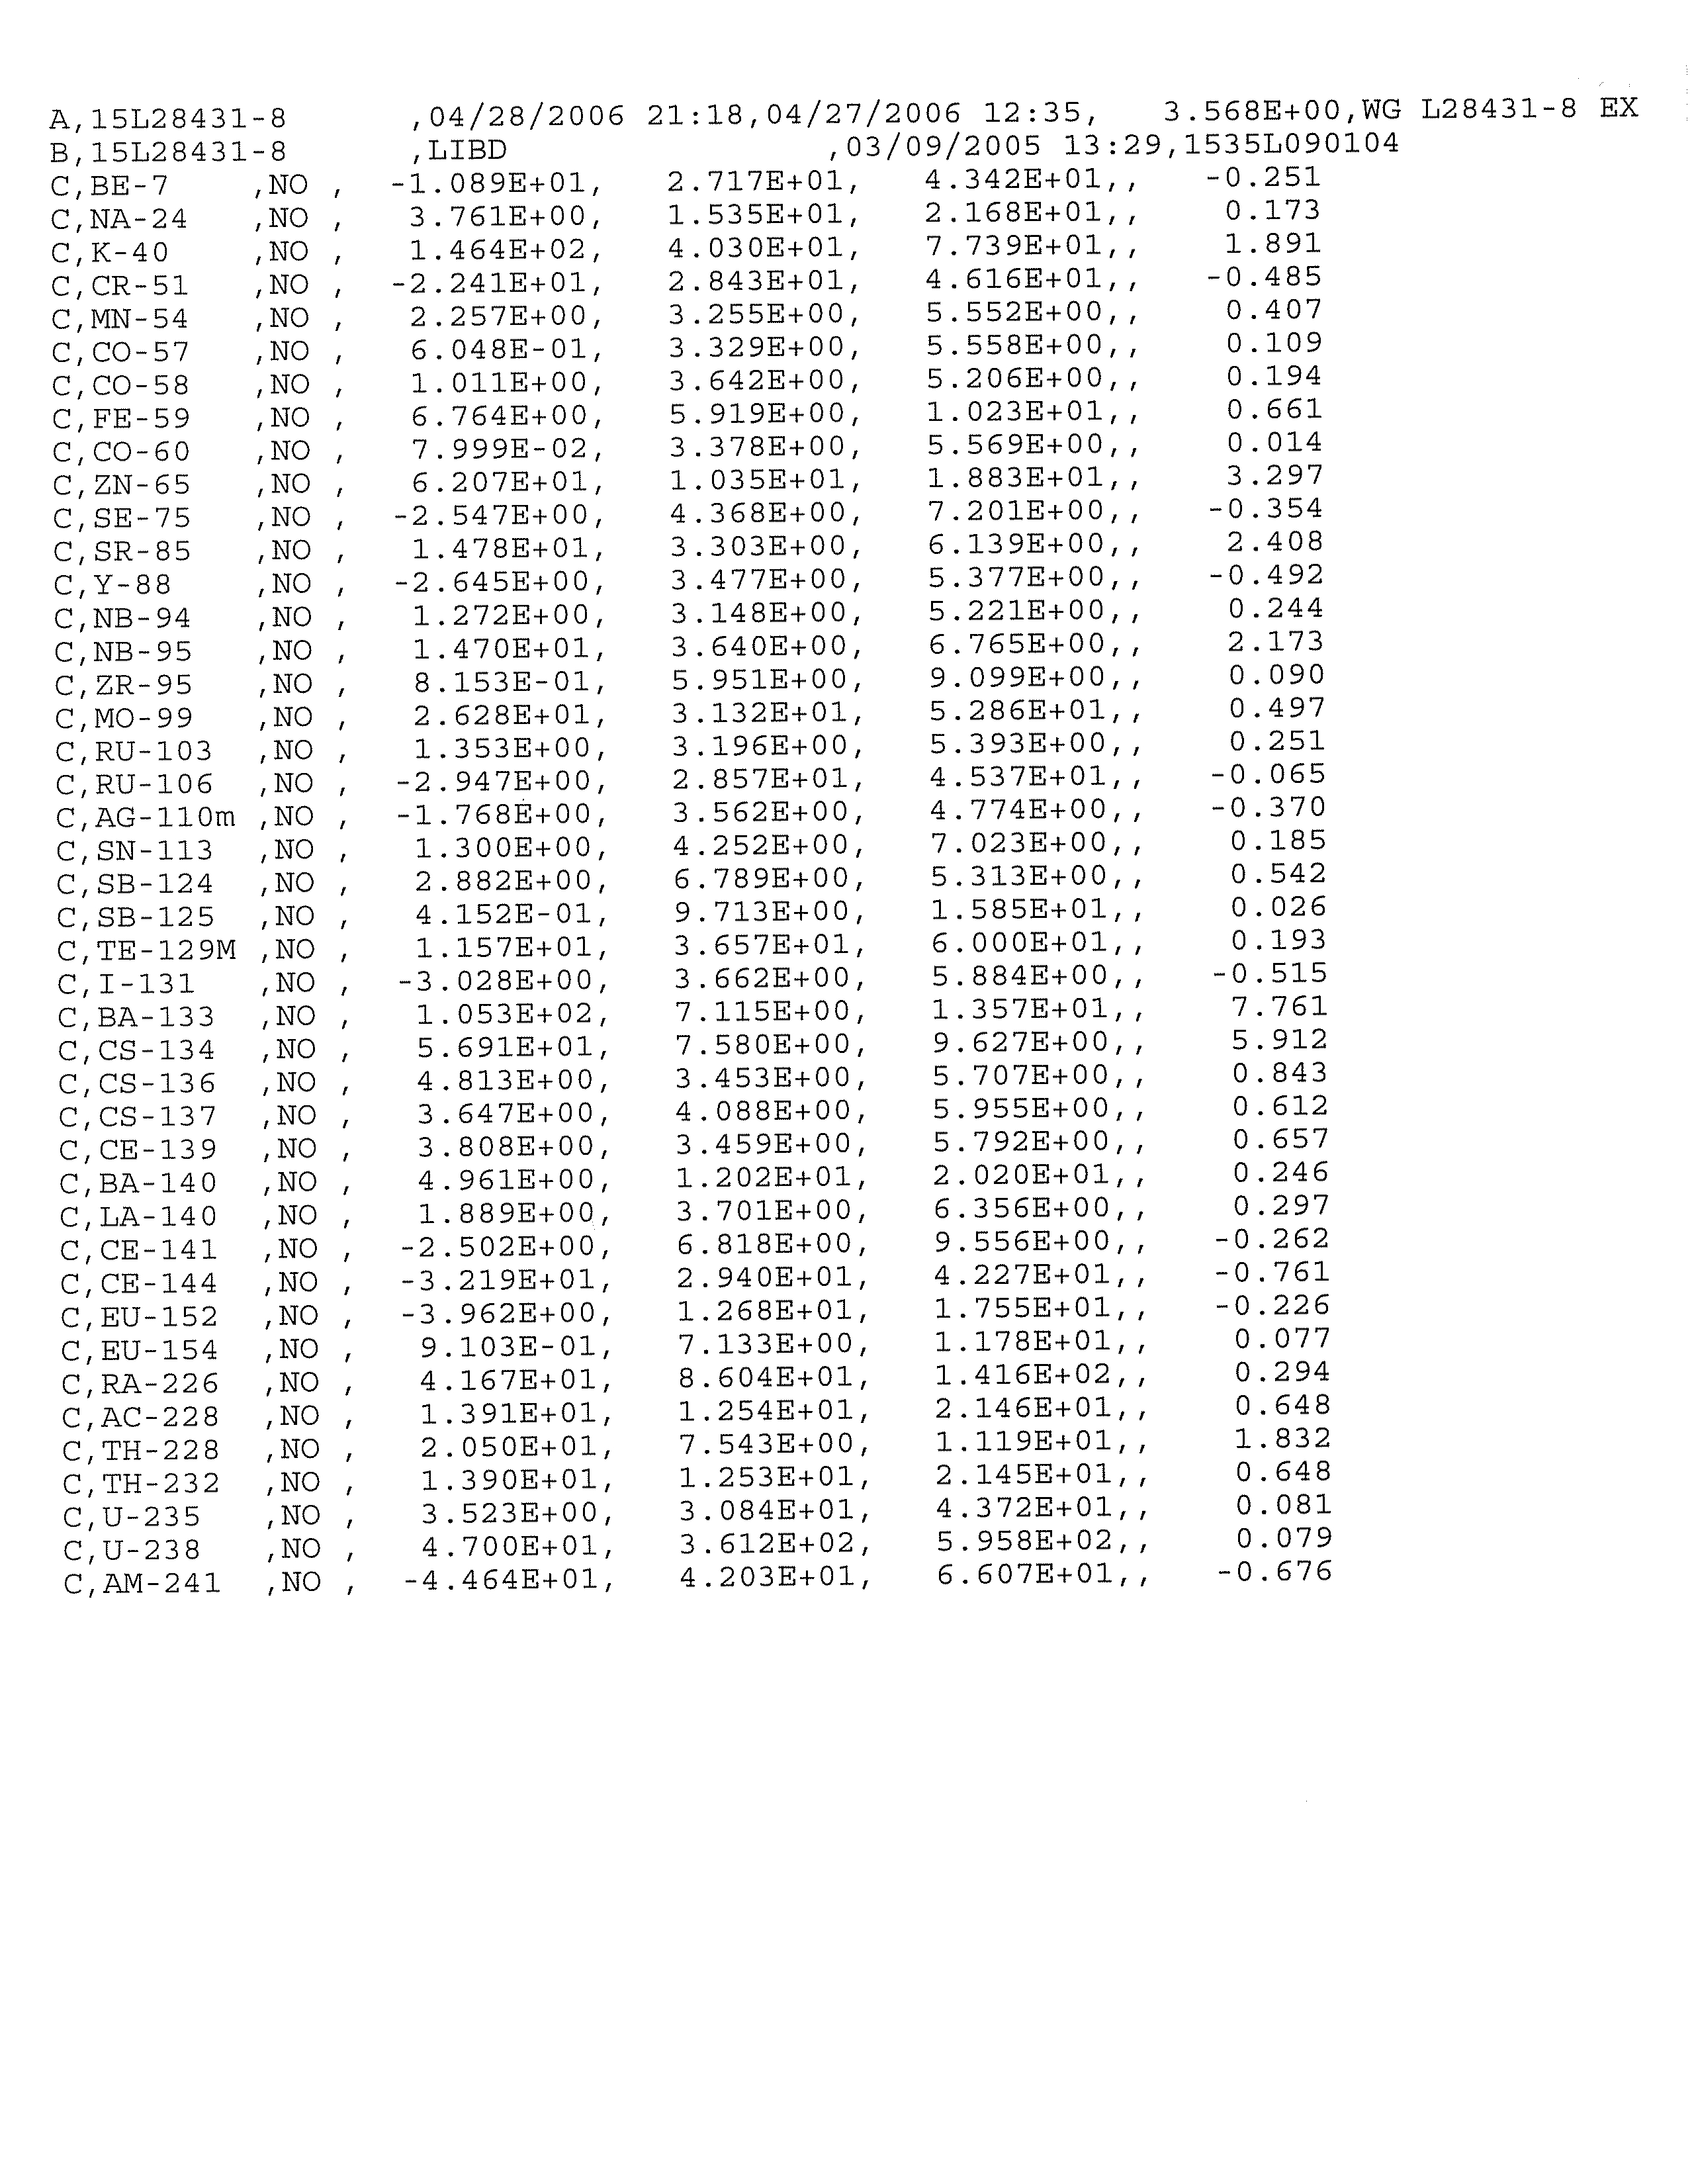
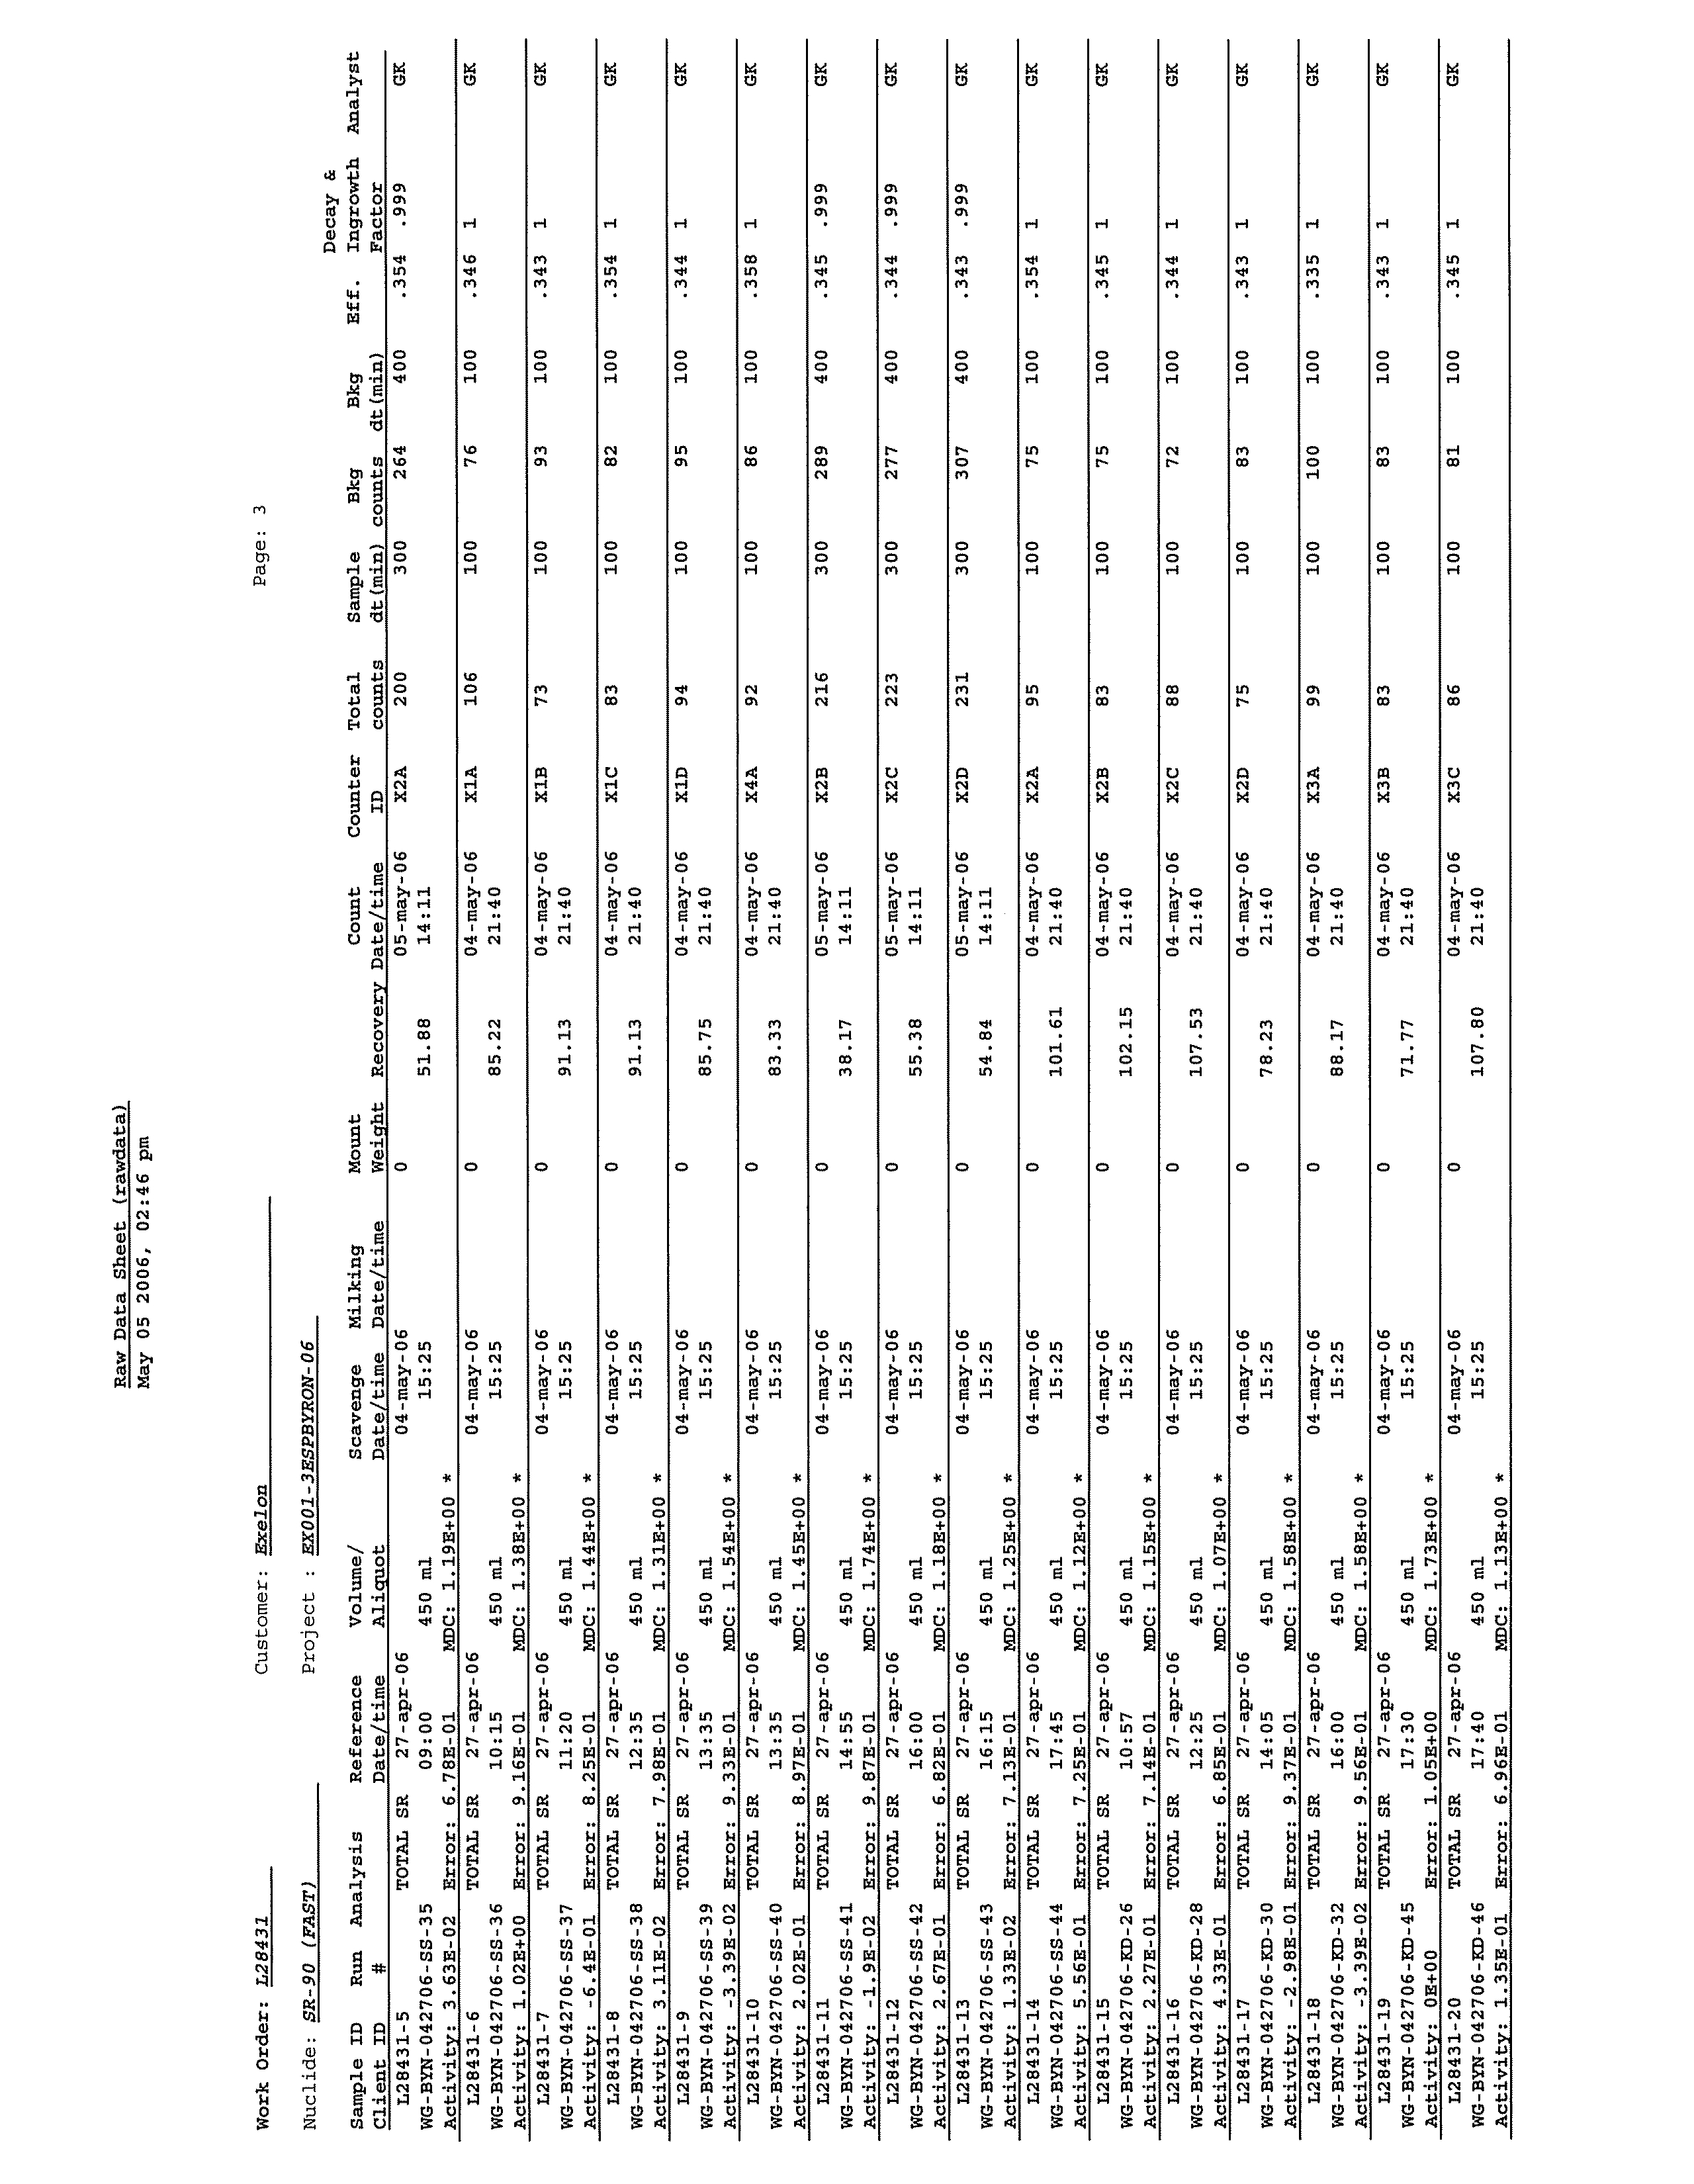
TELEDYNE BROWN ENGINEERING, INC.
APPENDIX E
DATA VALIDATION MEMORANDUM
045136 (13) Byron Generating Station
CONESTOGA-ROVERS & ASSOCIATES
Revision 1
EXECUTIVE SUMMARY
This Hydrogeologic Investigation Report (HIR) documents the results of
Conestoga-Rovers & Associates' (CRA's) May
2006 Hydrogeologic Investigation Work
Plan (Work Plan) pertaining to the Byron Generating Station in Byron, Illinois. CRA
prepared this HIR for Exelon as part of its Fleetwide Program to determine whether
groundwater at and in the vicinity of its nuclear power generating facilities has been
adversely impacted by any releases of radionuclides. This report also documents the
results of CRA's and the Byron Station's investigation beginning in January 2006 in
relation to the current and former blowdown lines.
CRA collected and analyzed information on historical releases, the structures,
components,
and areas of the Station that have the potential to release tritium or other
radioactive liquids to the environment and past hydrogeologic investigations at the
Station. CRA used this information, combined with its understanding of groundwater
flow and sample locations at the Station to identify the AFEs for the Station.
CRA collected 39 groundwater samples during the blowdown line investigation and
41
groundwater samples during the fleetwide investigation. CRA also collected two full
rounds of water levels from the newly installed and existing wells. The Work Plan was
completed in March and April 2006. All groundwater samples were analyzed for
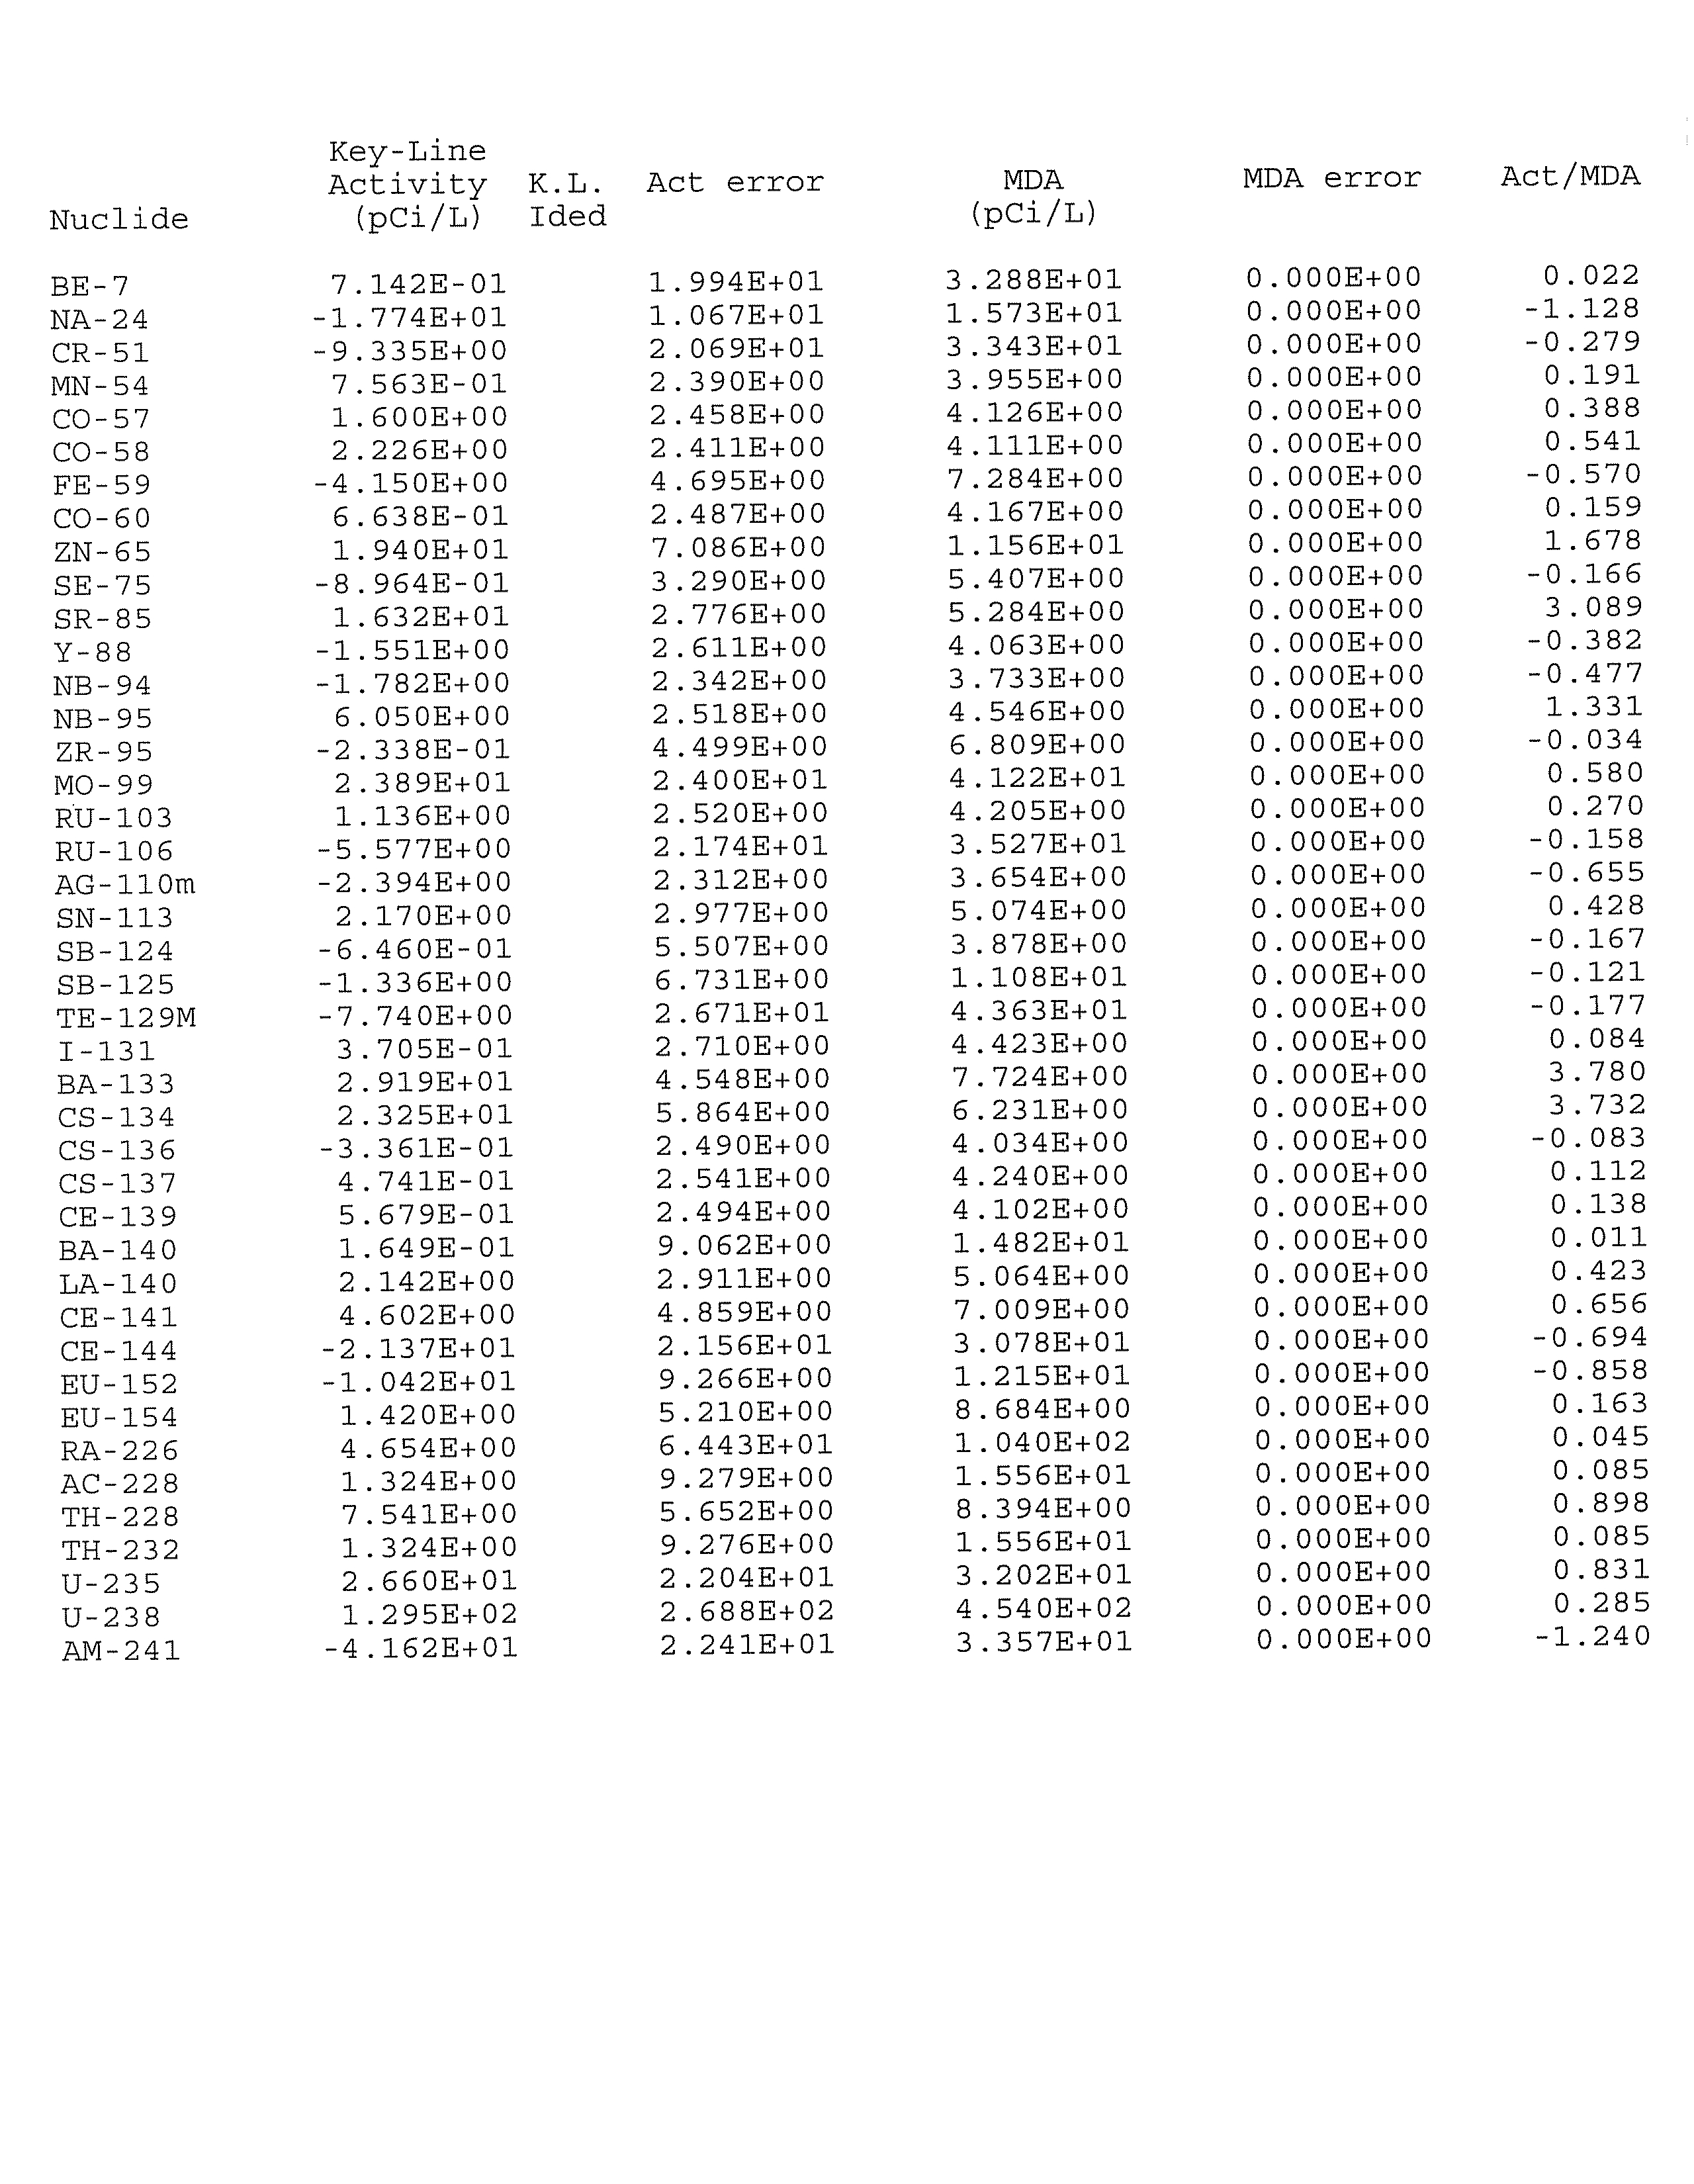
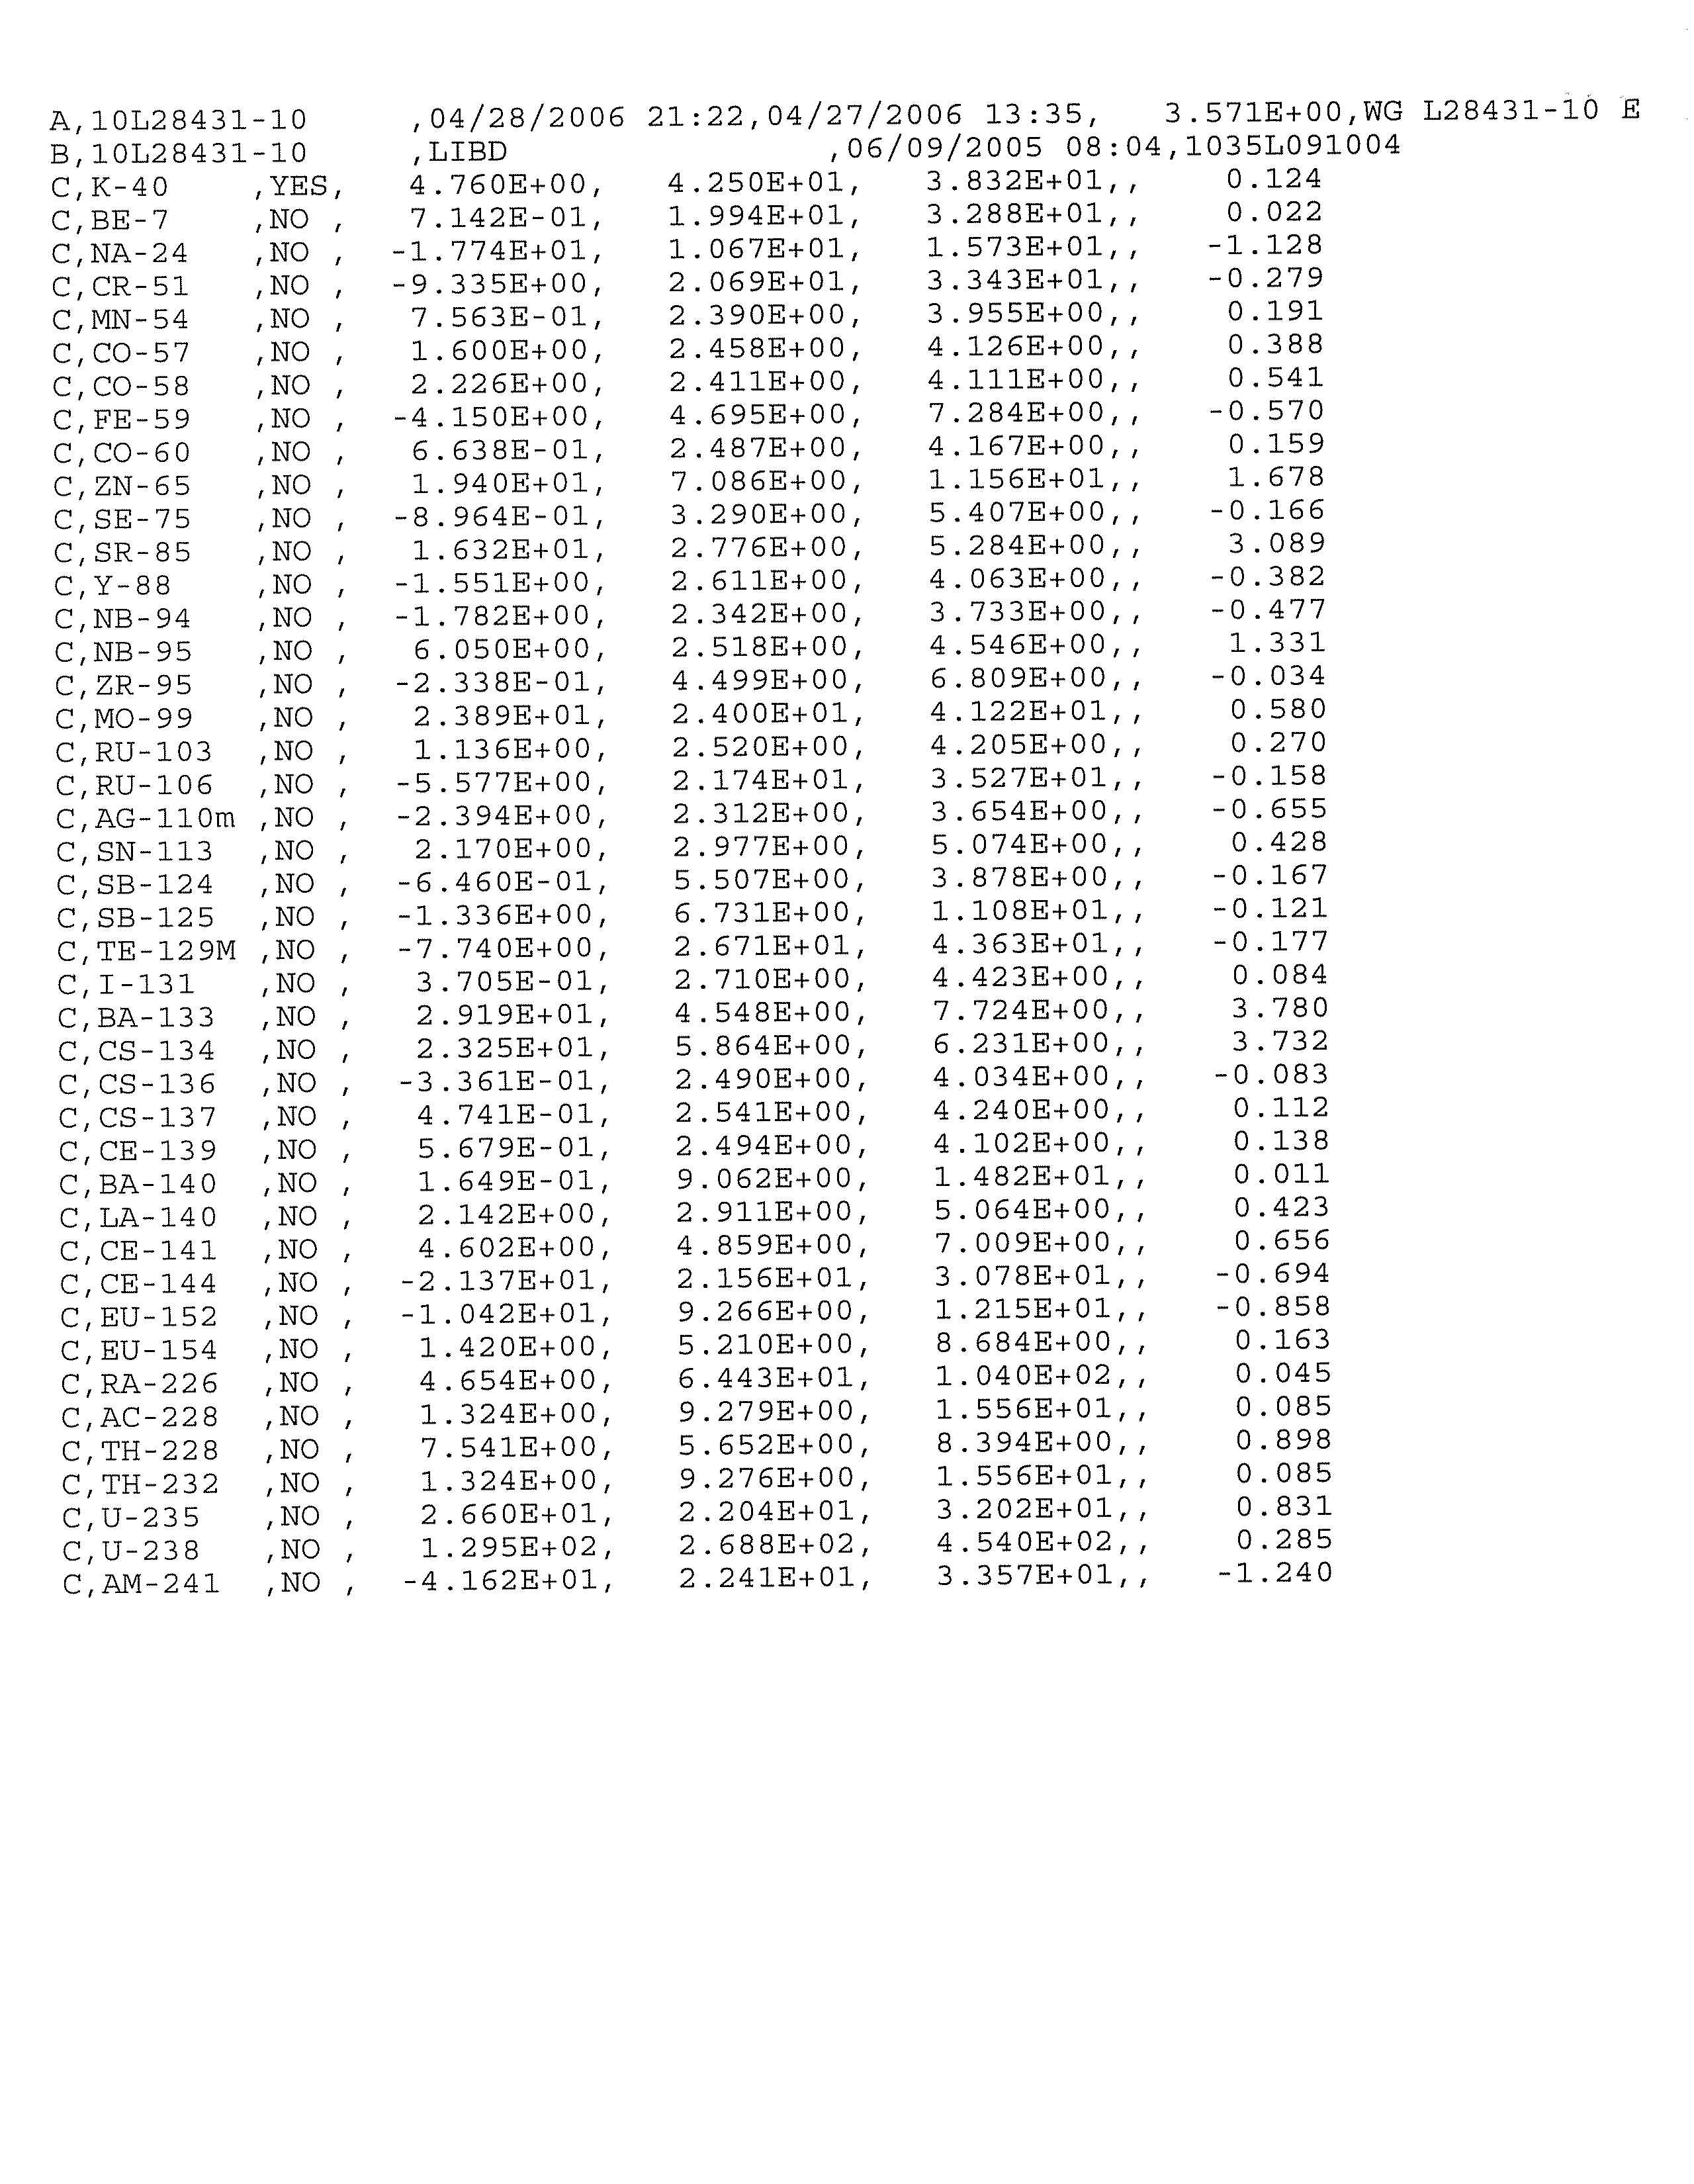
tritium, strontium-89/90 and gamma-emitting radionuclides.
The results of the hydrogeologic investigation are:
•
Gamma-emitting radionuclides associated
with licensed plant operations were not
detected at concentrations greater than their respective Lower Limits of Detection
(LLDs) in any of the groundwater samples obtained and analyzed during the course
of this investigation;
•
Strontium-89/90 was not detected at a concentration greater than the LLD
of
2 picoCuries per liter (pCi/L) in any of the groundwater samples obtained and
analyzed during the course of this investigation;
•
Tritium was not detected at concentrations that are
greater than the United States
Environmental Protection Agency (USEPA) drinking water standard of
20,000 pCi/L;
•
Low
levels of tritium were detected at concentrations greater than the LLD of
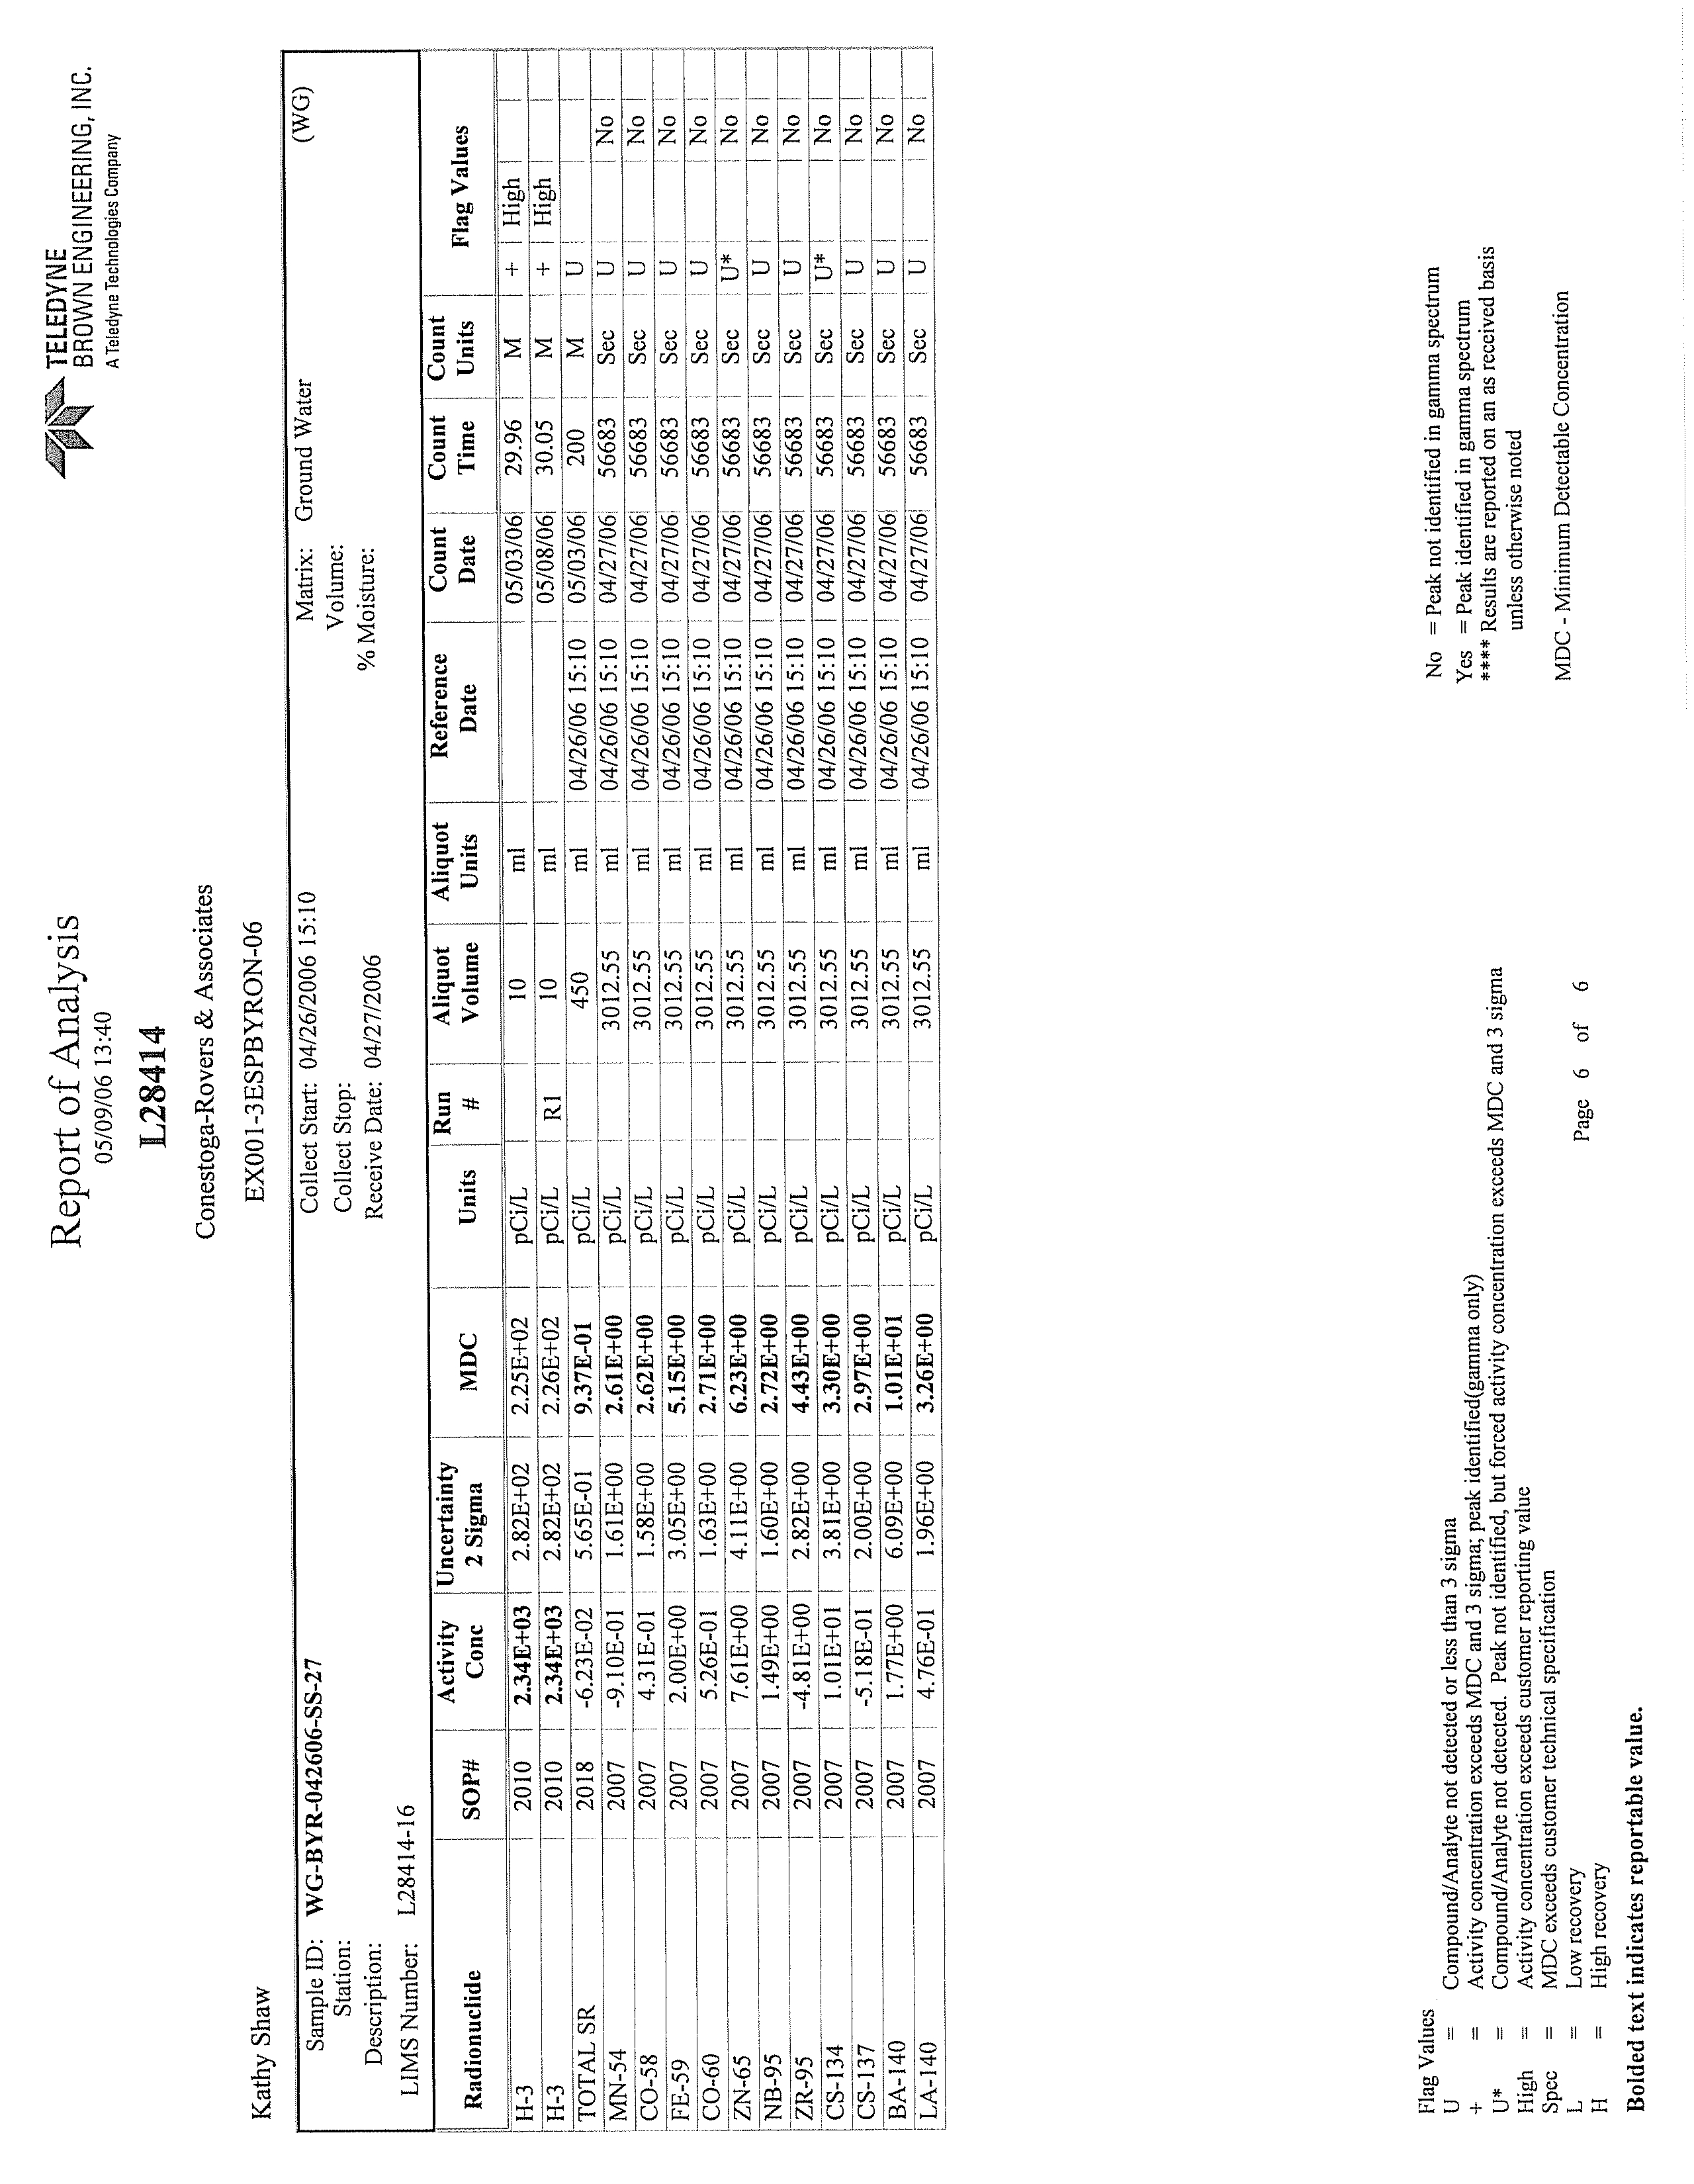
200 pCi/L in four out of 39 samples collected, which is considered background, but
well below the applicable drinking water standard. These tritium concentrations
ranged from 234 ± 128 pCi/L to 3,260 ± 367 pCi/L. These four samples were all
045136 (13) Byron Generating Station
i
CONESTOGA-ROVERS & ASSOCIATES
Revision 1
collected from monitoring wells near three vacuum breaker vaults: VB-2, VB-3, and
VB-4. The source of the tritium concentrations in the groundwater was periodic
leaks during re-seating of the blowdown line vacuum breaker valves;
•
Based on the results of this investigation, tritium is not migrating off the Station
property at detectable concentrations;
•
Based on the results
of this investigation, there is no current risk from exposure to
radionuclides associated with licensed plant operations through any of the identified
potential exposure pathways; and
•
Based on the results of this investigation, there
are no known active releases into the
groundwater at the Station.
Based upon the information collected to date, CRA recommends that Exelon conduct
periodic monitoring of selected sample locations.
045136 (13) Byron Generating Station
ii
CONESTOGA-ROVERS & ASSOCIATES
Revision 1
1.0
INTRODUCTION
Conestoga-Rovers & Associates (CRA) has prepared this Hydrogeologic Investigation
Report (HIR) for Exelon Generation Company, LLC (Exelon) as part of its Fleetwide
Program to determine whether groundwater at and in the vicinity of its nuclear power
generating facilities has been adversely impacted by any releases of radionuclides. This
report documents the results of CRA's May 2006 Hydrogeologic Investigation Work
Plan (Work Plan). This investigation pertains to Exelon's Byron Generating Station in
Byron, Illinois (Station) (refer to Figure 1.1). This report also documents the results of
CRA's and the Station's investigation conducted beginning in January 2006 in relation to
the current and former blowdown lines.
The Station is defined as all property, structures, systems, and components owned and
operated
by Exelon located at 4450 North German Church Road in Byron, Illinois,
Rockvale and Marion Townships, Ogle County. The approximate property boundaries
are shown on Figure 1.2.
Pursuant to the Work Plan, CRA assessed groundwater quality at the Station in
locations designated as Areas for
Further Evaluation (AFEs). The process by which CRA
identified AFEs is discussed in Section 3.0 of this report.
The objectives of the Work Plan were to:
•
characterize the geologic and hydrogeologic conditions at the Station, including
subsurface soil types, the presence or absence
of confining layers, and the direction
and rate of groundwater flow;
•
characterize the groundwater/surface water interaction at the Station, including a
determination of the surface water flow regime;
•
evaluate
groundwater quality at the Station, including the vertical and horizontal
extent, quantity, concentrations, and potential sources of tritium and other
radionuclides in the groundwater, if any;
•
define the probable sources of any radionuclides released at the Station;
•
evaluate potential human, ecological, or environmental receptors of any
radionuclides that might have been released to the environment; and
•
evaluate whether interim response activities are warranted.
045136 (13) Byron Generating Station
1
CONESTOGA-ROVERS & ASSOCIATES
Revision 1
2.0
STATION DESCRIPTION
The following section presents a general summary of the Station location and definition,
overview of Station operations, surrounding land use, and an overview of both regional
and Station-specific topography, surface water features, geology, hydrogeology, and
groundwater flow conditions. This section also presents an overview of groundwater
use in the area.
2.1
STATION LOCATION
The Station is located at 4450 North German Church Road in Byron, Illinois, Rockvale
and Marion Townships, Ogle County. The Station consists of approximately 1,900 acres,
of which approximately 1,200 acres are used for the generating facility. The other
approximately 700 acres of property encompass a 'buffer zone' around the facility and
property to the west of the facility.
The Byron Station is located approximately 2
miles east of the Rock River. The
blowdown line extends from the Station to the Rock River, and discharges into the Rock
River. Figure 1.2 presents a Station Property Map showing the Station structures and
the approximate property boundary.
2.2
OVERVIEW OF COOLING WATER OPERATIONS
Operations at the Station began in 1985. The two nuclear reactors at the Station (Unit 1
and Unit 2) are both pressurized water reactors. The Station produces approximately
2,400 megawatts of electricity.
Non-contact cooling water from the Rock River that is used in the electricity generation
process is cooled through the Station's
two cooling towers.
The water is then
recirculated through the flume and discharged through the blowdown line back to the
Rock River in accordance with an Illinois Environmental Protection Agency (Illinois
EPA) National Pollution Discharge Elimination System (NPDES) permit (IL0048313) and
Nuclear Regulatory Commission (NRC) Operating Licenses, NPF-37 (Unit 1) and
NPF-66 (Unit 2).
Water from the Station's Radioactive Waste Treatment system is transferred to
the liquid
Radioactive Waste Storage Tank where it is sampled and analyzed. Once the analysis is
reviewed and the water is determined to be in compliance with the NPDES permit and
045136 (13) Byron Generating Station
2
CONESTOGA-ROVERS & ASSOCIATES
Revision 1
the NRC Operating License discharge limitations, it is batch released through the
blowdown line.
The blowdown line and make-up line were constructed adjacent to each other and
follow
a northwest and then westerly path from the Station for approximately 2 miles to
the Rock River. At the Rock River, the make-up line is located approximately 300 feet
upstream of the blowdown line. Along the length of the two lines, there are six vacuum
breaker (VB) locations (VB-1 through VB-6) for each line. The breakers are located
within concrete vaults. There are two vaults at each breaker location, one for each line.
There are seven ponds in the northeast section of the Station. Six of these ponds are
concrete-lined process catch basins and are aligned in an east-west
trending series.
These are referred to as the Treated Runoff ponds. The four western ponds collect water
from the Station; the water from these four ponds is pumped to the waste treatment
building for processing. The two eastern ponds collect rainwater from the storm water
drain system; the water from these ponds is pumped to the Construction Run-off Pond
(CROP) located north of the Treated Runoff ponds. The CROP is lined at the bottom
with 1 foot of clay. Water from the CROP is eventually pumped back into the Station's
cooling towers.
2.3
SURROUNDING LAND USE
The land surrounding the Station in all directions is primarily farmland. Approximately
0.3 mile north of the Station property along the Rock River is a small residential
subdivision named Rock Terrace. In addition, there are two small residential areas
along the Rock River approximately 0.1 mile and 0.8 mile south of the Station property.
The Byron Salvage Superfund Site (Byron Salvage Site) is immediately to the
north of
the west portion of the Station along Razorville Road. The Byron Salvage Site is
administered by United States Environmental Protection Agency (USEPA) Region 5. It
was placed on the National Priorities List (NPL) in 1982 and has the USEPA
identification number ILD010236230. The Byron Salvage Site consists of two separate
properties: the Byron Salvage Yard property and the Dirk's Farm property (see
Figure 1.2). The Dirk's Farm property is currently owned by Exelon, and is a former
farm located west of the Byron Salvage Yard property across Razorville Road.
Waste disposal at the Byron Salvage Site is known to have occurred on each of the two
properties. From the mid 1960s to 1972, approximately
10 acres of the Byron Salvage
Site were used as an automotive salvage yard and dump where miscellaneous waste
045136 (13) Byron Generating Station
3
CONESTOGA-ROVERS & ASSOCIATES
Revision 1
and debris were disposed. Such wastes and debris included drums of electroplating
wastes and other materials including oil sludges, cutting wheels, solvents, scrap metal,
and industrial wastes. Plating waste containing cyanide was sprayed onto roads as dust
control at the Byron Salvage Site.
At the direction of Illinois EPA, from 1974 through 1976 Exelon's predecessor,
Commonwealth Edison Company (ComEd)
removed the waste material from the Dirks
Farm property. After 1976, ComEd continued monitoring the groundwater at the Dirks
Farm property. Investigative and remedial actions were conducted at the Byron Salvage
Yard portion of the Site beginning in 1983. Drums were present at the Byron Salvage
Yard on the surface and buried underground. Hazardous wastes were found to contain
lead, arsenic, cyanides, halogenated organics, zinc, nickel, and low concentrations of
polychlorinated biphenyls (PCBs). Between 1986 and 1998, soil removal and cleanup
activities were conducted on the Byron Salvage Site.
The Byron Salvage Site
remediation is in the long-term groundwater monitoring phase for volatile organic
compounds (VOCs) and cyanides. ComEd resolved its alleged liability for the Byron
Salvage Site in a settlement with USEPA.
2.4
STATION SETTING
The following sections present a summary of the topography, surface water features,
geology, hydrogeology, and groundwater flow conditions in the region surrounding the
Station. The information was primarily gathered from Sections 2.1 and 2.5 of the Byron
Station Updated Final Safety Analysis Report (UFSAR), Revision 10 dated
December 2004, and from the well logs contained in the Byron Salvage Yard Remedial
Design Work Plan (CRA, June 2001). The main references that the UFSAR relied upon
are listed in Section 10.0 of this HIR. CRA checked and verified all UFSAR references
that apply to this HIR.
2.4.1
TOPOGRAPHY AND SURFACE WATER FEATURES
The Station's location is on the Oregon, Illinois 7.5-minute United States Geological
Service (USGS) quadrangle topographic maps, dated 1976 (Stillman Valley) and 1983
(Oregon) (see Figure 1.1). The property boundaries fall within the following sections of
the map: T24N R10E Sections 12, 13, 14, 15, 22, 23, and 24, and T24N R11E Sections 7, 18,
and 19. The Byron, Illinois area is part of the Rock River Hill Country physiographic
subsection. The Rock River Hill Country is characterized by gently rolling, dissected
uplands covered by thin deposits of glacial drift overlain by a thin cap of loess. The
045136 (13) Byron Generating Station
4
CONESTOGA-ROVERS & ASSOCIATES
Revision 1
southwest-trending Rock River valley passes through the eastern portion of the
subsection. Bedrock is exposed locally along the Rock River and along small tributary
streams and valleys of the Rock River. The topography that is indicated on the Oregon,
Illinois 7.5-minute quadrangle is consistent with this physiography.
The Station was constructed on a local topographic
high. In each direction from the
Station, the topography undulates, with rolling hills and valleys. Along the Rock River,
erosional valleys cut by tributary streams are present. The ground surface elevation at
the Station is approximately 200 feet higher than the ground surface near the Rock River.
The Rock River, the largest body of water in the area, is located approximately 2
miles to
the west of the Station. The river flows southward with an average flow of 4,000 cubic
feet per second (cfs) and is primarily used for recreation, including boating, fishing, and
water skiing. Streams in the Byron area discharge into the Rock River; the confluence of
the Rock River with the Mississippi River is approximately 115 river miles south of the
Station (Willman, et al., 1967).
The Woodland Creek is located to the north of the Station and flows to the northwest
toward the Rock River. Additionally, an unnamed creek is located to the
west of the
Station and flows west toward the Rock River. Both of these creeks are ephemeral,
flowing only during times of heavy rainfall.
2.4.2
GEOLOGY
The northern portion of the mid-western United States is in the Central Lowlands
Physiographic Province (Willman et al., 1975). This physiographic province has been
divided into several physiographic sections. Parts of northern Illinois are located in the
Wisconsin Driftless Section, the Till Plains Section, and the Great Lake Section.
Byron Station is located within the Till Plains
Section. The Till Plains Section is
characterized, in general, by the presence of glacial deposits overlying the bedrock
surface. Local outcrops of bedrock are present. The Till Plains Section in Illinois is
further subdivided into the following physiographic subsections: the Rock River Hill
Country, the Green River Lowland, the Bloomington Ridged Plain, the Galesburg Plain,
the Kankakee Plain, and the Springfield Plain. The Byron Station is in the Rock River
Hill Country physiographic subsection (Willman et al., 1975).
The soil units in the region, adjacent to the Station, are relatively thin or locally absent.
They include alluvial deposits associated with the rivers and streams in the area, glacial
045136 (13) Byron Generating Station
5
CONESTOGA-ROVERS & ASSOCIATES
Revision 1
deposits of till and outwash generally located in the upland areas, thin loess deposits
that overlie the till, and locally, some thin residual soils developed from the weathering
of the bedrock.
The Station is underlain by a veneer of overburden
deposits that vary in thickness from
less than 1 foot to approximately 12 feet and consist mainly of silty loam and loess, with
alluvial deposits near the Rock River. The predominant soil types at the Station are the
Martinsville Silt Loam, the Whalen Loam, and the Lamont Sandy Loam (Ogle
County, 2006). These three soil types consist of loamy soil with varying amounts of silt
and sand, with slopes ranging from 2 to 18 percent (United States Department of
Agriculture, 2006).
The distribution of the rock units that form the bedrock surface within the region
include a sedimentary sequence
of Cambrian to Cretaceous-rocks and an igneous and
metamorphic complex of Precambrian-aged rocks.
The sedimentary sequence in
northern Illinois near the Station includes Ordovician-aged and Cambrian-aged strata.
These strata consist of 2,000 to 3,000 feet of dolomites, sandstones, and shales. The
Precambrian basement in northern Illinois consists of granites and granodiorites
(Bradbury and Atherton, 1965).
The Byron Station lies within the Central Stable Region tectonic province of the
North
American continent.
This tectonic region is characterized by a sequence of
southward-thickening sedimentary strata overlying the Precambrian basement and was
subjected to a series of vertical crustal movements forming broad basins and arches
during Paleozoic and early Mesozoic time. Local folding and faulting has modified the
arches and basins (Buschbach, 1964) (Willman et al., 1975).
The bedrock under the Station is comprised of flat-lying Ordovician-aged dolomitic and
sandstone layers progressing downward as follows:
•
Galena Group Dolomites;
•
Platteville Group Dolomites; and
•
Ancell Group, consisting of:
−
Glenwood Formation (shale with sandy dolomite, semi-confining layer),
−
St. Peter Sandstone Formation, and
−
older Cambrian formations.
The generating facility was constructed on an area of a 'bedrock high', and the
foundation was installed into the
bedrock. Figures 2.1 and 2.2 present generalized
045136 (13) Byron Generating Station
6
CONESTOGA-ROVERS & ASSOCIATES
Revision 1
cross-sections of the area geology prepared from geologic information gathered from
boreholes advanced prior to construction of the Station.
The locations of the
cross-sections are shown on Figure 1.2.
CRA has prepared hydrogeologic cross-sections depicting the geology and groundwater
elevations under the Station. These figures
are discussed in Section 5.0 of this Report.
2.4.3
HYDROGEOLOGY
Ordovician-age Galena-Platteville dolomites and the older Ordovician-age Glenwood
Formation and St. Peter Sandstone underlie the area. The most important aquifer in the
region is the Cambrian-Ordovician Aquifer, made up of all bedrock between the top of
the Galena-Platteville dolomites and the top of the Eau Claire Formation. These strata
are, in descending order, the Ordovician-age Galena Formation, Platteville Formation,
Ancell Formation (Glenwood, St. Peter, and older Cambrian formations), Prairie du
Chien Formation, and Ironton and Galesville Sandstones. At the Bryon Station, the
Galena-Platteville dolomites are separated from the rest of the Cambrian-Ordovician
Aquifer by the Harmony Hill Shale Member of the Glenwood Formation. Available
data indicate that, on a regional basis, the entire sequence of strata above the Eau Claire
Formation behaves hydraulically as one aquifer. In places, pressure heads between the
water bearing units differ, and the hydraulic connection is imperfect.
The Galena and Platteville Groups dolomites are extensively fractured near the top,
with
solutionally enlarged openings in places but become dense at depth. Water from the
Galena-Platteville dolomites in the area is generally hard. Relatively low yields, water
hardness, and susceptibility of the aquifer to contamination because of thin drift,
fractures, and solution channels do not favor development of the Galena-Platteville
dolomites.
Below the Galena-Platteville dolomites are the thin
shales, sandstones, and limestones of
the Glenwood Formation. This unit grades downward into the thick sandstones of the
St. Peter Sandstone. The Ordovician-age St. Peter Sandstone is permeable and has a
relatively uniform lithology throughout the area. The St. Peter Sandstone is recharged
from overlying glacial deposits in the central and western parts of northern Illinois, and
also by vertical leakage through the Maquoketa Shale Group in northeastern Illinois and
by through-flow from the outcrop area in southern Wisconsin (Buschbach, 1964).
045136 (13) Byron Generating Station
7
CONESTOGA-ROVERS & ASSOCIATES
Revision 1
2.4.3.1
EXISTING WELL NETWORK
Groundwater (the water table) under the Station is first encountered within the
Galena-Platteville limestones and dolomites. The depth to the groundwater varies with
the topography, ranging from approximately 17 feet below ground surface (feet bgs) to
115 feet bgs. Near the Rock River, the water table is in the unconsolidated deposits.
There are 77 wells at the Station. Figure 2.3 presents the locations of the wells. Of the
77
wells, the Station owns 33 wells and the remaining 44 wells are owned by the Byron
Salvage Site PRP Group. A summary of the existing well information is provided in
Table 2.1. These wells were used during the investigations to provide information on
the geology and groundwater levels at the Station.
The monitoring wells are set at different depths to screen all three hydrogeologic units
located under the Station. CRA monitors the levels and water quality of the Byron
Salvage
Site wells at the Station as part of the long-term monitoring program for the
Byron Salvage Site.
There are two deep wells in the Protected Area (PA). The wells are designated Deep
Well
1 and Deep Well 2 and are used for the Station's water supply (see Figure 2.3).
Both wells were installed during the construction of the Station and draw water from
depths greater than 500 feet below grade at an average flow rate of 800 gallons per
minute (gpm) per well. Water is pumped from each well at different times, and the
piping from the wells combines into a common manifold to supply the Station's water
supply.
There are two former farmhouse water supply wells on the Station. The wells are
designated
GW-9 and Well 7. During an investigation of the blowdown line, which
began in early 2006 (refer to Section 3.3.2.2), 16 overburden monitoring wells and
13 bedrock wells were installed along the blowdown line and also within the PA.
Further details regarding the most recent monitoring wells are provided in Section 3.4 of
this report.
CRA expects most of the private wells in the vicinity of the Station are completed in the
St.
Peter Sandstone, however, well completion information was not available for all
private wells identified by CRA, in order to confirm this observation.
045136 (13) Byron Generating Station
8
CONESTOGA-ROVERS & ASSOCIATES
Revision 1
2.4.3.2
GROUNDWATER FLOW
Groundwater flow in the Galena-Platteville dolomites occurs along joints and bedding
planes. Solutioning along these pathways continues at an imperceptible rate due to the
low solubility of the dolomite, the hardness of the groundwater, and the relatively low
hydraulic gradient within the aquifer.
The general regional groundwater flow direction in the Galena-Platteville dolomites and
the underlying Glenwood Formation and St.
Peter Sandstone is to the west toward the
Rock River. Local groundwater flow conditions are typically influenced by surface
topography and aquifer thickness.
Groundwater flow patterns vary under the Station property. In July
1974, the Station
assessed groundwater flow using a system of wells and piezometers installed prior to
Station construction. Since the facility sits upon a bedrock high, groundwater flow
directly beneath the facility was radially outward in all directions. Figure 2.4 presents
the groundwater flow for the Station.
On the western portion of the Station near the blowdown line, groundwater flow was
historically assessed as part of the Byron Salvage
Site remedial investigation. CRA
measured water levels at the Byron Salvage Site monitoring wells on March 23, 2006.
Groundwater contours for the entire Station (both the blowdown line area and the
generating facility), are shown on Figure 2.4 which presents a combined generalized
contour map of the 1974 data (for the generating facility) and the March 2006 data (for
the blowdown line area). There is a northwest/southeast trending groundwater divide
near Razorville Road, west of the generating facility, and perpendicular to the
blowdown line. The direction of groundwater flow at points along the blowdown line
varies depending upon the location. However, the general groundwater flow direction
is to the west toward the Rock River.
2.5
AREA GROUNDWATER USE
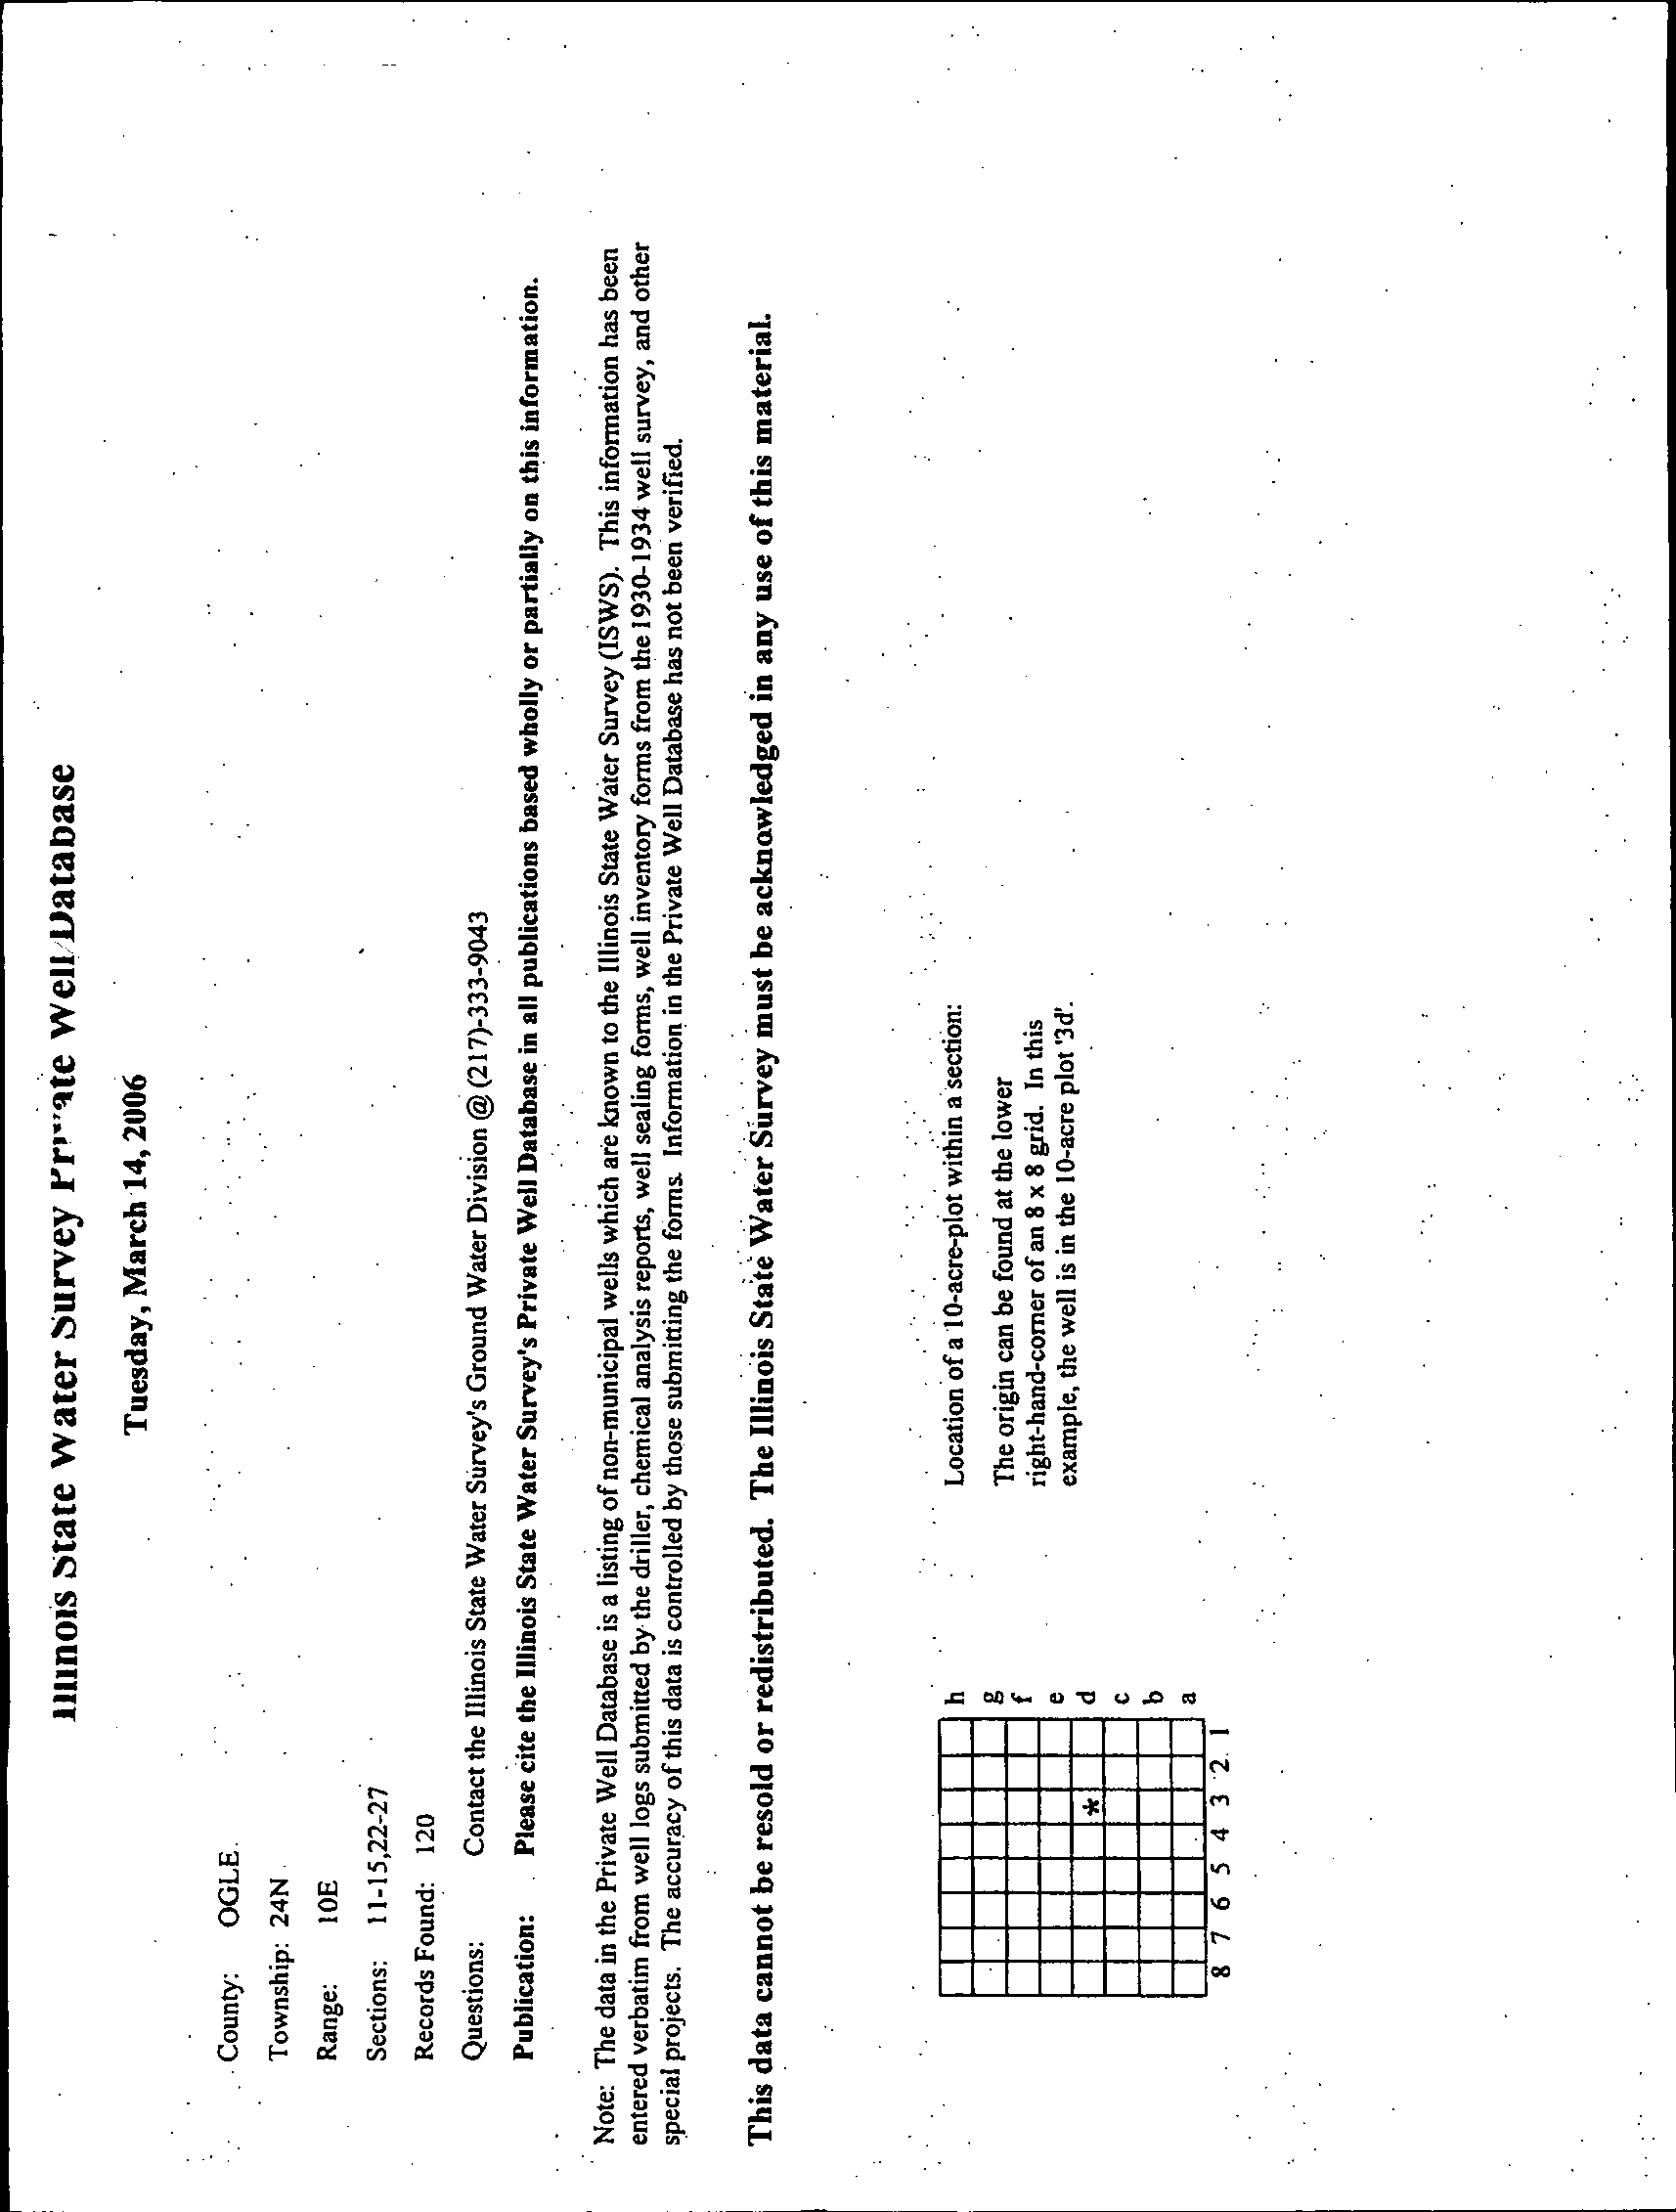
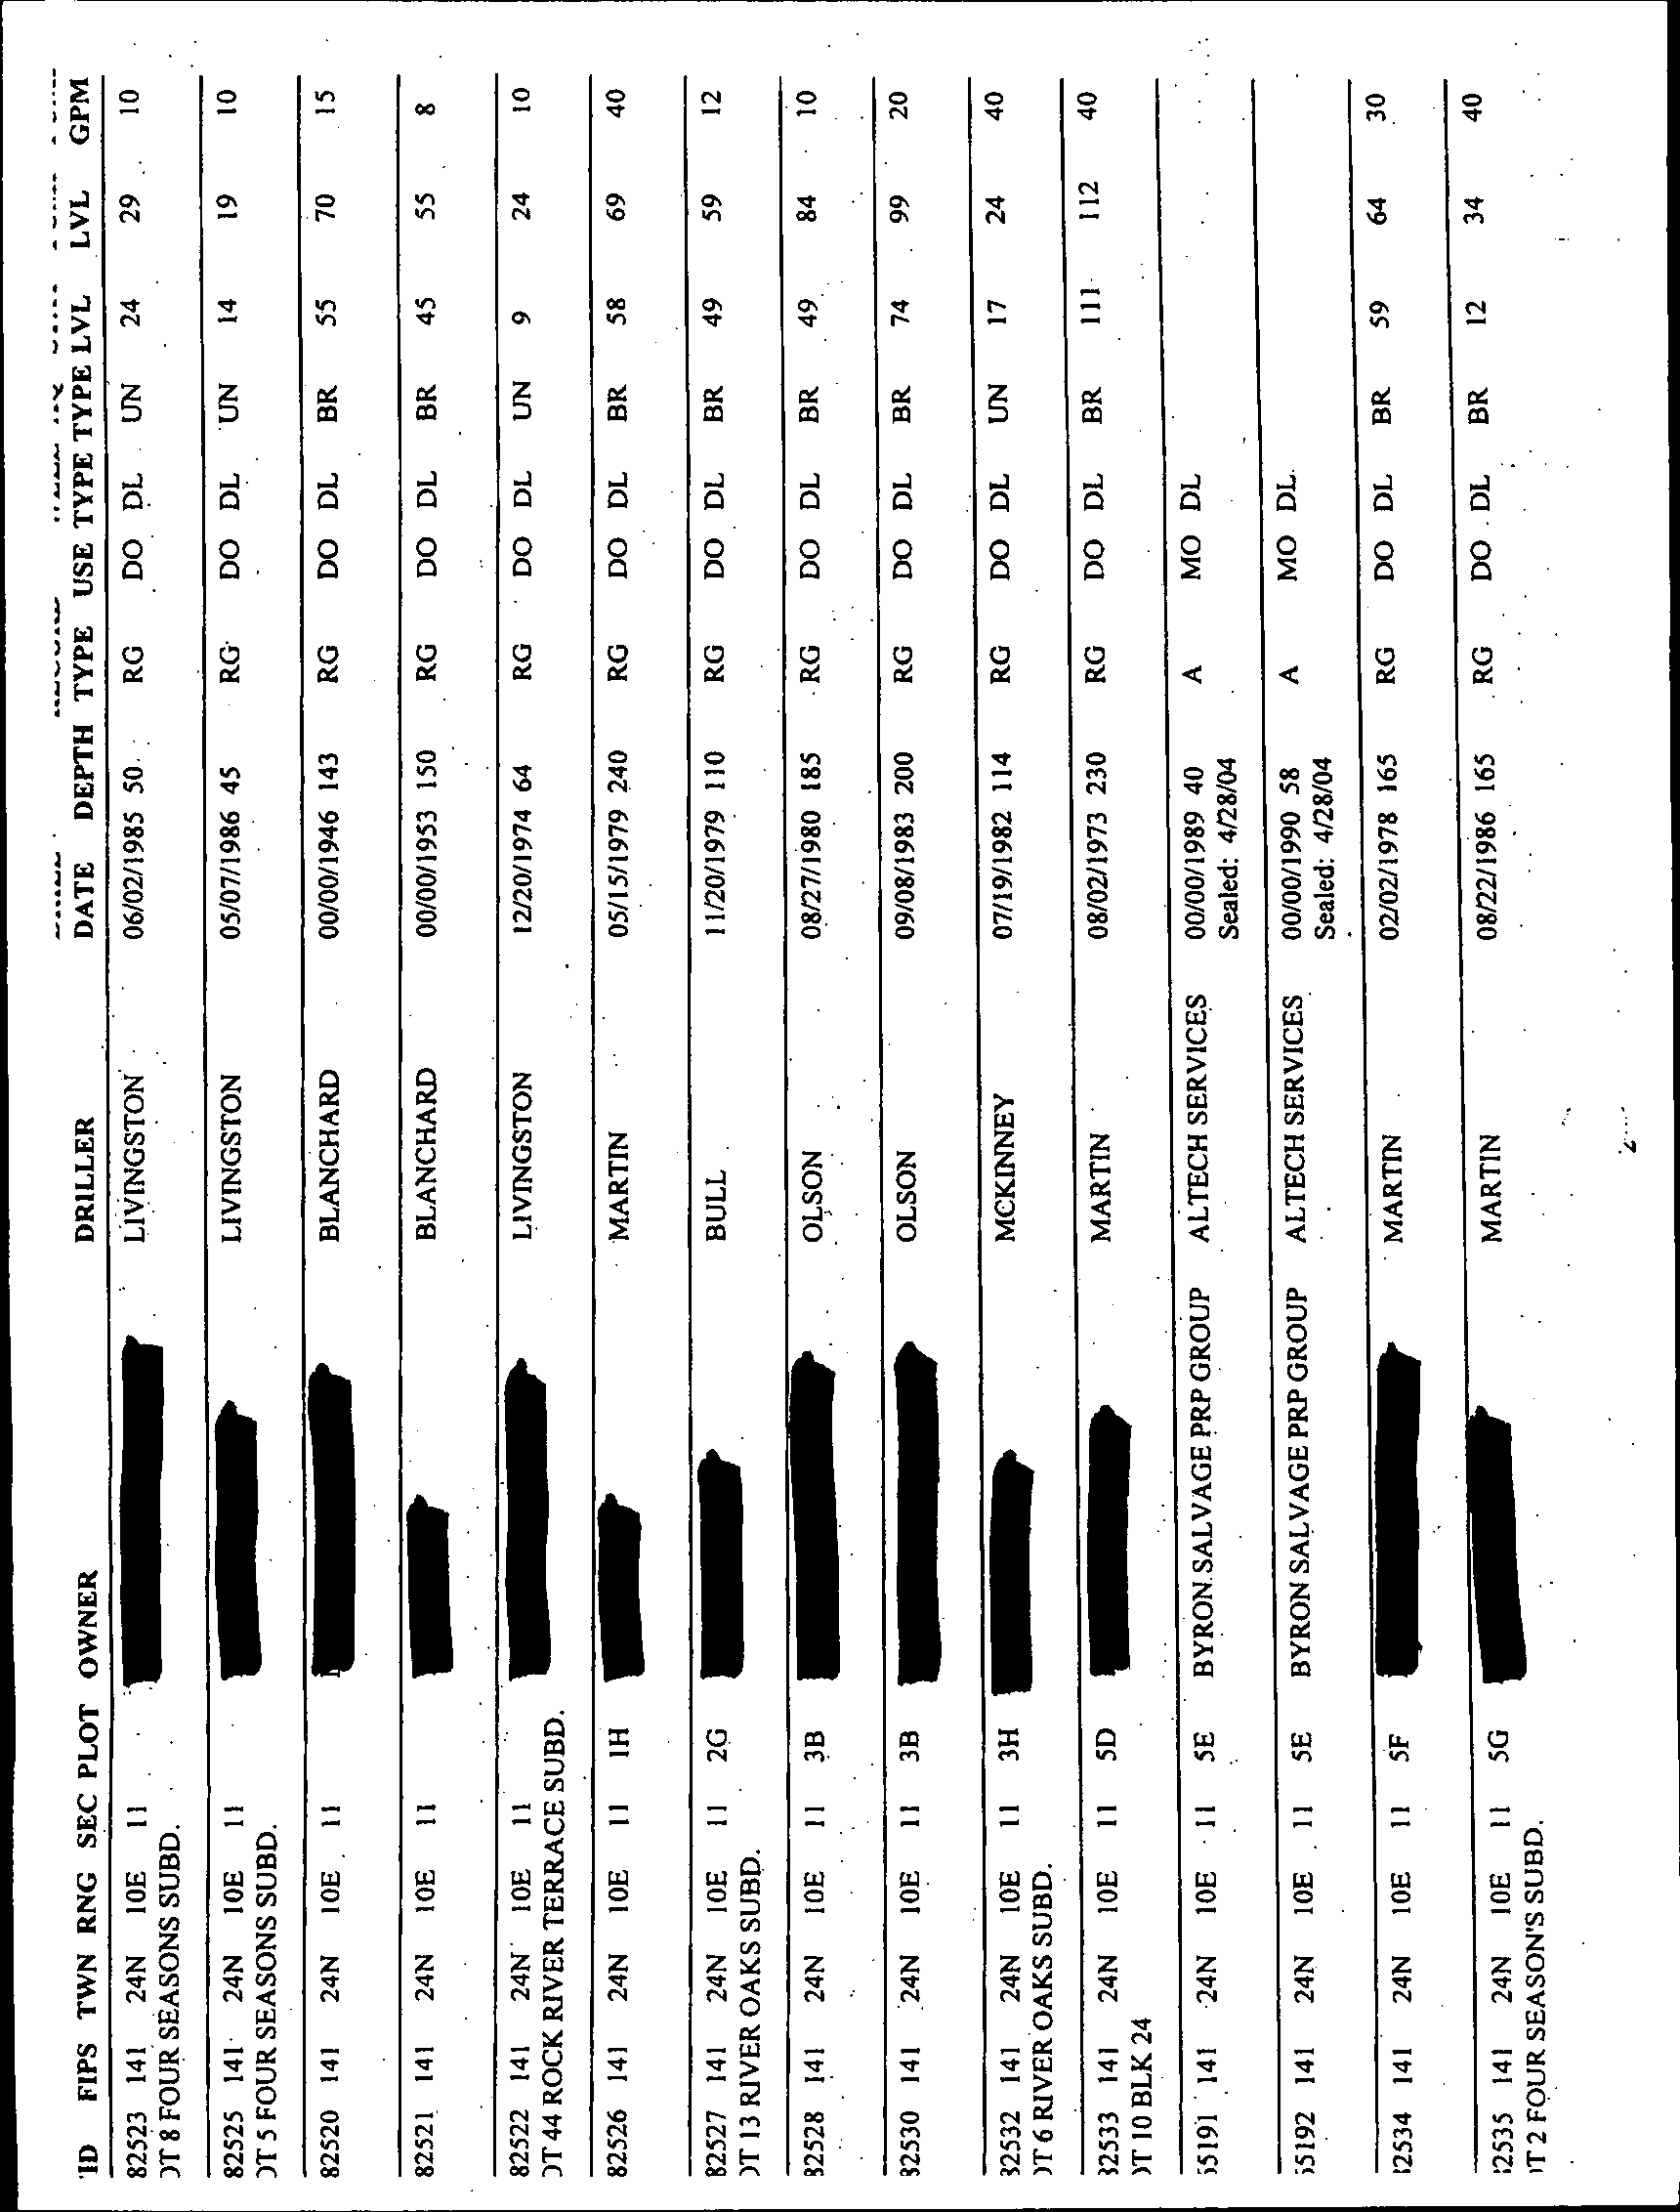
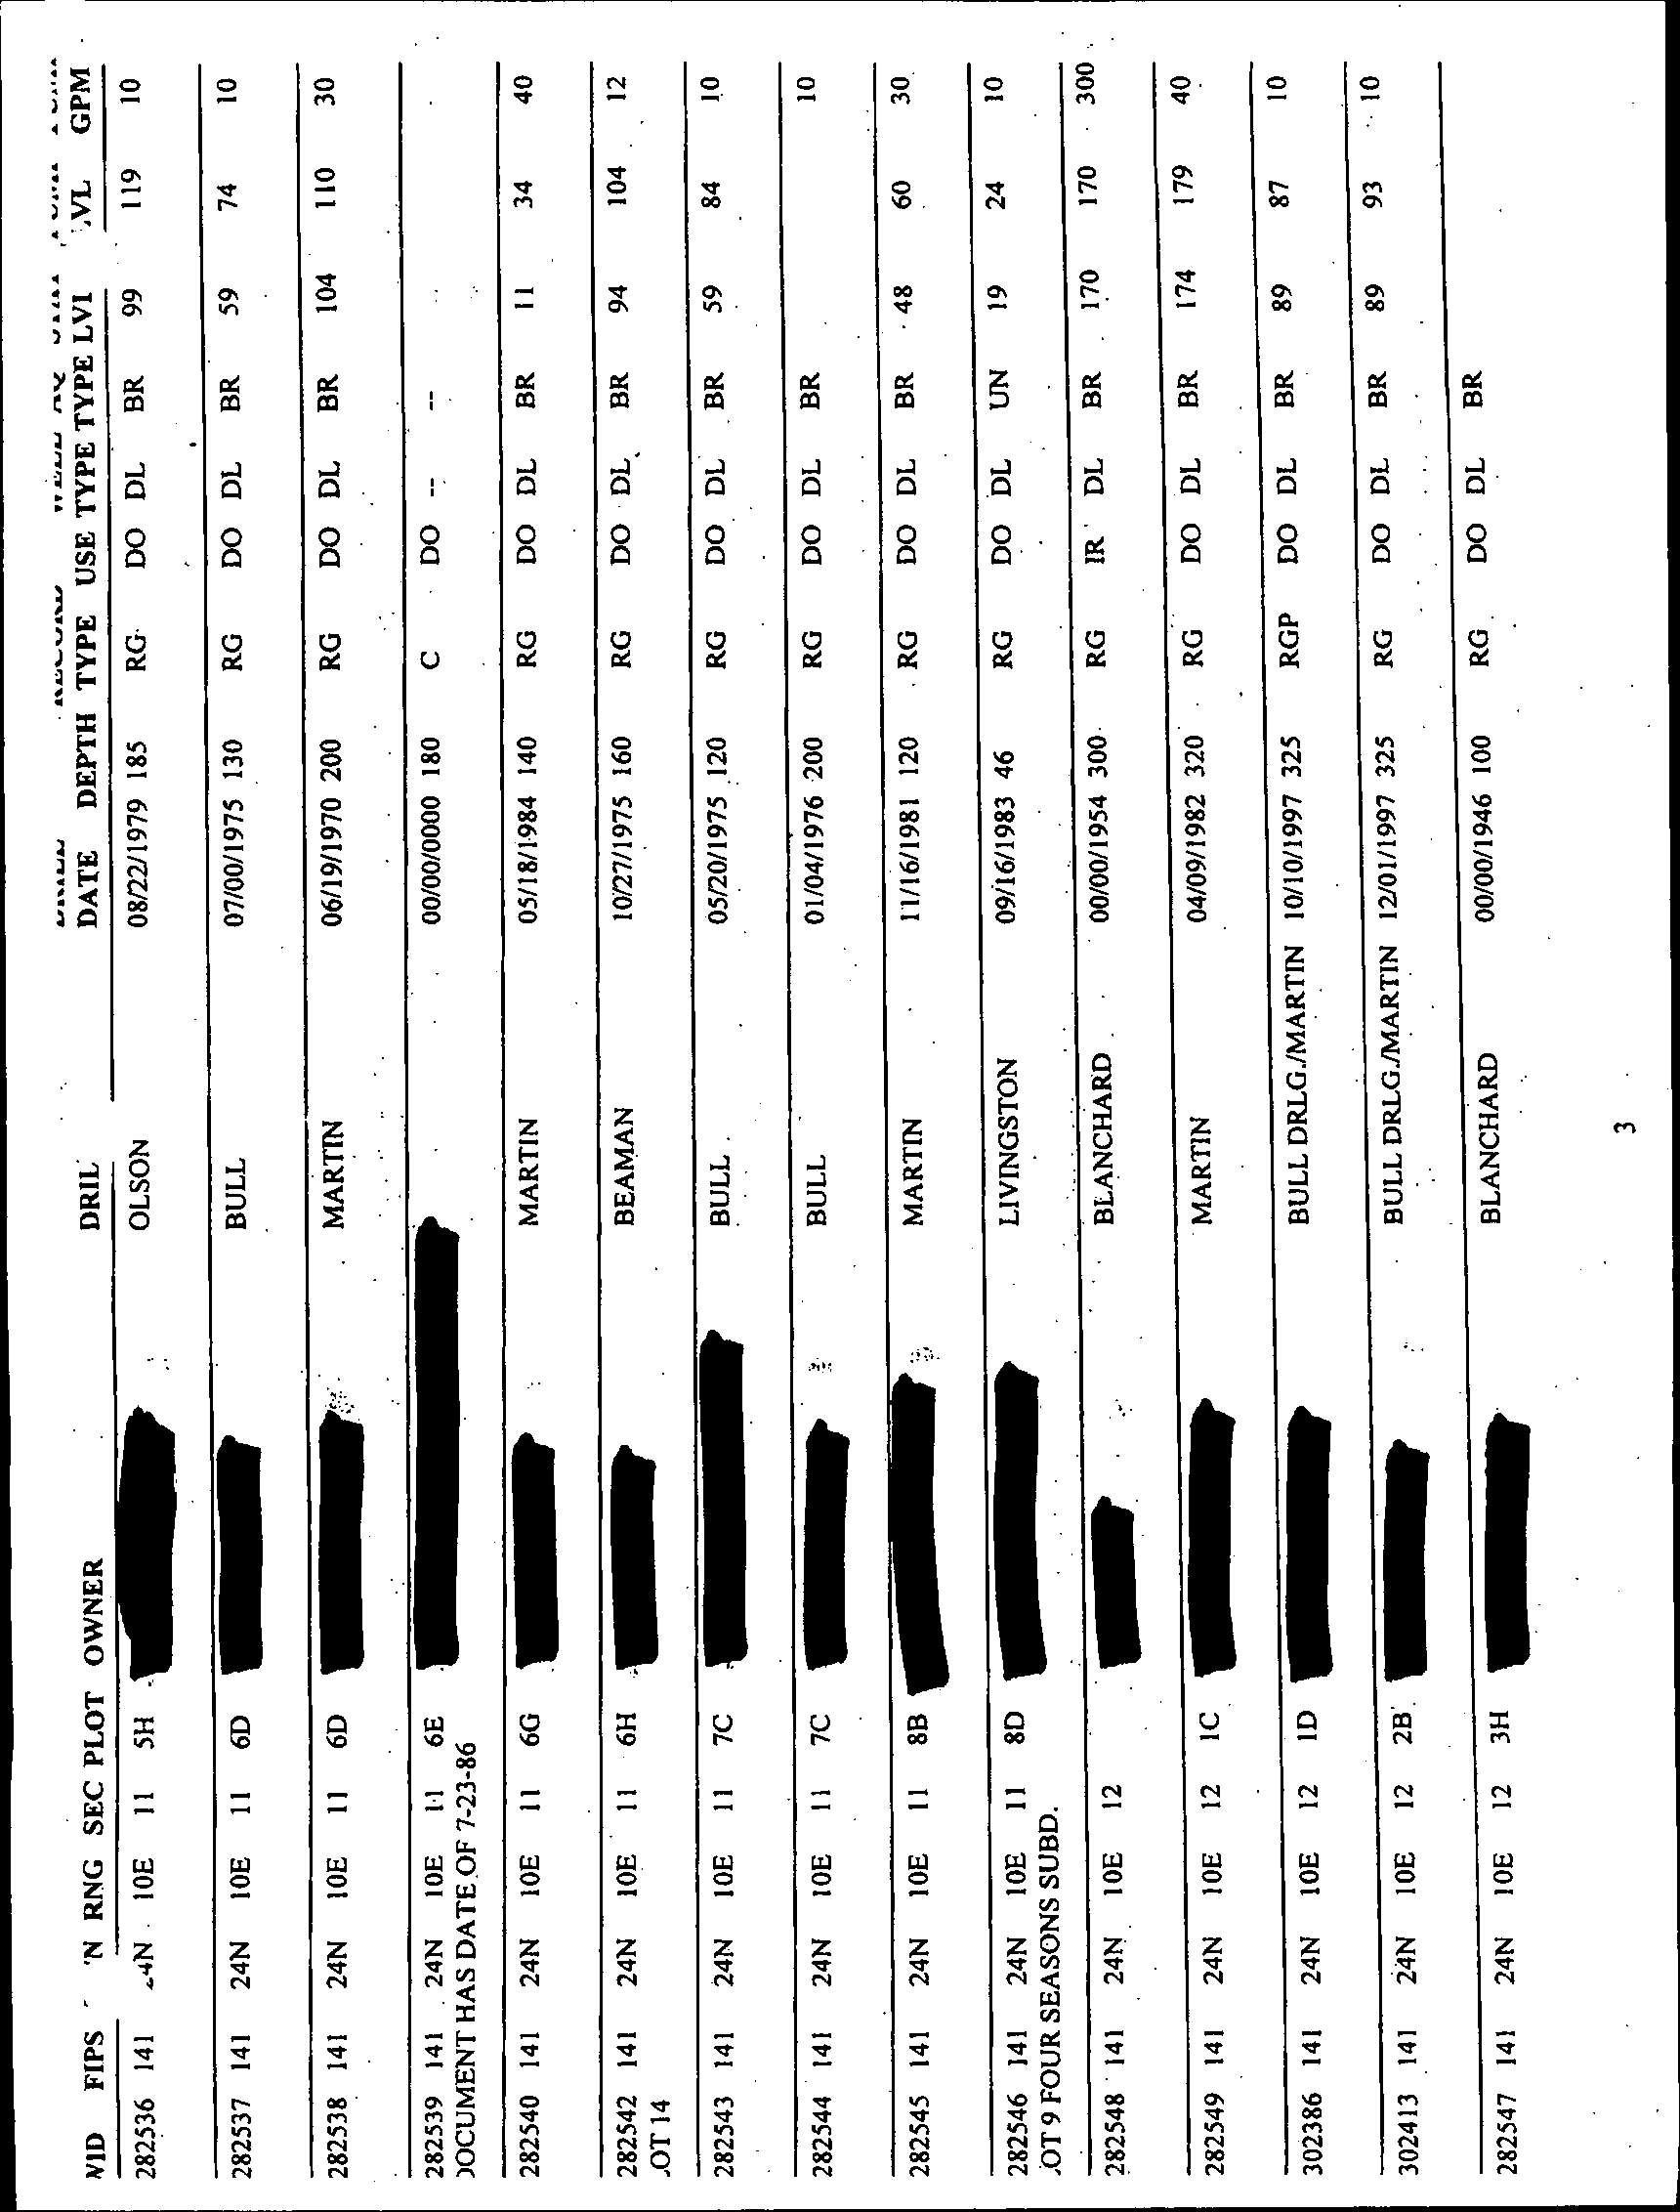
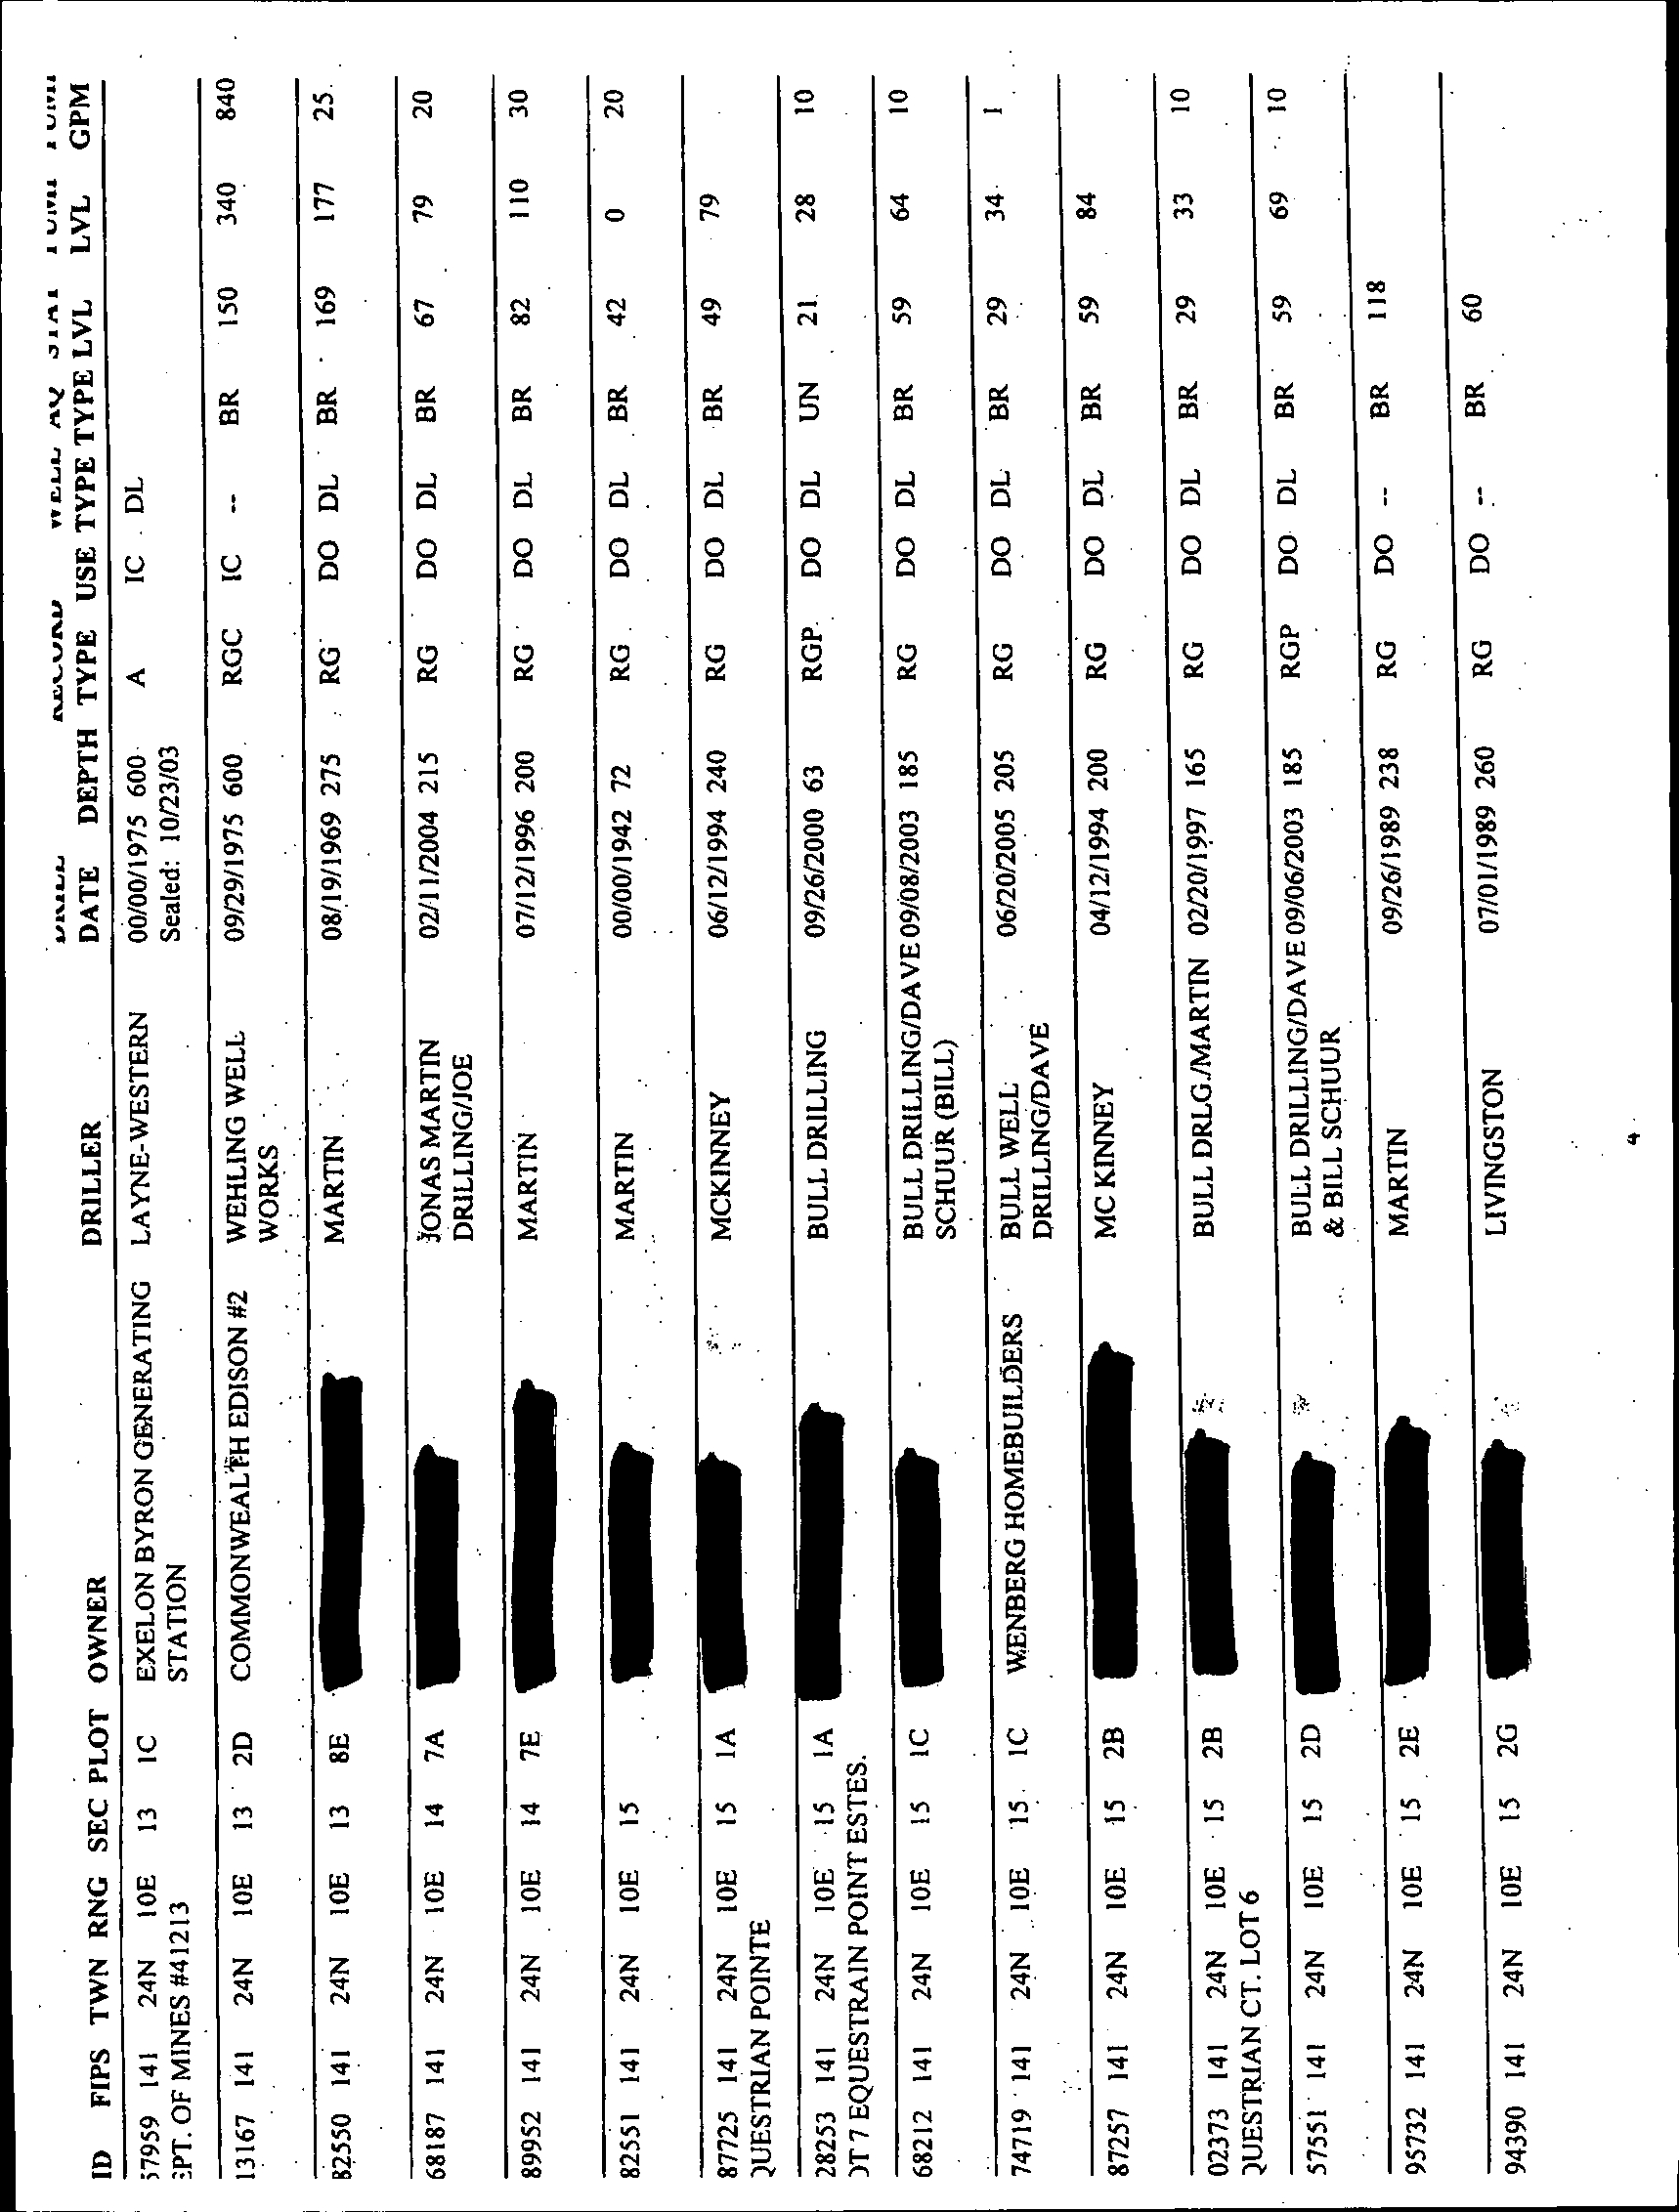
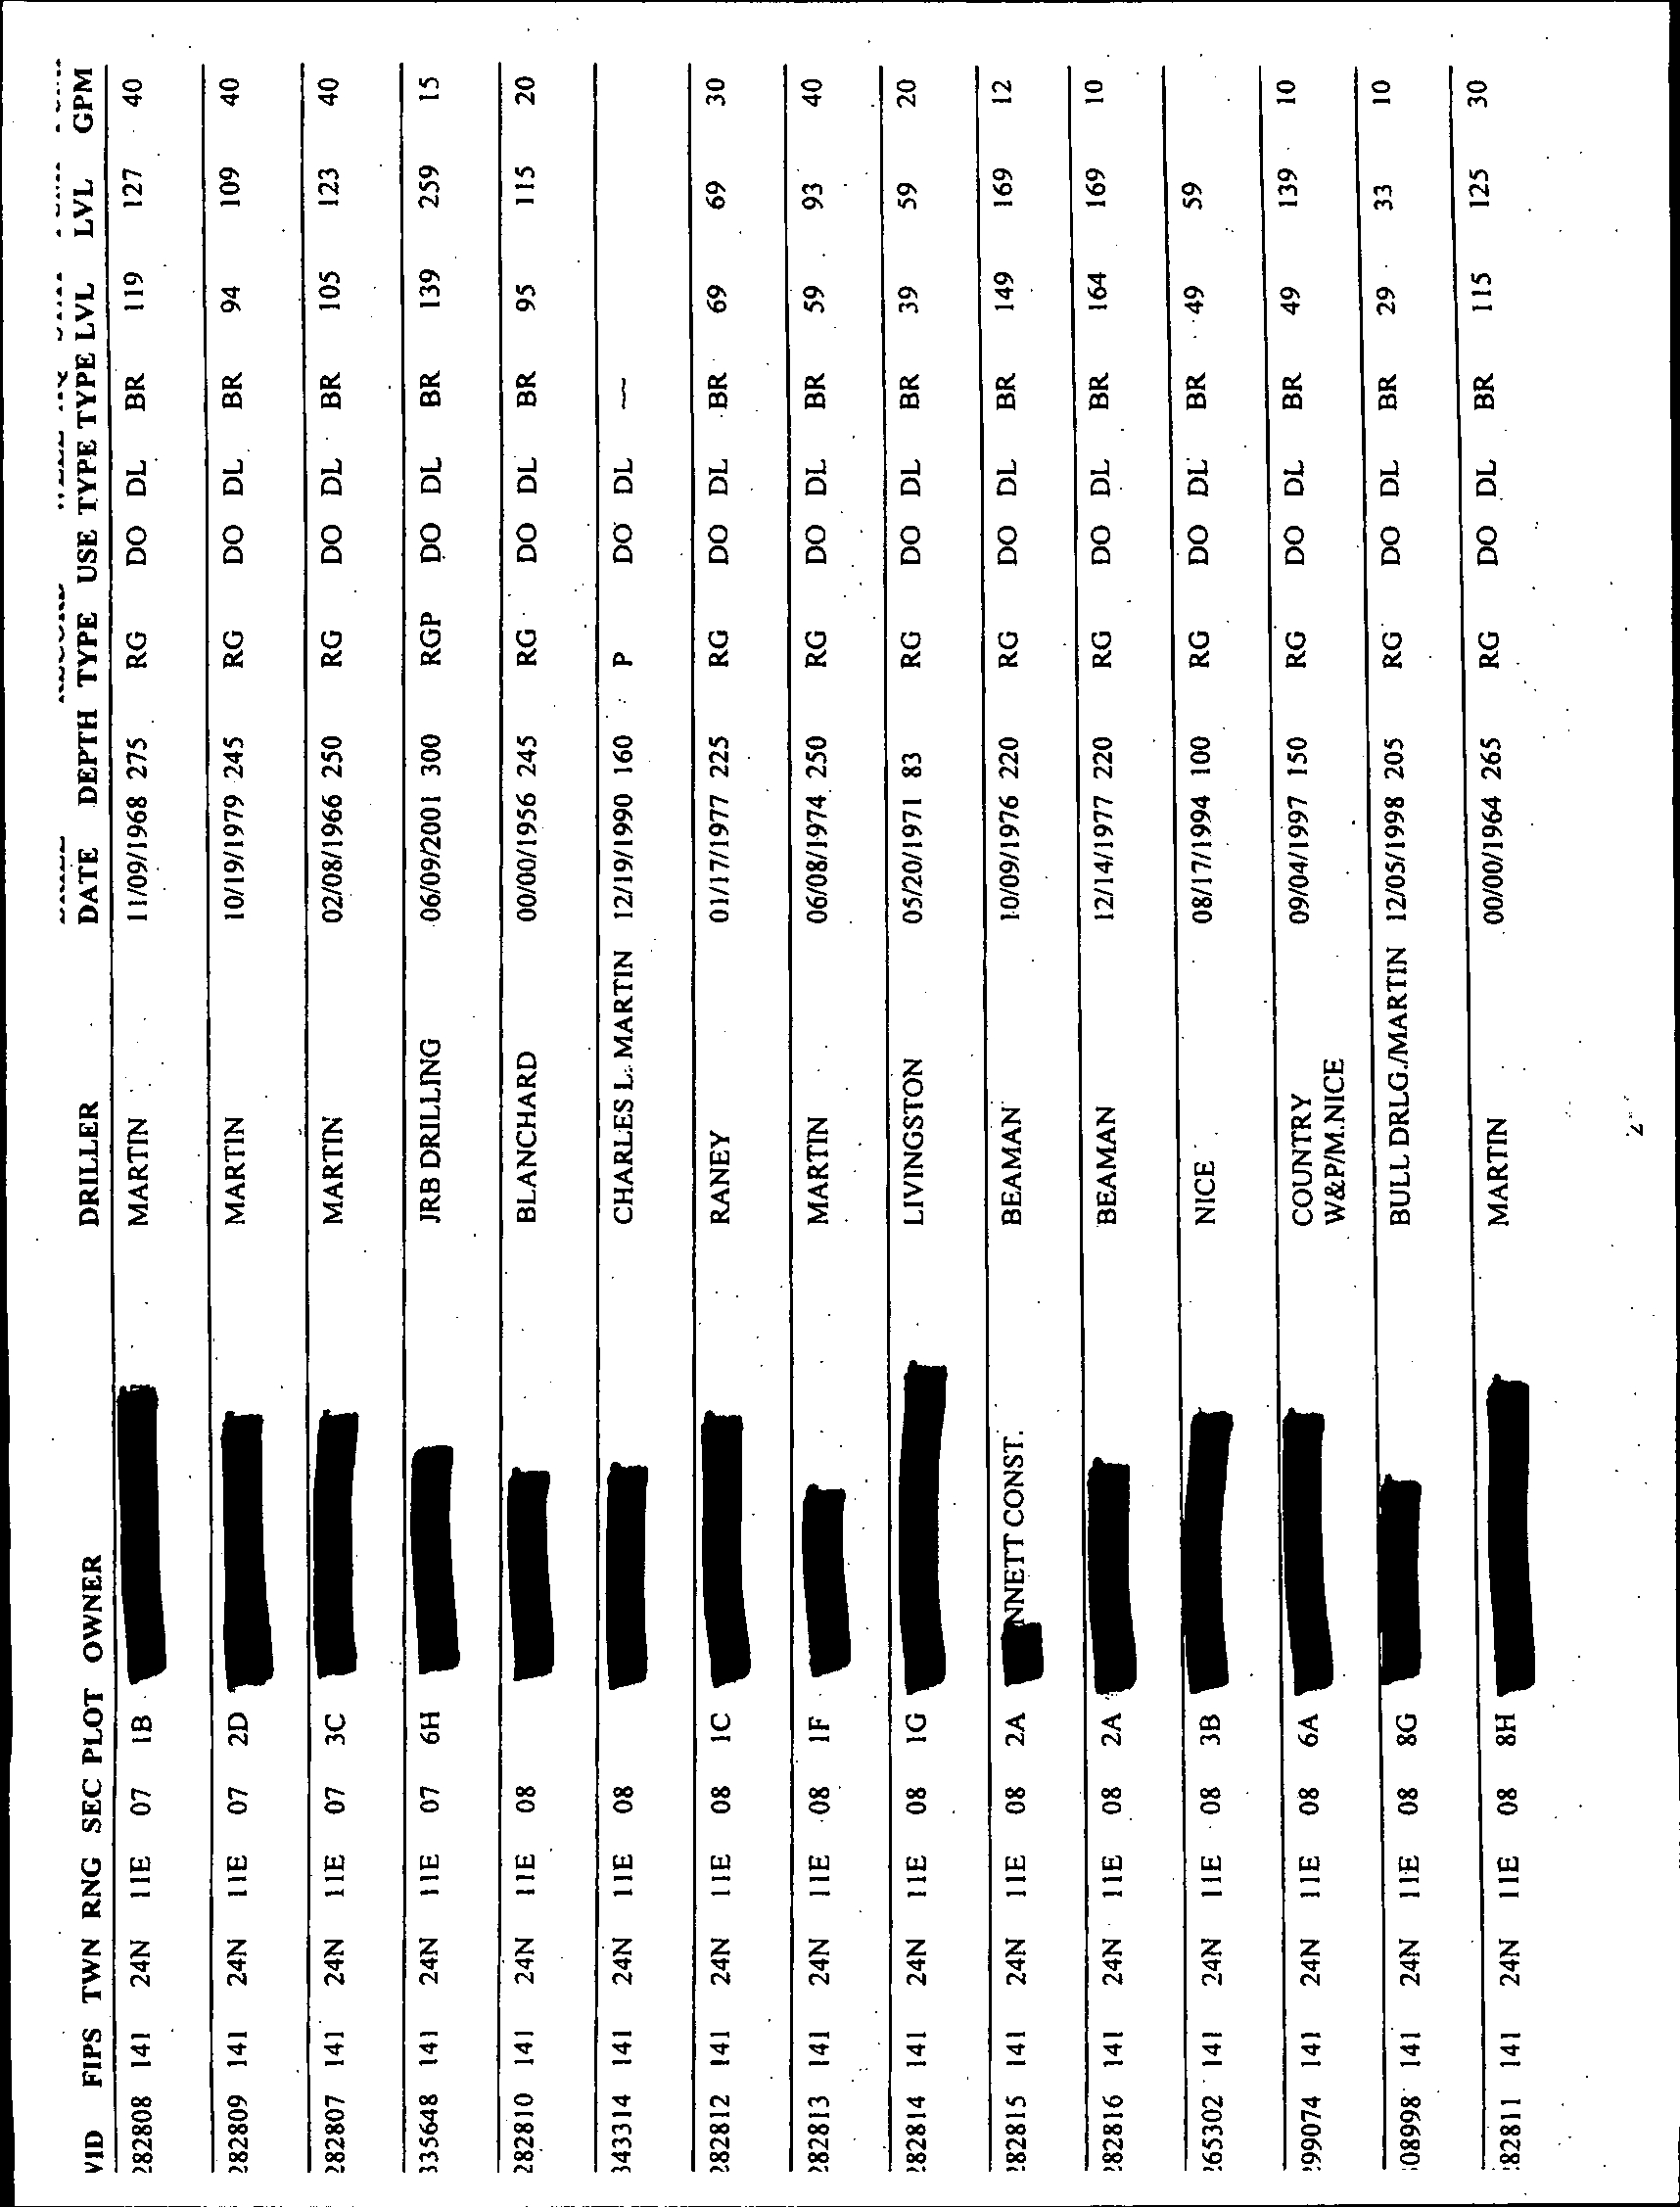
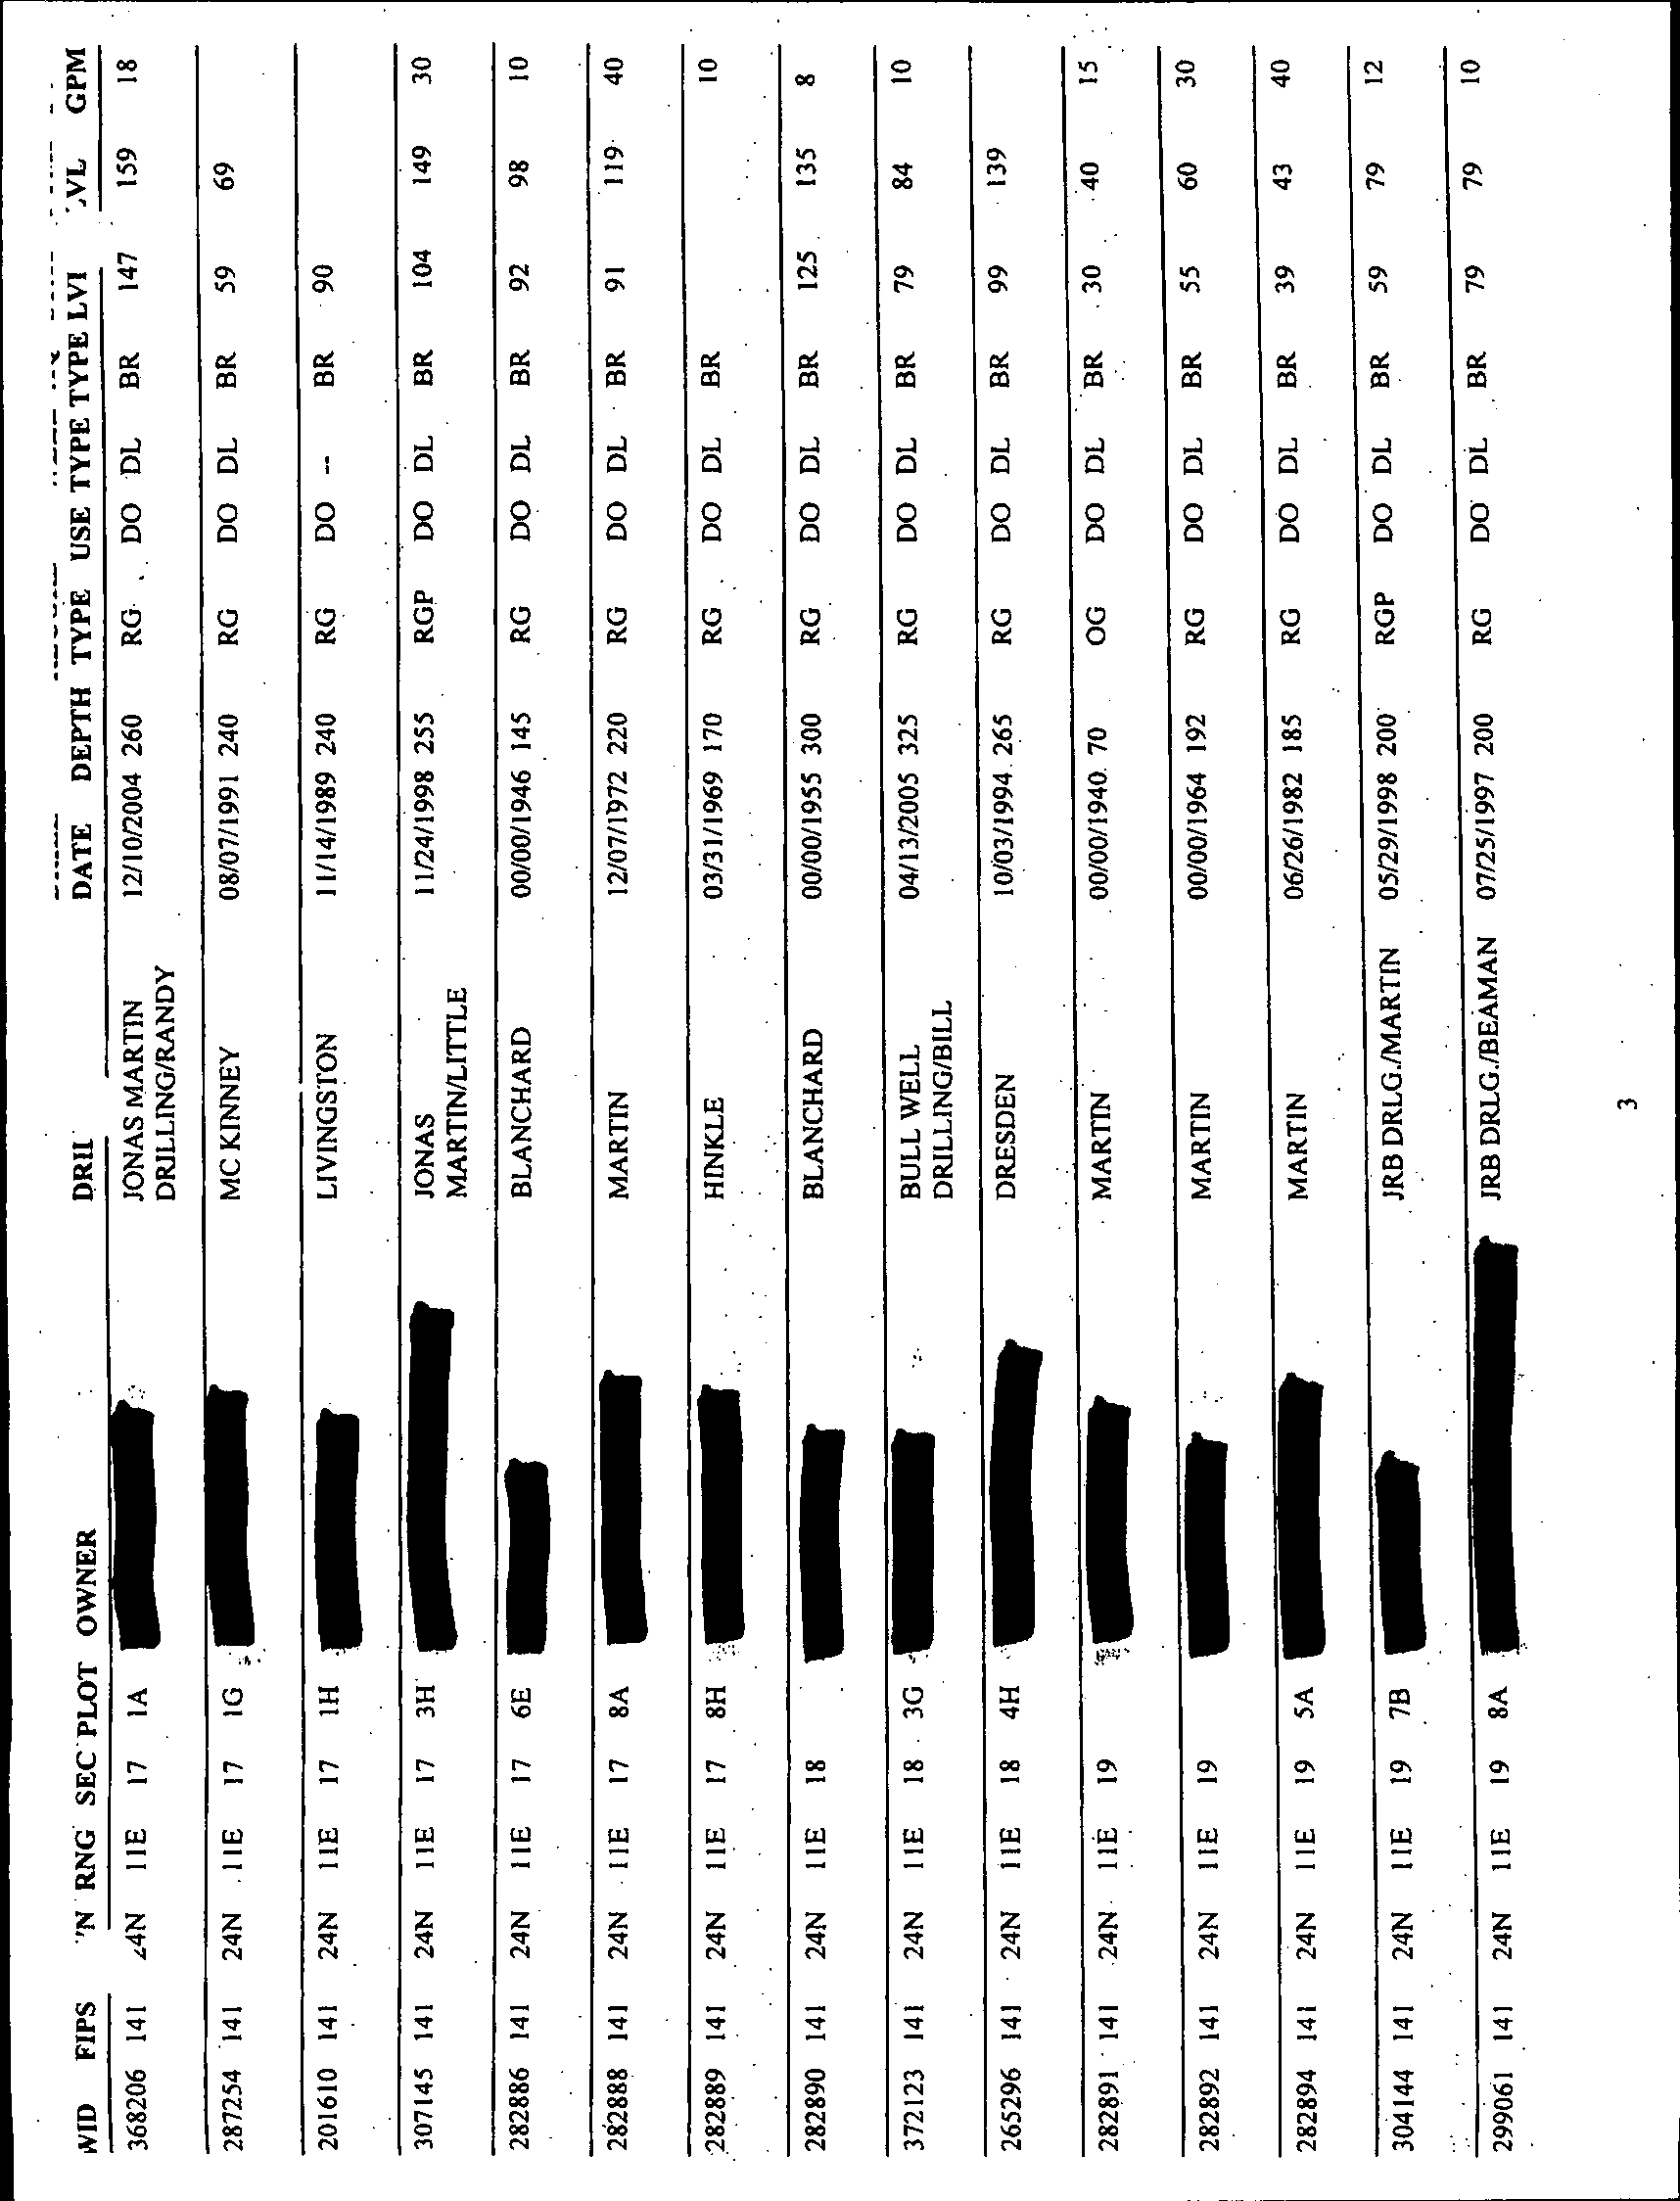
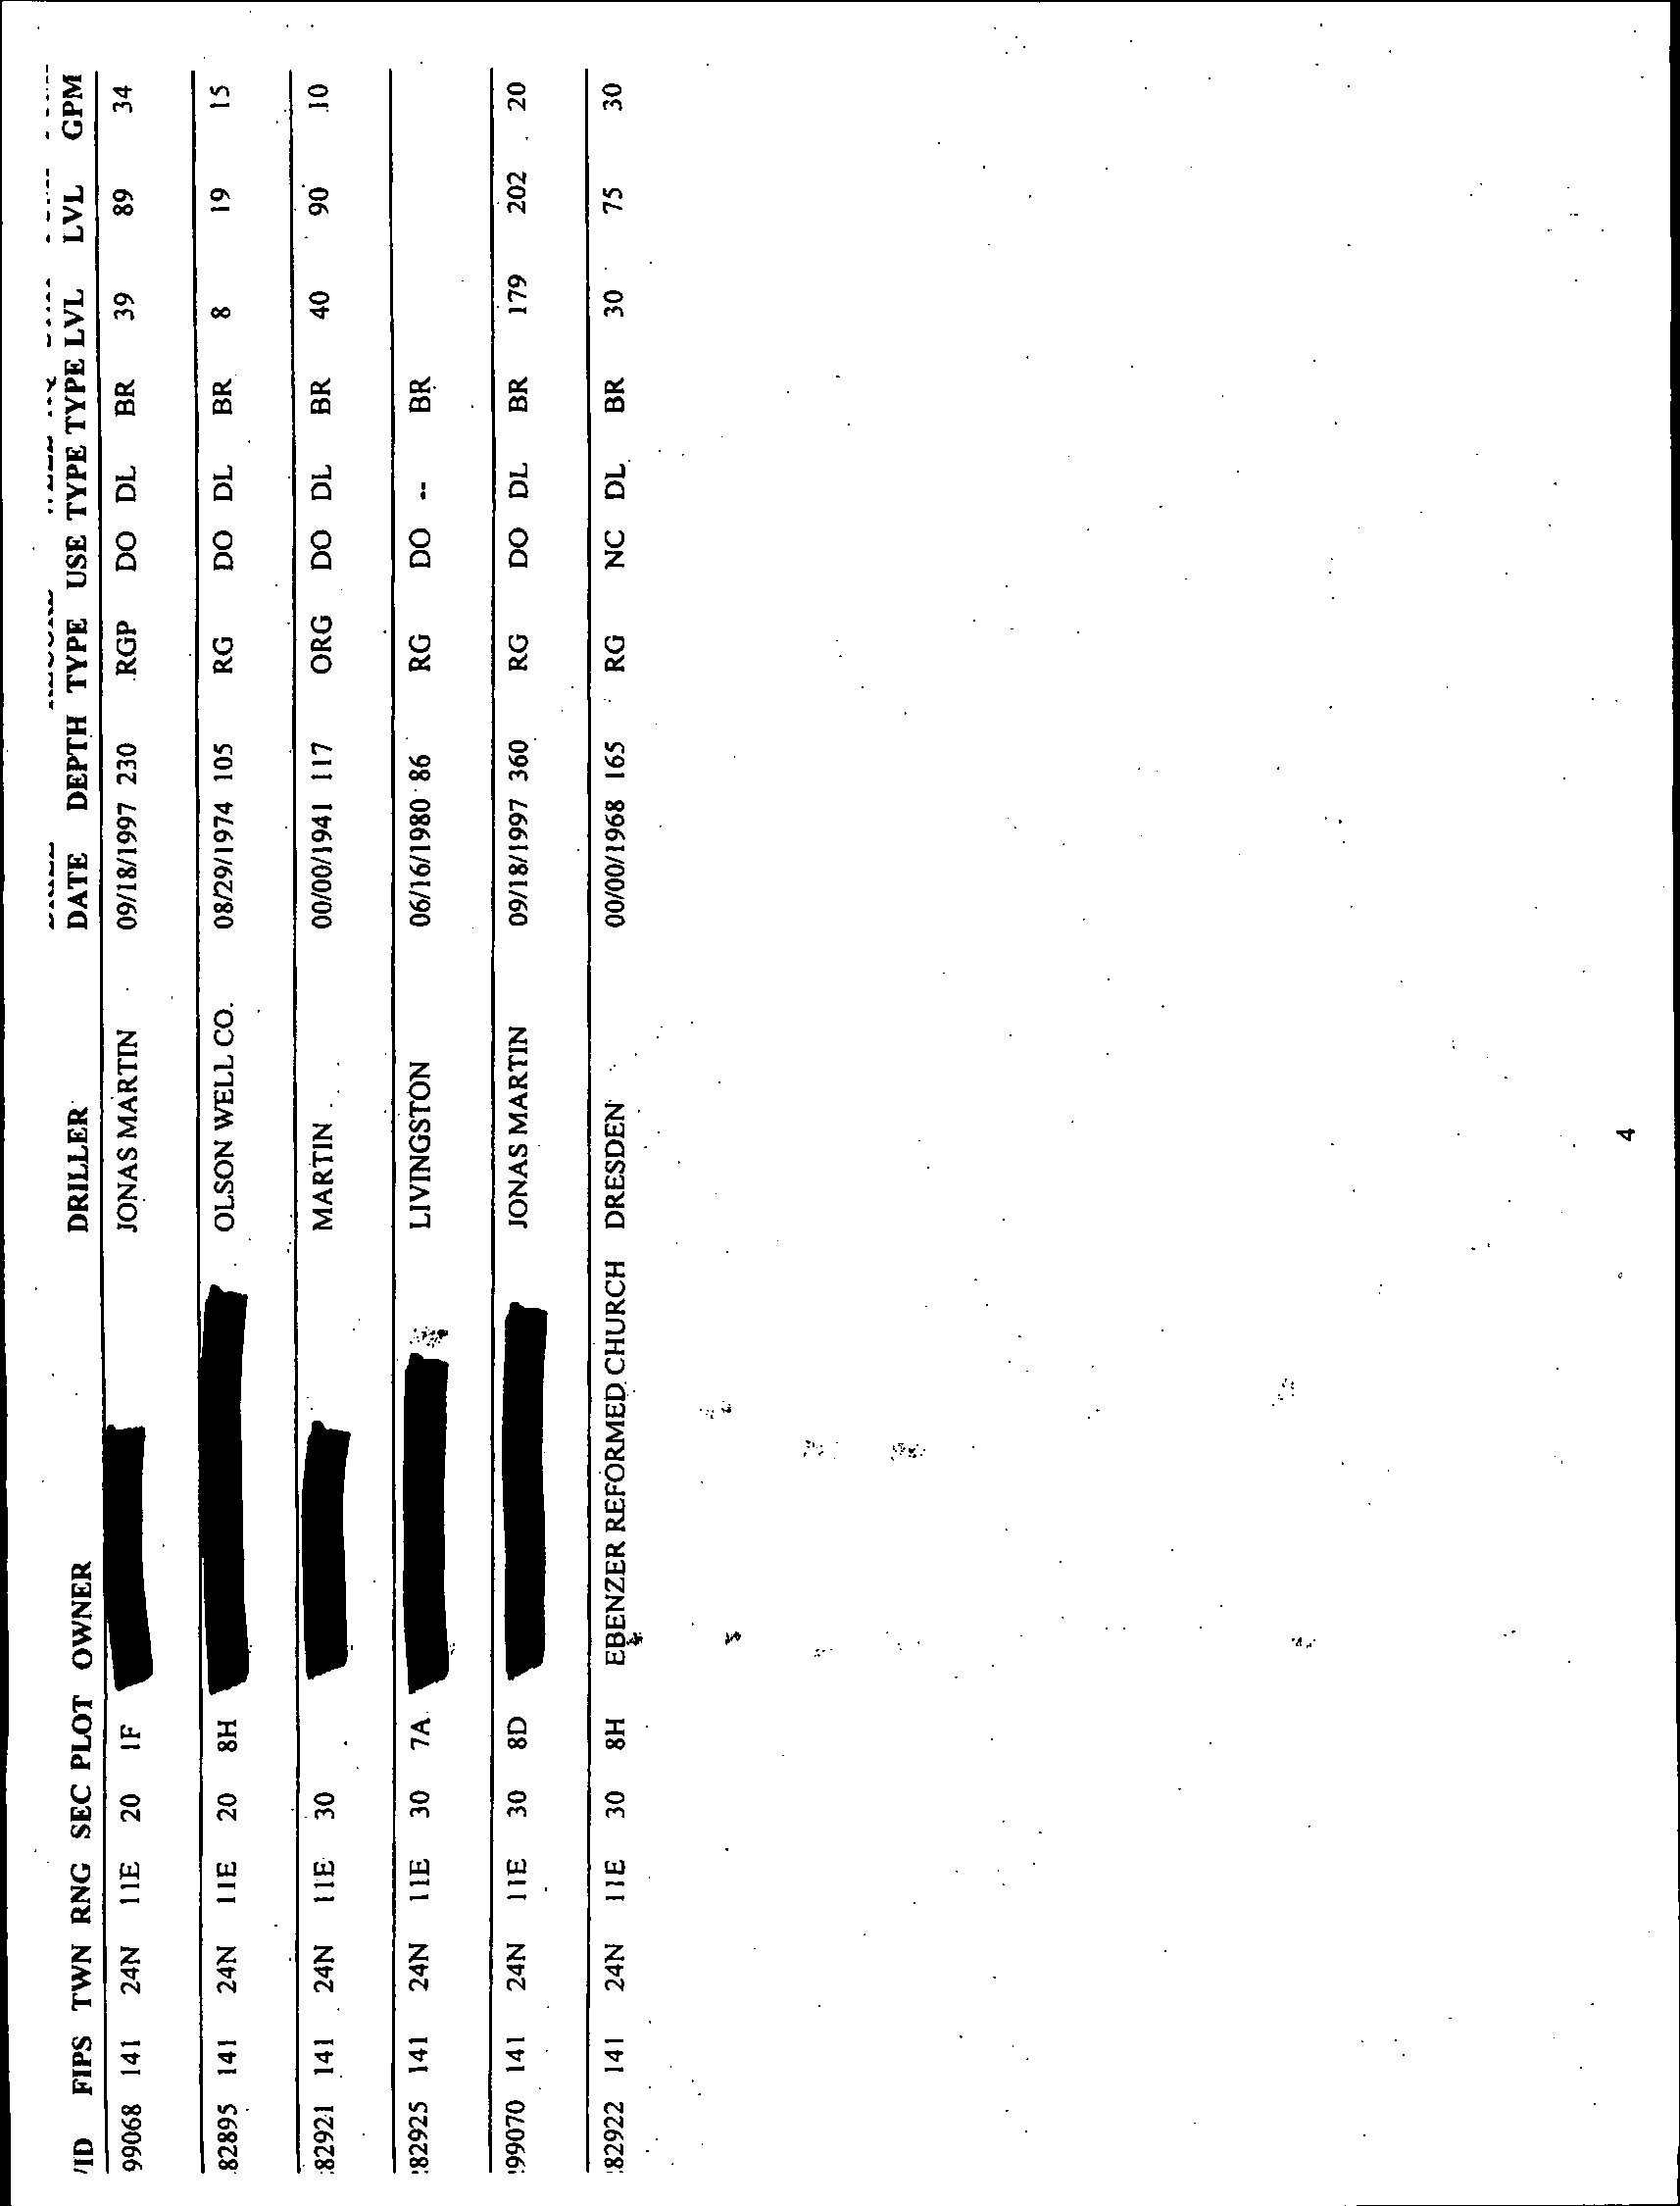
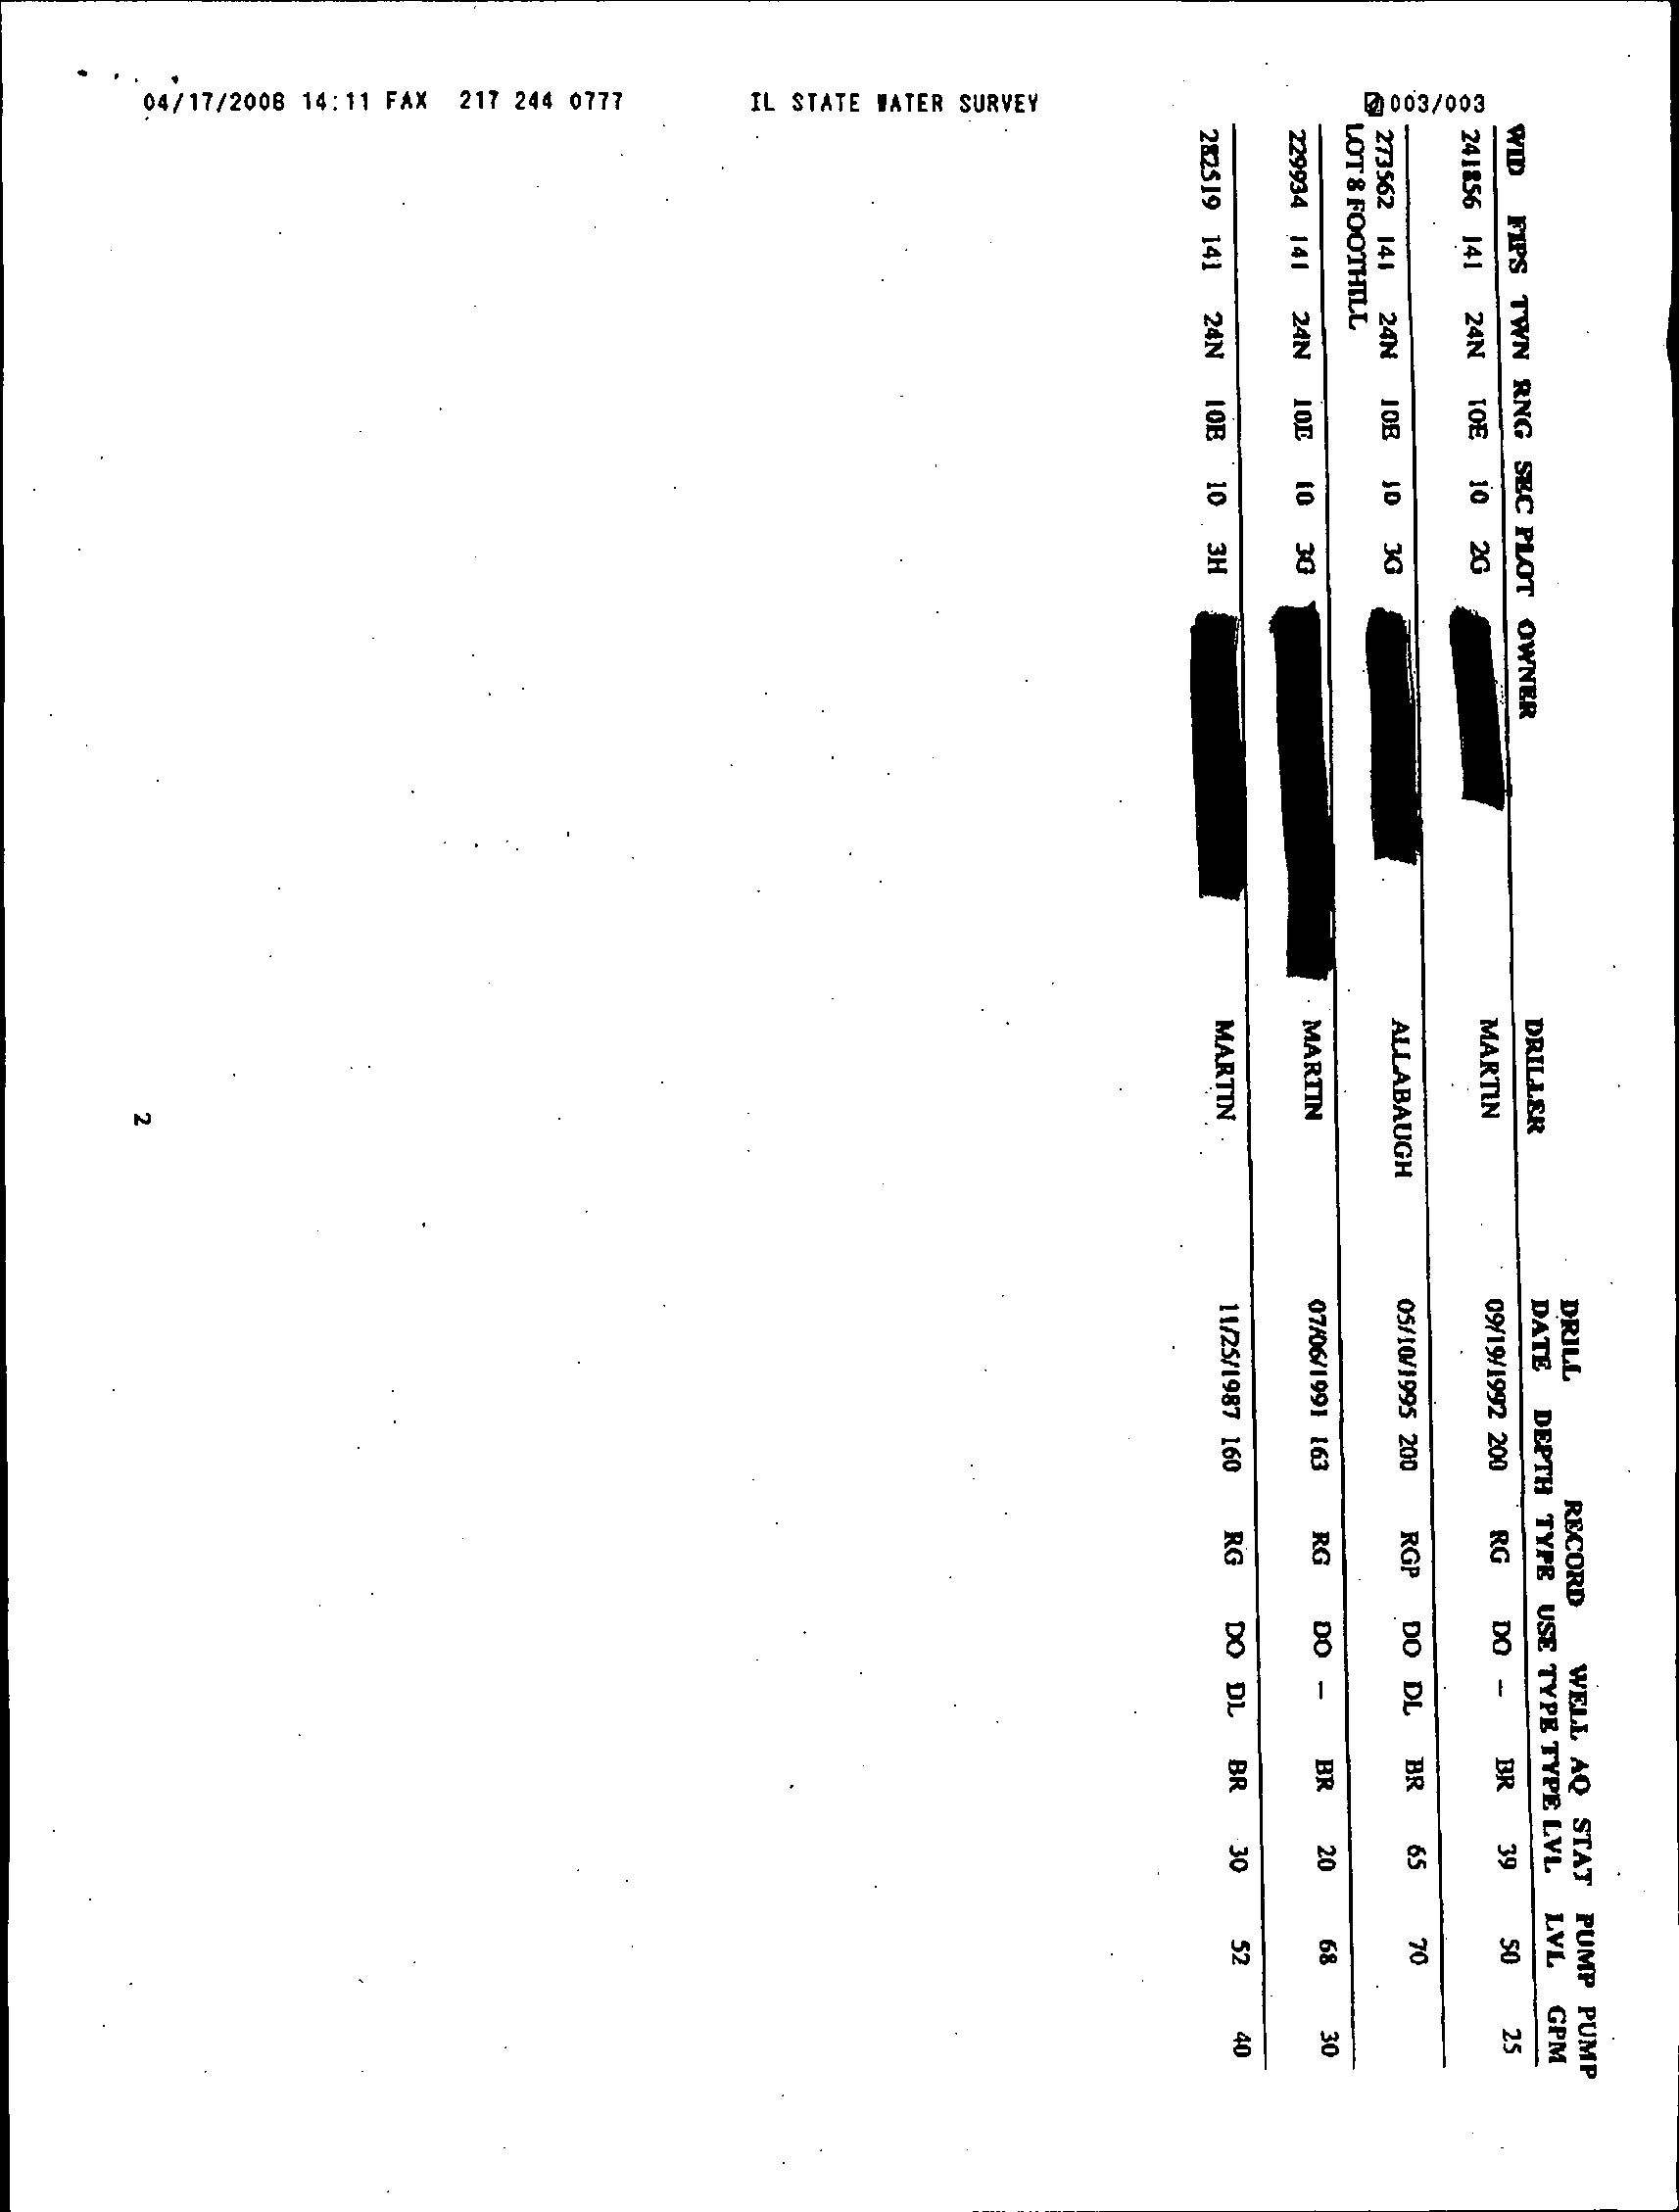
RETEC completed a water well search and survey for the Station property ("Residential
Well Survey", RETEC Group, Inc, September 23, 2005). CRA expanded the water well
search between March and May 2006 to identify the public and private water wells
located within approximately 1 mile of Station property. CRA contacted the following
sources for information:
045136 (13) Byron Generating Station
9
CONESTOGA-ROVERS & ASSOCIATES
Revision 1
•
Illinois State Water Survey (ISWS);
•
Illinois State Geological Survey (ISGS);
•
Illinois EPA database; and
•
Ogle County GIS system.
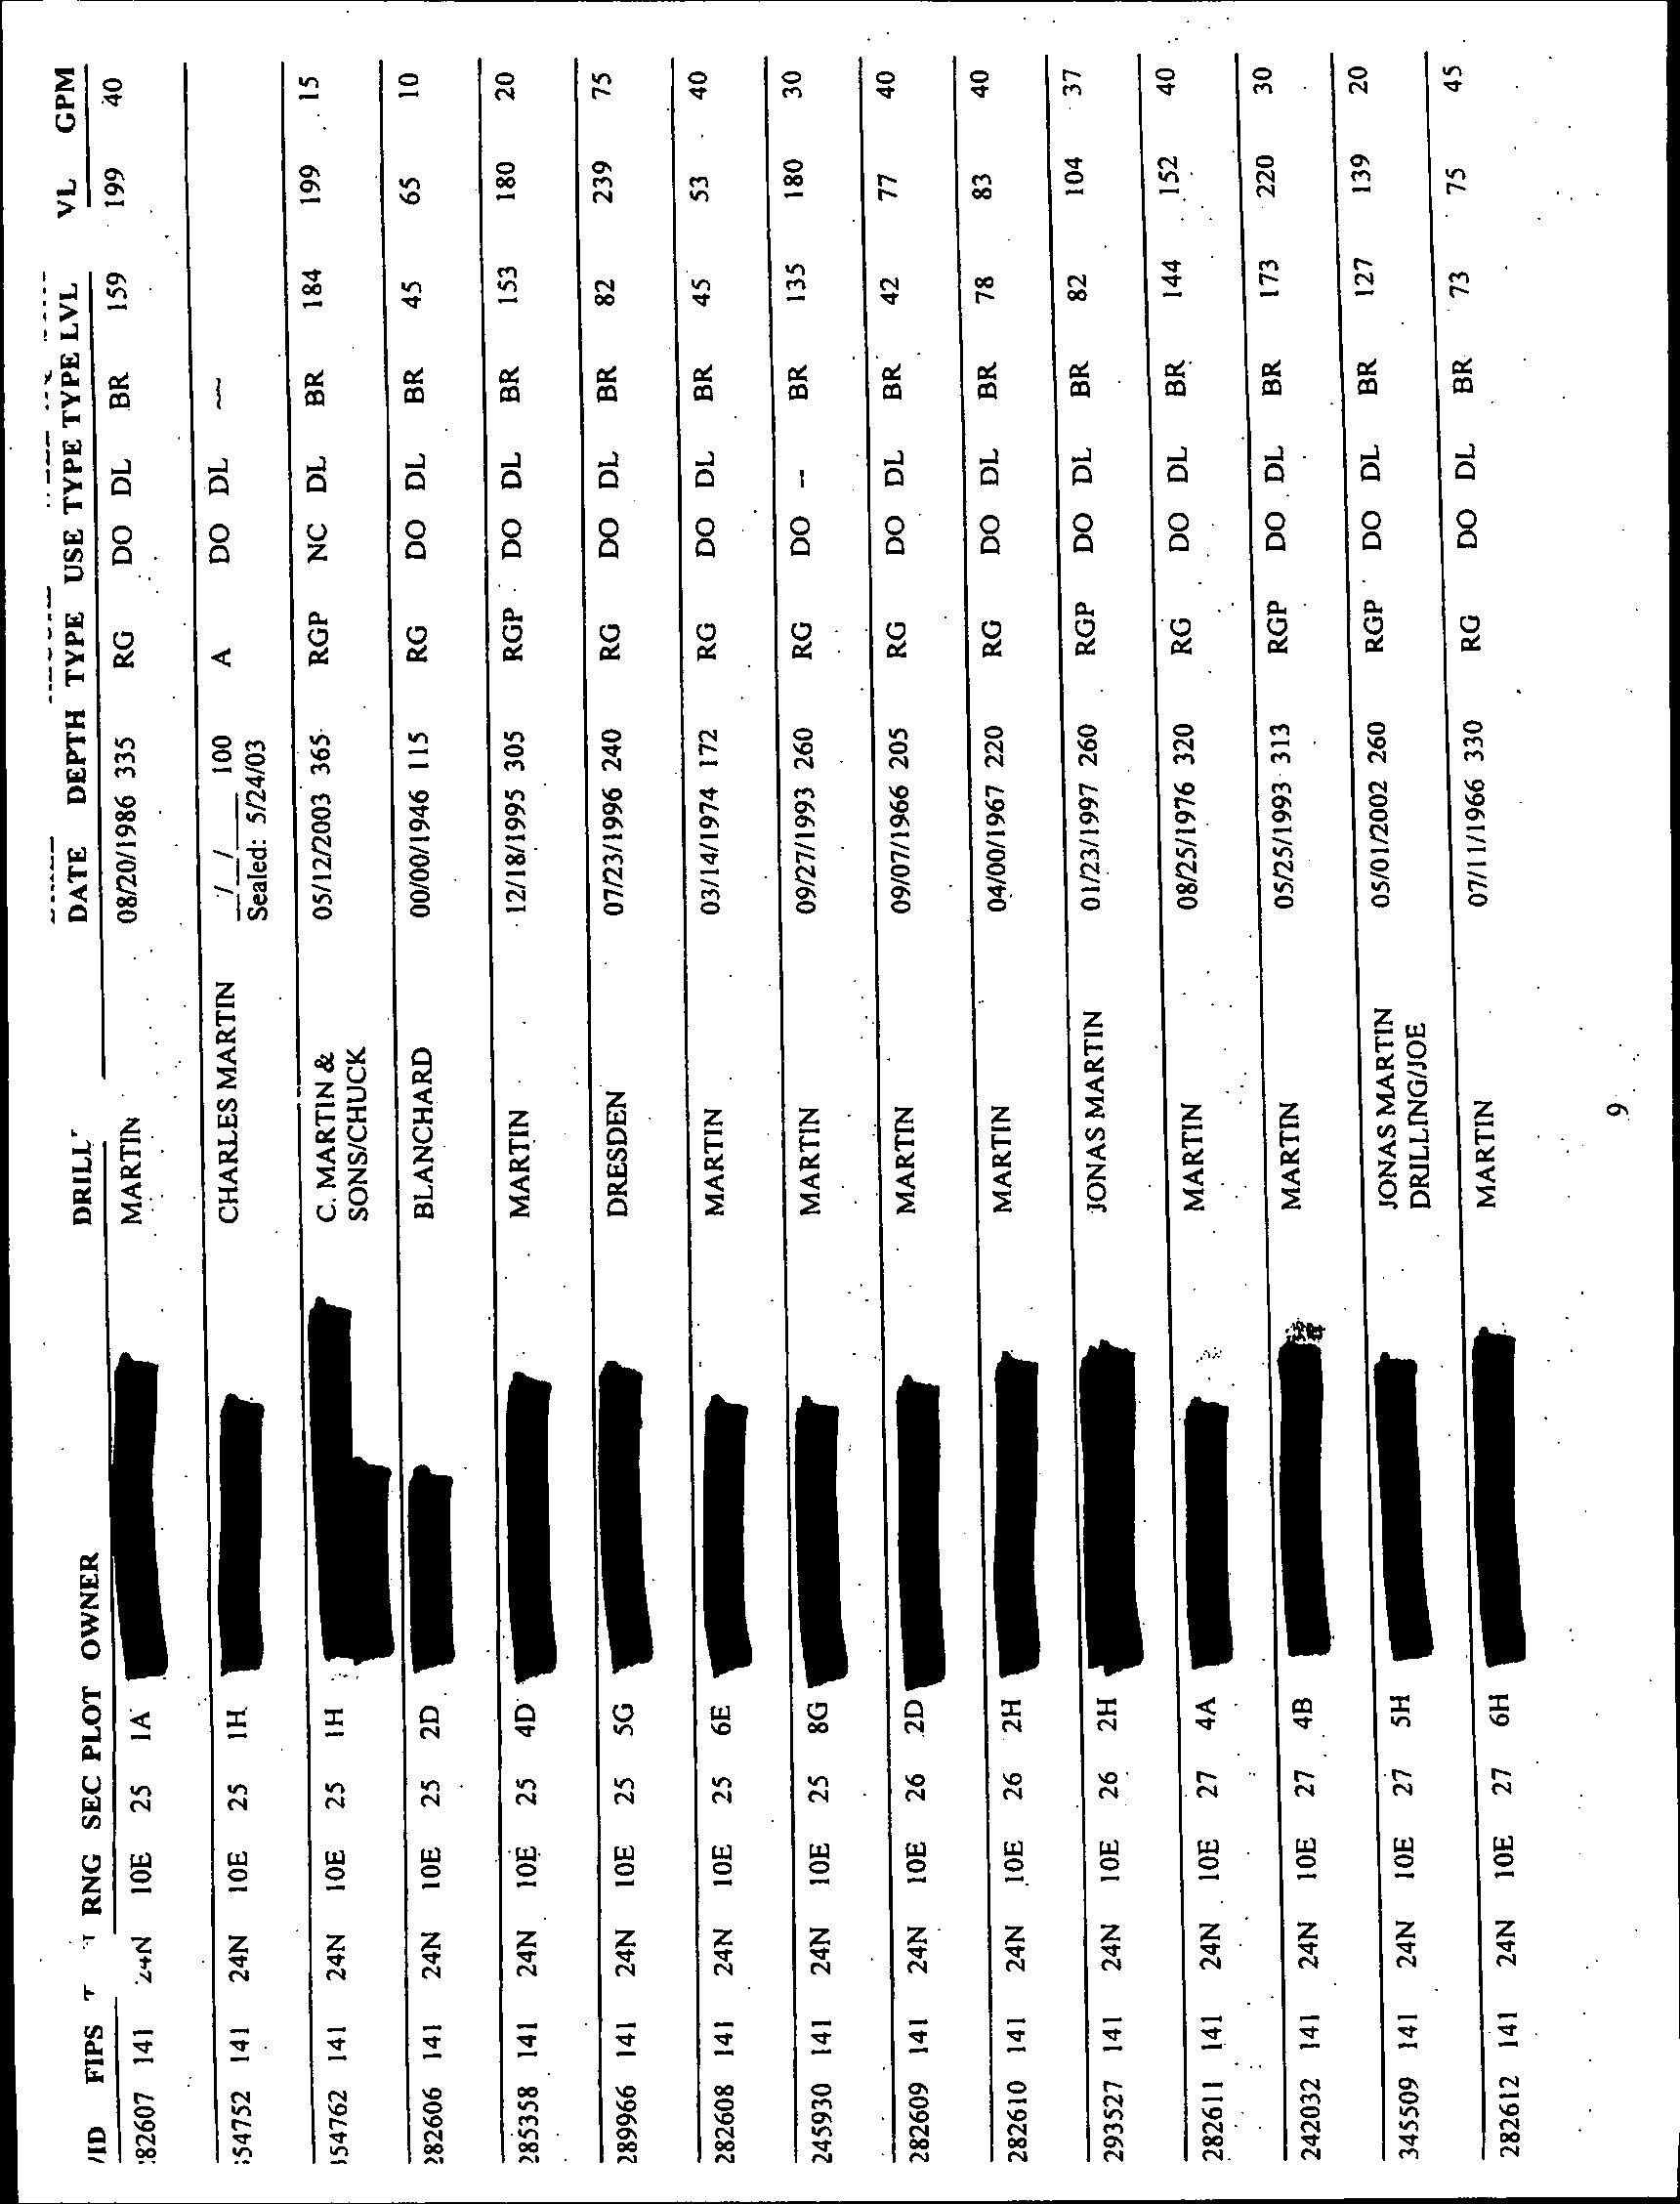
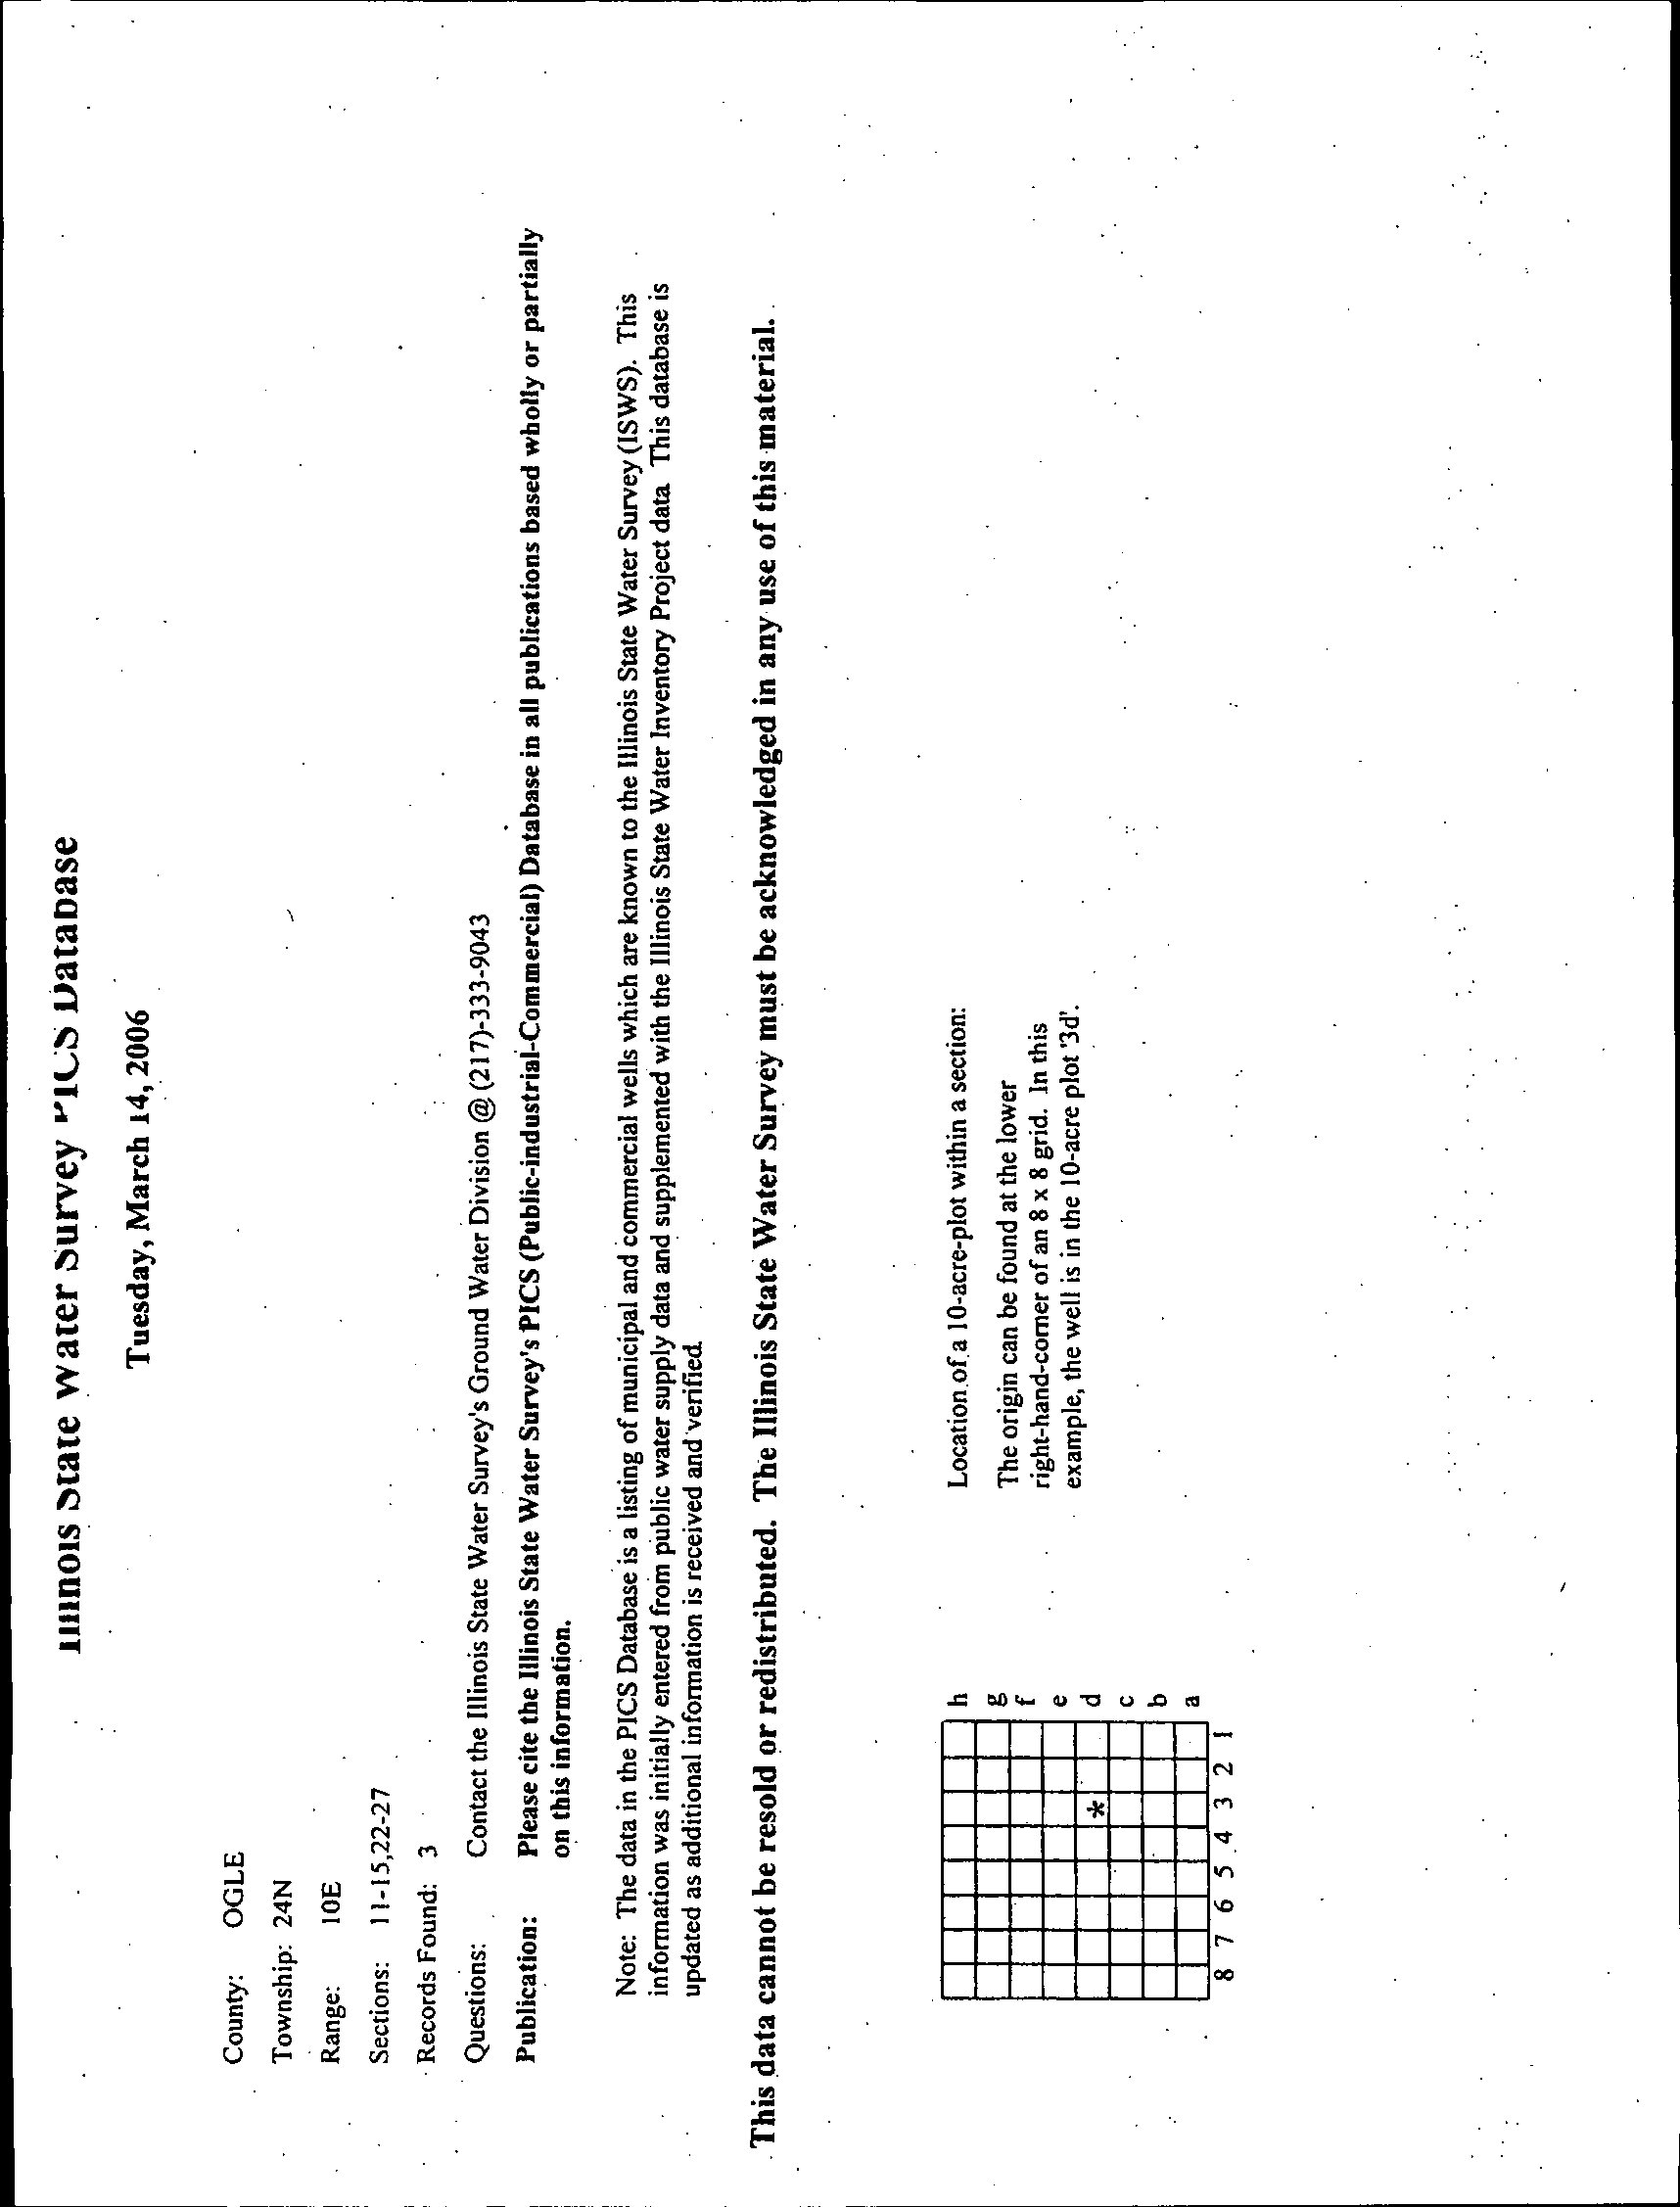
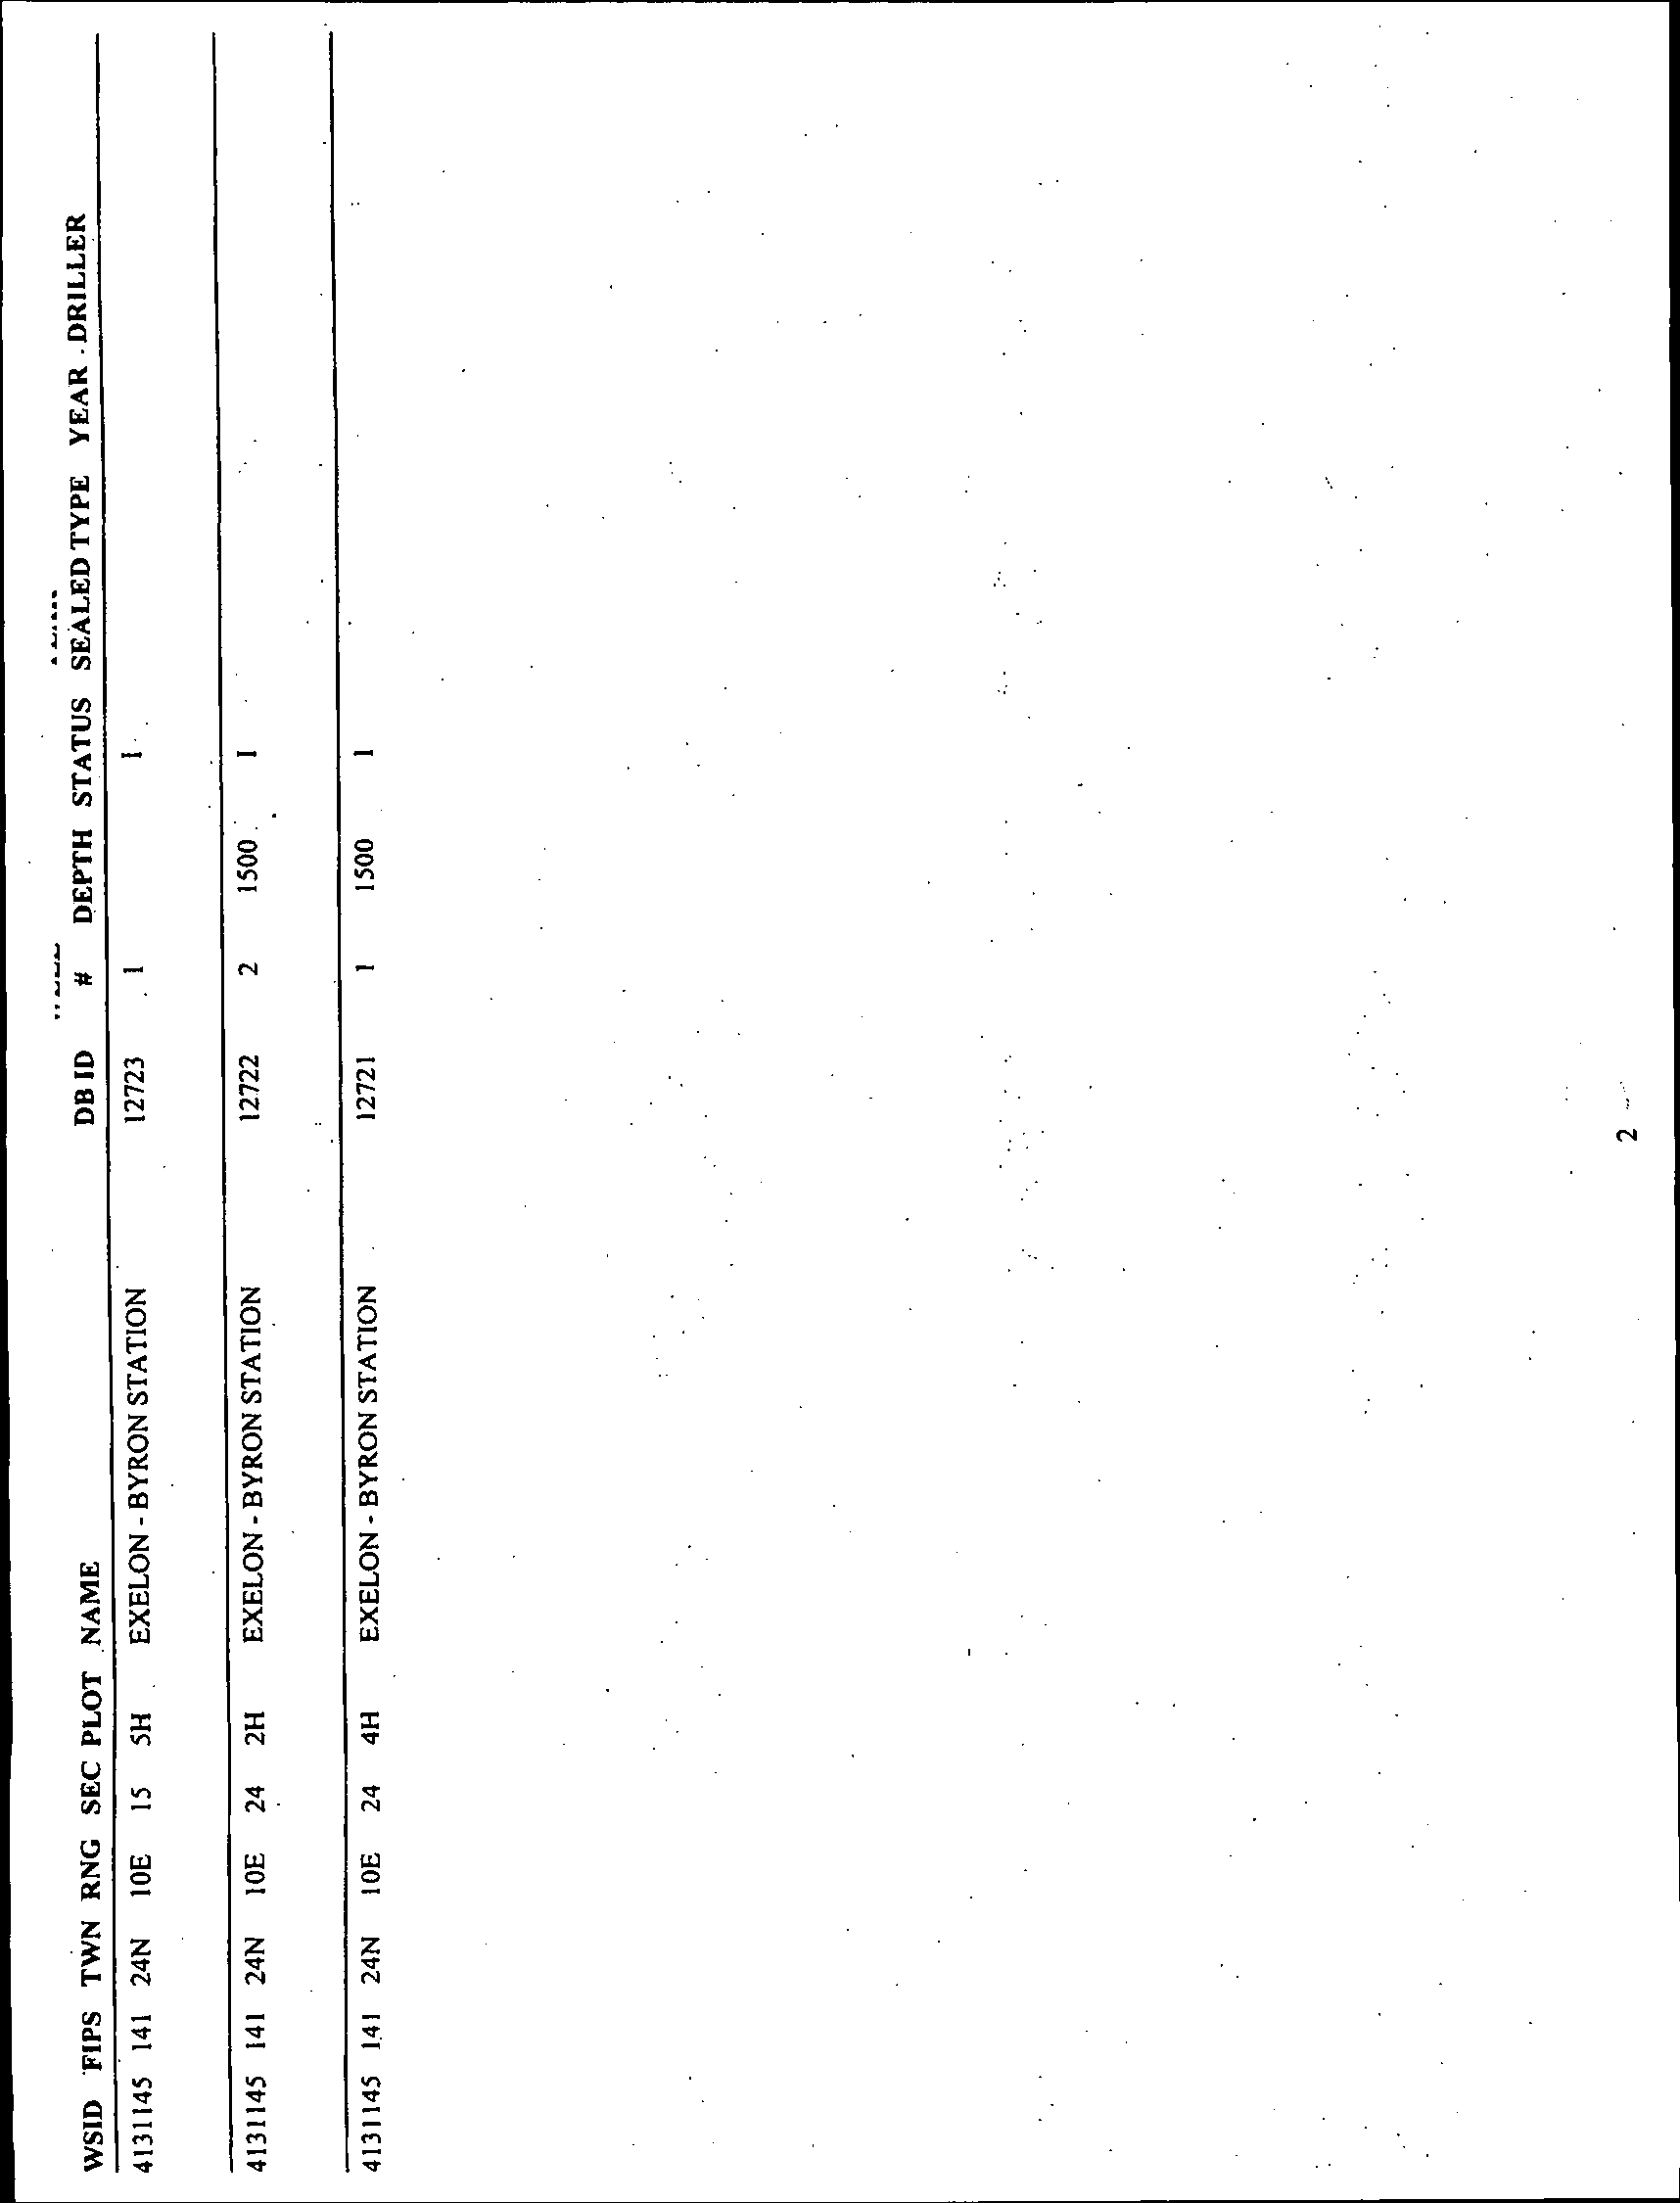
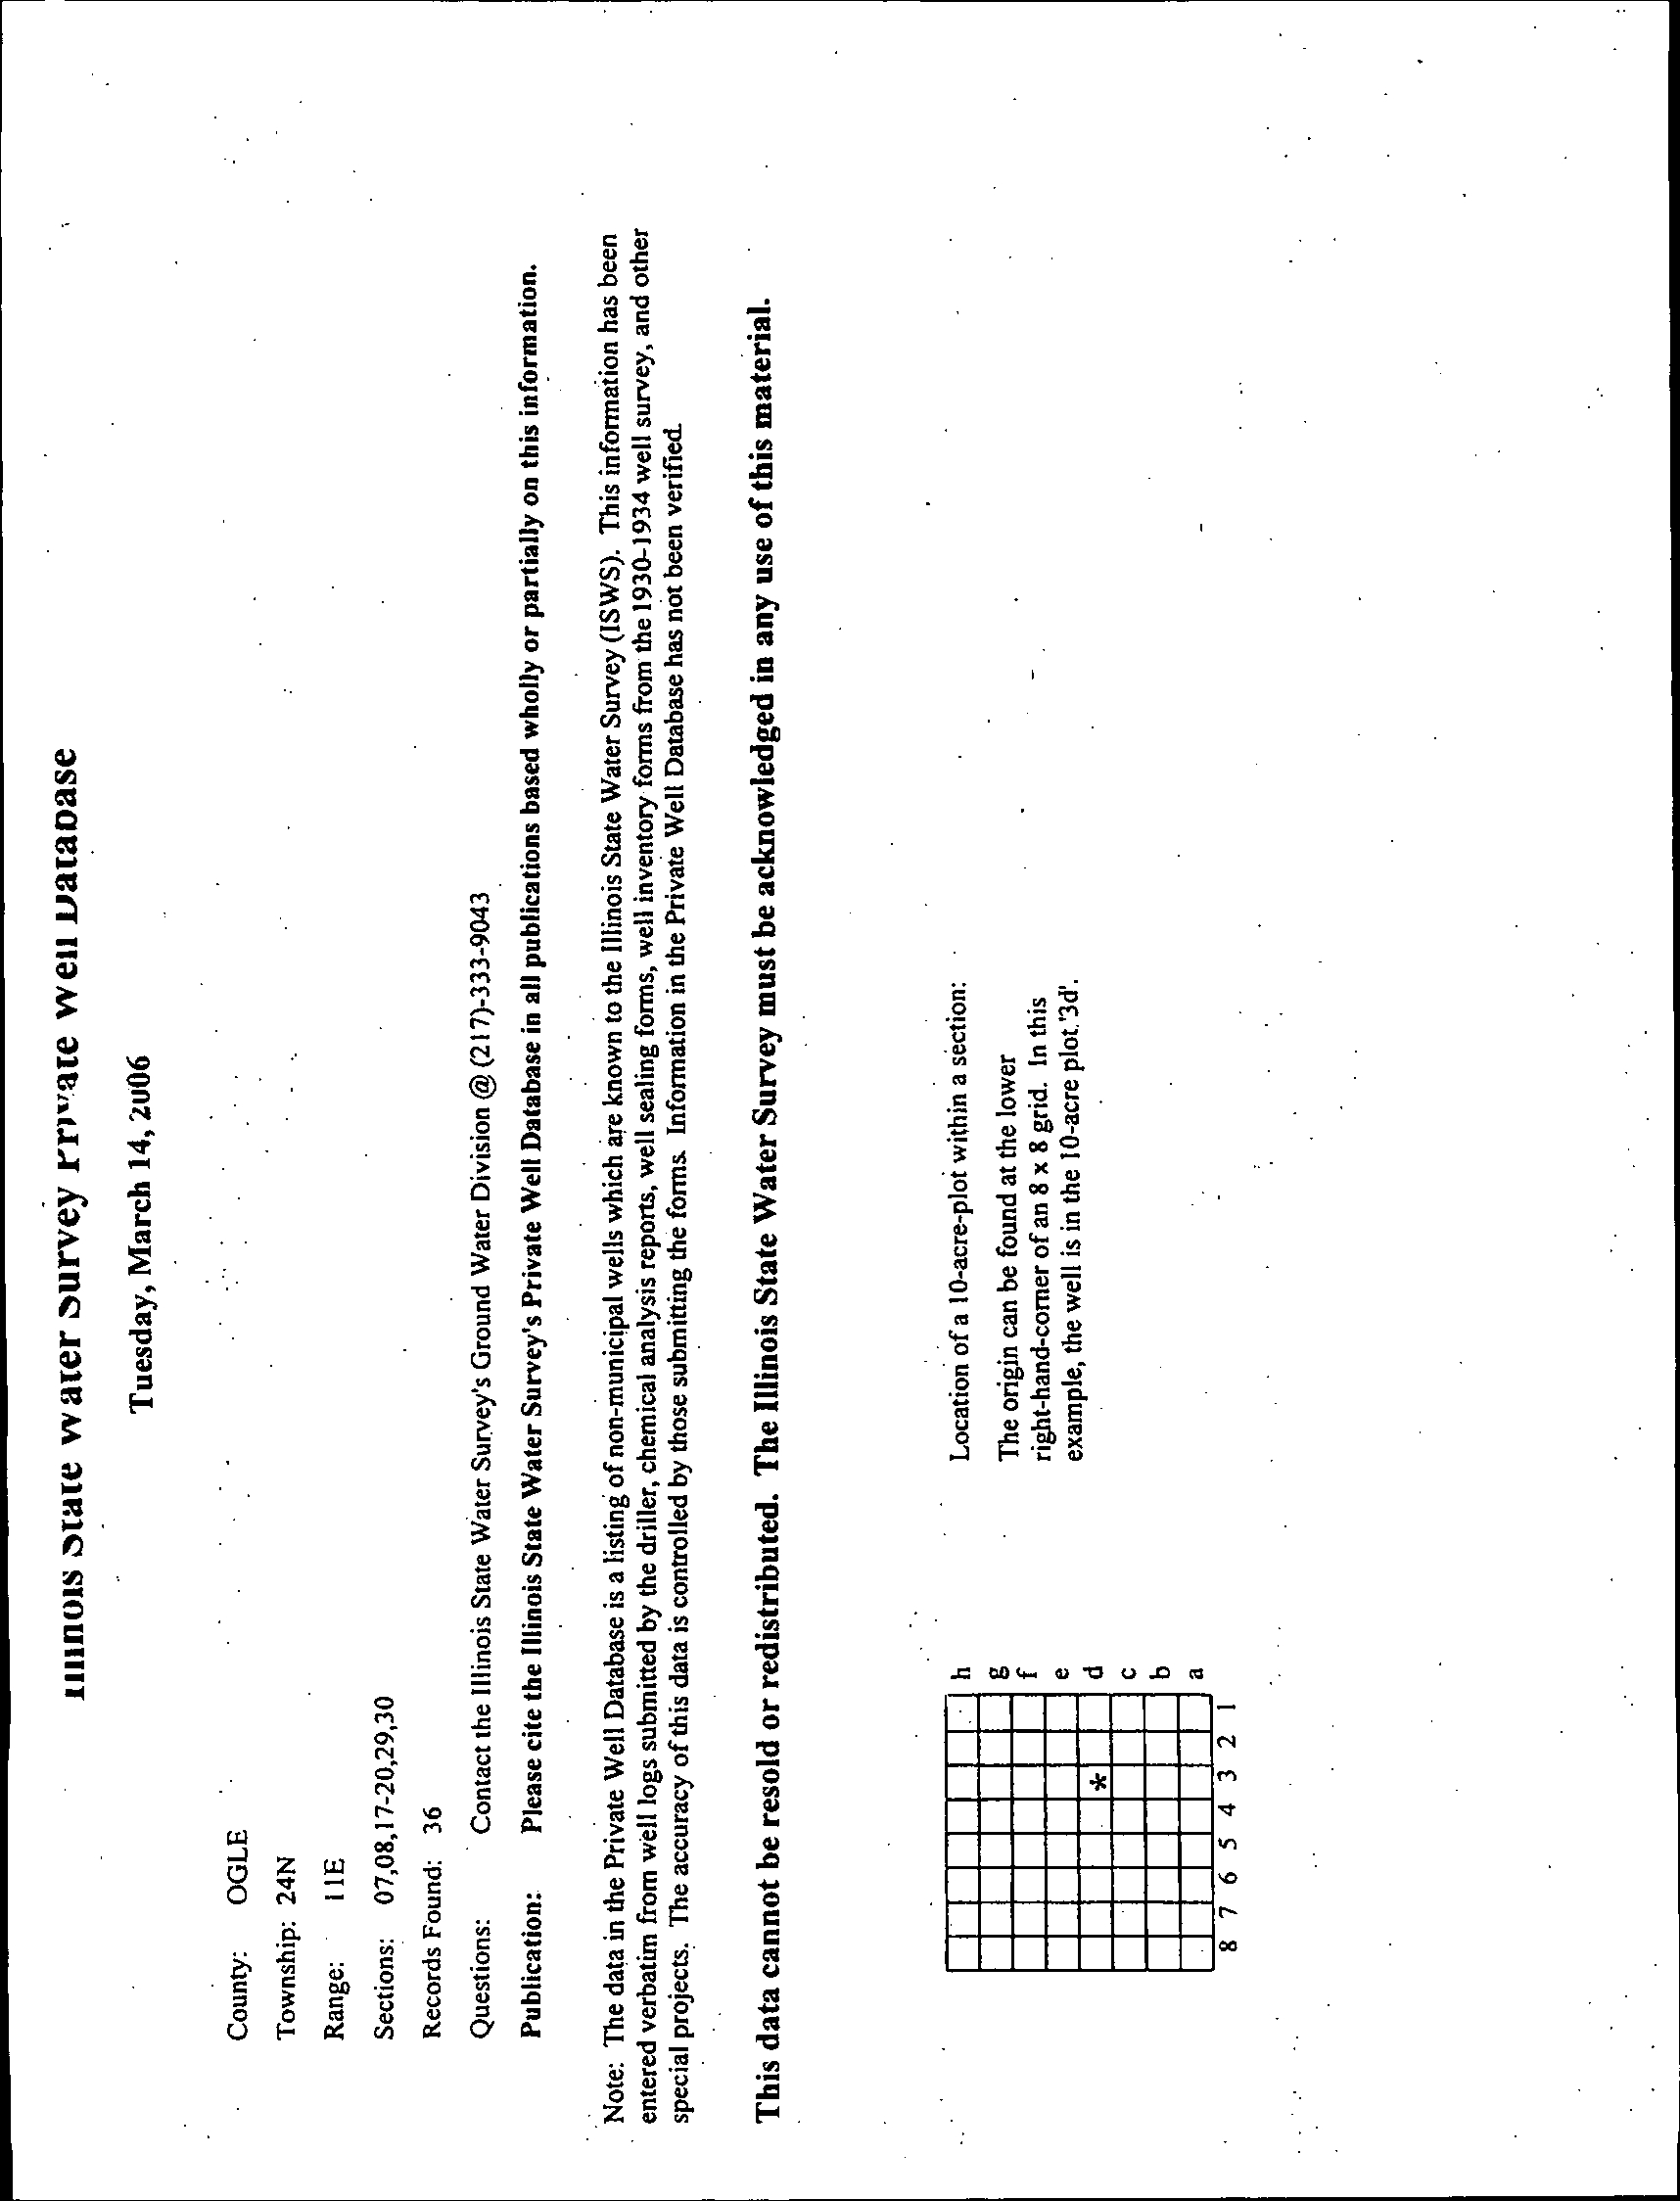
The ISGS (in association with the Illinois EPA)
and the ISWS maintain databases of
water well information. The ISWS and ISGS provided lists of water wells for the Station
and for the area surrounding the Station. A figure of the approximate locations of the
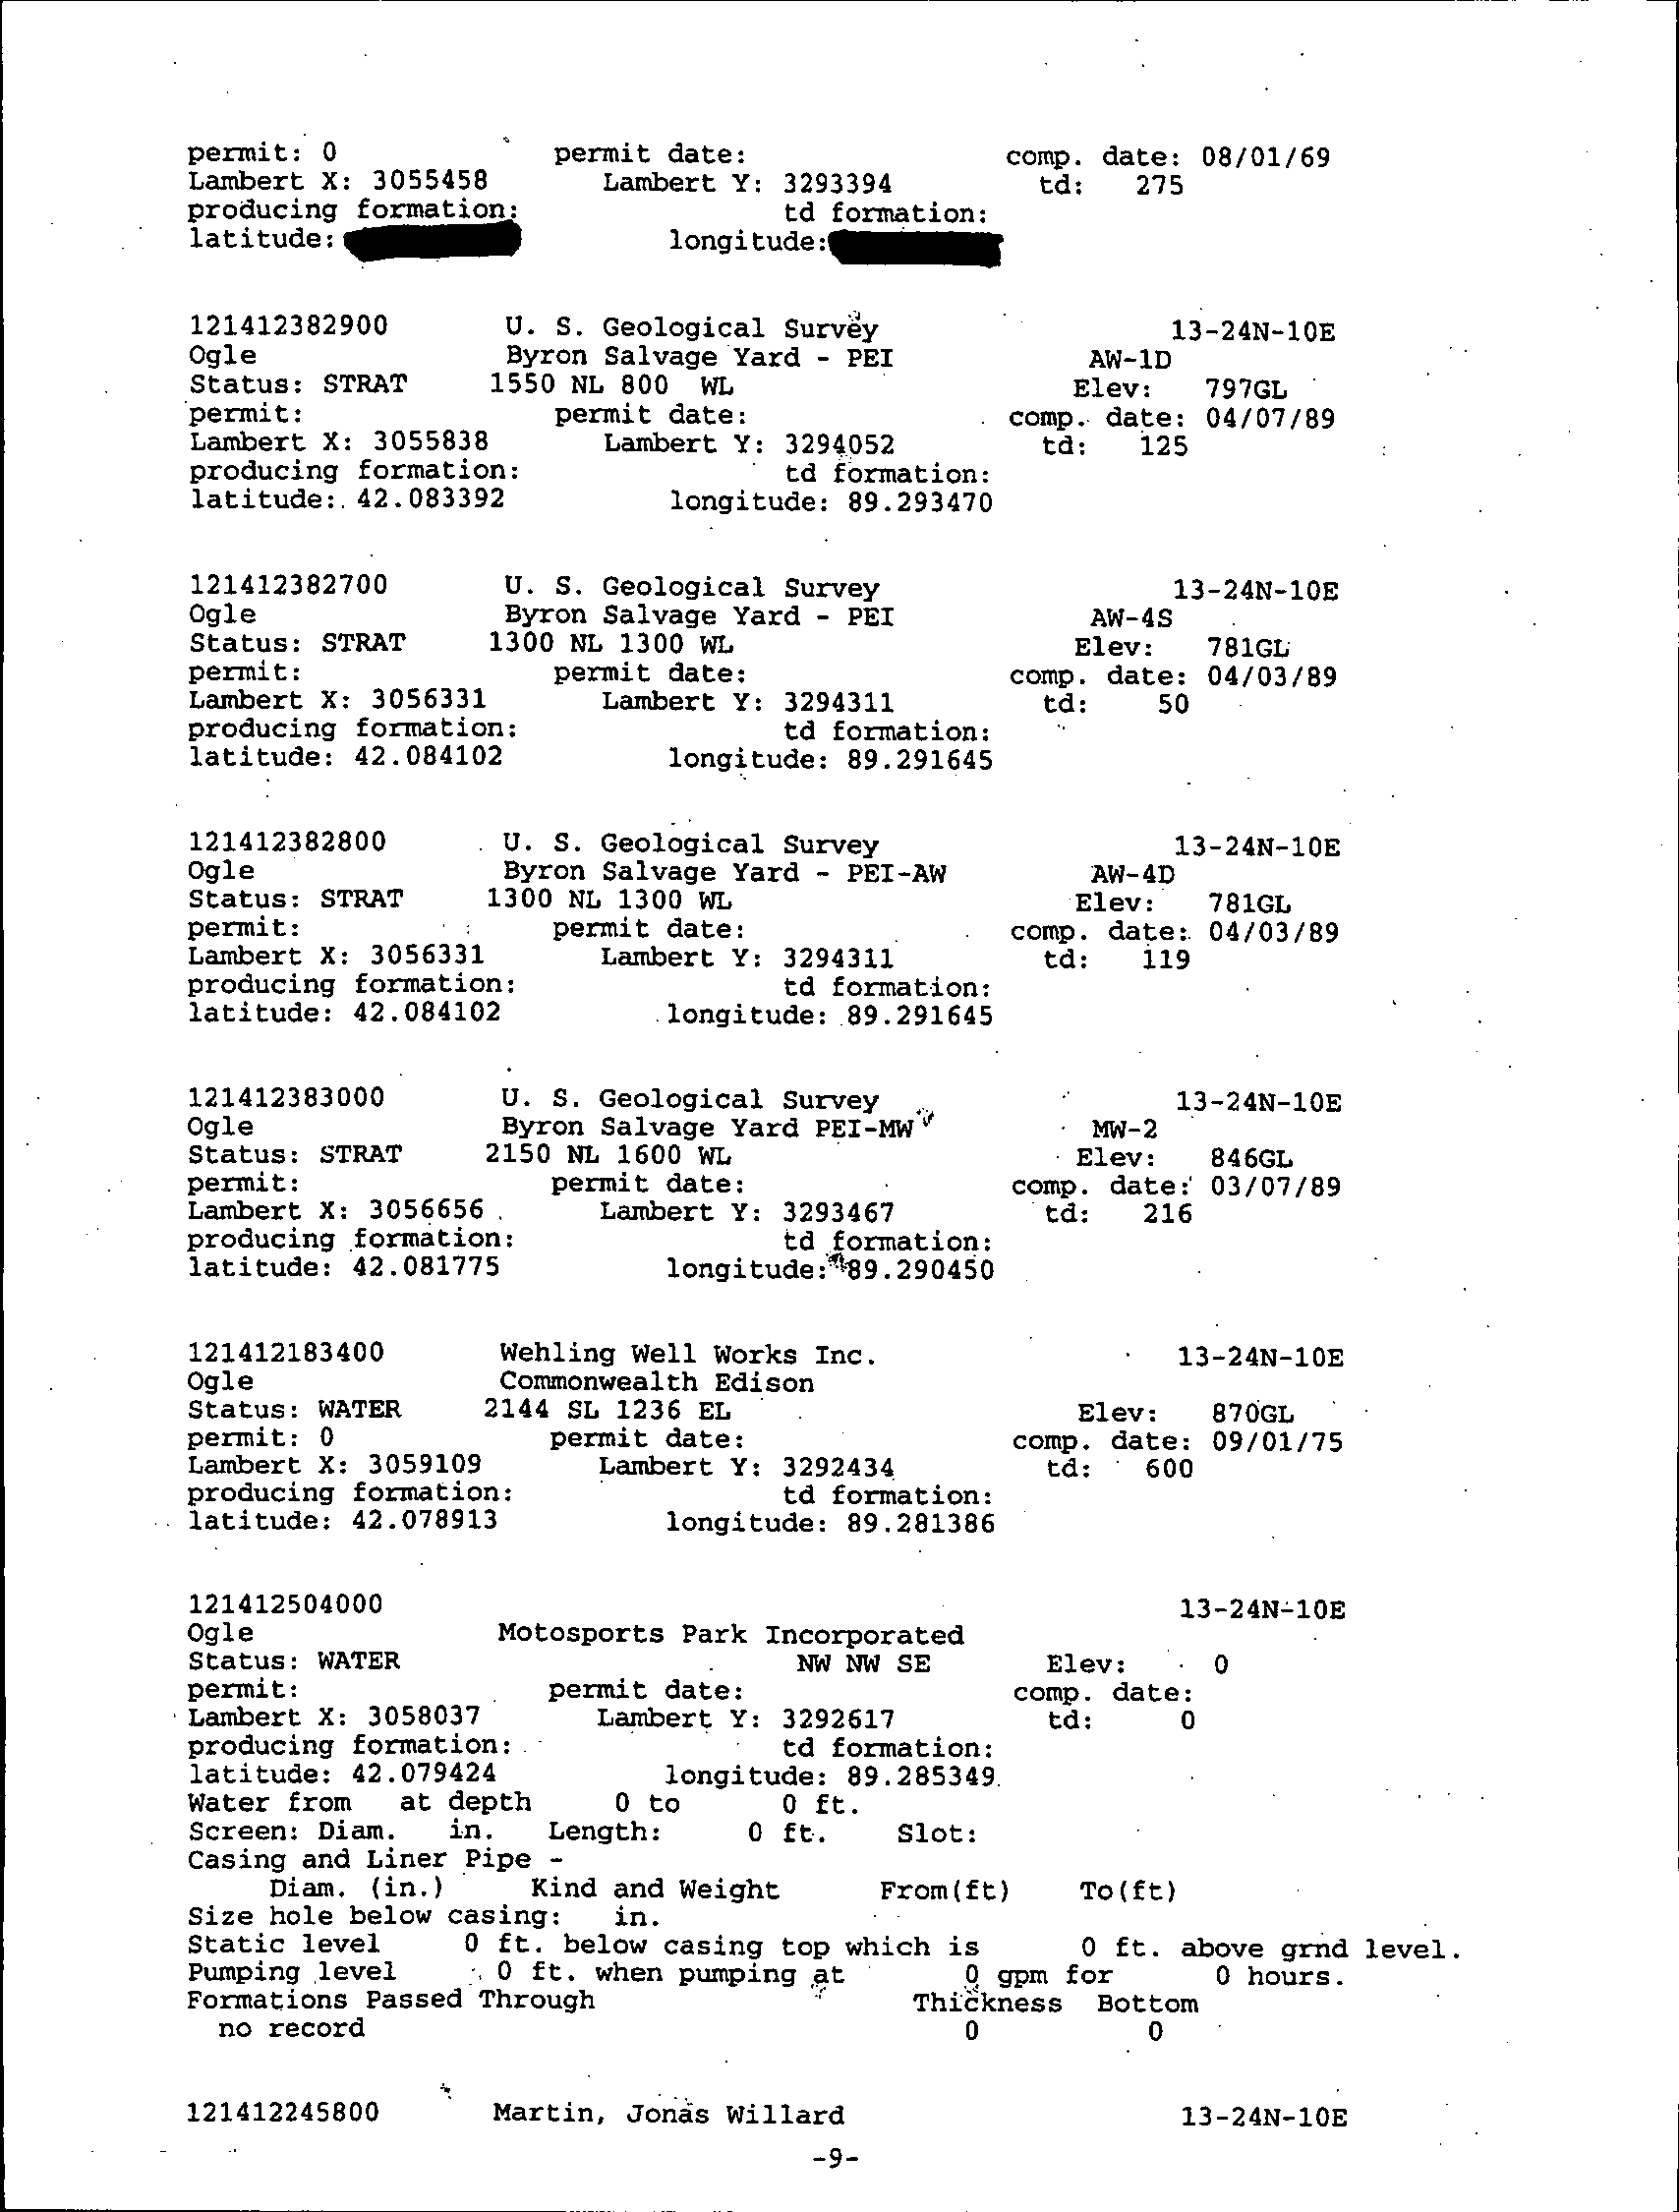
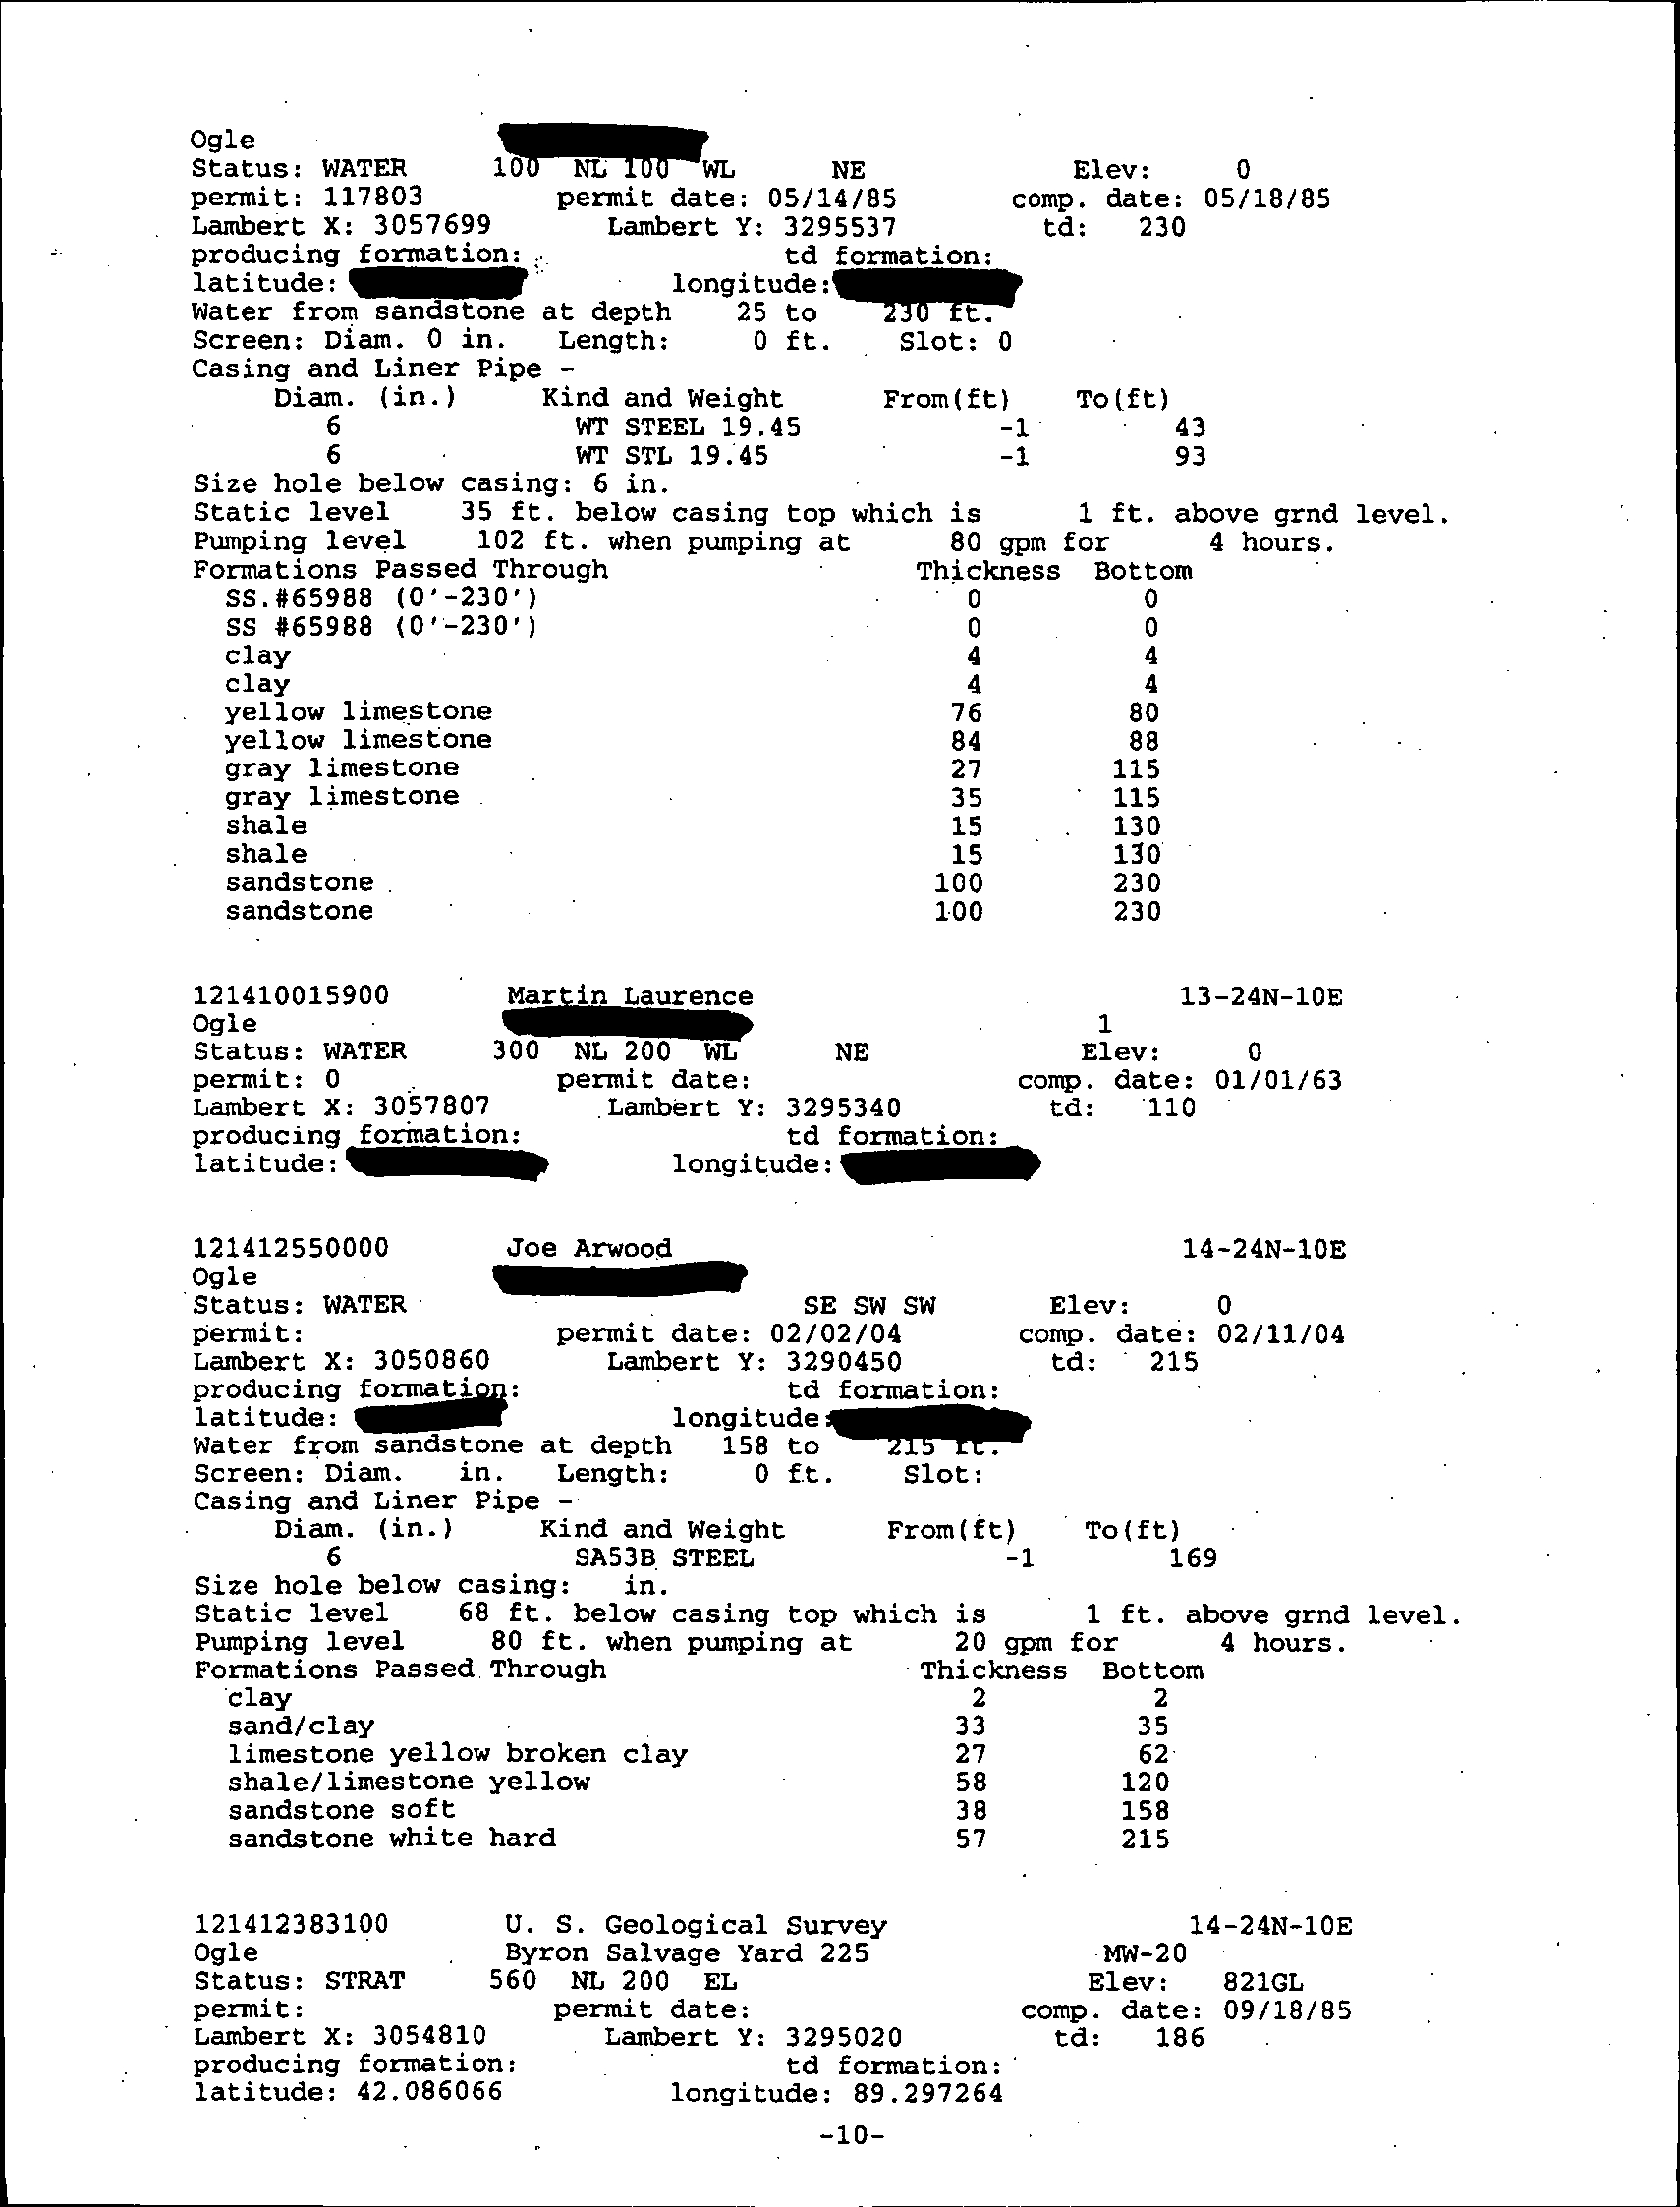
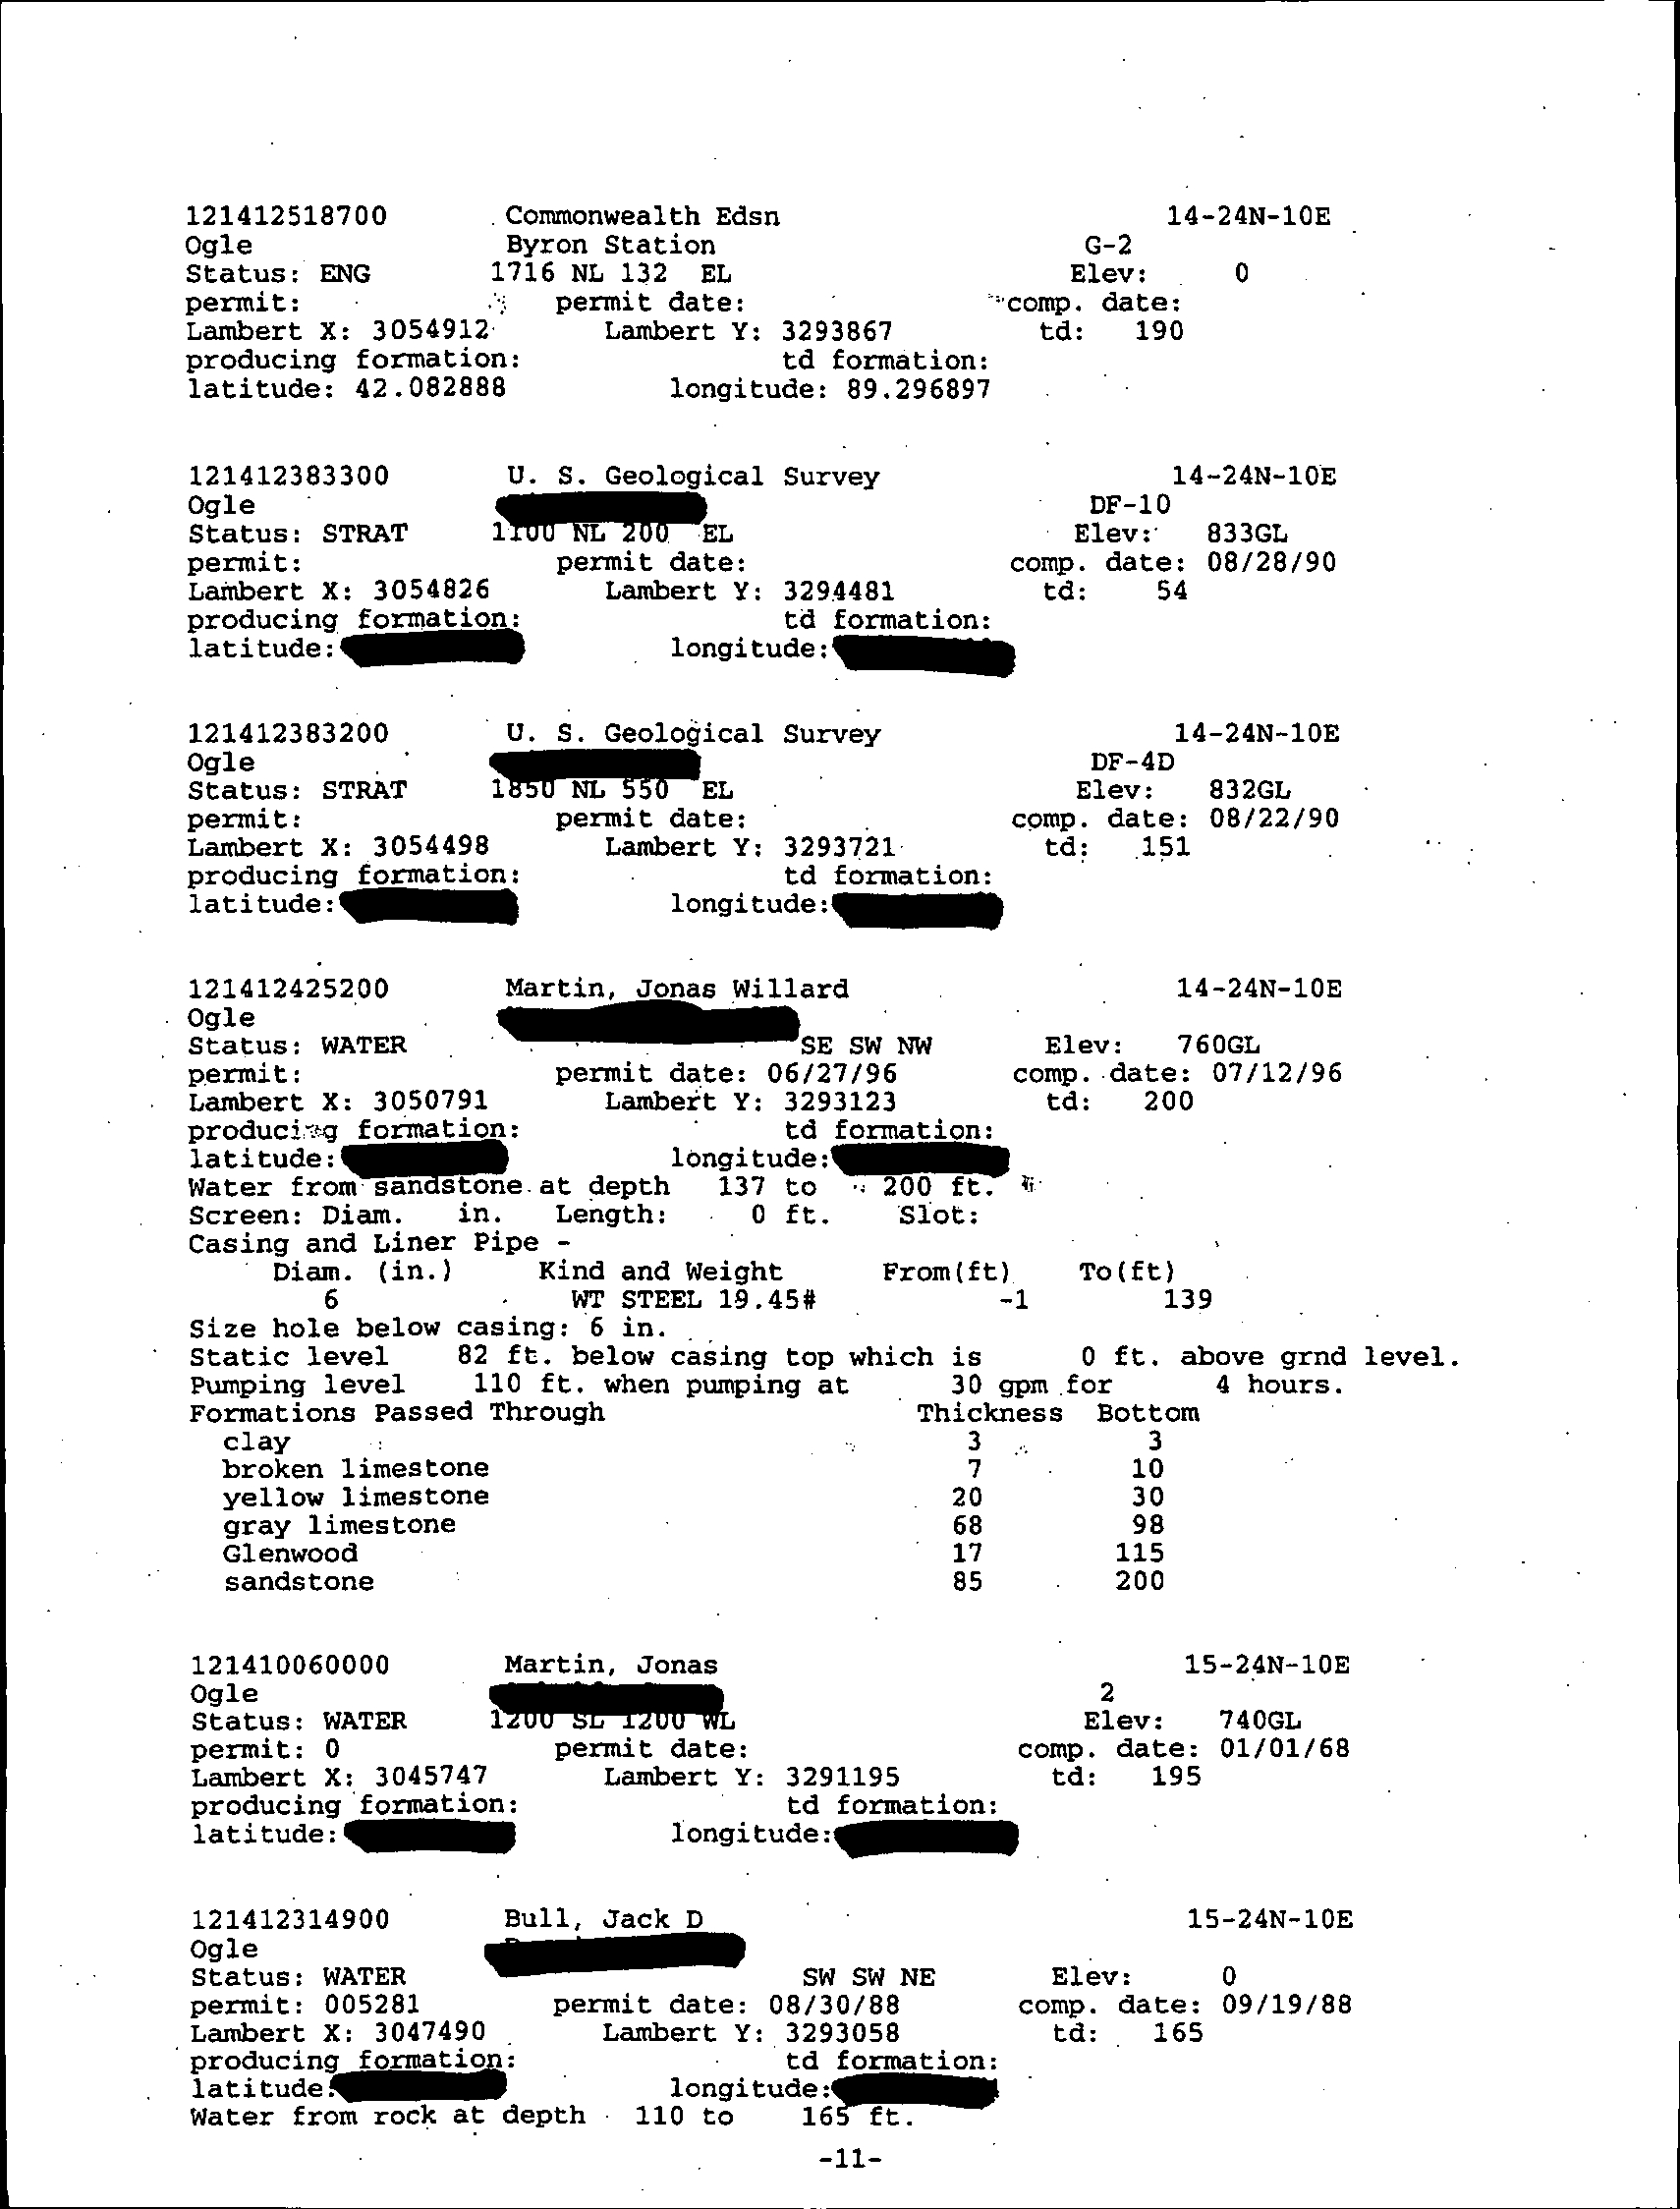
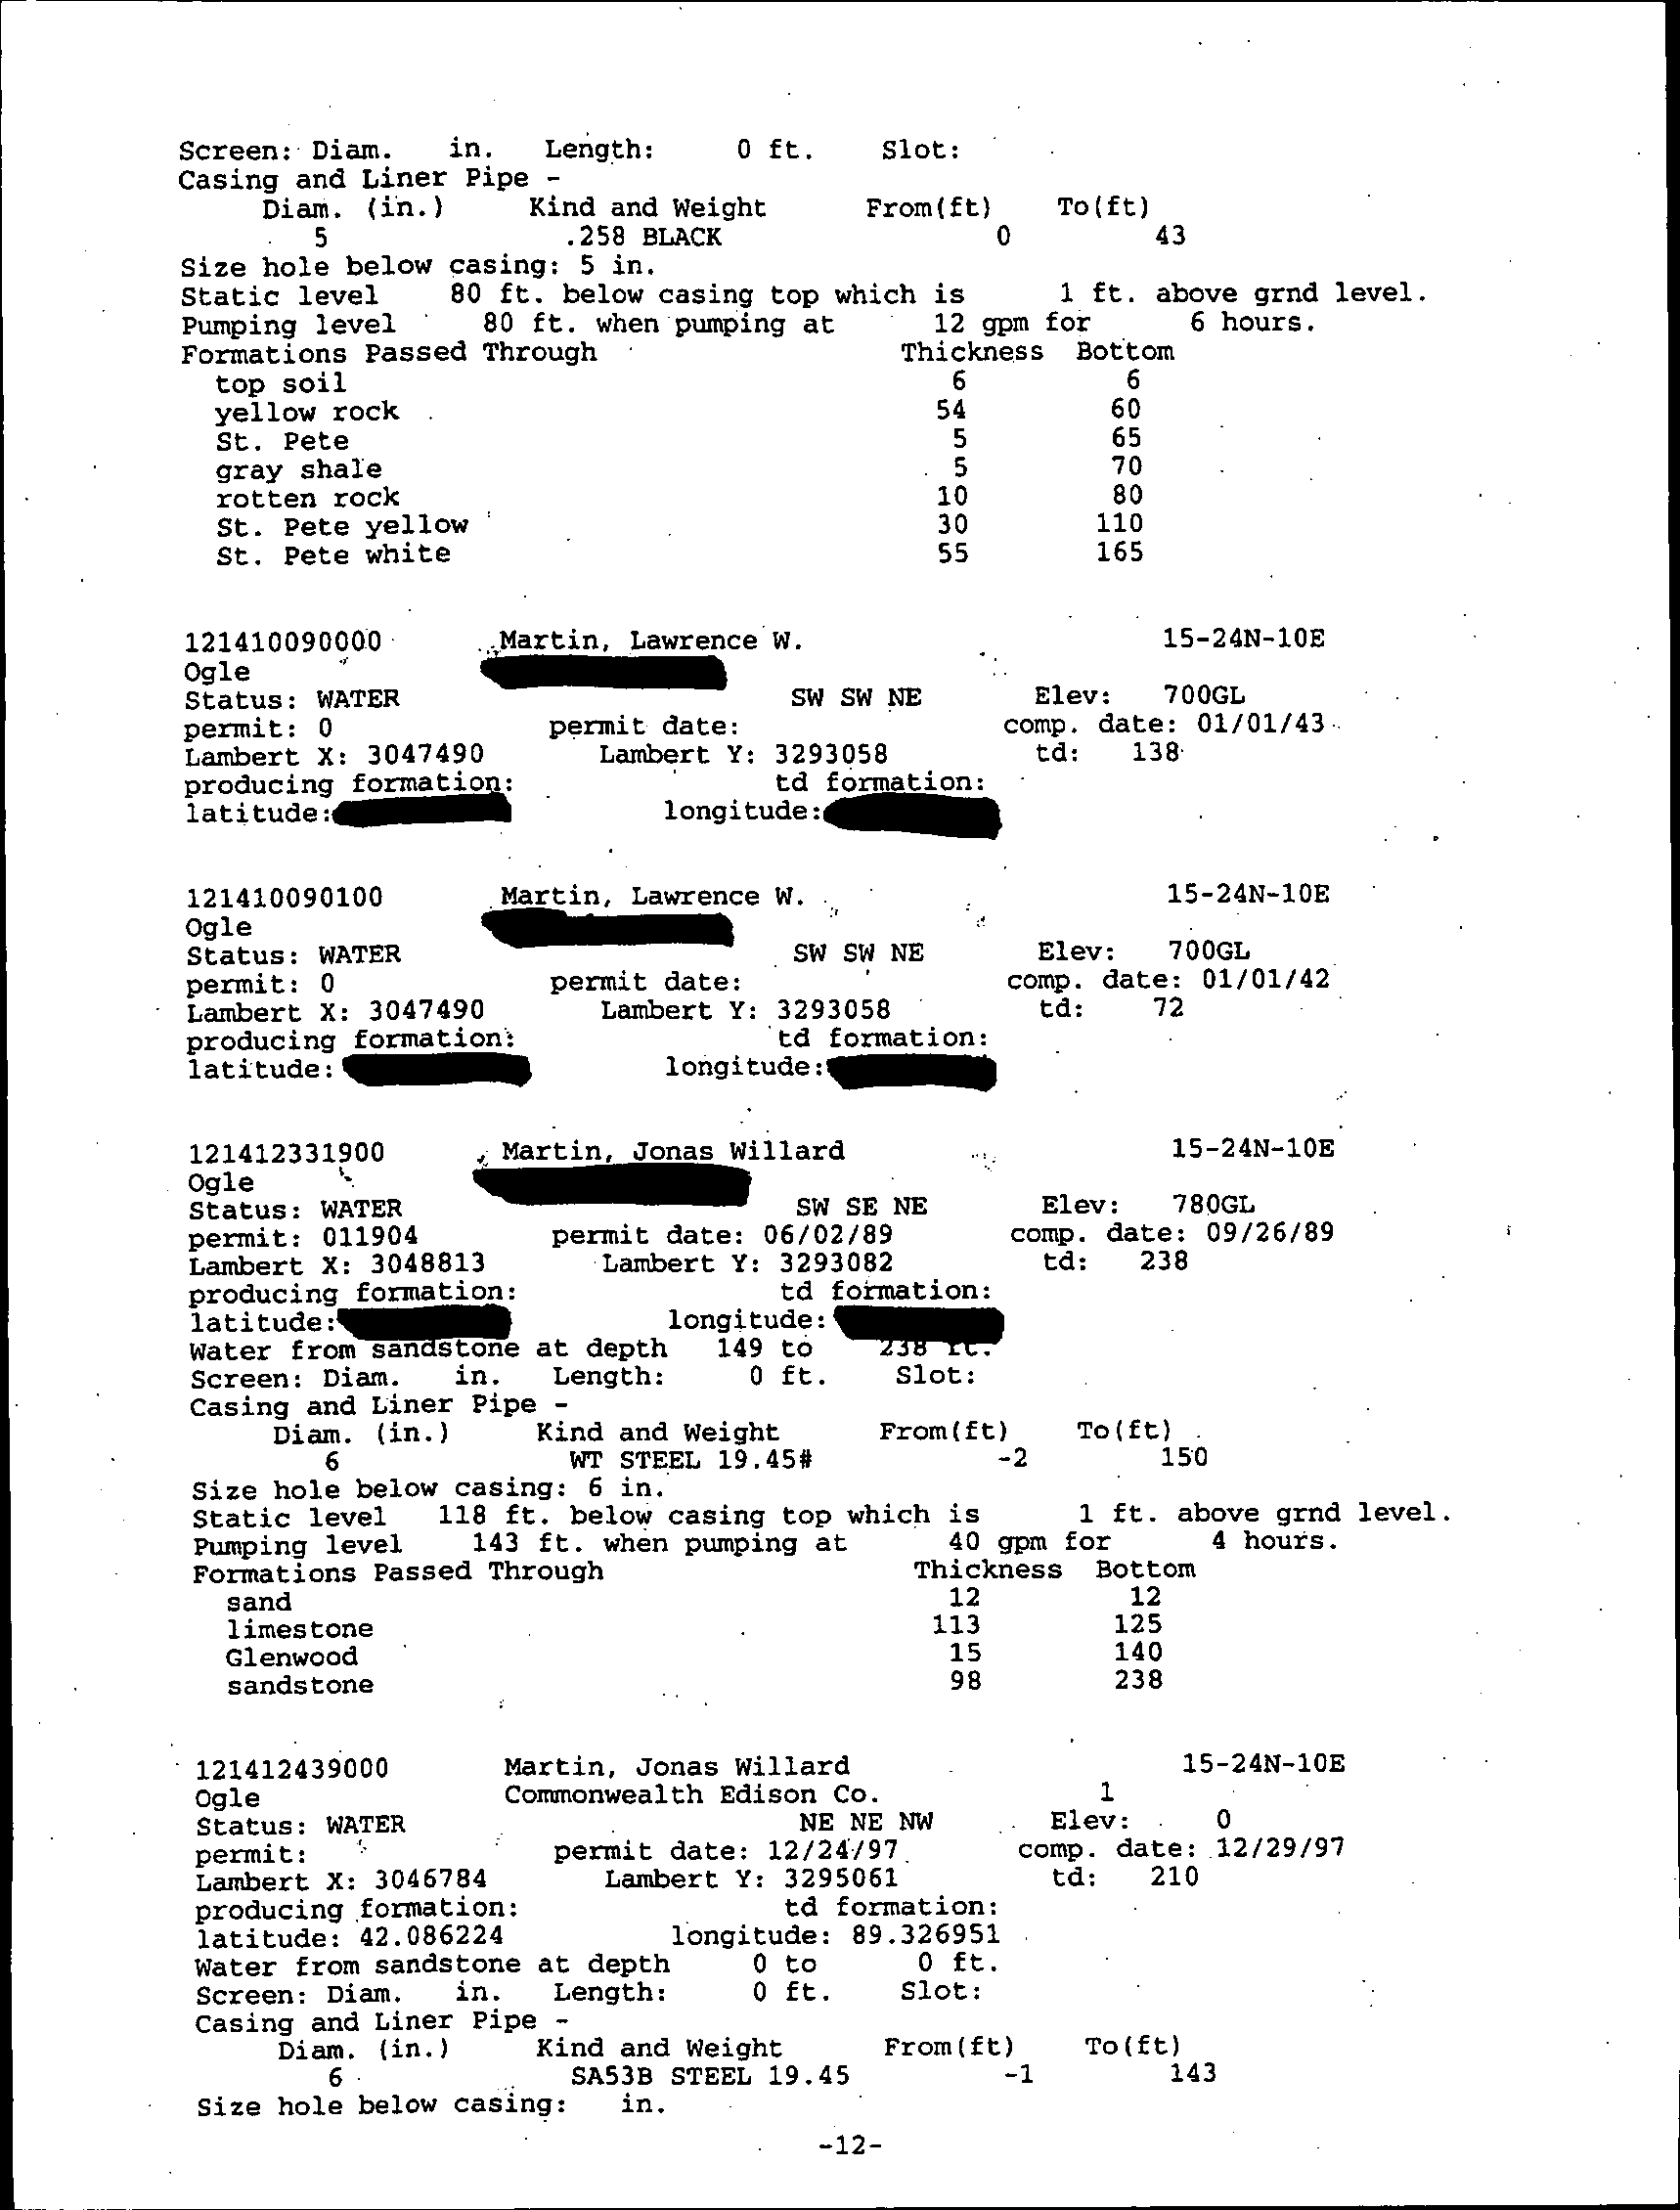
water wells surrounding the Station (Figure A.1), along with copies of the information
gathered from the ISWS and ISGS are provided in Appendix A. All of the water wells
listed are for residential use; none are listed for commercial, industrial, or public water
supply uses.
The St. Peter Sandstone is the primary aquifer for residential potable water in the area.
The most important aquifer in the region is the Cambrian-Ordovician Aquifer, made up
of all bedrock between the top of the Galena-Platteville dolomites and the top of the Eau
Claire Formation.
Potable water for the residences south, east, and some north of the Station is provided
by private water wells at each property. As part of the Byron Salvage Site groundwater
remediation,
an alternate water supply and distribution system was provided to many
of the residences located north of the Station.
045136 (13) Byron Generating Station
10
CONESTOGA-ROVERS & ASSOCIATES
Revision 1
3.0
AREAS FOR FURTHER EVALUATION
CRA considered all Station operations in assessing groundwater quality at the Station.
During this process, CRA identified areas at the Station that warranted further
evaluation or "AFEs". This section discusses the process by which AFEs were selected.
CRA's identification of AFEs involved the following components:
•
Station inspection on March 21 and 22, 2006;
•
interviews with Station personnel;
•
evaluation of Station systems;
•
investigation of confirmed and unconfirmed releases of radionuclides; and
•
review of previous Station investigations.
CRA analyzed the information collected from these components combined with
information obtained from CRA's study of hydrogeologic conditions at the
Station to
identify those areas where groundwater potentially could be impacted from operations
at the Station.
CRA then designed an investigation to determine whether any confirmed or potential
releases
or any other release of radionuclides adversely affected groundwater. This
entailed evaluating whether existing Station groundwater monitoring systems were
sufficient to assess the groundwater quality at the AFEs. If the systems were not
sufficient to adequately investigate groundwater quality associated with any AFE,
additional monitoring wells were installed by CRA.
The following sections describe the above considerations and the identification of AFEs.
The results of CRA's investigation are discussed in Section 5.0.
3.1
SYSTEMS EVALUATIONS
Exelon launched an initiative to systematically assess the structures, systems and
components that store, use, or convey potentially radioactively contaminated liquids.
Maps depicting each of these systems were developed and provided to CRA for review.
The locations of these systems are presented on Figures 3.1 through 3.3. The Station
identified a total of 30 systems that contain or could potentially contain radioactively
contaminated liquids. The following presents a list of these systems.
045136 (13) Byron Generating Station
11
CONESTOGA-ROVERS & ASSOCIATES
Revision 1
System Identification
Description
AB
Boric Acid Process
AS
Auxiliary Steam
BR
Boron Thermal Regeneration
CD
Condensate
CP
Condensate Polishing
CW
Circulating Water
DM
Miscellaneous Building Drain
DV
Miscellaneous Drains and Vents
FC
Fuel Pool Cooling
FP
Fire Protection
GS
Turbine Gland Seals
HD
Feedwater Drains
MS
Main Steam
OD
Equipment/Floor Oil Drain
PS
Process Sampling
PW
Primary Water
RF
Reactor Building Floor Drains
SH
Station Heat
SI
Safety Injection
ST
Sewage Treatment
SX
Essential Service Water
TE
Turbine Building Equipment Drains
TF
Turbine Building Floor Drains
TR
Treated Runoff
VF
Filtered Vents
VR
Volume Reduction
WE
Auxiliary Building Equipment Drain
WF
Auxiliary Building Floor Drain
WS
Non-Essential Service Water
WX
Radwaste Disposal
After these systems were identified, Exelon developed a list of the various structures,
components and areas of the
systems (e.g., piping, tanks, process equipment) that
handle or could potentially handle any radioactively contaminated liquids.
The
structures, components, and areas may include:
•
aboveground storage tanks;
•
condensate vents;
•
areas where confirmed or potential historical releases, spills or
accidental discharges
may have occurred;
045136 (13) Byron Generating Station
12
CONESTOGA-ROVERS & ASSOCIATES
Revision 1
•
pipes;
•
pools;
•
sumps;
•
surface water bodies (i.e., basins, pits, ponds, or lagoons);
•
trenches;
•
underground storage tanks; and
•
vaults.
The Station then individually evaluated the various system components
to determine
the potential for any release of radioactively contaminated liquid to enter the
environment.
Each structure or identified component was evaluated against the
following seven primary criteria:
•
location of the component (i.e., basement or second floor of building);
•
component construction material (i.e., stainless steel or steel tanks);
•
construction methodologies (i.e., welded or mechanical pipe joints);
•
concentration of radioactively contaminated liquid stored or conveyed;
•
amount of radioactively contaminated
liquid stored or conveyed;
•
existing
controls (i.e., containment and detection); and
•
maintenance history.
System components, which were located inside a building or that otherwise had some
form
of secondary containment, such that a release of radioactively contaminated liquid
would not be discharged directly to the environment, were eliminated from further
evaluation. System components that are not located within buildings or did not have
some other form of secondary containment were retained for further qualitative
evaluation of the risk of a release of radioactively contaminated liquid to the
environment and the potential magnitude of any release.
Exelon's risk evaluation took into consideration factors such as:
•
the potential concentration of radionuclides;
•
the volume of liquid
stored or managed;
•
the
probabilities of the systems actually containing radioactively contaminated
liquid; and
045136 (13) Byron Generating Station
13
CONESTOGA-ROVERS & ASSOCIATES
Revision 1
•
the potential for a release of radioactively contaminated liquid from the system
component.
These factors were then used to rank the systems and system components according to
the
risk for a potential release of a radioactively contaminated liquid to the environment.
The evaluation process resulted in the identification of structures, components, and
areas to be considered for further evaluation.
3.2
HISTORICAL RELEASES
CRA also reviewed information concerning confirmed or potential historical releases of
radionuclides at the Station, including reports and documents previously prepared by
Exelon and compiled for CRA's review. CRA evaluated this information in identifying
the AFEs. Any historical releases identified during the course of this assessment that
may have a current impact on Station conditions are further discussed in Section 3.4.
3.3
STATION INVESTIGATIONS
CRA also considered previous Station investigations
in the process of selecting the AFEs
for the Station. This section presents a summary of the pre-operational radiological
environmental monitoring program (pre-operational REMP), past Station investigations,
and the radiological environmental monitoring program (REMP).
3.3.1
PRE-OPERATIONAL RADIOLOGICAL
ENVIRONMENTAL MONITORING PROGRAM
A pre-operational REMP was conducted between 1981 and 1984 to establish background
radioactivity levels prior to operation of the Station. While a summary report for the
pre-operational REMP was not available to CRA, CRA reviewed the pre-operational
REMP data. An April 1987 REMP report prepared by Teledyne Isotopes Midwest
Laboratory entitled "Radioactive Waste and Environmental Monitoring Annual Report
1986" identifies that a comparison of the 1985 and 1986 data to the pre-operational
REMP data indicates that there was no measurable amount of radioactivity due to the
Station's operation.
045136 (13) Byron Generating Station
14
CONESTOGA-ROVERS & ASSOCIATES
Revision 1
3.3.2
RADIOLOGICAL ENVIRONMENTAL MONITORING
PROGRAM
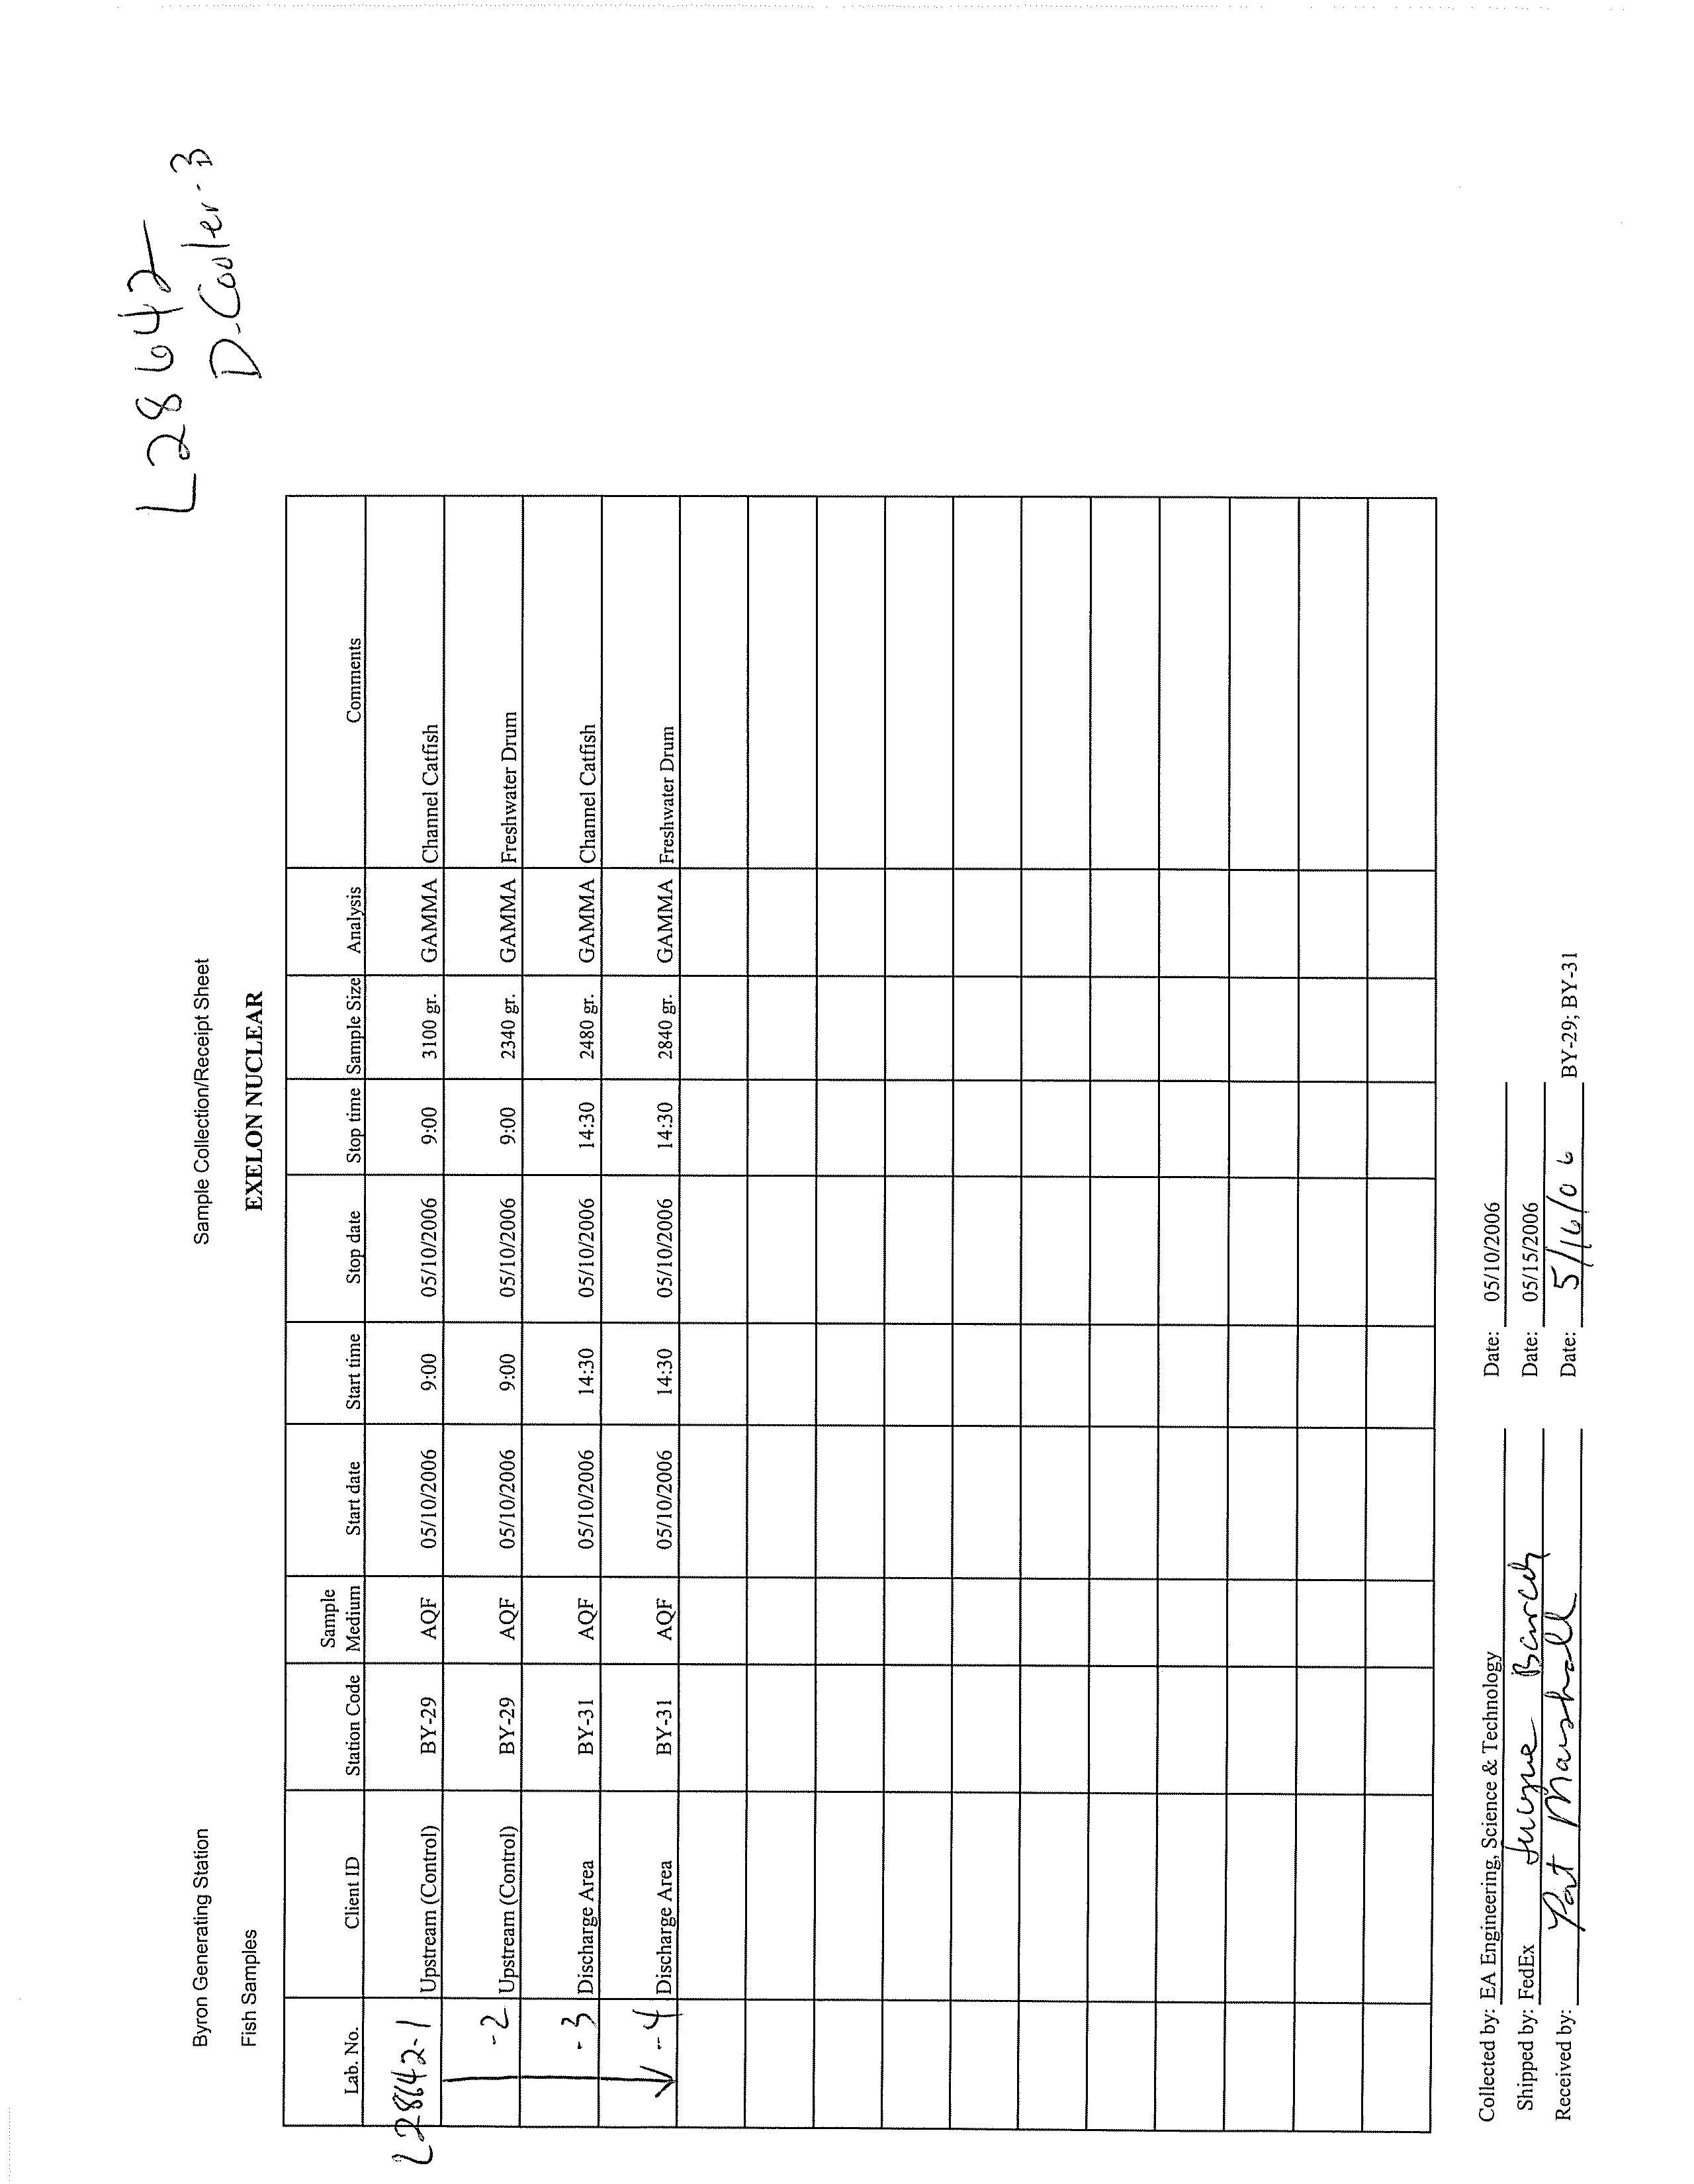
The REMP at the Station was initiated in 1985. The REMP includes the collection of
multi-media samples including air, surface water, groundwater, fish, sediment,
vegetation, local cow milk, and residential potable water. The samples are analyzed for
beta and gamma-emitting radionuclides, tritium, iodine-131, and/or strontium as
established in the procedures developed for the REMP. The samples are collected at
established locations, identified as stations, so that trends in the data can be monitored.
An annual report is prepared providing a description of the activities performed and the
results of the analysis of the samples collected from
the various media. The latest report
generated was prepared by Station personnel and is entitled "Radioactive Effluent
Release Report - January 2005 Through December 2005." This report concluded that the
operation of the Station had no adverse radiological impact on the environment. The
annual report is submitted to the NRC.
3.3.3
HISTORIC INVESTIGATIONS
This section summarizes historic investigations undertaken at the Station prior to this
hydrogeologic investigation, related to actual or potential releases of radioactively
contaminated liquids to the subsurface.
3.3.3.1
POWER PLANT DOCUMENTS - UFSAR REPORT
During the construction of the Station, a series of comprehensive investigations of
regional and local geology, surface water, and groundwater conditions were conducted.
These studies are documented in the UFSAR, Rev. 10, dated December 2004 (Byron
Station UFSAR, 2004).
3.3.3.2
BLOWDOWN LINE INVESTIGATION
In July 2005, water was observed in the concrete vault for vacuum breaker 6 (VB-6). A
water sample collected from the concrete vault, at that time, contained less than
2,000 picoCuries per liter (pCi/L) of tritium.
045136 (13) Byron Generating Station
15
CONESTOGA-ROVERS & ASSOCIATES
Revision 1
In January 2006, the Station initiated an investigation into the blowdown line. A
program of inspections of the concrete vaults, along with routine observations for water
within the vaults was begun. Subsequent to the initial discovery of water in the vaults,
Exelon performed construction upgrades on each of the six breaker vaults. These
upgrades are intended to ensure that there will be no future releases of potentially
contaminated liquid to the subsurface.
3.4
IDENTIFIED AREAS FOR FURTHER EVALUATION
CRA used the information presented in the above sections along with its understanding
of the hydrogeology at the Station to identify AFEs, which were a primary consideration
in the development of the scope of work in the Work Plan. The establishment of AFEs is
a standard planning practice in hydrogeologic investigations to focus the investigation
activities at areas where there is the greatest potential for impact to groundwater.
Specifically, AFEs were identified based on these six considerations:
•
systems evaluations;
•
risk evaluations;
•
review of confirmed and/or potential releases;
•
review of documents;
•
review of the hydrogeologic conditions; and
•
Station inspection completed on March 22 and 23, 2006.
Prior to CRA completing its analysis and determination of AFEs, Station personnel
completed an exhaustive
review of all historic and current management of systems that
may contain potentially radioactively contaminated liquids.
CRA reviewed the systems identified by the Station, which have the potential for the
release of radioactively contaminated liquids
to the environment, and groundwater flow
at the Station. This evaluation allowed CRA to become familiar with Station operations
and potential systems that may impact groundwater. CRA then evaluated information
concerning historic releases as provided by the Station. This information, along with a
review of the results from historic investigations, was used to refine CRA's
understanding of areas likely to have the highest possibility of impacting groundwater.
Where at risk systems or identified historical releases were located in close proximity or
were located in areas which could not be evaluated separately, the systems and
045136 (13) Byron Generating Station
16
CONESTOGA-ROVERS & ASSOCIATES
Revision 1
historical releases were combined into a single AFE. At times, during the Station
investigation, separate AFEs were combined into one or were otherwise altered based on
additional information and consideration.
Finally, CRA used its understanding of known hydrogeologic conditions (prior to this
investigation)
to identify AFEs. Groundwater flow was an important factor in deciding
whether to combine systems or historical releases into a single AFE or create separate
AFEs. For example, groundwater beneath several systems that contain radioactively
contaminated liquids that flows toward a common discharge point were likely
combined into a single AFE. The AFEs were created based on known groundwater flow
conditions prior to the work completed during this investigation.
Based upon its review of information concerning
confirmed or potential historical
releases, historic investigations, and the systems at the Station that have the potential for
release of radioactively contaminated liquids to the environment combined with its
understanding of groundwater flow at the Station, CRA identified three AFEs (see
Figures 3.1 through 3.3).
AFE-Byron-1 – Former Fiberglass Blowdown Line
This AFE is the area in which, in April 1986, after the initial six
months of Unit 1
operation, there were three separate ruptures of the original fiberglass blowdown line.
The three ruptures were all in the same area, near River Road (Figure 3.1). Soil and
water samples collected as part of the investigation of each rupture indicated the
presence of minimal amounts of radioactive material. Following the ruptures, the
Station replaced sections of the fiberglass blowdown line. The Station subsequently
abandoned the entire line in place and installed a new carbon steel blowdown line in
1987.
AFE-Byron-2 – Vacuum Breaker Vaults
In December 2005/January 2006, water was observed in the vacuum breaker vaults.
Exelon initiated an investigation into potential groundwater impact near all 12 vacuum
breaker vaults (Figure 3.2), plugged the drainage holes and sealed all six blowdown line
vaults.
AFE-Byron-3 - Protected Area
Based on the risk ranking, several systems within the PA scored high as systems in
which tritiated water could be released to the environment if a failure or if a set of events
045136 (13) Byron Generating Station
17
CONESTOGA-ROVERS & ASSOCIATES
Revision 1
were to occur. These systems include: systems located within the Auxiliary Building,
Radwaste Building, Containment Building, and the Turbine Building, the Condensate
and Condensate Polishing systems, the Fuel Handling Building systems, the Circulating
Water Pump House systems, and the CROP.
To evaluate the groundwater quality in the area
of these systems, monitoring wells were
installed in locations that are hydraulically downgradient of the AFE (Figure 3.3). The
downgradient locations of the monitoring wells were selected based on the radial
groundwater flow outward from the PA (Figure 2.4) due to the topographic high on
which the PA was constructed. These monitoring well locations were situated to
provide for adequate indication of historic releases and future leak detection.
045136 (13) Byron Generating Station
18
CONESTOGA-ROVERS & ASSOCIATES
Revision 1
4.0
FIELD METHODS
CRA and Station personnel completed two investigations at the Station:
●
the blowdown line investigation; and
●
the fleetwide investigation.
During the blowdown line investigation conducted from February through April
2006,
CRA oversaw the installation and development of 12 temporary and 17 permanent
monitoring wells at the Station. CRA and Station personnel collected multiple samples
from the vacuum breaker vaults, from nearby residential wells, from the blowdown line
itself, from holding ponds, and from the existing and the CRA-installed monitoring
wells.
During the fleetwide investigation completed in April and May 2006, CRA conducted a
second round of groundwater sampling of 41
monitoring wells, collected a full round of
water level measurements from 63 monitoring wells, and surveyed five monitoring
wells that had not been surveyed as part of the blowdown line investigation. The field
investigations were completed in accordance with the methodologies presented in the
Work Plan (CRA, 2006).
The following sections discuss the field activities conducted during these two
investigations.
4.1
BLOWDOWN LINE INVESTIGATION ACTIVITIES
4.1.1
GROUNDWATER MONITORING WELL INSTALLATION
Prior to completing any ground penetration activities, CRA completed subsurface utility
clearance procedures to minimize the potential of injury to workers and/or damage to
subsurface utility structures.
The subsurface clearance procedures consisted of
completing an electronic survey within a minimum of 10-foot radius of the proposed
location utilizing electromagnetic and ground penetrating radar technology.
Additionally, an air knife was utilized within the PA to verify utilities were not present
at the proposed location to a depth to 10 feet bgs.
From late February 2006 to early April 2006, CRA supervised the installation of
17
monitoring wells and 12 temporary wells along the blowdown line and at other
045136 (13) Byron Generating Station
19
CONESTOGA-ROVERS & ASSOCIATES
Revision 1
locations at the Station to evaluate the quality of the groundwater in the areas of the
three AFEs. The monitoring well locations are presented on Figure 2.3.
Monitoring wells TW-13 through TW-15 were installed to evaluate the groundwater
quality
near River Road, downgradient of the 1986 former fiberglass blowdown line
ruptures (AFE-Byron-1). These wells were originally constructed as temporary wells,
but were eventually converted to permanent monitoring wells.
For AFE-Byron-2, at each of the six vacuum breaker vault locations along the blowdown
line, two temporary wells were installed
adjacent to the concrete vault and within the
bedding material of the blowdown line and make-up line (TW-1 through TW-12). These
shallow overburden wells were installed to determine whether groundwater was
present in the overburden materials above the bedrock. These 12 temporary wells were
dry.
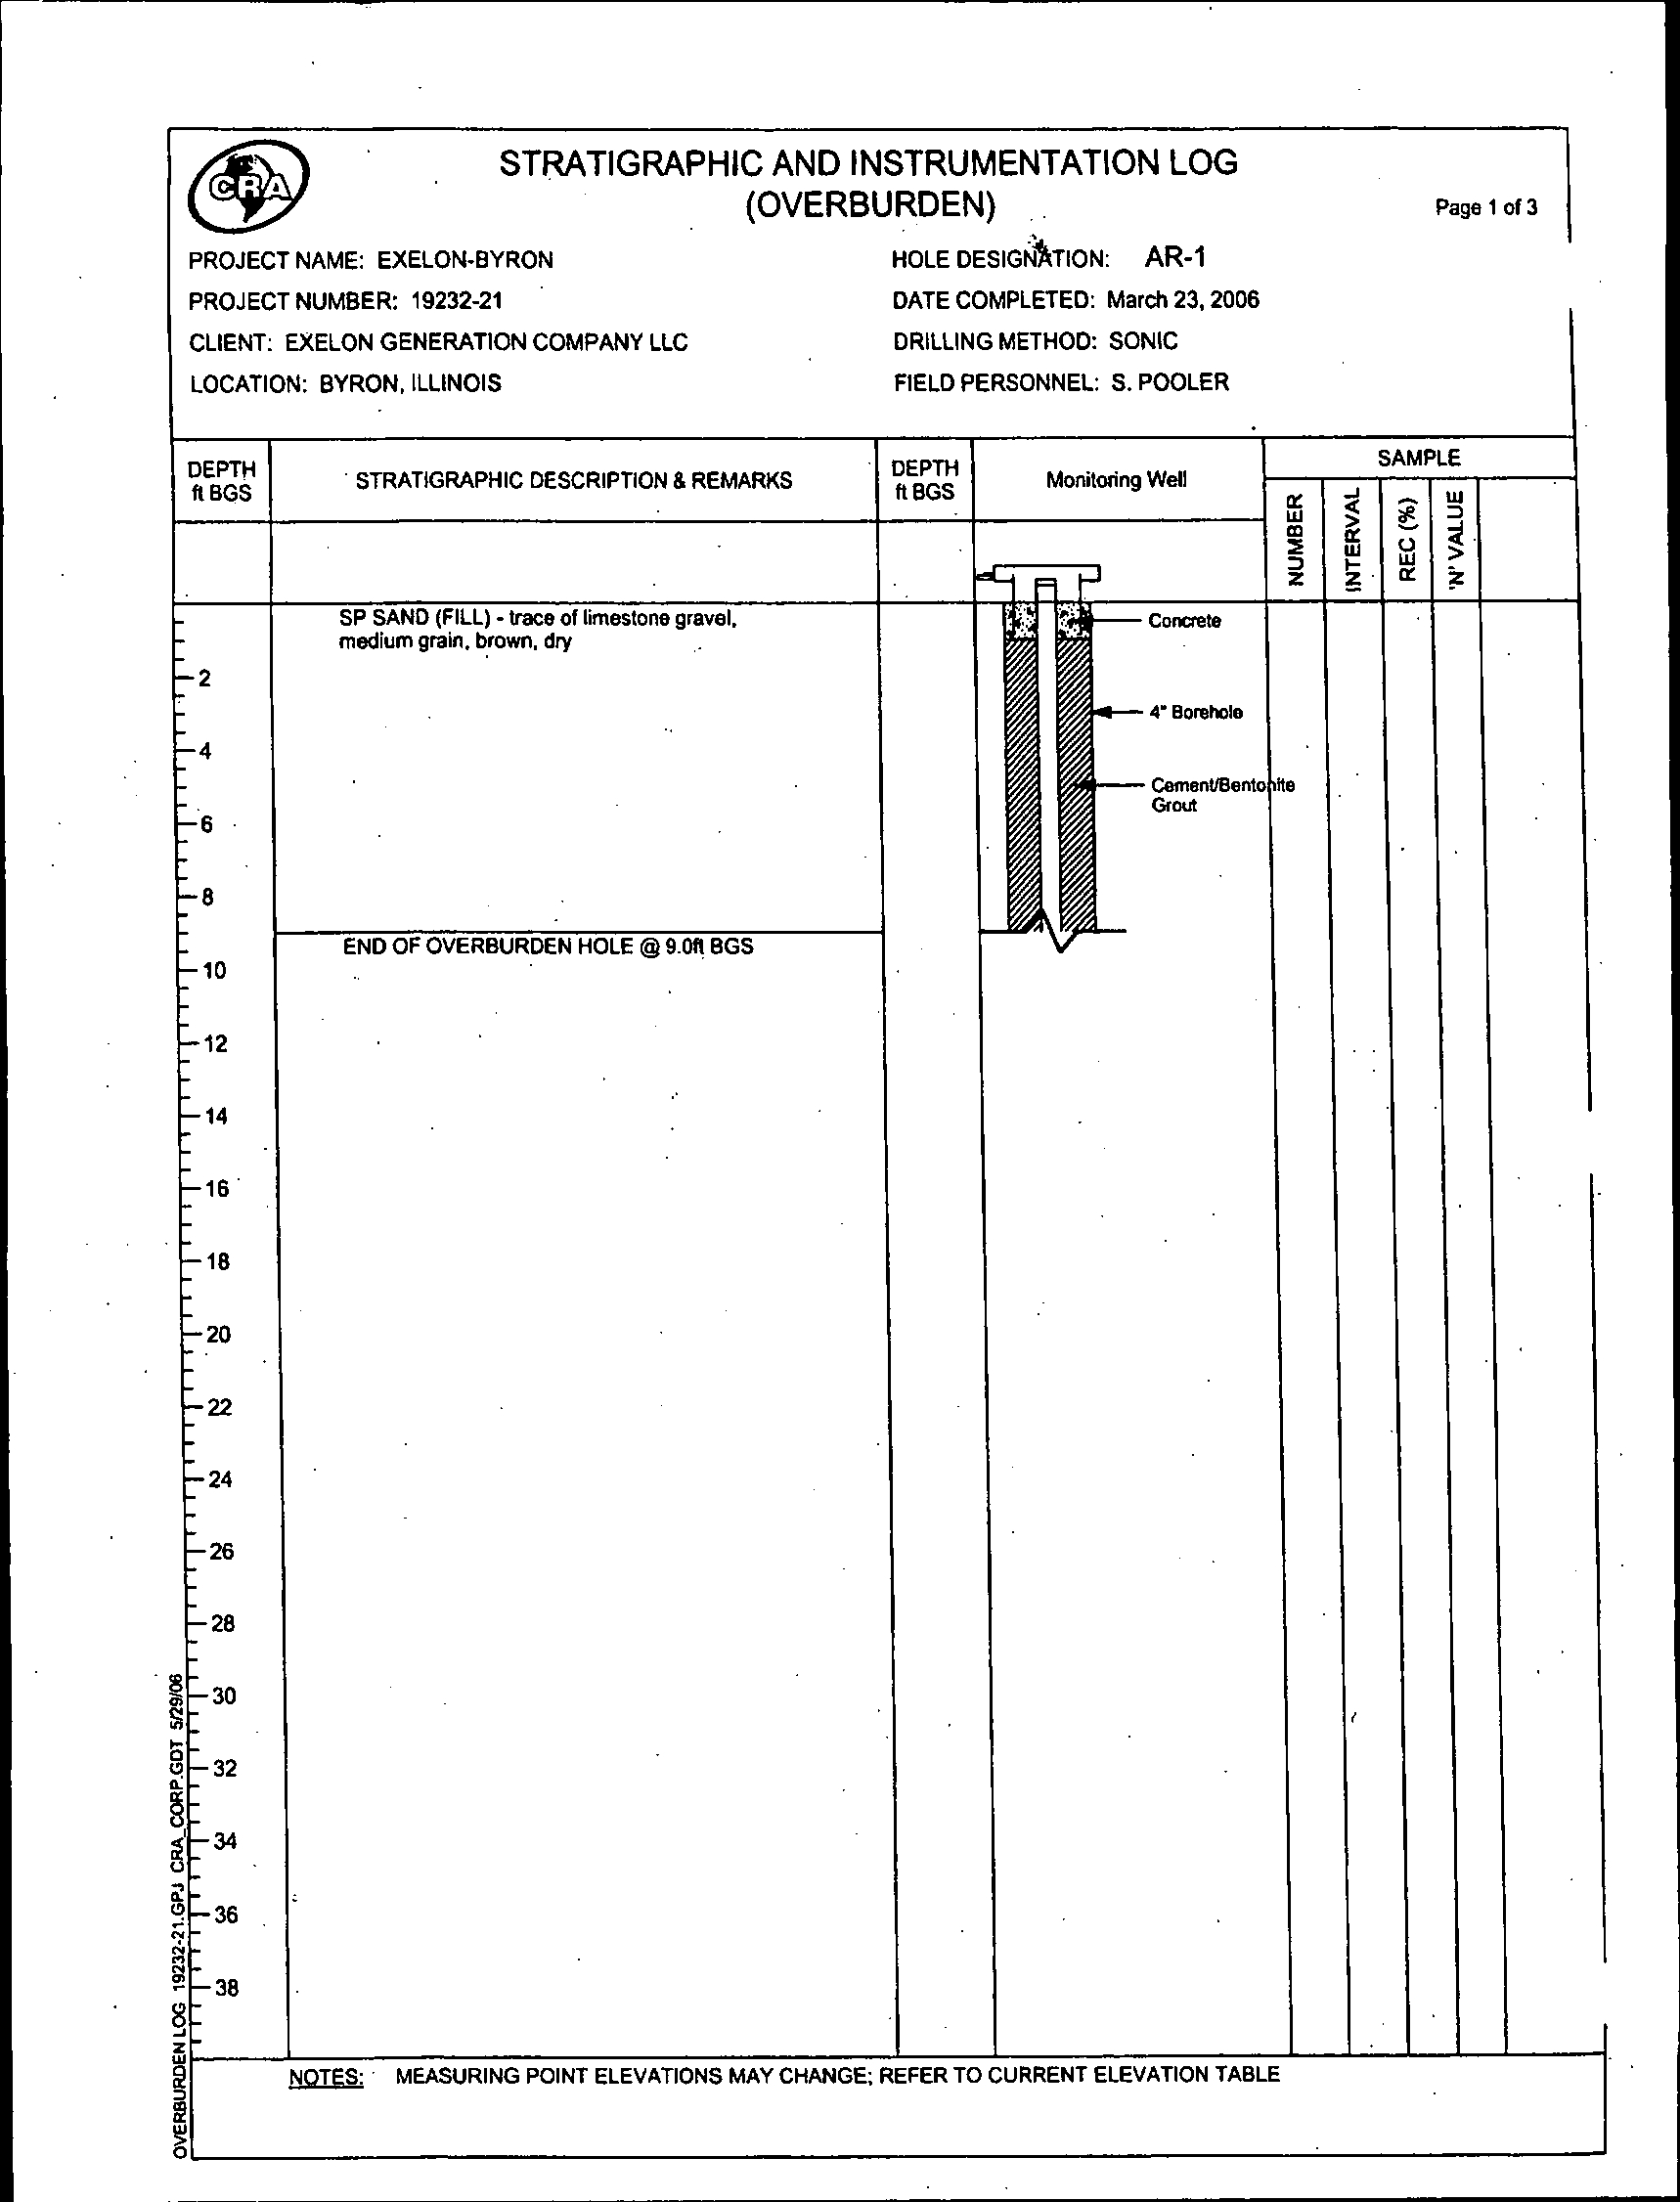
Twelve monitoring wells (AR-1 through AR-10, CAR-2, and CAR-3) were installed
to
screen the first occurrence of groundwater (the water table) within the Galena-Platteville
limestones and dolomites. One well was placed adjacent to each vacuum breaker vault
(AR-1 through AR-6) in an anticipated downgradient location as determined from
historic groundwater elevations measured in the Byron Salvage Site monitoring wells
and levels measured in early March 2006. Monitoring well CAR-2 was installed at a
location at the bottom of the valley downgradient from the vault for vacuum breaker 4,
which contained water with the highest concentrations of tritium. Five monitoring wells
(AR-7 through AR-10 and CAR-3) were installed within and around the PA to evaluate
the groundwater quality in the areas of the high-ranking systems (AFE-Byron-3).
Two additional monitoring wells were also installed. Monitoring well CAR-1 was
screened in the alluvial
sediments adjacent to TW-14 to evaluate the groundwater
quality approximately 20 feet below the water table. Due to detections of tritium
concentrations in groundwater samples from monitoring well AR-4, monitoring well
AR-11 was screened to monitor the groundwater quality at the base of the
Galena-Platteville aquifer. In total, 13 bedrock monitoring wells were constructed as
part of the blowdown line investigation.
The bedrock monitoring wells were all installed using a combination of
augering,
coring, and air rotary drilling techniques.
The monitoring wells with the AR
designation were drilled using air rotary techniques, and the wells with the CAR
designation were first cored prior to using rotary techniques. The coring was planned to
be completed at three locations to confirm the geology that was already expected based
on the drilling logs from the Byron Salvage Site monitoring wells. The exception to the
045136 (13) Byron Generating Station
20
CONESTOGA-ROVERS & ASSOCIATES
Revision 1
nomenclature designation is monitoring well CAR-1. Because the bedrock was not
encountered at the base of the hill near River Road, coring was not necessary, and
CAR-1 was augered to the target depth.
Specific installation protocols for the monitoring wells (other than the shallow
temporary wells TW-1 through TW-12) are described below:
•
the borehole was advanced to the target depth using one of the drilling techniques
listed above;
•
a nominal 2-inch diameter (No. 10 slot) PVC screen, of varying length, attached to a
sufficient length of 2-inch diameter schedule 40 PVC riser pipe to extend to the
surface, was placed into the borehole;
•
a filter sand pack consisting of silica sand was installed to a minimum height of
2 feet above the top of the screen;
•
in most cases, a minimum 2-foot thick seal consisting of bentonite chips was placed
on top of the sand pack;
•
the remaining borehole annulus was sealed to within 1 foot of the surface using a
cement-bentonite grout; and
•
the remaining portion of the annulus was filled with concrete and a 6-inch diameter
protective above-grade casing.
Table 2.1 presents a summary of the well information for the wells
installed during the
blowdown line investigation. All monitoring well locations are presented on Figure 2.3.
Monitoring well stratigraphic and instrumentation logs are provided in Appendix B.
The wells were surveyed for horizontal and vertical control by an Illinois-licensed
professional surveyor.
4.1.2
GROUNDWATER MONITORING WELL DEVELOPMENT
After installation, CRA developed the 29 monitoring wells installed during the
blowdown line investigation.
To establish good hydraulic communication with
the aquifer and reduce the volume of
sediment in the monitoring well, monitoring well development was performed in
accordance with the procedure outlined below:
045136 (13) Byron Generating Station
21
CONESTOGA-ROVERS & ASSOCIATES
Revision 1
•
Monitoring wells were surged using a pre-cleaned surge block for a period of at least
20 minutes.
•
Water was purged from the monitoring
well using a pneumatic submersible pump.
•
Groundwater was collected at
regular intervals with the pH, temperature, and
conductivity measured using field instruments. These instruments were calibrated
daily according to the manufacturer's specifications. Additional observations such
as color, odor, and turbidity of the purged water were recorded in the field book.
•
Development
continued until the turbidity and silt content of the monitoring wells
was significantly reduced and three consistent readings of pH, temperature, and
conductivity were recorded, or a minimum of ten well volumes were purged.
A summary of the monitoring well development activities is provided in Table 4.1.
4.1.3
SURVEY
The new monitoring wells were surveyed to establish reference elevations relative to
mean sea level. The top of each well casing was surveyed to the nearest 0.01 foot
relative to the North American Vertical Datum 88 (NAVD). The survey included the
ground elevation at each well to the nearest 0.10 foot relative to the NAVD, and the well
location to the nearest 1.0 foot.
4.1.4
GROUNDWATER ELEVATION MEASUREMENTS
During the blowdown line investigation, CRA collected two full rounds of water level
measurements from both the Station wells existing at the time and from Byron Salvage
Site's monitoring wells located both on and off of the Station property. Synoptic water
level measurements were collected on March 23, 2006 and April 4, 2006. Based on the
measured depth to water from the reference point and the surveyed elevation of the
reference point, the groundwater elevation was calculated. A summary of groundwater
elevations for the two measuring events is provided in Table 4.2.
4.1.5
GROUNDWATER SAMPLE COLLECTION
CRA conducted one round of groundwater sampling during the blowdown line
investigation. A total of 39 monitoring wells were sampled during the event. These
wells included 19 of the 23 wells owned by the Station (TW-1 through TW-12 were dry
045136 (13) Byron Generating Station
22
CONESTOGA-ROVERS & ASSOCIATES
Revision 1
and the two deep wells are sampled on a quarterly basis and have never indicated
tritium impacts) and 20 selected Byron Salvage Site monitoring wells located at the
Station. The Byron Salvage Site wells were selected based on the proximity of the wells
to the blowdown line, their location downgradient of the blowdown line, and in order to
provide a vertical characterization of the groundwater quality.
CRA conducted this round of sampling March 7, 2006 to April 18, 2006. Most of the
monitoring wells were sampled on more than one occasion during this time
period.
Monitoring wells AR-11 and GW-9 were only sampled once. In addition, a total of
22 Byron Salvage Site monitoring wells were originally selected for sampling. However,
Well 7 was not sampled because the old farmhouse pump and drop tube were still in the
well and were not removed until April 2006, and well DF-13 could not be sampled due
to an obstruction in the well that was later removed. CRA conducted the sampling
using a combination of bailers and PVC and stainless steel submersible pumps,
employing both slow purging and low flow purging techniques. A summary of the
purging parameters is presented in Table 4.3, and a sample summary is presented in
Table 4.4.
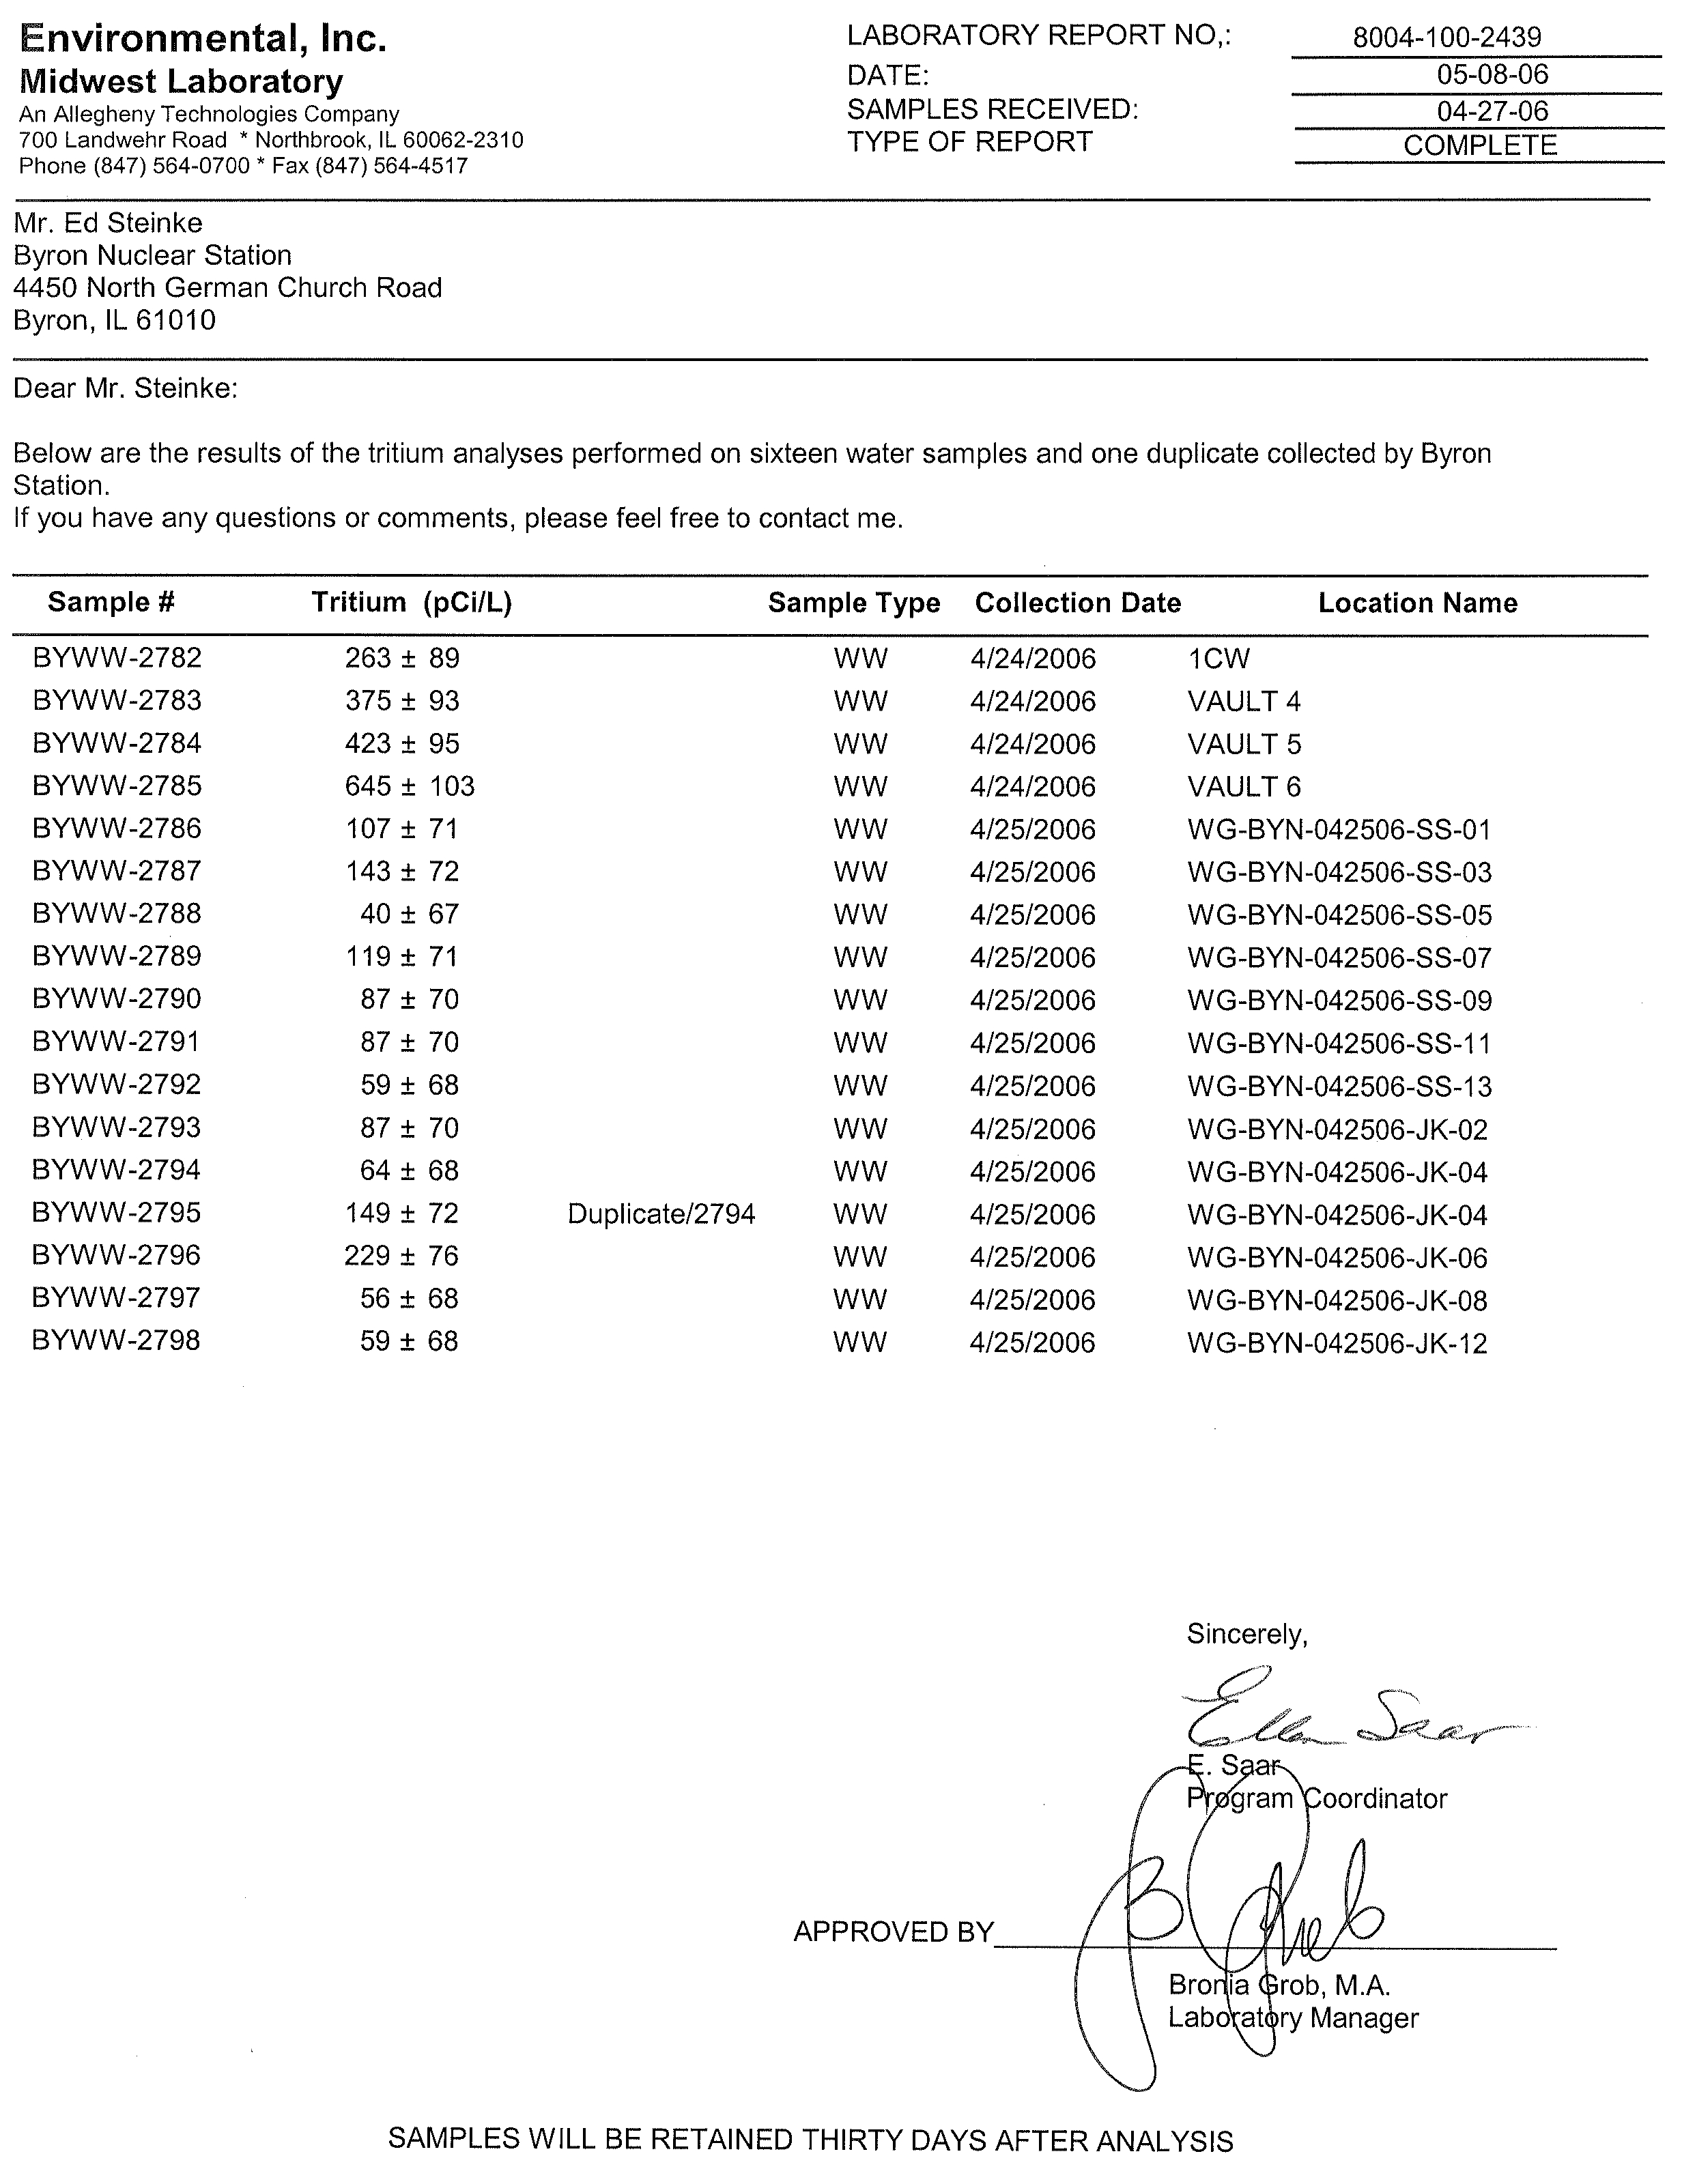
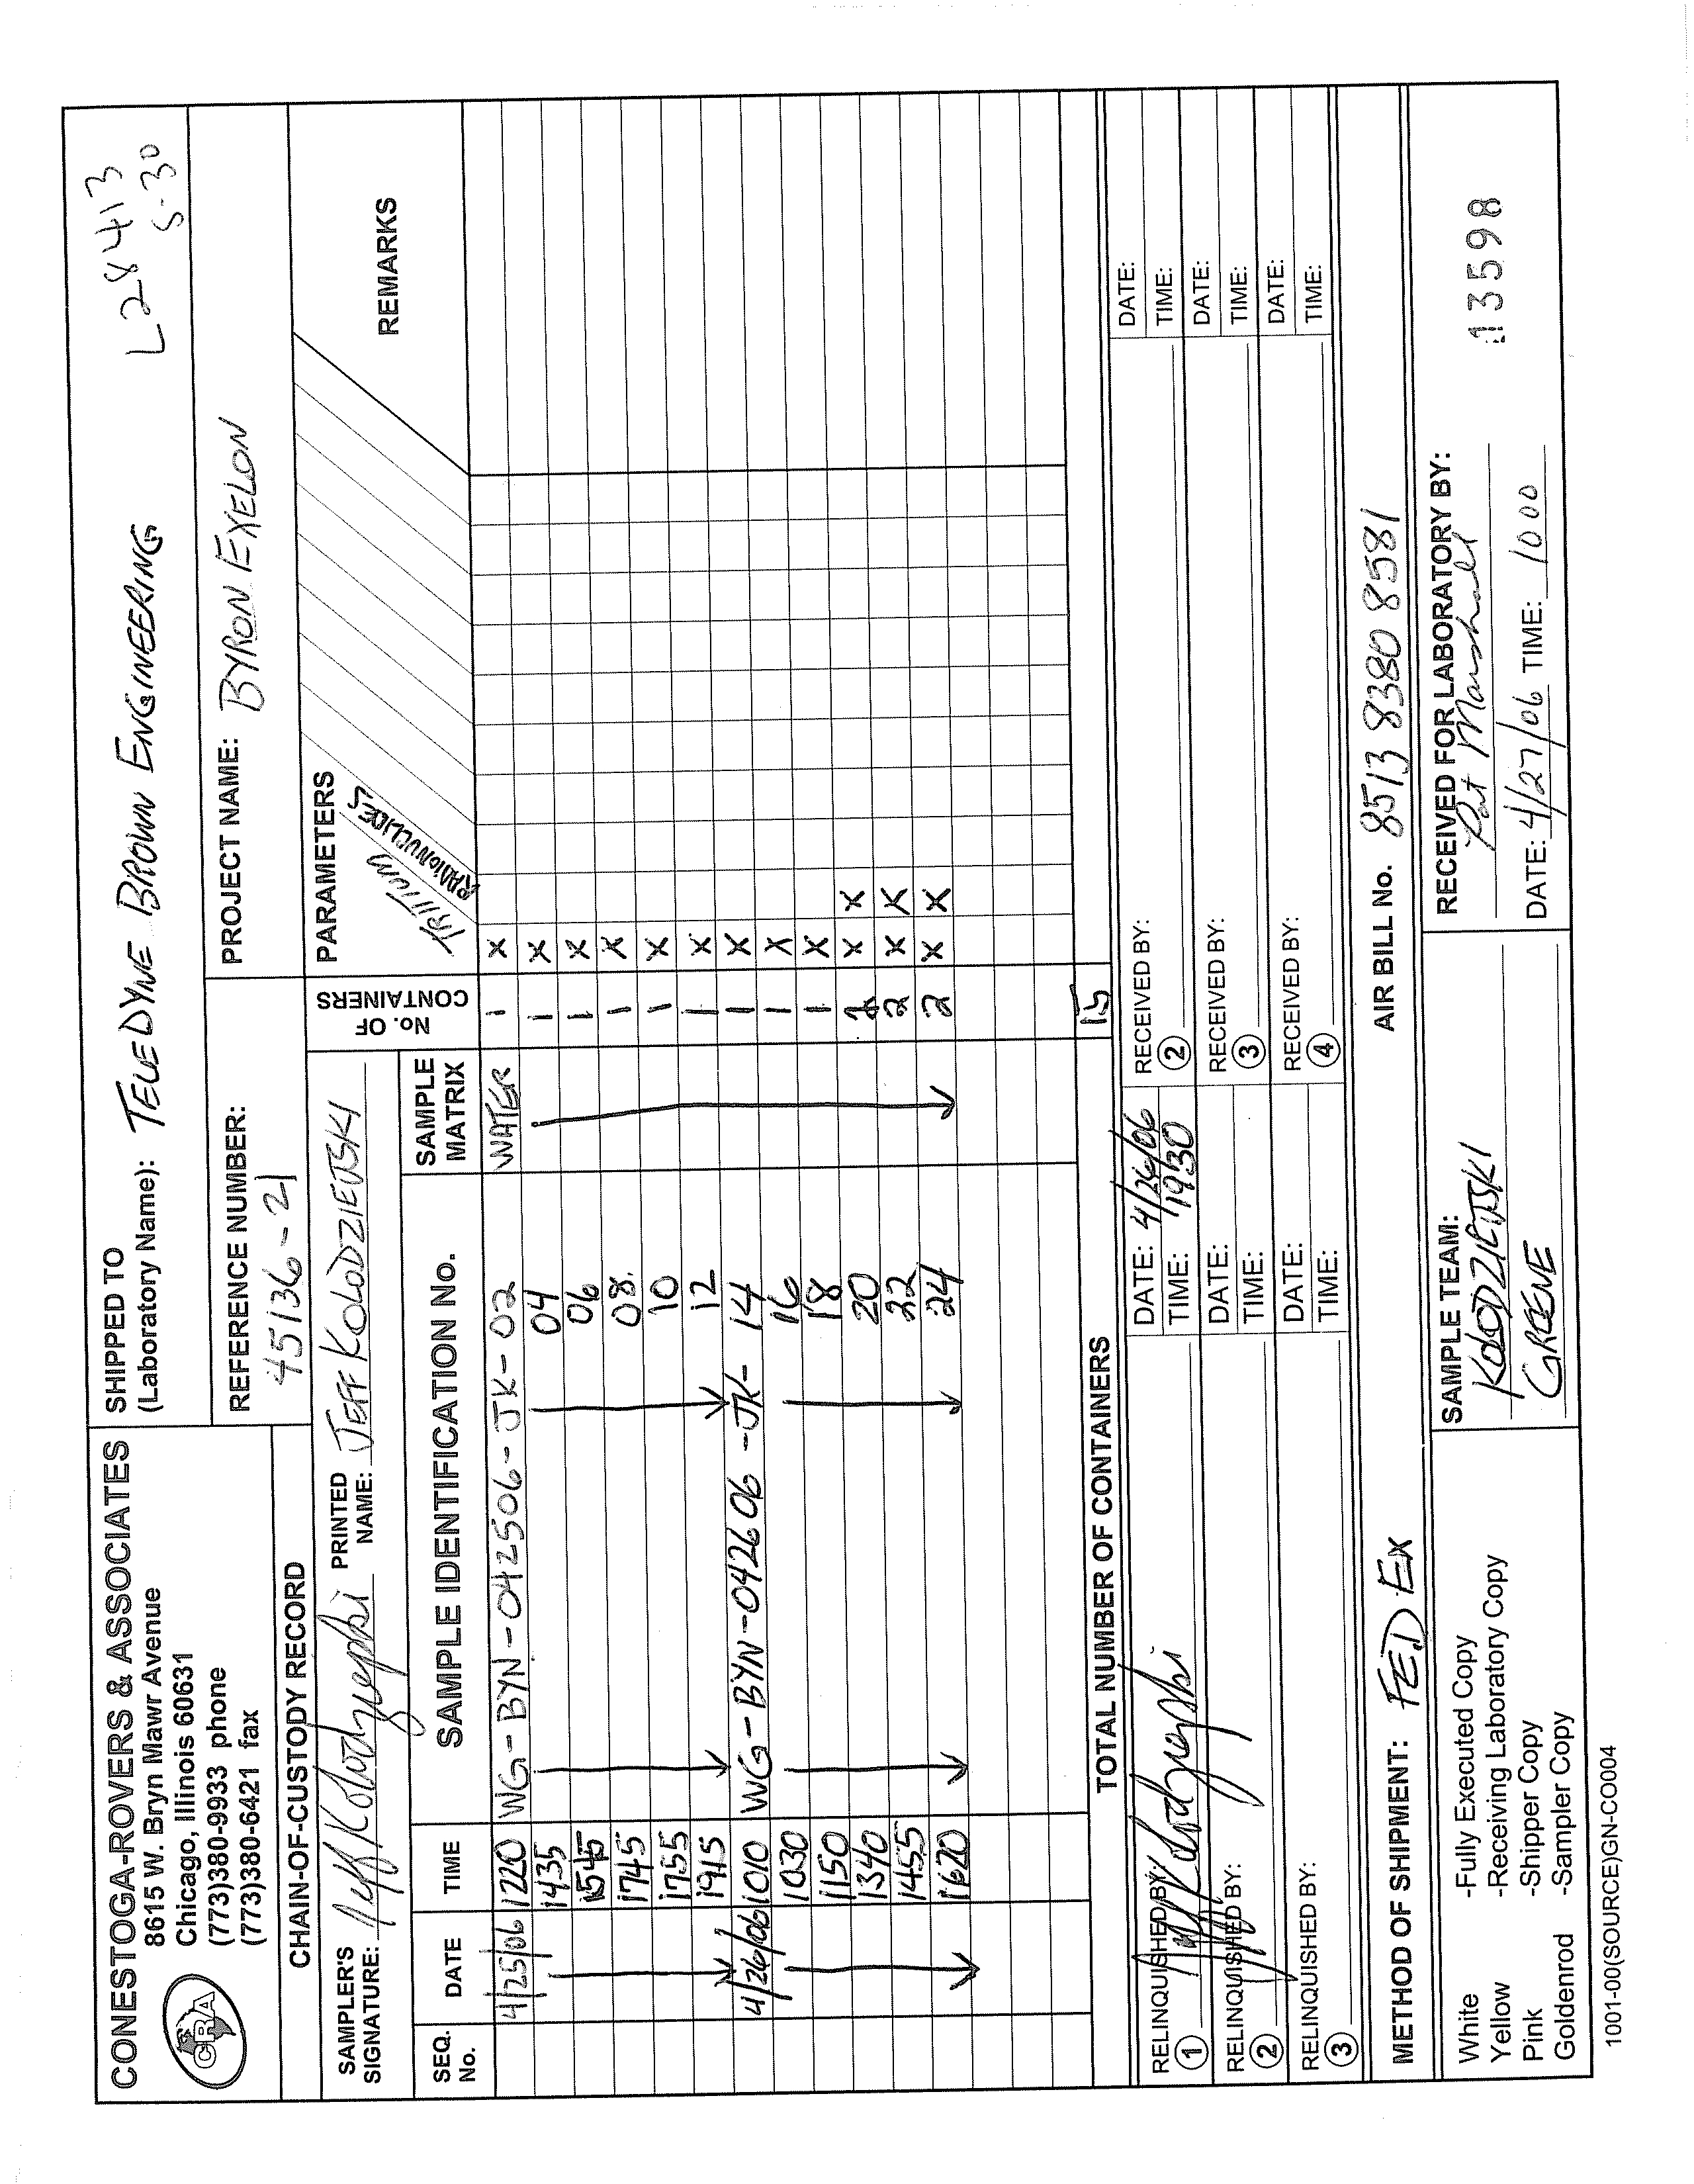
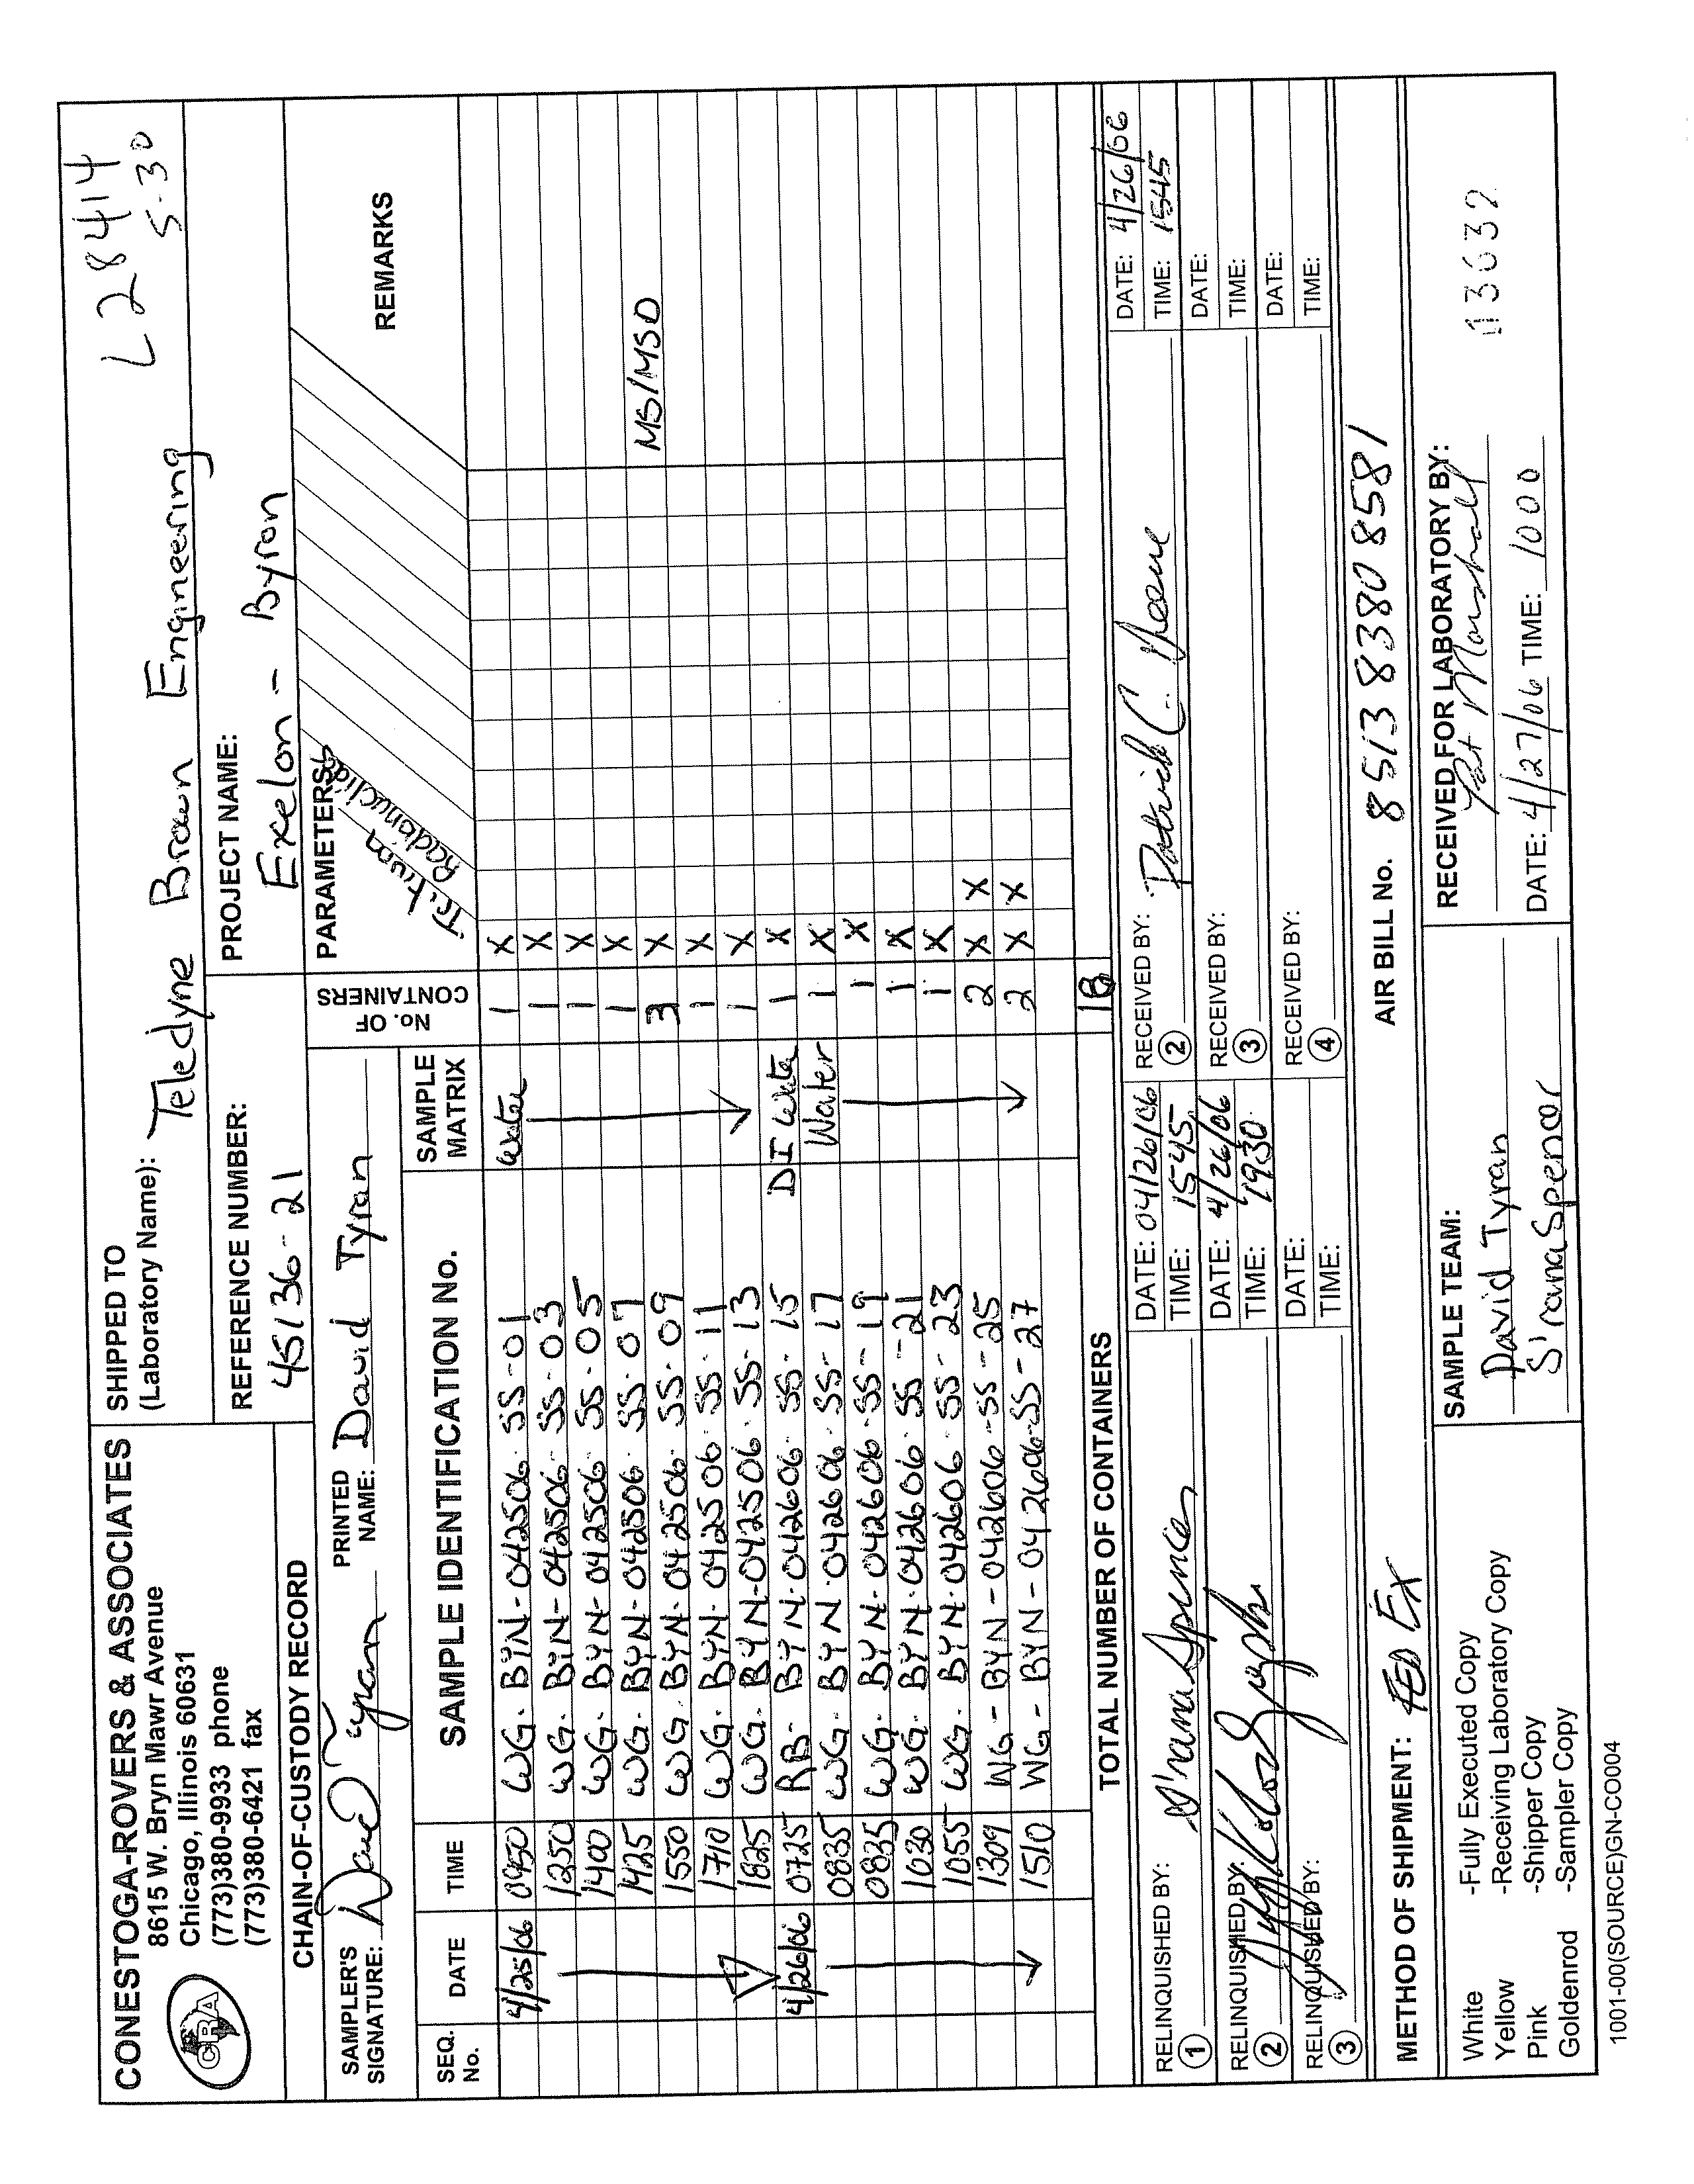
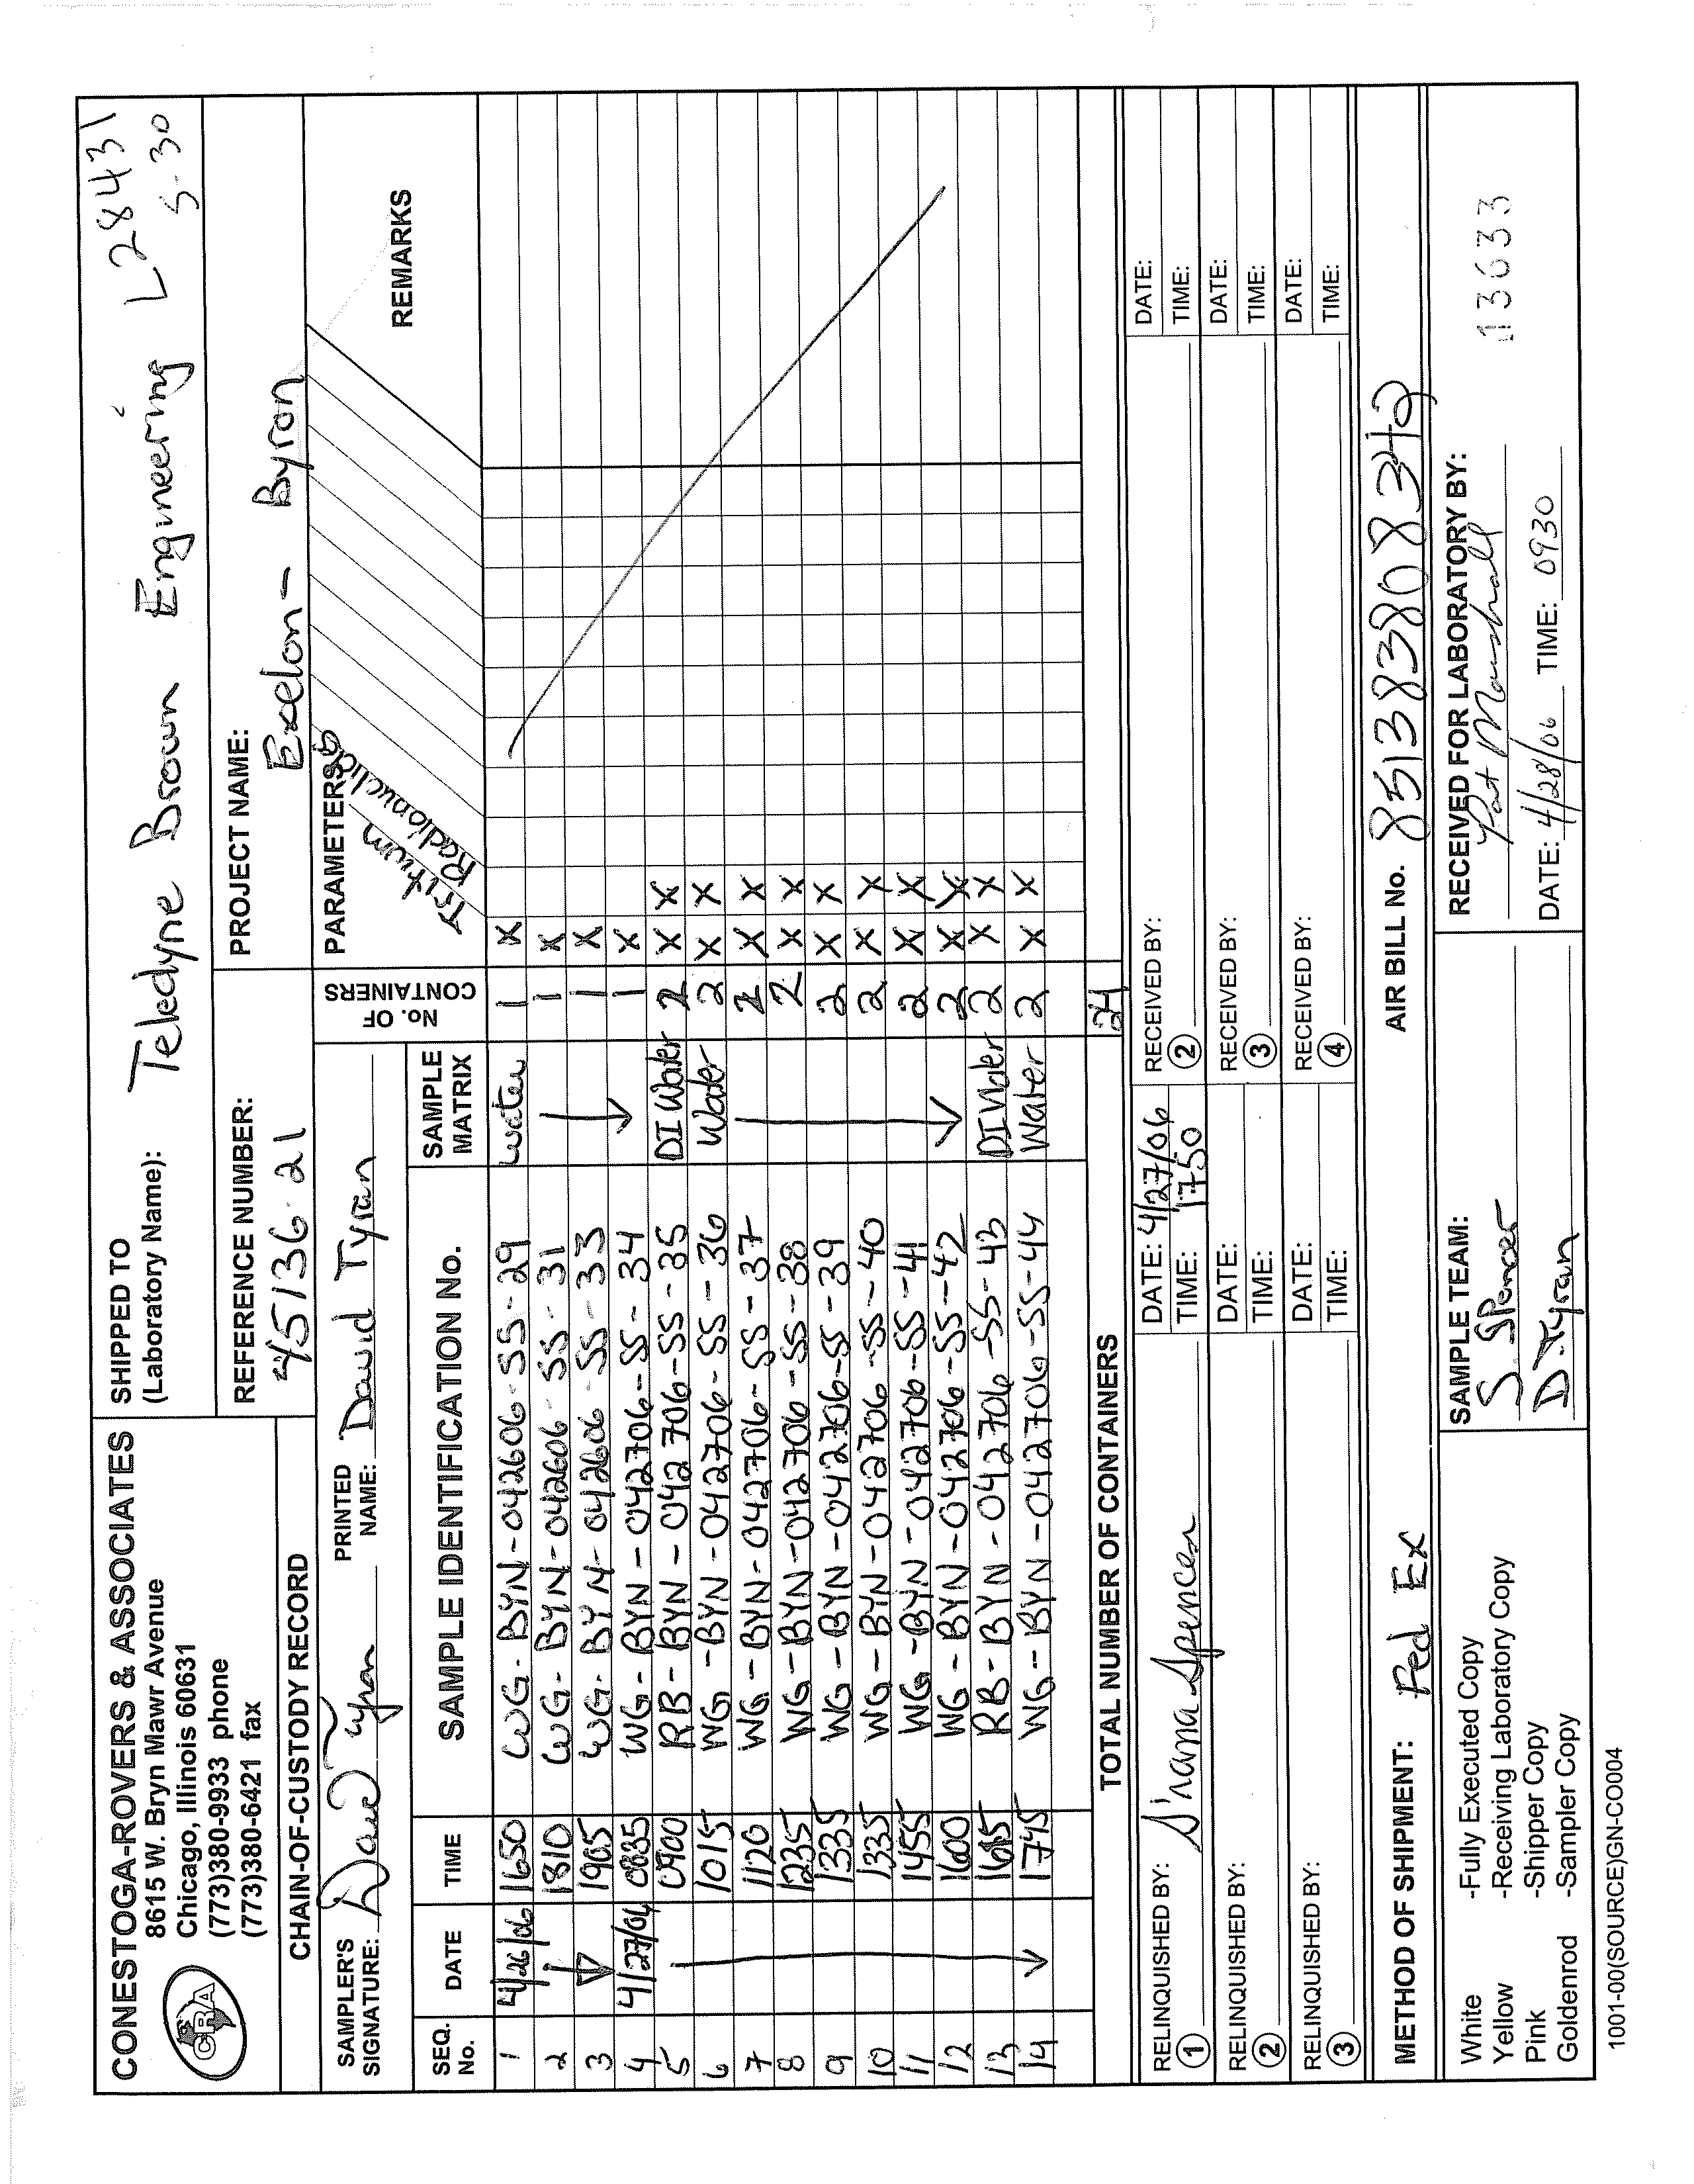
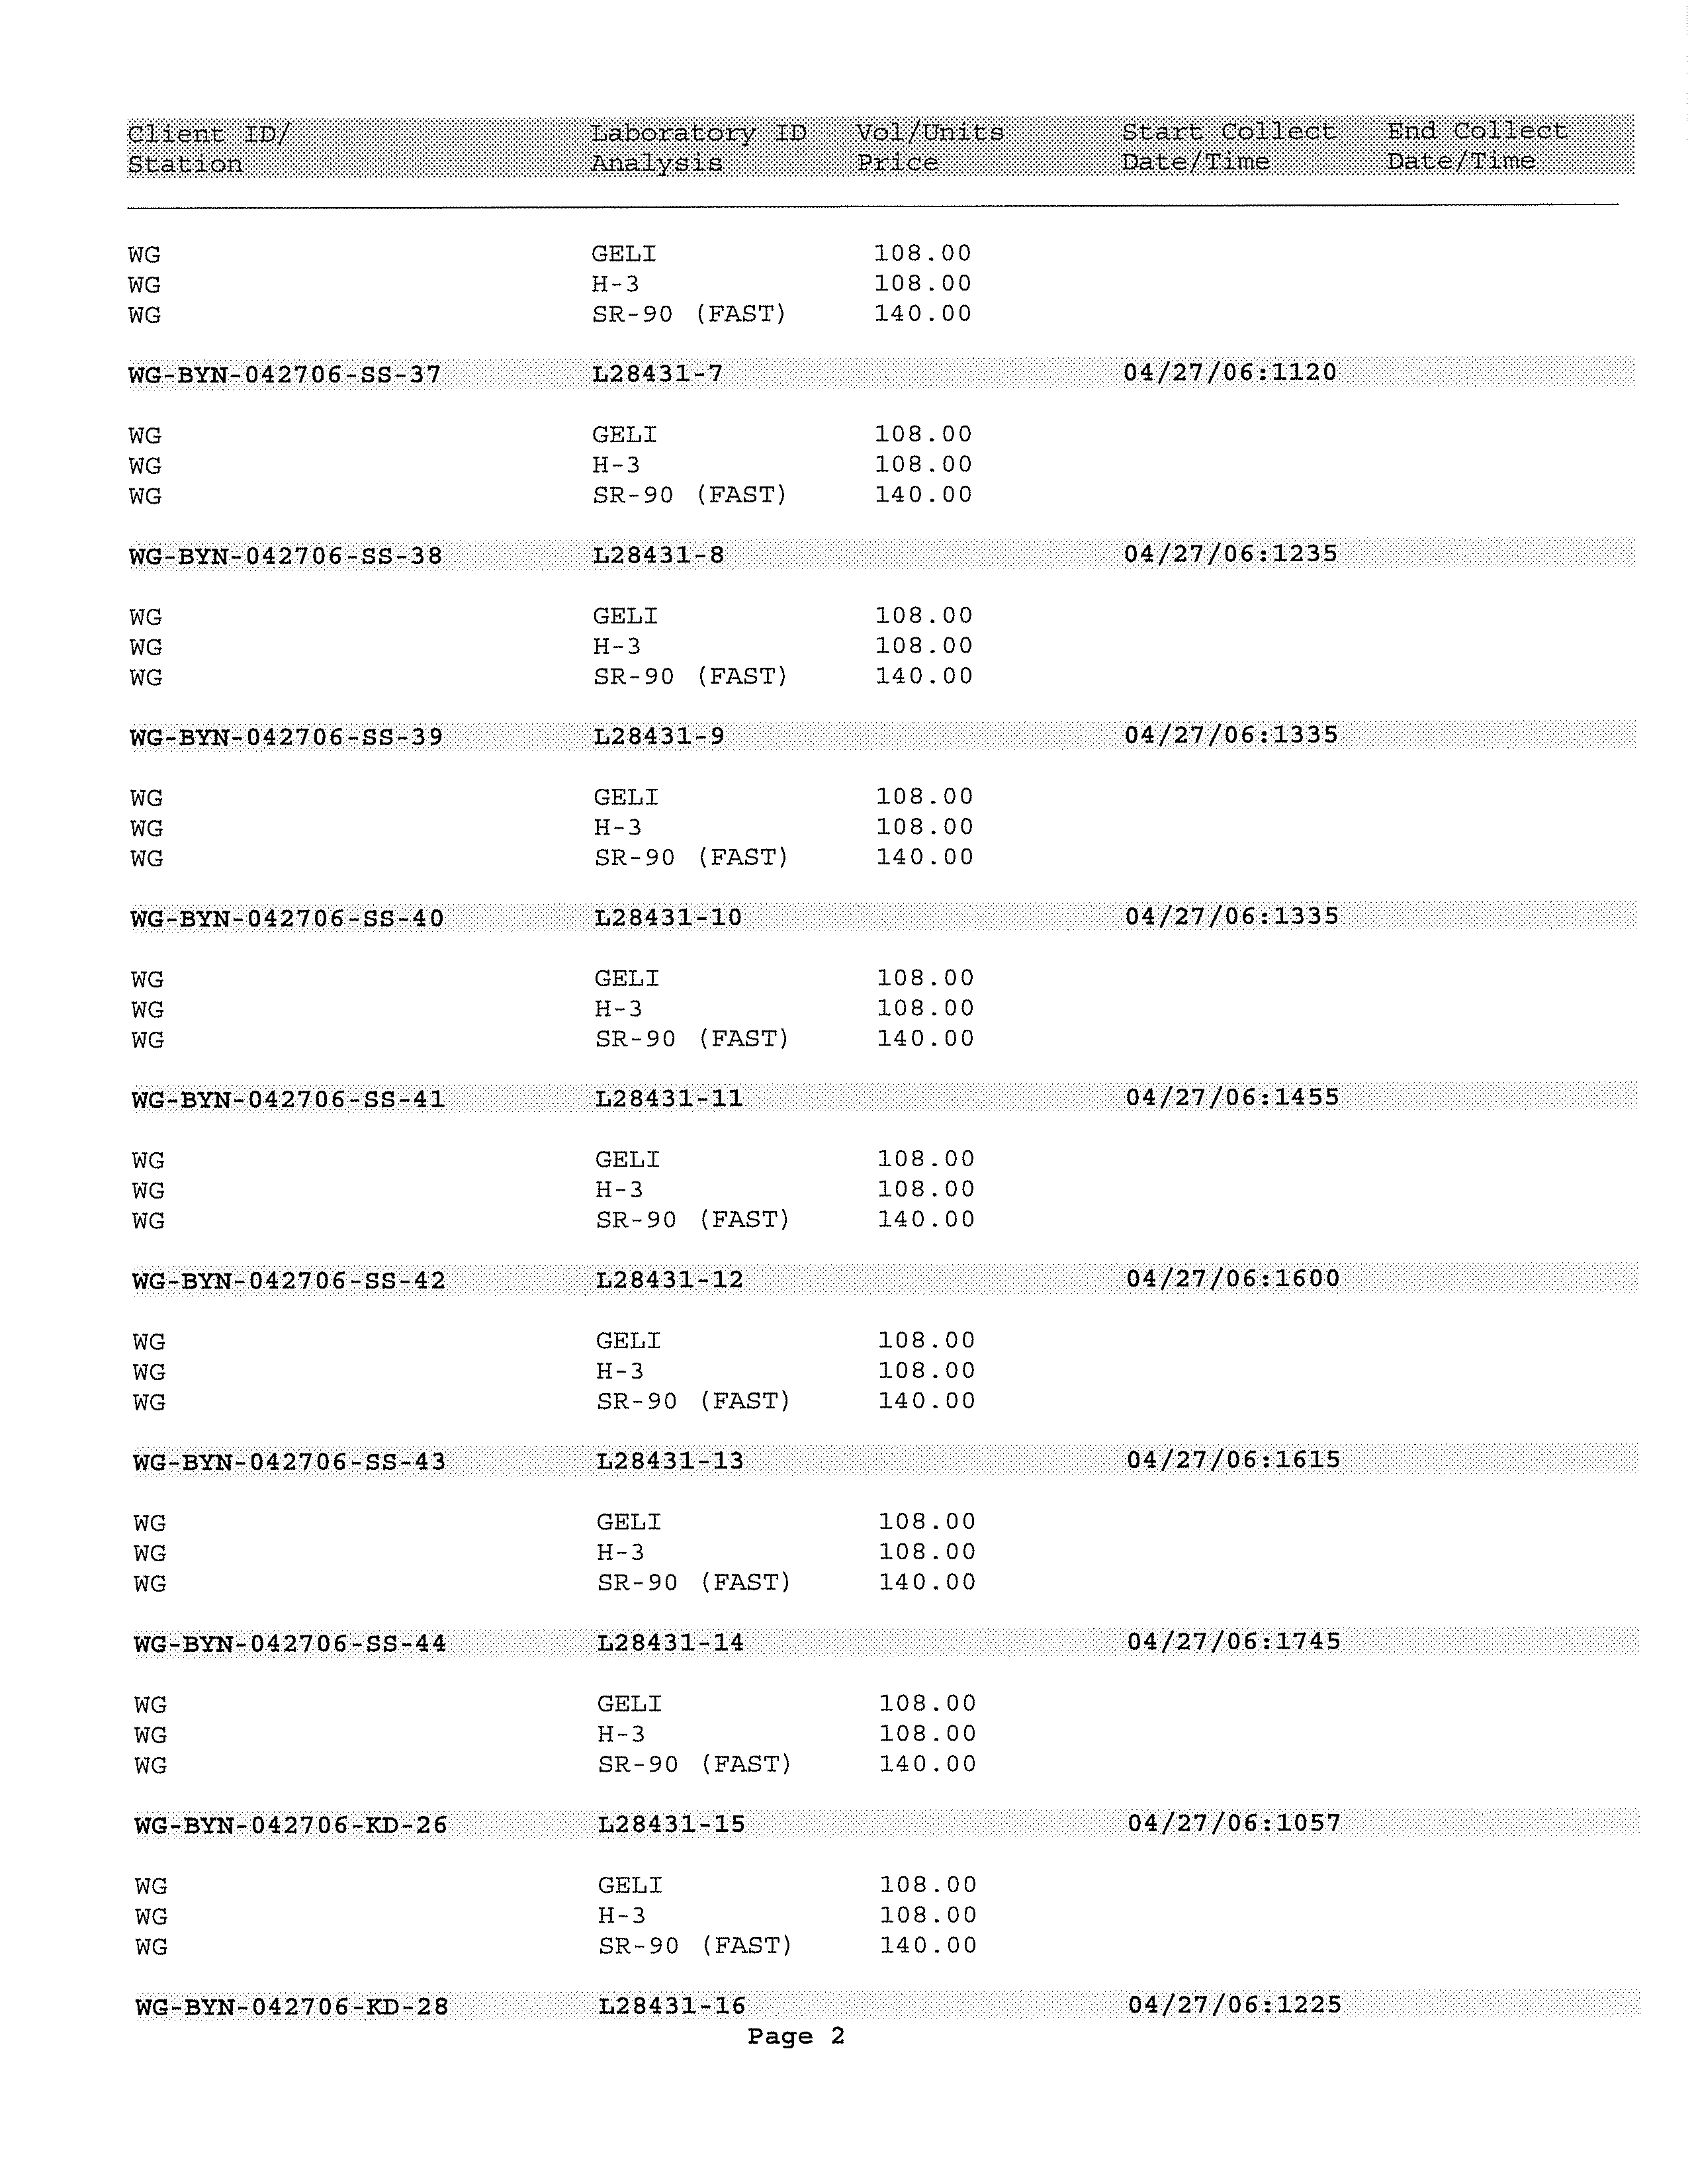
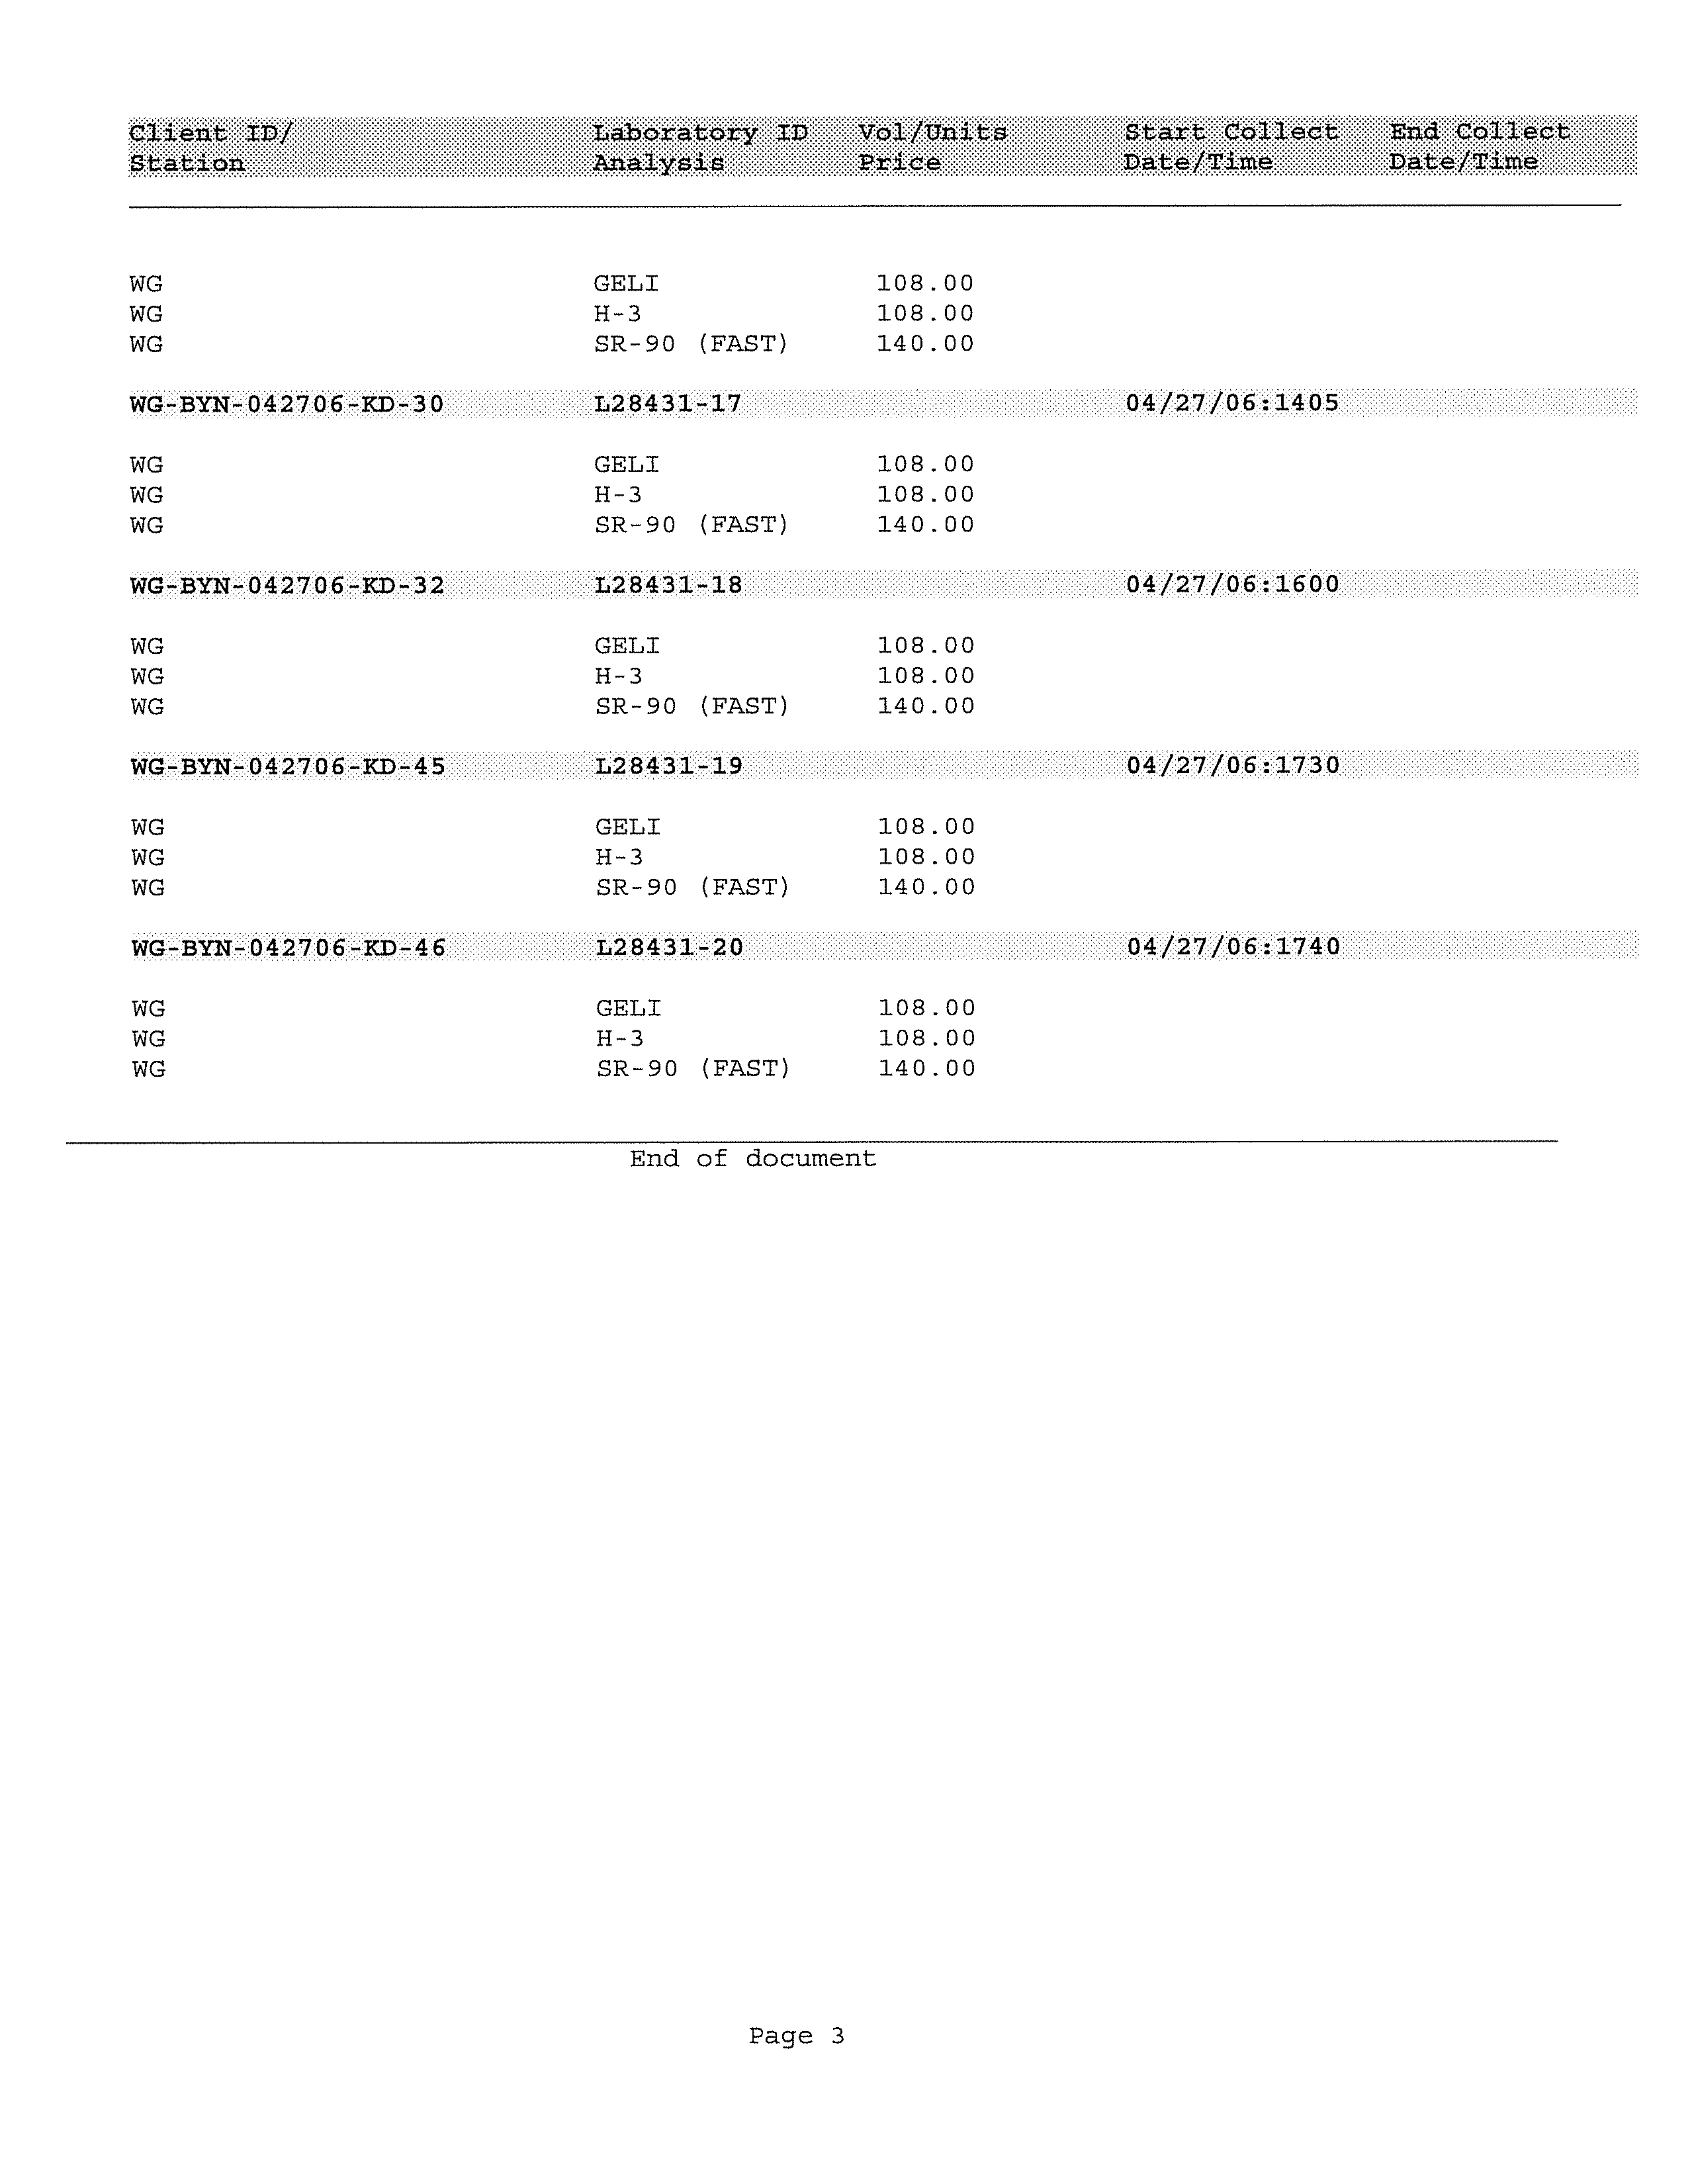
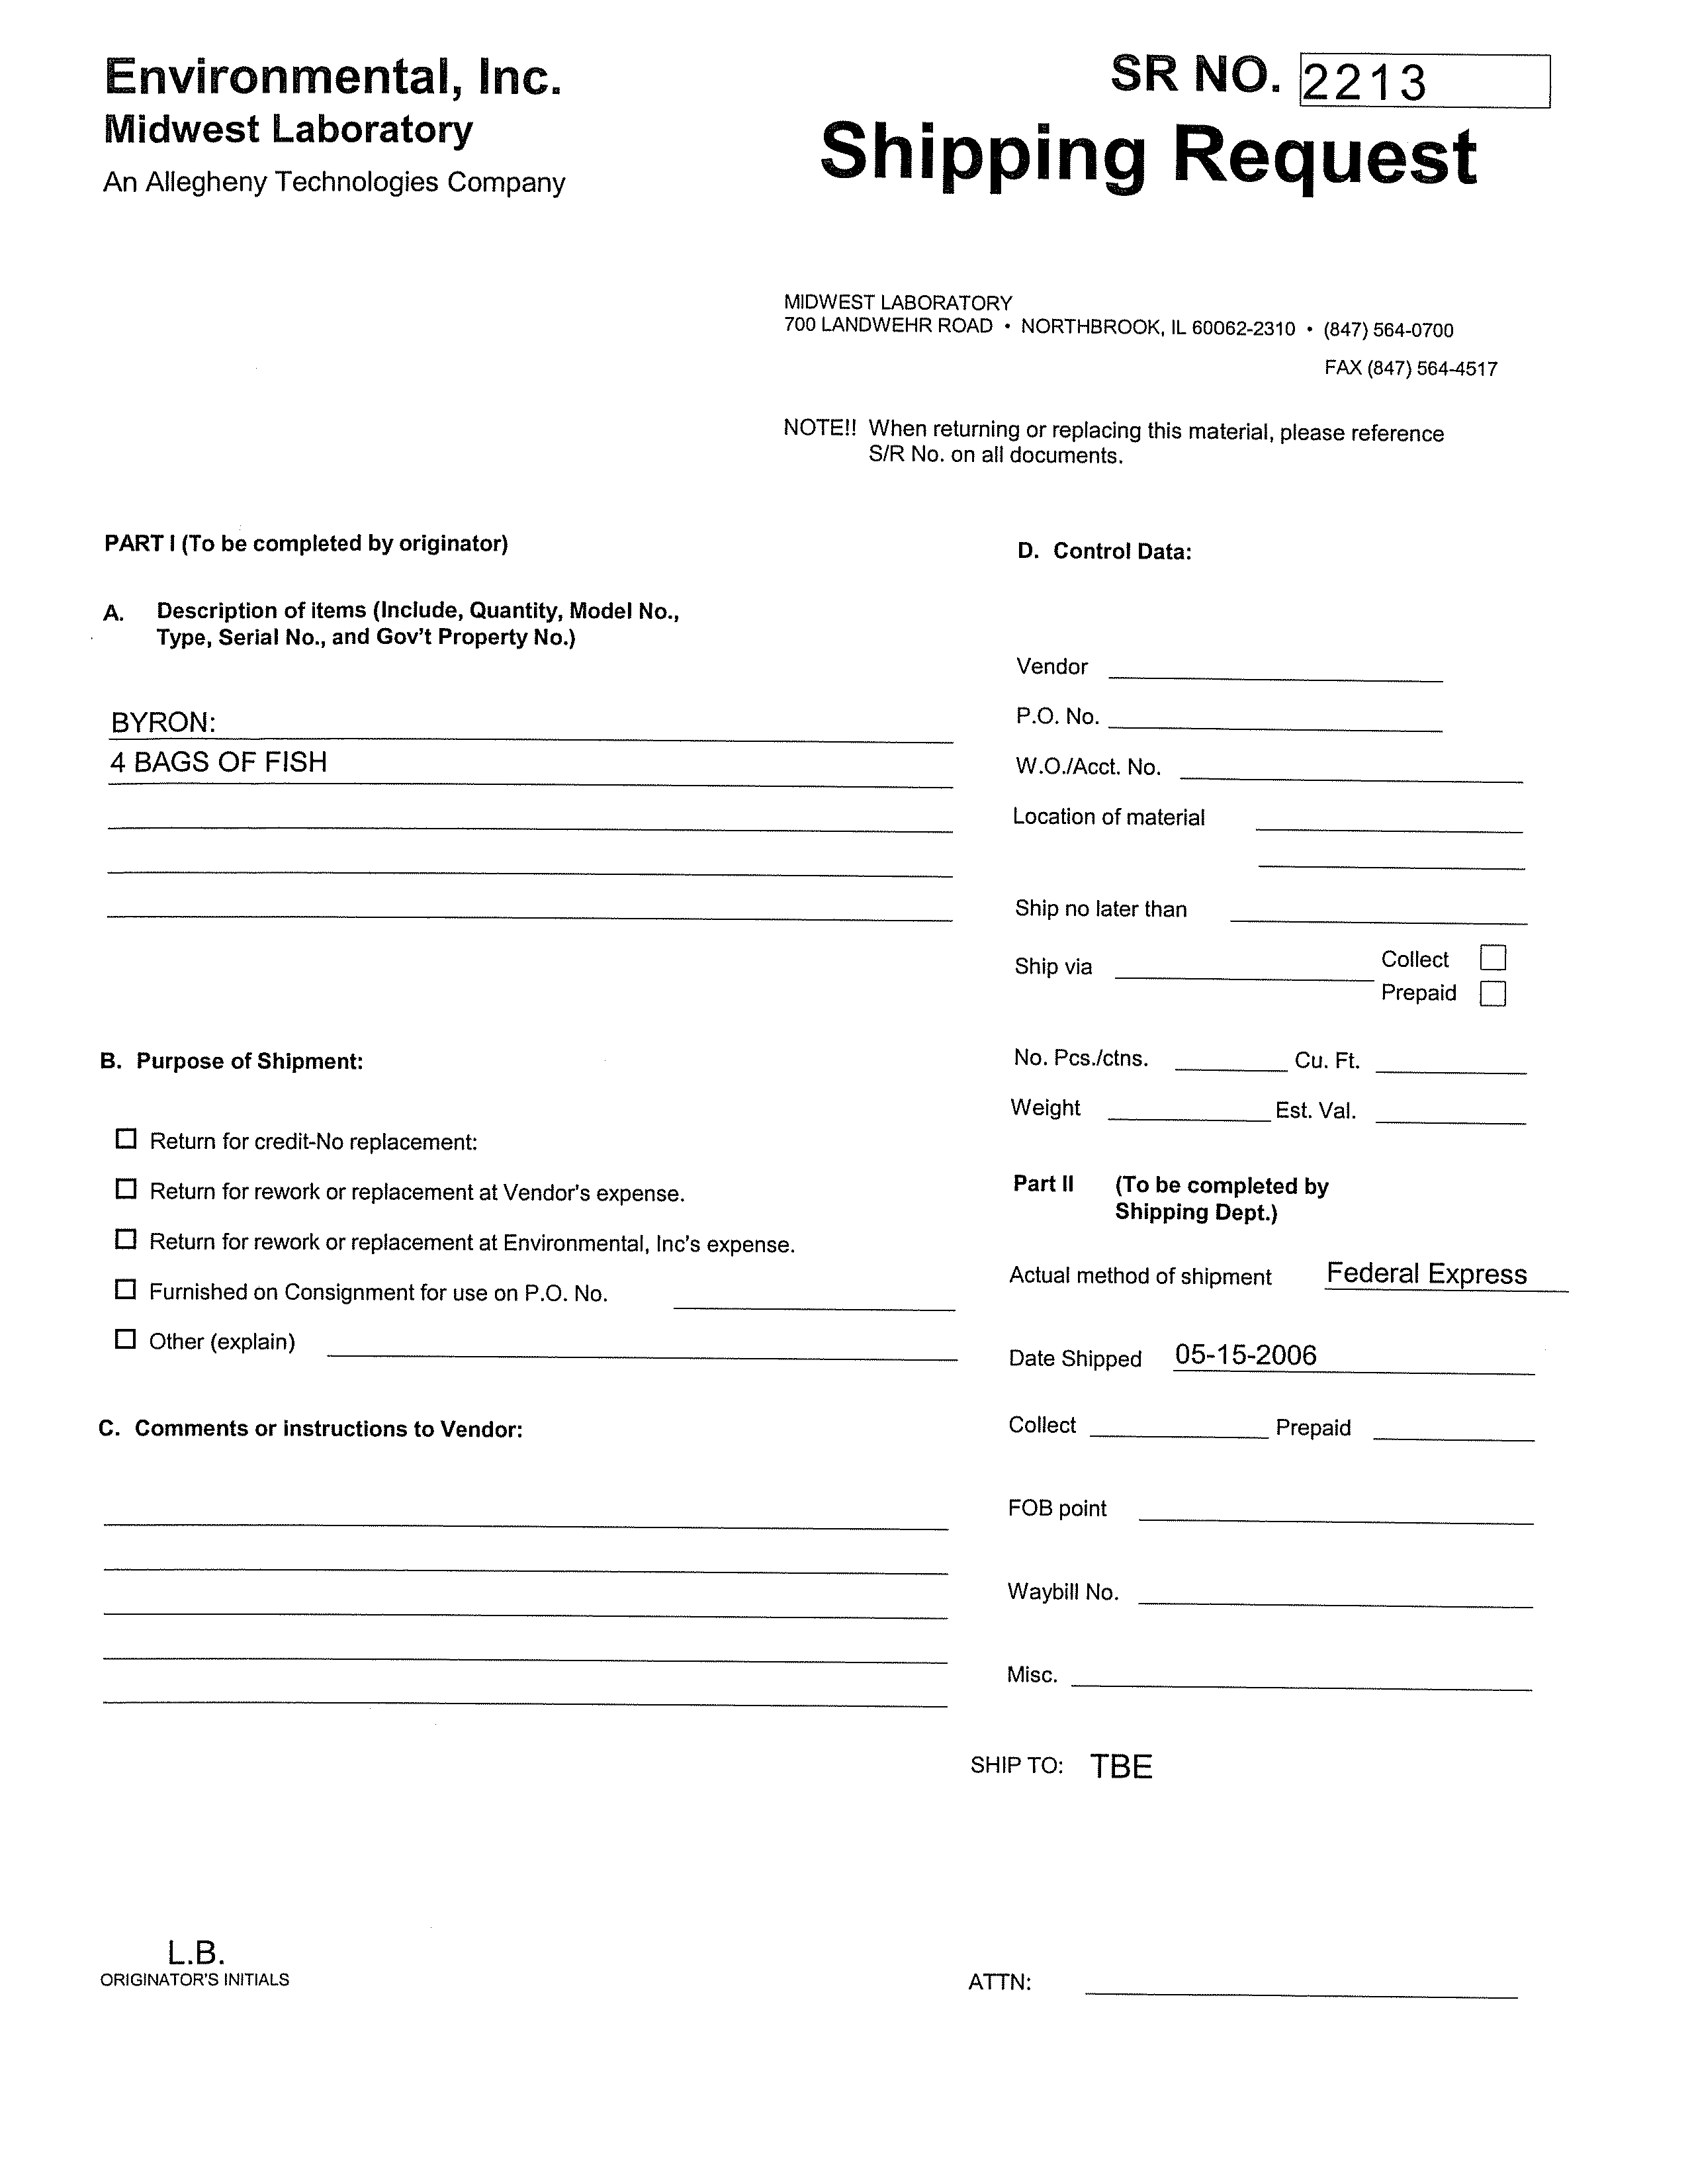
All groundwater samples were labeled with a unique
sample number, the date and time,
the parameters to be analyzed, the job number, and the sampler's initials. The samples
were then packed in a cooler for screening by the Station and shipment to the project
laboratory, Environmental, Inc., via overnight courier under chain-of-custody protocol
for tritium analysis. Split samples were also collected for the NRC and Illinois
Emergency Management Agency (IEMA) for tritium analysis simultaneously with the
actual sample at every sample location. The split samples were delivered to the Station
personnel for delivery to the NRC and IEMA.
The water purged from the Byron Salvage Site wells during the sampling event was
placed into two plastic holding tanks at the Station pending
characterization and
disposal in accordance with the Station's NPDES permit.
4.2
FLEETWIDE INVESTIGATION ACTIVITIES
4.2.1
GROUNDWATER ELEVATION MEASUREMENTS
On April 24, 2006, CRA collected a round of water level measurements from 63 of the
77 Station monitoring wells in accordance with the Work Plan. Based on the measured
depth to water from the reference point and the surveyed elevation of the reference
point, the groundwater elevation was calculated.
A summary of groundwater
045136 (13) Byron Generating Station
23
CONESTOGA-ROVERS & ASSOCIATES
Revision 1
elevations for the April 24, 2006 event is provided in Table 4.5.
Water level
measurements were collected using a portable electronic depth-to-water probe accurate
to ± 0.01 foot. The measurements were made from a designated location at the highest
point on each well's inner riser or steel casing. The water level measurements were
obtained using the following procedures:
•
the proper elevation of the
meter was checked by inserting the tip into water and
noting if the contact was registering correctly;
•
the tip was dried, and then slowly lowered into
the well until contact with the water
was indicated;
•
the tip was slowly raised until the light
and/or buzzer just began to activate. This
indicated the static water level;
•
the reading at the reference point was noted to the nearest hundredth of a foot.
•
the reading was then re-checked; and
•
the water level was then recorded, and the water level meter decontaminated prior
to use at the next well location.
4.2.2
GROUNDWATER SAMPLE COLLECTION
CRA conducted a second round of groundwater sampling from April 24 through
April 28, 2006. A total of 41 monitoring wells were sampled during the second event.
These included the 39 wells sampled during the first event and wells DF-13 and Well 7.
At these monitoring well locations, CRA conducted the sampling using pneumatic
bladder pumps or peristaltic pumps and dedicated polyethylene tubing to employ low
flow purging techniques as described in Puls and Barcelona (1996).
The groundwater in the monitoring wells was sampled by the following
low-flow
procedures:
•
the wells were correctly located and identification numbers were verified;
•
a water level measurement was taken;
•
the well was sounded by carefully lowering the electronic depth-to-water probe to
the
bottom of the well (as to minimize penetration and disturbance of the well
bottom sediment), and comparing the sounded depth to the installed depth to assess
the presence of any excess sediment or drill cuttings;
045136 (13) Byron Generating Station
24
CONESTOGA-ROVERS & ASSOCIATES
Revision 1
•
the pump or tubing was lowered slowly into the well and fixed into place such that
the intake was located at the mid-point of the well screen, or a minimum of 2 feet
above the well bottom/sediment level;
•
the purging was conducted using
a pumping rate between 100 to 500 milliliters per
minute (mL/min). Initial purging began using the lower end of this range. The
groundwater level was monitored to ensure that a drawdown of less than 0.3 foot
occurred. If this criterion was met, the pumping rate was increased dependent on
the behavior of the well. During purging, the pumping rate and groundwater level
were measured and recorded every 10 minutes;
•
the
field parameters (pH, temperature, conductivity, oxidation-reduction potential
(ORP), dissolved oxygen (DO), and turbidity) were monitored during the purging to
evaluate the stabilization of the purged groundwater. Stabilization was considered
to be achieved when three consecutive readings for each parameter, taken at
5-minute intervals, were within the following limits:
pH
±
0.1 pH units of the average value of the three readings,
Temperature
±
3 percent of the average value of the three readings,
Conductivity
±
0.005 milliSiemen per centimeter (mS/cm) of the average value
of the three readings for conductivity <1 mS/cm and
±
0.01 mS/cm of the average value of the three readings for
conductivity >1 mS/cm,
ORP
±
10 millivolts (mV) of the average value of the three readings,
DO
±
10 percent of the average value of the three readings, and
Turbidity
±
10 percent of the average value of the three readings, or a final
value of less than 5 nephelometric turbidity units (NTU);
•
once purging was complete, the groundwater samples were collected directly from
the pump/tubing into the sample containers; and
•
in the event that the groundwater recharge to the monitoring well was
insufficient to
conduct low flow sampling procedure, the well was pumped dry and allowed to
sufficiently recharge prior to sampling.
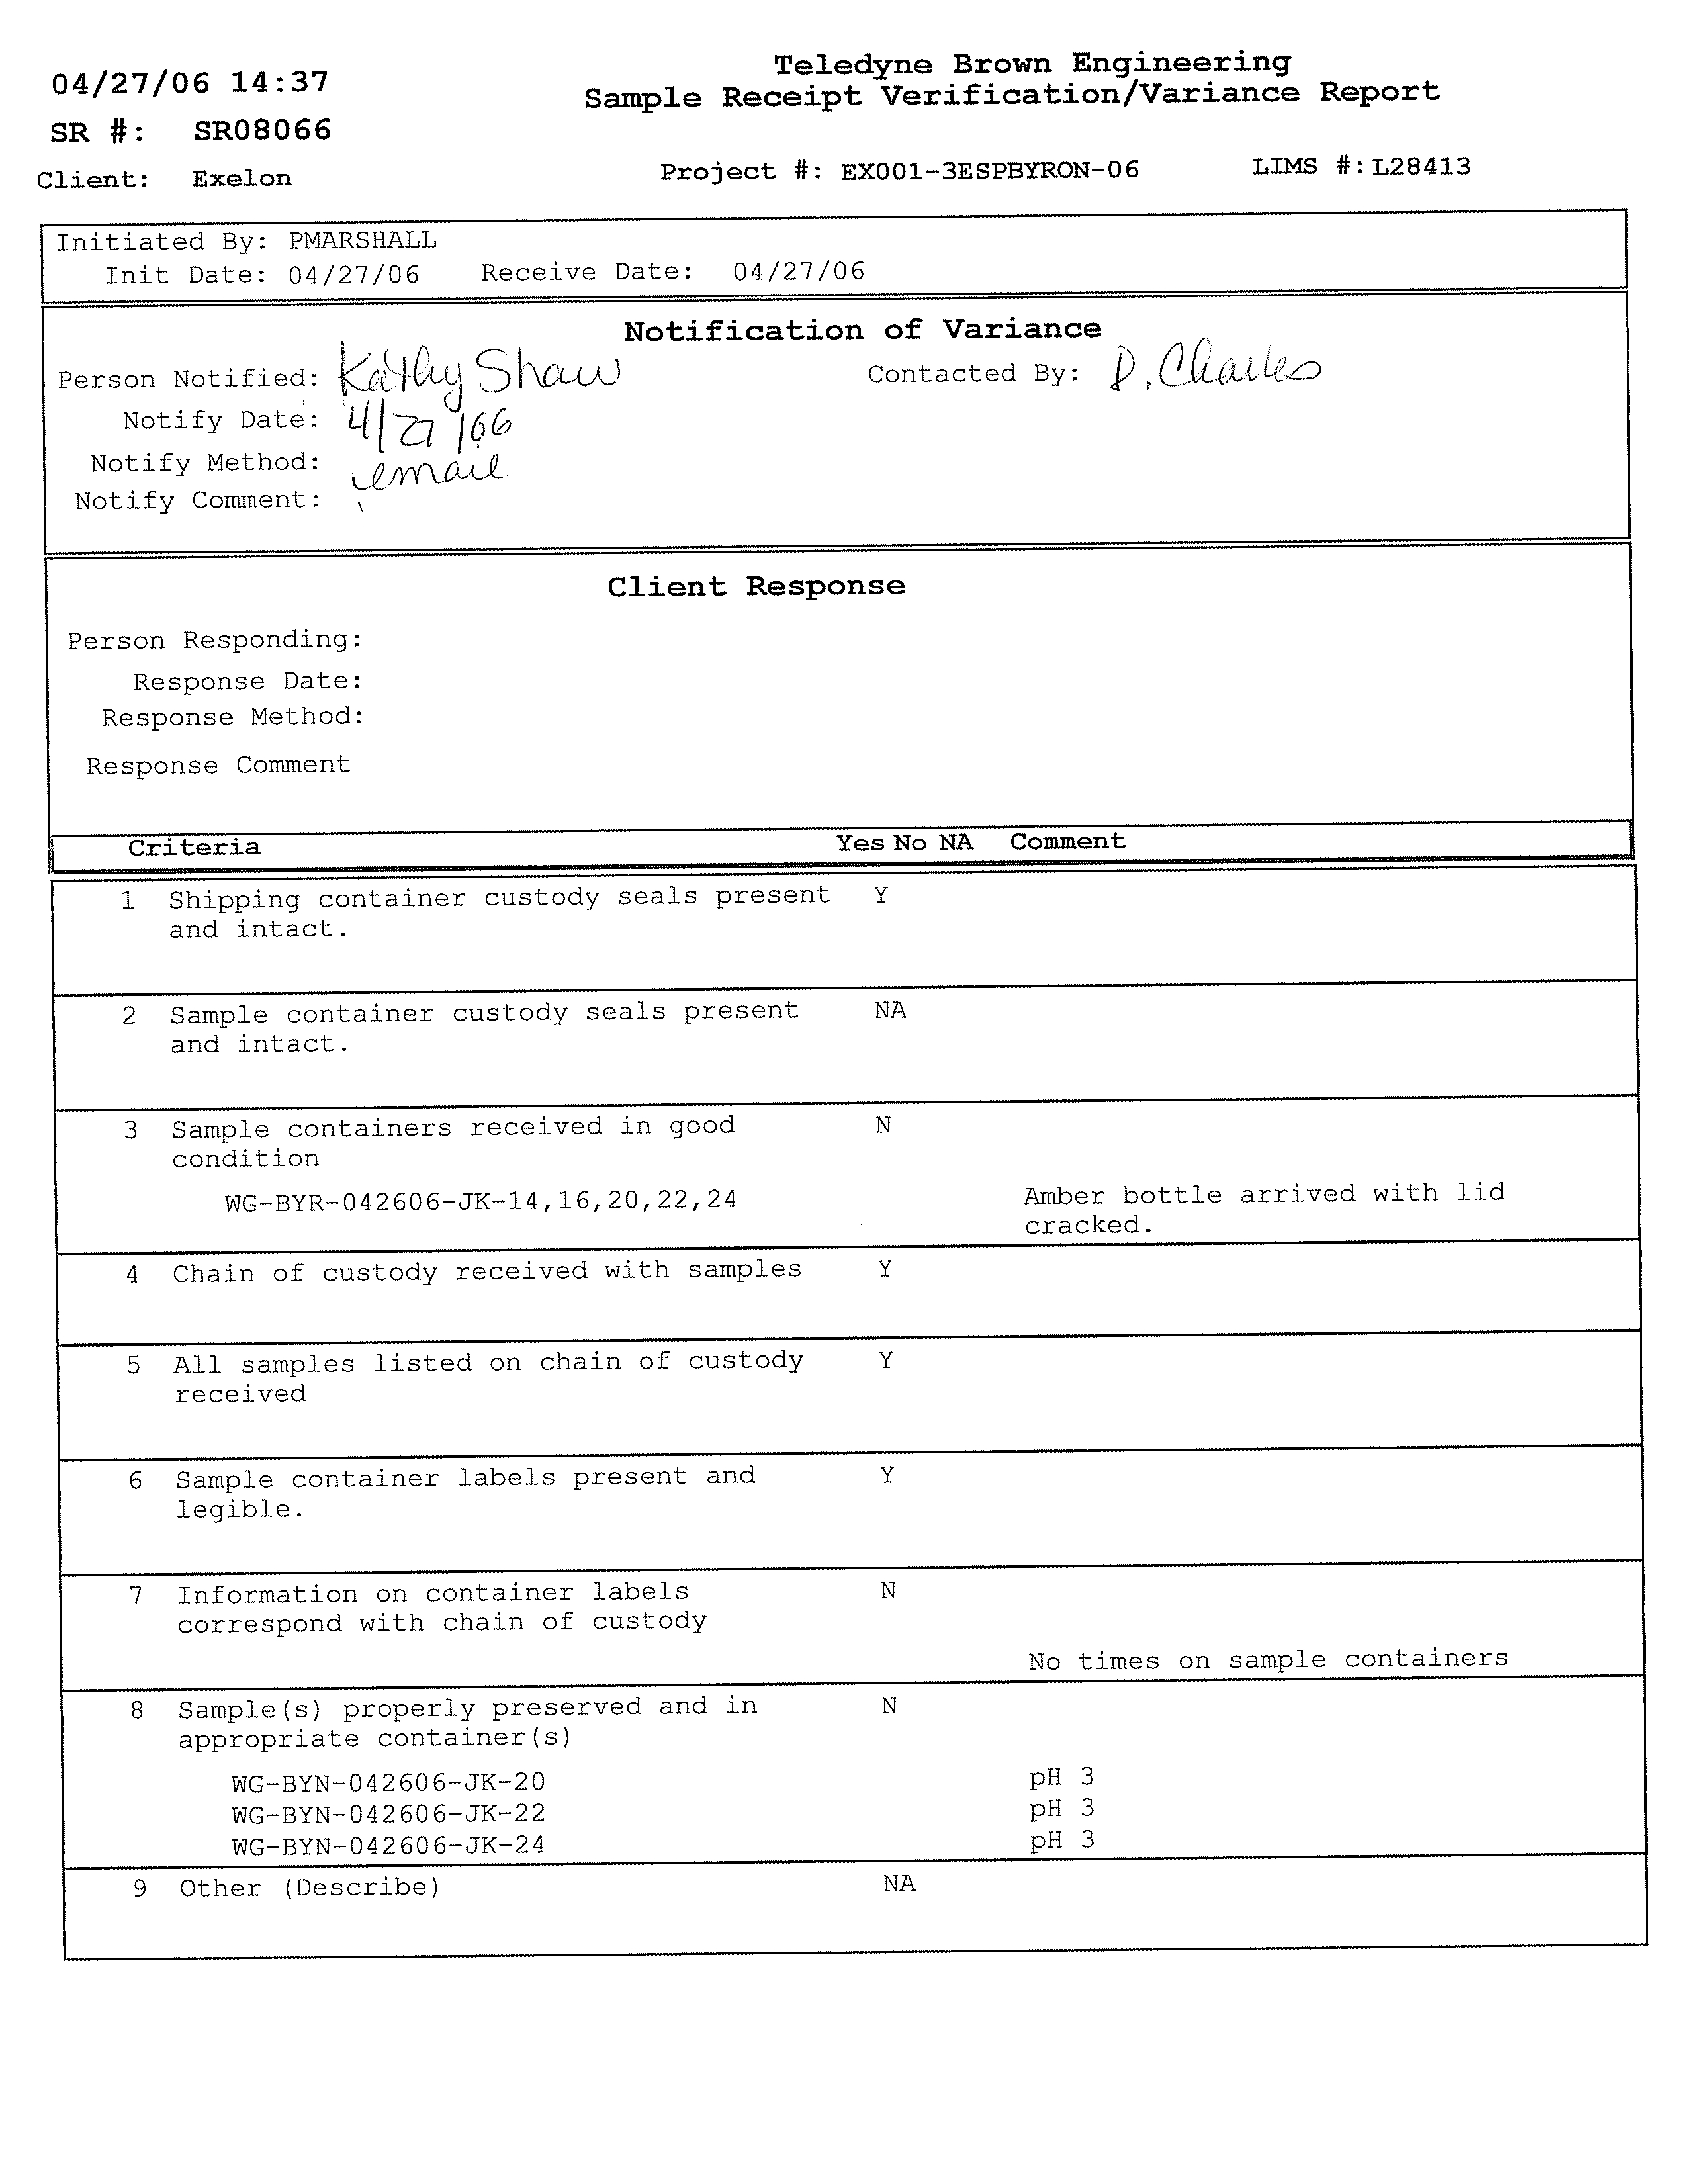
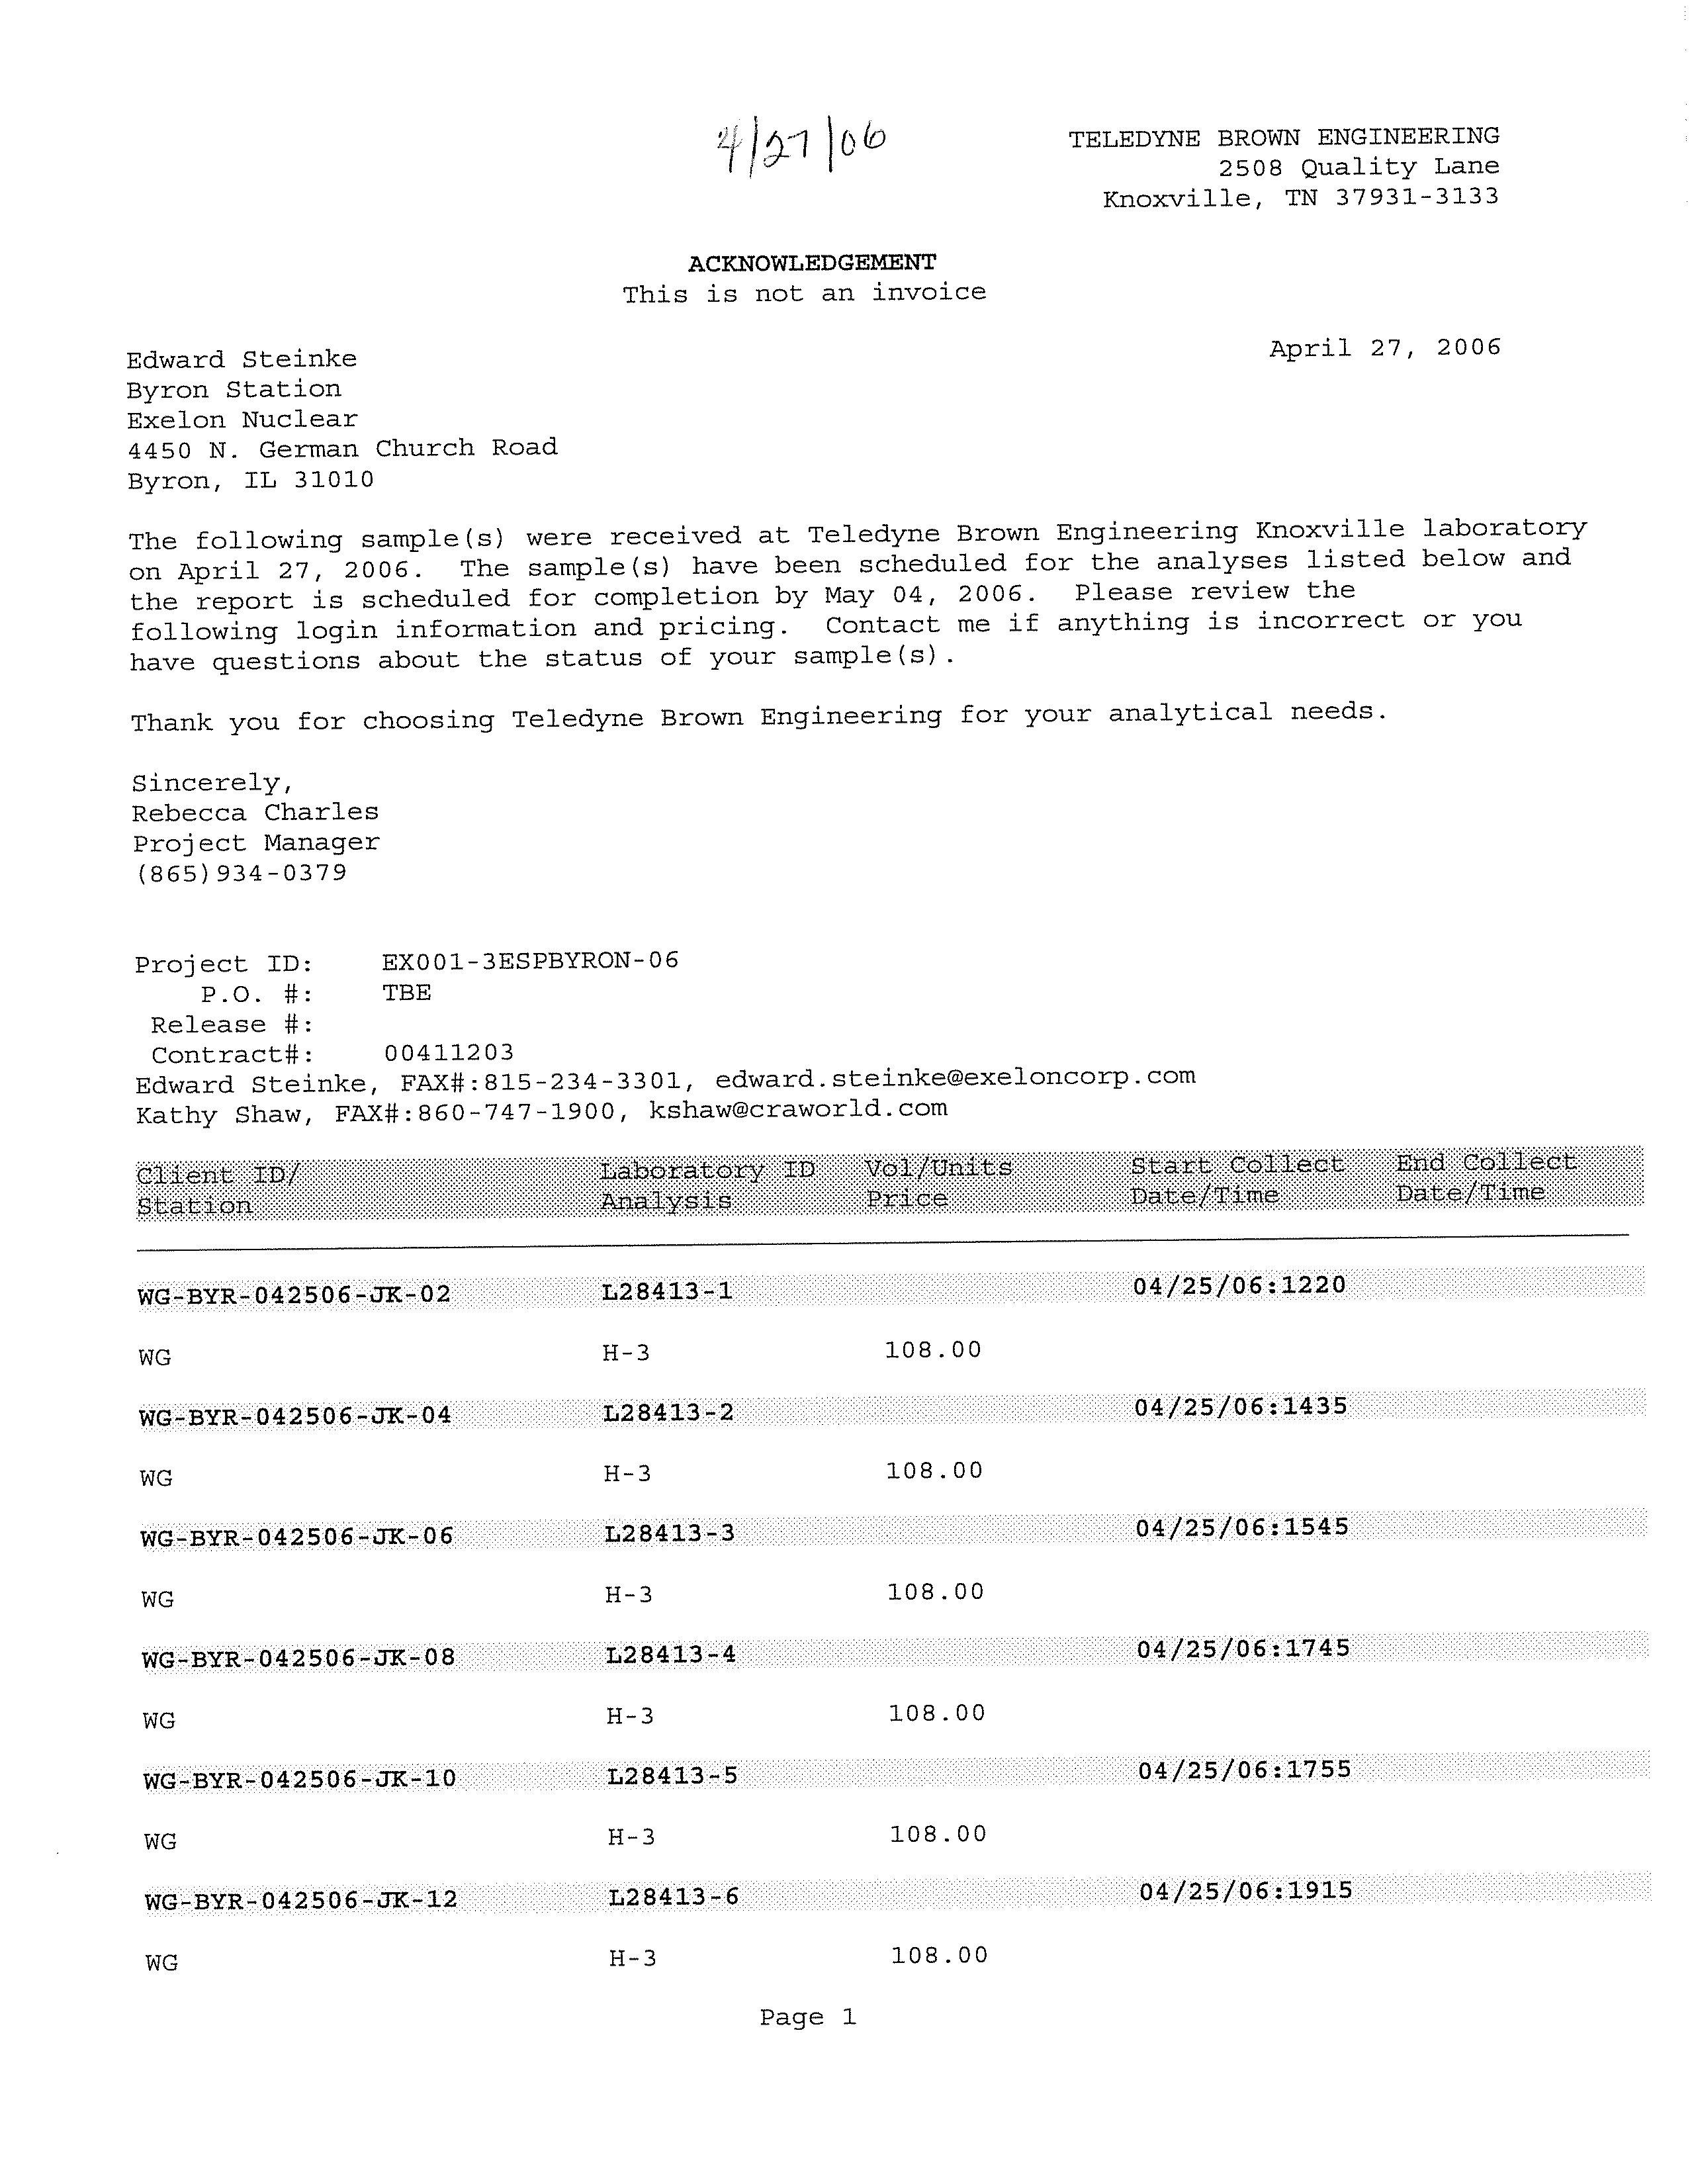
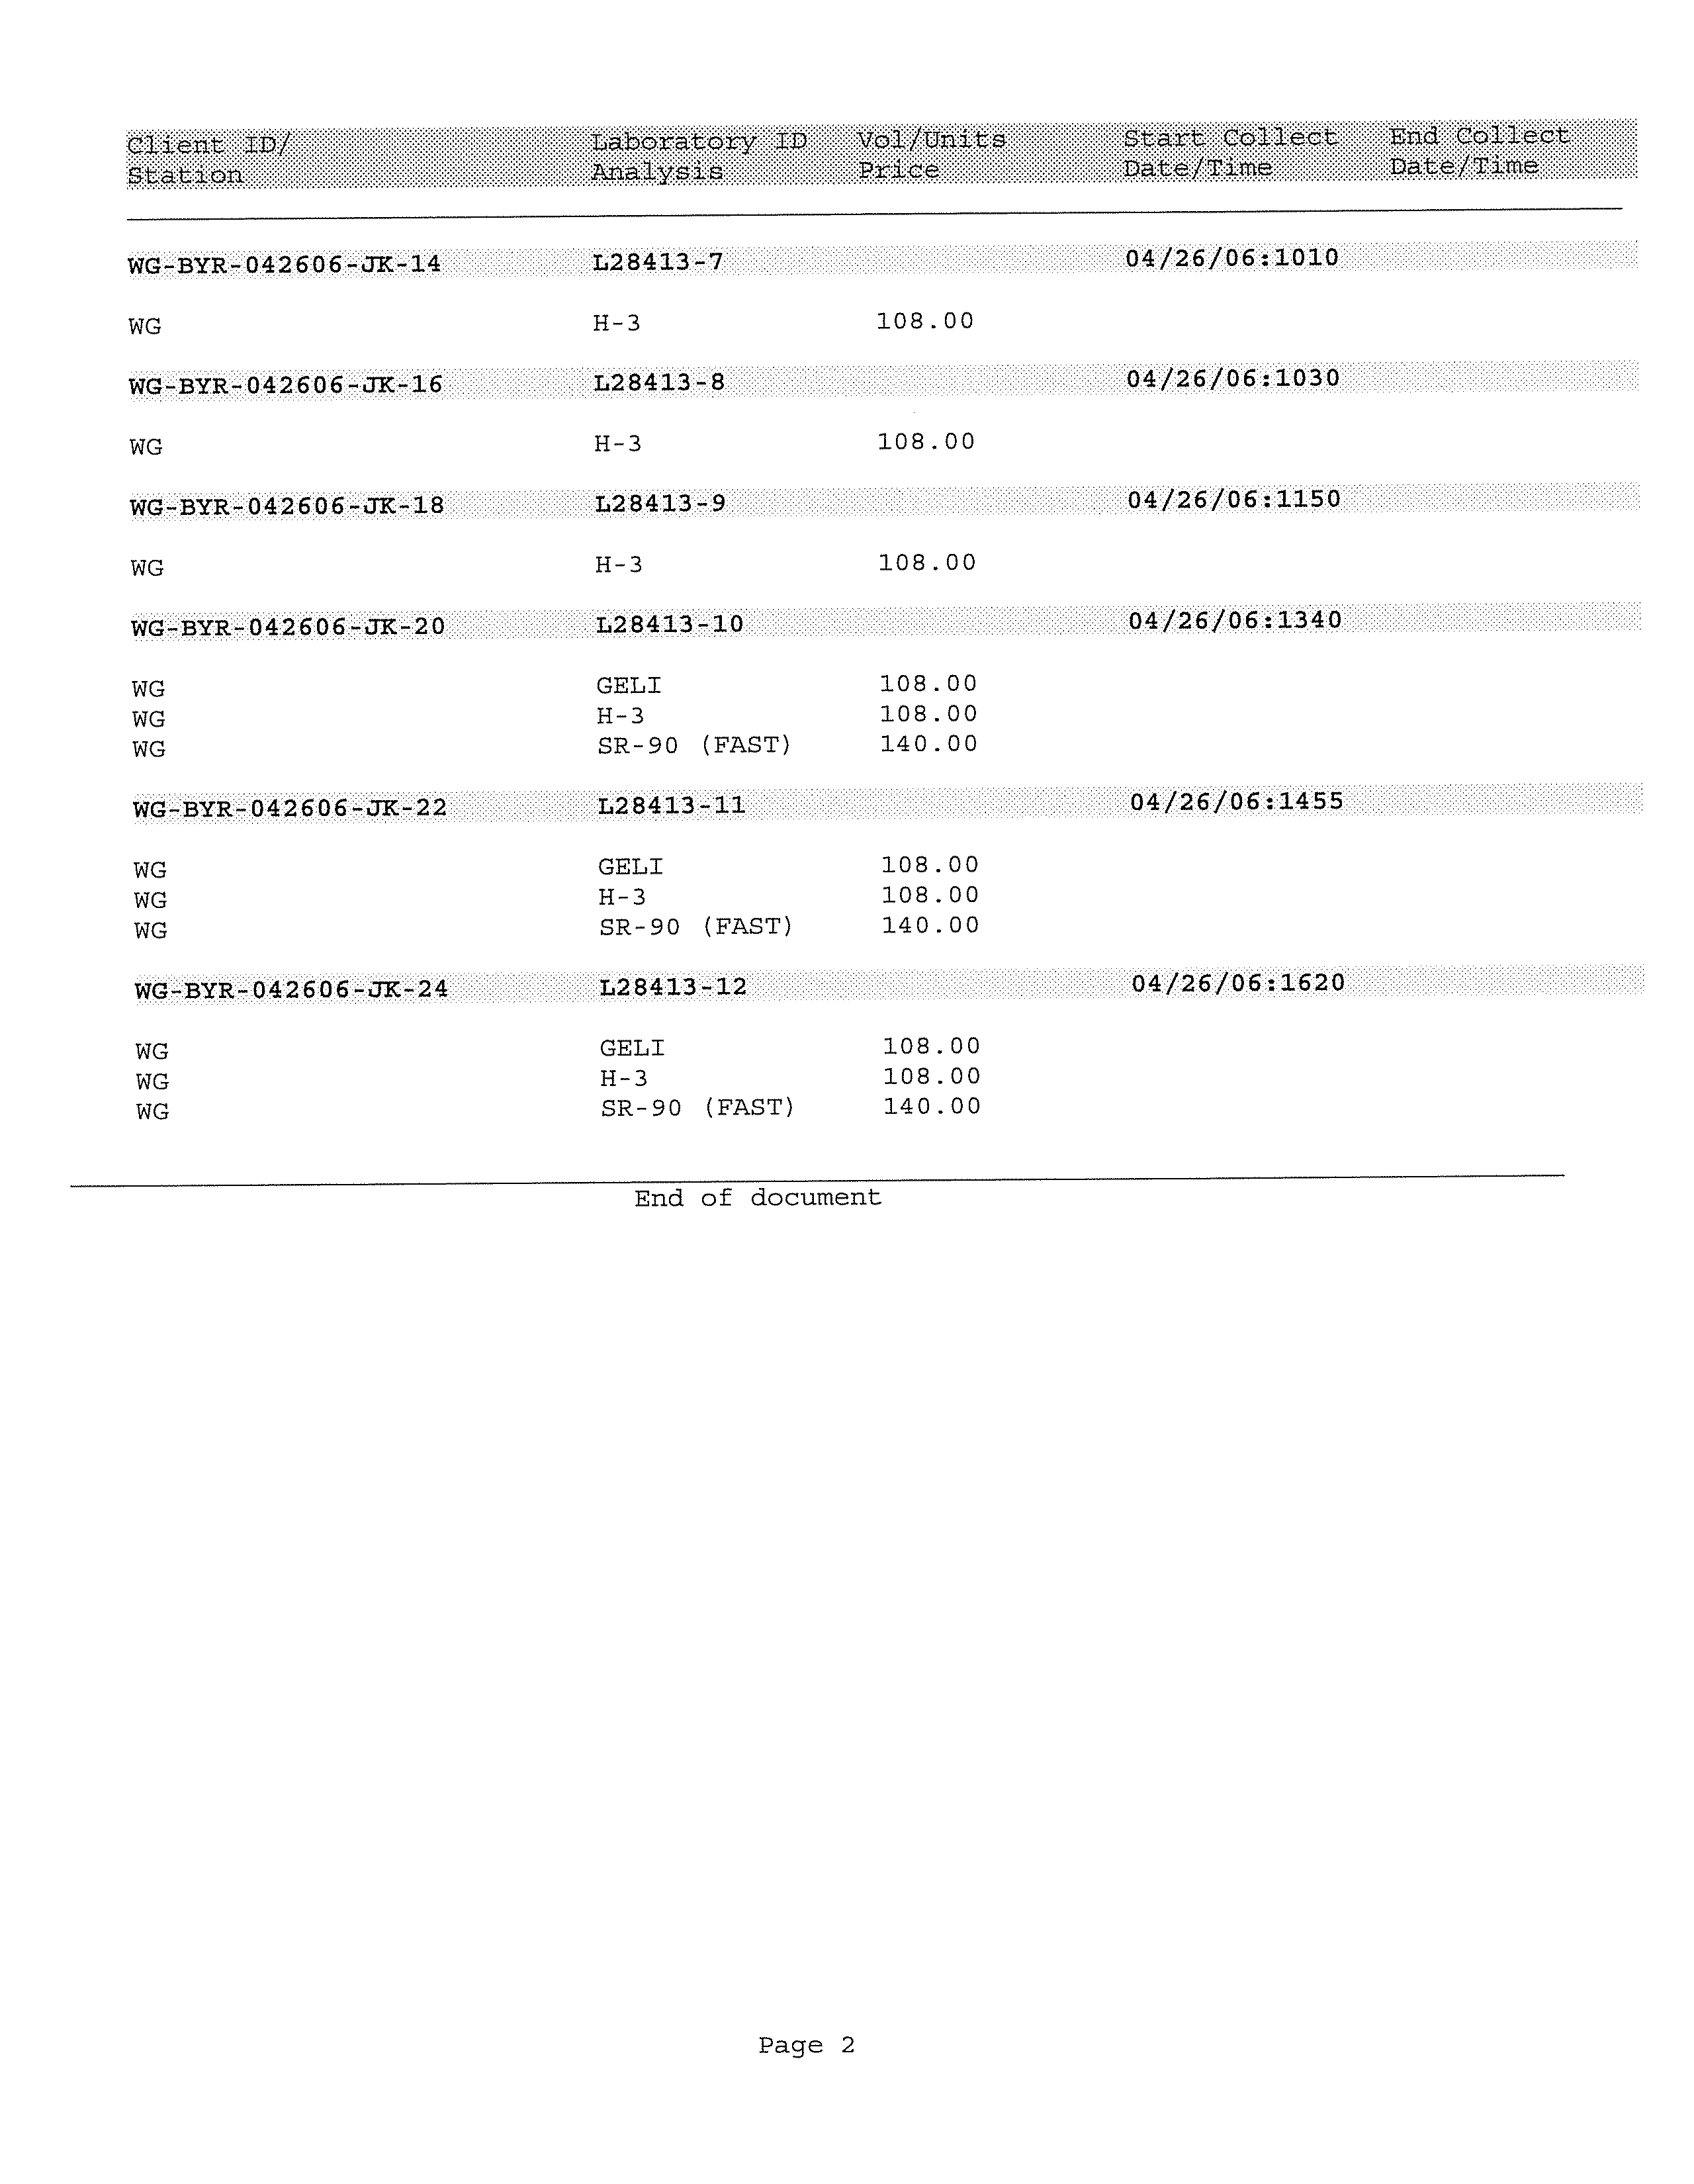
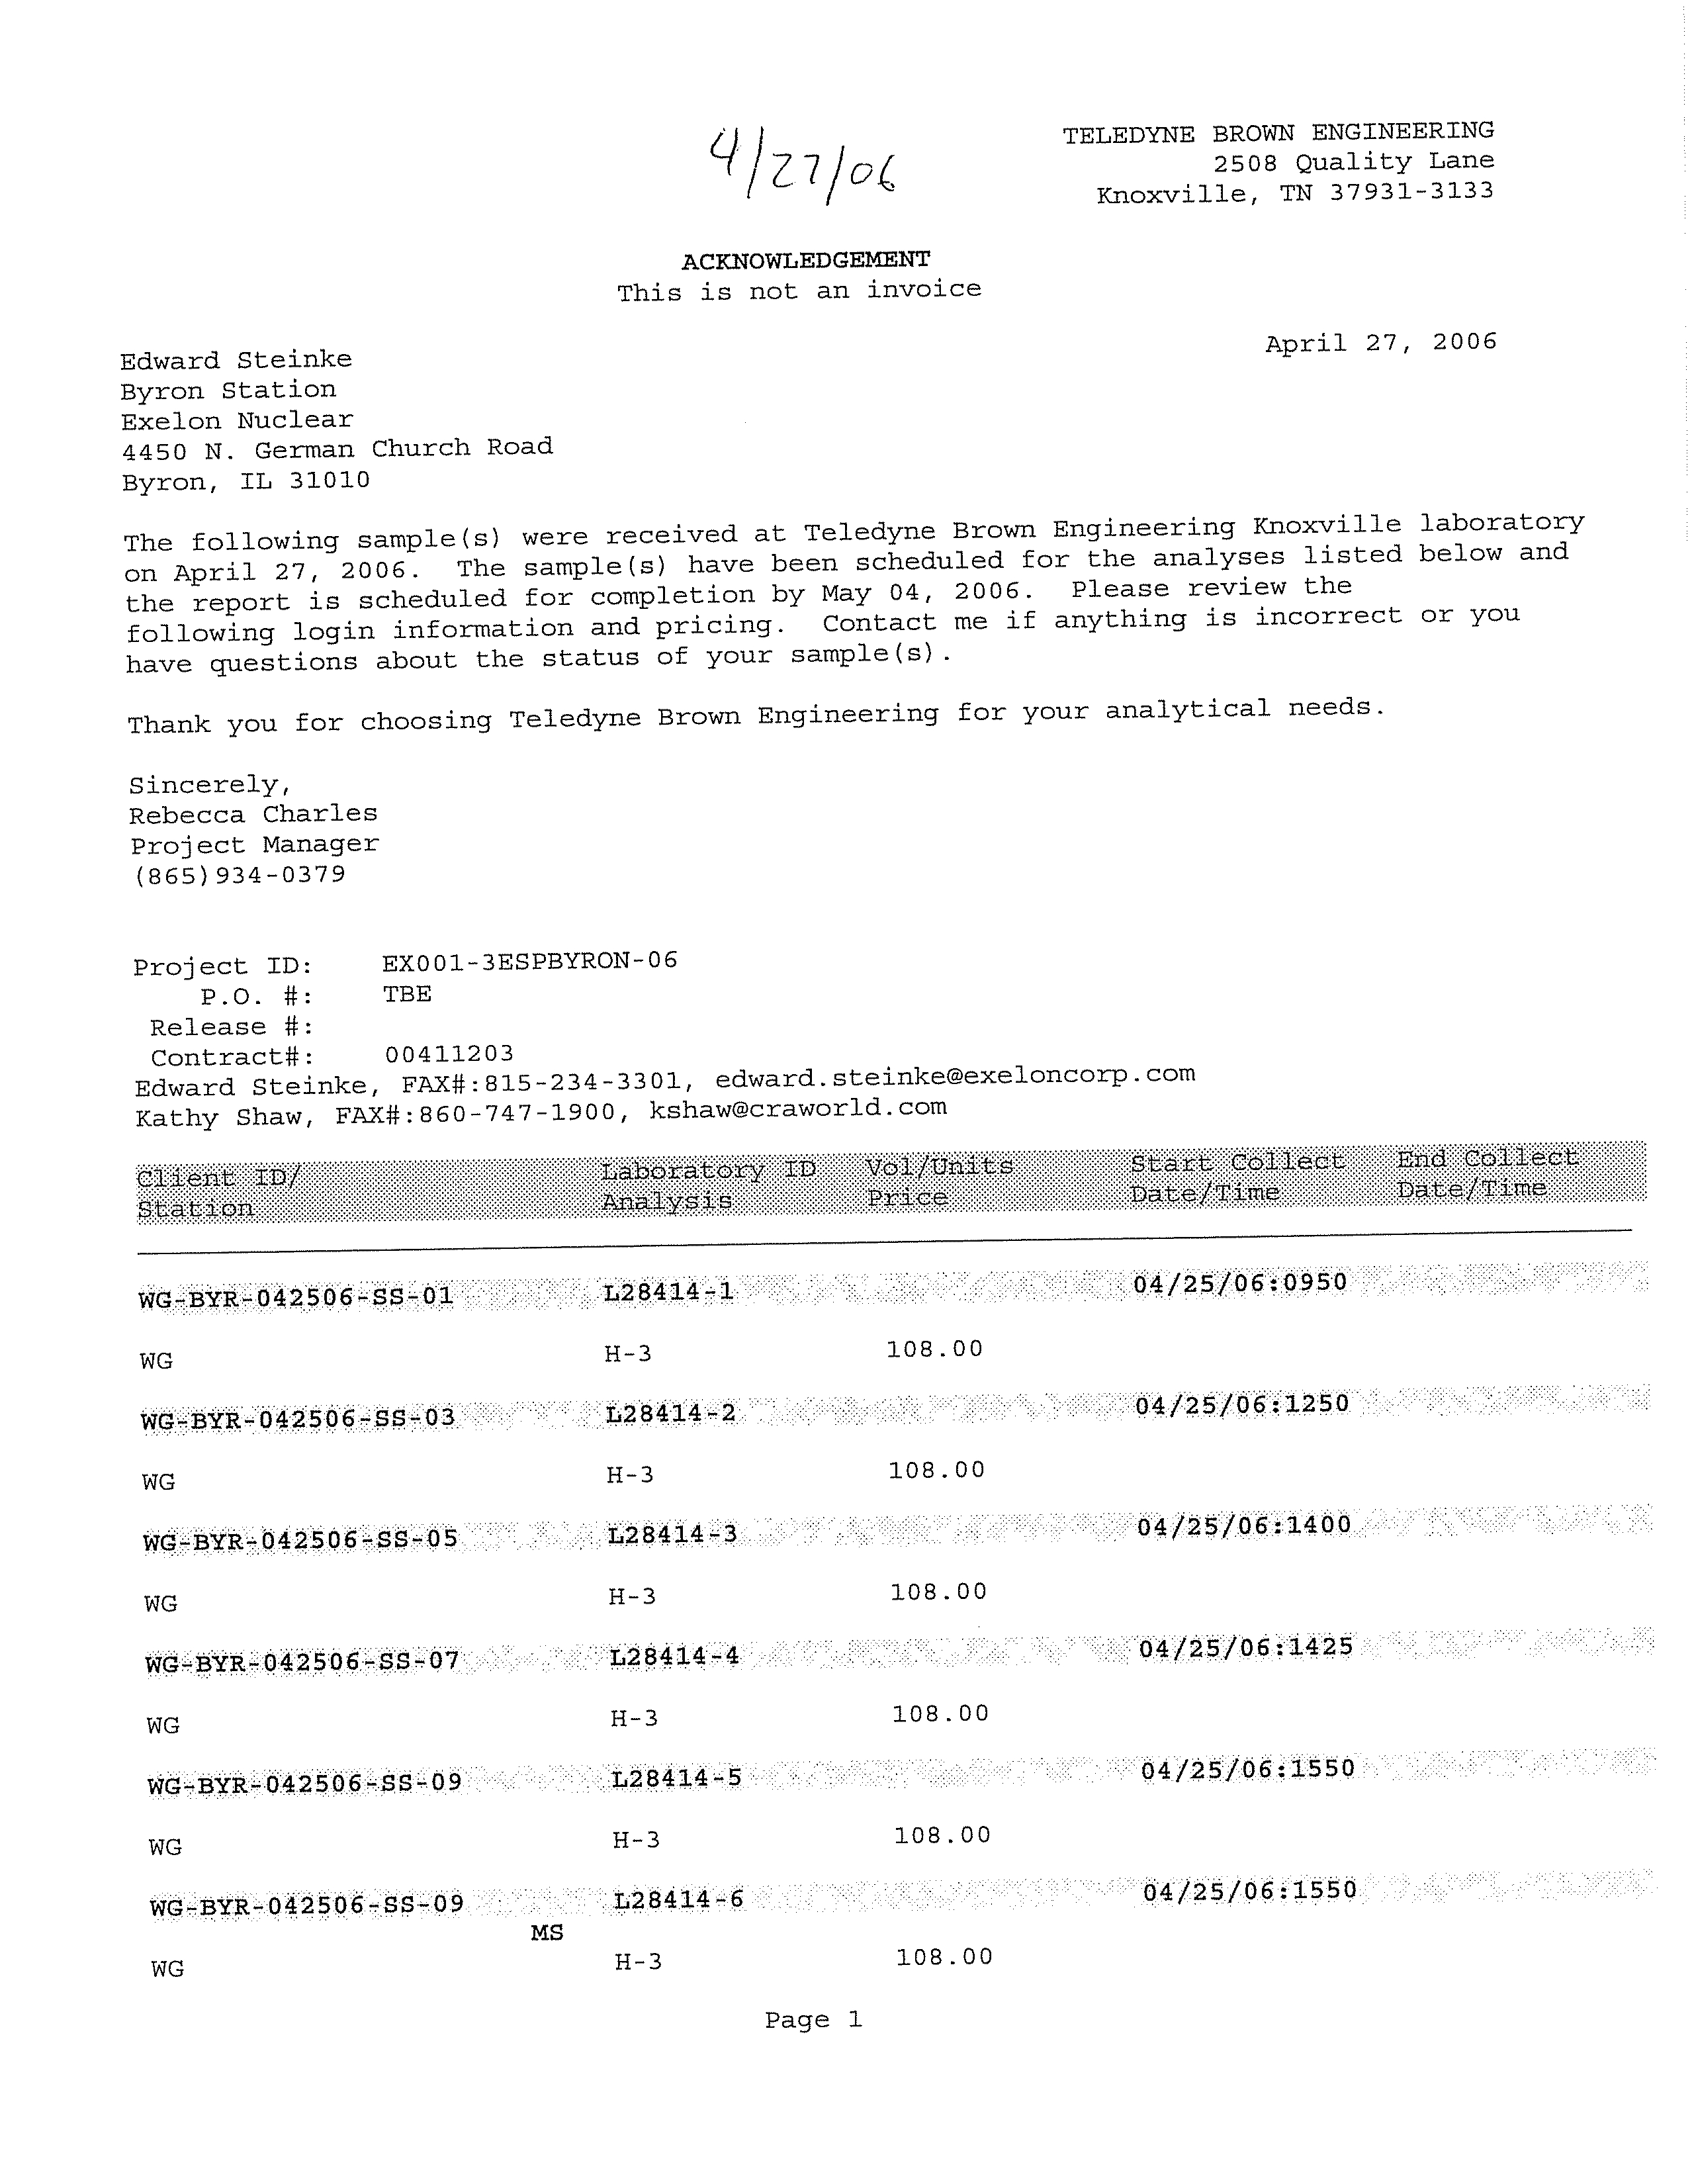
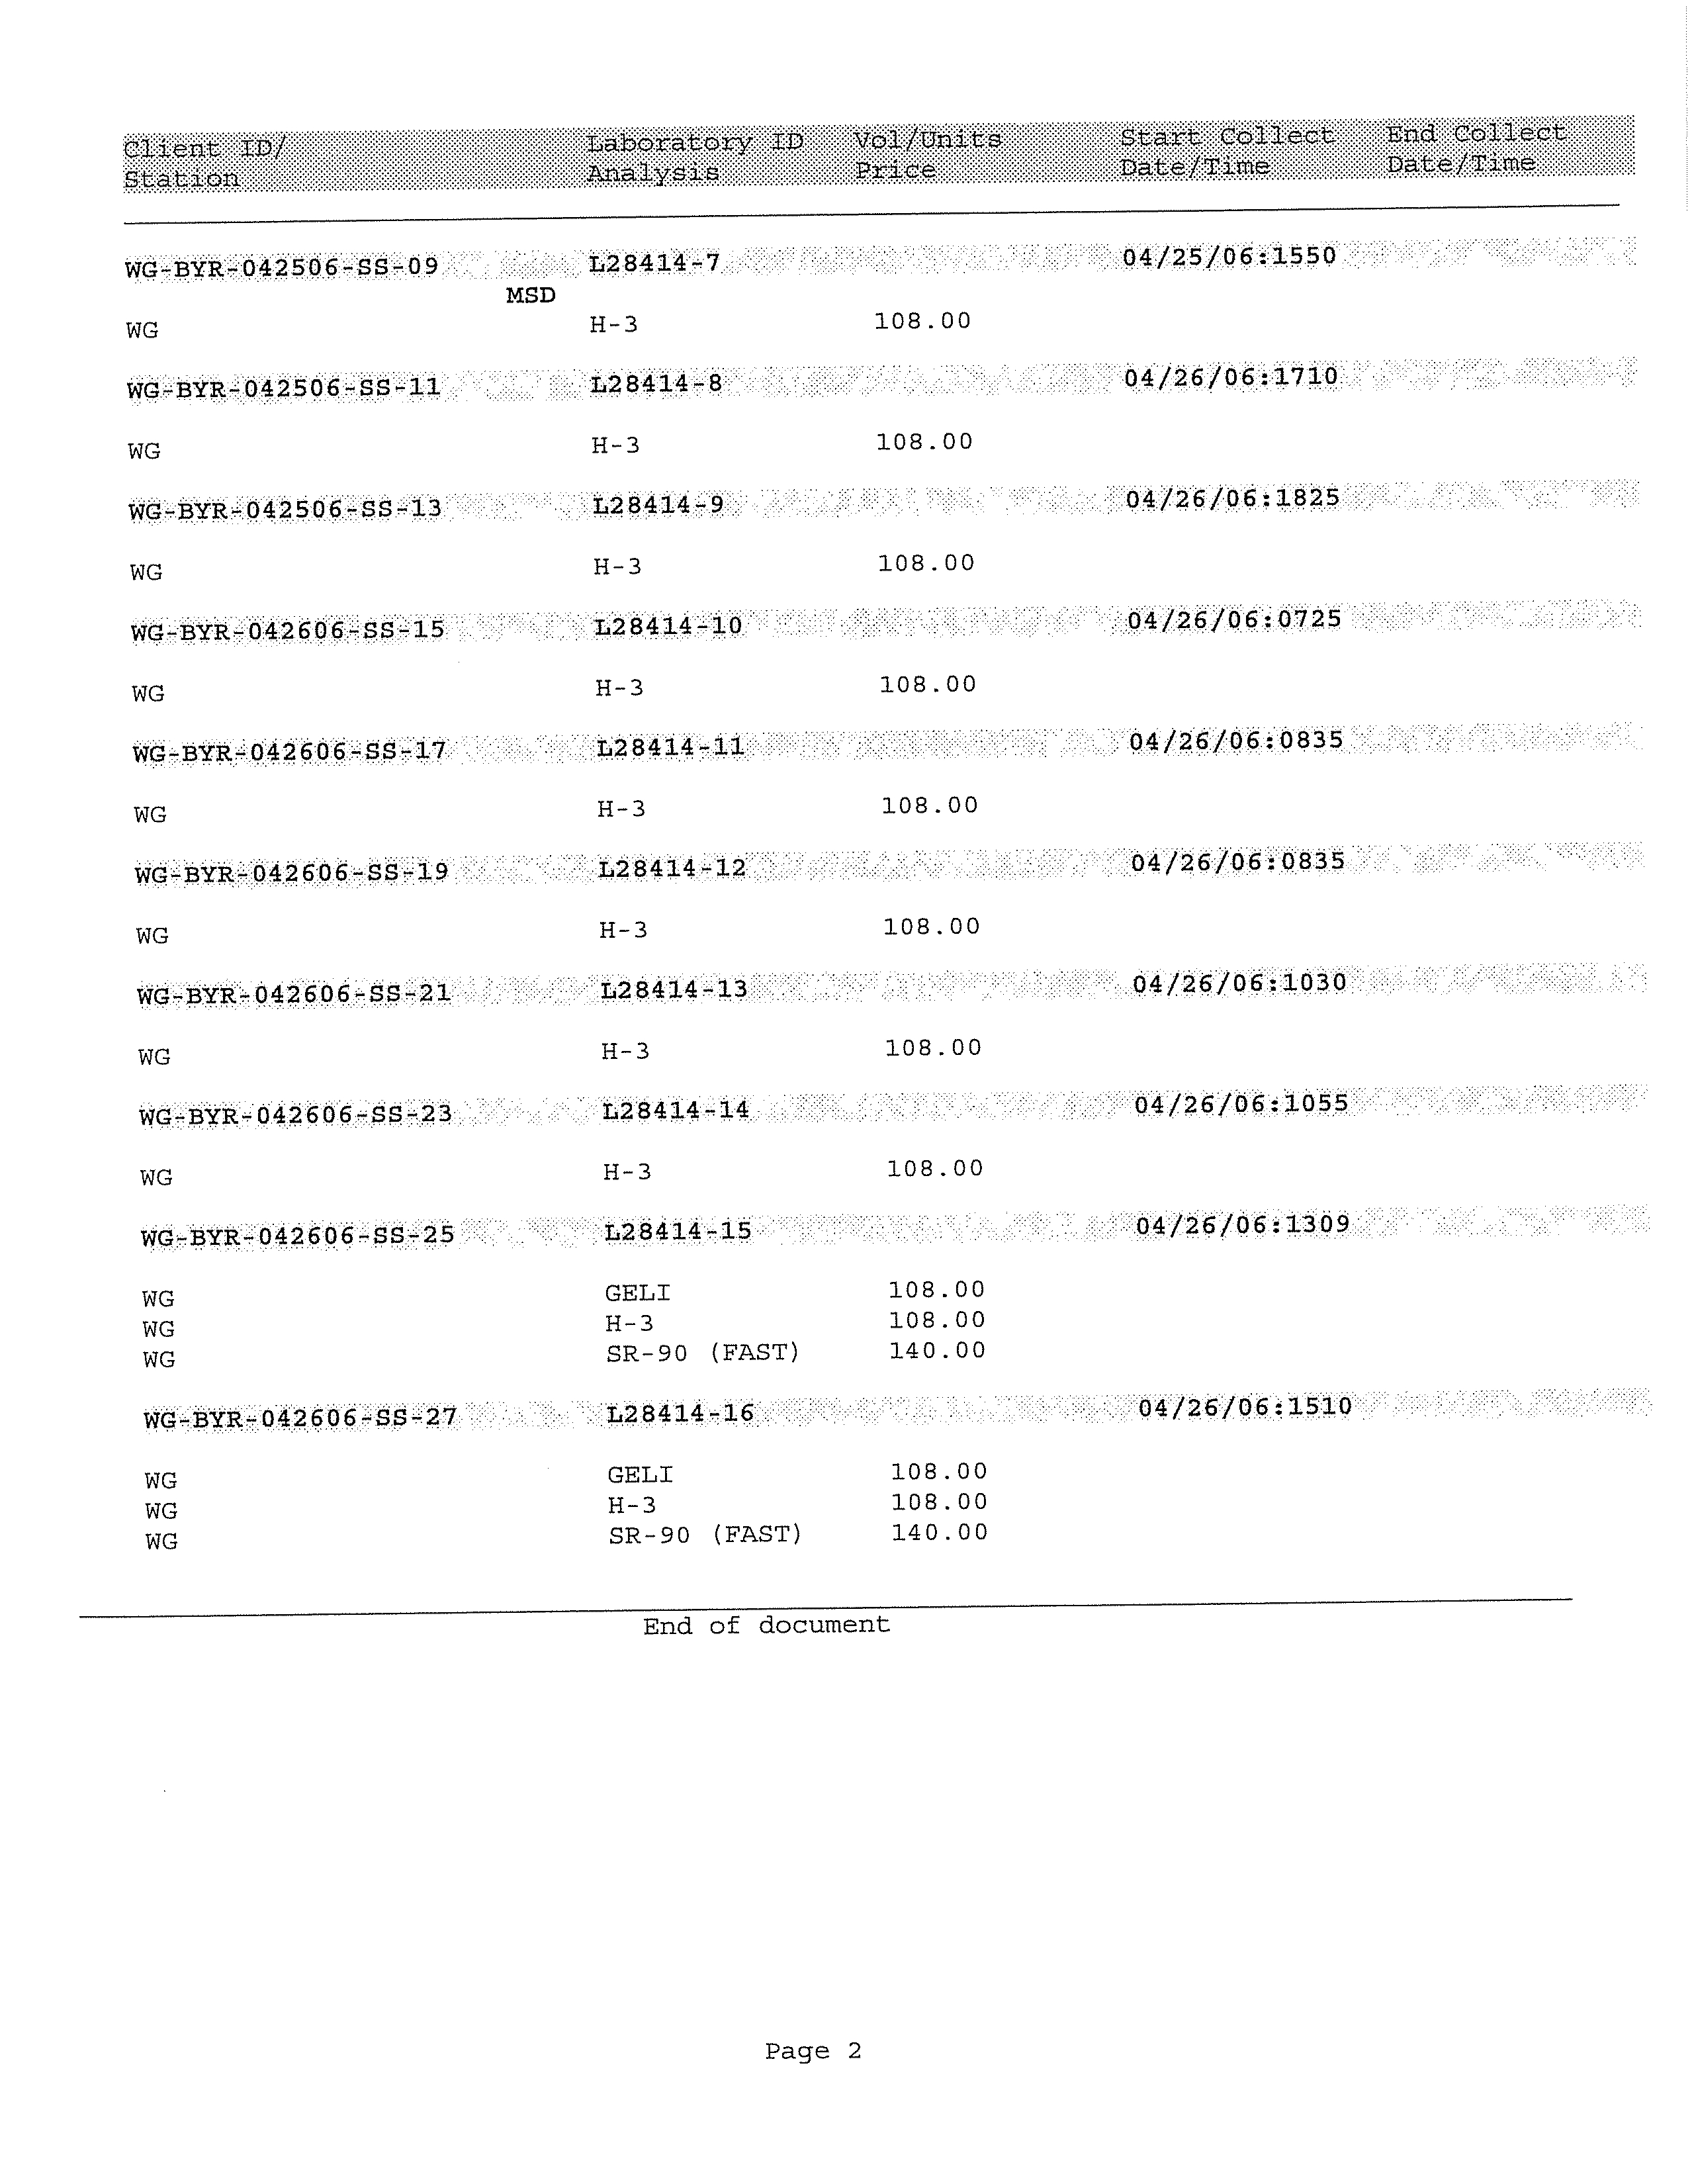
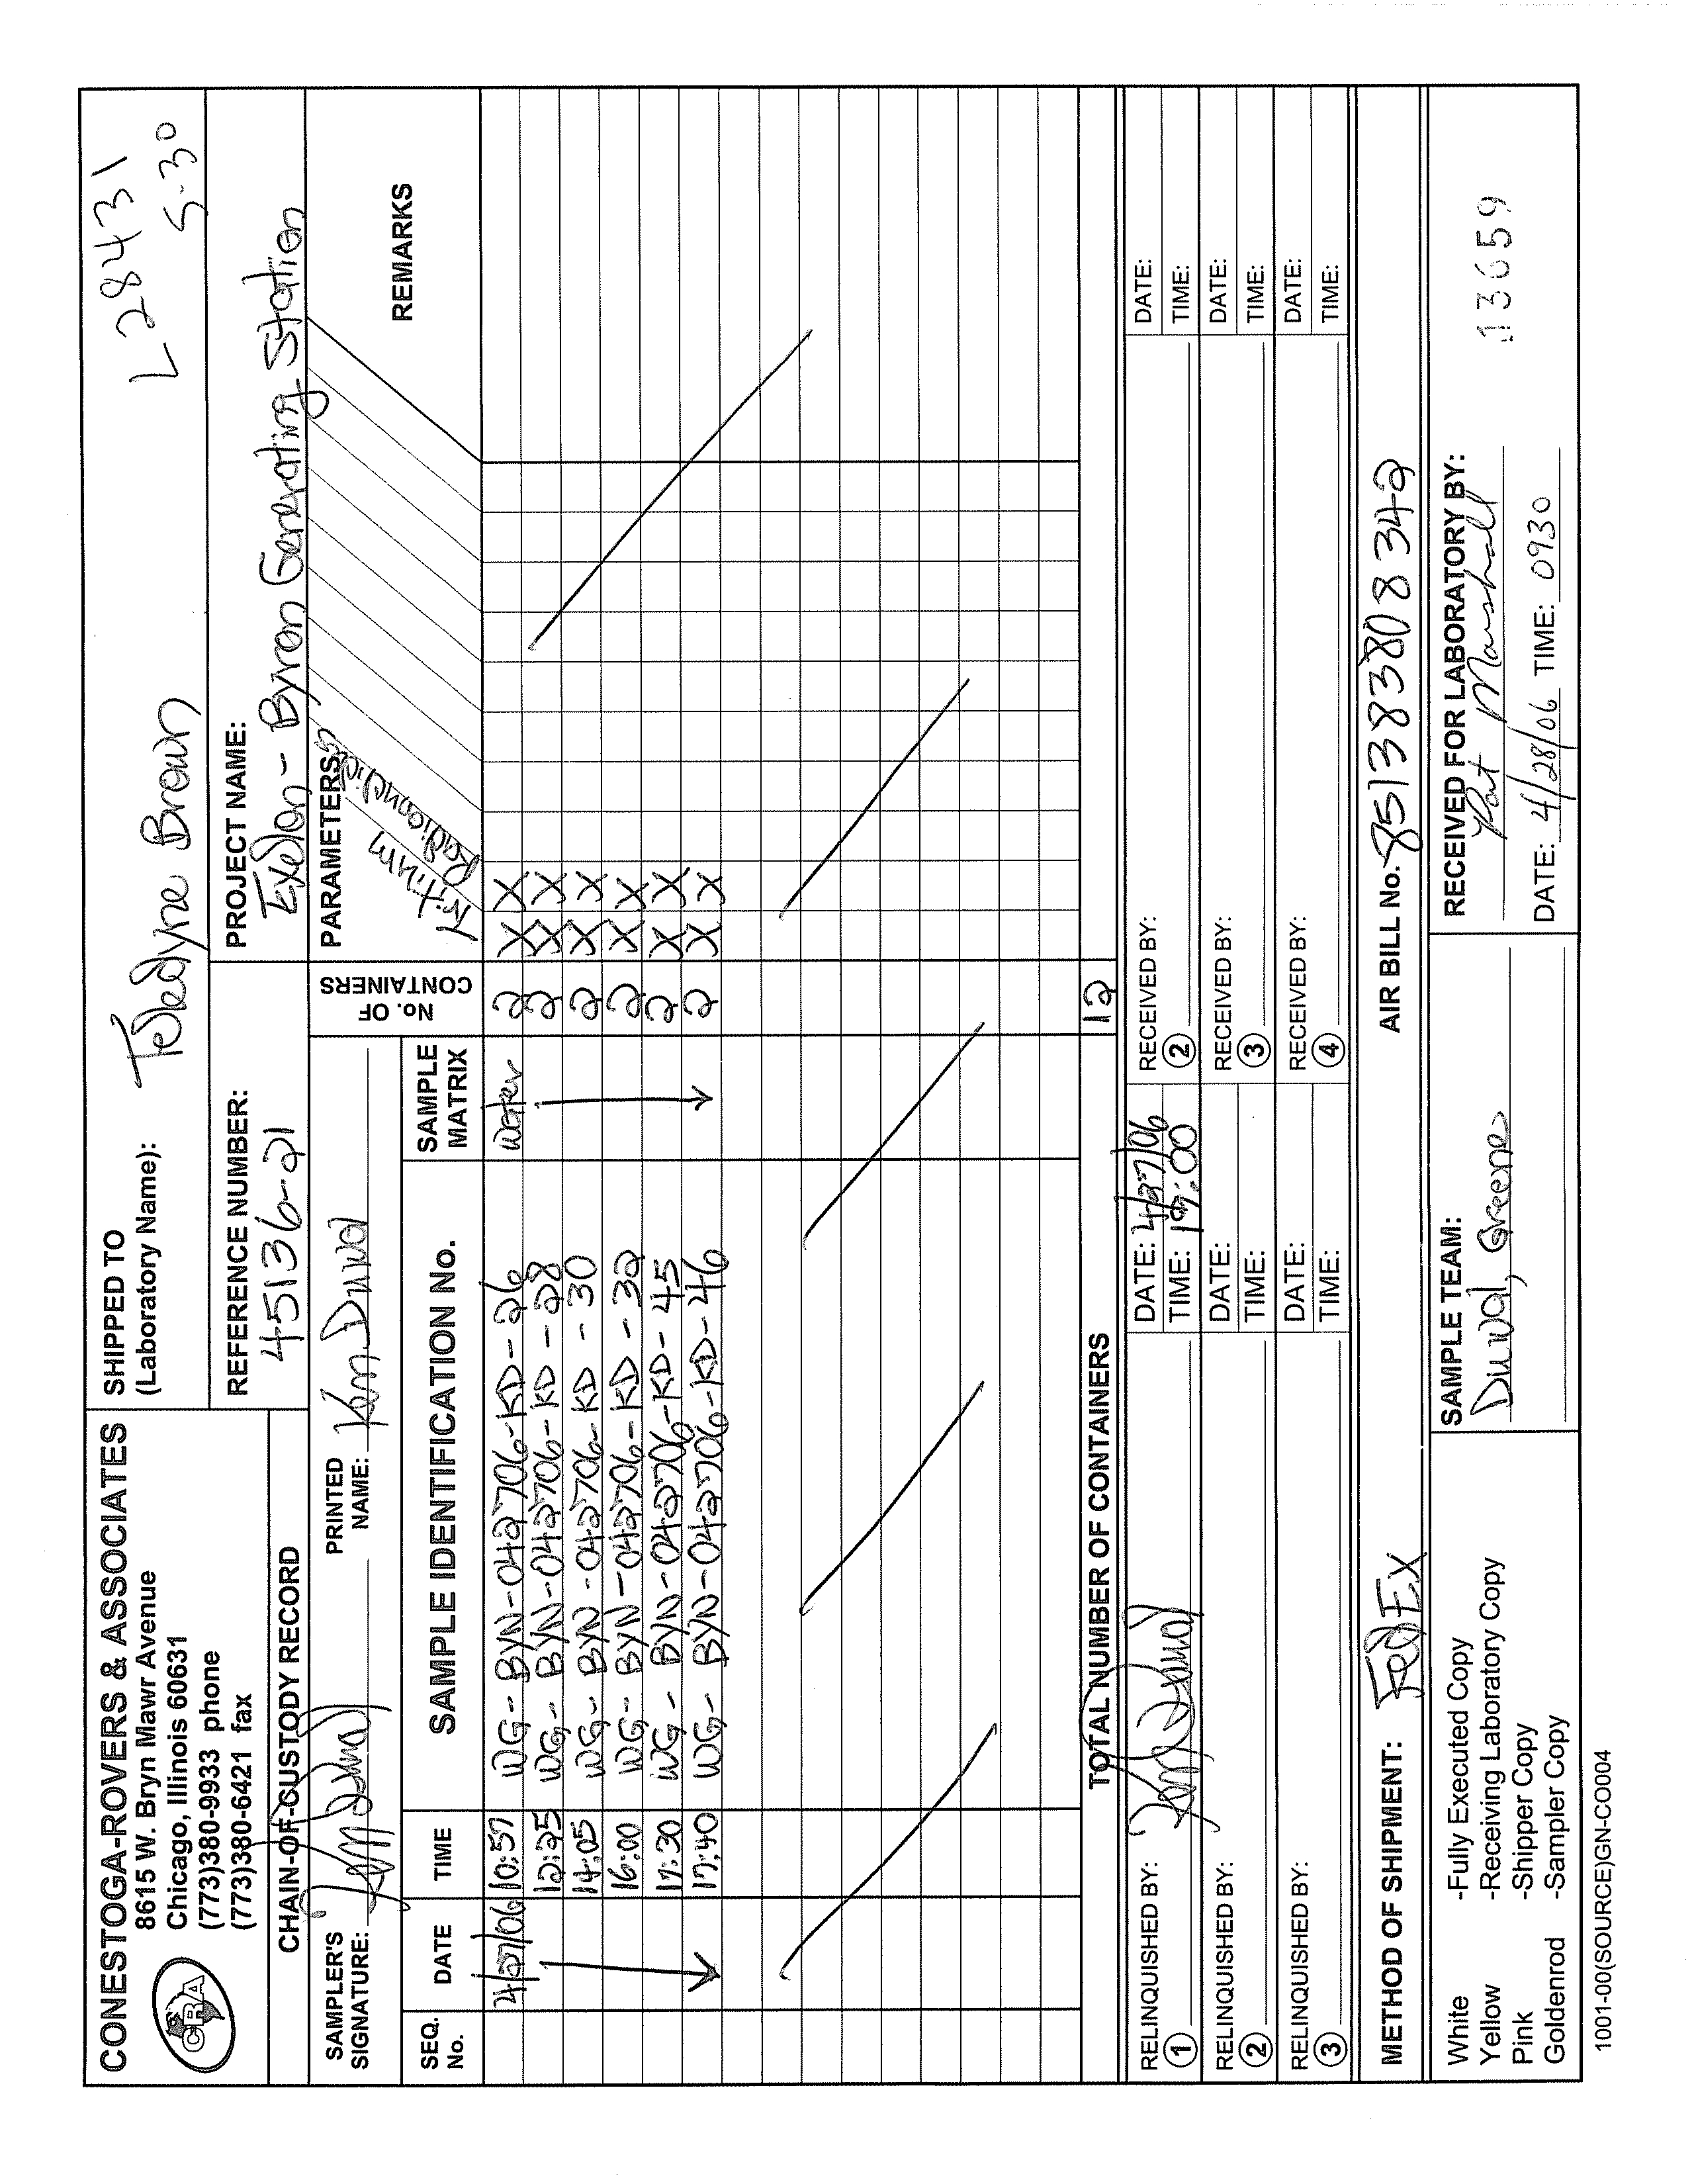
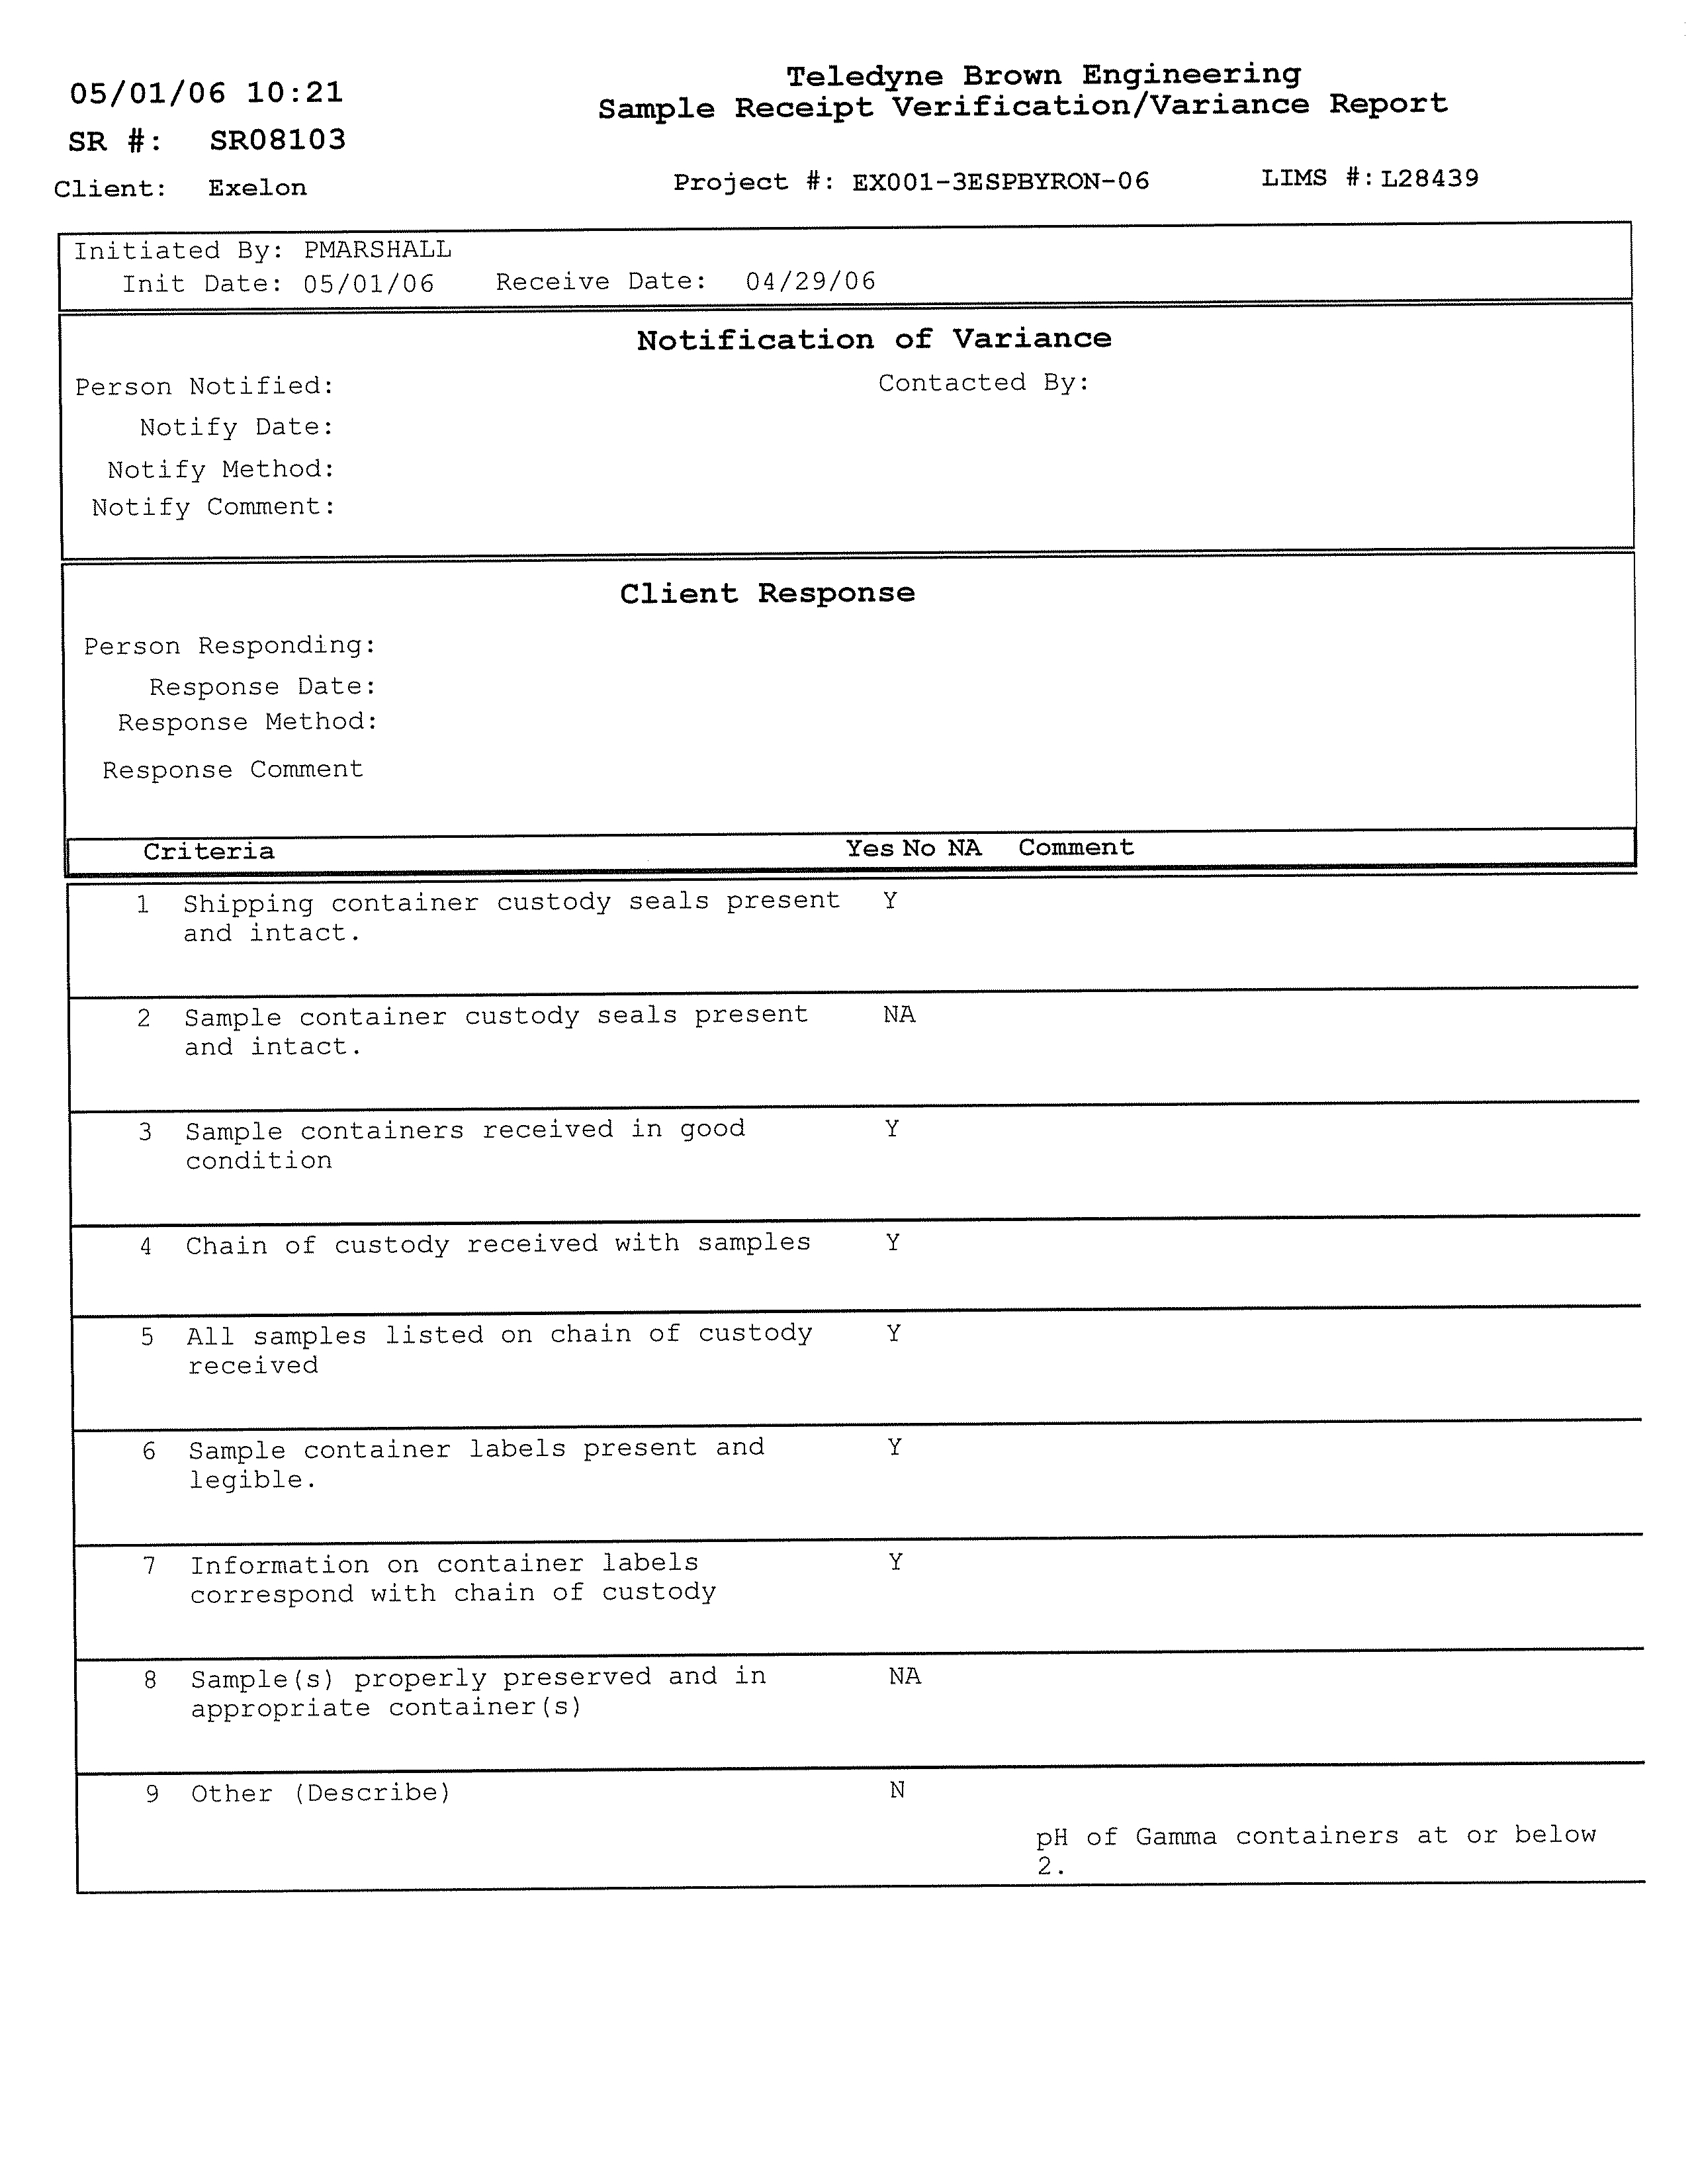
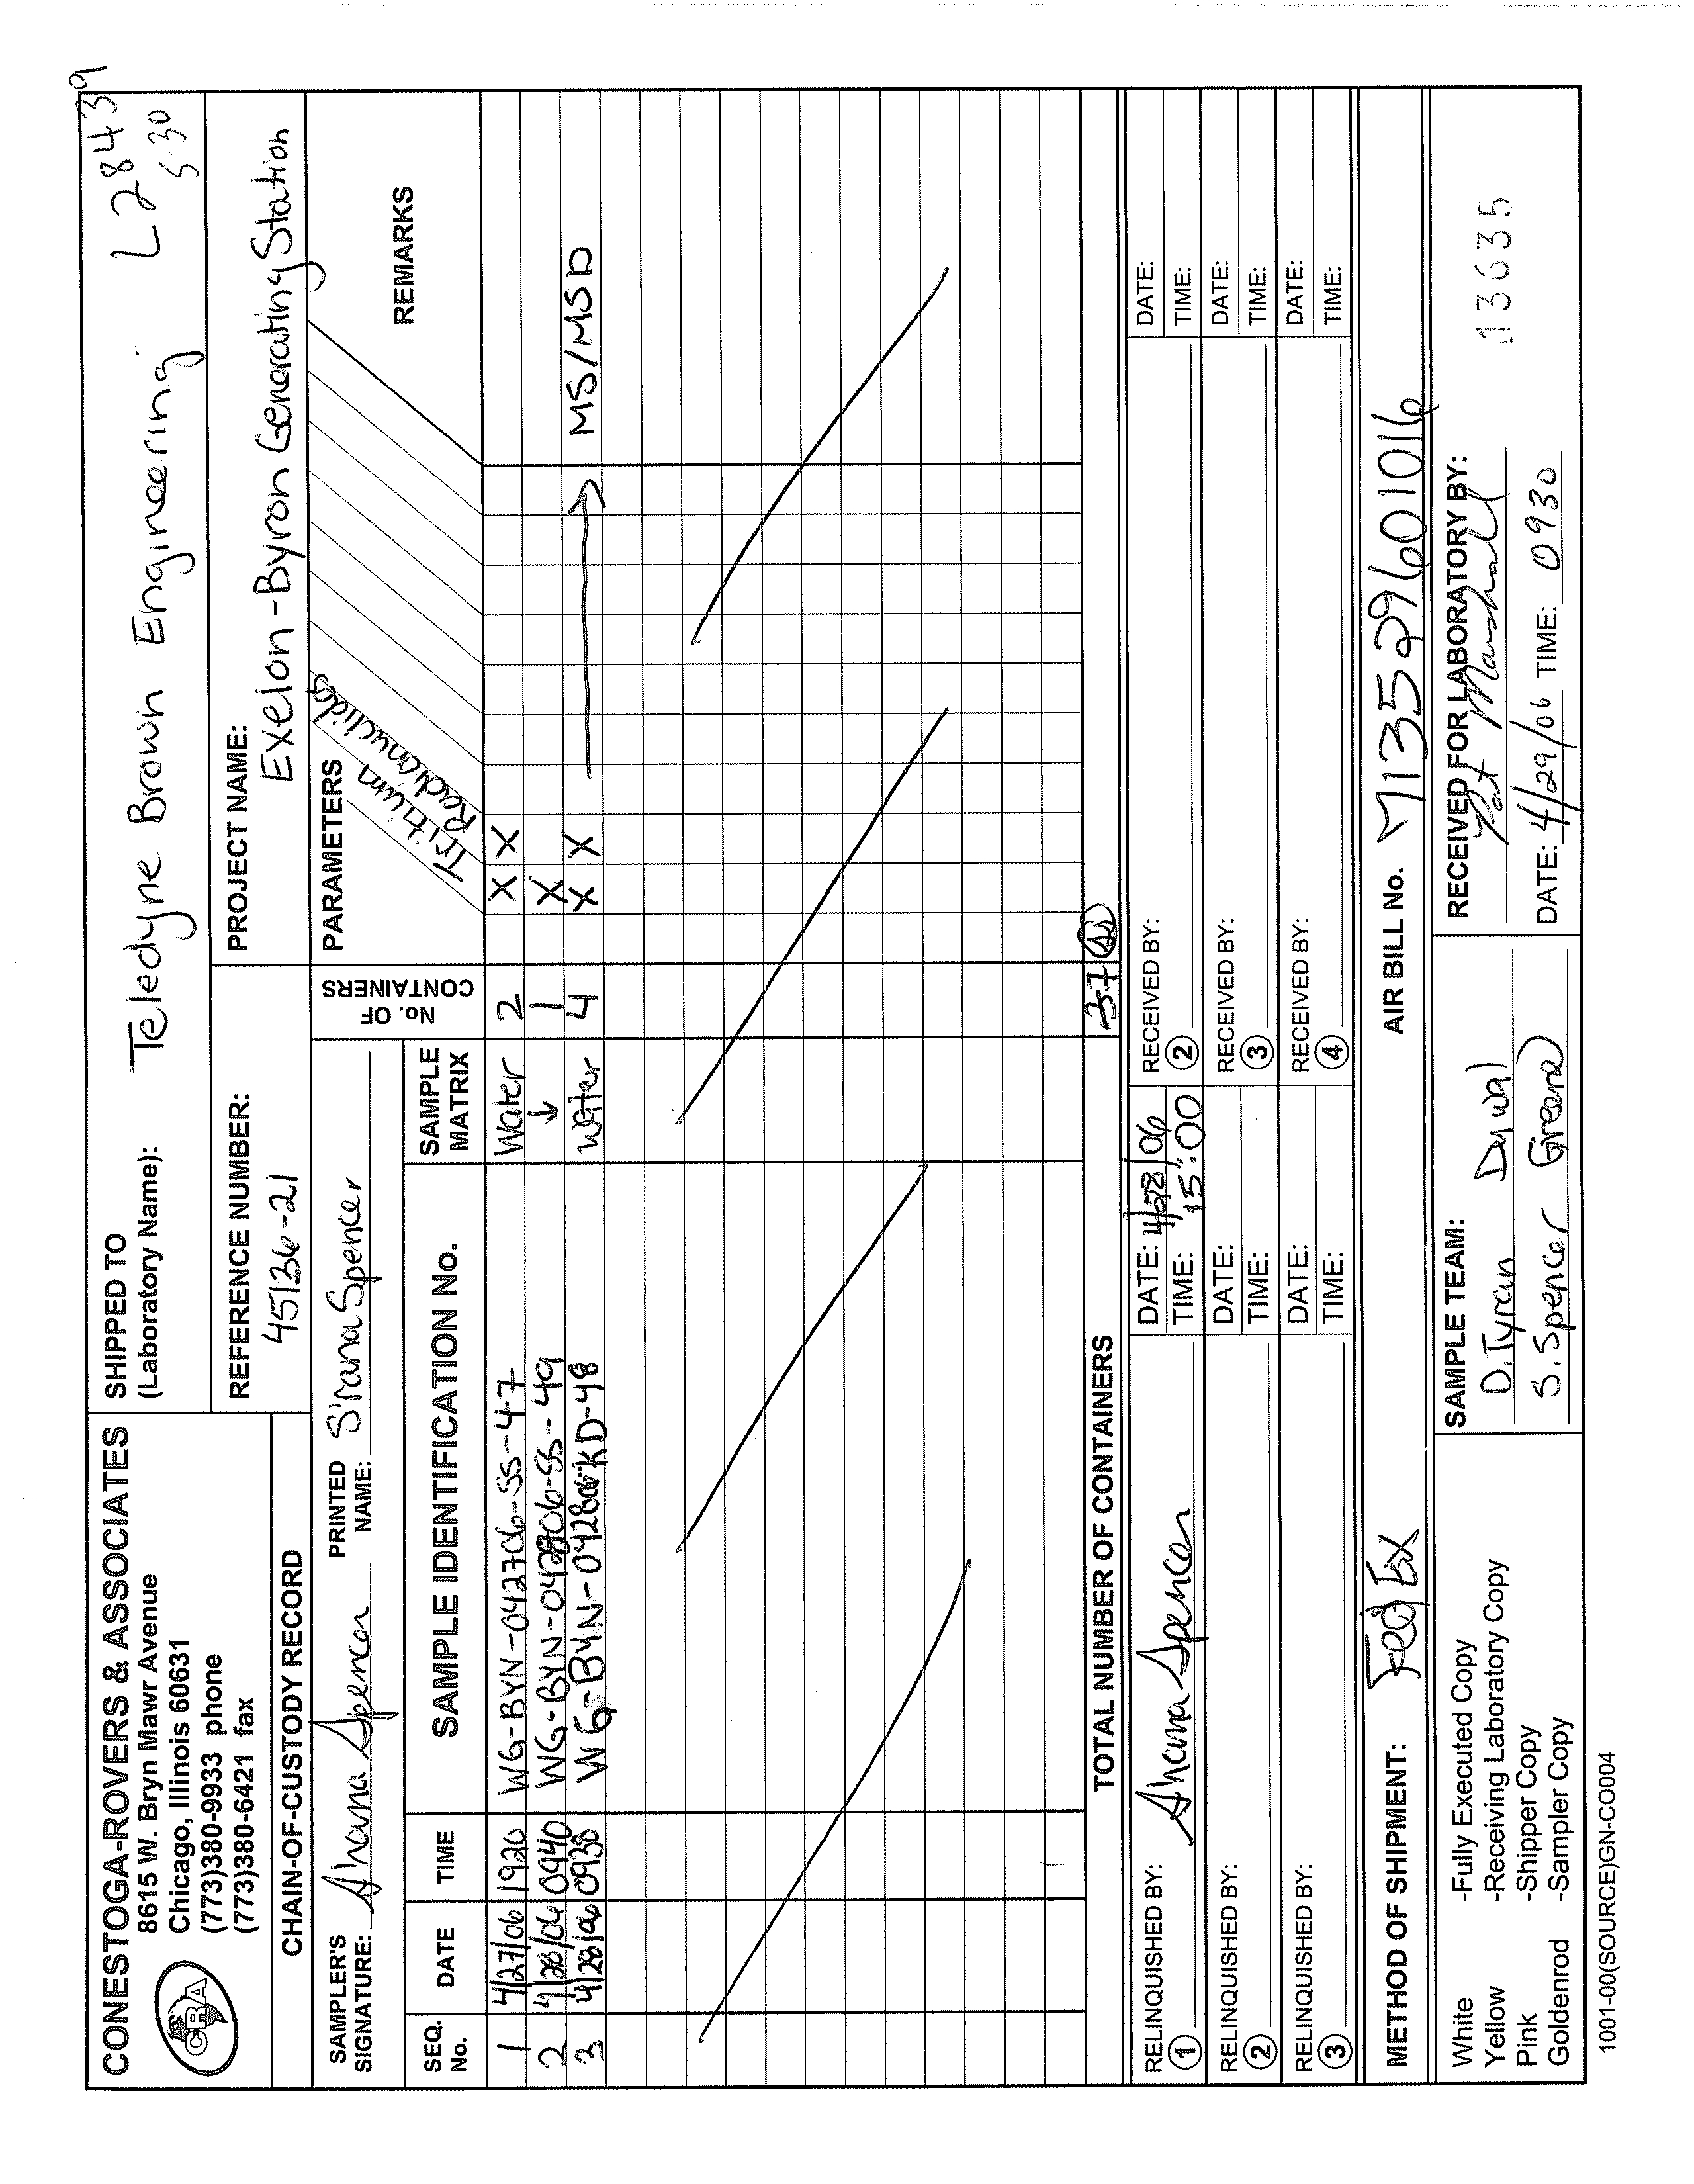
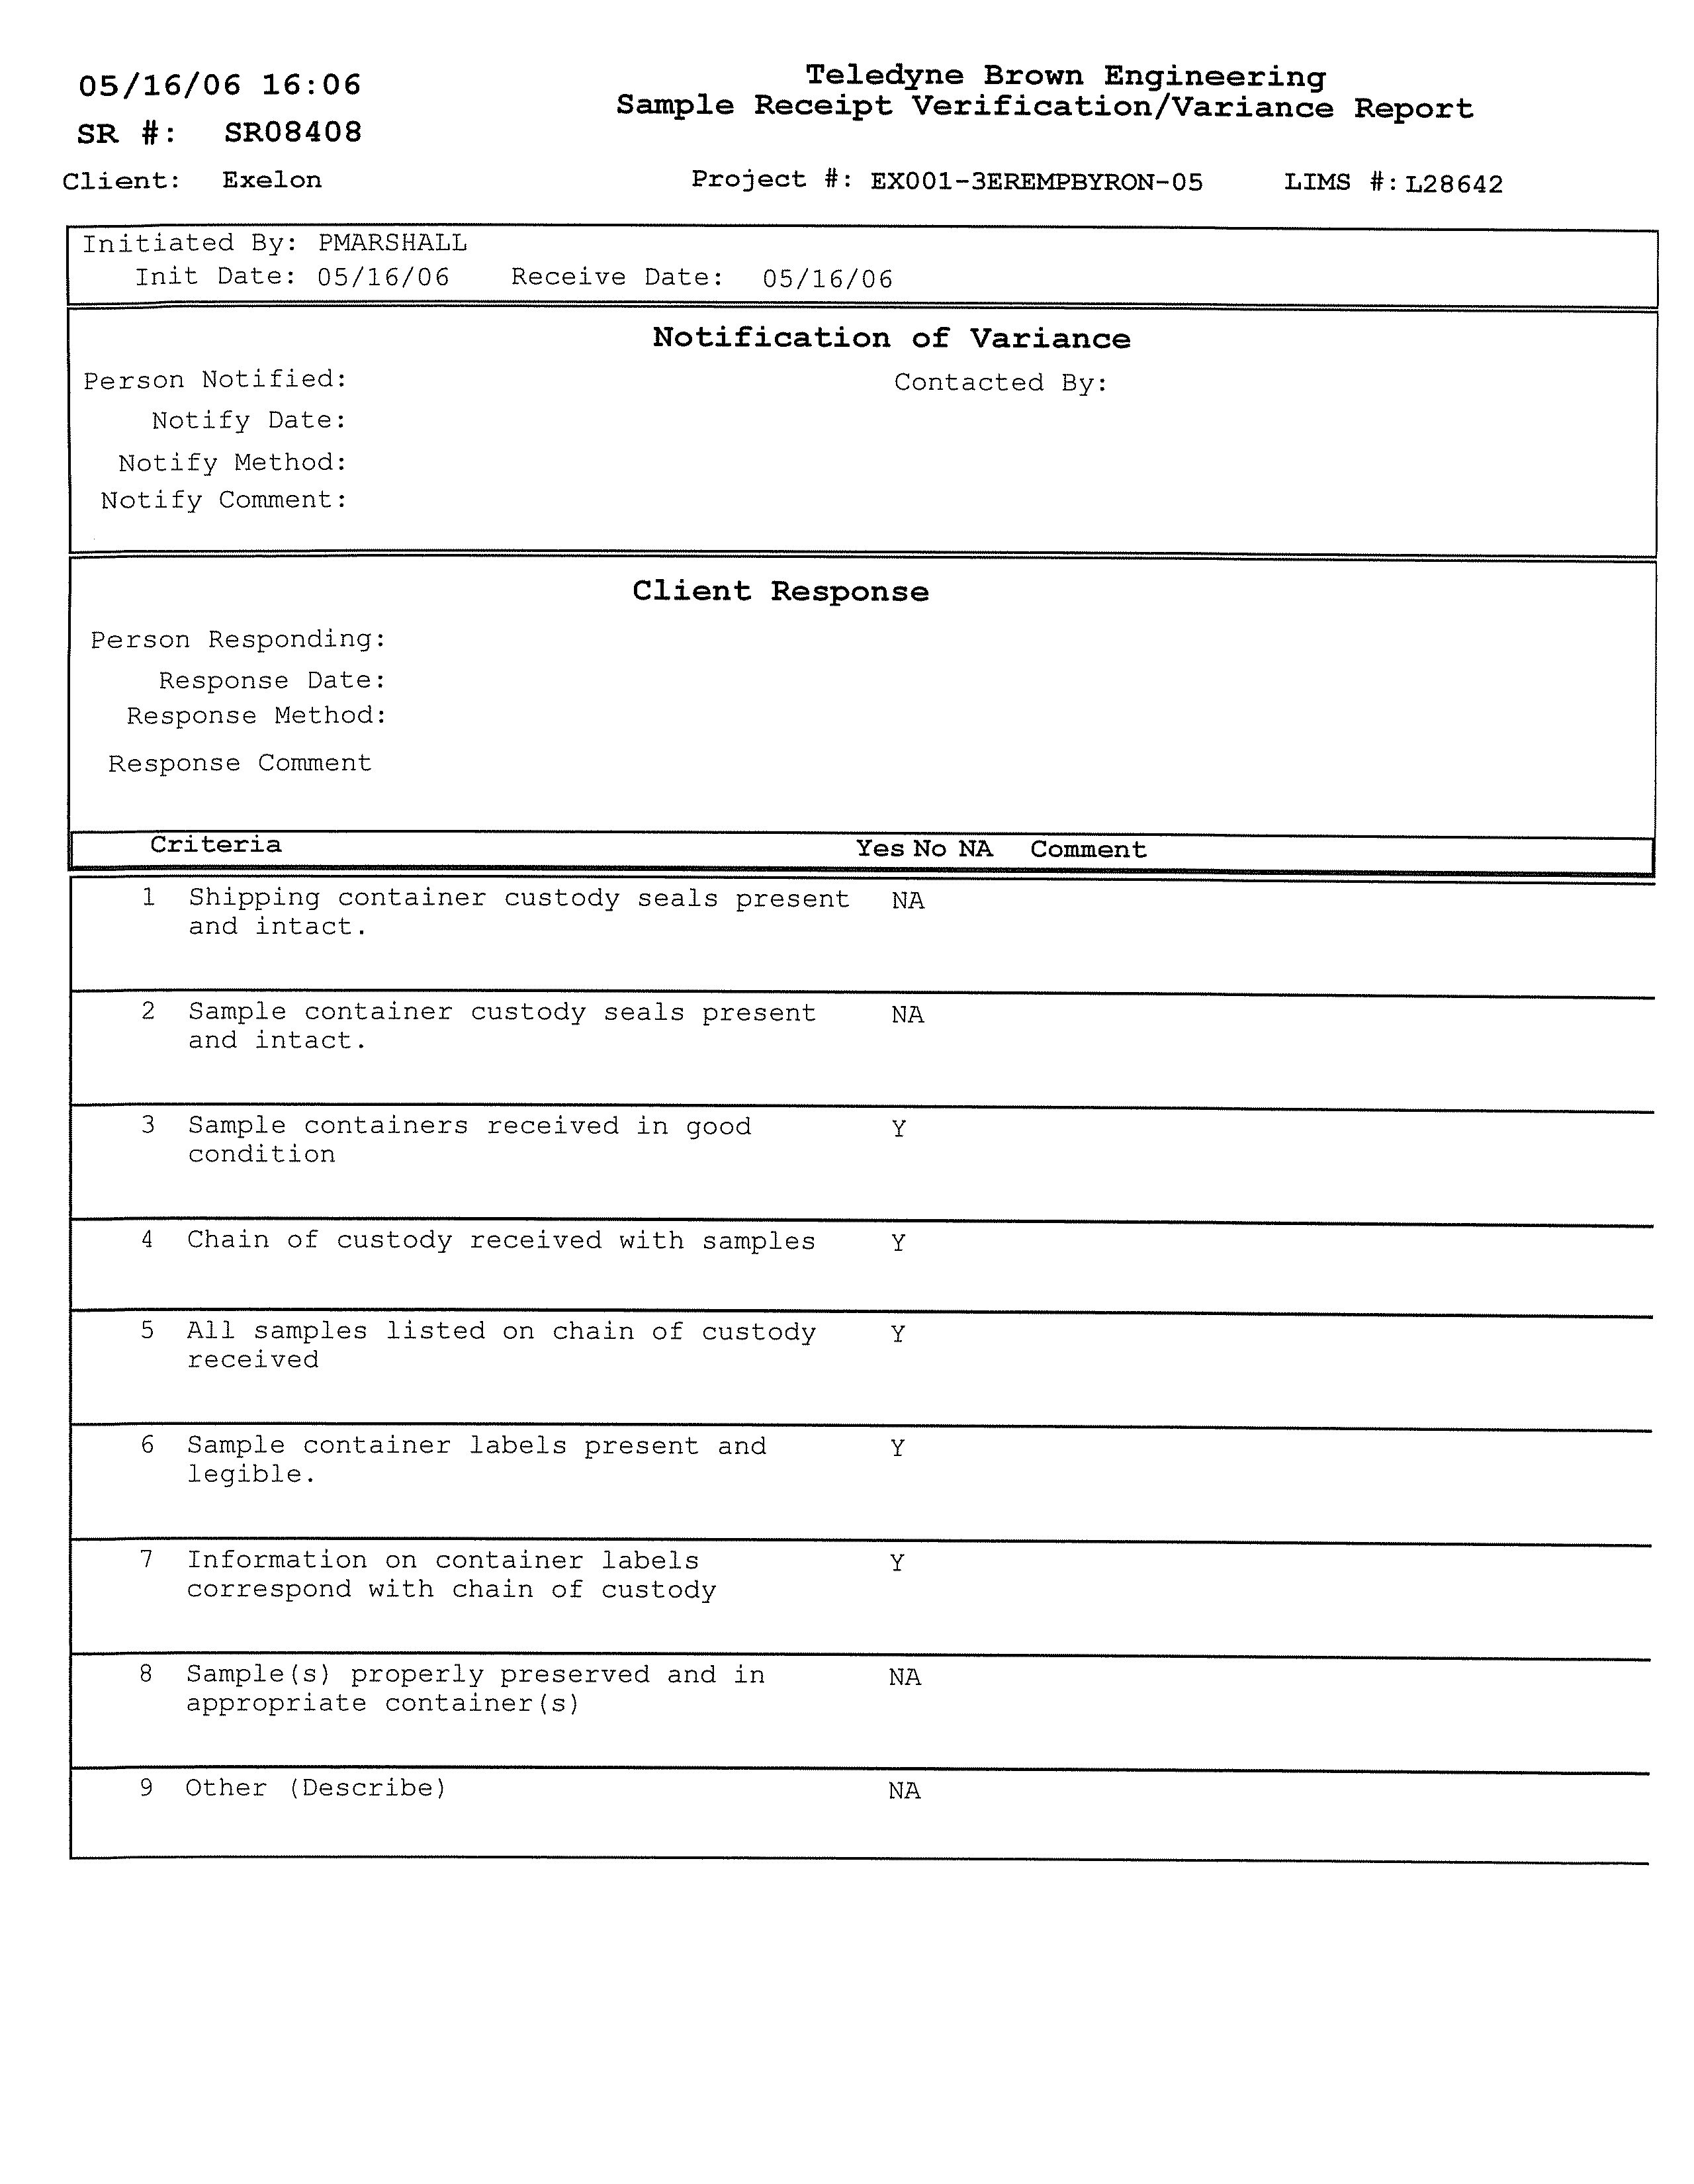
All groundwater samples were labeled with a unique
sample number, the date and time,
the parameters to be analyzed, the job number, and the sampler's initials. The samples
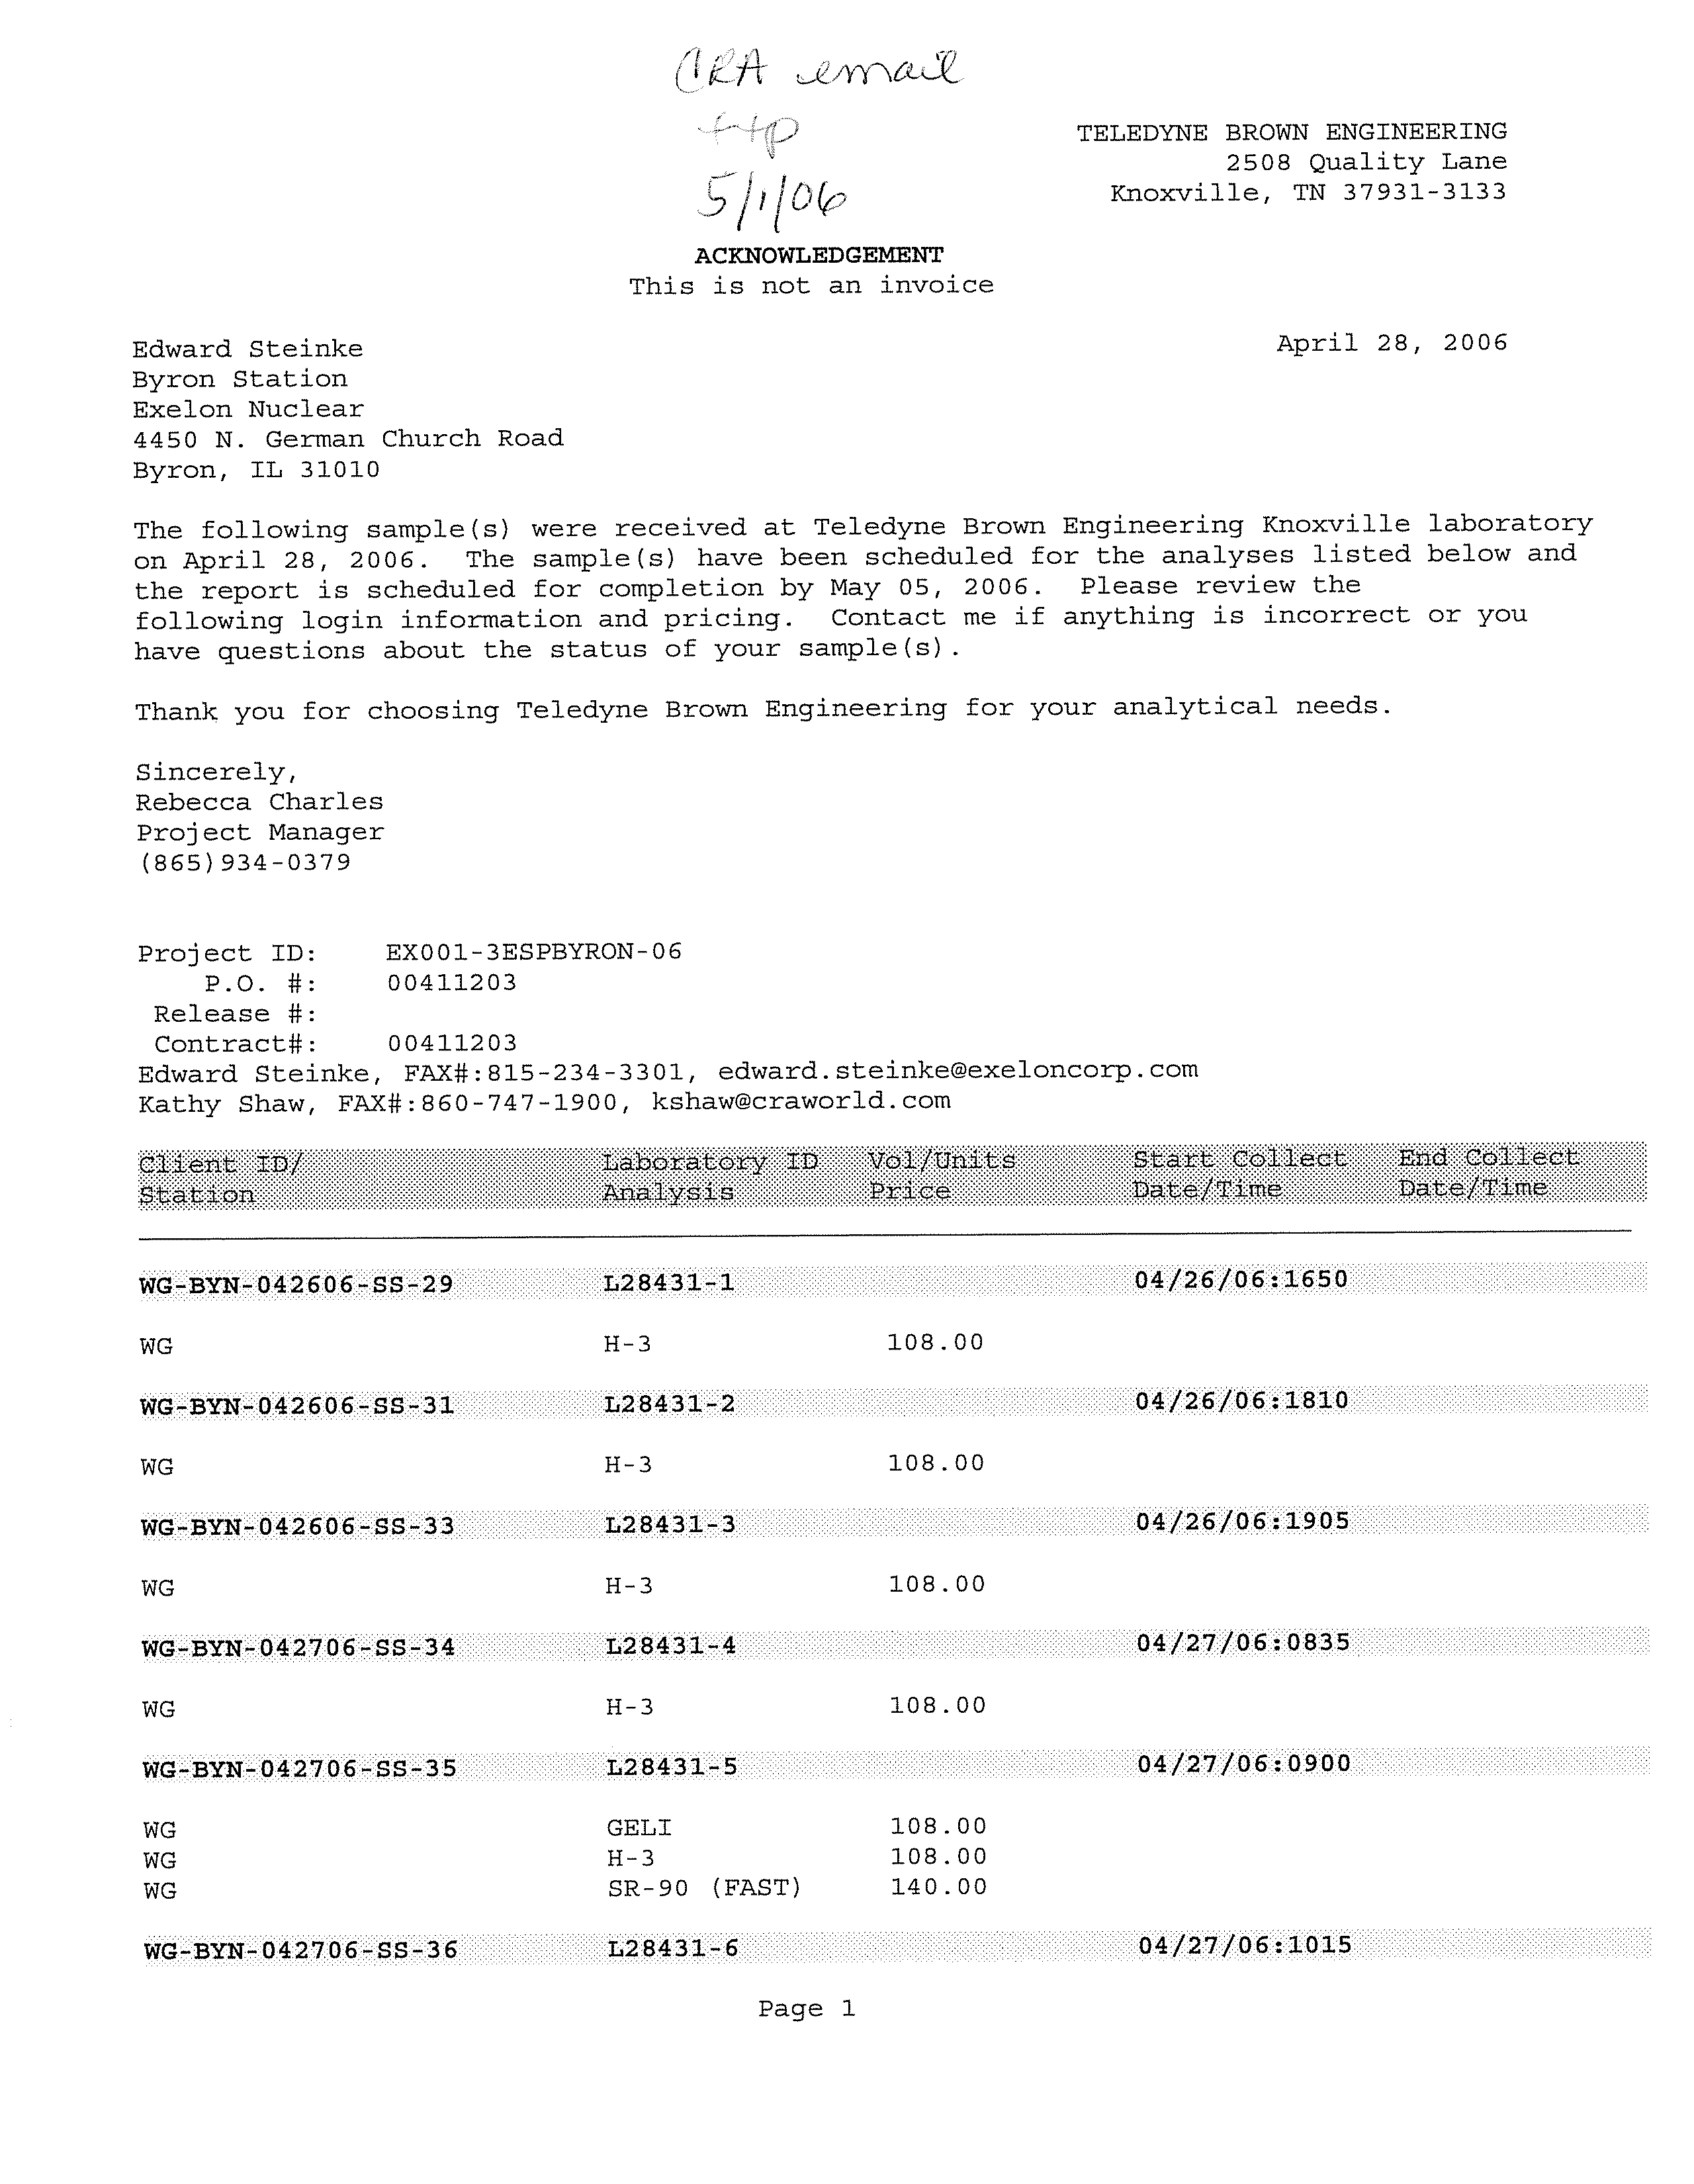
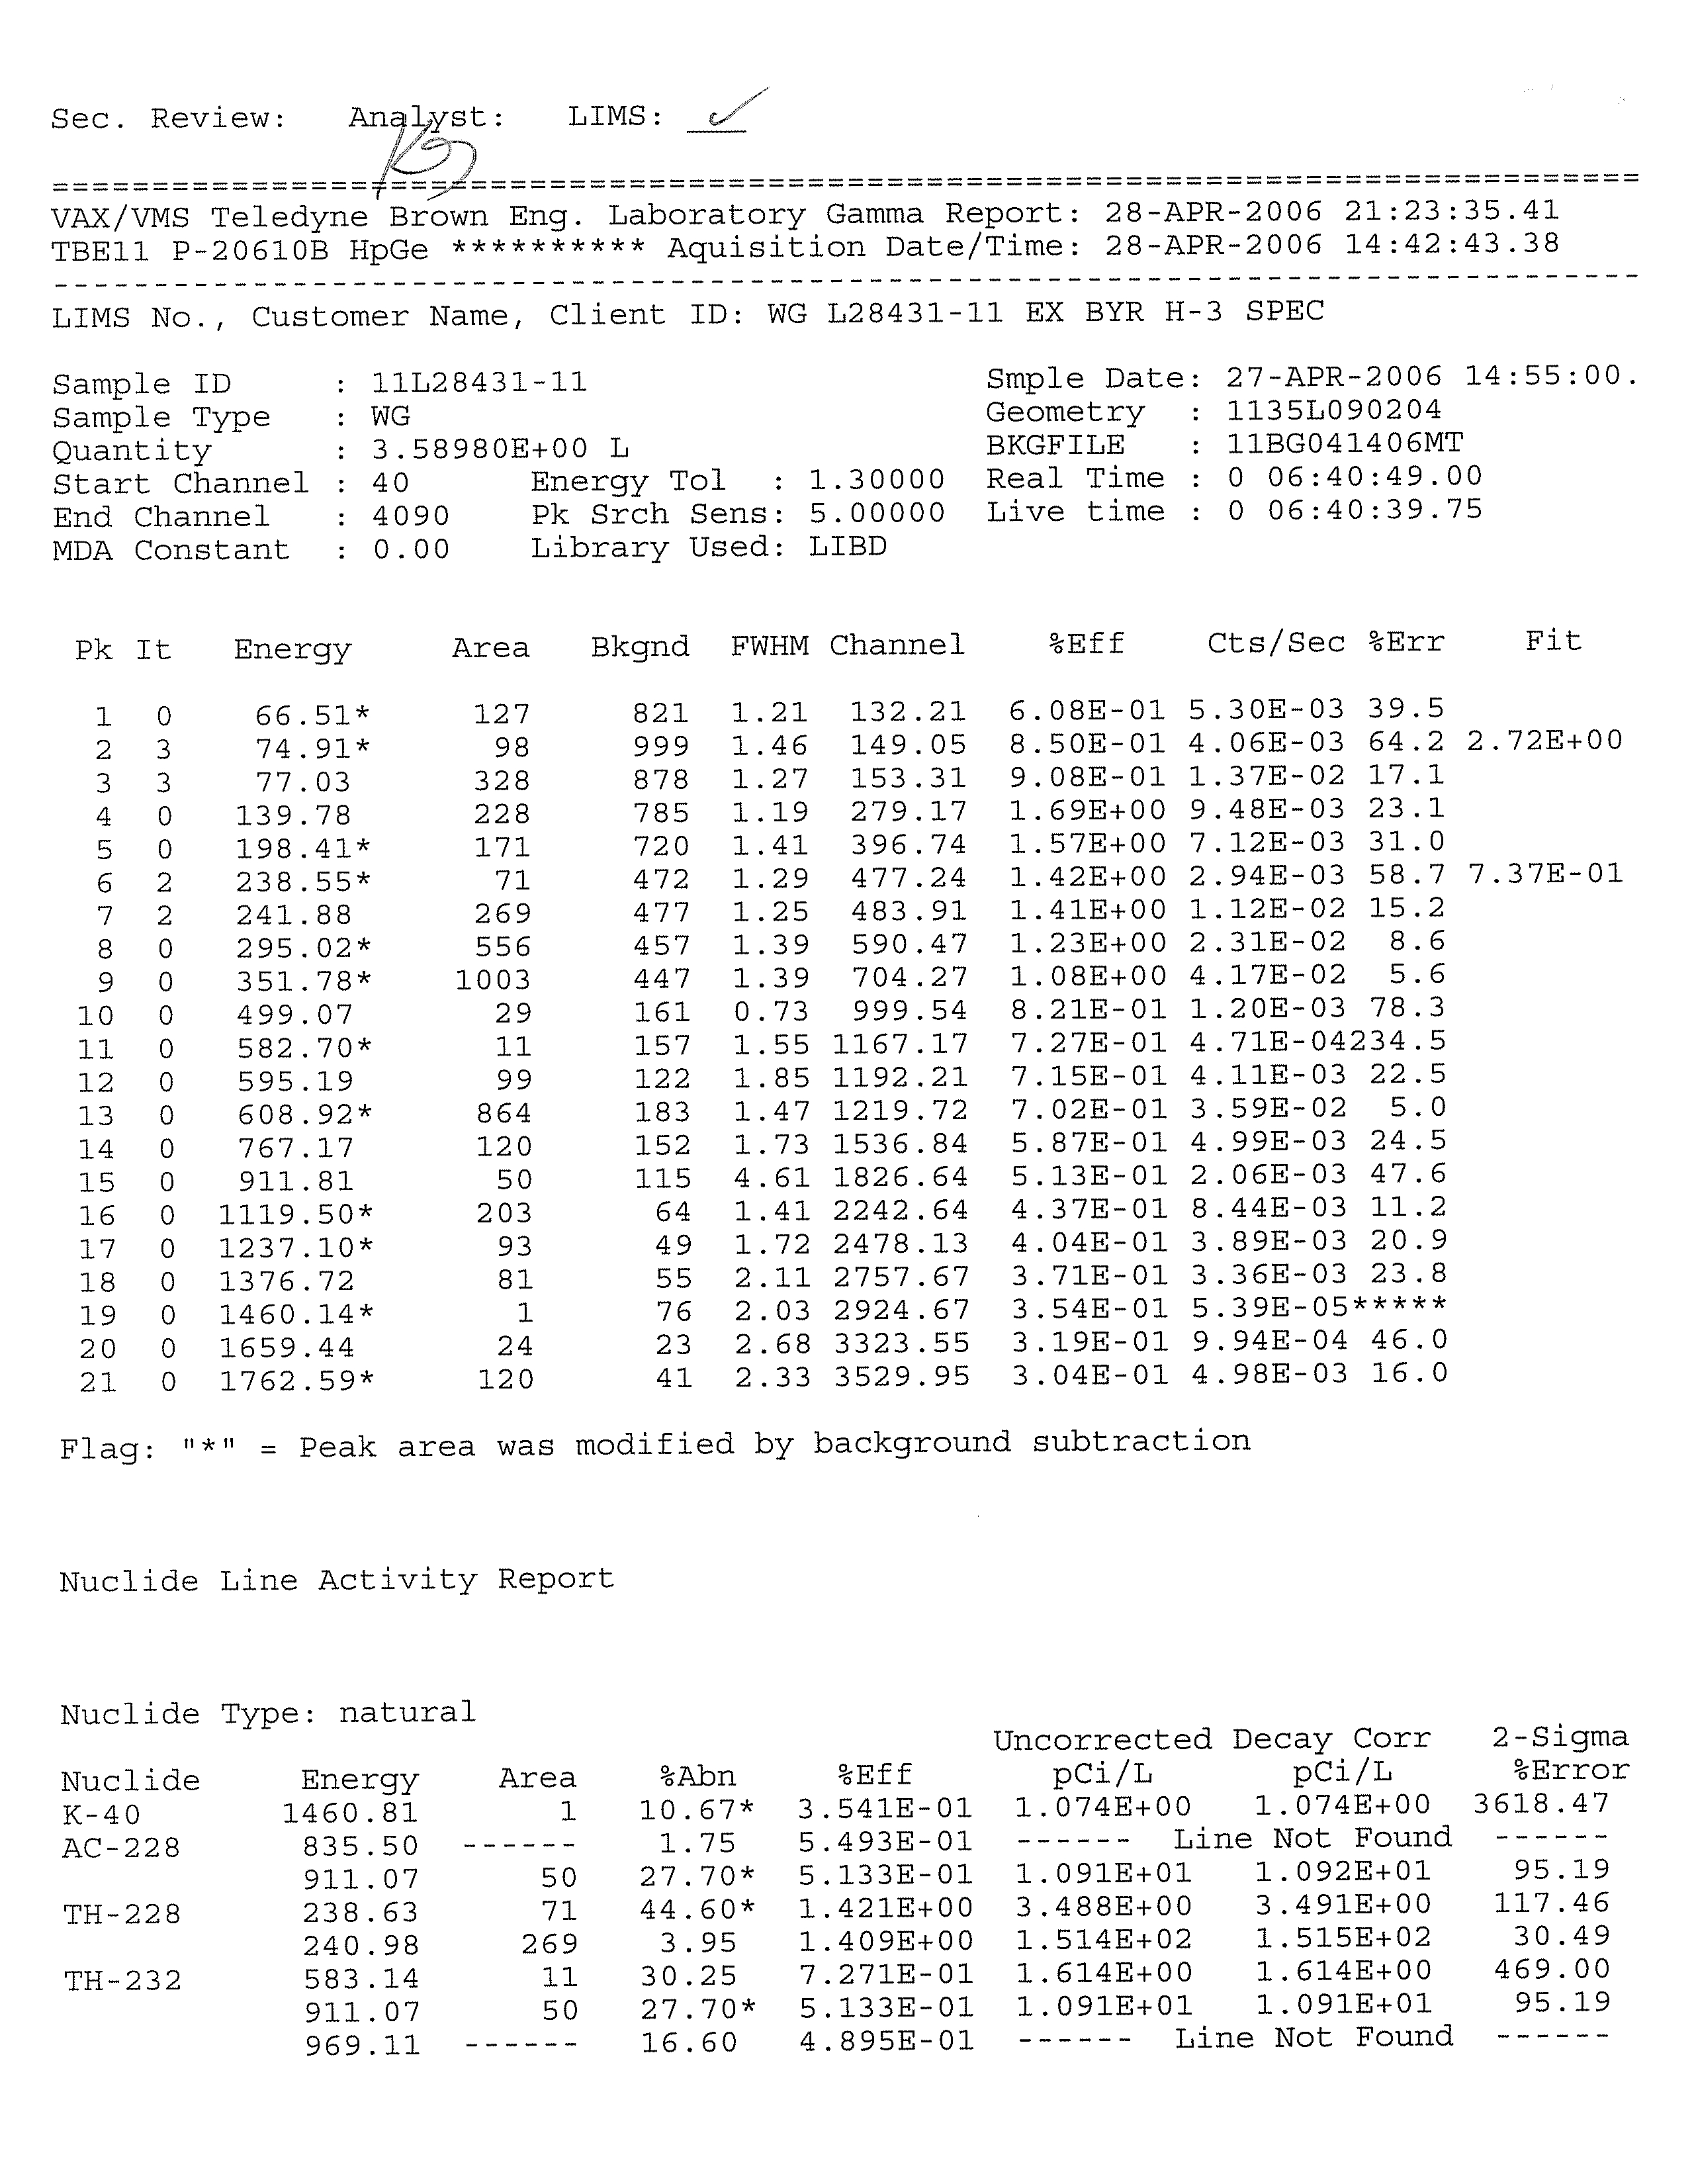
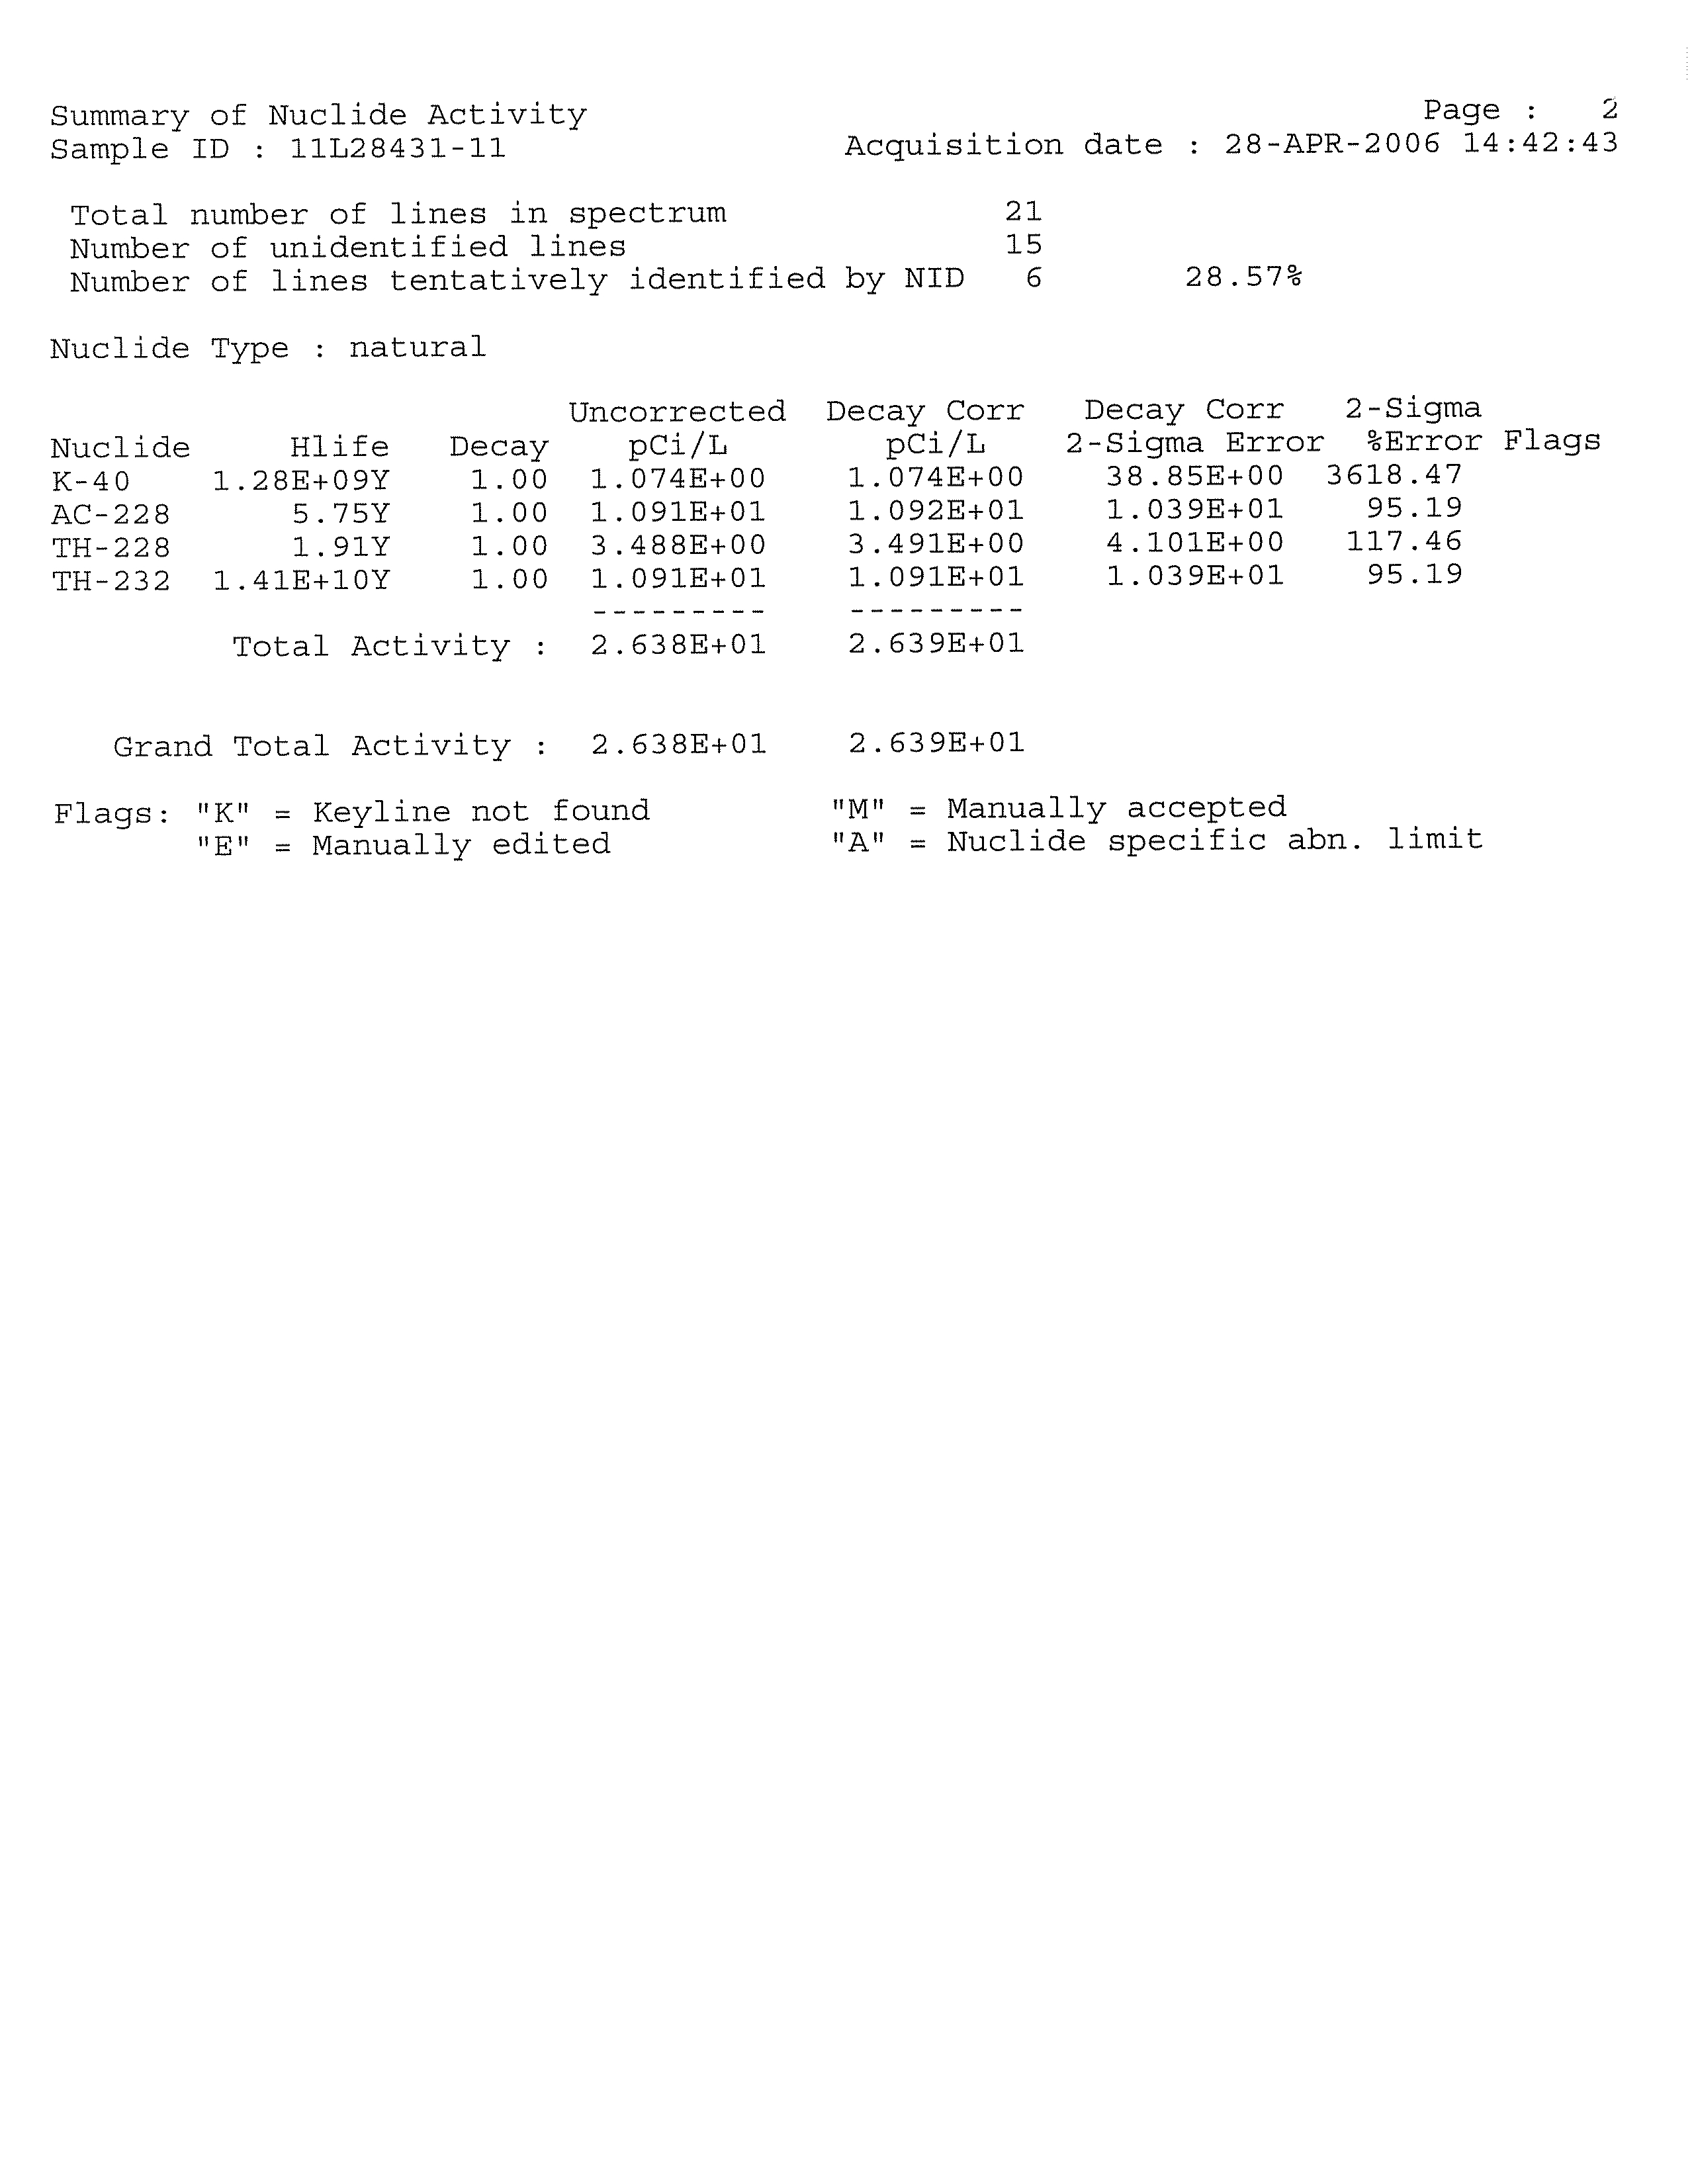
were then packed in a cooler for screening by the Station and shipment to Teledyne
Brown Engineering, Inc. (Teledyne Brown).
A sample summary is presented in
Table 4.6; field measurements for the fleetwide event are presented in Table 4.7.
045136 (13) Byron Generating Station
25
CONESTOGA-ROVERS & ASSOCIATES
Revision 1
CRA containerized the water purged from all of the wells during the fleetwide event.
The water was placed into the two plastic holding tanks at the Station, pending
characterization. The water was processed by the Station in accordance with their
NPDES permit.
4.2.3
DATA QUALITY OBJECTIVES
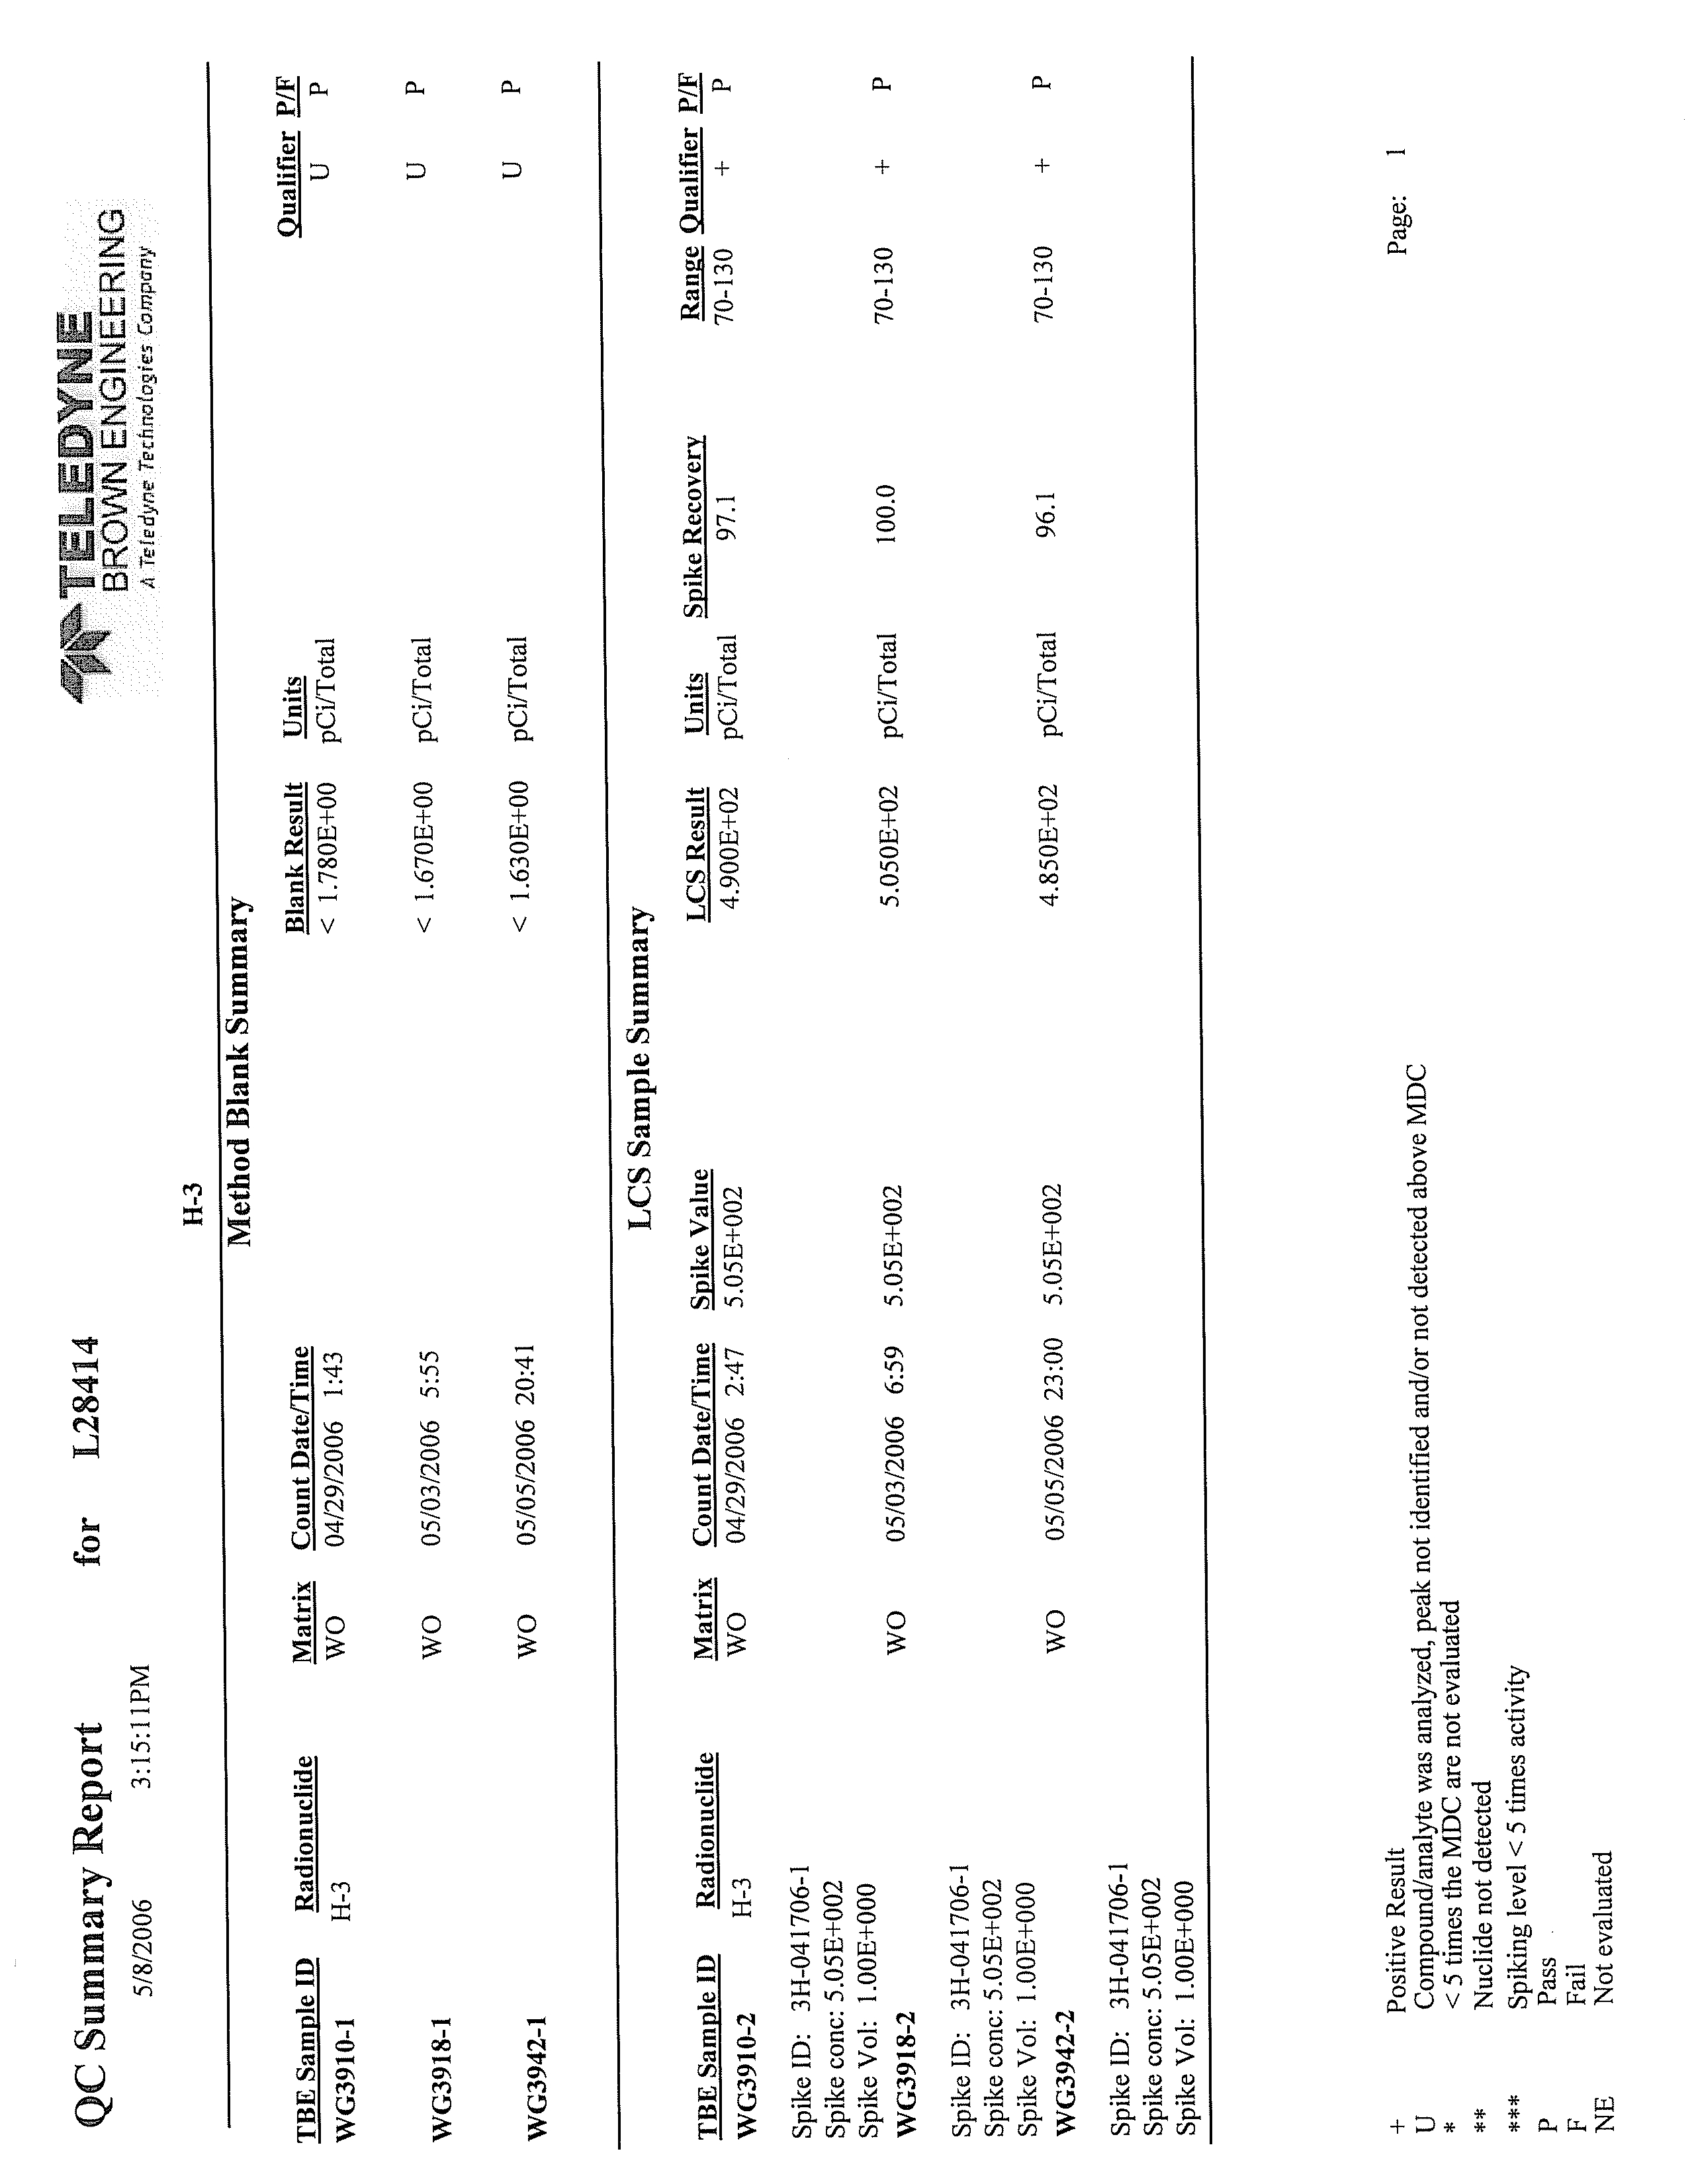
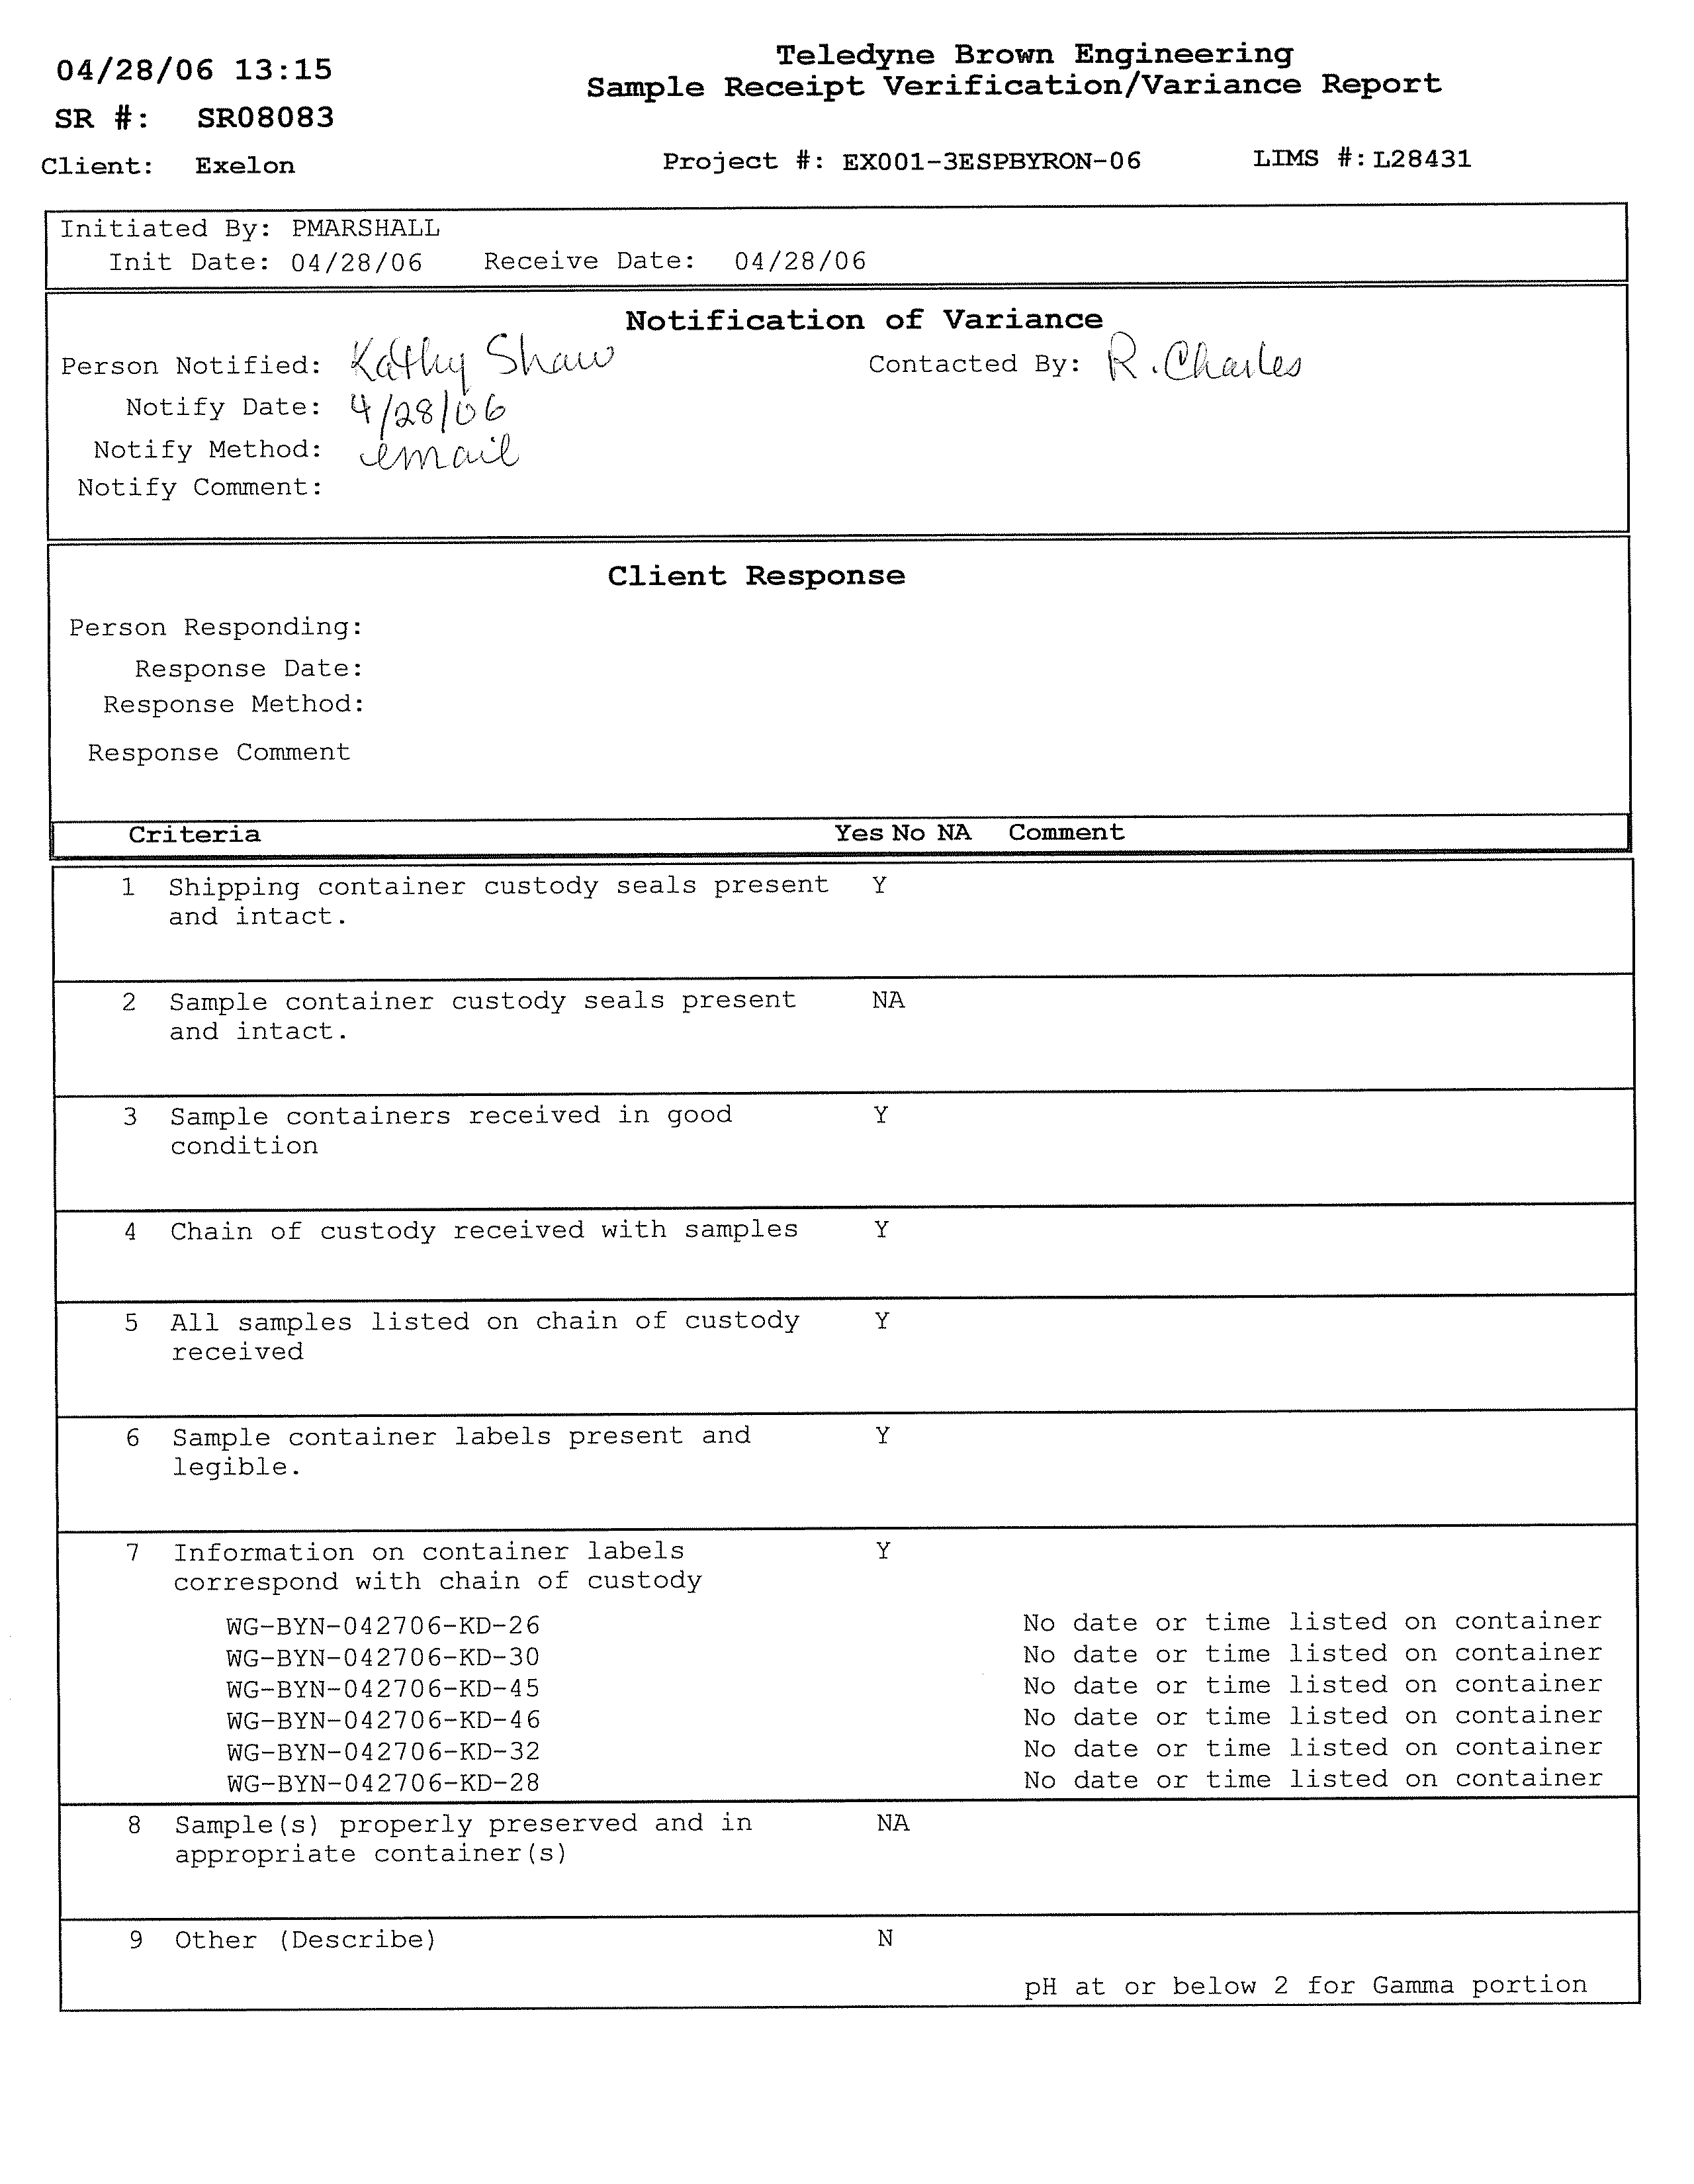
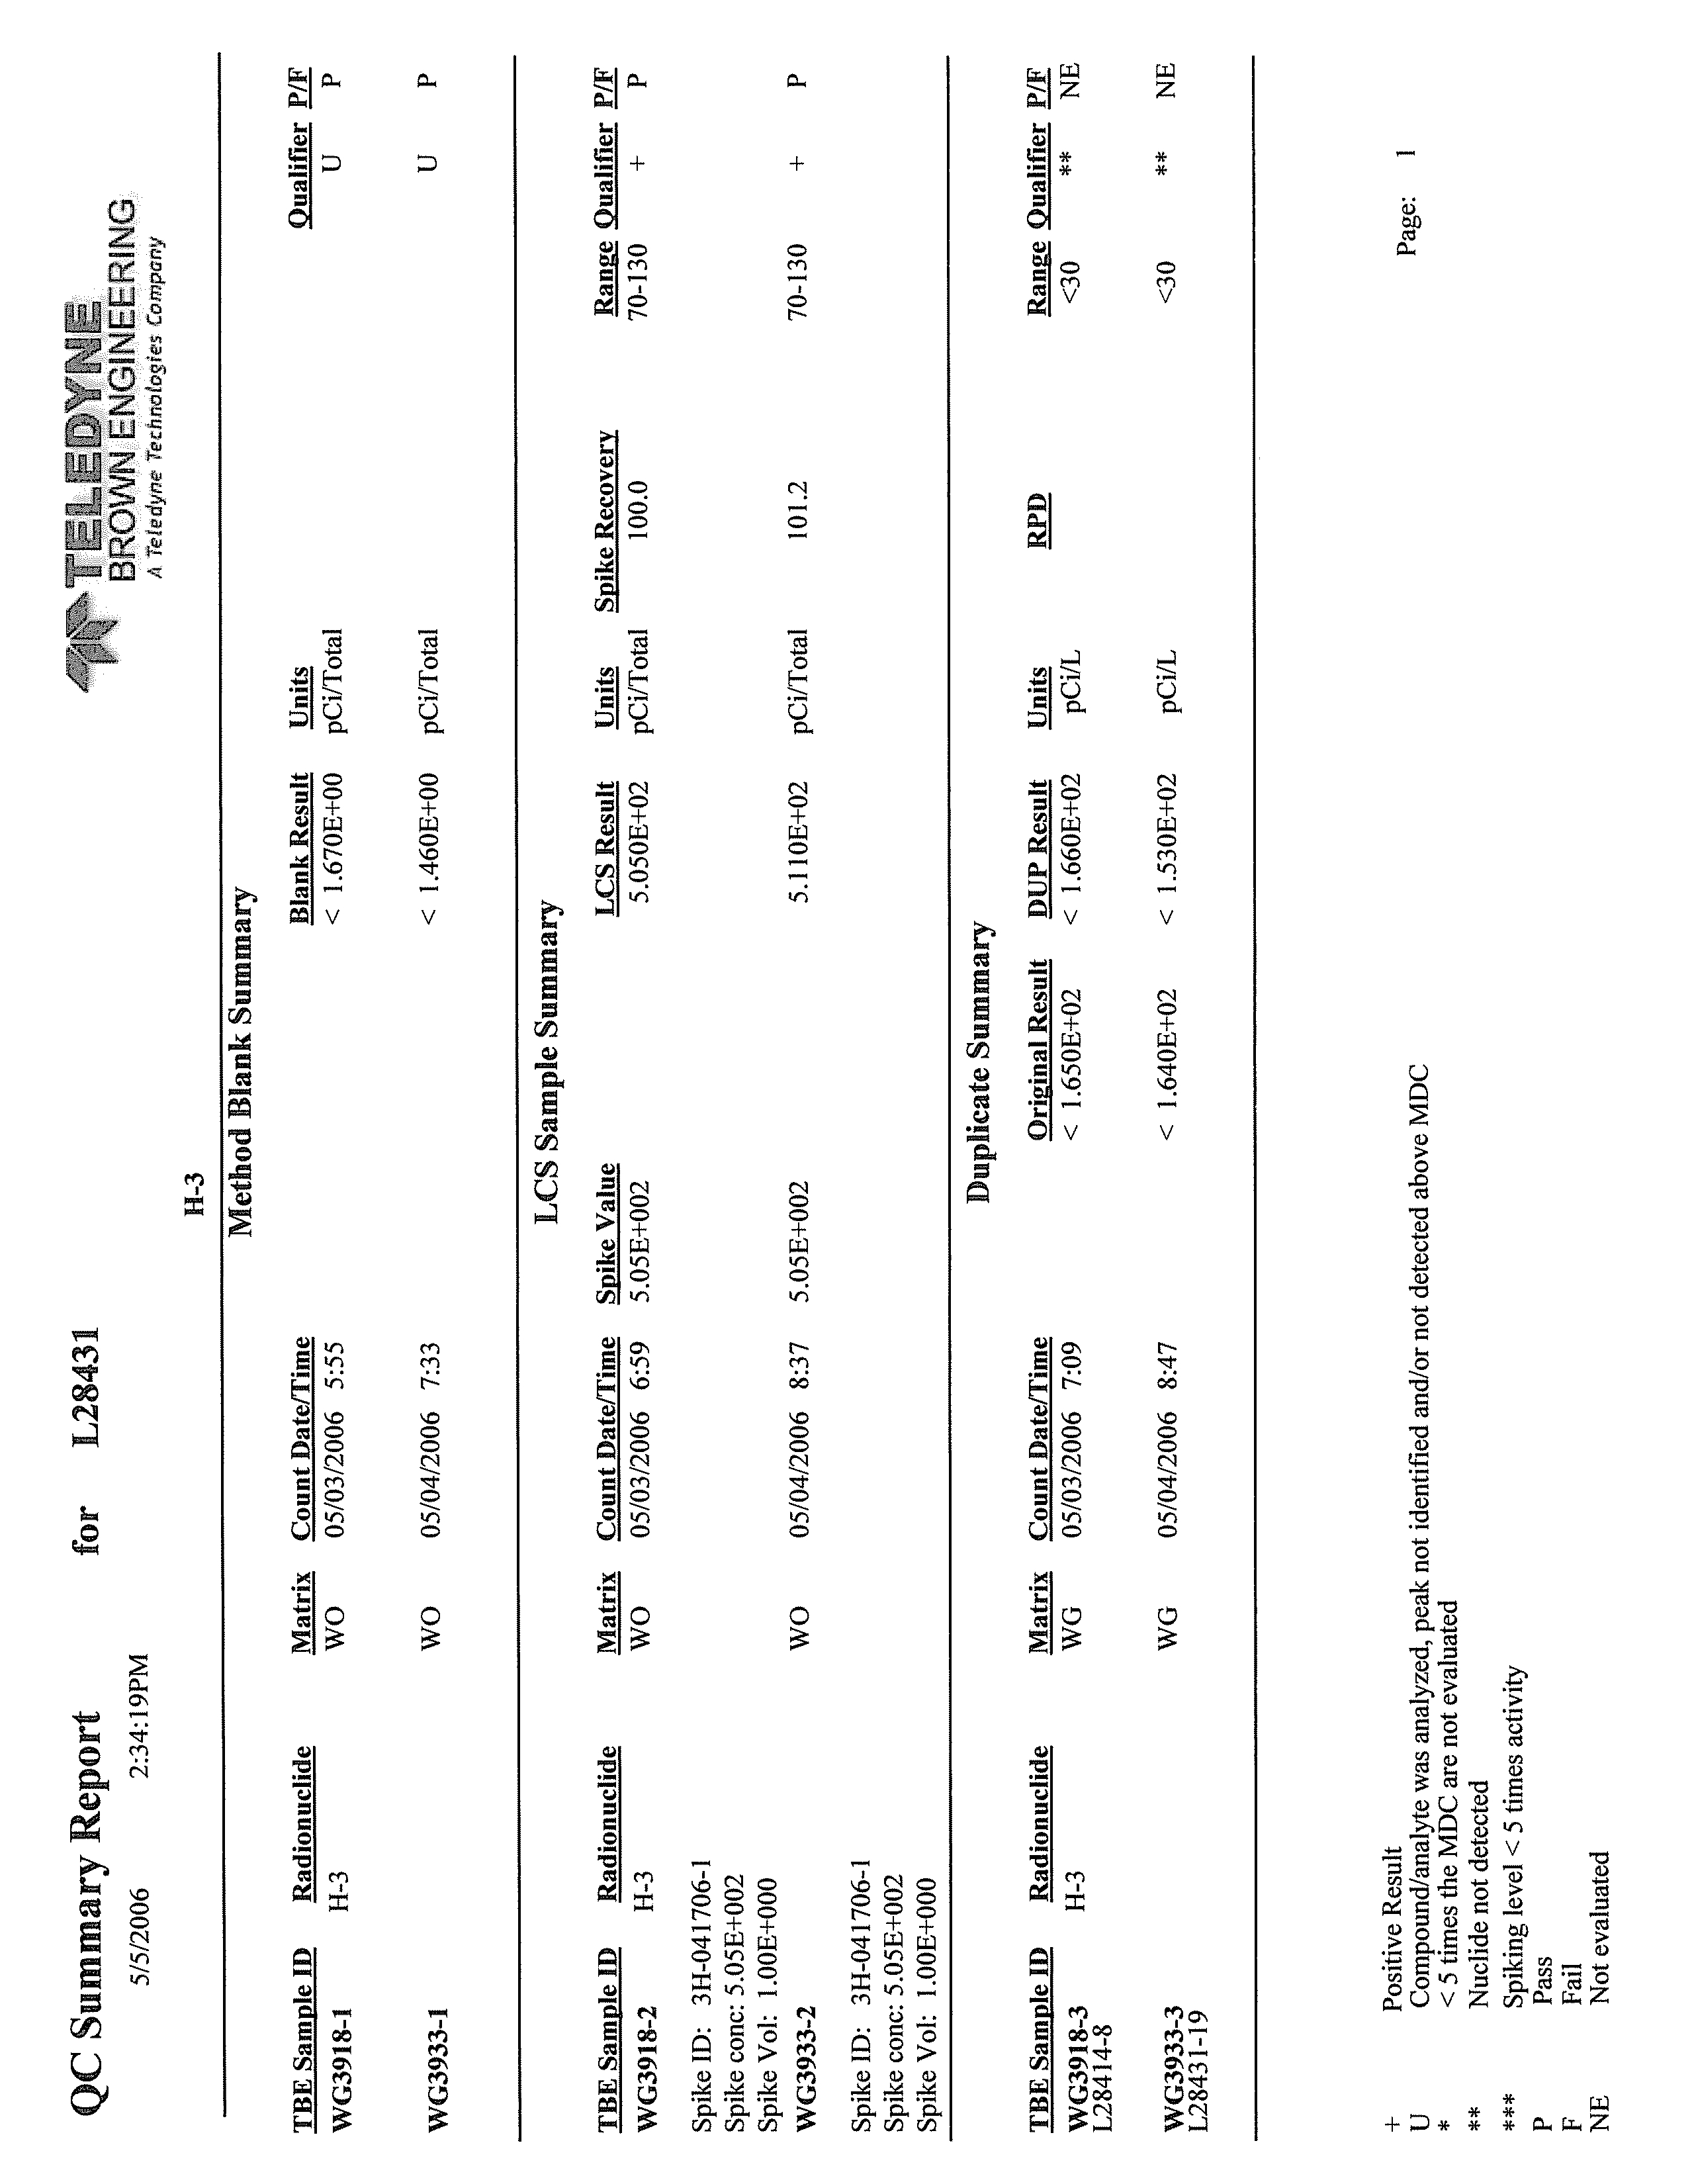
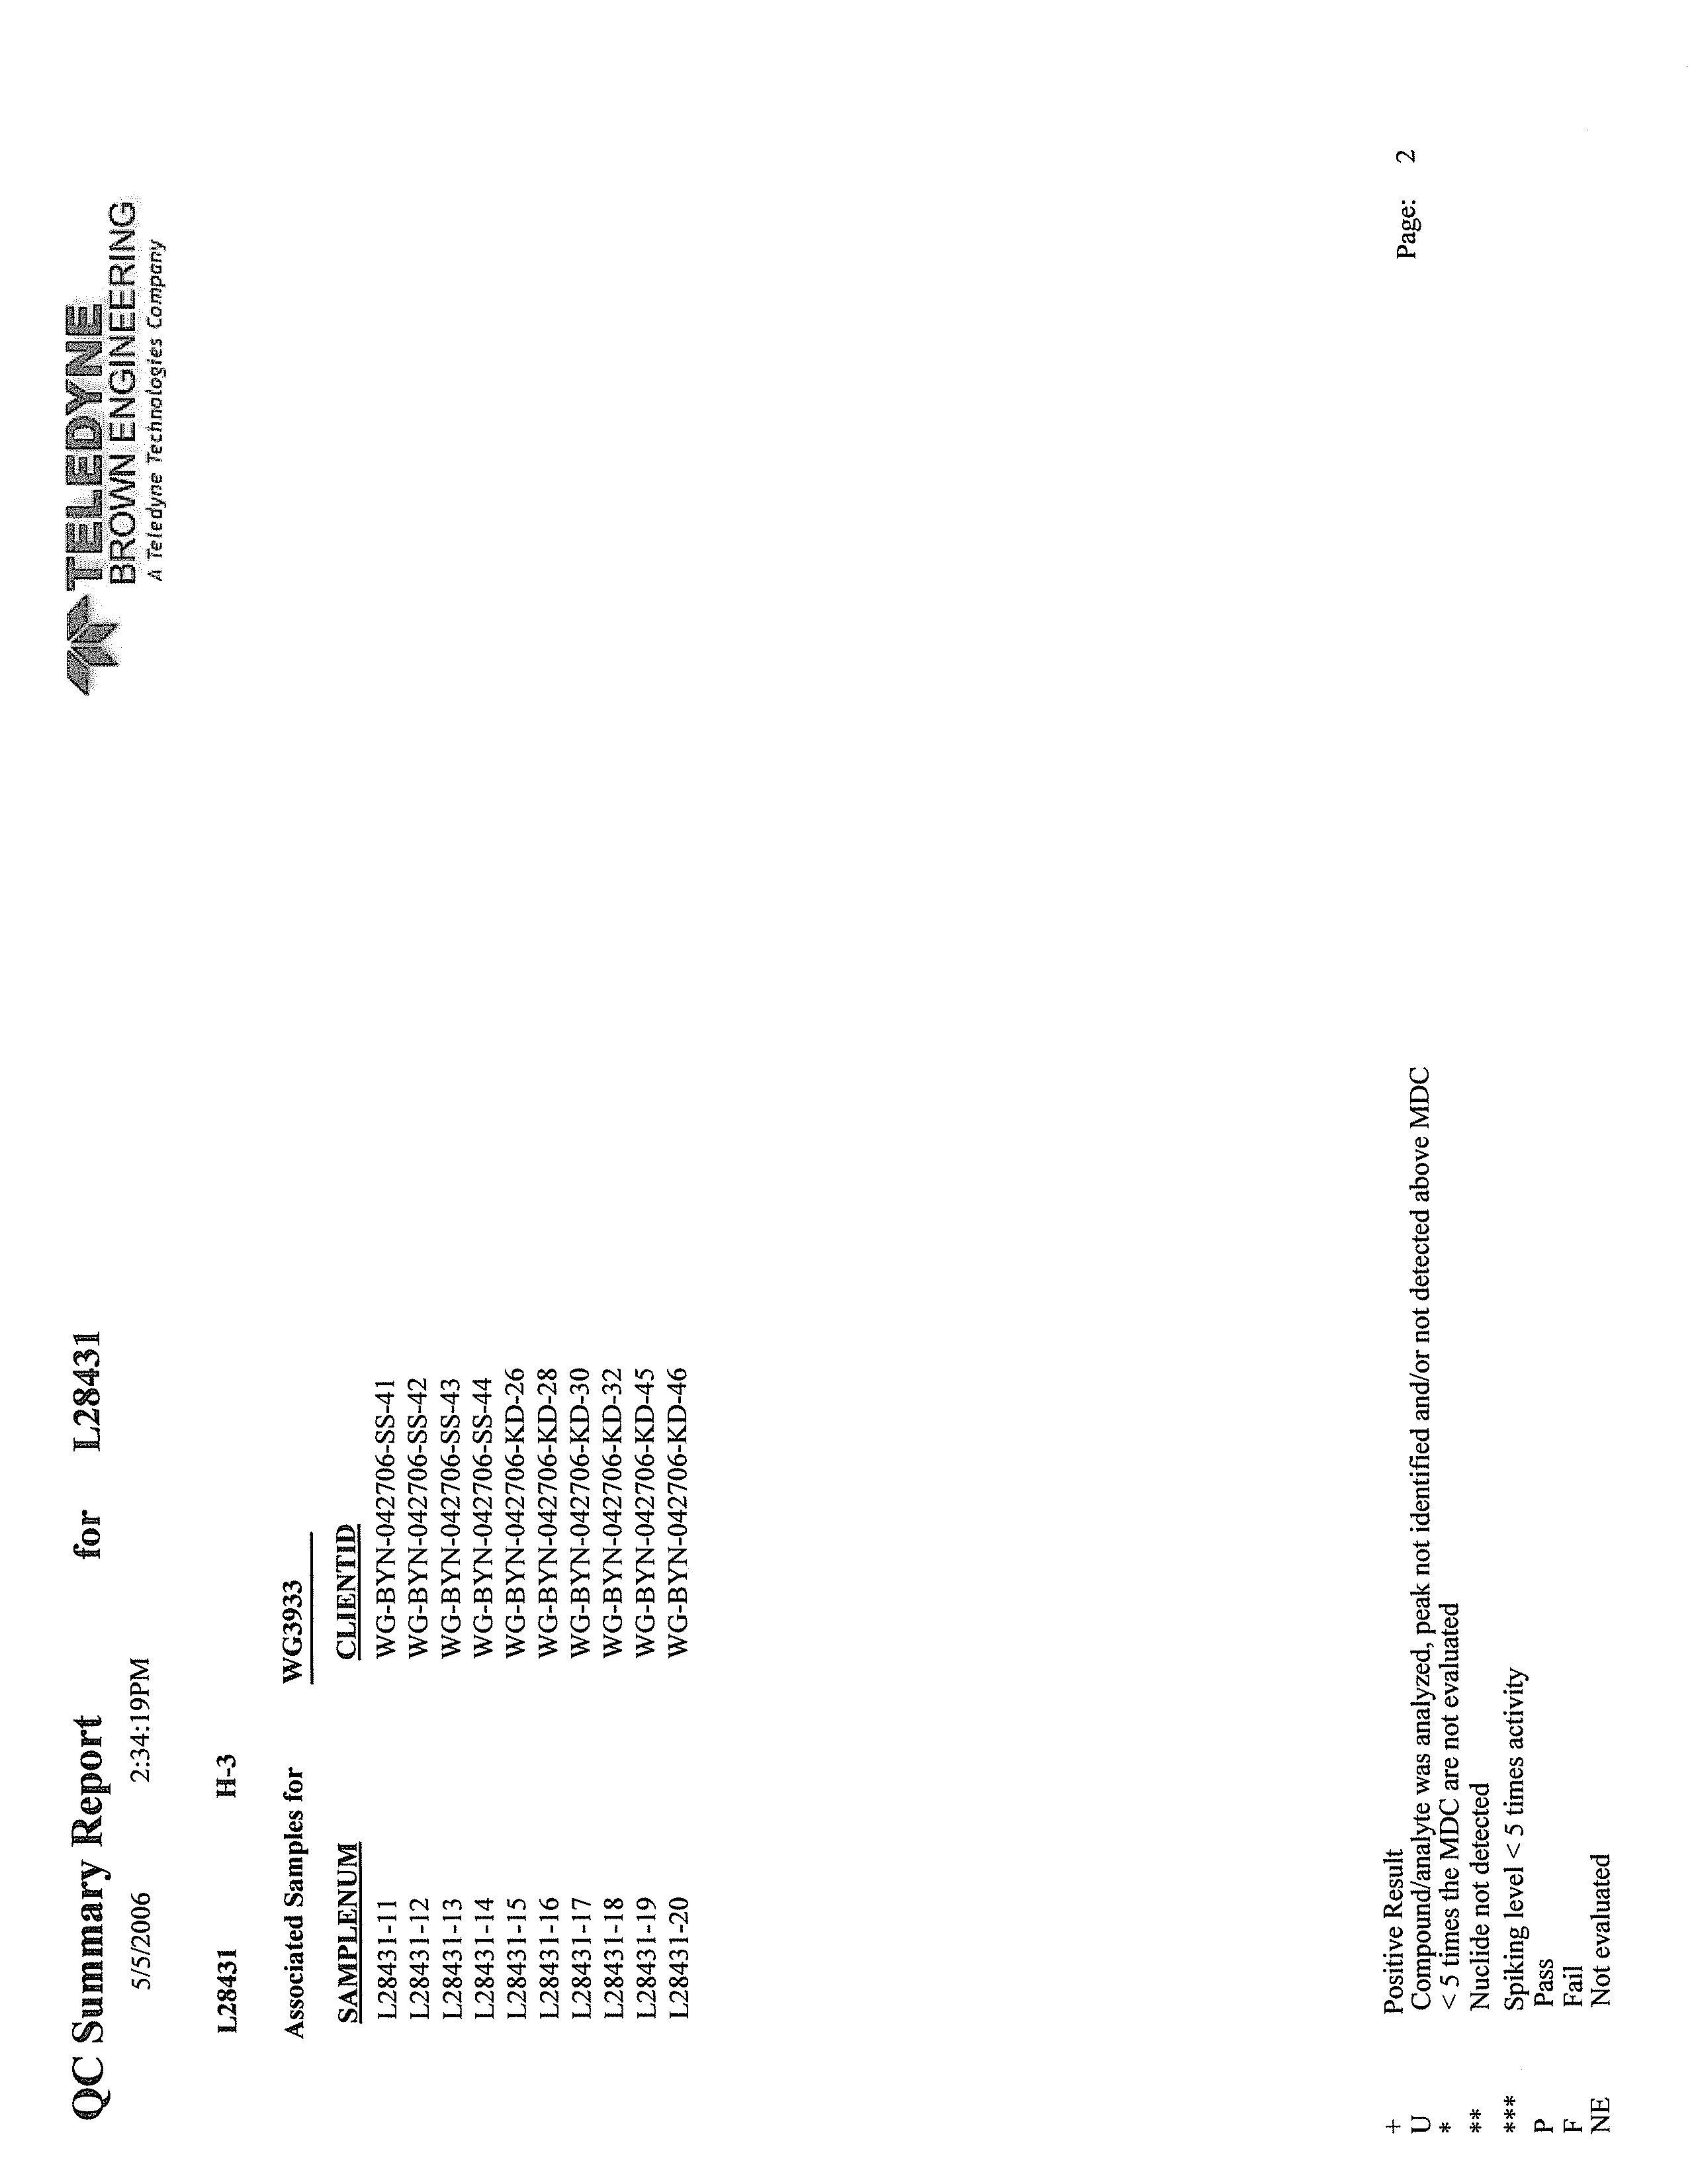
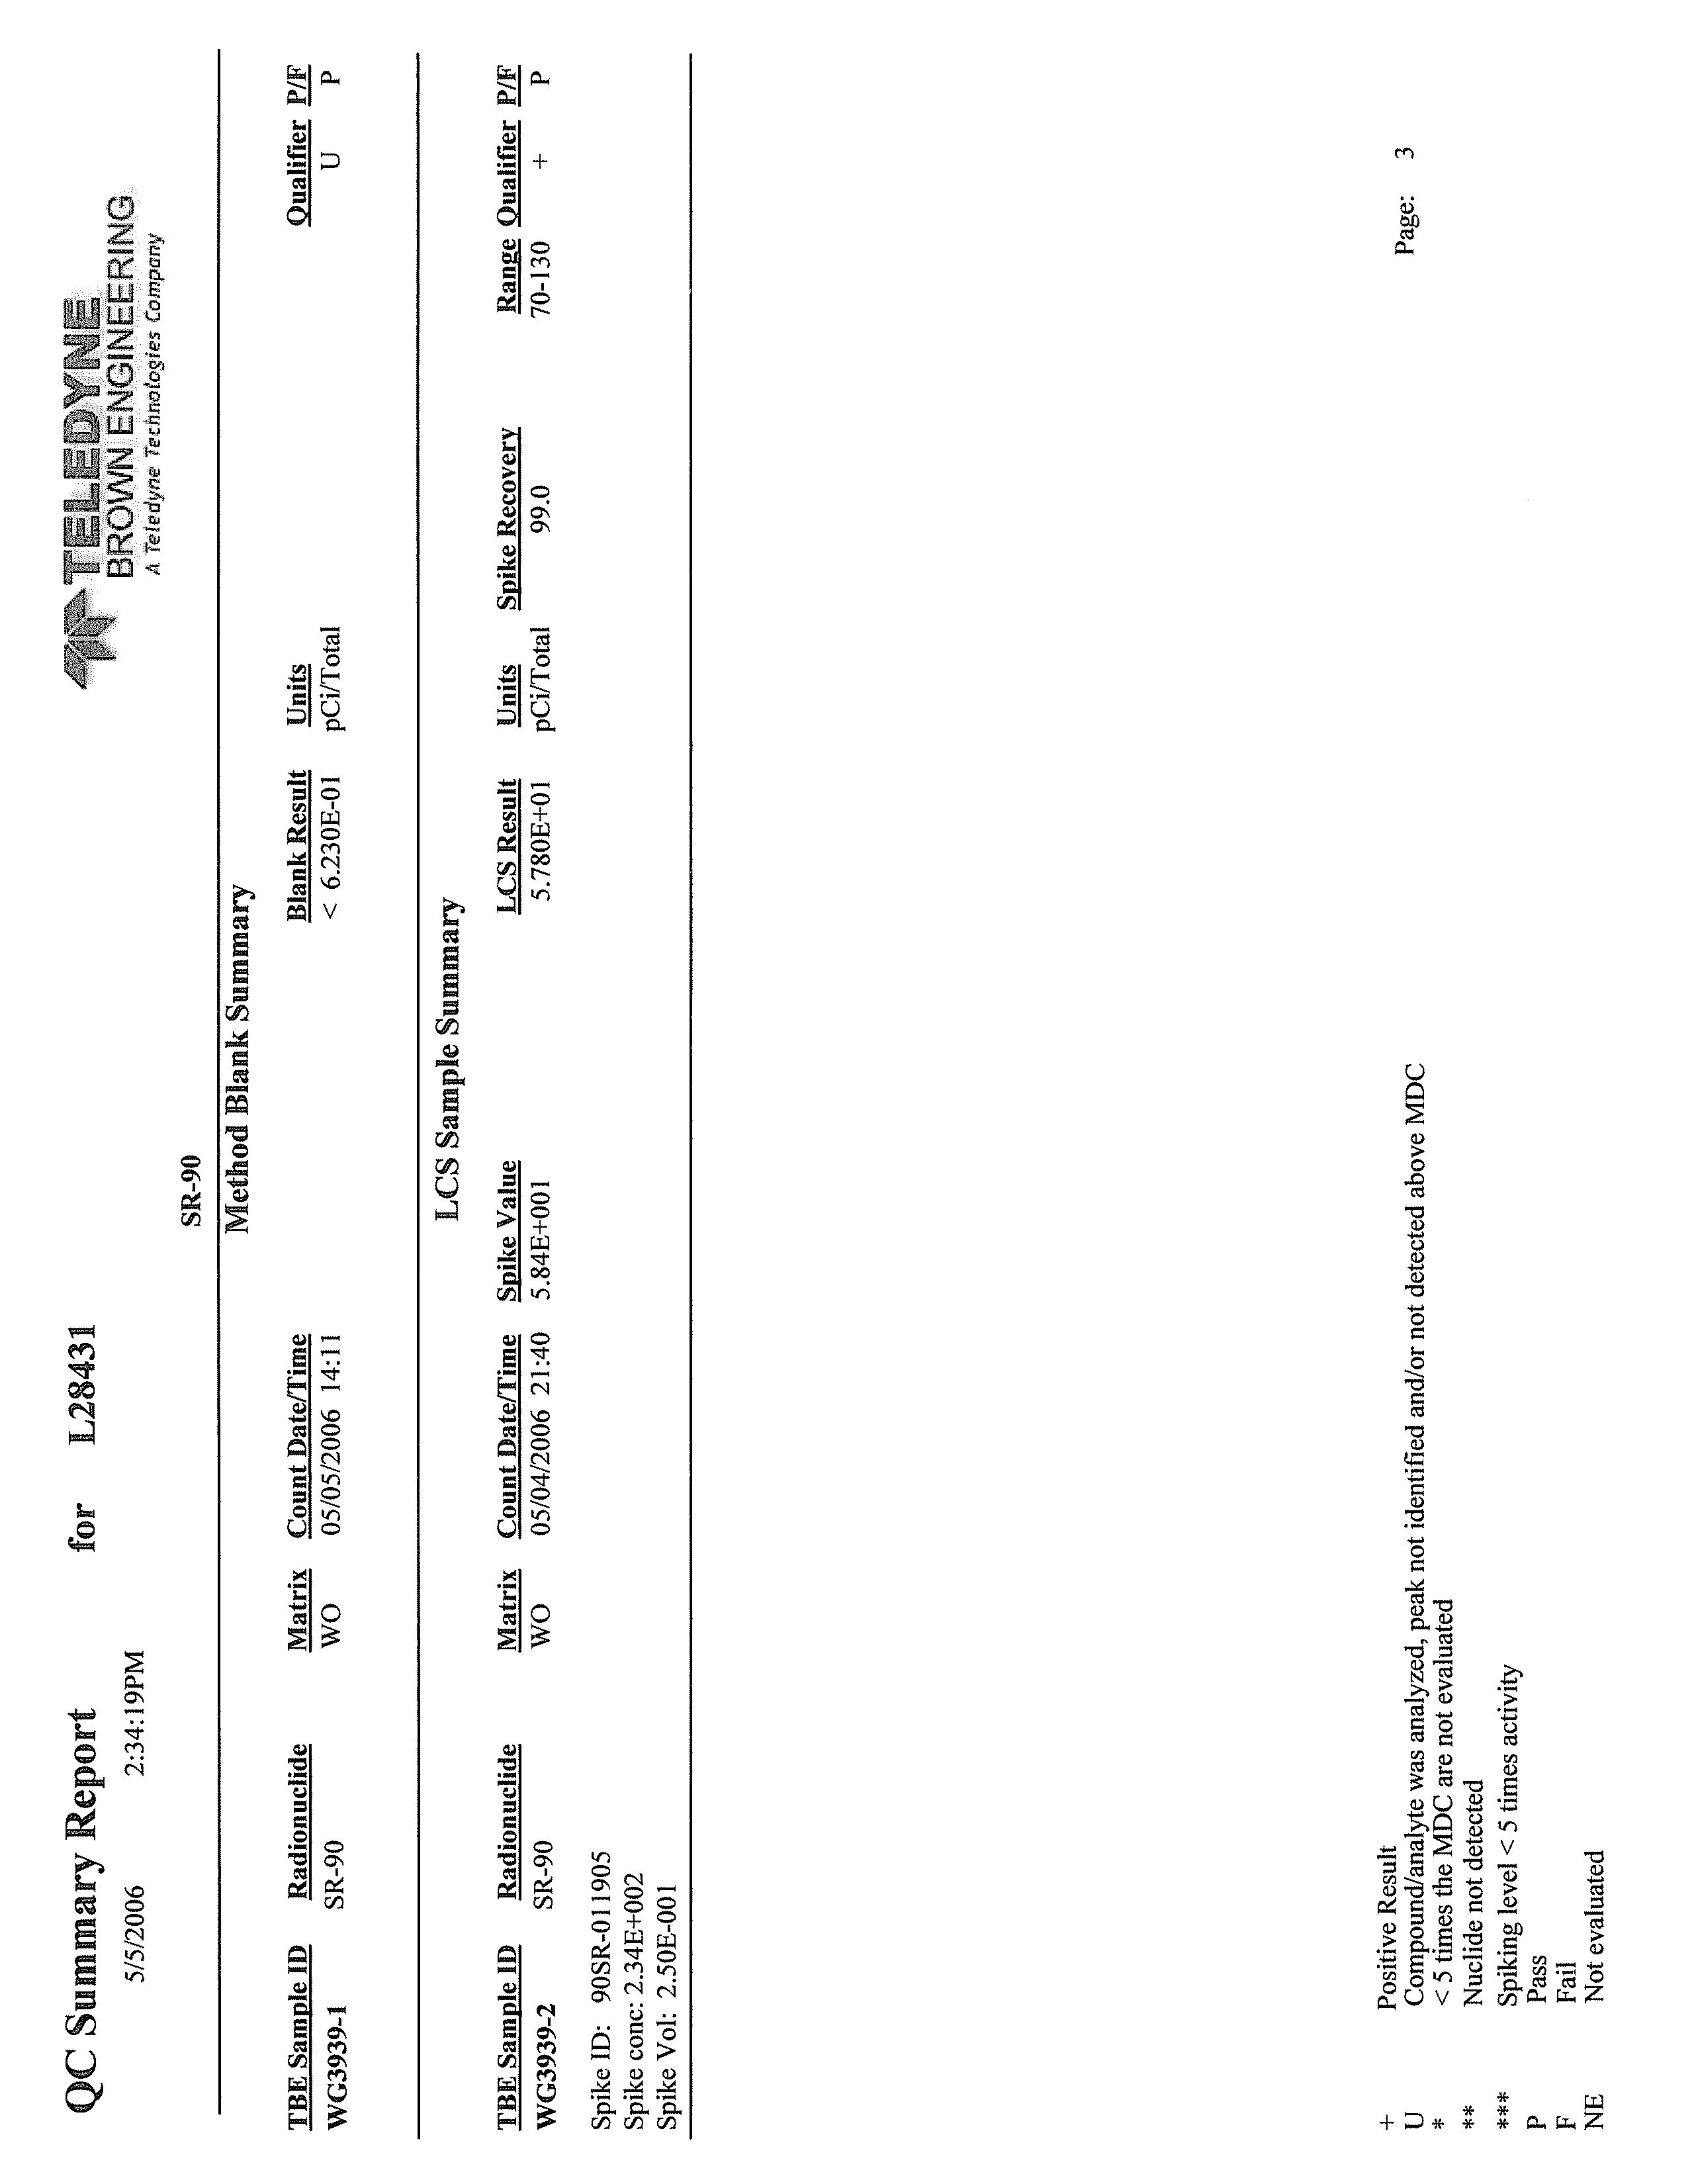
CRA has validated the analytical data to establish the accuracy and completeness of the
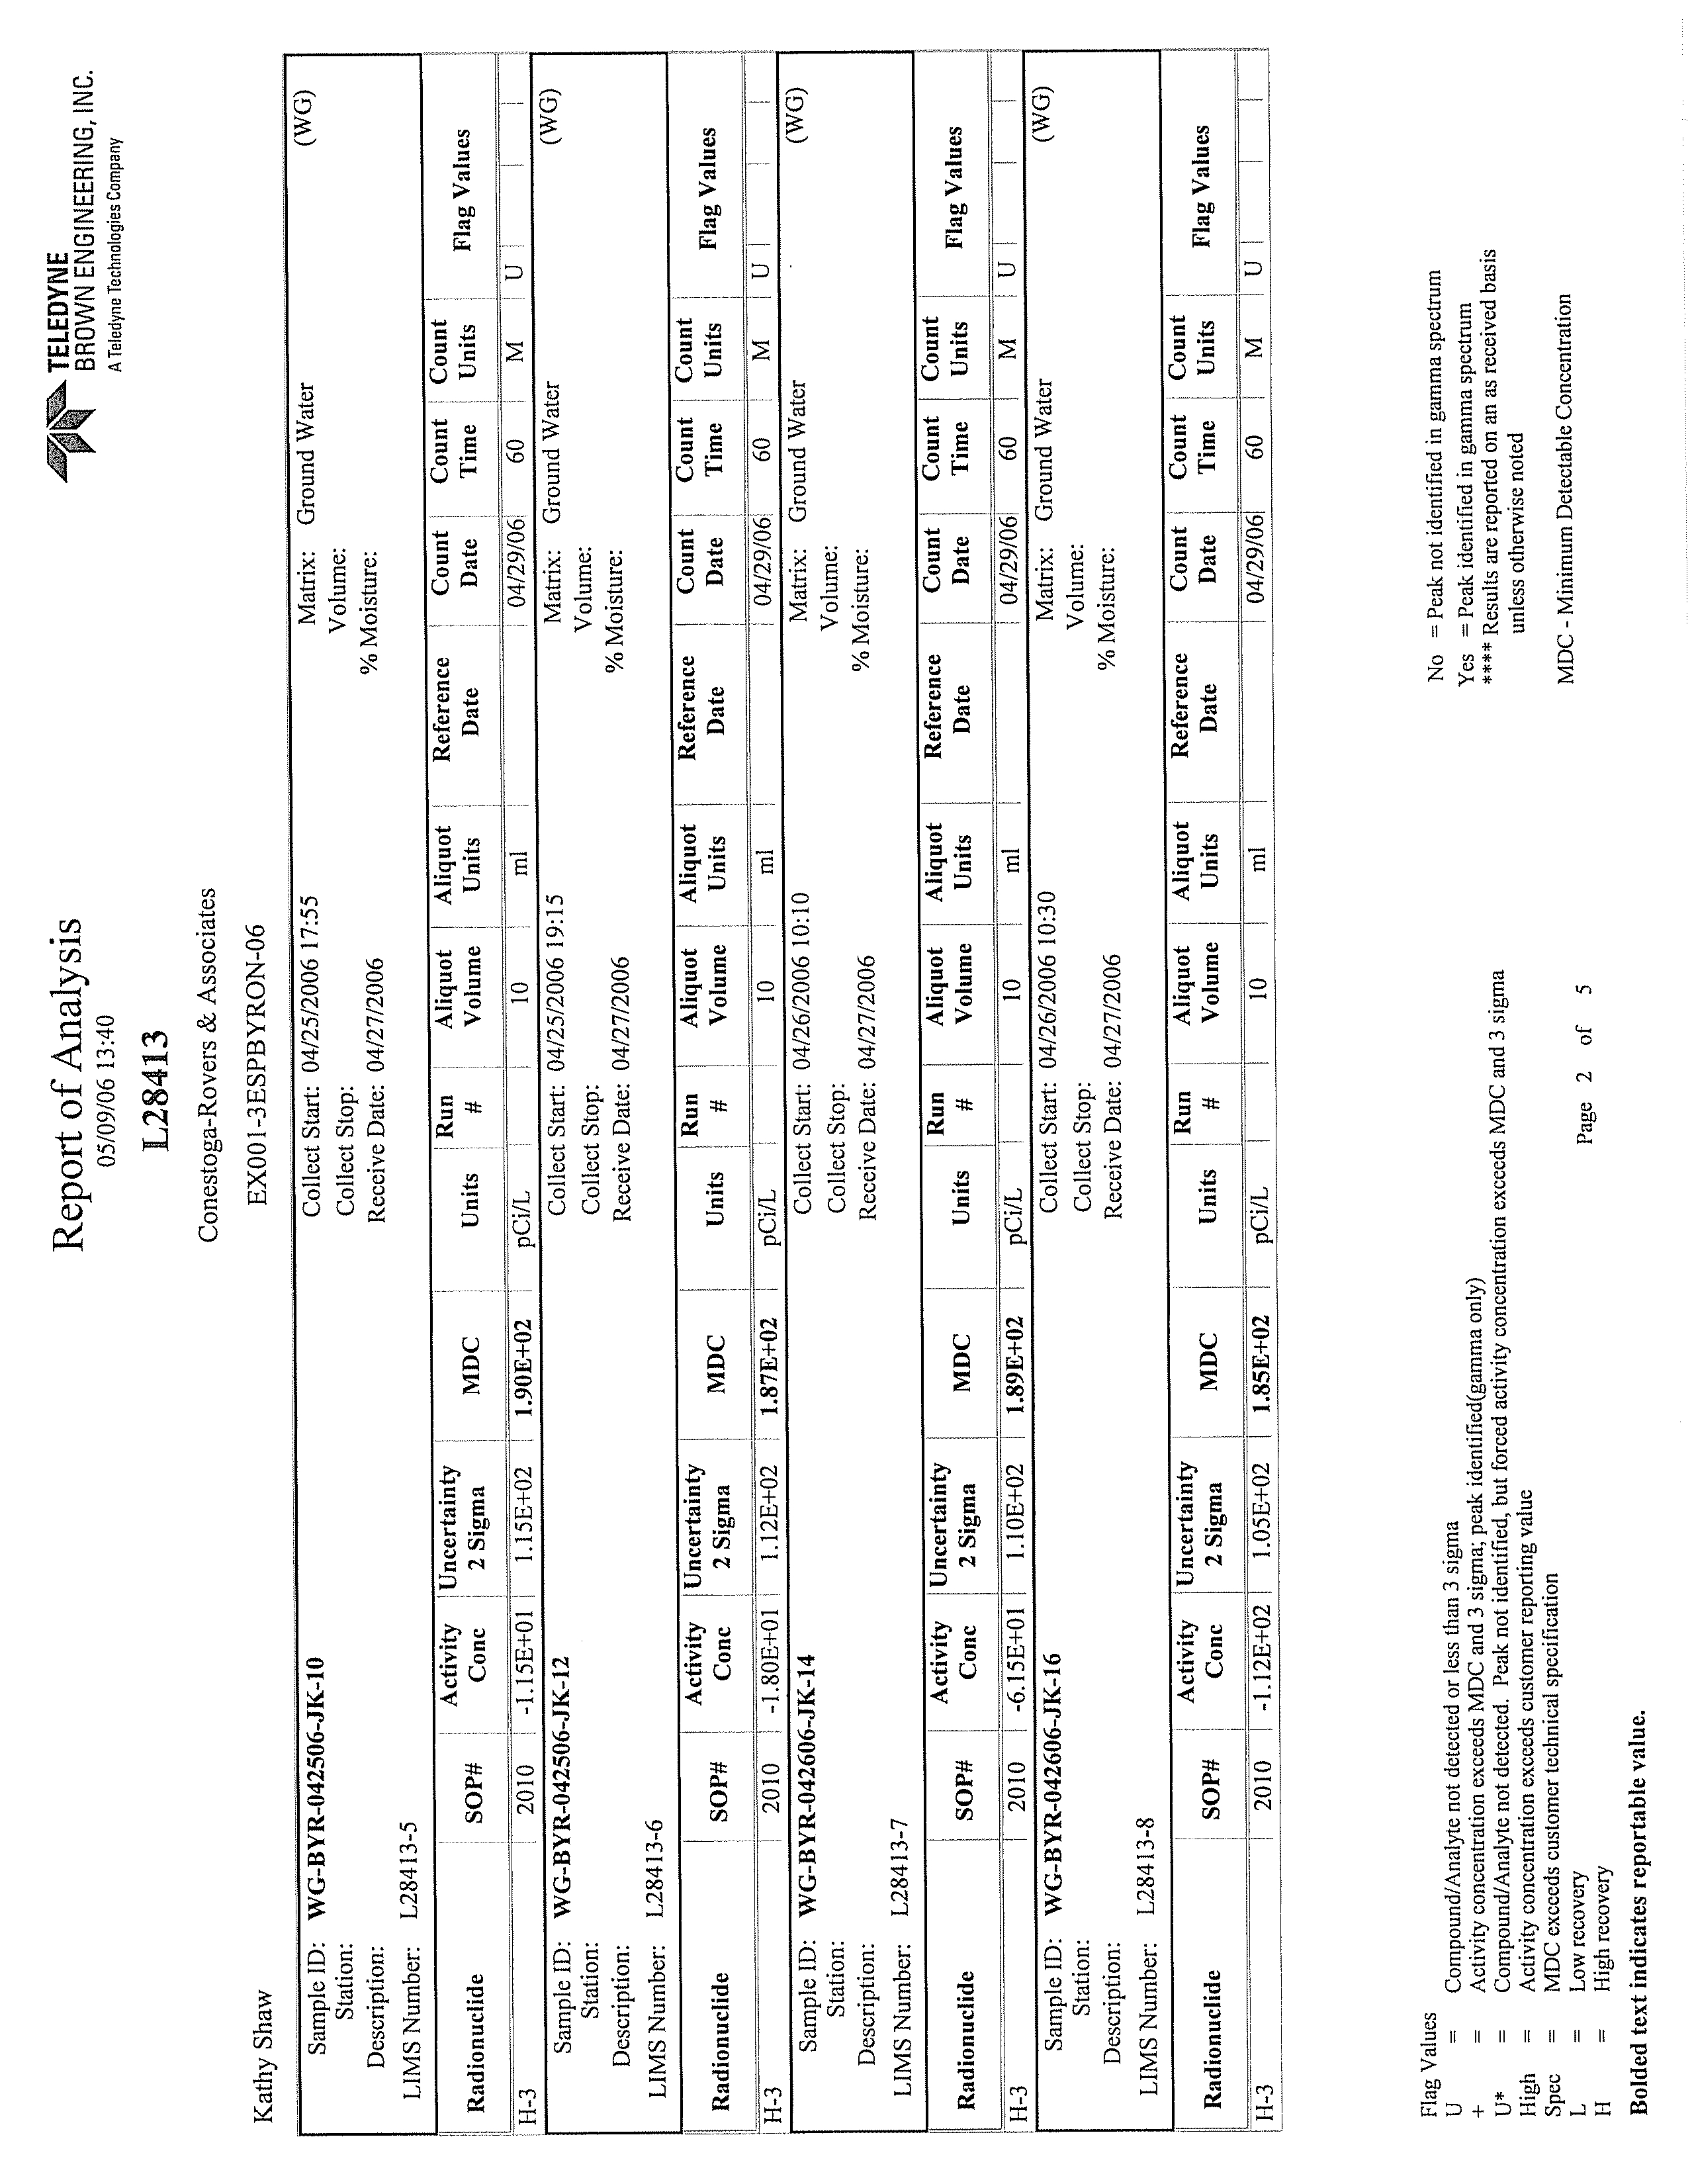
data reported. Teledyne Brown provided the analytical services. The Quality Assurance
Programs are described in Appendix C. Analytical data for groundwater samples
collected in accordance with the Work Plan are presented in Appendix D. Data
validation reports are presented in Appendix E. The data validation included the
following information and evaluations:
•
sample preservation;
•
sample holding times;
•
laboratory method blanks;
•
laboratory control samples;
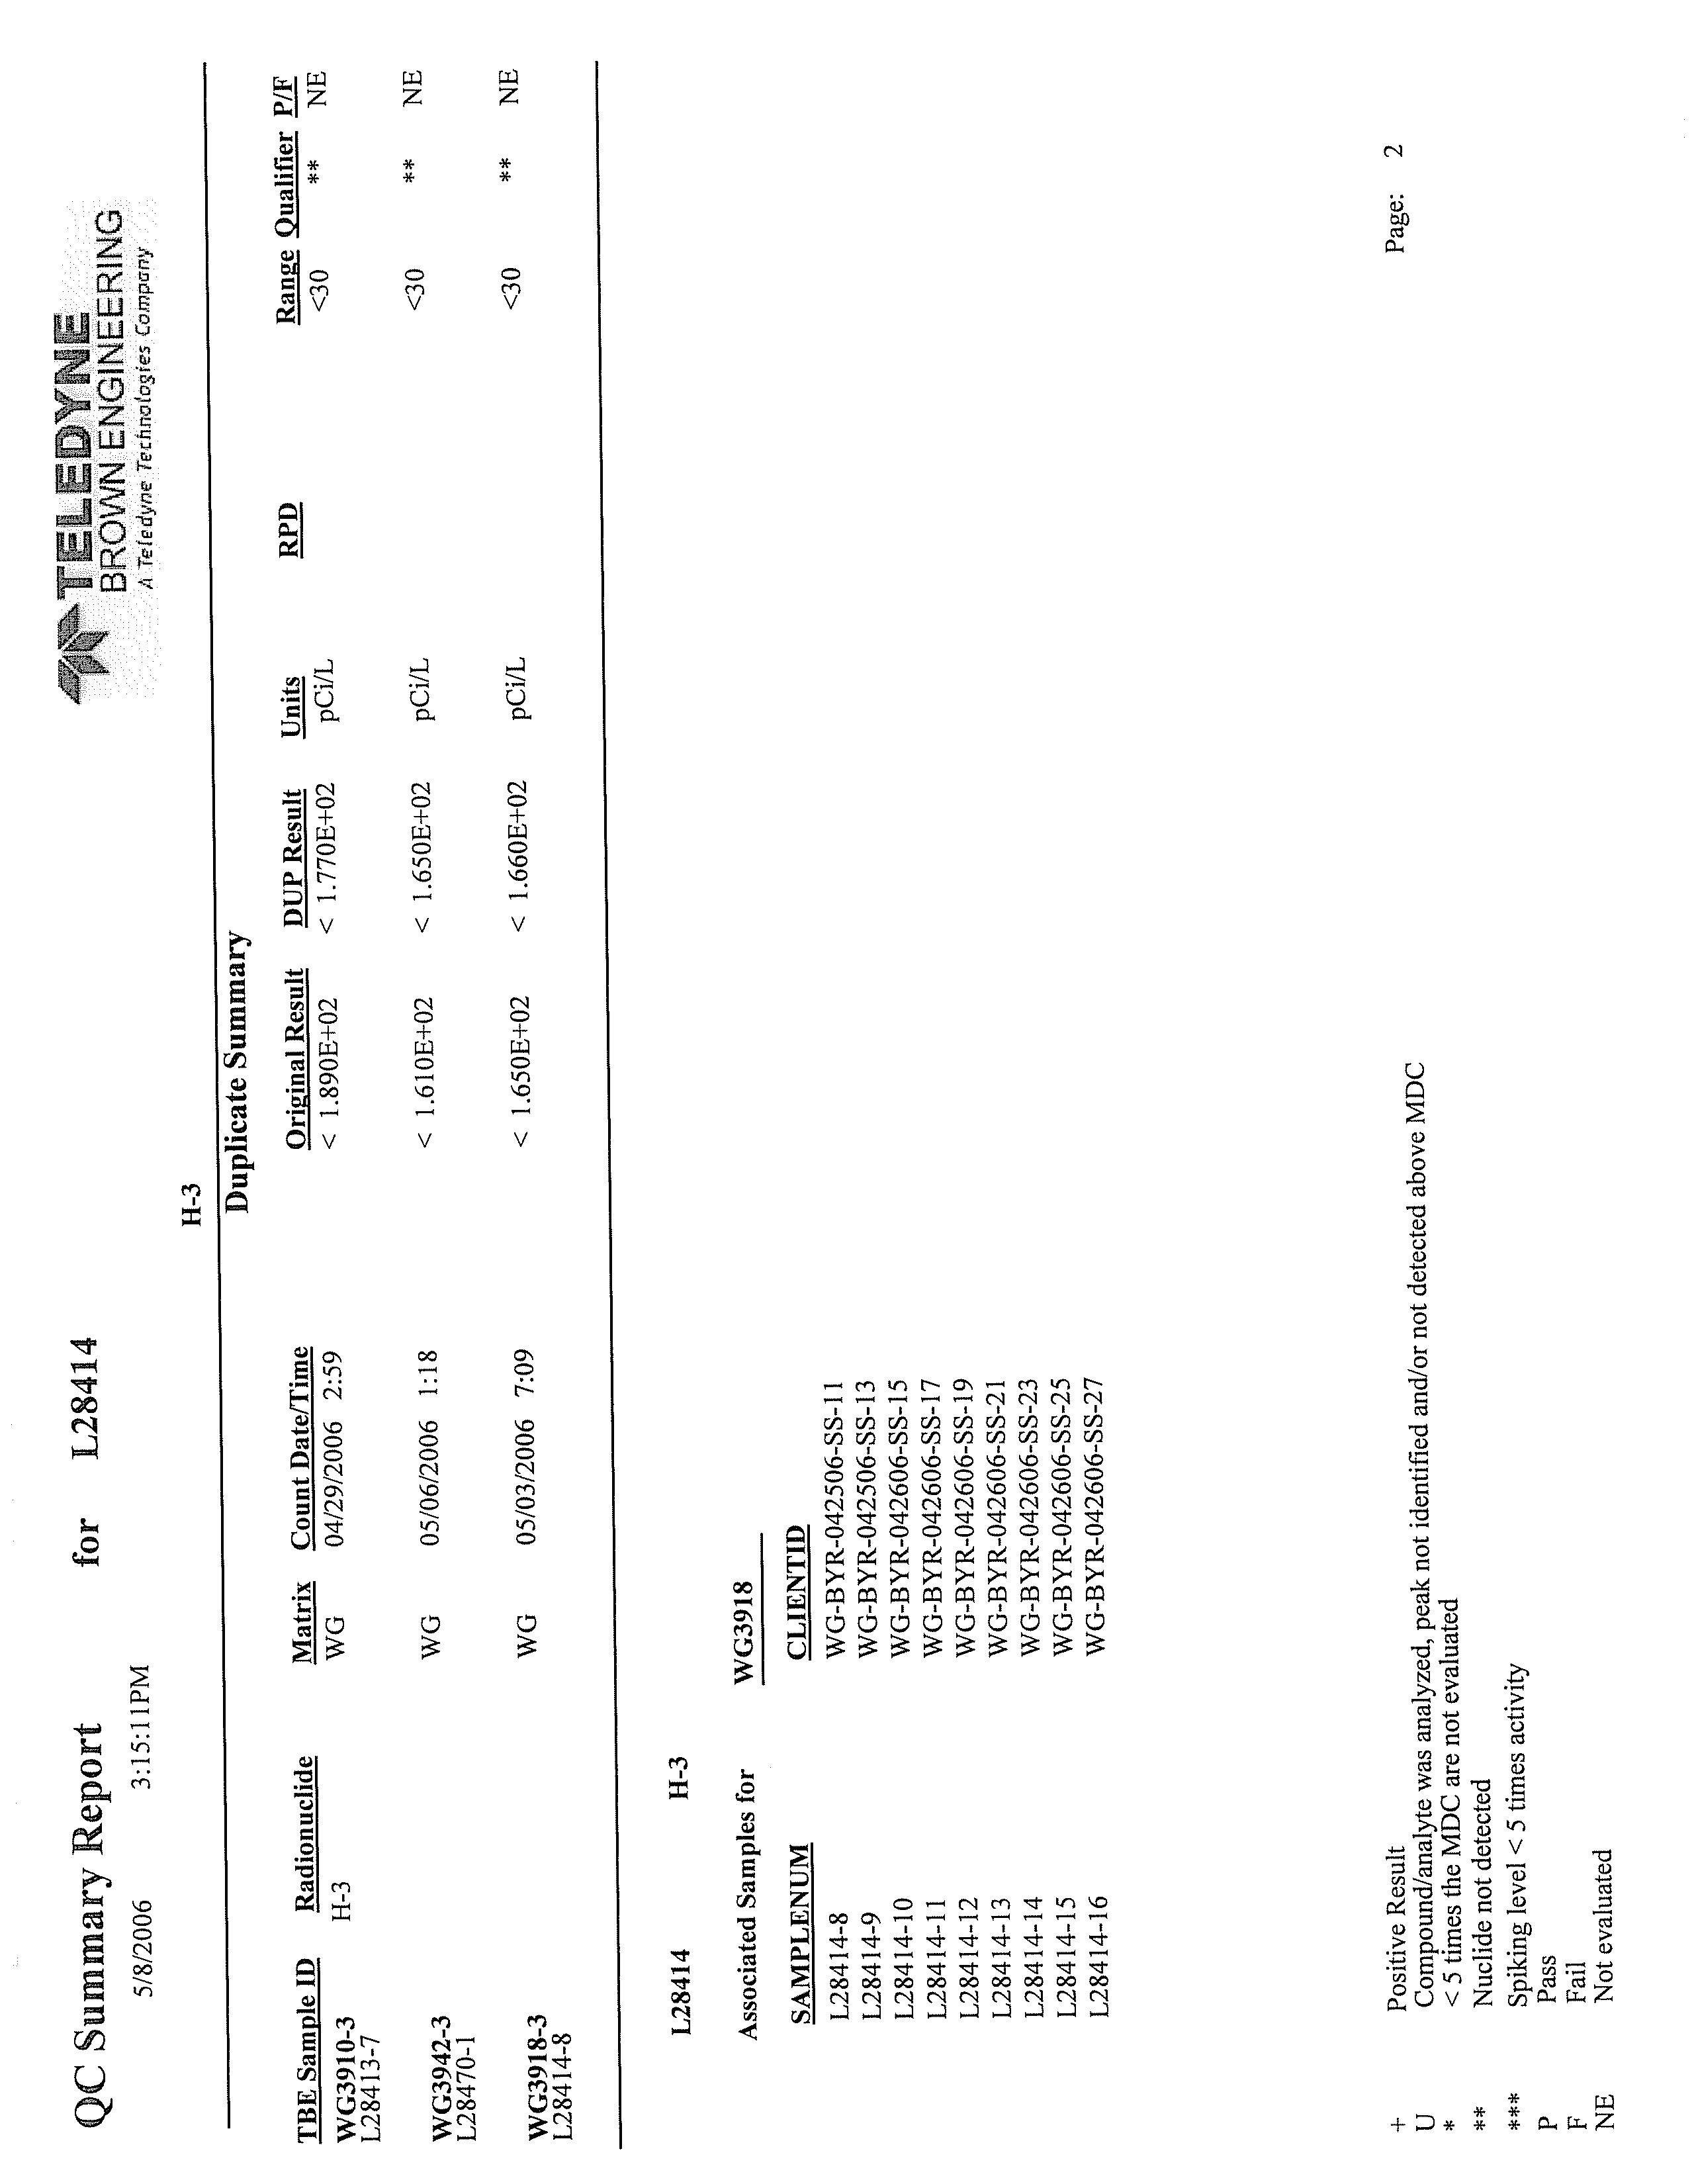
•
laboratory duplicates;
•
verify laboratory qualifiers; and
•
field quality
control (field blanks and duplicates).
Following the completion of field activities, CRA compiled and reviewed the geologic,
hydrogeologic, and analytical data.
The data were reviewed using the following techniques:
•
data tables and databox figures;
•
hydrogeologic cross-sections; and
•
hydraulic analyses.
4.2.4
SAMPLE IDENTIFICATION
For the fleetwide sampling, systematic sample identification codes were used to
uniquely identify all samples. The identification code format used in the field was:
045136 (13) Byron Generating Station
26
CONESTOGA-ROVERS & ASSOCIATES
Revision 1
WG-BYN–042506-SS-01. A summary of sample identification numbers for the fleetwide
investigation is presented in Table 4.6.
WG
-
Sample matrix -groundwater
RB
-
Sample matrix – rinse blank
BYN
-
Station code (for Byron)
042506
-
Date (month/day/year)
SS
-
Sampler's initials
01
-
Sample number
4.2.5
CHAIN-OF-CUSTODY RECORD
The samples were delivered to Station personnel under chain-of-custody protocol.
Subsequently, the Station or CRA shipped the samples under chain-of-custody protocol
to Teledyne Brown for analyses.
4.2.6
QUALITY CONTROL SAMPLES
Quality control samples were collected to evaluate the sampling and analysis process.
Field Duplicates
Field duplicates were collected to verify the accuracy of the analytical laboratory by
providing two samples collected at the same location and then
comparing the analytical
results for consistency. Field duplicate samples were collected at a frequency of one
duplicate for every ten samples collected. The locations of duplicate samples were
selected in the field during the performance of sample collection activities. The
duplicate samples were collected simultaneously with the actual sample and were
analyzed for the same parameters as the actual samples.
Rinsate Blank Samples
Rinsate blanks were collected during the fleetwide investigation to verify that
decontamination procedures conducted in the field
were adequate. Rinsate blanks were
collected by routing Station-supplied demineralized water through decontaminated
sampling equipment. Rinsate blanks were collected at a frequency of one rinsate blank
045136 (13) Byron Generating Station
27
CONESTOGA-ROVERS & ASSOCIATES
Revision 1
for every day samples were collected using non-disposable or non-dedicated equipment.
A total of four rinsate blanks were collected.
Split Samples
Split samples were collected for the NRC and IEMA for tritium simultaneously with the
actual sample at every sample location. Split samples were delivered
to the Station
personnel and made available to the NRC and IEMA.
4.2.7
ANALYSES
Groundwater samples were analyzed for tritium and gamma-emitting radionuclides as
listed in NUREG-1301 and strontium-89/90 as listed in 40 CFR 141.25.
045136 (13) Byron Generating Station
28
CONESTOGA-ROVERS & ASSOCIATES
Revision 1
5.0
RESULTS SUMMARY
This section provides a summary of Station-specific geology and hydrogeology, along
with a discussion of hydraulic gradients, groundwater elevations, and flow directions in
the vicinity of the Station. This section also presents and evaluates the analytical results
obtained from activities performed during the blowdown line and
fleetwide
investigations.
5.1
STATION GEOLOGY
Bedrock under the Station is generally found within the top 10 feet, under a veneer of
unconsolidated deposits, except near the Rock River, where the bedrock has been
eroded and is encountered at deeper depths. The Station geology is consistent with the
regional geology and is comprised of flat-lying Ordovician-aged dolomitic and
sandstone layers progressing downward as follows:
•
Galena Group Dolomites;
•
Platteville Group Dolomites; and
•
Ancell Group, consisting of:
−
Glenwood Formation (shale with sandy dolomite, semi-confining layer),
−
St. Peter Sandstone Formation, and
−
older Cambrian formations.
The generating facility was constructed on an area of a 'bedrock high', and the
foundation was installed into the bedrock.
5.2
STATION HYDROGEOLOGY
There are two aquifers within the first 230 feet beneath the Station property:
•
the
upper aquifer is the Galena-Platteville aquifer consisting of Galena-Platteville
limestones and dolomites; and
•
the lower aquifer is the St. Peter Sandstone aquifer.
The Glenwood Formation separates the above two aquifers. The Glenwood contains
shale
at the top and sandy dolomite at its base. The shale acts as a semi-confining
aquitard between the upper Galena-Platteville aquifer and lower St. Peter Sandstone
045136 (13) Byron Generating Station
29
CONESTOGA-ROVERS & ASSOCIATES
Revision 1
aquifer. The first occurrence of groundwater (the water table) is encountered within the
unconsolidated deposits near the Rock River, and within the upper fractured portions of
the Galena-Platteville aquifer in the upland areas, east of the Rock River.
The monitoring wells at the Station were installed to monitor three intervals within the
two aquifers
(see Table 2.1):
•
wells screened across the water table, either
in the unconsolidated sediments near
the Rock River or in the upper portions of the Galena-Platteville aquifer;
•
wells screened at the bottom of the Galena-Platteville
aquifer, just above the shale
unit; and
•
wells screened in the St. Peter Sandstone aquifer.
Figure 5.1 presents the locations of four hydrogeologic cross-sections prepared for the
Station. The four
cross-sections depict the relationship between the geology and
measured groundwater elevations.
Figure 5.2 presents an east-west cross-section
parallel to the groundwater flow direction, along the blowdown line. Figure 5.3
presents a north-south cross-section perpendicular to the groundwater flow, through
vacuum breaker 4 (VB-4). This location was chosen because water with the highest
concentrations of tritium was encountered in the concrete vault at VB-4. Also indicated
on Figures 5.1 through 5.3 are the approximate limits of the historical Byron Salvage Site
groundwater plumes. Figure 5.4 presents two cross-sections through the PA, one
trending to the northeast through Unit 2 and the other to the east through Unit 2.
5.2.1
GROUNDWATER FLOW DIRECTIONS
CRA used a commercially available contouring program (Surfer, Version
8.02, 2002) to
provide an initial contouring of the measured groundwater elevations. CRA then
refined the initial contours, using professional judgment, to prepare final contour maps.
Figure 2.4 presents the water table groundwater contours in the upper portion of the
Galena-Platteville aquifer based on data collected by CRA on March 23, 2006 for the
blowdown line area, along with historical data collected in 1974 for the generating
facility area. Figures 5.5 through 5.7 present the groundwater contours based on
April 24, 2006 data for the upper portion of the Galena-Platteville aquifer, the bottom of
the Galena-Platteville aquifer, and the St. Peter Sandstone aquifer, respectively.
The general groundwater flow direction in all three intervals is to the west toward Rock
River. This is consistent with the regional
flow pattern, which is to the west toward the
045136 (13) Byron Generating Station
30
CONESTOGA-ROVERS & ASSOCIATES
Revision 1
Rock River, since the Rock River is the major water body in the area (UFSAR, 2004 and
CRA, 2001).
Within the upper portions of the Galena-Platteville aquifer, the direction
of groundwater
flow typically follows the topographic relief at points along the blowdown line. There is
a northwest/southeast trending groundwater divide within the Former Dirk's Farm
property, near Razorville Road, that is generally perpendicular to the blowdown line
(Figures 2.4 and 5.5).
5.2.2
MAN-MADE INFLUENCES ON GROUNDWATER FLOW
The PA sits upon a bedrock high, and as such, the groundwater beneath this area of the
Station flows radially outward in all directions. The bedrock below the generating
facility foundations was pressure grouted for structural reasons prior to constructing the
foundation. The pressure grouting sealed the pore space of the bedrock, thus causing
the groundwater to be observed at a deeper depth than that under normal conditions in
AR-7. Therefore, the groundwater elevation from AR-7 was not used in the contouring
of Figure 5.5.
5.2.3
VERTICAL HYDRAULIC GRADIENTS
CRA calculated vertical hydraulic gradients at the locations where depth specific wells
were clustered together. Table 5.1 presents the calculated vertical gradients. Between
the upper portion of the Galena-Platteville aquifer and the bottom of the aquifer, there is
a slight downward vertical gradient of approximately 0.01 feet/foot. This is consistent
with the effects of recharge from the higher/elevated areas of the Station and discharge
to the Rock River. However, at the PC-3B/DF-6 well cluster location on the former
Dirk's Farm property, the downward vertical gradient is greater, at 0.443 feet/foot. The
vertical gradients measured within the Galena-Platteville aquifer are in the same range
as the measured horizontal hydraulic gradient.
There is only one cluster of wells in which both wells are screened
within the St. Peter
Sandstone aquifer: MW-20R and MW-21. The measured vertical hydraulic gradient at
this well cluster is very low at 0.001 feet/foot. This suggests primarily horizontal flow
within the St. Peter Sandstone aquifer, which is consistent with the high conductivity of
the St. Peter Sandstone.
045136 (13) Byron Generating Station
31
CONESTOGA-ROVERS & ASSOCIATES
Revision 1
The groundwater elevation data confirm that the Galena-Platteville and St. Peter
Sandstone aquifers are not hydraulically connected.
The groundwater elevations
measured in wells that are screened in the St. Peter Sandstone aquifer are typically more
than 50 feet lower than those in wells screened at the bottom of the Galena-Platteville
aquifer. Vertical hydraulic gradients between these two aquifers, measured at five well
clusters, range between 0.622 feet/foot and 1.893 feet/foot, with the average being
1.127 feet/foot. These are much greater than the horizontal gradients measured in either
of the two aquifers. These groundwater data provide evidence that the shale of the
Glenwood Formation, which separates the bottom of the Galena-Platteville aquifer from
the underlying St. Peter Sandstone aquifer, is acting as a local aquitard or semi-confining
unit.
5.2.4
LATERAL GROUNDWATER FLOW AND VELOCITY
Across the more than two-mile distance between the generating facility and the Rock
River, the water table elevation drops approximately 160 feet, creating a shallow
horizontal hydraulic gradient of approximately 0.014 feet/foot. The limestones and
dolomites that comprise the Galena-Platteville aquifer generally have hydraulic
conductivities that can vary significantly; a study for the Byron Salvage Site immediately
to the north of the west portion of the station, reported mean hydraulic conductivities
ranging from 0.31 feet/day to 240 feet/day with a primary porosity of around
10 percent (Kay et al., 1997). With a gradient of 0.014 feet/foot, the average shallow
horizontal groundwater flow velocity can be calculated to be 15.8 feet/year to
12,200 feet/year.
The groundwater flow direction at the bottom
of the Galena-Platteville aquifer has a
southwest component, under a horizontal hydraulic gradient of approximately
0.011 feet/foot (Figure 5.6). However, the wells screened at the bottom of the aquifer are
only located near the blowdown line, on the Former Dirk's Farm property, not across the
entire length of the Station property. In this same area for the upper Galena-Platteville
aquifer, the groundwater contours also suggest a component of flow to the southwest.
In St. Peter Sandstone aquifer, the groundwater contours suggest a groundwater flow to
the
west toward the Rock River, under a low horizontal hydraulic gradient of
approximately 0.001 feet/foot (Figure 5.7). This is consistent with expected regional
groundwater flow within the lower aquifer.
Using the hydraulic gradient of
0.001 feet/foot with a reported hydraulic conductivity range of 2.0 feet/day to
8.7 feet/day (Kay et al., 1997) and a reported primary porosity of 0.14 (Kay et al., 1997)
045136 (13) Byron Generating Station
32
CONESTOGA-ROVERS & ASSOCIATES
Revision 1
yields an average horizontal groundwater velocity in the St. Peter Sandstone of
5.2 feet/year to 22.7 feet/year.
5.3
GROUNDWATER QUALITY
During the blowdown line investigation and the fleetwide assessment, both CRA and
Station personnel collected numerous samples from the vacuum breaker vaults and
other Station locations, from nearby residential wells, from the blowdown line itself,
from the on-Station CROP, and from a subset of the monitoring wells located on the
Station property. As discussed in Sections 4.1 and 4.2, the samples were analyzed for
tritium, and some of the samples were also analyzed for strontium-89/90 and additional
radionuclides.
Table 5.2 presents a summary of tritium analyses for water samples collected by the
Station from the vacuum breaker vaults, the beginning and end of the blowdown line,
and the CROP. Table
5.3 presents a summary of tritium analyses for groundwater
samples collected during both the blowdown line investigation and the fleetwide
investigation. Table 5.4 presents a summary of tritium analyses for groundwater
samples collected from residential water supply wells. Table 5.5 presents a summary of
the other radionuclide analyses (strontium-89/90 and gamma-emitting radionuclides)
for groundwater samples collected during both the blowdown line investigation and the
fleetwide investigation.
The analytical data presented herein has been subjected to CRA's data validation process
(see Appendix
E for the data validation reports).
CRA has used the data with
appropriate qualifiers, where necessary.
The data reported in the figures and tables does not include the results of re-analyses or
recounts that the laboratory completed,
except if those results ultimately replaced an
initial report. The tables and figures, therefore, include only the first analysis reported
by the laboratory.
045136 (13) Byron Generating Station
33
CONESTOGA-ROVERS & ASSOCIATES
Revision 1
5.3.1
SUMMARY OF BETA-EMITTING RADIONUCLIDES
ANALYTICAL RESULTS
5.3.1.1
STATION SAMPLING POINTS
During the blowdown line investigation, Station personnel collected multiple samples
on different dates from the vacuum breaker vaults, the beginning and end of the
blowdown line, and the CROP. A summary of the tritium results for the water samples
collected from the Station sampling locations is provided in Table 5.2. The tritium data
are presented graphically on Figure 5.8.
5.3.1.2
GROUNDWATER MONITORING WELL SAMPLES
A summary of the tritium results for the groundwater samples collected during both the
blowdown line investigation and the fleetwide investigation is provided in Table 5.3.
Figures 5.9 through 5.11 present the tritium data graphically for the groundwater
samples collected on different dates from the monitoring wells screened in the upper
portions of the Galena-Platteville aquifer, the bottom of Galena-Platteville aquifer, and
the St. Peter Sandstone aquifer, respectively.
All tritium concentrations were below the USEPA drinking water standard of
20,000
pCi/L. Tritium was not detected at concentrations greater than the LLD of
200 pCi/L in 35 of the 39 groundwater samples collected.
Strontium-89/90 was not detected at concentrations greater than the LLD of 2.0 pCi/L.
A summary of the strontium-89/90 results for the groundwater samples collected as
part of the investigations that are the subject of this HIR is provided in Table 5.5.
Galena-Platteville Aquifer
Groundwater samples were collected from 32 different monitoring wells screened in the
upper portions of Galena-Platteville aquifer (Figure
5.9). Concentrations of tritium
exceeding the LLD of 200 pCi/L for tritium were only detected in the groundwater
samples collected from three of the monitoring wells: AR-2, AR-3, and AR-4. The most
recent concentrations of tritium detected at each location were:
•
AR-2
432 ± 140 pCi/L;
•
AR-3
234 ± 128 pCi/L; and
•
AR-4
3,260 ± 367 pCi/L.
045136 (13) Byron Generating Station
34
CONESTOGA-ROVERS & ASSOCIATES
Revision 1
The original groundwater sample collected from TW-13 had a tritium
concentration less
than the LLD of 200 pCi/L; however, a detection of tritium slightly greater than the
LLD, 201 ± 110 pCi/L, was detected in a duplicate groundwater sample collected as part
of the fleetwide sampling event at the same time on the same date. In consideration of
the original sample being less than the LLD, and the duplicate sample at 201 pCi/L with
an error of ±
110 pCi/L, the tritium concentration at this location is regarded as less than
the LLD.
CRA collected five groundwater samples from
monitoring wells installed at the bottom
of Galena-Platteville aquifer (Figure 5.10), and only the samples from monitoring well
AR-11 contained tritium at concentrations greater than the LLD of 200 pCi/L. The
highest tritium concentration detected in a groundwater sample collected from
monitoring well AR-11 was 2,340 ± 282 pCi/L. Monitoring well AR-11 is a bedrock well
located in a downgradient direction from monitoring well AR-4 and VB-4 (Figure 2.3),
and screened in a deeper portion of the bedrock (bottom of the Galena-Platteville
aquifer) than AR-4 (upper portion of the Galena-Platteville aquifer) (Figure 5.2). The
inferred vertical limits of the groundwater containing tritium exceeding the LLD of
200 pCi/L are depicted on Figures 5.2 and 5.3.
Strontium-89/90 was not detected at concentrations greater than the LLD of 2.0 pCi/L.
A summary of the strontium 89/90 results for the groundwater
samples collected as part
of the investigations that are the subject of this HIR is provided in Table 5.5.
St. Peter Sandstone Aquifer
CRA collected groundwater samples from four monitoring wells screened in the
St.
Peter Sandstone aquifer (Figure 5.11). None of the groundwater samples contained
detectable concentrations of tritium above the LLD of 200 pCi/L.
Strontium-89/90 was not detected at concentrations greater than the LLD of 2.0 pCi/L.
A summary of the strontium-89/90 results for the groundwater samples collected as
part of the investigations that are the subject of this HIR is provided in Table 5.5.
5.3.1.3
RESIDENTIAL WATER SUPPLY WELLS
Station personnel collected water samples from nine of the residences located adjacent to
the Station property, along the blowdown line. In addition, a water sample was also
045136 (13) Byron Generating Station
35
CONESTOGA-ROVERS & ASSOCIATES
Revision 1
collected from the well of a residence located approximately 2 miles east of the Station
(Goral Well) to be used as a background water sample.
Tritium was not detected above the LLD of 200 pCi/L in any of the 10 residential well
samples
collected. A summary of the tritium results for the residential water samples is
provided in Table 5.4, and the tritium data is presented graphically on Figure 5.12.
Strontium-89/90 was not detected at concentrations greater than the LLD of 2.0 pCi/L.
A summary of the strontium-89/90 results for the groundwater samples collected as
part of the investigations that are the subject of this HIR is provided in Table 5.5.
5.3.2
SUMMARY OF GAMMA-EMITTING RADIONUCLIDES
ANALYTICAL RESULTS
Gamma-emitting target radionuclides were not detected at concentrations greater than
their
respective LLD. CRA collected groundwater samples from 19 monitoring wells
and the samples were analyzed for gamma-emitting radionuclides. A summary of the
radionuclide results is provided in Table 5.5 and presented graphically on Figure 5.13.
Other non-targeted radionuclides were also included in the tables but excluded from
discussion in this report.
These radionuclides were either a) naturally occurring and
thus not produced by the Station, or b) could be definitively evaluated as being naturally
occurring due to the lack of presence of other radionuclides which would otherwise
indicate the potential of production from the Station.
5.3.3
SUMMARY OF FIELD MEASUREMENTS
A summary of the field measurement results for the groundwater samples collected as
part of the blowdown line investigation is provided in Table 4.3. A summary of the field
measurement results for the groundwater samples collected as part of the fleetwide
investigation is provided in Table 4.7.
These field measurements included pH,
Dissolved Oxygen, Conductivity, Turbidity and Temperature.
045136 (13) Byron Generating Station
36
CONESTOGA-ROVERS & ASSOCIATES
Revision 1
5.4
SURFACE WATER QUALITY
No samples were collected from the surface water bodies. The two surface water
drainage creeks located in the area of the Station are both ephemeral streams, flowing
only during times of heavy rainfall.
045136 (13) Byron Generating Station
37
CONESTOGA-ROVERS & ASSOCIATES
Revision 1
6.0
RADIONUCLIDES OF CONCERN AND SOURCE AREAS
This section discusses radionuclides evaluated in
this investigation, potential sources of
the radionuclides detected, and their distribution.
6.1
GAMMA-EMITTING RADIONUCLIDES
Gamma-emitting target radionuclides were not detected at concentrations greater than
their respective LLD. Other non-targeted
radionuclides were also included in the tables
but excluded from discussion in this report.
These radionuclides were either
a) naturally occurring and thus not produced by the Station, or b) could be definitively
evaluated as being naturally occurring due to the lack of presence of other radionuclides
which would otherwise indicate the potential of production from the Station.
6.2
BETA-EMITTING RADIONUCLIDES
Strontium-89/90 was not detected in any of the groundwater samples collected at
concentrations greater than the LLD of 2.0 pCi/L. Tritium was detected in four of the
39 total sample locations. Concentrations of tritium ranged between 234 ± 128 pCi/L to
3,260 ± 367 pCi/L.
Since only tritium was detected at concentrations greater than its
LLD during the
fleetwide investigation, the following sections focus on tritium; specifically, providing
general characteristics of tritium, potential sources, distribution in groundwater, and a
conceptual model for migration.
6.3
TRITIUM
This section discusses the general characteristics of tritium, the distribution of tritium in
groundwater and surface water, and the conceptual model of tritium release and
migration.
6.3.1
GENERAL CHARACTERISTICS
Tritium (chemical symbol H-3) is a radioactive isotope of hydrogen. The
most common
forms of tritium are tritium gas and tritium oxide, which is also called "tritiated water."
045136 (13) Byron Generating Station
38
CONESTOGA-ROVERS & ASSOCIATES
Revision 1
The chemical properties of tritium are essentially those of ordinary hydrogen. Tritiated
water behaves the same as ordinary water in both the environment and the body.
Tritium can be taken into the body by drinking water, breathing air, eating food, or
absorption through skin. Once tritium enters the body, it disperses quickly and is
uniformly distributed throughout the body. Tritium is excreted primarily through urine
within a month or so after ingestion. Organically bound tritium (tritium that is
incorporated in organic compounds) can remain in the body for a longer period.
Tritium is produced naturally in the upper atmosphere when cosmic rays strike air
molecules.
Tritium is also produced during nuclear weapons explosions,
as a
by-product in reactors producing electricity, and in special production reactors, where
the isotopes lithium-7 and/or boron-10 are bombarded to produce tritium.
Although tritium can be a gas, its most
common form is in water because, like
non-radioactive hydrogen, radioactive tritium reacts with oxygen to form water.
Tritium replaces one of the stable hydrogen atoms in the water molecule and is called
tritiated water. Like normal water, tritiated water is colorless and odorless. Tritiated
water behaves chemically and physically like non-tritiated water in the subsurface, and
therefore tritiated water will travel at the same velocity as the average groundwater
velocity.
Tritium has a half-life of approximately 12.3 years. It decays spontaneously to helium-3
(
3
He). This radioactive decay releases a beta particle (low-energy electron). The
radioactivity of tritium is the source of the risk of exposure.
Tritium is one of the least dangerous radionuclides because it emits
very weak radiation
and leaves the body relatively quickly. Since tritium is almost always found as water, it
goes directly into soft tissues and organs. The associated dose to these tissues is
generally uniform and is dependent on the water content of the specific tissue.
6.3.2
DISTRIBUTION IN STATION GROUNDWATER
This section provides an overview of the lateral and vertical distribution of
tritium
found in groundwater beneath the Station. Tritium was only detected in groundwater
at concentrations exceeding the LLD of 200 pCi/L near the vaults along the blowdown
line.
The groundwater under the PA does not appear to be impacted by
tritium based on the
groundwater analytical results from the five monitoring wells installed in and around
045136 (13) Byron Generating Station
39
CONESTOGA-ROVERS & ASSOCIATES
Revision 1
the PA (AR-7 through AR-10 and CAR-3) in locations that are hydraulically
downgradient of Station systems. Tritium was not detected at concentrations greater
than the LLD of 200 pCi/L in any of the groundwater samples collected from these five
monitoring wells during the investigation.
Tritium was not detected at concentrations greater than the LLD of 200 pCi/L in the
water
samples collected from the residential water wells. The St. Peter Sandstone is the
primary aquifer for residential potable water in the area, and the water in the St. Peter
Sandstone aquifer is separated from the water in the Galena-Platteville aquifer by the
shale unit of the Glenwood Formation (see Section 5.1.2).
The only tritium concentrations greater than the LLD of 200
pCi/L were detected during
the blowdown line and fleetwide investigations in groundwater samples collected from
four wells: AR-2, AR-3, AR-4, and AR-11. Monitoring wells AR-2, AR-3, and AR-4
screen the water table, and AR-11 is screened at the bottom of the Galena-Platteville
aquifer. These four locations are adjacent to the three vacuum breaker vaults VB-2,
VB-3, and VB-4, that had water within the concrete vaults exhibiting the highest
concentrations of tritium (see Figure 5.8).
The tritium concentrations detected in the groundwater samples collected from
monitoring
wells AR-2 and AR-3, which are near VB-2 and VB-3, are not much higher
than 200 pCi/L. The concentrations in these two wells fluctuate, but are all less than
600 pCi/L. The detected tritium concentrations in the groundwater samples collected
during the fleetwide investigation from monitoring wells AR-4 and AR-11 were
3,260 ± 367 pCi/L and 2,340 ± 282 pCi/L, respectively. These wells are near VB-4. AR-4
screens the water table, and AR-11 is deeper and screens the bottom of the
Galena-Platteville aquifer.
The original groundwater sample collected from TW-13 had a tritium
concentration less
than the LLD of 200 pCi/L; however, tritium was detected at a very low concentration,
201 ± 110 pCi/L, in a duplicate groundwater sample collected as part of the fleetwide
sampling event at the same time on the same date. In consideration of the original
sample being less than the LLD, and the duplicate sample at just 201 pCi/L with an
error of ±
110, the tritium concentration at this location is regarded as less than the LLD.
Monitoring well TW-13 is a shallow well (18 feet deep) located near River Road and
installed within the unconsolidated alluvial sediments.
In summary, there are only three areas at the Station where tritium has been detected.
They
are all located near vacuum breakers along the blowdown line. These three areas
are: VB-2 (well AR-2), VB-3 (well AR-3), and VB-4 (wells AR-4 and AR-11). The
045136 (13) Byron Generating Station
40
CONESTOGA-ROVERS & ASSOCIATES
Revision 1
groundwater impacted at each of these areas is localized within the Galena-Platteville
aquifer. The inferred vertical limits of the groundwater containing tritium exceeding
200 pCi/L are depicted on Figures 5.2 and 5.3. Based on the data collected, none of the
other aquifers appears to have been impacted.
6.3.3
CONCEPTUAL MODEL OF TRITIUM RELEASE AND MIGRATION
This section presents CRA's conceptual model of groundwater and tritium migration at
the Station.
As identified in Section 6.3.2, the groundwater under the PA does not appear to be
impacted by tritium above the LLD of 200
pCi/L. Tritium was also not detected at
concentrations exceeding the LLD of 200 pCi/L in the water samples collected from the
residential water wells.
The highest concentrations of tritium detected in the Station sampling points were from
water samples collected from within
the vacuum breaker vaults along the blowdown
line. The source of the tritium in the groundwater at the four wells is minor failures of
the blowdown line vacuum breakers. This water originated from the blowdown line.
The water encountered in the vaults was pumped out and processed in accordance with
the Station's NPDES permit.
As discussed in Section 3.3.2.2, Exelon performed
construction upgrades on each of the six breaker vaults to ensure that there will not be
any future releases of tritium to the groundwater.
Sources and Migration of Tritium
The detections of tritium exceeding 200 pCi/L in monitoring wells AR-2, AR-3, AR-4,
and AR-11 appear to be localized and confined to the areas around the wells. Tritium
was not detected at the LLD of 200
pCi/L in the groundwater samples collected from
monitoring wells and residential wells downgradient of these locations. The source of
the tritium in the groundwater at these four well locations is the blowdown line vacuum
breakers (AFE-Byron-2). Once in the subsurface, the tritiated water migrated downward
through the unsaturated overburden and fractured bedrock to the water table. Once at
the water table, downward vertical gradients caused the tritiated water to migrate
downward to the base of the Galena-Platteville aquifer, where tritium was detected in
the groundwater sample from monitoring well AR-11 (Figure 5.2).
The shale of the Glenwood Formation has a low permeability and acts as a barrier to
further downward migration of the tritiated water.
Due to the low permeabilities of the
045136 (13) Byron Generating Station
41
CONESTOGA-ROVERS & ASSOCIATES
Revision 1
Galena-Platteville limestones/dolomites, combined with the shallow horizontal
gradient, the tritiated water should not migrate very far laterally from the vacuum
breakers. There is no indication from the HIR data that tritium-impacted groundwater
in this area is migrating off the Station property.
045136 (13) Byron Generating Station
42
CONESTOGA-ROVERS & ASSOCIATES
Revision 1
7.0
EXPOSURE PATHWAY ASSESSMENT
This section addresses the groundwater impacts from tritium and other radionuclides
at
the Station and potential risks to human health and the environment.
Based upon historical knowledge and data related to the Station operations and based
upon radionuclide analyses of groundwater samples, the primary constituent of concern
(COC) is tritium. The discussions that follow are focused on the exposure pathways
related to tritium.
Teledyne Brown reports all samples to their statistically-derived minimum detectable
concentration (MDC) of approximately
150 to 170 pCi/L, which is associated with
95 percent confidence interval on their hardcopy reports. However, the laboratory uses
a 99 percent (± 3-sigma) confidence range for determining whether to report the sample
activity concentration as detected or not. This 3-sigma confidence range typically
equates to 150 (± 135.75) pCi/L.
Exelon has specified a LLD of 200 pCi/L for the Fleetwide Assessment. Exelon
has also
required the laboratory to report related peaks identified at the 95 percent confidence
level (2-sigma).
This HIR, therefore, screens and assesses data using Exelon's
LLD of 200 pCi/L. As is
outlined below, this concentration is also a reasonable approximation of the background
concentration of tritium in groundwater at the Station.
7.1
HEALTH EFFECTS OF TRITIUM
Tritium is a radionuclide that decays by emitting a low-energy beta particle that cannot
penetrate deeply into tissue or travel far in air. A person's exposure to
tritium is
primarily through the ingestion of water (drinking water) or through ingestion of water
bearing food products. Inhalation of tritium requires the water to be in a vapor form
(i.e., through evaporation or vaporization due to heating). Inhalation is a minor
exposure route when compared to direct ingestion or drinking of tritiated water.
Absorption of tritium through skin is possible, but tritium exposure is more limited here
versus direct ingestion or drinking of tritiated water.
045136 (13) Byron Generating Station
43
CONESTOGA-ROVERS & ASSOCIATES
Revision 1
7.2
BACKGROUND CONCENTRATIONS OF TRITIUM
The purpose of the following paragraphs is
to establish a background concentration
through review of various media.
7.2.1
GROUNDWATER
Tritium is created in the environment from naturally occurring processes both cosmic
and subterranean, as well as from anthropogenic (i.e., man-made) sources. In the upper
atmosphere, "cosmogenic" tritium is produced from the bombardment of stable nuclides
and combines with oxygen to form tritiated water, which will then enter the hydrologic
cycle. Below ground, "lithogenic" tritium is produced by the bombardment of natural
lithium isotopes
6
Li (92.5 percent abundance) and
7
Li (7.5 percent abundance) present in
crystalline rocks by neutrons produced by the radioactive decay of uranium and
thorium. Lithogenic production of tritium is usually negligible compared to other
sources due to the limited abundance of lithium in rock. The lithogenic tritium is
introduced directly to groundwater.
A major anthropogenic source of tritium comes from the former atmospheric testing of
thermonuclear weapons. Levels of tritium in precipitation increased during the 1950s
and early 1960s, coinciding with the release of significant amounts of tritium to
the
atmosphere during nuclear weapons testing prior to the signing of the Limited Test Ban
Treaty in 1963, which prohibited atmospheric nuclear tests.
7.2.2
PRECIPITATION DATA
Precipitation samples are routinely collected at stations around the world for the
analysis of tritium and other radionuclides. Two publicly available databases that
provided tritium concentrations in precipitation are Global Network of Isotopes in
Precipitation (GNIP) and USEPA's RadNet database.
GNIP provides tritium
precipitation concentration data for samples collected world wide from 1960 to 2006.
RadNet provides tritium precipitation concentration data for samples collected at
Stations through the U.S. from 1960 up to and including 2006.
Based on GNIP data for sample stations located in the U.S. Midwest including Chicago,
St.
Louis and Madison, Wisconsin, as well as Ottawa Ontario, and data from the
University of Chicago, tritium concentrations peaked around 1963. This peak, which
approached 10,000 pCi/L for some stations, coincided with the atmospheric testing of
045136 (13) Byron Generating Station
44
CONESTOGA-ROVERS & ASSOCIATES
Revision 1
thermonuclear weapons. Tritium concentrations showed a sharp decline up until 1975
followed by a gradual decline since that time. Tritium concentrations in Midwest
precipitation have typically been less than 100 pCi/L since around 1980.
The RadNet database for several stations in
the U.S. Midwest (Chicago, Columbus,
Indianapolis, Lansing, Madison, Minneapolis, Painesville, Toledo, and Welsch, MN) did
not show the same trend, which can be attributed to pre-1995 data handling procedures.
The pre-1995 data were rounded to the nearest 100 pCi/L, which damped out variances
in the data. The post-1995 RadNet data, where rounding was not applied, exhibit much
more scatter, and similar to the GNIP data, the vast majority of the data were less than
100 pCi/L.
CRA constructed a non-parametric upper tolerance
limit with a confidence of 95 percent
and a coverage of 95 percent based on RadNet data for USEPA Region 5 from 2004 to
2005. The resulting upper tolerance limit is 133 pCi/L, which indicates that CRA is
95 percent confident that 95 percent of the ambient precipitation concentration results
are less than 133 pCi/L. The statistical confidence, however, must be compared with the
limitations of the underlying RadNet data, which does not include the minimum
detectable concentration for a majority of the measurements. Some of the RadNet values
less than 200 pCi/L may be approximated.
Nevertheless, these results show a
background contribution for precipitation of up to 133 pCi/L.
7.2.3
SURFACE WATER DATA
Tritium concentrations are routinely measured in large surface water bodies, including
Lake Michigan and the Mississippi River. Surface water data from the RadNet database
for Illinois sampling stations include East Moline (Mississippi River), Moline
(Mississippi River), Marseilles (Illinois River), Morris (Illinois River), Oregon (Rock
River), and Zion (Lake Michigan). As is the case for the RadNet precipitation data, the
pre-September 1995 Illinois surface water data was rounded to the nearest 100 pCi/L,
creating a dampening of variances in the data. The post-1995 Illinois surface water data,
similar to the post-1995 Midwest precipitation data, were less than 100 pCi/L with the
exception of the Moline (Mississippi River) station.
Tritium surface water
concentrations at this location varied between 100 and 800 pCi/L, which may reflect
local natural or anthropogenic inputs.
Recent surface water measurements for tritium sampling locations upstream of the
Quad
Cities Generating Station show that concentrations in the Mississippi River are
consistently less than 200 pCi/L (Exelon, 2005).
045136 (13) Byron Generating Station
45
CONESTOGA-ROVERS & ASSOCIATES
Revision 1
These results indicate that there is a background tritium concentration in surface water
that is typically less than 100 pCi/L, but have approached 800 pCi/L in the Mississippi
River.
The USEPA RadNet surface water data typically has a reported "Combined Standard
Uncertainty"
of 35 to 50 pCi/L.
According to USEPA, this corresponds to a
± 70 to 100 pCi/L 95 percent confidence bound on each given measurement. Therefore,
the typical background data provided may be subject to measurement uncertainty of
approximately ± 70 to 100 pCi/L.
7.2.4
DRINKING WATER DATA
Tritium concentrations in drinking water from the RadNet database for three Illinois
sampling stations (Chicago, Morris, and East Chicago) exhibit similar trends as the
precipitation and surface water data. As with the precipitation and surface water data,
the pre-1995 data has dampened out variances due to rounding the data to the nearest
100 pCi/L. The post-1995 results show tritium concentrations in drinking water well
less than 100 pCi/L and the tritium concentrations found in precipitation and surface
water.
7.2.5
EXPECTED TRITIUM BACKGROUND FOR THE STATION
As reported in the GNIP and RadNet databases, tritium concentrations in U.S. Midwest
precipitation have typically been less than 100 pCi/L since 1980. Tritium concentrations
reported in the RadNet database for Illinois surface water and groundwater, at least
since 1995, have typically been less than 100 pCi/L. Based on the USEPA Region 5's
2004 to 2005 RadNet precipitation data, 95 percent of the ambient concentrations of
tritiated water in Illinois are expected to be less than 133 pCi/L, based on a 95 percent
confidence limit. Tritium concentrations in surface water and drinking water are
expected to be comparable or less based on historical data and trends.
Concentrations in groundwater similar to surface water and drinking water are expected
to be less as compared to precipitation values. The lower groundwater concentrations
are related to the age of the groundwater as compared to the half-life of tritium. Deep
aquifers in proximity to crystalline basement rock, however, potentially can also show
elevated concentrations of tritium due to lithogenic sources.
045136 (13) Byron Generating Station
46
CONESTOGA-ROVERS & ASSOCIATES
Revision 1
As was noted in Section 7.0, the analytical laboratory is reporting tritium results to a
LLD of 200 pCi/L. This concentration also represents a reasonable representation of
background groundwater quality, given the data for precipitation, surface water, and
drinking water.
Based on the evaluation presented above, the background concentration for
tritium at
the Station is reasonably represented by the LLD of 200 pCi/L.
7.3
IDENTIFICATION OF POTENTIAL EXPOSURE PATHWAYS AND
POTENTIAL RECEPTORS
Three potential exposure pathways were considered during the evaluation of tritium in
groundwater:
•
potential groundwater migration to the Station's potable water supply well;
•
potential groundwater migration off
the Station property to private water supply
wells; and
•
potential groundwater migration off the Station property to a surface water body.
The following section provides an overview of each of these three potential exposure
pathways for tritium in groundwater.
7.3.1
POTENTIAL GROUNDWATER MIGRATION TO DRINKING
WATER USERS AT THE STATION PROPERTY
At the Station, the tritium detected in groundwater samples has been isolated to the
Galena-Platteville aquifer, which is isolated from the deeper regional groundwater
aquifer by the semi-confining Glenwood Formation. Groundwater quality
data from
production wells and monitoring wells at the Station located below this aquitard do not
indicate concentrations of tritium greater than the LLD of 200 pCi/L. As such, the
tritium impact is limited to the Galena-Platteville aquifer. There are no water supply
wells located on the Station property that draw water from the Galena-Platteville
aquifer. The Station receives its potable water from two cased 1,500-foot bedrock wells
on the Site, which are installed in the Ironton-Galesville Sandstone. The vertical
movement of tritiated water from the Galena-Platteville aquifer into deeper formations
is restricted by the semi-confining Glenwood Formation. Since vertical migration of
tritiated water through the Glenwood Formation to the Ironton-Galesville Aquifer is
045136 (13) Byron Generating Station
47
CONESTOGA-ROVERS & ASSOCIATES
Revision 1
restricted but theoretically not eliminated, this is a potentially complete exposure
pathway but there is no current risk for groundwater ingestion at the Station.
7.3.2
POTENTIAL GROUNDWATER MIGRATION TO DRINKING
WATER USERS OFF THE STATION PROPERTY
Based on the results of the investigations and the conceptual model, the only potentially
complete exposure
route (pathway) for tritiated water at the Station is ingestion of the
groundwater at nearby private water supply wells. However, due to low permeabilities
of the limestones and dolomites of the Galena-Platteville aquifer, along with the general
hardness of the water, this aquifer is typically not used for potable water in the area.
The St. Peter Sandstone is the primary source for potable water in the area. The St.
Peter
Sandstone aquifer is separated from the Galena-Platteville aquifer by a low permeability
shale of the Glenwood Formation. Residential water wells that are both off the Station
property and in the direction of groundwater flow downgradient from the blowdown
line typically obtain water from the St. Peter Sandstone aquifer. These water wells were
sampled and were not impacted. In addition, none of the groundwater samples
collected from monitoring wells near the property line contained tritium at
concentrations greater than the LLD of 200 pCi/L. Therefore, although there is a
potentially complete exposure pathway, there is no current risk of exposure associated
with groundwater ingestion off the Station property.
7.3.3
POTENTIAL GROUNDWATER MIGRATION TO
SURFACE WATER USERS
Groundwater does not discharge to the local surface water drainages (ephemeral creeks)
and the nearest wells located adjacent to the Rock River have not contained tritium.
There is no potentially complete exposure pathway, therefore there is no current risk of
exposure associated with groundwater migration to surface water at the Station.
7.4
SUMMARY OF POTENTIAL TRITIUM EXPOSURE
PATHWAYS
There are three potential exposure pathways for tritium at the Station:
•
potential groundwater migration to the Station's potable supply well;
045136 (13) Byron Generating Station
48
CONESTOGA-ROVERS & ASSOCIATES
Revision 1
•
potential groundwater migration off the Station property to private water supply
wells; and
•
potential groundwater migration off the Station property to a surface water body.
Based upon the groundwater and surface water data provided and referenced in this
investigation,
none of the potential receptors are at risk of exposure to concentrations of
tritium in excess of the USEPA drinking water standard (20,000 pCi/L).
7.5
OTHER RADIONUCLIDES
Target radionuclides were not detected at concentrations greater than the LLDs in the
groundwater samples collected. Other non-targeted radionuclides were also included in
the tables but excluded from discussion in this report. These radionuclides were either
a) naturally occurring and thus not produced by the Station, or b) could be definitively
evaluated as being naturally occurring due to the lack of presence of other radionuclides
which would otherwise indicate the potential of production from the Station.
045136 (13) Byron Generating Station
49
CONESTOGA-ROVERS & ASSOCIATES
Revision 1
8.0
CONCLUSIONS
Based on all of the studies completed to date at the Station, CRA concludes:
Groundwater Flow
•
There are two groundwater aquifers
within the first 230 feet beneath the Station: the
Galena-Platteville aquifer (upper aquifer) and the St. Peter Sandstone aquifer (lower
aquifer).
•
The two aquifers
are separated by a semi-confining shale layer of the Glenwood
Formation and, therefore, not hydraulically connected under the Station.
•
Groundwater (the water table) is first encountered
in the upper fractured portions of
the Galena-Platteville aquifer. Near the Rock River, the bedrock has been eroded,
and the water table is in unconsolidated alluvial material.
•
The
general direction of groundwater flow in both aquifers is to the west toward the
Rock River.
•
The groundwater flows radially away from the facility.
•
The horizontal gradient in the Galena-Platteville aquifer is shallow. There is a
slight
downward vertical gradient between the upper portion and bottom of the
Galena-Platteville aquifer.
Groundwater Quality
•
Tritium
concentrations in groundwater were not detected at concentrations greater
than the USEPA drinking water standard of 20,000 pCi/L.
•
Tritium
was not detected at concentrations greater than the LLD of 200 pCi/L in
samples collected from the five monitoring wells located in the PA.
•
Tritium
was not detected at concentrations greater than the LLD of 200 pCi/L in
35 of the 39 groundwater samples collected. Concentrations of tritium in the four
remaining samples, all collected near vacuum breakers, ranged between
234 ± 128 pCi/L to 3,260 ± 367 pCi/L.
•
Gamma-emitting radionuclides associated
with licensed plant operations were not
detected at concentrations greater than their respective LLDs in any of the most
recent water samples collected as part of this investigation.
•
Strontium-89/90 was not detected at concentrations greater than the
LLD of 2 pCi/L
in any sample collected as part of this investigation.
045136 (13) Byron Generating Station
50
CONESTOGA-ROVERS & ASSOCIATES
Revision 1
•
Tritium was not detected at concentrations greater than the LLD of 200 pCi/L in the
water samples collected from the residential water wells.
•
The HIR data indicate that tritium is not migrating off the Station property.
AFE-Byron-1 – Former Fiberglass Blowdown Line
•
Gamma-emitting radionuclides associated
with licensed plant operations were not
detected at concentrations greater than their respective LLDs in any of the
13 groundwater samples collected from the four monitoring wells in the vicinity of
AFE-Byron-1.
•
Strontium-89/90 was not detected at a concentration greater than the LLD
of
2 pCi/L in any of the 13 groundwater samples collected from the four monitoring
wells in the vicinity of AFE-Byron-1.
•
Tritium
was not detected at concentrations greater than the LLD of 200 pCi/L in any
of the groundwater samples collected from the four monitoring wells in the vicinity
of AFE-Byron-1.
•
There is no current impact from this AFE to groundwater.
AFE-Byron-2 – Vacuum Breaker Vaults
•
Gamma-emitting radionuclides associated
with licensed plant operations were not
detected at concentrations greater than their respective LLDs in any of the
groundwater samples most recently collected from monitoring wells near AFE-
Byron-2.
•
Strontium-89/90
was not detected at a concentration greater than the LLD of 2
pCi/L in any of the groundwater samples collected from monitoring wells near
AFE-Byron-2.
•
To the west of the generating facility, near
the blowdown line, the concentrations of
tritium were greater than the LLD of 200 pCi/L in four monitoring wells: AR-2,
AR-3, AR-4, and AR-11. These four wells are adjacent to three vacuum breaker
vaults: VB-2, VB-3, and VB-4. These vaults formerly contained water with elevated
concentrations of tritium.
•
Two areas where tritium was found in the
groundwater near VB-2 and VB-3 are
limited to the shallow portions of the Galena-Platteville aquifer.
•
Near
VB-4, the groundwater contains tritium down to the bottom of the
Galena-Platteville aquifer.
045136 (13) Byron Generating Station
51
CONESTOGA-ROVERS & ASSOCIATES
Revision 1
•
The source of the tritium concentrations in the groundwater was periodic leaks
during re-seating of the blowdown line vacuum breaker valves.
•
None of the tritium concentrations detected
in the groundwater exceed the USEPA
drinking water standard of 20,000 pCi/L.
•
The
shale unit of the Glenwood Formation has a low permeability and acts as a
barrier to further downward migration of impacted water down to the St. Peter
Sandstone aquifer.
Due to the low permeabilities of the Galena-Platteville
limestones/dolomites combined with the shallow gradient of the water table, the
tritiated water in the Galena-Platteville aquifer will not migrate very far laterally
from the VB-2, VB-3, and VB-4 areas.
•
Tritiated groundwater at the
Station is isolated in three areas, and the evidence
indicates that it is not migrating off Station property. This is based upon the inferred
slow groundwater flow velocities and that groundwater sampling results indicate
that monitoring wells outside of these three areas are not impacted. The unimpacted
wells include: monitoring wells located hydraulically downgradient, monitoring
wells located at the property line, and residential water wells. The tritium detected
in groundwater is not the result of large failures of the blowdown line, but of minor
failures of the vacuum breaker valves to re-seat during blowdown line discharge
events.
No knowledge or evidence of large failures of or releases from the
blowdown line have been documented or identified through the investigations.
•
Therefore, additional plume delineation activities or groundwater remediation are
not warranted.
AFE-Byron-3 –Protected Area
•
Groundwater under the PA flows radially outward due to the topographic high on
which the PA was constructed. The downgradient locations of the monitoring wells
were selected based on this radial groundwater flow pattern. These monitoring
wells are situated to provide for an adequate indication for future leak detection.
•
Tritium was not detected at concentrations greater than the LLD of 200 pCi/L in any
of the groundwater samples collected from seven monitoring wells in the vicinity of
AFE-Byron-3.
•
Gamma-emitting radionuclides associated with licensed plant operations were not
detected at concentrations greater than their respective LLDs in any of the
groundwater samples most recently collected from seven monitoring wells in the
vicinity of AFE-Byron-3.
045136 (13) Byron Generating Station
52
CONESTOGA-ROVERS & ASSOCIATES
Revision 1
•
Strontium-89/90 was not detected at a concentration greater than the LLD of 2
pCi/L in any of the groundwater samples collected from monitoring wells in the
vicinity of AFE-Byron-3.
•
There is no current impact from this AFE to groundwater.
Potential Receptors
•
Based on the results of this investigation
1
, there is no current risk from exposure to
radionuclides associated with licensed plant operations through any of the identified
potential exposure pathways.
General Conclusions
•
Based on the results of this investigation, tritium is not migrating off the Station
property at detectable concentrations.
•
Based on the results of this investigation, there are no known active releases into the
groundwater at the Station.
1
Using the LLD specified in this HIR.
045136 (13) Byron Generating Station
53
CONESTOGA-ROVERS & ASSOCIATES
Revision 1
9.0
RECOMMENDATIONS
The following presents CRA's recommendations for proposed activities to be completed
at the Byron Station.
9.1
DATA GAPS
Based on the results of this hydrogeologic investigation, there are no data gaps
remaining to support CRA’s conclusions regarding
the characterization of the
groundwater regime and potential impacts from radionuclides at the Station.
9.2
GROUNDWATER MONITORING
Based upon the information collected to date, CRA recommends that Exelon conduct
periodic monitoring of selected groundwater monitoring well locations.
045136 (13) Byron Generating Station
54
CONESTOGA-ROVERS & ASSOCIATES
Revision 1
10.0
REFERENCES
The materials referenced in the generation of this HIR include:
Byron Station Radiological Environmental Monitoring Program (REMP) Reports.
Byron Station Radiological Effluent Tracking Statistics (RETS) Reports from 1984 to 2005.
Byron Station Updated Final Safety Analysis Report (UFSAR), Rev. #10, December 2004.
Conestoga-Rovers & Associates, June 2001.
"Remedial Design Work Plan – Byron
Salvage Yard".
Conestoga-Rovers & Associates, May 2006. "Hydrogeologic Investigation Work Plan –
Fleetwide Tritium Assessment –
Byron Generating Station".
Exelon Generation Company, May 2005. "Quad Cities Nuclear Power Station, 2004
Annual Radiological Environmental Operating
Report", Exelon, Cordoa, Illinois.
Kay, Robert T.,
Douglas J. Yeskis,
William J. Bolen,
James R. Rauman,
and
Scott T. Prinos, 1997. Geology,
Hydrology, and Ground-Water Quality at the
Byron Superfund Site Near Byron, Illinois, United States Geological Survey,
Water-Resources Investigations Report 95-4240, Prepared in Cooperation with
the U.S. Environmental Protection Agency Ogle County, 2006, Geographical
Information System (GIS) database, http://www.Oglecountygis.org.
Puls, R.W.,
and
M.J. Barcelona, April 1996. Low-Flow
(Minimal
Drawdown)
Ground-Water
Sampling
Procedures,
EPA
Ground
Water
Issue,
EPA/540/S-92/005, R. S. Kerr Environmental Research Center, United States
Environmental Protection Agency, Ada, Oklahoma.
RETEC Group, Inc., September 23, 2005. "Residential Well Survey".
United States Department of Agriculture, 2006. Natural
Resources Conservation Service
website, http.//www.nrcs.usda.gov.
The main references cited in the UFSAR related to this HIR include:
Bradbury, J.C. and Atherton, E., 1965. The Precambrian Basement of Illinois, Circular
382, Illinois State Geological Survey.
Buschbach, T.C., 1964. Cambrian and Ordovician Strata of Northeastern
Illinois, Illinois
State Geological Survey, Report of Investigation 218, 90 p.
Frye, J.C., et al., 1969. Glacial Tills of Northwestern
Illinois, Illinois State Geological
Survey, Cir. 437, 45 p.
Willman, H.B., et al., 1967. Geological Map of Illinois, Illinois State Geological Survey.
045136 (13) Byron Generating Station
55
CONESTOGA-ROVERS & ASSOCIATES
Revision 1
Willman, H.B., et al., 1975. Handbook of Illinois Stratigraphy, Bulletin 95, Illinois State
Geological Survey.
Willman, H.B. and Frye, J.C., 1970. Pleistocene Stratigraphy of Illinois, Bulletin
94,
Illinois State Geological Survey.
045136 (13) Byron Generating Station
56
CONESTOGA-ROVERS & ASSOCIATES
STATION
SOURCE: USGS QUADRANGLE MAP;
0
2000
4000ft
STILLMAN VALLEY, ILLINOIS (1976)
figure 1.1
STATION LOCATION MAP
BYRON GENERATING STATION
EXELON GENERATION COMPANY, LLC
45136-21(013)GN-WA001 JUL 13/2006
OREGON, ILLINOIS (1983)
FIGURE 1.2 STATION BOUNDARIES
AND FEATURES
(Withheld)
figure 2.1
LOCAL GEOLOGIC CROSS-SECTIONS A-A' AND B-B'
BYRON GENERATING STATION
EXELON GENERATION COMPANY, LLC
45136-21(013)GN-WA009 JUL 13/2006
figure 2.2
LOCAL GEOLOGIC CROSS-SECTION C-C'
BYRON GENERATING STATION
EXELON GENERATION COMPANY, LLC
45136-21(013)GN-WA009 JUL 13/2006
FIGURE 2.3 MONITORING WELL
LOCATIONS
(Withheld)
FIGURE 2.4 GROUNDWATER
CONTOUR MAP - MARCH 2006
(Withheld)
FIGURE 3.2 AREA FOR FURTHER
EVALUATION – BLOWDOWN LINE
(Withheld)
FIGURE 3.3 AREA FOR FURTHER
EVALUATION – PROTECTED AREA
(Withheld)
FIGURE 5.1 HYDROGEOLOGIC
CROSS-SECTION LOCATIONS
(Withheld)
PROPERTY BOUNDARY
VB-2
VB-3
VB-4
VB-5
VB-6
X1'
EAST
1000
ELEVATION (ft. AMSL)
600
X1
ELEVATION (ft. AMSL)
WEST
DISTANCE (ft.)
600
0
620
640
660
680
700
720
740
760
780
800
820
840
860
880
900
620
640
660
680
700
720
740
760
780
800
820
840
860
880
900
2000
3000
4000
5000
6000
7000
8000
9000
10000
ROAD
CAR-1
TW-14
AR-6
AR-5
CAR-2
AR-11 (2340 pCi/L - APRIL 26, 2006)
AR-4 (4080 pCi/L - APRIL 26, 2006)
PC-6B
DF-6
PC-3B
DF-5S
MW-3
AR-3 (489 pCi/L - APRIL 3, 2006)
MW-2
MW-1
AR-2 (527 pCi/L - APRIL 3, 2006)
672.63
672.93
675.00
688.08
742.41
743.18
739.29
742.74
760.58
736.89
799.77
787.51
796.87
684.22
799.63
798.50
672
Scale:
Source Reference:
Project Manager:
Reviewed By:
Project N
o
:
Date:
Report N
o
:
Drawing N
o
:
THIS BAR MEASURES 1" ON ORIGINAL. ADJUST SCALE ACCORDINGLY.
SCALE VERIFICATION
EXELON GENERATION COMPANY, LLC
BYRON, ILLINOIS
HYDROGEOLOGIC CROSS-SECTION X1-X1'
BYRON GENERATING STATION
FLEETWIDE ASSESSMENT
S. QUIGLEY
M. KELLY
JULY 2006
45136-21
013
figure 5.2
45136-21(013)GN-WA010 JUL 13/2006
AS SHOWN
AR-4 (4080 pCi/L - APRIL 26, 2006)
DATE SAMPLE COLLECTED
TRITIUM CONCENTRATION
500
X2
ELEVATION (ft. AMSL)
SOUTH
DISTANCE (ft.)
600
0
620
640
660
680
700
720
740
760
780
800
820
840
860
880
900
1000
1500
2000
2500
3000
MW-41
AR-4 (4080 pCi/L - APRIL 26, 2006)
AR-11 (2340 pCi/L - APRIL 26, 2006)
DF-24
PC-1B/DF-8/PC-1C
MW-30/DF-23
720.26
717.17
718.01
717.60
679.53
723.79
742.41
742.74
745.49
Scale:
Source Reference:
Project Manager:
Reviewed By:
Project N
o
:
Date:
Report N
o
:
Drawing N
o
:
THIS BAR MEASURES 1" ON ORIGINAL. ADJUST SCALE ACCORDINGLY.
SCALE VERIFICATION
EXELON GENERATION COMPANY, LLC
BYRON, ILLINOIS
HYDROGEOLOGIC CROSS-SECTION X2-X2'
BYRON GENERATING STATION
FLEETWIDE ASSESSMENT
S. QUIGLEY
M. KELLY
JULY 2006
45136-21
013
figure 5.3
45136-21(013)GN-CO002 JUL 13/2006
AS SHOWN
AR-4 (4080 pCi/L - APRIL 26, 2006)
DATE SAMPLE COLLECTED
TRITIUM CONCENTRATION
UNIT #2
AUXILIARY BUILDING
TURBINE BUILDING
SERVICE BUILDING
CONSTRUCTION
RUN-OFF POND
UNIT #2
AUXILIARY BUILDING
TURBINE BUILDING
CIRCULATING WATER
PUMP HOUSE
FLUME
500
DISTANCE (ft.)
0
1000
1500
ELEVATION (ft. AMSL)
720
740
760
780
800
820
840
860
880
900
X3'
NORTHEAST
ELEVATION (ft. AMSL)
720
740
760
780
800
820
840
860
880
900
X3
WEST
500
DISTANCE (ft.)
0
1000
1500
ELEVATION (ft. AMSL)
720
740
760
780
800
820
840
860
880
900
X3''
SOUTHEAST
ELEVATION (ft. AMSL)
720
740
760
780
800
820
840
860
880
900
X3
WEST
766.74
837.66
766.74
817.27
2000
2000
AR-7
AR-10
AR-7
AR-9
Scale:
Source Reference:
Project Manager:
Reviewed By:
Project N
o
:
Date:
Report N
o
:
Drawing N
o
:
THIS BAR MEASURES 1" ON ORIGINAL. ADJUST SCALE ACCORDINGLY.
SCALE VERIFICATION
EXELON GENERATION COMPANY, LLC
BYRON, ILLINOIS
HYDROGEOLOGIC CROSS-SECTION X3-X3' AND X3-X3''
BYRON GENERATING STATION
FLEETWIDE ASSESSMENT
S. QUIGLEY
M. KELLY
JULY 2006
45136-21
013
figure 5.4
45136-21(013)GN-CO003 AUG 18/2006
AS SHOWN
AR-4
FIGURE 5.5 POTENTIOMETRIC
SURFACE CONTOURS - APRIL 2006 –
UPPER GALENA-PLATTEVILLE
AQUIFER
(Withheld)
FIGURE 5.6 POTENTIOMETRIC
SURFACE CONTOURS - APRIL 2006 –
BOTTOM
OF GALENA-PLATTEVILLE AQUIFER
(Withheld)
FIGURE 5.7 POTENTIOMETRIC
SURFACE CONTOURS - APRIL 2006 –
ST. PETER SANDSTONE AQUIFER
(Withheld)
FIGURE 5.8 TRITIUM
CONCENTRATIONS – STATION
SAMPLING LOCATIONS
(Withheld)
FIGURE 5.9 TRITIUM
CONCENTRATIONS – UPPER
GALENA-PLATTEVILLE AQUIFER
(Withheld)
FIGURE 5.10 TRITIUM
CONCENTRATIONS – BOTTOM OF
GALENA.PLATTEVILLE AQUIFER
(Withheld)
FIGURE 5.11 TRITIUM
CONCENTRATIONS – ST. PETER
SANDSTONE AQUIFER
(Withheld)
FIGURE 5.12 TRITIUM
CONCENTRATIONS – RESIDENTIAL
WELL LOCATIONS
(Withheld)
FIGURE 5.13 RADIONUCLIDE
CONCENTRATIONS
(Withheld)
TABLE 2.1
SUMMARY OF EXISTING WELL INFORMATION
FLEETWIDE ASSESSMENT
BYRON GENERATING STATION
BYRON, ILLINOIS
Page 1 of 3
Surface
Reference
Hydrogeologic
X coor.
Y coor.
Elevation
Elevation
Top
Bottom
Top
Bottom Middle
Well
Unit
Sample Location
(ft
AMSL)
2
(ft AMSL)
Construction
Screened
1
Exelon-Owned Wells
Previously Existing Water Wells
GW-9
4
2532455.60
1972488.60
841.51
841.73
NA
5
NA
- -
- -
- -
6-inch open hole
GPWT
Well 7
4
2538213.33
1969732.76
891.17
891.24
NA
NA
- -
- -
- -
6-inch open hole
GPWT
Deep Well 1
2537066.85
1970148.36
NA
NA
NA
~ 1500
- -
- -
- -
12 to 15-inch open hole
NA
Deep Well 2
2535936.76
1969964.84
NA
NA
NA
~ 1500
- -
- -
- -
12 to 15-inch open hole
NA
Monitoring Wells Installed During the Blowdown Line Investigation
AR-1
2536048.98
1972460.65
868.11
871.10
50
70
818.11
798.11
808.11
2-inch PVC screen
GPWT
AR-2
2534570.16
1973401.77
864.37
867.38
71
81
793.37
783.37
788.37
2-inch PVC screen
GPWT
AR-3
2533354.08
1973345.67
857.76
860.64
60
70
797.76
787.76
792.76
2-inch PVC screen
GPWT
AR-4
2530325.59
1974343.03
830.23
832.74
99.5
119.5
730.73
710.73
720.73
2-inch PVC screen
GPWT
AR-5
2526970.90
1974279.73
793.27
795.75
102
122
691.27
671.27
681.27
2-inch PVC screen
GPWT
AR-6
2526375.64
1974201.54
782.22
784.55
95
115
687.22
667.22
677.22
2-inch PVC screen
GPWT
AR-7
2536172.26
1970914.51
868.99
871.28
102
112
766.99
756.99
761.99
2-inch PVC screen
GPWT
AR-8
2536591.62
1970080.22
869.71
872.11
30
50
839.71
819.71
829.71
2-inch PVC screen
GPWT
AR-9
2537777.21
1970783.66
873.77
876.77
55.5
65.5
818.27
808.27
813.27
2-inch PVC screen
GPWT
AR-10
2537573.15
1971916.71
856.65
859.15
19
29
837.65
827.65
832.65
2-inch PVC screen
GPWT
AR-11
2530300.13
1974330.58
829.35
831.65
139.5
149.5
689.85
679.85
684.85
2-inch PVC screen
BGP
CAR-1
2525447.90
1974018.64
692.25
694.87
45
55
647.25
637.25
642.25
2-inch PVC screen
UAWT
CAR-2
2529246.47
1974300.12
769.40
772.01
25
35
744.40
734.40
739.40
2-inch PVC screen
GPWT
CAR-3
2537064.71
1970545.52
869.11
872.16
43
63
826.11
806.11
816.11
2-inch PVC screen
GPWT
TW-1
2536119.01
1972474.04
868.81
870.70
3.5
8.5
865.31
860.31
862.81
2-inch PVC screen
Shallow Overburden
TW-2
2536137.15
1972477.09
869.11
870.73
2
7
867.11
862.11
864.61
2-inch PVC screen
Shallow Overburden
TW-3
2534676.01
1973300.70
866.92
868.35
5.5
10.5
861.42
856.42
858.92
2-inch PVC screen
Shallow Overburden
TW-4
2534674.53
1973321.59
866.53
869.48
5.5
10.5
861.03
856.03
858.53
2-inch PVC screen
Shallow Overburden
TW-5
2533371.75
1973305.18
858.37
860.78
3
8
855.37
850.37
852.87
2-inch PVC screen
Shallow Overburden
TW-6
2533370.28
1973323.29
858.07
859.93
3.5
8.5
854.57
849.57
852.07
2-inch PVC screen
Shallow Overburden
TW-7
2530360.35
1974366.22
830.91
832.25
6
11
824.91
819.91
822.41
2-inch PVC screen
Shallow Overburden
TW-8
2530358.62
1974386.10
830.10
831.67
7
12
823.10
818.10
820.60
2-inch PVC screen
Shallow Overburden
TW-9
2527013.94
1974272.31
793.82
796.42
3
8
790.82
785.82
788.32
2-inch PVC screen
Shallow Overburden
TW-10
2527013.99
1974256.60
793.70
795.88
2.5
7.5
791.20
786.20
788.70
2-inch PVC screen
Shallow Overburden
TW-11
2526439.04
1974253.50
782.38
785.16
5
10
777.38
772.38
774.88
2-inch PVC screen
Shallow Overburden
TW-12
2526438.39
1974235.97
783.38
785.32
7
12
776.38
771.38
773.88
2-inch PVC screen
Shallow Overburden
TW-13
2525412.16
1974276.44
698.03
700.47
13
18
685.03
680.03
682.53
2-inch PVC screen
Shallow Overburden
Screened Interval
(State Plane Coordinates)
(ft bgs)
3
(ft AMSL)
CRA 045136 (13) Byron Generating Station
TABLE 2.1
SUMMARY OF EXISTING WELL INFORMATION
FLEETWIDE ASSESSMENT
BYRON GENERATING STATION
BYRON, ILLINOIS
Page 2 of 3
Surface
Reference
Hydrogeologic
X coor.
Y coor.
Elevation
Elevation
Top
Bottom
Top
Bottom Middle
Well
Unit
Sample Location
(ft
AMSL)
2
(ft AMSL)
Construction
Screened
1
Screened Interval
(State Plane Coordinates)
(ft bgs)
3
(ft AMSL)
TW-14
2525537.43
1974058.60
697.40
699.41
24
34
673.40
663.40
668.40
2-inch PVC screen
Shallow Overburden
TW-15
2525587.27
1973925.58
694.32
695.73
24
29
670.32
665.32
667.82
2-inch PVC screen
Shallow Overburden
Byron Salvage PRP Group-Owned Monitoring Wells
DF-1S
2531216.65
1973682.92
785.49
786.89
44
59
741.49
726.49
733.99
2-inch stainless steel screen
GPWT
DF-1D
2531226.90
1973676.38
786.32
787.48
79
84
707.32
702.32
704.82
2-inch stainless steel screen
BGP
DF-2S
2531242.96
1973864.59
794.44
794.96
59
74
735.44
720.44
727.94
2-inch stainless steel screen
GPWT
DF-3S
2531570.17
1973536.07
790.26
791.82
51
66
739.26
724.26
731.76
2-inch stainless steel screen
GPWT
DF-4DS
2532386.02
1973588.26
831.41
832.98
46
61
785.41
770.41
777.91
2-inch stainless steel screen
GPWT
DF-4DD
2532385.52
1973588.31
NA
832.79
144
149
- -
- -
- -
2-inch stainless steel screen
BGP
DF-5S
2532646.87
1973412.71
843.19
844.12
13
65
830.19
778.19
804.19
6-inch open hole
GPWT
DF-6
2531991.61
1973735.68
826.31
827.89
118
123
708.31
703.31
705.81
2-inch stainless steel screen
BGP
DF-7S
2527903.67
1975299.65
709.98
712.38
22
27
687.98
682.98
685.48
2-inch stainless steel screen
UAWT
DF-7D
2527898.09
1975298.28
709.67
712.55
43
48
666.67
661.67
664.17
2-inch stainless steel screen
UAM
DF-8
2530141.74
1973270.87
755.05
757.47
58
63
697.05
692.05
694.55
2-inch stainless steel screen
BGP
DF-10
2532417.79
1974527.51
833.04
834.01
69
84
764.04
749.04
756.54
2-inch stainless steel screen
GPWT
DF-11
2532534.02
1974574.44
833.05
834.21
68
83
765.05
750.05
757.55
2-inch stainless steel screen
GPWT
DF-12
2532609.19
1974523.28
831.43
834.48
127
132
704.43
699.43
701.93
2-inch stainless steel screen
BGP
DF-13
2532200.73
1973830.53
836.33
838.84
106
111
730.33
725.33
727.83
2-inch stainless steel screen
MGP
DF-15
2532645.11
1972942.97
846.50
847.79
7
115
839.50
731.50
785.50
6-inch open hole
GPWT
DF-17
2531725.46
1972911.91
817.65
820.14
115
120
702.65
697.65
700.15
2-inch stainless steel screen
BGP
DF-18
2531124.33
1973590.07
777.77
780.28
45
60
732.77
717.77
725.27
2-inch stainless steel screen
GPWT
DF-19
2531143.77
1973770.63
786.13
788.53
55
65
731.13
721.13
726.13
2-inch stainless steel screen
GPWT
DF-22S
2531524.65
1972931.42
808.73
811.85
76
86
732.73
722.73
727.73
2-inch stainless steel screen
GPWT
DF-22D
2531524.95
1972931.41
808.73
811.56
101
106
707.73
702.73
705.23
2-inch stainless steel screen
BGP
DF-23
2530101.41
1972863.81
752.57
755.39
60
65
692.57
687.57
690.07
2-inch stainless steel screen
BGP
DF-24
2530081.29
1974051.80
812.28
813.68
19
102
793.28
710.28
751.78
6-inch open hole
GPWT
DF-25
2530981.83
1973779.38
785.15
786.36
NA
NA
- -
- -
- -
- -
NA
MW-1
2534233.15
1973475.34
859.96
861.77
13
71
846.96
788.96
817.96
4-inch open hole
GPWT
MW-2
2534208.57
1973479.15
860.08
861.07
225
230
635.08
630.08
632.58
2-inch stainless steel screen
SS
MW-3
2533174.54
1973415.41
855.90
858.6
14
76
841.90
779.90
810.90
4-inch open hole
GPWT
CRA 045136 (13) Byron Generating Station
TABLE 2.1
SUMMARY OF EXISTING WELL INFORMATION
FLEETWIDE ASSESSMENT
BYRON GENERATING STATION
BYRON, ILLINOIS
Page 3 of 3
Surface
Reference
Hydrogeologic
X coor.
Y coor.
Elevation
Elevation
Top
Bottom
Top
Bottom Middle
Well
Unit
Sample Location
(ft
AMSL)
2
(ft AMSL)
Construction
Screened
1
Screened Interval
(State Plane Coordinates)
(ft bgs)
3
(ft AMSL)
MW-15
2532472.31
1974788.27
821.22
822.23
75
86
746.22
735.22
740.72
2-inch stainless steel screen
GPWT
MW-16
2532464.57
1974786.05
821.29
823.47
109
120
712.29
701.29
706.79
2-inch stainless steel screen
BGP
MW-20R
2532466.05
1974790.91
820.57
821.85
181
191
639.57
629.57
634.57
2-inch stainless steel screen
SS
MW-21
2532458.60
1974791.94
820.42
821.63
224
234
596.42
586.42
591.42
2-inch stainless steel screen
SS
MW-30
2530196.65
1972880.11
754.70
758.68
27
37
727.70
717.70
722.70
2-inch stainless steel screen
GPWT
MW-36
2532608.79
1973569.23
841.60
843.73
146
156
695.60
685.60
690.60
2-inch stainless steel screen
BGP
MW-37
2532608.88
1973558.19
841.16
843.33
192
202
649.16
639.16
644.16
2-inch stainless steel screen
SS
MW-39
2532616.75
1974389.87
834.18
836.67
175
185
659.18
649.18
654.18
2-inch stainless steel screen
SS
MW-41
2531156.40
1975401.53
814.46
816.87
111
121
703.46
693.46
698.46
2-inch stainless steel screen
BGP
MW-42
2532613.32
1974380.69
834.21
836.31
141
151
693.21
683.21
688.21
2-inch stainless steel screen
BGP
PC-1B
2530160.35
1973268.15
755.49
757.28
36
46
719.49
709.49
714.49
2-inch stainless steel screen
GPWT
PC-1C
2530162.01
1973286.18
755.80
757.89
101
111
654.80
644.80
649.80
2-inch stainless steel screen
SS
PC-2B
2532010.43
1974162.53
840.43
842.54
85
103
755.43
737.43
746.43
2-inch stainless steel screen
GPWT
PC-3B
2532010.72
1973717.55
826.58
828.3
67
78
759.58
748.58
754.08
2-inch stainless steel screen
GPWT
PC-4B
2531377.35
1973122.19
800.53
802.8
71
81
729.53
719.53
724.53
2-inch stainless steel screen
GPWT
PC-5B
2530689.47
1973701.97
786.26
788.35
62
72
724.26
714.26
719.26
2-inch stainless steel screen
GPWT
PC-6B
2531016.38
1974314.45
828.85
831.01
86
96
742.85
732.85
737.85
2-inch stainless steel screen
GPWT
Notes:
1
Hydrogeologic unit screened:
GPWT, well open to the water table in the Galena-Platteville aquifer
BGP, well open to the base of the Galena-Platteville aquifer
MGP, well open to the middle of the Galena-Platteville aquifer
UAWT, well open to the water table in the unconsolidated aquifer
UAM, well open to the middle of the unconsolidated aquifer
SS, well open to the St. Peter Sandstone aquifer
2
ft AMSL - feet Above Mean Sea Level
3
ft bgs - feet below ground surface
4
The tops of the wells for GW-9 and Well 7 are located underground within concrete vaults. The surveyed reference elevation is actually the top
of the metal rim of the concrete vault at the ground surface.
5
NA - not available
CRA 045136 (13) Byron Generating Station
TABLE 4.1
SUMMARY OF MONITORING WELL DEVELOPMENT - BLOWDOWN LINE INVESTIGATION
FLEETWIDE ASSESSMENT
BYRON GENERATING STATION
BYRON, ILLINOIS
Page 1 of 2
Sample
Volume
Location
Date
Purged
pH
Conductivity
Temperature
Observations
(gallons)
(Std. Units)
1
(μS/cm)
2
(°C)
3
AR-1
3/23/06
100
NR
4
NR
NR
NR
AR-2
3/21/06
100
NR
NR
NR
NR
AR-3
3/22/06
75
NR
NR
NR
NR
AR-4
3/27/06
NR
7.04
1,300
12.5
Murky
NR
7.47
1,405
12.8
Murky
15
7.32
863
12.6
Murky
AR-5
03/23/06
7
NR
NR
NR
NR
AR-6
3/22/06
1.5
NR
NR
NR
Misty, turbid
3/23/06
5
NR
NR
NR
NR
7
7.79
637
10.4
Murky
9
8.01
638
10.3
Murky
Well going dry
AR-7
3/28/06
50
NR
NR
NR
NR
AR-8
3/31/06
10
NR
NR
NR
NR
AR-9
4/4/06
12
NR
NR
NR
NR
AR-10
4/5/06
25
NR
NR
NR
NR
AR-11
4/11/06
Development conducted by the drilling company.
CAR-1
3/22/06
100
7.43
577
11.1
Clear
105
7.44
577
11.2
Clear
CAR-2
3/22/06
7
NR
NR
NR
NR
Well runs dry
CAR-3
3/29/06
40
NR
NR
NR
NR
Well runs dry
45
NR
NR
NR
NR
Well runs dry
TW-13
3/7/06
8
7.41
743
10.7
Cloudy, light brown
10
7.45
744
10.5
Cloudy, light brown
12
7.42
744
10.7
Cloudy
, light brown
CRA 045136 (13) Byron Generating Station
TABLE 4.1
SUMMARY OF MONITORING WELL DEVELOPMENT - BLOWDOWN LINE INVESTIGATION
FLEETWIDE ASSESSMENT
BYRON GENERATING STATION
BYRON, ILLINOIS
Page 2 of 2
Sample
Volume
Location
Date
Purged
pH
Conductivity
Temperature
Observations
(gallons)
(Std. Units)
1
(μS/cm)
2
(°C)
3
TW-14
3/7/06
Well is dry
- -
- -
- -
- -
4/5/06
75
NR
NR
NR
Clear
TW-15
3/7/06
1.0
NR
NR
NR
Light brown
Well runs dry
1.3
NR
NR
NR
NR
Well runs dry
6.3
7.54
737
9.7
Cloudy
11.3
7.62
704
10.6
Cloudy
16.3
7.57
689
10.6
Cloudy
Notes:
1
Std. Units - standard units
2
μS/cm - microSiemens per centimeter
3
degrees Celsius
4
NR - Not Reported
CRA 045136 (13) Byron Generating Station
TABLE 4.2
SUMMARY OF GROUNDWATER ELEVATIONS - MARCH/APRIL 2006
FLEETWIDE ASSESSMENT
BYRON GENERATING STATION
BYRON, ILLINOIS
Page 1 of 2
March 23, 2006
April 4, 2006
Sample
Reference
Depth to
Groundwater
Depth to
Groundwater
Location
Elevation
Water
Elevation
Water
Elevation
(ft AMSL)
(1)
(feet below Reference)
(feet AMSL)
(feet below Reference)
(feet AMSL)
AR-1
871.10
39.70
831.40
39.72
831.38
AR-2
864.37
65.69
798.68
66.06
798.31
AR-3
857.76
59.60
798.16
60.27
797.49
AR-5
793.27
105.37
687.90
104.21
689.06
AR-6
782.22
107.75
674.47
107.54
674.68
AR-7
868.99
- -
- -
103.02
765.96
AR-8
869.71
- -
- -
53.57
816.14
CAR-1
692.25
20.03
672.22
20.06
672.20
CAR-2
769.40
32.90
736.50
26.84
742.56
CAR-3
869.11
- -
- -
44.49
824.62
DF-12
834.48
90.13
744.35
- -
- -
DF-13
838.84
94.45
744.39
94.16
744.68
DF-15
847.79
102.30
745.49
107.32
740.47
DF-17
820.14
91.00
729.14
90.87
729.27
DF-18
780.28
55.60
724.68
55.48
724.80
DF-19
788.53
64.02
724.51
63.90
724.63
DF-1D
787.48
62.92
724.56
62.75
724.73
DF-1S
786.89
61.92
724.97
61.80
725.09
DF-22D
811.56
85.78
725.78
- -
- -
DF-22S
811.85
75.99
735.86
85.86
725.99
DF-23
755.39
28.73
726.66
60.02
695.37
DF-24
813.68
91.28
722.40
91.11
722.57
DF-2S
794.96
69.48
725.48
69.00
725.96
DF-3S
791.82
65.54
726.28
65.46
726.36
DF-4DD
832.79
88.30
744.49
88.01
744.78
DF-6
827.89
90.71
737.18
89.72
738.17
DF-8
757.47
40.57
716.90
40.47
717.00
DF-9S
707.43
21.63
685.80
21.35
686.08
MS-1
728.94
34.91
694.03
35.60
693.34
MS-2
730.86
53.95
676.91
54.08
676.78
MW-1
861.77
61.82
799.95
61.01
800.76
MW-11
747.68
- -
- -
34.01
713.67
MW-12I
726.57
21.65
704.92
21.67
704.90
MW-12S
728.15
23.70
704.45
21.86
706.29
MW-15
822.23
78.25
743.98
78.02
744.21
MW-16
823.47
79.54
743.93
79.28
744.19
MW-2
861.07
177.45
683.62
176.89
684.18
MW-20R
821.85
141.20
680.65
141.12
680.73
MW-21
821.63
141.05
680.58
140.93
680.70
MW-30
758.68
38.27
720.41
- -
- -
MW-36
843.73
99.26
744.47
99.00
744.73
MW-37
843.33
161.72
681.61
161.60
681.73
MW-39
836.67
155.73
680.94
155.61
681.06
MW-41
816.87
73.02
743.85
72.74
744.13
MW-42
836.31
92.17
744.14
91.84
744.47
OS-NW-1D
825.05
148.85
676.20
81.93
743.12
CRA 045136 (13) Byron Generating Station
TABLE 4.2
SUMMARY OF GROUNDWATER ELEVATIONS - MARCH/APRIL 2006
FLEETWIDE ASSESSMENT
BYRON GENERATING STATION
BYRON, ILLINOIS
Page 2 of 2
March 23, 2006
April 4, 2006
Sample
Reference
Depth to
Groundwater
Depth to
Groundwater
Location
Elevation
Water
Elevation
Water
Elevation
(ft AMSL)
(1)
(feet below Reference)
(feet AMSL)
(feet below Reference)
(feet AMSL)
OS-NW-1S
825.10
82.50
742.60
50.94
774.16
OS-SW-1
729.34
59.40
669.94
50.91
678.43
OS-SW-2D
734.21
54.45
679.76
54.32
679.89
OS-SW-2I
734.38
54.50
679.88
54.38
680.00
OS-SW-2S
734.26
49.75
684.51
49.20
685.06
OS-SW-3D
799.65
117.13
682.52
140.53
659.12
OS-SW-3S
800.11
104.29
695.82
126.28
673.83
PC-1B
757.28
40.07
717.21
40.03
717.25
PC-1C
757.89
78.90
678.99
78.90
678.99
PC-2B
842.54
- -
- -
86.26
756.28
PC-4B
802.80
76.65
726.15
76.53
726.27
PC-5B
788.35
65.44
722.91
65.88
722.47
PC-6B
831.01
81.19
749.82
90.43
740.58
RR-9
688.97
18.05
670.92
17.92
671.05
RR-10
675.83
- -
- -
3.66
672.17
Notes:
(1) feet AMSL - feet Above Mean Sea Level
CRA 045136 (13) Byron Generating Station
TABLE 4.3
SUMMARY OF MONITORING WELL PURGING PARAMETERS - MARCH/APRIL 2006
FLEETWIDE ASSESSMENT
BYRON GENERATING STATION
BYRON, ILLINOIS
Page 1 of 5
Sample
Well
Volume
Location
Date
Volume
Purged
pH
Conductivity
Temperature
Turbidity
Observations
(gallons)
(gallons)
(Std. Units)
(μS/cm)
(1)
(°C)
(NTU)
(2)
AR-1
3/24/06
- -
- -
7.79
609
10.3
17
- -
- -
7.89
600
10.8
14.6
- -
7
7.66
588
11.0
14
- -
3/29/06
- -
- -
7.82
571
10.6
29.2
- -
- -
7.68
572
11.2
12.1
- -
- -
7.52
565
11.4
7.9
- -
7
7.54
560
11.3
6.2
- -
4/6/06
- -
5
7.35
574
11.5
121
- -
10
7.39
570
11.6
74
- -
15
7.41
568
11.6
47
- -
4/12/06
- -
- -
8.44
638
14.3
- -
Clear to murky
- -
7.89
572
13.3
- -
Clear to murky
7
7.79
564
13.4
- -
Clear to murky
AR-2
3/24/06
- -
- -
7.53
806
9.0
216
- -
- -
7.53
811
9.9
510
- -
2.5
7.78
862
9.8
625
- -
3/27/06
2.5
- -
8.39
807
10.3
80.5
- -
- -
7.94
792
10.2
65
- -
- -
7.78
800
10.6
41.6
- -
- -
7.73
812
10.2
40.3
- -
3.5
7.69
801
10.1
37.8
- -
3/29/06
- -
- -
7.93
825
11.2
91.9
- -
- -
7.71
830
12.1
82.7
- -
- -
7.55
831
11.9
74.5
- -
5
7.68
821
11.9
89.3
- -
4/3/06
- -
- -
7.75
845
13.2
78.9
- -
- -
7.67
854
13.3
125
- -
5
7.65
870
13.6
127
- -
4/10/06
- -
- -
7.45
880
12.5
166
- -
- -
7.56
857
12.3
135
- -
3
7.43
871
13.4
117
- -
AR-3
3/24/06
0.2
- -
7.30
735
9.6
300
- -
- -
7.17
724
10.6
310
- -
5
7.14
732
10.6
315
- -
3/27/06
- -
- -
7.30
731
10.9
64.9
- -
- -
7.19
714
11.1
46.4
- -
- -
7.18
722
11.3
25.2
- -
- -
7.19
723
11.4
15.3
- -
7
- -
- -
- -
12.5
- -
3/29/06
- -
- -
7.27
708
11.2
15.05
- -
- -
7.28
714
11.2
7.48
- -
7
7.21
711
11.5
4.82
- -
4/3/06
- -
- -
7.40
762
13.1
22
- -
- -
7.40
712
11.9
12
- -
8
7.43
715
12.2
9.6
- -
4/10/06
- -
- -
7.26
734
13.8
84.4
- -
- -
7.37
728
13.4
78.2
- -
8
7.15
726
13.4
75.3
- -
AR-4
3/28/06
4.9
- -
7.31
1,220
12.6
560
- -
- -
7.31
1,215
13.0
416
- -
5
7.41
1,213
12.2
518
- -
3/29/06
1.4
- -
7.45
1,169
13.0
116
- -
- -
7.22
1,168
13.5
165.2
- -
6.5
7.32
1,162
13.3
160.2
- -
4/4/06
- -
- -
7.16
1,223
11.3
608
- -
- -
7.65
1,224
12.3
574
- -
10
7.62
1,221
12.3
511
- -
4/10/06
- -
- -
6.61
1,209
11.3
522
- -
- -
6.72
1,148
13.3
439
- -
- -
6.85
1,129
14.2
204
- -
9.5
7.05
1,160
14.4
336
- -
AR-5
3/24/06
- -
- -
8.14
998
10.0
908
- -
- -
7.86
930
10.1
552
- -
CRA 045136 (13) Byron Generating Station
TABLE 4.3
SUMMARY OF MONITORING WELL PURGING PARAMETERS - MARCH/APRIL 2006
FLEETWIDE ASSESSMENT
BYRON GENERATING STATION
BYRON, ILLINOIS
Page 2 of 5
Sample
Well
Volume
Location
Date
Volume
Purged
pH
Conductivity
Temperature
Turbidity
Observations
(gallons)
(gallons)
(Std. Units)
(μS/cm)
(1)
(°C)
(NTU)
(2)
- -
7.71
880
10.2
950
- -
3/29/06
2.6
- -
7.85
895
10.6
205
- -
- -
7.68
888
12.2
160
- -
4.5
7.63
892
13.3
163.7
- -
4/6/06
- -
- -
7.81
1,104
10.4
355
- -
- -
7.90
1,025
11.2
313
- -
- -
7.81
1,037
11.6
- -
- -
4/11/06
- -
- -
7.20
1,047
12.7
862
- -
- -
7.16
1,077
14.5
884
- -
4.5
7.18
1,072
14.9
927
- -
AR-6
3/24/06
- -
- -
7.87
334
9.7
1,041
- -
- -
8.06
628
10.0
1,065
- -
2.5
7.96
624
10.2
1,030
- -
3/29/06
1.3
- -
8.00
635
11.6
1,080
- -
- -
7.78
614
11.3
1,182
- -
3.5
7.69
616
11.9
1,052
- -
4/6/06
- -
3.5
7.92
606
13.7
123
- -
4/11/06
- -
- -
7.36
629
12.5
430
- -
- -
7.36
645
12.5
381
- -
- -
7.36
648
12.6
422
- -
AR-7
3/30/06
1.5
6.8
7.94
1,100
13.5
>999
- -
4/5/06
- -
1
7.98
1,189
12.1
439
- -
1.5
7.58
1,168
13.1
420
- -
2.5
7.56
1,151
13.4
415
- -
4/11/06
1.1
- -
8.08
1,205
14.4
- -
Murky
- -
7.78
1,178
13.9
- -
Murky
2
7.78
1,160
13.7
- -
Murky
AR-8
4/5/06
- -
0.5
8.15
522
11.5
343
- -
0.75
8.26
509
11.9
400
- -
2
8.46
543
11.7
609
- -
4/11/06
3.0
- -
8.08
572
12.6
- -
- -
- -
8.02
571
12.7
- -
- -
3
8.35
536
12.6
- -
- -
AR-9
4/5/06
- -
0.75
7.77
985
13.6
452
- -
1.25
7.78
989
13.0
470
- -
- -
7.69
919
13.1
- -
- -
4/11/06
1.6
- -
7.61
909
14.6
114
- -
- -
7.81
912
13.8
202
- -
2.5
7.88
911
13.8
286
- -
AR-10
4/6/06
1.6
1.6
7.11
4.64
10.5
624
- -
3
7.00
4.28
10.6
711
- -
4.5
6.97
4.20
10.6
763
- -
4/12/06
1.6
- -
7.22
3,850
11.7
- -
Clear to murky
- -
7.08
3,870
11.3
- -
Clear to murky
3
7.03
3,800
11.2
- -
Clear to murky
AR-11
4/18/06
10.1
7.5
Water level dropped to the top of the pump, no readings
Clear, no odor
11.5
No readings
Clear, no odor
CAR-1
3/23/06
5.6
- -
7.08
566
11.0
63
- -
- -
7.48
562
11.7
50.2
- -
- -
7.45
561
10.9
34
- -
3/29/06
- -
- -
7.75
565
10.1
405
- -
- -
7.63
551
10.4
203
- -
- -
7.55
559
10.5
69.7
- -
- -
7.54
561
10.5
31.7
- -
8
- -
- -
- -
11.6
- -
4/6/06
5.5
20
7.76
547
10.8
72
- -
4/12/06
- -
- -
7.92
572
13.8
--
Clear to murky
- -
7.97
562
12.7
--
Clear to murky
5
7.90
565
13.0
--
Clear to murky
CRA 045136 (13) Byron Generating Station
TABLE 4.3
SUMMARY OF MONITORING WELL PURGING PARAMETERS - MARCH/APRIL 2006
FLEETWIDE ASSESSMENT
BYRON GENERATING STATION
BYRON, ILLINOIS
Page 3 of 5
Sample
Well
Volume
Location
Date
Volume
Purged
pH
Conductivity
Temperature
Turbidity
Observations
(gallons)
(gallons)
(Std. Units)
(μS/cm)
(1)
(°C)
(NTU)
(2)
CAR-2
3/24/06
0.6
1
7.11
878
9.8
>999
- -
3/29/06
0.4
- -
7.72
809
11.4
1210
- -
0.33
7.42
807
11.0
1232
- -
4/6/06
1.4
1.5
7.67
800
11.3
>999
- -
3
7.60
793
11.1
>999
- -
4/12/06
- -
- -
7.79
865
12.0
- -
- -
- -
7.38
864
11.7
- -
- -
1
7.37
858
12.1
- -
- -
CAR-3
3/30/06
2.9
3
7.98
920
17.1
>999
- -
4/5/06
- -
1.25
7.75
956
16.4
168
- -
- -
7.67
947
16.4
144
- -
3.5
7.65
957
16.5
108
- -
4/11/06
3.1
- -
7.79
933
17.0
- -
- -
- -
7.89
945
17.1
- -
- -
4
7.87
949
17.2
- -
- -
DF-1S
3/30/06
0.25
- -
7.28
823
11.6
170
- -
- -
7.27
818
11.1
182
- -
1
7.24
815
11.1
161
- -
4/6/06
0.24
0.25
7.77
838
8.4
>999
- -
0.5
7.71
844
8.4
>999
- -
0.75
7.69
846
8.4
>999
- -
DF-1D
3/29/06
3.6
- -
7.38
820
12.2
7.65
- -
- -
7.38
812
11.9
2.37
- -
8.5
7.41
811
11.9
3.62
- -
4/6/06
3.5
3.5
6.54
387
9.4
36
- -
7
6.50
426
9.5
41
- -
10.5
6.40
444
9.5
10
- -
DF-2S
3/29/06
1.1
- -
7.87
690
14.8
217
- -
- -
7.27
681
13.4
217
- -
- -
7.20
684
13.5
217
- -
Well dry
at slow purge rate
4/6/06
1.2
1
No readings
- -
Dry
at approximately 1.0 gallon
DF-3S
3/31/06
0.6
- -
8.16
795
10.8
760
Murky
- -
7.99
793
10.6
683
Murky
2
7.94
793
10.6
694
Murky
4/6/06
0.54
2
No readings
- -
DF-4DS
3/30/06
0.94
- -
8.05
707
11.9
1415
- -
- -
7.93
712
11.1
1398
- -
3
7.98
718
11.1
1440
- -
4/6/06
0.91
3
7.94
727
11.1
>999
- -
DF-6
3/30/06
5.3
- -
7.18
668
14.0
10.55
- -
- -
7.21
656
14.6
11.58
- -
6
7.26
651
14.1
13.7
- -
4/6/06
- -
- -
7.27
691
10.9
19.1
- -
- -
7.26
670
11.2
20.2
- -
10
7.30
656
11.4
23.2
- -
DF-12
3/31/06
7.5
- -
7.70
771
11.9
1.47
- -
- -
7.35
773
11.6
0.97
- -
8.5
7.28
771
11.6
1.07
- -
4/6/06
- -
- -
7.27
779
11.8
2.08
- -
- -
7.26
782
12.1
0.99
- -
8.5
7.26
782
12.1
0.82
- -
DF-19
3/30/06
0.5
5
7.22
837
11.0
289
- -
4/6/06
0.29
3
7.31
848
9.5
61
- -
DF-24
3/30/06
- -
- -
7.62
850
13.4
49.4
- -
- -
7.32
844
13.2
34.9
- -
- -
7.27
845
13.2
25.4
- -
CRA 045136 (13) Byron Generating Station
TABLE 4.3
SUMMARY OF MONITORING WELL PURGING PARAMETERS - MARCH/APRIL 2006
FLEETWIDE ASSESSMENT
BYRON GENERATING STATION
BYRON, ILLINOIS
Page 4 of 5
Sample
Well
Volume
Location
Date
Volume
Purged
pH
Conductivity
Temperature
Turbidity
Observations
(gallons)
(gallons)
(Std. Units)
(μS/cm)
(1)
(°C)
(NTU)
(2)
20
7.29
843
13.2
34.5
- -
4/6/06
- -
- -
7.22
844
11.3
2.84
- -
- -
7.16
846
11.4
0.8
- -
22
7.15
848
11.4
0.37
- -
GW-9
3/7/06
39
20
7.43
816
12.6
- -
Clear, no odor
40
7.42
814
12.6
- -
Clear, no odor
60
7.39
811
12.4
- -
Clear, no odor
MW-1
3/31/06
1.8
- -
7.44
554
10.7
516
- -
- -
7.67
542
10.4
600
- -
4
7.39
541
10.3
502
- -
4/6/06
- -
- -
7.73
560
10.4
176
- -
7
7.71
559
10.5
160
- -
MW-2
3/31/06
6.5
- -
8.39
397
13.9
6.17
- -
- -
8.18
543
13.7
15.4
- -
15
7.65
563
13.9
5.43
- -
4/6/06
- -
- -
7.50
589
12.6
3.28
- -
- -
7.47
594
12.8
1.70
- -
15
7.49
584
12.8
1.28
- -
MW-3
3/31/06
1.4
- -
7.67
670
11.7
156
- -
- -
7.33
663
11.6
210
- -
2.8
7.29
665
11.6
199
- -
4/6/06
1.4
6
7.29
644
11.6
142
- -
MW-30
3/31/06
0.5
- -
7.60
589
9.8
840
- -
- -
7.55
587
10.1
972
- -
0.8
7.52
589
10.1
1,024
- -
4/6/06
0.4
1
No readings
- -
MW-36
3/31/06
9.5
- -
7.30
842
12.9
74.9
- -
- -
7.28
815
12.1
39.3
- -
18
7.32
812
12.6
39.8
- -
4/6/06
- -
- -
7.15
831
11.9
9.82
- -
- -
7.18
833
11.9
8.19
- -
12
7.21
831
10.9
6.19
- -
MW-37
3/31/06
6.5
- -
7.46
616
15.0
11.8
- -
- -
7.41
604
14.6
4.81
- -
15
7.38
604
14.4
0.67
- -
4/6/06
- -
- -
7.21
609
12.5
5.2
- -
- -
7.27
609
12.9
2.94
- -
8
7.29
615
12.9
2.43
- -
MW-39
3/31/06
2.2
- -
12.20
2,630
13.1
8.41
- -
- -
11.45
1,002
14.3
128
- -
- -
10.55
357
13.6
9.79
- -
- -
9.41
393
13.2
- -
- -
10
9.27
394
13.5
- -
- -
4/6/06
- -
- -
9.31
543
12.6
23
- -
- -
9.16
553
12.8
14.26
- -
8
8.96
573
12.9
13.28
- -
PC-1B
3/31/06
1.3
- -
7.37
783
9.4
1,180
- -
- -
7.32
788
9.9
1,124
- -
3.5
7.28
788
9.9
1,098
- -
4/6/06
1.25
3
7.88
825
9.0
72.1
- -
PC-1C
3/31/06
6
- -
7.42
615
11.7
12.95
- -
CRA 045136 (13) Byron Generating Station
TABLE 4.3
SUMMARY OF MONITORING WELL PURGING PARAMETERS - MARCH/APRIL 2006
FLEETWIDE ASSESSMENT
BYRON GENERATING STATION
BYRON, ILLINOIS
Page 5 of 5
Sample
Well
Volume
Location
Date
Volume
Purged
pH
Conductivity
Temperature
Turbidity
Observations
(gallons)
(gallons)
(Std. Units)
(μS/cm)
(1)
(°C)
(NTU)
(2)
- -
7.37
615
11.9
6.89
- -
7.5
7.47
615
11.9
4.76
- -
4/6/06
- -
5
7.44
655
10.3
98.3
- -
PC-2B
3/31/06
1.2
- -
7.49
683
12.0
798
- -
- -
7.46
686
11.1
752
- -
4
7.33
664
11.1
722
- -
4/6/06
1.2
3.5
7.33
657
11.1
641
- -
PC-5B
3/31/06
1.4
- -
7.69
776
10.6
1040
- -
- -
7.35
782
10.5
182
- -
- -
7.27
778
10.7
144
- -
3.5
7.27
775
10.7
138
- -
4/6/06
1.4
1.5
7.97
763
10.6
210
- -
3
7.48
741
10.7
164
- -
PC-6B
3/31/06
1.2
- -
7.15
975
14.1
540
- -
- -
7.06
990
11.6
566
- -
2.5
7.08
987
12.0
612
- -
4/6/06
1.25
3.5
7.69
830
9.0
>999
- -
TW-13
3/8/06
0.4
0.5
7.59
757
10.3
- -
Clear
1
7.54
757
10.3
- -
Clear
1.5
7.54
756
10.3
- -
Clear
4/6/06
0.48
1
7.64
800
9.9
>999
- -
4/12/06
0.5
- -
7.77
791
11.1
- -
Murky
- -
7.70
770
10.4
- -
Murky
1
7.72
775
10.3
- -
Murky
TW-14
4/6/06
1.5
1
7.83
842
10.6
>999
- -
2
7.77
836
10.7
>999
- -
3
7.69
819
10.7
>999
- -
4/12/06
1.4
- -
7.59
793
11.2
--
Murky
- -
7.66
785
10.9
--
Murky
2.5
7.60
779
10.8
--
Murky
TW-15
3/8/06
0.9
13
7.49
678
11.7
- -
Slightly cloudy
14
7.48
681
11.7
- -
Slightly cloudy
15
7.43
681
11.7
- -
Slightly
cloudy
4/6/06
1.12
1
7.71
782
9.8
>999
- -
Dry at 2
No readings
- -
3
No readings
- -
4/12/06
1.1
- -
7.53
814
11.5
- -
Murky
- -
7.52
775
10.3
- -
Murky
2.5
7.51
776
10.3
- -
Murky
Notes:
(1)
μS/cm - microSiemens per centimeter
(2)
NTU - nephelometric turbidity units
CRA 045136 (13) Byron Generating Station
TABLE 4.4
SAMPLE SUMMARY - BLOWDOWN LINE INVESTIGATION
FLEETWIDE ASSESSMENT
BYRON GENERATING STATION
BYRON, ILLINIOS
Page 1 of 3
Sample
Sample
Location
Sample Identification
QC Sample
Date
Sample Analyses
GW-9
GW-030806-KD-01
- -
3/8/2006
Tritium
TW-13
GW-030806-KD-02
- -
3/8/2006
Tritium
TW-13
GW-030806-KD-03
Duplicate
3/8/2006
Tritium
TW-15
GW-030806-KD-04
- -
3/8/2006
Tritium
CAR-1
GW-19232-032306-SP-CAR-1
- -
3/23/2006
Tritium
AR-1
GW-19232-032306-SP-AR-1
- -
3/24/2006
Tritium
AR-2
GW-19232-032306-SP-AR-2
- -
3/24/2006
Tritium
AR-3
GW-19232-032306-SP-AR-3
- -
3/24/2006
Tritium
AR-5
GW-19232-032306-SP-AR-5
- -
3/24/2006
Tritium
AR-6
GW-19232-032306-SP-AR-6
- -
3/24/2006
Tritium
CAR-2
GW-19232-032306-SP-CAR-2
- -
3/24/2006
Tritium
AR-3
GW-19232-032706-NK-AR-3
- -
3/27/2006
Tritium
AR-2
GW-19232-032708-EV-AR-2
- -
3/27/2006
Tritium
AR-4
GW-19232-032806-NK-CAR-4
- -
3/28/2006
Tritium
AR-5
GW-19232-032906-EV-AR-5
- -
3/29/2006
Tritium
AR-6
GW-19232-032906-EV-AR-6
- -
3/29/2006
Tritium
CAR-2
GW-19232-032906-EV-CAR-2
- -
3/29/2006
Tritium
AR-4
GW-19232-032906-EV-CAR-4
- -
3/29/2006
Tritium
AR-1
GW-19232-032906-NK-AR-1
- -
3/29/2006
Tritium
AR-2
GW-19232-032906-NK-AR-2
- -
3/29/2006
Tritium
AR-3
GW-19232-032906-NK-AR-3
- -
3/29/2006
Tritium
CAR-1
GW-19232-032906-NK-CAR-1
- -
3/29/2006
Tritium
AR-7
AR-7
- -
3/30/2006
Tritium
CAR-3
CAR-3
- -
3/30/2006
Tritium
DF-19
DF-19
- -
3/30/2006
Tritium
DF-1D
DF-1D
- -
3/30/2006
Tritium
DF-1S
DF-1S
- -
3/30/2006
Tritium
DF-24
DF-24
- -
3/30/2006
Tritium
DF-2S
DF-2S
- -
3/30/2006
Tritium
DF-4DS
DF-4DS
- -
3/30/2006
Tritium
DF-6
DF-6
- -
3/30/2006
Tritium
DF-12
DF-12
- -
3/31/2006
Tritium
DF-3S
DF-3S
- -
3/31/2006
Tritium
MW-1
MW-1
- -
3/31/2006
Tritium
MW-2
MW-2
- -
3/31/2006
Tritium
MW-3
MW-3
- -
3/31/2006
Tritium
MW-30
MW-30
- -
3/31/2006
Tritium
MW-36
MW-36
- -
3/31/2006
Tritium
MW-37
MW-37
- -
3/31/2006
Tritium
MW-39
MW-39
- -
3/31/2006
Tritium
PC-1B
PC-1B
- -
3/31/2006
Tritium
PC-1C
PC-1C
- -
3/31/2006
Tritium
CRA 45136(13) Bryon Generating Station
TABLE 4.4
SAMPLE SUMMARY - BLOWDOWN LINE INVESTIGATION
FLEETWIDE ASSESSMENT
BYRON GENERATING STATION
BYRON, ILLINIOS
Page 2 of 3
Sample
Sample
Location
Sample Identification
QC Sample
Date
Sample Analyses
PC-2B
PC-2B
- -
3/31/2006
Tritium
PC-5B
PC-5B
- -
3/31/2006
Tritium
PC-5B
PC-5B
Duplicate
3/31/2006
Tritium
PC-6B
PC-6B
- -
3/31/2006
Tritium
AR-2
GW040306-NK-AR-2
- -
4/3/2006
Tritium
AR-3
GW040306-NK-AR-3
- -
4/3/2006
Tritium
AR-4
GW040406-NK-AR-4
- -
4/4/2006
Tritium
AR-7
GW-040506-NK-AR-7
- -
4/5/2006
Tritium and Radionuclides
(1)
AR-8
GW-040506-NK-AR-8
- -
4/5/2006
Tritium and Radionuclides
AR-9
GW-040506-NK-AR-9
- -
4/5/2006
Tritium and Radionuclides
CAR-3
GW-040506-NK-CAR-3
- -
4/5/2006
Tritium and Radionuclides
AR-5
GW-040606-NK-AR-5
- -
4/6/2006
Tritium and Radionuclides
AR-6
GW-040606-NK-AR-6
- -
4/6/2006
Tritium and Radionuclides
DF-12
GW-040606-NK-DF-12
- -
4/6/2006
Tritium
DF-24
GW-040606-NK-DF-24
- -
4/6/2006
Tritium
DF-6
GW-040606-NK-DF-6
- -
4/6/2006
Tritium
DF-6
GW-040606-NK-DF-6
Duplicate
4/6/2006
Tritium
MW-1
GW-040606-NK-MW-12
- -
4/6/2006
Tritium
MW-2
GW-040606-NK-MW-12
- -
4/6/2006
Tritium
MW-36
GW-040606-NK-MW-36
- -
4/6/2006
Tritium
MW-37
GW-040606-NK-MW-37
- -
4/6/2006
Tritium
MW-39
GW-040606-NK-MW39
- -
4/6/2006
Tritium
PC-1C
GW-040606-NK-PC-1C
- -
4/6/2006
Tritium
MW-3
GW-19232-0406060-BW-MW-3
- -
4/6/2006
Tritium
AR-1
GW-19232-040606-BW-AR-1
- -
4/6/2006
Tritium and Radionuclides
AR-10
GW-19232-040606-BW-AR-10
- -
4/6/2006
Tritium and Radionuclides
CAR-1
GW-19232-040606-BW-CAR-1
- -
4/6/2006
Tritium and Radionuclides
CAR-2
GW-19232-040606-BW-CAR-2
- -
4/6/2006
Tritium and Radionuclides
DF-19
GW-19232-040606-BW-DF-19
- -
4/6/2006
Tritium
DF-1D
GW-19232-040606-BW-DF-1D
- -
4/6/2006
Tritium
DF-1S
GW-19232-040606-BW-DF-1S
- -
4/6/2006
Tritium
DF-2S
GW-19232-040606-BW-DF-2S
- -
4/6/2006
Tritium
DF-4DS
GW-19232-040606-BW-DF-4DS
- -
4/6/2006
Tritium
DF-4DS
GW-19232-040606-BW-DF-4DS
Duplicate
4/6/2006
Tritium
PC-1B
GW-19232-040606-BW-PC-1B
- -
4/6/2006
Tritium
PC-2B
GW-19232-040606-BW-PC-2B
- -
4/6/2006
Tritium
PC-5B
GW-19232-040606-BW-PC-5B
- -
4/6/2006
Tritium
PC-6B
GW-19232-040606-BW-PC-6B
- -
4/6/2006
Tritium
TW-13
GW-19232-040606-BW-TW-13
- -
4/6/2006
Tritium and Radionuclides
TW-14
GW-19232-040606-BW-TW-14
- -
4/6/2006
Tritium and Radionuclides
TW-15
GW-19232-040606-BW-TW-15
- -
4/6/2006
Tritium and Radionuclides
DF-3S
GW-19232-040606-DW-DF-3S
- -
4/6/2006
Tritium
CRA 45136(13) Bryon Generating Station
TABLE 4.4
SAMPLE SUMMARY - BLOWDOWN LINE INVESTIGATION
FLEETWIDE ASSESSMENT
BYRON GENERATING STATION
BYRON, ILLINIOS
Page 3 of 3
Sample
Sample
Location
Sample Identification
QC Sample
Date
Sample Analyses
MW-30
GW-19232-040606-GW-MW-30
- -
4/6/2006
Tritium
AR-2
GW-19232-041006-EV-AR-2
- -
4/10/2006
Tritium and Radionuclides
AR-3
GW-19232-041006-EV-AR-3
- -
4/10/2006
Tritium and Radionuclides
AR-4
GW-19232-041006-EV-AR-4
- -
4/10/2006
Tritium and Radionuclides
AR-5
GW-19232-041106-EV-AR-5
- -
4/11/2006
Tritium and Radionuclides
AR-6
GW-19232-041106-EV-AR-6
- -
4/11/2006
Tritium and Radionuclides
AR-7
GW-19232-041106-EV-AR-7
- -
4/11/2006
Tritium and Radionuclides
AR-8
GW-19232-041106-EV-AR-8
- -
4/11/2006
Tritium and Radionuclides
AR-9
GW-19232-041106-EV-AR-9
- -
4/11/2006
Tritium and Radionuclides
CAR-3
GW-19232-041106-EV-CAR-3
- -
4/11/2006
Tritium and Radionuclides
AR-1
GW-19232-041106-EV-AR-1
- -
4/12/2006
Tritium and Radionuclides
AR-10
GW-19232-041106-EV-AR-10
- -
4/12/2006
Tritium and Radionuclides
CAR-1
GW-19232-041106-EV-CAR-1
- -
4/12/2006
Tritium and Radionuclides
CAR-2
GW-19232-041106-EV-CAR-2
- -
4/12/2006
Tritium and Radionuclides
CAR-2
GW-19232-041106-EV-CAR-2
Duplicate
4/12/2006
Tritium and Radionuclides
TW-14
GW-19232-041106-EV-TW-14
- -
4/12/2006
Tritium and Radionuclides
TW-15
GW-19232-041106-EV-TW-15
- -
4/12/2006
Tritium and Radionuclides
TW-13
GW-19232-041206-EV-TW-13
- -
4/12/2006
Tritium and Radionuclides
AR-11
GW-041806-KD-AR-11
- -
4/18/2006
Tritium and Radionuclides
Notes:
QC - Quality Control
(1) Radionuclides: Sr-89/90, Mn-54, Fe-59, Co-58, Co-60, Zn-65, Zr-Nb-95, I-131, Cs-134, Cs-137, and Ba-La-140
CRA 45136(13) Bryon Generating Station
TABLE 4.5
SUMMARY OF GROUNDWATER ELEVATIONS - APRIL 24, 2006
FLEETWIDE ASSESSMENT
BYRON GENERATING STATION
BYRON, ILLINOIS
Page 1 of 2
April 24, 2006
Sample
Reference
Depth to
Groundwater
Location
Elevation
Water
Elevation
(ft
AMSL)
(ft below Reference)
(ft AMSL)
Exelon-Owned Wells
AR-1
871.10
35.16
835.94
AR-2
867.38
68.88
798.50
AR-3
860.64
63.77
796.87
AR-4
832.74
90.00
742.74
AR-5
795.75
107.67
688.08
AR-6
784.55
109.55
675.00
AR-7
871.28
104.54
766.74
AR-8
872.11
33.56
838.55
AR-9
876.77
59.50
817.27
AR-10
859.15
21.49
837.66
AR-11
831.65
89.24
742.41
CAR-1
694.87
22.24
672.63
CAR-2
772.01
35.12
736.89
CAR-3
872.16
45.64
826.52
TW-13
700.47
17.11
683.36
TW-14
699.41
26.48
672.93
TW-15
695.73
22.84
672.89
GW-9
841.73
96.27
745.46
Well 7
891.24
115.77
775.47
Byron Salvage PRP Group-Owned Wells
DF-1S
786.89
60.85
726.04
DF-1D
787.48
61.81
725.67
DF-2S
794.96
67.88
727.08
DF-3S
791.82
64.49
727.33
DF-4DS
832.98
67.16
765.82
DF-4DD
832.79
86.62
746.17
DF-5S
844.12
44.35
799.77
DF-6
827.89
88.69
739.20
DF-7S
712.38
Dry
- -
DF-7D
712.55
37.47
675.08
DF-8
757.47
39.87
717.60
DF-10
834.01
Dry
- -
DF-11
834.21
85.21
749.00
DF-12
834.48
88.42
746.06
DF-13
838.84
92.78
746.06
DF-15
847.79
106.81
740.98
DF-17
820.14
90.38
729.76
DF-18
780.28
54.56
725.72
CRA 045136 (13) Byron Generating Station
TABLE 4.5
SUMMARY OF GROUNDWATER ELEVATIONS - APRIL 24, 2006
FLEETWIDE ASSESSMENT
BYRON GENERATING STATION
BYRON, ILLINOIS
Page 2 of 2
April 24, 2006
Sample
Reference
Depth to
Groundwater
Location
Elevation
Water
Elevation
(ft
AMSL)
(ft below Reference)
(ft AMSL)
DF-19
788.53
62.93
725.60
DF-22S
811.85
85.51
726.34
DF-22D
811.56
85.22
726.34
DF-23
755.39
38.22
717.17
DF-24
813.68
89.89
723.79
DF-25
786.36
17.25
769.11
MW-1
861.77
62.14
799.63
MW-2
861.07
176.85
684.22
MW-3
858.6
71.09
787.51
MW-15
822.23
76.67
745.56
MW-16
823.47
77.91
745.56
MW-20R
821.85
140.66
681.19
MW-21
821.63
140.47
681.16
MW-30
758.68
38.42
720.26
MW-36
843.73
97.59
746.14
MW-37
843.33
161.18
682.15
MW-39
836.67
155.18
681.49
MW-41
816.87
71.38
745.49
MW-42
836.31
90.46
745.85
PC-1B
757.28
39.27
718.01
PC-1C
757.89
78.36
679.53
PC-2B
842.54
86.31
756.23
PC-3B
828.3
67.72
760.58
PC-4B
802.8
76.31
726.49
PC-5B
788.35
64.75
723.60
PC-6B
831.01
87.83
743.18
Notes:
ft AMSL - feet above Mean Sea Level
CRA 045136 (13) Byron Generating Station
TABLE 4.7
SUMMARY OF MONITORING WELL PURGING PARAMETERS - FLEETWIDE SAMPLING EVENT
FLEETWIDE ASSESSMENT
BYRON GENERATING STATION
BYRON, ILLINOIS
Page 1 of 8
Sample
Initial Depth
Time
Dissolved
Depth to
Location
Date
to Water
Purged
pH
Temperature
Conductivity
Turbidity
ORP
(3)
Oxygen
Water
Observations
(ft below Reference)
(minutes)
(Std. Units)
(°C)
(μS/cm)
(1)
(NTU)
(2)
(mV)
(4)
(mg/L)
(5)
(ft below Reference)
AR-1
4/26/06
34.91
7
7.70
13.37
543
11.3
53.6
10.79
37.30
- -
12
7.51
13.72
538
- -
57.3
9.68
- -
- -
Equipment malfunction
58
8.14
14.23
531
7.5
43.7
9.42
38.02
- -
63
7.89
13.69
531
4.3
54.7
10.64
42.45
- -
68
7.72
13.69
529
3.2
60.4
10.54
43.36
- -
73
7.66
13.82
530
2.4
61.5
10.94
43.62
- -
76
7.68
13.82
528
2.5
62.8
10.16
43.45
- -
AR-2
4/26/06
68.72
10
7.18
13.28
814
50
112
8.20
72.45
Slightly cloudy, no odor
15
7.16
13.54
820
27
112
8.15
73.90
Slightly cloudy, no odor
20
7.11
13.84
814
22
114
7.97
74.03
Clear
25
7.13
13.22
814
18
114
7.89
74.10
Clear
30
7.15
13.20
820
15
110
7.86
74.14
Clear
35
7.14
13.18
824
16
109
7.82
74.17
Clear
AR-3
4/26/06
63.90
10
7.02
13.09
683
50
91
6.58
64.10
Slightly cloudy, no odor
15
7.01
13.23
684
50
95
6.57
64.12
Slightly cloudy, no odor
20
6.98
13.20
682
33
100
6.32
64.13
Clear
25
7.01
13.17
683
19
101
6.29
64.15
Clear
30
6.98
13.22
682
12
105
6.40
64.17
Clear
AR-4
4/27/06
89.63
8
7.99
15.90
1,138
232
30.1
7.45
93.27
- -
13
9.22
15.86
1,133
265
31.4
6.97
93.59
- -
18
9.69
15.44
1,125
294
30.3
6.48
93.91
- -
23
9.66
15.79
1,125
282
29.3
5.90
94.31
- -
28
9.60
15.86
1,123
270
28.3
5.40
94.62
- -
33
9.27
16.10
1,124
252
31.3
5.11
94.88
- -
36
9.33
16.19
1,124
226
30.2
4.92
95.00
- -
39
9.25
16.57
1,124
208
29.7
4.72
95.09
- -
42
9.20
16.67
1,125
188
30.6
4.62
95.15
- -
AR-5
4/27/06
107.49
5
7.55
16.16
988
497
20.4
4.88
110.99
- -
10
7.83
16.94
997
404
16.3
3.09
111.37
- -
15
7.96
17.52
1,002
349
17.3
2.90
111.69
- -
20
8.19
18.23
1,008
332
13.8
2.97
112.10
- -
25
8.38
18.52
1,013
318
10.1
2.91
112.38
- -
28
8.39
18.77
1,017
308
8.0
2.94
112.51
- -
AR-6
4/27/06
109.51
5
7.55
15.83
606
119
15.1
5.58
111.75
- -
10
7.76
15.48
599
167
11.7
3.23
112.47
- -
15
7.60
17.21
608
167
17.5
2.83
112.43
- -
20
7.49
17.93
612
197
18.1
2.70
112.74
- -
25
7.54
18.56
617
154
16.5
2.52
113.10
- -
CRA 045136 (13) Byron Generating Station
TABLE 4.7
SUMMARY OF MONITORING WELL PURGING PARAMETERS - FLEETWIDE SAMPLING EVENT
FLEETWIDE ASSESSMENT
BYRON GENERATING STATION
BYRON, ILLINOIS
Page 2 of 8
Sample
Initial Depth
Time
Dissolved
Depth to
Location
Date
to Water
Purged
pH
Temperature
Conductivity
Turbidity
ORP
(3)
Oxygen
Water
Observations
(ft below Reference)
(minutes)
(Std. Units)
(°C)
(μS/cm)
(1)
(NTU)
(2)
(mV)
(4)
(mg/L)
(5)
(ft below Reference)
30
7.52
19.82
615
99.1
17.9
2.17
113.50
- -
35
7.52
20.94
616
90.2
18.4
2.04
113.59
- -
38
7.51
21.23
619
75.9
18.3
2.02
113.66
- -
AR-7
4/27/06
104.61
10
7.28
19.45
1,206
800
325
4.63
104.40
Brown color, no odor
15
7.42
19.08
1,199
577
333
3.70
104.60
Very cloudy
20
7.45
19.15
1,196
454
338
3.67
104.40
Very cloudy
25
7.31
21.10
1,221
978
335
3.46
104.40
Very cloudy
30
7.11
21.47
1,199
>1000
329
3.70
104.40
Brown color
35
7.39
18.58
1,190
304
337
3.79
104.40
Cloudy
40
7.60
18.38
1,191
79
340
3.76
104.40
Slightly cloudy
45
7.38
18.54
1,189
41.1
342
3.74
104.40
Slightly cloudy
48
7.29
18.65
1,190
25.5
343
3.75
104.40
Slightly cloudy
51
7.24
18.75
1,188
23
344
3.70
104.40
Clear
54
7.24
18.75
1,187
24
344
3.71
104.40
Clear
AR-8
4/27/06
33.30
10
7.90
17.80
644
167
286
7.61
34.45
Cloudy
15
7.76
18.20
642
154
283
7.64
34.55
Cloudy
20
7.58
18.20
642
127
285
7.59
34.65
Cloudy
25
7.42
18.90
639
115
291
7.45
34.63
Cloudy
30
7.30
189.00
639
109
267
7.30
34.63
Cloudy
33
7.28
19.00
639
112
266
7.29
34.63
Cloudy
AR-9
4/27/06
59.30
10
6.95
18.80
910
263
231
6.20
61.16
Cloudy
20
6.87
19.80
907
83
182
5.98
61.60
Slightly cloudy
25
6.83
20.80
906
32
175
5.59
61.90
Clear
28
6.80
20.50
907
29
180
5.60
61.90
Clear
31
6.80
20.50
908
29
175
5.59
61.90
Clear
33
6.80
20.50
908
29
177
5.59
61.90
Clear
AR-10
4/26/06
21.46
10
7.05
13.00
3,220
90
119
1.11
21.55
Cloudy
15
7.04
12.56
3,225
70
118
1.11
21.55
Slightly cloudy
20
7.03
12.45
3,220
29
121
1.04
21.58
Clear
25
7.02
12.42
3,225
17
127
0.93
21.60
Clear
30
7.04
12.40
3,220
11
127
0.90
21.60
Clear
AR-11
4/26/06
87.12
18
8.27
14.78
979
179
-0.8
5.89
- -
- -
23
8.82
14.40
983
200
5.5
2.36
97.57
- -
28
8.69
15.17
983
138
16.6
1.70
98.32
- -
33
8.66
14.83
979
111
18.2
1.36
99.72
- -
38
7.49
15.55
980
77.7
29.6
1.14
100.20
- -
43
8.48
15.40
977
69.3
19.6
1.03
100.71
- -
48
8.53
15.86
978
59.5
16.7
0.99
100.70
- -
53
8.32
15.53
972
79
22.7
0.95
100.70
- -
58
8.38
14.75
975
115
21.2
0.91
101.09
- -
CRA 045136 (13) Byron Generating Station
TABLE 4.7
SUMMARY OF MONITORING WELL PURGING PARAMETERS - FLEETWIDE SAMPLING EVENT
FLEETWIDE ASSESSMENT
BYRON GENERATING STATION
BYRON, ILLINOIS
Page 3 of 8
Sample
Initial Depth
Time
Dissolved
Depth to
Location
Date
to Water
Purged
pH
Temperature
Conductivity
Turbidity
ORP
(3)
Oxygen
Water
Observations
(ft below Reference)
(minutes)
(Std. Units)
(°C)
(μS/cm)
(1)
(NTU)
(2)
(mV)
(4)
(mg/L)
(5)
(ft below Reference)
61
8.37
14.78
967
101
20.0
0.86
101.68
- -
64
8.45
14.76
964
68.5
19.0
0.78
102.15
- -
67
8.43
14.71
966
52.1
16.9
0.69
102.43
- -
70
8.43
14.92
969
46.1
15.9
0.69
102.59
- -
73
8.43
14.79
967
46.5
15.3
0.69
102.75
- -
CAR-1
4/27/06
22.51
7
7.93
12.80
552
514
42.9
7.52
22.63
- -
12
6.96
13.15
547
285
52.3
6.78
22.61
- -
17
8.22
13.13
546
102
44.3
6.69
22.61
- -
22
8.32
13.06
548
41.1
42.3
6.70
22.63
- -
27
6.22
13.08
547
16.6
55.9
6.67
22.64
- -
32
6.56
13.23
546
8.4
51.3
6.62
22.64
- -
35
6.52
13.20
548
8.4
49.6
6.74
22.63
- -
38
6.59
13.17
546
5.5
48.7
6.71
22.63
- -
CAR-2
4/27/06
35.23
0
8.06
14.02
822
32.5
29.3
10.74
- -
- -
3
8.20
12.60
817
23.8
19.9
10.40
- -
- -
CAR-3
4/27/06
45.40
10
7.15
21.40
974
12
244
7.00
46.10
Clear
13
7.08
21.50
986
10
254
7.00
46.10
Clear
16
7.08
21.50
990
7.5
255
6.99
46.10
Clear
19
7.08
21.50
991
4.8
256
6.99
46.10
Clear
DF-1D
4/25/06
61.81
7
8.43
12.89
801
4.16
25.7
3.58
61.95
- -
12
8.26
13.23
808
2.21
27.0
2.88
61.95
- -
17
8.30
13.42
808
1.79
33.6
2.70
61.95
- -
22
8.41
13.36
809
1.78
18.2
2.63
61.95
- -
25
8.49
13.26
807
1.74
13.9
2.60
61.95
- -
28
8.52
13.32
807
1.71
10.5
2.59
61.95
- -
31
8.49
13.24
809
1.87
11.7
2.59
61.95
- -
36
8.62
13.19
807
1.5
10.4
2.55
61.95
- -
DF-1S
4/25/06
60.83
10
6.98
14.09
804
100
-110
0.40
61.03
Slightly cloudy, no odor
15
7.00
13.34
794
65
-115
0.40
60.96
Slightly cloudy, no odor
20
7.04
14.10
798
65
-125
0.33
60.97
Slightly cloudy, no odor
25
7.02
14.12
792
50
-130
0.29
60.99
Slightly cloudy, no odor
30
6.99
14.04
788
40
-123
0.28
61.02
Slightly cloudy, no odor
DF-2S
4/25/06
67.81
10
7.00
12.25
687
9.4
65
3.17
70.74
Clear
15
7.05
11.54
691
13
39
2.50
71.42
Clear
20
7.00
11.55
694
9.4
40
2.29
72.40
Clear
25
6.98
11.55
691
7.1
42
2.28
72.66
Clear
30
6.99
11.54
690
7
40
2.25
72.69
Clear
CRA 045136 (13) Byron Generating Station
TABLE 4.7
SUMMARY OF MONITORING WELL PURGING PARAMETERS - FLEETWIDE SAMPLING EVENT
FLEETWIDE ASSESSMENT
BYRON GENERATING STATION
BYRON, ILLINOIS
Page 4 of 8
Sample
Initial Depth
Time
Dissolved
Depth to
Location
Date
to Water
Purged
pH
Temperature
Conductivity
Turbidity
ORP
(3)
Oxygen
Water
Observations
(ft below Reference)
(minutes)
(Std. Units)
(°C)
(μS/cm)
(1)
(NTU)
(2)
(mV)
(4)
(mg/L)
(5)
(ft below Reference)
DF-3S
4/25/06
64.47
10
6.95
10.81
728
110
140
4.44
64.52
Cloudy, yellow, no odor
15
6.95
10.87
737
70
141
3.89
64.52
Slightly cloudy, yellow, no
odor
20
6.96
10.98
745
37
139
3.38
64.52
Slightly cloudy
DF-4DS
4/25/06
57.20
10
6.96
9.68
669
55
139
7.21
59.15
Slightly cloudy, no odor
15
6.96
10.45
670
37
130
7.48
60.35
Slightly cloudy, no odor
20
6.96
10.70
668
270
89.0
6.83
61.35
Cloudy
DF-6
4/25/06
88.18
13
8.99
11.99
881
12.3
12.2
1.60
96.10
- -
18
8.69
12.46
671
12.3
15.1
1.13
98.00
- -
23
8.54
13.36
665
12.9
9.4
1.13
98.61
- -
28
8.81
14.35
660
12.9
8.6
1.08
100.30
- -
31
8.60
14.80
661
12.9
14.3
1.07
101.02
- -
34
8.60
14.75
661
12.7
18.7
1.03
101.95
- -
DF-12
4/25/06
88.42
10
6.52
12.51
775
2.4
11.4
7.58
88.39
- -
15
6.77
12.51
772
1.9
20.7
7.08
88.42
- -
20
6.98
12.51
772
1.8
-2.1
6.97
88.41
- -
30
8.67
11.89
768
1.6
-26.6
7.00
88.42
- -
35
9.24
11.91
768
1.5
-34.3
6.97
88.40
- -
40
9.55
11.90
768
1.1
-41.5
6.99
88.40
- -
45
9.80
11.90
767
1.4
-45.8
6.97
88.40
- -
48
9.81
11.90
767
1.3
-44.6
6.97
88.40
- -
51
10.16
11.90
767
0.8
-53.2
6.94
88.40
- -
54
10.17
11.90
767
1
-51.2
6.90
88.40
- -
57
10.23
11.91
767
1.2
-53.7
6.84
88.40
- -
DF-13
4/26/06
93.13
5
10.03
14.87
825
25.6
-5.5
3.43
93.30
- -
10
9.77
15.12
807
20
5.7
2.16
93.30
- -
15
9.50
15.37
794
12.5
4.8
1.97
93.30
- -
20
9.42
15.41
788
9.5
5.5
1.97
93.30
- -
25
9.29
15.33
785
7.5
7.1
1.97
93.30
- -
28
9.31
15.28
784
7
5.5
1.97
93.30
- -
DF-19
4/25/06
62.93
10
6.95
10.48
760
>1000
73
2.48
63.04
Orange, no odor
15
6.97
11.12
781
>1000
32
1.28
63.08
Very cloudy, orange
20
6.98
11.07
785
589
1
1.01
63.07
Cloudy, orange tint
25
6.95
11.09
791
334
-7
0.93
63.08
Cloudy
30
6.98
11.19
786
191
-18
0.96
63.08
Cloudy
35
6.97
11.41
785
128
-19
0.96
63.08
Cloudy
40
6.98
11.34
785
120
-13
0.95
63.08
Cloudy
45
6.95
11.35
786
85
-11
0.97
63.08
Cloudy
DF-24
4/25/06
89.91
7
9.33
12.49
855
3.75
21.5
7.28
89.91
- -
CRA 045136 (13) Byron Generating Station
TABLE 4.7
SUMMARY OF MONITORING WELL PURGING PARAMETERS - FLEETWIDE SAMPLING EVENT
FLEETWIDE ASSESSMENT
BYRON GENERATING STATION
BYRON, ILLINOIS
Page 5 of 8
Sample
Initial Depth
Time
Dissolved
Depth to
Location
Date
to Water
Purged
pH
Temperature
Conductivity
Turbidity
ORP
(3)
Oxygen
Water
Observations
(ft below Reference)
(minutes)
(Std. Units)
(°C)
(μS/cm)
(1)
(NTU)
(2)
(mV)
(4)
(mg/L)
(5)
(ft below Reference)
12
9.33
13.01
850
28.2
19.8
7.21
89.91
- -
17
8.88
13.10
843
22.4
28.6
7.42
89.91
- -
22
8.74
13.16
842
19.4
31.3
7.51
89.91
- -
25
8.75
13.08
840
17.3
30.7
7.56
89.91
- -
GW-9
4/28/06
96.30
10
7.21
14.40
963
11
389
5.68
97.00
Clear
15
6.65
15.20
962
7
395
5.70
97.50
Clear
20
6.65
15.20
962
6.6
396
5.73
97.50
Clear
23
6.63
15.20
962
6.8
396
5.72
97.50
Clear
26
6.63
15.20
961
7
396
5.72
97.50
Clear
MW-1
4/26/06
62.30
10
7.03
10.09
543
>1000
-17
5.12
63.75
Tan color, no odor
15
7.03
10.75
549
>1000
-11
4.97
64.25
Tan color, no odor
20
7.03
11.11
549
>1000
-2
4.63
64.55
Tan color, no odor
25
7.01
11.38
549
>1000
10
4.56
64.81
Tan color, no odor
30
7.00
11.41
553
>1000
3.7
4.75
64.95
Brownish color
35
7.06
11.72
539
>1000
26
5.31
65.70
Very cloudy
40
6.99
11.46
536
>1000
38
5.31
65.95
Very cloudy
45
7.00
11.40
535
>1000
40
5.36
65.99
Very cloudy
50
7.01
11.45
537
>1000
41
5.35
65.99
Very cloudy
55
7.04
11.36
533
950
44
5.41
66.00
Very cloudy
60
7.04
11.33
531
950
46
5.45
66.00
Very cloudy
MW-2
4/27/06
177.10
5
8.06
13.06
489
4.5
-68.9
1.79
178.34
- -
10
8.01
14.16
509
8.4
-72.5
0.98
178.51
- -
15
7.72
14.26
564
4.2
-37.3
0.84
178.60
- -
20
7.62
14.02
568
2.3
-21.2
0.72
178.66
- -
25
7.56
13.88
569
1.9
-11.8
0.68
178.66
- -
30
7.53
13.96
568
2.4
-7.3
0.63
178.70
- -
33
7.52
13.92
569
2
-4.7
0.61
178.70
- -
MW-3
4/26/06
71.45
10
6.97
11.13
639
100
37
8.15
72.39
Slightly cloudy
15
7.02
11.70
639
90
37
8.08
73.53
Slightly cloudy
20
7.02
11.94
638
65
41
8.01
73.86
Slightly cloudy
25
7.00
11.99
637
65
47
8.05
74.37
Slightly cloudy
30
6.99
12.05
638
60
55
8.02
74.87
Slightly cloudy
35
6.99
12.09
637
55
60
7.94
74.90
Slightly cloudy
40
6.99
12.10
637
55
63
8.06
74.92
Slightly cloudy
MW-30
4/28/06
38.51
15
6.51
11.26
579
>1000
148.9
10.55
- -
- -
MW-36
4/25/06
97.16
5
9.26
12.19
974
79.4
23.8
3.66
99.70
- -
10
8.55
13.46
973
32.2
25.9
1.59
99.80
- -
15
9.59
13.32
852
20
11.3
1.04
99.80
- -
CRA 045136 (13) Byron Generating Station
TABLE 4.7
SUMMARY OF MONITORING WELL PURGING PARAMETERS - FLEETWIDE SAMPLING EVENT
FLEETWIDE ASSESSMENT
BYRON GENERATING STATION
BYRON, ILLINOIS
Page 6 of 8
Sample
Initial Depth
Time
Dissolved
Depth to
Location
Date
to Water
Purged
pH
Temperature
Conductivity
Turbidity
ORP
(3)
Oxygen
Water
Observations
(ft below Reference)
(minutes)
(Std. Units)
(°C)
(μS/cm)
(1)
(NTU)
(2)
(mV)
(4)
(mg/L)
(5)
(ft below Reference)
20
9.99
13.31
828
20
2.2
0.91
99.80
- -
25
9.98
13.34
818
12.3
1.6
0.82
99.80
- -
30
9.88
13.45
814
9.86
10.9
0.73
99.93
- -
MW-37
4/26/06
161.37
5
8.99
14.14
602
17.2
35.6
1.80
161.95
- -
10
8.57
15.06
603
8.8
34.3
0.90
161.97
- -
15
8.82
14.83
601
4.9
32.2
0.65
162.03
- -
20
8.82
14.68
599
3.5
32.2
0.57
162.02
- -
23
8.69
14.62
598
3.1
33.3
0.54
162.02
- -
MW-39
4/26/06
154.82
5
10.98
13.76
637
682
-10.8
6.35
157.18
- -
10
10.25
16.16
551
325
19.5
1.99
157.50
- -
15
9.88
15.75
589
54.5
26.4
1.35
- -
- -
20
9.77
15.58
598
28.9
26
1.05
- -
- -
25
9.84
15.57
598
18.8
24.9
0.89
157.64
- -
30
9.83
15.59
599
16.3
23.5
0.76
157.64
- -
33
9.68
15.65
600
15.4
24.9
0.69
157.54
- -
36
9.74
15.67
598
16.8
23.8
0.66
157.64
- -
PC-1B
4/26/06
39.28
35
7.18
12.53
790
6.7
56.9
6.70
39.23
- -
40
7.30
12.59
792
6.2
59.0
6.29
39.23
- -
45
7.33
12.60
794
4.7
60.7
6.26
39.34
- -
48
7.64
12.59
794
3.85
54.0
6.27
39.34
- -
51
7.64
12.56
795
3.54
52.7
6.27
39.34
- -
54
7.69
12.59
794
3.27
51.4
6.27
39.34
- -
PC-1C
4/26/06
78.63
9
9.10
12.61
619
393
17.0
8.07
79.44
- -
14
8.58
12.64
617
275
21.0
3.83
79.44
- -
19
8.44
12.65
615
187
24.0
3.54
79.44
- -
24
8.34
12.67
615
103
26.1
3.50
79.44
- -
29
8.28
12.68
614
58.3
27.8
3.49
79.46
- -
34
8.22
12.71
612
42.3
29.3
3.53
79.46
- -
37
8.18
12.75
612
37.7
29.9
3.57
79.46
- -
40
8.19
12.80
612
34.7
30.9
3.56
79.46
- -
43
8.16
12.85
610
30.7
31.6
3.61
79.46
- -
PC-2B
4/25/06
86.67
10
9.80
13.40
696
21.1
28.4
9.60
87.79
- -
15
8.68
13.93
695
23
0.8
7.26
87.90
- -
20
7.22
14.88
686
18.6
53.3
7.18
88.17
- -
25
8.11
14.50
691
22.5
27.3
6.99
88.85
- -
30
8.17
13.77
692
13.2
26.3
6.97
89.38
- -
35
8.35
12.72
694
22.4
19.7
6.89
89.78
- -
40
8.52
11.76
693
22.6
13.6
6.93
89.95
- -
45
8.61
11.06
692
23.9
17.5
6.75
90.28
- -
CRA 045136 (13) Byron Generating Station
TABLE 4.7
SUMMARY OF MONITORING WELL PURGING PARAMETERS - FLEETWIDE SAMPLING EVENT
FLEETWIDE ASSESSMENT
BYRON GENERATING STATION
BYRON, ILLINOIS
Page 7 of 8
Sample
Initial Depth
Time
Dissolved
Depth to
Location
Date
to Water
Purged
pH
Temperature
Conductivity
Turbidity
ORP
(3)
Oxygen
Water
Observations
(ft below Reference)
(minutes)
(Std. Units)
(°C)
(μS/cm)
(1)
(NTU)
(2)
(mV)
(4)
(mg/L)
(5)
(ft below Reference)
50
8.26
18.73
705
- -
14.7
6.07
- -
- -
PC-5B
4/25/06
164.94
5
9.92
12.84
813
79.9
-11.6
6.62
64.94
- -
10
9.23
13.02
815
25
-11.0
4.90
64.94
- -
15
9.17
13.05
815
10.1
-5.7
4.70
64.94
- -
20
9.15
13.02
815
5.48
-4.4
4.69
64.94
- -
25
9.13
13.02
815
4.34
-3.7
4.69
64.94
- -
28
9.13
13.01
816
3.75
-3.6
4.69
64.94
- -
PC-6B
4/26/06
87.78
10
8.27
14.38
929
123
-2.5
6.77
90.11
- -
15
8.24
14.59
927
145
-2.2
6.37
90.20
- -
20
8.18
15.42
932
141
-1.7
5.94
90.21
- -
25
8.10
15.81
934
114
-0.6
5.57
90.15
- -
30
8.03
16.00
936
93.2
1.3
5.52
89.97
- -
35
8.02
15.96
936
77.2
1.5
5.40
89.93
- -
40
7.94
15.82
935
67.1
3
5.15
89.73
- -
45
7.93
15.75
936
58.1
2.1
5.22
89.73
- -
50
7.92
16.01
937
48.1
0.7
5.18
89.69
- -
TW-13
4/27/06
17.16
7
6.69
13.16
784
>1000
26.7
12.38
17.37
- -
12
6.87
11.90
769
268
36.2
10.52
17.37
- -
17
6.87
12.03
768
71.8
43.7
10.42
17.37
- -
22
6.89
11.97
769
26.2
43.3
10.44
17.37
- -
27
6.93
11.91
771
12.1
41.6
10.58
17.37
- -
32
6.94
11.94
770
8
39.8
10.48
17.37
- -
35
6.89
11.96
770
6.6
39.6
10.47
17.37
- -
TW-14
4/27/06
26.72
7
7.31
13.28
742
712
43.0
8.88
26.73
- -
12
7.33
14.34
738
570
39.2
7.57
26.74
- -
17
7.34
14.66
742
448
38.1
7.50
26.75
- -
22
7.26
14.64
742
362
38.3
7.58
26.74
- -
27
6.89
14.78
740
299
39.3
7.47
26.75
- -
32
6.93
14.90
738
257
38.4
7.41
26.72
- -
35
7.21
14.98
739
236
35.0
7.19
26.74
- -
38
7.06
15.11
739
203
36.6
7.23
26.73
- -
41
7.56
15.24
739
178
32.7
7.19
26.73
- -
44
7.49
15.45
739
164
33.8
7.26
26.73
- -
47
7.46
15.48
739
158
33.4
7.17
26.73
- -
TW-15
4/27/06
23.08
13
7.08
12.83
738
261
34.3
8.18
23.08
- -
18
7.34
12.82
735
107
40.4
7.95
23.08
- -
23
6.91
12.81
734
49
46.6
7.99
23.08
- -
28
6.85
12.88
732
25.4
47.4
7.99
23.08
- -
31
6.89
12.69
732
18.5
46.3
8.06
23.08
- -
CRA 045136 (13) Byron Generating Station
TABLE 4.7
SUMMARY OF MONITORING WELL PURGING PARAMETERS - FLEETWIDE SAMPLING EVENT
FLEETWIDE ASSESSMENT
BYRON GENERATING STATION
BYRON, ILLINOIS
Page 8 of 8
Sample
Initial Depth
Time
Dissolved
Depth to
Location
Date
to Water
Purged
pH
Temperature
Conductivity
Turbidity
ORP
(3)
Oxygen
Water
Observations
(ft below Reference)
(minutes)
(Std. Units)
(°C)
(μS/cm)
(1)
(NTU)
(2)
(mV)
(4)
(mg/L)
(5)
(ft below Reference)
34
6.92
12.62
732
15.1
45.0
8.16
23.08
- -
37
6.90
12.70
731
9.7
43.4
8.19
23.08
- -
Well 7
4/27/06
115.60
10
8.00
14.60
791
10
369
7.50
115.60
Clear
15
7.36
15.90
790
12
375
7.30
115.60
Clear
18
7.27
16.20
790
11
375
7.26
115.60
Clear
21
7.25
16.30
790
10
376
7.24
115.60
Clear
24
7.25
16.30
790
10
376
7.24
115.60
Clear
Notes:
(1) μS/cm - microSiemens per centimeter
(2) NTU - nephelometric turbidity units
(3) ORP - oxidation reduction potential
(4)
mV - millivolts
(5)
mg/L - milligrams per liter
CRA 045136 (13) Byron Generating Station
TABLE 5.1
CALCULATED VERTICAL HYDRAULIC GRADIENTS
FLEETWIDE ASSESSMENT
BYRON GENERATING STATION
BYRON, ILLINOIS
Page 1 of 1
Well
Elevation of
Water Level
Vertical
Cluster
Screen Middle
April 24, 2006
Gradient
(ft AMSL)
(1)
(ft AMSL)
(ft/ft downward)
Water Table to Lower Galena-Platteville
AR-4
720.7
742.74
0.009
AR-11
684.9
742.41
TW-14
668.4
672.93
0.011
CAR-1
642.3
672.63
DF-1S
734.0
726.04
0.013
DF-1D
704.8
725.67
PC-3B
754.1
760.58
0.443
DF-6
705.8
739.20
DF-11
757.6
749.00
0.053
DF-12
701.9
746.06
DF-22S
727.7
726.34
0.0
DF-22D
705.2
726.34
MW-30
722.7
720.26
0.095
DF-23
690.1
717.17
MW-15
740.7
745.56
0.0
MW-16
706.8
745.56
PC-1B
714.5
718.01
0.021
DF-8
694.6
717.60
Across the Glenwood Formation
MW-1
818.0
799.63
0.622
MW-2
632.6
684.22
MW-16
706.8
745.56
0.892
MW-20R
634.6
681.19
MW-36
690.6
746.14
1.379
MW-37
644.2
682.15
MW-42
688.2
745.85
1.893
MW-39
654.2
681.49
DF-8
694.6
717.60
0.850
PC-1C
649.8
679.53
Within the St. Peter Sandstone
MW-20R
634.6
681.19
0.001
MW-21
591.4
681.16
Notes:
(1) ft AMSL - feet above Mean Sea Level
CRA 045136 (13) Byron Generating Station
TABLE 5.2
SUMMARY OF TRITIUM CONCENTRATIONS IN WATER - STATION SAMPLING LOCATIONS
FLEETWIDE ASSESSMENT
BYRON GENERATING STATION
BYRON, ILLINOIS
Page 1 of 1
Result
Sample Location
Sample Identification
Sample Date Laboratory Analysis Tritium (pCi/L) Error
ABANDONED VAULT ABANDONED VAULT
2/3/2006
EI
ND (200)
-
CROP
CROP
3/23/2006
EI
ND (200)
-
CWBD STEEL POT
CWBD STEEL POT
2/27/2006
EI
ND (200)
-
CWBD STEEL POT
1CW
4/24/2006
EI
263
+/-89
OREPRO10
OREPRO10
2/27/2006
EI
ND (200)
-
Potable Water
POTABLE WATER
3/23/2006
EI
ND (200)
-
VAULT #1
1 Blowdown
3/16/2006
EI
ND (1960) *
-
VAULT #2
VAULT #2
2/3/2006
EI
40727
+/-552
VAULT #2
VAULT #2
2/16/2006
EI
33900
NR
VAULT #2
VAULT #2
3/2/2006
EI
1680
NR
VAULT #2
2 Blowdown
3/16/2006
EI
ND (1960) *
-
VAULT #3
VAULT #3
2/3/2006
EI
37895
+/-523
VAULT #3
VAULT #3
2/16/2006
EI
34400
NR
VAULT #3
3 Blowdown
3/16/2006
EI
7730
NR
VAULT #4
VAULT #4
2/3/2006
EI
80123
+/-756
VAULT #4
VAULT #4
2/16/2006
EI
72300
NR
VAULT #4
VAULT #4
3/2/2006
EI
18100
NR
VAULT #4
4 Blowdown
3/16/2006
EI
9100
NR
VAULT #4
Vault 4
4/24/2006
EI
375
+/-93
VAULT #5
VAULT #5
2/3/2006
EI
1843
+/-138
VAULT #5
VAULT #5
2/16/2006
EI
5430
NR
VAULT #5
5 Blowdown
3/16/2006
EI
3130
NR
VAULT #5
Vault 5
4/24/2006
EI
423
+/-95
VAULT #6
VAULT #6
2/3/2006
EI
29162
+/-460
VAULT #6
VAULT #6
2/16/2006
EI
29600
NR
VAULT #6
6 Blowdown
3/16/2006
EI
7580
NR
VAULT #6
Vault 6
4/24/2006
EI
645
+/-103
Notes:
EI - Environmental, Inc.
ND ( ) - Non-detect; value in parentheses is the LLD.
LLD - Lower limit of detection.
* - Non-detect at the value in parentheses.
NR - +/- value not reported.
- -
Non-detect value, +/- value not reported.
CRA 45136 (13) Byron Generating Station
TABLE 5.3
SUMMARY OF TRITIUM CONCENTRATIONS IN GROUNDWATER - FEBRUARY - APRIL 2006
FLEETWIDE ASSESSMENT
BYRON GENERATING STATION
BYRON, ILLINOIS
Page 1 of 3
Result
Sample Location
Sample Identification
Sample Date
QC Sample
Laboratory Analyses
Tritium (pCi/L)
Error
AR-1
GW-19232-032306-SP-AR-1
3/24/2006
EI
ND (200)
-
AR-1
GW-19232-032906-NK-AR-1
3/29/2006
EI
ND (200)
-
AR-1
GW-19232-040606-BW-AR-1
4/6/2006
EI
ND (200)
-
AR-1
GW-19232-041106-EV-AR-1
4/12/2006
EI
ND (200)
-
AR-1
WG-BYN-042606-SS-25
4/26/2006
TBE
ND (200)
-
AR-2
GW-19232-032306-SP-AR-2
3/24/2006
EI
205
+/-84
AR-2
GW-19232-032306-SP-AR-2
3/24/2006
EI
Recount
ND (200)
-
AR-2
GW-19232-032306-SP-AR-2
3/24/2006
EI
Repeat Recount
ND (200)
-
AR-2
GW-19232-032708-EV-AR-2
3/27/2006
EI
315
+/-96
AR-2
GW-19232-032906-NK-AR-2
3/29/2006
EI
361
+/-95
AR-2
GW-19232-032906-NK-AR-2
3/29/2006
EI
Original Recount
208
+/-96
AR-2
GW-19232-032906-NK-AR-2
3/29/2006
EI
Original Recount #2
223
+/-97
AR-2
GW-19232-032906-NK-AR-2
3/29/2006
EI
1st Repeat
ND (200)
-
AR-2
GW-19232-032906-NK-AR-2
3/29/2006
EI
1st Repeat Recount
200
+/-96
AR-2
GW-19232-032906-NK-AR-2
3/29/2006
EI
2nd Repeat
ND (200)
-
AR-2
GW-19232-032906-NK-AR-2
3/29/2006
EI
2nd Repeat Recount
ND (200)
-
AR-2
GW040306-NK-AR-2
4/3/2006
EI
442
+/-100
AR-2
GW040306-NK-AR-2
4/3/2006
EI
Recount
475
+/-93
AR-2
GW-19232-041006-EV-AR-2
4/10/2006
EI
566
NR
AR-2
WG-BYN-042606-JK-22
4/26/2006
TBE
432
+/-140
AR-2
WG-BYN-042606-JK-22
4/26/2006
TBE
Re-run
527
+/-142
AR-3
GW-19232-032306-SP-AR-3
3/24/2006
EI
214
+/-84
AR-3
GW-19232-032306-SP-AR-3
3/24/2006
EI
Recount
ND (200)
-
AR-3
GW-19232-032306-SP-AR-3
3/24/2006
EI
Repeat Recount
271
+/-95
AR-3
GW-19232-032706-NK-AR-3
3/27/2006
EI
459
+/-124
AR-3
GW-19232-032706-NK-AR-3
3/27/2006
EI
Recount
346
+/-109
AR-3
GW-19232-032906-NK-AR-3
3/29/2006
EI
372
+/-122
AR-3
GW040306-NK-AR-3
4/3/2006
EI
489
+/-102
AR-3
GW-19232-041006-EV-AR-3
4/10/2006
EI
351
NR
AR-3
WG-BYN-042606-JK-20
4/26/2006
TBE
234
+/-128
AR-4
GW-19232-032806-NK-CAR-4
3/28/2006
EI
3572
+/-198
AR-4
GW-19232-032806-NK-CAR-4
3/28/2006
EI
Recount
3631
+/-192
AR-4
GW-19232-032906-EV-CAR-4
3/29/2006
EI
3817
+/-202
AR-4
GW040406-NK-AR-4
4/4/2006
EI
3741
+/-183
AR-4
GW-19232-041006-EV-AR-4
4/10/2006
EI
3469
NR
AR-4
WG-BYN-042706-SS-44
4/27/2006
TBE
3260
+/-367
AR-4
WG-BYN-042706-SS-44
4/27/2006
TBE
Re-run
4080
+/-463
AR-5
GW-19232-032306-SP-AR-5
3/24/2006
EI
ND (200)
-
AR-5
GW-19232-032906-EV-AR-5
3/29/2006
EI
ND (200)
-
AR-5
GW-040606-NK-AR-5
4/6/2006
EI
ND (200)
-
AR-5
GW-19232-041106-EV-AR-5
4/11/2006
EI
ND (200)
-
AR-5
WG-BYN-042706-SS-42
4/27/2006
TBE
ND (200)
-
AR-6
GW-19232-032306-SP-AR-6
3/24/2006
EI
ND (200)
-
AR-6
GW-19232-032906-EV-AR-6
3/29/2006
EI
ND (200)
-
AR-6
GW-040606-NK-AR-6
4/6/2006
EI
ND (200)
-
AR-6
GW-19232-041106-EV-AR-6
4/11/2006
EI
ND (200)
-
AR-6
WG-BYN-042706-SS-41
4/27/2006
TBE
ND (200)
-
AR-7
AR-7
3/30/2006
EI
ND (200)
-
AR-7
GW-040506-NK-AR-7
4/5/2006
EI
ND (200)
-
AR-7
GW-19232-041106-EV-AR-7
4/11/2006
EI
ND (200)
-
AR-7
WG-BYN-042706-KD-32
4/27/2006
TBE
ND (200)
-
AR-8
GW-040506-NK-AR-8
4/5/2006
EI
ND (200)
-
AR-8
GW-19232-041106-EV-AR-8
4/11/2006
EI
ND (200)
-
AR-8
WG-BYN-042706-KD-30
4/27/2006
TBE
ND (200)
-
AR-9
GW-040506-NK-AR-9
4/5/2006
EI
ND (200)
-
AR-9
GW-19232-041106-EV-AR-9
4/11/2006
EI
ND (200)
-
AR-9
WG-BYN-042706-KD-26
4/27/2006
TBE
ND (200)
-
AR-10
GW-19232-040606-BW-AR-10
4/6/2006
EI
ND (200)
-
AR-10
GW-19232-041106-EV-AR-10
4/12/2006
EI
ND (200)
-
AR-10
WG-BYN-042606-JK-24
4/26/2006
TBE
ND (200)
-
AR-11
GW-041806-KD-AR-11
4/18/2006
EI
2260
+/-162
AR-11
GW-041806-KD-AR-11
4/18/2006
EI
Repeat
1965
NR
AR-11
WG-BYN-042606-SS-27
4/26/2006
TBE
2340
+/-282
AR-11
WG-BYN-042606-SS-27
4/26/2006
TBE
Re-run
2340
+/-282
CRA 045136 (13) Byron Generating Station
TABLE 5.3
SUMMARY OF TRITIUM CONCENTRATIONS IN GROUNDWATER - FEBRUARY - APRIL 2006
FLEETWIDE ASSESSMENT
BYRON GENERATING STATION
BYRON, ILLINOIS
Page 2 of 3
Result
Sample Location
Sample Identification
Sample Date
QC Sample
Laboratory Analyses
Tritium (pCi/L)
Error
CAR-1
GW-19232-032306-SP-CAR-1
3/23/2006
EI
ND (200)
-
CAR-1
GW-19232-032906-NK-CAR-1
3/29/2006
EI
ND (200)
-
CAR-1
GW-19232-040606-BW-CAR-1
4/6/2006
EI
ND (200)
-
CAR-1
GW-19232-041106-EV-CAR-1
4/12/2006
EI
ND (200)
-
CAR-1
WG-BYN-042706-SS-36
4/27/2006
TBE
ND (200)
-
CAR-2
GW-19232-032306-SP-CAR-2
3/24/2006
EI
ND (200)
-
CAR-2
GW-19232-032906-EV-CAR-2
3/29/2006
EI
ND (200)
-
CAR-2
GW-19232-040606-BW-CAR-2
4/6/2006
EI
ND (200)
-
CAR-2
GW-19232-041106-EV-CAR-2
4/12/2006
EI
ND (200)
-
CAR-2
GW-19232-041106-EV-CAR-2
4/12/2006
Duplicate (CAR-2)
EI
ND (200)
-
CAR-2
WG-BYN-042706-SS-47
4/27/2006
TBE
ND (200)
-
CAR-3
CAR-3
3/30/2006
EI
ND (200)
-
CAR-3
GW-040506-NK-CAR-3
4/5/2006
EI
ND (200)
-
CAR-3
GW-19232-041106-EV-CAR-3
4/11/2006
EI
ND (200)
-
CAR-3
WG-BYN-042706-KD-28
4/27/2006
TBE
ND (200)
-
DF-1D
DF-1D
3/30/2006
EI
ND (200)
-
DF-1D
GW-19232-040606-BW-DF-1D
4/6/2006
EI
ND (200)
-
DF-1D
WG-BYN-042506-SS-03
4/25/2006
TBE
ND (200)
-
DF-1S
DF-1S
3/30/2006
EI
ND (200)
-
DF-1S
GW-19232-040606-BW-DF-1S
4/6/2006
EI
ND (200)
-
DF-1S
WG-BYN-042506-JK-04
4/25/2006
TBE
ND (200)
-
DF-2S
DF-2S
3/30/2006
EI
ND (200)
-
DF-2S
GW-19232-040606-BW-DF-2S
4/6/2006
EI
ND (200)
-
DF-2S
WG-BYN-042506-JK-06
4/25/2006
TBE
ND (200)
-
DF-3S
DF-3S
3/31/2006
EI
ND (200)
-
DF-3S
GW-19232-040606-DW-DF-3S
4/6/2006
EI
ND (200)
-
DF-3S
WG-BYN-042506-JK-08
4/25/2006
TBE
ND (200)
-
DF-3S
WG-BYN-042506-JK-10
4/25/2006
Duplicate (JK-08)
TBE
ND (200)
-
DF-4DS
DF-4DS
3/30/2006
EI
ND (200)
-
DF-4DS
GW-19232-040606-BW-DF-4DS
4/6/2006
EI
ND (200)
-
DF-4DS
GW-19232-040606-BW-DF-4DS
4/6/2006
Duplicate (DF-4DS)
EI
ND (200)
-
DF-4DS
WG-BYN-042506-JK-02
4/25/2006
TBE
ND (200)
-
DF-6
DF-6
3/30/2006
EI
ND (200)
-
DF-6
GW-040606-NK-DF-6
4/6/2006
EI
ND (200)
-
DF-6
GW-040606-NK-DF-6
4/6/2006
Duplicate (DF-6)
EI
ND (200)
-
DF-6
WG-BYN-042506-SS-05
4/25/2006
TBE
ND (200)
-
DF-12
DF-12
3/31/2006
EI
ND (200)
-
DF-12
GW-040606-NK-DF-12
4/6/2006
EI
ND (200)
-
DF-12
WG-BYN-042506-SS-01
4/25/2006
TBE
ND (200)
-
DF-13
WG-BYN-042606-SS-31
4/26/2006
TBE
ND (200)
-
DF-19
DF-19
3/30/2006
EI
ND (200)
-
DF-19
GW-19232-040606-BW-DF-19
4/6/2006
EI
ND (200)
-
DF-19
WG-BYN-042506-JK-12
4/25/2006
TBE
ND (200)
-
DF-24
DF-24
3/30/2006
EI
ND (200)
-
DF-24
GW-040606-NK-DF-24
4/6/2006
EI
ND (200)
-
DF-24
WG-BYN-042506-SS-13
4/25/2006
TBE
ND (200)
-
GW-9
GW-030806-KD-01
3/8/2006
EI
ND (200)
-
GW-9
WG-BYN-042806-KD-48
4/28/2006
TBE
ND (200)
-
MW-1
MW-1
3/31/2006
EI
ND (200)
-
MW-1
GW-040606-NK-MW-12
4/6/2006
EI
ND (200)
-
MW-1
WG-BYN-042606-JK-14
4/26/2006
TBE
ND (200)
-
MW-2
MW-2
3/31/2006
EI
ND (200)
-
MW-2
GW-040606-NK-MW-12
4/6/2006
EI
ND (200)
-
MW-2
WG-BYN-042706-SS-34
4/27/2006
TBE
ND (200)
-
MW-3
MW-3
3/31/2006
EI
ND (200)
-
MW-3
GW-19232-0406060-BW-MW-3
4/6/2006
EI
ND (200)
-
MW-3
WG-BYN-042606-JK-18
4/26/2006
TBE
ND (200)
-
MW-30
MW-30
3/31/2006
EI
ND (200)
-
MW-30
GW-19232-040606-GW-MW-30
4/6/2006
EI
ND (200)
-
MW-30
WG-BYN-042806-SS-49
4/28/2006
TBE
ND (200)
-
MW-36
MW-36
3/31/2006
EI
ND (200)
-
MW-36
GW-040606-NK-MW-36
4/6/2006
EI
ND (200)
-
MW-36
WG-BYN-042506-SS-09
4/25/2006
TBE
ND (200)
-
MW-37
MW-37
3/31/2006
EI
ND (200)
-
CRA 045136 (13) Byron Generating Station
TABLE 5.3
SUMMARY OF TRITIUM CONCENTRATIONS IN GROUNDWATER - FEBRUARY - APRIL 2006
FLEETWIDE ASSESSMENT
BYRON GENERATING STATION
BYRON, ILLINOIS
Page 3 of 3
Result
Sample Location
Sample Identification
Sample Date
QC Sample
Laboratory Analyses
Tritium (pCi/L)
Error
MW-37
GW-040606-NK-MW-37
4/6/2006
EI
ND (200)
-
MW-37
WG-BYN-042606-SS-33
4/26/2006
TBE
ND (200)
-
MW-39
MW-39
3/31/2006
EI
ND (200)
-
MW-39
GW-040606-NK-MW39
4/6/2006
EI
ND (200)
-
MW-39
WG-BYN-042606-SS-29
4/26/2006
TBE
ND (200)
-
PC-1B
PC-1B
3/31/2006
EI
ND (200)
-
PC-1B
GW-19232-040606-BW-PC-1B
4/6/2006
EI
ND (200)
-
PC-1B
WG-BYN-042606-SS-23
4/26/2006
TBE
ND (200)
-
PC-1C
PC-1C
3/31/2006
EI
ND (200)
-
PC-1C
GW-040606-NK-PC-1C
4/6/2006
EI
ND (200)
-
PC-1C
WG-BYN-042606-SS-21
4/26/2006
TBE
ND (200)
-
PC-2B
PC-2B
3/31/2006
EI
ND (200)
-
PC-2B
GW-19232-040606-BW-PC-2B
4/6/2006
EI
ND (200)
-
PC-2B
WG-BYN-042506-SS-07
4/25/2006
TBE
ND (200)
-
PC-5B
PC-5B
3/31/2006
EI
ND (200)
-
PC-5B
PC-5B
3/31/2006
Duplicate (PC-5B)
EI
ND (200)
-
PC-5B
GW-19232-040606-BW-PC-5B
4/6/2006
EI
ND (200)
-
PC-5B
WG-BYN-042506-SS-11
4/25/2006
TBE
ND (200)
-
PC-6B
PC-6B
3/31/2006
EI
ND (200)
-
PC-6B
GW-19232-040606-BW-PC-6B
4/6/2006
EI
ND (200)
-
PC-6B
WG-BYN-042606-SS-17
4/26/2006
TBE
ND (200)
-
PC-6B
WG-BYN-042606-SS-19
4/26/2006
Duplicate (SS-17)
TBE
ND (200)
-
TW-13
GW-030806-KD-02
3/8/2006
EI
ND (200)
-
TW-13
GW-030806-KD-03
3/8/2006
Duplicate (KD-02)
EI
ND (200)
-
TW-13
GW-19232-040606-BW-TW-13
4/6/2006
EI
ND (200)
-
TW-13
GW-19232-041206-EV-TW-13
4/12/2006
EI
ND (200)
-
TW-13
WG-BYN-042706-SS-39
4/27/2006
TBE
ND (200)
-
TW-13
WG-BYN-042706-SS-40
4/27/2006
Duplicate (SS-39)
TBE
201
+/-110
TW-14
GW-19232-040606-BW-TW-14
4/6/2006
EI
ND (200)
-
TW-14
GW-19232-041106-EV-TW-14
4/12/2006
EI
ND (200)
-
TW-14
WG-BYN-042706-SS-37
4/27/2006
TBE
ND (200)
-
TW-15
GW-030806-KD-04
3/8/2006
EI
ND (200)
-
TW-15
GW-19232-040606-BW-TW-15
4/6/2006
EI
ND (200)
-
TW-15
GW-19232-041106-EV-TW-15
4/12/2006
EI
ND (200)
-
TW-15
WG-BYN-042706-SS-38
4/27/2006
TBE
ND (200)
-
Well 7
WG-BYN-042706-KD-45
4/27/2006
TBE
ND (200)
-
Well 7
WG-BYN-042706-KD-46
4/27/2006
Duplicate (KD-45)
TBE
ND (200)
-
Notes:
EI - Environmental, Inc.
TBE - Teledyne Brown Engineering, Inc.
ND ( ) - Non-detect; value in parentheses is the LLD.
LLD - Lower limit of detection.
QC - Quality Control
NR - +/- value not reported.
CRA 045136 (13) Byron Generating Station
TABLE 5.4
SUMMARY OF TRITIUM CONCENTRATIONS IN WATER - RESIDENTIAL WATER SUPPLY WELLS
FLEETWIDE ASSESSMENT
BYRON GENERATING STATION
BYRON, ILLINOIS
Page 1 of 1
Result
Sample Location
Sample Identification
Sample Date Laboratory Analyses Tritium (pCi/L) Error
ALEXANDER WELL
ALEXANDER WELL
2/28/2006
EI
ND (200)
-
BLANCHARD WELL
BLANCHARD RESIDENCE
2/16/2006
EI
ND (200)
-
BLANCHARD WELL
BLANCHARD WELL
2/28/2006
EI
ND (200)
-
BRENDEL WELL
BRENDEL WELL
2/28/2006
EI
ND (200)
-
DILLINGER WELL
DILLINGER WELL
2/28/2006
EI
ND (200)
-
GORAL WELL
GORAL WELL
2/28/2006
EI
ND (200)
-
LANDIS WELL
LANDIS WELL
2/28/2006
EI
ND (200)
-
MASTNY WELL
MASTNY WELL
2/28/2006
EI
ND (200)
-
STORZ WELL
STORZ WELL
2/28/2006
EI
ND (200)
-
VANCKO WELL
VANECKO RESIDENCE
2/16/2006
EI
ND (200)
-
VANCKO WELL
VANCKO WELL
2/28/2006
EI
ND (200)
-
WILSON WELL
WILSON WELL
2/28/2006
EI
ND (200)
-
Notes:
EI - Environmental, Inc.
ND ( ) - Non-detect; value in parentheses is the LLD.
LLD - Lower limit of detection.
- -
Non-detect value, +/- value not reported.
CRA 045136 (13) Byron Generating Station
TABLE 5.5
SUMMARY OF RADIONUCLIDE CONCENTRATIONS IN GROUNDWATER
FLEETWIDE ASSESSMENT
BYRON GENERATING STATION
BYRON, ILLINOIS
Page 1 of 13
Sample Location:
AR-1
AR-1
AR-1
AR-1
AR-1
AR-1
AR-2
AR-2
Sample Identification:
GW-19232-040606-BW-AR-1
Result
GW-19232-041106-EV-AR-1
Result
WG-BYN-042606-SS-25
Result
GW-19232-041006-EV-AR-2
Result
Sample Date:
4/6/2006
Error
4/12/2006
Error
4/26/2006
Error
4/10/2006
Error
Laboratory:
EI
EI
TBE
EI
Analysis:
Target Radionuclides
Units
Barium-140
pCi/L
ND (60)
-
ND (60)
-
ND (60)
-
ND (60)
-
Cesium-134
pCi/L
ND (10)
-
ND (10)
-
ND (10) U*
-
ND (10)
-
Cesium-137
pCi/L
ND (18)
-
ND (18)
-
ND (18) U*
-
ND (18)
-
Cobalt-58
pCi/L
ND (15)
-
ND (15)
-
ND (15)
-
ND (15)
-
Cobalt-60
pCi/L
ND (15)
-
ND (15)
-
ND (15)
-
ND (15)
-
Iron-59
pCi/L
ND (30)
-
ND (30)
-
ND (30)
-
ND (30)
-
Lanthanum-140
pCi/L
ND (15)
-
ND (15)
-
ND (15)
-
ND (15)
-
Manganese-54
pCi/L
ND (15)
-
ND (15)
-
ND (15)
-
ND (15)
-
Niobium-95
pCi/L
ND (10)
-
ND (10)
-
ND (10) U*
-
ND (10)
-
Strontium-89
pCi/L
ND (2)
-
ND (2)
-
NA
-
ND (2)
-
Strontium-89/90 (Total)
pCi/L
NA
-
NA
-
ND (2)
-
NA
-
Strontium-90
pCi/L
ND (2)
-
ND (2)
-
NA
-
ND (2)
-
Zinc-65
pCi/L
ND (30)
-
ND (30)
-
ND (30) U*
-
ND (30)
-
Zirconium-95
pCi/L
ND (10)
-
ND (10)
-
ND (10)
-
ND (10)
-
Non-Target Radionuclides
(1)
Potassium-40
(1)
pCi/L
NA
-
NA
-
RNI
-
NA
-
Thorium-228
(1)
pCi/L
NA
-
NA
-
RNI
-
NA
-
Notes:
EI - Environmental, Inc.
TBE - Teledyne Brown Engineering, Inc.
(1) - These non-targeted radionuclides are included
in this table but excluded from the discussion in this
report. These radionuclides were either a) naturally
occurring and thus not produced by the Station,
or b) could be definitively evaluated as being naturally
occurring due to the lack of presence of other
radionuclides which would otherwise indicate the
potential of production from the Station.
RNI- Radionuclide Not Identified during analysis.
NA - Data not available or not analyzed.
ND ( ) - Non-detect; value in parentheses is the LLD.
LLD - Lower limit of detection.
U* - Compound/Analyte not detected.
Peak not identified, but forced activity
concentration exceeds Minimum
Detectable Concentration and 3 sigma.
- -?Non-detect value, +/- value not reported.
CRA 45136 (13) Byron Generating Station
q018AI-XT2-WG WS-Historical-37-TH-RADIO
7/13/2006
TABLE 5.5
SUMMARY OF RADIONUCLIDE CONCENTRATIONS IN GROUNDWATER
FLEETWIDE ASSESSMENT
BYRON GENERATING STATION
BYRON, ILLINOIS
Page 2 of 13
Sample Location:
Sample Identification:
Sample Date:
Laboratory:
Analysis:
Target Radionuclides
Units
Barium-140
pCi/L
Cesium-134
pCi/L
Cesium-137
pCi/L
Cobalt-58
pCi/L
Cobalt-60
pCi/L
Iron-59
pCi/L
Lanthanum-140
pCi/L
Manganese-54
pCi/L
Niobium-95
pCi/L
Strontium-89
pCi/L
Strontium-89/90 (Total)
pCi/L
Strontium-90
pCi/L
Zinc-65
pCi/L
Zirconium-95
pCi/L
Non-Target Radionuclides
(1)
Potassium-40
(1)
pCi/L
Thorium-228
(1)
pCi/L
Notes:
EI - Environmental, Inc.
TBE - Teledyne Brown Engineering, Inc.
(1) - These non-targeted radionuclides are included
in this table but excluded from the discussion in this
report. These radionuclides were either a) naturally
occurring and thus not produced by the Station,
or b) could be definitively evaluated as being naturally
occurring due to the lack of presence of other
radionuclides which would otherwise indicate the
potential of production from the Station.
RNI- Radionuclide Not Identified during analysis.
NA - Data not available or not analyzed.
ND ( ) - Non-detect; value in parentheses is the LLD.
LLD - Lower limit of detection.
U* - Compound/Analyte not detected.
Peak not identified, but forced activity
concentration exceeds Minimum
Detectable Concentration and 3 sigma.
- -?Non-detect value, +/- value not reported.
AR-2
AR-2
AR-3
AR-3
AR-3
AR-3
AR-4
AR-4
WG-BYN-042606-JK-22
Result
GW-19232-041006-EV-AR-3
Result
WG-BYN-042606-JK-20
Result
GW-19232-041006-EV-AR-4
Result
4/26/2006
Error
4/10/2006
Error
4/26/2006
Error
4/10/2006
Error
TBE
EI
TBE
EI
ND (60)
-
ND (60)
-
ND (60)
-
ND (60)
-
ND (10) U*
-
ND (10)
-
ND (10) U*
-
ND (10)
-
ND (18)
-
ND (18)
-
ND (18) U*
-
ND (18)
-
ND (15)
-
ND (15)
-
ND (15)
-
ND (15)
-
ND (15)
-
ND (15)
-
ND (15)
-
ND (15)
-
ND (30)
-
ND (30)
-
ND (30)
-
ND (30)
-
ND (15)
-
ND (15)
-
ND (15)
-
ND (15)
-
ND (15)
-
ND (15)
-
ND (15)
-
ND (15)
-
ND (10) U*
-
ND (10)
-
ND (10) U*
-
ND (10)
-
NA
-
ND (2)
-
NA
-
ND (2)
-
ND (2)
-
NA
-
ND (2)
-
NA
-
NA
-
ND (2)
-
NA
-
ND (2)
-
ND (30) U*
-
ND (30)
-
ND (30) U*
-
ND (30)
-
ND (10)
-
ND (10)
-
ND (10)
-
ND (10)
-
RNI
-
NA
-
RNI
-
NA
-
RNI
-
NA
-
RNI
-
NA
-
CRA 45136 (13) Byron Generating Station
q018AI-XT2-WG WS-Historical-37-TH-RADIO
7/13/2006
TABLE 5.5
SUMMARY OF RADIONUCLIDE CONCENTRATIONS IN GROUNDWATER
FLEETWIDE ASSESSMENT
BYRON GENERATING STATION
BYRON, ILLINOIS
Page 3 of 13
Sample Location:
Sample Identification:
Sample Date:
Laboratory:
Analysis:
Target Radionuclides
Units
Barium-140
pCi/L
Cesium-134
pCi/L
Cesium-137
pCi/L
Cobalt-58
pCi/L
Cobalt-60
pCi/L
Iron-59
pCi/L
Lanthanum-140
pCi/L
Manganese-54
pCi/L
Niobium-95
pCi/L
Strontium-89
pCi/L
Strontium-89/90 (Total)
pCi/L
Strontium-90
pCi/L
Zinc-65
pCi/L
Zirconium-95
pCi/L
Non-Target Radionuclides
(1)
Potassium-40
(1)
pCi/L
Thorium-228
(1)
pCi/L
Notes:
EI - Environmental, Inc.
TBE - Teledyne Brown Engineering, Inc.
(1) - These non-targeted radionuclides are included
in this table but excluded from the discussion in this
report. These radionuclides were either a) naturally
occurring and thus not produced by the Station,
or b) could be definitively evaluated as being naturally
occurring due to the lack of presence of other
radionuclides which would otherwise indicate the
potential of production from the Station.
RNI- Radionuclide Not Identified during analysis.
NA - Data not available or not analyzed.
ND ( ) - Non-detect; value in parentheses is the LLD.
LLD - Lower limit of detection.
U* - Compound/Analyte not detected.
Peak not identified, but forced activity
concentration exceeds Minimum
Detectable Concentration and 3 sigma.
- -?Non-detect value, +/- value not reported.
AR-4
AR-4
AR-5
AR-5
AR-5
AR-5
AR-5
AR-5
WG-BYN-042706-SS-44
Result
GW-040606-NK-AR-5
Result
GW-19232-041106-EV-AR-5
Result
WG-BYN-042706-SS-42
Result
4/27/2006
Error
4/6/2006
Error
4/11/2006
Error
4/27/2006
Error
TBE
EI
EI
TBE
ND (60)
-
ND (60)
-
ND (60)
-
ND (60)
-
ND (10) U*
-
ND (10)
-
ND (10)
-
ND (10) U*
-
ND (18)
-
ND (18)
-
ND (18)
-
ND (18)
-
ND (15)
-
ND (15)
-
ND (15)
-
ND (15)
-
ND (15)
-
ND (15)
-
ND (15)
-
ND (15)
-
ND (30)
-
ND (30)
-
ND (30)
-
ND (30)
-
ND (15)
-
ND (15)
-
ND (15)
-
ND (15)
-
ND (15)
-
ND (15)
-
ND (15)
-
ND (15)
-
ND (10)
-
ND (10)
-
ND (10)
-
ND (10)
-
NA
-
ND (2)
-
ND (2)
-
NA
-
ND (2)
-
NA
-
NA
-
ND (2)
-
NA
-
ND (2)
-
ND (2)
-
NA
-
ND (30) U*
-
ND (30)
-
ND (30)
-
ND (30) U*
-
ND (10)
-
ND (10)
-
ND (10)
-
ND (10)
-
RNI
-
NA
-
NA
-
RNI
-
RNI
-
NA
-
NA
-
5.123
+/-2.552
CRA 45136 (13) Byron Generating Station
q018AI-XT2-WG WS-Historical-37-TH-RADIO
7/13/2006
TABLE 5.5
SUMMARY OF RADIONUCLIDE CONCENTRATIONS IN GROUNDWATER
FLEETWIDE ASSESSMENT
BYRON GENERATING STATION
BYRON, ILLINOIS
Page 4 of 13
Sample Location:
Sample Identification:
Sample Date:
Laboratory:
Analysis:
Target Radionuclides
Units
Barium-140
pCi/L
Cesium-134
pCi/L
Cesium-137
pCi/L
Cobalt-58
pCi/L
Cobalt-60
pCi/L
Iron-59
pCi/L
Lanthanum-140
pCi/L
Manganese-54
pCi/L
Niobium-95
pCi/L
Strontium-89
pCi/L
Strontium-89/90 (Total)
pCi/L
Strontium-90
pCi/L
Zinc-65
pCi/L
Zirconium-95
pCi/L
Non-Target Radionuclides
(1)
Potassium-40
(1)
pCi/L
Thorium-228
(1)
pCi/L
Notes:
EI - Environmental, Inc.
TBE - Teledyne Brown Engineering, Inc.
(1) - These non-targeted radionuclides are included
in this table but excluded from the discussion in this
report. These radionuclides were either a) naturally
occurring and thus not produced by the Station,
or b) could be definitively evaluated as being naturally
occurring due to the lack of presence of other
radionuclides which would otherwise indicate the
potential of production from the Station.
RNI- Radionuclide Not Identified during analysis.
NA - Data not available or not analyzed.
ND ( ) - Non-detect; value in parentheses is the LLD.
LLD - Lower limit of detection.
U* - Compound/Analyte not detected.
Peak not identified, but forced activity
concentration exceeds Minimum
Detectable Concentration and 3 sigma.
- -?Non-detect value, +/- value not reported.
AR-6
AR-6
AR-6
AR-6
AR-6
AR-6
AR-7
AR-7
GW-040606-NK-AR-6
Result
GW-19232-041106-EV-AR-6
Result
WG-BYN-042706-SS-41
Result
GW-040506-NK-AR-7
Result
4/6/2006
Error
4/11/2006
Error
4/27/2006
Error
4/5/2006
Error
EI
EI
TBE
EI
ND (60)
-
ND (60)
-
ND (60)
-
ND (60)
-
ND (10)
-
ND (10)
-
ND (10) U*
-
ND (10)
-
ND (18)
-
ND (18)
-
ND (18)
-
ND (18)
-
ND (15)
-
ND (15)
-
ND (15)
-
ND (15)
-
ND (15)
-
ND (15)
-
ND (15)
-
ND (15)
-
ND (30)
-
ND (30)
-
ND (30)
-
ND (30)
-
ND (15)
-
ND (15)
-
ND (15)
-
ND (15)
-
ND (15)
-
ND (15)
-
ND (15)
-
ND (15)
-
ND (10)
-
ND (10)
-
ND (10) U*
-
ND (10)
-
ND (2)
-
ND (2)
-
NA
-
ND (2)
-
NA
-
NA
-
ND (2)
-
NA
-
ND (2)
-
ND (2)
-
NA
-
ND (2)
-
ND (30)
-
ND (30)
-
ND (30) U*
-
ND (30)
-
ND (10)
-
ND (10)
-
ND (10)
-
ND (10)
-
NA
-
NA
-
RNI
-
NA
-
NA
-
NA
-
RNI
-
NA
-
CRA 45136 (13) Byron Generating Station
q018AI-XT2-WG WS-Historical-37-TH-RADIO
7/13/2006
TABLE 5.5
SUMMARY OF RADIONUCLIDE CONCENTRATIONS IN GROUNDWATER
FLEETWIDE ASSESSMENT
BYRON GENERATING STATION
BYRON, ILLINOIS
Page 5 of 13
Sample Location:
Sample Identification:
Sample Date:
Laboratory:
Analysis:
Target Radionuclides
Units
Barium-140
pCi/L
Cesium-134
pCi/L
Cesium-137
pCi/L
Cobalt-58
pCi/L
Cobalt-60
pCi/L
Iron-59
pCi/L
Lanthanum-140
pCi/L
Manganese-54
pCi/L
Niobium-95
pCi/L
Strontium-89
pCi/L
Strontium-89/90 (Total)
pCi/L
Strontium-90
pCi/L
Zinc-65
pCi/L
Zirconium-95
pCi/L
Non-Target Radionuclides
(1)
Potassium-40
(1)
pCi/L
Thorium-228
(1)
pCi/L
Notes:
EI - Environmental, Inc.
TBE - Teledyne Brown Engineering, Inc.
(1) - These non-targeted radionuclides are included
in this table but excluded from the discussion in this
report. These radionuclides were either a) naturally
occurring and thus not produced by the Station,
or b) could be definitively evaluated as being naturally
occurring due to the lack of presence of other
radionuclides which would otherwise indicate the
potential of production from the Station.
RNI- Radionuclide Not Identified during analysis.
NA - Data not available or not analyzed.
ND ( ) - Non-detect; value in parentheses is the LLD.
LLD - Lower limit of detection.
U* - Compound/Analyte not detected.
Peak not identified, but forced activity
concentration exceeds Minimum
Detectable Concentration and 3 sigma.
- -?Non-detect value, +/- value not reported.
AR-7
AR-7
AR-7
AR-7
AR-8
AR-8
AR-8
AR-8
AR-8
GW-19232-041106-EV-AR-7
Result
WG-BYN-042706-KD-32
Result
GW-040506-NK-AR-8
Result
GW-19232-041106-EV-AR-8
Result
WG-BYN-042706-KD-30
4/11/2006
Error
4/27/2006
Error
4/5/2006
Error
4/11/2006
Error
4/27/2006
EI
TBE
EI
EI
TBE
ND (60)
-
ND (60)
-
ND (60)
-
ND (60)
-
ND (60)
ND (10)
-
ND (10) U*
-
ND (10)
-
ND (10)
-
ND (10) U*
ND (18)
-
ND (18)
-
ND (18)
-
ND (18)
-
ND (18)
ND (15)
-
ND (15)
-
ND (15)
-
ND (15)
-
ND (15)
ND (15)
-
ND (15)
-
ND (15)
-
ND (15)
-
ND (15)
ND (30)
-
ND (30)
-
ND (30)
-
ND (30)
-
ND (30)
ND (15)
-
ND (15)
-
ND (15)
-
ND (15)
-
ND (15)
ND (15)
-
ND (15)
-
ND (15)
-
ND (15)
-
ND (15)
ND (10)
-
ND (10) U*
-
ND (10)
-
ND (10)
-
ND (10) U*
ND (2)
-
NA
-
ND (2)
-
ND (2)
-
NA
NA
-
ND (2)
-
NA
-
NA
-
ND (2)
ND (2)
-
NA
-
ND (2)
-
ND (2)
-
NA
ND (30)
-
ND (30) U*
-
ND (30)
-
ND (30)
-
ND (30) U*
ND (10)
-
ND (10)
-
ND (10)
-
ND (10)
-
ND (10)
NA
-
RNI
-
NA
-
NA
-
RNI
NA
-
RNI
-
NA
-
NA
-
RNI
CRA 45136 (13) Byron Generating Station
q018AI-XT2-WG WS-Historical-37-TH-RADIO
7/13/2006
TABLE 5.5
SUMMARY OF RADIONUCLIDE CONCENTRATIONS IN GROUNDWATER
FLEETWIDE ASSESSMENT
BYRON GENERATING STATION
BYRON, ILLINOIS
Page 6 of 13
Sample Location:
Sample Identification:
Sample Date:
Laboratory:
Analysis:
Target Radionuclides
Units
Barium-140
pCi/L
Cesium-134
pCi/L
Cesium-137
pCi/L
Cobalt-58
pCi/L
Cobalt-60
pCi/L
Iron-59
pCi/L
Lanthanum-140
pCi/L
Manganese-54
pCi/L
Niobium-95
pCi/L
Strontium-89
pCi/L
Strontium-89/90 (Total)
pCi/L
Strontium-90
pCi/L
Zinc-65
pCi/L
Zirconium-95
pCi/L
Non-Target Radionuclides
(1)
Potassium-40
(1)
pCi/L
Thorium-228
(1)
pCi/L
Notes:
EI - Environmental, Inc.
TBE - Teledyne Brown Engineering, Inc.
(1) - These non-targeted radionuclides are included
in this table but excluded from the discussion in this
report. These radionuclides were either a) naturally
occurring and thus not produced by the Station,
or b) could be definitively evaluated as being naturally
occurring due to the lack of presence of other
radionuclides which would otherwise indicate the
potential of production from the Station.
RNI- Radionuclide Not Identified during analysis.
NA - Data not available or not analyzed.
ND ( ) - Non-detect; value in parentheses is the LLD.
LLD - Lower limit of detection.
U* - Compound/Analyte not detected.
Peak not identified, but forced activity
concentration exceeds Minimum
Detectable Concentration and 3 sigma.
- -?Non-detect value, +/- value not reported.
AR-8
AR-9
AR-9
AR-9
AR-9
AR-9
AR-9
AR-10
AR-10
Result
GW-040506-NK-AR-9
Result
GW-19232-041106-EV-AR-9
Result
WG-BYN-042706-KD-26
Result
GW-19232-040606-BW-AR-10
Result
Error
4/5/2006
Error
4/11/2006
Error
4/27/2006
Error
4/6/2006
Error
EI
EI
TBE
EI
-
ND (60)
-
ND (60)
-
ND (60)
-
ND (60)
-
-
ND (10)
-
ND (10)
-
ND (10) U*
-
ND (10)
-
-
ND (18)
-
ND (18)
-
ND (18)
-
ND (18)
-
-
ND (15)
-
ND (15)
-
ND (15)
-
ND (15)
-
-
ND (15)
-
ND (15)
-
ND (15)
-
ND (15)
-
-
ND (30)
-
ND (30)
-
ND (30)
-
ND (30)
-
-
ND (15)
-
ND (15)
-
ND (15)
-
ND (15)
-
-
ND (15)
-
ND (15)
-
ND (15)
-
ND (15)
-
-
ND (10)
-
ND (10)
-
ND (10) U*
-
ND (10)
-
-
ND (2)
-
ND (2)
-
NA
-
ND (2)
-
-
NA
-
NA
-
ND (2)
-
NA
-
-
ND (2)
-
ND (2)
-
NA
-
ND (2)
-
-
ND (30)
-
ND (30)
-
ND (30) U*
-
ND (30)
-
-
ND (10)
-
ND (10)
-
ND (10)
-
ND (10)
-
-
NA
-
NA
-
RNI
-
NA
-
-
NA
-
NA
-
RNI
-
NA
-
CRA 45136 (13) Byron Generating Station
q018AI-XT2-WG WS-Historical-37-TH-RADIO
7/13/2006
TABLE 5.5
SUMMARY OF RADIONUCLIDE CONCENTRATIONS IN GROUNDWATER
FLEETWIDE ASSESSMENT
BYRON GENERATING STATION
BYRON, ILLINOIS
Page 7 of 13
Sample Location:
Sample Identification:
Sample Date:
Laboratory:
Analysis:
Target Radionuclides
Units
Barium-140
pCi/L
Cesium-134
pCi/L
Cesium-137
pCi/L
Cobalt-58
pCi/L
Cobalt-60
pCi/L
Iron-59
pCi/L
Lanthanum-140
pCi/L
Manganese-54
pCi/L
Niobium-95
pCi/L
Strontium-89
pCi/L
Strontium-89/90 (Total)
pCi/L
Strontium-90
pCi/L
Zinc-65
pCi/L
Zirconium-95
pCi/L
Non-Target Radionuclides
(1)
Potassium-40
(1)
pCi/L
Thorium-228
(1)
pCi/L
Notes:
EI - Environmental, Inc.
TBE - Teledyne Brown Engineering, Inc.
(1) - These non-targeted radionuclides are included
in this table but excluded from the discussion in this
report. These radionuclides were either a) naturally
occurring and thus not produced by the Station,
or b) could be definitively evaluated as being naturally
occurring due to the lack of presence of other
radionuclides which would otherwise indicate the
potential of production from the Station.
RNI- Radionuclide Not Identified during analysis.
NA - Data not available or not analyzed.
ND ( ) - Non-detect; value in parentheses is the LLD.
LLD - Lower limit of detection.
U* - Compound/Analyte not detected.
Peak not identified, but forced activity
concentration exceeds Minimum
Detectable Concentration and 3 sigma.
- -?Non-detect value, +/- value not reported.
AR-10
AR-10
AR-10
AR-10
AR-11
AR-11
AR-11
AR-11
GW-19232-041106-EV-AR-10
Result
WG-BYN-042606-JK-24
Result
GW-041806-KD-AR-11
Result
WG-BYN-042606-SS-27
Result
4/12/2006
Error
4/26/2006
Error
4/18/2006
Error
4/26/2006
Error
EI
TBE
EI
TBE
ND (60)
-
ND (60)
-
ND (60)
-
ND (60)
-
ND (10)
-
ND (10) U*
-
ND (10)
-
ND (10) U*
-
ND (18)
-
ND (18) U*
-
ND (18)
-
ND (18)
-
ND (15)
-
ND (15)
-
ND (15)
-
ND (15)
-
ND (15)
-
ND (15)
-
ND (15)
-
ND (15)
-
ND (30)
-
ND (30)
-
ND (30)
-
ND (30)
-
ND (15)
-
ND (15)
-
ND (15)
-
ND (15)
-
ND (15)
-
ND (15)
-
ND (15)
-
ND (15)
-
13.6
NR
ND (10) U*
-
ND (10)
-
ND (10)
-
ND (2)
-
NA
-
ND (2)
-
NA
-
NA
-
ND (2)
-
NA
-
ND (2)
-
ND (2)
-
NA
-
ND (2)
-
NA
-
ND (30)
-
ND (30) U*
-
ND (30)
-
ND (30) U*
-
ND (10)
-
ND (10)
-
ND (10)
-
ND (10)
-
NA
-
RNI
-
NA
-
RNI
-
NA
-
6.173
+/-3.26
NA
-
RNI
-
CRA 45136 (13) Byron Generating Station
q018AI-XT2-WG WS-Historical-37-TH-RADIO
7/13/2006
TABLE 5.5
SUMMARY OF RADIONUCLIDE CONCENTRATIONS IN GROUNDWATER
FLEETWIDE ASSESSMENT
BYRON GENERATING STATION
BYRON, ILLINOIS
Page 8 of 13
Sample Location:
Sample Identification:
Sample Date:
Laboratory:
Analysis:
Target Radionuclides
Units
Barium-140
pCi/L
Cesium-134
pCi/L
Cesium-137
pCi/L
Cobalt-58
pCi/L
Cobalt-60
pCi/L
Iron-59
pCi/L
Lanthanum-140
pCi/L
Manganese-54
pCi/L
Niobium-95
pCi/L
Strontium-89
pCi/L
Strontium-89/90 (Total)
pCi/L
Strontium-90
pCi/L
Zinc-65
pCi/L
Zirconium-95
pCi/L
Non-Target Radionuclides
(1)
Potassium-40
(1)
pCi/L
Thorium-228
(1)
pCi/L
Notes:
EI - Environmental, Inc.
TBE - Teledyne Brown Engineering, Inc.
(1) - These non-targeted radionuclides are included
in this table but excluded from the discussion in this
report. These radionuclides were either a) naturally
occurring and thus not produced by the Station,
or b) could be definitively evaluated as being naturally
occurring due to the lack of presence of other
radionuclides which would otherwise indicate the
potential of production from the Station.
RNI- Radionuclide Not Identified during analysis.
NA - Data not available or not analyzed.
ND ( ) - Non-detect; value in parentheses is the LLD.
LLD - Lower limit of detection.
U* - Compound/Analyte not detected.
Peak not identified, but forced activity
concentration exceeds Minimum
Detectable Concentration and 3 sigma.
- -?Non-detect value, +/- value not reported.
CAR-1
CAR-1
CAR-1
CAR-1
CAR-1
CAR-1
CAR-2
CAR-2
GW-19232-040606-BW-CAR-1
Result
GW-19232-041106-EV-CAR-1
Result
WG-BYN-042706-SS-36
Result
GW-19232-040606-BW-CAR-2
Result
4/6/2006
Error
4/12/2006
Error
4/27/2006
Error
4/6/2006
Error
EI
EI
TBE
EI
ND (60)
-
ND (60)
-
ND (60)
-
ND (60)
-
ND (10)
-
ND (10)
-
ND (10) U*
-
ND (10)
-
ND (18)
-
ND (18)
-
ND (18)
-
ND (18)
-
ND (15)
-
ND (15)
-
ND (15)
-
ND (15)
-
ND (15)
-
ND (15)
-
ND (15)
-
ND (15)
-
ND (30)
-
ND (30)
-
ND (30)
-
ND (30)
-
ND (15)
-
ND (15)
-
ND (15)
-
ND (15)
-
ND (15)
-
ND (15)
-
ND (15)
-
ND (15)
-
ND (10)
-
ND (10)
-
ND (10) U*
-
ND (10)
-
ND (2)
-
ND (2)
-
NA
-
ND (2)
-
NA
-
NA
-
ND (2)
-
NA
-
ND (2)
-
ND (2)
-
NA
-
ND (2)
-
ND (30)
-
ND (30)
-
ND (30) U*
-
ND (30)
-
ND (10)
-
ND (10)
-
ND (10)
-
ND (10)
-
NA
-
NA
-
RNI
-
NA
-
NA
-
NA
-
6.113
+/-3.568
NA
-
CRA 45136 (13) Byron Generating Station
q018AI-XT2-WG WS-Historical-37-TH-RADIO
7/13/2006
TABLE 5.5
SUMMARY OF RADIONUCLIDE CONCENTRATIONS IN GROUNDWATER
FLEETWIDE ASSESSMENT
BYRON GENERATING STATION
BYRON, ILLINOIS
Page 9 of 13
Sample Location:
Sample Identification:
Sample Date:
Laboratory:
Analysis:
Target Radionuclides
Units
Barium-140
pCi/L
Cesium-134
pCi/L
Cesium-137
pCi/L
Cobalt-58
pCi/L
Cobalt-60
pCi/L
Iron-59
pCi/L
Lanthanum-140
pCi/L
Manganese-54
pCi/L
Niobium-95
pCi/L
Strontium-89
pCi/L
Strontium-89/90 (Total)
pCi/L
Strontium-90
pCi/L
Zinc-65
pCi/L
Zirconium-95
pCi/L
Non-Target Radionuclides
(1)
Potassium-40
(1)
pCi/L
Thorium-228
(1)
pCi/L
Notes:
EI - Environmental, Inc.
TBE - Teledyne Brown Engineering, Inc.
(1) - These non-targeted radionuclides are included
in this table but excluded from the discussion in this
report. These radionuclides were either a) naturally
occurring and thus not produced by the Station,
or b) could be definitively evaluated as being naturally
occurring due to the lack of presence of other
radionuclides which would otherwise indicate the
potential of production from the Station.
RNI- Radionuclide Not Identified during analysis.
NA - Data not available or not analyzed.
ND ( ) - Non-detect; value in parentheses is the LLD.
LLD - Lower limit of detection.
U* - Compound/Analyte not detected.
Peak not identified, but forced activity
concentration exceeds Minimum
Detectable Concentration and 3 sigma.
- -?Non-detect value, +/- value not reported.
CAR-2
CAR-2
CAR-2
CAR-2
CAR-2
CAR-2
CAR-3
CAR-3
GW-19232-041106-EV-CAR-2
Result
GW-19232-041106-EV-CAR-2
Result
WG-BYN-042706-SS-47
Result
GW-040506-NK-CAR-3
Result
4/12/2006
Error
4/12/2006
Error
4/27/2006
Error
4/5/2006
Error
Duplicate
EI
EI
TBE
EI
ND (60)
-
ND (60)
-
ND (60)
-
ND (60)
-
ND (10)
-
ND (10)
-
ND (10) U*
-
ND (10)
-
ND (18)
-
ND (18)
-
ND (18)
-
ND (18)
-
ND (15)
-
ND (15)
-
ND (15)
-
ND (15)
-
ND (15)
-
ND (15)
-
ND (15)
-
ND (15)
-
ND (30)
-
ND (30)
-
ND (30)
-
ND (30)
-
ND (15)
-
ND (15)
-
ND (15)
-
ND (15)
-
ND (15)
-
ND (15)
-
ND (15)
-
ND (15)
-
ND (10)
-
ND (10)
-
ND (10) U*
-
ND (10)
-
ND (2)
-
ND (2)
-
NA
-
ND (2)
-
NA
-
NA
-
ND (2)
-
NA
-
ND (2)
-
ND (2)
-
NA
-
ND (2)
-
ND (30)
-
ND (30)
-
ND (30) U*
-
ND (30)
-
ND (10)
-
ND (10)
-
ND (10)
-
ND (10)
-
NA
-
NA
-
RNI
-
NA
-
NA
-
NA
-
RNI
-
NA
-
CRA 45136 (13) Byron Generating Station
q018AI-XT2-WG WS-Historical-37-TH-RADIO
7/13/2006
TABLE 5.5
SUMMARY OF RADIONUCLIDE CONCENTRATIONS IN GROUNDWATER
FLEETWIDE ASSESSMENT
BYRON GENERATING STATION
BYRON, ILLINOIS
Page 10 of 13
Sample Location:
Sample Identification:
Sample Date:
Laboratory:
Analysis:
Target Radionuclides
Units
Barium-140
pCi/L
Cesium-134
pCi/L
Cesium-137
pCi/L
Cobalt-58
pCi/L
Cobalt-60
pCi/L
Iron-59
pCi/L
Lanthanum-140
pCi/L
Manganese-54
pCi/L
Niobium-95
pCi/L
Strontium-89
pCi/L
Strontium-89/90 (Total)
pCi/L
Strontium-90
pCi/L
Zinc-65
pCi/L
Zirconium-95
pCi/L
Non-Target Radionuclides
(1)
Potassium-40
(1)
pCi/L
Thorium-228
(1)
pCi/L
Notes:
EI - Environmental, Inc.
TBE - Teledyne Brown Engineering, Inc.
(1) - These non-targeted radionuclides are included
in this table but excluded from the discussion in this
report. These radionuclides were either a) naturally
occurring and thus not produced by the Station,
or b) could be definitively evaluated as being naturally
occurring due to the lack of presence of other
radionuclides which would otherwise indicate the
potential of production from the Station.
RNI- Radionuclide Not Identified during analysis.
NA - Data not available or not analyzed.
ND ( ) - Non-detect; value in parentheses is the LLD.
LLD - Lower limit of detection.
U* - Compound/Analyte not detected.
Peak not identified, but forced activity
concentration exceeds Minimum
Detectable Concentration and 3 sigma.
- -?Non-detect value, +/- value not reported.
CAR-3
CAR-3
CAR-3
CAR-3
GW-9
GW-9
TW-13
TW-13
GW-19232-041106-EV-CAR-3
Result
WG-BYN-042706-KD-28
Result
WG-BYN-042806-KD-48
Result
GW-19232-040606-BW-TW-13
Result
4/11/2006
Error
4/27/2006
Error
4/28/2006
Error
4/6/2006
Error
EI
TBE
TBE
EI
ND (60)
-
ND (60)
-
ND (60)
-
ND (60)
-
ND (10)
-
ND (10) U*
-
ND (10) U*
-
ND (10)
-
ND (18)
-
ND (18)
-
ND (18)
-
ND (18)
-
ND (15)
-
ND (15)
-
ND (15)
-
ND (15)
-
ND (15)
-
ND (15)
-
ND (15)
-
ND (15)
-
ND (30)
-
ND (30)
-
ND (30)
-
ND (30)
-
ND (15)
-
ND (15)
-
ND (15)
-
ND (15)
-
ND (15)
-
ND (15)
-
ND (15)
-
ND (15)
-
ND (10)
-
ND (10) U*
-
ND (10) U*
-
ND (10)
-
ND (2)
-
NA
-
NA
-
ND (2)
-
NA
-
ND (2)
-
ND (2)
-
NA
-
ND (2)
-
NA
-
NA
-
ND (2)
-
ND (30)
-
ND (30) U*
-
ND (30) U*
-
ND (30)
-
ND (10)
-
ND (10)
-
ND (10)
-
ND (10)
-
NA
-
RNI
-
40.44
+/-23.27
NA
-
NA
-
6.427
+/-2.496
RNI
-
NA
-
CRA 45136 (13) Byron Generating Station
q018AI-XT2-WG WS-Historical-37-TH-RADIO
7/13/2006
TABLE 5.5
SUMMARY OF RADIONUCLIDE CONCENTRATIONS IN GROUNDWATER
FLEETWIDE ASSESSMENT
BYRON GENERATING STATION
BYRON, ILLINOIS
Page 11 of 13
Sample Location:
Sample Identification:
Sample Date:
Laboratory:
Analysis:
Target Radionuclides
Units
Barium-140
pCi/L
Cesium-134
pCi/L
Cesium-137
pCi/L
Cobalt-58
pCi/L
Cobalt-60
pCi/L
Iron-59
pCi/L
Lanthanum-140
pCi/L
Manganese-54
pCi/L
Niobium-95
pCi/L
Strontium-89
pCi/L
Strontium-89/90 (Total)
pCi/L
Strontium-90
pCi/L
Zinc-65
pCi/L
Zirconium-95
pCi/L
Non-Target Radionuclides
(1)
Potassium-40
(1)
pCi/L
Thorium-228
(1)
pCi/L
Notes:
EI - Environmental, Inc.
TBE - Teledyne Brown Engineering, Inc.
(1) - These non-targeted radionuclides are included
in this table but excluded from the discussion in this
report. These radionuclides were either a) naturally
occurring and thus not produced by the Station,
or b) could be definitively evaluated as being naturally
occurring due to the lack of presence of other
radionuclides which would otherwise indicate the
potential of production from the Station.
RNI- Radionuclide Not Identified during analysis.
NA - Data not available or not analyzed.
ND ( ) - Non-detect; value in parentheses is the LLD.
LLD - Lower limit of detection.
U* - Compound/Analyte not detected.
Peak not identified, but forced activity
concentration exceeds Minimum
Detectable Concentration and 3 sigma.
- -?Non-detect value, +/- value not reported.
TW-13
TW-13
TW-13
TW-13
TW-13
TW-13
TW-14
TW-14
GW-19232-041206-EV-TW-13
Result
WG-BYN-042706-SS-39
Result
WG-BYN-042706-SS-40
Result
GW-19232-040606-BW-TW-14
Result
4/12/2006
Error
4/27/2006
Error
4/27/2006
Error
4/6/2006
Error
Duplicate
EI
TBE
TBE
EI
ND (60)
-
ND (60)
-
ND (60)
-
ND (60)
-
ND (10)
-
ND (10) U*
-
ND (10) U*
-
ND (10)
-
ND (18)
-
ND (18)
-
ND (18)
-
ND (18)
-
ND (15)
-
ND (15)
-
ND (15)
-
ND (15)
-
ND (15)
-
ND (15)
-
ND (15)
-
ND (15)
-
ND (30)
-
ND (30)
-
ND (30)
-
ND (30)
-
ND (15)
-
ND (15)
-
ND (15)
-
ND (15)
-
ND (15)
-
ND (15)
-
ND (15)
-
ND (15)
-
ND (10)
-
ND (10) U*
-
ND (10) U*
-
ND (10)
-
ND (2)
-
NA
-
NA
-
ND (2)
-
NA
-
ND (2)
-
ND (2)
-
NA
-
ND (2)
-
NA
-
NA
-
ND (2)
-
ND (30)
-
ND (30) U*
-
ND (30) U*
-
ND (30)
-
ND (10)
-
ND (10)
-
ND (10)
-
ND (10)
-
NA
-
RNI
-
RNI
-
NA
-
NA
-
RNI
-
RNI
-
NA
-
CRA 45136 (13) Byron Generating Station
q018AI-XT2-WG WS-Historical-37-TH-RADIO
7/13/2006
TABLE 5.5
SUMMARY OF RADIONUCLIDE CONCENTRATIONS IN GROUNDWATER
FLEETWIDE ASSESSMENT
BYRON GENERATING STATION
BYRON, ILLINOIS
Page 12 of 13
Sample Location:
Sample Identification:
Sample Date:
Laboratory:
Analysis:
Target Radionuclides
Units
Barium-140
pCi/L
Cesium-134
pCi/L
Cesium-137
pCi/L
Cobalt-58
pCi/L
Cobalt-60
pCi/L
Iron-59
pCi/L
Lanthanum-140
pCi/L
Manganese-54
pCi/L
Niobium-95
pCi/L
Strontium-89
pCi/L
Strontium-89/90 (Total)
pCi/L
Strontium-90
pCi/L
Zinc-65
pCi/L
Zirconium-95
pCi/L
Non-Target Radionuclides
(1)
Potassium-40
(1)
pCi/L
Thorium-228
(1)
pCi/L
Notes:
EI - Environmental, Inc.
TBE - Teledyne Brown Engineering, Inc.
(1) - These non-targeted radionuclides are included
in this table but excluded from the discussion in this
report. These radionuclides were either a) naturally
occurring and thus not produced by the Station,
or b) could be definitively evaluated as being naturally
occurring due to the lack of presence of other
radionuclides which would otherwise indicate the
potential of production from the Station.
RNI- Radionuclide Not Identified during analysis.
NA - Data not available or not analyzed.
ND ( ) - Non-detect; value in parentheses is the LLD.
LLD - Lower limit of detection.
U* - Compound/Analyte not detected.
Peak not identified, but forced activity
concentration exceeds Minimum
Detectable Concentration and 3 sigma.
- -?Non-detect value, +/- value not reported.
TW-14
TW-14
TW-14
TW-14
TW-15
TW-15
TW-15
TW-15
GW-19232-041106-EV-TW-14
Result
WG-BYN-042706-SS-37
Result
GW-19232-040606-BW-TW-15
Result
GW-19232-041106-EV-TW-15
Result
4/12/2006
Error
4/27/2006
Error
4/6/2006
Error
4/12/2006
Error
EI
TBE
EI
EI
ND (60)
-
ND (60)
-
ND (60)
-
ND (60)
-
ND (10)
-
ND (10) U*
-
ND (10)
-
ND (10)
-
ND (18)
-
ND (18)
-
ND (18)
-
ND (18)
-
ND (15)
-
ND (15)
-
ND (15)
-
ND (15)
-
ND (15)
-
ND (15)
-
ND (15)
-
ND (15)
-
ND (30)
-
ND (30)
-
ND (30)
-
ND (30)
-
ND (15)
-
ND (15)
-
ND (15)
-
ND (15)
-
ND (15)
-
ND (15)
-
ND (15)
-
ND (15)
-
ND (10)
-
ND (10) U*
-
ND (10)
-
ND (10)
-
ND (2)
-
NA
-
ND (2)
-
ND (2)
-
NA
-
ND (2)
-
NA
-
NA
-
ND (2)
-
NA
-
ND (2)
-
ND (2)
-
ND (30)
-
ND (30) U*
-
ND (30)
-
ND (30)
-
ND (10)
-
ND (10)
-
ND (10)
-
ND (10)
-
NA
-
RNI
-
NA
-
NA
-
NA
-
RNI
-
NA
-
NA
-
CRA 45136 (13) Byron Generating Station
q018AI-XT2-WG WS-Historical-37-TH-RADIO
7/13/2006
TABLE 5.5
SUMMARY OF RADIONUCLIDE CONCENTRATIONS IN GROUNDWATER
FLEETWIDE ASSESSMENT
BYRON GENERATING STATION
BYRON, ILLINOIS
Page 13 of 13
Sample Location:
Sample Identification:
Sample Date:
Laboratory:
Analysis:
Target Radionuclides
Units
Barium-140
pCi/L
Cesium-134
pCi/L
Cesium-137
pCi/L
Cobalt-58
pCi/L
Cobalt-60
pCi/L
Iron-59
pCi/L
Lanthanum-140
pCi/L
Manganese-54
pCi/L
Niobium-95
pCi/L
Strontium-89
pCi/L
Strontium-89/90 (Total)
pCi/L
Strontium-90
pCi/L
Zinc-65
pCi/L
Zirconium-95
pCi/L
Non-Target Radionuclides
(1)
Potassium-40
(1)
pCi/L
Thorium-228
(1)
pCi/L
Notes:
EI - Environmental, Inc.
TBE - Teledyne Brown Engineering, Inc.
(1) - These non-targeted radionuclides are included
in this table but excluded from the discussion in this
report. These radionuclides were either a) naturally
occurring and thus not produced by the Station,
or b) could be definitively evaluated as being naturally
occurring due to the lack of presence of other
radionuclides which would otherwise indicate the
potential of production from the Station.
RNI- Radionuclide Not Identified during analysis.
NA - Data not available or not analyzed.
ND ( ) - Non-detect; value in parentheses is the LLD.
LLD - Lower limit of detection.
U* - Compound/Analyte not detected.
Peak not identified, but forced activity
concentration exceeds Minimum
Detectable Concentration and 3 sigma.
- -?Non-detect value, +/- value not reported.
TW-15
TW-15
Well 7
Well 7
Well 7
Well 7
WG-BYN-042706-SS-38
Result
WG-BYN-042706-KD-45
Result
WG-BYN-042706-KD-46
Result
4/27/2006
Error
4/27/2006
Error
4/27/2006
Error
Duplicate
TBE
TBE
TBE
ND (60)
-
ND (60)
-
ND (60)
-
ND (10) U*
-
ND (10) U*
-
ND (10) U*
-
ND (18)
-
ND (18) U*
-
ND (18) U*
-
ND (15)
-
ND (15)
-
ND (15) U*
-
ND (15)
-
ND (15)
-
ND (15)
-
ND (30)
-
ND (30)
-
ND (30)
-
ND (15)
-
ND (15) U*
-
ND (15)
-
ND (15)
-
ND (15)
-
ND (15)
-
ND (10) U*
-
ND (10) U*
-
ND (10) U*
-
NA
-
NA
-
NA
-
ND (2)
-
ND (2)
-
ND (2)
-
NA
-
NA
-
NA
-
ND (30) U*
-
ND (30) U*
-
ND (30) U*
-
ND (10)
-
ND (10)
-
ND (10)
-
RNI
-
RNI
-
RNI
RNI
-
RNI
-
RNI
CRA 45136 (13) Byron Generating Station
q018AI-XT2-WG WS-Historical-37-TH-RADIO
7/13/2006
Revision 0
APPENDIX A
WATER SUPPLY WELL INFORMATION
045136 (13) Byron Generating Station
FIGURE A.1
(Withheld)
(Withheld)
(Withheld)
Revision 0
APPENDIX B
MONITORING WELL STRATIGRAPHIC AND INSTRUMENTATION LOGS
045136 (13) Byron Generating Station
WEATHERED DOLOMITE - fissured, fractured,
light brown, wet
2" PVC Well
Casing
Cement/Bentonite
Grout
9.00
(BEDROCK)
Page 2 of 3
RUN
NUMBER
CORE
RECOVERY %
RQD %
AR-1
STRATIGRAPHIC AND INSTRUMENTATION LOG
10
12
14
16
18
20
22
24
26
28
30
32
34
36
38
40
42
44
46
DEPTH
ft BGS
PROJECT NAME: EXELON-BYRON
PROJECT NUMBER: 19232-21
CLIENT: EXELON GENERATION COMPANY LLC
LOCATION: BYRON, ILLINOIS
HOLE DESIGNATION:
STRATIGRAPHIC DESCRIPTION & REMARKS
NOTES:
MEASURING POINT ELEVATIONS MAY CHANGE; REFER TO CURRENT ELEVATION TABLE
DATE COMPLETED: March 23, 2006
DRILLING METHOD: SONIC
FIELD PERSONNEL: S. POOLER
BEDROCK LOG 19232-21.GPJ CRA_CORP.GDT 5/29/06
DEPTH
Monitoring Well
ft BGS
END OF BOREHOLE @ 70.0ft BGS
2" PVC Well
Screen
Sand Pack
WELL DETAILS
Screened interval:
50.00 to 70.00ft BGS
Length: 20ft
Diameter: 2in
Slot Size: 0.010
Material: PVC
Sand Pack:
47.00 to 70.00ft BGS
Material: #2 Sand
70.00
(BEDROCK)
Page 3 of 3
RUN
NUMBER
CORE
RECOVERY %
RQD %
AR-1
STRATIGRAPHIC AND INSTRUMENTATION LOG
50
52
54
56
58
60
62
64
66
68
70
72
74
76
78
80
82
84
86
DEPTH
ft BGS
PROJECT NAME: EXELON-BYRON
PROJECT NUMBER: 19232-21
CLIENT: EXELON GENERATION COMPANY LLC
LOCATION: BYRON, ILLINOIS
HOLE DESIGNATION:
STRATIGRAPHIC DESCRIPTION & REMARKS
NOTES:
MEASURING POINT ELEVATIONS MAY CHANGE; REFER TO CURRENT ELEVATION TABLE
DATE COMPLETED: March 23, 2006
DRILLING METHOD: SONIC
FIELD PERSONNEL: S. POOLER
BEDROCK LOG 19232-21.GPJ CRA_CORP.GDT 5/29/06
DEPTH
Monitoring Well
ft BGS
UNCONSOLIDATED SEDIMENTS
LIMESTONE - weathered
- competent rock at 19.0ft BGS
END OF BOREHOLE @ 29.0ft BGS
Concrete
Cement/Bentonite
Grout
2" PVC Well
Casing
9" Borehole
from 0-19'
Bentonite
Chips
4" Borehole
from 19-29'
2" PVC Well
Screen
Sand Pack
WELL DETAILS
Screened interval:
19.00 to 29.00ft BGS
Length: 10ft
Diameter: 2in
Slot Size: 0.010
Material: PVC
Sand Pack:
17.00 to 29.00ft BGS
Material: Sand
15.00
29.00
INTERVAL
SAMPLE
REC (%)
NUMBER
'N' VALUE
(OVERBURDEN)
Page 1 of 1
AR-10
STRATIGRAPHIC AND INSTRUMENTATION LOG
2
4
6
8
10
12
14
16
18
20
22
24
26
28
30
32
34
36
38
DEPTH
ft BGS
PROJECT NAME: EXELON-BYRON
PROJECT NUMBER: 19232-21
CLIENT: EXELON GENERATION COMPANY LLC
LOCATION: BYRON, ILLINOIS
HOLE DESIGNATION:
STRATIGRAPHIC DESCRIPTION & REMARKS
NOTES:
MEASURING POINT ELEVATIONS MAY CHANGE; REFER TO CURRENT ELEVATION TABLE
DATE COMPLETED: April 5, 2006
DRILLING METHOD: 4-1/4" HSA/AIR ROTARY
FIELD PERSONNEL: B. WILLIAMS
OVERBURDEN LOG 19232-21.GPJ CRA_CORP.GDT 5/29/06
DEPTH
Monitoring Well
ft BGS
UNCONSOLIDATED SEDIMENTS
BEDROCK - gray limestone
Concrete
6" Borehole
from 0-8'
Cement/Bentonite
Grout
4" Borehole
from 8-150.5'
2" PVC Well
Casing
8.00
INTERVAL
SAMPLE
REC (%)
NUMBER
'N' VALUE
(OVERBURDEN)
Page 1 of 4
AR-11
STRATIGRAPHIC AND INSTRUMENTATION LOG
2
4
6
8
10
12
14
16
18
20
22
24
26
28
30
32
34
36
38
DEPTH
ft BGS
PROJECT NAME: EXELON-BYRON
PROJECT NUMBER: 19232-21
CLIENT: EXELON GENERATION COMPANY LLC
LOCATION: BYRON, ILLINOIS
HOLE DESIGNATION:
STRATIGRAPHIC DESCRIPTION & REMARKS
NOTES:
MEASURING POINT ELEVATIONS MAY CHANGE; REFER TO CURRENT ELEVATION TABLE
DATE COMPLETED: April 11, 2006
DRILLING METHOD: AIR ROTARY
FIELD PERSONNEL: E. VARNAS
OVERBURDEN LOG 19232-21.GPJ CRA_CORP.GDT 5/29/06
DEPTH
Monitoring Well
ft BGS
- some red color at 70.0ft BGS
- gray color at 74.0ft BGS
- red color at 78.0ft BGS
4" Borehole
from 8-150.5'
INTERVAL
SAMPLE
REC (%)
NUMBER
'N' VALUE
(OVERBURDEN)
Page 2 of 4
AR-11
STRATIGRAPHIC AND INSTRUMENTATION LOG
42
44
46
48
50
52
54
56
58
60
62
64
66
68
70
72
74
76
78
DEPTH
ft BGS
PROJECT NAME: EXELON-BYRON
PROJECT NUMBER: 19232-21
CLIENT: EXELON GENERATION COMPANY LLC
LOCATION: BYRON, ILLINOIS
HOLE DESIGNATION:
STRATIGRAPHIC DESCRIPTION & REMARKS
NOTES:
MEASURING POINT ELEVATIONS MAY CHANGE; REFER TO CURRENT ELEVATION TABLE
DATE COMPLETED: April 11, 2006
DRILLING METHOD: AIR ROTARY
FIELD PERSONNEL: E. VARNAS
OVERBURDEN LOG 19232-21.GPJ CRA_CORP.GDT 5/29/06
DEPTH
Monitoring Well
ft BGS
- 1' of gray color at 106.0ft BGS
4" Borehole
from 8-150.5'
INTERVAL
SAMPLE
REC (%)
NUMBER
'N' VALUE
(OVERBURDEN)
Page 3 of 4
AR-11
STRATIGRAPHIC AND INSTRUMENTATION LOG
82
84
86
88
90
92
94
96
98
100
102
104
106
108
110
112
114
116
118
DEPTH
ft BGS
PROJECT NAME: EXELON-BYRON
PROJECT NUMBER: 19232-21
CLIENT: EXELON GENERATION COMPANY LLC
LOCATION: BYRON, ILLINOIS
HOLE DESIGNATION:
STRATIGRAPHIC DESCRIPTION & REMARKS
NOTES:
MEASURING POINT ELEVATIONS MAY CHANGE; REFER TO CURRENT ELEVATION TABLE
DATE COMPLETED: April 11, 2006
DRILLING METHOD: AIR ROTARY
FIELD PERSONNEL: E. VARNAS
OVERBURDEN LOG 19232-21.GPJ CRA_CORP.GDT 5/29/06
DEPTH
Monitoring Well
ft BGS
SHALE
END OF BOREHOLE @ 150.5ft BGS
Bentonite
Chips
4" Borehole
from 8-150.5'
2" PVC Well
Screen
Sand Pack
WELL DETAILS
Screened interval:
139.50 to 149.50ft BGS
Length: 10ft
Diameter: 2in
Slot Size: 0.010
Material: PVC
Sand Pack:
136.00 to 150.50ft BGS
Material: Sand
150.00
150.50
INTERVAL
SAMPLE
REC (%)
NUMBER
'N' VALUE
(OVERBURDEN)
Page 4 of 4
AR-11
STRATIGRAPHIC AND INSTRUMENTATION LOG
122
124
126
128
130
132
134
136
138
140
142
144
146
148
150
152
154
156
158
DEPTH
ft BGS
PROJECT NAME: EXELON-BYRON
PROJECT NUMBER: 19232-21
CLIENT: EXELON GENERATION COMPANY LLC
LOCATION: BYRON, ILLINOIS
HOLE DESIGNATION:
STRATIGRAPHIC DESCRIPTION & REMARKS
NOTES:
MEASURING POINT ELEVATIONS MAY CHANGE; REFER TO CURRENT ELEVATION TABLE
DATE COMPLETED: April 11, 2006
DRILLING METHOD: AIR ROTARY
FIELD PERSONNEL: E. VARNAS
OVERBURDEN LOG 19232-21.GPJ CRA_CORP.GDT 5/29/06
DEPTH
Monitoring Well
ft BGS
SM SILTY SAND - with fine gravel, compact, fine
grained, poorly graded, brown, moist
DOLOSTONE - fissured, fractured, light brown
END OF OVERBURDEN HOLE @ 20.0ft BGS
Concrete
Cement/Bentonite
Grout
6" Borehole
from 0-10'
2" PVC Well
Casing
4" Borehole
from 10-81'
10.00
INTERVAL
SAMPLE
REC (%)
NUMBER
'N' VALUE
(OVERBURDEN)
Page 1 of 3
AR-2
STRATIGRAPHIC AND INSTRUMENTATION LOG
2
4
6
8
10
12
14
16
18
20
22
24
26
28
30
32
34
36
38
DEPTH
ft BGS
PROJECT NAME: EXELON-BYRON
PROJECT NUMBER: 19232-21
CLIENT: EXELON GENERATION COMPANY LLC
LOCATION: BYRON, ILLINOIS
HOLE DESIGNATION:
STRATIGRAPHIC DESCRIPTION & REMARKS
NOTES:
MEASURING POINT ELEVATIONS MAY CHANGE; REFER TO CURRENT ELEVATION TABLE
DATE COMPLETED: March 21, 2006
DRILLING METHOD: SONIC
FIELD PERSONNEL: S. POOLER
OVERBURDEN LOG 19232-21.GPJ CRA_CORP.GDT 5/29/06
DEPTH
Monitoring Well
ft BGS
4" Borehole
from 10-81'
(BEDROCK)
Page 2 of 3
RUN
NUMBER
CORE
RECOVERY %
RQD %
AR-2
STRATIGRAPHIC AND INSTRUMENTATION LOG
20
22
24
26
28
30
32
34
36
38
40
42
44
46
48
50
52
54
56
DEPTH
ft BGS
PROJECT NAME: EXELON-BYRON
PROJECT NUMBER: 19232-21
CLIENT: EXELON GENERATION COMPANY LLC
LOCATION: BYRON, ILLINOIS
HOLE DESIGNATION:
STRATIGRAPHIC DESCRIPTION & REMARKS
NOTES:
MEASURING POINT ELEVATIONS MAY CHANGE; REFER TO CURRENT ELEVATION TABLE
DATE COMPLETED: March 21, 2006
DRILLING METHOD: SONIC
FIELD PERSONNEL: S. POOLER
BEDROCK LOG 19232-21.GPJ CRA_CORP.GDT 5/29/06
DEPTH
Monitoring Well
ft BGS
- wet at 65.0ft BGS
- wet at 75.0ft BGS
END OF BOREHOLE @ 81.0ft BGS
4" Borehole
from 10-81'
2" PVC Well
Screen
Sand Pack
WELL DETAILS
Screened interval:
71.00 to 81.00ft BGS
Length: 10ft
Diameter: 2in
Slot Size: 0.010
Material: PVC
Sand Pack:
68.00 to 81.00ft BGS
Material: #2 Sand
81.00
(BEDROCK)
Page 3 of 3
RUN
NUMBER
CORE
RECOVERY %
RQD %
AR-2
STRATIGRAPHIC AND INSTRUMENTATION LOG
60
62
64
66
68
70
72
74
76
78
80
82
84
86
88
90
92
94
96
DEPTH
ft BGS
PROJECT NAME: EXELON-BYRON
PROJECT NUMBER: 19232-21
CLIENT: EXELON GENERATION COMPANY LLC
LOCATION: BYRON, ILLINOIS
HOLE DESIGNATION:
STRATIGRAPHIC DESCRIPTION & REMARKS
NOTES:
MEASURING POINT ELEVATIONS MAY CHANGE; REFER TO CURRENT ELEVATION TABLE
DATE COMPLETED: March 21, 2006
DRILLING METHOD: SONIC
FIELD PERSONNEL: S. POOLER
BEDROCK LOG 19232-21.GPJ CRA_CORP.GDT 5/29/06
DEPTH
Monitoring Well
ft BGS
INTERVAL
SAMPLE
REC (%)
NUMBER
'N' VALUE
(OVERBURDEN)
Page 1 of 3
AR-3
SM SILTY SAND - with fine gravel, compact, fine
grained, poorly graded, brown, moist
END OF OVERBURDEN HOLE @ 11.0ft BGS
Concrete
4" Borehole
Cement/Bentonite
Grout
2" PVC Well
Casing
STRATIGRAPHIC AND INSTRUMENTATION LOG
2
4
6
8
10
12
14
16
18
20
22
24
26
28
30
32
34
36
38
DEPTH
ft BGS
PROJECT NAME: EXELON-BYRON
PROJECT NUMBER: 19232-21
CLIENT: EXELON GENERATION COMPANY LLC
LOCATION: BYRON, ILLINOIS
HOLE DESIGNATION:
STRATIGRAPHIC DESCRIPTION & REMARKS
NOTES:
MEASURING POINT ELEVATIONS MAY CHANGE; REFER TO CURRENT ELEVATION TABLE
DATE COMPLETED: March 22, 2006
DRILLING METHOD: SONIC
FIELD PERSONNEL: S. POOLER
OVERBURDEN LOG 19232-21.GPJ CRA_CORP.GDT 5/29/06
DEPTH
Monitoring Well
ft BGS
DOLOSTONE - fissured, fractured, light brown
4" Borehole
11.00
(BEDROCK)
Page 2 of 3
RUN
NUMBER
CORE
RECOVERY %
RQD %
AR-3
STRATIGRAPHIC AND INSTRUMENTATION LOG
12
14
16
18
20
22
24
26
28
30
32
34
36
38
40
42
44
46
48
DEPTH
ft BGS
PROJECT NAME: EXELON-BYRON
PROJECT NUMBER: 19232-21
CLIENT: EXELON GENERATION COMPANY LLC
LOCATION: BYRON, ILLINOIS
HOLE DESIGNATION:
STRATIGRAPHIC DESCRIPTION & REMARKS
NOTES:
MEASURING POINT ELEVATIONS MAY CHANGE; REFER TO CURRENT ELEVATION TABLE
DATE COMPLETED: March 22, 2006
DRILLING METHOD: SONIC
FIELD PERSONNEL: S. POOLER
BEDROCK LOG 19232-21.GPJ CRA_CORP.GDT 5/29/06
DEPTH
Monitoring Well
ft BGS
- wet at 65.0ft BGS
END OF BOREHOLE @ 71.0ft BGS
Cement/Bentonite
Grout
4" Borehole
2" PVC Well
Screen
Sand Pack
WELL DETAILS
Screened interval:
60.00 to 70.00ft BGS
Length: 10ft
Diameter: 2in
Slot Size: 0.010
Material: PVC
Sand Pack:
57.00 to 71.00ft BGS
Material: #2 Sand
71.00
(BEDROCK)
Page 3 of 3
RUN
NUMBER
CORE
RECOVERY %
RQD %
AR-3
STRATIGRAPHIC AND INSTRUMENTATION LOG
52
54
56
58
60
62
64
66
68
70
72
74
76
78
80
82
84
86
88
DEPTH
ft BGS
PROJECT NAME: EXELON-BYRON
PROJECT NUMBER: 19232-21
CLIENT: EXELON GENERATION COMPANY LLC
LOCATION: BYRON, ILLINOIS
HOLE DESIGNATION:
STRATIGRAPHIC DESCRIPTION & REMARKS
NOTES:
MEASURING POINT ELEVATIONS MAY CHANGE; REFER TO CURRENT ELEVATION TABLE
DATE COMPLETED: March 22, 2006
DRILLING METHOD: SONIC
FIELD PERSONNEL: S. POOLER
BEDROCK LOG 19232-21.GPJ CRA_CORP.GDT 5/29/06
DEPTH
Monitoring Well
ft BGS
8.00
INTERVAL
SAMPLE
UNCONSOLIDATED SEDIMENTS
(see logs for TW-7 and TW-8)
BEDROCK
- competent rock at 12.0ft BGS
Concrete
Bentonite
Grout
2" PVC Well
Casing
6" Borehole
from 0-12'
4" Borehole
from 12-121.5
REC (%)
NUMBER
'N' VALUE
(OVERBURDEN)
Page 1 of 3
AR-4
STRATIGRAPHIC AND INSTRUMENTATION LOG
2
4
6
8
10
12
14
16
18
20
22
24
26
28
30
32
34
36
38
40
42
44
DEPTH
ft BGS
PROJECT NAME: EXELON-BYRON
PROJECT NUMBER: 19232-21
CLIENT: EXELON GENERATION COMPANY LLC
LOCATION: BYRON, ILLINOIS
HOLE DESIGNATION:
STRATIGRAPHIC DESCRIPTION & REMARKS
NOTES:
MEASURING POINT ELEVATIONS MAY CHANGE; REFER TO CURRENT ELEVATION TABLE
DATE COMPLETED: March 24, 2006
DRILLING METHOD: AIR ROTARY
FIELD PERSONNEL: N. KUHL
OVERBURDEN LOG 19232-21.GPJ CRA_CORP.GDT 5/29/06
DEPTH
Monitoring Well
ft BGS
Cement/Bentonite
Grout
4" Borehole
from 12-121.5
INTERVAL
SAMPLE
REC (%)
NUMBER
'N' VALUE
(OVERBURDEN)
Page 2 of 3
AR-4
STRATIGRAPHIC AND INSTRUMENTATION LOG
46
48
50
52
54
56
58
60
62
64
66
68
70
72
74
76
78
80
82
84
86
88
DEPTH
ft BGS
PROJECT NAME: EXELON-BYRON
PROJECT NUMBER: 19232-21
CLIENT: EXELON GENERATION COMPANY LLC
LOCATION: BYRON, ILLINOIS
HOLE DESIGNATION:
STRATIGRAPHIC DESCRIPTION & REMARKS
NOTES:
MEASURING POINT ELEVATIONS MAY CHANGE; REFER TO CURRENT ELEVATION TABLE
DATE COMPLETED: March 24, 2006
DRILLING METHOD: AIR ROTARY
FIELD PERSONNEL: N. KUHL
OVERBURDEN LOG 19232-21.GPJ CRA_CORP.GDT 5/29/06
DEPTH
Monitoring Well
ft BGS
121.50
END OF BOREHOLE @ 121.5ft BGS
Bentonite
Chips
4" Borehole
from 12-121.5
2" PVC Well
Screen
Sand Pack
WELL DETAILS
Screened interval:
99.50 to 119.50ft BGS
Length: 20ft
Diameter: 2in
Slot Size: 0.010
Material: PVC
Sand Pack:
95.50 to 121.50ft BGS
Material: Sand
INTERVAL
SAMPLE
REC (%)
NUMBER
'N' VALUE
(OVERBURDEN)
Page 3 of 3
AR-4
STRATIGRAPHIC AND INSTRUMENTATION LOG
92
94
96
98
100
102
104
106
108
110
112
114
116
118
120
122
124
126
128
130
132
134
DEPTH
ft BGS
PROJECT NAME: EXELON-BYRON
PROJECT NUMBER: 19232-21
CLIENT: EXELON GENERATION COMPANY LLC
LOCATION: BYRON, ILLINOIS
HOLE DESIGNATION:
STRATIGRAPHIC DESCRIPTION & REMARKS
NOTES:
MEASURING POINT ELEVATIONS MAY CHANGE; REFER TO CURRENT ELEVATION TABLE
DATE COMPLETED: March 24, 2006
DRILLING METHOD: AIR ROTARY
FIELD PERSONNEL: N. KUHL
OVERBURDEN LOG 19232-21.GPJ CRA_CORP.GDT 5/29/06
DEPTH
Monitoring Well
ft BGS
UNCONSOLIDATED SEDIMENTS
(see logs for TW-9 and TW-10)
BEDROCK - weathered, gray limestone
- competent rock at 12.0ft BGS
Concrete
Cement/Bentonite
Grout
6" Borehole
from 0-12'
2" PVC Well
Casing
4" Borehole
from 12-122'
3.50
INTERVAL
SAMPLE
REC (%)
NUMBER
'N' VALUE
(OVERBURDEN)
Page 1 of 3
AR-5
STRATIGRAPHIC AND INSTRUMENTATION LOG
2
4
6
8
10
12
14
16
18
20
22
24
26
28
30
32
34
36
38
40
42
44
DEPTH
ft BGS
PROJECT NAME: EXELON-BYRON
PROJECT NUMBER: 19232-21
CLIENT: EXELON GENERATION COMPANY LLC
LOCATION: BYRON, ILLINOIS
HOLE DESIGNATION:
STRATIGRAPHIC DESCRIPTION & REMARKS
NOTES:
MEASURING POINT ELEVATIONS MAY CHANGE; REFER TO CURRENT ELEVATION TABLE
DATE COMPLETED: March 23, 2006
DRILLING METHOD: AIR ROTARY
FIELD PERSONNEL: N. KUHL
OVERBURDEN LOG 19232-21.GPJ CRA_CORP.GDT 5/29/06
DEPTH
Monitoring Well
ft BGS
- gray-brown at 62.0ft BGS
4" Borehole
from 12-122'
INTERVAL
SAMPLE
REC (%)
NUMBER
'N' VALUE
(OVERBURDEN)
Page 2 of 3
AR-5
STRATIGRAPHIC AND INSTRUMENTATION LOG
46
48
50
52
54
56
58
60
62
64
66
68
70
72
74
76
78
80
82
84
86
88
DEPTH
ft BGS
PROJECT NAME: EXELON-BYRON
PROJECT NUMBER: 19232-21
CLIENT: EXELON GENERATION COMPANY LLC
LOCATION: BYRON, ILLINOIS
HOLE DESIGNATION:
STRATIGRAPHIC DESCRIPTION & REMARKS
NOTES:
MEASURING POINT ELEVATIONS MAY CHANGE; REFER TO CURRENT ELEVATION TABLE
DATE COMPLETED: March 23, 2006
DRILLING METHOD: AIR ROTARY
FIELD PERSONNEL: N. KUHL
OVERBURDEN LOG 19232-21.GPJ CRA_CORP.GDT 5/29/06
DEPTH
Monitoring Well
ft BGS
END OF BOREHOLE @ 122.0ft BGS
Bentonite
Chips
4" Borehole
from 12-122'
2" PVC Well
Screen
Sand Pack
WELL DETAILS
Screened interval:
102.00 to 122.00ft BGS
Length: 20ft
Diameter: 2in
Slot Size: 0.010
Material: PVC
Sand Pack:
98.00 to 122.00ft BGS
Material: #6 Sand
122.00
INTERVAL
SAMPLE
REC (%)
NUMBER
'N' VALUE
(OVERBURDEN)
Page 3 of 3
AR-5
STRATIGRAPHIC AND INSTRUMENTATION LOG
92
94
96
98
100
102
104
106
108
110
112
114
116
118
120
122
124
126
128
130
132
134
DEPTH
ft BGS
PROJECT NAME: EXELON-BYRON
PROJECT NUMBER: 19232-21
CLIENT: EXELON GENERATION COMPANY LLC
LOCATION: BYRON, ILLINOIS
HOLE DESIGNATION:
STRATIGRAPHIC DESCRIPTION & REMARKS
NOTES:
MEASURING POINT ELEVATIONS MAY CHANGE; REFER TO CURRENT ELEVATION TABLE
DATE COMPLETED: March 23, 2006
DRILLING METHOD: AIR ROTARY
FIELD PERSONNEL: N. KUHL
OVERBURDEN LOG 19232-21.GPJ CRA_CORP.GDT 5/29/06
DEPTH
Monitoring Well
ft BGS
UNCONSOLIDATED SEDIMENTS
(see logs for TW-11 and TW-12)
BEDROCK
- competent rock at 12.0ft BGS
Concrete
Cement/Bentonite
Grout
6" Borehole
from 0-12'
2" PVC Well
Casing
4" Borehole
from 12-122'
8.00
INTERVAL
SAMPLE
REC (%)
NUMBER
'N' VALUE
(OVERBURDEN)
Page 1 of 3
AR-6
STRATIGRAPHIC AND INSTRUMENTATION LOG
2
4
6
8
10
12
14
16
18
20
22
24
26
28
30
32
34
36
38
40
42
44
DEPTH
ft BGS
PROJECT NAME: EXELON-BYRON
PROJECT NUMBER: 19232-21
CLIENT: EXELON GENERATION COMPANY LLC
LOCATION: BYRON, ILLINOIS
HOLE DESIGNATION:
STRATIGRAPHIC DESCRIPTION & REMARKS
NOTES:
MEASURING POINT ELEVATIONS MAY CHANGE; REFER TO CURRENT ELEVATION TABLE
DATE COMPLETED: March 21, 2006
DRILLING METHOD: AIR ROTARY
FIELD PERSONNEL: E. VARNAS
OVERBURDEN LOG 19232-21.GPJ CRA_CORP.GDT 5/29/06
DEPTH
Monitoring Well
ft BGS
'N' VALUE
(OVERBURDEN)
Page 2 of 3
AR-6
STRATIGRAPHIC AND INSTRUMENTATION LOG
46
48
50
52
54
56
58
60
62
64
66
68
70
72
74
76
78
80
82
84
86
88
DEPTH
ft BGS
PROJECT NAME: EXELON-BYRON
PROJECT NUMBER: 19232-21
CLIENT: EXELON GENERATION COMPANY LLC
LOCATION: BYRON, ILLINOIS
HOLE DESIGNATION:
STRATIGRAPHIC DESCRIPTION & REMARKS
4" Borehole
from 12-122'
Cement/Bentonite
Grout
Bentonite
Chips
INTERVAL
SAMPLE
REC (%)
NUMBER
NOTES:
MEASURING POINT ELEVATIONS MAY CHANGE; REFER TO CURRENT ELEVATION TABLE
DATE COMPLETED: March 21, 2006
DRILLING METHOD: AIR ROTARY
FIELD PERSONNEL: E. VARNAS
OVERBURDEN LOG 19232-21.GPJ CRA_CORP.GDT 5/29/06
DEPTH
Monitoring Well
ft BGS
END OF BOREHOLE @ 122.0ft BGS
4" Borehole
from 12-122'
2" PVC Well
Screen
Sand Pack
WELL DETAILS
Screened interval:
95.00 to 115.00ft BGS
Length: 20ft
Diameter: 2in
Slot Size: 0.010
Material: PVC
Sand Pack:
85.00 to 122.00ft BGS
Material: #6 Sand
122.00
INTERVAL
SAMPLE
REC (%)
NUMBER
'N' VALUE
(OVERBURDEN)
Page 3 of 3
AR-6
STRATIGRAPHIC AND INSTRUMENTATION LOG
92
94
96
98
100
102
104
106
108
110
112
114
116
118
120
122
124
126
128
130
132
134
DEPTH
ft BGS
PROJECT NAME: EXELON-BYRON
PROJECT NUMBER: 19232-21
CLIENT: EXELON GENERATION COMPANY LLC
LOCATION: BYRON, ILLINOIS
HOLE DESIGNATION:
STRATIGRAPHIC DESCRIPTION & REMARKS
NOTES:
MEASURING POINT ELEVATIONS MAY CHANGE; REFER TO CURRENT ELEVATION TABLE
DATE COMPLETED: March 21, 2006
DRILLING METHOD: AIR ROTARY
FIELD PERSONNEL: E. VARNAS
OVERBURDEN LOG 19232-21.GPJ CRA_CORP.GDT 5/29/06
DEPTH
Monitoring Well
ft BGS
SP SAND/GRAVEL FILL
SC CLAYEY SAND
BEDROCK LIMESTONE - weathered
- competent rock at 20.0ft BGS
Concrete
9" Borehole
from 0-20'
Cement/Bentonite
Grout
2" PVC Well
Casing
4" Borehole
from 20-113'
15.00
17.00
INTERVAL
SAMPLE
REC (%)
NUMBER
'N' VALUE
(OVERBURDEN)
Page 1 of 3
AR-7
STRATIGRAPHIC AND INSTRUMENTATION LOG
2
4
6
8
10
12
14
16
18
20
22
24
26
28
30
32
34
36
38
DEPTH
ft BGS
PROJECT NAME: EXELON-BYRON
PROJECT NUMBER: 19232-21
CLIENT: EXELON GENERATION COMPANY LLC
LOCATION: BYRON, ILLINOIS
HOLE DESIGNATION:
STRATIGRAPHIC DESCRIPTION & REMARKS
NOTES:
MEASURING POINT ELEVATIONS MAY CHANGE; REFER TO CURRENT ELEVATION TABLE
DATE COMPLETED: March 28, 2006
DRILLING METHOD: AIR ROTARY
FIELD PERSONNEL: B. WILLIAMS
OVERBURDEN LOG 19232-21.GPJ CRA_CORP.GDT 5/29/06
DEPTH
Monitoring Well
ft BGS
- occasional sand pockets from 60-79' at 60.0ft
BGS
INTERVAL
SAMPLE
REC (%)
NUMBER
'N' VALUE
(OVERBURDEN)
Page 2 of 3
AR-7
STRATIGRAPHIC AND INSTRUMENTATION LOG
42
44
46
48
50
52
54
56
58
60
62
64
66
68
70
72
74
76
78
DEPTH
ft BGS
PROJECT NAME: EXELON-BYRON
PROJECT NUMBER: 19232-21
CLIENT: EXELON GENERATION COMPANY LLC
LOCATION: BYRON, ILLINOIS
HOLE DESIGNATION:
STRATIGRAPHIC DESCRIPTION & REMARKS
NOTES:
MEASURING POINT ELEVATIONS MAY CHANGE; REFER TO CURRENT ELEVATION TABLE
DATE COMPLETED: March 28, 2006
DRILLING METHOD: AIR ROTARY
FIELD PERSONNEL: B. WILLIAMS
OVERBURDEN LOG 19232-21.GPJ CRA_CORP.GDT 5/29/06
DEPTH
Monitoring Well
ft BGS
END OF BOREHOLE @ 113.0ft BGS
Bentonite
Chips
2" PVC Well
Screen
Sand Pack
WELL DETAILS
Screened interval:
102.00 to 113.00ft BGS
Length: 11ft
Diameter: 2in
Slot Size: 0.010
Material: PVC
Sand Pack:
100.00 to 113.00ft BGS
Material: #5 Sand
113.00
INTERVAL
SAMPLE
REC (%)
NUMBER
'N' VALUE
(OVERBURDEN)
Page 3 of 3
AR-7
STRATIGRAPHIC AND INSTRUMENTATION LOG
82
84
86
88
90
92
94
96
98
100
102
104
106
108
110
112
114
116
118
DEPTH
ft BGS
PROJECT NAME: EXELON-BYRON
PROJECT NUMBER: 19232-21
CLIENT: EXELON GENERATION COMPANY LLC
LOCATION: BYRON, ILLINOIS
HOLE DESIGNATION:
STRATIGRAPHIC DESCRIPTION & REMARKS
NOTES:
MEASURING POINT ELEVATIONS MAY CHANGE; REFER TO CURRENT ELEVATION TABLE
DATE COMPLETED: March 28, 2006
DRILLING METHOD: AIR ROTARY
FIELD PERSONNEL: B. WILLIAMS
OVERBURDEN LOG 19232-21.GPJ CRA_CORP.GDT 5/29/06
DEPTH
Monitoring Well
ft BGS
GPS SAND/GRAVEL (FILL)
LIMESTONE - weathered
- competent rock at 5.0ft BGS
Concrete
9" Borehole
from 0-5'
4" Borehole
from 5-53'
Cement/Bentonite
Grout
2" PVC Well
Casing
Bentonite
Chips
2" PVC Well
Screen
Sand Pack
2.00
INTERVAL
SAMPLE
REC (%)
NUMBER
'N' VALUE
(OVERBURDEN)
Page 1 of 2
AR-8
STRATIGRAPHIC AND INSTRUMENTATION LOG
2
4
6
8
10
12
14
16
18
20
22
24
26
28
30
32
34
36
38
DEPTH
ft BGS
PROJECT NAME: EXELON-BYRON
PROJECT NUMBER: 19232-21
CLIENT: EXELON GENERATION COMPANY LLC
LOCATION: BYRON, ILLINOIS
HOLE DESIGNATION:
STRATIGRAPHIC DESCRIPTION & REMARKS
NOTES:
MEASURING POINT ELEVATIONS MAY CHANGE; REFER TO CURRENT ELEVATION TABLE
DATE COMPLETED: March 31, 2006
DRILLING METHOD: 4-1/4" HSA/AIR ROTARY
FIELD PERSONNEL: B. WILLIAMS
OVERBURDEN LOG 19232-21.GPJ CRA_CORP.GDT 5/29/06
DEPTH
Monitoring Well
ft BGS
END OF BOREHOLE @ 53.0ft BGS
4" Borehole
from 5-53'
WELL DETAILS
Screened interval:
30.00 to 50.00ft BGS
Length: 20ft
Diameter: 2in
Slot Size: 0.010
Material: PVC
Sand Pack:
28.00 to 53.00ft BGS
Material: Sand
53.00
INTERVAL
SAMPLE
REC (%)
NUMBER
'N' VALUE
(OVERBURDEN)
Page 2 of 2
AR-8
STRATIGRAPHIC AND INSTRUMENTATION LOG
42
44
46
48
50
52
54
56
58
60
62
64
66
68
70
72
74
76
78
DEPTH
ft BGS
PROJECT NAME: EXELON-BYRON
PROJECT NUMBER: 19232-21
CLIENT: EXELON GENERATION COMPANY LLC
LOCATION: BYRON, ILLINOIS
HOLE DESIGNATION:
STRATIGRAPHIC DESCRIPTION & REMARKS
NOTES:
MEASURING POINT ELEVATIONS MAY CHANGE; REFER TO CURRENT ELEVATION TABLE
DATE COMPLETED: March 31, 2006
DRILLING METHOD: 4-1/4" HSA/AIR ROTARY
FIELD PERSONNEL: B. WILLIAMS
OVERBURDEN LOG 19232-21.GPJ CRA_CORP.GDT 5/29/06
DEPTH
Monitoring Well
ft BGS
DATE COMPLETED: April 4, 2006
DRILLING METHOD: 4-1/4" HSA/AIR ROTARY
FIELD PERSONNEL: B. WILLIAMS
OVERBURDEN LOG 19232-21.GPJ CRA_CORP.GDT 5/29/06
DEPTH
Monitoring Well
ft BGS
UNCONSOLIDATED SEDIMENTS
BEDROCK - weathered
- competent rock at 25.0ft BGS
Concrete
Cement/Bentonite
Grout
9" Borehole
from 0-25'
2" PVC Well
Casing
4" Borehole
from 25-68'
20.00
INTERVAL
SAMPLE
REC (%)
NUMBER
'N' VALUE
(OVERBURDEN)
Page 1 of 2
AR-9
STRATIGRAPHIC AND INSTRUMENTATION LOG
2
4
6
8
10
12
14
16
18
20
22
24
26
28
30
32
34
36
38
DEPTH
ft BGS
PROJECT NAME: EXELON-BYRON
PROJECT NUMBER: 19232-21
CLIENT: EXELON GENERATION COMPANY LLC
LOCATION: BYRON, ILLINOIS
HOLE DESIGNATION:
STRATIGRAPHIC DESCRIPTION & REMARKS
NOTES:
MEASURING POINT ELEVATIONS MAY CHANGE; REFER TO CURRENT ELEVATION TABLE
INTERVAL
SAMPLE
REC (%)
NUMBER
'N' VALUE
(OVERBURDEN)
Page 2 of 2
END OF BOREHOLE @ 68.0ft BGS
4" Borehole
from 25-68'
Bentonite
Chips
2" PVC Well
Screen
Sand Pack
WELL DETAILS
Screened interval:
55.50 to 65.50ft BGS
Length: 10ft
Diameter: 2in
Slot Size: 0.010
Material: PVC
Sand Pack:
54.00 to 68.00ft BGS
Material: #6 Sand
68.00
AR-9
STRATIGRAPHIC AND INSTRUMENTATION LOG
42
44
46
48
50
52
54
56
58
60
62
64
66
68
70
72
74
76
78
DEPTH
ft BGS
PROJECT NAME: EXELON-BYRON
PROJECT NUMBER: 19232-21
CLIENT: EXELON GENERATION COMPANY LLC
LOCATION: BYRON, ILLINOIS
HOLE DESIGNATION:
STRATIGRAPHIC DESCRIPTION & REMARKS
NOTES:
MEASURING POINT ELEVATIONS MAY CHANGE; REFER TO CURRENT ELEVATION TABLE
DATE COMPLETED: April 4, 2006
DRILLING METHOD: 4-1/4" HSA/AIR ROTARY
FIELD PERSONNEL: B. WILLIAMS
OVERBURDEN LOG 19232-21.GPJ CRA_CORP.GDT 5/29/06
DEPTH
Monitoring Well
ft BGS
SP SAND - fine grained, trace medium sand, poorly
graded, medium brown, moist
- some coarse sand, dark brown at 11.2ft BGS
- trace fine gravel at 15.0ft BGS
- some fine gravel at 20.0ft BGS
- wet at 27.0ft BGS
Concrete
8" Borehole
Cement/Bentonite
Grout
2" PVC Well
Casing
HOLE DESIGNATION:
STRATIGRAPHIC DESCRIPTION & REMARKS
NOTES:
MEASURING POINT ELEVATIONS MAY CHANGE; REFER TO CURRENT ELEVATION TABLE
DATE COMPLETED: March 21, 2006
DRILLING METHOD: 4-1/4" HSA
FIELD PERSONNEL: B. WILLIAMS
OVERBURDEN LOG 19232-21.GPJ CRA_CORP.GDT 5/29/06
DEPTH
Monitoring Well
ft BGS
INTERVAL
SAMPLE
REC (%)
NUMBER
'N' VALUE
(OVERBURDEN)
Page 1 of 2
CAR-1
STRATIGRAPHIC AND INSTRUMENTATION LOG
2
4
6
8
10
12
14
16
18
20
22
24
26
28
30
32
34
36
38
DEPTH
ft BGS
PROJECT NAME: EXELON-BYRON
PROJECT NUMBER: 19232-21
CLIENT: EXELON GENERATION COMPANY LLC
LOCATION: BYRON, ILLINOIS
55.00
- dense at 50.0ft BGS
END OF BOREHOLE @ 55.0ft BGS
Bentonite
Chips
8" Borehole
2" PVC Well
Screen
Sand Pack
WELL DETAILS
Screened interval:
45.00 to 55.00ft BGS
Length: 10ft
Diameter: 2in
Slot Size: 0.010
Material: PVC
Sand Pack:
43.00 to 55.00ft BGS
Material: Sand
INTERVAL
SAMPLE
REC (%)
NUMBER
'N' VALUE
(OVERBURDEN)
Page 2 of 2
CAR-1
STRATIGRAPHIC AND INSTRUMENTATION LOG
42
44
46
48
50
52
54
56
58
60
62
64
66
68
70
72
74
76
78
DEPTH
ft BGS
PROJECT NAME: EXELON-BYRON
PROJECT NUMBER: 19232-21
CLIENT: EXELON GENERATION COMPANY LLC
LOCATION: BYRON, ILLINOIS
HOLE DESIGNATION:
STRATIGRAPHIC DESCRIPTION & REMARKS
NOTES:
MEASURING POINT ELEVATIONS MAY CHANGE; REFER TO CURRENT ELEVATION TABLE
DATE COMPLETED: March 21, 2006
DRILLING METHOD: 4-1/4" HSA
FIELD PERSONNEL: B. WILLIAMS
OVERBURDEN LOG 19232-21.GPJ CRA_CORP.GDT 5/29/06
DEPTH
Monitoring Well
ft BGS
SP SAND
END OF OVERBURDEN HOLE @ 20.0ft BGS
Concrete
9" Borehole
2" PVC Well
Casing
Cement/Bentonite
Grout
INTERVAL
SAMPLE
REC (%)
NUMBER
'N' VALUE
(OVERBURDEN)
Page 1 of 2
CAR-2
STRATIGRAPHIC AND INSTRUMENTATION LOG
2
4
6
8
10
12
14
16
18
20
22
24
26
28
30
32
34
36
38
DEPTH
ft BGS
PROJECT NAME: EXELON-BYRON
PROJECT NUMBER: 19232-21
CLIENT: EXELON GENERATION COMPANY LLC
LOCATION: BYRON, ILLINOIS
HOLE DESIGNATION:
STRATIGRAPHIC DESCRIPTION & REMARKS
NOTES:
MEASURING POINT ELEVATIONS MAY CHANGE; REFER TO CURRENT ELEVATION TABLE
DATE COMPLETED: March 22, 2006
DRILLING METHOD: 4-1/4" HSA/4" ROTARY
FIELD PERSONNEL: B. WILLIAMS
OVERBURDEN LOG 19232-21.GPJ CRA_CORP.GDT 5/29/06
DEPTH
Monitoring Well
ft BGS
1
2
3
4.6
100
100
LIMESTONE/DOLOMITE (highly weathered) - thinly
bedded, trace fine sand pockets, white/beige, dry,
calcareous nodules
END OF BOREHOLE @ 36.5ft BGS
8" Borehole
from 0-20'
Bentonite
Chips
2" PVC Well
Screen
4" Borehole
from 20-36.5'
Sand Pack
WELL DETAILS
Screened interval:
25.00 to 35.00ft BGS
Length: 10ft
Diameter: 2in
Slot Size: 0.010
Material: PVC
Sand Pack:
23.00 to 36.50ft BGS
Material: Sand
20.00
36.50
(BEDROCK)
Page 2 of 2
RUN
NUMBER
CORE
RECOVERY %
RQD %
CAR-2
STRATIGRAPHIC AND INSTRUMENTATION LOG
20
22
24
26
28
30
32
34
36
38
40
42
44
46
48
50
52
54
56
DEPTH
ft BGS
PROJECT NAME: EXELON-BYRON
PROJECT NUMBER: 19232-21
CLIENT: EXELON GENERATION COMPANY LLC
LOCATION: BYRON, ILLINOIS
HOLE DESIGNATION:
STRATIGRAPHIC DESCRIPTION & REMARKS
NOTES:
MEASURING POINT ELEVATIONS MAY CHANGE; REFER TO CURRENT ELEVATION TABLE
DATE COMPLETED: March 22, 2006
DRILLING METHOD: 4-1/4" HSA/4" ROTARY
FIELD PERSONNEL: B. WILLIAMS
BEDROCK LOG 19232-21.GPJ CRA_CORP.GDT 5/29/06
DEPTH
Monitoring Well
ft BGS
UNCONSOLIDATED SEDIMENTS
WEATHERED LIMESTONE BEDROCK
Concrete
Cement/Bentonite
Grout
9" Borehole
from 0-25'
2" PVC Well
Casing
Bentonite
Chips
19.00
INTERVAL
SAMPLE
REC (%)
NUMBER
'N' VALUE
(OVERBURDEN)
Page 1 of 2
CAR-3
STRATIGRAPHIC AND INSTRUMENTATION LOG
2
4
6
8
10
12
14
16
18
20
22
24
26
28
30
32
34
36
38
DEPTH
ft BGS
PROJECT NAME: EXELON-BYRON
PROJECT NUMBER: 19232-21
CLIENT: EXELON GENERATION COMPANY LLC
LOCATION: BYRON, ILLINOIS
HOLE DESIGNATION:
STRATIGRAPHIC DESCRIPTION & REMARKS
NOTES:
MEASURING POINT ELEVATIONS MAY CHANGE; REFER TO CURRENT ELEVATION TABLE
DATE COMPLETED: March 29, 2006
DRILLING METHOD: AIR ROTARY
FIELD PERSONNEL: B. WILLIAMS
OVERBURDEN LOG 19232-21.GPJ CRA_CORP.GDT 5/29/06
DEPTH
Monitoring Well
ft BGS
END OF BOREHOLE @ 63.0ft BGS
4" Borehole
from 25-63'
2" PVC Well
Screen
Sand Pack
WELL DETAILS
Screened interval:
43.00 to 63.00ft BGS
Length: 20ft
Diameter: 2in
Slot Size: 0.010
Material: PVC
Sand Pack:
40.00 to 63.00ft BGS
Material: #5 Sand
63.00
INTERVAL
SAMPLE
REC (%)
NUMBER
'N' VALUE
(OVERBURDEN)
Page 2 of 2
CAR-3
STRATIGRAPHIC AND INSTRUMENTATION LOG
42
44
46
48
50
52
54
56
58
60
62
64
66
68
70
72
74
76
78
DEPTH
ft BGS
PROJECT NAME: EXELON-BYRON
PROJECT NUMBER: 19232-21
CLIENT: EXELON GENERATION COMPANY LLC
LOCATION: BYRON, ILLINOIS
HOLE DESIGNATION:
STRATIGRAPHIC DESCRIPTION & REMARKS
NOTES:
MEASURING POINT ELEVATIONS MAY CHANGE; REFER TO CURRENT ELEVATION TABLE
DATE COMPLETED: March 29, 2006
DRILLING METHOD: AIR ROTARY
FIELD PERSONNEL: B. WILLIAMS
OVERBURDEN LOG 19232-21.GPJ CRA_CORP.GDT 5/29/06
DEPTH
Monitoring Well
ft BGS
1GP
2GP
0.0
0.0
TOPSOIL
SP SAND (FILL) - trace limestone gravel, medium
grain, brown, dry
LIMESTONE - sandy and silty, weathered, brown,
dry
- AUGER REFUSAL at 8.5ft BGS
- GEOPROBE REFUSAL at 9.0ft BGS
END OF BOREHOLE @ 9.0ft BGS
Bentonite
Chips
2" PVC Well
Casing
8" Borehole
2" PVC Well
Screen
Sand Pack
WELL DETAILS
Screened interval:
3.50 to 8.50ft BGS
Length: 5ft
Diameter: 2in
Slot Size: 0.010
Material: PVC
Sand Pack:
2.50 to 8.50ft BGS
Material: Sand
1.00
8.00
9.00
INTERVAL
SAMPLE
REC (%)
NUMBER
'N' VALUE
PID (ppm)
(OVERBURDEN)
Page 1 of 1
TW-1
STRATIGRAPHIC AND INSTRUMENTATION LOG
2
4
6
8
10
12
14
16
18
20
22
24
26
28
30
32
34
36
38
DEPTH
ft BGS
PROJECT NAME: EXELON-BYRON
PROJECT NUMBER: 19232-21
CLIENT: EXELON GENERATION COMPANY LLC
LOCATION: BYRON, ILLINOIS
HOLE DESIGNATION:
STRATIGRAPHIC DESCRIPTION & REMARKS
NOTES:
MEASURING POINT ELEVATIONS MAY CHANGE; REFER TO CURRENT ELEVATION TABLE
DATE COMPLETED: February 27, 2006
DRILLING METHOD: GEOPROBE/4-1/4" HSA
FIELD PERSONNEL: R. AAMOT
OVERBURDEN LOG 19232-21.GPJ CRA_CORP.GDT 5/29/06
DEPTH
Temporary Well
ft BGS
1GP
2GP
0.0
0.0
TOPSOIL
CL CLAY (FILL) - sandy, low plasticity, brown,
moist
SP SAND - medium grain, brown, dry
WEATHERED LIMESTONE - sandy, silty, brown,
dry
- AUGER REFUSAL at 7.5ft BGS
- GEOPROBE REFUSAL at 8.0ft BGS
END OF BOREHOLE @ 8.0ft BGS
Bentonite
Chips
2" PVC Well
Casing
8" Borehole
2" PVC Well
Screen
Sand Pack
WELL DETAILS
Screened interval:
2.50 to 7.50ft BGS
Length: 5ft
Diameter: 2in
Slot Size: 0.010
Material: PVC
Sand Pack:
1.50 to 7.50ft BGS
Material: Sand
1.00
3.00
7.00
8.00
INTERVAL
SAMPLE
REC (%)
NUMBER
'N' VALUE
PID (ppm)
(OVERBURDEN)
Page 1 of 1
TW-10
STRATIGRAPHIC AND INSTRUMENTATION LOG
2
4
6
8
10
12
14
16
18
20
22
24
26
28
30
32
34
36
38
DEPTH
ft BGS
PROJECT NAME: EXELON-BYRON
PROJECT NUMBER: 19232-21
CLIENT: EXELON GENERATION COMPANY LLC
LOCATION: BYRON, ILLINOIS
HOLE DESIGNATION:
STRATIGRAPHIC DESCRIPTION & REMARKS
NOTES:
MEASURING POINT ELEVATIONS MAY CHANGE; REFER TO CURRENT ELEVATION TABLE
DATE COMPLETED: March 1, 2006
DRILLING METHOD: GEOPROBE/4-1/4" HSA
FIELD PERSONNEL: R. AAMOT
OVERBURDEN LOG 19232-21.GPJ CRA_CORP.GDT 5/29/06
DEPTH
Temporary Well
ft BGS
1GP
2GP
0.0
0.0
TOPSOIL
CL CLAY (FILL) - sandy, low plasticity, brown,
moist
SP SAND - medium grained, brown, dry
WEATHERED LIMESTONE - sandy, silty, brown,
dry
- GEOPROBE REFUSAL at 9.0ft BGS
- AUGER REFUSAL at 10.0ft BGS
END OF BOREHOLE @ 10.0ft BGS
Bentonite
Chips
2" PVC Well
Casing
8" Borehole
2" PVC Well
Screen
Sand Pack
WELL DETAILS
Screened interval:
5.00 to 10.00ft BGS
Length: 5ft
Diameter: 2in
Slot Size: 0.010
Material: PVC
Sand Pack:
4.00 to 10.00ft BGS
Material: Sand
1.00
4.50
9.00
10.00
INTERVAL
SAMPLE
REC (%)
NUMBER
'N' VALUE
PID (ppm)
(OVERBURDEN)
Page 1 of 1
TW-11
STRATIGRAPHIC AND INSTRUMENTATION LOG
2
4
6
8
10
12
14
16
18
20
22
24
26
28
30
32
34
36
38
DEPTH
ft BGS
PROJECT NAME: EXELON-BYRON
PROJECT NUMBER: 19232-21
CLIENT: EXELON GENERATION COMPANY LLC
LOCATION: BYRON, ILLINOIS
HOLE DESIGNATION:
STRATIGRAPHIC DESCRIPTION & REMARKS
NOTES:
MEASURING POINT ELEVATIONS MAY CHANGE; REFER TO CURRENT ELEVATION TABLE
DATE COMPLETED: March 1, 2006
DRILLING METHOD: GEOPROBE/4-1/4" HSA
FIELD PERSONNEL: R. AAMOT
OVERBURDEN LOG 19232-21.GPJ CRA_CORP.GDT 5/29/06
DEPTH
Temporary Well
ft BGS
1GP
2GP
0.0
0.0
TOPSOIL
CL CLAY (FILL) - sandy, low plasticity, moist
SP SAND - medium grained, brown, dry
WEATHERED LIMESTONE - sandy, silty, brown,
dry
- GEOPROBE REFUSAL at 9.0ft BGS
- AUGER REFUSAL at 12.0ft BGS
END OF BOREHOLE @ 12.0ft BGS
Bentonite
Chips
2" PVC Well
Casing
8" Borehole
2" PVC Well
Screen
Sand Pack
WELL DETAILS
Screened interval:
7.00 to 12.00ft BGS
Length: 5ft
Diameter: 2in
Slot Size: 0.010
Material: PVC
Sand Pack:
5.50 to 12.00ft BGS
Material: Sand
1.00
4.50
9.00
12.00
INTERVAL
SAMPLE
REC (%)
NUMBER
'N' VALUE
PID (ppm)
(OVERBURDEN)
Page 1 of 1
TW-12
STRATIGRAPHIC AND INSTRUMENTATION LOG
2
4
6
8
10
12
14
16
18
20
22
24
26
28
30
32
34
36
38
DEPTH
ft BGS
PROJECT NAME: EXELON-BYRON
PROJECT NUMBER: 19232-21
CLIENT: EXELON GENERATION COMPANY LLC
LOCATION: BYRON, ILLINOIS
HOLE DESIGNATION:
STRATIGRAPHIC DESCRIPTION & REMARKS
NOTES:
MEASURING POINT ELEVATIONS MAY CHANGE; REFER TO CURRENT ELEVATION TABLE
DATE COMPLETED: March 1, 2006
DRILLING METHOD: GEOPROBE/4-1/4" HSA
FIELD PERSONNEL: R. AAMOT
OVERBURDEN LOG 19232-21.GPJ CRA_CORP.GDT 5/29/06
DEPTH
Temporary Well
ft BGS
1GP
2GP
3GP
0.0
0.0
0.0
TOPSOIL
CL CLAY - sandy, low plasticity, brown, moist
SP SAND - medium grain, brown, dry
GC CLAYEY GRAVEL (limestone) - sandy,
orange/brown, dry
SP SAND - medium grain, brown, dry
- GEOPROBE REFUSAL at 12.0ft BGS
- saturated at 15.0ft BGS
- AUGER REFUSAL at 18.0ft BGS
END OF BOREHOLE @ 18.0ft BGS
Bentonite
Chips
2" PVC Well
Casing
8" Borehole
2" PVC Well
Screen
Sand Pack
WELL DETAILS
Screened interval:
13.00 to 18.00ft BGS
Length: 5ft
Diameter: 2in
Slot Size: 0.010
Material: PVC
Sand Pack:
11.00 to 18.00ft BGS
Material: Sand
1.00
4.00
8.00
10.00
18.00
INTERVAL
SAMPLE
REC (%)
NUMBER
'N' VALUE
PID (ppm)
(OVERBURDEN)
Page 1 of 1
TW-13
STRATIGRAPHIC AND INSTRUMENTATION LOG
2
4
6
8
10
12
14
16
18
20
22
24
26
28
30
32
34
36
38
DEPTH
ft BGS
PROJECT NAME: EXELON-BYRON
PROJECT NUMBER: 19232-21
CLIENT: EXELON GENERATION COMPANY LLC
LOCATION: BYRON, ILLINOIS
HOLE DESIGNATION:
STRATIGRAPHIC DESCRIPTION & REMARKS
NOTES:
MEASURING POINT ELEVATIONS MAY CHANGE; REFER TO CURRENT ELEVATION TABLE
WATER FOUND
DATE COMPLETED: March 1, 2006
DRILLING METHOD: GEOPROBE/4-1/4" HSA
FIELD PERSONNEL: R. AAMOT
OVERBURDEN LOG 19232-21.GPJ CRA_CORP.GDT 5/29/06
DEPTH
Temporary Well
ft BGS
1GP
2GP
3GP
4GP
5GP
0.0
0.0
0.0
0.0
0.0
TOPSOIL
CL CLAY - sandy, low plasticity, brown, moist
SP SAND - medium grained, brown, dry
- moist at 8.5ft BGS
GC CLAYEY GRAVEL (limestone) - sandy,
orange/brown, moist
- interbedded layers of sand at 21.0ft BGS
- weathered sandstone pieces mixed in medium
grained, green/gray at 24.0ft BGS
- GEOPROBE REFUSAL at 25.0ft BGS
END OF BOREHOLE @ 34.0ft BGS
Concrete
Cement/Bentonite
Grout
2" PVC Well
Casing
Bentonite
Chips
9" Borehole
2" PVC Well
Screen
Sand Pack
WELL DETAILS
Screened interval:
24.00 to 34.00ft BGS
Length: 10ft
Diameter: 2in
Slot Size: 0.010
Material: PVC
Sand Pack:
22.00 to 34.00ft BGS
Material: Sand
1.00
4.00
13.00
34.00
INTERVAL
SAMPLE
REC (%)
NUMBER
'N' VALUE
PID (ppm)
(OVERBURDEN)
Page 1 of 1
TW-14
STRATIGRAPHIC AND INSTRUMENTATION LOG
2
4
6
8
10
12
14
16
18
20
22
24
26
28
30
32
34
36
38
40
42
DEPTH
ft BGS
PROJECT NAME: EXELON-BYRON
PROJECT NUMBER: 19232-21
CLIENT: EXELON GENERATION COMPANY LLC
LOCATION: BYRON, ILLINOIS
HOLE DESIGNATION:
STRATIGRAPHIC DESCRIPTION & REMARKS
NOTES:
MEASURING POINT ELEVATIONS MAY CHANGE; REFER TO CURRENT ELEVATION TABLE
DATE COMPLETED: April 5, 2006
DRILLING METHOD: GEOPROBE/4-1/4" HSA
FIELD PERSONNEL: R. AAMOT
OVERBURDEN LOG 19232-21.GPJ CRA_CORP.GDT 5/29/06
DEPTH
Temporary Well
ft BGS
1GP
2GP
3GP
4GP
5GP
6GP
0.0
0.0
0.0
0.0
0.0
0.0
TOPSOIL
SP SAND - medium grained, brown, moist
- increasing clay with depth at 14.0ft BGS
CI CLAY - silty, medium plasticity, brown, moist
SP SAND - medium grained, brown, moist
GC CLAYEY GRAVEL - sandy, light brown,
saturated
- GEOPROBE REFUSAL at 29.0ft BGS
- AUGER REFUSAL at 30.0ft BGS
END OF BOREHOLE @ 30.0ft BGS
Bentonite
Chips
2" PVC Well
Casing
8" Borehole
2" PVC Well
Screen
Sand Pack
WELL DETAILS
Screened interval:
24.00 to 29.00ft BGS
Length: 5ft
Diameter: 2in
Slot Size: 0.010
Material: PVC
Sand Pack:
22.00 to 29.00ft BGS
Material: Sand
1.00
16.00
18.00
25.00
30.00
INTERVAL
SAMPLE
REC (%)
NUMBER
'N' VALUE
PID (ppm)
(OVERBURDEN)
Page 1 of 1
TW-15
STRATIGRAPHIC AND INSTRUMENTATION LOG
2
4
6
8
10
12
14
16
18
20
22
24
26
28
30
32
34
36
38
DEPTH
ft BGS
PROJECT NAME: EXELON-BYRON
PROJECT NUMBER: 19232-21
CLIENT: EXELON GENERATION COMPANY LLC
LOCATION: BYRON, ILLINOIS
HOLE DESIGNATION:
STRATIGRAPHIC DESCRIPTION & REMARKS
NOTES:
MEASURING POINT ELEVATIONS MAY CHANGE; REFER TO CURRENT ELEVATION TABLE
DATE COMPLETED: March 1, 2006
DRILLING METHOD: GEOPROBE/4-1/" HSA
FIELD PERSONNEL: R. AAMOT
OVERBURDEN LOG 19232-21.GPJ CRA_CORP.GDT 5/29/06
DEPTH
Temporary Well
ft BGS
1GP
2GP
0.0
0.0
TOPSOIL
SP SAND (FILL) - trace of limestone gravel,
medium grain, brown, dry
- AUGER REFUSAL at 7.0ft BGS
WEATHERED LIMESTONE - sandy, silty, brown,
dry
- GEOPROBE REFUSAL at 9.0ft BGS
END OF BOREHOLE @ 9.0ft BGS
Bentonite
Chips
2" PVC Well
Casing
8" Borehole
2" PVC Well
Screen
Sand Pack
WELL DETAILS
Screened interval:
2.00 to 7.00ft BGS
Length: 5ft
Diameter: 2in
Slot Size: 0.010
Material: PVC
Sand Pack:
1.50 to 7.00ft BGS
Material: Sand
1.00
8.00
9.00
INTERVAL
SAMPLE
REC (%)
NUMBER
'N' VALUE
PID (ppm)
(OVERBURDEN)
Page 1 of 1
TW-2
STRATIGRAPHIC AND INSTRUMENTATION LOG
2
4
6
8
10
12
14
16
18
20
22
24
26
28
30
32
34
36
38
DEPTH
ft BGS
PROJECT NAME: EXELON-BYRON
PROJECT NUMBER: 19232-21
CLIENT: EXELON GENERATION COMPANY LLC
LOCATION: BYRON, ILLINOIS
HOLE DESIGNATION:
STRATIGRAPHIC DESCRIPTION & REMARKS
NOTES:
MEASURING POINT ELEVATIONS MAY CHANGE; REFER TO CURRENT ELEVATION TABLE
DATE COMPLETED: February 27, 2006
DRILLING METHOD: GEOPROBE/4-1/4" HSA
FIELD PERSONNEL: R. AAMOT
OVERBURDEN LOG 19232-21.GPJ CRA_CORP.GDT 5/29/06
DEPTH
Temporary Well
ft BGS
1GP
2GP
0.0
0.0
TOPSOIL
CL CLAY (FILL) - sandy, low plasticity, brown,
moist
SP SAND - medium grain, brown, dry
- moist at 8.5ft BGS
WEATHERED LIMESTONE - sandy, silty, brown,
dry
- GEOPROBE REFUSAL at 9.0ft BGS
- AUGER REFUSAL at 10.5ft BGS
END OF BOREHOLE @ 10.5ft BGS
Bentonite
Chips
2" PVC Well
Casing
8" Borehole
2" PVC Well
Screen
Sand Pack
WELL DETAILS
Screened interval:
5.50 to 10.50ft BGS
Length: 5ft
Diameter: 2in
Slot Size: 0.010
Material: PVC
Sand Pack:
4.50 to 10.50ft BGS
Material: Sand
1.00
4.00
9.00
10.50
INTERVAL
SAMPLE
REC (%)
NUMBER
'N' VALUE
PID (ppm)
(OVERBURDEN)
Page 1 of 1
TW-3
STRATIGRAPHIC AND INSTRUMENTATION LOG
2
4
6
8
10
12
14
16
18
20
22
24
26
28
30
32
34
36
38
DEPTH
ft BGS
PROJECT NAME: EXELON-BYRON
PROJECT NUMBER: 19232-21
CLIENT: EXELON GENERATION COMPANY LLC
LOCATION: BYRON, ILLINOIS
HOLE DESIGNATION:
STRATIGRAPHIC DESCRIPTION & REMARKS
NOTES:
MEASURING POINT ELEVATIONS MAY CHANGE; REFER TO CURRENT ELEVATION TABLE
DATE COMPLETED: February 28, 2006
DRILLING METHOD: GEOPROBE/4-1/4" HSA
FIELD PERSONNEL: R. AAMOT
OVERBURDEN LOG 19232-21.GPJ CRA_CORP.GDT 5/29/06
DEPTH
Temporary Well
ft BGS
1GP
2GP
0.0
0.0
TOPSOIL
CL CLAY (FILL) - sandy, low plasticity, brown,
moist
SP SAND - medium grain, brown, dry
WEATHERED LIMESTONE - sandy, silty, brown,
dry
- GEOPROBE REFUSAL at 9.0ft BGS
- AUGER REFUSAL at 10.5ft BGS
END OF BOREHOLE @ 10.5ft BGS
Bentonite
Chips
2" PVC Well
Casing
8" Borehole
2" PVC Well
Screen
Sand Pack
WELL DETAILS
Screened interval:
5.50 to 10.50ft BGS
Length: 5ft
Diameter: 2in
Slot Size: 0.010
Material: PVC
Sand Pack:
4.50 to 10.50ft BGS
Material: Sand
1.00
4.00
9.00
10.50
INTERVAL
SAMPLE
REC (%)
NUMBER
'N' VALUE
PID (ppm)
(OVERBURDEN)
Page 1 of 1
TW-4
STRATIGRAPHIC AND INSTRUMENTATION LOG
2
4
6
8
10
12
14
16
18
20
22
24
26
28
30
32
34
36
38
DEPTH
ft BGS
PROJECT NAME: EXELON-BYRON
PROJECT NUMBER: 19232-21
CLIENT: EXELON GENERATION COMPANY LLC
LOCATION: BYRON, ILLINOIS
HOLE DESIGNATION:
STRATIGRAPHIC DESCRIPTION & REMARKS
NOTES:
MEASURING POINT ELEVATIONS MAY CHANGE; REFER TO CURRENT ELEVATION TABLE
DATE COMPLETED: February 28, 2006
DRILLING METHOD: GEOPROBE/4-1/4" HSA
FIELD PERSONNEL: R. AAMOT
OVERBURDEN LOG 19232-21.GPJ CRA_CORP.GDT 5/29/06
DEPTH
Temporary Well
ft BGS
1GP
2GP
0.0
0.0
TOPSOIL
CL CLAY (FILL) - sandy, low plasticity, brown,
moist
SP SAND - medium grain, brown, dry
- GEOPROBE REFUSAL at 8.0ft BGS
- AUGER REFUSAL at 8.0ft BGS
END OF BOREHOLE @ 8.0ft BGS
Bentonite
Chips
2" PVC Well
Casing
8" Borehole
2" PVC Well
Screen
Sand Pack
WELL DETAILS
Screened interval:
3.00 to 8.00ft BGS
Length: 5ft
Diameter: 2in
Slot Size: 0.010
Material: PVC
Sand Pack:
2.00 to 8.00ft BGS
Material: Sand
1.00
4.00
8.00
INTERVAL
SAMPLE
REC (%)
NUMBER
'N' VALUE
PID (ppm)
(OVERBURDEN)
Page 1 of 1
TW-5
STRATIGRAPHIC AND INSTRUMENTATION LOG
2
4
6
8
10
12
14
16
18
20
22
24
26
28
30
32
34
36
38
DEPTH
ft BGS
PROJECT NAME: EXELON-BYRON
PROJECT NUMBER: 19232-21
CLIENT: EXELON GENERATION COMPANY LLC
LOCATION: BYRON, ILLINOIS
HOLE DESIGNATION:
STRATIGRAPHIC DESCRIPTION & REMARKS
NOTES:
MEASURING POINT ELEVATIONS MAY CHANGE; REFER TO CURRENT ELEVATION TABLE
DATE COMPLETED: February 28, 2006
DRILLING METHOD: GEOPROBE/4-1/4" HSA
FIELD PERSONNEL: R. AAMOT
OVERBURDEN LOG 19232-21.GPJ CRA_CORP.GDT 5/29/06
DEPTH
Temporary Well
ft BGS
1GP
2GP
0.0
0.0
TOPSOIL
CL CLAY (FILL) - sandy, low plasticity, brown,
moist
SP SAND - medium grain, brown, dry
- GEOPROBE REFUSAL at 8.5ft BGS
- AUGER REFUSAL at 8.5ft BGS
END OF BOREHOLE @ 8.5ft BGS
Bentonite
Chips
2" PVC Well
Casing
8" Borehole
2" PVC Well
Screen
Sand Pack
WELL DETAILS
Screened interval:
3.50 to 8.50ft BGS
Length: 5ft
Diameter: 2in
Slot Size: 0.010
Material: PVC
Sand Pack:
2.50 to 8.50ft BGS
Material: Sand
1.00
4.00
8.50
INTERVAL
SAMPLE
REC (%)
NUMBER
'N' VALUE
PID (ppm)
(OVERBURDEN)
Page 1 of 1
TW-6
STRATIGRAPHIC AND INSTRUMENTATION LOG
2
4
6
8
10
12
14
16
18
20
22
24
26
28
30
32
34
36
38
DEPTH
ft BGS
PROJECT NAME: EXELON-BYRON
PROJECT NUMBER: 19232-21
CLIENT: EXELON GENERATION COMPANY LLC
LOCATION: BYRON, ILLINOIS
HOLE DESIGNATION:
STRATIGRAPHIC DESCRIPTION & REMARKS
NOTES:
MEASURING POINT ELEVATIONS MAY CHANGE; REFER TO CURRENT ELEVATION TABLE
DATE COMPLETED: February 28, 2006
DRILLING METHOD: GEOPROBE/4-1/4" HSA
FIELD PERSONNEL: R. AAMOT
OVERBURDEN LOG 19232-21.GPJ CRA_CORP.GDT 5/29/06
DEPTH
Temporary Well
ft BGS
1GP
2GP
0.0
0.0
TOPSOIL
CL CLAY (FILL) - sandy, low plasticity, brown,
moist
SP SAND, medium grain, brown, dry
CL CLAY - sandy, low plasticity, brown, moist
- GEOPROBE REFUSAL at 9.5ft BGS
- AUGER REFUSAL at 11.0ft BGS
END OF BOREHOLE @ 11.0ft BGS
Bentonite
Chips
2" PVC Well
Casing
8" Borehole
2" PVC Well
Screen
Sand Pack
WELL DETAILS
Screened interval:
6.00 to 11.00ft BGS
Length: 5ft
Diameter: 2in
Slot Size: 0.010
Material: PVC
Sand Pack:
5.00 to 11.00ft BGS
Material: Sand
1.00
3.50
9.50
11.00
INTERVAL
SAMPLE
REC (%)
NUMBER
'N' VALUE
PID (ppm)
(OVERBURDEN)
Page 1 of 1
TW-7
STRATIGRAPHIC AND INSTRUMENTATION LOG
2
4
6
8
10
12
14
16
18
20
22
24
26
28
30
32
34
36
38
DEPTH
ft BGS
PROJECT NAME: EXELON-BYRON
PROJECT NUMBER: 19232-21
CLIENT: EXELON GENERATION COMPANY LLC
LOCATION: BYRON, ILLINOIS
HOLE DESIGNATION:
STRATIGRAPHIC DESCRIPTION & REMARKS
NOTES:
MEASURING POINT ELEVATIONS MAY CHANGE; REFER TO CURRENT ELEVATION TABLE
DATE COMPLETED: February 28, 2006
DRILLING METHOD: GEOPROBE/4-1/4" HSA
FIELD PERSONNEL: R. AAMOT
OVERBURDEN LOG 19232-21.GPJ CRA_CORP.GDT 5/29/06
DEPTH
Temporary Well
ft BGS
1GP
2GP
0.0
0.0
TOPSOIL
CL CLAY (FILL) - sandy, low plasticity, brown,
moist
SP SAND - medium grain, brown, dry
CL CLAY - sandy, low plasticity, brown, moist
- GEOPROBE REFUSAL at 9.5ft BGS
- AUGER REFUSAL at 12.0ft BGS
END OF BOREHOLE @ 12.0ft BGS
Bentonite
Chips
2" PVC Well
Casing
8" Borehole
2" PVC Well
Screen
Sand Pack
WELL DETAILS
Screened interval:
7.00 to 12.00ft BGS
Length: 5ft
Diameter: 2in
Slot Size: 0.010
Material: PVC
Sand Pack:
6.00 to 12.00ft BGS
Material: Sand
1.00
3.50
9.50
12.00
INTERVAL
SAMPLE
REC (%)
NUMBER
'N' VALUE
PID (ppm)
(OVERBURDEN)
Page 1 of 1
TW-8
STRATIGRAPHIC AND INSTRUMENTATION LOG
2
4
6
8
10
12
14
16
18
20
22
24
26
28
30
32
34
36
38
DEPTH
ft BGS
PROJECT NAME: EXELON-BYRON
PROJECT NUMBER: 19232-21
CLIENT: EXELON GENERATION COMPANY LLC
LOCATION: BYRON, ILLINOIS
HOLE DESIGNATION:
STRATIGRAPHIC DESCRIPTION & REMARKS
NOTES:
MEASURING POINT ELEVATIONS MAY CHANGE; REFER TO CURRENT ELEVATION TABLE
DATE COMPLETED: February 28, 2006
DRILLING METHOD: GEOPROBE/4-1/4" HSA
FIELD PERSONNEL: R. AAMOT
OVERBURDEN LOG 19232-21.GPJ CRA_CORP.GDT 5/29/06
DEPTH
Temporary Well
ft BGS
1GP
2GP
0.0
0.0
TOPSOIL
CL CLAY (FILL) - sandy, low plasticity, brown,
moist
SP SAND - medium grain, brown, dry
WEATHERED LIMESTONE - sandy, silty, brown,
dry
- GEOPROBE REFUSAL at 8.0ft BGS
- AUGER REFUSAL at 8.0ft BGS
END OF BOREHOLE @ 8.0ft BGS
Bentonite
Chips
2" PVC Well
Casing
8" Borehole
2" PVC Well
Screen
Sand Pack
WELL DETAILS
Screened interval:
3.00 to 8.00ft BGS
Length: 5ft
Diameter: 2in
Slot Size: 0.010
Material: PVC
Sand Pack:
2.00 to 8.00ft BGS
Material: Sand
1.00
3.00
7.00
8.00
INTERVAL
SAMPLE
REC (%)
NUMBER
'N' VALUE
PID (ppm)
(OVERBURDEN)
Page 1 of 1
TW-9
STRATIGRAPHIC AND INSTRUMENTATION LOG
2
4
6
8
10
12
14
16
18
20
22
24
26
28
30
32
34
36
38
DEPTH
ft BGS
PROJECT NAME: EXELON-BYRON
PROJECT NUMBER: 19232-21
CLIENT: EXELON GENERATION COMPANY LLC
LOCATION: BYRON, ILLINOIS
HOLE DESIGNATION:
STRATIGRAPHIC DESCRIPTION & REMARKS
NOTES:
MEASURING POINT ELEVATIONS MAY CHANGE; REFER TO CURRENT ELEVATION TABLE
DATE COMPLETED: February 28, 2006
DRILLING METHOD: GEOPROBE/4-1/4" HSA
FIELD PERSONNEL: R. AAMOT
OVERBURDEN LOG 19232-21.GPJ CRA_CORP.GDT 5/29/06
DEPTH
Temporary Well
ft BGS
Revision 0
045136 (13) Byron Generating Station
APPENDIX C
QUALITY ASSURANCE PROGRAM
C.1
ENVIRONMENTAL, INC.
C.2
TELEDYNE BROWN ENGINEERING, INC.
Revision 0
045136 (13) Byron Generating Station
C.1
ENVIRONMENTAL, INC.
Revision 0
045136 (13) Byron Generating Station
C.2
TELEDYNE BROWN ENGINEERING, INC.
Page 2 of 32
TABLE OF CONTENTS
Section
Title
Page
1.0
KNOXVILLE QAM SECTION INTRODUCTION
7
2.0
QUALITY SYSTEM
10
2.1
Policy
10
2.2
Quality System Structure
10
2.3
Quality System Objectives
10
2.4
Personnel Orientation, Training, and Qualification
11
3.0
ORGANIZATION, AUTHORITY, AND RESPONSIBILITY
12
4.0
PERSONNEL ORIENTATION, DATA INTEGRITY, TRAINING,
AND QUALIFICATION
13
4.1
Orientation
13
4.2
Data Integrity
13
4.3
Training
13
4.4
Qualification
13
4.5
Records
13
5.0
CUSTOMER INTERFACES
14
5.1
Interface Personnel
14
5.2
Bid Requests and Tenders
14
5.3
Contracts
14
5.4
TBE’s Expectation of Customers
14
5.5
Customer Satisfaction
15
5.5.1
Customer Complaints
15
5.5.2
Customer Confidentiality
15
6.0
DOCUMENTATION GENERATION AND CONTROL
16
6.1
General
16
6.2
New Documentation
16
6.3
Documentation Changes
16
Page 3 of 32
TABLE OF CONTENTS - Continued
6.4
Documentation Lists and Distributions
16
6.5
Other Documentation
16
6.6
Documentation Reviews
16
7.0
DESIGN OF LABORATORY CONTROLS
17
7.1
General
17
7.2
Facility
17
7.3
Technical Processes and Methods
17
7.3.1
Operational Flow
17
7.3.2
Methods
18
7.3.3
Data Reduction and Analysis
18
7.4
Verification of Technical Processes, Methods, and Software
18
7.4.1
Operational Flow Verification
18
7.4.2
Method Verifications
18
7.4.3
Data Reduction and Analysis Verification
18
7.5
Design of Quality Controls
18
7.5.1
General
19
7.5.2
Demonstration of Capability (D of C)
19
7.5.3
Process Control Checks
19
7.6
Counting Instrument Controls
20
8.0
PURCHASING AND SUBCONTRACT CONTROLS
21
8.1
General
21
8.2
Source Selection
21
8.3
Procurement of Supplies and Support Services
21
8.3.1
Catalog Supplies
21
8.3.2
Support Services
21
8.3.3
Equipment and Software
22
8.4
Subcontracting of Analytical Services
22
8.5
Acceptance of Items or Services
22
Page 4 of 32
TABLE OF CONTENTS - Continued
9.0
TEST SAMPLE IDENTIFICATION AND CONTROL
23
9.1
Sample Identification
23
9.2
LIMS
23
9.3
Sample Control
23
10.0
SPECIAL PROCESSES, INSPECTION, AND TEST
24
10.1
Special Processes
24
10.2
Inspections and Tests
24
10.2.1 Intra Laboratory Checks (QC Checks)
24
10.2.2 Inter Laboratory Checks
24
10.2.3 Data Reviews
24
10.3
Control of Sampling of Samples
24
10.4
Reference Standards / Material
24
10.4.1 Weights and Temperatures
25
10.4.2 Radioactive Materials
25
11.0
EQUIPMENT MAINTENANCE AND CALIBRATION
26
11.1
General
26
11.2
Support Equipment
26
11.3
Instruments
26
11.4
Nonconformances and Corrective Actions
26
11.5
Records
27
12.0
NONCONFORMANCE CONTROLS
28
12.1
General
28
12.2
Responsibility and Authority
28
12.3
10CFR21 Reporting
28
Page 5 of 32
TABLE OF CONTENTS - Continued
13.0
CORRECTIVE AND PREVENTIVE ACTIONS
29
13.1
General
29
13.2
Corrective Actions
29
13.3
Preventive Actions
29
14.0
RESULTS ANALYSIS AND REPORTING
30
14.1
General
30
14.2
Results Review
30
14.3
Reports
30
15.0
RECORDS
31
15.1
General
31
15.2
Type of Records
31
15.3
Storage and Retention
31
15.4
Destruction or Disposal
31
16.0
ASSESSMENTS
32
16.1
General
32
16.2
Audits
32
16.3
Management Reviews
32
Page 6 of 32
REVISION HISTORY
Revision 7
Complete re-write
January 1, 2005
Bill Meyer
Revision 8
Updated organization
chart, minor change to
1.0, 4.4, 7.5.3.2,
10.2.3, and 12.3
Page 7 of 32
1.0
Knoxville QAM Section Introduction
This Quality Assurance Manual (QAM) and related Procedures describes the
Knoxville Environmental Services Laboratory’s QA system. This system is designed
to meet multiple quality standards imposed by Customers and regulatory agencies
including:
NRC’s 10 CFR 50 Appendix B
NRC’s Regulatory Guide 4.15
DOE’s Order 414.1
DOE’s QSAS
ANSI N 42.23
ANSI N 13.30
NELAC Standard, Chapter 5
The Environmental Services (ES) Laboratory does low level radioactivity
analyses for Power Plants and other customers. It primarily analyzes environmental
samples (natural products from around plants such as milk), in-plant samples (air
filters, waters), bioassay samples from customer’s employees, and waste disposal
samples (liquids and solids).
Potable and non-potable water samples are tested using methods based on
EPA standards as cited in State licenses (see Procedure 4010). The listing [current
as of initial printing of this Manual – see current index for revision status and
additions / deletions] of implementing Procedures (SOPs) covering Administration,
Methods, Counting Instruments, Technical, Miscellaneous, and LIMS is shown in
Table 1-1. Reference to these Procedures by number is made throughout this QAM.
Table 1-1
Number
Title
Part 1
Administrative Procedures
1001
Validation and Verification of Computer Programs for Radiochemistry Data
Reduction
1002
Organization and Responsibility
1003
Control, Retention, and Disposal of Quality Assurance Records
1004
Definitions
1005
Data Integrity
1006
Job Descriptions
1007
Training and Certifications
1008
Procedure and Document Control
1009
Calibration System
1010
Nonconformance Controls
1011
10CFR21 Reporting
1012
Corrective Action and Preventive Action
Page 8 of 32
Number
Title
1013
Internal Audits and Management Reviews
1014
RFP, Contract Review, and Order Entry (formerly 4001)
1015
Procurement Controls
Part 2
Method Procedures
2001
Alpha Isotopic and Plutonium-241
2002
Carbon-14 Activity in Various Matrices
2003
Carbon-14 and Tritium in Soils, Solids, and Biological Samples; Harvey
Oxidizer Method
2004
Cerium-141 and Cerium-144 by Radiochemical Separation
2005
Cesium-137 by Radiochemical Separation
2006
Iron-55 Activity in Various Matrices
2007
Gamma Emitting Radioisotope Analysis
2008
Gross Alpha and/or Gross Beta Activity in Various Matrices
2009
Gross Beta Minus Potassium-40 Activity in Urine and Fecal Samples
2010
Tritium and Carbon-14 Analysis by Liquid Scintillation
2011
Tritium Analysis in Drinking Water by Liquid Scintillation
2012
Radioiodine in Various Matrices
2013
Radionickel Activity in Various Matrices
2014
Phosphorus-32 Activity in Various Matrices
2015
Lead-210 Activity in Various Matrices
2016
Radium-226 Analysis in Various Matrices
2017
Total Radium in Water Samples
2018
Radiostrontium Analysis by Chemical Separation
2019
Radiostrontium Analysis by Ion Exchange
2020
Sulfur-35 Analysis
2021
Technetium-99 Analysis by Eichrom Resin Separation
2022
Total Uranium Analysis by KPA
2023
Compositing of Samples
2024
Dry Ashing of Environmental Samples
2025
Preparation and Standardization of Carrier Solutions
2026
Radioactive Reference Standard Solutions and Records
2027
Glassware Washing and Storage
2028
Moisture Content of Various Matrices
2029
Polonium-210 Activity in Various Matrices
2030
Promethium-147 Analysis
Page 9 of 32
Number
Title
Part 3
Instrument Procedures
3001
Calibration and Control of Gamma-Ray Spectrometers
3002
Calibration of Alpha Spectrometers
3003
Calibration and Control of Alpha and Beta Counting Instruments
3004
Calibration and Control of Liquid Scintillation Counters
3005
Calibration and Operation of pH Meters
3006
Balance Calibration and Check
3008
Negative Results Evaluation Policy
3009
Use and Maintenance of Mechanical Pipettors
3010
Microwave Digestion System Use and Maintenance
Part 4
Technical Procedures
4001
Not Used
4002
QC Checks on Data
4003
Sample Regent and Control
4004
Data Package Preparation and Reporting
4005
Blank, Spike, and Duplicate Controls
4006
Inter-Laboratory Comparison Study Process
4007
Method Basis and Initial Validation Process
4008
Not Used
4009
MDL Controls
4010
State Certification Process
4011
Accuracy, Precision, Efficiency, and Bias Controls and Data Quality Objectives
4012
Not Used
4013
Not Used
4014
Facility Operation and Control
4015
Documentation of Analytical Laboratory Logbooks (formerly 1002)
4016
Total Propagated Uncertainty (formerly 1004)
4017
LIMS Operation
4018
Instrument Calibration System
4019
Radioactive Reference Material Standards
Part 5
Miscellaneous Procedures
5001
Laboratory Hood Operations
5002
Operation and Maintenance of Deionized Water System
5003
Waste Management
5004
Acid Neutralization and Purification System Operation Procedure
Page 10 of 32
Part 6
LIMS
6001
LIMS Raw Data Processing and Reporting
6002
Software Development and/or Pilots of COTS Packages
6003
Software Change and Version Control
6004
Backup of Data and System Files
6005
Disaster Recovery Plan
6006
LIMS Hardware
6007
LIMS User Access
6008
LIMS Training
6009
LIMS Security
2.0
QUALITY SYSTEM
The TBE-ES QA system is designed to comply with multiple customer- and
regulatory agency-imposed specifications related to quality. This quality system
applies to all activities of TBE-ES that affect the quality of analyses performed by the
laboratory.
2.1
Policy
The TBE quality policy, given in Company Policy P-501, is “TBE will
continually improve our processes and effectiveness in providing products and
services that exceed our customer’s expectations.”
This policy is amplified by this Laboratory’s commitment, as attested to by the
title page signatures, to perform all work to good professional practices and to
deliver high quality services to our customers with full data integrity. (See Section
4.0 and Procedure 1005).
2.2
Quality System Structure
The Quality System is operated by the organizations described in Section 3.0
of this Manual. The Quality System is described in this Manual and in the
Procedures Manual, both of which are maintained by the QA Manager. Procedures
are divided into 6 sections – Administrative, Methods, Equipments, Technical,
Miscellaneous, and LIMS. This Manual is structured as shown in the Table of
Contents and refers to Procedures when applicable.
Cross references to the
various imposed quality specifications are contained in Appendices to this Manual.
2.3
Quality System Objectives
The Quality System is established to meet the objective of assuring all
operations are planned and executed in accordance with system requirements. The
Quality System also assures that performance evaluations are performed (see
Procedure 4006), and that appropriate verifications are performed (see Procedures
in the 1000 and 4000 series) to further assure compliance. Verification includes
Page 11 of 32
examination of final reports (prior to submittal to customers) to determine their
quality (see Procedure 4004).
To further these objectives, various in-process assessments of data, as well
as assessments of the system, via internal audits and management reviews, are
performed. Both internal experts and customer / regulatory agencies perform further
assessments of the system and compliance to requirements.
2.4
Personnel Orientation, Training, and Qualification
TBE provides indoctrination and training to employees and performs
proficiency evaluation of technical personnel. This effort is described in Section 4.0.
Page 12 of 32
3.0
ORGANIZATION, AUTHORITY, AND RESPONSIBILITY
TBE has established an effective organization for conducting laboratory
analyses at the Knoxville Environmental Services Laboratory.
The basic
organization is shown in Figure 3-1. Detail organization charts with names,
authorities, and responsibilities are given in Procedure 1002. Job descriptions are
given in Procedure 1006.
This organization provides clearly established Quality Assurance authorities,
duties, and functions. QA has the organizational freedom needed to:
(1)
Identify problems
(2)
Stop nonconforming work
(3)
Initiate investigations
(4)
Recommend corrective and preventive actions
(5)
Provide solutions or recommend solutions
(6)
Verify implementation of actions
All Laboratory personnel have the authority and resources to do their
assigned duties and have the freedom to act on problems. The QA personnel have
direct, independent access to Company management as shown in Figure 3-1.
Figure 3.1. Laboratory Organization
President
VP
Administration & QA
VP
Environmental
Product Assurance
Director
Lab QA Manager
Lab Operations
Manager
Program
Managers
Lab
Supervisor
Administration
Staff
Page 13 of 32
4.0 PERSONNEL ORIENTATION, DATA INTEGRITY, TRAINING, AND
QUALIFICATION
4.1
Orientation
All laboratory personnel must receive orientation to the quality program if their
work can affect quality. Orientation includes a brief review of customer- and
regulatory agency-imposed quality requirements, the structure of the QAM, and the
implementing procedures. The goal of orientation is to cover the nature and goals of
the QA program.
4.2
Data Integrity
The primary output of the Laboratory is data. Special emphasis and training
in data integrity is given to all personnel whose work provides or supports data
delivery. The Laboratory Data Integrity Procedure (Procedure 1005) describes
training, personnel attestations, and monitoring operations. Annual reviews are
required.
4.3
Training
The Quality Assurance Manager (QAM) maintains a training matrix indicating
which laboratory personnel need training in which specific Procedures. This matrix
is updated when personnel change or change assignments. All personnel are
trained per these requirements and procedures. This training program is described
in Procedure 1007. The assigned responsibilities for employees are described in
Procedure 1002 (See Section 3.0) on Organization and in Procedure 1006, Job
Descriptions. Refresher training or re-training is given annually as appropriate.
4.4
Qualification
Personnel are qualified as required by their job description. Management and
non-analysts are evaluated based on past experience, education, and
management’s assessment of their capabilities. Formal qualification is required of
analysts and related technical personnel who perform laboratory functions. Each
applicable person is given training and then formally evaluated by the Operations
Manager (or his designees) and by QA. Each analyst must initially demonstrate
capability to perform each assigned analytical effort. Each year, thereafter, he or
she must perform similar analyses on Interlab Comparison Samples (see Procedure
4006) or on equivalent blanks and spikes samples. Acceptable results extend
qualifications (certification). Unacceptable results require retraining in the subject
method / Procedures. (See Procedure 1007 for added information, records, forms,
etc. used.)
4.5
Records
Records of training subjects, contents, attendees, instructors, and
certifications are maintained by QA.
Page 14 of 32
5.0
CUSTOMER INTERFACES
5.1
Interface Personnel
The Laboratory has designated Program Managers as the primary interface
with all customers. Other interfaces may be the QA Manager or the Lab Operations
Manager.
5.2
Bid Requests and Tenders
The Program Managers respond to customer requests for bids and proposals
per Procedure 1014 for bids, proposals, and contract reviews. They clarify customer
requests so both the customer and the lab staff understand requests. As responses
are developed, internal reviews are conducted to ensure that requirements are
adequately defined and documented and to verify that the Laboratory has adequate
resources in physical capabilities, personal skills, and technical information to
perform the work. Accreditation needs are reviewed. If subcontracts are required to
perform any analysis, the subcontractor is similarly evaluated and the client notified
in writing of the effort. Most qualifications are routine with standard pricing and the
review of these quotes is performed by the Program Manager. Larger or more
complex quotes are reviewed by the Operations Manager and the QA Manager (or
designees). Evidence of review is by initialing and dating applicable papers,
signatures on quotations, or by memo.
5.3
Contracts
The Program Manager’s receive contract awards (oral or written) and
generate the work planning for initiation preparation (charge numbers, data structure
or contents in LIMS, etc.). They review contracts for possible differences from
quotations and, if acceptable, contracts are processed. Documentation of the review
is by initials and date as a minimum. Contract changes receive similar reviews and
planning.
5.4
TBE’s Expectation of Customers
TBE expects customers to provide samples suitable for lab analysis. These
expectations include:
Accurate and unambiguous identification of samples
Proper collection and preservation of samples
Use of appropriate containers free from external and internal
contamination
Integrity preservation during shipment and timely delivery of samples that
are age sensitive
Adequate sized samples that allow for retest, if needed
Specification of unique MOA/MDC requirements
Alerting the lab about abnormal samples (high activity, different chemical
contents, etc.)
Chain of custody initiation, when required.
Page 15 of 32
5.5
Customer Satisfaction
TBE’s quality policy centers on customer satisfaction (See 2.0). TBE will
work to satisfy customers through full compliance with contract requirements,
providing accurate data and properly responding to any questions or complaints.
Customers are provided full cooperation in their monitoring of Laboratory
performance. Customers are notified if any applicable State Accreditation is
withdrawn, revoked, or suspended.
5.5.1 Customer Complaints
Any customer complaints are documented and tracked to closure. Most
complaints concern analysis data and are received by Program Managers. They
log each such complaint, order retests for verification, and provide documented
results to customers. Complaints may also be received by QA or Operations.
If complaints are other than re-test type, the nonconformance and corrective
action systems (Sections 12 and 13) are used to resolve them and record all actions
taken.
5.5.2 Customer Confidentiality
All laboratory personnel maintain confidentiality of customer-unique
information.
Page 16 of 32
6.0
DOCUMENTATION GENERATION & CONTROL
6.1
General
The documentation generation and control system is detailed in Procedure
1008. An overview is given below. The basic quality system documents are
described in Section 2.0.
6.2
New Documentation
Each Procedure and this QAM is written by appropriate personnel, validated if
applicable (see Section 7.0), reviewed for adequacy, completeness, and
correctness, and, if acceptable, accepted by the authorized approver [QA Manager,
Operations Manager (or their designee)]. Both approvals are required if a Procedure
affects both QA and Operations. (See Responsibilities in Section 3.0).
These
procedures control the quality measurements and their accuracy.
Each document carries a unique identification number, a revision level, dates,
page numbers and total page count, and approver identification and sign off. If TBE
writes code for software, the software is version identified and issued after
Verification and Validation per Section 7.0.
6.3
Documentation Changes
Each change is reviewed in the same manner and by the same people as
new documentation. Revision identifications are updated and changes indicated by
side bars, italicized words, or by revision description when practical. Obsolete
revisions are maintained by QA after being identified as obsolete.
6.4
Documentation Lists and Distributions
Computer indexes of documents are maintained by Quality showing the
current authorized revision level of each document. These revisions are placed on
the Laboratory server and obsolete ones are removed so that all personnel have
only the current documents. If hard copies are produced and distributed, separate
distribution lists are maintained indicating who has them and their revision level(s).
Copies downloaded off the server are uncontrolled unless verified by the user (on
the computer) to be the latest revision.
6.5
Other Documentation
In addition to TBE-generated documentation, QA maintains copies of
applicable specifications, regulations, and standard methods.
6.6
Documentation Reviews
Each issued document is reviewed at least every third year by the approving
personnel. This review determines continued suitability for use and compliance with
requirements.
Page 17 of 32
7.0
DESIGN OF LABORATORY CONTROLS
7.1
General
The Laboratory and its operating procedures are designed specifically for low
level (environmental and in-plant) radioactive sample analysis. The various aspects
of the laboratory design include the following which are discussed in subsequent
paragraphs of this Section:
(a) Facility
(b) Technical Processes and Methods
(c) Verification of Design of Processes, Methods, and Software.
(d) Design of Quality Controls
(e) Counting Instrument Controls
7.2
Facility
The facility was designed and built in 2000 to facilitate correct performance of
operations in accordance with good laboratory practices and regulatory
requirements. It provides security for operations and samples. It separates sample
storage areas based on activity levels, separates wet chemistry from counting
instrumentation for contamination control, and provides space and electronic
systems for documentation, analysis, and record storage. Procedure 4014 describes
the facility, room uses, layouts, etc.
7.3
Technical Processes and Methods
7.3.1 Operational Flow
The laboratory design provides for sample receipt and storage (including
special environmental provisions for perishable items) where samples are received
from clients and other labs (see Section 9.0). The samples are logged into the
computer based Laboratory Information Management System (LIMS) and receive
unique identification numbers and bar code labels. (See Procedure 4017 for LIMS
description and user procedures). The Program Managers then plan the work and
assure LIMS contains any special instructions to analysts. Samples then go to
sample preparation, wet chemistry (for chemical separation), and counting based on
the radionuclides. See Procedures in the 2000 and 3000 series. Analysts perform
the required tasks with data being entered into logbooks, LIMS, and counting
equipment data systems as appropriate. Results are collected and reviewed by the
Operations Manager and Program Managers and reports to clients are generated
(See Section 14.0). All records (electronic or hard copy) are maintained in files or in
back-up electronic copies (see Section 15.0). After the required hold periods and
client notification and approval, samples are disposed of in compliance with
regulatory requirements (see Procedures 5003 and 5004).
Page 18 of 32
7.3.2 Methods
The laboratory methods documented in the 2000 and 3000 series of
Procedures were primarily developed by senior TBE laboratory personnel based on
years of experience at our prior facility in New Jersey. They have been improved,
supplemented and implemented here. Where EPA or other accepted national
methods exist (primarily for water analyses under State certification programs - see
Procedure 4010), the TBE methods conform to the imposed requirements or State
accepted alternate requirements. Any method modifications are documented and
described in the Procedure. There are no nationally recognized methods for most
other analysis methods but references to other method documents are noted where
applicable.
7.3.3 Data Reduction and Analysis
Whenever possible automatic data capture and computerized data reduction
programs are used. Calculations are either performed using commercial software
(counting system operating systems) or TBE developed and validated software is
used (see 7.4 below). Analysis of reduced data is performed as described in Section
14.0 and Procedure 4004.
7.4
Verification of Technical Processes, Methods, and Software
7.4.1 Operational Flow Verification
The entire QA Manual and related procedures describe the verification of
elements of the technical process flow and the establishment of quality check points,
reviews, and controls.
7.4.2 Method Verifications
Methods are verified and validated per Procedure 4007 prior to use unless
otherwise agreed to by the client. For most TBE methods initial validation occurred
well in the past. New or significantly revised Methods receive initial validation by
demonstration of their performance using known analytes (NIST traceable) in
appropriate matrices. Sufficient samples are run to obtain statistical data that
provides evidence of process capability and control, establishes detection levels
(see procedure 4009), bias and precision data (see Procedure 4011). All method
procedures and validation data are available to respective clients. Also see Section
7.5 below for the Demonstration of Capability program.
7.4.3 Data Reduction and Analysis Verification
Data reduction and analysis verification is performed by personnel who did
not generate the data. (See Section 14.0).
7.5
Design of Quality Controls
Page 19 of 32
7.5.1 General
There are multiple quality controls designed into the laboratory operations.
Many of these are described elsewhere in this manual and include personnel
qualification (Section 4.0), Document control (6.0), Sample identification and control
(9.0), Use of reference standards (10.0), intra- and inter- laboratory tests (10.0), etc.
This Section describes the basic quality control systems used to verify Method
capability and performance.
7.5.2 Demonstration of Capability (D of C)
The demonstration of capability system verifies and documents that the
method, analyst, and the equipment can perform within acceptable limits. The D of C
is certified for each combination of analyte, method, and instrument type. D of C's
are certified based on objective evidence at least annually. This program is
combined with the analyst D of C program (See Section 4.0). Initial D of C's use the
method validation effort as covered above. Subsequent D of C's use Inter-
Laboratory samples (Procedure 4006) or, if necessary, laboratory generated
samples using NIST traceable standards. If results are outside of control limits, re-
demonstration is required after investigation and corrective action is accomplished
(See Sections 12.0 and 13.0)
7.5.3 Process Control Checks
Process control checks are designed to include Inter-Lab samples, Intra-lab
QC check samples, and customer provided check samples. 10% of laboratory
analysis samples are for process control purposes.
7.5.3.1 Inter- Lab Samples.
Inter-lab samples are procured or
obtained from sources providing analytes of interest in matrices similar to normal
client samples. These samples may be used for Demonstration of Capability of
analyst's, equipment and methods. They also provide for independent insight into
the lab's process capabilities. Any value reported as being in the warning zone (over
2 sigma) is reviewed and improvements taken. Any value failing (over 3 sigma) is
documented on an NCR and formal investigation per Section 12.0 and 13.0 is
performed. If root causes are not clearly understood and fixed, re-tests are required
using lab prepared samples (See Procedure 4006).
7.5.3.2 QC Samples.
QC samples, along with Inter-lab samples and
customer check samples, are 10% of the annual lab workload for the applicable
analyte and method. If batch processing is used, some specifications require specific
checks with each batch or each day rather than as continuous process controls.
(See Procedure 4005)
QC samples consist of multiple types of samples including:
(a) Method blanks
(b) Blank spikes
(c) Matrix spikes
Page 20 of 32
(d) Duplicates
(e) Tracers and carriers
Acceptance limits for these samples are given in Procedures or in lab
standards. The number, frequency, and use of these sample types varies with the
method, matrix, and supplemental requirements. The patterns of use versus method
and the use of the resulting test data is described in Procedure 4005.
7.5.3.3 Customer Provided Check Samples.
Customers may
provide blind check samples and duplicates to aid in their evaluation of the
Laboratory. When the lab is notified that samples are check samples their results are
included in the QC sample percentage counts. Any reported problems are treated as
formal complaints and investigated per Section 5.
7.6
Counting Instrument Controls
The calibration of instruments is their primary control and is described in
Section 11.0. In addition, counting procedures (3000 series) also specify use of
background checks (method blank data is not used for this) to evaluate possible
counting equipment contamination. Instrument calibration checks using a lab
standard from a different source than the one used for calibration are also used.
Background data can be used to adjust client and test data. Checks with lab
standards indicate potential calibration changes.
Page 21 of 32
8.0
PURCHASING AND SUBCONTRACT CONTROLS
8.1
General
Procurement and Subcontracts efforts use the Huntsville-based Cost Point
computer system to process orders.
The Laboratory-generated Purchase
Requisitions are electronically copied into Purchase Orders in Huntsville. The
Laboratory also specifies sources to be used. Procured items and services are
received at the Laboratory where receiving checks and inspections are made.
Laboratory Procedure 1015 provides details on the procurement control system at
the Laboratory and references the Huntsville procedures as applicable.
8.2
Source Selection
Sources for procurements of items and services are evaluated and approved
by QA as described in Procedure 1015. Nationally recognized catalog item sources
are approved by the QA Manager based on reputation. Maintenance services by an
approved distributor or the equipment manufacturing company are pre-approved.
Sources for other services are evaluated by QA, based on service criticality to the
quality system, by phone, mail out, or site visit.
Subcontract sources for laboratory analysis services are only placed with
accredited laboratories (by NELAP, NUPIC, State, Client, etc.) as applicable for the
type of analysis to be performed. QA maintains lists of approved vendors and
records of evaluations performed.
8.3
Procurement of Supplies and Support Services
8.3.1 Catalog Supplies
The Laboratory procures reagents, processing chemicals, laboratory
“glassware,” consumables, and other catalog items from nationally known vendors
and to applicable laboratory grades, purities, concentrations, accuracy levels, etc.
Purchase Requisitions for these items specify catalog numbers or similar call-outs
for these off-the-shelf items. Requisitions are generated by the personnel in the lab
needing the item and are approved by the Operations or Production Manager.
Reagents are analytical reagent grade only.
8.3.2 Support Services
Purchase Requisitions for support services (such as balance
calibration, equipment maintenance, etc.) are processed as in 8.3.1 but technical
requirements are specified and reviewed before approvals are given.
Page 22 of 32
8.3.3 Equipment and Software
Purchase Requisitions for new equipment, software programs, and
major facility modifications affecting the quality system are reviewed and approved
by the Operations Manager and the QA Manager.
8.4
Subcontracting of Analytical Services
When necessary, the Laboratory may subcontract analytical services required
by a client. This may be because of special needs, infrequency of analysis, etc.
Applicable quality and regulatory requirements are imposed in the Purchase
Requisition and undergo a technical review by QA. TBE reserves the right of access
by TBE and our client for verification purposes.
8.5
Acceptance of Items or Services
Items and services affecting the quality system are verified at receipt based
on objective evidence supplied by the vendor. Supply items are reviewed by the
requisitioner and, if acceptable, are accepted via annotation on the vendor packing
list or similar document. Similarly, equipment services are accepted by the
requisitioning lab person. Calibration services are accepted by QA based on
certification reviews. (See Section 11.0.)
Data reports from analytical subcontractors are evaluated by Program
Managers and subsequently by the Operations Manager (or designee) as part of
client report reviews.
Items are not used until accepted and if items or services are rejected, QA is
notified and nonconformance controls per Section 12.0 are followed. Vendors may
be removed from the approved vendor’s list if their performance is unacceptable.
Page 23 of 32
9.0
TEST SAMPLE IDENTIFICATION AND CONTROL
9.1
Sample Identification
Incoming samples are inspected for customer identification, container
condition, chain of custody forms, and radioactivity levels. If acceptable, the sample
information is entered into LIMS which generates bar coded labels for attachment to
the sample(s). The labels are attached and samples stored in the assigned location.
If environmental controls are needed (refrigeration, freezing, etc.), the samples are
placed in these storage locations. If not acceptable, the Program Manager is
notified, the customer contacted, and the problem resolved (return of sample, added
data receipts, etc.). See Procedure 4003 for more information on sample receipt.
9.2
LIMS
The LIMS is used to schedule work, provide special information to analysts,
and record all actions taken on samples. See Procedure 4017 and the 6000 series
of procedures for more information on LIMS operations.
9.3
Sample Control
The sample, with its bar coded label, is logged out to the applicable lab
operation where the sample is processed per the applicable methods (Procedures
2000 and 3000). The LIMS-assigned numbers are used for identification through all
operations to record data. Data is entered into LIMS, log books (kept by the
analysts) or equipment data systems to record data. The combination of LIMS,
logbooks, and equipment data systems provide the Chain of Custody data and
document all actions taken on samples. Unused sample portions are returned to its
storage area for possible verification use. Samples are discarded after required time
limits are passed and after client notification and approval, if required.
Page 24 of 32
10.0 SPECIAL PROCESSES, INSPECTION, AND TEST
10.1 Special Processes
The Laboratory’s special processes are the methods used to analyze a
sample and control equipment. These methods are defined in Procedures in the
2000 and 3000 series. These processes are performed to the qualified methods
(see Section 7.0) by qualified people (see 4.0).
10.2 Inspections and Tests
The quality of the process is monitored by indirect means. This program
involves calibration checks on counting equipments (see Section 11.0), intra-
laboratory checks, and inter-laboratory checks. In addition, some customers submit
quality control check samples (blinds, duplicates, external reference standards). All
generated data gets independent reviews.
10.2.1 Intra Laboratory Checks (QC Checks)
The quantity and types of checks varies with the method, but basic checks
which may include blanks, spiked blanks, matrix spikes, matrix spike duplicates, and
duplicates are used as appropriate for customer samples. This process is described
in Procedure 4005 and in Section 7.0.
10.2.2 Inter Laboratory Checks
TBE participates in Inter-lab performance evaluation (check) programs with
multiple higher level labs. These programs provide blind matrices for the types of
matrix/analyte combinations routinely processed by the Lab, if available. This
program is described in Procedure 4006.
10.2.3 Data Reviews
Raw data and reports are reviewed by the Operations Manager, or
designees.
This review checks for data logic, expected results, procedure
compliance, etc. (See Section 14.0).
10.3 Control of Sampling of Samples
Samples for analysis are supplied by customers preferably in quantities
sufficient to allow re-verification analyses if needed. The samples are prepared for
analysis by analysts and then an aliquot (partial sample extraction) is taken from the
homogeneous customer sample for the initial analysis. Methods specify standard
volumes of sample material required. Sampling data is recorded in LIMS and/or
logbooks.
10.4 Reference Standards / Material
Page 25 of 32
10.4.1 Weights and Temperatures
Reference standards are used by the Laboratory’s calibration vendor to
calibrate the Labs working instruments measuring weights and thermometers.
10.4.2 Radioactive Materials
Reference radioactive standards, traceable to NIST, are procured from higher
level laboratories. These reference materials are maintained in the standards area
and are diluted down for use by laboratory analysts. All original and diluted volumes
are fully traceable to source, procedure, analyst, dilution, and acquisition dates. See
Section 11.0 and Procedure 1009.
Page 26 of 32
11.0 EQUIPMENT MAINTENANCE AND CALIBRATION
11.1 General
There are two types of equipment used by the Laboratory:
support
equipment (scales, glassware, weights, thermometers, etc.) and instruments for
counting. Standards traceable to NIST are used for calibration and are of the
needed accuracy for laboratory operations. Procedures 1009, 4018, and 4019
describe the calibration and maintenance programs.
11.2 Support Equipment
Analytical support equipment is purchased with the necessary accuracies and
appropriate calibration data. If needed, initial calibration by the Laboratory or its
calibration vendor is performed. Recalibration schedules are established and
equipment recalibrated by the scheduled date by a calibration vendor or by
Laboratory personnel. Maintenance is performed, as needed, per manufacturer’s
manuals or lab procedures.
In addition to calibrations and recalibrations, checks are made on the
continued accuracy of items as described in Procedure 1009. Records are
maintained of calibration and specified checks.
11.3 Instruments
Instruments receive initial calibration using radioactive sources traceable to
NIST. The initial calibration establishes statistical limits of variation that are used to
set control limits for future checks and recalibration. This process is described in
Procedure 4018. Instruments are maintained per Instrument Manual requirements.
Recalibrations are performed per the Procedure.
Between calibrations, check sources are used to assure no significant
changes have occurred in the calibration of items. Background checks are
performed to check for possible radioactive contamination. Background values are
used to adjust sample results. Hardware and software are safeguarded from
adjustments that could invalidate calibrations or results.
11.4 Nonconformances and Corrective Actions
If calibrations or checks indicate a problem, the nonconformance system
(Section 12.0) and corrective action system (Section 13.0) are initiated to document
the problem and its resolution. Equipment is promptly removed from service if
questionable.
Page 27 of 32
11.5 Records
Records of calibrations are maintained.
Calibration certificates from
calibration vendors are maintained by QA. Other calibration data and check data is
maintained in log books, LIMS, or instrument software as appropriate and as
described in Procedures 1009, 4018, and 4019.
Page 28 of 32
12.0 NONCONFORMANCE CONTROLS
12.1 General
The nonconformance control system is implemented whenever a
nonconforming condition on any aspect of Laboratory analysis, testing, or results
exist. The system takes graded actions based on the nature and severity of the
nonconformance. Nonconforming items or processes are controlled to prevent
inadvertent use. Nonconformances are documented and dispositioned. Notification
is made to affected organizations, including clients. Procedure 1010 describes the
procedures followed. Sample results are only reported after resolution.
12.2 Responsibility and Authority
Each Laboratory employee has the responsibility to report nonconformances
and the authority to stop performing nonconforming work or using nonconforming
equipment. Laboratory supervision can disposition and take corrective actions on
minor problems.
Any significant problem is documented by QA using the
Laboratory’s NCR system per Procedure 1010. QA conducts or assures the conduct
of cause analyses, disposition of items or data, and initiation of corrective action if
the nonconformance could recur.
12.3 10CFR21 Reporting
The QA Manager reviews NCRs for possible need of customer and/or NRC
notification per the requirements of 10CFR21. Procedure 1011 is followed in this
review and for any required reporting.
Page 29 of 32
13.0 CORRECTIVE AND PREVENTIVE ACTIONS
13.1 General
The Laboratory takes corrective actions on significant nonconformances (see
Section 12.0). It also initiates preventive and improvement actions per the Company
Quality Policy (see Section 2.0). The procedures for Corrective Action/Preventive
Action systems are contained in Procedure 1012.
13.2 Corrective Actions
Corrective actions are taken by Operations and Quality to promptly correct
significant conditions adverse to quality. The condition is identified and cause
analysis is performed to identify root causes. Solutions are evaluated and the
optimum one selected that will prevent recurrence, can be implemented by the
Laboratory, allows the Laboratory to meet its other goals, and is commensurate with
the significance of the problem. All steps are documented, action plans developed
for major efforts, and reports made to Management. QA verifies the implementation
effectiveness. Procedure 1012 provides instructions and designates authorities and
responsibilities.
13.3 Preventive Actions
Preventive actions are improvements intended to reduce the potential for
nonconformances. Possible preventive actions are developed from suggestions
from employees and from analysis of Laboratory technical and quality systems by
management. If preventive actions or improvements are selected for investigation,
the issues, investigation, recommendations, and implementation actions are
documented. Follow up verifies effectiveness.
Page 30 of 32
14.0 RESULTS ANALYSIS AND REPORTING
14.1 General
The Laboratory’s role is to provide measurement-based information to clients
that is technically valid, legally defensible, and of known quality.
14.2 Results Review
The results obtained from analytical efforts are collected and reviewed by the
Operations Manager and the Program Manager.
This review verifies the
reasonableness and consistency of the results. It includes review of sample and the
related QC activity data. Procedure 4002 describes the process. Any deficiencies
are corrected by re-analyses, recalculations, or corrective actions per Sections 12.0
and 13.0. Use of the LIMS with its automatic data loading features (see Procedure
4017) minimizes the possibility of transcription or calculation errors.
14.3 Reports
Reports range from simple results reporting to elaborate analytical reports
based on the client requirements and imposed specifications and standards. (See
Procedure 4004.) Reports present results accurately, clearly, unambiguously,
objectively, and as required by the applicable Method(s).
Reports include
reproduction restrictions, information on any deviations from methods, and any
needed data qualifiers based on QC data. If any data is supplied by analytical
subcontractors (see Section 8.0), it is clearly identified and attributed to that
Laboratory by either name or accreditation number.
If results are faxed or transmitted electronically, confidentiality statements are
included in case of receipt by other than the intended client.
Reports are approved by the Program Manager and Operations Manager and
record copies kept in file (See Section 15.0).
Page 31 of 32
15.0 RECORDS
15.1 General
The Laboratory collects generated data and information related to quality or
technical data and maintains them as records. Records are identified, prepared,
reviewed, placed in storage, and maintained as set forth in Procedure 1003.
15.2 Type of Records
All original observations, calculations, derived data, calibration data, and test
reports are included. In addition QA data such as audits, management reviews,
corrective and preventive actions, manuals, and procedures are included.
15.3 Storage and Retention
Records are stored in files after completion in the lab. Files are in specified
locations and under the control of custodians. Filing systems provide for retrieval.
Electronic files are kept on Company servers (with regular back up) or on media
stored in fireproof file cabinets. Records are kept in Laboratory files for at least 2
years after the last entry and then in Company files for another year as a minimum.
Some customers specify larger periods – up to 7 years – which is also met. Generic
records supporting multiple customers are kept for the longest applicable period.
15.4 Destruction or Disposal
Records may be destroyed after the retention period and after client
notification and acceptance, if required. If the Laboratory closes, records will go in to
company storage in Huntsville unless otherwise directed by customers. If the
Laboratory is sold, either the new owner will accept record ownership or the records
will go into Company storage as stated above.
Page 32 of 32
16.0 ASSESSMENTS
16.1 General
Assessments consist of internal audits and management reviews as set forth
in Procedure 1013.
16.2 Audits
Internal audits are planned, performed at least annually on all areas of the
quality system, and are performed by qualified people who are as independent as
possible from the activity audited.
(The Laboratory’s small size inhibits full
independence in some technical areas.) Audits are coordinated by the Quality
Manager who assures audit plans and checklists are generated and the results
documented. Reports include descriptions of any findings and provide the auditor’s
assessment of the effectiveness of the audited activity. Report data includes
personnel contacted.
Audit findings are reviewed with management and corrective actions agreed
to and scheduled. Follow up is performed by QA to verify accomplishment and
effectiveness of the corrective action.
16.3 Management Reviews
The Annual Quality Assurance Report, prepared for some clients, is the
Management Review vehicle. These reports cover audit results, corrective and
preventive actions, external assessments, and QC and inter-laboratory performance
checks. The report is reviewed with Management by the QA Manager for the
continued suitability of the Quality Program and its effectiveness. Any needed
improvements are defined, documented, and implemented. Follow ups are made to
verify implementation and effectiveness.
Revision 0
045136 (13) Byron Generating Station
APPENDIX D
LABORATORY ANALYTICAL REPORTS
D.1
ENVIRONMENTAL, INC.
D.2
TELEDYNE BROWN ENGINEERING, INC.
Revision 0
045136 (13) Byron Generating Station
D.1
ENVIRONMENTAL, INC.
Revision 0
045136 (13) Byron Generating Station
D.2
TELEDYNE BROWN ENGINEERING, INC.
L28413 1 of 45
L28413 2 of 45
L28413 3 of 45
L28413 4 of 45
L28413 5 of 45
L28413 6 of 45
L28413 7 of 45
L28413 8 of 45
L28413 9 of 45
L28413 10 of 45
L28413 11 of 45
L28413 12 of 45
L28413 13 of 45
L28413 14 of 45
L28413 15 of 45
L28413 16 of 45
L28413 17 of 45
L28413 18 of 45
L28413 19 of 45
L28413 20 of 45
L28413 21 of 45
L28413 22 of 45
L28413 23 of 45
L28413 24 of 45
L28413 25 of 45
L28413 26 of 45
L28413 27 of 45
L28413 28 of 45
L28413 29 of 45
L28413 30 of 45
L28413 31 of 45
L28413 32 of 45
L28413 33 of 45
L28413 34 of 45
L28413 35 of 45
L28413 36 of 45
L28413 37 of 45
L28413 38 of 45
L28413 39 of 45
L28413 40 of 45
L28413 41 of 45
L28413 42 of 45
L28413 43 of 45
L28413 44 of 45
L28413 45 of 45
L28414 1 of 44
L28414 2 of 44
L28414 3 of 44
L28414 4 of 44
L28414 5 of 44
L28414 6 of 44
L28414 7 of 44
L28414 8 of 44
L28414 9 of 44
L28414 10 of 44
L28414 11 of 44
L28414 12 of 44
L28414 13 of 44
L28414 14 of 44
L28414 15 of 44
L28414 16 of 44
L28414 17 of 44
L28414 18 of 44
L28414 19 of 44
L28414 20 of 44
L28414 21 of 44
L28414 22 of 44
L28414 23 of 44
L28414 24 of 44
L28414 25 of 44
L28414 26 of 44
L28414 27 of 44
L28414 28 of 44
L28414 29 of 44
L28414 30 of 44
L28414 31 of 44
L28414 32 of 44
L28414 33 of 44
L28414 34 of 44
L28414 35 of 44
L28414 36 of 44
L28414 37 of 44
L28414 38 of 44
L28414 39 of 44
L28414 40 of 44
L28414 41 of 44
L28414 42 of 44
L28414 43 of 44
L28414 44 of 44
L28431 1 of 147
L28431 2 of 147
L28431 3 of 147
L28431 4 of 147
L28431 5 of 147
L28431 6 of 147
L28431 7 of 147
L28431 8 of 147
L28431 9 of 147
L28431 10 of 147
L28431 11 of 147
L28431 12 of 147
L28431 13 of 147
L28431 14 of 147
L28431 15 of 147
L28431 16 of 147
L28431 17 of 147
L28431 18 of 147
L28431 19 of 147
L28431 20 of 147
L28431 21 of 147
L28431 22 of 147
L28431 23 of 147
L28431 24 of 147
L28431 25 of 147
L28431 26 of 147
L28431 27 of 147
L28431 28 of 147
L28431 29 of 147
L28431 30 of 147
L28431 31 of 147
L28431 32 of 147
L28431 33 of 147
L28431 34 of 147
L28431 35 of 147
L28431 36 of 147
L28431 37 of 147
L28431 38 of 147
L28431 39 of 147
L28431 40 of 147
L28431 41 of 147
L28431 42 of 147
L28431 43 of 147
L28431 44 of 147
L28431 45 of 147
L28431 46 of 147
L28431 47 of 147
L28431 48 of 147
L28431 49 of 147
L28431 50 of 147
L28431 51 of 147
L28431 52 of 147
L28431 53 of 147
L28431 54 of 147
L28431 55 of 147
L28431 56 of 147
L28431 57 of 147
L28431 58 of 147
L28431 59 of 147
L28431 60 of 147
L28431 61 of 147
L28431 62 of 147
L28431 63 of 147
L28431 64 of 147
L28431 65 of 147
L28431 66 of 147
L28431 67 of 147
L28431 68 of 147
L28431 69 of 147
L28431 70 of 147
L28431 71 of 147
L28431 72 of 147
L28431 73 of 147
L28431 74 of 147
L28431 75 of 147
L28431 76 of 147
L28431 77 of 147
L28431 78 of 147
L28431 79 of 147
L28431 80 of 147
L28431 81 of 147
L28431 82 of 147
L28431 83 of 147
L28431 84 of 147
L28431 85 of 147
L28431 86 of 147
L28431 87 of 147
L28431 88 of 147
L28431 89 of 147
L28431 90 of 147
L28431 91 of 147
L28431 92 of 147
L28431 93 of 147
L28431 94 of 147
L28431 95 of 147
L28431 96 of 147
L28431 97 of 147
L28431 98 of 147
L28431 99 of 147
L28431 100 of 147
L28431 101 of 147
L28431 102 of 147
L28431 103 of 147
L28431 104 of 147
L28431 105 of 147
L28431 106 of 147
L28431 107 of 147
L28431 108 of 147
L28431 109 of 147
L28431 110 of 147
L28431 111 of 147
L28431 112 of 147
L28431 113 of 147
L28431 114 of 147
L28431 115 of 147
L28431 116 of 147
L28431 117 of 147
L28431 118 of 147
L28431 119 of 147
L28431 120 of 147
L28431 121 of 147
L28431 122 of 147
L28431 123 of 147
L28431 124 of 147
L28431 125 of 147
L28431 126 of 147
L28431 127 of 147
L28431 128 of 147
L28431 129 of 147
L28431 130 of 147
L28431 131 of 147
L28431 132 of 147
L28431 133 of 147
L28431 134 of 147
L28431 135 of 147
L28431 136 of 147
L28431 137 of 147
L28431 138 of 147
L28431 139 of 147
L28431 140 of 147
L28431 141 of 147
L28431 142 of 147
L28431 143 of 147
L28431 144 of 147
L28431 145 of 147
L28431 146 of 147
L28431 147 of 147
L28642 1 of 28
L28642 2 of 28
L28642 3 of 28
L28642 4 of 28
L28642 5 of 28
L28642 6 of 28
L28642 7 of 28
L28642 8 of 28
L28642 9 of 28
L28642 10 of 28
L28642 11 of 28
L28642 12 of 28
L28642 13 of 28
L28642 14 of 28
L28642 15 of 28
L28642 16 of 28
L28642 17 of 28
L28642 18 of 28
L28642 19 of 28
L28642 20 of 28
L28642 21 of 28
L28642 22 of 28
L28642 23 of 28
L28642 24 of 28
L28642 25 of 28
L28642 26 of 28
L28642 27 of 28
L28642 28 of 28
Revision 0
045136 (13) Byron Generating Station
APPENDIX E
DATA VALIDATION MEMORANDUM