IN THE MATTER OF :
SITE SPECIFIC PETITION OF
MOBIL OIL CORPORATION FOR
RELIEF FROM 35 ILL. ADM. CODE 304 .122,
AMMONIA NITROGEN EFFLUENT STANDARDS
NOTICE OF FILING
To:
See Attached Service List
PLEASE TAKE NOTICE that this day I have filed with the Illinois Pollution Control
Board a
PETITION FOR SITE-SPECIFIC RELIEF FROM 35 ILL . ADM. CODE 304
.122,
AMMONIA NITROGEN EFFLUENT STANDARDS
on behalf of Mobil Oil Corporation . Copies
are attached and served upon you .
Respectfully submitted,
BEFORE THE POLLUTION CONTROL BOARD
OF THE STATE OF ILLINOIS
RECEIVED
CLERK'S OFFICE
APR 2 4 1997
STATE Oh ILUNUIS
POLLUTION
CONTROL BOARD
R97-
(Water - Regulatory)
Dated: April 24, 1997
ROSS & HARDIES
James T. Harrington,
Esq .
David L . Rieser, Esq .
David A . Piech, Esq .
150 North Michigan Avenue
Suite 2500
Chicago, Illinois 60601
(312) 558-1000
THIS FILING IS SUBMITTED ON RECYCLED PAPER
BEFORE THE POLLUTION CONTROL BOARD
OF THE STATE OF ILLINOIS
RECEIVED
CLERK'S OFFICE
APR 2 4 1997
STATE Of- ILLINOIS
POLLUTION CONTROL
OARD
IN THE MATTER OF
:
)
SITE SPECIFIC PETITION OF
)
R97-
MOBIL OIL CORPORATION FOR
)
(Water - Regulatory)
RELIEF FROM 35 ILL. ADM. CODE 304 .122,
)
AMMONIA NITROGEN EFFLUENT STANDARDS )
PETITION FOR SITE-SPECIFIC RELIEF
FROM 35 ILL . ADM
. CODE 304 .122,
AMMONIA NITROGEN EFFLUENT STANDARDS
The Mobil Oil Corporation (Mobil), by and through its attorneys, Ross &
Hardies, files this petition to seek site-specific relief from 35 Ill
. Adm. Code 304 .122 and to
propose site-specific effluent standard for discharges from Mobil's Joliet, Illinois' refinery .
BACKGROUND AND DESCRIPTION OF THE RELIEF SOUGHT
1 .
On January 7, 1988, the Illinois Pollution Control Board ('Board")
granted Mobil site-specific relief from the ammonia nitrogen standard of 35 Ill
. Adm . Code
304 .122 . (In the matter of
: Proposal of Mobil Oil Corporation to Amend the Water Pollution
Regulations,
R84-16, January 7, 1988) The Board adopted Section 304 .214 which included
ammonia nitrogen effluent standards applicable only to the Joliet refinery in its discharge to
the Des Plaines River but provided that those site-specific standards would terminate as of
December 31, 1993 .
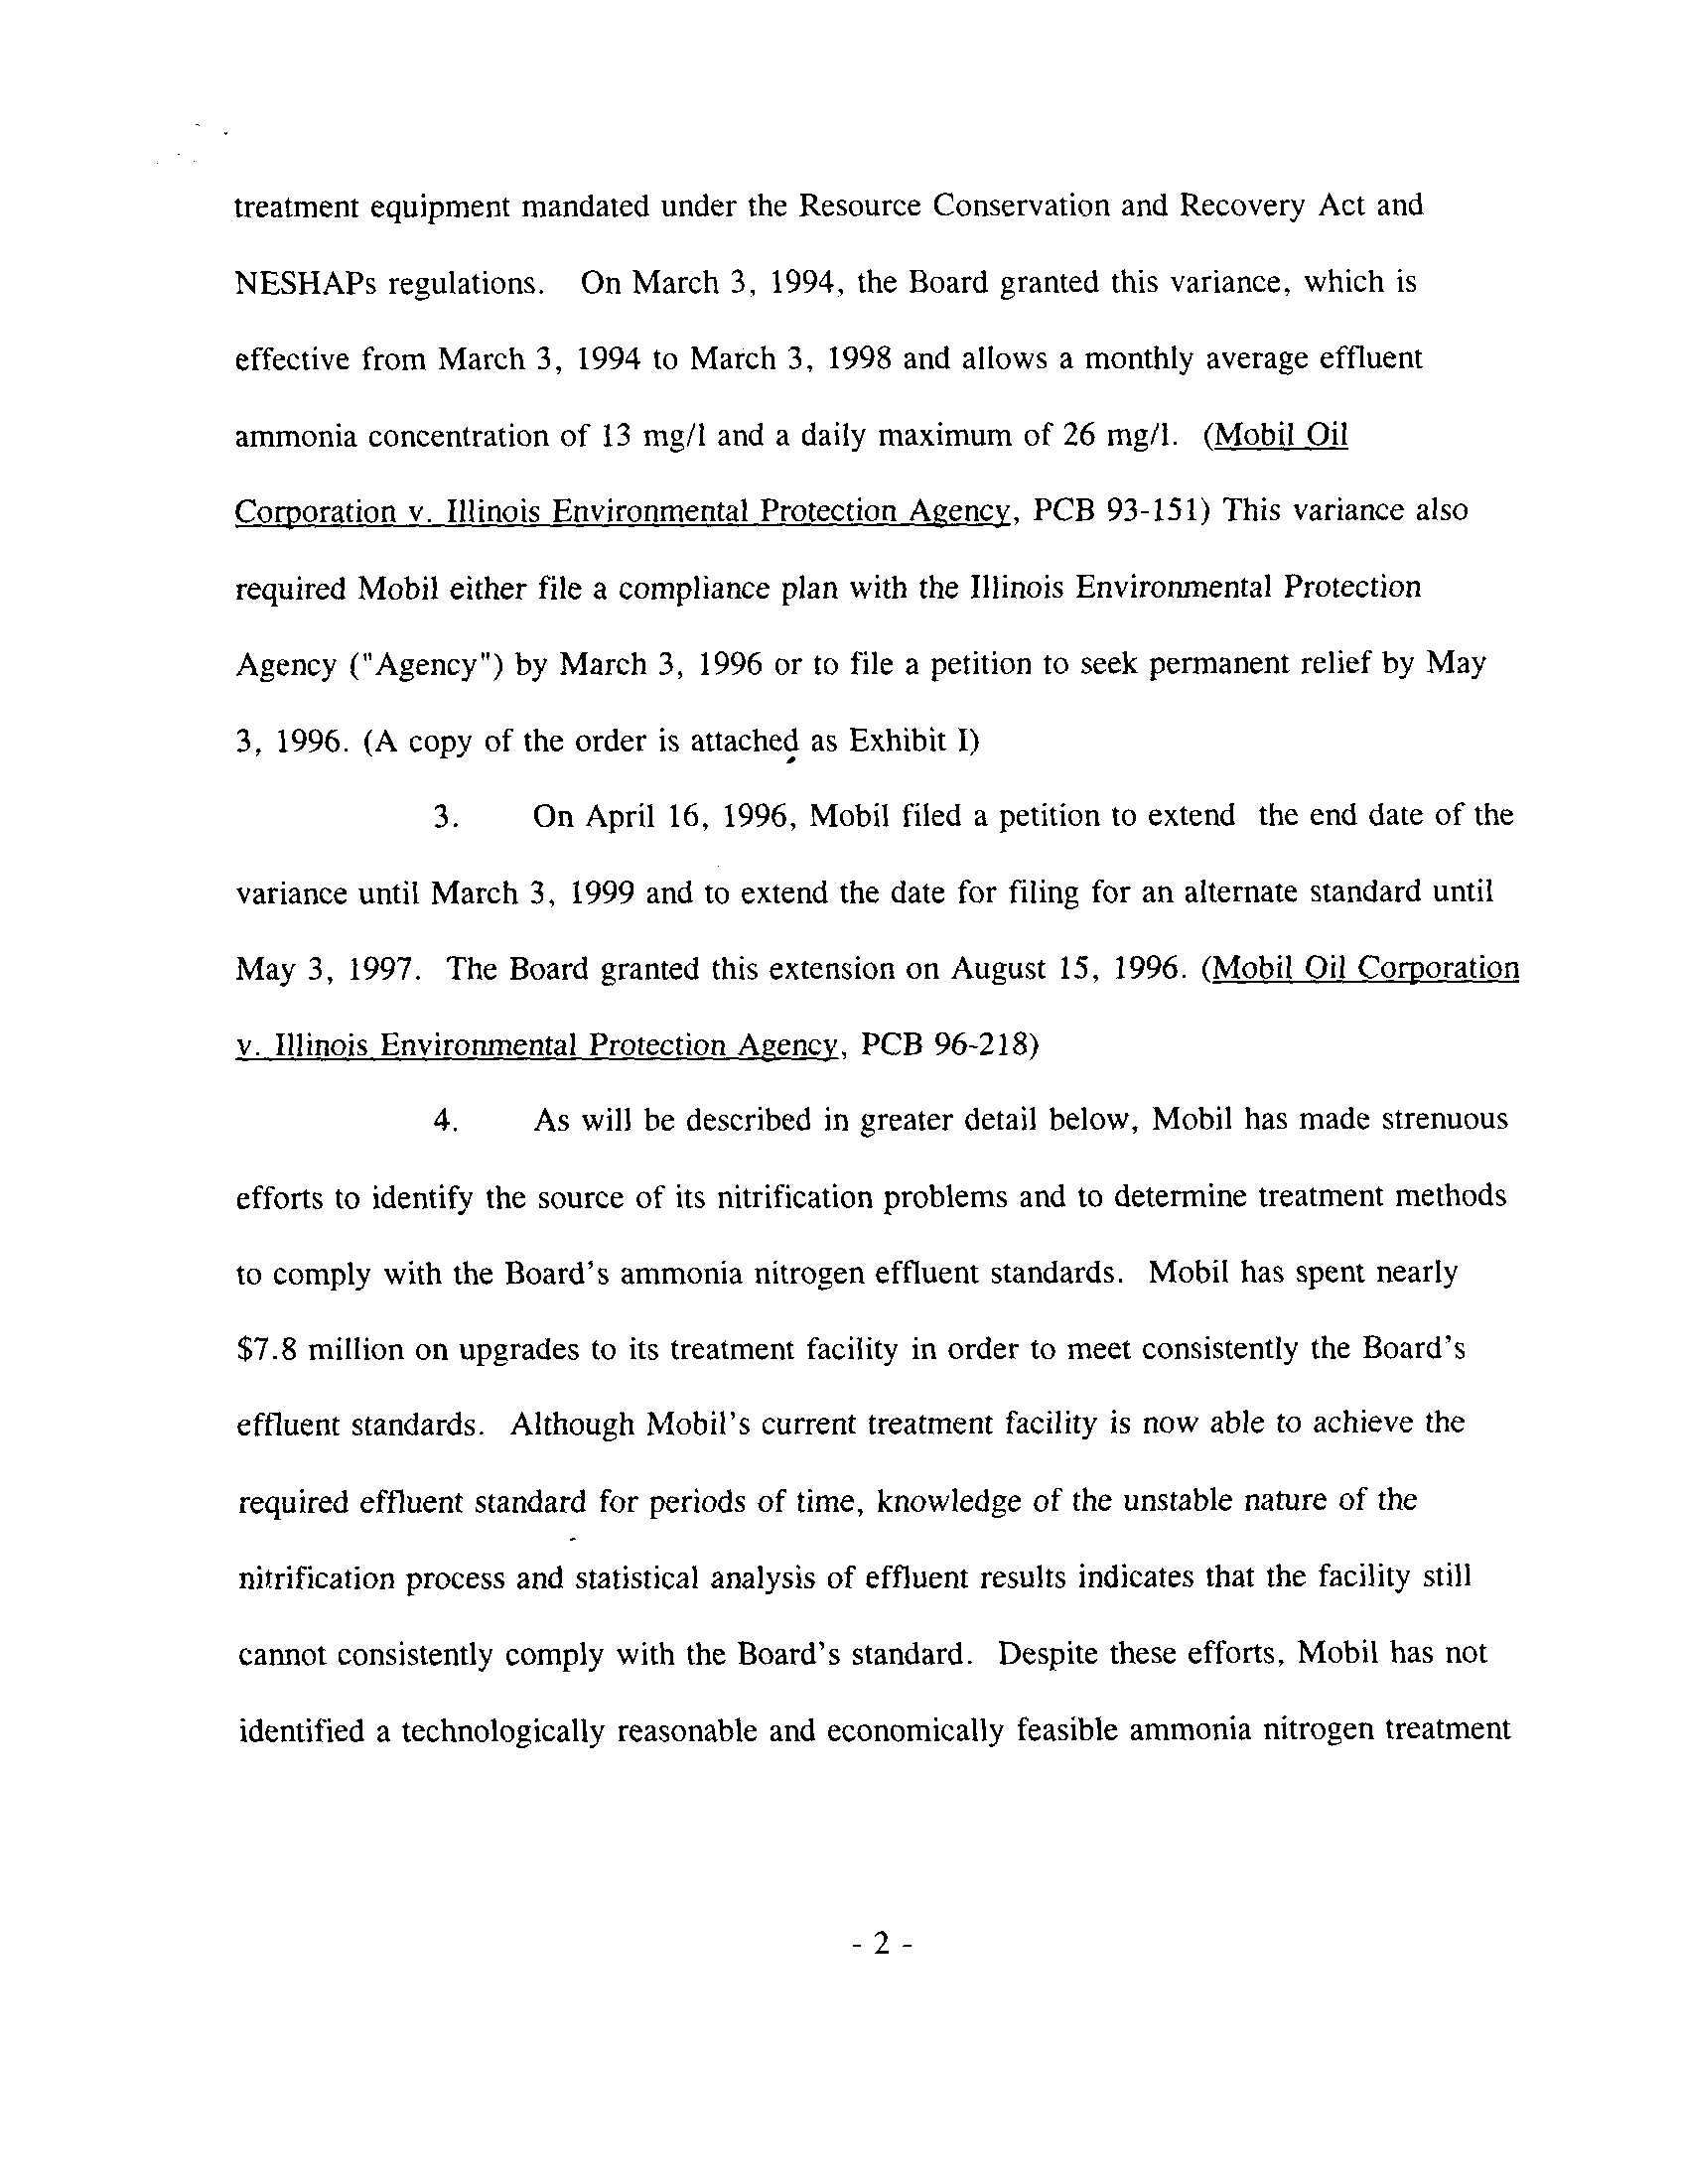
2 .
On August 18, 1993, Mobil petitioned the Board for a variance from
Section 304 .122, identifying continuing nitrification problems caused by the inclusion of
THIS FILING SUBMITTED ON RECYCLED PAPER
treatment equipment mandated under the Resource Conservation and Recovery Act and
NESHAPs regulations .
On March 3, 1994, the Board granted this variance, which is
effective from March 3, 1994 to March 3, 1998 and allows a monthly average effluent
ammonia concentration of 13 mg/l and a daily maximum of 26 mg/1 . (Mobil Oil
Corporation v . Illinois Environmental Protection Agency, PCB 93-151) This variance also
required Mobil either file a compliance plan with the Illinois Environmental Protection
Agency ("Agency") by March 3, 1996 or to file a petition to seek permanent relief by May
3, 1996. (A copy of the order is attached as Exhibit I)
3 .
On April 16, 1996, Mobil filed a petition to extend the end date of the
variance until March 3, 1999 and to extend the date for filing for an alternate standard until
May 3, 1997 . The Board granted this extension on August 15, 1996 . (Mobil Oil Corporation
v. Illinois Environmental Protection Agency, PCB 96-218)
4.
As will be described in greater detail below, Mobil has made strenuous
efforts to identify the source of its nitrification problems and to determine treatment methods
to comply with the Board's ammonia nitrogen effluent standards
. Mobil has spent nearly
$7 .8 million on upgrades to its treatment facility in order to meet consistently the Board's
effluent standards
. Although Mobil's current treatment facility is now able to achieve the
required effluent standard for periods of time, knowledge of the unstable nature of the
nitrification process and statistical analysis of effluent results indicates that the facility still
cannot consistently comply with the Board's standard
. Despite these efforts, Mobil has not
identified a technologically reasonable and economically feasible ammonia nitrogen treatment
2
system which will be guaranteed to achieve the required effluent values . Therefore, Mobil
now files this petition to seek permanent site-specific relief .
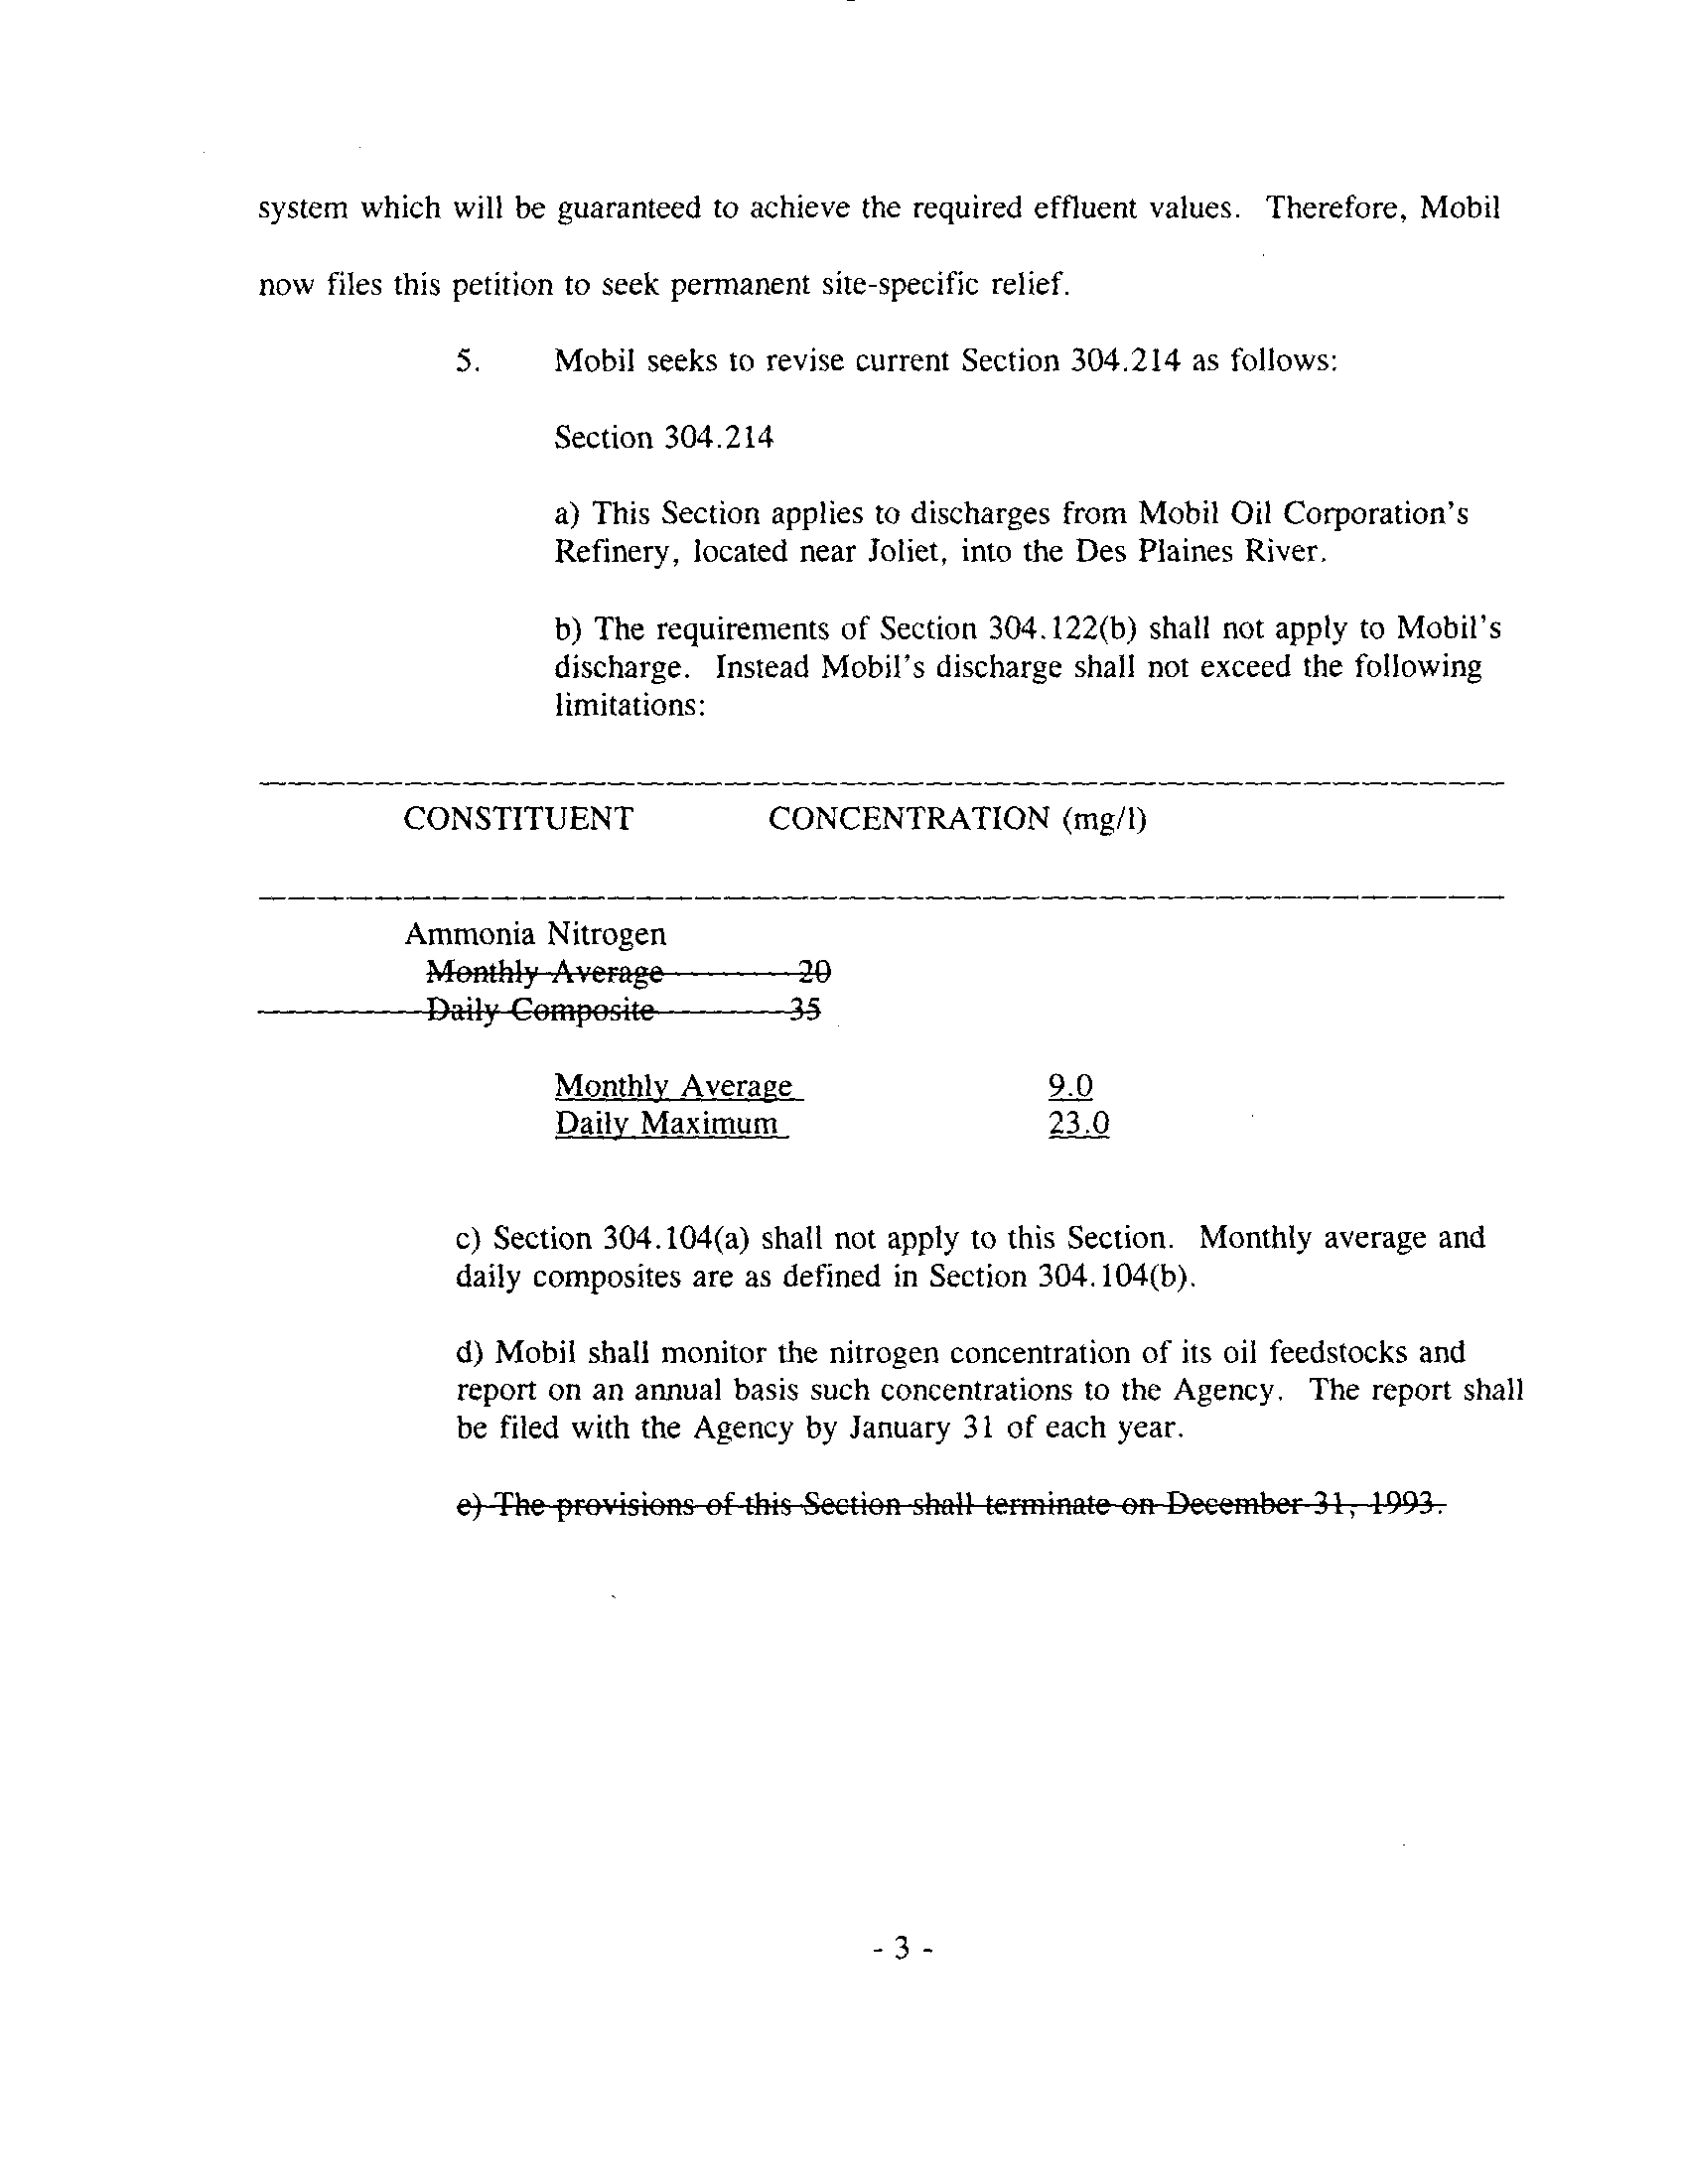
5 .
Mobil seeks to revise current Section 304 .214 as follows
:
Section 304
.214
a) This Section applies to discharges from Mobil Oil Corporation's
Refinery, located near Joliet, into the Des Plaines River .
b) The requirements of Section 304 .122(b) shall not apply to Mobil's
discharge . Instead Mobil's discharge shall not exceed the following
limitations
:
Monthly Average 20
Daily Composite 35
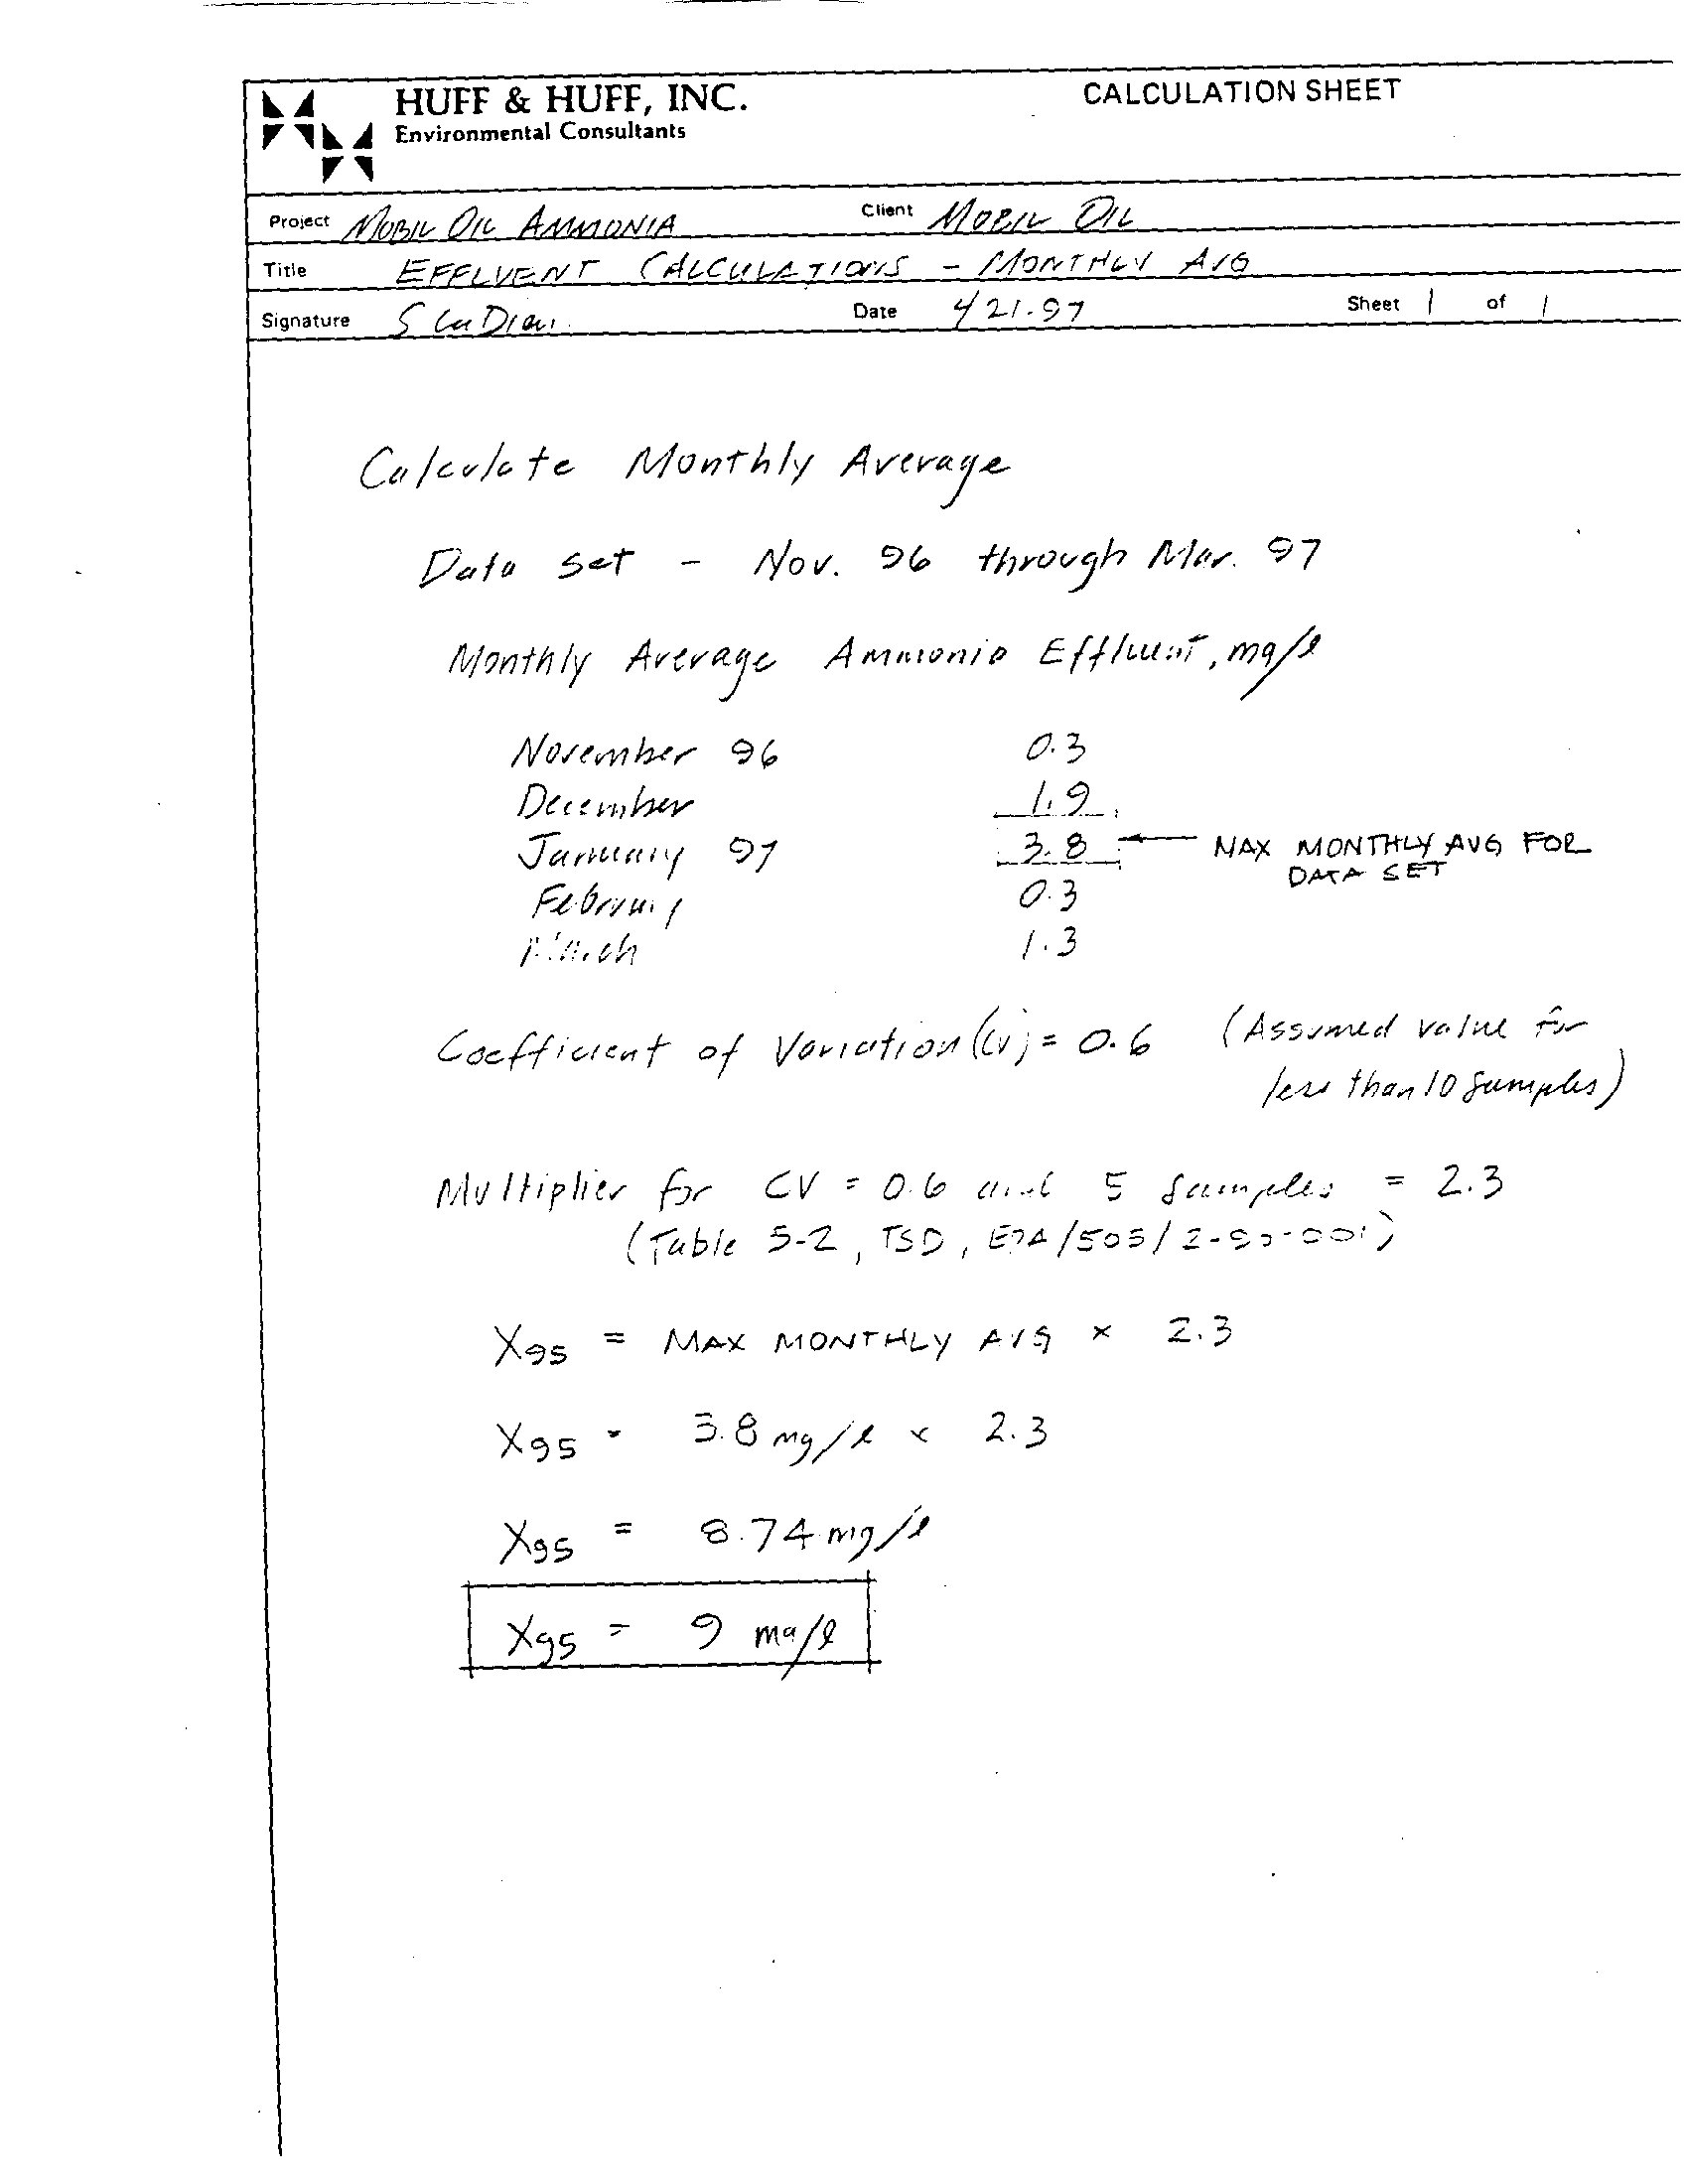
Monthly Average
9 .0
Daily Maximum
23 .0
c) Section 304 .104(a) shall not apply to this Section . Monthly average and
daily composites are as defined in Section 304 .104(b) .
d) Mobil shall monitor the nitrogen concentration of its oil feedstocks and
report on an annual basis such concentrations to the Agency . The report shall
be filed with the Agency by January 31 of each year
.
e) The provisions
of this Section shall terminate on December 31, 1993 .
----------------------------------------
CONSTITUENT
CONCENTRATION (mg/1)
--
---------------------------------------- --
Ammonia Nitrogen
DESCRIPTION OF THE FACILITY
6.
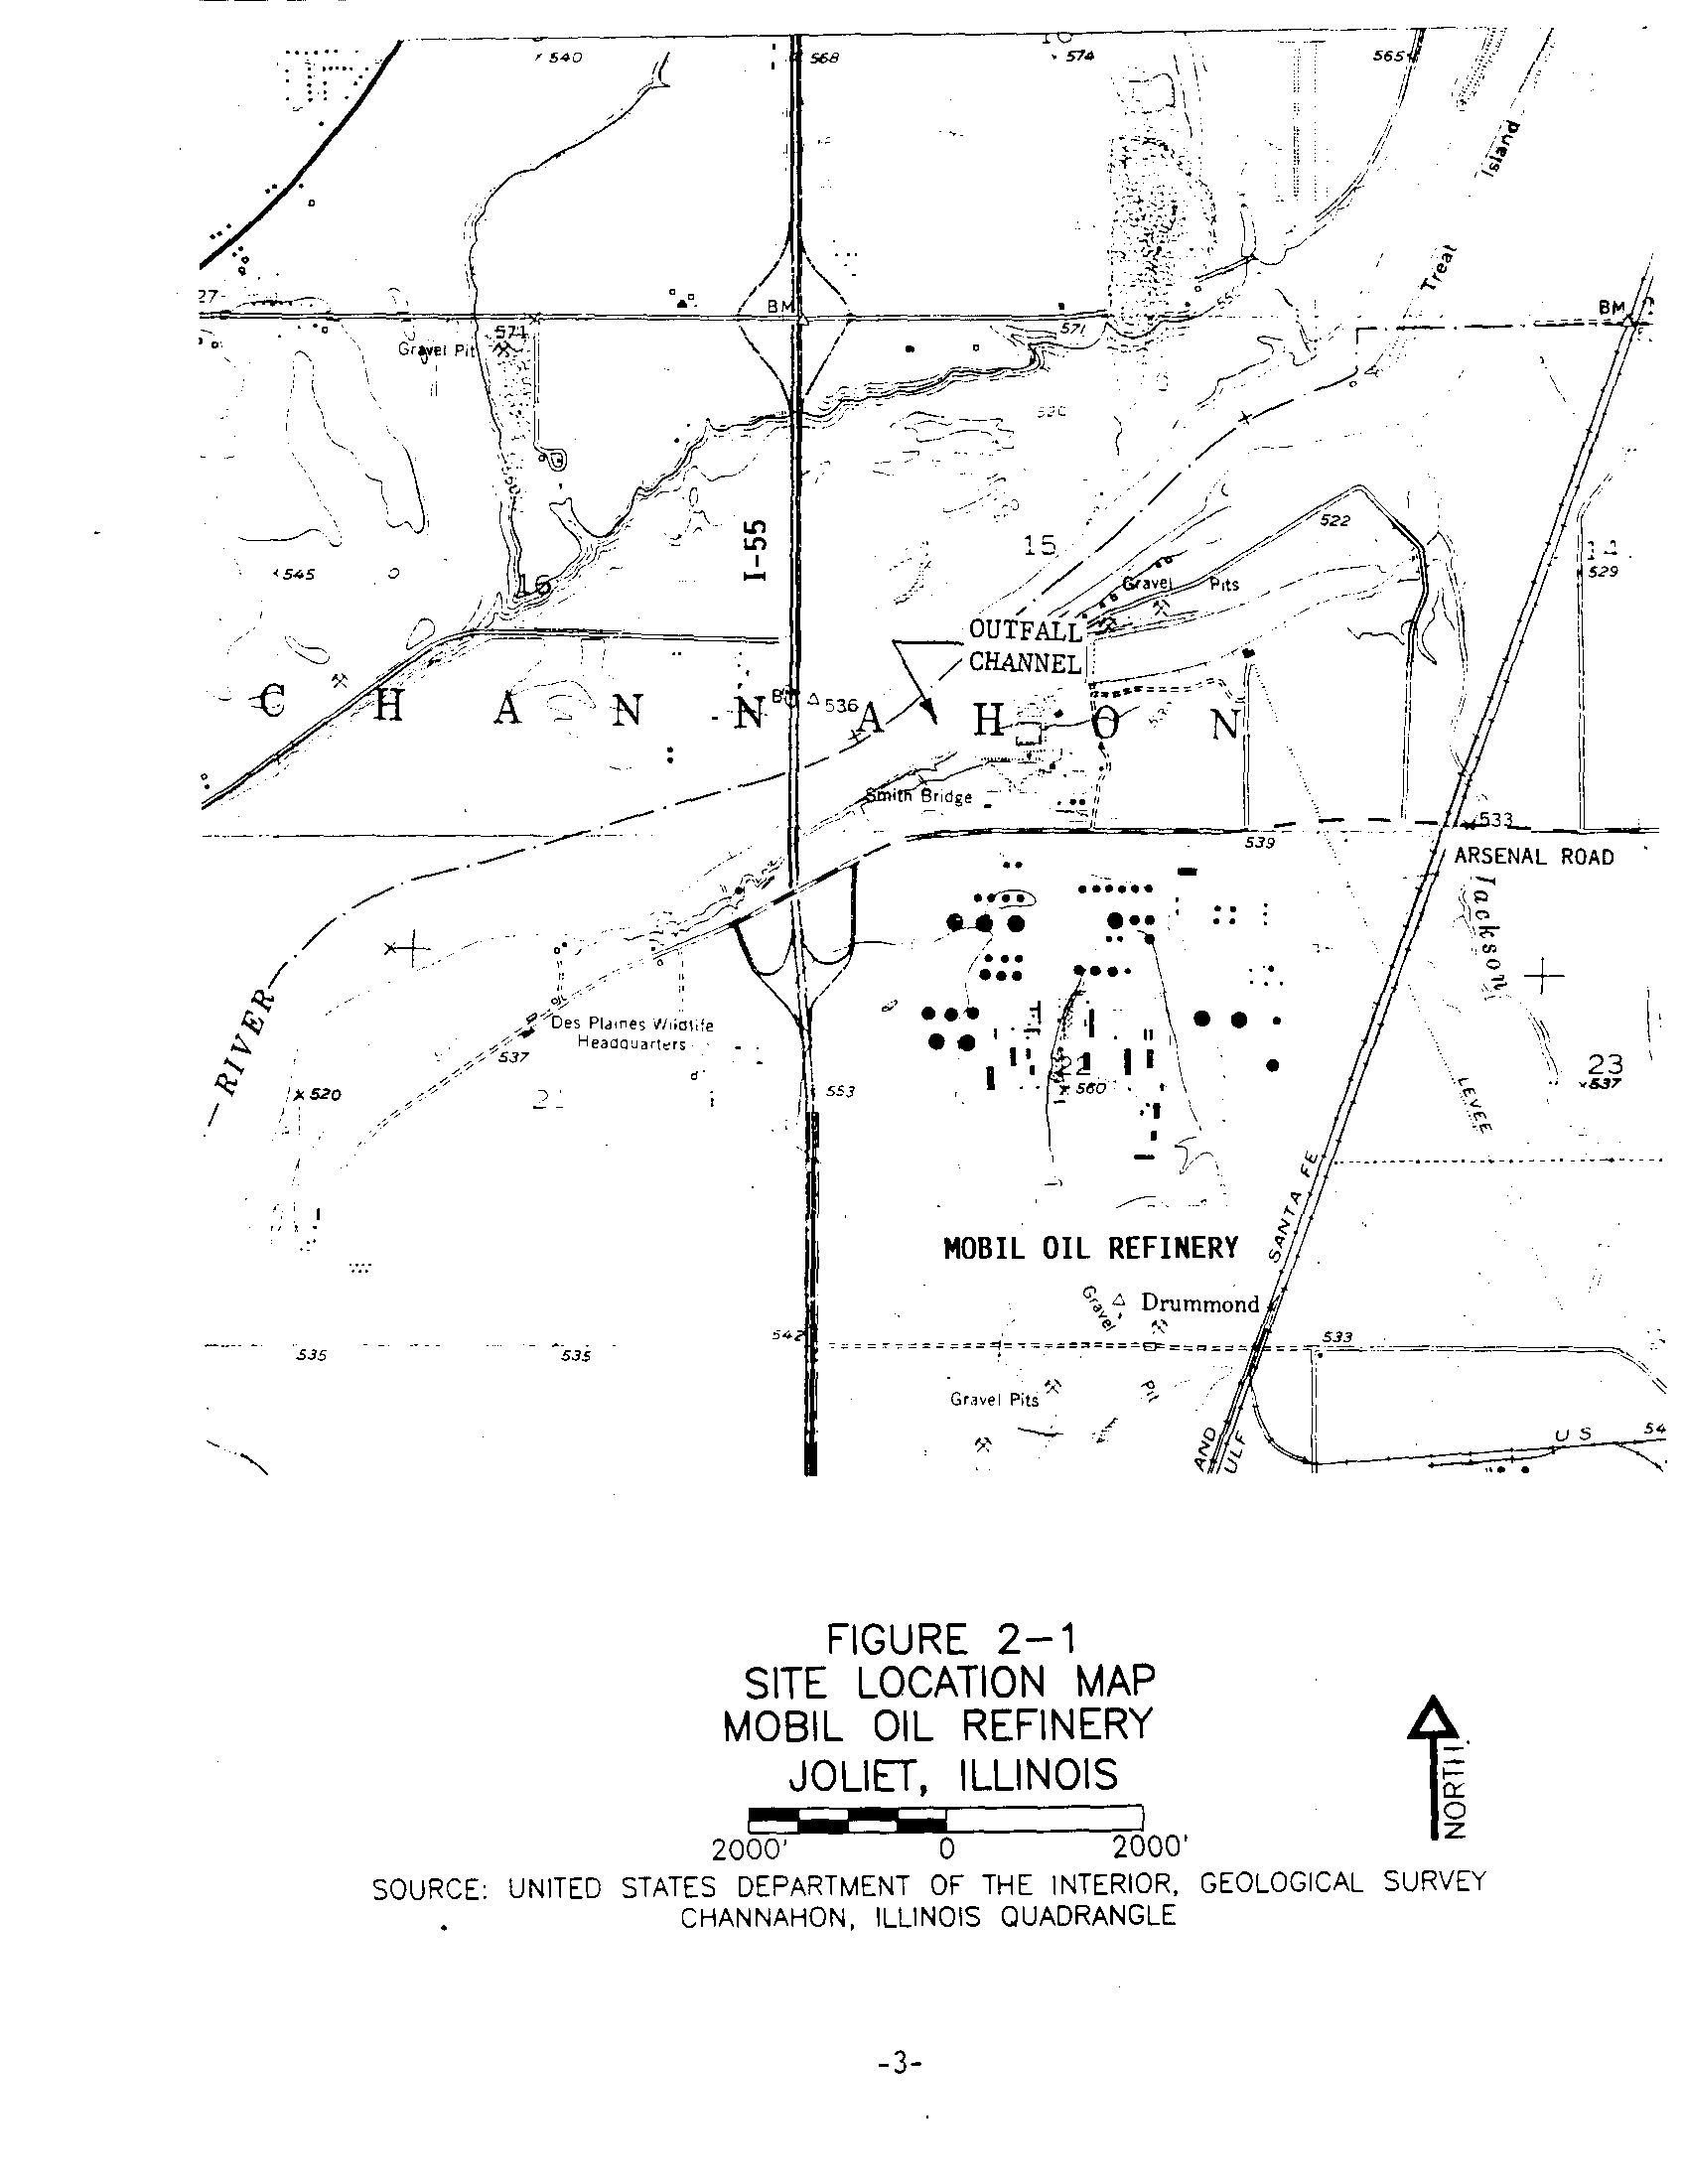
Mobil owns and operates a petroleum refinery located on Arsenal Road
near Interstate 55
in Channahon Township, Will County, Illinois, with access to the southern
bank of the Des Plaines River . This location is approximately 10 miles southwest of Joliet
and 45 miles southwest of Chicago .
7 .
The Joliet Refinery is Mobil's newest domestic refining facility,
beginning operations in early 1973 . It has a rated capacity of 200,000 barrels of crude oil
throughput per operating day and employs approximately
575
persons
. The refinery has
been uniquely designed to process high sulfur and high nitrogen North American crudes,
which currently comprise 70% of total throughput. Designated a "conventional fuels"
refinery, its principal products are motor gasolines and distillate fuel oil. Other products
include kerosene jet fuel, propane, petroleum coke, sulfur, and some heavy fuel oil . The
products produced at Joliet Refinery are primarily transported by pipeline or barge for
marketing in Illinois and other midwestern states .
8 .
The refinery uses Des Plaines River water for boiler feed, cooling
tower make-up, and non-contact cooling
. Well water is used for drinking, sanitary purposes,
and general services . Separate sewer systems have been provided to segregate the various
types of water discharged into the Des Plaines River . These include clean stormwater
(Outfall
003), noncontact cooling water (Outfall 002), and process water which is treated at
the refinery's wastewater treatment facility before release to the river (Outfall 001)
.
Advanced water conservation practices were incorporated in the refinery design, including
:
•
Extensive Air Cooling
-4-
•
Cooling Tower Recycle to Minimize Blowdown
•
Steam Condensate Recovery
•
Condensate Reuse for Process Water
•
Stripped Sour Water Reused for Crude Desalting and Process Wash Water
•
Self Contained Coker Water System
9 .
In fact, only 14 gallons of water are used per barrel of crude refined .
This compares with an average of 39 gallons per barrel for the calculated U .S . EPA Best
Available Technology economically achievable (BAT) flow for a refinery of Joliet's size .
However, the conservation efforts inevitably result in more concentrated effluent . In the case
of Mobil Refinery, the multiple between allowable BAT flow and the actual flow is 2
.8 (39
gal/BBL/14 gal/BBL) . If a similar ratio were applied to the existing ammonia nitrogen
standard, it would result in an "equivalent" increase from 3 .0 mg/1 to 8 .4 mg/1 .
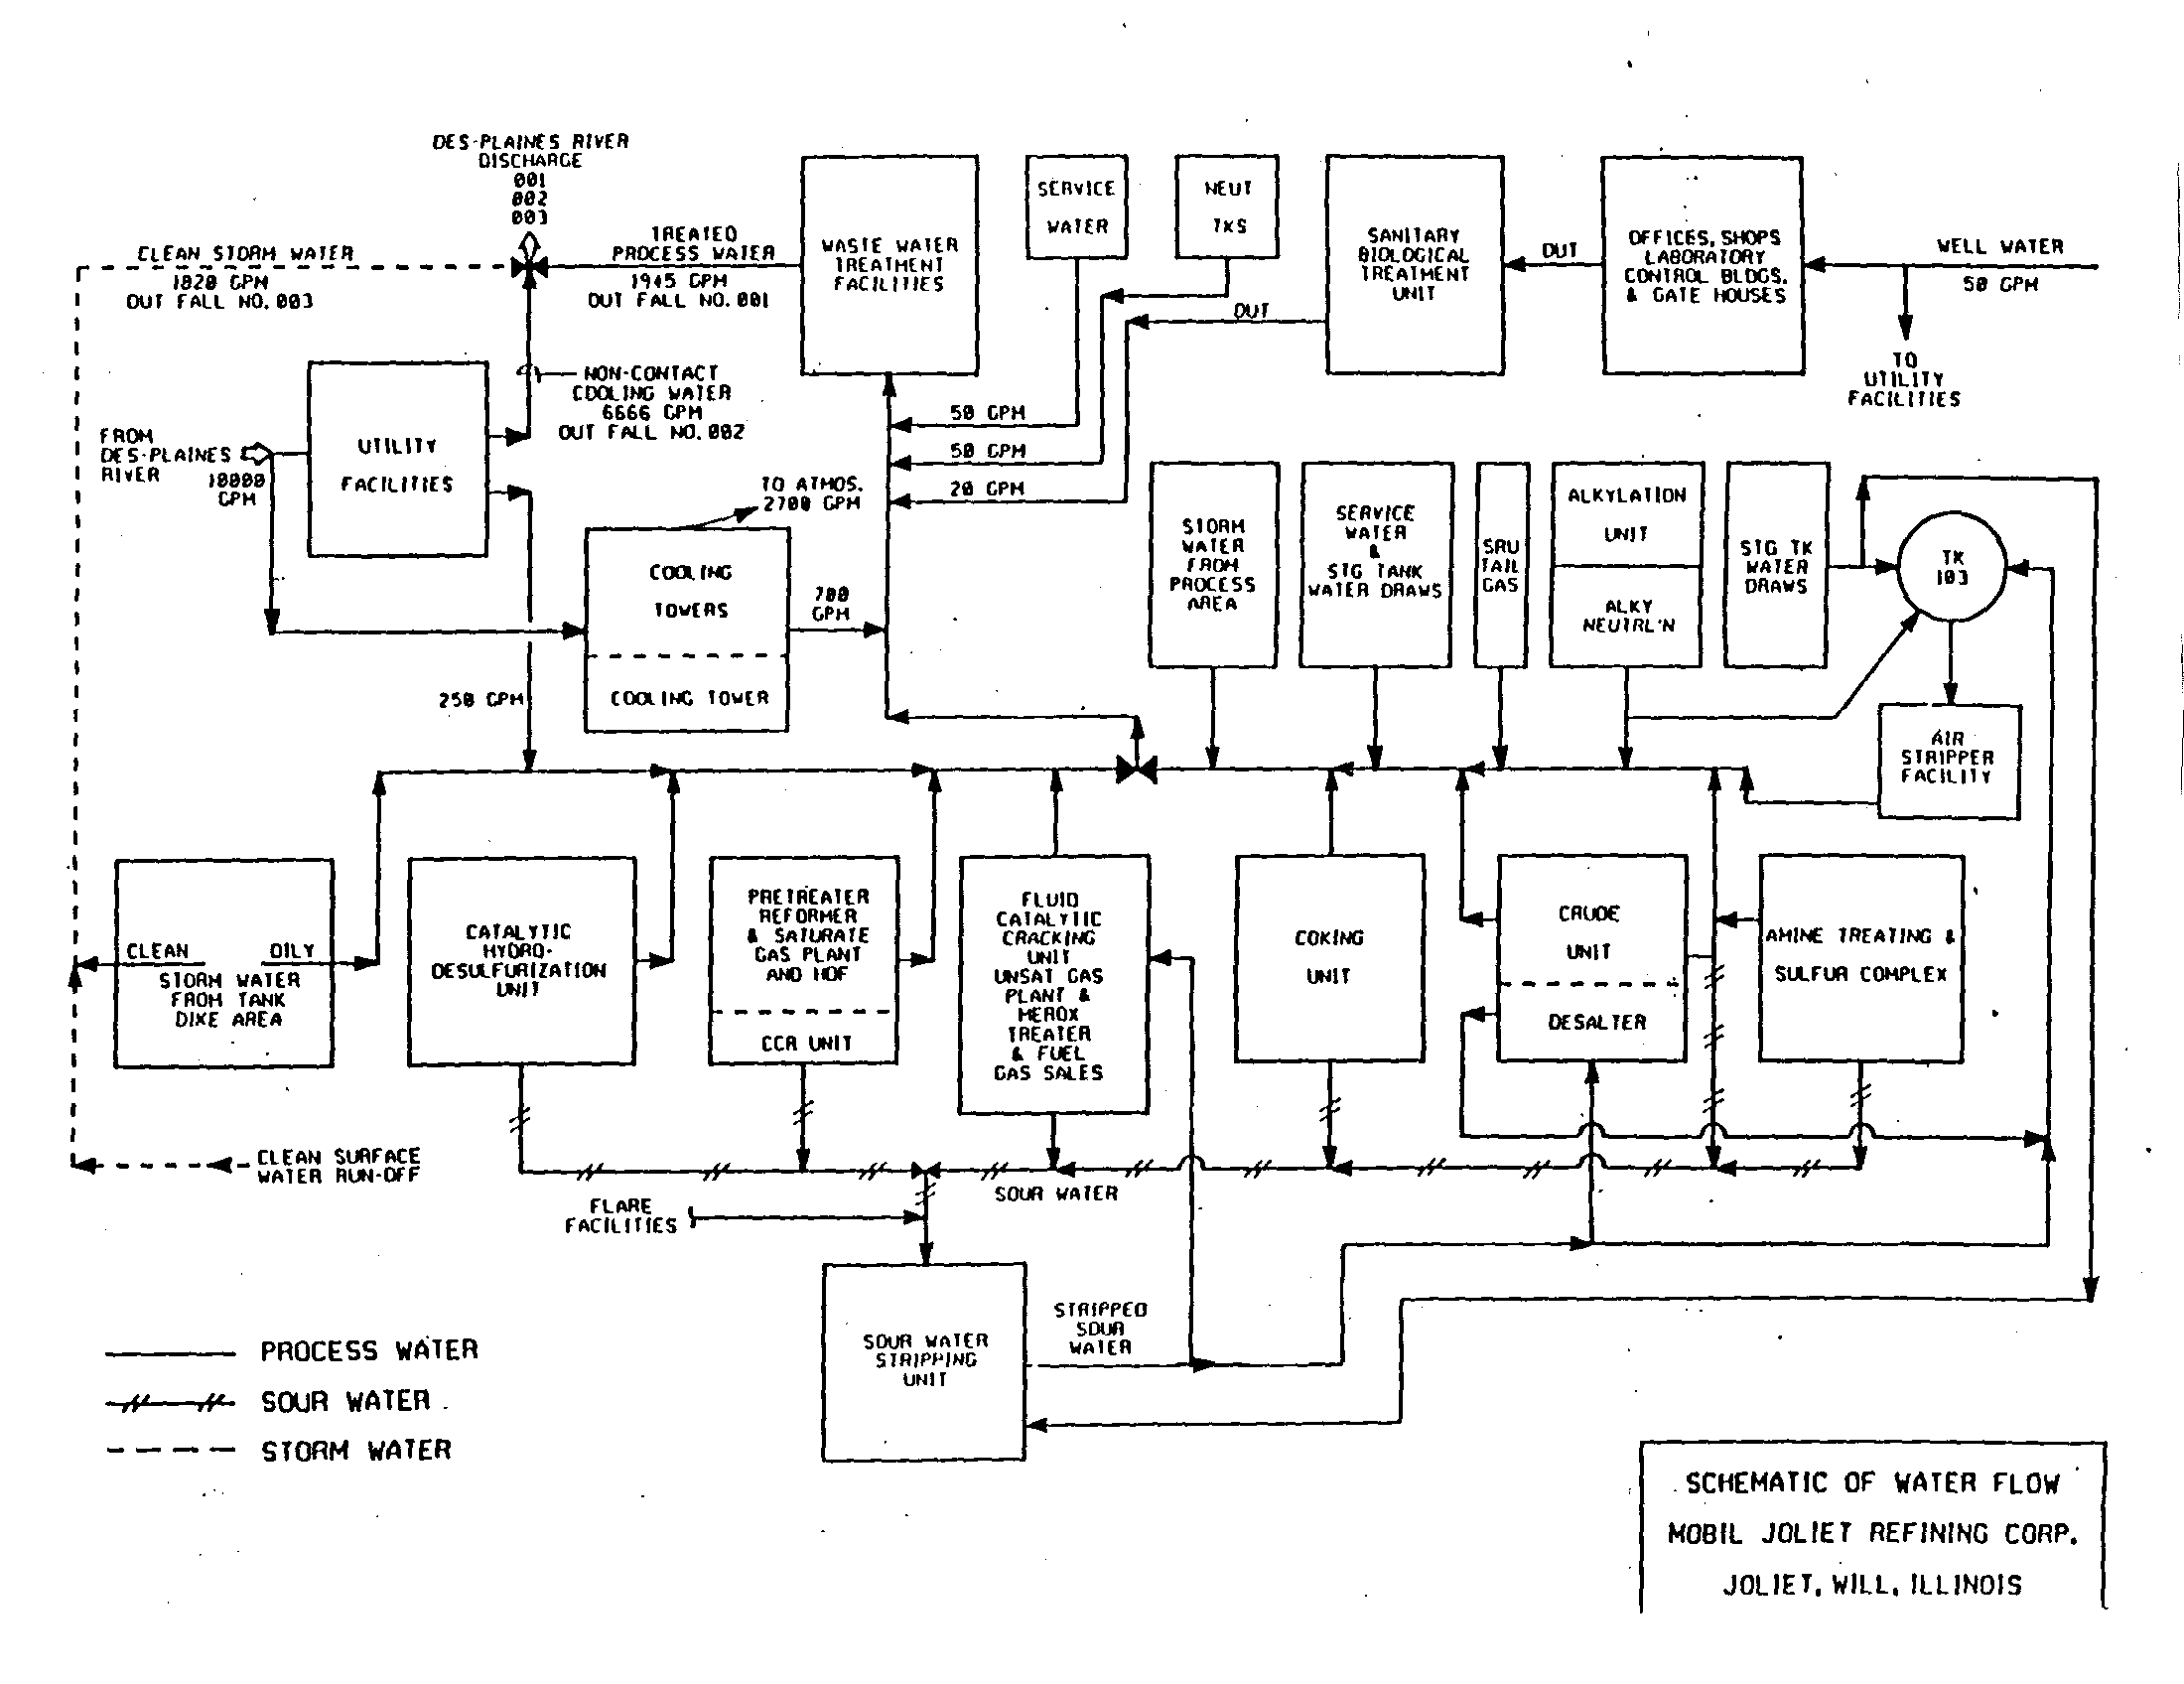
WASTEWATER TREATMENT
10.
An average of about 1900 gallons per minute (GPM) of process
wastewater and contaminated surface run-off is processed through the Refinery Wastewater
Treatment Plant (WWTP), shown in Figure I . This is mainly accomplished by a program to
increase cooling tower recycling and in-plant water reuse, thereby lessening water discharge
to the sewer. In comparison, the calculated U
.S
. EPA Best Available Technology
economically achievable (BAT) guidelines flow for a refinery of Joliet's size and
configuration is about 5200 gpm.
11 .
The Waste Water Treatment process consists of :
•
Sour Water Stripper
Primary removal of ammonia and sulfide
5
-6-
12.
The WWTP discharge is maintained in compliance with all applicable
federal and state limitations except for previously noted exceedences of the ammonia nitrogen
standard which led to the filing of the variance
. With the exception of the facility's ammonia
nitrogen monthly average in January, 1995 (caused by an upset in another treatment unit),
and March and April of 1996 (caused by a release from a product storage unit) Mobil has
complied with its variance limitations from March 1994 to the present
.
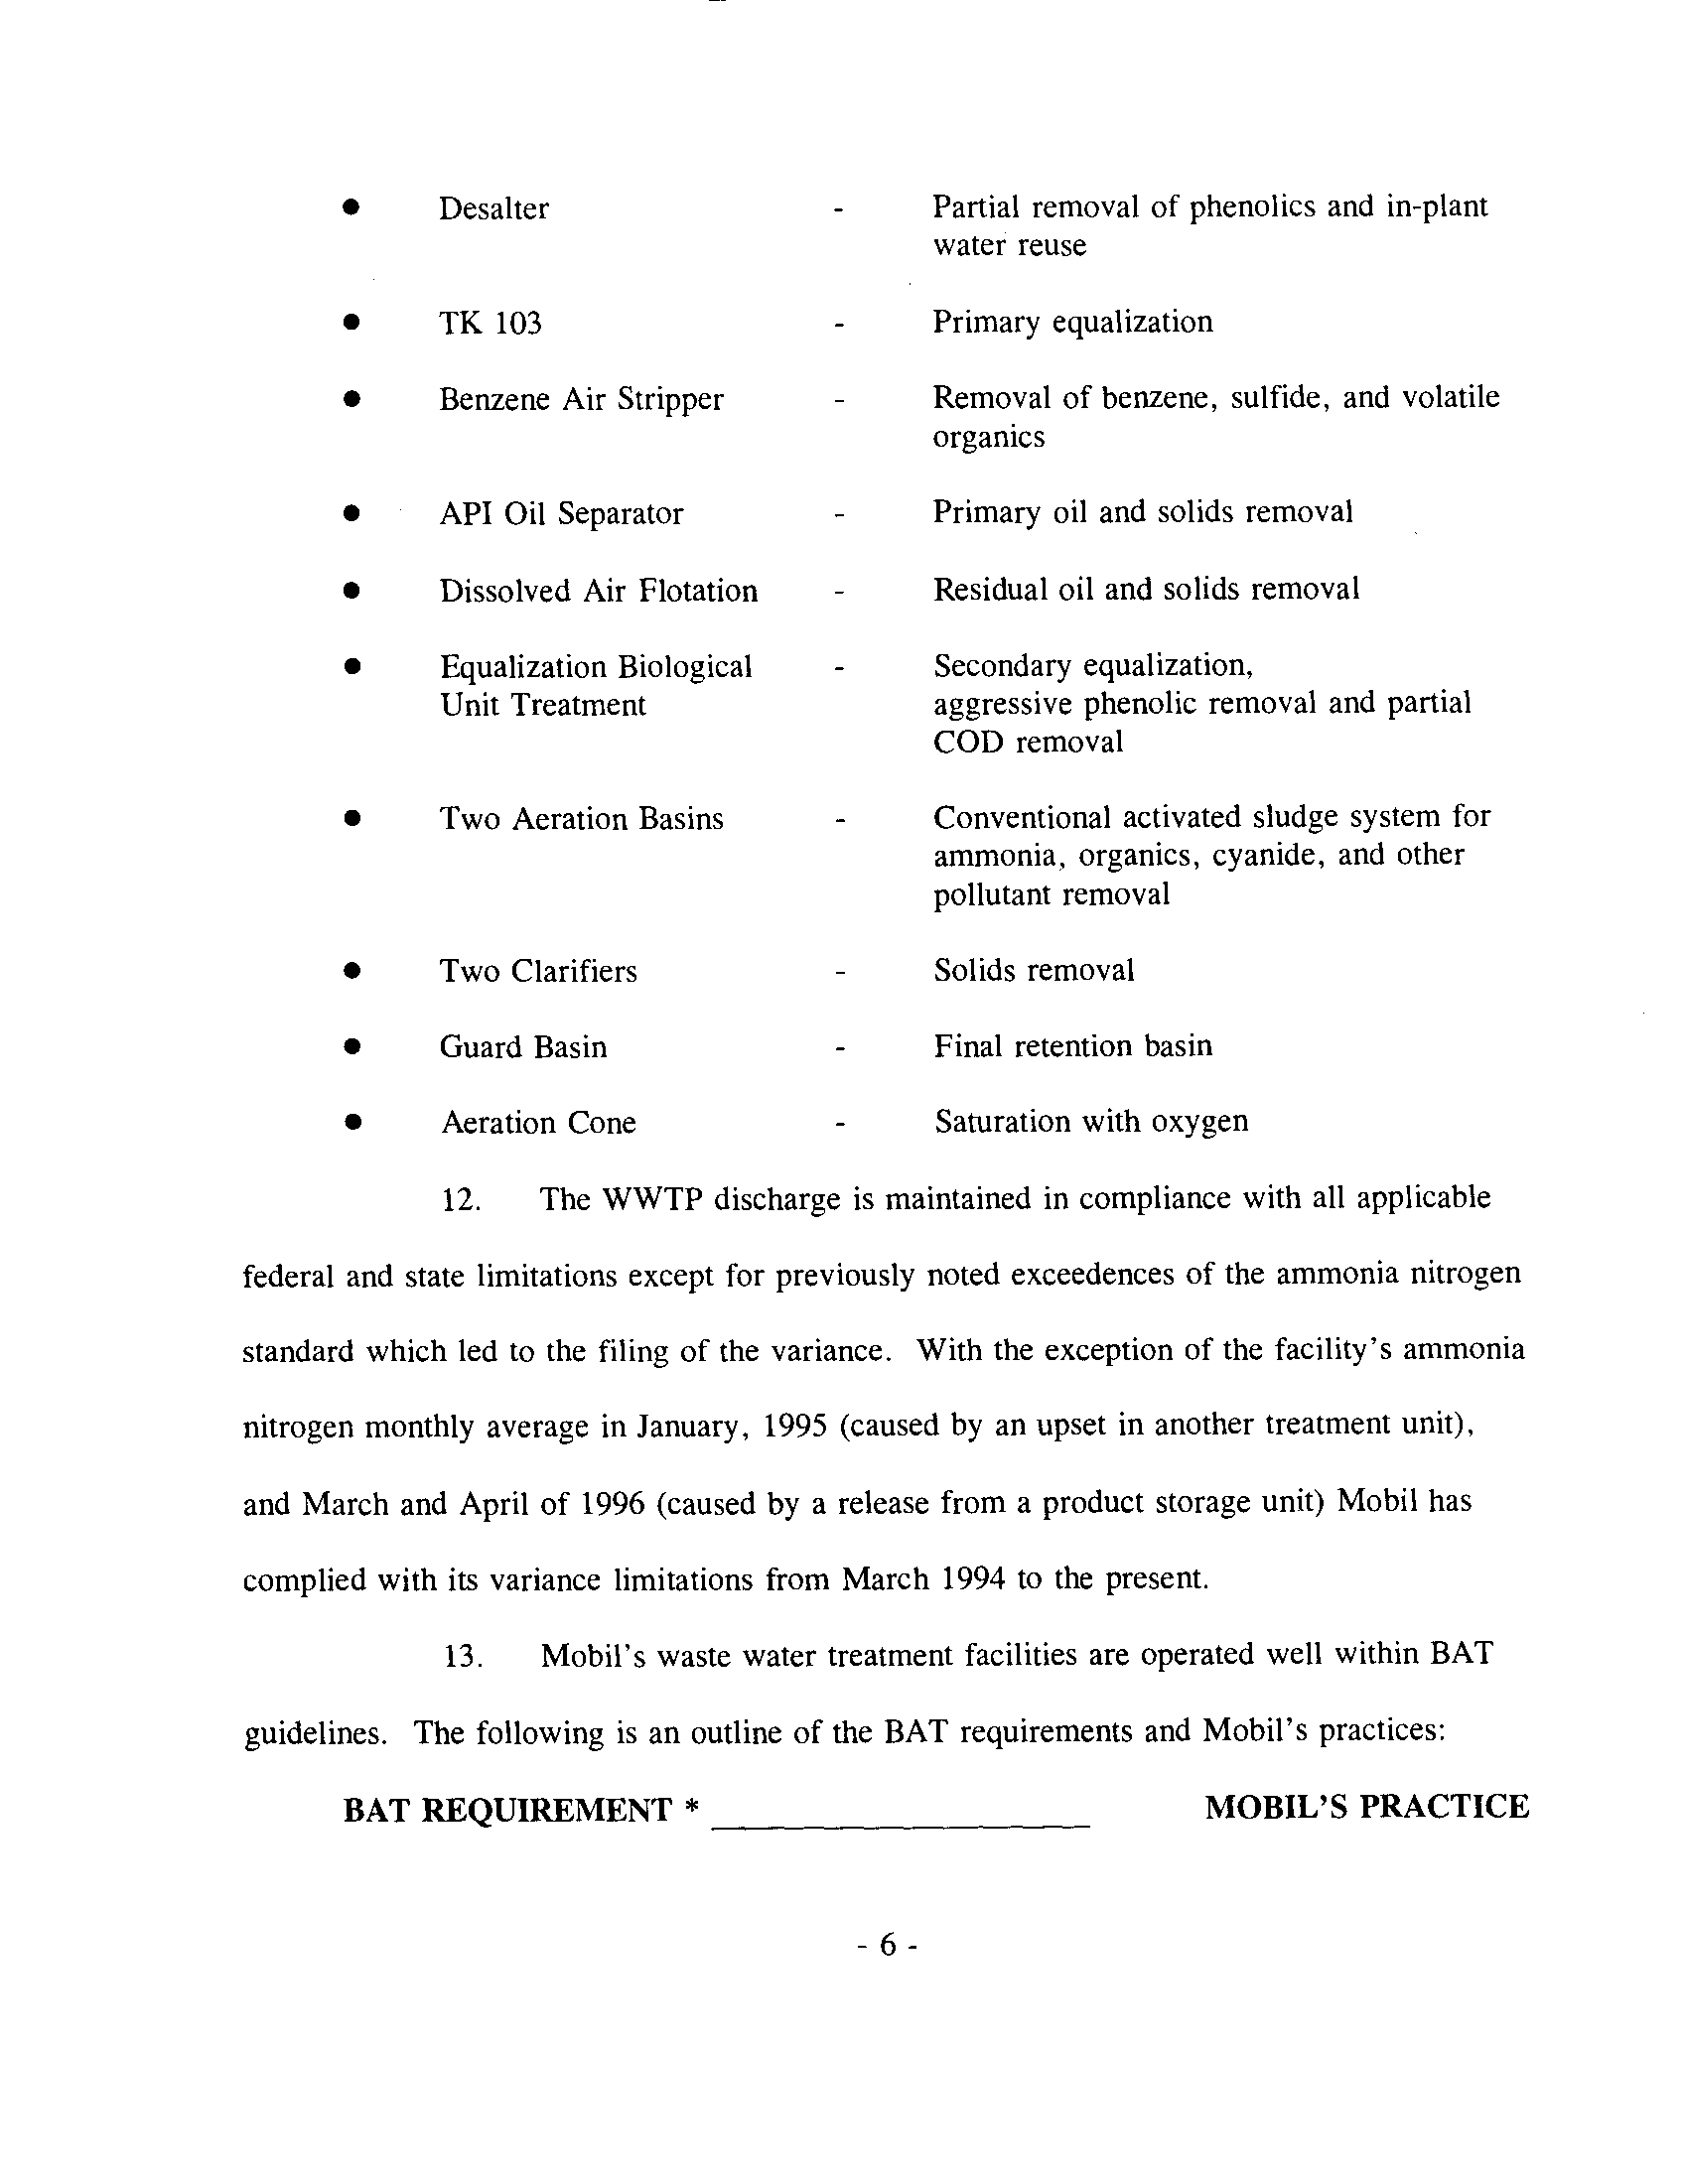
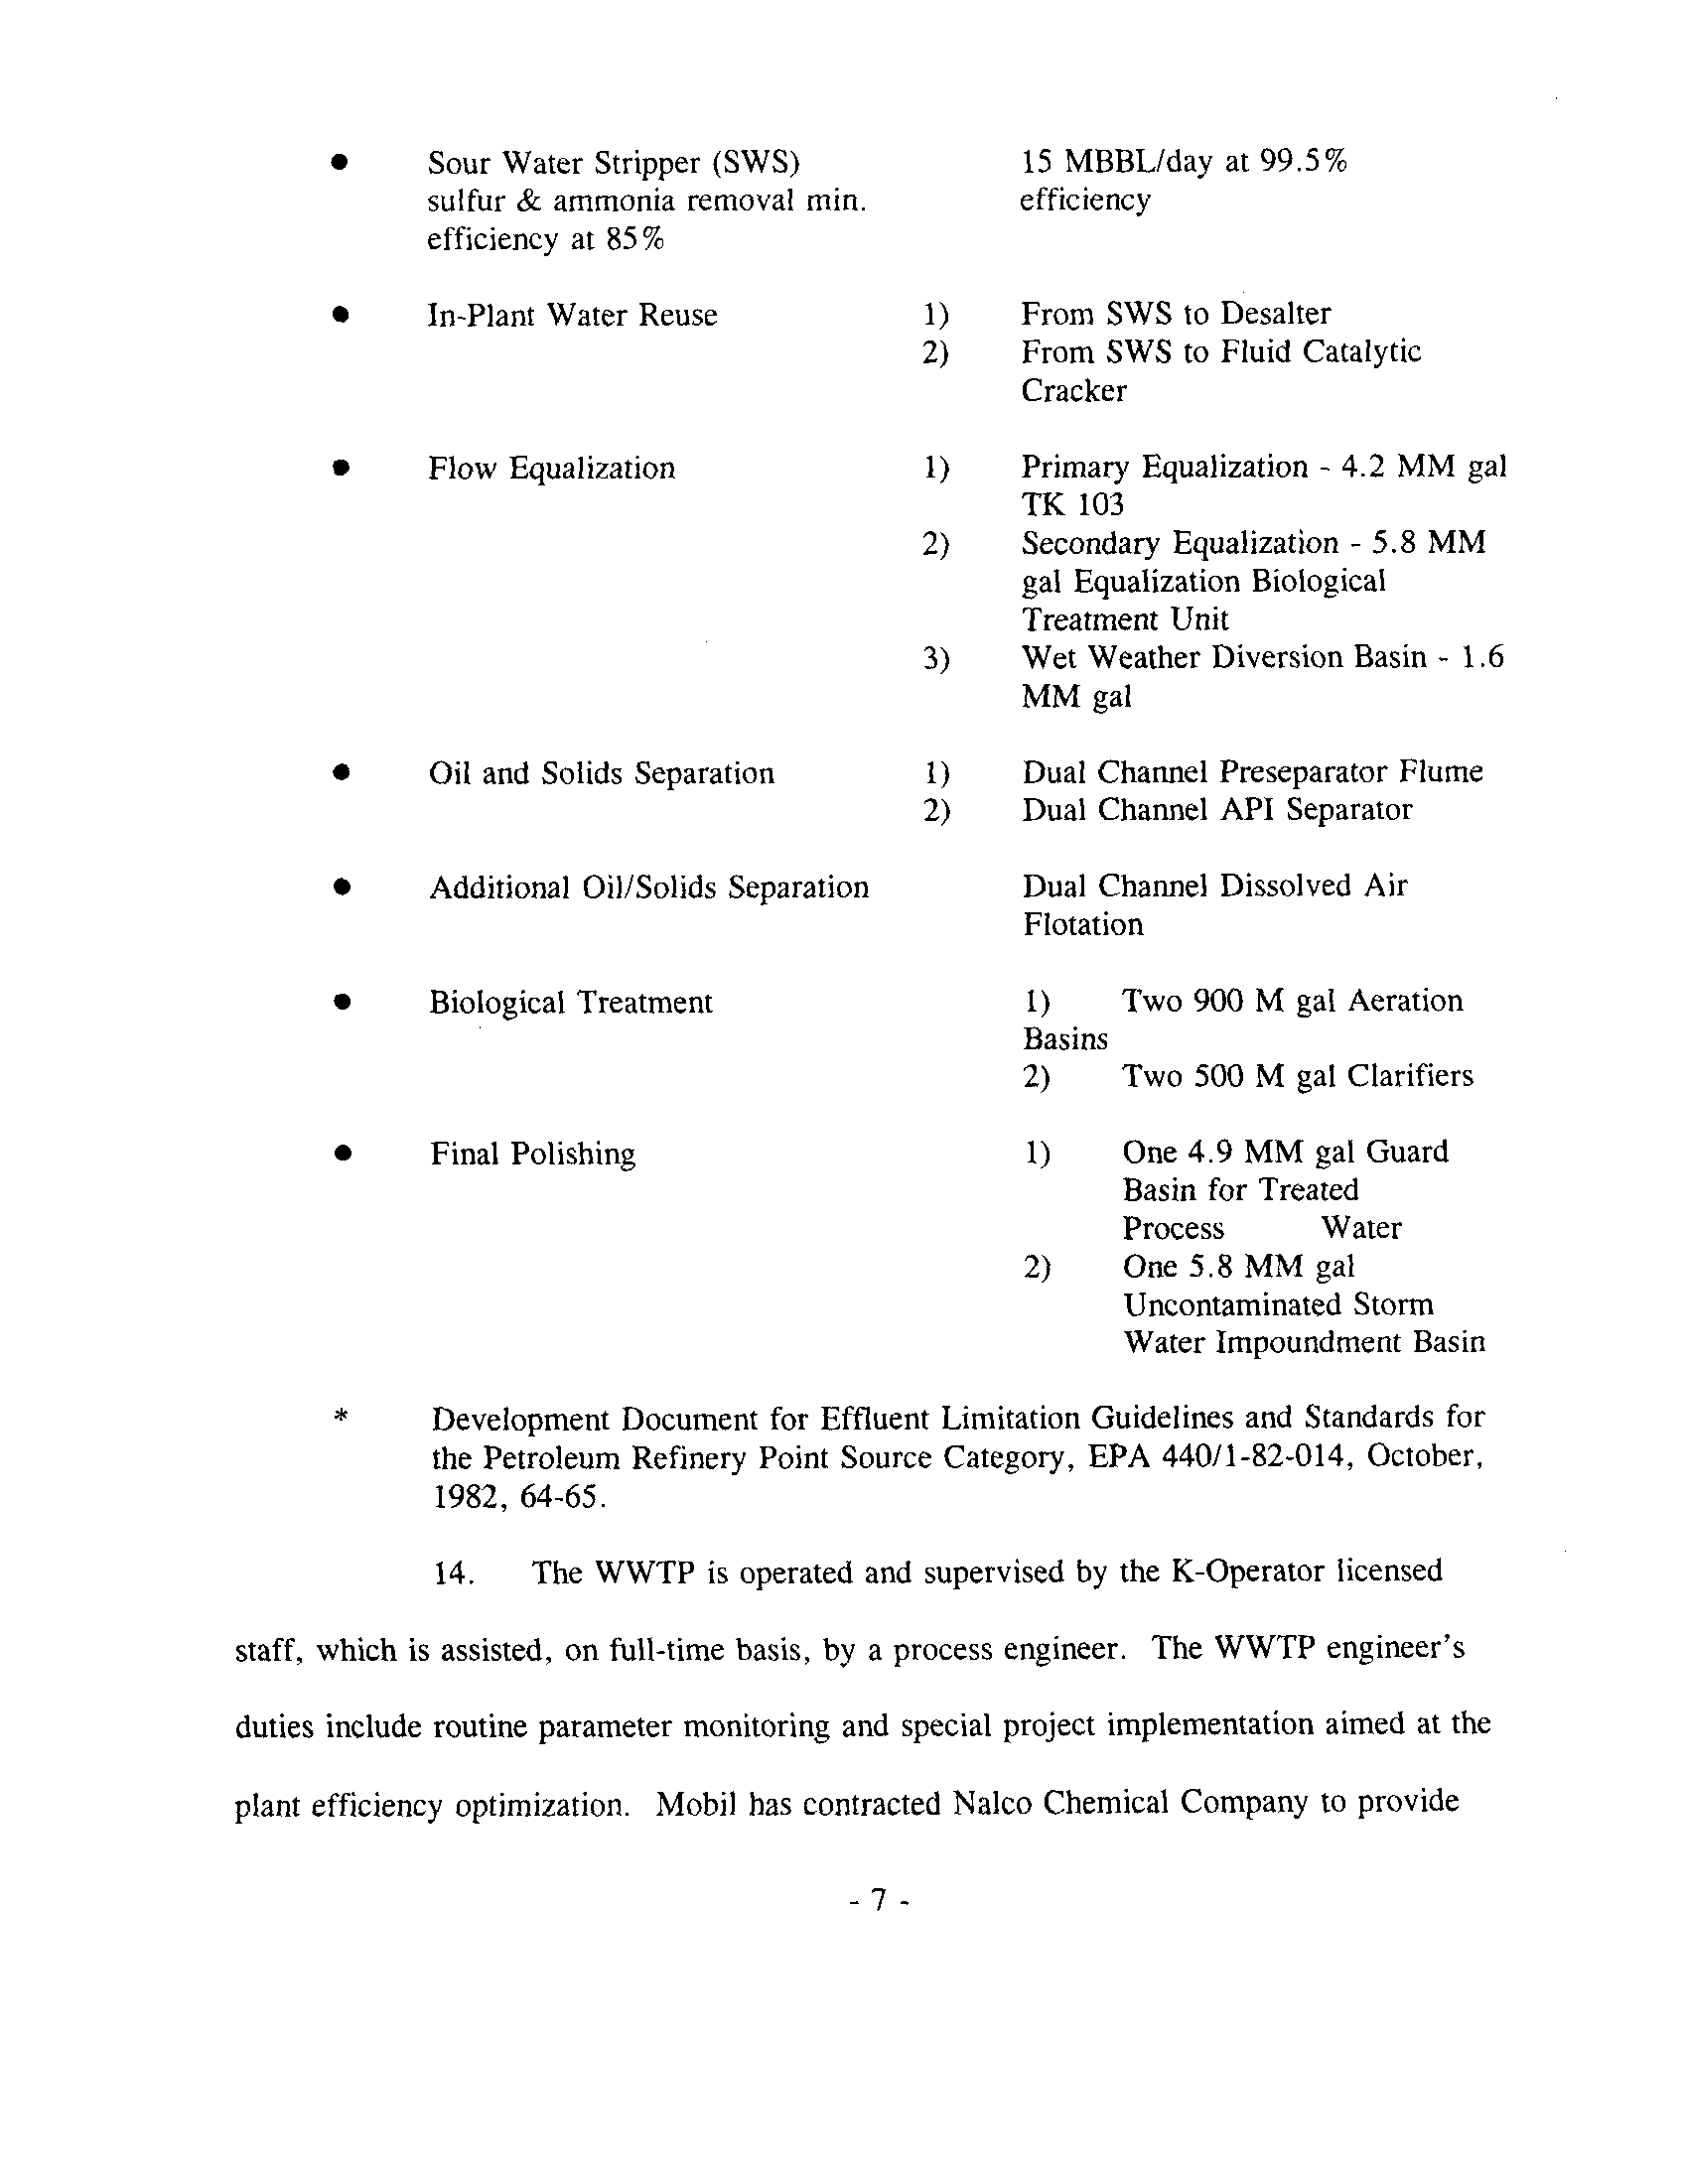
13 .
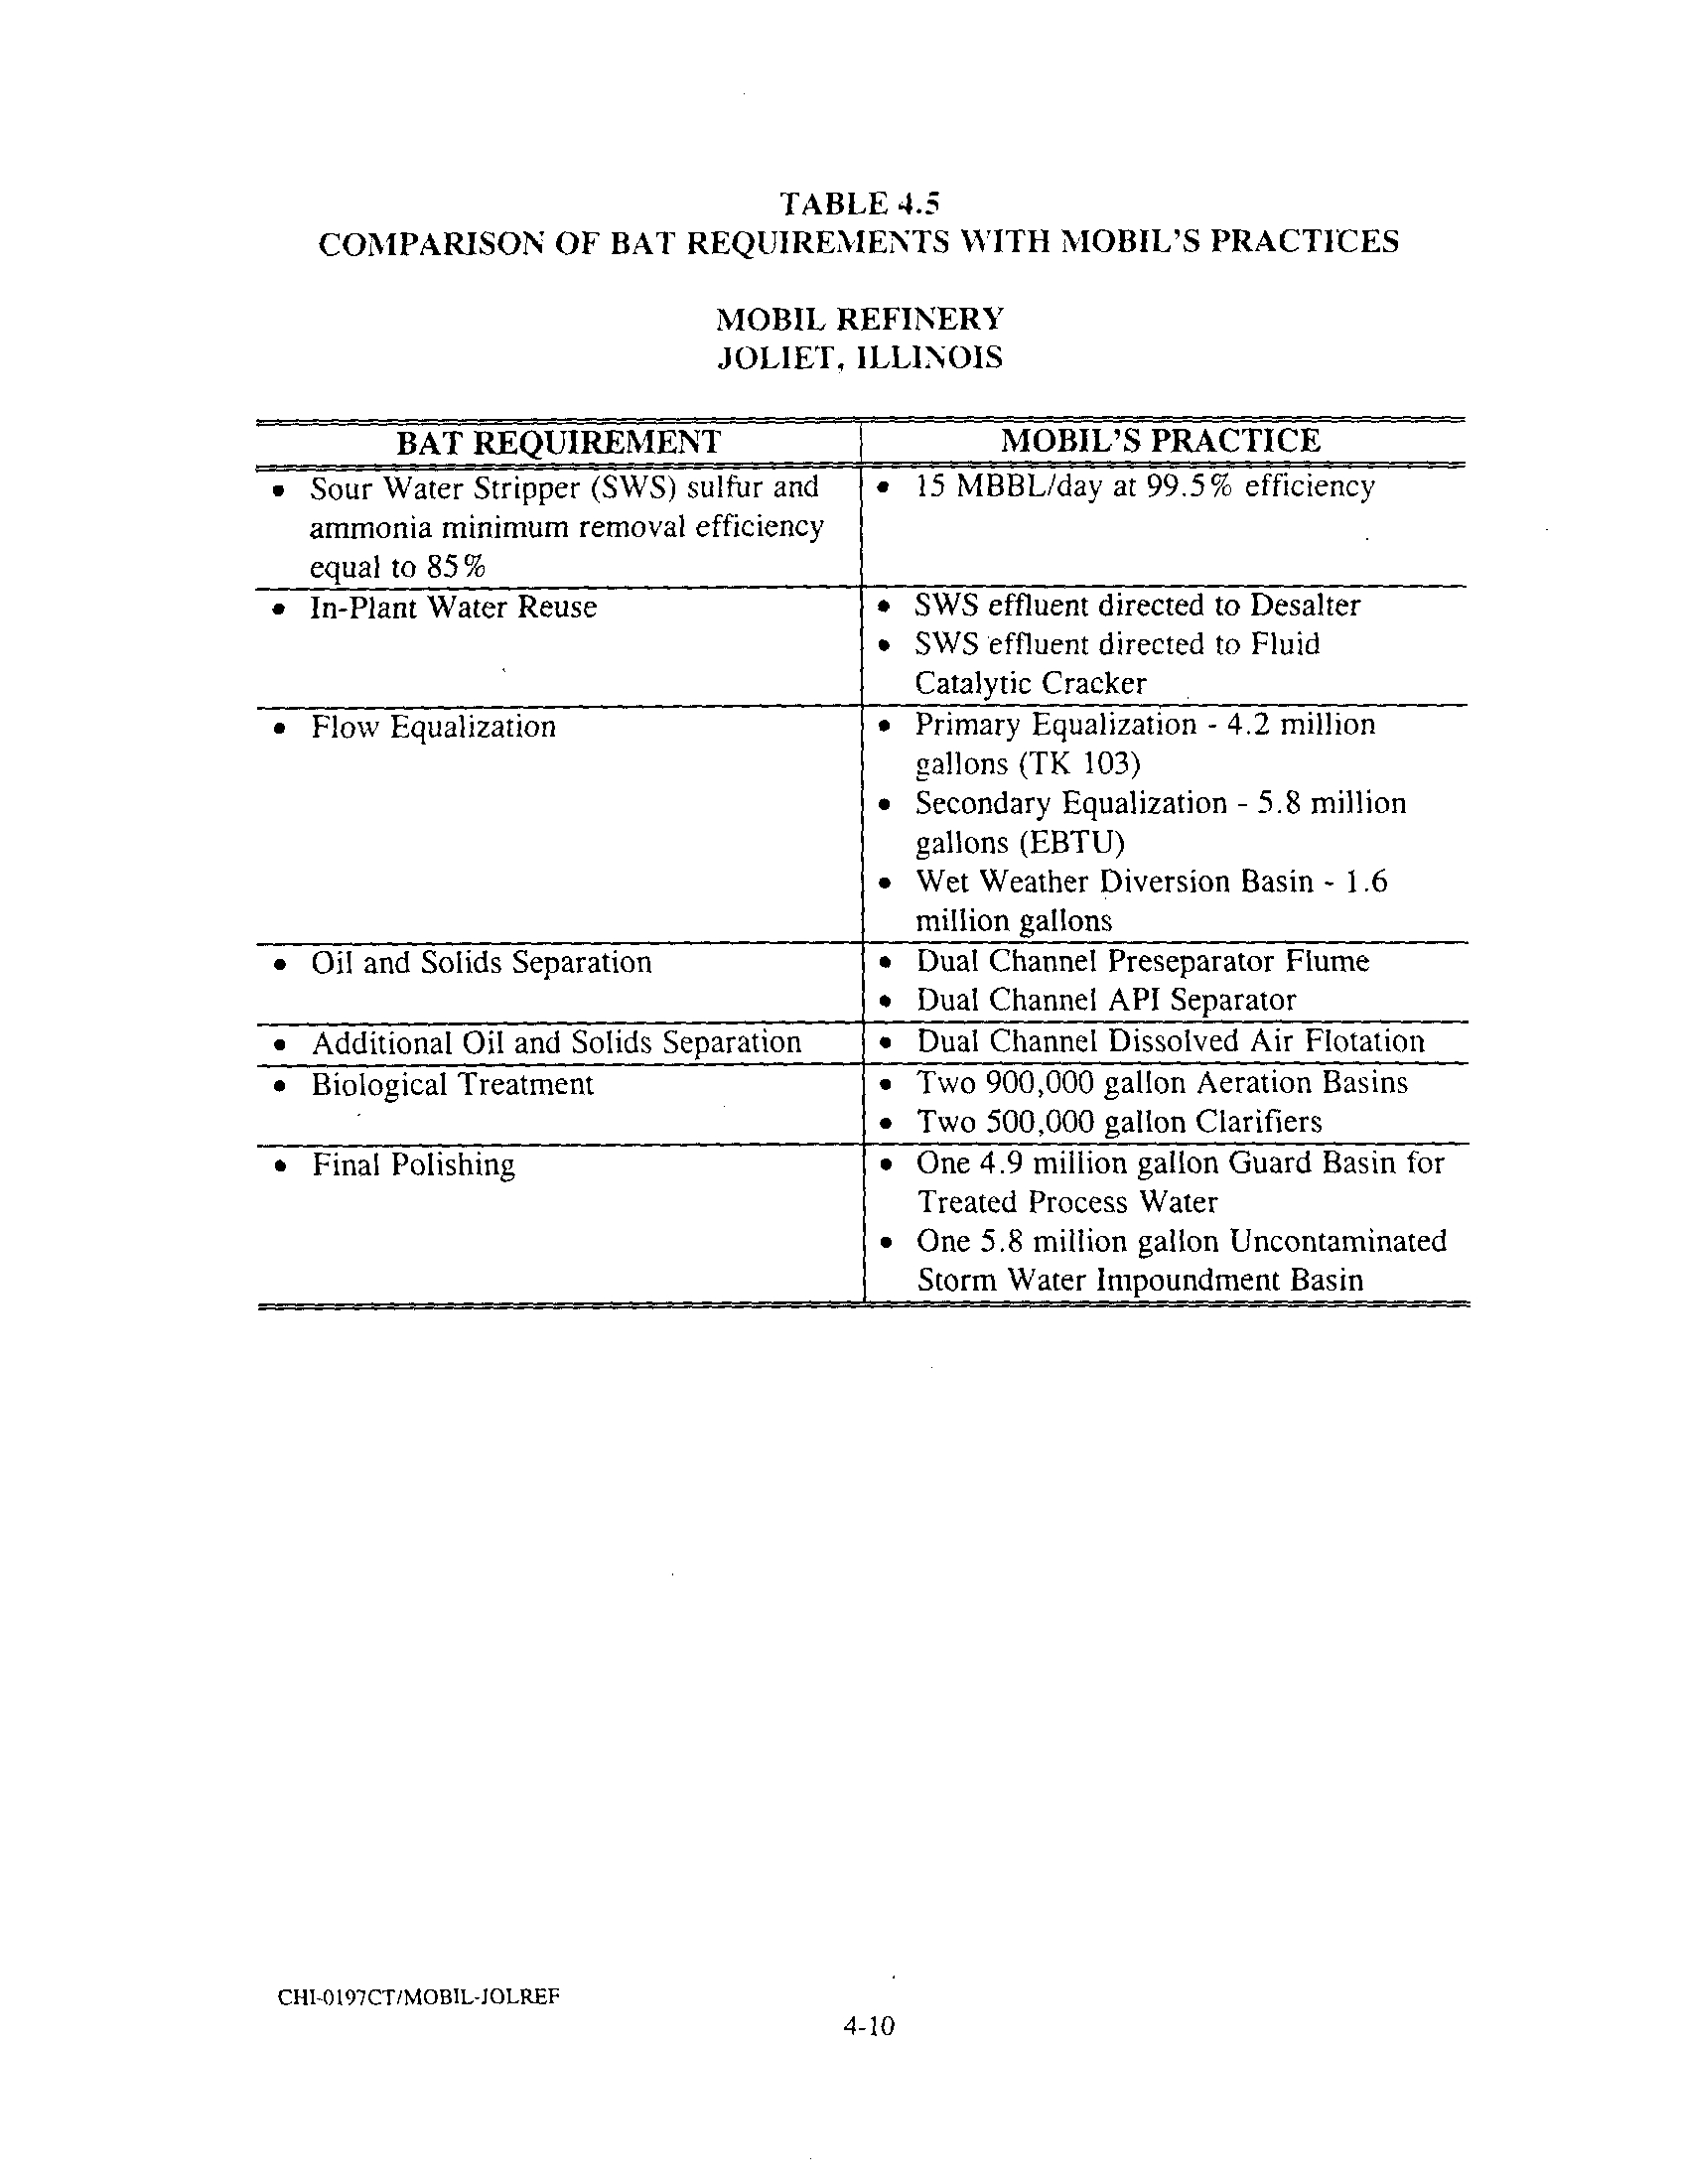
Mobil's waste water treatment facilities are operated well within BAT
guidelines
. The following is an outline of the BAT requirements and Mobil's practices
:
BAT REQUIREMENT
* MOBIL'S
PRACTICE
•
Desalter
Partial removal of phenolics and in-plant
water reuse
•
TK 103
Primary equalization
•
Benzene Air Stripper
Removal of benzene, sulfide, and volatile
organics
•
API Oil Separator
Primary oil and solids removal
•
Dissolved Air Flotation
Residual oil and solids removal
•
Equalization Biological
Secondary equalization,
Unit Treatment
aggressive phenolic removal and partial
COD removal
•
Two Aeration Basins
Conventional activated sludge system for
ammonia, organics, cyanide, and other
pollutant removal
•
Two Clarifiers
Solids removal
•
Guard Basin
Final retention basin
•
Aeration Cone
Saturation with oxygen
•
Sour Water Stripper (SWS)
15 MBBL/day at 99 .5%
sulfur & ammonia removal min .
efficiency
efficiency at 85%
•
In-Plant Water Reuse
1) From SWS to Desalter
2)
From SWS to Fluid Catalytic
Cracker
•
Flow Equalization
1)
Primary Equalization - 4 .2 MM gal
TK 103
2)
Secondary Equalization - 5 .8 MM
gal Equalization Biological
Treatment Unit
3)
Wet Weather Diversion Basin - 1 .6
MM gal
•
Oil and Solids Separation
1)
Dual Channel Preseparator Flume
2)
Dual Channel API Separator
•
Additional Oil/Solids Separation
Dual Channel Dissolved Air
Flotation
•
Biological Treatment
1) Two 900 M gal Aeration
Basins
2)
Two 500 M gal Clarifiers
•
Final Polishing
1)
One 4 .9 MM gal Guard
Basin for Treated
Process
Water
2)
One 5.8 MM gal
Uncontaminated Storm
Water Impoundment Basin
Development Document for Effluent Limitation Guidelines and Standards for
the Petroleum Refinery Point Source Category, EPA 440/1-82-014, October,
1982, 64-65 .
14 .
The WWTP is operated and supervised by the K-Operator licensed
staff, which is assisted, on full-time basis, by a process engineer
. The WWTP engineer's
duties include routine parameter monitoring and special project implementation aimed at the
plant efficiency optimization
. Mobil has contracted Nalco Chemical Company to provide
-7-
bioaugmentation services for the WWTP, when required . In this process, specialty bacteria
are added to the Activated Sludge system to enhance the removal of organic material and
ammonia.
AMMONIA REDUCTION PROGRAM
15 .
In 1990, Mobil constructed a Benzene Stripping Unit (BRU), as
required by RCRA . The unit removes benzene and other volatile hydrocarbons from the
major portion of the process water, as well as a substantial amount of sulfide . Similarly, in
1991, upon the listing of F037 and F038 sludges, an equalization basin was converted to an
Equalization Biological Treatment Unit . The conversion resulted in additional pretreatment
of the process water . However, the cumulative effect of RCRA and NESHAPS changes
appears to have enhanced nitrification inhibition .
16 .
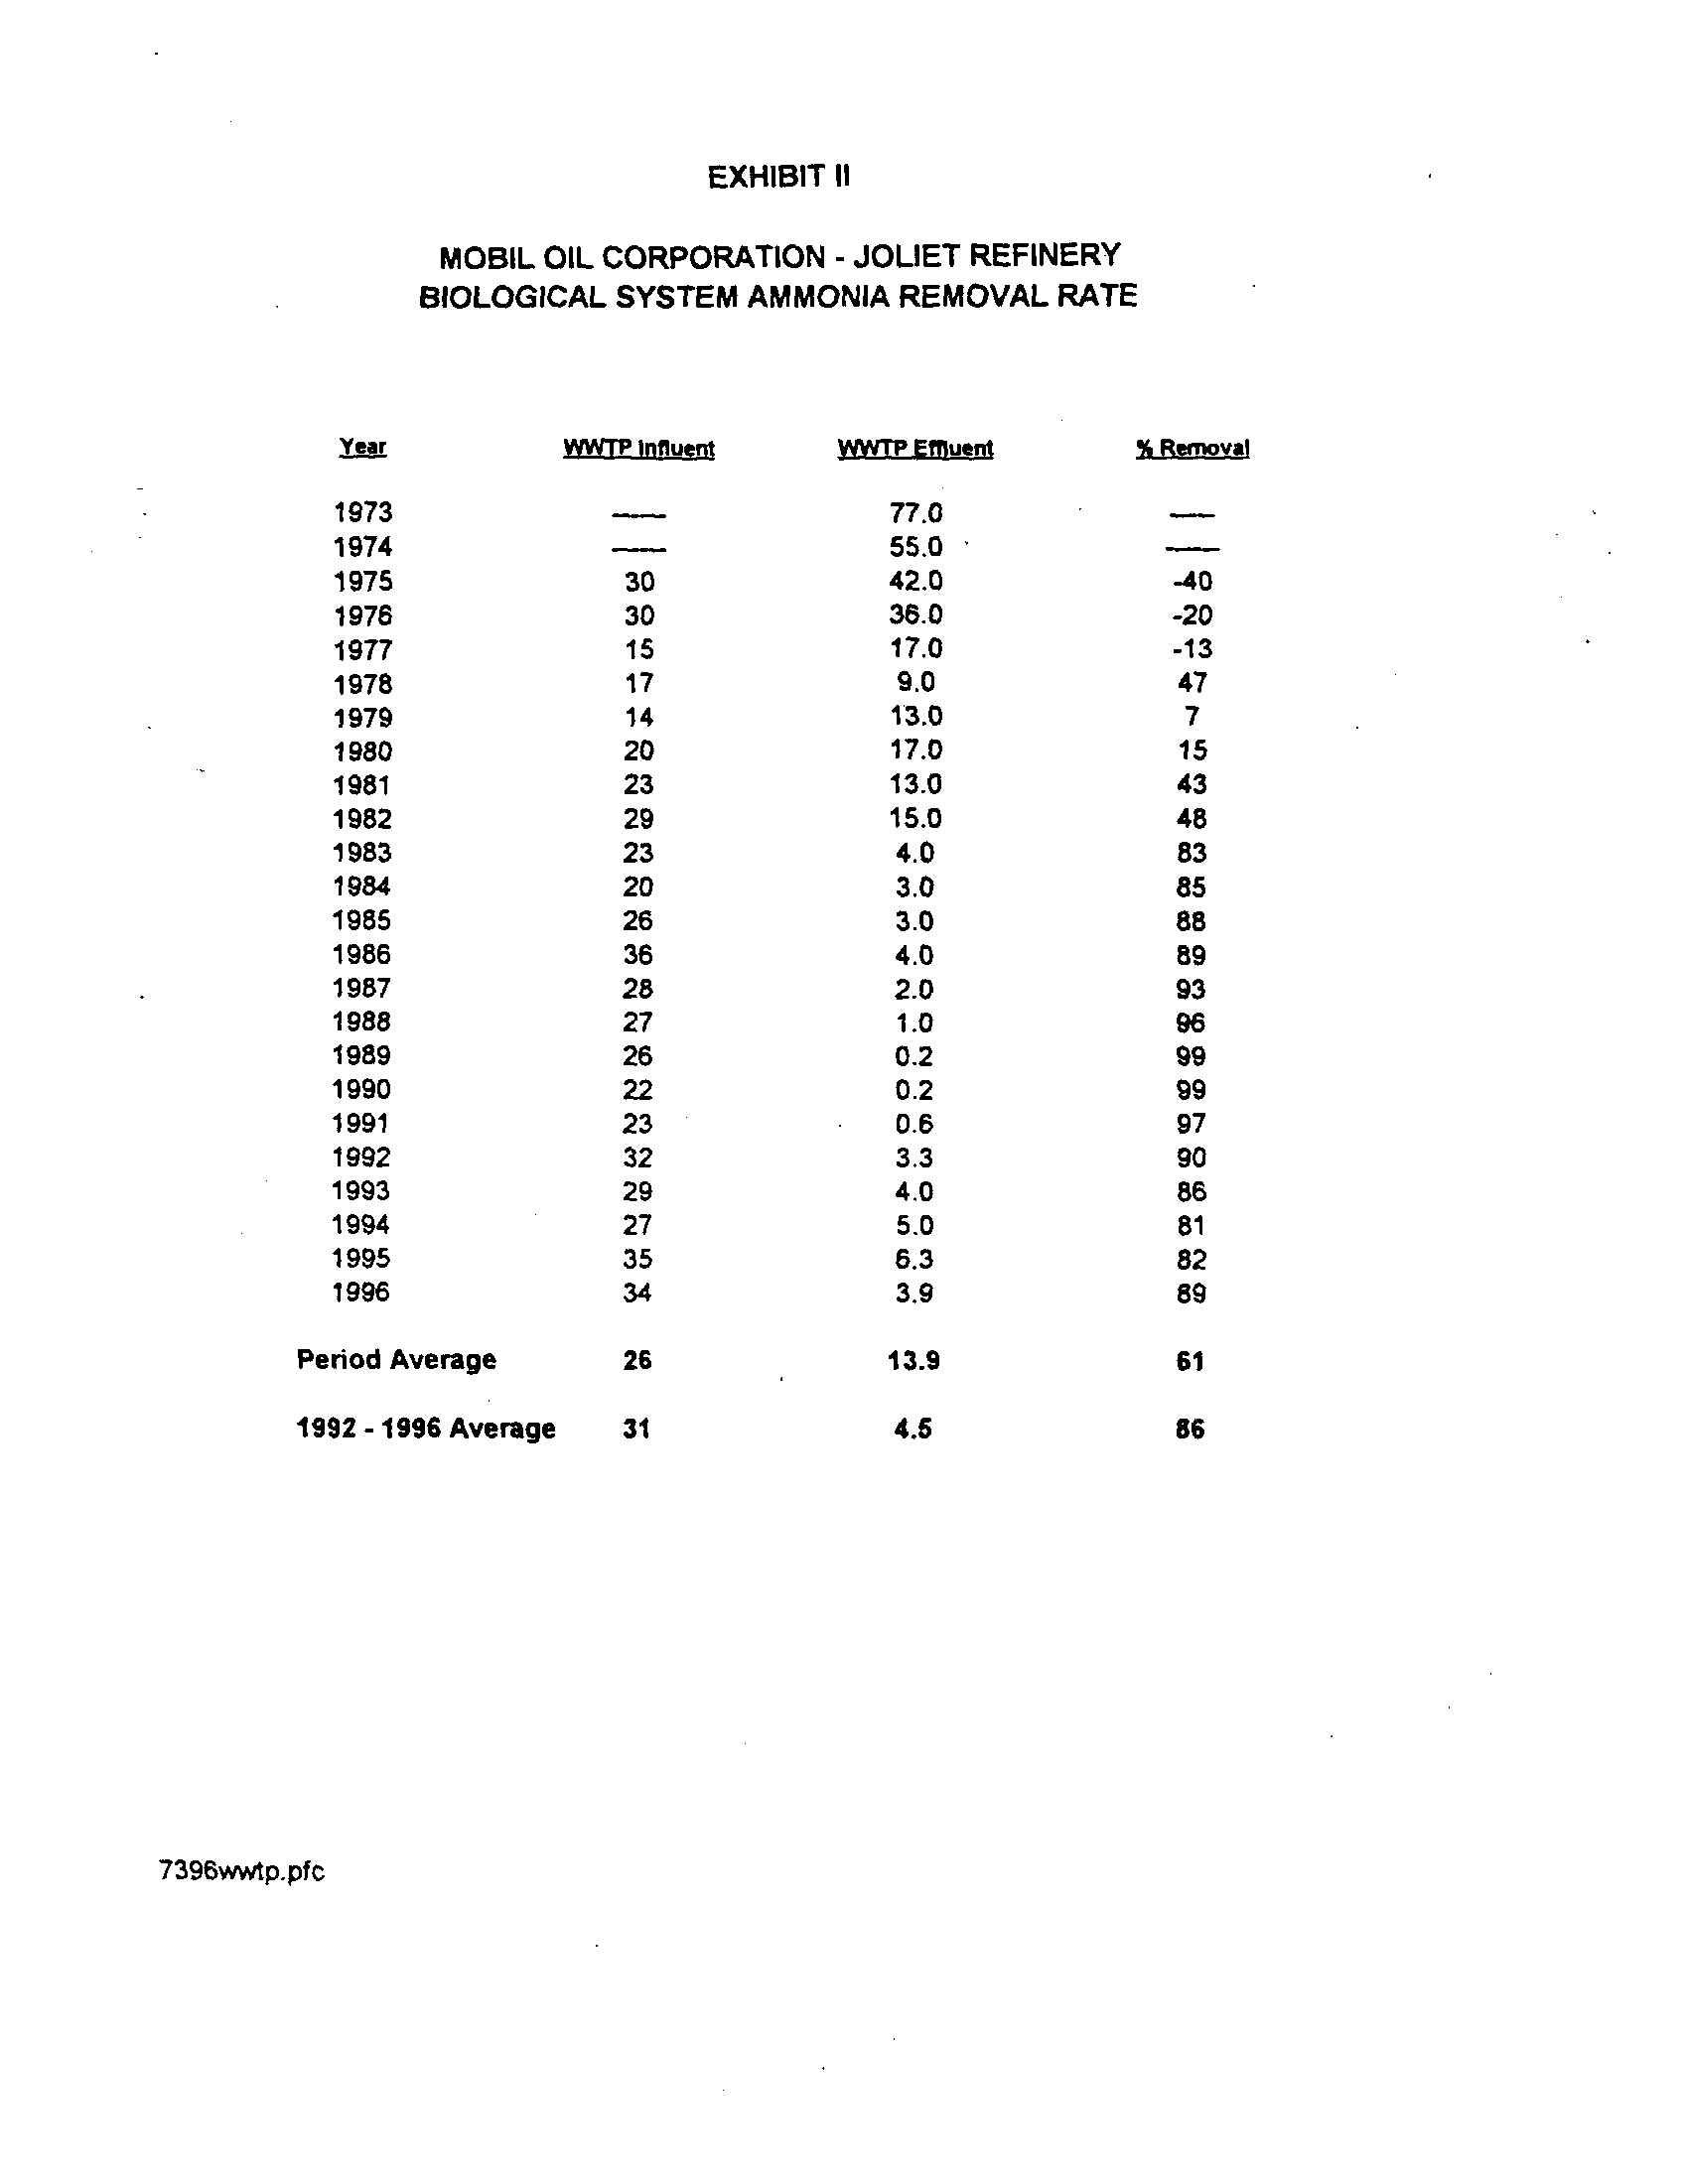
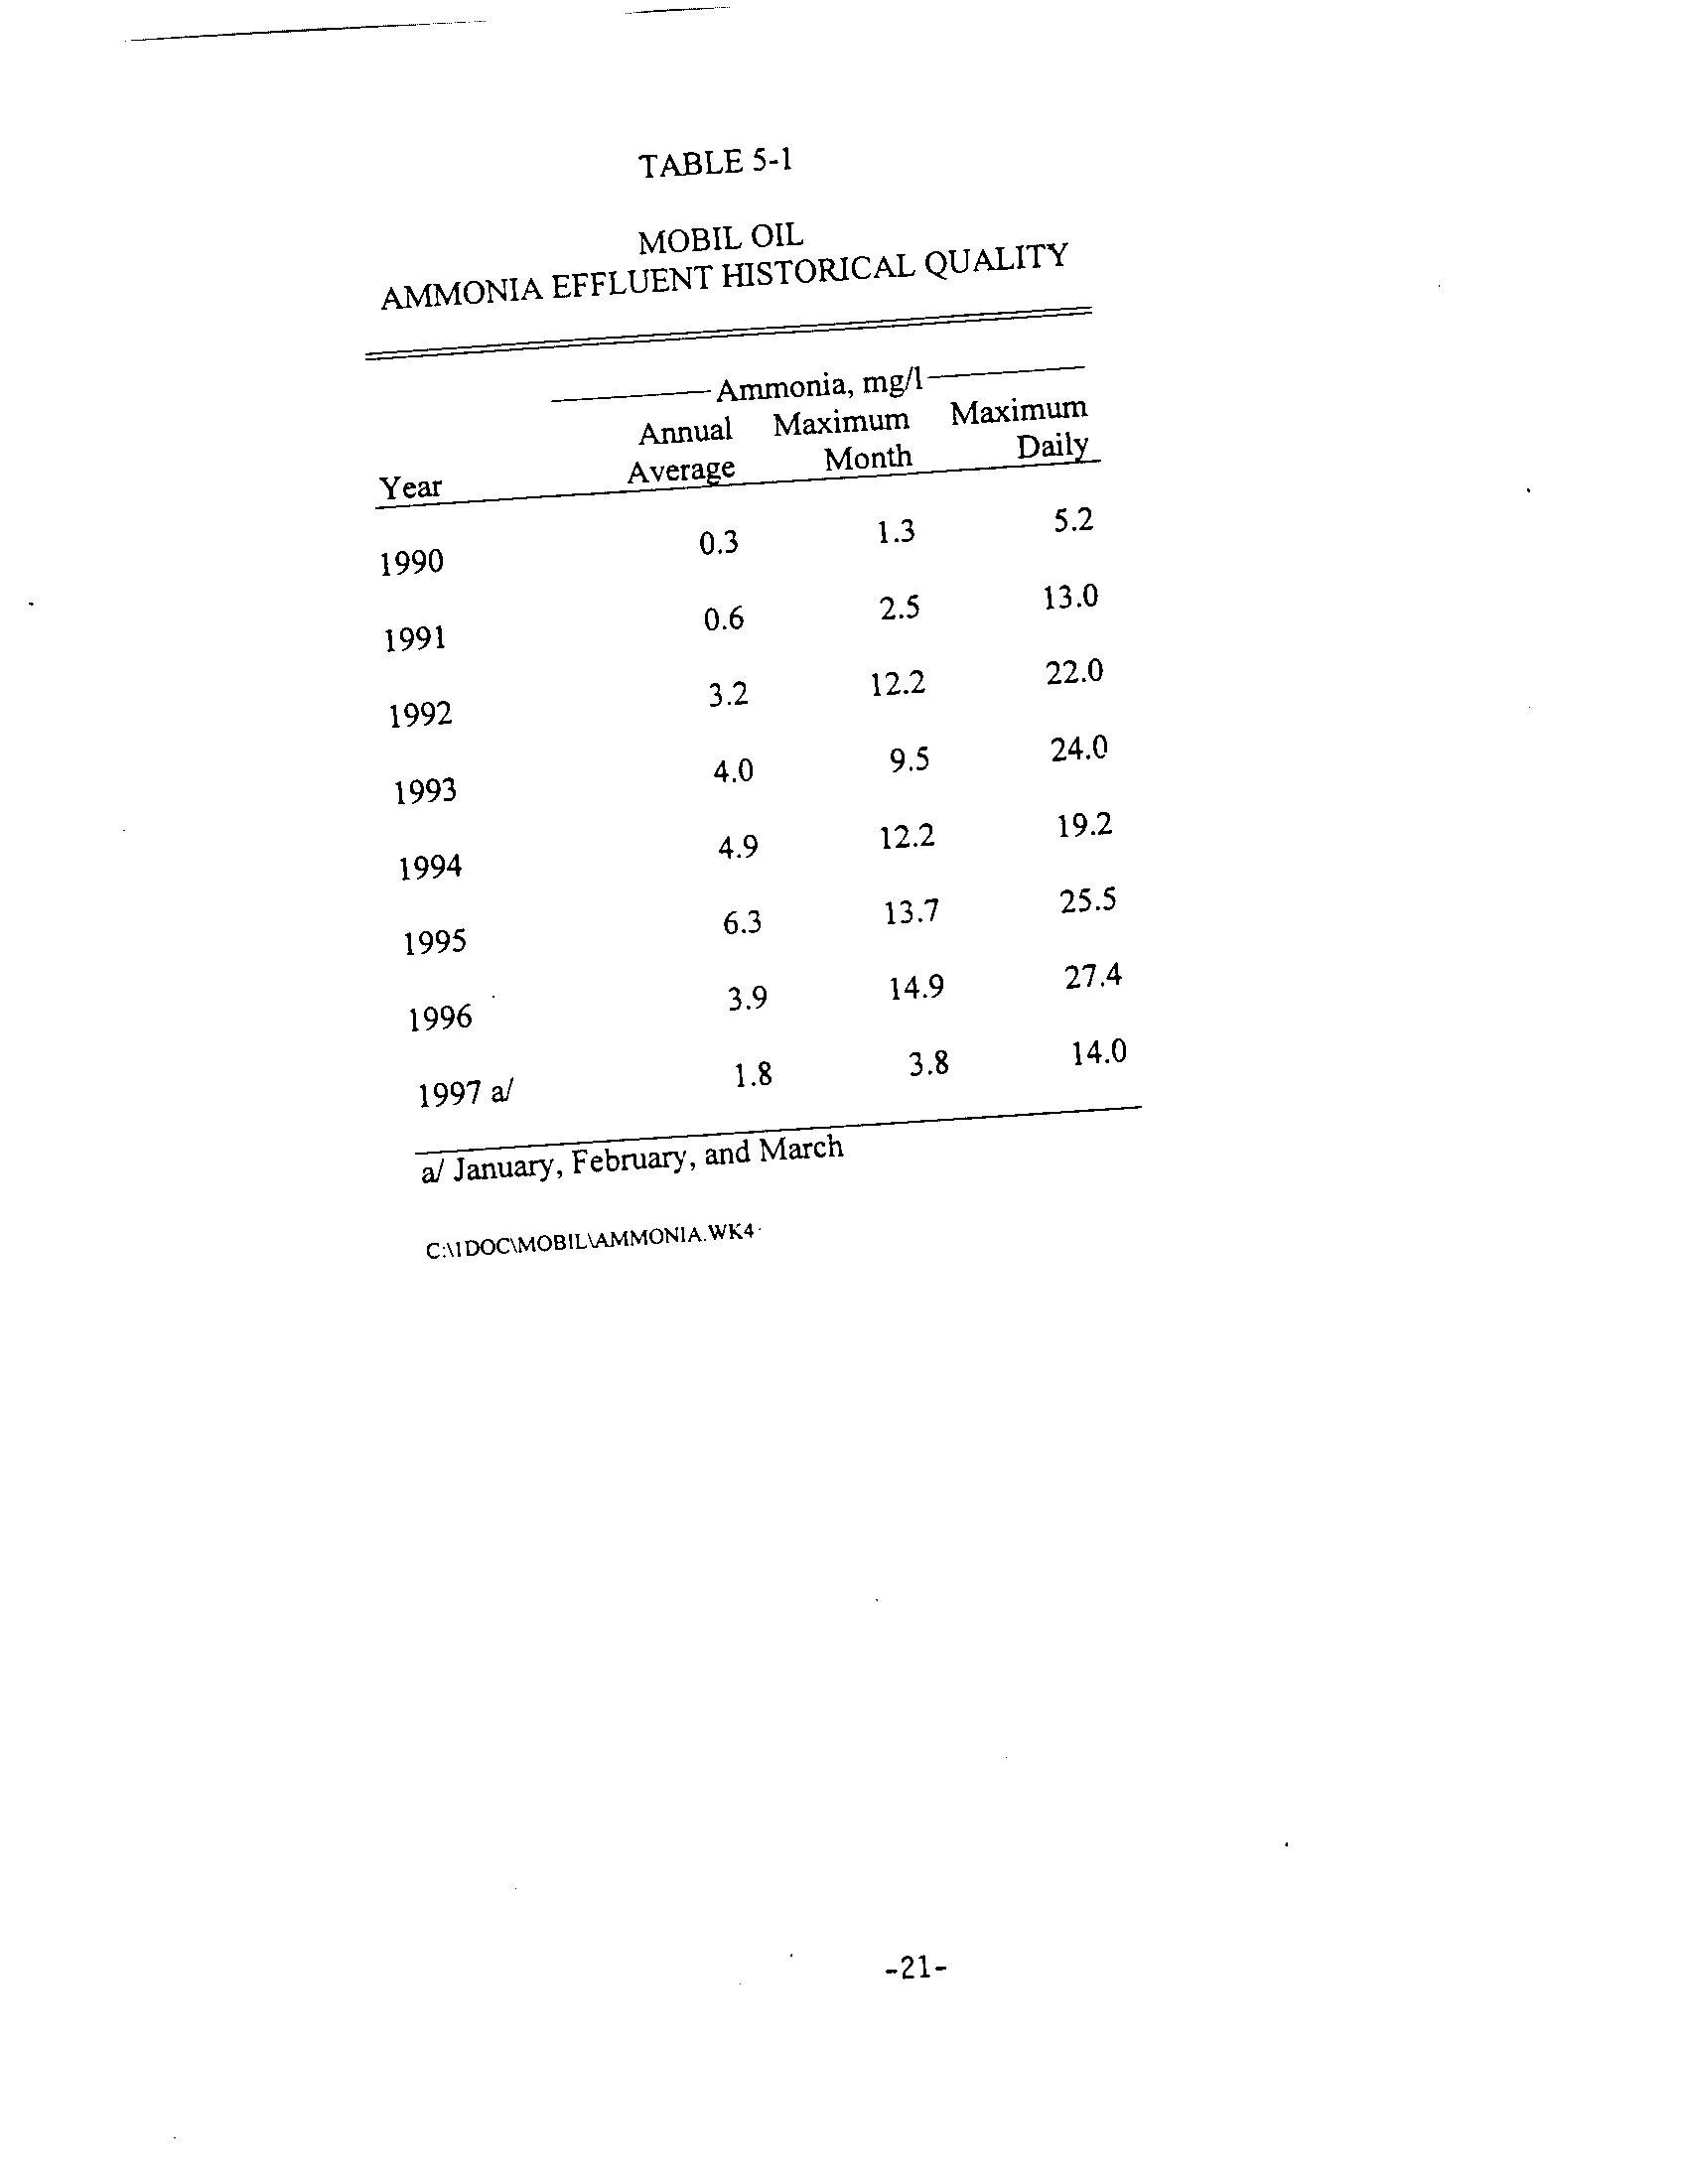
The performance of the WWTP has progressively improved from the
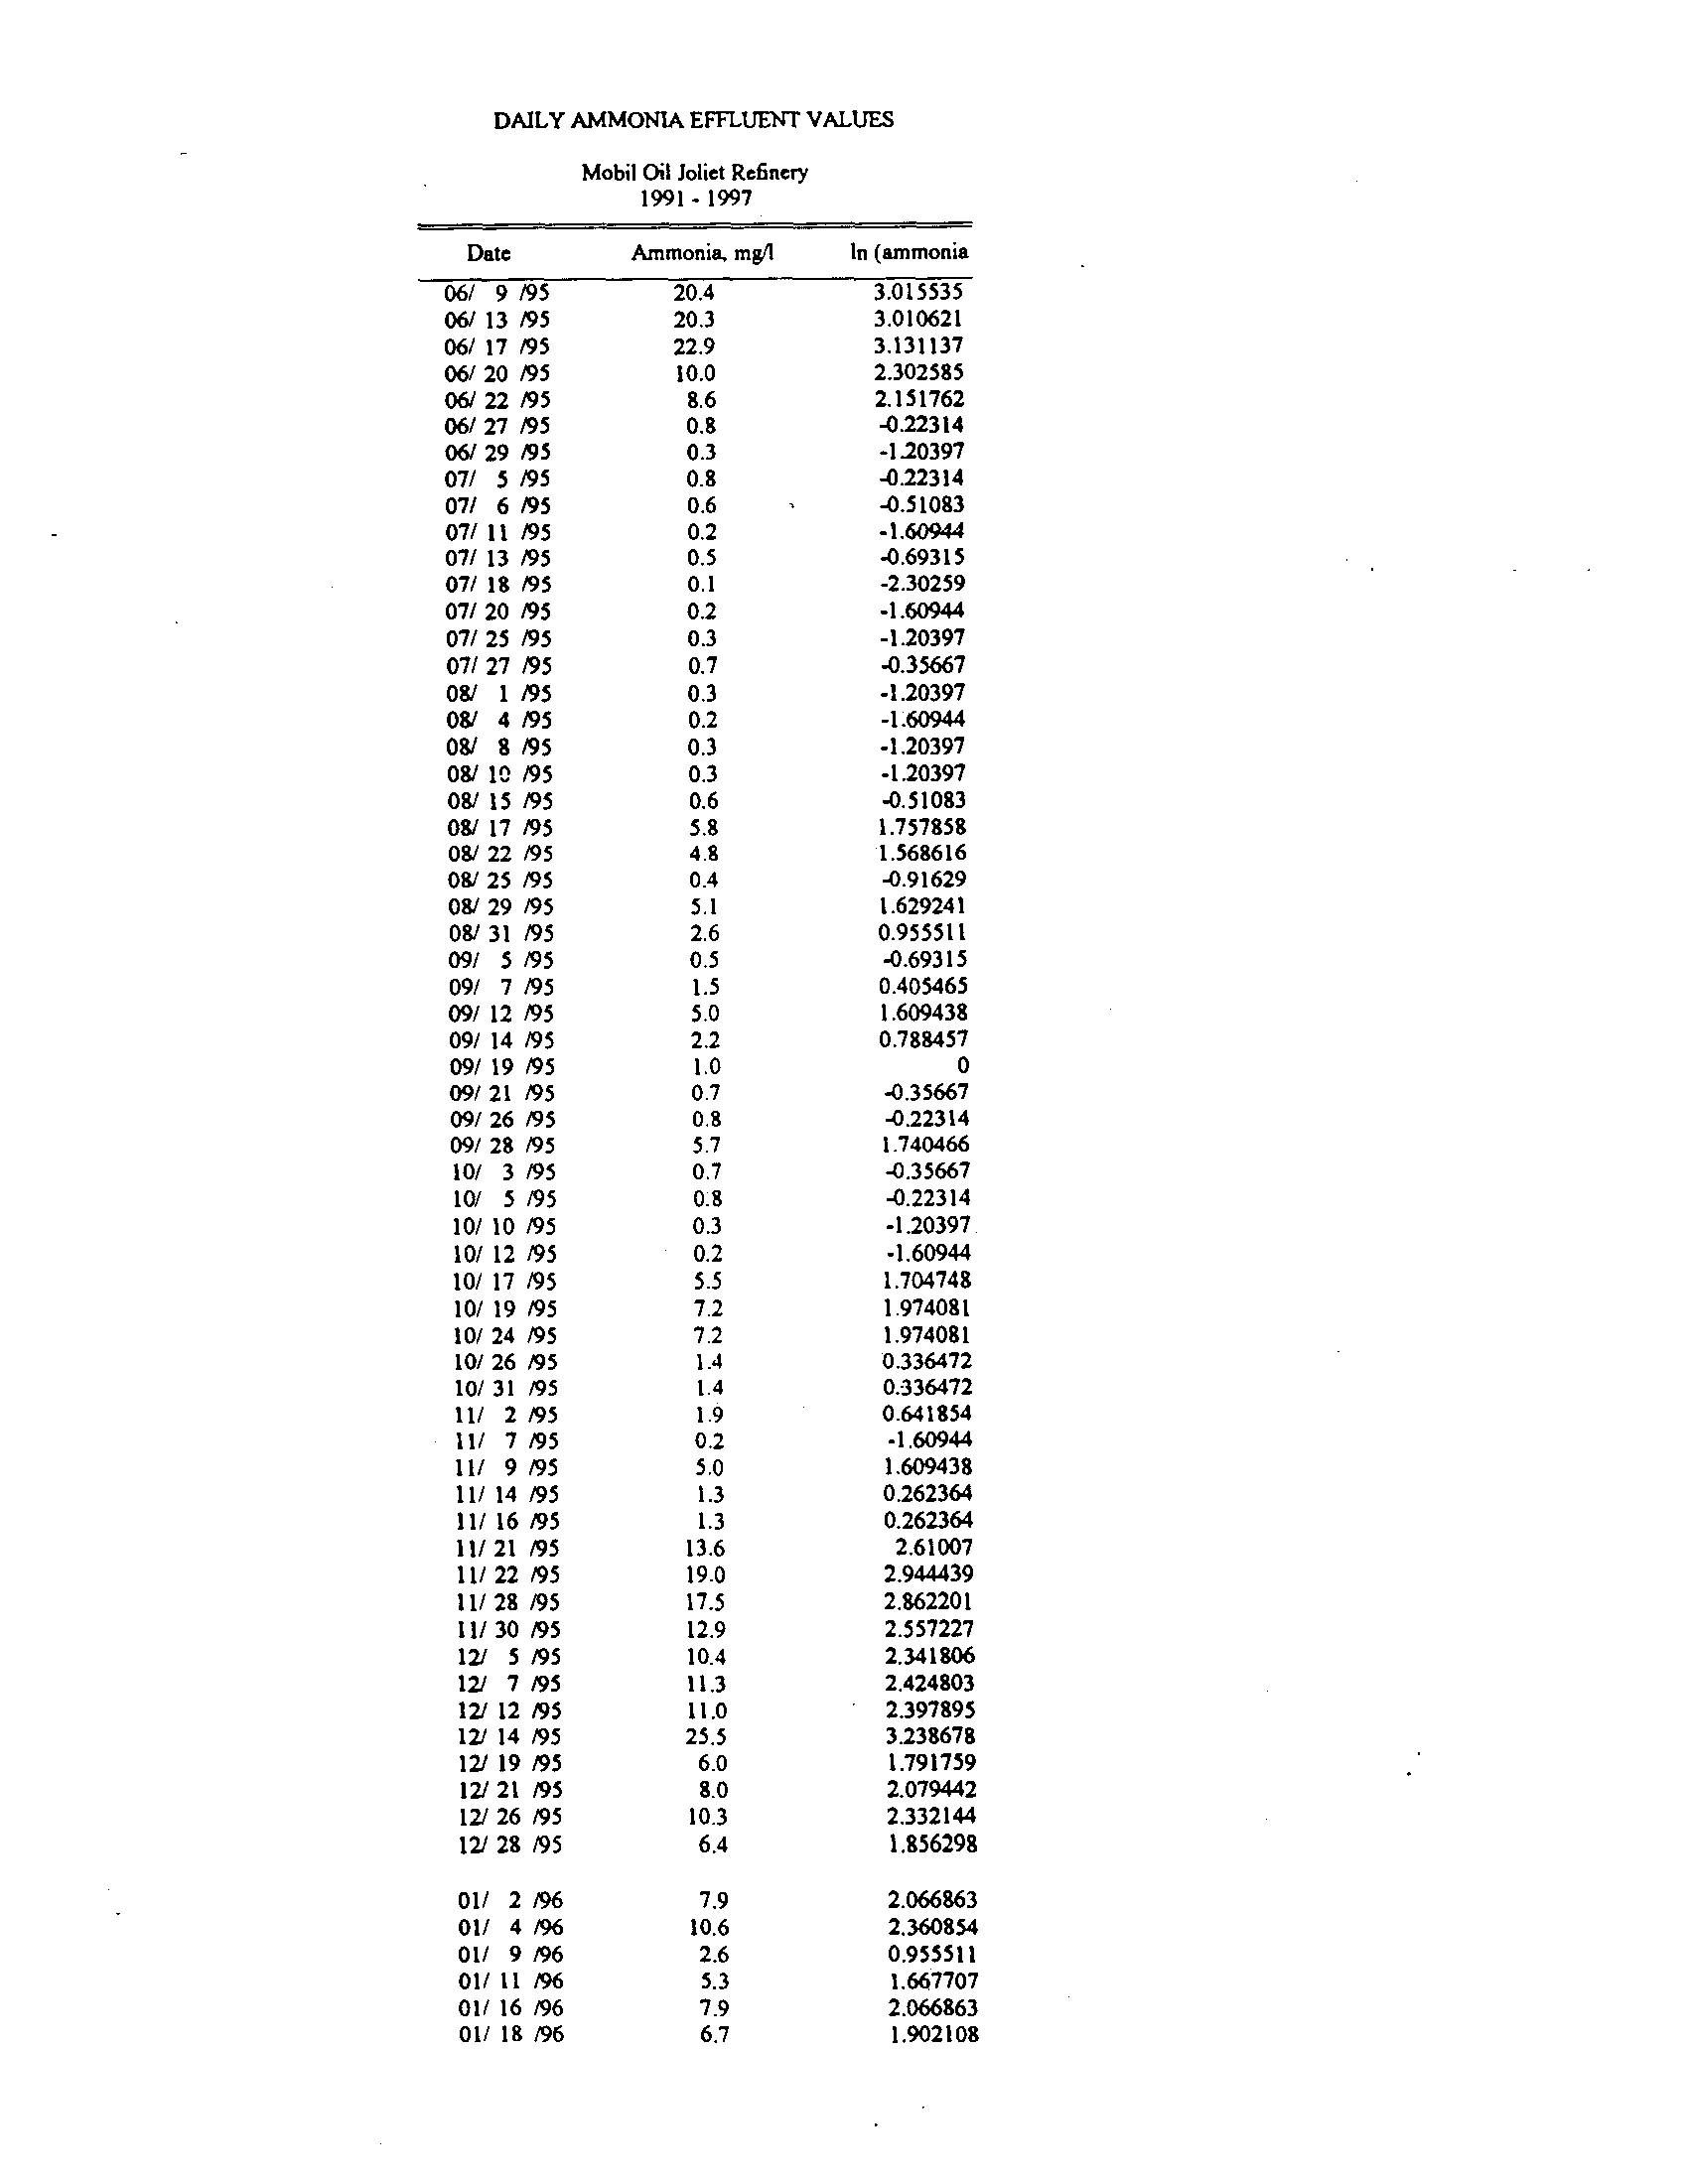
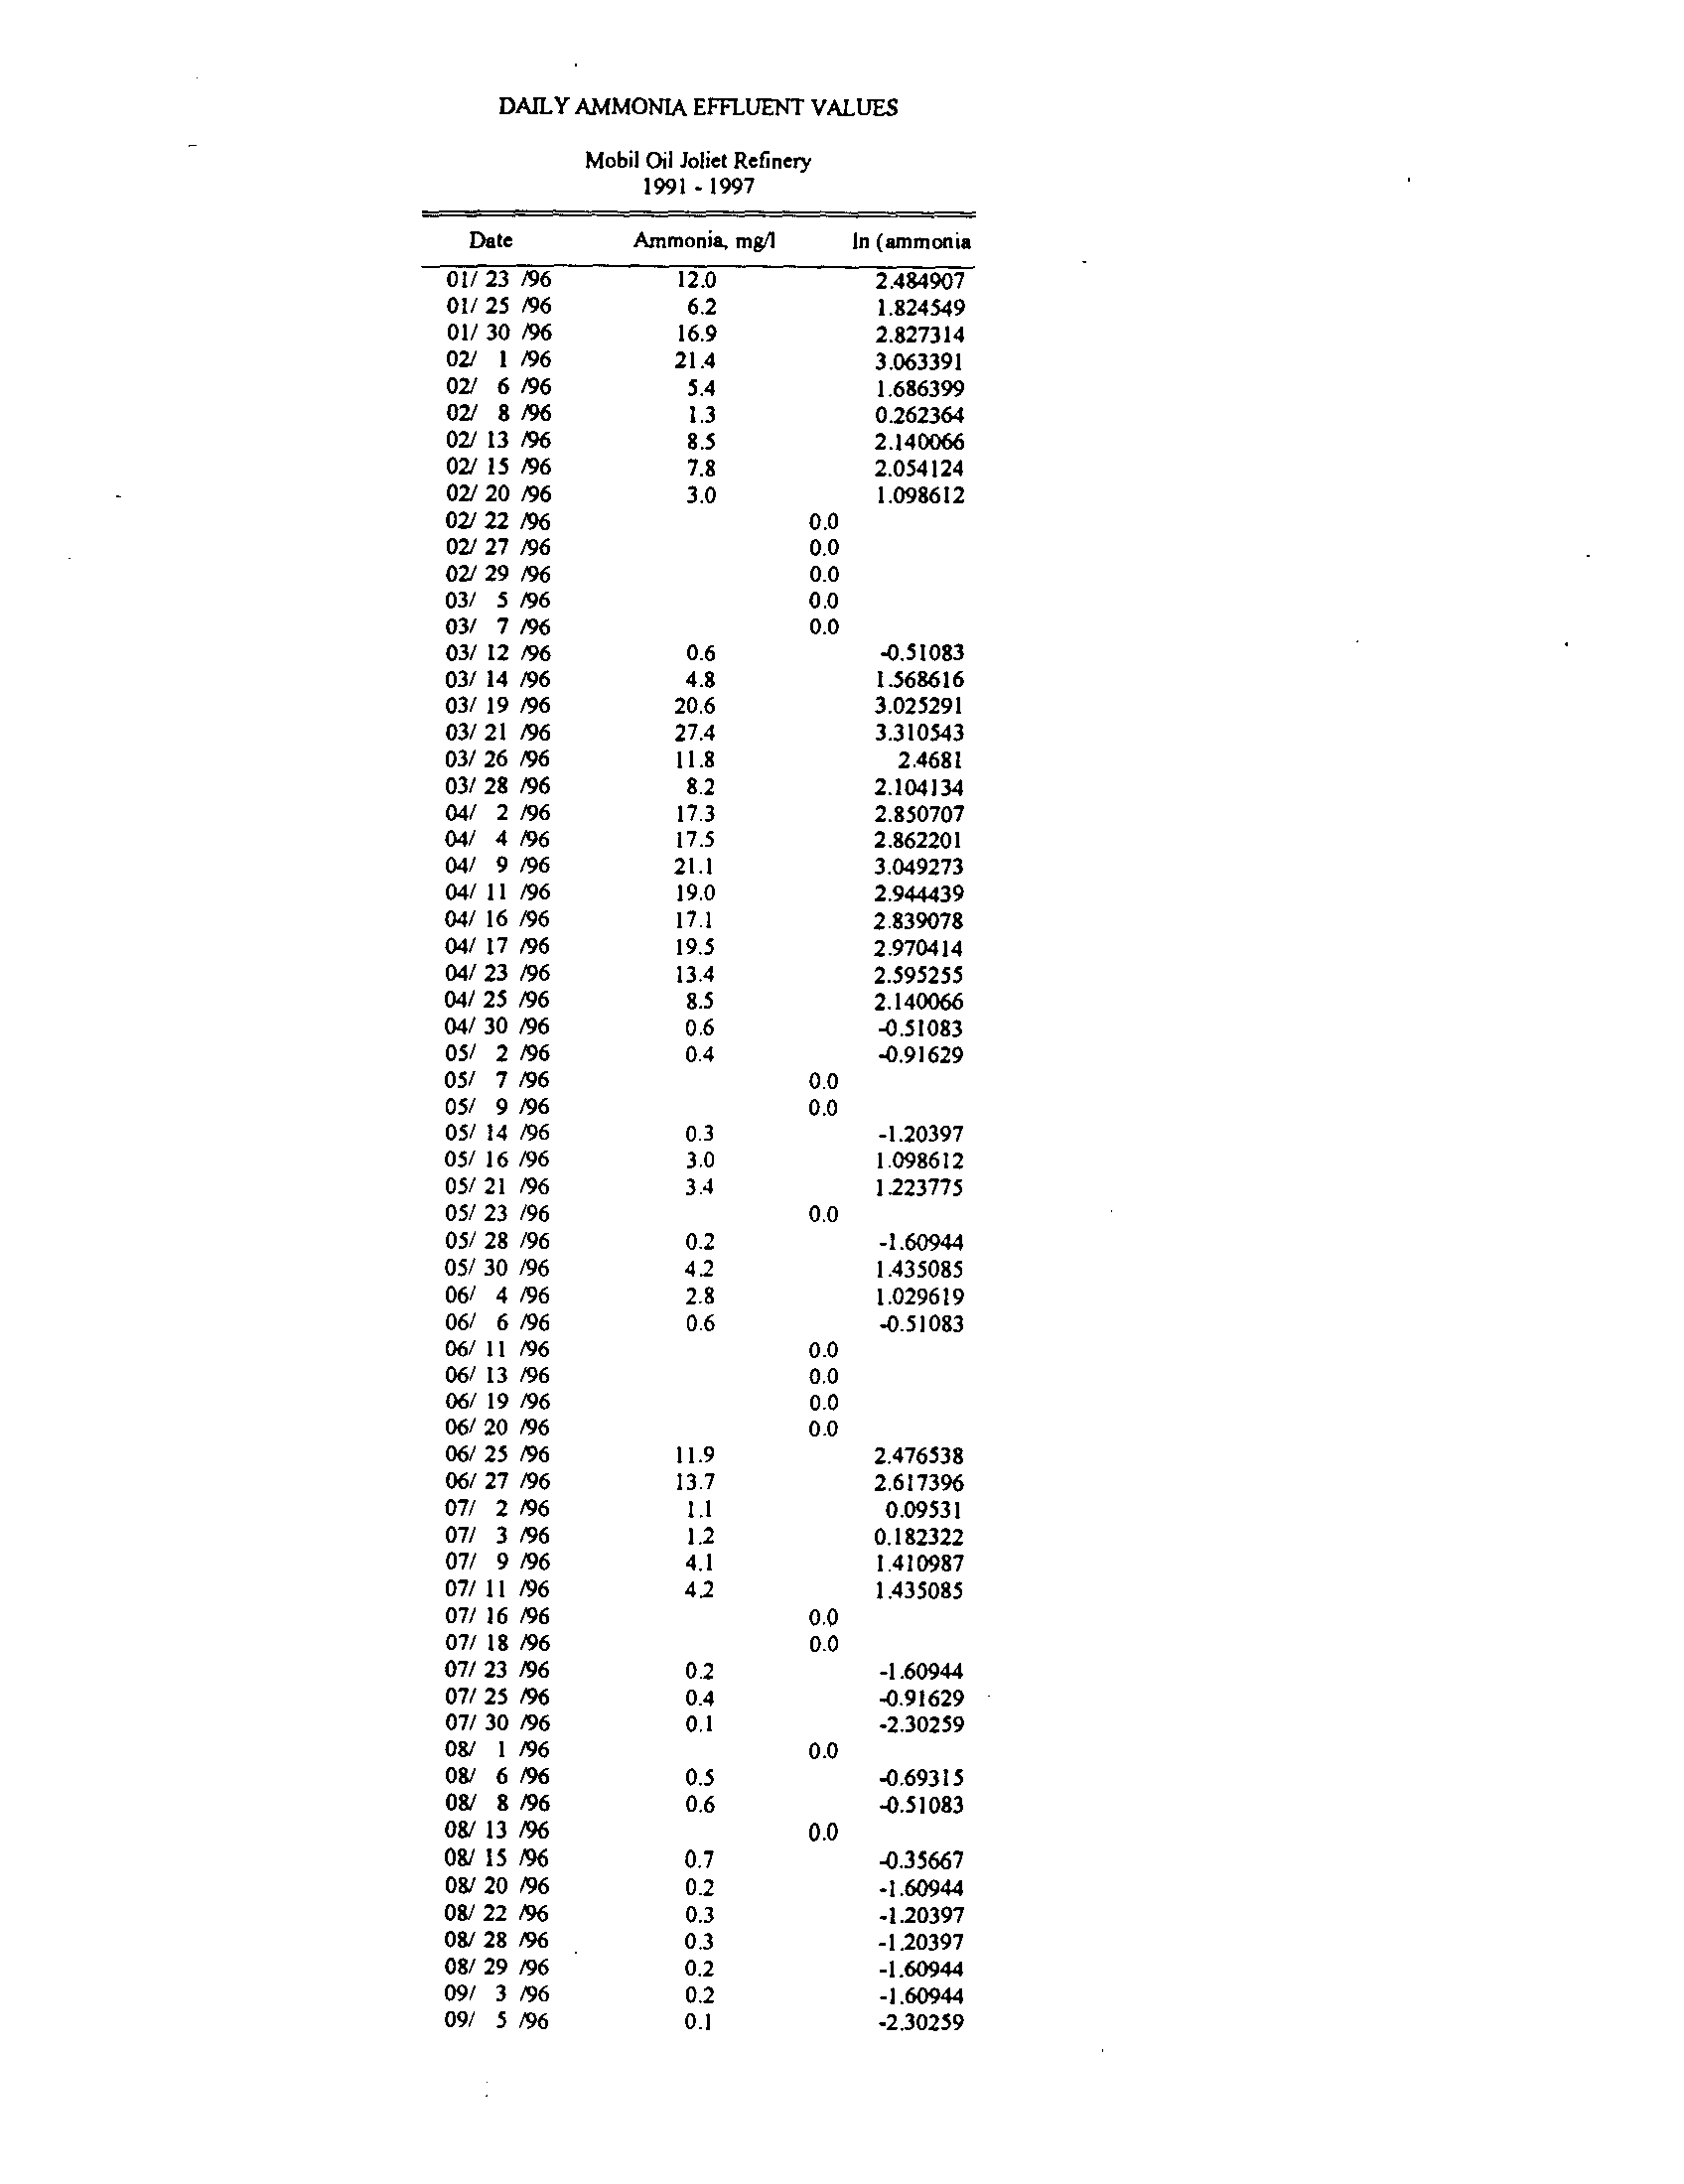
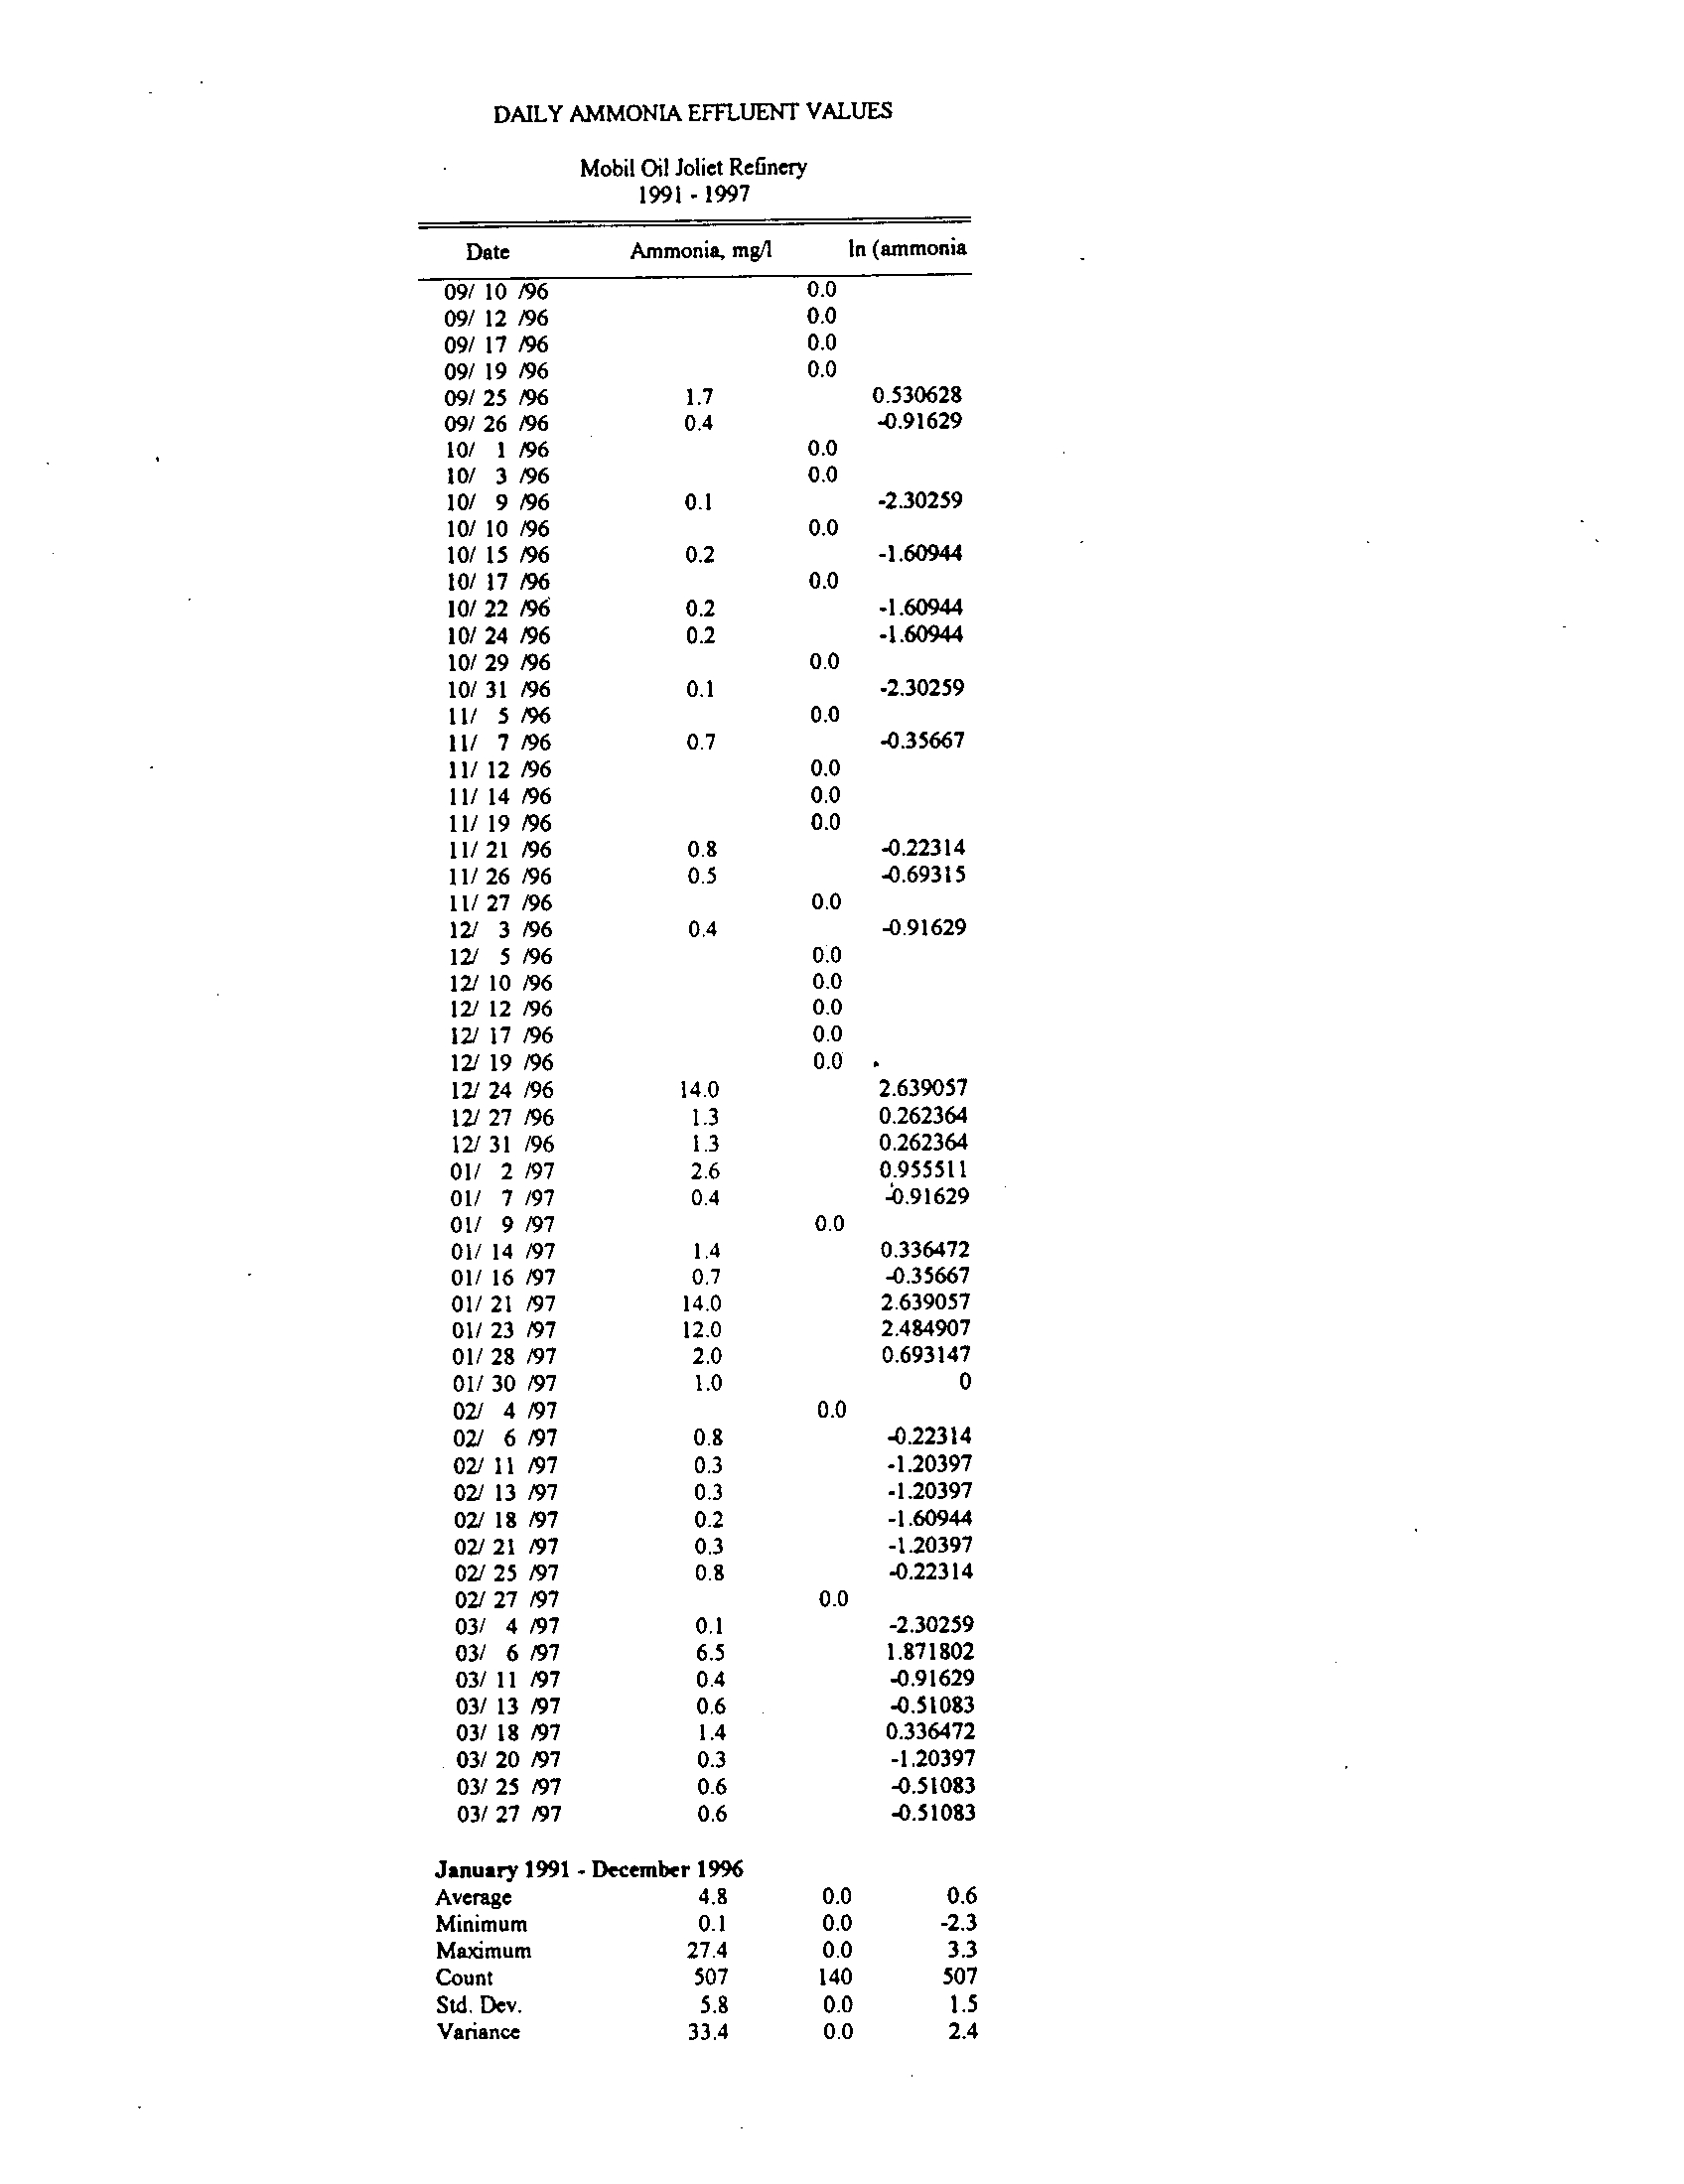
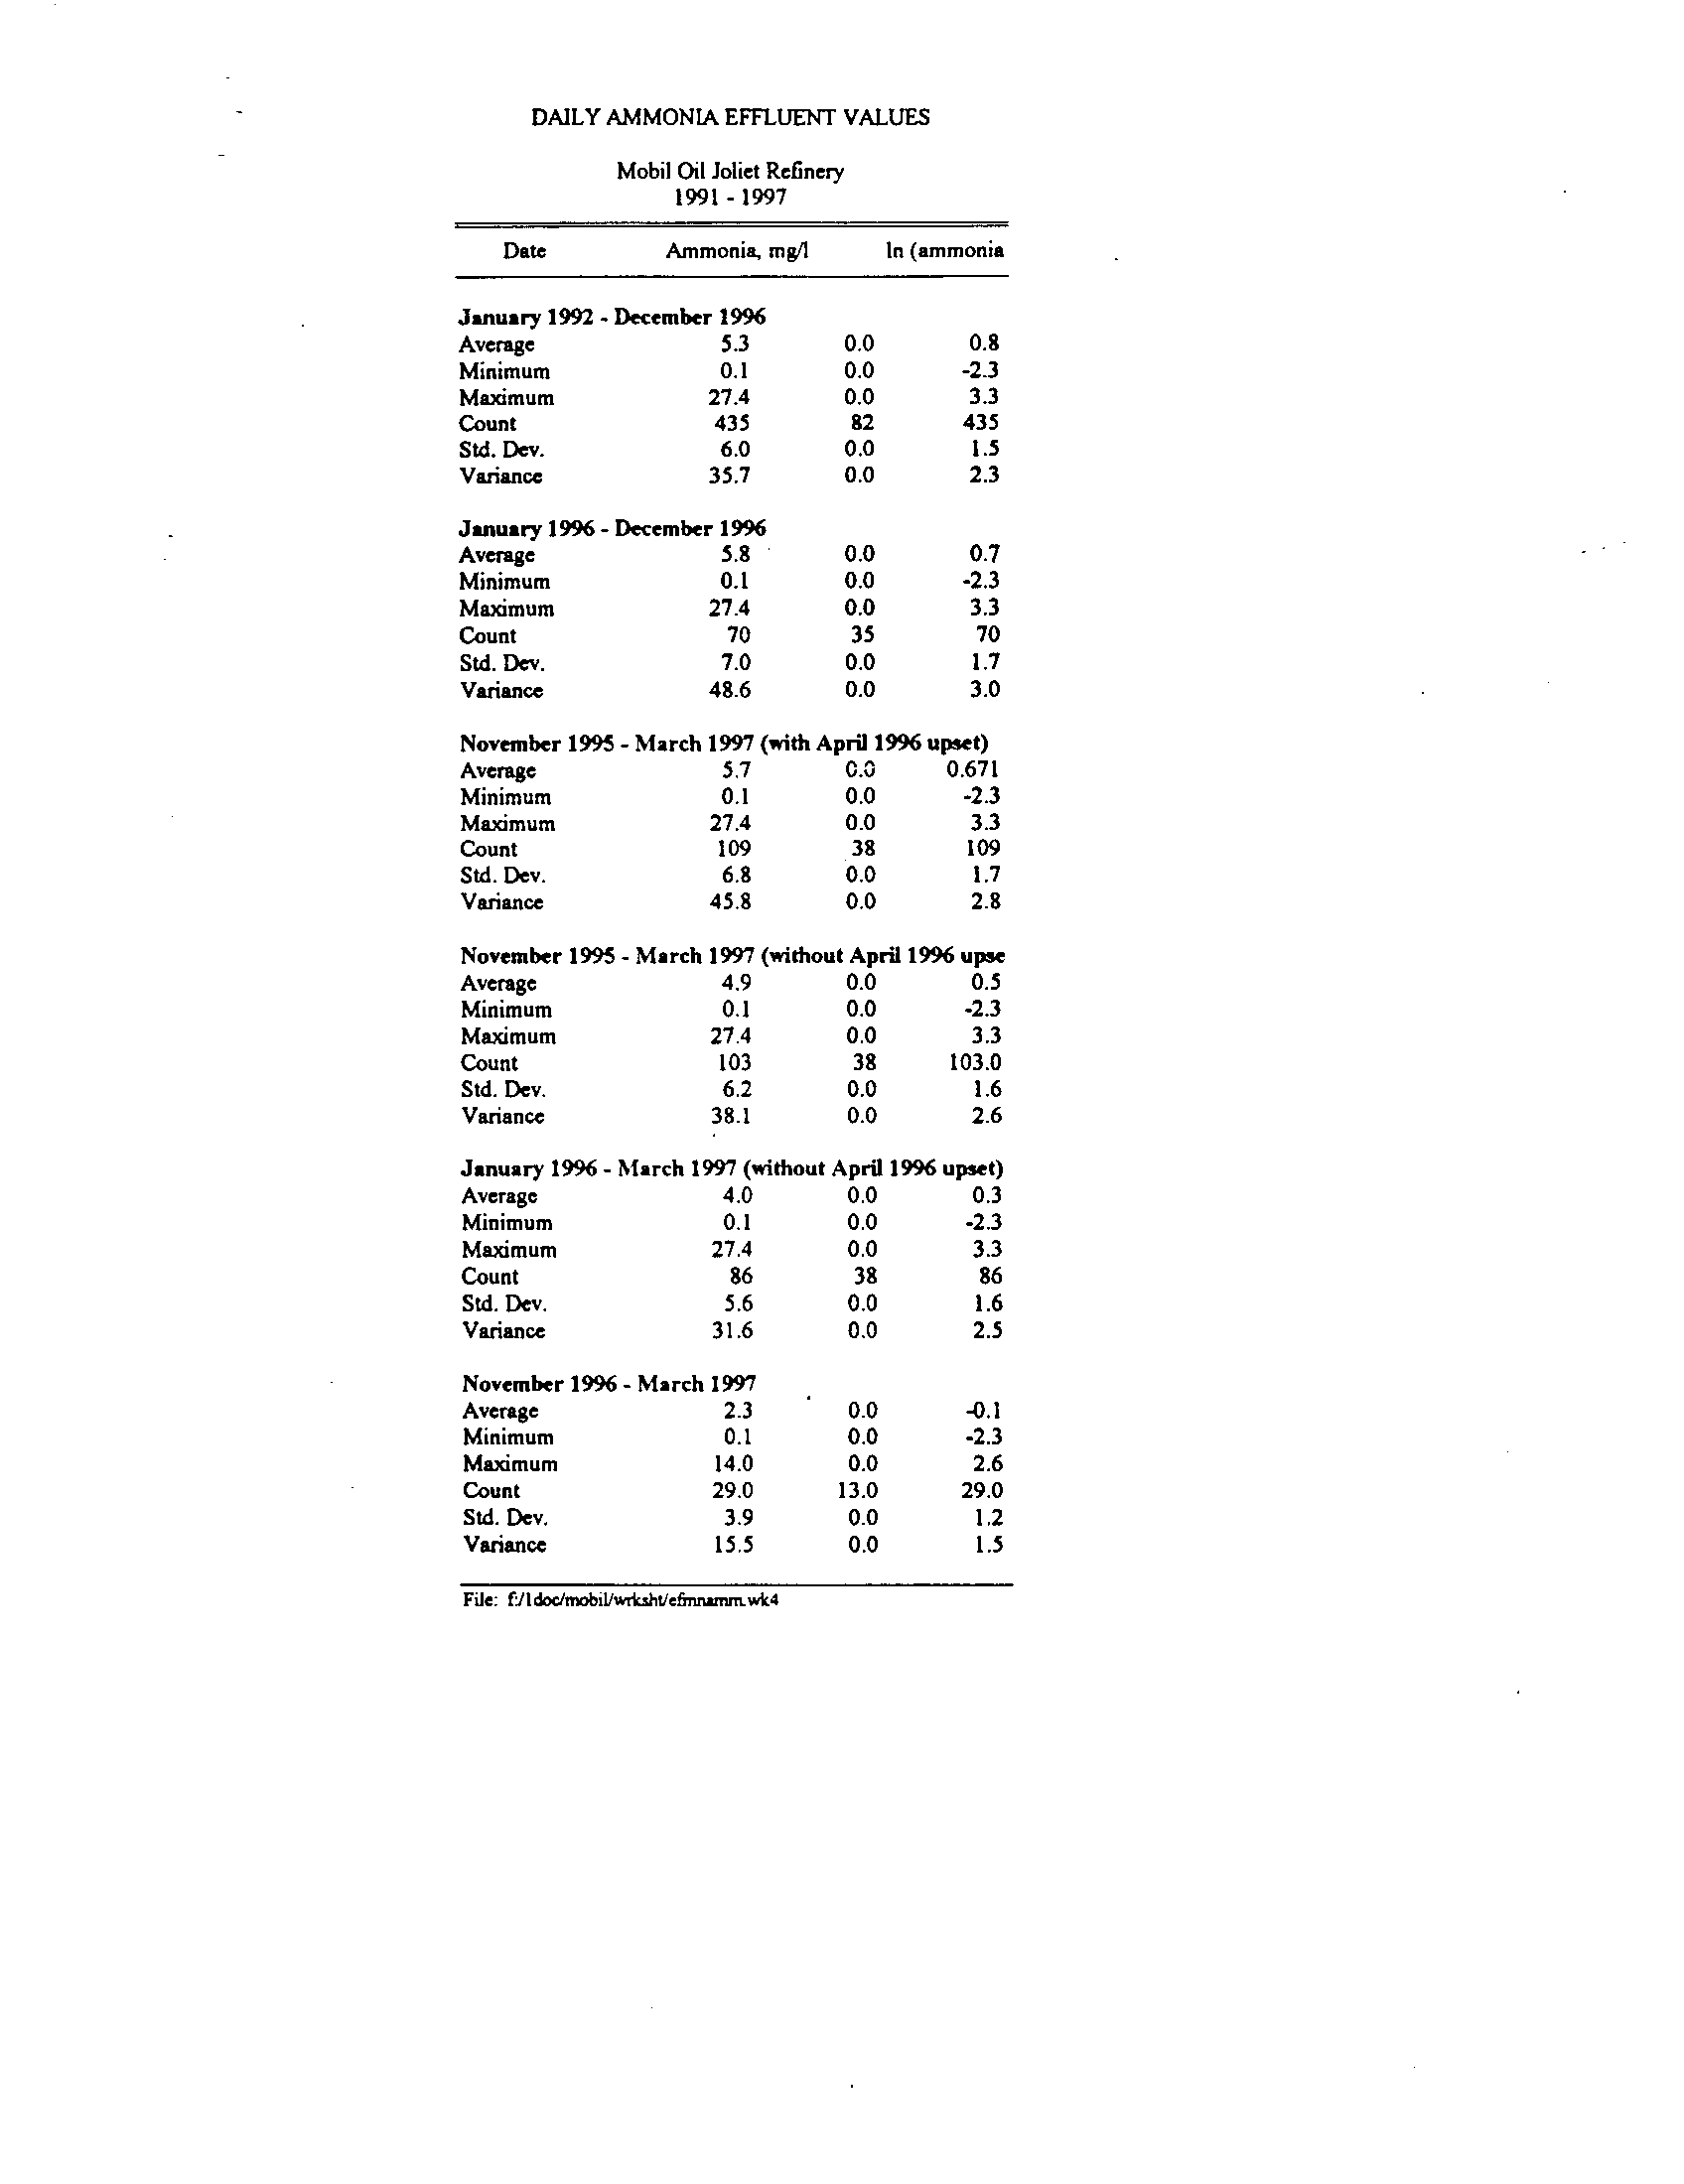
start up in 1973 to the present as shown in Exhibit II . From March, 1994 to February,
1997, the WWTP ammonia reduction averaged about 83% and achieved 5
.0 mg/I average
effluent concentration
. The monthly limitation of 13 mg/l was exceeded only in January,
1995 and March and April of 1996 . The 1995 exceedance was directly attributable to a
malfunction in a Sand Filtration system in the Merox Gasoline Treating Unit, which resulted
in intermittent carry over of small amounts of spent caustic into Process Water system . The
spent caustic is normally segregated from the Process Water, because of its high pH, phenol
and cyanide content, all of which are known to inhibit the nitrification process
. However,
since this incident, the Refinery has installed a caustic free Merox Gasoline Treating Unit,
thus precluding a recurrence of a similar incident . The 1996 exceedence occurred when 100
8-
gallons of diethanol amine (DEA) was drained to a process sewer instead of a holding tank .
Maintenance procedures were reviewed and revised to ensure that this event would not
reoccur
. The daily maximum limitation of 26 mg/1 was not exceeded in the first incident but
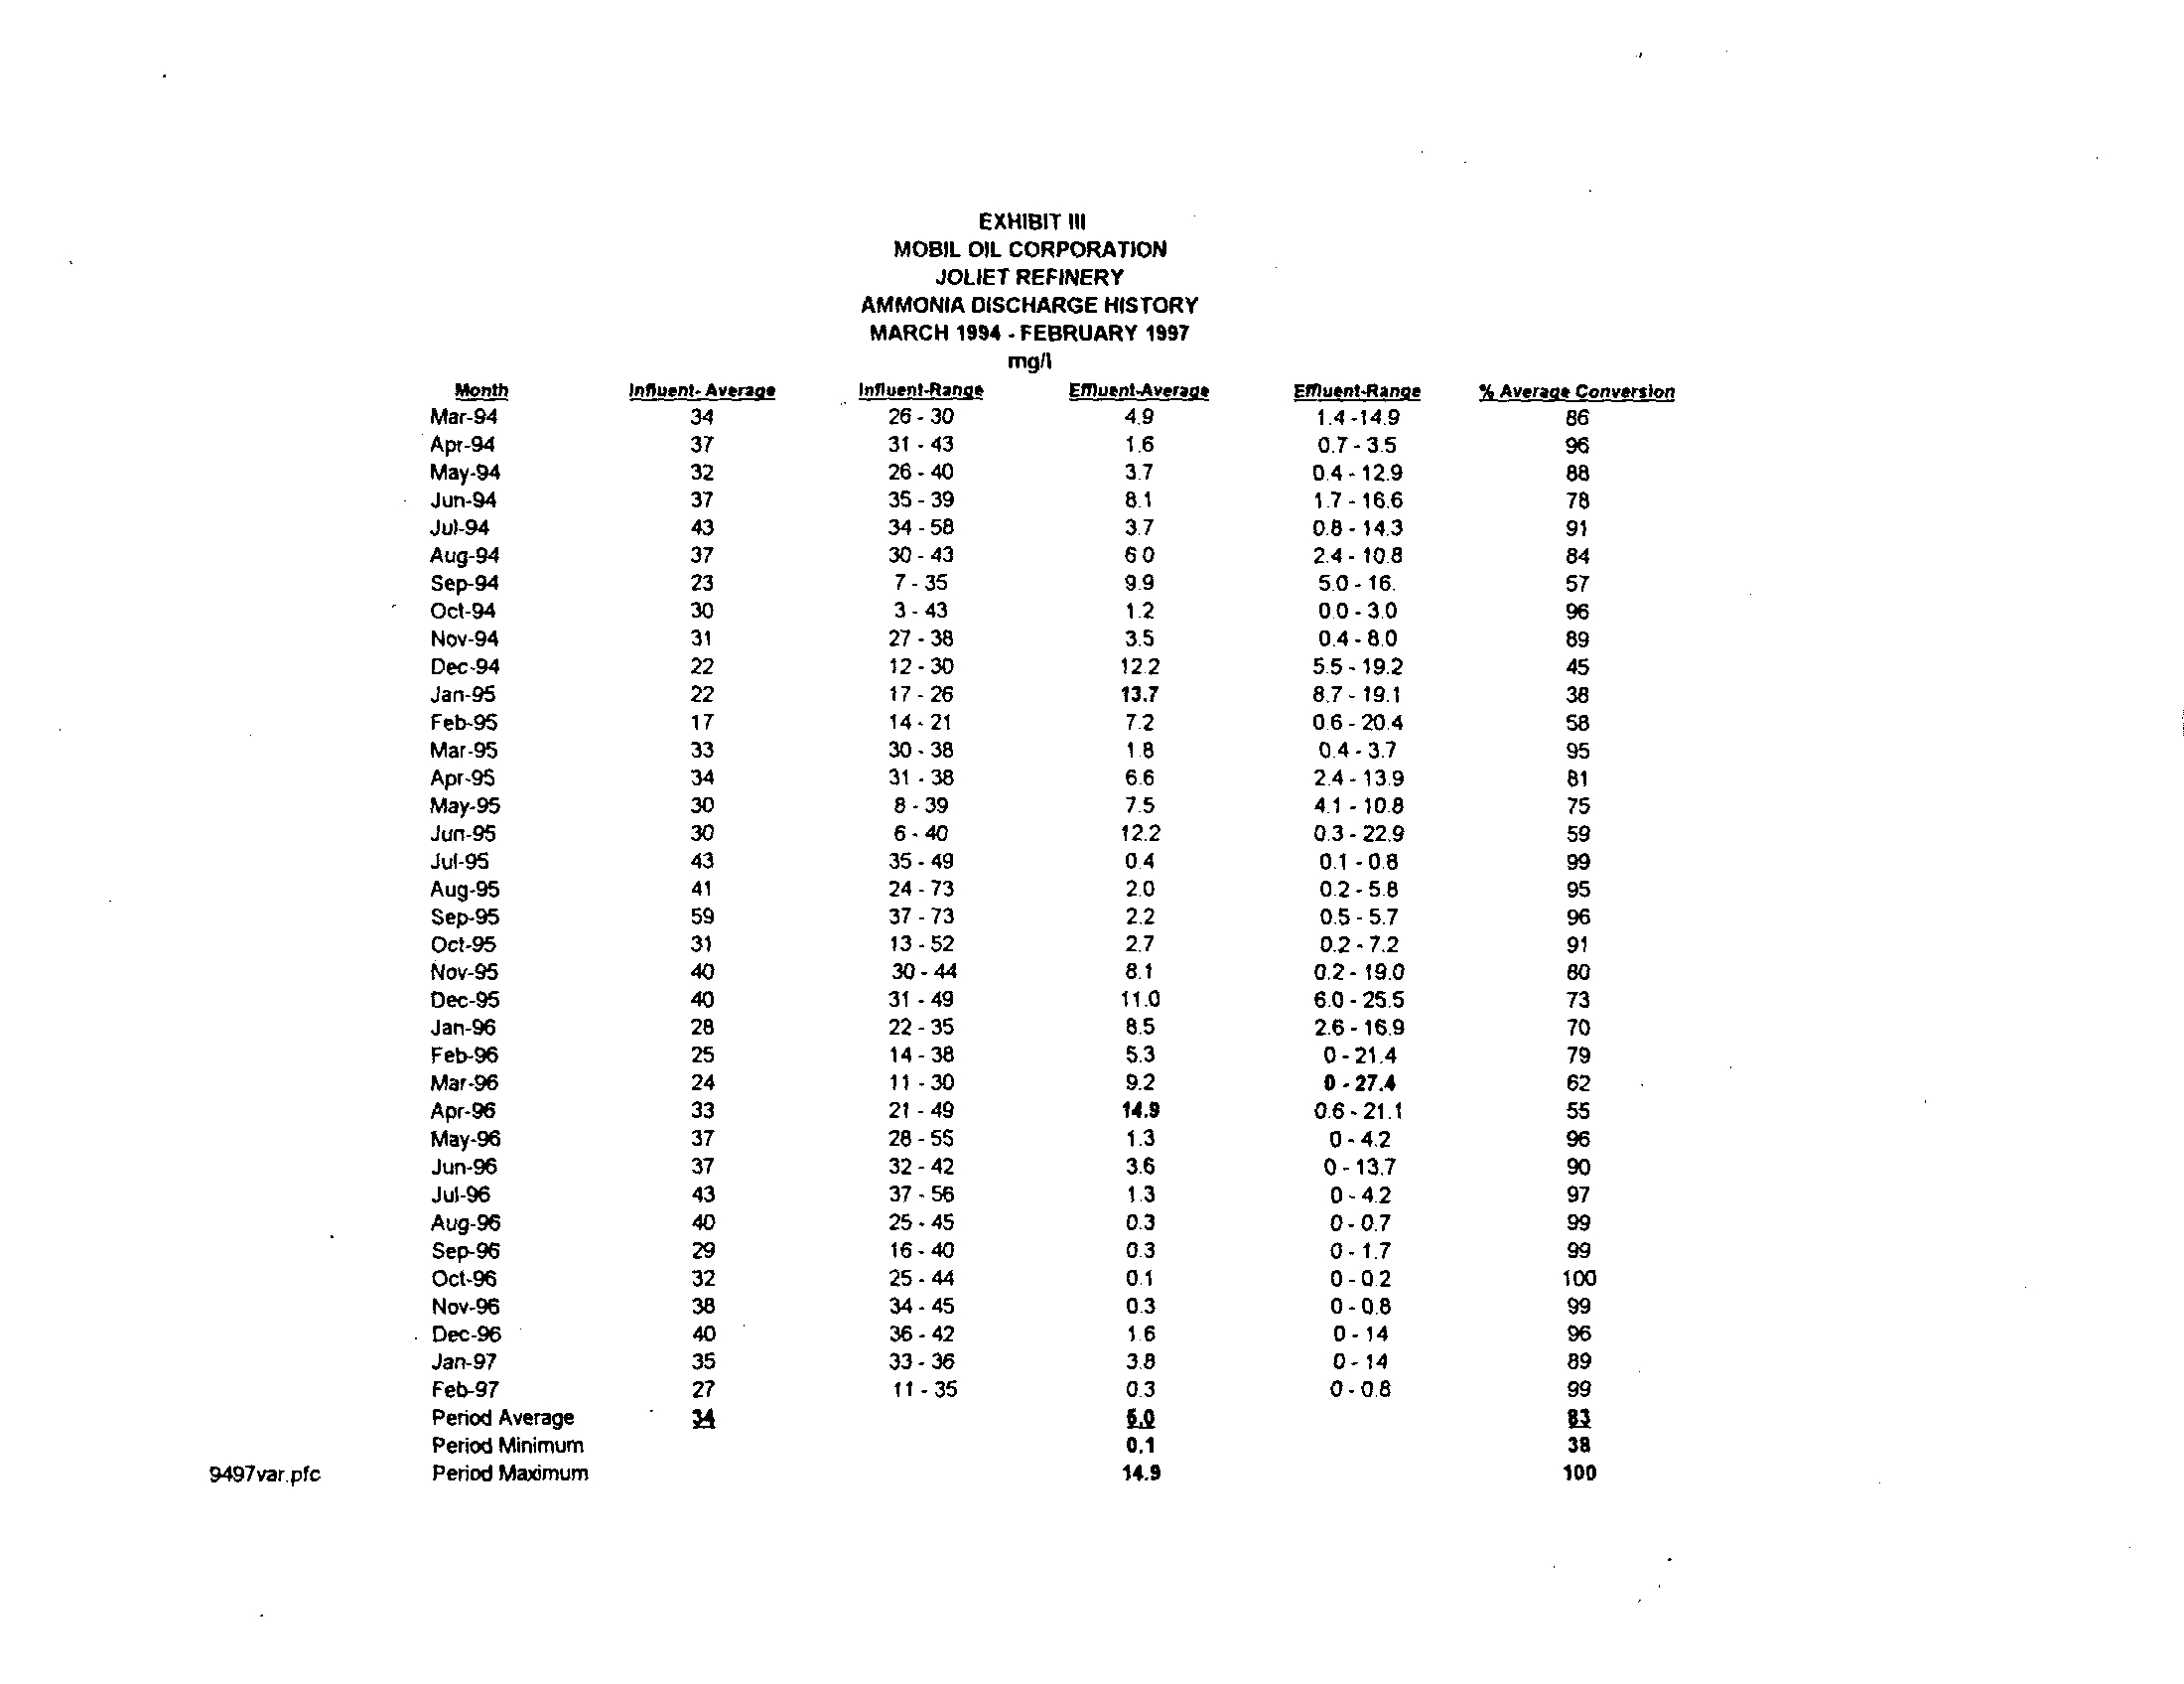
was exceeded in the second incident
. The WWTP performance for the period March 8, 1994
through February, 1997 is shown in Exhibit III .
RESULTS OF NITRIFICATION OPTIMIZATION STUDY
17 .
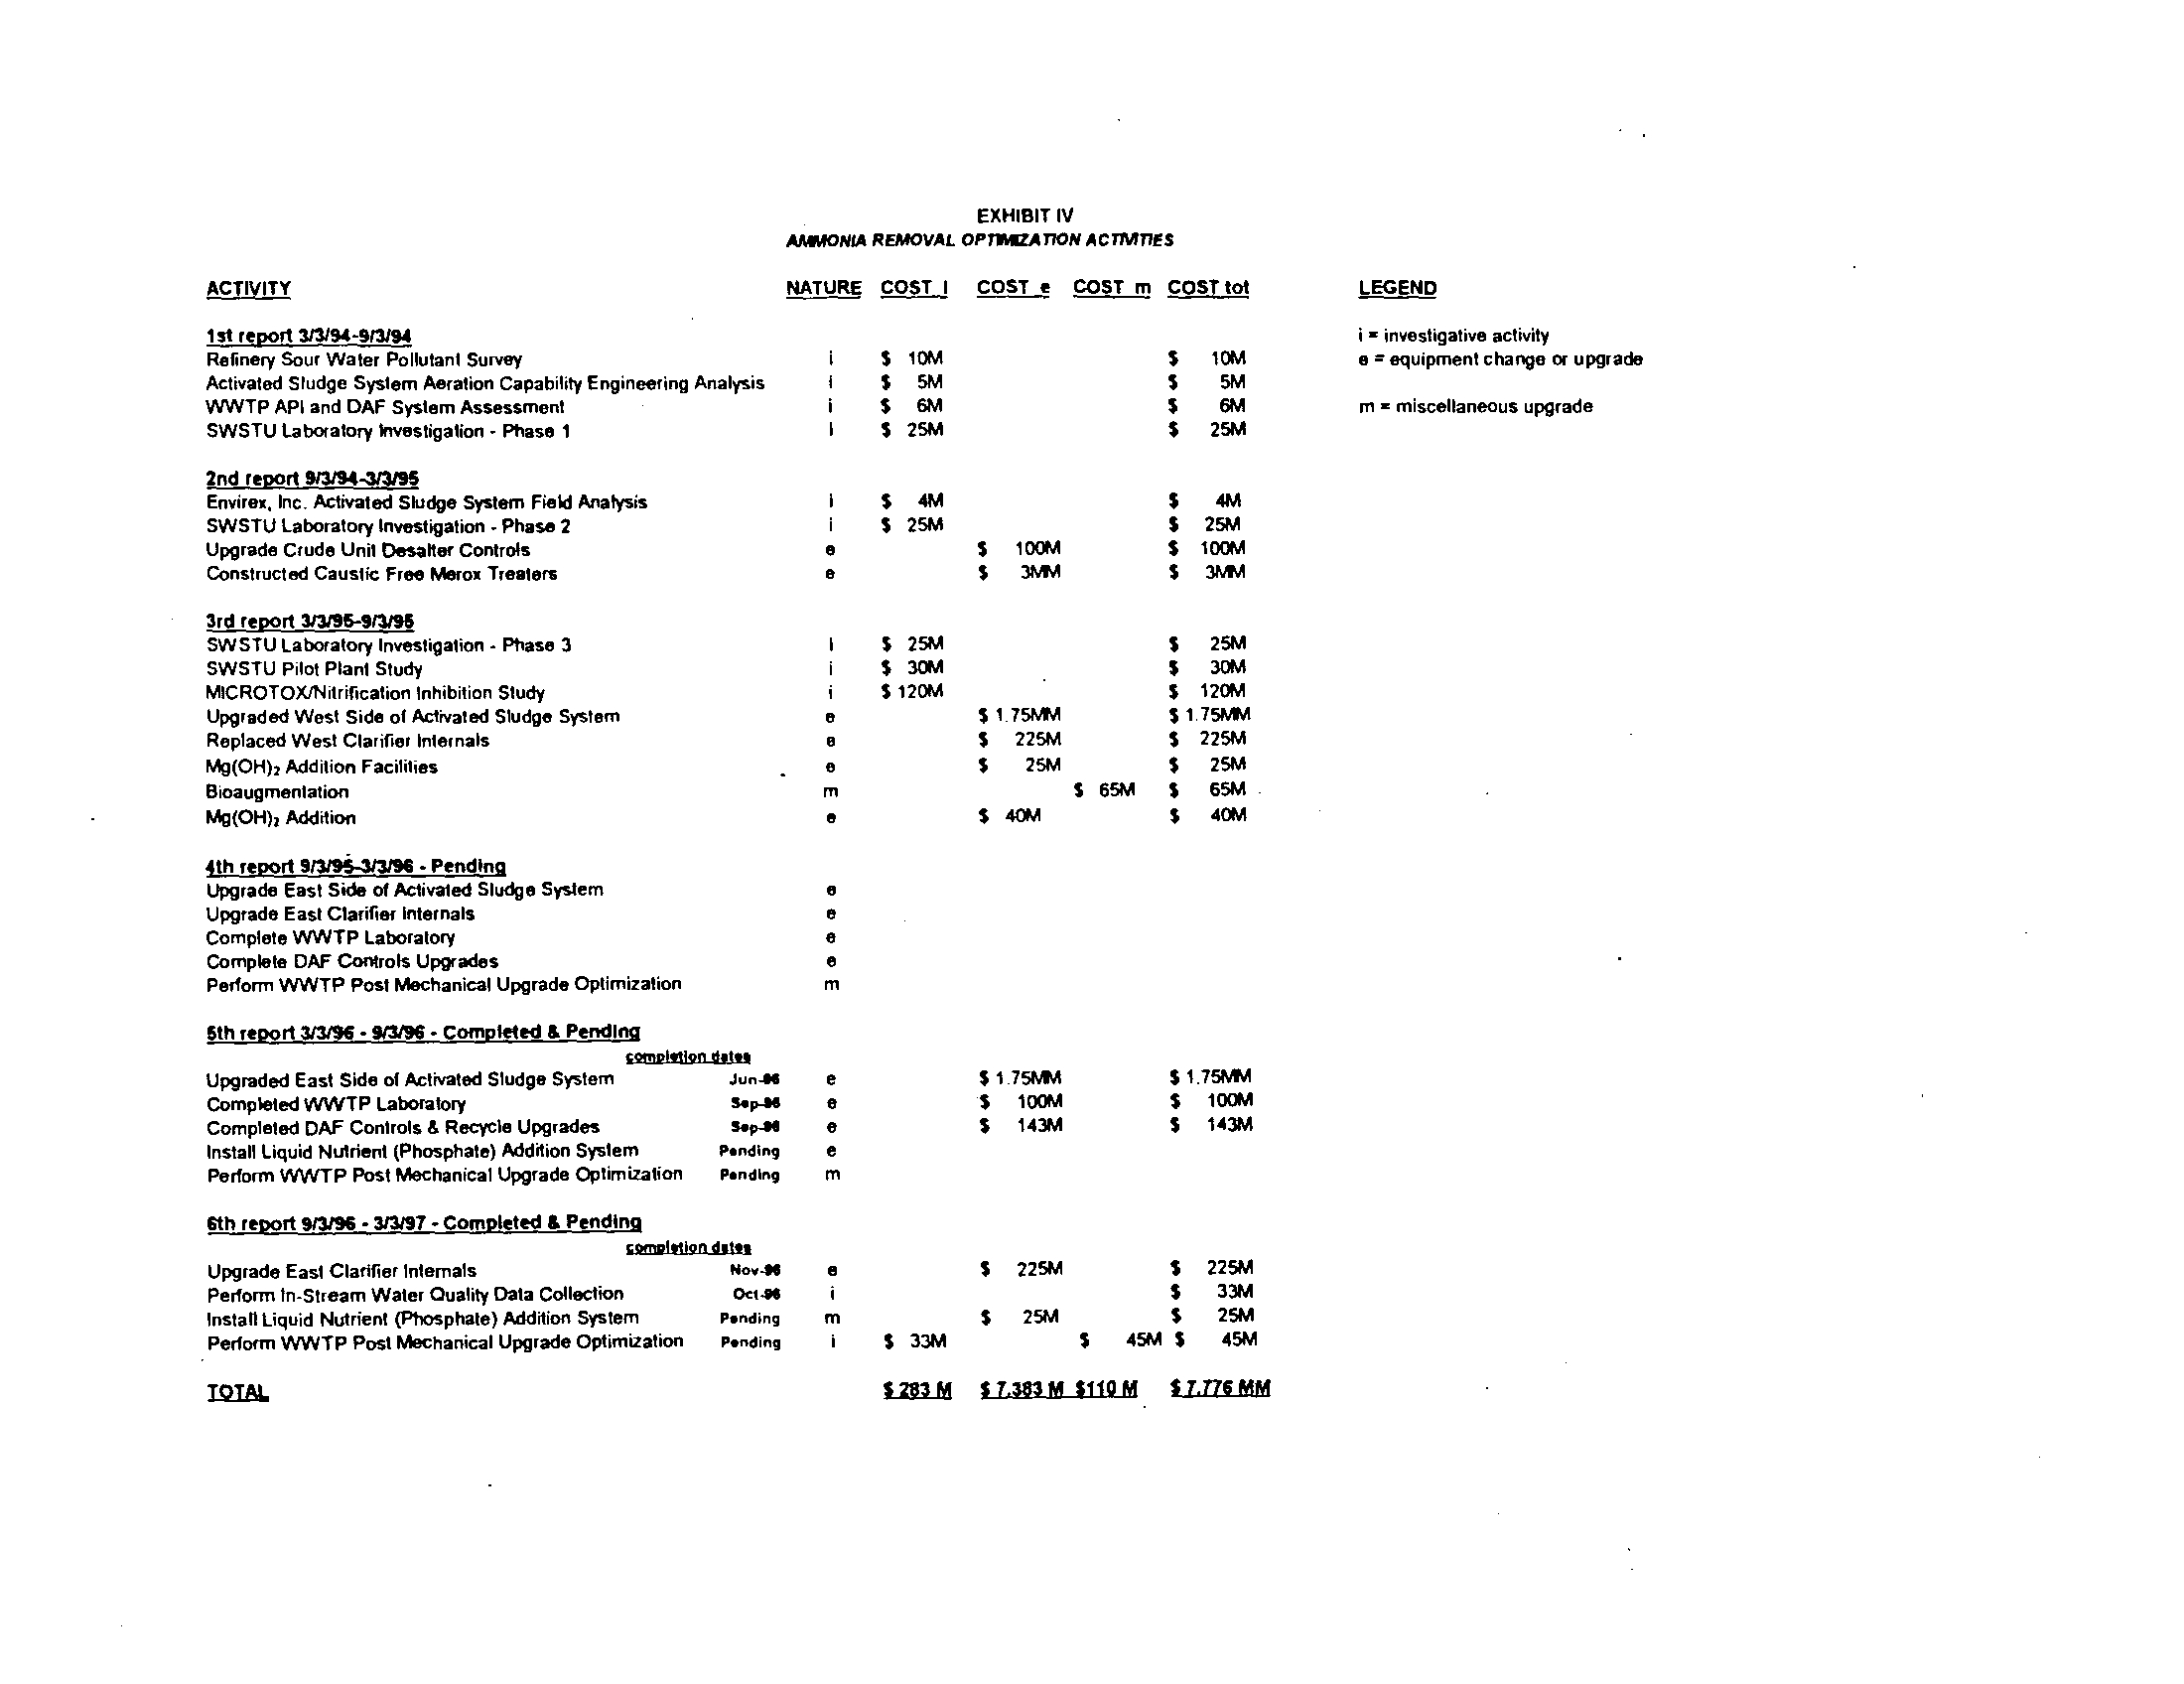
In seeking the variance in PCB 93-151, Mobil pledged to perform a
detailed nitrification optimization study . The variance required that Mobil submit progress
reports every six months detailing completed and anticipated events in the study and any
process changes made to reduce ammonia nitrogen discharge . So far, Mobil has submitted
six progress reports detailing the outcome of the activities listed in Exhibit IV .
18.
The reports describe the extent of the investigation and the numerous
changes Mobil has made to its waste water treatment system as a result of its findings . The
first progress report, dated September 14, 1994, reported that the existing aeration basins
were found oxygen deficient at peak loading . In order to correct this deficiency as soon as
possible, Mobil obtained a construction permit (Permit No . 1995-EN-3140), from the IEPA
on May 9, 1995, to replace the existing mechanical aerators with a fine bubble diffuser
network . Additionally, in order to upgrade the existing activated sludge system further, the
clarifier internals were changed from suction riser pipe configuration to a more efficient
bottom suction header configuration
. These mechanical upgrades have already been
implemented in both the west and east sides of the activated sludge system
.
-9-
19 .
The third Ammonia Optimization Study Progress Report dated October
6, 1995, described how the biological studies referred to as MICROTOX/Nitrification
Inhibition Study confirmed Mobil's contention that the installation of Benzene Reduction Unit
(BRU) increased toxicity of the WWTP influent . The BRU unit was installed in September
of 1990 as required by RCRA and NESHAPS regulations . Since that time, the operation of
the WWTP has become less reliable . In order to avoid a recurrence of the WWTP upset
caused by spent caustic which occurred in January 1995, Mobil replaced the caustic Merox
Gasoline Treaters with a caustic free process
. The installation of the caustic free Merox
Gasoline Treater not only precludes another upset of the WWTP by spent caustic, it also
partially offsets the increase in toxicity resulting from the RCRA mandated installation of the
BRU unit
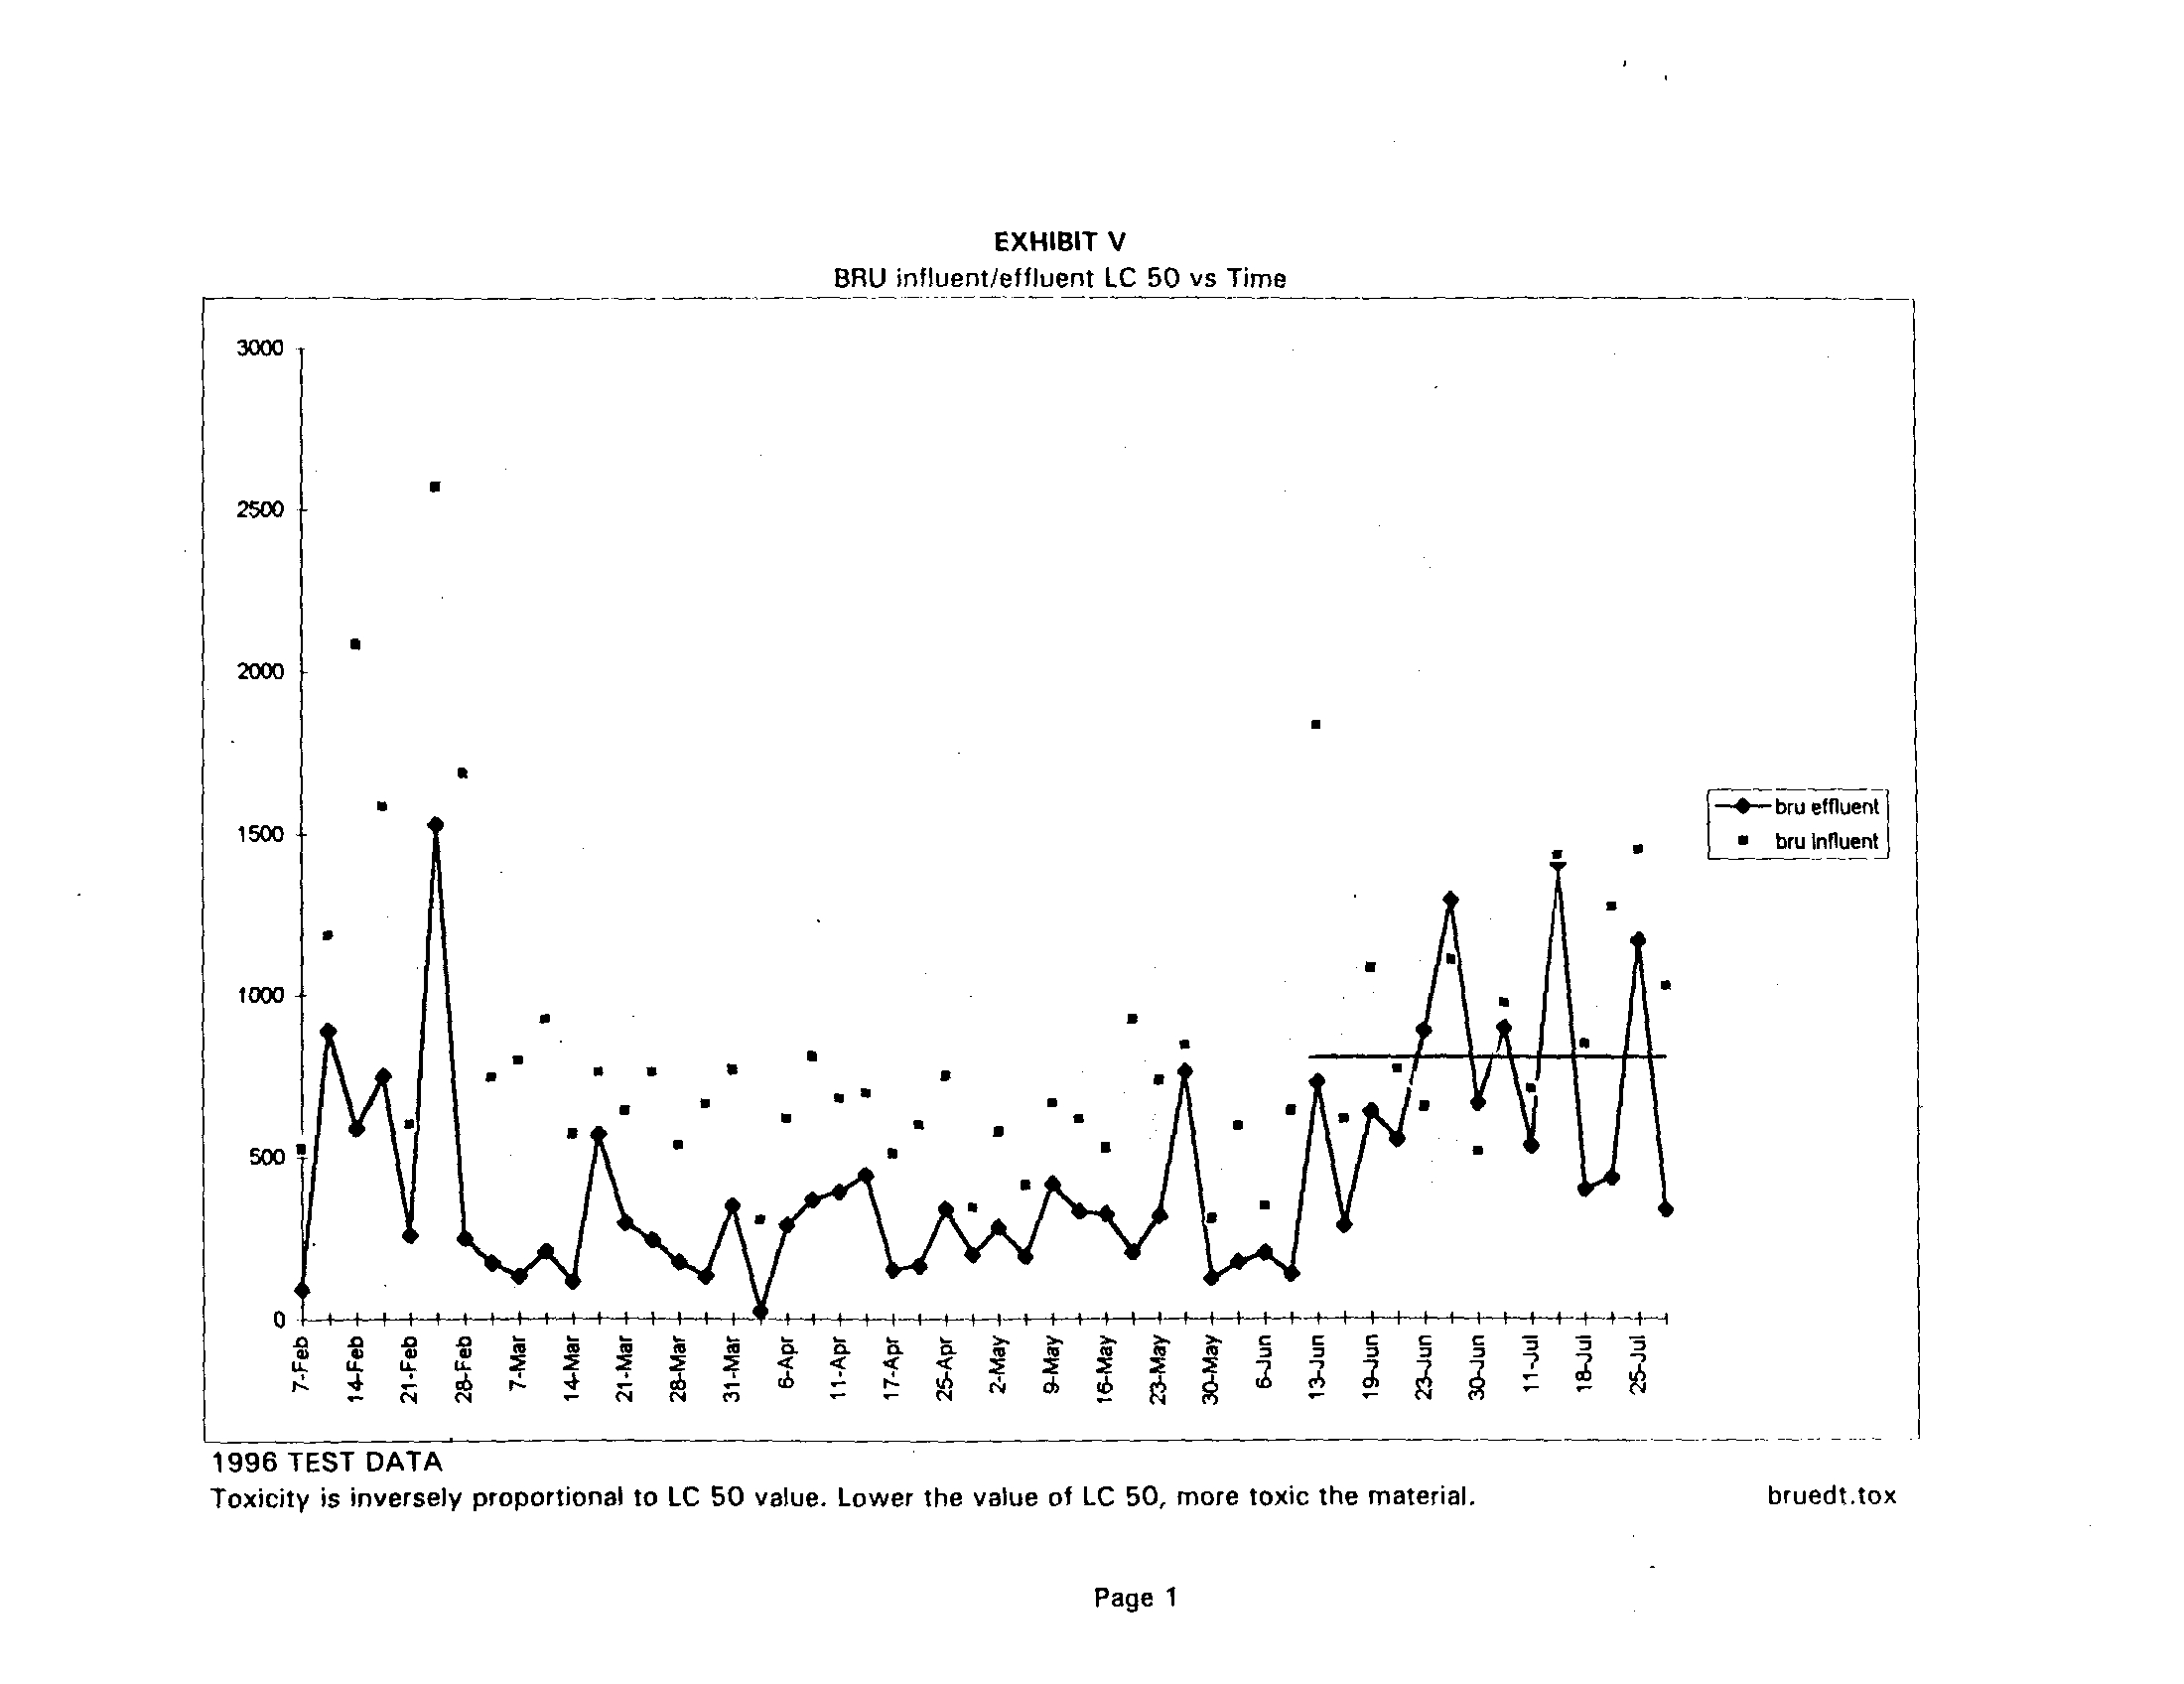
. The caustic free Merox Treater was commissioned in June, 1995 . Exhibit V
shows the toxicity increase across the BRU unit and an overall decrease in toxicity
subsequent to the installation of caustic free Merox Gasoline Treater.
20.
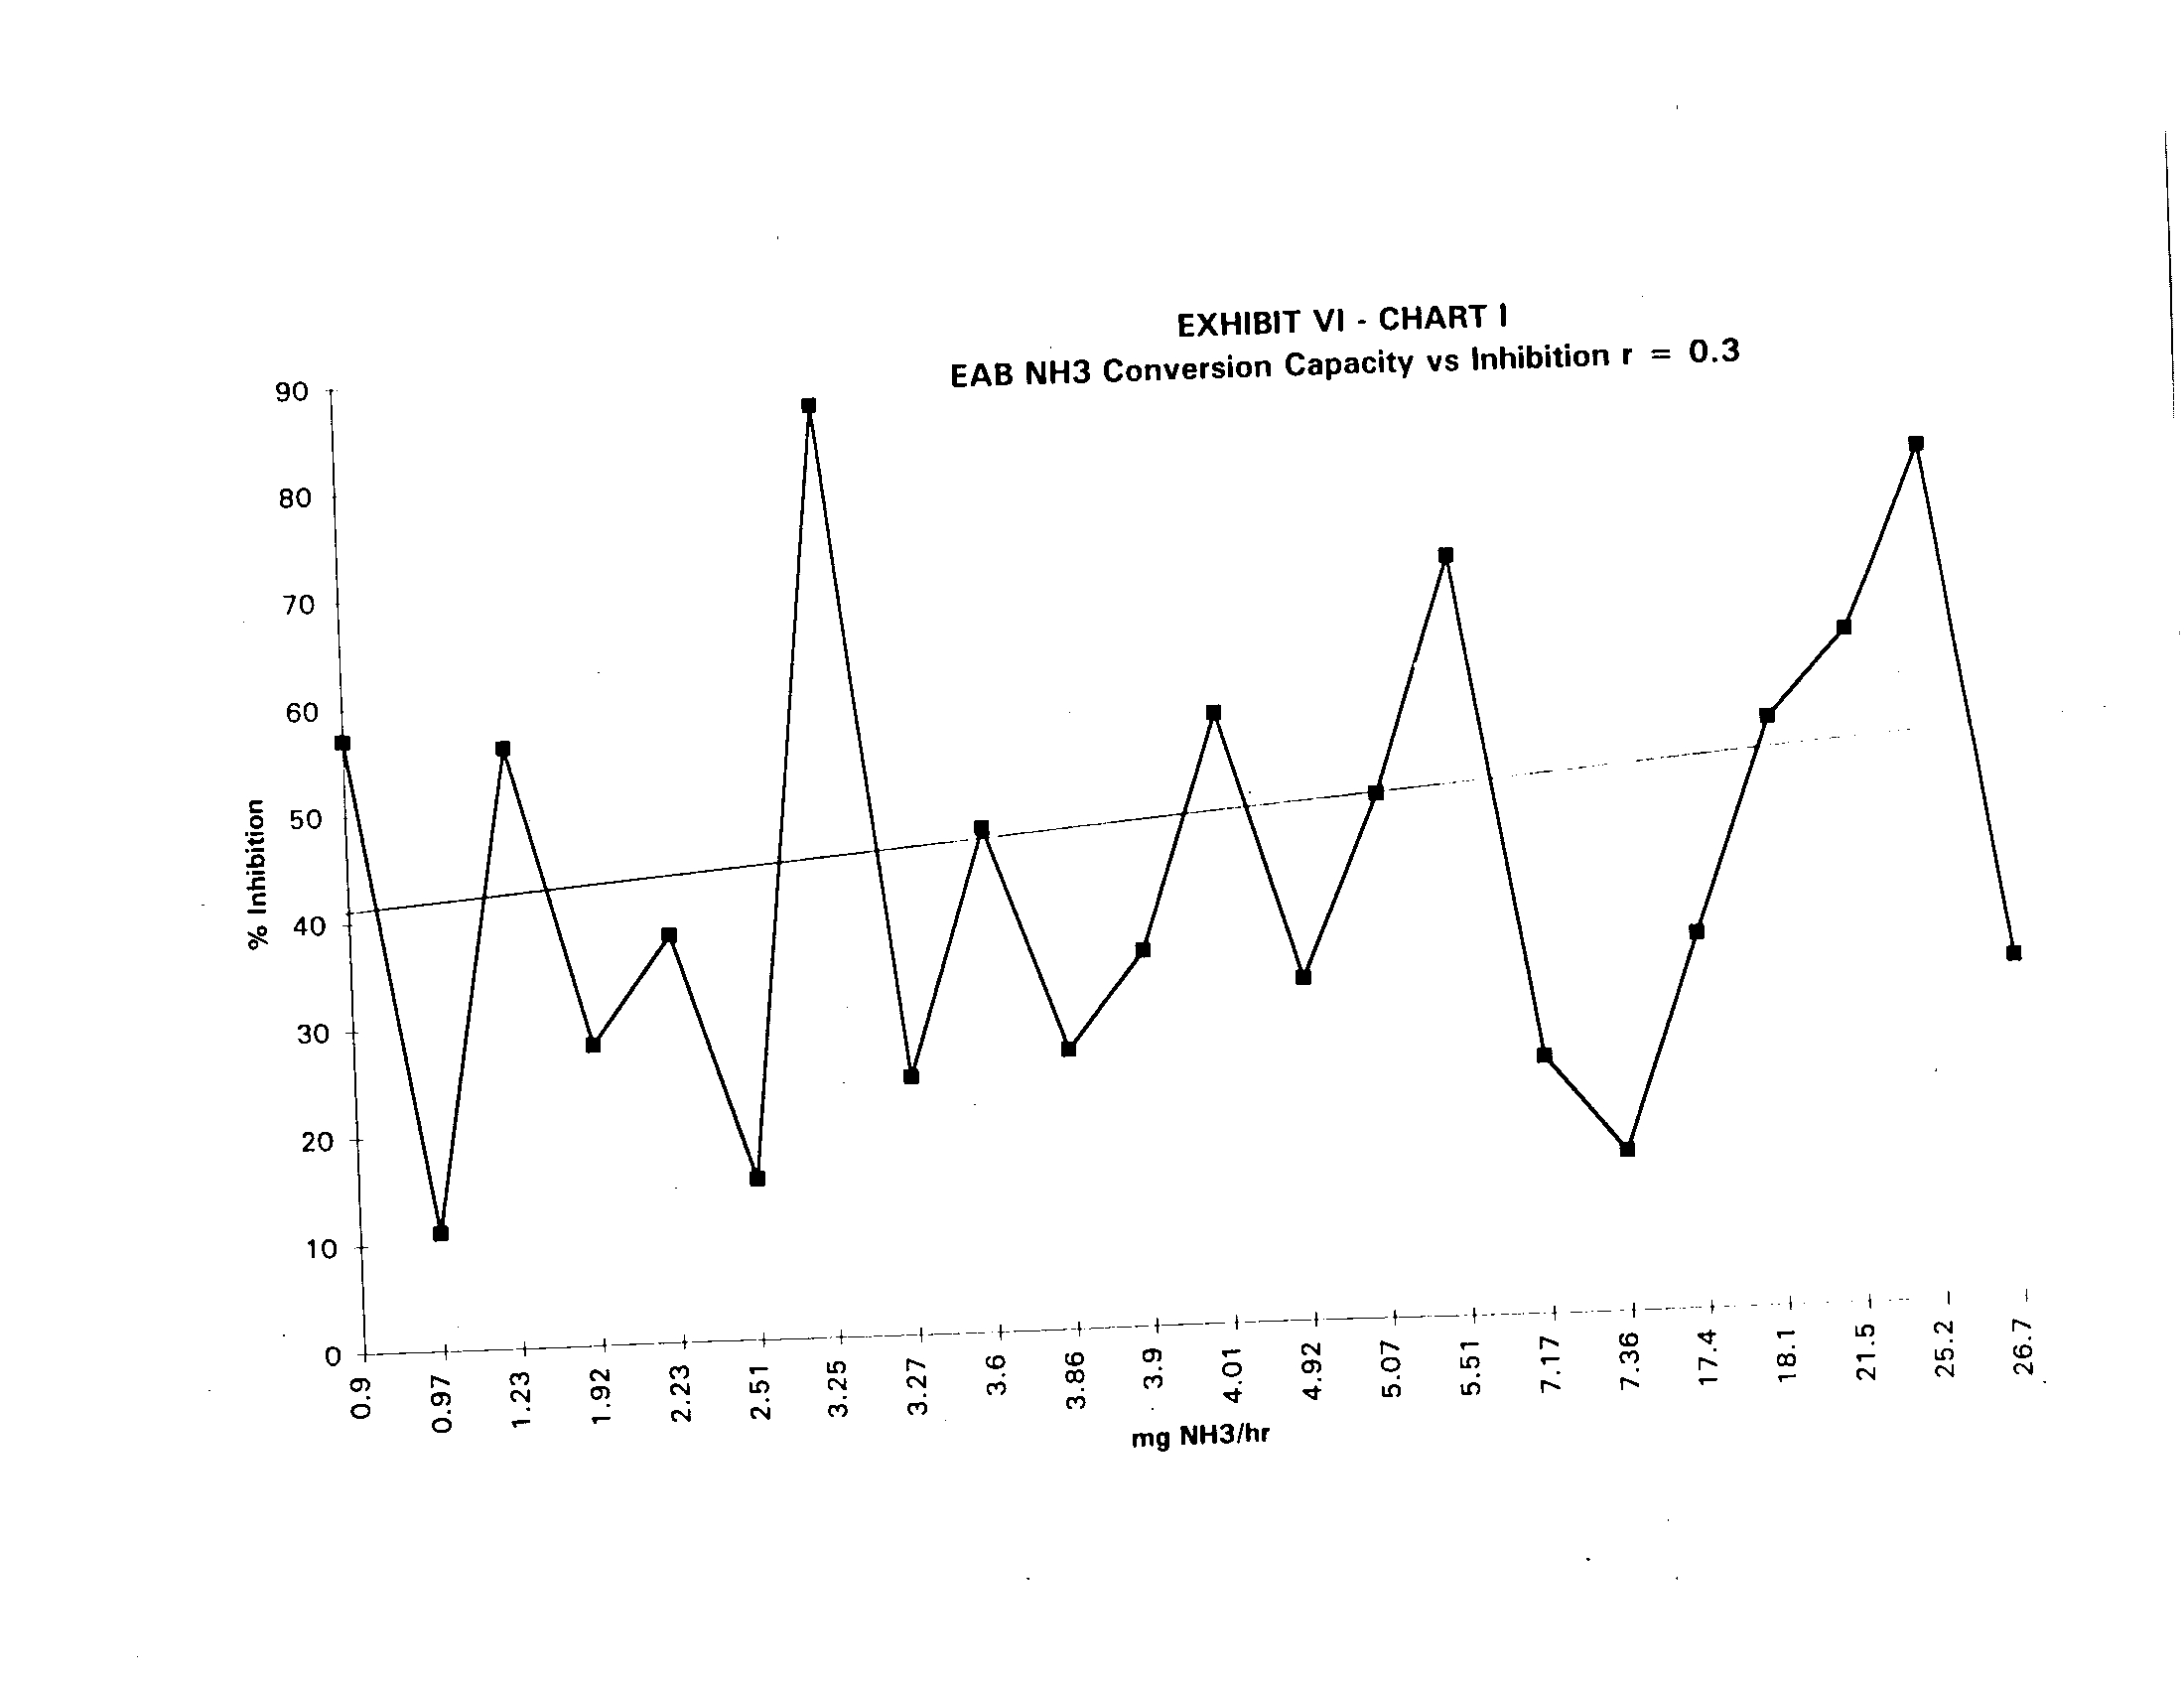
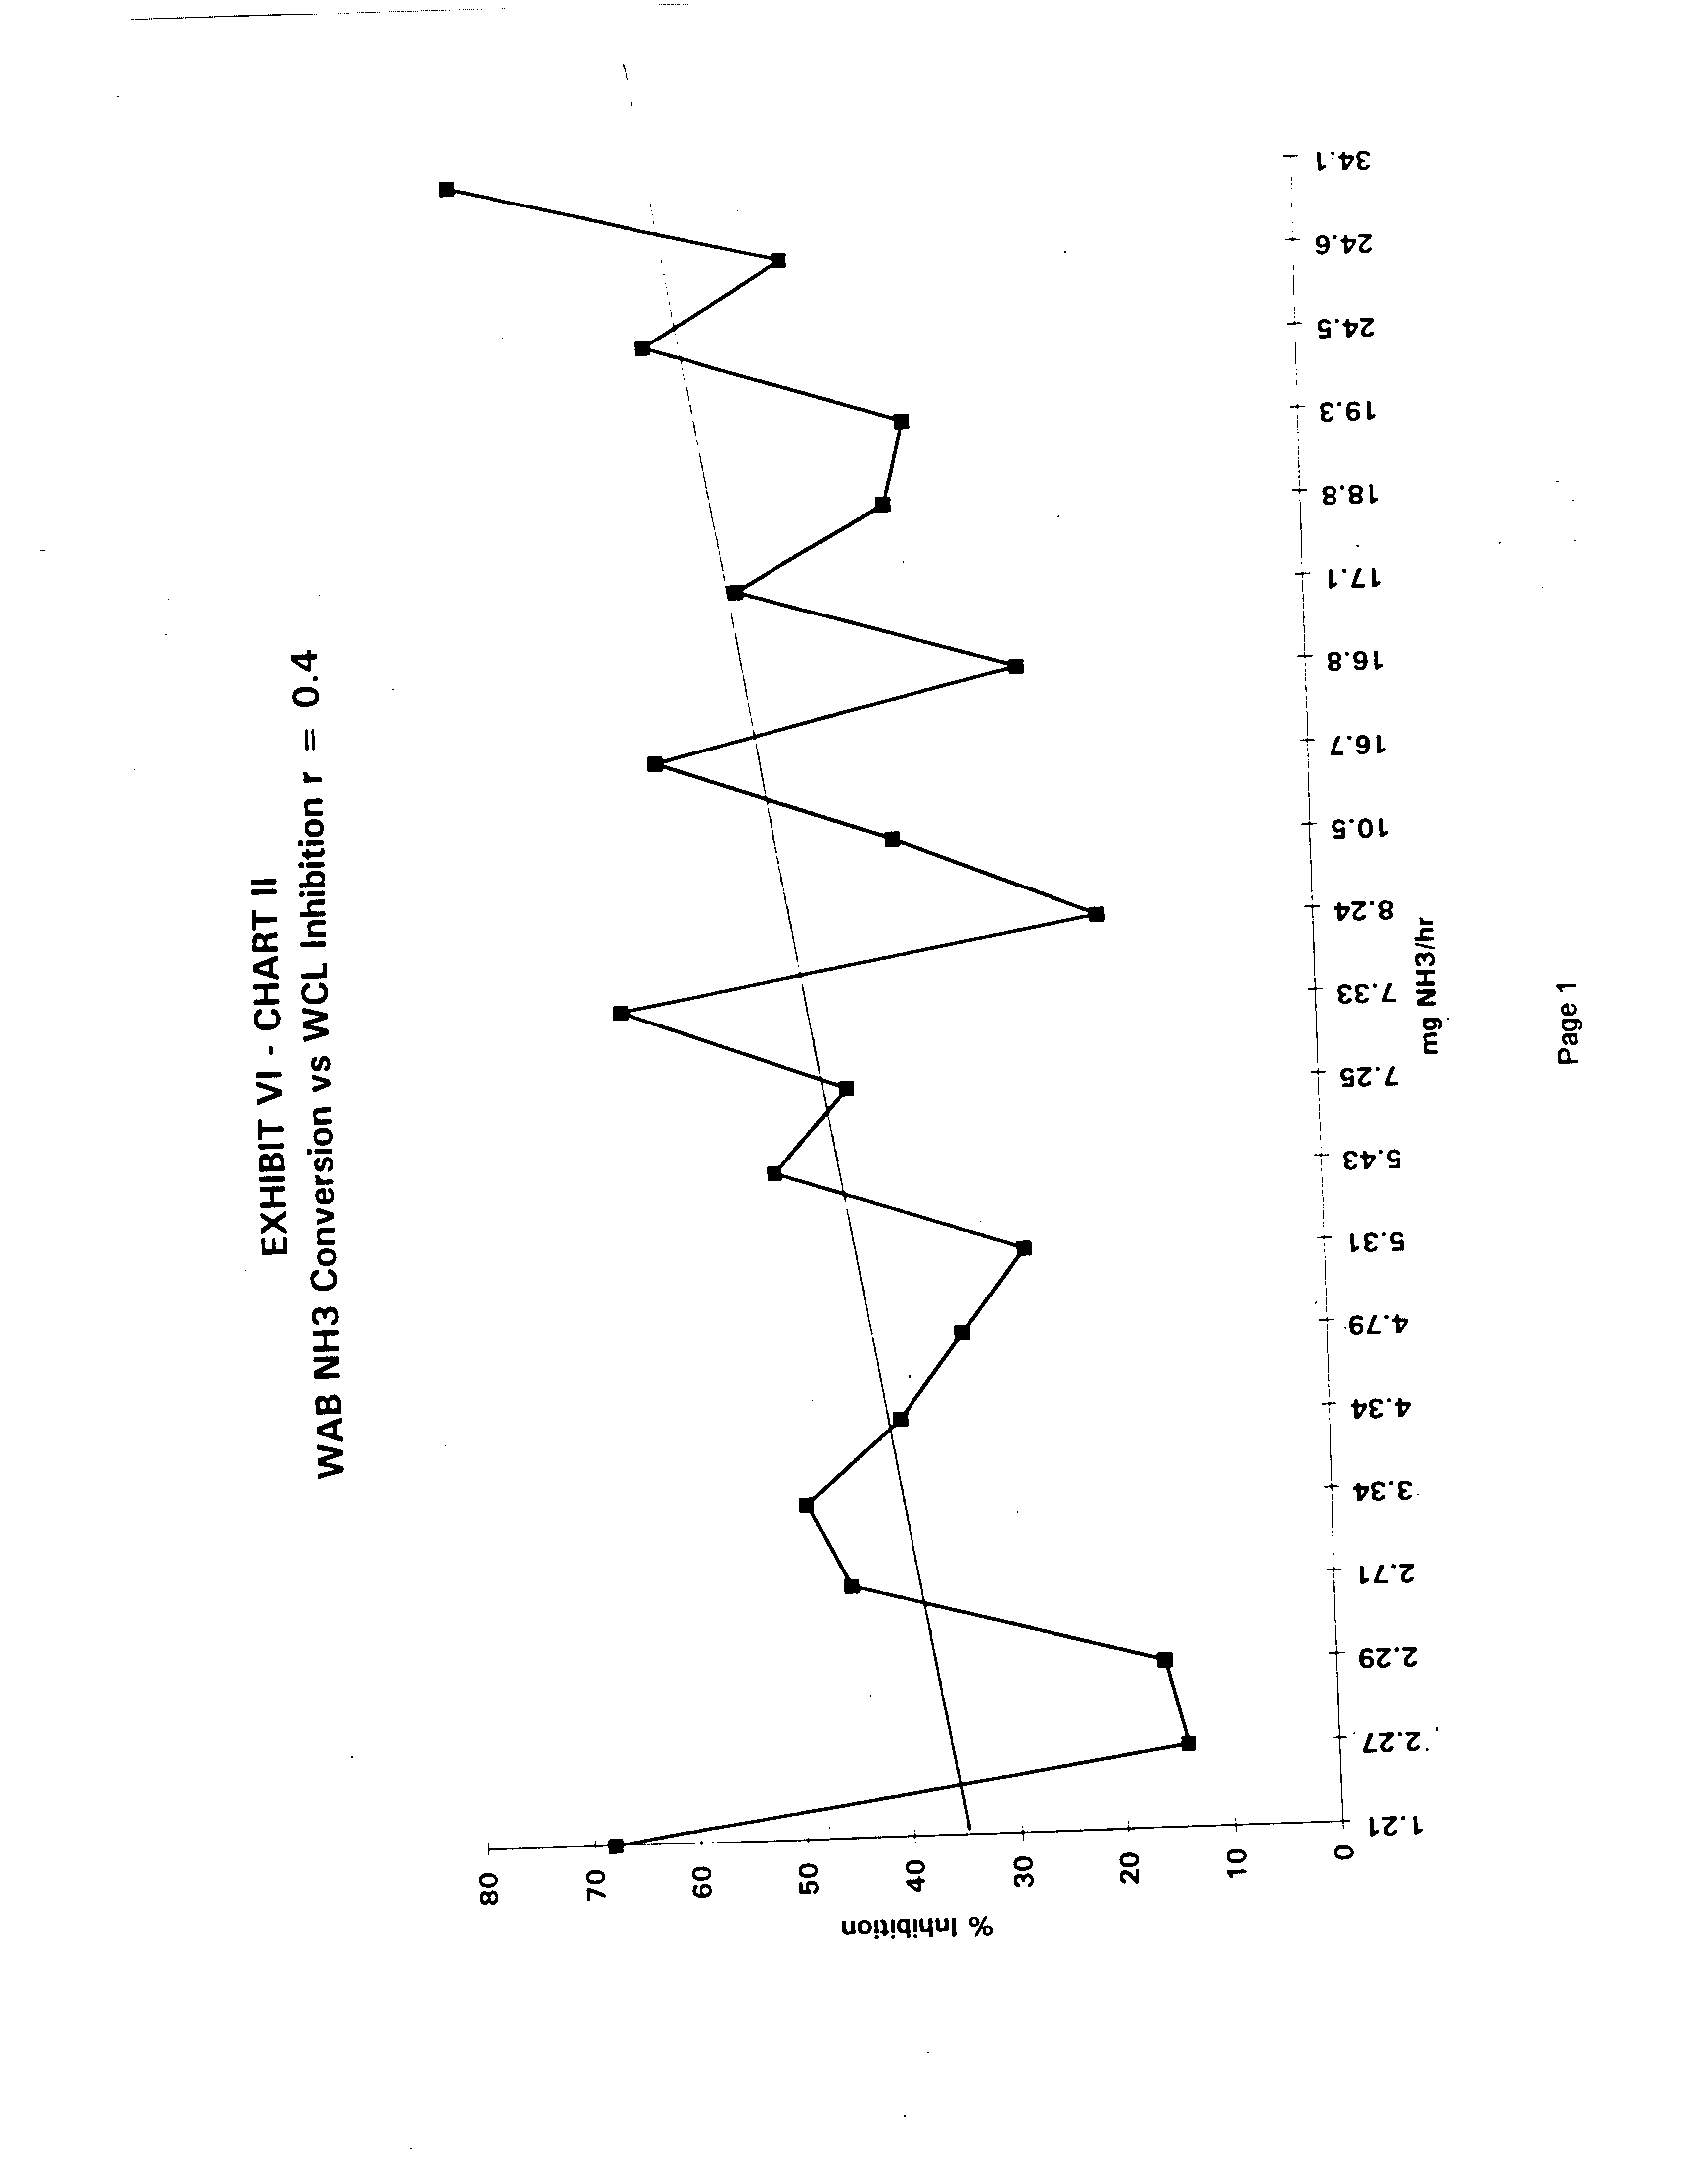
The MICROTOX/Nitrification Inhibition Study also concluded that the
activated sludge process is significantly inhibited by the biodegradation byproducts . Fifteen
streams comprising WWTP influent, east and west clarifiers and waste water effluent were
tested for nitrification inhibition . An increase in the degree of inhibition in those samples
that were diluted with the waste water effluent indicated that an additional organic material,
with powerful inhibitory effect, is generated during the activated sludge biodegradation
process. Further support for this finding is found in the correlation between the conversion
capacity of the aeration basins and the degree of nitrification inhibition in the clarifier
samples
. An increase in the conversion capacity (higher degree of biological activity) of the
- 10-
aeration basins results in an increase in the nitrification inhibition in the clarifiers . The
summary of these findings is shown in Exhibit VI .
21 .
Mobil investigated the feasibility of implementing an upstream process
that could remove known nitrification inhibitors, such as phenols, from the WWTP influent .
A process referred to as a Sour Water Stripper Tail Unit (SWSTU) was investigated from
Laboratory to Pilot Plant phase
. In spite of the promising results obtained under the
Laboratory Study conditions, the Pilot Plant Study results indicated that the removal of
phenol was not a result of catalytic oxidation, but a result of absorption by activated carbon
support material . As such, the process is not commercially viable for removal of phenol
from the Refinery WWTP influent . Even had this process been available, upstream
reduction of organic inhibitors may not improve the WWTP performance, due to the
signification inhibition caused by the biodegradation byproducts, as described above .
Therefore, the investigation associated with SWSTU was discontinued
.
22 .
Mobil retained Parsons Engineering Science to review historical
ammonia nitrogen data and the nitrification studies and to draw conclusions regarding the
potential for further improvement in nitrification at the facility
. This report is included
herein as Exhibit VII . Parsons notes that with the completion of the WWTP upgrade and the
subsequent plant optimization, the performance of the WWTP has been more robust and
generally more consistent
. However, Parsons also concludes that in light of the
autoinhibition effects, substantiated by the MICROTOX/Nitrification Inhibition Study, it is
technically infeasible to assure total consistency with the Board's ammonia effluent
limitation . Therefore, Mobil files this site-specific relief
.
23.
Since beginning the investigation, Mobil has incurred $283,000 in
investigation costs to evaluate the nitrification performance of the WWTP . In addition,
Mobil has spent $ 7.78
million on the upgrades to its WWTP to improve its performance and
encourage more efficient nitrification
. It has completely performed the studies it described in
its PCB 93-151 petition .
ENVIRONMENTAL IMPACT
24 .
The impact of the relief on the ammonia nitrogen load in the Des
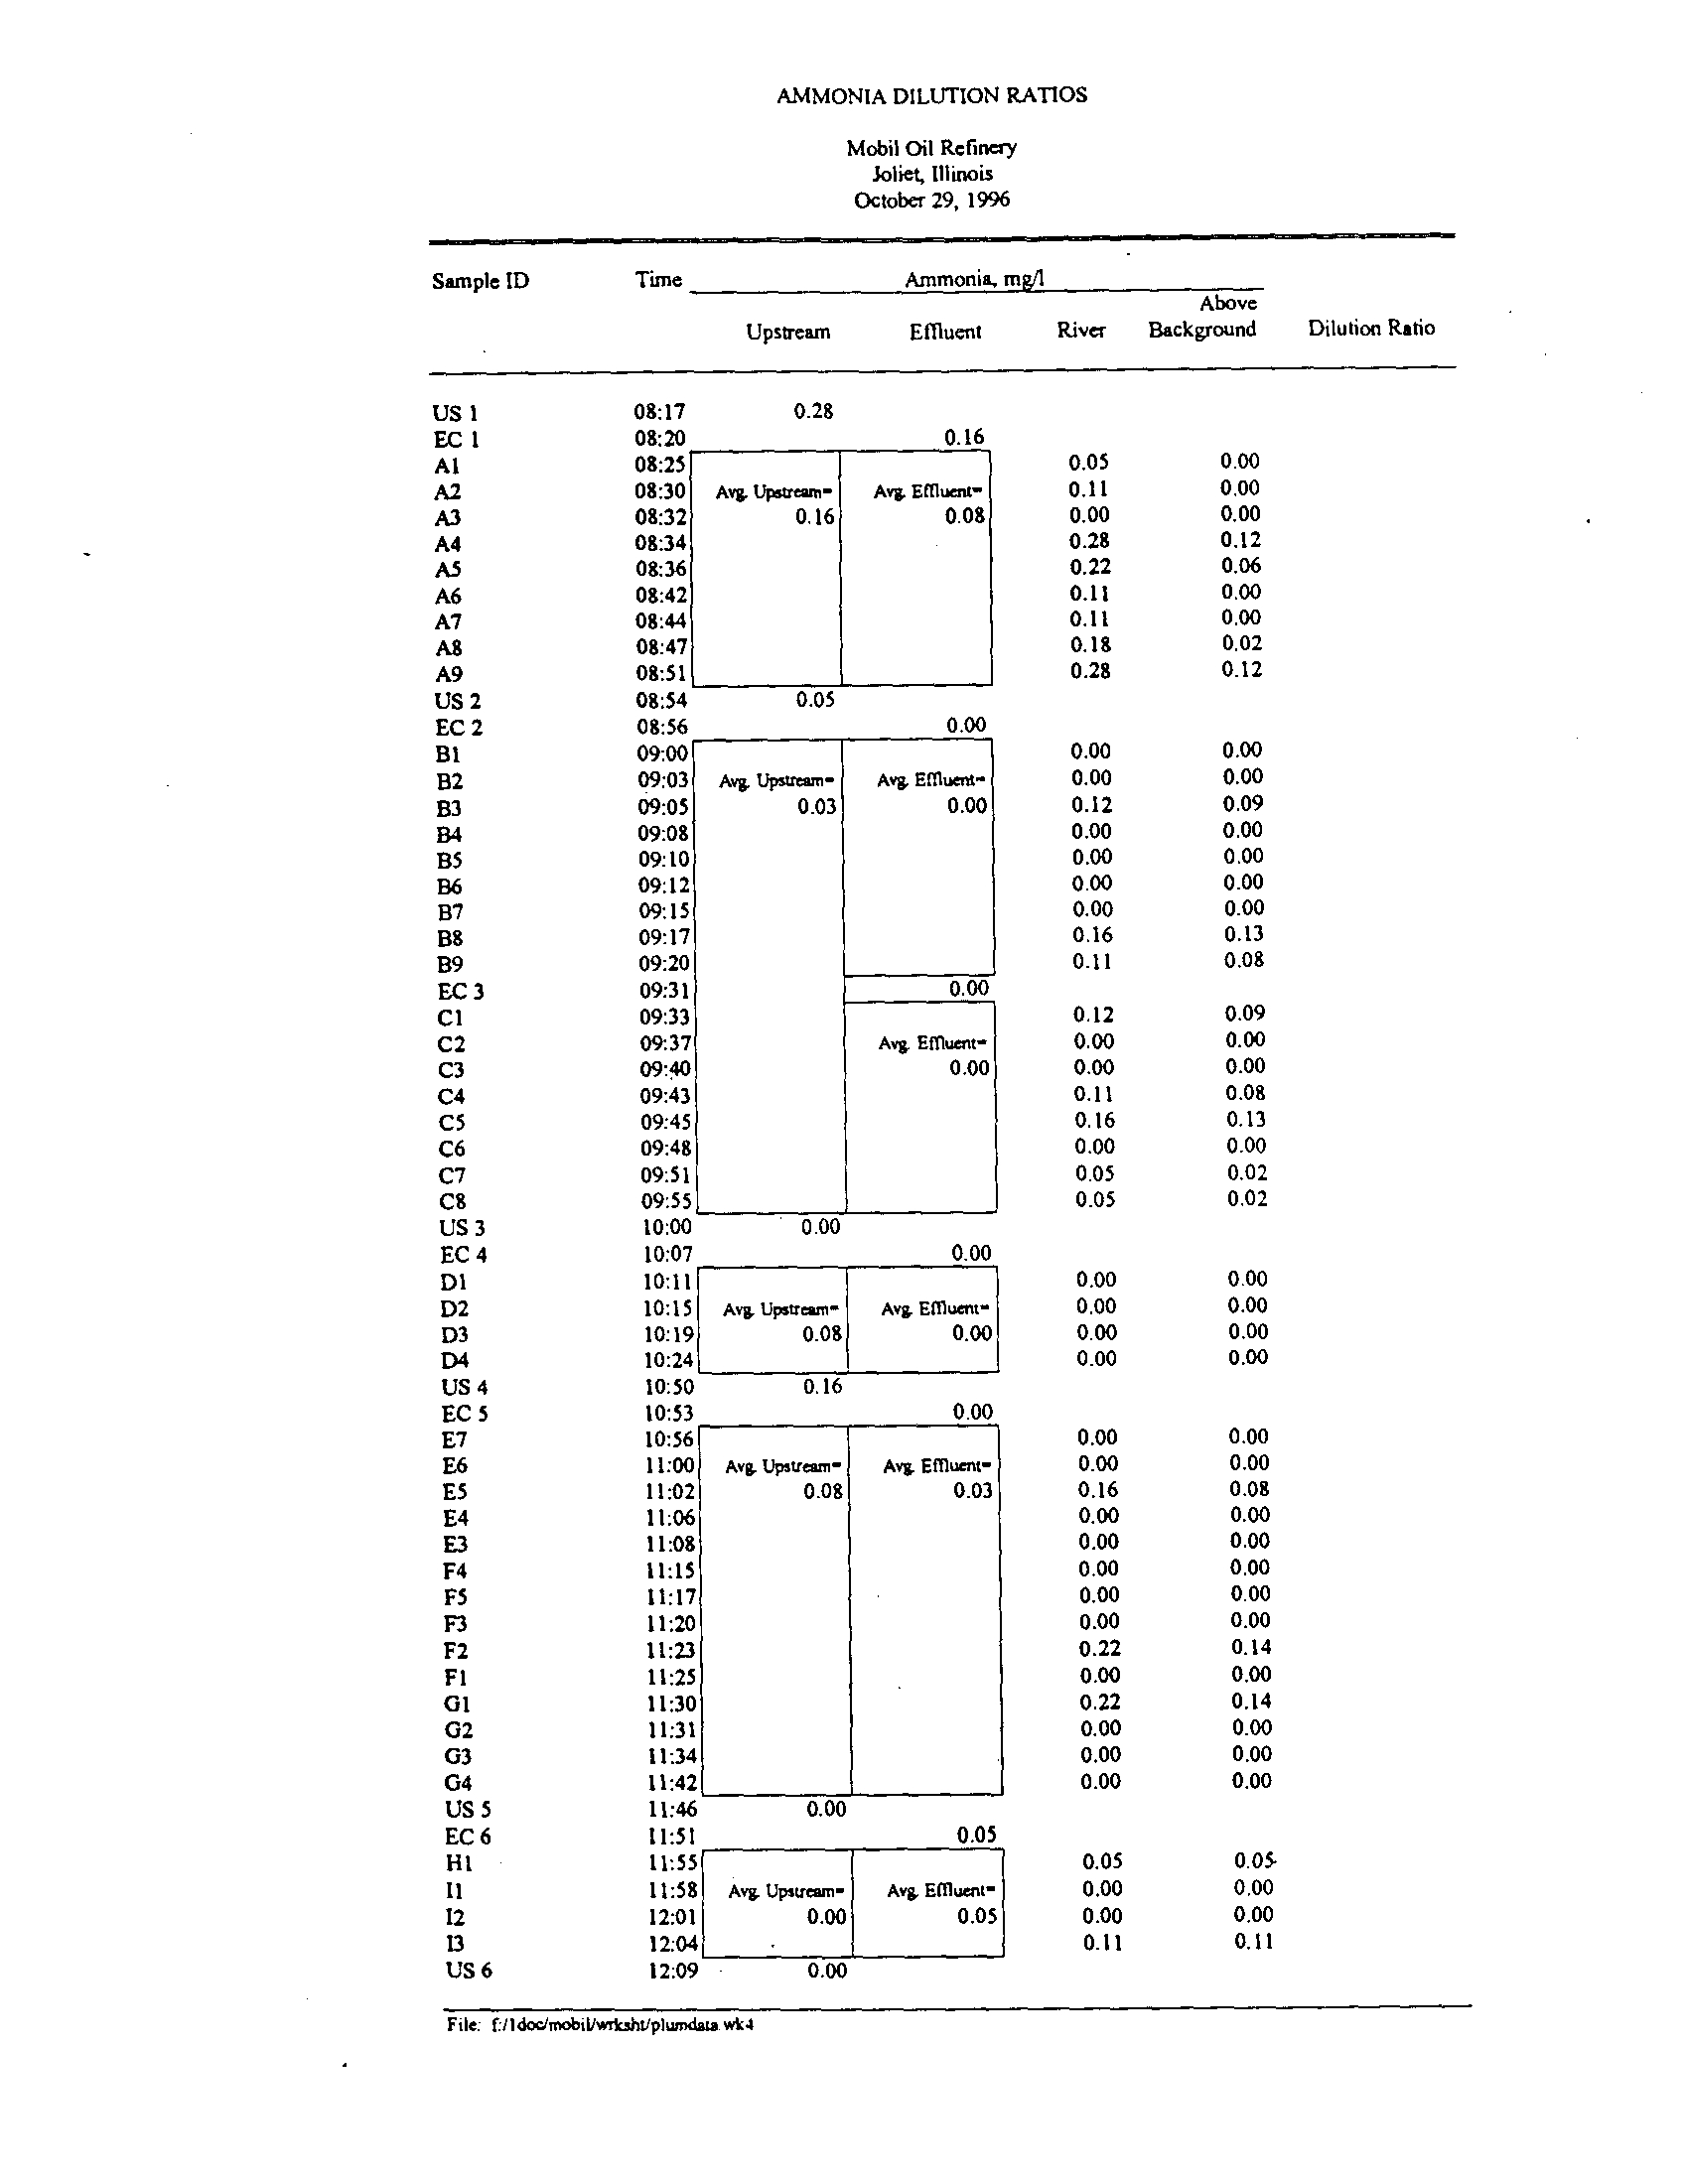
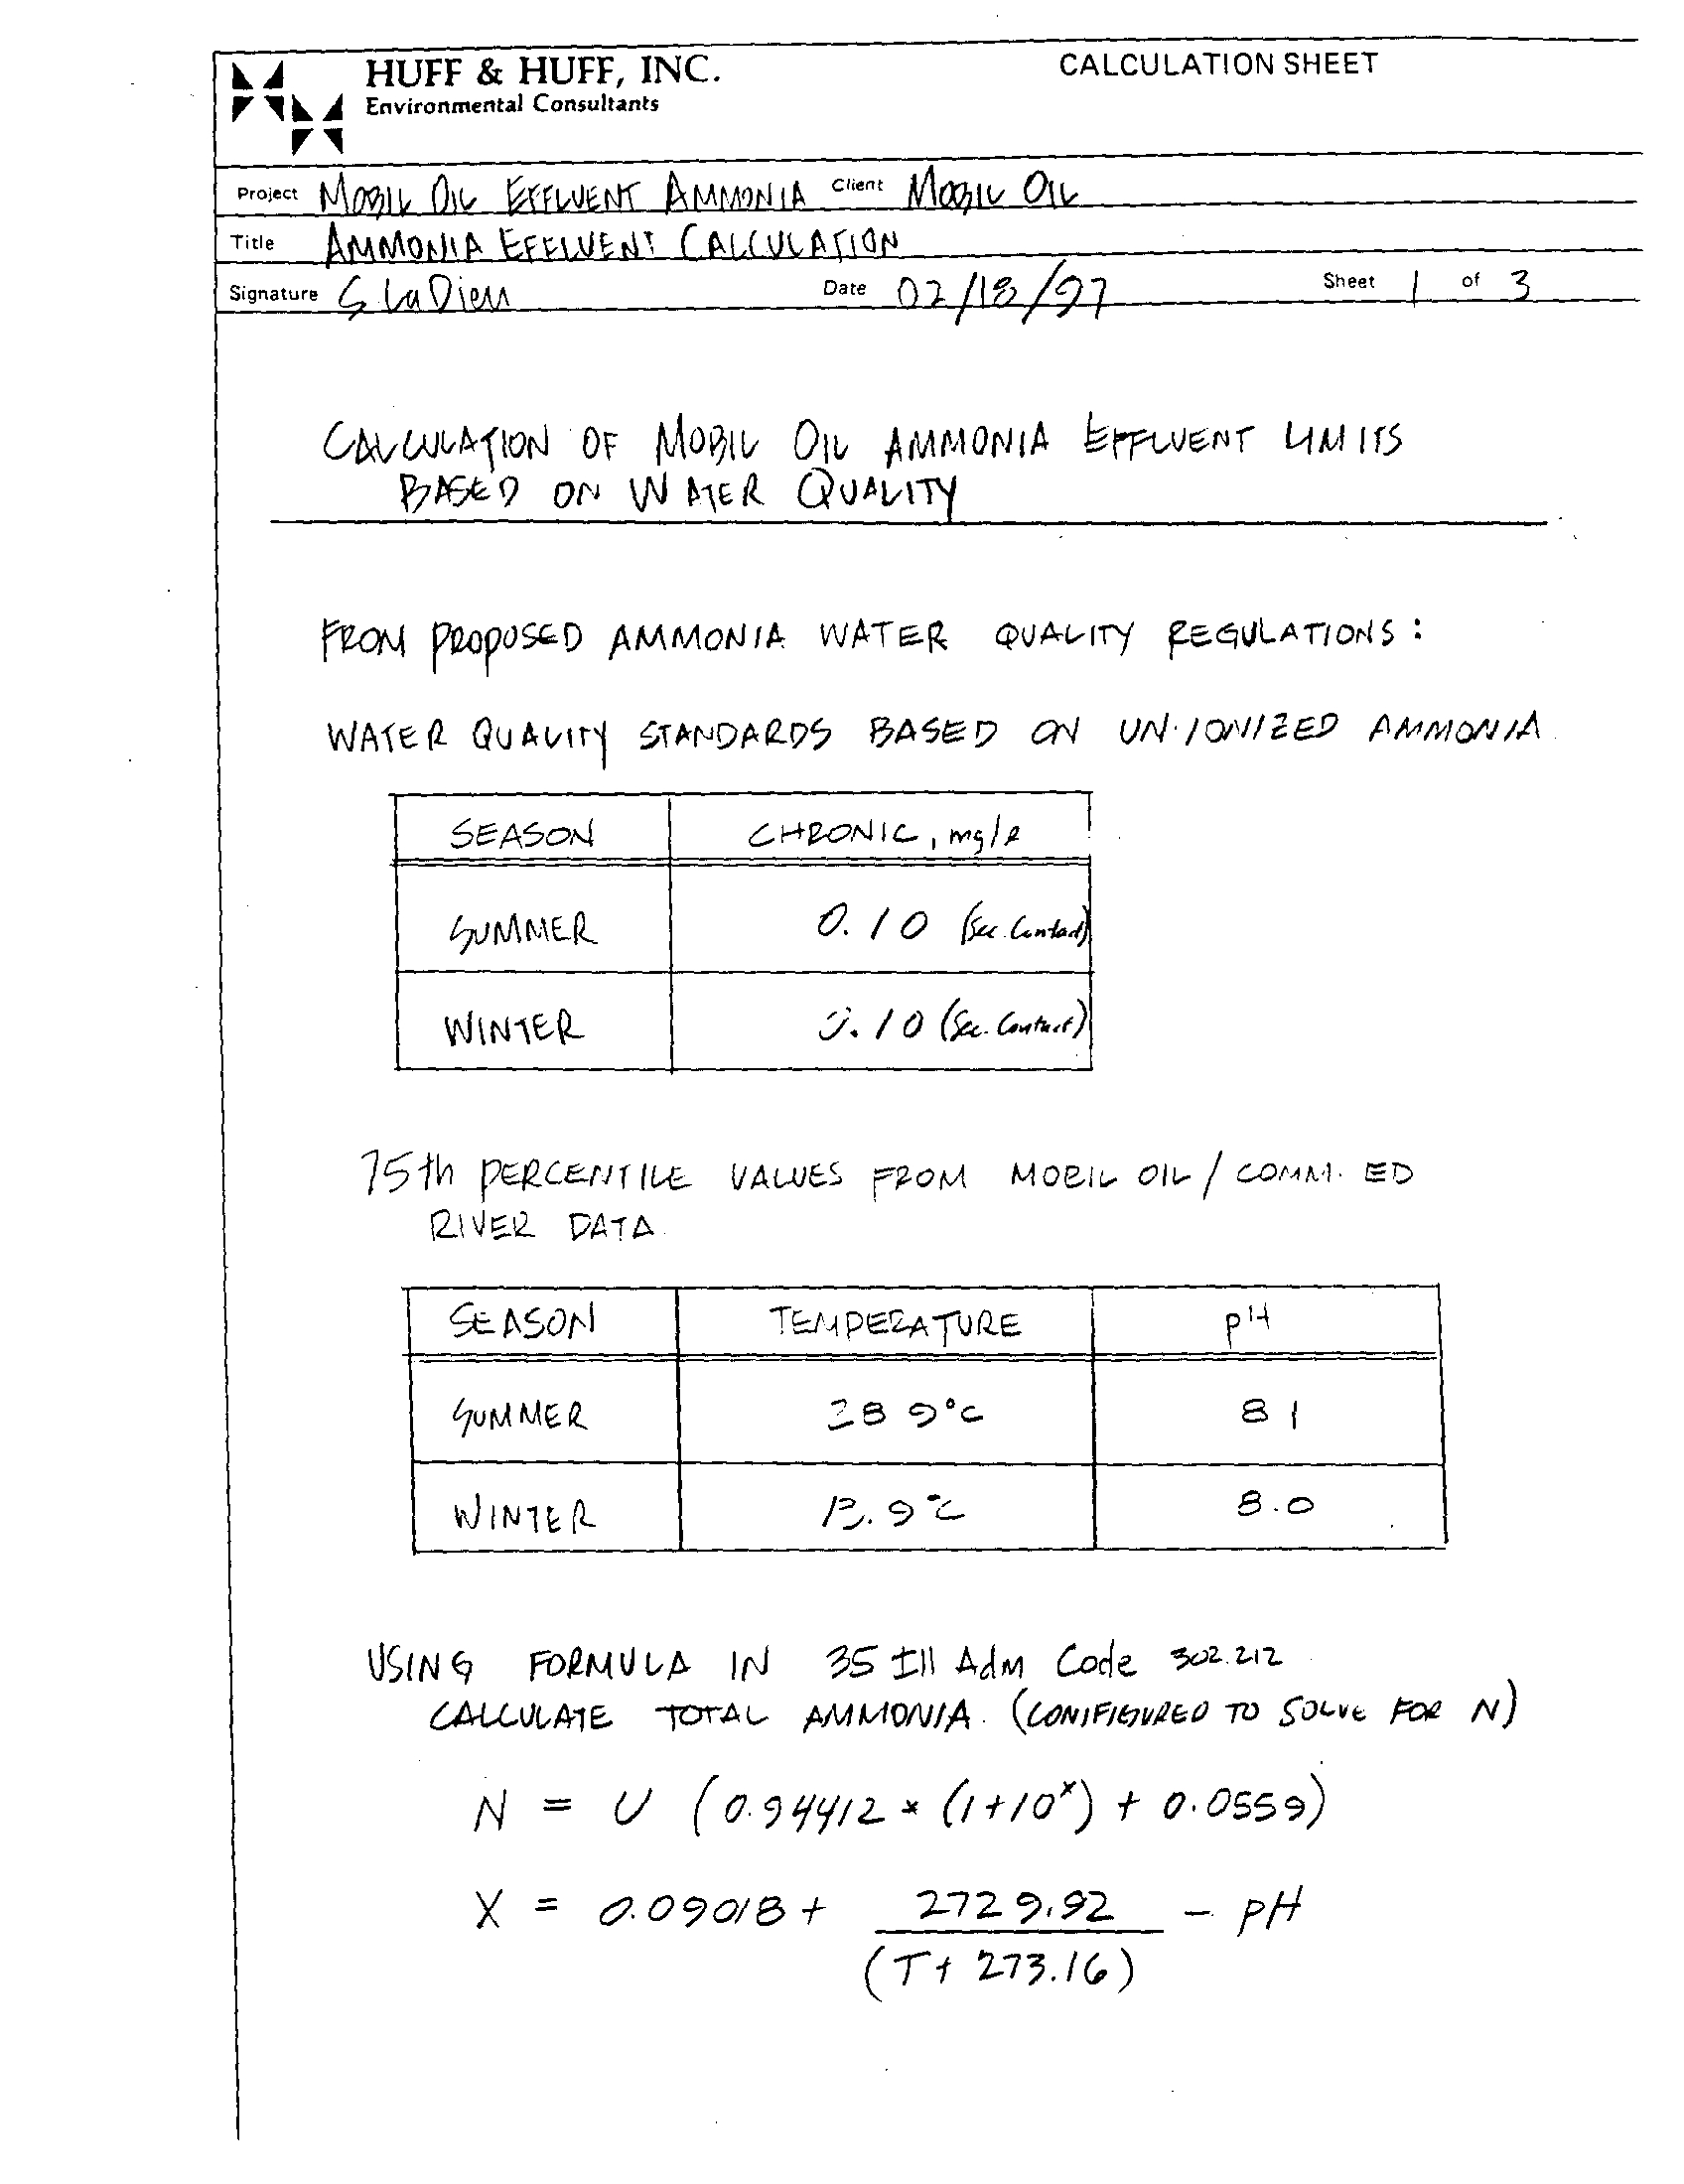
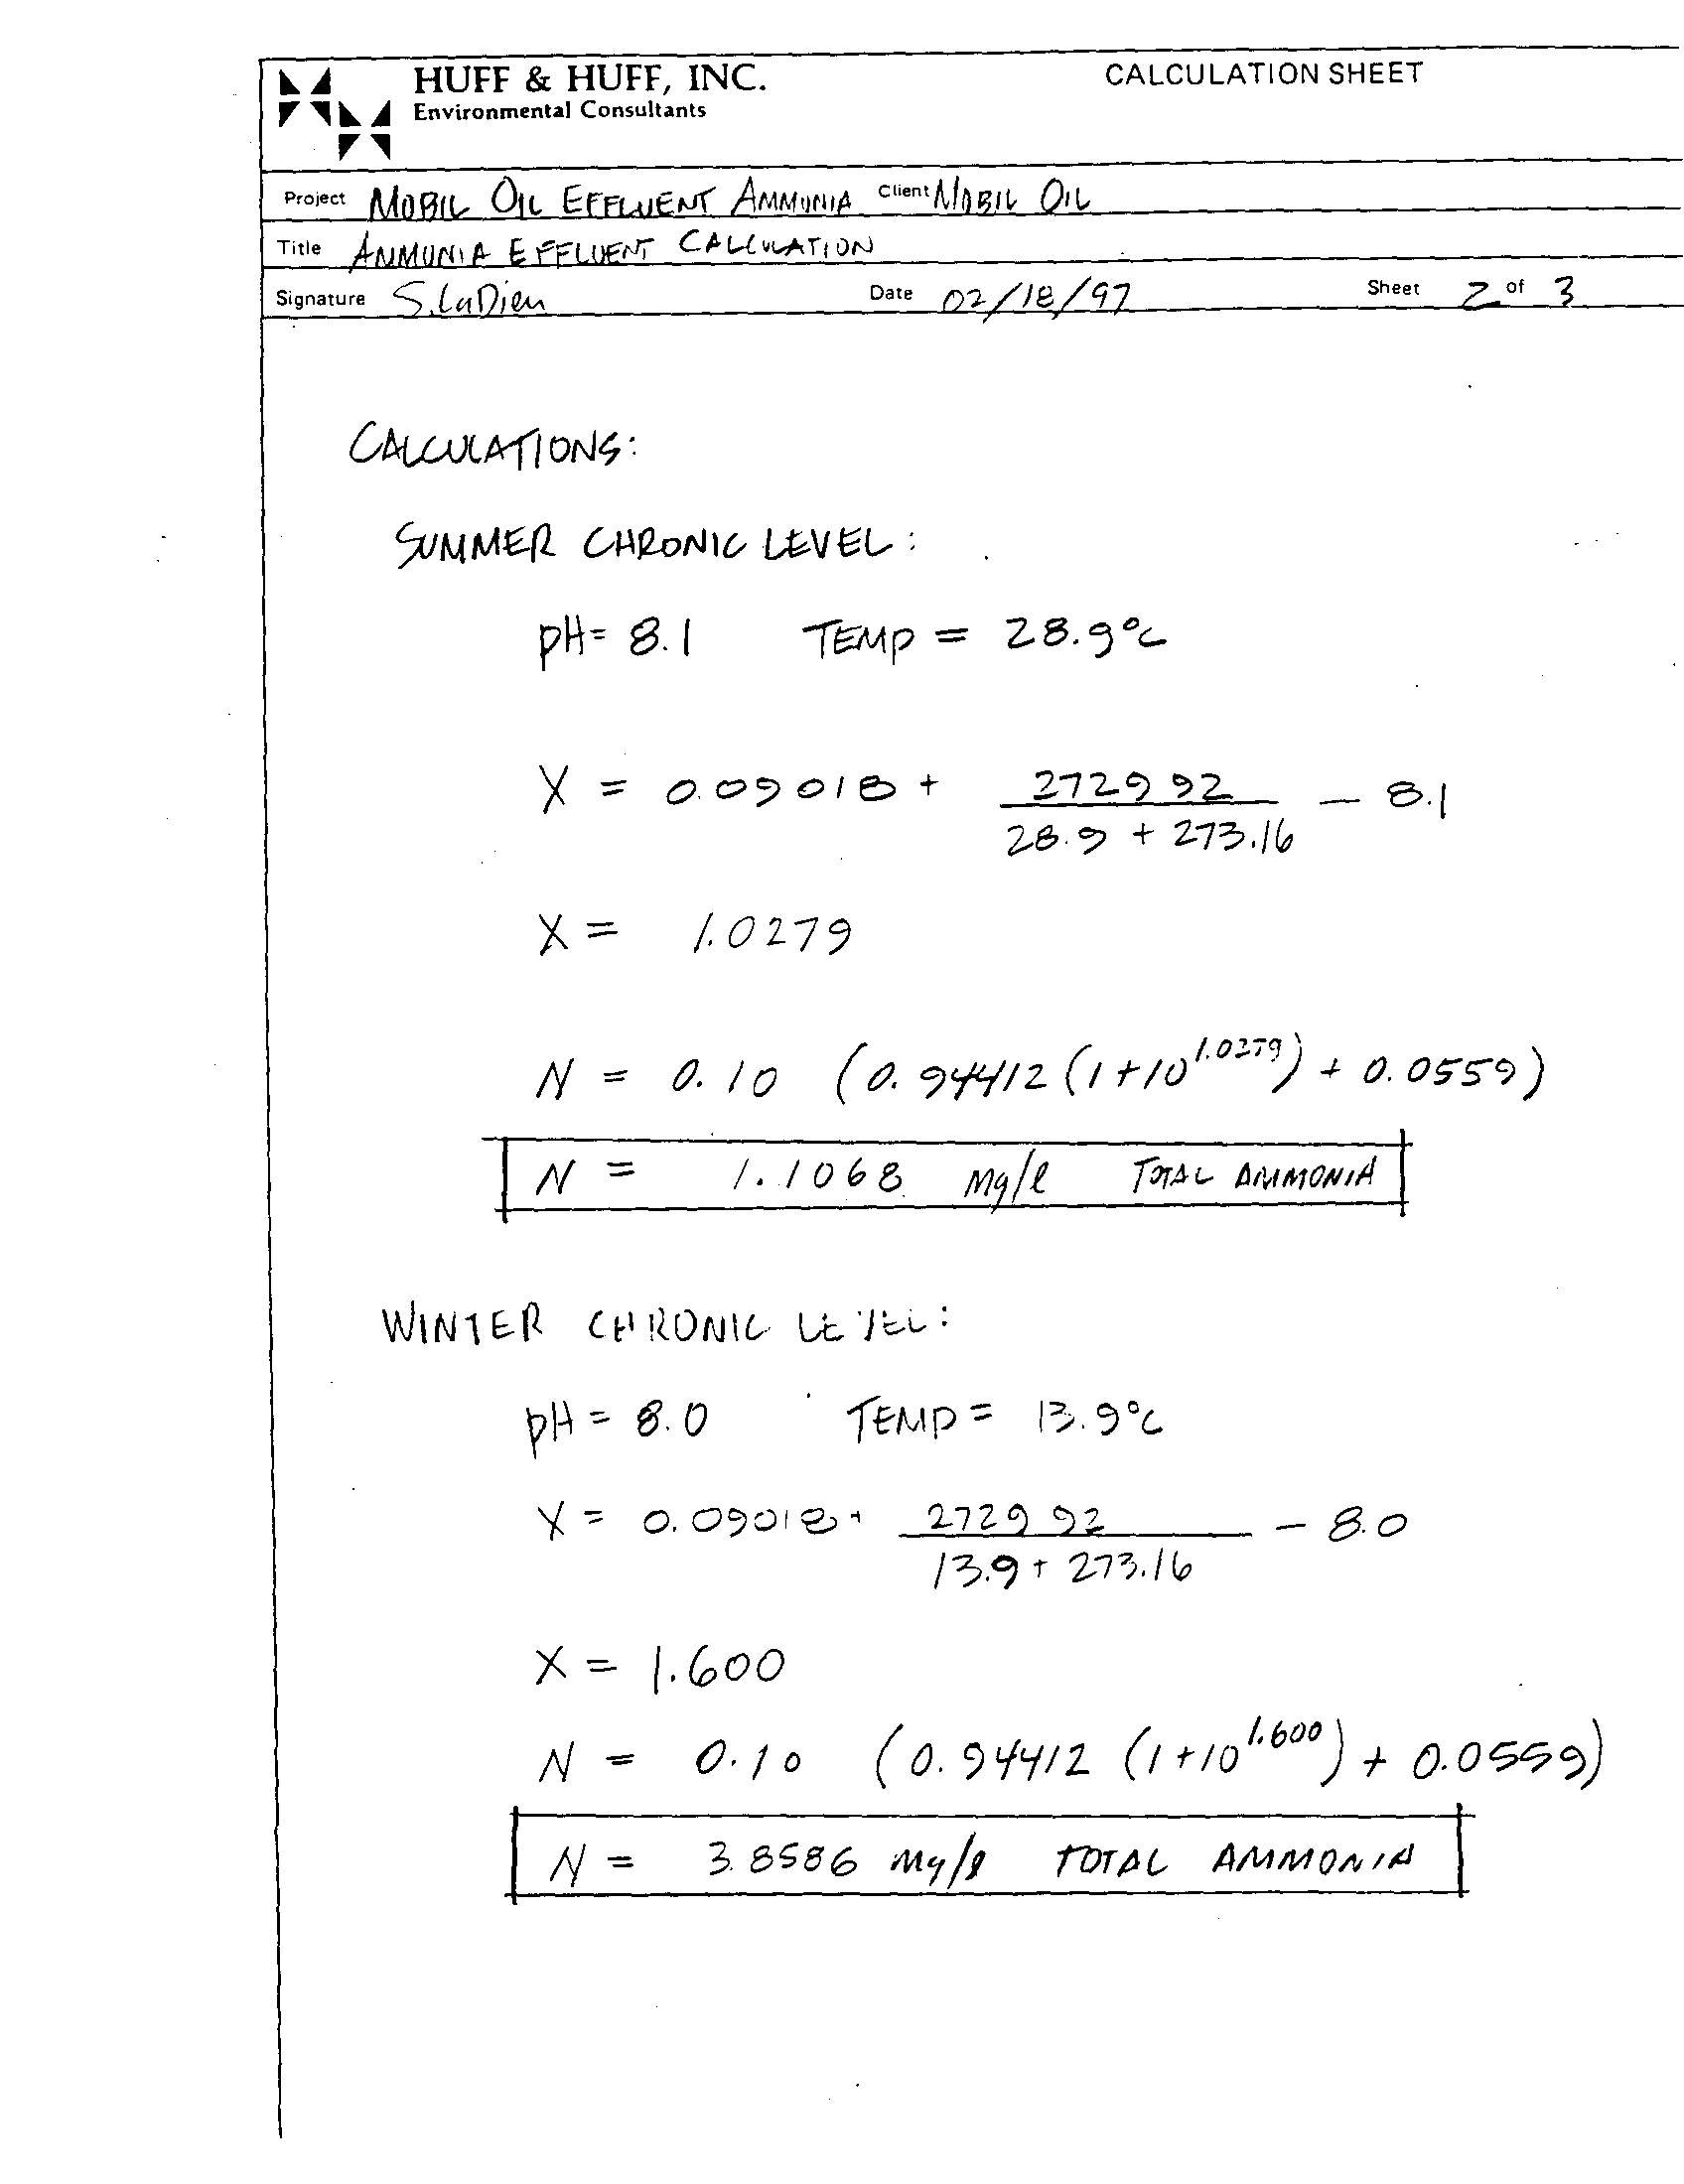
Plaines River will be insignificant . Mobil commissioned a study by Huff and Huff, Inc
.
regarding the impact on the water quality of the Des Plaines River of the ammonia nitrogen
component of the Mobil discharge at the current and proposed levels . This study is attached
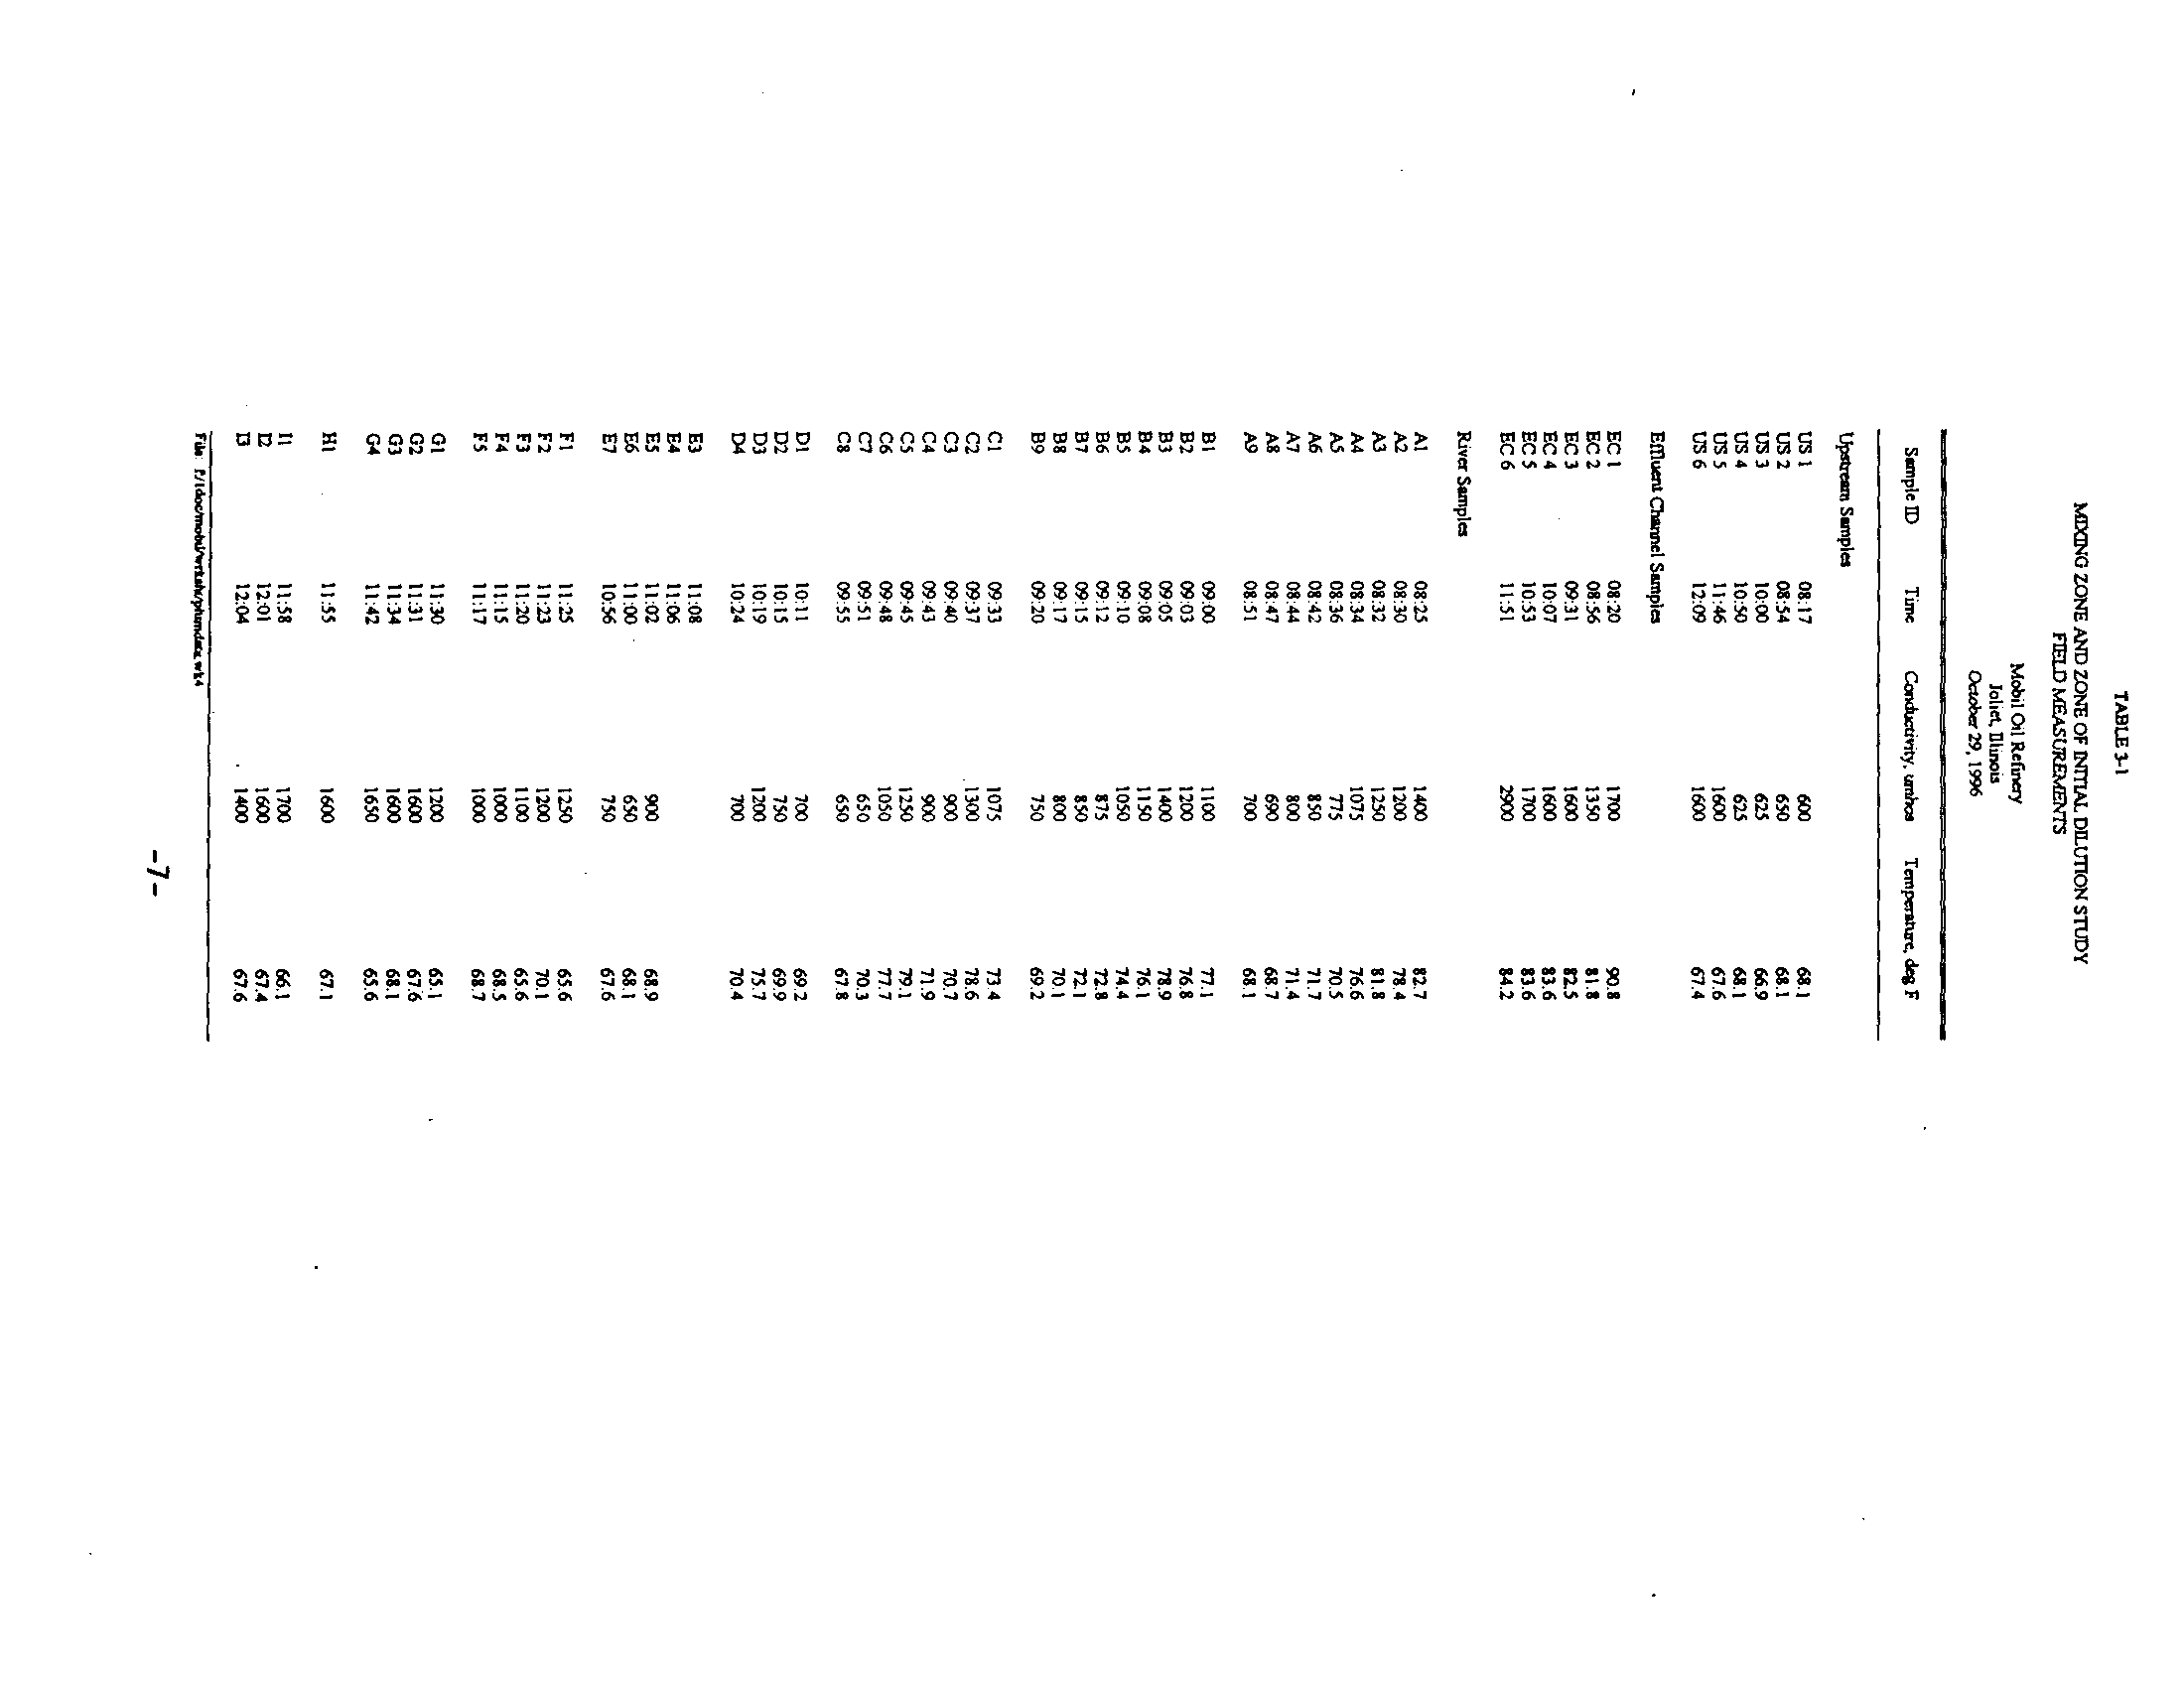
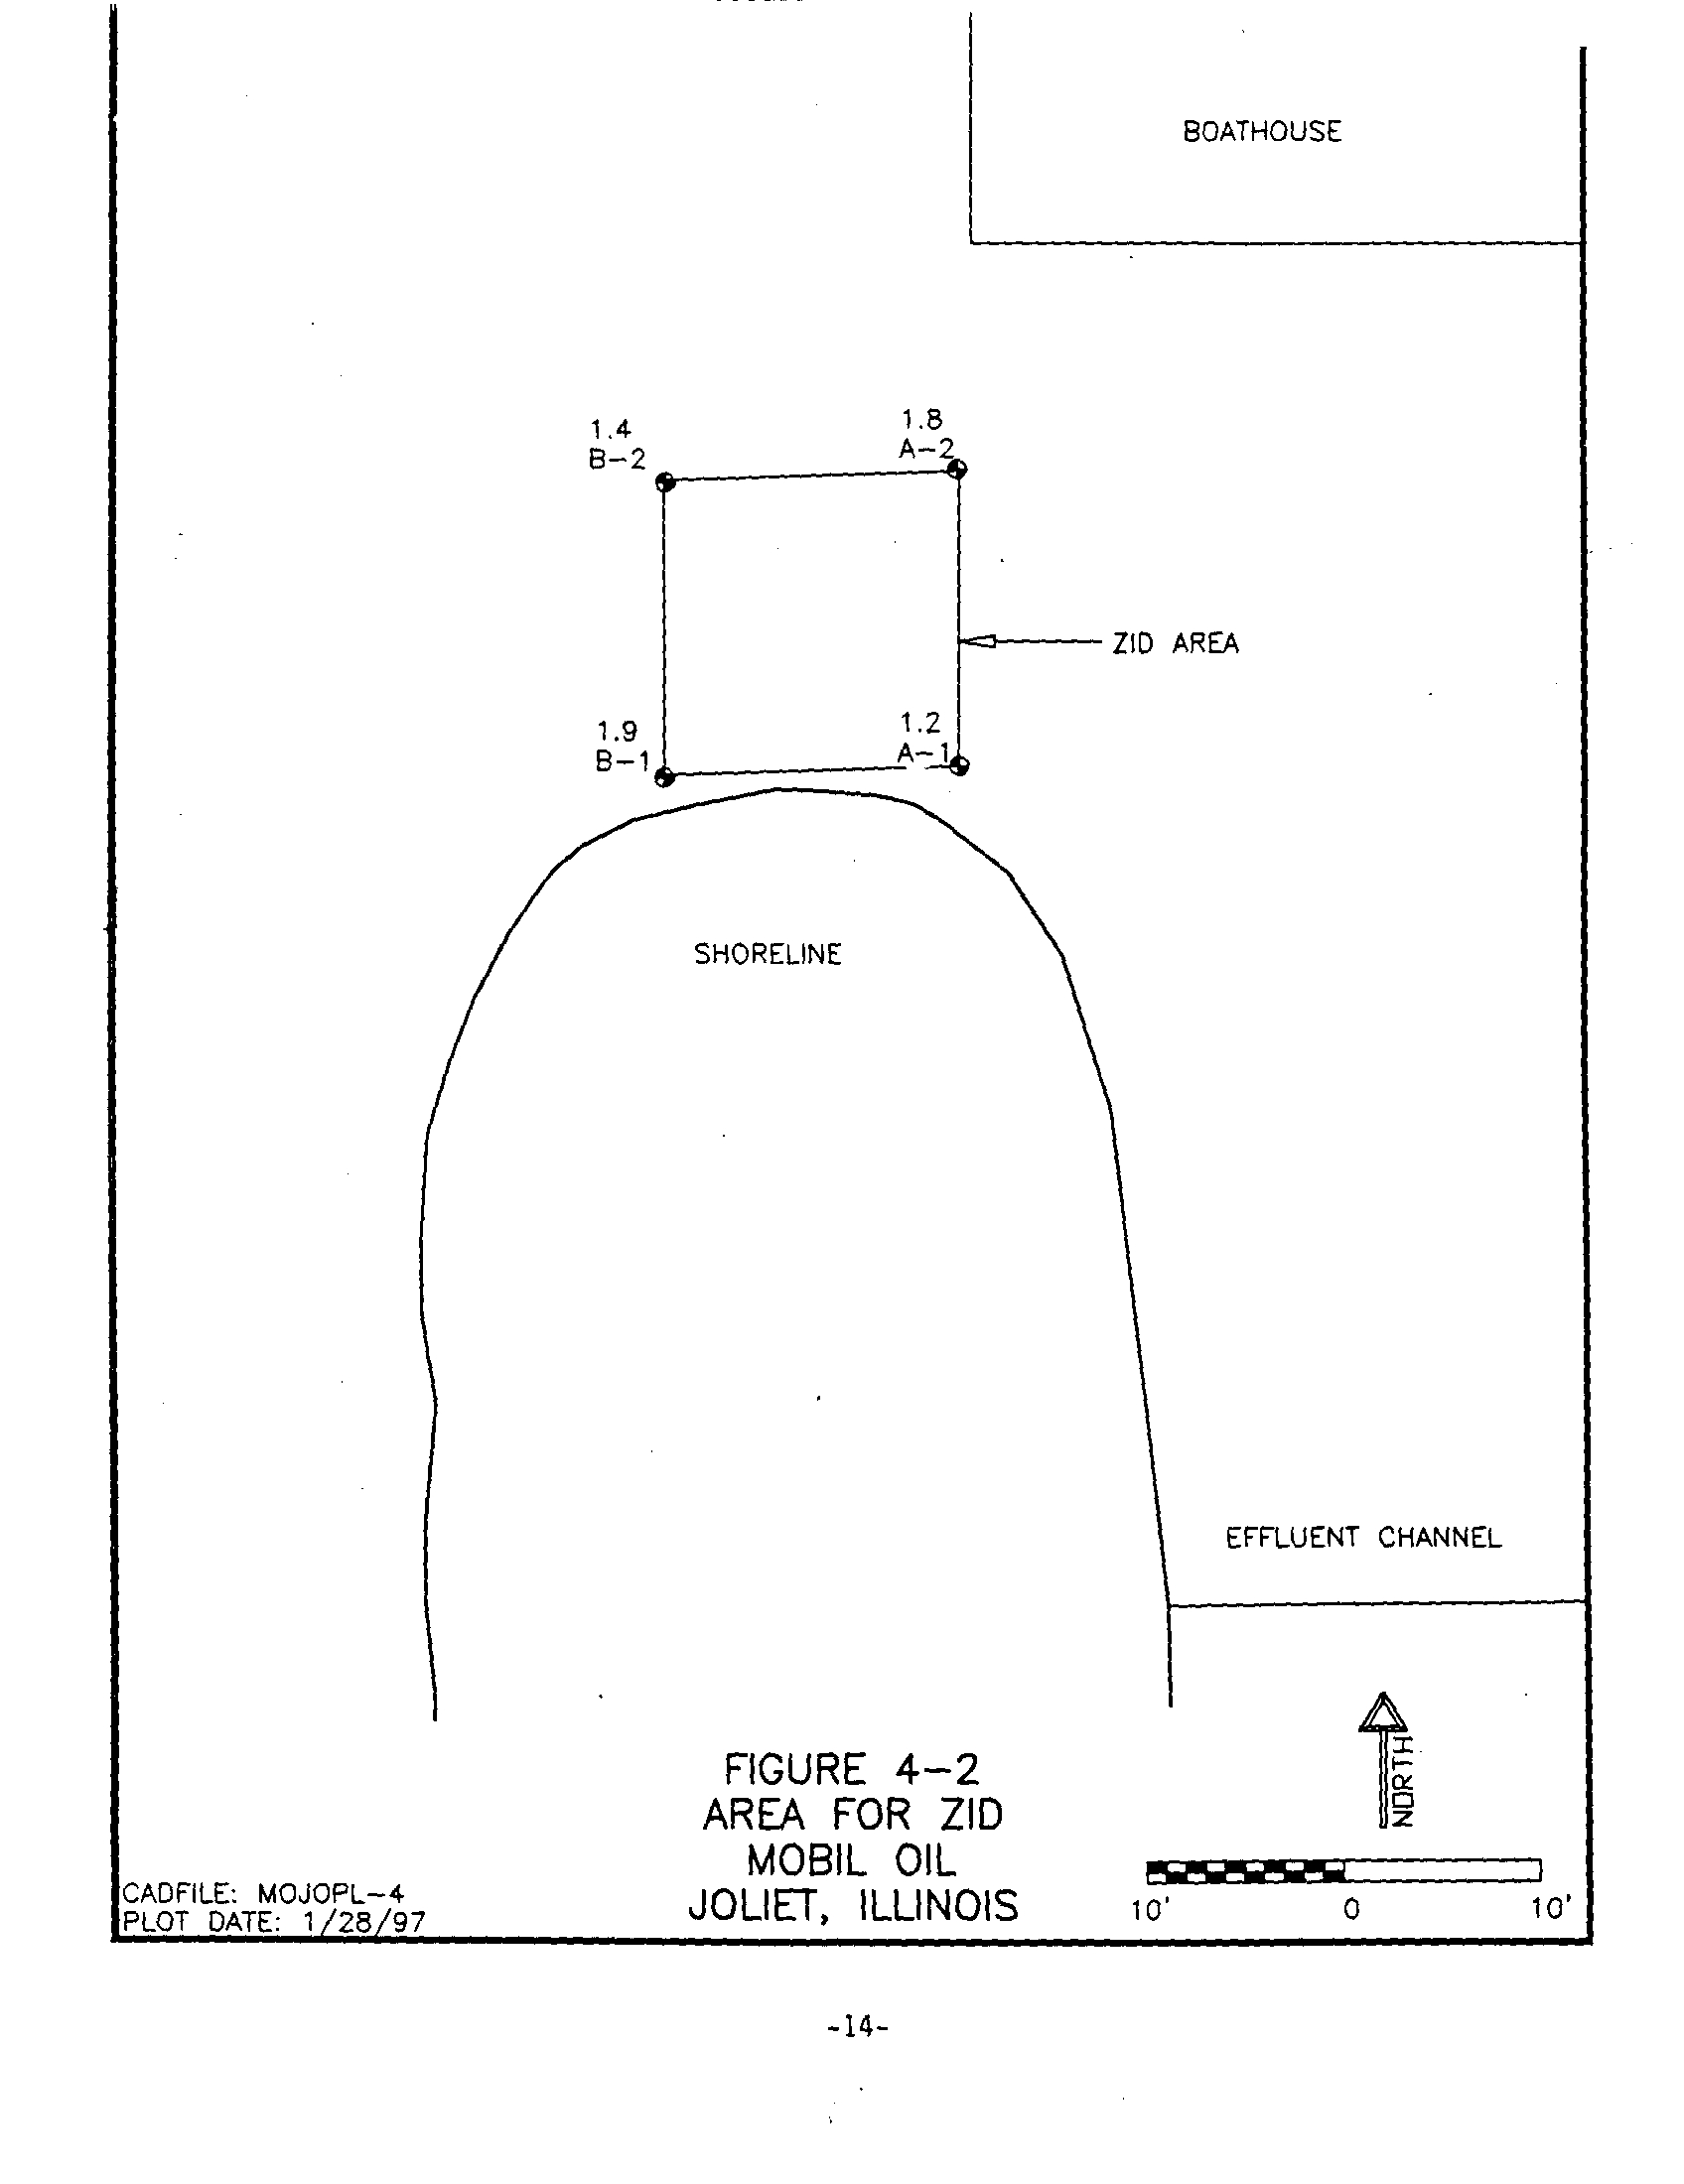
as Exhibit VIII . This study evaluates the size of the mixing zone and ZID available to Mobil
in the Des Plaines River and identifies alternative effluent standards including both a water
quality based standard and a standard based on a USEPA Guidance document used by the
IEPA in setting permit limits . The report concludes that water quality based effluent
standards would be significantly higher than those based on the USEPA Guidance
. The report
concludes that at the proposed discharge levels, river water quality would not be affected
.
This sampling also demonstrates that the plume of discharge does not move past the Interstate
55 Bridge which is the dividing line between the designated Secondary Contact Waterway of
the Des Plaines River and the General Use Waterway in the Illinois River
.
25 .
This information demonstrates that the continued discharge of ammonia
nitrogen at the proposed effluent levels will not significantly change the levels of ammonia
nitrogen in the Des Plaines or Illinois Rivers and will not threaten water quality standards for
- 12-
these parameters . Thus, there will be no negative effect on the aquatic community in the
Des Plaines or Illinois Rivers .
ALTERNATE TECHNOLOGIES
26 .
Mobil's Research and Development Department (MRDC) in Princeton,
New Jersey, previously evaluated the available alternate technologies and the associated
costs
. That evaluation was updated by Parsons in Exhibit VII . As the Parsons report
demonstrates, all of the alternative technologies have significant capital and operating costs .
Further the incremental cost of removing any additional ammonia nitrogen to meet
consistently the Board's standard would be significantly larger than the current cost of
nitrification . Further, the optimization studies demonstrated that the other technologies will
not be effective since the inhibition appears to arise also within the wastewater treatment
system itself and not as a result of other waste streams .
27 .
The least expensive of the technologies would be breakpoint
chlorination
. Yet, this process carries significant personnel risks which far outweigh its
utility in reducing the ammonia nitrogen levels . In addition, the Board has already
acknowledged that the use of breakpoint chlorination is inappropriate since it would result in
the formation of chlorinated hydrocarbons . (In the Matter of
: Proposal of Mobil Oil
Corporation to Amend the Water Pollution Regulations,
R84-16, Final Order, January 7,
1988, p. 3 . )
28.
As shown in Exhibit VII, Mobil has already spent nearly $ 7
.78 million
on the Ammonia Optimization Study and related equipment upgrades
. These costs have
increased Mobil's average cost for removal per pound of ammonia by $16
. If the Joliet
-13-
Refinery must further reduce ammonia in its effluent by means of alternate technology, it can
only do so by incurring disproportionately high capital and operating costs . The average cost
to remove an incremental pound of ammonia above the upgraded BAT system's capability
would be $421/lb . This would result in an annual additional capital cost of $920,000 and
operating costs of $1 .4 million .
COMPLIANCE WITH FEDERAL LAW
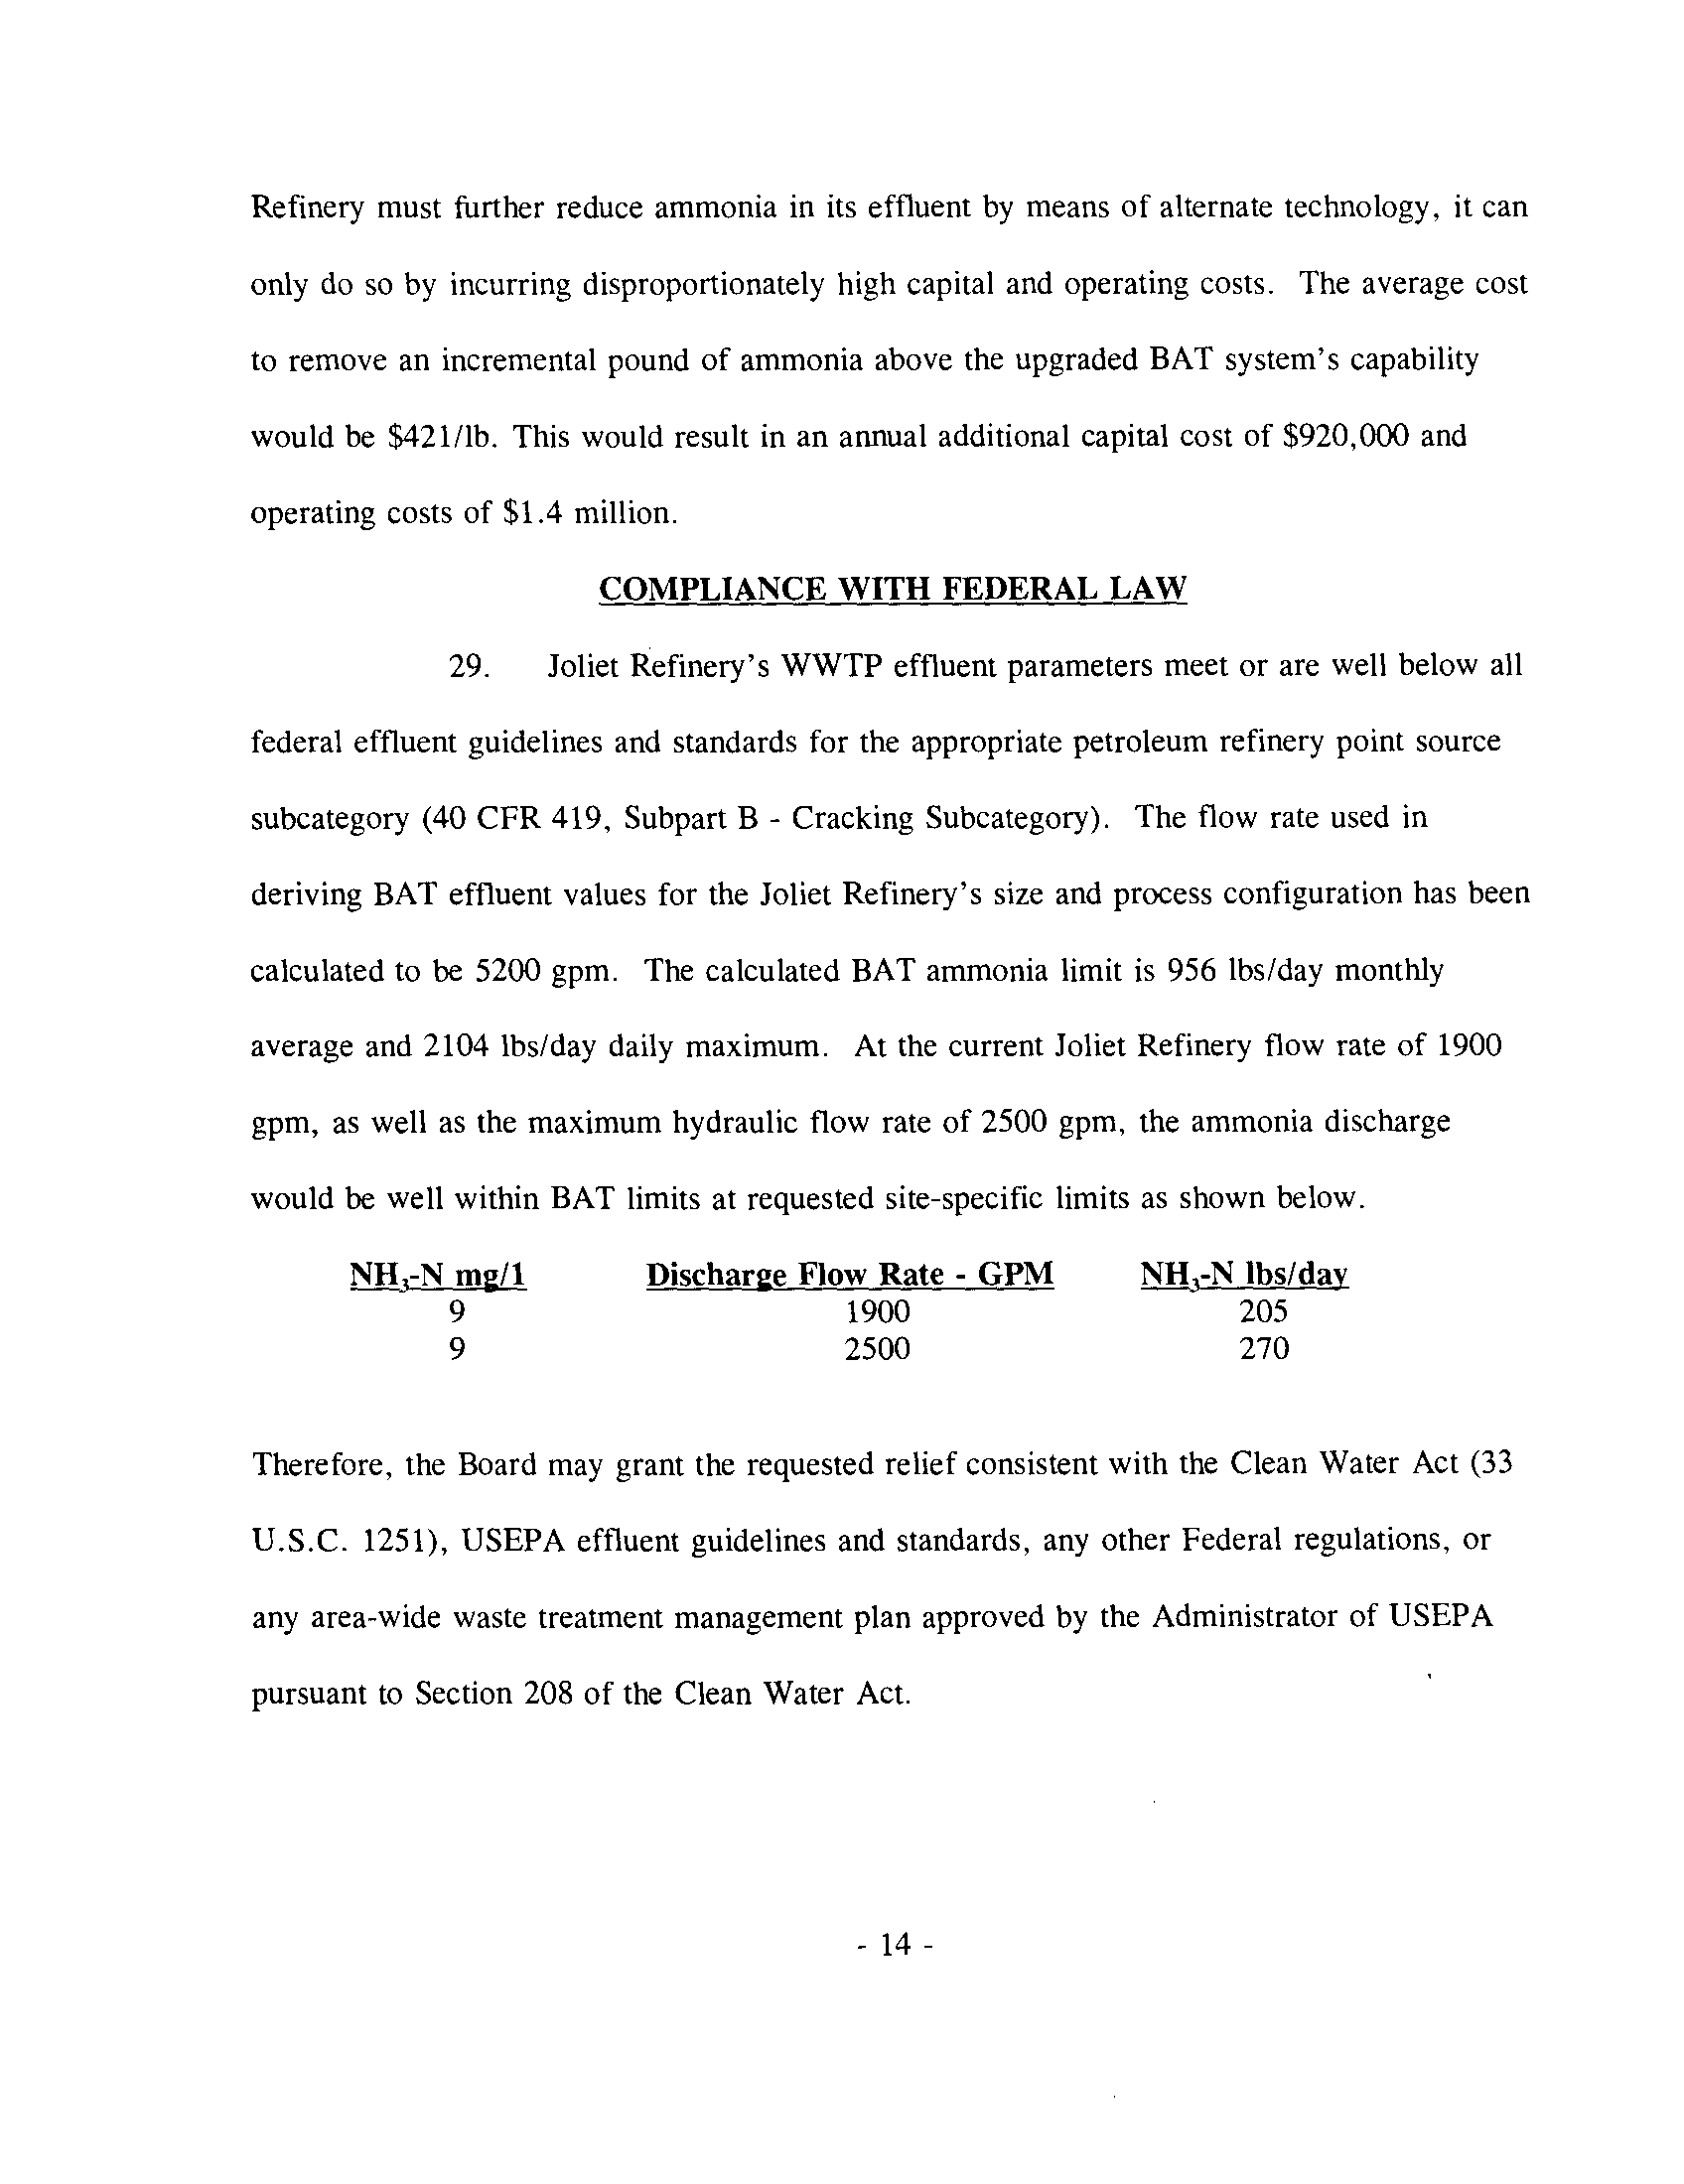
29.
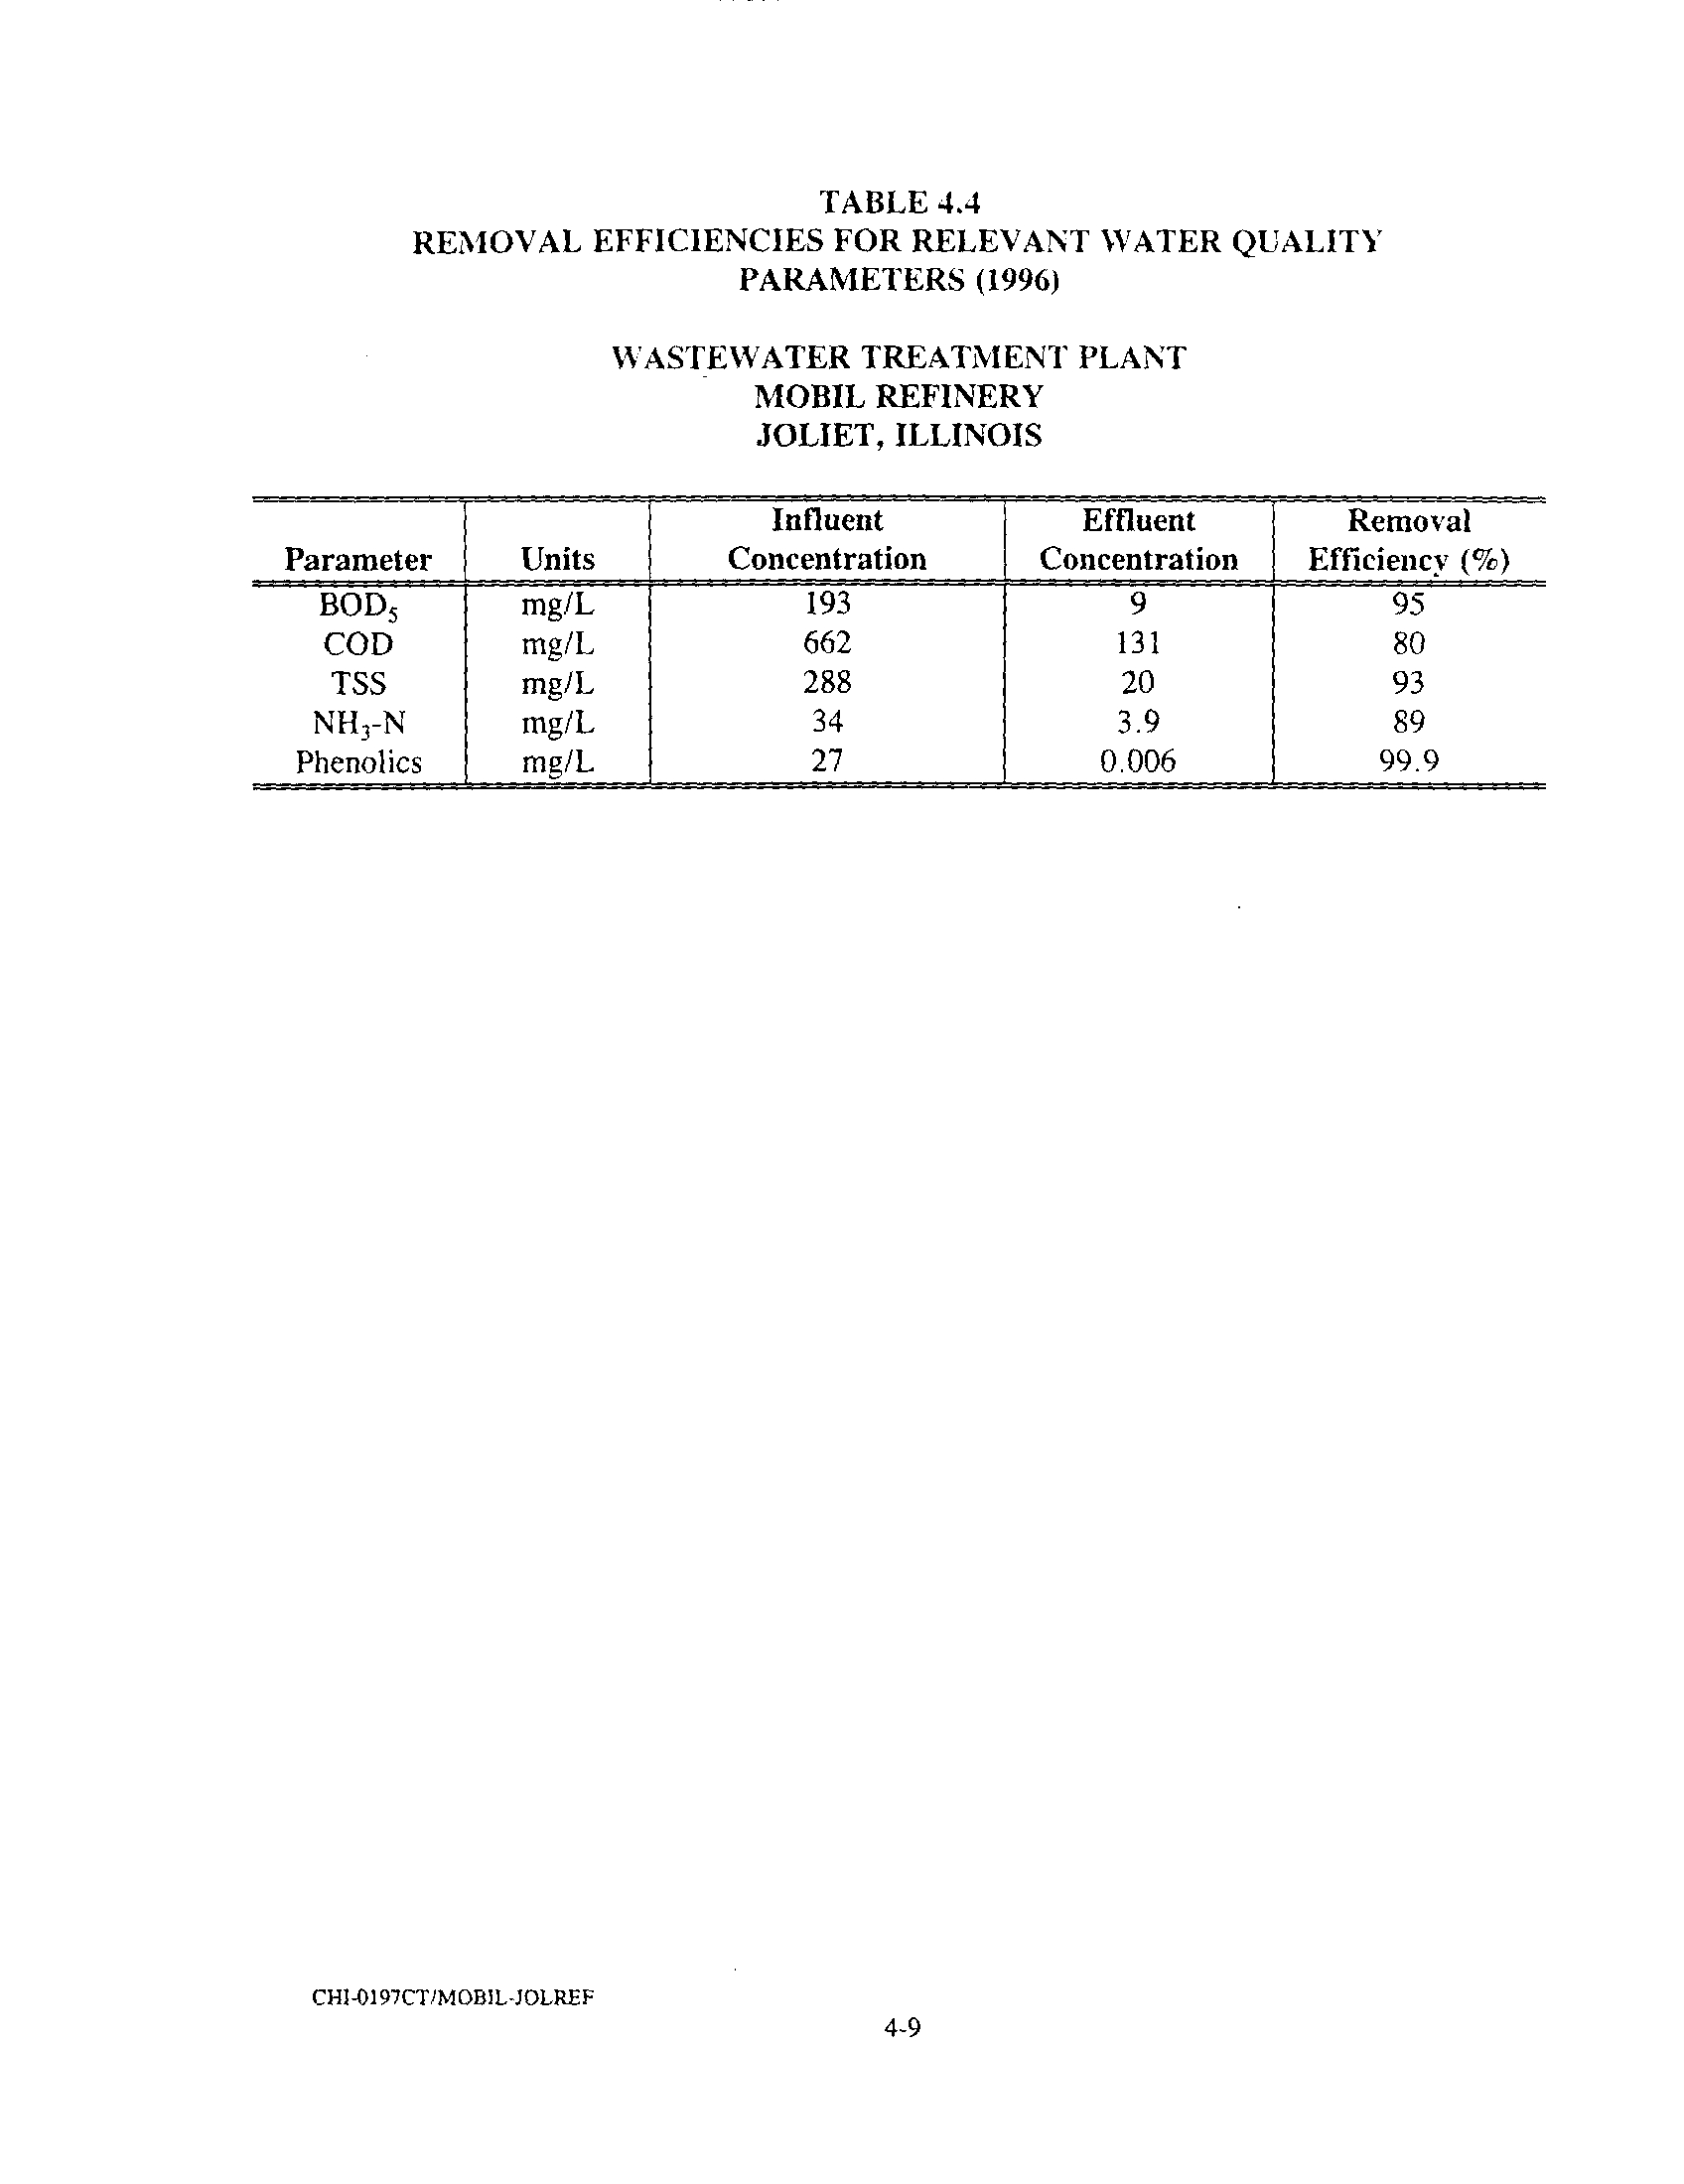
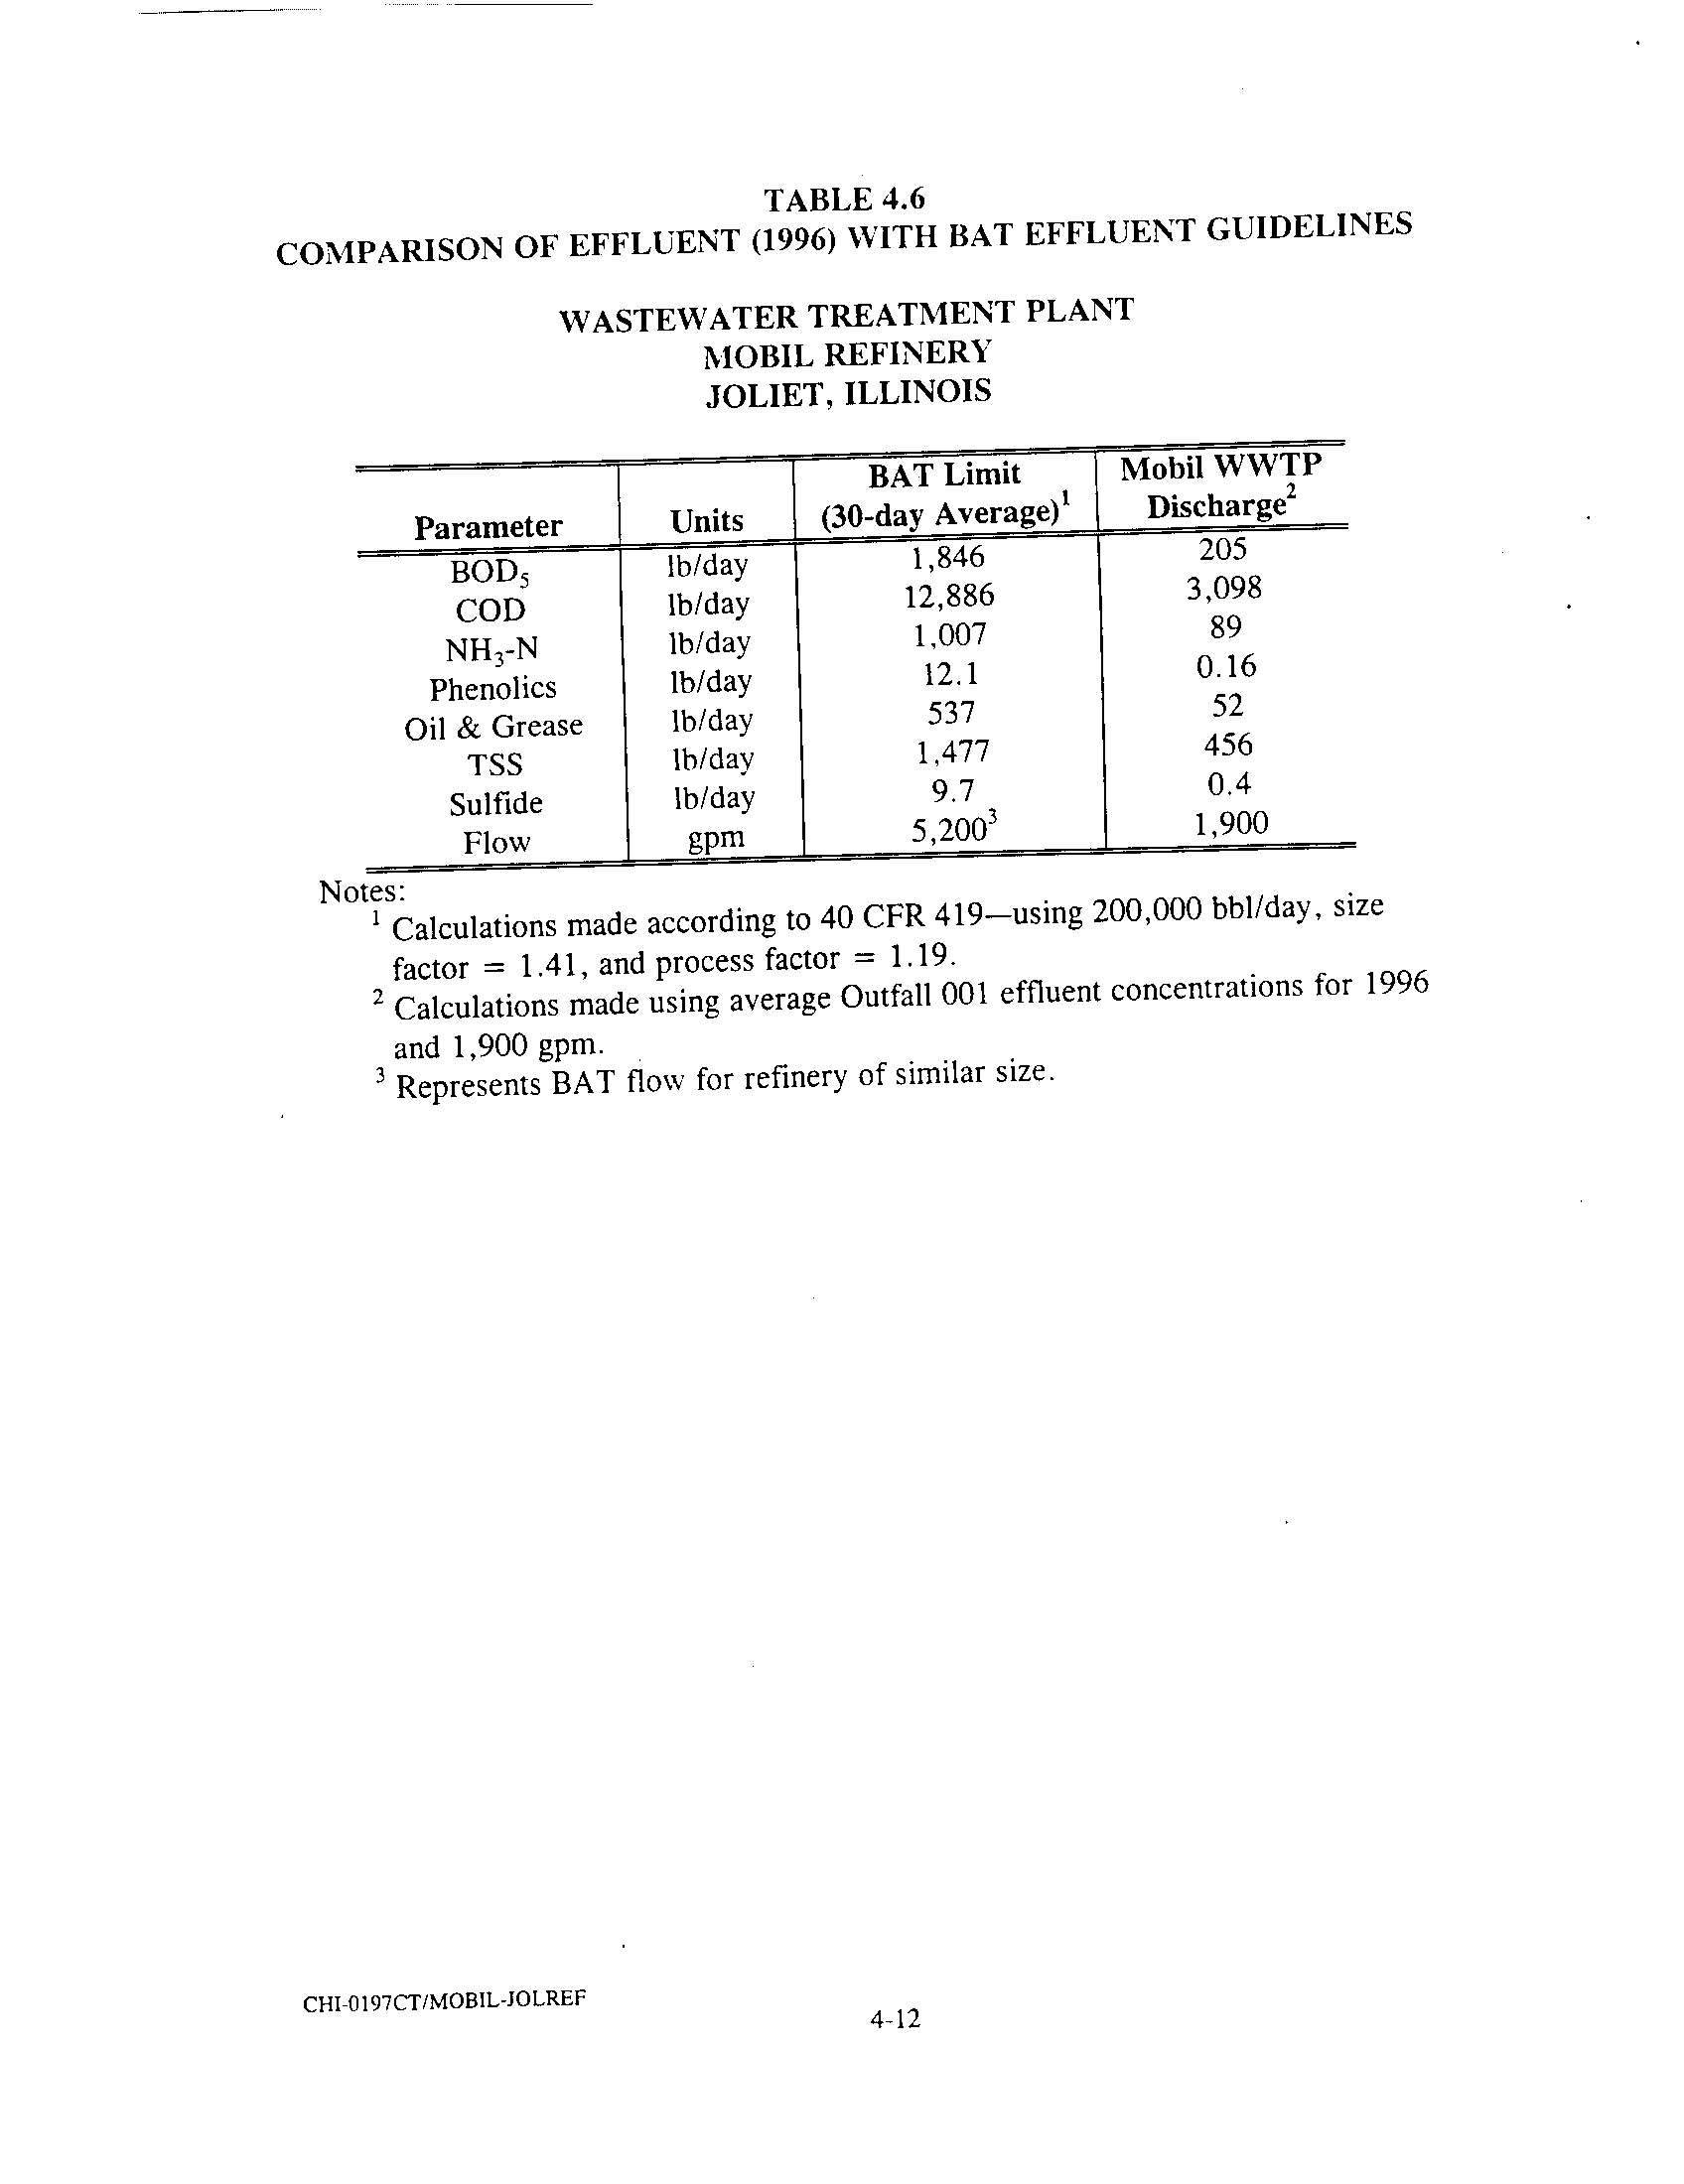
Joliet Refinery's WWTP effluent parameters meet or are well below all
federal effluent guidelines and standards for the appropriate petroleum refinery point source
subcategory (40 CFR 419, Subpart B - Cracking Subcategory)
. The flow rate used in
deriving BAT effluent values for the Joliet Refinery's size and process configuration has been
calculated to be 5200 gpm . The calculated BAT ammonia limit is 956 lbs/day monthly
average and 2104 lbs/day daily maximum . At the current Joliet Refinery flow rate of 1900
gpm, as well as the maximum hydraulic flow rate of 2500 gpm, the ammonia discharge
would be well within BAT limits at requested site-specific limits as shown below
.
Therefore, the Board may grant the requested relief consistent with the Clean Water Act (33
U
.S.C
. 1251), USEPA effluent guidelines and standards, any other Federal regulations, or
any area-wide waste treatment management plan approved by the Administrator of USEPA
pursuant to Section 208 of the Clean Water Act .
- 14-
NH3-N mu/1
Discharge Flow Rate - GPM
NH,-N lbs/dav
9
1900
205
9
2500
270
STATUTORY STANDARDS
30 .
Section 27(a) of the Act requires the Board to consider numerous
factors in determining whether to issue regulations including site-specific regulations . These
include : the existing physical conditions, the character of the area involved, the nature of the
receiving body of water, and the technical feasibility and economic reasonableness of
measuring or reducing the particular type of pollution
. (415 ILCS 5/27(a)) . Consideration
of all of these factors supports the relief which Mobil seeks . The areas involved is primarily
industrial and the receiving body of water is a Secondary Contact Water with recognized
limits on its ability to support a diverse warmwater aquatic habitat use . The Uno-Ven
petroleum refinery upstream of Mobil has also received site-specific relief .
(In the Matter of:
Petition of Uno-Ven To Amend Regulations Pertaining to Water Pollution, R93-8, December
16, 1993) Clearly the relief is consistent with the use of the waterway and the surrounding
area .
31
. Further, Mobil has demonstrated in this petition that the relief it seeks is
consistent with the statutory requirement that the Board's regulations be technically feasible
and economically reasonable
. While there are technologies available to achieve complete
compliance with the Board's standards, their implementation at the Joliet Refinery would be
highly expensive and carry significant safety and environmental risks . The following reasons
also demonstrate why the relief is consistent with technical feasibility and economic
reasonableness :
•
Proven and cost effective technology to insure consistent compliance with the
ammonia effluent standard has not been identified, in spite of many years of
- 15-
intensive investigation, significant capital improvements and ammonia
reduction efforts .
•
Mobil's ammonia discharge has an insignificant effect on the ammonia
concentration of the Des Plaines River and no deleterious environmental
impact on the environment
.
•
Requiring compliance with the current standard would not result in any
measurable progress toward lowering ammonia concentrations in the receiving
waters. Mobil's contribution to river ammonia loading is a minuscule fraction
of the existing river loading .
•
Mobil has made extensive and strenuous efforts to meet its investigative
responsibilities under its previous variance and continues to demonstrate a
good faith effort to reduce effluent ammonia levels . During the term of the
site-specific rule (R96-14) in effect prior to the variances granted in PCB 93-
151 and 96-218, these efforts resulted in the lowest annualized average
ammonia concentrations ever achieved by Joliet Refinery . During the term of
the variance granted in PCB 93-151 and extended in PCB 96-218, Mobil has
undertaken a significant investigation to identify and resolve the problem and
has performed numerous plant upgrades in response to the findings . It has
spent $283,000 on contract costs for the investigation and $7 .78 million on
plant upgrades . It now seeks this relief to make final any issues regarding
ammonia nitrogen at the facility .
- 16-
•
The addition now of any system designed to upgrade Mobil's treatment plant
would cost a minimum of $2 .2 million in capital and would require $800,000
dollars in annual operating costs (see Exhibit VII) . However, even though the
break point chlorination would probably reduce ammonia concentration in the
effluent, the formation of chlorinated hydrocarbons as by-products would be of
great concern . Furthermore, no single system can assure that the refinery
would consistently achieve 3
.0 mg/1 effluent standard . Thus, if the Joliet
Refinery were now required to add multiple systems in an attempt to comply
with 3 .0 mg/1 limitation, it would simply constitute a costly technological
experiment and undue hardship in comparison to other discharges with similar
effluent quality .
•
The Board has previously found that site-specific relief is appropriate for the
circumstances at the site . That relief only lasted five years . Although Mobil
was able to improve its nitrification processes and achieve extraordinary levels
of ammonia nitrogen, new regulatory requirements resulted in increased
ammonia levels . Mobil has now adjusted to the new regulatory requirements
and reduced ammonia levels significantly . Yet because of these other
regulatory requirements, Mobil can no longer be assured that it can
consistently comply with the Board's current standards
. Thus the factors that
supported the previous relief continue to support relief here
.
•
The Board should note that although Mobil has received site-specific relief and
several variances in the past, Mobil has never sought to avoid its responsibility
- 17 -
to comply with the ammonia nitrogen standard . Mobil has spent millions of
dollars in investigations and upgrades in order to achieve compliance .
Further, the current problems are entirely separate from those on which the
original variances and the first site-specific rule change were based . The
Nitrification Optimization Study and Parsons report attached as Exhibit VIII
document that the current problems arose from the installation of new
treatment equipment required by federal regulations . Since this nitrification
problem arises from new conditions, and is not a result of Mobil's process
activities, the Board should base its decision on current conditions .
SUMMARY OF TESTIMONY
32 .
Mobil intends to call at least three witnesses to support this Petition
.
Ms
. Lilliana Gachich will testify regarding the facility and treatment processes as well as
Mobil's past efforts to achieve compliance
. Dr. John H . Koon of Parsons Engineering
Science, Inc
. will testify as to Mobil's past nitrification investigations, availability of
alternate technologies and the cost of attempting to implement an alternate technology .
Finally Mr . James Huff of Huff and Huff, Inc
. will testify as to the lack of environmental
impact and the appropriateness of the proposed effluent standards .
ECONOMIC IMPACT STUDY
33 .
Pursuant to P .A
. 87-860, Economic Impact Studies are no longer
required for proposed Board regulations . Should this requirement be modified during this
rulemaking, Mobil requests that the Board determine that an Economic Impact Study is not
necessary
. The proposed rule affects only Mobil's facility and will have no environmental
- 18-
impact. The Board may determine the economic reasonableness and technical feasibility
based on the technical information and cost data submitted by Mobil in this proceeding .
WHEREFORE, for the reasons stated in this petition, Mobil Oil Corporation
respectfully requests the Board to grant the site specific relief requested in this petition .
Respectfully submitted
MOBIL OIL CORPORATION
DATED : April 24, 1997
ROSS & HARDIES
James T. Harrington
David L
. Rieser
150 North Michigan Avenue
Chicago, Illinois 60601-7567
(312) 558-1000
ILLINOIS POLLUTION CONTROL BOARD
March 3, 1994
MOBIL OIL CORPORATION,
)
Petitioner,
)
v .
)
PCB 93-151
(Variance)
ILLINOIS ENVIRONMENTAL
)
PROTECTION AGENCY,
)
Respondent .
)
)
DAVID L
. RIESER, of ROSS & HARDIES, APPEARED ON BEHALF OF
PETITIONER ; and
ROBB H
. LAYMAN APPEARED ON BEHALF OF RESPONDENT
.
OPINION AND ORDER OF THE BOARD (by J
. Theodore Meyer) :
This matter is before the Board on petitioner Mobil Oil
Corporation's August 18, 1993 petition for variance from 35 111
.
Adm . Code 304
.122, as that section relates to ammonia nitrogen
effluent limitations
. Mobil seeks a five-year variance for its
Joliet refinery
. The Illinois Environmental Protection Agency
(Agency) filed its recommendation on October 27, 1993, and Mobil
filed a response to that recommendation, and a request for
hearing, on November 2, 1993
. Hearing was held on December 29,
1993, in Joliet
. No members of the public attended .
As set forth below, the Board finds that Mobil would suffer
an arbitrary or unreasonable hardship if variance were not
granted
. Therefore, variance will be granted, subject to
conditions .
BACKGROUND
Mobil owns and operates a petroleum refinery on Arsenal Road
in Will County, Illinois, approximately 10 miles southwest of
Joliet . This refinery began operation in 1973, and is Mobil's
newest domestic refining facility
. The Joliet facility has a
rated capacity of 190,000 barrels of crude oil throughput per
operating day, and employs approximately 675 people
. The
refinery processes high sulfur and high nitrogen North American
crudes, which comprise 70% of total throughput
. Its principal
products are motor gasolines and distillate fuel oil
. The
refinery also produces kerosene jet fuel, propane, petroleum
coke, sulfur, and some heavy fuel oil
. The refinery's products
are primarily marketed in Illinois and other midwestern states
.
(Pet . at 2 .)
The Joliet refinery
I
uses water from the Des Plaines River
EXHIBIT
3
The Agency recommends that Mobil be granted a variance .
However, the Agency recommends that the study period be shortened
Mobil
to 1/
can
years
provide
(instead
more
of
data
3 years),
on the
which
progress
could
of
be
the
extended
research
ifand
design program . (Agency Rec
. at 6-7 .) Additionally, the Agency
recommends that the variance terminate earlier if the Joliet
facility shows compliance with the general effluent standard of
Section 304
.122(b) for four consecutive quarters . (Agency Rec .
at 7
.) Mobil objects to both of these recommendations .
(Response to Rec . at 1-3 .) These issues were the focus of the
hearing in this matter
.
ENVIRONMENTAL IMPACT
Mobil contends that the impact of the requested variance . on
the ammonia nitrogen load in the Des Plaines River would be
insignificant . Mobil has provided a table which summarizes
calculated increases in river ammonia concentrations attributable
to Mobil's discharge at actual past average performance,
conditions under the now-expired site-specific rule, requested
variance conditions, and conditions permissible under BAT .
(Pet ., Table VII .) Mobil concludes that in all cases, Mobil's
impact is negligible, with a maximum change in ammonia
concentration of 0 .198 mg/1 at BAT conditions
. (Pet
. at 6, Table
VIIammonia
.) Mobil
water
has
quality
also included
data from
a
1989
summary
to 1992,
of dissolved
and states
oxygen
thatand
existing water quality in the vicinity of Mobil's discharge is
well
Therefore,
within
Mobil
applicable
concludes
standardsthat
its
. (Petrequested
. at 6,
discharge
Table VIIIof.)
ammonia nitrogen will not threaten water quality standards, and
that there will be no negative effect on the aquatic community in
the Des Plaines or Illinois Rivers
. (Pet . at 6 .)
be no
The
long-term
Agency
impairment
agrees with
of
Mobil's
the water's
conclusion
uses
that
or aquatic
there shouldlife
.
(Agency Rec . at 5 .)
){ARDSHIP
Mobil states that it has evaluated three alternate
technologies, and associated costs for those options . Mobil
lists those technologies as activated sludge with PAC, granular
media
chlorinationfiltration/selective
. Mobil states
ion
that
exchange,
the capital
and
investment
breakpoint
for these
options would range from $1.9 to $13 .8 million, with annual
operating costs between $0 .7 to $1 .7"million . (Pet ., Table IX .)
Mobil concludes that these costs are disproportionately high,
because the average cost to remove an incremental pound of
ammonia
$40 per
above
pound
.
the
Mobil
existing
states
system's
this figure
current
is $32
capability
over the
would
costbe
incurred to remove a pound of ammonia using its existing BAT
technology . (Pet . at 6 .) Mobil contends that denying a variance
5
consultants would not shorten the time frame for study of the
problem (Tr
. at 78-79), and that the time frame cannot be
shortened without compromising the quality of the work (Tr
. at
42-43)
. Mobil also points to the testimony of Dr
. William
Patterson that the scope of work proposed by Mobil will require a
full three years . (Tr . at 66
.) Mobil argues that the Agency did
not present any evidence in support of its position that the work
be performed within 18 months
. Thus, Mobil contends that
imposing the 18 month study period would be unreasonable,
arbitrary, and capricious
.
In response, the Agency
maintains that it is not convinced
that Mobil has exhausted all of the available steps to keep its
research timeframe within a "reasonable" time period . The Agency
points
early 1992,
out that
and thus
Mobil
has
became
had almost
aware of
two
the
years
ammonia
to study,
problem
explore,in
and investigate compliance alternatives
. The Agency continues to
recommend an 18-month study period, with Mobil having an option
to
investigation
ask the Board
phase
to modify
by the
the
additional
variance
18
to
monthsextend
.
the
The Board will grant Mobil two years for the study of the
problem,
permanent
and
relieftwo .
years
We recognize
to make necessary
that nitrification
modifications
inhibition
or seekis
a complicated problem, and that the necessary studies and
investigations are time consuming . However, as the Agency points
out, Mobil has been aware of the current problems since early
1992 . Additionally, prior to the January 1988 grant of the now-
expired site-specific rule, Mobil's Joliet facility had operated
under five prior variances for ammonia nitrogen . (Mobiloil
Corporation v . Illinois Environmental Protection Agency
(September 20, 1984), PCB 84-37 ; (June 10, 1982), PCB 82-36 ;
(July 10, 1980), PCB 80-54 ; (June 8, 1978), PCB 78-97 ; (June 9,
1977), PCB 77-22 .) The first of those variances was granted on
June
variance
9, 1977or
site-specific
. Thus, the Joliet
rule for
facility
the majority
has been
of
operating
the past 17under
years . We will not, at this time, extend that period for five
shortened
additional
study
yearsperiod
. We believe
. Mobil's
that
timetable
the record
shows
does
that
support
the bulk
a
of
Exhthe
.
study
3, Table
steps
IVare
.)
to
Granting
be completed
a two-year
by the
study
end
period,
of 1995
until
. (PetMarch
.
3, 1996, will give Mobil some additional time to complete those
steps . Mobil will then have an additional two years as it has
requested, to make modifications or seek site-specific relief .'
Additionally, the Agency recommends that the variance expire
if the Joliet facility shows compliance with Section 304 .122(b)
'
Mobil, like any other variance petitioner, can move for
modification of variance during the pendency of the variance .
5
consultants would not shorten the time frame for study of the
problem (Tr
. at 78-79), and that the time frame cannot be
shortened without compromising the quality of the work (Tr
. at
42-43)
. Mobil also points to the testimony of Dr . William
Patterson that the scope of work proposed by Mobil will require a
full three years . (Tr
. at 66 .) Mobil argues that the Agency did
not present any evidence in support of its position that the work
be performed within 18 months
. Thus, Mobil contends that
imposing the 18 month study period would be unreasonable,
arbitrary, and capricious
.
In response, the Agency maintains that it is not convinced
that Mobil
. has exhausted all of the available steps to keep its
points
research
out
timeframe
that Mobil
within
became
a "reasonable"
aware of the
time
ammonia
periodproblem
. The
inAgency
early 1992, and thus has had almost two years to study, explore,
and investigate compliance alternatives
. The Agency continues to
recommend an 18-month study period, with Mobil having an option
to ask the Board to modify the variance to extend the
investigation phase by the additional 18 months .
The Board will grant Mobil two years for the study of the
problem, and two years to make necessary modifications or seek
permanent relief . We recognize that nitrification inhibition is
a complicated problem, and that the necessary studies and
investigations are time consuming . However, as the Agency points
out, Mobil has been aware of the current problems since early
1992 . Additionally, prior to the January 1988 grant of the now-
expired site-specific rule, Mobil's Joliet facility had operated
under five prior variances for ammonia nitrogen . (Mobil Oil
Corporation v . Illinois Environmental Protection Aaencv
(September 20, 1984), PCB 84-37 ; (June 10, 1982), PCB 82-36 ;
(July 10, 1980), PCB 80-54 ; (June 8, 1978), PCB 78-97 ; (June 9,
variance
1977),
June 9,
PCB
1977or
77-22site-specific
. Thus,
.) The
the
first
Joliet
rule
of
for
facility
those
the
variances
majority
has been
of
was
operating
the
granted
past
under17on
years . We will not, at this time, extend that period for five
shortened
additional
study
yearsperiod
. We believe
. Mobil's
that
timetable
the record
shows
does
that
support
the bulk
a
of
Exhthe
.
study
3, Table
steps
IVare
.) Granting
to be completed
a two-year
by the
study
end
period,
of 1995until
. (PetMarch
.
3,
steps1996,
. Mobil
will
will
give
then
Mobil
have
some
an
additional
additional
time
two
to
years,
complete
as it
thosehas
requested, to make modifications or seek site-specific relief
.'
Additionally, the Agency recomiends that the variance expire
if the Joliet facility shows compliance with Section 304 .122(b)
1
Mobil, like any other variance petitioner, can move for
modification of variance during the pendency of the variance
.
treatment
6 . Mobil
plant
shall
so
continue
as to produce
to operate
the best
its wastewatereffluent
practicable and to achieve compliance with 35 Ill . Adm . Code
304 .122(b) as soon as possible
.
7
. Within 45 days of the date of the final Board order in
this case, Mobil shall execute and forward to Robb Layman,
Division of Legal Counsel, Illinois Environmental Protection
Agency, 2200 Churchill Road, P .O. Box 19276, Springfield, IL
62794-9276, a certificate of acceptance and agreement to be
bound to all terms and conditions of this variance . The 45-
day period will be held in abeyance during any period that
this matter is appealed
. Failure to execute and forward
this certificate within 45 days shall render this variance
null and void
. The form of the certificate shall be as
follows
:
CERTIFICATION
I (We),
, hereby
the
accept
Pollution
and agree
Control
to be
Board's
bound by
March
all
3,terms
1994and
order
conditions
in PCB
of93-
151 .
Petitioner
Authorized l Agent
Title
Date
IT IS SO ORDERED
.
7
I, Dorothy M . Gunn, Clerk of the Illinois Pollution Control
Board,
adopted
of ( -
hereby
0on
thece
_9tify
h.e-
that
day ofthe bove
opinion
-~ and ,
order
1994,
wasby
a vote
orothy M6 nn, Clerk
Illinois P ution Control Board
7396wwtp.pfc
EXHIBIT II
MOBIL OIL CORPORATION
- JOLIET REFINERY
BIOLOGICAL SYSTEM AMMONIA REMOVAL RATE
Year
W WTP Influent
WWTP Effluent
% Removal
19741973
--
5577.0.0
----
1975
30
42.0
-40
1976
30
36.0
-20
1977
15
17.0
-13
1978
17
9.0
47
1979
14
13.0
7
1980
20
17.0
15
1981
23
13.0
43
1982
29
15.0
48
1983
23
4.0
83
1984
20
3 .0
85
1985
26
3 .0
86
1986
36
4 .0
89
1987
28
2.0
93
1988
27
1 .0
96
1989
26
0.2
99
1990
22
0 .2
99
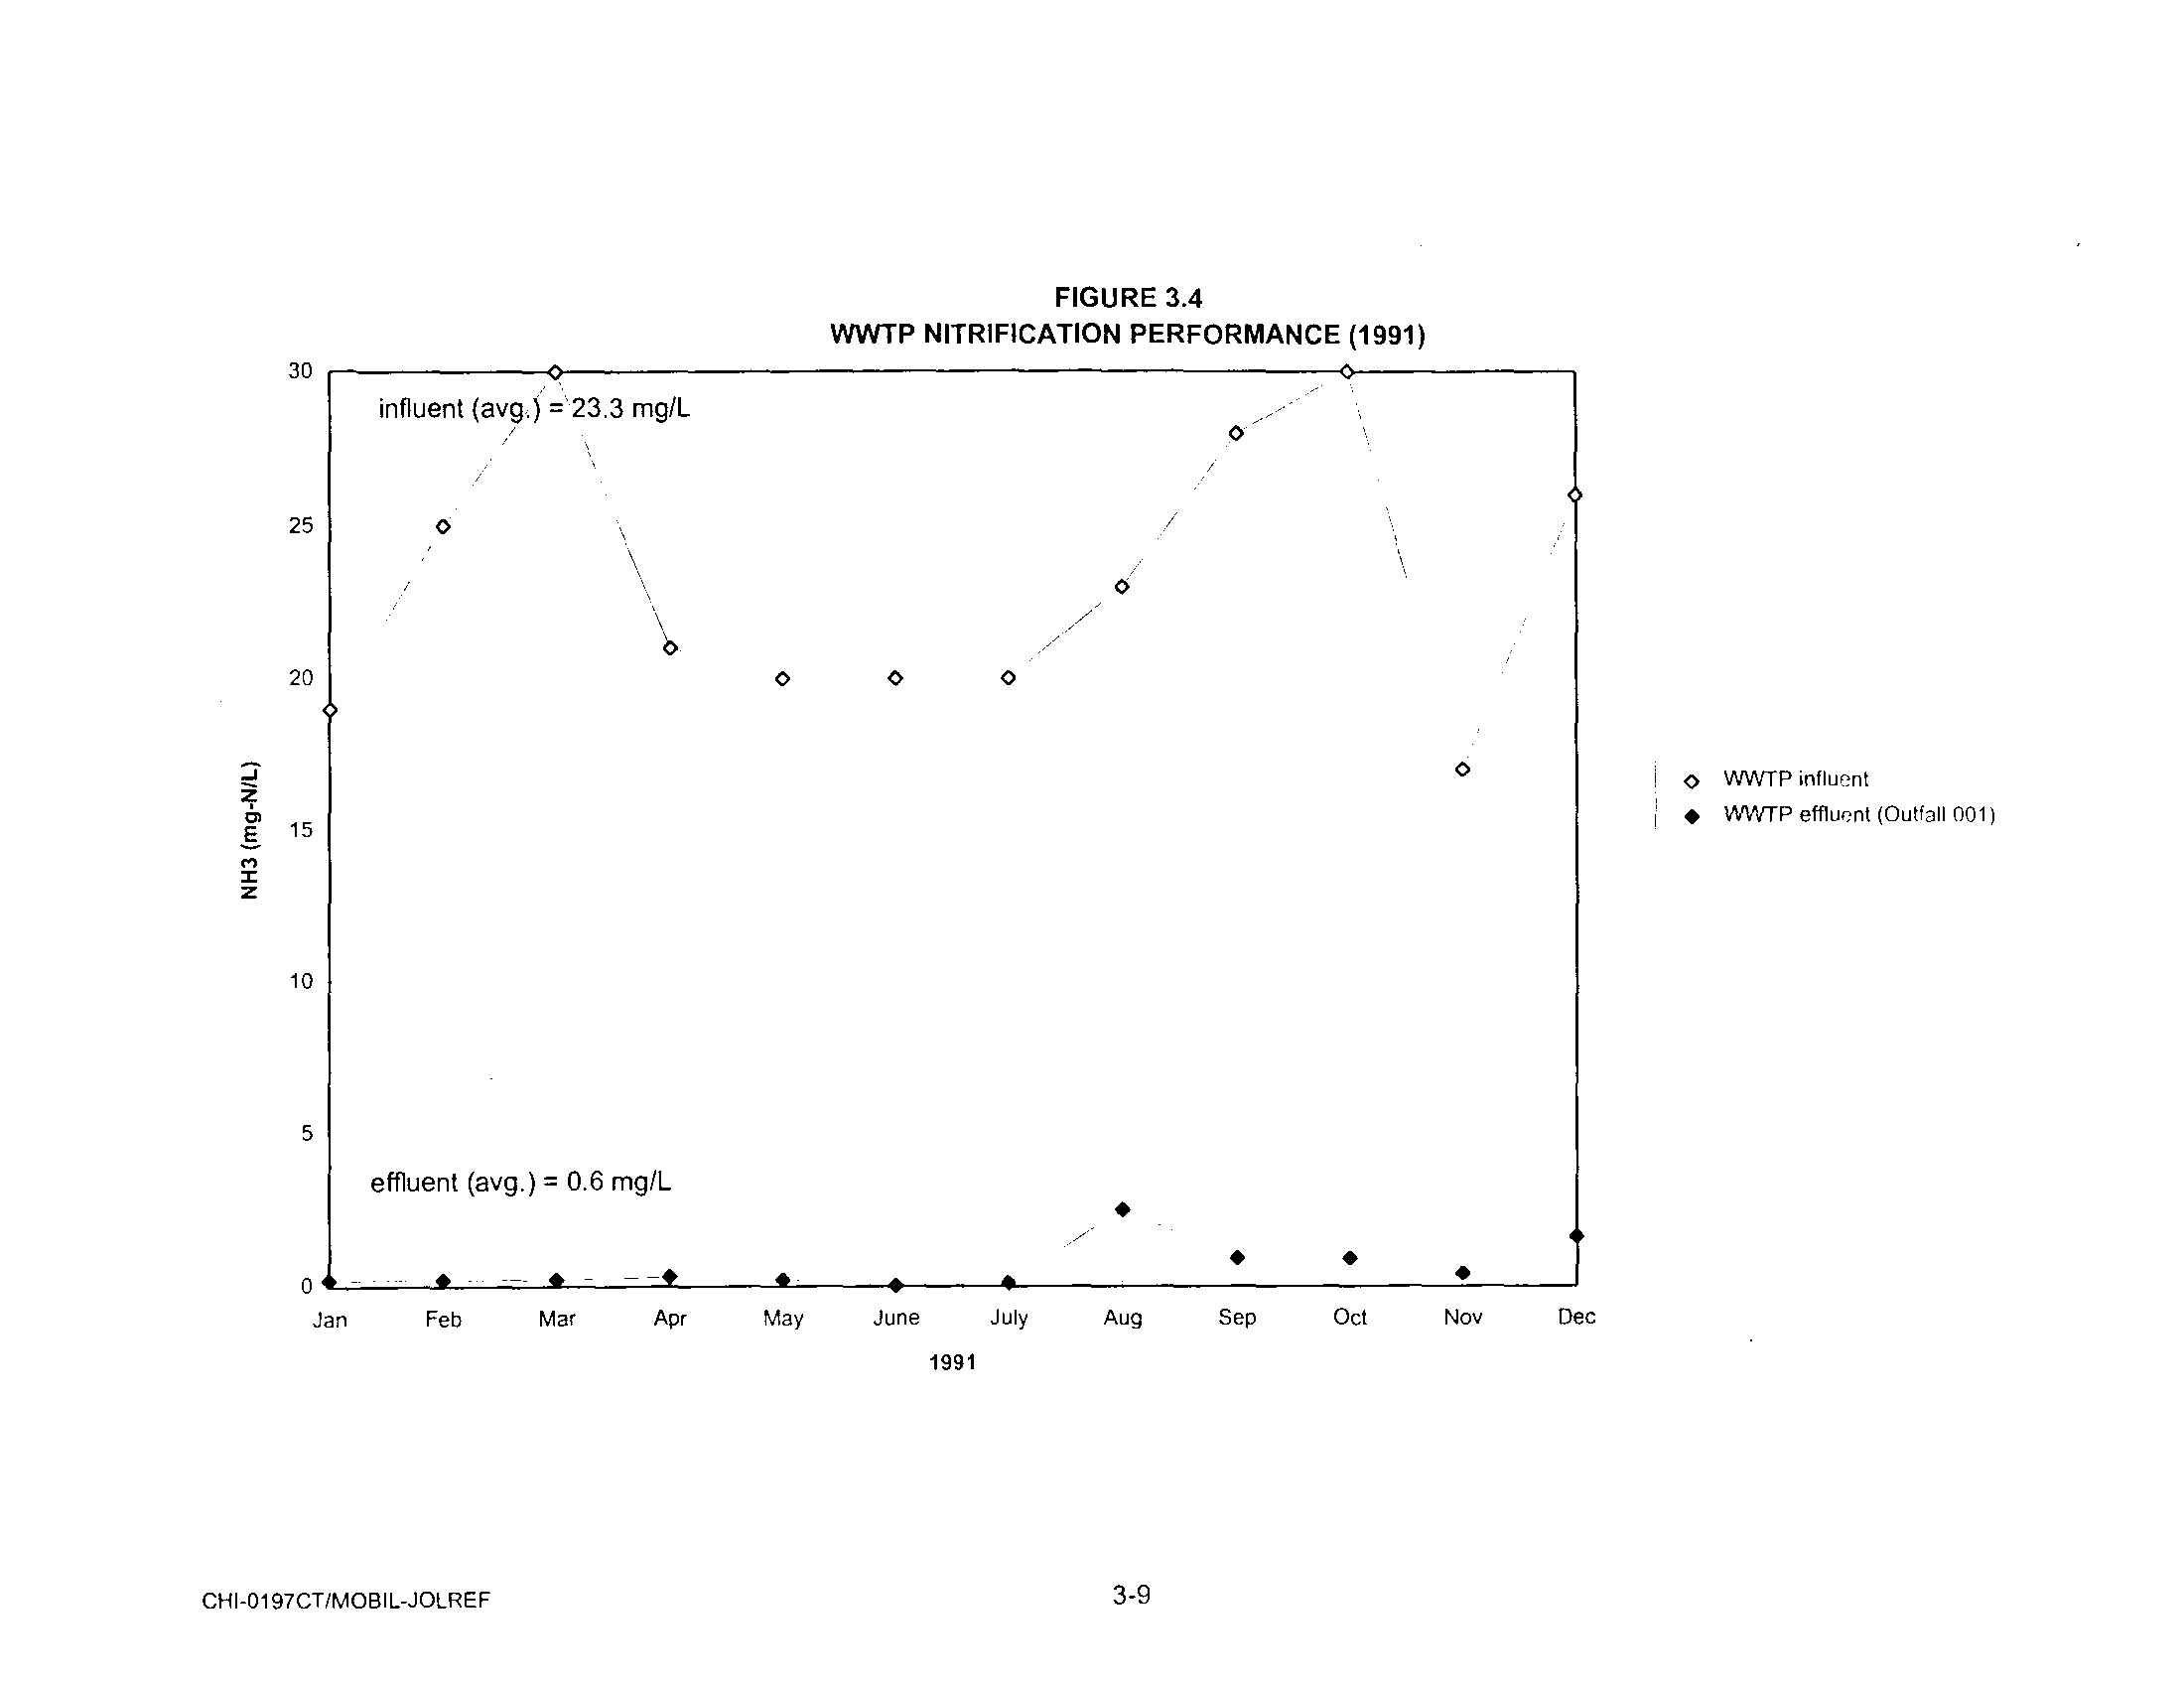
1991
23
0.6
97
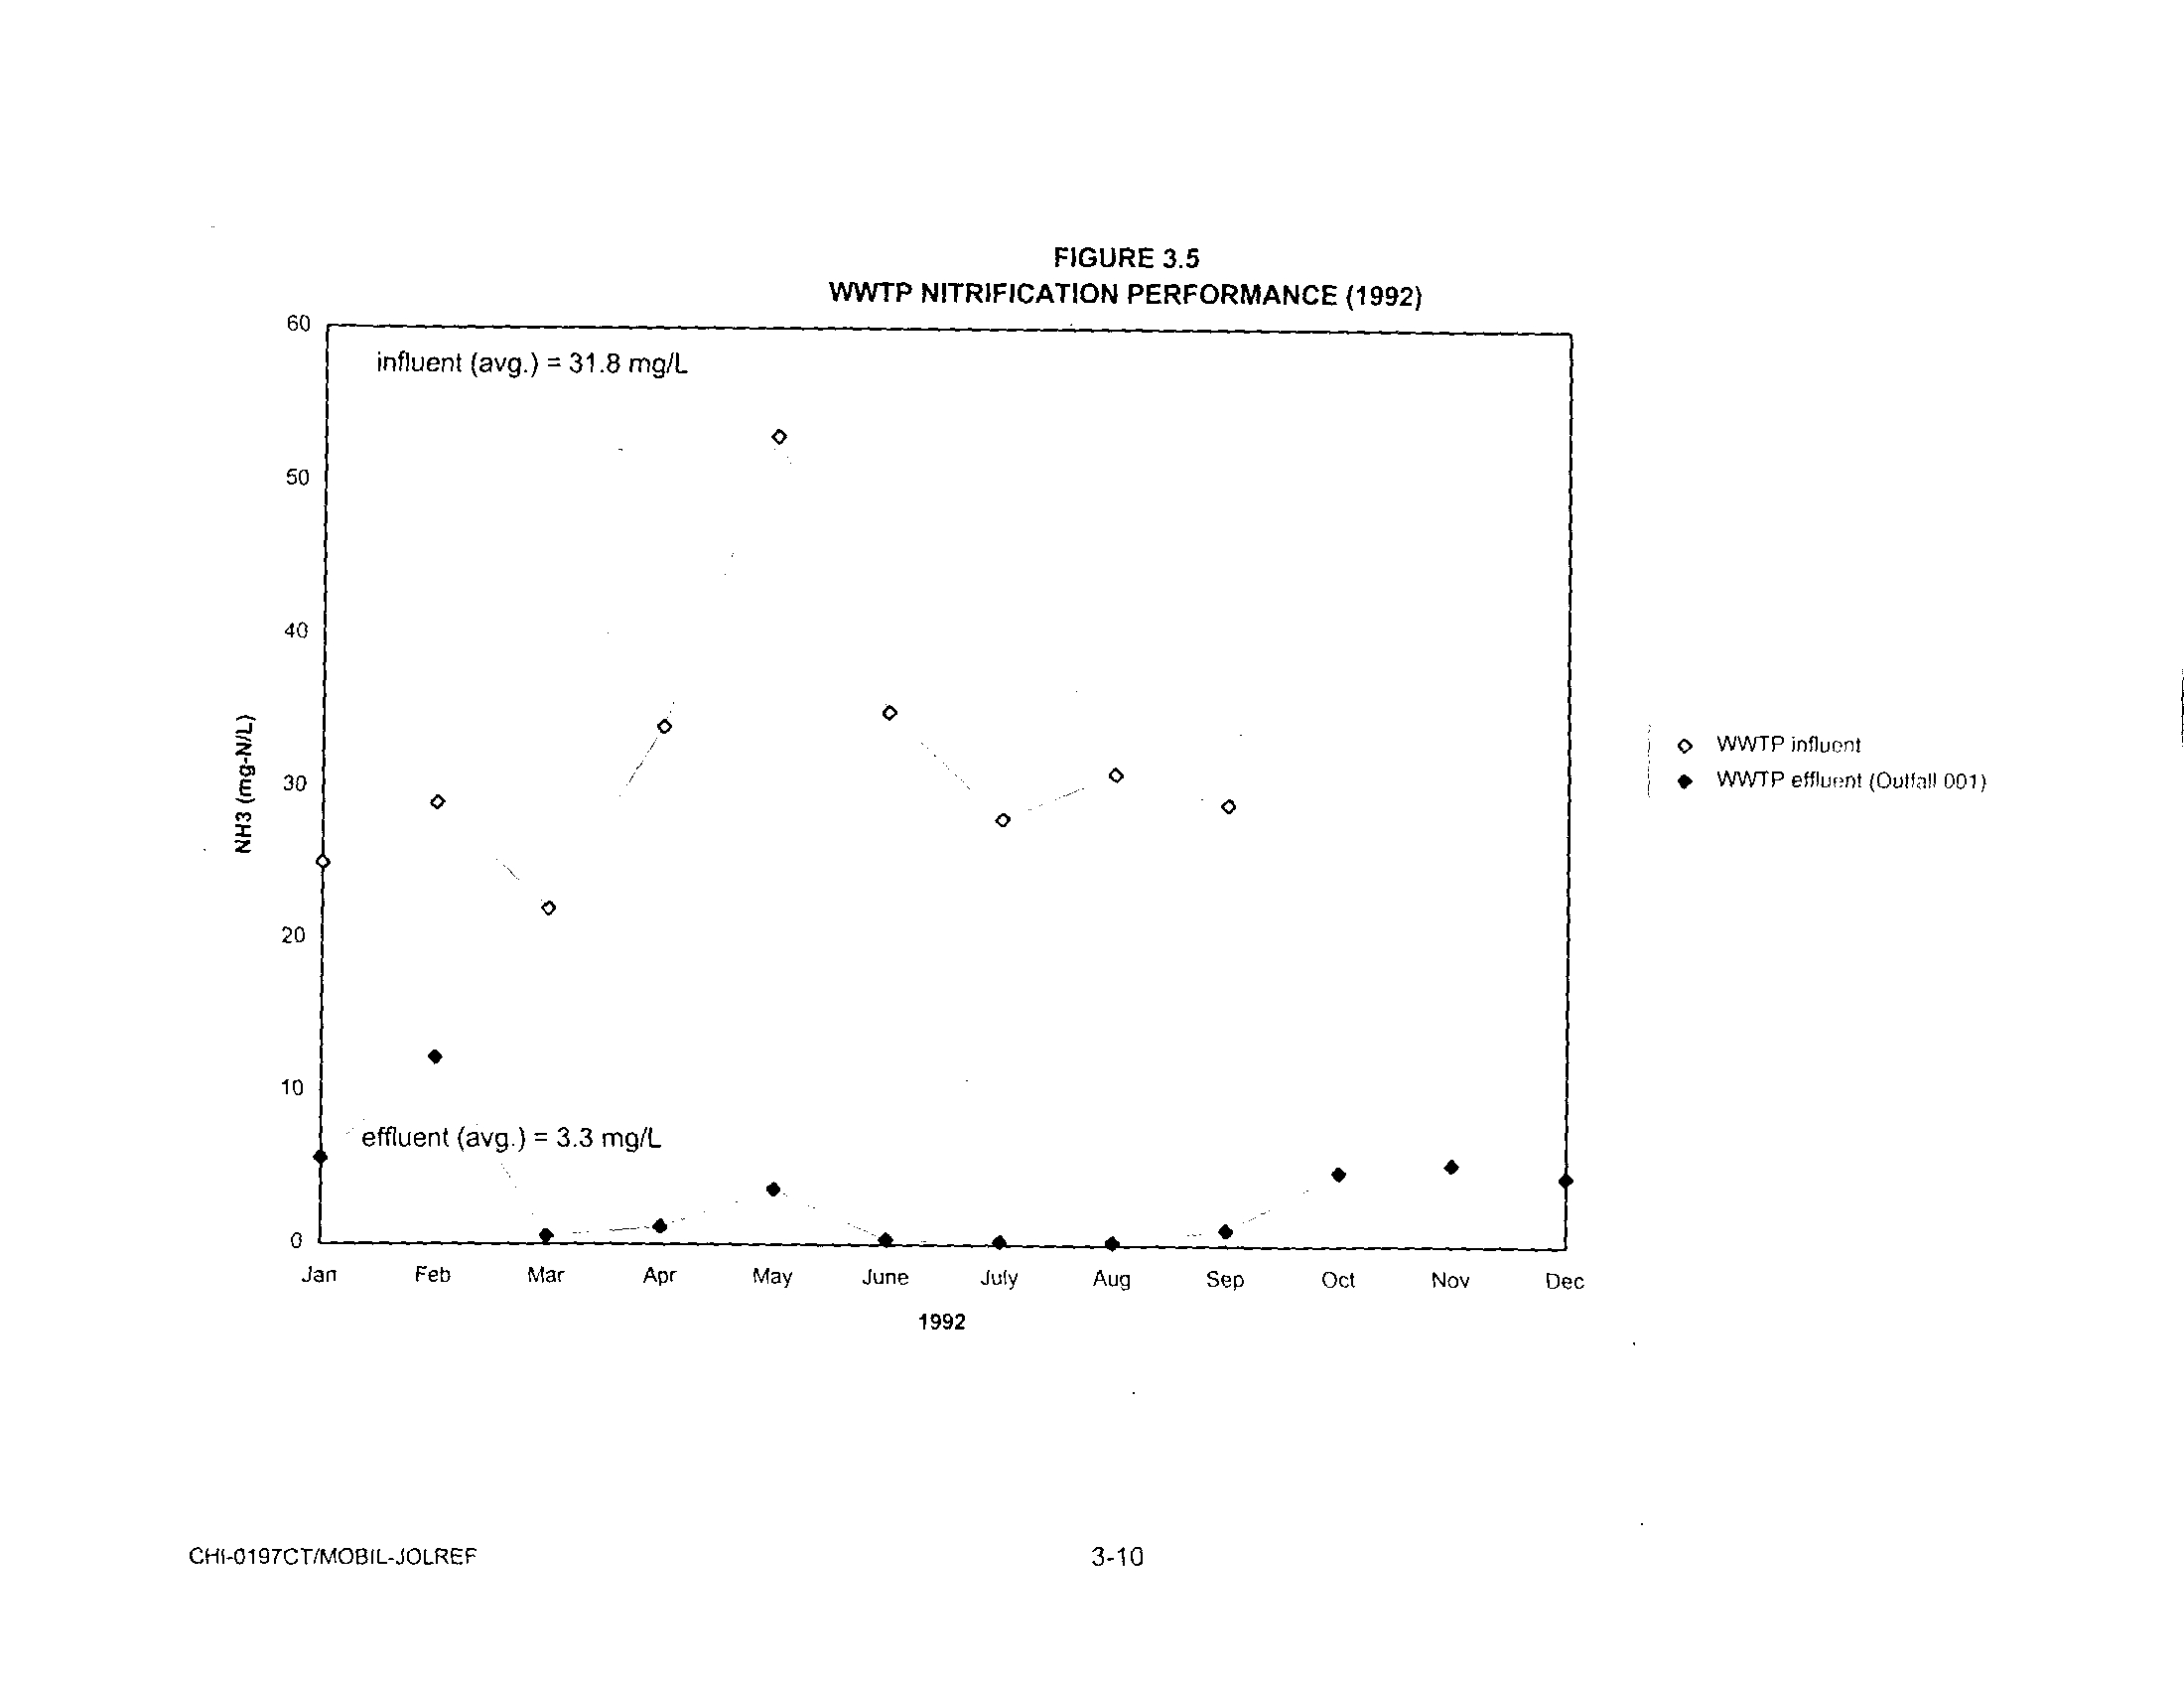
1992
32
3 .3
90
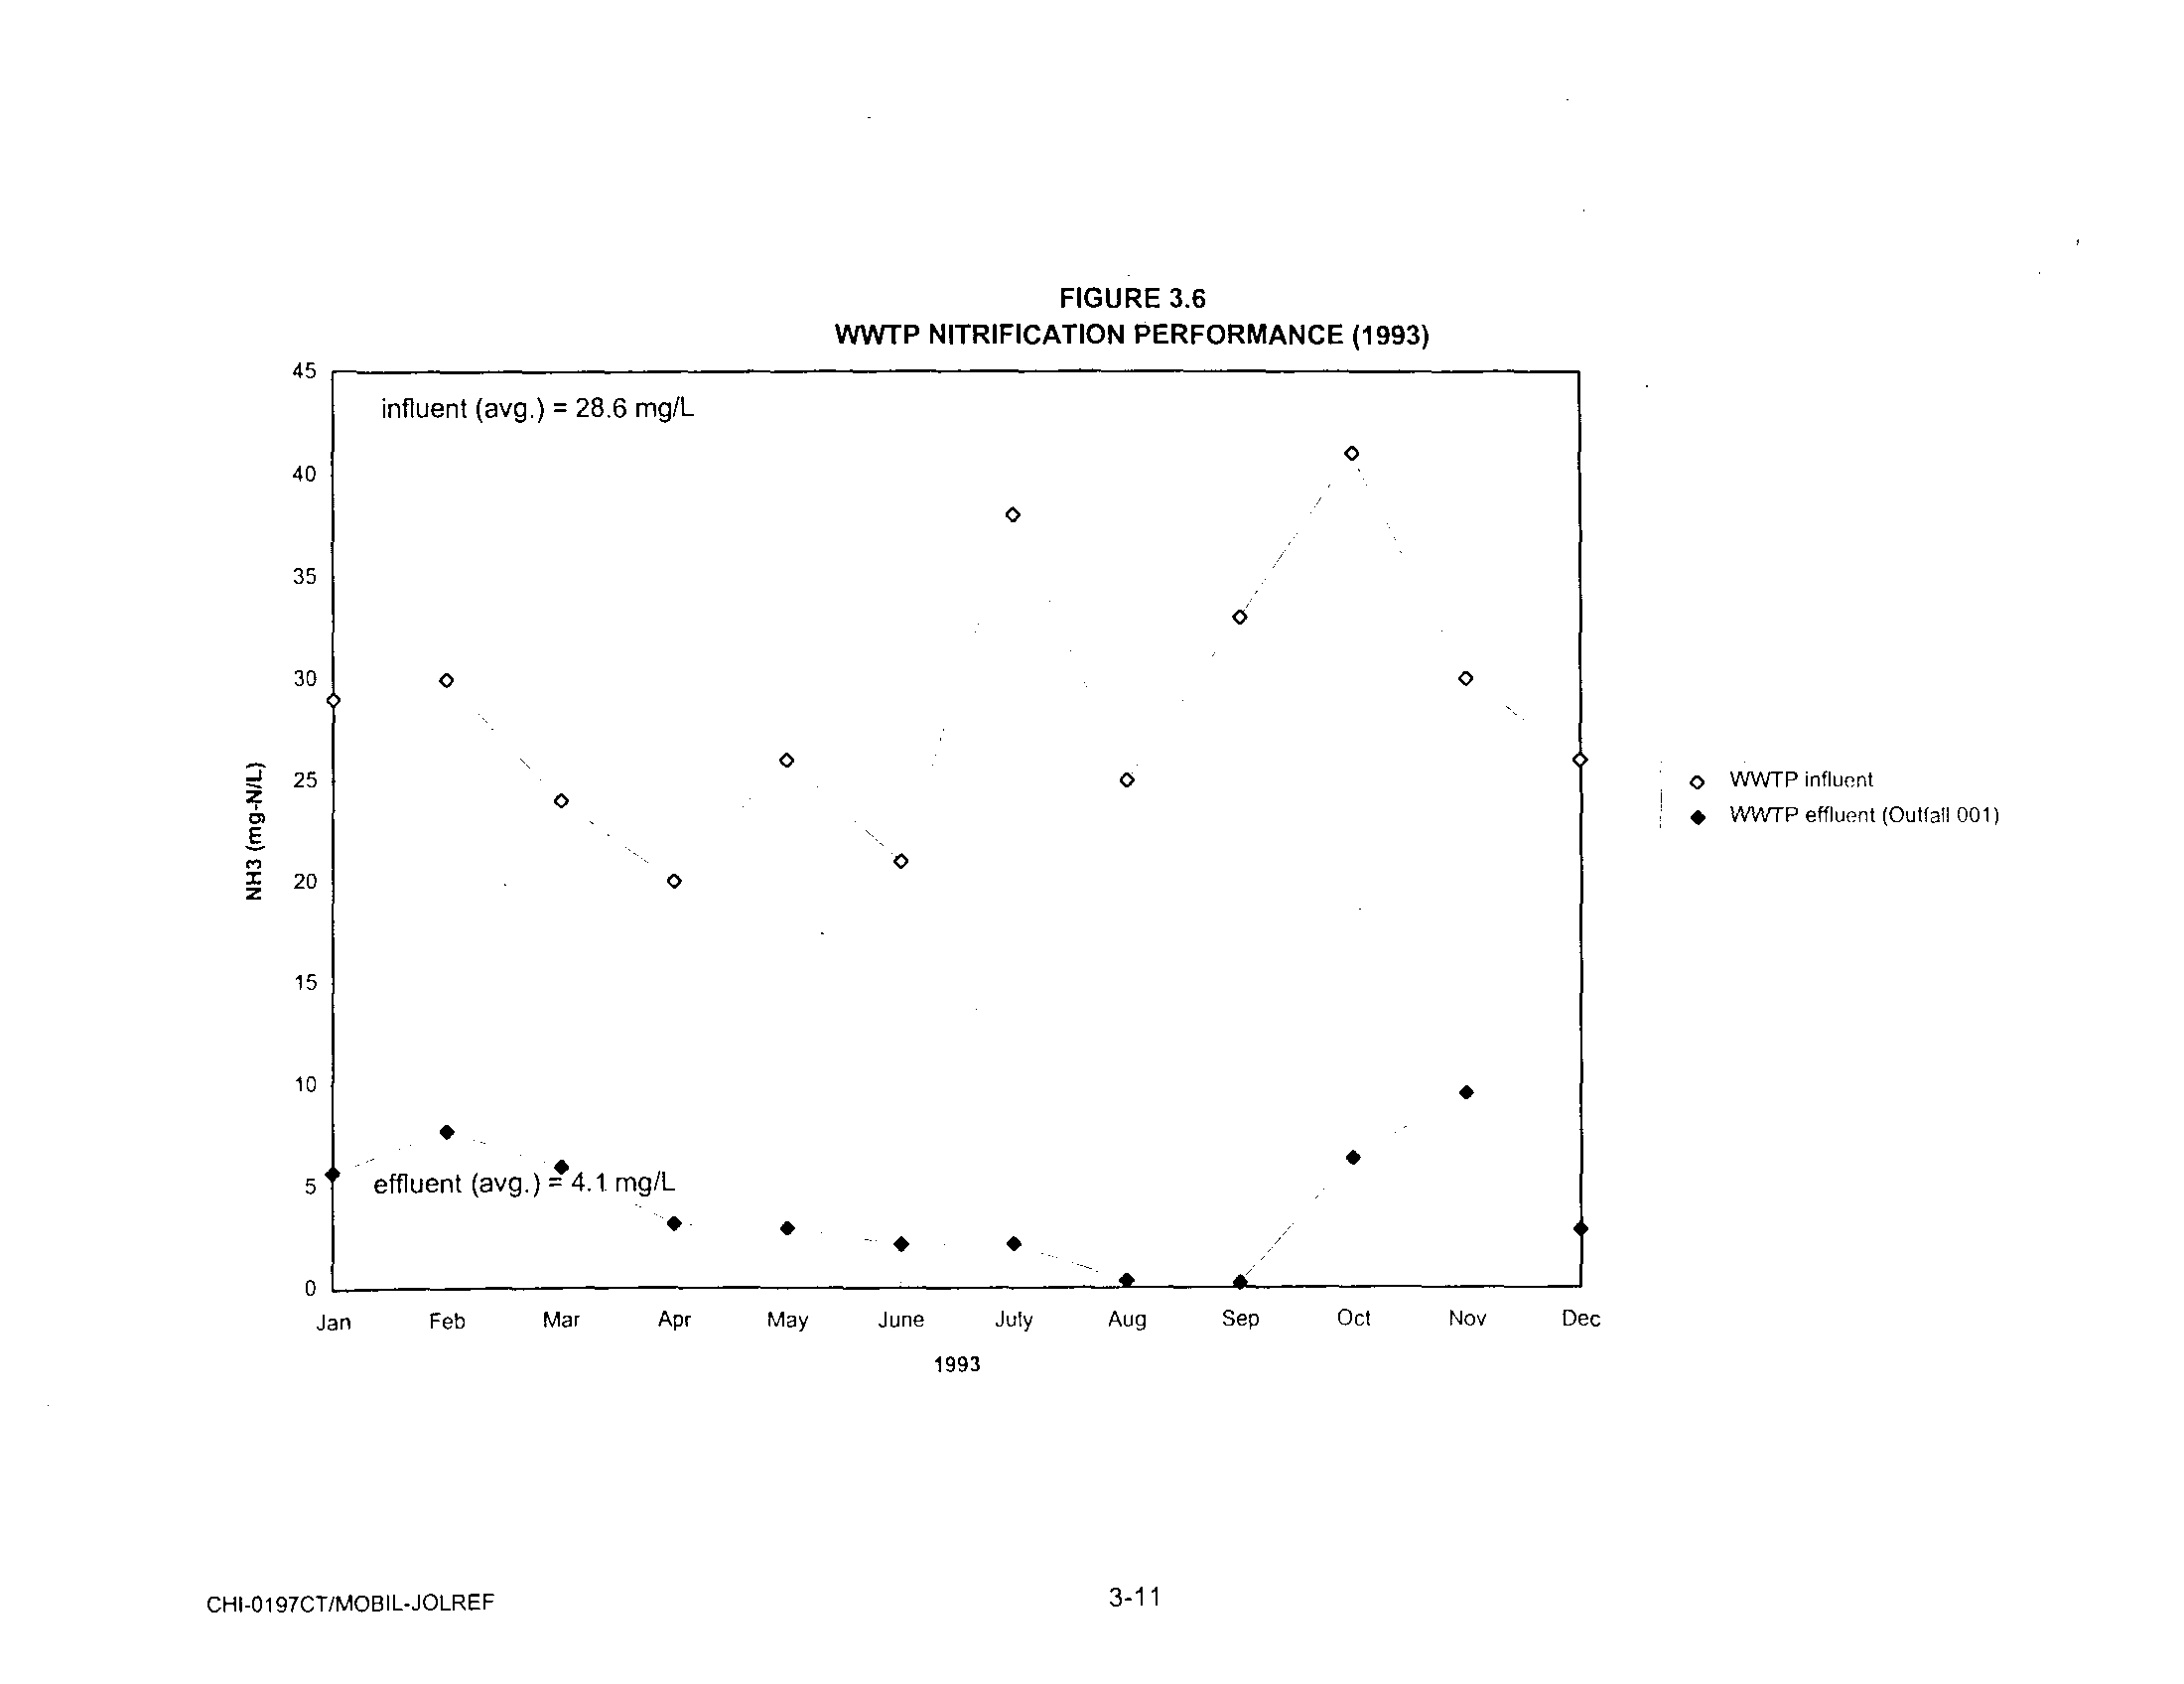
1993
29
4 .0
86
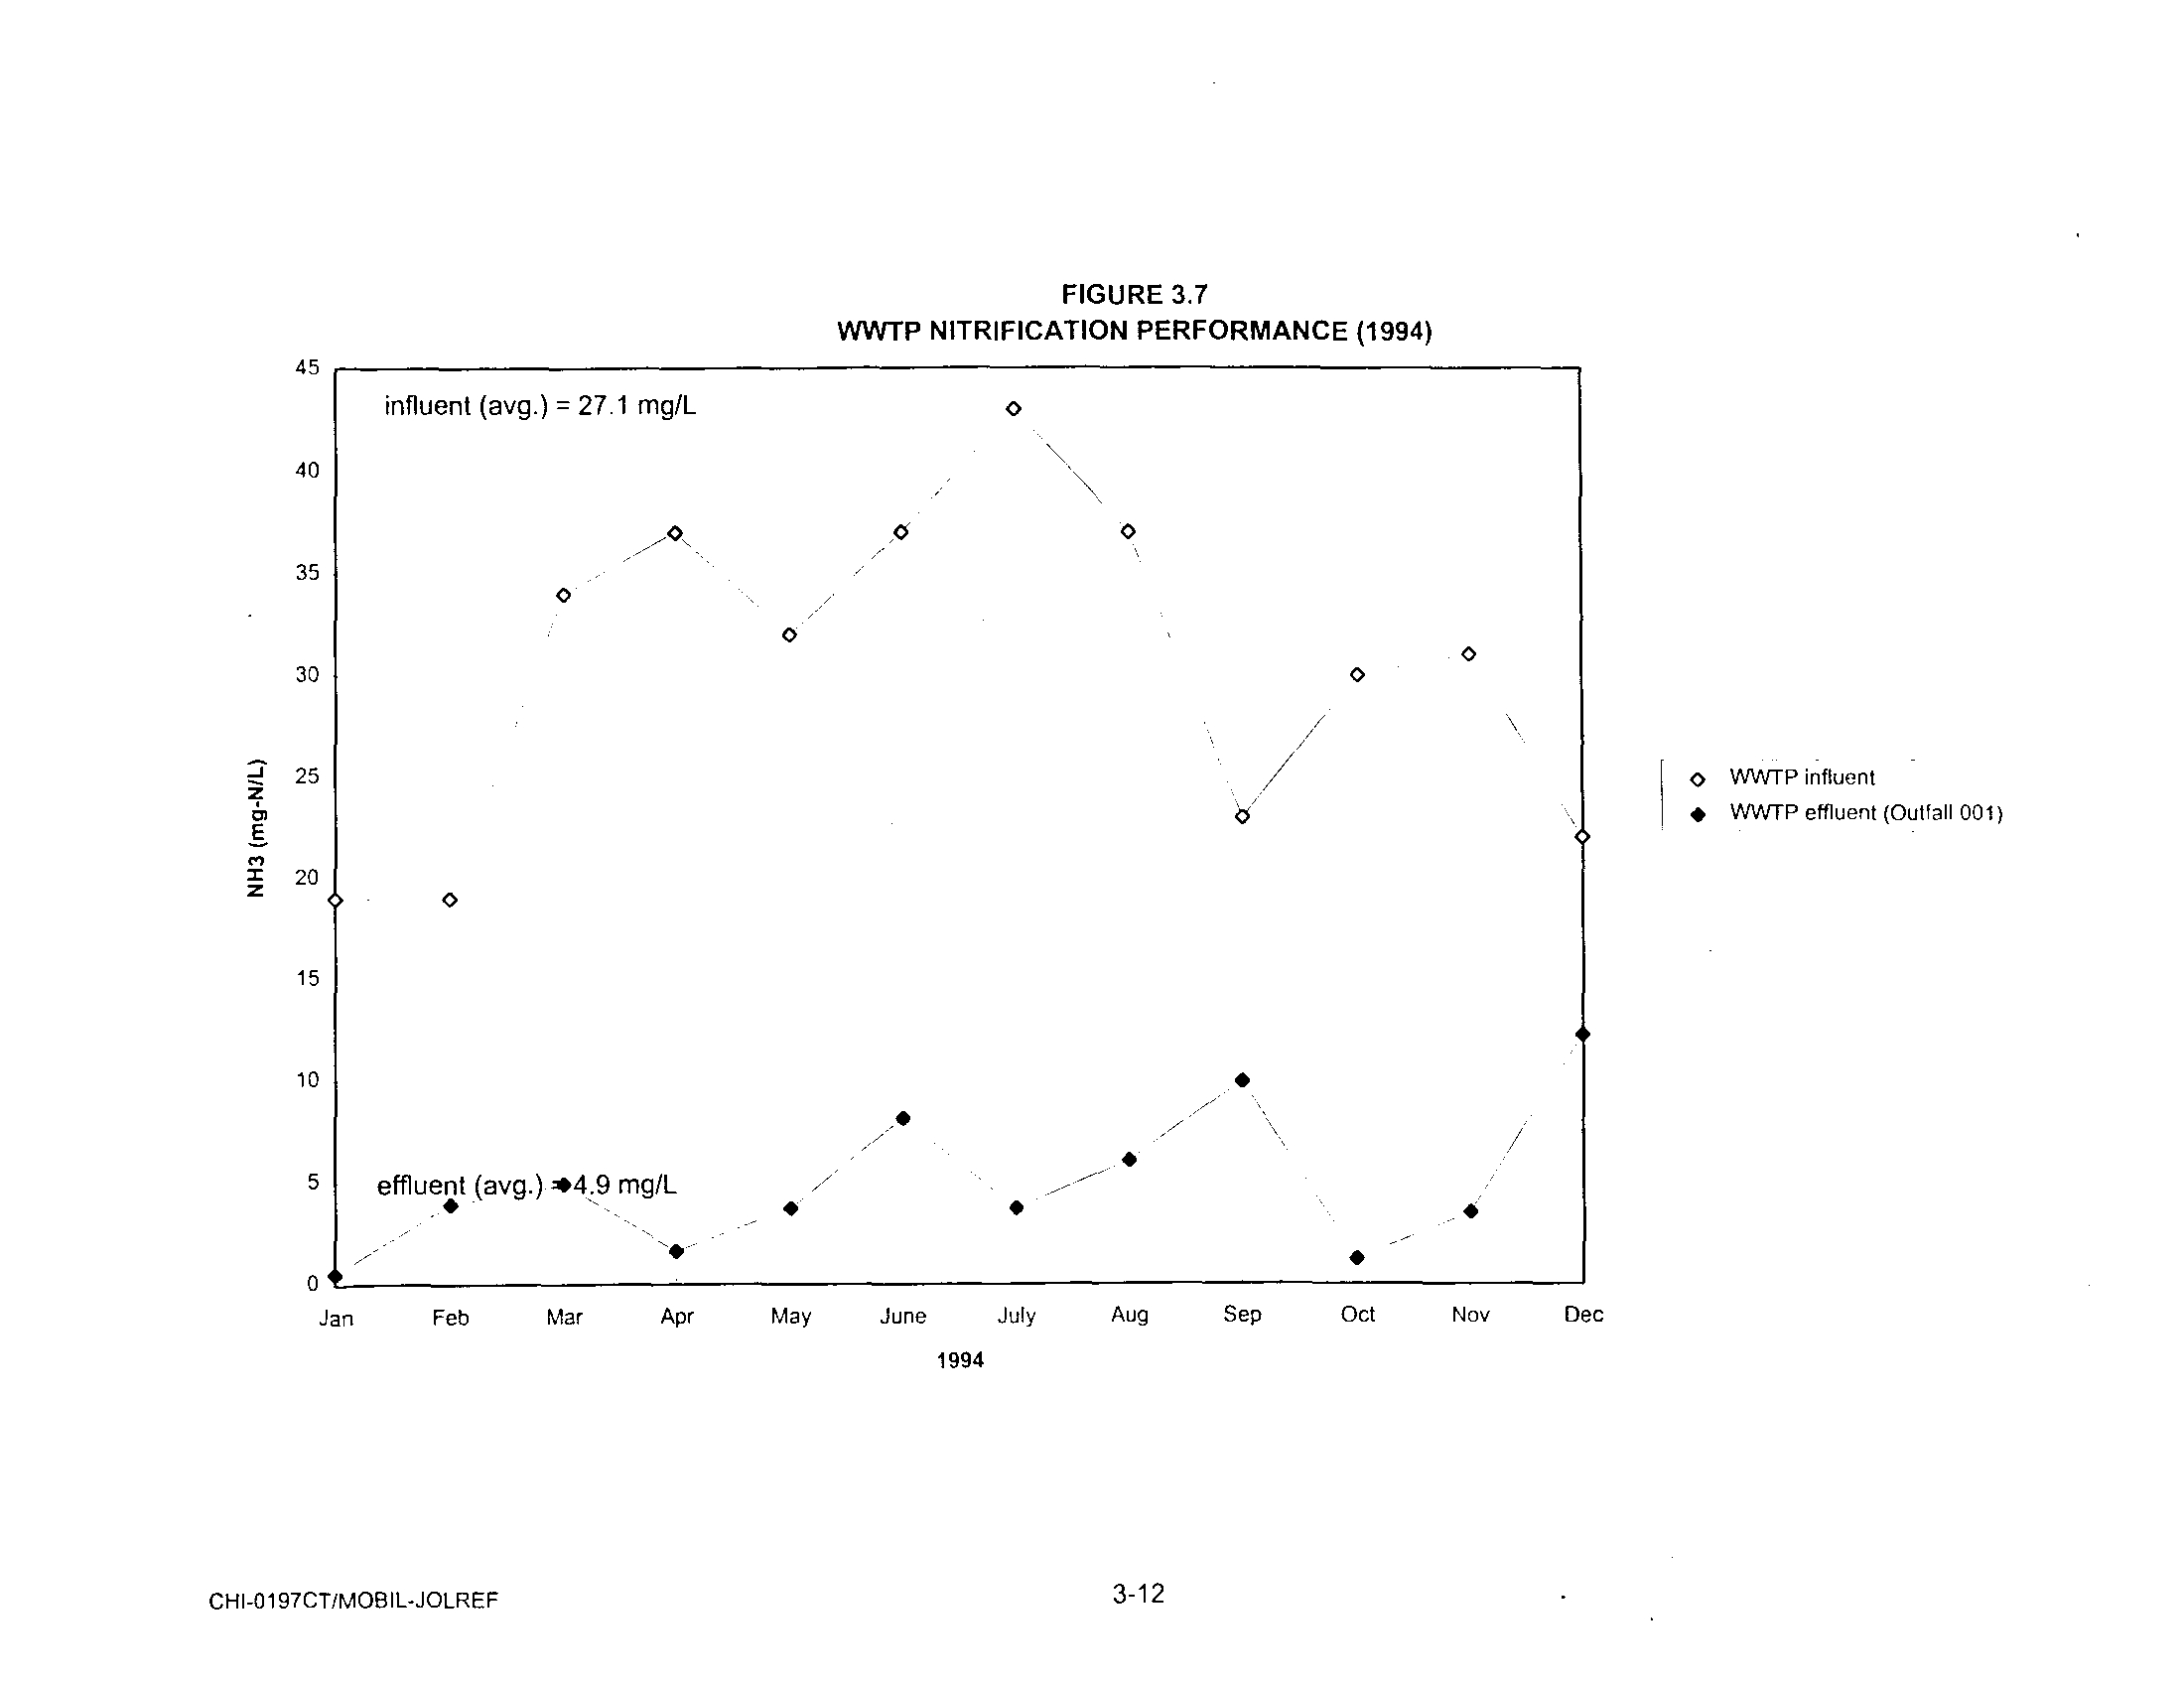
1994
27
5 .0
81
1995
35
6.3
82
1996
34
3.9
89
Period Average
26
13.9
61
1992 -1996 Average
31
4.5
86
EXHIBIT III
MOBIL OIL CORPORATION
JOLIET REFINERY
AMMONIA DISCHARGE HISTORY
MARCH 1994 -FEBRUARY 1997
mg/1
Month
Influent-Average
Influent-Range
EmuentAvenue
Effluent-Range
%Averac,Conversion
Mar-94
34
26 - 30
4 .9
1 .4-14 .9
86
Apr-94
37
31-43
1,6
0 .7-35
May-94
32
26-40
37
0 .4 .12.96.9
88
Jun-94
37
35-39
81
17-16.6
78
Jul-94
43
34 - 58
3.7
0,8-14,3
91
Aug-94
37
30-43
60
2.4-108
84
Sep-94
23
7-35
99
50-16 .
57
Oct-94
30
3-43
12
00-3 .0
96
Nov-94
31
27 - 38
3.5
0 .4 - 8 .0
89
Dec-94
22
12-30
122
55-19.2
Jan-95
22
17-26
13 .7
8,7-19.45.1
38
Feb-95
17
14 .21
7.2
06-204
58
Mar-95
33
30 - 38
1 8
04-3 .7
Apr-95
34
31 .38
6 .6
24-13.95.9
81
May-95
30
8-39
7 .5
4 .1 -108
75
Jun-95
30
6 .40
12 .2
0 .3-22,9
59
Jul-95
43
35-49
04
0
.1 -08
99
Aug-95
41
24-73
2 .0
02-58
Sep-95
59
37-73
2.2
05-5
.
.95.7
96
Oct-95
31
13-52
2.7
0.2
.7
.2
91
Nov-95
40
30-44
8.1
0 .2-19 .0
80
Dec-95
40
31-49
11 .0
6,0-255
73
Jan-96
28
22 -
35
8 .5
2 .6-16,9
70
Feb-96
25
14-38
5 .3
0-21 .4
79
Mar-96
24
11-30
9.2
0-27 .4
62
Apr-96
33
21 - 49
14 .9
0.6 .21 .1
55
May-96
37
28-55
1 .3
0 .4 .2
96
Jun-96
37
32-42
3 .6
0-13.7
90
Jul-96
43
37 - 56
1 .3
0-42
97
Aug-96
40
25-45
0 .3
0-0.7
99
Sep-96
29
16-40
03
0-1 .7
99
Oct-96
32
25
- 44
0 .1
0-02
100
Nov-96
38
34
- 45
0 .3
0-0,8
99
Dec-96
40
36-42
16
0-14
96
Jan-97
35
33 - 36
3 .8
0-14
89
Feb-97
27
11
-
35
0 .3
0-0 .8
99
Period Average
H
b4
V
Period Minimum
0 .1
38
9497var.pfc
Period Maximum
14 .9
100
LEGEND
i - investigative activity
a=equipment change or upgrade
m - miscellaneous upgrade
EXHIBIT IV
AMNONLA
REMOVAL OPTIMIZATION ACTM77ES
ACTIVITY
NATURE COST I COST e COST m COST tot
1st report 3/3/94-913/94
Refinery Sour Water Pollutant Survey
$ 10M
$ 10M
Activated Sludge System Aeration Capability Engineering Analysis
$
SM
$
SM
W NTP API and DAF System Assessment
I $ 6M
$ 6M
SWSTULaboratory irrvestigalion-Phase 1
I
$ 25M
$ 25M
2nd report 913/91-317195
Envires, Inc . Activated Sludge System Field Analysis
I
$
4M
$
4M
SWSTULaboratory Investigation -Phase 2
$ 25M
$ 25M
Upgrade Crude Unit Desaler Controls
e
$
1IXIM
$
l0%l
Constructed Caustic Free Merm Trealers
e
$
3Mv1
$ 31.9.1
3rd report 313/96-91796
SW STU Laboratory Investigation - Phase 3
I
$ 25M
S 25M
SWSTU Pilot Plant Study
$ 30M
$ 30M
MICROTOX/Nitrifcation Inhibition Study
S 120M
$
120M
Upgraded West Side of Activated Sludge System
$ 1 .75NW
$ 1
.75MM
Replaced West Clarifier Internals
$
225M
$
225M
Mg(OH)2
Addition Facilities
e
$
25M
$ 25M
Bioaugmenlation
m
S 65M
S
65M
Mg(OH), Addition
e
$ 40M
$
40M
4th report 9/3195313196 - Pending
Upgrade East Side of Activated Sludge System
Upgrade East Clarifies Internals
Complete W W TP Laboratory
Complete DAF Controls Upgrades
Perform W WTP Post Mechanical Upgrade Optimization
6th report 313/96 .9896- Completed & Pending
e
e
e
e
m
cwnpl .egn d.tq
Upgraded East Side of Activated Sludge System
Jun-ti
e
S 1 75KW
$ 1 75M.1
Completed WWTP Laboratory
up-se e
$
loom
$ loom
Completed DAF Controls & Recycle Upgrades
se," e
$ 143M
$
143M
Install Liquid Nutrient (Phosphate) Addition System
Pending
Perform WWTP Post Mechanical Upgrade Optimization
Pending
6th report 9/3/96 -313197 - Completed 6 Pendinq
e
m
c
.nwietiond.ttt
Upgrade East Clarifier Internals
Novae e
$ 225M
S
225M
Perform In-Stream Water Quality Data Collection
Octse
i
$ 33M
Install Liquid Nutrient (Phosphate) Addition System
Pending m
$ 25M
$
25M
Perform W WTP Post Mechanical Upgrade Optimization
P.nding
I
S 33M
$
45M
$
45M
TOTAL
S283 M $7.363M MOM S7.776MM
EXHIBIT V
BRU influent/effluent
LC 50
vs
Time
Page 1
-•--bru effluent
•
bru Influent
1996 TEST DATA
Toxicity is inversely proportional to LC 50 value . Lower the value of LC 50, more toxic the material .
bruedt .tox
30
20
10
0
O
r
m
N
('7
r
pp
O
a)
Q)
N
0)
N
LO
N
O
r
d d
N N
Ch
m
mg NH3/hr
EXHIBIT VI
-
CHART I
EAB NH3 Conversion Capacity
vs
Inhibition r = 0
.3
--
---1-
-I
N
N
to
`t
0 m
Ch
N
m
L6
U r r
r
CD
N
er
'
`
8'9L
O
II
I-
•
I
L'9L
1
9'0L
T
V TS
£E'L 2
E
! SZ L
F-
im 'vi
0
T E4'S
S 4)
Lu
C
-
, LE'S
U
S
*I 6L'b
Z
Q
- b£'b
0o)
ON
00
0
0
1o
0
e
uo!L!q!4ul %
0N
0r
L'b£
8' 81.
T L'LL
t 4£'E
LL'Z
t 6Z'Z
LZ'Z
.
0
LZ'L
c
Z
C
Q
Z OJ
1
U
>
.
3
>0
:
SITE-SPECIFIC AMMONIA RELIEF
PETITION REPORT
FOR THE
WASTEWATER TREATMENT PLANT
MOBIL OIL REFINERY
JOLIET, ILLINOIS
Prepared for
:
MOBIL OIL CORPORATION
POST OFFICE BOX 874
JOLIET, ILLINOIS 60434
MARCH 1997
Prepared by:
PARSONS ENGINEERING SCIENCE, INC .
1000 JORIE BOULEVARD, SUITE 250
OAKBROOK, IL 60521
Parsons ES Project No . 730508
CHI-0197 CT/MOBIL-IOLREF
TABLE OF CONTENTS
SECTION 1 EXECUTIVE SUMMARY 1-1
1
.1 Executive Summary
1-1
SECTION 2 INTRODUCTION
2-1
2 .1 Project Background
2-1
2
.2
Project Objective
2-1
2 .3 Report Organization
2-2
2 .4 The Mobil Joliet Refinery
2-2
2
.5 Wastewater Treatment Plant Overview 2-3
2 .6 Report Authors
2-5
SECTION 3
AMMONIA STANDARD COMPLIANCE EFFORTS 3-1
3 .1 Introduction
3-1
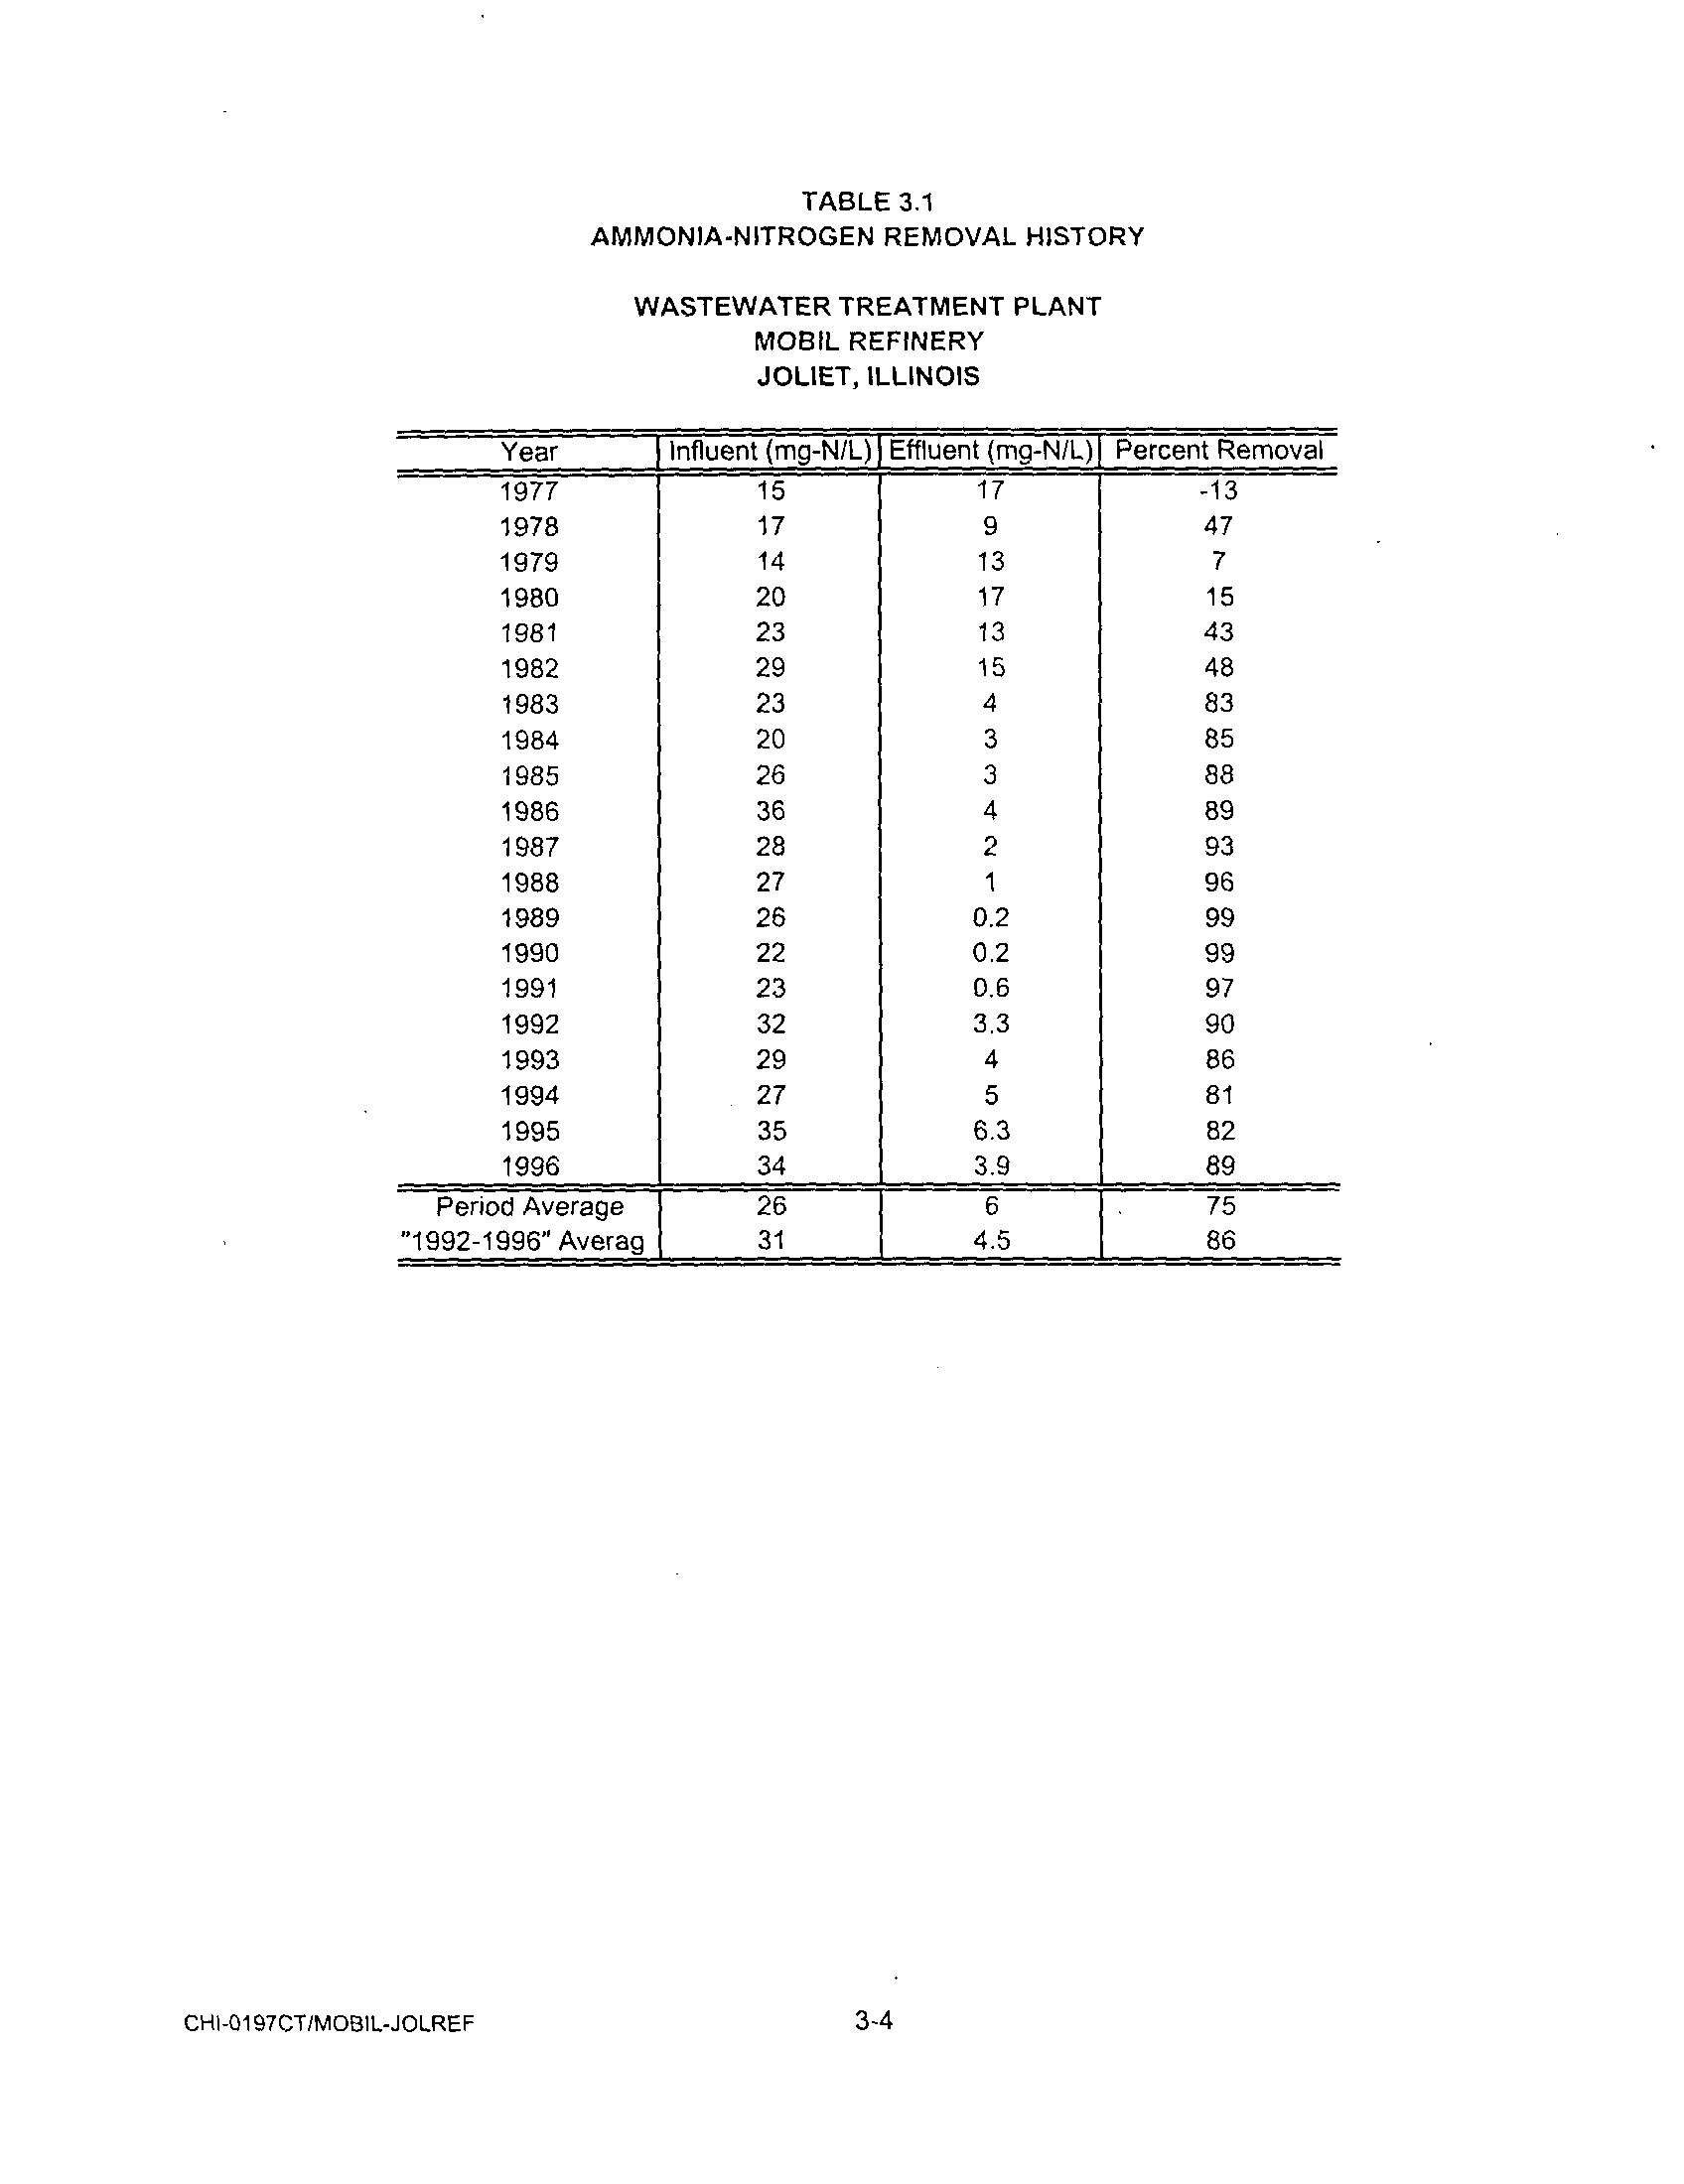
3 .2 Facility Ammonia Removal History 3-1
3.2.1
Influent Ammonia Concentrations 3-1
3.2.2 Effluent Ammonia Concentrations
3-3
3 .3 APPLICABLE AND RELEVANT AMMONIA STANDARDS
3-6
3.3.1
The Illinois Ammonia Standard 3-6
3.3.2
USEPA Discharge Limitation 3-6
3
.4 Administrative Proceedings Summary 3-15
3 .5
Facility Modifications
3-17
3.5.1
Facility Modifications front 1973 to 1990 3-17
3.5.2
Facility Modifications Since 1990 3-18
3 .6 Laboratory Study Summary
3-21
3.6.1 SWSTU Process
3-21
3 .6.2
MICROTOX Study
3-22
3.6.3
Nalco Chemical Company Ammonia Inhibition
Study Summary
3-22
3 .7 Summary
3-23
SECTION 4
ANALYSES OF THE WASTEWATER TREATMENT
PLANT OPERATION
4-1
4.1 Introduction
4-1
4.2 Current Facility Configuration and Operation
4-1
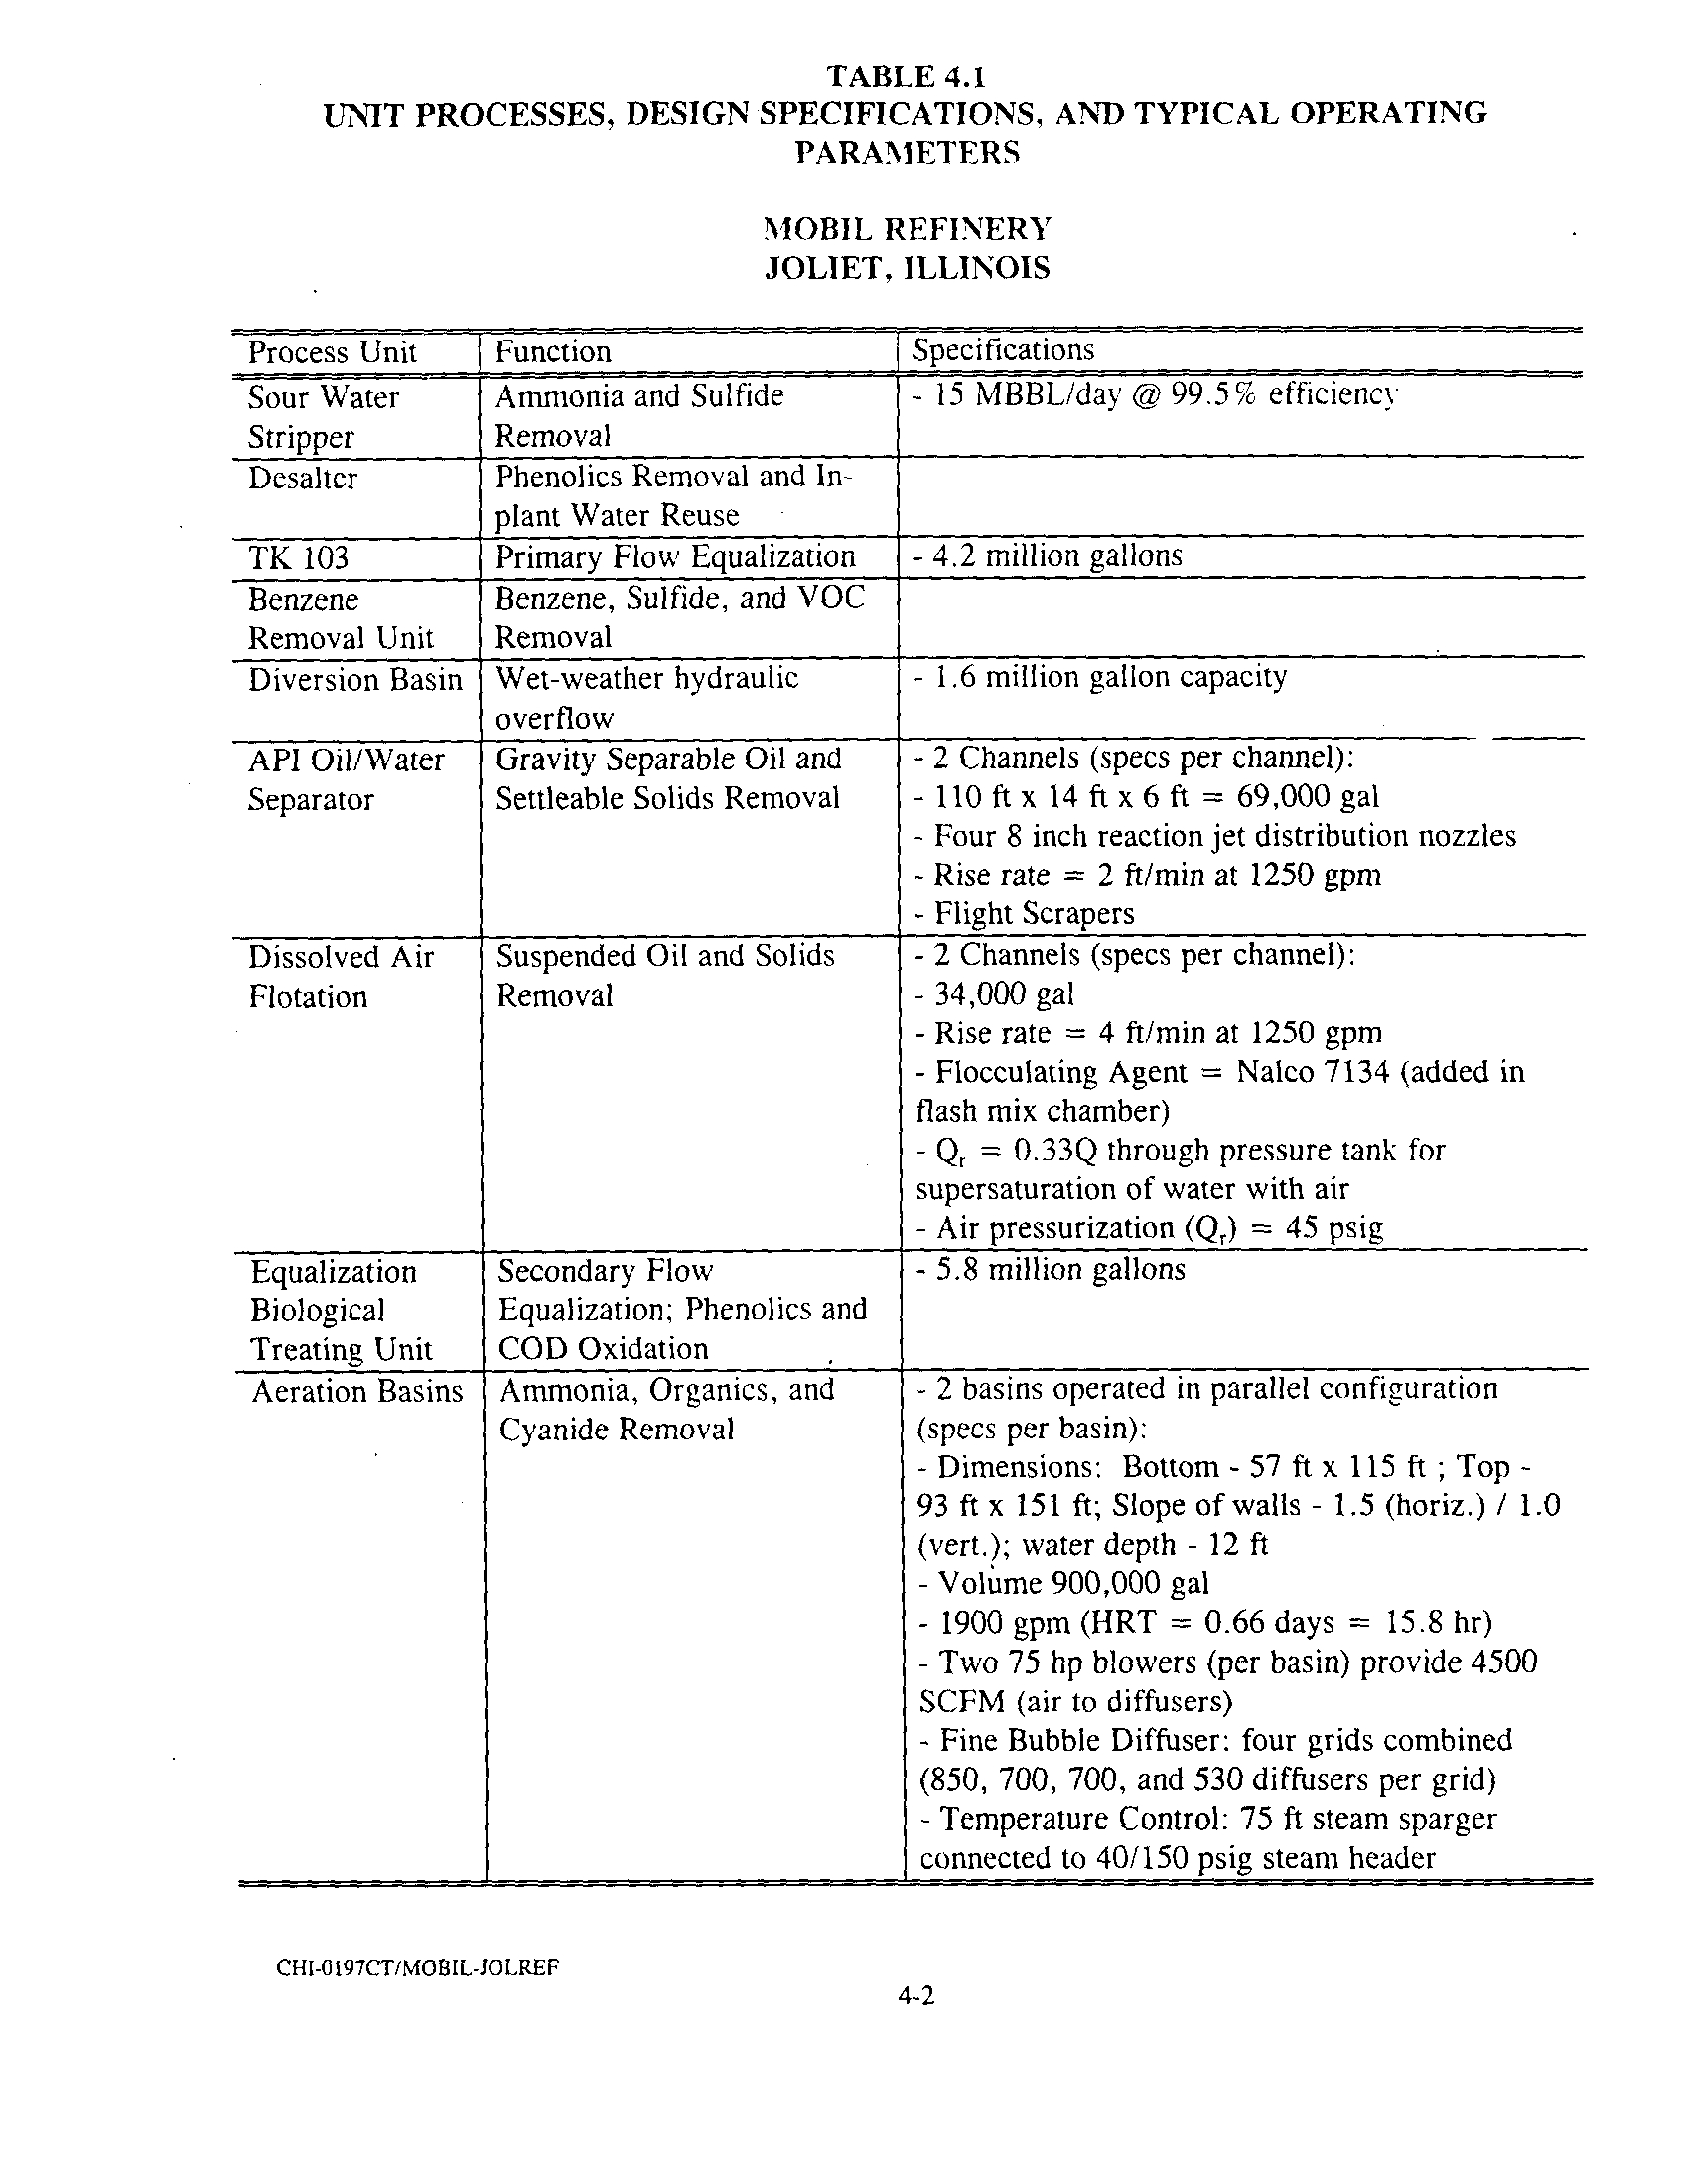
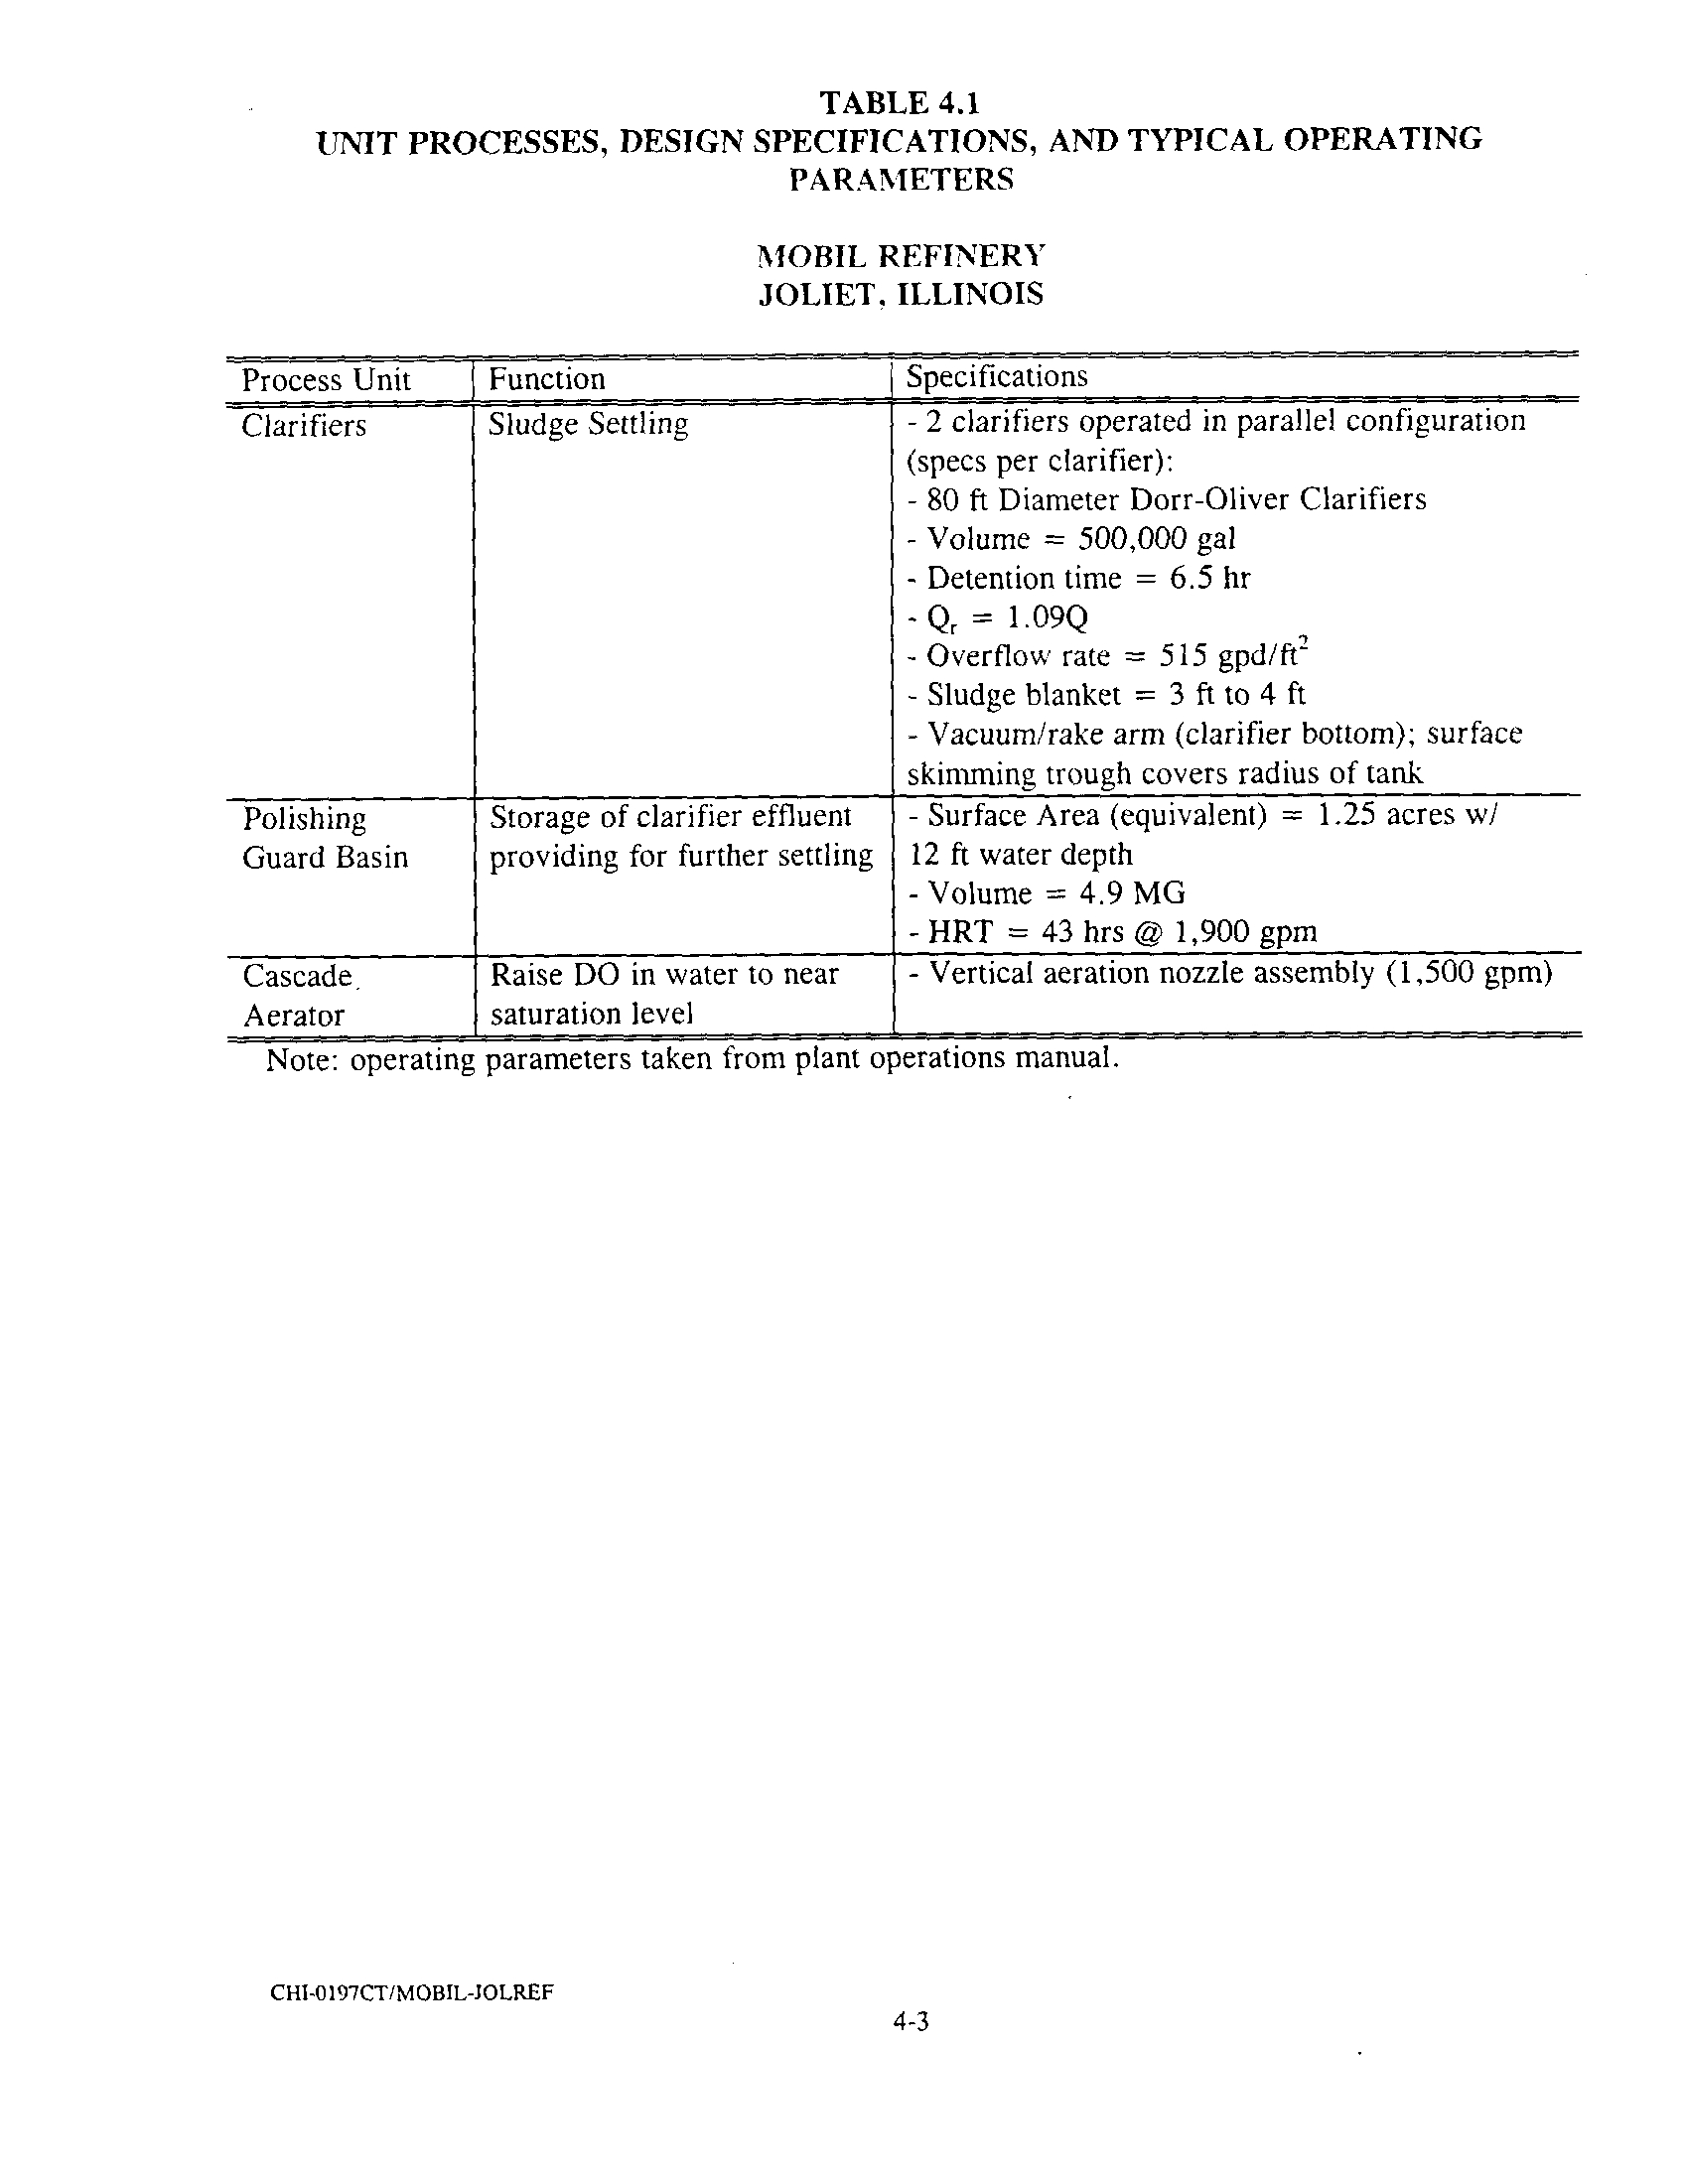
4.2.1 Treatment Plant Description
4-1
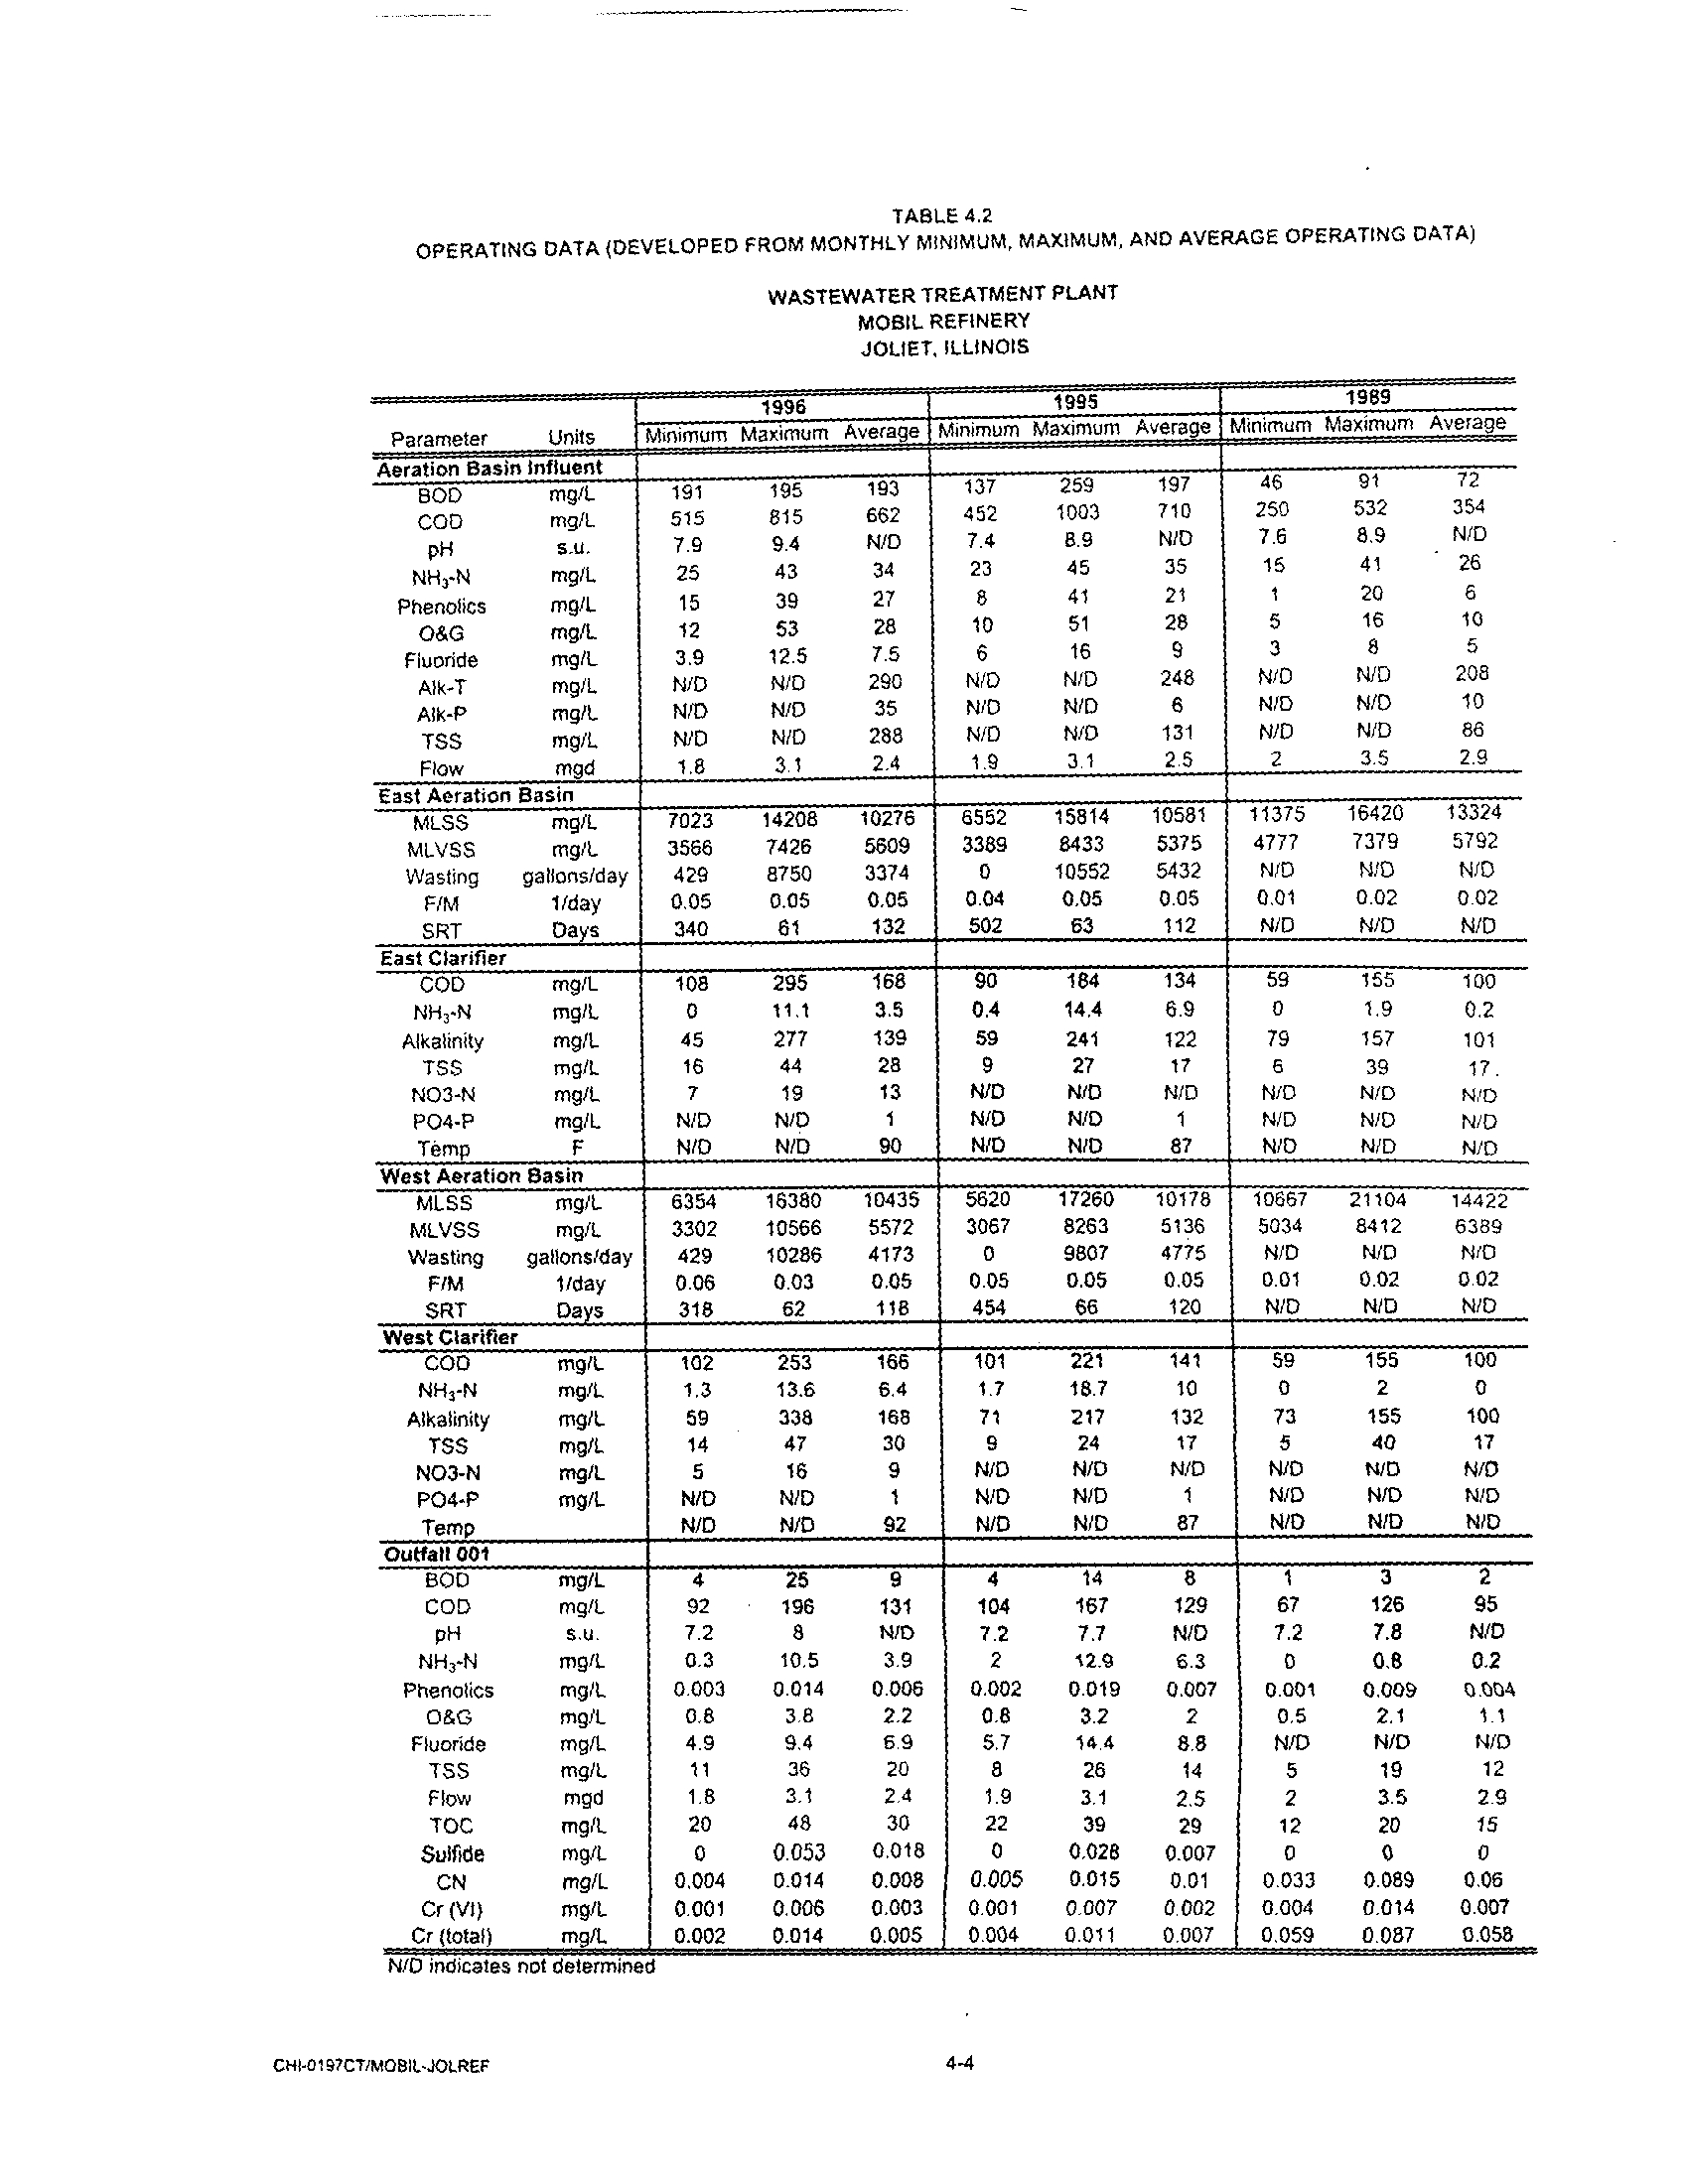
4.2.2 Nitrification Assessment
4-1
4.2.3 General Facility Performance Assessment
4-6
4.3 Comparison to Industry Practices and Guidelines 4-8
4 .4 Alternative Technology Assessment
4-11
SECTION 5 SUMMARY AND CONCLUSIONS
5-1
TABLE 3.1
TABLE 3 .2
TABLE 3.3
TABLE 3.4
TABLE 4.1
TABLE 4.2
CH 1-01 97MMOBILAOLREF
TABLE OF CONTENTS
LIST OF TABLES
AMMONIA-NITROGEN REMOVAL HISTORY 3-4
AMMONIA-NITROGEN (NH3-N) DATA (MG/L) FOR 1989,
1995, AND 1996
3-5
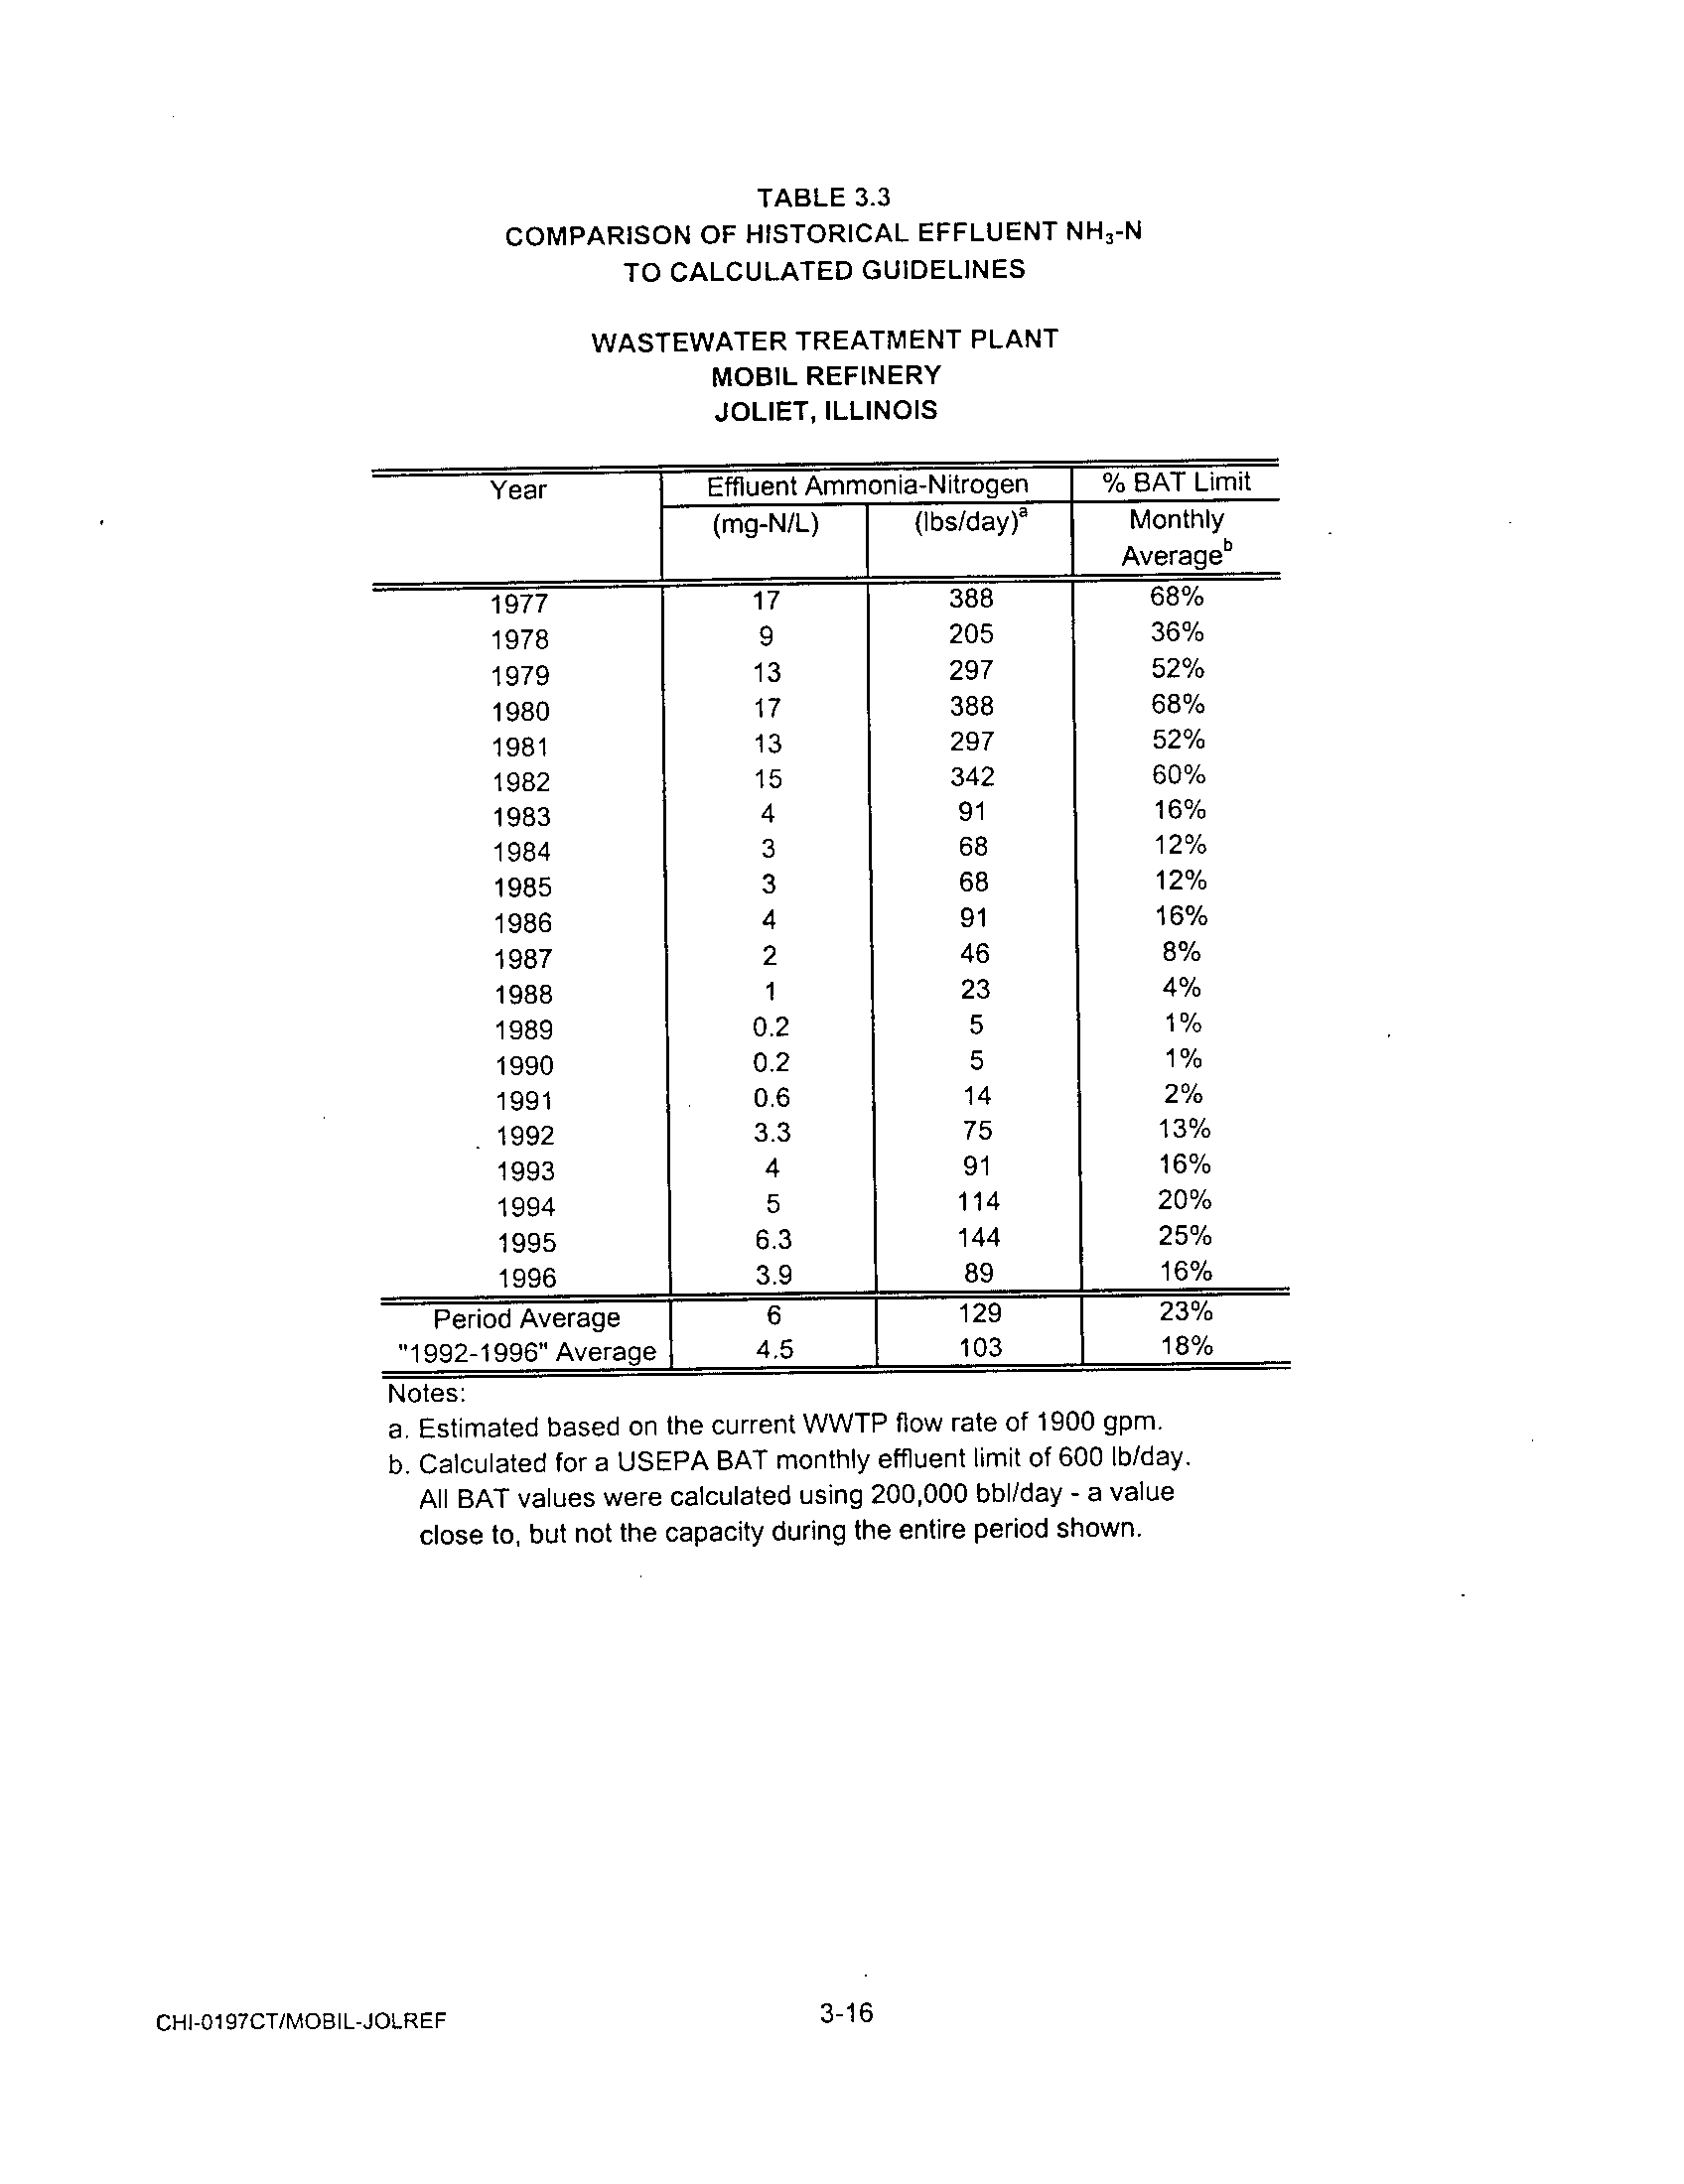
COMPARISON OF HISTORICAL EFFLUENT NH3-N TO
CALCULATED GUIDELINES
3-16
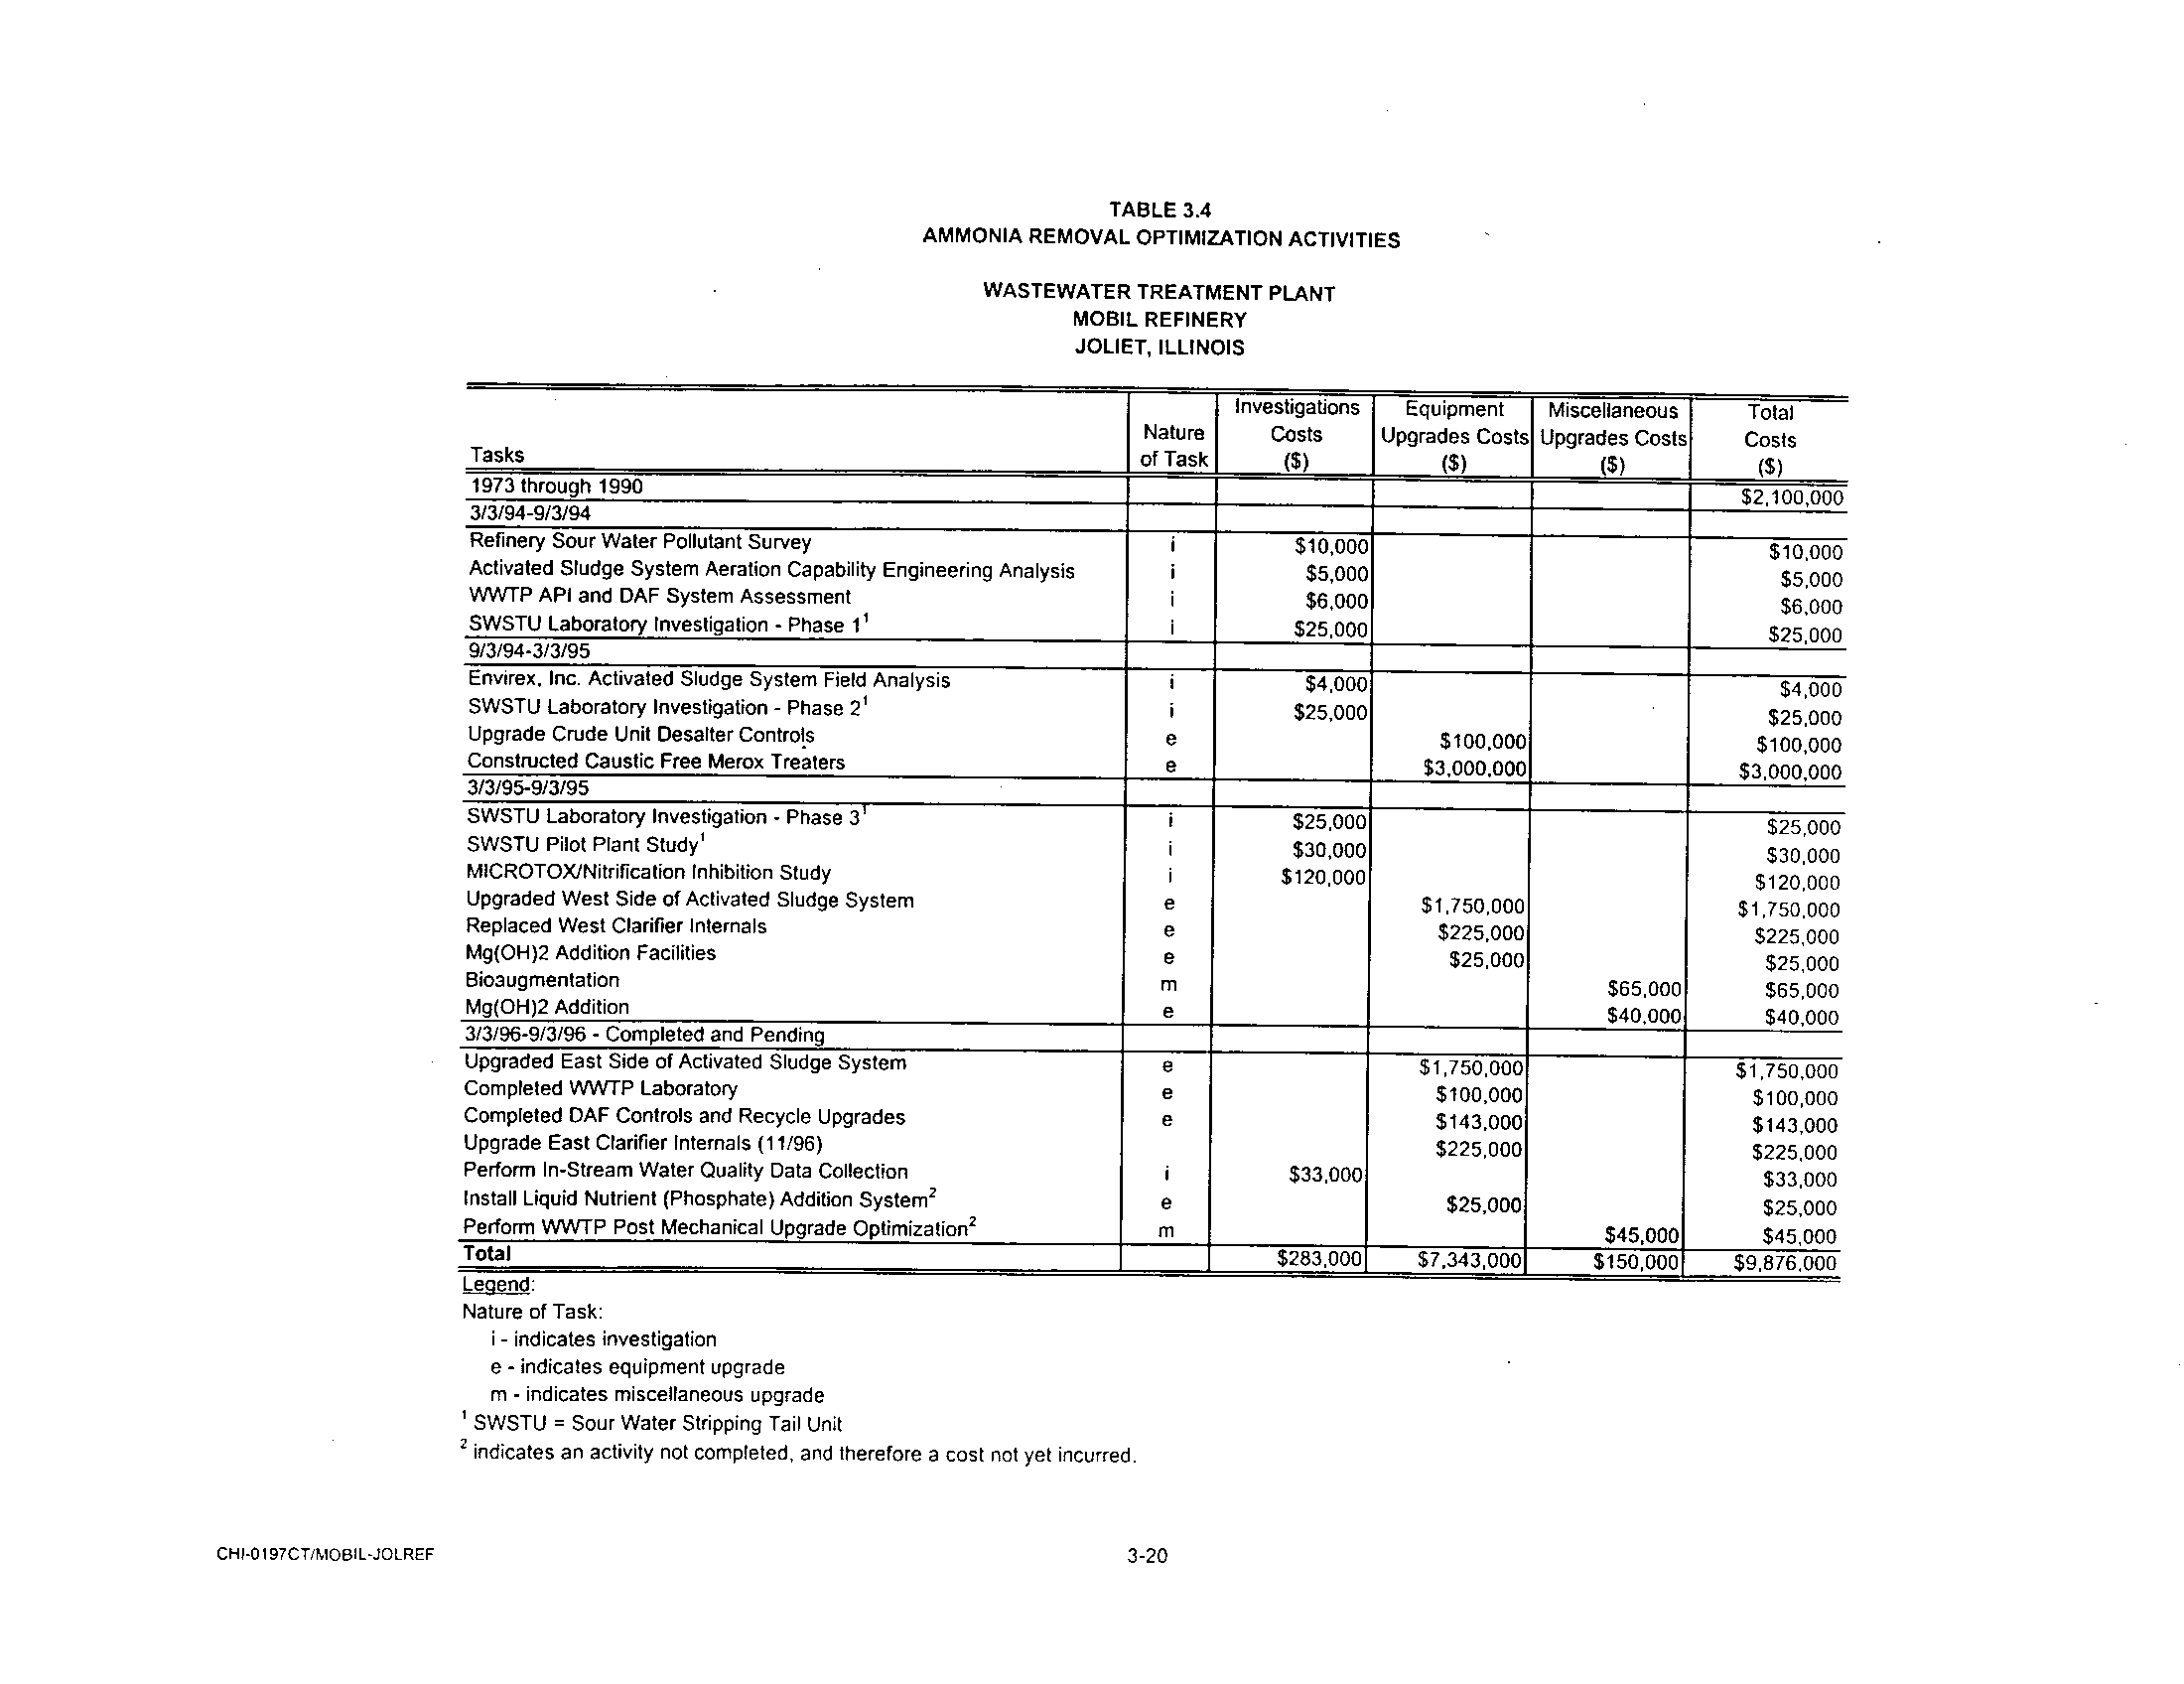
AMMONIA REMOVAL OPTIMIZATION ACTIVITIES 3-20
UNIT PROCESSES, DESIGN SPECIFICATIONS, AND
TYPICAL OPERATING PARAMETERS 4-2
WWTP OPERATING DATA
4-4
LIST OF FIGURES
FIGURE 2.1
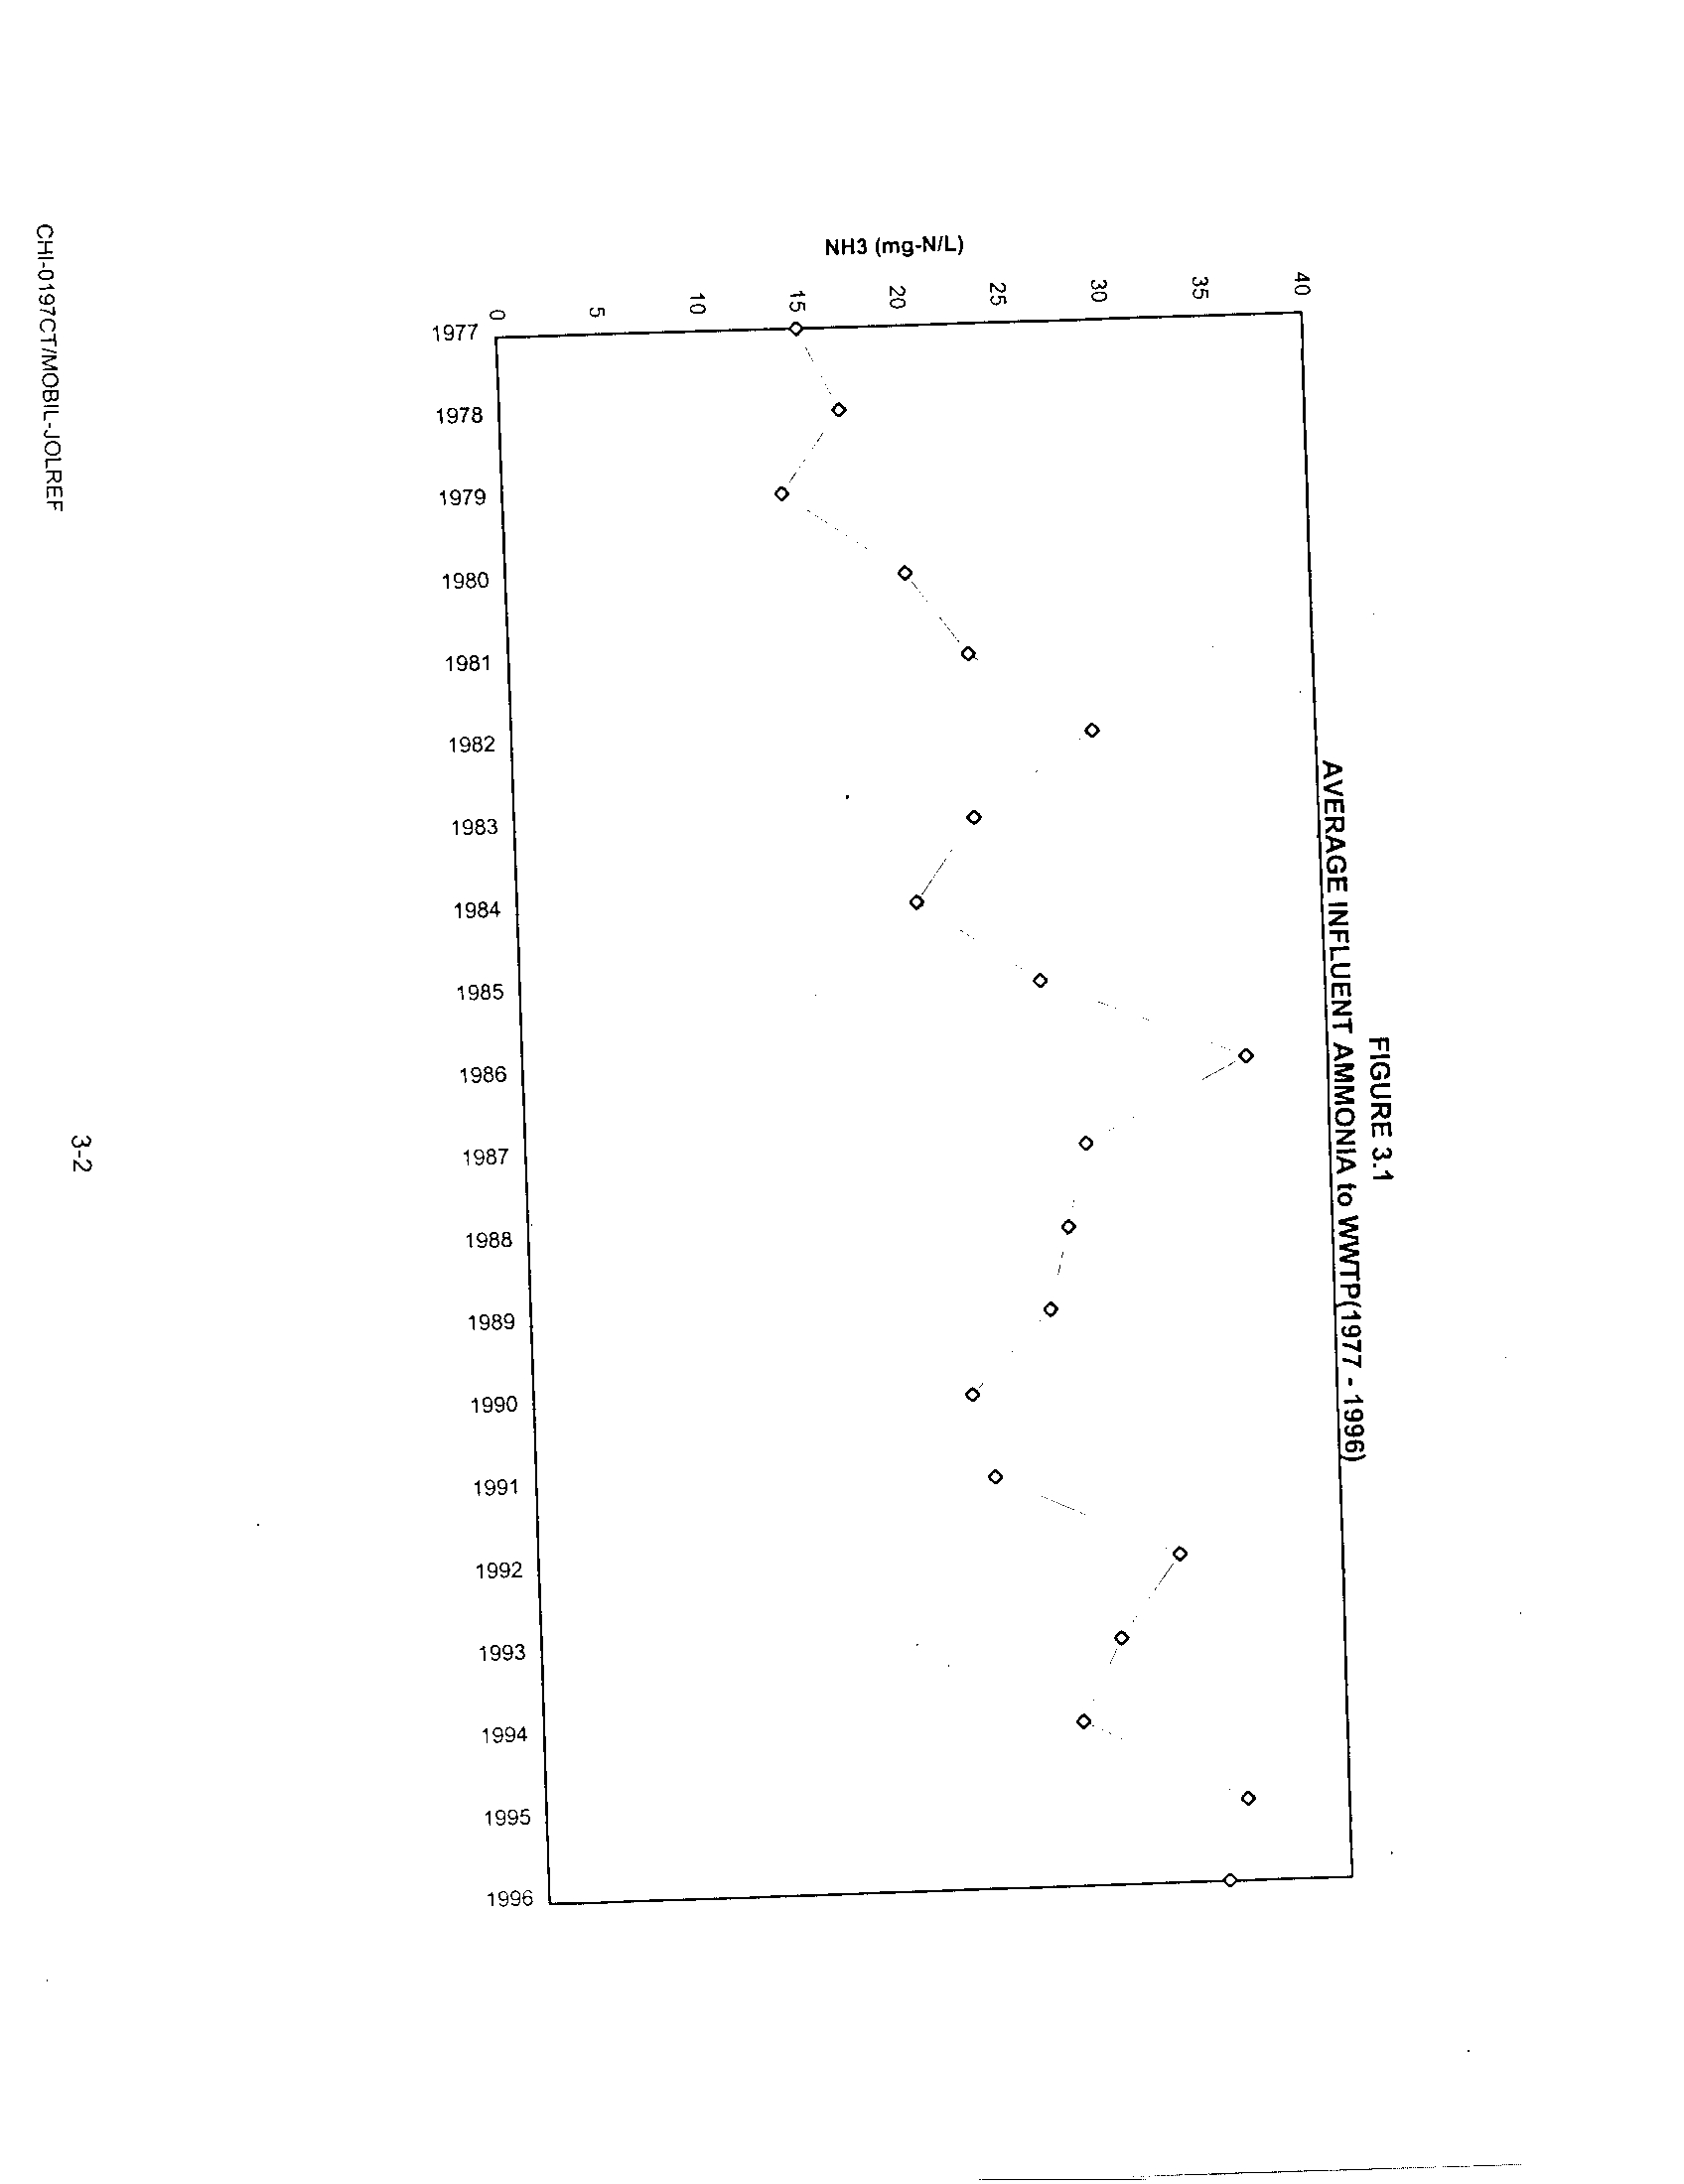
FIGURE 3.1
WWTP PROCESS FLOW DIAGRAM 2-4
AVERAGE INFLUENT AMMONIA TO WWTP
(1997- 1996)
3-2
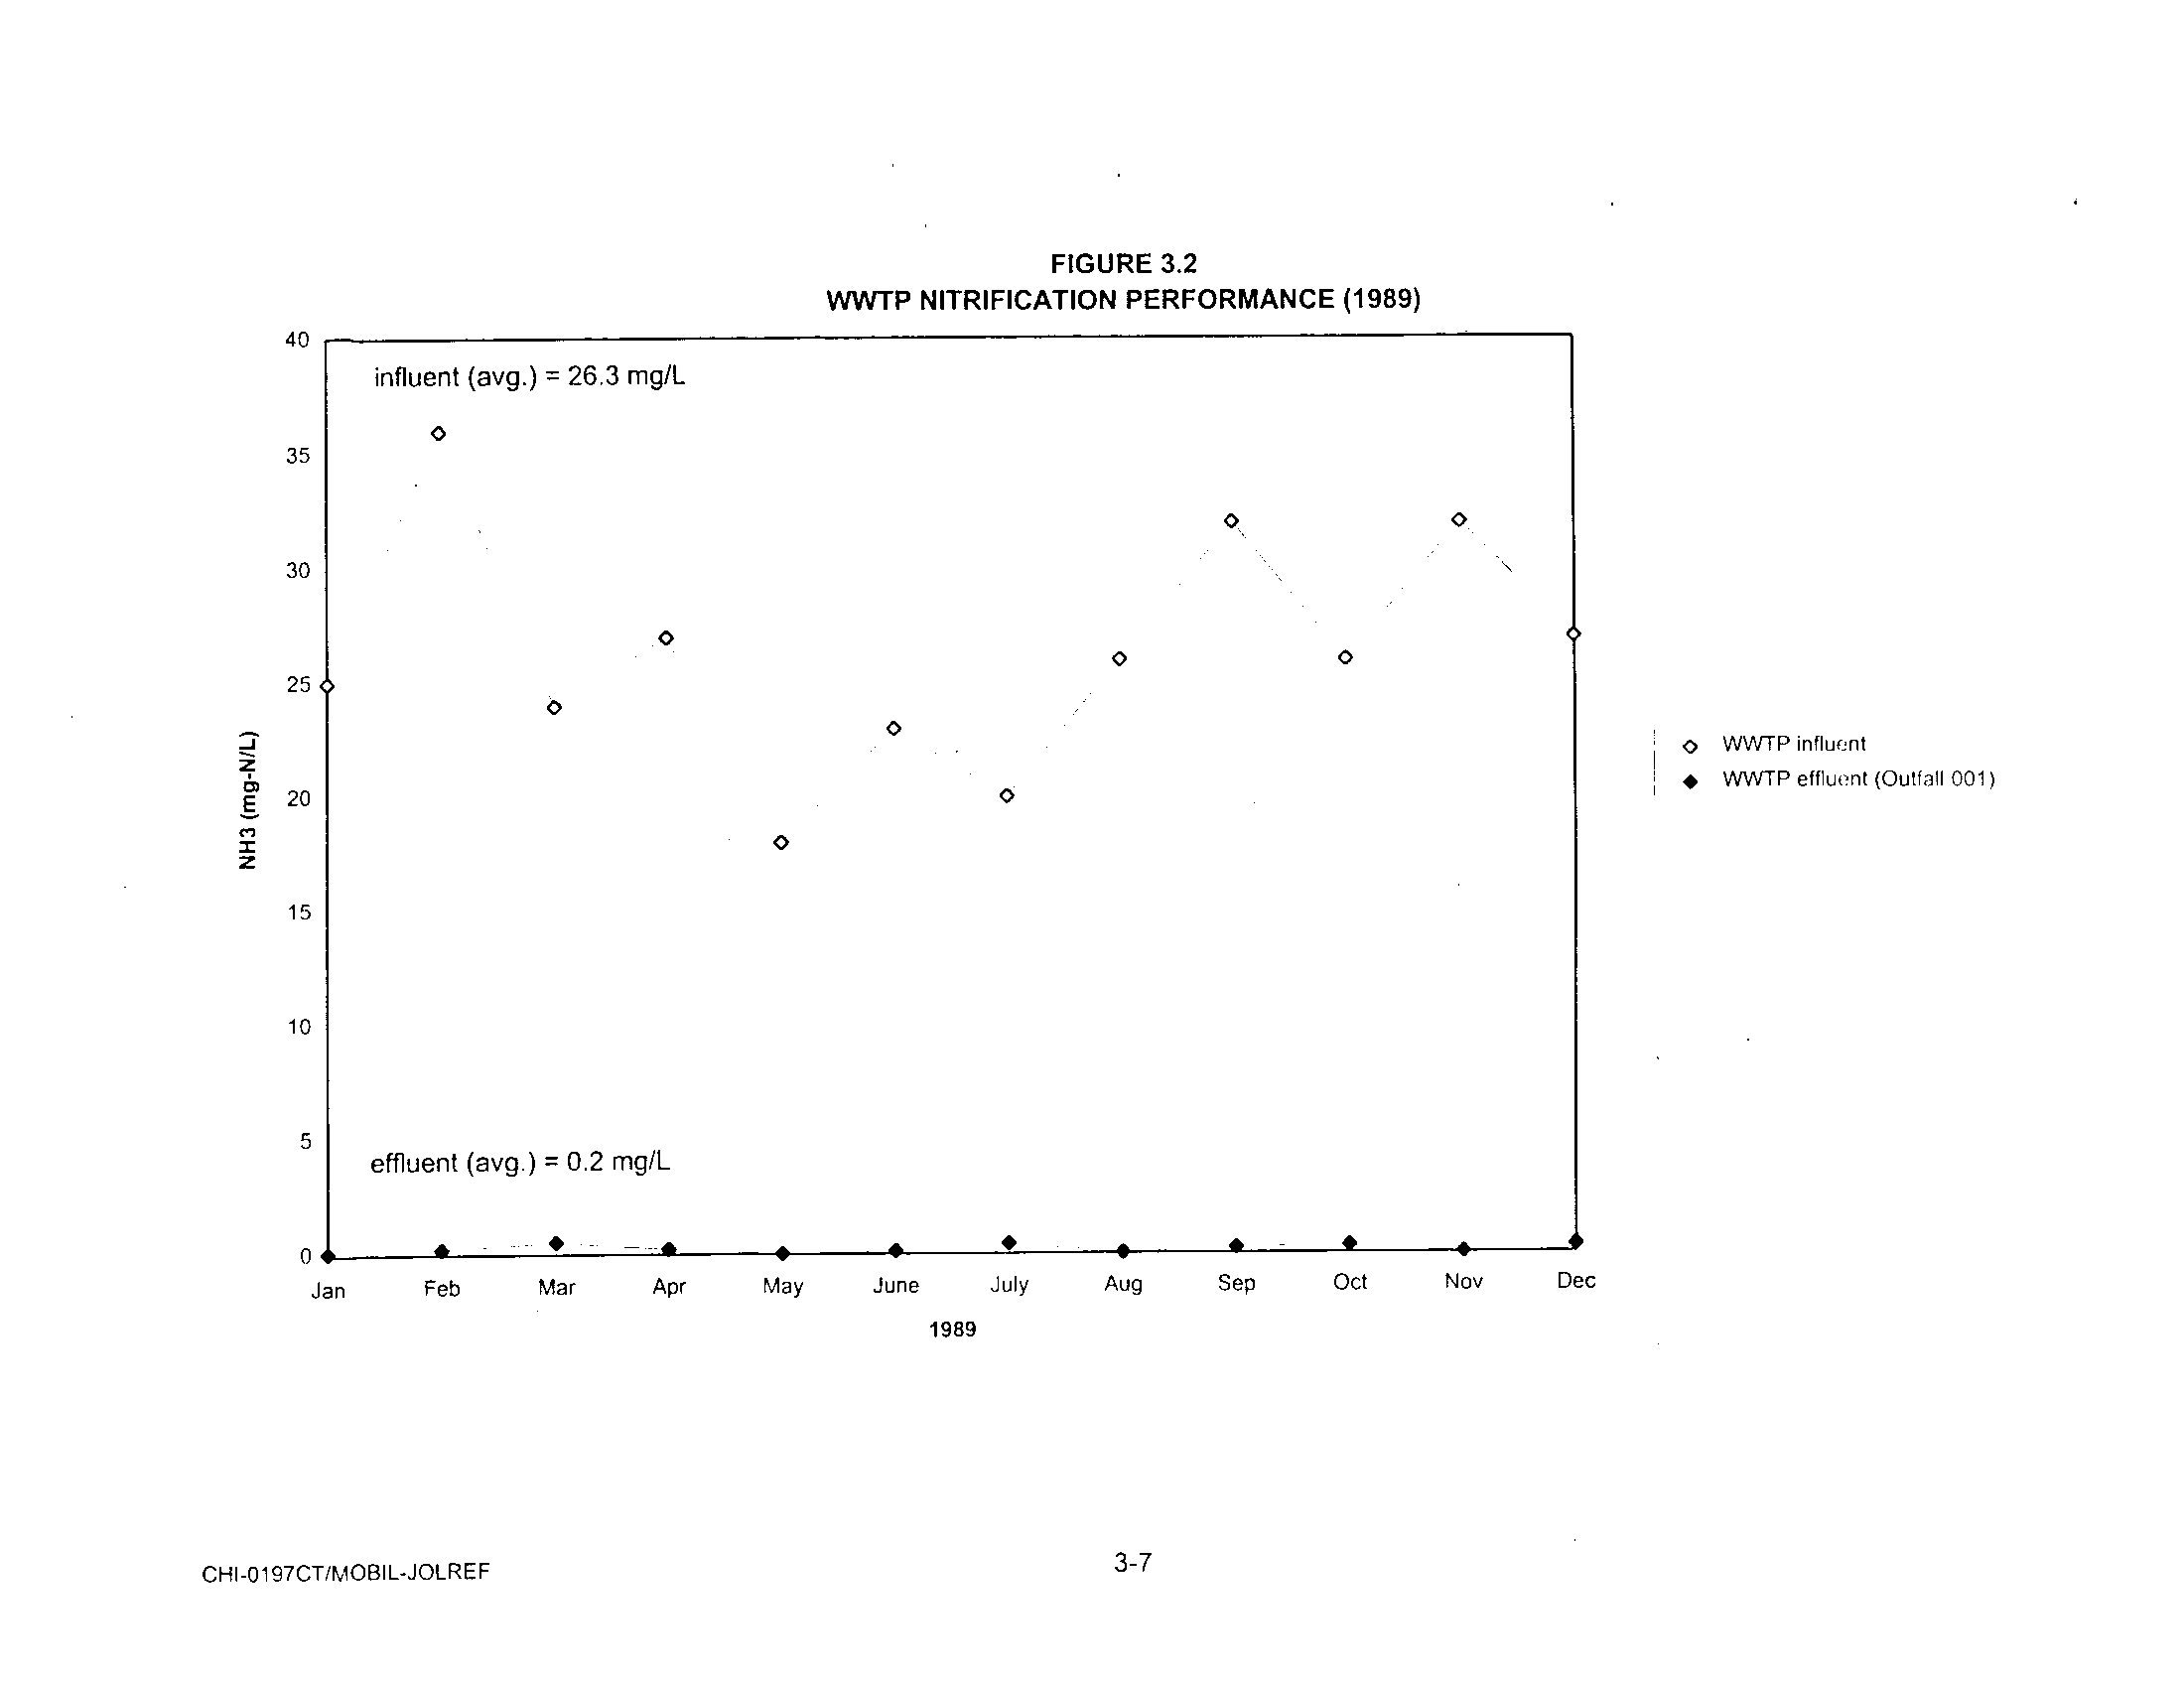
FIGURE 3.2
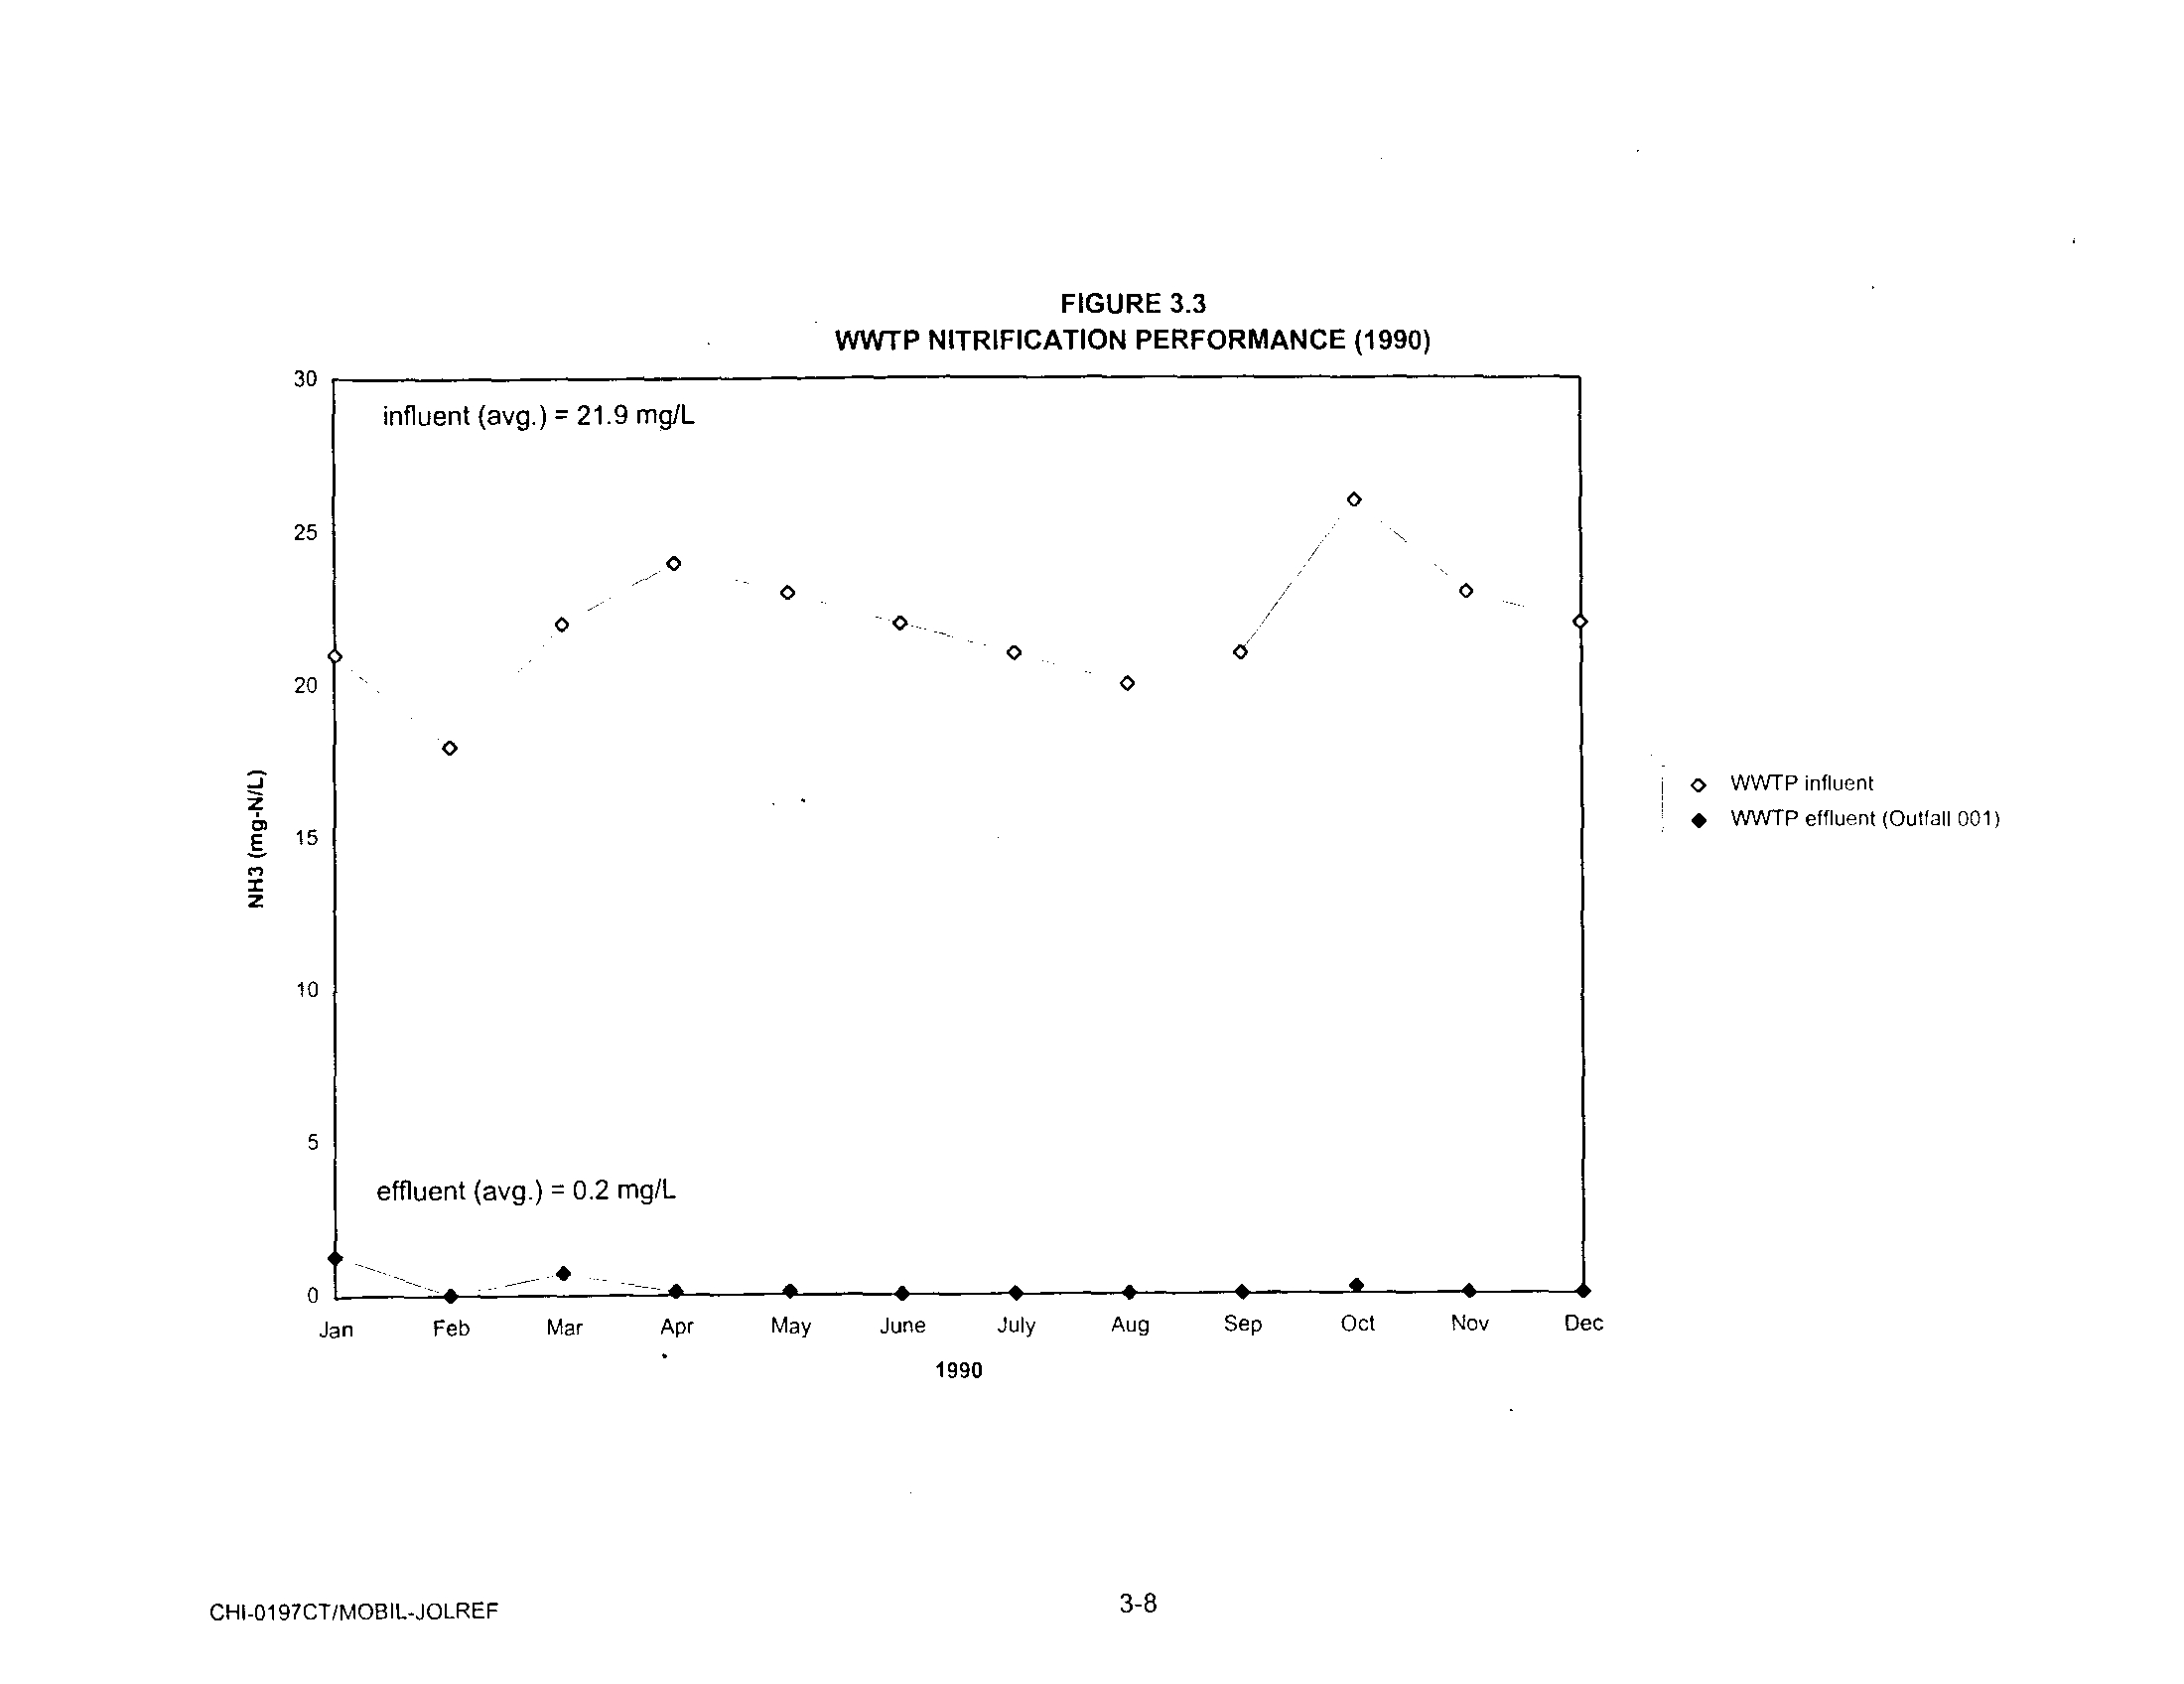
FIGURE 3.3
FIGURE 3 .4
FIGURE 3 .5
WWTP NITRIFICATION PERFORMANCE (1989) 3-7
WWTP NITRIFICATION PERFORMANCE (1990) 3-8
WWTP NITRIFICATION PERFORMANCE (1991) 3-9
WWTP NITRIFICATION PERFORMANCE (1992) 3-10
FIGURE 3 .6
WWTP NITRIFICATION PERFORMANCE (1993) 3-11
FIGURE 3 .7
WWTP NITRIFICATION PERFORMANCE (1994)
3-12
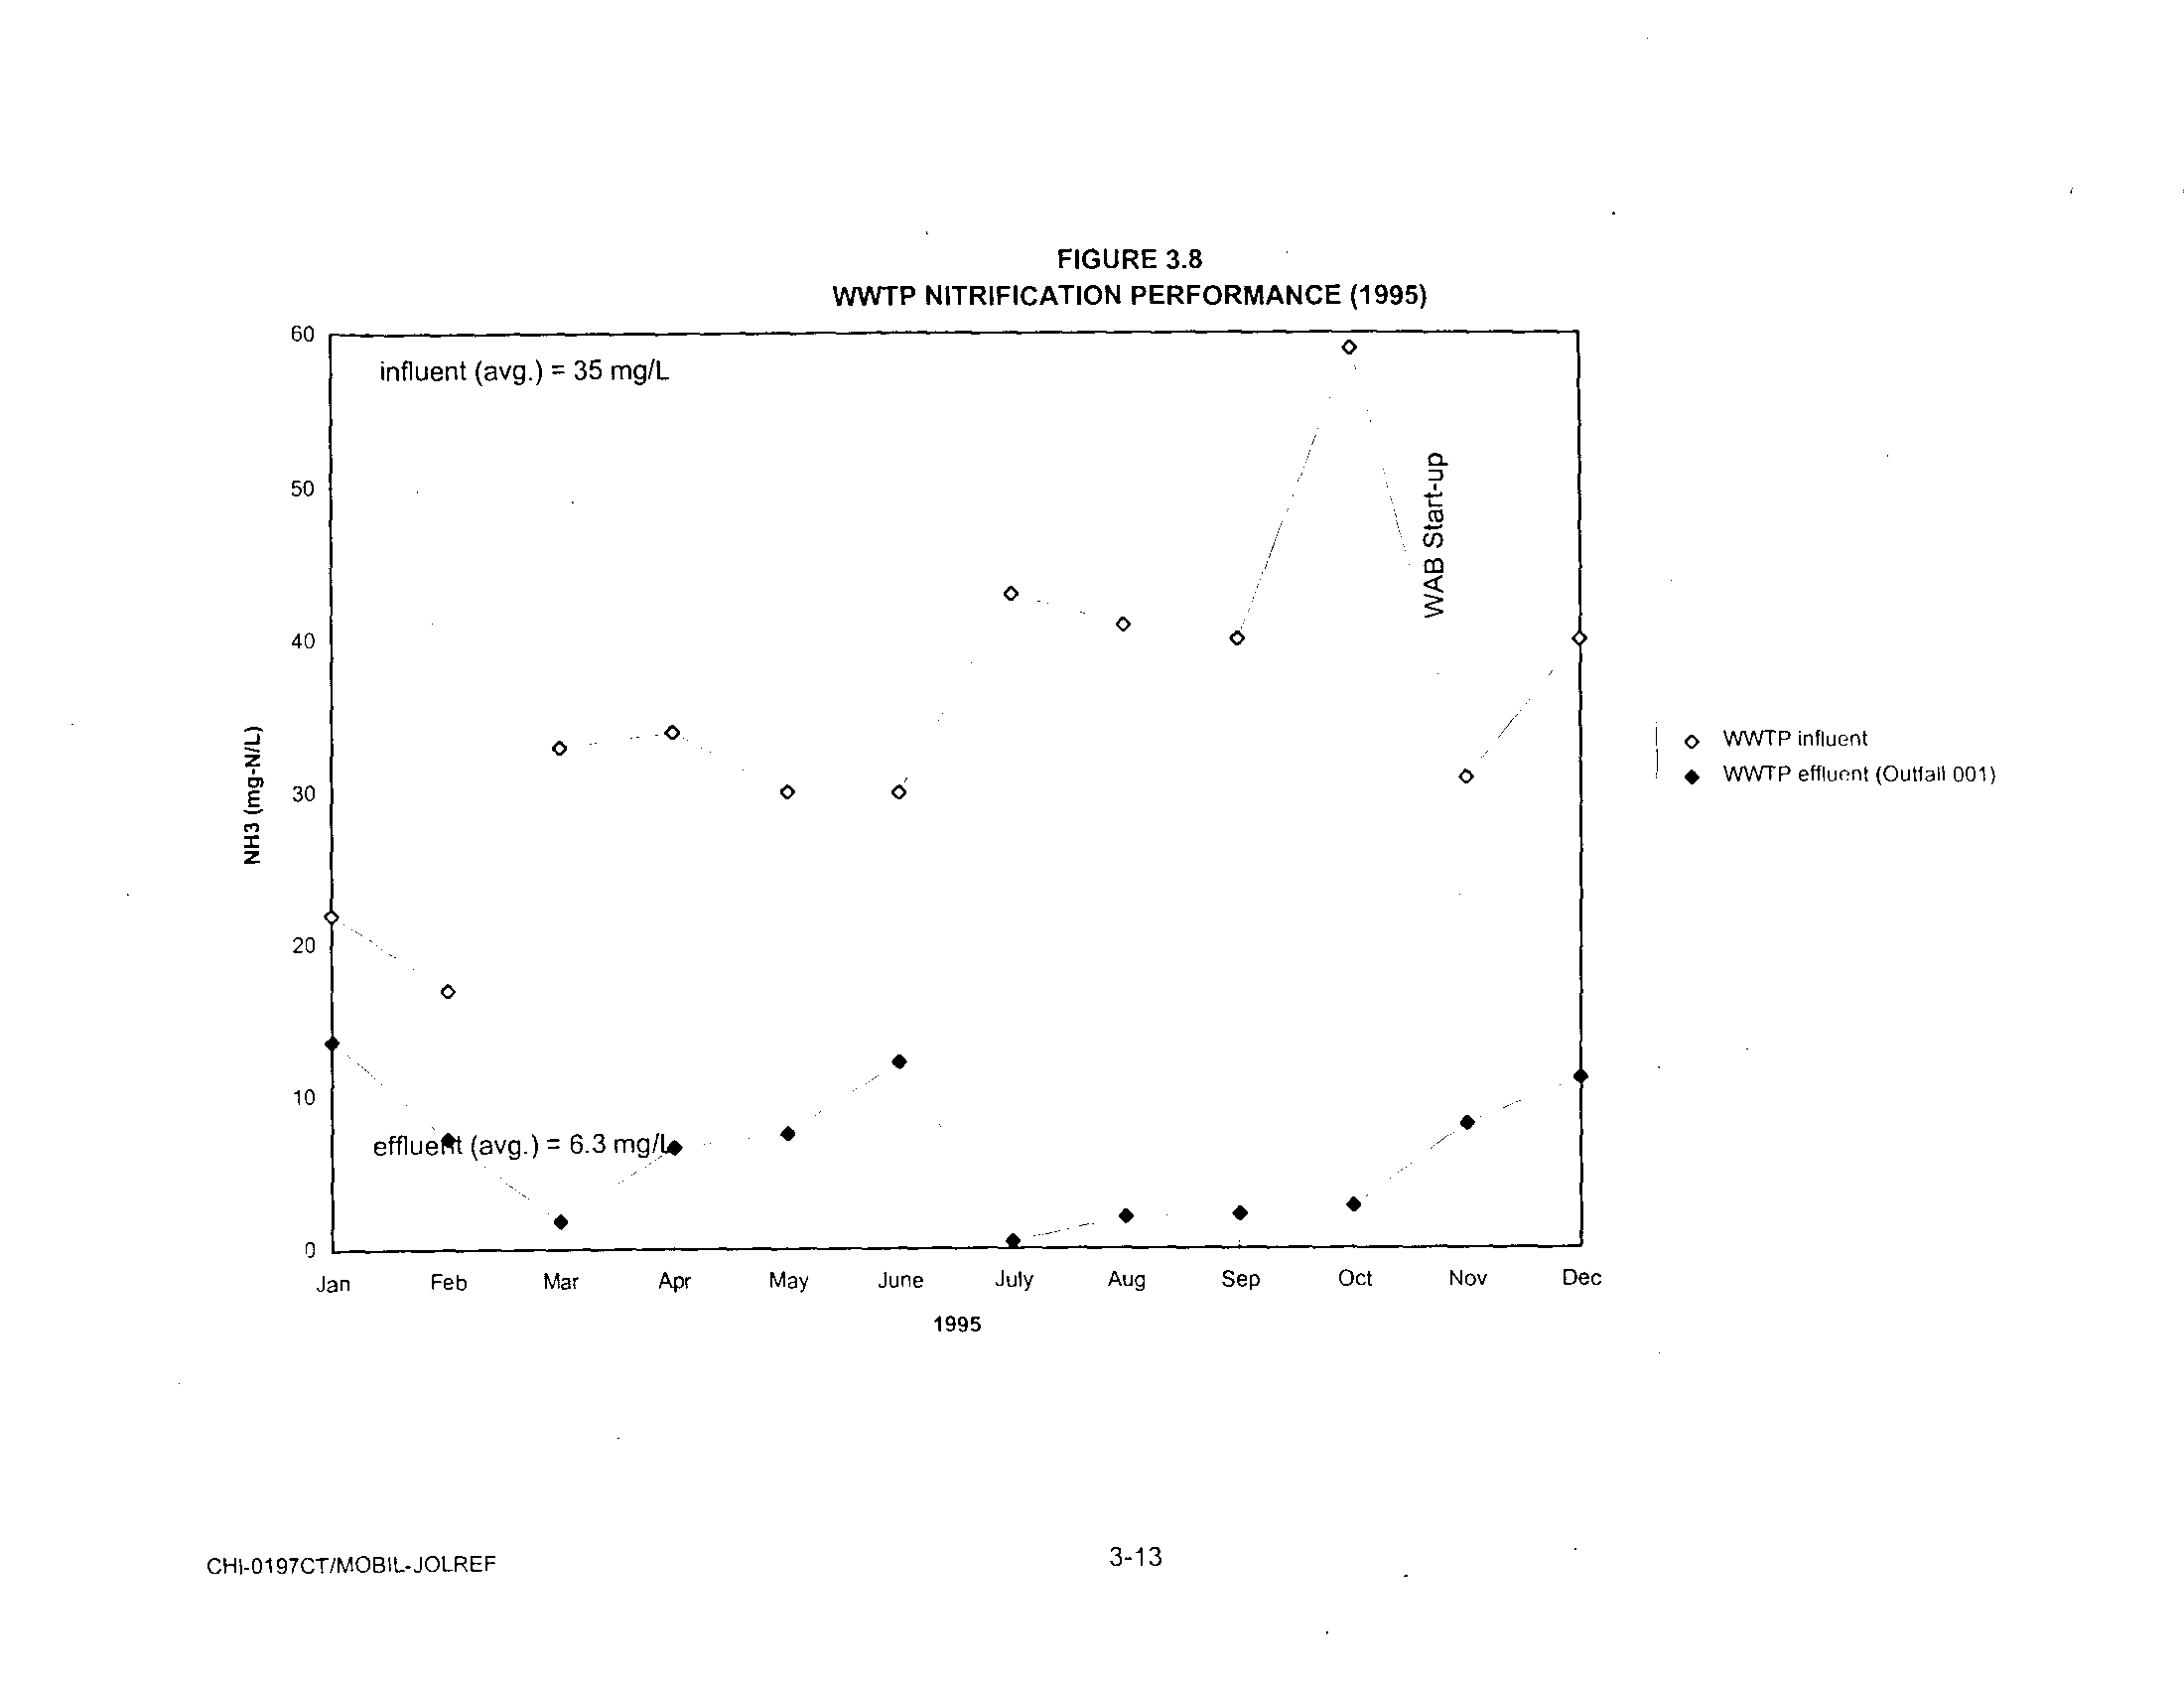
FIGURE 3 .8
WWTP NITRIFICATION PERFORMANCE (1995) 3-13
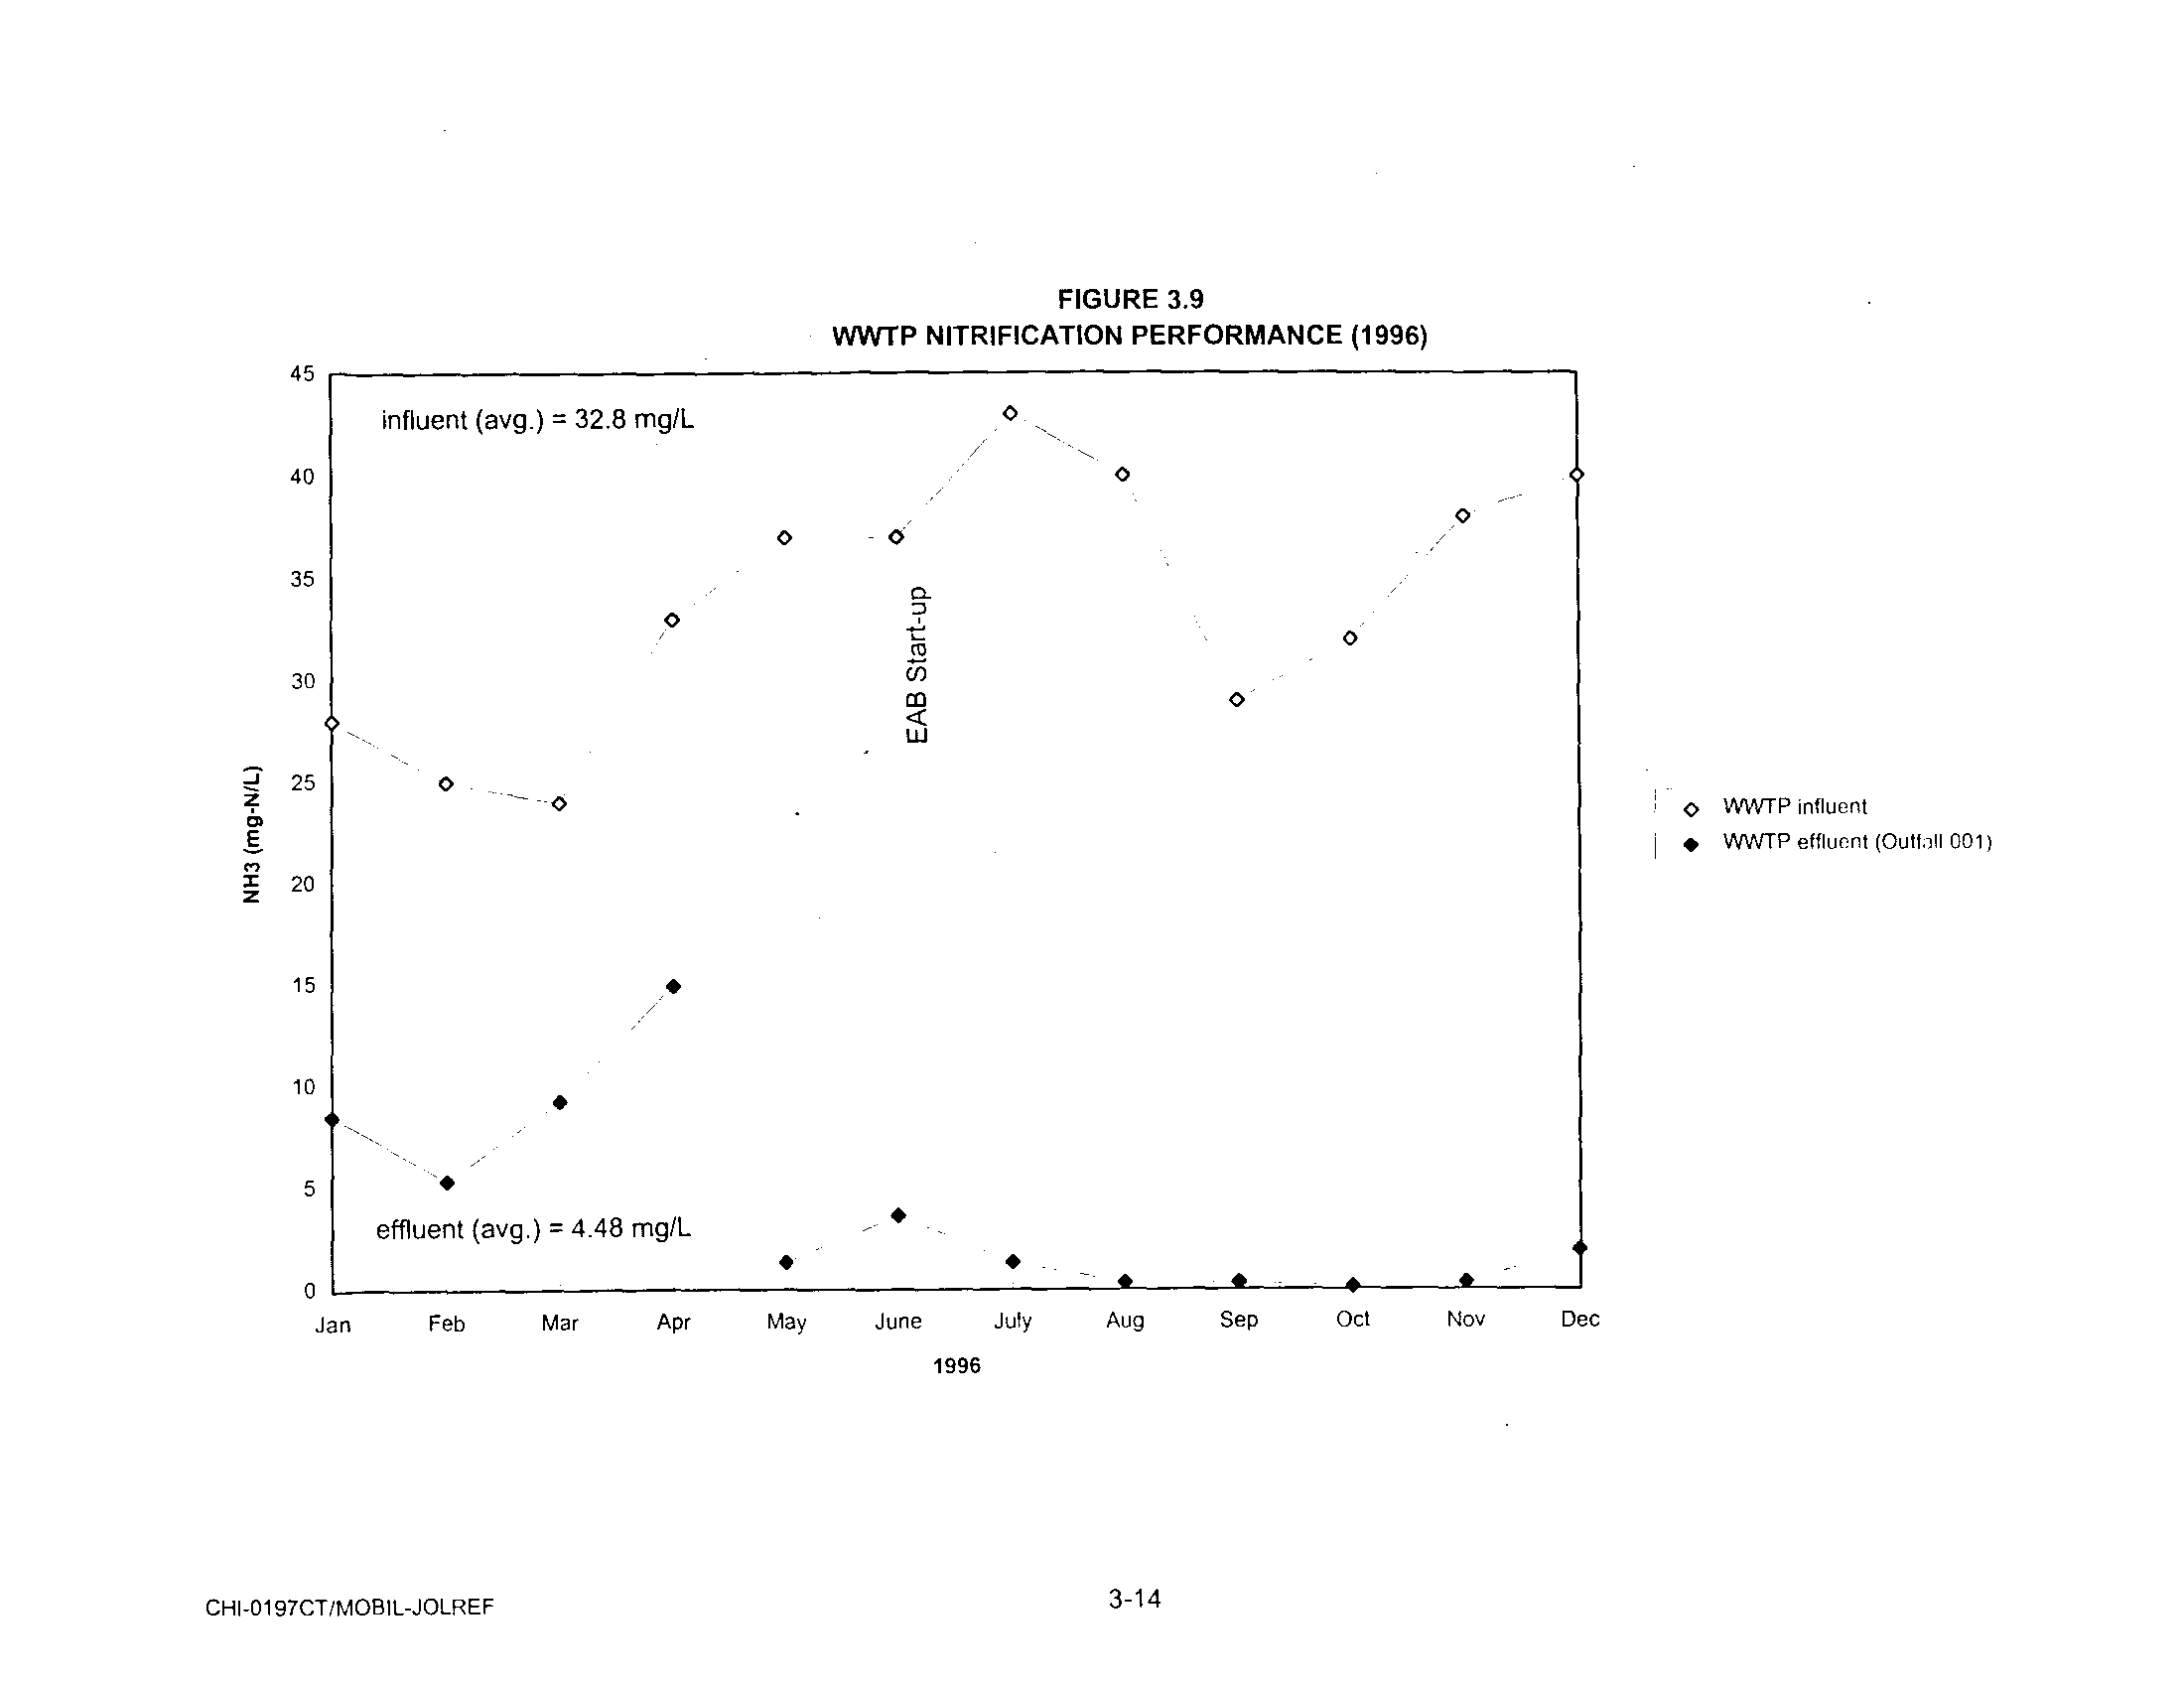
FIGURE 3 .9
FIGURE 4.1
WWTP NITRIFICATION PERFORMANCE (1996) 3=14
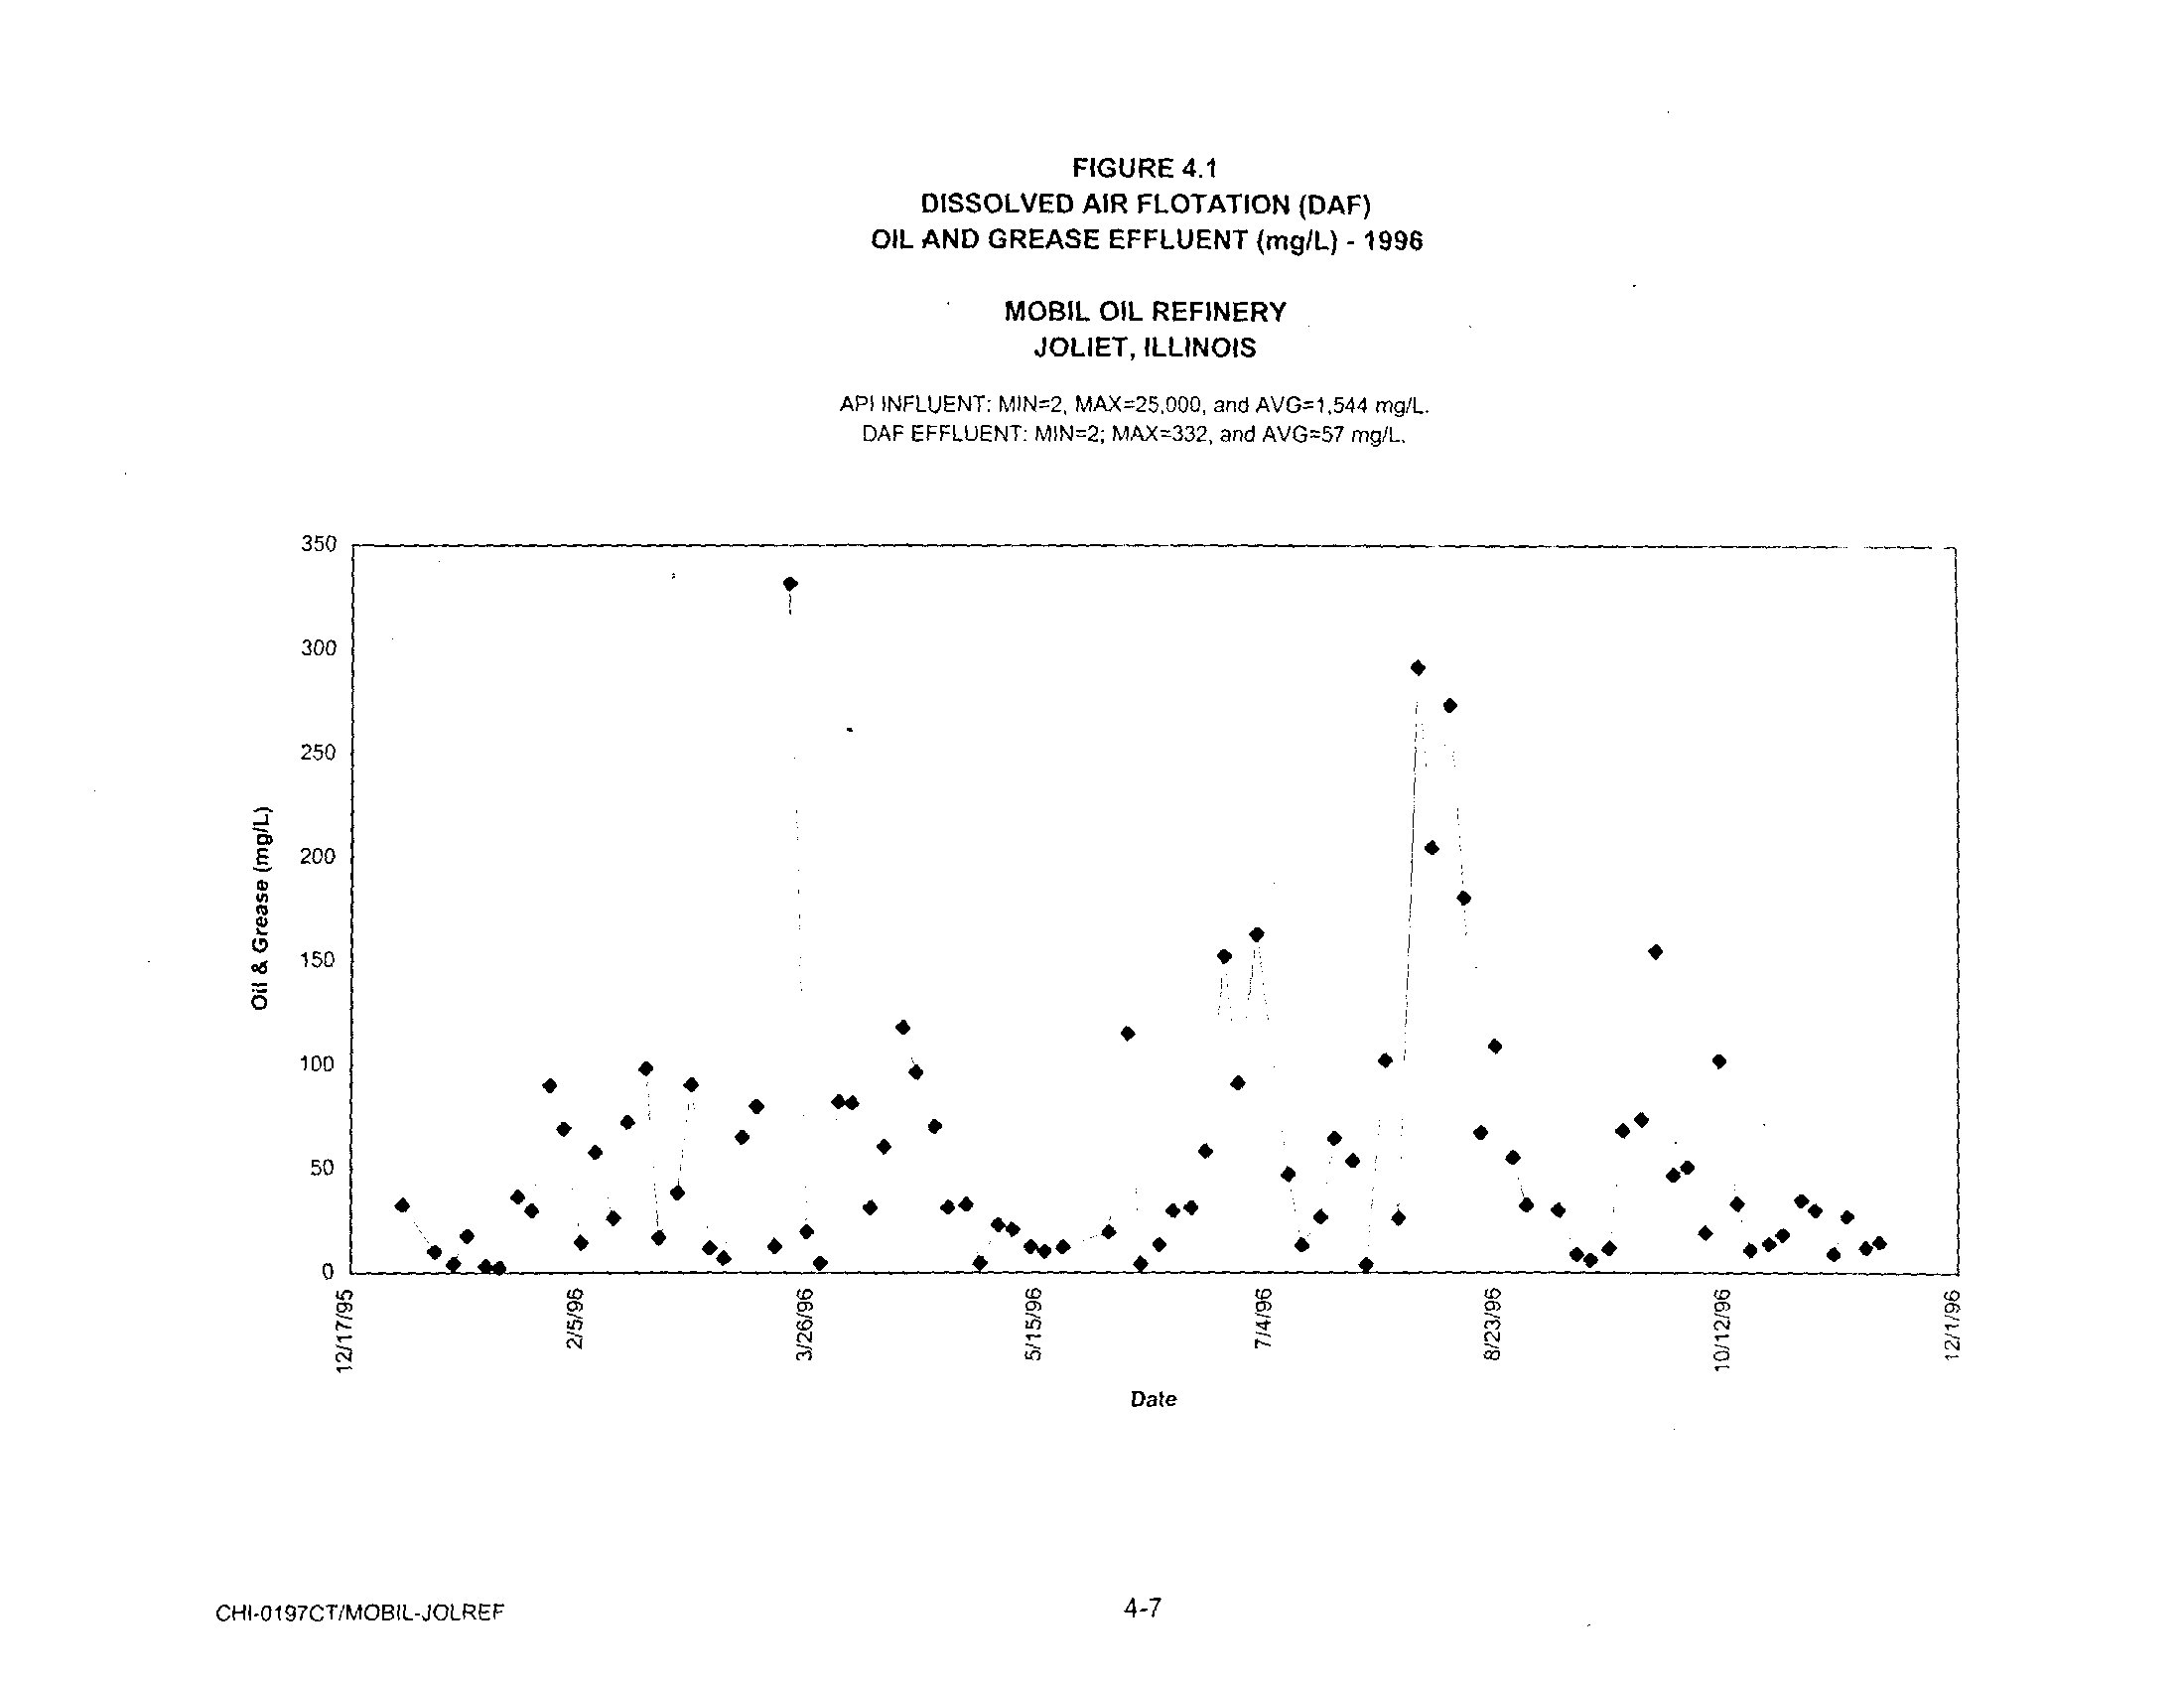
DISSOLVED AIR FLOTATION (DAF)
- OIL AND
GREASE EFFLUENT - 1996
4-7
TABLE
4.3
TABLE 4.4
TABLE 4.5
TABLE 4.6
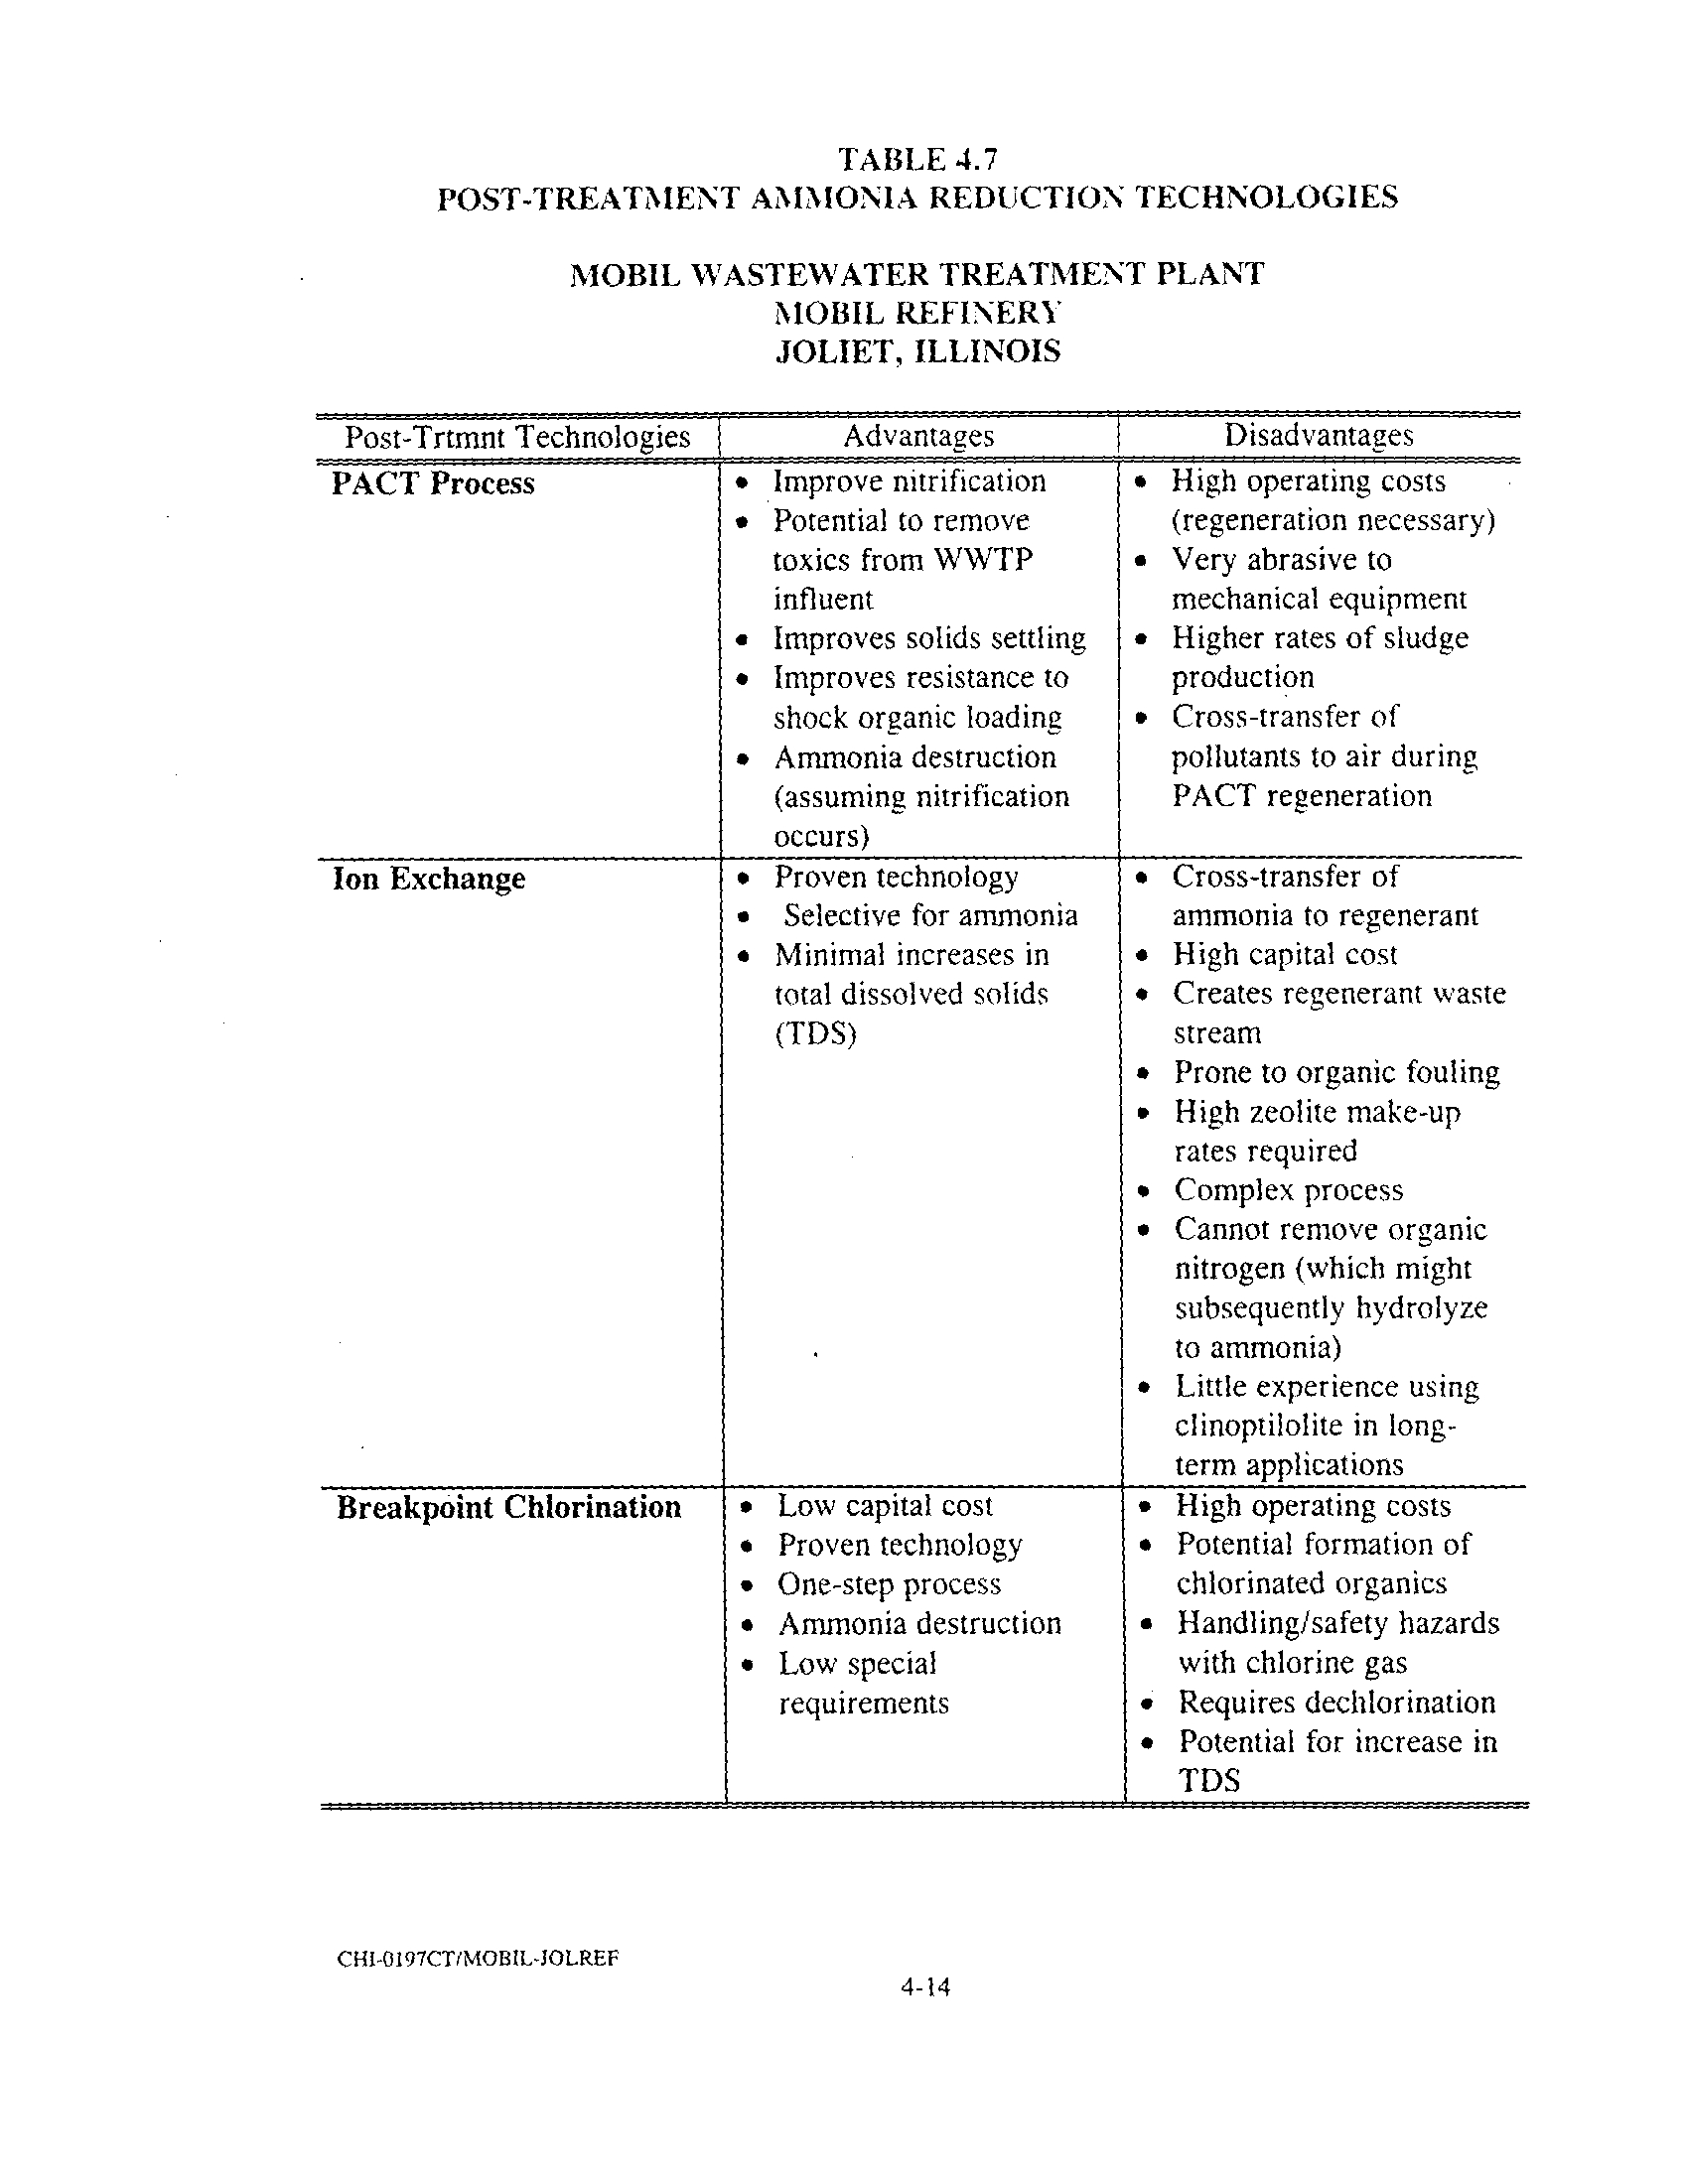
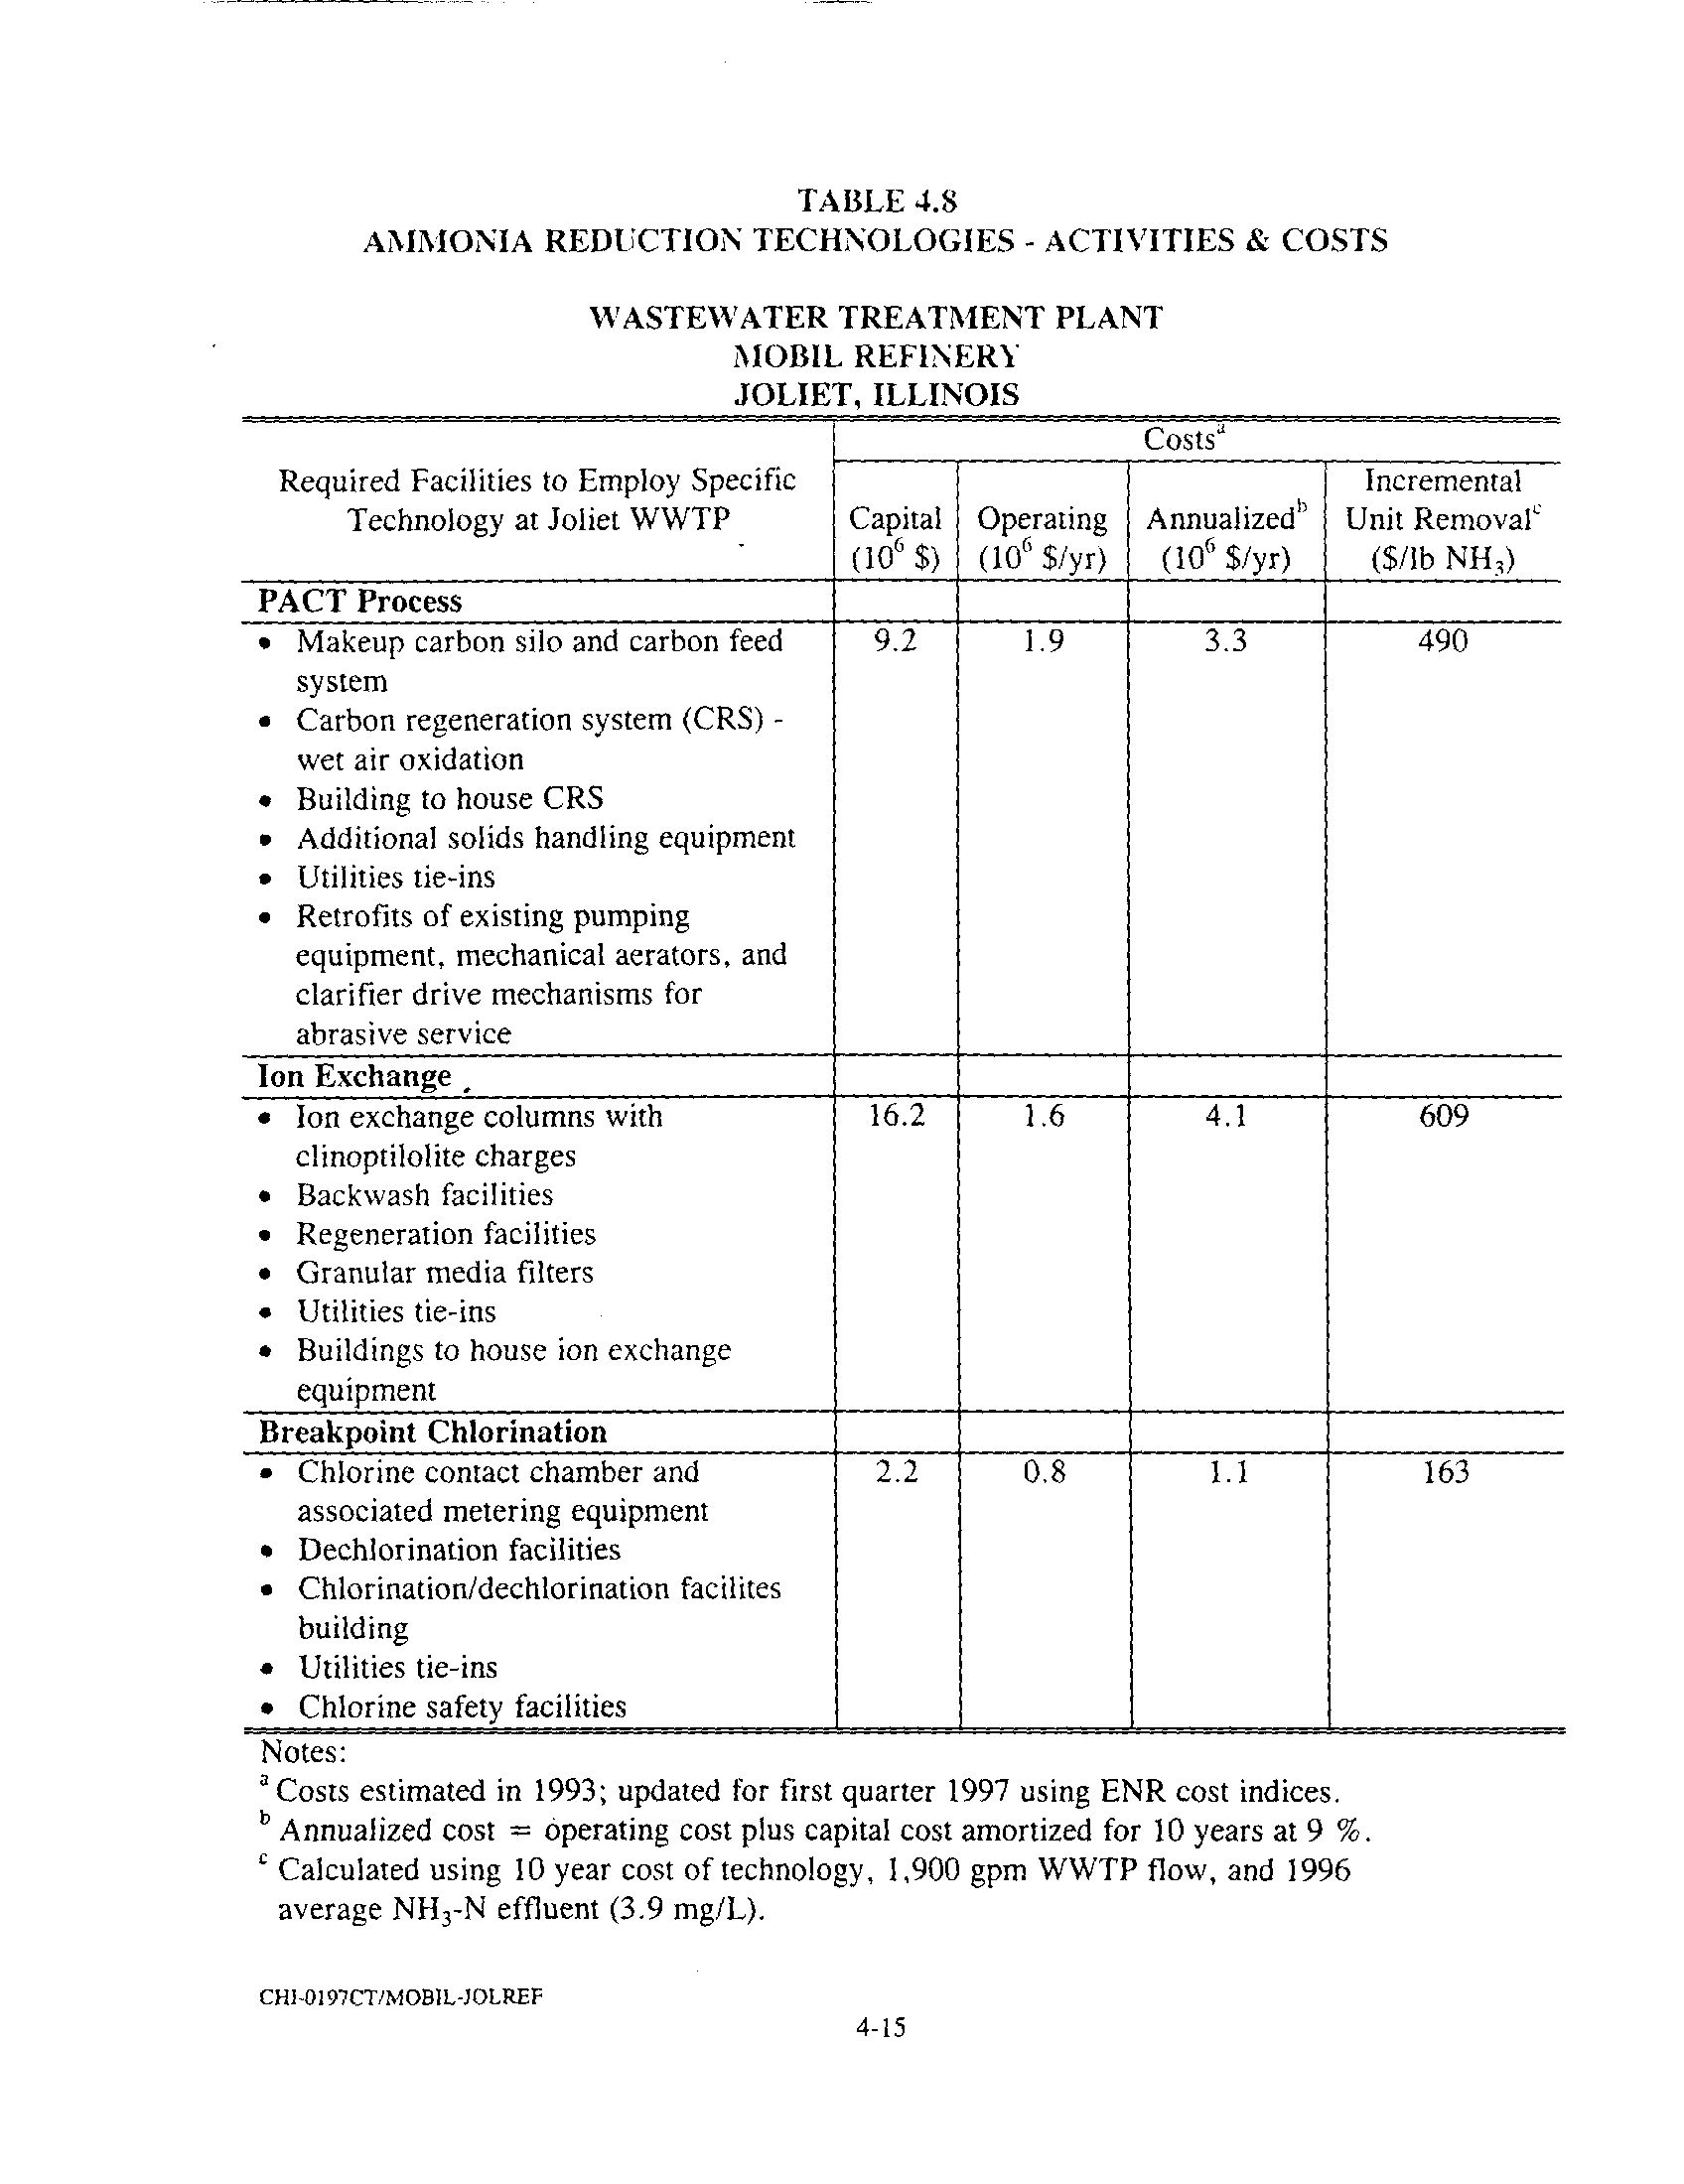
TABLE 4 .7
TABLE 4 .8
CHI- 0 1 97CT/MOBIL-JOLREF
TABLE OF CONTENTS
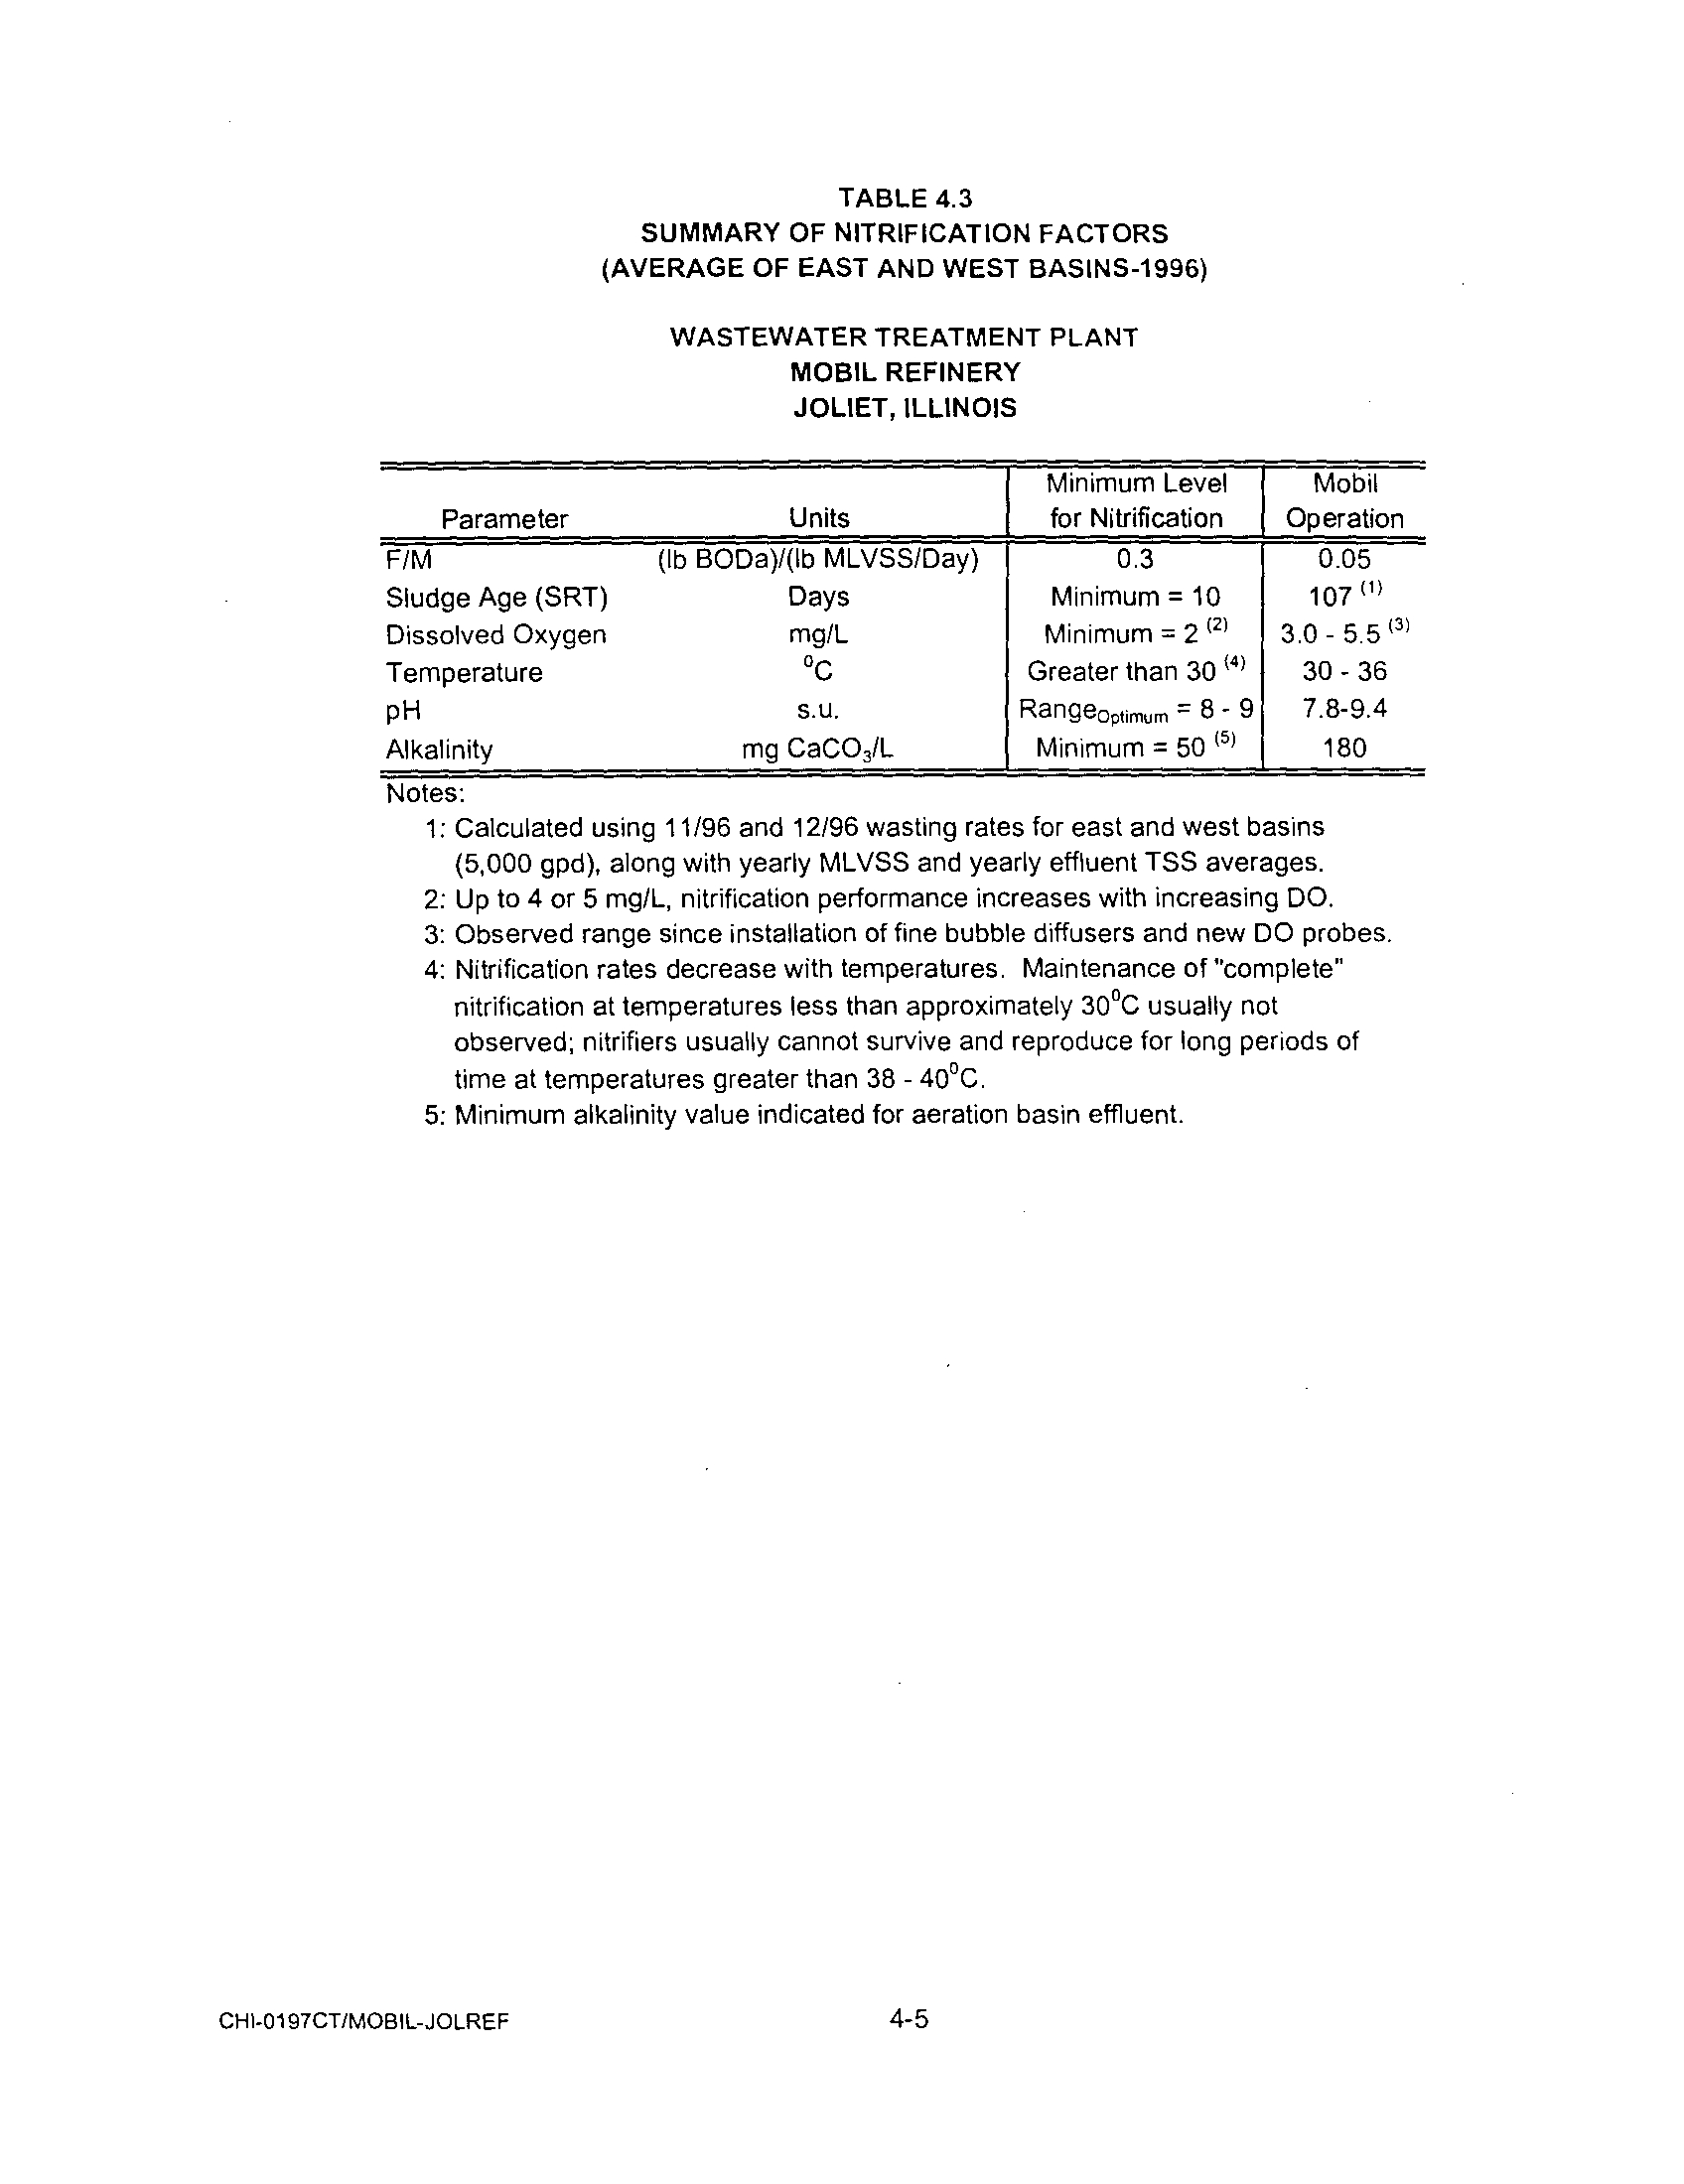
SUMMARY OF NITRIFICATION FACTORS (AVERAGE OF
EAST AND WEST BASINS - 1996)
4-5
REMOVAL EFFICIENCIES FOR RELEVANT WATER
QUALITY PARAMETERS (1996) 4-9
COMPARISON OF BAT REQUIREMENTS WITH MOBIL'S
PRACTICES
4-10
COMPARISON OF EFFLUENT (1996)
WITH BAT EFFLUENT
GUIDELINES
4-12
POST-TREATMENT AMMONIA REDUCTION
TECHNOLOGIES
4-14
AMMONIA REDUCTION TECHNOLOGIES -
ACTIVITIES
AND COSTS
4-15
CHL0197CT/MOBIL401REF
SECTION 1
EXECUTIVE SUMMARY
1 .1 EXECUTIVE SUMMARY
Mobil Oil Corporation (Mobil) owns and operates a 200,000 barrels per day
throughput (bbl/day) refinery on the Des Plaines River in Joliet, Illinois
. The refinery
treatment system performs very well when judged against its permit and against United
States Environmental Protection Agency (USEPA) guidelines
. However, the refinery
has been unable to consistently meet the state of Illinois ammonia nitrogen standard of
3
.0 milligrams per liter (mg/L) that applies to all discharges to rivers of the state . This
investigation was conducted to evaluate the wastewater treatment system design and
performance, to review and comment on previous work commissioned by and
performed by the refinery, to attempt to meet the ammonia standard, to offer
suggestions as to how the ammonia standard might be met, and to render an opinion
regarding the achievability of the Illinois ammonia standard .
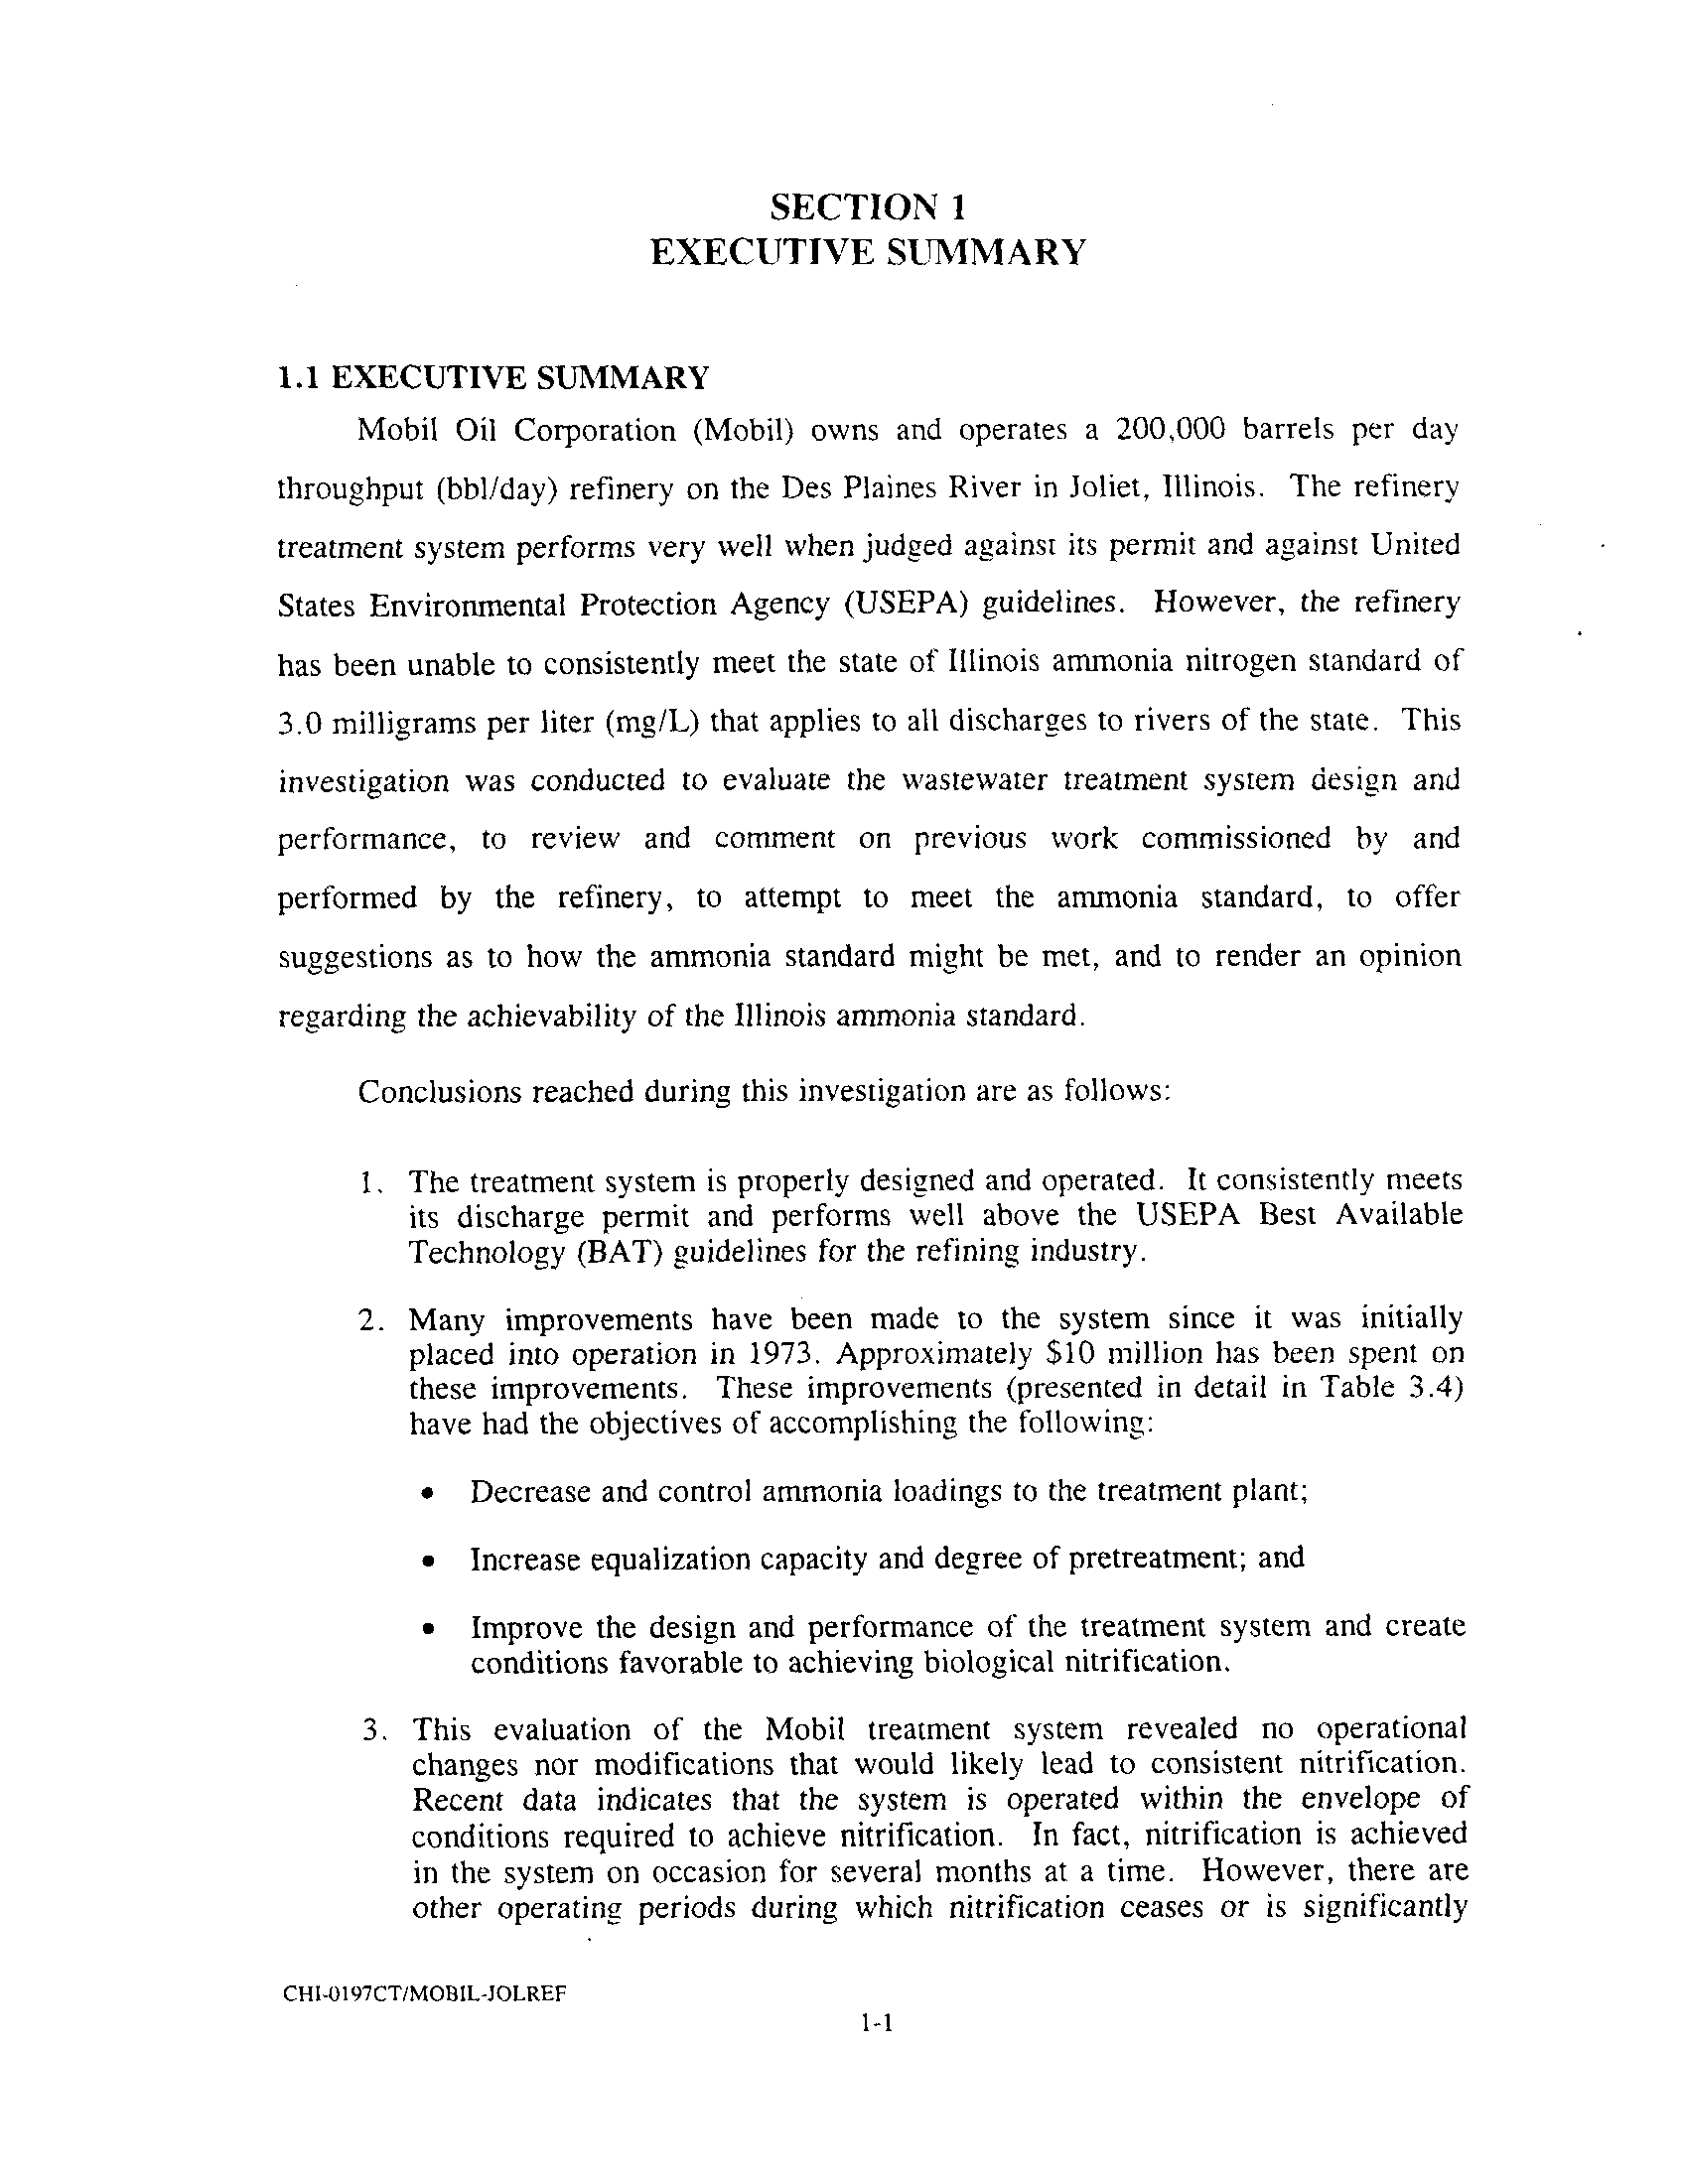
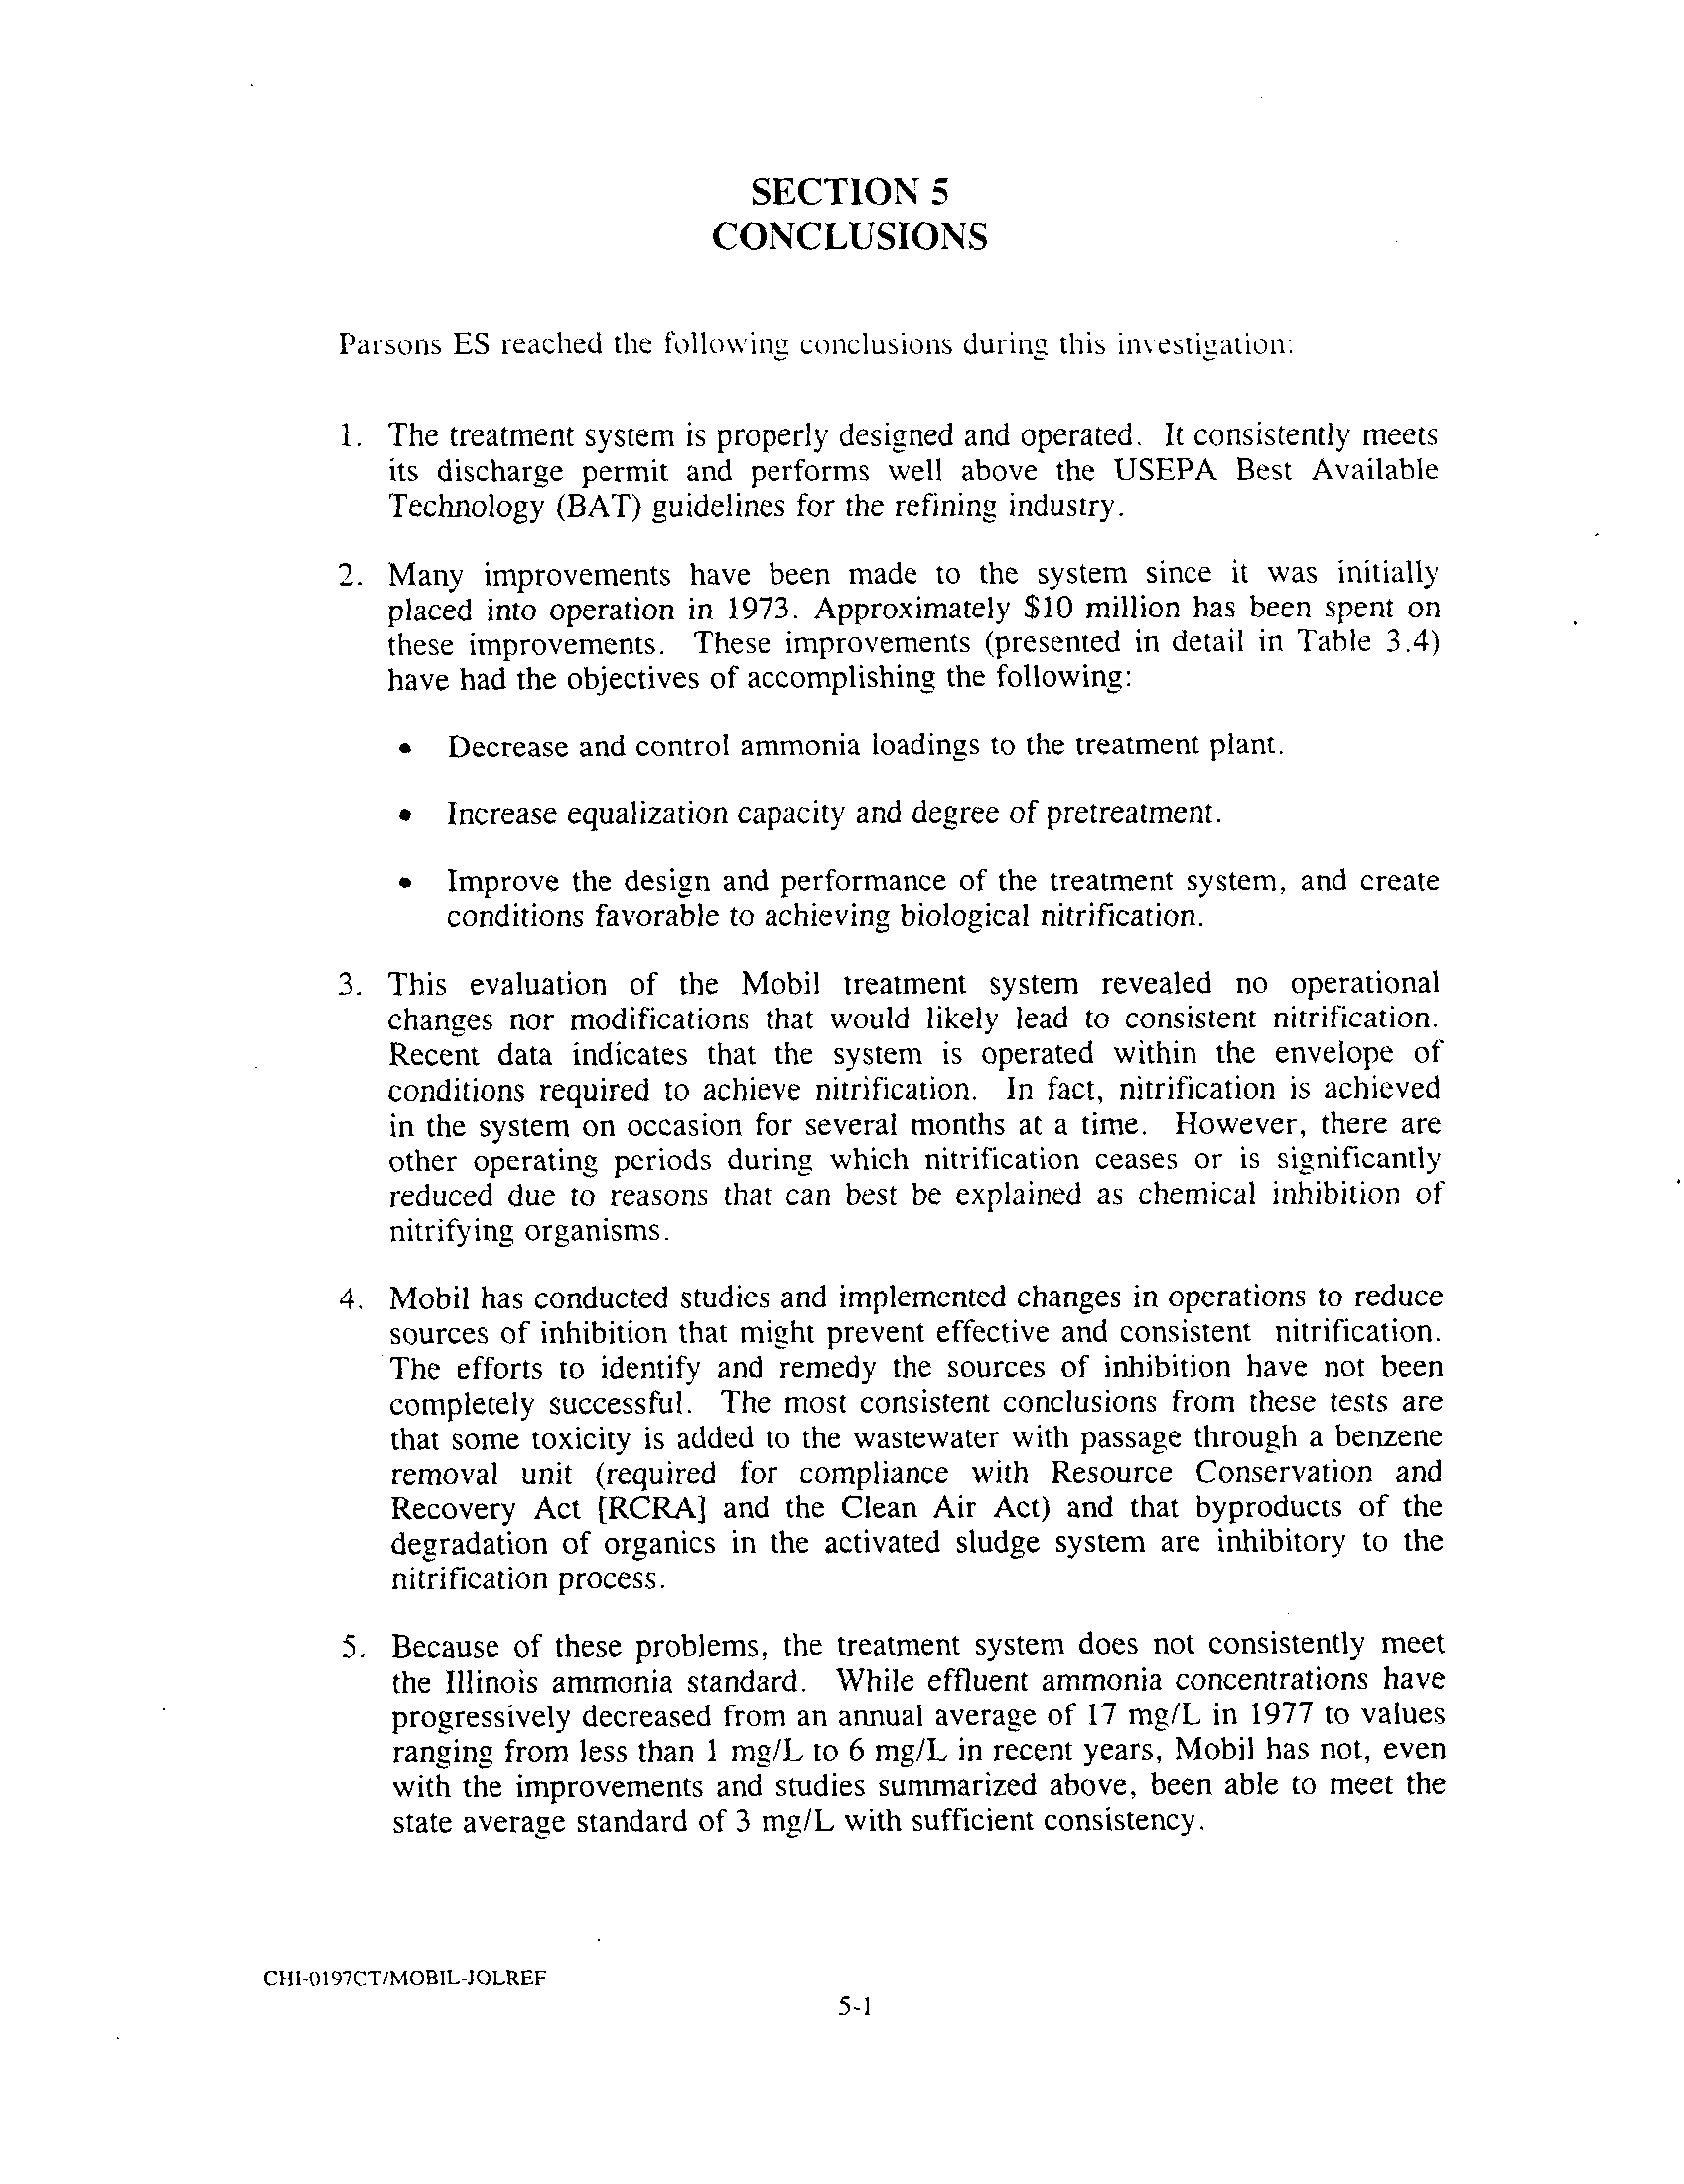
Conclusions reached during this investigation are as follows :
1
. The treatment system is properly designed and operated
. It consistently meets
its discharge permit and performs well above the USEPA Best Available
Technology (BAT) guidelines for the refining industry
.
2
. Many improvements have been made to the system since it was initially
placed into operation in 1973
. Approximately $10 million has been spent on
these improvements . These improvements (presented in detail in Table 3 .4)
have had the objectives of accomplishing the following :
•
Decrease and control ammonia loadings to the treatment plant ;
•
Increase equalization capacity and degree of pretreatment ; and
•
Improve the design and performance of the treatment system and create
conditions favorable to achieving biological nitrification
.
3, This evaluation of the Mobil treatment system revealed no operational
changes nor modifications that would likely lead to consistent nitrification .
Recent data indicates that the system is operated within the envelope of
conditions required to achieve nitrification
. In fact, nitrification is achieved
in the system on occasion for several months at a time
. However, there are
other operating periods during which nitrification ceases or is significantly
1 -1
reduced due to reasons that can best he explained as chemical inhibition of
nitrifying organisms .
4
. Mobil has conducted studies and implemented changes in operations to reduce
sources of inhibition that might prevent effective and consistent nitrification
.
The efforts to identify and remedy the sources of inhibition have not been
completely successful
. The most consistent conclusions from these tests are
that some toxicity is added to the wastewater with passage through a benzene
removal unit (required for compliance with Resource Conservation and
Recovery Act [RCRA] and the Clean Air Act) and that byproducts of the
degradation of organics in the activated sludge system are inhibitory to the
nitrification process .
5 . Because of these problems, the treatment system does not consistently meet
the Illinois ammonia standard . While effluent ammonia concentrations have
progressively decreased from an annual average of 17 mg/L in 1977 to values
ranging from less than 1 mg/L to 6 mg/L in recent years, Mobil has not, even
with the improvements and studies summarized above, been able to meet the
state average standard of 3 mg/L with sufficient consistency .
6
. Mobil has investigated a number of technologies with the hope of identifying
one which could achieve compliance with the state ammonia standard
.
No
applicable process has been identified
. Problems with the technologies
evaluated include high cost, site suitability problems, and generation of
chlorinated organics . These technologies are not proven for the Mobil Joliet
Refinery application, and their cost is prohibitively high to recommend them
for implementation .
CHI-OI97CT/MOBIL-JOLREF
1-2
SECTION 2
INTRODUCTION
2.1 PROJECT BACKGROUND
Mobil operates a petroleum refinery in Joliet, Illinois
. Wastewater produced
during the refining processes is treated in an on site wastewater treatment plant
(WWTP) and discharged under a
National Pollution Discharge Elimination System
(NPDES) permit to the Des Plaines River
.
The WWTP typically meets and is usually far below permit requirements . Mobil
has examined a number of options, conducted treatability testing, and implemented
equipment changes which increased ammonia removal, but did not achieve total
consistency with the state average effluent standard of 3 mg/L
. Mobil has undertaken
numerous and expensive endeavors to remedy their ammonia problem
. Mobil has
retained Parsons Engineering Science, Inc
. (Parsons ES) to review the WWTP
operation including facility modifications, evaluate operational changes that may further
enhance the WWTP performance, and identify additional technologies, if any, to be
considered. If these evaluations indicate the plant cannot feasibly further reduce
ammonia in its discharge, Parsons ES will assist Mobil in their petition to obtain a site-
specific rule change to the state of Illinois' effluent ammonia-nitrogen concentration
limit (ammonia limit) .
The following report presents'a history of the treatment plant performance, a
description of the efforts made by Mobil to enhance ammonia removal, a summary of
the industry standard for refinery wastewater treatment, and the rationale for seeking
the site-specific variance to the ammonia limit .
2 .2 PROJECT OBJECTIVE
The objective of this project was to evaluate the WWTP and treatment process
modifications that have been made or investigated with specific regard to the removal
CHI-0 197CT/MOBIL-JOLREF
2-1
of ammonia . As part of this evaluation
. Parsons ES was charged with the following
tasks:
1
. Evaluate the design, operation, and performance of the existing wastewater
treatment system, paying special attention to any circumstances that would
interfere with biological nitrification .
2
. Determine if changes in the treatment system operation would improve
ammonia removal .
3
. Determine if the present wastewater treatment system meets USEPA BAT
economically achievable criteria .
4
. Determine how recent changes in the RCRA regulations have adversely
impacted the ammonia removal performance of the system .
5
. Review the evaluation of alternative ammonia removal technologies
performed by Mobil, evaluate any additional technologies, as appropriate, and
develop current cost estimates for the construction of applicable technologies
.
The results of these investigations are presented in subsequent sections of this report .
2
.3
REPORT ORGANIZATION
The remainder of this introductory section provides an overview of the Joliet
refinery and the facility's WWTP and a summary of the Parsons ES project engineers'
credentials
.
Section 3 presents the results of Parsons ES's review of the historical
performance of the WWTP, the ammonia standard, and Mobil's efforts to improve
ammonia removal . Section 4 presents Parsons ES's evaluation of Mobil's current
WWTP configuration and operation, a comparison of their facility to industry practices
and guidelines, and an assessment of alternate technologies that might remedy Mobil's
nitrification inconsistency
.
2 .4 THE MOBIL JOLIET REFINERY
Mobil built the Joliet refinery as a "grass roots" facility 1972
. The refinery is
located on the Des Plaines River near the intersection of Interstate 55 and Arsenal
Road, approximately 10 miles southwest of Joliet, Illinois . The refinery began
operation in early 1973 .
CH I-0197CT/MOBIL-JOLREF
2-2
The refinery's rated capacity is 200 .000 bbl/day of crude oil throughput . The
refinery was designed to process high sulfur and high nitrogen North American crudes .
which currently comprise approximately 70 percent of the total feed stock throughput .
The plant is a "conventional fuels" refinery and its principal products are gasoline and
distillate fuel oil
. Other products include kerosene, jet fuel, propane, petroleum coke,
sulfur, and some heavy fuel oil .
The refinery draws water from the Des Plaines River for boiler feed . cooling
tower make-up, noncontact cooling
. Well water is used for potable needs . sanitary
purposes, and general service .
As noted, treated process wastewater is discharged to
the Des Plaines River through Outfall 001 under NPDES Permit No. IL0002861 . The
facility has eight other permitted outfalls, 002 (noncontact cooling water) and 003 to
009 (storm-water runoff) .
2.5
WASTEWATER TREATMENT PLANT OVERVIEW
Process wastewater and contact storm water runoff are treated in the facility's
WWTP .
A process flow diagram of the treatment plant is provided as Figure 2 .1 .
Major unit process included in the treatment plant include
:
•
Sour Water Stripper -
Primary removal of ammonia and sulfide . This
treatment unit is located in the refinery process area .
•
Desalter
- Partial removal of phenolics and in-plant water reuse . This unit is
located in the refinery process area .
•
TIC 103
- Wastewater flow equalization . This unit is located in the refinery
process area.
•
Benzene Removal Unit - An air-stripping process for removal of benzene,
sulfide, and volatile organic compounds . This unit is located in the refinery
process area .
•
Diversion Basin -Basin used for hydraulic overflow during wet weather . .
•
API Oil/Water Separator
- Parallel basin process for the oil removal of
gravity separable oil .
CHI-0 197CT/MOBIL-JOLREF
2-3
• Dissolved Air Flotation - Parallel basin process for the removal of suspended
oil .
The DAF system was modified/upgraded in 1996 with enhanced air
injection features .
• Equalization Biological Treatment Unit (EBTU) -
Secondary equalization with
surface aerators for phenolic and other chemical oxygen demand (COD)
oxidation . The EBTU normally receives treated sanitary wastewater and
effluent from the dissolved air flotation units (DAF) .
• Aeration Basins - Parallel activated sludge basins for ammonia, organic,
cyanide and other pollutant removal
.
The aeration basins were upgraded in
1996 with the installation of a fine bubble air diffuser system and new
aeration blowers .
• Clarifiers -
Parallel clarifiers for solids removal/sludge settling . The settled
sludge and surface skimming mechanisms in the clarifiers were replaced to
improve separated solids removal from the units
.
•
Guard Basin - Effluent retention prior to discharge .
The facility also has a biological-sludge thickening tank, where waste activated
sludge is gravity settled and stabilized . Waste bio-sludge is then hauled to the on-site
coker for recycling .
The nominal design capacity of the treatment plant is 2,500 gallons per minute
(gpm) . Current throughput is 1,900 gpm
. The calculated USEPA BAT economically
achievable (BAT) flow rate for a refinery process of Mobil's size and configuration is
5,200 gpm
.
Employing the stream segregation aspect of Best Management Practices
(BMP), the Mobil facility operates at 37 percent of the BAT flow . This efficiency in
water conservation penalizes Mobil in achieving a concentration-based effluent
standard
. Additional detail on the WWTP is provided in Section 4 .2 .
2 .6 REPORT AUTHORS
The three primary engineers that conducted the evaluation and contributed to this
document are :
John H
. Koon, PhD ., P.E. - Dr. Koon has over 27 years of extensive technical
experience, primarily in industrial wastewater treatment . He is a recognized
authority in the field and a key contributor to significant advances in
technologies used worldwide .
He has extensive experience in the evaluation
CH I-0197CT/MOBIL-JOLREF
2-5
and design of biological wastewater treatment processes, and assisting industrial
clients with regulatory issues
.
Dr . Koon is a Parsons ES Vice President and the Technical Manager of
Industrial and Hazardous Wastes. In this role, he is responsible for directing
the company's industrial wastewater program, working with clients on complex
technical issues, and providing technical direction on industrial wastewater
projects .
Dr . Koon holds a B .E
. in Civil Engineering and an M .S . in Environmental
Engineering from Vanderbilt University, Nashville, Tennessee ; and a Ph .D . in
Environmental Engineering from the University of California, Berkeley
.
Christopher Donohoe
- Mr . Donohoe is a staff engineer in the Parsons ES Oak
Brook, Illinois office
. He has participated in treatability studies for chemical,
pharmaceutical, petroleum refining facilities ; including projects involving
complex nitrification/denitrification inhibition issues
. Mr . Donohoe also has
assisted in a Toxicity Reduction Evaluation (TRE) for a petrochemical facility .
Mr . Donohoe holds a B .S . in Mathematics from the University of Notre Dame,
South Bend, Indiana ; and an M .S. in Environmental Engineering and Science
from the University of Illinois, Urbana, Illinois .
Gregory M. Gibbons, P.E. - Mr. Gibbons has over 16 years of experience in
the environmental engineering field . He has managed industrial and municipal
wastewater treatment system design/upgrade projects . Mr. Gibbons, an
Associate of the firm, is the Engineering Manager of the Parsons ES Oak Brook
office.
In this role he is responsible for oversight of the office engineering
projects .
Mr . Gibbons holds a B
.S . in Civil Engineering from the University of Notre
Dame, South Bend, Indiana
; and an M .S . in Sanitary Engineering from the
University of Michigan, Ann Arbor, Michigan .
CH I-0197CT/MOBIL-JOLREF
2-6
SECTION 3
AMMONIA STANDARD COMPLIANCE EFFORTS
3 .1 INTRODUCTION
Parsons ES's evaluation
of compliance with the ammonia effluent standard
included:
1
. Reviewing of the refinery's WWTP history of ammonia removal
.
2 . Examining and comparing the Illinois Environmental Protection Agency and
USEPA effluent limitations .
3 . Summarizing the administrative record/past variance petitions
; and
4 . Evaluating Mobil's efforts to increase ammonia removal and overall WWTP
performance .
The results of these investigations are presented in this section
. Much of this
information has been evaluated and presented to the Illinois Pollution Control Board
(IL PCB) in previous variance petitions
.
3
.2 FACILITY AMMONIA REMOVAL HISTORY
Ammonia loading and ammonia removal histories for the refinery WWTP arc
provided in the following subsections to provide a basis for the discussions on Mobil's
biological nitrification problems .
3.2 .1 Influent Ammonia Concentrations
Yearly average influent ammonia-nitrogen (ammonia) levels to the WWTP for
1977 through 1996 are shown on Figure 3 .1 . There has been a general trend of
increasing average influent ammonia concentration during this period . Mobil attributes
this to increased nitrogen and sulfur levels in the crude oil supply used by the refinery,
as well as to the effects of water reuse and conservation . Mobil utilizes North
American crude as their feedstock . Higher sulfur levels are significant since ammonia
is produced in the processes designed to remove sulfur from petroleum products .
CHI -0197CT/MOBIL-JOLREF
3-1
Thus . the increase in sulfur removal results in greater generation of ammonia which
eventually enters the WWTP, as illustrated on Figure 3 .1 .
3.2.2
Effluent Ammonia Concentrations
The WWTP's ammonia removal history from 1977 through 1996 is presented in
detail in Table 3
.1
. Ammonia removal from 1977 to 1982 was erratic with fluctuating
removal efficiencies . The maximum removal efficiency during this period was 48
percent . The low removal efficiency is attributed to the absence of nitrification during
biological treatment.
Removal efficiency increased dramatically in 1983 to 83 percent . The average
effluent concentration dropped to 4 mg/L
. Removal efficiency continued to increase
through 1989 .
The WWTP consistently discharged ammonia at concentrations less than 1 mg/L
during 1989, 1990, and 1991-indicating excellent nitrification performance-but
witnessed much higher levels in the years that followed . Over the past 5 years the
refinery WWTP has treated an average influent ammonia level of 31 mg/L to an
effluent average of 4 .5 mg/L, representing an 86 percent removal . The minimum
annual average of 3 .3 mg/L was achieved in 1992 .
Table 3.2
presents the progression of ammonia treatment, by outlining ammonia
concentrations at different stages of the treatment plant-aeration basin influent, east
and west clarifier effluent, and treatment plant effluent
. Minimum, maximum, and
average ammonia data for three different years-1989, 1995, and 1996-are presented
.
These years were selected since 1989 is representative of a time during which the
effluent ammonia was very low-indicating good WWTP ammonia reduction
performance-while 1995 and 1996 represent periods of poor and improving
performance, respectively .
Mobil's ammonia removal efficiency has varied significantly over the period of
operation of the treatment plant. WWTP influent and effluent ammonia concentration
CHI-0 197CT/MOBIL-JOLREF
3-3
TABLE 3.1
AMMONIA-NITROGEN REMOVAL HISTORY
WASTEWATER TREATMENT PLANT
MOBIL REFINERY
JOLIET, ILLINOIS
CHI-0197CT/MOBIL-JOLREF
3-4
Year
Influent (mg-NIL) Effluent (mg-NIL) Percent Removal
1977
15
17
-13
1978
17
9
47
1979
14
13
7
1980
20
17
15
1981
23
13
43
1982
29
15
48
1983
23
4
83
1984
20
3
85
1985
26
3
88
1986
36
4
89
1987
28
2
93
1988
27
1
96
1989
26
0.2
99
1990
22
0 .2
99
1991
23
0.6
97
1992
32
3 .3
90
1993
29
4
86
1994
27
5
81
1995
35
6 .3
82
1996
34
3 .9
89
Period Average
26
6
75
"1992-1996" Averag
31
4 .5
86
TABLE 3.2
AMMONIA-NITROGEN (NH3-N) DATA (mg/L) for 1989, 1995, and 1996
WASTEWATER TREATMENT PLANT
MOBIL REFINERY
JOLIET, ILLINOIS
CHI-019707/MOBIL-JOLREF
3-5
I Annual
Jan Feb Mar
Apr
May
June July Aug Sep Oct N v Dec
1989
Aeration Basin Influent
Minimum
Maximum
Average
14 .50
41
.42
26 .33
20
32
25
23
57
36
9
58
24
12
48
27
10
15
25
31
18
23
11
28
20
15
45
26
22
46
32
11
34
26
13
50
32
13
43
27
East Clarifier
Minimum
Maximum
Average
0 .00
1 .85
0 .24
0
1 .8
0 .3
0
1
.9
0 .2
0
2 .4
0 .3
0
2 .6
0 .2
0
0
0 .4
0 .3
0 .1
0 .1
0
0.8
0
.3
0
0,7
0 .3
0
9
0 .5
0
1
0 .3
0
0 .3
0 .1
0
1
0 .2
West Clarifier
Minimum
Maximum
Average
0 .00
2 .23
0 .25
0
1 .8
0 .3
0
2 .9
0.4
0
13 .1
0 .6
0
2 .6
0
.3
0
0
0 .4
0 .4
0 .1
0 .1
0
0 .7
0 .3
0
0 .6
0 .2
0
0 .6
0.2
0
1
0 .3
0
0
.3
0
0
2 .4
0 .2
Outfall 001
Minimum
Maximum
Average
0 .00
0 .83
0 .19
0
0 .6
0 .1
0
0 .3
0 .2
0
3 .1
0 .5
0
0 .4
0 .2
0
0
0 .2
0 .1
0
0 .1
0
2
0 .4
0
0 .3
0
0
0 .6
0 .2
0
1
0 .3
0
0 .3
0
0
1
0 .3
1995
Aeration Basin Influent
Minimum
Maximum
Average
23 .00
45 .08
35 .00
17
26
22
14
21
17
30
38
33
31
38
34
8
6
38
40
30
30
35
49
43
24
73
41
30
44
40
37
73
59
13
52
31
31
49
40
East Clarifier
Minimum
Maximum
Average
0.38
14 .35
6.90
1 .5
27
12
0 .3
19
.9
13 .2
0 .2
3
1
0 .4
6
3 .4
0 .3
0 .8
2 .8
32 .2
1 .4
17 .7
0 .3
0 .8
0 .6
0
20
5 .7
0 .6
4
1 .5
0
6
3 .1
0 .2
21 .9
7 .9
0
28 .6
15 .3
West Clarifier
Minimum
Maximum
Average
1 .69
18
.73
10 .00
7 .6
24 .9
17 .5
0
24 .9
12 .6
0 .4
11 .2
3.1
0 .4
6
3.4
4 .5
0 .8
20
.7 32 .5
14 .9 23 .2
0
.3
0.8
0.6
0
20
5.8
16 .6
5
.6
5
22
14 .3
0
15
7 .5
0 .2
30.2
11 .5
Outfall 001
Minimum
Maximum
Average
1 .98
12 .90
6 .29
8 .7
19 .1
13 .7
0 .6
20 .4
7 .2
0 .4
3 .7
1
.8
2 .4
13 .9
6
.6
4 .1
0 .3
10
.8 22 .9
7 .5
12 .2
0 .1
0 .8
0 .4
0 .2
5 .8
2
0 .5
5 .7
2 .2
0 .2
7 .2
2 .7
0 .2
19
8 .1
6
25 .5
11 .1
1996
Aeration Basin Influent
Minimum
Maximum
Average
23 .10
43 .40
32 .80
22
35
28
14
38
25
11
30
24
21
49
33
28
32
55
42
37
37
37
56
43
25
45
40
16
40
29
25
44
32
34
45
38
36
42
40
East Clarifier
Minimum
Maximum
Average
0 .00
12.45
3 .76
0
19
6
.2
0
11 .5
2 .7
0
29
.6
8 .8
0
17 .6
5 .2
0
0
15
22 .5
4
7 .5
0
8 .7
2 .8
0
0.3
0 .2
0
0.3
0 .2
0
0
0
0
9
4 .5
0
0
0
West Clarifier
Minimum
Maximum
Average
1 .52
16 .30
7.72
0
31
.5
11 .5
0
17 .5
5 .7
0 .2
32 .2
17.9
15
42 .6
32.6
0
0
38
0 .2
8 .8
0.1
0
0 .4
0.2
0
0 .3
0 .2
0
0 .3
0 .2
0
0
0
0
0
0
0
0
0
Outfal l 001
Minimum
Maximum
Average
0.32
11 .15
4 .48
2.6
16 .9
8 .5
0
21 .4
5 .3
0
27 .4
9 .2
0 .6
21 .1
14
.9
0
0
4 .2
13 .7
1 .3
3 .6
0
4 .2
1 .3
0
0 .7
0 .3
0
1 .7
0 .3
0
0 .2
0 .1
0
0 .8
0 .3
0
14
1 .9
data is also shown graphically for the period of 1989 through October 1996 on figures
3 .2 through 3 .9.
There have been extended periods of low effluent NH
;-N However
.
the WWTP also has a history of periods of monthly average effluent NH ;-N levels
greater than 3 mg/L .
Several events occurred beginning in the latter part of 1990 that preceded a
decrease in the ammonia removal performance of the system . In September 1990, a
benzene removal unit (BRU) was added in the refinery to strip benzene from benzene-
laden streams .
The following year, the operational practice of the diversion basin at
the wastewater treatment facility was changed to receive wet-weather overflow ; the
equalization basin in the treatment plant area was converted to an aggressive biological
treatment unit . The changes were made in May 1991 . All of these changes were
necessary to comply with several RCRA and NESHAPS regulations . Soon after these
changes were made, a deterioration in the ammonia removal performance of the
treatment system was observed. Beginning in the last half of 1991, the ammonia
removal performance was significantly less than it had been since 1988 . This subject is
discussed further in Section 4
.2, in which performance-related parameters of the system
are discussed .
3.3 APPLICABLE AND RELEVANT AMMONIA STANDARDS
3.3 .1 The Illinois Ammonia Standard
The general effluent standard for ammonia discharge in Illinois is 3
.0 mg/L as
specified in Title 35, Subtitle C (Water Pollution) §304 .122 of the Illinois Regulations
(35 111. Adm . code 304.122
(b)) .
3
.3 .2 USEPA Discharge Limitation
The USEPA has established effluent guidelines or limitations for industry
categories based upon the application of the best practical control technology available
(BPT) and BAT economically achievable .
Limitations for the Cracking Subcategory
are specified in 40 CFR 419 Subpart B
.
CHI-0197CT/MOBIL-JOLREF
3-6
40
35
30
25
Jz
E 20
Iz
15
10
5
influent (avg .) = 26.3
mg/L
0
0
0
0
0
effluent (avg .) = 0 .2 mg/L
a
0
0
0
0
Jan
Feb
CHI -0197CT/MOBIL-JOLREF
Mar
Apr
May
FIGURE 3 .2
WWTP NITRIFICATION PERFORMANCE (1989)
June
July
1989
Aug
3-7
Sep
Oct
Nov
Dec
0 WWTPinfluent
•
WWTP effluent (Outfall 001)
JZ
EE
z
CHI- 0 1
97CT/MOBIL-JOLREF
FIGURE 3 .3
WWTP NITRIFICATION PERFORMANCE (1990)
1990
3-8
O WWTP influent
•
WWTPeffluent (Outfall001)
30
25
20
Jz
E
15
xz
10
5
0
influent (avg
.) ='23 .3 mg/L
0
effluent (avg .) = 0.6 mg/L
0
0
0
0
Jan
Feb
CHI- 0 1
97CT/MOBIL-JOLREF
Mar
Apr
May
FIGURE 3
.4
WWTP NITRIFICATION PERFORMANCE (1991)
June
July
1991
Aug
3-9
Sep
Oct
Nov
Dec
O WWTPinfluent
•
%WfPeffluent(Outfall001)
60
CHI-01 9TCT/MOBIL-JOLREF
FIGURE 3 .5
WWTP NITRIFICATION PERFORMANCE (1992)
1992
3-10
influent (avg .) = 31 .8 mg/L
50
40
Ji
E 30
O WWTPinfluent
•
WWTP effluent (Outfall 001)
0
M
0
Z
0
20
10
0
effluent (avg .) = 3 .3 mg/L
Jan
Feb
Mar
Apr
May
June
July
Aug
Sep
Oct
Nov
Dec
CHI- 0
197CT/MOBIL-JOLREF
FIGURE 3 .6
WWTP NITRIFICATION PERFORMANCE (1993)
1993
3-11
O WVVTP influent
W WTP effluent (Outfall 001)
CHI-0 197CT/MOBIL-JOLREF
FIGURE 3 .7
WWTP NITRIFICATION PERFORMANCE (1994)
1994
3-12
p VJWTP influent
•
WWTPeffluent (Outfall001)
60
50
40
Z
E 30
n
z
20
10
influent (avg .) = 35 mg/L
0
0
effluent (avg
.) = 6.3 mg4 -
0
00
0
0
Jan
Feb
CHI- 0 1
97CT/MOBIL-JOLREF
Mar
Apr
May
FIGURE 3 .8
WWfP NITRIFICATION PERFORMANCE (1995)
June
July
1995
Aug
3-13
Sep
Oct
Nov
Dee
O
VVVVTP influent
WWTP effluent (Outfall 001)
45
40
35
30
i
25
E
Z 20
10
5
influent (avg .) = 32
.8 mg/L
0
0
a
m
muJ
W
Y
effluent (avg .) = 4.48 mg/L
0
•
Jan
Feb
CHI-01 97CT/MOBIL-JOLREF
Mar
Apr
May
FIGURE 3 .9
WWTP NITRIFICATION PERFORMANCE (1996)
June
July
1996
Aug
3-14
Sep
Oct
Nov
Dec
O
VAWP influent
•
WWTPeffluent(Outtdll001)
The Cracking Subcategory is applicable to the Mobil Joliet refinery . As stated in
Subsection 2
.4, the refinery's rated capacity in 1996 is 200,000 bbl/day of crude oil
throughput . According to 40 CFR 419 Subpart B. both the BPT and BAT effluent
limitations for ammonia-nitrogen (ammonia) are 6
.6 lb/1,000 bbl daily maximum and
3 .0 lb/1,000 bbl daily average (30 days)-hereafter referred to as the "BAT limits" .
As a result, Mobil's USEPA BAT effluent ammonia limitations would be a daily
maximum of 2,215 lb/day and a daily average of 1,007 lb/day . The average daily flow
to the WWTP is 1,900 gpm (2 .74 million gallons per day [mgd]). Therefore, the BAT
effluent limits, on a concentration basis, for the Joliet facility would be 97 mg/L daily
maximum and 44 mg/L 30-day average .
The refinery ammonia discharge history is presented as a calculated mass
discharge (lb/day) of ammonia in Table 3
.3 as a second comparison to the USEPA
BAT limits
. With respect to effluent ammonia, the plant has consistently exceeded the
level of treatment required by the USEPA discharge criteria, and in the period of 1992
to 1996 the facility had an average discharge of only 18 percent of the federal limit .
3
.4 ADMINISTRATIVE PROCEEDINGS SUMMARY
The Mobil refinery has operated under some relief from ammonia effluent limit
since the limit became effective . The following bulleted items highlight Mobil's recent
administrative proceedings to obtain a site-specific ammonia standard :
•
January 15, 1988 - The IL PCB granted Mobil 5 year site-specific relief from
the state's NH 3-N limitation . The NH 3 standard granted was a 20 mg/L
monthly average and a 35 mg/L daily maximum .
•
December, 31, 1993 - The site-specific NH
3-N
standard relief for Mobil
expired .
•
March 3, 1994 -
The IL PCB granted Mobil a 4-year variance (PCB 93-151)
from the state's NH 3-N limitation .
The relief standard granted was a
13 mg/L monthly average and a 26 mg/L daily maximum .
CHI-0197CT/MOBIL-JOLREF
3
-15
TABLE 3.3
COMPARISON OF HISTORICAL EFFLUENT NH3-N
TO CALCULATED GUIDELINES
WASTEWATER TREATMENT PLANT
MOBIL REFINERY
JOLIET, ILLINOIS
Notes :
a . Estimated based on the current WWTP flow rate of 1900 gpm
.
b . Calculated for a USEPA BAT monthly effluent limit of 600 Ib/day
.
All BAT values were calculated using 200,000 bbl/day - a value
close to, but not the capacity during the entire period shown
.
CHI- 01
97CT/MOBIL-JOLREF
3-16
Year
Effluent Ammonia-Nitrogen
% BAT Limit
(mg-N/L)
(lbs/day)a
Monthly
Average'
1977
17
388
68%
1978
9
205
36%
1979
13
297
52%
1980
17
388
68%
1981
13
297
52%
1982
15
342
60%
1983
4
91
16%
1984
3
68
12%
1985
3
68
12%
1986
4
91
16%
1987
2
46
8%
1988
1
23
4%
1989
0 .2
5
1%
1990
0 .2
5
1%
1991
0.6
14
2%
1992
3.3
75
13%
1993
4
91
16%
1994
5
114
20%
1995
6
.3
144
25%
1996
3.9
89
16%
Period Average
6
129
23%
"1992-1996" Average
4.5
103
18%
•
April 24, 1996 -
Mobil filed an amended petition with the IL PCB for a
variance extension granted under PCB 93-151
.
•
August 15, 1996 -
The IL PCB granted Mobil a 1-year variance extension
until March 3, 1999, with the same limitations as granted in IPCB-93-151 .
3
.5 FACILITY MODIFICATIONS
From 1973 to 1996, Mobil made numerous modifications to their wastewater
treatment facility
. These changes were made to both improve the WWTP performance
and to comply with NESHAPs and RCRA mandated requirements
.
3 .5
.1 Facility Modifications from 1973 to 1990
From 1973 through 1990, Mobil implemented a number of programs that
improved WWTP operation and further reduced the ammonia concentrations in its
discharge .
During the first 5 years of refinery operation, Mobil conducted major
studies to reduce ammonia at its source in the process area
. These studies identified
numerous ammonia sources and programs required for ammonia control
. Mobil made
expenditures to enlarge the sour water collection system by constructing a new sour
water tank and improving the existing sour water stripping system
. This overall effort
resulted in significant reduction of the ammonia influent level to the WWTP
.
Mobil also provided for ammonia stream equalization during this period by
removing a large crude storage tank from service and modifying it to collect several
ammonia-bearing process streams that flowed directly to the WWTP
. This
modification helped to equalize both the flow of these streams as well as the ammonia
influent loading, and yielded more uniform biological nitrification performance
.
In addition, Mobil focused efforts on temperature and alkalinity, two operational
parameters important to nitrification
. First, for temperature control, Mobil installed a
40 pounds per square inch gauge (psig) system and later upgraded to a 150 psig system
to supply steam to the aeration basins to elevate aeration basin temperatures to 85 to
90°F
to achieve nitrification during the winter months
. Second, although tests showed
the WWTP influent contained sufficient alkalinity for nitrification, Mobil investigated
whether these levels were maintained during nitrification as well as during periods of
CHI-0197CTIMOBIL-JOLREF
3-17
peak influent ammonia loading . Mobil learned that the WWTP could experience
periodic alkalinity deficiencies and that the lime slurry produced from boiler feed water
treatment was the most cost-effective potential source of increased alkalinity . Mobil
began adding this lime slurry to both aeration basins in 1982 and switched to
magnesium hydroxide addition in 1995 .
Mobil made WWTP operational improvements to reduce ammonia during this
period . First, refinery personnel experimented with varying the WWTP's sludge
retention time (SRT) and implemented a procedure of more frequent/reduced volume
wasting to stabilize the nitrification conditions and reduce fluctuations in performance
of the treatment system
.
In October 1981, Mobil initiated a nitrification inhibition study to isolate and
identify nitrification inhibitors in facility wastewaters . Although results from 1981 and
1982 indicated some nitrification inhibition, beginning in January 1983, treatment
system effluent no longer exhibited nitrification inhibition . The 1983 results indicated
that any inhibitors then present were biodegradable under existing treatment system
conditions . Mobil was unable to identify the reasons for this change, but believed that
the improved nitrification performance during 1983 was due in large part to an
apparent change in the nature of nitrification inhibitors .
Mobil made capital expenditures in excess of $2 .1 million for the aforementioned
ammonia reduction improvements .
3 .5 .2 Facility Modifications Since 1990
Since 1990, Mobil has made the following modifications :
•
Installed a benzene removal unit (BRU) .
•
Converted an equalization basin to an aerated biological pretreatment unit,
referred to as the equalization biological treatment unit (EBTU)
.
•
Switched to a caustic-free Merox gasoline treating unit .
•
Upgraded to diffused aerators in the activated sludge basins
.
•
Upgraded the WWTP clarifiers .
CHI-01 97CT/MOBIL-JOLREF
3 -18
•
Made extensive modifications to the dissolved air flotation (DAF) system .
3 .5 .2
.1 RCRA and NESHAP Driven Modifications
The
BRU
was installed in September of 1990 to meet the requirements of RCRA
(40 CFR 261) and the National Emission Standards for Hazardous Air Pollutants
(NESHAPS-40 CFR 61) regulations at a cost of $2 .1 million. Mobil constructed and
operated the unit to remove benzene, other volatile hydrocarbons, and a substantial
amount of sulfide from a major portion of their process wastewater .
The
EBTU, converted from an existing equalization basin in May 1991, is an
aggressive biological treatment unit . This was required to meet RCRA regulations and
involved the addition of aerators to the basin . As discussed in Subsection 3 .2 . the
nitrification performance of the treatment system has deteriorated since 1991 . This is
most likely attributable to increases in some chemical inhibitory substance in the
BRU
or the EBTU . A
nearly identical conclusion was made at the UNO-VEN refinery in
Lemont, Illinois, in a 1993 petition to the IL
PCB (R 93-8) .
3 .5 .2
.2 WWTP Performance Enhancement Driven Modifications
In recent years, Mobil has made various upgrades to their WWTP to improve its
performance and to encourage more efficient nitrification . The ammonia reduction
costs prior to 1990, the ammonia removal optimization activities undertaken by the
refinery, and the associated costs since March 1994 are presented in Table 3 .4.
Activities have included investigative endeavors, miscellaneous upgrades,
and
equipment changes or upgrades
. In total, Mobil has spent close to $10 million in
attempting to identify sources of nitrification inhibition, in pretreating waste streams,
and in modifying the treatment system to achieve optimum conditions to achieve
biological nitrification.
In June of 1995 . Mobil began operating a newly constructed caustic-free Merox
gasoline treating unit (Merox unit)
. The nature of the new Merox unit is such that its
operation precludes a recurrence of WWTP upsets caused by incursion of the phenolic
CH 1 -0197CT/MOBIL-JOLREF
3-19
CHI- 0 I97CT/MOBIL-JOLREF
Nature of Task :
i - indicates investigation
e - indicates equipment upgrade
m - indicates miscellaneous upgrade
' SWSTU = Sour Water Stripping Tail Unit
' indicates an activity not completed, and therefore a cost not yet incurred
.
TABLE 3 .4
AMMONIA REMOVAL OPTIMIZATION ACTIVITIES
WASTEWATER TREATMENT PLANT
MOBIL REFINERY
JOLIET, ILLINOIS
3-20
Tasks
Na ure
o Tas
Investigations
Costs
($)
Equipment
Upgrades Costs
($)
Miscellaneous
Upgrades Costs
($)
Total
Costs($)
3/3/94-9/3/941973
through 1990
$2,100,000
9/3/94-3/3/95W
Refinery
SWSTU
Activated
WTP
Laboratory
API
Sour
Sludge
and
Water
DAF
System
InvestigationPollutant
System
Aeration
AssessmentSurvey-Capability
Phase 1'
Engineering Analysis
1
$10,000$25,000$6,000$5,000
$10,000$25,000$5,000$6,000
3/3/95-9/3/95Constructed
Upgrade
Envirex,
SWSTU Laboratory
Crude
Inc .
Caustic
Activated
Unit
InvestigationDesalter
Free
Sludge
Merox
ControlsSystem
Treaters-
Phase
Field
2'Analysis
ea
1
$25,000$4,000
$3,000,000$100,000
$3,000,000$100,000$00,000$4,000
3/3/96-9/3/96Replaced
MICROTOX/Nitrificalion
SWSTU
Upgraded
Mg(OH)2
Mg(OH)2
BioaugmentationSWSTU
Laboratory
Pilot
Addition
AdditionWest
West
Plant
-Clarifier
Completed
Side
FacilitiesInvestigation
Study'of
Inhibition
InternalsActivated
and Pending-StudySludge
Phase 3System
emeee
$120,000$25,000$30,000
$1,750,000$225,000$25,000
$65,000$40,000
$1,750,000$120,000$225,000$20,000$40,000$65,000$25,000$25,000
Perform
Upgraded
Completed
TotalCompleted
Upgrade
Perform
Install
East
Liquid
In-Stream
WWTP
East
DAF
WWTP
Clarifier
Post
Side
Nutrient
Controls
LaboratoryWater
Mechanical
of
Internals
Activated
(Phosphate)
Quality
and Recycle
(11/96)Upgrade
Data
Sludge
Addition
CollectionUpgradesOptimization'SystemSystem
maeea
1
$283,000$33,000
$1,750,000$7,343,000$143,000$225,000$100,000$25,000
$150,000$45,000
$9,876,000$1,750,000$100,000$143,000$225,000$45,000$33,000$25,000
spent caustic into the wastewater system thus, at least removing one source of known
inhibitory substances .
Mobil also upgraded the WWTP's activated sludge basins and clarifiers to
enhance nitrification .
To promote more efficient oxygen transfer and to increase the
dissolved oxygen (DO) levels in the aeration basins-creating a more suitable
environment for nitrifiers-Mobil replaced the mechanical aerators of the west and east
basins with fine bubble diffusers (November 1995 and June 1996, respectively) . Mobil
spent $3
.5 million in modifying the activated sludge basins . Moreover . Mobil replaced
the east and west clarifier internals by removing the suction-riser-pipe and installing
bottom-suction-header equipment in each clarifier costing
. These changes cost
$450,000 .
Mobil made upgrades to the dissolved air flotation (DAF) recycle system to
increase the efficiency of the air saturation system . This also resulted in improvements
operability and reliability over the original system
. At the front end of the system the
air is released from the water to form small air bubbles that cause the oil particles to
float to the surface where the skimming can remove them . Mobil upgraded the recycle
system for $143,000 .
3.6 LABORATORY STUDY SUMMARY
Mobil's recent ammonia removal optimization activities are outlined in Table 3 .4
and further detailed in this section
. Mobil performed the following studies per IPCB
order in PCB 93-151 .
Furthermore, since September 1994, Mobil has submitted
progress reports every 6 months to the Agency .
3 .6.1 SWSTU Process
Mobil suspected that the stripped sour water stream was the most likely source of
substances inhibitory to nitrification .
As a result, they conducted investigations to
pinpoint and possibly remove inhibitors .
Mobil's SWSTU activities consisted of a
refinery sour water pollutant survey, three phases of laboratory investigations, and a
pilot-scale study .
CHI-01 97 CT/MOBIL-JOLREF
3 -21
Mobil performed laboratory investigations between March and September 1994
.
The objective of the investigations was to determine the most probable cause of
inhibition and to identify a promising treatment technology
. Mobil researchers
suspected
phenol to be a major cause of inhibition and developed a nickel-tungsten
catalyst bonded to activated carbon (Ni/W-AC) to remove phenol by catalytic
oxidation .
Laboratory investigations with the catalyst yielded positive results .
However, pilot-scale testing with the Ni/W-AC process between March and September
1995 was less successful .
Mobil researchers observed that phenol was removed by
adsorption to the activated carbon, not by catalytic oxidation, and concluded that
adsorption was not a commercially viable option for phenol removal from sour water
.
Mobil spent in excess of $100,000 for the multiple phases of the SWSTU investigation
.
3.6.2 MICROTOX Study
Using MICROTOX technology, Mobil performed a toxicity identification study
elucidating toxic inputs to the WWTP
. This study concluded :
•
Toxicity increases across the BRU-supporting Mobil's contention that the
operation and performance of the WWTP has become less reliable after the
BRU installation.
•
Commissioning of the new Merox unit lead to an overall decrease in toxicity .
•
River intake water, at some times, may contain toxic constituents that neither
the refinery's processes nor the WWTP can remove
.
3 .6
.3 Nalco Chemical Company Ammonia Inhibition Study Summary
Mobil has on several occasions-between 1981 and 1995-attempted to identify
sources of inhibition to biological nitrification in its wastewaters
. As described in
Subsection 3
.5
. 1, Mobil conducted a nitrification inhibition study from October 1981
through January 1983 .
Results from this study indicated that factors inhibitory to
biological nitrification in Mobil's wastewaters were recurring and unpredictable
.
In 1995 Mobil contracted with Nalco Chemical Company (Nalco) to conduct a
second ammonia inhibition study on input streams to the WWTP
. The work involved
laboratory testing and a general review of the wastewater generation and treatment
processes . Nalco conducted their study to assess the degree of nitrification inhibition
CHI-0 197CT/MOBIL-JOLREF
3 -22
of 15 wastewater influent component streams and their overall contribution to the
quality of the final effluent
. Nalco also attempted to correlate measured nitrification
inhibition to such parameters as pH, ammonia, residual COD following biological
treatment, cyanide, sulfide, phenols, conductivity (dissolved salts), nitrates, and
process unit variability .
The principal finding of the study was that inhibition to the
nitrification process was caused by biological degradation products produced in the
activated sludge process
. Thus, by accomplishing its primary
objective, i
.e ., the
oxidation of degradable organics, the biological treatment process appeared to be
creating conditions that prevented it from achieving high levels of nitrification
.
Mobil spent a total of $120,000 for the MICROTOX and the Nalco nitrification
inhibition studies
.
3 .7 SUMMARY
The Mobil Joliet refinery WWTP has a history of varying ammonia removal due
to inhibition of nitrification in the treatment plant
. Nitrification is a sensitive process
that can be affected by many factors
. Mobil has been able to identify some causes for
reduced nitrification,
e .g
.,
increased WWTP influent toxicity resulting from the
installation of the BRU
; and incursion of the phenolic spent caustic into the wastewater
system.
However, even after installing the caustic free Merox unit and totally
upgrading the WWTP, Mobil is unable to consistently meet the state effluent standard
.
The Joliet refinery WWTP effluent is significantly below the USEPA BPT and
BAT ammonia effluent limitations (daily maximum of 2,215 lb/day and daily average
of 1,007 lb/day)
. The facility also has operated at flow rates significantly lower than
the BPT average flow rate, due to water conservation and stream segregation
. These
water conservation and segregation practices may, in a sense, hinder Mobil's efforts to
meet the Illinois concentration-based effluent limit
. The net result of discharging less
water is that wastewater constituents are concentrated in the reduced flow
.
CHI-01 97CT/MOBIL-JOLREF
3-23
Mobil has
extensively
investigated
and
implemented alternatives to increase
ammonia removal and to upgrade the WWTP performance . Mobil has invested close
to $10 million in these efforts . Their investment has improved ammonia removal in the
WWTP; however, not to a level that will consistently meet the 3 mg/L monthly
average effluent standard .
CHI-0197CT/MOBIL-JOLREF
3 -24
SECTION 4
ANALYSES OF THE
WASTEWATER TREATMENT PLANT OPERATION
4.1 INTRODUCTION
Parsons ES's evaluation of the operation of Mobil's wastewater treatment facility
included the following tasks :
1
. Reviewing the current operation and configuration of the facility - review
includes a description of the WWTP, and both facility nitrification and
general WWTP assessment .
2
. Comparing the Joliet Refinery WWTP to industry practices and guidelines
.
3
. Assessing alternative technologies to achieve complete ammonia removal
.
4.2 CURRENT FACILITY CONFIGURATION AND OPERATION
4.2 .1 Treatment Plant Description
Subsection 2
.5 presented a brief overview of the wastewater treatment plant . In
Table 4
.1 the WWTP is further characterized by the outlining of the functions and
specifications of the individual unit processes .
4 .2 .2 Nitrification Assessment
Table 4.2
presents refinery WWTP operating data for 1989, 1995, and 1996
.
These years were selected since 1989 is representative of a time during which the
effluent ammonia was very
low-indicating good
WWTP ammonia reduction
performance-while 1995
and
1996 represent periods of poor and
improving
performance, respectively
.
Outlined in the table are the treatment plant influent,
clarifier effluent, and treated-water quality as well as operating parameters (flow, mix-
liquor concentration, wasting rate, food-to-mass ratio, and sludge age) within the
aeration basins .
Nitrifying bacteria require specific conditions to oxidize ammonia
. There is a
fairly narrow band of favorable nitrifying conditions, and therefore, nitrification can be
an inconsistent process .
Table 4
.3 compares the values of nitrification factors for
CHI-0 I97CT/MOBIL-JOLREF
4-1
TABLE 4.1
UNIT PROCESSES, DESIGN SPECIFICATIONS, AND TYPICAL OPERATING
PARAMETERS
MOBIL REFINERY
JOLIET, ILLINOIS
CHI-0 197CT/MOBIL-JOLREF
4-2
Process Unit
Function
Sour
Water
,
J
Specifications
Stripper
Ammonia and Sulfide
Removal
- 15 MBBL/day @a 99 .5 % efficiency
Desalter
Phenolics Removal and In-
plant Water Reuse
TK 103
Primary Flow Equalization - 4
.2 million gallons
Benzene
Removal Unit
Benzene, Sulfide, and VOC
Removal
Diversion Basin
Wet-weather hydraulic
overflow
-
1 .6 million gallon capacity
API Oil/Water
Separator
Gravity Separable Oil and
Settleable Solids Removal
- 2 Channels (specs per channel) :
- 110 ft x 14 ft x 6 ft = 69,000 gal
- Four 8 inch reaction jet distribution nozzles
- Rise rate = 2 ft/min at 1250 gpm
- Flight Scrapers
Dissolved Air
Flotation
Suspended Oil and Solids
Removal
- 2 Channels (specs per channel) :
- 34,000 gal
-
Rise rate = 4 ft/min at 1250 gpm
- Flocculating Agent = Nalco 7134 (added in
flash mix chamber)
- Q, = 0 .33Q through pressure tank for
supersaturation of water with air
- Air pressurization (Q,) = 45 psig
Equalization
Biological
Treating Unit
Secondary Flow
Equalization; Phenolics and
COD Oxidation
- 5
.8 million gallons
Aeration Basins Ammonia, Organics, and
Cyanide Removal
- 2 basins operated in parallel configuration
(specs per basin) :
- Dimensions : Bottom - 57 ft x 115 ft ; Top -
93 ft x 151 ft ; Slope of walls
-
1.5 (horiz.) / 1 .0
(vert .); water depth - 12 ft
- Volume 900,000 gal
- 1900 gpm (HRT = 0.66
days = 15 .8 hr)
- Two 75 hp blowers (per basin) provide 4500
SCFM (air to diffusers)
- Fine Bubble Diffuser: four grids combined
(850, 700, 700, and 530 diffusers per grid)
- Temperature Control : 75 ft
steam sparger
connected to 40/150 psig steam header
TABLE 4
.1
UNIT PROCESSES, DESIGN SPECIFICATIONS, AND TYPICAL OPERATING
PARAMETERS
MOBIL REFINERY
JOLIET. ILLINOIS
Note
: operating parameters taken from plant operations manual
.
CHI-0 197CTIMOBIL-JOLREF
4-3
Process Unit
Function
Specifications
Clarifiers
Sludge Settling
-
2 clarifiers operated in parallel configuration
(specs per clarifier) :
- 80 ft Diameter Dorr-Oliver Clarifiers
- Volume = 500,000 gal
- Detention time = 6 .5 hr
- Q, = 1.09Q
- Overflow rate = 515 gpd/ft2
- Sludge blanket = 3 ft to 4 ft
- Vacuum/rake arm (clarifier bottom) ; surface
skimming trough covers radius of tank
Polishing
Guard Basin
Storage of clarifier effluent
providing for further settling
- Surface Area (equivalent) = 1
.25 acres w/
12 ft water depth
- Volume = 4.9 MG
-HRT = 43 hrs @ 1,900 gpm
Cascade .
Aerator
Raise DO in water to near
saturation level
- Vertical aeration nozzle assembly (1,500 gpm)
TABLE 4 .2
OPERATING DATA (DEVELOPED FROM MONTHLY MINIMUM, MAXIMUM, AND AVERAGE OPERATING DATA)
WASTEWATER TREATMENT PLANT
MOBIL REFINERY
JOLIET, ILLINOIS
CHI-0 197CTIMOBIWOLREF
N/D indicates not determined
4 -4
Parameter
Units
1996
Minimum
Maximum
Average
1995
Minimum
Maximum Average
Minimum
Maximum
1989
Average
Aeration Basin Influent
BOD
mg/L
191
195
193
137
259
197
46
91
72
COD
mgIL
515
815
662
452
1003
710
250
532
354
pH
s .u .
7 .9
9.4
NO
7 .4
8 .9
NO
7 .6
8 .9
NID
NH3-N
mg/t.
25
43
34
23
45
35
15
41
26
Phenolics
mgfL
15
39
27
8
41
21
1
20
6
O&G
mg/L
12
53
28
10
51
28
5
16
I0
Fluoride
mg/L
3.9
12.5
7.5
6
16
9
3
8
5
Alk-T
mg/1 .
NO
MID
290
NO
NO
248
MID
NO
208
Alk-P
mgll
NO NO
35 NO
NO
6
NO NO
10
TSS
mg/L
ND
N1D
288
NO
MID
131
NO
NO
86
Flow
mgd
1 .8
3 .1
2 .4
1 .9
3 .1
2 .5
2
3.5
2 .9
East Aeration Basin
MLSS
m91L
7023 14208 10276
6552 15814 10581
11375 16420
13324
MLVSS
mglL
3566 7426 5609
3389 8433
5375
4777
7379
5792
Wasting
gallonslday
429
8750
3374
0
10552 5432
NO
MID
WD
F/M
1/day
0 .05
0 .05
0 .05
0 .04
0.05
0 .05
0 .01
0 .02
0 .02
SRT
Days
340
61
132
502
63
112
NO
NO
NO
East Clarifier
COD
mg/L
108
295
168
90
184
134
59
155
100
NH,-N
mgIL
0
11 .1
3 .5
0 .4
14 .4
6 .9
0
1
.9
0 .2
Alkalinity
mg/L
45
277
139
59
241
122
79
157
101
TSS
mg/L
16
44
28
9
27
17
6
39
17 .
N03-N
mg/L
7
19
13
ND NO NO NfD
MID
ND
P04-P
mg/1-
NO NO
I
NO NO
1
NO NO
NO
Temp
F
NO
NID
90
NO
NO
87
N10 NO
MID
West Aeration Basin
MLSS
mg/L
6354
16380 10435 5620 17260 10178 10667 21104 14422
MLVSS
mg1L
3302
10566 5572 3067 8263
5136
5034
8412
6389
Wasting
gallonslday
429 10286 4173
0
9807 4775 NO
NO
WD
FIM
Ilday
0 .06
0 .03
0 .05
0 .05
0 .05
0 .05
0 .01
0 .02
0 .02
SRT
Days
318
62
118
454
66
120
NO
NO
NID
West Clarifier
COD
mgr-
102
253
166
101
221
141
59
155
100
NH3 -N
mg/L
1 .3
13.6
6 .4
1 .7
18 .7
10
0
2
0
Alkalinity
mg/L
59
338
168
71
217
132
73
155
100
TSS
mg/L
14
47
30
9
24
17
5
40
17
N03-N
mg/L
5
16
9
NO NO NO NO NO NO
P04P
mg/L
NO
N1D
I
NO NO
I
NO
NO NO
Temp
NO MID 92
NO
NID 87
NO NO NO
Outfall 001
BOD
mg/L
4
25
9
4
14
8
1
3
2
COD
mg/L
92
196
131
104
167
129
67
126
95
pH
s .u .
7 .2
8
NO
7
.2
7 .7
NO
7 .2
7 .8
NO
NH3-N
mg/L
0 .3
10 .5
3 .9
2
12 .9
6 .3
0
0 .8
0 .2
Phenolics
mg/L
0 .003
0 .014
0 .006
0.002 0 .019
0 .007
0 .001
0 .009
0004
O&G
mg/L
0 .8
3 .8
2 .2
0.8
3 .2
2
0 .5
2 .1
1 .1
Fluoride
mg/L
4 .9
9 .4
6 .9
5 .7
14
.4
8 .8
NO
NO
NO
TSS
mgll
11
36
20
8
26
14
5
19
12
Flow
mgd
1 .8
3 .1
24
1 .9
3 .1
2 .5
2
3 .5
2 .9
TOC
mg/l-
20
48
30
22
39
29
12
20
15
Sulfide
mg/L
0
0 .053
0 .018
0
0 .028
0.007
0
0
0
CN
mg/L
0,004
0 .014
0.008
0.005
0 .015
0 .01
0 .033
0 .089
0 .06
Or (VI)
mg/L
0 .001
0.006
0.003 0 .001
0.007 0 .002 0 .004
0.014 0 .007
Cr (total)
mg/I-
0 .002
0.014
0 .005
0 .004
0 .011
0 .007
0 .059
0 .087
0 .058
TABLE 4 .3
SUMMARY OF NITRIFICATION FACTORS
(AVERAGE OF EAST AND WEST BASINS-1996)
WASTEWATER TREATMENT PLANT
MOBIL REFINERY
JOLIET, ILLINOIS
CHI-0197CT/MOBIL-JOLREF
4-5
1 : Calculated using 11/96 and 12/96 wasting rates for east and west basins
(5,000 gpd), along with yearly MLVSS and yearly effluent TSS averages .
2
: Up to 4 or 5 mg/L, nitrification performance increases with increasing DO .
3: Observed range since installation of fine bubble diffusers and new DO probes .
4: Nitrification rates decrease with temperatures . Maintenance of "complete"
nitrification at temperatures less than approximately 30 °C usually not
observed ; nitrifiers usually cannot survive and reproduce for long periods of
time at temperatures greater than 38 - 40°C .
5: Minimum alkalinity value indicated for aeration basin effluent
.
Parameter
Units
Minimum Level
for Nitrification
Mobil
Operation
F/M
(lb BODa)/(Ib MLVSS/Day)
0 .3
0.05
Sludge Age (SRT)
Days
Minimum = 10
107 (11
Dissolved Oxygen
mg/L
Minimum = 2
(2)
3.0 - 5.5 '
Temperature
o C
Greater than 30 1' 1 30-36
pH
S .U .
Rangeoptimum = 8
- 9
7.8-9
.4
Alkalinity
mg CaCO,/L
Minimum = 50
(5)
180
Notes :
Mobil's operating
conditions with values of the
same parameter required for
nitrification . Average 1996 values for both east and west aeration basins were utilized
to calculate the values of Mobil's nitrification parameters . While dissolved oxygen
(DO), temperature, pH, and alkalinity are directly measured factors, the food-to-mass
ratio (F/M) and sludge retention time (SRT) are calculated parameters
. The F/M ratio
relates the organic matter available (organic loading) to the quantity of biomass within
the system .
The SRT, which describes the age of the biomass within the aeration
basin, is dependent upon the rate at which the biomass grows and on the sludge wasting
rate of the treatment plant
. Of these two parameters, the sludge age is the critical one .
The sludge age must be greater than the inverse of the growth rate of nitrifying bacteria
to prevent these organisms from being washed out of the system as sludge is wasted .
Under ideal conditions, a minimum sludge age of 3 to 5 days is required . Experience
with refinery wastes indicates that a minimum value of approximately 10 days is often
required . The approximate value of the F/M ratio (BOD basis) equivalent to a sludge
age of 10 days is 0.3/day .
The comparison in Table 4 .3 indicates that the treatment system is operated at
conditions favorable to achieving nitrification
. The fact that nitrifying is not achieved
consistently implies that chemical inhibition occurs .
4.2 .3 General Facility Performance Assessment
4
.2 .3
.1 API Separators and Dissolved Air Flotation Units
It was possible to assess the performance of the API oil/water separator (API)
and dissolved air flotation (DAF) processes, units upstream of the activated sludge
process in the WWTP . Figure 4
.1 plots 1996 oil and grease effluent values from the
DAF. Average influent oil and grease to the API was 1,544 mg/L, and effluent oil and
grease was 57 mg/L .
This translates into a removal efficiency of 96 percent
. The
effluent oil and grease concentration at Outfall 001 averaged 2 mg/L in 1996, which is
excellent performance for the system .
Cn1-0197CT/MOBIL-JOLREF
4-6
350
300
250
100
50
0
CHI-0197CT/MOBIL-JOLREF
FIGURE 4 .1
DISSOLVED AIR FLOTATION (DAF)
OIL AND GREASE EFFLUENT (mg/L)
- 1996
MOBIL OIL REFINERY
JOLIET, ILLINOIS
API INFLUENT : MIN=2, MAX=25,000, and AVG=1,544 mg/L.
DAF EFFLUENT : MIN=2 ; MAX=332, and AVG=57 mg/L .
Date
4-7
•
• ••
r
rn
0
m
(D
l0
a,
to
a
rn
NN
Mtp
N
m
mN_
In
m7
toN
rn
N
O
4 .2 .3 .2 Aeration Basins (Activated Sludge Process)
The data in Table 4 .2 can be used to assess the facility's activated sludge process
performance. Table 4 .4 presents removal efficiencies determined for relevant water
quality parameters using the 1996 summary presented in Table 4 .2 . The removal
efficiencies displayed in Table 4
.4 indicate outstanding performance for the treatment
of a refinery wastewater .
4
.2 .3
.3 General Facility Operation Observations
Following a thorough inspection of the Mobil WWTP grounds and operating
data, Parsons ES concludes that Mobil properly operates their treatment facility .
Moreover, performance data are indicative of an exemplary treatment plant, evidenced
by BOD 5, TSS, and phenolics data . Although the facility design promotes conditions
well within the range for nitrification, the WWTP does not consistently achieve levels
of nitrification necessary to meet Illinois regulations . Studies have indicated that this
inconsistency can be attributed to inhibitory agents resulting from RCRA and NESHAP
mandated upgrades to the WWTP
. Therefore, it is the opinion of Parsons ES that
ammonia levels above the Illinois ammonia effluent standard do not result from poor
facility operation . Furthermore, it is unlikely that significant additional removal of
organics and ammonia
could
be
achieved through operating or equipment
modifications .
4 .3 COMPARISON TO INDUSTRY PRACTICES AND GUIDELINES
Detailed in Subsection 4 .2 are the unit processes employed by the Mobil WWTP
.
A comparison of Mobil's treatment plant practices with BAT requirements are
presented in Table 4 .5 .
Mobil meets or exceeds all BAT treatment plant process
requirements .
In addition, as previously stated in Subsection 3 .3 .2 the plant has consistently
performed far below the USEPA ammonia discharge criteria, and in the period of 1992
to 1996 the facility has had an average ammonia discharge of only 18 percent of the
CHI-0 I 97CT/MOBIL-JOLREF
4 -8
TABLE 4
.4
REMOVAL EFFICIENCIES FOR RELEVANT WATER QUALITY
PARAMETERS (1996)
WASTEWATER TREATMENT PLANT
MOBIL REFINERY
JOLIET, ILLINOIS
CHI -0197CTIMOBIL-JOLREF
4-9
Parameter
Units
Influent
Concentration
Effluent
Concentration
Removal
Efficiency (%)
BODS
mg/L
193
9
95
COD
mg/L
662
131
80
TSS
mg/L
288
20
93
NH 3 -N
mg/L
34
3 .9
89
Phenolics
mg/L
27
0 .006
99 .9
TABLE 4 .5
COMPARISON OF BAT REQUIREMENTS WITH MOBIL'S PRACTICES
MOBIL REFINERY
JOLIET, ILLINOIS
CHI-0197CT/MOBIL-1OLREF
4-10
BAT REQUIREMENT
MOBIL'S PRACTICE
•
Sour Water Stripper (SWS) sulfur and
ammonia minimum removal efficiency
equal to 85%
• 15 MBBL/day at 99 .5% efficiency
• In-Plant Water Reuse
•
•
SWS effluent directed to Desalter
SWS effluent directed to Fluid
Catalytic Cracker
• Flow Equalization
•
•
•
Primary Equalization - 4 .2 million
gallons (TK 103)
Secondary Equalization - 5 .8 million
gallons (EBTU)
Wet Weather Diversion Basin - 1 .6
million gallons
• Oil and Solids Separation
•
•
Dual Channel Preseparator Flume
Dual Channel API Separator
• Additional Oil and Solids Separation
•
Dual Channel Dissolved Air Flotation
• Biological Treatment
•
•
Two 900,000 gallon Aeration Basins
Two 500,000 gallon Clarifiers
• Final Polishing
•
•
One 4 .9 million gallon Guard Basin for
Treated Process Water
One 5 .8 million gallon Uncontaminated
Storm Water Impoundment Basin
federal limit
. Moreover, Table 4 .6 presents a comparison of Mobil's WWTP effluent
(1996 average) with BAT effluent guidelines and highlights that the facility is
significantly less than all federal effluent requirements .
4.4 ALTERNATIVE TECHNOLOGY ASSESSMENT
On several occasions, Mobil has assessed alternate technologies to promote
compliance with the Illinois ammonia standard . This section details Mobil's activities
predating their preparation for the ICPB 93-151 variance petition and those related to
this petition .
Beginning in the late 1970s Mobil investigated technology options that might be
employed to comply with the ammonia standard .
From 1979 through 1982, Mobil
constructed and operated a two-stage pilot treatment system with the objective of
determining if this level of treatment was capable of meeting the state of Illinois
standard
. The results demonstrated that this system could not produce an effluent that
consistently met the standard .
In 1984 Mobil retained consultants who evaluated several technologies potentially
capable of complying with the state of Illinois standard .
The consultants initially
considered ion exchange, breakpoint chlorination, ozonation, air stripping, and land
application, but rejected all of these based on considerations including performance
limitations and commercial availability, site suitability, production of chlorinated
organics, and the generation of other toxic byproducts .
In addition, while these
processes are frequently listed in textbooks for the removal of ammonia from industrial
wastes, there are few full-scale installations on which to judge the performance of these
processes
. These consultants considered three processes in greater detail :
•
Addition of rotating biological contactors (ABCs) as a second stage of
treatment
.
•
Addition of a trickling filter as a second stage of treatment,
•
Addition of a third aeration basin and clarifier in parallel to the existing
activated sludge system .
CHI-01 97CT/MOBIL-JOLREF
4-11
TABLE 4.6
COMPARISON OF EFFLUENT (1996)
WITH BAT EFFLUENT GUIDELINES
WASTEWATER TREATMENT PLANT
MOBIL REFINERY
JOLIET, ILLINOIS
CHI-0 197CT/MOBIL-JOLREF
Notes :
1
Calculations made according to 40 CFR 419-using 200,000 bbl/day, size
factor = 1
.41, and process factor = 1
.19.
2
Calculations made using average Outfall 001 effluent concentrations for 1996
and 1,900 gpm
.
3
Represents BAT flow for refinery of similar size
.
4-12
Parameter
BOD5
Units
lb/day
BAT Limit
I
Mobil WWTP
(30-day
Average)'
Discharge2
1,846
205
COD
lb/day
12,886
3,098
NH3-N
lb/day
1,007
89
Phenolics
lb/day
12 .1
0 .16
Oil & Grease
lb/day
537
52
TSS
lb/day
1,477
456
Sulfide
lb/day
9 .7
0 .4
Flow
gpm
5,200
1,900
The consultants rejected these systems due to prohibitive associated costs and/or
because they were unproven technologies in the improvement of ammonia
reduction
.
Parsons ES concurs with these conclusions of the previous consultant .
Mobil also looked at other options in 1995, in preparation of the ICPB 93-151
variance petition . Using in-house research group resources, Mobil conducted an
evaluation of treatment technologies that could be added to the existing treatment
system to achieve compliance with the state of Illinois ammonia standard . Based upon
their review of published literature, previous studies of Joliet's process wastewater, and
the experiences
at other refineries, Mobil personnel identified
the following
commercially-available technologies
:
•
Activated sludge with powdered activated carbon (PACT process) - the PACT
Process might adsorb organics inhibitory to nitrifiers.
•
Selective ion exchange of WWTP effluent - sodium ions held by electrostatic
forces to charged functional groups on the surface of a solid are exchanged
for ammonia from a solution in which the solid is immersed .
•
Breakpoint chlorination of WWTP effluent - chlorine gas is added to
wastewater in sufficient amounts to cause the oxidation of the ammonium ions
in solution to end products composed predominantly of nitrogen gas .
Detailed in Table 4 .7 are the advantages and disadvantages of the ammonia
reduction technologies researched by Mobil . Table 4 .8 details activities and costs
associated with the implementation of the alternative treatment technologies . The costs
presented in Table 4
.8 were developed from process designs using literature values for
the needed design parameters . Budget quotes from manufacturers were used as the
base of the cost estimates . Factors were applied to account for site preparation,
electrical, instrumentation, piping, and structural work, Factors were also added to
account for engineering, construction management, and administration of the contract .
It is the opinion of Parsons ES that Mobil's alternative treatment survey was thorough
and included appropriate technologies . Mobil's evaluations included a biological
option (the PACT process) which has been applied in other applications
to adsorb
CHI-01 97CT/MOBIL-JOLREF
4-13
TABLE 4.7
POST-TREATMENT AMMONIA REDUCTION TECHNOLOGIES
MOBIL WASTEWATER TREATMENT PLANT
MOBIL REFINERY
JOLIET, ILLINOIS
CHI-0 197CTIMOBZL-IOLREF
4-14
Post-Trtmnt Technologies
Advantages
Disadvantages
PACT Process
•
Improve nitrification
High operating costs
• Potential to remove
(regeneration necessary)
•
toxics from WWTP
influent
Improves solids settling
Improves resistance to
Very abrasive to
mechanical equipment
Higher rates of sludge
production
shock organic loading
• Cross-transfer of
• Ammonia destruction
pollutants to air during
(assuming nitrification
occurs)
PACT regeneration
Ion Exchange
• Proven technology
•
Cross-transfer of
•
Selective for ammonia
Minimal increases in
•
ammonia to regenerant
High capital cost
total dissolved solids
• Creates regenerant waste
(TDS)
•
stream
Prone to organic fouling
• High zeolite make-up
•
rates required
Complex process
• Cannot remove organic
•
nitrogen (which might
subsequently hydrolyze
to ammonia)
Little experience using
clinoptilolite in long-
term applications
Breakpoint Chlorination
• Low capital cost
• High operating costs
• Proven technology
• Potential formation of
•
One-step process
Ammonia destruction
•
chlorinated organics
Handling/safety hazards
• Low special
with chlorine gas
requirements
• Requires dechlorination
• Potential for increase in
TDS
TABLE 4.8
AMMONIA REDUCTION TECHNOLOGIES - ACTIVITIES & COSTS
WASTEWATER TREATMENT PLANT
MOBIL REFINERY
JOLIET, ILLINOIS
Notes :
Costs estimated in 1993
; updated for first quarter 1997 using ENR cost indices .
b Annualized cost = operating cost plus capital cost amortized for 10 years at 9 % .
` Calculated using 10 year cost of technology, 1,900 gpm WWTP flow, and 1996
average NH 3-N effluent (3 .9 mg/L) .
CHI-0197CTIMOBIL-JOLREF
4-15
Required Facilities to Employ Specific
Technology at Joliet WWTP
Costs'
Capital(10
1$ )
Operating
(101 $/yr)
Annualized'
(106 $/yr)
Incremental
Unit Removal`
($/lb NH,)
PACT Process
•
Makeup carbon silo and carbon feed
system
•
Carbon regeneration system (CRS) -
wet air oxidation
•
Building to house CRS
•
Additional solids handling equipment
•
Utilities tie-ins
•
Retrofits of existing pumping
equipment, mechanical aerators, and
clarifier drive mechanisms for
abrasive service
9 .2
1
.9
3.3
490
Ion Exchange ,
•
Ion exchange columns with
clinoptilolite charges
•
Backwash facilities
•
Regeneration facilities
•
Granular media filters
•
Utilities tie-ins
•
Buildings to house ion exchange
equipment
16 .2
1 .6
4
.1
609
Breakpoint Chlorination
•
Chlorine contact chamber and
associated metering equipment
•
Dechlorination facilities
•
Chlorination/dechlorination facilites
building
•
Utilities tie-ins
•
Chlorine safety facilities
2 .2
0 .8
1 .1
163
inhibitory organics and two physical-chemical processes (selective ion exchange and
breakpoint chlorination) that have the potential to remove ammonia and would not be
affected by inhibitory substances .
Mobil has experimented with and performed engineering evaluations on a number
of processes that might provide the means to comply with the state ammonia standard .
None have proved suitable due to a variety of problems including performance
shortfalls, unreasonable cost, unsuitability for the Joliet site, and the generation of
unacceptable toxic byproducts .
Furthermore, the process costs associated with removing the incremental amount of
ammonia necessary to meet the state effluent guideline are prohibitive. Unit removal
costs, which reflect the dollars per pound of ammonia removed, are presented in
Table 4 .8 . These values were calculated using the 1996 average ammonia effluent (3 .9
mg/L), a flow of 1,900 gpm, and the process technology 10 year cost . Assuming that
3 mg/L effluent ammonia concentration could be consistently reached, in order to .
remove an additional 0 .9 mg/L to meet the 3 mg/L effluent limitation, PACT, ion
exchange, and breakpoint chlorination will cost $490/lb NH
3 , $609/lb NH3,
$
163/lb
NH3, respectively .
To put these costs for ammonia removal in perspective, they were compared to
existing Joliet Refinery treatment costs . A baseline ammonia removal cost was
calculated that reflects the costs prior to the upgrades made between 1990 and 1996
(these upgrades are presented in Subsection 3
.5 .2) . The cost was derived by dividing
the total treatment system operating cost by the quantity of ammonia removed, The
"pre-upgraded" cost was $8/lb of NH3 removed .
Considering the cost of the upgrades to promote ammonia removal (Subsection
3 .5 .2), ammonia removal following these upgrades costs $24/lb . These costs include
the treatment system operating cost as well as the amortized capital cost of the
upgrades. According to the costs presented in Table 4
.8, the least expensive alternate
technology, breakpoint chlorination, would add an expense of approximately $163/lb
CHI-0197CT/MOBIL-JOLREF
4-16
NH3 removed-representing an increase of 20 times the "pre-upgrades" ammonia
removal cost (seven times the current ammonia removal cost)
. Moreover . emplov°ing
ion exchange technology, the most expensive treatment alternative
. would add an
expense of approximately $609/lb NH 3 removed, an increase of 76 times the "pre-
upgrade" cost (25 times the current ammonia removal cost)
.
CHI-(n 97CT/MOBIL-JOLREF
4- 1 7
SECTION 5
CONCLUSIONS
Parsons ES reached the following conclusions during this investigation :
1 . The treatment system is properly designed and operated
. It consistently meets
its discharge permit and performs well above the USEPA Best Available
Technology (BAT) guidelines for the refining industry
.
2. Many improvements have been made to the system since it was initially
placed into operation in 1973
. Approximately $10 million has been spent on
these improvements
. These improvements (presented in detail in Table 3
.4)
have had the objectives of accomplishing the following
:
•
Decrease and control ammonia loadings to the treatment plant
.
•
Increase equalization capacity and degree of pretreatment .
•
Improve the design and performance of the treatment system, and create
conditions favorable to achieving biological nitrification .
3
. This evaluation of the Mobil treatment system revealed no operational
changes nor modifications that would likely lead to consistent nitrification .
Recent data indicates that the system is operated within the envelope of
conditions required to achieve nitrification . In fact, nitrification is achieved
in the system on occasion for several months at a time
. However, there are
other operating periods during which nitrification ceases or is significantly
reduced due to reasons that can best be explained as chemical inhibition of
nitrifying organisms .
4
. Mobil has conducted studies and implemented changes in operations to reduce
sources of inhibition that might prevent effective and consistent nitrification .
The efforts to identify and remedy the sources of inhibition have not been
completely successful
. The most consistent conclusions from these tests are
that some toxicity is added to the wastewater with passage through a benzene
removal unit (required for compliance with Resource Conservation and
Recovery Act [RCRA] and the Clean Air Act) and that byproducts of the
degradation of organics in the activated sludge system are inhibitory to the
nitrification process .
5
. Because of these problems, the treatment system does not consistently meet
the Illinois ammonia standard .
While effluent ammonia concentrations have
progressively decreased from an annual average of 17 mg/L in 1977 to values
ranging from less than I mg/L to 6 mg/L in recent years, Mobil has not, even
with the improvements and studies summarized above, been able to meet the
state average standard of 3 mg/L with sufficient consistency .
CHI-0197CTIMOBIL-JOLREF
5-1
6 . Mobil has investigated a number of technologies with the hope of identifying
one which could achieve compliance with the state ammonia standard
.
No
applicable process has been identified
. Problems with the technologies
evaluated include high cost, site suitability problems, and generation of
chlorinated organics
. These technologies are not proven for the Mobil Joliet
Refinery application and their cost is prohibitively high to recommend them
for implementation .
CHI-0197CT/MOBIL-JOLREF
5-2
EXHIBIT VIII
PLUME STUDY
and
EFFLUENT LIMIT
DERIVATIONS REPORT
MOBIL OIL CORPORATION
JOLIET REFINERY
JOLIET, ILLINOIS
Prepared by :
James E . Huff, P.E.
Sean D. LaDieu
April 21, 1997
HUFF & HUFF, INC
.
ENVIRONMENTAL
La GRANGE, ILLINOISCONSULTANTS
TABLE OF CONTENTS
Page
1 . INTRODUCTION
1
2
. BACKGROUND
2
2.1 Mobil Oil Refinery WWTP
2
2
.2 Des Plaines River
2
2
.3 Mixing Zone and Zone of Initial Dilution Regulations and Policies 4
3
. FIELD RESULTS
5
3 .1 Plume Study Sampling
5
3 .2 Sampling Methods
5
4. MIXING ZONE AND ZID DETERMINATION
12
4.1 Mixing Zone Size
12
4 .2 ZID Size
12
4.3 Available Mixing Discussion
15
5
. APPLICABLE PERMIT LIMITS
17
5.1 Derivation of Effluent Limits
17
5.2 Water Quality-Based Effluent Limits
17
5 .3 Existing Ammonia Effluent-Based Limits
18
5 .4 Existing Permit Limits
19
5.5 Applicable Ammonia Effluent Limits
20
5.6 Discussion
20
LIST OF FIGURES,
FIGURE 2-1 : SITE LOCATION MAP
3
FIGURE 3-1 : SAMPLE LOCATION MAP
9
FIGURE 4-1
: CHLORIDE DILUTION ISOPLETHS
13
FIGURE 4-2 : AREA FOR ZID
14
LIST OF TABLES
TABLE 3-1
:
MIXING ZONE AND ZONE OF INITIAL DILUTION STUDY
FIELD MEASUREMENTS
7
TABLE 3-2 : MIXING ZONE AND ZONE OF INITIAL DILUTION STUDY
RAW DATA
10
TABLE 3-3 :
CHLORIDE DILUTION RATIOS
11
TABLE 5-1 : AMMONIA EFFLUENT HISTORICAL QUALITY 21
3 .3 Sampling at Effluent Channel
6
3 .4 Sampling Data
8
APPENDICES
APPENDIX A :
AMMONIA DILUTION RATIOS
APPENDIX B :
SCHEMATIC OF WATER FLOW
-
MOBIL JOLIET REFINERY
APPENDIX C :
WATER-QUALITY BASED AMMONIA EFFLUENT CALCULATION
APPENDIX D :
EXISTING EFFLUENT QUALITY BASED EFFLUENT LIMITS
1 . JNTRODUCTION,
The Mobil Oil Corporation - Joliet Refinery (Mobil) operates a wastewater treatment plant (W WTP)
for the treatment of process wastewater and in-plant surface run-off. The WWTP flowrate on
average is approximately 1,900 gallons per minute (gpm) or 2 .7 million gallons per day (mgd) and
discharges to the Des Plaines River through Outfall 001 . Mobil currently operates the W WTP under
National Pollution Discharge Elimination System (NPDES) permit no
. 11,0002861 .
The ammonia limits set forth in the NPDES permit are based on a variance for effluent limits . The
variance allows a monthly average ammonia limit of 13 mg/I and a daily maximum limit of 26 mg/l .
This was granted on March 3, 1994 and originally expired on March 3, 1998
. The variance now
expires on March 3, 1999 after a one year extension was granted to Mobil . Unless site specific relief
is adopted before the current variance expires, the ammonia effluent limits will be reduced to the
applicable Illinois effluent limits of 3 .0 mg/I and 6 .0 mg/I for the monthly average and daily
maximum, respectively
.
A plume study was conducted at Outfall 001 in order to determine the extent of mixing that occurs
between the outfall and the Des Plaines River . The plume study included an evaluation of the
mixing zone and the Zone of Initial Dilution (ZID)
. The report contained herein documents the
procedures used for the study, results, and implications for future limits .
2. BACKGROUND
2 .1 Mobil Oil Refinery WWTP
The Mobil refinery is located in Will County approximately 10 miles southwest of Joliet, Illinois,
on the south side of the Des Plaines River just east of the Interstate 55 bridge
. The location of the
refinery is depicted on Figure 2-1 with the WWTP located on the north side of Arsenal Road
. The
WWTP is an activated sludge system that is preceded by an API oil/water separator system, a
dissolved air flotation system, and equalization biological treatment units
.
The existing NPDES permit for the refinery covers nine outfalls numbered as Outfall 001 through
Outfall 009. Outfall 001 discharges the treated process wastewater to a manmade outfall channel
depicted in Figure 2-1 . Outfall 002 discharges non-contact cooling water from the plant into the
same manmade outfall channel,
as does Outfall 003 which discharges stormwater for the west
storage basin
. The remaining outfalls (004 through 009) are all stormwater runoff discharges .
2.2 Des Plaines River
The refinery WWTP discharges into the Des Plaines River upstream of the 1-55 bridge at River Mile
278.5 (approximately) . The Des Plaines River originates near Kenosha, Wisconsin and travels south
and then southwest before merging with the Kankakee River near Channahon, Illinois, where the
combined rivers become the Illinois River. The width of the Des Plaines River at the point of the
refinery WWTP outfall is approximately 600 feet .
The Des Plaines River is designated as a Secondary Contact Water under 35 Ill . Adm. Code 303 .441
from the confluence with the Chicago Sanitary and Ship Canal to the Interstate 55 bridge . The water
quality standards for Secondary Contact Waters are set forth in 35 Ill . Adm. Code 302 Subpart D .
The ammonia water quality standard for these waters is based upon the un-ionized portion of
ammonia with the established limit being 0
.1 mg/l
.
535
"Des Plaines Vl6ol,4e
'S
HeaaaUa,ters
MOBIL OIL REFINERY y
c_
<P,°
Drummond
h
FIGURE 2-1
SITE LOCATION
MAP
MOBIL OIL
REFINERY
JOLIET,
ILLINOIS
0
2000'
0
2000'
Z
SOURCE
: UNITED STATES DEPARTMENT OF THE INTERIOR, GEOLOGICAL SURVEY
CHANNAHON, ILLINOIS QUADRANGLE
2 .3 Mixing Zone and Zone of Initial Dilution
Regulations and Policies
The mixing zone and Zone of Initial Dilution (ZID) are components of the State's program to protect
water quality within the vicinity of wastewater outfalls
. The mixing zone defines an area within
which the acute toxicity standard is to be met but the water quality standard may be exceeded
. The
water quality standards are to be met at the edge of the mixing zone
. The ZID is a portion of the
mixing zone and defines a boundary at which the acute toxicity standards are to be met
. Both of
these components are defined in 35 Ill . Adm. Code 302 as follows:
"'Mixing Zone' means a portion of the waters of the State identified as a region within which
mixing is allowed pursuant to Section 302.102(d)."
"'ZID' or 'Zone of Initial Dilution' means a portion of a mixing zone, identified pursuant to
Section 302 .102(e), within which acute toxicity standards need not be met
."
The concepts of the mixing zone and ZID are used to derive effluent limits protective of the
receiving stream's water quality standard
. Section 302 .102 sets the allowable area for the mixing
zone based upon the receiving stream dimensions
. The area and volume within which mixing occurs
is limited to 25% of the cross-sectional area and volume of the stream
. In no case shall the mixing
zone area be greater than 26 acres
.
Title 35 111
. Adm Code 302 defines the area allowed for the ZID as an area "within which effluent
dispersion is immediate and rapid" . The Illinois Environmental Protection Agency (IEPA) has
issued a guidance document for mixing zones that states the acute standard (the ZID area) "must be
met within 10% of the distance from the edge of the outfall to the edge of the regulatory mixing zone
in any spatial direction" .
The present study for Mobil was conducted to determine the available dilutional mixing available
for Outfall 001
. The study was conducted consistent with the regulations and policies described
above.
-4-
3 . FIELD RESULTS
3.1 Plume Study Sampling
Field sampling for the plume study was conducted on October 29, 1996
. Mobil provided the boat
and driver, the necessary sample bottles, and the laboratory analyses for the plume study evaluation .
Sampling locations were determined using a total station surveying system to measure angle and
distance .
The weather on the day of sampling was cold and rainy . The temperature during the day was
between 45 and 50 degrees fahrenheit
. The rain was intermittent with periods of heavy downpour .
The rain did not influence the low flow stream conditions that existed during the study period .
3 .2 Sampling Methods
Samples were analyzed for conductivity using a YSI Model 33 conductivity meter and temperature
was measured with a Cole-Panner Digi-Sense Type K Digital Thermometer
. These two parameters
were analyzed at the sample location . Mobil's laboratory analyzed the samples for ammonia,
chlorides, and pH on the same day
as collected . The rationale for the analyses conducted is as
follows:
•
Conductivity and Temperature -
These parameters were analyzed in the field as a method for
tracking the plume
. The plume effluent temperature and conductivity are both normally
higher than the receiving stream's .
•
Chlorides -
This parameter was chosen because it is a conservative pollutant
. There is
usually a large difference between river and effluent chloride levels and the analysis is fairly
accurate.
-5-
•
Ammonia - The intent of the plume study was primarily to determine the available dilution
within the mixing zone as it relates to the ammonia levels in the effluent .
•
pH - This parameter is easy to measure and is used in calculating un-ionized ammonia .
3 .3 Sampling at Effluent
Channel
The sampling for the Mobil plume study was conducted on
October 29, 1996, a day with low flow
river conditions. The United States Geological Survey operates a gaging station on the Des Plaines
River at Riverside, Illinois . This station is located approximately 39 miles upstream of the Mobil
discharge
. The nearest downstream station is the USGS station in Marseilles, Illinois on the Illinois
River located 32 miles from Mobil's outfall
. The flow values for these two stations, including the
day of sampling and the plant effluent flow are presented below :
The sampling program began by determining the general location and direction of the plume and the
depth of the plume
. This was determined by measuring the background water conductivity and
temperature, and comparing it to the effluent
. Using the boat, the river was then traversed to locate
the general shape of the plume by observing the conductivity and temperature measurements as they
compared to background levels . The measurements made in the field are presented in Table 3-1
.
The conductivity at a depth of one foot near the mouth of the outfall channel measured 2,000
umhos/cm, while at a depth of three feet, the conductivity was 750 umhos/cm
. Additional
conductivity probing consistently showed the plume was spreading on the surface, indicating a
"floating" plume . All samples were therefore collected at a depth of one foot .
-6-
USGS Monitoring
Station
7Q10 Flow, cfs
Sampling Day Flow,
October 29, 1996, cfs
Harmonic Mean
Flow, cfs
Des Plaines River at
Riverside
139
190
(October 28, 1996)
'70
Illinois River at
Marseilles
3,185
4,700
(October 28, 1996)
7,200
W WTP Effluent Flow
----
2 .9
----
V1
F
I
G
y
_
p QggymgWmmVmy0
OO~D y2~m
Z;====
Npy-Oy,OpS,eP
Y am u
N Y ~'~ Jup
W t,
228sssss
00e >- u- u- m u
u
S-- O J uNO-
u W 0
.J 4 P Y N p 4
_ wOJ
P O O `O P O O Y J
9§s § H§9 ~~s"s -"s
~8H M~5s
H.-.OM M
oms~U ss s§s~yu"s §
8
JJP
MPJ4 iPNOM JOOm
ONbO JOJO :~O-W 'POO/+4>PaOP4 PW~~~P~00N
P j-
AVWI°SPO
P P- J 1n P- P P- b
A J `O N m u
G J P 4 N--m
4- V m- -J y J u P m O J
N P P u m m
O P- 'O --
After the general direction and depth of the effluent plume was determined, samples were collected
for analysis . Each sample location was labeled with an alpha-numeric character and then a numeric
character
. The alpha-numeric character increased in the downstream direction while the second
numeric character increased with distance from the shoreline . Figure 3-1 depicts the sample
locations .
3 .4 Sampling Data
The sampling data for the measurements made at the sampling location, which include conductivity
and temperature were presented in Table 3-1 . The laboratory results for the parameters measured
in the laboratory are presented in Table 3-2
. These parameters include chlorides, pH, and ammonia .
Table 3-3 presents the chlorides values and compares the results to levels measured in the samples
collected from the upstream locations . These upstream samples were collected to determine
background levels in the river . The chloride results were used to calculate the dilution ratios for the
sample locations .
The dilution ratio is used to determine the degree of mixing that is occurring in the river
. The ratio
is determined by dividing the effluent value above background by the river sample value above
background . Higher dilution ratios indicate more dilution as the difference between the effluent
levels and the river levels is greater (the river level being lower than the effluent level) . The
background levels are subtracted from both the effluent sample and river sample to establish the
background level as the baseline level . The dilution ratios for the chlorides have been calculated and
are presented in Table 3-3
.
The ammonia effluent levels on the day of sampling ranged from 0
.00 mg/I to 0.16 mg/l . Four out
of the six effluent samples collected were 0 .00 mg/I
. In comparison, the upstream samples ranged
from 0
.00 mg/I (3 out of 6 samples) to 0
.28 mg/l. These levels were too low to produce results that
would allow tracking of the ammonia plume at any degree of certainty, and therefore were not used
for the plume delineation
. The ammonia analytical results as they compare to background levels are
included in Appendix A .
-8
TABLE 3-2
MIXING ZONE AND ZONE OF IN177AL DILUTION STUDY
RAW DATA
Mobil Oil Refinery
loud,
fllinou
Octobee29, 1996
File : flldWmobd/w 1wplumdauwk4
-10-
Sampk ID
Tune CWotide; mg!l
pH, units Ammonia, mgA
Upueam Sample.
US 1
08 :17
92
7 .57
0.28
US 2
08 :54
92
7 .50
0 .05
US 3
10 :00
93
7.64
0 .00
US 4
10 :50
94
7
.75
0.16
US 5
11 :46
93
7.81
0 .00
US 6
12:09
92
7.77
0 .00
Effluent Channel Sample.
EC 1
08:20
270
8 .09
0.16
EC 2
08 :56
227
7 .69
0.00
EC 3
09
:31
277
8 .09
0.00
EC 4
10 :07
279
8 .00
0.00
EC 5
10 :53
313.
8 .11
0.00
EC 6
11 :51
349
8 .17
0.05
Riwr Sampk+
Al
08 :25
228
7.79
0 .05
A2
08
:30
181
7.49
0 .11
A3
08 :32
197
7 .85
0 .00
A4
08 :34
166
7.69
0 .28
A5
08 :36
105
7 .65
0 .22
A6
08 :42
142
7 .64
0.11
A7
08 :44
121
7 .55
0.11
AS
08
:47
%
7 .29
0.18
A9
08 :51
103
7 .41
0.29
BI
09 :00
178
7 .71
0 .00
B2
09 :03
204
7
.73
0 .00
B3
09 :05
239
7 .89
0 .12
B4
09 :08
184
7 .69
0 .00
B5
09 :10
165
7 .74
0
.00
B6
09:12
153
7 .73
0.00
B7
09:15
135
7.64
0.00
B8
09:17
146
7 .67
0.16
B9
09 :20
121
8.05
0 .11
CI
09 :33
174
7 .87
0 .12
C12
09 :37
220
8 .02
0 .00
C3
09 :40
143
7 .80
0 .00
C4
09 :43
150
7 .76
0.11
C5
09
:45
218
793
0 .16
C6
09:48
198
7.86
0.00
C7
09 :51
133
7 .52
0 .05
C8
09 :55
93
7.62
0 .05
Dl
10 :11
106
7 .75
0 .00
D2
10 :15
128
7.75
0.00
D3
10 :19
205
7 .90
0 .00
D4
10:24
95
7 .74
0.00
E3
11 :08
120
7 .67
0.00
E4
11 :06
117
7 .78
0.00
E5
11 :02
101
7 .70
0.16
E6
11 :00
99
7
.72
0 .00
E7
10 :56
110
7.73
0
.00
Fl
1125
124
7.86
0 .00
F?
11 :23
148
7.85
0 .22
F3
11 :20
94
7 .86
0.00
F4
11 :15
93
7 .79
0.00
FS
11 :17
93
7 .82
0.00
GI
11)0
102
7 .75
0.22
G2
11 :31
99
7 .72
0 .00
G3
1194
94
7.82
0 .00
G4
11 :42
95
7 .86
0 .00
HI
11 :55
105
7 .74
0.05
11
11 :58
%
7 .76
0.00
12
12
:01
94
7 .76
0.00
13
12 :04
94
7 .74
0.11
TABLE 3-3
CHLORIDE DILUTION RATIOS
Mobil Oil Refinery
Joliet
. Illinois
October 29, 1996
Sample ID
Time
Chlorides, mg/l
Dilution Ratio
Upstream
Efflued
River
River Above
Background
us
1
08:17
92
EC I
08 :20
270
Al
08 :25
228
136
1 .2
A2
08:30 Avg Up-- Avg E®uaa-
181
89
1.8
A3
08 :32
92
249
197
105
1 .5
A4
08 :34
166
74
2.1
AS
08 :36
105
13
12.1
A6
08
:42
142
50
3 .1
A7
08 :44
121
29
5.4
A8
08:47
%
4
39.3
A9
08 :51
103
11
14.3
US 2
08 :54
92
EC 2
08 :56
227
B I
09 :00
178
85
1 .9
B2
09 :03
Avg Upcemn-
Avg Effluent
-
204
III
1 .4
B3
09 :05
93
252
239
146
1 .1
B4
09 :08
184
91
1 .7
B5
09 :10
165
72
2 .2
B6
09 :12
153
60
2 .7
B7
09 :15
135
42
3 .8
B8
09 :17
146
53
3 .0
B9
09 :20
121
28
5 .7
EC 3
09 :31
277
CI
09
:33
174
81
2.3
C2
09 :37
Avg EElunu -
220
127
1 .5
C3
09:40
278
143
SO
3.7
C4
09 :43
150
57
3 .2
C5
09 :45
218
125
1 .5
C6
09 :48
198
105
1 .8
C7
09 :51
133
40
4 .6
C8
09:55
93
0
a bacl ou d
US 3
10 :00
93
EC 4
10 :07
279
DI
10 :11
106
12
16 .8
D2
10 :15
Avg Up--
AvgEfflEfflt
-
128
34
5 .9
D3
10:19
94
205
III
1 .8
D4
10:24
95
I
202.0
US 4
10:50
94
EC 5
10 :53
313
E7
10 :56
110
16
14.8
E6
11 :00 Mg Up-" Avg Effluent-
99
5
47.4
E5
11 :02
94
331
101
7
33 .9
E4
11:06
117
23
10.3
E3
11:08
120
26
9.1
F4
11:15
93
0
a b.ekpourd
FS
11:17
93
0
a b.ekgmmd
F3
11:20
94
0
at background
F2
11
:23
148
54
4.4
Fl
11 :25
124
30
7.9
01
11 :30
102
8
29 .6
G2
11:31
99
5
47.4
G3
11:34
94
0
a b.ekgrmnd
G4
11:42
95
1
237.0
US 5
11:46
93
EC 6
11 :51
349
HI
11 :55
lOS
12
21 .3
11
11:58 Avg
Up-" Avg E®utit -
96
3
85.3
12
12 :01
93
349
94
1
256
.0
13
12:04
94
1
256.0
US 6
12 :09
92
Fde: Uldodmobd/wrblulplumdaa .wk4
Dilution Ratio
'Effluent Value Above Background
Effluent Avg. - Background Avg
River Sample Value Above Background
River Sample - Background Avg.
4. MIXING ZONE AND ZID DETERMINATION
4
.1
MixingZone Size
The mixing zone size is limited to 25% of the cross-sectional area of the stream . The Des Plaines
River at the Mobil outfall channel is approximately 600 feet wide . The river is dredged in the area
of the Mobil Oil outfall channel, making the bottom of the river fairly level . The mixing zone width
is therefore limited to a width of 150 feet (25% of 600 feet) . The surface area of the mixing zone
is limited to 26 acres . The maximum length of the mixing zone allowed to Mobil is therefore 7,500
feet or approximately 1
.4 miles
.
Figure 4-1 depicts the chloride plume generated from plotting the dilution ratios . Based upon the
chloride dilution ratios, the minimum dilution achieved at the edge of the mixing zone is 21 :1 . This
is the dilution ratio determined from the sample results of sample Hl collected 150 feet from the
shoreline. This is the maximum width allowed and is within the main flow pattern of the plume .
4.2 LID Size
The ZID size is limited to 10% of the mixing zone in any spatial direction . The mixing zone width
is 150 feet wide at the outfall location . The ZID would therefore be limited to 15 feet wide, and
based upon the IEPA interpretation, also limited to 15 feet in length . This area would be
immediately outside the outfall channel .
Figure 4-2 depicts the area outside the outfall channel along with the chloride dilution ratios
. The
terminus of the effluent channel is defined as the end of the boathouse, as everything to this point
is manmade for purposes of the effluent discharge
. The 15 foot by 15 foot area allowed for the ZID
is depicted in Figure 4-2 and delineated by the sample points A-1, A-2, B-1, and B-2 . The minimum
mixing achieved within this area is 1 .4:1, as determined by the sample collected at B-2 .
-12-
CADFILE
: MOJOPL-4
PLOT DATE : 1/28/97
1 .4
1 .8
B-2
A-2
SHORELINE
-14-
FIGURE 4-2
AREA FOR ZID
MOBIL
OIL
JOLIET, ILLINOIS
ZID AREA
10'
BOATHOUSE
EFFLUENT CHANNEL
0
10'
4.3 Available
Mixing Discussion
The dilution achieved at the edge of the mixing zone and edge of the ZID are determined based upon
the dilutions determined from the chlorides analysis . Chlorides are conservative pollutants and often
used for plume studies . The dilutions achieved for the mixing zone and ZID, based upon chlorides
is 21 :1 and 1 .4 :1, respectively .
The dilution ratios for non-conservative pollutants, such as ammonia, would be expected to be higher
at the same sample locations for non-conservative pollutants . Effluent ammonia levels are affected
by other factors besides mixing when discharged into the receiving stream . Ammonia is subject to
continued nitrification, volatilization, and plant uptake . These factors combined make ammonia a
non-conservative pollutant and would therefore be expected to have higher dilution ratios than those
determined from the chloride samples .
A factor to be included in the WWTP ammonia effluent limit calculation is the mixing of non-
contact cooling water prior to the discharge into the Des Plaines River . Based upon the schematic
of water flow provided in Appendix B, the non-contact cooling water flow is 6,666 gallons per
minute compared to 1,975 gallons per minute for the WWTP effluent . The non-contact cooling
water accounts for 77 percent of the discharged water or a ratio of approximately 3
:1 . Factoring this
dilution from the non-contact cooling water prior to the mixing with the river water, the appropriate
dilutions to use for the effluent limit calculations for the W WTP through Outfall 001 would be as
follows
:
-15-
Plume Zone
Cooling Water
Mixing
Des Plaines River Mixing Total Dilution
Mixing Zone
3 :1
21
:1
63 :1
Zone of Initial
Dilution
3 :1
1 .4 :1
4 .2 :1
Also of interest from Figure 4-1 is the available mixing at the 1-55 Bridge . While the available
mixing within the mixing zone is 21 :1, by the 1-55 Bridge, the available mixing is 85 :1 . If the
maximum un-ionized ammonia at the edge of the mixing zone is 0 .1 mg/1, by the 1-55 Bridge, the
maximum ammonia will be
:
0.1 mg/l 21 :1
85 :1
= 0.025 mg/I
Thus, effluent limits protective of the Secondary Contact Water Quality Standard (0 .1 mg/1), will
also assure compliance with the General Use Water Quality winter un-ionized standard (0
.025 mg/1).
5.
APPLICABLE PERMIT LIMITS
5 .1 derivation of Effluent Limits
Ammonia effluent limits are established based upon treatment technology . For dischargers to the
Illinois waterway, this treatment technology was established at 3 .0 mg/I ammonia, based upon a
monthly average
. Mobil, like other refineries, has not been able to consistently achieve the 3 .0 mg/I
limit, and has previously been granted relief by the Illinois Pollution Control Board .
Alternative ammonia effluent limits have been derived based upon the existing effluent quality
. The
derivation of existing effluent quality limits is specified in U .S. EPA's "Technical Support
Document" (1991). The existing adjusted standard effluent limits were derived using this approach
.
In addition to calculating effluent limits based upon existing effluent quality, water quality-based
effluent limits are also appropriately derived, with the lower calculated limits of the two approaches
used for establishing effluent limits.
5 .2 Water Ouality-Based Effluent I,imitg
The mixing zone study and ZID study were conducted to determine the available dilution near the
effluent channel outlet at Mobil . The water quality-based limits for Mobil were calculated for
ammonia using the un-ionized ammonia water quality standards and the measured available dilution .
The water quality standard for un-ionized ammonia in secondary contact waters is 0 .1 mg/l. Using
this water quality limit, the corresponding total ammonia level at the edge of the mixing zone can
be determined using the 75th percentile pH and temperature values for the receiving stream,
consistent with IEPA procedures .
The 75th percentile values for pH and temperature determined from the 1996 Des Plaines River data
are as follows :
The dilution ratios determined from the mixing zone study were presented in Chapter 4
. The total
ammonia effluent limits for the WWTP outfall can be determined using the calculated water quality
ammonia levels and the available dilution at the edge of the mixing zone
(63 :1) . The calculations
for these limits are provided in Appendix C
. The limits derived from the water quality standard,
applied at the edge of the mixing zone would establish the monthly effluent limit . The limits
calculated are as follows
:
5 .3 Existing Ammonia Effluent-Based Limits
The existing ammonia effluent data were used to derive ammonia effluent limits based upon existing
WWTP performance
. The "Technical Support Document for Water Quality-based Toxics Control"
(1991) provides a methodology to calculate monthly effluent limits and daily maximum effluent
limits based upon the 95th percentile distribution
. Different databases were used to determine the
monthly average limit and the daily maximum limit
. The daily maximum limit was evaluated using
ammonia effluent data collected from January 1992 through December 1996
. The monthly average
limit was calculated using the monthly averages generated from November 1996 through March
1997.
-18-
Season
Water Quality Based Effluent Limits
(Monthly Average Limit)
Summer
70 mg/I
Winter
243 mg/I
Season
75th percentile pH L 75th per ntde temperature, deg C
Summer
8.1
28
.9
Winter
8.0
139
Mobil Oil has recently completed upgrading the WWTP at the refinery . The upgraded plant was
fully operational starting in November, 1996
. The ammonia effluent quality expected from the
upgraded WWTP can be estimated from the November 1996 to March 1997 data. This limited
database was therefore used for the monthly average limit determination
. Although the upgraded
plant provides better control of ammonia effluent quality, the ammonia spikes generated from the
refinery operation will still occur, and carry through the upgraded WWTP . However, the WWTP
recovery time will be shortened due to the upgrade . The database for determining the daily
maximum includes data from January 1992 to December 1996 . This data set includes periods of
WWTP operation during typical ammonia spikes .
The monthly average permit limit was calculated using the methodology in the "Technical Support
Document" for small sample numbers
. The daily maximum limit was calculated using the delta-
lognormal distribution due to the number of ammonia effluent values below the detection limits .
The calculations are provided in Appendix D . The ammonia effluent levels calculated using the U .S .
EPA "Technical Support Document" are as follows :
5 .4
Existing Permit limits
The Illinois Pollution Control Board granted Mobil an ammonia effluent limit variance in 1994 . The
existing limits for the WWTP outfall at Mobil as they exist in the NPDES permit are as follows :
-19-
Data Set
Monthly Effluent Limit I Daily Maximum Limit
Nov . 1996 to Mar . 1996 Ammonia Effluent
9 mg/1
1996 Ammonia Effluent
18 mg/l
28 mg/I
1992 to 1996 Ammonia Effluent
16 mg/I
23 mg/I
Existing Permit Limits
Monthly Effluent Limit
Daily Maximum
Ammonia Effluent
13 mg/I
26 mg/l
5 .5
Apnlicable Ammonia Effluent Limits
The applicable ammonia effluent limits for Mobil's discharge are the most restrictive of the water
quality derived limits, existing effluent quality derivation, or the existing effluent NPDES limits .
The adjusted standard was granted to Mobil Oil given the inability of the WWTP to consistently
achieve the technology-based ammonia effluent limit of 3 .0 mg/1. The ammonia effluent limits
generated based upon water quality and existing effluent then become viable options for determining
appropriate ammonia effluent limits . The ammonia effluent limits generated from these
methodologies are summarized as follows :
The applicable ammonia limits for Mobil's discharge become the most restrictive of these ammonia
effluent limits and have been highlighted in the table . The proposed limits are as follows :
5.6 Discussion
Table 5-1 summarizes Mobil's ammonia effluent quality since 1990 . Over this period, Mobil's
effluent has averaged 3 .1 mg/1, only three percent above the 3
.0 mg/I effluent limit. However,
effluent limits are to be met every month, not on a long term basis . When predicting the monthly
-20-
Methodology
Monthly Effluent Limit I Daily Maximum Limit
Water Quality-based
Summer
70 mg/I
---
Winter
243 mg/I
---
Existing Effluent Ammonia Data -
1996
18 mg/)
28 mg/I
Existing Effluent
1992 to 1996Ammonia
Data
16 mg/I
23 mg/I
Existing Permit Limits
13 mg/I
26 mg/I
Nov. 1996 to Mar . 1997
9 mg/I
---
Permit Limit
Effluent Ammonia Limit
Monthly Effluent
9 mg/l
Daily Maximum
23 mg/I
TABLE 5-1
MOBIL OIL
AMMONIA EFFLUENT HISTORICAL QUALITY
a/ January, February, and March
C
:UDOC\MOBILWMMONIA
.WK4
Ammonia, mg/1
Maximum
Annual
Dail
Avers e
Maximum
Month
0 .3
1 .3
5.2
1990
0 .6
2 .5
13
.0
1991
3 .2
12.2
22
.0
1992
4.0
9 .5
24.0
1993
4
.9
12 .2
19.2
1994
6.3
13 .7
25 .5
1995
3 .9
14.9
27
.4
1996
1997 a/
1 .8
3 .8
14.0
limit based upon the last five years existing effluent quality data, a limit of 16 mg/I is derived, above
the current variance limit of 13 mg/1 . Due to recent upgrades of the WWTP, a more restrictive
effluent limit of 9 mg/) is suggested based upon data obtained after the upgrade was complete . This
represents a 31 percent reduction from the current variance limit . The 23 mg/I daily maximum limit,
derived from the existing effluent database, reflects a 12 percent reduction from the current variance
limit.
The water quality-based effluent limits (70 mg/I summer and 243 mg/1 winter) were over five times
higher than the existing and proposed monthly average ammonia limits of 13 and 9 mg/I,
respectively. Thus, the proposed effluent limits are clearly protective of water quality . With the
measured dilution at the 1-55 Bridge, where the General Use Water Quality Standards begin, there
is adequate dilution to achieve the water quality General Use Standards even if Mobil were
discharging at 243 mg/I total ammonia.
Mobil Oil has expended approximately $7 .8 million over the past five years to lower its effluent
ammonia levels. The last two months of 1996 and the first three months of 1997 have shown a
.
more
consistent reduction in ammonia, suggesting the expenditure has resulted in lower effluent ammonia
levels. However, in spite of this improvement, unanticipated deviations can occur, as evidenced by
historical patterns presented in Table 5-1
. In 1990 and 1991, Mobil's effluent averaged 0.3 and 0.6
mg/l, respectively, and it looked like Mobil was on its way toward complying with the 3 .0 mg/I
effluent standard . In fact, the maximum monthly discharge in 1990/1991 was only 2 .5 mg/1 .
However, 1992 through 1995, Mobil's effluent ammonia level averaged 4 .6 mg/I. In 1990 and 1991,
Mobil could not have predicted the poorer performance of the sensitive nitrifying bacteria.
Similarly, at this time, Mobil cannot predict the future performance of the W WTP any more than it
could have done so in 1990/1991
. Therefore, it can only propose effluent limitation on the basis of
the existing effluent quality . The proposed limits of 9 mg/I for the monthly average and 23 mg/I for
the daily maximum are based on the data generated since the VAM upgrades and the 1992 to 1996
WWTP performance, respectively . The 1992 - 1996 data set contains 517 ammonia sample
measurements with the following concentration distribution :
-22-
1992 - 1996 WWTP Ammonia Discharge Samples
The 1992 - 1996
data shows, that in spite of the WWTP performance disruption due to RCRA
NESHAP's and other
upsets, Mobil's discharge was below the 6.0 mg/I daily ammonia limit 72
percent of the time . With the recent upgrades, it is reasonable to expect that WWTP performance
will further improve .
Based upon the most restrictive of the ammonia effluent limits presented, site specific relief with the
following effluent limits are proposed :
-23-
Concentration mg/l
No. of Samples
<0.1
83
0.l to 3 .0
215
3 .0 to
6.0
72
6.0 to 13.0
88
13 .0 to 23 .0
56
>23.0
_ 3
Total # Samples
517
Monthly Average :
9 mg/I
Daily Maximum:
23 mg/1
REFERENCES
U.S . Environmental Protection Agency, Technical Sunoort Document For Water Ouality-based
Toxics Control, EPA/505/2-90-001, PB91-127415, March 1991 .
APPENDICES
APPENDIX A
AMMONIA DILUTION RATIOS
Mobil Oil Refinery
5oliet, Illinois
October 29, 1996
File : fJldodmobil1wrkshVplumdasawk4
Sample ID
Time
Ammonia
. MP/1
Above
Upstream
Effluent
River
Background
Dilution Ratio
us 1
08 :17
0 .28
EC 1
08:20
0
.16
Al
08 :25
0
.05
0 .00
A2
08 :30 Avg Up--
Avg EOlurnt-
0 .11
0 .00
A3
08 :32
0 .16
0 .08
0
.00
0 .00
A4
08 :34
0 .28
0 .12
AS
08 :36
0.22
0 .06
A6
08 :42
0.11
0
.00
A7
08 :44
0.11
0 .00
AS
08
:47
0.18
0.02
A9
08 :51
0 .28
0.12
US 2
08 :54
0 .05
EC 2
08:56
0 .00
B1
09:00
0
.00
0 .00
B2
09 :03 Avg Up-
Avg EOlumt-
0 .00
0 .00
B3
09 :05
!team-0.03
0 .00
0 .12
0
.09
B4
09 :08
0 .00
0 .00
B5
09
:10
0 .00
0 .00
B6
09 :12
0 .00
0 .00
B7
09 :15
0.00
0 .00
B8
09 :17
0 .16
0
.13
B9
09
:20
0 .11
0 .08
EC 3
09:31
0.00
Cl
09:33
0 .12
0
.09
C2
09:37
Avg EOluent-
0 .00
0.00
C3
09:40
0 .00
0 .00
0
.00
C4
09:43
0
.11
0 .08
C5
09:45
0 .16
0 .13
C6
09 :48
0 .00
0 .00
C7
09 :51
0 .05
0 .02
C8
09
:55
0 .05
0
.02
US 3
10 :00
0 .00
EC 4
10 :07
0.00
DI
10 :11
0 .00
0 .00
D2
10 :15 Avg UpaVam- Avg Effluent-
0 .00
0 .00
D3
10:19
0
.08
0.00
0 .00
0 .00
D4
10 :24
0 .00
0 .00
US 4
10:50
0.16
EC 5
10:53
0 .00
E7
10:56
0 .00
0 .00
E6
11 :00 Avg UpsVam- Avg Efluent-
0 .00
0 .00
ES
11 :02
0 .08
0 .03
0 .16
0 .08
E4
11 :06
0.00
0.00
E3
11:08
0 .00
0
.00
F4
11 :15
0 .00
0 .00
FS
11 :17
0
.00
0 .00
F3
11 :20
0 .00
0
.00
F2
11
:23
0 .22
0 .14
F1
11 :25
0
.00
0 .00
G1
11 :30
0 .22
0 .14
G2
11 :31
0.00
0 .00
G3
11 :34
0.00
0 .00
G4
11
:42
0 .00
0 .00
US 5
11 :46
0 .00
EC 6
11 :51
0
.05
HI
11
:55
0 .05
0 .05
11
11
:58 Avg Upsuam- Avg Effluent-
0 .00
0 .00
12
12 :01
0 .00
0.05
0 .00
0 .00
13
12:04
0 .11
0 .11
US 6
12 :09
0
.00
APPENDIX B
1
CLEAN SURFACE
WATER RUN-OFF
PROCESS
WATER
,% .T'- SOUR
WATER .
- - - - STORM
WATER
FLARE
FACILITIES S
SOUR WATER
STRIPPING
UNIT
SOUR
WATER
STRIPPED
SOUR
WATER
10
UTILITY
FACILITIES
INE TREATING K
SULFUR COMPLEX
WELL WATER
50 GPM
SCHEMATIC OF WATER FLOW
MOBIL JOLIET REFINING CORP.
JULIET . WILL . ILLINOIS
CLEAN
OILY
CATALYTIC
HYORO-
PREIPEATER
REFORMER
& SATURATE
GAS PLANT
-0-
CATALYTIC
CRACKING
FLUID
UNIT
COKING
CRUDE
UNIT
STORM WATER
FROM TANK
DIKE
AREA
OESULFI.% ~ZATION
UNI
AND NOF
CCR UNIT
UNSAI
&
PLANT
TREATER
GAS
&
HEROx
FUEL
UNIT
_ _
_
DESALTER
GAS SALES
DES -PLAINES
001
002003
DISCHARGE
RIVER
CLEAN STORM WATER
SERVICE
WATER
NEVI
TICS
SANITARY
BIOLOGICALTREATMENT
UNIT
r
OUT
OFF ICE
LA80RATORY
TREATED
S . SHOPS
PROCESS WATER
WASTE WATER
1915 GPM
TREATMENT
FACILITIES
r - - - 1820 GPN
iWE
CONTROL BLOCS .
_ 104
I
l GATE HOUSES
OUT FALL NO.003
WI FALL NO.001
1
1
I
C1-- Nom-CONTACT
I
1
COOLING
6666 CPMWATER
50 GPM
FROM
.-~ OUT FALL NO
. 09Z
I DES-PLAINES J11~1-
UTILITY
0 LPM
RIVER
leep009
FACILITIES
TO ATHOS .
20 GPM
ALKYLAIION
I
2700
GPM
STORMWATER
SERVICE
WATER
l
SITU
Url I
SIG TK
i
Cook ING
FROM
PROCESS
SIG TANK
TAIL
GAS
WATER
i1
TOWERS
lee
DRAWS
GPM
AREA
WATER DRAWS
NEUIRL'NAL
KY
1
I
1
250 CPu
COOLING TOWER
1
1
I
APPENDIX C
HUFF & HUFF, INC
.
CALCULATION SHEET
11`14(\,j Environmental Consultants
IF
14
Project
NApgl~
IJI`, GSft., w
1\MDM11A Chent
Wlatt,
Oil,
Title
AMMobI\P .FG~,UFrI~V
Ajoo
Signature
f (/G V\PAA
Date
t 1 -~
/I
Sheet
(
of
3
(l
b
~I
, Ar
for
OF
MO
~
I'
DIL AMMONIA
&-rF1,uIrNr
L
A lff
~7
C
% 9
or' 0
p1Ea
. 0UAIIII
-WN FaoPos%D
AMMONIA
wATI.R
QuA-lry
F
&LArOri5
WW
II
QuAvrl
STAN9A2(I5
}3A5r9
CN
oN
/cb1/C ~ /nr1oN,A
151h
~7W2CerJf
(v
UAcAJES IoM
Mo~i~ ol~
~til ~~
USIN
h FORMULA IN 35 tl
AAM Cock
'° Z'Z
GAdGULAYE 1 "AU AMUON/A ~~NIF/hv~~a n) S-01-Y,
r09 N)
(0 9 yy/Z -V (~ fro") t o
. 0559)
X = p O9O/8 t
27Z 9,92. - p/1
( -ri 273
.10
l\SD~I
T~ra P~
'(u2E
F
1 ~
yumkx
~S 9
° G
8 I
VJINJ
SC-ASo 1
G ~+Zonl
I c ,
r05
/"
4NM"HER
fl
/ O (~ , )
MN1E4-
2. / D
(S-,-
V I S A
HUFF
Environmental
& HUFF,
Consultants
INC .
Vill
Project
AAogaL'OIL&FI.ueJ(AMMum4
Client~,l^n11
Oww
Title
j-mmuri'-
& tLU¢~GF~°N'`rtor
1V
I,7
V
1
Signature
'~; toI/ )94A
Date o2//(J/q
7
G~cv,-f~ nr~5
zJt4M-R GNQoNio l, V l~ -
~y= g.
Tip =
zS.g
2.72
92- - _ g,1
~g .9 +
2:7 3'/l0
X =
102-79
/y = o d ~o ~yyiz (~ tiv
/. oil(7 t 0.
occ9)
t ~, _
/ .
/ v
6
g
My~e rn
-,1,y
Qi,e!
WIN1 ~-4
CN !ZONIL
X = o 09o S
2726)
`2
/ 3.9 r
273 .
/
(o
)( = (
. GoO
/boo
N =
0'/0
~D
. 9~y/2 c/
t/v
) f 0.0
9
/~ = 3.
8x8( qt y/p tbr,4L AM'WQA/4 j
CALCULATION SHEET
Sheet
7 of
3
HUFF & HUFF, INC
.
CALCULATION SHEt i
IF 1`A Environmental Consultants
or
1
Protect 41y,(
a~`.
6' c,rp AvivON fa Client
110/4
Q/4
Title ,414l41,4
;
/t
Signature >(€'
[7, .,t
Date
Ce //9/9y
'2JMA,4RP-'( DE-
Tzk - AM,iAQIJI A bf%UE14t ' JITH
N3 91w~WtJ
~A%9 cy~ MIXINC1 -2DN
e
At&,j SID ~vq
IES
)
rf+(El
#V,1--IC,A&LG 'PILuTION AT TNG
E9D e
of THESE
~orJGS, SA=cP oN -rtlE
N1
E-,
ASvZM~;Nr OF 1~
Go NSe ~v4 -p vc ?a_~c1rt~NT (c c ael
of >) ,
me
vA-c -?-c
rILVTION
IS A S r u
l oW
S'
V--,p
cv. 0F-
M Iwni
C7
--2-0
ME
Sheet
3
of 3
5.JMM+
- ~
.Ip
:3WJo
W1NT~l
- 3, 35b~
'?
THE
AMMONIA
LEV cS
-r
YiviT?
, -rrle ccxX
Inl
&,, w4 i~
? 7 ` H E
MUST Be
g ~oUnlrE,~
rNIS pCp'I
:~S
~~~I~I
;NAt_
lJ
OF -
I
1-H, C0 NA (3IP
9
CfLV~
Tie
TN1U ~P-IC F~L
( 0tA, i
I
$~
kJ i t 4
S
I
uri oM
t
- ~ L
-A-AtI-I
o1\I / Q
t~,U'--j\i
LI `S
~>C CJn
t `}c -
Lov`JiN C
t-))t
2I
:
I
(ur c e«u
MON L?
/ AvEI IC-7
u M I rs .
4~eASO~J
--to N5;-~7
C+ffZc)t.JK
. LEJELS
(x 63
-,UmME2
b973
M?fit
*J I NTEj'~
293
.1
Mill Q
APPENDIX D
11L
/
HUFF & HUFF, INC
.
CALCULATION SHEET
,,, A
Environmental Consultants
C lient
Title
4~,,~vFlyrC,41
.ewApo-11 -
/
Sheet
I
of
Si
C5
9nature ~
. ~
12/
4k,
Date
OZ/07/~7
AMPoniu
£.j.</.crew
t 9o /a .
t
the doIM
-/al4cr$7F/
c%str/b"/7w' pftr/7r' dafi,
Go'7fainin>
a mi,/fiVe
o/ rJandtfle7
`a/NCJ
and
of
loei
afOre Van Wefe I
12a 71-10
-
3S
/~/oq d~t~T
vy6tcl.~
~~ ms
/i)
jai% Ayerd,t
G (X
V .,erlce
:
(i'~)e,~p~2~ t6
' y) Le
P (o ;)
~t-s)1kc(I-e)D'~D-
':'
r ~ cG 1
C TICICnfa`VoI
:
t
k = nur"bxu
04{ Sa :~t
les
D =c {L
io I
115
V= Plvm[yr
of kluridctect
aolueS In SaM(~I~
k-r
= flvwber
o f
Vokes yreJJe' than
tke detedfiot^ Ilwil+
z =
(y l _ ~~~ /(~
I l
r/ k
=
1o5
r =
35
/0
i 0 lVAq
n =
0 -
;
AVh pluM R 0~ `~A^"P
LES
/ jL I UN1 N
11L
A
PF
'4 h j Environmental
HUFF & HUFF,
Consultants
INC .
PF 14
Project
Mom,OiuAMMoAII4 giant MOPJII_
Title
„FUF~I~
G4
/
GV(sE'(/c3^vS
BASED
Upon1-TSPP~n2 WCJ
;~oTn c5 ~rnr
Signature 4 . I
'*
71P~1
DateOZ/07
/
e-)
7 Sheet
2 of
S
I . . .l
:J
r Do
1 r'
(ot 9 .57 +-
\I (X'~= ( ° 5 `1 1 7
CALCULATION SHEET
USA~(
Q
9
951+
s
=
pe&eofll
~S~h /zrr~~ti
e -}-o
./e
n
~~
4 ymlvle~I on tb
MS
O
a
tly
y
.
Aug
l~,%, f
-
A
Yaps
d
' °
9 5
MAX [D, e%F ~ y„ t
Gr ~~
4b/e-)0
7
6
e, L0,
( 0 33)
(0.lo)+
~I'033
eyP(o
.
+
a.s(3.o)~
(0
.033)
fi
(0.61)
E (X x ) _
~
.
o797
V GO _
~
1-Q
.33~exa (2(D .?~+
3.O I LeiP (3.o)
-(1-0.33)
+ o
b3(I~a33) (o.l)
Co.) -leiP ~o.~
0.5(3
= 0 •0 stn (4.4)
(19.410
+ (0.02211)
F -
17.951
h /
HUFF & HUFF, INC
.
CALCULATION SHEET
P 'M h 4 Environmental Consultants
OF 1
Project
14a>lt
e9/G A4&AoN/ .4 client laoB/ U
Title FFLUEr/1 C CVr~on/S rJ/5Fd ujiog TSP Fat WC 13FSEP 5xics CpyreoL
Signature S 1,('9I PM
Date TJ L/I4/, /
Sheet3 of5
60
NAER.E
,)
- I 0 59,1- / 13,75 C (0.0797
- (0.33)875`Q
~))Z~
4 = 1059.17 / C8.?5
( 3(;,
,
)]
~~ n
(LE X(
-d D
(
;
- [0.3
; (0 I)1 (I -x.33
7 n - C
P7
~6IZ3K13'j/3~9~3
41,
(2 (0 3~ 1(~
.i~~/~(~,07~? -(o .33~a7~ (o ~)~
G
~
.22,g7,104 6.o797
x /o -"
HUFF & HUFF, INC .
r 1, 4 Environmental Consultants
CALCULATION
SHEET
PF ,
Project
M G AA MaLiIA
Client
MuBlc
Of(/
Title
L~~ ,~,rl
lrc~~ dr
a~,s
~,rr
r
oOoa f~~)
Signature
5,(s [)I G./
Date
o Z/fJ/C
I
Sheet 4 .., of GJ"
7?
Gn
u = In
((- 0.~3~"~~i
r3 .2~~+
(
t,G5l~~7o $~ tZ.Ol~tx/o`~
Gn z = In
L
(o .
999
o .
S-
G„' _ l
qf5 7
,y k - /,1, [
/ 6
o797-
O 3;)
0.33")]-0S(l.'/SZ7j
~ 0
777/099~9~
_
/ 1050 - 5.72 G
/o7e7
wfs- Co•9S'
O.
33/ l/
-
D 33, ~~
Wtrtro r cu/2axlo~
TJ
3." fCja,til wA
- /5222
~0PIZU7,oe(b
n )
e ar
(
0
7e7 r / 5222-
ON
27)Iz
WOULO IV M&
03 7
~( p ys
6 4-2 myf
v rwiw
-y A01:44
9C-
kL 'A
HUFF & HUFF, INC
.
IF, k 4
Environmental Consultants
OF ,
Project 4194/cOtL A)ii
4104' i4L
Client
Title
At, On
'r
Signature
r(si O'Qv
Date ~7//
Sheet
S of
S
1~a/z-y
MAX,1'fv^q
=
exP ~-yX
i ~ ~ C
eyp
(V7*-
eip (>
. 44 )
CALCULATION SHEET
I A
HUFF & HUFF, INC
.
CALCULATION SHEET
V I, A Environmental Consultants
/991-/ffG /Ar
:
.
Project
clientNlO
/L o/L
Title
goo
. 1W
.
Signature
Date
7
~~ /Iv dC/4 - /~cior~ stP4"'s4` /6ot/o n (/fey/ 74'- Wa fir
Cop) far irl /nJ a pq,X/v e
. o iaor~ ~Cc >'c~ Ya l~.~o as
./
va (e'tta ,6ov2 v1Ovi •d
6.fet
.
/7u h/ 5t- /f7,;-
74!) /77c
OZ- /7C
.17 dc-74--d kd /btJ
Vuiki Avev c L (x ) ' ~12 + ~~ _ Q )esp (4
Scry
.
VCIVIA~1C~
: ~I-~~erp ~Z~~y+ay~ Lt (y )'~)-Q ~' +e
~= rvMb~i cr 5OMp)ef
p=
feofr~oc IIwl
-c nVMbe o f ~ndefc~f 1/o~Ues Ivy sawl~h
rc HVM'Y o-{ ValNec Sroa+er tkaVl -flv A~f ,0t-1
I = in (XI )
G4
_
,-,y y)Z /l~-r-11
= Sl_7
r
-V
-
=
8z4&S
r) = 0 IDm9
(1s/V/:'-1
s)
Sheet / of 5-
HUFF & HUFF, INC
.
pr
r
„A
,
Environmental Consultants
Project
M761V
O/G AM
f0A"a
Client
RO//`
O/C
`fPi v r c'- V
S
~~
Date 02-1071
Title
Signature
X
= numhcr o f
SaMp~~ pev Month
~vlr~f~)
/%72
r
rA~
/00
/71
/-0 r,4 1,
/
"(7110Y
jbrAL
/ 97y
[VIM
/9t(
TMAL-
O. 'S
fir. VfirrcE
W here y
/oy
/d y
CALCULATION SHEET
97
c'O „ya1>hs
"Zoo
/yam
%s f"
pt/c~N;
/r t- 1
~4,wiw
/ nrr+c/ A v
5 LM iT
Sheet Z of 5
; 5
ih prclrm/c r-4/u/
r 9
/'ni'-4
1 '
o-
9S
rr
ED,
eip
"-1~
+
152-
A/ -
5 ~g hc'7Z6 T~6LE>
t 12
= 2 3 !5~ 40rvl r, 4-az~
V 'I, A
HUFF
Environmental
& HUFF,
Consultants
INC .
IF,
Protect
11(o(,
C
lient
Title
Signature
Date
-
Lfoeli
x/0
-"
Vor~c
o,21121
m
CALCULATION SHEET
Cx
'= `~ =
(o /~
o
. i
r
/-o/b
)( ) ~
~~,~
(aatos(~ 3))
O o/G t O. 84 (e~p / 9S~
~~x `)
= 5920
Sheet
7 of
s
V ~X } -
(f-0.16) e?(p
(2 (0.8)
f-
3~EcFP(
14
)
- ~~
- a
/d]+(D.16~ (I
-
o.IC~~o )[D.~ ZaT
(ad .
os~z=
(9- 1312)
+ o 13
4( -I3. 5
~4)
v
(x
4
377 .17-67
6~ z
A V
Y
/~
X11 .I S~/L8
~5.047G~~
4_ /25/q
~~ .
-
[o.lb~`(0.,1)1(i -
016~~]~
(~ 9w'
-
0166 (o D)Z
-
[l `303]
7
;
,aff7G
IL 14
k t Environmental
HUFF & HUFF,
Consultants
INC .
or I
Project L1 wl., l/r(, ARddrl~I¢'
Title
~"f1'16 ~If'GG
Signature
S
1/,
y.1PV'f
Client
,///,any'
CALCULATION SHEET
Date /'-;
.Z/i/~7
Sheet
of
(xy- )-
)
G -
(2
(o ~~)to'O) ~c 9Z o'
- (p./6J~`~ ~J~
G
~ S 5
2l ~/~ "~
Cn 2=
rn ~f /-
O.
/~ S9(it
i;i/
t (
q03//Yh
- ')fy%2/YJo
_ lr
(
D 9999) (2 Z~l ~)5
/n
2 .25 /y
;
/a
[ 9?o/
-(0./&
8
`)(i)~~-0./6 9 )-]
-- o.S('o3~~G)
~~L S,92O/
~o.e)9)°)J
-
O .yoSs
/kYc 0rs-ai&y/(~-ai&,J
5 / /
WITNavr coga;~
lop
CoRQarIm
( r)
HIUItI:4
V I Jk 4 Environmental
HUFF & HUFF, INC .
Consultants
CALCULATION SHEET
Project
Client
/G
Title
Signature
Date
Sheet
s"
of S
Qy,
exl o
(/ ;7z
2, -7 6
t
n
/
.3535
x~,ps
/5
,
90 nay/~
IJA/i-y
A4AxiMvA,
XOy
;
=
Z3
. ZS
A
HUFF & HUFF, INC
.
IF 1, A
Environmental Consultants
or 1
Protect
X0,3/1- Q//'If41,0oi//f7
client
10111-/4-
9
Title 5GFl,%r-Nr(,4C6!L1ric:i'v.f'
-///o,vrr''~Ato
Signature
Date
CC,/ % tc' 111lohrh/y AV-C7,11-
ju /a .S-t
- /No v.
9lo
fhrvv
h
/L/.er
97
/1/v&41/ 4vlvaty Axinrv•r/n
I
O~3
/ .3
VGv
r
c1ft
(V
/
=
G7.
~o
NlvIfiphtf j r
CV = Q-la ur-C
~~,r,~P, = Z
•3
('lib1C
`J-2 ~
r5j, Lea/C~=/--
^
.fir /
X
95
'X') S; -
MPx
MoNr~-y
ti5 x
z
.3
CALCULATION SHEET
O.3
3'_ g
N
.4x MONT}+t-'/ AV 5
Foe-
C)
O `~
Sheet +
of
t
(,4 5JxtLc VG/~C
rir
4z tho /D
)
DAILY AMMONIA EFFLUENT VALUES
Mobil Oil Joliet Refinery
1991-1997
Date
Ammonia- mg/I
In (ammonia
01/ 2 /91
0.0
01/ 3 /91
0.0
Ot/ 9 /91
0.0
01/ 10 /91
0.0
01/15 91
0 .0
01/ 17 /91
0.0
01/ 22 91
0.0
01/ 24 /91
2 .0
0 .693147
01/ 29 /91
0.0
01/ 31 /91
0.0
02/ 5 91
0.0
02/ 7 91
0.0
02/ 12 /91
0.0
02/ 15 91
1.0
0
021 19 91
0
.5
-0 .69315
021 21 /91
0.0
021 26 /91
0.0
021 28 /91
0 .4
-0 .91629
03/ 5 91
0.0
03/
7 91
0.0
03/ 12 /91
0.4
-0 .91629
03/ 14 /91
0 .4
-0 .91629
03/ 19 /91
0.0
03/ 21 /91
0.3
-1 .20397
03/ 26 /91
0.0
03/ 28 /91
0
.2
-1 .60944
04/ 2
91
0 .8
-0 .22314
04/ 4 /91
0 .4
-0 .91629
04/ 9 /91
0 .2
-1 .60944
04/ 11 91
0.0
04/ 16 /91
0.0
04/ 18 /91
0 .4
-0
.91629
04/ 23 /91
0 .2
-1 .60944
04/ 25 91
0.3
-1 .20397
04/ 30 /91
0 .1
-2 .30259
05/ 2 91
0.0
05/ 7 /91
0.0
05/
9 /91
0 .4
-0 .91629
05/ 14 /91
0.0
05/ 16 91
0 .4
-0 .91629
05/ 21 /91
0 .2
-1 .60944
05/ 23 /91
0 .9
-0 .10536
05/ 29 /91
0.0
05/ 30 /91
0.0
06/ 4 91
0.0
06/ 6 91
0.0
06/ 11 /91
0.0
061 13 /91
0.0
06/ 18 91
0.0
06/ 20
91
0.0
06/ 25 91
0.0
07/ 2 /91
0.0
07/
5 91
0.0
07/ 9 /91
0.0
07/ 11 )91
0.0
07/ 16 /91
0.0
07/ 18 91
0.0
07/ 23 /91
0 .3
-1 .20397
07/ 25 91
0 .3
-1
.20397
07/ 30 91
0 .2
-1 .60944
O8/ 2 91
0.0
08/ 6 /91
0 .1
-2 .30259
08/ 8 /91
0.2
-1
.60944
08/ 13 /91
0 .8
-0.22314
08/ 15 /91
0 .4
-0.91629
09120 /91
0 .0
DAILY AMMONIA EFFLUENT VALUES
Mobil Oil Jolict Refinery
1991-1997
Date
Ammonia, mg/I
In (ammonia
081 22 /91
0 .3
-120397
08/ 28 /91
13 .0
2.564949
081 30 /91
7 .6
2 .028148
09/09/
3
5
/91
,91
33.7.0
11.308333.098612
09110 191
0 .0
09/ 12 /91
0 .3
-1,20397
091 17 191
0
.2
-1 .60944
09/ 19 /9l
0.0
09/ 24 /91
0.0
09/ 26 /91
0 .3
-1 .20397
10/ 1 /91
0.0
10/ 3 191
0.0
I0/10/
to
8 191191
00.5.5
-0-0.69315.69315
lo/
10115
17
/91/91
00.0.0
10/ 22 /91
0.0
10124 191
0.0
10/ 29 /91
5 .6
1.722767
11110/
31
5
/91191
20.2.5
0-1.916291.60944
11/ 7 /91
0.0
11/ 12 /91
3 .0
1 .098612
It/
11/
14
19 /91191
0 .3
0.0
-1 .20397
11/
11122
21
/91/91
0.3
0.0
-1.20397
11/ 26 /91
0 .0
l2/
11/ 27
3 191191
00.0.0
Iv 5 /91
1.0
0
12/
121
10
12/91/91
31.0.0
1.0986120
12/ 17 /91
0 .8
-0.22314
12./ 19 /91
0 .9
-0 .10536
I21
12/
26
24 /91N
I
23.9.0
01.360977.693147
12/31 /91
2 .0
0 .693147
O1/
Oil
2
7/92/92
00.3.8
-)-0.20397.22314
01/
Oil14 9
/92
/92
5
0
.8
.3
1-1.757858.20397
Oil 16 /92
12 .0
2 .484907
01/21 192
16 .0
2 .772589
01/ 23 192
4 .0
1 .386294
01/
02/
02/28
6
4
/92/92/92
1340.5.5.3
21-0.587764.504077.69315
OV 11 /92
19 .0
2 .944439
O2/ 13/92
22 .0
3 .091042
02/ 18 /92
12 .0
2
.484907
021 20 192
4 .0
1 .386294
02
02/
.125
27 /92/92
108.6.4
22.341806.151762
031 3 /92
0 .4
-0.91629
03/
03/
031
10
12
5 /92/92192
000.3.6.3
-1-0-1.20397.51083.20397
03/
03/
03/
19
17
24/92/92192
001.0.3.4
-0,91629-1.203970
03/
04/
26
2/92/92
0 .3
0 .0
-1 .20397
04/ 7 /92
0 .4
-0.91629
DAILY AMMONIA EFFLUENT VALUES
Mobil Oil Joliet Refinery
1991-1997
Date
Ammonia, mg/I
In (ammonia
04/ 9 /92
0.7
-0.35667
04/ 14 /92
0 .8
-0 .22314
04/ 16 /92
6 .0
1 .791759
04/ 21 /92
0
.3
-1
.20397
04/ 23 /92
0 .2
-1 .60944
04/ 28 /92
0 .0
04/ 30 /92
0.0
05/ 5 /92
16 .0
2.772589
05/ 7 /92
8.9
2 .186051
05/ 12 /92
0 .0
05/ 14 /92
0.0
05/ 19 /92
0.0
05/ 21 /92
0.0
05/ 26 /92
0.0
05/ 28 /92
0.0
06/ 2/92
0 .0
06/ 4 /92
0.3
-1
.20397
06/ 9 /92
1.1
0 .09531
06/ 11 /92
0.0
06/ 16 /92
0.0
06/ 18 /92
0 .3
-1 .20397
06/ 23 /92
0 .3
-1
.20397
06/ 25 /92
0.0
07/ 2 /92
0.0
07/ 7 /92
0.0
07/ 9 /92
0.0
07/ 14 /92
0 .6
-0 .51083
07/ 16 /92
0 .5
-0.69315
07/ 21 ro2
0.0
07/ 23 /92
0 .1
-2.30259
07/ 28 /92
0 .3
-1
.20397
07/ 30 /92
4 .6
1 .526056
08/ 4 ro2
0.0
08/
6 192
0.0
08/ 11 '92
0 .4
-0 .91629
08/ 13 /92
1.0
0
08/ 18 /92
0.0
08/ 20 /92
0.0
08/ 25 /92
0.0
08/ 27 /92
1 .4
0.336472
09/
1 /92
5.0
1.609438
09/ 3 /92
2.0
0.693147
09/ 8/92
0.0
09/ 10 /92
0.0
09/ 15 /92
0.0
09/ 17 /92
0.0
09/ 22 /92
0.0
09/ 24 /92
1 .2
0 .182322
09/ 29 /92
0.0
10/ 6 /92
0.0
10/
8 /92
0 .8
-0.22314
10/ 13 /92
6 .7
1 .902108
10/ 15 92
14 .0
2 .639057
10/ 20 /92
9 .3
2 .230014
10/ 22 92
2 .7
0 .993252
10/ 27 92
0.0
10/ 29 /92
5 .4
1.686399
11/ 3 /92
22 .0
3 .091042
11/ 6 /92
13 .0
2
.564949
11/ 10 /92
1 .5
0.405465
11/ 13 /92
0.0
11/ 17 92
0.0
11/ 20 /92
0 .2
-1 .60944
11/ 24 92
0 .2
-1 .60944
111 27 92
0.0
12/ 1 /92
0.3
-1.20397
DAILY AMMONIA EFFLUENT VALUES
Mobil Oil Joliet Rcfinery
1991 -1997
Date
Ammonia, mgi
In (ammonia
12/ 3 /92
0.2
-1 .60944
121 8192
0 .1
-2 .30259
12/ 10192
0 .8
-0.22314
12/ 15 192
0 .8
-0.22314
12/ 17 192
3 .0
1 .098612
12/ 22 /92
11 .0
2 .397895
12) 24 /92
20 .1
3 .00072
12/ 29 192
14 .0
2 .639057
Ol/ 5/93
11 .4
2 .433613
Oil 7 /93
6.3
1 .84055
01l 12 /93
6 .4
1 .856298
01/ 14 193
6 .8
1 .916923
Oil 19 /93
2 .6
0 .955511
01/ 21 /93
3 .8
1335001
0(126 /93
2 .4
0 .875469
01/ 28 /93
5 .9
1 .774952
02/ 2 193
4 .8
1 .568616
02J 4 /93
6 .3
1 .84055
02/ 9 /93
14 .0
2 .639057
02/ 11 /93
14 .9
2 .701361
021 16 /93
3 .9
1 .360977
02/ 18 193
3 .5
1 .252763
02/ 23 193
6 .0
) .791759
02J 25 /93
8 .4
2 .128232
03/
2 193
2.9
1.064711
031 4 /93
4 .0
1
.386294
03/ 9 193
6 .2
1 .824549
03/ 11 193
8 .3
2 .116256
03/ 16 193
10 .5
2 .351375
031 18 /93
8 .2
2 .104134
03/ 24 /93
8 .0
2
.079442
03126193
4
.8
1 .568616
031 30 /93
0 .6
-0 .51083
04/ 1 /93
0.3
-1 .20397
04/ 6 /93
3 .6
1 .280934
04/ 8 193
4 .6
1 .526056
04/ 13 /93
1 .3
0 .262364
04/ 15 193
0 .7
-0 .35667
04/ 20 /93
0.8
-0 .22314
04/ 22 /93
2 .7
0
.993252
04/ 27 /93
1
.8
0 .587787
04/ 29 /93
1 .8
0 .587787
05/ 4 193
0 .4
-0 .91629
051 6 /93
0 .3
-1 .20397
05111 /93
0 .9
-0,10536
05/ 13 /93
0 .6
-0.51083
051 18 /93
3 .1
1.131402
051 20 /93
3 .3
1 .193922
05/ 25 /93
7,2
1 .974081
05/ 27 /93
7 .2
1974081
06/
1193
132
2 .580217
061 3 193
5 .3
1 .667707
061 9 193
0 .3
-1 .20397
06110193
0 .1
-2.20727
06/ 15 /93
0 .2
-1 .77196
06/ 17 /93
0,0
06/ 22 193
0.0
0x124 /93
0.0
06/ 29 193
0 .1
-2 .20727
07/ 1 193
0.0
07/ 6 193
0.0
07/ 8 193
0.1
-2 .30259
071 13 /93
0.0
07/ 15 193
0.0
07/ 20 /93
0.0
DAILY AMMONIA EFFLUENT VALUES
Mobil Oil Jolict Rctncry
1991-1997
Date
Ammonia, m8/1
In (ammonia
07/ 2,2 /93
0.2
-1
.60944
07/ 27 /93
12.6
2 .533691
07/ 29 N3
6.2
1 .824549
08/
08/
3
5/93/93
00.0.0
O81 10 /93
0.0
08/ 12 193
0 .3
-1 .20397
08/ 17 193
0 .3
-1 .20397
08/ 19 /93
0.0
08/
09(26
24
/93/93
01.1.9
-00.09531.10536
08/ 31 /93
0 .2
-1 .60944
09/
09/
2
7
/93/93
00.3.1
-110397-2.30259
09/ 9 /93
0 .2
-1 .60944
09/
091
16
14 /93/93
00.1.1
-2-2.30259.30259
09/ 21 /93
0 .2
-1 .60944
09/ 23 N3
0 .3
-1.20397
09/ 28 N3
0 .4
-0.91629
10/
091
10/10/
1230
7
5
/93/9319
19
3
3
24
18
30
.0
.6.0.3
321.280934-1.178054.890372.20397
10/ 14 193
1 .2
0 .182322
10/
101
21
19
/93193
00.6.9
-0-0.10536.51083
10/ 26 N3
0 .6
-0 .51083
10/ 28 N3
1 .6
0 .470004
11/
11/
4
2 193/93
00.6.5
-0-0.69315.51083
It/
I1/11 9
193/93
01.3.2
0-1.262364.60944
It/ 16 /93
12 .3
2 .509599
11/ 18 /93
12 .2
2 .501436
11/
11/
24
23
/93N3
2115.7.6
23.072693.753661
111 30 /93
21 .3
3 .058707
12/
12/
7
2 /93/93
154.1.7
21.753661.410987
l2/ 9 /93
1 .6
0 .470004
121 14 /93
0 .6
-0 .51083
12/ 16 /93
0 .7
-0 .35667
12 21 193
0 .8
-0 .22314
)2/30
12/
12/
23
28
/93/93N3
000.8.3.6
-0-1-0.20397.51083.22314
01/ 4 /94
0
.5
-0 .69315
01/
01/
01/
13
11
6 194/94N4
000.4.4.6
-0-0-0.91629.51083.91629
01/
01/
20
18 194/94
00.2.4
-0-1.91629.60944
02/01/
01/
25
271
/94/94
19
4
000.6.9.7
-0-0-0.51083.35667.10536
02/ 3 194
0 .6
-0 .51083
02/02/
10
8
/94/94
3 .5
0 .0
1 .252763
02/
02
02 22
17
15
/94/94/94
1194.4.0.5
212.504077.197225.433613
031
02 24
1
/94
N4
1
1.4
.9
00.641854.336472
03/ 3 /94
1 .4
0 .336472
DAILY AMMONIA EFFLUENT VALUES
Mobil Oil Joliet Refinery
1991-1997
Date
Ammonia, m8/I
In (ammonia
031
8 /94
1 .8
0.587787
031 10 /94
2 .6
0 .955511
031 15 /94
2 .7
0
.993252
03/ 17 194
6 .2
1 .824549
03/ 22 /94
10 .1
2 .312535
03/ 24 /94
14 .9
2 .701361
03/ 29 /94
4 .1
1 .410987
031 31 /94
3 .8
1 .335001
04/ 5 194
1.2
0.182322
04/ 7 /94
3 .4
1223775
041 12 /94
0.9
-0.10536
04/ 14 /94
0.8
-0 .22314
04/ 19 /94
1 .3
0.262364
041 21 /94
3 .5
1 .252763
04/ 26 /94
1.2
0 .182322
04/ 28 /94
0.7
-0 .35667
05/ 3 /94
0.6
-0 .51083
051 5 /94
0.4
-0.91629
051 10 /94
0 .4
-0 .91629
05/ 12 /94
0 .8
-0 .22314
05/ 17 /94
1.0
0
05119194
3 .4
1 .223775
05/ 24 /94
12 .9
2 .557227
05/ 26 /94
9 .9
2 .292535
05/ 31 /94
4 .0
1 .386294
06/ 3/94
10
.4
2 .341806
061 7 /94
5 .8
1 .757858
06/ 9 /94
5.4
1 .686399
06/ 14 /94
16 .6
2 .809403
06/ 16 )94
14 .0
2 .639057
06/ 21 /94
3 .2
1 .163151
06/ 23 /94
12 .0
2
.484907
06/ 28 194
1 .7
0 .530628
06/ 30 /94
4
.2
1 .435085
071 5/94
1.2
0 .182322
07/
7 /94
2.1
0 .741937
07/ 12 /94
0.8
-0 .22314
071 14 /94
1 .2
0 .182322
07/ 19 /94
0 .8
.0 .22314
07/ 21 /94
4 .7
1 .547563
07/ 26 /94
14 .3
2
.66026
071 28 '94
4 .8
1 .568616
081 2 /94
2 .4
0 .875469
08/ 4 194
10 .4
2 .341806
08/ 9 /94
4.5
1 .504077
08/ 11 /94
3 .3
1 .193922
081 16 /94
7
.3
1 .987874
08/ 18 /94
3 .9
1 .360977
081 23 /94
7 .1
1.960095
08/ 25/94
10.8
2 .379546
08/ 30 /94
4
.3
1 .458615
09/ 1 /94
5.8
1.757858
09/ 6 /94
11 .0
2 .397895
09/
8 /94
12.0
2 .484907
09/ 13 /94
7 .8
2
.054124
09/ 15 /94
5
.0
1,609438
09/ 20 194
16 .0
2
.772589
091 22 /94
11 .6
2 .451005
09/ 27 /94
6 .6
1 .88707
09/ 29 /94
13 .0
2 .564949
10/ 4 /94
2 .1
0.741937
10/ 6 /94
0.0
101 11/94
0 .7 .
-0 .35667
101 13 /94
0 .6
-0 .51083
10/ 18 /94
0 .3
-1 .20397
10/ 20 /94
0 .2
-1 .60944
DAILY AMMONIA EFFLUENT VALUES
Mobil Oil Jolict Refinery
1991 -1997
Date
Ammonia mg/I
In (ammonia
10/ 25 /94
2 .5
0 .916291
10/ 27 /94
3 .0
1 .098612
It/ 194
3 .0
1 .098612
It/ 3/94
8 .0
2
.079442
It/ 8 /94
6.9
1 .931521
11/ 10 /94
3 .1
1 .131402
11/ 15 /94
1 .8
0 .587787
11/ 17 /94
2 .0
0 .693147
11/ 22 /94
0 .6
-0 .51083
11/ 23 /94
0 .4
-0 .91629
11/ 29 /94
5 .6
1 .722767
12/ 1 /94
10.7
2.370244
12/ 6 /94
8 .5
2 .140066
12/ 8 /94
5 .5
1 .704748
12/ 13 /94
18
.6
2 .923162
12/ 15 /94
19 .2
2 .95491
12/ 20 /94
11
.1
2 .406945
12/ 22 /94
12 .5
2.525729
12/ 27 /94
13 .9
2 .631889
12/ 29 /94
9.7
2.272126
01/ 3 /95
19.1
2 .949688
01/01/10
5
/95/95
1618.9.1
22.895912.827314
01/ 12 /95
8.7
2.163323
01/ 17 /95
10 .6
2 .360854
01/ 19 /95
9 .0
2 .197225
01/
24 /95
13 .7
2.6173%
01/ 26 /95
10
.4
2 .341806
01/ 31 /95
16
.8
2 .821379
02/ 2 /95
20 .4
3 .015535
02/
7 /95
15 .5
2 .74084
02/ 9 /95
13 .0
2 .564949
02/ 14 /95
5 .1
1 .629241
02/ 16/95
1 .0
0
02/21 /95
0 .6
-0 .51083
02/ 23/95
1 .0
0
02/ 28 /95
0 .6
-0 .51083
03/ 2 /95
0 .4
-0 .91629
03/ 7 /95
0 .7
-0 .35667
03/03/14
9 /95/95
03.7.6
-01.308333.51083
03/ 16 /95
1 .1
0 .09531
03/ 21 /95
1 .2
0 .182322
03/03/28
23/95/95
23.5.8
11.029619.252763
03/ 30 /95
2 .2
0 .788457
04/04/ 6
4
/95/95
22.6.4
00.875469.955511
04/04/13
11 /95/95
33.8.3
11.193922.335001
04/ 18 95
8 .5
2 .140066
04/ 21 /95
4 .4
1 .481605
04/ 25 95
13 .9
2.631889
04/ 27 /95
13 .7
2 .617396
05/ 2 /95
9 .6
2 .261763
05/05/
4
9 /9595
108.2.0
22.079442.322388
05/05/16
11
/9595
48.8.3
12.116256.568616
05/ 18 95
4 .1
1 .410987
05/ 23 /95
5 .8
1 .757858
05/05/30
25 /95/95
106.1.8
21.379546.808289
06/ 1 /95
9 .0
2 .197225
06/ 6 95
17 .1
2 .839078
DAILY AMMONIA EFFLUENT VALUES
Mobil Oil Joliet Refinery
1991-1997
Date
Ammonia mg/I
In (ammonia
06/ 9 /95
20 .4
3 .015535
06/ 13 /95
20 .3
3 .010621
06/ 17 /95
22 .9
3 .131137
06/ 20 /95
10.0
2.302585
06/22 /95
8.6
2.151762
06/ 27 /95
0.8
-0 .22314
06/ 29 95
0 .3
-1 .20397
07/ 5 /95
0.8
-0 .22314
07/ 6 /95
0 .6
-0 .51083
07/ 11/95
0 .2
-1 .60944
07/ 13 /95
0 .5
-0 .69315
07/ 18 /95
0 .1
-2 .30259
07/ 20 /95
0 .2
-1
.60944
07/ 25 /95
0 .3
-1 .20397
07/ 27 /95
0 .7
-0.35667
08/ 1 /95
0 .3
-1
.20397
08/ 4 /95
0 .2
-1 .60944
08/ 8 '95
0 .3
-1 .20397
08/ 10 /95
0 .3
-1
.20397
O8/ 15 /95
0.6
-0.51083
08/ 17 /95
5 .8
1 .757858
08/ 22 /95
4 .8
1 .568616
08/ 25 /95
0 .4
-0 .91629
08/ 29/95
5 .1
1 .629241
08/ 31 /95
2 .6
0 .955511
09/ 5 /95
0 .5
-0 .69315
09/ 7 /95
1 .5
0 .405465
09/ 12 /95
5 .0
1
.609438
09/ 14 195
2 .2
0 .788457
09/ 19 95
1.0
0
09/ 21 /95
0 .7
-0 .35667
09/ 26 /95
0 .8
-0
.22314
09/ 28 /95
5 .7
1 .740466
10/ 3 /95
0 .7
-0
.35667
10/ 5 /95
0.8
-0
.22314
10/ 10 /95
0 .3
-1 .20397
.
10/ 12 /95
0.2
-1 .60944
10/ 17 195
5 .5
1 .704748
10/ 19 /95
7 .2
1 .974081
10/ 24 /95
7 .2
1 .974081
10/ 26 195
1 .4
0 .336472
10/ 31 /95
1.4
0.336472
11/ 2 /95
1 .9
0 .641854
11/ 7 /95
0
.2
-1 .60944
11/ 9 /95
5 .0
1 .609438
11/ 14 /95
1 .3
0
.262364
11/ 16 /95
1 .3
0 .262364
11/ 21 95
13 .6
2 .61007
l l/ 22 95
19 .0
2 .944439
11/ 28 /95
17 .5
2 .862201
11/ 30 /95
12 .9
2 .557227
12/
5 /95
10.4
2.341806
12/ 7 /95
11 .3
2.424803
12/ 12 95
11
.0
2 .397895
12./ 14 95
25 .5
3 .238678
12/ 19 /95
6 .0
1 .791759
12/ 21 /95
8 .0
2 .079442
12/ 26 /95
10 .3
2 .332144
12/ 28 95
6 .4
1 .856298
O1/ 2 /96
7 .9
2.066863
O1/ 4 96
10 .6
2.360854
Olt 9 96
2 .6
0
.955511
Olt 11 /96
5
.3
1 .667707
OI / 16 /96
7 .9
2 .066863
Olt 18 196
6.7
1 .902108
DAILY AMMONIA EFFLUENT VALUES
Mobil Oil Joliet Refinery
1991-1997
Date
Ammonia, mg/I
In (ammonia
01/ 23 /96
12 .0
2 .484907
01/ 25 /96
6 .2
1 .824549
01/ 30 /96
16 .9
2 .827314
02/ 1 /96
21 .4
3 .063391
02/ 6 /96
5.4
1 .686399
02/ 8 /96
1 .3
0 .262364
02/ 13 /96
8 .5
2 .140066
02/ 15 /96
7.8
2 .054124
02/ 20 /96
3 .0
1 .098612
02/22 /96
0 .0
02/ 27 /96
0.0
02/ 29 /96
0.0
03/ 5 /96
0.0
03/ 7 /96
0.0
03/ 12 /96
0.6
-0 .51083
03/ 14 /96
4
.8
1.568616
03/ 19 /96
20.6
3 .025291
03/ 21 /96
27.4
3 .310543
03/ 26196
11
.8
2 .4681
03/ 28 /96
8 .2
2
.104134
04/ 2 /96
17 .3
2 .850707
04/ 4 /96
17
.5
2 .862201
04/ 9 /96
21 .1
3 .049273
04/ 11 /96
19 .0
2 .944439
04/ 16 /96
17 .1
2 .839078
04/ 17 /96
19 .5
2 .970414
04/ 23 /96
13 .4
2 .595255
04/ 25 /96
8 .5
2.140066
04/ 30 /96
0 .6
-0 .51083
05/ 2 /96
0 .4
-0
.91629
05/ 7 /96
0.0
05/ 9 /96
0.0
05/ 14 /96
0 .3
-1 .20397
05/ 16 /96
3 .0
1 .098612
05/ 21 /96
3 .4
1 .223775
05/ 23 /96
0.0
05/ 28 /96
0 .2
-1
.60944
05/ 30/96
42
1 .435085
06/ 4 /96
2 .8
1
.029619
06/ 6 /96
0 .6
-0 .51083
06/ 11 /96
0.0
06/ 13 /96
0.0
06/ 19 /96
0.0
06/ 20 /96
0.0
06/ 25 /96
11 .9
2.476538
06/ 27 /96
13 .7
2 .617396
07/ 2 /96
1 .1
0 .09531
07/ 3 /96
1 .2
0.182322
07/ 9 /96
4 .1
1410987
07/ 11 /96
4 .2
1 .435085
07/ 16 /96
0.0
07/ 18 /96
0.0
07/ 23
/96
0 .2
-1 .60944
07/ 25 /96
0 .4
-0 .91629
07/ 30 /96
0 .1
-2
.30259
08/ 1/96
0.0
08/ 6 /96
0 .5
-0 .69315
08/ 8 /96
0 .6
-0 .51083
08/ 13 /96
0.0
08/ 15 /96
0 .7
-0 .35667
081 20 /96
0
.2
-1 .60944
08/ 22 /96
0 .3
-1
.20397
08/ 28 /96
0 .3
-1
.20397
08/ 29 /96
0 .2
-1 .60944
09/ 3 /96
0 .2
-1 .60944
09/ 5 /96
0 .1
-2 .30259
DAILY AMMONIA EFFLUENT VALUES
Mobil Oil Joliet Refinery
1991-1997
Date
Ammonia, mg/I
In (ammonia
09/ 10 /96
0.0
09/ 12 /96
0.0
09/ 17 /96
0.0
09/ 19 /96
0.0
09/ 25 /96
1 .7
0 .530628
09/ 26 /96
0 .4
-0.91629
10/ 1 /96
0.0
10/ 3 /96
0.0
10/ 9 /96
0 .1
-2
.30259
10/ 10 /96
0.0
10/ 15 /96
0 .2
-1 .60944
10/ 17 /96
0.0
10/ 22 /96
0 .2
-1
.60944
10/ 24/96
0 .2
-1 .60944
10/ 29 /96
0.0
10/ 31 196
0.1
-2
.30259
ll/ 5 /96
0.0
11/ 7 /96
0 .7
-0 .35667
11/ 12 /96
0.0
11/ 14 /96
0 .0
11/ 19 /96
0 .0
11/ 21 /96
0 .8
-0 .22314
11/ 26 /96
0 .5
-0 .69315
11/ 27 /96
0.0
12/ 3 /96
0 .4
-0 .91629
12/ 5/96
0 .0
12/ 10 /96
0.0
12/ 12 /96
0.0
I2/ 17 /96
0.0
121 19/96
0 .0
12/ 24 /96
14 .0
2 .639057
12/ 27 /96
1 .3
0 .262364
12/ 31 /96
1 .3
0 .262364
01/ 2 /97
2 .6
0 .955511
01/ 7 /97
0 .4
-b .91629
01/ 9 /97
0.0
01/ 14 /97
1 .4
0 .336472
01/ 16 /97
0 .7
-0 .35667
01/ 21 /97
14 .0
2 .639057
01/ 23 197
12 .0
2 .484907
01/ 28 /97
2 .0
0.693147
01/ 30 /97
1 .0
0
02/ 4/97
0 .0
02/ 6 /97
0 .8
-0 .22314
02/ 1I /97
0 .3
-1 .20397
02/ 13 /97
0 .3
-1 .20397
02/ 18 /97
0 .2
-1
.60944
02/ 21 /97
0 .3
-1
.20397
021 25 /97
0 .8
-0.22314
02/ 27 /97
0 .0
03/ 4 /97
0 .1
-2
.30259
03/ 6 /97
6 .5
1 .871802
03/ 11 /97
0 .4
-0 .91629
03/ 13 /97
0 .6
-0 .51083
03/ 18 /97
1 .4
0 .336472
03/ 20 /97
0.3
-1 .20397
03/ 25 /97
0.6
-0.51083
03/ 27 /97
0 .6
-0.51083
January 1991
Average
- December 1996
4 .8
0 .0
0 .6
Minimum
0 .1
0 .0
-2 .3
Maximum
27 .4
0 .0
3 .3
Count
507
140
507
Std . Dev.
5 .8
0 .0
1 .5
Variance
33 .4
0 .0
2.4
Date
DAILY AMMONIA EFFLUENT VALUES
Mobil Oil Joliet Refinery
19,91-1997
Ammonia, mg/l
In (ammonia
January 1992 - December 1996
File : flldodmobi/wkxht/ehnnunmwk4
Average
Minimum
Maximum
Count
Std . Dev.
Variance
5 .3
0 .1
27 .4
435
6 .0
35 .7
0 .0
0 .0
0 .0
82
0 .0
0 .0
0 .0
0 .0
0 .0
35
0 .0
0 .0
0 .8
-2 .3
3 .3
435
1 .5
2 .3
0.7
-2.3
3 .3
70
1 .7
3 .0
January 1996 - December 19%
Average
Minimum
Maximum
Count
Std . Dev .
Variance
5 .8
0 .1
27
.4
70
7 .0
48 .6
November 1995
Average
Minimum
Maximum
Count
Std . Dev .
Variance
November 1995
Average
Minimum
Maximum
Count
Std. Dev.
Variance
-
March 1997 (with April 1996 upset)
5 .7
27 .4
109
6 .8
45 .8
0 .0
0 .0
0 .0
38
0.0
0.0
0 .671
-2 .3
3 .3
109
1 .7
2 .8
-
March 1997 (without April 1996 upse
4 .9
0.1
27
.4
103
6 .2
38 .1
0.0
0.0
0 .0
38
0 .0
0 .0
0 .5
-2 .3
3 .3
103 .0
1 .6
2 .6
January 19% -
March 1997 (without April 1996 upset)
Average
4 .0
0 .0
0 .3
Minimum
0 .1
0 .0
-2 .3
Maximum
27 .4
0 .0
3 .3
Count
86
38
86
Std . Dev
.
5 .6
0 .0
1 .6
Variance
31
.6
0 .0
2 .5
November 1996
Average
- March 1997
2 .3
0 .0
-0.1
Minimum
0 .1
0 .0
-2.3
Maximum
14 .0
0 .0
2 .6
Count
29 .0
13 .0
29.0
Std . Dev .
3 .9
0 .0
1 .2
Variance
15 .5
0 .0
1 .5
PROOF OF SERVICE
I, DAVID L. RIESER, an attorney, hereby certify that on April 24, 1997, I caused
copies of the foregoing PETITION FOR SITE-SPECIFIC RELIEF FROM 35
ILL. ADM. CODE
304.122,
AMMONIA NITROGEN EFFLUENT STANDARDS to be served upon the attached service
list.
0-M
.
I
i -
_~,`