BEFORE THE ILLINOIS POLLUTION CONTROL BOARD
IN THE MATTER OF:
NITROGEN OXIDES EMISSIONS FROM
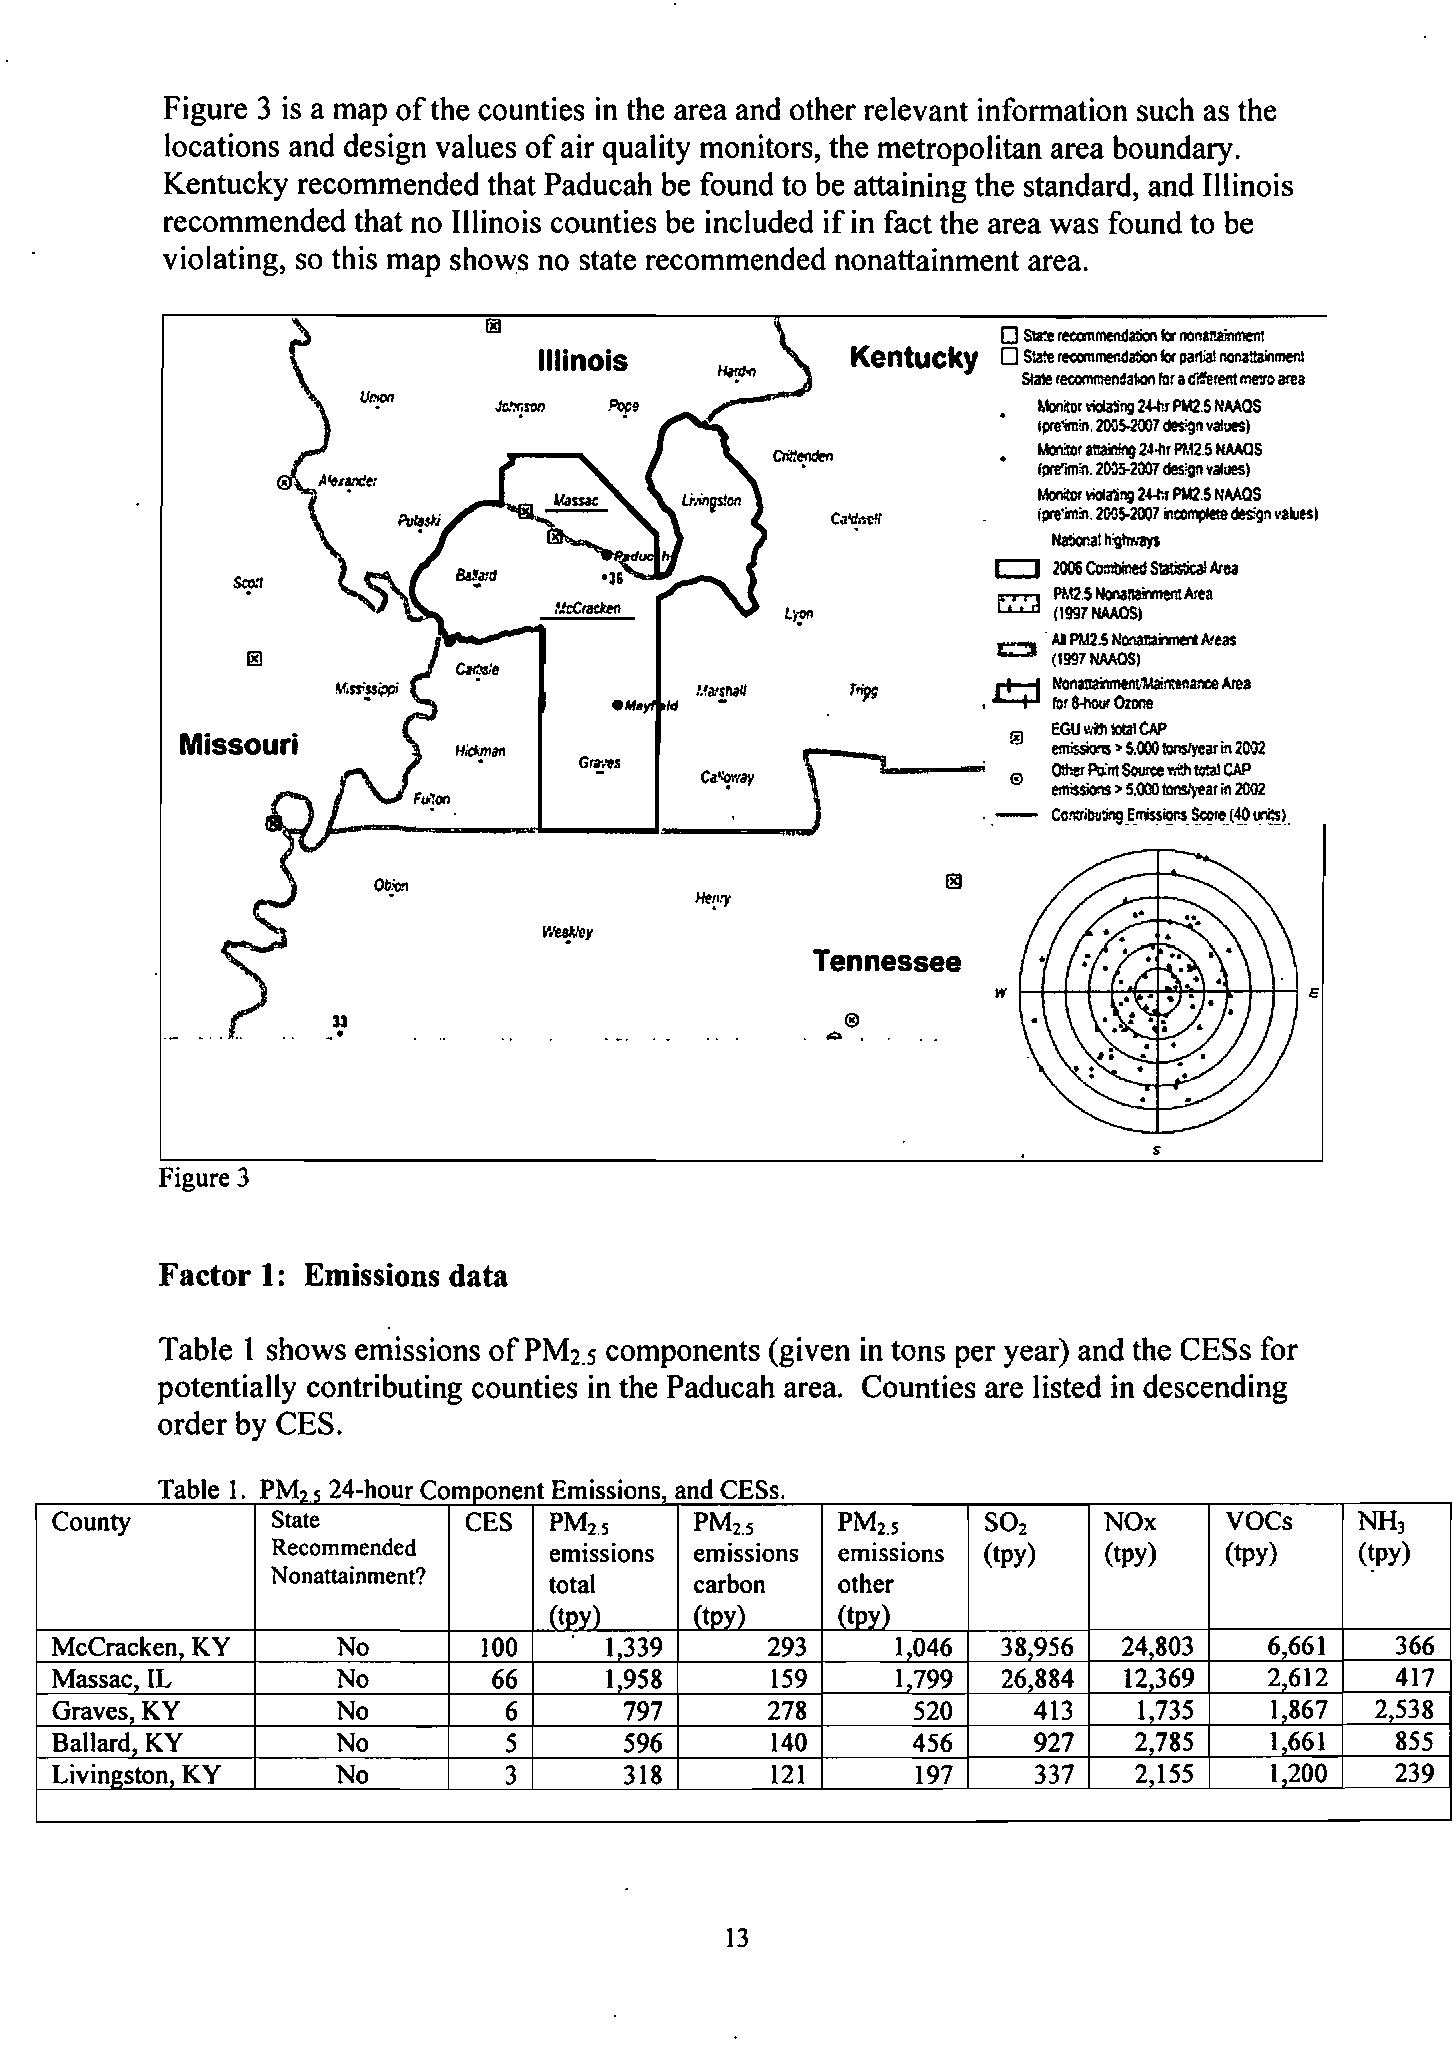
VARIOUS SOURCE CATEGORIES:
AMENDMENTS TO 35 ILL. ADM. CODE
PARTS
211 AND 217
)
)
)
)
)
)
R08-19
(Rulemaking - Air)
NOTICE
TO:
John Therriault
Assistant Clerk
Illinois Pollution Control Board
James
R.
Thompson Center
100 West Randolph St., Suite 11-500
Chicago,IL 60601
SEE ATTACHED SERVICE LIST
PLEASE TAKE NOTICE that I have today filed with the Office
ofthe Clerk ofthe
Illinois Pollution Control Board the ILLINOIS ENVIRONMENTAL PROTECTION
AGENCY'S ANSWERS TO MIDWEST GENERATION'S QUESTIONS
FOR AGENCY
WITNESSES, a copy
of which is herewith served upon you.
ILLINOIS ENVIRONMENTAL
PROTECTION AGENCY
BY:~~
G
~occaforte
Assistant Counsel
Division
of Legal Counsel
DATED: September 30, 2008
1021 North Grand Avenue East
P.
O. Box 19276
Springfield,
IL 62794-9276
217/782-5544
TillS FILING IS SUBMITTEO
ON RECYCLED PAPER
???????????
??????? ?? ??????????
???????? ???????? ??????????
???? ????
BEFORE THE ILLINOIS POLLUTION CONTROL BOARD
IN THE MATTER OF:
NITROGEN OXIDES EMISSIONS FROM
VARIOUS SOURCE CATEGORIES:
AMENDMENTS TO
35 ILL. ADM. CODE
PARTS 211 AND 217
)
)
)
)
)
)
R08-19
(Rulemaking - Air)
THE ILLINOIS ENVIRONMENTAL PROTECTION AGENCY'S ANSWERS TO
MIDWEST GENERATION'S QUESTIONS FOR AGENCY WITNESSES
NOW COMES the lllinois Environmental Protection Agency ("Illinois EPA"), by its
attorneys, and pursuant to the Hearing Officer'sOrder dated June 12,2008, respectfully submits
the Illinois EPA'sAnswers to Midwest Generation's Questions for Agency Witnesses:
Questions for Mr. Kaleel
1.
Please explain the relationship between these proposed rules establishing reasonably
available control technology ("RACT")/reasonably available control measures ("RACM")
for the current ozone and fine particulate matter ("PM2.5") national ambient air quality
standards ("NAAQS") and what may be required for the revised ozone and PM2.5
NAAQS.
Unless USEPA issues new guidance regarding NOx control technology, we expect
that this RACT proposal will satisfy requirements to implement NOx RACT under
the revised NAAQS for the source categories and geographic areas to which this
proposal applies. The Illinois EPA has not yet determined the emissions reduction
measures needed to attain the revised ozone and PM
2.5 NAAQS.
It
may be
necessary to implement more stringent measures, however,
if additional measures
are necessary for attainment.
2.
What distinction, in the definitions or use, between industrial boilers, fossil fuel-fired
boilers, and electric generating units ("EGUs") does the Agency make or intend in this
rule?
EGU boilers are used primarily to generate electricity to sell on the electricity grid.
Industrial boilers are used primarily to generate power (steam
or electricity) for use
at the source. Both types of boilers may use fossil fuels, coal, oil, or gas.
3.
Ifthere are no cement kilns in the nonattainrnent areas, why are cement kilns included in
this rulemaking? Likewise, ifthere are no aluminum melting furnaces affected, why does
the rule include that sector?
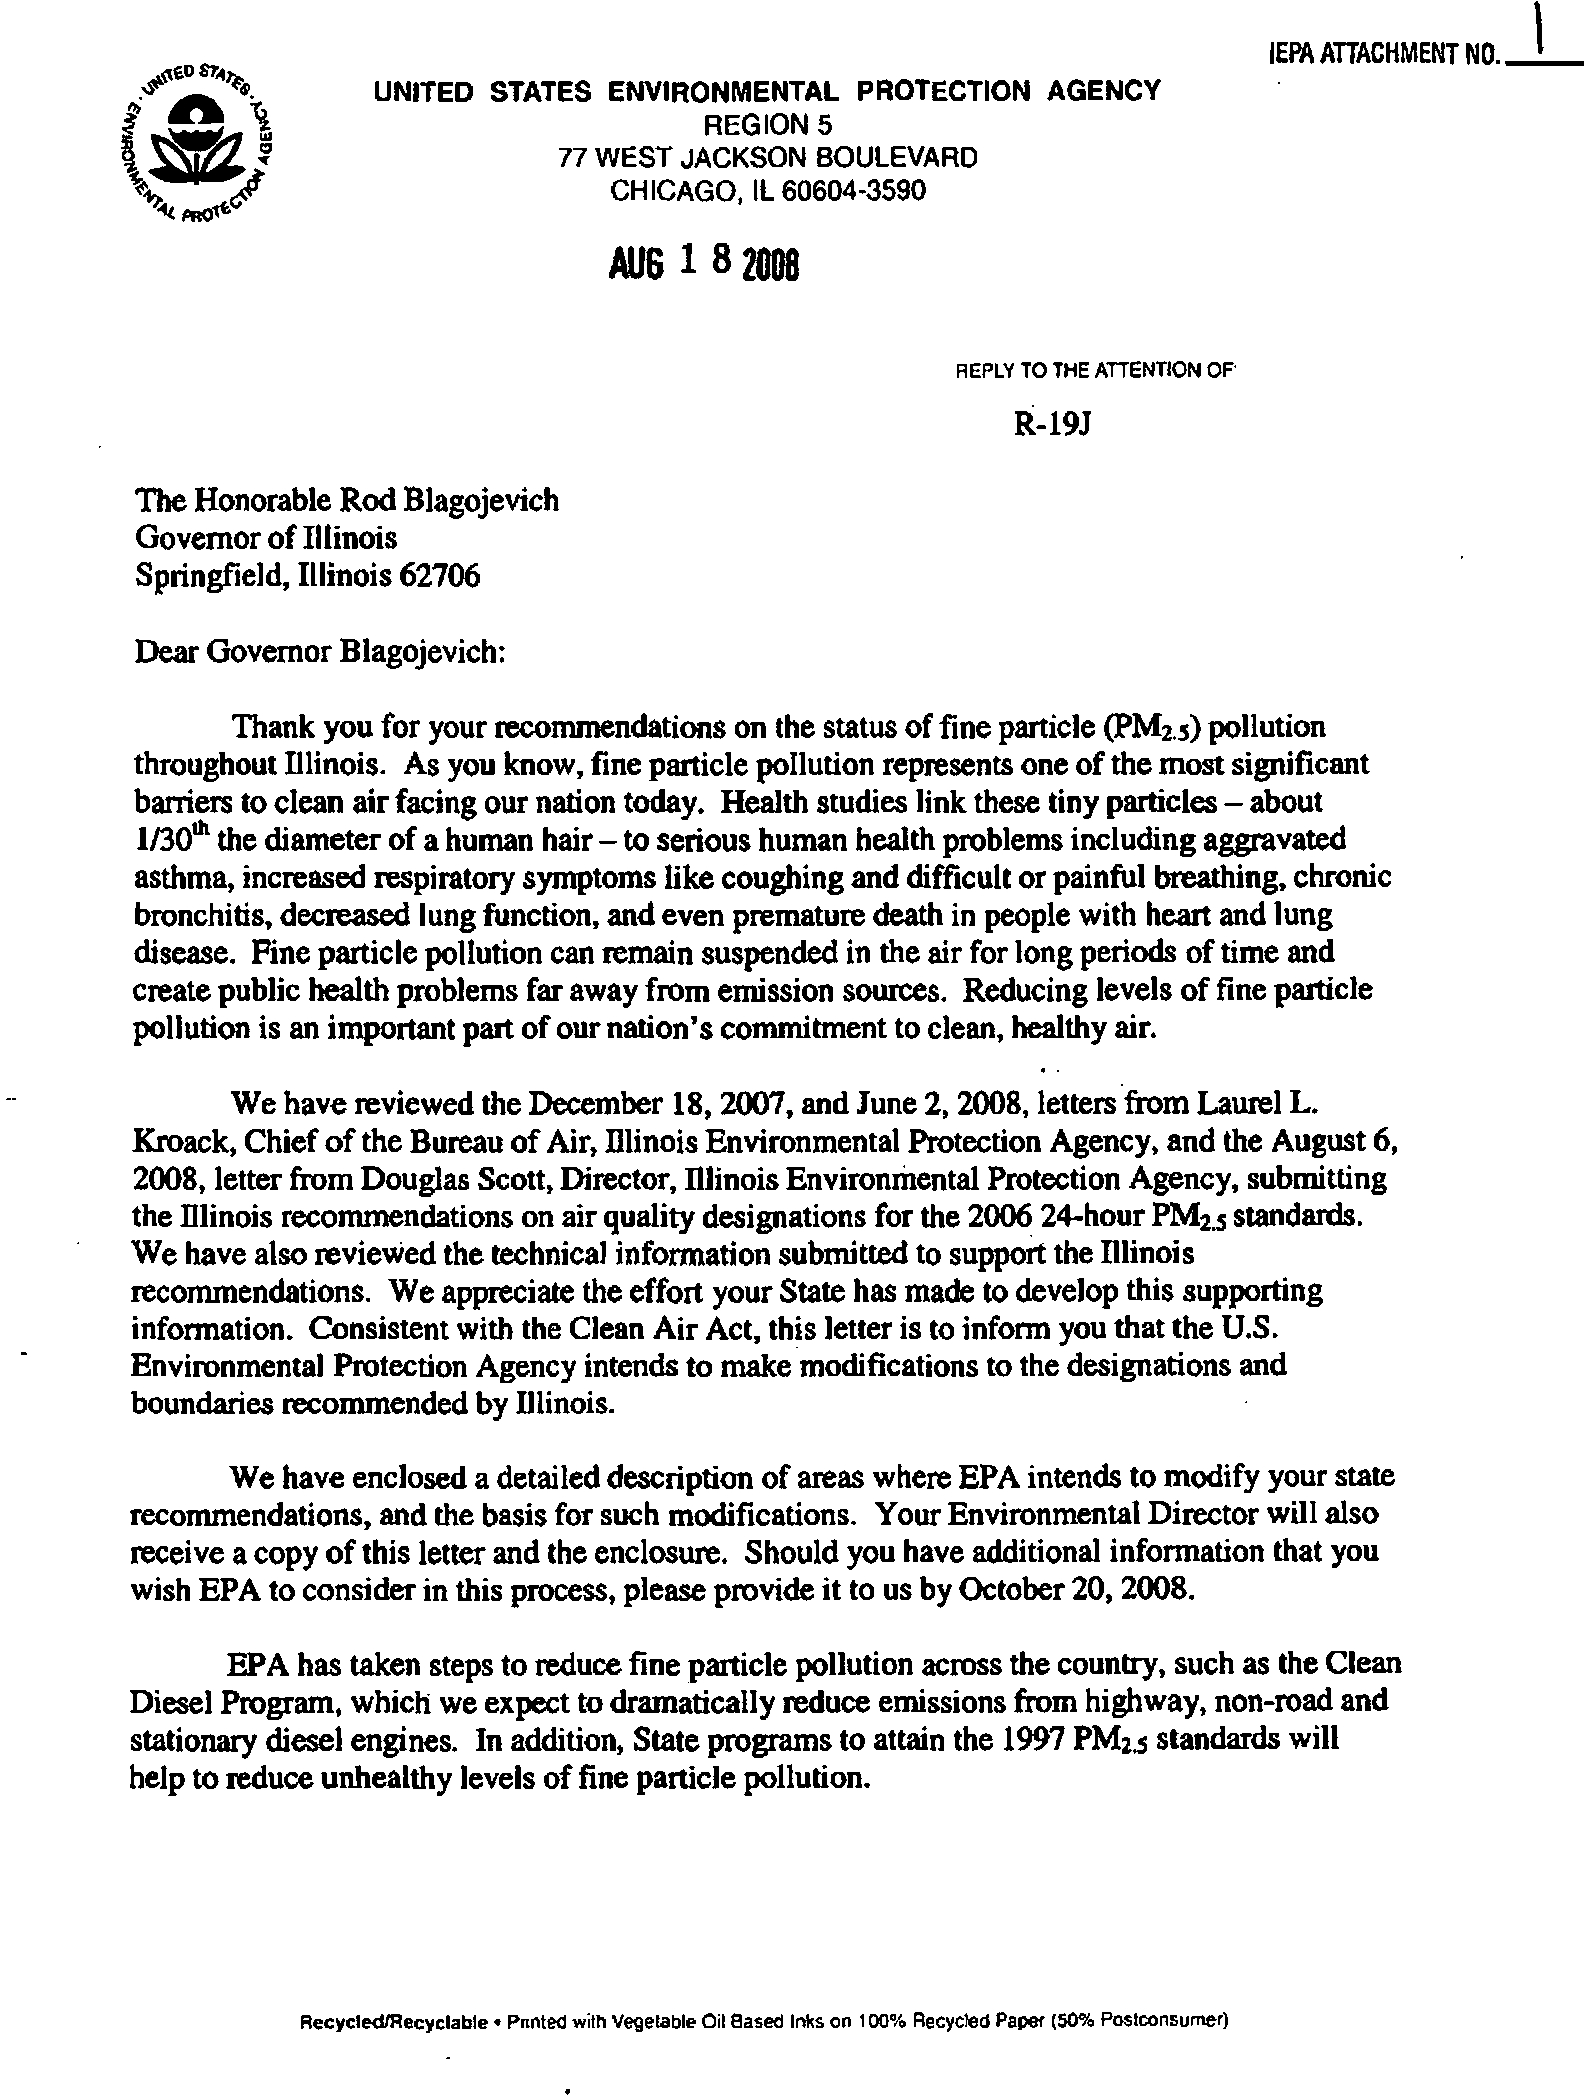
There is an aluminum melting furnace in the Chicago non-attainment area (NAA),
although it has not operated for several years. To the best of
our knowledge, the
emission unit has not been torn down,
so it is possible that the company, or a future
???????????
??????? ?? ??????????
???????? ???????? ??????????
???? ????
owner, will seek to operate the furnace in the future. There are no cement kilns in
the
current NAAs, although there is a cement kiln in Massac County, which USEPA
intends to designate as nonattainment for the 24-hour PM2.5 NAAQS.
The attached
letter shows USEPA's inteut regarding Massac County. See, Attachment 1.
4.
How will the limitation of a unit to only one emissions averaging plan in this rule interact
with the averaging plan provisions
of other rules? That is, is it the Agency's intent for this
rule
to preclude participation or inclusion of a unit that is in an averaging plan under this
rule from participating in averaging plans under other rules and vice versa?
It
is the Illinois EPA's intent that an emission unit be included
in
only one seasonal
and one annual averaging plan. Units affected by Subpart Q (Engine Rule) can be
included in an averaging plan with units affected by this proposal.
5.
In Section 217.150(a)(2), the regulatory language uses the word "emits." How will the
Agency determine whether a unit is subject to the rule? That is, how will the Agency
determine whether a unit emits, as opposed
to having the potential to emit, at the
threshold levels?
In general, the Illinois EPA intends to rely on Annual Emission Reports submitted
by owners/operators
of emissions sources.
6.
Applicability ofSubpart M and the nonapplicability of Subpart D are premised upon the
applicability
of the Part 225, Subparts C, D, and E ("the Illinois [Clean Air Interstate
Rule] CAIR") to electric generating units ("EGUs"). However, the federal rule
underlying the Illinois CAIR has been overturned (assuming that the D.C. Circuit Court
issues the mandate for its decision in appeal
ofthe rule), thus invalidating the Illinois
CAIR. Therefore, it appears that EGUs, which the Agency apparently intended to cover
in Subpart M
ofthis rulemaking, are covered by Subpart D. Does the Agency intend to
amend the language in Subpart M?
If
so, how?
The Illinois EPA does not agree with the Underlying premise
of this question;
however, the Illinois
EPA is amenable to amending Sections 217.340, 217.342,
211.3100,
and 217.160 as set forth in the response to Question 20, below.
7.
What does the Agency consider to be the nominal cost per ton for RACT for nitrogen
oxides ("NOx")?
The USEPA and the Illinois EPA have not established a specific cost threshold for
RACT, although the Illinois EPA has used $2500 to $3000
per ton as a range for cost
effectiveness.
8.
Does a load shaving unit (Section 211.3475) include a peaker power plant?
Yes.
9.
Section 217.150(a) says, "The provisions of this Subpart and Subparts D, E, F, G, H, and
M" ofthis Part apply to ... 1) All sources.... " (Emphasis added.) Is it the Agency's intent
2
???????????
??????? ?? ??????????
???????? ???????? ??????????
???? ????
that all of these subparts actually apply to all sources in the specified geographic areas?
Isn't actually the Agency's intent that only one subpart will apply
to a unit or units at
threshold sources, as determined by the characteristics
of the unit?
It
is the Illinois EPA's intent that each respective Subpart apply to sources that meet
the applicability criteria and individual emission units
at such sources that meet the
applicability criteria, i.e., the provisions
of a respective Subpart apply to the extent a
source includes emission units
of the type covered under that Subpart.
10.
The "all industrial boilers" language in Section 217.160(a) and similar language in the
other subparts could be construed
to expand the scope of Section 217.150(a)(2), which
refers to "any industrial boiler [and other types
of emission units] that emits NOx in an
amount equal
to or greater than 15 tons per year and equal to or greater than five tons per
ozone season." Is it the Agency's intent to expand the applicability
ofthe rule in this
way?
The Illinois EPA's intent is that each Subpart apply to all of the affected emission
units
at an affected source, e.g., "any" emission unit that meets the applicability
criteria.
1I.
Is it the Agency's intent that the proposed rule applies to areas designated nonattainment
for either ozone or PM2.5?
Yes.
12.
What comprises the second compliance period ifthe first is May 1, 2010, through April
30,2011, and then is subsequently on a calendar year basis?
See
Section 217.152.
January 1, 2011, through December 31, 2011.
13.
How is the second sentence of Section 217.152(b) ("The owner or operator of an
emission unit that is subject to Subpart D, E, F,
G, H, or M must operate such unit in a
manner consistent with good air pollution control practice to minimize NOx emissions."
related to the compliance date?
There is no relation.
14.
Can the recordkeeping systems that sources already have in place comprise the "Iogs"
required at Sections 217.156(b)(8) and (9), assuming all
of the information required by
the rule is included?
Yes, as long as all ofthe required information under the rule is included.
15.
What is an "applicable compliance period" referred to in Section 21 7. I56(g)?
The annual or ozone season compliance period.
3
???????????
??????? ?? ??????????
???????? ???????? ??????????
???? ????
16.
Does Section 217.156(k), which requires compliance certifications, recordkeeping, and
reporting for Subpart M units pursuant to 40 CFR Part 96, supersede the other
recordkeeping and reporting requirements
of Section 217.156?
The Illinois EPA's intent is that electric generating nnits subject to Subpart M
comply with
the compliance certifications, recordkeeping, and reporting
requirements
pursuant to 40 CFR Part 96, in conjunction with the other
recordkeeping and reporting requirements under Section 217.156, to the extent the
requirements
are not duplicative.
17.
Does the Agency have information confirming that the stacks at affected units that are
typically small can be tested safely, as required by Section 217.1517
No.
18.
Section 21 7.158(b) requires that averaging plans be submitted by May 1, 2010. What if
a source decides in 2010 that it does not want to average, but in 2015 it decides that it
does want to average?
Is that source precluded from establishing an averaging plan? Is
this a "once out/always out" provision?
Averaging plans can be amended once per year at the discretion of the
owner/operator. Units not previously included in an averaging plan can
be included
at a date later than May 1, 2010.
It
is not the Illinois EPA's intent to establish a
"once out/always
out" provision.
19.
What is the Agency's basis for establishing a rate ofO.08Ib/mmBtu rate for gas-fired
industrial boilers greater than 100 mmBtu? (Section 217.164(a))
The basis for this limit is set forth in the TSD, at page 43, specifically, Table 2-17a:
Cost Effectiveness
Data for Natural Gas-Fired ICI Boilers.
20.
Based upon the proposed applicability language in Subpart M, Section 217.340, assuming
the D.C. Circuit Court issues the mandate implementing its decision in the appeal
ofthe
CAIR, EGUs would be subject to the provisions
of Subpart D. Is the Agency amenable
to amending Sections 217.340, 217.342, 211.3100, and 217.160, as follows:
Section 217.340
Applicability [Subpart M)
Notwithstanding Subpart V or W
ofthis Part, the provisions of Subpart C of this
Part and this Subpart apply to all fussil fuel firee statienary beilers s\fbjeet te the
CAIR
1>10)(
Traeing Pregrams \fneer 81!llpart D er E efPart 225 any fossil fuel-
fired stationary boiler serving a generator that has a nameplate capacity greater
than
25 MWe and produces electricity for sale, excluding any units listed in
Appendix D
ofthis Part, located at sources subject to this Subpart pursuant to
Section 217.150
of this Part.
Section 217.342
Exemptions
4
???????????
??????? ?? ??????????
???????? ???????? ??????????
???? ????
a)
Notwithstanding Section 217.340 ofthis Subpart, the provisions ofthis
Subpart do not apply to a fossil fuel-fired stationary boiler operating under
a federally enforceable limit
of NOx emissions from such boiler to less
than
15 tons per year and less than five tons per ozone season.
b)
Notwithstanding Section 217.340
ofthis Subpart, the provisions ofthis
Subpart
do not apply to a coal-fired stationary boiler that commenced
operation before January 1,2008, that is complying with Part 225.Subpart
B through the multi-pollutant standard under Section 225.233
of Part 225
or the combined pollutant standards under Subpart F
ofPart 225.
Section 211.3100
Industrial Boiler
"Industrial boiler" means, for purposes
ofPart 217, an enclosed vessel in which
water is heated and circulated either as hot water or as steam for heating or for
power, or both. This term does not include boilers serving a generator that has a
nameplate capacity greater than
25 MWe and produces electricity for sale, and
cogeneration units, as that term
is defined in Section 225.130 ofPart 225, if sueh
bailers
ar eageaeratiaauaits are subjeet ta the CAlR
~IOl(
TFaBiag Pragrams
uaBer Subpart
Dar II afPart 225.
Section 217.1
60
Applicability [Subpart D]
b)
The provisions ofthis Subpart do not apply to boilers serving a generator
that has a nameplate capacity greater than
25 MWe and produces
electricity for sale, and cogeneration units, as that term
is defined
in
Section 225.230 of Part 225, ifsueh bailers ar eageaeratiaauaits are
slllJjeet ta the CAlR
~IOl(
TraBiag Pragrams llI1Ber Subpart D ar II afPart
m.
The lIIinois EPA is amenable to amending Sections 217.340, 217.342, 211.3100, and
217.160 as follows:
Section 217.340
Applicability [Subpart
M]
Notwithstanding Subpart V or W of this Part, the provisions of Subpart C of
this Part and this Subpart apply to all fessil fuel fired stationary boilers
subjeet to the
CAIR NOx Trading Programs under Subpart D or E of Part
m any fossil fuel-fired stationary boiler serving at any time a generator that
has a nameplate capacity greater than 25 MWe and produces electricity for
sale, excluding any units listed in Appendix D
of this Part, located at sources
subject to this
Subpart pursuant to Section 217.150 of this Part.
Section 217.342
Exemptions
a)
Notwithstanding Section 217.340 of this
Subpart, the provisions of
this Subpart do not apply to a fossil fuel-fired stationary boiler
operating
under a federally enforceable limit of NOx emissions from
5
???????????
??????? ?? ??????????
???????? ???????? ??????????
???? ????
such boiler to less than 15 tons per year and less than five tons per
ozone season.
b)
Notwithstanding Section 217.340
ofthis Subpart, the provisions of
this Subpart do not apply to a coal-fired stationary boiler that
commenced operation before January 1, 2008, that is complying with
Part 225.Subpart B through the multi-pollutant standard under
Section 225.233 ofPart 225 or the combined pollutant standards
under Subpart F of Part 225.
Section 211.3100
Industrial Boiler
"Industrial boiler" means, for purposes
of Part 217, an enclosed vessel in
which water
is heated and circulated either as hot water or as steam for
heating
or for power, or both. This term does not include boilers serving a
generator
that has a nameplate capacity greater than 25 MWe and produces
electricity for sale,
and eogeneration units, as dlat term is defiBed in Seetion
22S.HO of Part 22S, if such boilers or eogeneration units are subjed to meet
the applicability criteria
under Subpart M of Part 217 the
CUR NOll:
Trading Programs under Subpart D or E of Part 22S.
Section 217.160
Applicability [Subpart
D]
b)
The provisions ofthis Subpart do not apply to boilers serving a
generator
that has a nameplate capacity greater than 25 MWe and
produces electricity for sale, and eogeneration units, as dlat term is
defined
in
Seetion
22S.2~O
of Part 22S, if such boilers or eogeneration
units
are subjeet to meet the applicability criteria under Subpart M of
Part 217 die CAIR
NOll:
Trading Programs under Subpart
D
or
E
of
Part 22S.
21.
What is the basis for determining that the O.091b/mmBtu rate at Section 217.344(a) is
RACT?
The technologies to control utility boilers to below 0.09 Ib/MMBtu
are certainly
available
as evidenced by the number of utility boilers in Illinois and throughout tbe
United States
that currently control to that level or less. Emissions data for over 100
coal units equipped with SCRs and other low NOx technology were examined in a
comprehensive study by Erickson and Staudt with the results presented
at the EPA-
DOE-EPRI Combined Power Plant Air Pollution Control Symposium (the MEGA
Symposium) in 2006. See, Attachment
29 to the TSD, Selective Catalytic Reduction
System Performance
and Reliability Review, the 2006 MEGA Symposium, Paper
#121, by Clayton A. Erickson and James E. Staudt. Without a doubt, coal-fired
units have demonstrated
that emissions under 0.09 Ib/MMBtu are possible using
combustion controls, post-combustion controls,
or combinations of the two. In fact,
Illinois' own Baldwin Unit
#3 achieves below 0.091b1MMBtu using only combustion
control.
Otber units in Illinois achieve under 0.09 Ib/MMBtu using SCR.
6
???????????
??????? ?? ??????????
???????? ???????? ??????????
???? ????
So, from the perspective of RACT, the only remaining question is whether or not the
technology is reasonable in cost. As a benchmark of what is reasonable, the United
States Environmental Protection Agency (USEPA) determined in its Clean Air
Interstate Rule analysis, which motivated installation of SCRs,
that
The EPA's analysis indicates that emissions reductions from electric
generating units (EGUs) are highly cost effective,
and EPA encourages States
to adopt controls for EGUs.
See, 70 Fed. Reg. 25162, 25165 (May 12, 2005).
Further, in describing
what is "highly cost effective" USEPA stated:
(II) Determination
of Highly Cost-Effective Amount
The EPA determined the dollar amount considered to be highly cost effective
by reference to the cost effectiveness
of recently promulgated or proposed
NOX controls. The EPA determined
that the average cost effectiveness of
controls in the reference list ranged up to approximately $1,800 per ton of
NOX removed (1990$), on an annual basis. The EPA considered the controls
in the reference list to be cost effective.
See,
70 Fed. Reg. 25162, 25173 (May 12, 2005).
It
is widely recognized that combustion controls are reasonable in cost. However,
SCR also provides NOx reductions
at reasonable costs. Figure 2-17 from the TSD
can be used to make this point. A capital cost of
$200/KW
is near the high end of
what a utility SCR retrofit would typically be expected to cost and this translates
roughly to $20,000IMMBtulbr, assuming a heat rate on the
order of 10,000
Btu/kWhr.
Using Figure 2-17 and an assumed uncontrolled NOx level of 0.50
IbIMMBtu, one arrives
at $2000/ton of NOx removed. Uncontrolled units would
typically have an emissions rate
of at least 0.50 IbIMMBtu. But, even at
uncontrolled NOx levels of 0.40 IbIMMBtu, the cost is estimated at about $2500/ton.
For more typical capital cost numbers in the range of $100/KW to
$150/KW
(roughly $10,000-$15,00 OIMMBtu/hr on Figure 2-17), the cost of NOx reduction
would be below $2000/ton. Companies typically do not publish their cost data. But,
fortunately, cost data is available for some SCR retrofits.
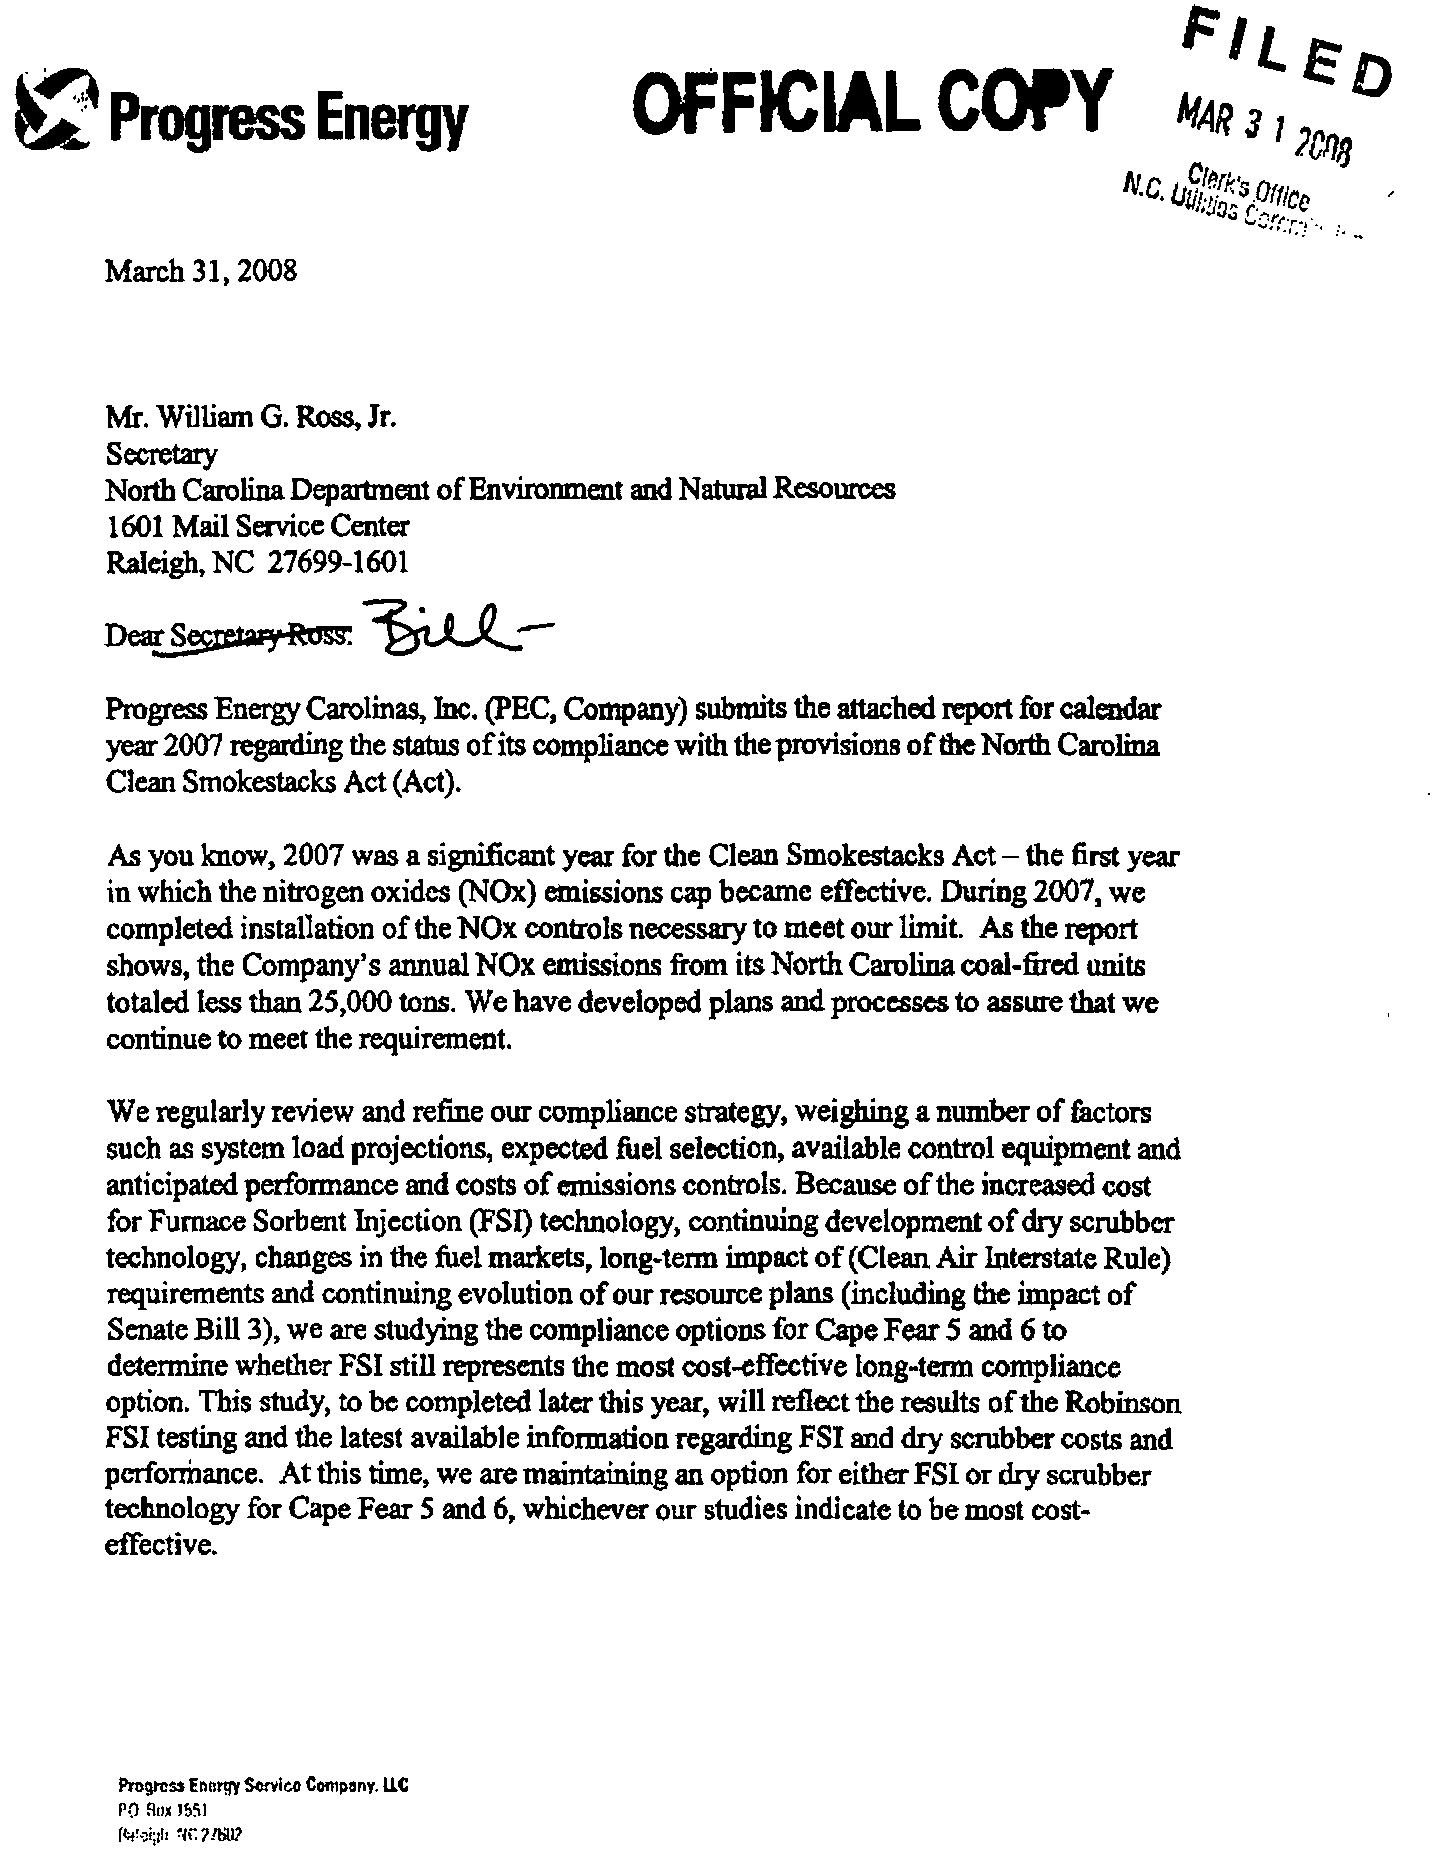
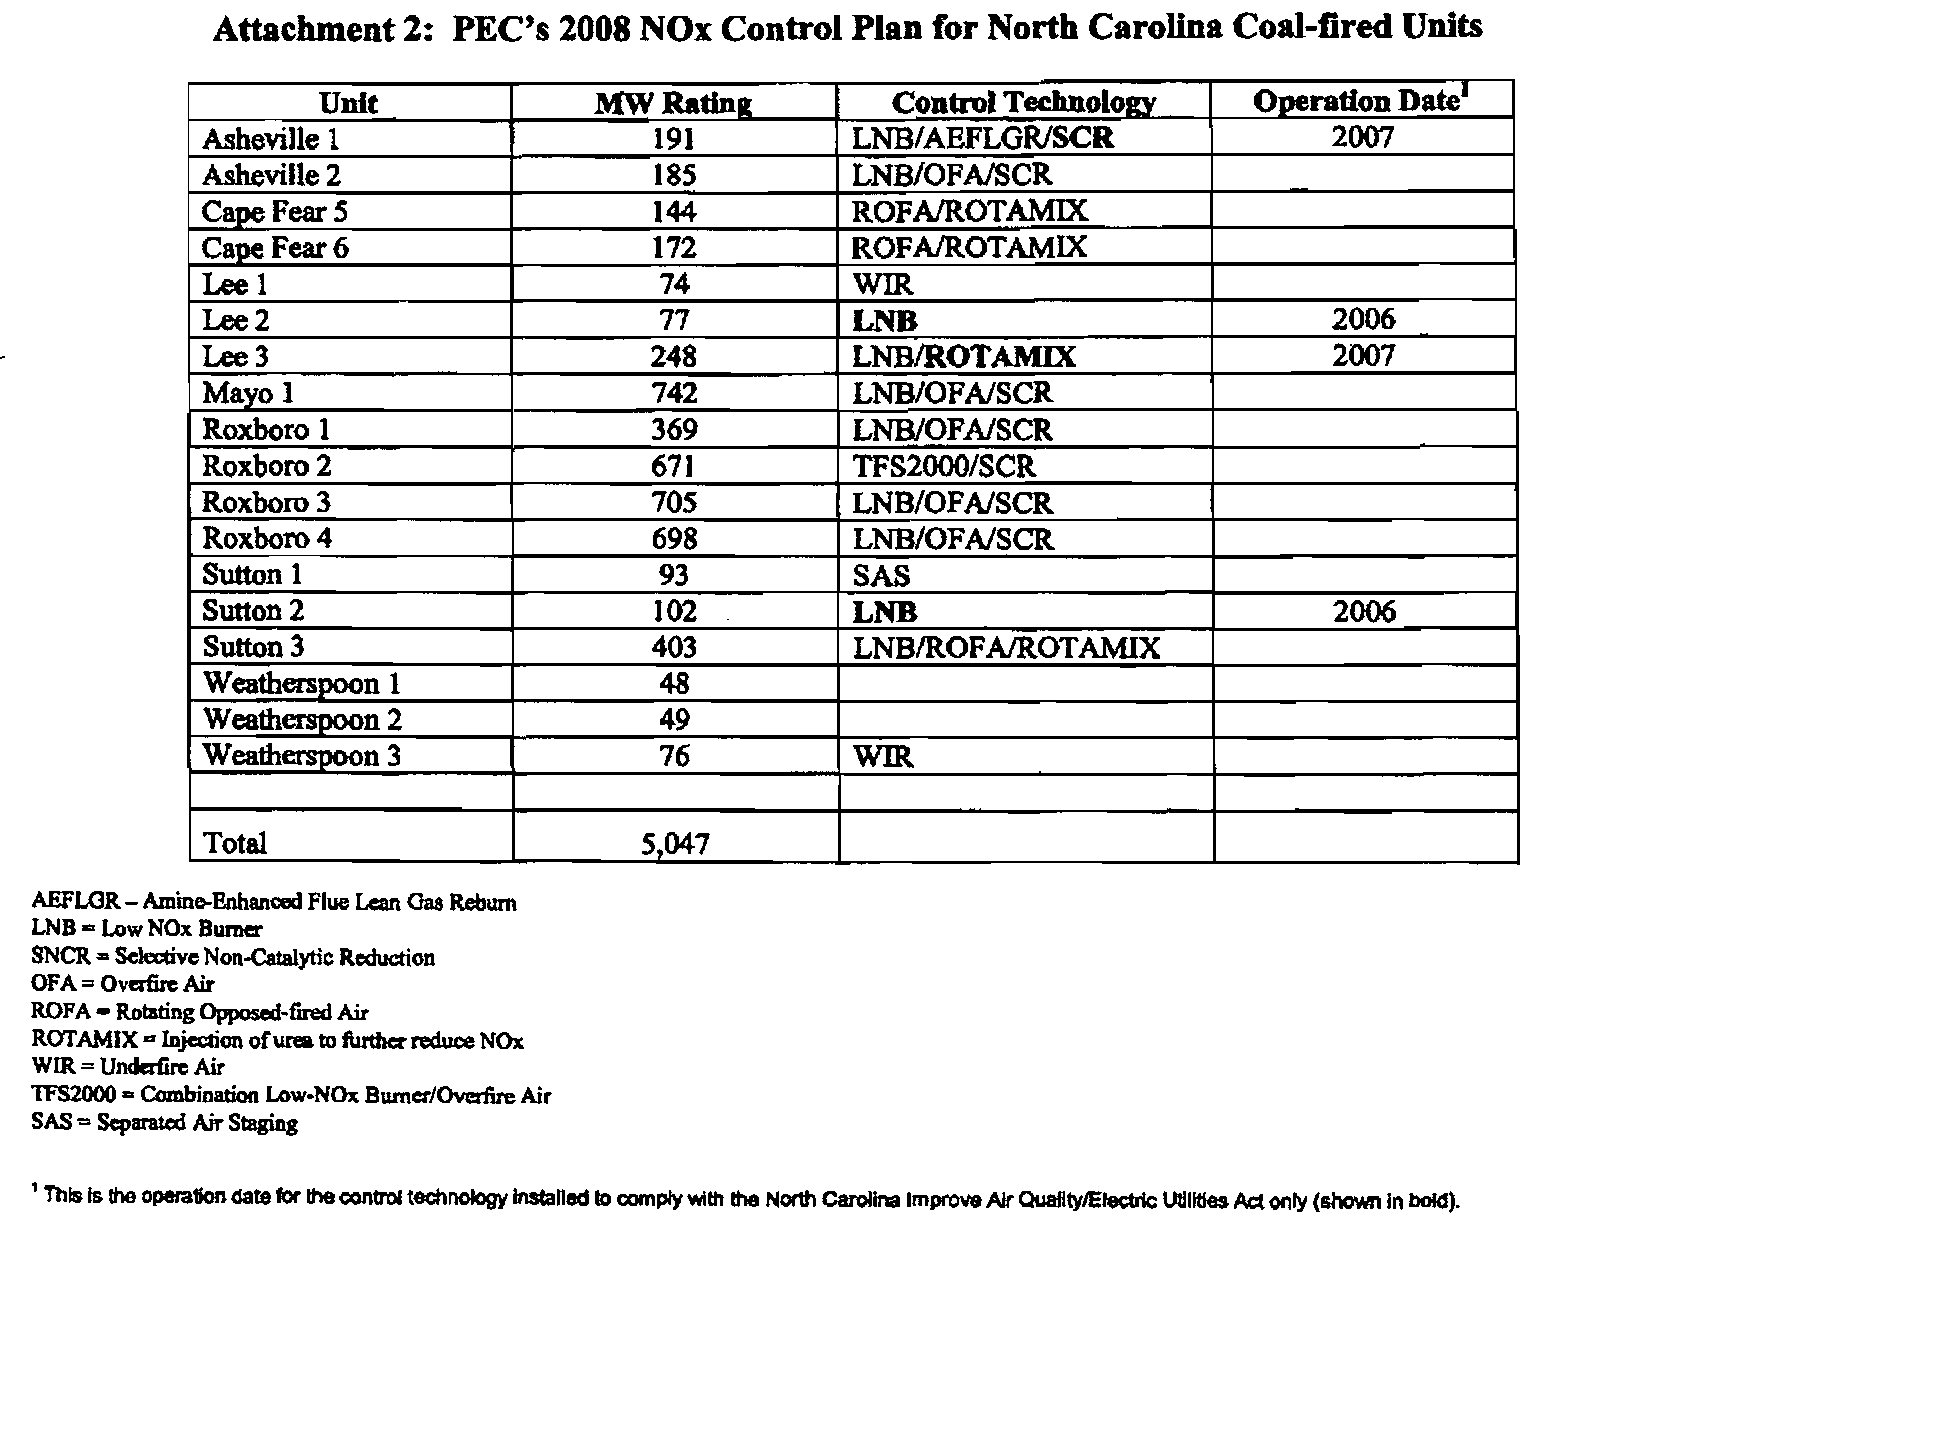
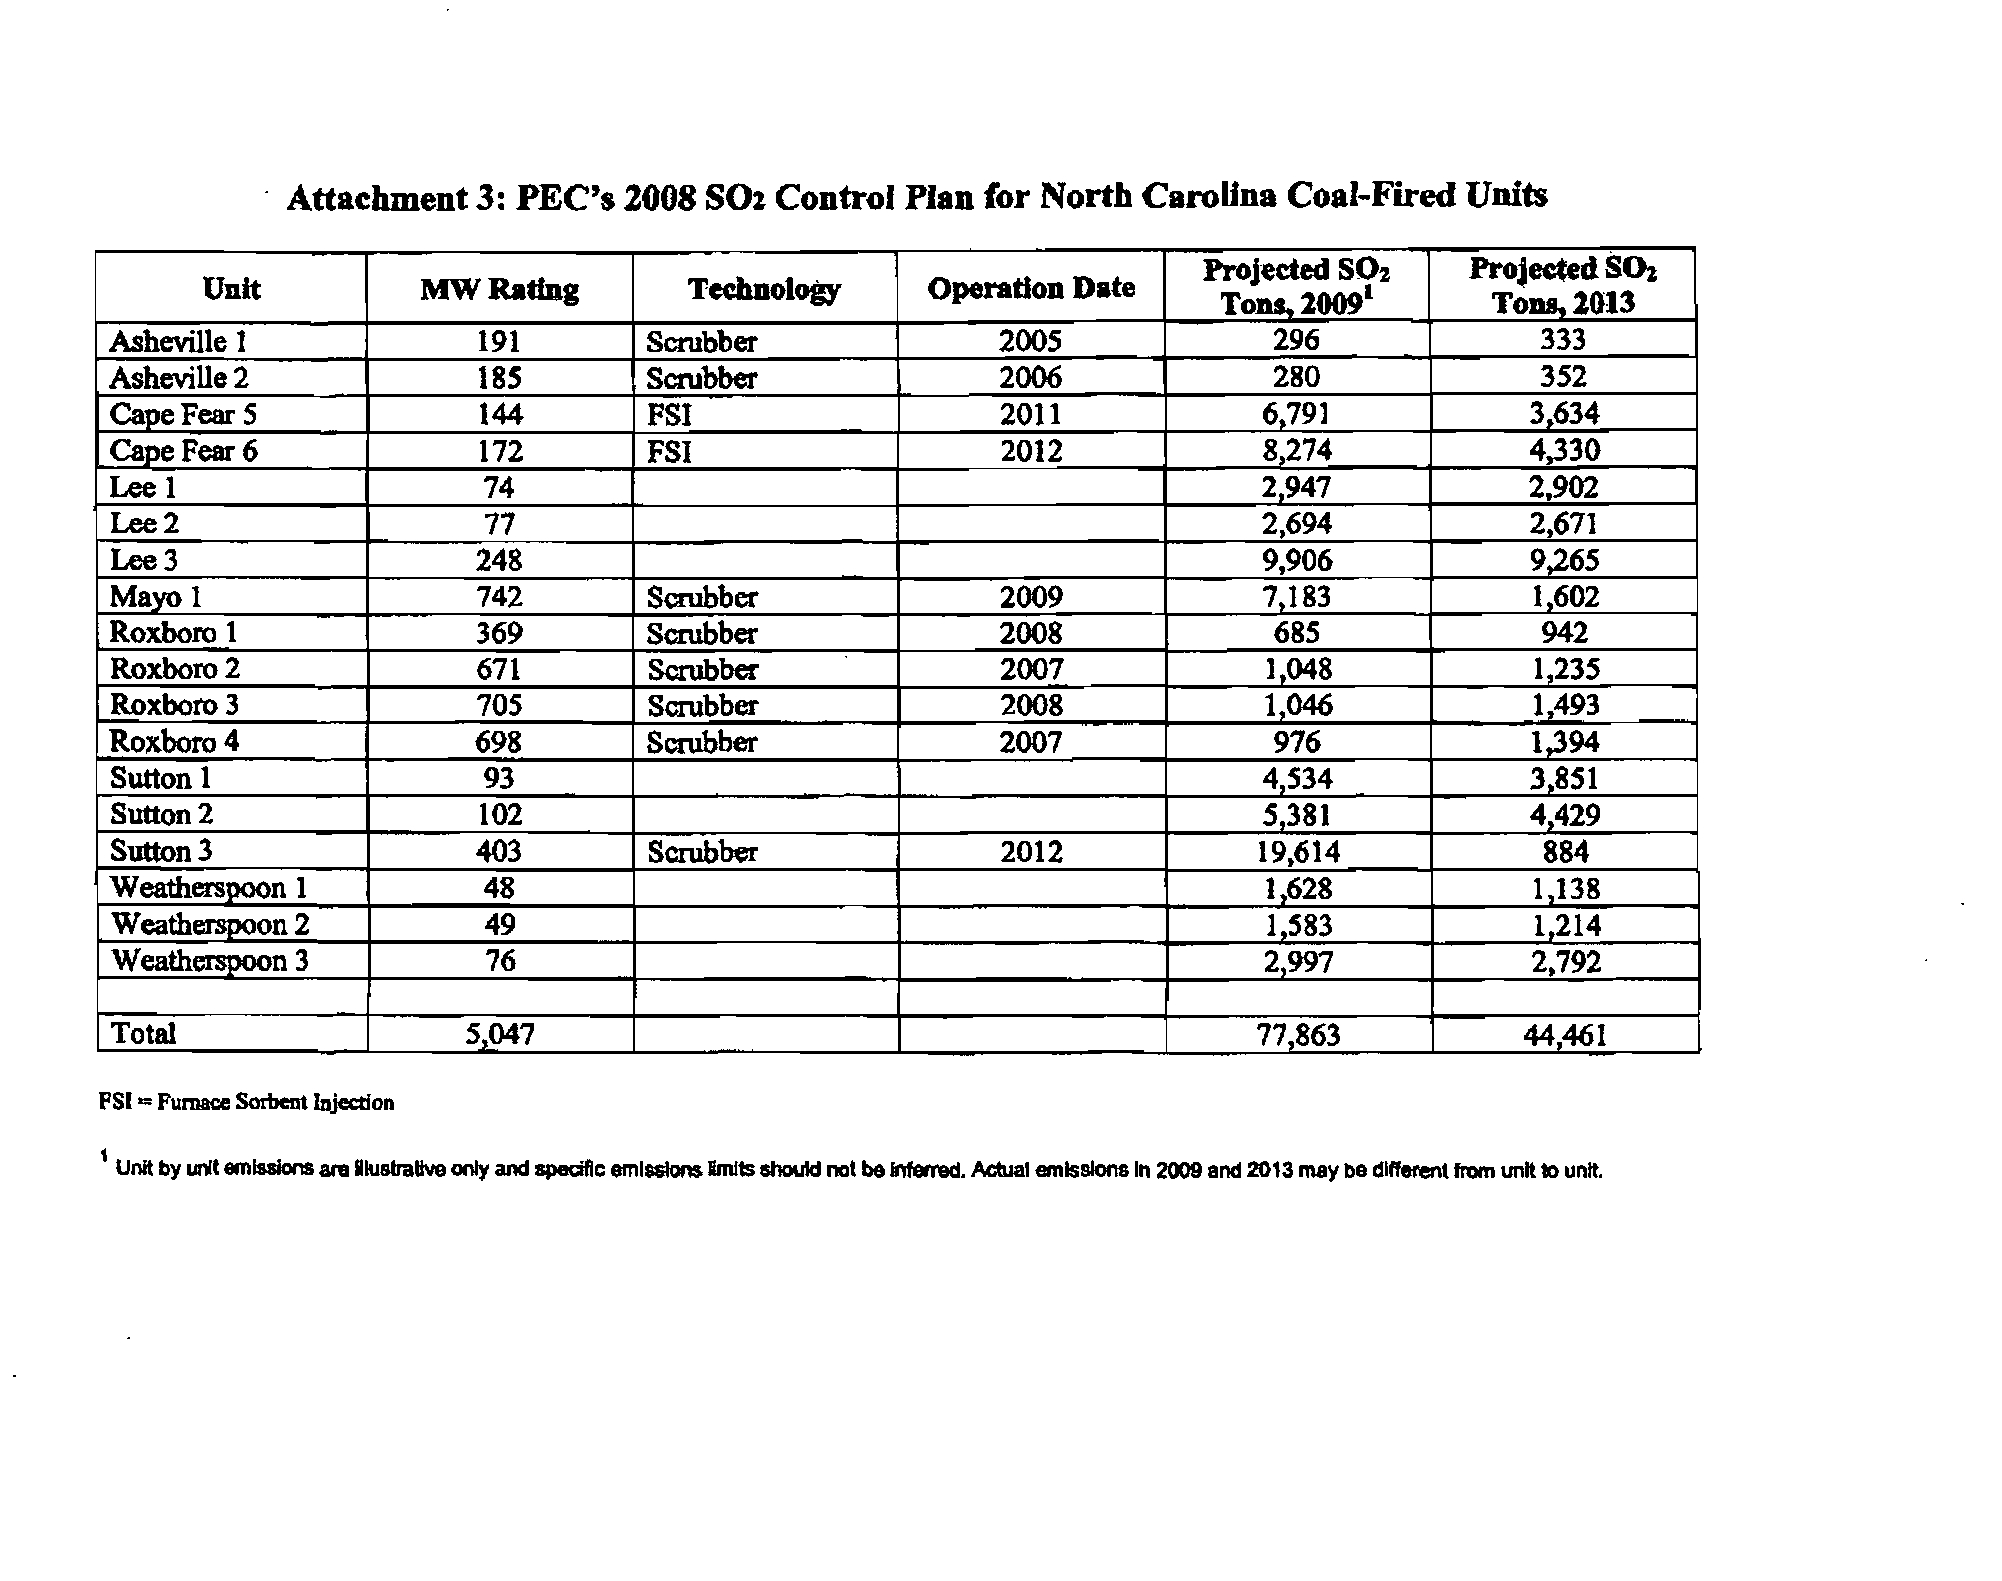
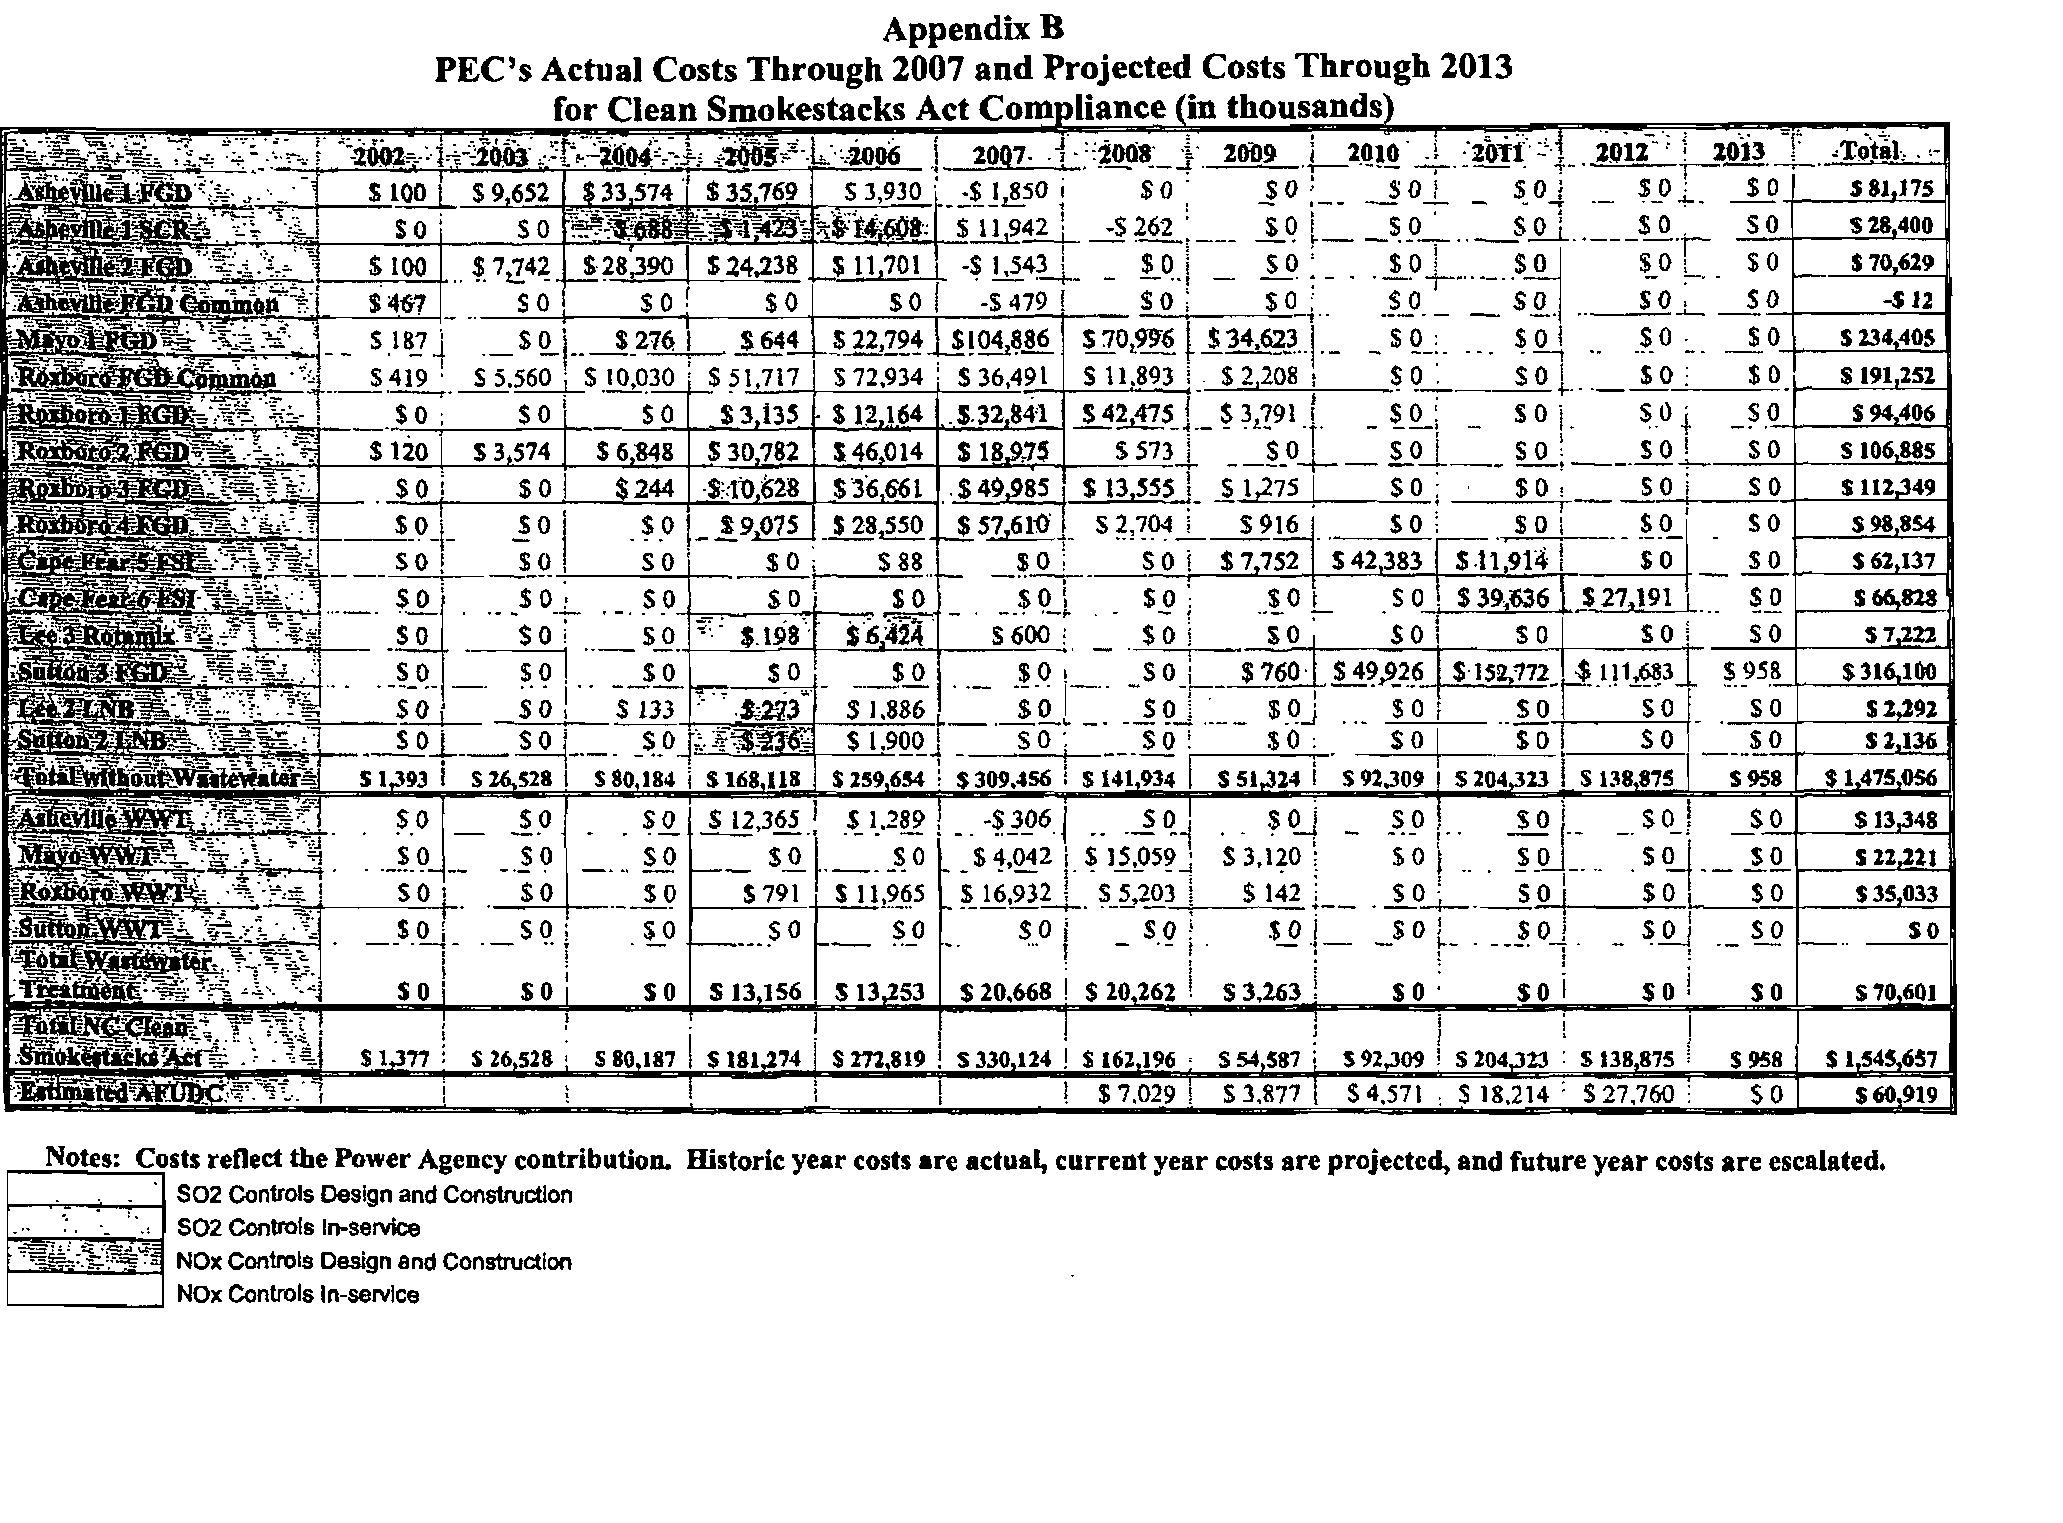
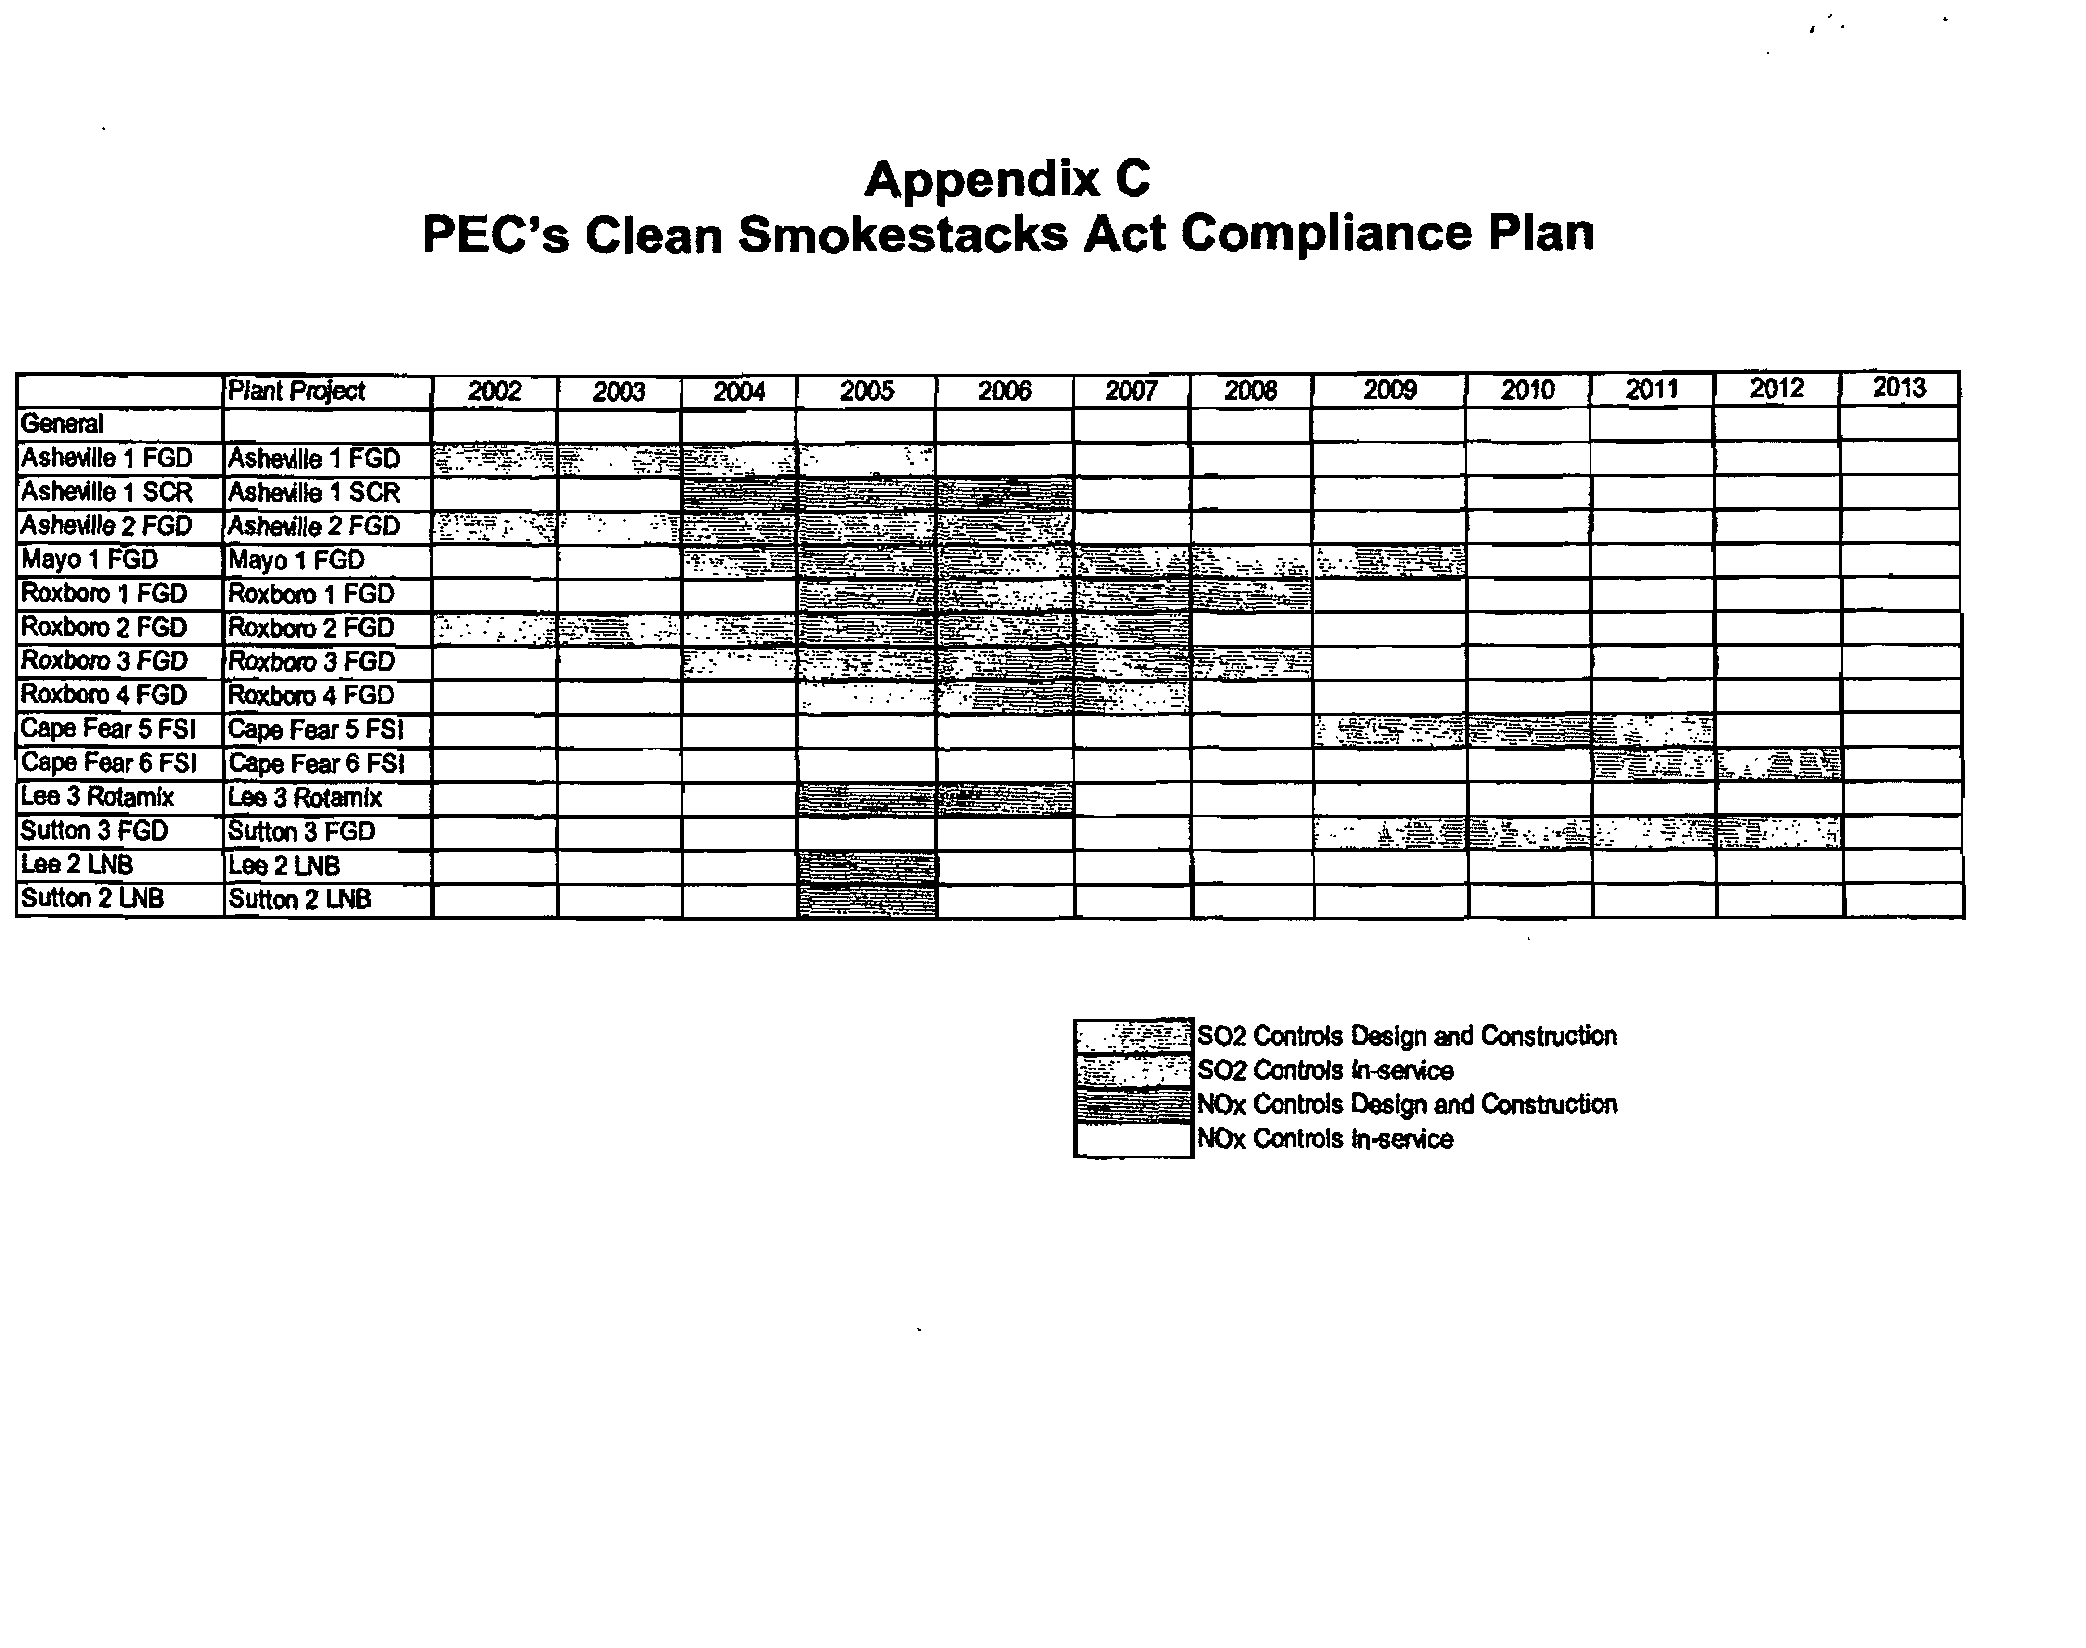
As shown in the attached
report submitted by Progress Energy to the North Carolina Public Utilities
Commission, the Asheville Unit 1 SCR retrofit cost
$28 million on the 191 MW unit
- $149/KW.
See, Attachment 2. And, as reported in Power Engineering Magazine,
(http://pepei.pennnet.com/display_
article/162367/61
ARTCL/none/none/l/SCR-=-
Supremely-Complex-Retrofitl), in an article titled
"SCR =Supremely Complex
Retrofit), Duke Power'stwo Belews Creek Units
(2 times 1120 MW) were retrofit
for $325 million,
or $145/KW. See, Attachment 3. Thus, a "Supremely Complex
Retrofit" cost $145/KW.
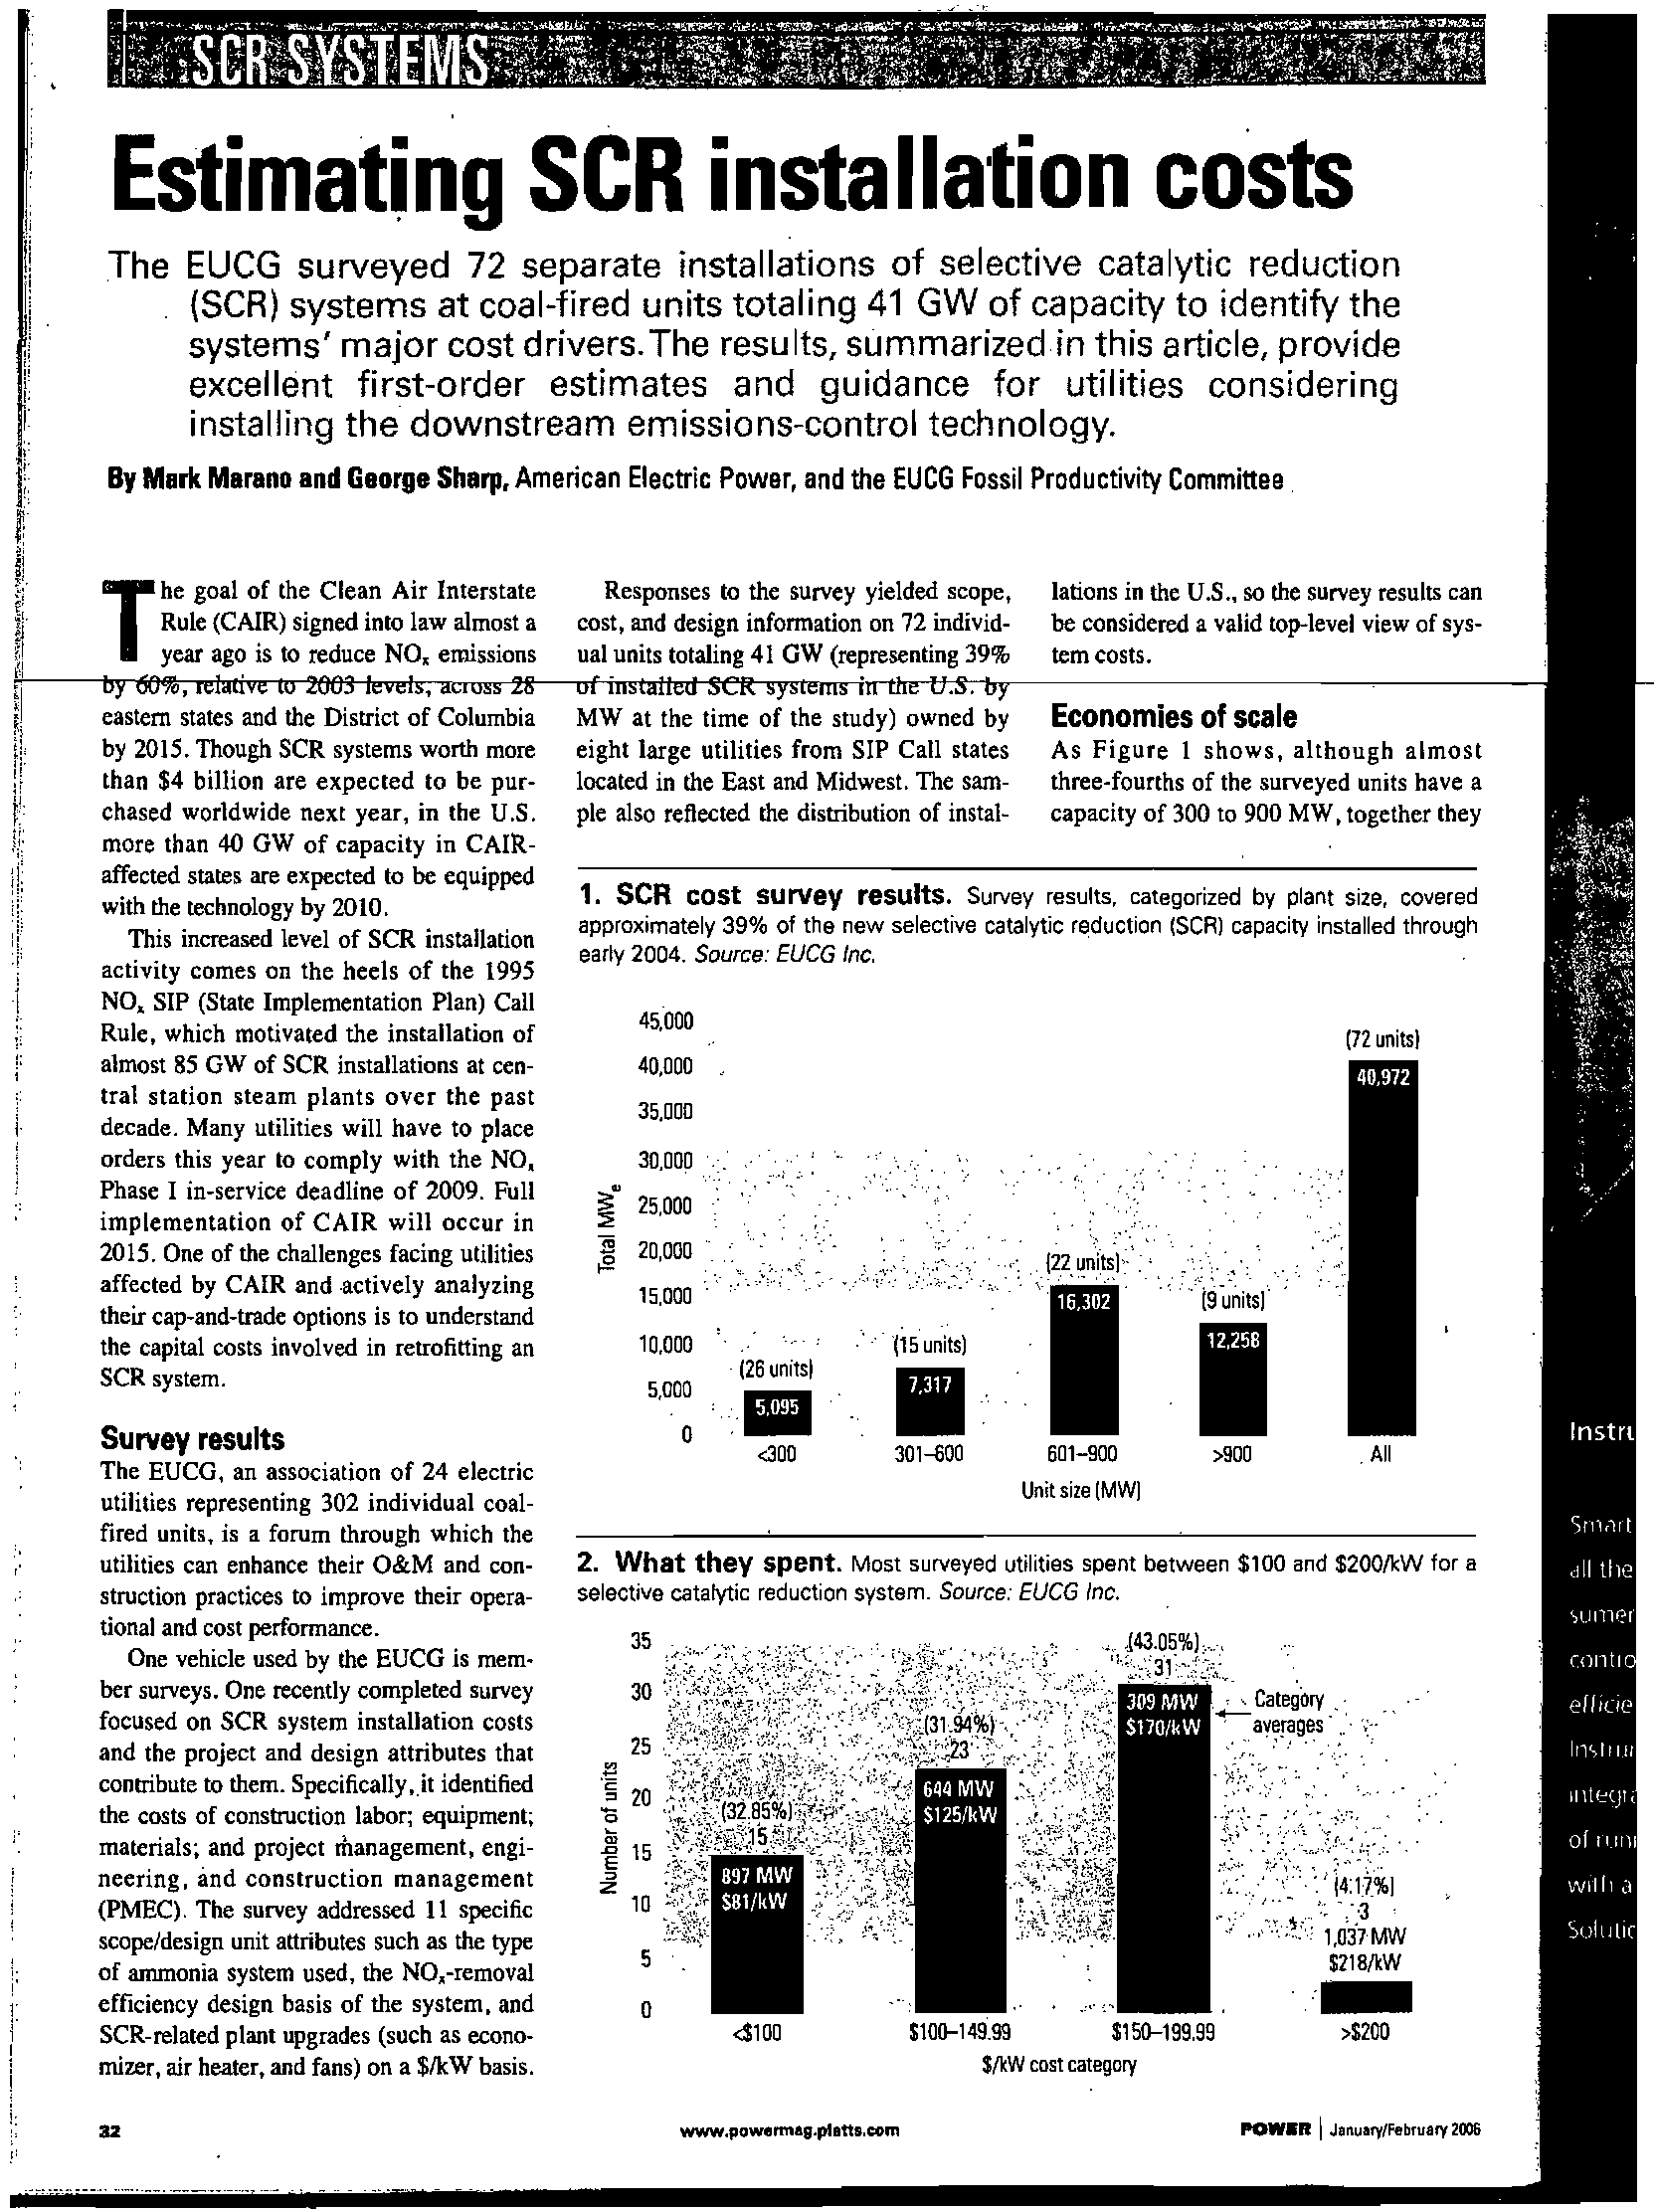
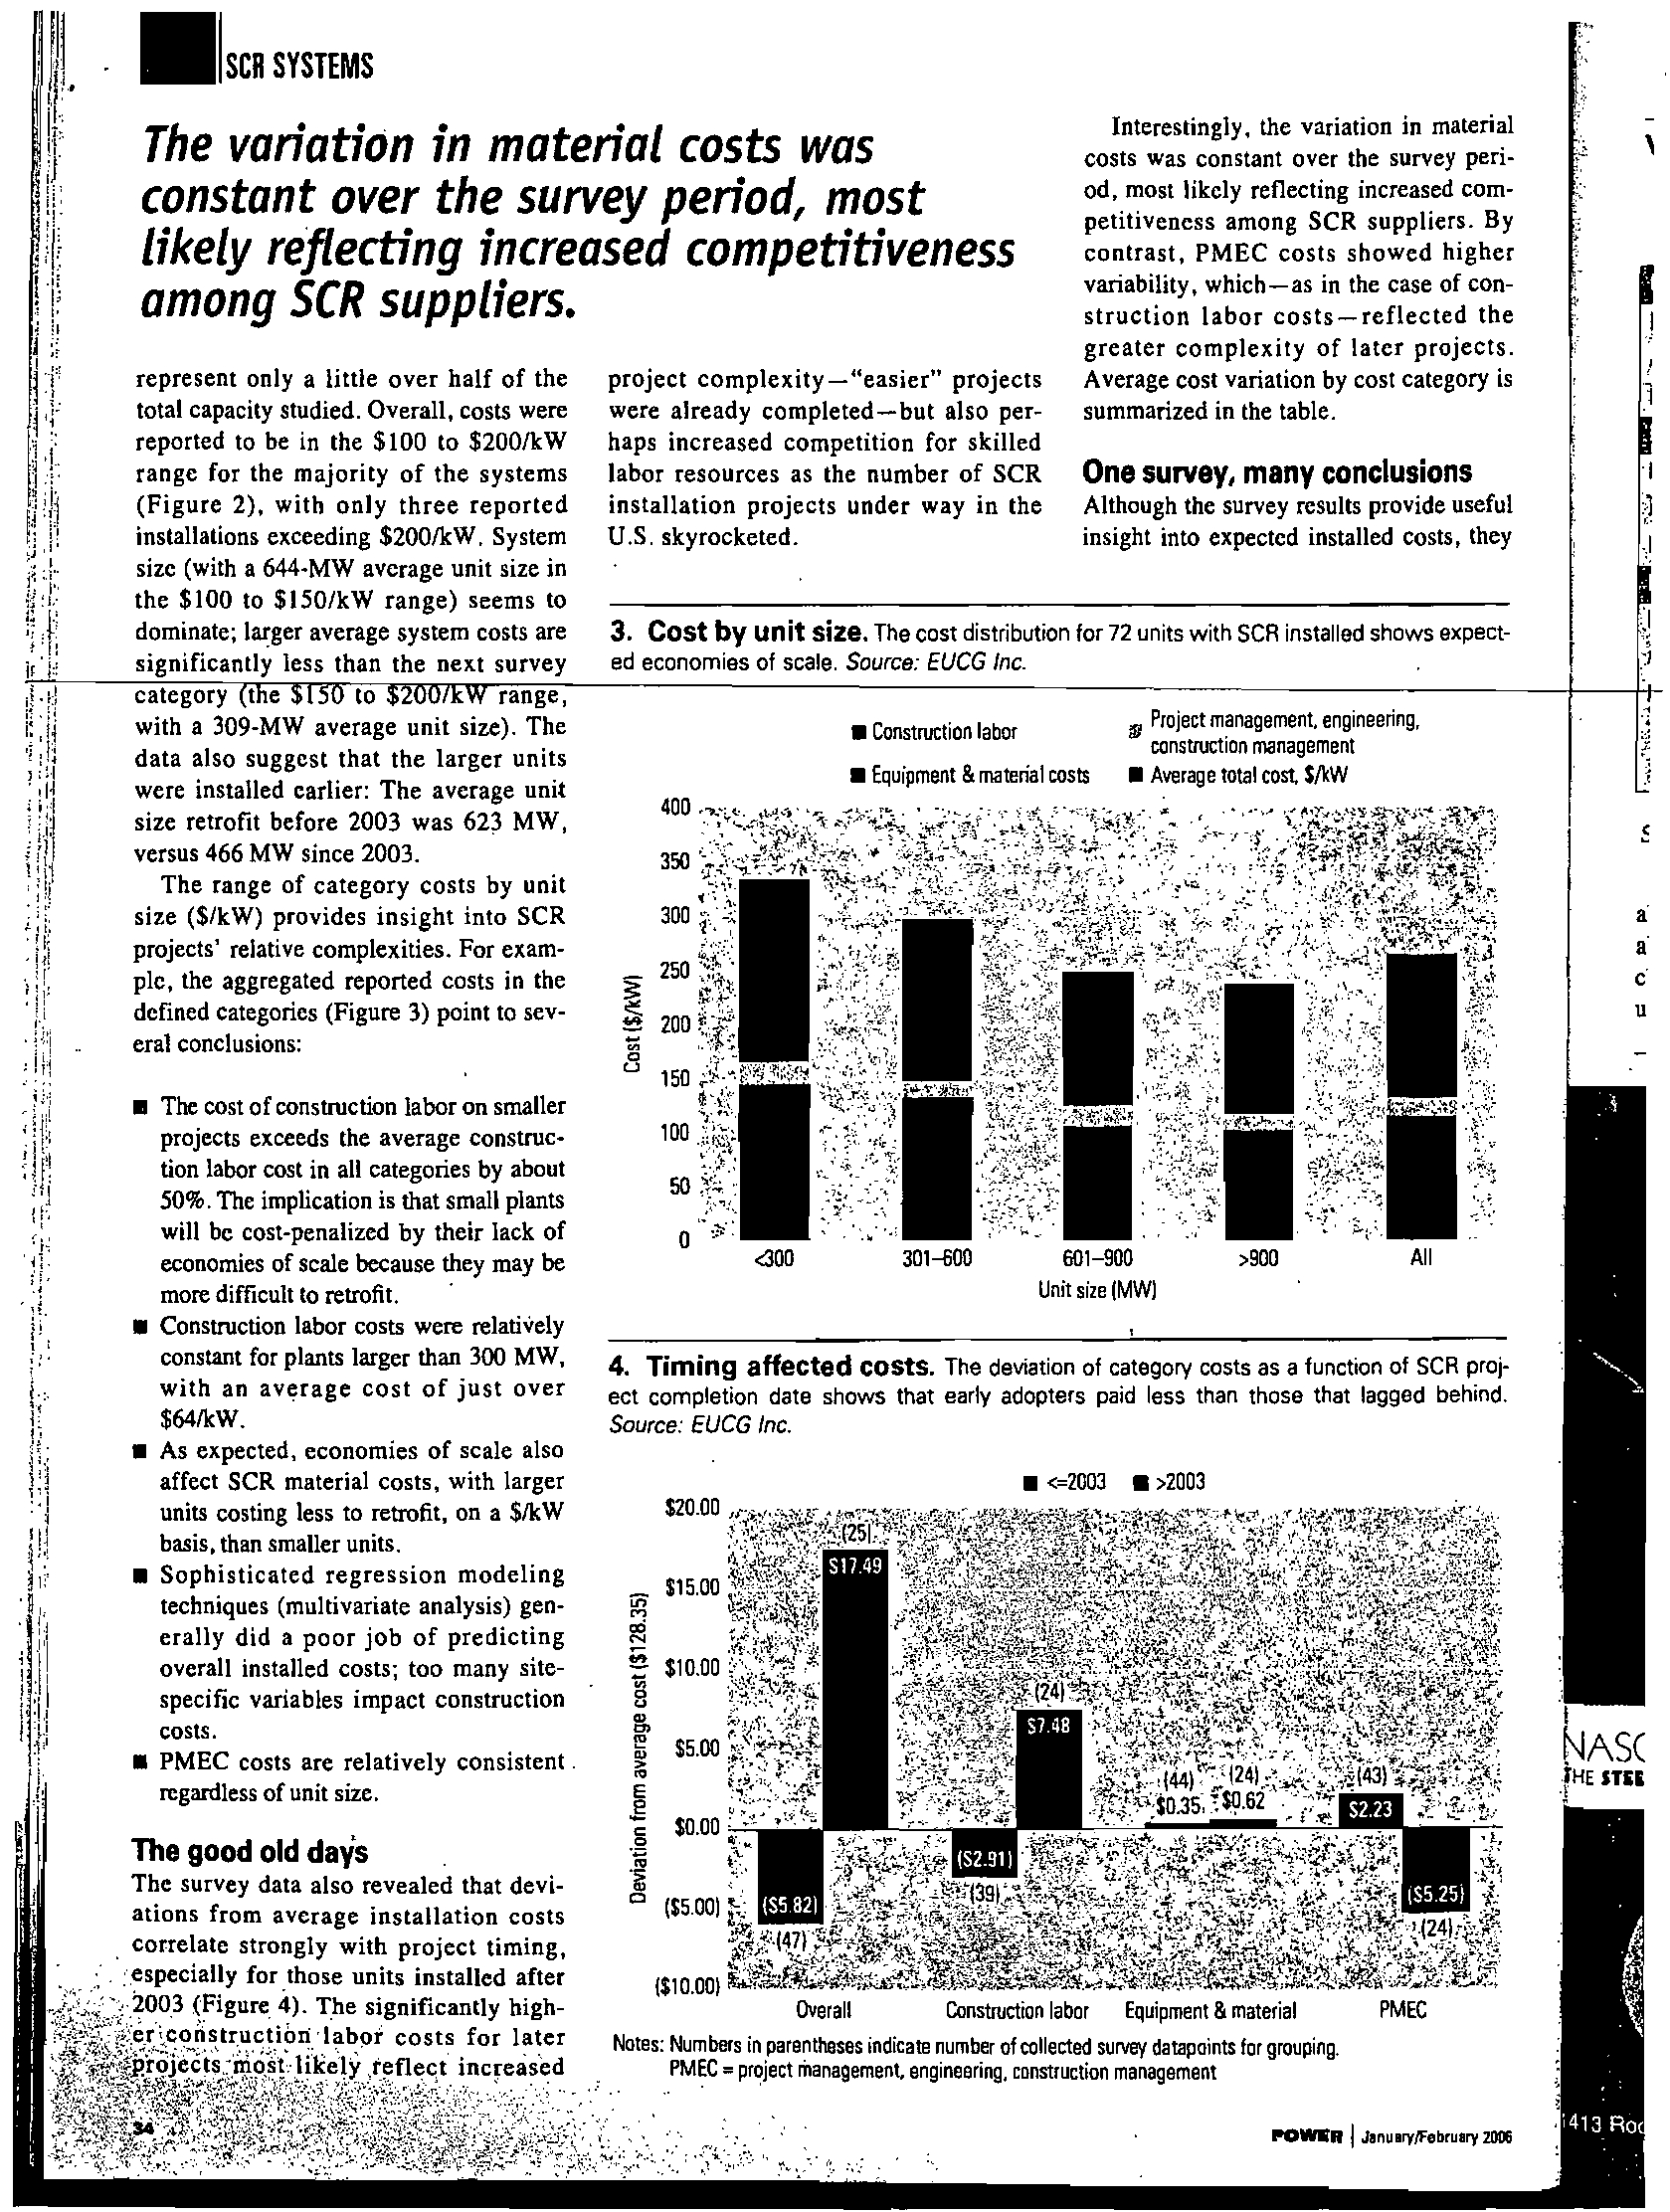
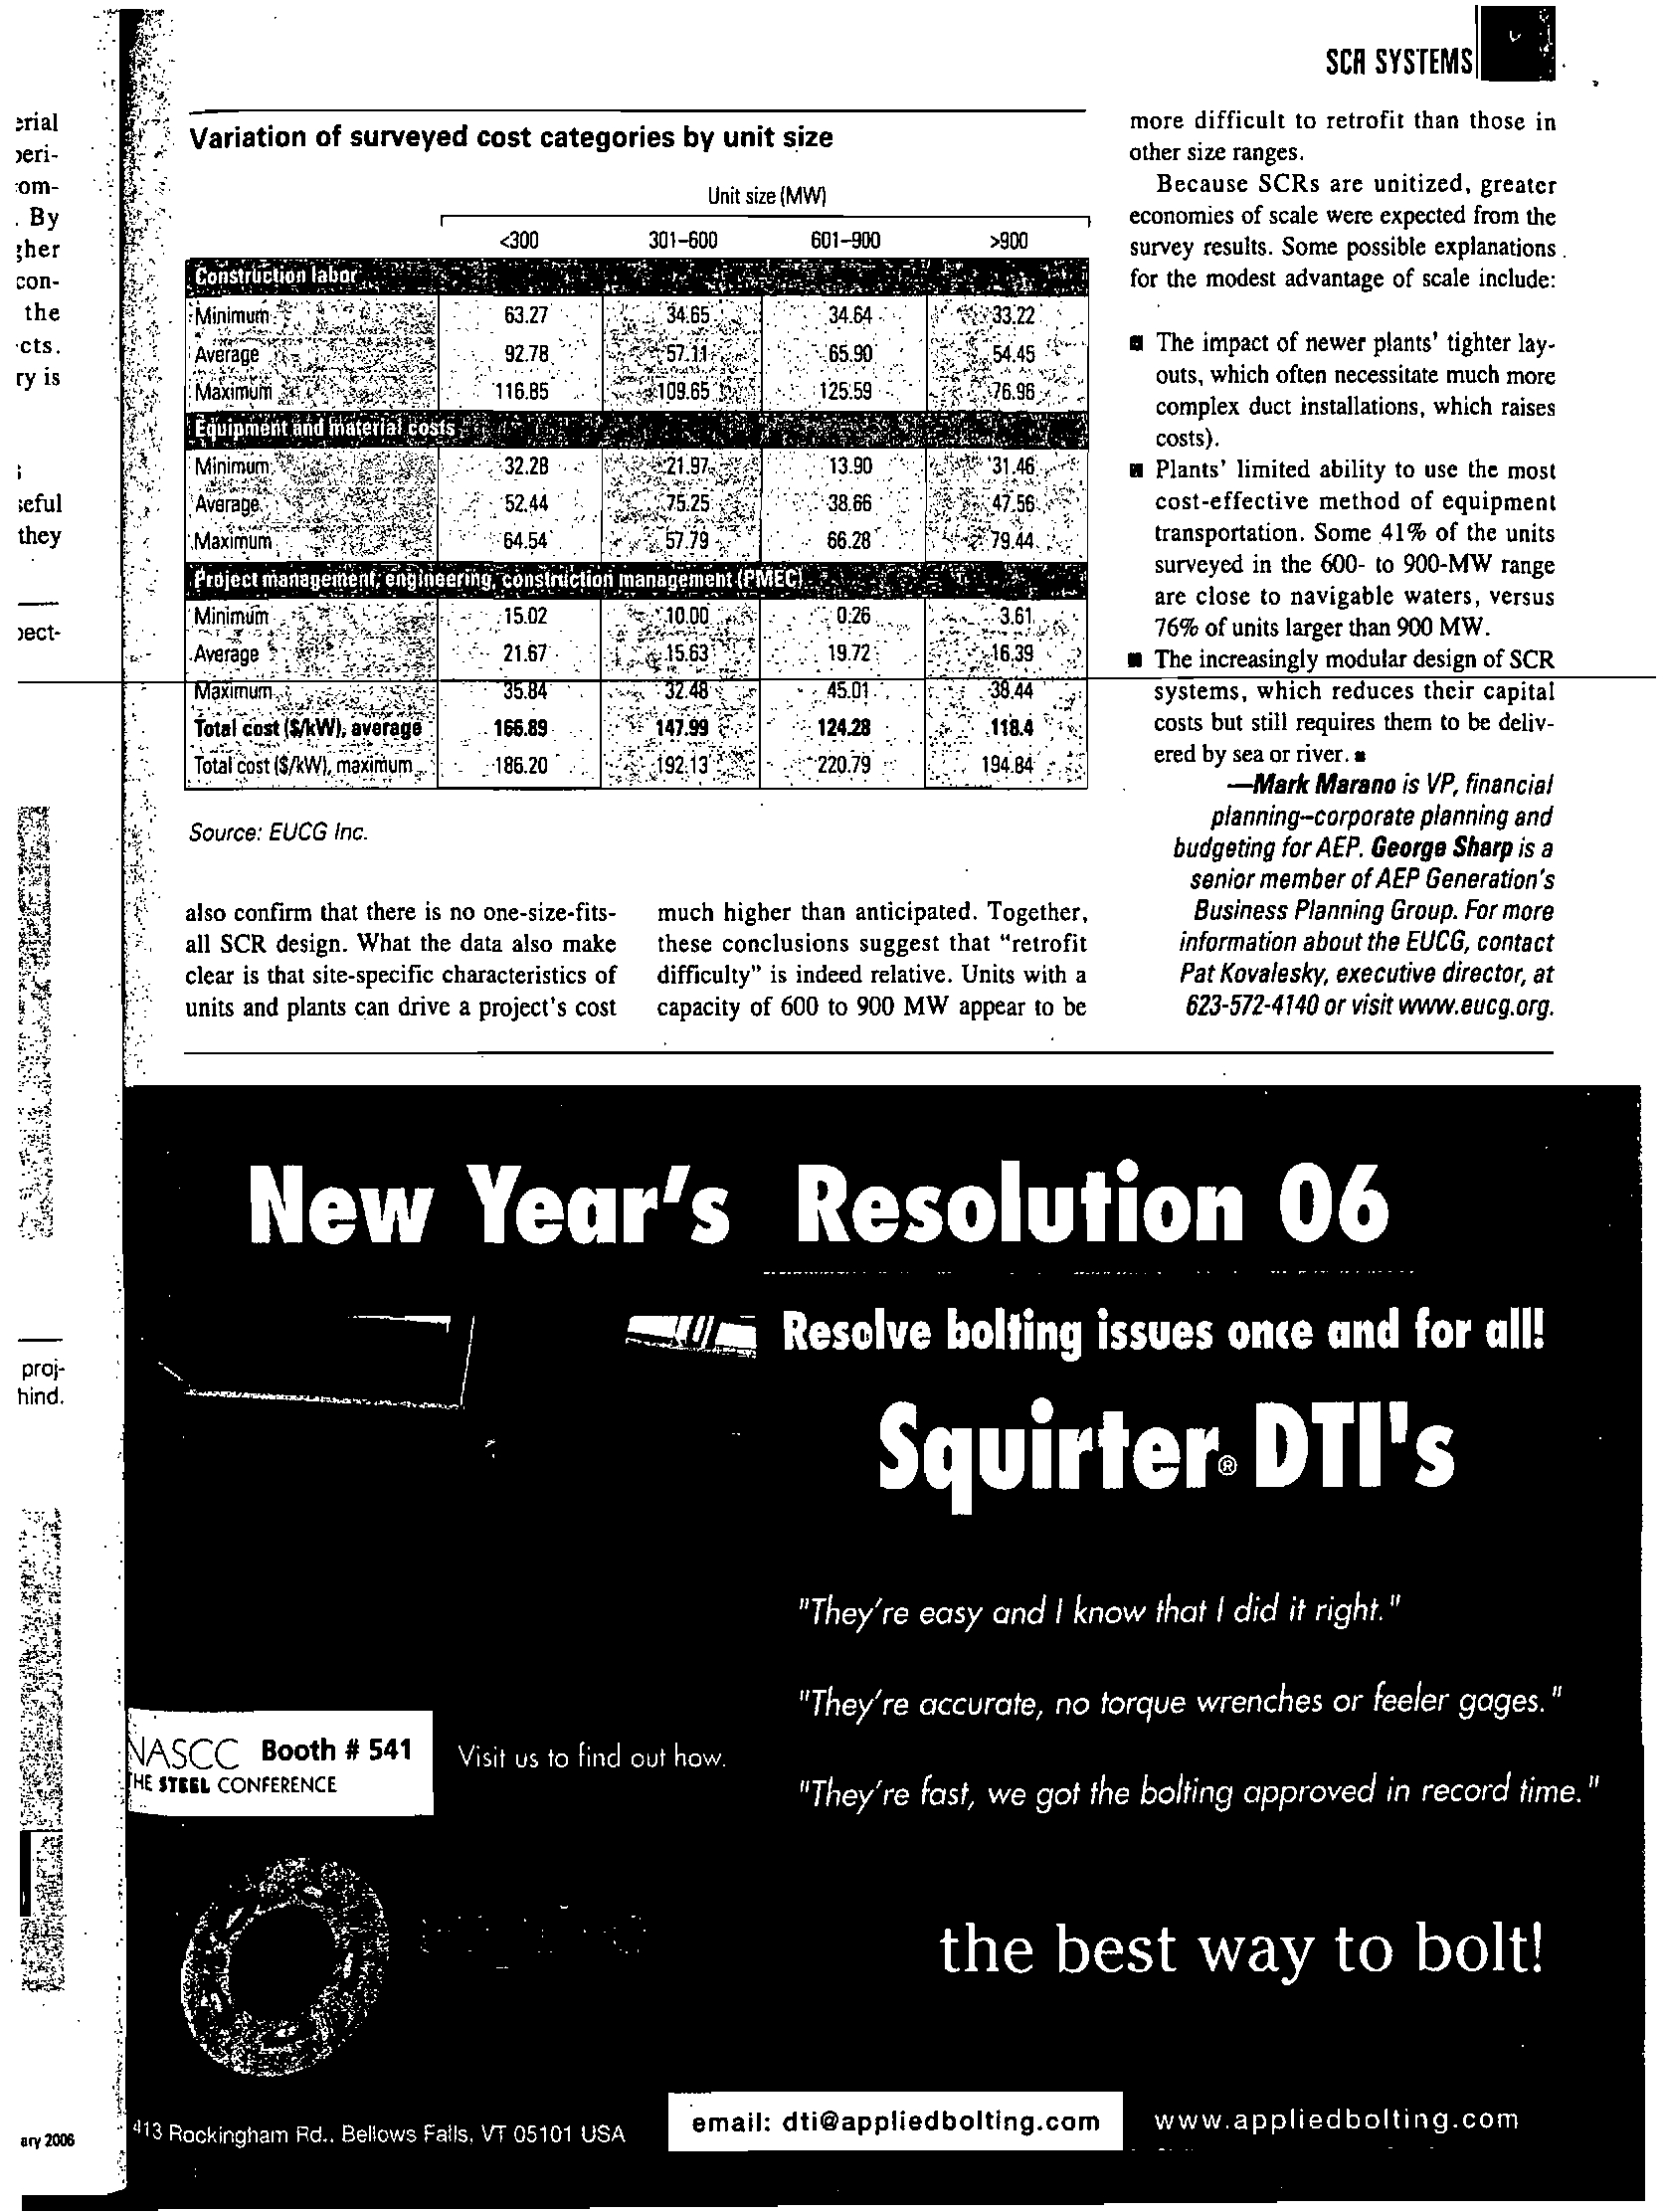
According to a study of SCR costs published by Murano and
Sharp in February
2006, (http://findarticles.com/p/articles/mi_qa5392/is_200602lai_n21409717)
7
???????????
??????? ?? ??????????
???????? ???????? ??????????
???? ????
"Overall, costs were reported to be in the $100 to $200/kW range for the
majority
of the systems (Figure 2), with only three reported installations
exceeding $200IkW. System size (with a 644-MW average unit size in the
$100 to $1501kW range) seems to dominate; larger average system costs
are
significantly less than the next survey category (the $150 to $200/kW range,
with a 309-MW average unit size)."
See, Attachment
4. As a result, multiple studies have affirmed the cost of SCR to be
in a capital cost range where they
are shown to provide reductions below the "highly
cost effective" level established by USEPA.
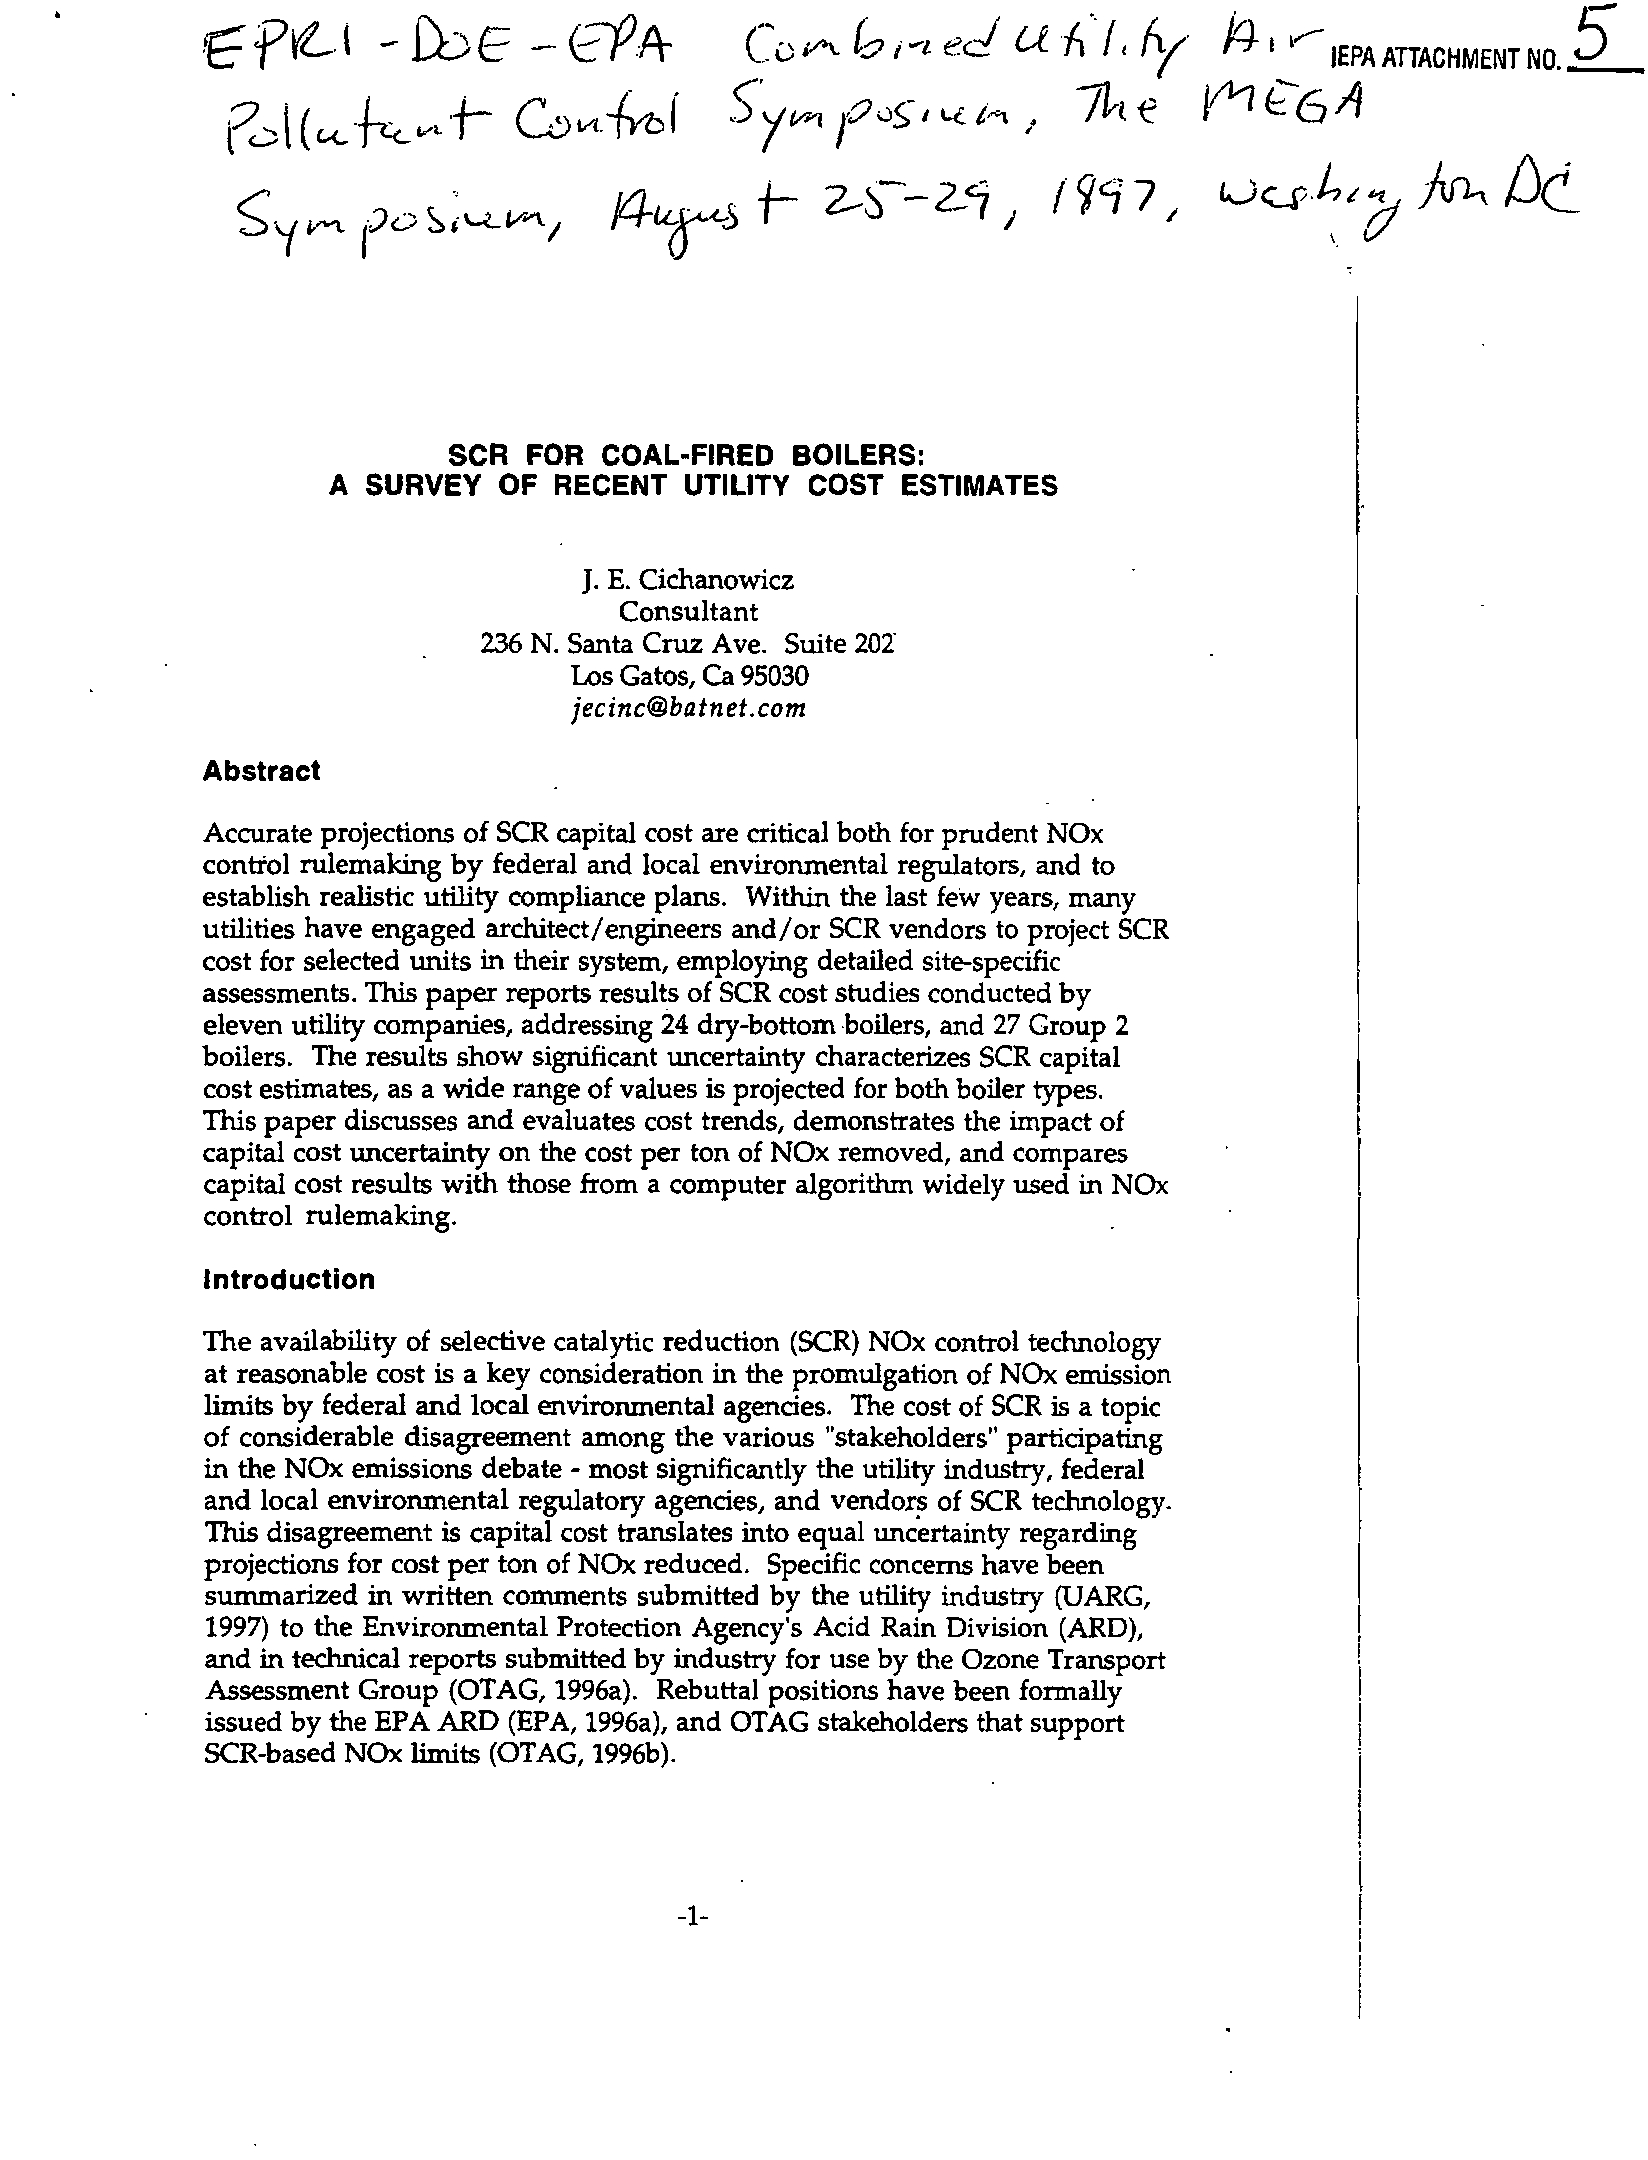
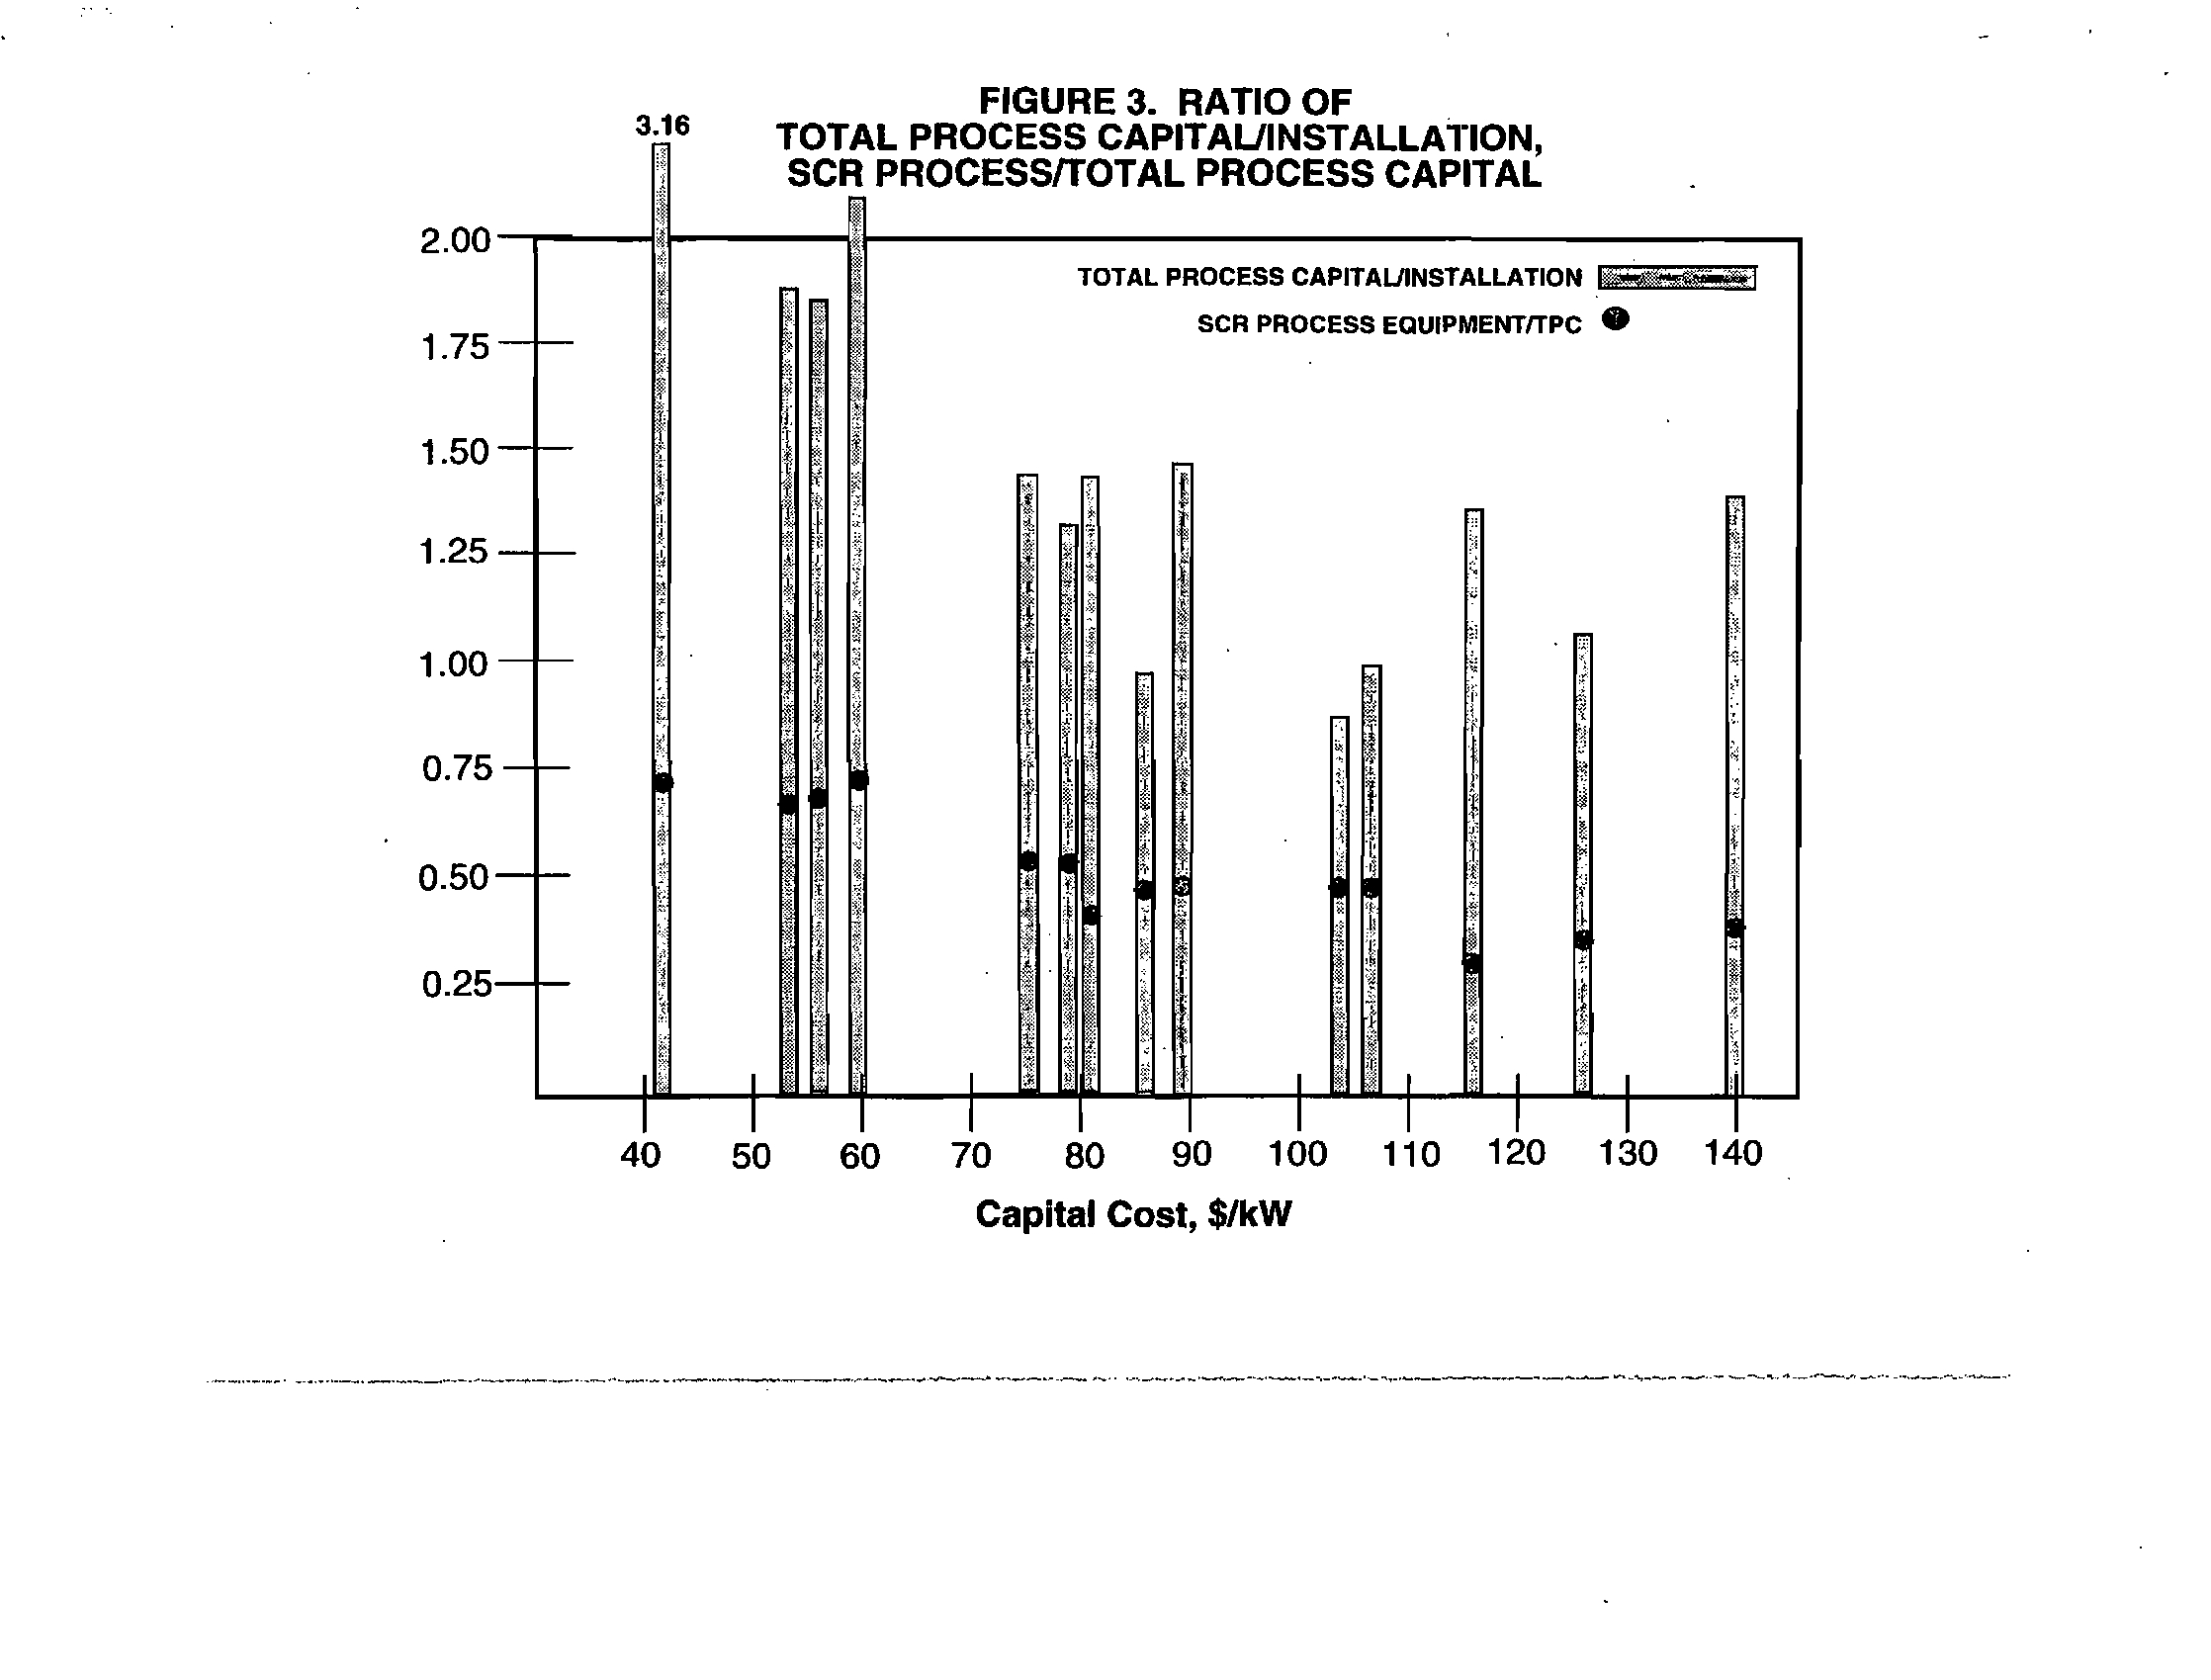
Earlier studies using capital costs in the range of
$70-$90/KW
determined that NOx
could be controlled from
SCR at costs in the range of
$400-$17681
ton. See,
Attachment 22 to the TSD,
and Attachment 5, Cichanowicz, "SCR for Coal-Fired
Boilers: A Survey
of Recent Utility Cost Estimates," EPRl-DOE-EPA Combined
Power Plant Air Pollutant Control Symposium, the MEGA Symposium, August 25-
29, 1997, Washington, DC. This
is below the
$1800/ton
(in 1990$) that USEPA
determined to be "highly cost effective." However, SCR costs have gone
up faster
than inflation. But, even doubling
that cost range to
$800-$3536/ton
of NOx
reduced to account for escalation
of SCR costs, keeps the cost in the range of what
USEPA determined to be "highly cost effective" except
at the very highest end.
22.
The Technical Support Document ("TSD") indicates on page 130 that there are a total of
12 industrial boilers subject to the NOx SIP call affected by this proposed rule while the
Statement
ofReasons on page 10 states that there are 80 industrial boilers affected by the
proposed rule. Are these additional
50 industrial boilers all less than 250 mmBtu?
The additional
68 industrial boilers are less than 250 mmBtu and are not subject to
the NOx SIP Call.
23.
The TSD claims there are a total of 18 EGUs subject to the rule, while the Statement of
Reasons says there are 20 "fossil fuel-fired stationary boilers" subject to the rule. Are
there fossil fuel-fired stationary boilers that are not EGUs that
are subject to the rule?
No, there are 20 EGU boilers. Table E-l of the TSD Appendices lists units;
however, there
are two instances in which one unit is comprised of two boilers (see,
Midwest Generation LLC, Joilet 29: Unit 7, Boilers
71 and 72, and Joliet 29: Unit 8,
Boilers 81 and 82).
Ouestions for Dr. Staudt
24.
Are NO and N0
2
the only components ofNOx?
Yes, however, they are reported on a mass basis as if they were all in the form of
NO
z•
For boilers, the majority of the NOx is in the form of NO as it leaves the stack.
However, the NO subsequently oxidizes to
NO
z
in the atmosphere.
8
???????????
??????? ?? ??????????
???????? ???????? ??????????
???? ????
25.
Explain oxy-combustion. In your testimony, you say that NOx is reduced by reducing
the amount
of oxygen available for the nitrogen to combine with, yet oxy-combustion
appears to provide even more oxygen in the combustion chamber.
Oxycombustion
is described in my testimony as a nitrogen-depletion approach.
Normally, nitrogen comprises 79%
of combustion air. By having an enriched
oxygen environment, nitrogen
is depleted in the combustion air to much lower
amounts. One benefit
of this is that there is less nitrogen available to oxidize at high
temperature to NO
or N02.
26.
Your testimony suggests there are other post-combustion controls besides SCR and
SNCR. What are those other types
of post-combustion controls?
Other approaches include oxidation of the NO to water soluble oxides using ozone,
peroxide,
or with an electric barrier discharge reactor, and then scrubbing them out
with a wet scrubber, and injection of Trona. Duct injection of Trona (sodinm
sesquicarbonate) will remove some NOx as well as S02. However, SNCR and SCR
are the most widely used post-combustion controls.
27.
Is SCR RACT? Or is it beyond RACT?
SCR can be RACT.
In fact, the first retrofit of SCR on a coal fired utility boiler was
at Public Service Company of New Hampshire'sMerrimack Unit #2 in 1995, and
this was in response to
New Hampshire'sNOx RACT rule that was implemented at
that time. SCR has been retrofit on several other coal fired boilers in response to
the Ozone
Transport Commission NOx budget rule (PSNH Merrimack 1) and on a
number of Group 2 boilers in response to regulations enacted under Title IV of the
Clean
Air Act. Both of these regulations were ostensibly intended to impose NOx
controls
at a cost ($/ton of NOx) similar to low NOx burners, which are widely
regarded
as within RACT.
If
$2500-$3000/ton is to be the guide for what is RACT,
Figure 2-17
of the TSD demonstrates that SCR is capable of being RACT. However,
having said that, I do not believe
that SCR is likely to be necessary under the
proposed rule. I expect
that less expensive controls or combinations of less
expensive controls
are most likely to be used.
28.
Would a wet scrubber intended to reduce S02 be a NOx scrubber as well if the NOx were
first oxidized?
See
Section 1.2.2, page 4 of the TSD.
Yes,
if the NOx were both oxidized to a water-soluble form and subsequently
captured in the scrubber.
29.
What does the following mean: nNOx emissions from residual oil-fire boilers can be
controlled level by using residual
fuel oil. ...n (Emphasis added.)
See
Section 2.1, page 5
ofthe TSD.
The term "level"
is a typographical error. Once you remove that, the sentence
should make sense. But, to explain, reducing fuel nitrogen
is a way of controlling
NOx emissions.
9
???????????
??????? ?? ??????????
???????? ???????? ??????????
???? ????
30.
Is it the case that there are currently no wood-fired boilers that would be subject to the
proposed rule?
That is my understanding.
31.
Does the fact that pulverized coal is used in wall-fired boilers contribute to the NOx
levels?
See
Section 2.2.1, page 9
ff.
of the TSD.
Yes, coal contains significant levels of fuel nitrogen, which contributes to NOx.
32.
Page
13 ofthe TSD says that Cleaver Brooks illustrates that with proper control, NOx
emissions can be reduced, and page 15 ofthe TSD says that Cleaver Brooks illustrates
that with proper retrofits, NOx emissions can be reduced. What are those "proper"
controls and retrofits? How are they effective
in reducing NOx? Who is Cleaver
Brooks?
The
"proper" retrofits referred to are low NOx burners. The effectiveness of these
controls in reducing NOx is shown in Tables
2-2 and 2-3 of the TSD, wbich are from
Cleaver Brooks
and referenced in a letter, dated May 19, 2006, submitted by Daniel
J. Willems of Cleaver Brooks to the New Hampshire Division of Environmental
Services (see, Attachment 8 to the TSD). The data in these tables demonstrate
that
these burners are capable of achieving emission rates at extremely low levels - well
below the proposed limits.
As noted in the TSD, at page 13, Cleaver Brooks is the
largest producer of hot water
and steam boilers in the United States.
33.
How do excess air and complete combustion affect safety?
See
Section 2.3.1, page 20 of
the TSD.
Reducing excess
air too far can make the flame unstable or even extinguish it. In
this case there is a risk
of high combustible levels remaining in the gas that can
affect safety.
In a worst-case scenario there is risk of a boiler explosion. However,
operating limitations and control devices prevent these conditions from occurring.
As excess air is reduced, operating limitations on CO emissions or high unburned
carbon in the case of coal-fired boilers will be reached well before unsafe conditions
are reached, preventing the operator from reducing excess
air further. Also, boilers
have flame monitors as
part of their controls that also assure safety by alerting the
operator to a problem with the flame. So, a boiler is capable
of operating at low
excess
air to reduce NOx while also operating in a safe manner.
34.
Page 22 of the TSD refers to 100-600 hp boilers. How large are these boilers in terrns of
mrnBtu heat input capacity?
One
hp is 2524 Btu/hr. So, 100-600 hp boilers are in the range of 252,000 Btulbr to
about 1.5 million Btu/br. The specific reference you have identified is in the section
on combustion tuning (mostly
of interest for small boilers) and relates to the cost of
oxygen
trim systems in the range of $6000-$7000 for boilers of that size. And, as
noted in the TSD, for larger boilers the cost would be somewhat higher.
Of course,
10
???????????
??????? ?? ??????????
???????? ???????? ??????????
???? ????
100-600 hp boilers are well below the size of boilers that are subject to emissions
limitations. However, small boilers may be subject to the combustion tuning
requirement, depending upon the emissions
ofthe boiler.
35.
Please describe the combustion tuning training requirement and where companies may
obtain such training.
This is described in the TSD. Boiler manufacturers
and private companies offer
such training. The American Boiler Manufacturer'sAssociation website
(www.abma.comltraining.html) lists training courses
that are available.
36.
Regarding SNCR, the TSD says that there need to be several injection points to inject the
reagent
at proper temperatures for large boilers. What happens ifthe reagent is injected at
an improper temperature?
See
page 30 of the TSD.
The injectors
are placed in locations on the boiler designed to inject the reagent into
a temperature zone where the desired chemical reactions occur. The
proper
temperature zone changes as boiler conditions, such as load, change. So, multiple
injection zones may be needed. SNCR systems have control systems to determine
the
proper injectors to use for a given load snch that the reagent is injected in the
correct location (and therefore, the correct temperature)
at all times. Since there
are hundreds of SNCR systems installed on industrial and utility boilers, this is
something that engineers have good experience with.
If
the reagent were not
injected in the
proper location (where the correct temperature is), then poor NOx
reduction
or high ammonia slip would result.
37.
Why would the cost ofSNCR on a wood-fired boiler be about the same as for a coal-fired
boiler
ofthe same size?
The capital cost
of an SNCR system depends primarily on the number of injectors,
which
is largely related to the boiler size and heat input, and the amount of reagent
used (which determines the size
of the storage tank). So, for solid fuel boilers of
similar heat input and similar NOx levels, you would expect similar costs.
38.
Looking at Table 2-12a, what is a "Wood Fired IPP"?
In
this same column, the table says
that the fuels are "Biomass Wood/Coal." What does this mean?
A "Wood fired
IPP" is an Independent Power Producer that has a boiler that burns
wood. Fuels "Biomass Wood /Coal" mean
that the boiler fires those fuels - and may
fire combinations
of these fuels.
39.
Page 30 of the TSD states, "For EGU's SNCR capital cost is in the range of about
$15/KW, and in most cases NOx reductions in the rage
of about 30% are possible." How
does this translate
to dollars per ton ofNOx removed?
Figures 2-14a
and 2-14b of the TSD, which are data for
Industrial/Commercial/Institutional (ICI) boilers,
are also useful for getting a sense
ofthe cost for utility boilers if you look at the far right where the information for
11
???????????
??????? ?? ??????????
???????? ???????? ??????????
???? ????
large ICI boilers is shown. As shown in Figure 2-14b, the capital cost is about
$1500/MMBtu for large ICI boilers, which is roughly equivalent to $15/KW. And,
as shown in Figure 2-14a, the $/tou
of NOx reduced is in the range of about
$1500/ton on an annual basis.
40.
On page
36 ofthe TSD is a discussion of the cost of SCR; the TSD appears to essentially
argue that a cost expressed
in dollars per mmBtu is a better measure of RACT because an
expression in dollars per ton removed depends upon baseline NOx. Please explain.
This does not argue for
or even suggest a different measure for RACT. The reason
the cost in $IMMBtu is showu
is to give the cost in terms offuel use, which may be
useful for industrial boiler owners in the same sense
that $/MWhr would be of
interest to a power plant owner.
41.
Have the cost calculations for industrial/commercial/institutional ("ICI") boilers included
retrofit issues?
Yes
42.
It
appears that the TSD includes a number of evaluations of cost-effectiveness of
proposed rule from a number of different sources. What is the bottom line,
i.e.,
the
Agency'sdetermination
of the cost-effectiveness ofthe proposed rule, in at least 2006
dollars?
See
TSD pages 41-42.
The bottom line is as stated in my prefiled testimony.
"Fortunately, for each
of the source categories affected there are available controls
that can be used to provide the NOx reductions required by the rule at costs
envisioned to be within the expectations for RACT."
43.
What is the significance
ofthe statement on page 126 of the TSD that "the [USEPA cost]
model does not allow for differences
in stack height, or explicitly distinguish between
Part 60 and Part
75 systems"?
The significance of this statement is that the model used was developed primarily
for utility boilers, which generally have taller stacks
than industrial boilers and Part
75 systems. Therefore, I would expect that an industrial boiler continuous emissions
monitoring system's(CEMS) costs would likely be less since the stacks
are smaller
and also they would likely have a Part 60 CEMS.
44.
The TSD
at page 126 suggests that opacity monitoring is required by this rule where a
source, because
of the size ofthe affected unit, must employ Part 75 monitoring. Is it the
intent
of this rule to require opacity monitoring? If so, why is opacity monitoring part of
a NOx RACT rule?
No.
45.
What is a "point source"?
See
TSD page 130. Is the term defined in the rule?
12
???????????
??????? ?? ??????????
???????? ???????? ??????????
???? ????
A point source is an individual stationary emission unit. No, the term is used in the
TSD, but is not defined in the rule.
46.
The TSD states on page 131, "The NOx inventory was generated through the use of year
2005 annual emission reports submitted pursuant to 35
Ill.
Adm. Code Part 234. For our
purpose, year 2005, instead of year 2002, was selected because some sources have been
either shut down or modified since 2002." What is the significance of 2002 that the TSD
would explain using 2005 data instead?
USEPA'simplementation rules for ozone and PM2.5 require the use of 2002 as the
base year for emissions inventories and determining reasonable further progress.
The I1Iinois EPA used 2005 emissions data to identify potentially affected units
because 2005 data are more current.
47.
Please explain the difference between Tables H-I and I-I. Appendix pages 31 and 33.
Table
0-1
sorts all sources by the ID number, whereas Table
1-1
groups them by
emission category and nonattainment area.
48.
In
Appendix A, Table A-4, what does "703" in the first column mean?
It
means uncontrolled emissions are 703 tons per year for the gas fired refinery
boiler that was being evaluated in Table A-4.
Respectfully submitted,
ILLINOIS ENVIRONMENTAL
PRO~ON
AGENCY
BY:~
Gina Roccaforte
Assistant Counsel
Division of Legal Counsel
DATED: September 30,2008
1021 North Grand Avenue East
P. O. Box 19276
Springfield, IL 62794-9276
217/782-5544
13
THIS FILING IS SUBMITTED
ON RECYCLED PAPER
???????????
??????? ?? ??????????
???????? ???????? ??????????
???? ????
STATE OF ILLINOIS
COUNTY OF SANGAMON
)
)
)
)
SS
CERTIFICATE OF SERVICE
I, the undersigned, an attorney, state that I have served electronically the attached
ILLINOIS ENVIRONMENTAL PROTECTION AGENCY'S ANSWERS TO
MIDWEST GENERATION'S OUESTIONS
FOR AGENCY WITNESSES, upon the
following person:
John Therriault
Assistant Clerk
Illinois Pollution Control Board
James
R. Thompson Center
100 West Randolph St., Suite 11-500
Chicago,IL 60601
and mailing it
by first-class mail from Springfield, Illinois, with sufficient postage affixed
to the following persons:
SEE ATTACHED SERVICE LIST
ILLINOIS ENVIRONMENTAL
PROTECTION AGENCY,
Assistant
G~
Counsel
Division
of Legal Counsel
Dated: September 30, 2008
1021 North Grand Avenue East
Springfield, Illinois 62794-9276
(217) 782-5544
???????????
??????? ?? ??????????
???????? ???????? ??????????
???? ????
SERVICE LIST 08-19
Timothy
J. Fox
Hearing Officer
Illinois Pollution Control Board
100
W. Randolph St., Suite 11-500
Chicago, IL 60601
Virginia Yang
Deputy Legal Counsel
Illinois Department
ofNatural Resources
One Natural Resources Way
Springfield,
IL
62702-1271
Katherine D. Hodge
Monica
T. Rios
Hodge Dwyer Zeman
3150 Roland Ave.
P.O. Box 5776
Springfield,
IL
62705-5776
Matthew Dunn
Chief
Environmental Bureau North
Office
ofthe Attorney General
69
W. Washington St., Suite 1800
Chicago, IL 60602
Kathleen
C. Bassi
Sheldon A. Zabel
Stephen
J. Bonebrake
SchiffHardin LLP
6600 Sears Tower
233
S. Wacker Drive
Chicago, IL 60606-6473
Alec M. Davis
General Counsel
Illinois Environmental Regulatory Group
215
E. Adams St.
Springfield, IL 62701
???????????
??????? ?? ??????????
???????? ???????? ??????????
???? ????
IEPA ATTACHMENT No.l
UNITED STATES ENVIRONMENTAL PROTECTION AGENCY
REGION 5
77 WEST JACKSON BOULEVARD
CHICAGO, IL 60604.3590
AUG 1 82008
REPLY TO THE ATIENTION OF'
R-19J
The Honorable Rod Blagojevich
Governor of Illinois
Springfield, Illinois
62706
Dear
Governor Blagojevich:
Thank
you for your recommendations on the status of fine particle (PMZ,5) pollution
throughout
D1inois. As you know, fine particle pollution represents one of the most significant
baniers to clean air facing our
nation today. Health studies link these tiny particles - about
I130
1h
the diameter of a human hair - to serious human health problems including aggravated
asthma, increased respiratory symptoms
like coughing and difficult or painful breathing, chronic
bronchitis, decreased
lung function, and even premature
death
in people with heart and lung
disease. Fine particle pollution
can remain suspended in the air for long periods of time and
create public health problems
far away from emission sources. Reducing levels of fine particle
pollution
is an important part of our nation'scommitment to clean, healthy air.
We have reviewed the December 18, 2007, and June 2,2008, letters from Laurel
L.
Kroack, Chief of the Bureau of Air, D1inois Environmental Protection Agency, and the August 6,
2008, letter from Douglas Scott, Director, D1inois Environmental Protection Agency, submitting
the
D1inois recommendations on air quality designations for the 2006 24-hour PM
Z
.5 standards.
We have also reviewed the technical information submitted to support the D1inois
recommendations. We appreciate the effort your State has made to develop this supporting
information. Consistent
with the Clean Air Act, this letter is to inform you that the U.S.
Environmental Protection Agency intends to make modifications to the designations and
boundaries recommended
by D1inois.
We have enclosed a detailed description of areas where EPA intends to modify your state
recommendations, and
the basis for such modifications. Your Environmental Director will also
receive a copy
of this letter and the enclosure. Should you have additional information that you
wish EPA to consider in this process, please provide it to us by October 20, 2008.
EPA has taken steps to reduce fine particle pollution across the country, such as the Clean
Diesel Program, which
we expect to dramatically reduce emissions from highway, non-road and
stationary diesel engines.
In addition, State programs to attain the 1997 PM
z
.5 standards will
help to reduce unhealthy levels of fine particle pollution.
RecycledlRecyciable • Pnnted with Vegetable Oil eased Inks 00 100% Recycled Paper (50% Poslconsurner)
???????????
??????? ?? ??????????
???????? ???????? ??????????
???? ????
We intend to make final designation decisions for the 2006 24-Hour PM2.S standards by
December
18. W08. Please also be aware that EPA plans to publish a notice in the Federal
Register
in the near future in order to solicit public comments on our intended designation
decisions. If
you have any questions. please do not hesitate to contact me. We look fOlward to a
continued dialogue
with you as we work together to implement the PM2.S standards.
Sincerely,
~r.:-0uJJ
Regional Administrator
Enclosure
cc: Douglas P. Scott
Director
D1inois Environmental Protection Agency
2
???????????
??????? ?? ??????????
???????? ???????? ??????????
???? ????
Review of Designations in Illinois
For the Particulate Matter Air Quality Standard
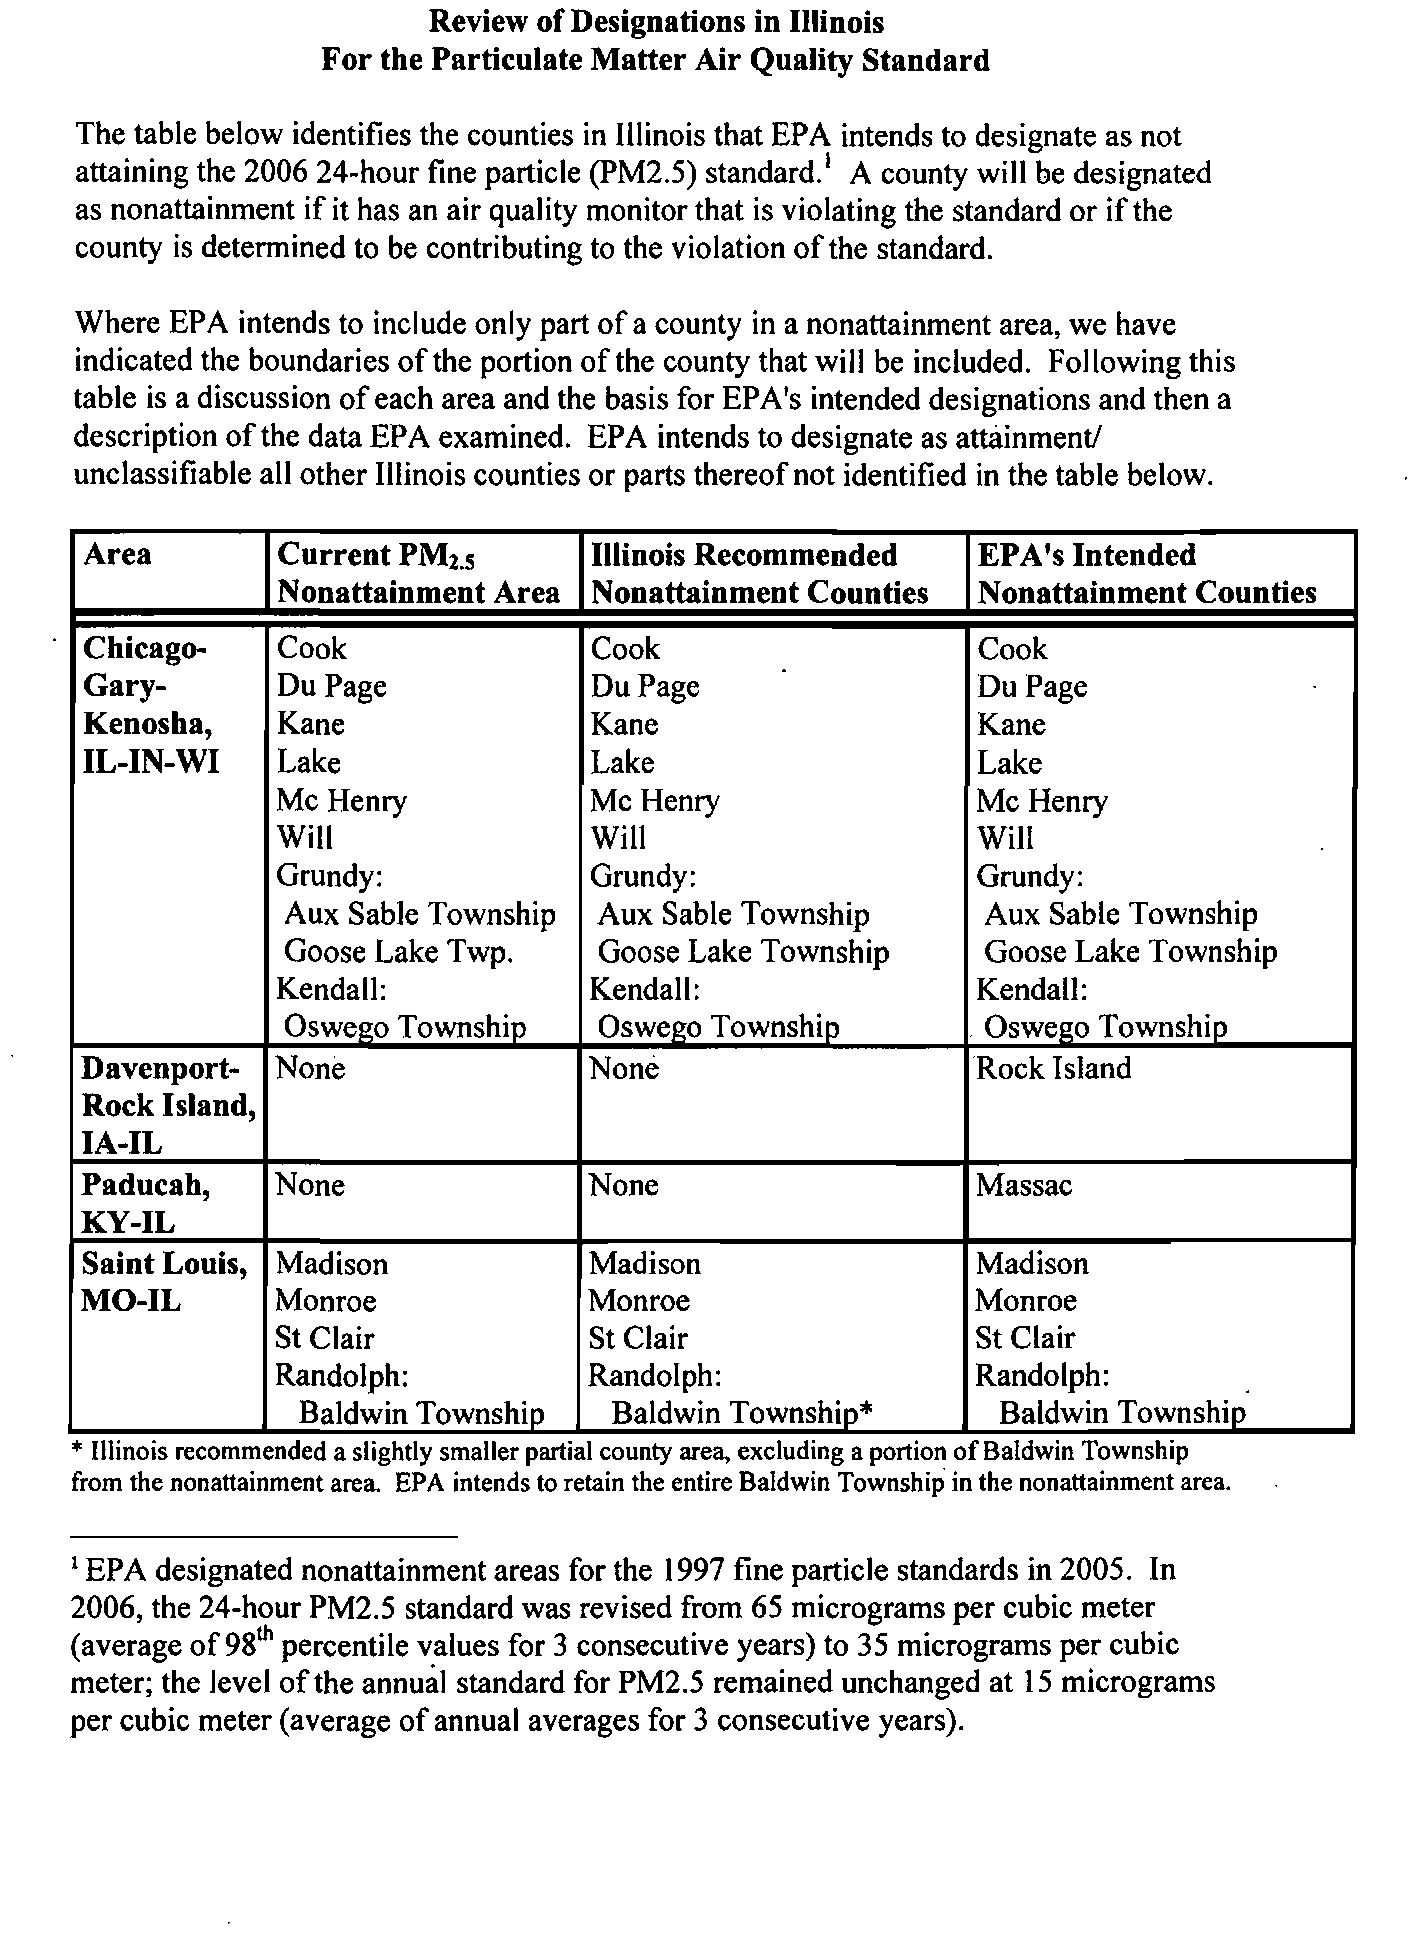
The table below identifies the counties in l1linois that EPA intends to designate as not
attaining the 2006 24-hour fine particle (pM2.5) standard.' A county will
be designated
as nonattainment
if it has an air quality monitor that is violating the standard or if the
county
is determined to be contributing to the violation of the standard.
Where EPA intends to include only part
of a county in a nonattainment area, we have
indicated the boundaries
of the portion of the county that will be included. Following this
table
is a discussion of each area and the basis for EPA's intended designations and then a
description
of the data EPA examined. EPA intends to designate as attainment!
unclassifiable all other l1linois counties or parts thereof not identified
in the table below.
Area
Current PMZ.5
Illinois Recommended
EPA'sIntended
Nonattainment Area Nonattainment Counties
Nonattainment Counties
Chicago-
Cook
Cook
Cook
Gary-
DuPage
DuPage
Du Page
Kenosha,
Kane
Kane
Kane
IL-IN-WI
Lake
Lake
Lake
Mc Henry
Mc Henry
Mc Henry
Will
Will
Will
Grundy:
Grundy:
Grundy:
Aux Sable Township
Aux Sable Township
Aux Sable Township
Goose Lake Twp.
Goose Lake Township
Goose Lake Township
Kendall:
Kendall:
Kendall:
Oswel!o Townshio
Oswel!o Townshio
Oswel!o Townshio
Davenport-
None
None
Rock Island
Rock Island,
IA-IL
Paducah,
None
None
Massac
KY-IL
Saint Louis, Madison
Madison
Madison
MO-IL
Monroe
Monroe
Monroe
St Clair
St Clair
St Clair
Randolph:
Randolph:
Randolph:
Baldwin Townshio
Baldwin Townshio*
Baldwin Township
• IllInOIS recommended a slightly smaller partIal county area, excludmg a portIon of Baldwm TownshIp
from the nonattainment area. EPA intends to retain the entire Baldwin Township'in the nonattainment area.
1 EPA designated nonattainment areas for the 1997 fine particle standards in 2005. In
2006, the 24-hour PM2.5 standard was revised from 65 micrograms per cubic meter
(average
of9S
th
percentile values for 3 consecutive years) to 35 micrograms per cubic
meter; the level
ofthe annwil standard for PM2.5 remained unchanged at 15 micrograms
per cubic meter (average
of annual averages for 3 consecutive years).
???????????
??????? ?? ??????????
???????? ???????? ??????????
???? ????
On June 8, 2007, in a memorandum from Robert Meyers to the EPA Regional
Administrators, EPA issued guidance on a timetable for designation
of areas violating the
PM2.5 air quality standards promulgated in 2006 and factors that EPA urged states to
consider as they prepared recommendations for nonattainment area boundaries. This
guidance was sent to the Governor
of Illinois as an attachment to a letter dated July 9,
2007, requesting the State'srecommendations.
Pursuant to section 107(d) of the Clean Air Act, EPA must designate as nonattainment
those areas that violate the NAAQS and those areas that contribute to violations. The
technical analysis for each area identifies the counties with monitors that violate the 24-
hour PM2.5 standard and evaluates the counties that potentially contribute
to fine particle
concentrations
in the area. EPA has evaluated these counties based on the weight of
evidence of the following nine factors recommended in EPA guidance and any other
relevant information:
- pollutant emissions
- air quality data
- population density and degree
of urbanization
- traffic and commuting patterns
- growth
- meteorology
- geography and topography
- jurisdictional boundaries
- level of control of emissions sources
Additional background information on each
of the nine factors can also be found in the
background section below.
EPA also computed a Contributing Emissions Score (CES) for each county. The CES is
a metric that takes into consideration emissions data, meteorological data, and air quality
monitoring information
to provide a relative ranking of potential impacts of counties in
and near an area on violating monitors. While this metric provides a useful synthesis of
important relevant information, including weighting the emissions ofvarious pollutants
according
to estimates of the relative importance of each pollutant, the CES is not the
exclusive variable EPA uses to consider these factors. A summary
of the CES is included
in the background section, and a more detailed description can be found at
http://www.epa.gov/ttn/naags/pm/pm252006techinfo.html#C.
Review for the Illinois Portion of the Chicago-GaIT-Kenosha. IL-IN-WI
Metropolitan Area
Discussion:
EPA reviewed relevant information for the ten counties (including eight counties in
Illinois) partly or fully within the area designated nonattainment for the 1997 standards as
well as for surrounding counties. There are violating monitors in Cook and Will
Counties and
in Lake County, Indiana. Illinois recommended a definition ofthe
2
???????????
??????? ?? ??????????
???????? ???????? ??????????
???? ????
nonattainment area for the 2006 standards that reflects the same boundaries within
Illinois as were established for the 1997 standards, including (within Illinois) Cook, Du
Page, Kane, Lake, Mc Henry, and Will counties, Aux Sable and Goose Lake Townships
in Grundy County, and Oswego Township
in Kendall County. EPA agrees with this
recommendation.
EPA also examined information for other counties within and adjacent to the Combined
Statistical Area as well as for adjacent counties. The bulk
of emissions and population
are captured without including DeKalb, Grundy, Kankakee and Kendall Counties, since
these counties have limited emissions and population. Nevertheless, we support the
recommendation by the Illinois EPA to include the three townships
in Grundy and
Kendall counties in the nonattainment area to maintain consistency with the ozone
designations and the prior PM
25
designations and thereby facilitate planning, as well as to
include slightly more emissions
in the planning area.
Emissions for other surrounding counties are relatively low, and no other factor
warranted designating these other counties nonatlainment.
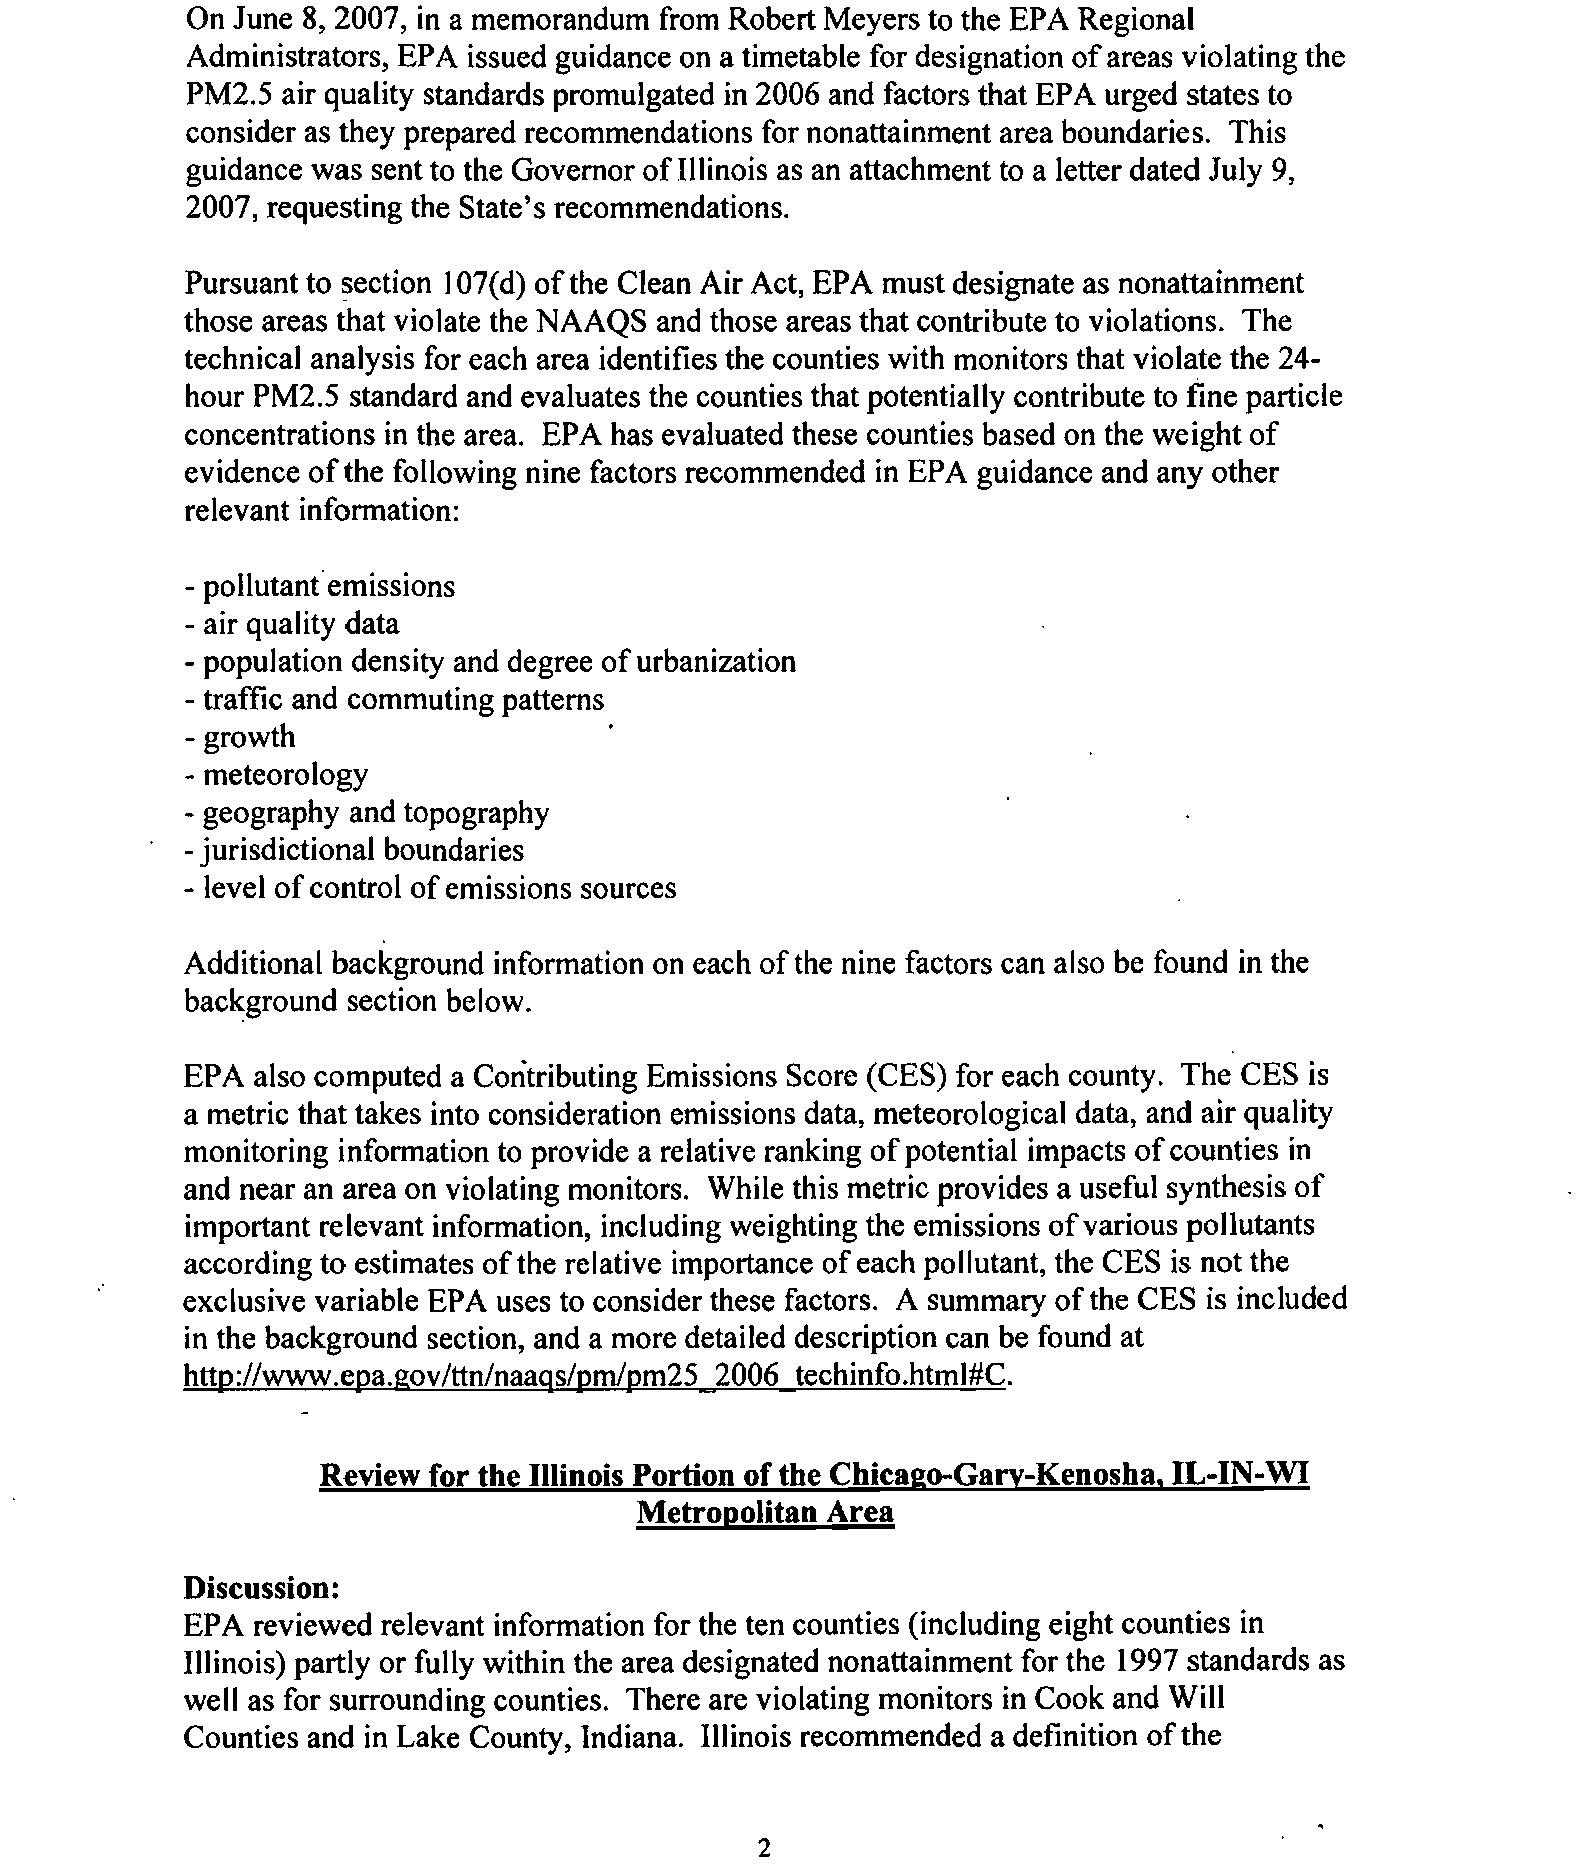
Figure I is a map of the counties in the area and other relevant information such as the
locations and design values
of air quality monitors, the metropolitan area boundary, and
counties recommended as nonattainment by the States.
sin
ROf'
~
<1"
I!!>
l!"
Illinois
.
.,
o
Stlle
1~1Idaton
!Of I'ICI"l3tl!inment
-34,
0
Sl.r.ereoJmleMatcmforparbal oonattalmntll1
SII:e retOll\'Tlel1daSOllIOta (ilfe{enz rr:t1tO area
Mo&.or Yiola:ing 24-tlr PU2.S NAAQS
(pre'imin.
2005.2001
design
'ti1!Ues)
Mi.
M~r.rairl'ng24-IlrPM2.5NMas
lpre"min. 2005-2001 des'gn va:t.les)
M~\'IoIating
24.flr PM2.S NMOS
Iprl!rrmln_ 2005-2007 incomplete
~I!sig:l ~arues)
National higllway$
c::J 2006 Combined
Sla~cal
Area
'~
PM2.SNoniIlIainmentArea
(1997 NMOS)
JiI
~~,..---
r::::::I
All 1'1.'2.5 NonattainmentAleas
11991 NMOS).
r-t--1
NonallaM1tim'Ma~enantIJ
Atea
......... for 8-1W Olone
~
EGUnilh!IUJCAP
emissiOns>
5.000
tDllSr'year in
2002
@
o:tlef
Point
Source
with total CAP
emissions>
5.000
tDf15fYUr
il2002
.-
Com~~~_~(49~1
Indiana ••
,
Figure 1- Note: Map produced prior to Indiana's nonattainment recommendation for Lake County, Ind.
3
???????????
??????? ?? ??????????
???????? ???????? ??????????
???? ????
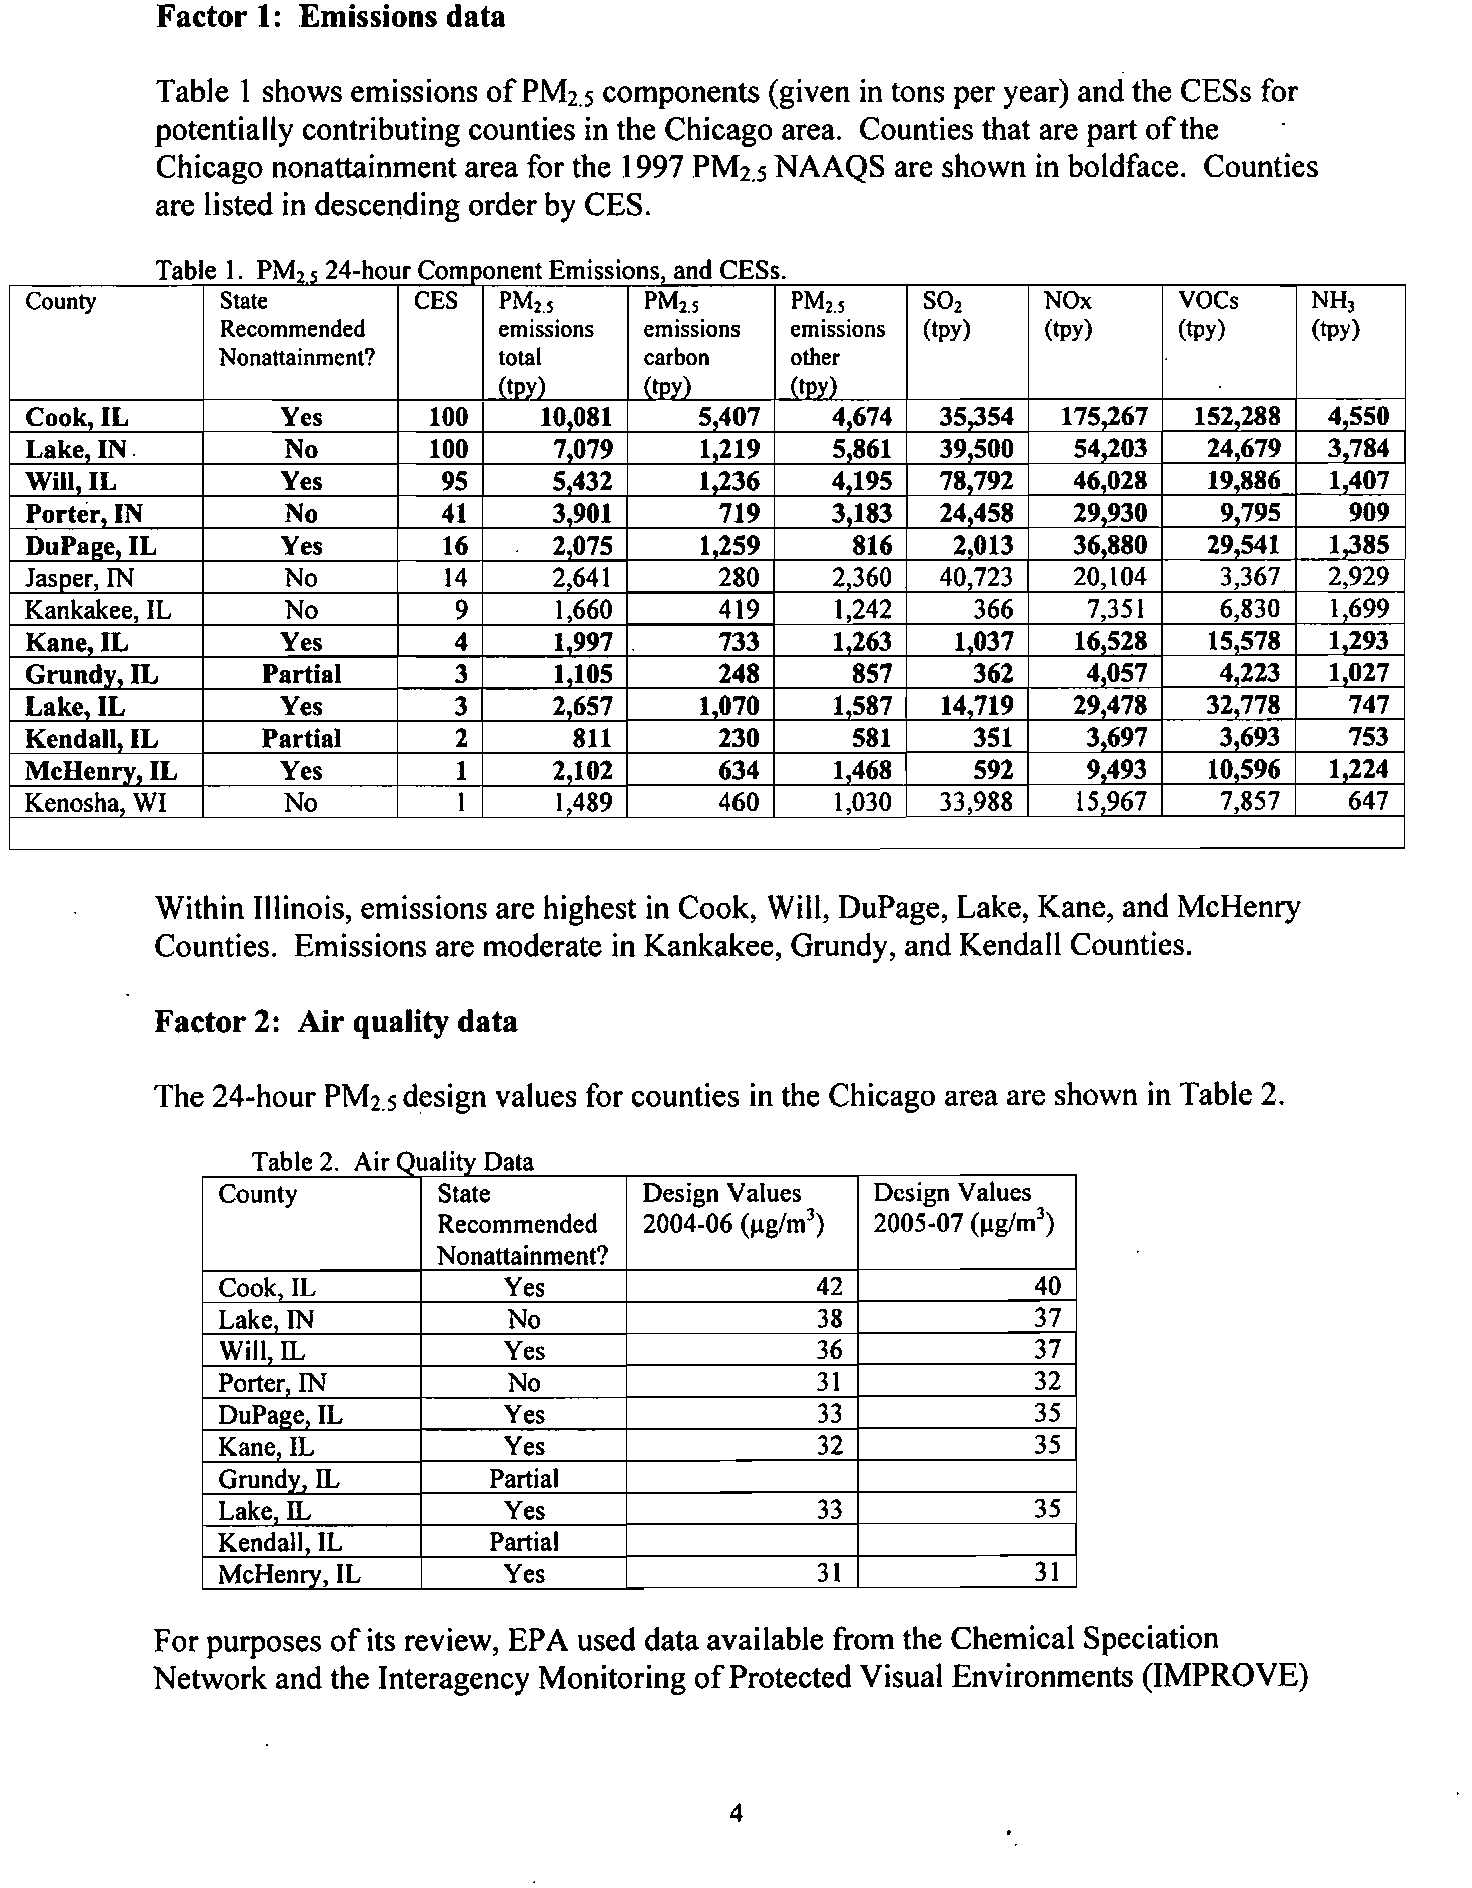
Factor 1: Emissions data
Table 1 shows emissions of PM2.5 components (given in tons per year) and the CESs for
potentially contributing counties in the Chicago area. Counties that are part
ofthe
Chicago nonattainment area for the 1997 PM
2
.
5
NAAQS are shown in boldface. Counties
are listed
in descending order by CES.
Tbl
a e 1. PM
~"
24h
- our Comt anent EmISSions an
d
CESs.
County
State
CES
PM"
PM,.,
PM,.,
SO,
NOx
VOCs
NH,
Recommended
emissions
emissions
emissions
(tpy)
(tpy)
(tpy)
(tpy)
Nonattainment?
total
carbon
other
(tnv)
(tnv)
(tnv)
Cook
IL
Yes
100
10081
5407
4674
35.354
175.267
152288
4550
Lake IN.
No
100
7079
1219
5861
39500
54.203
24679
3784
Will IL
Yes
95
5432
1.236
4195
78792
46028
19886
1407
Porter IN
No
41
3901
719
3183
24458
29930
9795
909
DuPa2e
IL
Yes
16
2075
1259
816
2013
36880
29541
1.385
Jasper, IN
No
14
2641
280
2360
40723
20,104
3,367
2,929
Kankakee, IL
No
9
1,660
419
1242
366
7,351
6,830
1699
Kane
IL
Yes
4
1997
733
1263
1037
16528
15578
1293
Grundy, IL
Partial
3
1105
248
857
362
4057
4223
1027
Lake
IL
Ves
3
2,657
1070
1587
14719
29478
32778
747
Kendall,IL
Partial
2
811
230
581
351
3697
3693
753
MeHenry,IL
Ves
1
2102
634
1,468
592
9493
10596
1224
Kenosha WI
No
I
1489
460
1,030
33,988
15967
7,857
647
Within lIlinois, emissions are highest in Cook, Will, DuPage, Lake, Kane, and McHenry
Counties. Emissions are moderate in Kankakee, Grundy, and Kendall Counties.
Factor 2:
Air
quality data
The 24-hour PM2.5 design values for counties in the Chicago area are shown in Table 2.
Table 2. Air Oualitv Dala
County
State
Design Values
Design Values
Recommended
2004.06 (j.tglm')
2005.07 (j.tglm')
Nonattainment?
Cook IL
Yes
42
40
Lake IN
No
38
37
Will IL
Yes
36
37
Porter IN
No
31
32
DuPa2e IL
Yes
33
35
Kane IL
Yes
32
35
Grundv. IL
Partial
Lake IL
Yes
33
35
Kendall IL
Partial
McHenry,IL
Yes
31
31
For purposes of its review, EPA used data available from the Chemical Speciation
Network and the Interagency Monitoring
ofProtected Visual Environments (IMPROVE)
4
???????????
??????? ?? ??????????
???????? ???????? ??????????
???? ????
network to estimate the composition of fine particle mass on days with the highest fine
particle concentrations. On high concentration days during cold weather months in this
area, EPA found on average a total urban contribution
of 8.8 flg/m
3
,
consisting of
004
flg/m
3
of sulfate, no nitrate,
804
flg/m
3
of organic particles, and no miscellaneous
inorganic particulate. On high concentration days during warm weather months
in this
area, EPA found on
avera~e
a total urban contribution of3.9 flg/m
3
, consisting of 0.5
flg/m
3
of sulfate, 3.1 flg/m of organic particles, and 0.3 flg/m
3
of miscellaneous
inorganic particulate. These estimates were used for weighting
of the emissions of
different pollutants in calculating the contributing emissions scores.
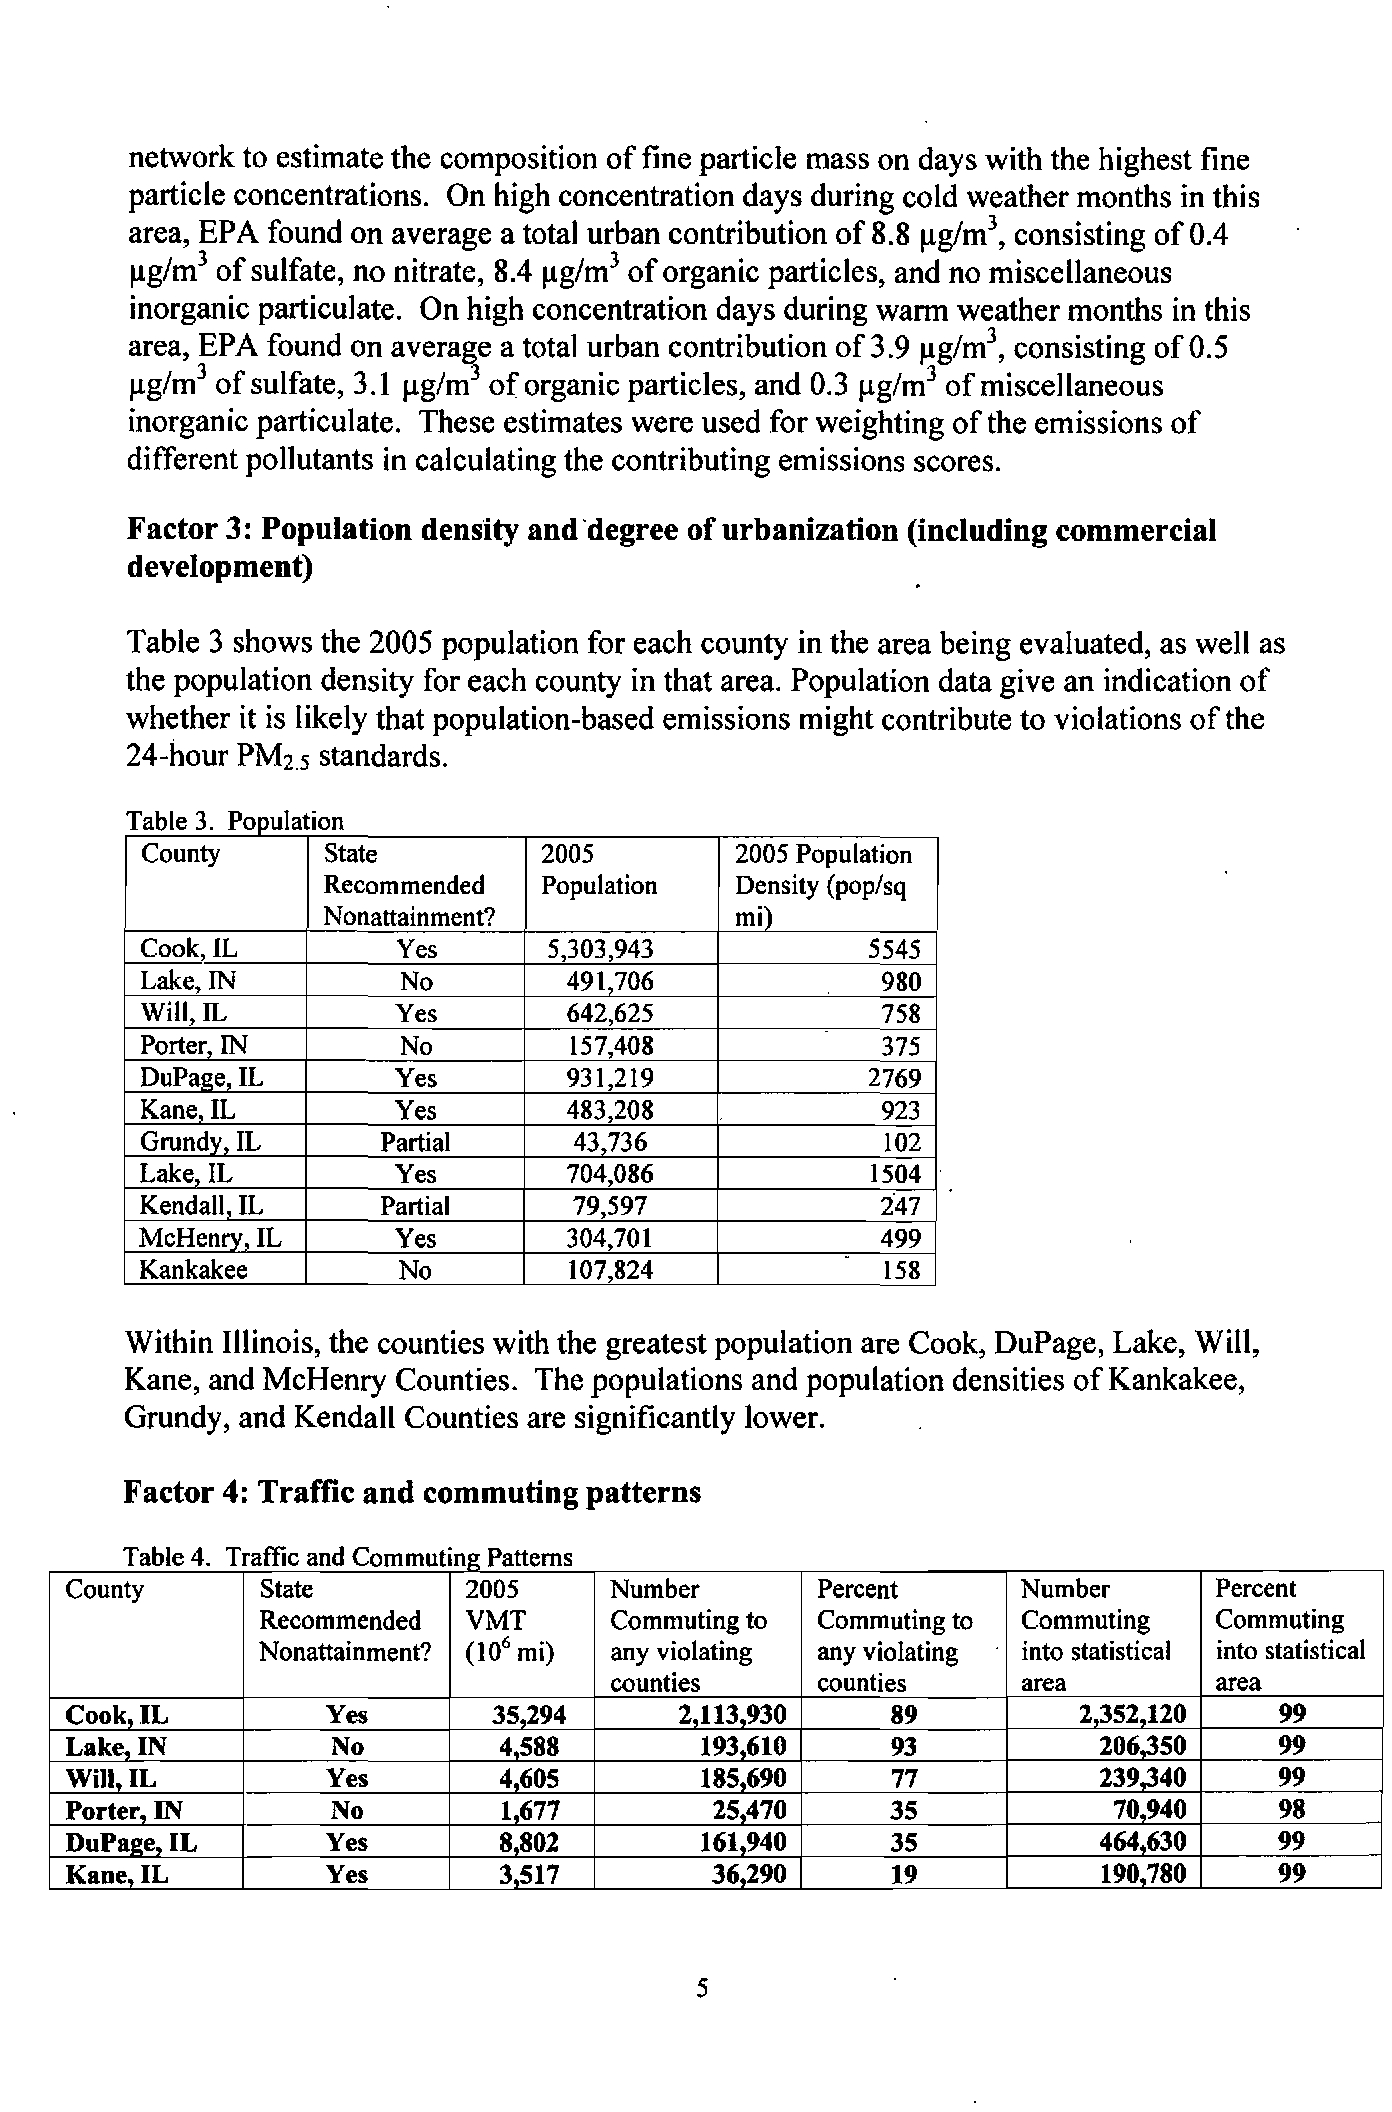
Factor 3: Population density and 'degree of urbanization (including commercial
development)
Table 3 shows the 2005 population for each county in the area being evaluated, as well as
the population density for each county in that area. Population data give an indication
of
whether it is likely that population-based emissions might contribute to violations of the
24-hour
PM25 standards.
Table 3. Ponulation
County
State
2005
2005 Population
Recommended
Population
Density (pop/sq
Nonattainment?
mil
Cook,IL
Yes
5,303,943
5545
Lake, IN
No
491706
980
Will, IL
Yes
642,625
758
Porter IN
No
157,408
375
DuPaoe IL
Yes
931,219
2769
Kane IL
Yes
483,208
923
Grundv IL
Partial
43736
102
Lake lL
Yes
704,086
1504
Kendall IL
Partial
79,597
247
McHen~
IL
Yes
304,701
499
Kankakee
No
107,824
158
Within Illinois, the counties with the greatest population are Cook, DuPage, Lake, Will,
Kane, and McHenry Counties. The populations and population densities
of Kankakee,
Grundy, and Kendall Counties are significantly lower.
Factor 4: Traffic and commuting patterns
Table 4. Traffic and Commutino Patterns
County
State
2005
Number
Percent
Number
Percent
Recommended
VMT
Commuting to
Commuting to
Commuting
Commuting
Nonattainment?
(10' mil
any violating
any violating
into statistical
into statistical
counties
counties
area
area
Cook
IL
Yes
35294
2.113930
89
2.352.120
99
Lake:" IN
No
4588
193610
93
206."50
99
Will IL
Yes
4.605
185.690
77
239-l40
99
Porter. IN
No
1.677
25.470
35
70940
98
DuPa~e
IL
Yes
8.802
161.940
35
464 630
99
Kane IL
Yes
3.517
36.290
19
190780
99
5
???????????
??????? ?? ??????????
???????? ???????? ??????????
???? ????
Grundy.IL
Partial
623
6.990
38
I7--nO
95
Lake.IL
Yes
6016
83.930
26
313 250
99
Kendall
IL
Partial
678
4,230
15
27860
99
McHenry,IL
Yes
2104
31.680
24
130520
98
The listing of counties on Table 4 reflects a ranking based on the number ofpeople
commuting to other counties. The counties that are in the nonattainment area for the 1997
PM25 NAAQS are shown in boldface. All counties in this table are highly integrated into
the Chicago area.
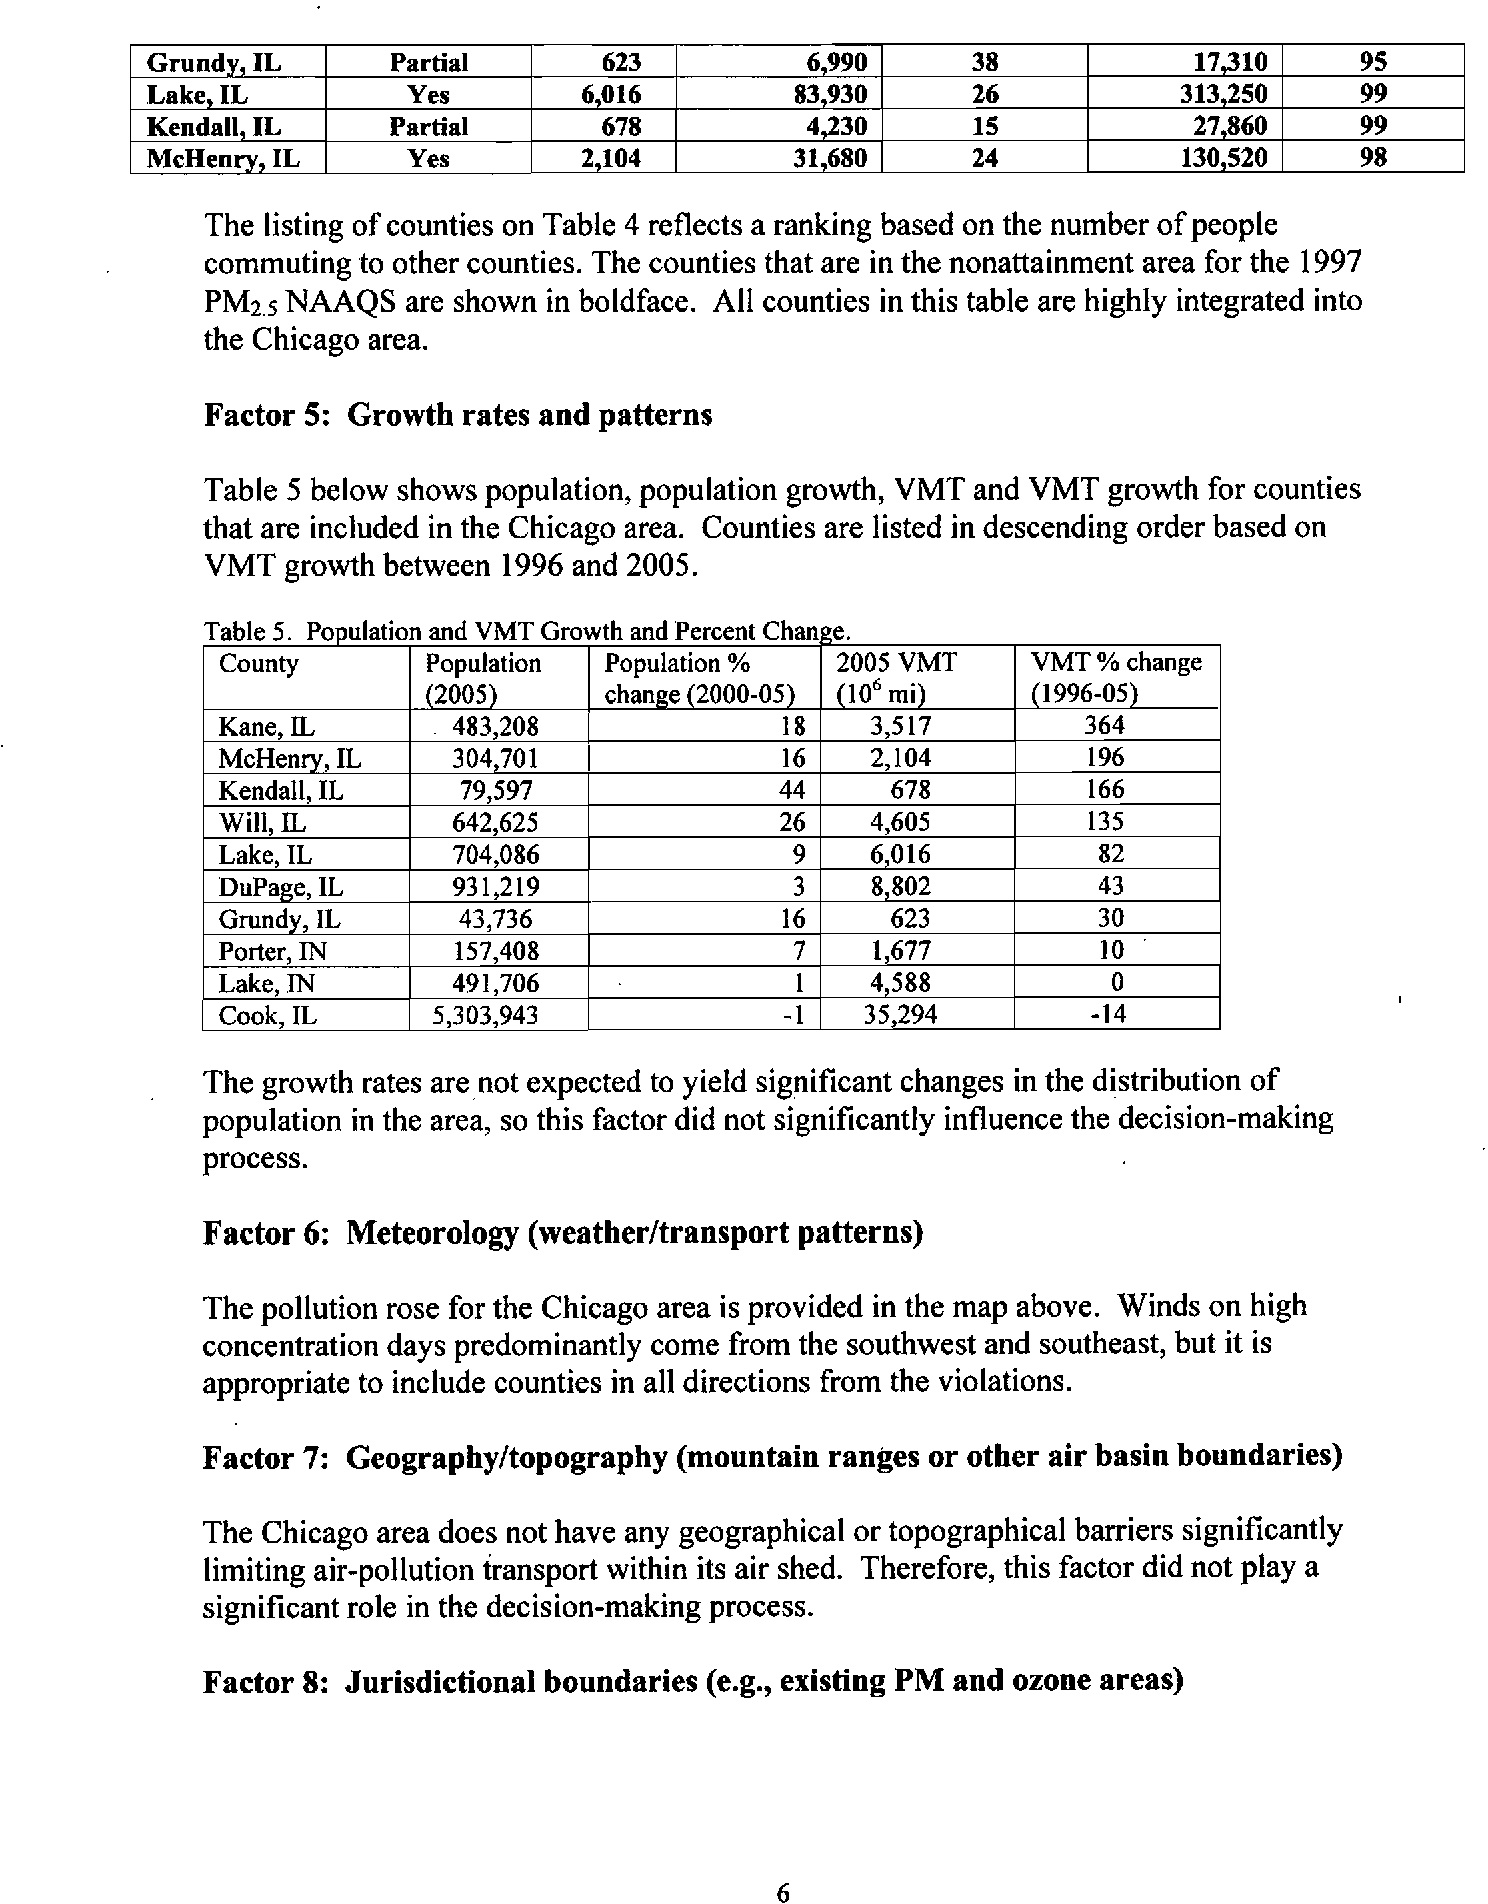
Factor 5: Growth rates and patterns
Table 5 below shows population, population growth, VMT and VMT growth for counties
that are included in the Chicago area. Counties are listed in descending order based on
VMT growth between 1996 and 2005.
Table
5. PoouIatlon
.
and VMT Growth and Percent Chan e.
County
Population
Population %
2005 VMT
VMT%change
(2005)
chanee (2000-05)
00'mil
0996-05\
Kane, IL
483,208
18
3,517
364
McHenry,IL
304701
I
16
2,104
196
Kendall,IL
79597
44
678
166
Will, IL
642,625
26
4,605
135
Lake,IL
704,086
9
6016
82
DuPaee,IL
931,219
3
8802
43
GrundV,IL
43,736
16
623
30
Porter,
IN
157,408
7
1,677
10
Lake,IN
491,706
I
4588
0
Cook,IL
5,303,943
-1
35,294
-14
The growth rates are not expected to yield significant changes in the distribution of
population in the area, so this factor did not significantly influence the decision-making
process.
Factor 6: Meteorology (weather/transport patterns)
The pollution rose for the Chicago area is provided in the map above. Winds on high
concentration days predominantly come from the southwest and southeast, but it
is
appropriate to include counties in all directions from the violations.
Factor 7: Geography/topography (mountain ranges or other air basin boundaries)
The Chicago area does not have any geographical or topographical barriers significantly
limiting air-pollution iransport within its air shed. Therefore, this factor did not
playa
significant role in the decision-making process.
Factor 8: Jurisdictional boundaries (e.g., existing PM and ozone areas)
6
???????????
??????? ?? ??????????
???????? ???????? ??????????
???? ????
The Chicago Area Transportation Study (CATS) Policy Committee is the Metropolitan
Planning Organization (MPO) for the northeastern Illinois region. CATS webpage:
http://www.catsmpo.coml.
The Illinois portion
of the Chicago ozone nonattainment area consists of the following
counties: Cook, Du Page, Kane, Lake, Mc Henry, Will,
Aux Sable and Goose Lake
Townships in Grundy County, and Oswego Township in Kendall County. Designating a
nonattainment area matching these boundaries will facilitate planning.
Factor 9: Level of control of emission sources
The emission estimates on Table 1 include any control strategies implemented by the
States in the Chicago area before 2005 that may influence emissions
of any component of
PM2.5 emissions (i.e., total carbon, S02, NOx, and crustal PM2.s).
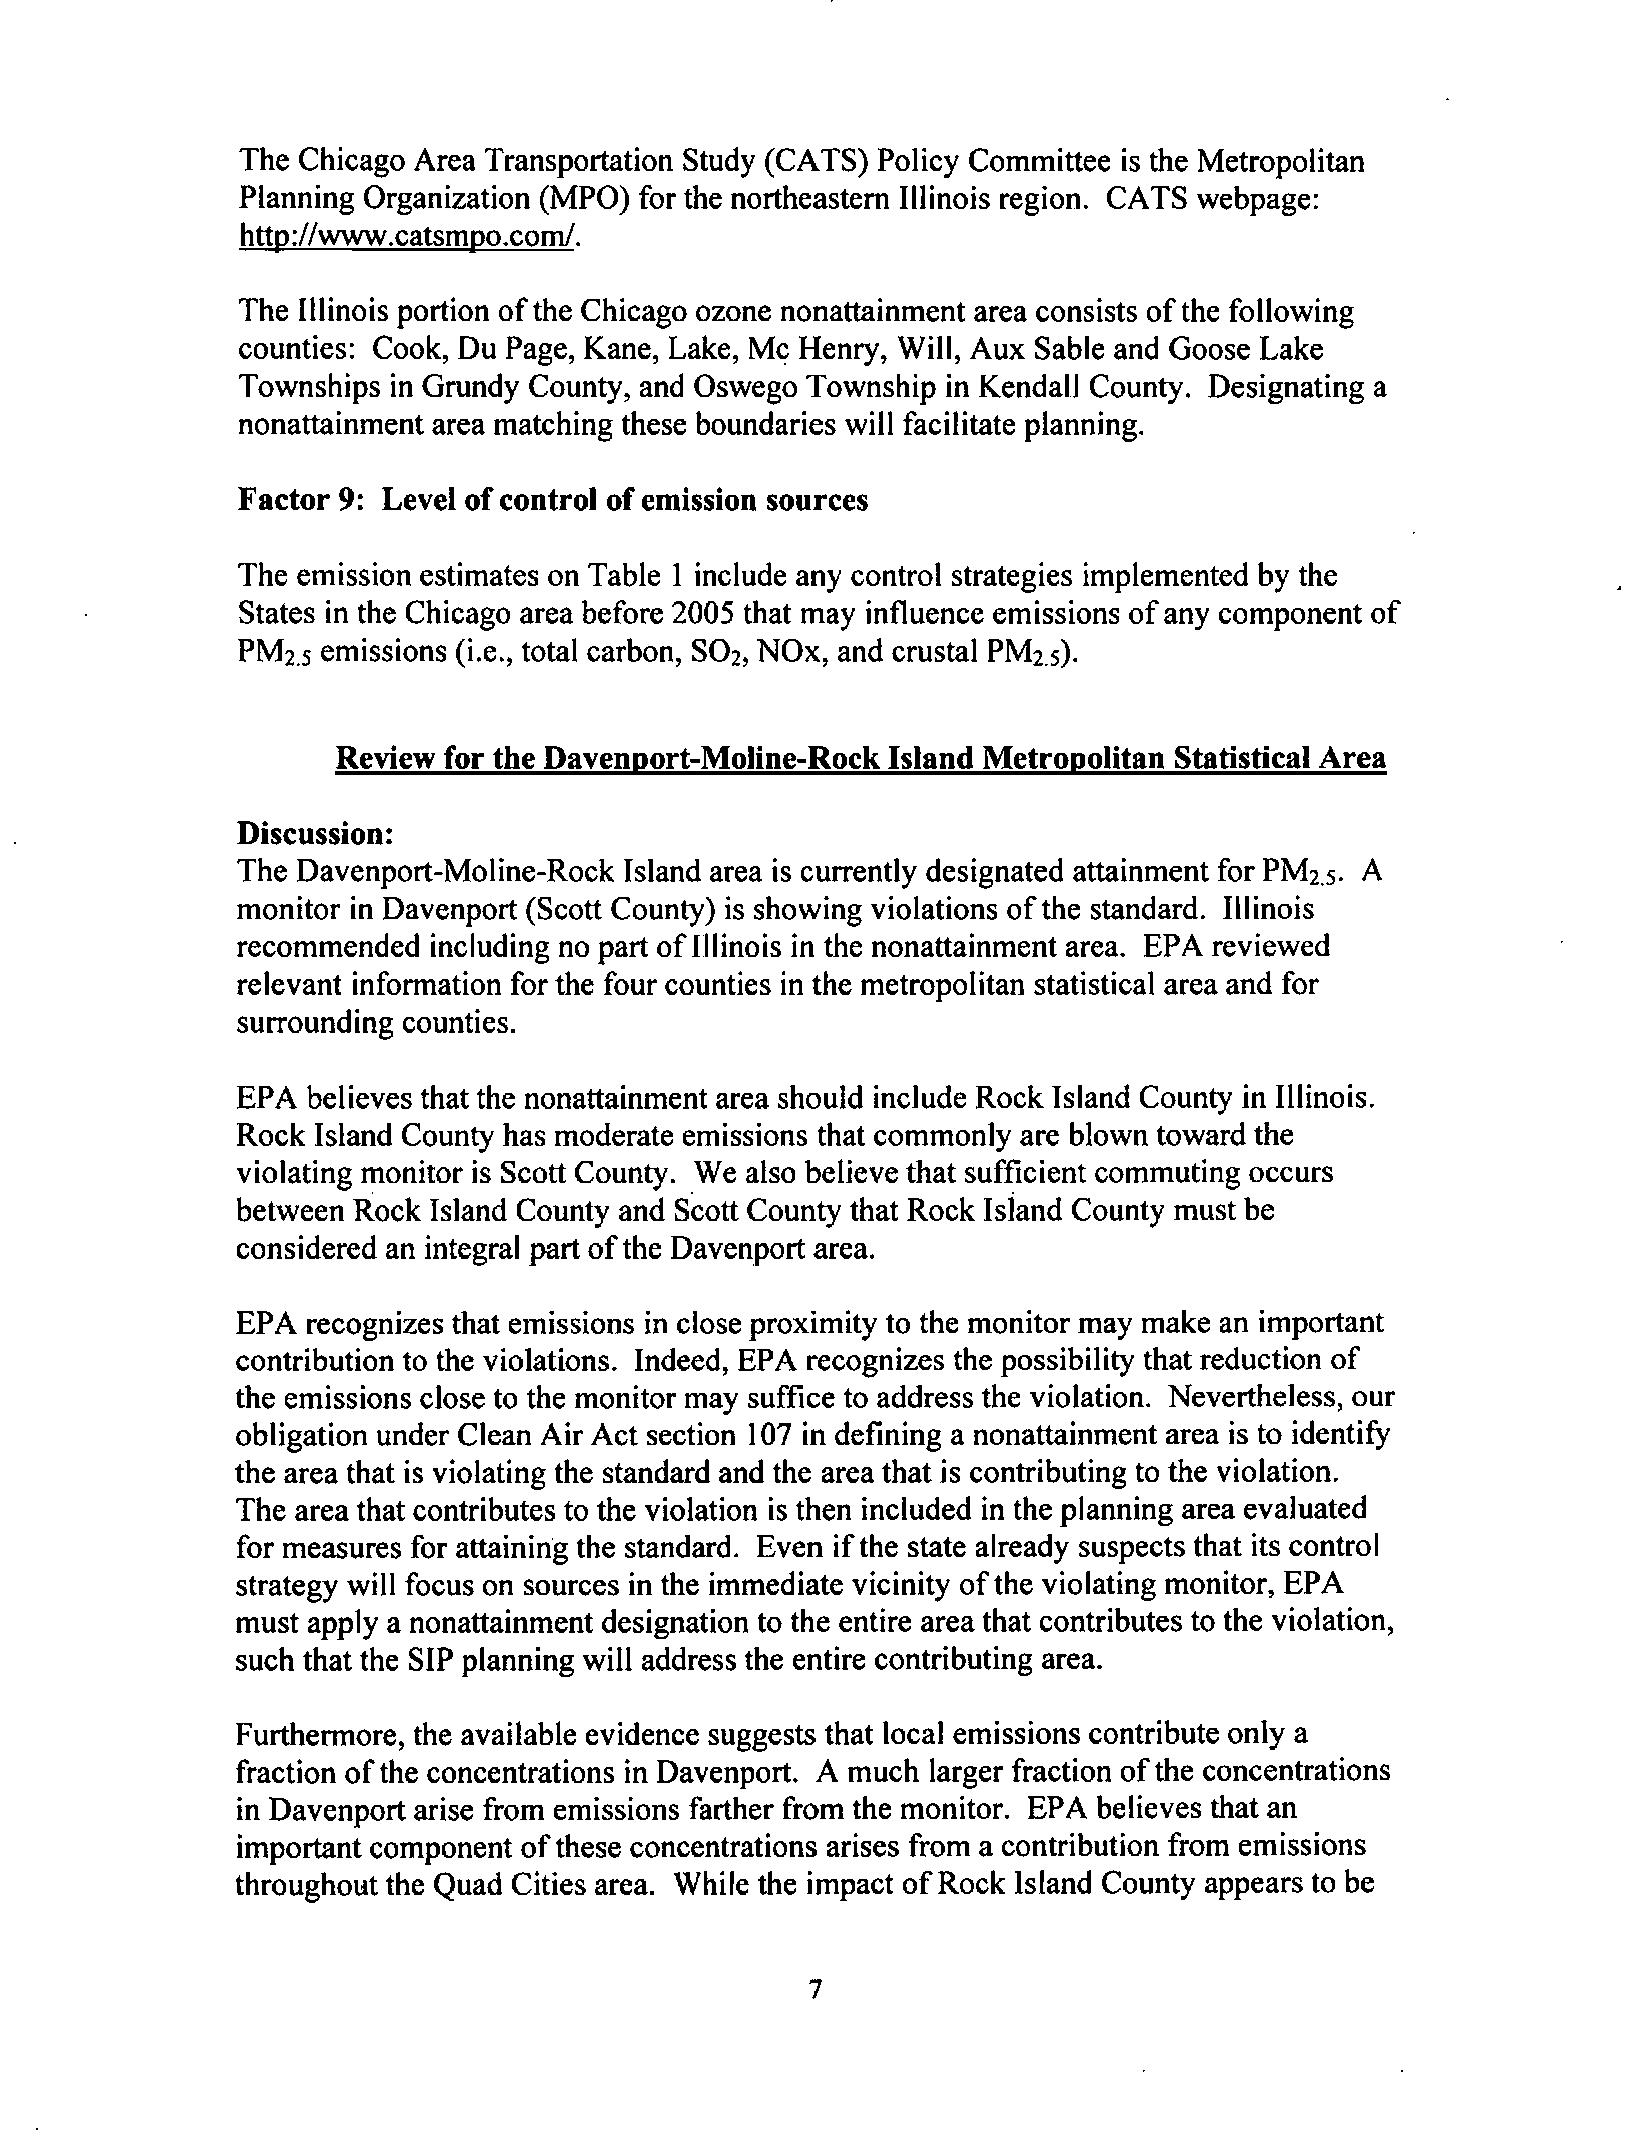
Review for the Davenport-Moline-Rock Island Metropolitan Statistical Area
Discussion:
The Davenport-Moline-Rock Island area is currently designated attainment for PM2.5. A
monitor in Davenport (Scott County) is showing violations
of the standard. Illinois
recommended including no part
of Illinois in the nonattainment area. EPA reviewed
relevant information for the four counties in
the metropolitan statistical area and for
surrounding counties.
EPA believes that the nonattainment area should include Rock Island County in Illinois.
Rock Island County has moderate emissions that commonly are blown toward the
violating monitor is Scott County. We also believe
that sufficient commuting occurs
between Rock Island County and Scott County that Rock Isiand County must
be
considered an integral part of the Davenport area.
EPA recognizes that emissions in close proximity to the monitor may make an important
contribution to the violations. Indeed, EPA recognizes the possibility that reduction
of
the emissions close to the monitor may suffice to address the violation. Nevertheless, our
obligation under Clean Air Act section 107 in defining a nonattainment area is to identify
the area that is violating the standard and the area that is contributing to the violation.
The area that contributes to the violation is then included in the planning area evaluated
for measures for attaining the standard. Even
if the state already suspects that its control
strategy will focus on sources in the immediate vicinity
of the violating monitor, EPA
must apply a nonattainment designation to the entire area that contributes to the violation,
such that the SIP planning will address the entire contributing area.
Furthermore, the available evidence suggests that local emissions contribute only a
fraction
of the concentrations in Davenport. A much larger fraction of the concentrations
in Davenport arise from emissions farther from the monitor. EPA believes that
an
important component of these concentrations arises from a contribution from emissions
throughout the Quad Cities area. While the impact
of Rock Island County appears to be
7
???????????
??????? ?? ??????????
???????? ???????? ??????????
???? ????
less than that of Scott Counties, Iowa, the impact nevertheless appears sufficiently
substantial to include Rock Island County in the nonattainment area.
EPA also examined information for Henry and Mercer Counties as well as for nearby
counties outside the metropolitan area.
EPA found that these other counties have
relatively low emissions, and no other factor warranted inclusion
of the counties in the
nonattainment area.
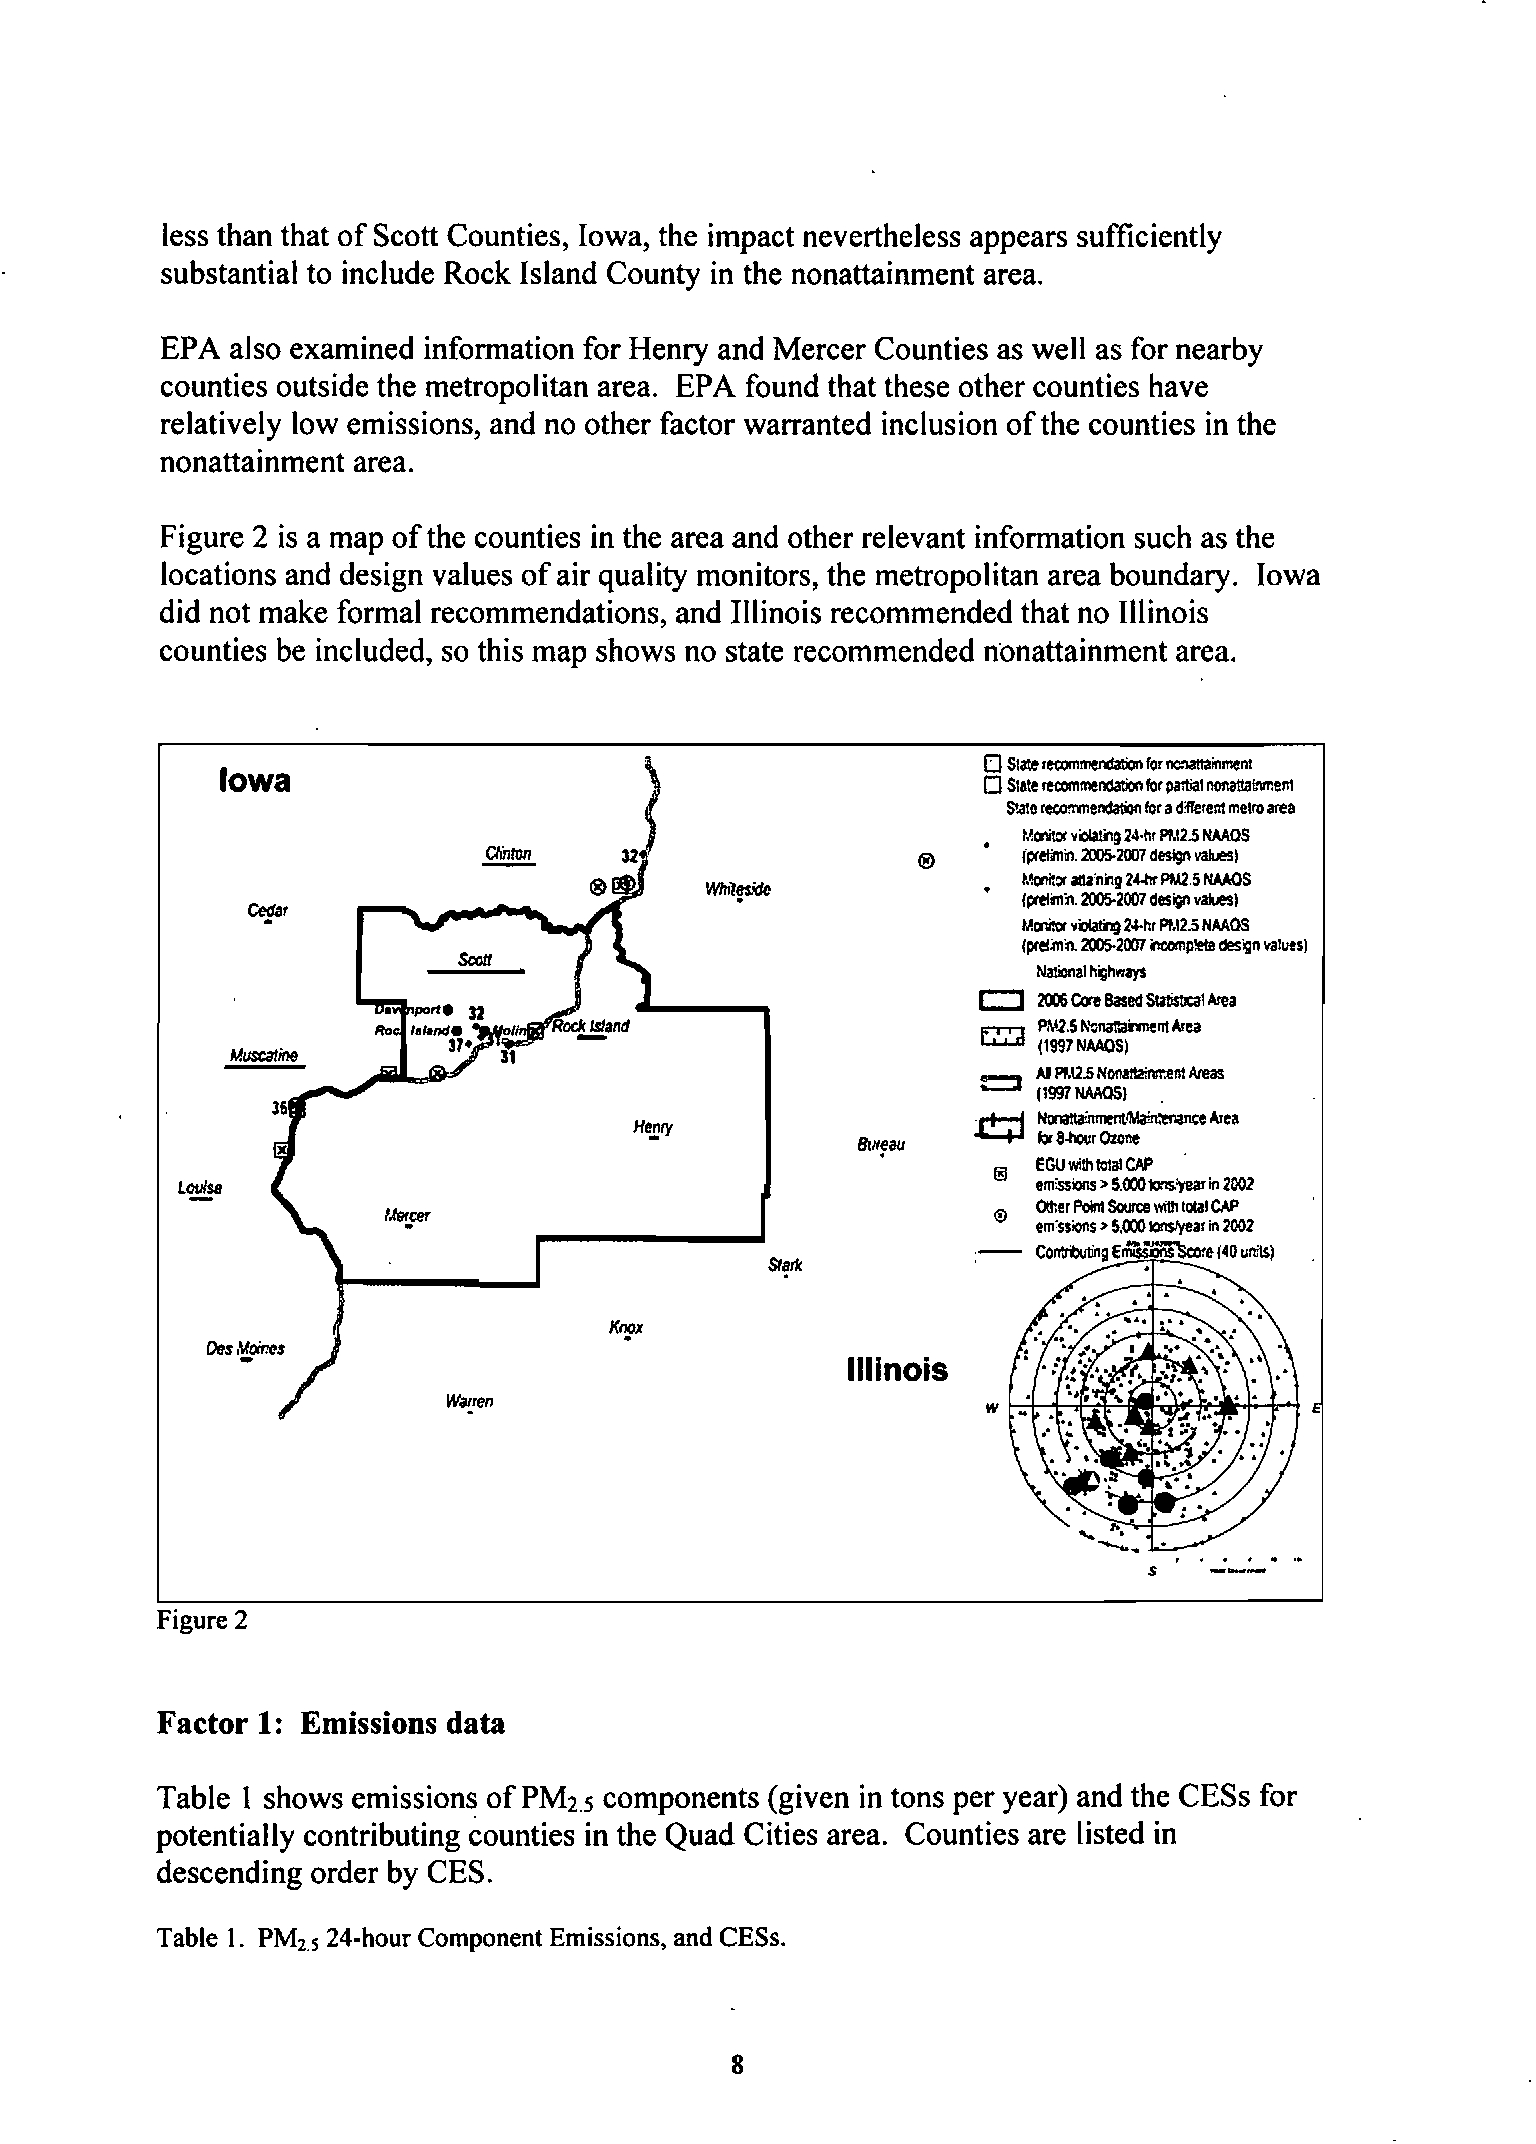
Figure 2
is a map of the counties in the area and other relevant information such as the
locations and design values
of air quality monitors, the metropolitan area boundary. Iowa
did not make formal recommendations, and Illinois recommended that no Illinois
counties be included, so this map shows no state recommended nonattainment area.
Iowa
o Sla:le'lecommerclalion for nc::l3t1amme:nt
o
Slale recommendation for partial nonattal.'lmell1
St.alll recomnendatiofl for ad:trerent metro area
MCritot
~iOIali'ltl24·llf
pt12.5 NMOS
~
12
@
ipretmin. 2005-2007 dMign vah.e!l1
Whir~
Mcrli::l!' atIi'nng2U!r PM2,5I'WtOS
IllttIini'l.2005-2007 des9'lvalles}
C<!"
Mcnilor ¥0Iali'.g2+lu Pt.l2.5 NMOS
Iprelinn. 200S-2001 irlcetnll!etB desi;n ..-alias)
Nalionalllighl'l1)'$
c:J 2006
Co'! Based
Stitistita1
Area
""
~
PM2.5f\>Onor.ai'mentArea
~
(1997 NAAQS)
:::::I
AI PP.l2.5 Nonatl21M::ent
Areas
(l997NAAOSI
.
He~1Y
J:!:+j
~~"JI:a
8I1t~au
br
UlOUr Otone
.,
EGUwllhlolalCAP
l~
em;sslons;>
5.«01ons.')'earin2002
f.t8f..
cer
"
OtIler Polnl Source
\mt1latalCN'
em:ssiOns > S,COO lQnSfyeal in
2002
St!fk
.-
COrr:rtutin9E~l!"1401,lrt\$)
~
illinois
~"'"
w
...
........
".
s
Figure 2
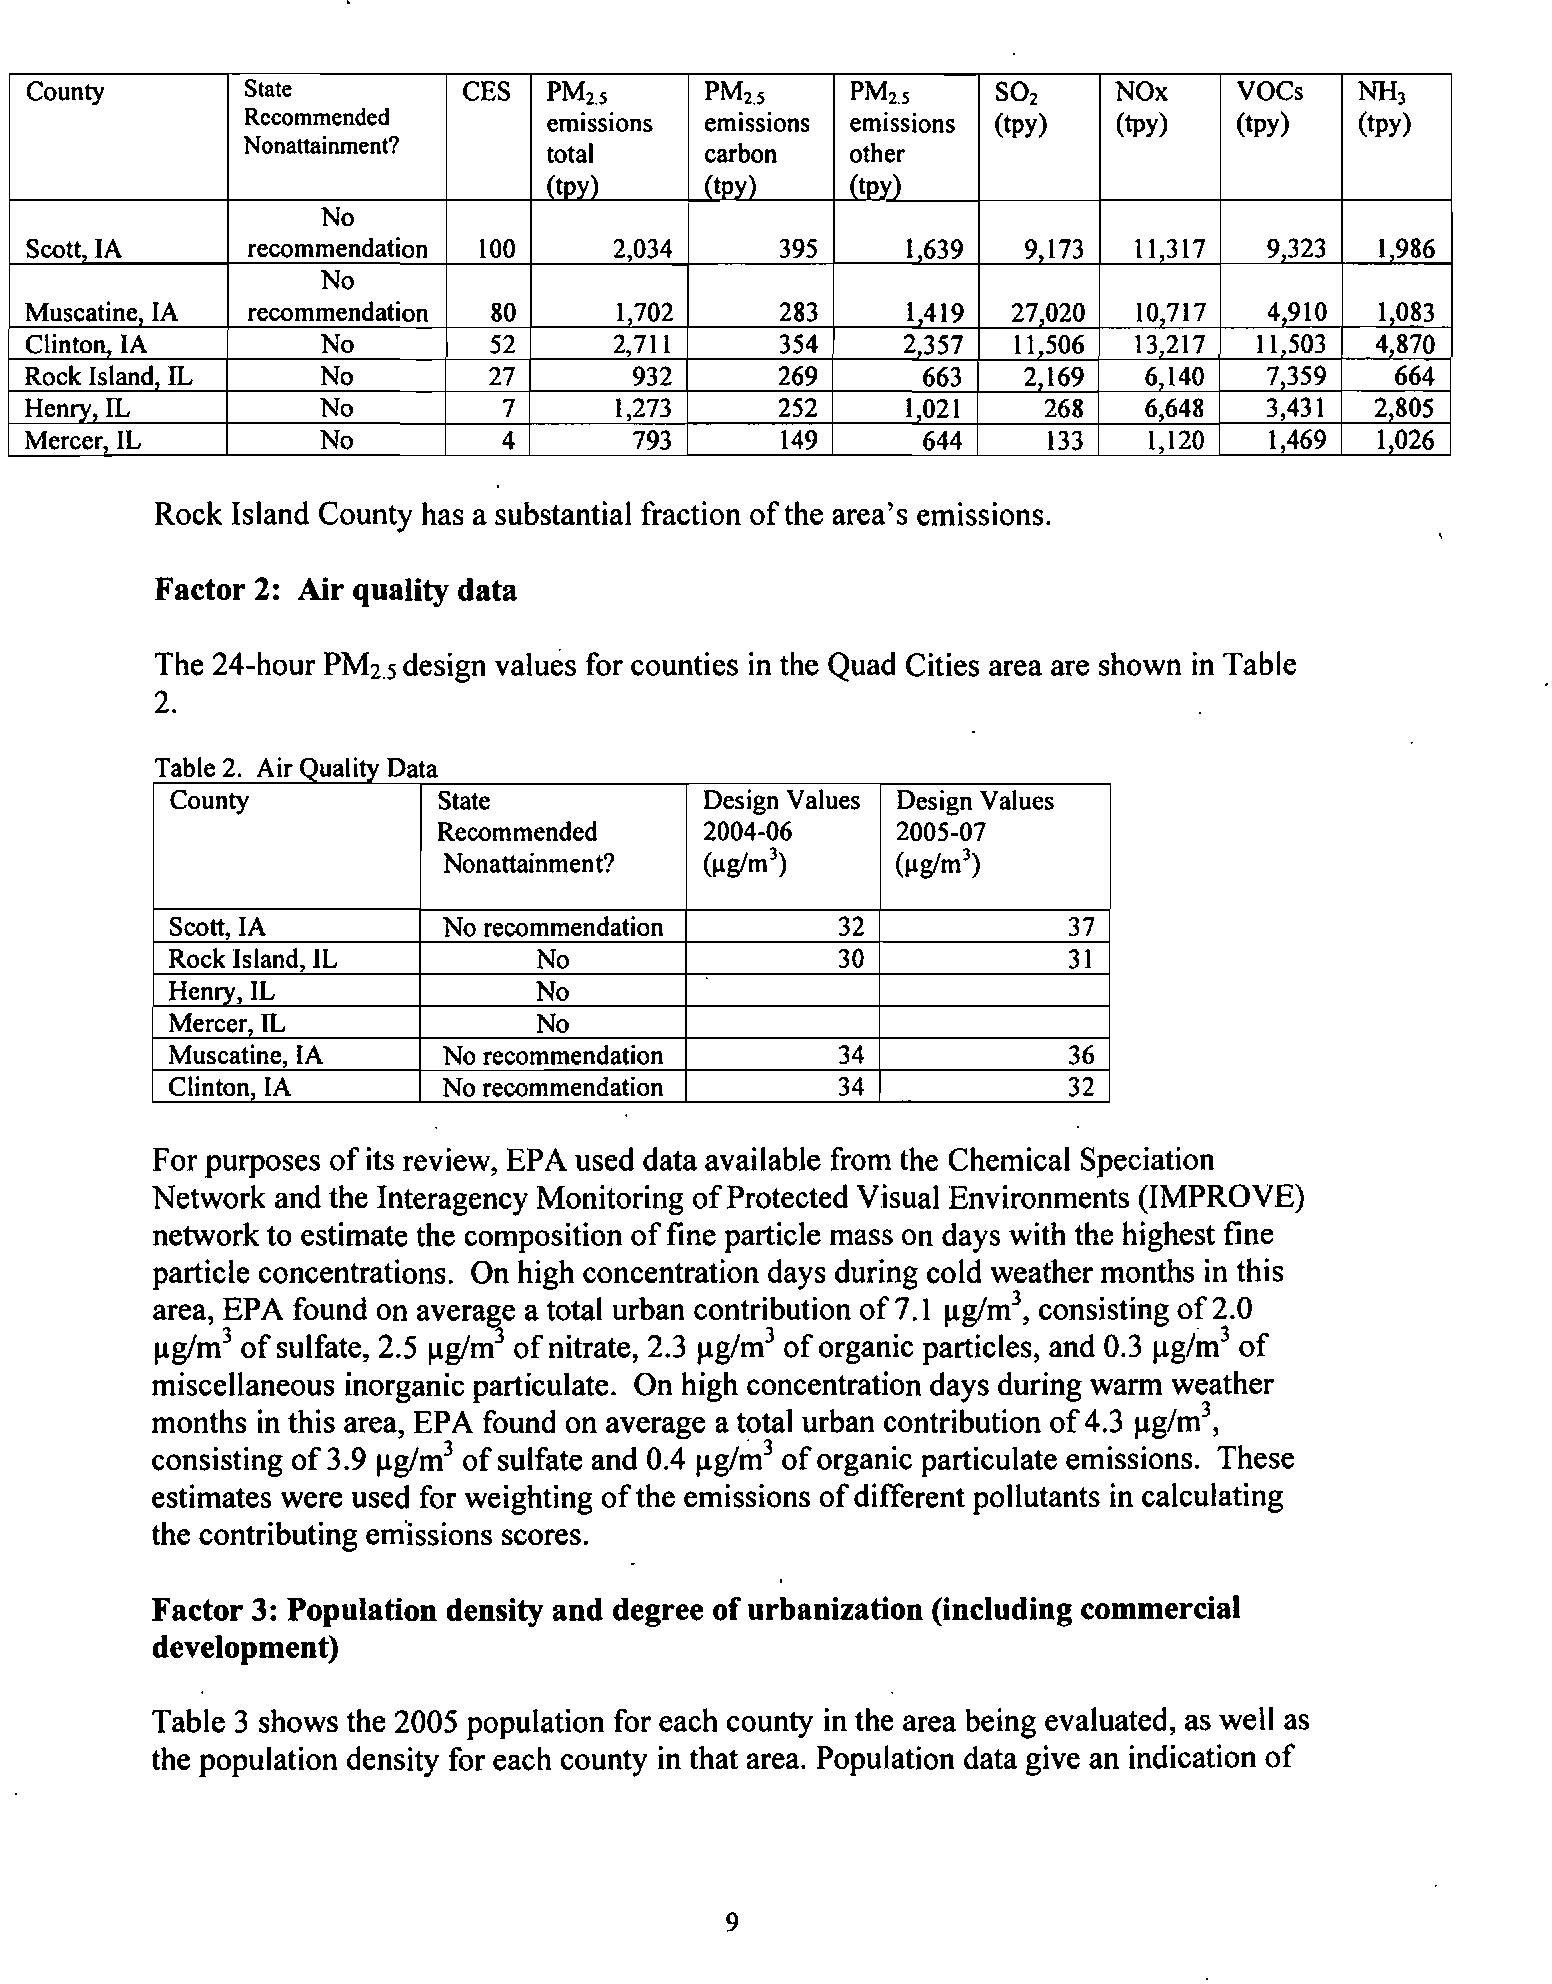
Factor 1: Emissions data
Table I shows emissions of PM25 components (given in tons per year) and the CESs for
potentially contributing counties in the Quad Cities area. Counties are listed in
descending order by CES.
Table 1. PM,s 24.hour Component Emissions, and CESs.
8
???????????
??????? ?? ??????????
???????? ???????? ??????????
???? ????
County
State
CES
PM"
PM"
PM"
SO,
NOx
VOCs
NH,
Recommended
emissions
emissions
emissions
(tpy)
(tpy)
(tpy)
(tpy)
Nonattainment?
total
carbon
other
(tDV)
(tDV)
(tDV)
No
Scoll IA
recommendation
100
2,034
395
1639
9 173
11 317
9323
1986
No
Muscatine
IA
recommendation
80
1702
283
1419
27020
10717
4910
1083
Clinton. IA
No
52
2,711
354
2357
II 506
13217
11 503
4870
Rock Island IL
No
27
932
269
663
2 169
6 140
7359
664
Henrv. IL
No
7
1,273
252
1021
268
6,648
3,431
2805
Mercer IL
No
4
793
149
644
133
1,120
1,469
1026
Rock Island County has a substantial fraction of the area's emissions.
Factor 2: Air quality data
The 24-hour PM
25
design values for counties in the Quad Cities area are shown in Table
2.
Table 2. Air Oualitv Data
County
State
Design Values
Design Values
Recommended
2004-06
2005-07
Nonaltainment?
(~glm')
(~glm')
Scott,IA
No recommendation
32
37
Rock Island, IL
No
30
31
Henrv,IL
No
Mercer IL
No
Muscatine,
IA
No recommendation
34
36
Clinton
IA
No recommendation
34
32
For purposes of its review, EPA used data available from the Chemical Speciation
Network and the Interagency Monitoring
of Protected Visual Environments (IMPROVE)
network to estimate the composition
of fine particle mass On days with the highest fine
particle concentrations. On high concentration days during cold weather months
in this
area, EPA found
On
avera~e
a total urban contribution of7.1
~glm3,
consisting of2.0
~glm3
of sulfate, 2.5
~glm
of nitrate, 2.3 j!glm
3
of organic particles, and 0.3 j!g/m
3
of
miscellaneous inorganic particulate. On high concentration days during warm weather
months
in this area, EPA found On average a total urban contribution of 4.3 j!g/m
3
,
consisting of 3.9
~glm3
of sulfate and 0.4 j!glm
3
of organic particulate emissions. These
estimates were used for weighting
of the emissions of different pollutants in calculating
the contributing em'issions scores.
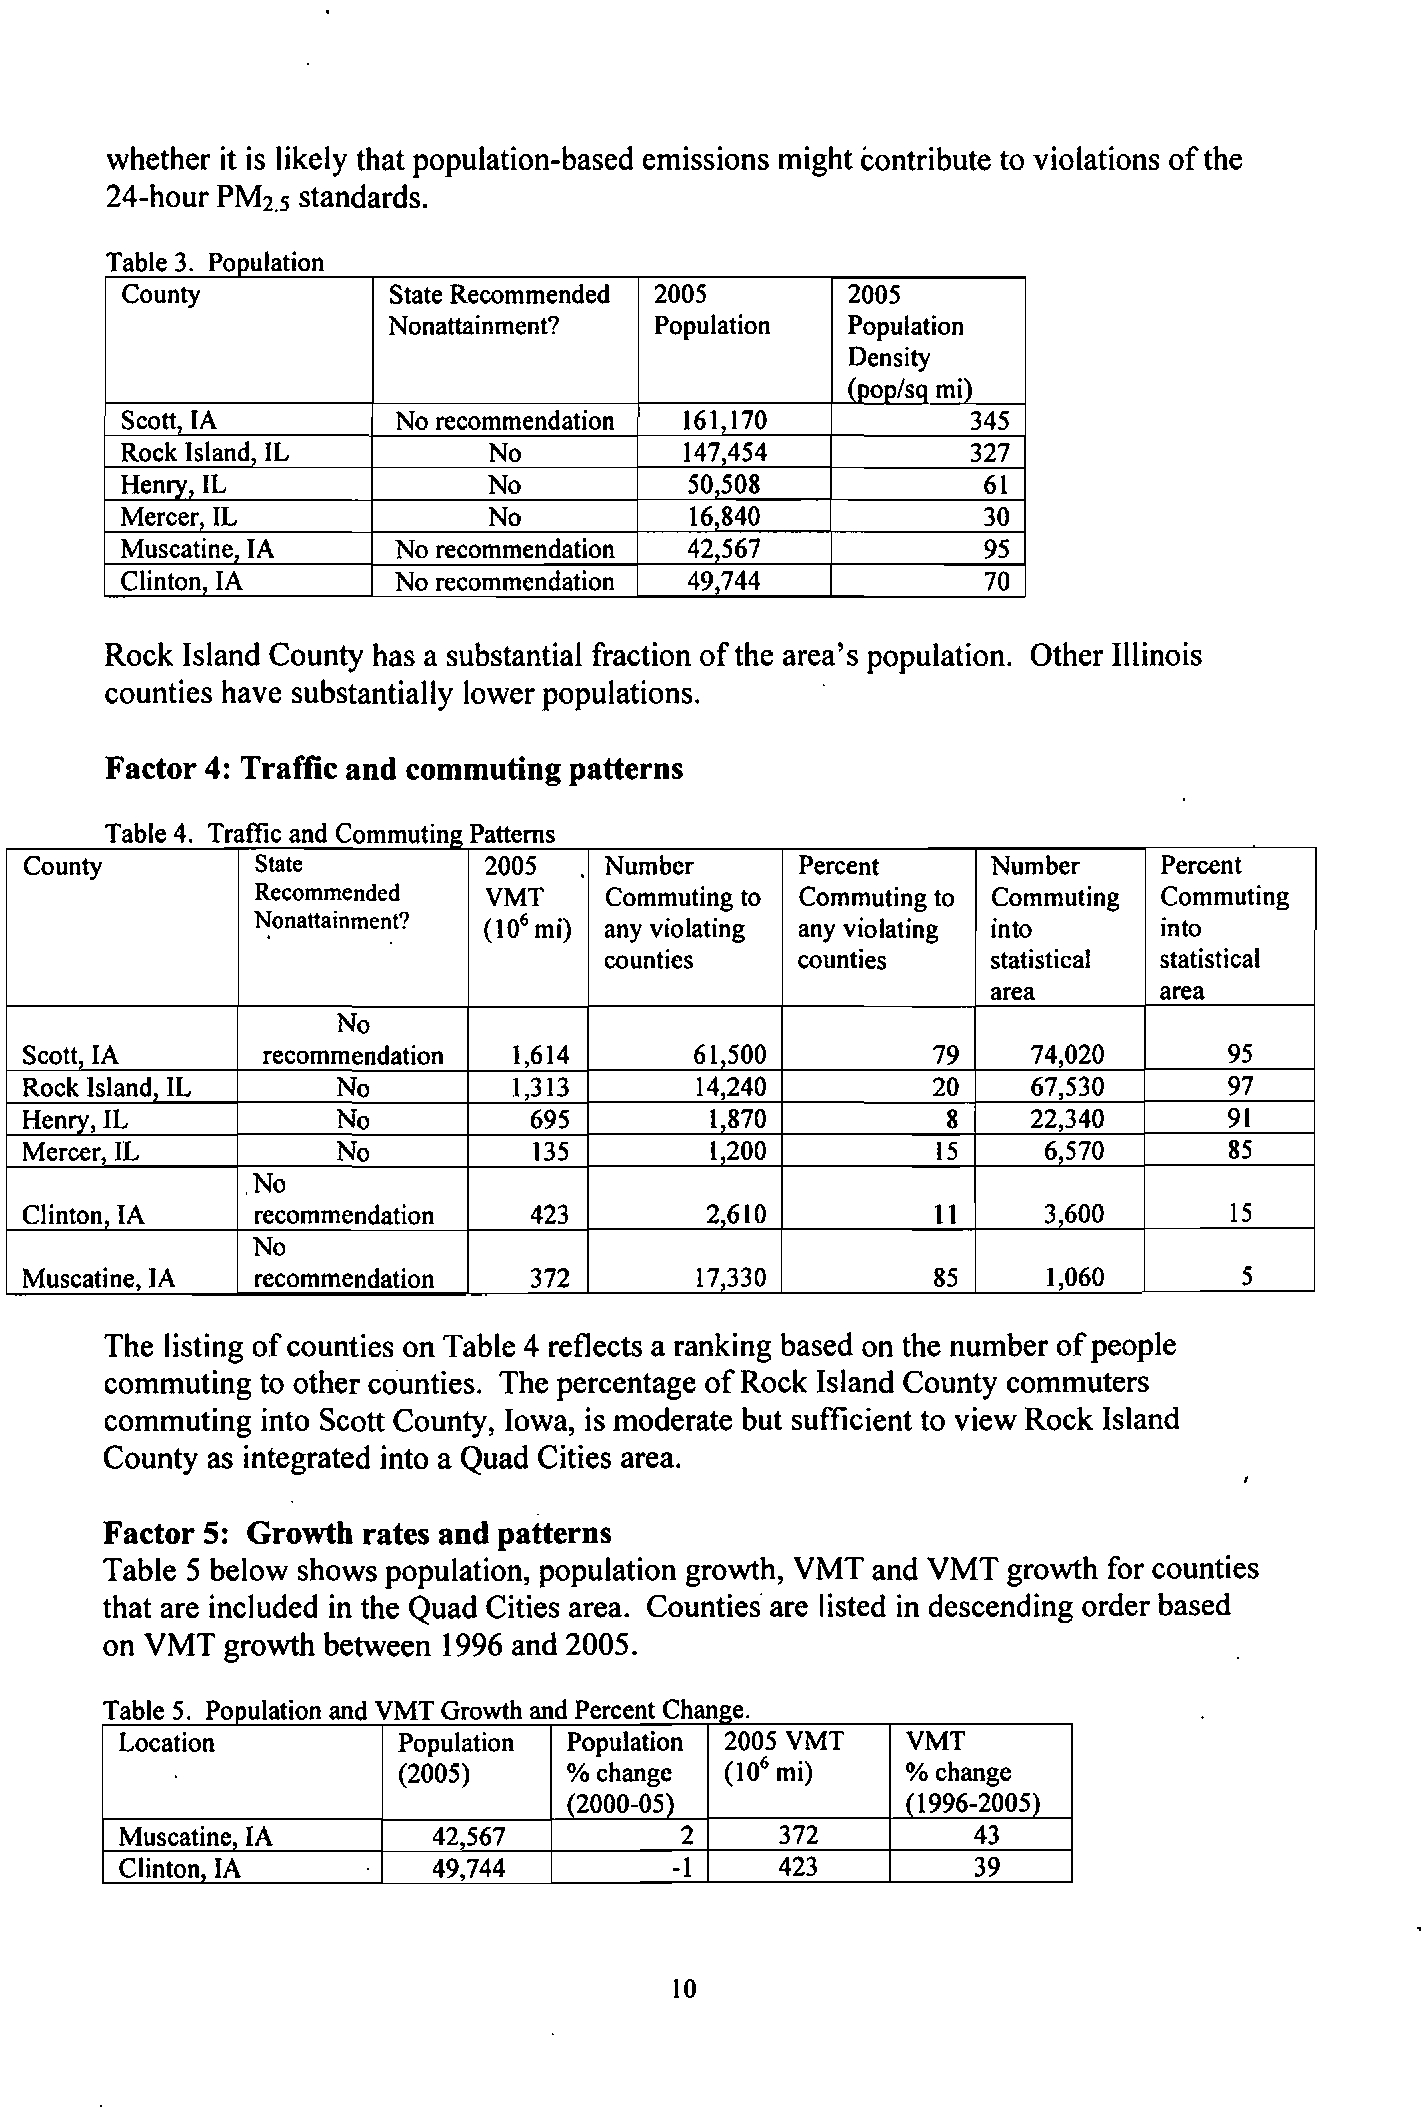
Factor 3: Population density and degree of urbanization (including commercial
development)
Table 3 shows the 2005 population for each county in the area being evaluated, as well as
the population density for each county in that area. Population data give an indication
of
9
???????????
??????? ?? ??????????
???????? ???????? ??????????
???? ????
whether it is likely that population-based emissions might contribute to violations ofthe
24-hour PM
2
.5 standards.
T
a
bl
e
3
.
Popu
I'
atmo
County
State Recommended
2005
2005
Nonattainment?
Population
Population
Density
(DoD/sa mil
Scott
[A
No recommendation
161 170
345
Rock [sland IL
No
147454
327
Henrv.
[L
No
50508
61
Mercer IL
No
16840
30
Muscatine [A
No recommendation
42567
95
Clinton IA
No recommendation
49744
70
Rock Island County has a substantial fraction of the area'spopulation. Other Illinois
counties have substantially lower populations.
Factor 4: Traffic and commuting patterns
Tbl4Tffi
a e
fa Ie an
dC
ommutmg
P
attems
County
State
2005
Number
Percent
Number
Percent
Recommended
VMT
Commuting to
Commuting to
Commuting
Commuting
Nonattainment?
(10'mil
any violating
any violating
into
into
counties
counties
statistical
statistical
area
area
No
Scott IA
recommendation
[,614
61500
79
74,020
95
Rock [sland IL
No
1,313
14,240
20
67,530
97
Henrv,IL
No
695
1870
8
22,340
91
Mercer IL
No
135
1200
15
6570
85
.No
Clinton IA
recommendation
423
2610
\I
3600
15
No
Muscatine,
[A
recommendation
372
17330
85
1,060
5
The listing of counties on Table 4 reflects a ranking based on the number ofpeople
commuting to other counties. The percentage
of Rock Island County commuters
commuting into Scott County, Iowa, is moderate but sufficient to view Rock Island
County as integrated into a Quad Cities area.
Factor 5: Growth rates and patterns
Table 5 below shows population, population growth, VMT and VMT growth for counties
that are included in the Quad Cities area. Counties are listed
in descending order based
on VMT growth between 1996 and 2005.
Table 5.
PI'
opu atlon and VMT
Growlh
andP
ercent
Ch
anl!c.
Location
Population
Population
2005 VMT
VMT
(2005)
% change
(10'mil
% change
(2000-05)
11996-2005)
Muscatine [A
42,567
2
372
43
Clinton [A
49,744
-1
423
39
10
???????????
??????? ?? ??????????
???????? ???????? ??????????
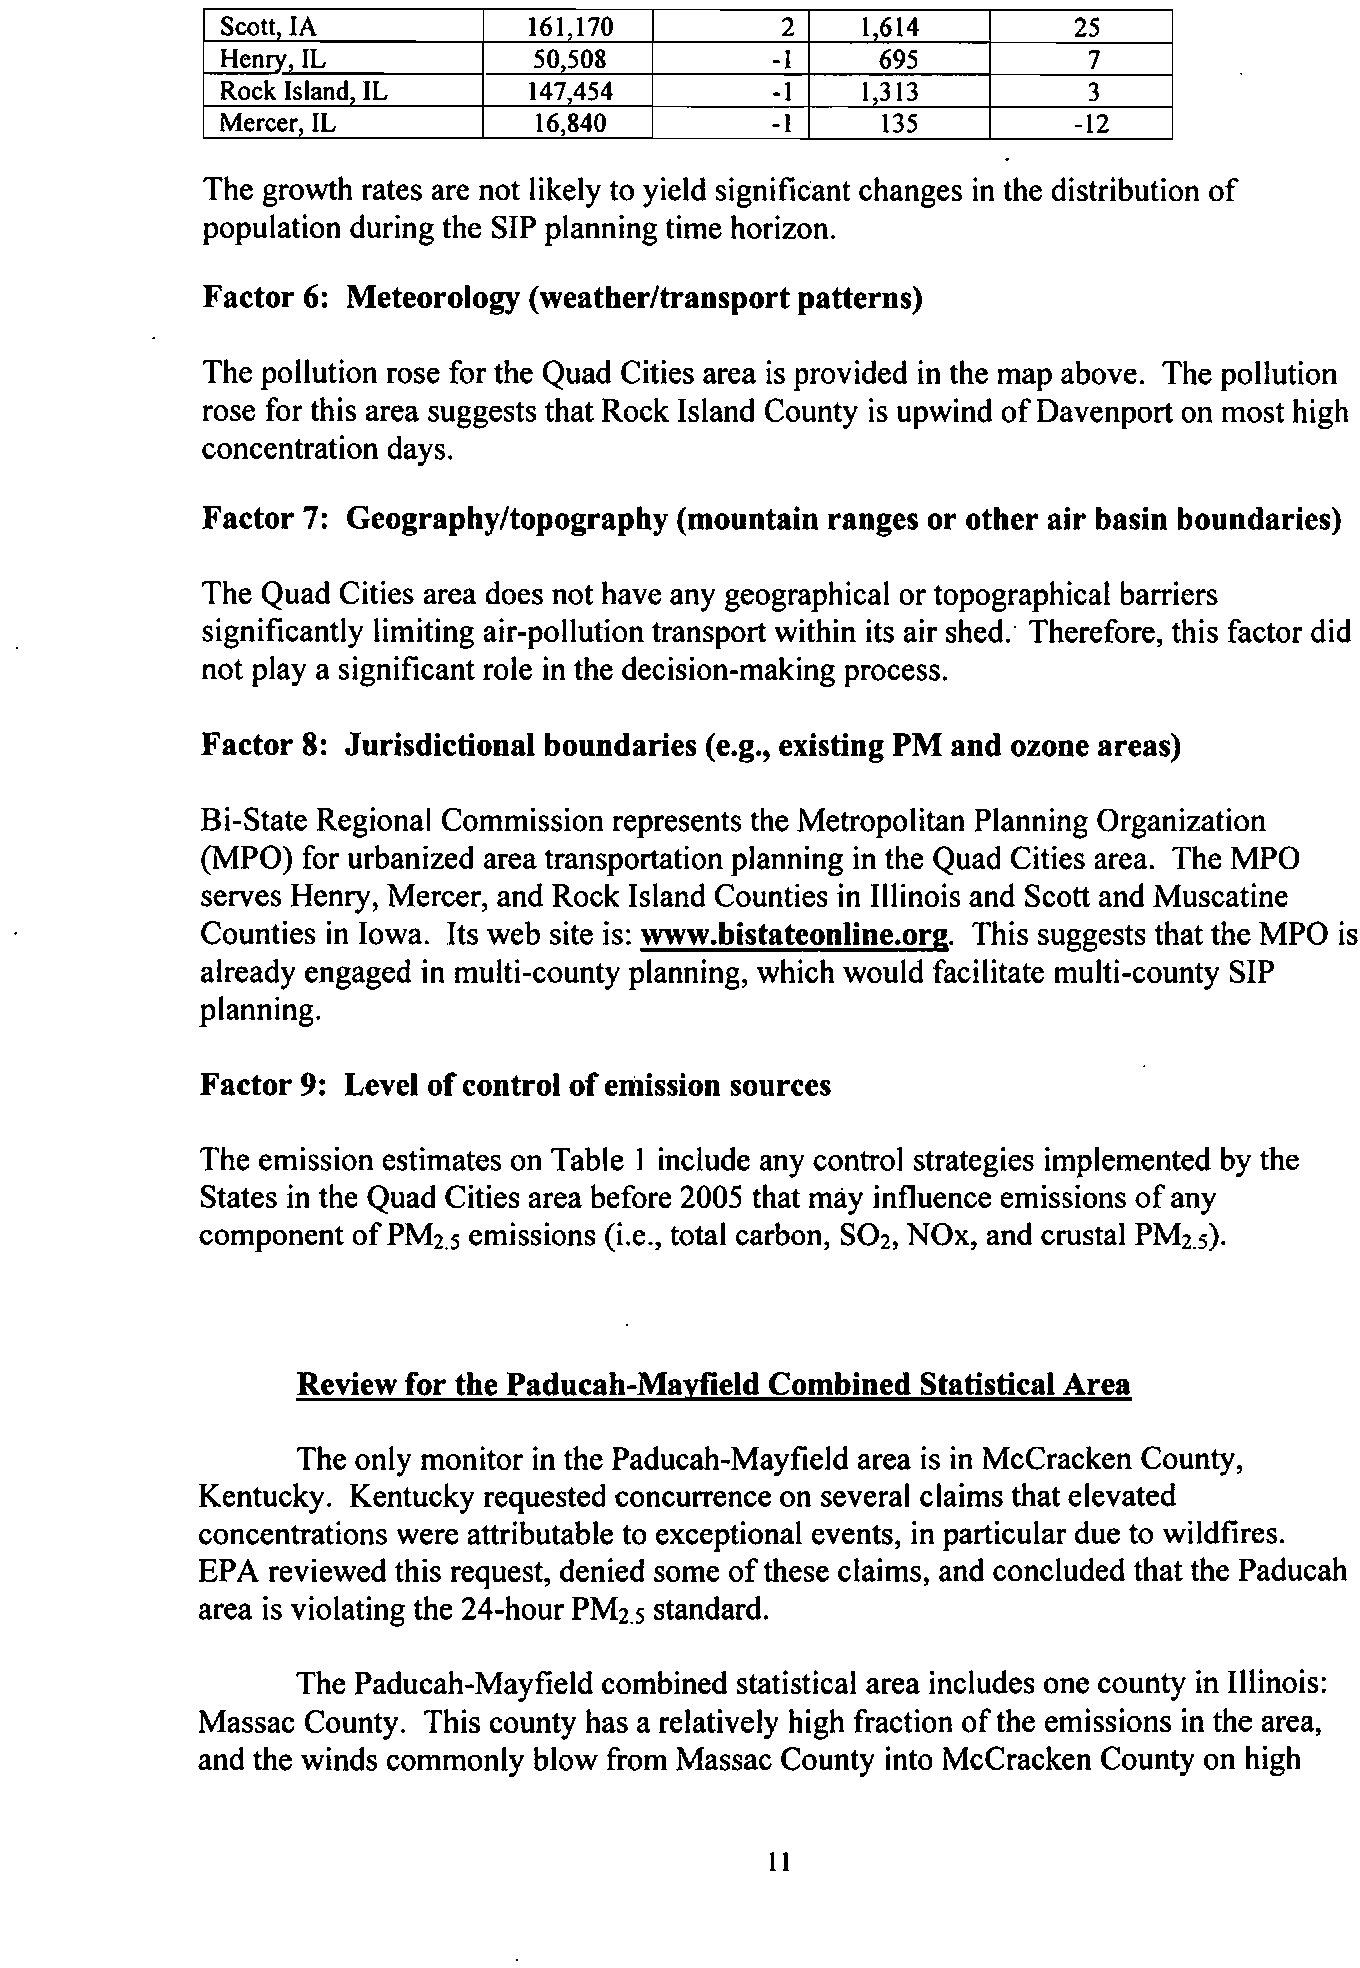
???? ????
Scott IA
161 170
2
1614
25
Henrv.IL
50508
-1
695
7
Rock Island IL
147454
-I
1 313
3
Mercer IL
16,840
-I
135
-12
The growth rates are not likely to yield significant changes in the distribution of
population during the SIP planning time horizon.
Factor 6: Meteorology (weather/transport patterns)
The pollution rose for the Quad Cities area is provided in the map above. The pollution
rose for this area suggests that Rock Island County
is upwind of Davenport on most high
concentration days.
Factor 7: Geography/topography (mountain ranges or other air basin boundaries)
The Quad Cities area does not have any geographical or topographical barriers
significantly limiting air-pollution transport within its air shed. Therefore, this factor did
not
playa significant role in the decision-making process.
Factor 8: Jurisdictional boundaries (e.g., existing PM and ozone areas)
Bi-State Regional Commission represents the Metropolitan Planning Organization
(MPO) for urbanized area transportation planning in the Quad Cities area. The MPO
serves Henry, Mercer, and Rock Island Counties in Illinois and Scott and Muscatine
Counties
in Iowa. Its web site is: www.bistateonline.org.This suggests that the MPO is
already engaged in multi-county planning, which would facilitate multi-county SIP
planning.
Factor 9: Level of control of emission sources
The emission estimates on Table I include any control strategies implemented by the
States in the Quad Cities area before 2005 that may influence emissions of any
component
of PM2.
S
emissions (i.e., total carbon, S02, NOx, and crustal PM2.
S
).
Review for the Paducah-Mayfield Combined Statistical Area
The only monitor in the Paducah-Mayfield area is in McCracken County,
Kentucky. Kentucky requested concurrence on several claims that elevated
concentrations were attributable
to exceptional events, in particular due to wildfires.
EPA reviewed this request, denied some
of these claims, and concluded that the Paducah
area
is violating the 24-hour PM2.s standard.
The Paducah-Mayfield combined statistical area includes one county in Illinois:
Massac County. This county has a relatively high fraction
of the emissions in the area,
and the winds commonly blow from Massac County into McCracken County on high
1I
???????????
??????? ?? ??????????
???????? ???????? ??????????
???? ????
concentration days.
A
substantial fraction of the Massac County emissions are
attributable to the Joppa Steam Plant.
In considering county-level emissions, EPA considered 2005 emissions data from
the National Emissions Inventory. EPA recognizes that the Joppa Steam Plant may have
installed emission controls
or otherwise significantly reduced emissions since 2005 and
that this information may not be reflected
in this analysis. EPA will consider additional
information on emission controls
in making final designation decisions. In cases where
specific plants already have installed emission controls or plan to install such controls
in
the near future, EPA requests additional information on:
- the plant name, city, county, and township
- identification
of emission units at the plant, fuel use, and megawatt capacity
- identification
of emission units on which controls will be installed, and units on which
controls will not be installed
- identification
of the type of emission control that has been or will be installed on each
unit, the date on which the control device became / will become operational, and the
emission reduction efficiency
ofthe control device
- the estimated pollutant emissions for each unit before and after implementation
of
emission controls
- whether the requirement
to operate the emission control device will be federally
enforceable by December 2008, and the instrument by which federal enforceability will
be ensured (e.g. through source-specific SIP revision, operating permit requirement,
consent decree)
In the designation process for the 1997 PM2.5 standards, in some cases EPA
identified a nearby county
as contributing to a violating monitor, and it was determined
that a very high percentage
of the county'semissions came from a large power plant. In
certain cases, EPA concluded that only the portion
of the county including the source
with the'contributing emissions needed to be designated as nonattainment.
If Illinois
. believes that a similar situation exists for Massac County, the State should provide EPA
the necessary information to demonstrate that the source dominates the overall county
emissions and to identify a reasonable partial county boundary.
In its designations for the 1997 standards, EPA included portions
of counties in a
number
of cases in which large sources dominated the emissions from the county, such
that EPA concluded that the relevant portion
of the county was the only portion of the
county that contributed to the violations.
If Illinois believes this is the case in Massac
County, for example
if Illinois believes that only a single township containing the Joppa
Steam plant contributes to violations in Paducah, Illinois should provide the information
necessary to support this view.
EPA also examined information for other Illinois counties around the Paducah-
Mayfield area. These other counties have relatively low emissions, and no other factor
warrants their inclusion
in the Paducah-Mayfield nonattainment area.
12
???????????
??????? ?? ??????????
???????? ???????? ??????????
???? ????
Figure 3 is a map of the counties in the area and other relevant information such as the
locations and design values
of air quality monitors, the metropolitan area boundary.
Kentucky recommended that Paducah be found to be attaining the standard, and Illinois
recommended that no Illinois counties be included
if in fact the area was found to be
violating, so this map shows no state recommended nonattainment area.
wH++-f':'+'~4-+-HE
o SIn reecmmenllaticn b'nonll'..ainmenl
o State re«nunel"odaticll
b'
pallial nonattainmenl
SID!
fecommen~alian
rar a
c"f.'erentme:ro
illl!3
Monitor
riclIaSng
24-t>.r PM2.S
NMOS
1pre'1m1i,2005-2007 de$.ign values)
UiWtlr
at!aIlIng
2,J.f1r PM2.5 NMOS
fpre'"IlIl'n. 21):5-2001
des'gn
'talll!5)
Monitllr
~t:lin;
2.u.r PM2.5 NMOS
i;re'6I'J:n.
ms.-2m7
in~deSgn ~akJHI
Na:ior,at h'gh?'!)'S
c:::J
2006 Co:ntJined
~
Area
~
PM2,S NtwIanaimentArea
(1991 NAAOSI
t:::J -
AI PM2.5
N~Ntas
(l!l97NAAOSI
r+--I
Norlmi'mltntiMairmanceArea
,.a......r-
rof 8-houI'
Ozone
EGUwitllotalC/IP
@
emisskt'ts.. 5.000 tonstyeilf
in
21m
Qlher
Pll'1'll Source 11th ttt.al
CAP
@
ert\i$SiCInS :>
5.000 tons.')'ear
in
2002
.-
C(llltl'jbll'3ng_E_~~_~_('!9~).
Kentucky
Tennessee
Illinois
Uilf!naII
Trip<
"'~111
G~"s
Coil~ay
..J
Ot;;m
IBI
Jolt!'.')'
r~y
Missouri
,
Figure 3
Factor 1: Emissions data
Table I shows emissions of PMz.5 components (given in tons per year) and the CESs for
potentially contributing counties in the Paducah area. Counties are listed in descending
order by CES.
Table 1. PM. - 24-hour Comoonent Emissions and CESs.
County
State
CES
PM"
PM,.,
PM,.,
SO,
NOx
VOCs
NH,
Recommended
emissions
emissions
emissions
(tpy)
(tpy)
(tpy)
(tpy)
Nonattainment?
total
carbon
other
(tnv)
(tnv)
(tov)
McCracken KY
No
100
1339
293
1046
38956
24803
6661
366
Massac IL
No
66
1958
159
I
799
26884
12369
2612
417
Graves KY
No
6
797
278
520
413
1735
1.867
2538
Ballard KY
No
5
596
140
456
927
2785
1661
855
Livin-"ston
KY
No
3
318
121
197
337
2155
1200
239
13
???????????
??????? ?? ??????????
???????? ???????? ??????????
???? ????
McCracken and Massac Counties have substantially greater emissions than any other
nearby county.
Factor 2: Air quality data
The 24-hour PM25 design values for counties in the Paducah area are shown in Table 2.
The design value
of McCracken County, Kentucky is above the 2006 PM2.5 standard.
There
is no PM2.5 air quality data for the other area counties.
Table 2. Air Qualitv Data
County
State
Design Values
Design Values
Recommended
2004-06
2005-07
Nonattainment?
(ltg/m')
(ltg/m')
McCracken, KY
No
33
36
Massac,IL
No.
Graves, KY
No
Ballard
KY
No
Livingston, KY
No
For purposes of its review, EPA used data available from the Chemical Speciation
Network and the Interagency Monitoring
of Protected Visual Environments (IMPROVE)
network to estimate the composition
of fine particle mass on days with the highest fine
particle concentrations. On high concentration days during cold weather months in this
area, EPA found on average a total urban contribution
of 4.3
~g/m3,
consisting of 0.9
I!g/m
3
of sulfate, 2.2
~g/m3
of nitrate, 1.2
~g/m3
of organic particles, and no
miscellaneous inorganic particulate. On high concentration days during warm weather
months
in this area, EPA found on average a total urban contribution of 5.2
~g/mJ,
consisting of 3.0
~g/m3
of sulfate and 2.2
~g/m3
of organic particulate emissions. These
estimates were used for weighting
of the emissions of different pollutants in calculating
the contributing emissions scores.
Factor 3: Population density and degree of urbanization (including commercial
development)
Table 3 shows the 2005 population for each county in the area being evaluated, as well as
the population density for each county in that area. Population data give an indication
of
whether it is likely that population-based emissions might contribute to violations of the
24-hour
PM2.5 standards.
.
Tbl3P
a e
oou
I'
atlon
County
State
200S
200S.
Recommended
Population
Population
Nonattainment?
Density
(pop/sq mil
McCracken KY
No
64690
241
Massac IL
No
15,225
63
Graves, KY
No
37,650
68
Ballard KY
No
8,262
30
14
???????????
??????? ?? ??????????
???????? ???????? ??????????
???? ????
I
Livingston, KY
No
9,783
McCracken County has most of the area'spopulation; the population of Massac County
is not a significant factor in determining the nonattainment area boundaries.
Factor 4: Traffic and commuting patterns
T bl 4 T
fli
dC
a e
ra Ie an
ommuhng
P
attems
County
State
2005
Number
Percent
Number
Percent
Recommended
VMT
Commuting to
Commuting to
Commuting
Commuting
Nonattainment?
(
10
6
m
i)
any violating
any violating
into
into statistical
counties
cQu'nties
statistical
area
area
McCracken KY
No
832
24200
84
26830
93
Graves KY
No
435
2,350
15
12880
83
Massac,IL
No
225
I
950
30
5860
90
Livineston, KY
No
174
I
770
41
3580
82
Ballard
KY
No
102
I
290
35
3380
92
The listing of counties on Table 4 reflects a ranking based on the number of people
commuting t6 other counties. A modest number
ofpeople from Massac County commute
into McCracken County.
Factor 5: Growth rates and patterns
Table 5 below shows population, population growth, VMT and VMT growth for counties
that are included in the Paducah area. Counties are listed in descending order based on
VMT growth between 1996 and 2005.
Ta
bl
e 5. Popu
I
atlon
.
an
dVMTG
rowt
h
an
dPereent Change.
County
Population.
Population
2005 VMT
VMT
(2005)
% change
(10
6
mil
% change
(2000-0~;)
(] 996-2005)
McCracken KY
64,690
-I
832
26
Massac lL
15,225
1
225
25
Graves KY
37650
2
435
21
Ballard KY
8262
-1
102
12
Livineston KY
9783
0
174
56
The growth rates are not expected to change the population distribution of the area
significantly during the SIP planning time horizon.
Factor 6: Meteorology (weather/transport patterns)
A pollution rose for the Paducah area is provided
in the map above. Both the pollution
roses and the trajectory frequency information suggest that emissions from the full range
.
of directions, including from the direction of Massac County, contribute to PM2.5 on
high concentration days
in Paducah.
Factor 7: Geography/topography (mountain ranges or other air basin boundaries)
15
???????????
??????? ?? ??????????
???????? ???????? ??????????
???? ????
The Paducah area does not have any geographical or topographical barriers significantly
limiting air-pollution transport within its air shed. Therefore, this factor did not
playa
significant role in the decision-making process.
Factor 8: Jurisdictional boundaries (e.g., existing PM and ozone areas)
The Paducah maintenance area from its former one-hour ozone designation was
comprised
of Livingston and Marshall Counties in Kentucky. No portion of Illinois was
in the Paducah ozone nonattainment area.
Factor 9: Level of control of emission sources
The emission estimates on Table 1 include any control strategies implemented by the
States
in the Paducah area before 2005 that may influence emissions of any component of
PM2.5 emissions (i.e., total carbon, S02, NOx, and crustal PM2.5).
Review for the Saint Louis Combined Statistical Area
Discussion:
EPA reviewed relevant information for the nine counties (including four counties
in
Illinois) partly or fully within the area designated nonattainment for the 1997 standards as
well as for surrounding counties. There are violating monitors in Madison County.
llIinois recommended a definition
of the nonattainment area for the 2006 standards that is
similar to the boundaries that were established for the 1997 standards, including Madison,
Monroe and St. Clair Counties along with a portion
of Randolph County. Illinois
recommended that the nonattainment area for the 2006 standards differ from the
nonattainment area
for the 1997 standards by the exclusion of the portion of Baldwin
Township in Randolph County that
is west of the Kaskaskia River.
EPA concurs with Illinois's recommendation to include Madison, Monroe, and St. Clair
Counties
in the St. Louis nonattainment area. However, EPA believes that all of Baldwin
Township
of Randolph County should be included as well. The most impoitant factor
influencing this judgment
is the factor relating to jurisdictional boundaries. The inclusion
of a.full township will make nonattainment requirements easier to administer, since
information on emissions and source locations are more readily available on a township
basis than with respect to a specially defined subset
of the township. Furthermore, EPA
believes that establishment
of a nonattainment area that fully matches the nonattainment
area established for the 1997 standards would simplify nonattainment planning by
assuring that identical requirements apply for an identical area.
At the same time, as
addressed in more detail
in our documentation of our designations for the 1997 standards,
Baldwin Township contains almost all
of the emissions and therefore makes almost the
entirety
of the contribution of Randolph County to the violations, so that a designation of
just Baldwin Township as nonattainment will suffice to address the contribution of this
portion
of the area.
16
???????????
??????? ?? ??????????
???????? ???????? ??????????
???? ????
In considering county-level emissions, EPA considered 2005 emissions data from the
National Emissions Inventory. EPA has signed a consent decree that requires Dynegy to
install and operate highly effective
502 control equipment at its Baldwin power plant by
the end
of 2010, 20
II,
and 2012 for its first, second, and third unit installations,
respectively. EPA notes that these dates are between 2 and 4 years after the time we are
judging what areas contribute to nonattainment. The company has already installed
effective NOx control equipment. EPA welcomes any further relevant information that
Illinois may have. EPA will consider additional information on emission controls in
making final designation decisions. In cases where specific plants already have installed
emission controls or plan to install such controls in the near future, EPA requests
additional information on:
- the plant name, city, county, and township
- identification
of emission units at the plant, fuel use, and megawatt capacity
- identification
of emission units on which controls will be installed, and units on which
controls will not be installed
- identification
of the type of emission control that has been or will be installed on each
unit, the date on which the control device became / will become operational, and the
emission reduction efficiency
ofthe control device
- the estimated pollutant emissions for each unit before and after implementation
of
emission controls
- whether the requirement to operate the emission control device will be federally
enforceable by December 2008, and the instrument by which federal enforceability will
be ensured (e.g. through source-specific SIP revision, operating permit requirement,
consent decree)
EPA reviewed the relevant information for other counties within the combined statistical
area as well
as counties adjacent to the combined statistical area in order to determine the
appropriate nonattainment area. Sangamon County has moderate emissions but is rarely
upwind on days with elevated 24-hour
PM25 concentrations. Other Illinois counties in or
near the combined statistical area have relatively low emissions, and no other factor
warranted inclusion
of the counties in the nonattainment area.
Figure 4 is a map
of the counties in the area and other relevant information such as the
locations and design values
of air quality monitors, the metropolitan area boundary, and
the counties recommended as nonattainment by the states.
17
???????????
??????? ?? ??????????
???????? ???????? ??????????
???? ????
~
Progress Energy
Ms. Renne Vance
ChiefClerk
North Carolina Utilities Commission
4325 Mail Service Center
Raleigh, NC
27699-4325
IEPA ATTACHMENT NO. Z
OFFICIAL Copy
March 31, 2008
~/Lt:O
MAil
3
12008
"0
C/~lk"
".
./lV/itlIlS. OlficB
cQlITmlsSion
Re:
Annual NC Clean Smokestacks Act Compliance Report
Docket
No. E-2, Sub 815
Dear Ms. Vance:
Progress Energy Carolinas, Inc. submits the attached report for calendar year
2007 regarding the status
of compliance with the provisions of the North Carolina Clean
Smokestacks Act. Section 9(i)
of the Act requires that an annual report of compliance
progress
be submitted to the Commission by April
1
of each year for the previous
calendar year.
Very truly yours,
£iPV
~/$'-~$"";
3/~4al;l
2.
/.J
E
..
j,.{~
'5/~£
la..
nl$.,I....#1f f"
~~$'
tJ 0}-.L/(£..1
L.
t.
I
"~A
f
{.
,,1.($,.,
,fJ...
If (J$<-.
LSA:mhm
Attachment
232822
Progress Energy SenriG8 Company, ltG
P,O.
Box
1551
Raleigh. NC 27602
ot.....- <J.
~ (Pr~)
Len
S. Anthony
General Counsel-Progress Energy Carolinas
e../-4./).g
/II-
7L ....,"
6~""',,k.
1<,'6.1
#00110«/
J{,f.....
rJ,
Ibll,'"
34.~.J--~
G/I(~<VJ
JrM-ej
???????????
??????? ?? ??????????
???????? ???????? ??????????
???? ????
~
Progress Energy
March 31, 2008
OFFICIAL Copy
Mr. William G. Ross,
Ir.
Secretary
North Carolina Department ofEnvironment
and
Natural Resources
1601 Mail Service Center
Raleigh, NC 27699-1601
DearS~Rt4~
Progress Energy Carolinas, Inc. (pEC, Company) subnrits the attached report for calendar
year
2007 regarding the status ofits compliance with the provisions ofthe North Carolina
Clean Smokestacks Act (Act).
As you know, 2007 was a significant year for the Clean Smokestacks Act - the first year
in
which the nitrogen oxides (NOx) emissions
cap
became effective. During 2007, we
completed installation of the NOx controls necessary to meet our limit. As the report
shows, the Company'sannual NOx emissions from its North Carolina coal-fired units
totaled less than 25,000 tons. We have developed plans
and
processes to assure that we
continue to meet the requirement.
We regularly review and refine oUI compliance strategy, weighing a number of metors
such as system load projections, expected fuel selection, available control equipment and
anticipated performance and costs ofemissions controls. Because ofthe increased cost
for Furnace Sorbent Injection (pSI) technology, continuing development ofdry scrubber
technology,
changes in the fuel markets,long-tenn impact of (Clean
Air
Interstate Rule)
requirements
and continuing evolution ofour resource plans (including the impact of
Senate Bill 3), we are studying the compliance options for Cape Fear 5
and
6 to
determine whether FSI
still represents the most cost-effective long-tenn compliance
option.
This study, to be completed later this year, will reflect the results ofthe Robinson
FSI testing and the latest available information regarding PSI and dry scrubber costs and
performance. At this time, we are maintaining an option for either
PSI
or
dry
scrubber
technology
for Cape Fear 5 and 6, whichever our studies indicate to be most cost.
effective.
Prn9J1lSS Enllrgy Scrvleo Compllny.
UC
po
Rll~
l!lSI
f/;f!-Jiilh
~'i:1mu?
???????????
??????? ?? ??????????
???????? ???????? ??????????
???? ????
We appreciate the excellent work ofthe Department staff, particularly those
in
the
Air
Quality and Water Quality divisions, who support our efforts to complete the projects
in
a
timely manner to assure compliance with the Acfs requirements. We look forWard to
continuing our positive working relationship to facilitate fulfillment ofthe Company's
obligations with
this
important law.
Please don'thesitate
to
contact me at (919) 546-3775
if
you have any questions.
Caroline Choi
Director, Energy Policy and Strategy
c:
North Carolina Utilities
Commission
Keith Overcash., DAQ
???????????
??????? ?? ??????????
???????? ???????? ??????????
???? ????
Progress Energy Carolinas, Inc. (pEe)
North Carolina Clean Smokestacks Act
Calendar Year 2007 Progress Report
On
June 20, 2002, North Carolina Senate Bill 1078, also known as the "Clean
Smokestaclcs Act," was signed into effecl
This
law requires significant reductions in the
emissions
ofnitrogen oxides (NOx) and sulfur dioxide (SO:z) from utility owned coal-
fired power plants located in North Carolina. Section 9(i), which is now incorporated as
Section 62-133.6(i) ofthe North Carolina General Statutes, requires that an annual
progress report regarding compliance
with the Clean Smokestacks Act be submitted on or
before April I
ofeach year. The report must contain the following elements, taken
verbatim
from the statute:
I. A detailed report
on the investor-owned public utility'splans for meeting the
emissions limitations
set out in G.S. 143-215.1070.
2. The
actua1
environmental compliance costs incurred by the investor-owned public
utility in the previous calendar year, including a description
ofthe construction
undertaken and
completed
that
year.
3. The amount ofthe investor-owned public utility'senvironmental compliance
costs amortized in the previous calendar
year.
4.
An
estimate ofthe investor-owned public utility's environmental compliance
costs
and
the basis for any revisions ofthose estimates when compared
to
the
estimates submitted during the previous
year.
5. A description ofall permits required in order to comply with
the
provisions of
O.S. 143-215.1070 for which the investor-owned public utility has applied and
the status ofthose permits or permit applications.
6. A description of the construction related to compliance with the provisions of
G.S. 143.215.1070
that
is anticipated during the following year.
7. A description of the applications for permits required in order to comply with the
provisions ofG.S. 143-215.1070 that are anticipated during the following year.
8. The results of equipment testing related
to
compliance with G.S. 143-215.1070.
9. The nwnber oftons ofoxides ofnitrogen (NOx) and sulfur dioxide (SO:z) emitted
during the previous calendar year from the coal-fired generating units that are
subject
to
the emissions limitations
set
out in G.S. 143-215.1 070.
10. The emissions allowances described in O.S. 143-215.107O(i)
that
are acquired by
the investor-owned public utility
that
result from compliance with the emissions
limitations set out in G.S. 143.215.1070.
II. Any other information requested by the Commission or the Department of
Environment and Natural Resources.
Information reaponsive to
each
ofthese report elements follows.
The
responses are given
by item nwnber in the order in which they are presented above.
1
???????????
??????? ?? ??????????
???????? ???????? ??????????
???? ????
1. A detailed report on the investor-owned pubUe utility's
plans
for meeting the
emissions Jimitations
set
out In G.S. 143-215.107D.
Under
G.S. § 143-215.l07D(f), "each investor-owned public utility...may detennine how
it will achieve the collective emissions limitations imposed by this section."
PEC
originally submitted
its
compliance plan on July 29,2002. Appendix A contains an
updated version
of this plan, effective April
I ,
2008. We continue
to
evaluate various
design, technology
and generation options that could affect our future compliance plans.
2. The actual environmental compliance costs incurred by the investor-owned
public ntility
in tile previous calendar year, inclnding a description of tile
construction undertaken
and completed that year.
In 2007, Progress Energy Carolinas, Inc. incurred actual capital
COlIts
of$330,124,OOO.
Asheville
Construction
was completed, and Asheville Unit
I
SCR was successfully placed in
service
in May 2007. This completed the Clean Smokestacks Act work planned for the
Asheville plant.
For Unit 3, we completed tuning ofthe Rotamix equipment for NOx emissions control
and placed the system
in service in March 2007. This completed the Clean Smokestacks
Act work planned
fur
the Lee plant
In 2007, we executed contracts
fur
the wastewater treatment bioreactor equipment and
engineering, and initialed work on the wastewater treatment systems. With respect to wet
scrubber
scope ofwork, engineering, procurement and construction activities continued
throughout
2007. Major milestones include: completed conslIUction of the chimney
shell; initiated installation
of the absoIber lower internals; received onsite a majority of
absoIber recycle pump, oxidation air blower, ID Fan and ball mill pieces/parts; and
obtained authorization to construct the wastewater treatment facility. At year
end,
the
Mayo scrubber project was 41
%
complete.
Roxboro
Construction work
on the scrubber project continued for all four units in 2007. Specific
project activities include the
following:
Common
In the common
area,
conslIUction ofthe limestone handling and preparation, gypsum
dewatering and handling, oxidation air system, make-up and service water
system,
and
2
???????????
??????? ?? ??????????
???????? ???????? ??????????
???? ????
major piping was completed and connnissioned in support ofUnit 2 scrubber startup in
April. Work
was also
started
on installation ofthe limestone silo. Limestone conveyors
and stack-out conveyors were completed as well.
Unit
I
Significant construction included completion offoundations for the booster fan and duct
supports. Fabrication ofthe duct was also completed. Erection ofthe absorber shell was
completed in October, and assembly ofthe absomer internals began. Erection ofthe
pump-house
and electrical building structural steel started in September 2007 and is
planned to be completed in the first quarter of2008. We also started installation ofthe
recycle
pumps, bleed pumps, and booster fans.
Unit 2
Significant milestones for 2007 include completion ofthe duct tie-in outage in April and
the successful startup
ofthe Unit 2 scrubber on April 24, 2007.
Unit 3
Significant construction included completion ofthe duet support and booster
fan
foundations, insta1lation ofthe booster fans, and installation ofduct
support
steel and
duct work. The absorber erection was completed as well as installation ofabsomer
internals
and absorber hood/elbow. Commissioning
began
checkout ofseveral systems in
preparation for the April 2008 tie-in outage
and
scrubber startup.
Unit 4
The significant milestone
was completion ofthe duct tie-in outage in December and the
successful startup
ofthe Unit 4 scrubber on December 1, 2007.
Wastewater Project
Significant construction activities included
completion ofthe wastewater blow-down line,
settling
and flush ponds. Construction ofthe bio-reactor facility was started and
completed in 2007. Commissioning activities started in De=nber with the first two
trains planned to be operational in early 2008. The remaining two trains are planned for
commissioning later in the second quarter of2008.
3. The amount of the investor-owned public utility'senvironmental compliance
costs amortized
in the previous calendar year.
Progress Energy Carolinas, Inc. amortized $33,881,190 in 2007.
4.
An
estimate of the Investor-owned pnbUc utility'senvironmental compliance
costs
and the basis for any revisious of those estimates when compared to the
estimates submitted
during the previons year.
Appendix B contains the capital costs incurred toward compliance with G.S. § 143-
215.1070 through 2007 and the projected costs for
future years through
2013. The costs
shown are the net costs to PEC, excluding the portion for which the Power Agency is
3
???????????
??????? ?? ??????????
???????? ???????? ??????????
???? ????
responsible. The estimated total capital costs, including escalation, are currently
projected
to be between $1.5
and
$1.6 billion, with the current point estimate being
$1.546 billion.
This
represents an increase from the 2007 cost estimate of $1.355 billion.
Prior reports have discussed the cost
impact ofproject scope changes and the impact of
significant increases in the cost ofmaterials and labor which have impacted construction
projects across the Southeast.
The current estimates continue to reflect those impacts as
well as the impact ofadditional planning, especially with respect to the emission controls
for Sutton Unit 3 and Cape Fear Units 5
and
6.
The current estimate for a dry scrubber at Sutton 3, while still conceptu.a1, reflects the
impact ofmore definitive site characteristics on the overall cost ofthe project. Space is
at a
premiwn at this site, the coastal location requires more stringent wind loading
criteria,
and
the soil characteristics are quite different from what we have at our other
plants
where we have installed scrubbers. As these criteria are reflected in the
conceptusl design,
we are seeing quantity increases (structural steel, concrete, and piping)
due
to the need for stronger foundations, increased structural steel, longer duct runs and
othet utilities
than
previously envisioned. To the extent
that
these increases can be
quantified based on the litnited
engineering completed to date, the costs have been
reflected in the current estimate.
In our last filing we noted that Furnace Sorbent Injection (FSI) technology offeted a
potentially more
cost
effective compliance option for our Cape Fear Units 5 and 6 and
discussed our plans to test
that
technology at our Robinson Unit I. Instal1ation of the test
unit
at Robinson is nearing completion and the testing should begin this sununer with
operating results available by the
end oftho year. The engineering knowledge we have
gained
to
date from the installation ofthe FSI test system at Robinson is being reflected
in updated cost estimates
for the installation ofFSI technology at Cape Fear. One
significant unknown regarding the use ofthis technology at Cape Fear
is
whether the
precipitator will have
to be replaced in order to maintain compliance with existing
particulate emission limits. A
final determination will require further engineering
analysis
and
the benefit oftest results from the Robinson demonstration. At this time, the
estimate for
Cape Fear Units 5 and 6 includes an allowance for replacement of the
precipitator.
Because
ofthe increased cost for FSI technology, continuing development ofdry
scrubber technology, changes in the fuel markets, the long
term
impact ofthe CAIR
requirements, and continuing evolution ofour resource plans (including the impact of
Senate 8ill3), PEC has initiated a study to revisit the compliance options for Cape Fear 5
and 6. This study, to be completed 1ater this year, will reflect the results of
the
Robinson
FSI testing and the latest available information regarding FSI
and
dry scrubber costs and
perfonnance. At this time, we are maintaining an option for either FSI or dry scrubber
technology, whichever our studies indicate
to be most cost-effective.
s. A description of all permits required
in
order to
l!OIDply
with the provisloDS of
G.S. 143-215.107D for wbich the lovestor-owned public utWty has applied and the
status of those permits or penni! applieatioDs.
4
???????????
??????? ?? ??????????
???????? ???????? ??????????
???? ????
Progress Energy applied for the following pennits in 2007:
Roxboro Plant
Air Pennit
An
update to the air pennit for coal handling and limestone equipment was submitted on
November 14, 2006. This request was approved on March 15, 2007.
A Notice for Intent to Construct for a diesel-fired emergency fire water pump was
approved on Febtuary 8, 2007
and
Air Quality Permit revision No. 01oo1T39 was issued
on AprilS. 2007.
Agency approval was received August 22, 2007 for oor request for Alternative Method of
Reporting ofAnnual Average Opacity for units equipped with Flue Gas Desulfurization.
A
Renewal Tide V Air Permit application was submitted on November 27. 2007. This
renewal application met the requirements ofthe Construction Permit for
the
Flue Gas
Desulfurization (FGD) System to submit a complete Title V Air Quality Pennit
Application onor before
12 months after commencing operation.
MavoPlant
NPDES
A request for authorization
to
construct a Flue Gas Desulfmization (FGD) Wastewater
Treatment System, submitted May 4, 2007, was approved and issued on November 28,
2007.
NPDES Permit modification approving our request for a mixing zone for chlorides was
issued on December 14, 2007.
Erosion
and
Sediment Control Plan
Revision G.
to
the Erosion and Sediment Control Plan for the increase in disturbed land
(from 35 acres to 98 acres) for the fiue gas desulfurization system was submitted January
29,2007 and was approved on April 12, 2007.
Lee Plant
AirPennit
A Title V Air Permit
application was submitted on April 19, 2007
in
accordance with
pennit requirements associated with the Low NOx Burner installation. This application
was required by the Construction Permit to be submitted within 12 months after
5
???????????
??????? ?? ??????????
???????? ???????? ??????????
???? ????
commencing operation ofthe 10w-NOx Burner.
NPDES
The NPDES Pennit revision for the Rotamix Urea Injection System on Unit 3 was issued
on
March 23, 2007.
6. A description of the construction related to compllanee
wltb
the provisions of
COS. t43-215.t07D that
is
anticipated during the following year.
During 2008, construction activities will focus on completion ofthe chimney lining and
installation
ofabsorber internals. Concurrently, placement ofID
fan
fOlDldations,
placement ofthe wastewater treatment bioreactor cells, erection ofstIUctural steel,
fabrication
offield
erected
tanks, and installation ofelectrical and I&C will be
completed. Engineering activities will continue, with the
focus
shifting
to
the wastewater
treatment related scope ofwork. Starting
in
the summer, commissioning activities will
intensitY in prq!8ration for
the
spring 2009 plant outage and subsequent mechanical
completion
and placement in service ofthe wet scrubber
and
wastewater treatment
systems.
Roxboro
Common
For 2008, significant construction activities planned in the common area include
completion
ofthe railroad track installation,
and
final site grading and paving. Specific
unit activities are described below:
Unit 1
Significant construction activities planned include completion
ofUnit I absoroer
internals, installation
of the absorber hood/elbow, completion ofthe pump-house and
electrical building, and installation ofthe booster fans and duct work. Commissioning
is
planning
to
start activities in June in preparation for the October tie-in outage.
Unit 3
Significant construction activities planned include completing electrical
power
and
control cabling and the balance ofcommissioning activities in preparation for the April
tie-in outage.
Unit 4
In service. Major activities include issue
ofas-built drawings, evaluation ofperfonnance,
and conducting performance tests as needed.
Wastewater
Significant construction activities planned
for the bio-reactor include completing
6
???????????
??????? ?? ??????????
???????? ???????? ??????????
???? ????
commissioning activities for the tim two bio-reactor
trains
with a contiouation of
commissioning activities
on
the remaining two bio-reactor
trains
in the 2
nd
quarter.
7. A description of the applications for permits
required in
order to comply with
the provisions of
G.5.
143-215.107D that are anddpated during the following
year.
General
We appreciate the collaborative efforts the DAQ and DWQ staffs have made to assure
our construction
and
installation schedules
remain
on
track.
However, the potential for
longer permit processing
times continue to
be
a serious concern for future projects.
PEe
will work collaboratively with
the
agency staffto prevent any delays from occurring.
The following permit applications and permit approvals are anticipated for 2008:
Roxboro Plant
Erosion
and
Sedimentation Control Plan
Plan revisions may be necessary as construction plans are further developed.
Mayo Plant
NPDES Permit
A
request for authorization to construct a new oil/water separator was submitted on
March 7, 2008 with a response expected by the end ofApril.
Erosion
and
Sedimentation Control Plan
Plan revisions may be necessary as construction plans are further developed.
Sutton
Plant
Air Permit
An
application for construction of a DIy Scrubber for Unit 3 is expected to be submitted
during the fourth quarter 2008 with
response expected
in the second quarter 2009.
8. The results ofequipment testing related to compliance with
G.8.
143-215.107D.
Performance testing
ofthe SCR at Asheville Unit I was completed in October 2007.
The testing indicated that
the system
met its performance guaranteed emissions rate of
O.04lb NOxIMMBtu.
7
???????????
??????? ?? ??????????
???????? ???????? ??????????
???? ????
Performance testing ofthe SNCR
system
at
Lee
Unit 3 was completed
in
March 2007.
The testing demonstrated
that
the system met its performance
gullIllDtee
of a 31
%
reduction in NO. emissions over the load range ofthe unit
Performance testing ofthe Scrubber at Roxboro Unit 2 was completed in September
2007. The testing confumed that the scrubber achieved its performance guarantee of
97"10
802
removal efficiency.
9. The number of tons ofoxides of nitrogen (NOx) and slllfur dioldde (SOz) emitted
during the previous ealeadar year from the
colli-fired
generating units that are
subject to the emlsslODllllmltatlons set out
In
G.S.143-215.107D.
The affected coal.fired PEe units have achieved a
59%
reduction
in
NOx and a
25%
reduction in
802
since 2002.
The
total calendar year 2007 emissions from the affected
coal-fired
Progress
Energy Carolinas units
are:
NOx 24,383 tons
802
147,242 tons
10.
The emissions allowances described
In
G.8. 143-215.107D(i) that are acquired by
the InVllfltor-owned public utility that result from eompllance with the eorlssions
Umitatiolls
set out
In
G.8. 143-215.107D.
During
2007, PEC did not acquire any allowances as a result ofcompliance
with
the
emission limitations
set
out
in
N.C. General Statute 143-215.1070.
11.
Any other Infonnation requested I!Y the Commission or the Department of
Environment lUld Natural Resources.
There
have been no additional requests for information from the North Carolina Utilities
Commission or the
Department ofEnvironment
and
Natural Resources since the last
report
8
???????????
??????? ?? ??????????
???????? ???????? ??????????
???? ????
Appendix A
Progress Energy Carolinas, In.:'s(pEC) AIr Quality Improvement Plan Supplement
April 1, 2008
On
June 20, 2002, Governor Easley signed inlo law SB1078, which
C8p5
emissions of
nitrogen oxides (NOx) and sulfur dioxide (S0:2) from utility owned coal-fired power
plants
located in North Carolina. Under the law, G.S. § 143-215.1070, PEC'sannual
NOx emissions must not exceed 25,000 Ions beginning in 2007 and annual S0:2 emissions
must
not exceed 100,000 Ions beginning
in
2009 and 50,000 tons beginning in 2013.
These caps represent a 56% reduction
in
NOx emissions from 2001 levels and a 74%
reduction
in
S0:2 emissions from 2001 levels for PEe.
PEe owns and operates 18 coal-fired units at seven plants in North Carolina. The
locations
ofthese plants are shown on Attachment
I.
Under G.S. § 143.215.107D(f),
"each investor-owned public utility...may
determine
how
it will achieve the collective
emissions limitations imposed by this section."
111trogen Oxides EmissIons Control Plan
PEC has been evaluating
and
installing NOx emissions controls on its coal-fired power
plants since
1995
in
order to comply with Tide IV of
the
Clean Air Act and the NOx SIP
Call TUle adopted by the Environmental Management Commission (EMC). Substantial
NOx emissions reductions have
been
achieved (24,383 tons ofNOx
in
2007 compared
with 112,000 tons
in
1997),
and
compliance with
the
Clean Smokestacks Act's25,000
ton
cap was achieved
in
calendar year 2007. This target was achieved with a mix of
combustion controls (which minimize the fonnation ofNOx), such as 10w-NOx burners
and over-fire air technologies,
and
post-eombustion controls (which reduce NOx
produced
during
the combustion offossil fuel to molecular nitrogen), such as selective
catalytic reduction
(SCR) and selective non-catalytic reduction (SNCR) technologies.
Attachment 2 details PEC'sNorth Carolina coal-fired electric generating units, their
name plale generation capacity, and installed NOx control technologies.
Sulfnr Dioxide Emissions Control Plan
PEC is installing wet flue gas desulfurization systems (FGD or "scrubbers") 10 remove
97% ofthe S0:2 from the flue gas at its Asheville, Roxboro and Mayo boilers. PEC
is
continuing its evaluation ofthe potential to use Furnace Soroent Injection (FSI)
technology
at our
Cape
Fear Plant. Use ofthe FSI technology eliminates the need for a
cosdy wastewater treatment
system. We plan
to
test the FSI technology at PEC'g
Robinson Unit I beginning in summer
2008. Since Robinson Unit I is similar in design
to the Cape Fear units, the Robinson test wiII indicate whether the use ofthis technology
will be effective at Cape Fear. While PEC continues 10 evaluate the use ofFSI at Cape
???????????
??????? ?? ??????????
???????? ???????? ??????????
???? ????
Fear, because of expected inaeased
cost
fur Furnace Sorbem Injection (PSI) technology,
continuing development
ofdry saubber technology, changes in
the
fuel markets, the long
term impact ofthe CAIR requirements and continuing evolution ofour resource plans
(including the impact
of Senate Bill 3), we are re-evaluating all compliance options for
Cape Fear 5 and 6.
The current compliance plan also contemplates the use ofa dry scrubber at Sutton Unit 3.
A
dry
scrubber at that unit represents a more cost-effective compliance solution and also
eliminates the need for a costly wastewater
treatment system.
Wet scrubbers produce unique
waste and byproduct streams. Issues related to wasteWater
permitting and solid waste
disposal
are being addressed for each site.
PEe
is treating the
scrubber wastewater
stream
at
the
Asheville Plant using an innovative constructed
wetlands treatment system
to ensure compliance with discharge limits. A bioreactor
technology will be
used
for the Roxboro and Mayo Plants
A contract
has
been
executed with a gypsum product end-user that will construct a
facility near
the
Roxboro Plant to use the synthetic gypsum produced by the Roxboro and
Mayo Plants for the manufacture ofdrywall products. PEe also has entered into an
agreement
that
enables PEC to market and sell synthetic gypsum produced at the
Asheville Plant.
Attachment 3 details PEC'sNorth Carolina coal-fired electric generating
units, their
summer net generation capability, installed
S~
control technologies and those planned
for installation. As technologies evolve or other cUcumstanccs change, a different
mix
of
controls may be selected. Attachment 3 also projects annual
S~
emissions on a unit-by-
unit basis based
on the energy demand forecast and expected efficiencies ofthe
S~
emissions controls employed. These projections are based on the planned removal
technologies
and PEC'scurrent fuel and operating furecasts. This information is provided
only
to
show how compliance may be achieved and is not intended in any way to suggest
unit-specific emission limits. Actual emissions for each unit may be substantially
different.
???????????
??????? ?? ??????????
???????? ???????? ??????????
???? ????
Asheville
Attachment 1: Location ofPEC's Coal-Fired
Power Plants
in
North Carolina
Roxboro
Back to top
Cape Fear
Back to top
Weatherspoon
:f
-Lee
???????????
??????? ?? ??????????
???????? ???????? ??????????
???? ????
Attachment 2: PEC's 2008 NOx Control Plan for North Carolina Coal-fired Units
Unit
MWRatlnll:
Control Technolol!Y
Operation Date'
Asheville 1
191
LNBfAEFLGRISCR
2007
Asheville 2
185
LNBlOFAfSCR
Cape Fear 5
144
ROFAfROTAMIX
Cane Fear 6
172
ROFAfROTAMIX
Lee 1
74
WIR
Lee
2
77
LNB
2006
Lee
3
248
LNBlROTAMIX
2007
Mayo 1
742
LNBfOFAfSCR
Roxboro 1
369
LNBfOFAISCR
Roxboro 2
671
TFS2000fSCR
Roxboro 3
705
LNBfOFAfSCR
Roxboro 4
698
LNBfOFAfSCR
Sutton 1
93
SAS
Sutton 2
102
LNB
2006
Sutton 3
403
LNBfROFAfROTAMtX
Weathersooon 1
48
Weath
n2
49
Weath
n3
76
WIR
Total
5,047
AEFLOR - Amin.,.Enhanaxl Flue
Lean
<las Rebum
LNB
~
Low NOx BllJll<:r
SNCR
a Selective
Non-eatalytic Reduction
OFA~Ov~Air
ROFA - Rotating Opposed-filed Air
ROTAMIX
~
Injcaion or""" to IImbened_ NOx
WIR
~
Undcrfin: Air
11'S2OOO
~
Combination Low.NOx
Bum...
/~
Air
SAS
= Separated Air
SIllging
, This Is
!he
o"",,,lIon <late
lor !he
oontrol technology InsCaned 10 comply
with !he
North C8roIIna ImP'0"81Vr QualItylElo<tric: UlII_1>&l. 0I11y
(sllovm
In
1loI<l).
???????????
??????? ?? ??????????
???????? ???????? ??????????
???? ????
. Attachment 3: PEC's2008 SOt Control Plan for North CaroUna Coal-Fired Units
Unit
MWRating
Technology
Operation Date
Projected 802
Projected
S~
Tons. 2009
1
TOIII.2013
Asheville 1
191
8crnbber
2005
296
333
Asheville 2
185
Scrubber
2006
280
352
CaDeFear 5
144
PSI
2011
6791
3634
CaDe Fear 6
172
FSI
2012
8274
4,330
Lee
1
74
2947
2,902
Lee
2
77
2694
2,671
Lee
3
248
9,906
9.265
MayO I
742
Scrubber
2009
7,183
1,602
Roxboro 1
369
Scrubber
2008
685
942
Roxboro 2
671
Scrubber
2007
1,048
1,235
Roxboro 3
70S
Scrubber
2008
1046
1,493
Roltboro 4
698
Scrubber
2007
976
1.394
Sutton 1
93
4534
3851
Sutton 2
102
5381
4429
Sutton 3
403
Scrubber
2012
19,614
884
Weathersooon 1
48
1,628
1138
Weathersooon 2
49
1,583
1214
Weatherspoon 3
76
2997
2792
Total
5047
77863
44461
PSI
~
Puma« Sorbent lDjectIon
, Unit by unit emissions ....
ilustralllle only
and speQlIc omloslono imlls should not be _.Aclual emissions In 2009 and 2013 may ba dlflerenlln>m untt 10 unn.
???????????
??????? ?? ??????????
???????? ???????? ??????????
???? ????
AppendixB
PEC'sActual Costs Through 2007 and Projected Costs Through 2013
for Clean Smokestacks Act Compliance (in thousands
560.919
$
1.545,657
so
$ 958
I
!
S 7.029! S 3.877
I
S 4,571 • S 18.214 : S 27.760 :
J
I
!
Ii!
S 26.528, 580.187
I
$ 18l,274 1 5
m.819
!
$ 330.124
!
S 16U96
554.587
$ 92,309 ' 5204,323 : $138.875 :
~o
'1"
.;:_~~"
r
"',2m~.:j,.'l00i
A':'::'tll04'.:,J-,;1ii6sf.L..<-io06
I
20Q7.
1·~0ll8~_J
20b9L2Qi!L:zoji
~L.
loi2";
~o:i3l-:-,Tot~t
.,-
"""'-,::.';;.<.. "
5\QQ.L
S9652.~.33.57~}!,~:'769
.hS,].•
930~~l~50~
so:
JO;__
~ol
..
$_O~
._ $.0-,-.
50
$81175
">:>
'Ai
$0'
SO
~,;
.
-t~1'413""'~tof.§Q!;
S..ill!£l....1~:_
..
.1.q
L__$.o_ .. _Sli..
_._~..
so
528400
~'!',:'~"'.~
5100
$7,z4~ ~28,390
I
524,238
5117011
-SI.54~L
. 1.0.1 _ .!2: .. .1.0+,.h .. dS.Q.j
!l0 C. so
$70,629
ilUno."::'f,i
5467. ..
so
so!
$ 0
sol
-s 479 !
$ 0 ;
S O.i
}Jl. __ sQ..1
.--!.Q.L.
so
-$12
a"i,
1..
S11[7 4-S !Li..
~.276
!
5
~i.
§
22.z~~.u!~~86
5
70,99(q.!34'~}hl..
• $
L
u. S
~
.. JOe""!0
$134405
~::'I.~.!12..;.
S 5.560
j
$
10.9.~
I-S 51.717
S 72,934 : S 36,491
S 11.893 :. $ 2,208 :
~
9_.
-...1.Q.L..
$ 0 :
$ o.
5191252
:;';0,.1
.$0;
sol
$0
$3135512164 .$.32.84'1
~2.475.Lp,79I!
.~Q..:
_
SOL
SOt
_~O
594406
slio.
$35741 561148 $30782 546014 S18.9,75
S5731
._to-L_~oJ._.li.:
__..!.QL
so
$106885
SOl
sol
5244 .$:;\'0628 S36661 .$49,9851 Sl3.sssL SI,275 1
SO;.
so,
so:
SO
$111.349
__s.o.l.
~O
I'
.S.O
1_.!9~.$28,SSO
.-1S7,6I:01.
S~,7041..
S916.iu
so_~
so
t
u
.~<L[
.
so
$98854
SO!
_SJl:
SO'
so:
S88+_
-~-4-.
SO! $7752"1 S42383
1
$.11,9141
so _
so
561137
SOt' ...S 0..;... .. S.o ...
$0 .'J,g. .. _.$O_l .' 52
;.~O
L
S 01 539636 J27.191
I.~.Q
$ 116.828
S0
$0 ;
50 ,.. $.198
$6424
S600 '
SO!
SO ,
S0
i
S0
50!
S0
$ 7.'
:~_ll. ~
$Q
I.:~
50.."
50•..
..J.Q._
.~.o I!_~ .so.~.
S!~!±~~2!i
I
515!l.172_r!IP~31
~~Sg
5316.100
c'"
~
SO,
S133~
S 1.886 __
..!Q... _..
29J .. _ $.Oj ... $ 0 Iso I
so
I..
so
51,291
;"" _..E.L_SOI_._ ..
~0-I~
SI.9001.
SOi
__ .
.!.Q:
SO'.~
.
..!Q.!
so _ ..SO
$1136
$1.193
j
S 16.52S! S 80184
i
$ 168118 5259654
i
$ 309.456
i
S 141934
I
551.'24
i
592,309 I $ 204.313
I
S 138875
I
$ 958
$1475056
$0 _
J!O
. . S.Q.
.!..g.365!~I
..289! _
-~}26
j
..21?~
.. S
Qj _
_~.o!.
S
Qi..
.$ 0.1
so
513.348
_~.O
.•. .!i0 _ .. so
1--_
S.Q.I
~o ~_$~.042
iSI~,95~':
53.120:
so
I ... H.L ..
s~._
50
521,221
~j
_.~~
i.._
:~.
~6 f-_~.7;~
r
11,~S~~
_~16'9:'}f
..
s.~~O~!
$
l~~ t~_~ ~
L
._;~J
.
:~
..
~ ~
_
$35~:
I
:
I
;
;
i
;
$ 0
i
$ 0
$ 0 S 13.156 . S 13,253
$ 20.668 ! S 20,262! S3.263
!
SO.
$ 0
i
$ 0
!
$ 0
570.601
Note5: Costs reDect the Power Agency contribution. Historic year costs are actual, curreDt yesr costs are projected, and future year costs are escalated.
~
.
. . S02 Controls Des!gn and Construction
.'.
.:. ... •.., S02 Contro!. In-service
~~,~~:
~~: ~o:::::: ~:~!;;d
Construction
.
???????????
??????? ?? ??????????
???????? ???????? ??????????
???? ????
.
Appendix C
PEC's Clean Smokestacks Act Compliance Plan
PlantP~
General
2002
2003
2004
2005
2006
2007
2008
2009
2010
2011
2012
2013
&0""''''6'
~"n
Asllll'Jlle 1 FGO
,,,,.,..,,,, 1;:>""
AsIlll'JIIe 1 SCR
'Asllll'Jlle 2 FGO,Ashevlle 2 FGI5
Mayo 1
u
FGO
IMayo 1 FGD
Roxboro 1 FGO
IRoxboro
1 FGO
Roxboro
2 FGOTROibOiu 2 FGD
Roxboro
:l FGO
IRoxbOro:!
FGO
Roxboro
4 FGO
rROxboro 4
FGO
·r~·~1r.i.
'~~~f
'-'.--
"~
;t;~~~~
.•.
':-.
;:.~-";\_;"""n:
-.;:sr...
~-~~.,
_.:- "-. -
;~:;W:::::·Fj.~
. ...
t'::.-~
3-::":
:,,:4;'"...
f~.::
.::~::;~~,-.£.~
~"r
.--:!":
Cape Fear-S
FSI
I~
Fear 5 FSI I
I
I
I
I
I
I
fr~~'?-t/.$:;;'~"'
.:",:"
cape FearS FSI
cape
FearSFSII I
I --..I""ci;lL,i§1§.!,j
Lea 3 Rolamlx
lee 3 RoIamlx
Sutton 3 FGD
utton 3 FGD
"
""'c.,,, ."
~~,~'.
'.;;i
Lee 2
LNB
Lee
2
LNB
Sutton 2 LNB
Sutton 2 LNB
~""""""'
-,,--',;.... ;';'.c 502
Controls
........
In-6enice
-
NOx Controls
Design
and
Construction
NOx Controls 1n-ser.iC9
???????????
??????? ?? ??????????
???????? ???????? ??????????
???? ????
VERIFICATION
STATE OF NORTH CAROLINA
)
)
COUNTY OF WAKE
)
NOW, BEFORE ME, the undersigned, personally came and appeared,
Paula Sims, who
first
duly sworn by me, did depose and say:
That she is Paula Sims, Senior Vice President-Power Operations
of
Carolina Power
&
Light Company, d/b/a Progress Energy Carolinas, Inc.;
she
has
the authority to verify the foregoing Progress Energy Carolinas, Inc.
North Carolina Clean Smokestacks Act Calendar Year 2007 Progress
Report; that she has read said Report and knows the contents thereof; are
true and correct
to the
best
ofher knowledge and beliefs.
Subscribed and sworn
to me
this~day
of March, 2008.
246373
???????????
??????? ?? ??????????
???????? ???????? ??????????
???? ????
Power Engineering - SCR = Supremely Complex Retrofit
P!!PIcmlOTH
r-~'
INNOVATIONS IN
~
ll.1~
I
ASH HANDLING
Page 1 0[2
IEPA ATTACHMENT NO.
..3..
C!§ PRINTTHIS
IJ!smlDTH
SCR = Supremely Complex Retrofit
Take one giant Manitowoc crane used in the recovery efforts
at the World Trade Center, 12,000-plus tons of
structural steel, 2,000 cubic yards of concrete, SOO-plus workers, and twin 1120 MW net supercritical boiler
units, and what have you got?
An engineer's playground, for sure, but also one of the largest selective
catalytic reduction (SCR) projects in
the U.S., at Duke Energy's Belews Creek Station in north-central North
Carolina.
Click here
to enlarge image
Duke Energy is installing SCR systems for NOx
control at its two-unit Belews Creek power
station
in north-central North Carolina. The
units, which wiIJ reduce NOx emissions from
0.50 Ib/MMBtu to 0.10 Ib/MMBtu, are
scheduled to come on./ine in 2003 and 2004.
Photo courtesy of Duke Energy.
The $325 million Belews Creek project is a shining example of the
challenges inherent to many of the large-scale SCR retrofits currently
underway around the country. Tucked
on a spit of land adjacent to
Belews Lake, Duke Energy and its project partners - Duke/Fluor
Daniel and Babcock Borsig Power - have had
to fit the proverbial
square
peg in a round hole, adapting system design to space
constraints and integrating construction activities with operational
and maintenance priorities.
Despite
their critical importance to NOx compliance strategies, SCR
installations are primarily structural and civil projects, with a splash
of process work thrown in. As the Duke workers joke at Belews, the
SCR reactor is really just a "wide spot in the duct." The structural
and civil challenges, however, are prodigious. At Belews Creek, for
example, the
SCR structure will extend above the boiler building,
more than
2S0 feet above ground level. A key design consideration,
therefore, concerned wind loads. The
SCR framework had to be able
to accommodate high wind loads, up
to and including hurricane-force
winds.
To keep the SCR structure from experiencing up-lift or tip-over, it had to be structurally anchored to the
ground and
to the existing boiler bUilding, according to Harold Backman, Duke Energy Generation Services'
Project Director.
At ground level, rock anchors - using anchor bolts 14 feet long and 4 inches in diameter - tie
the SCR addition to Mother Earth. At plant level, horizontal steel beams mate the new SCR facility to the
existing boiler structure, and vertical booster columns have been built around a number of the existing steel
columns
to handle the additional loading from the ductwork and structure located above the existing fan
room. The booster coiumns consist
of a set of four steel members welded to the corners of the original vertical
coiumns. A significant amount
of electrical, instrumentation and plant services had to be relocated during on-
line operation
to facilitate these tie-ins - a significant, but not unusual, occurrence in complex SCR retrofit
projects.
Some
of the other unique challenges associated with the Belews Creek retrofit include:
oIncreased
air demand - Supply of an additional 600 scfm dedicated air compressor to satisfy all of the extra
project
air requirements.
oID/FD fan upgrades - New impellers installed in all fans
to handle a gas flow of 10,272,000 Ib/hr. The
primary air fans will
be downsized as a result of the increased capacity in the FD fans.
http://pe.articles.printthis.clickability.com/pt/cpt?action=cpt&title=Power+Engineering+-+... 9/26/2008
???????????
??????? ?? ??????????
???????? ???????? ??????????
???? ????
Power Engineering - SCR = Supremely Complex Retrofit
Page 2
of2
.Equipment staging - The staging yard is located about one mile from the work site, demanding coordinated
and
timely movement of parts and supplies to match construction schedule.
• Air preheater design - The new vertical shaft rotary regenerative secondary
air preheaters are being installed
on the SCR structure beneath the SCR on both units. Outage work will require the removal of existing
secondary
air preheaters and associated ductwork in order to install new duct configuration.
The
SCRs for Belews Creek are scheduled to come on-line in Spring 2003 (Unit 1) and Spring 2004 (Unit 2).
The units are designed for a nominal 80 percent
NOx reduction, from 0.50 Ib/MMBtu to 0.10 Ib/MMBtu, at 2
ppm slip. The
SCR reactor will initially be charged with two layers of Ti02-V205-W03 catalyst from
Cormetech, with two spare layers available
for operating flexibility. Although Belews Creek could have
installed a bypass system and operated the
SCRs only during the ozone season to comply with the NOx SIP
Call, Duke decided
that the more cost-effective option was to eliminate the bypass since year-round operation
of the SCRs would be required to meet the NOx reduction provisions of the state's Clean Smokestacks
legislation by 2007.
Correction:
In the October article, "Inlet Air Filtration Adapts to Evolving Gas Turbine Technology," the caption
accompanying the photo
on page 51 is incorrect. The correct caption should be, "Coalescer fiiter." Power
Engineering regrets the error.
Power Engineering
November, 2002
Author(s):
Steve Blankinship
Find this article at:
htip:llpepei.pennnel.com/displar-arlicleJ162367/6/ARTCLInoneJnoneJ1/SCR-=-Supremely-Complex-Retrofrl
o
Check the box to inducte the list of links referenced in the article.
Copyright «} PennWell Corporation.
P!PIcmlDTH
rrJ
INNOVATIONS IN
~
J~l
ASH HANDLING
http://pe.articles.printthis.clickability.com/ptlcpt?action=cpt&title=Power+Engineering+-+...
9/2612008
???????????
??????? ?? ??????????
???????? ???????? ??????????
???? ????
Established 1882 • Vol. 150 • No.1
January/February 2006
www.powermag.platts.com
IEPA LIBRARY
DEPARTMENTS
On the cover
The Tennessee Valley Authority's Allen Plant
represented a unique challenge for catalyst
management
due to its two-layer catalyst
limitation
and because the units were built
without a selective catalytic reduction
bypass.
The units started with an B.2-mm-pitch
Cormetech honeycomb catalyst
but
a
7-mm
catalyst was also qualified during the initial
design and installation. In the second year of
service, after approximately
16,000
hours of
operation, catalyst management options
were investigated ranging from in-kind
replacement to in-situ washing, external
washing, .
and rejuvenation. The solution
involved
an in-situ replacement of" the 8.2-
mm-pitch product with an extension of the
prequalified 7-mm-pitch prodUct.
The same
process has been successfully carried out on
all three units over the.past 18 months.
Photo
courtesy of Tennessee Valley Authority
IEPA ATTACHMENT NO..!:L
mImCOIlIlW!lrID
FEB 2 7 Z006
24 LEGAL & REGULATORY
4 SPEAKING OF POWER
7 GLOBAL MONITOR
7 Frame 6C debuts in Turkey
7 1,200 MW in two years
.
8
Atlantic City bets on renewables
11 Peru commissions hydro plant
12 New edition of steam plant bible
15 FOCUS ON O&M
t5 CFB refractory repair
11 Upgrading conductivity monitoring
21 low-cost maintenance of spinning
reserve
_.powflrmeg.platt5.c:om
STEAM GENERATOR DESIGN
40 Constant and sliding-pressure options for new supercritical plants
The design and operating mode of a supercritical-pressure boiler should reflect the
economic practices
of its plant's market, which means a sliding-pressure unit could
be
harder to cost-justify in the
U.S.
than in Europe or Japan.
.SPECIAL REPORT
REFACTORY DESIGN
48 Understanding refractory failures
A five-step process for discovering the cause of those pesky refractory failures
(so
you don't encounter them again).
COAL COMBUSTION
54 CCPI bears firstfruit
Early results from a first-round Clean Coal Power Initiative project show promise for
a software-only solution to plant optimization.
32 Estimatmg CR installetion costs
According to the EUCG. the average installed system cost is $128/kW, with the
nebulous
"retrofit difficulty" the major cost-driving variable:
SCRSYSTEMS
26 Long-tenn catalyst health care
Careful analysis of catalyst- activity and consideration of operating requirements
and -limitations are essential
to ensuring long-term optimum catalyst performance
capable of producing significant cost savings.
FEATURES
EVENTS
60 The 2005 Global Energy Awards
In the words of Platts President Victoria Pao, .... The winners ... are the' companies
and individuals
who are building the future of our economies, our societies, and
our environment.
n
COVER STORY
J8nuaI'(/February 200!1 I
POWER
36 Catalyst regeneration: The business case.
The dollars saved have enough zeros to make the proposition worthwhile, the cost
can be capitalized, and
it
might even be possible to increase catalytic activity
beyond the original leveL
???????????
??????? ?? ??????????
???????? ???????? ??????????
???? ????
,All
(72
unitsl
:'1417%1
. -:,3
1.03IMW
5218/1:W
-
>5100
POwaR
I
January/February 2006
>900
lations in the U.S., so the survey results can
be
considered a valid top-level view of sys-
tem costs.
Economies of scale
As Figure
I
shows, although almost
three-fourths of the surveyed units have a
capacity of 300 to 900 MW, together they
601-900
Unit size (MWj
5100-149.99
$150--199.99
$(k.W
cost category
301-800
E ''''1'
,'-"" ..
,~&\
-"""'<"''',$
~
10
;,~l':
;'
~"
..
:~ ;~:-.f~-;[~~l
5
.
o
<$100
www.powermag.p1Btts.com
45.000
40,000
35.000
30.000
~.
25.000
];i
20,000
t5!
15.000
10.000
116 unitsl
5.000
0
II
<300
1. SCR cost survey results. Survey results. categorized by plant size, covered
approximately 39% of
the
new selective catalytic reduction (SeA) capacity installed through
early 2004.
Source: EUCG Inc.
2. What they spent. Most surveyed utilities spent between $100 and $200/kW for a
selective catalytic reduction system.
Source: EUCG Inc.
Responses to the survey yielded scope,
cost,
and design information on 72 individ-
ual units totaling
41 GW (representing 39%
of installed
SeE{
systems
i
MW at the time of the study) owned by
eight large utilities from SIP
Can states
located in the East and Midwest. The sam-
ple also reflected the distribution
of instal-
by 66%, relative
W
2tltl3 levels, acwss 28
eastern states and the District of Columbia
by 20I5. Though SCR systems worth more
than $4 billion
are expected to be pur-
chased worldwide next year, in the U.S.
more than
40 GW of capacity in CAIR-
affected states
are expected to
be
equipped
with the technology by 2010.
This increased level
of SCR installation
activity cnmes
on the heels of the 1995
NO, SIP (State Implementation Plan) Call
Rule, which motivated
the installation of
almost 8S GW of SCR installations at cen-
tral station steam plants over the past
decade. Many utilities will have to place
orders this year to comply with the NO.
Phase I in-service deadline of 2009. Full
implementation of CAIR will occur in
2015. One
of the challenges facing utilities
affected by
CAlR and ,actively analyzing
their cap-aDd-trade options is to understand
the capital costs involved in retrofitting an
SCR system.
T
he goal of the Clean Air Interstate
Rule (CAIR) signed into law almost a
year ago is to reduce
NO~
emissions
Estimating 8CH installation
co'sts
The EUCG surveyed 72 separate installations of selective catalytic reduction
(SCR) systems at coal-fired units totaling 41 GW of capacity to identify the
systems'
major cost drivers. The results, summarized in this article, provide
excellent first-order estimates and guidance
for utilities considering
installing the downstream emissions-control technology.
By
Mark Marano and George Sharp, American Electric Power, and the EUCG Fossil Productivity Committee
Survey results
The EUCG, an association of 24 electric
utilities representing 302 individual coal-
fired units, is a forum through which the
utilities can enhance their
O&M and con-
struction practices
to improve their opera-
tional and cost performance.
. One vehicle used by the EUCG is mem-
ber surveys. One recently completed survey
focused on SCR system installation costs
and the project and design attributes that
contrihute
to them. Specifically,.it identified
the costs
of construction labor; equipment;
materials~
and project management, engi-
neering
I
and construction management
(PMEC). The survey addressed II specific
scope/design unit attributes such as
the
type
of ammonia system used, the
NO~-removal
efficiency design basis of the system. and
SCR-related plant upgrades (such as econo-
mizer, air heater, and fans) on a $IkW basis.
???????????
??????? ?? ??????????
???????? ???????? ??????????
???? ????
I
scan
f
sys-
,nost
lve a
they
'ered
ough
for a
???????????
??????? ?? ??????????
???????? ???????? ??????????
???? ????
,
a:
a:
c
u
I
lHE
NASC
STU
1
PMEC
PO'Wa'R
IJanuary/February 2DD6
l1J
Project
m~nagement.
engineering,
construction management
• Average total cost, $/kW
Interestingly. the variation in material
costs was constant over the survey peri-
od, most Hkcly reflecting increased com-
petitiveness among SCR suppliers. By
contrast, PMEC costs showed higher
variability, which-as in the case of con-
struction labor costs-reflected the
greater complexity of later projects.
Average cost variation
by
cost category is
summarized in the table.
One survey, many conclusions
Although the survey results provide useful
insight into expected installed costs, they
• <=1003
• >1003
• Construction labor
• Equipment
&
material costs
.~
"
o
3. Cost by unit size. The cost distribution for 72 units with SCR installed shows expect-
ed economies of scale.
Source: EUCG Inc.
4. Timing affected costs. The deviation of category costs as a function of SCHproj-
ect completion date shows that early adopters paid less than those that lagged behind.
Source: EUCG Inc.
project complexity - lleasier" projects
were already completed-but also per-
haps increased competition for skilled
labor resources as the number of SCR
installation projects under way. in the
U.S. skyrocketed.
The variation in material costs was
constant over the survey period, most
likely reflecting increased competitiveness
among SCR suppliers.
represent only a little over half of the
total capacity studied. Overall, costs were
reported to be in the $100 to $200/kW
range for the majority of the systems
(Figure 2). with only three reported
installations exceeding $200/kW. System
size
(with a 644
4
MW average unit size in
the $100 to $150/kW range) seems 10
dominate; Iw:ger average system costs are
significantly less than the next survey
category
t
e
to
range,
with a 309-MW average unit size). The
data also suggest that the larger units
were installed earlier: The average unit
size retrofit before 2003
was 623 MW,
versus 466
MW since 2003.
The range of category costs
by
unit
size ($/kW) provides
insight into SCR
projects' relative complexities. For exam-
ple. the aggregated reported costs in the
defined categories (Figure 3) point to sev-
eral conclusions:
IIIlsCH
SYSTEMS
• The cost of construction labor on smaller
projects exceeds the average construe.
tion labor cost in all categories
by
about
50%. The implication is that small plants
will be cost-penalized
by their lack of
economies of scale because they may
be
more difficult to retrofit.
• Construction labor costs were relatively
constant for plants larger than 300 MW.
with an
av~rage
cost of just over
$64IkW.
• As expected, economies of scale also
affect
SCR material costs, with larger
units costing less
to retrofit, on a $IkW
basis, than smaller units.
•
Sophisticated regression modeling
techniques (multivariate analysis) gen-
erally did a poor job of predicting
overall installed costs; too many site-
specific variables impact construction
costs.
• PMEC costs are relatively consistent.
regardless of unit size.
The good old days
The survey data also revealed that devi-
ations from average installation costs
correlate strongly with project timing,
.,: .:'. ':',especiallyfor those units installed after
"M;:;~·:.;~_»OO.3
~\_;j-,-.",;:,,:w-"_<
,. - :. ,':
(Figure,
,
;'.'
4), The
.
significantly high-
Overall
Construction labor
Equipment
&
material
~l:~~:;;",:;r~;·eJ, ~~5)nstr,uct,lon'
lab~)r,
cpsts,,'for later
Notes: Numbers in parentheses indicate number of collected survey datapoints for grouping.
f\';~;~If.iJf,~,,".~"·""~--·--"
I
???????????
??????? ?? ??????????
???????? ???????? ??????????
???? ????
~~
...
~.,
..
.;:-
,~
~;S;_:·
;,~;
-V-a-ri-a-tj-o-n-o-f-s-u-rv-e-y-e-d-co-s-t-c-a-t-e-g-o-rj-e-s-b-y-u-n-j-t-s,-iz-e--------
~
,
...
more difficult to retrofit than those in
other size ranges.
Because SCRs are unitized, greater
economies of scale were expected from the
survey results. Some possible explanations,
for the modest advantage of scale inelude:
sen
SYSTEMS
III,
systems, which reduces their capital
costs but still requires them to be
deliv~
ered by sea or river.
•
-Marlr Marano
is
VP, financial
planning-corporate planning and
budgeting for AfP. George Sherp is a
senior member ofAfP Generation's
Business Planning Group. For more
information about the fUeG, contact
Pat Kovalesky, executive director, at
623-572-4140
or
visit www.eucg.org.
• The impact of newer plants' tighter lay-
outs, which often necessitate much more
complex duct installations, which raises
costs).
II
Plants' limited ability to use the most
cost-effective method of equipment
transportation, Some
41 % of the units
surveyed
in the
600-
to
900-MW
range
are close to navigable waters, versus
76% of units larger than 900 MW.
•
The increasingly modular design of SCR
601-900
>900
Unit size (MW)
much higher than anticipated, Together.
these conclusions suggest
that "retrofit
difficulty" is indeed relative. Units with a
capacity of
600
to
900
MW appear to be
<300
301-600
,166.89
. '186.20',
Source: EUCG Inc.
also confirm that there is no
one-size~fits
all SCR design. What the data also make
clear is that site-specific characteristics of
units
and plants can drive a project's cost
'i'
~X:~~~~\\:/~:f<~~~?;~~
lolal .oSt ($lkWI.....ragf:
·Totli.;~;($tkWI:~~~~~~~
,
proj-
hind,
;eful
they
the
'cts.
ry is
~rial
)eri~
'om-
, By
;her
con-
???????????
??????? ?? ??????????
???????? ???????? ??????????
???? ????
..6prL I -
W
E
-
e--PA
Co
JA
G
i
-t ed (Ail'
f, fy
/4 I ,.--- IEPA ATTACHMENT NO.
5
(01 (<-<..k
v ..
t-
G
Vi
~
(
.<)'yIfrI
r:?
0:; Hi. h
l
7/<1 e
1M <::6
A
<;'y
V"'l
/)0
~;,-<-v-'\I
I4IL05
t-
2-~--
2.-7
I
/9'17/
U<..f'~/?J
ju-J.,
fj~
SCR FOR COAL.FIRED BOILERS:
A SURVEY OF RECENT UTILITY COST ESTIMATES
J. E. Cichanowicz
Consultant
236 N. Santa Cruz Ave. Suite 202"
Los Gatos, Ca 95030
jecinc@batnet.com
Abstract
Accurate projections of SCR capital cost are critical both for prudent NOx
contiol rulemaking
by federal and local environmental regulators, and to
establish realistic utility compliance plans. Within the last few years, many
utilities have engaged architect/engineers
and/or SCR vendors to project SCR
cost for selected units in their system, employing detailed site-specific
assessments.
This
paper reports results of SCR cost studies conducted by
eleven utility companies, addressing 24 dry-bottom boilers, and 27 Group 2
boilers. The results
show Significant uncertainty characterizes SCR capital
cost estimates, as a
wide range of values is projected for both boiler types.
This
paper discusses and evaluates cost trends, demonstrates the impact of
capital cost uncertainty
on the cost per ton of NOx removed, and compares
capital cost results
with those from a computer algorithm widely used in NOx
control rulemaking.
Introduction
The availability of selective catalytic reduction (SCR) NOx control technology
at reasonable cost is a key consideration
in the promulgation of NOx emission
limits
by federal and local environmental agencies. The cost of SCR is a topic
of considerable disagreement among the various "stakeholders" participating
in the NOx emissions debate. most significantly the utility industry, federal
and local environmental regulatory agencies, and
vendo~
of SCR technology.
This
disagreement is capital cost translates into equal uncertainty regarding
projections for cost
per ton of NOx reduced. Specific concerns have been
summarized
in written comments submitted by the utility industry (UARG,
1997) to the Environmental Protection Agency's Acid Rain Division
(ARD),
and in technical reports submitted by industry for use by the Ozone Transport
Assessment Group (OTAG, 19960). Rebuttal positions have been formally
issued by the EPA ARD (EPA, 1996a), and OTAG stakeholders that support
SCR-based NOx limits (OTAG, 1996b).
-1-
???????????
??????? ?? ??????????
???????? ???????? ??????????
???? ????
In
December 1996, the EPA ARD issued NOx emissions for Group 2 boilers
based on an evaluated cost per ton of NOx removed, which required EPA to
project SCR capital cost for the national boiler population.
In
June of 1997,
. the OTAG Policy Committee issued general recommendations for the control
of
NOx emissions, which may require broad application of SCR from
generating units
in the 38 states that comprise OrAG'sinterest. Both the EPA
ARD
and the OrAG Policy Committee base their understanding of SCR cost
on discussions with equipment suppliers, and experience from Europe. EPA
ARD developed a cost algorithm to project
SCR capital cost as a function of
generating capacity, and used this algorithm to select the NOx levels proposed
in December 1996 (EPA,
1996b), as well as support OrAG analysis.
During approximately the same time period, many utilities sponsored
detailed studies
by architect/engineering firms and/or SCR vendors to
estimate SCR capital and operating cost. Given the significant cost
implications
of NOx policy decisions, it is prudent to summarize cost results
derived from these utility-sponsored engineering studies, for discussion and
comparison with other cost sources.
Objective
The objective of this paper is to report the range of SCR capital cost
determined by Site-specific engineering studies, estimated by either
architect/engineering firms and/or SCR technology vendors.
Subsequently,
the impact of capital cost on the cost per ton of NOx removed is
calculated. The influence
of two economic parameters that strongly dictate
SCR cost - capacity factor and capital recovery factor - is also demonstrated.
Approach
Utilities known to have sponsored major NOx planning studies that
employed detailed site assessments were requested to volunteer cost results
for
summary and comparison.
Given
the competitive climate within the utility industry, disclosure of
factors
that affect the cost of generation has become extremely sensitive. With
the exception
of two studies entered into the public record as part of CAAA
Section 407 rulernaking
(OVEC, 1997, and TEeO, 1996), utility companies only
shared cost information on the basis that specific uni
Is
remain anonymous.
This evaluation considered only engineering studies that employed a site
assessment
by the architect/engineer, or SCR vendor. Cost estimates were
required to be developed from specific equipment lists, derived after
considering
plant layout, design specifications of the plant and components,
and condition of existing equipment (e.g. flue gas handling components).
In
-2-
???????????
??????? ?? ??????????
???????? ???????? ??????????
???? ????
most cases, the studies employed a general arrangement drawing to identify
the location of the reactor and ancillary eqUipment, as well as flue gas routing.
Eleven utility
companies prOVided engineering studies for review that
addressed SCR capital cost for selected units in their system. These utilities
are located in the midwest, portions of the northeast, and the mid-Atlantic
states. The
data set consists of a total of 24 dry-bottom boilers (e.g. wall- and
tangential-fired), and 27 Group 2 boilers (cyclone, wet-bottom, and cell-fired).
The number of boilers represented is a small fraction of the national
inventory.
Within the 38 state OTAG region alone, approximately 700 dry-
bottom boilers exist. The total number of cyclone, wet-bottom, and cell-fired
boilers nationally
number approximately 140. No rigorous statistical analysis
is possible
with this data set, as the details of sites are unknown.
Description Of Cost Methodology
This
section summarizes the cost methodology followed by most studies.
Cost Methodology
A detailed description of SCR cost methodology has been presented in an
earlier. paper (Cichanowicz, 1993).
This
discussion highlights the following
cost elements that are of particular interest in this evaluation: Process
Capital, Installation Charge, Process/Project Contingency, Utility Indirect
Charge, and Allowance for Funds During Construction (AIDC)
Process Capital.
Process Capital reflects acquisition cost for equipment
required for both the SCR process, and modifications to the balance-of-plant
or ancillary components. The Process Capital reflects the sum of expenditures
for
equipment delivered to the site, but not an installation charge.
Table 1 summarizes the major Process Capital components. The first three
items (SCR catalyst, reactor, reagent storage, and reagent vaporization) are
direct SCR capital requirements, with remaining items denoted as balance-of-
plant components or installation expenditures. A subsequent section of this
paper addresses how costs partition between these two categories.
Installation Charge.
The Installation Charge reflects primarily the labor
charge and lease of special equipment required for installation/erection, as
well the upgrade of balance-of-plant equipment or ancillary components.
ProcesS/Project Contingency.
These cost elements comprise a "reserve"
fund for unanticipated expenses due to either project-spedfic or process-
specific issues.
Most of the engineering studies used 15-20% (of Process
Capital and Installation Charge) for the sum of both contingency funds.
-3-
I
I
i
I
???????????
??????? ?? ??????????
???????? ???????? ??????????
???? ????
Utility indirect Charge.
Utility-incurred costs are comprised of staff
engineering, project management, and facilities such as access roads,
buildings, etc.,
and is usually 5-10% of Process Capital and Installation Charge.
Allowance for Funds During Construction (AFDC).
AFDC is a finance
charge, incurred for time periods when equipment is
not employed in power
production. Although not necessarily a significant cost component compared
to the
sum of ali other components, AFDC represents a real incurred cost, and
is included for completeness. All planning studies reviewed included a
modest charge of nominally 4-5% annually, for a period of usually 1-2 years.
Most results were derived for a 1995-1997 dollar basis, and for generally
similar process conditions (major exceptions are noted). These similarities,
and the desire to observe only gross trends, allow the use of results as directly
reported,
thus not corrected for cost year basis and process conditions.
Capital Cost Components
Two cost indices are proposed to further characterize capital cost: (a) the
Process Capital/Installation Charge ratio,
and (b) the sum of the catalyst,
reactor,
and reagent storage/vaporization components to the Process Capital.
These cost ratios
are further described as foliows:
Ratio of Process Capitalllnstallation.
Process Capital/Installation Cost
ratio, determined before application of Process/Project Contingencies, Utility
Indirect Costs,
and AFDC indicates whether the bulk of direct costs are driven
by capital procurement (ratio >1) or manpower for installation (ratio
<1).
It
is anticipated a difficult retrofit site with signIficant obstacles that
complicate access of construction equipment would be characterized by a
relatively low Process Capital/Installation Cost ratio; a site
with relatively
unrestricted
acCesS would be characterized by Process Capital/Installation Cost
ratio of
>1.
Ratio of SCR ProcesslProcess Capital.
SCR Process/Process Capital
ratio, determined before application of Process/Project Contingencies, Utility
Indirect Costs,
and AFDC indicates whether the bulk of process equipment
acquisition costs are for SCR components, or balance-of-plant equipment to
allow
the boiler/plant to accommodate SCR process impacts.
It
is anticipated that sites requiring
few
modifications would be characterized
by a relatively high SCR Process/Process Capital ratio; retrofit sites that
require boiler modifications and upgrades to accommodate the SCR process
would be characterized by a relatively low SCR Process/Process Cost ratio.
???????????
??????? ?? ??????????
???????? ???????? ??????????
???? ????
Results
Results from
this
survey are presented according to two major boiler
categories:
dry bottom and Group 2 (cyclone, wet-bottom, and cell-fired).
Ideally, separate cost comparisons would
be developed for each of the five
major boiler categories. However, the relatively small
number of units and
the desire to observe only general trends allows this simplification. Results
are discussed according to (a) capital cost, and (b) components of capital cost.
Capftal Cost
Dry-Bottom Boilers,
Figure 1 summarizes SCR capital cost for dry-bottom
boilers,
presented as a function of generating capacity. The NOx reduction
efficiency for all units is 80-90%, with residual NH3 a
maximum of 5 ppm
(2 ppm for selected sites). With the exception of two units, boiler initial NOx
production rates are approximately equivalent to the Phase 1, Group 1 limits
of 0.45-0.50 Ibs/MBtu, depending on boiler type (e.g. tangential- or wall-fired).
Note several of the data represent multiple units at the same station.
Group
2
Boilers.
Figure 2 summarizes SCR capital cost for cyclone, wet-
bottom,
and cell-fired boilers, presented as a function of generating capacity.
The wet-bottom boilers, all which feature SCR designed for 50% NOx
removal from approximately 1.1-1.3 Ibs/MBtu, are identified separate from
the cyclone and cell-fired boilers. The SCR NOx reduction efficiency for the
cyclone
and cell-fired boilers
is
80%, with one case at 50% noted. Except as
indicated, all cyclone/cell-fired boiler NOx production rates are 12-1.5
Ibs/MBtu. All costs reflect sufficient catalyst to maintain a
residual NH3 level
of at most 5 ppm, throughout the entire operating period.
Capital Cost Components
Figure 3 presents trends in both the Process Capital/Installation Cost and SCR
Process/Process Capital cost ratios, as a function of projected capital cost, for
dry-bottom boilers. As suggested, the highest capital cost sites are
charactenzed by a Process Capital/Installation Cost ratio of 1-1.25; the lowest
capital cost sites can have values exceeding
2. The SCR Process/Process Capital
ratio
ranges from 0.50 for high cost sites, to 0.75 for low cost sites.
Results Discussion
Results
presented in this paper are based upon an extremely small sample of
the boilers, compared to the candidates considered to deploy SCR NOx
control. Clearly, caution should be exercised in extrapolating any results or
observations in cost trends from
this
sample to the national or the OTAG
regional
population.
-5-
???????????
??????? ?? ??????????
???????? ???????? ??????????
???? ????
Average Capital Cost
Dry-Borrom Boilers.
The average of capital cost for dry-bottom boilers for
all
24 boilers presented in Figure 1 is $86/kW. The average for units greater
than
175 MW capacity
is
$75/kW.
Figure 1 demonstrates the
wide variation in capital cost depending on site-
specific conditions.
If
only generating capacity
is
considered as an indicator of
"average".SCR capital cost, significant variations from the
$75/kW average
for units
>175 MW are witnessed. Specifically, within the cluster of units at
approximately 550
and 625 MW, any unit can vary in cost by $30-50/kW.
Group
2
Boflers.
The average of capital cost for Group 2 boilers for all units
presented in Figure 2, calculated
with four different averaging techniques,
ranges from $79-86/kW. The lowest cost ($79/kW)
was determined by
eliminating boilers of less
than 200 MW capacity, using only 2 boilers at each
of the Kyger
and Clifty Creek sites in the average, and eliminating balance-of-
plant upgrades necessary
to accommodate SCR at three large cyclones. The
highest cost
was determined by employing all boilers in Figure 2 in the
average
(allll Kyger and Clifty Creek units, and not eliminating small
boilers), and including balance-of-plant costs for the large cyclones.
For units above 200
MW capacity,
if
generating capacity alone is used to
project
SCR capital cost, significant variations from the nominal $83/kW
average are witnessed. These variations appear to be $15-50/kW.
Economies of Scale
SCR is generally recognized by most observers to exhibit economies of scale
with respect
to capital cost.
This
trend is dependent upon the assumption
that all other plant and SCR process design factors are maintained equivalent,
as generating capacity increases.
Figure 1 shows
that cost per unit capacity decreases as generating capacity
increases from 100
to 200 MW. The average SCR cost for the units at
approximately 600 MW suggests continued cost reduction at larger capacities.
For
the
Group 2 boilers, the different boiler designs prevent identifying any
trend between cost and generating capacity.
For
both boiler categories, the reduction in SCR unit cost with increasing
generating capacity is
most pronounced for increases from lowest (-100 MW)
to intermediate capacities (-175-200 MW). SCR capital cost may not exhibit
economies-of-scale anticipated
at larger capacities, as the design basis for the
SCR process and host unit changes significantly with increased capacity. An
example is the utilization of two reactors (each of 50% treating capacity) in
place of one reactor (at 100% capacity), to maintain turndown for larger units.
I
1
1
j
???????????
??????? ?? ??????????
???????? ???????? ??????????
???? ????
Cost Per Ton Evaluation
The cost of NOx control per ton of NOx removed - sometimes referred to as
cost-effectiveness -
is an important cost index. The EPA ARD has issued NOx
regulations for Group 2 boilers based
on the "cost-effectiveness" of low NOx
burners on Group 1 boilers compared to the "cost-effectiveness" of candidate
NOx control technologies on Group 2 boilers. Essentially all NOx trading
programs proposed or presently
in
place employ this cost index. Also, several
states have proposed definitions of Reasonably Available Control Technology
(RACT) depending on the "cost-effectiveness" of NOx reduction achieved by
any given technology.
It
is instructive to examine the significance of the
uncertainty
in capital cost observed in Figures 1 and 2 on the evaluated cost
per ton of NOx removed. Also, the impact on cost-effectiveness of two
economic factors of particular significance for
SCR - the capital recovery factor
and generation capacity factor -
is addressed.
Capital Cost
Table 2 summarizes NOx control cost per ton provided by SCR, as applied to
(a)
dry
bottom boilers
in
a "post-RACT" mode, and (b) Group 2 (cyclone) .
boilers.. Table 2 also presents the sensitivity of cost
per ton to uncertainties in
capital cost, capacity factor
(CF), and capital recovery factor (CRF).
Dry-Bottom Boilers.
Cost results apply only to the specified conditions of
80% NOx reduction, initial NOx production rates of 0.45-0.50 Ibs/MBtu, 4 year
mean catalyst life, and a
final
space velocity of 3200 l/h. The generation
capacity factor
and annual capital recovery factor are 65% and 0.15,
respectively. For the average SCR cost (as approximated from Figure 1) of
$75/kW, Table 2 shows that
SCR NOx control cost is $1600-1768/ton, for boiler
NOx production rates of
0.50 and 0.45 Ibs/MBtu, respectively.
Table 2 also
shows the impact of $15/kW variations in capital cost. mcreasing
capital cost
by $15/kW to $90/kW would increase the $1600-1768/ton cost
range by $220-25O/ton. Similarly, decreasing capital cost by $15/kW to
$60/kW would decrease the $1600-1768/ton range by approximately the same.
Group
2
Boilers.
Cost results apply only to the specified conditions of 80%
NOx reduction, 4 year average catalyst life, initial NOx production rate of 1.3
Ibs/MBtu, and a
final
space velocity of 2000 l/h.
For the average SCR cost (as approximated from Figure 1) of $79/kW, Table 2
shows that SCR NOx control cost
is $696/ton, for NOx production rates of 1.3
Ibs/MBtu. Adjustments to capital cost by $15/kW impact cost by $80/ton.
-7-
???????????
??????? ?? ??????????
???????? ???????? ??????????
???? ????
Sensitivity Analysis: Additional Factors
Although the focus of this paper is SCR capital cost, it is prudent to briefly
consider two other factors that can dominate the evaluated cost per ton of
NOx reduced by SCR. The ability to recover capital cost, as determined by \illit
capacity factor and financing conditions, is particularly important with SCR,
due to the high capital requirement compared to alternatives.
This
section
demonstrates how the range of capacity factor and capital recovery factor .
impact the evaluated cost per ton.
Capacity Factor.
Future projections of capacity factor for the deregulated
industry have received considerable attention recently. Projections for system
capacity factor averages range from 65% to as high as 85%, depending on the
economic conditions presumed for the relevant time period. This differential
of 20 percentage points translates into a considerable difference in cost per ton
of NOx. As shown in Table 2, Simply increasing capacity factor from
historical norrns of 65% to 85% lowers SCR cost per ton for dry-bottom boilers
by $340 to $380/ton, for boiler NOx productions rates of 0.50 and 0.45
Ibs/MBtu. For Group 2 boilers, the same increl\Se in capacity factor lowers
evaluated cost by approximately $120/ton.
Capital Recovery Factor.
Utility planning studies reviewed documented
the range in capital recovery factor employed for cost evaluations.
This
factor
depends not only on the details of financing capital, but also the secondary
cost of equipment ownership, such as property taxes, insurance, etc. Most
significantly,
the term over which the utility intends to operate the facility -
either 10, 15, or 20 years - exerts a dominant role in determining the capital
recovery factor. The studies reviewed for this paper show the range in capital
recovery factor to be 0.14- 0.167. Within the NOx policy debates, stakeholders
supporting the application of SCR have proposed a capital recovery factor of
0.115, for a 20 year plant
life.
Accordingly, a sensitivity analysis was conducted
to determine the impact of capital recovery factor to levels as low as 0.115.
Table 2 shows for dry bottom boilers reducing capital recovery factor to 0.115
lowers evaluated cost by $650/ton, for a boiler NOx production rate of 0.50
Ibs/MBtu. For Group 2 boilers, the same variation in capital recovery factor
lowers evaluated cost by $90/ton. Accordingly, the role of capital recovery
factor is Significant, and
is
equal to or greater than the impact of reasonable
changes in capacity factor or capital cost.
Observation
Results from this evaluation highlight how Wlcertainty in capital cost,
capacity factor, and capital recovery factor impact cost per ton of NOx.
-8-
???????????
??????? ?? ??????????
???????? ???????? ??????????
???? ????
Depending on the value of capital cost, capacity factor, and capital recovery
factor, the evaluated cost per ton of NOx can vary by almost 50%. Specifically,
Table 2 reports cost per ton for both dry-bottom and cyclone boilers,
employing inputs that based on the studies reviewed for this paper,
discussions with utilities, and economic projections, appear extreme. These
values are $60/kW capital cost, 85% capacity factor, and 0.115 capital recovery
factor. Employing these values for dry-bottom boilers produces a cost of $935-
1029/ton, approximately 55% of that estimated for the "baseline" case. For
cyclone boilers, cost is $424/ton, or 60% of the 'baseline"
The cost per ton is further reduced, when employing capital cost estimates
based on the computer algorithm describing capital cost versus generating
capacity, that was derived by EPA ARD. For dry-bottom boilers, using 550
MW as a reference case, this correlation used in OTAG rulemaking projects a
capital requirement of $47/kW, for an SCR process designed for 80% NOx
removal from Phase l/Group 1 boiler NOx production rates. A generating
capacity of 650 MW is anticipated to require SCR capital cost of $44/kW,
according to this correlation.
These algorithm-derived estimates are 60-65% of the average capital cost at
550 and 650 MW presented in Figure 1. Using these algorithm-derived capital
costs results in estimates of cost per ton of $791-818/ton, half of the baseline
~
Similar trends were noted with Group 2 boilers, where the algorithm
also significantly underpredicted cost for 50% NOx reduction cases.
Summary
Engineering studies submitted by 11 utility companies revealed trends in SCR
capital cost, based on detailed site-specific assessments. For dry bottom
boilers, the projected cost for SCR was $86/kW, and reduced to $75/kW when
boilers less than 175 MW were eliminated. For cyclone boilers, the average
cost was $79-86/kW, depending on how the average was calculated.
This significant capital cost uncertainty translates into equivalent uncertainty
in cost per ton. Economic and technical premises selected from this survey
suggest deploying SCR delivers NOx reduction for $160D-1768/ton, in a post-
LNB application. For cyclone boilers, the cost per ton anticipated for these
conditions is $674/ton.
Both capacity factor and capital recovery factor exert significant impact on cost
per ton. By using values for these inputs that
ba~ed
on the utility site-specific
studies appear to be extreme, evaluated cost can be reduced to 55-62% of the
previously cited values. Further complicating the matter is the apparent
tendency of the SCR capital cost algorithm developed for NOx rulernaking by
EPA ARD to underpredict SCR capital cost, prodUcing estimates
approximately 60-65%% of those inferred from Figure 1.
In
summary,
-9-
???????????
??????? ?? ??????????
???????? ???????? ??????????
???? ????
estimates ofSCR cost that do not employ a detailed site-specific analysis could
be significantly in error, and generating capacity and capital recovery factor
should be carefully considered to reflect authentic
industry experience.
References
Cichanowicz,
1993
EPA,1996a
EPA,1996b
OTAG,1996a
OTAG,1996b
OVEC, 1997
TEeO, 1996
UARG,1997
Cichanowicz et. a!., "Factors Affecting SCR Capital Costs For
Utility Boilers",
paper prepared for The Utility
Air
Regulatory
Group, October,
1993
Investigation of Performance and Cost of NOx Controls As
Applied to Group 2 Boilers, prepared
by The Cadmus Group,
August
1996, EPA Contract No. 68-D2-Q168, Work
Assignment No. 4C-02
..
Distributions
Of
NOx Emission Control Cost-Effectiveness By
Technology, prepared by rCF Incorporated, October 31, 1996,
EPA Contract No.
68-D3-Q005, Work Assignment No. 5F-Q1.
"Electric Utility Nitrogen Oxides Reduction Technology
Options For Application by The Ozone Transport Assessment
Group", January 1996, prepared by UARG for Consideration
by the OTAG Control Technologies
&
Options Workgroup.
"Electric Utility Nitrogen Oxides Reduction Technology
Options For Application
by The Ozone Transport Assessment
Group", April i996, prepared by Selected States
&
Stakeholders for Consideration by the OTAG Control
Technologies
&
Options Workgroup.
"SCR Capital and Operating Cost Estimate for Kyger Creek
and Clifty Creek", final report prepared for the Ohio Valley
Electric Corporation, May 1997
"Nitrogen Oxide Limitation Study",
prepared for Tampa
Electric Company, March 15,
1996
Comments Filed
On
Behalf of the Utility Air Regulatory
Group, In Response to The January 19, 1997 Proposed Rules
Implementing The Second Phase Of The Nitrogen Oxides
Reduction Provisions In Title
N
Of The Oean air Act, Docket
No. A-95-28.
-10-
???????????
??????? ?? ??????????
???????? ???????? ??????????
???? ????
TABLE 1
SUMMARY OF PROCESS CAPITAL COMPONENTS
FOR SCR RETROFIT
rnot
Comment
SCR Catalyst, Reactor
usually the largest cost components
Reagent Storage
facilities for the unloading, transfer,
and
storage for aqueous or anhydrous ammonia
reaj!ent
Reagent
equipment to vaporize reagent, and
Vaporization/Injection monitor and control injection rate
Sootblowers
included in almost all
SCR designs and cost
estimates; sometimes
not seperately
identified
Foundations
re-inforcing of existing foundations,
or
construction of new foundations depending
on reactor location
Structural Steel
re-inforcing of existing structures, or
construction of
new structures depending
on reactor location
Ductwork Modifications modifications to existing ductwork to
accommodate
SCR equipment
New Ductwork
new ductwork for process bypass, reactor
access, etc.
ProcessI&C
control systems for process operation
Fan Modifications
improvements to existing fans to increase
flow rate rating, or replacement with
new
fans
Balanced Draft
reinforcement of ductwork structure,
and
Conversion
addition of fans as necessary to convert
from forced to balanced
draft.
Electrical
additional auxiliary power supply for
reagent
t
blowers, etc. can require an increase
in power delivery capabilities on-site
Boiler Modifications
installation of economizer bypass, removal
or addition of heat absorbing surface area as
necessary to provide correct flue gas
temperature
vs. load
Other
(BOP)
modifications to the
air
heater to improve
tolerance to increased
503; improvements
to particulate control equipment to tolerate
residual NH3, 503; etc.
Duct Burner, Gas/Gas
heat exchange equipment necessary for
Heater
I
post-FGD applications
Misc/General
flow modeling, construction management,
demolition
charj!e, etc.
I
I
I
I
!
???????????
??????? ?? ??????????
???????? ???????? ??????????
???? ????
1000
I
I
800
,
T
700
3x
;.11;
it
-.!
'~Ii'l
•
Ii
','11i'
jlli
lH
,h
i11'11~INi
,
-qx
\
~II~
~
:f;
~i
'II'J
I
;
"
I
:J
,'
i
;
i~,
.~
f
,L
!
:
~
I
Hlou
I:'
IPtrll·~1
1
500
600
Generating Capacity, MW
FIGURE 1. DRY BOTTOM BOILERS:
SCR CAPITAL COST VS. CAPACITY
~
>
2x
"
1 il
~'
'JI
Iii'
~!!
j
~x
2x
lJ
~
~
I
q'
fI II
~'
~Irl
I~!
:j,
I~
¥
I~
~
Ii.
~1
~I
If
,
~,'WJ,
Ii
111,
100
200
300
400
;'11:
liiu
140
>
~127
60 -h-
IiI:
70 --+-
III
,K
1
Back to top
80-1-
50
-+-
I~II!
Back to top
40
-+-
Back to top
100-t-
Back to top
gO-+-
$/kW
2x
I~I~~,
'i
~6
~-~~~~~~~~=.::.:._-----,
11 0
-'---\1~
' __•
~~
__• __J""-
'
.~
•.
~ ~~-~-
.......
,--
..............
-_
......_--"
.~'-'
~. _.~_."
???????????
??????? ?? ??????????
???????? ???????? ??????????
???? ????
,
2
~
__ 00,
1
1
7
:.
r
~
I'
I;, 'tl
pi
we~:~:~:~e~::~~~:~
BOP Costs
:~: ~'.:",:i§i:,,,:%¥:':SF:'=:'
:.m"-""-""~wt
-~
,;:
1-:.:1:",
'tl'
% /
~~
.~
,f;
"Ii
(Ii
1<-::"
)I*,I
I~~'
1?:1
o
I}
In;
,
".~
'~'
,~
,
~I!>
'~-
Ie
It
'~lb
~I
1Jl3
Ii
~I
Ii
I~H
,;~
5
IiI
~
I'
~
'II!
r~ ~l
90
60
80
70
50
40
100
FIGURE 2. GROUP 2 BOILERS:
$/kW
125+U;
1;25+
SCR CA""PITAL COST VS. CAPACITY
110
" ;
125.
I
'
-
I!l'""---------:----------.
,.
~I
I
Generating Capacity, MW
100
200
300
400
500
600
700
1000
Nole
Scale Change
~
--.-.------_.,
???????????
??????? ?? ??????????
???????? ???????? ??????????
???? ????
3.16
,.J
FIGURE 3. RATIO OF
TOTAL PROCESS CAPITAUINSTALLATION,
SCR PROCESSITOTAL PROCESS CAPITAL
,:'
.~
~
,<',
,~.
.1.
it!
,
!
ii,
140
I
130
~
!
.::
~I
I
::~;
.~
it!
';}
,I,,'
:f
II
I
120
~
,oj
-i;
-~
;\1
<
'fl
i:
I
'il
I
110
:i.\
i-,
'1'.
d
,
, 1"
.~
i
-~i
I
fi
~~lItJ
I'
i-&
TOTAL PROCESS CAPITAUINSTALLATION
Ii I::' &!iTi!n
SCR PROCESS EQUIPMENTfTPC •
it
!,;,'"
I~\I
I{
<h
•
:~
ii
.~.
!
::f
I
I
I
70
80
90
100
Capital Cost,
$/kW
1""
r1.
if
;1
i~
ij
11I!.
",
~li
~.
~.;
~
f,
%
1*
Iii Ii
i
~Cl
fj"
J
f
~
I~
l j
I
I
50
60
g
~
,J
':!
~:
§
{'
:t.
[
II"
I
40
0.75
-+-
Back to top
0.25-1-
2.00
i
'.il.
!ill.
IiI
i
~.
t
if
Back to top
1.75-1-
Back to top
1.50-+-
Back to top
1.00-+-
Back to top
0.50-+-
Back to top
1.25-+-
__.. __
.~~.
__ .....__. _.
.~
__......__._.
..__._
~.~
..
_~
__
~_.r
....
_"
_,__
.,_~
,_",
.~,~_.
__ ,
._._,_~_.~
..
_~._.
~
~-"'
._.__ ---........ __
.~----".-
".
-."'-----...
~~_.
???????????
??????? ?? ??????????
???????? ???????? ??????????
???? ????
TABLE 2
COST PER
TON EVALUAnON
SCR ON POST.LNB DRY.BOTTOM, AND GROUP 2 BOILER
(Baseline Case And Sensitivity Analysis)
Cost Per Ton
$/T
(NOx)
Economic
~
Process
F.
ya
I
ua
!.
IOD
C
OD
d.ti
Ions
on
Baseline:
SCR Applied
80% NOx reduction!
$75/kW,65%
1600 (0.50)
to P05!.LNB, Dry-
S ppm slip, 3200 l!h SV,
CF, 0.15 CRF
1768 (0.45)
bottom Boiler
4
yr catalyst life
(Baseline)
Baseline:
SCR
Applied
80% NOx reduction!
$79/kW, 65%
696 (1.3)
to Group 2 (Cyclone)
5
ppm slip, 2000 l!h SV, 4 CF, 0.15 CRF
Boiler
yr catalyst life,
(Baseline)
Sensitivity:
Incremental
Dry-Bottom Baseline
same
<I
220 (0.50)
Capital
Boiler Case
<I
250 (0.45)
(+!- $15!kW)
Group 2 Boiler Baseline
same
<180 (1.3)
Case
Sensitivity:
Dry-Bottom Baseline
same, except
<I
340 (0.50)
Capacity Factor (65% to
Boiler Case
CF
<I
380 (0.45)
85% increase)
Group 2 Boiler Baseline
same, except
<1120 (1.3)
Case
CF
Sensitivity:
Dry-Bottom Boiler
same, except
Capital Recovery Factor Baseline Case
CRF
<1650 (0.50)
(0.15 to 0.115 decrease)
Group 2 Boiler Baseline
same, except
<190 (1.3)
Case
CRF
SCR!Dry-Bottom
Dry-Bottom Case, except as
as noted
($60/kW, 85% CF, 0.115
noted
935 (0.50)
CRF
1029 (0.45)
SCR!Group2
Group 2 Baseline Case,
as noted
424
(1.3)
($60!kW, 85% CF, 0.115
except as noted
eRF
???????????
??????? ?? ??????????
???????? ???????? ??????????
???? ????