TECHNICAL SUPPORT DOCUMENT
for
CONTROL OF NITROGEN OXIDE EMISSIONS
from
Industrial Boilers and Electrical Generating Unit Boilers
Process Heaters
Cement Kilns
Lime Kilns
Reheat, Annealing, and Galvanizing Furnaces used at Iron and Steel Plants
Glass Melting Furnaces
Aluminum Melting Furnaces
AQPSTR 07-02
March 2008
Prepared by
Andover Technology Partners and the Illinois Environmental Protection Agency
for
ILLINOIS ENVIRONMENTAL PROTECTION AGENCY
1021 NORTH GRAND AVENUE EAST
P. 0. Box 19276
SPRINGFIELD, ILLINOIS 62794-9276
This document was prepared by Andover Technology Partners (ATP) and the Illinois
Environmental Protection Agency (IEPA) under contract with the Lake Michigan Air Directors
Consortium (LADCO) and the Illinois Environmental Protection Agency (IEPA).
Contact at ATP
James E. Staudt, Ph.D., CFA
Andover Technology Partners
112 Tucker Farm Road
North Andover, MA 01845
978-683-9599
Staudt@AndoverTechnology.com
Table of Contents
Section
Page
1
The Formation and Control of NOx
1
1.1
NOx Formation
1
1.2
Controlling NOx emissions
3
2
Industrial Boilers and Electrical Generating Unit Boilers
5
2.1
Introduction and Summary of this Section
5
2.2
Process Description and Sources of Emissions
6
2.3
Technical Feasibility of NOx Control
19
2.4
Cost Effectiveness of NOx Controls
39
3
Process Heaters
46
3.1
Introduction and Summary of this Section
46
3.2
Process Description and Sources of Emissions
47
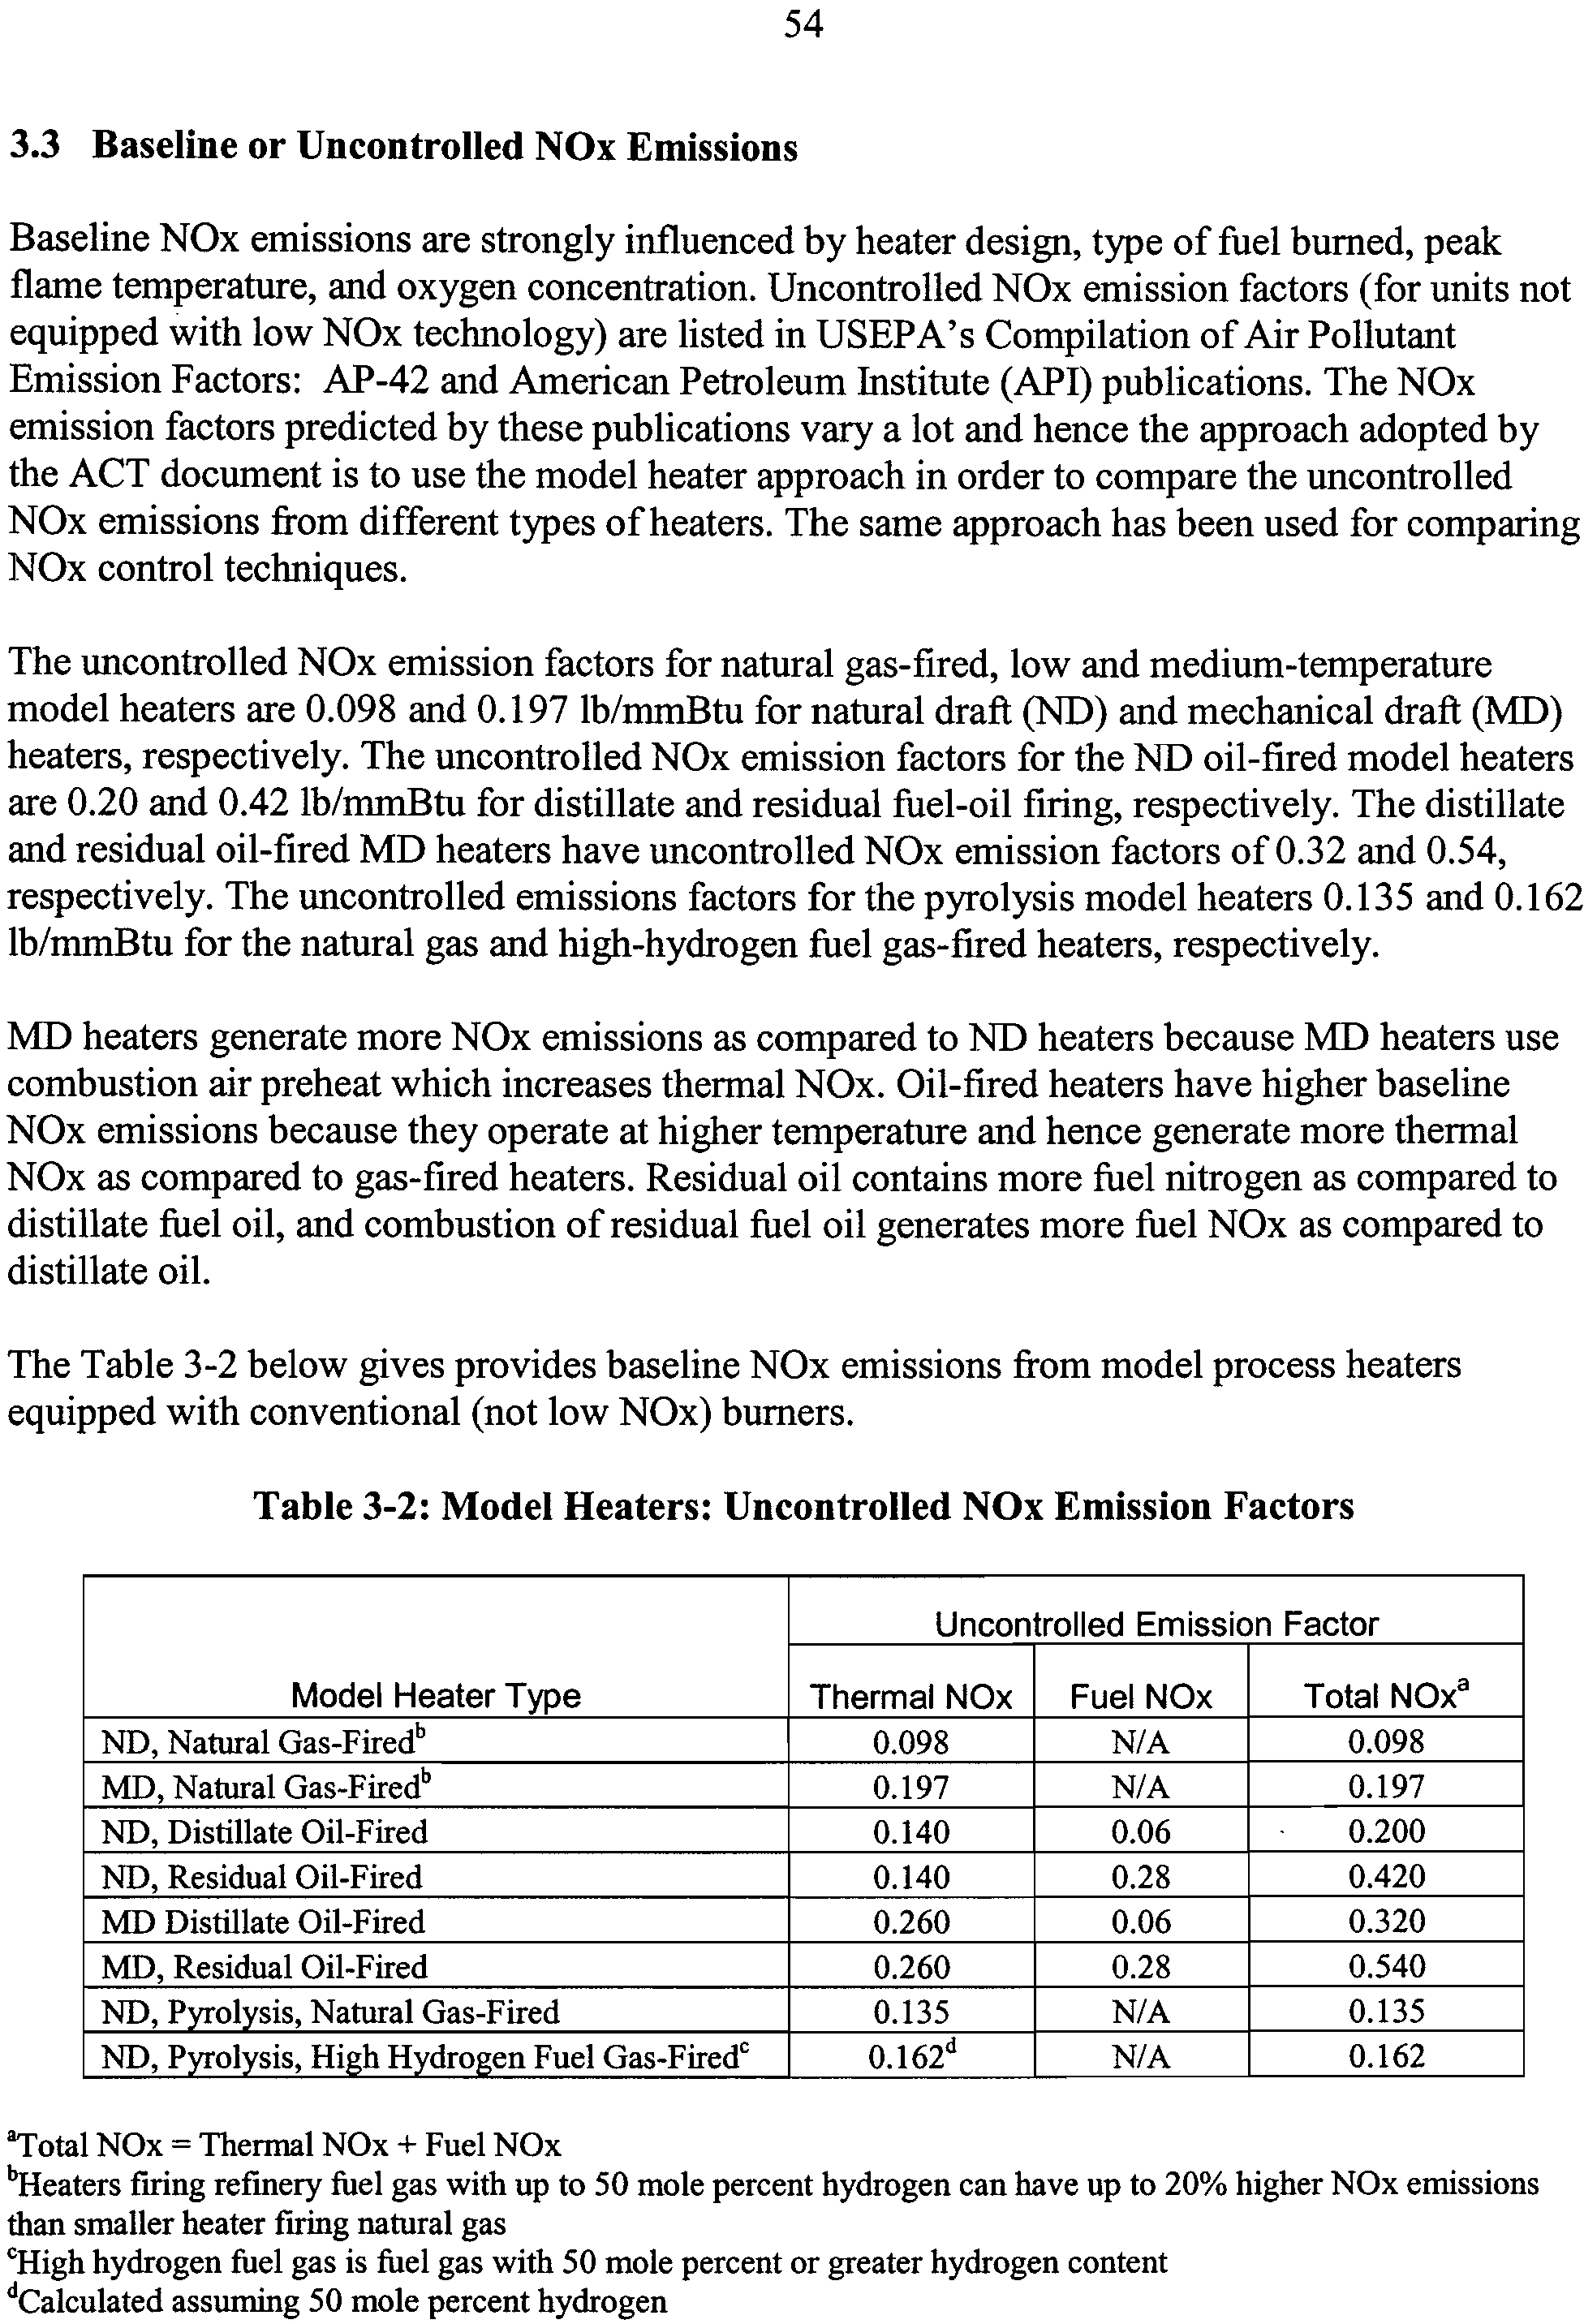
3.3
Baseline or Uncontrolled NOx Emissions
54
3.4
Technical Feasibility of NOx Control
55
3.5
Cost Effectiveness of NOx Controls
61
4
Cement Kilns
66
4.1
Introduction
66
4.2
Process Description and Sources of Emissions
66
4.3
Factors Affecting Uncontrolled NOx Emissions
68
4.4
Technical Feasibility of NOx Controls
71
4.5
Cost Effectiveness of NOx Controls
79
5
Lime Kilns
86
5.1
Introduction and Summary of this Section
86
5.2
Process Description and Sources of Emissions
86
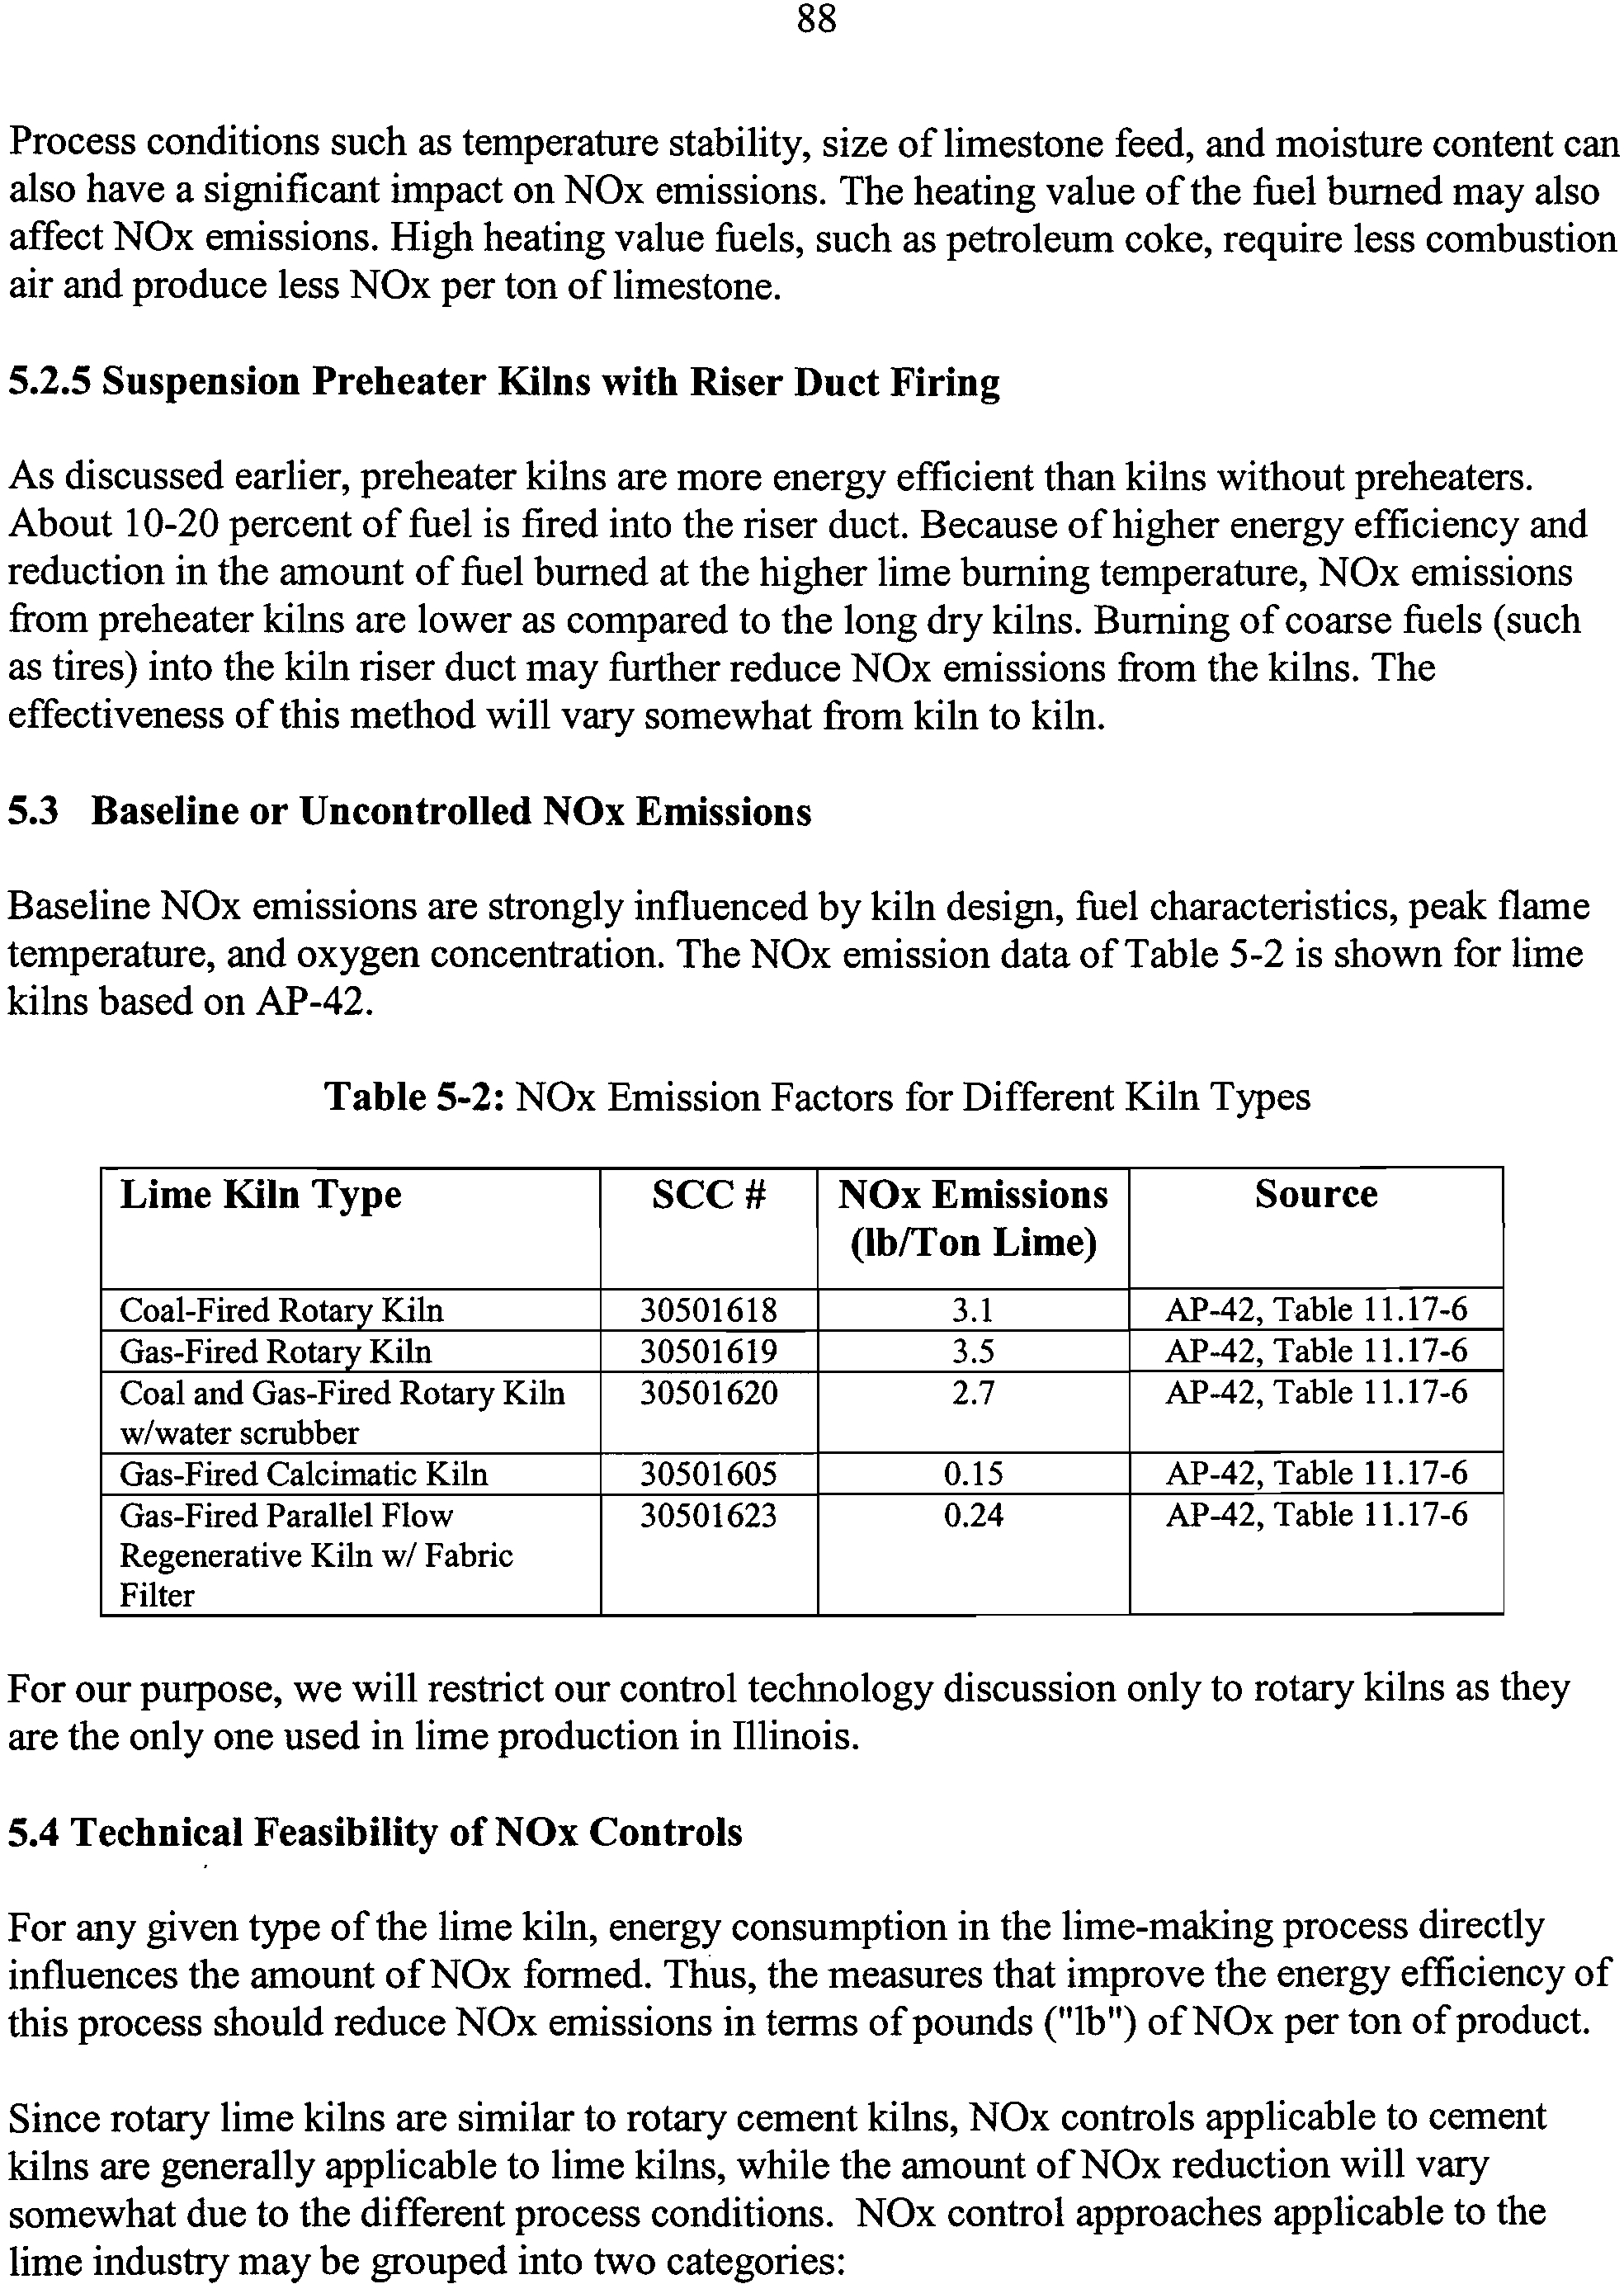
5.3
Baseline or Uncontrolled NOx Emissions
88
5.4
Technical Feasibility of NOx Controls
88
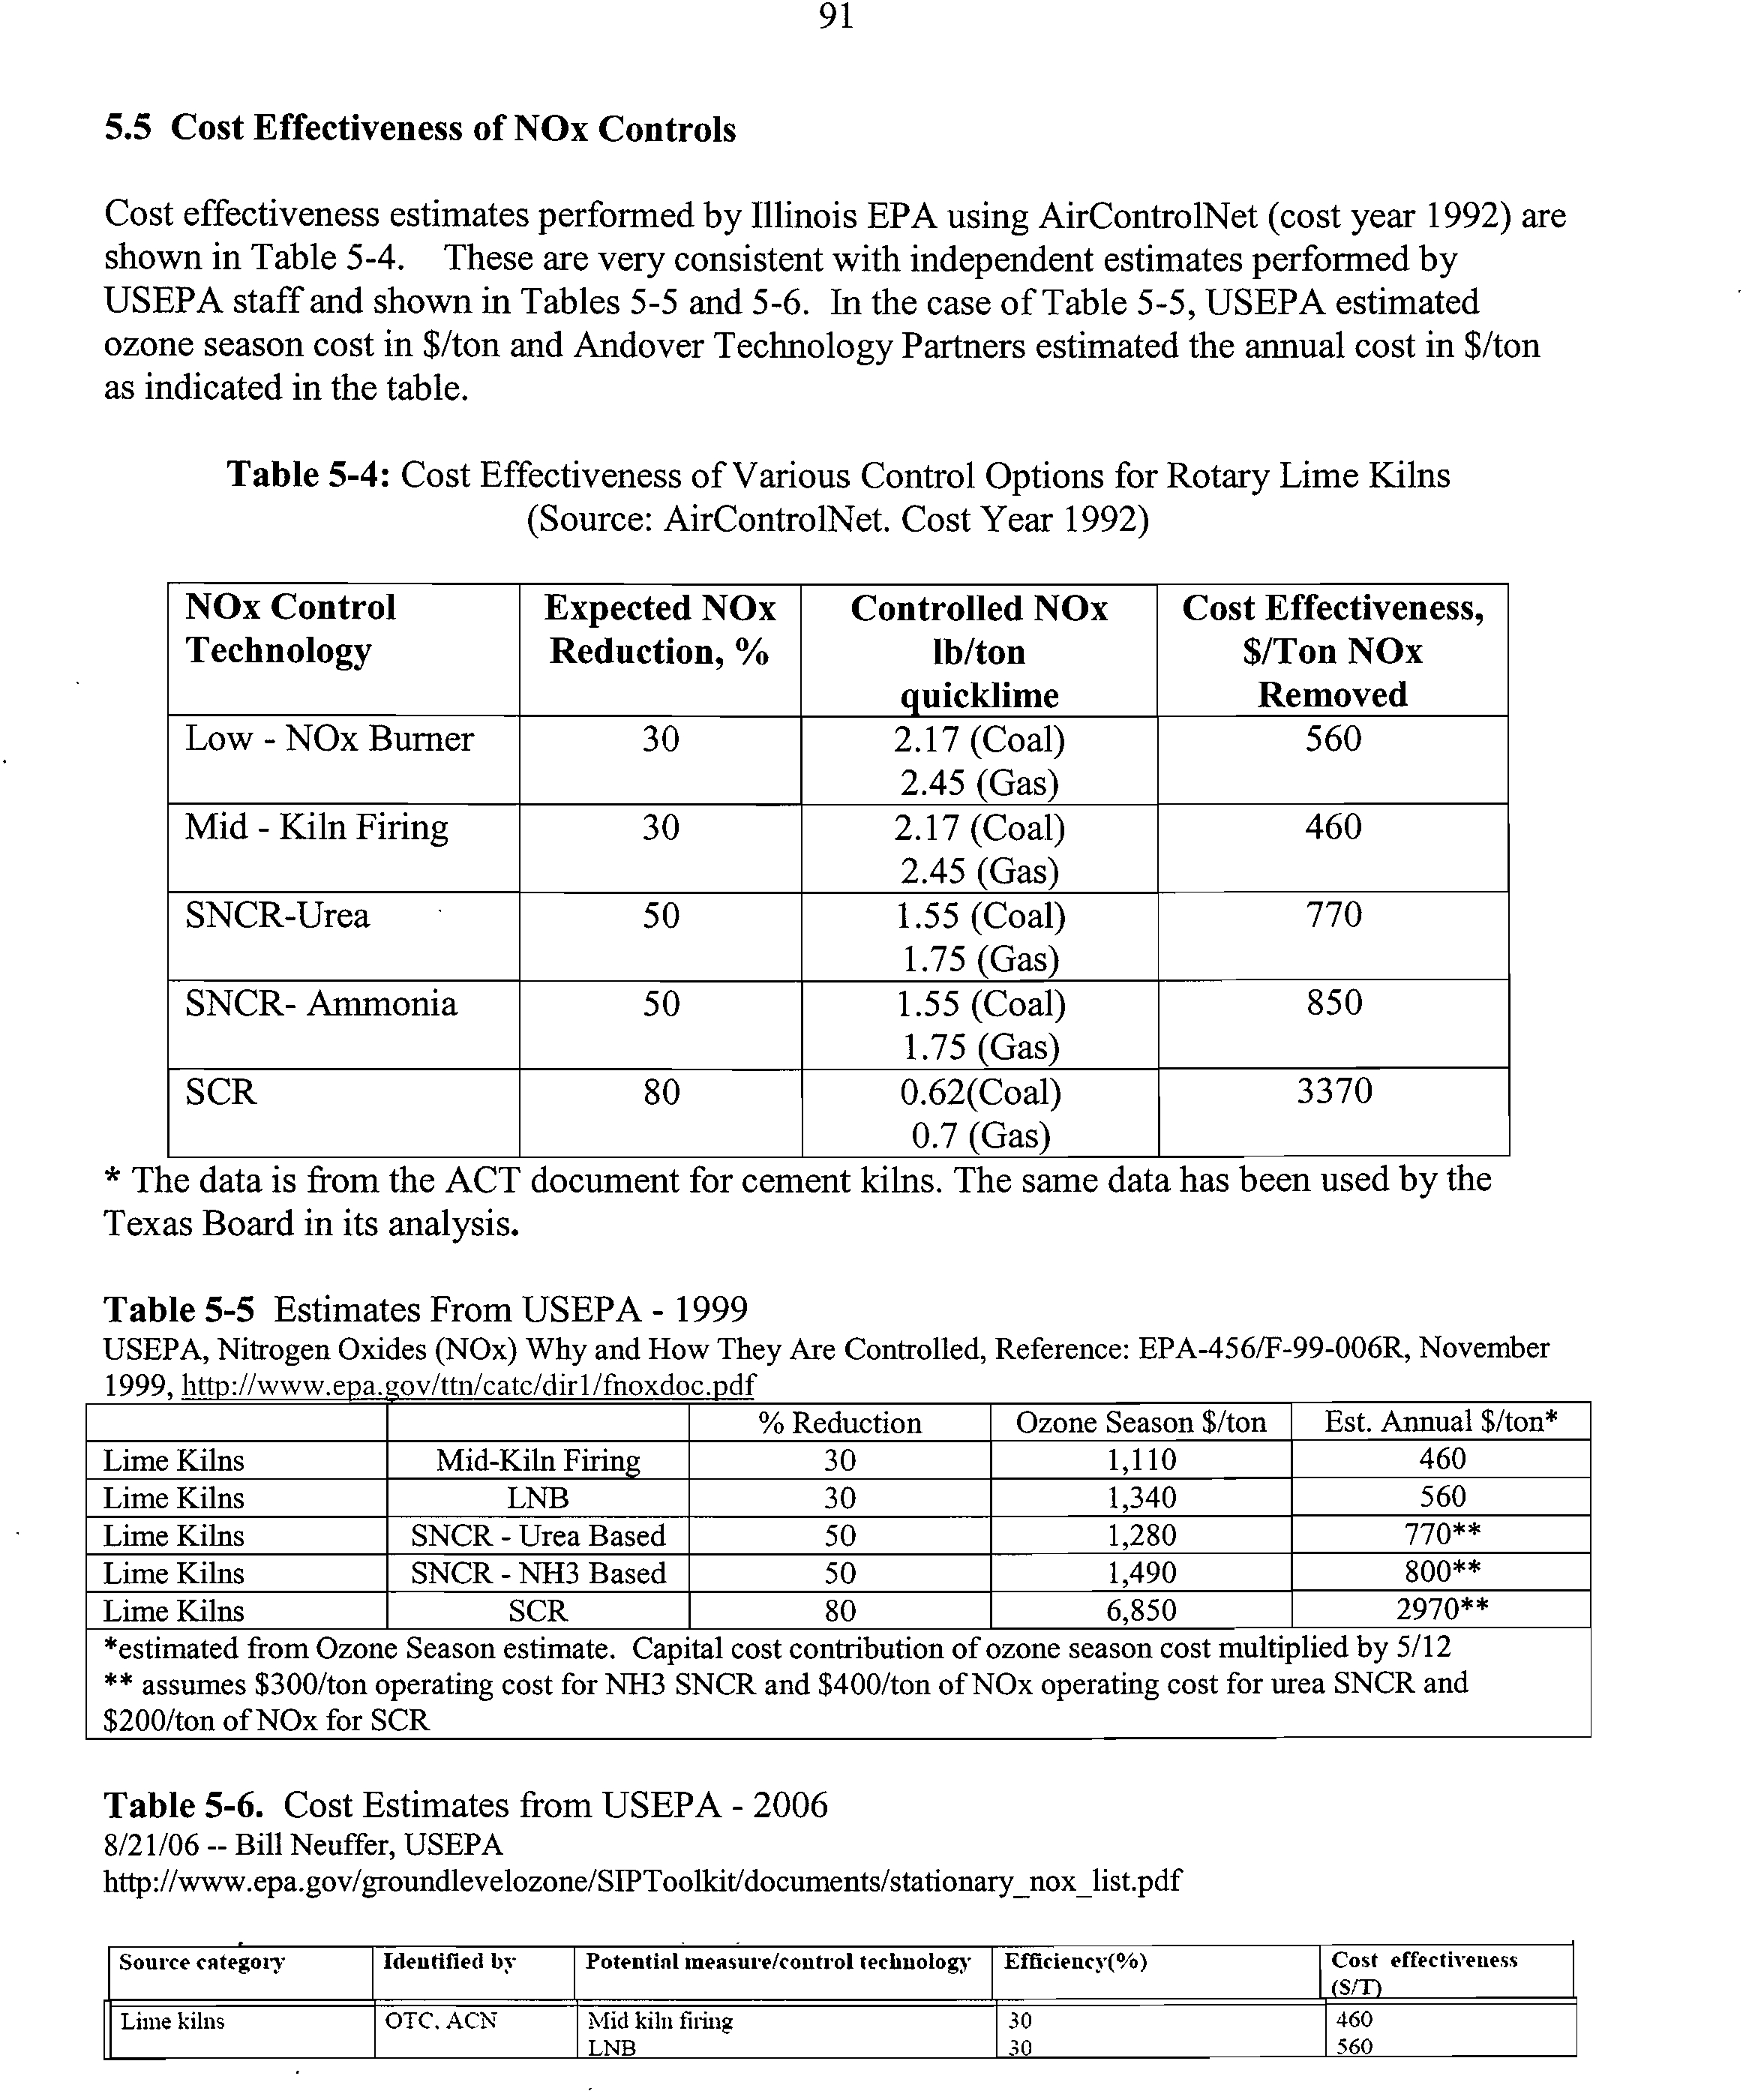
5.5
Cost Effectiveness of NOx Controls
91
6
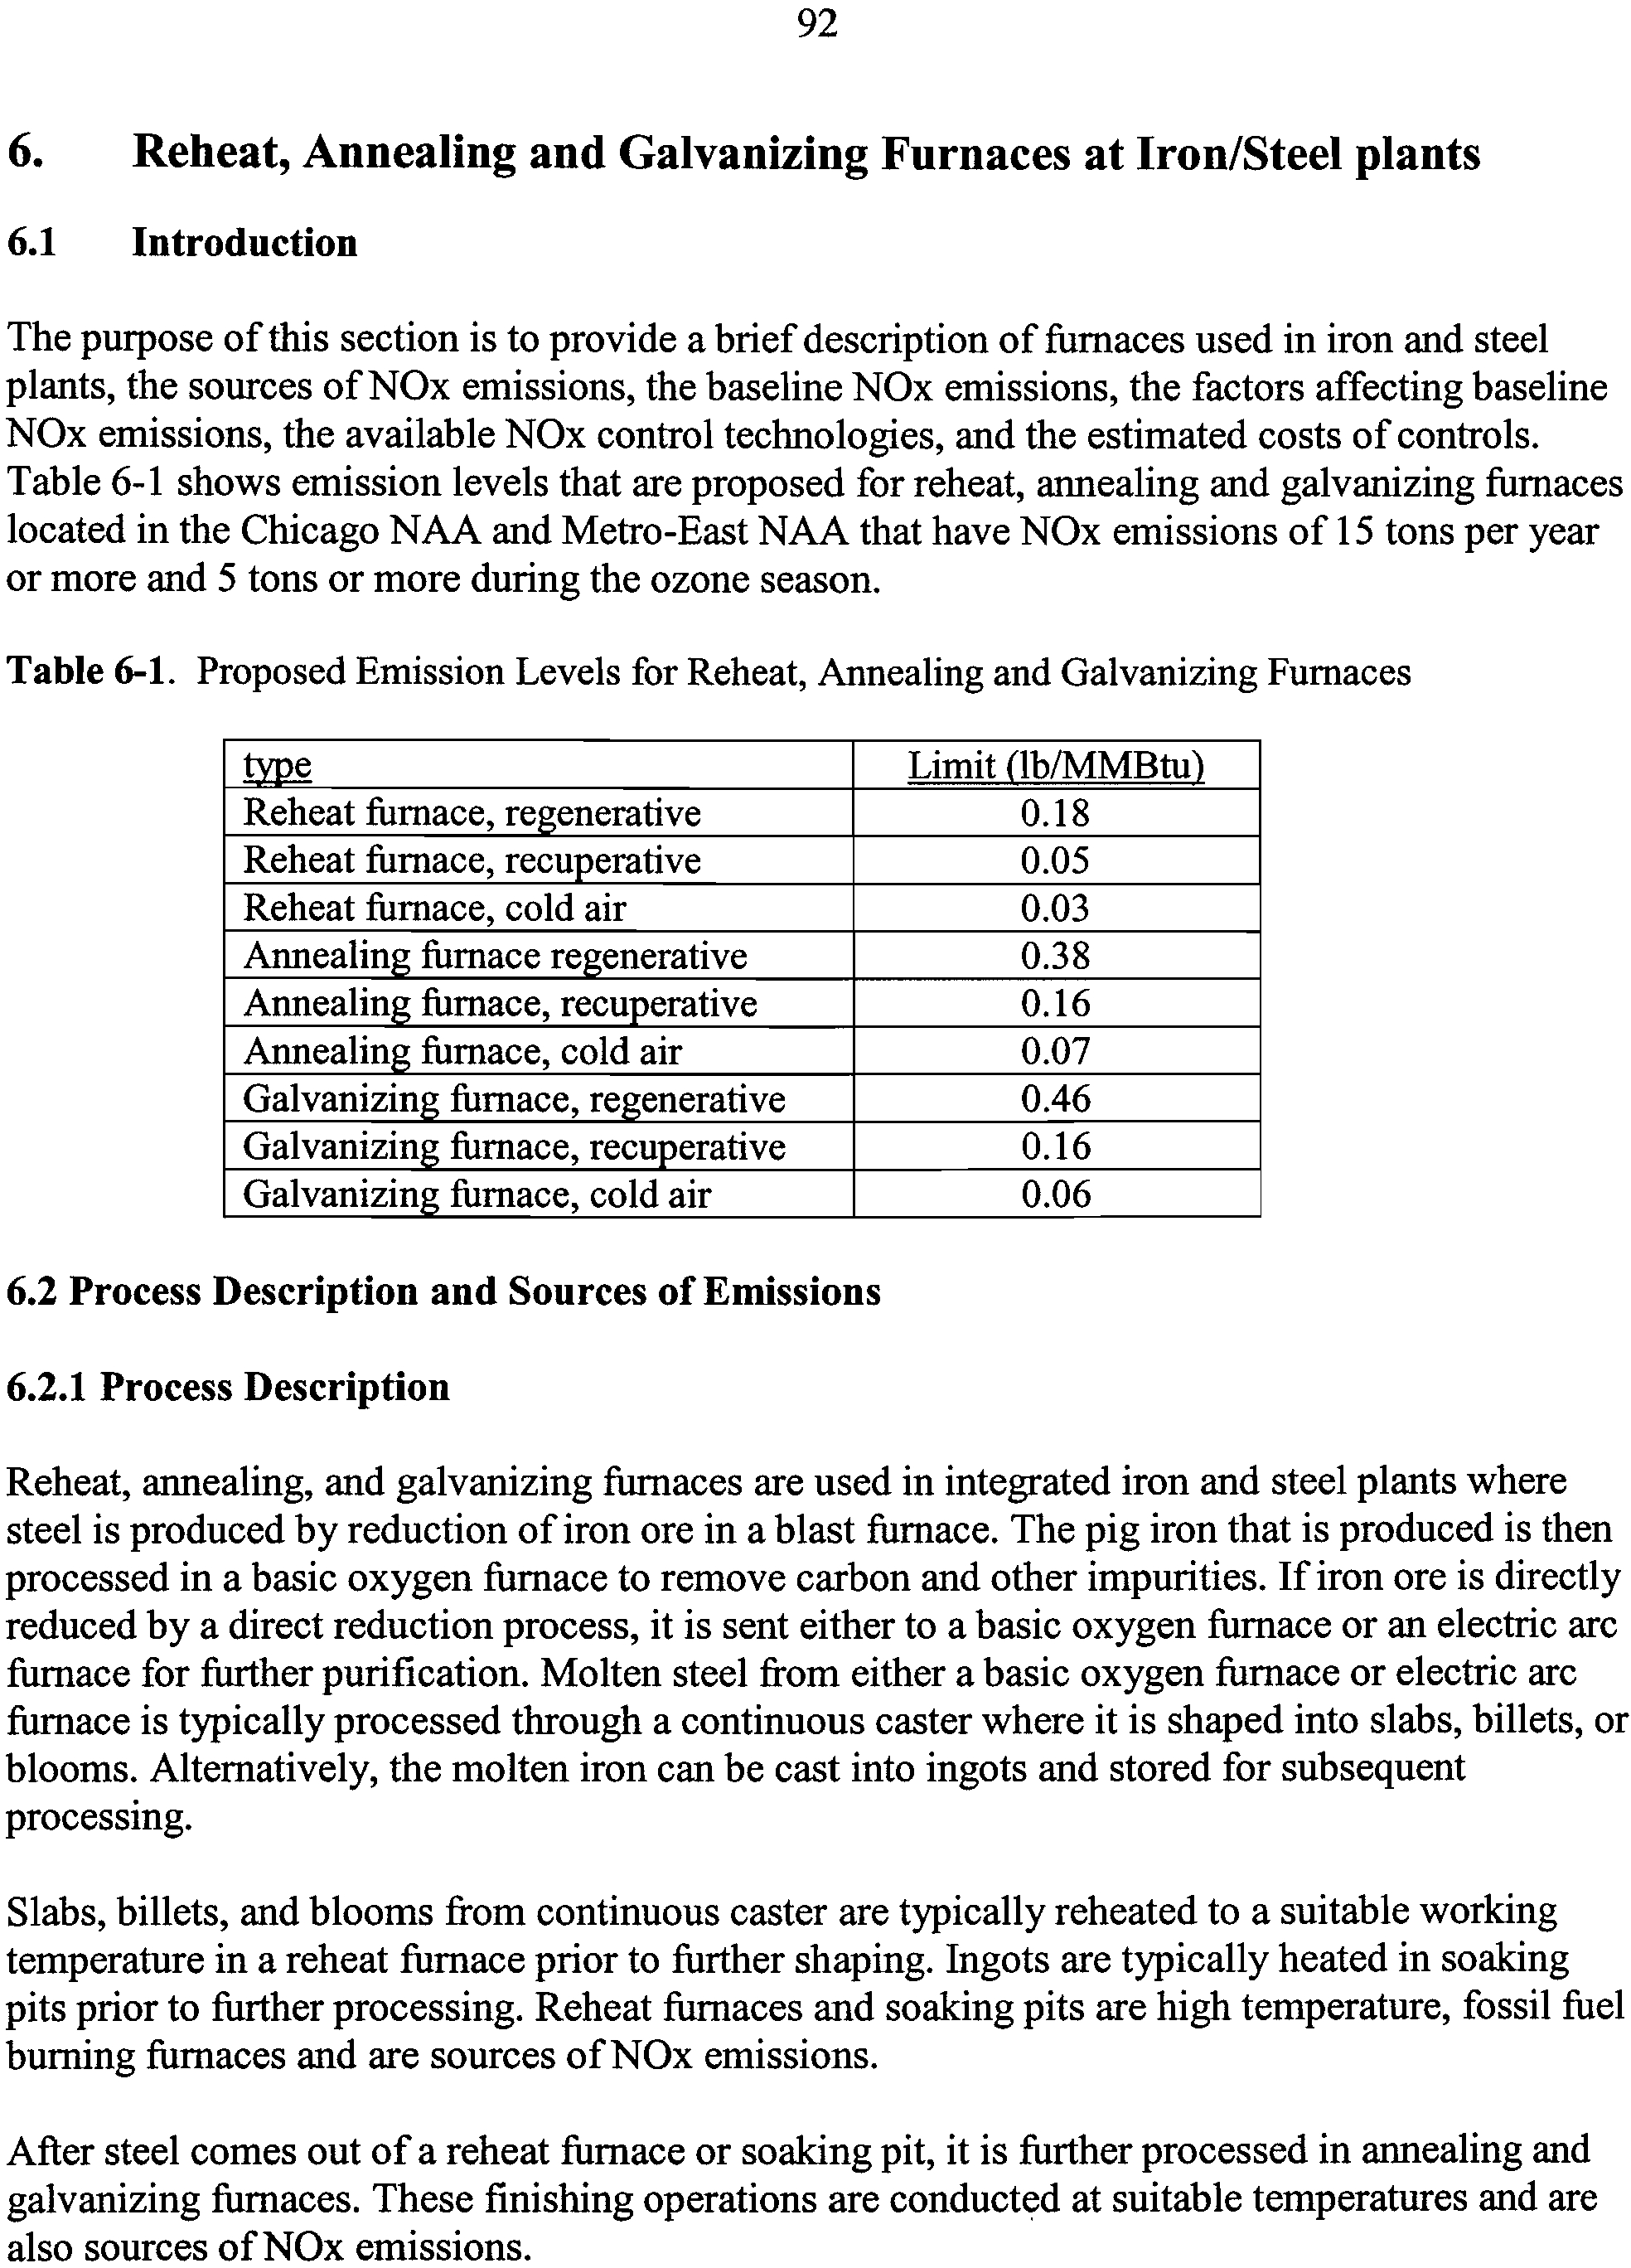
Reheat, Annealing and Galvanizing Furnaces at Iron/Steel plants
92
6.1
Introduction
92
6.2
Process Description and Sources of Emissions
92
6.3
Technical Feasibility of NOx Controls
95
6.4
Cost Effectiveness of NOx Controls
98
7
Glass Melting Furnaces
102
7.1
Introduction
102
7.2
Process Description and Sources of Emissions
102
7.3
Technical Feasibility of NOx Controls
105
7.4
Cost Effectiveness of NOx Controls
113
Section
Page
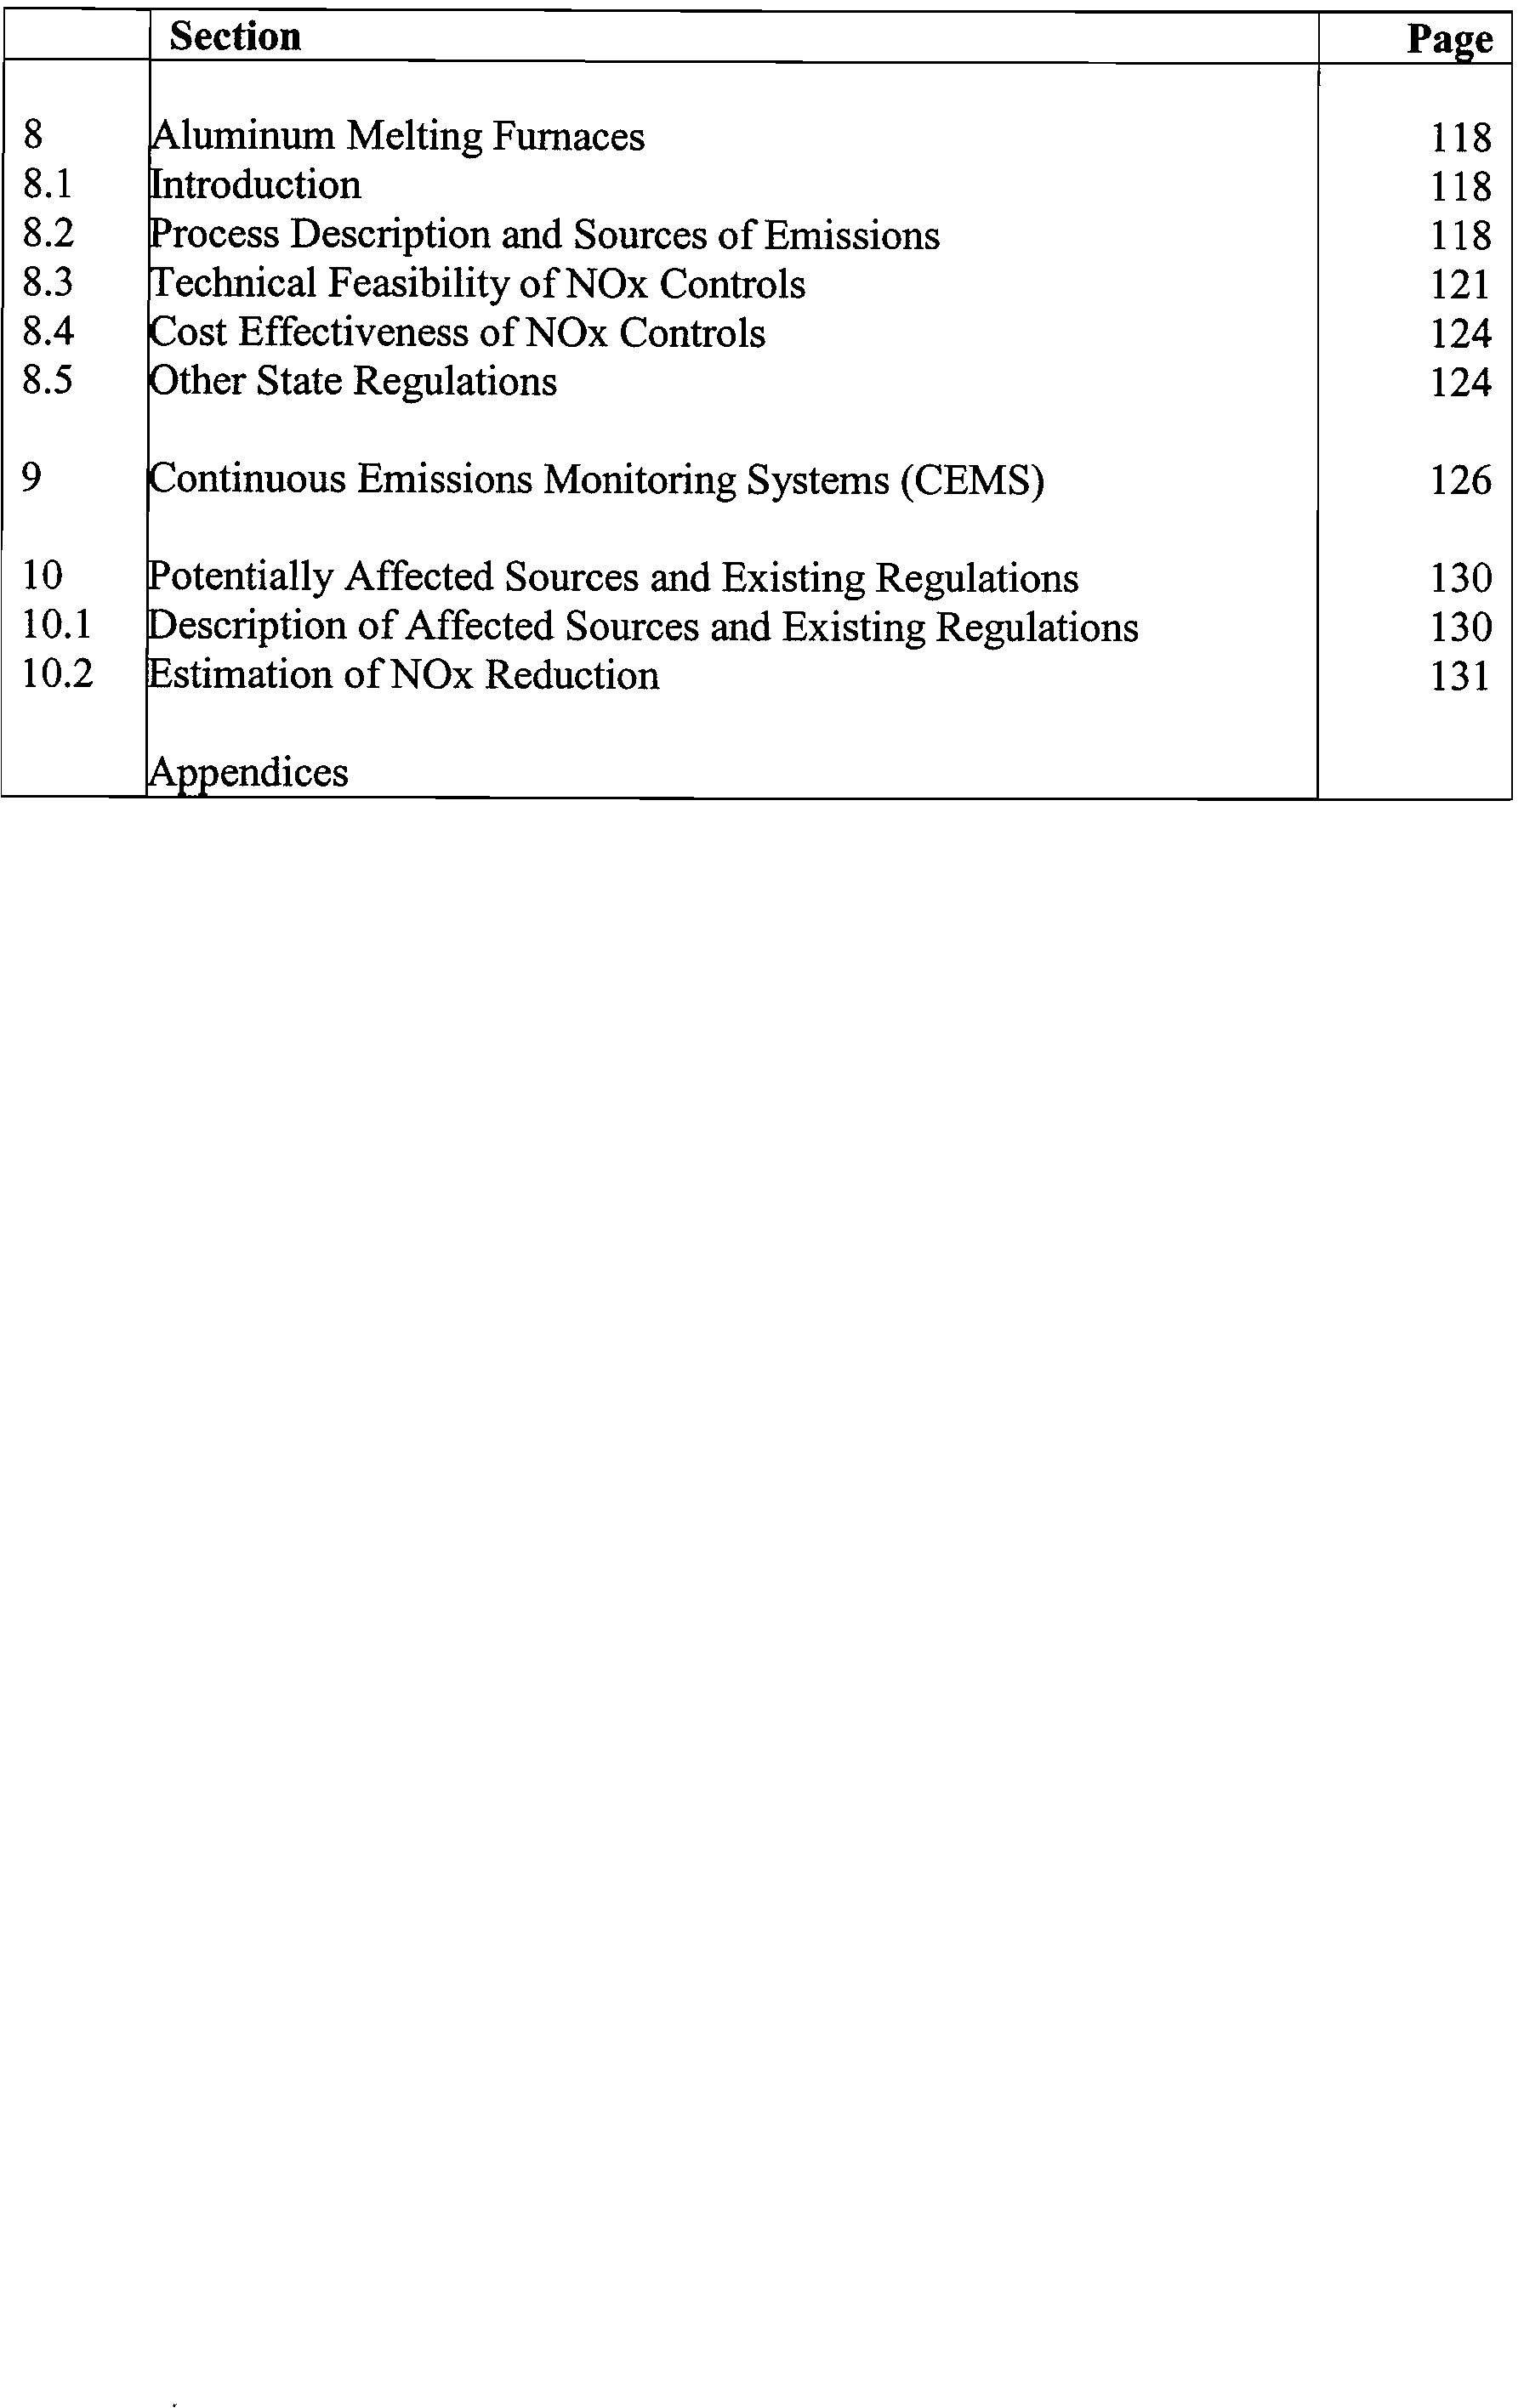
8
Aluminum Melting Furnaces
118
8.1
Introduction
118
8.2
Process Description and Sources of Emissions
118
8.3
Technical Feasibility of NOx Controls
121
8.4
Cost Effectiveness of NOx Controls
124
8.5
Other State Regulations
124
9
Continuous Emissions Monitoring Systems (CEMS)
126
10
Potentially Affected Sources and Existing Regulations
130
10.1
Description of Affected Sources and Existing Regulations
130
10.2
Estimation of NOx Reduction
131
Appendices
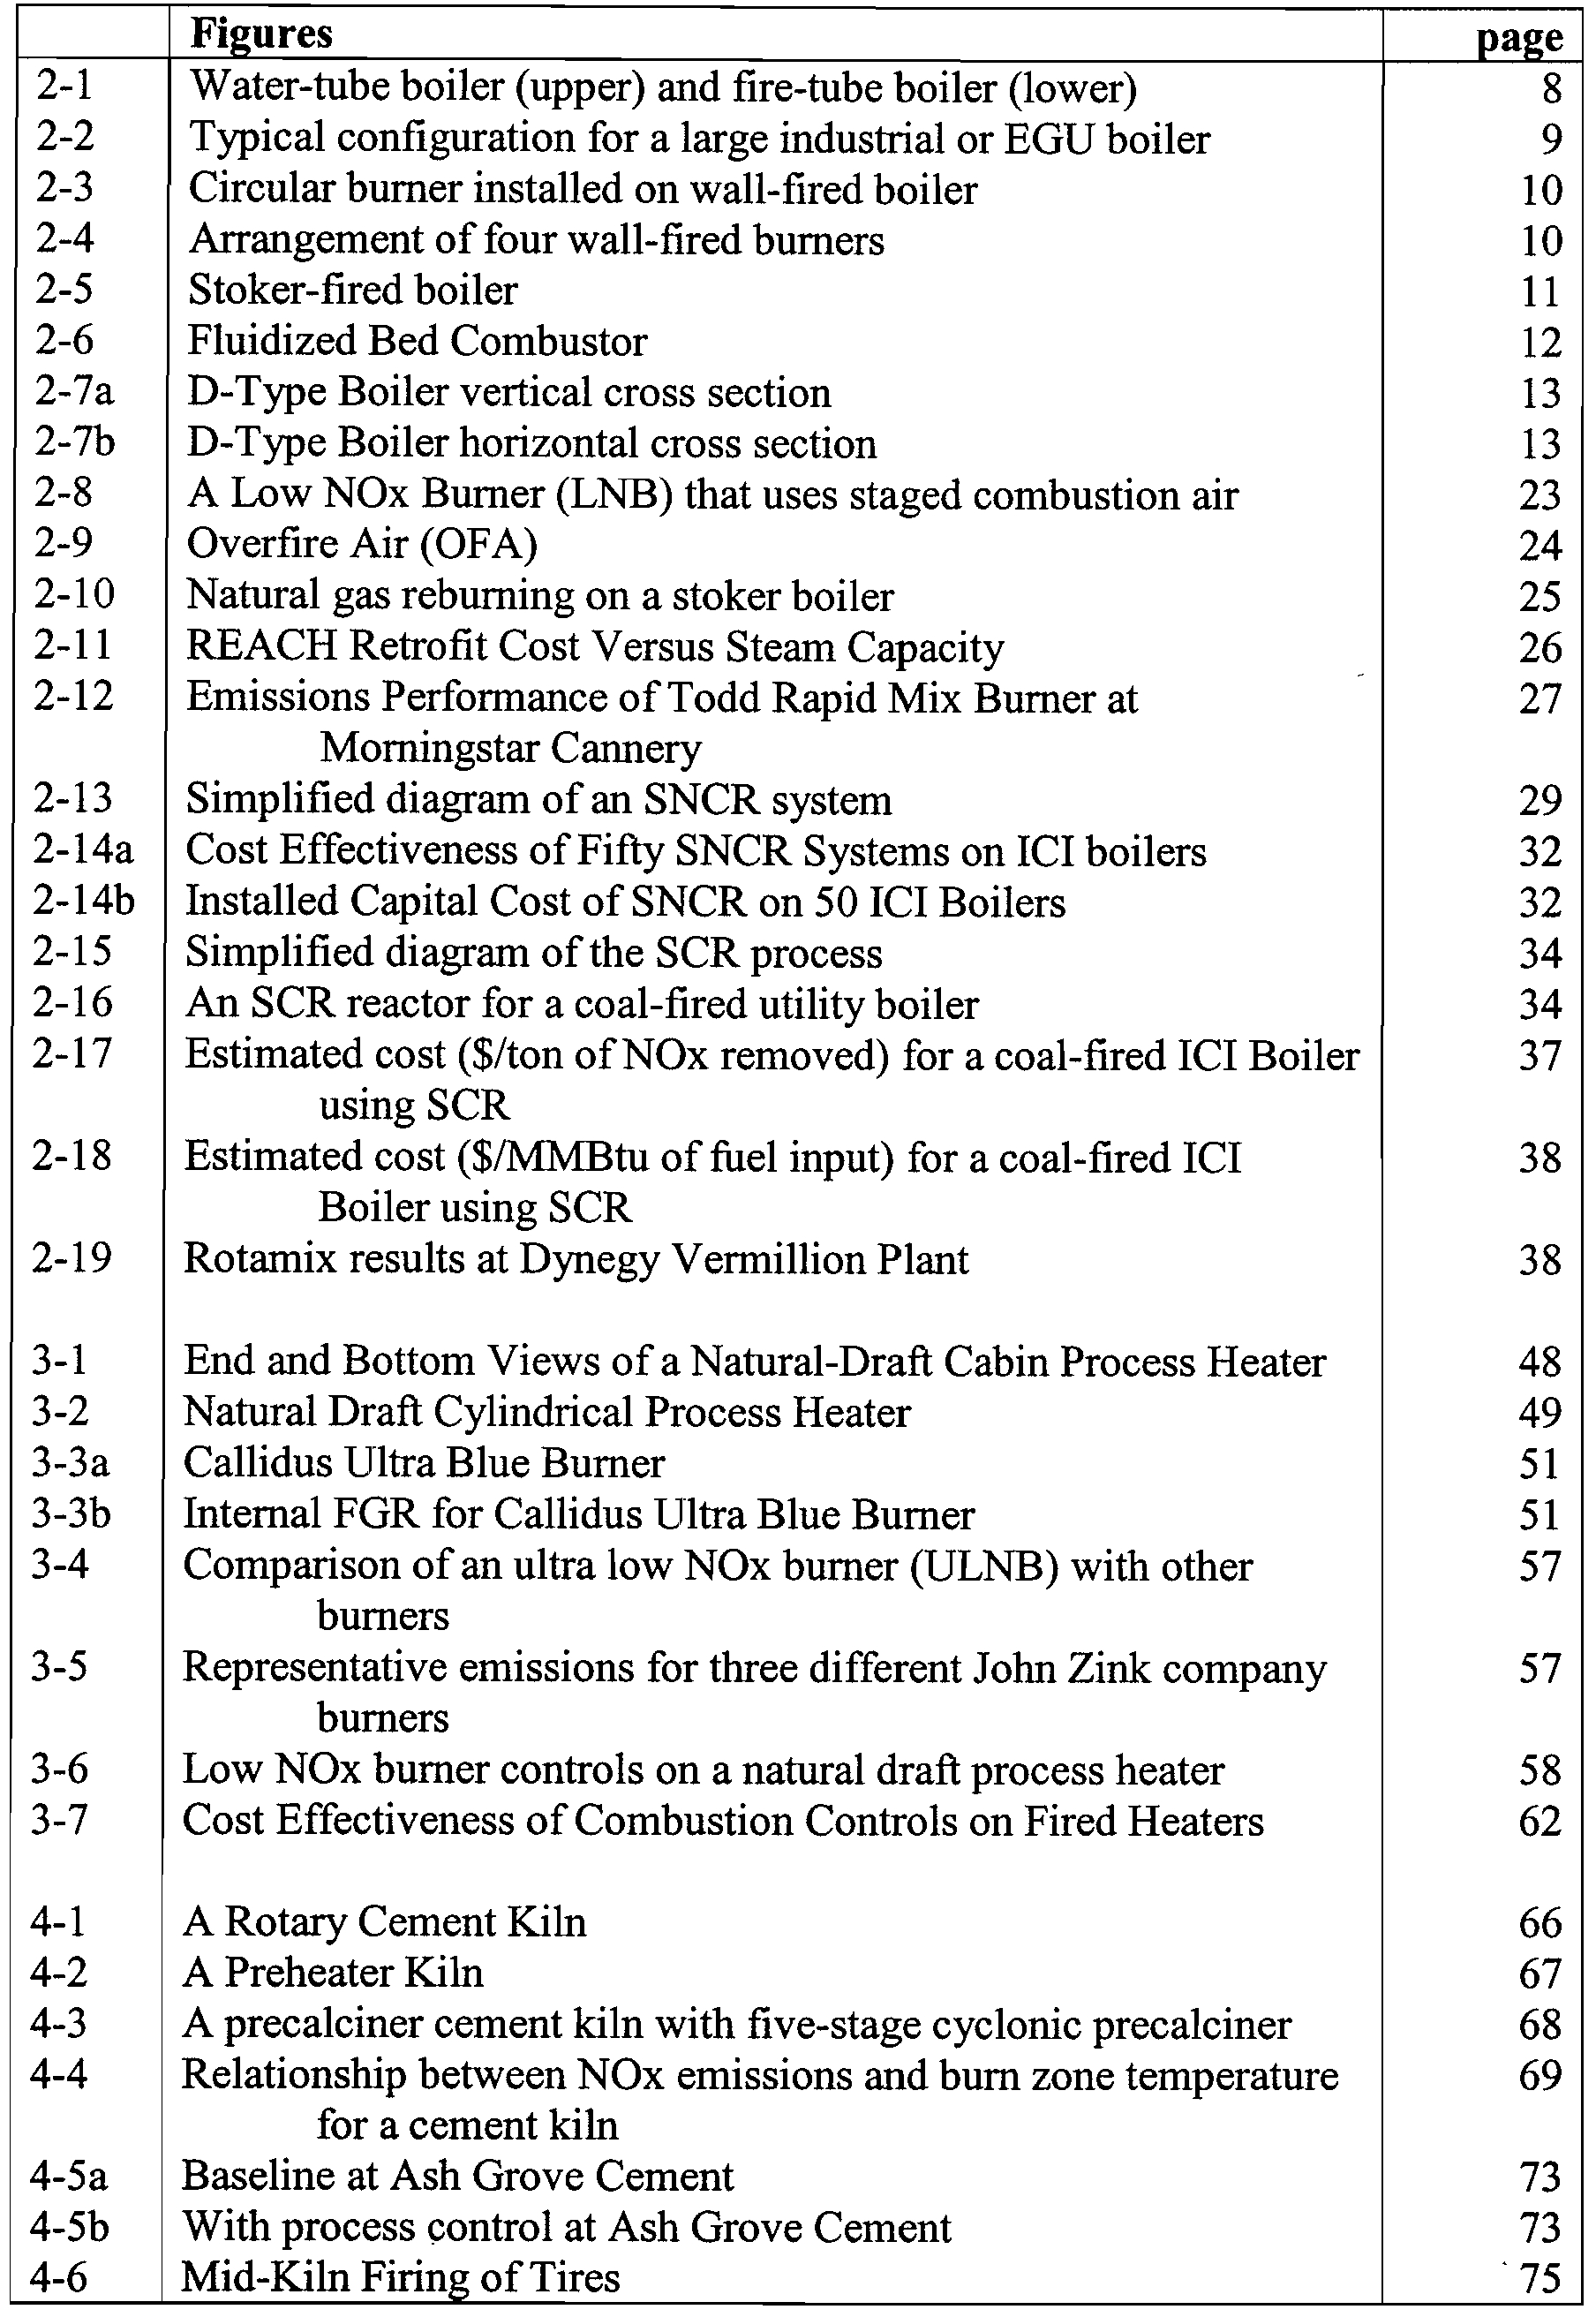
Figures
page
2-1
Water-tube boiler (upper) and fire-tube boiler (lower)
8
2-2
Typical configuration for a large industrial or EGU boiler
9
2-3
Circular burner installed on wall-fired boiler
10
2-4
Arrangement of four wall-fired burners
10
2-5
Stoker-fired boiler
11
2-6
Fluidized Bed Combustor
12
2-7a
D-Type Boiler vertical cross section
13
2-7b
D-Type Boiler horizontal cross section
13
2-8
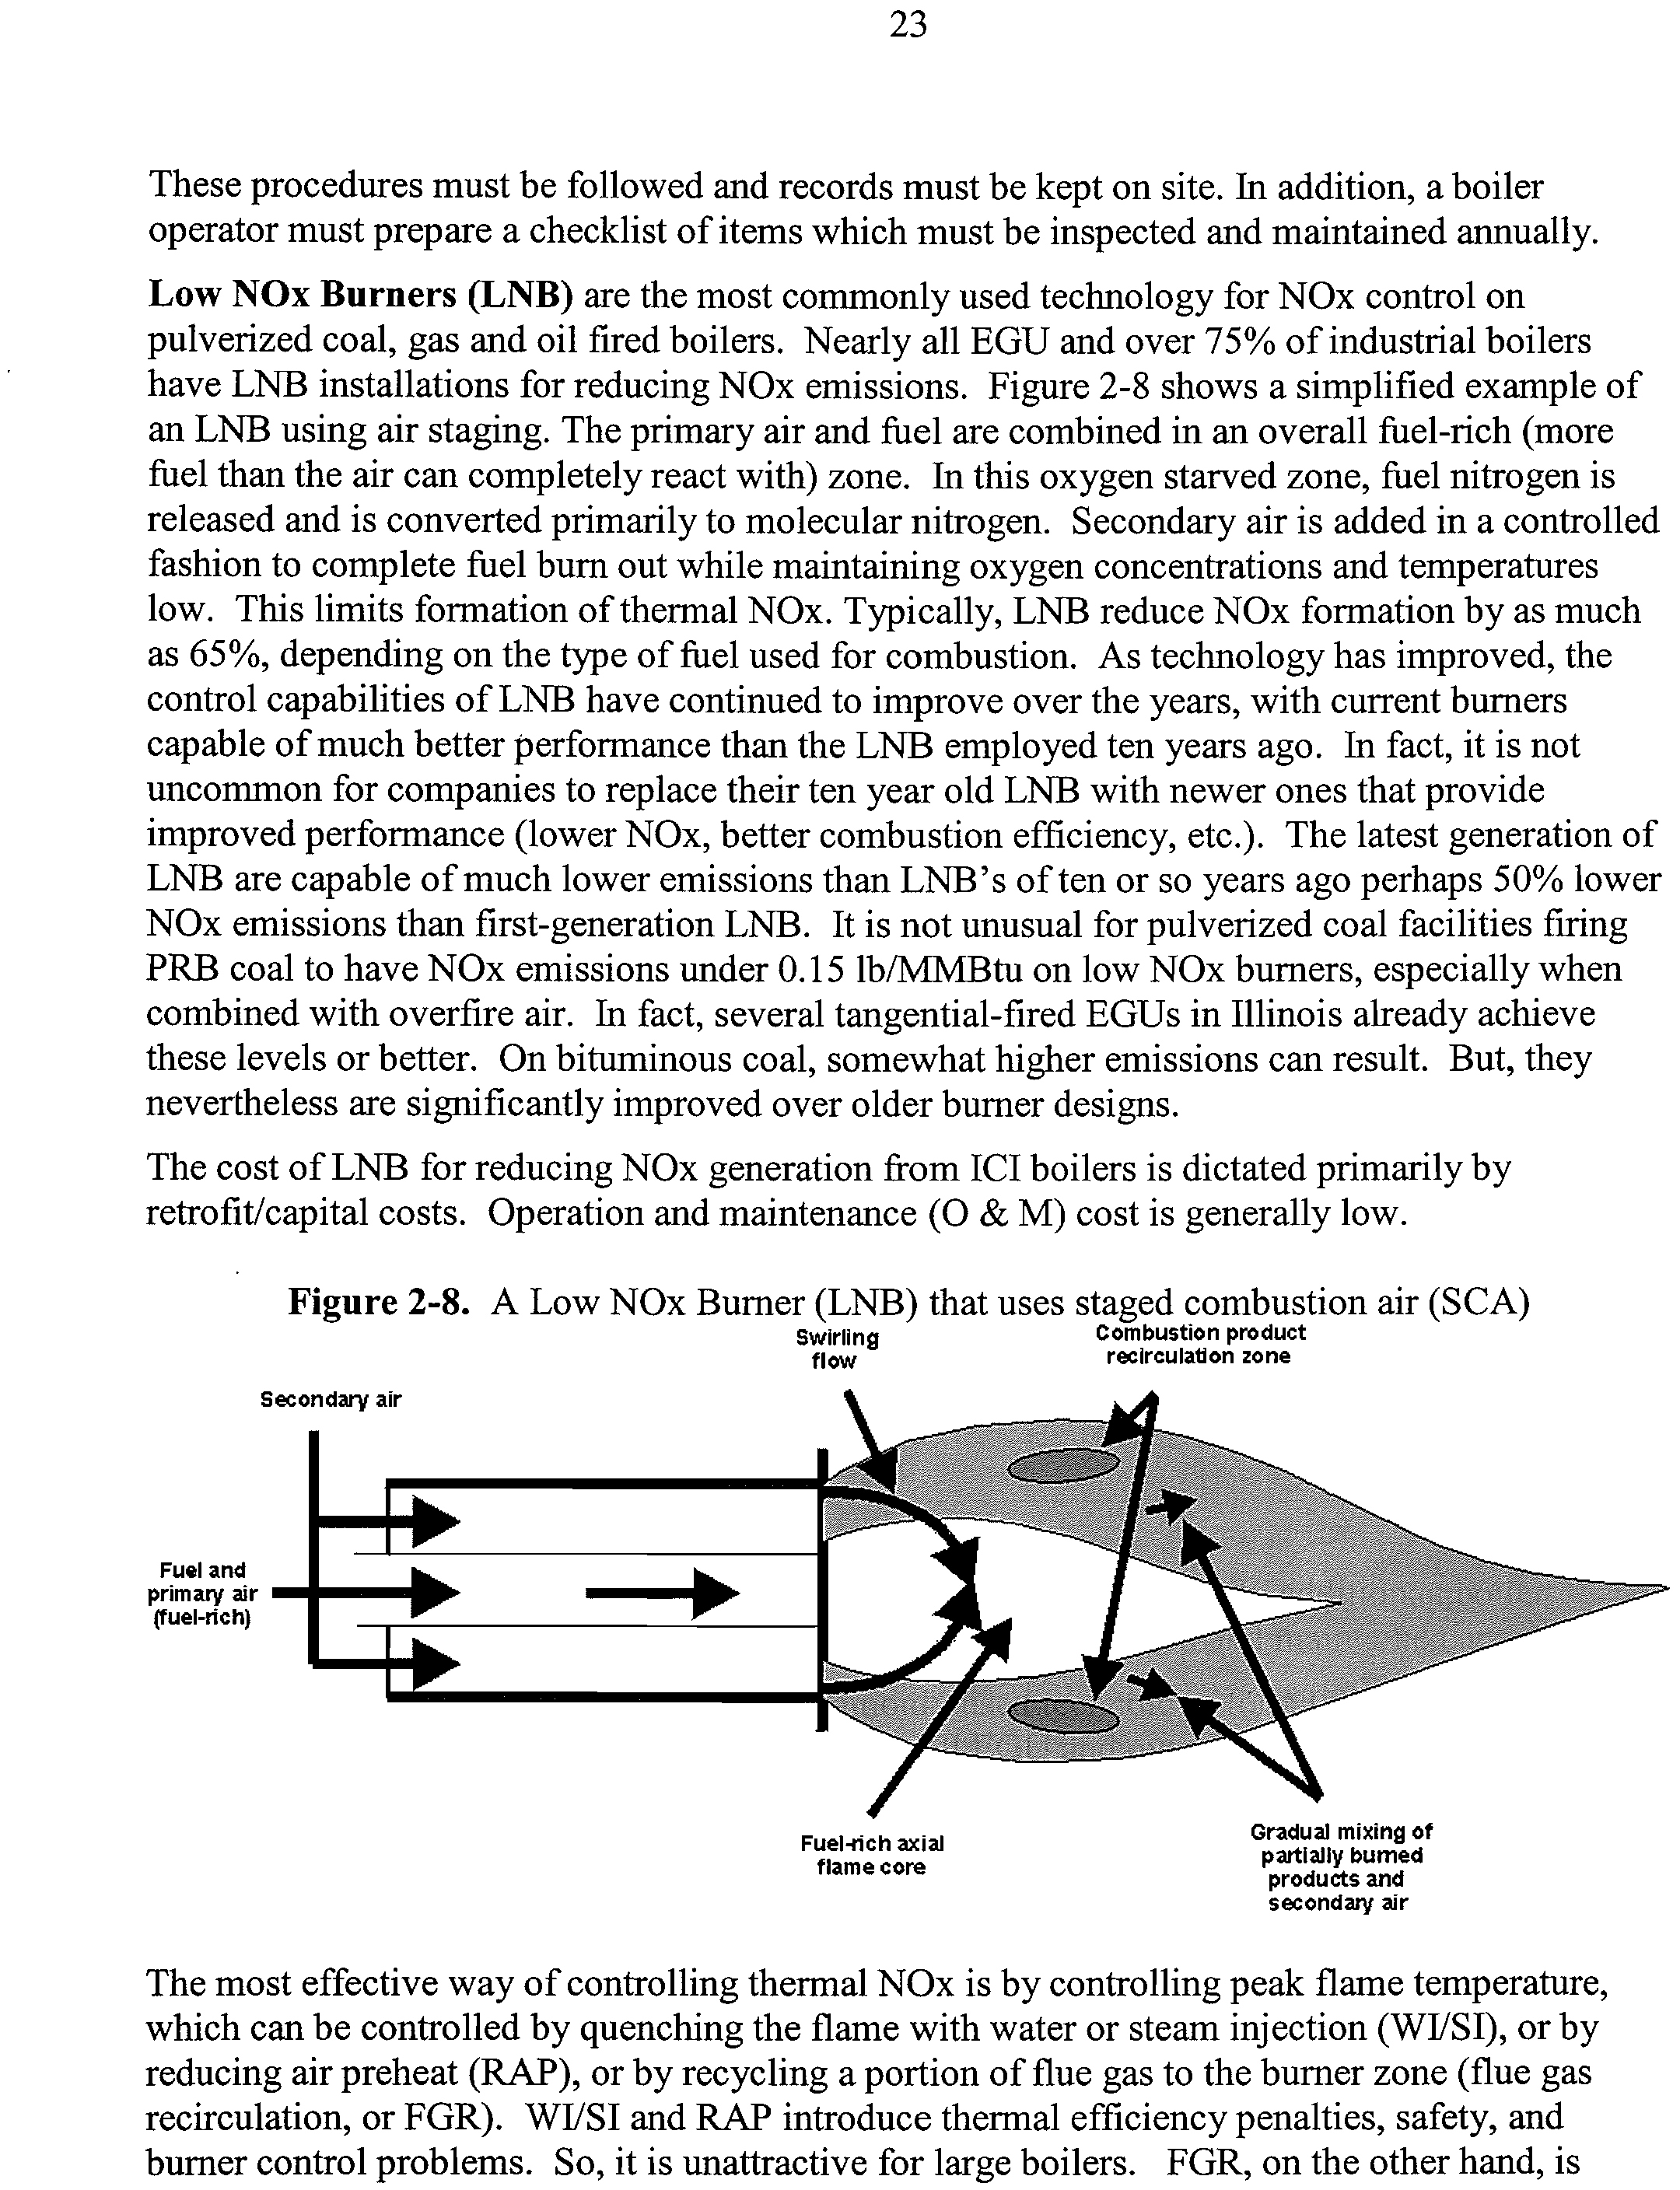
A Low NOx Burner (LNB) that uses staged combustion air
23
2-9
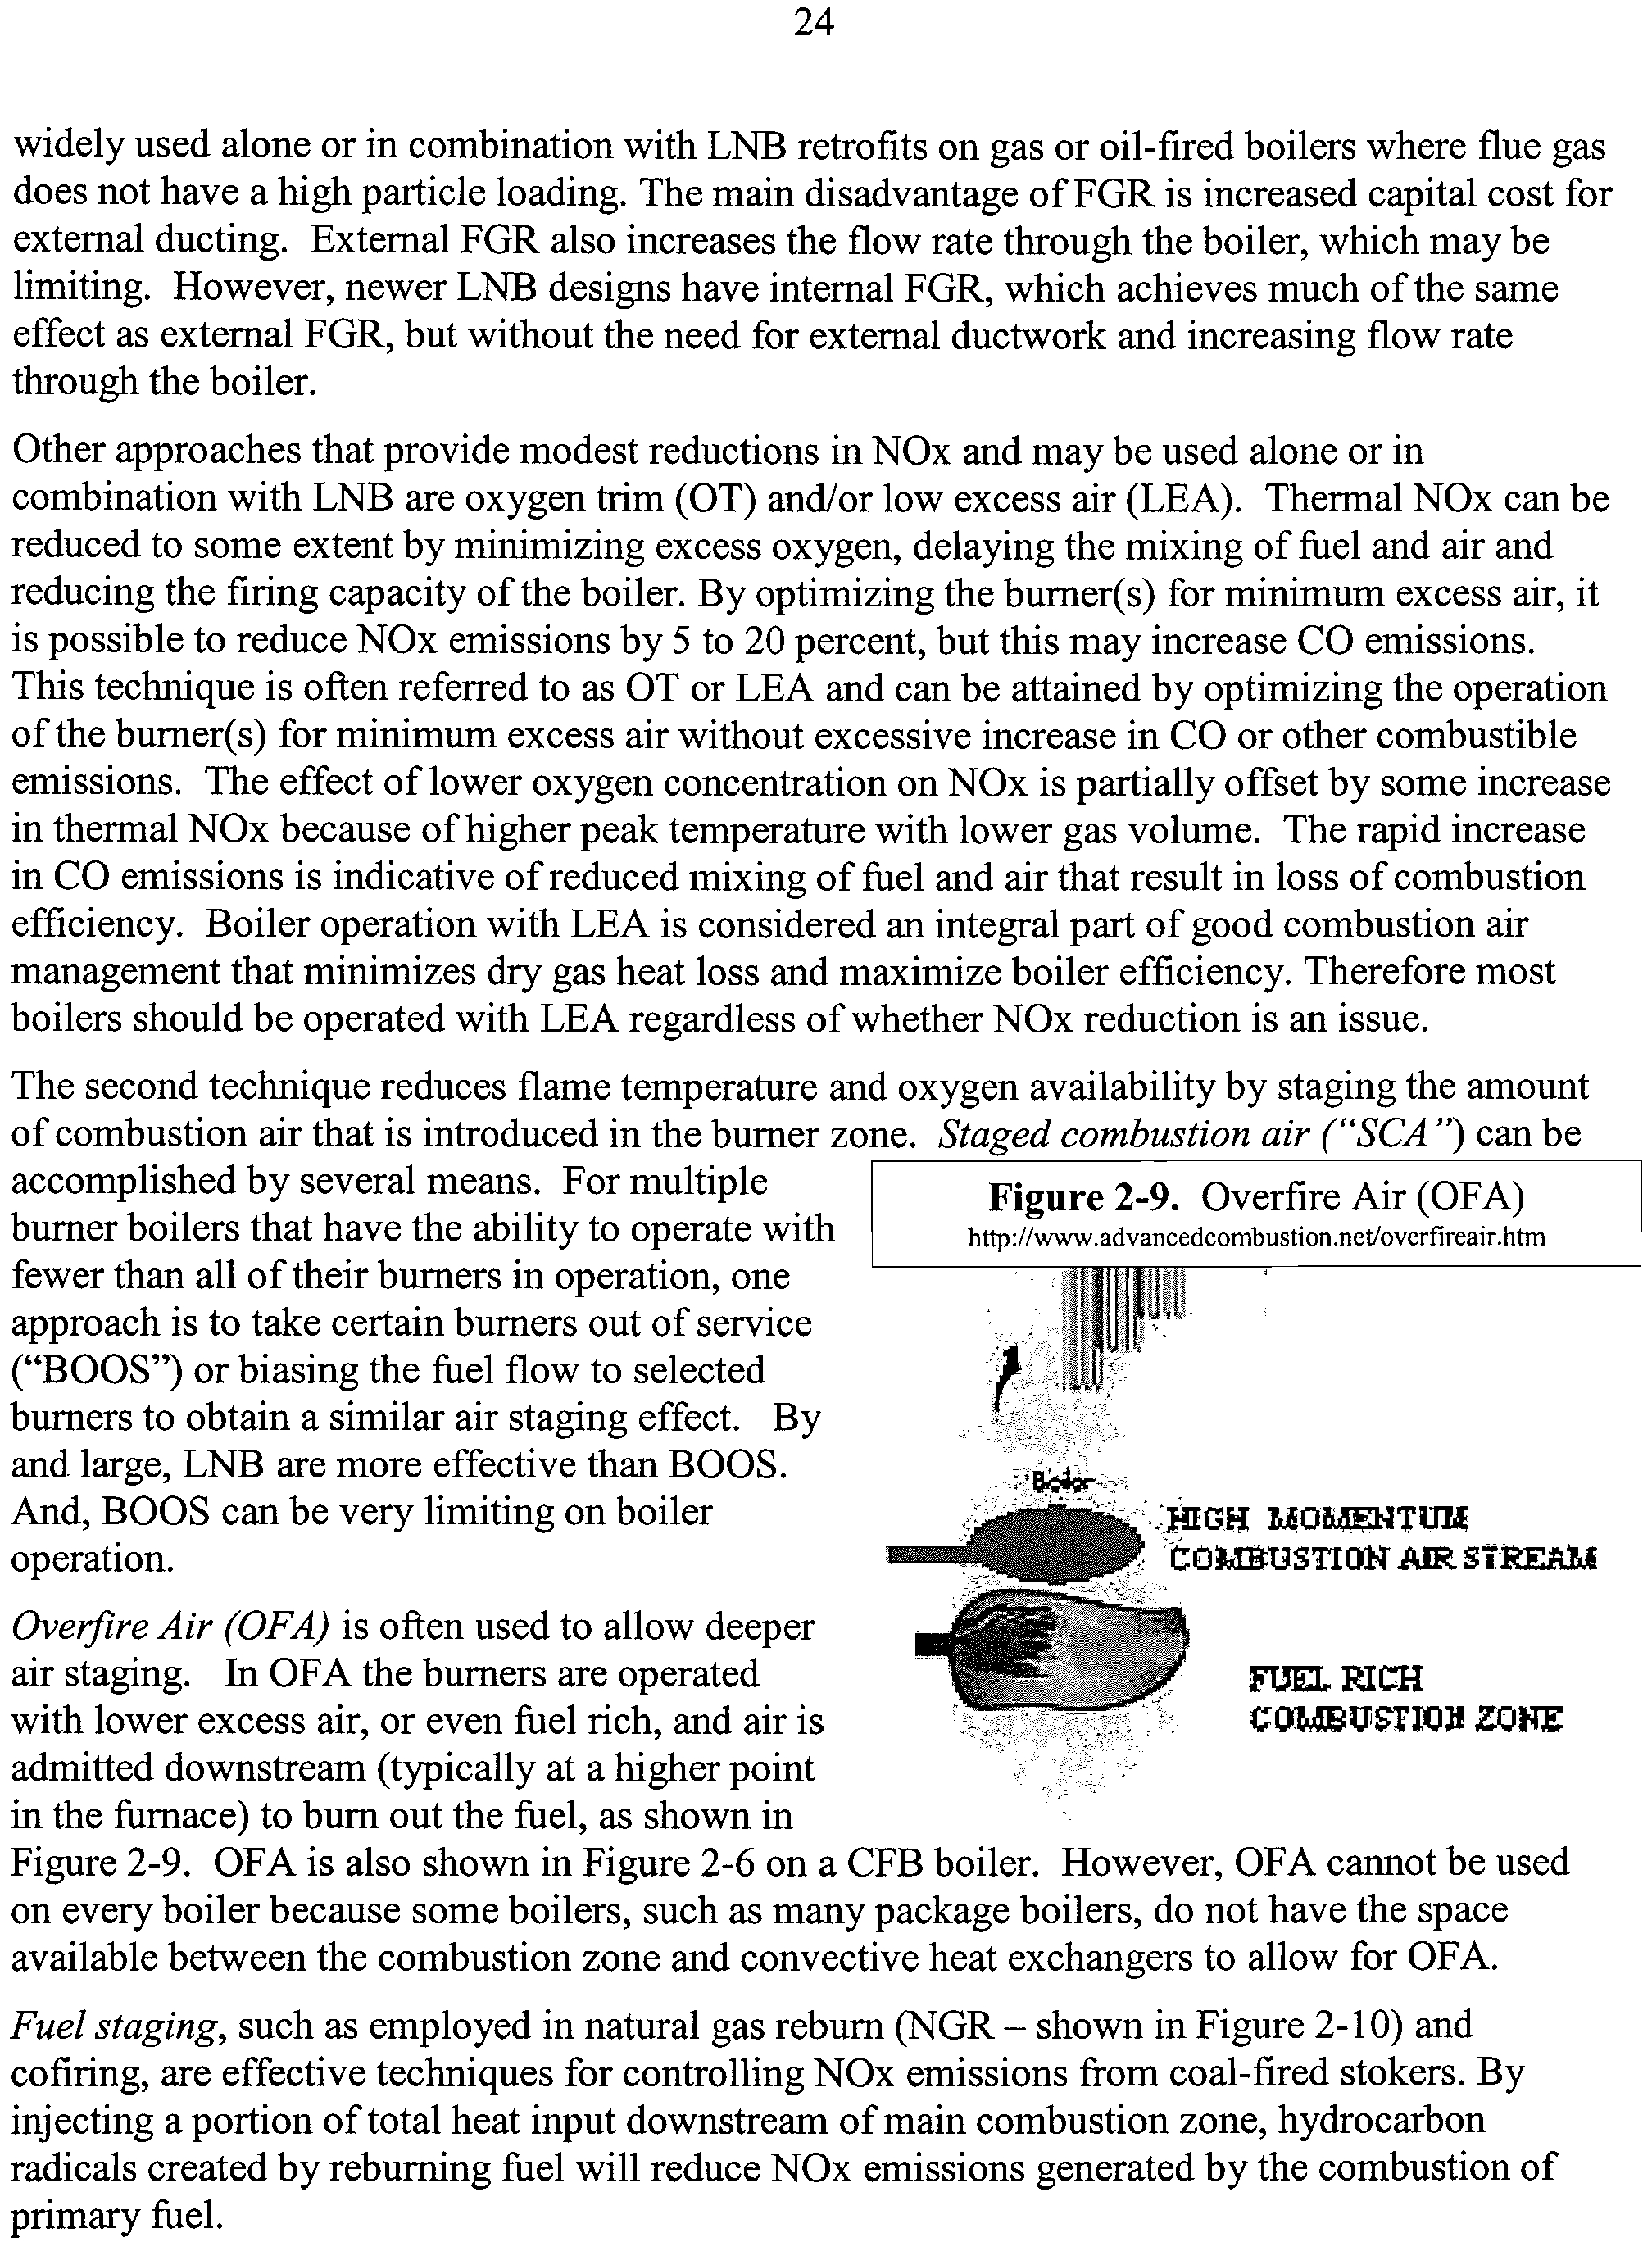
Overfire Air (OFA)
24
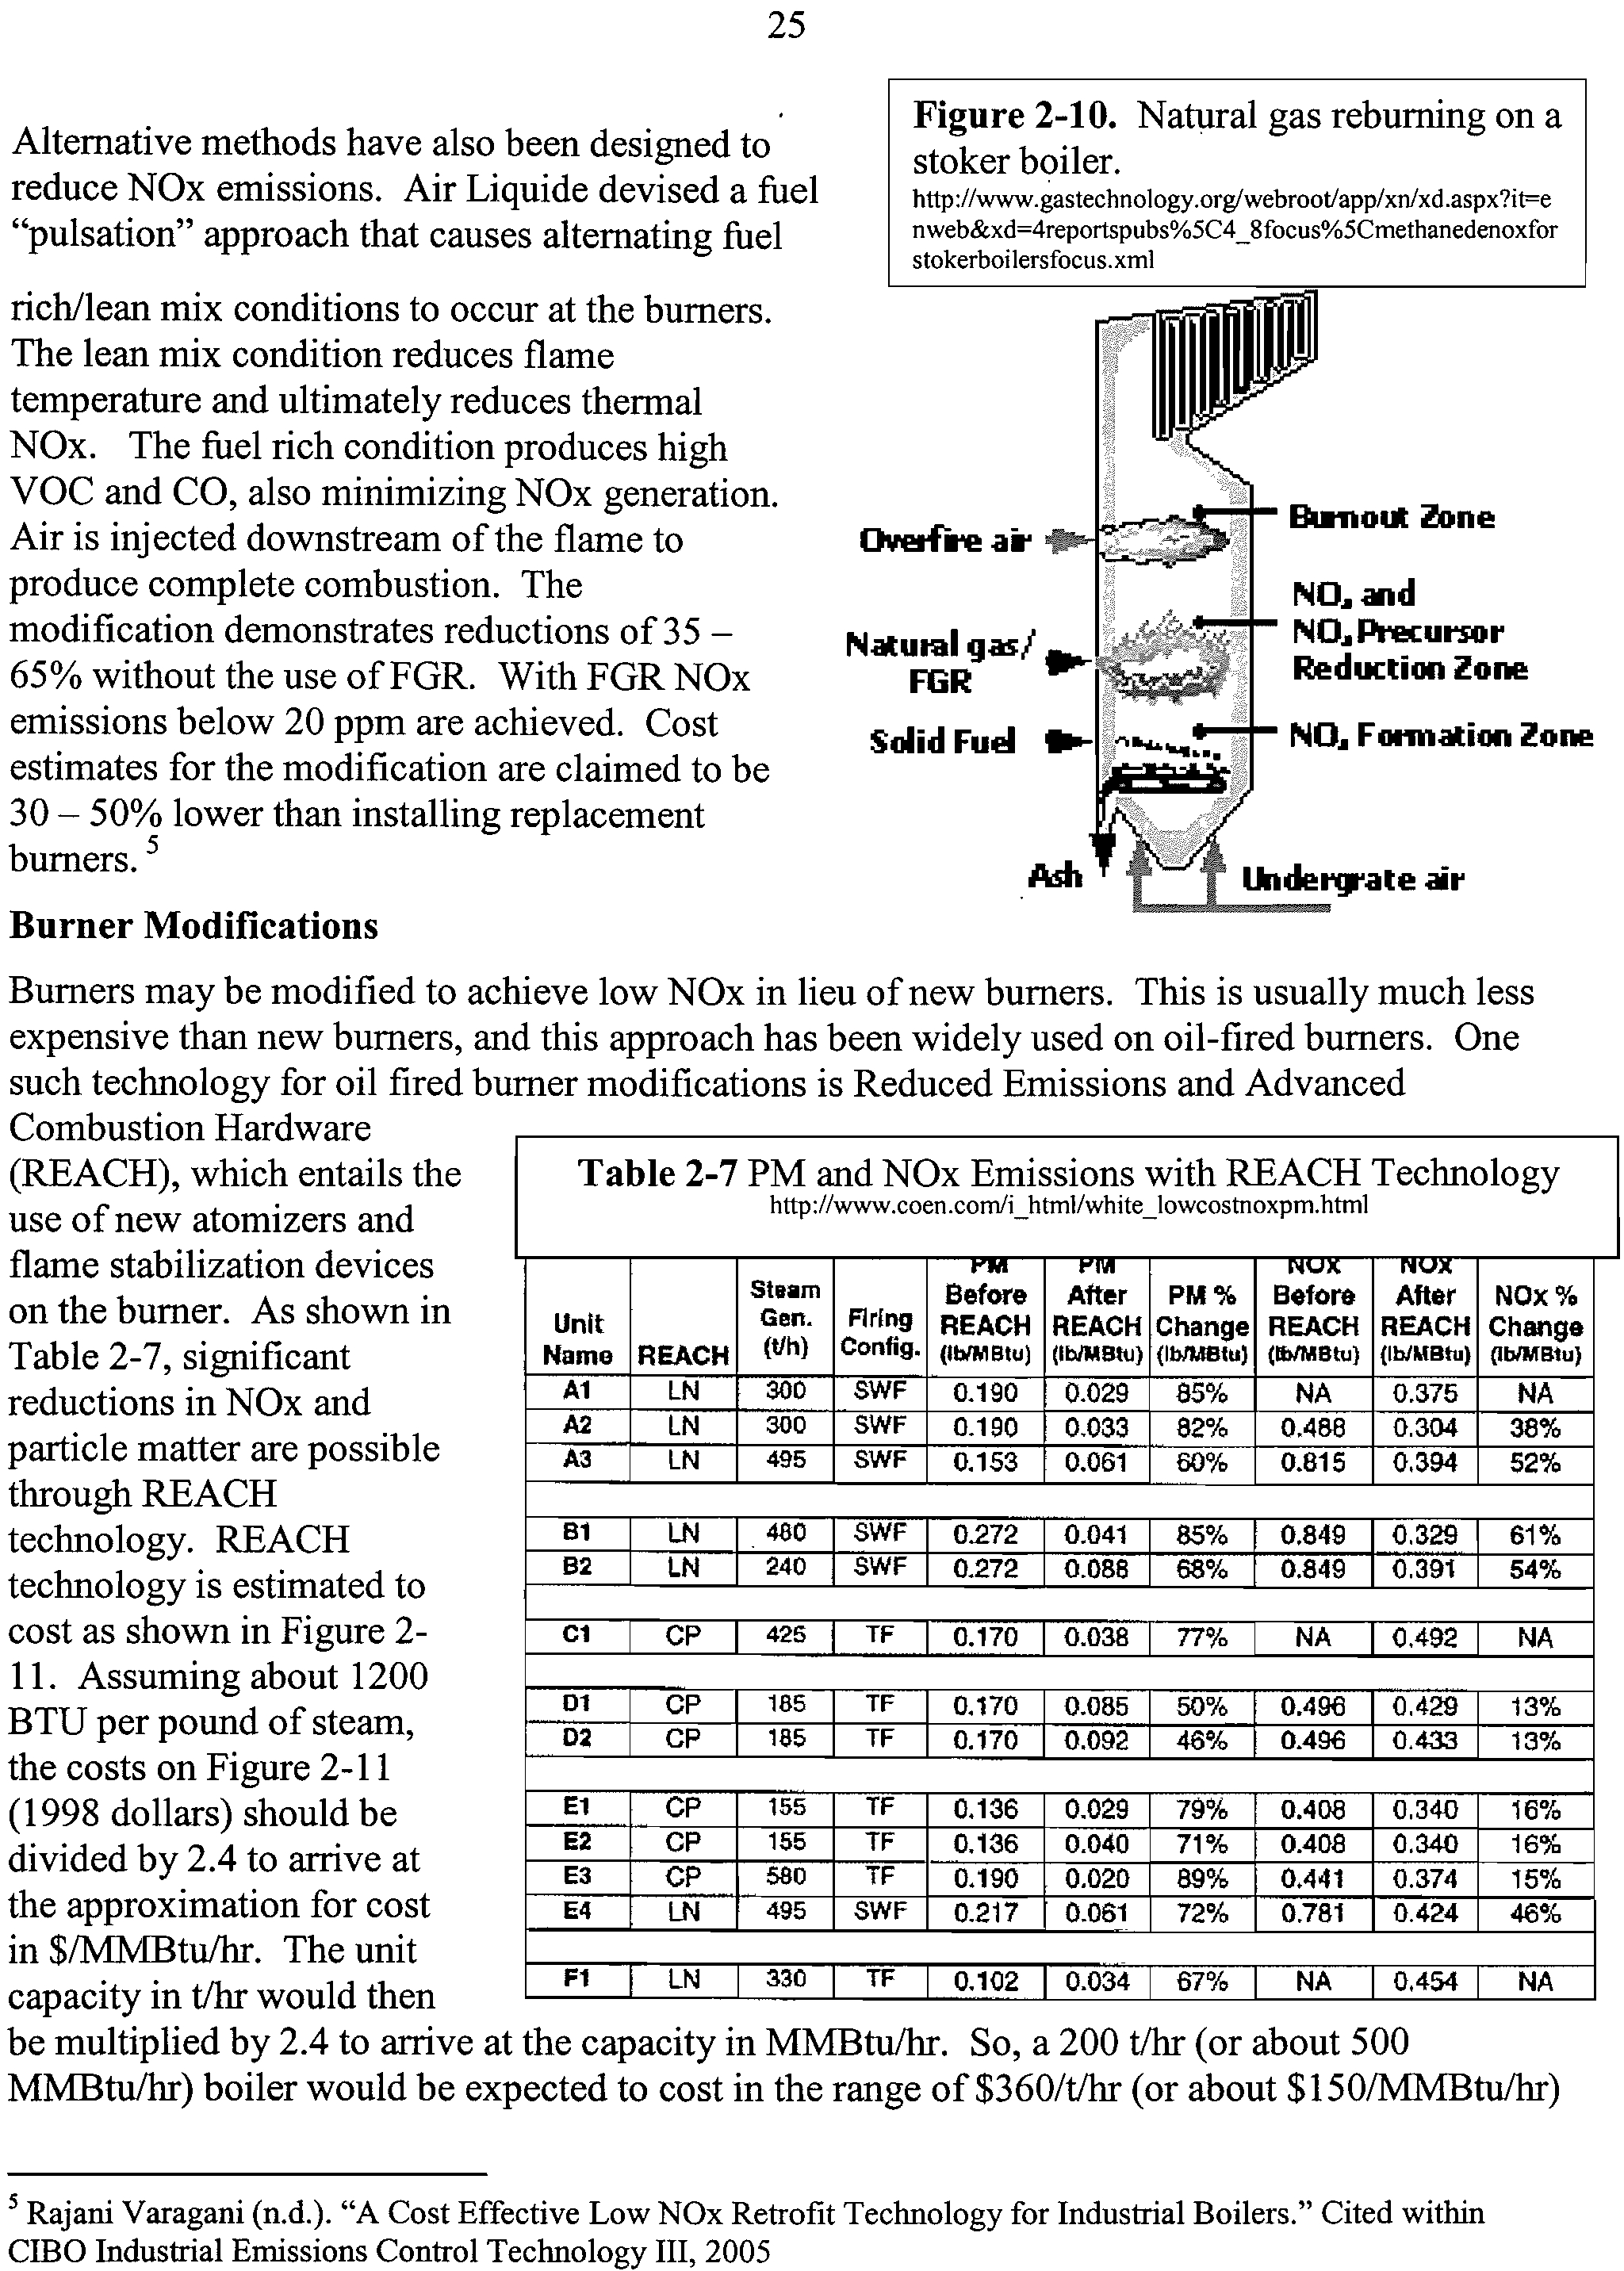
2-10
Natural gas reburning on a stoker boiler
25
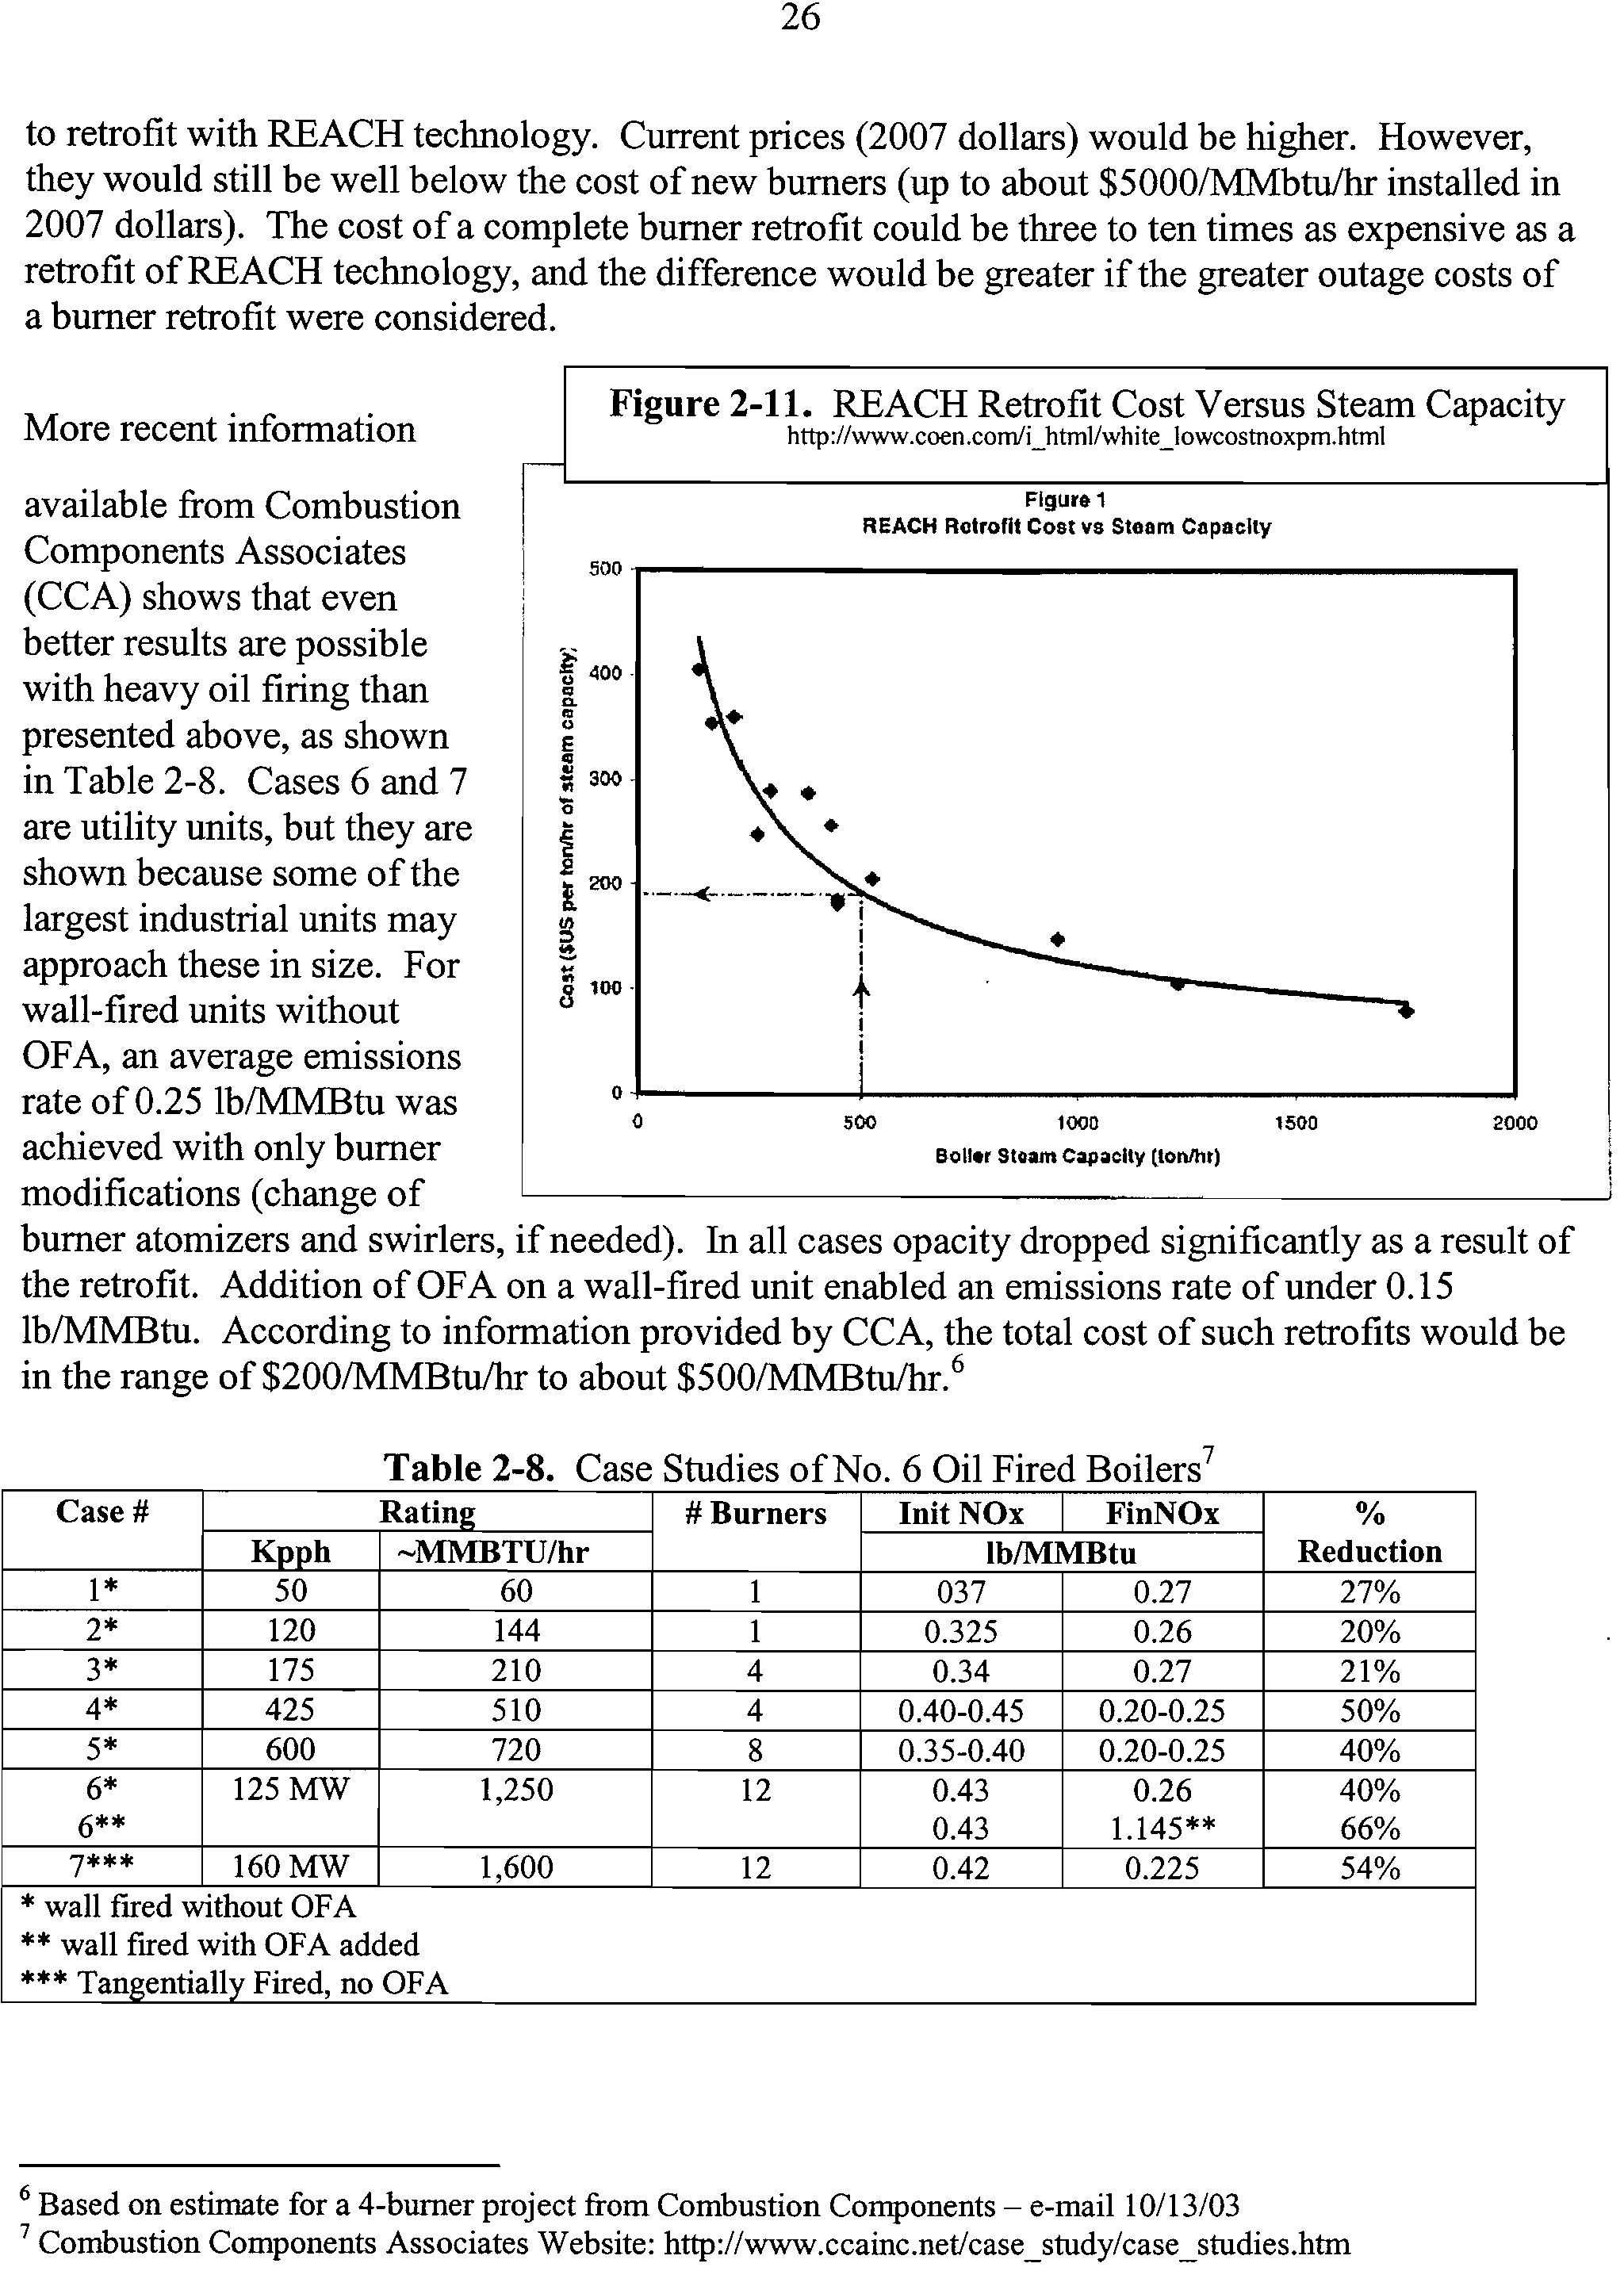
2-11
REACH Retrofit Cost Versus Steam Capacity
26
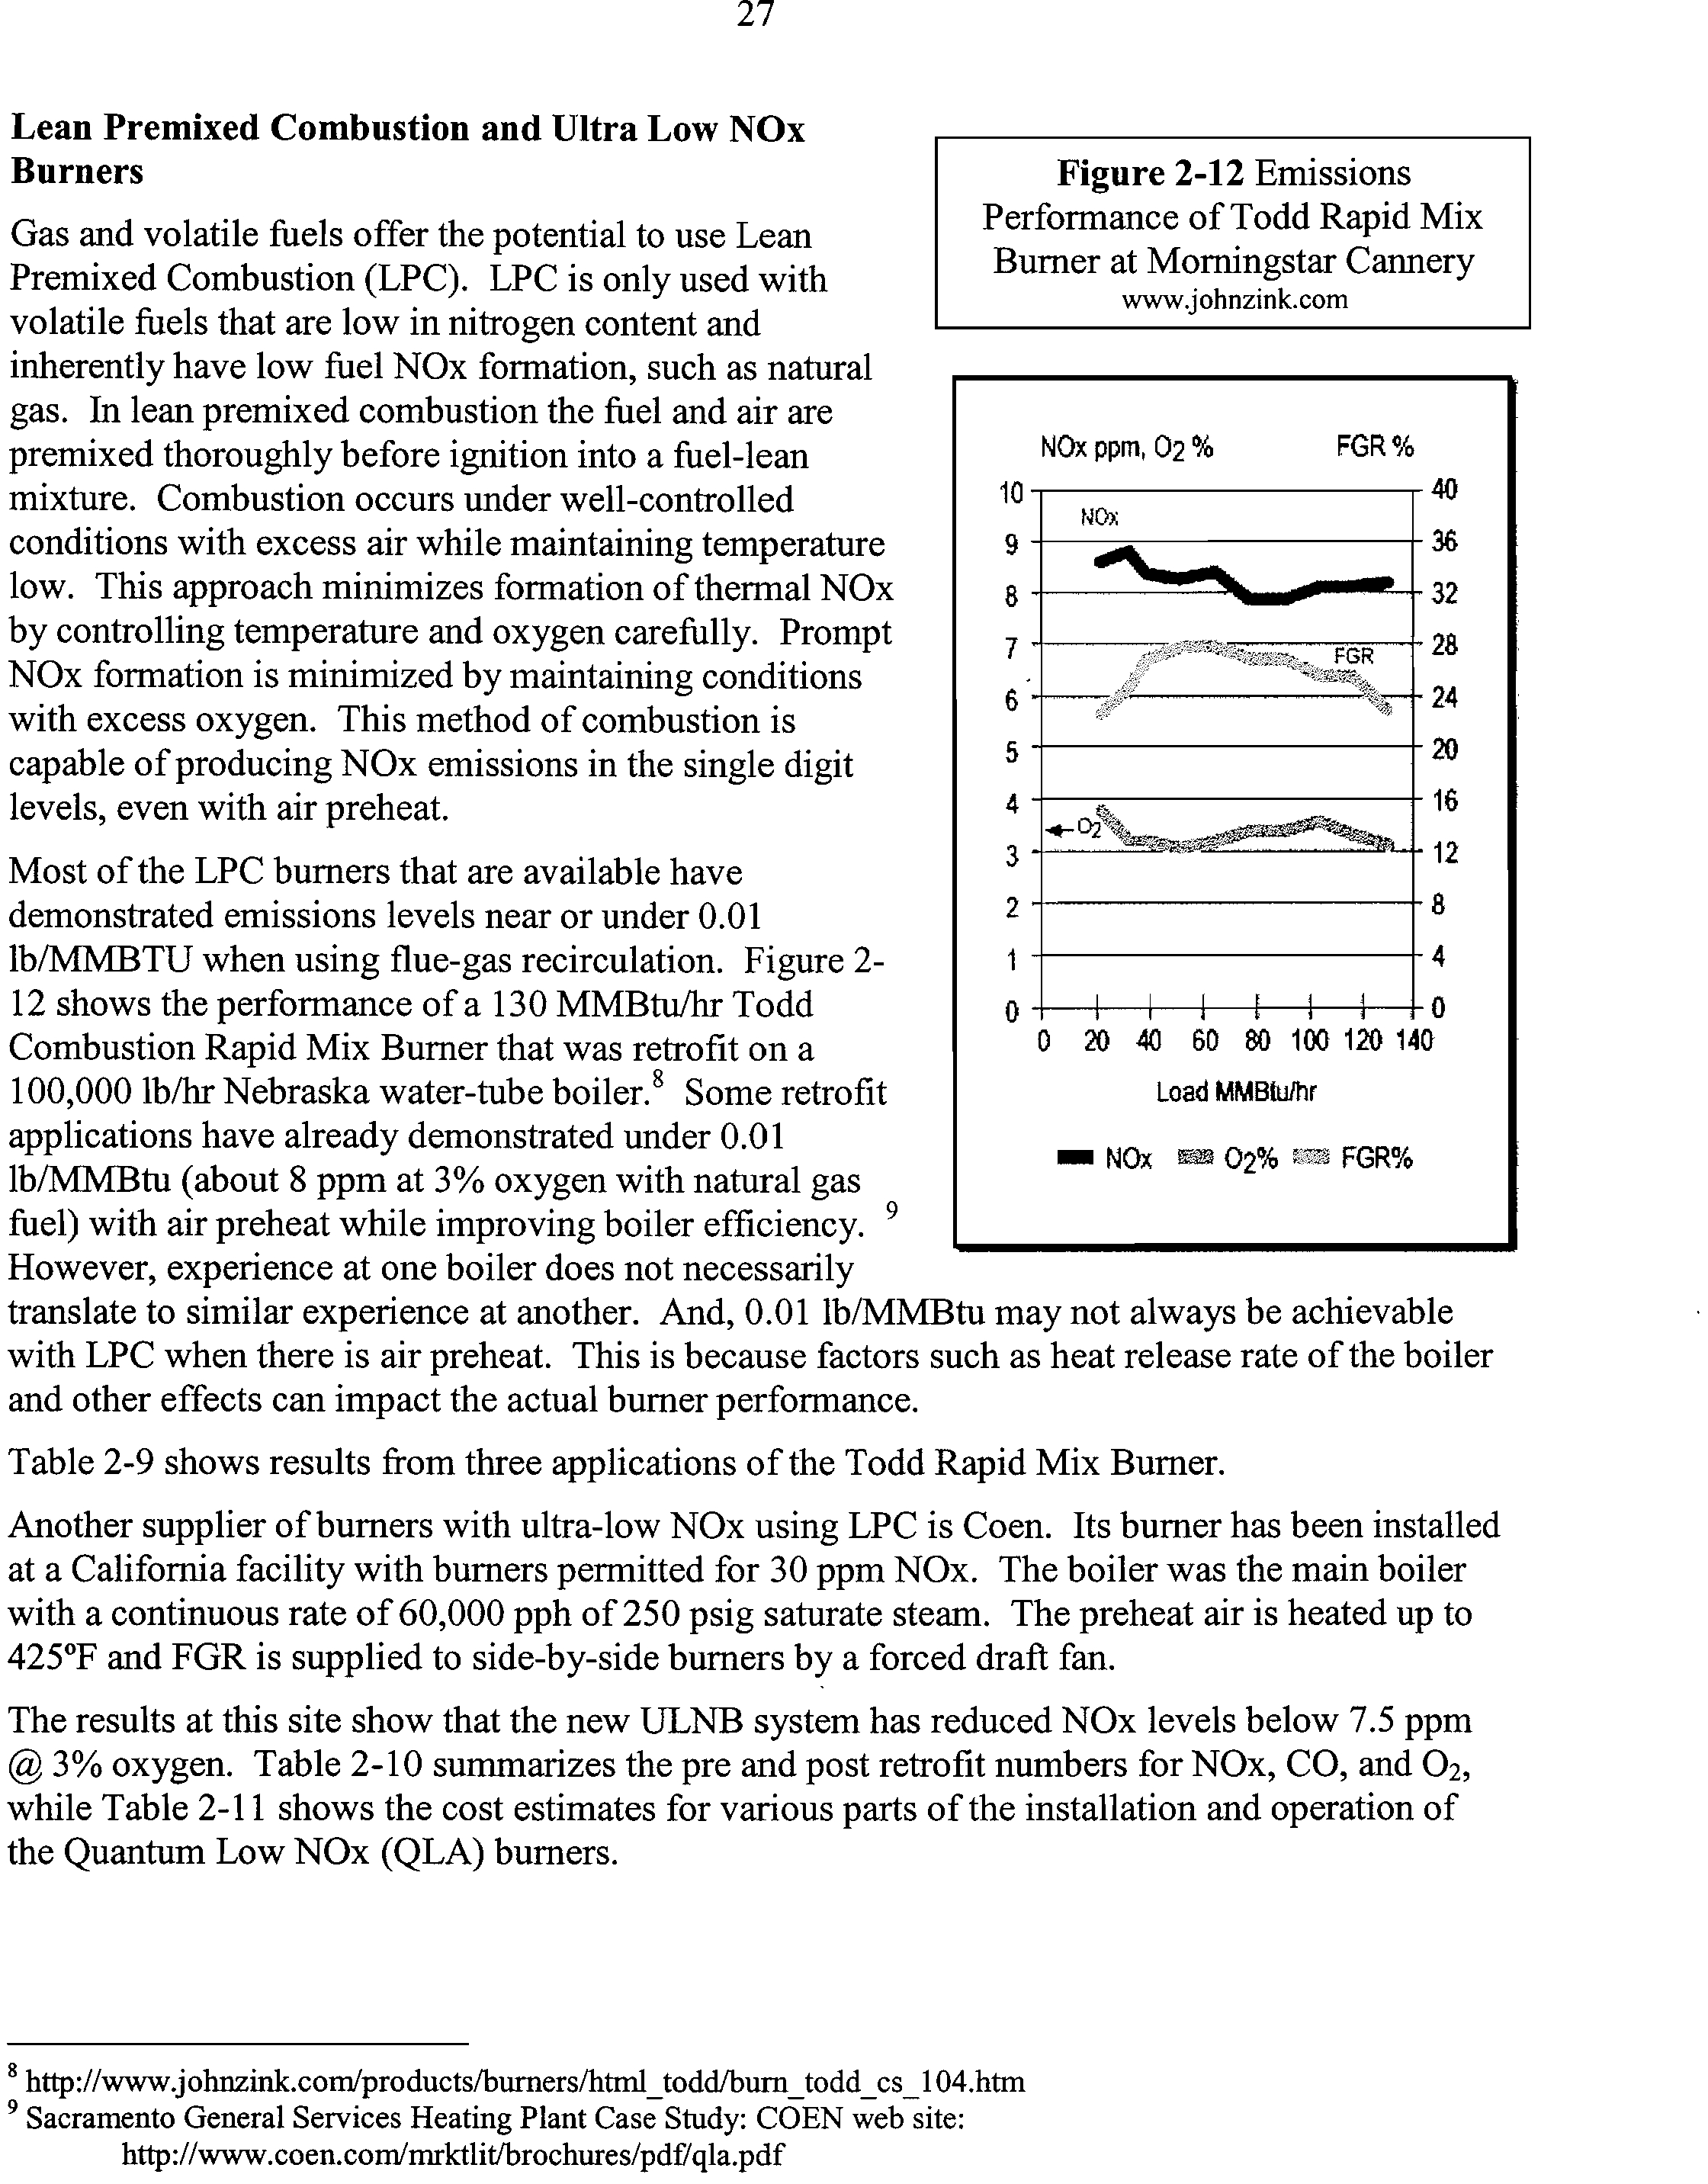
2-12
Emissions Performance of Todd Rapid Mix Burner at
27
Morningstar Cannery
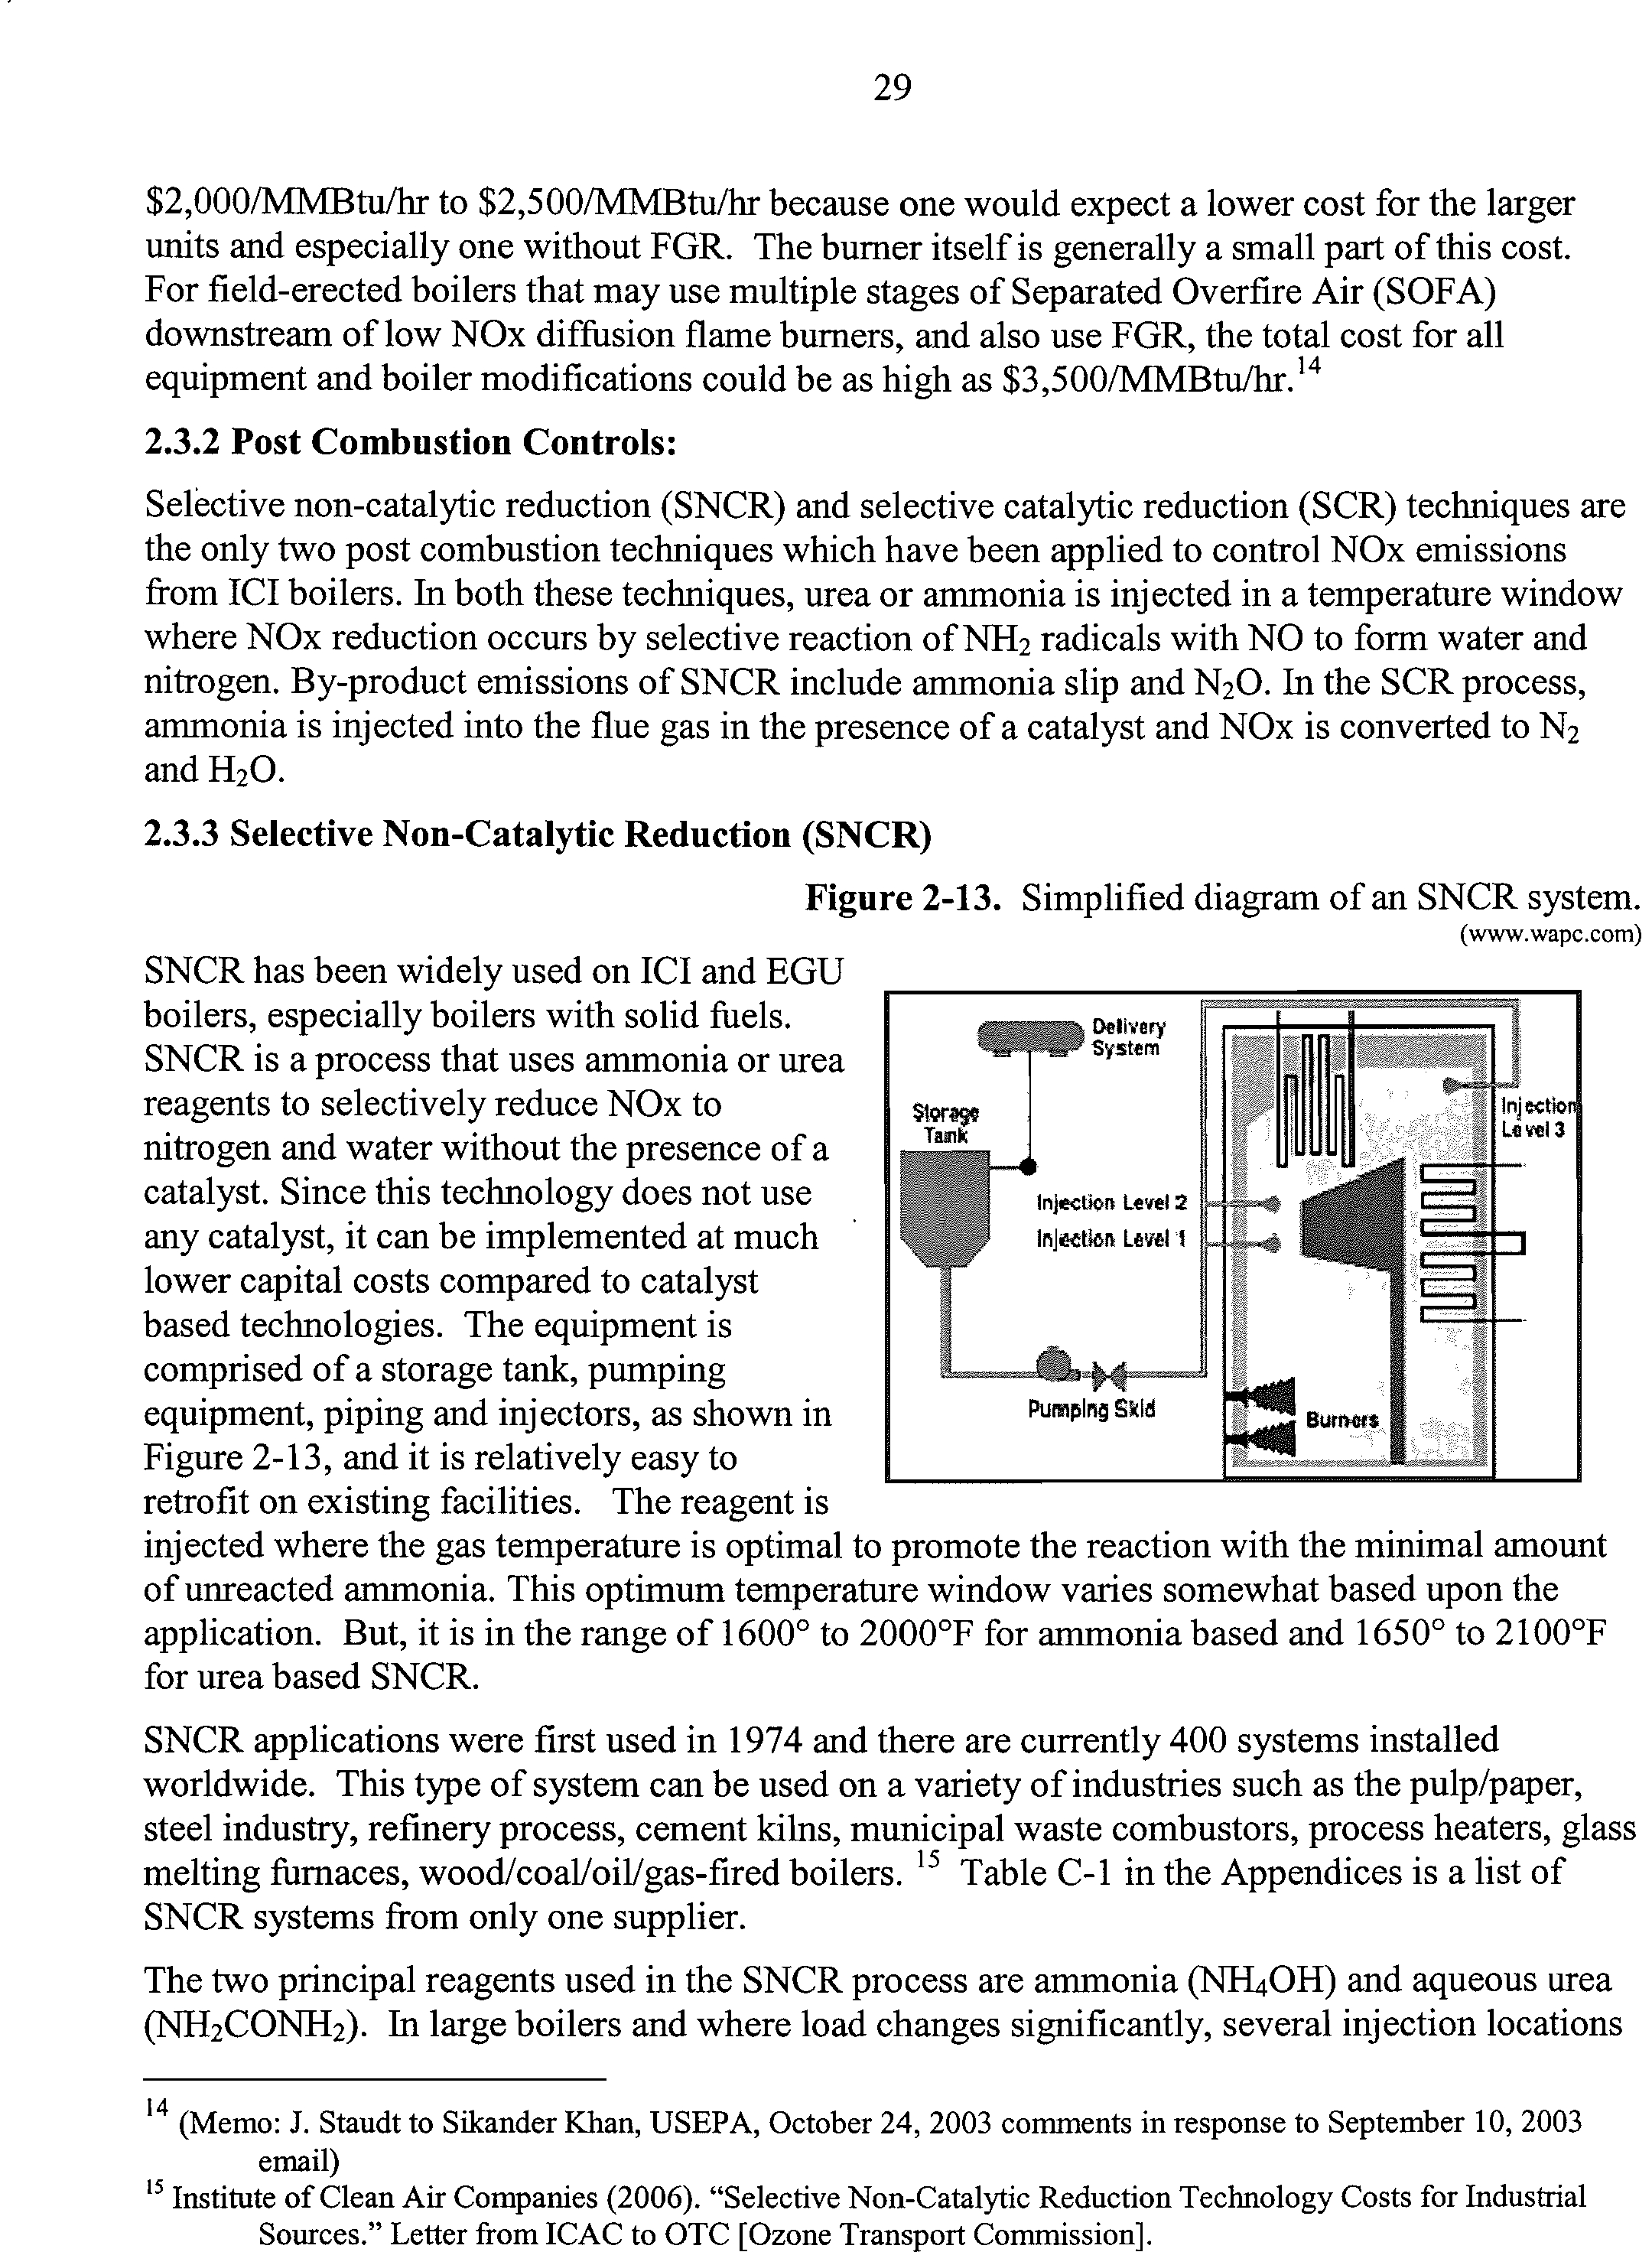
2-13
Simplified diagram of an SNCR system
29
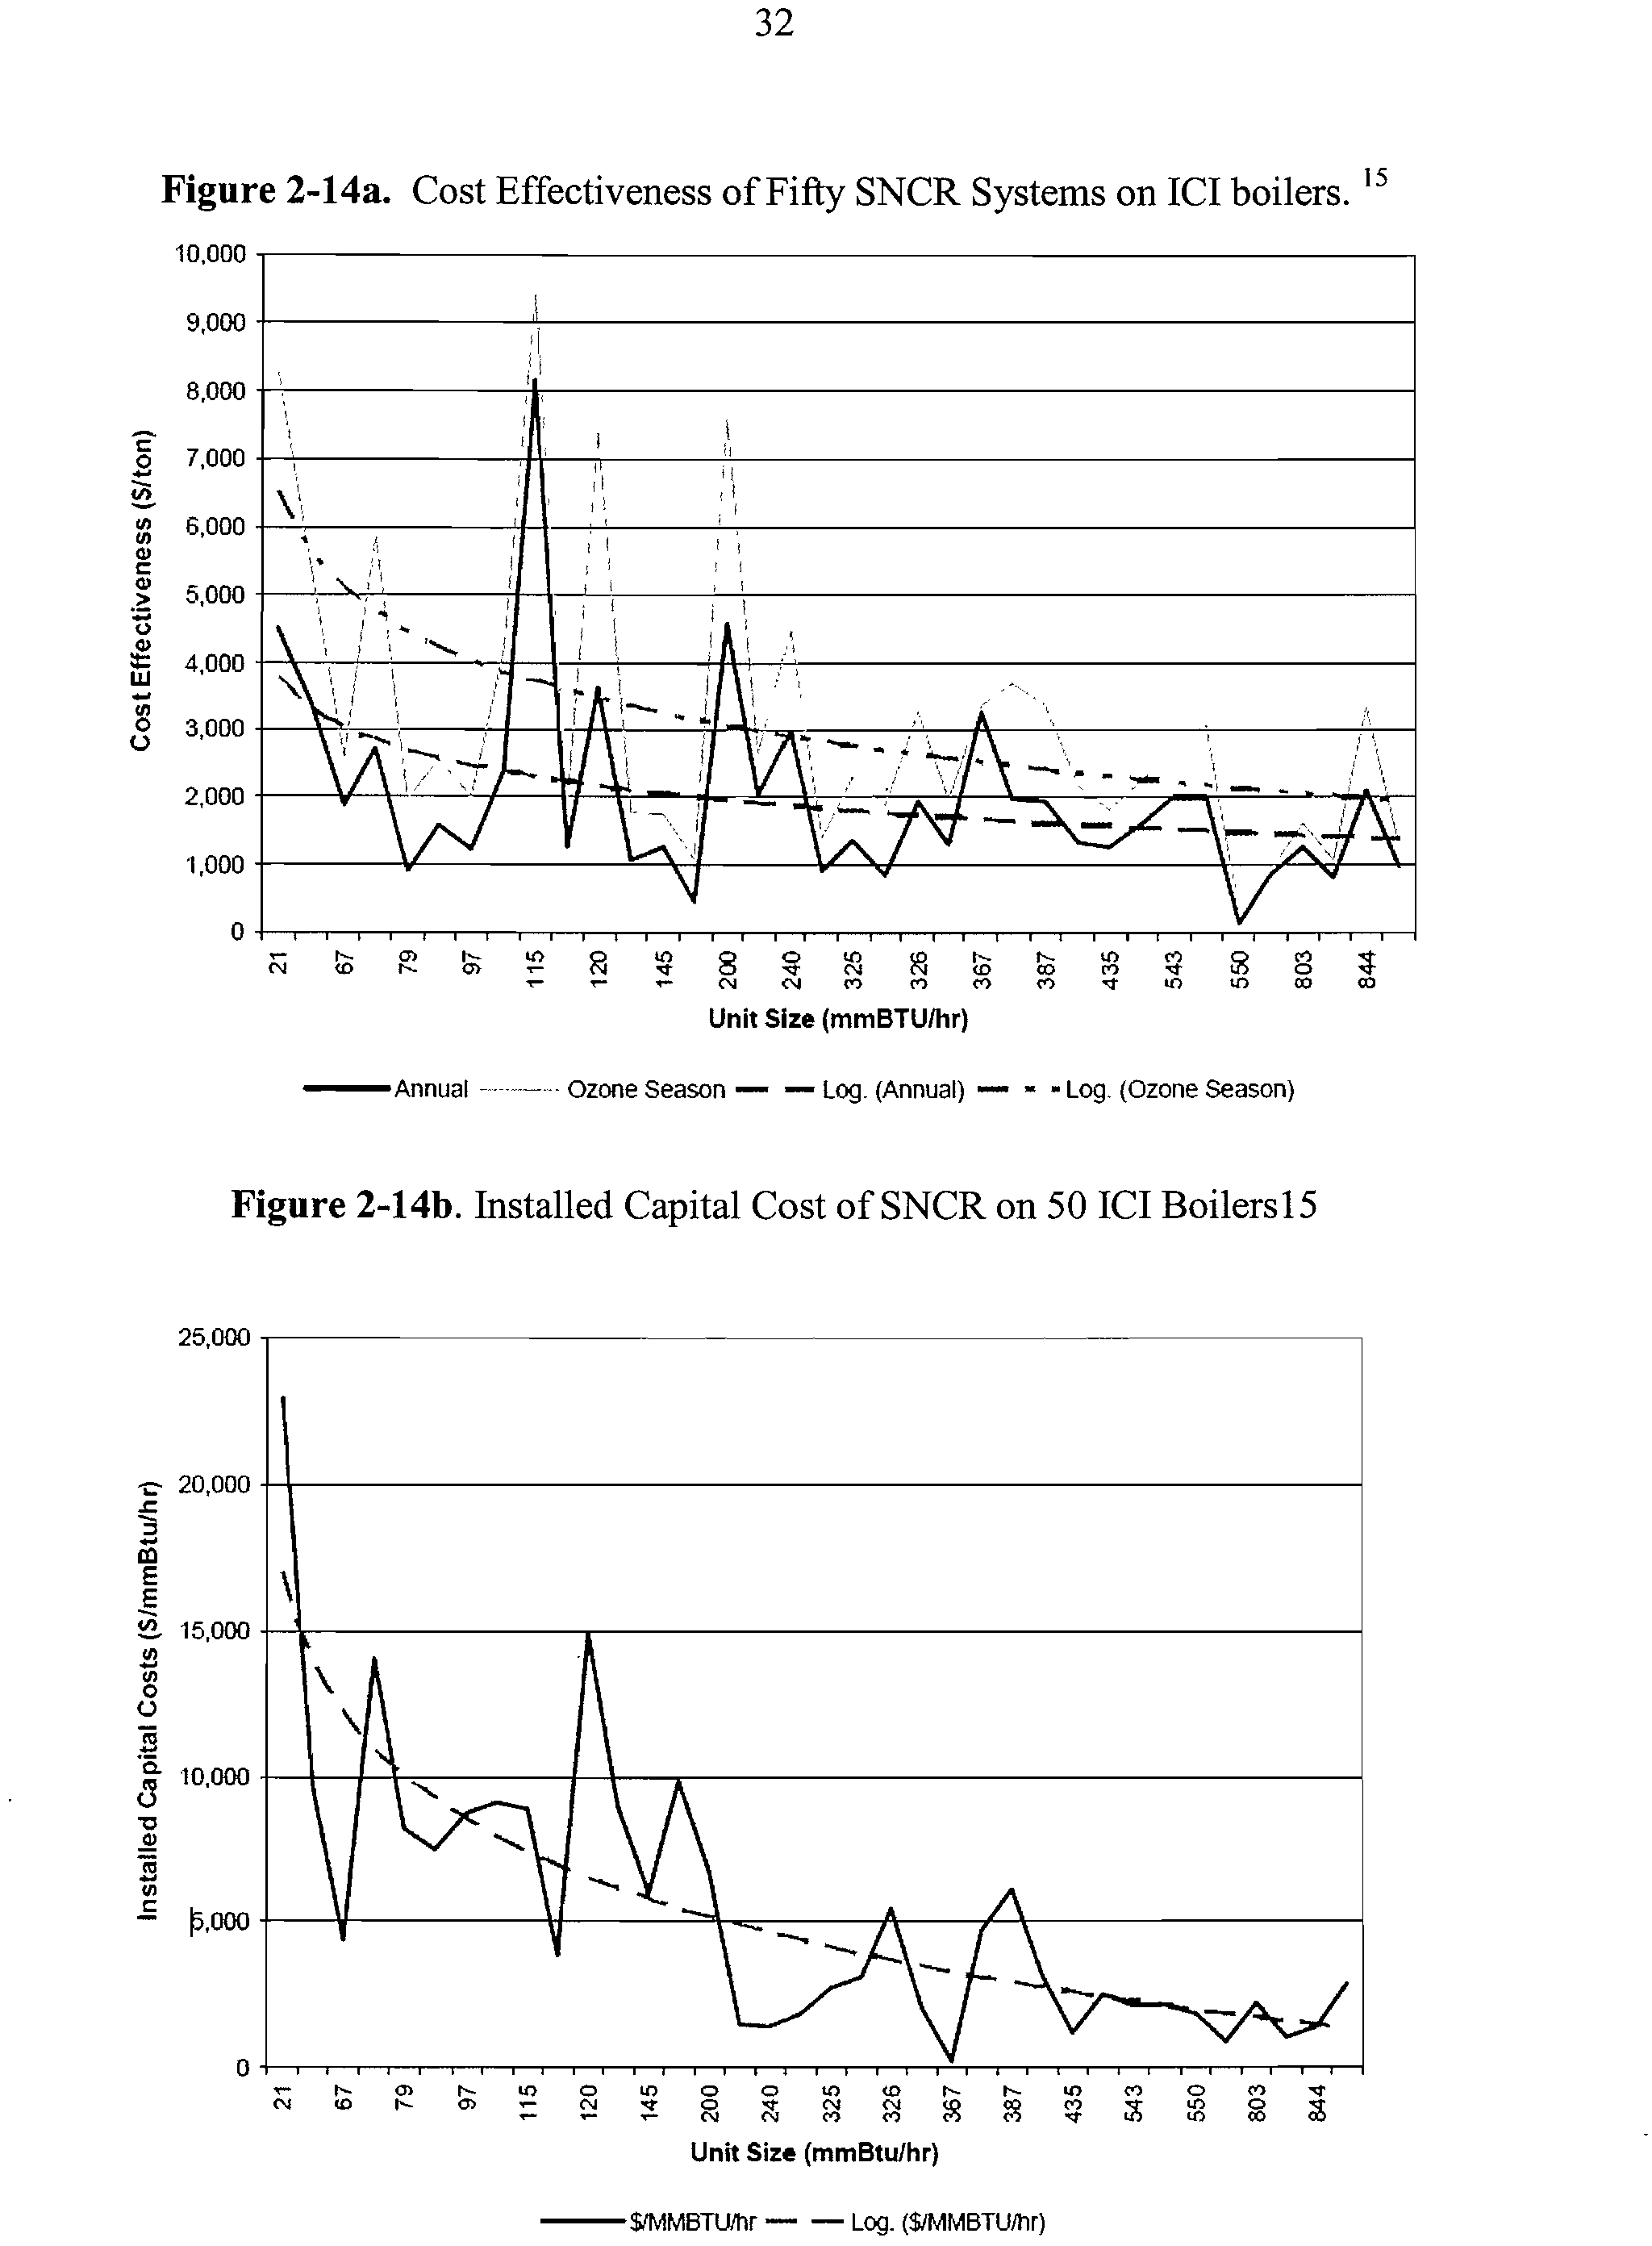
2-14a
Cost Effectiveness of Fifty SNCR Systems on ICI boilers
32
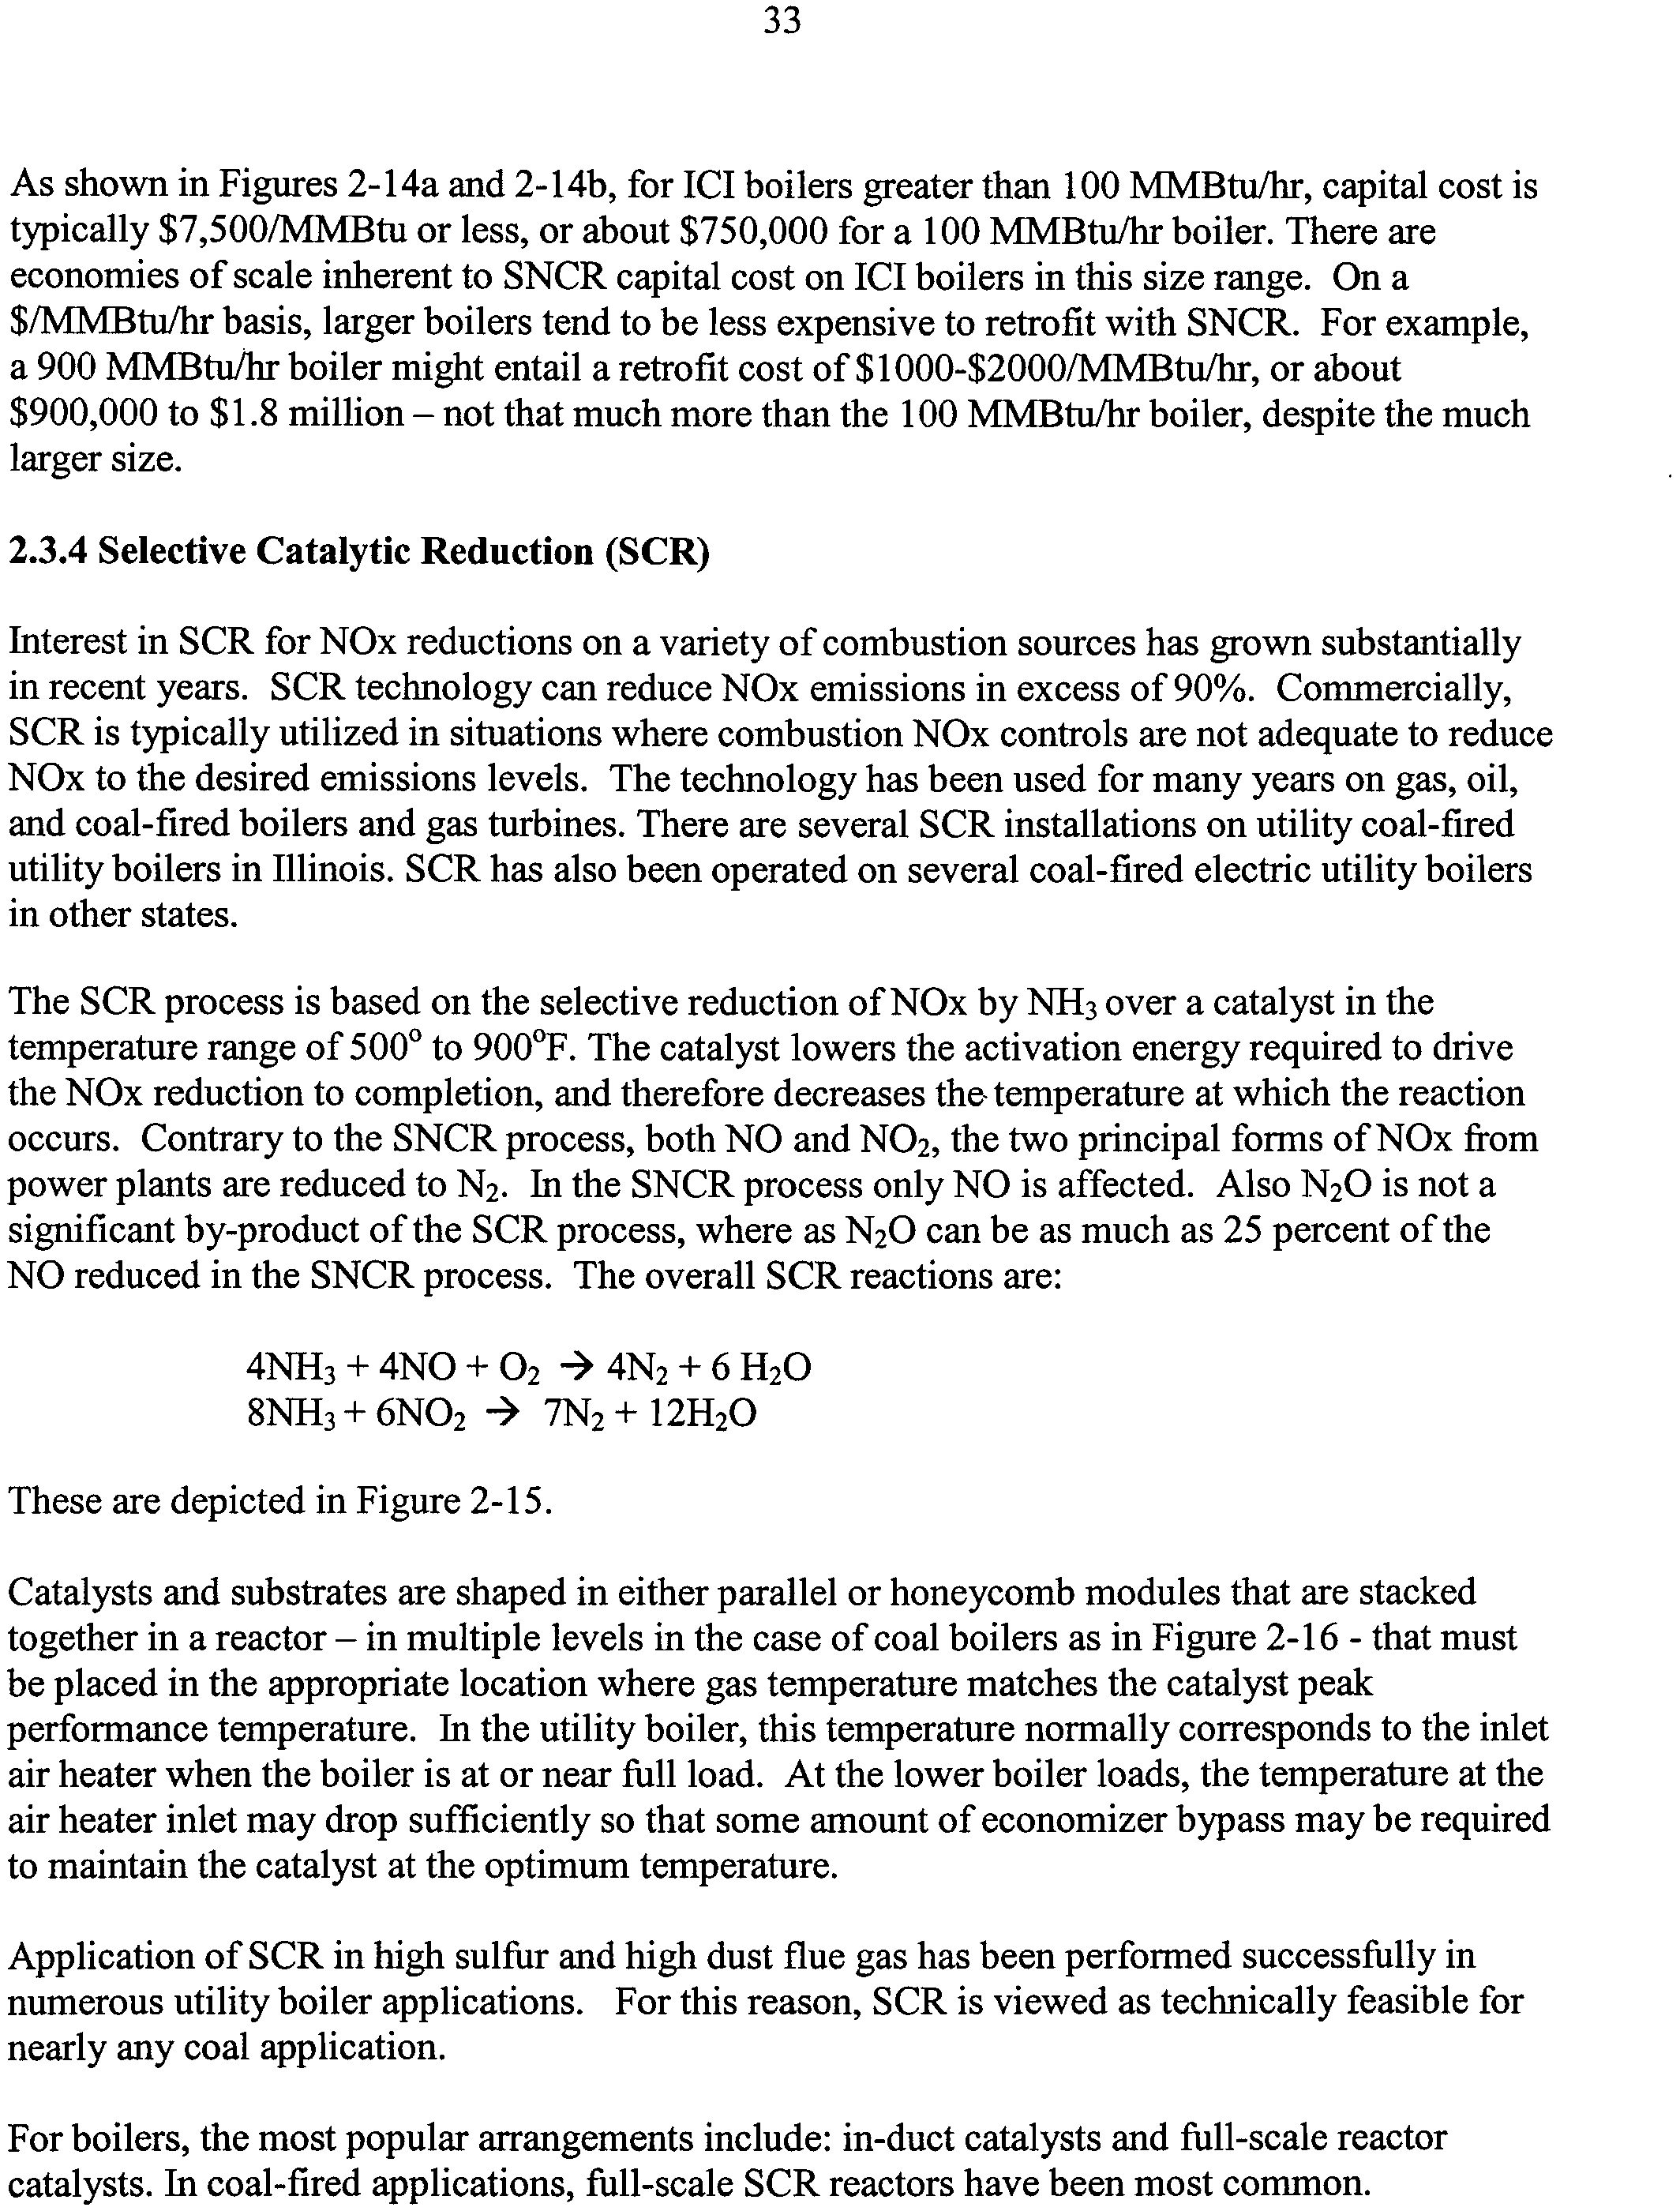
2-14b
Installed Capital Cost of SNCR on 50 ICI Boilers
32
2-15
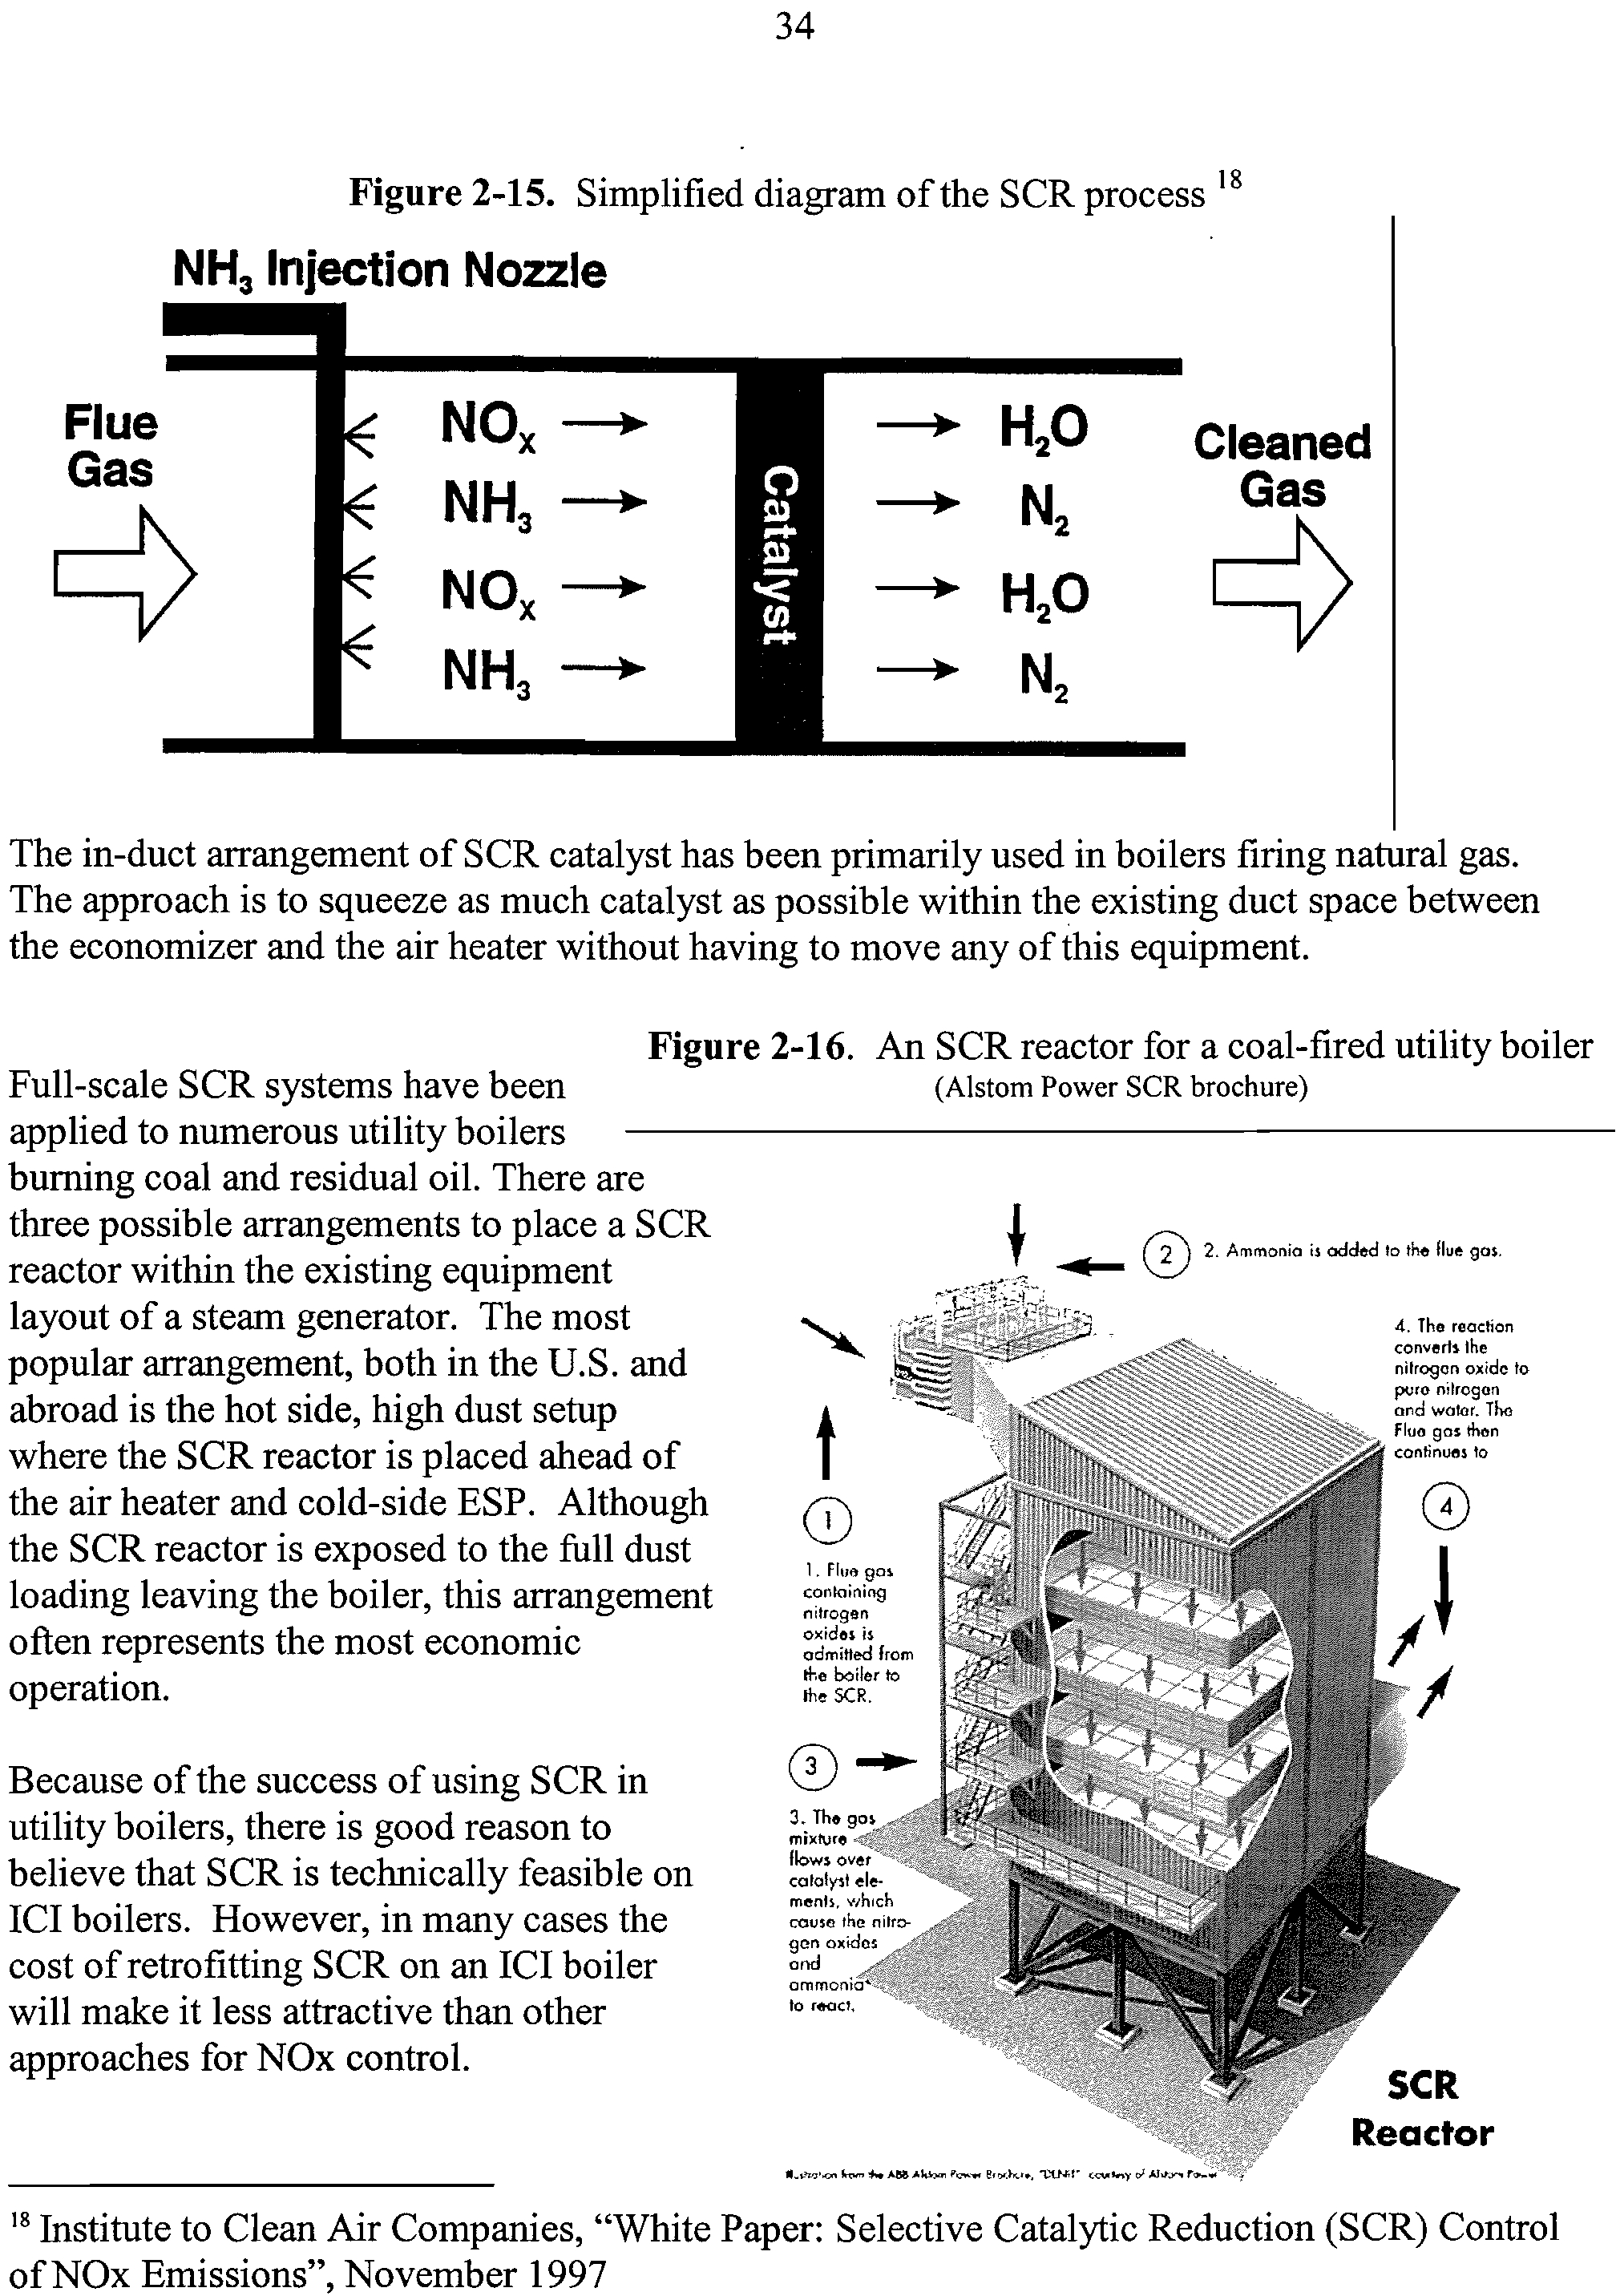
Simplified diagram of the SCR process
34
2-16
An SCR reactor for a coal-fired utility boiler
34
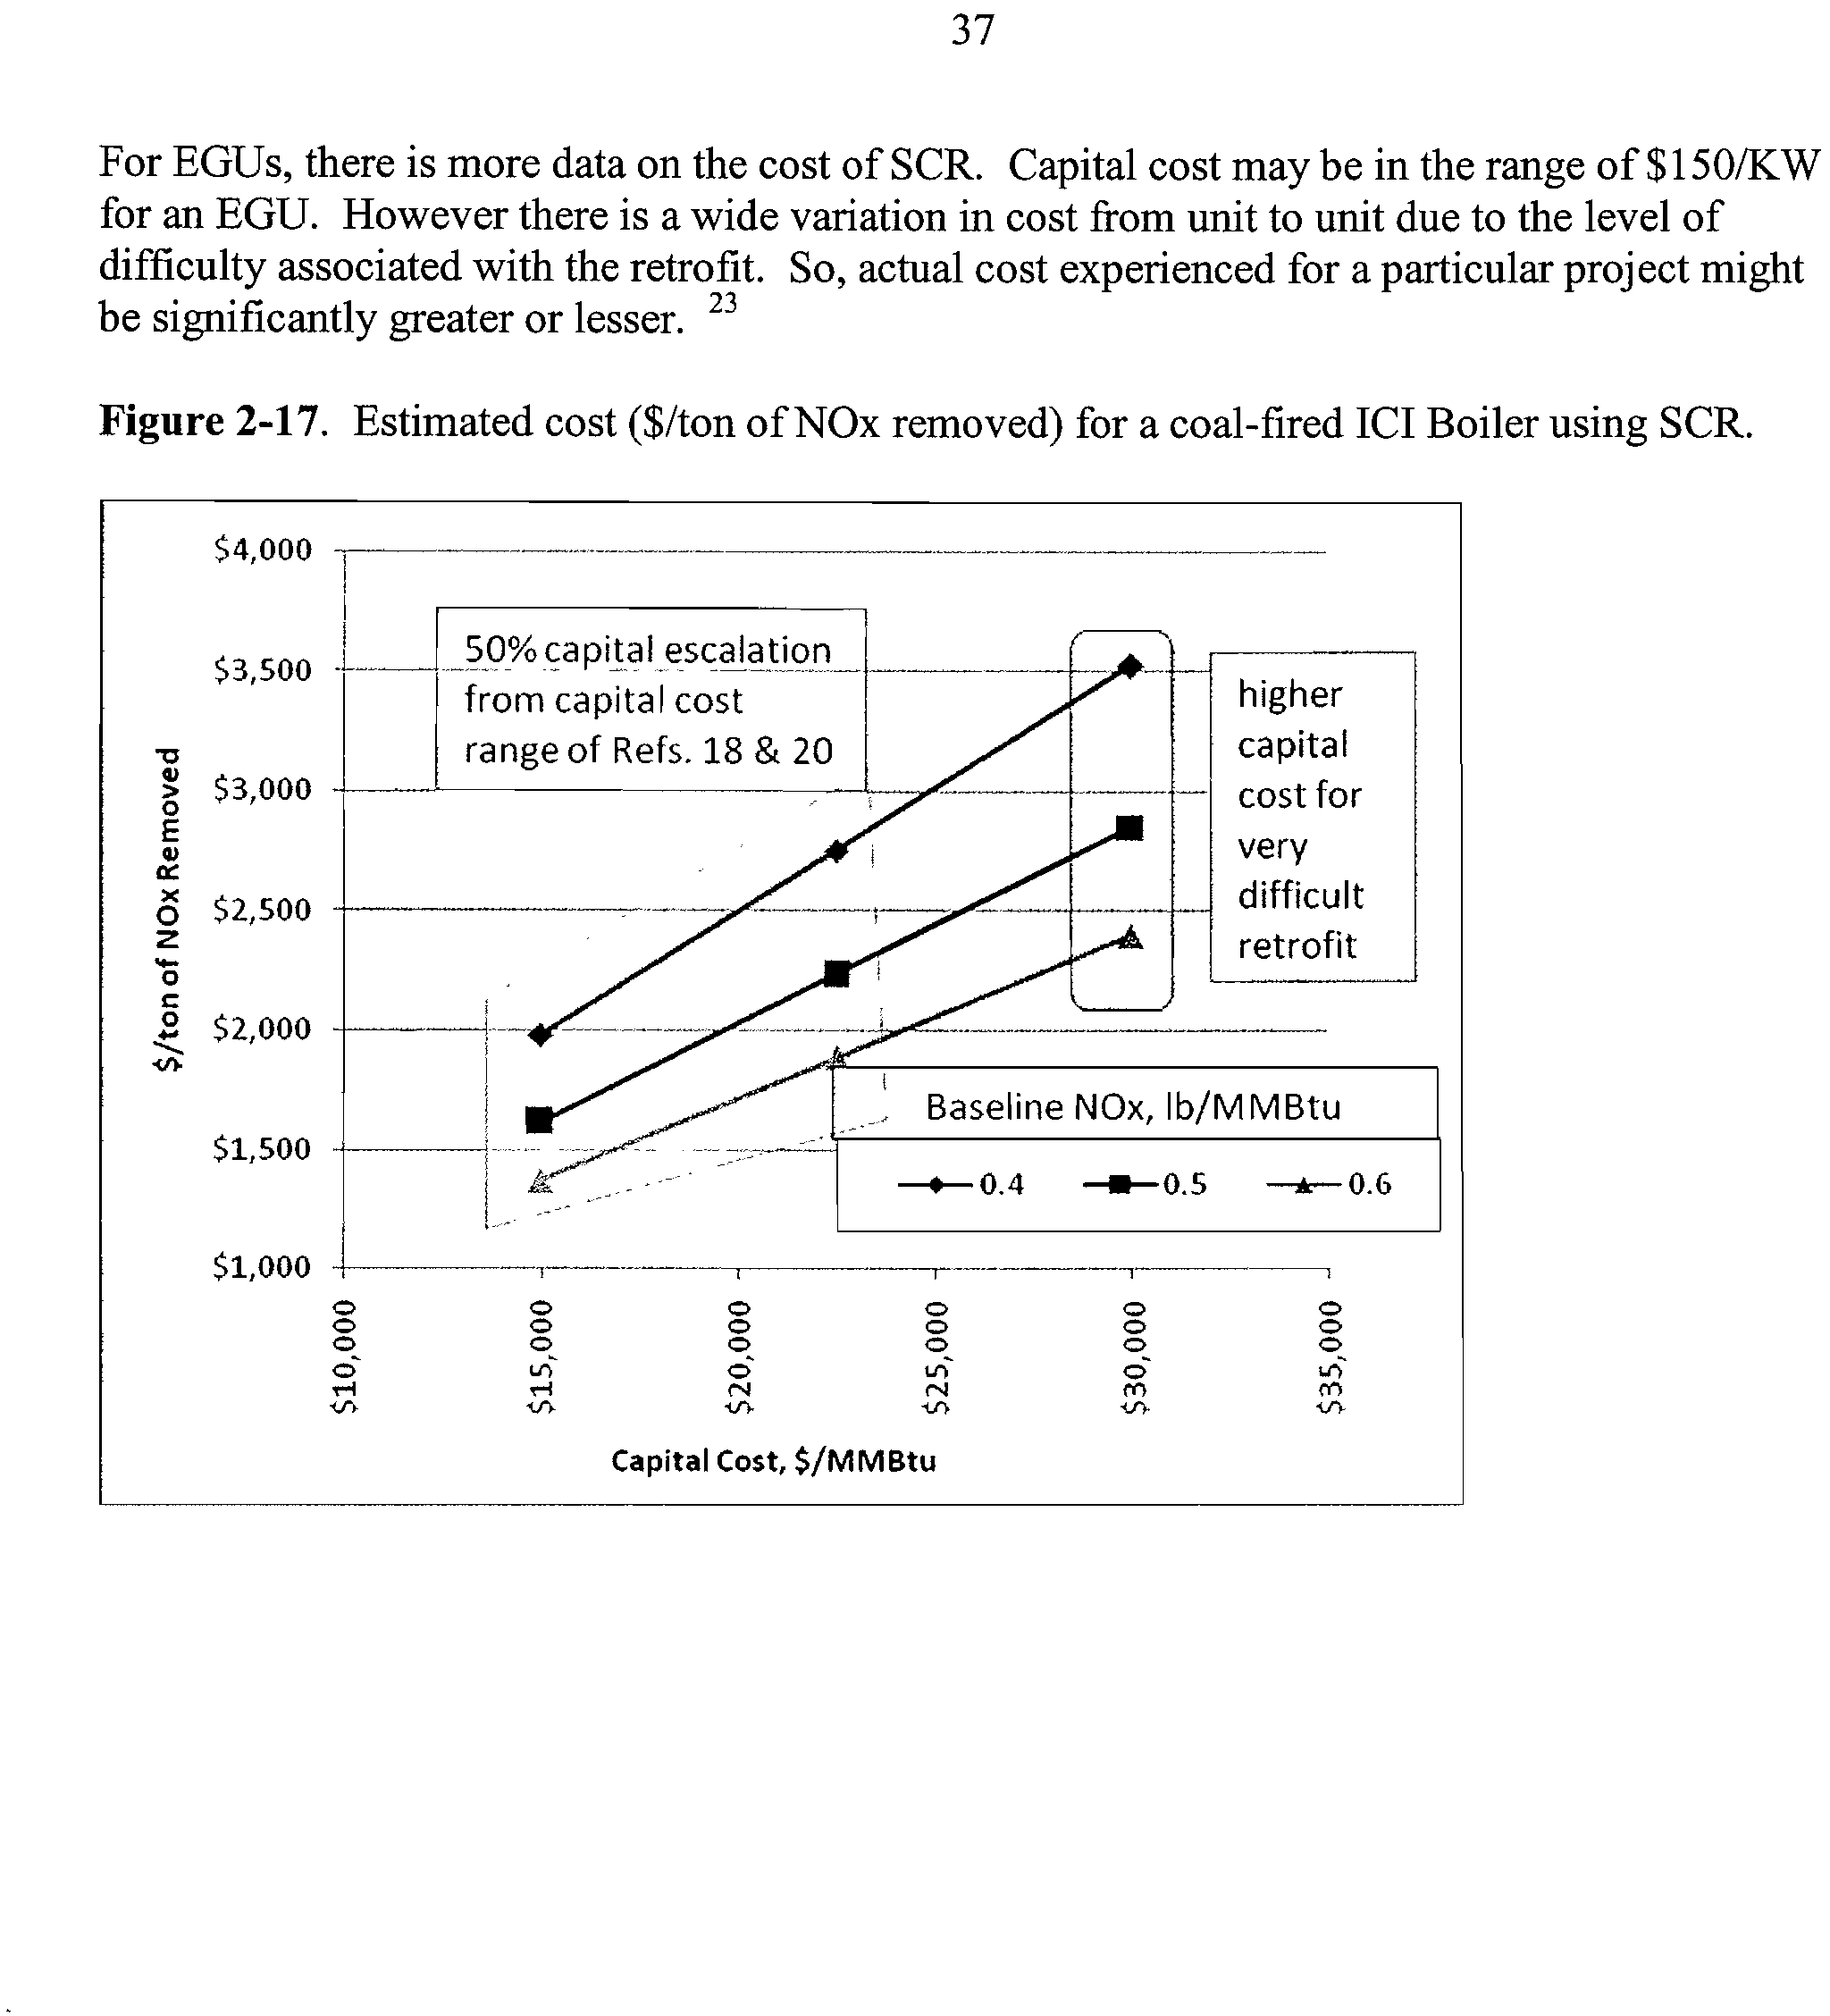
2-17
Estimated cost ($/ton of NOx removed) for a coal-fired ICI Boiler
using SCR
37
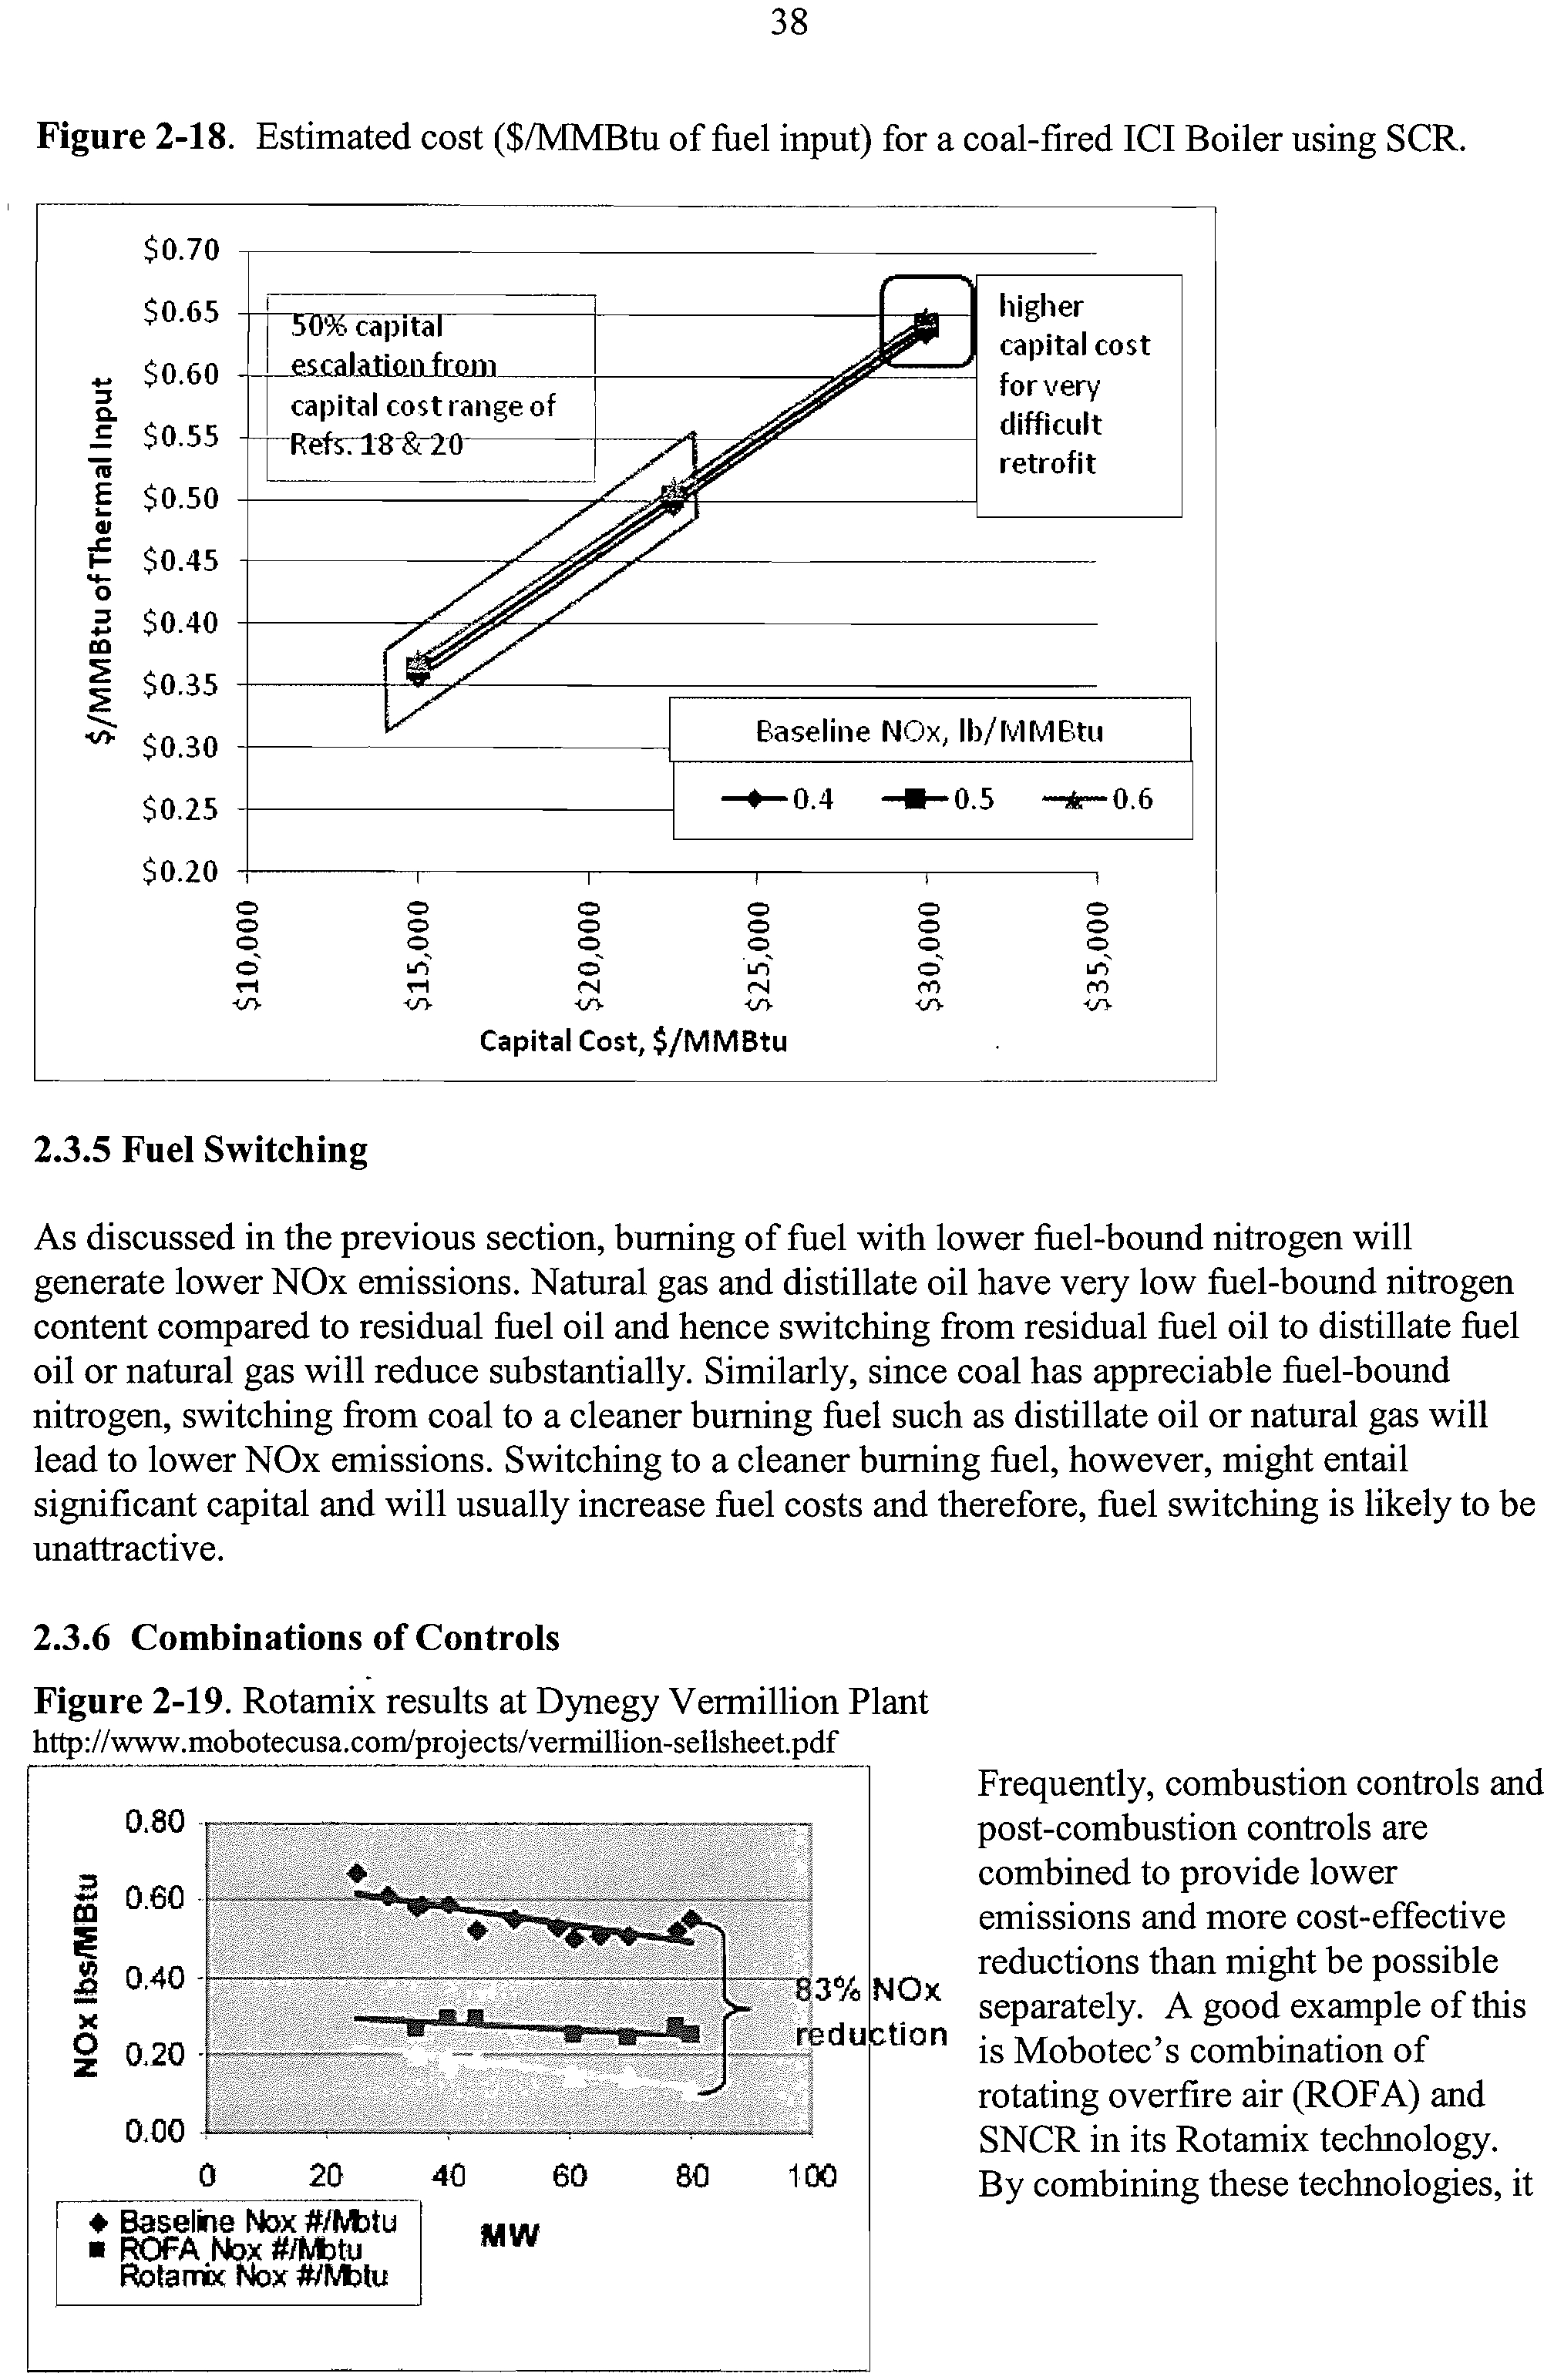
2-18
Estimated cost ($/MMBtu of fuel input) for a coal-fired ICI
38
Boiler using SCR
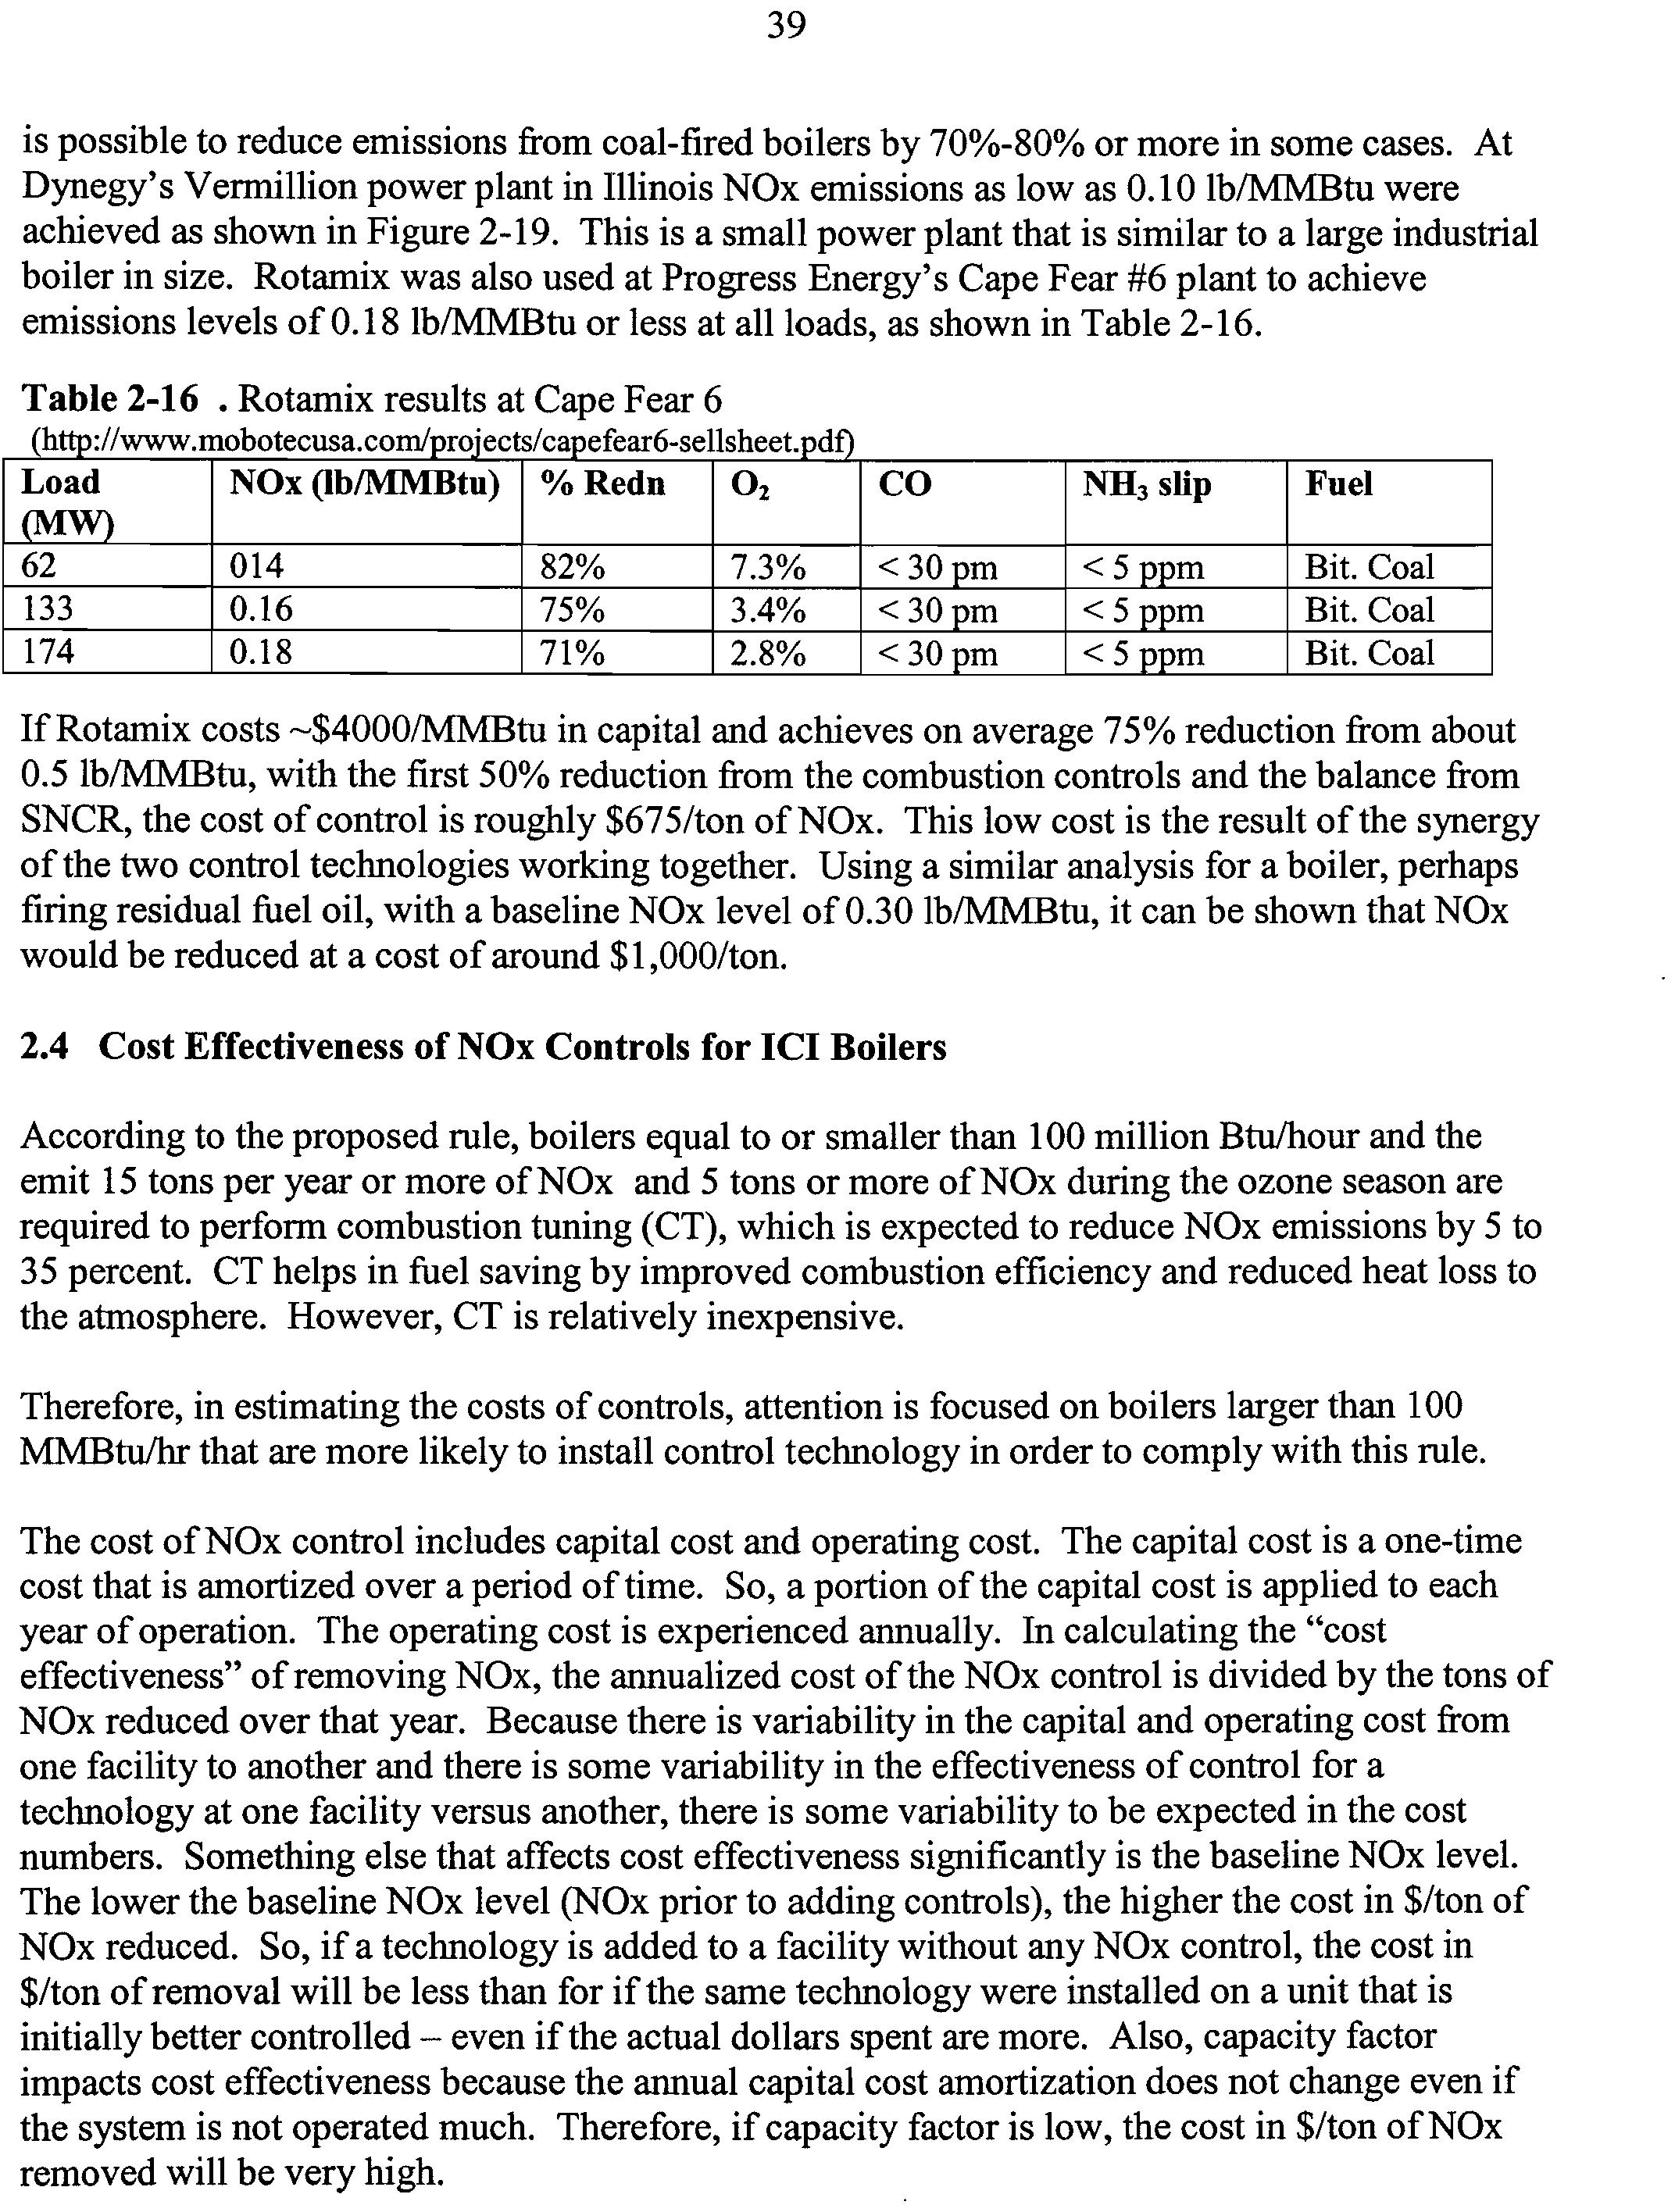
2-19
Rotamix results at Dynegy Vermillion Plant
38
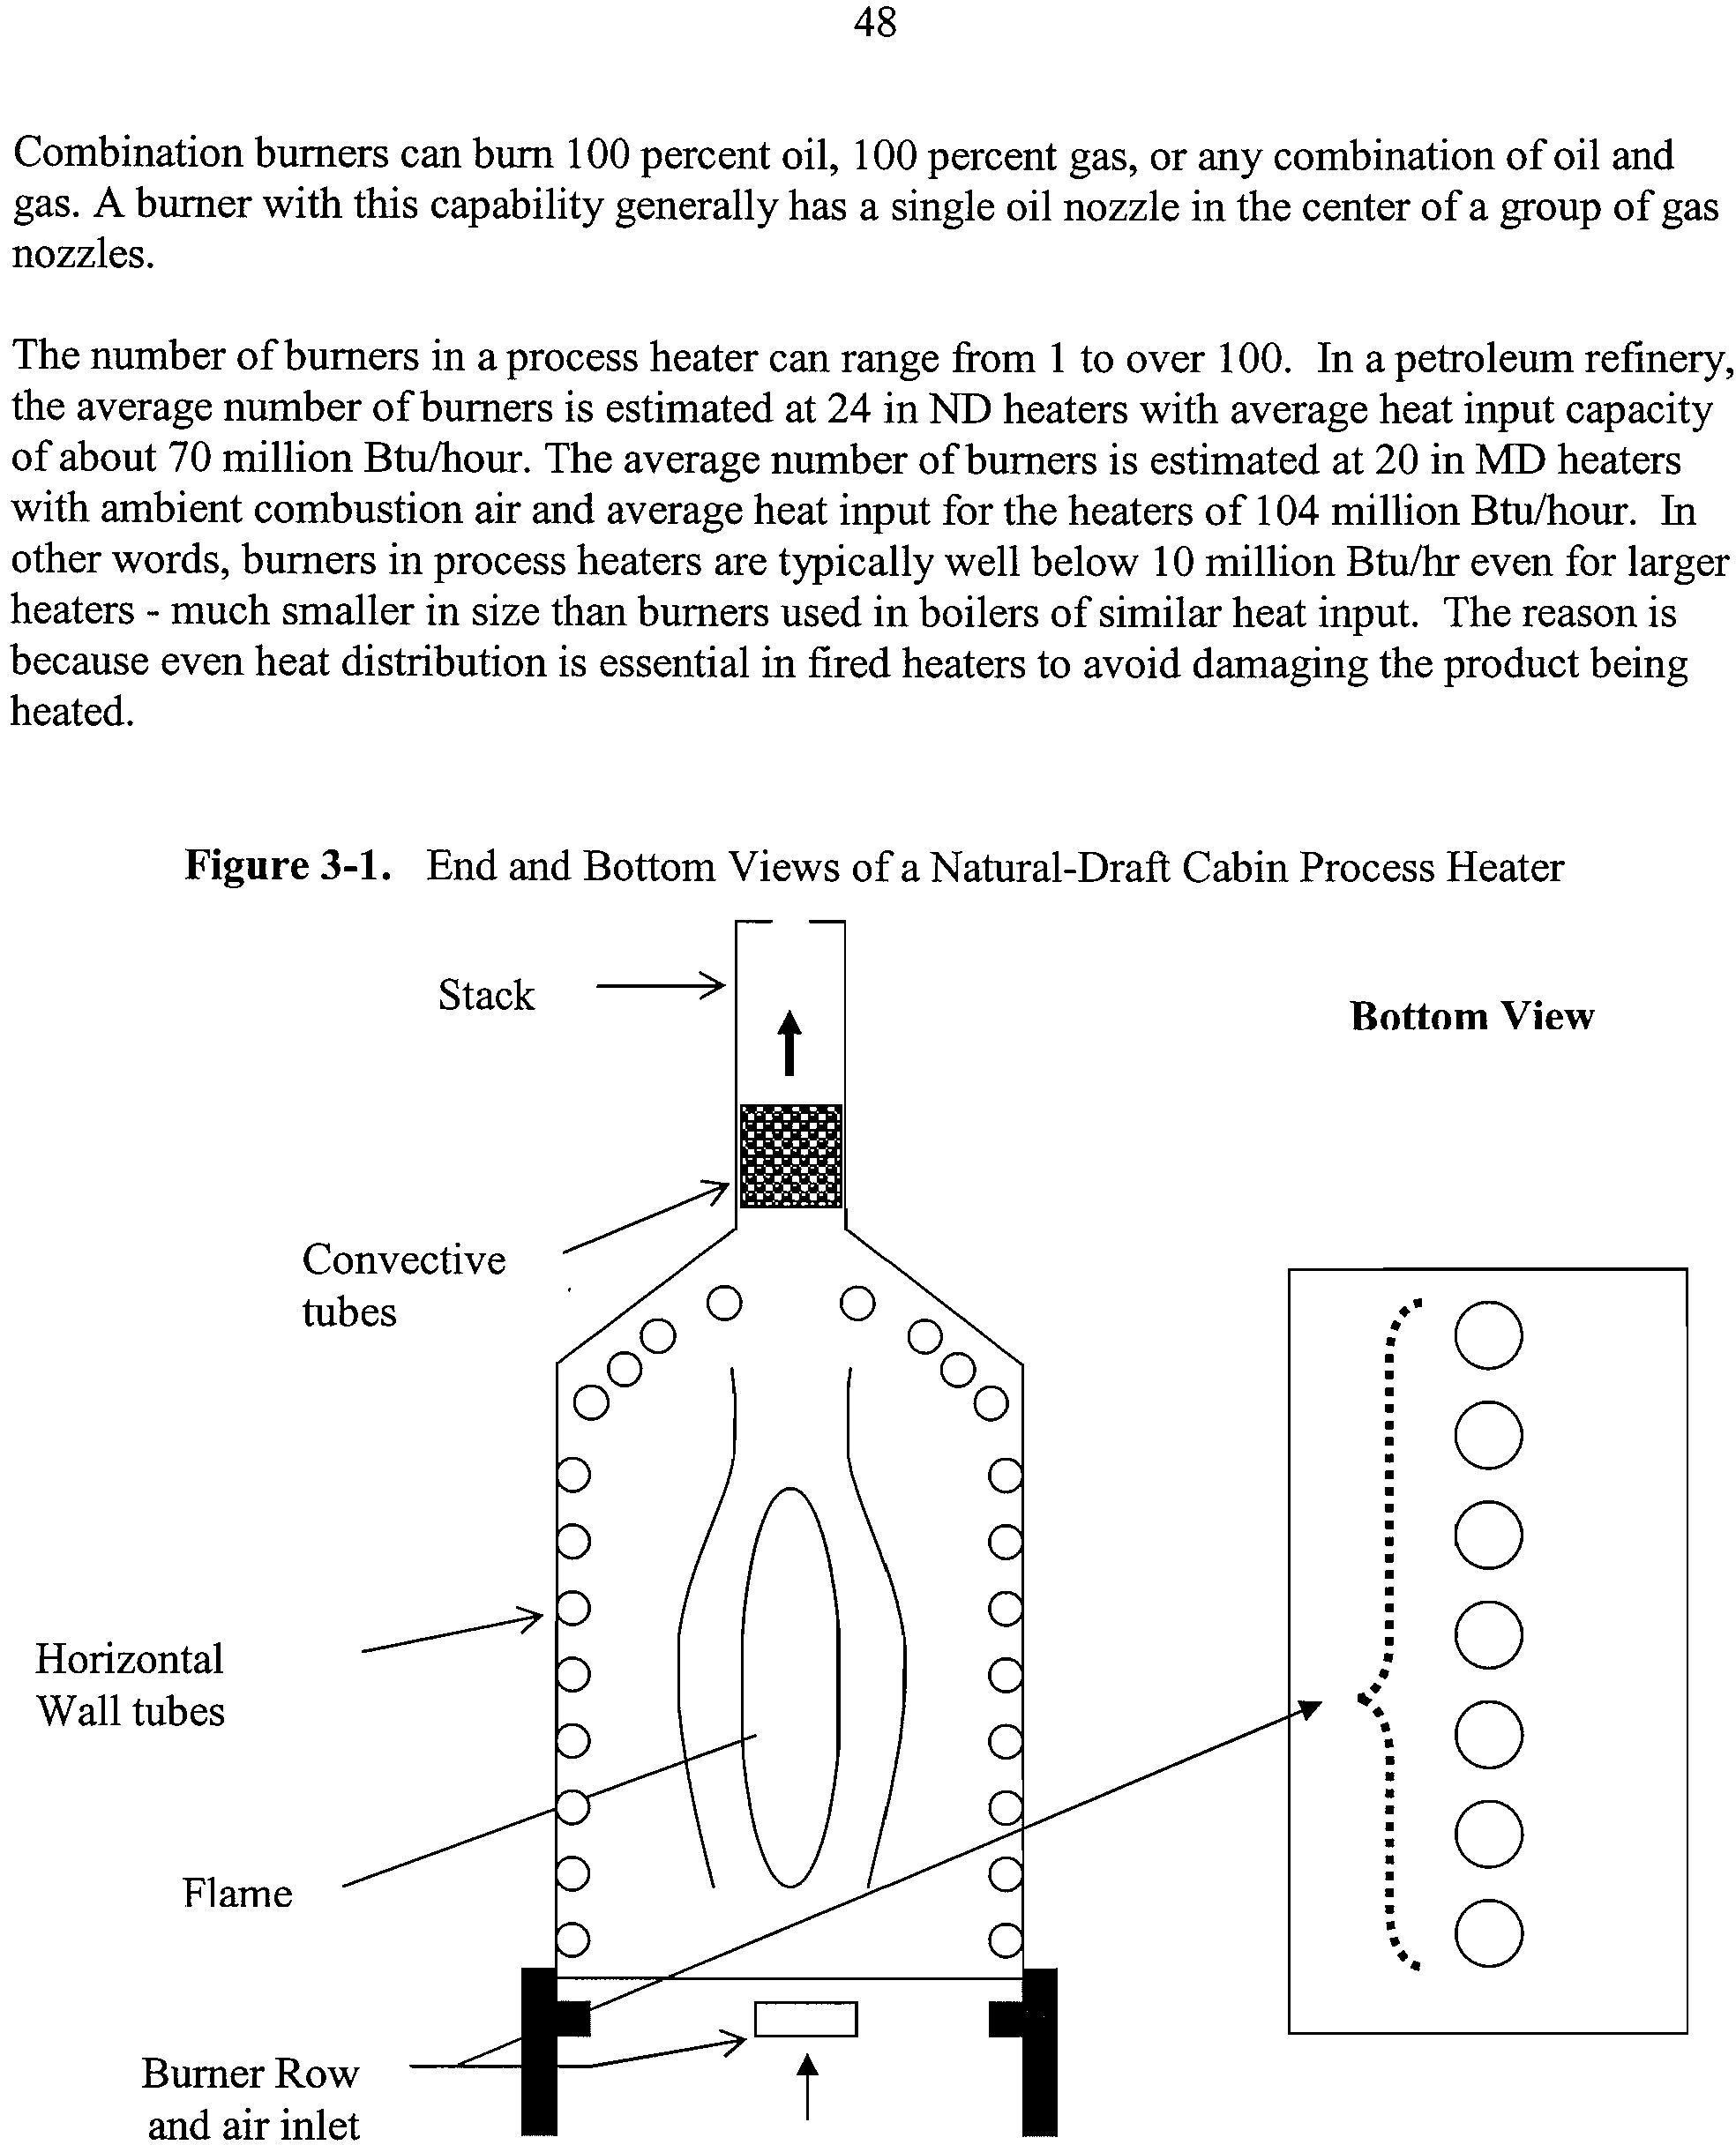
3-1
End and Bottom Views of a Natural-Draft Cabin Process Heater
48
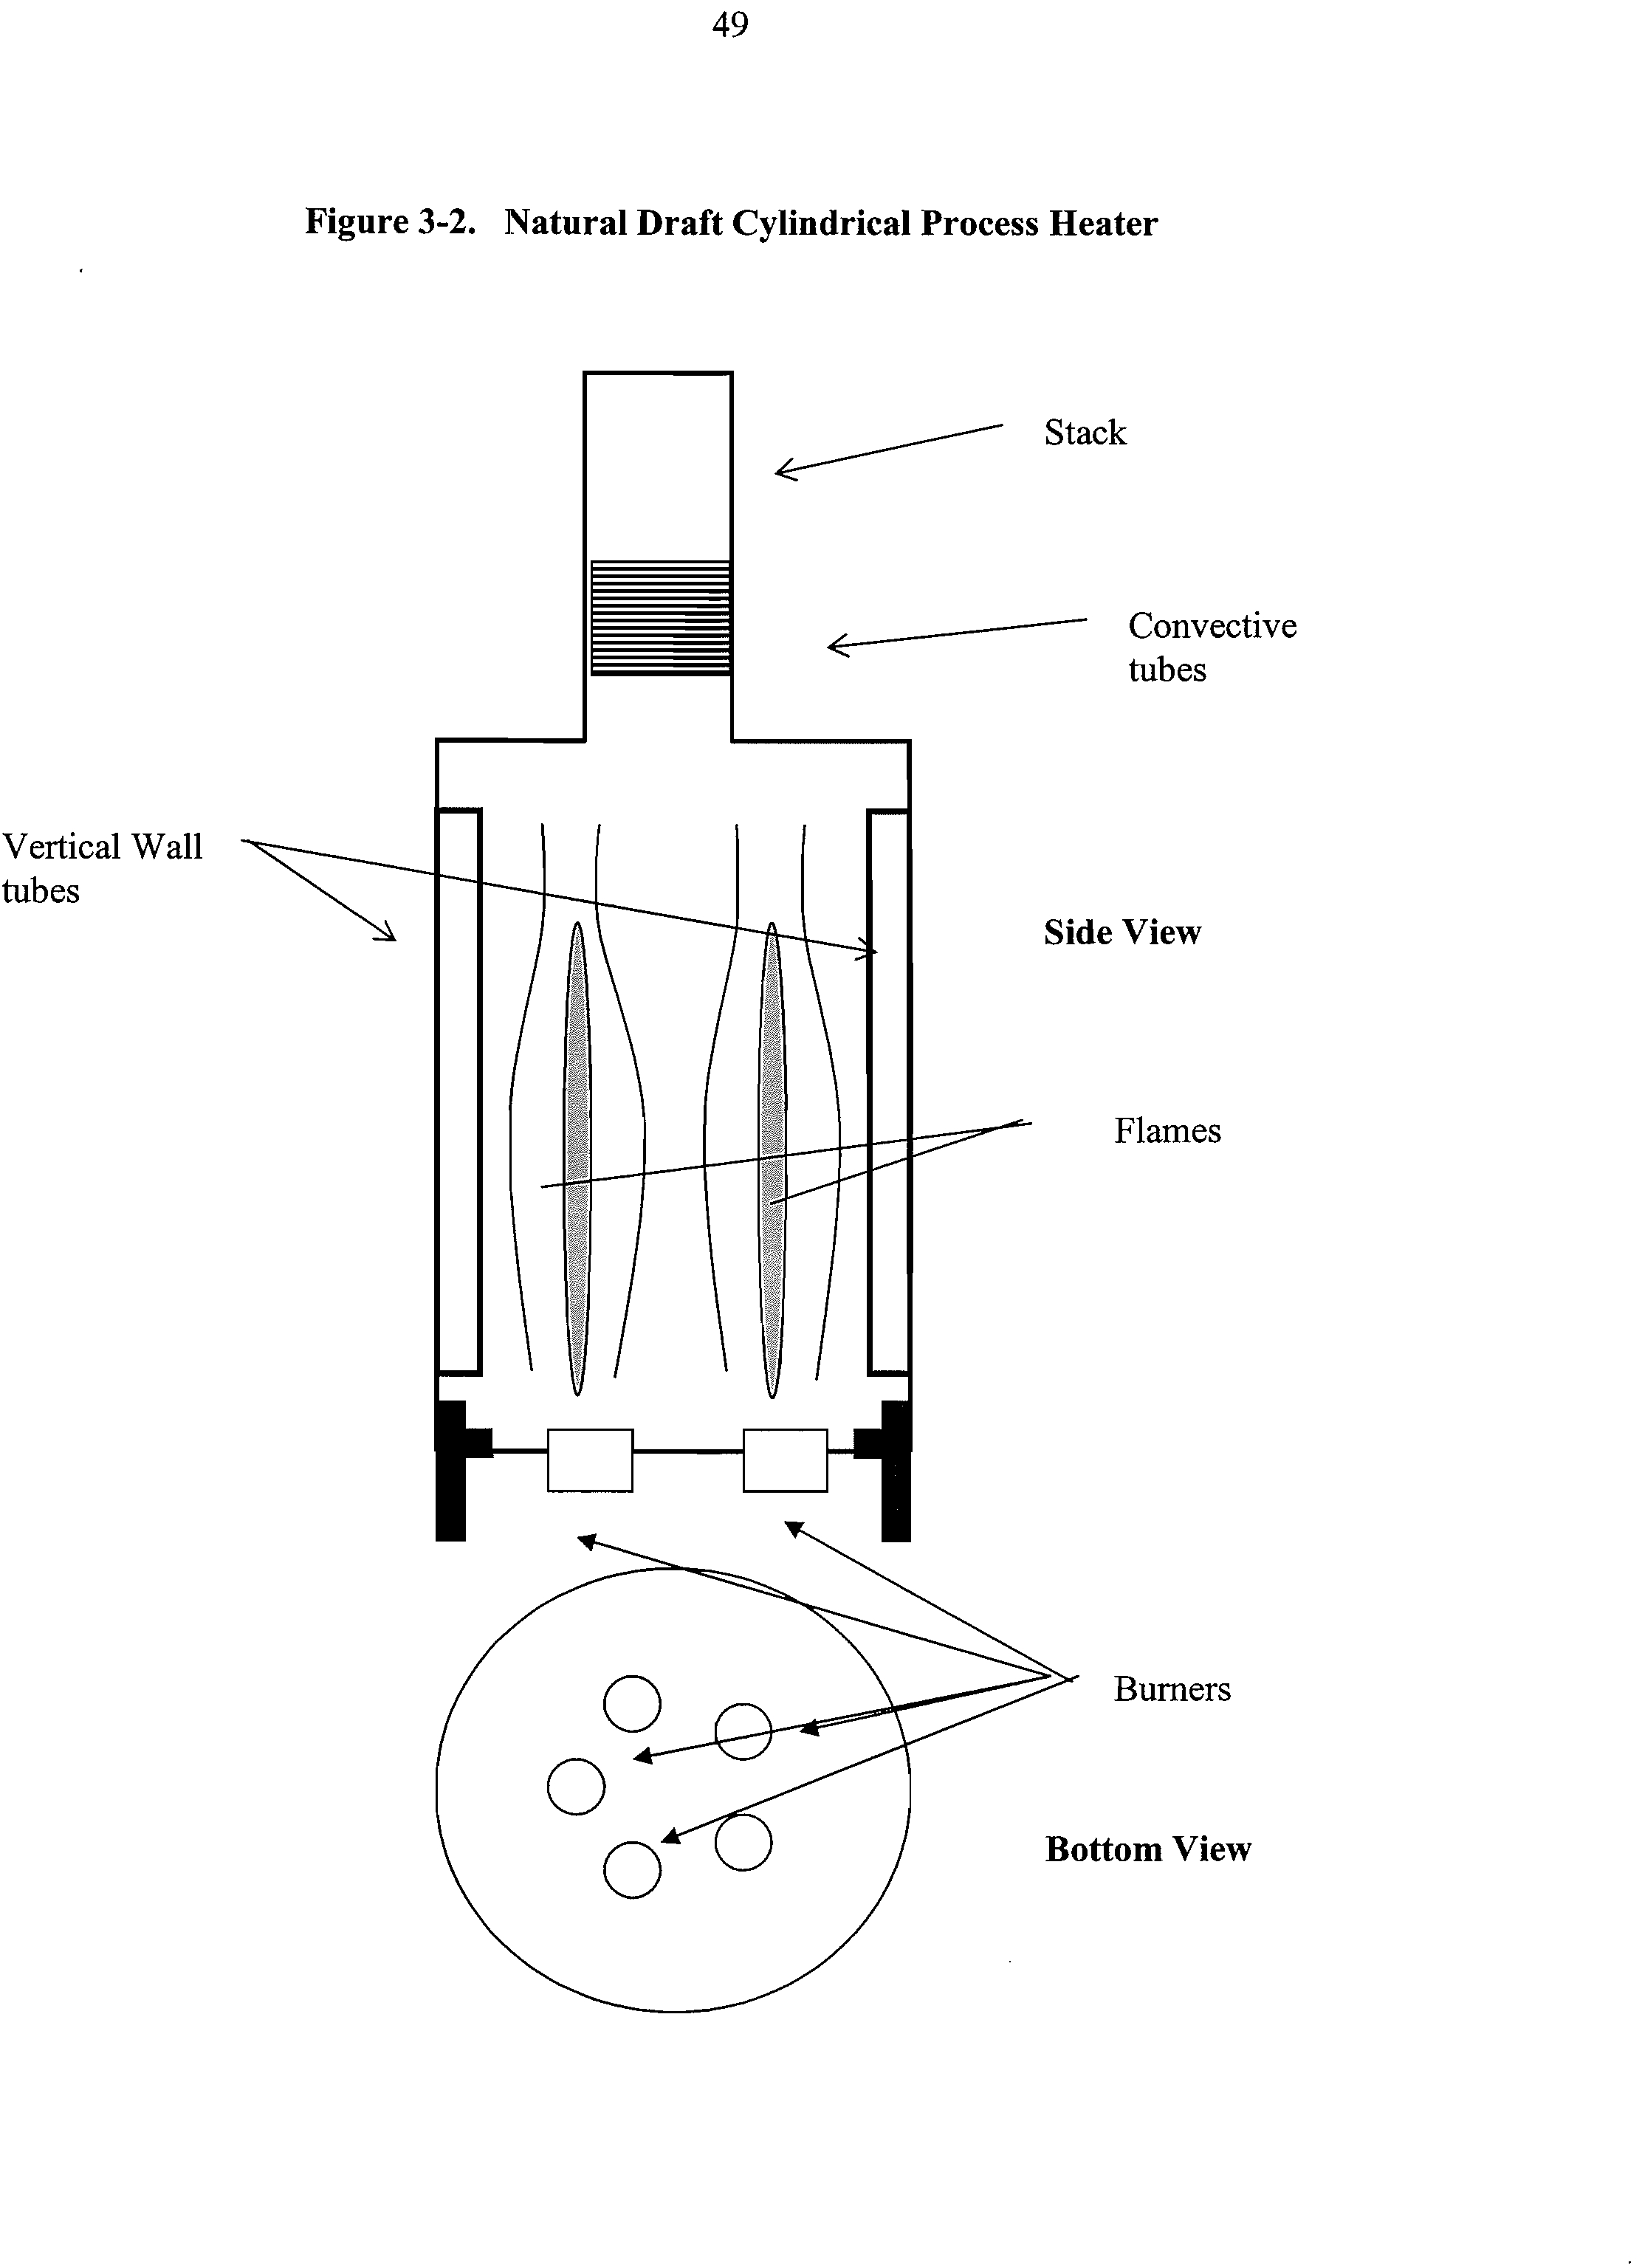
3-2
Natural Draft Cylindrical Process Heater
49
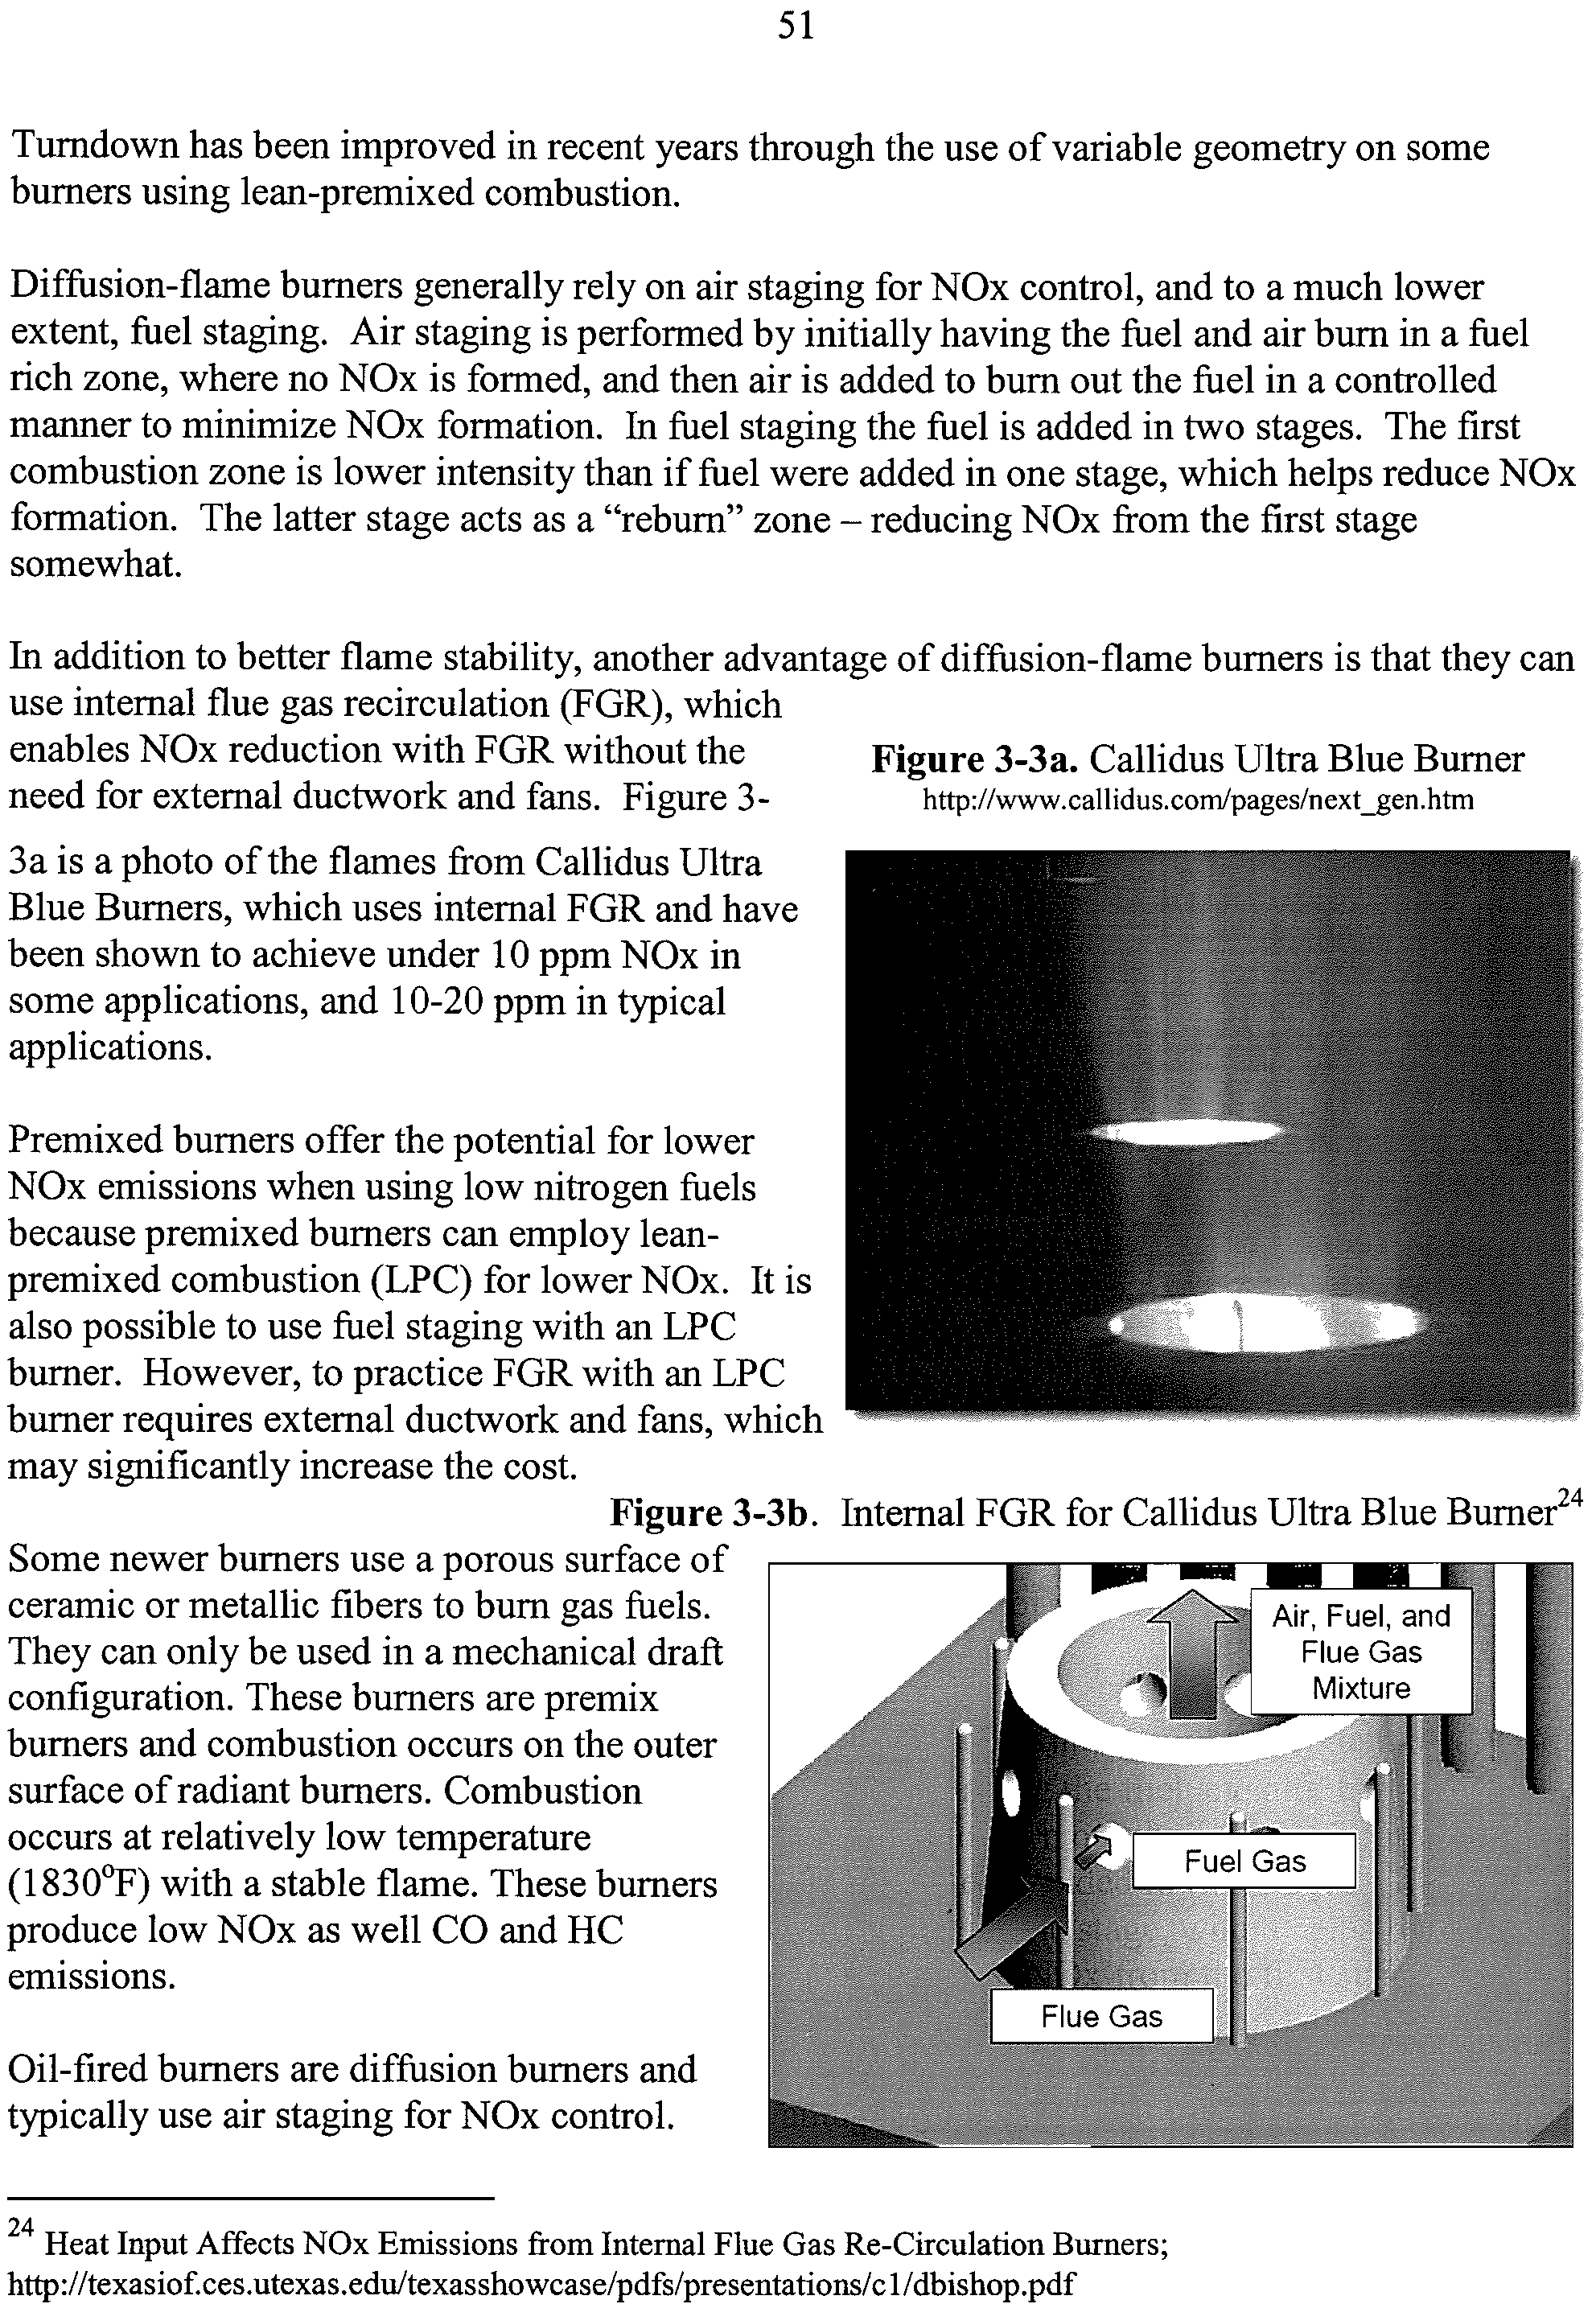
3-3a
Callidus Ultra Blue Burner
51
3-3b
Internal FGR for Callidus Ultra Blue Burner
51
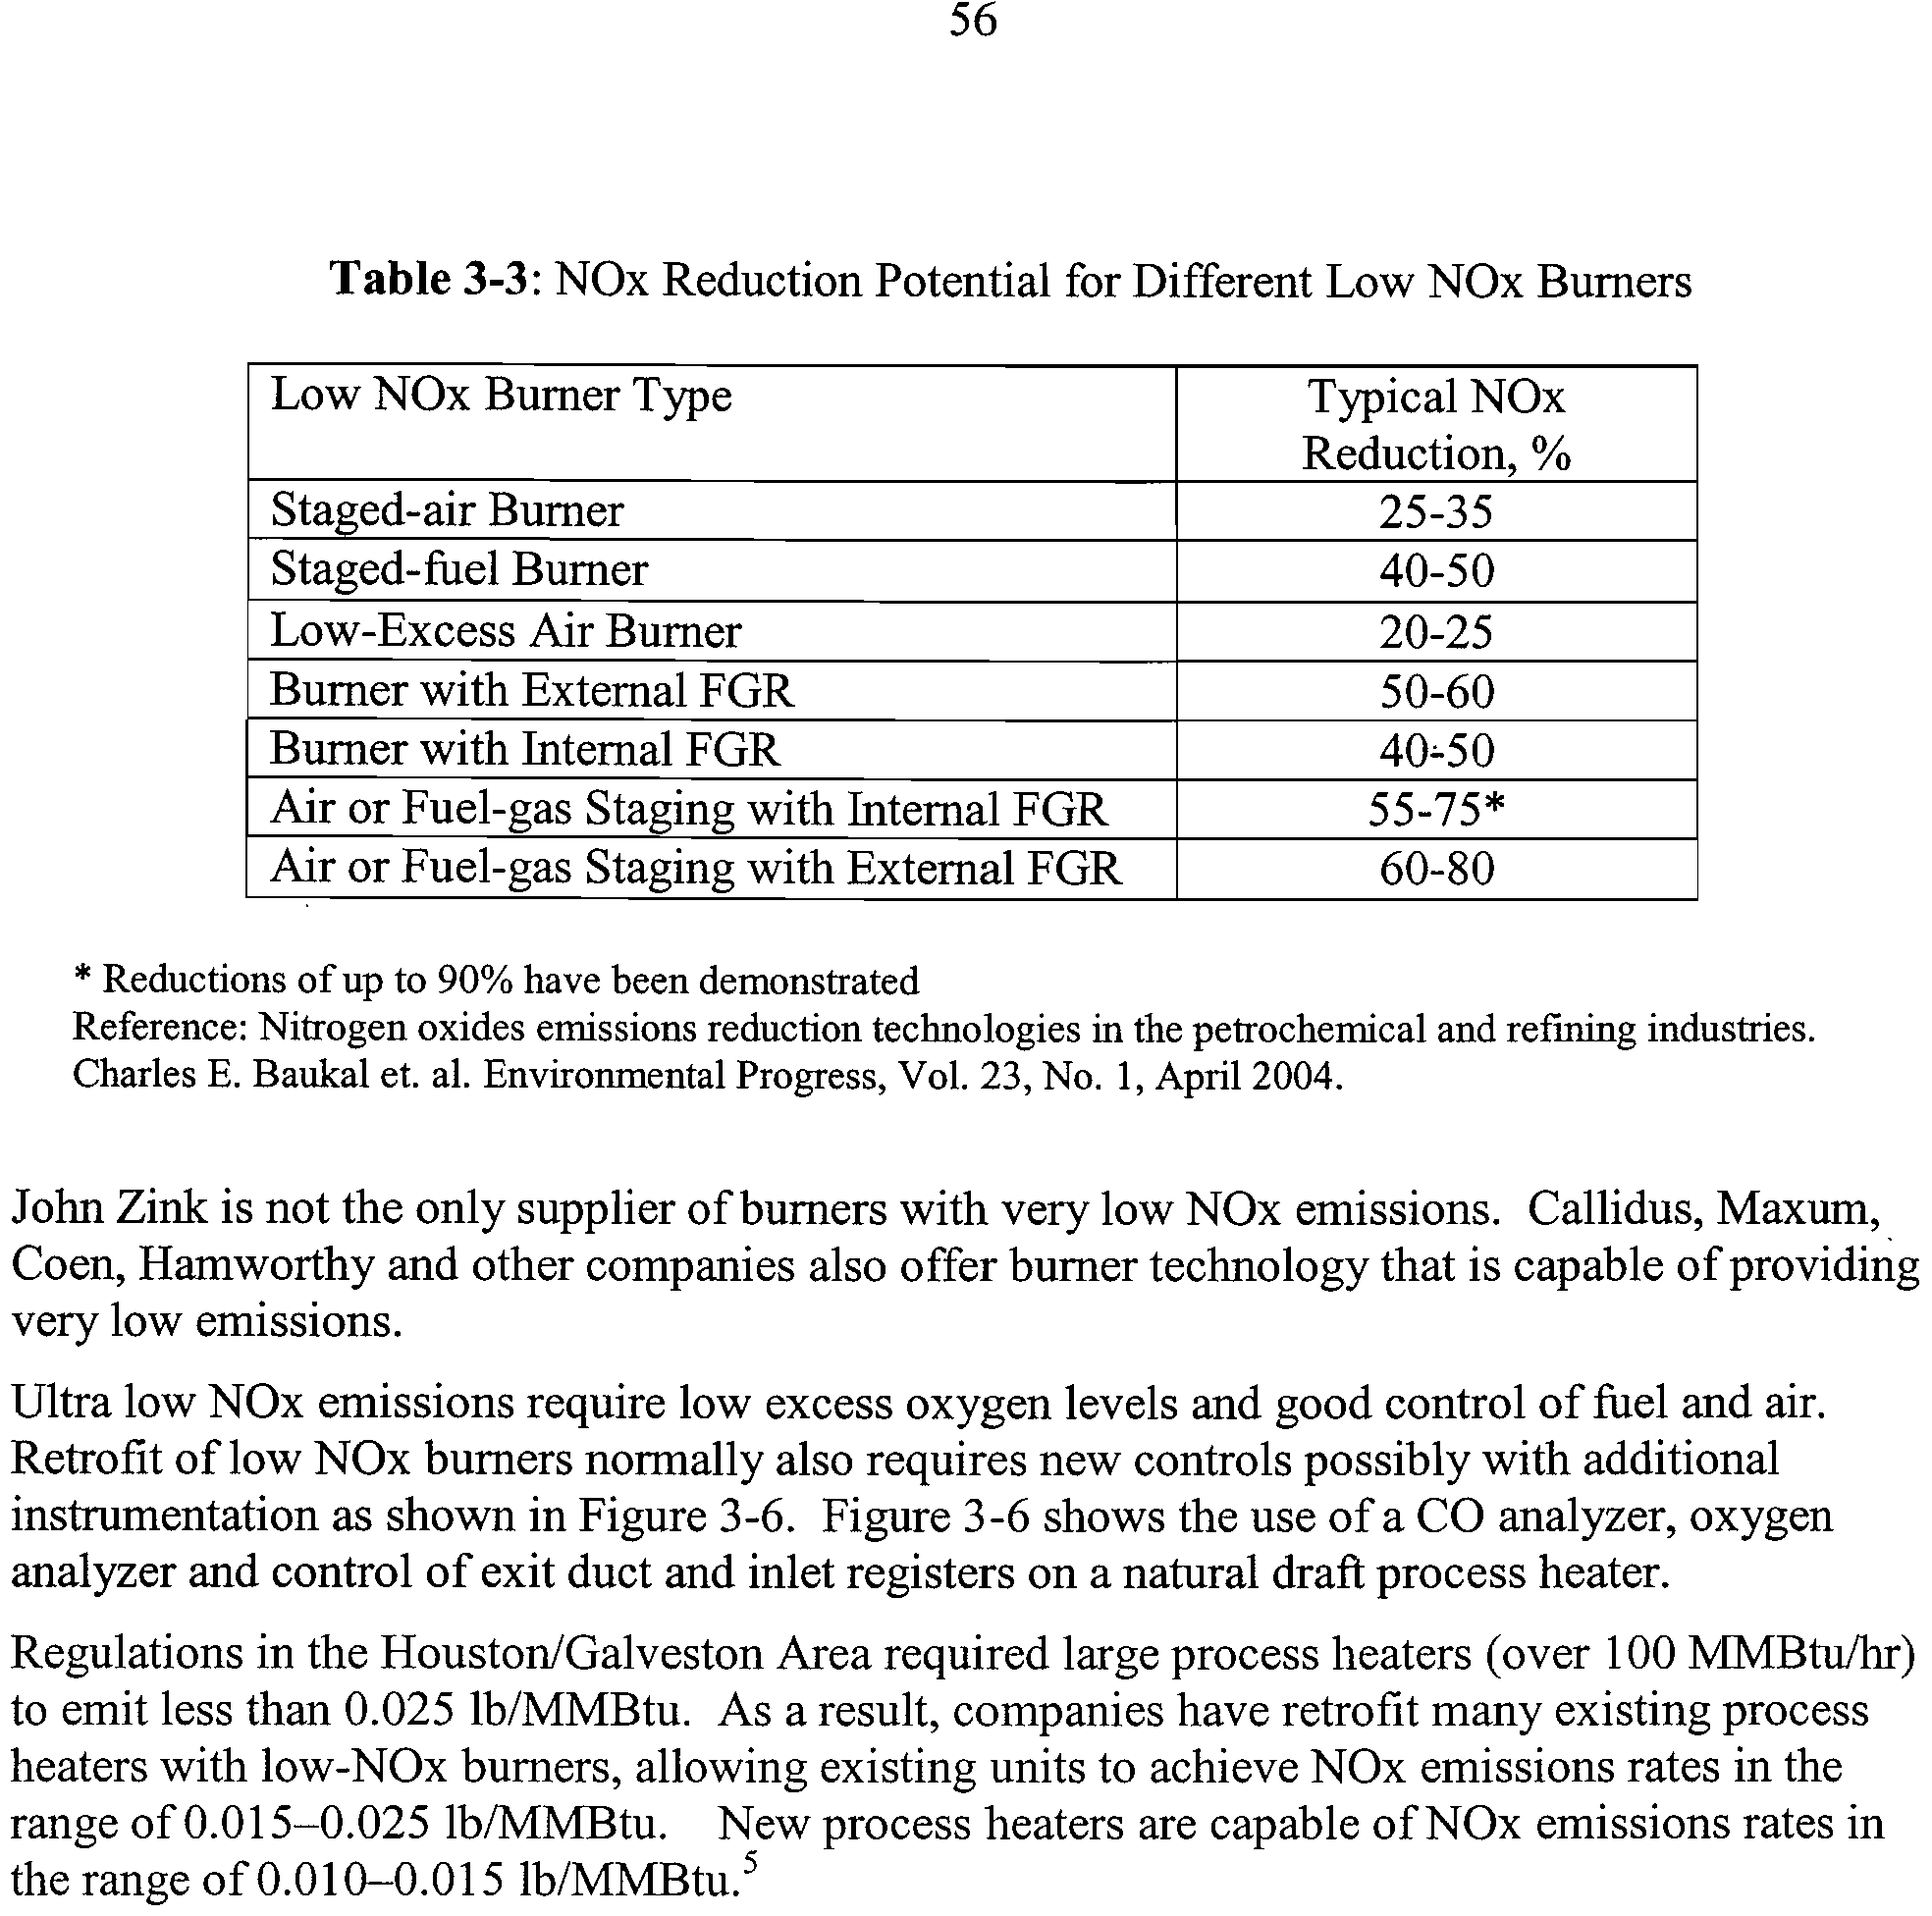
3-4
Comparison of an ultra low NOx burner (ULNB) with other
burners
57
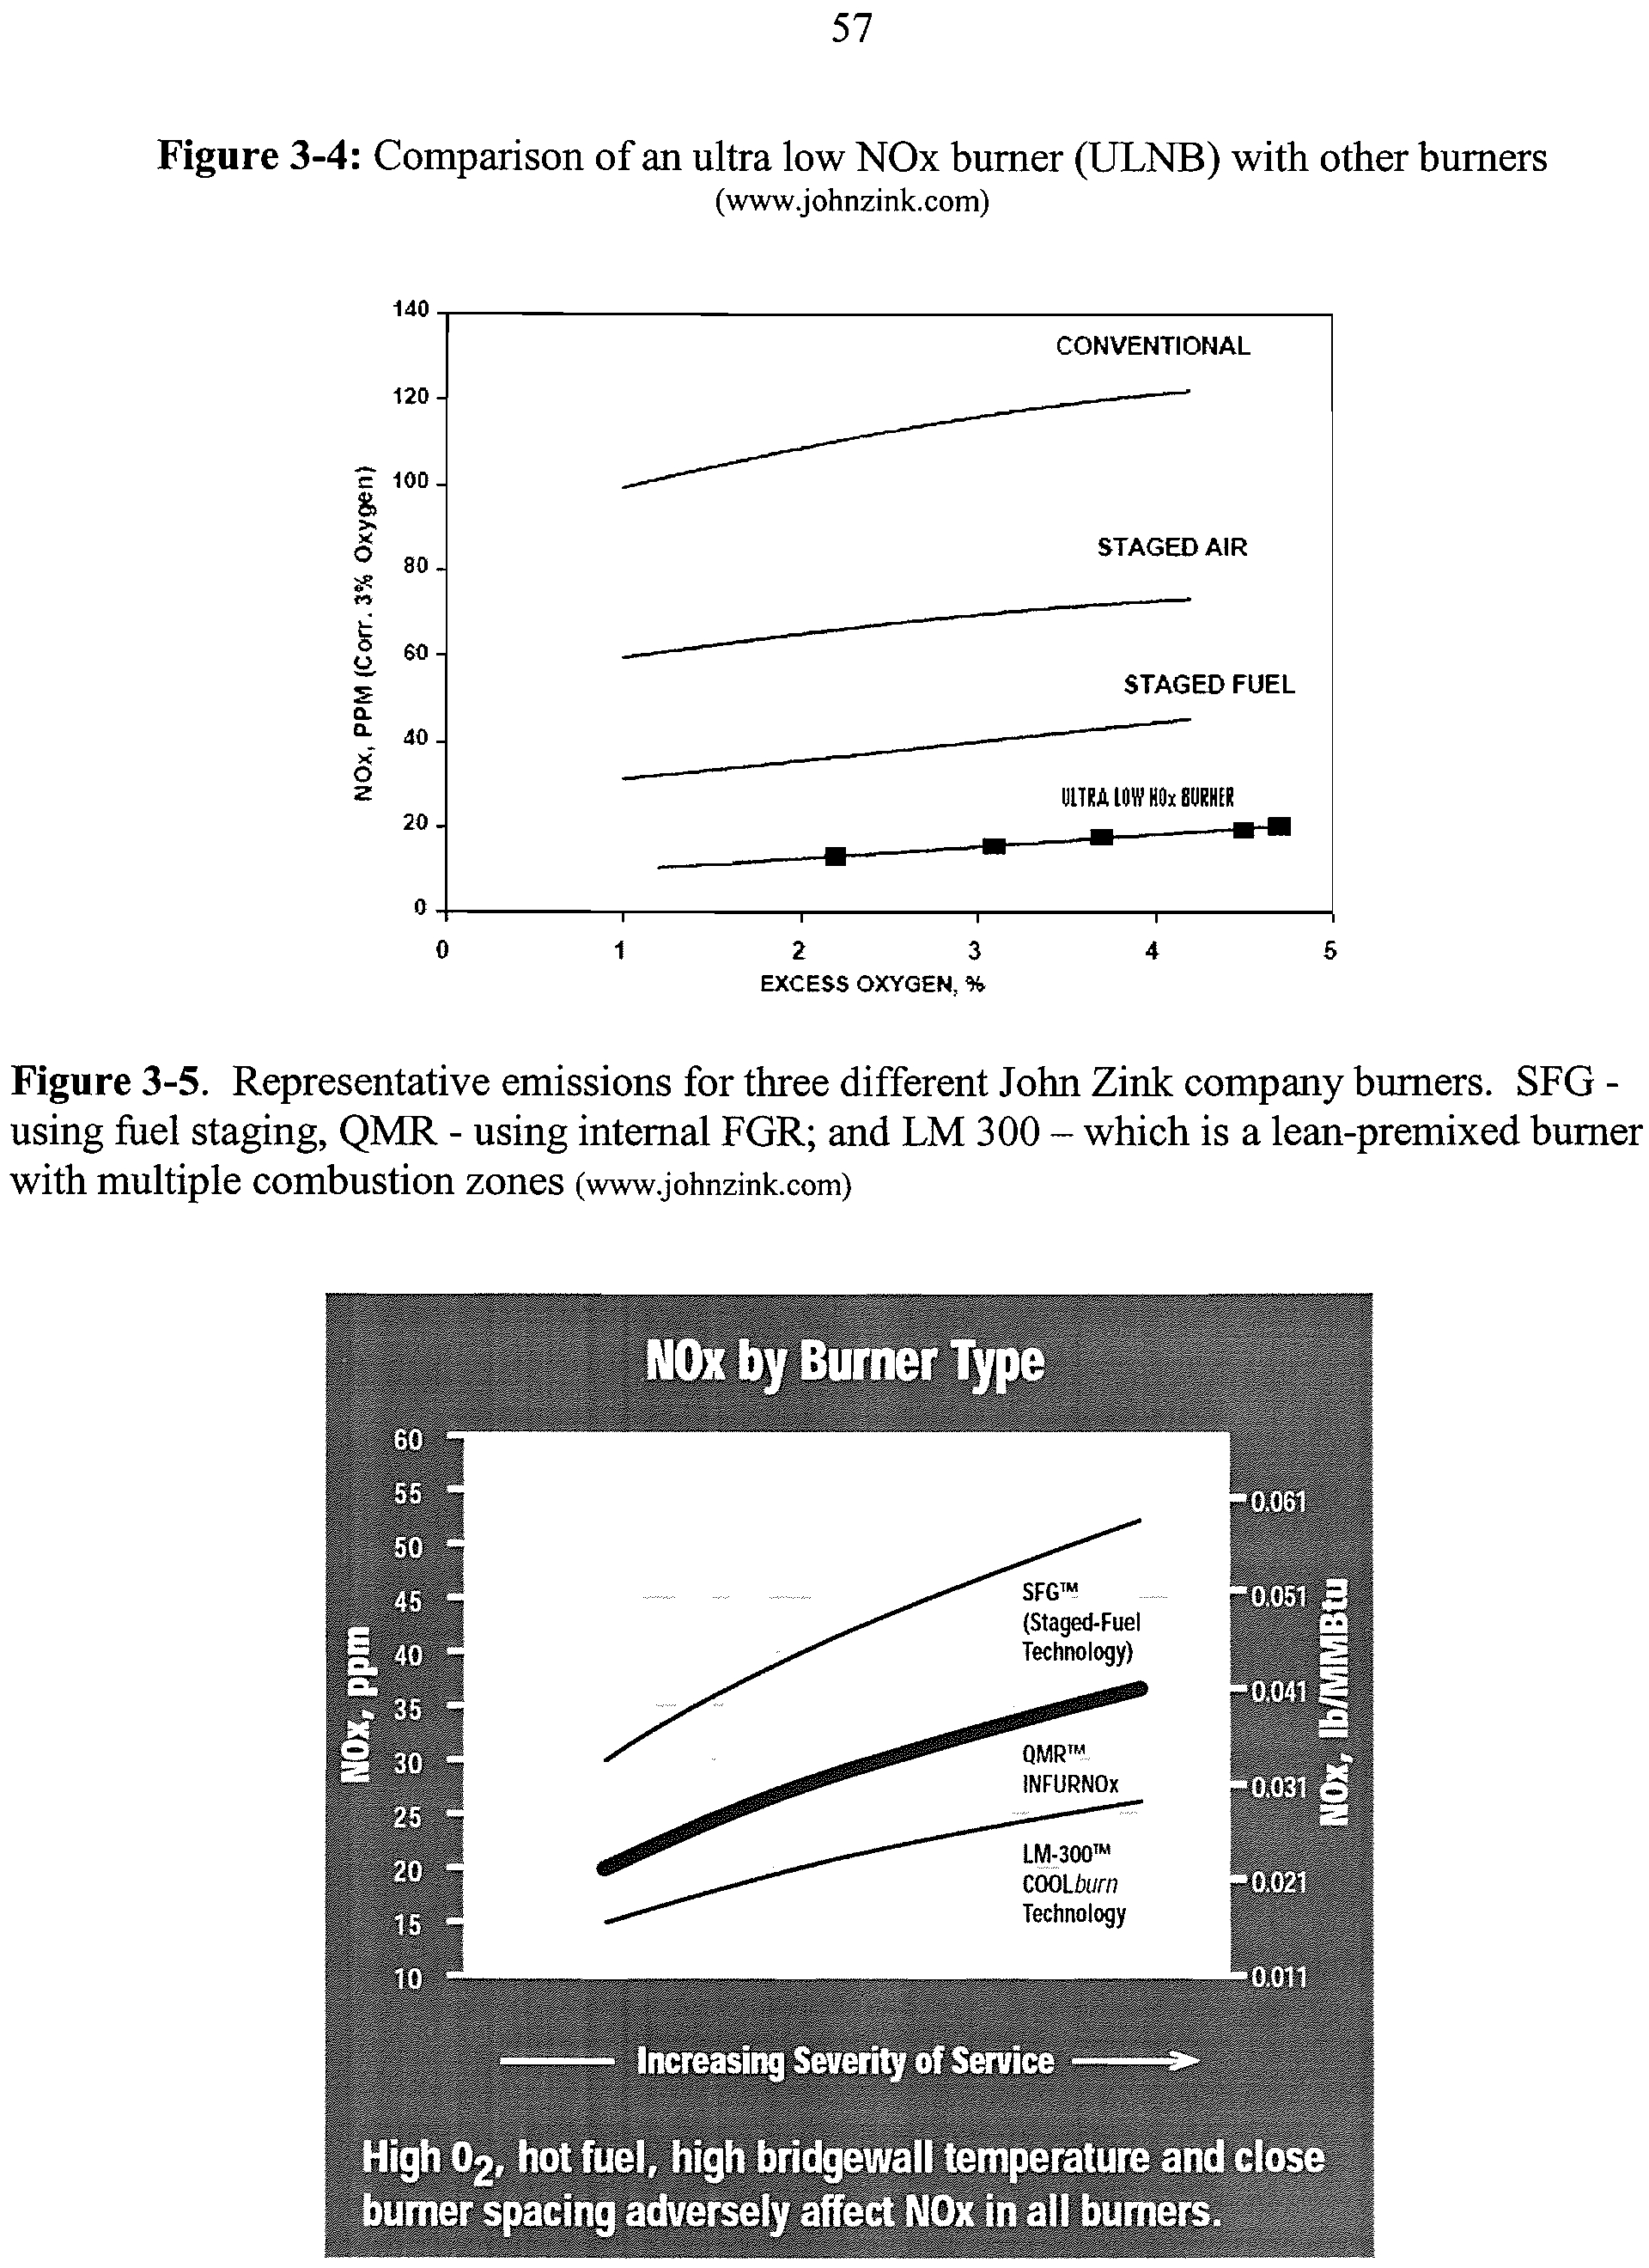
3-5
Representative emissions for three different John Zink company
burners
57
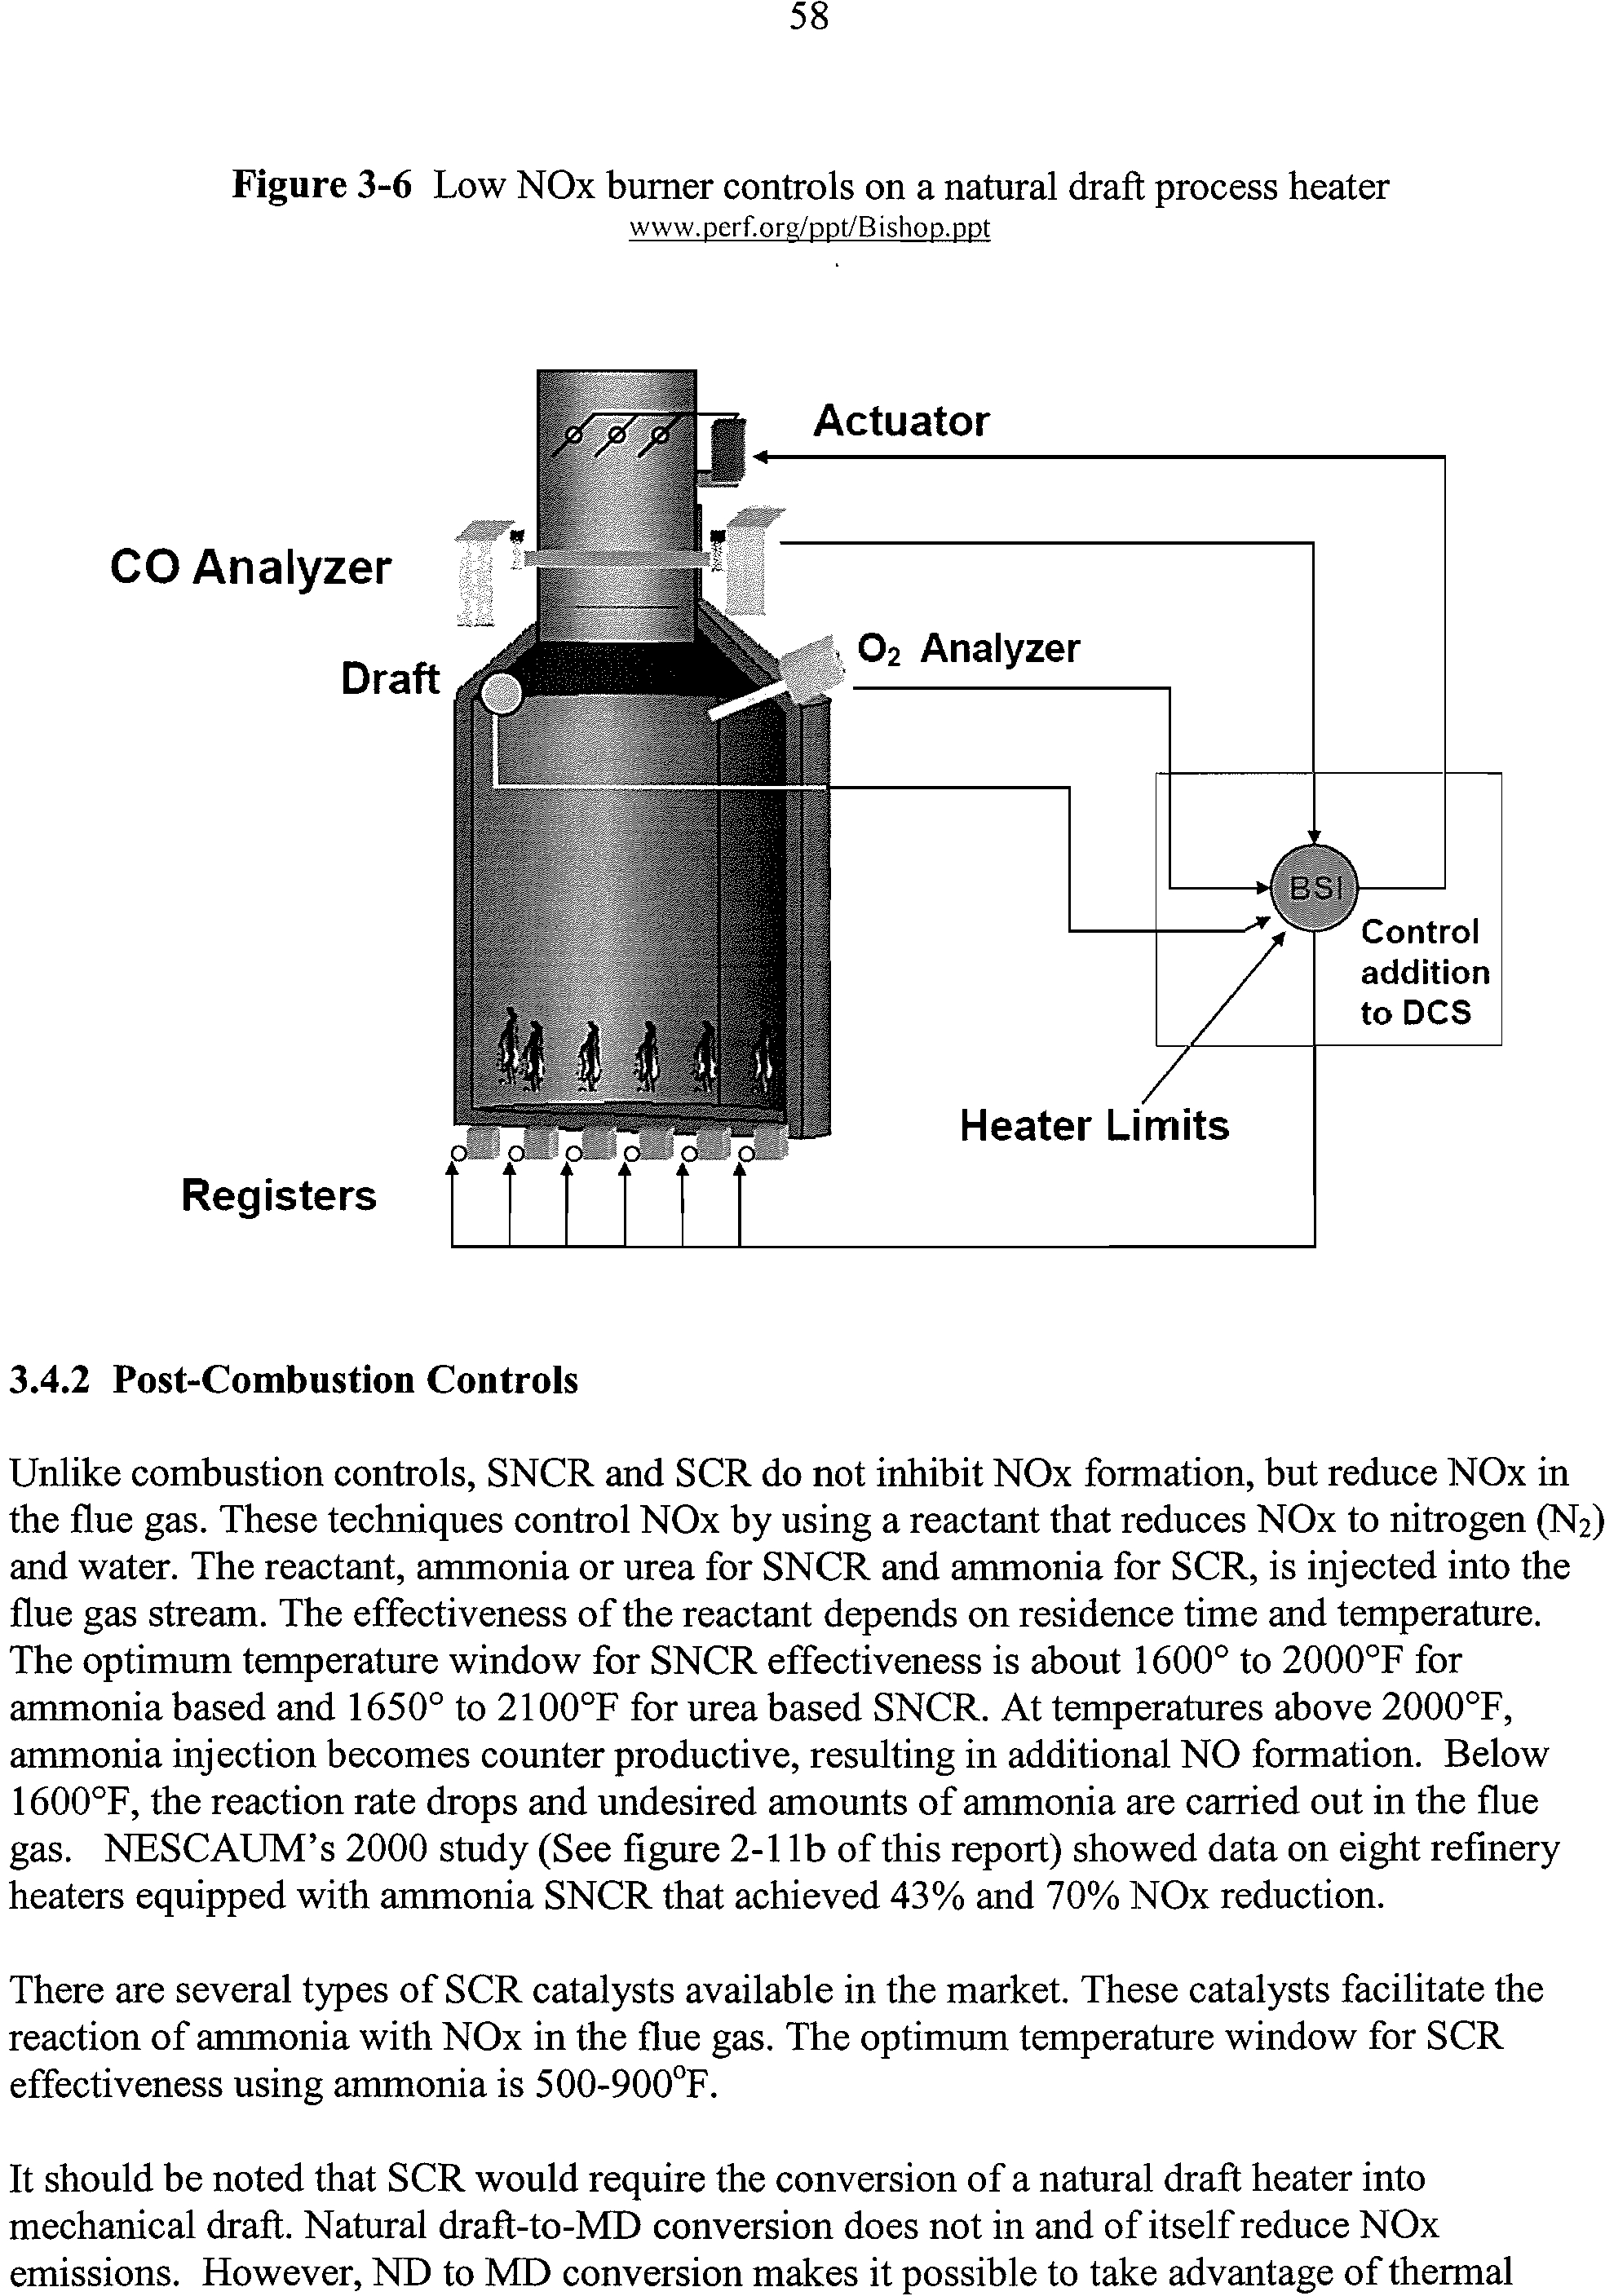
3-6
Low NOx burner controls on a natural draft process heater
58
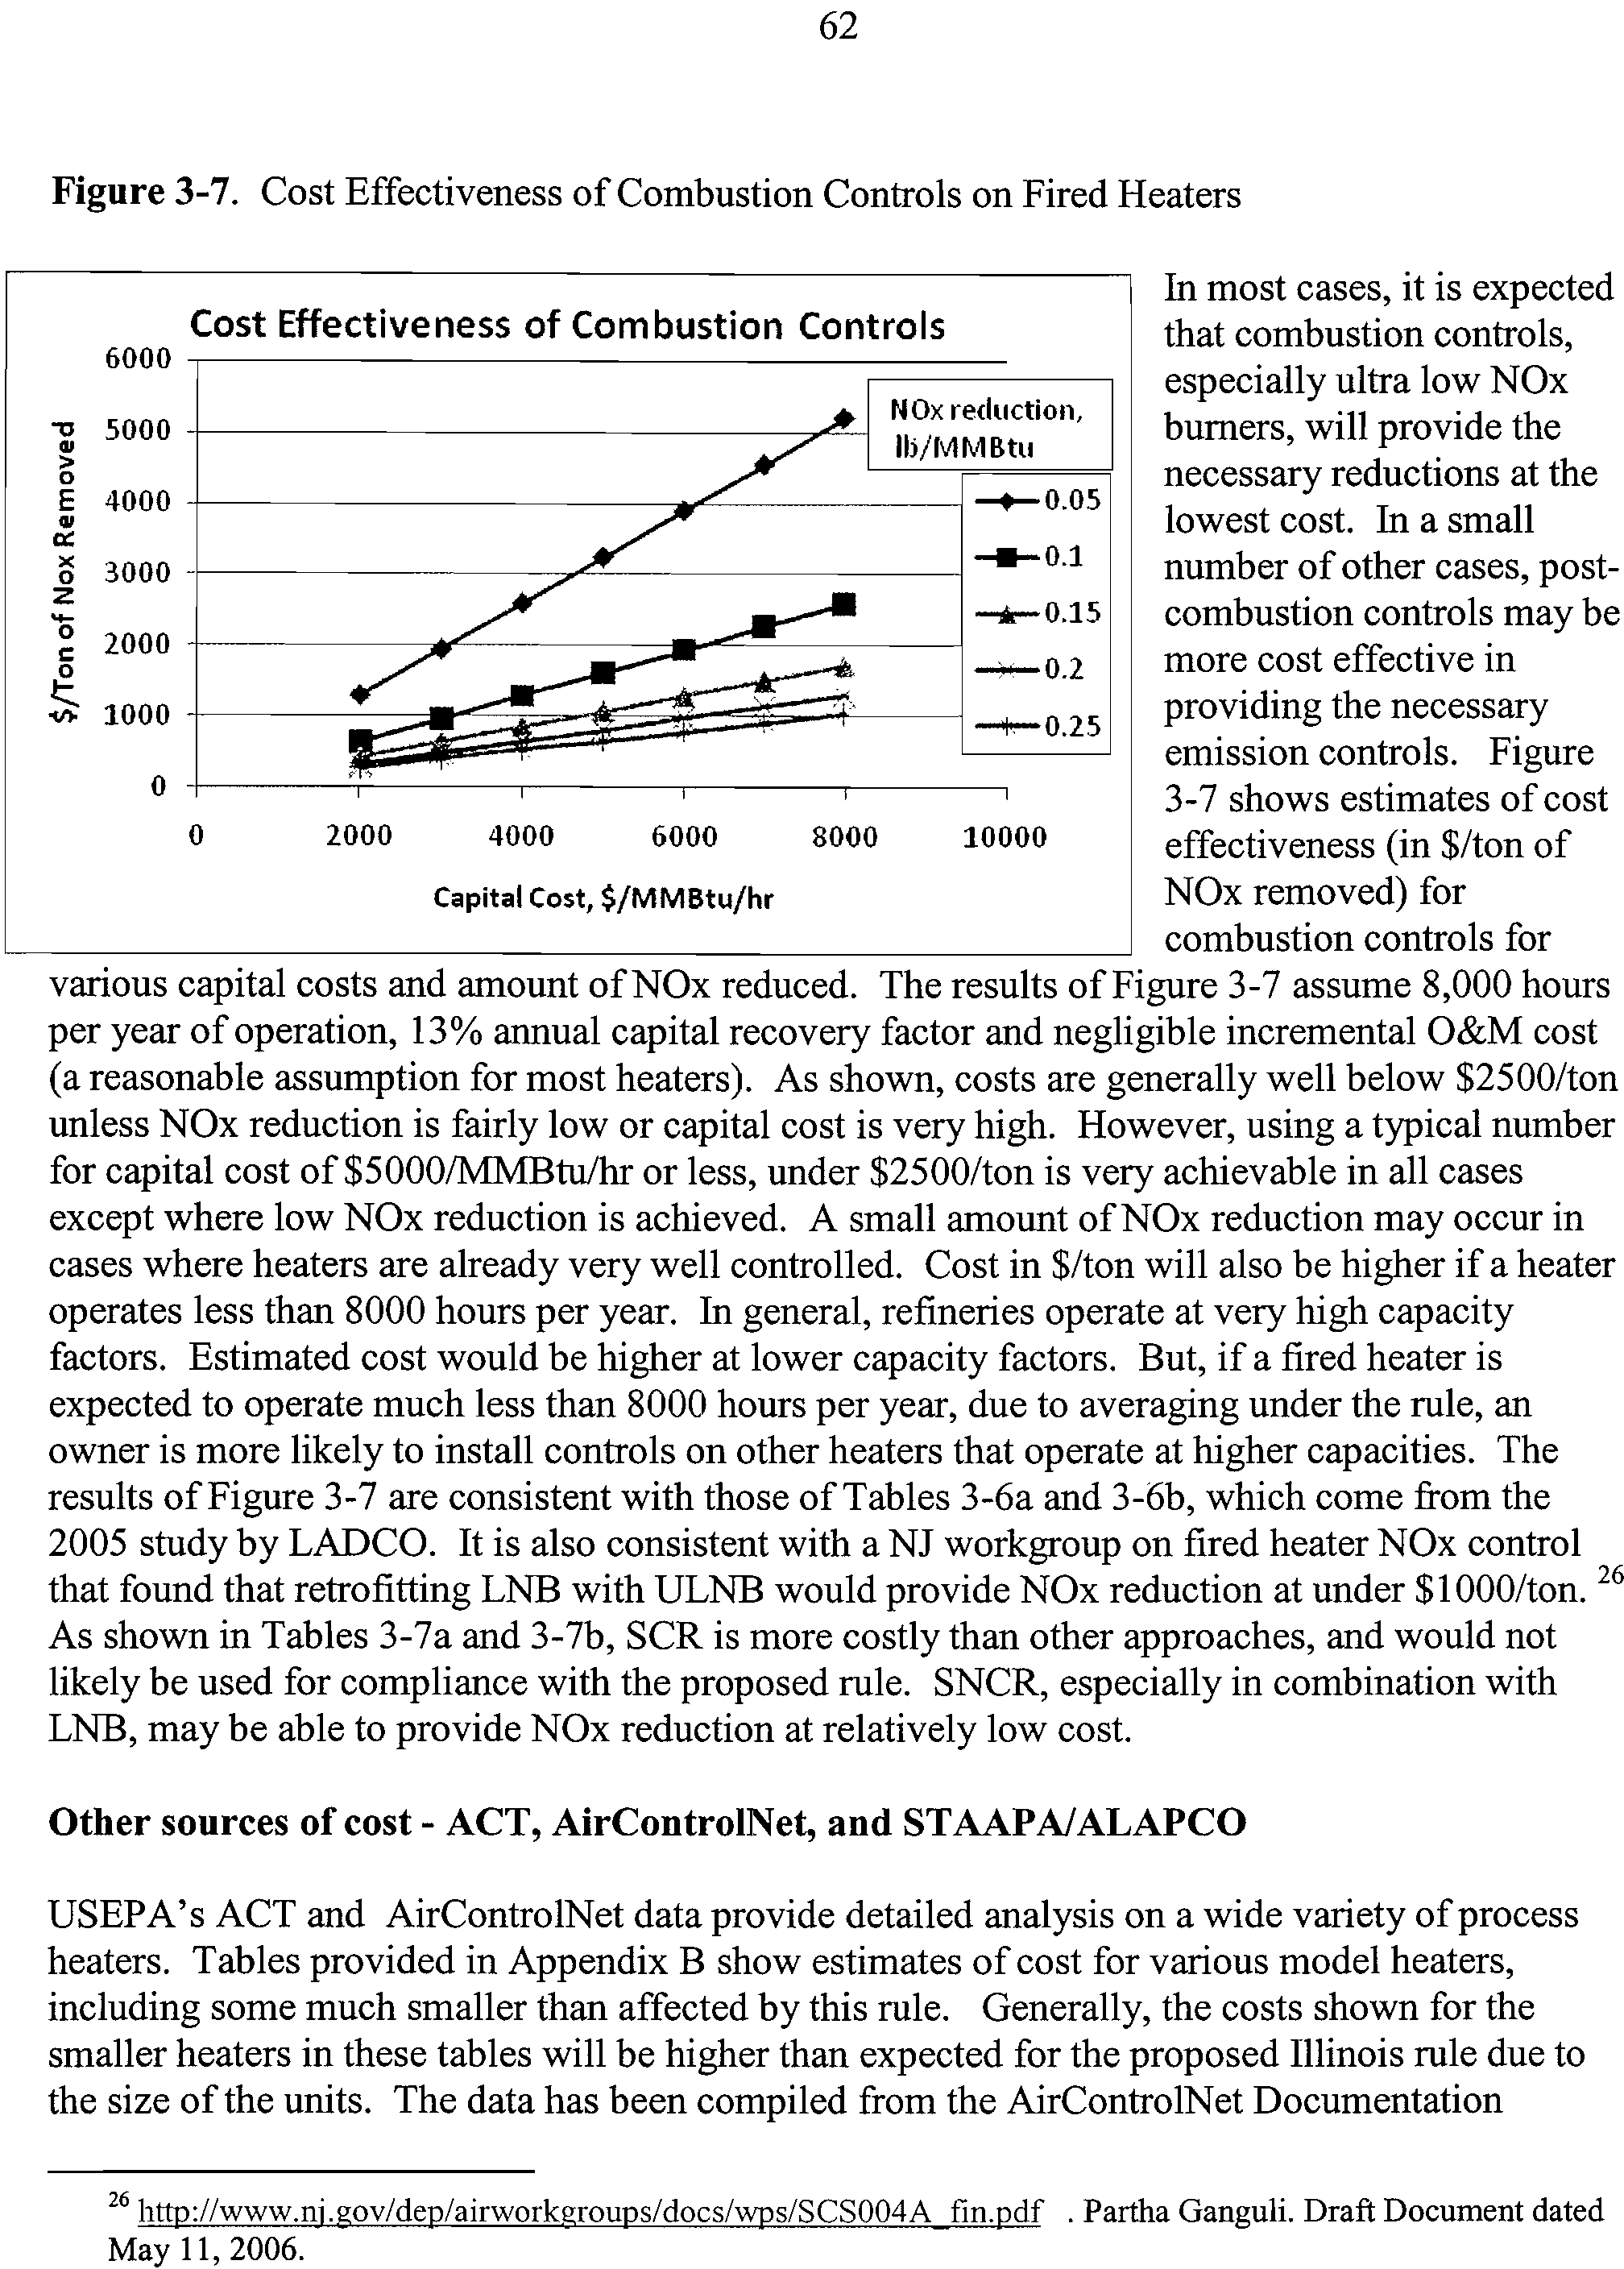
3-7
Cost Effectiveness of Combustion Controls on Fired Heaters
62
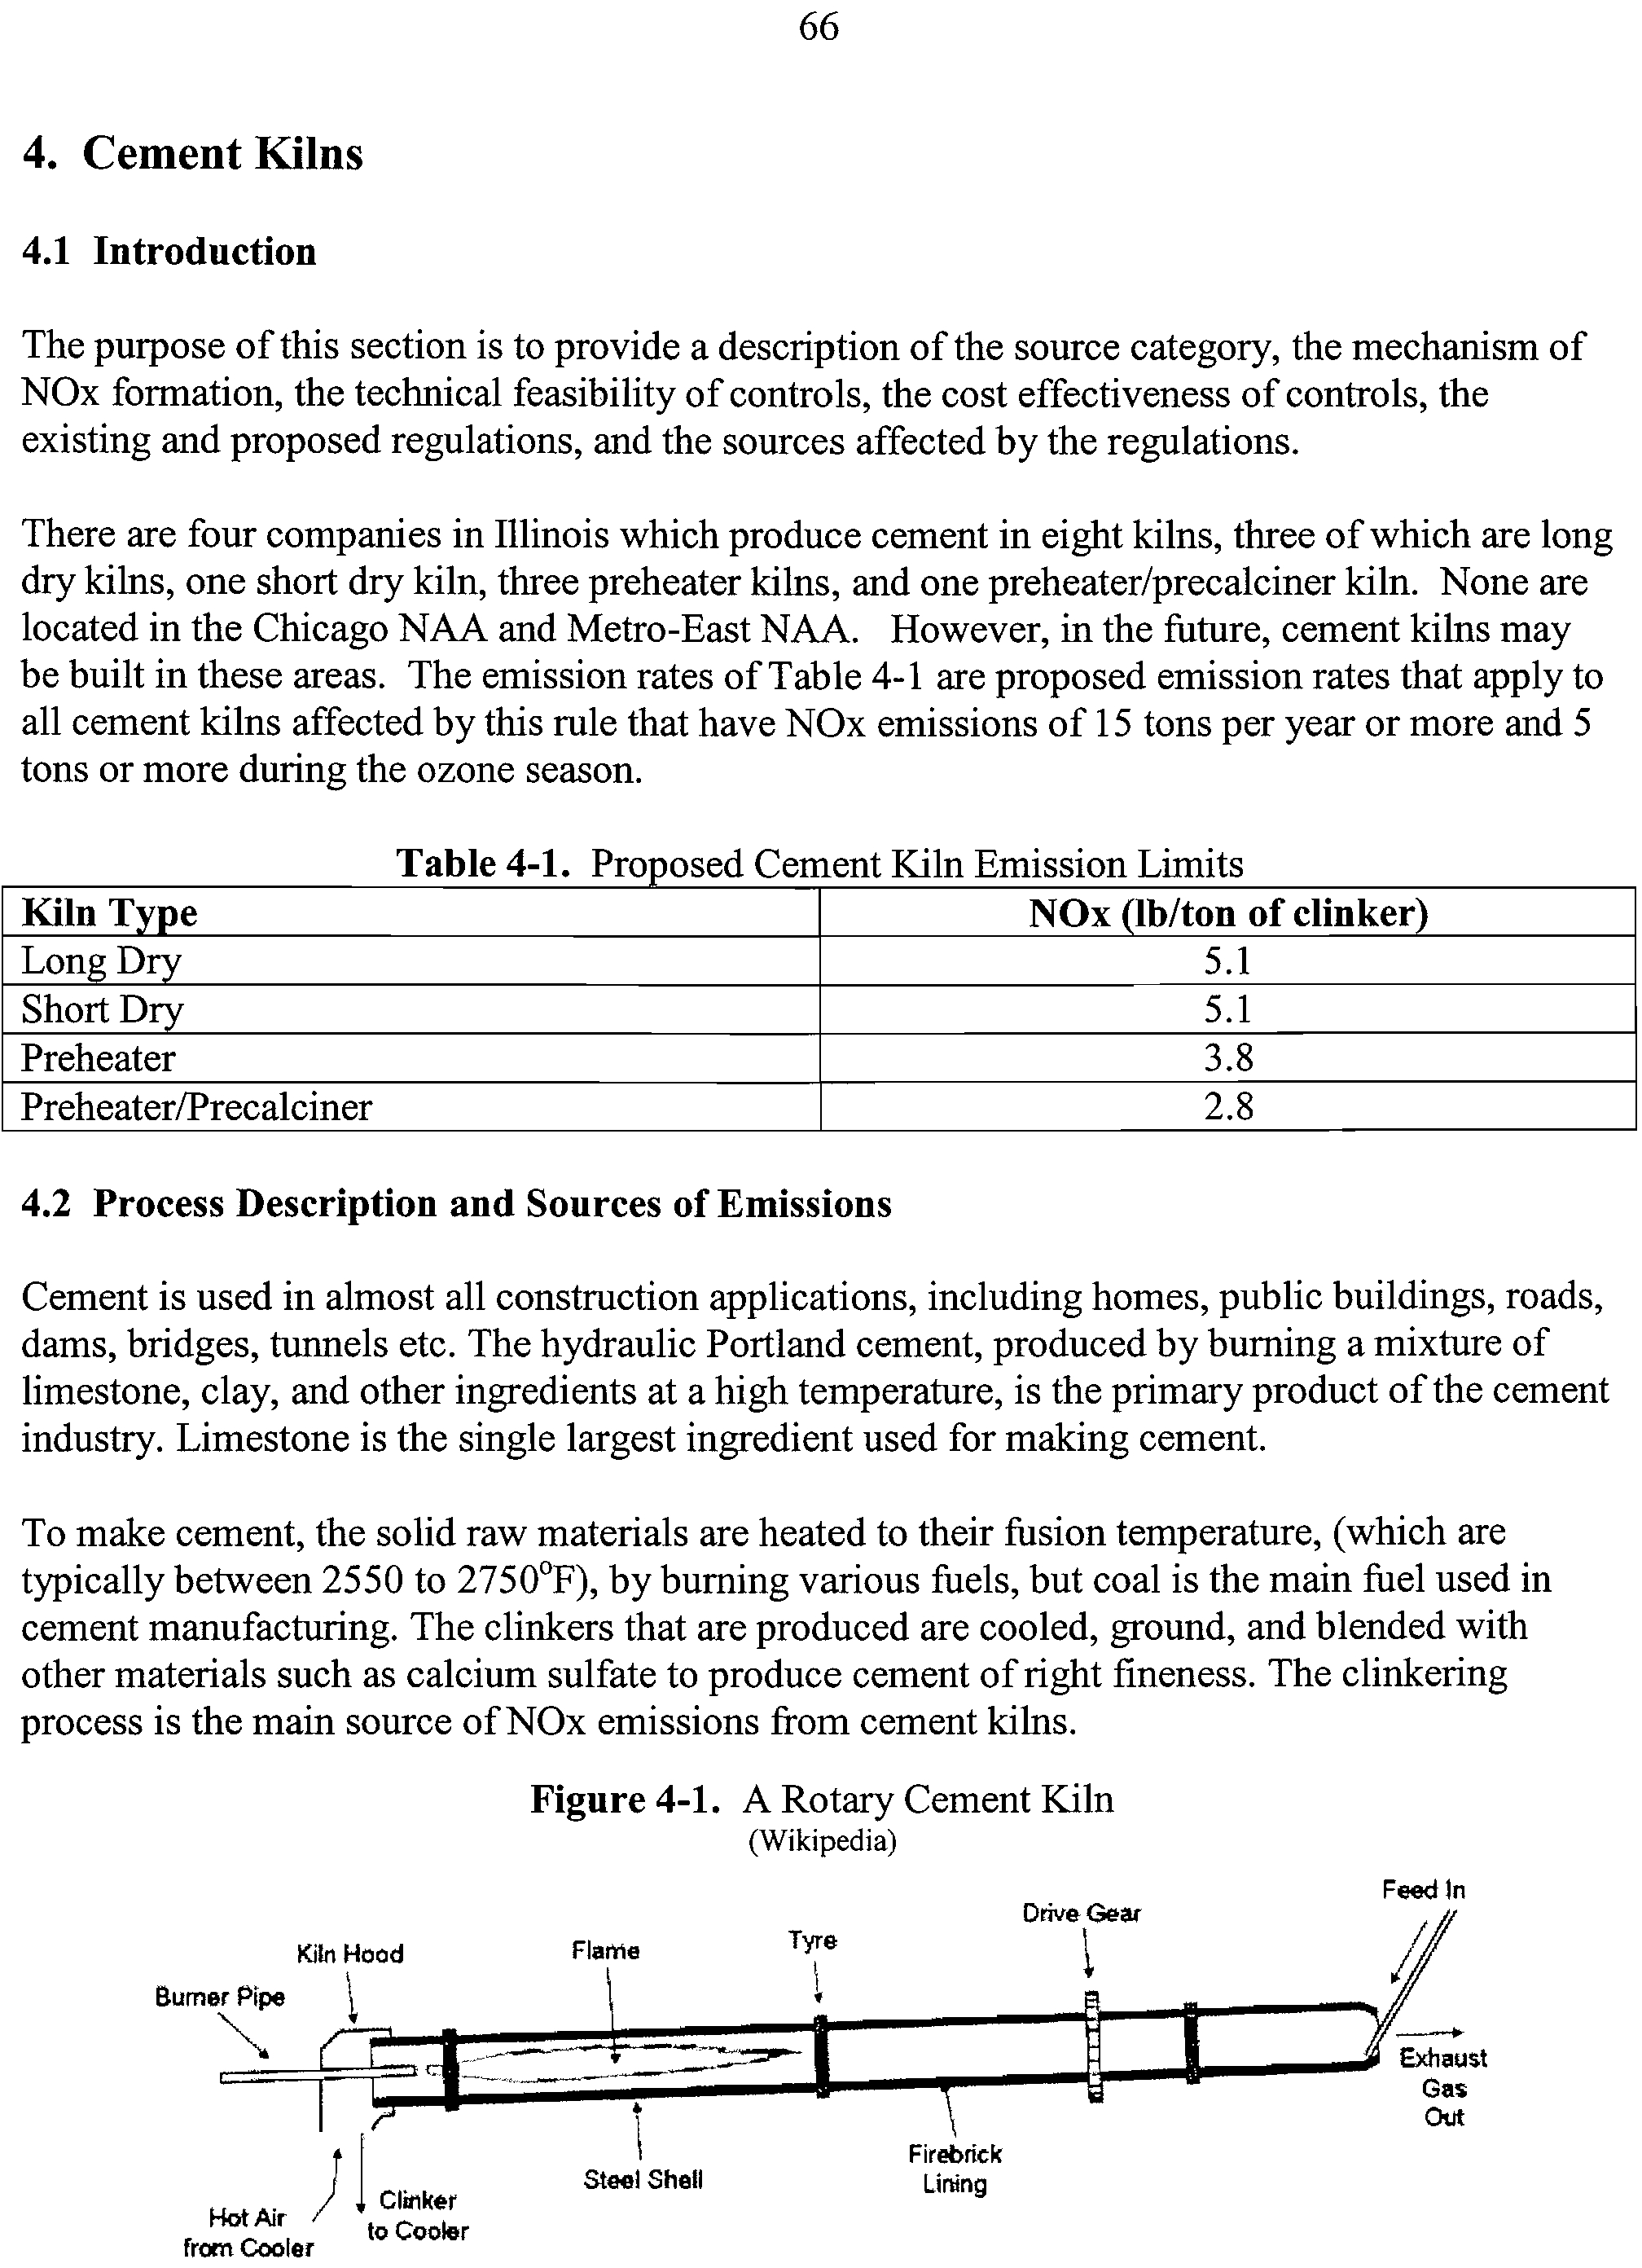
4-1
A Rotary Cement Kiln
66
4-2
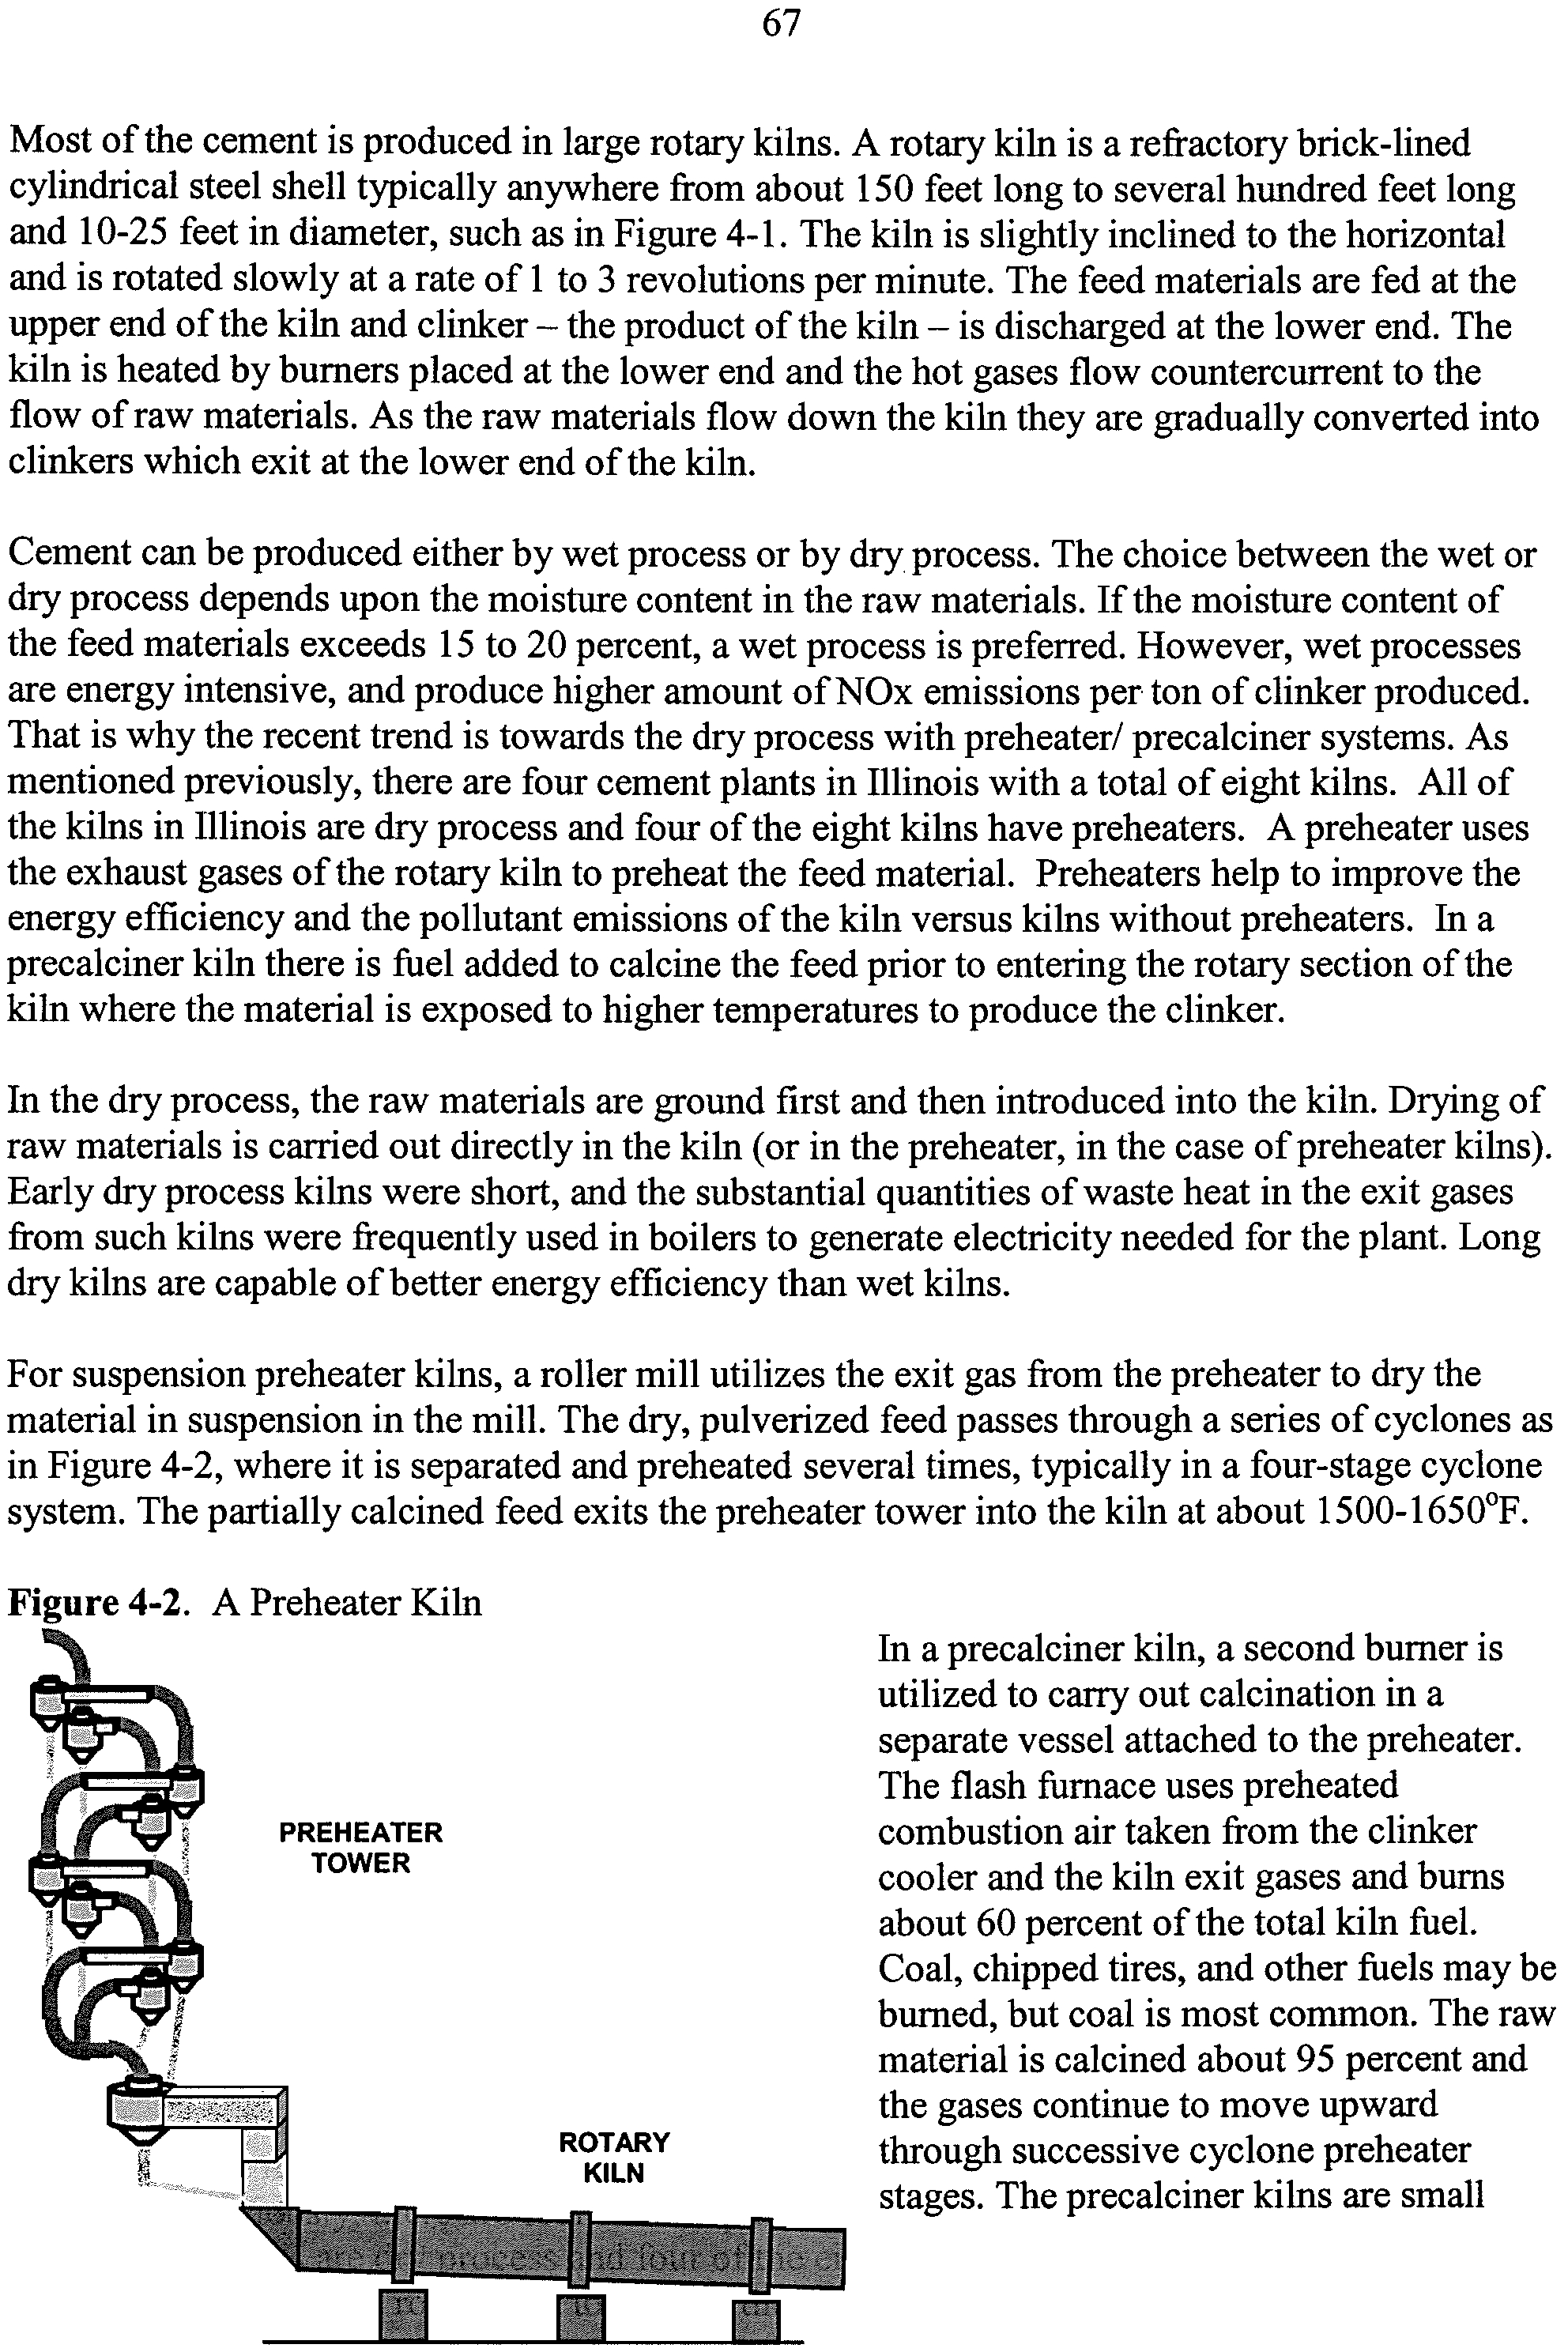
A Preheater Kiln
67
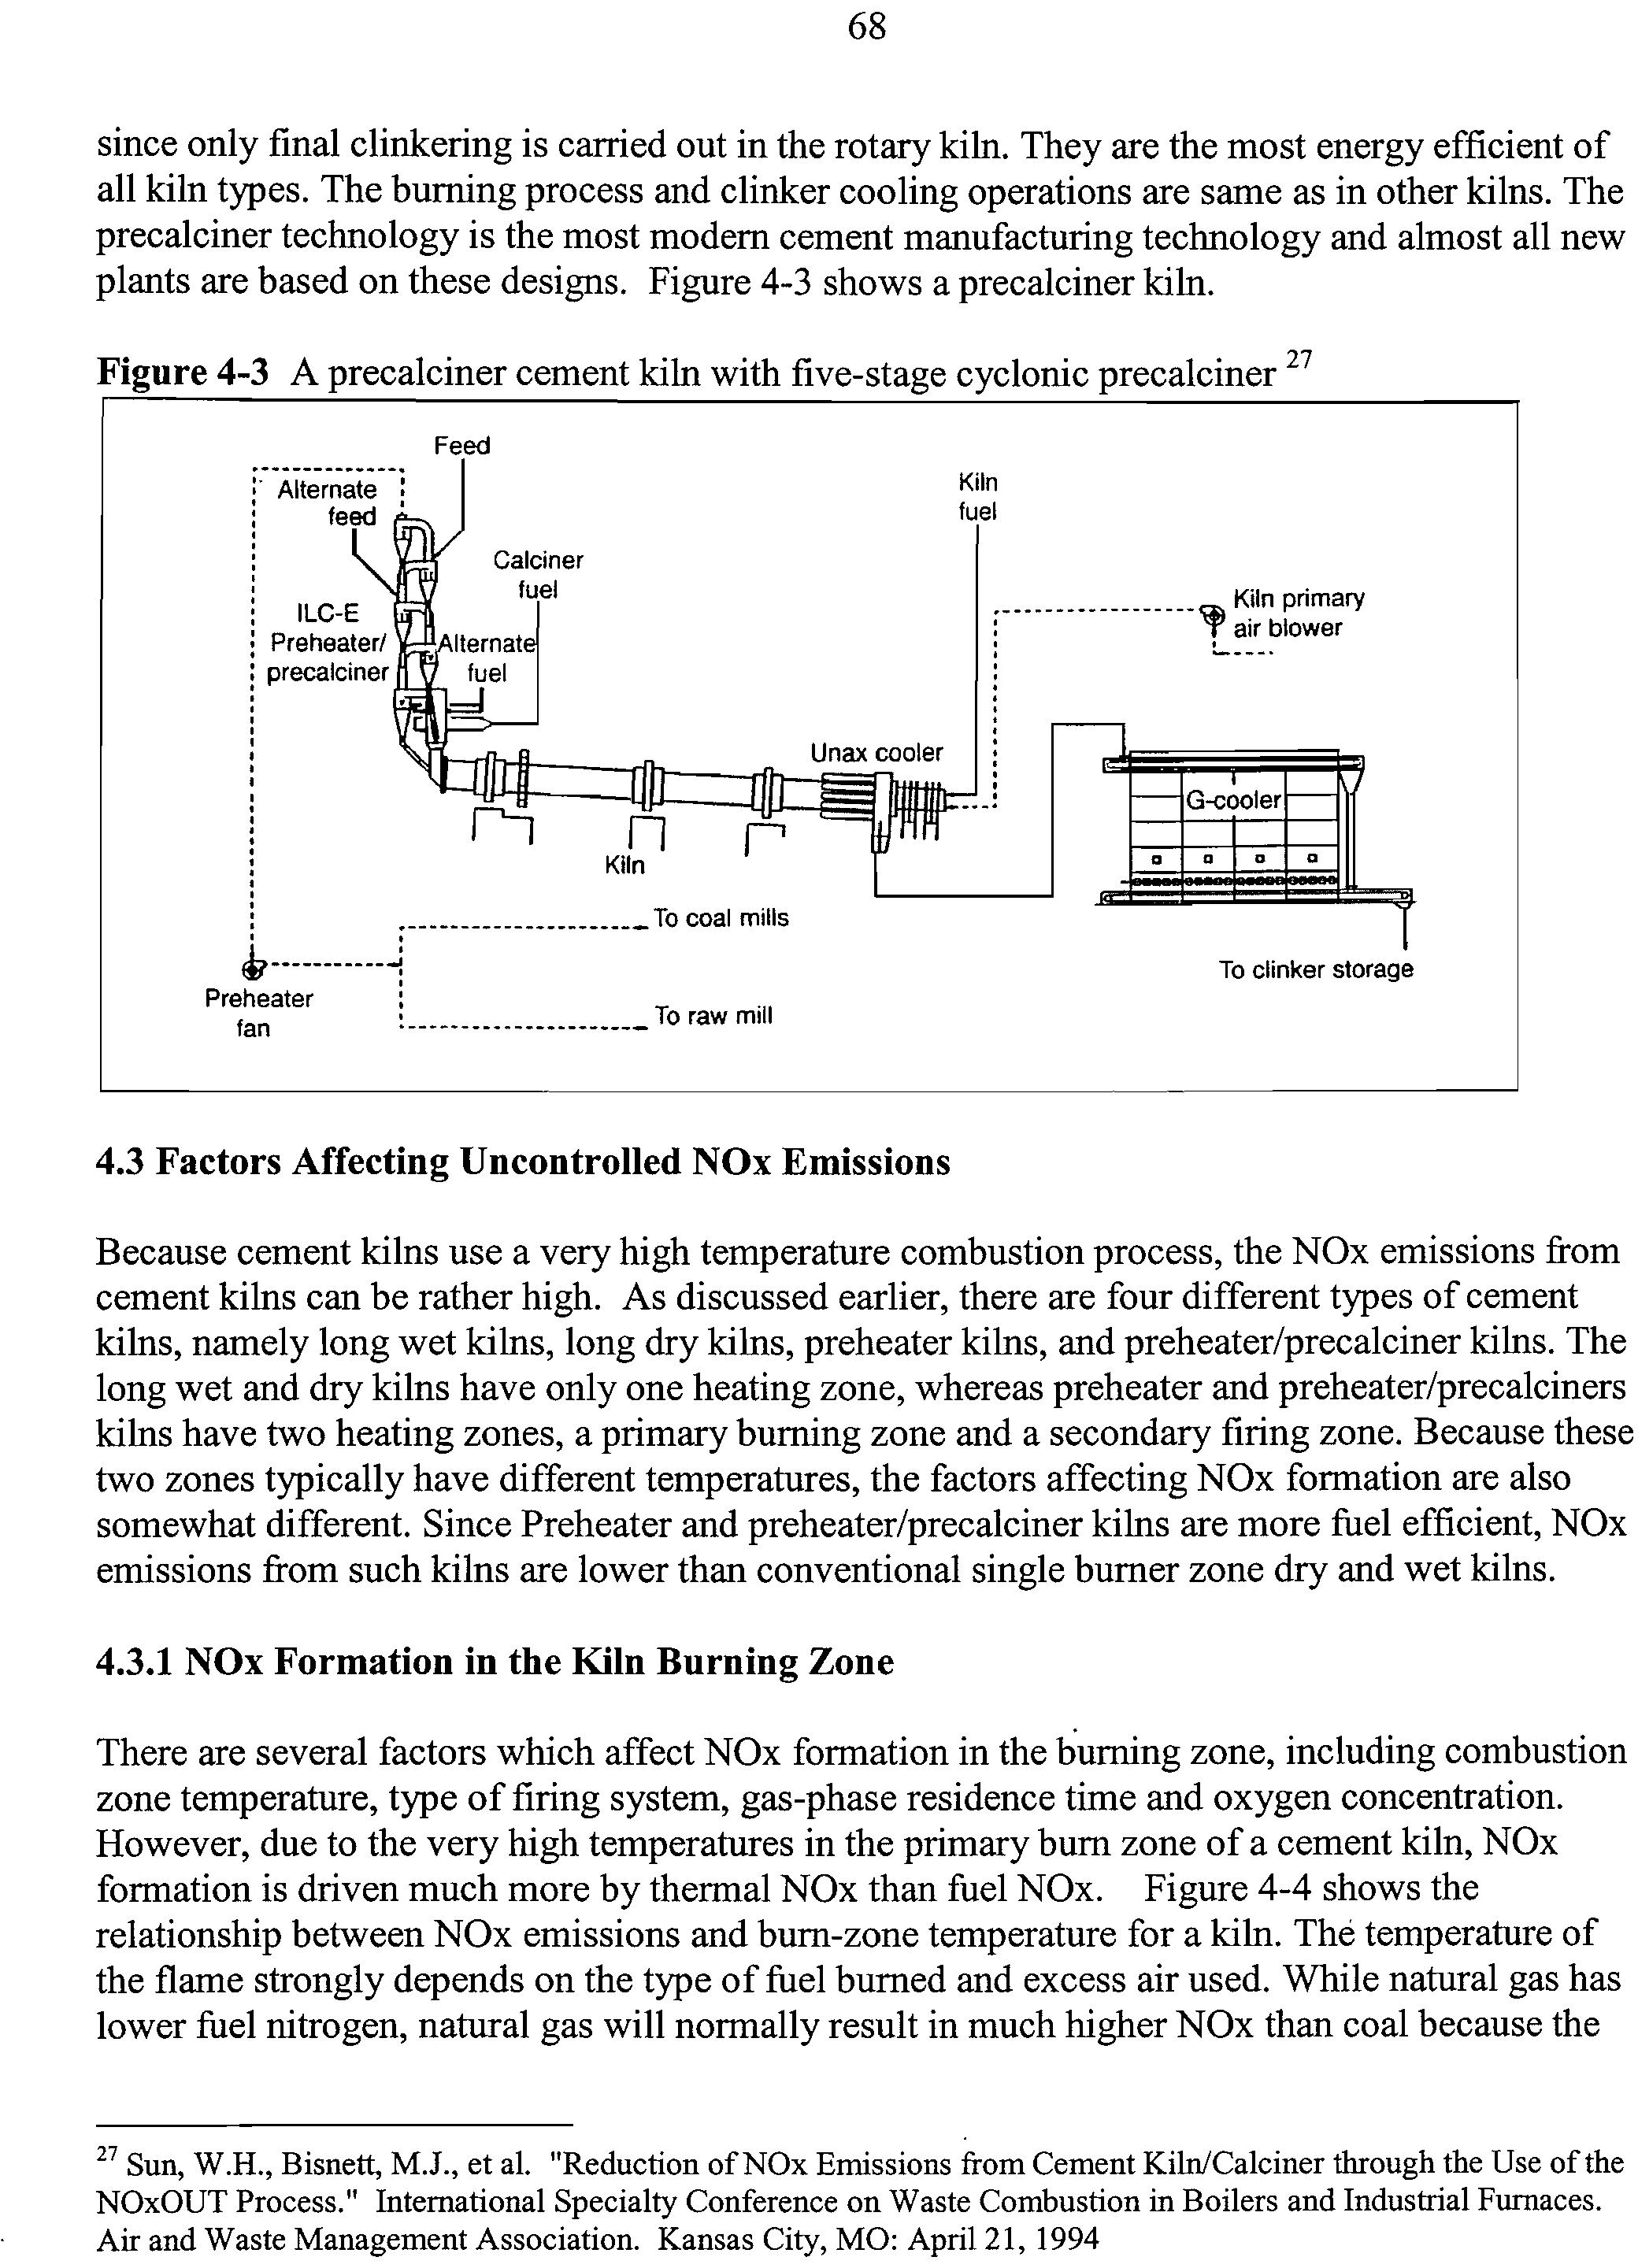
4-3
A precalciner cement kiln with five-stage cyclonic precalciner
68
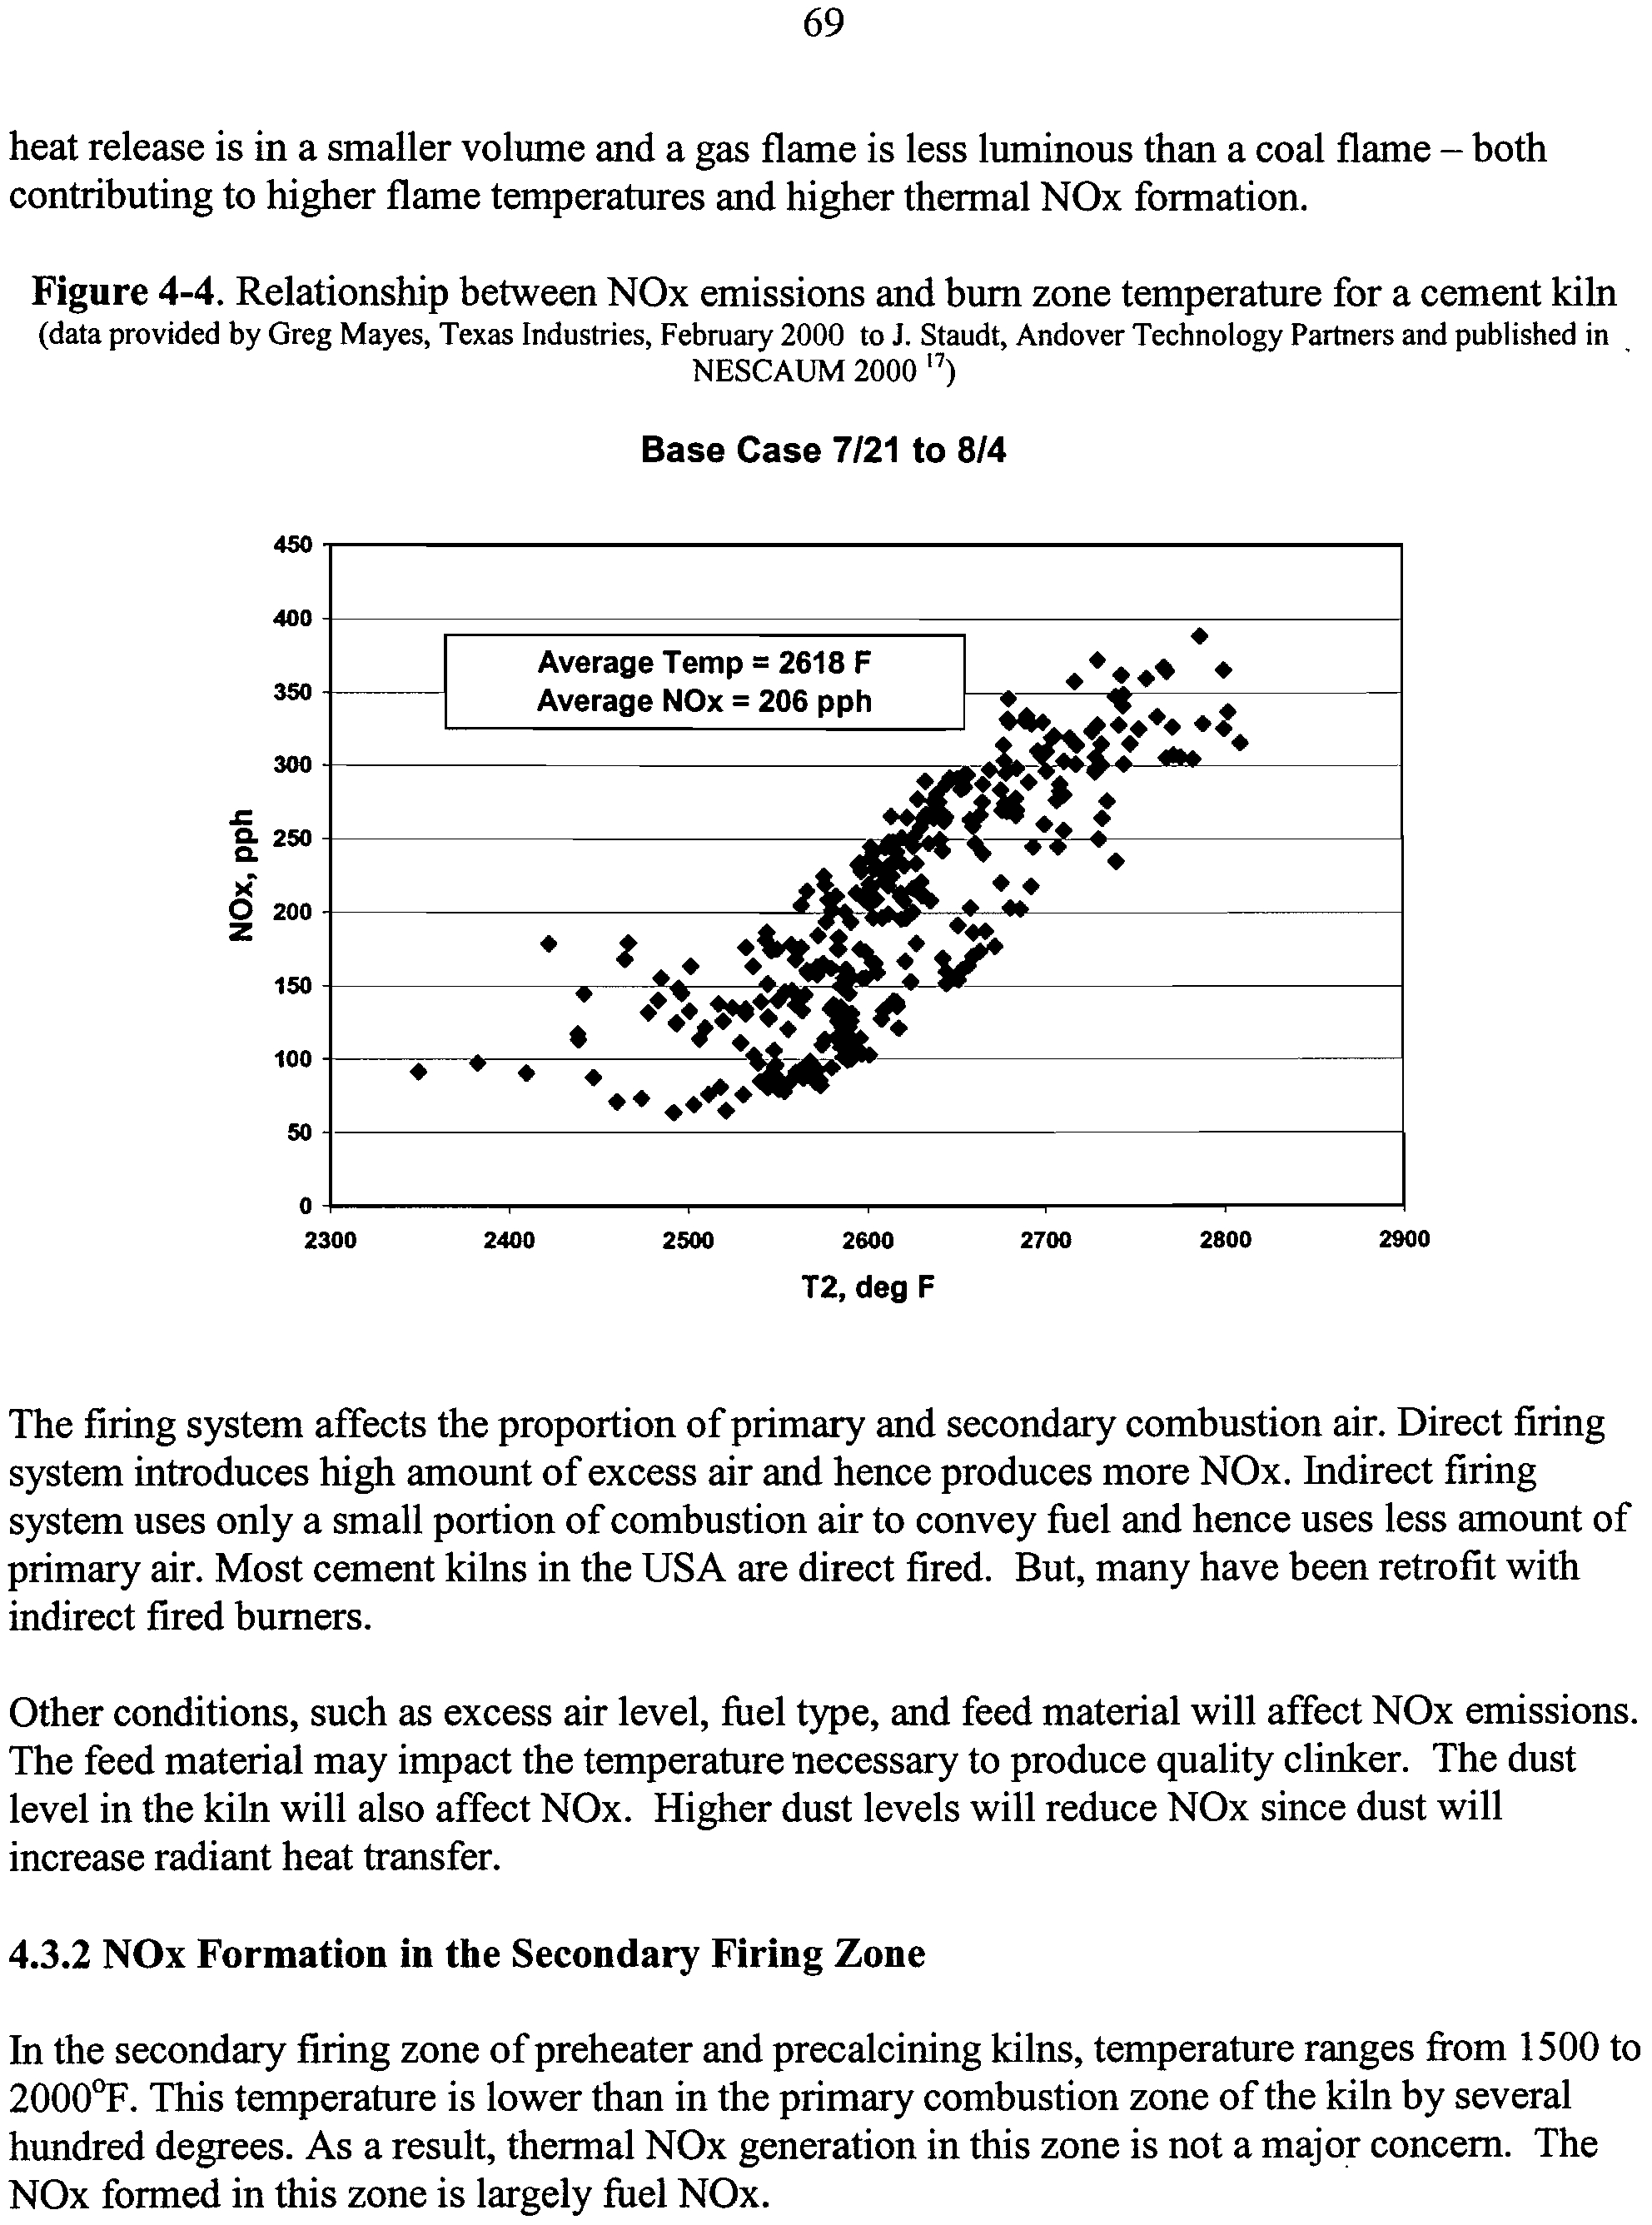
4-4
Relationship between NOx emissions and burn zone temperature
for a cement kiln
69
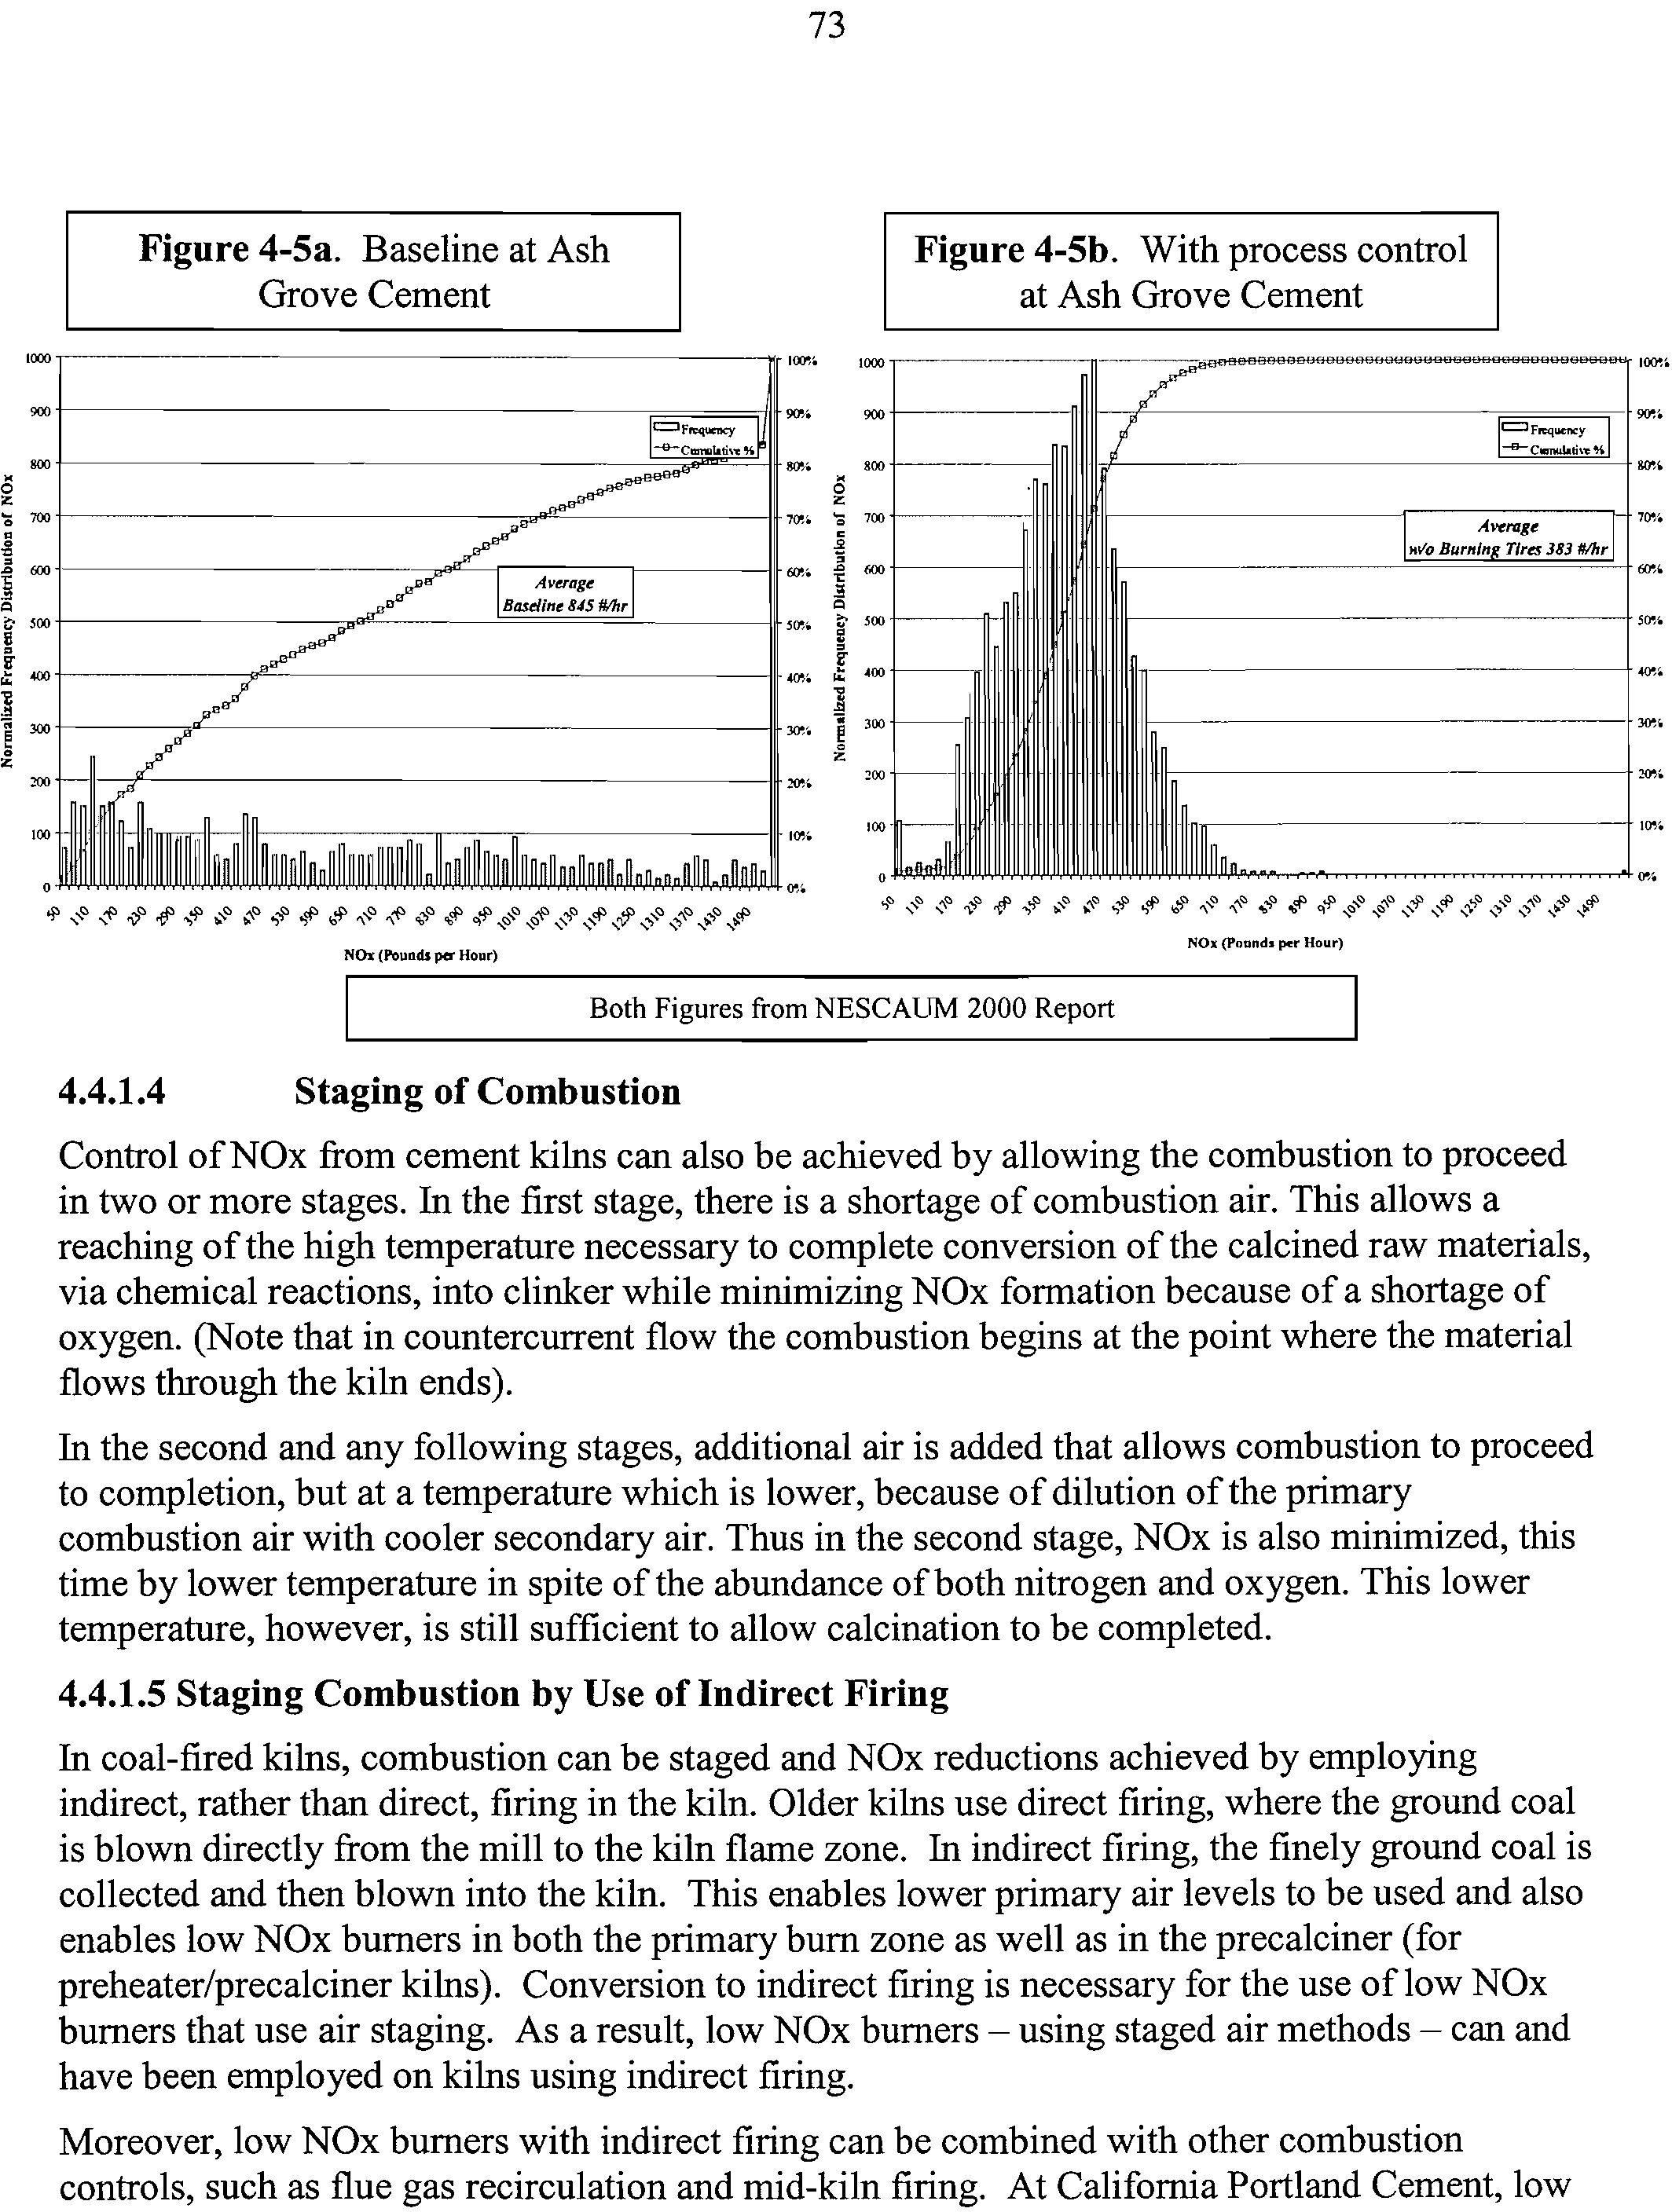
4-5a
Baseline at Ash Grove Cement
73
4-5b
With process control at Ash Grove Cement
73
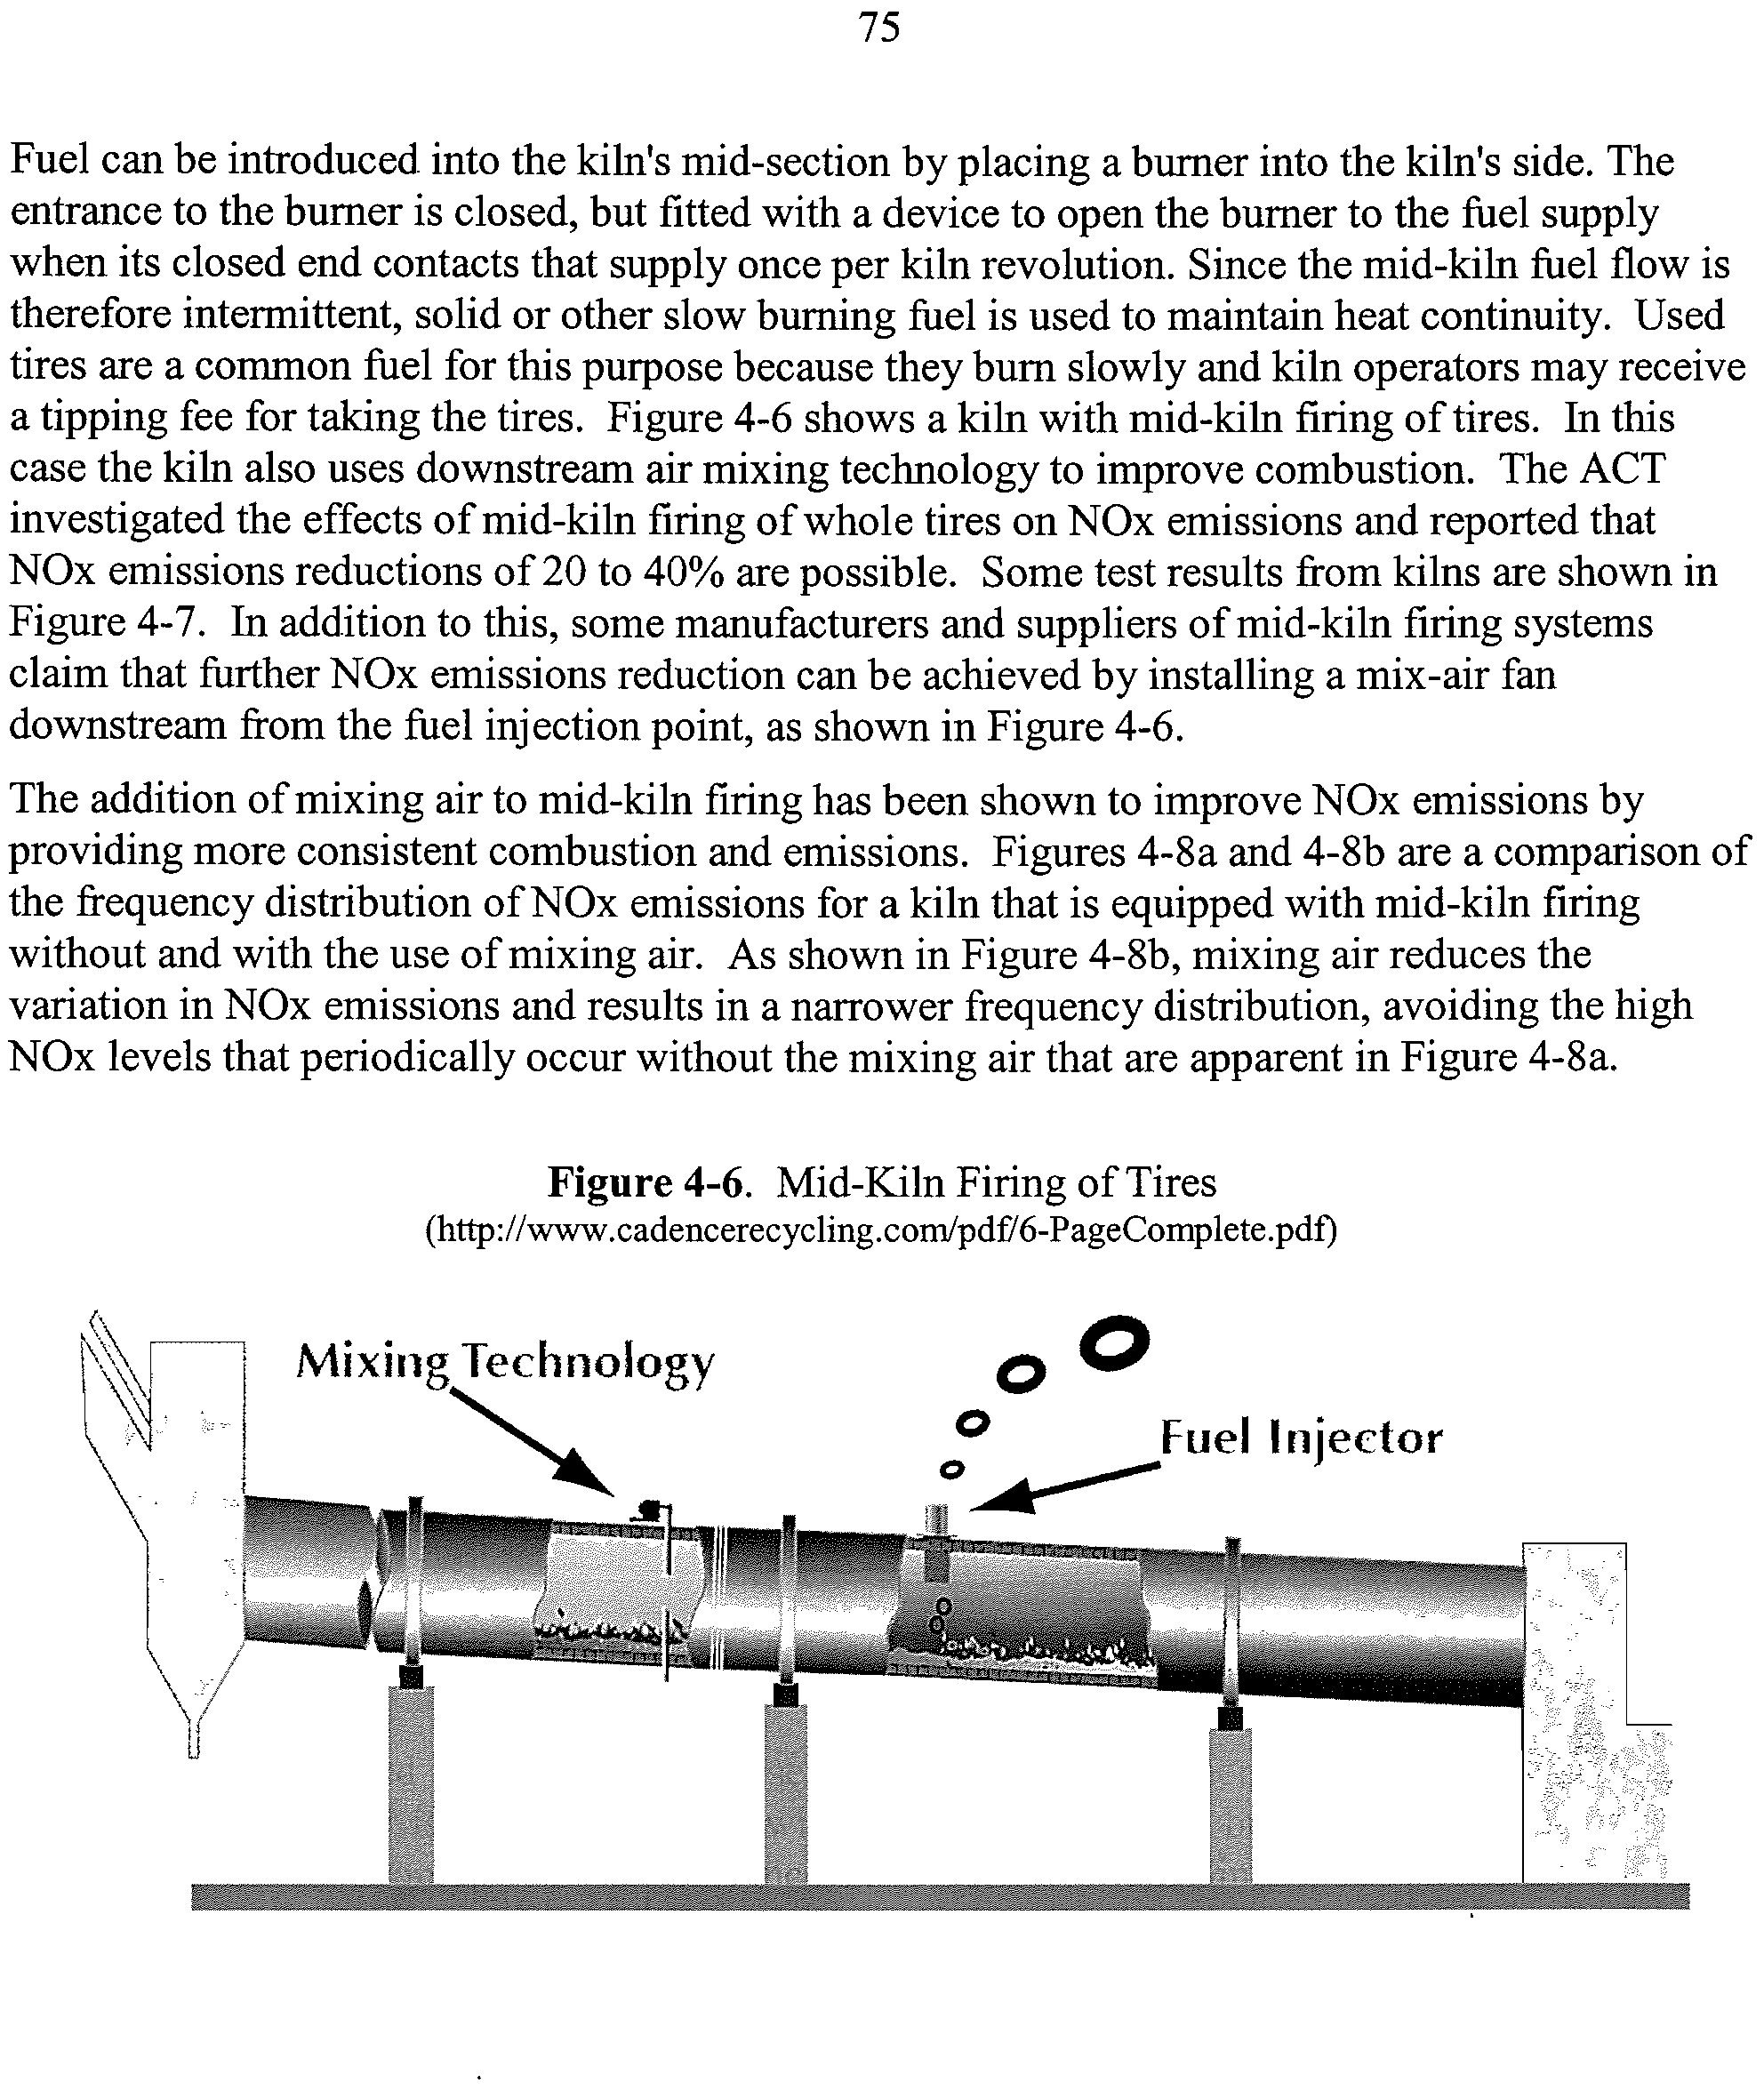
4-6
Mid-Kiln Firing of Tires
75
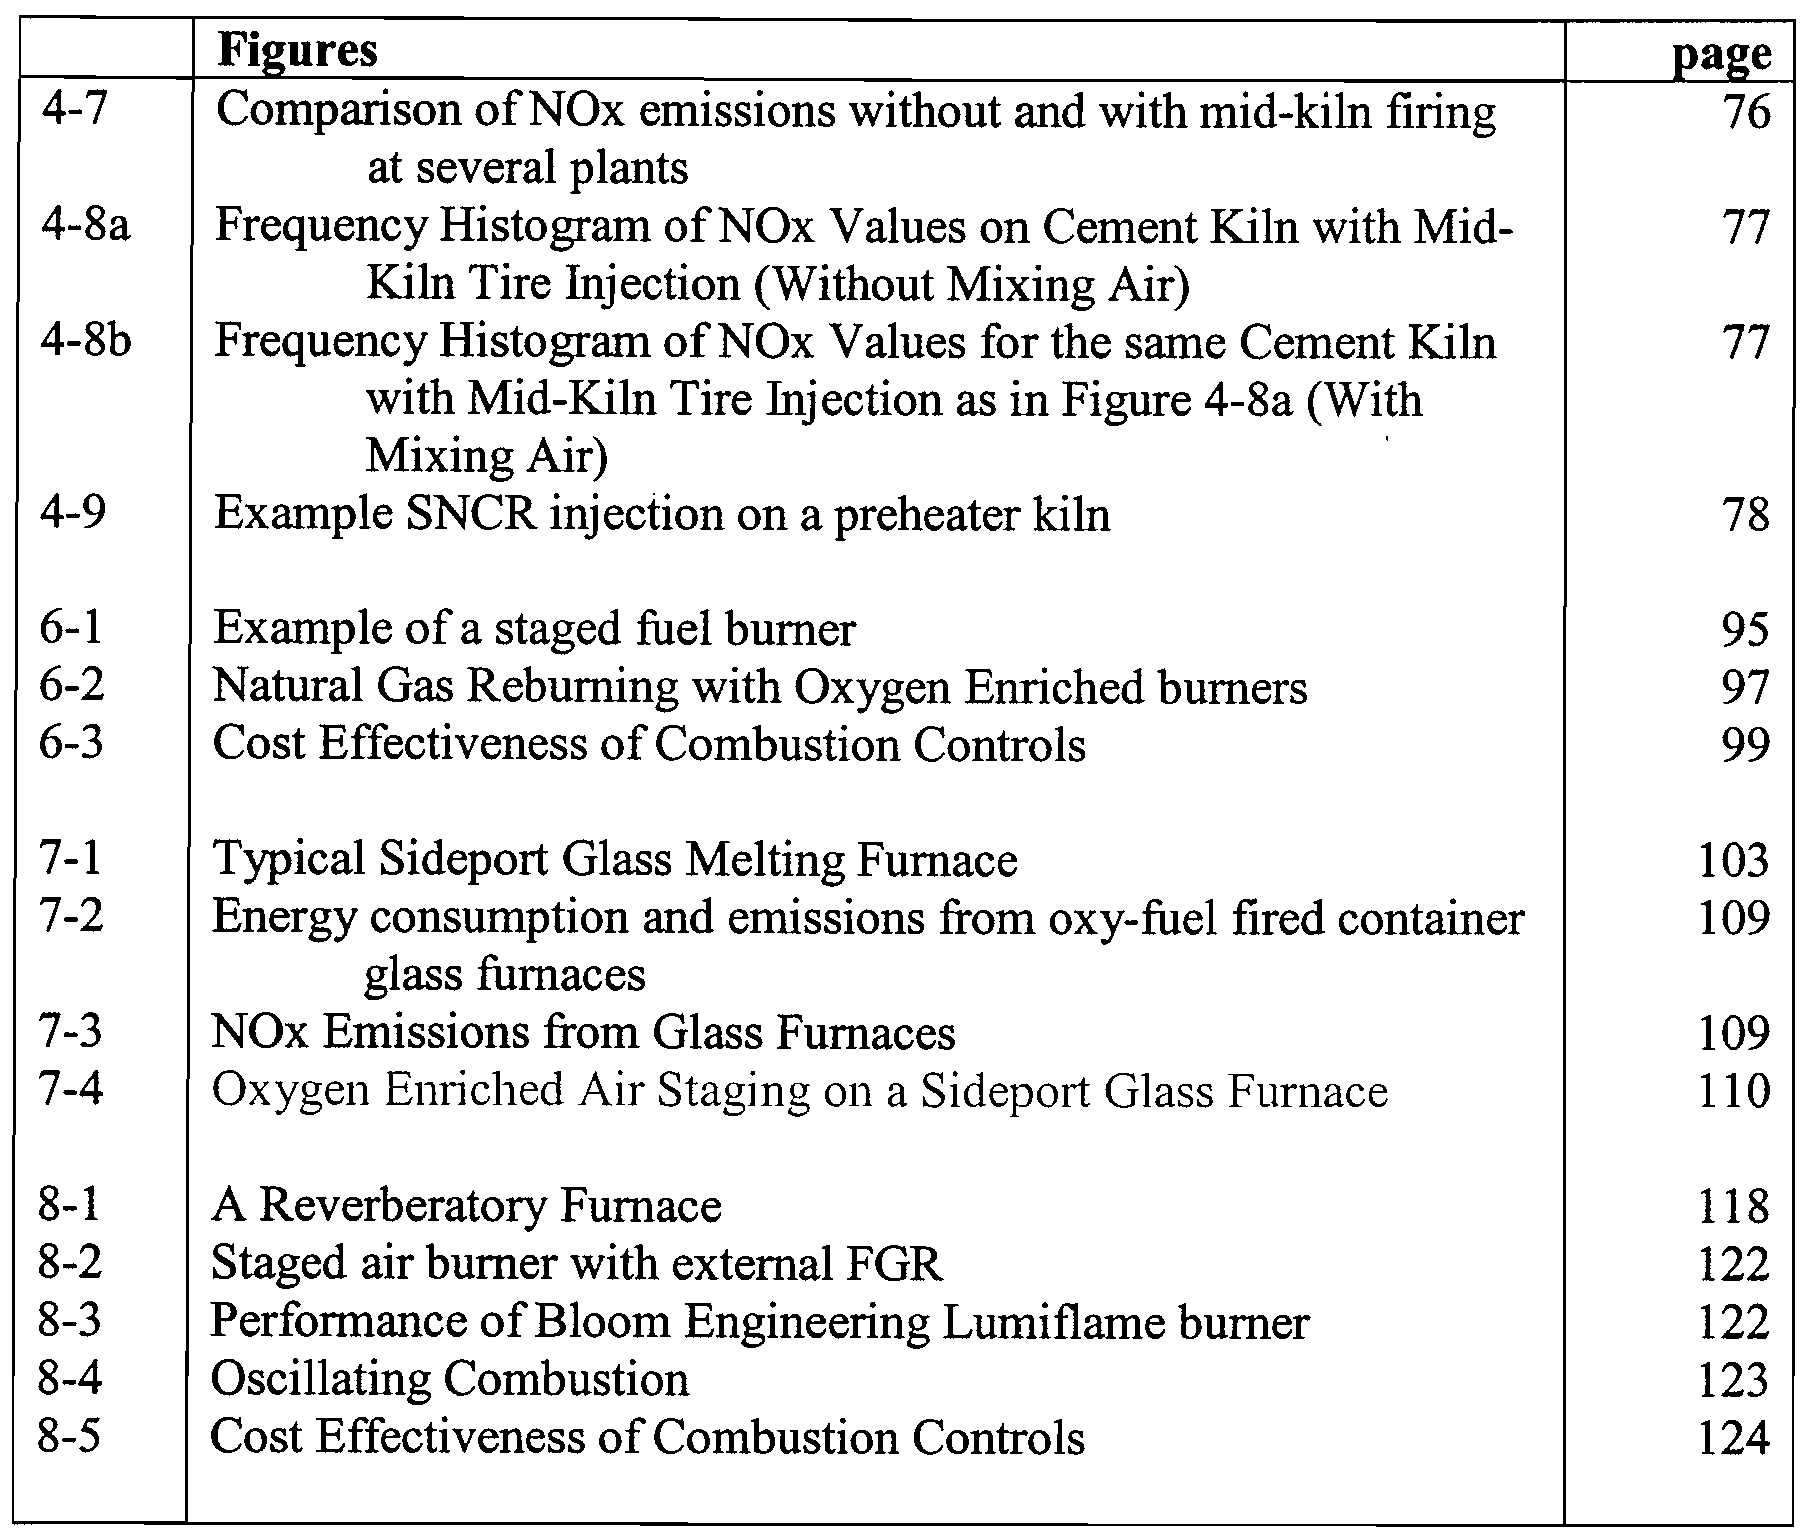
Figures
page
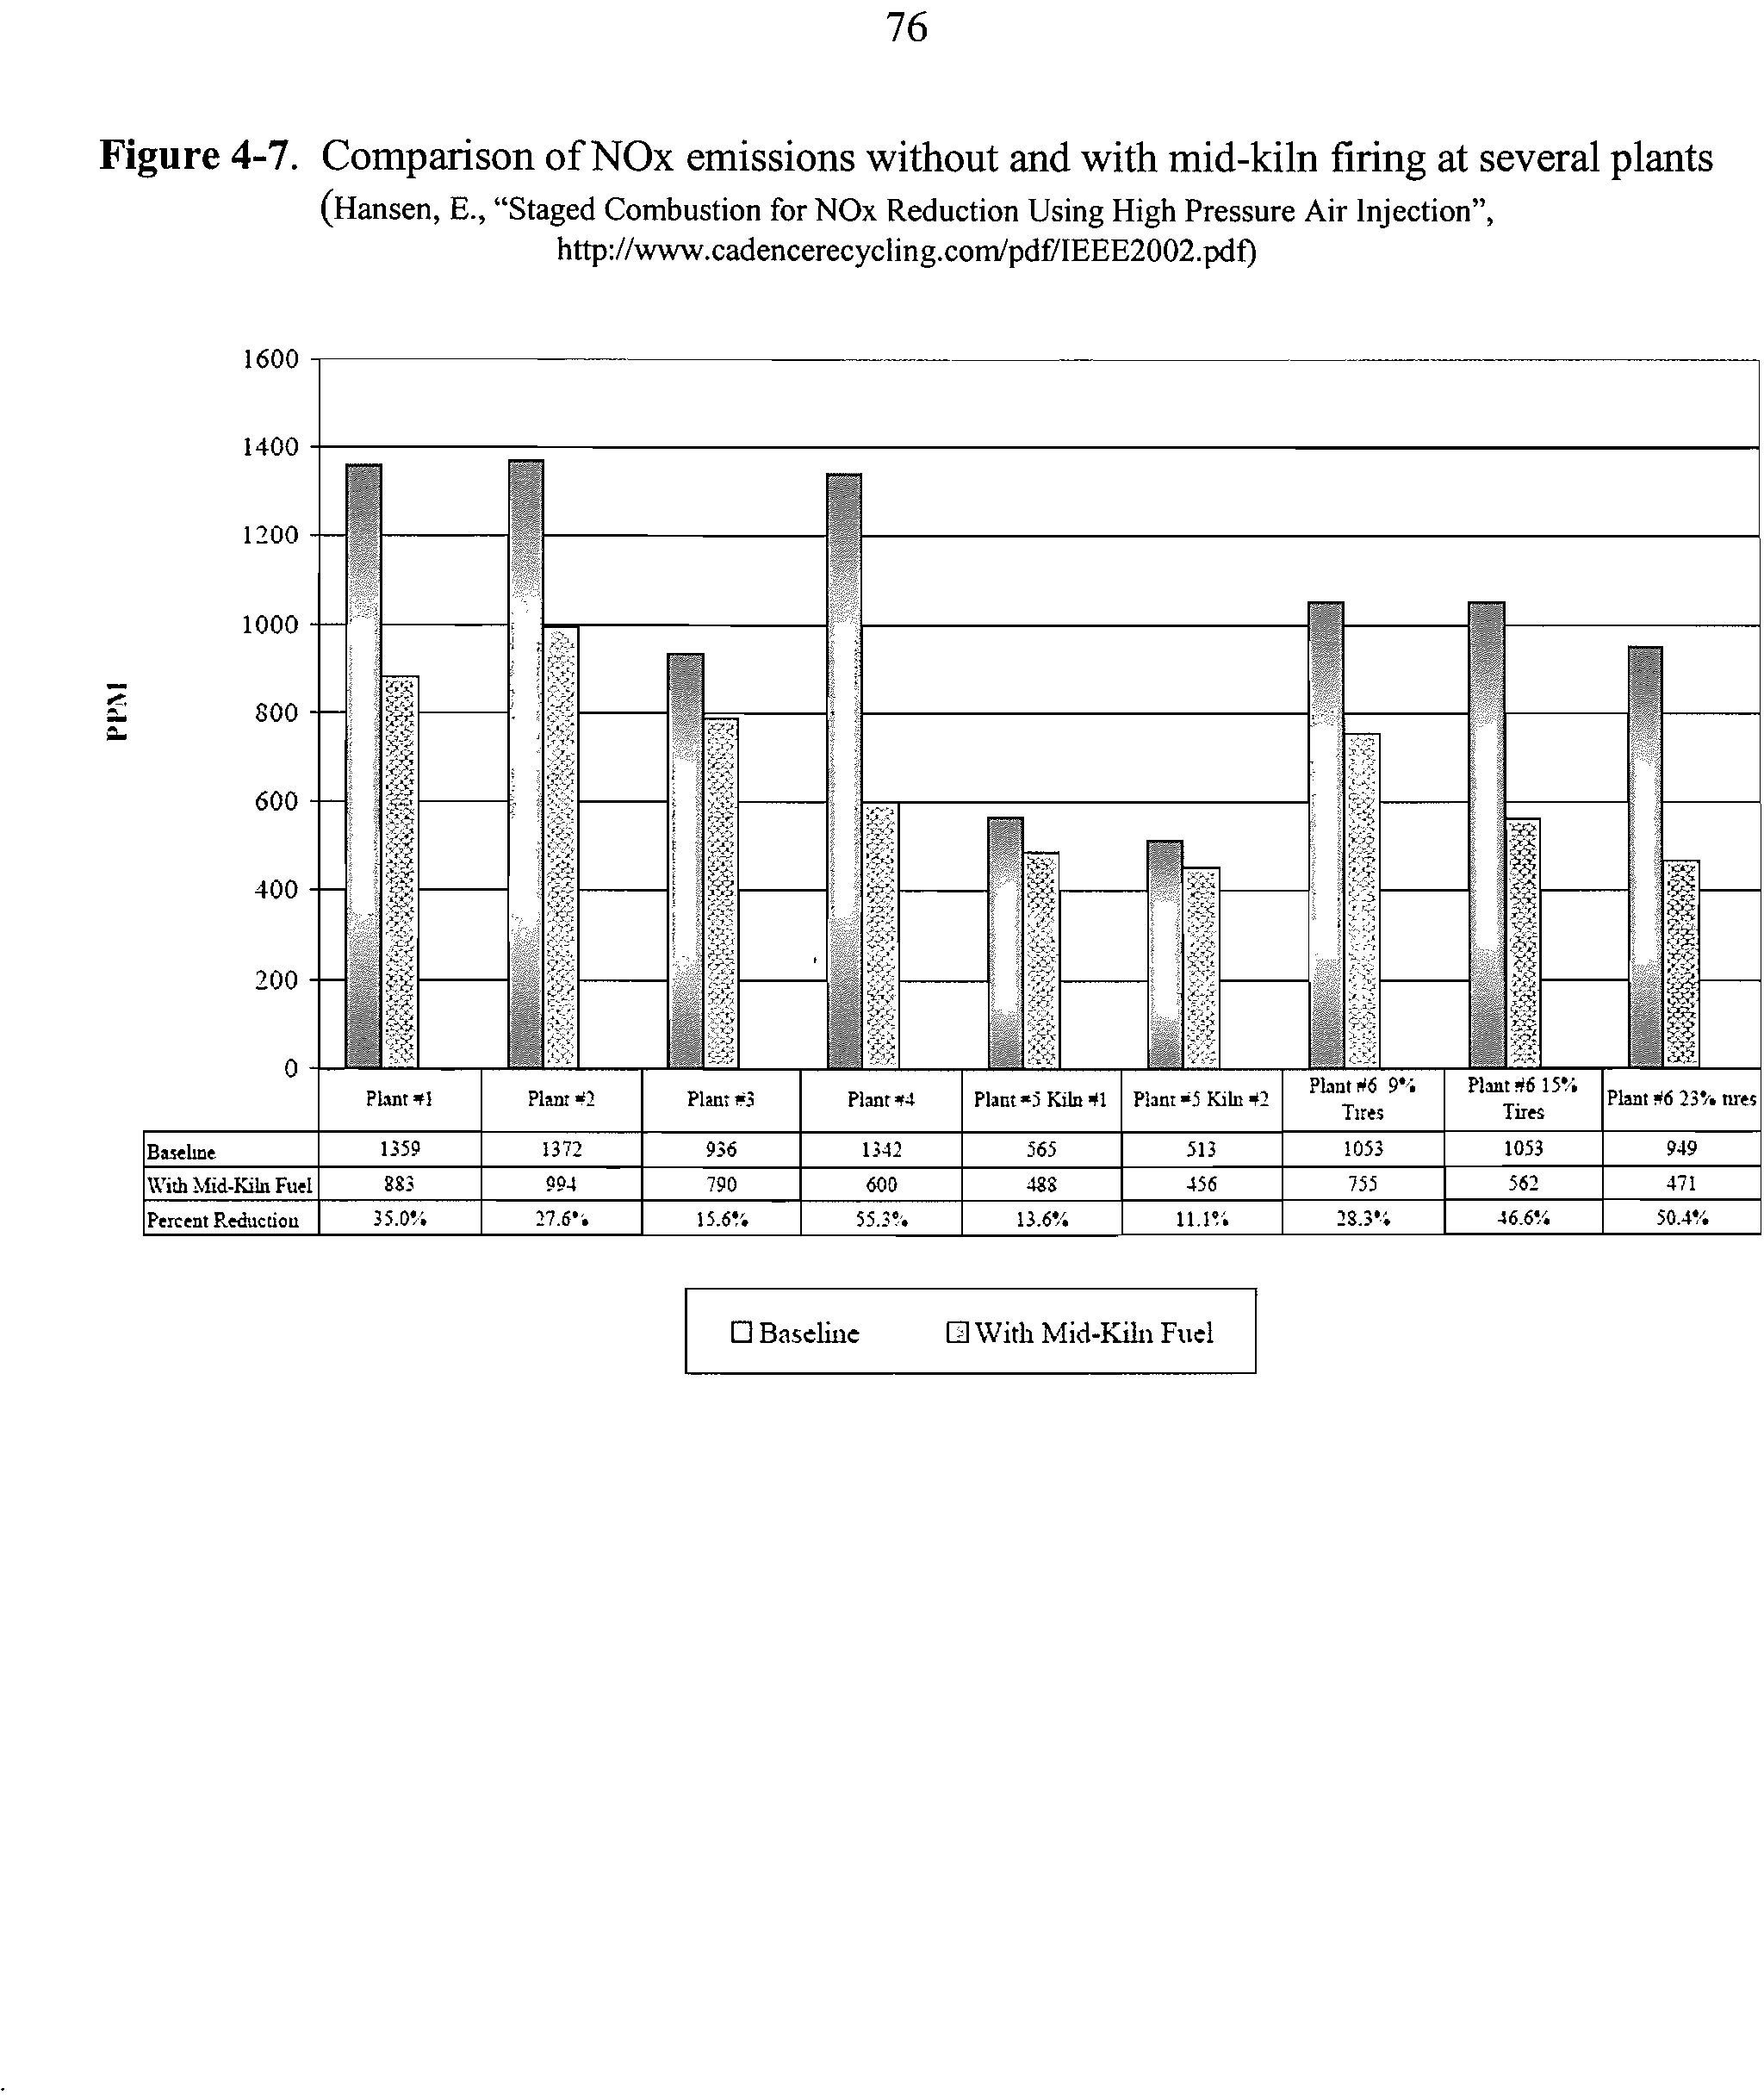
4-7
Comparison of NOx emissions without and with mid-kiln firing
at several plants
76
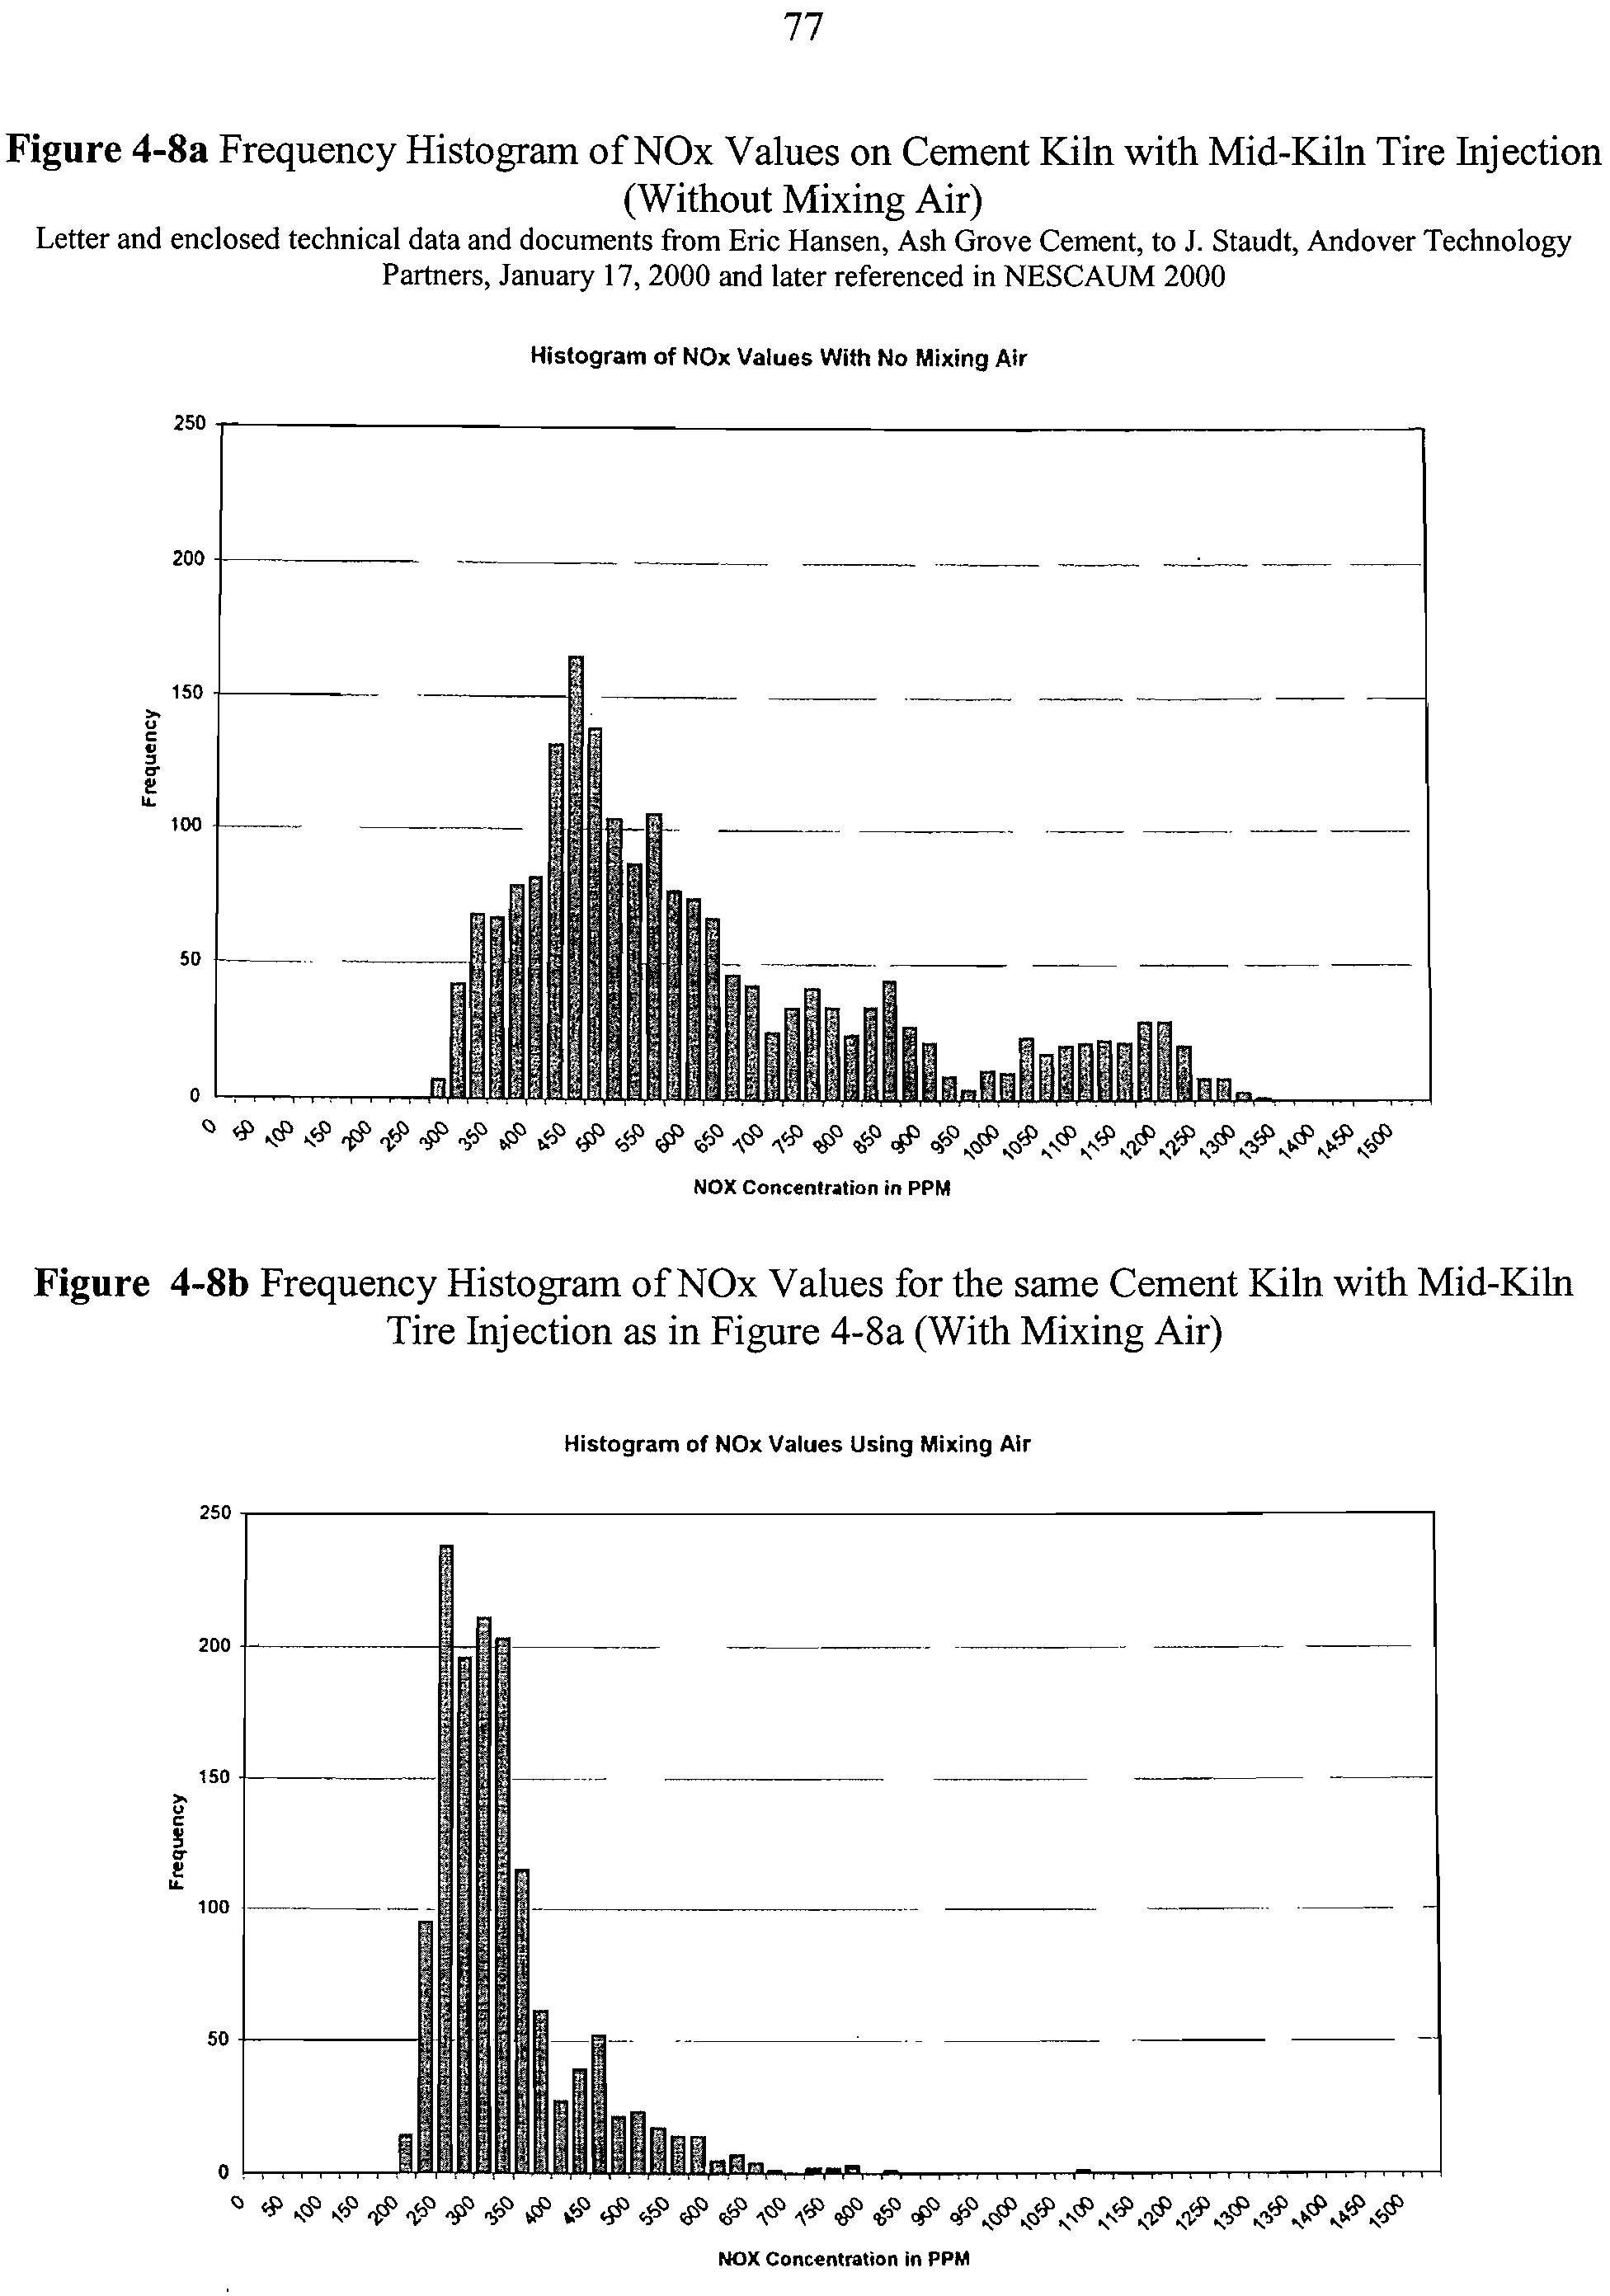
4-8a
Frequency Histogram of NOx Values on Cement Kiln with Mid-
77
Kiln Tire Injection (Without Mixing Air)
4-8b
Frequency Histogram of NOx Values for the same Cement Kiln
with Mid-Kiln Tire Injection as in Figure 4-8a (With
77
Mixing Air)
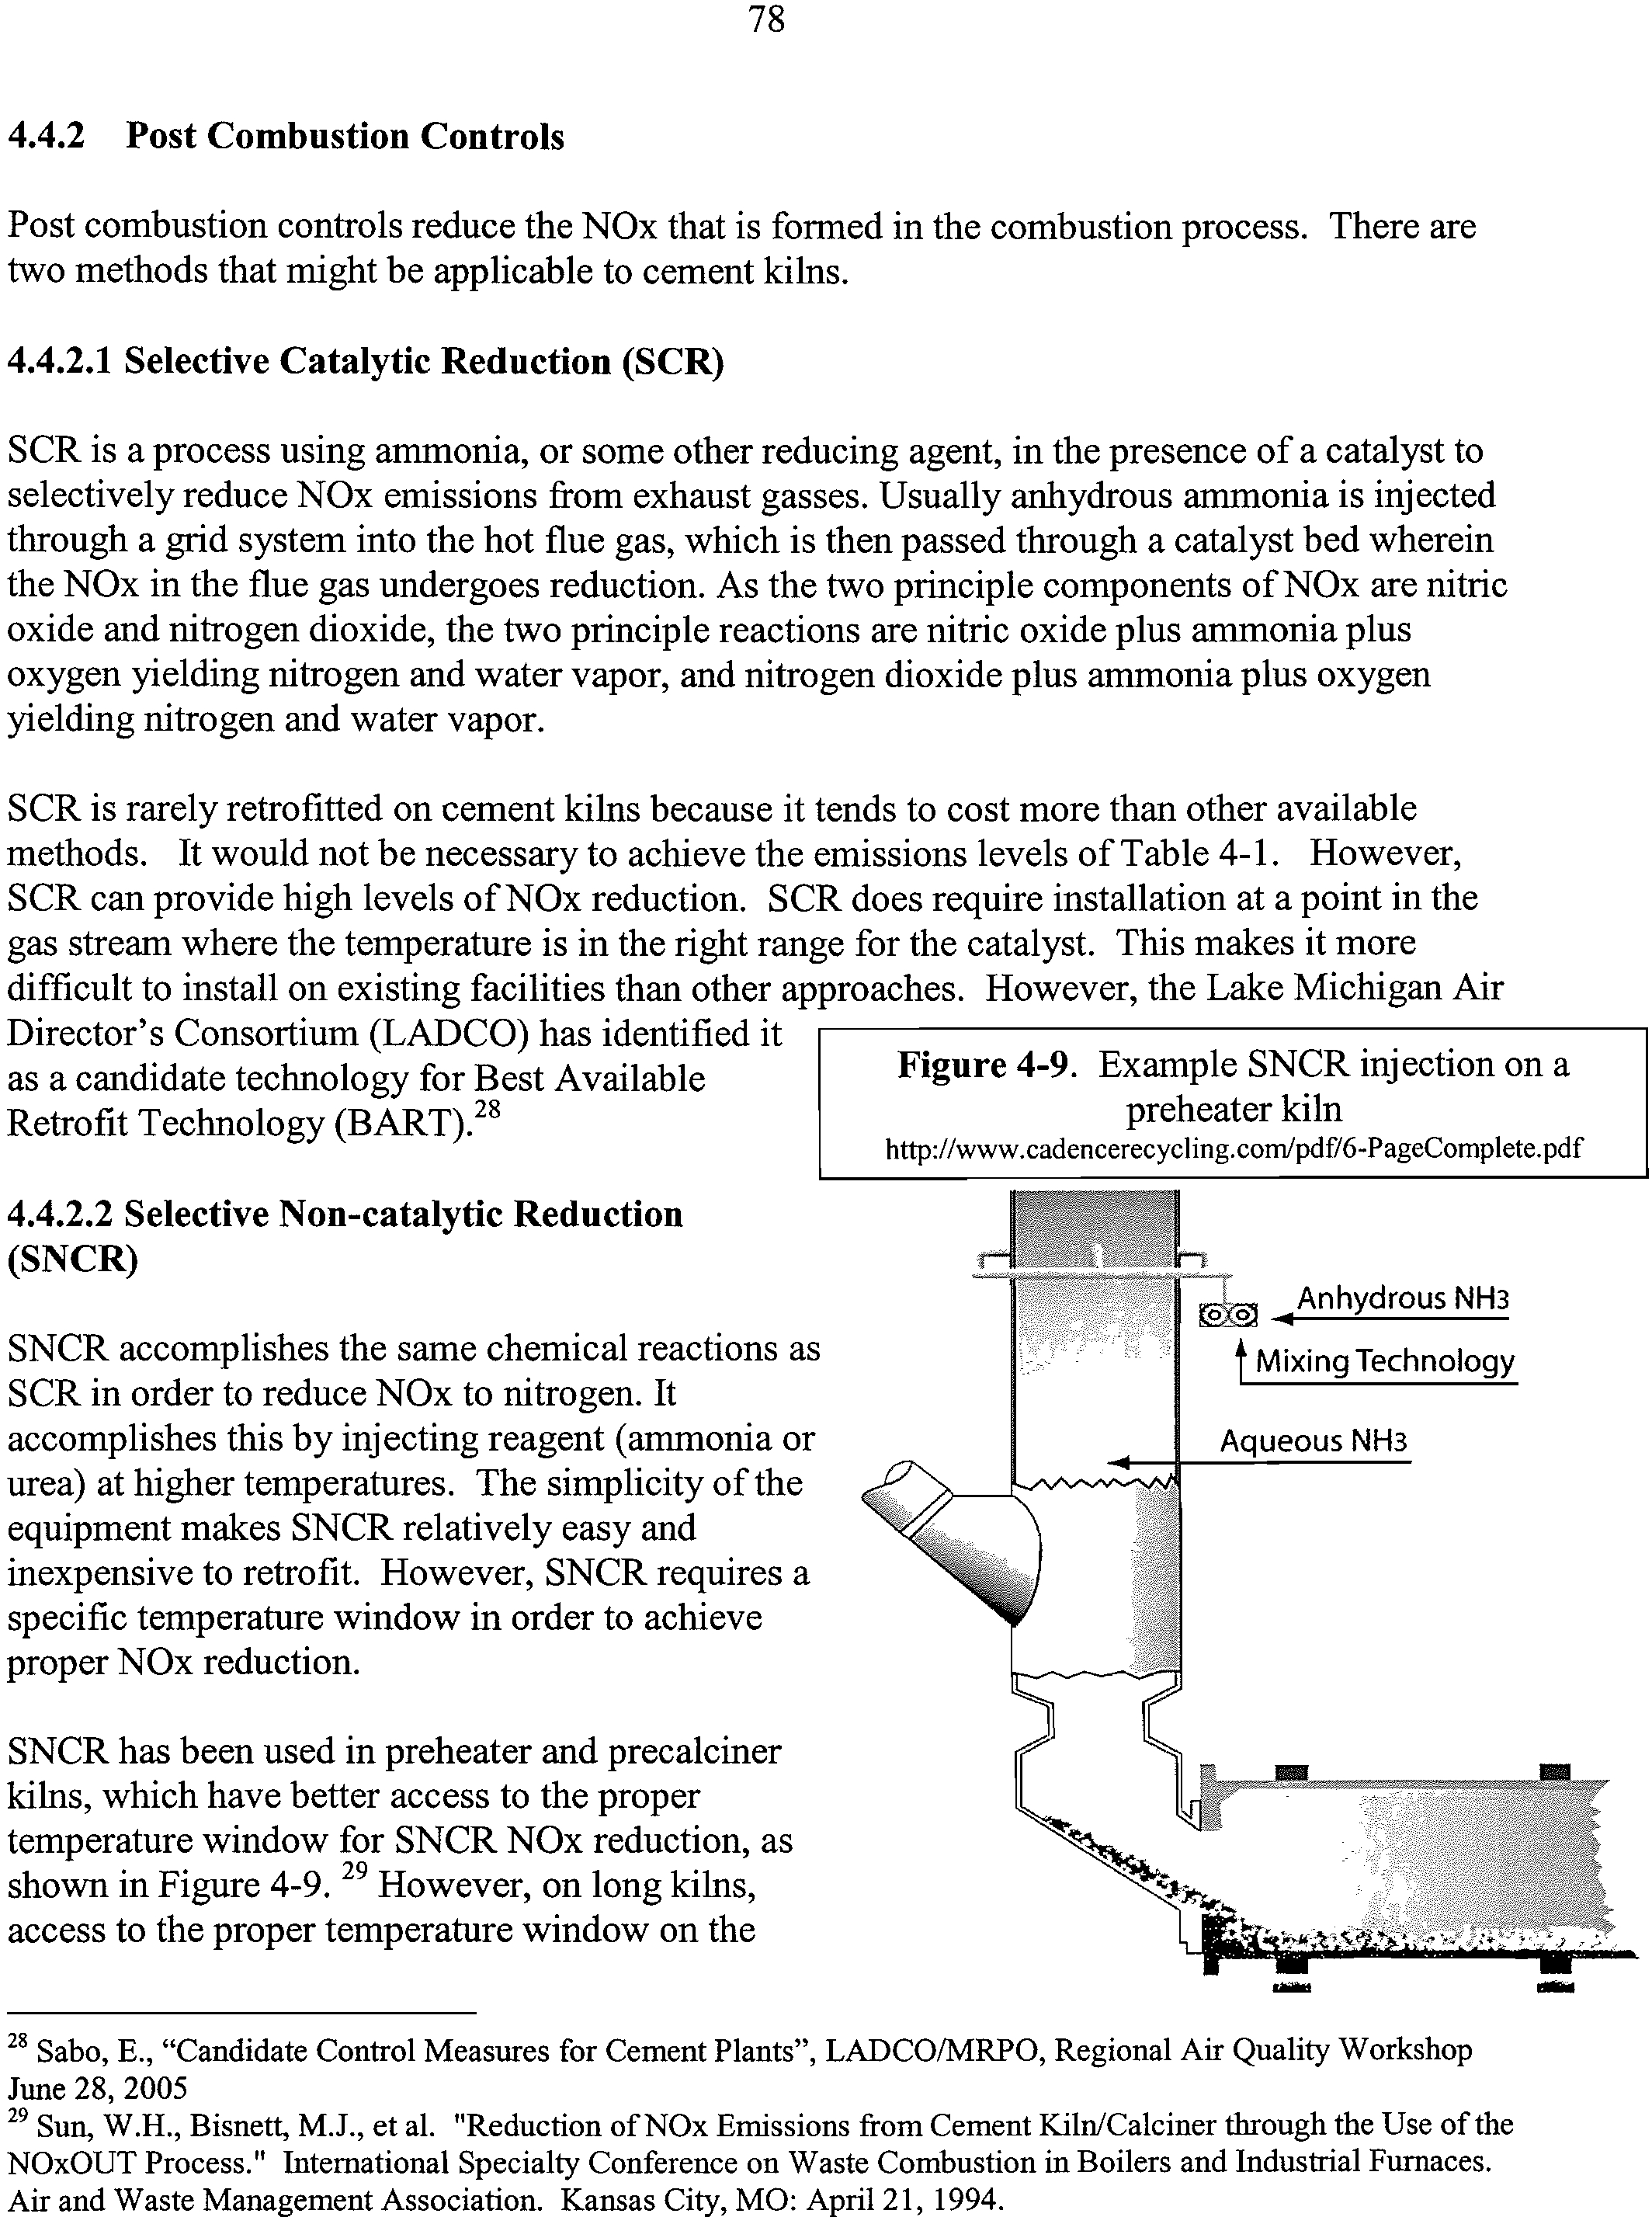
4-9
Example SNCR injection on a preheater kiln
78
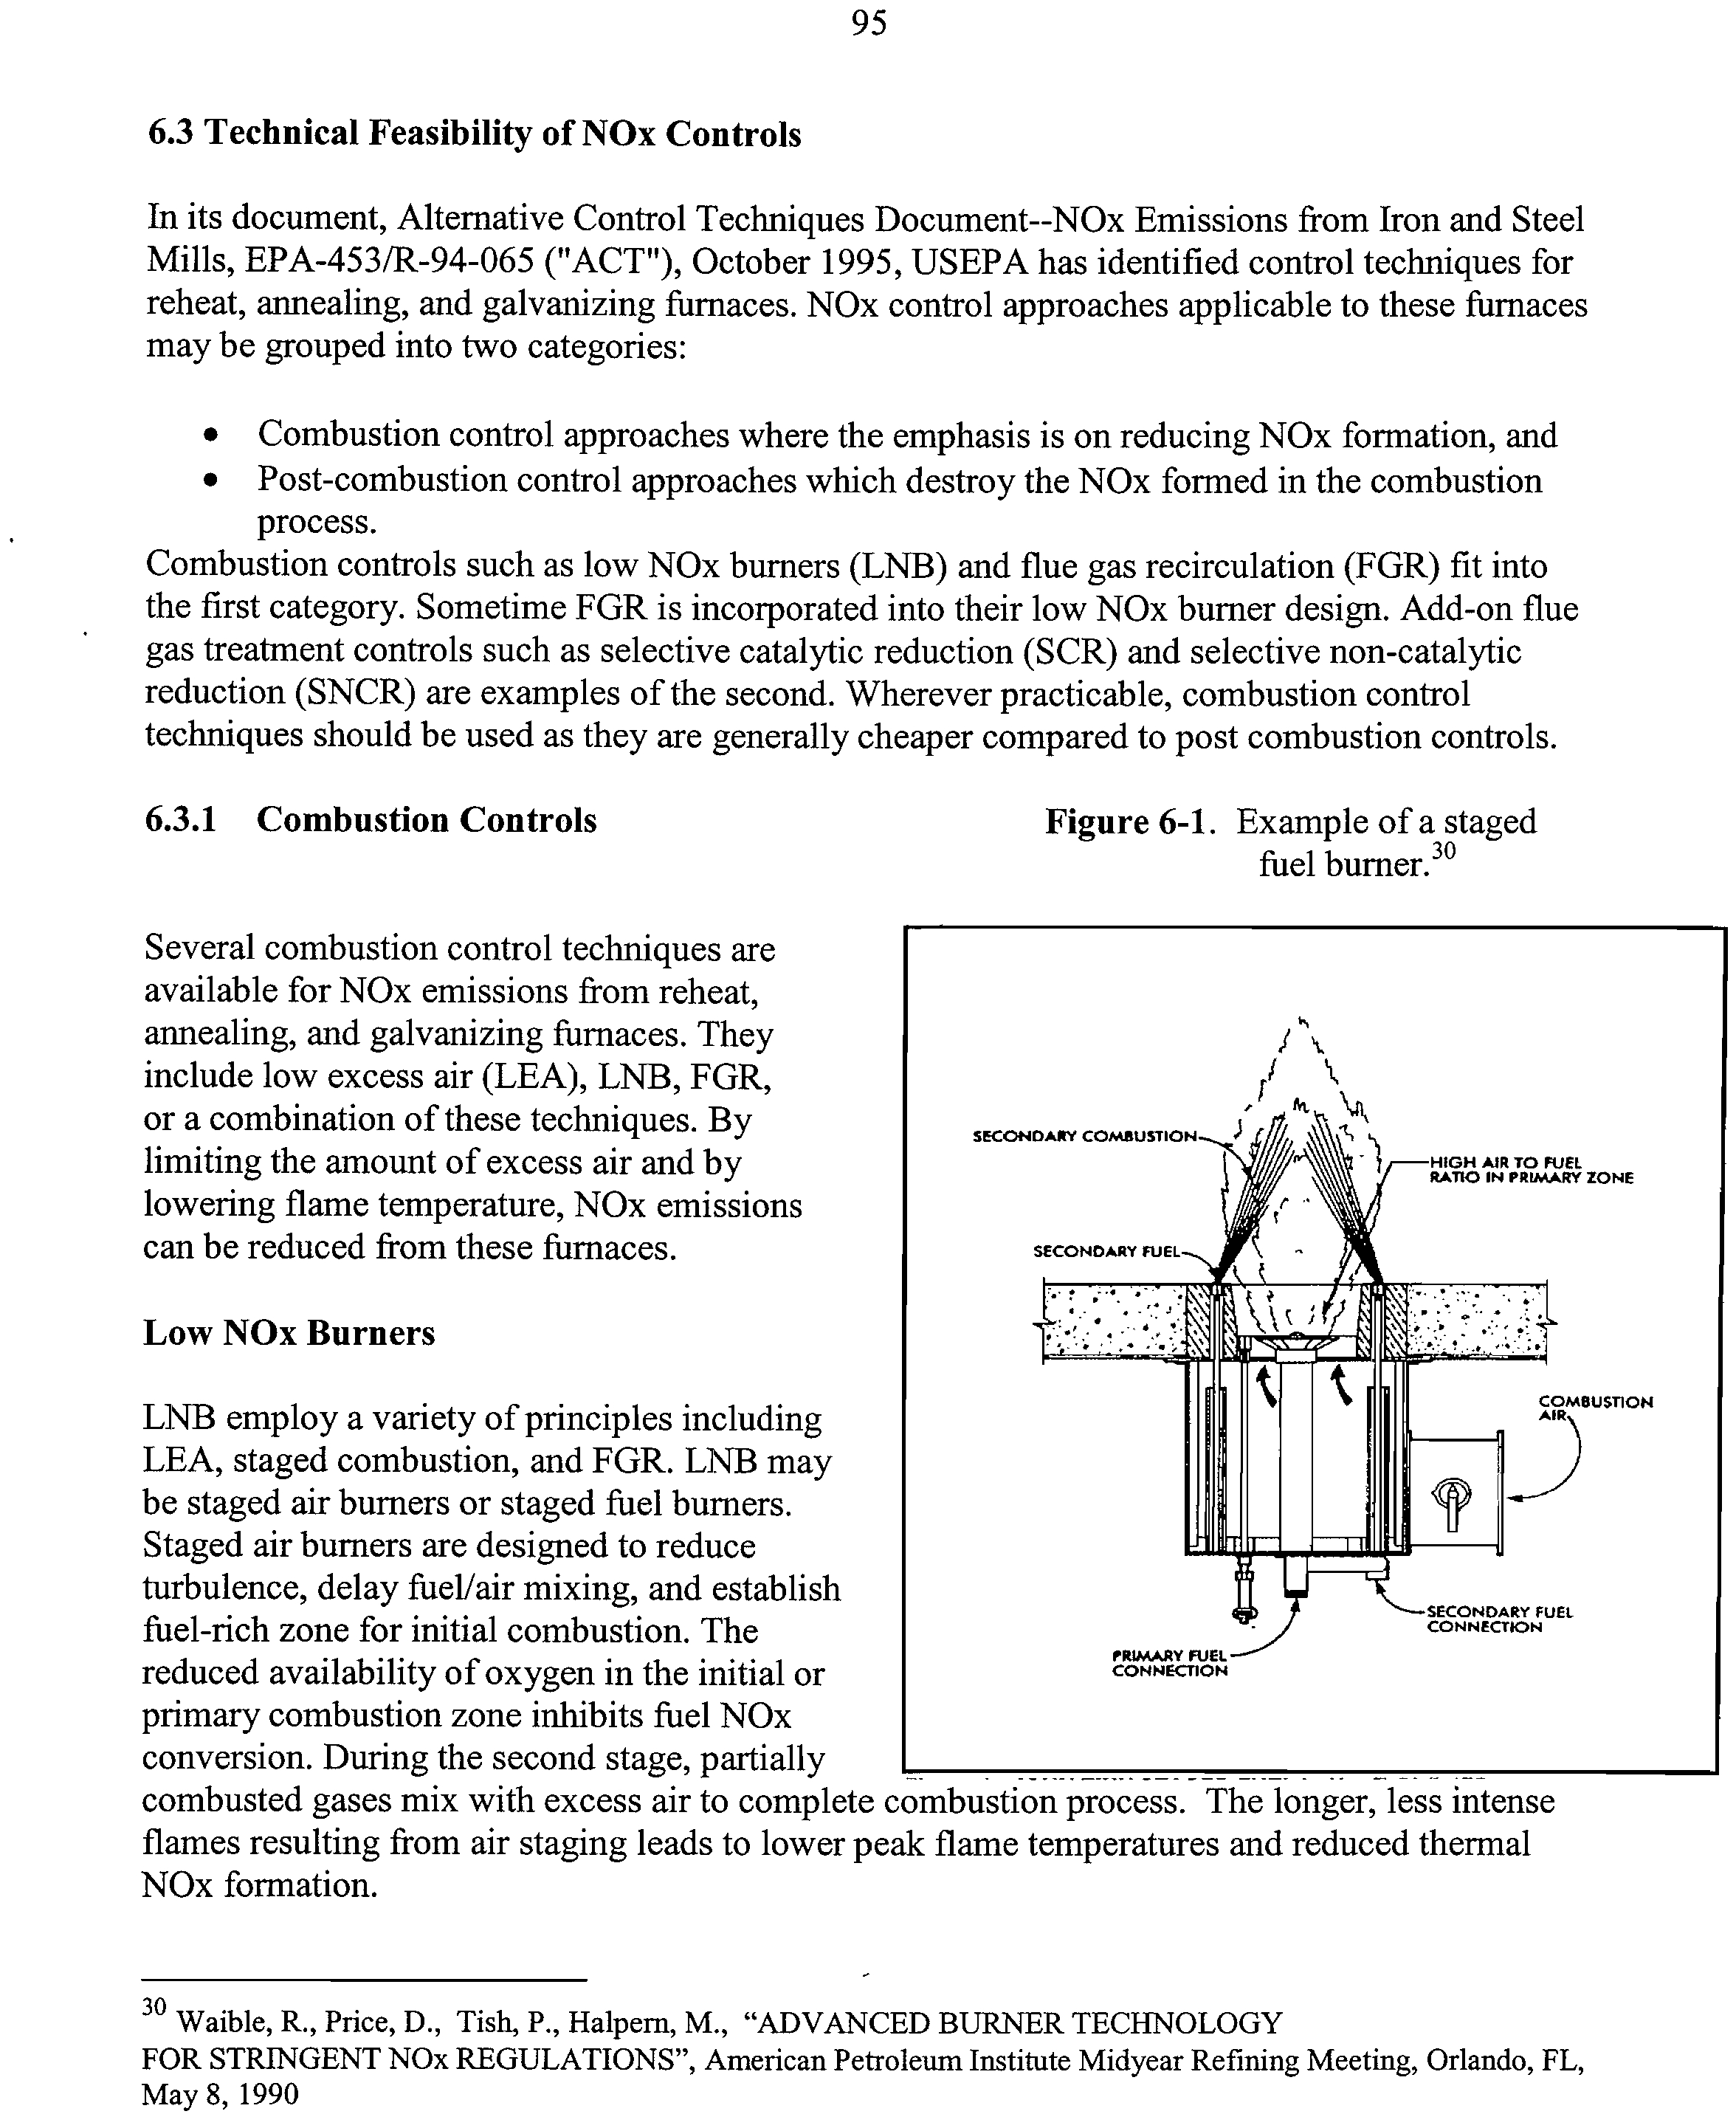
6-1
Example of a staged fuel burner
95
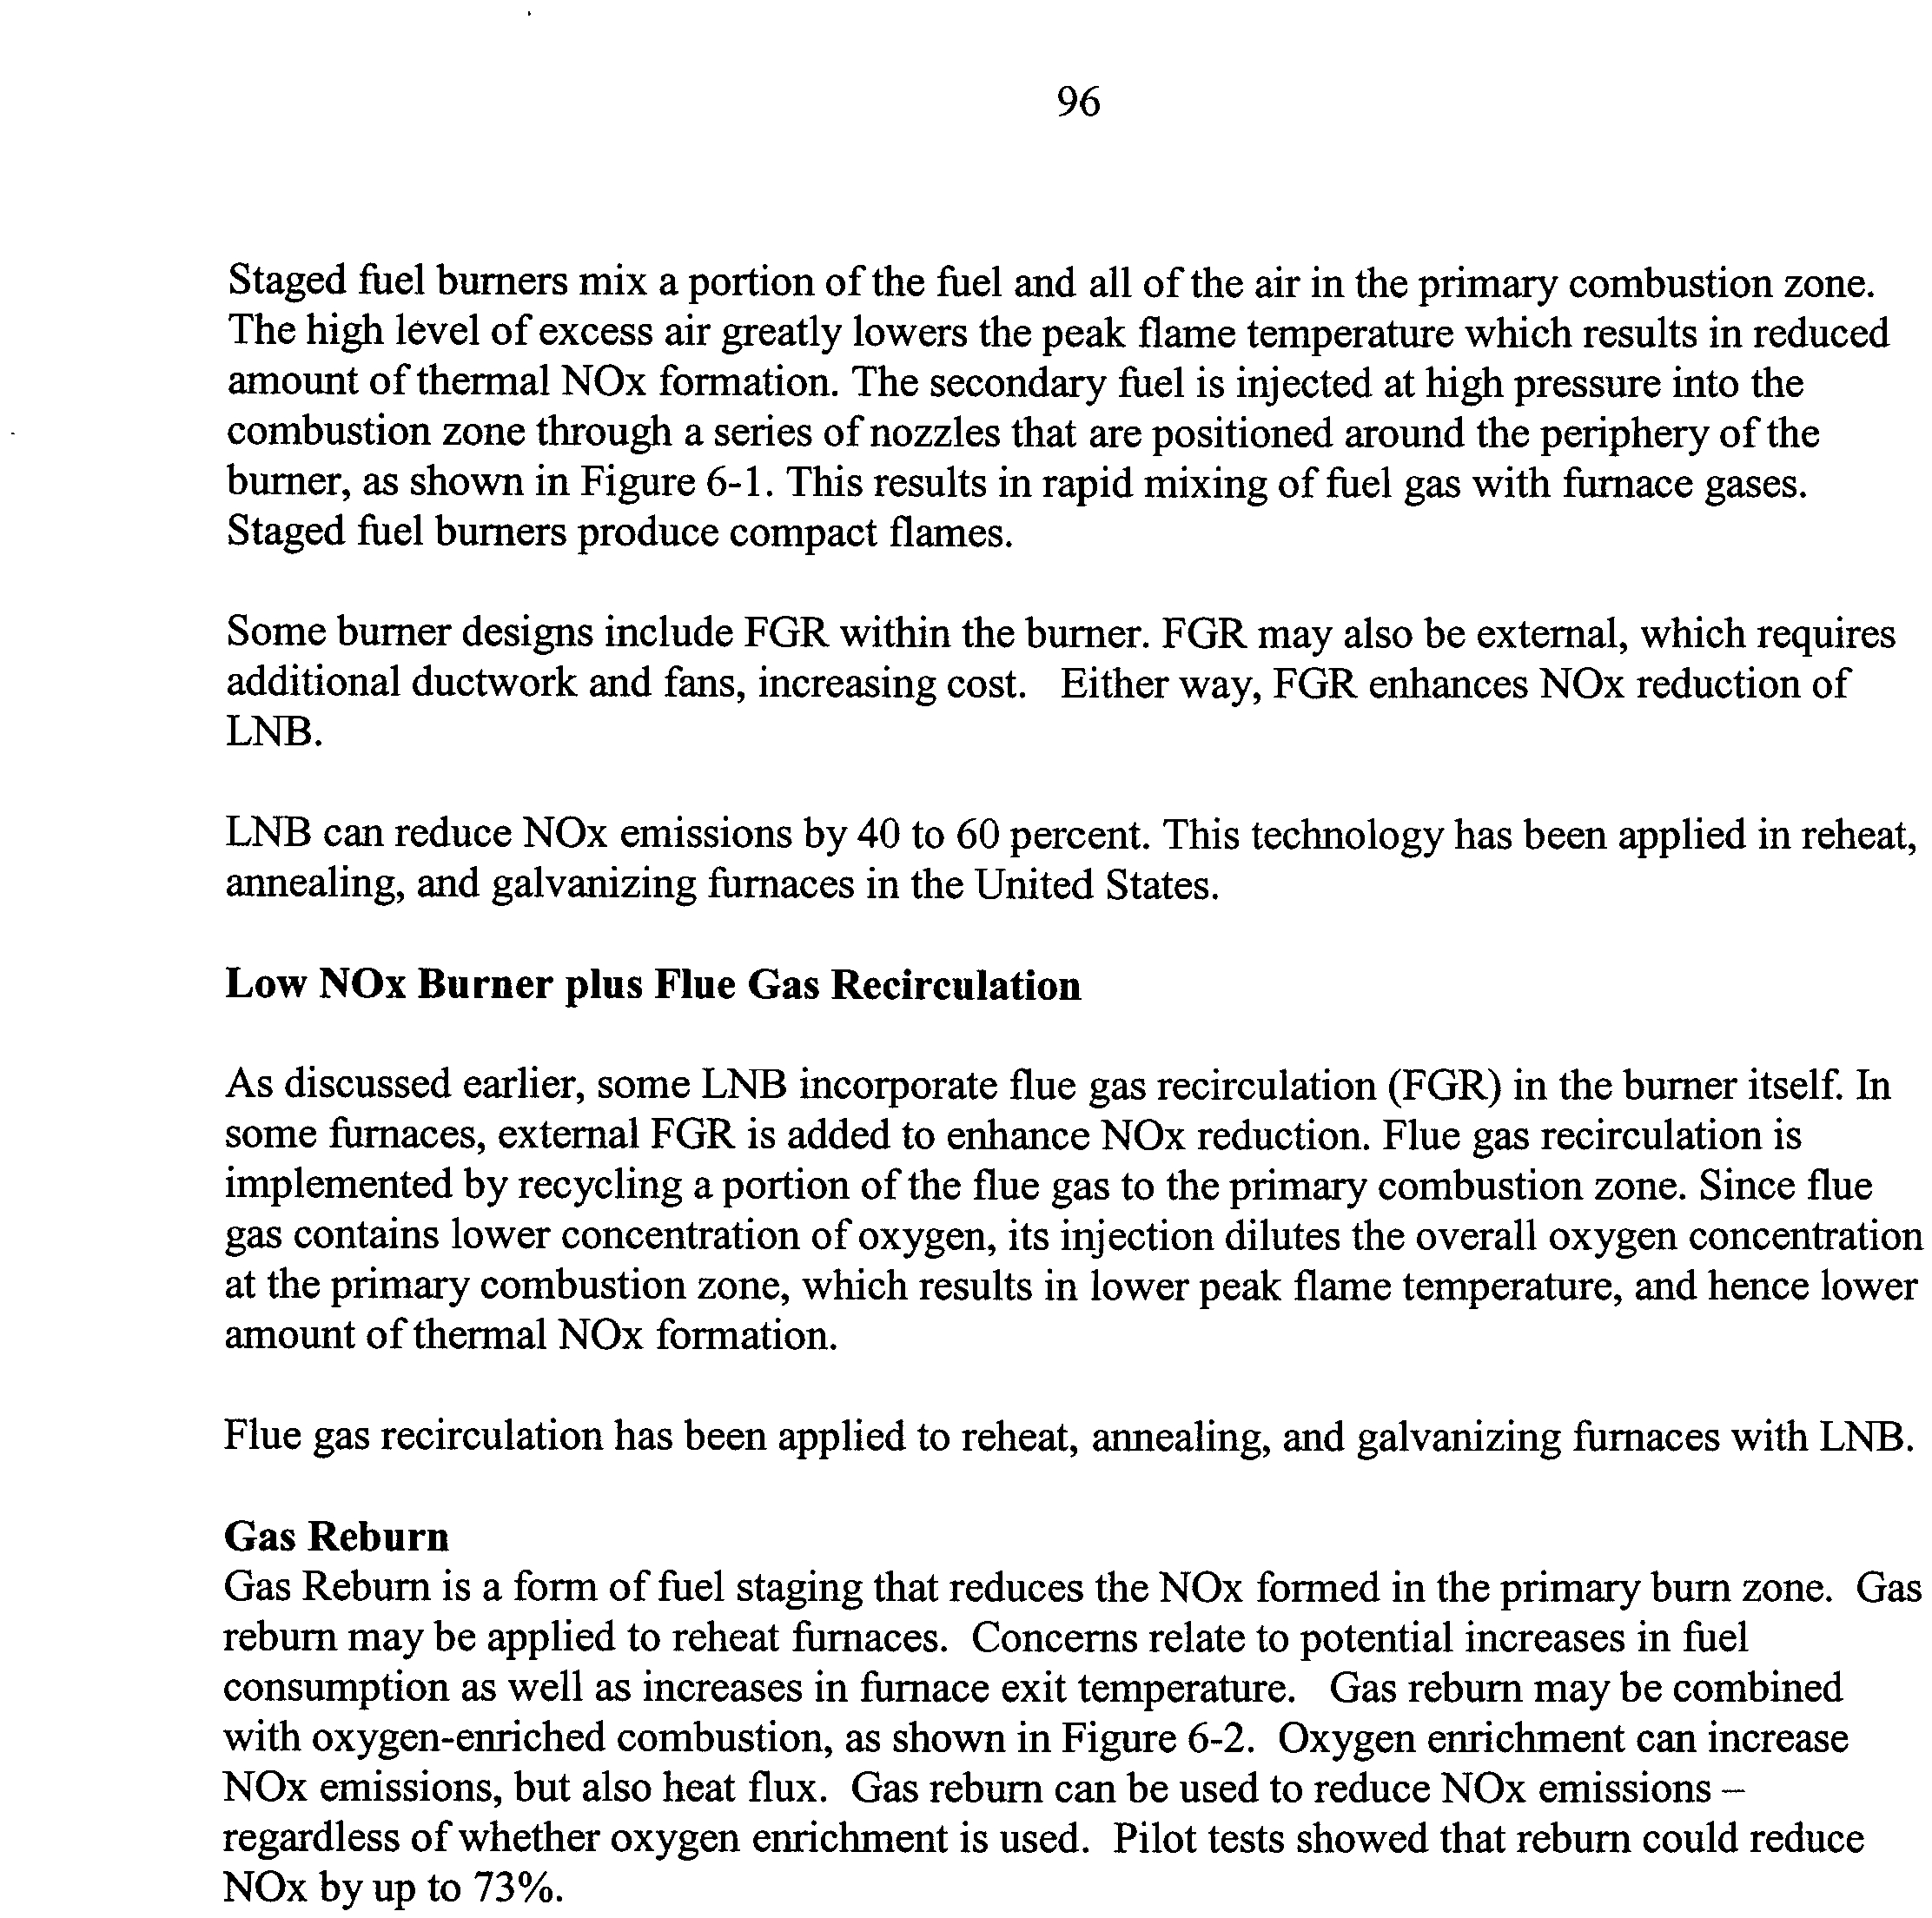
6-2
Natural Gas Reburning with Oxygen Enriched burners
97
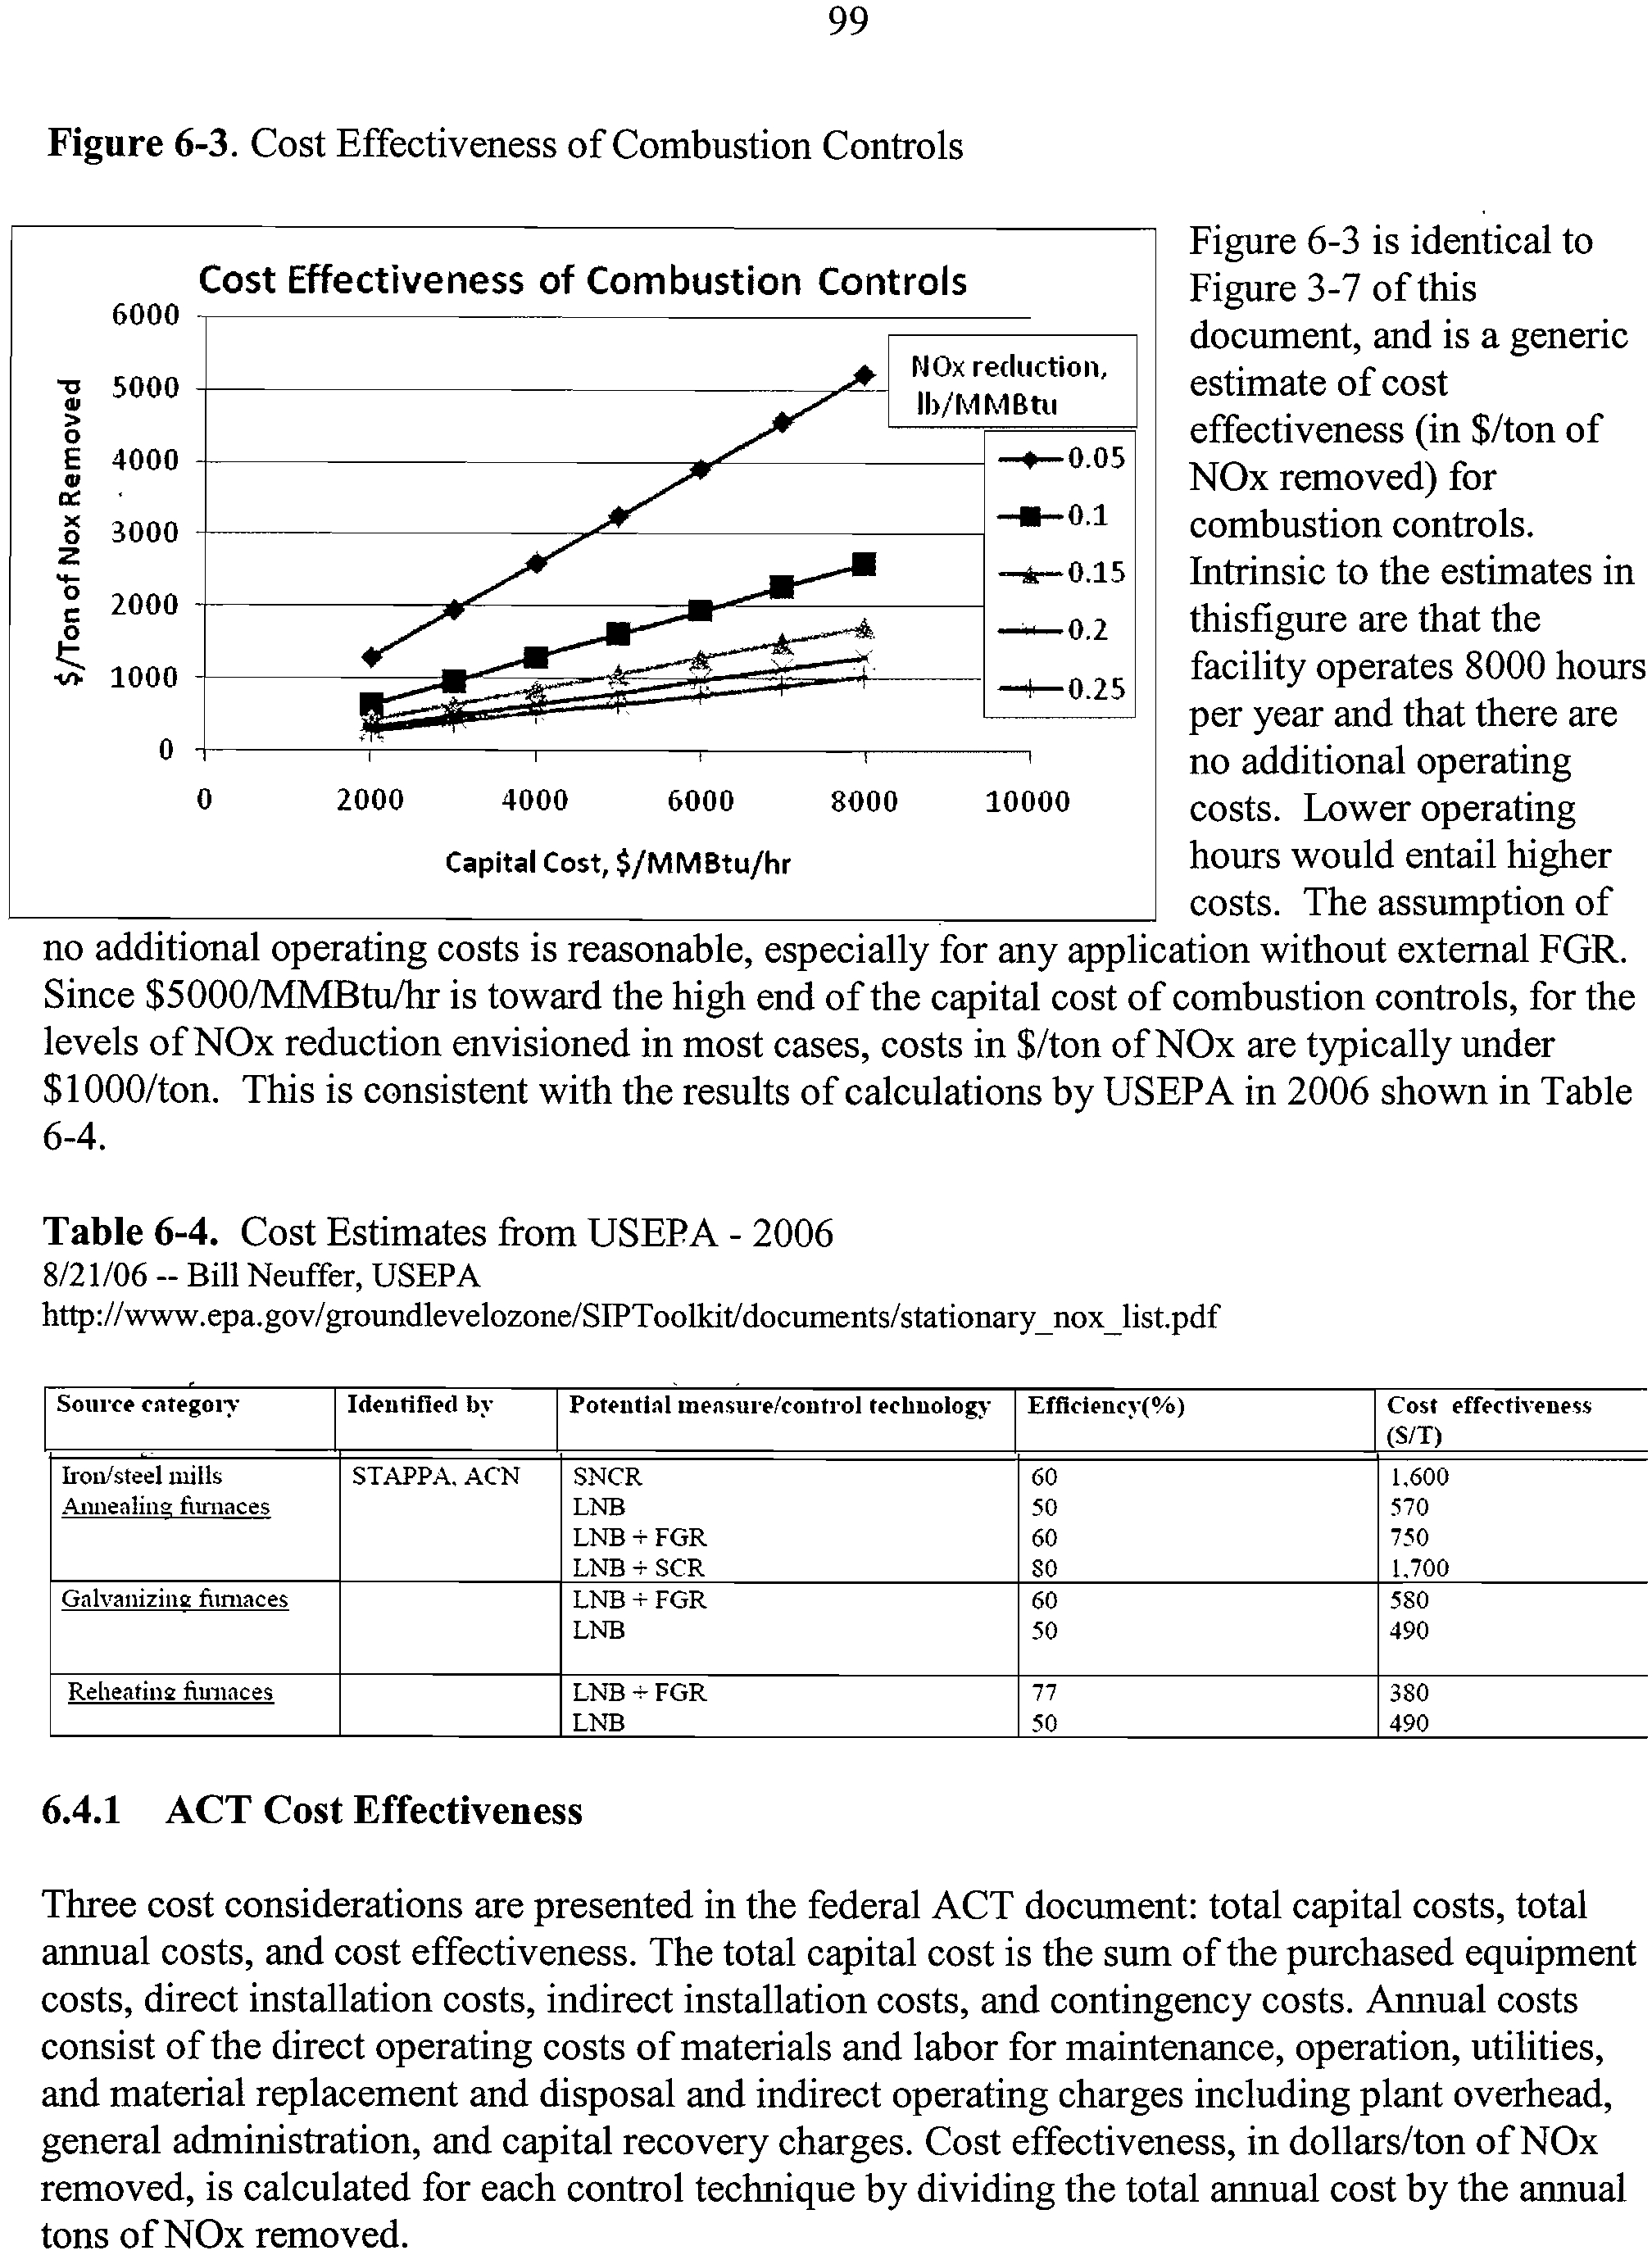
6-3
Cost Effectiveness of Combustion Controls
99
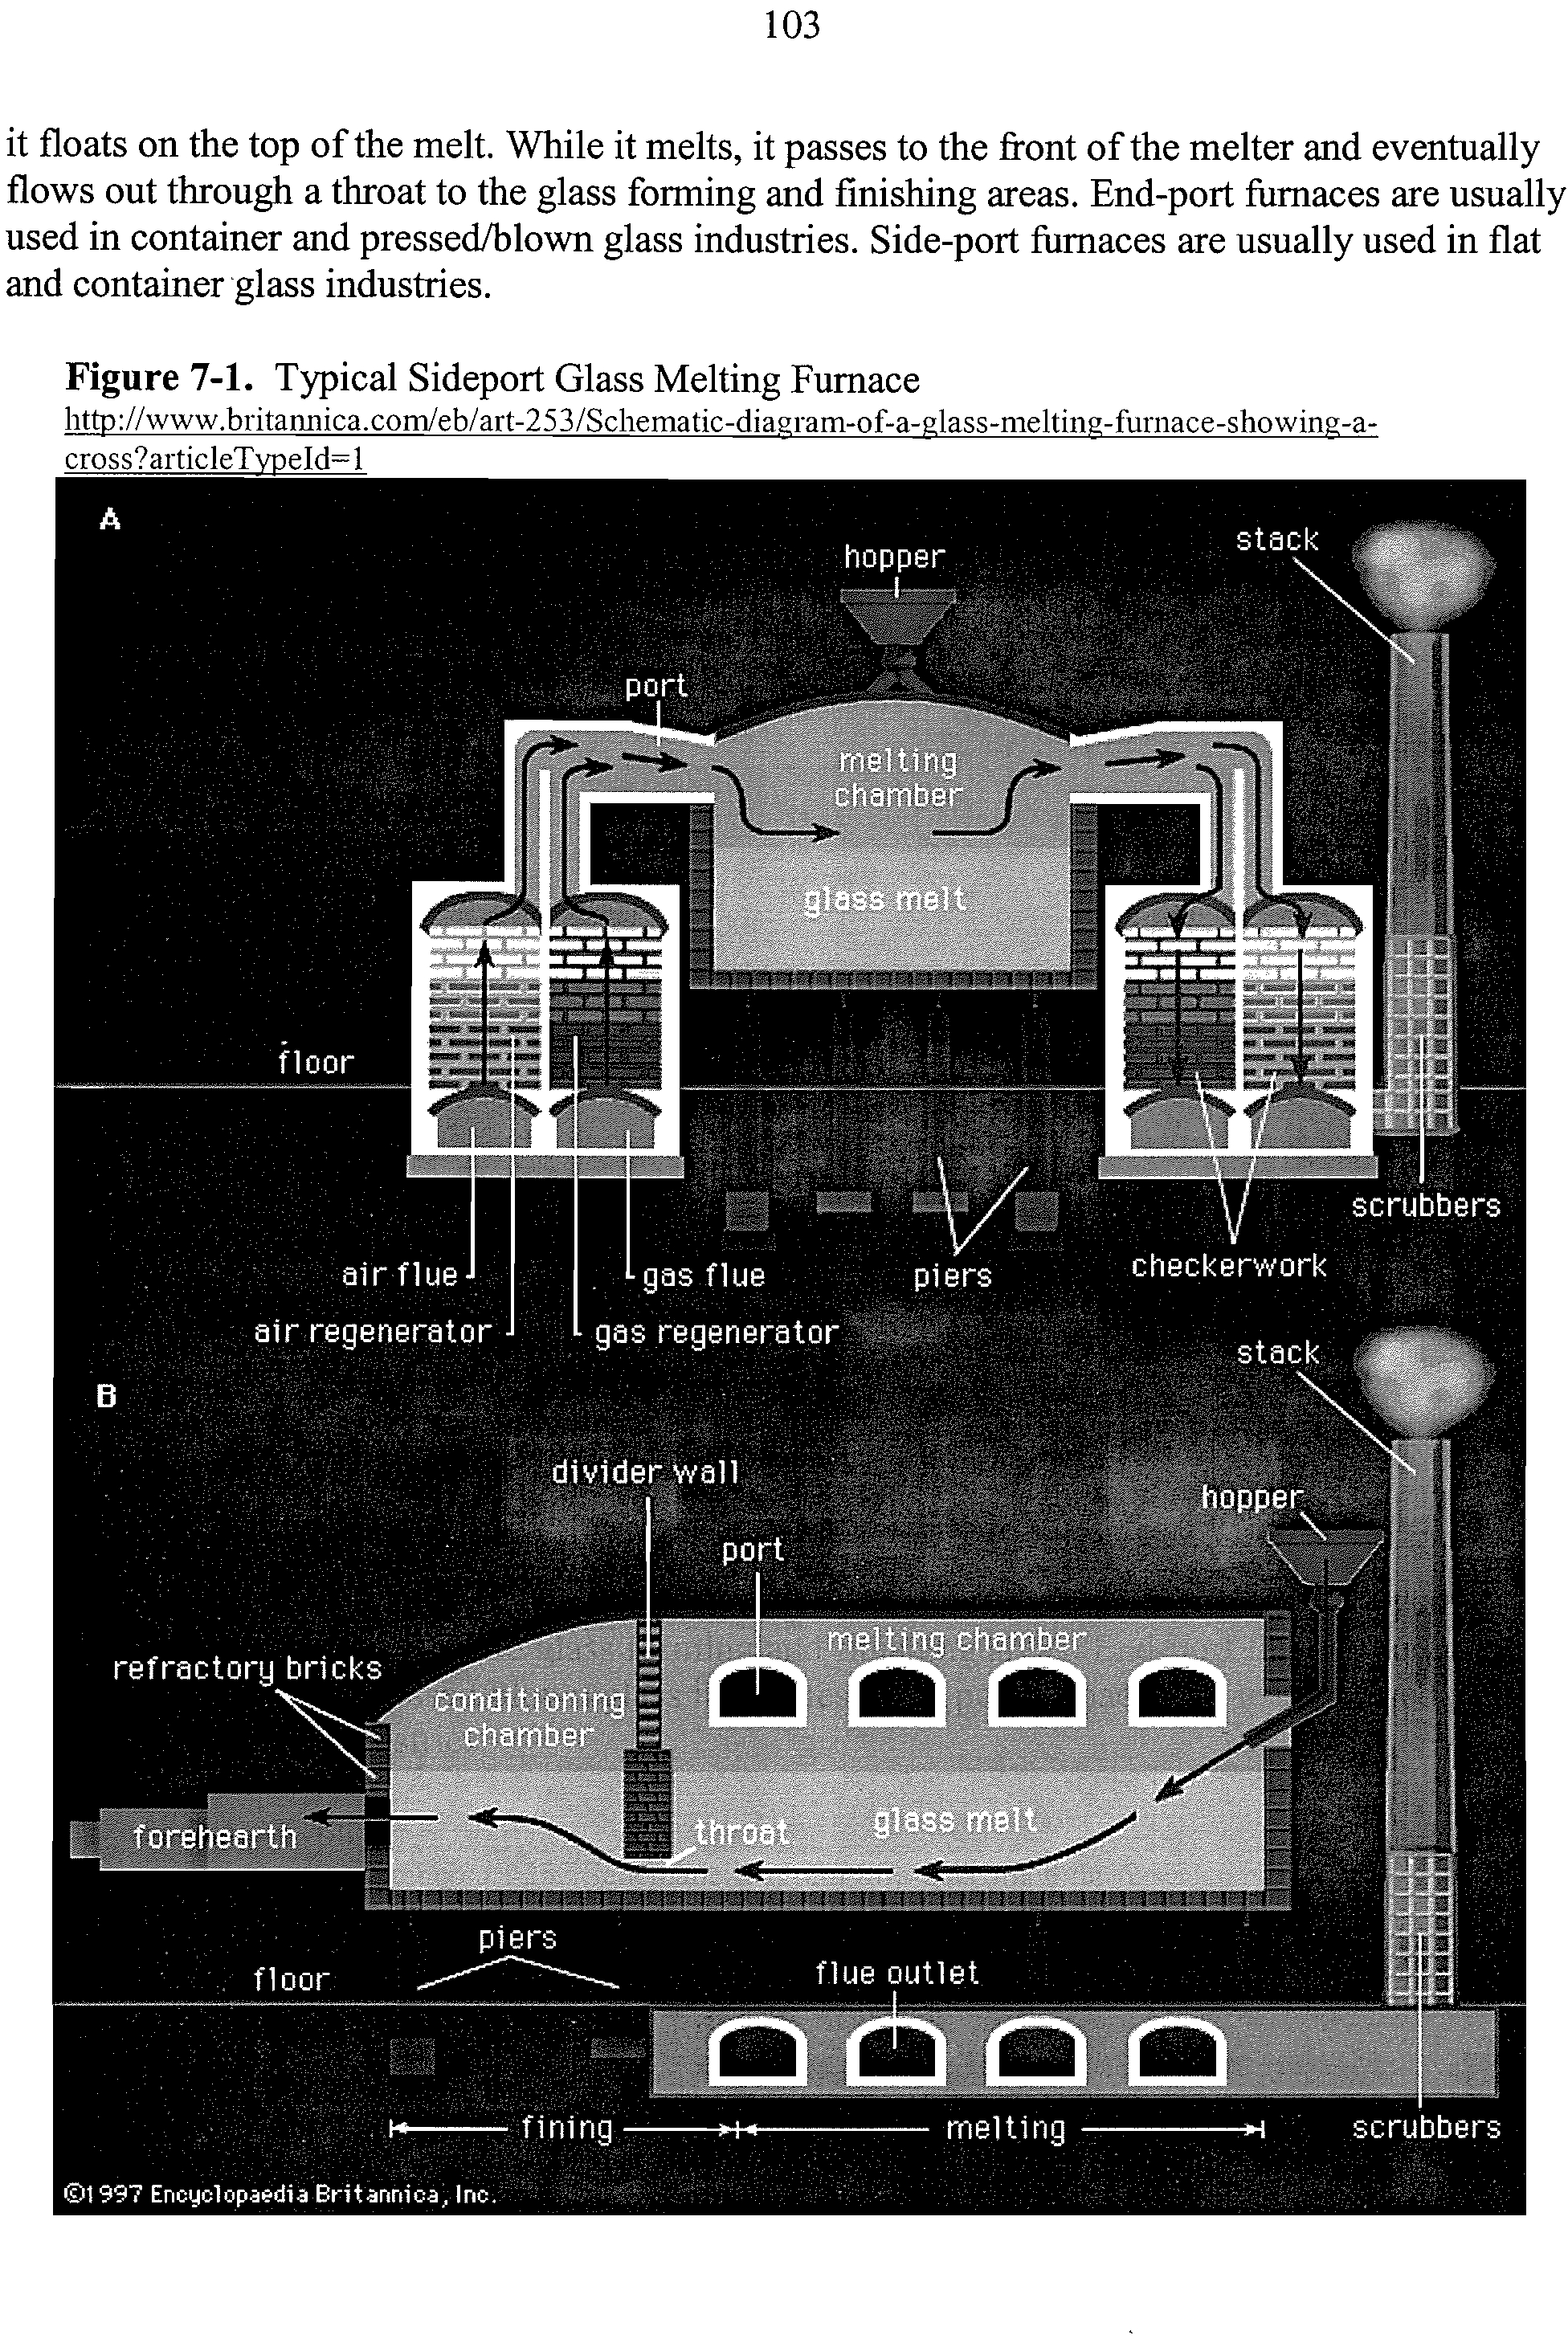
7-1
Typical Sideport Glass Melting Furnace
103
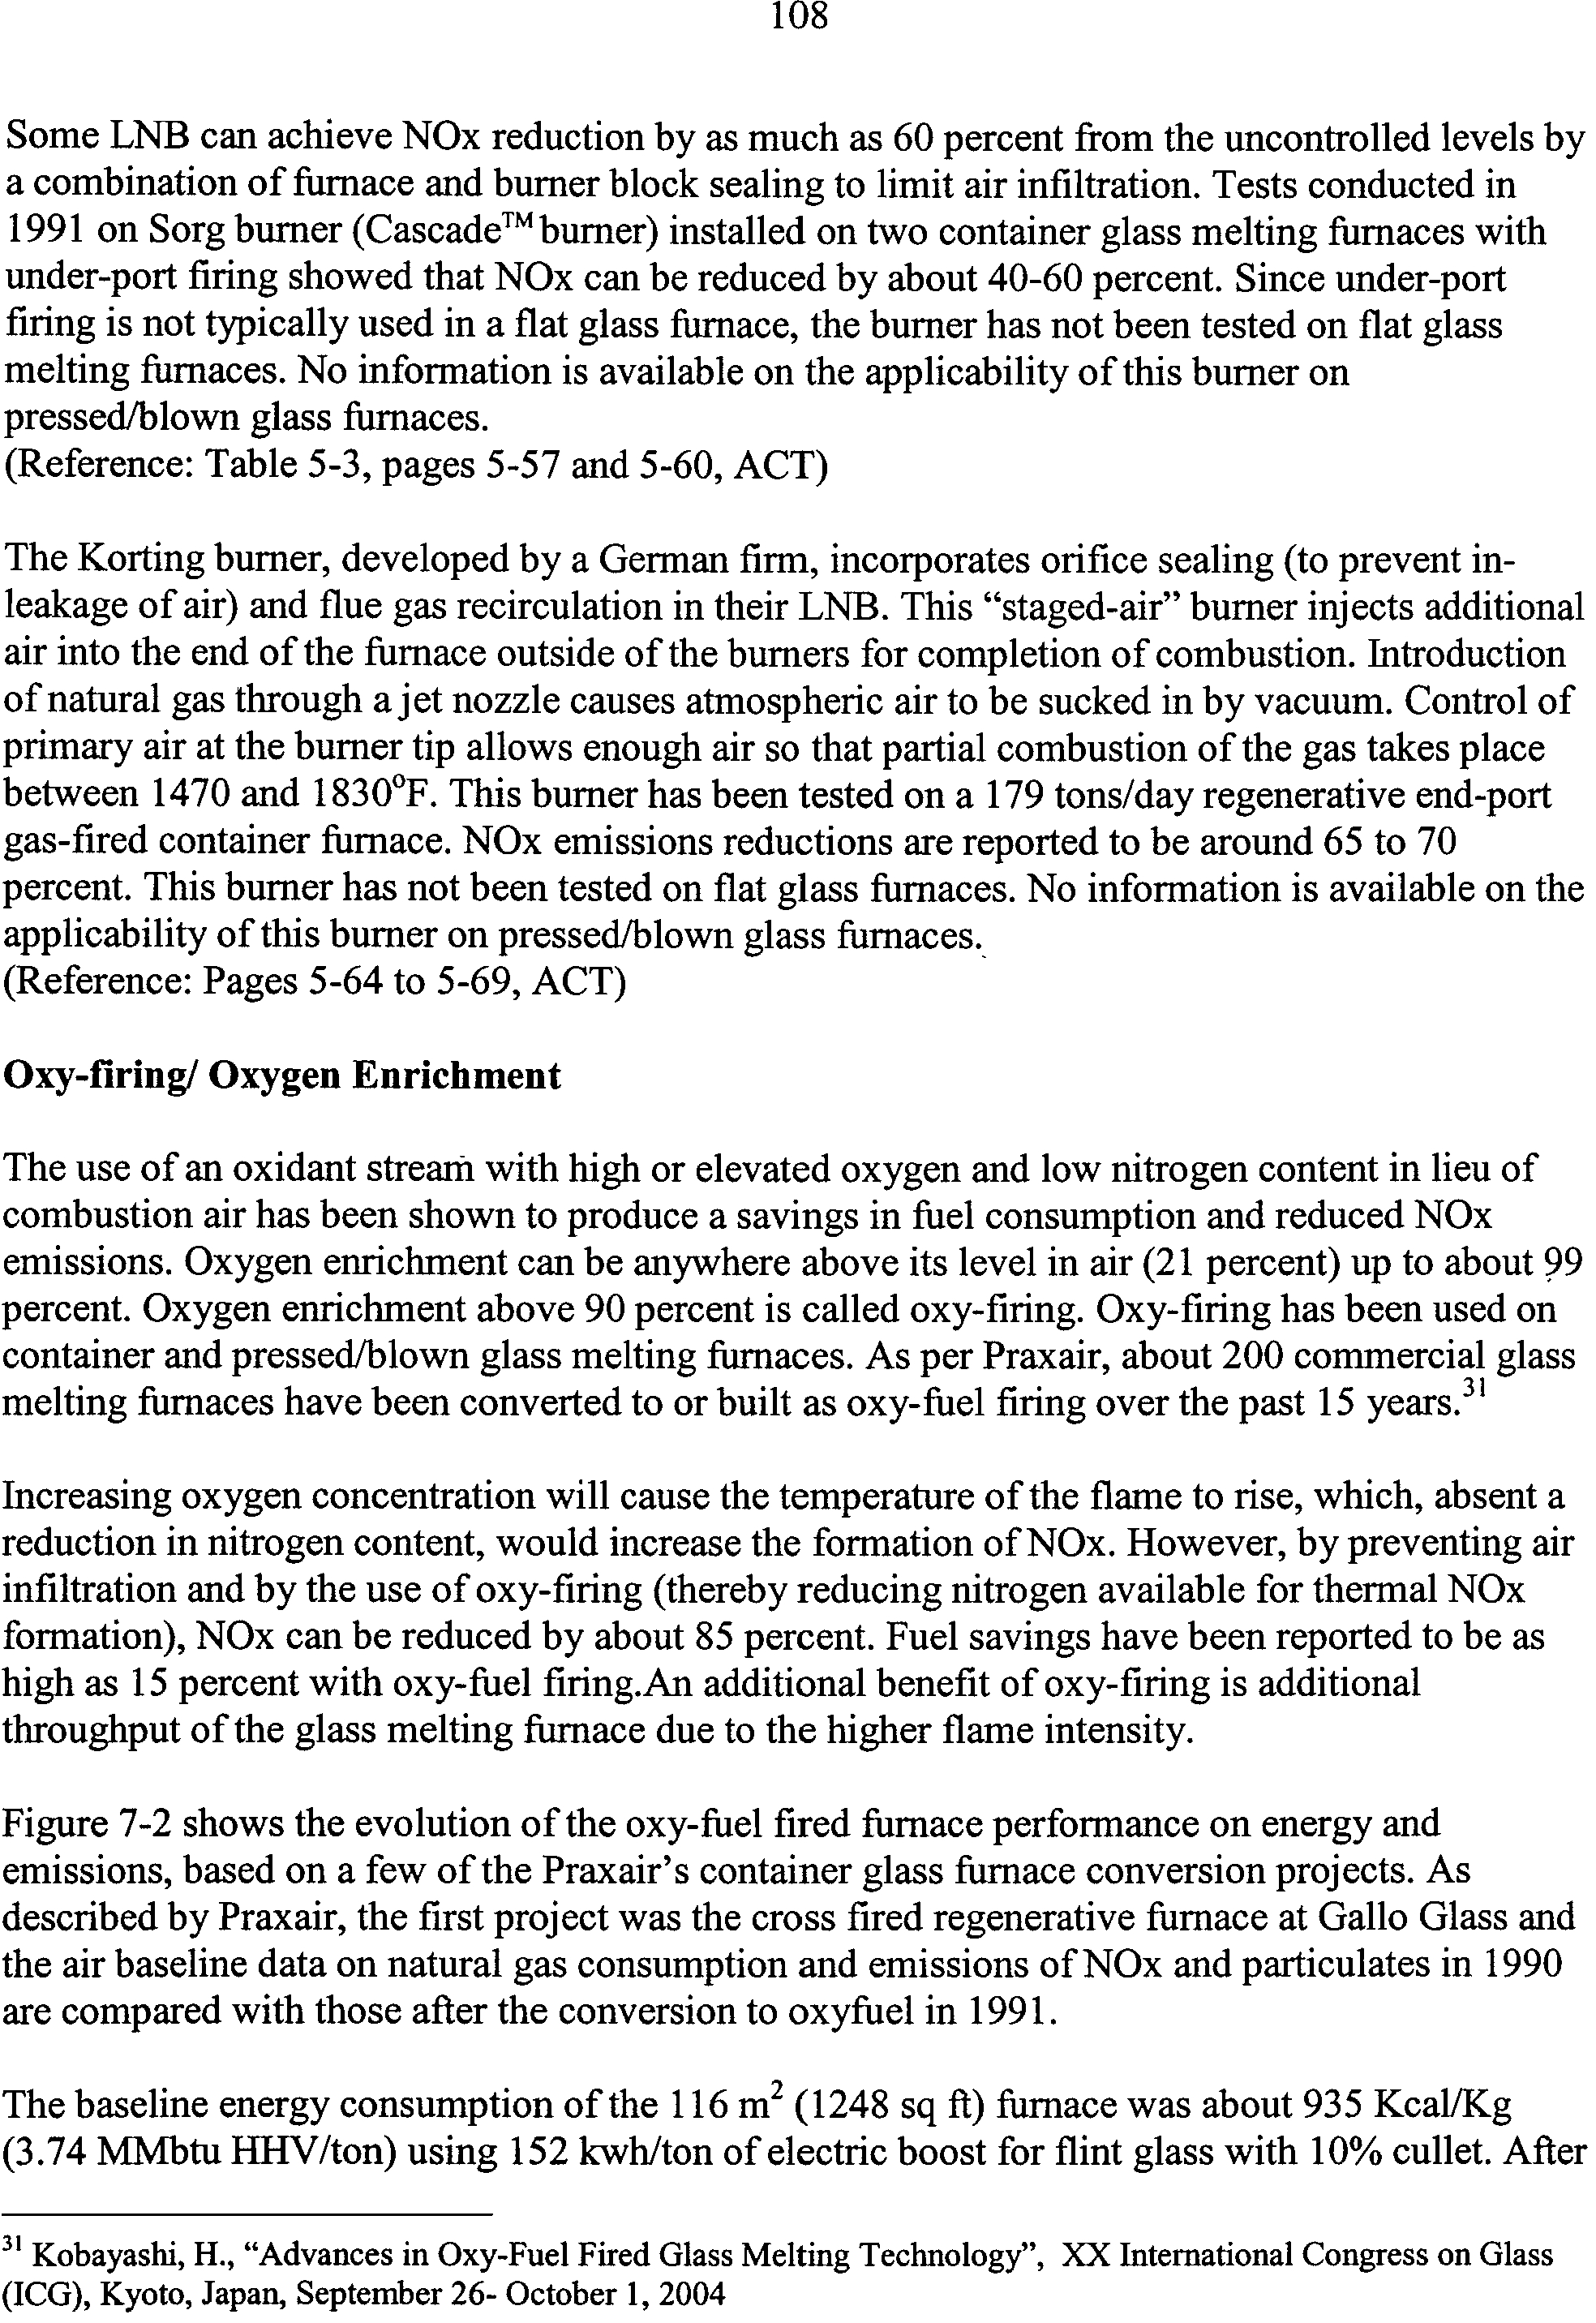
7-2
Energy consumption and emissions from oxy-fuel fired container
glass furnaces
109
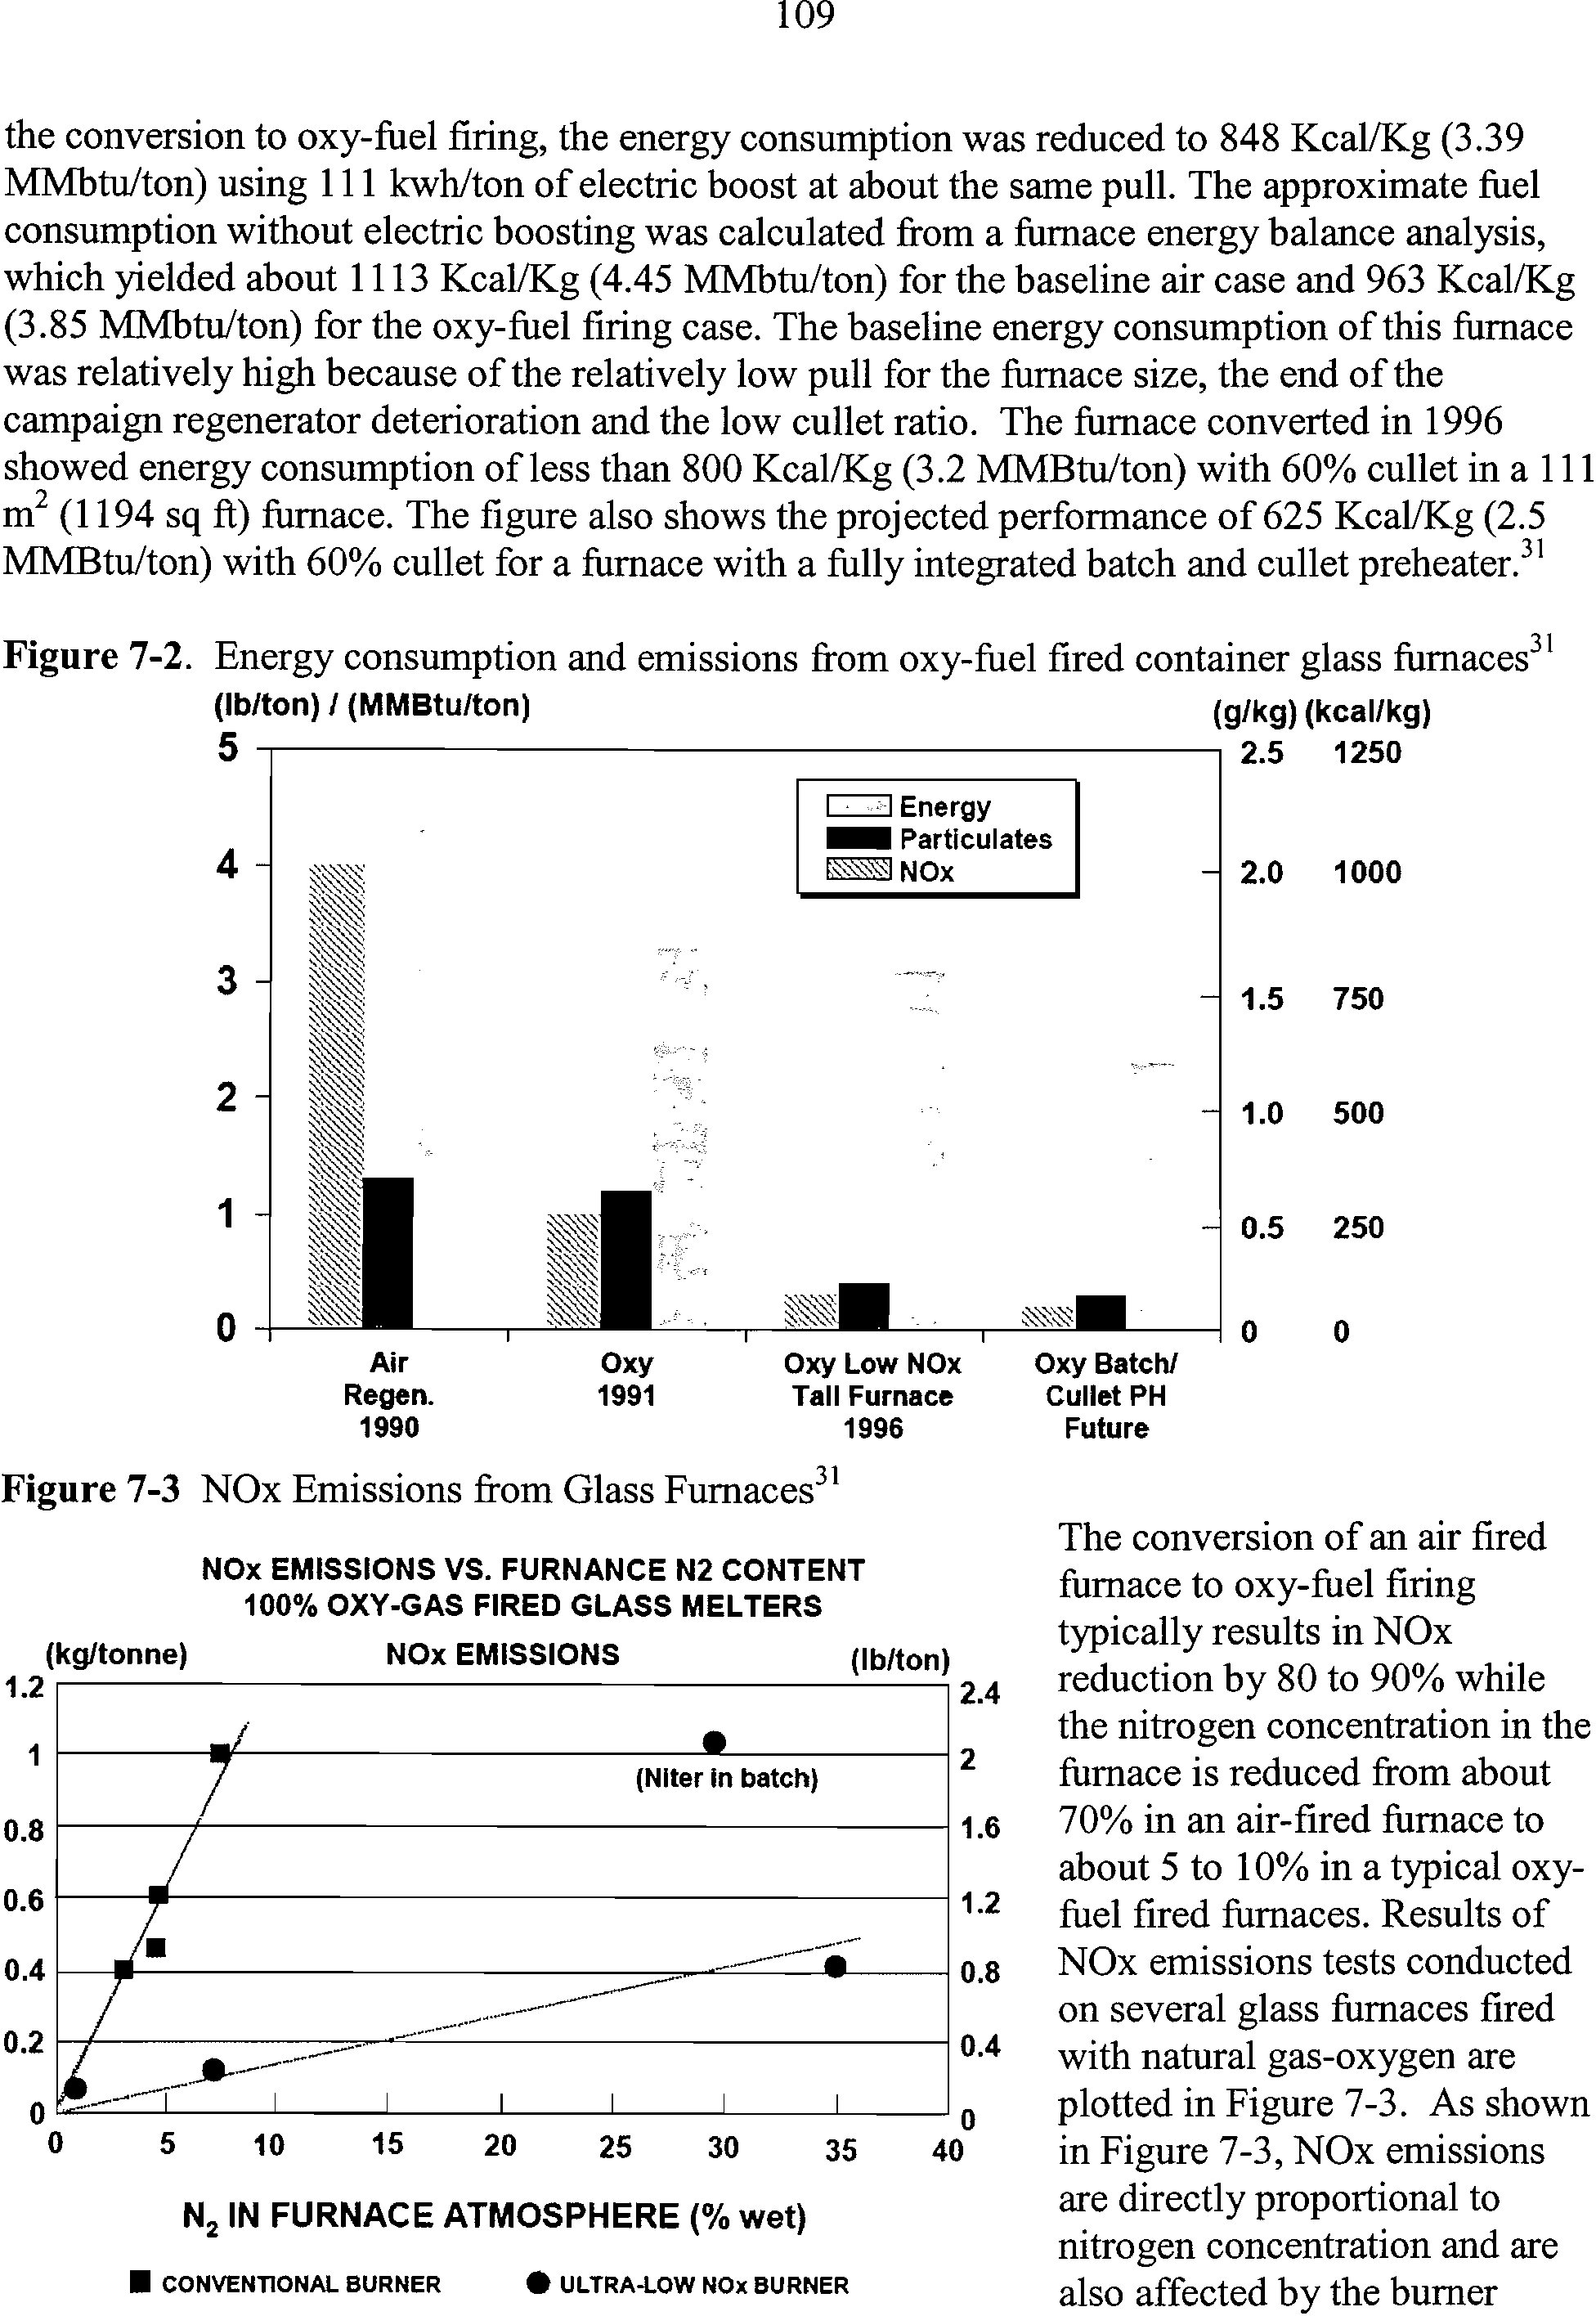
7-3
NOx Emissions from Glass Furnaces
109
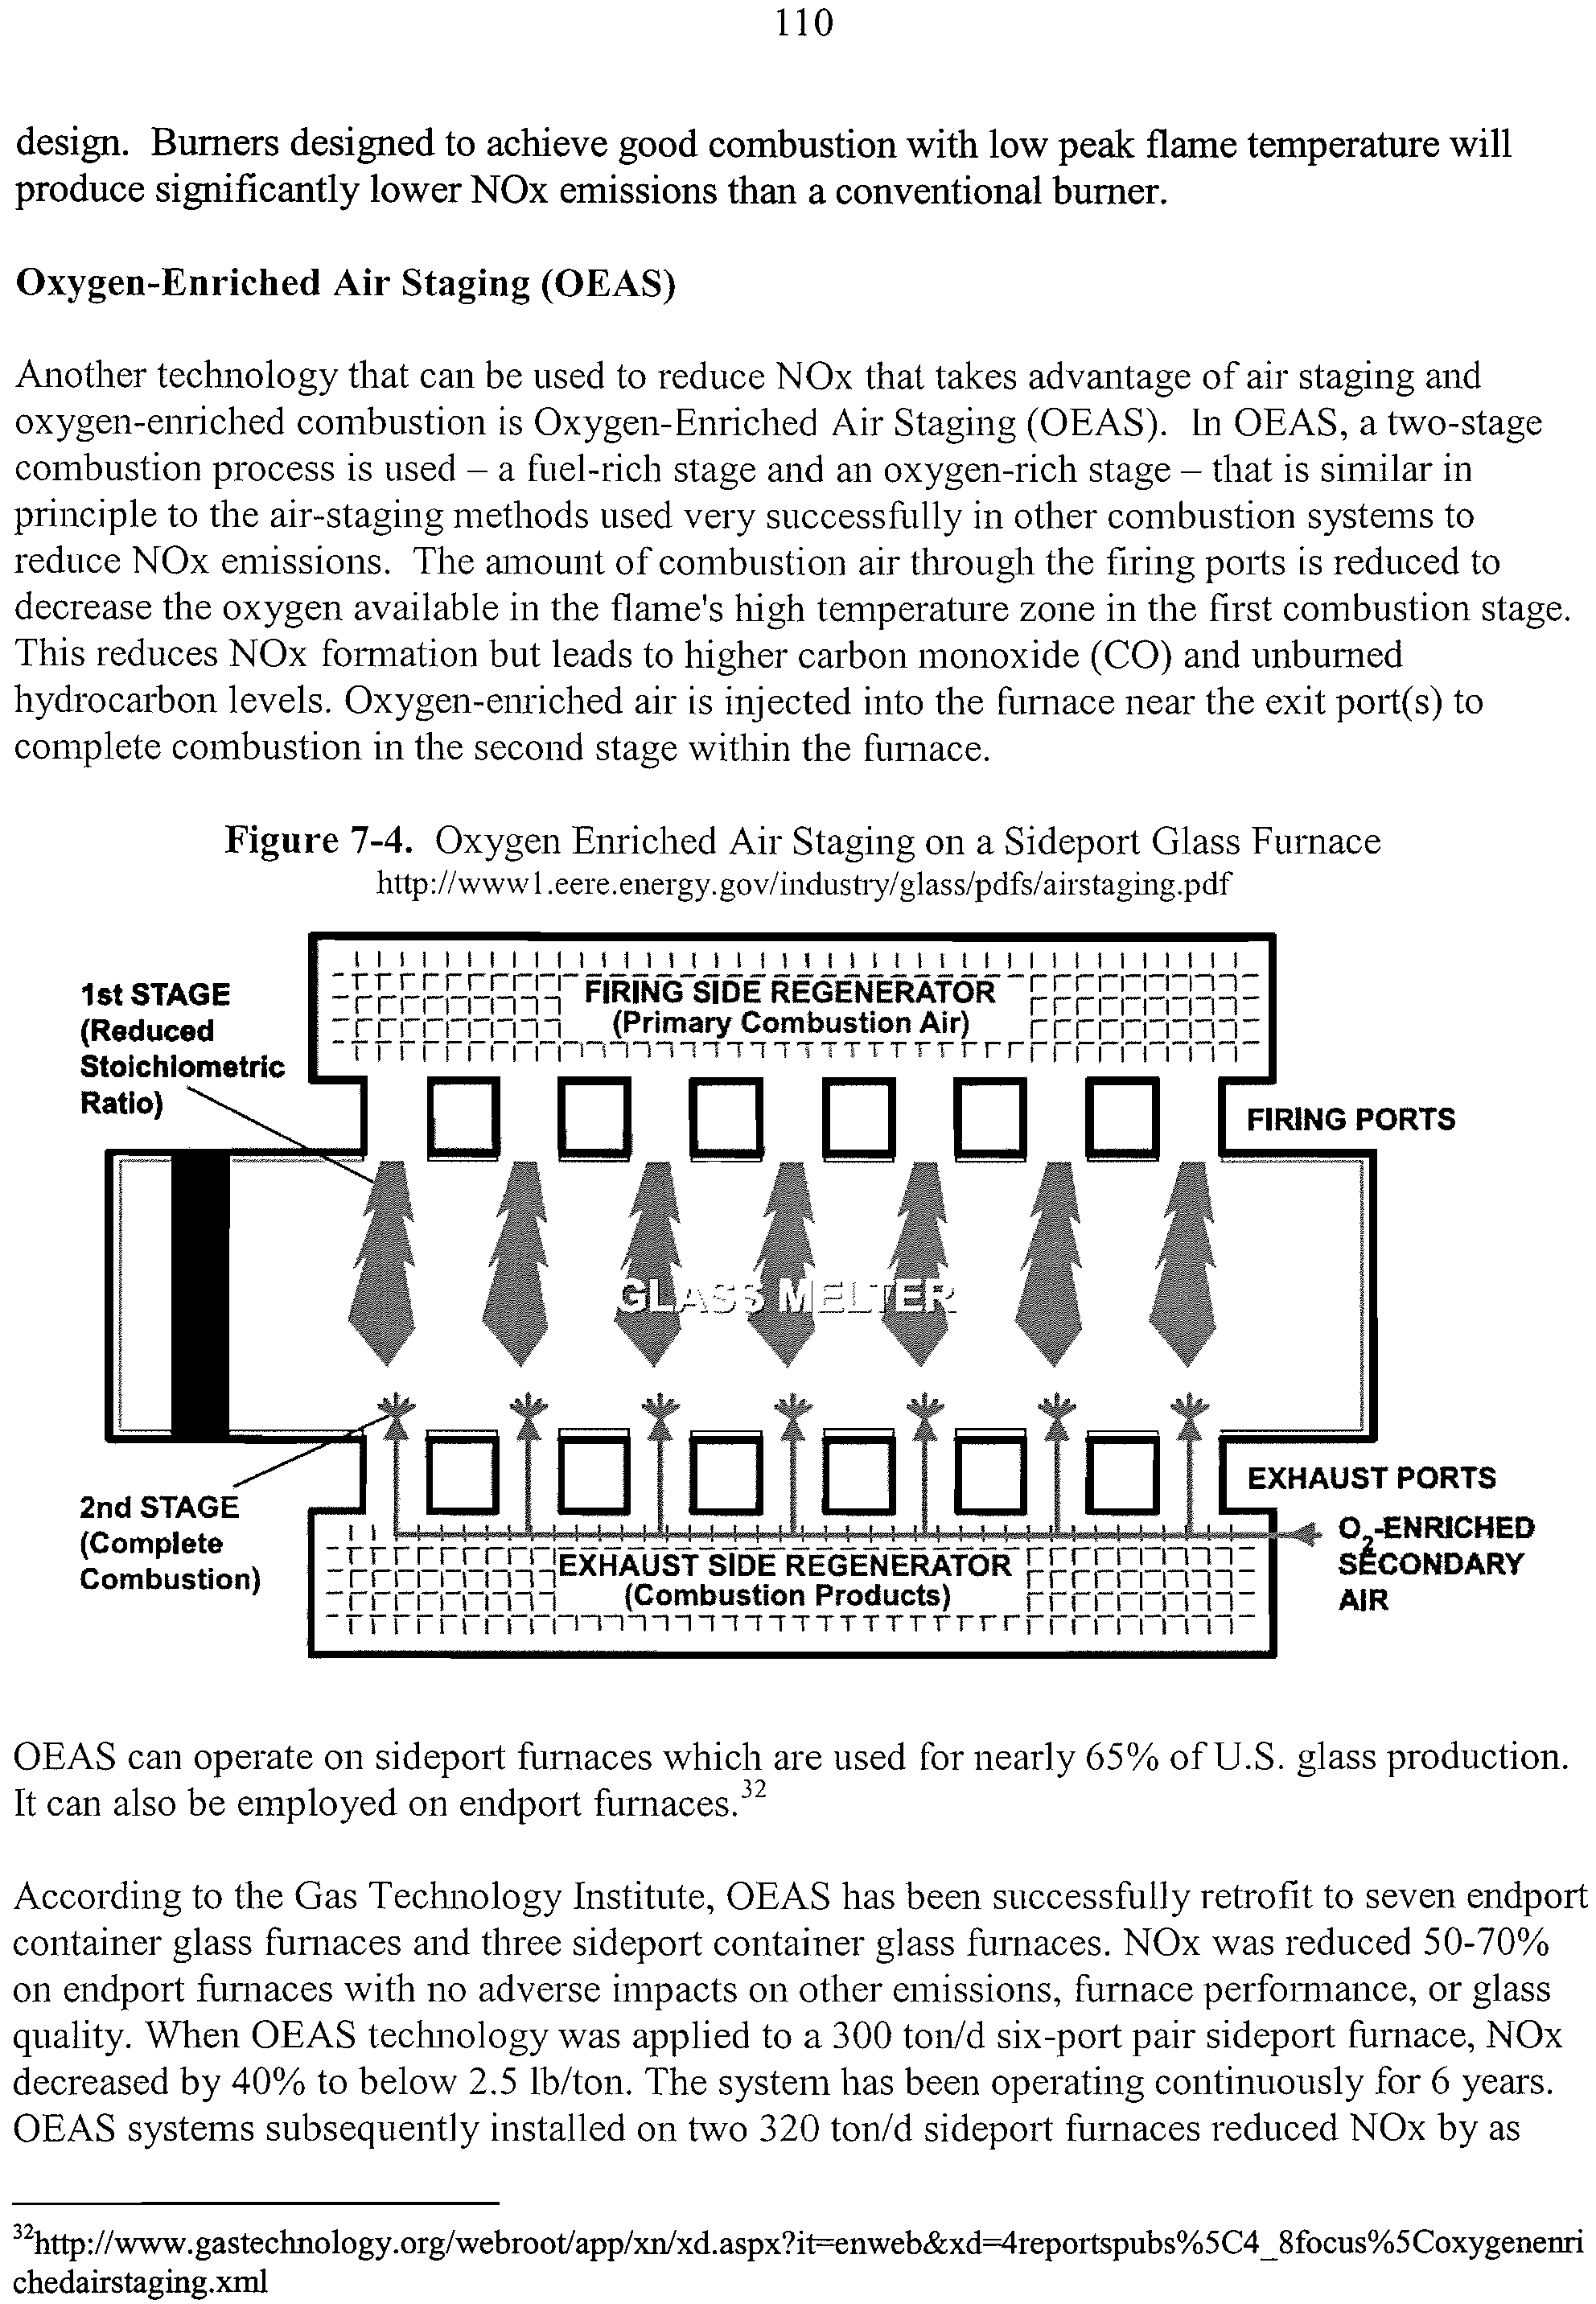
7-4
Oxygen Enriched Air Staging on a Sideport Glass Furnace
110
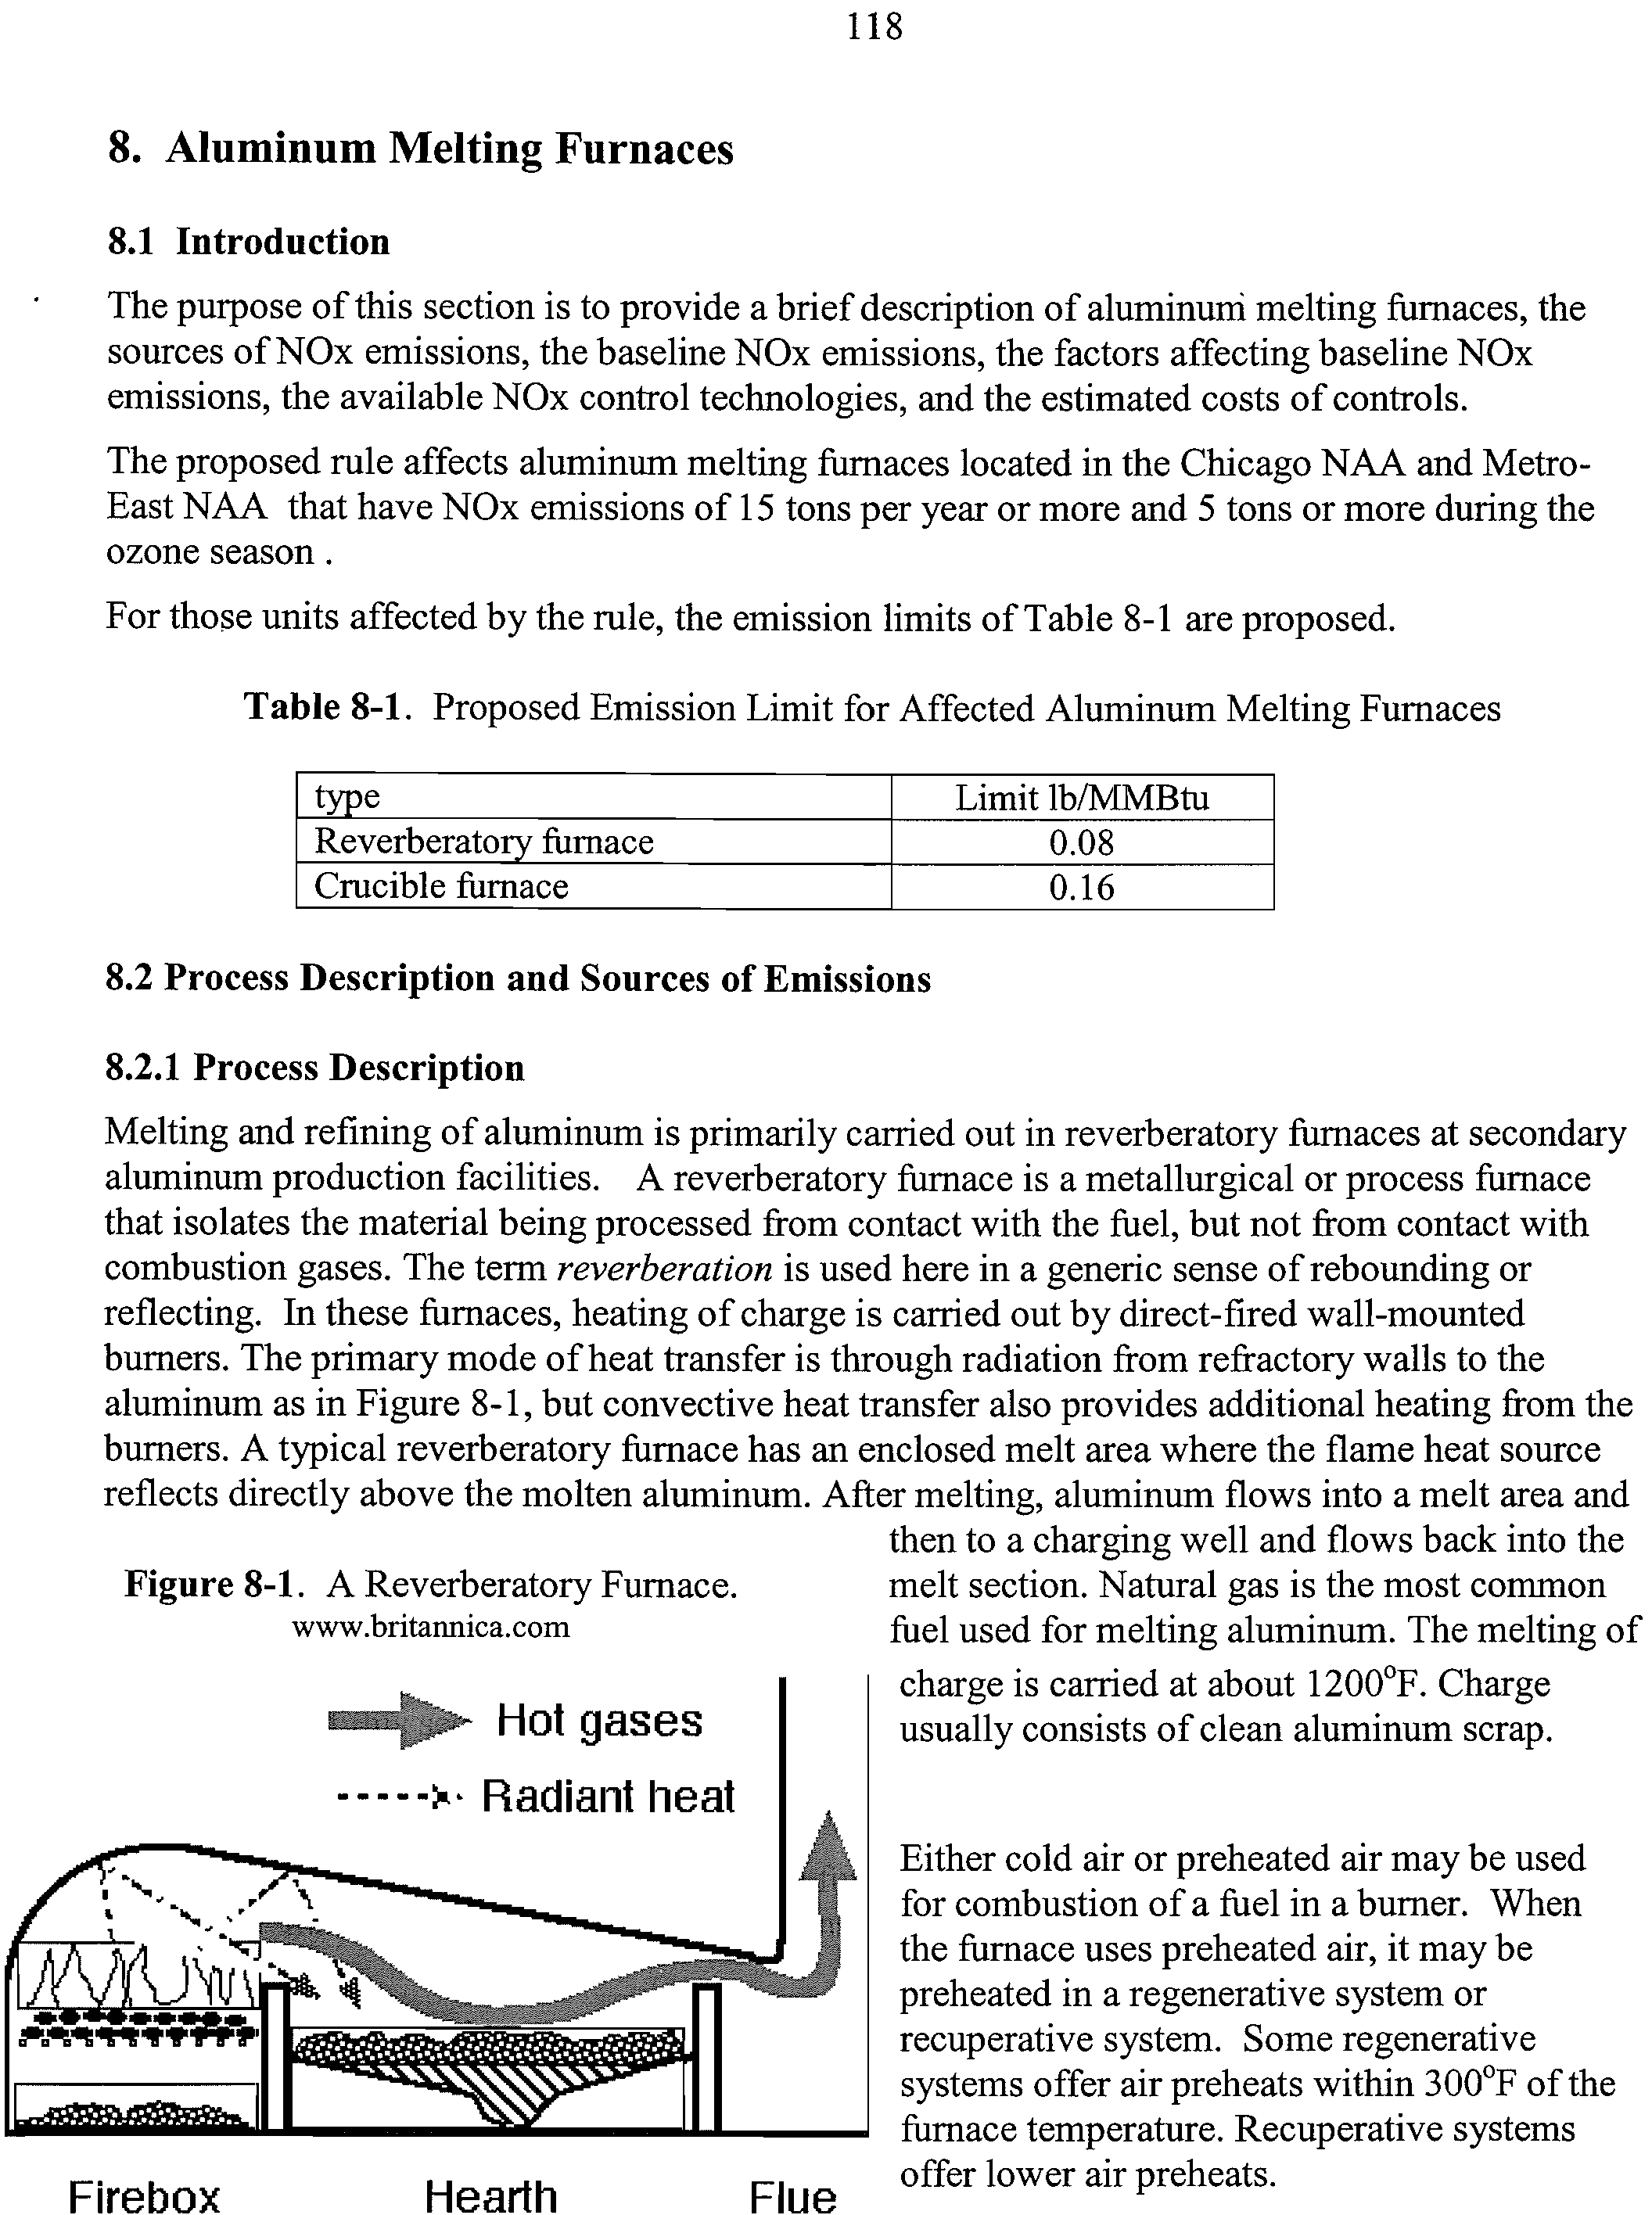
8-1
A Reverberatory Furnace
118
8-2
Staged air burner with external FGR
122
8-3
Performance of Bloom Engineering Lumiflame burner
122
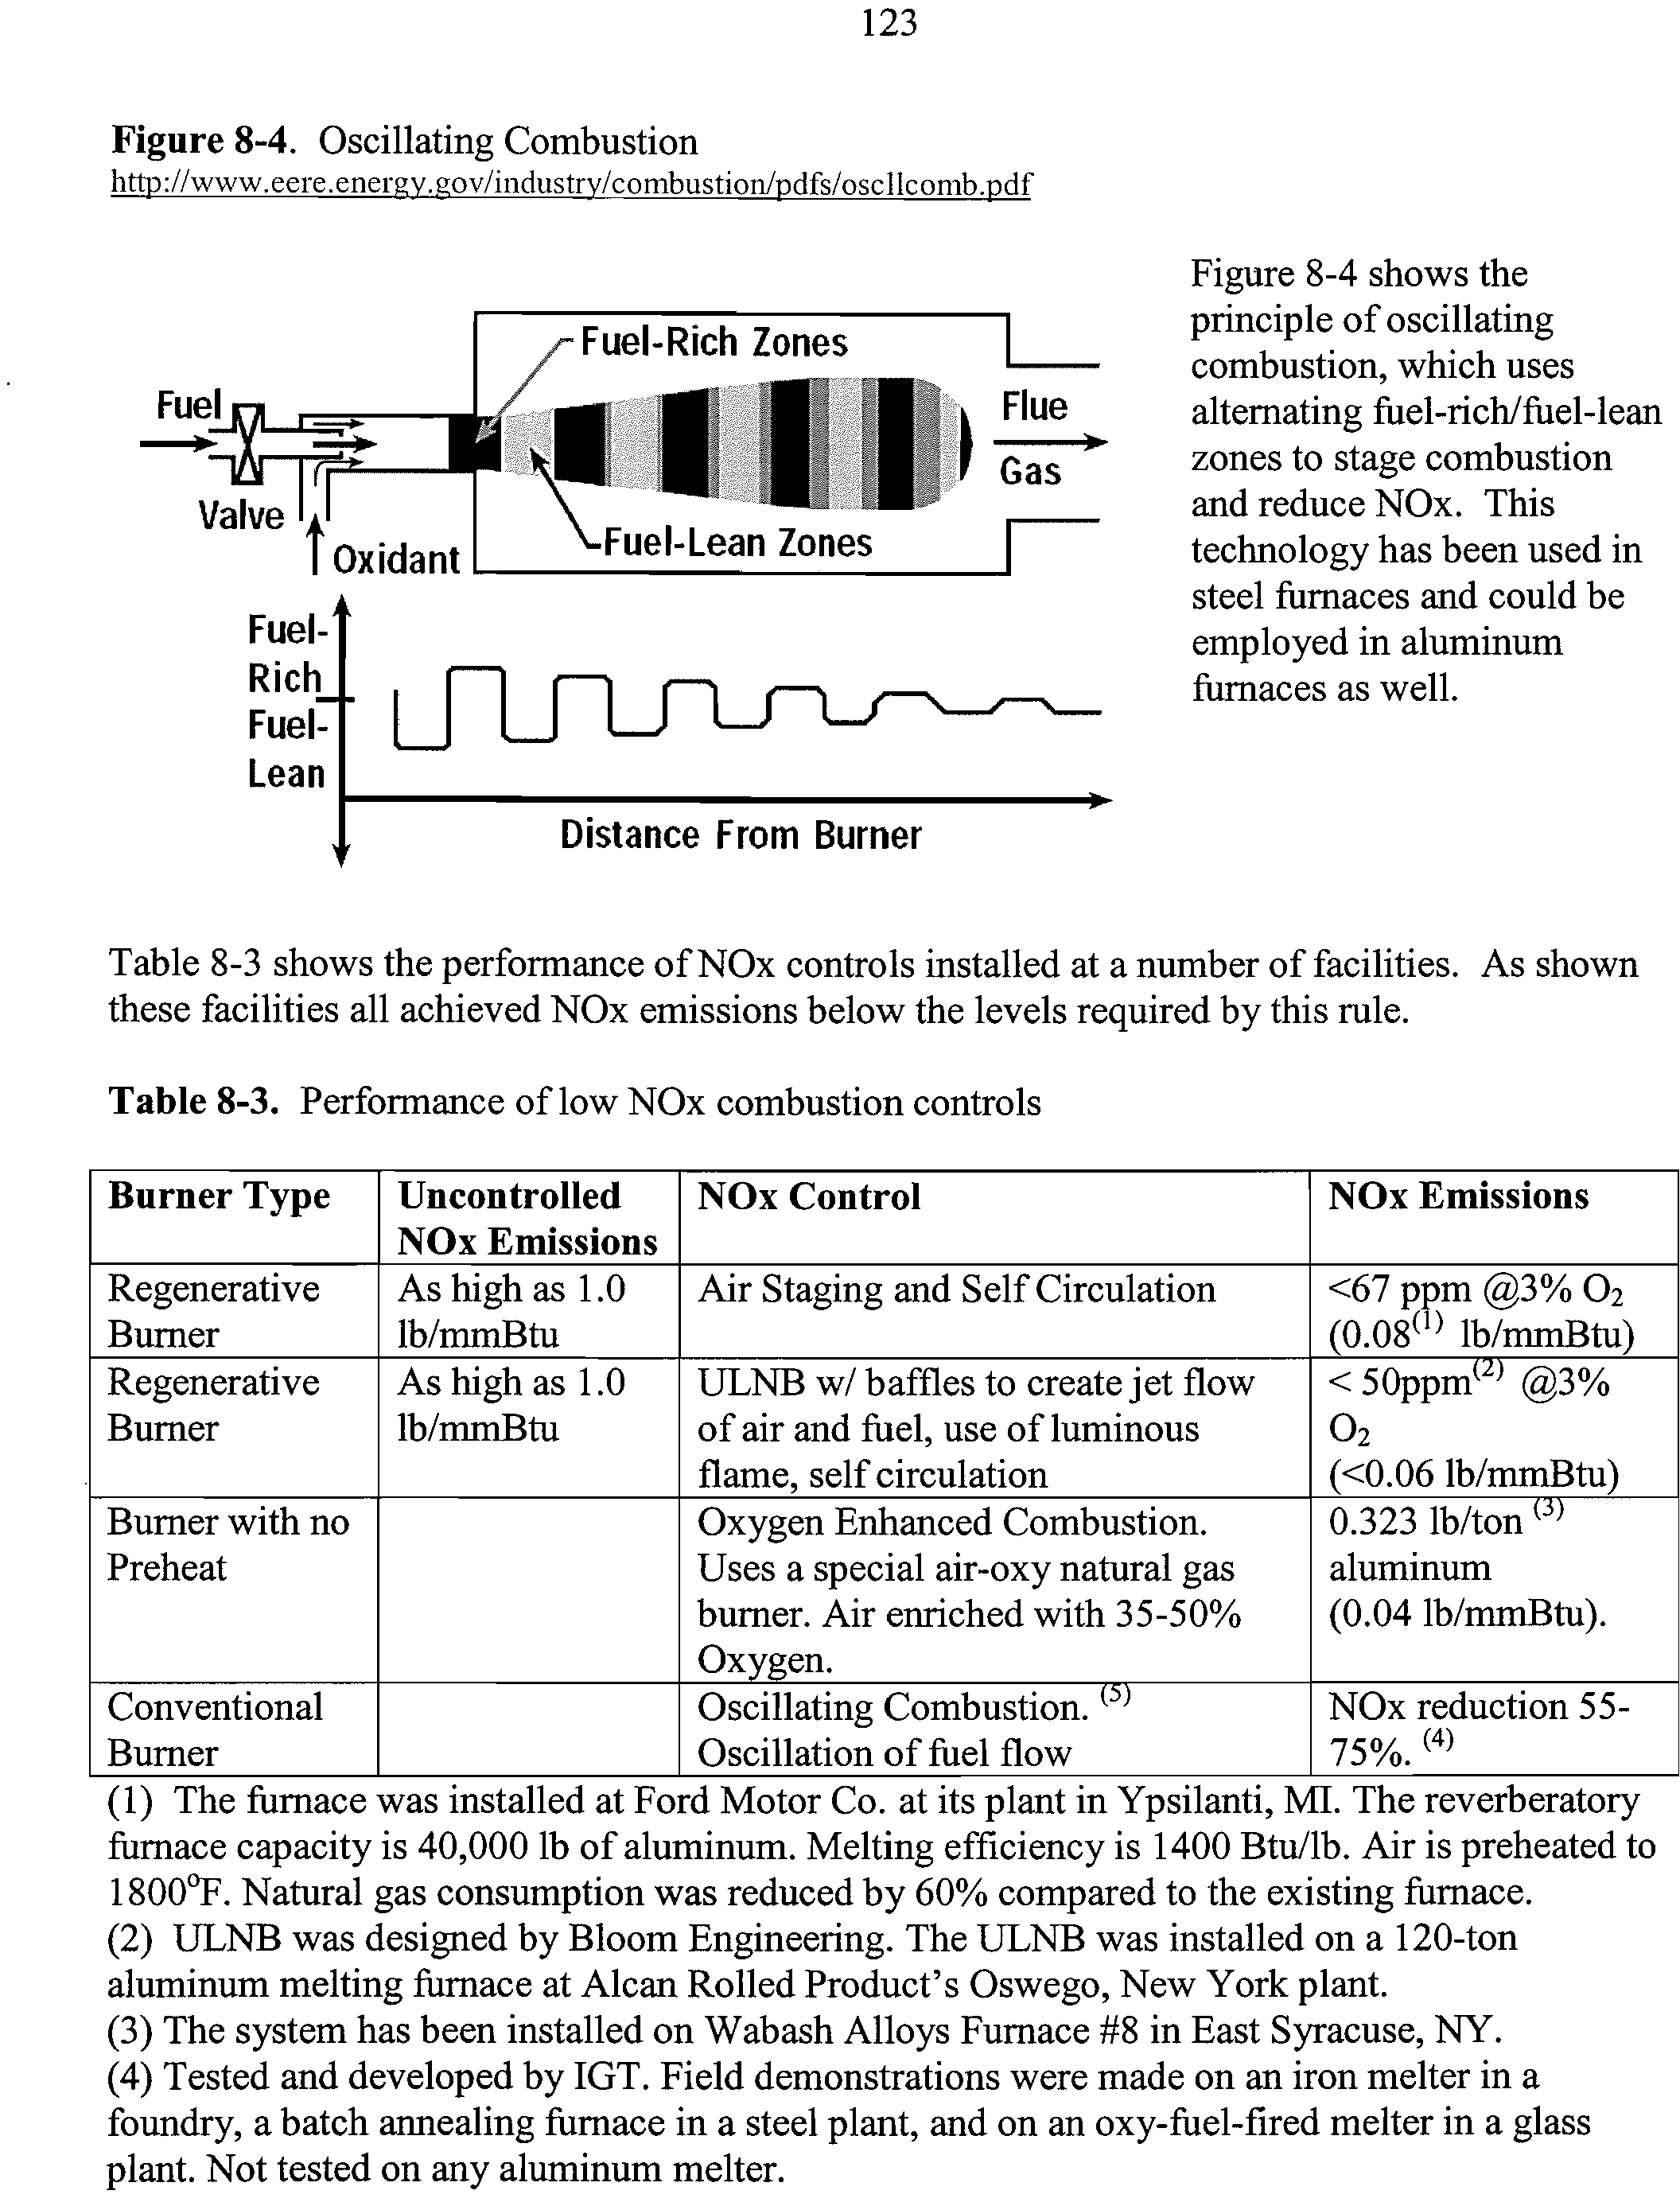
8-4
Oscillating Combustion
123
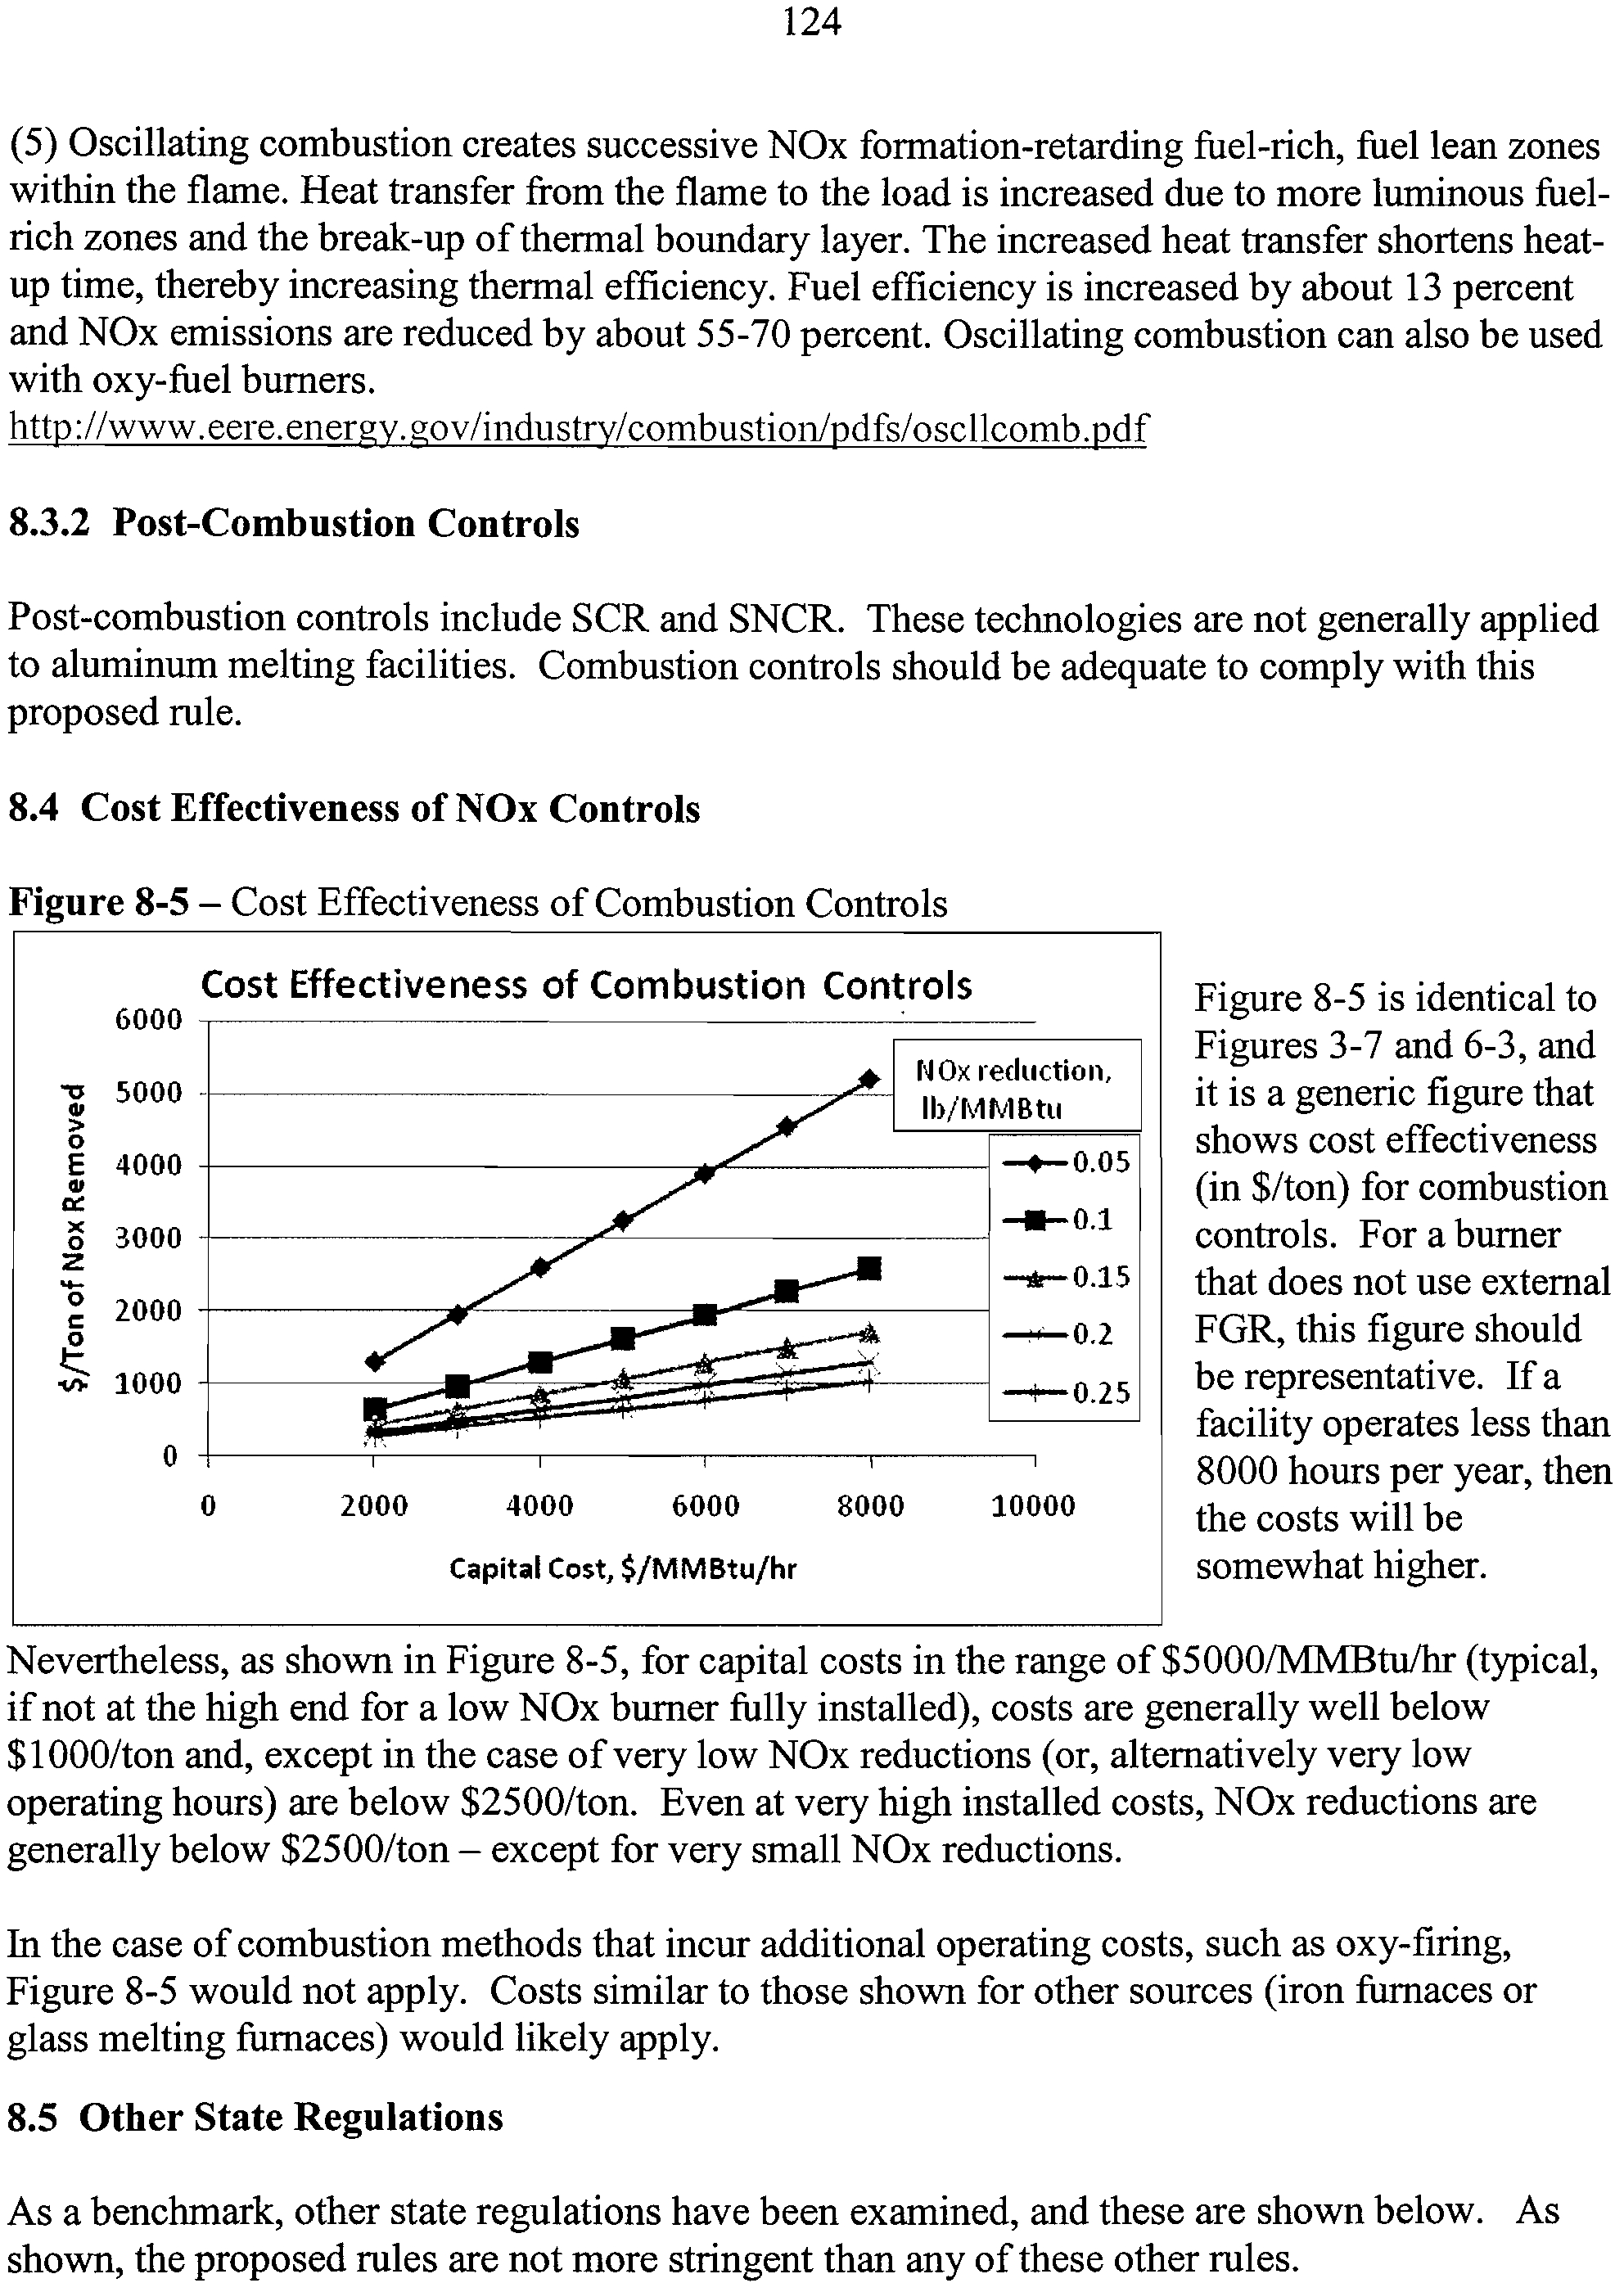
8-5
Cost Effectiveness of Combustion Controls
124
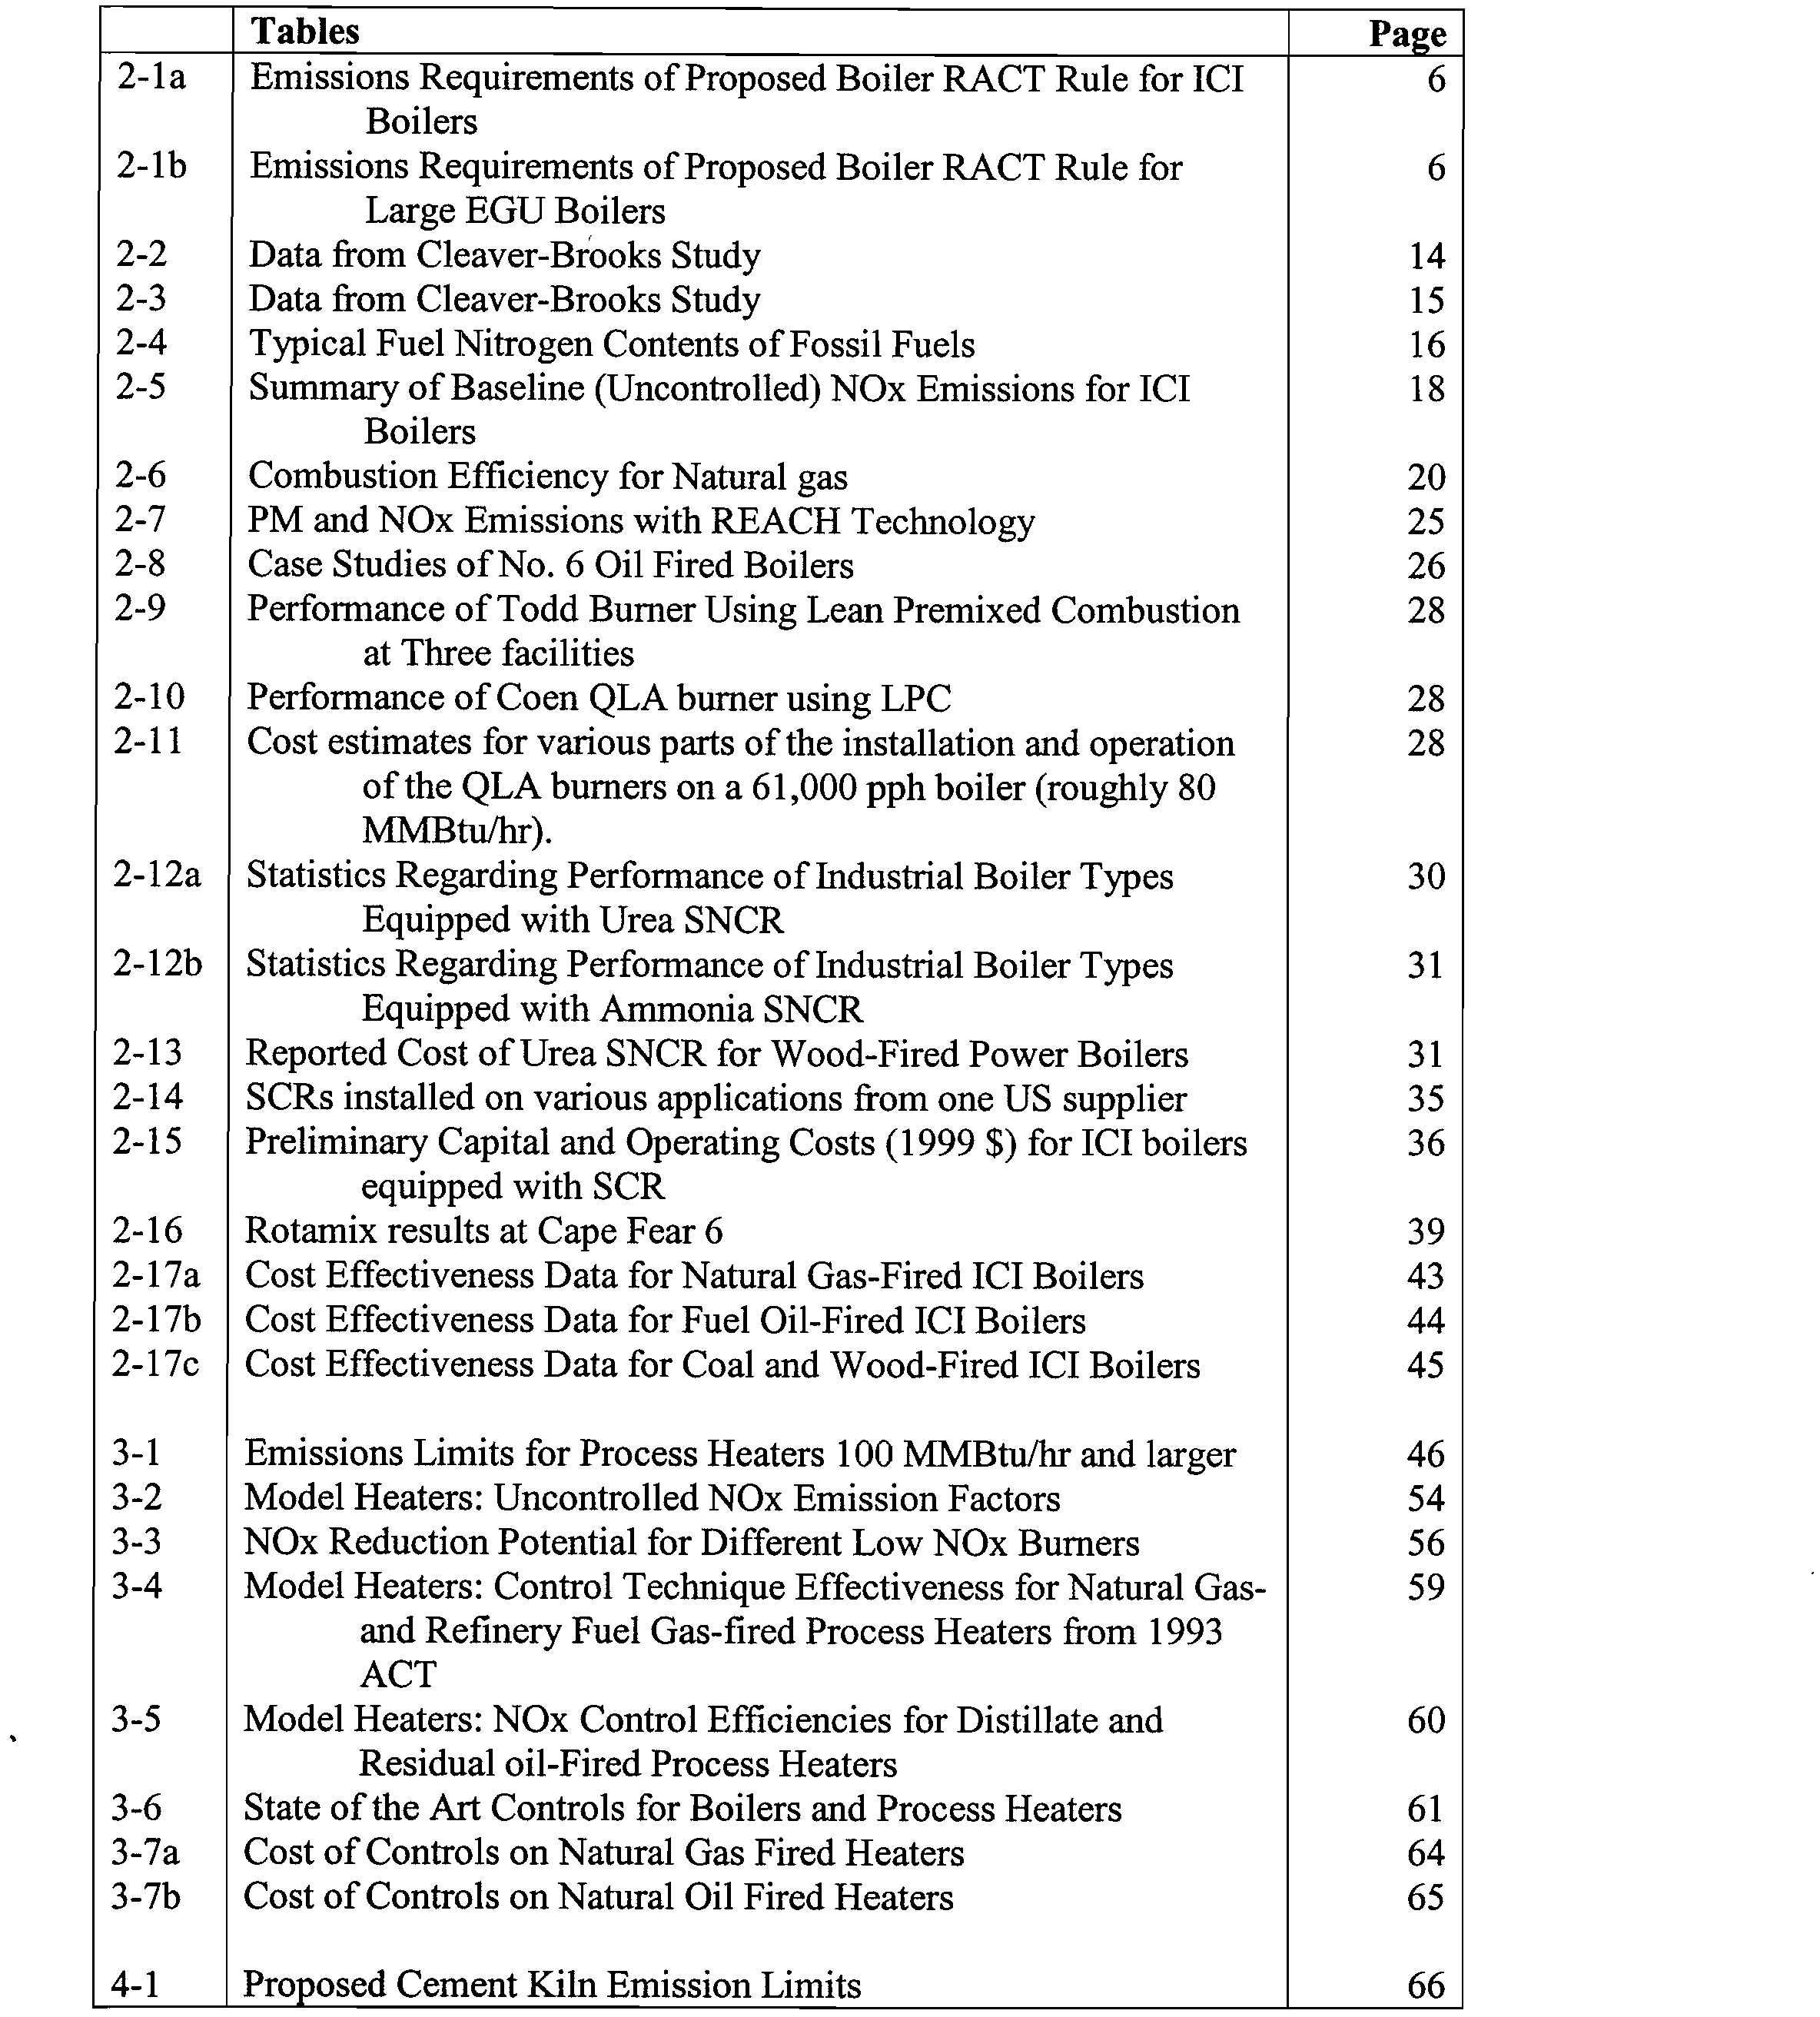
Tables
Page
2-la
Emissions Requirements of Proposed Boiler RACT Rule for ICI
6
Boilers
2-lb
Emissions Requirements of Proposed Boiler RACT Rule for
6
Large EGU Boilers
2-2
Data from Cleaver-Brooks Study
14
2-3
Data from Cleaver-Brooks Study
15
2-4
Typical Fuel Nitrogen Contents of Fossil Fuels
16
2-5
Summary of Baseline (Uncontrolled) NOx Emissions for ICI
18
Boilers
2-6
Combustion Efficiency for Natural gas
20
2-7
PM and NOx Emissions with REACH Technology
25
2-8
Case Studies of No. 6 Oil Fired Boilers
26
2-9
Performance of Todd Burner Using Lean Premixed Combustion
at Three facilities
28
2-10
Performance of Coen QLA burner using LPC
28
2-11
Cost estimates for various parts of the installation and operation
of the QLA burners on a 61,000 pph boiler (roughly 80
28
MMBtu/hr).
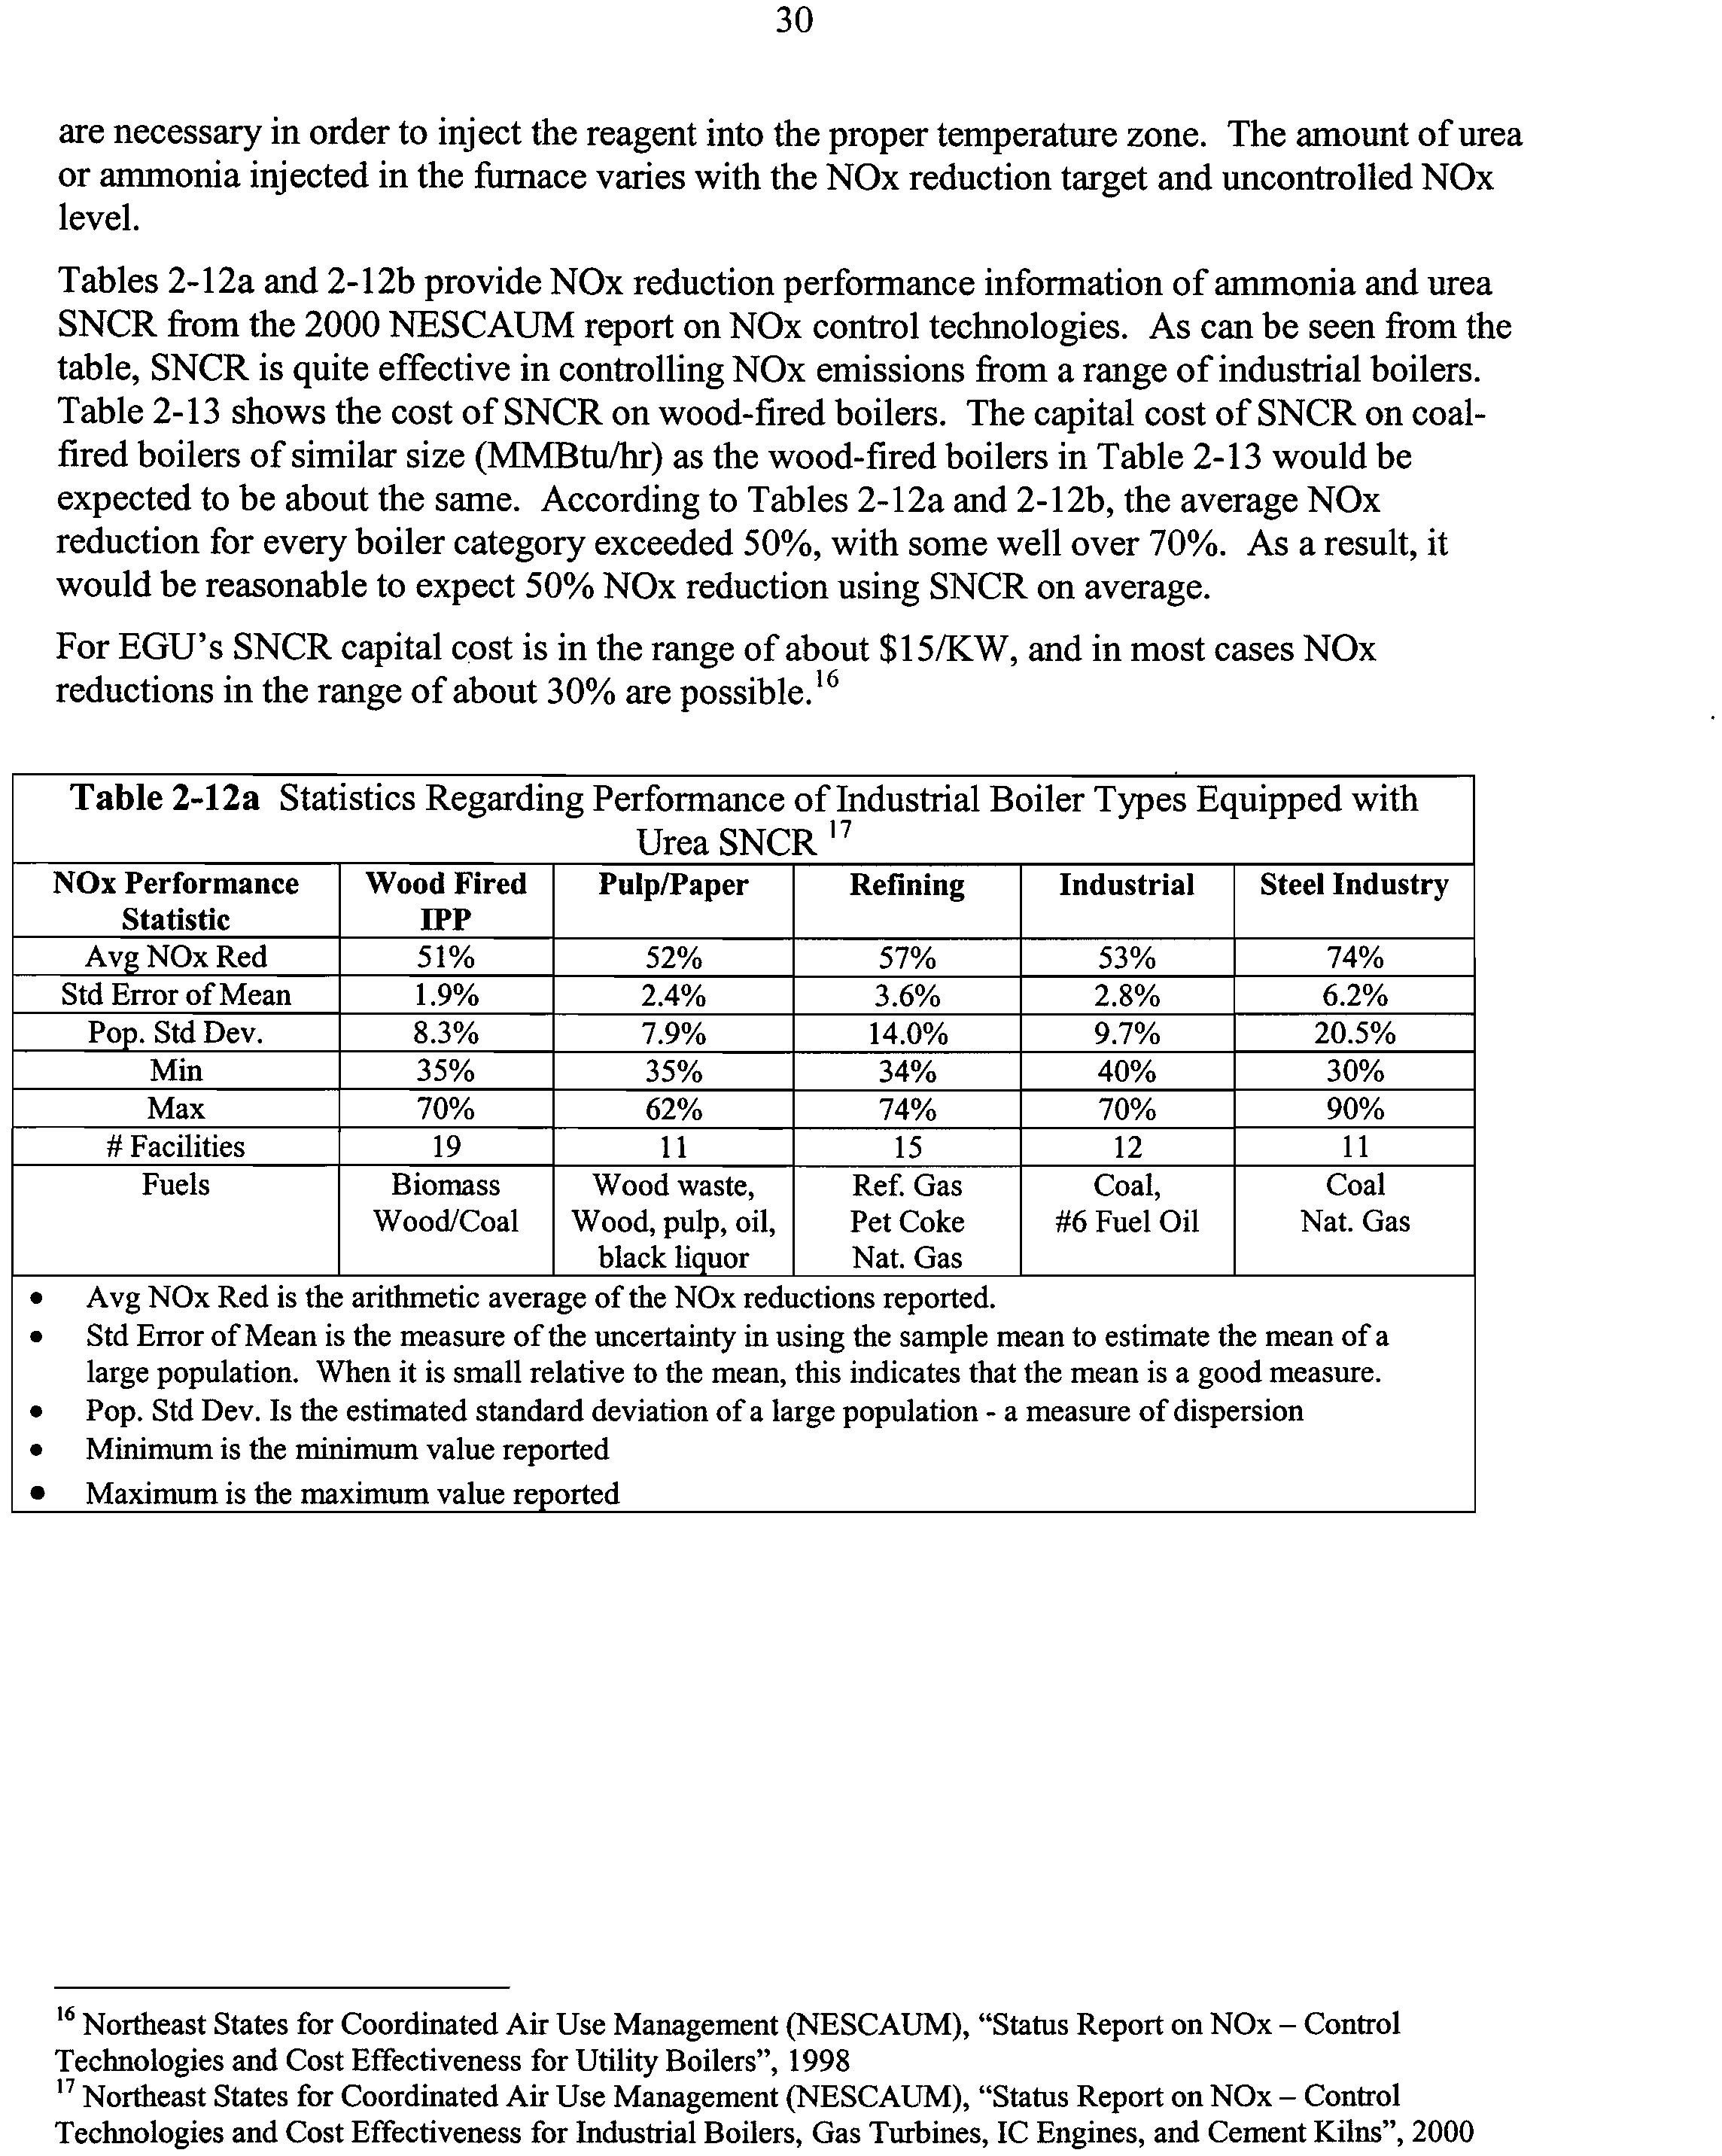
2-12a
Statistics Regarding Performance of Industrial Boiler Types
30
Equipped with Urea SNCR
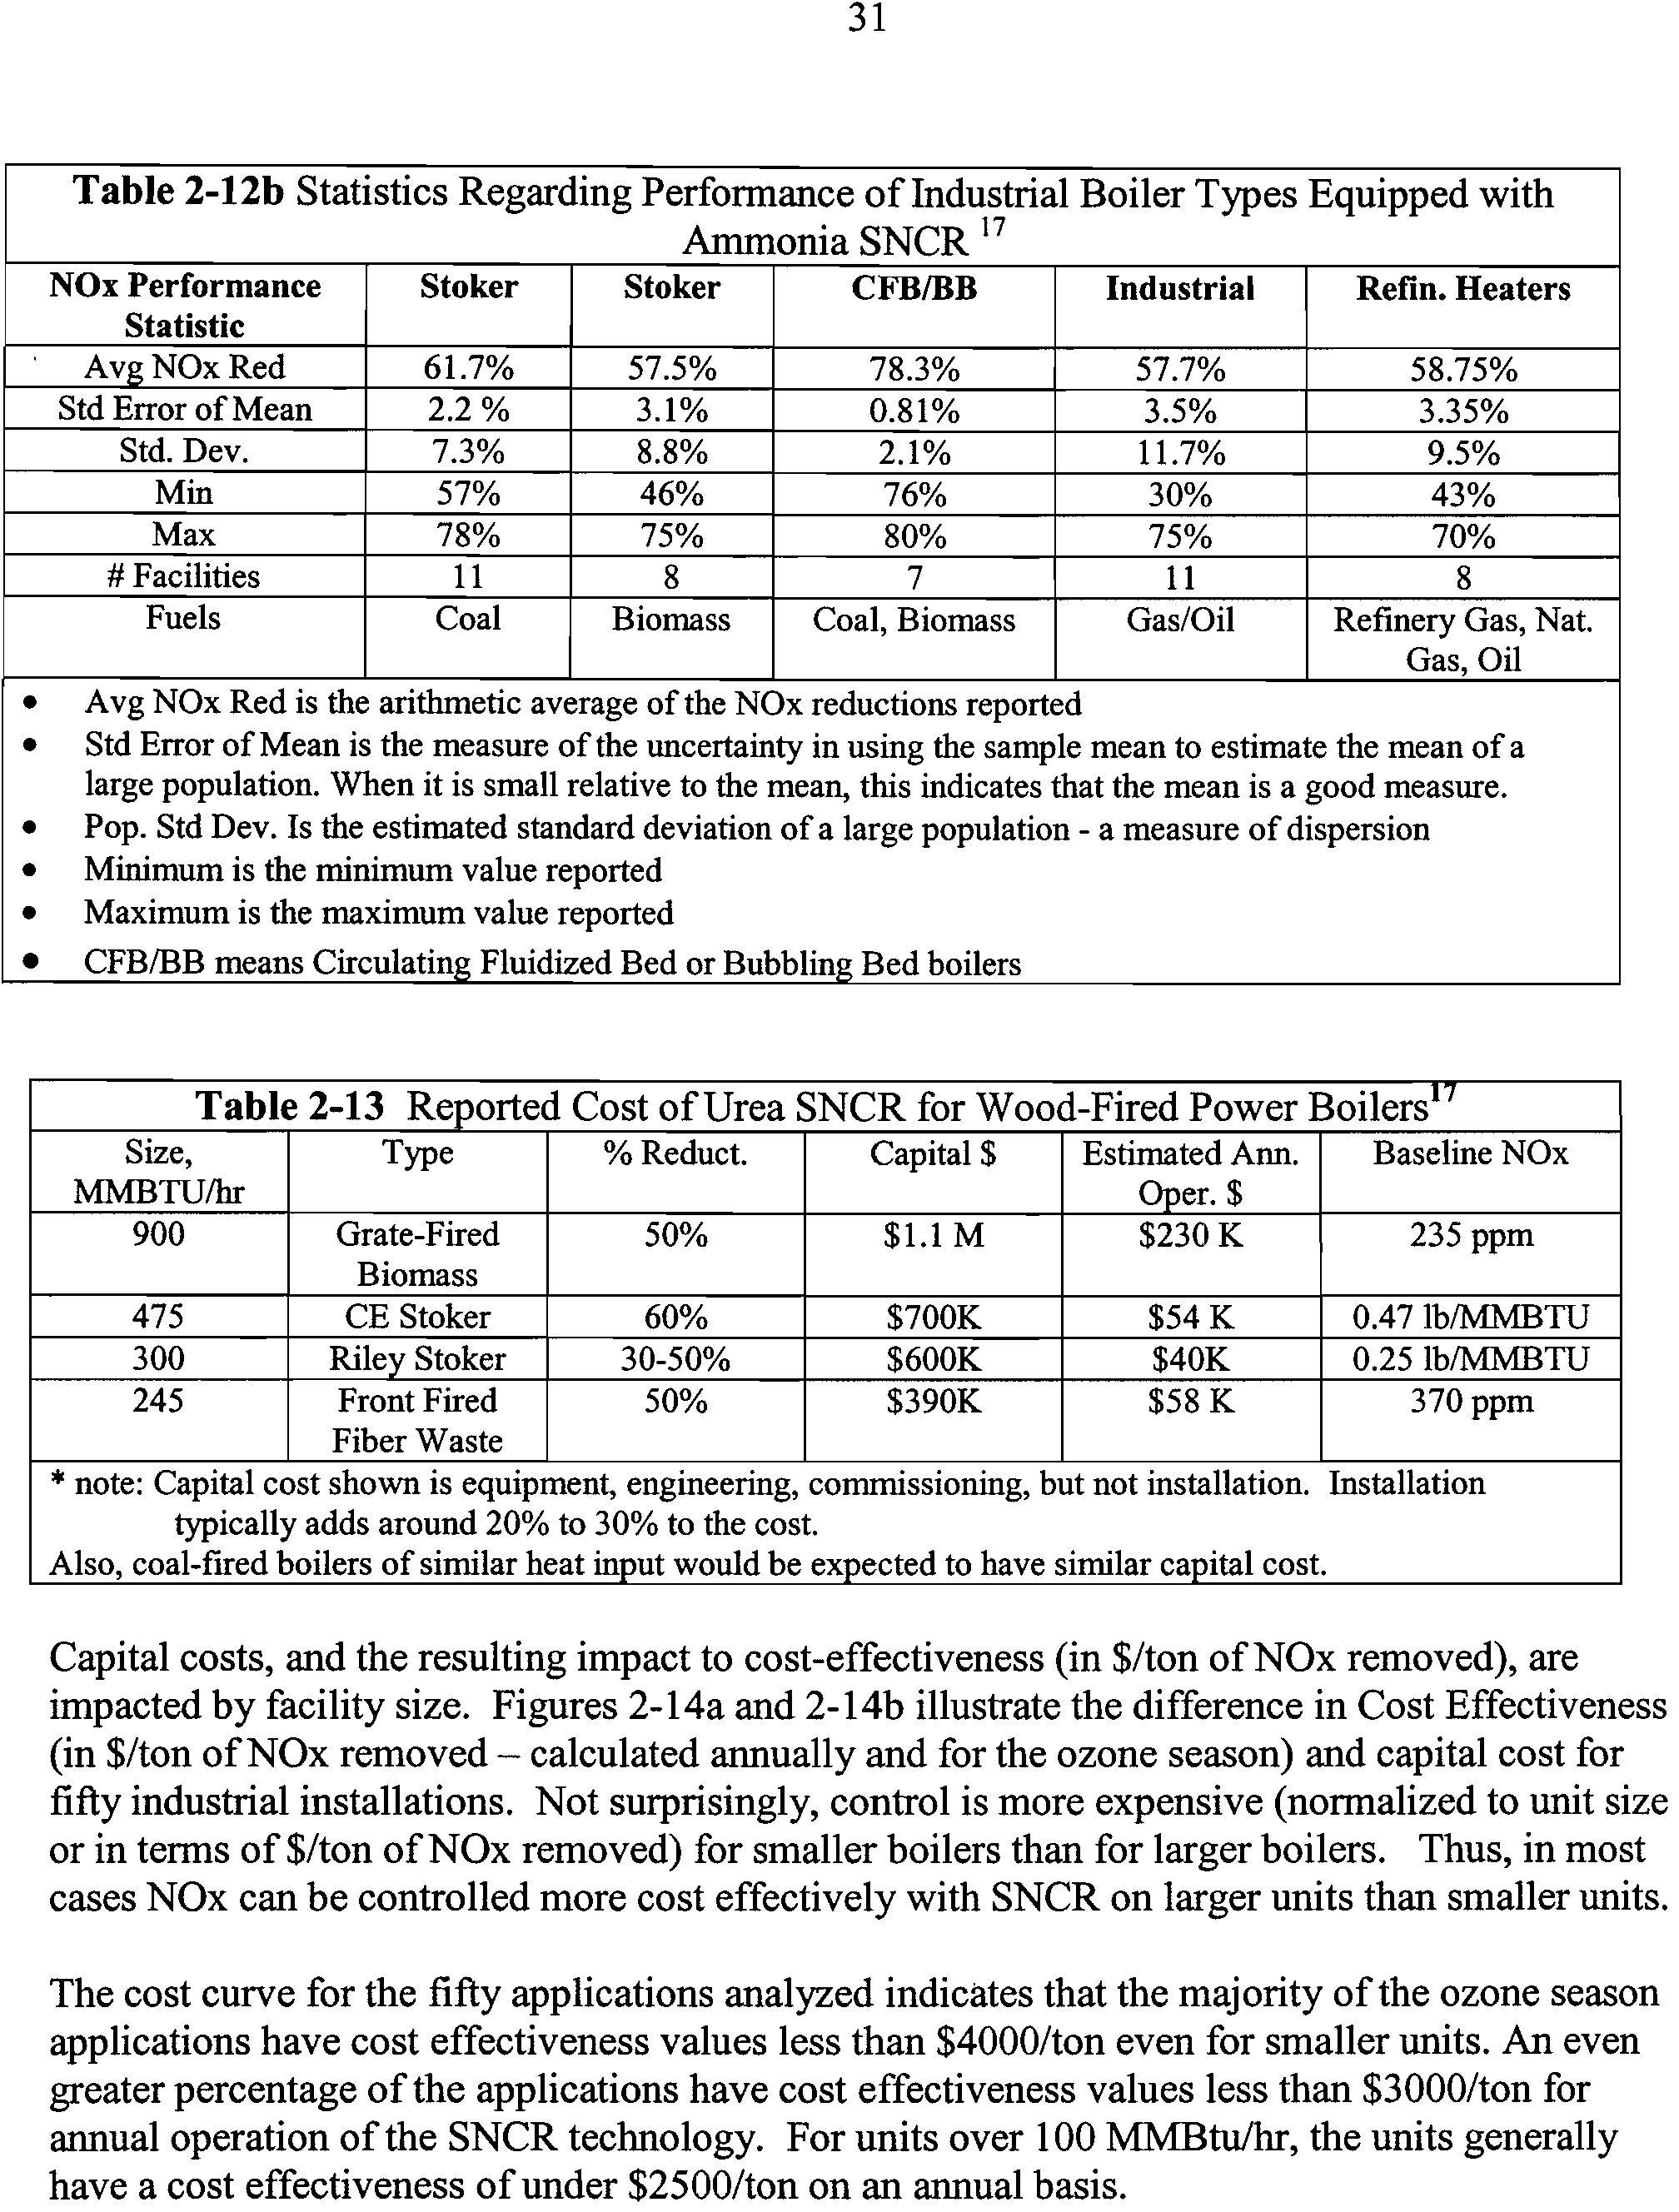
2-12b
Statistics Regarding Performance of Industrial Boiler Types
31
Equipped with Ammonia SNCR
2-13
Reported Cost of Urea SNCR for Wood-Fired Power Boilers
31
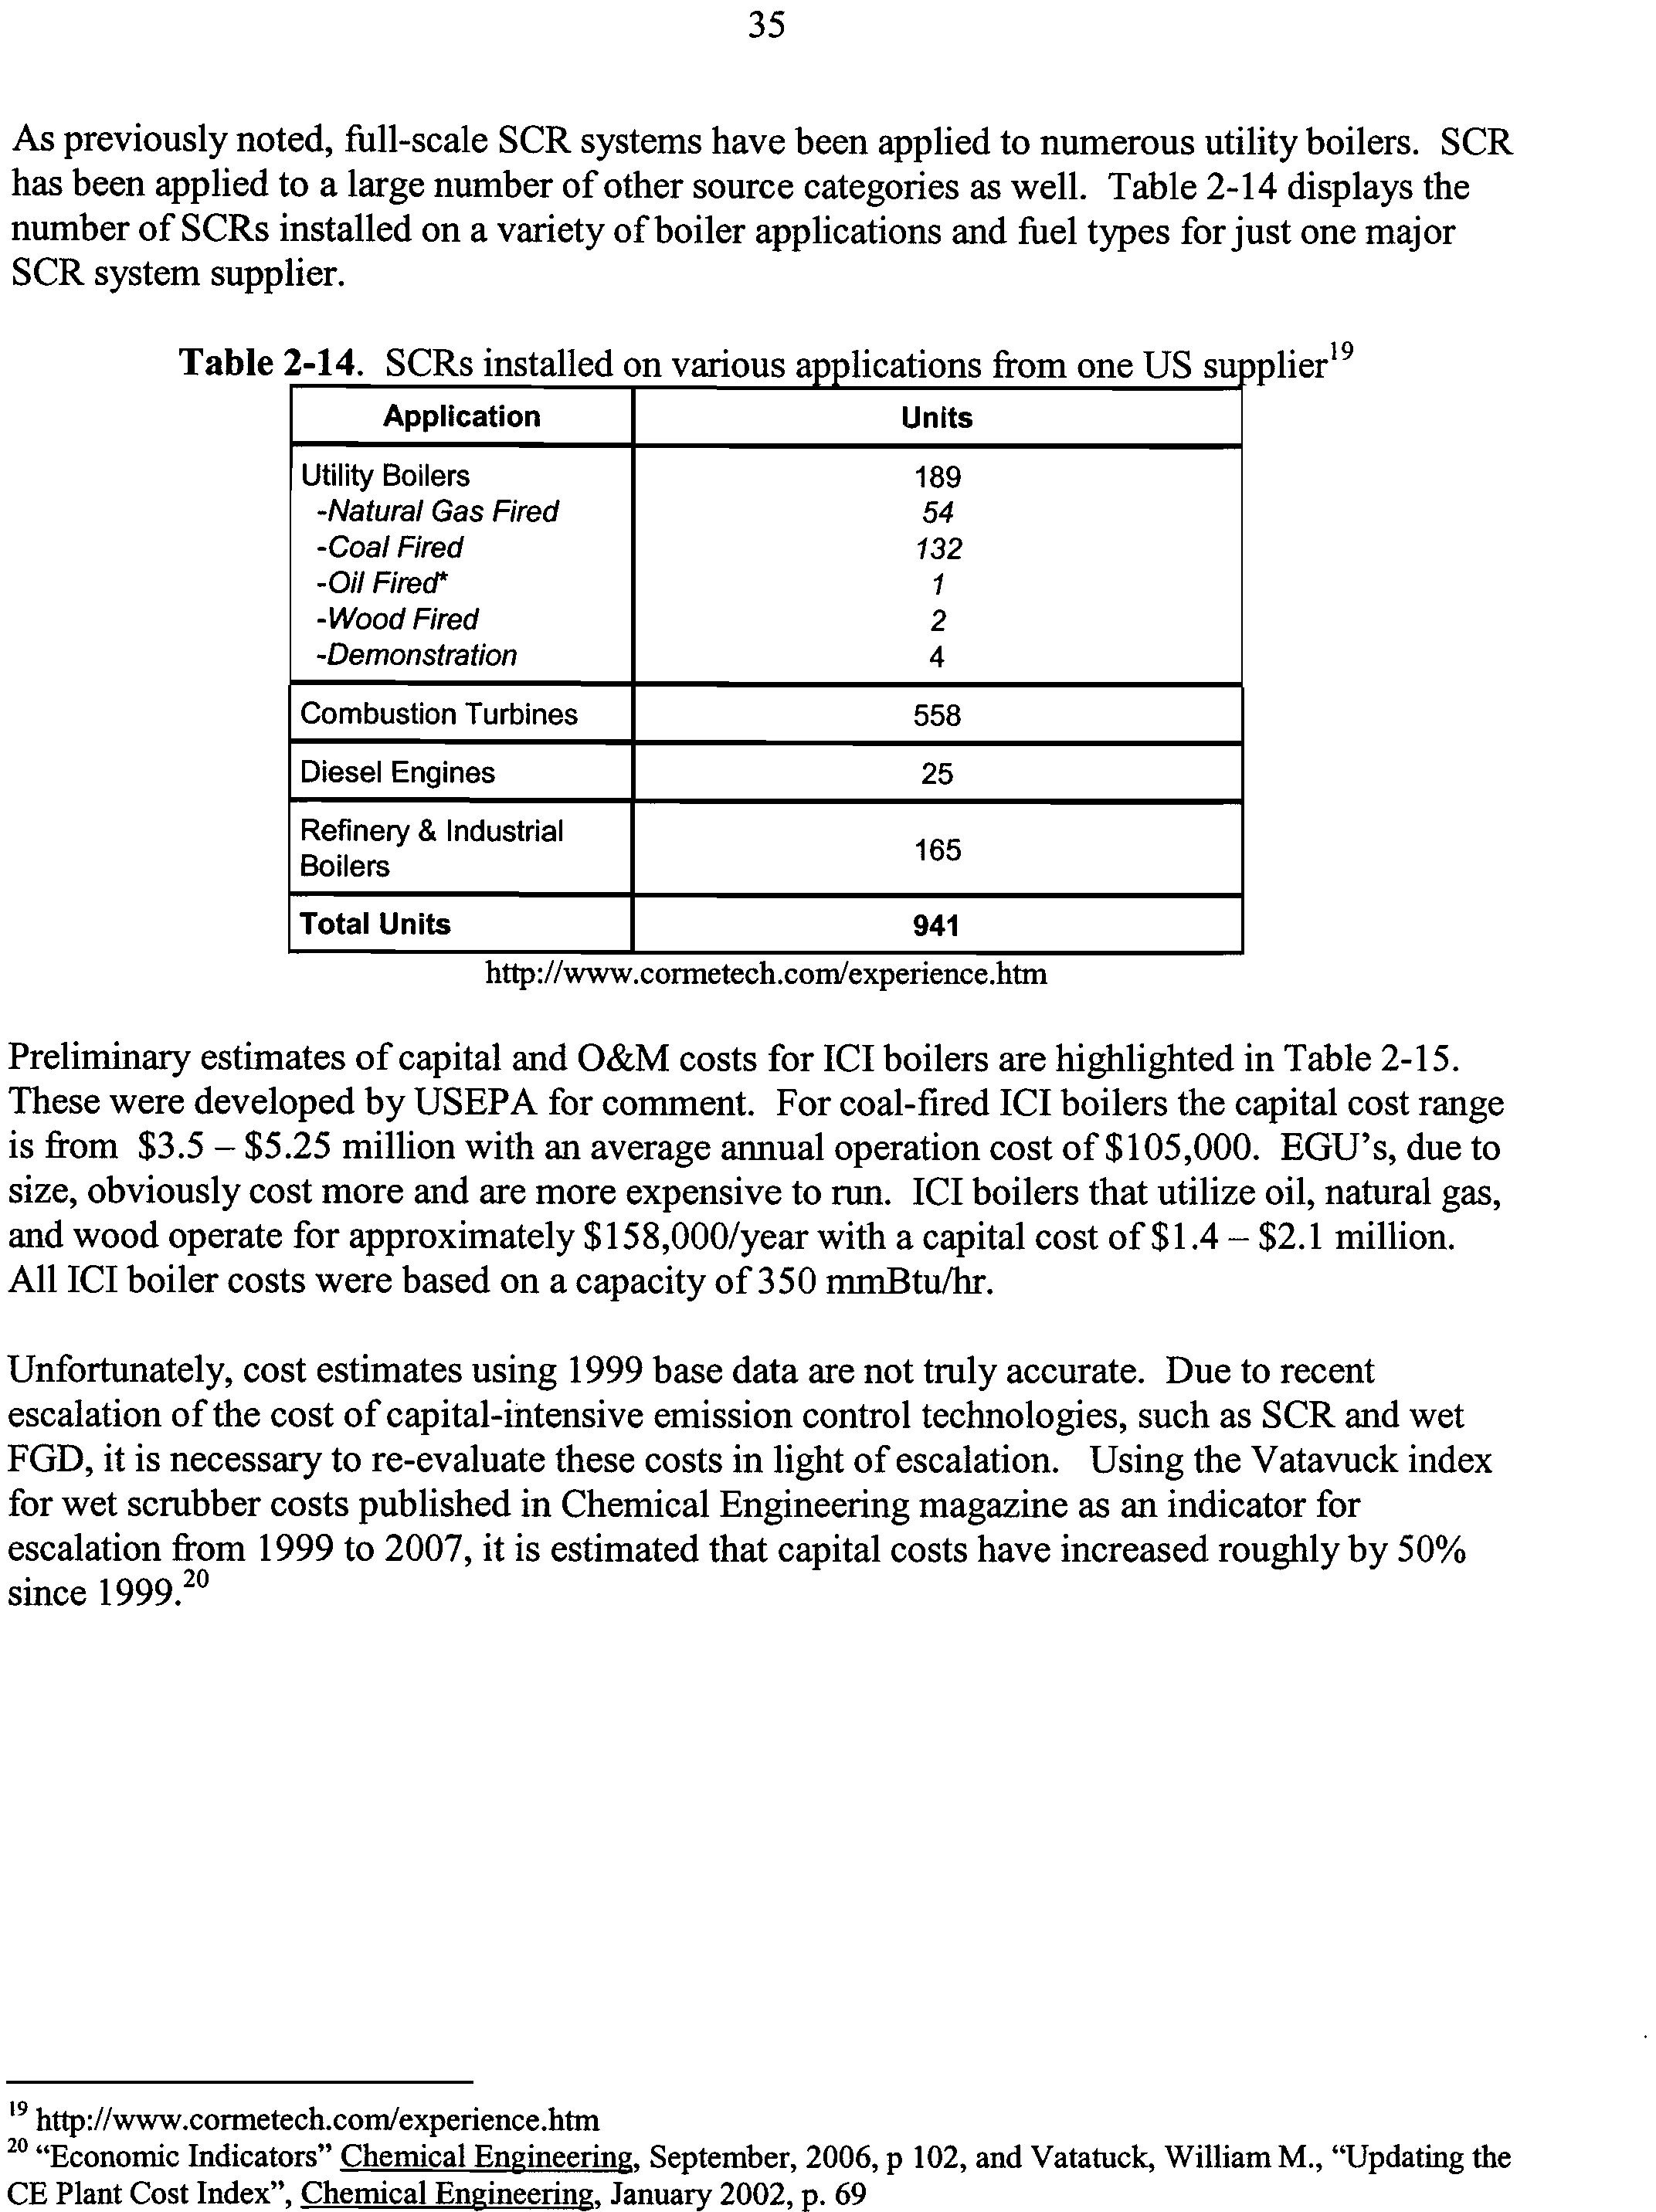
2-14
SCRs installed on various applications from one US supplier
35
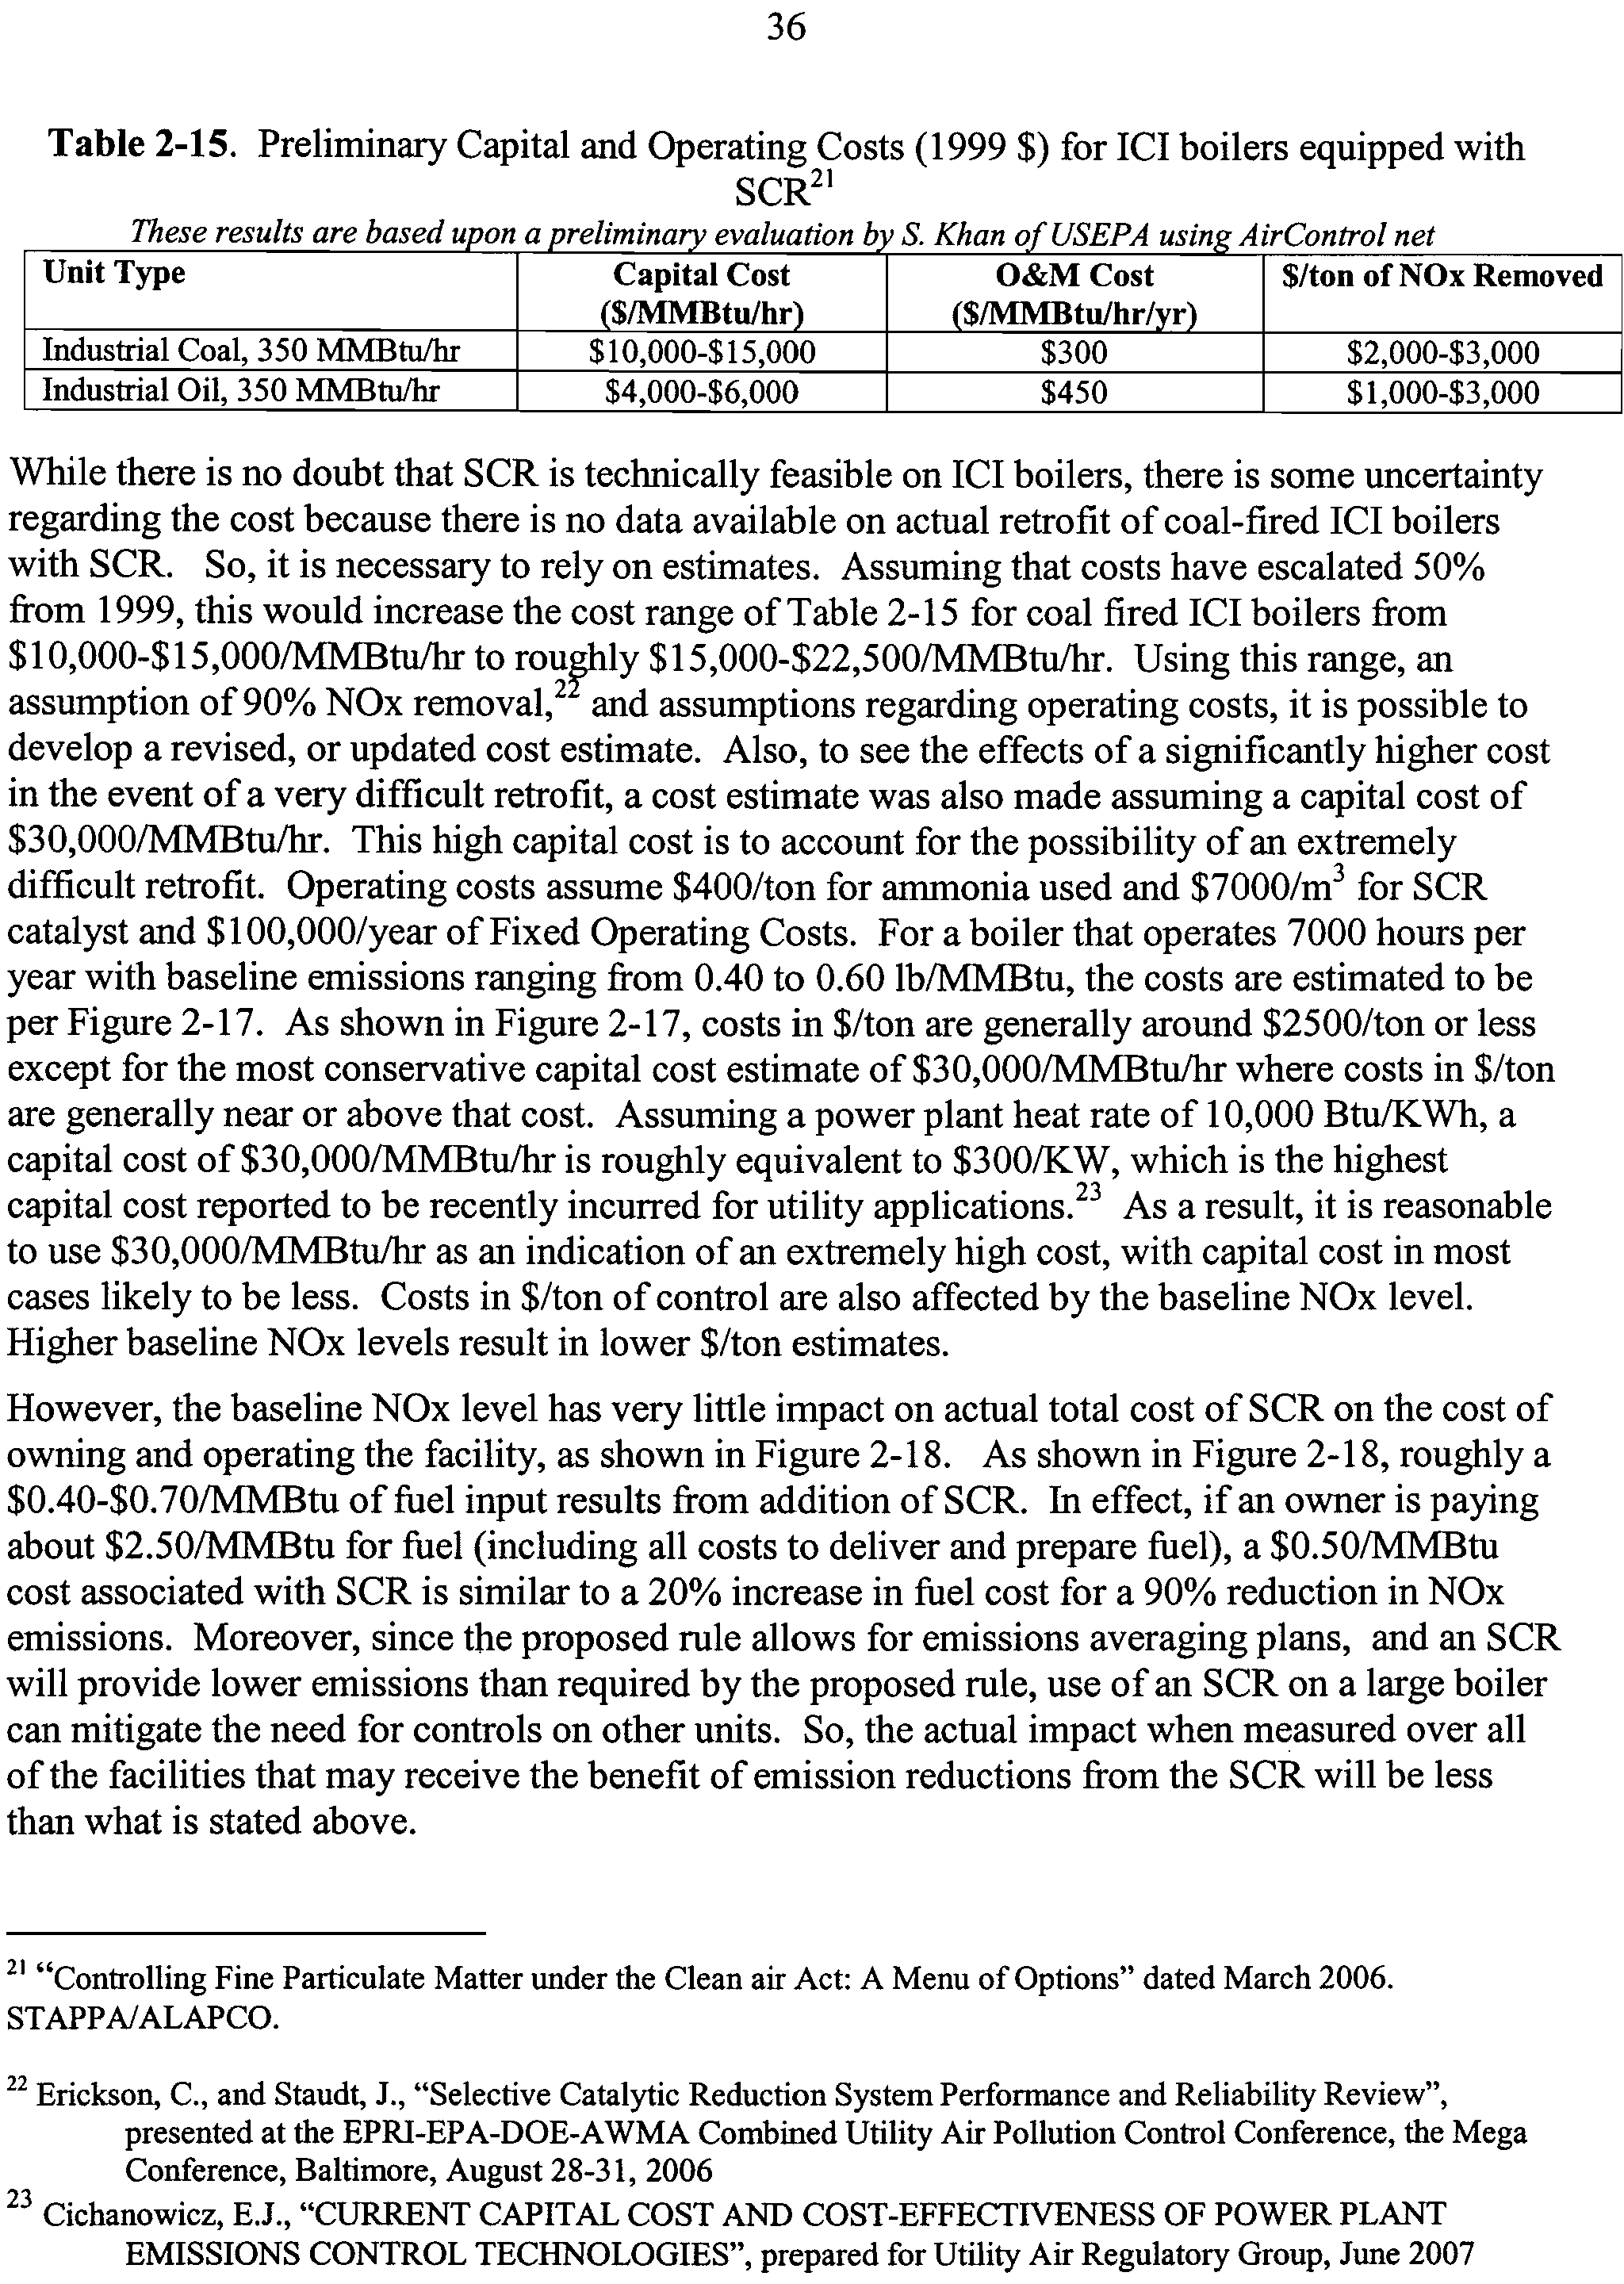
2-15
Preliminary Capital and Operating Costs (1999 $) for ICI boilers
equipped with SCR
36
2-16
Rotamix results at Cape Fear 6
39
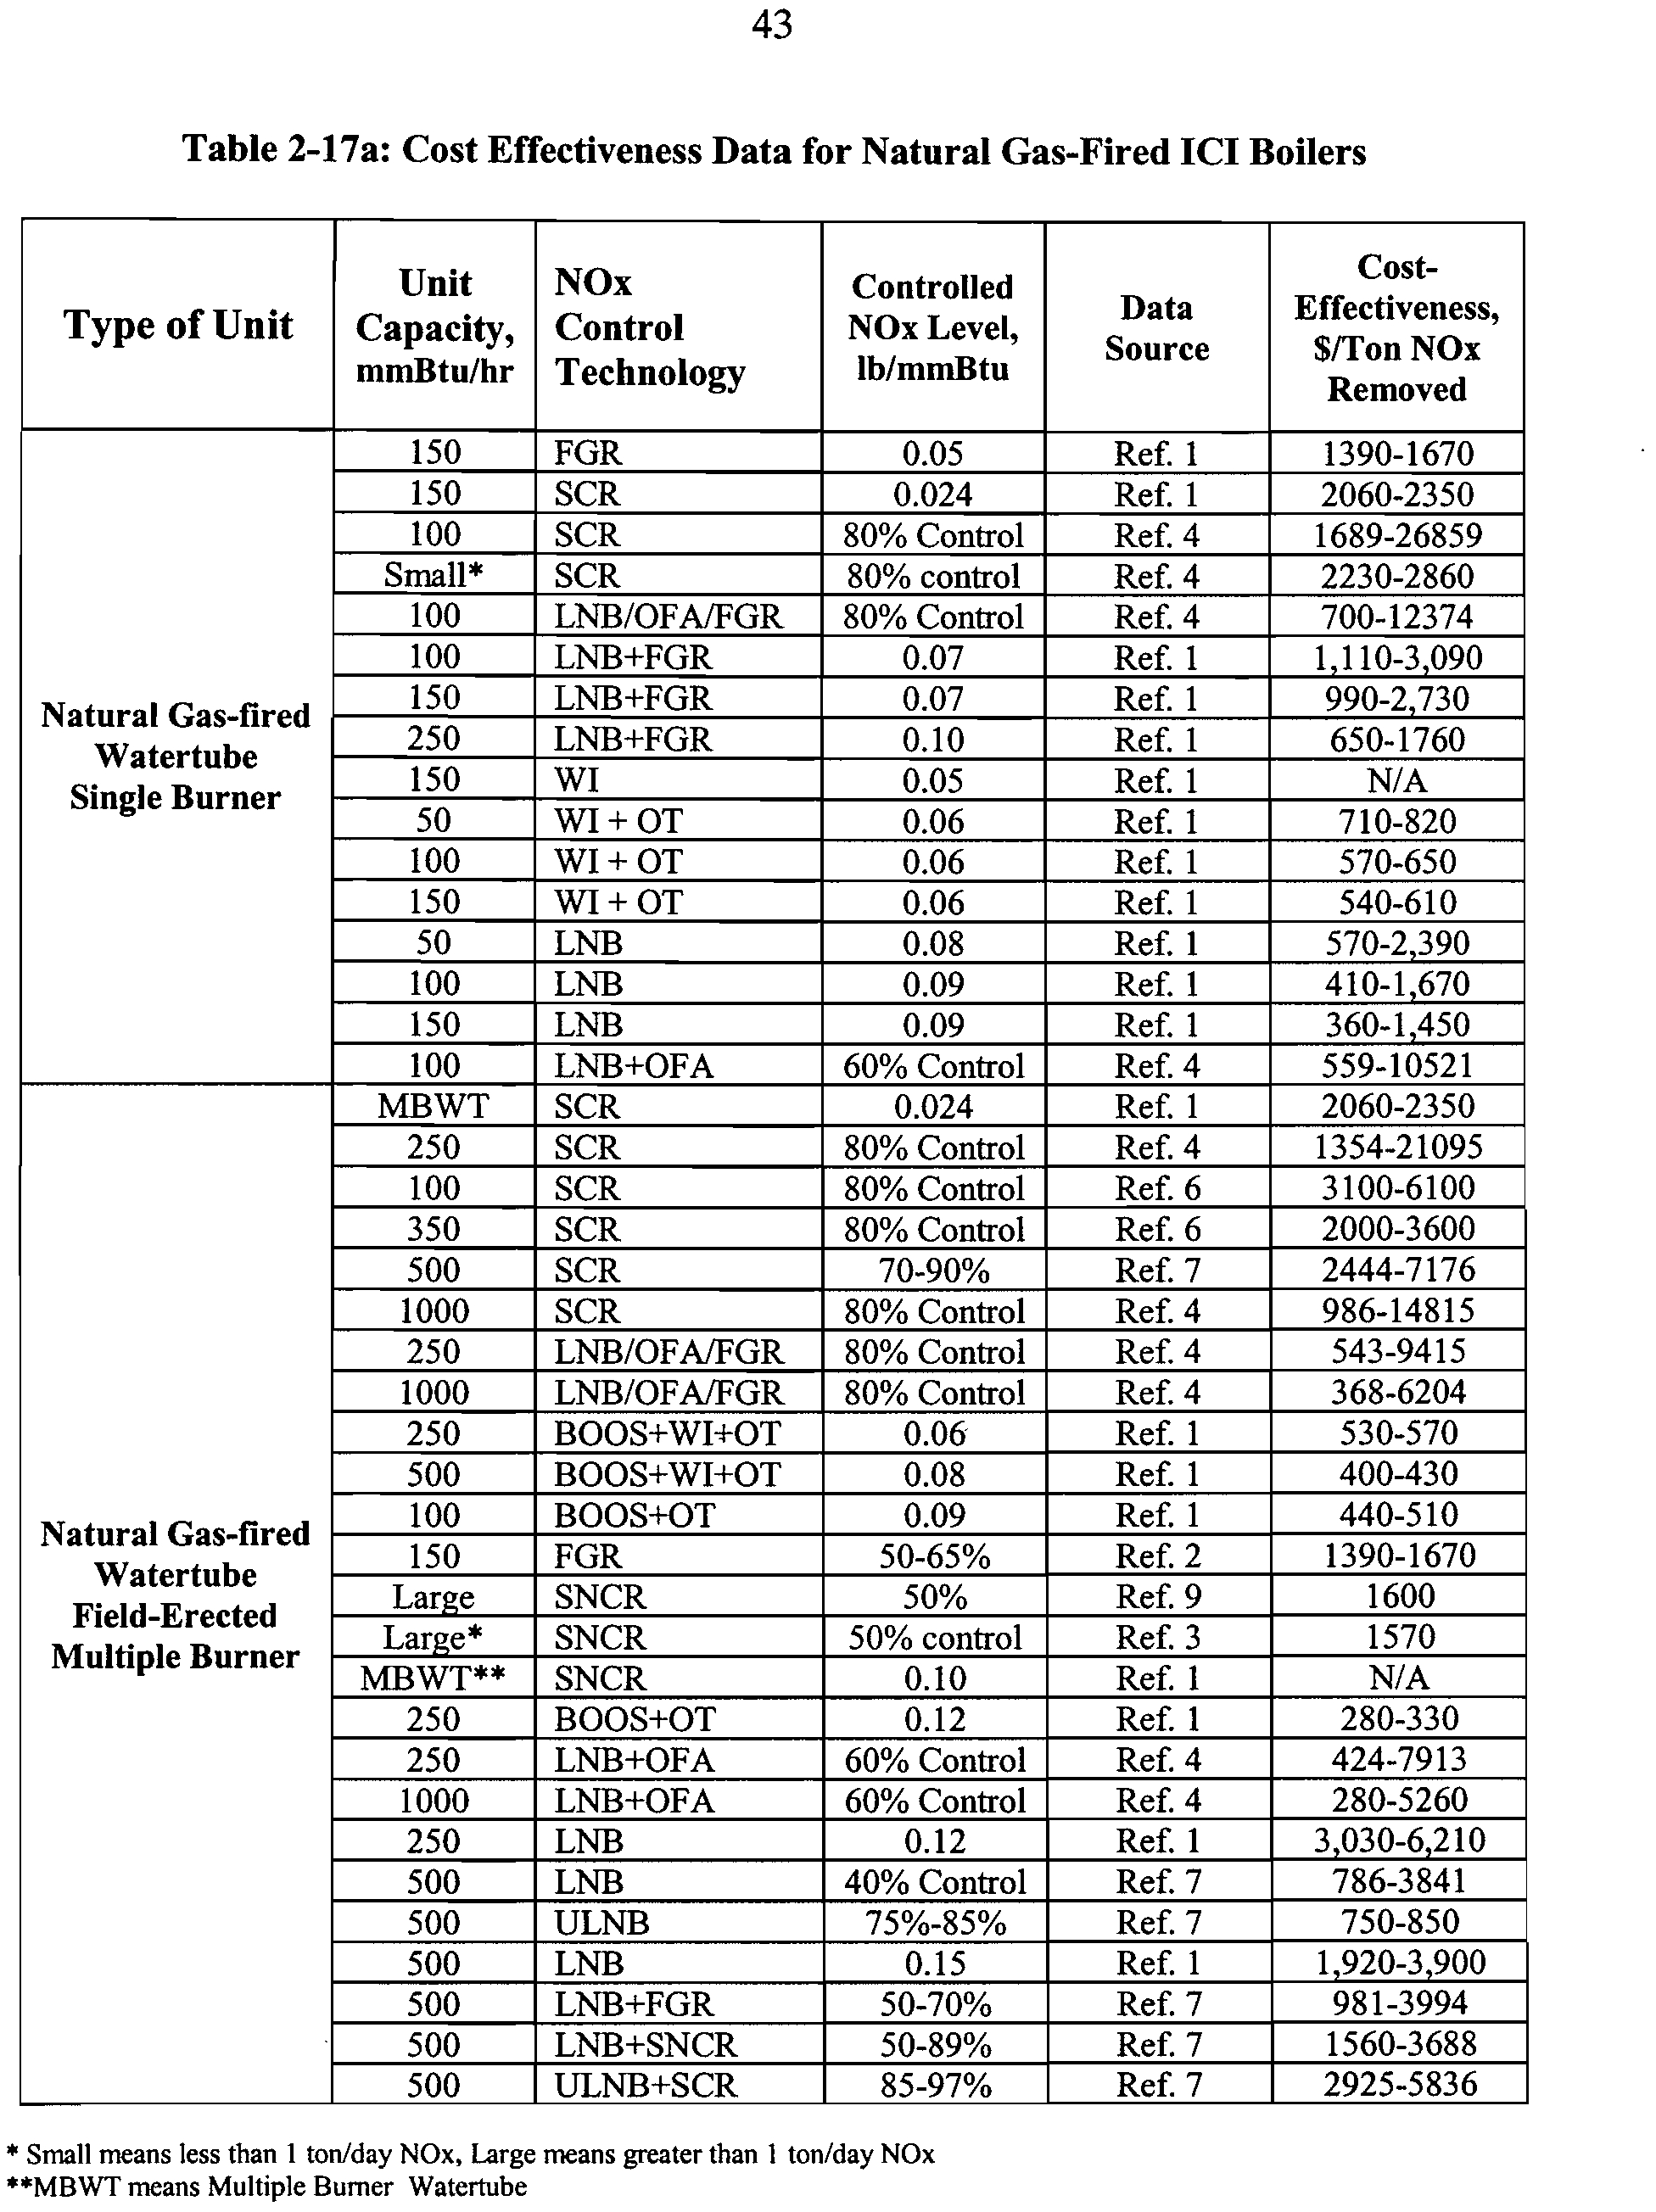
2-17a
Cost Effectiveness Data for Natural Gas-Fired ICI Boilers
43
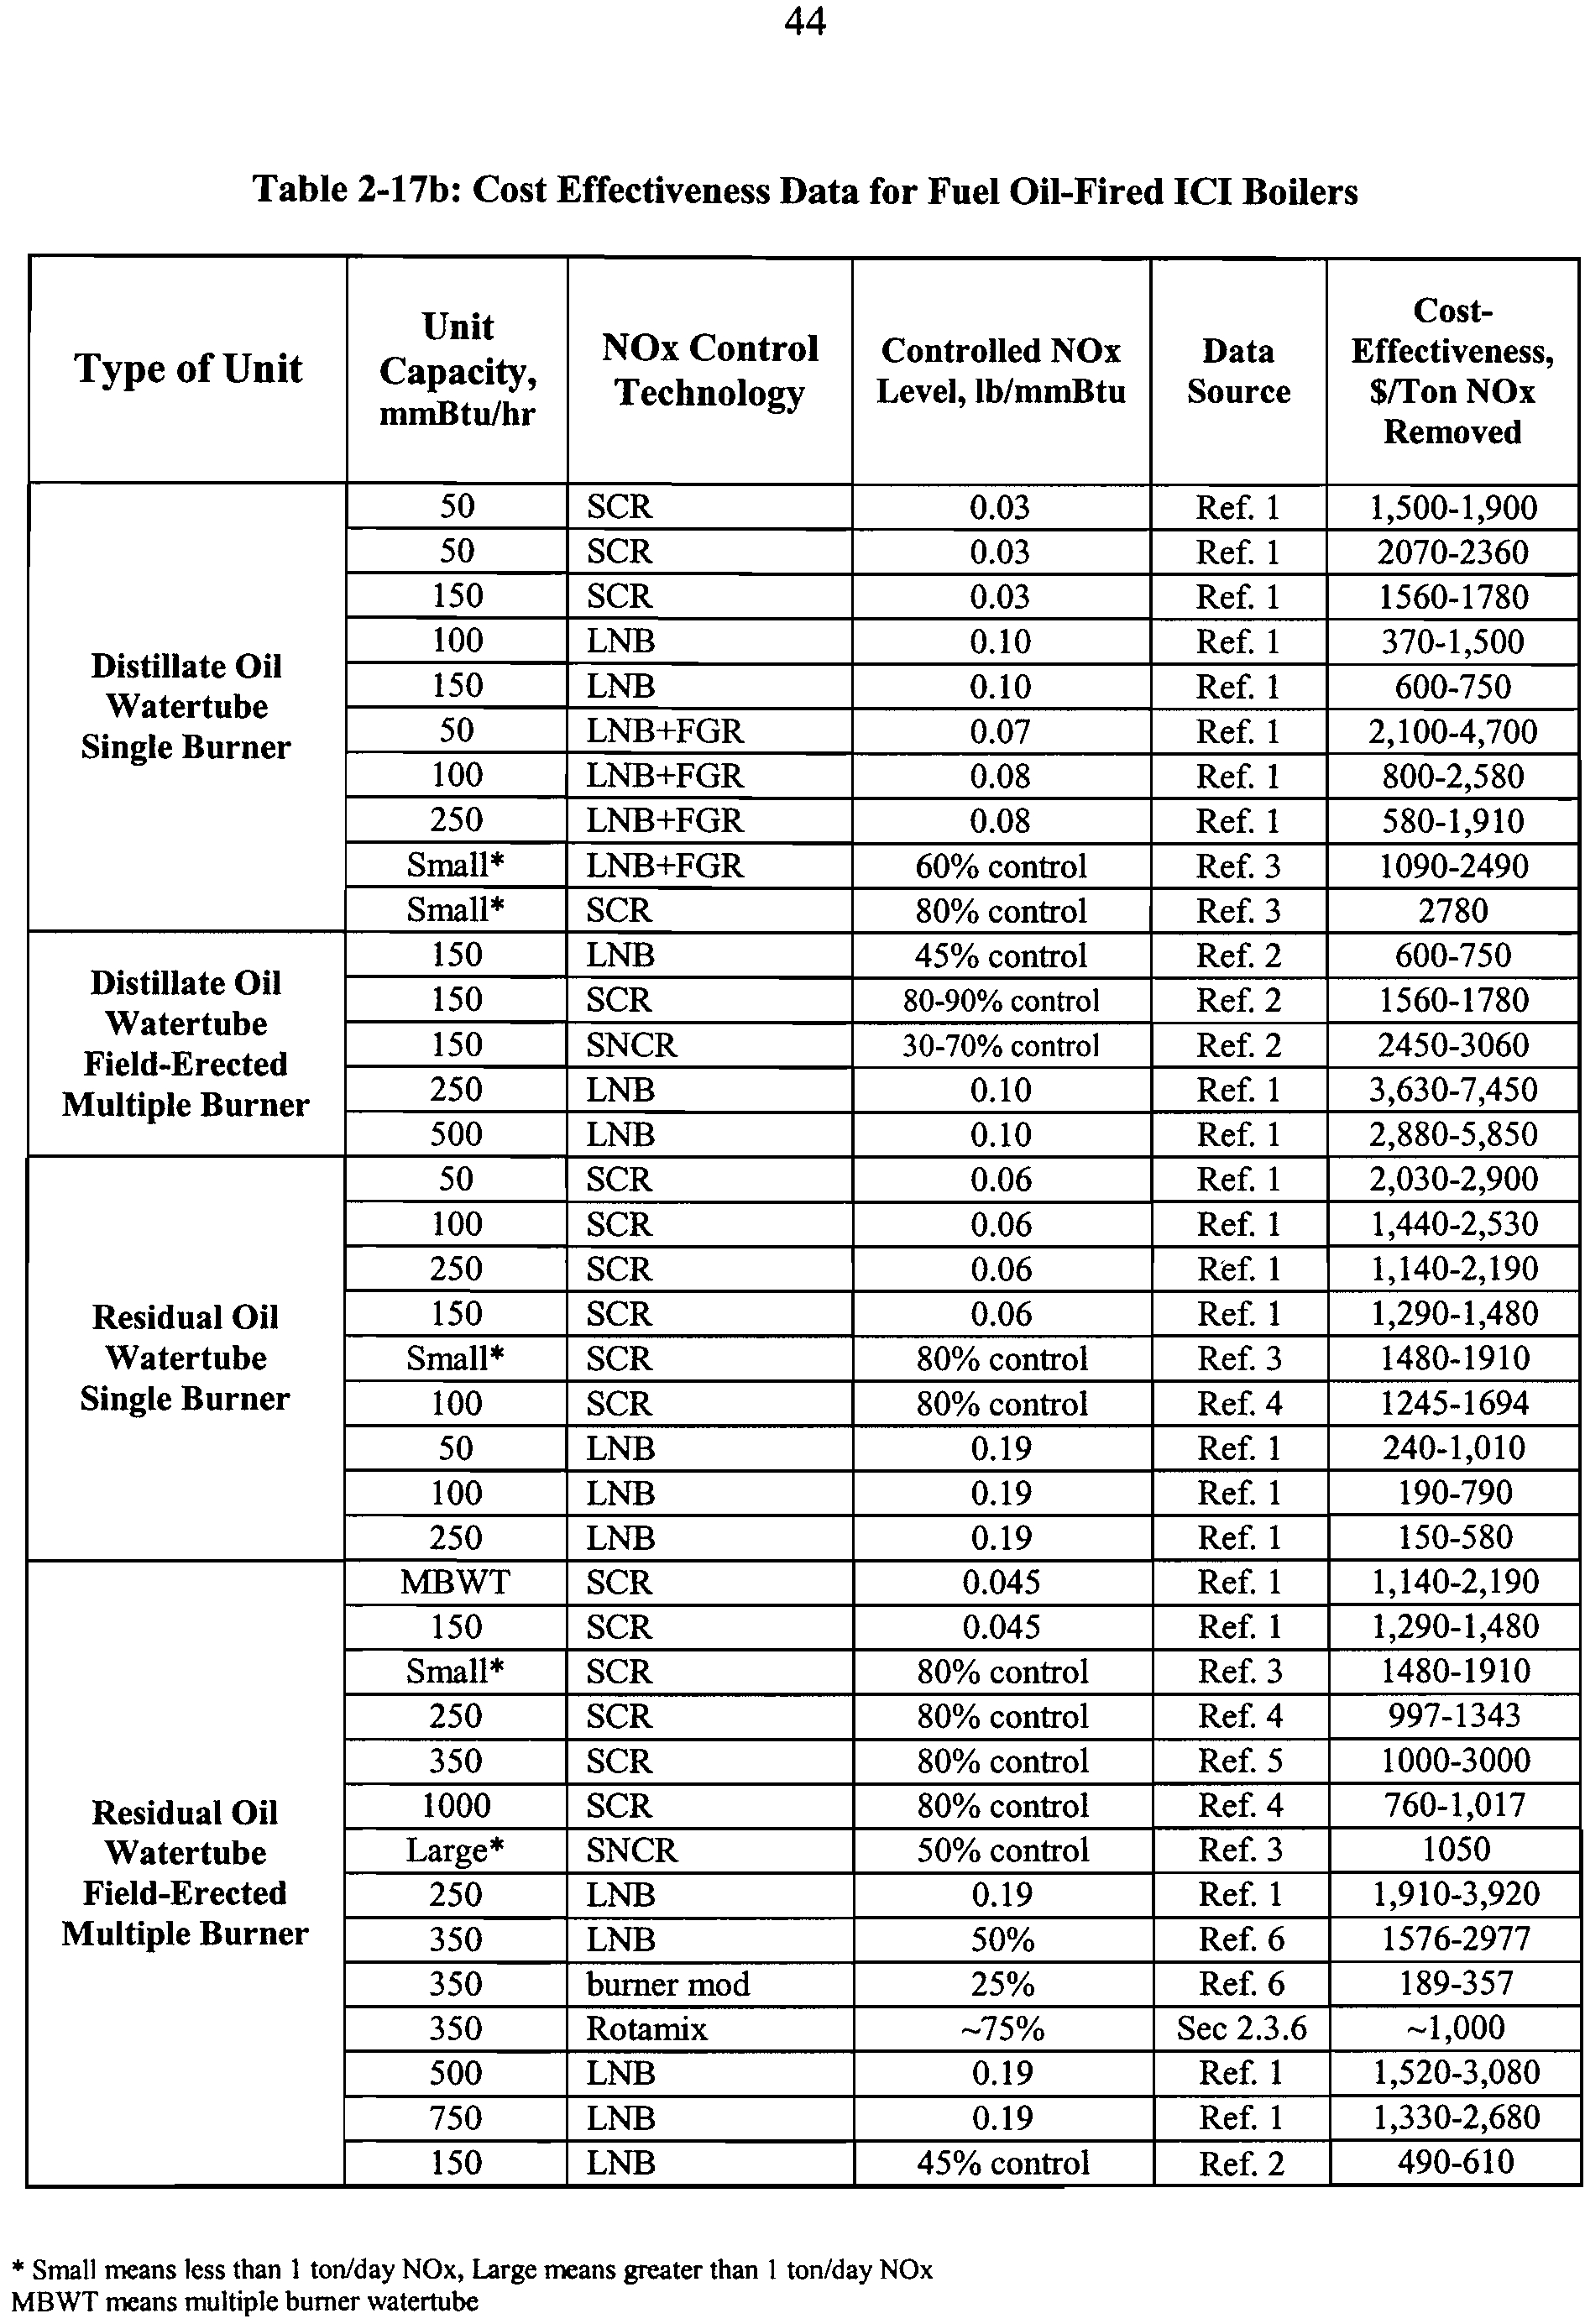
2-17b
Cost Effectiveness Data for Fuel Oil-Fired ICI Boilers
44
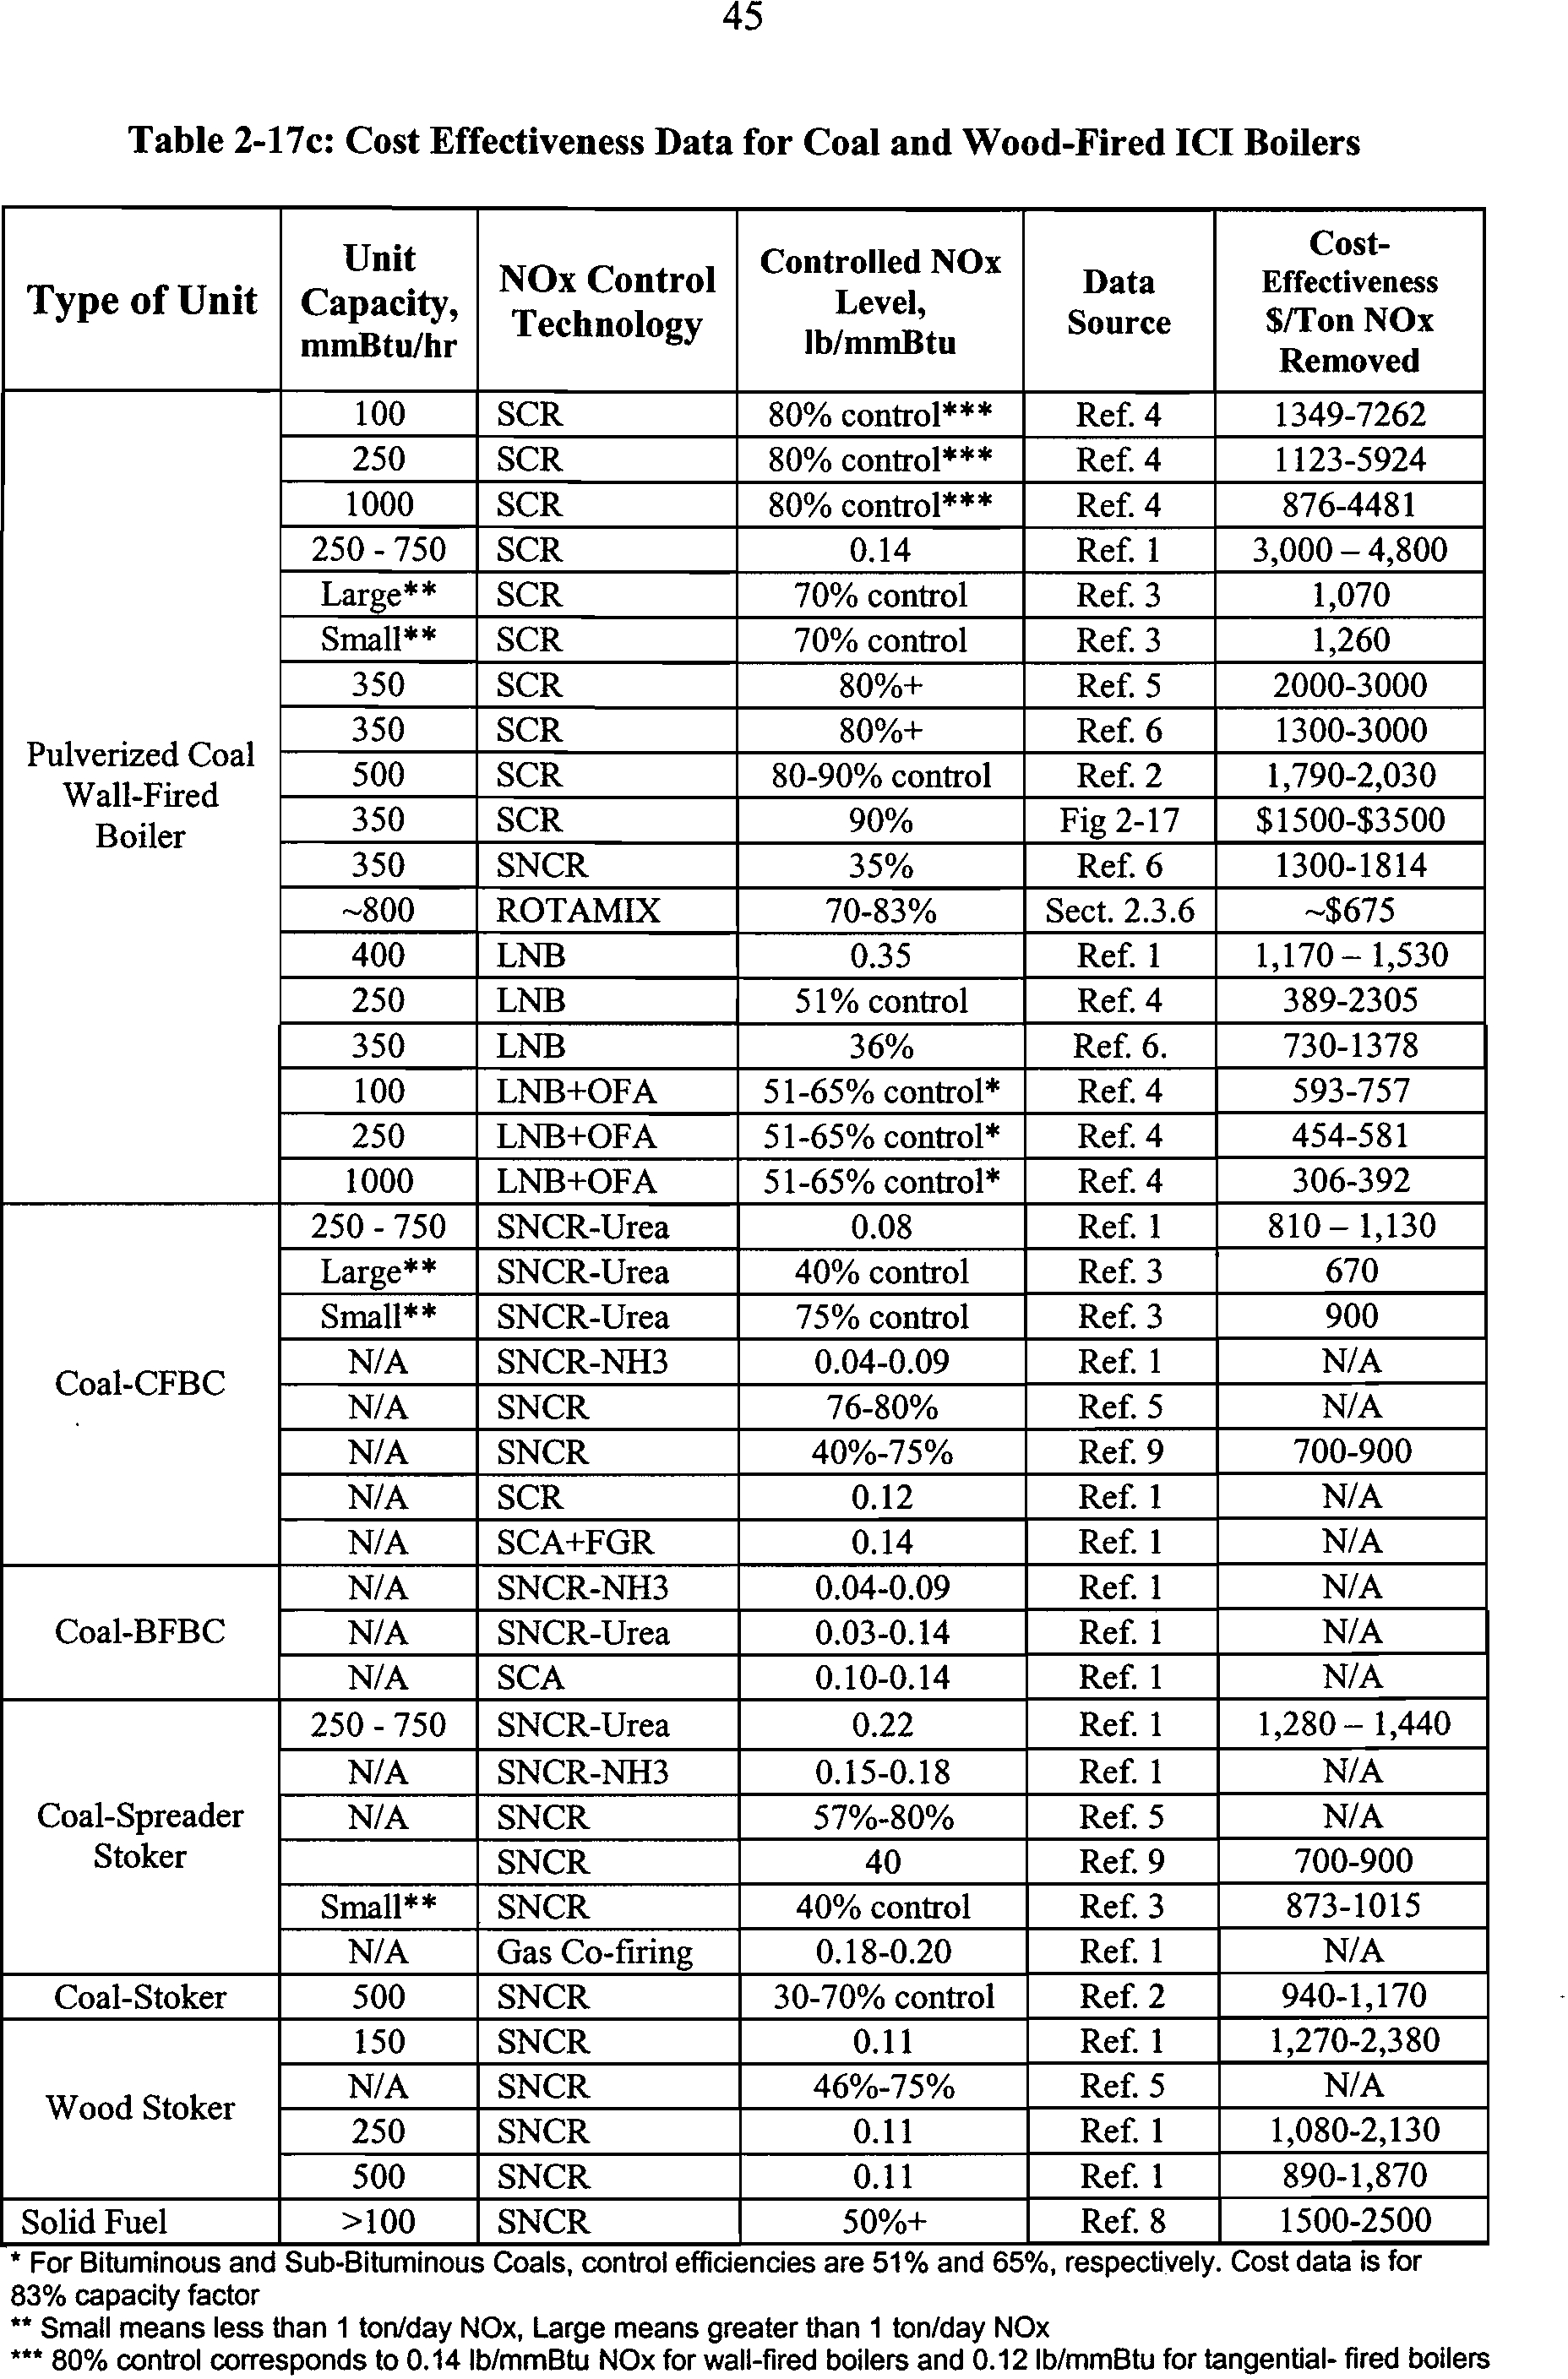
2-17c
Cost Effectiveness Data for Coal and Wood-Fired ICI Boilers
45
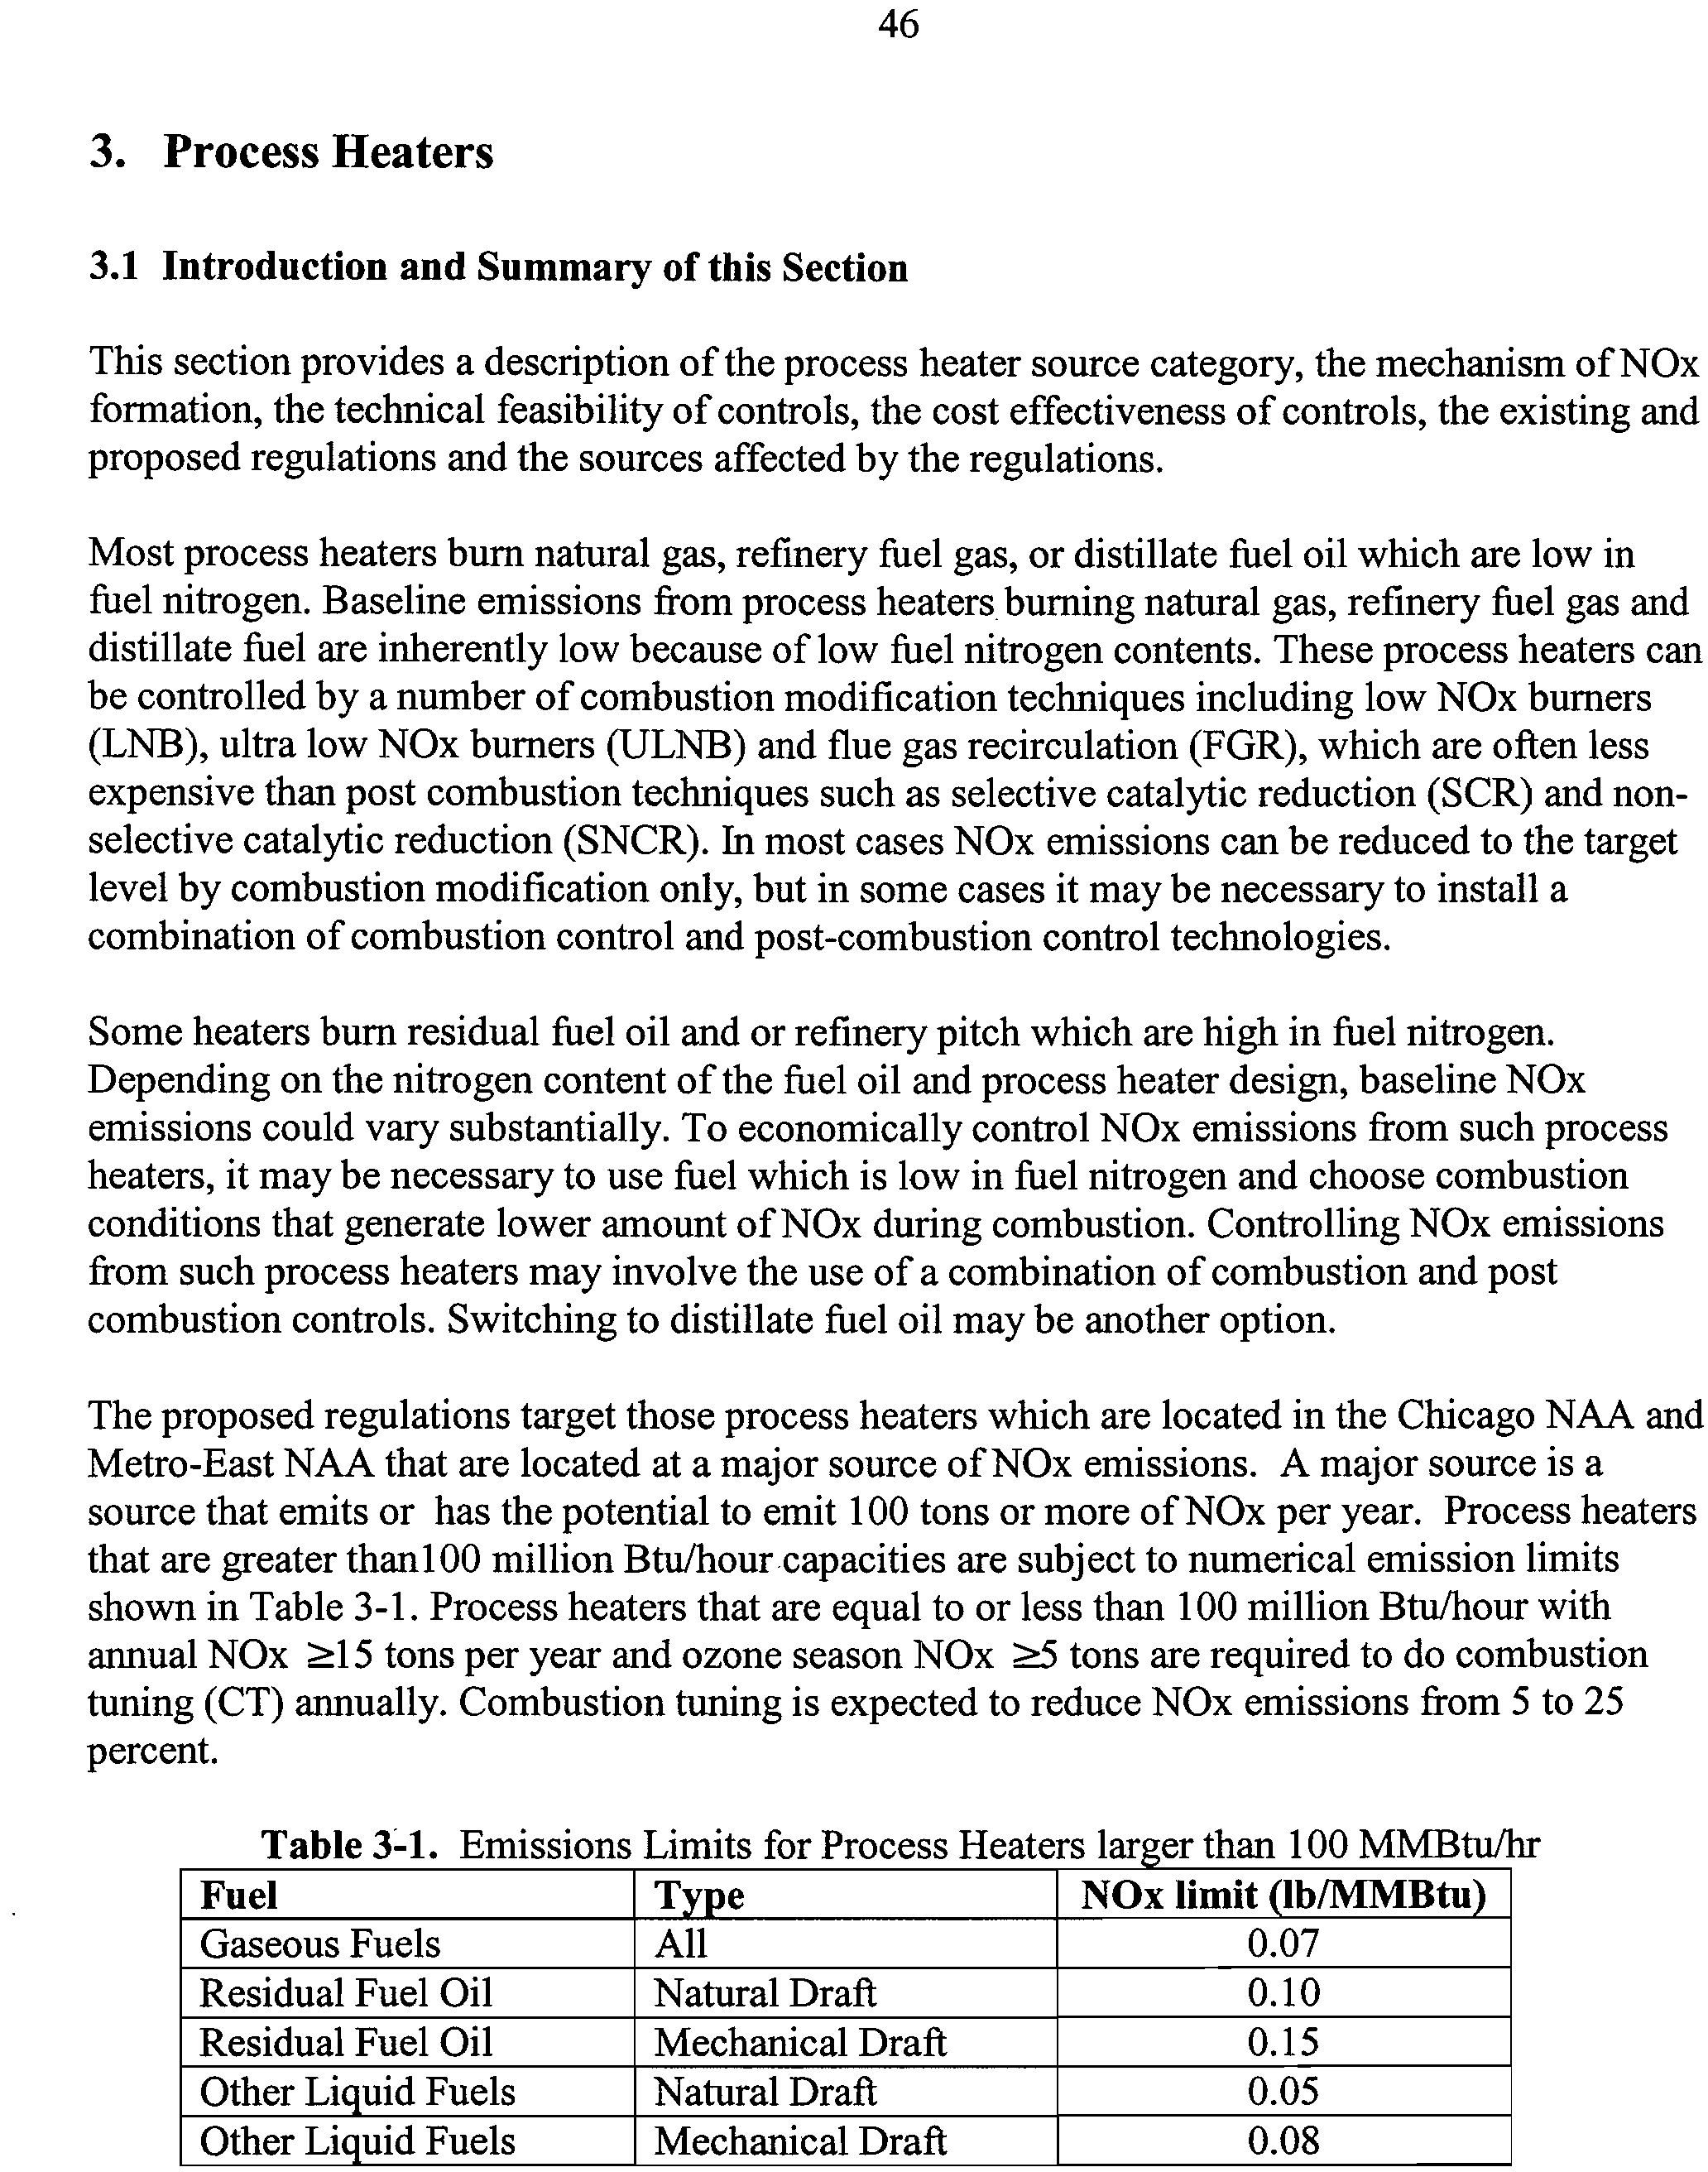
3-1
Emissions Limits for Process Heaters 100 MMBtu/hr and larger
46
3-2
Model Heaters: Uncontrolled NOx Emission Factors
54
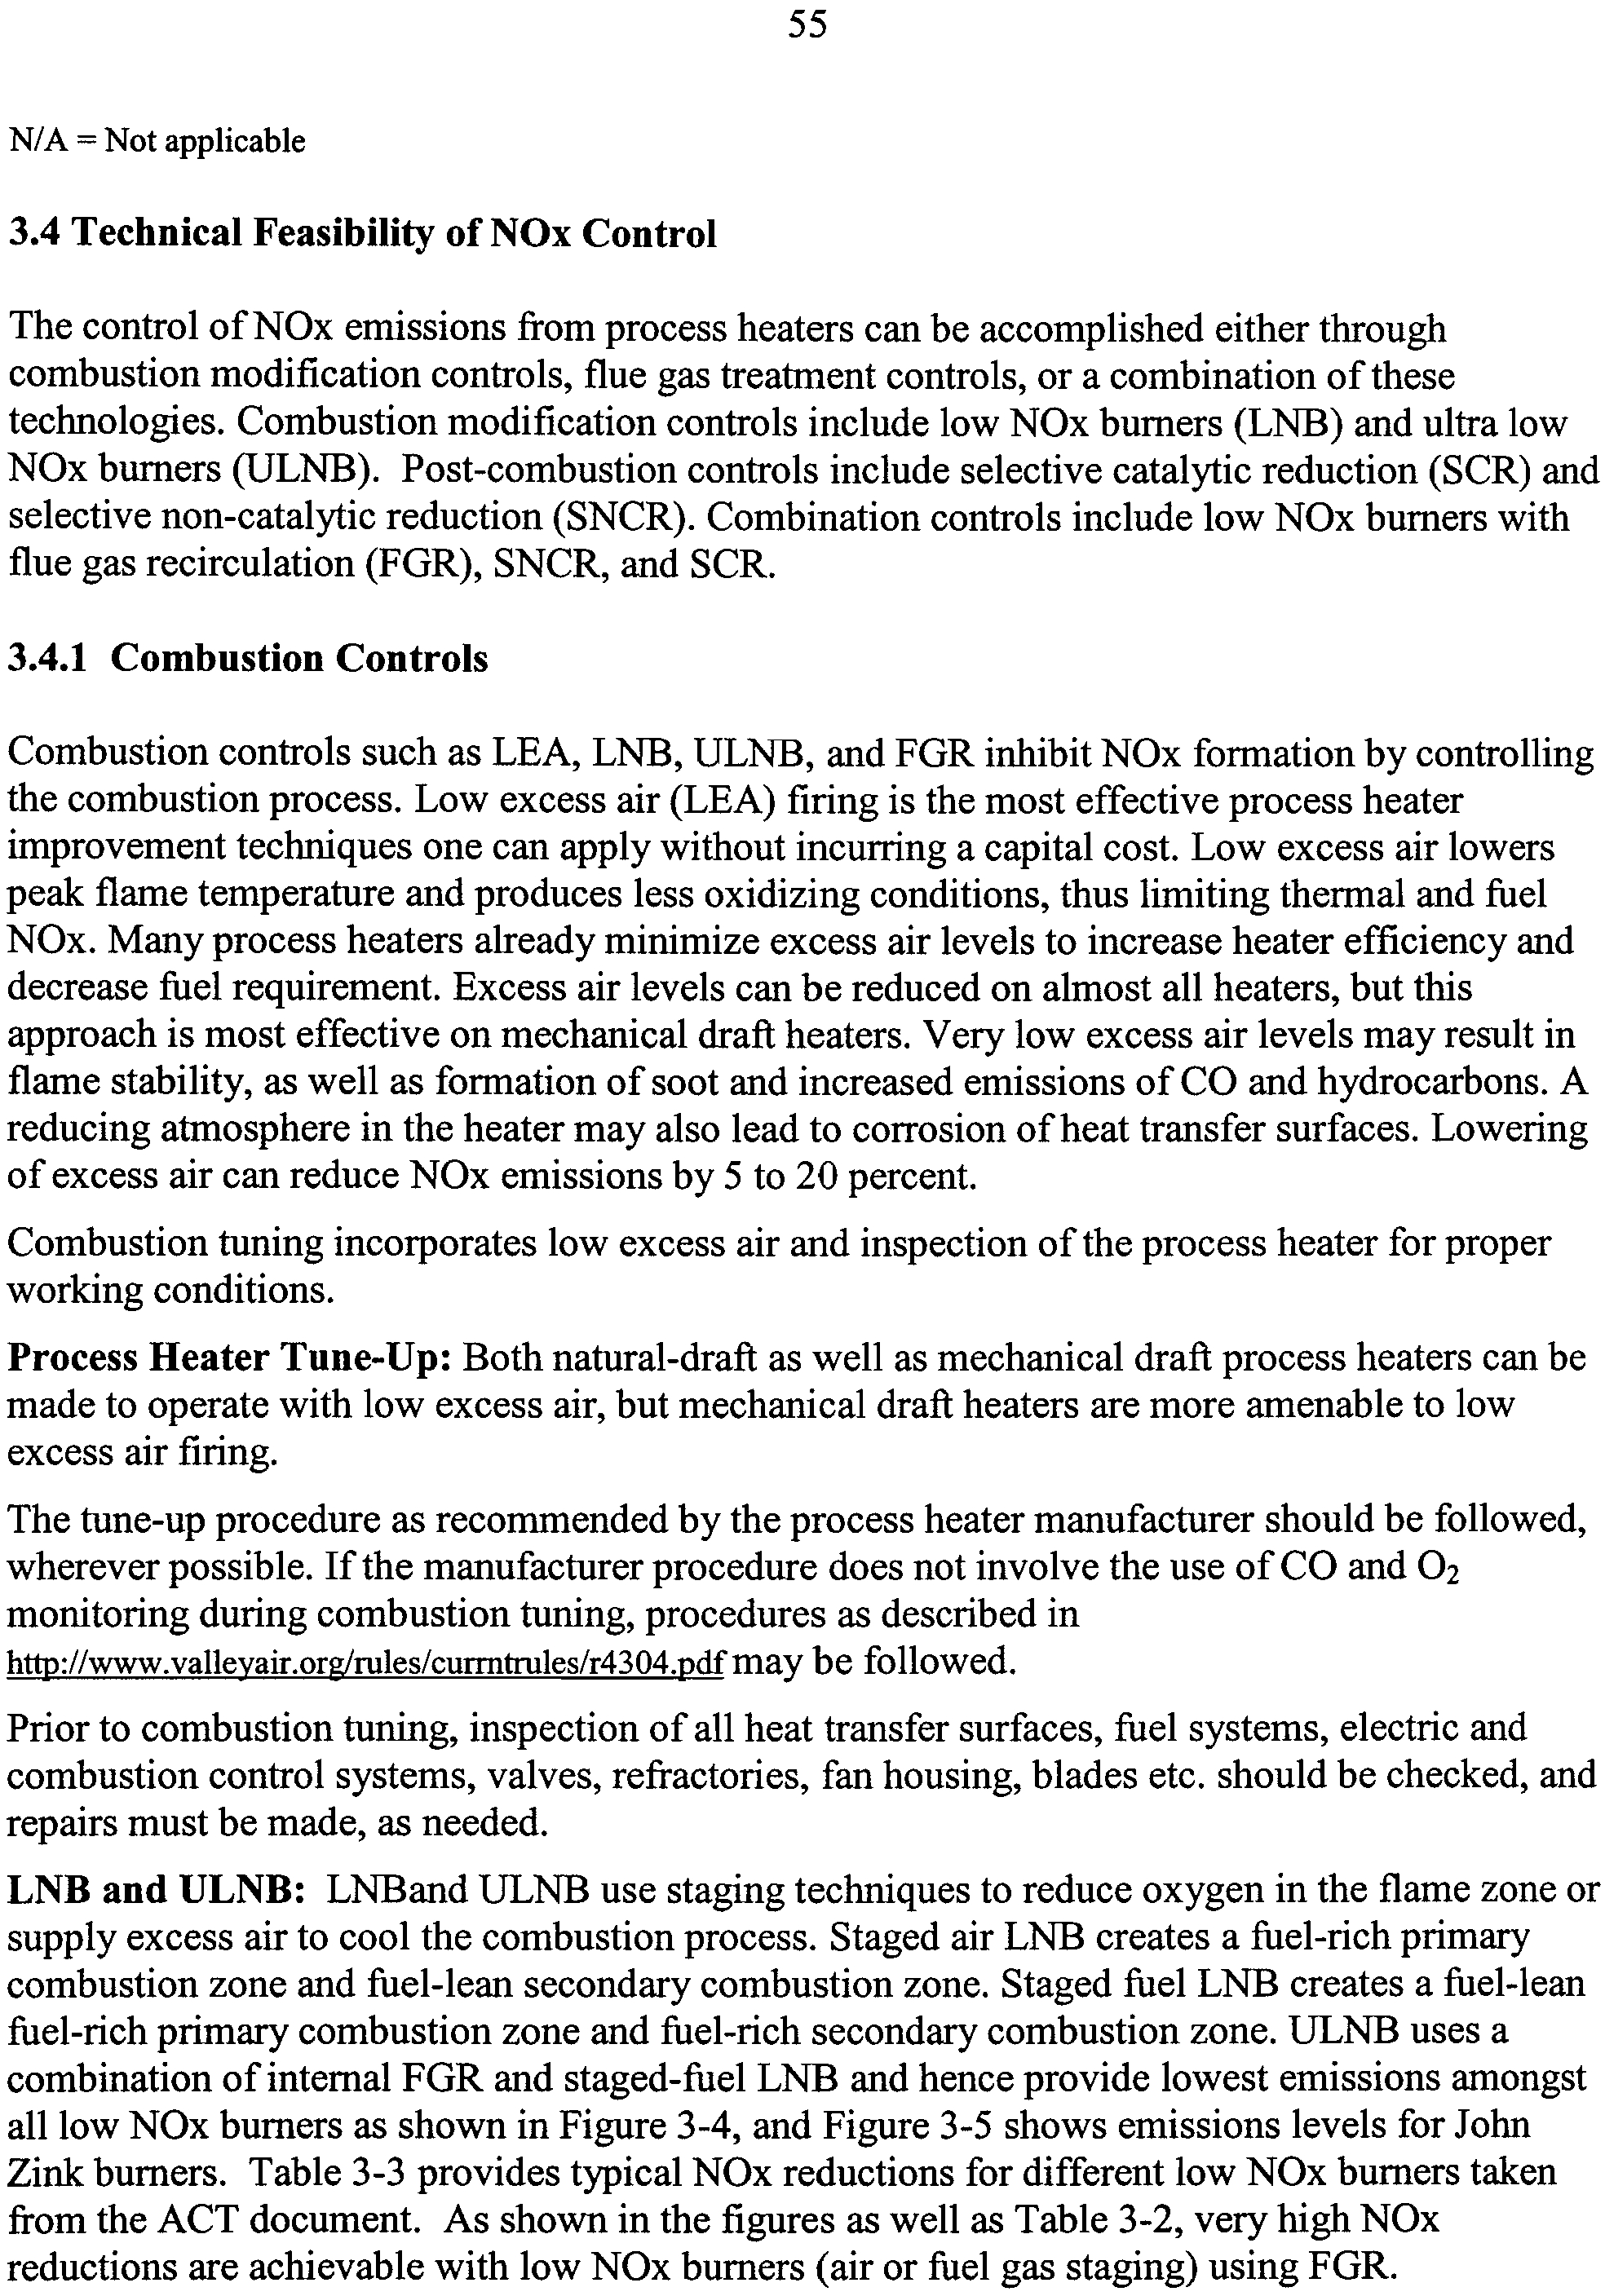
3-3
NOx Reduction Potential for Different Low NOx Burners
56
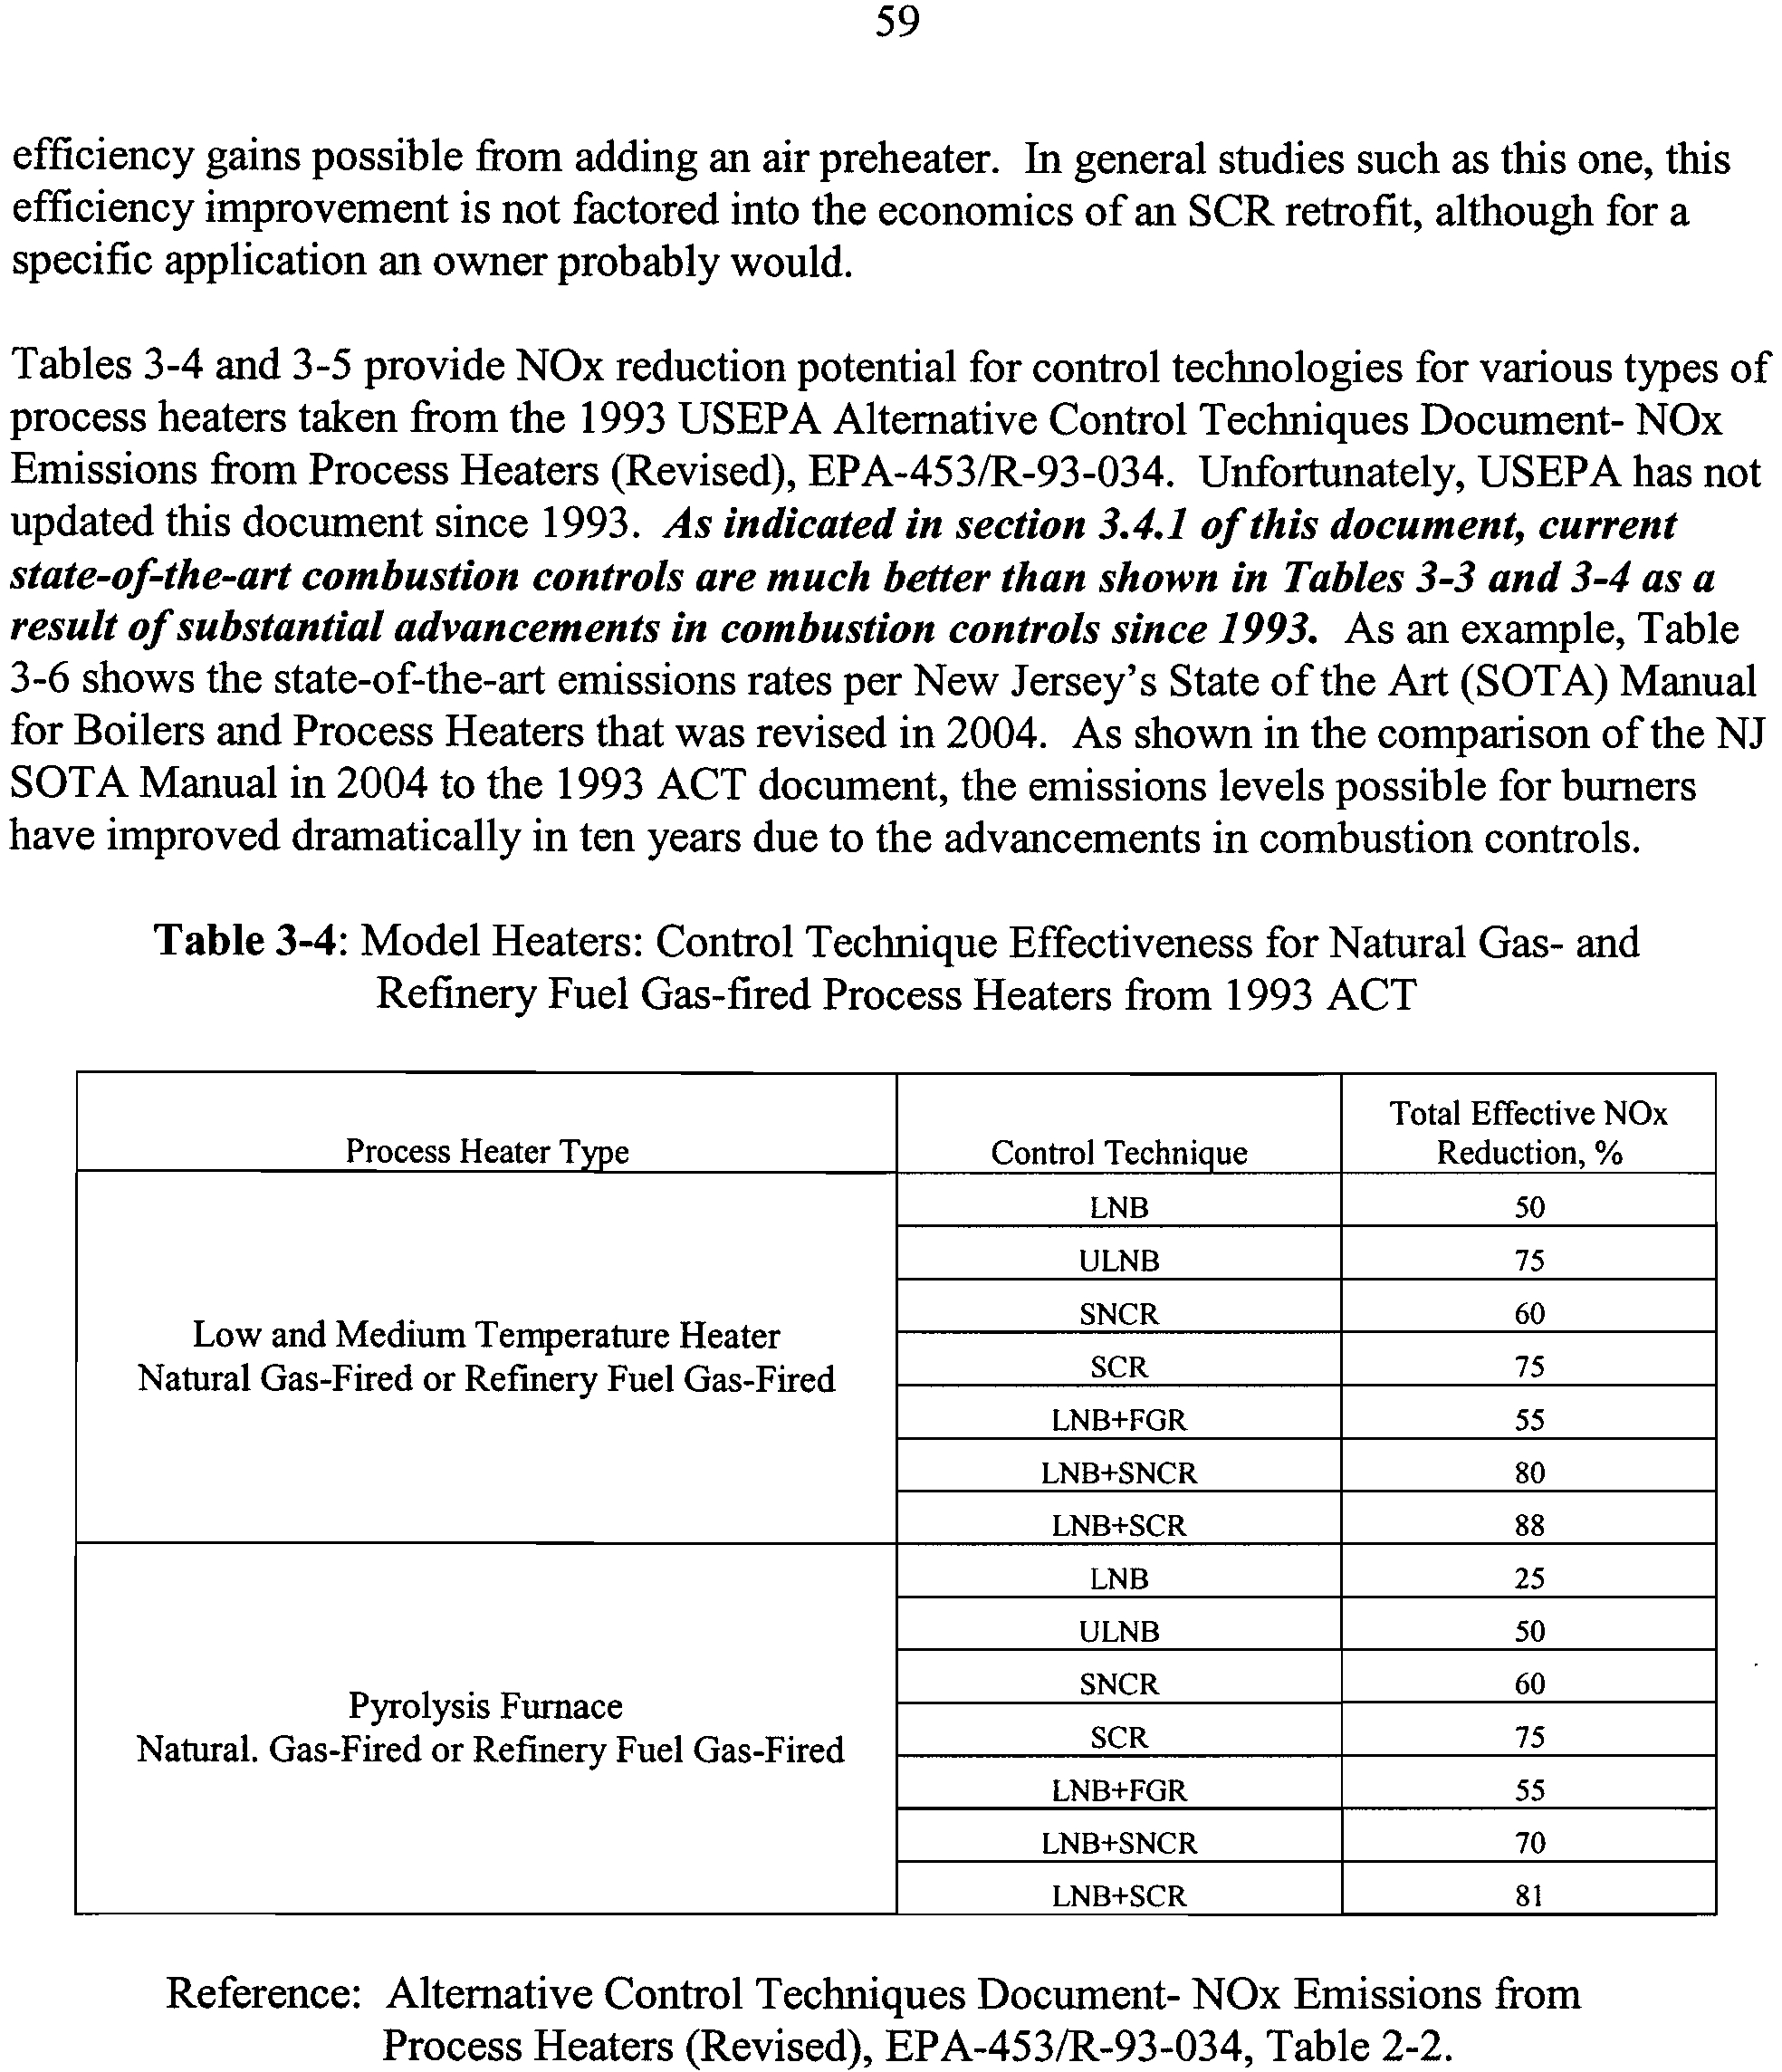
3-4
Model Heaters: Control Technique Effectiveness for Natural Gas-
and Refinery Fuel Gas-fired Process Heaters from 1993
59
ACT
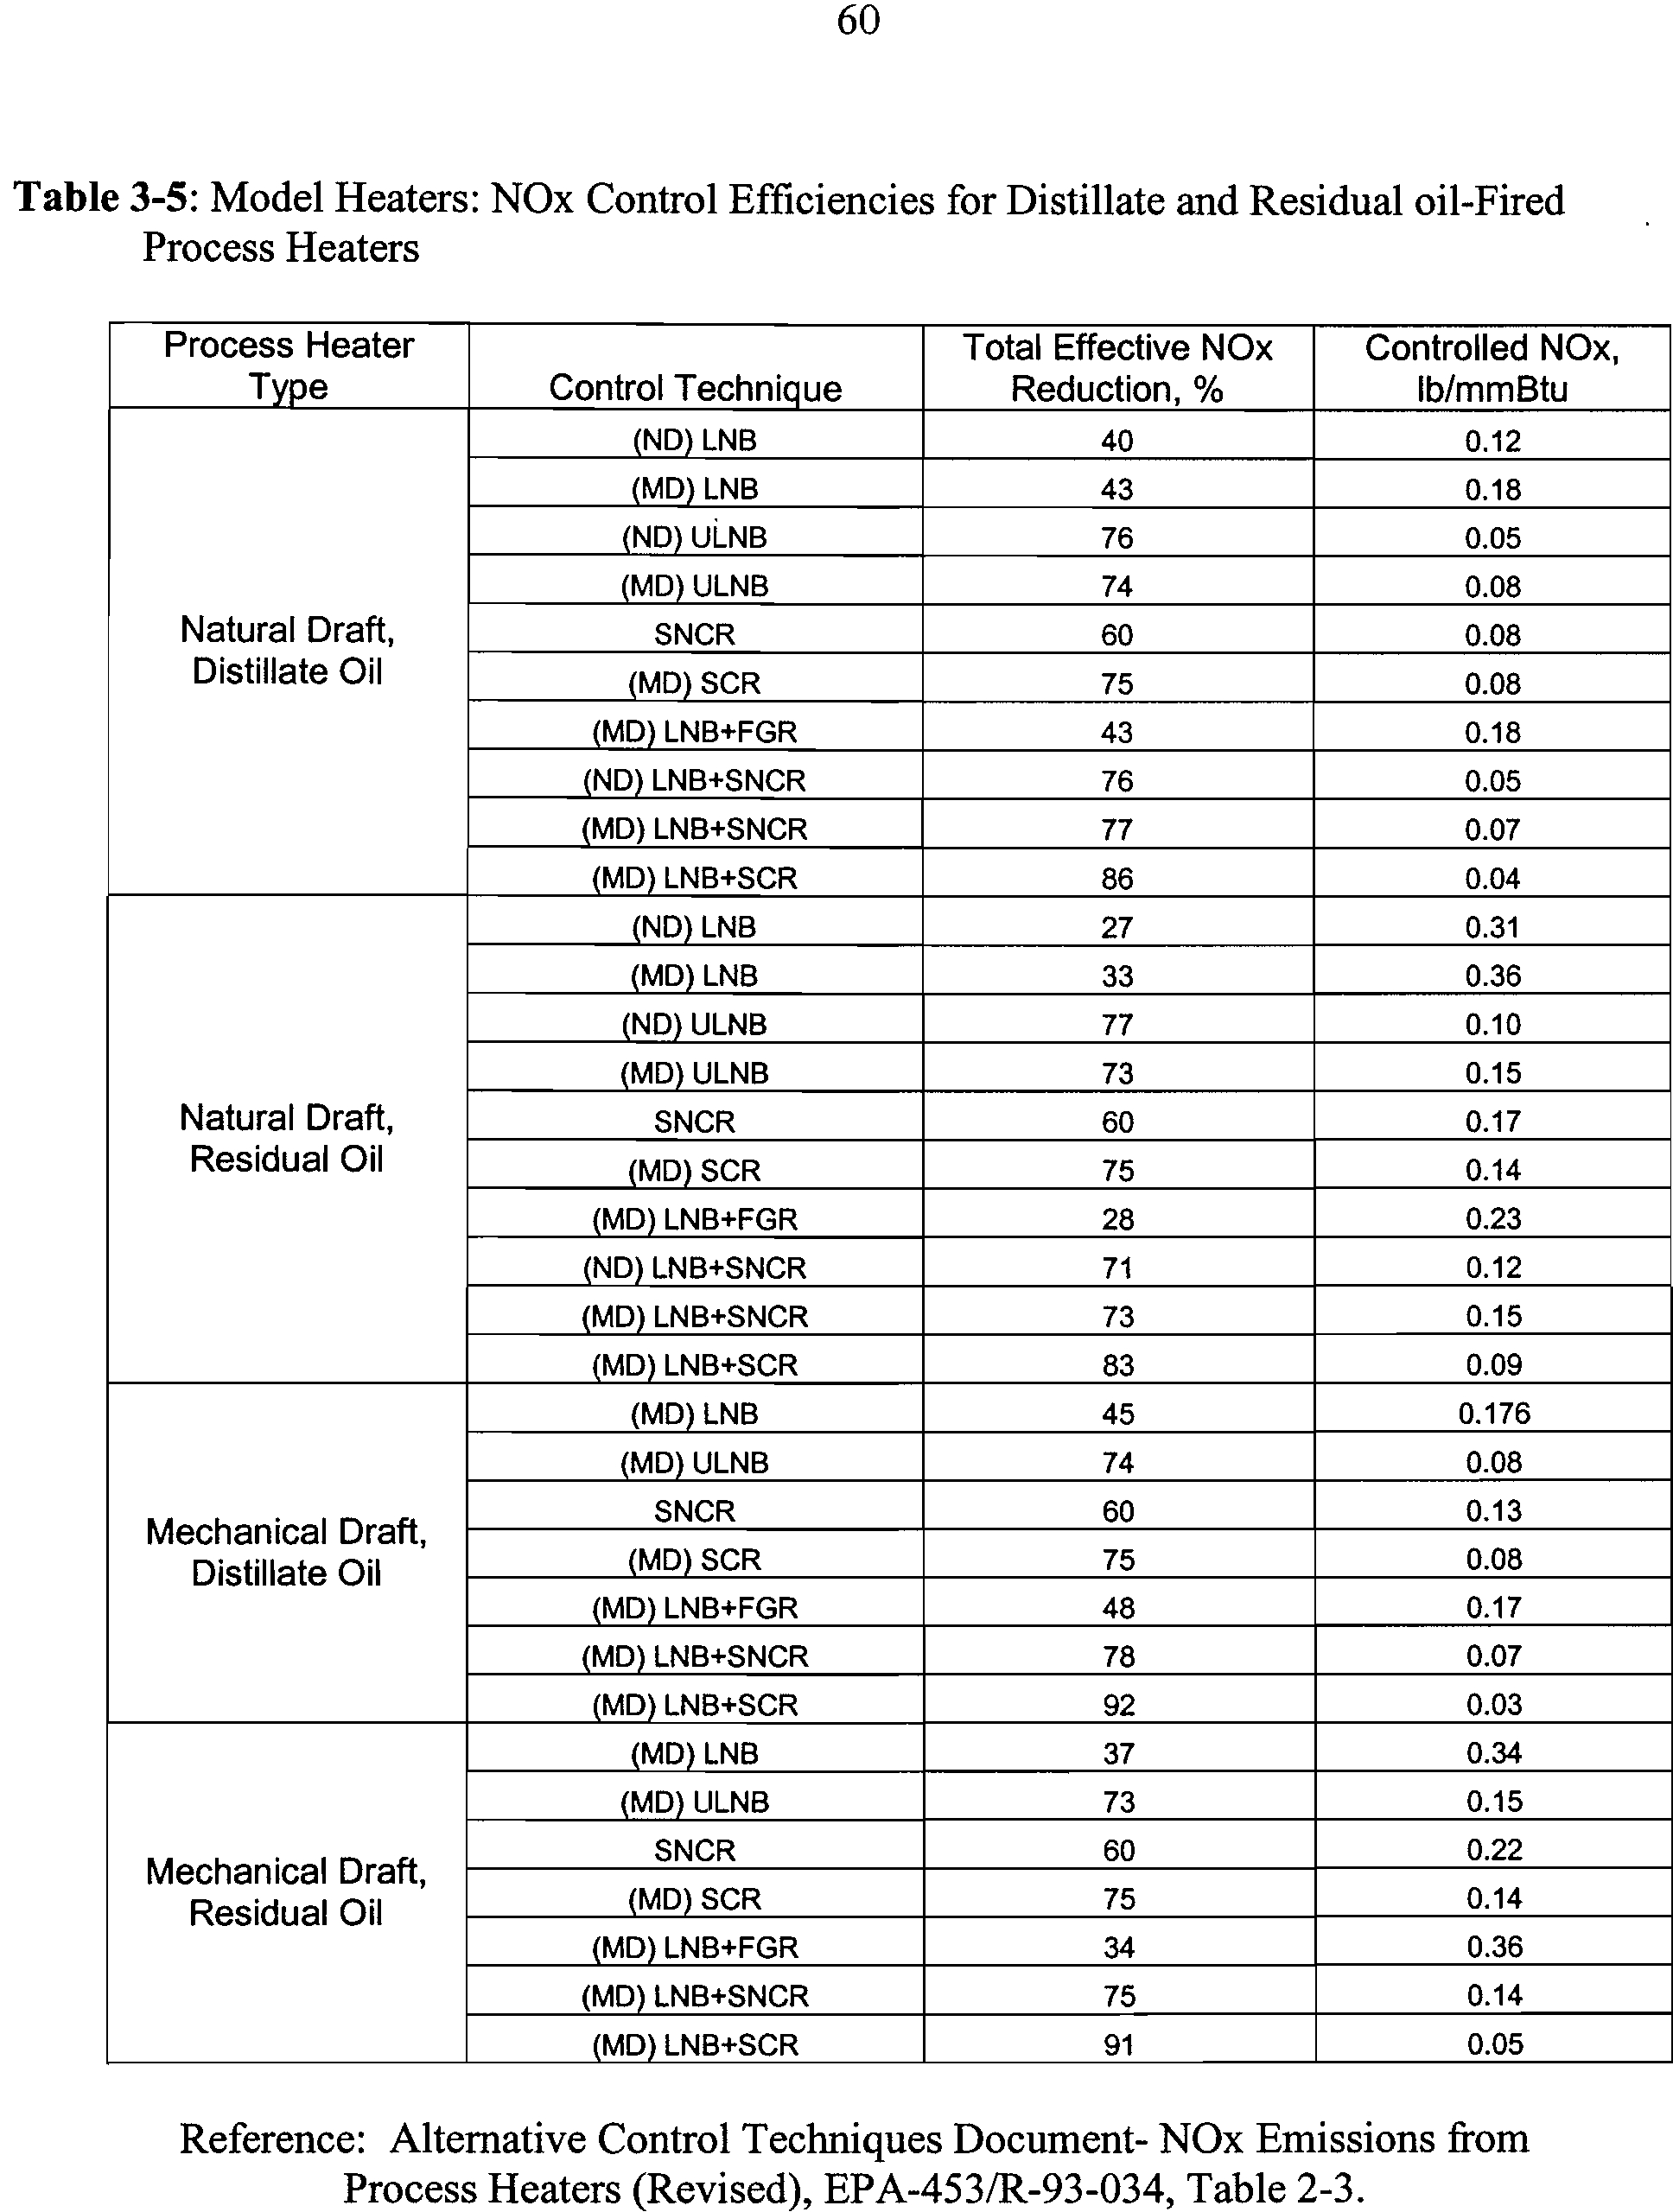
3-5
Model Heaters: NOx Control Efficiencies for Distillate and
60
Residual oil-Fired Process Heaters
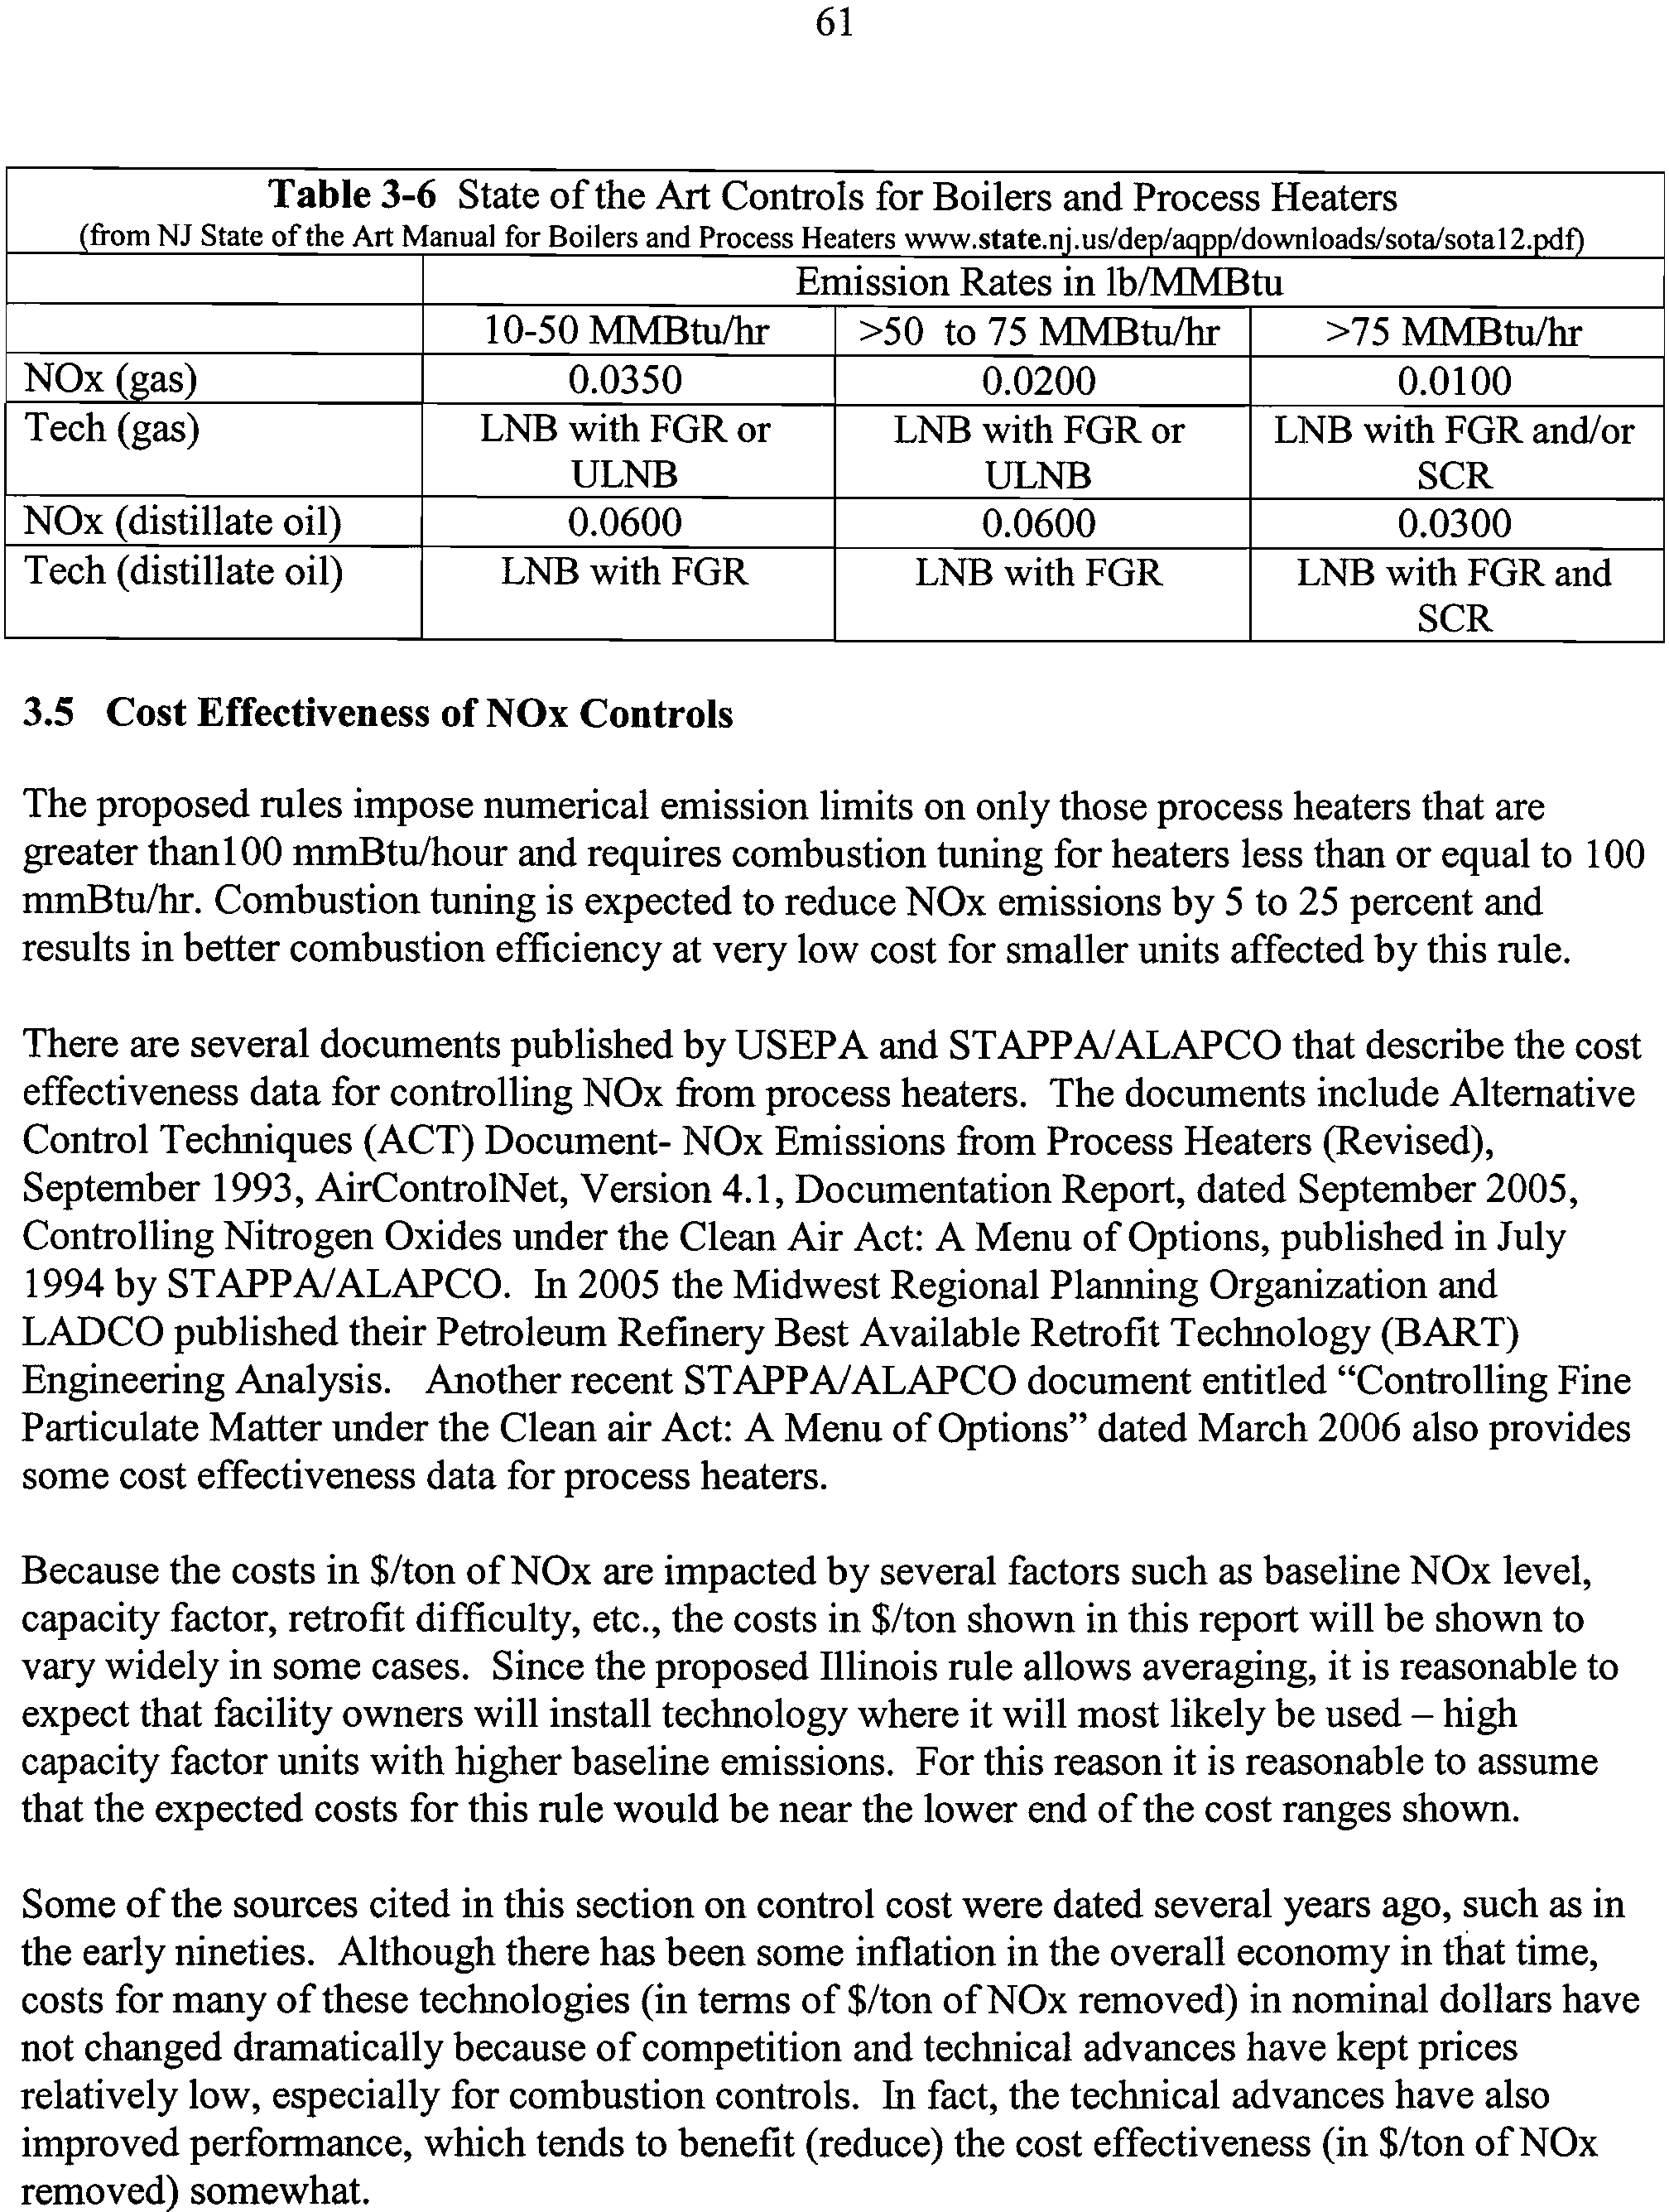
3-6
State of the Art Controls for Boilers and Process Heaters
61
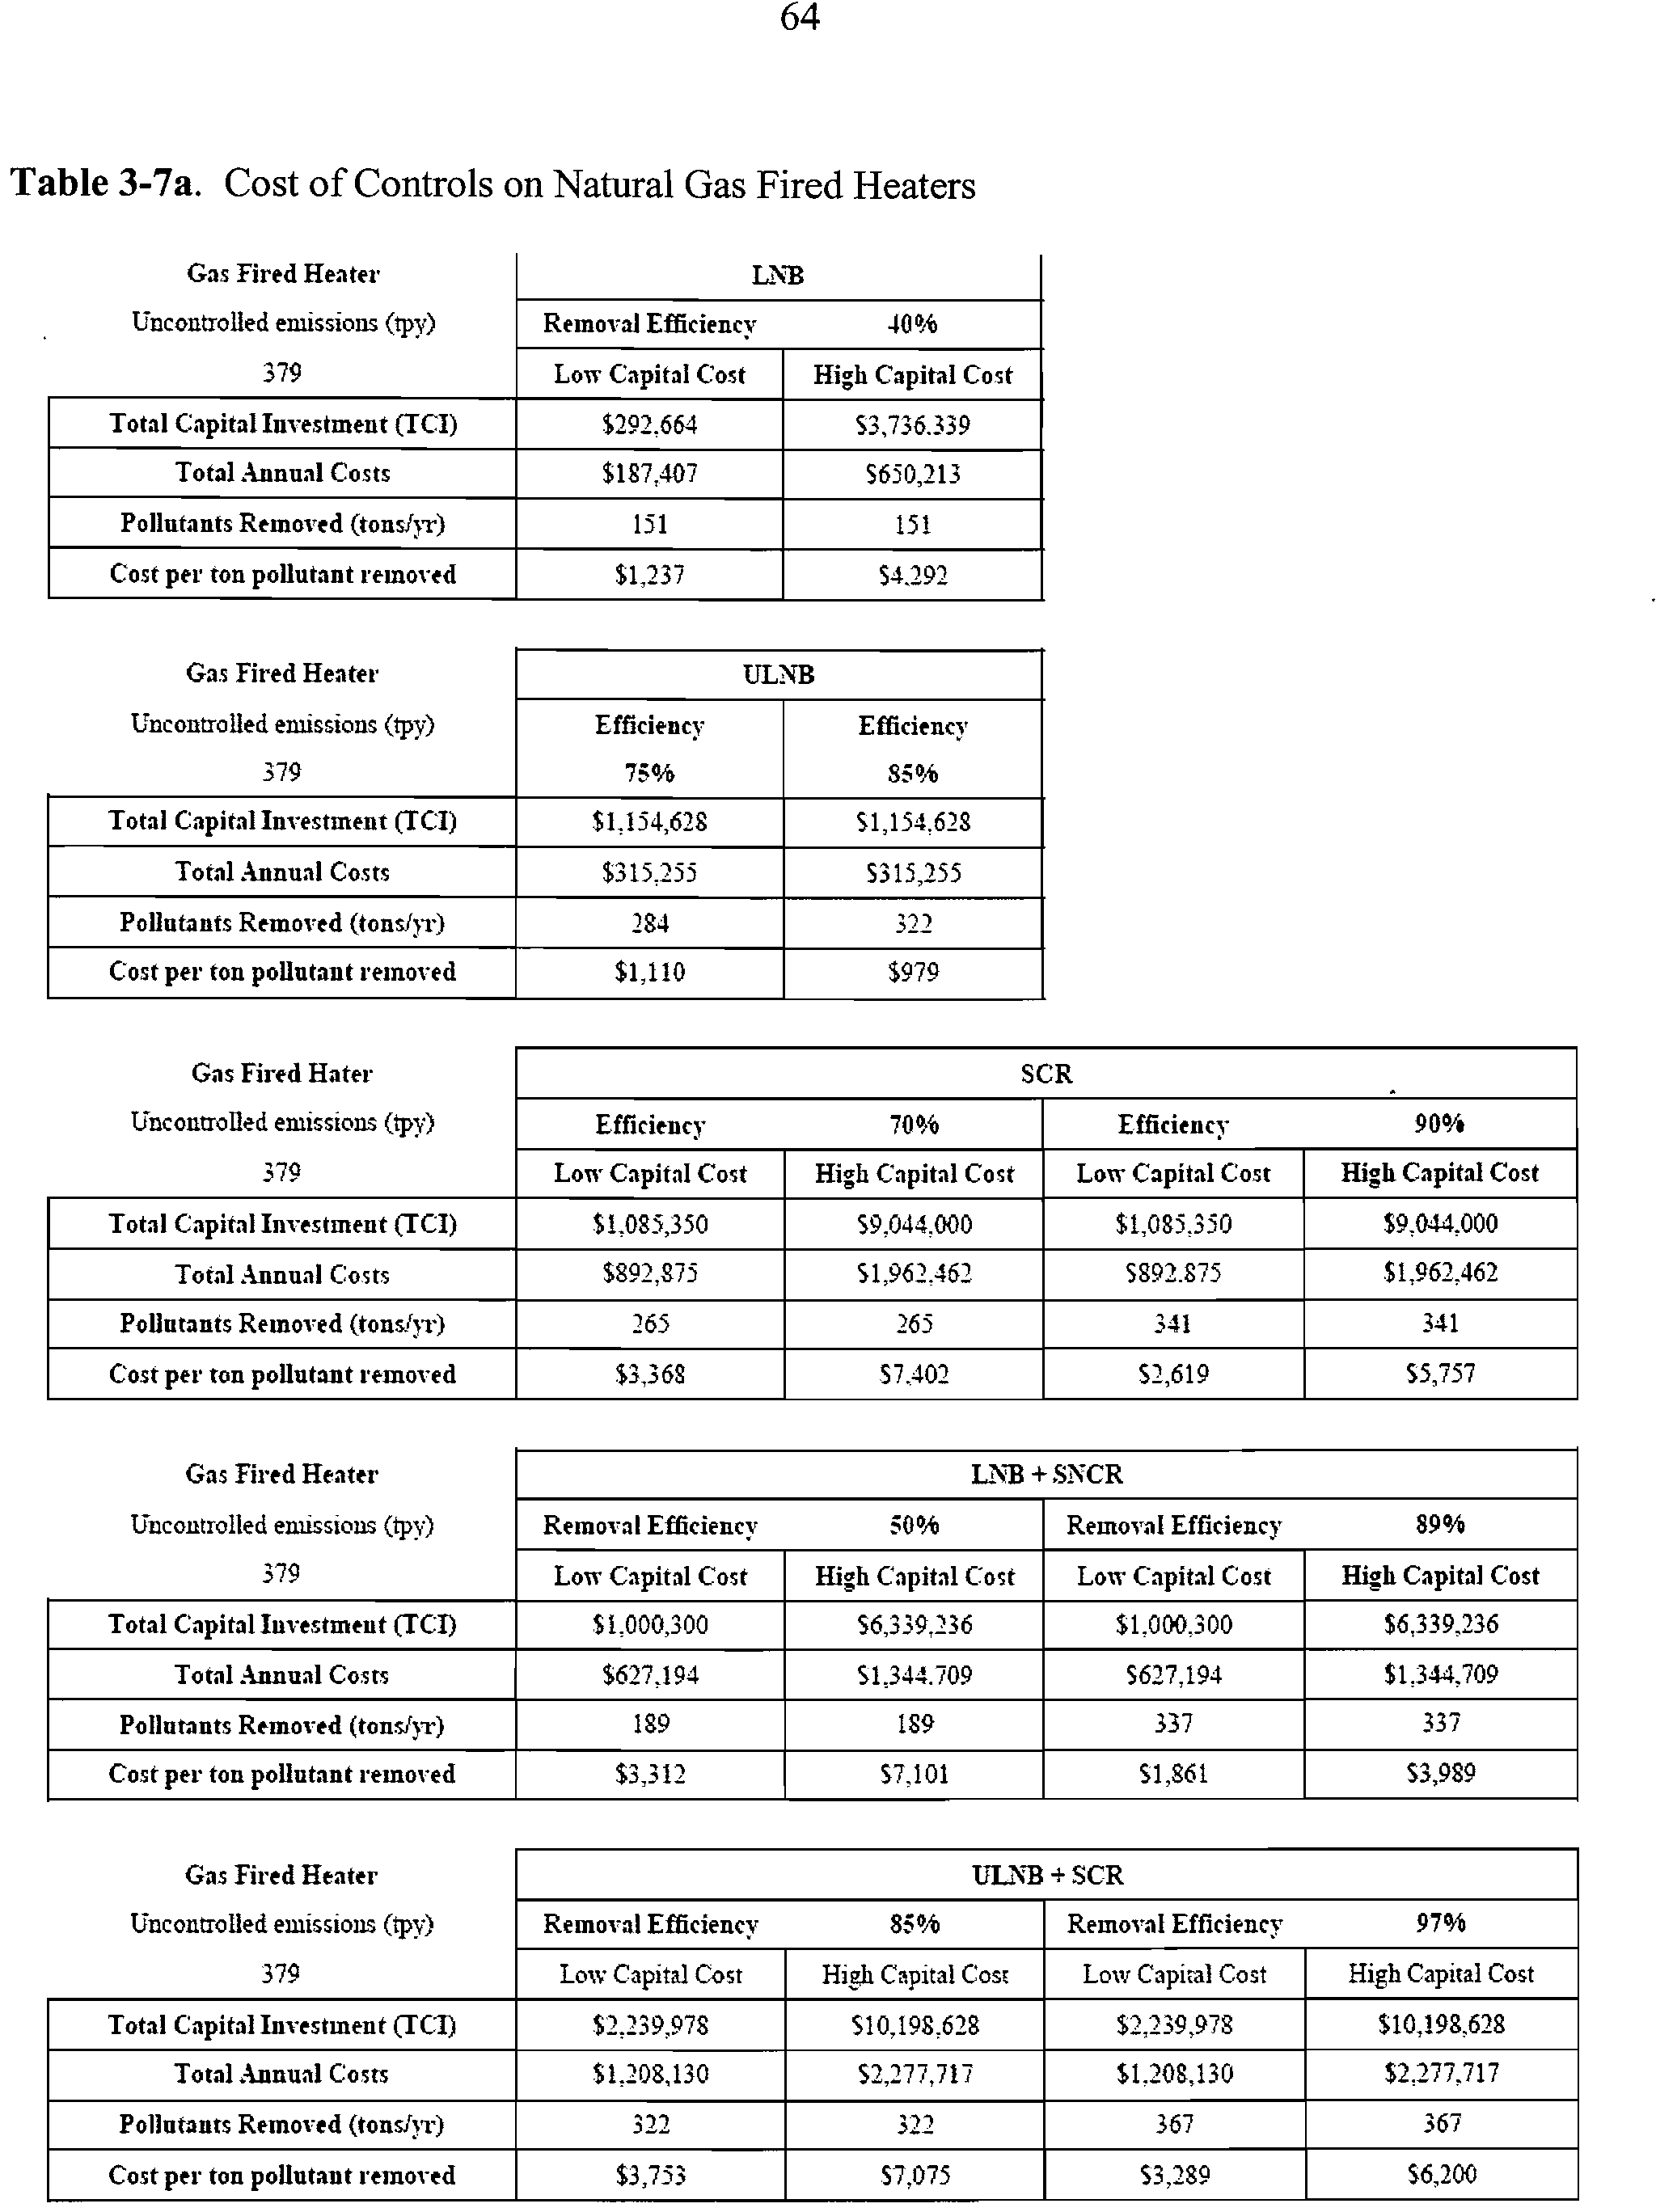
3-7a
Cost of Controls on Natural Gas Fired Heaters
64
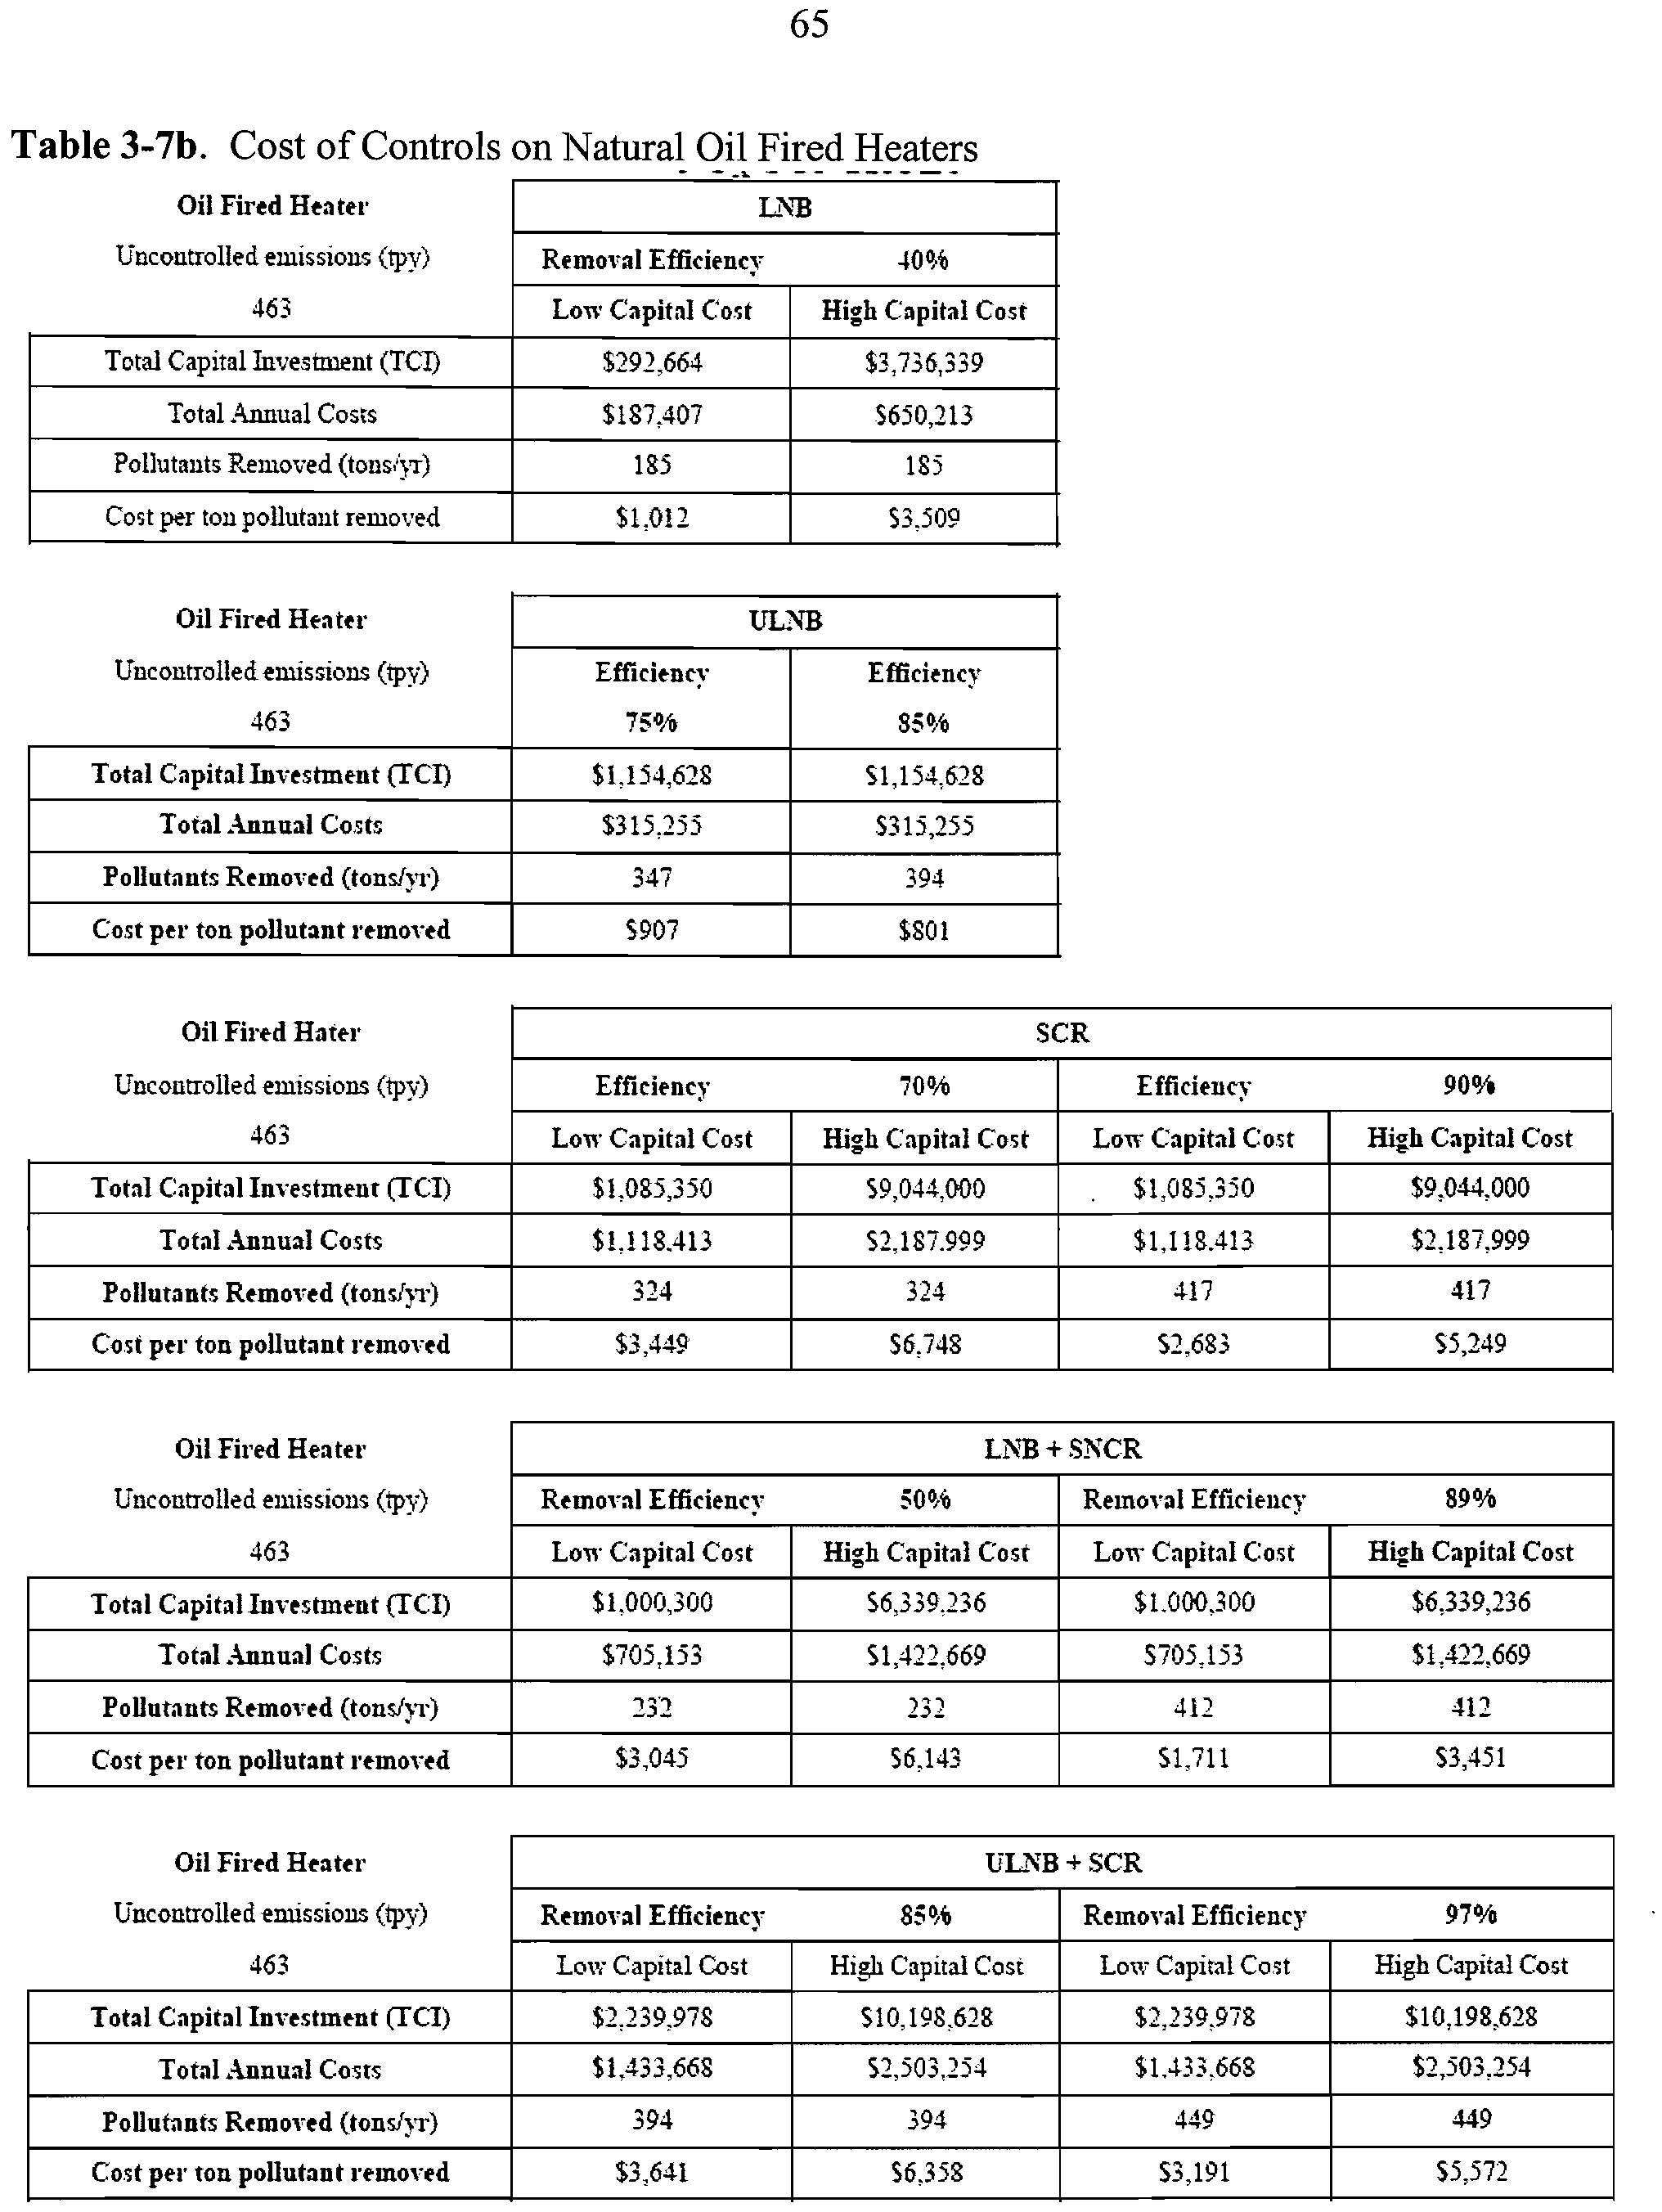
3-7b
Cost of Controls on Natural Oil Fired Heaters
65
4-1
Proposed Cement Kiln Emission Limits
66
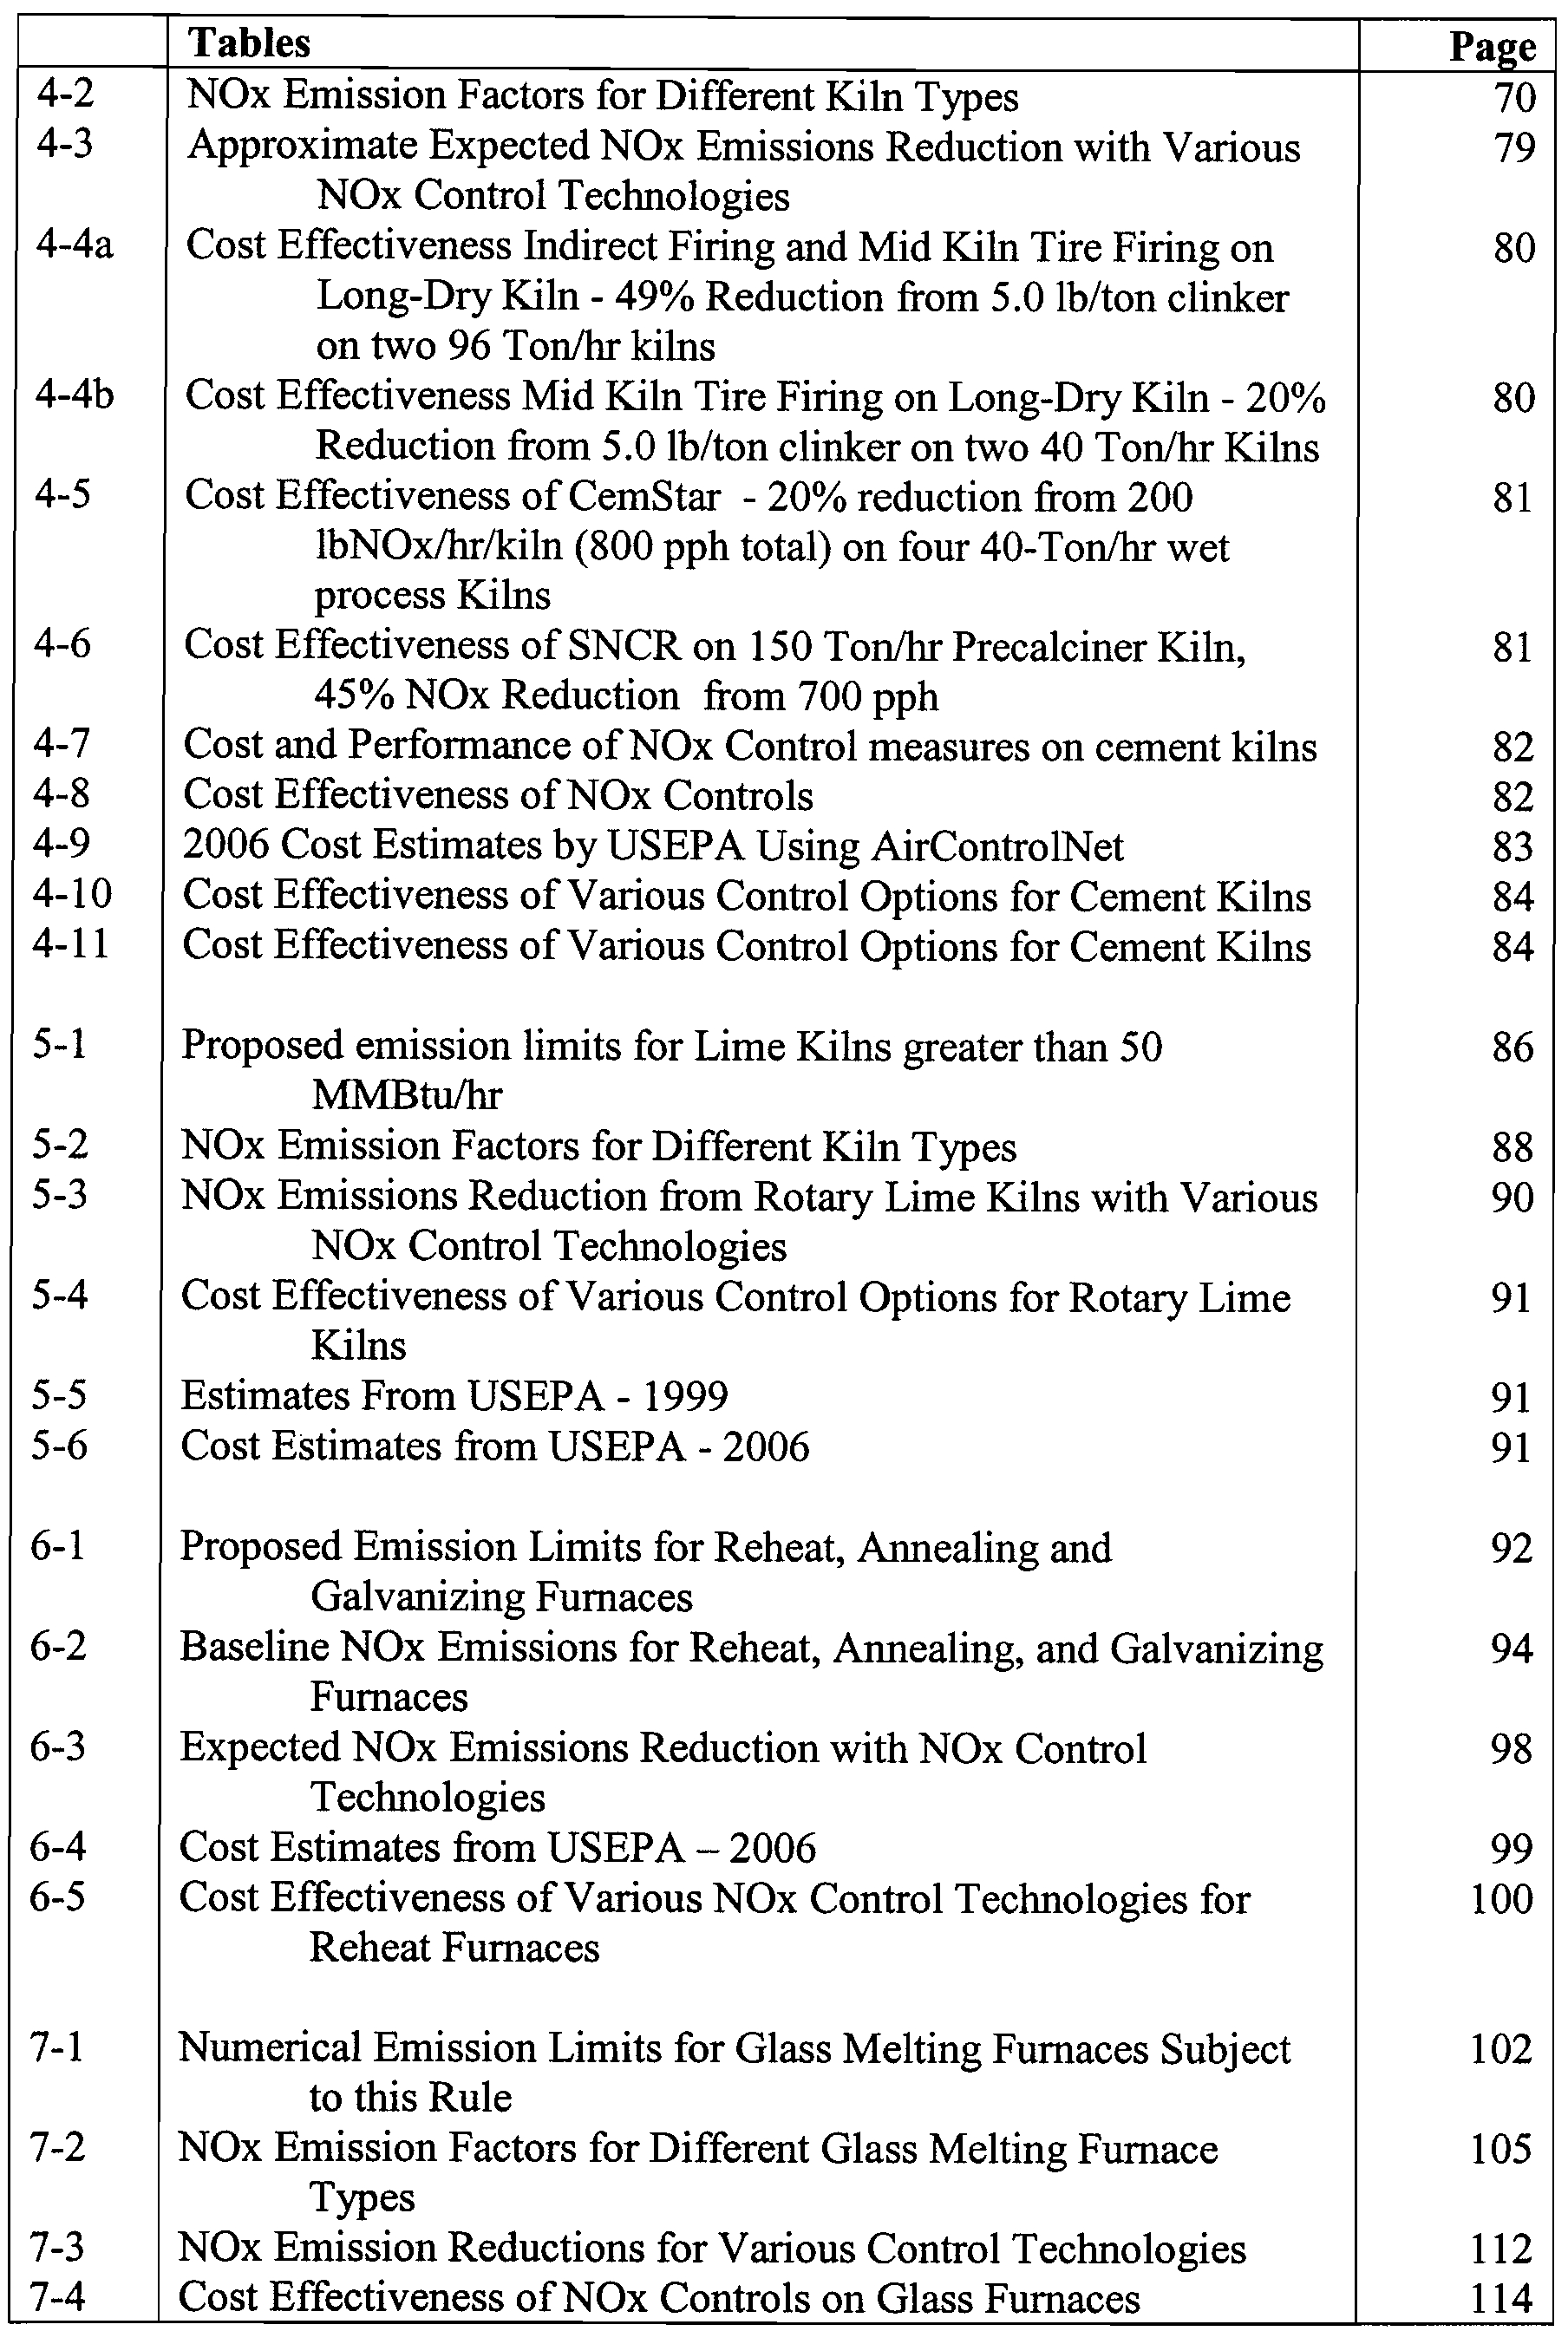
Tables
Page
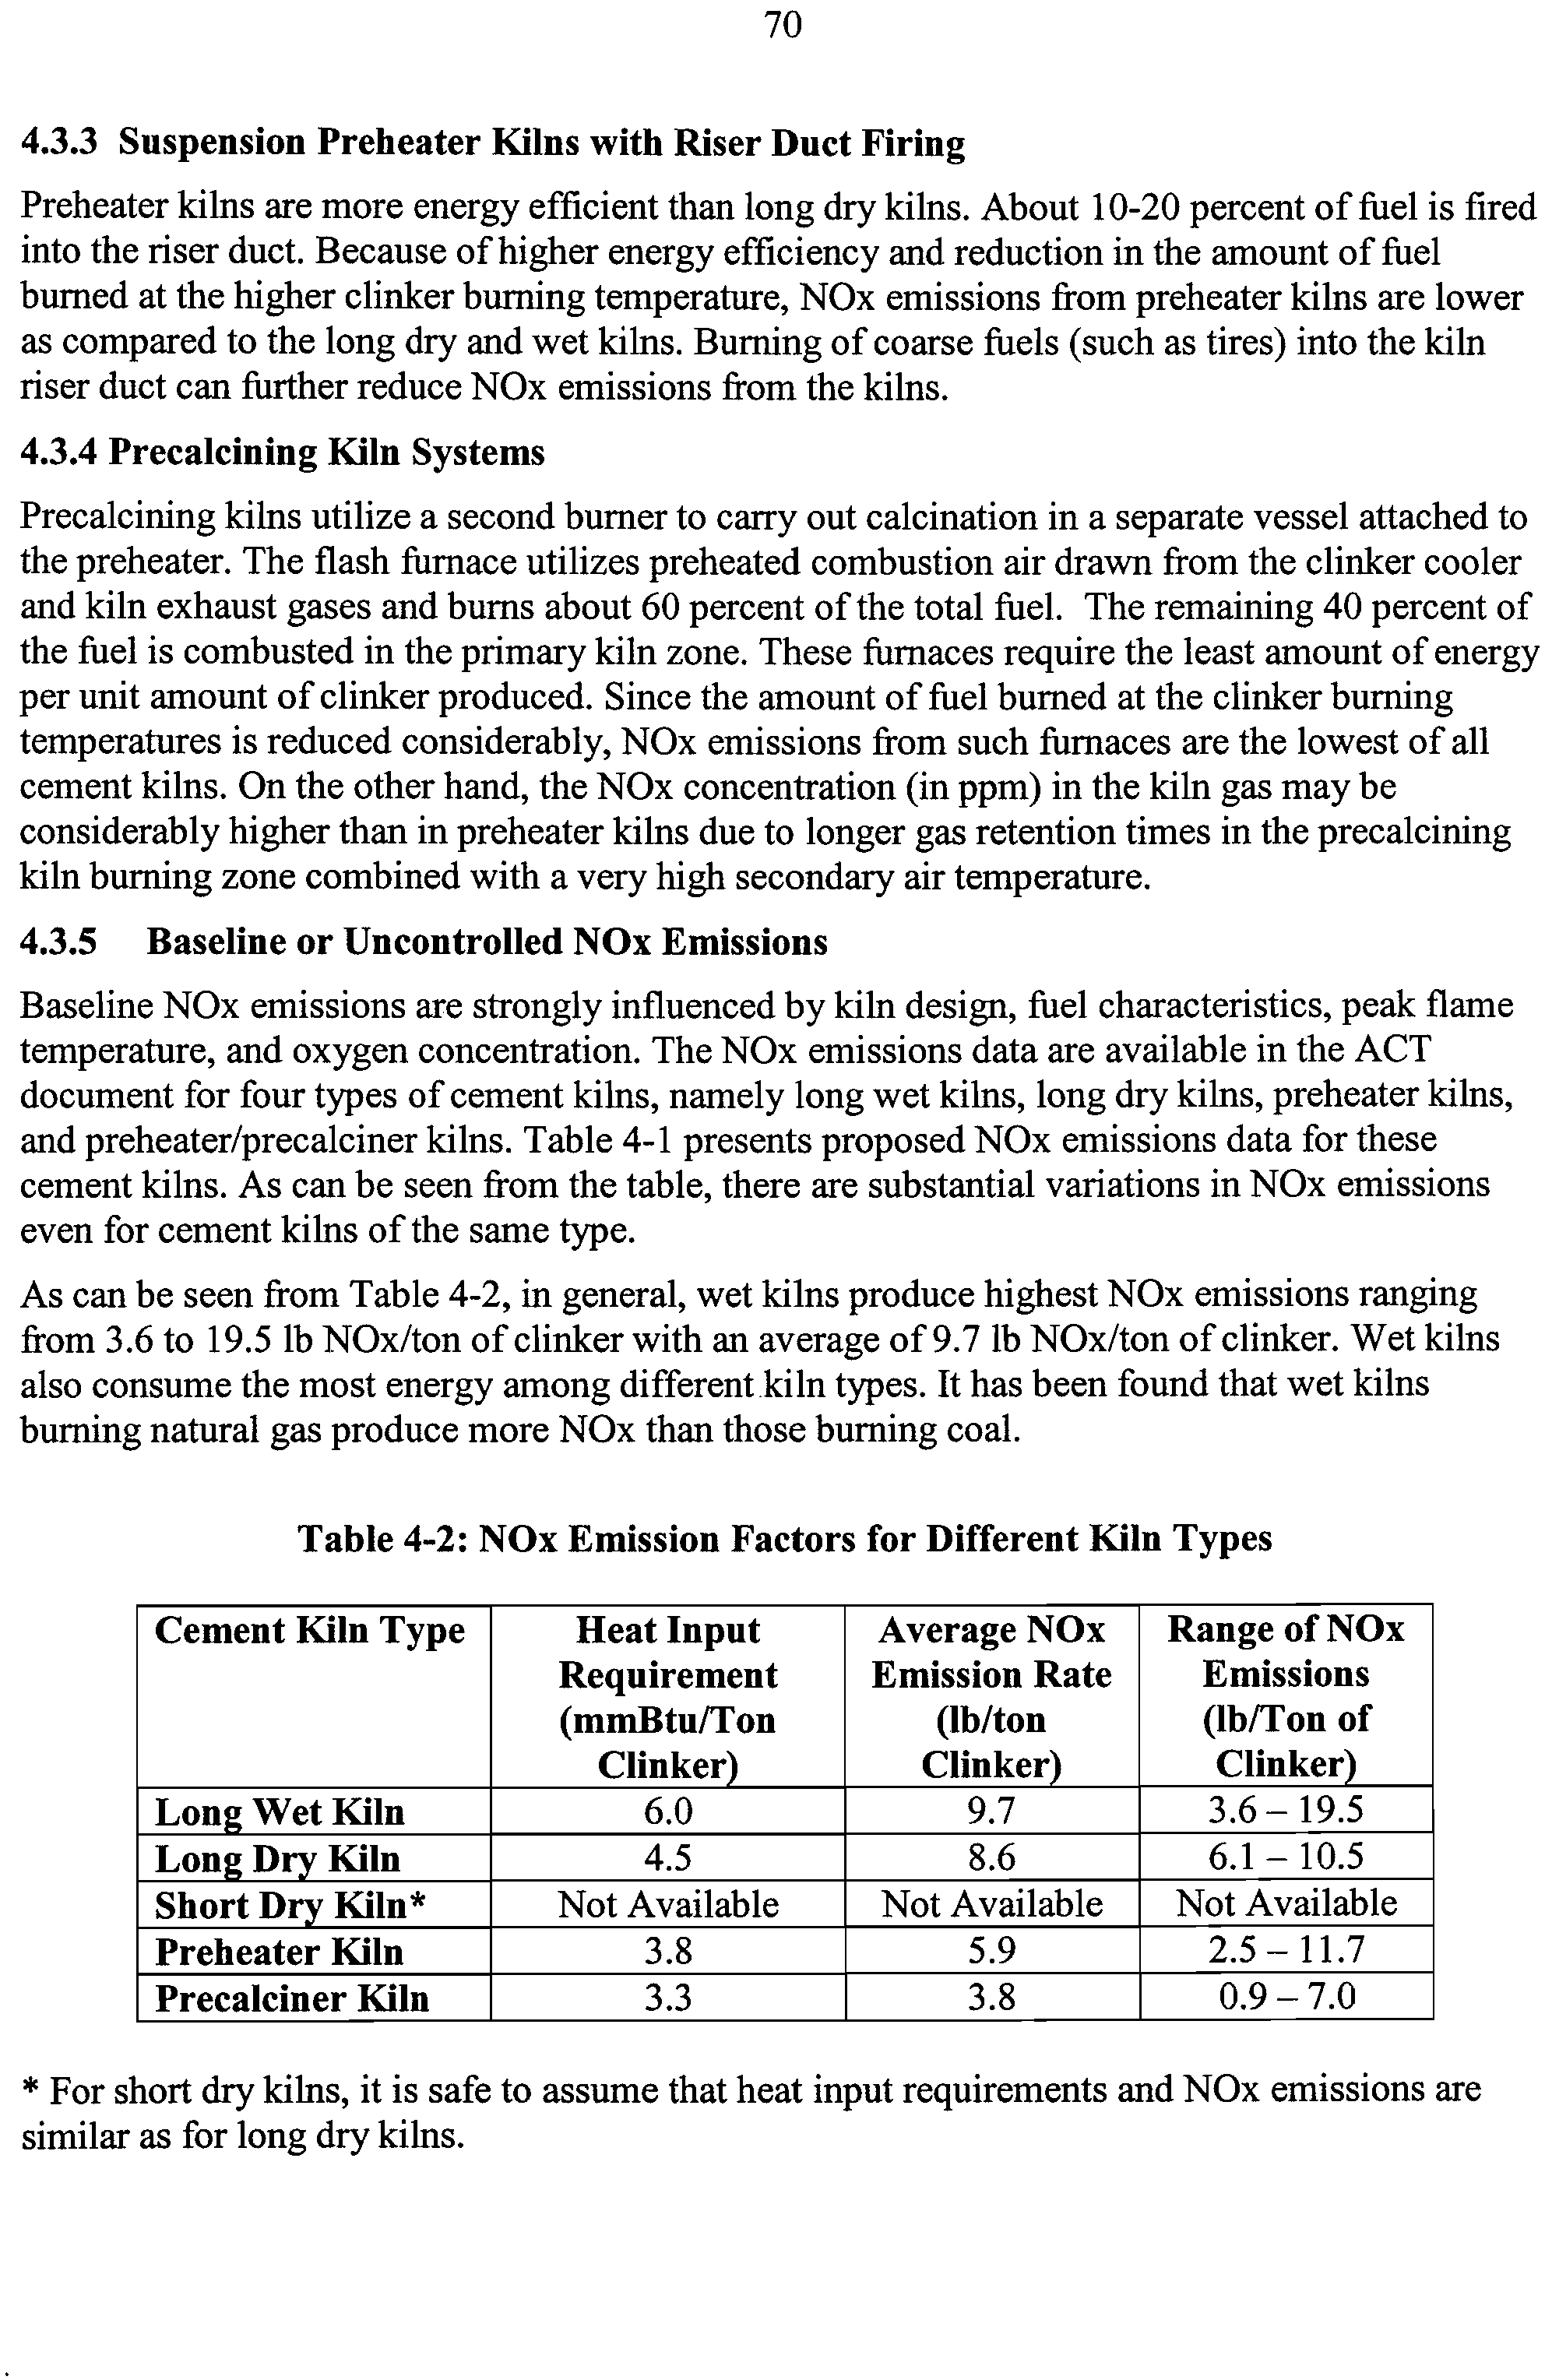
4-2
NOx Emission Factors for Different Kiln Types
70
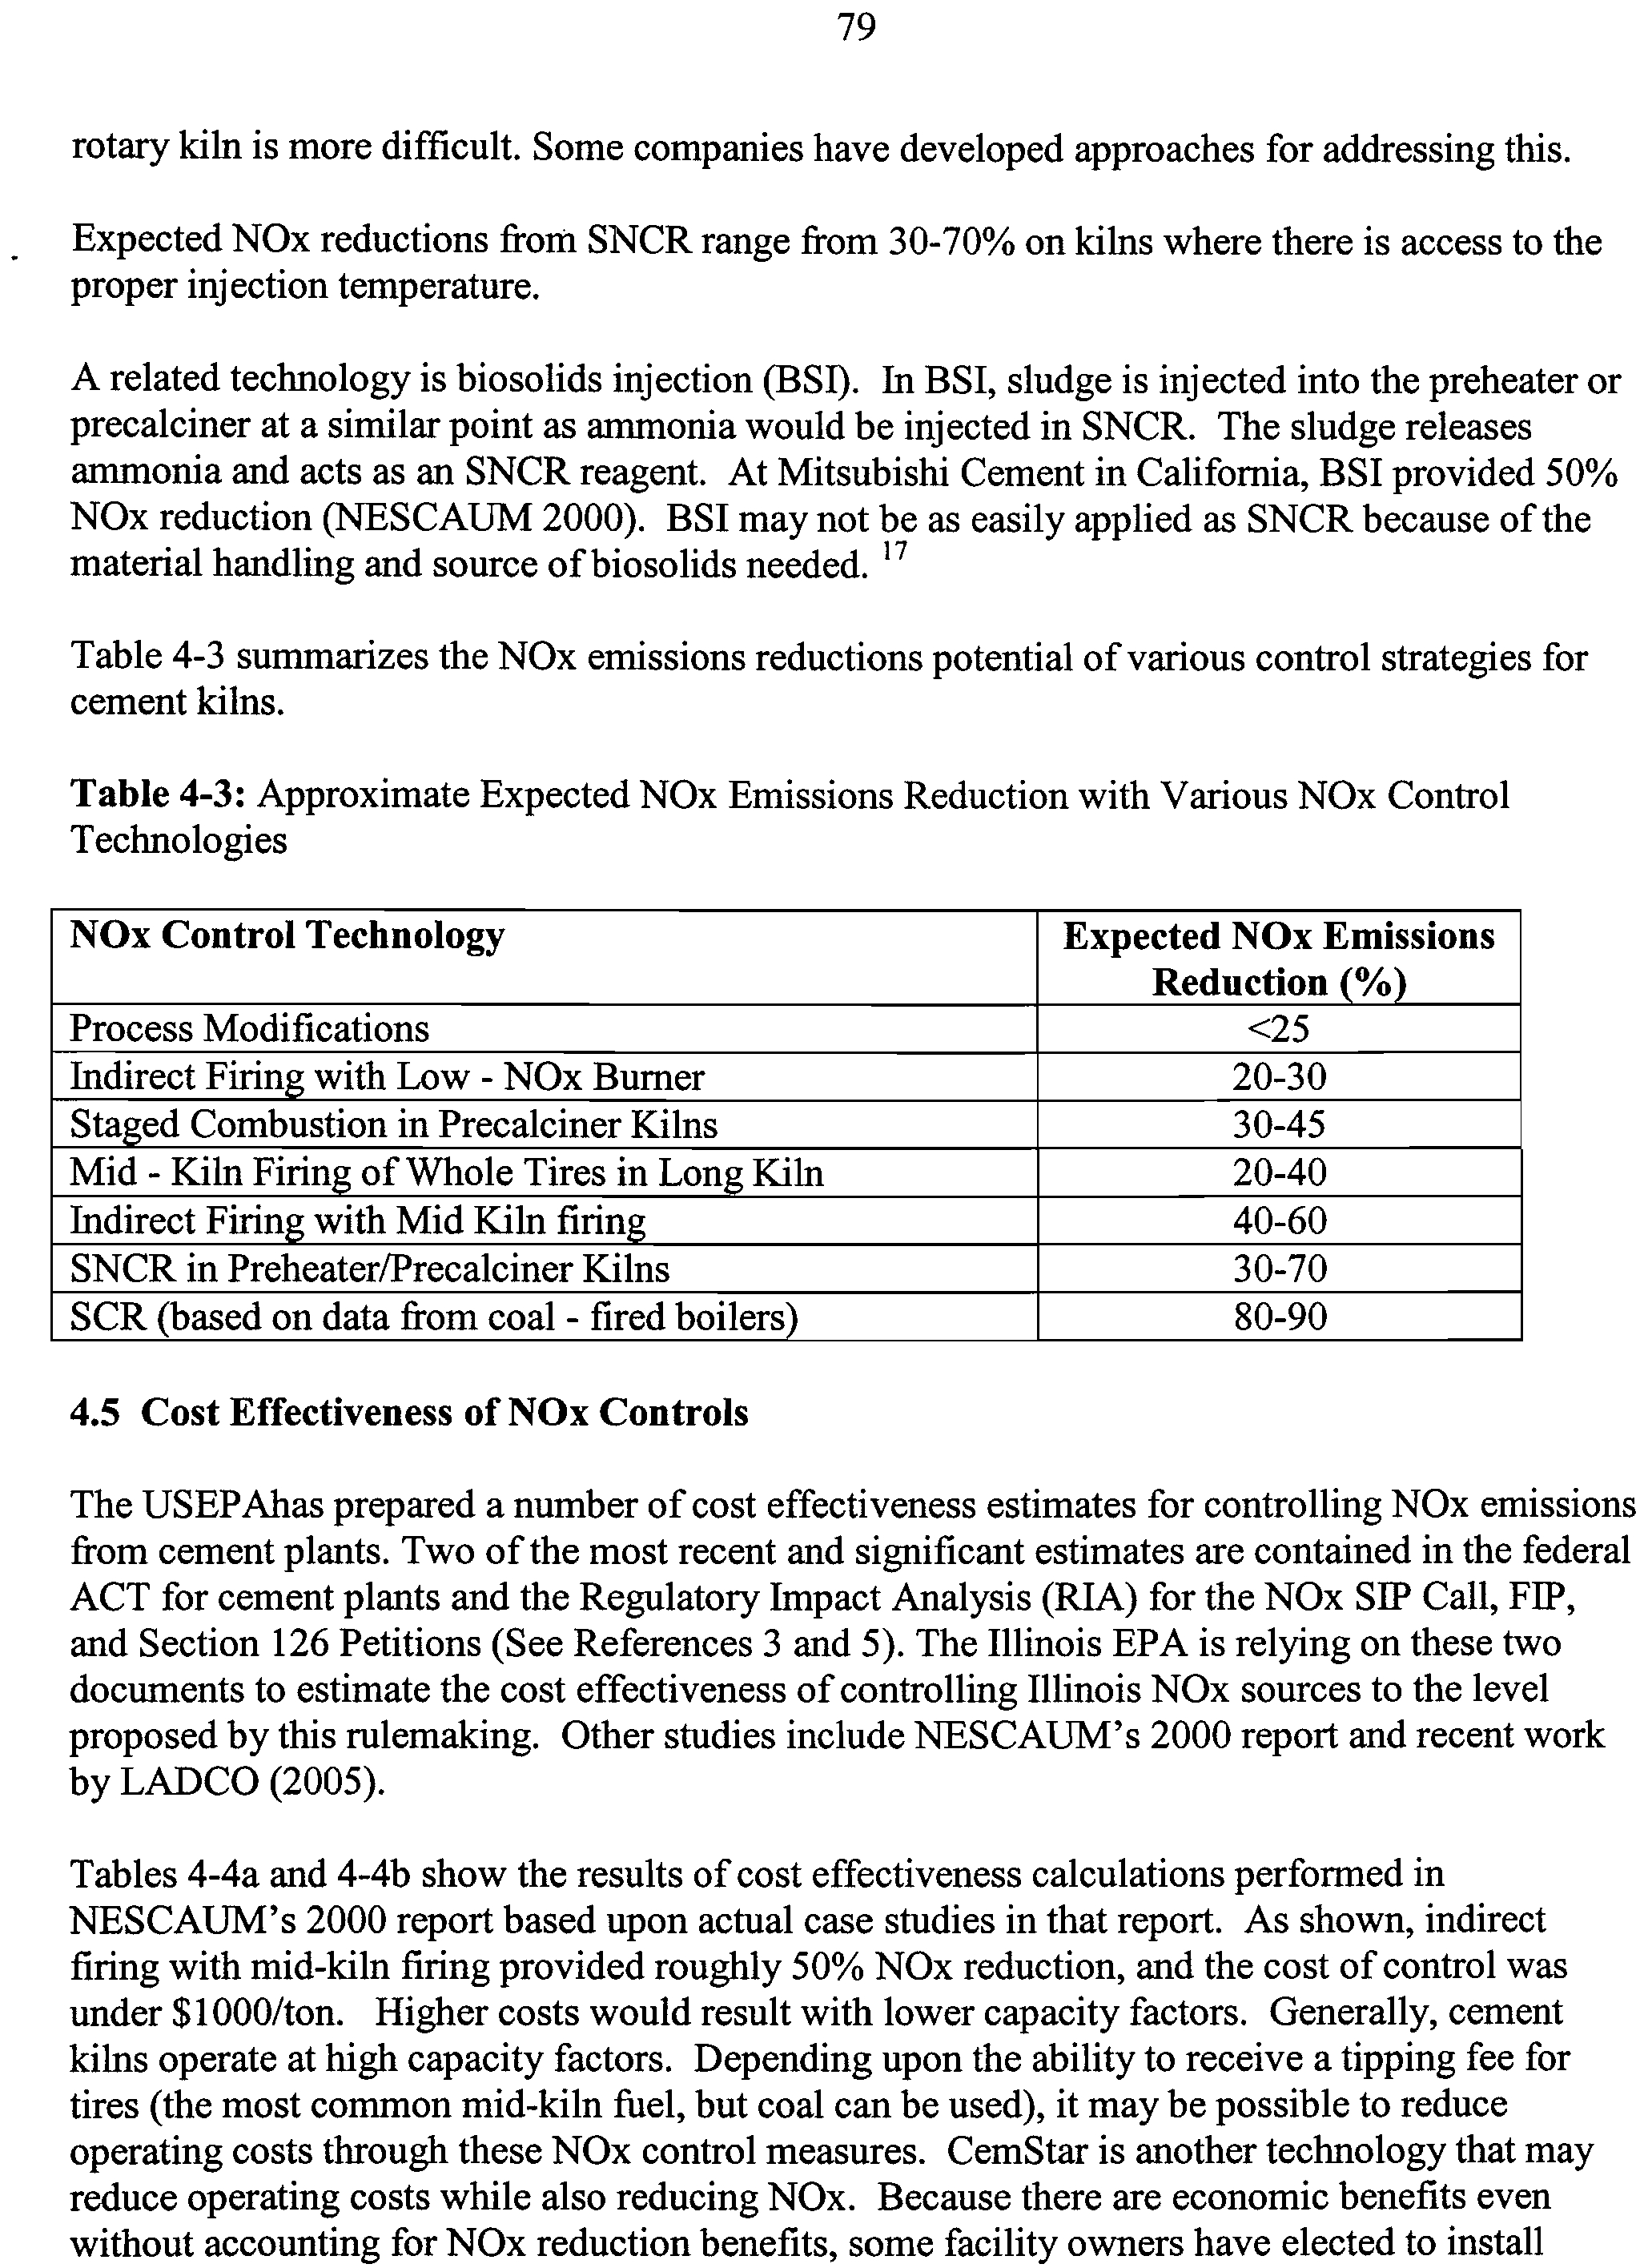
4-3
Approximate Expected NOx Emissions Reduction with Various
79
NOx Control Technologies
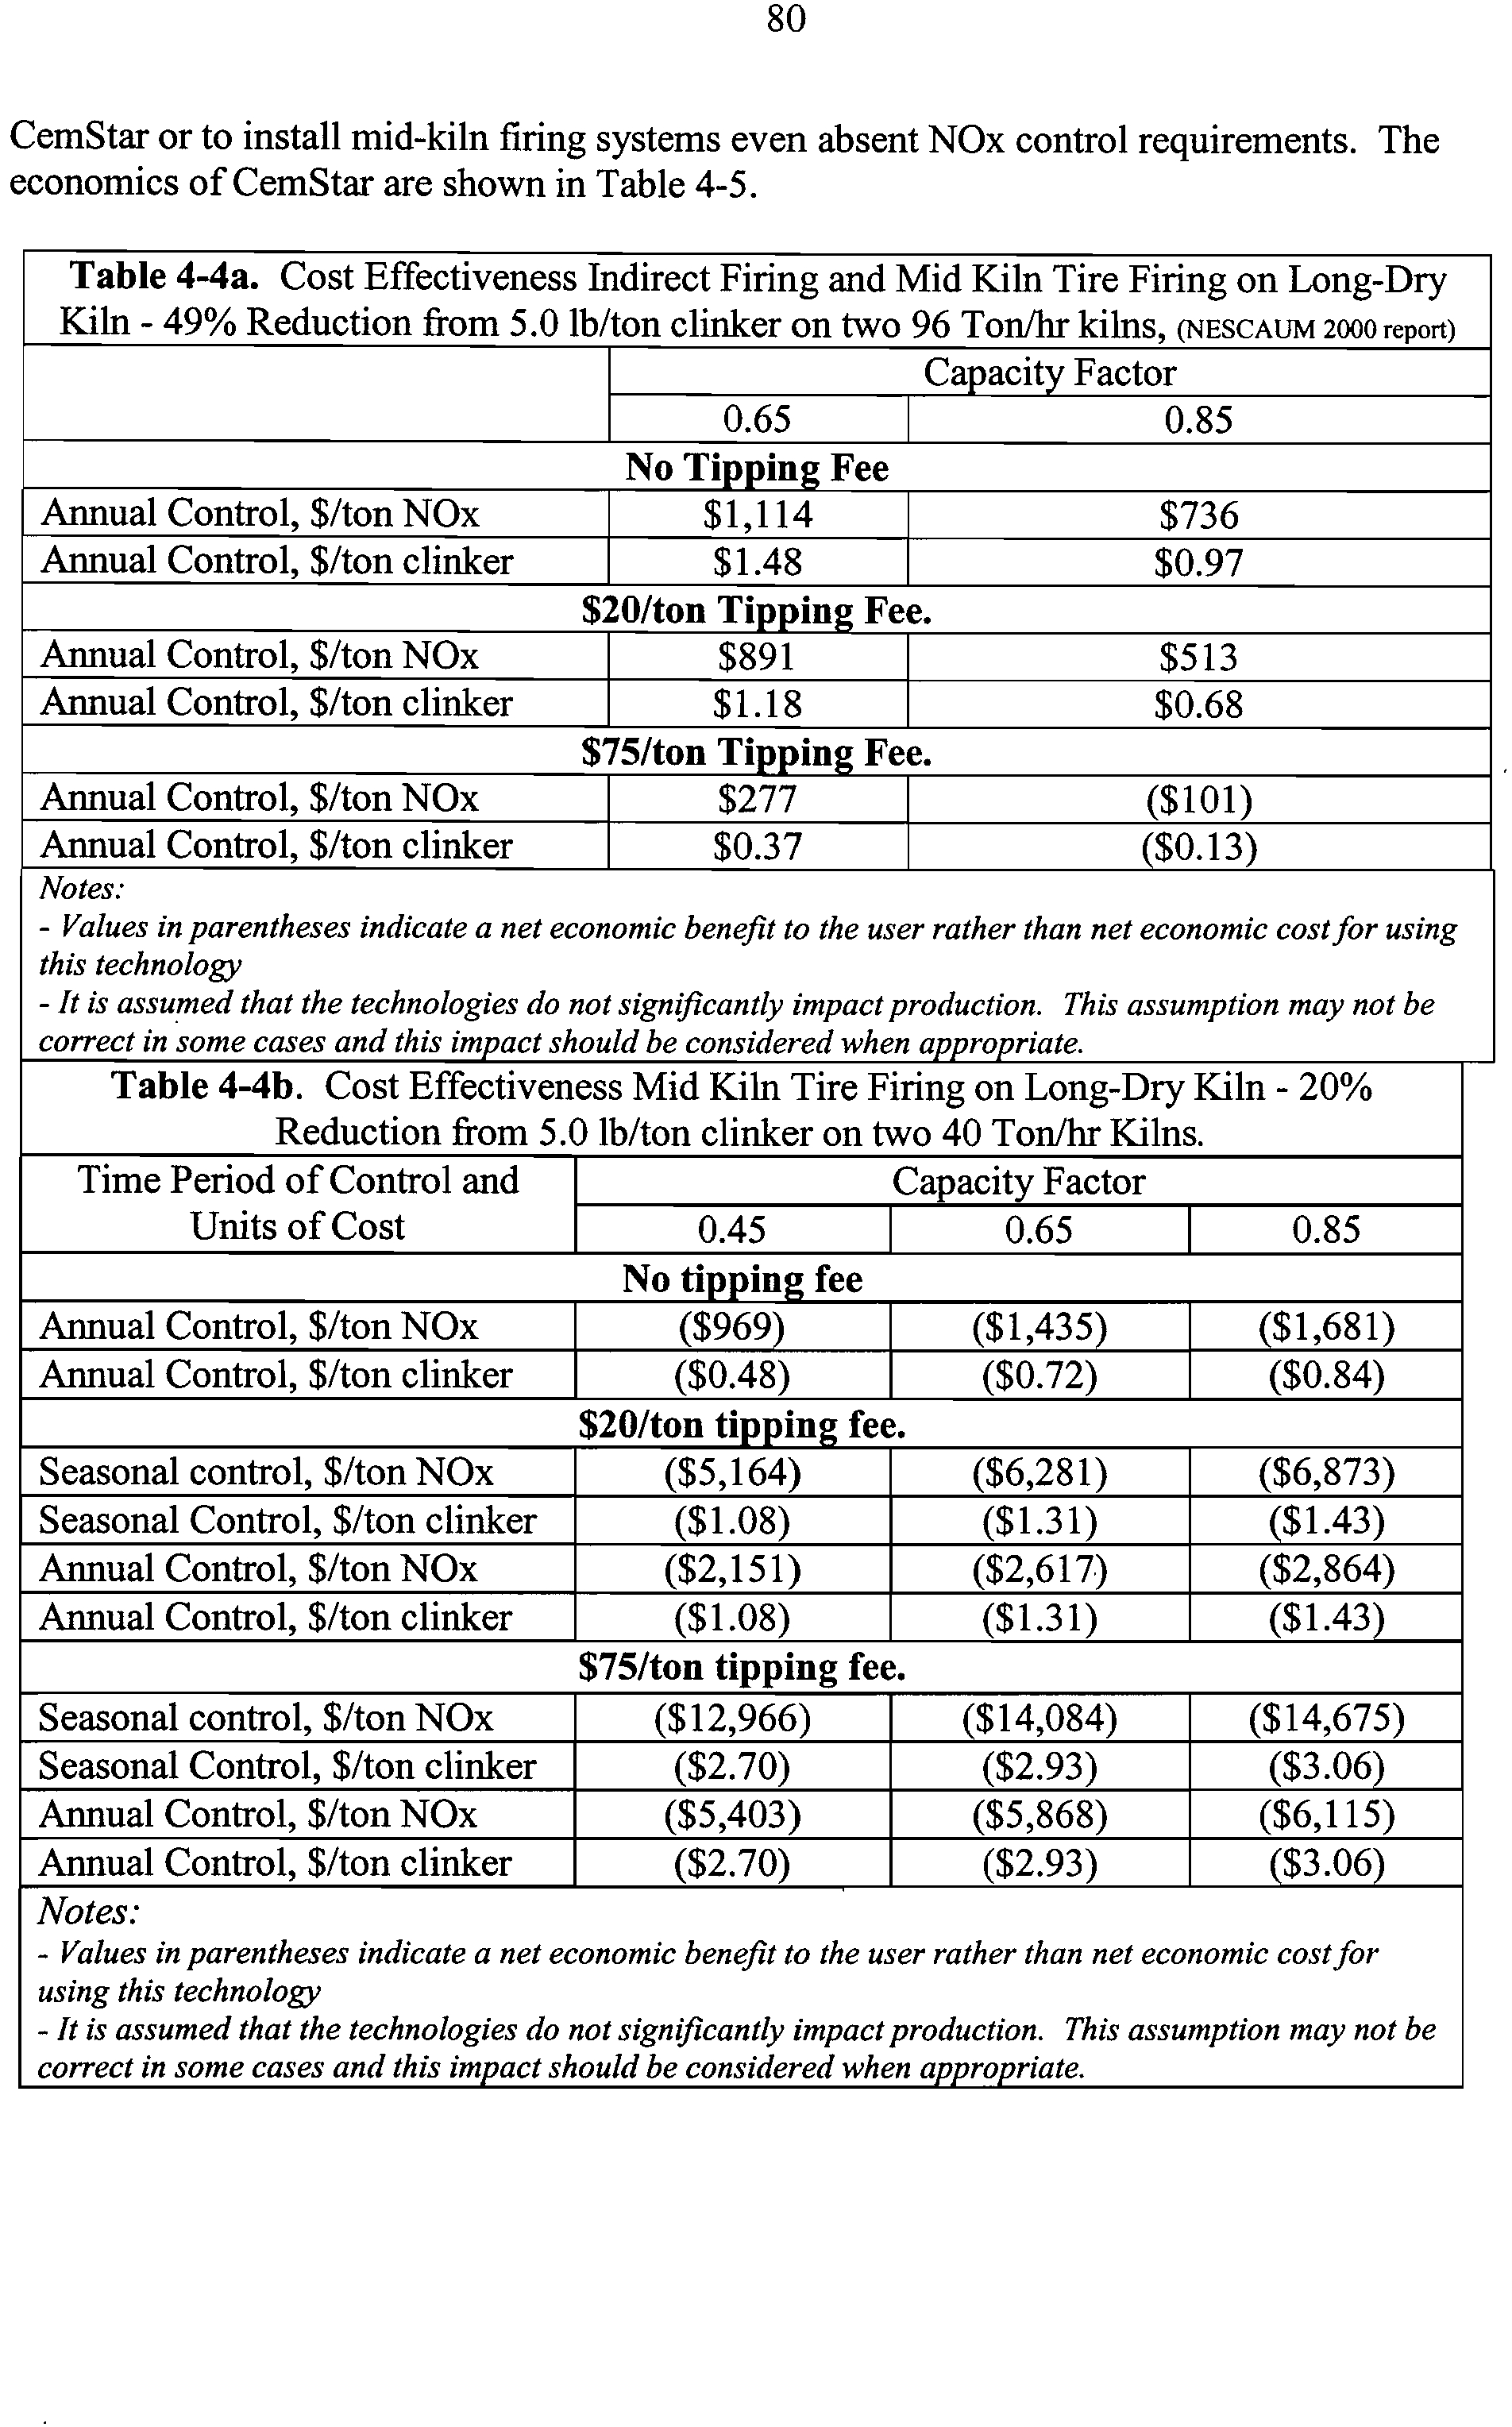
4-4a
Cost Effectiveness Indirect Firing and Mid Kiln Tire Firing on
80
Long-Dry Kiln - 49% Reduction from 5.0 lb/ton clinker
on two 96 Ton/hr kilns
4-4b
Cost Effectiveness Mid Kiln Tire Firing on Long-Dry Kiln - 20%
80
Reduction from 5.0 lb/ton clinker on two 40 Ton/hr Kilns
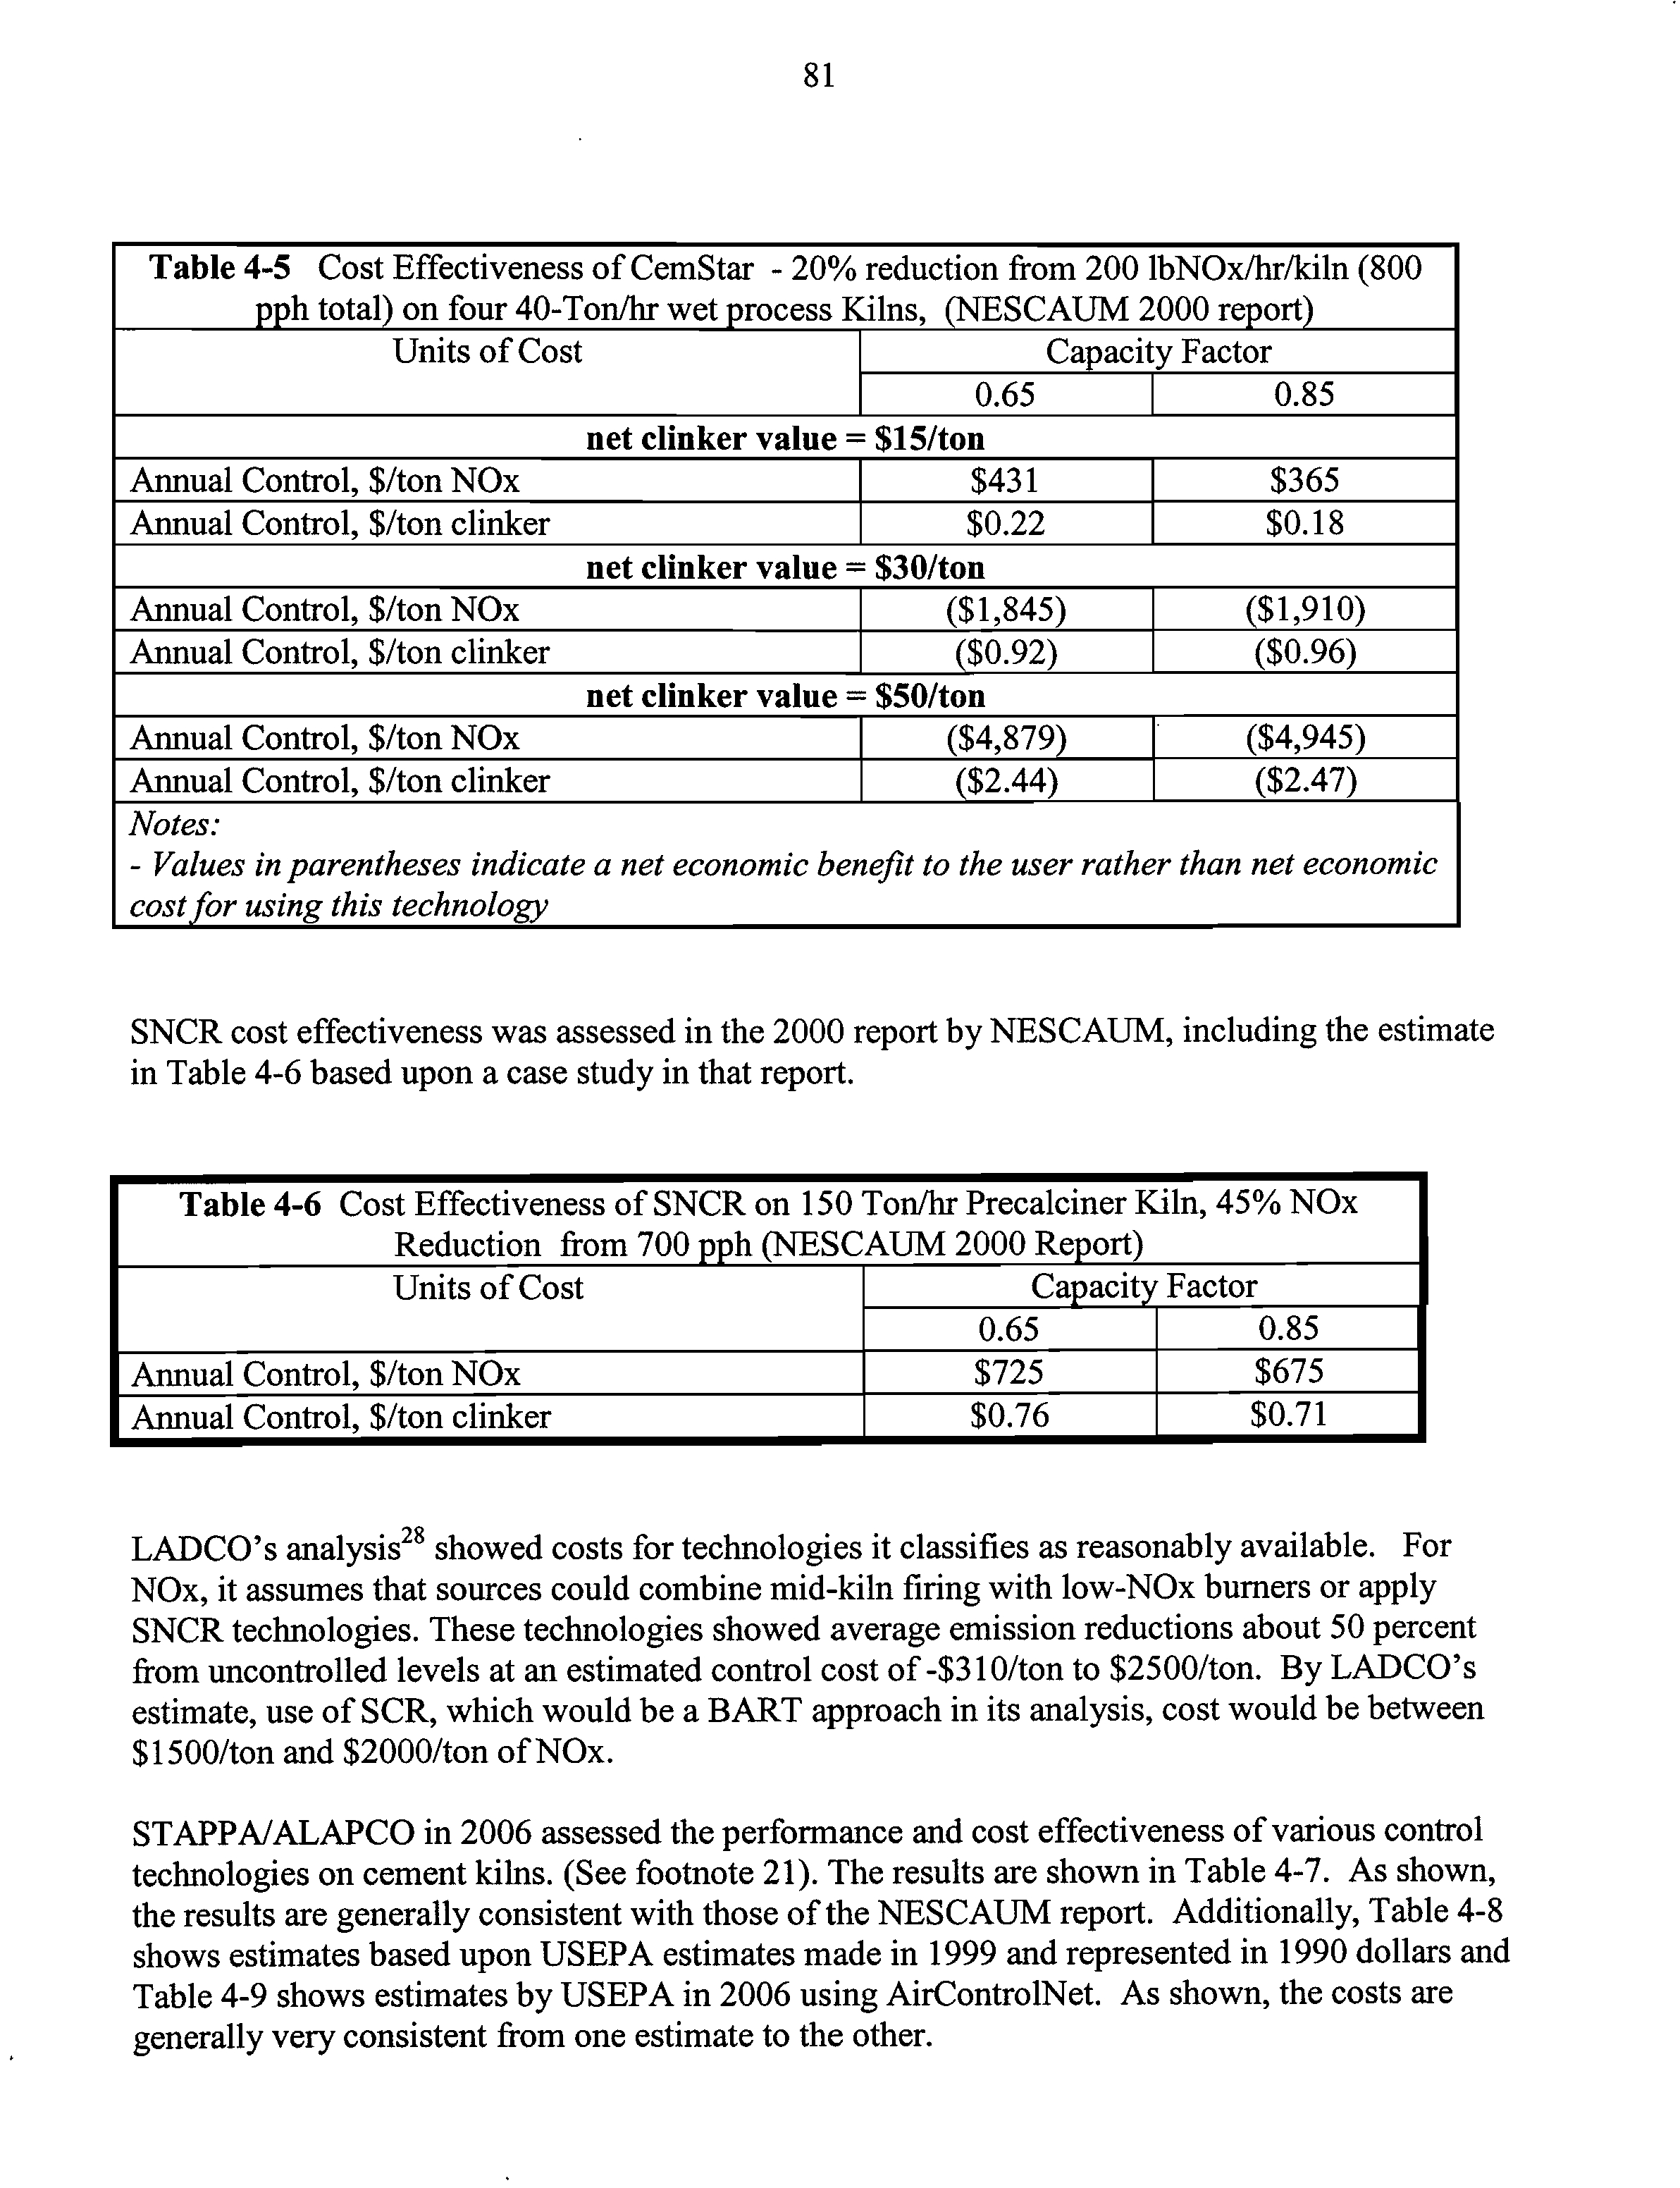
4-5
Cost Effectiveness of CemStar - 20% reduction from 200
lbNOx/hr/kiln (800 pph total) on four 40-Ton/hr wet
process Kilns
81
4-6
Cost Effectiveness of SNCR on 150 Ton/hr Precalciner Kiln,
45% NOx Reduction from 700 pph
81
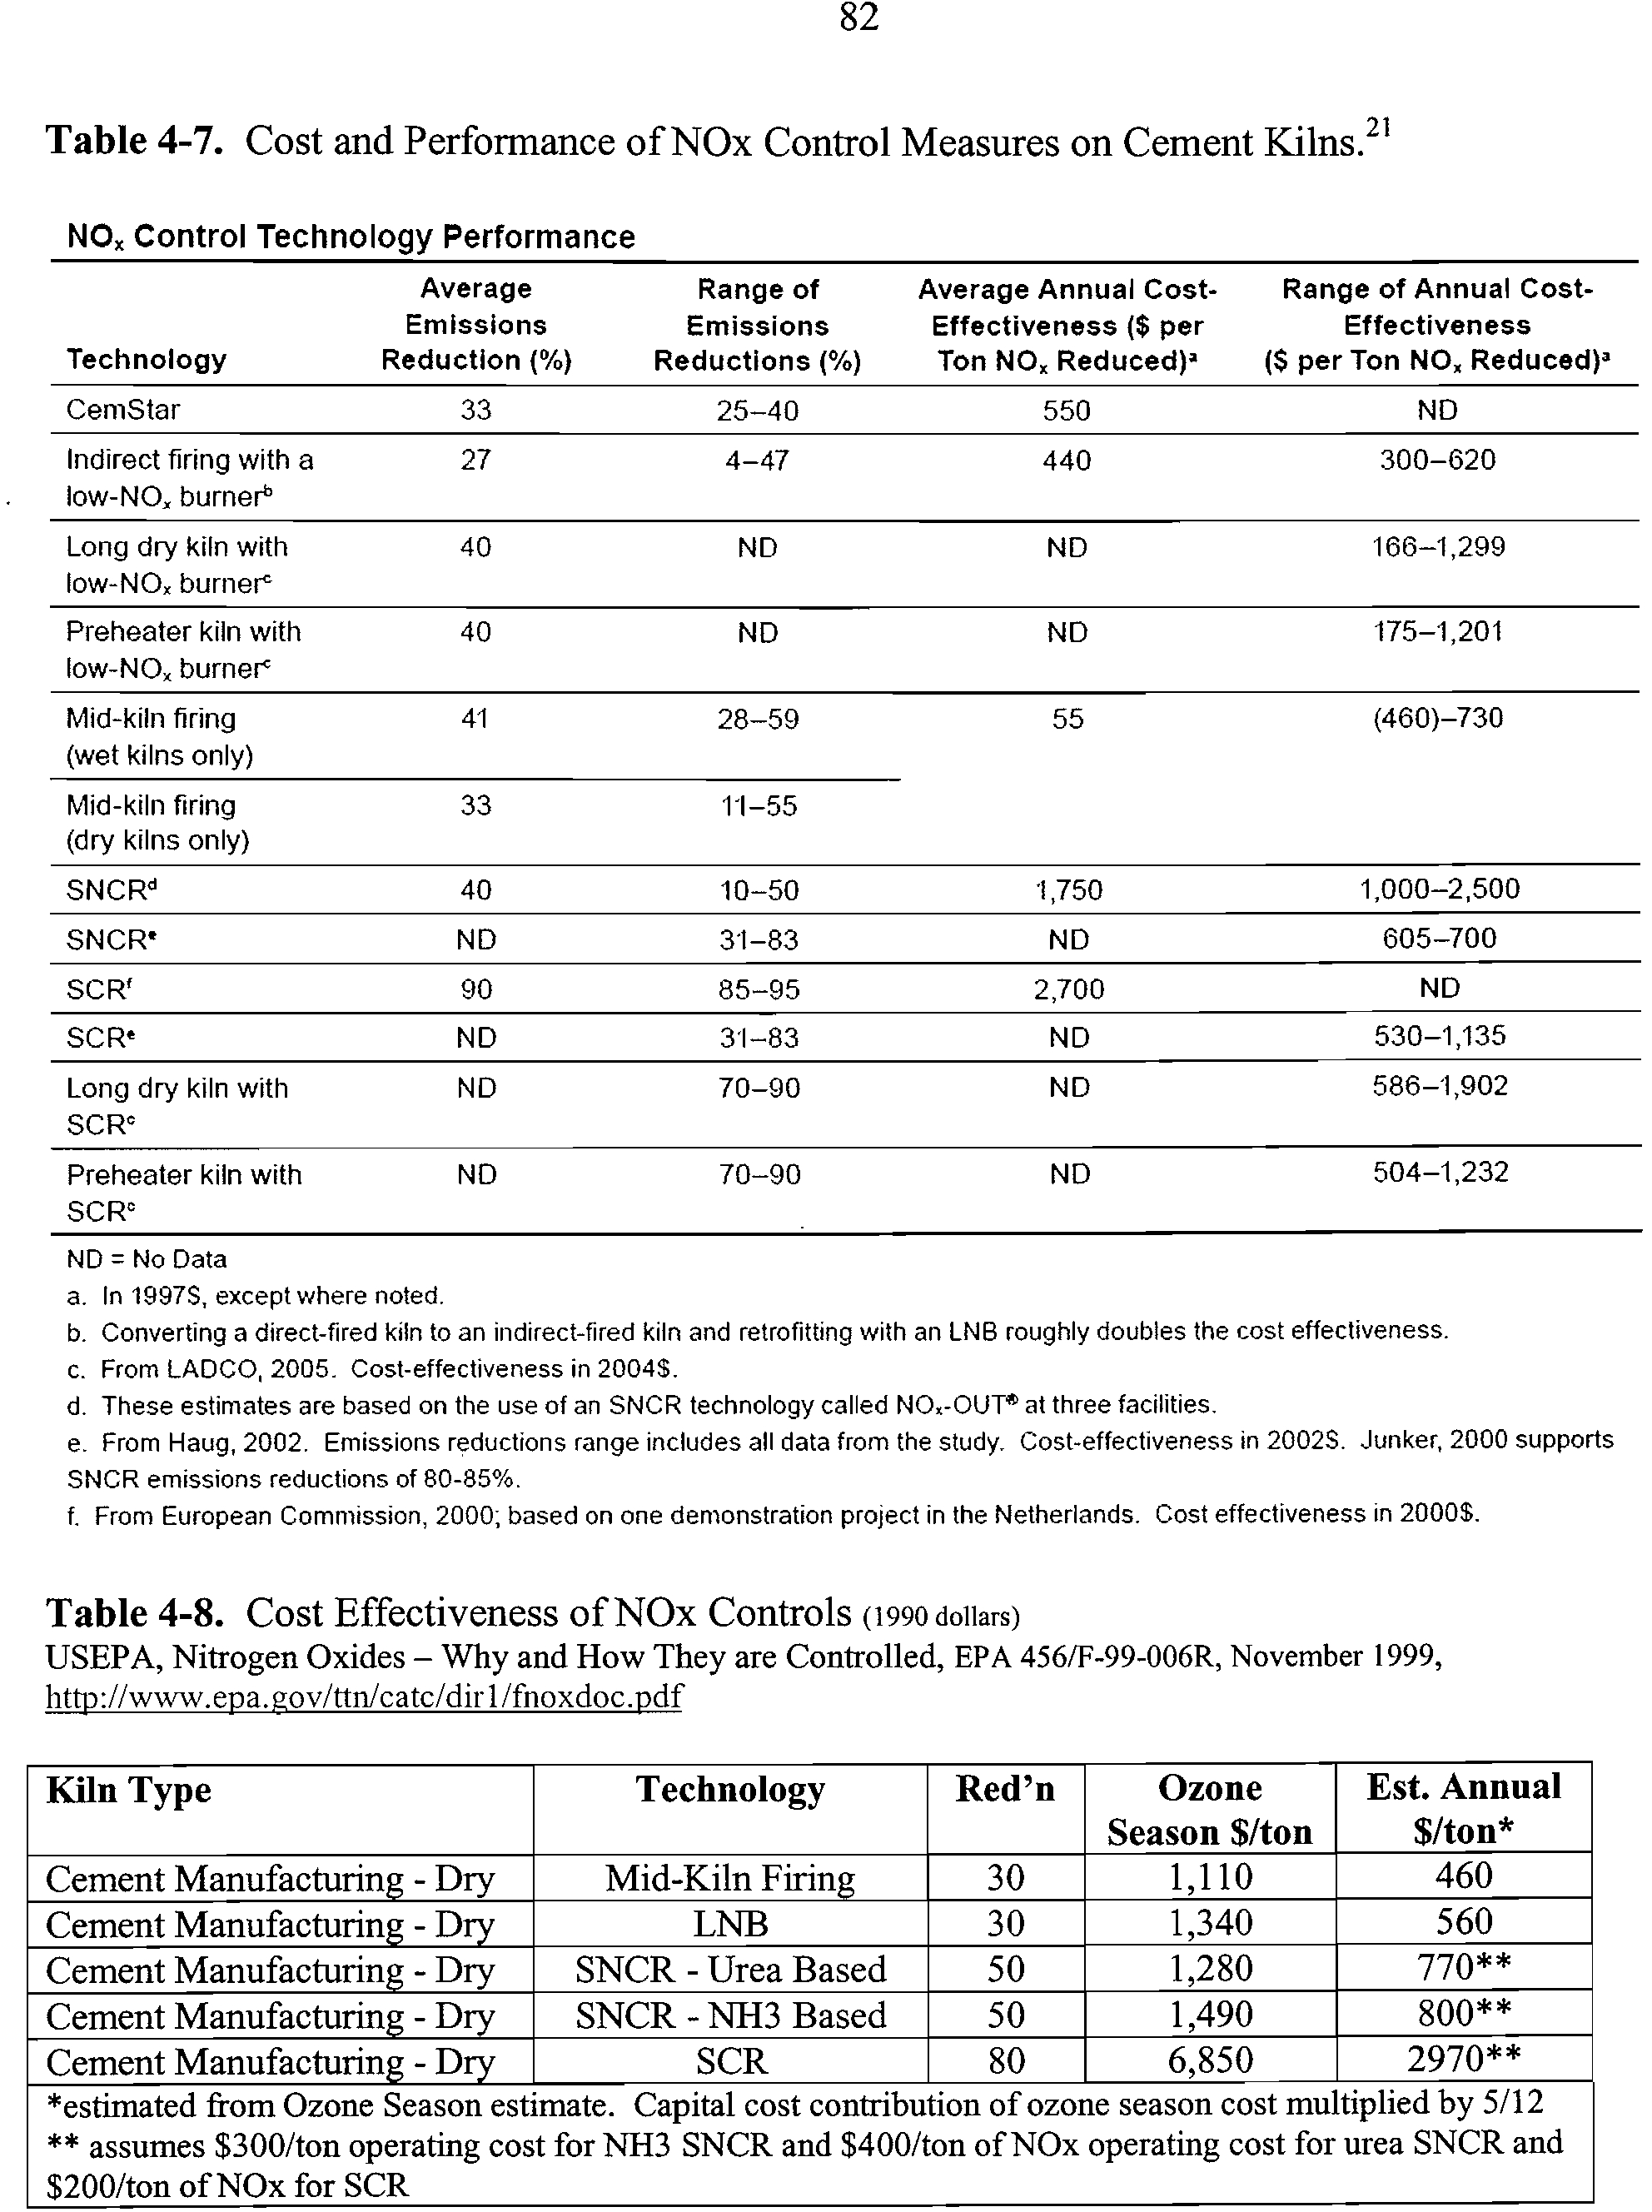
4-7
Cost and Performance of NOx Control measures on cement kilns
82
4-8
Cost Effectiveness of NOx Controls
82
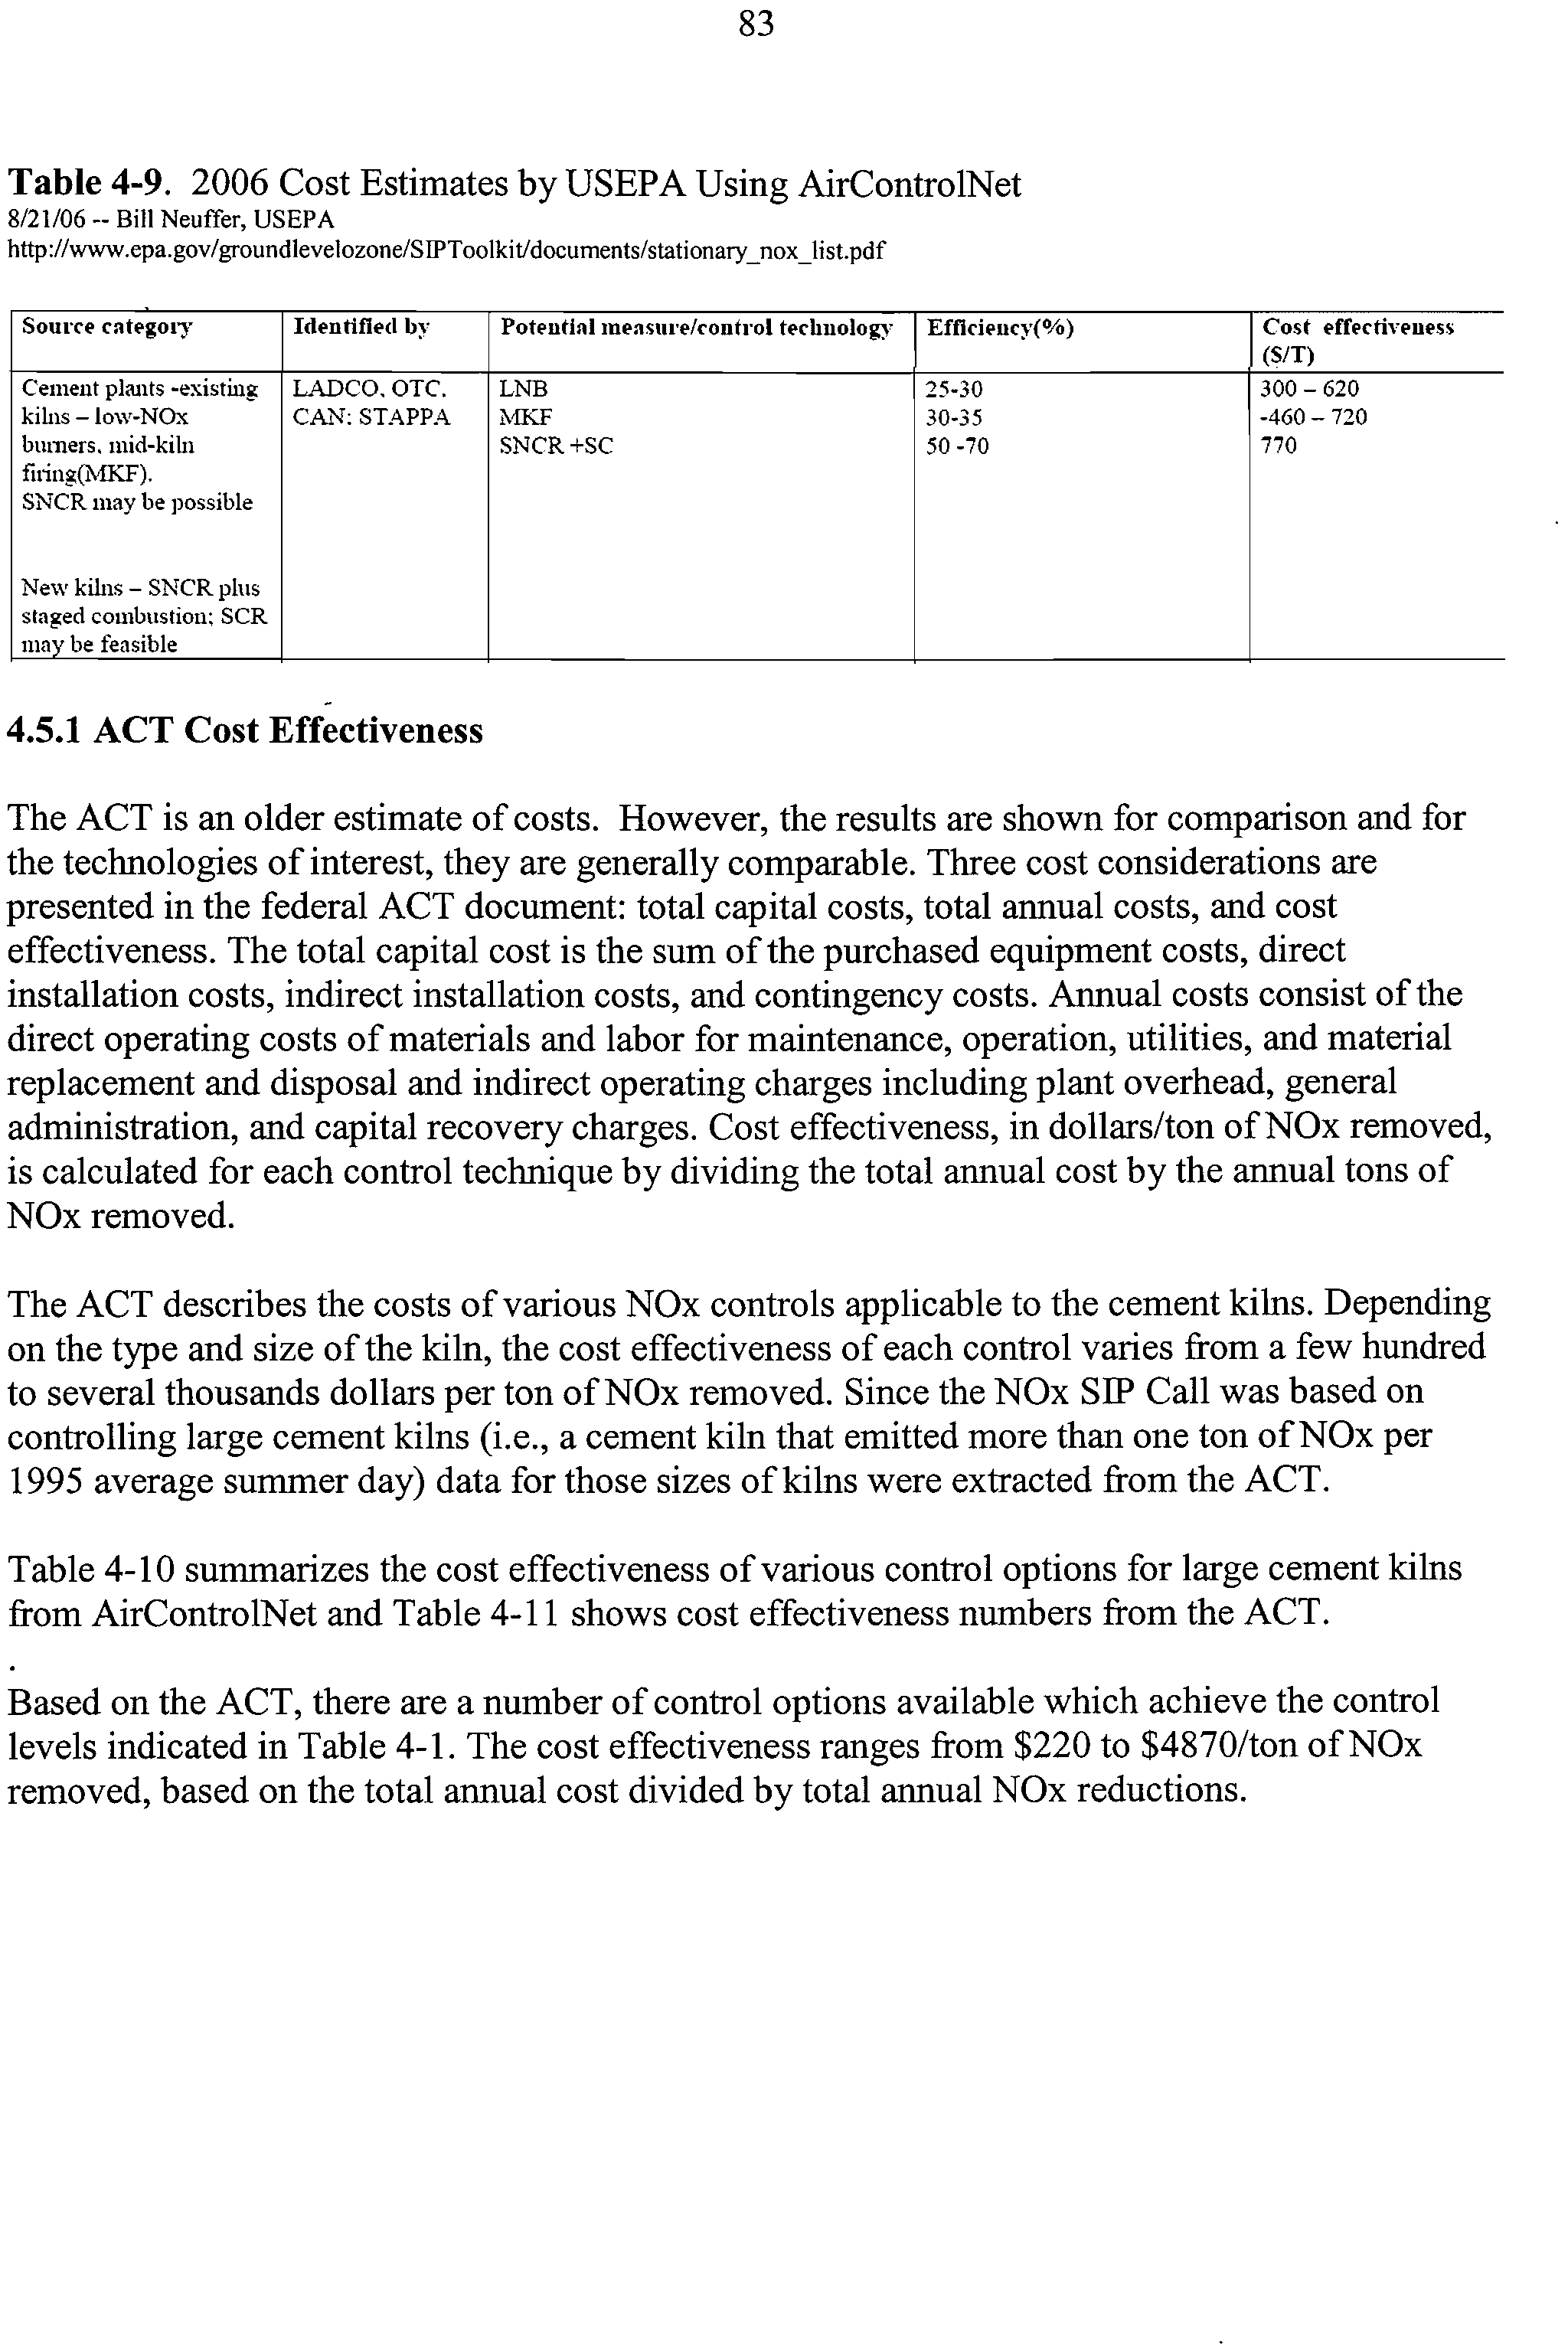
4-9
2006 Cost Estimates by USEPA Using AirControlNet
83
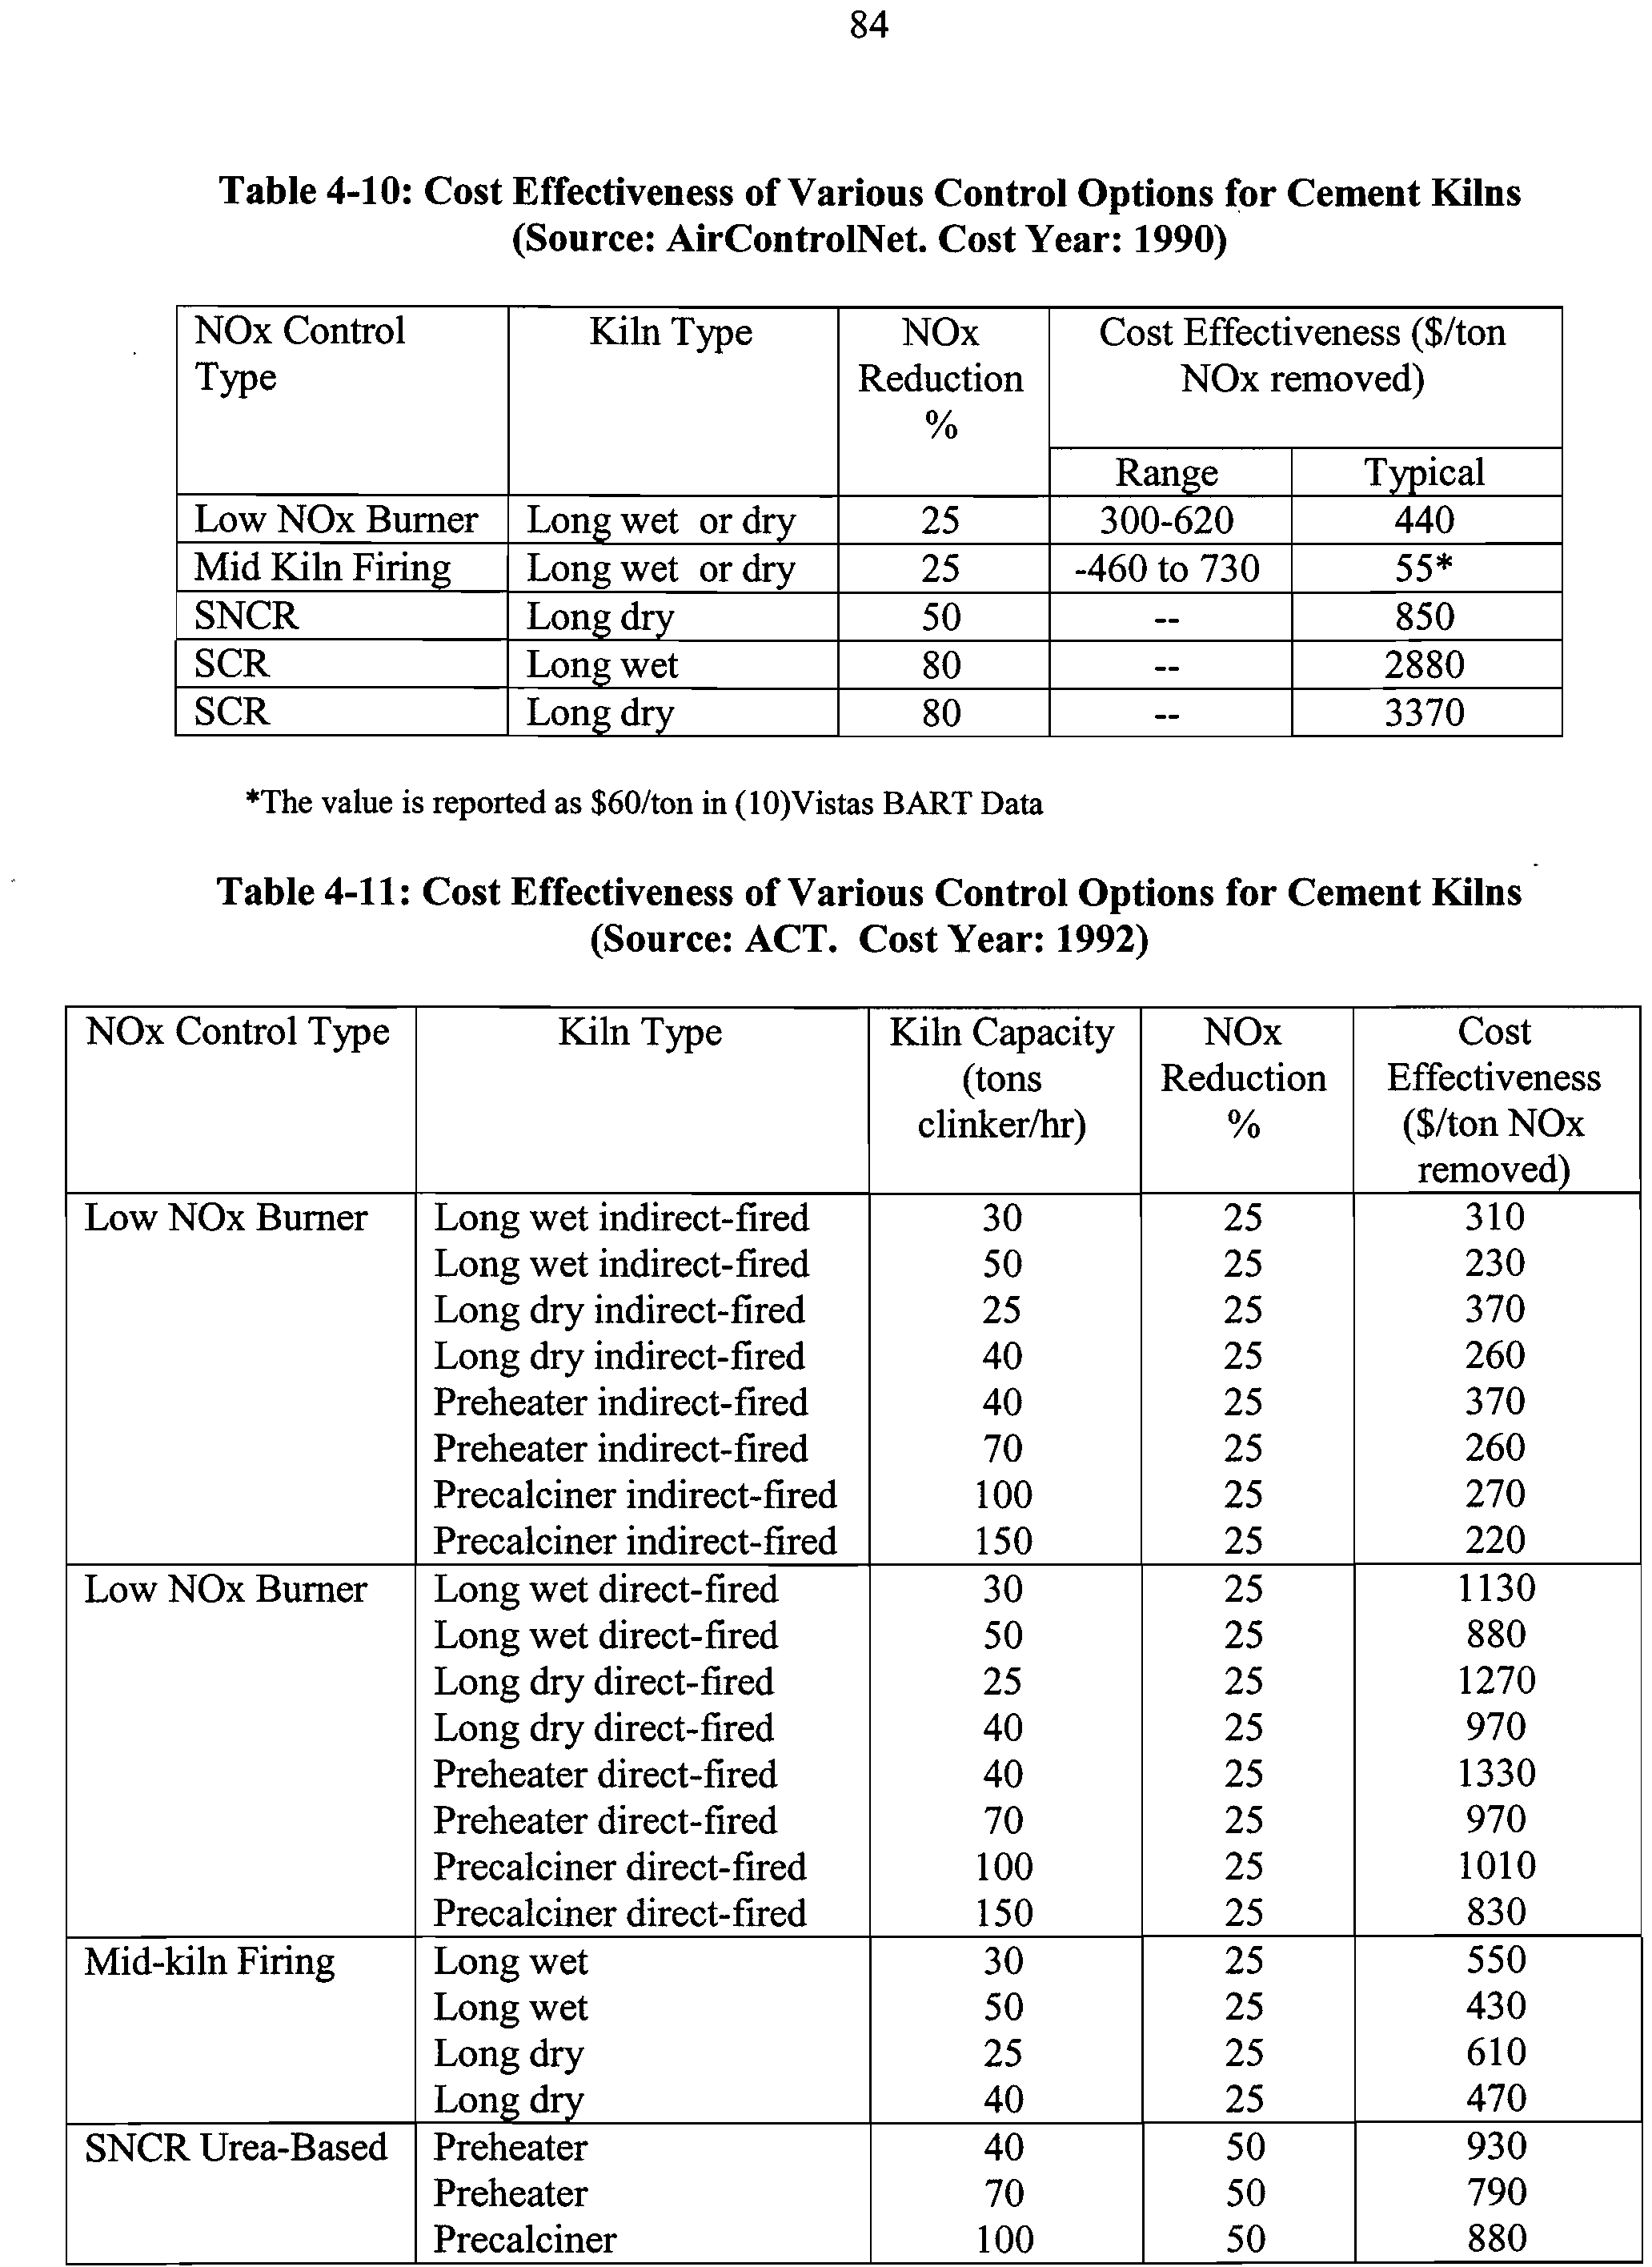
4-10
Cost Effectiveness of Various Control Options for Cement Kilns
84
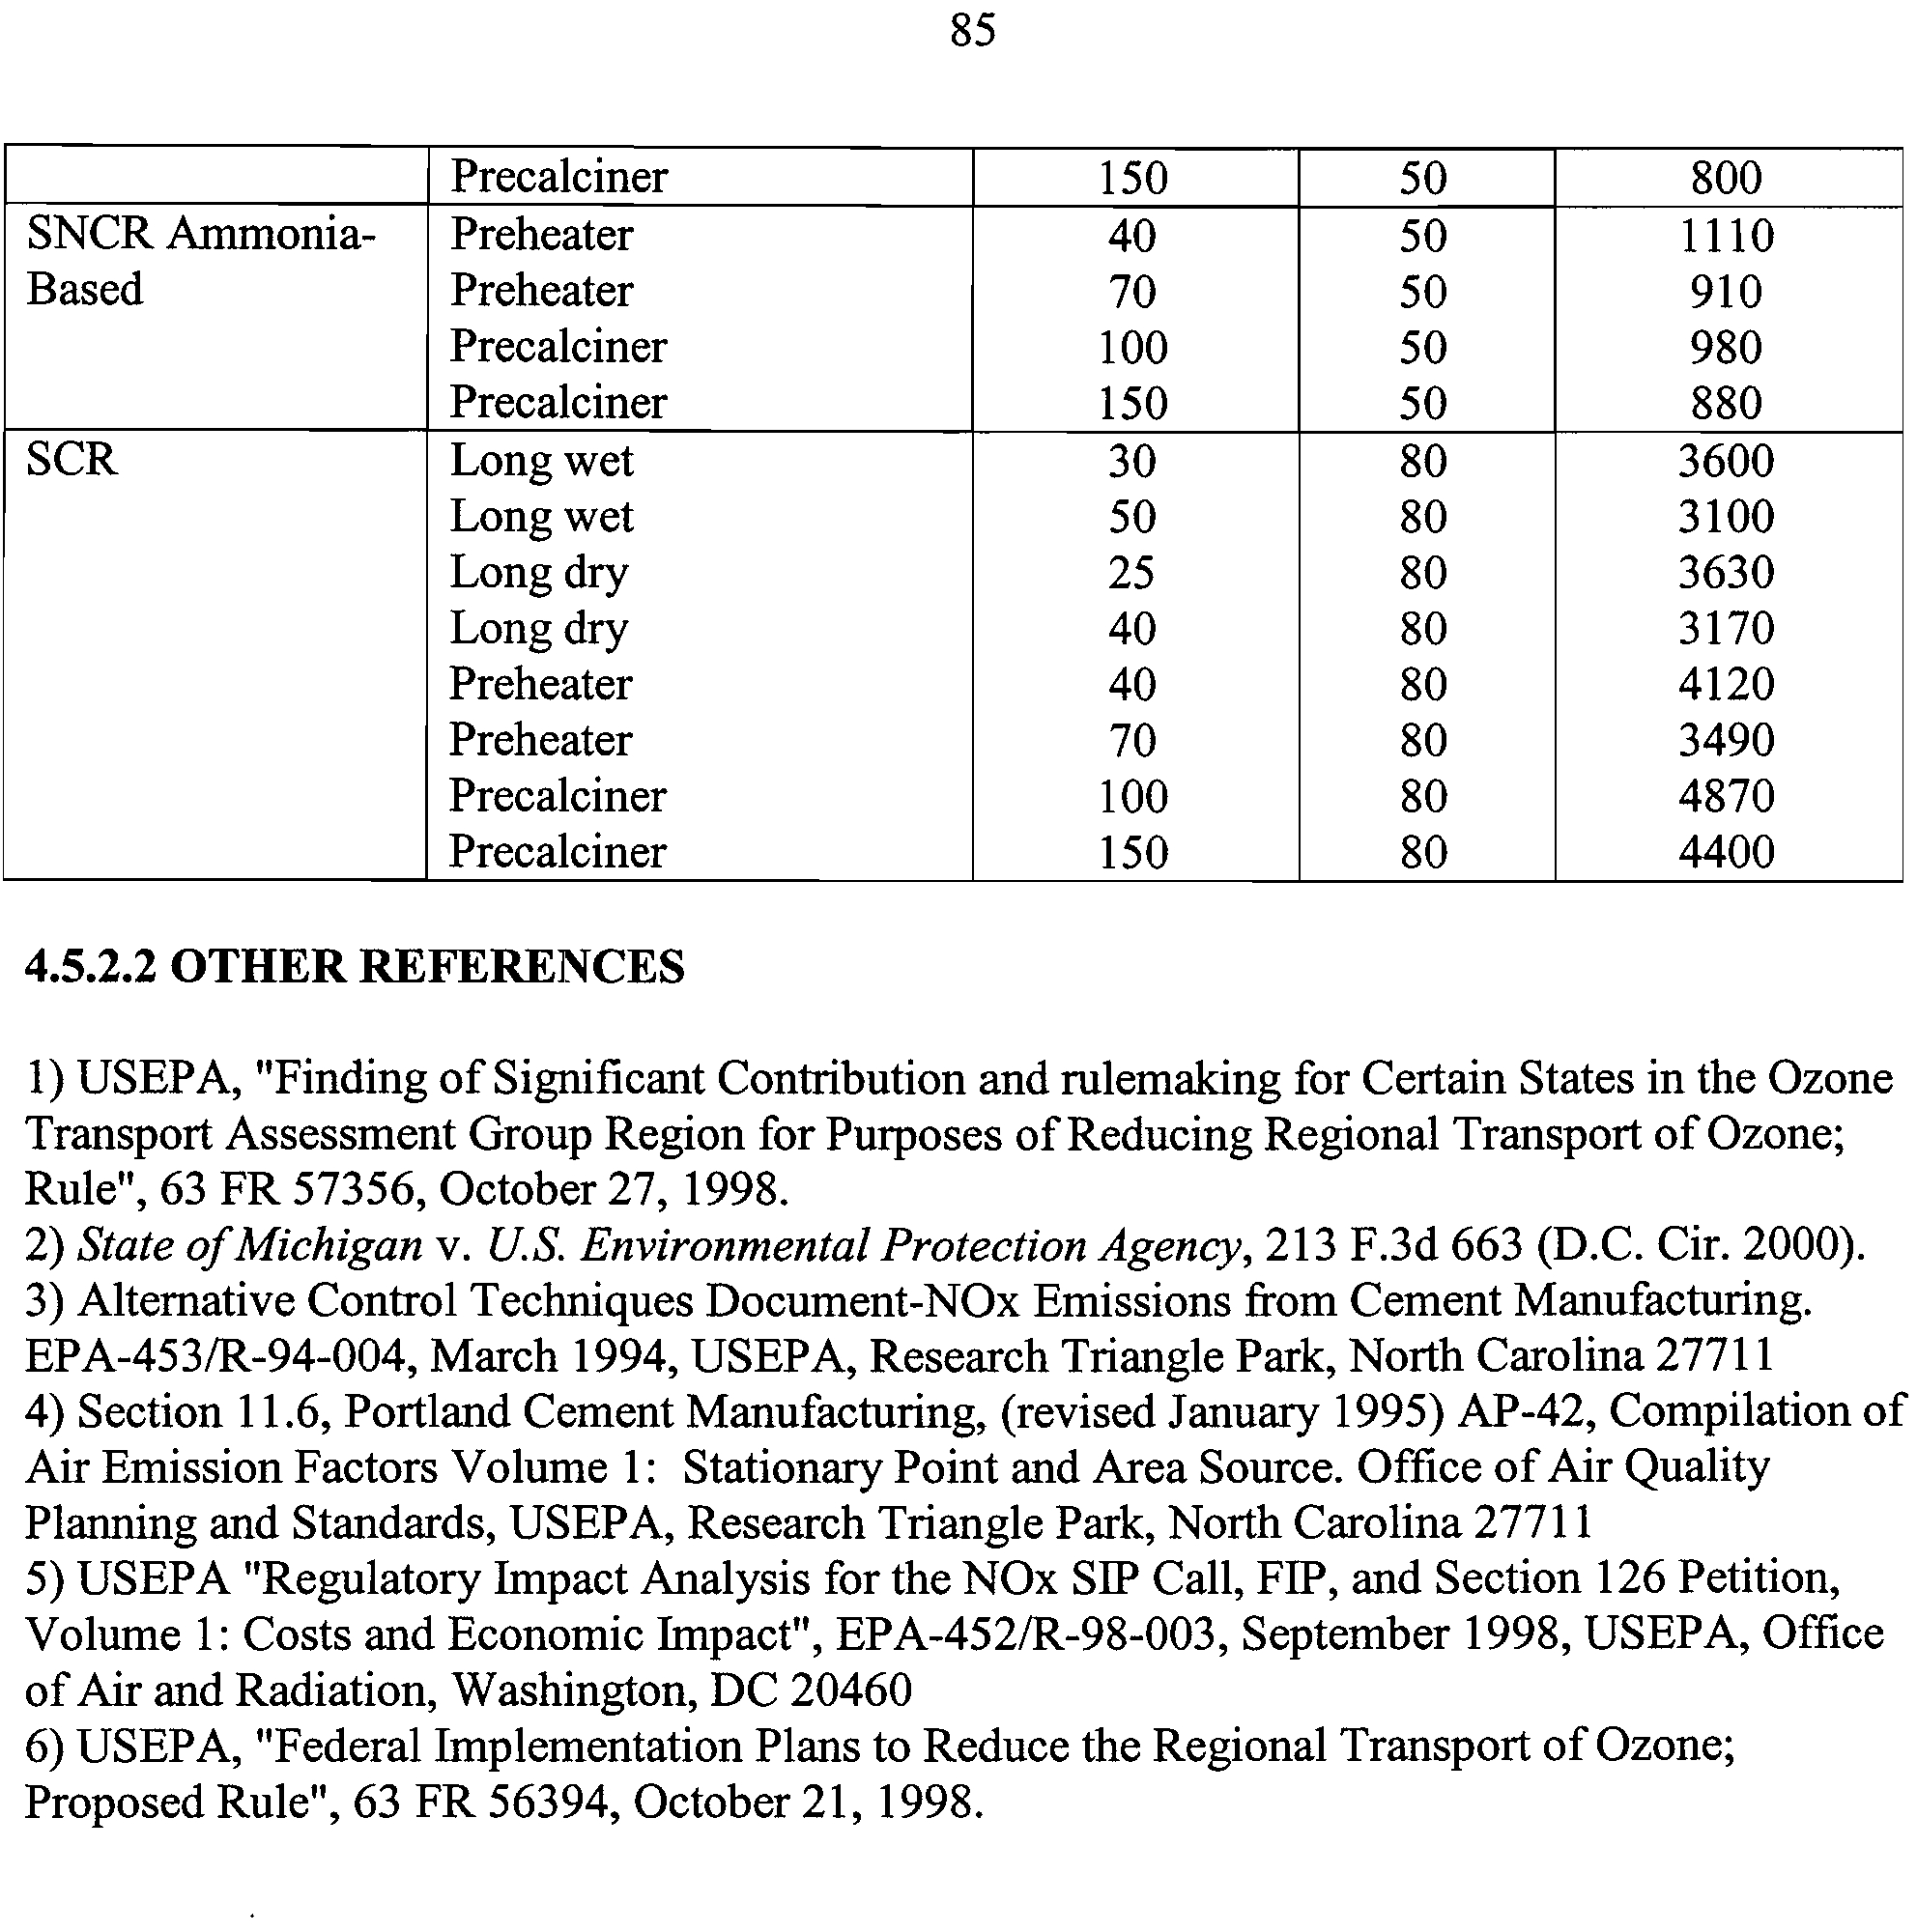
4-11
Cost Effectiveness of Various Control Options for Cement Kilns
84
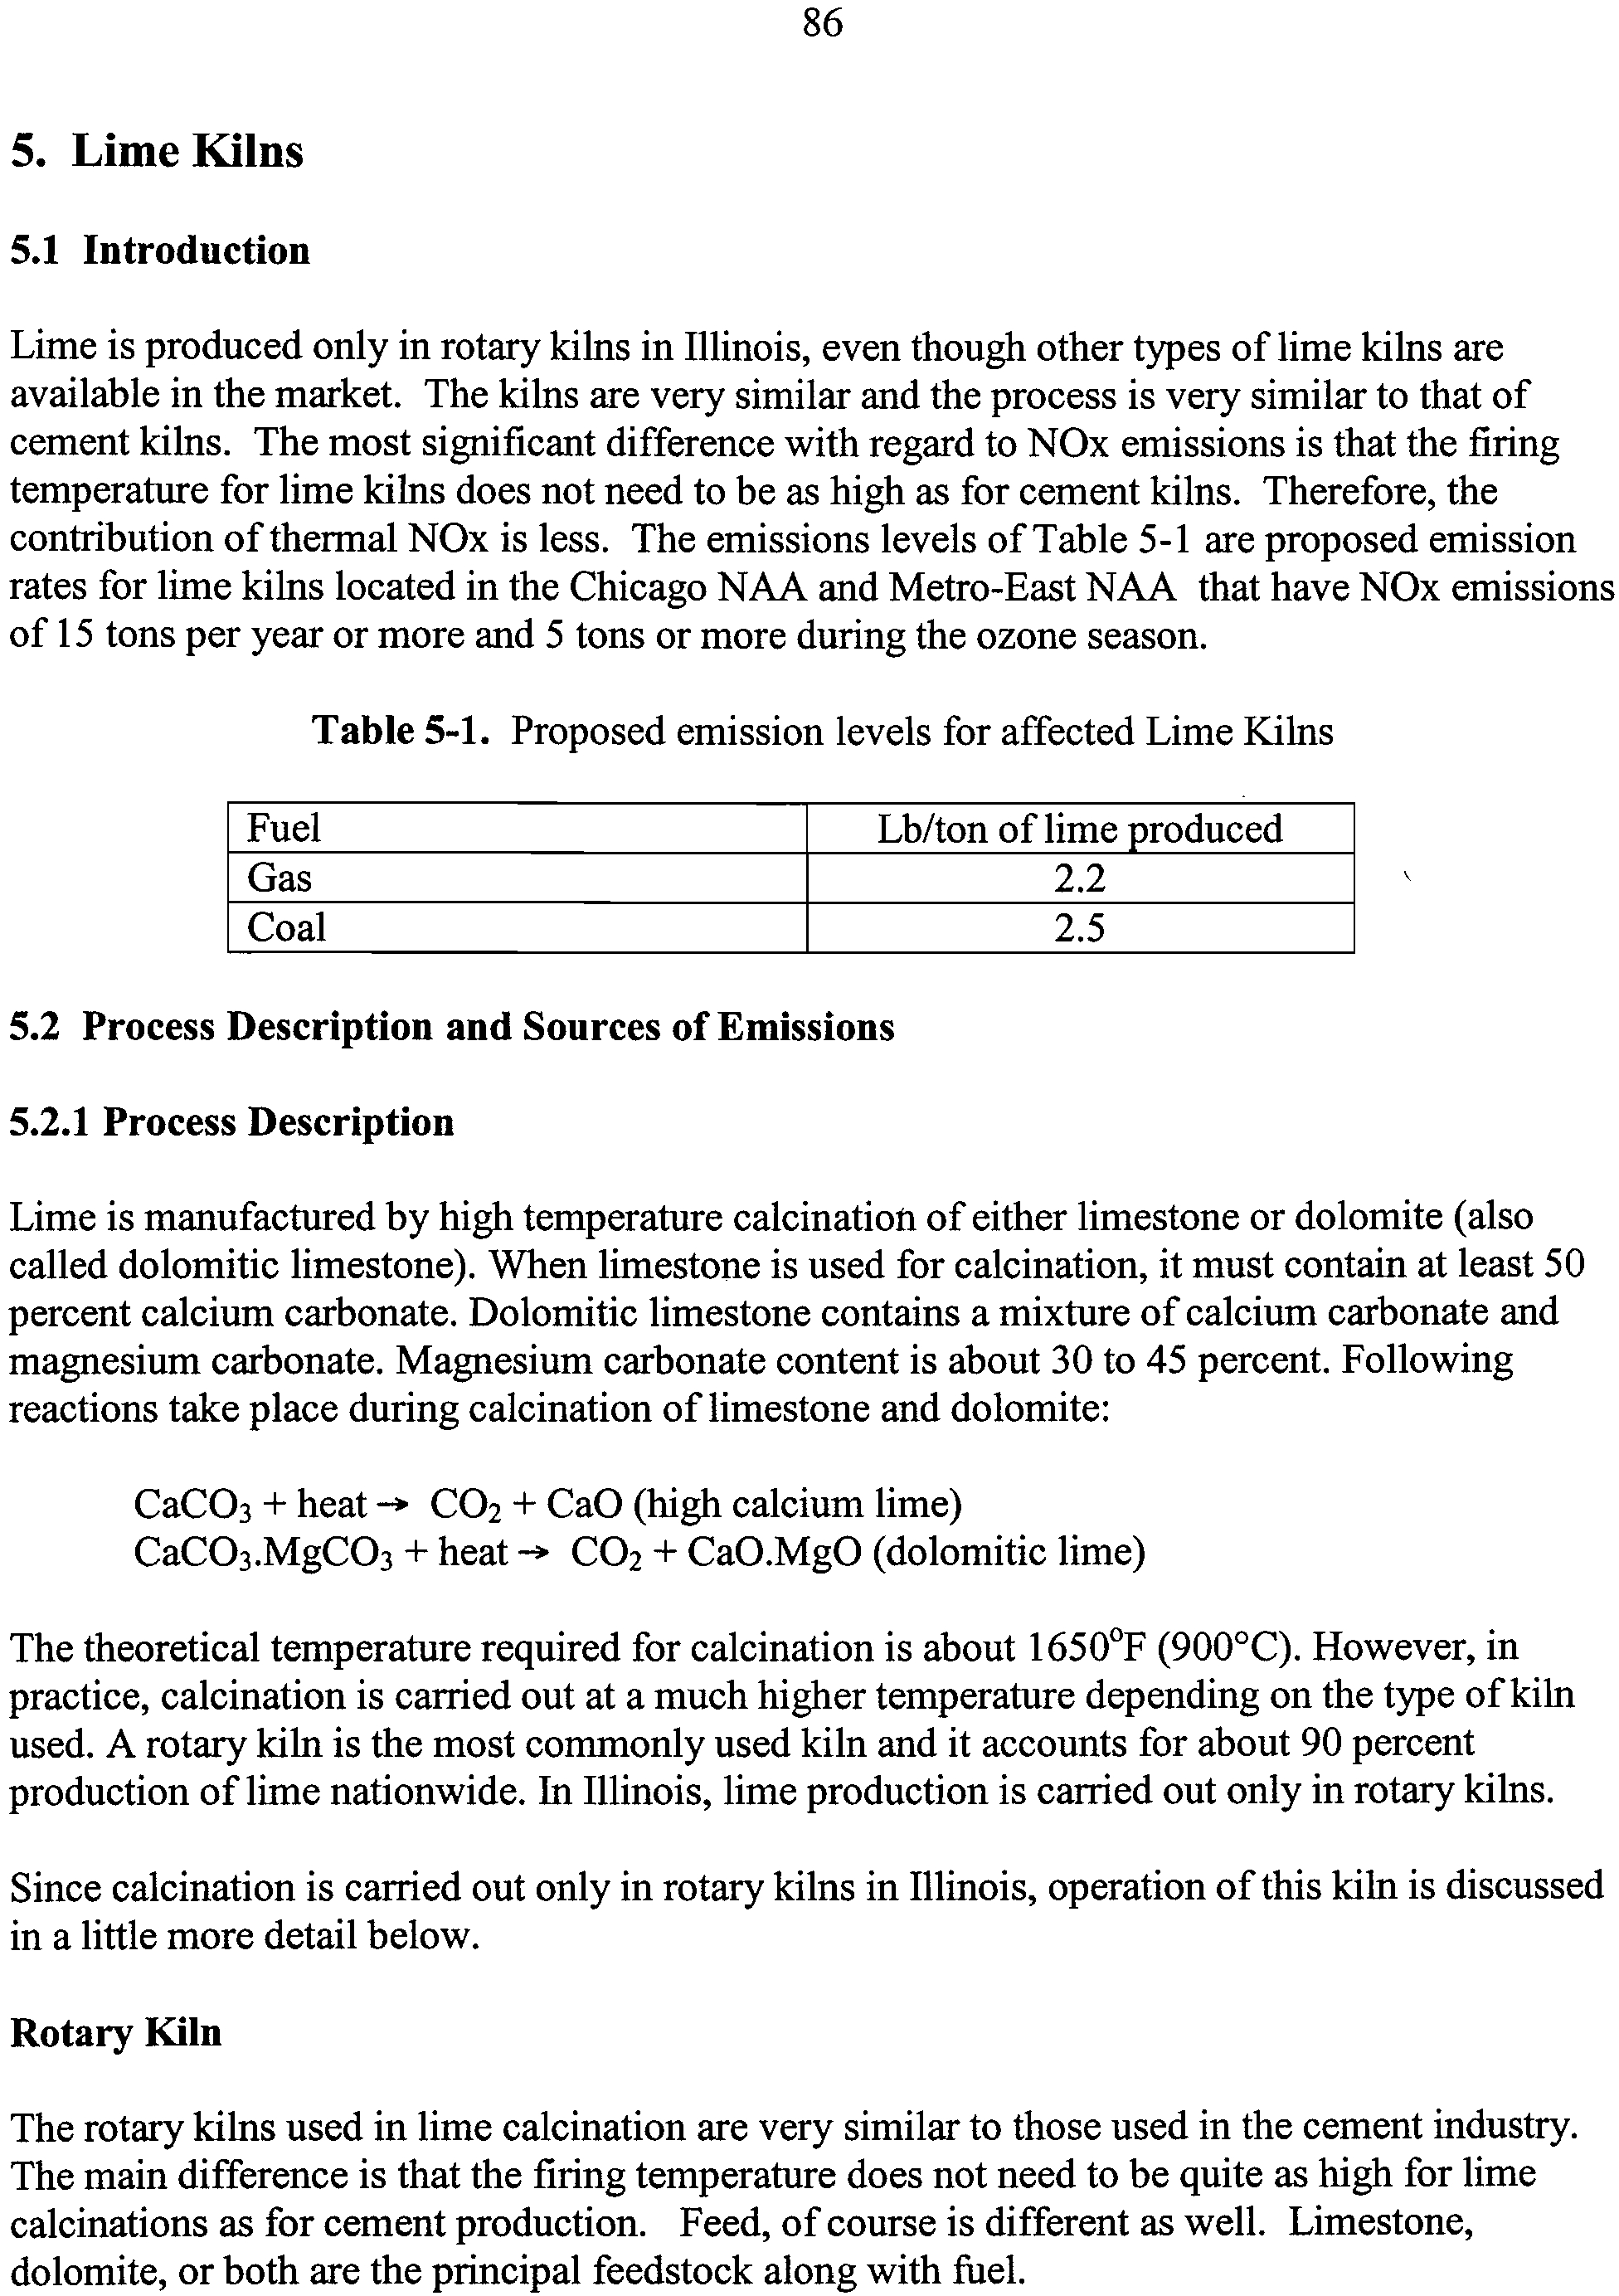
5-1
Proposed emission limits for Lime Kilns greater than 50
86
MIVIBtu/hr
5-2
NOx Emission Factors for Different Kiln Types
88
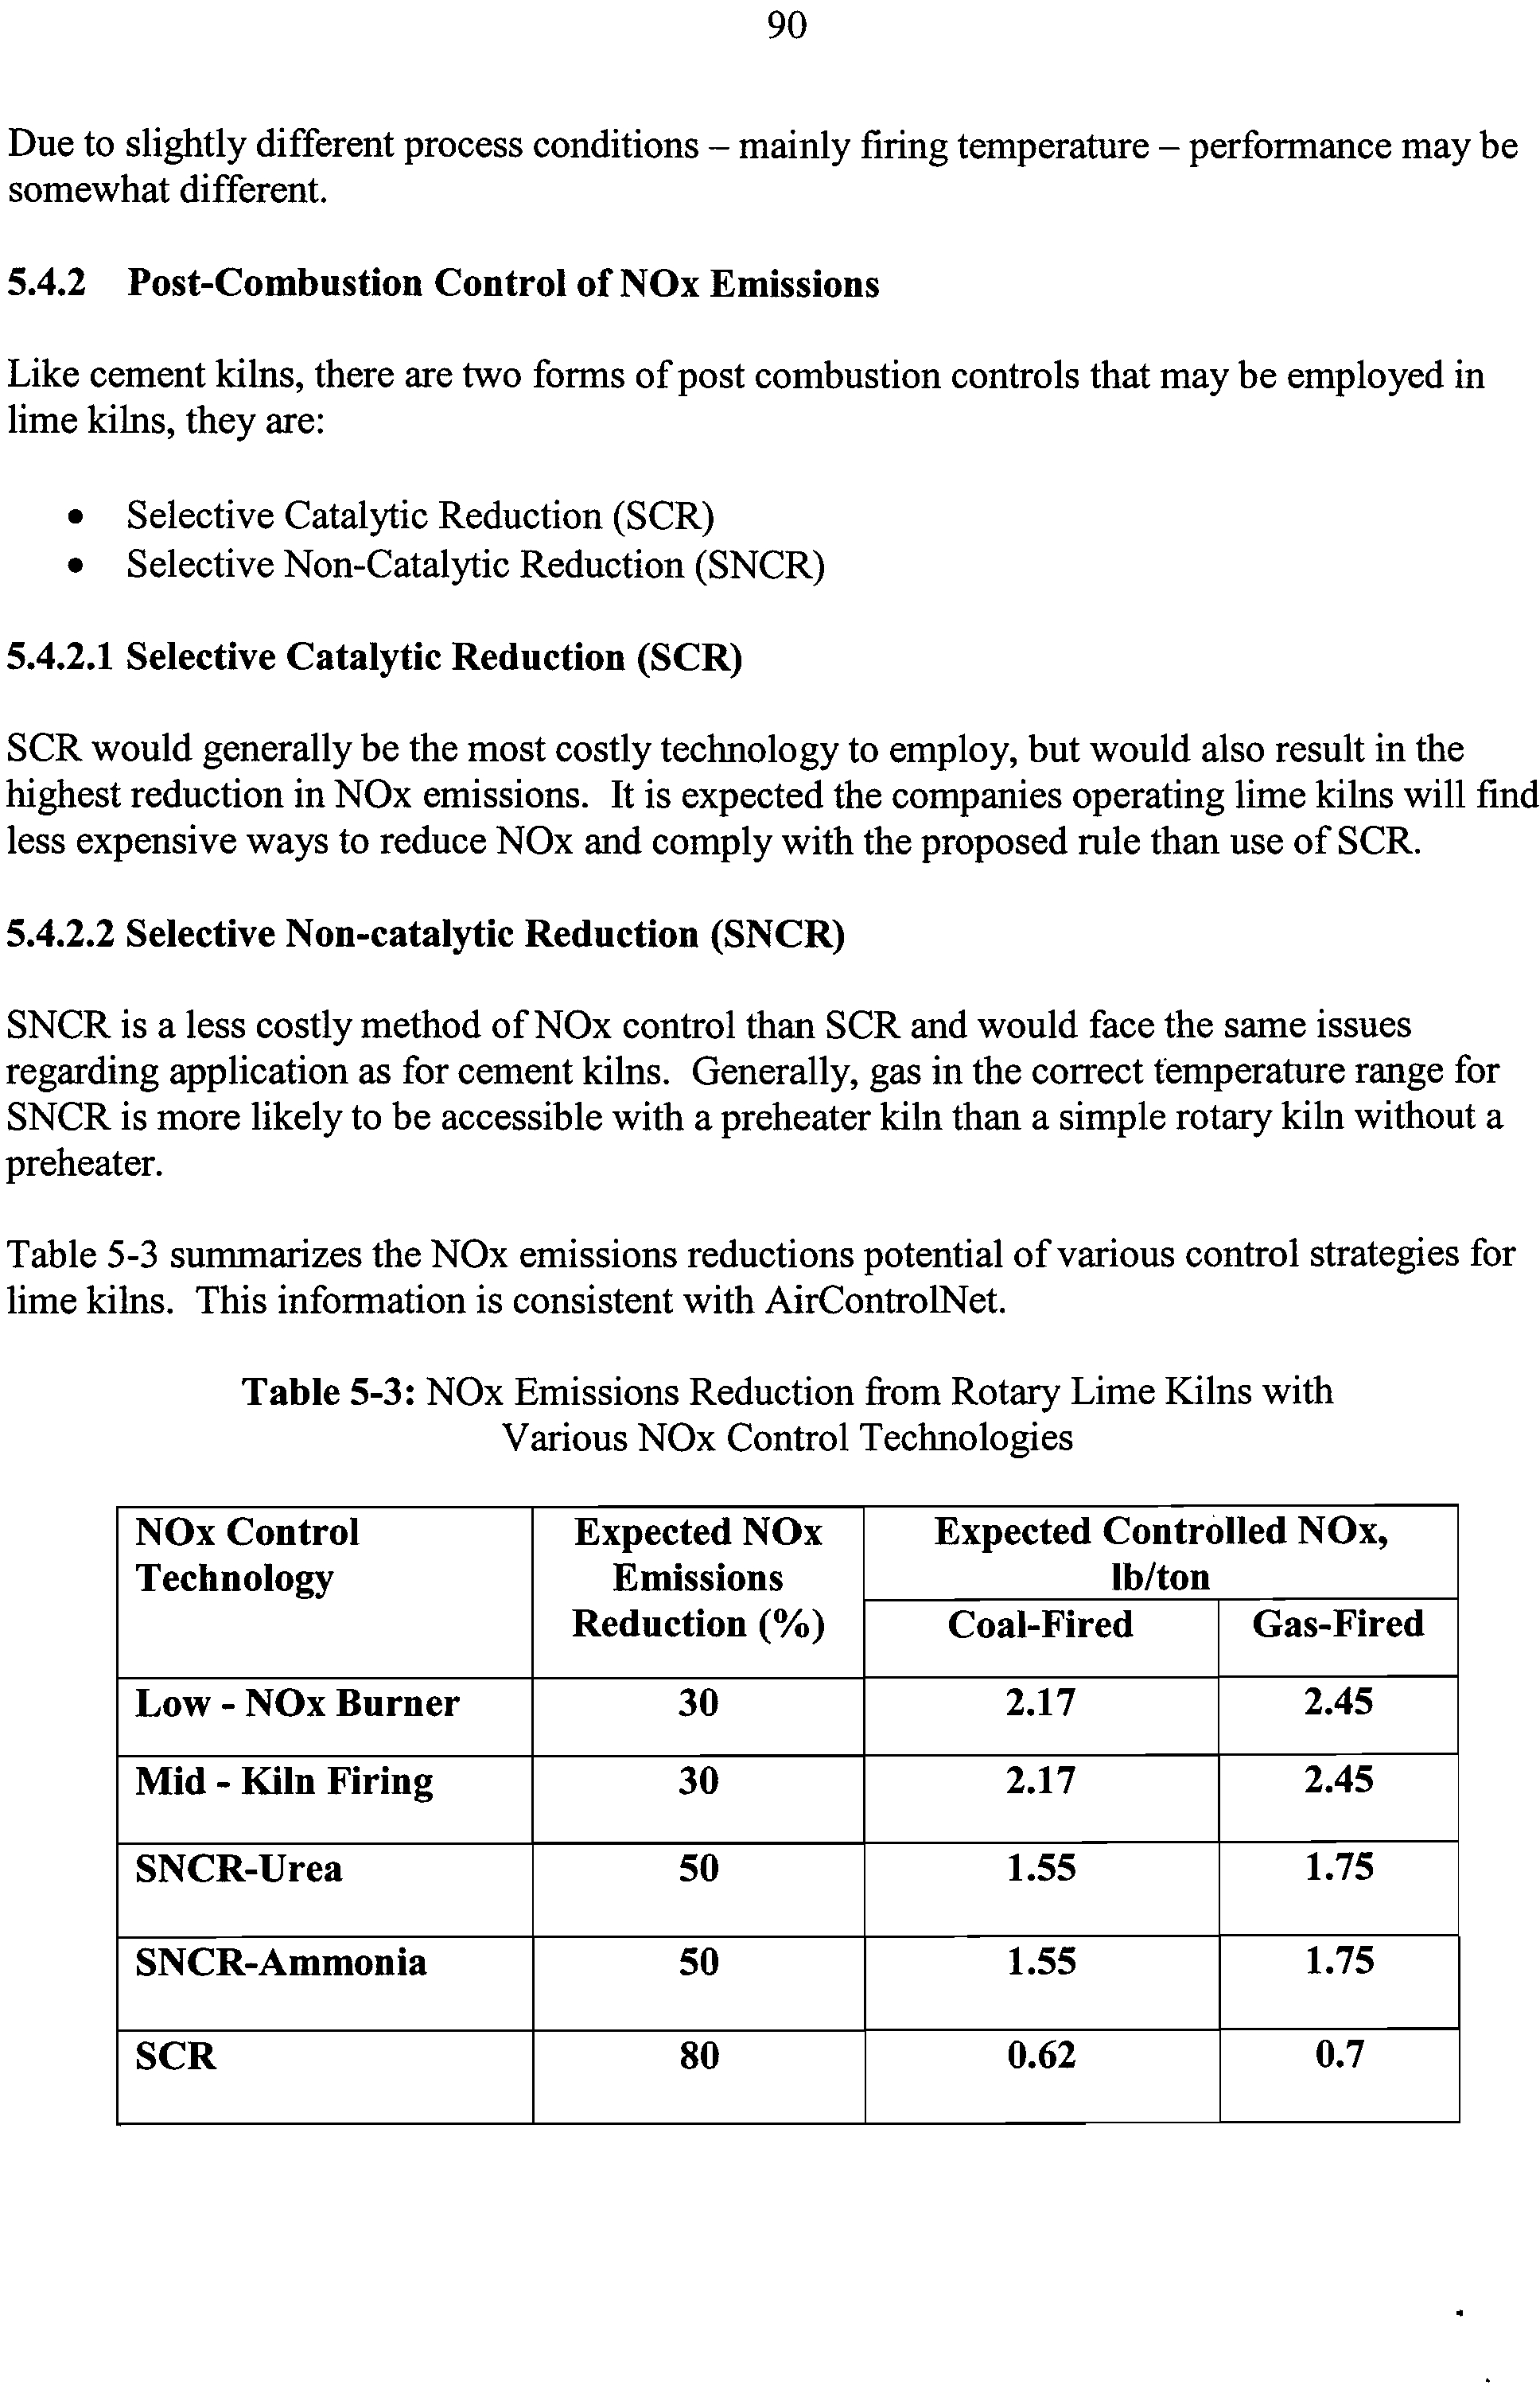
5-3
NOx Emissions Reduction from Rotary Lime Kilns with Various
90
NOx Control Technologies
5-4
Cost Effectiveness of Various Control Options for Rotary Lime
91
Kilns
5-5
Estimates From USEPA - 1999
91
5-6
Cost Estimates from USEPA - 2006
91
6-1
Proposed Emission Limits for Reheat, Annealing and
92
Galvanizing Furnaces
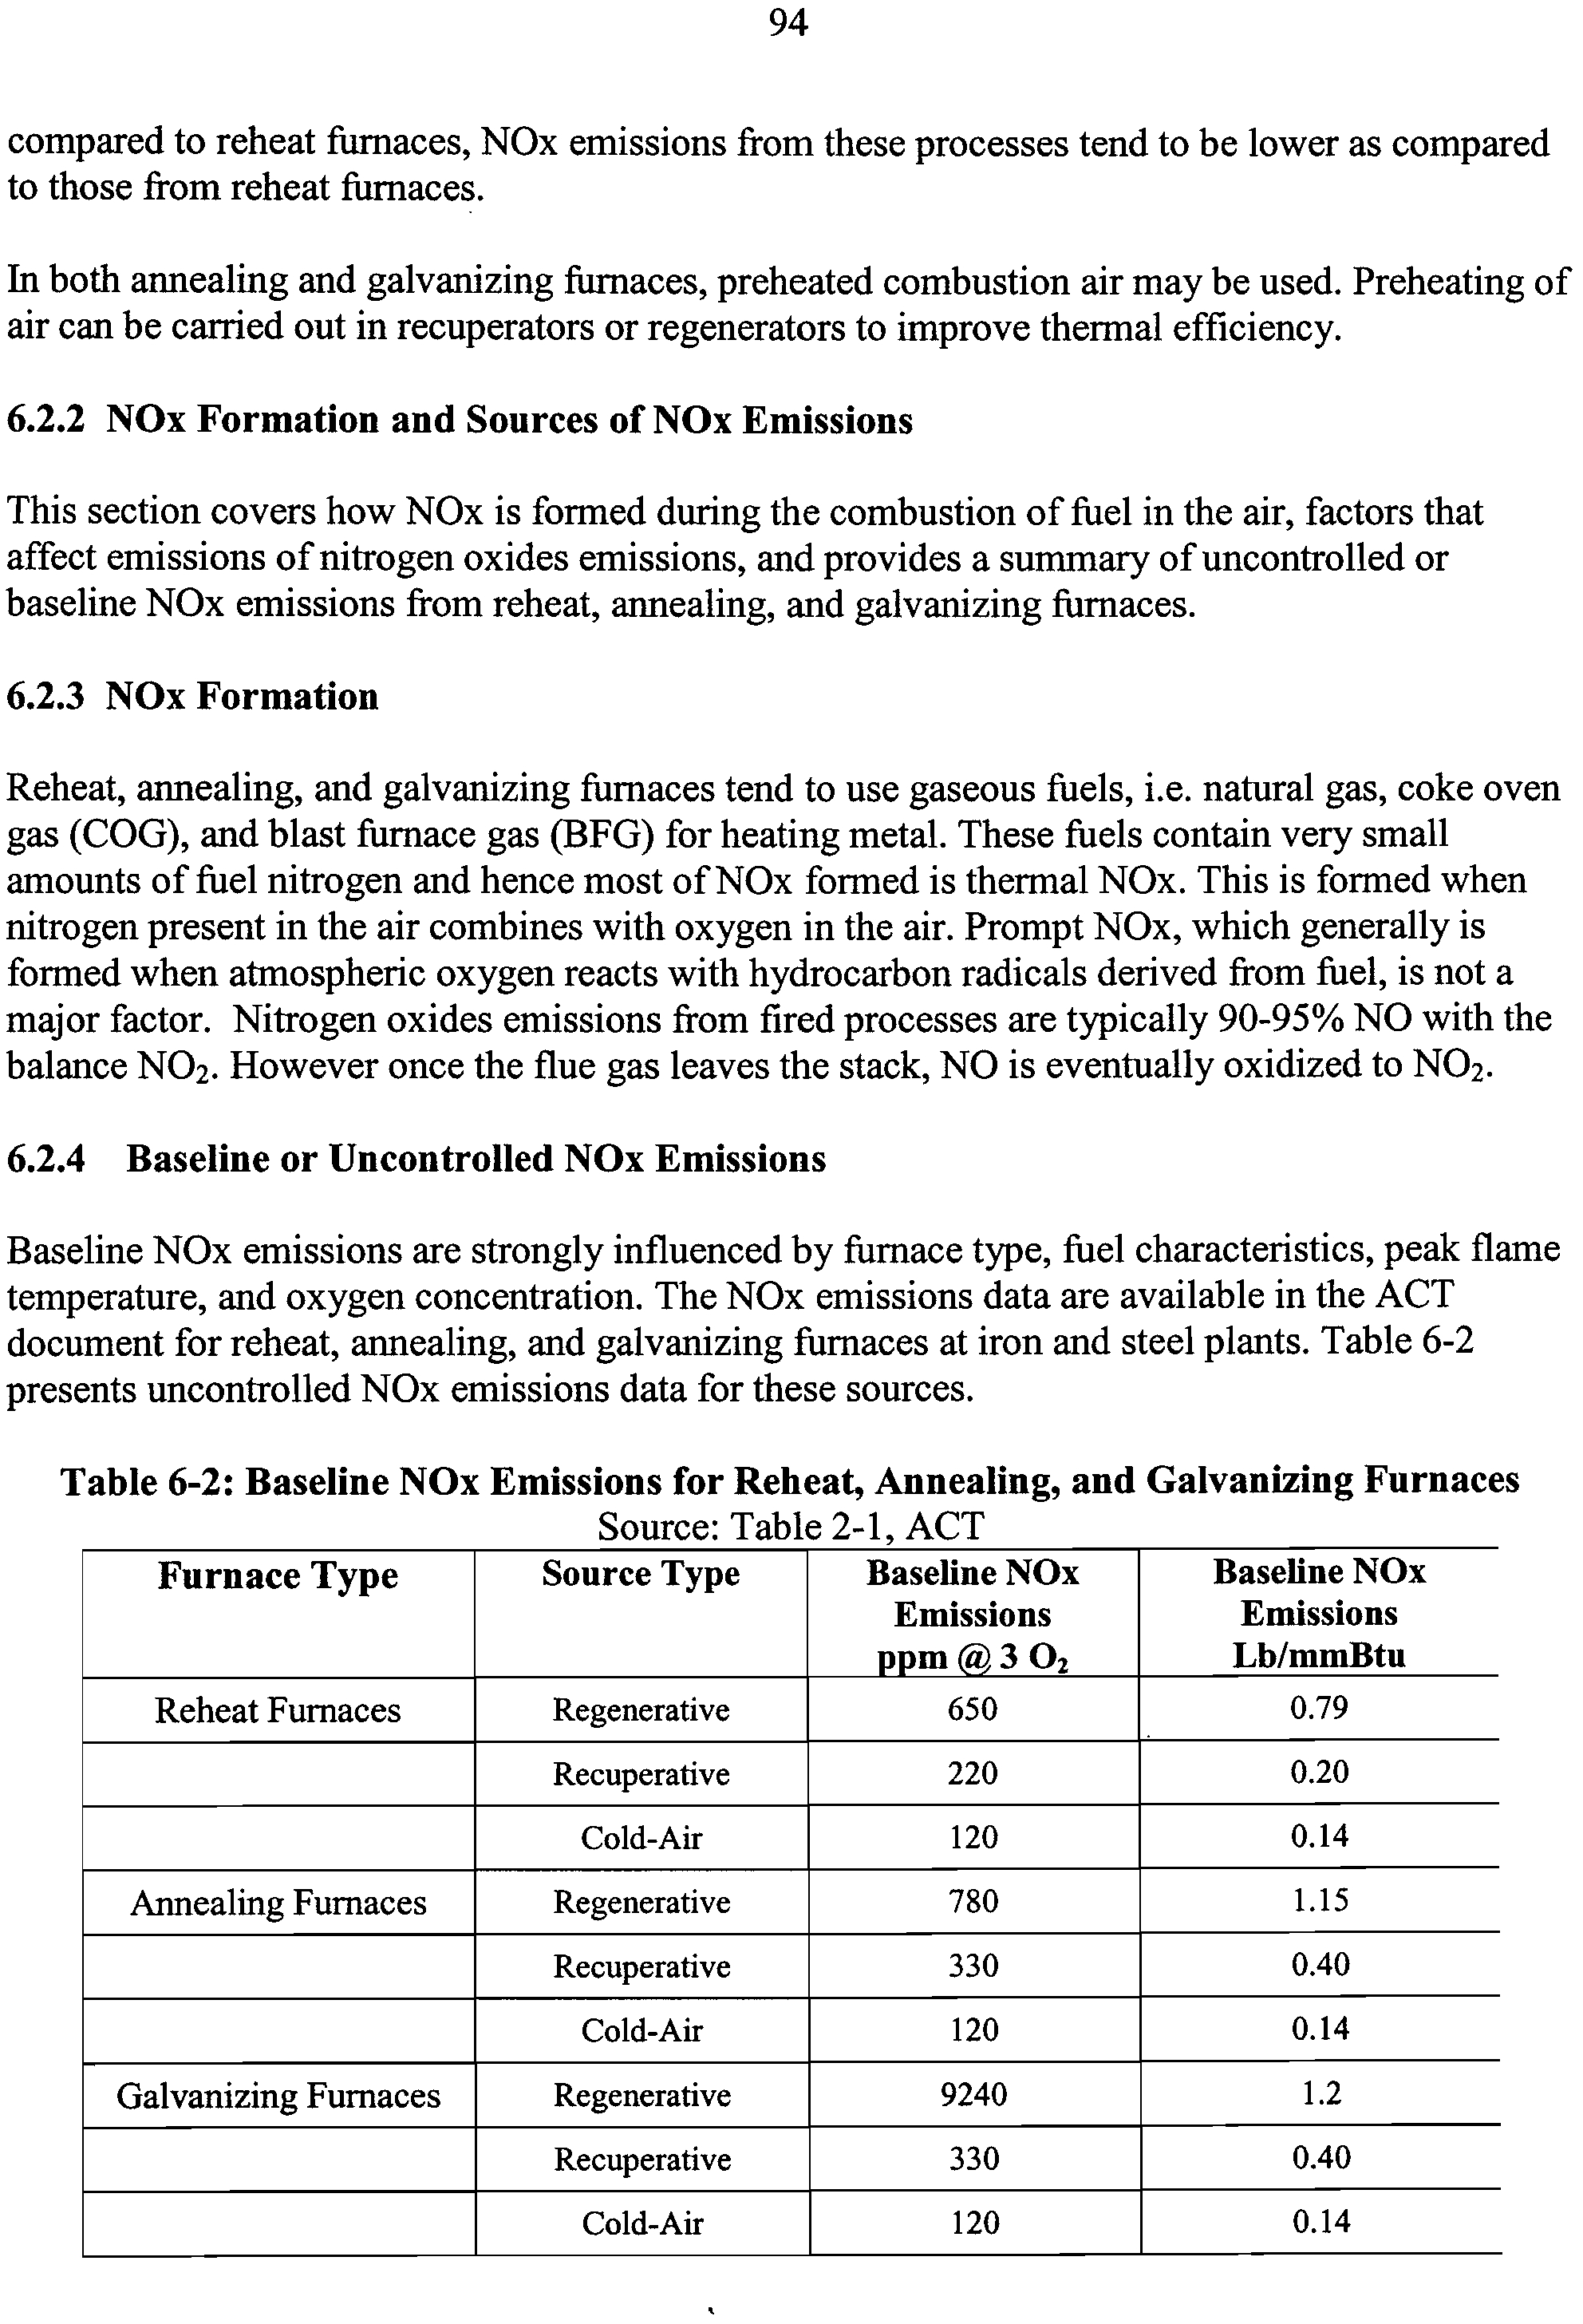
6-2
Baseline NOx Emissions for Reheat, Annealing, and Galvanizing
94
Furnaces
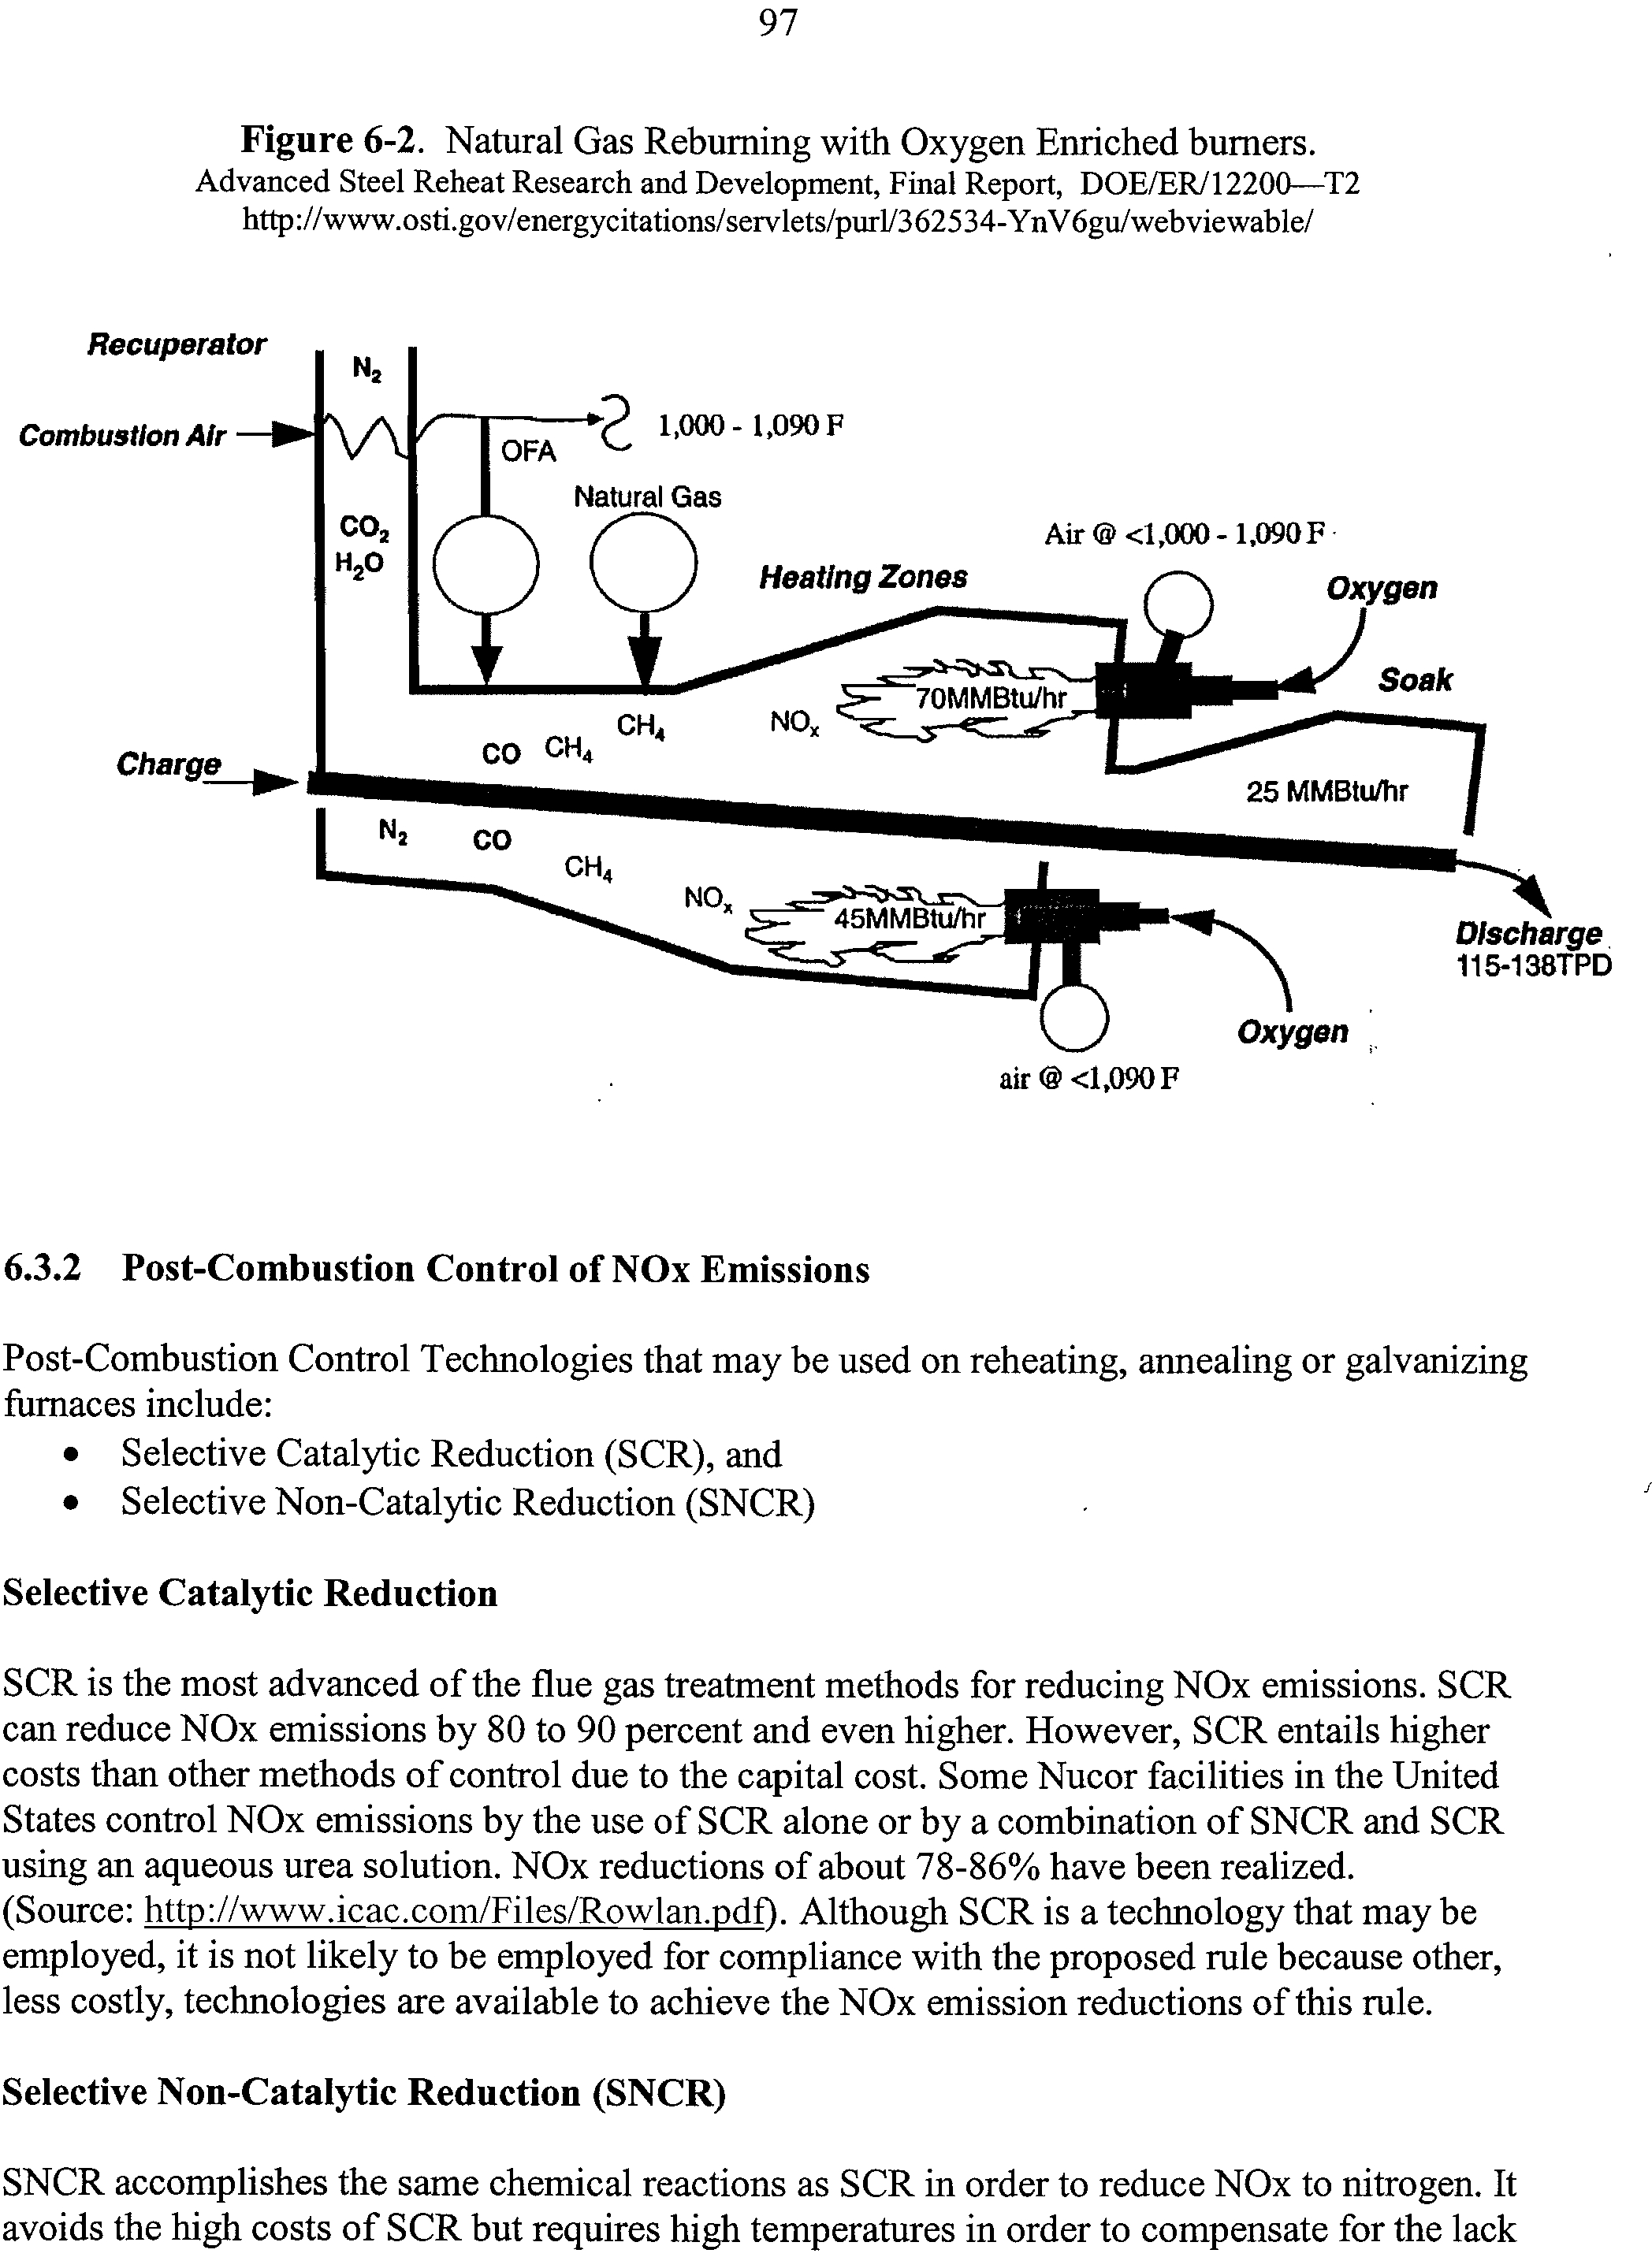
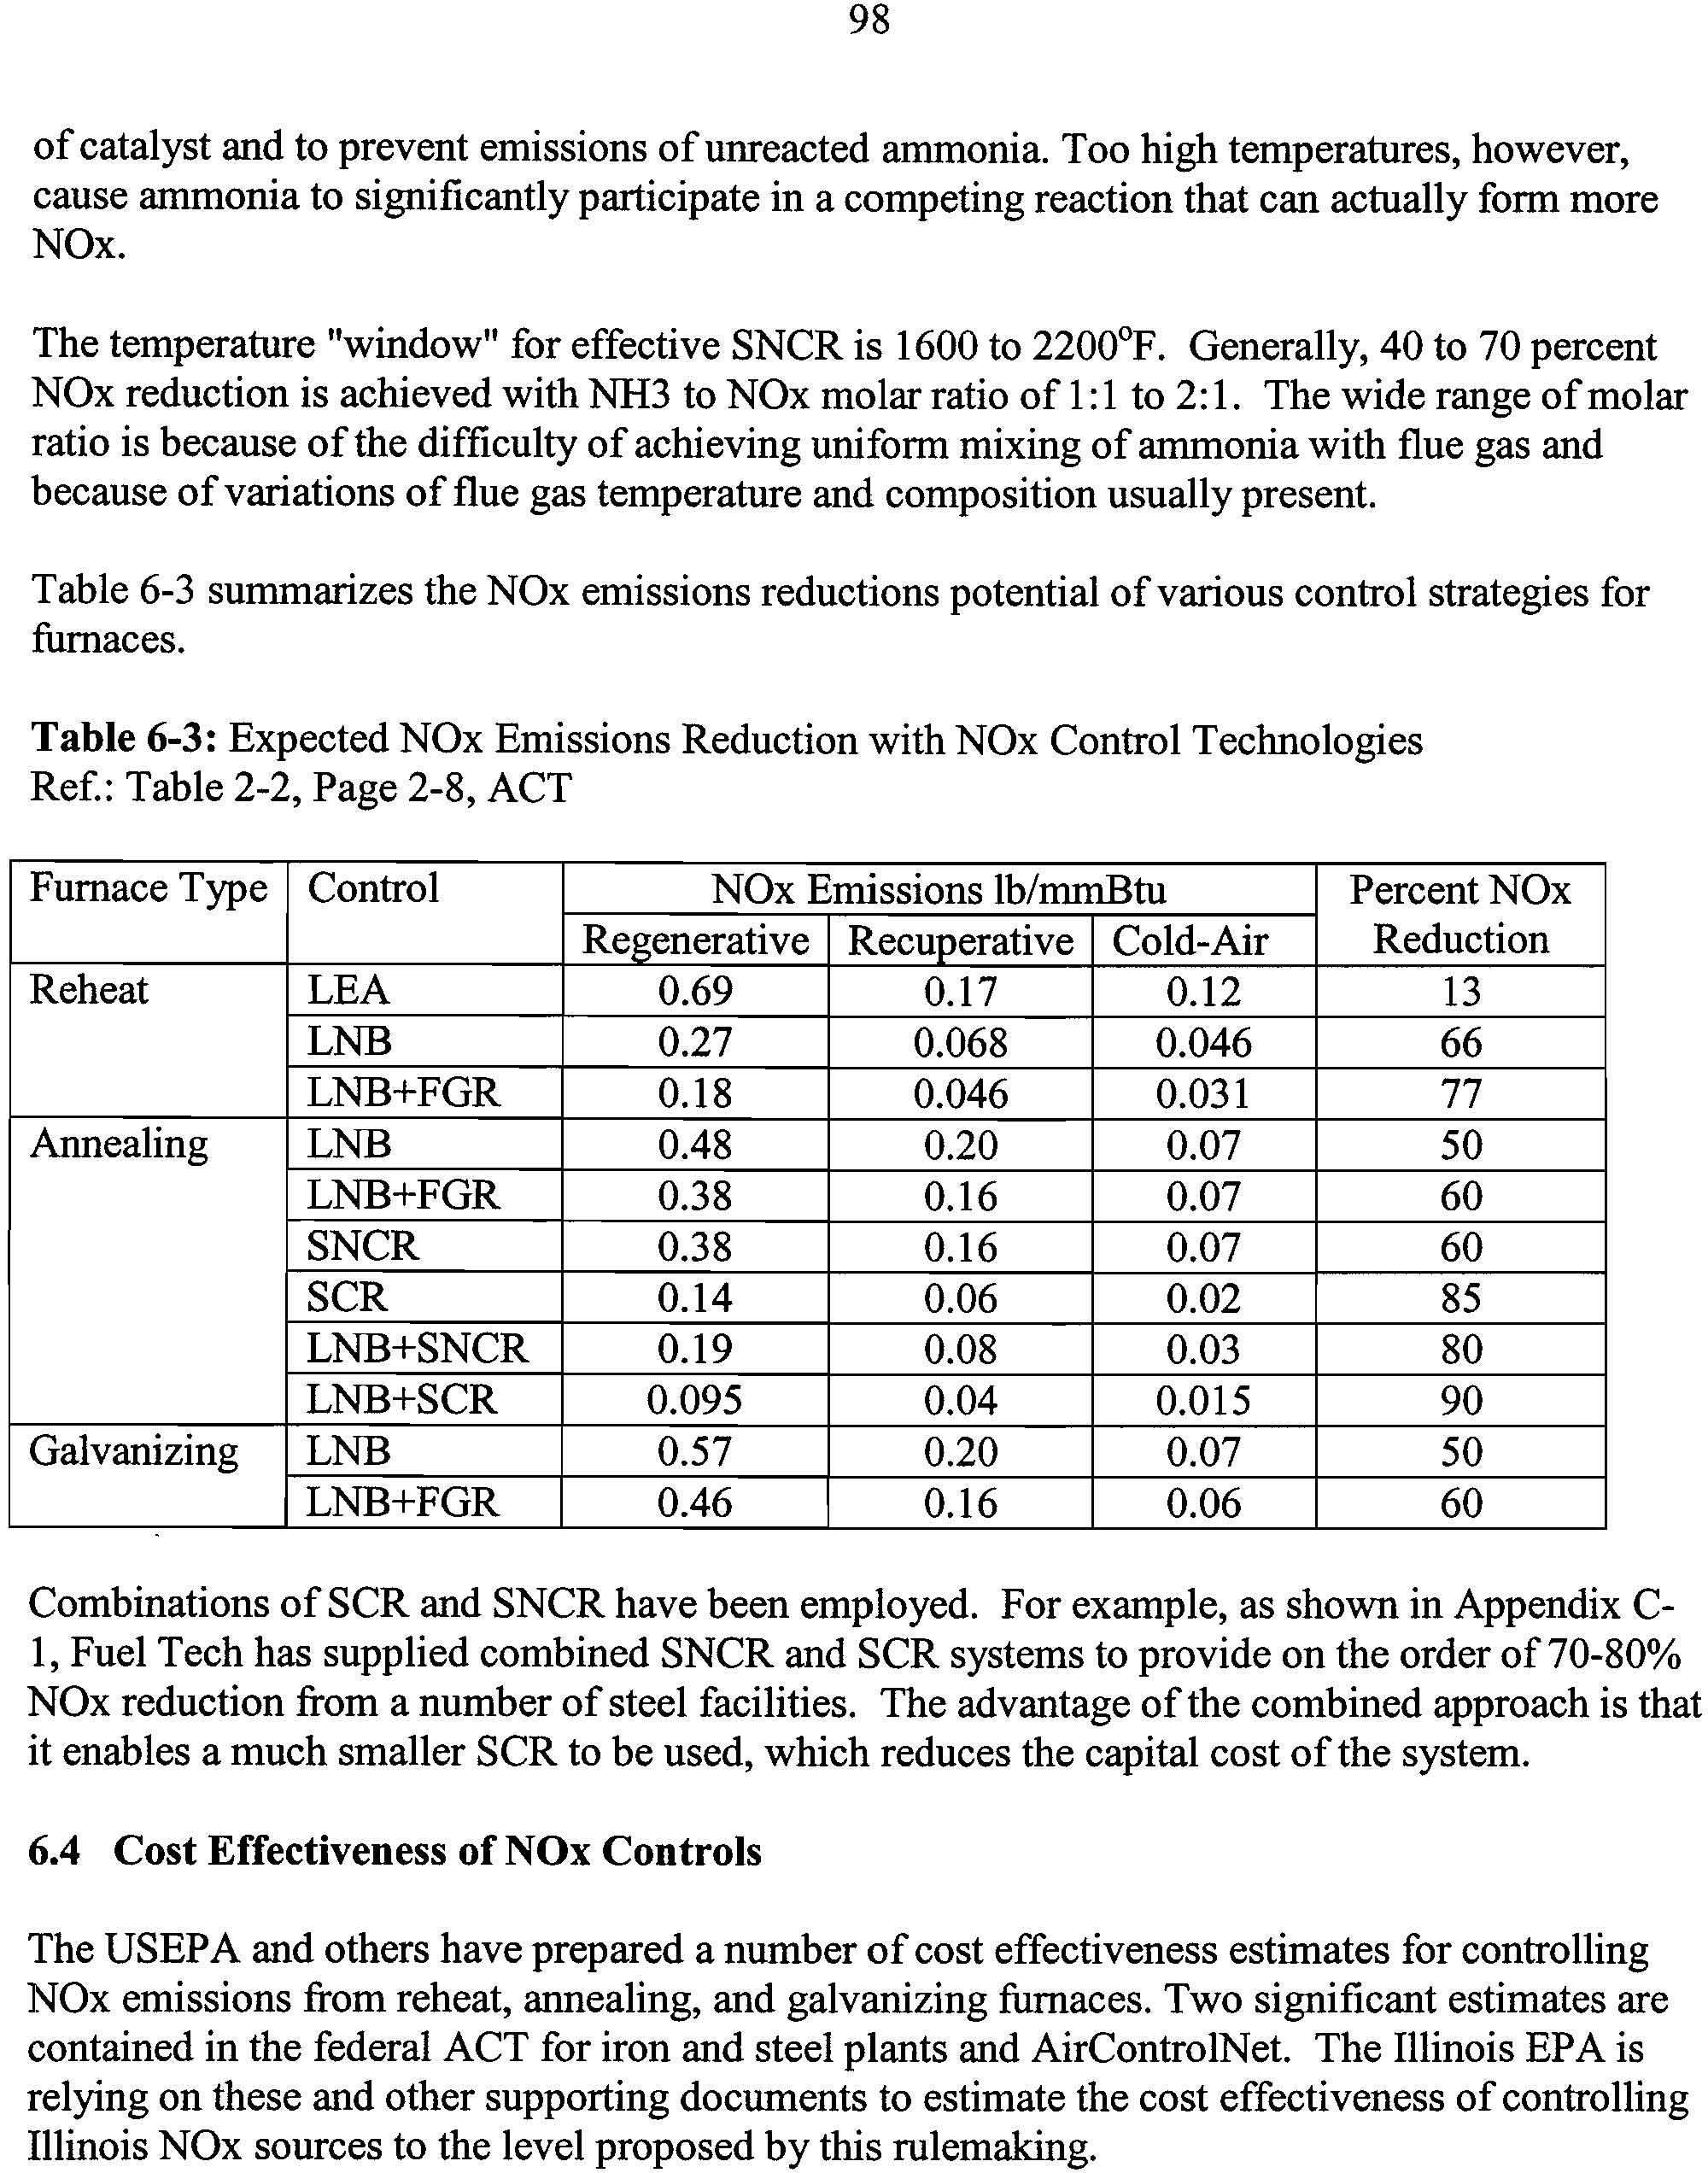
6-3
Expected NOx Emissions Reduction with NOx Control
98
Technologies
6-4
Cost Estimates from USEPA – 2006
99
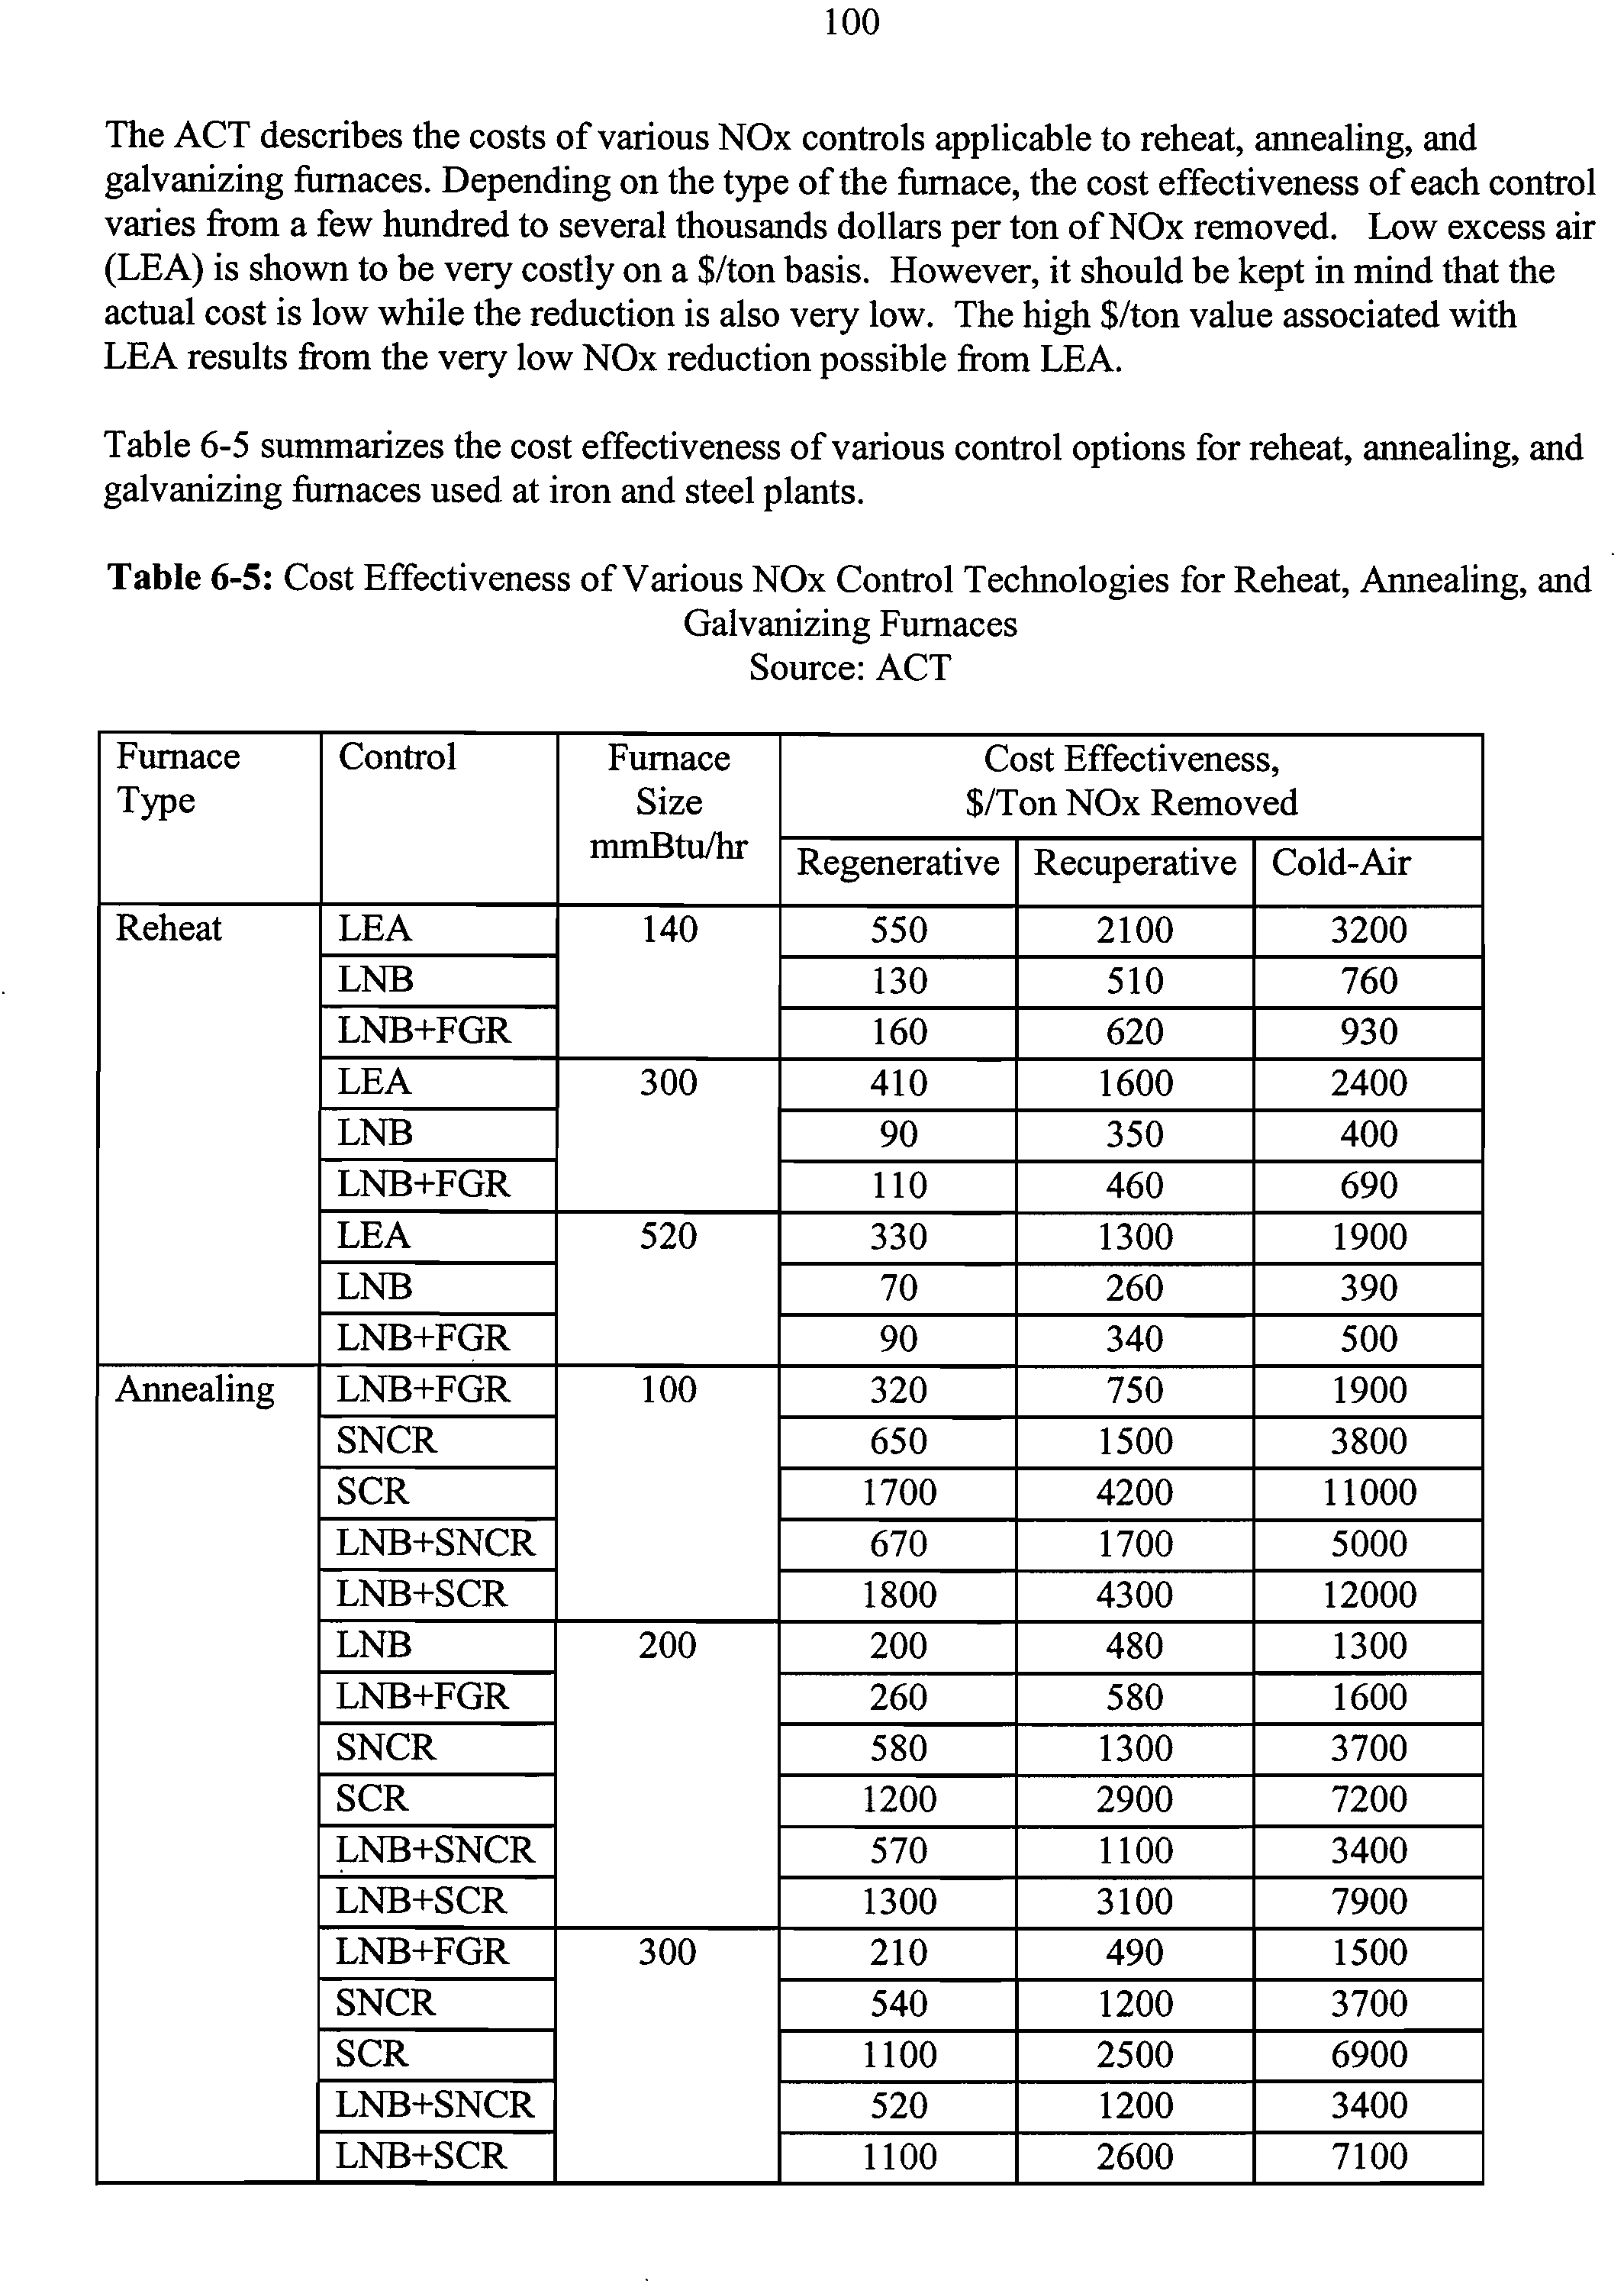
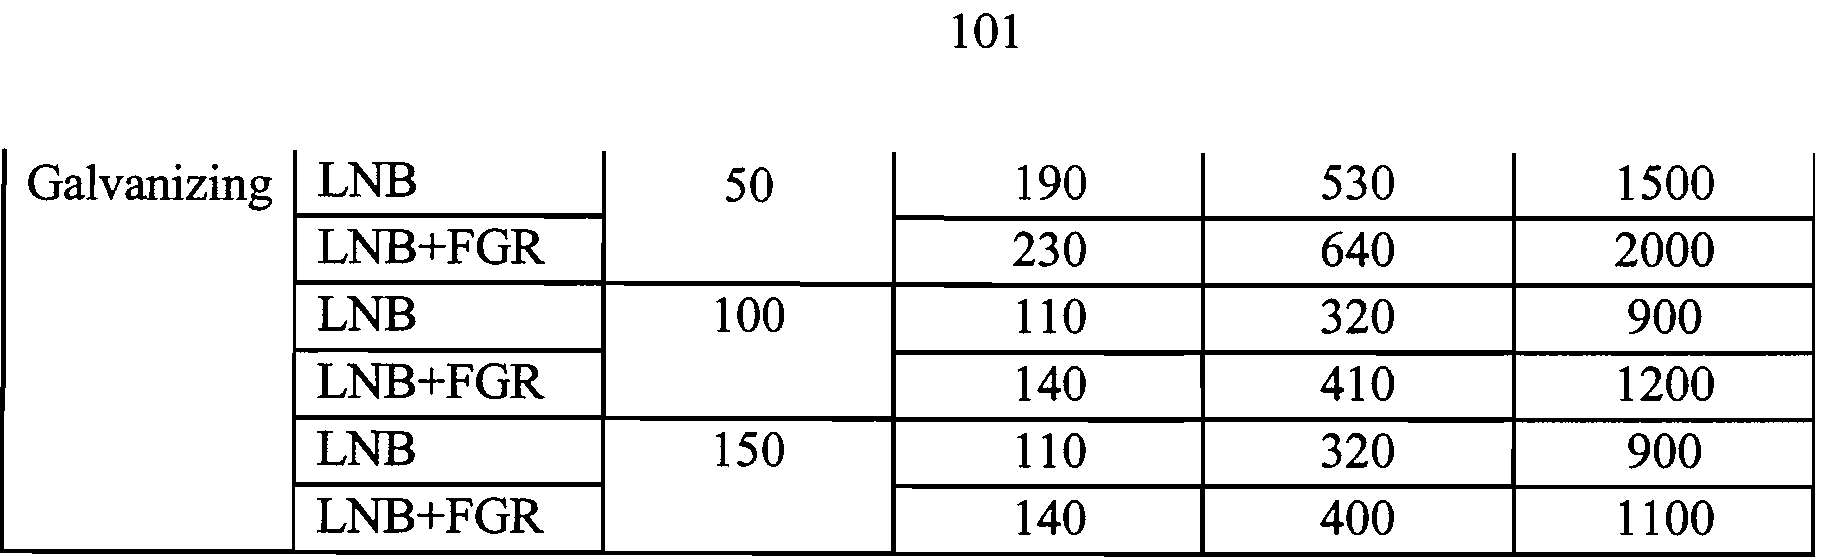
6-5
Cost Effectiveness of Various NOx Control Technologies for
100
Reheat Furnaces
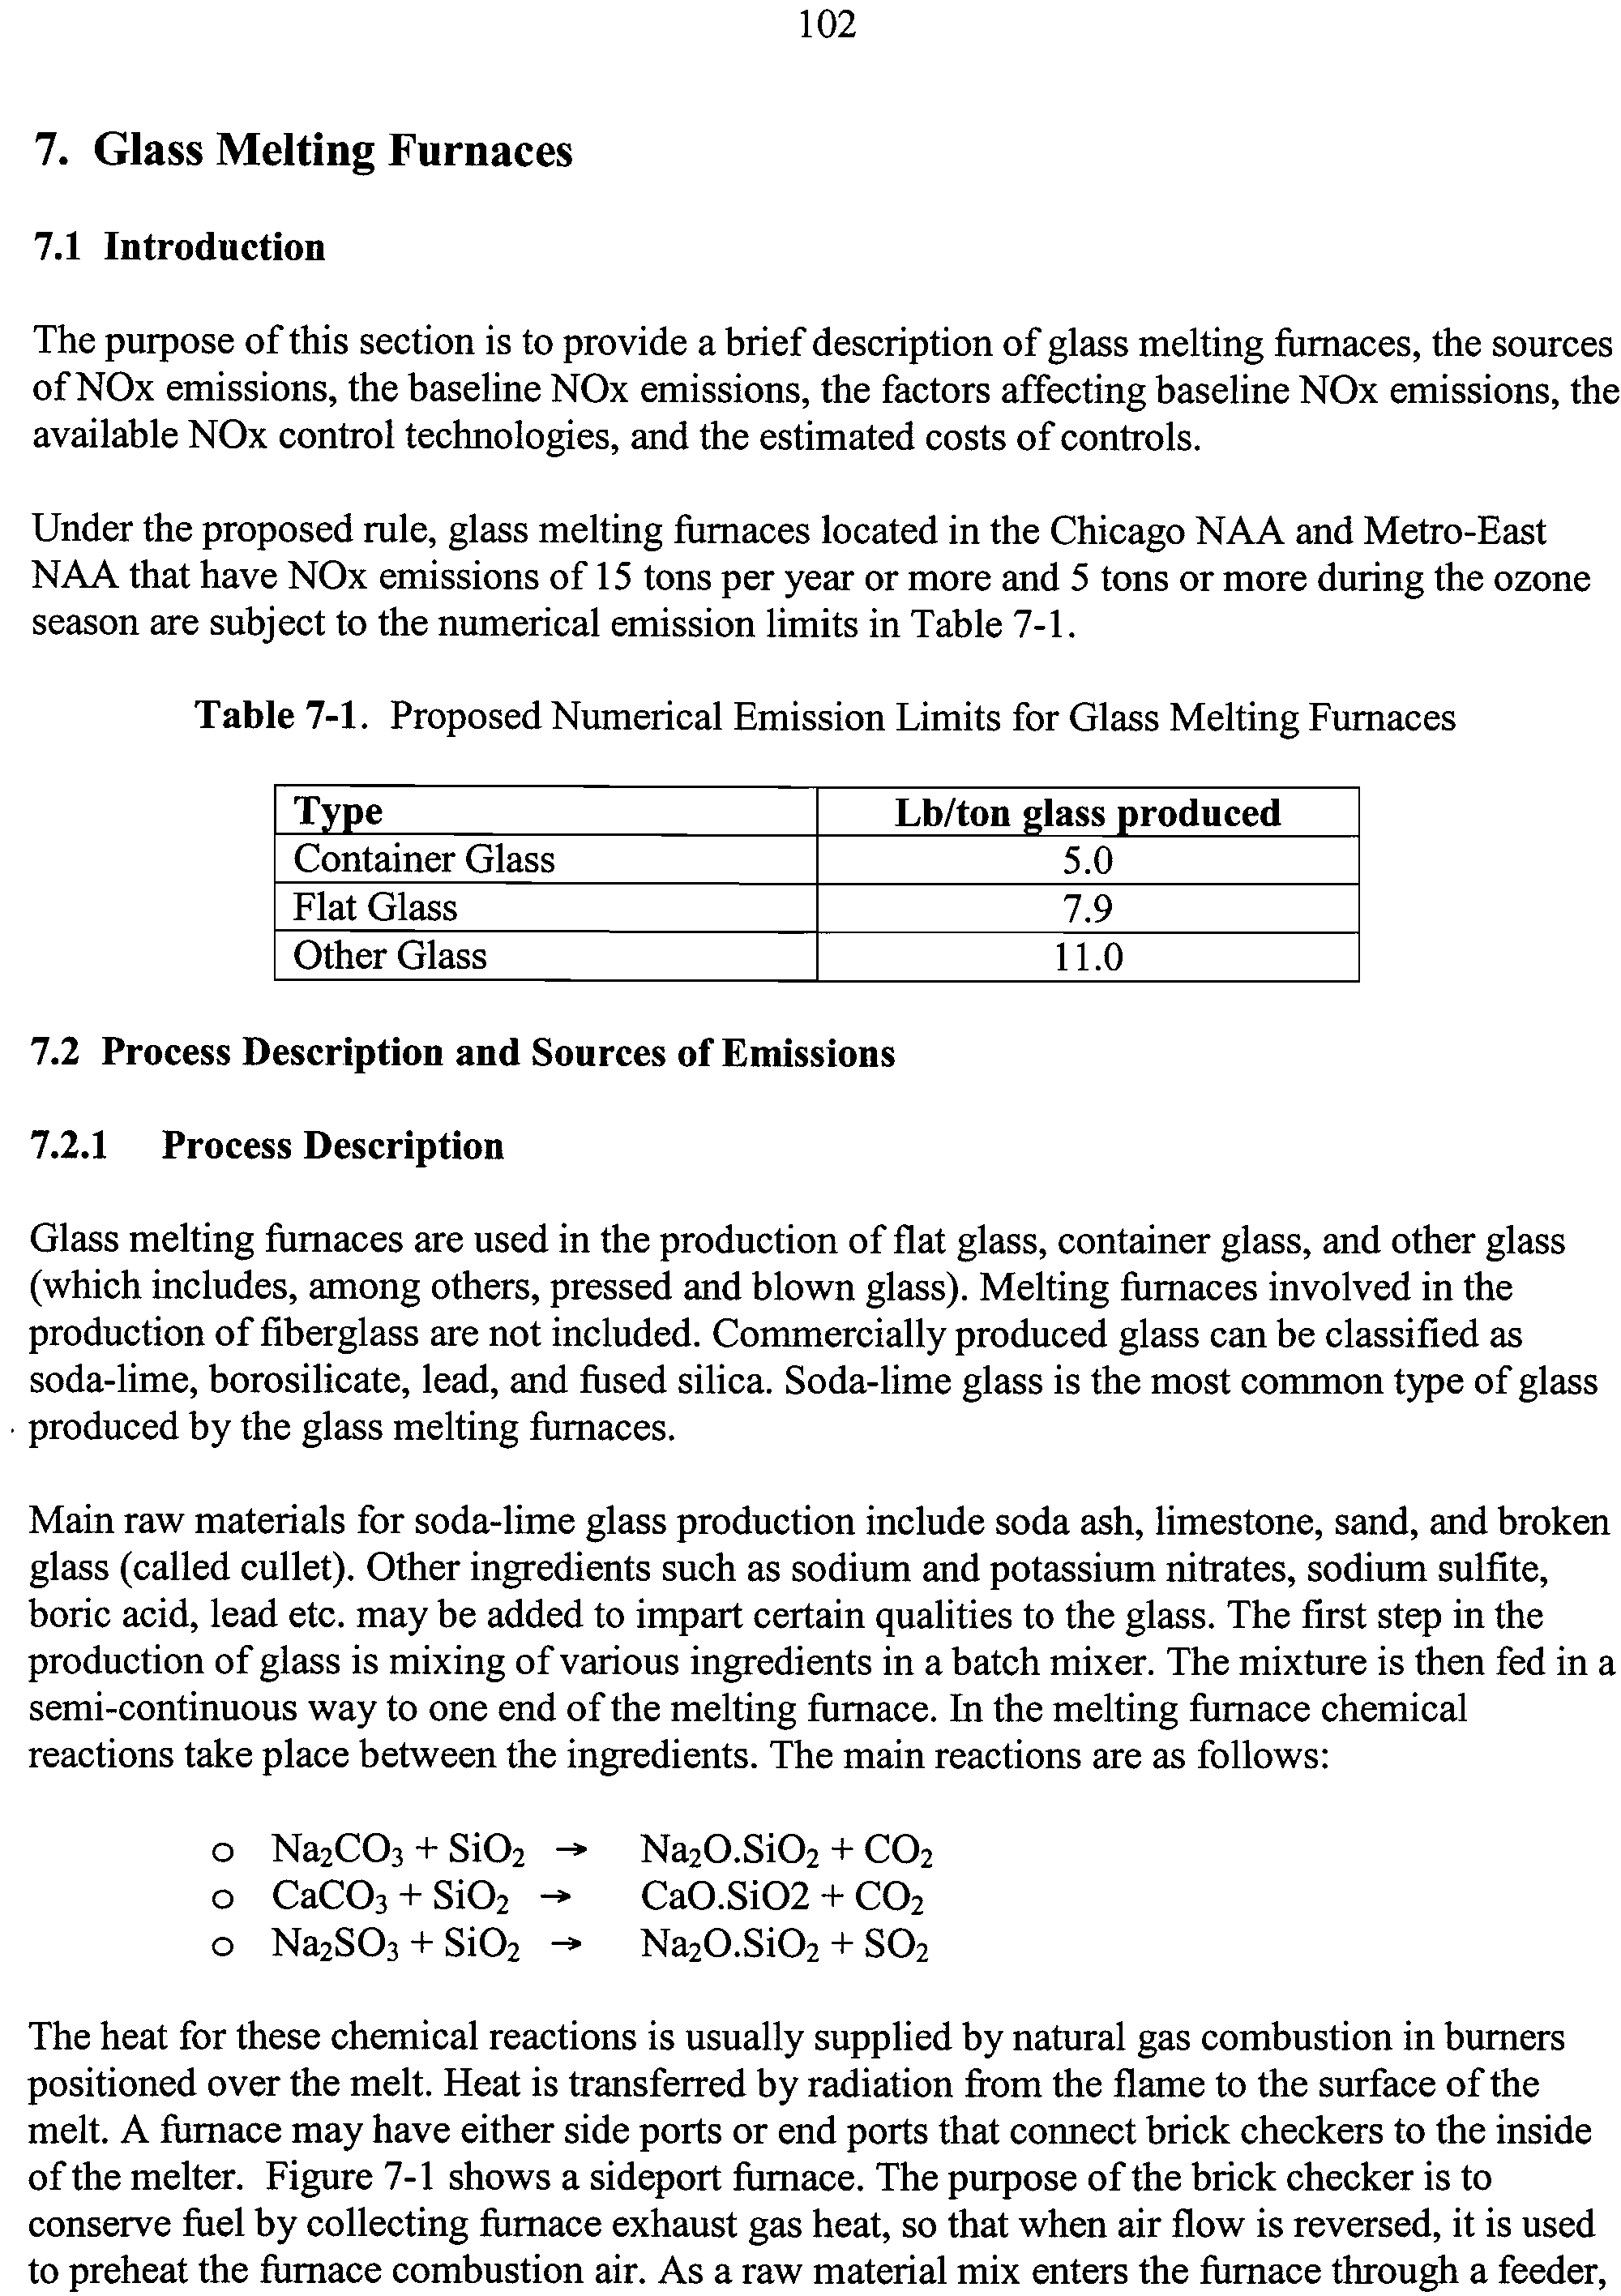
7-1
Numerical Emission Limits for Glass Melting Furnaces Subject
to this Rule
102
7-2
NOx Emission Factors for Different Glass Melting Furnace
105
Types
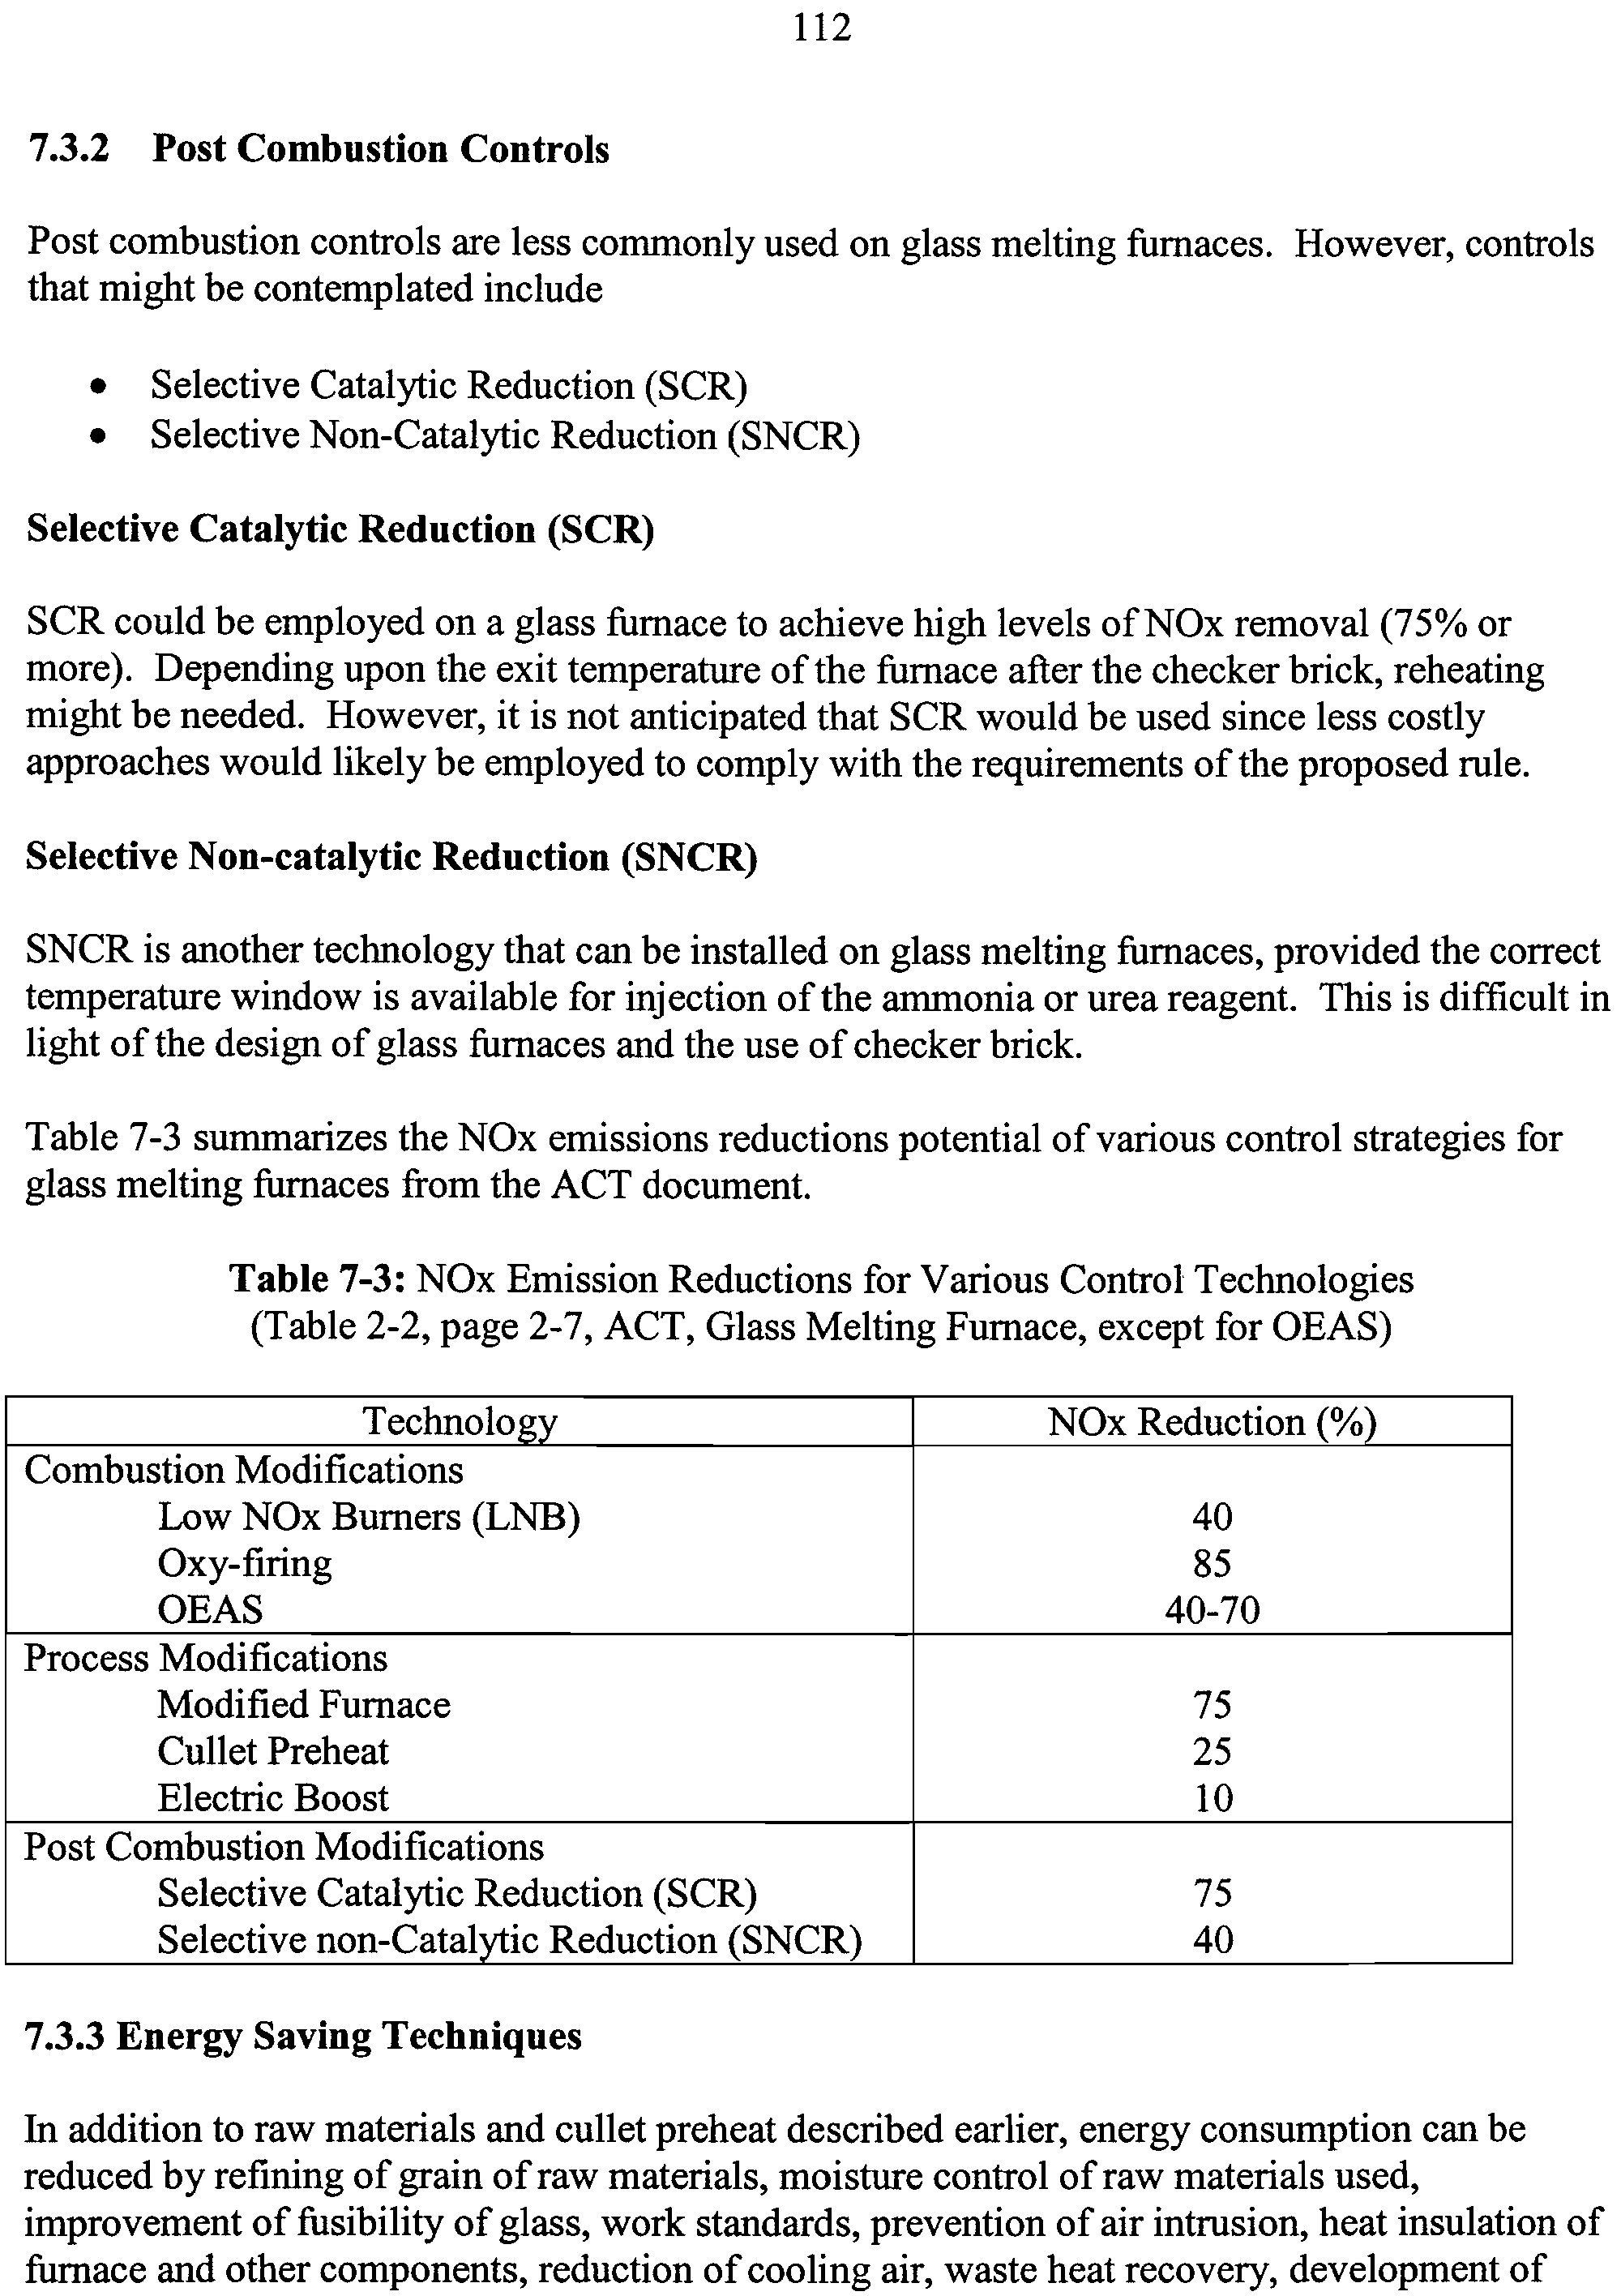
7-3
NOx Emission Reductions for Various Control Technologies
112
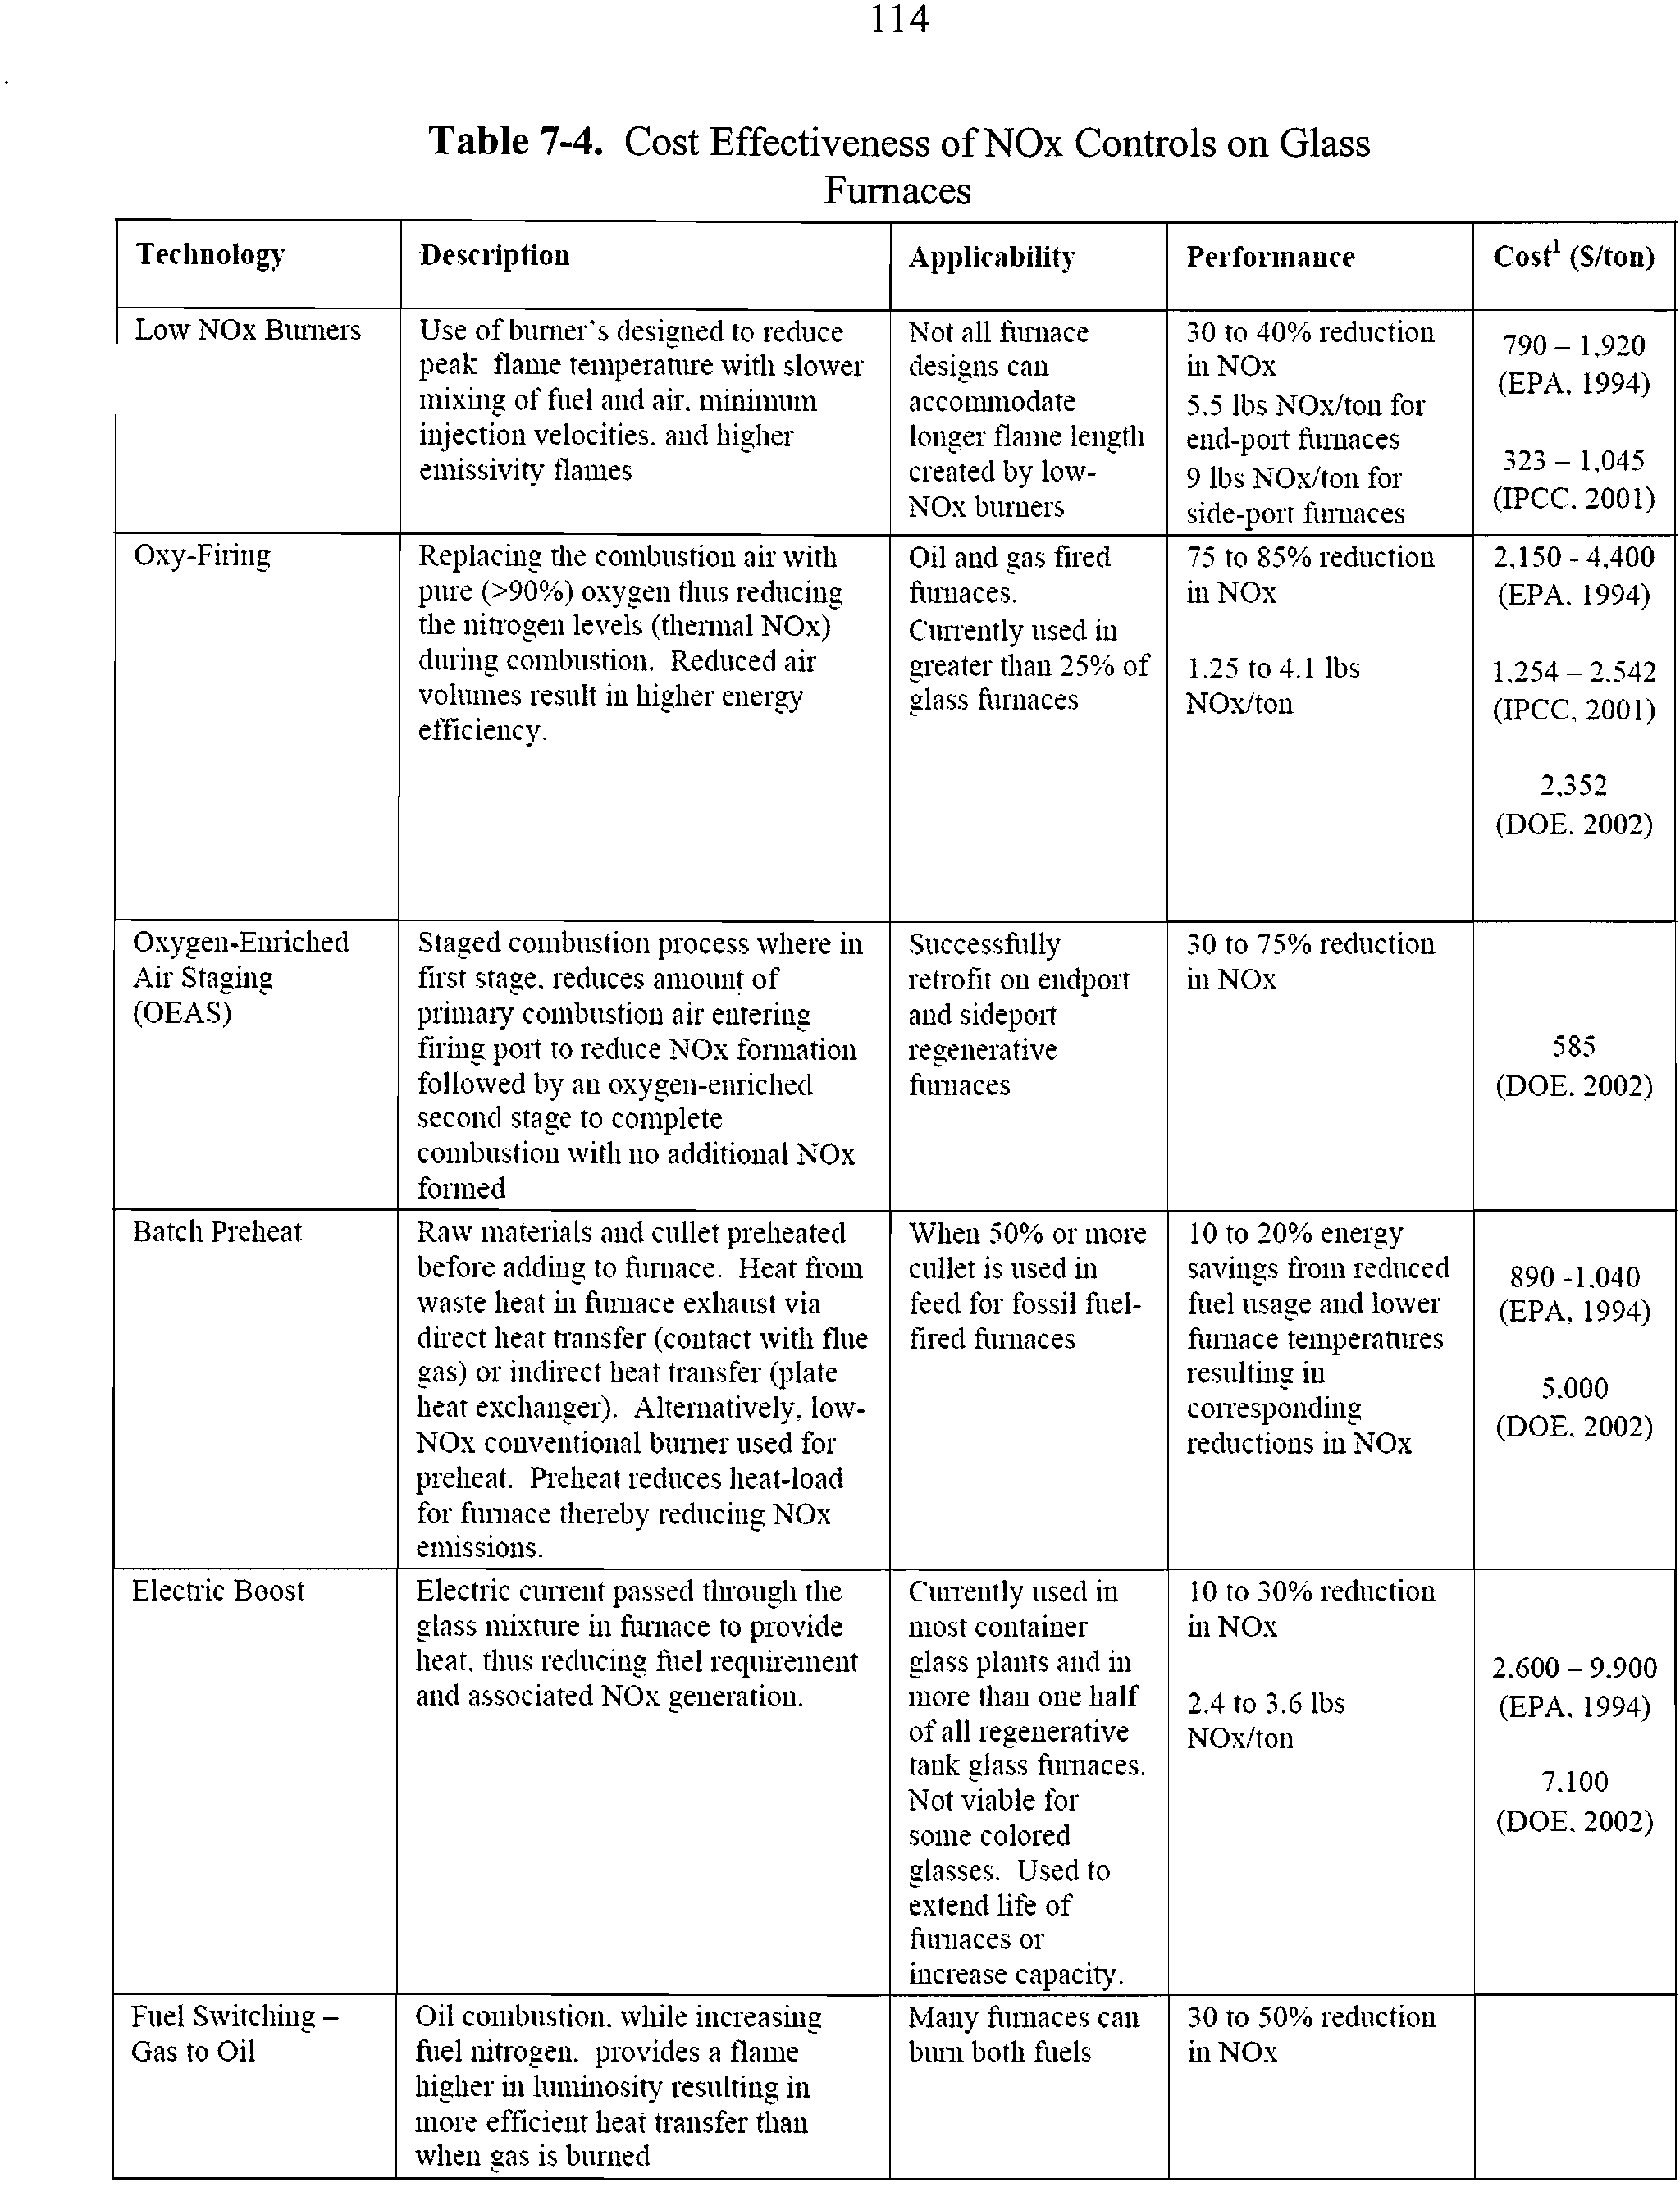
7-4
Cost Effectiveness of NOx Controls on Glass Furnaces
114
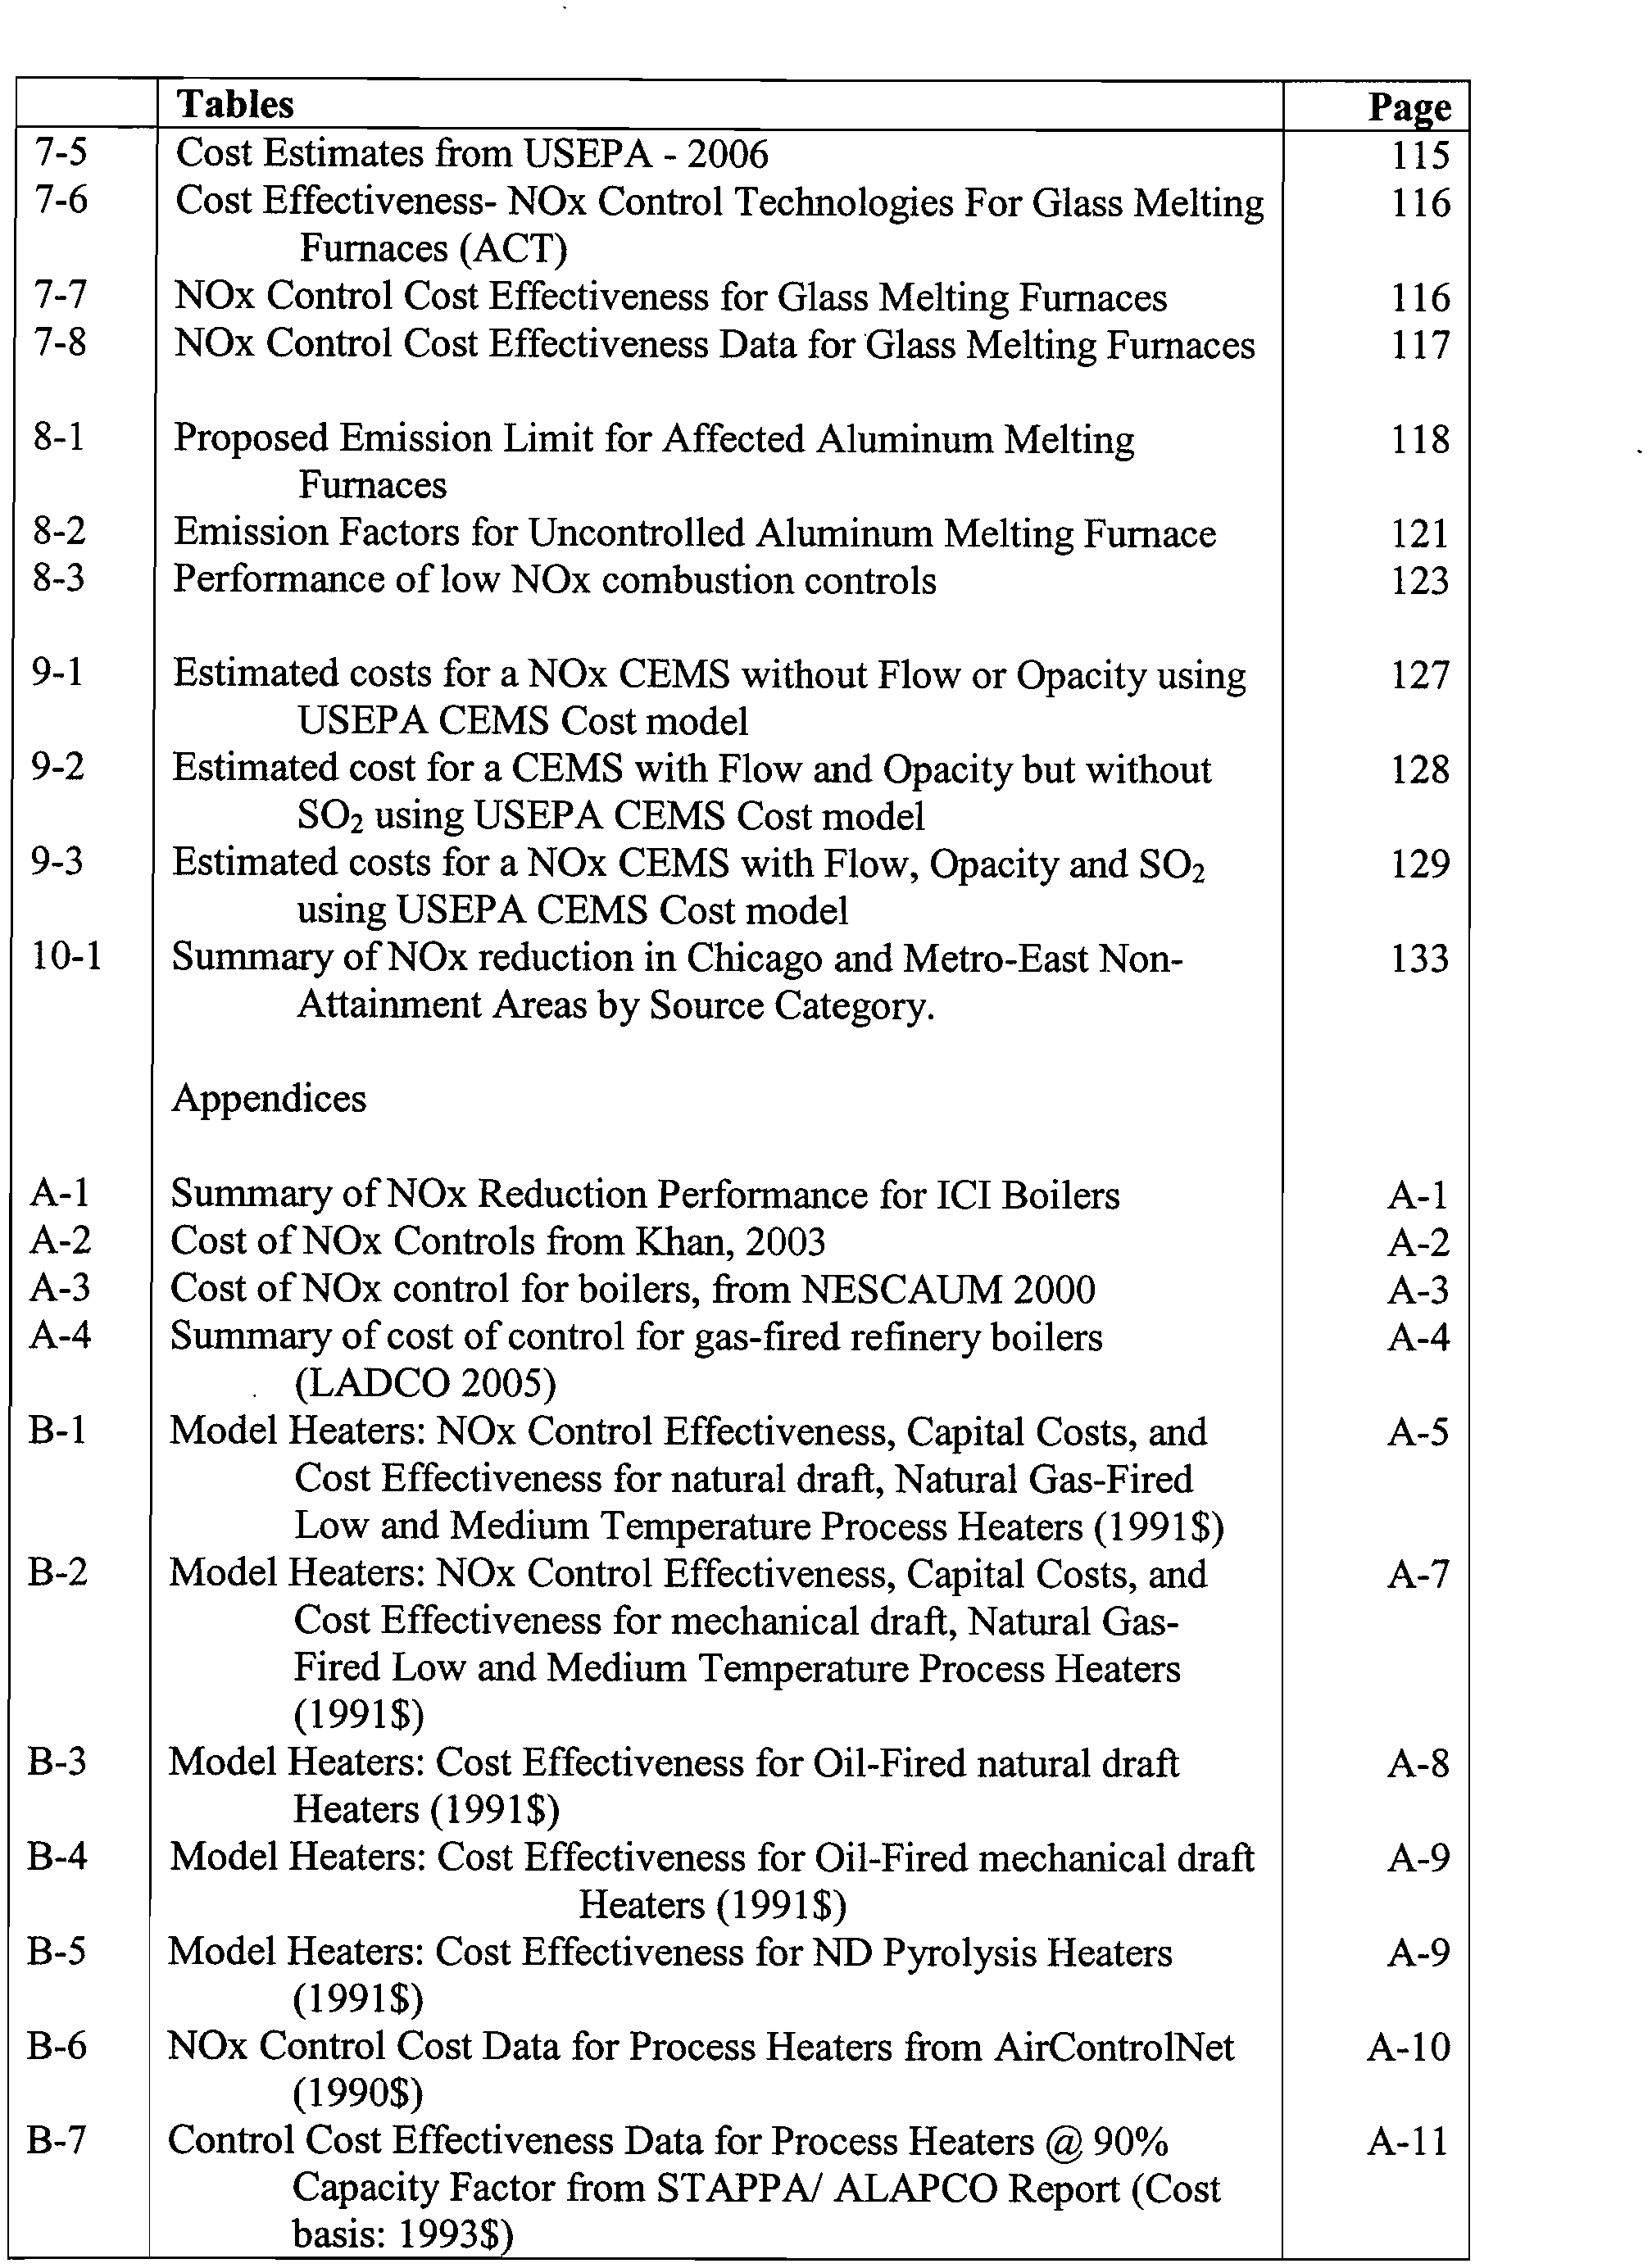
Tables
Page
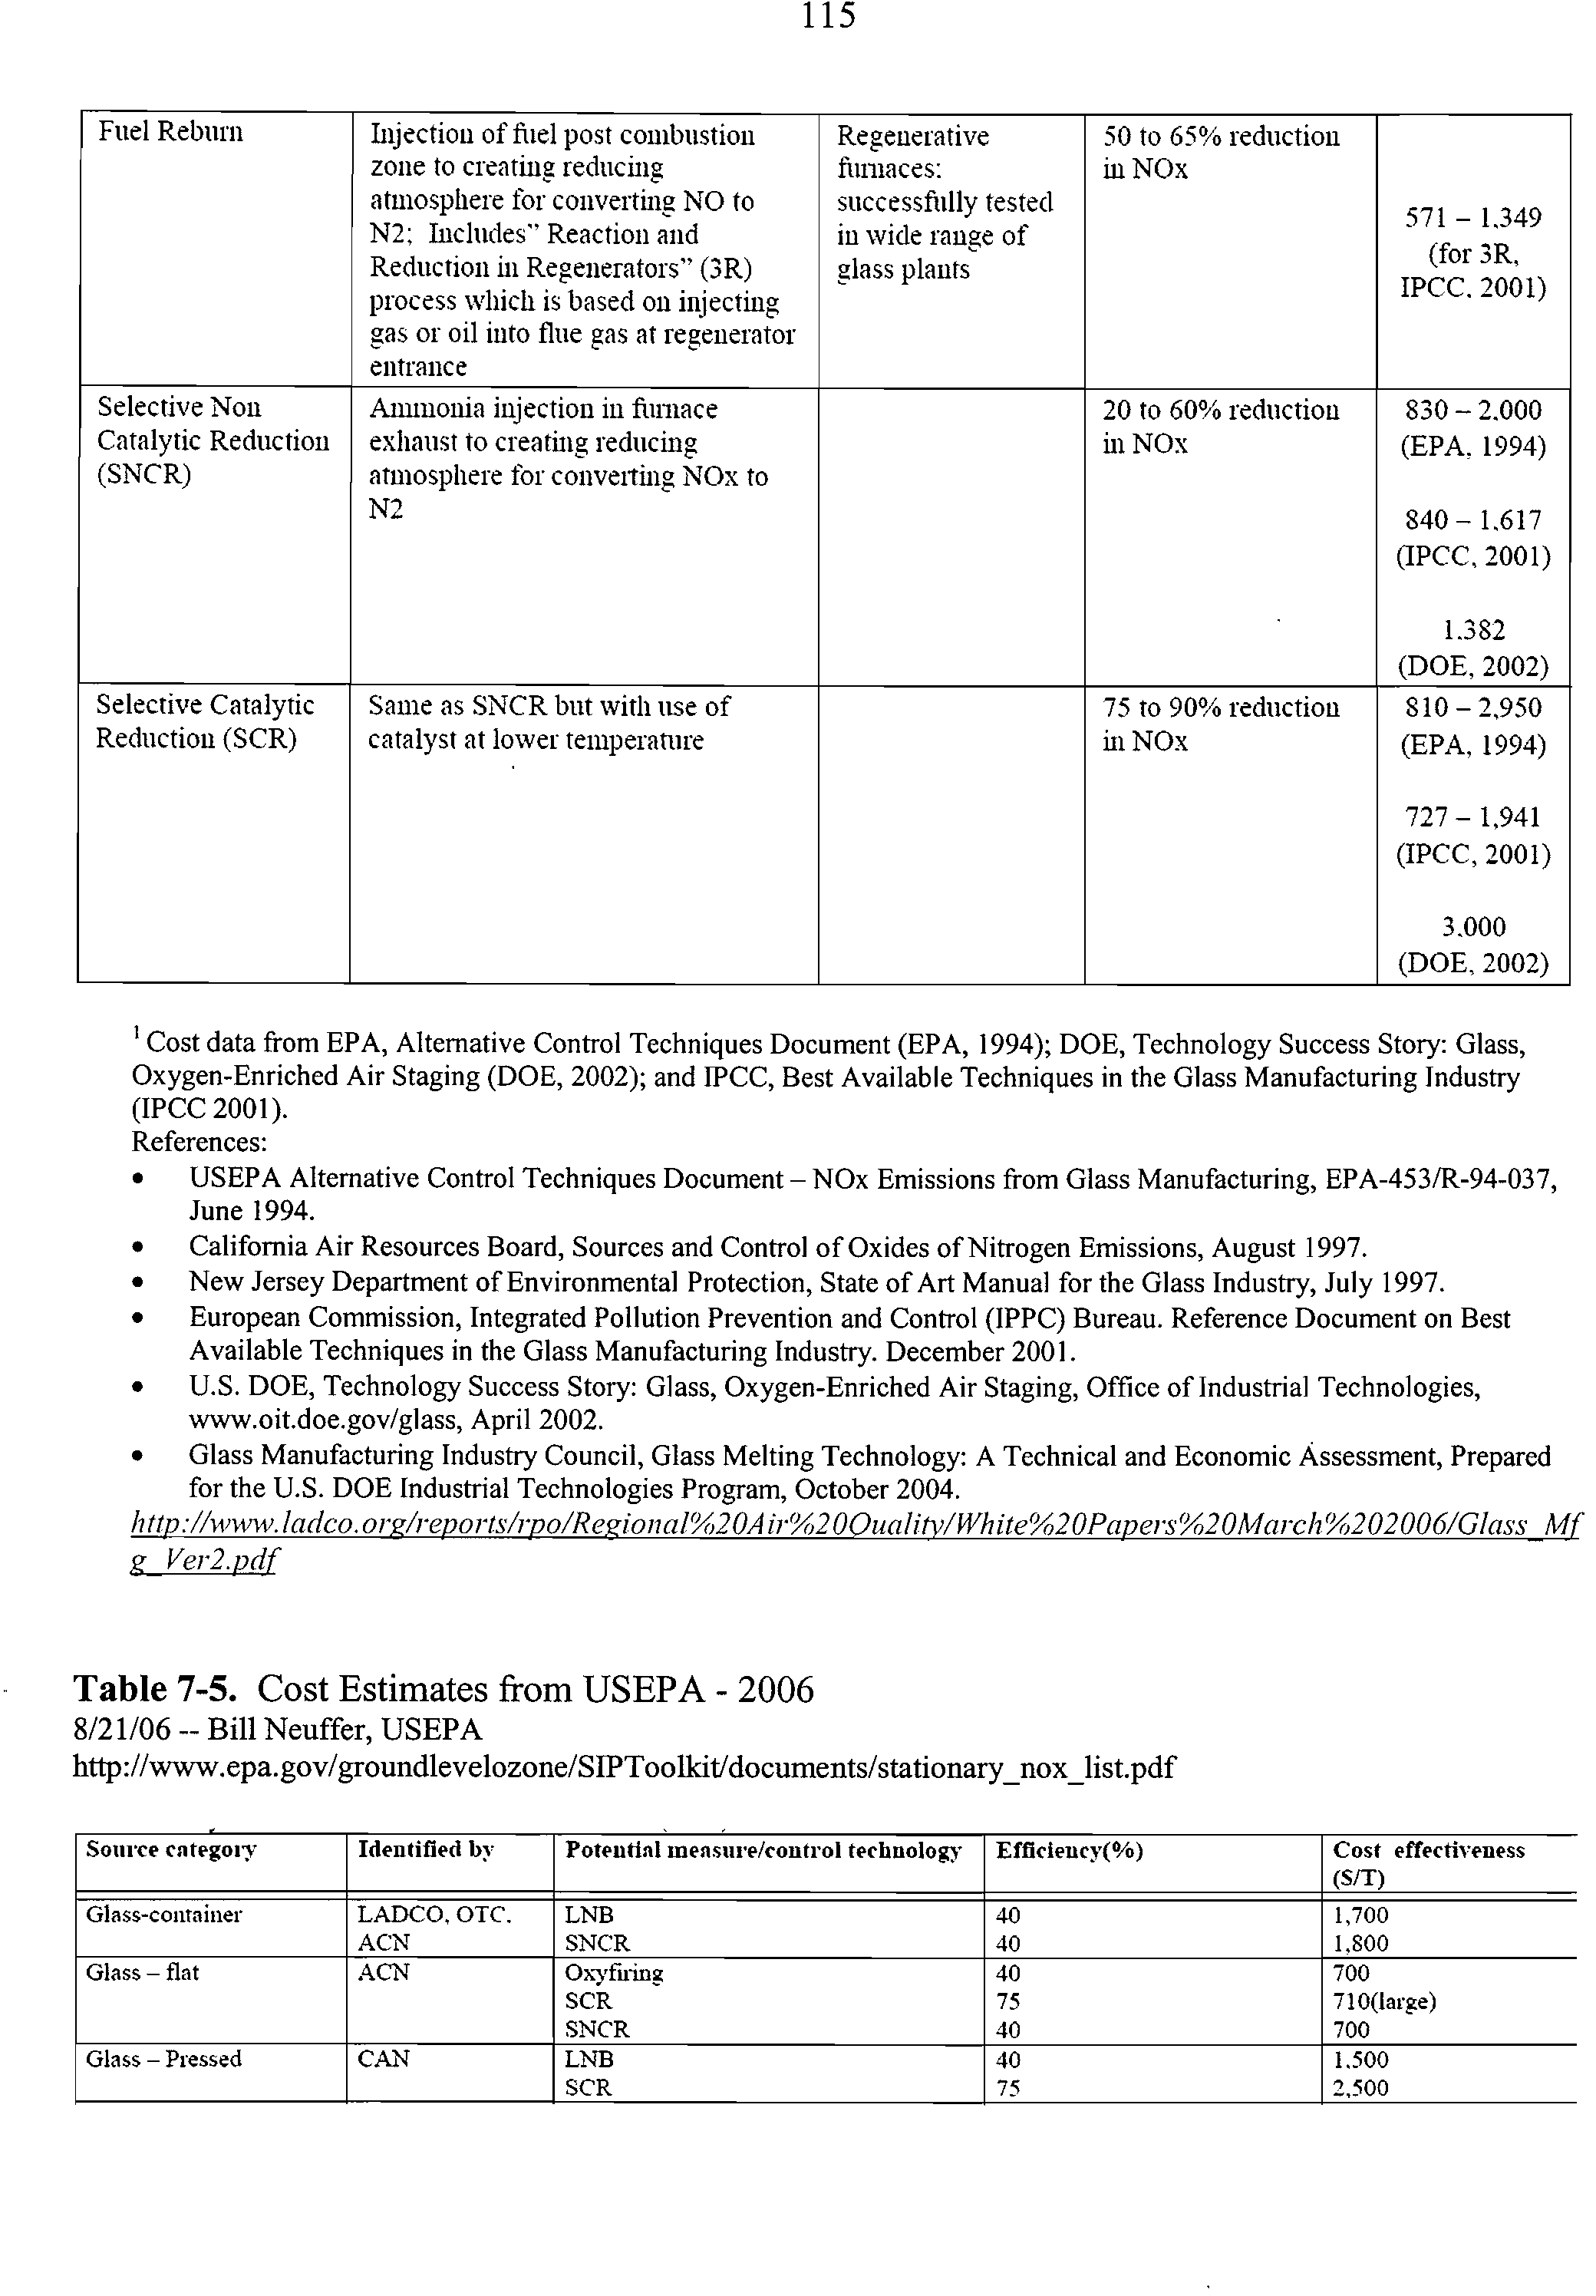
7-5
Cost Estimates from USEPA - 2006
115
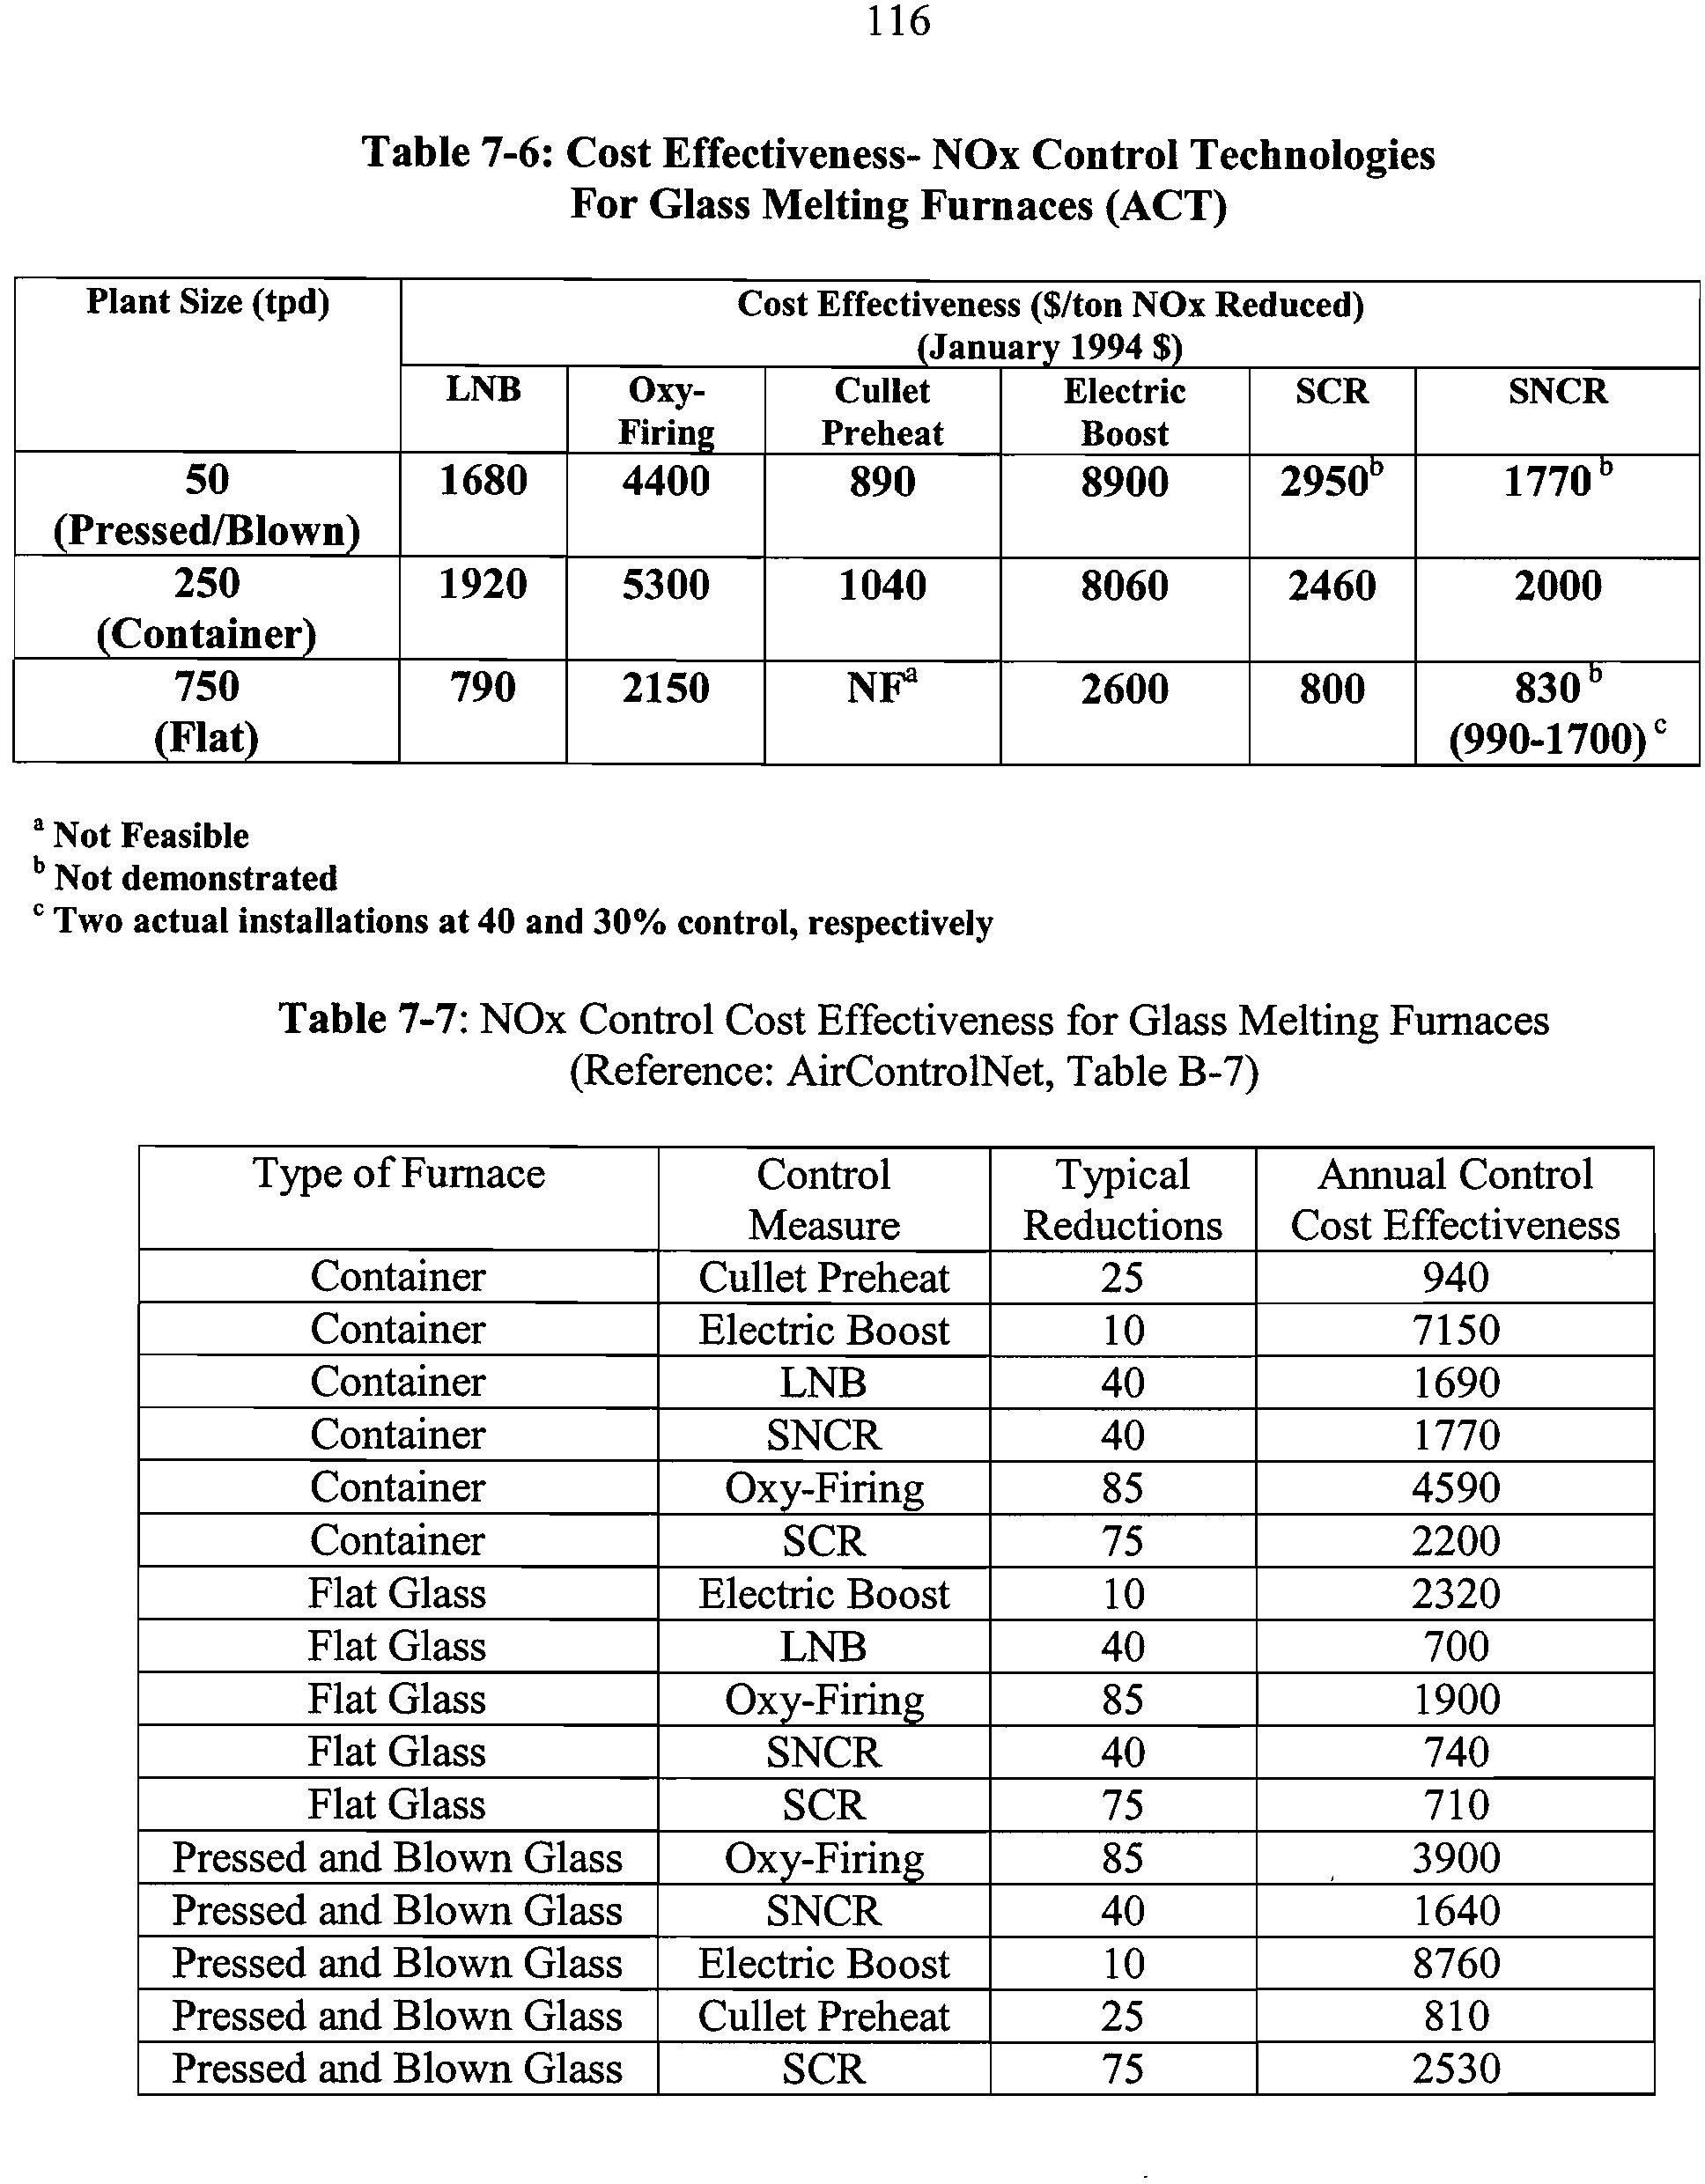
7-6
Cost Effectiveness- NOx Control Technologies For Glass Melting
116
Furnaces (ACT)
7-7
NOx Control Cost Effectiveness for Glass Melting Furnaces
116
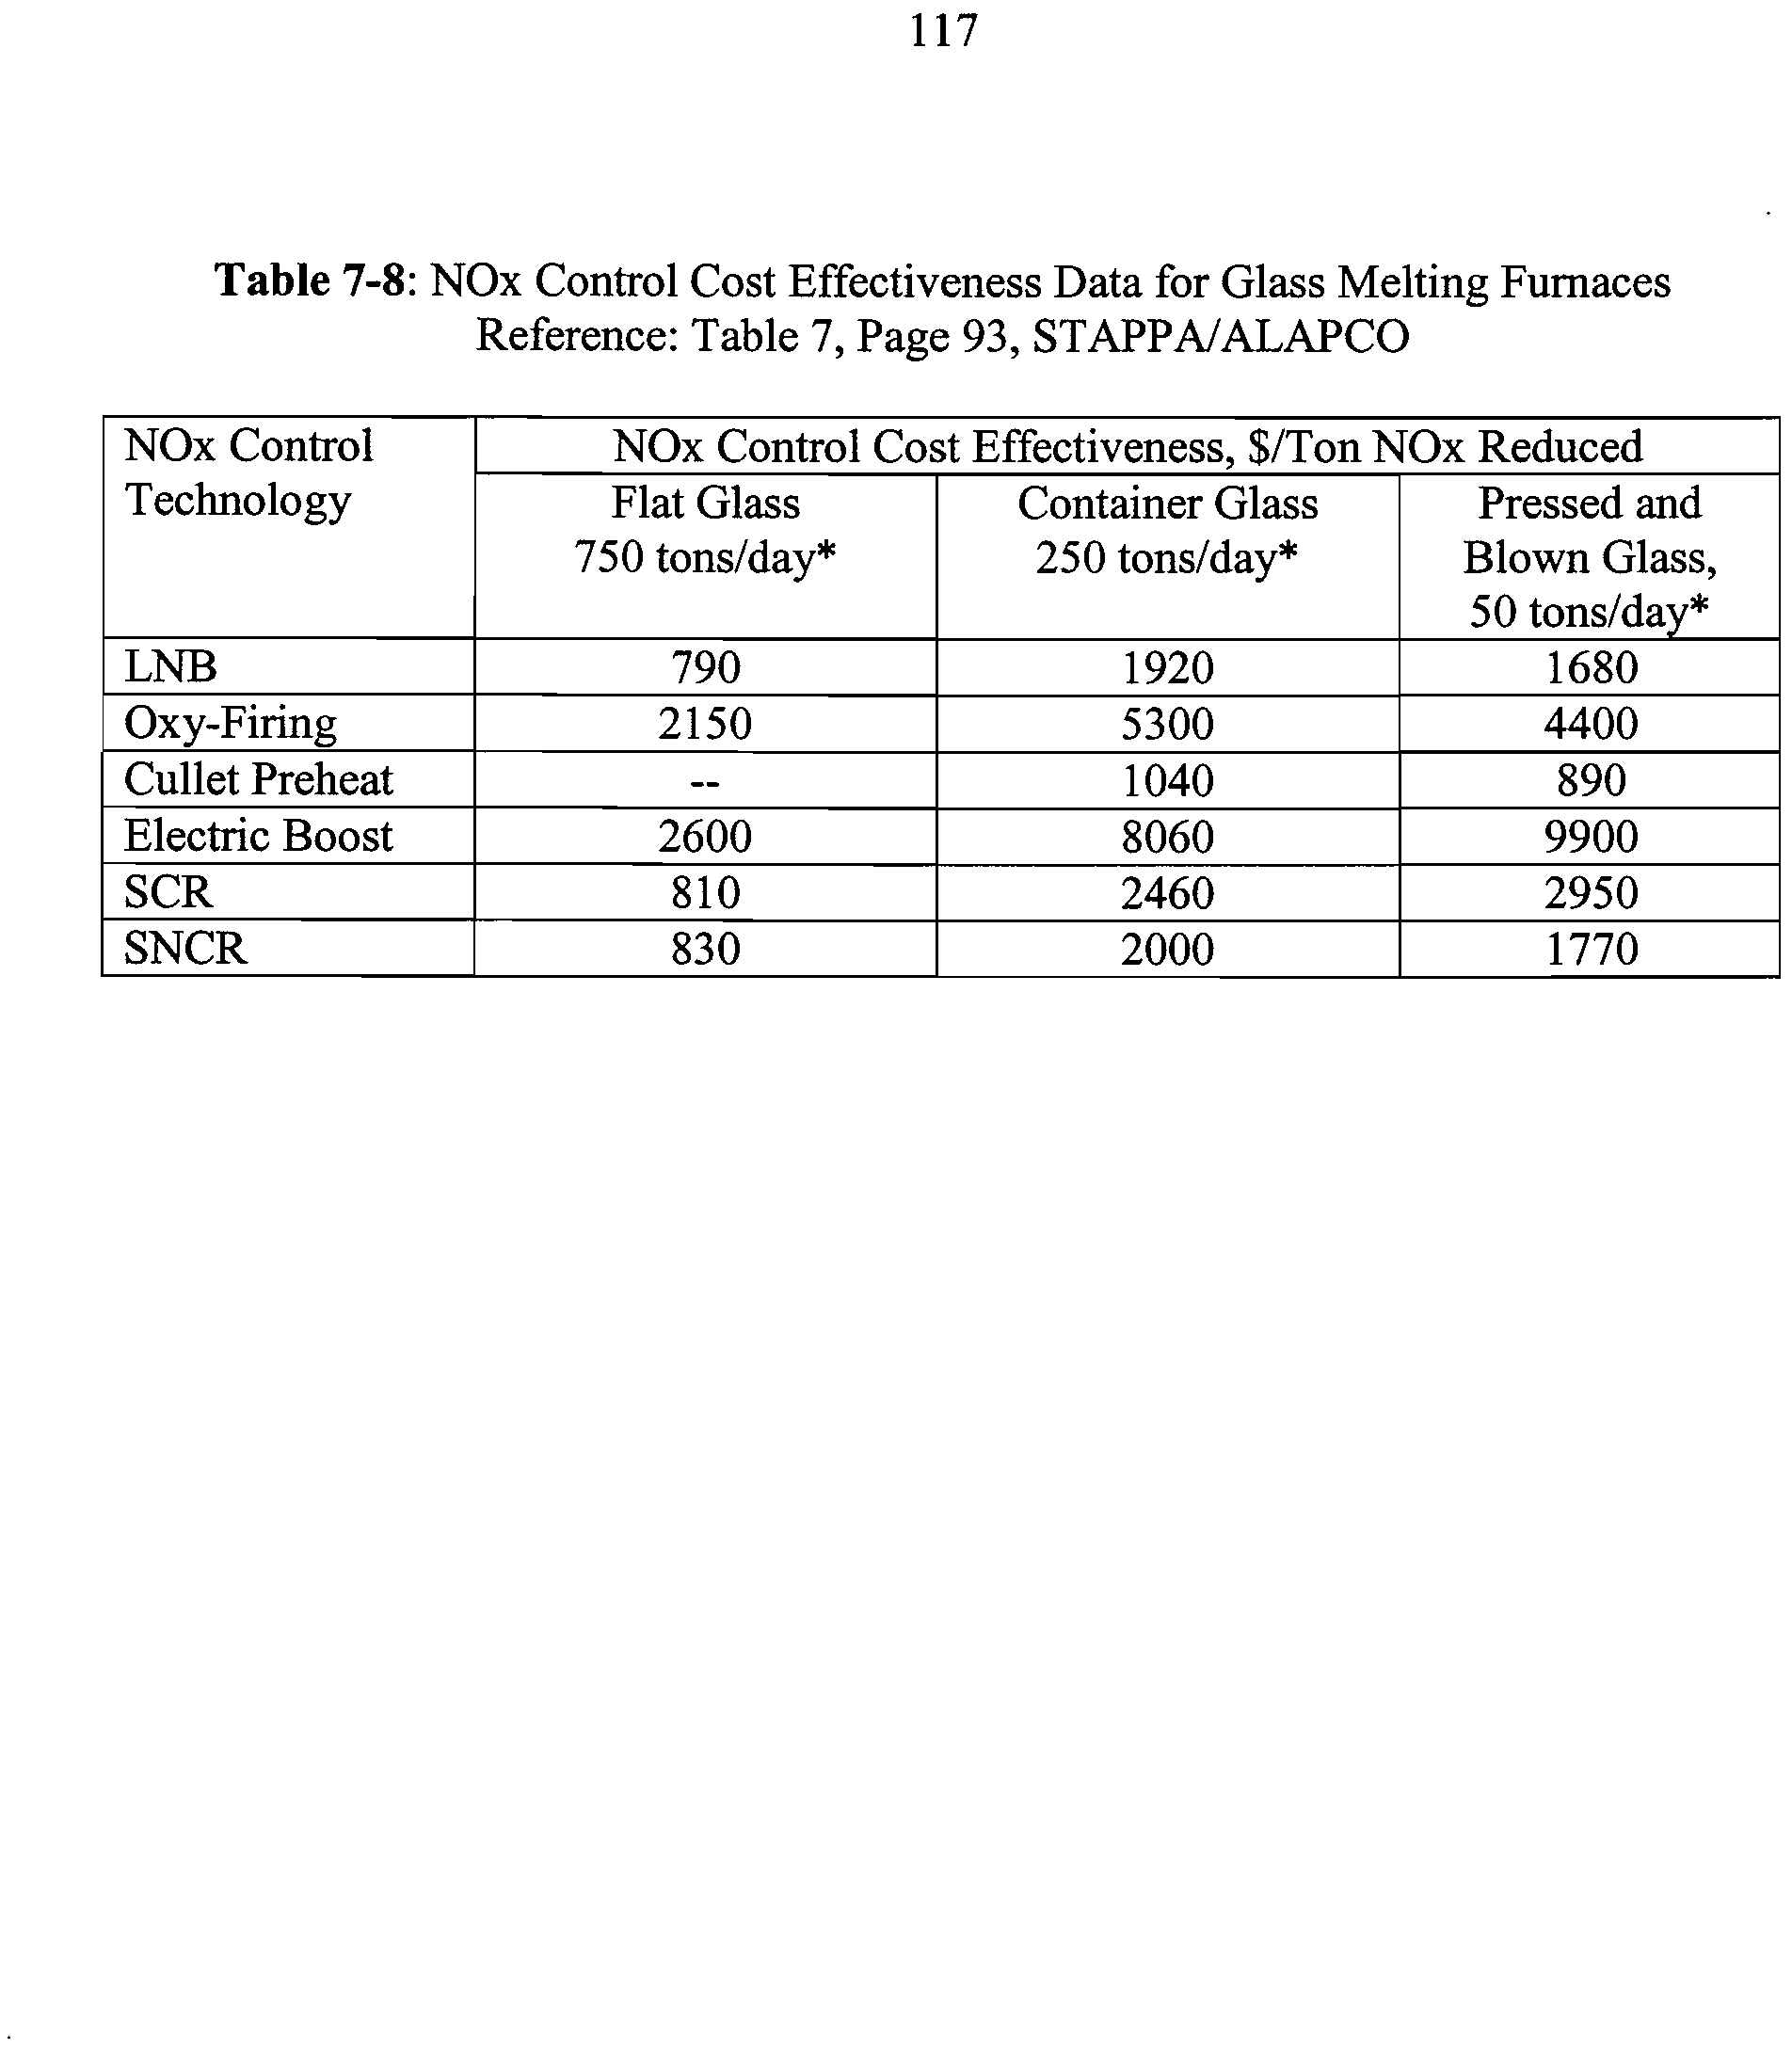
7-8
NOx Control Cost Effectiveness Data for Glass Melting Furnaces
117
8-1
Proposed Emission Limit for Affected Aluminum Melting
118
Furnaces
8-2
Emission Factors for Uncontrolled Aluminum Melting Furnace
121
8-3
Performance of low NOx combustion controls
123
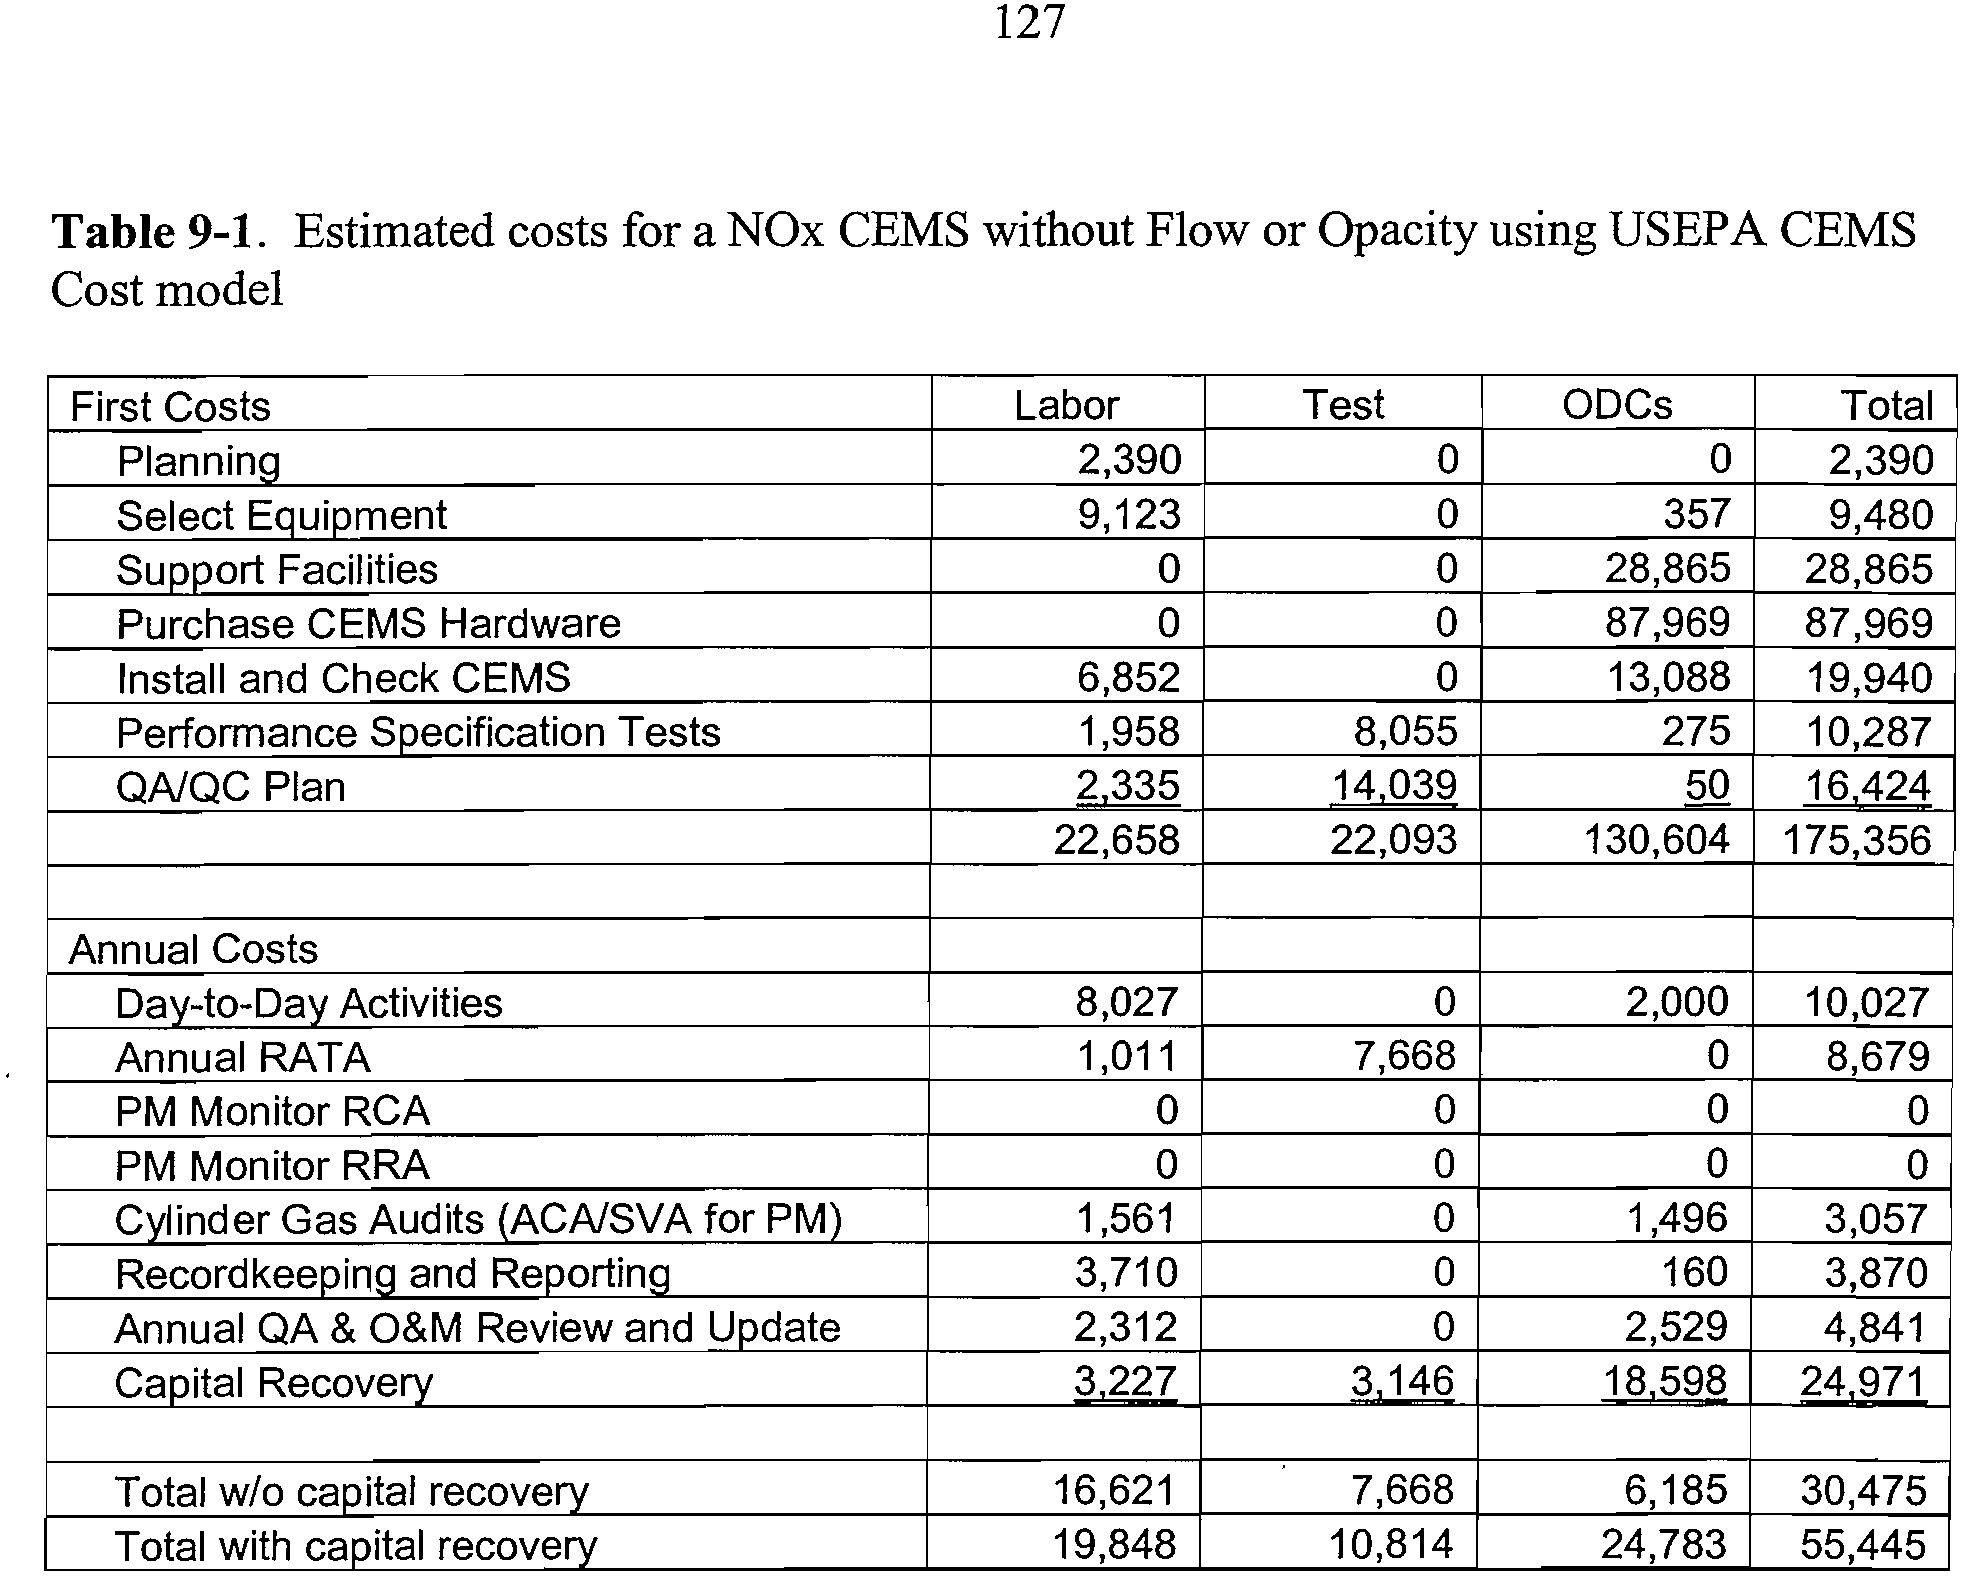
9-1
Estimated costs for a NOx CEMS without Flow or Opacity using
127
USEPA CEMS Cost model
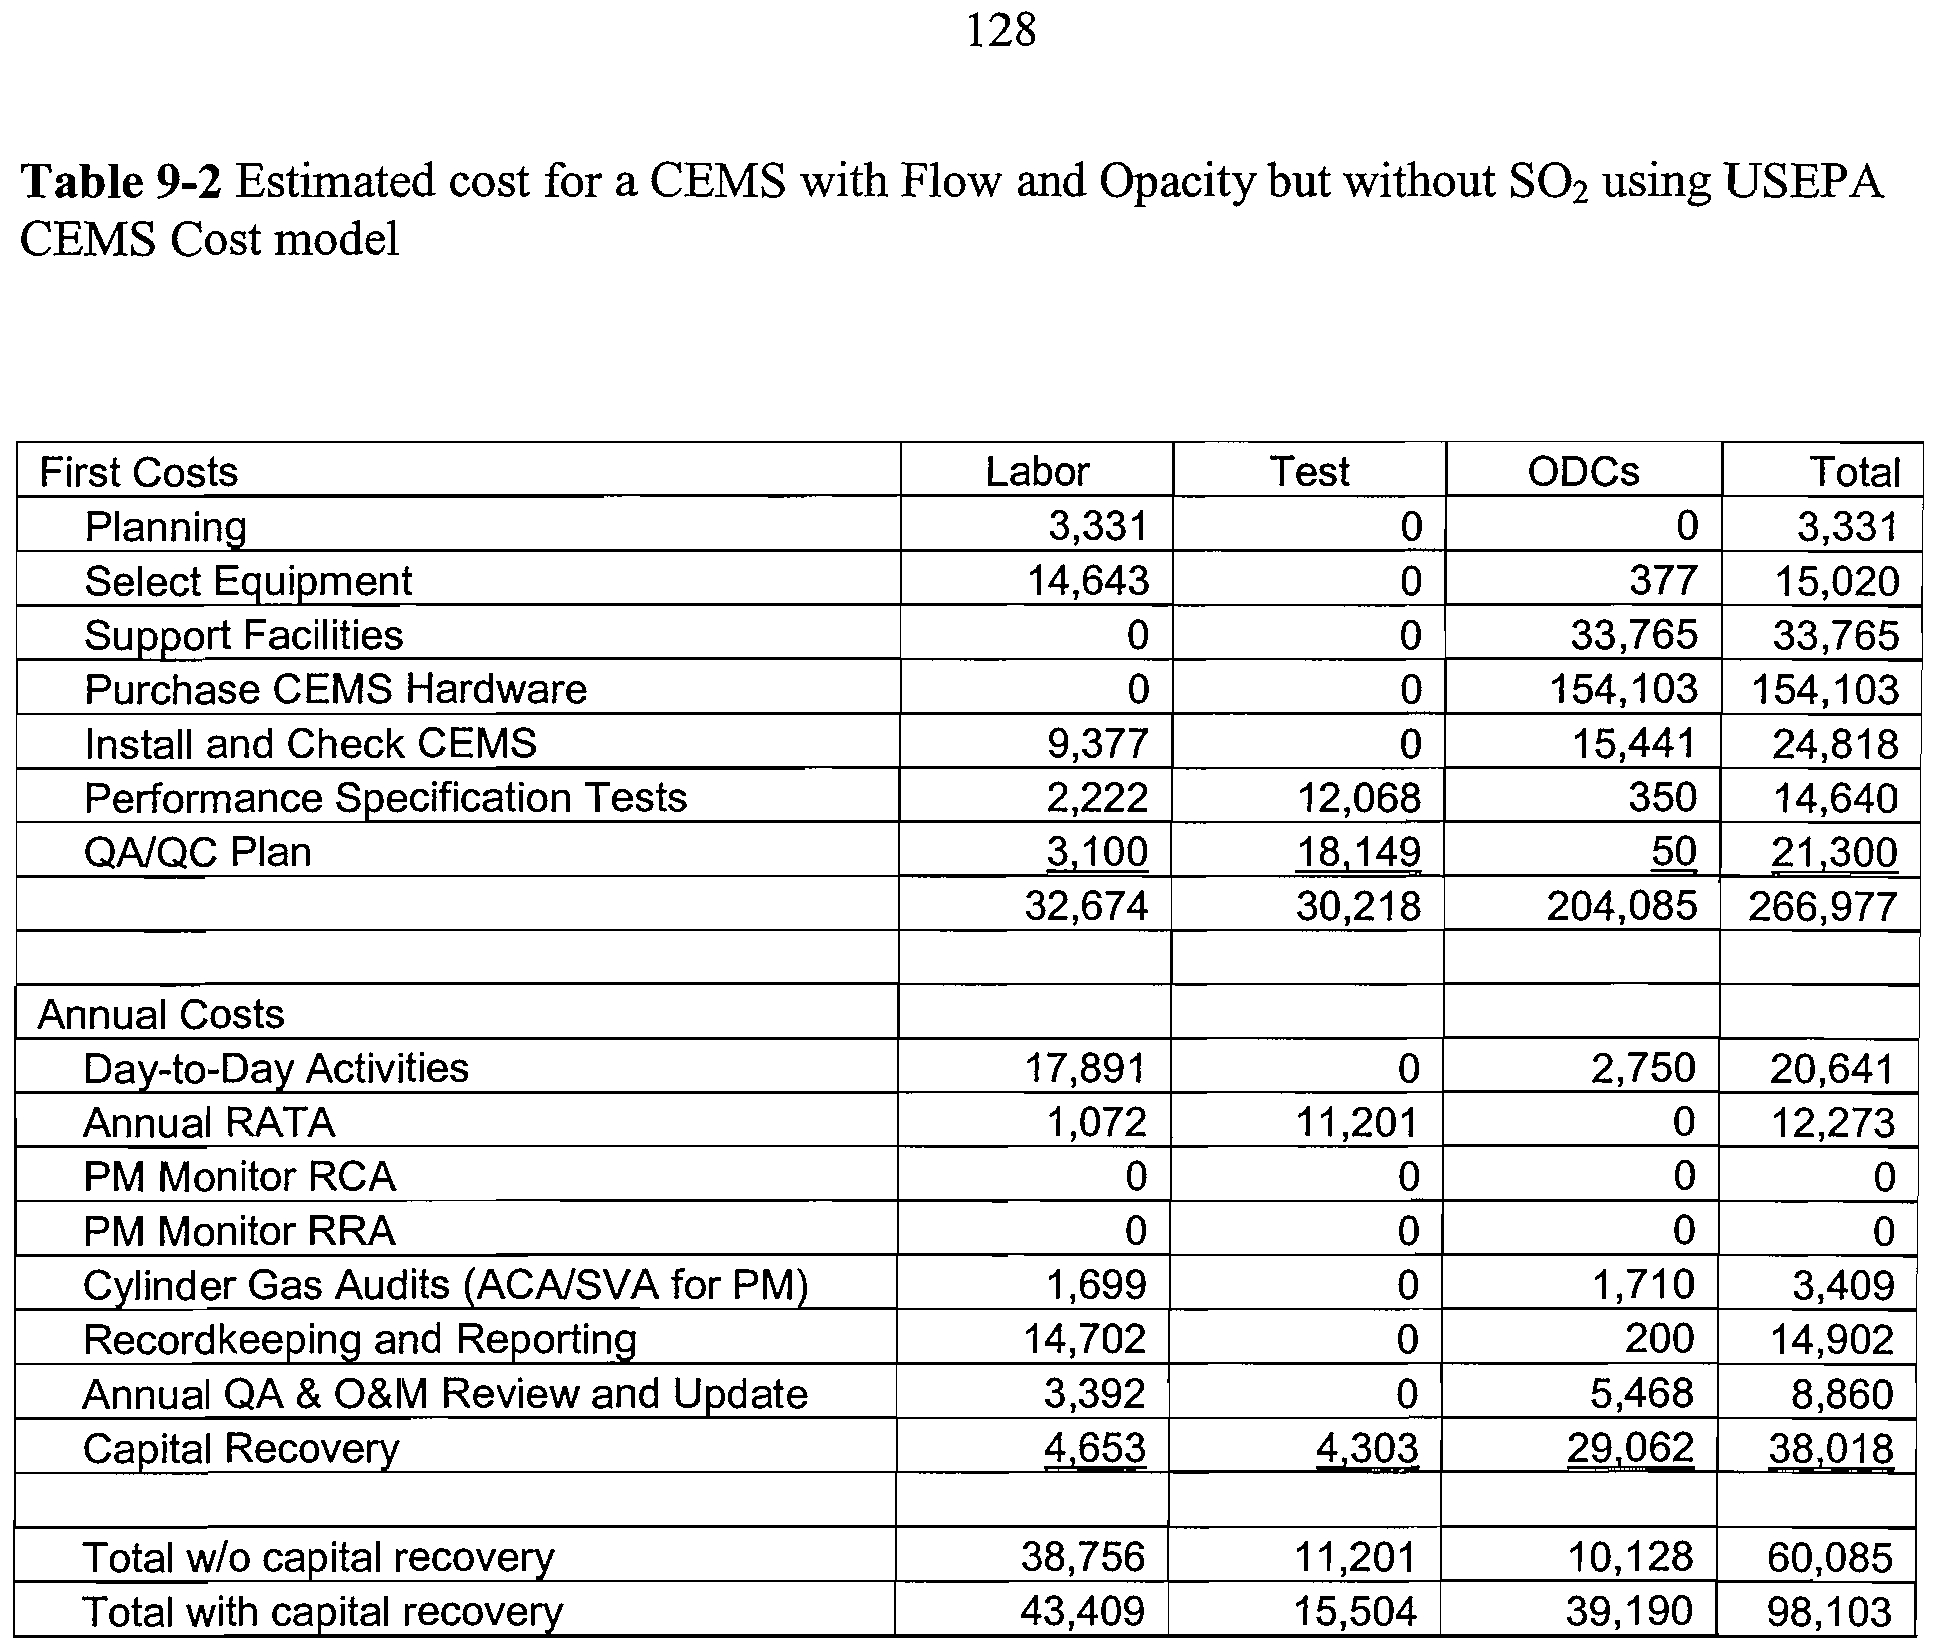
9-2
Estimated cost for a CEMS with Flow and Opacity but without
128
SO
2
using USEPA CEMS Cost model
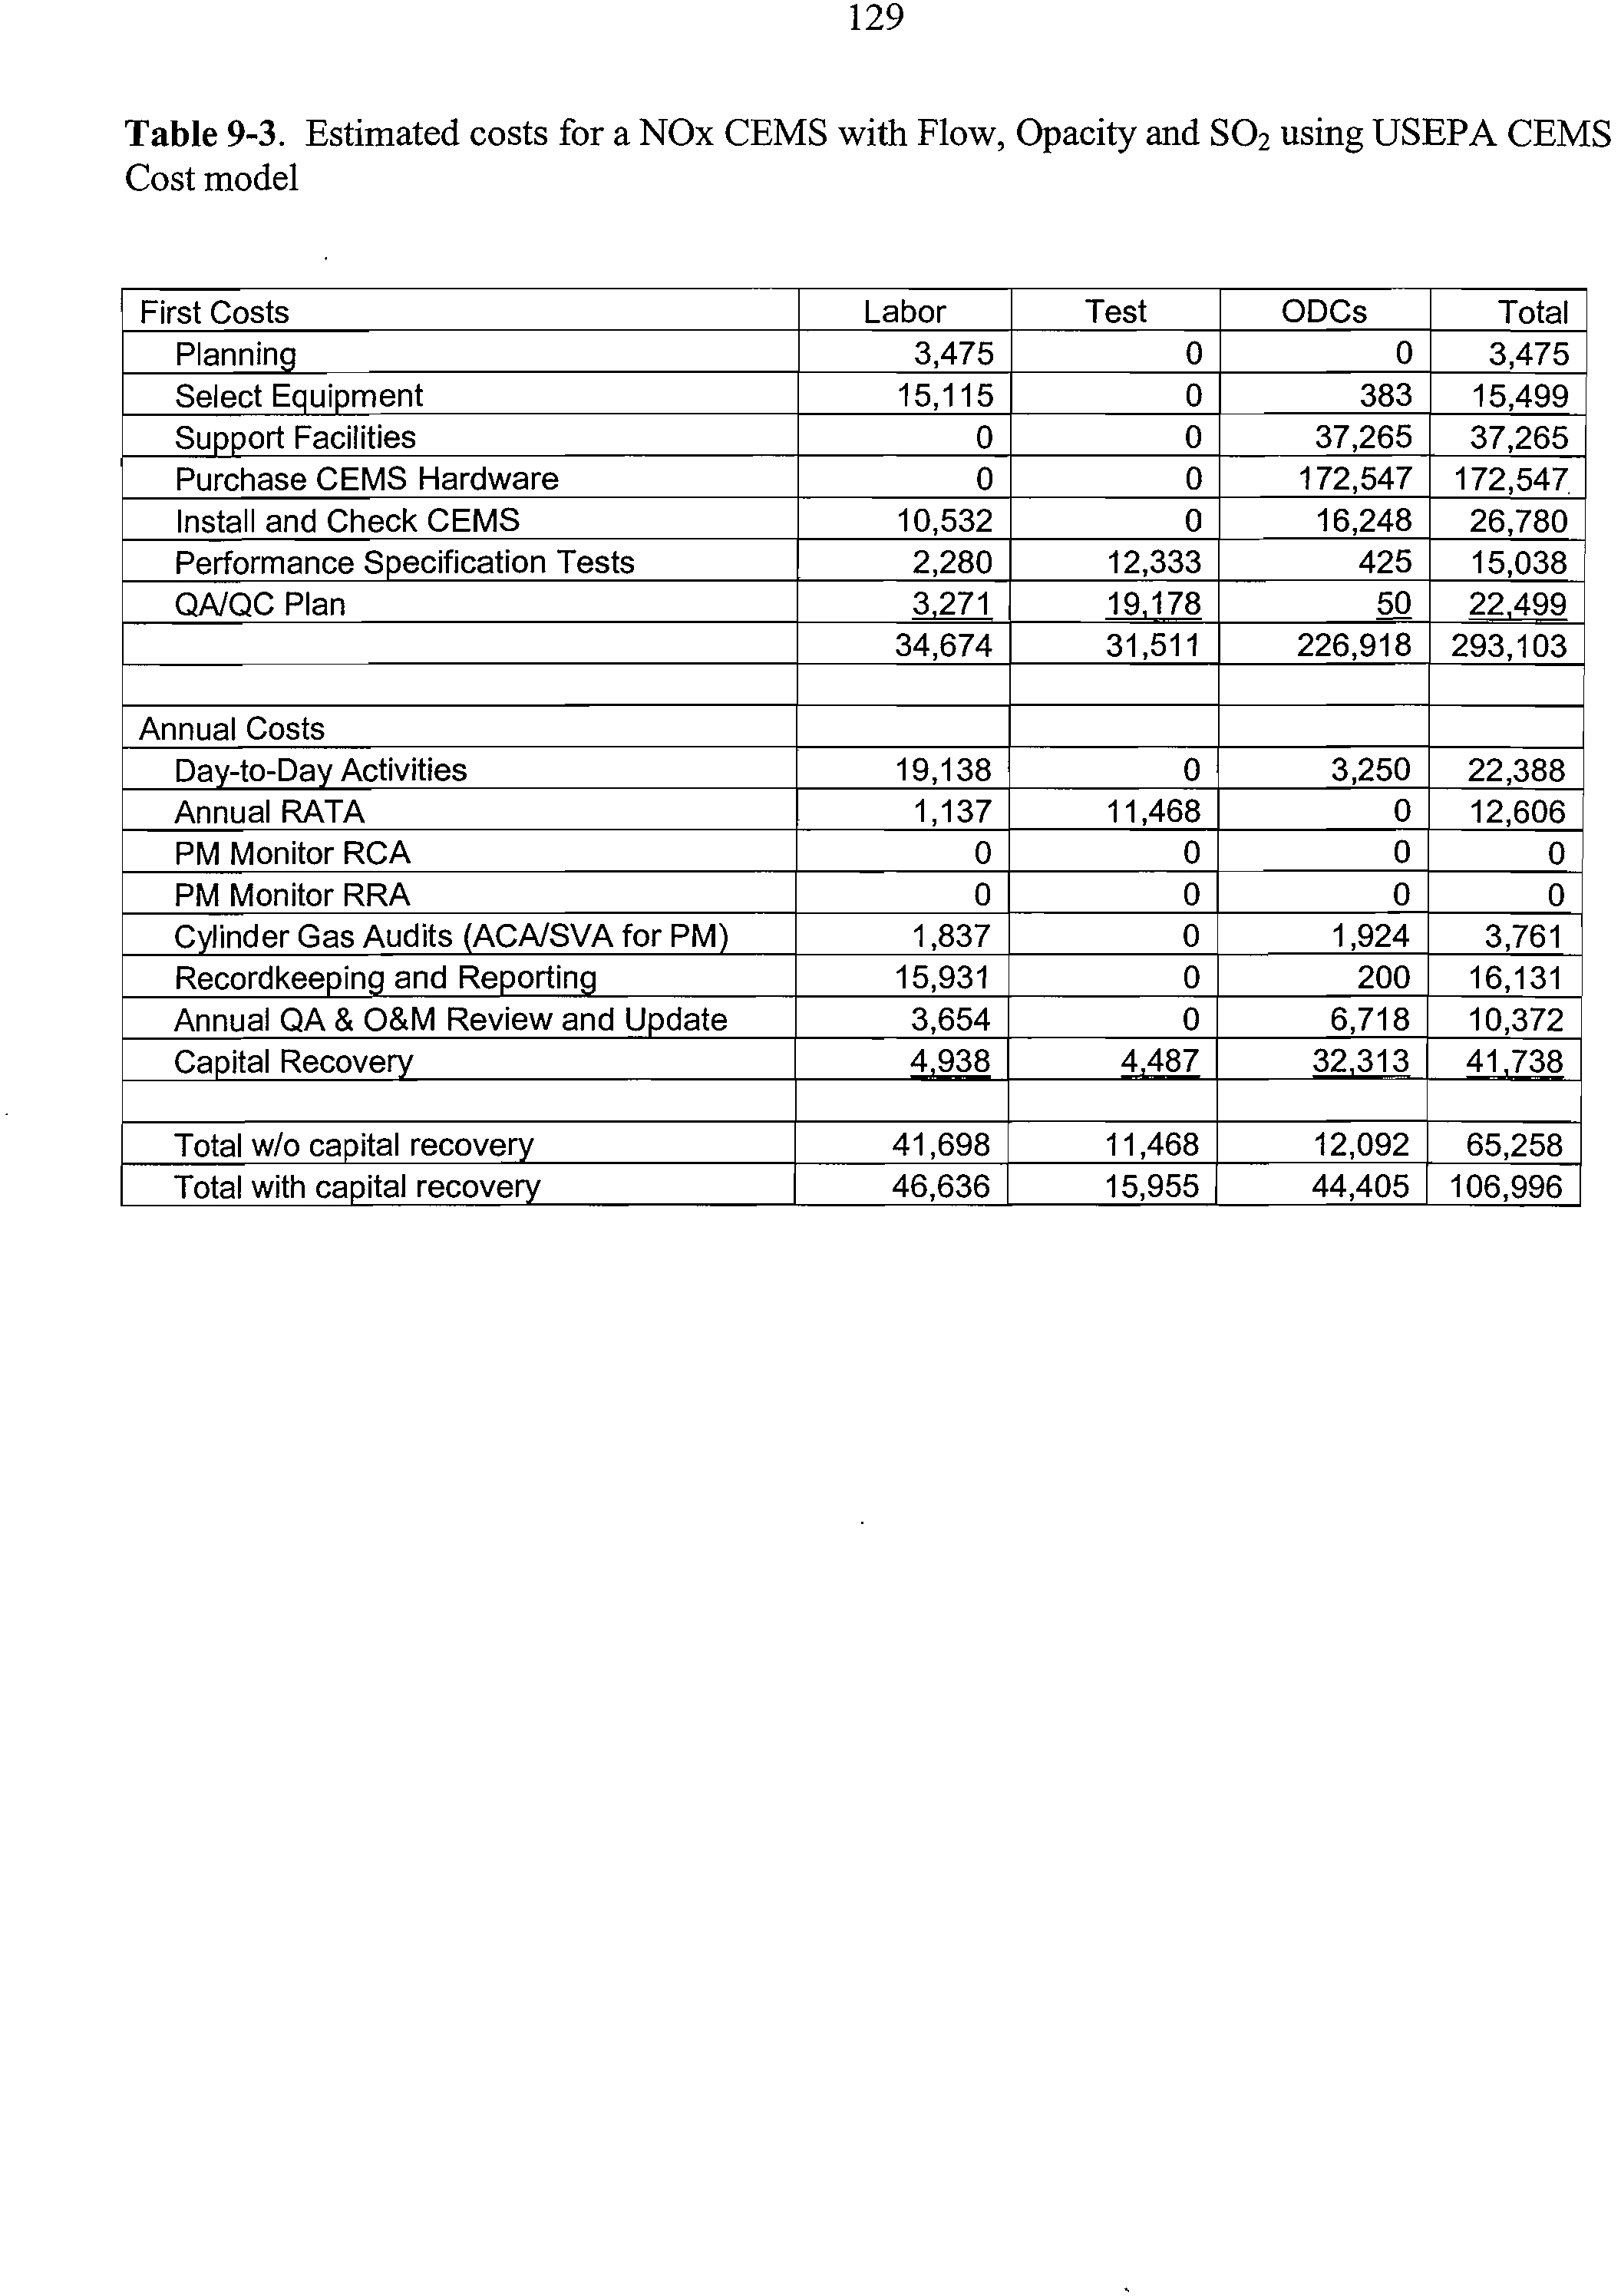
9-3
Estimated costs for a NOx CEMS with Flow, Opacity and SO
2
using USEPA CEMS Cost model
129
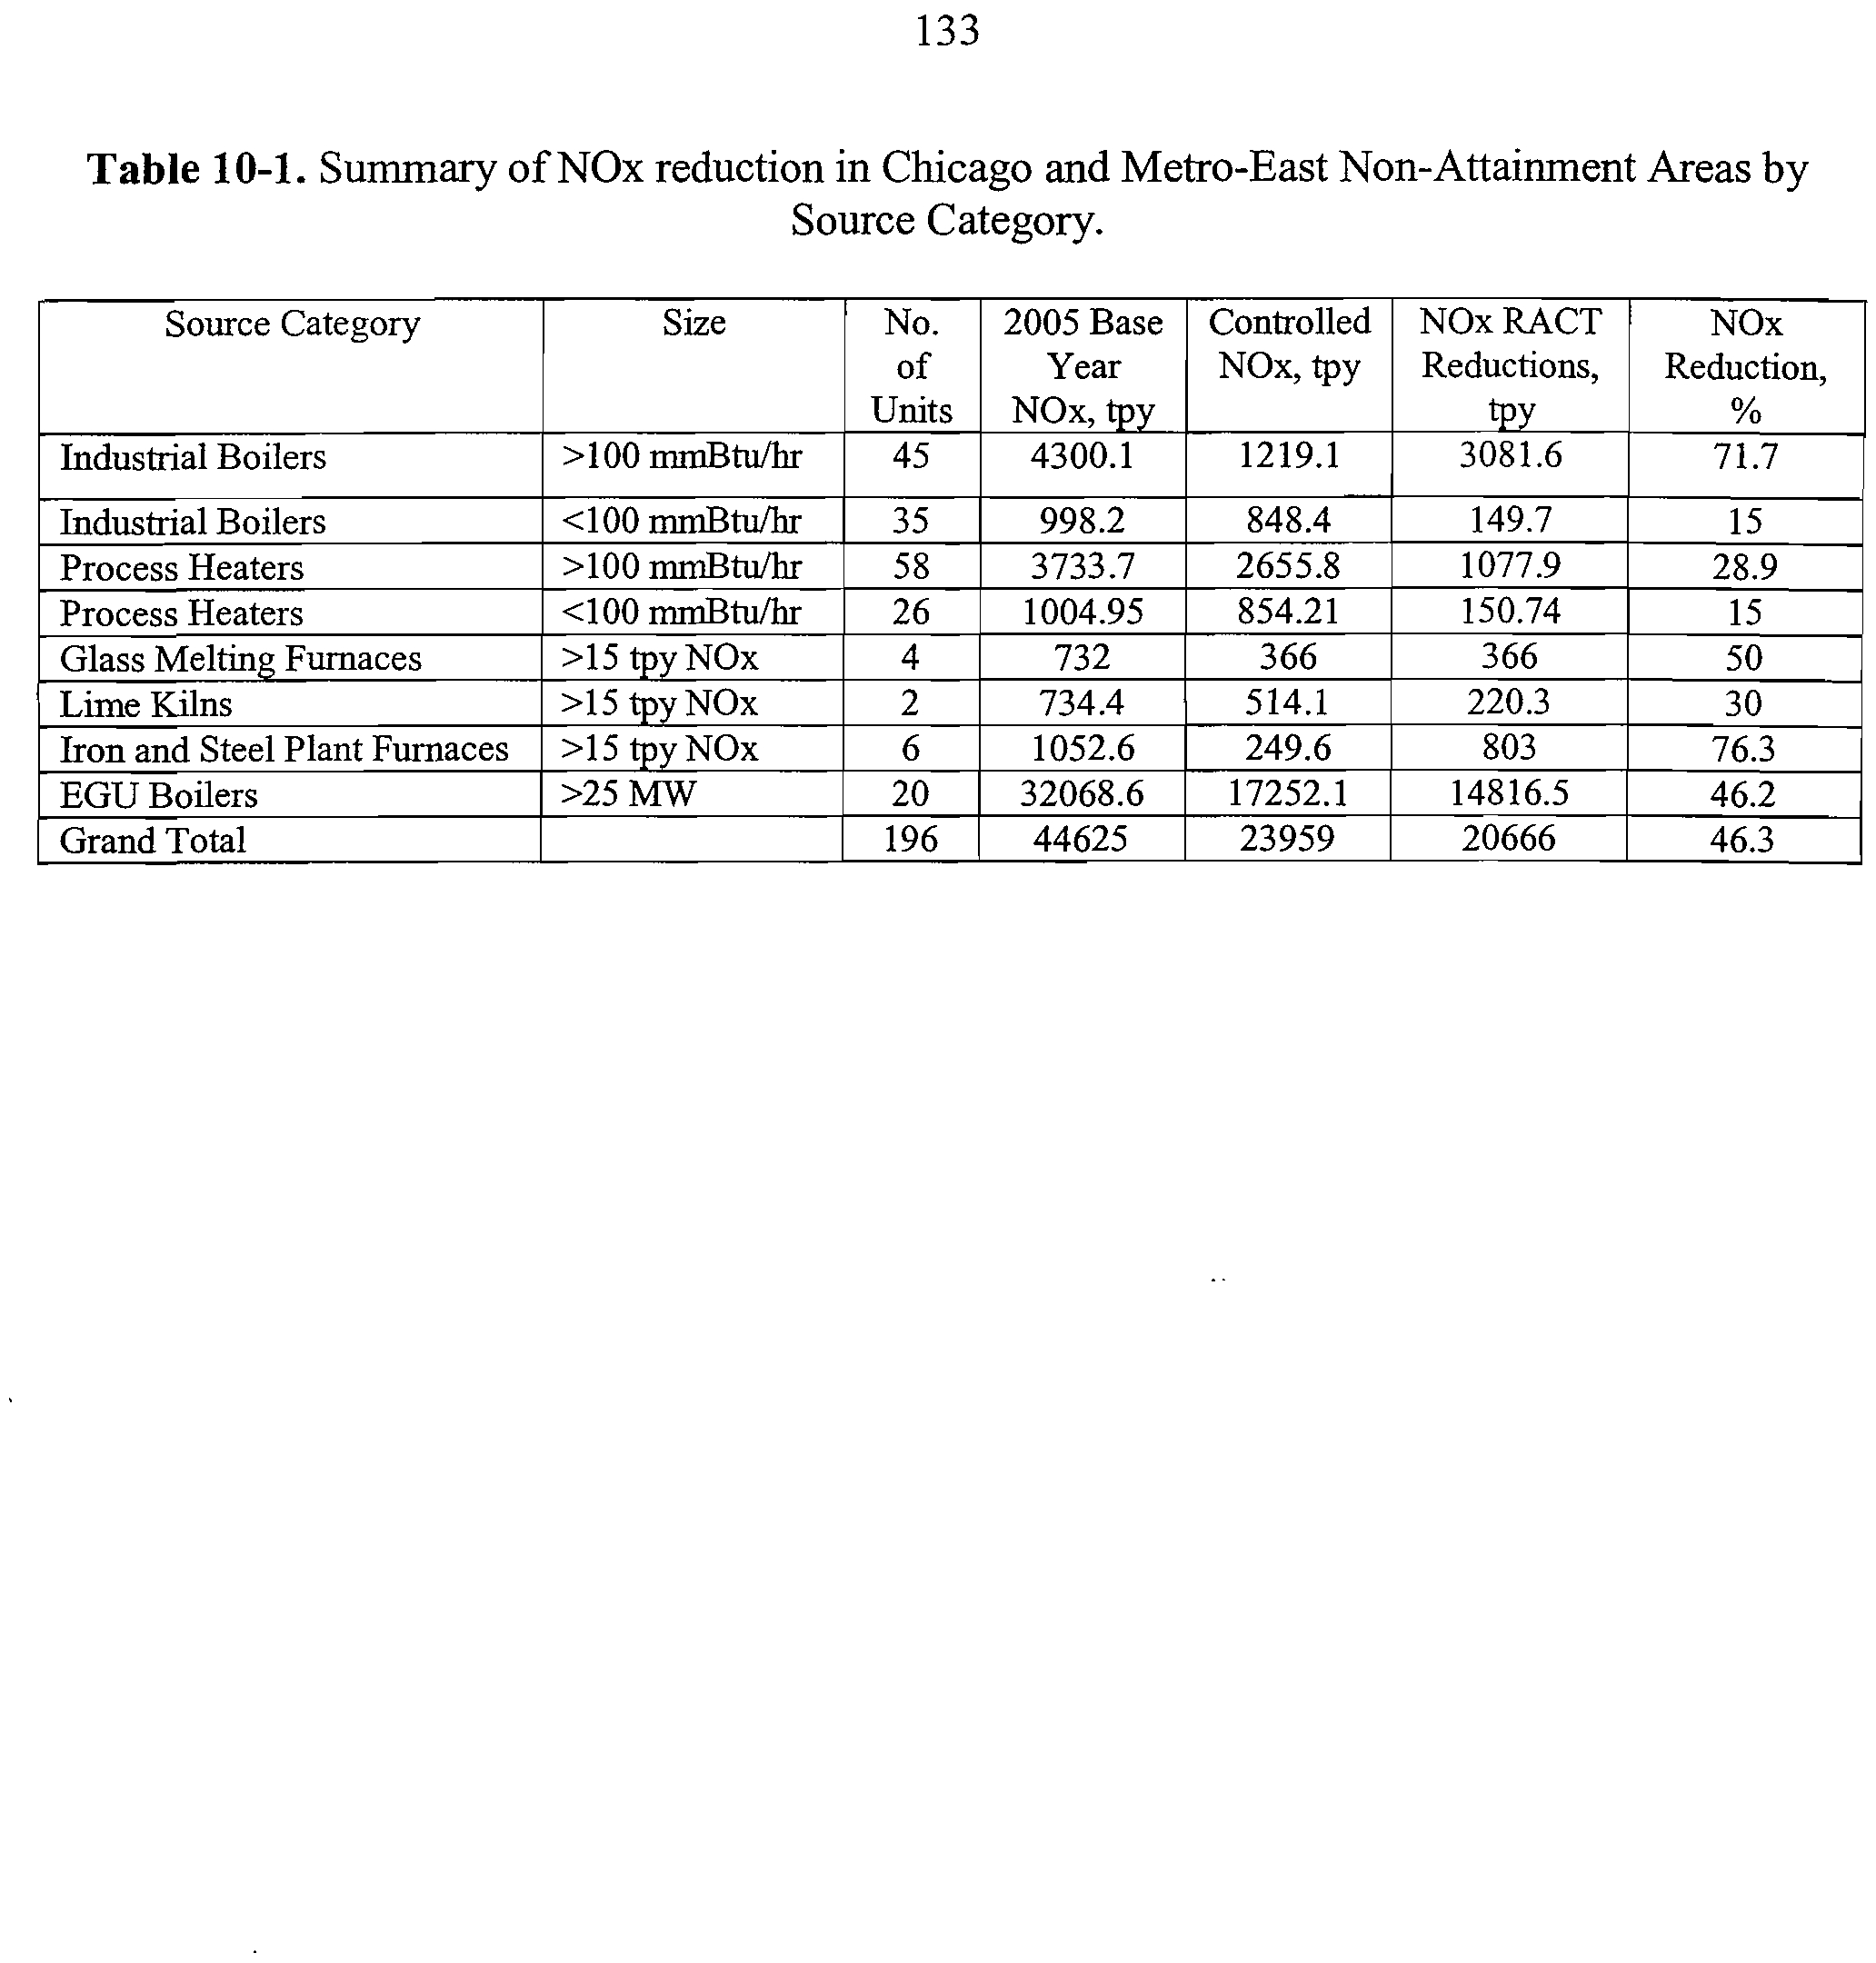
10-1
Summary of NOx reduction in Chicago and Metro-East Non-
133
Attainment Areas by Source Category.
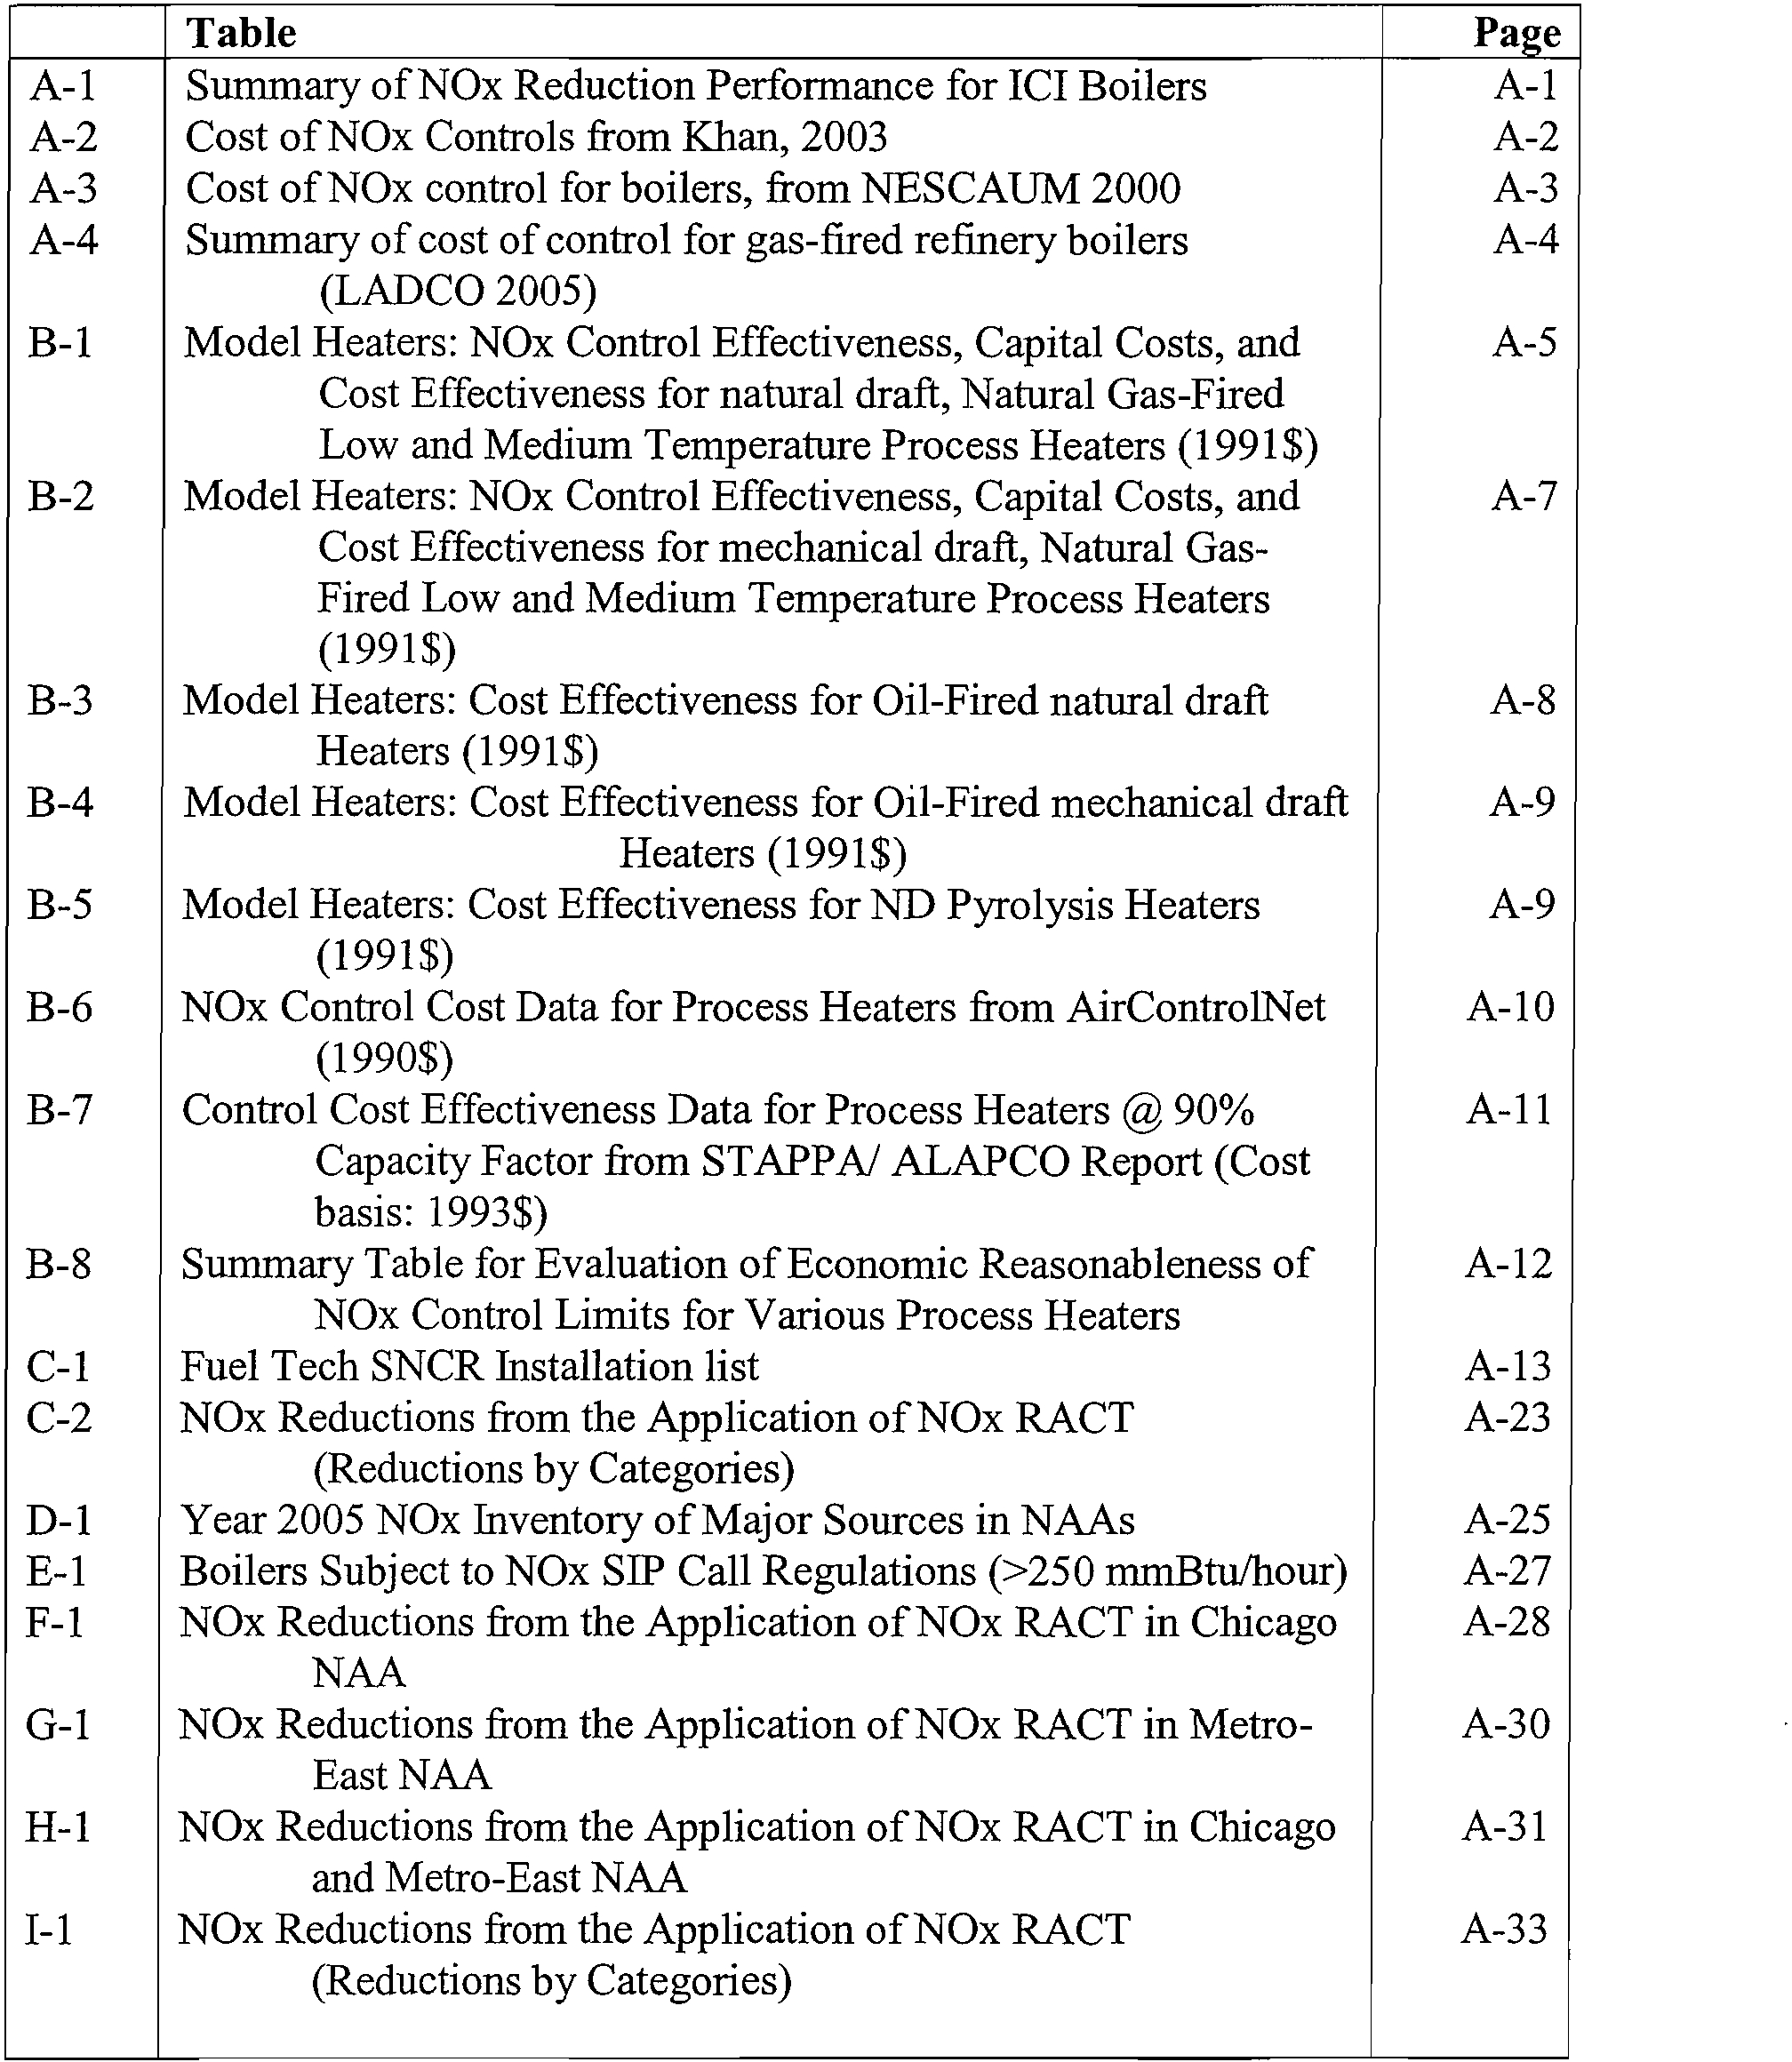
Appendices
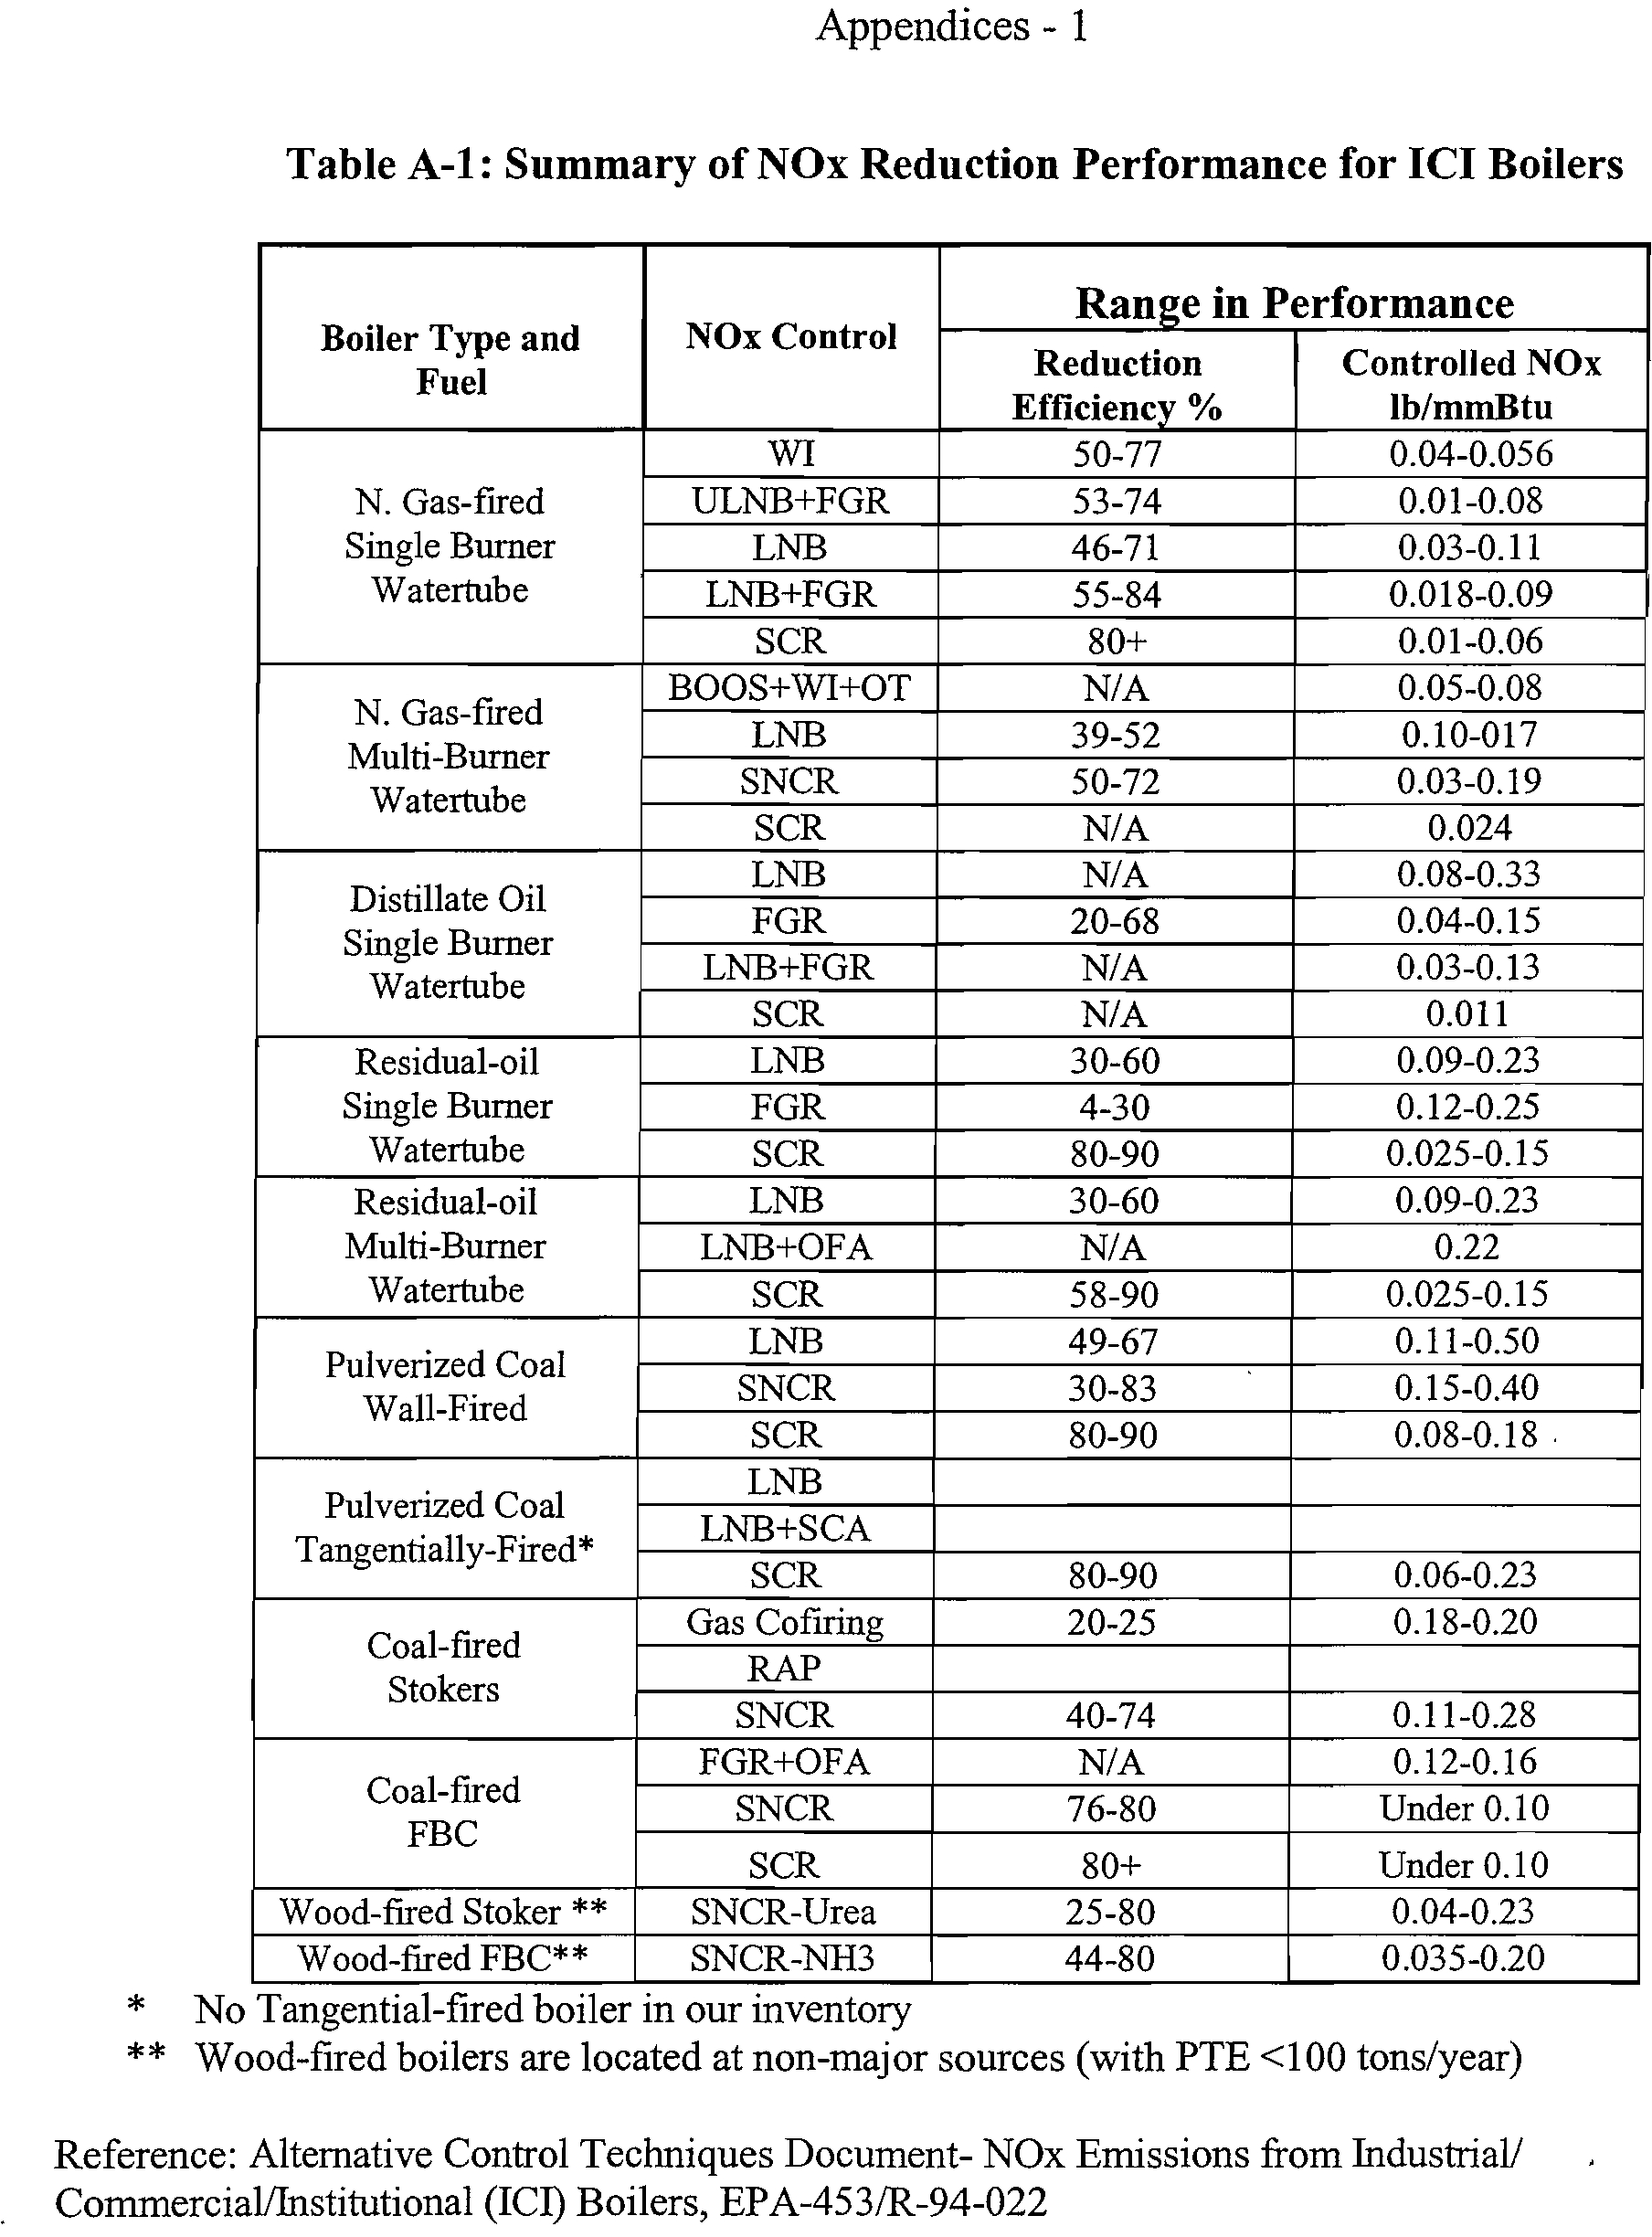
A-1
Summary of NOx Reduction Performance for ICI Boilers
A-1
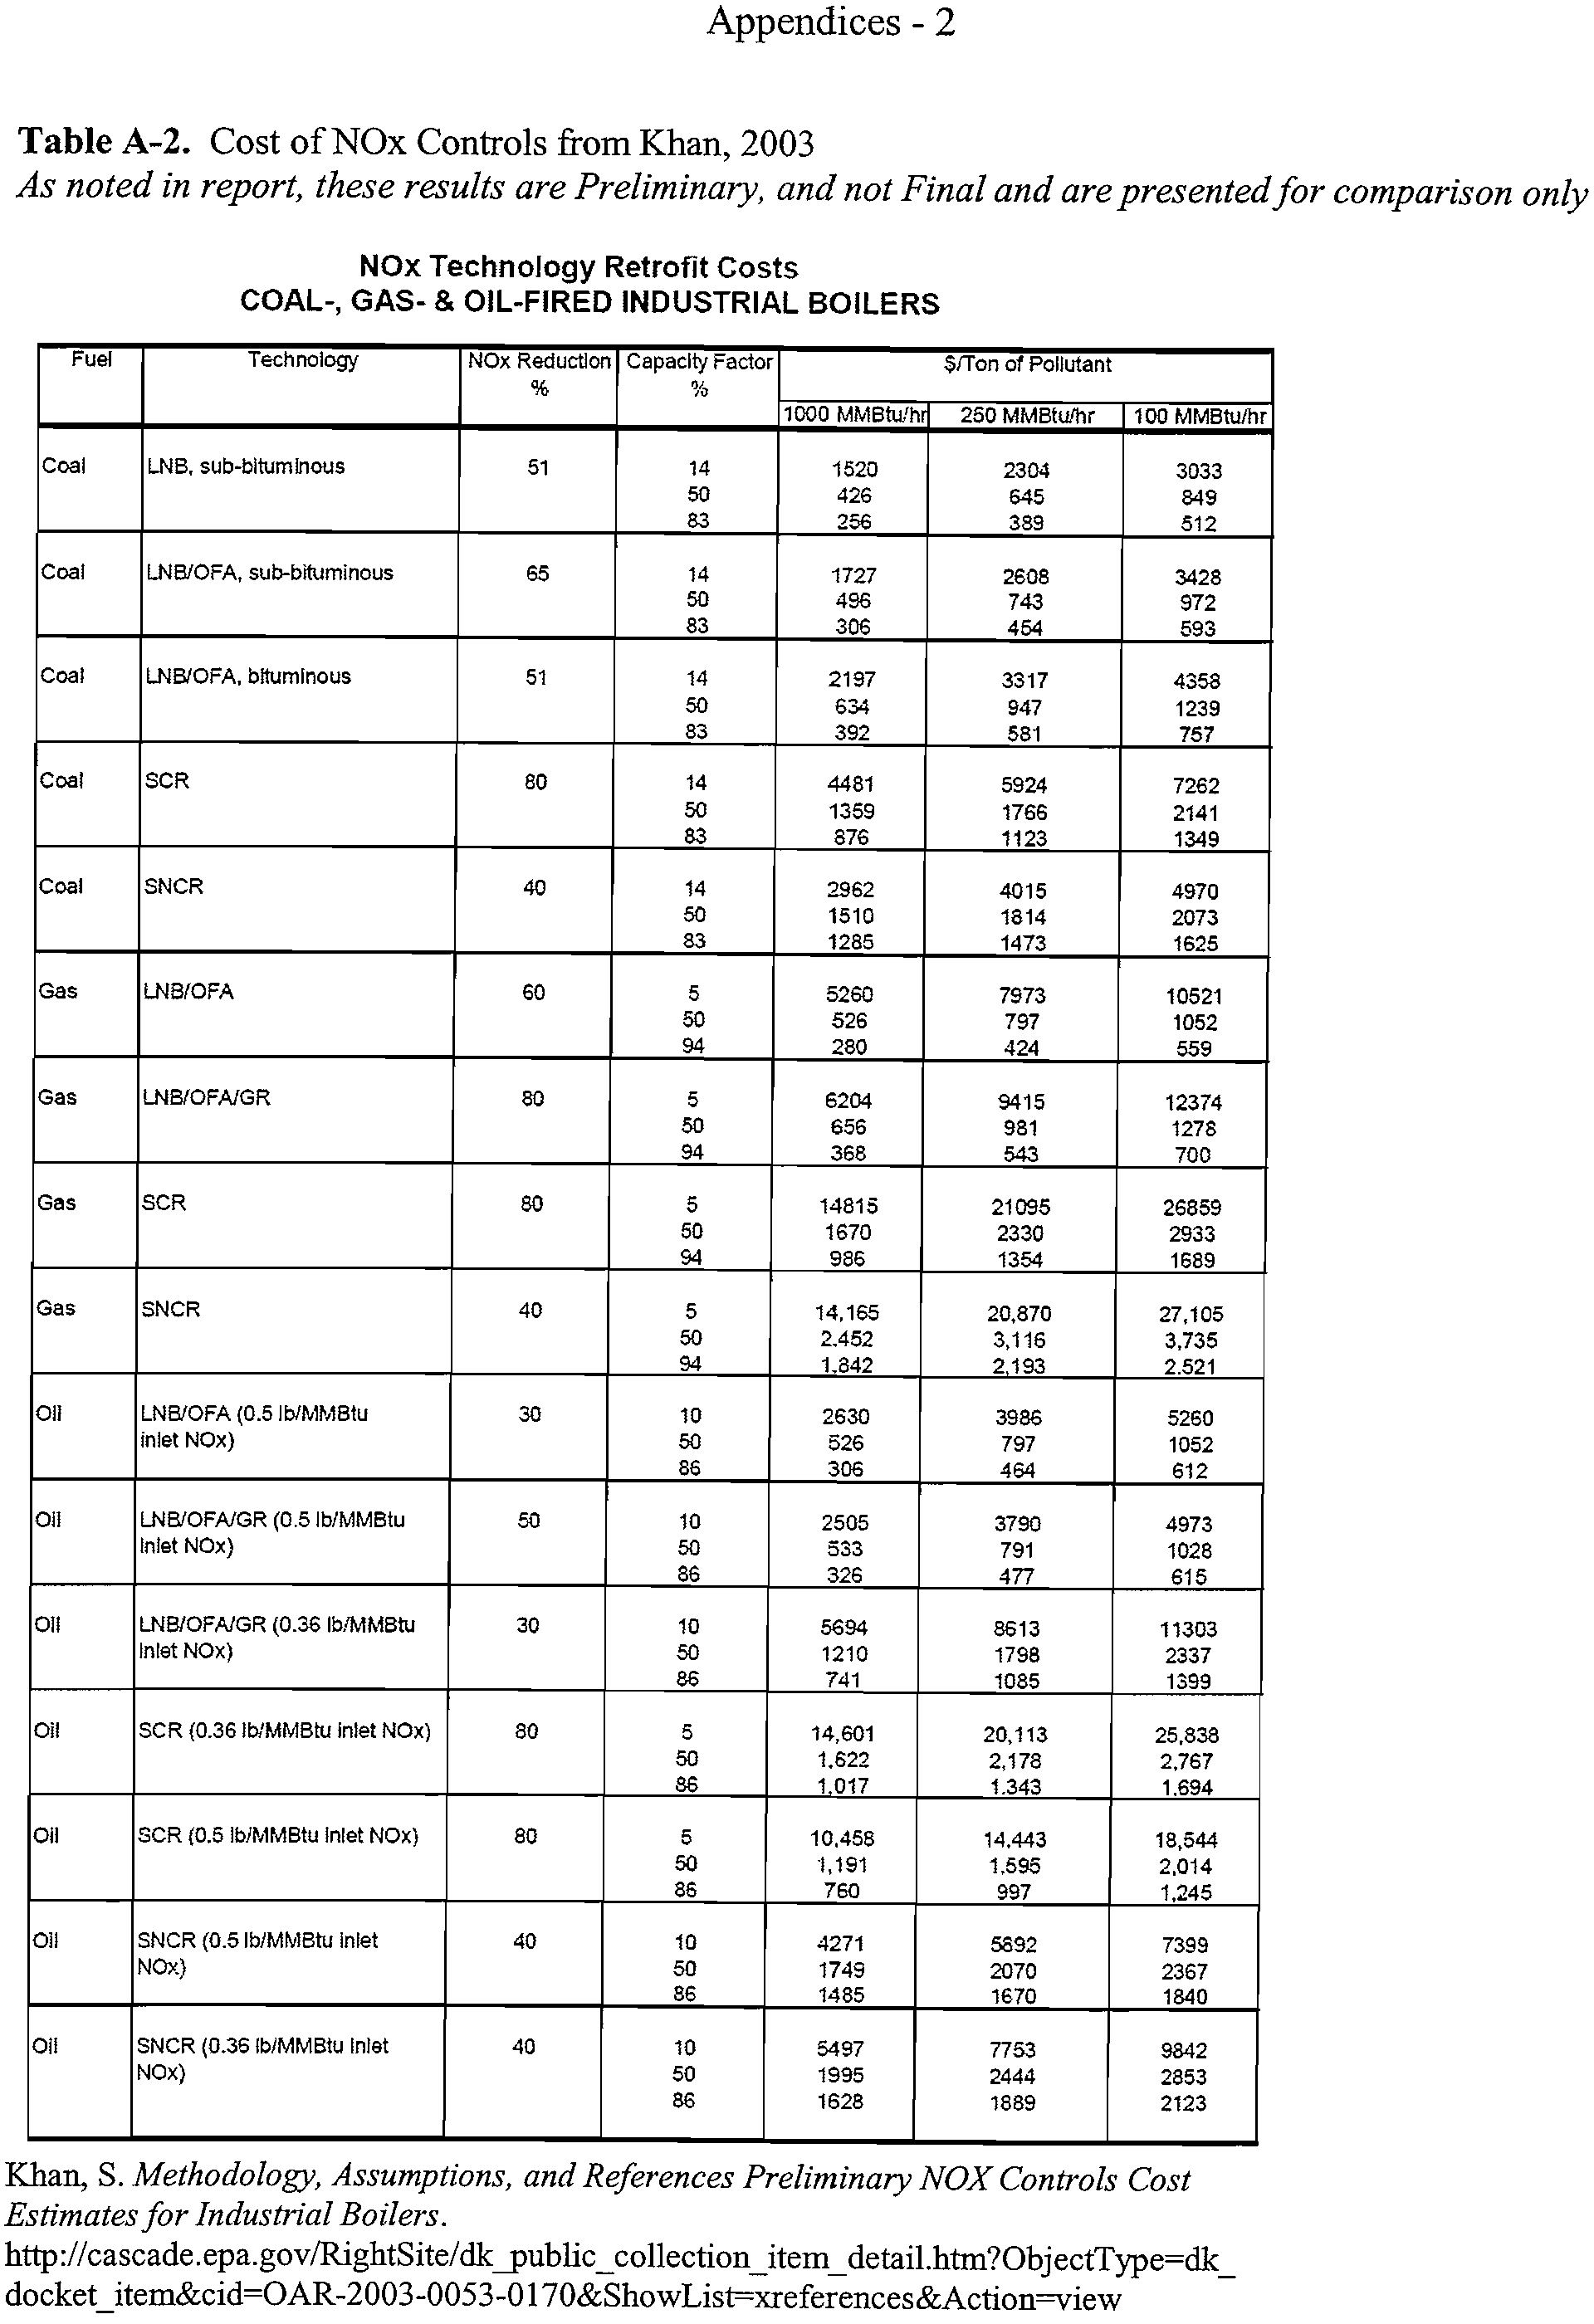
A-2
Cost of NOx Controls from Khan, 2003
A-2
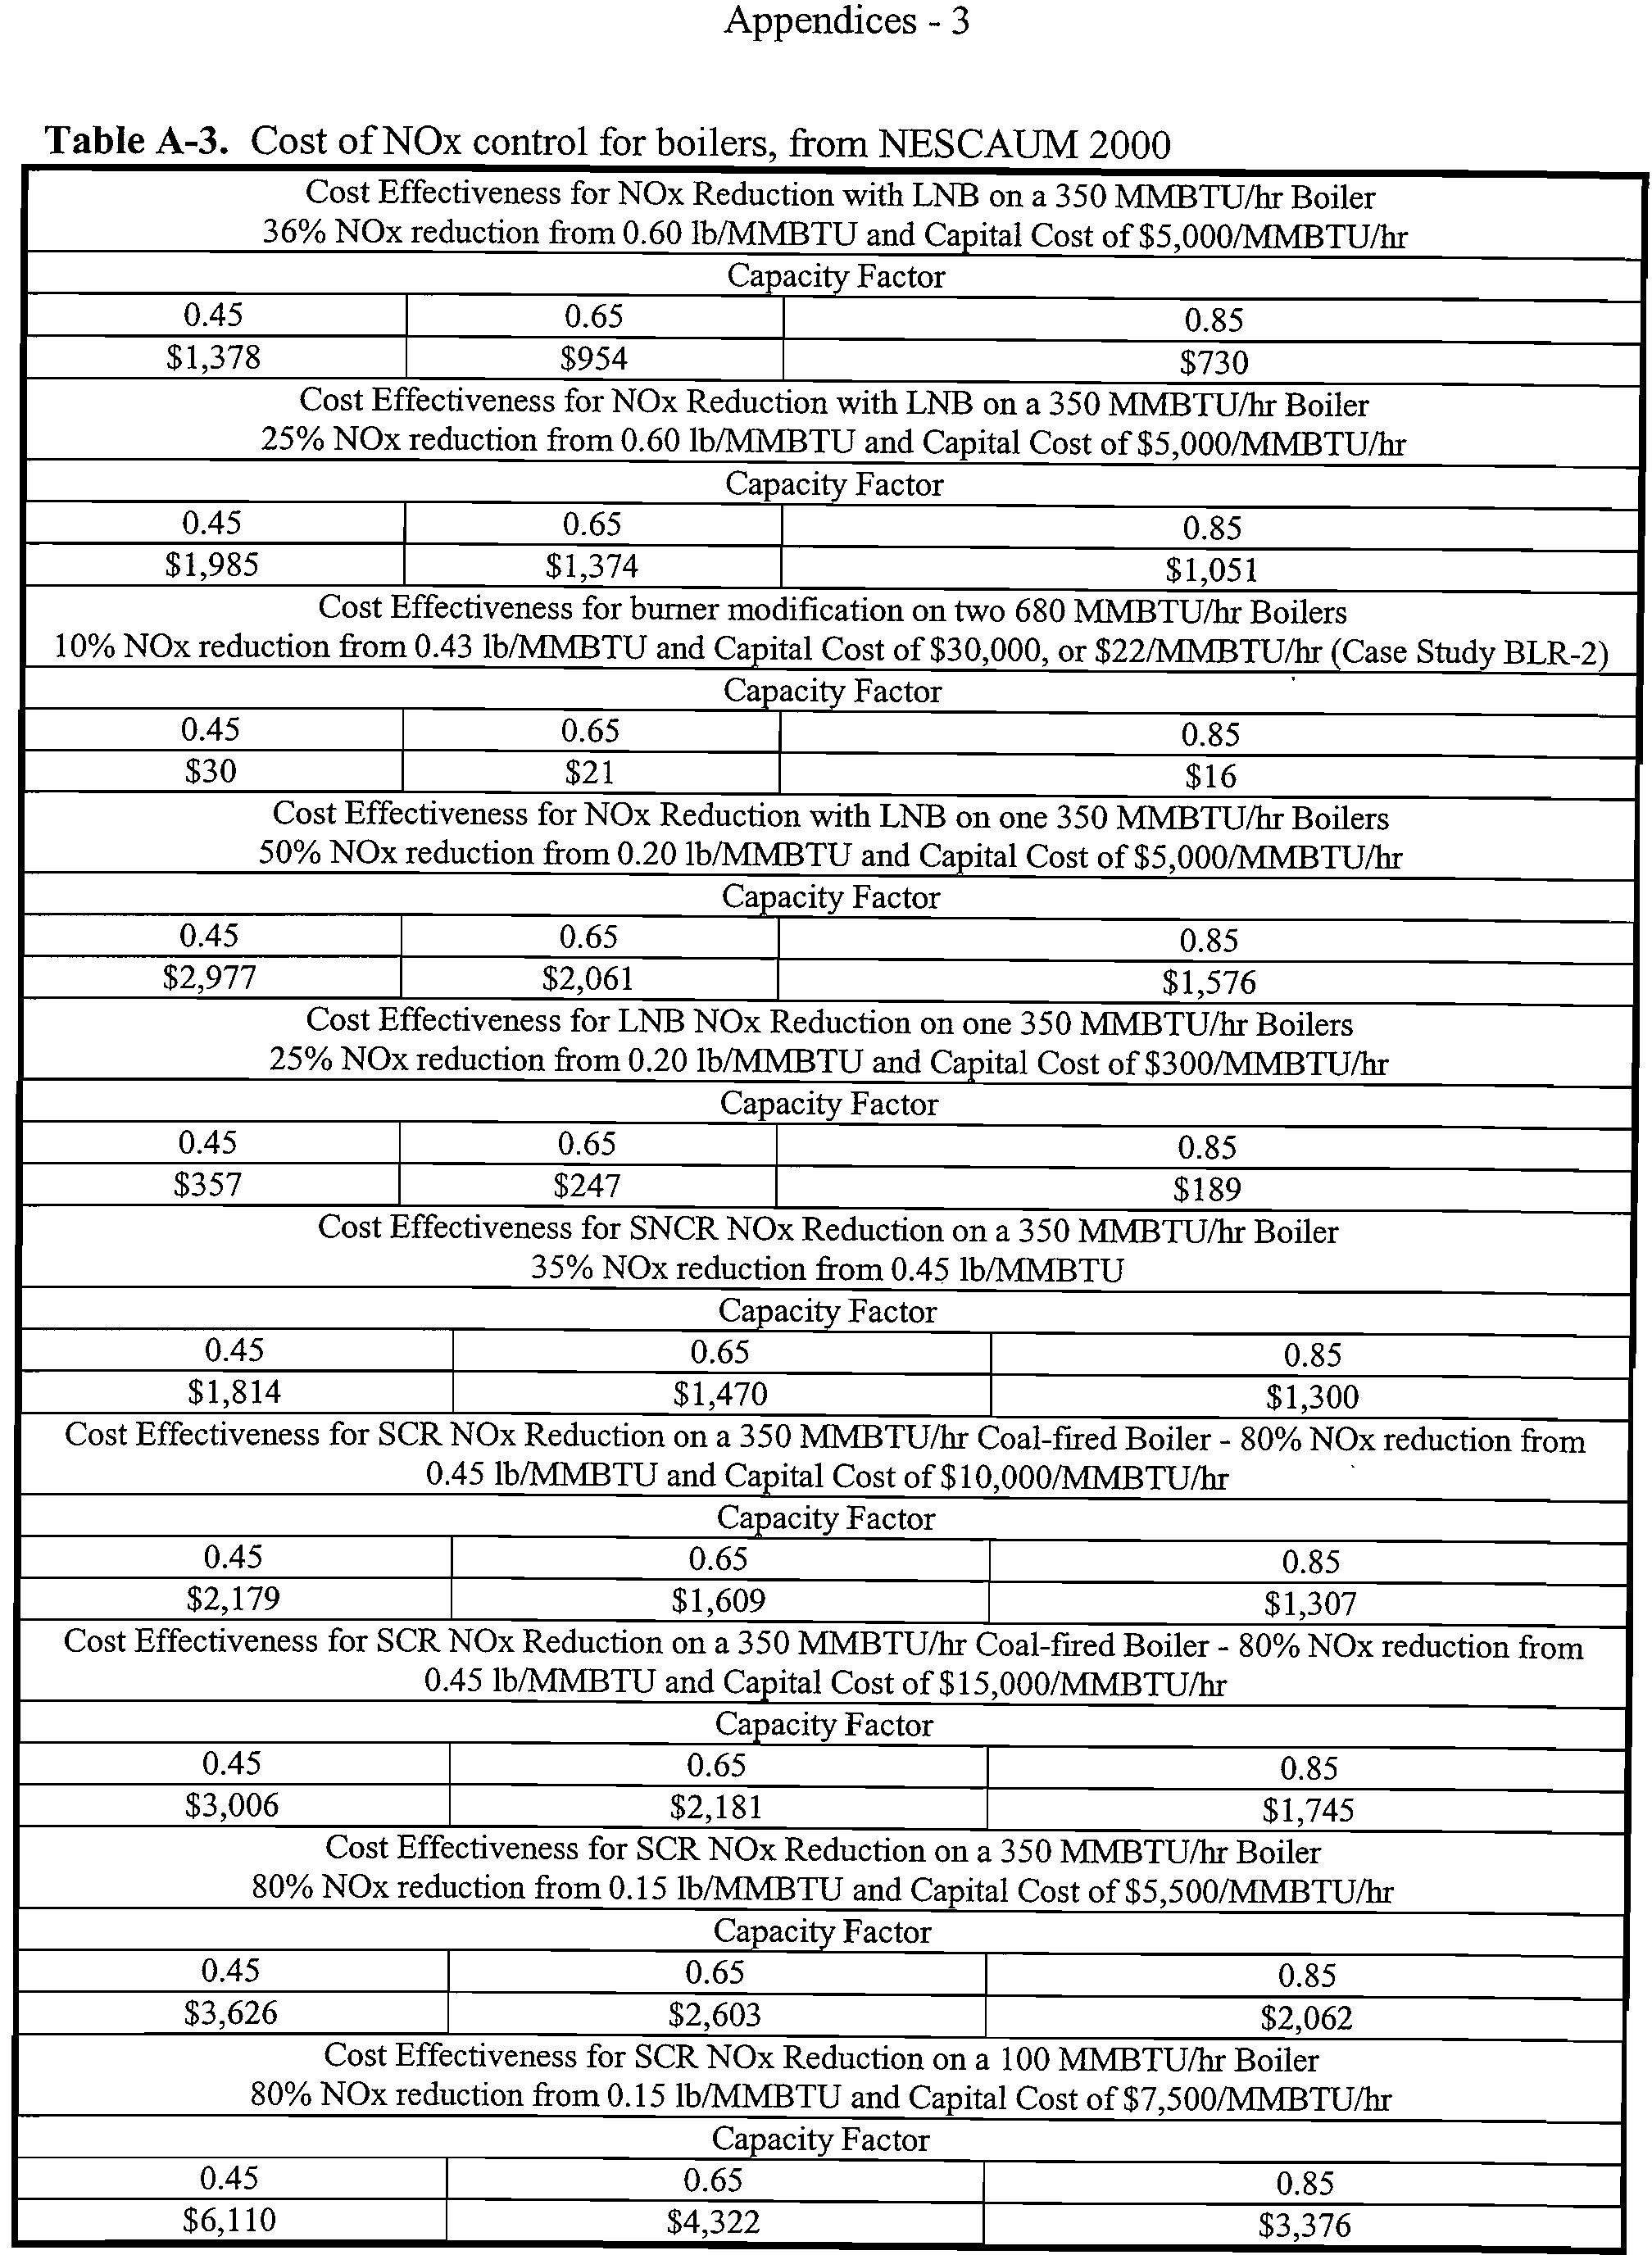
A-3
Cost of NOx control for boilers, from NESCAUM 2000
A-3
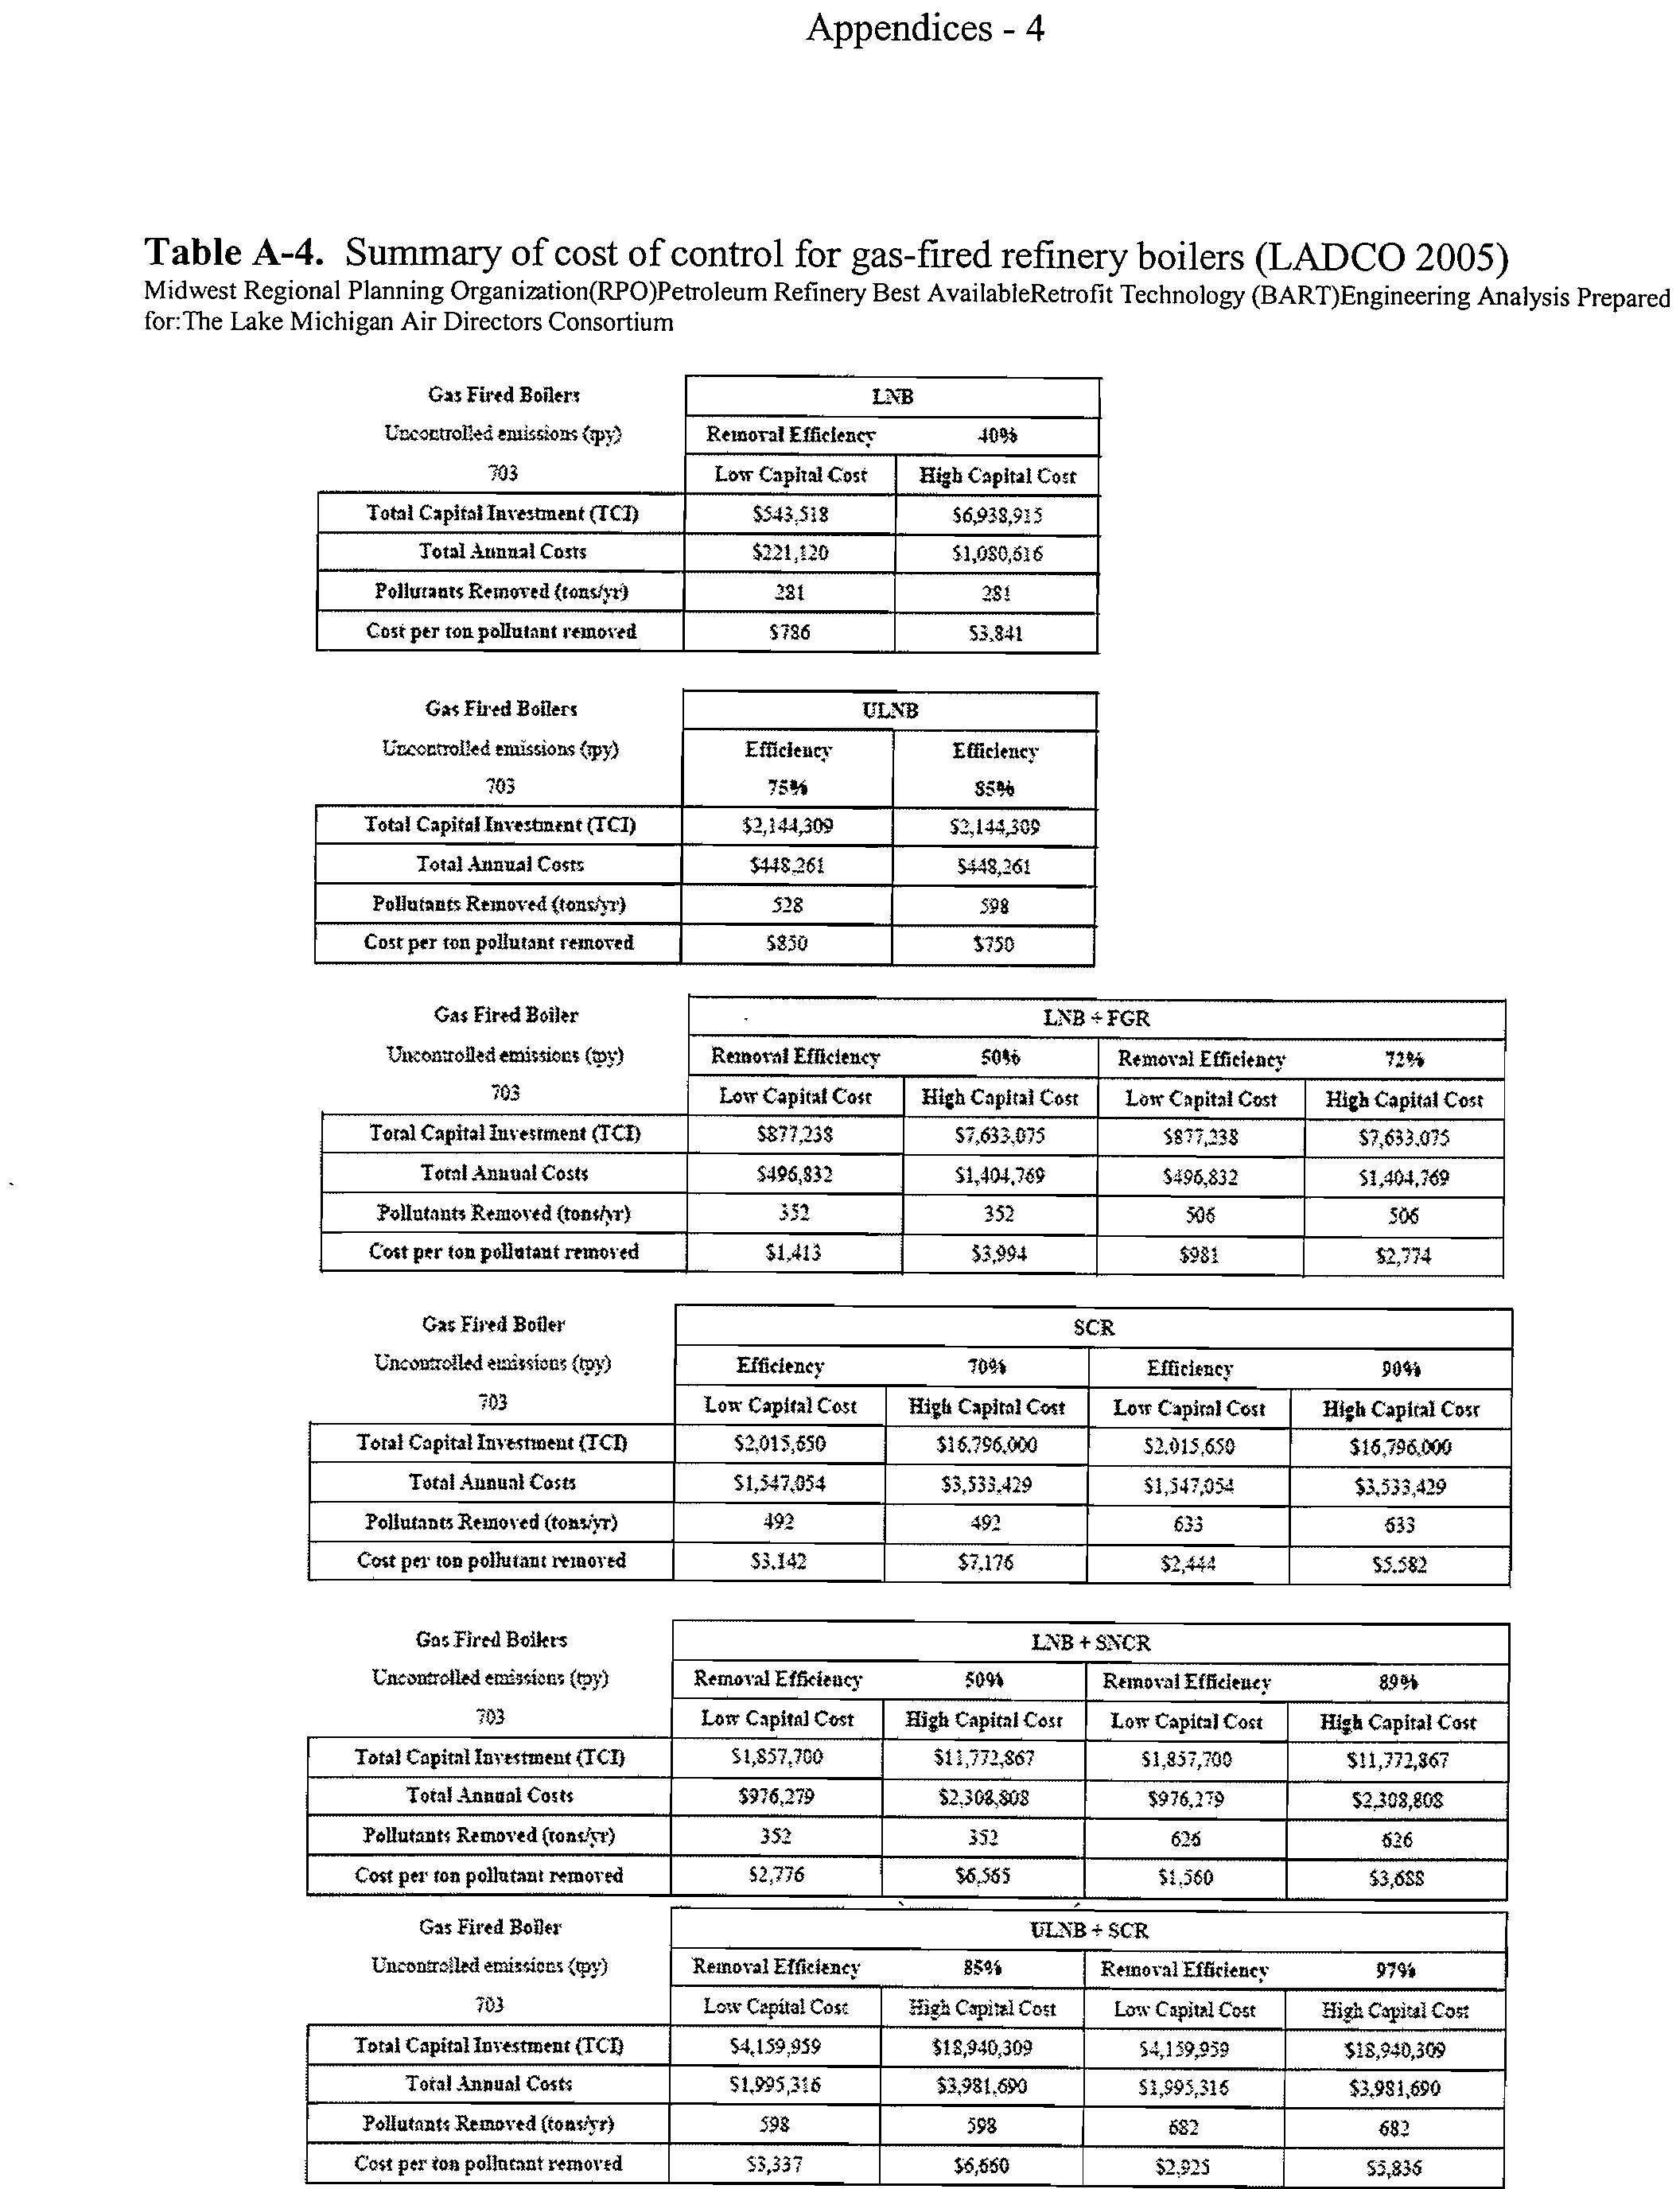
A-4
Summary of cost of control for gas-fired refinery boilers
A-4
(LADCO 2005)
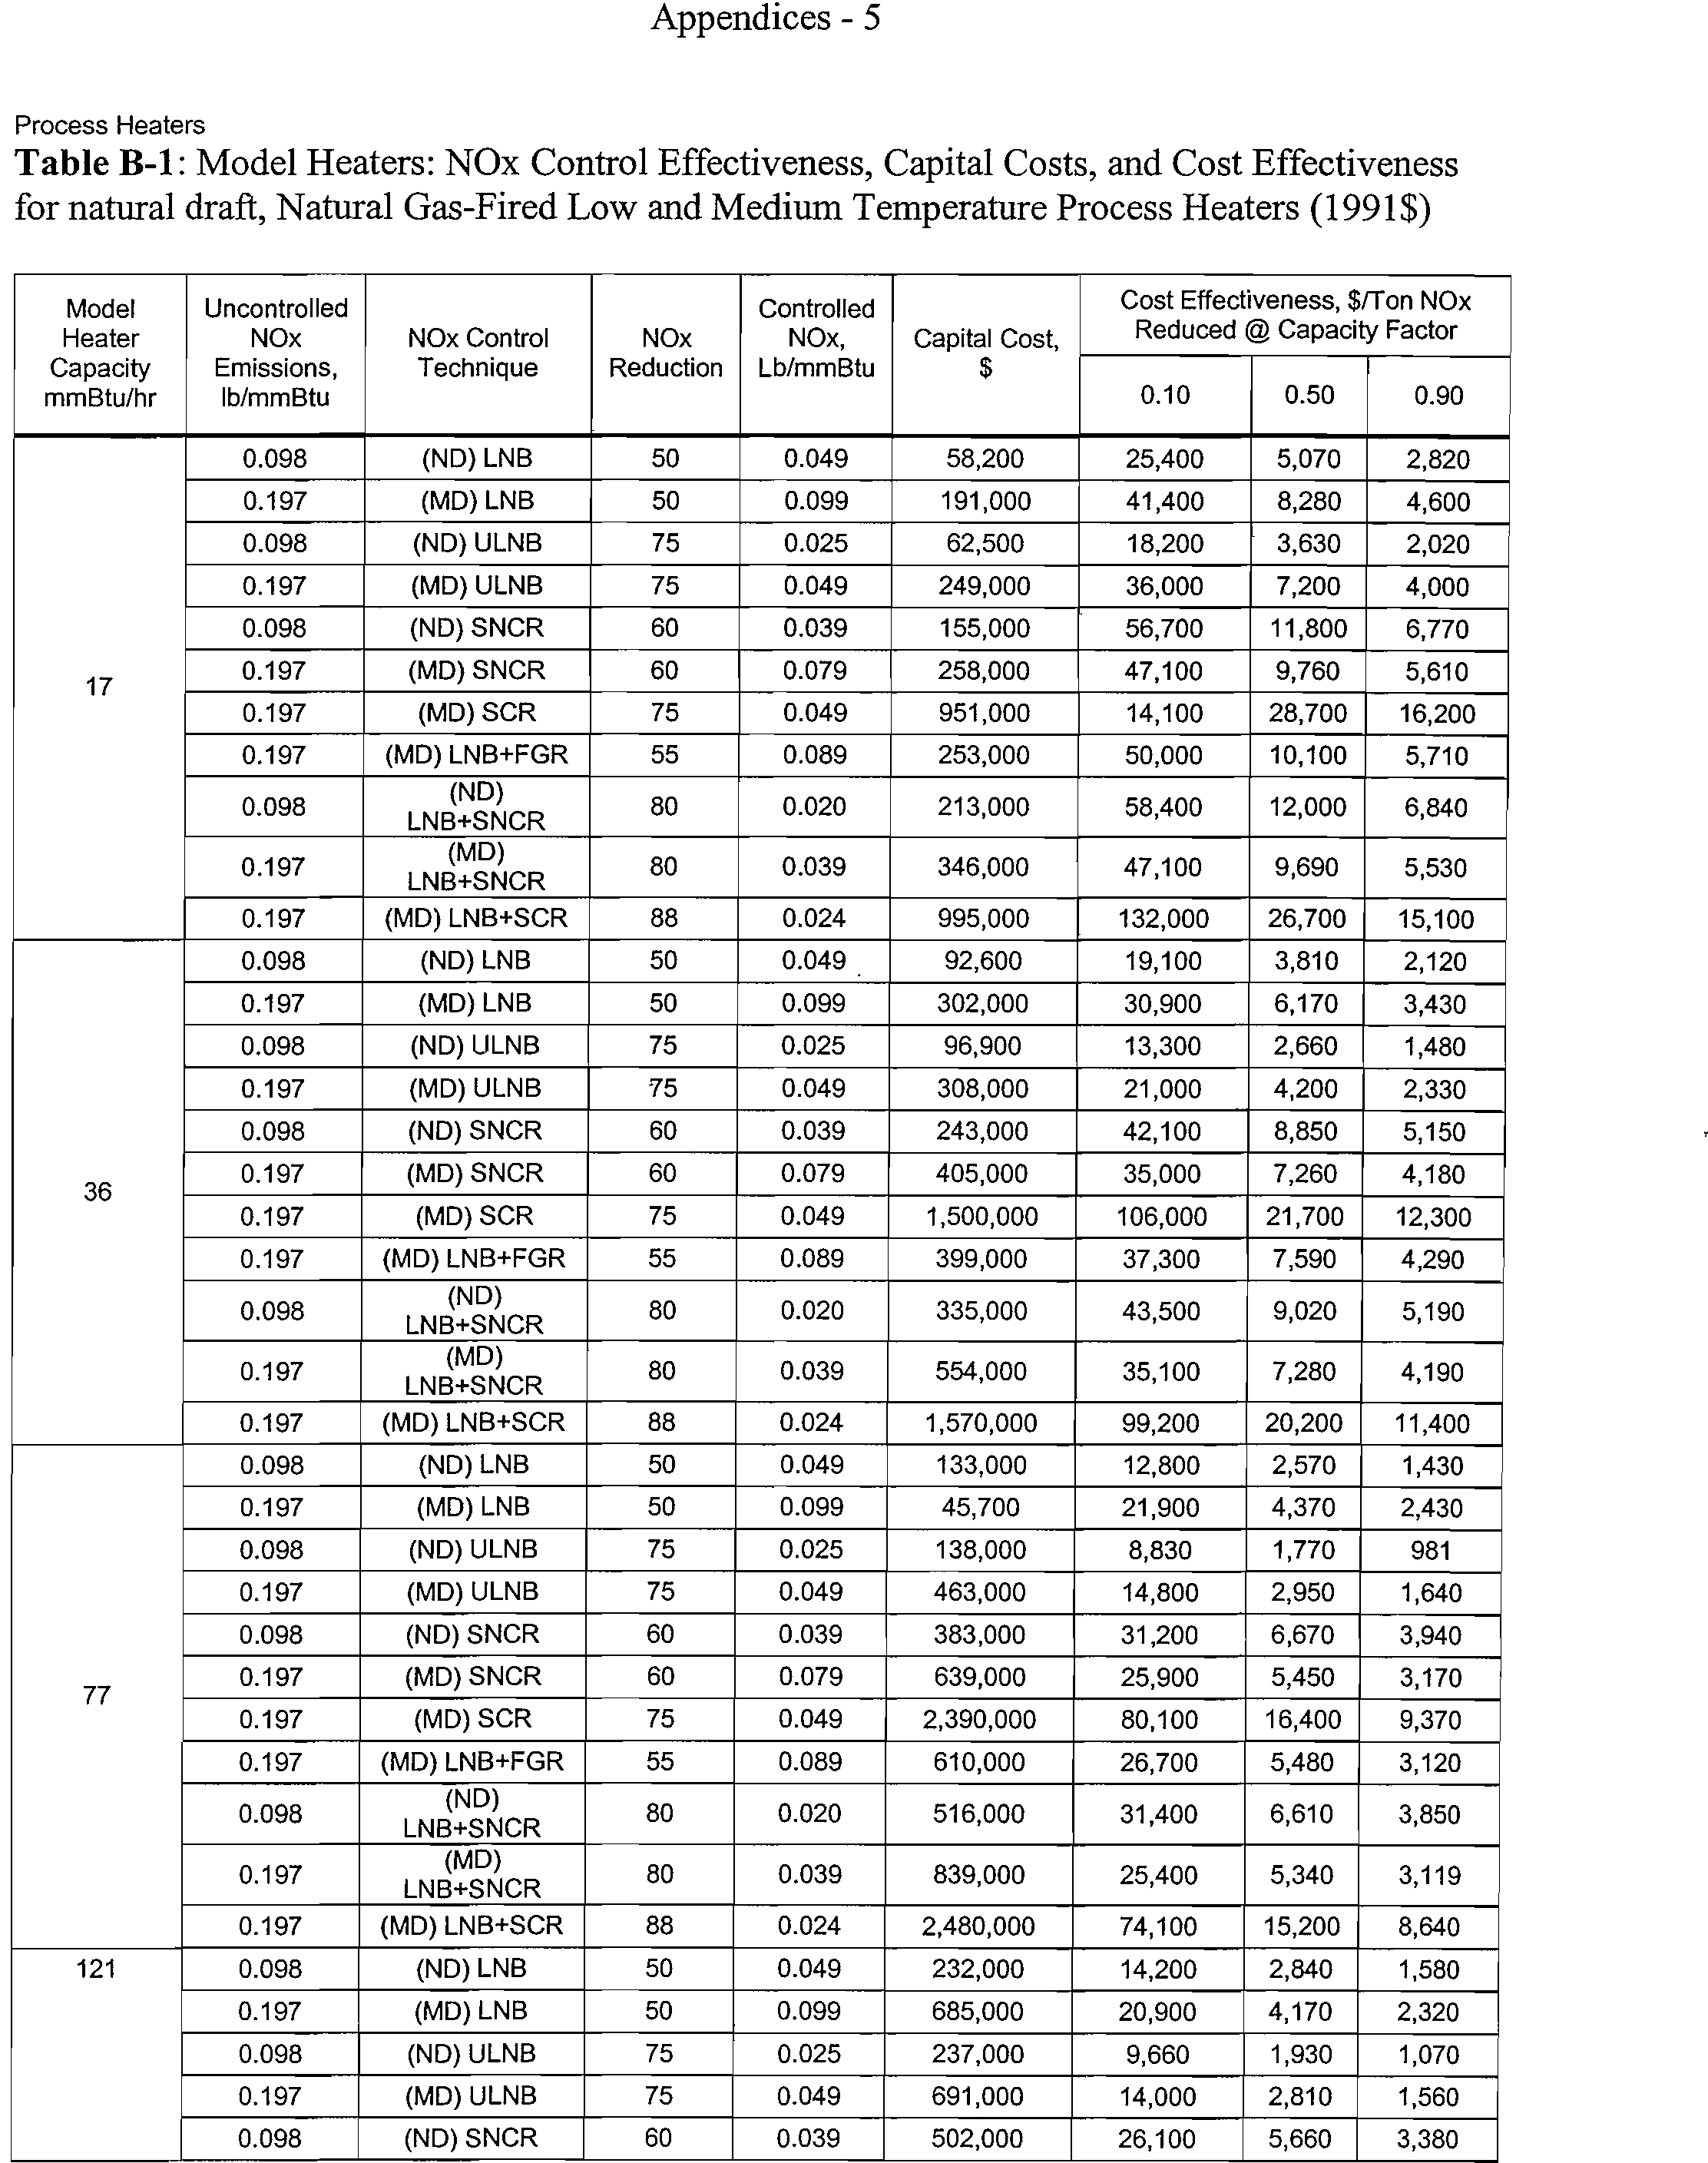
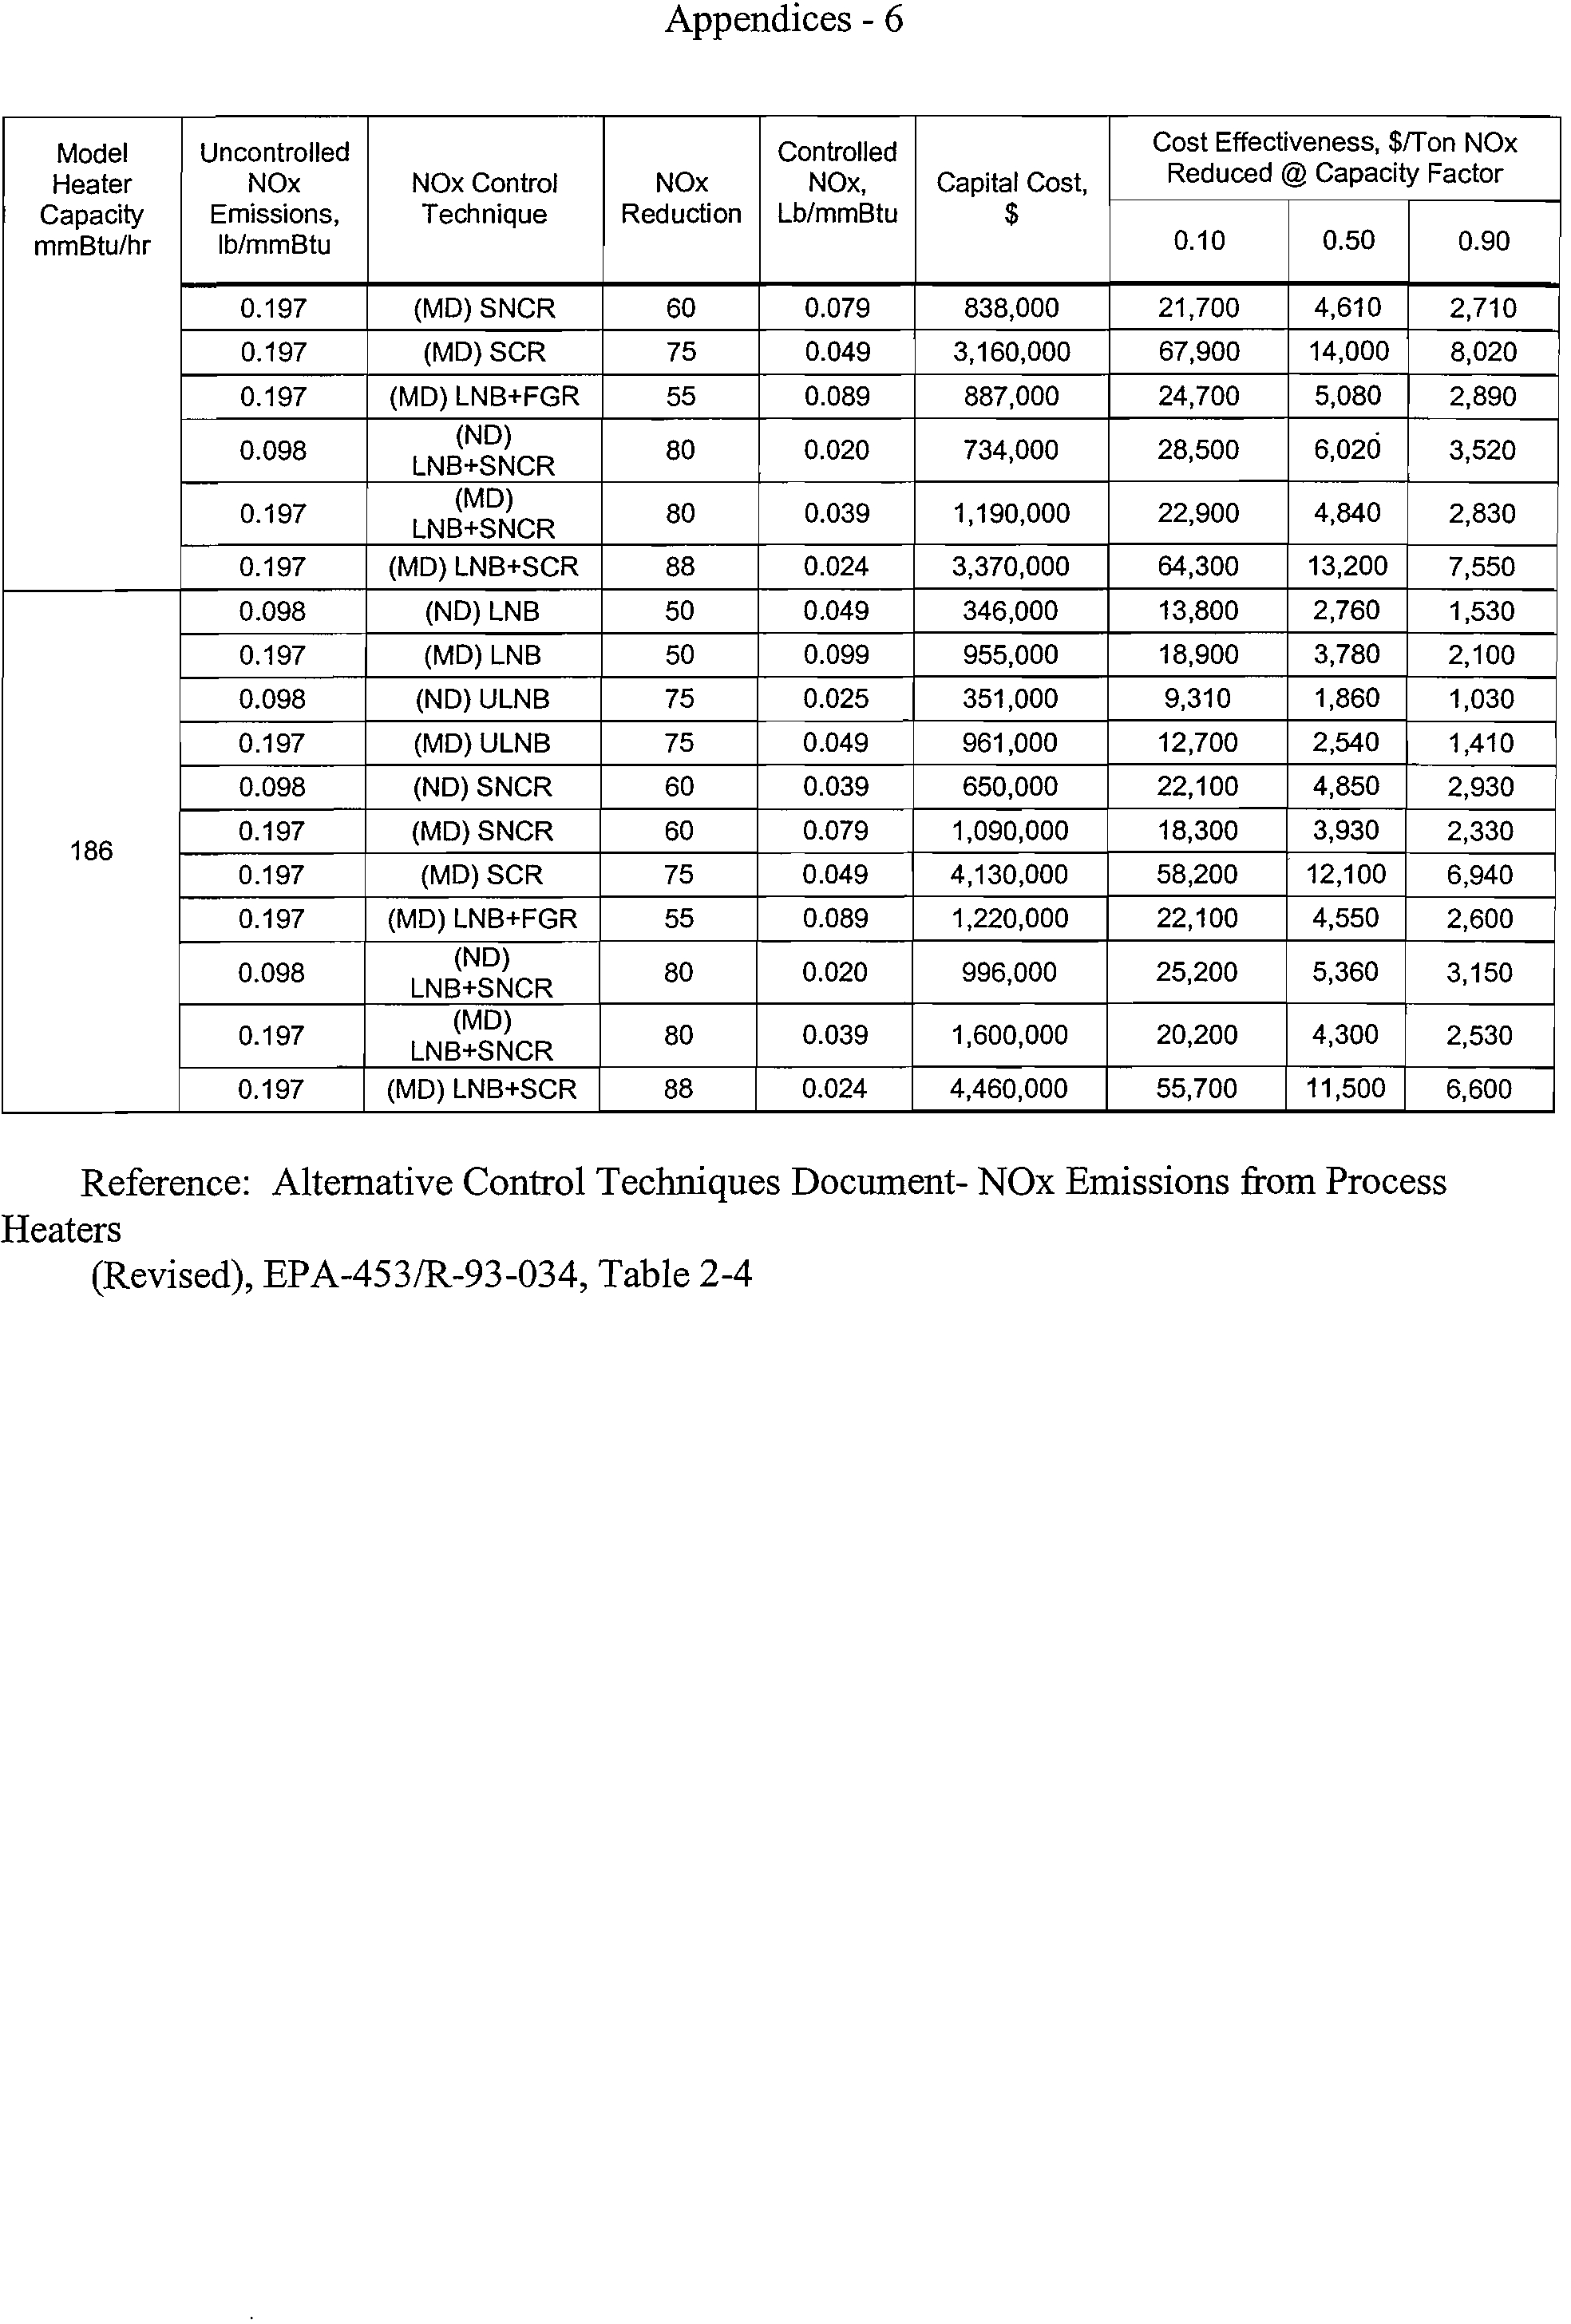
B-1
Model Heaters: NOx Control Effectiveness, Capital Costs, and
A-5
Cost Effectiveness for natural draft, Natural Gas-Fired
Low and Medium Temperature Process Heaters (1991$)
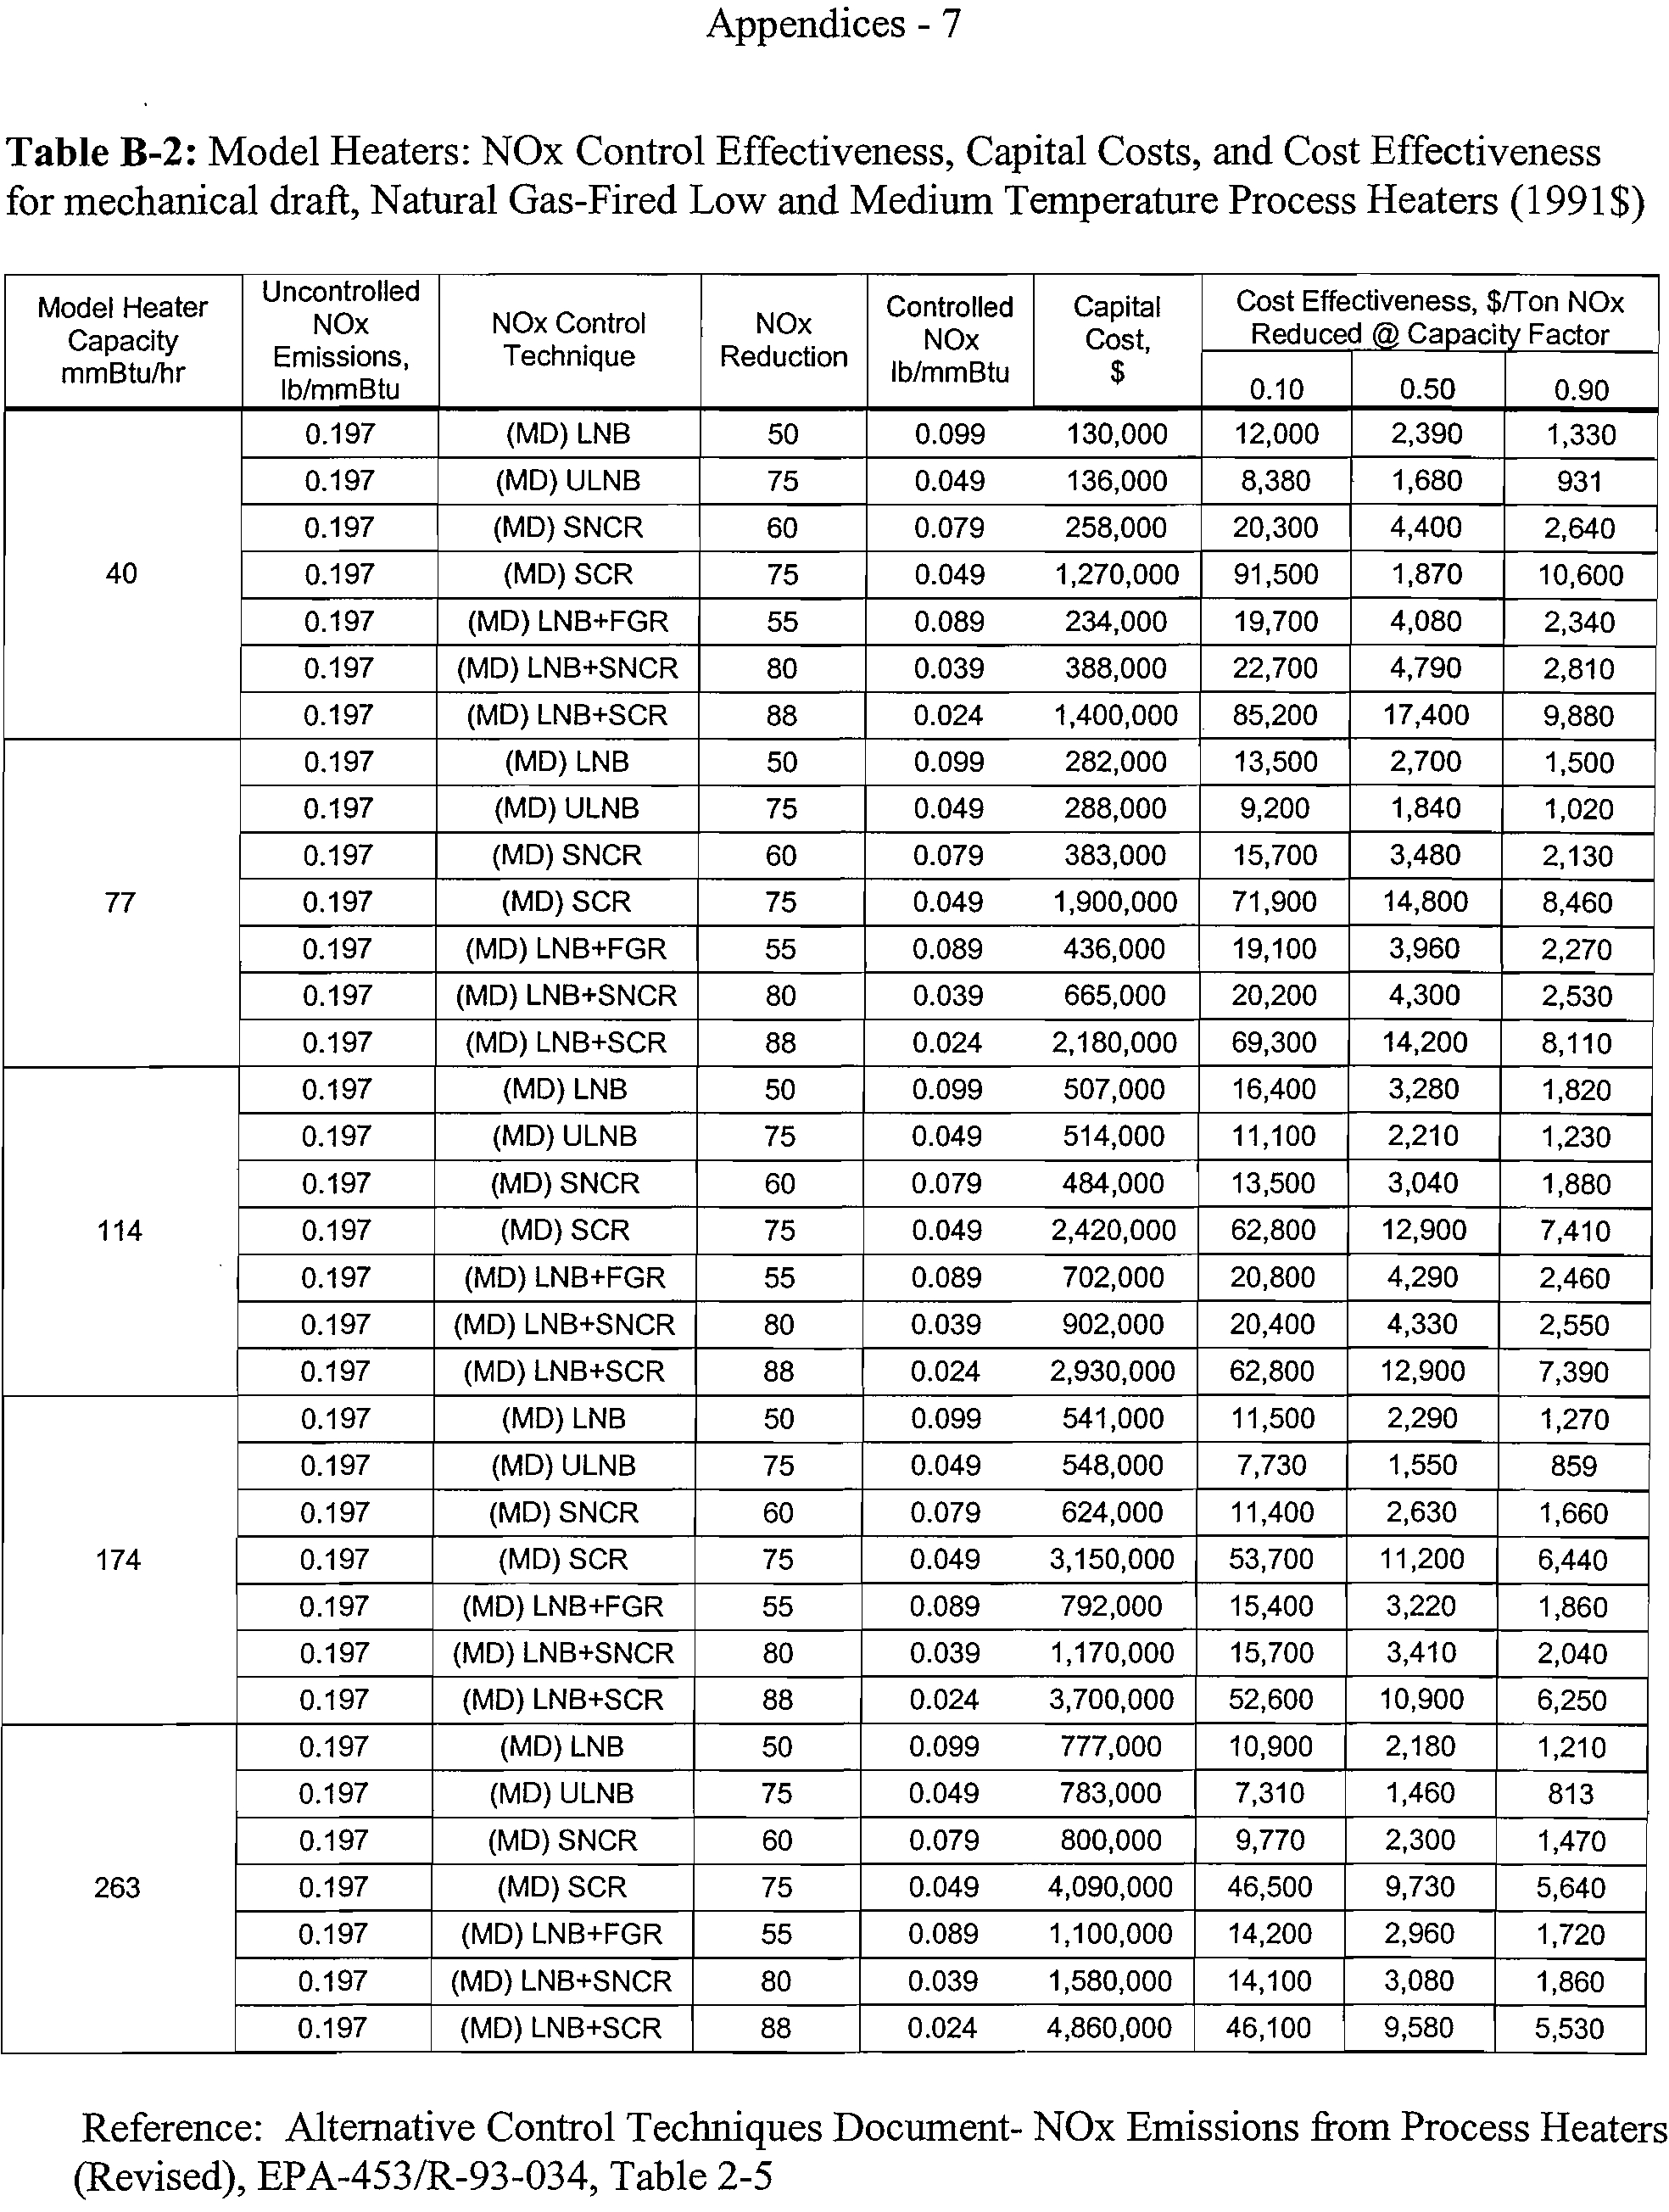
B-2
Model Heaters: NOx Control Effectiveness, Capital Costs, and
A-7
Cost Effectiveness for mechanical draft, Natural Gas-
Fired Low and Medium Temperature Process Heaters
(1991$)
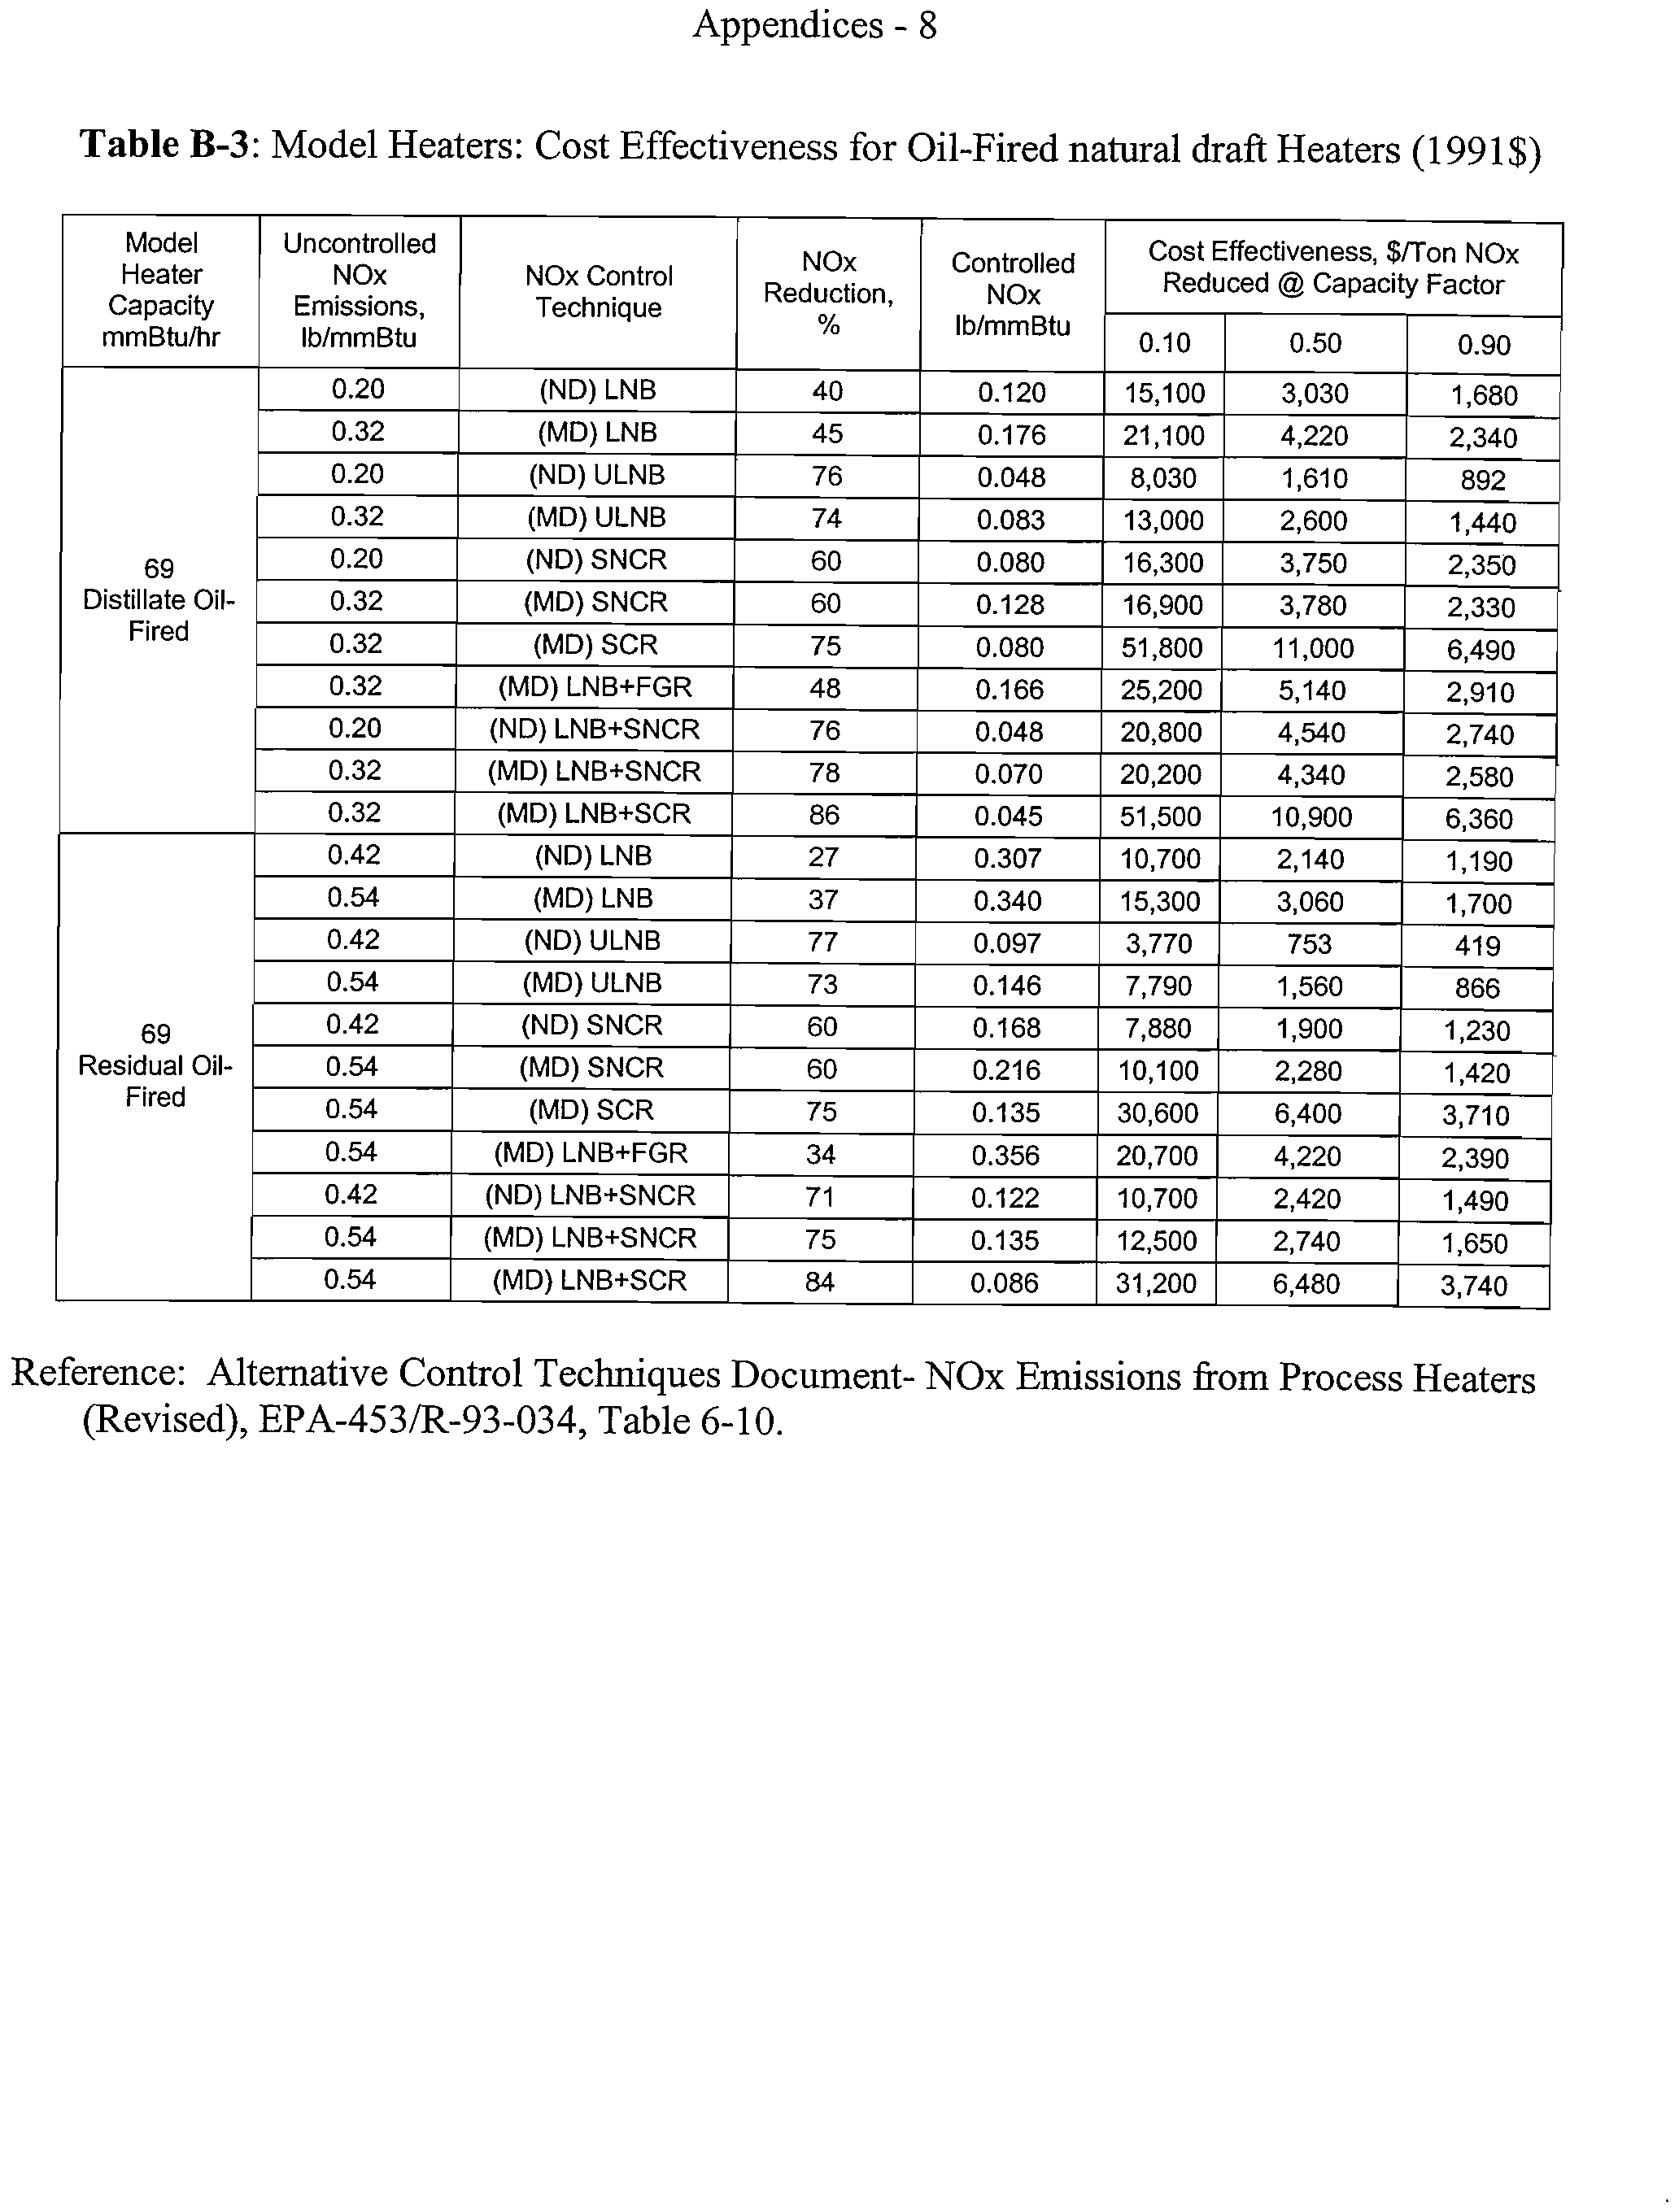
B-3
Model Heaters: Cost Effectiveness for Oil-Fired natural draft
A-8
Heaters (1991$)
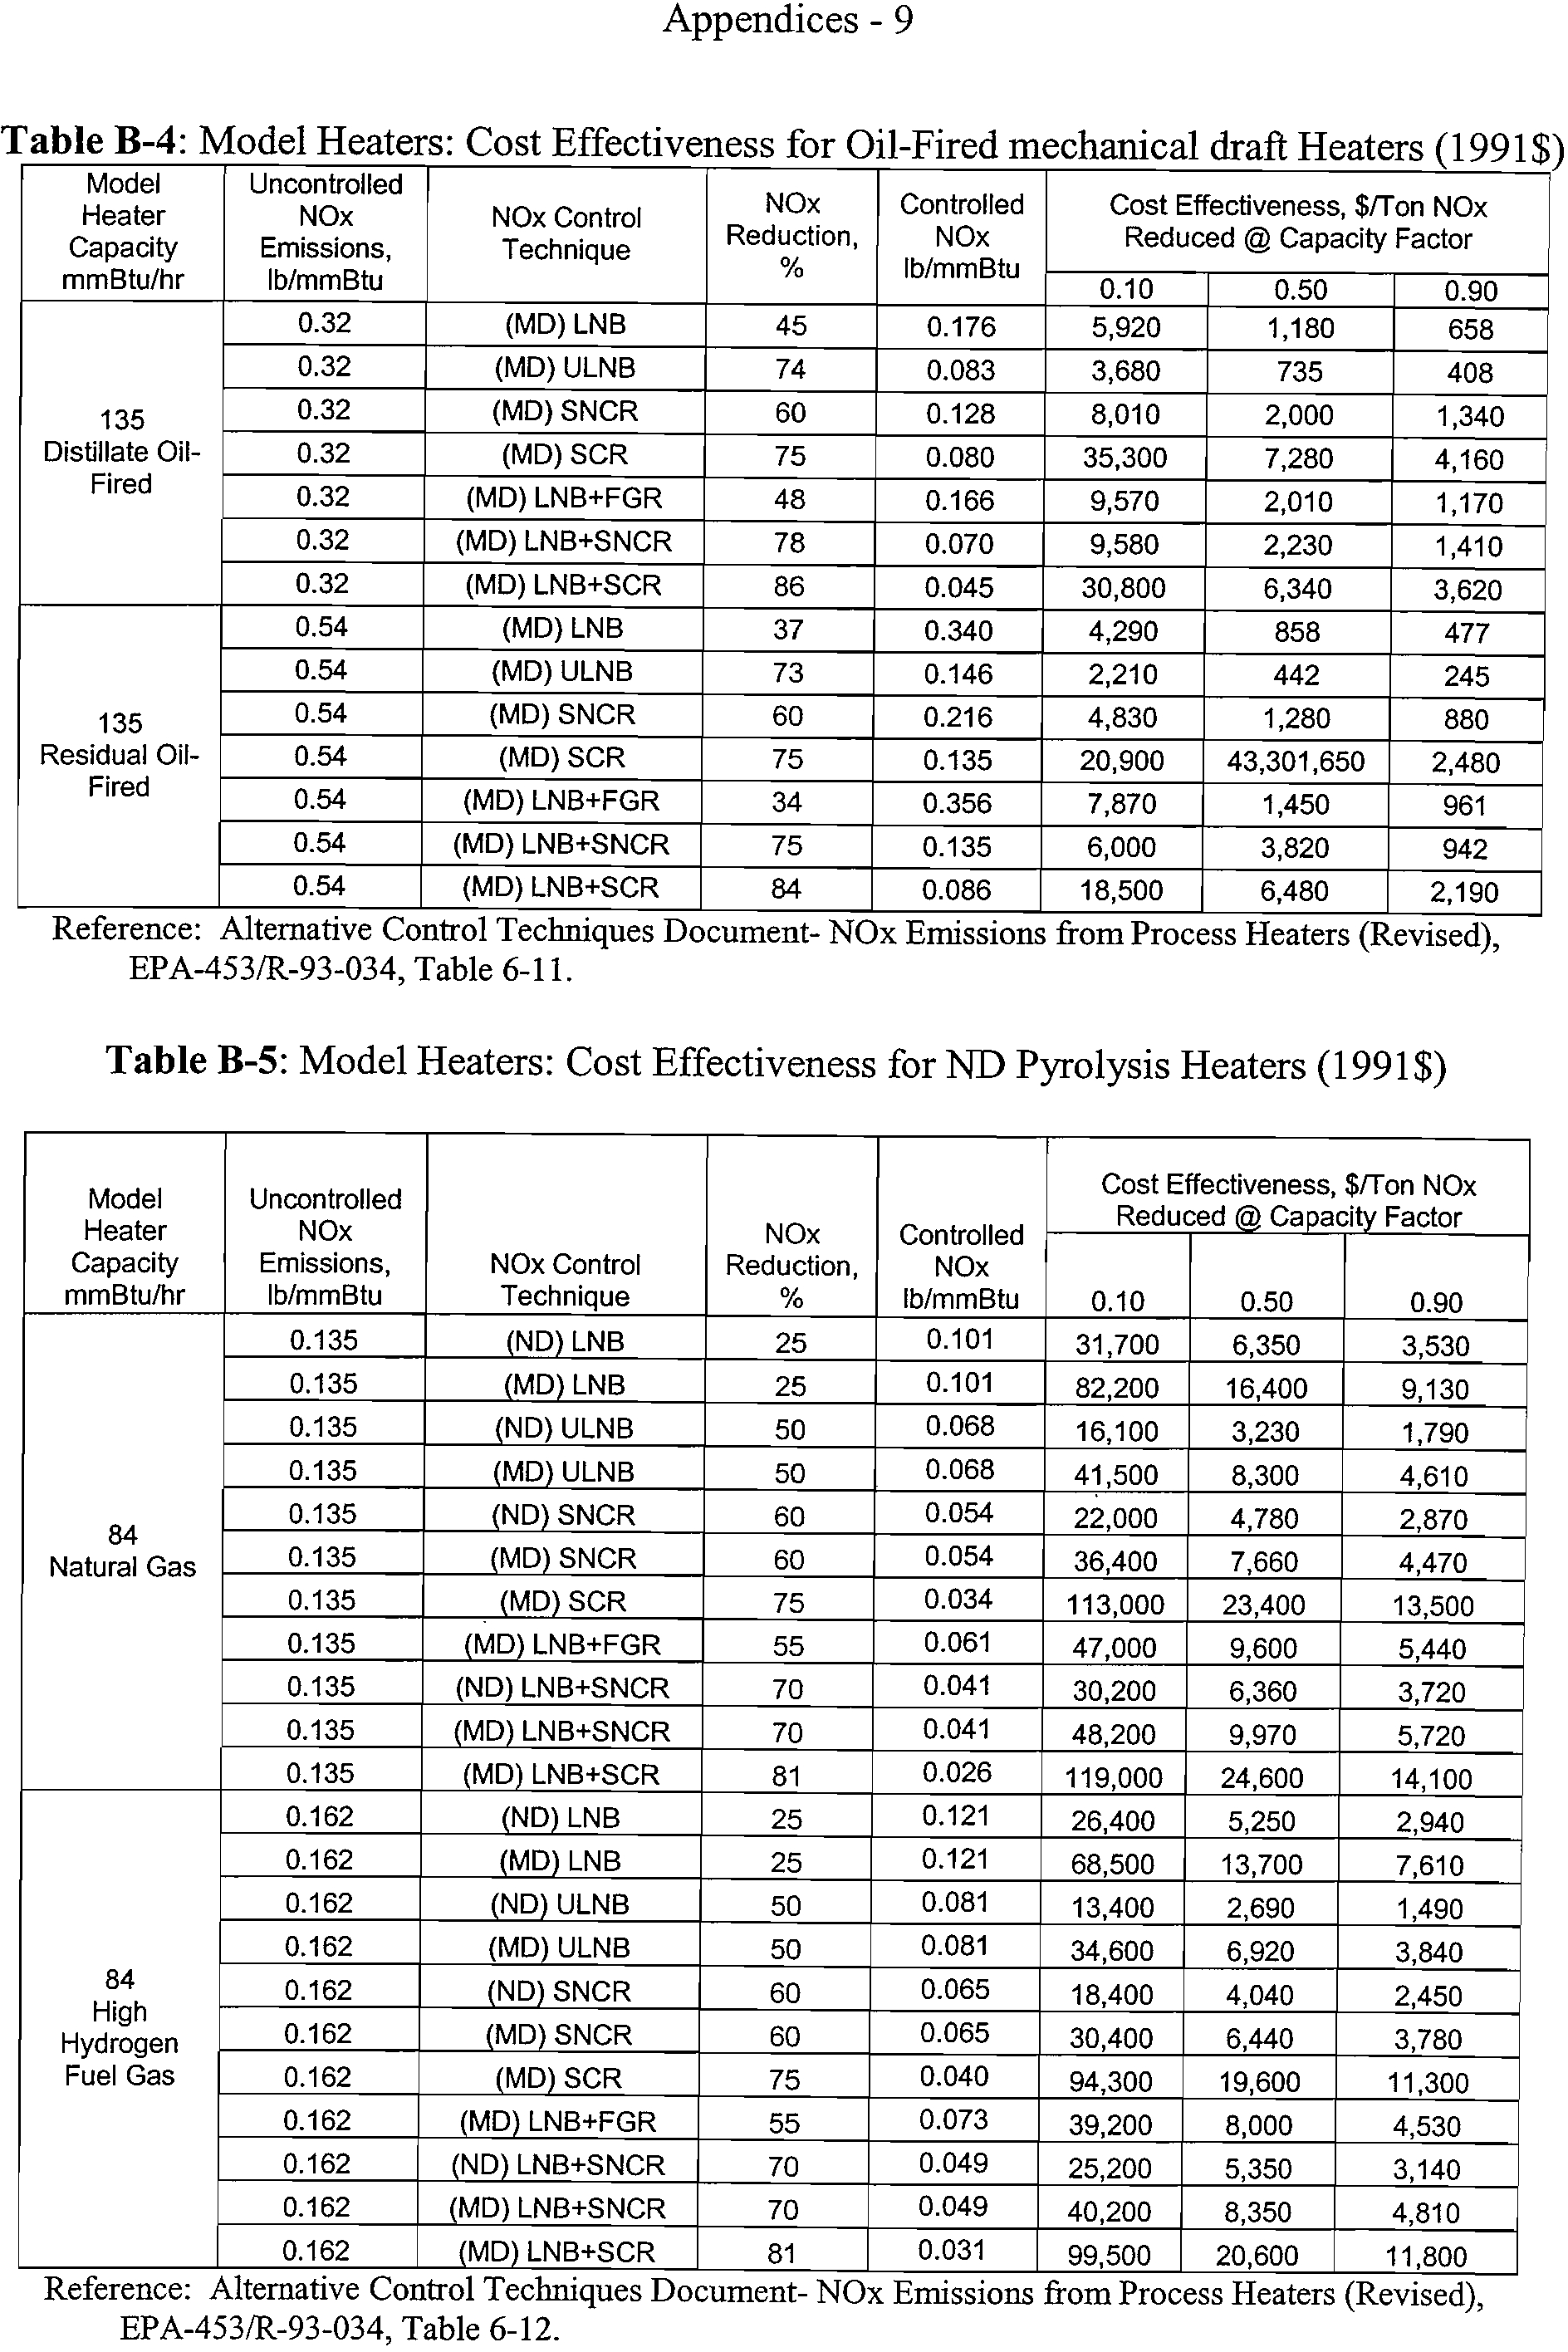
B-4
Model Heaters: Cost Effectiveness for Oil-Fired mechanical draft
A-9
Heaters (1991$)
B-5
Model Heaters: Cost Effectiveness for ND Pyrolysis Heaters
A-9
(1991$)
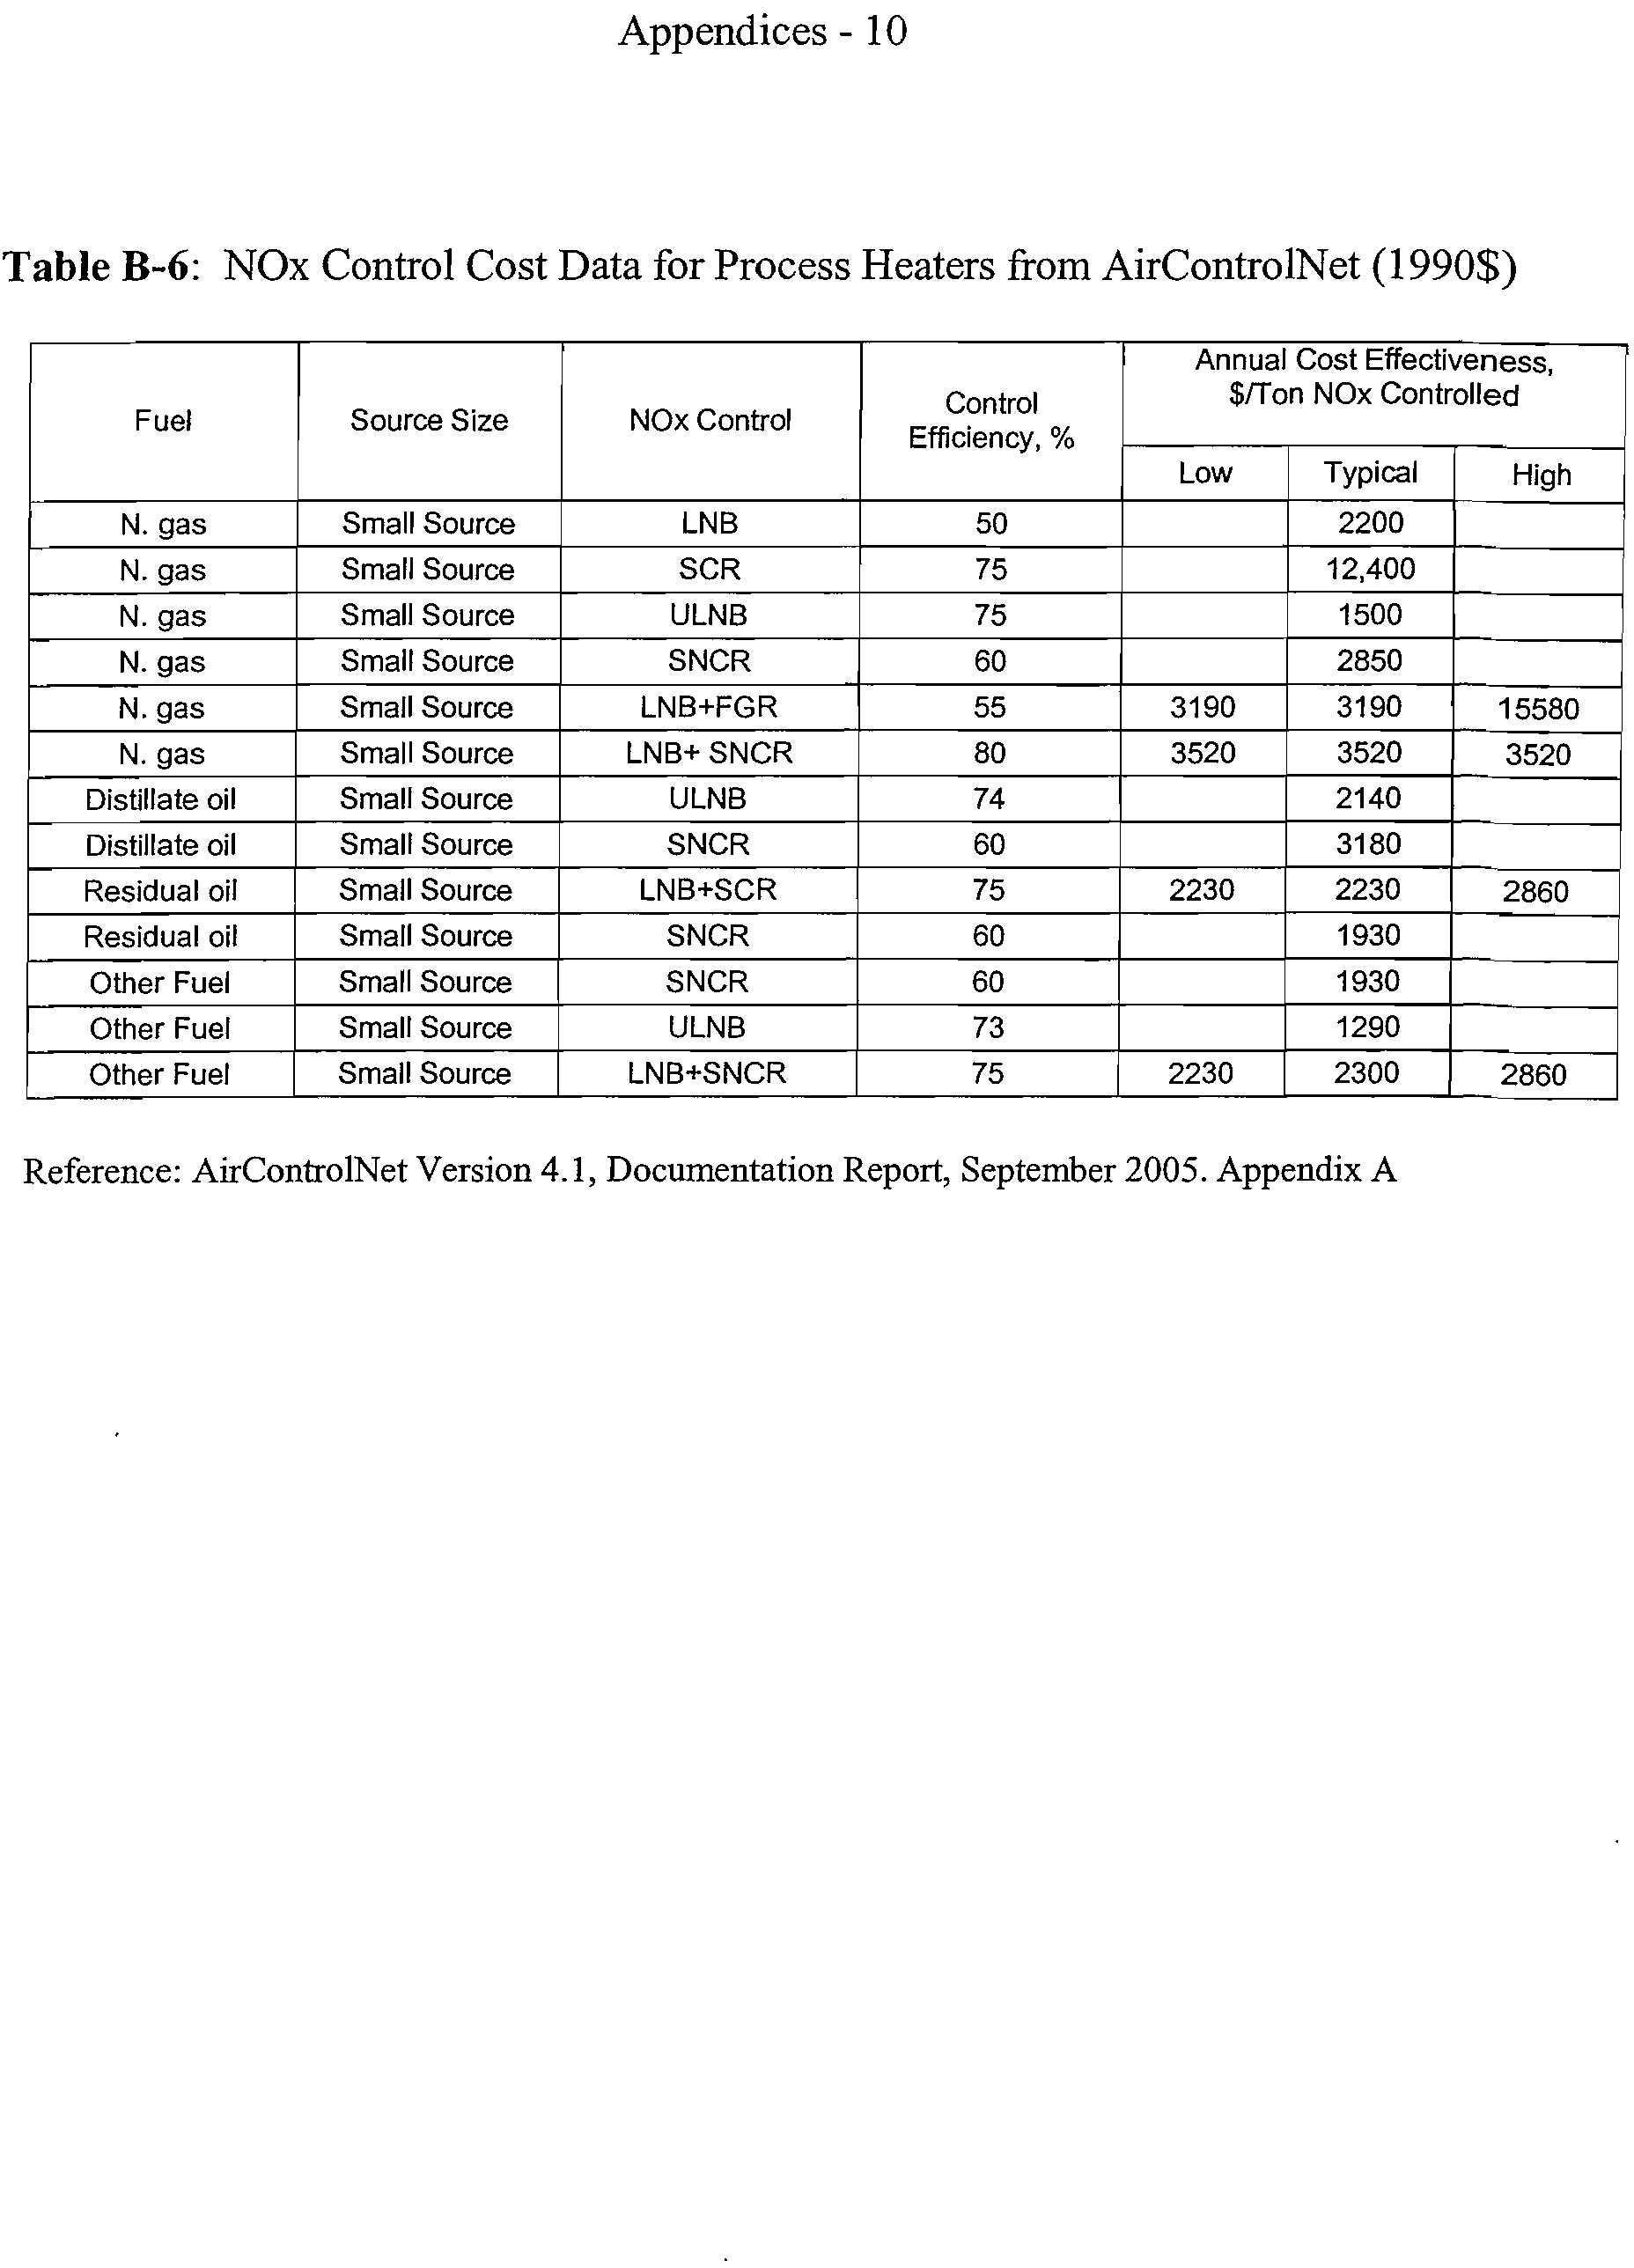
B-6
NOx Control Cost Data for Process Heaters from AirControlNet
A-10
(1990$)
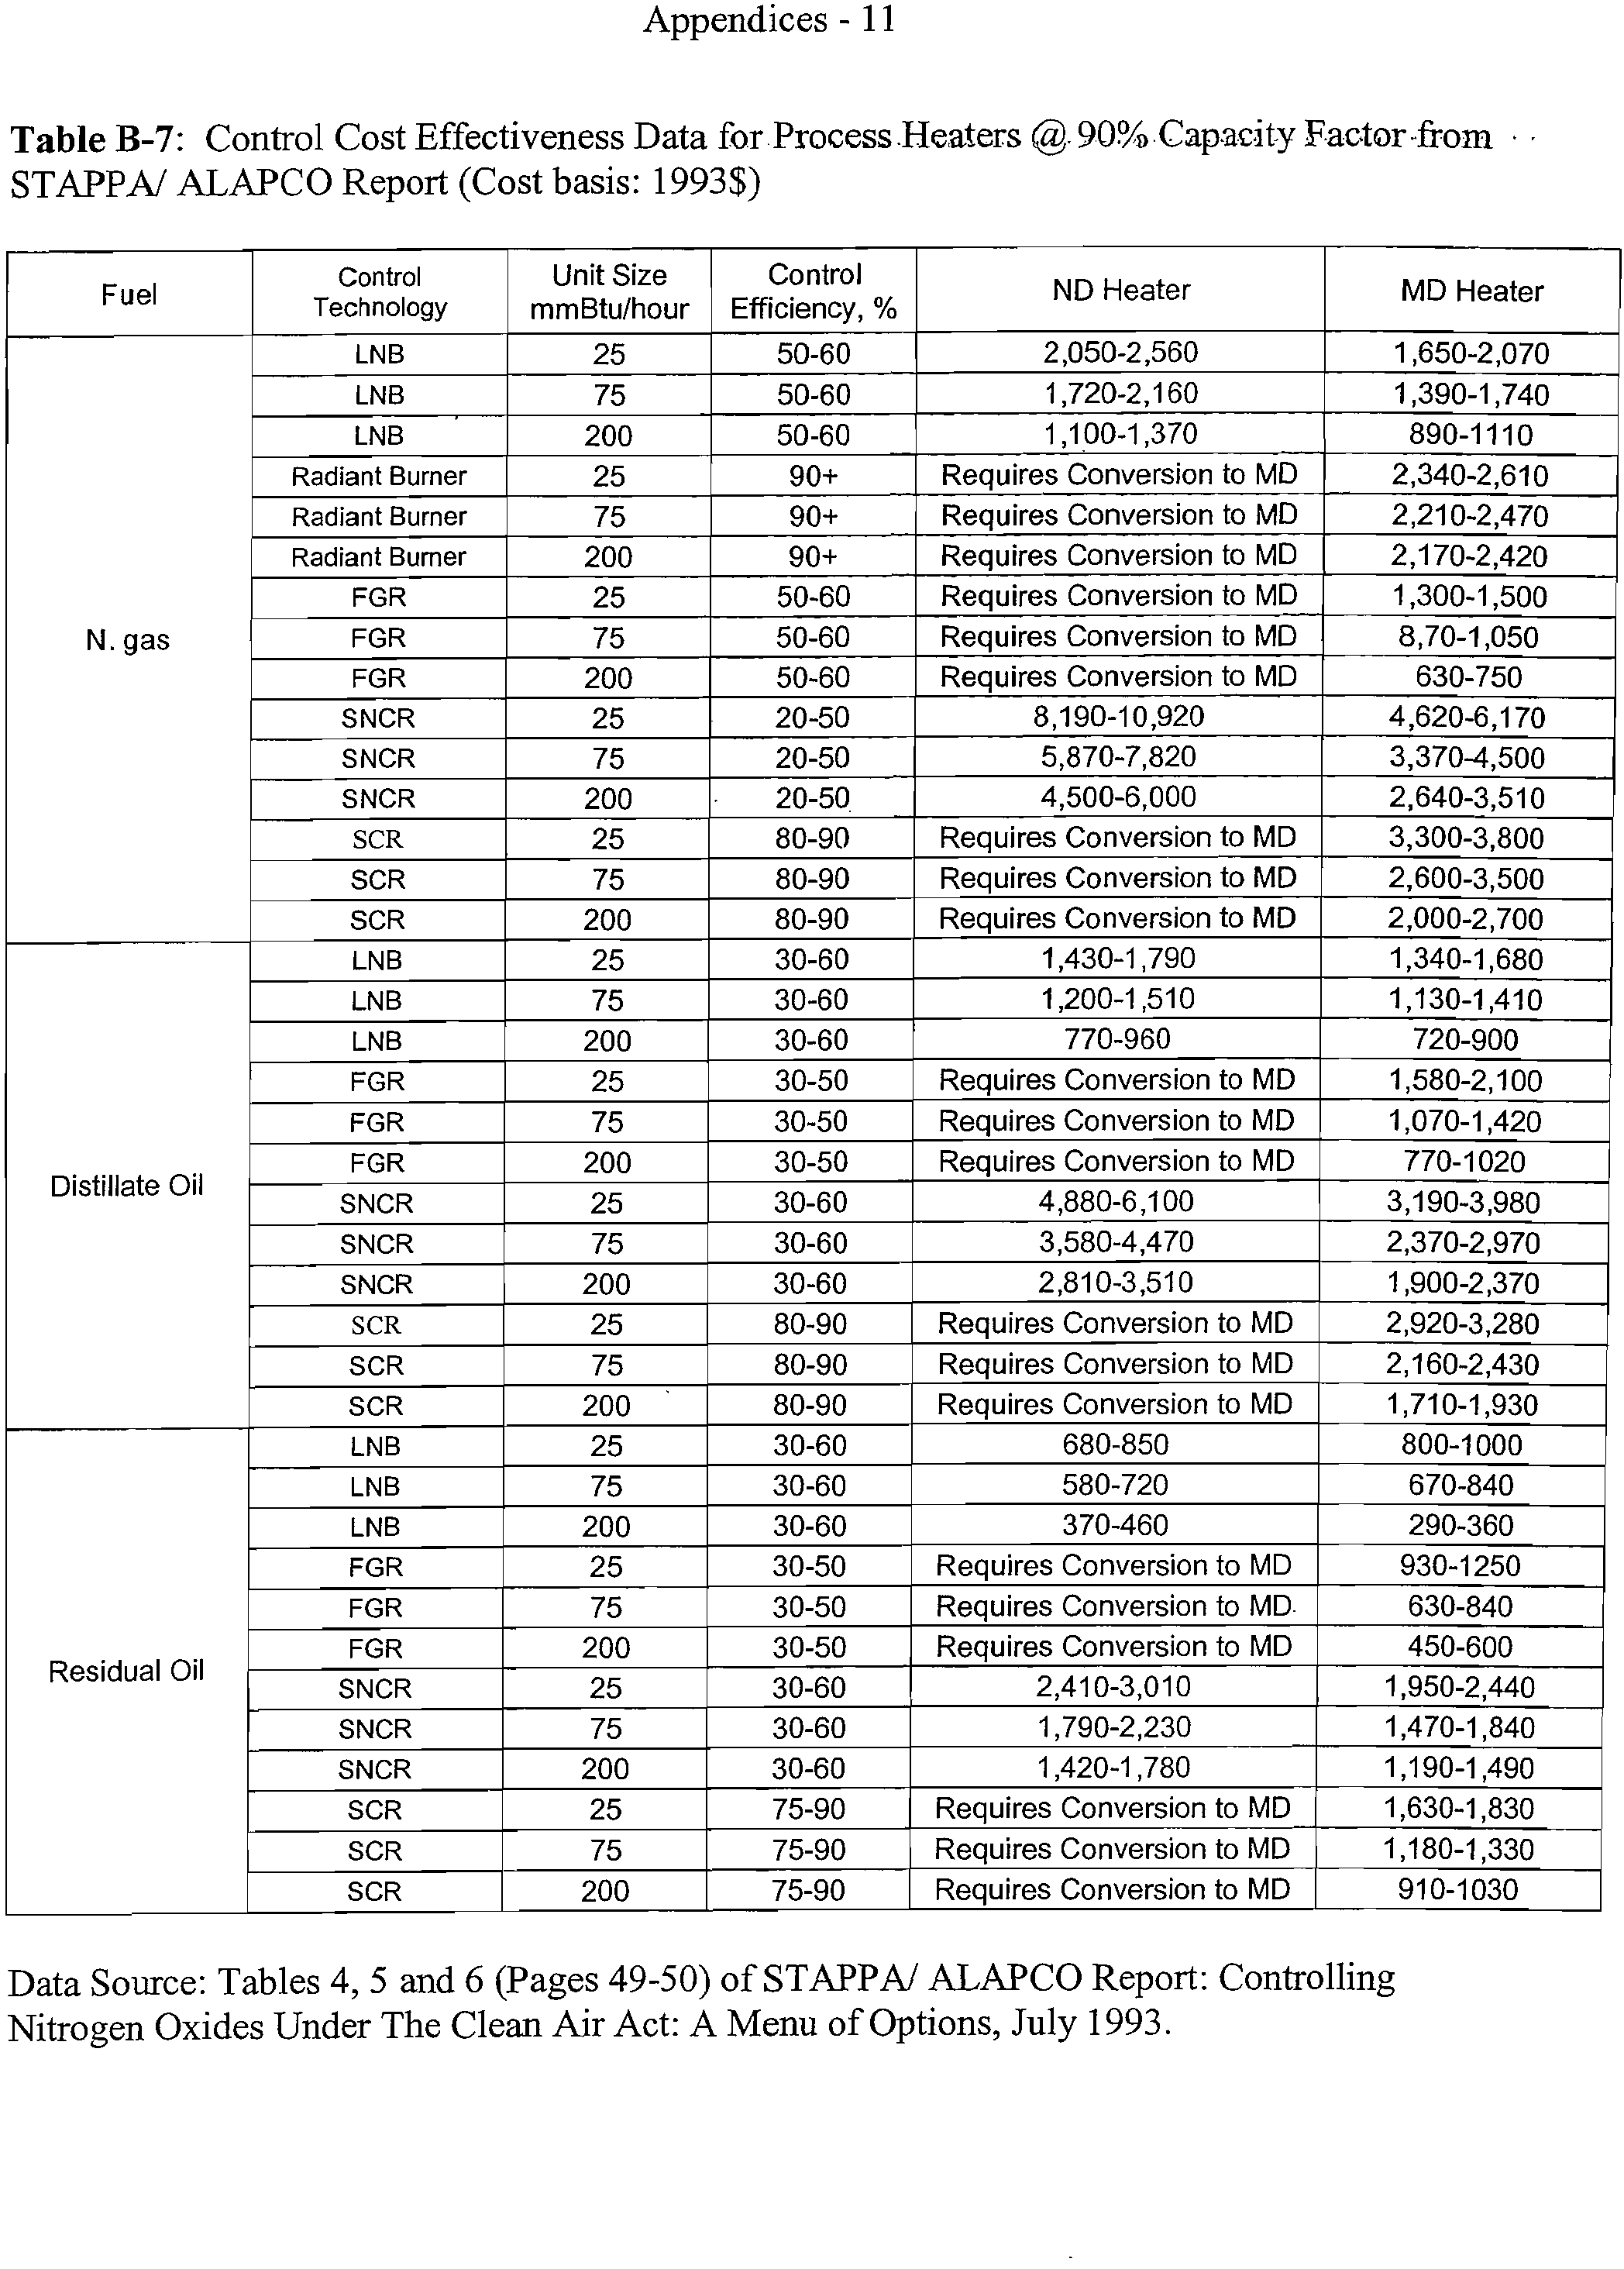
B-7
Control Cost Effectiveness Data for Process Heaters
@
90%
A-11
Capacity Factor from STAPPA/ ALAPCO Report (Cost
basis: 1993$)
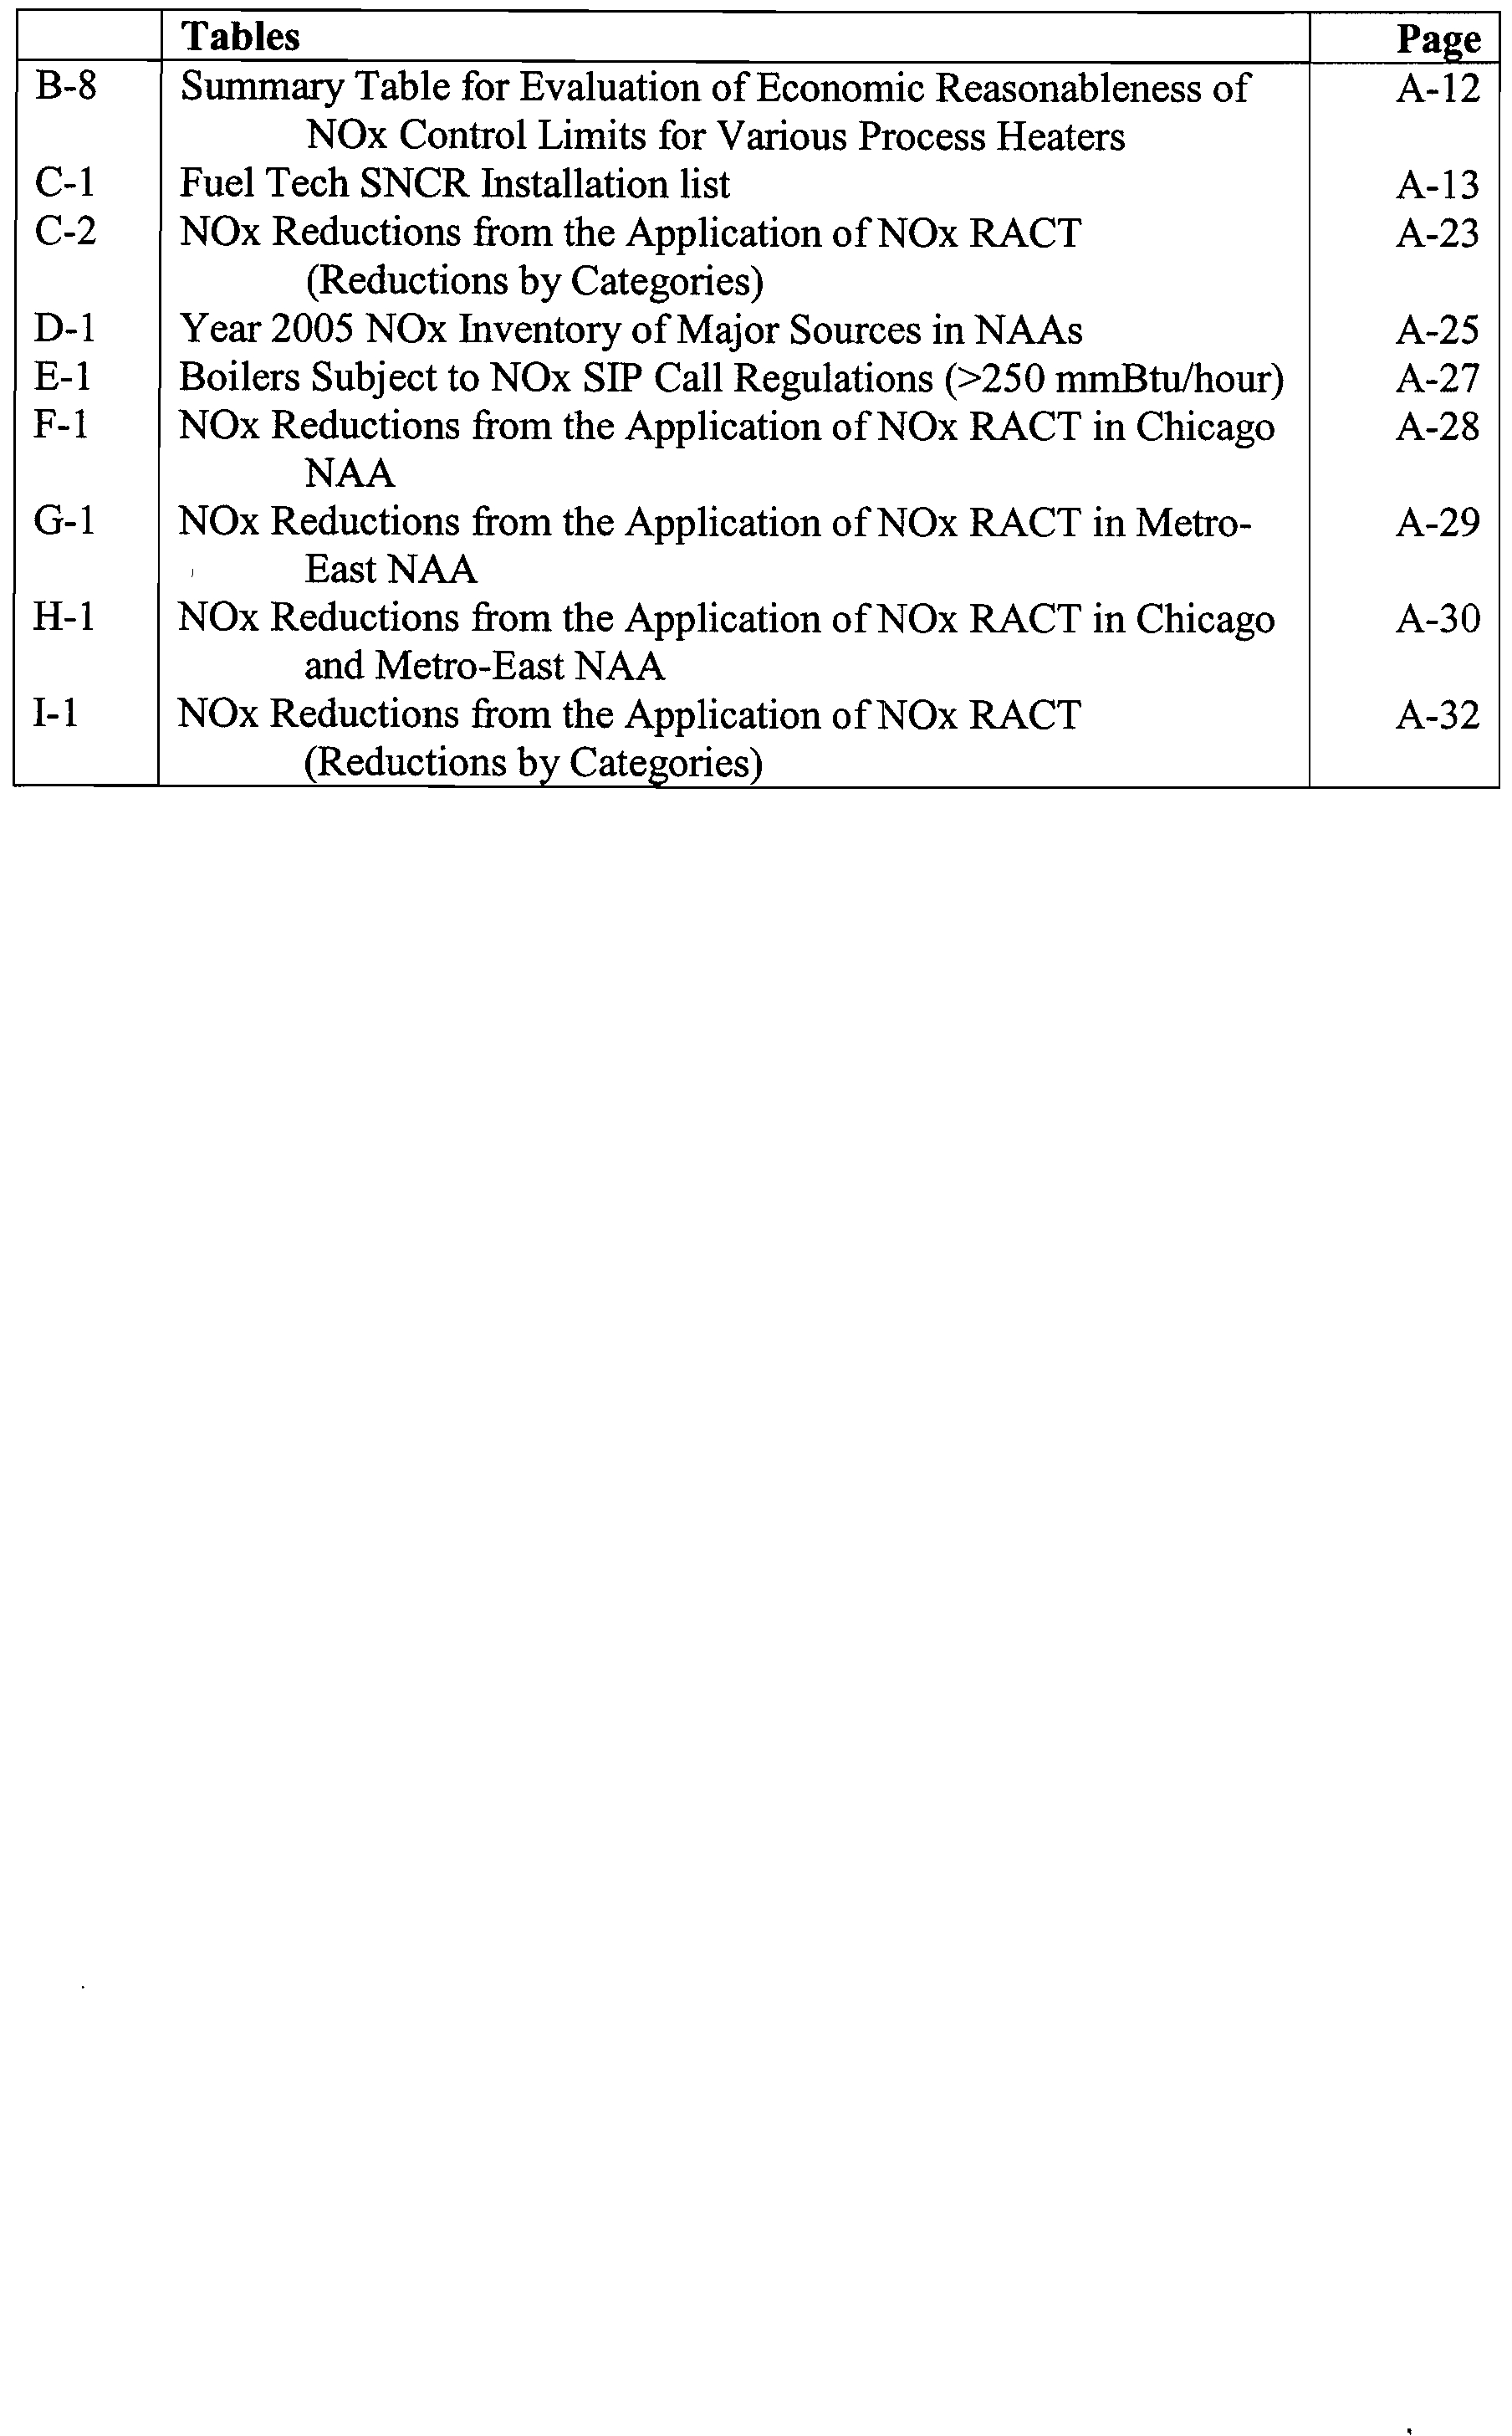
Tables
Page
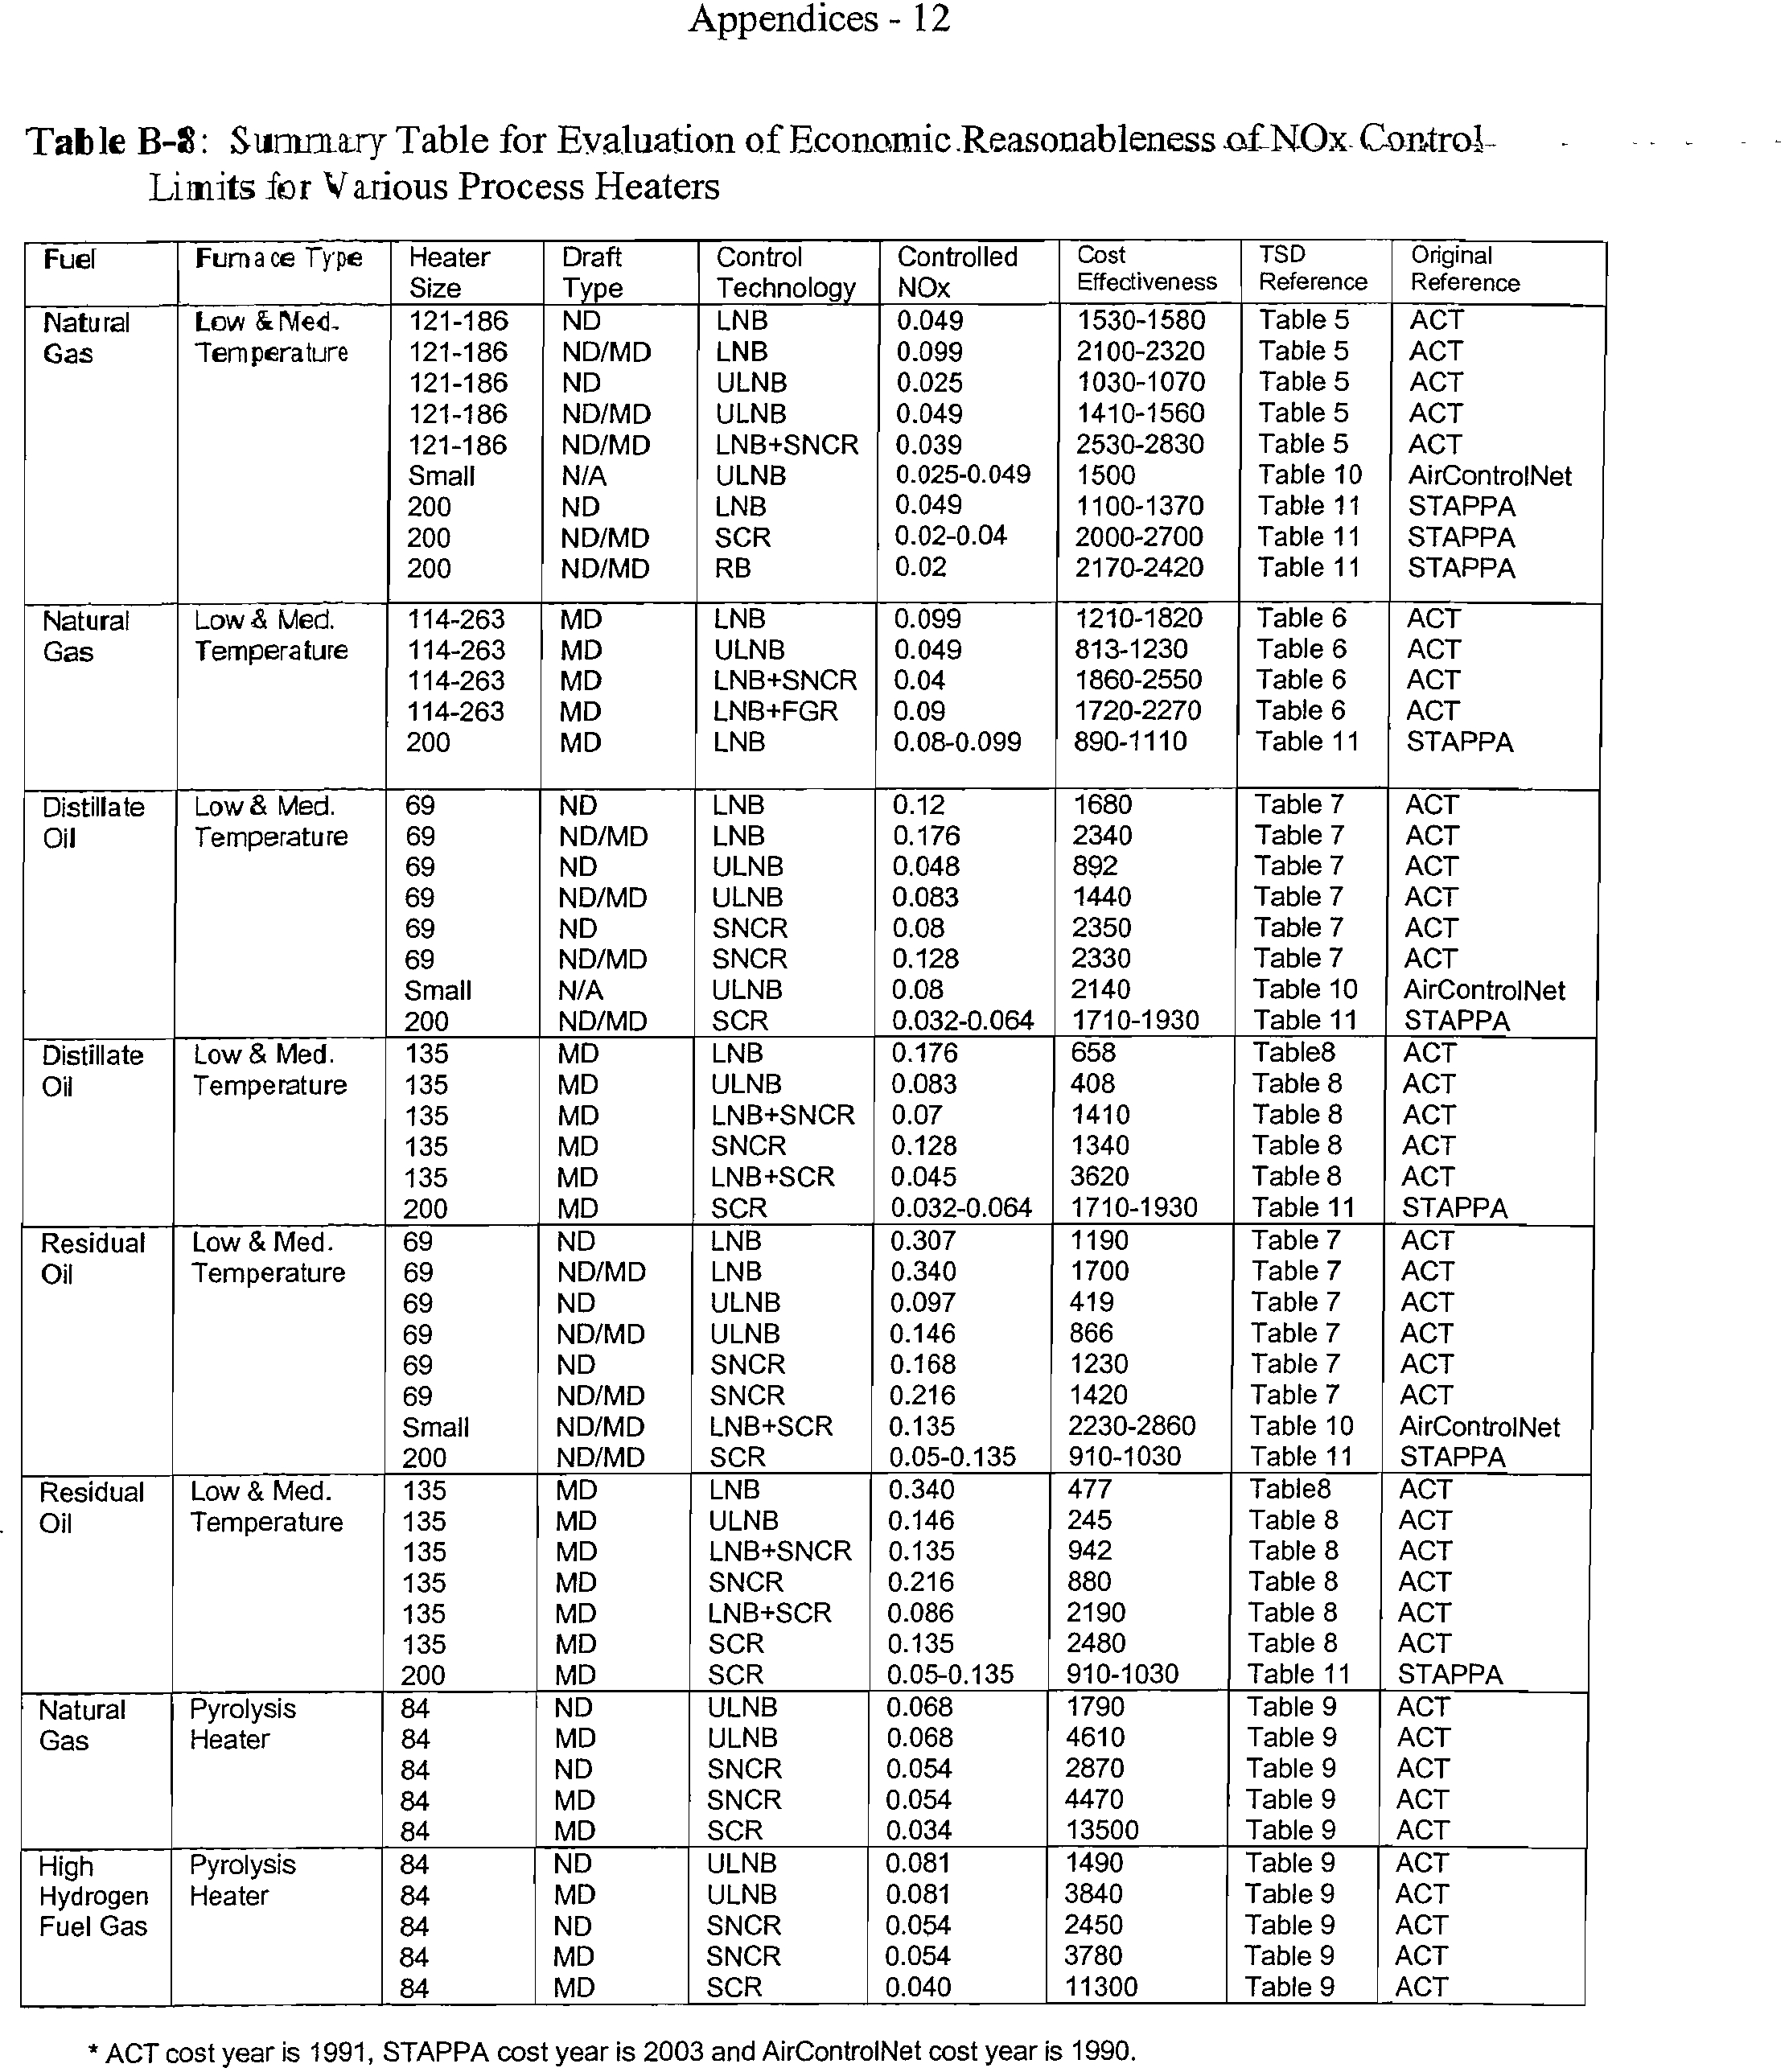
B-8
Summary Table for Evaluation of Economic Reasonableness of
A-12
NOx Control Limits for Various Process Heaters
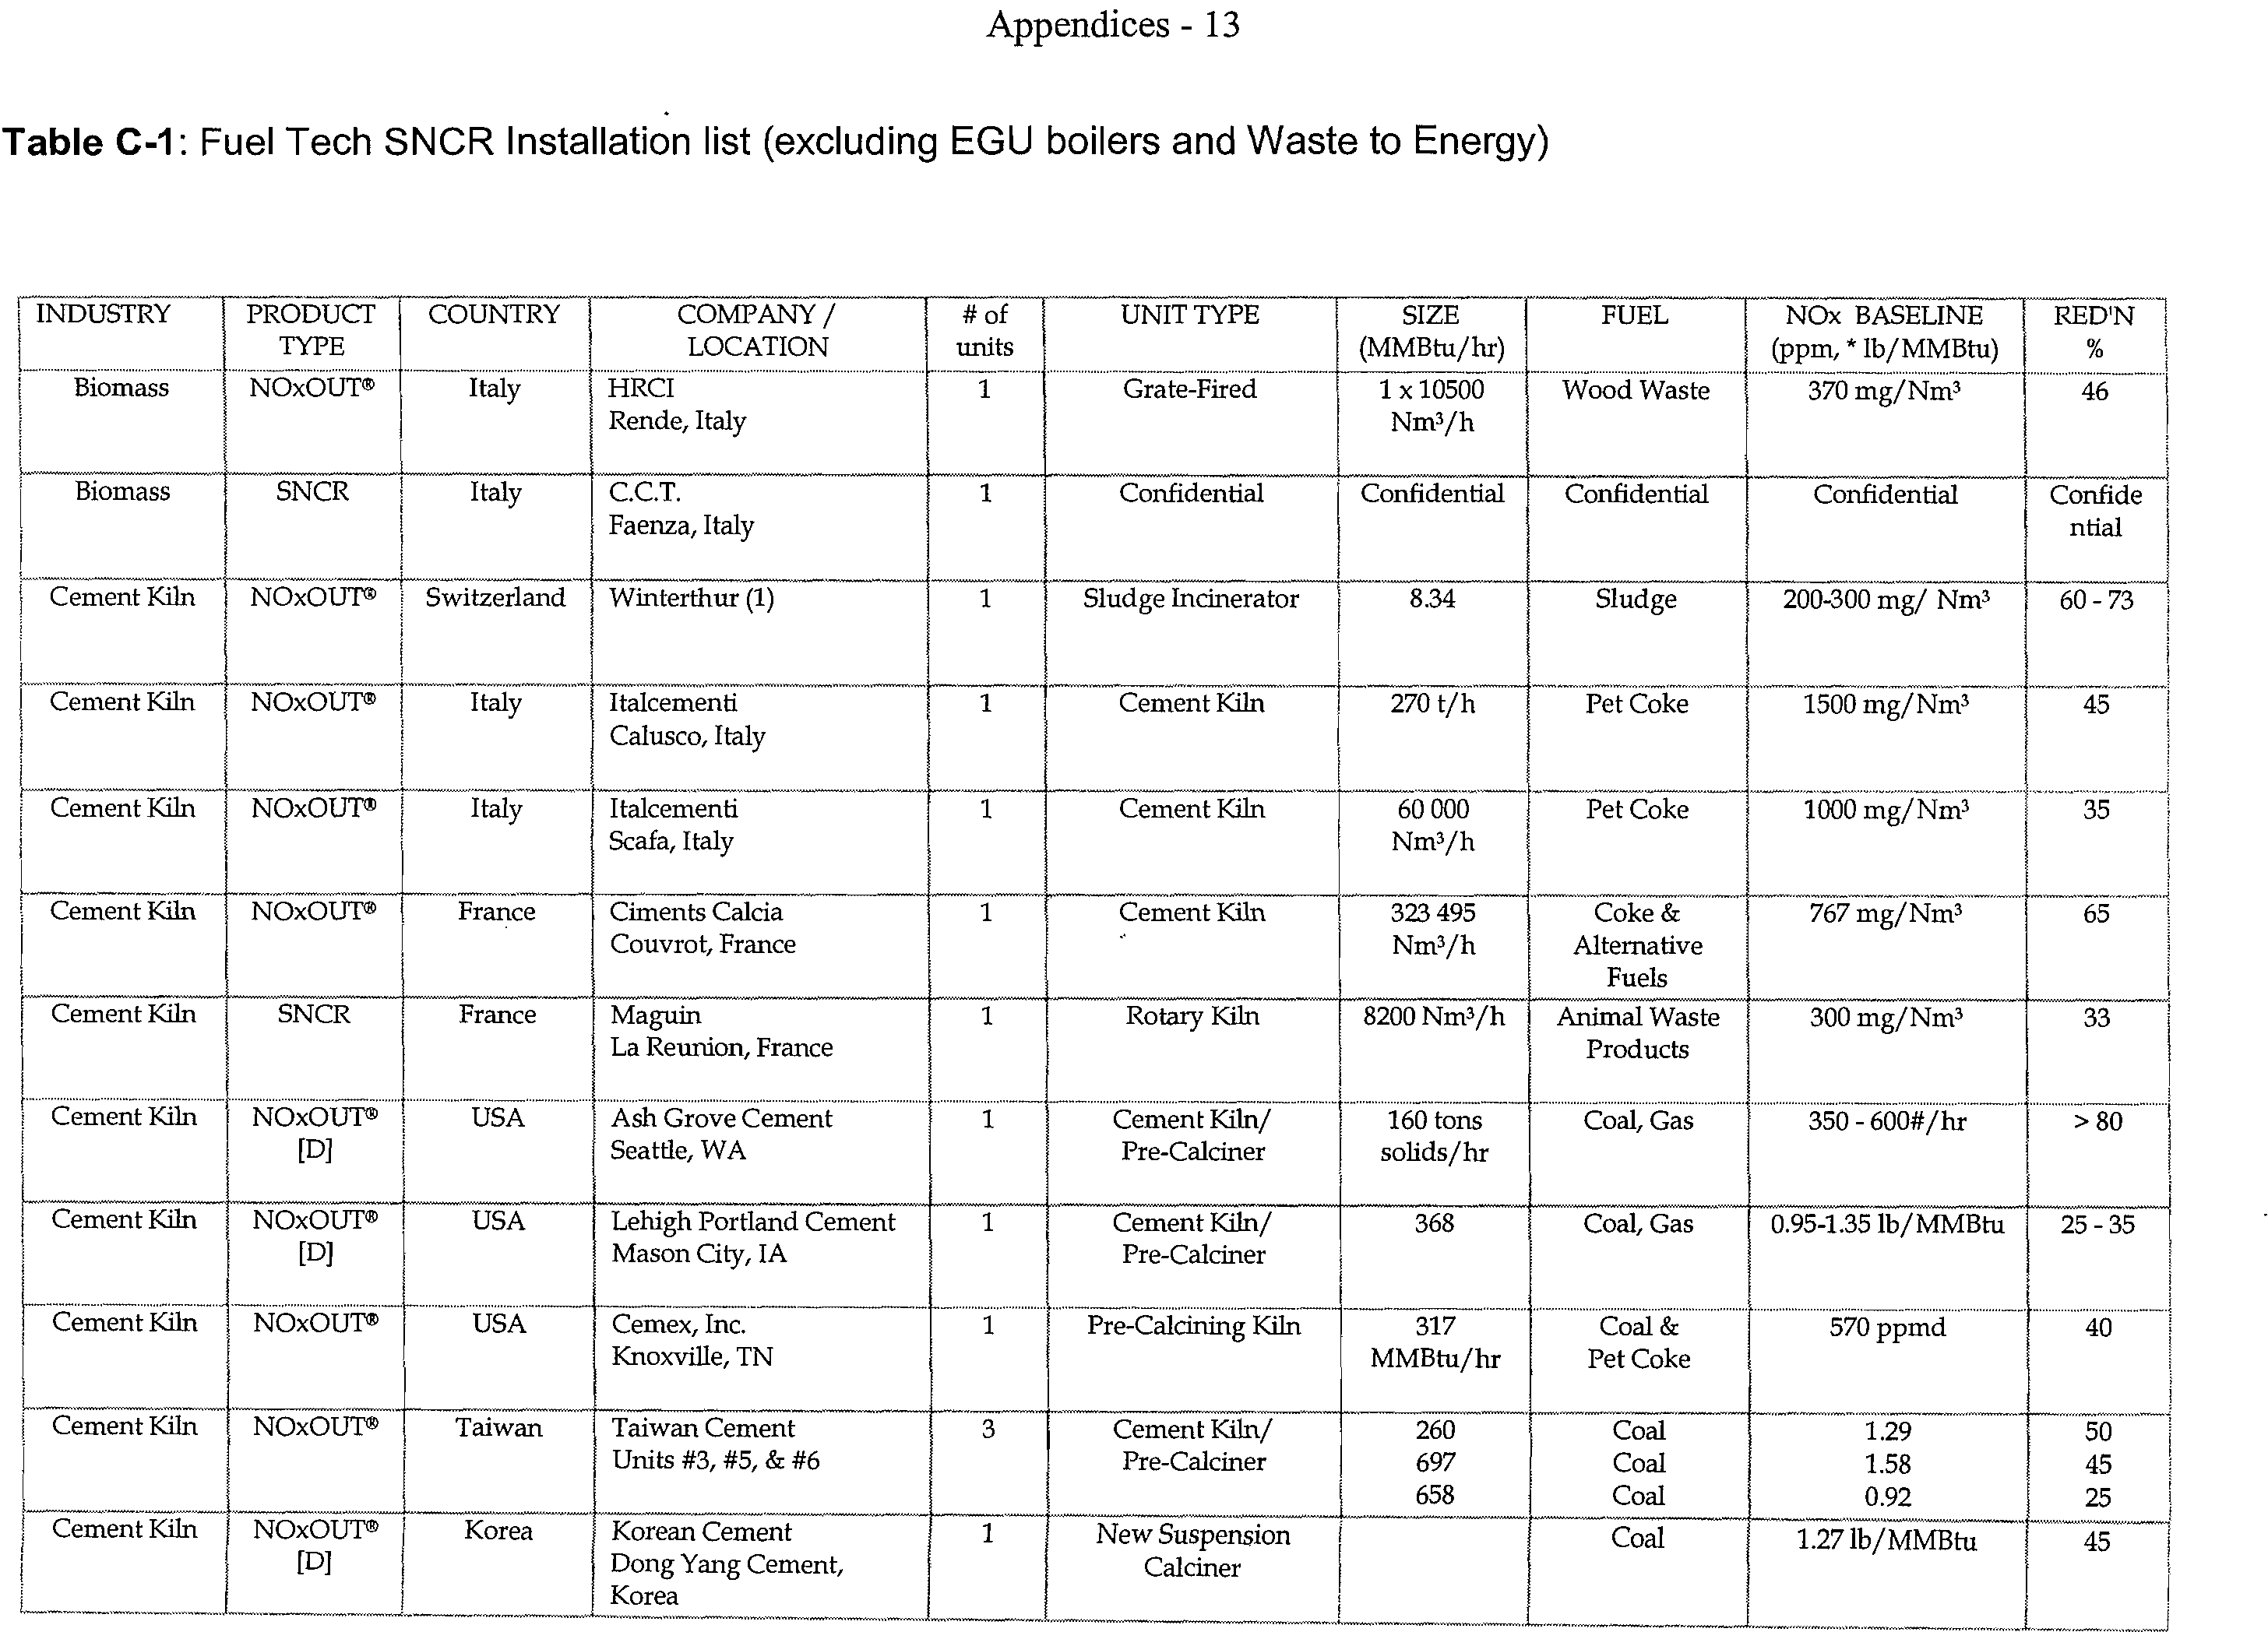
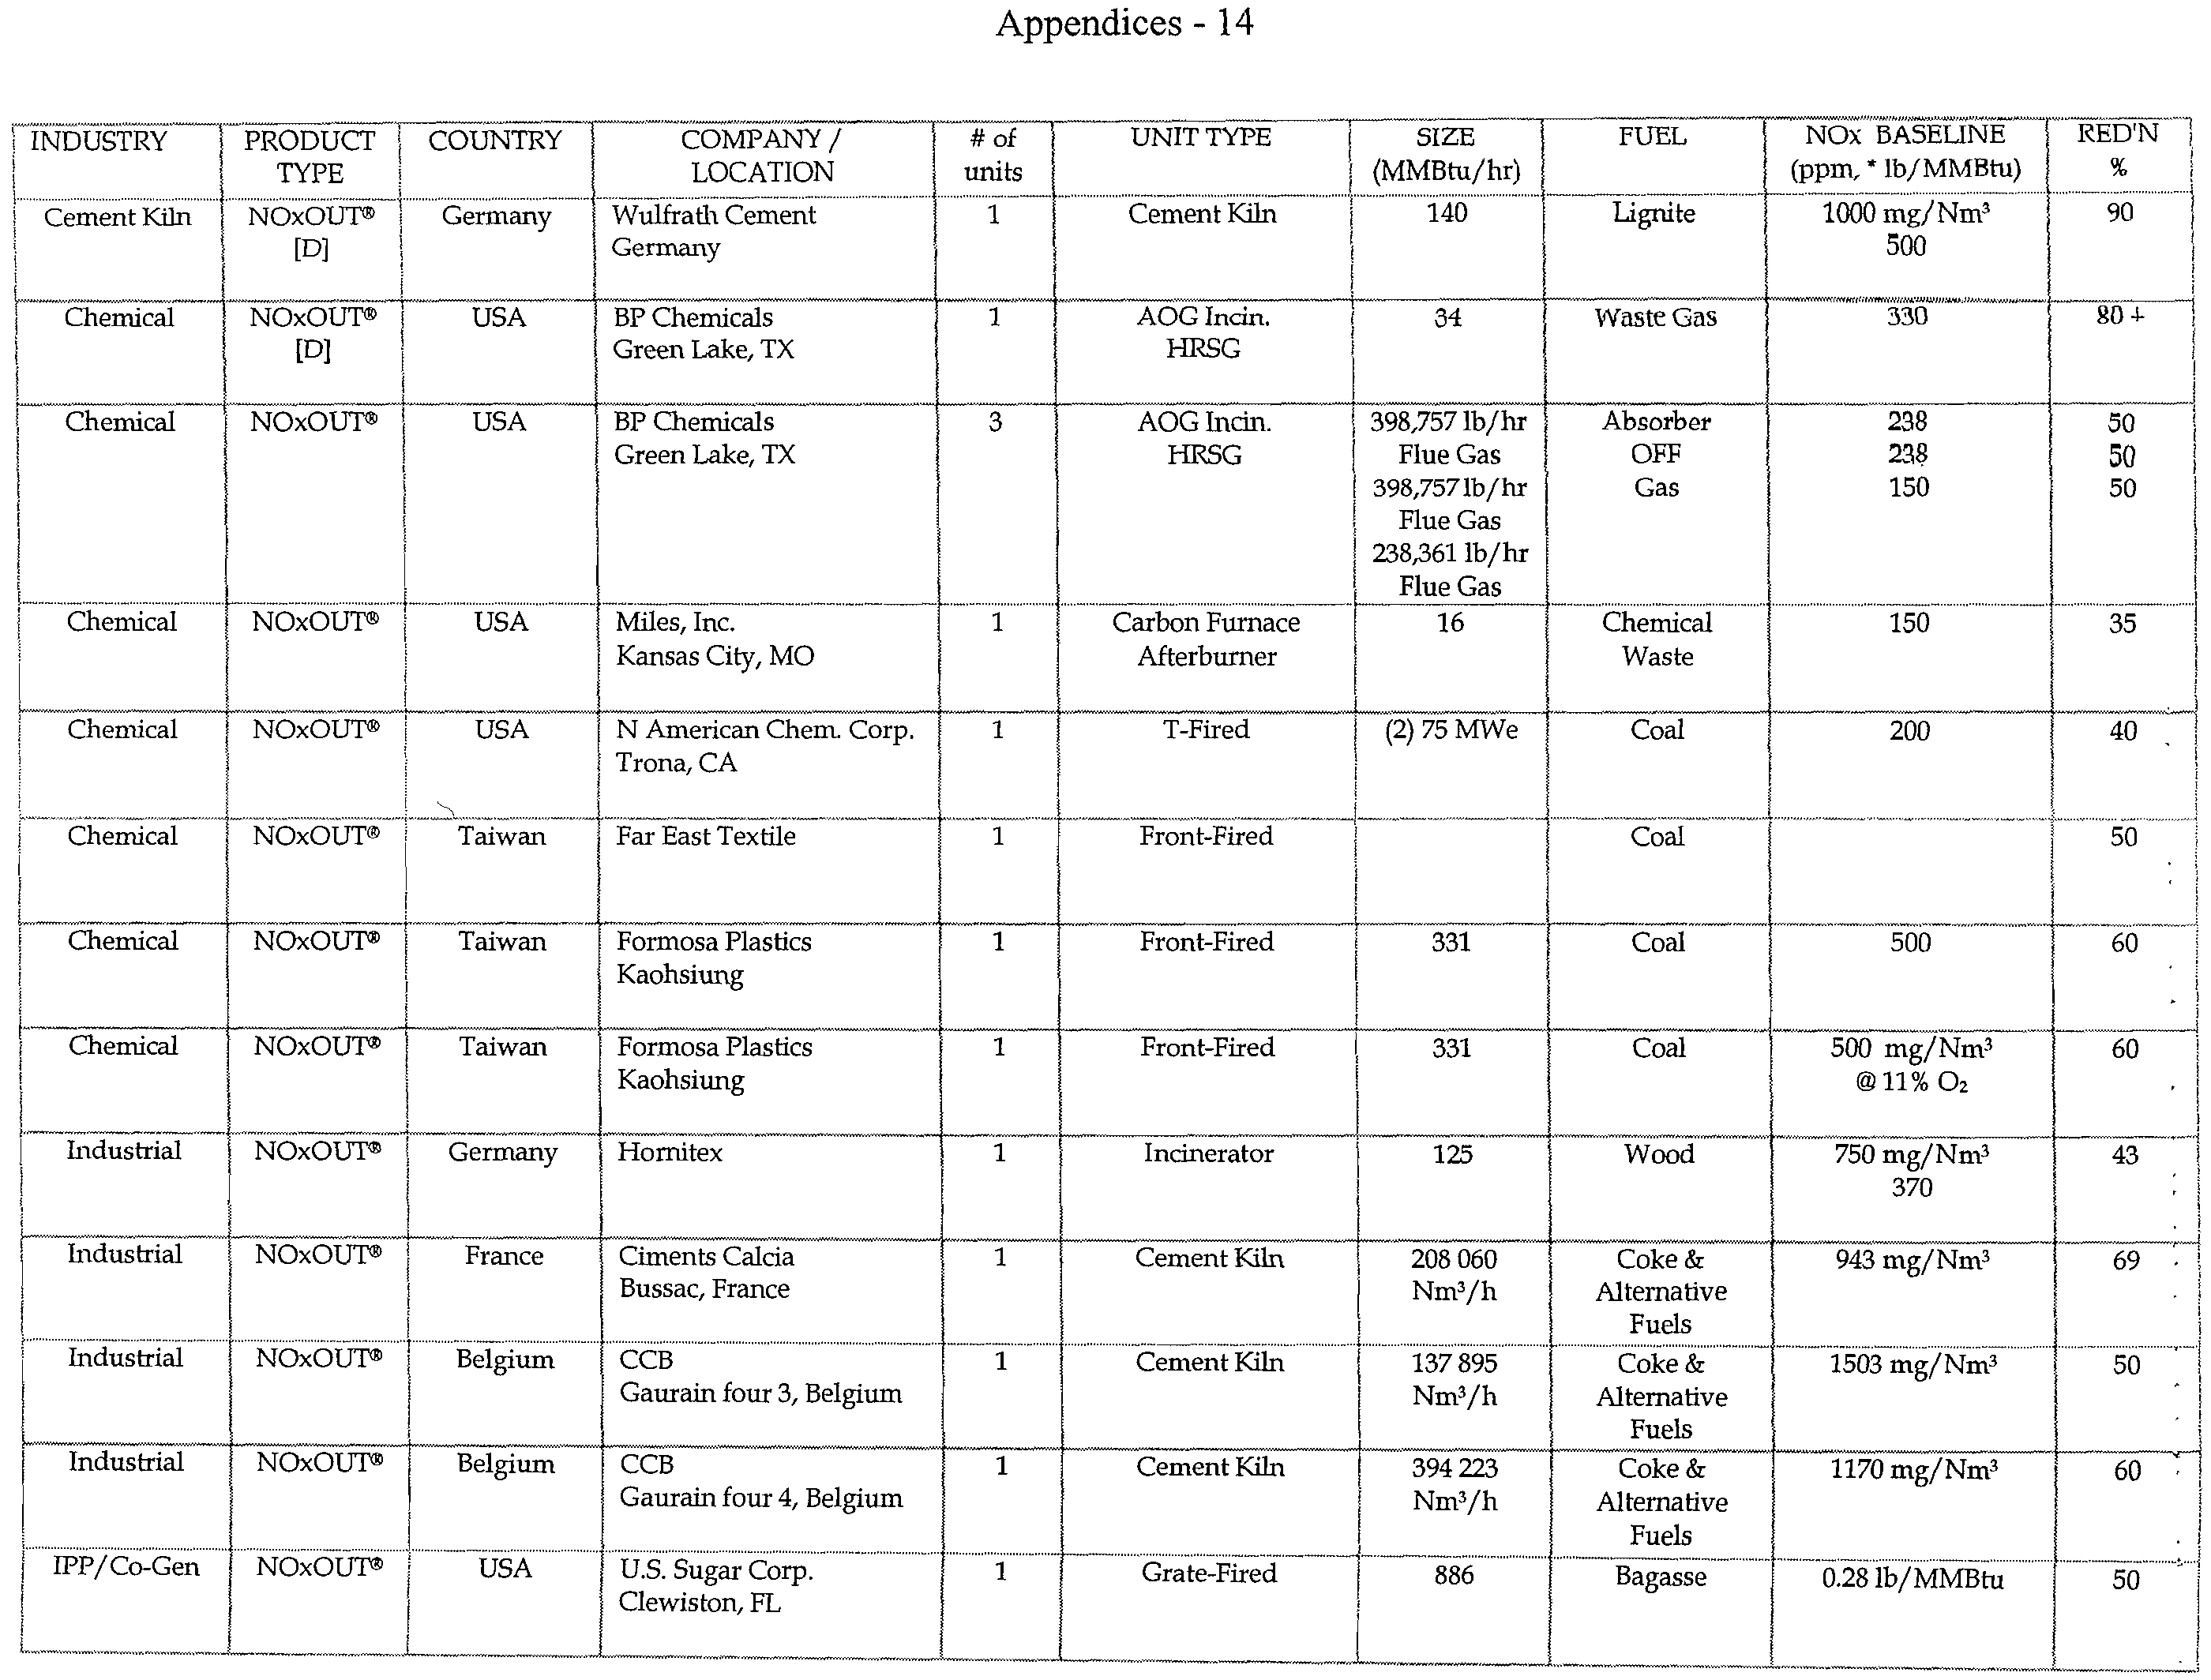
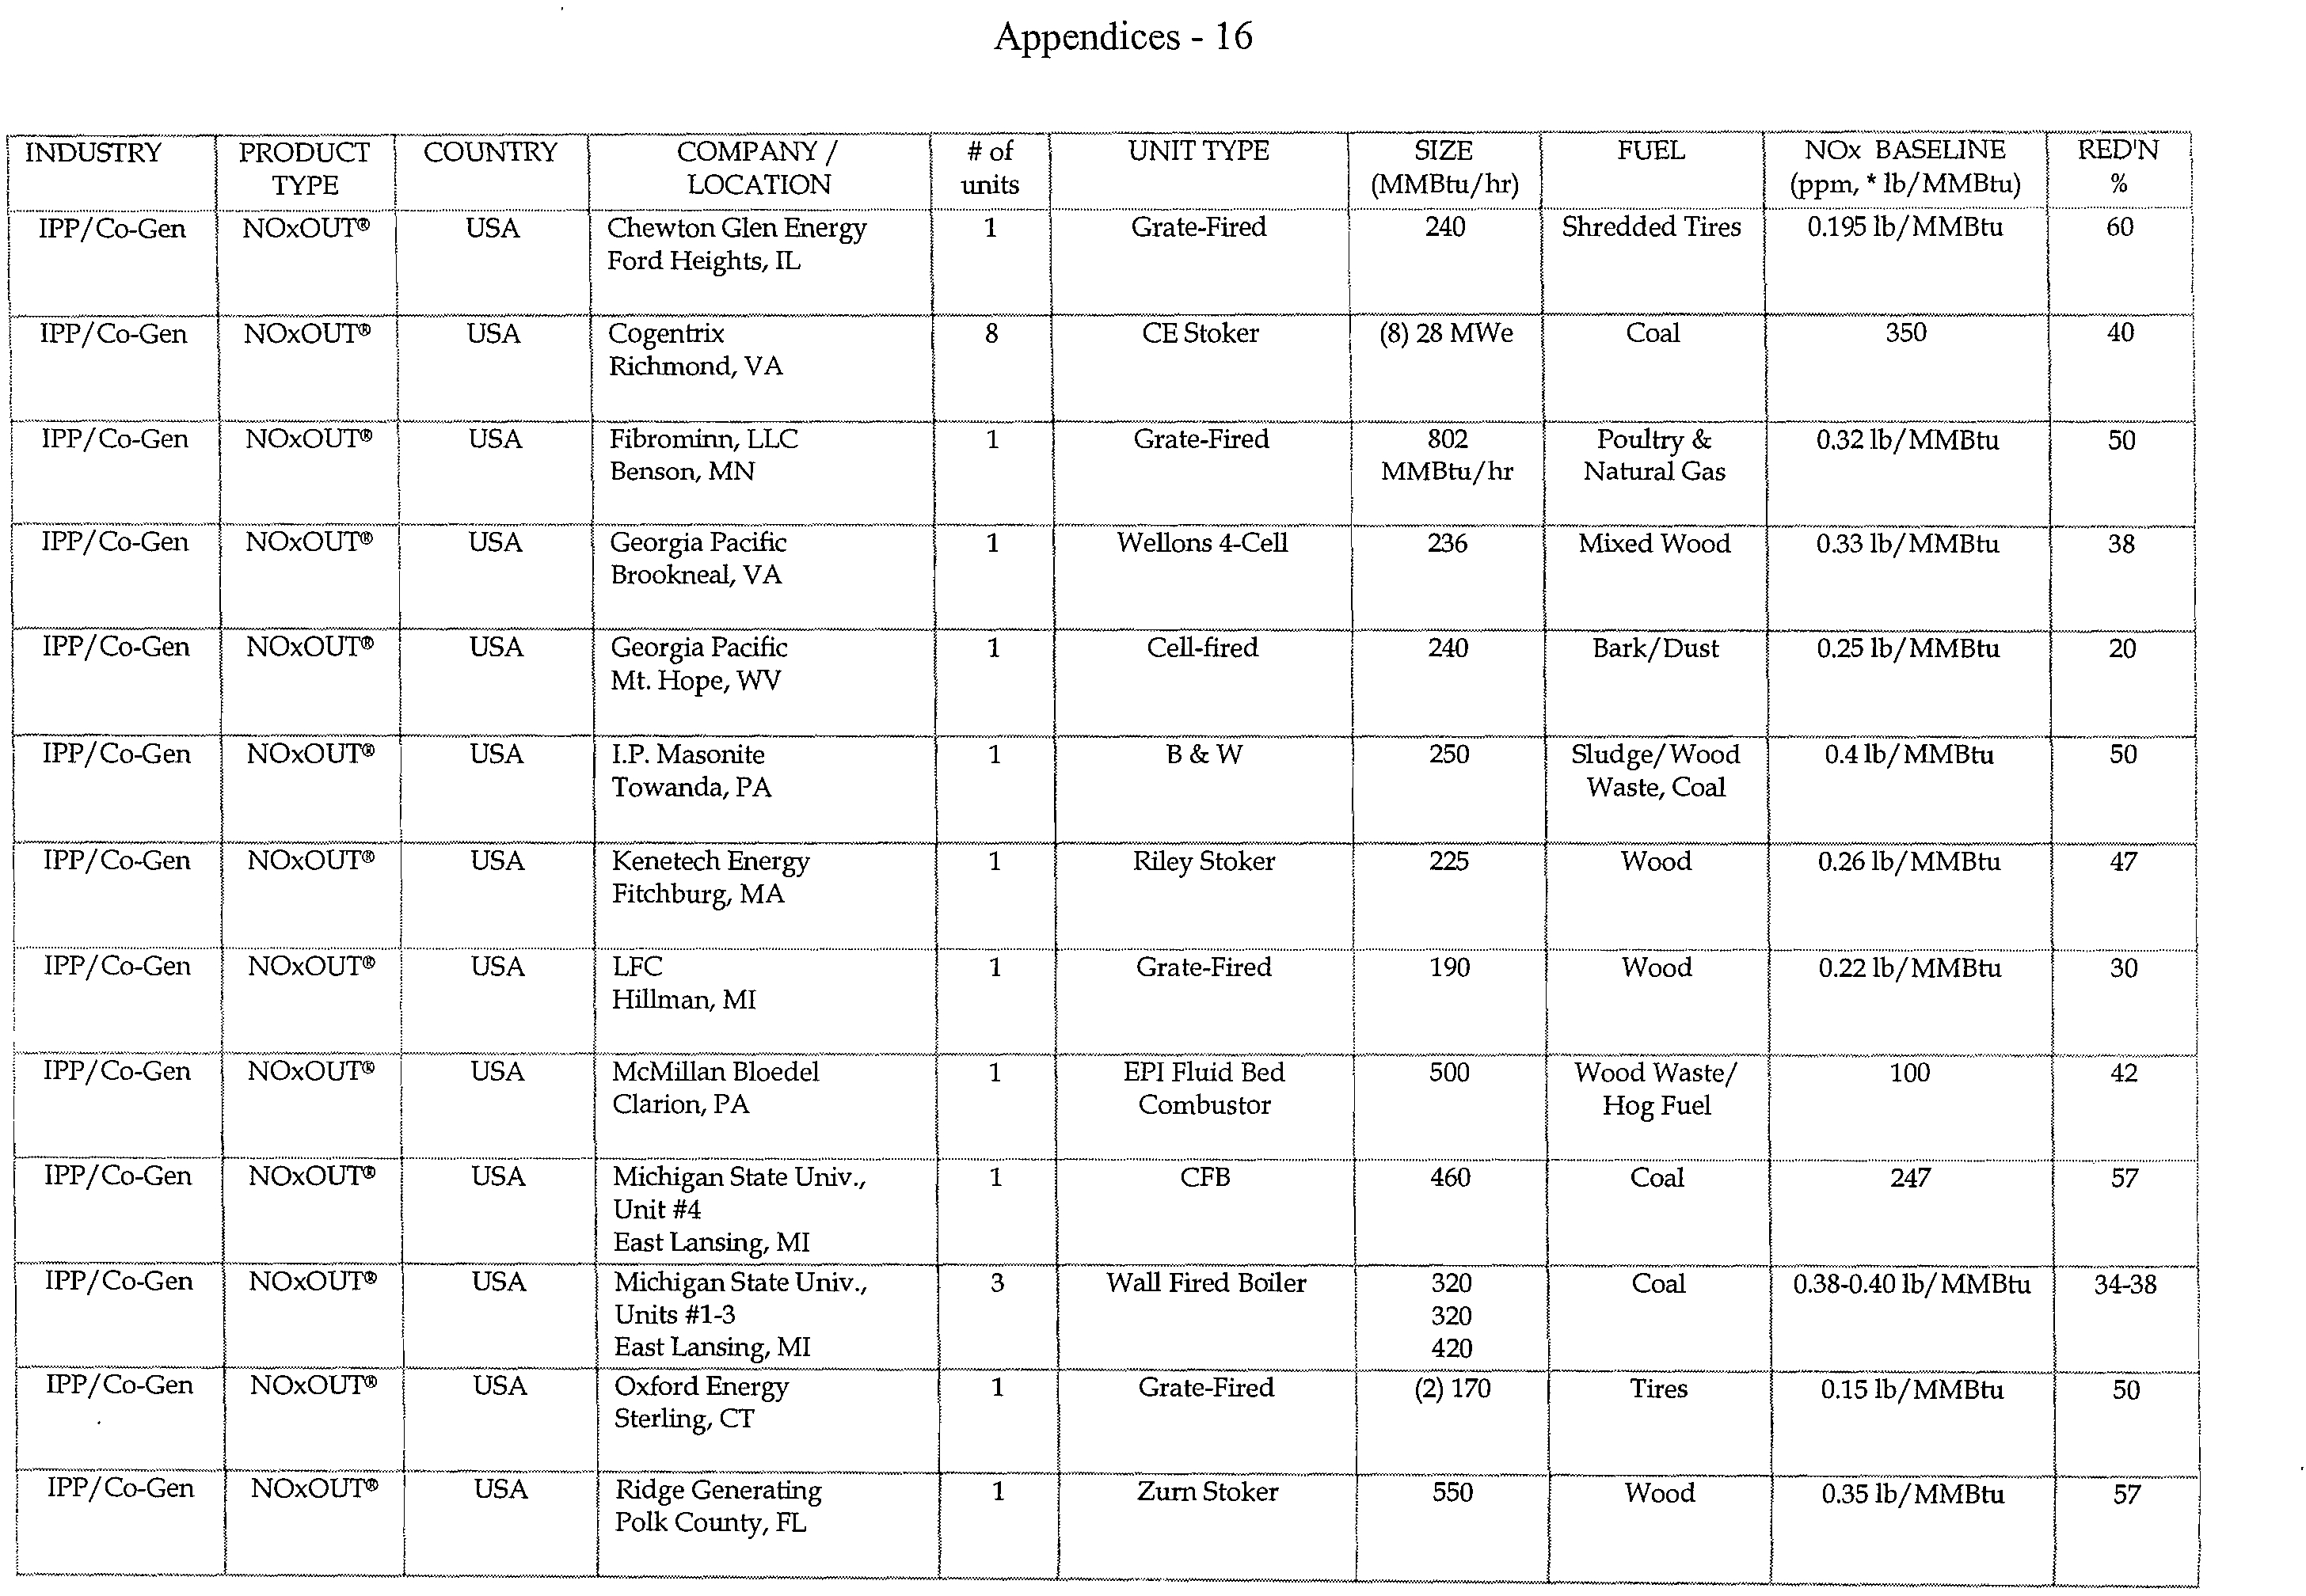
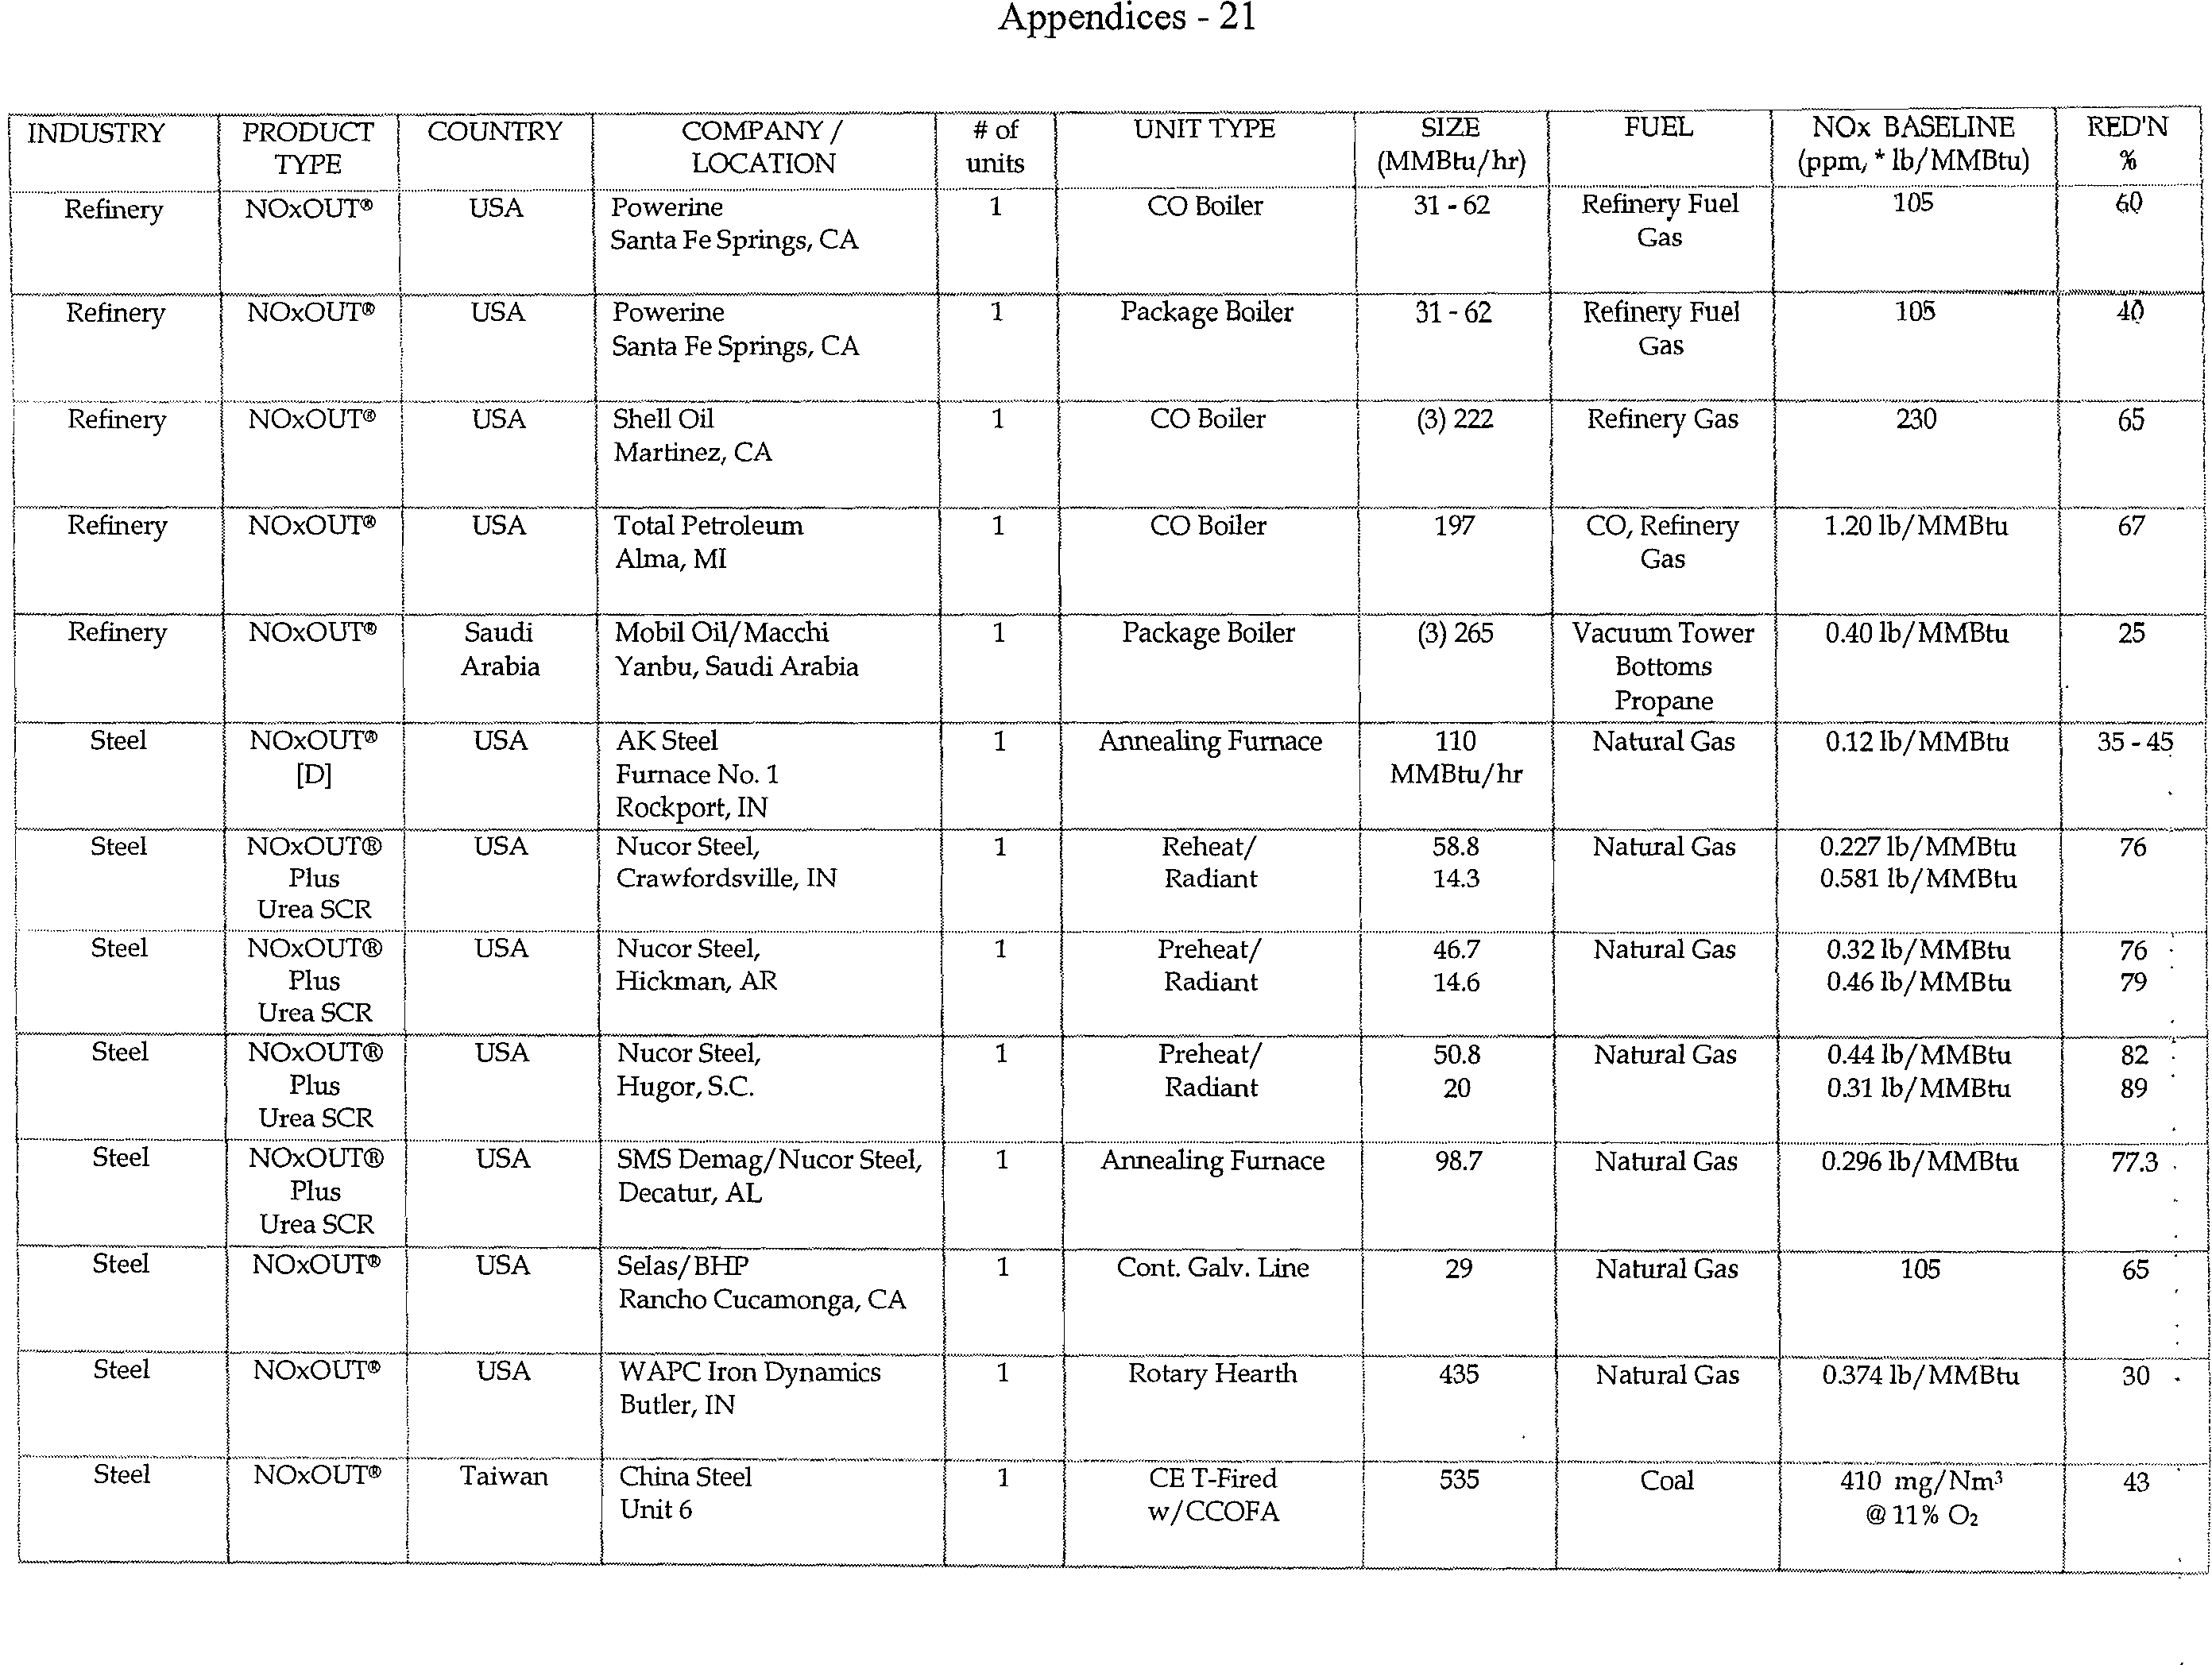
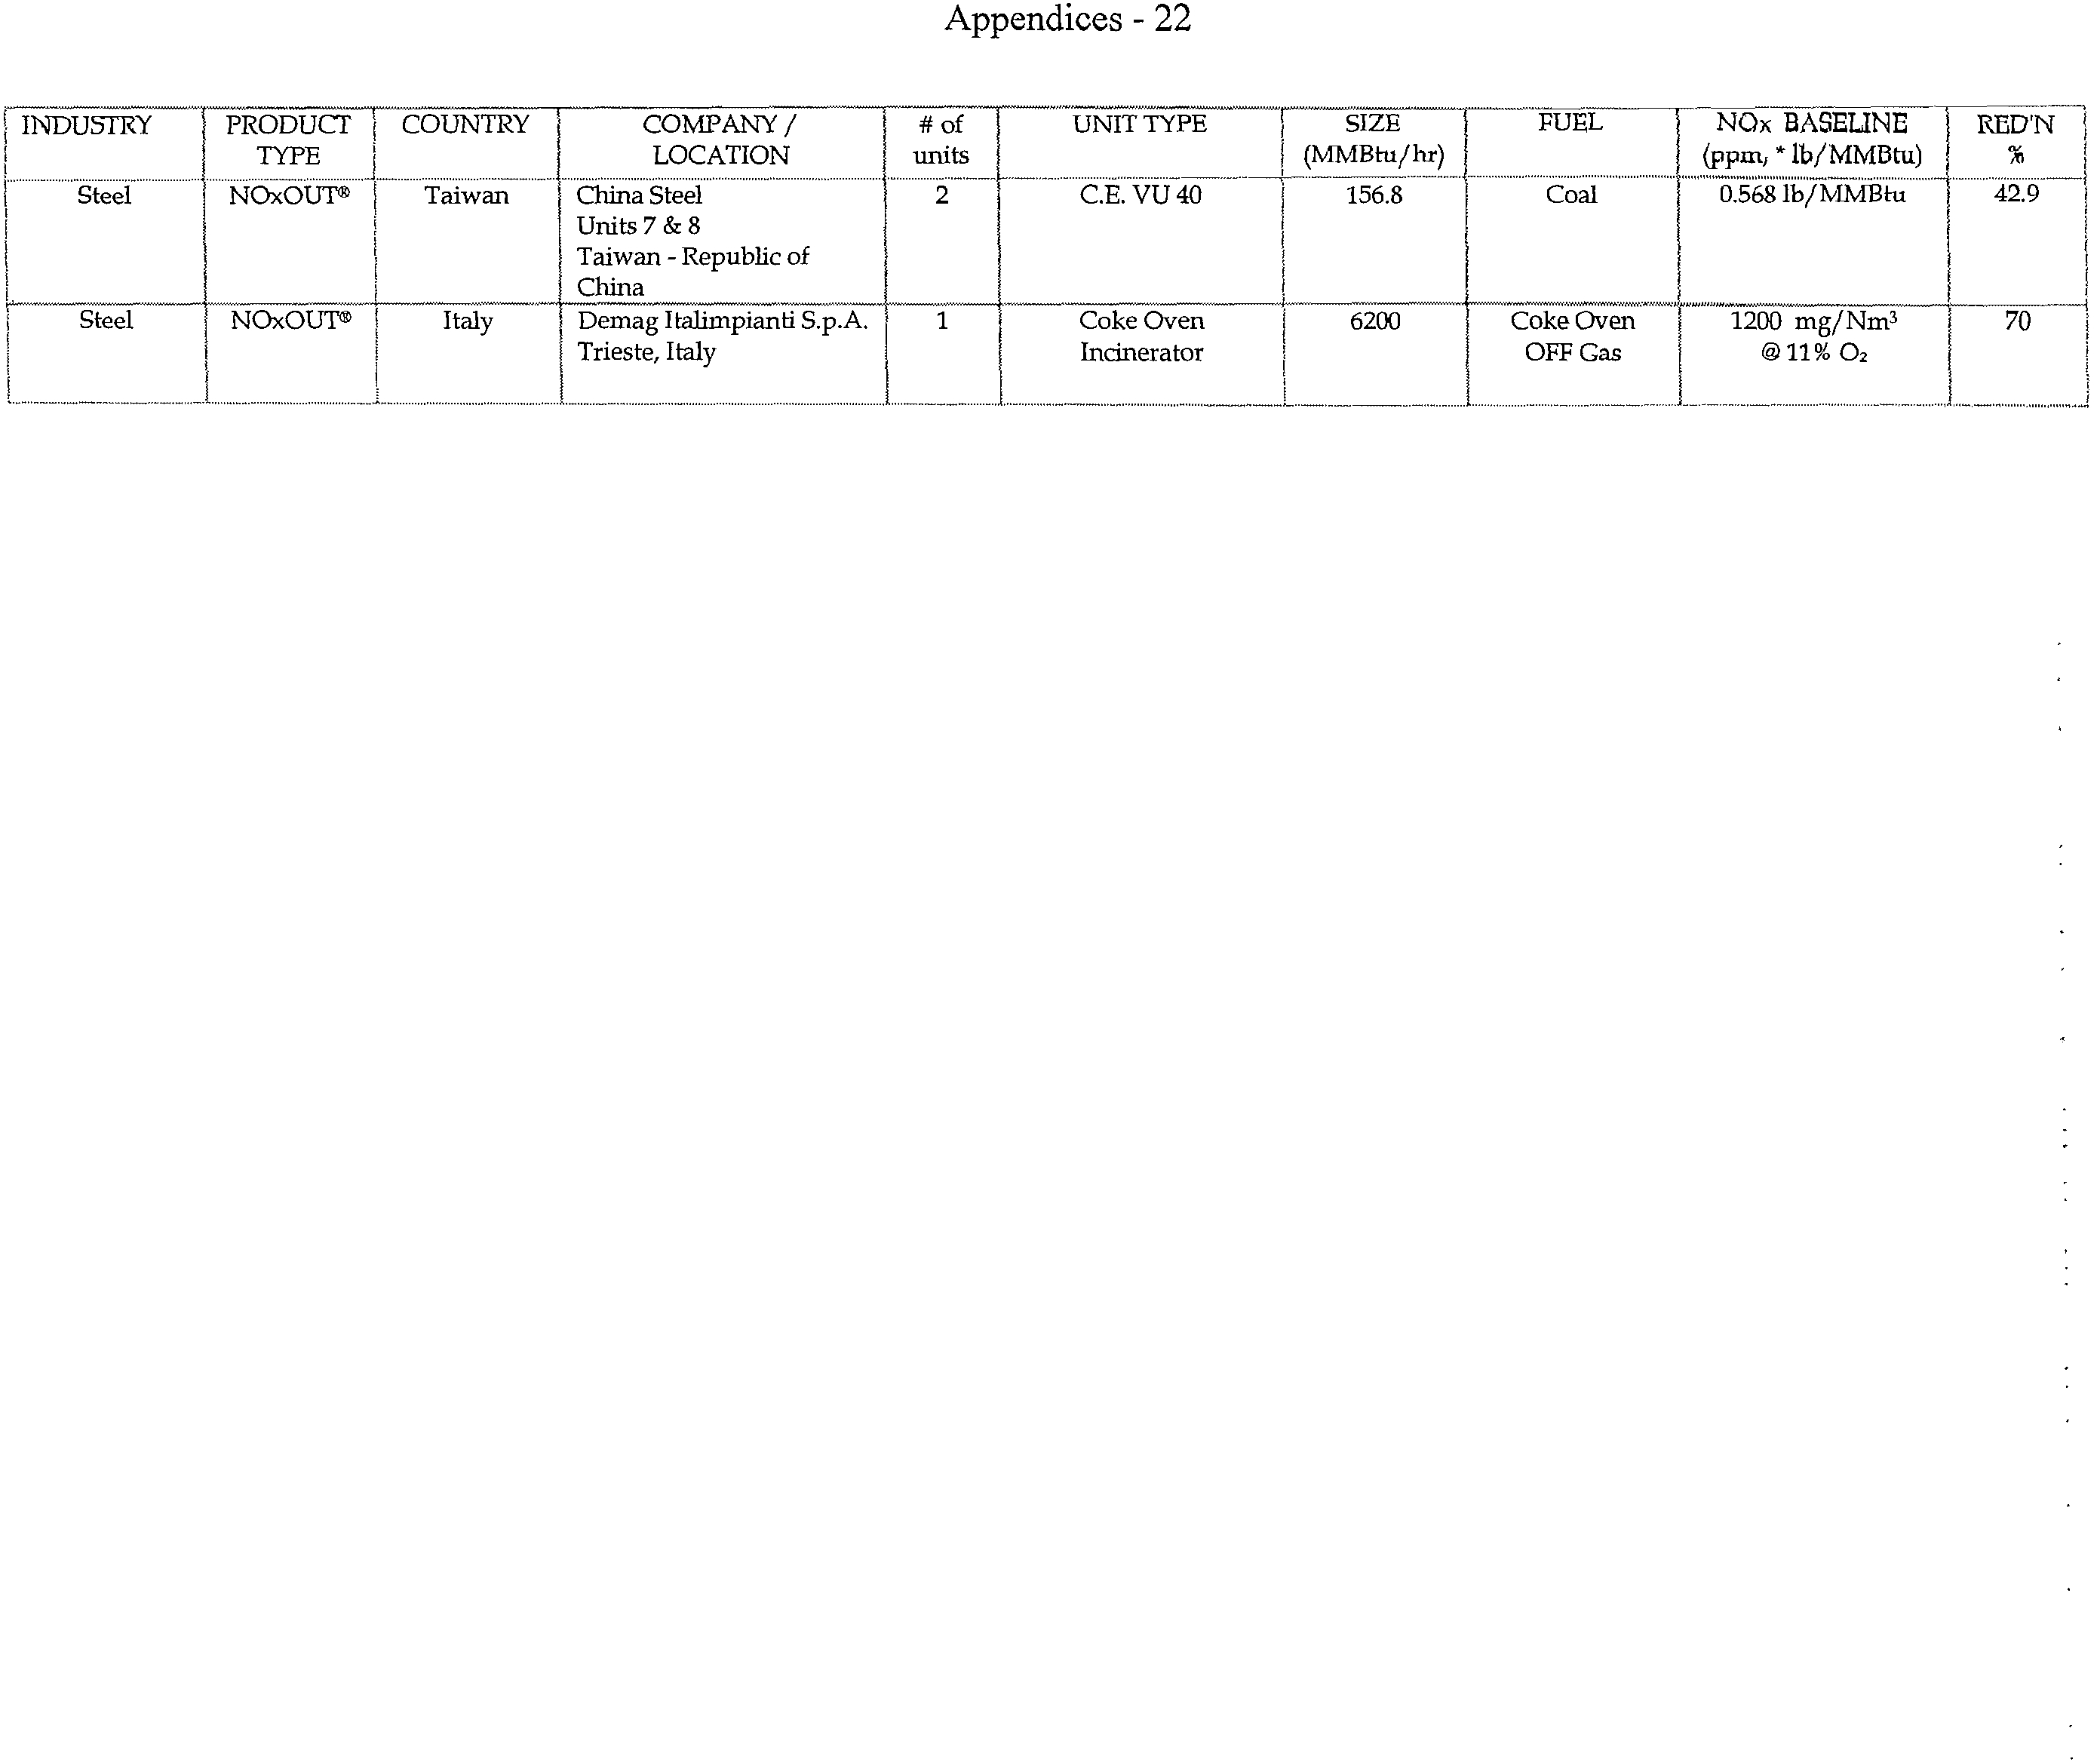
C-1
Fuel Tech SNCR Installation list
A-13
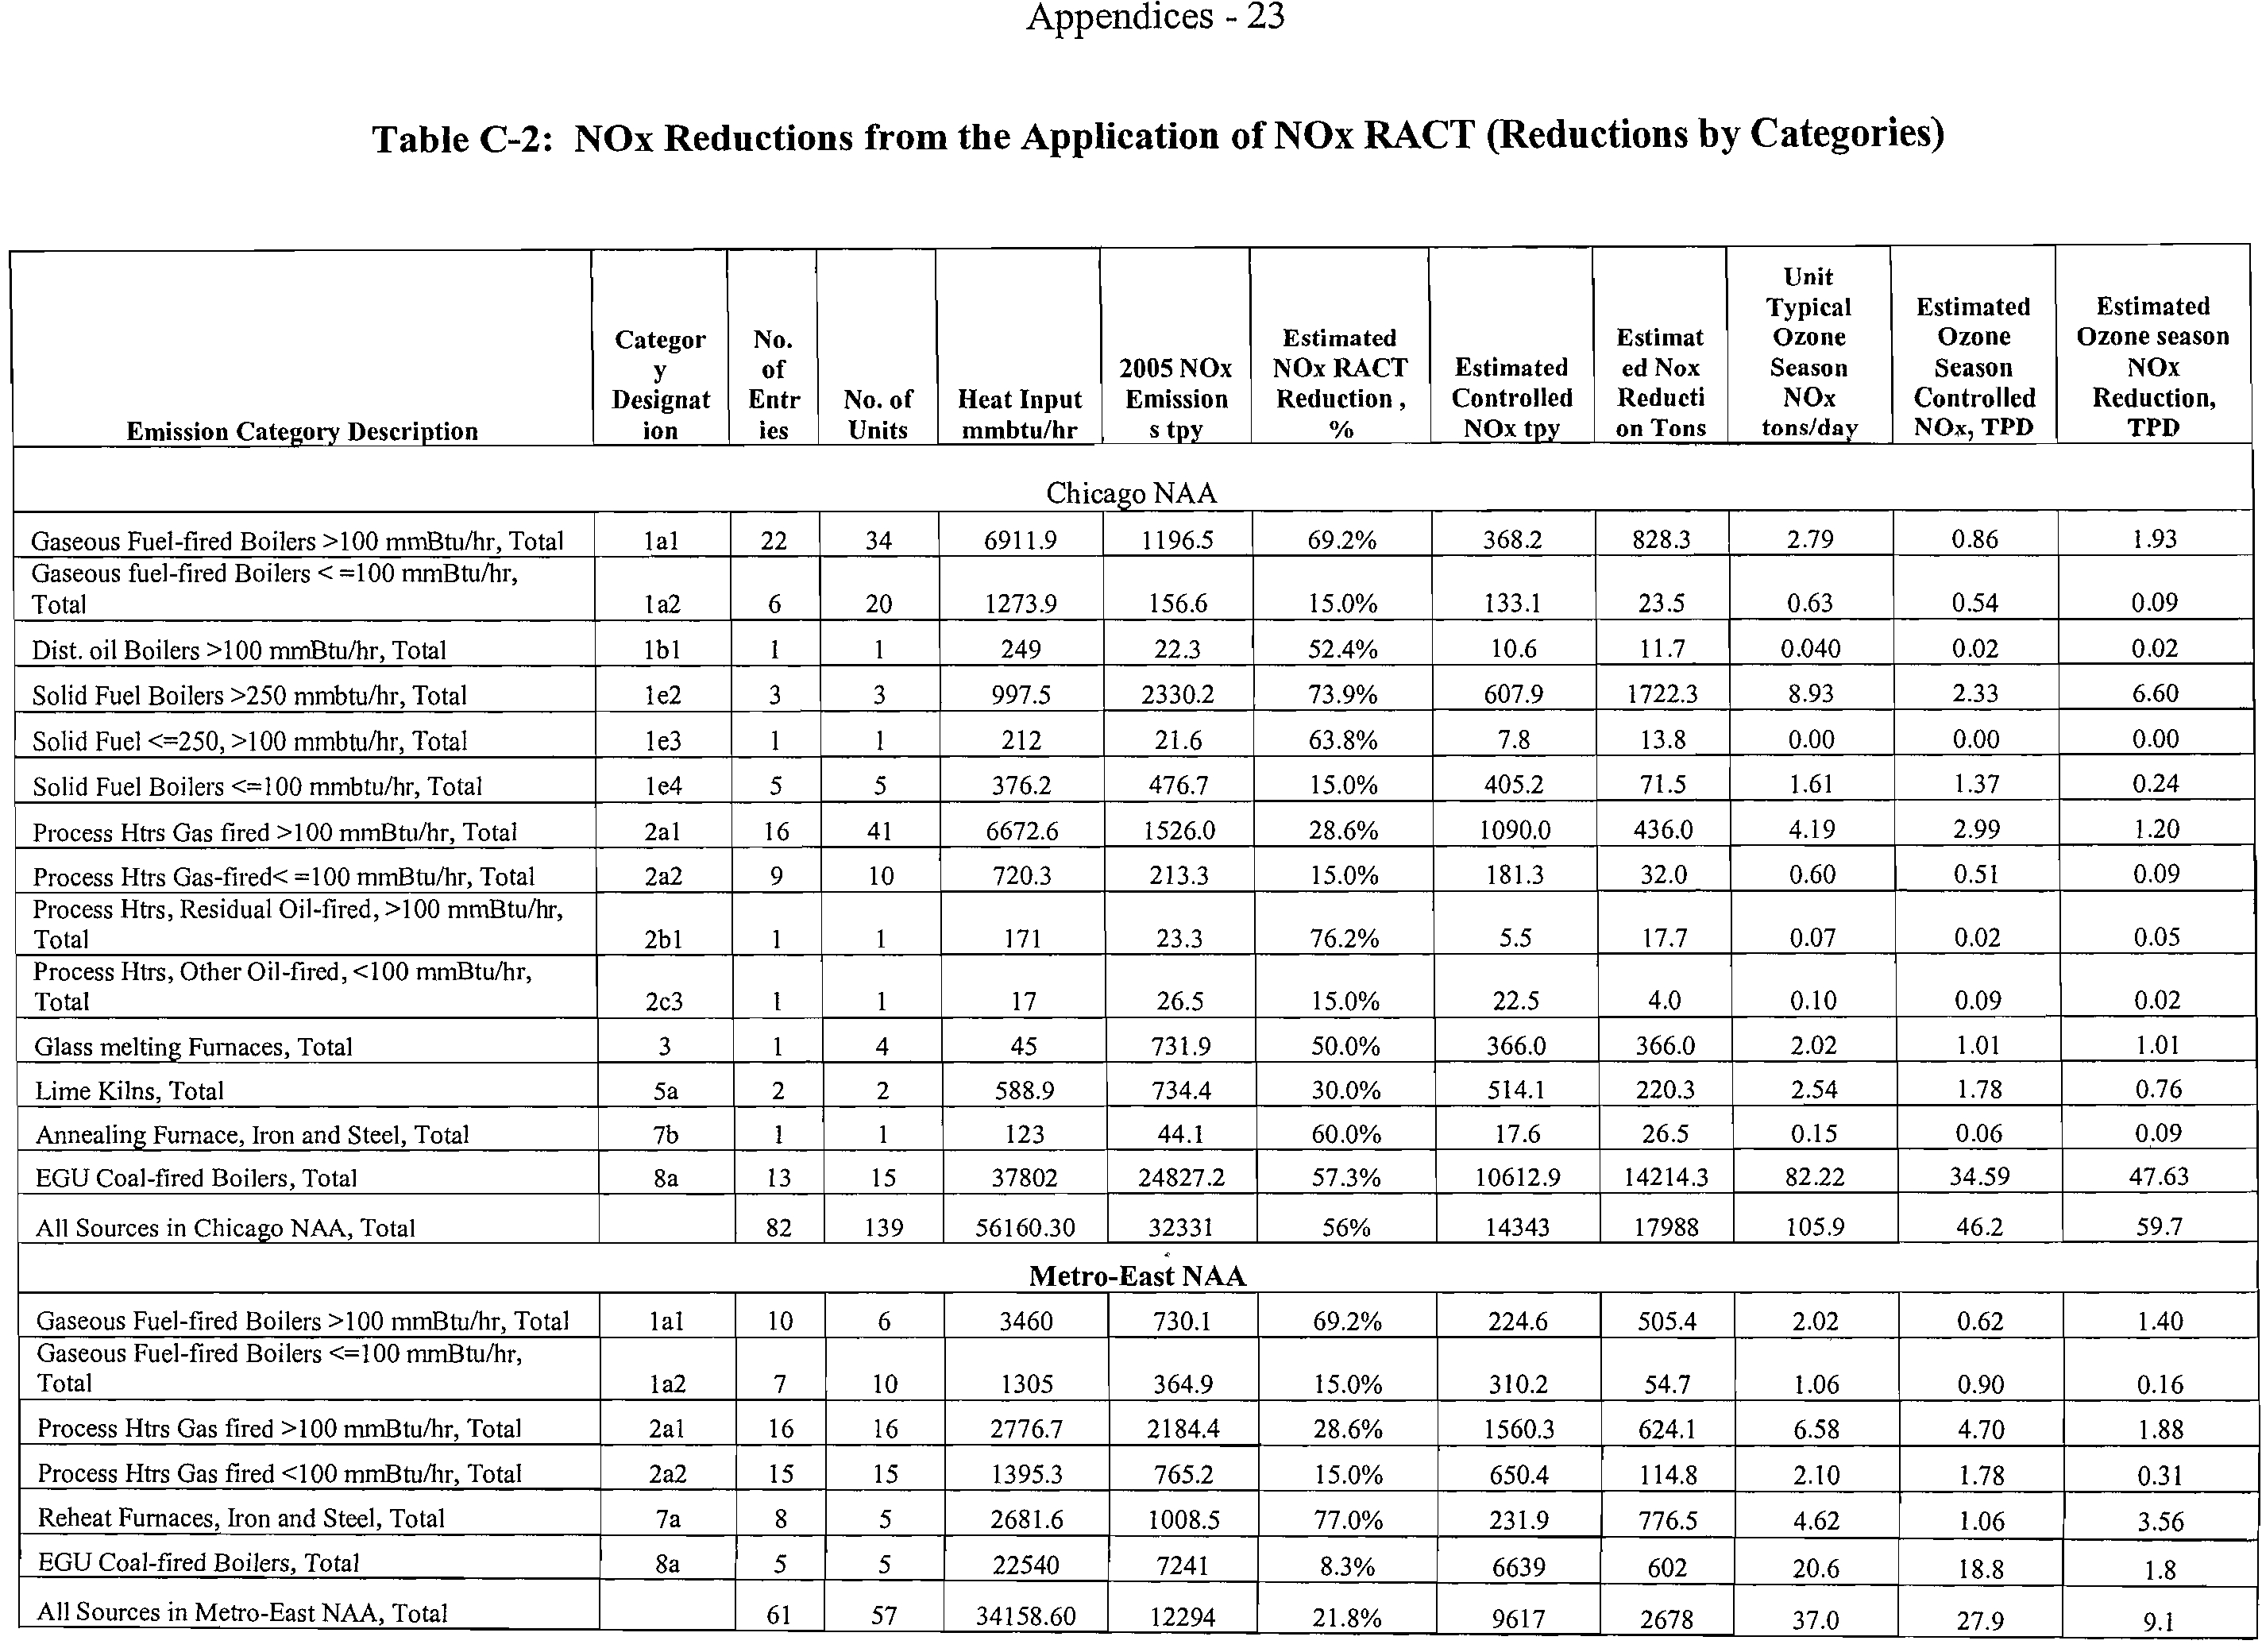
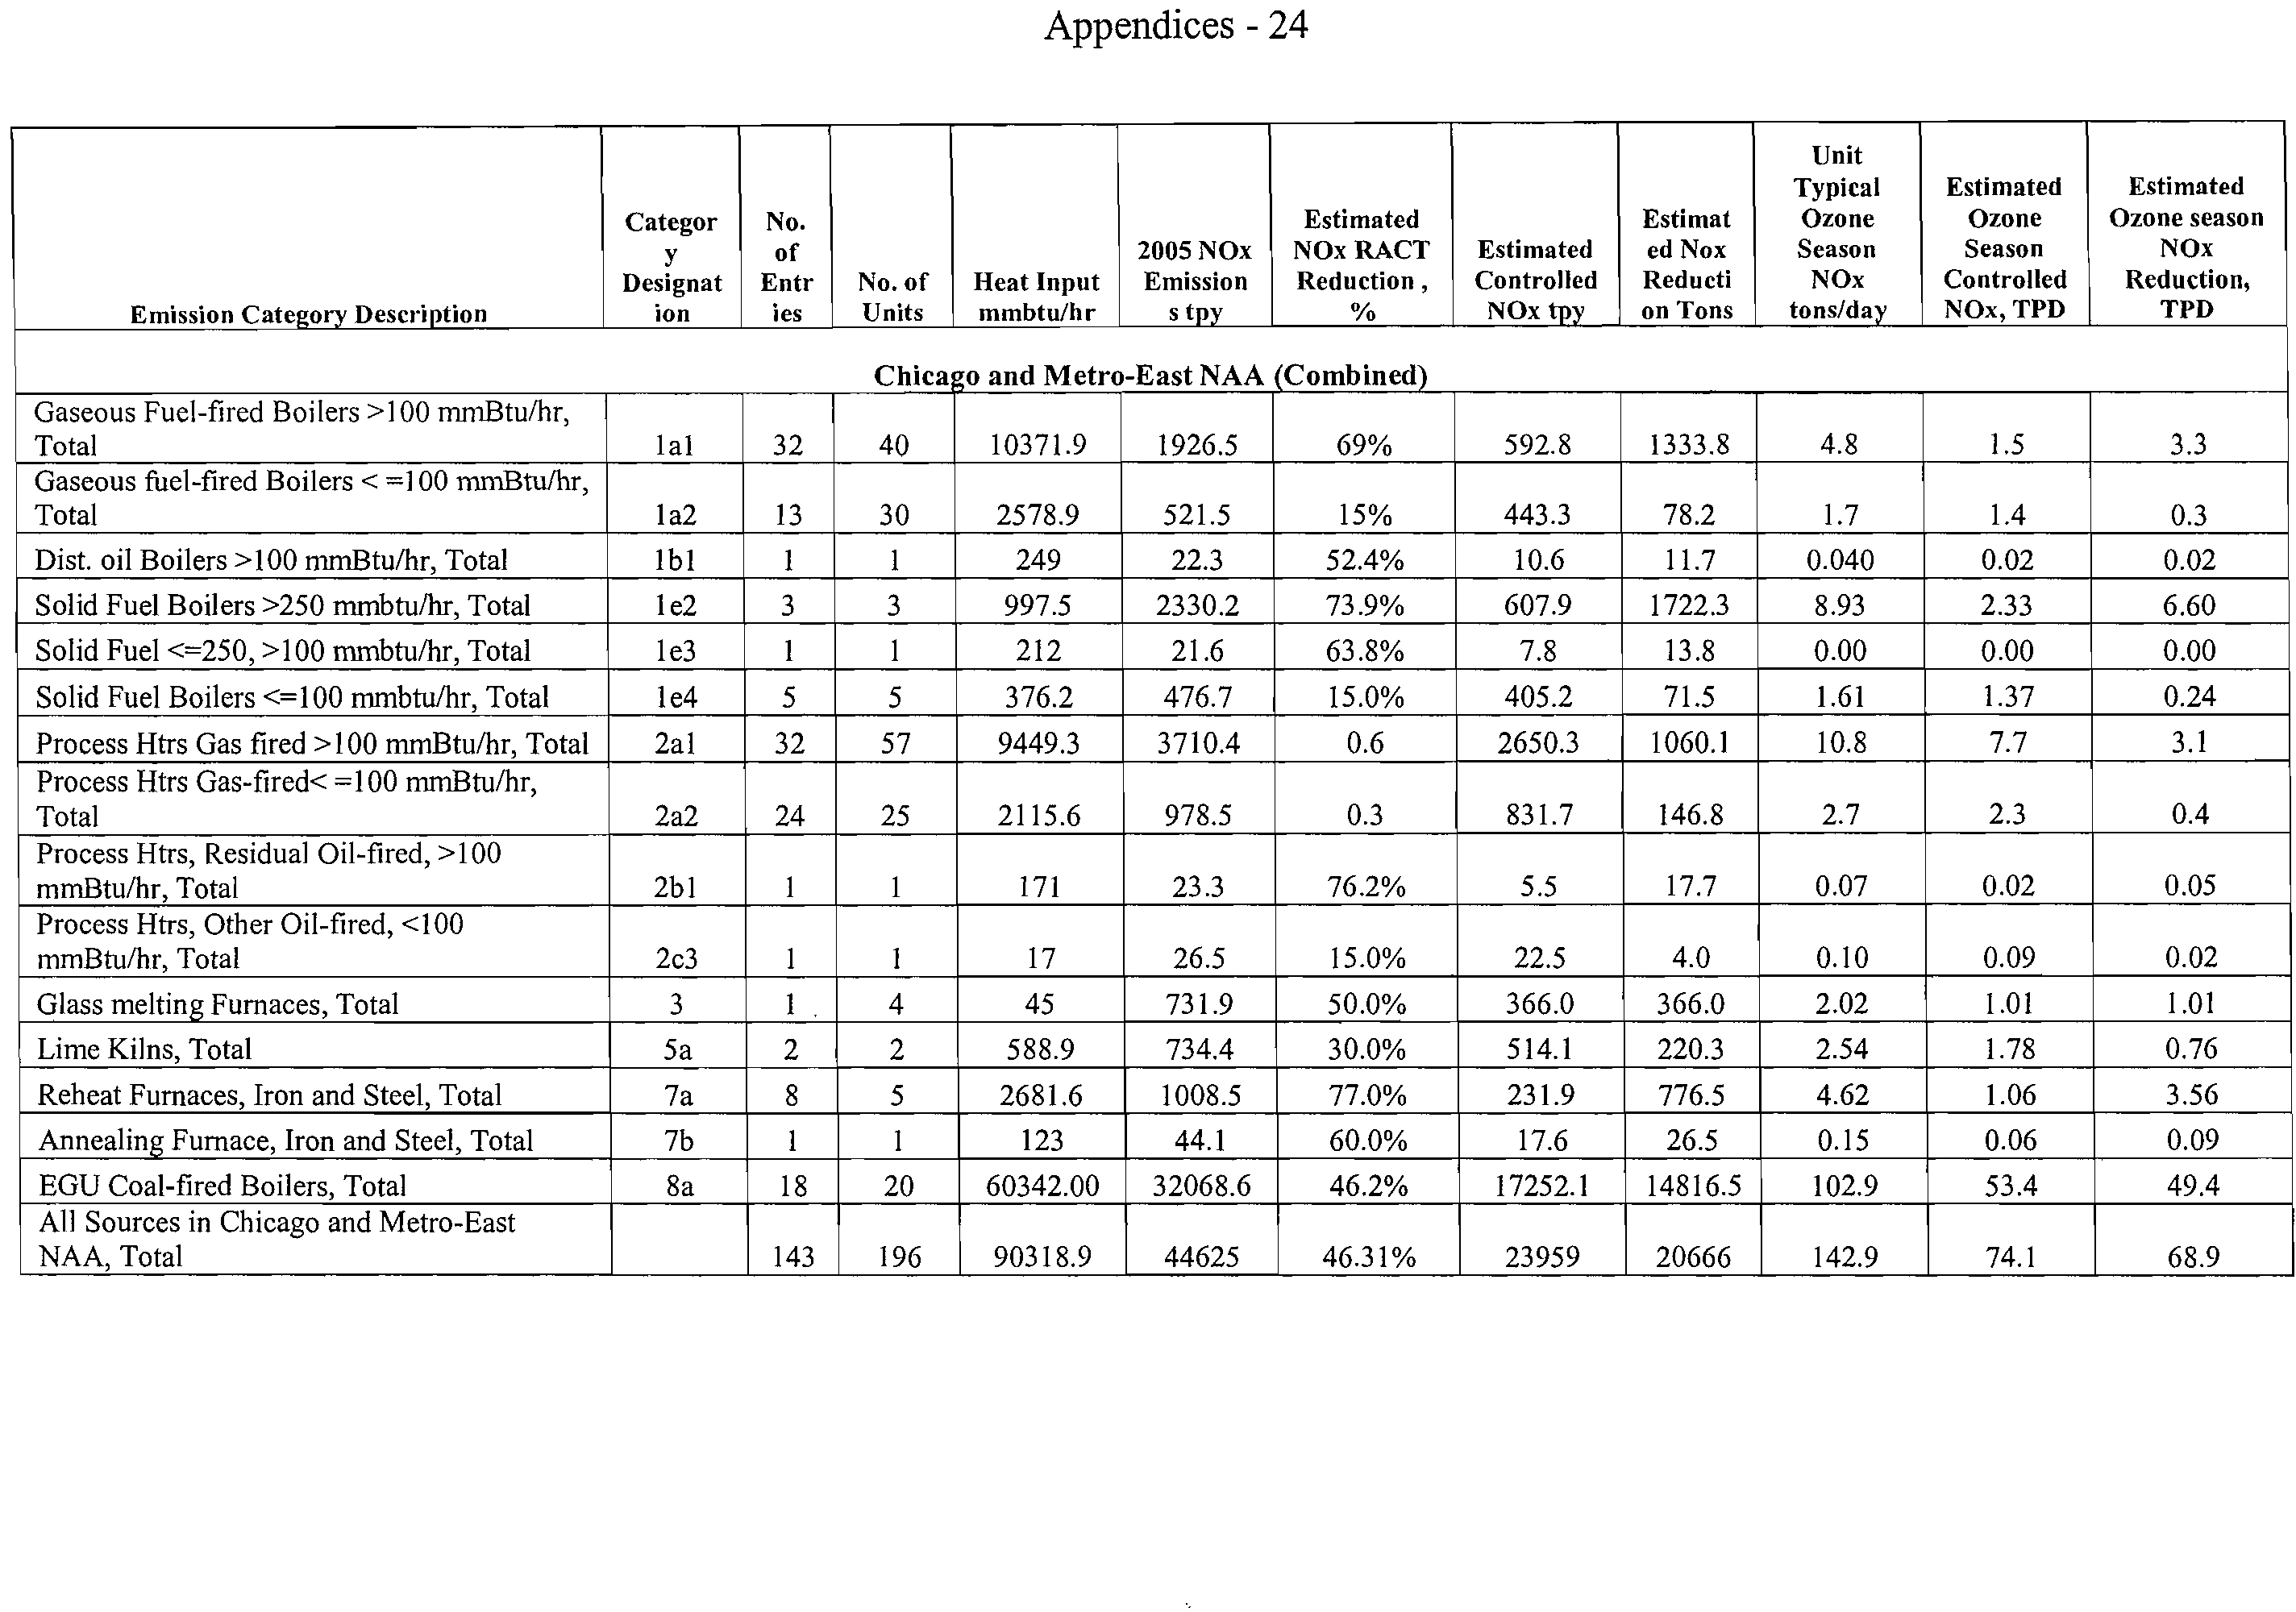
C-2
NOx Reductions from the Application of NOx RACT
A-23
(Reductions by Categories)
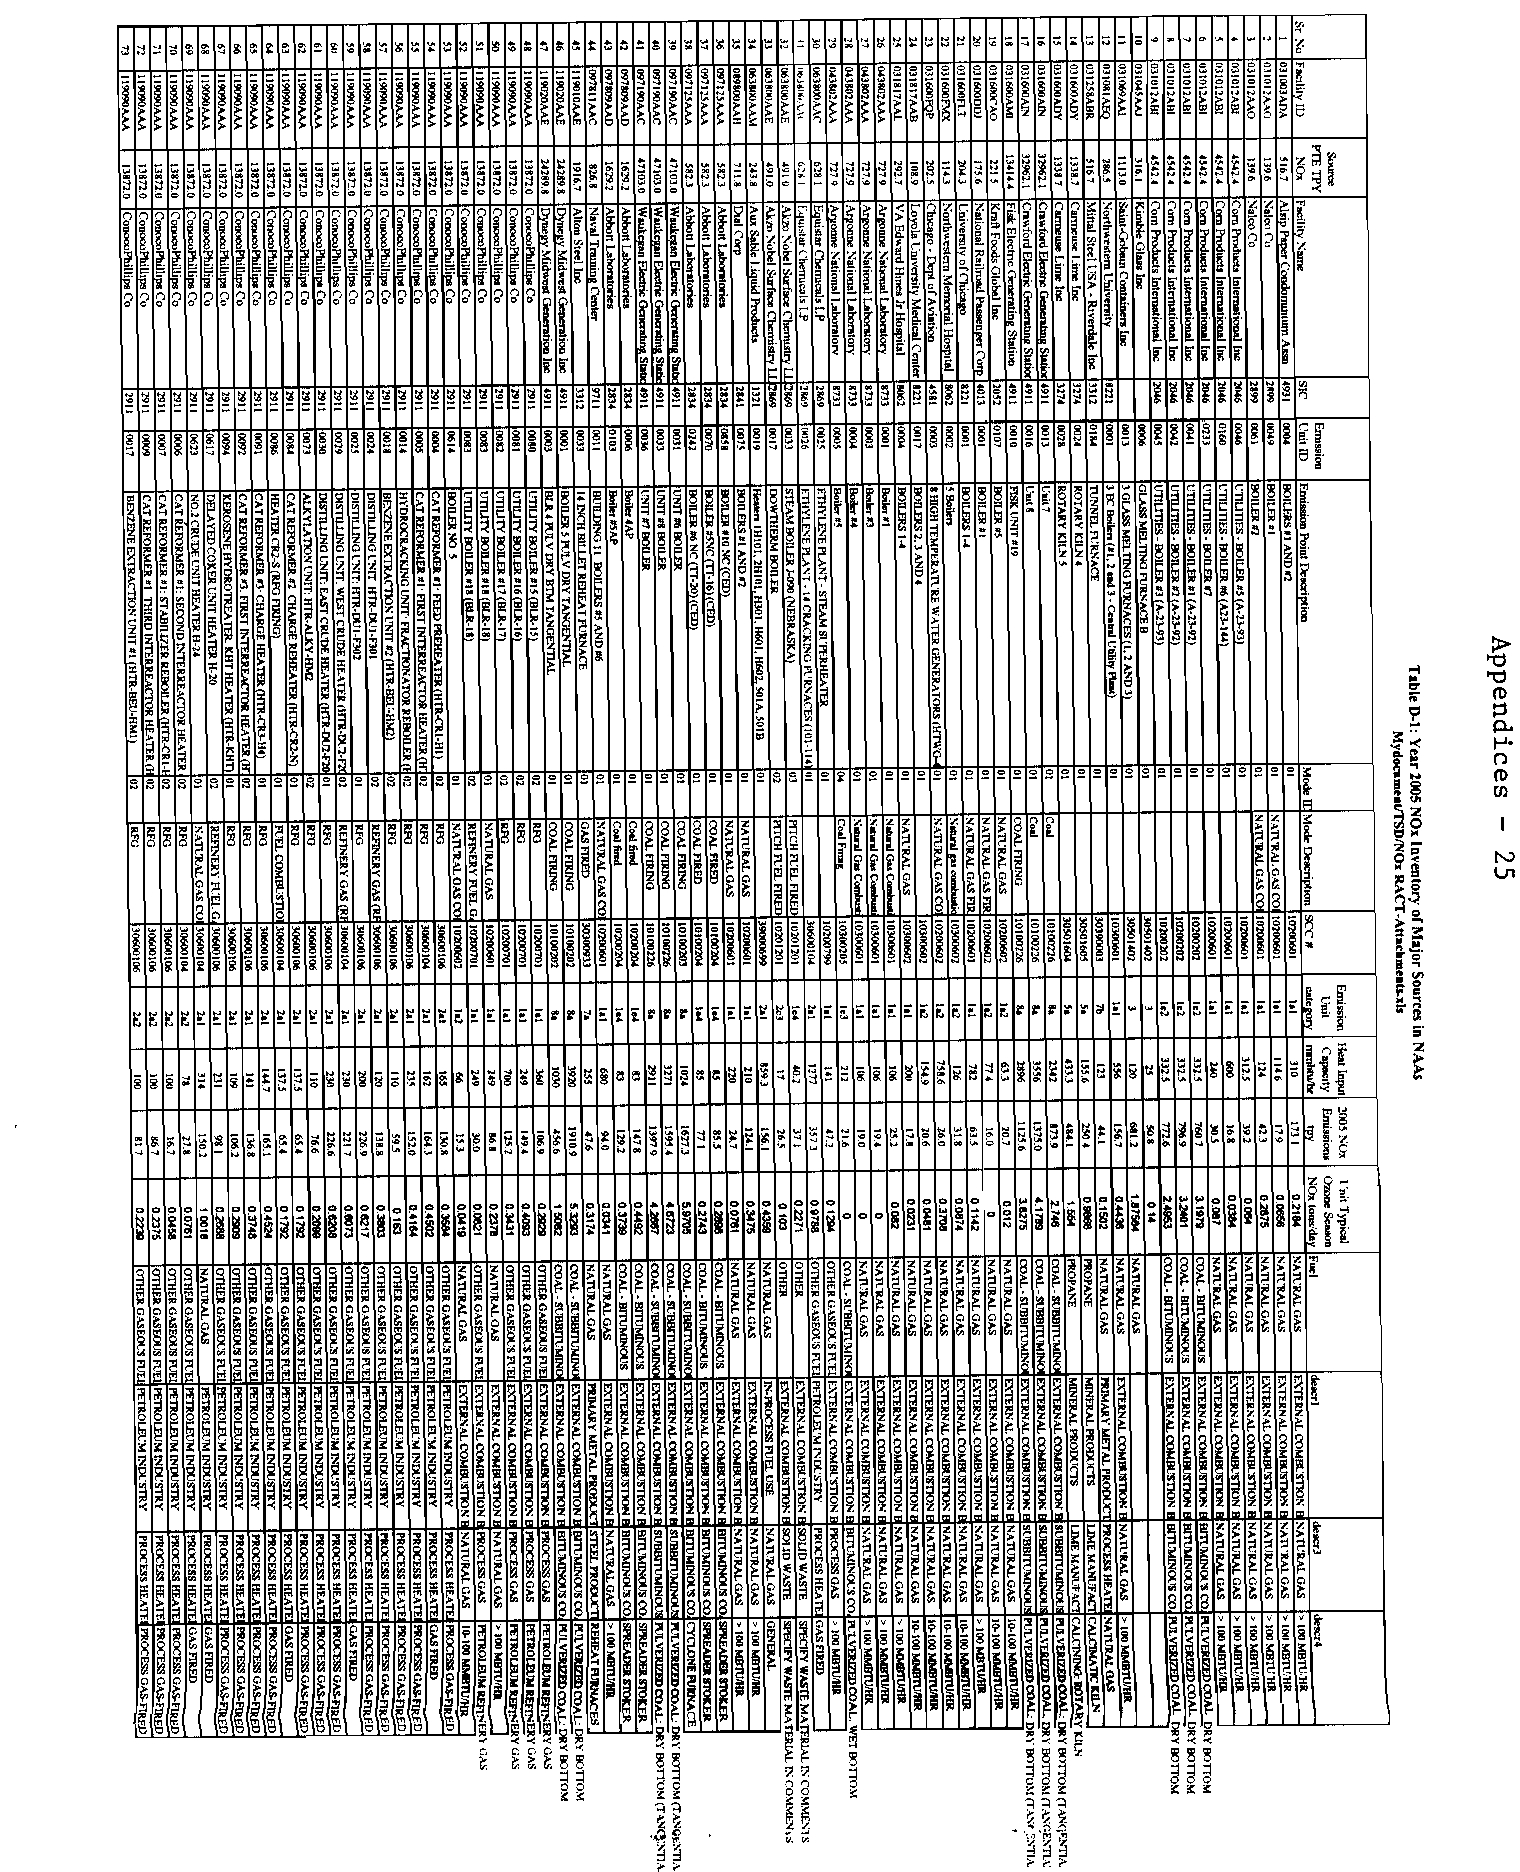
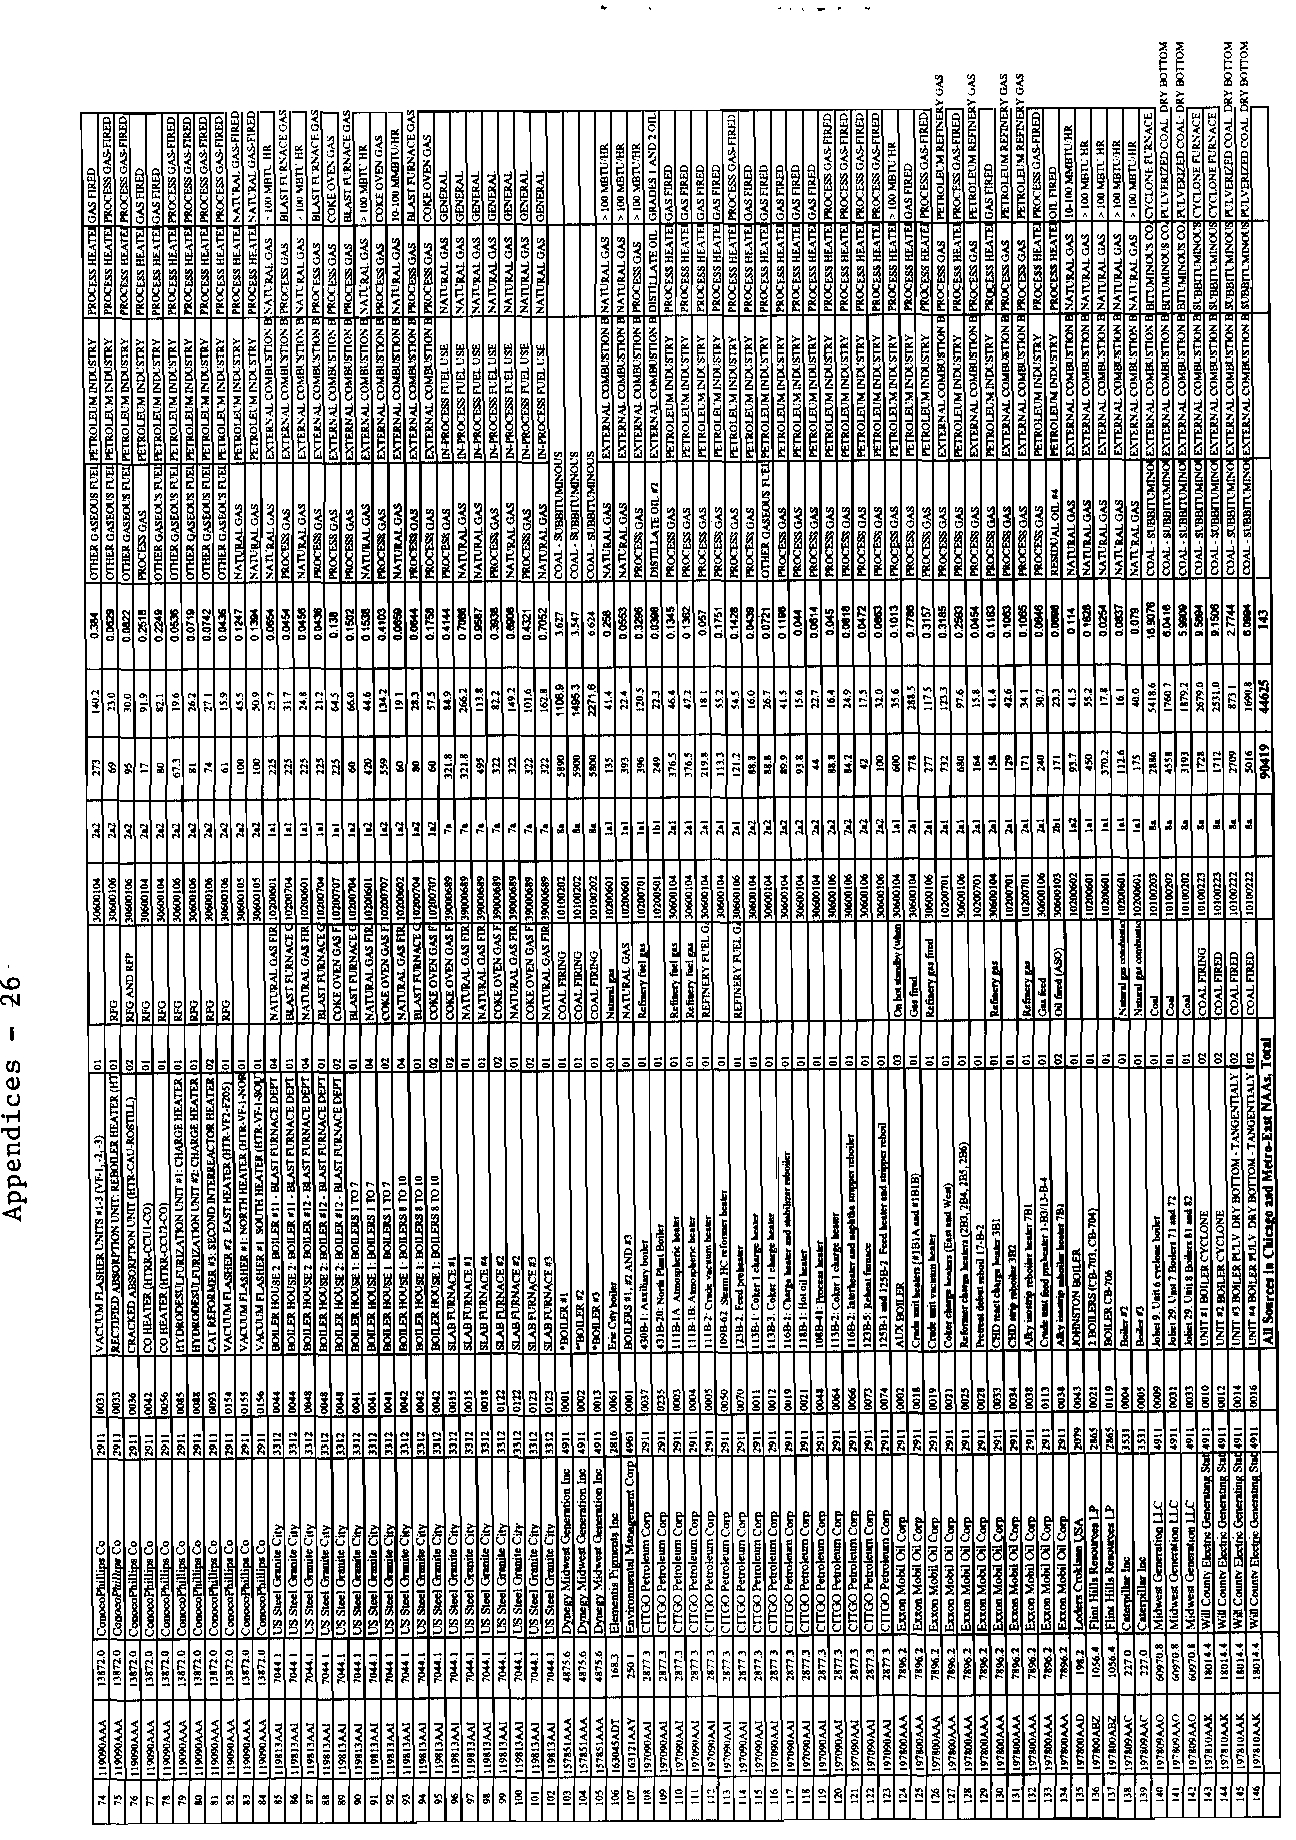
D-1
Year 2005 NOx Inventory of Major Sources in NAAs
A-25
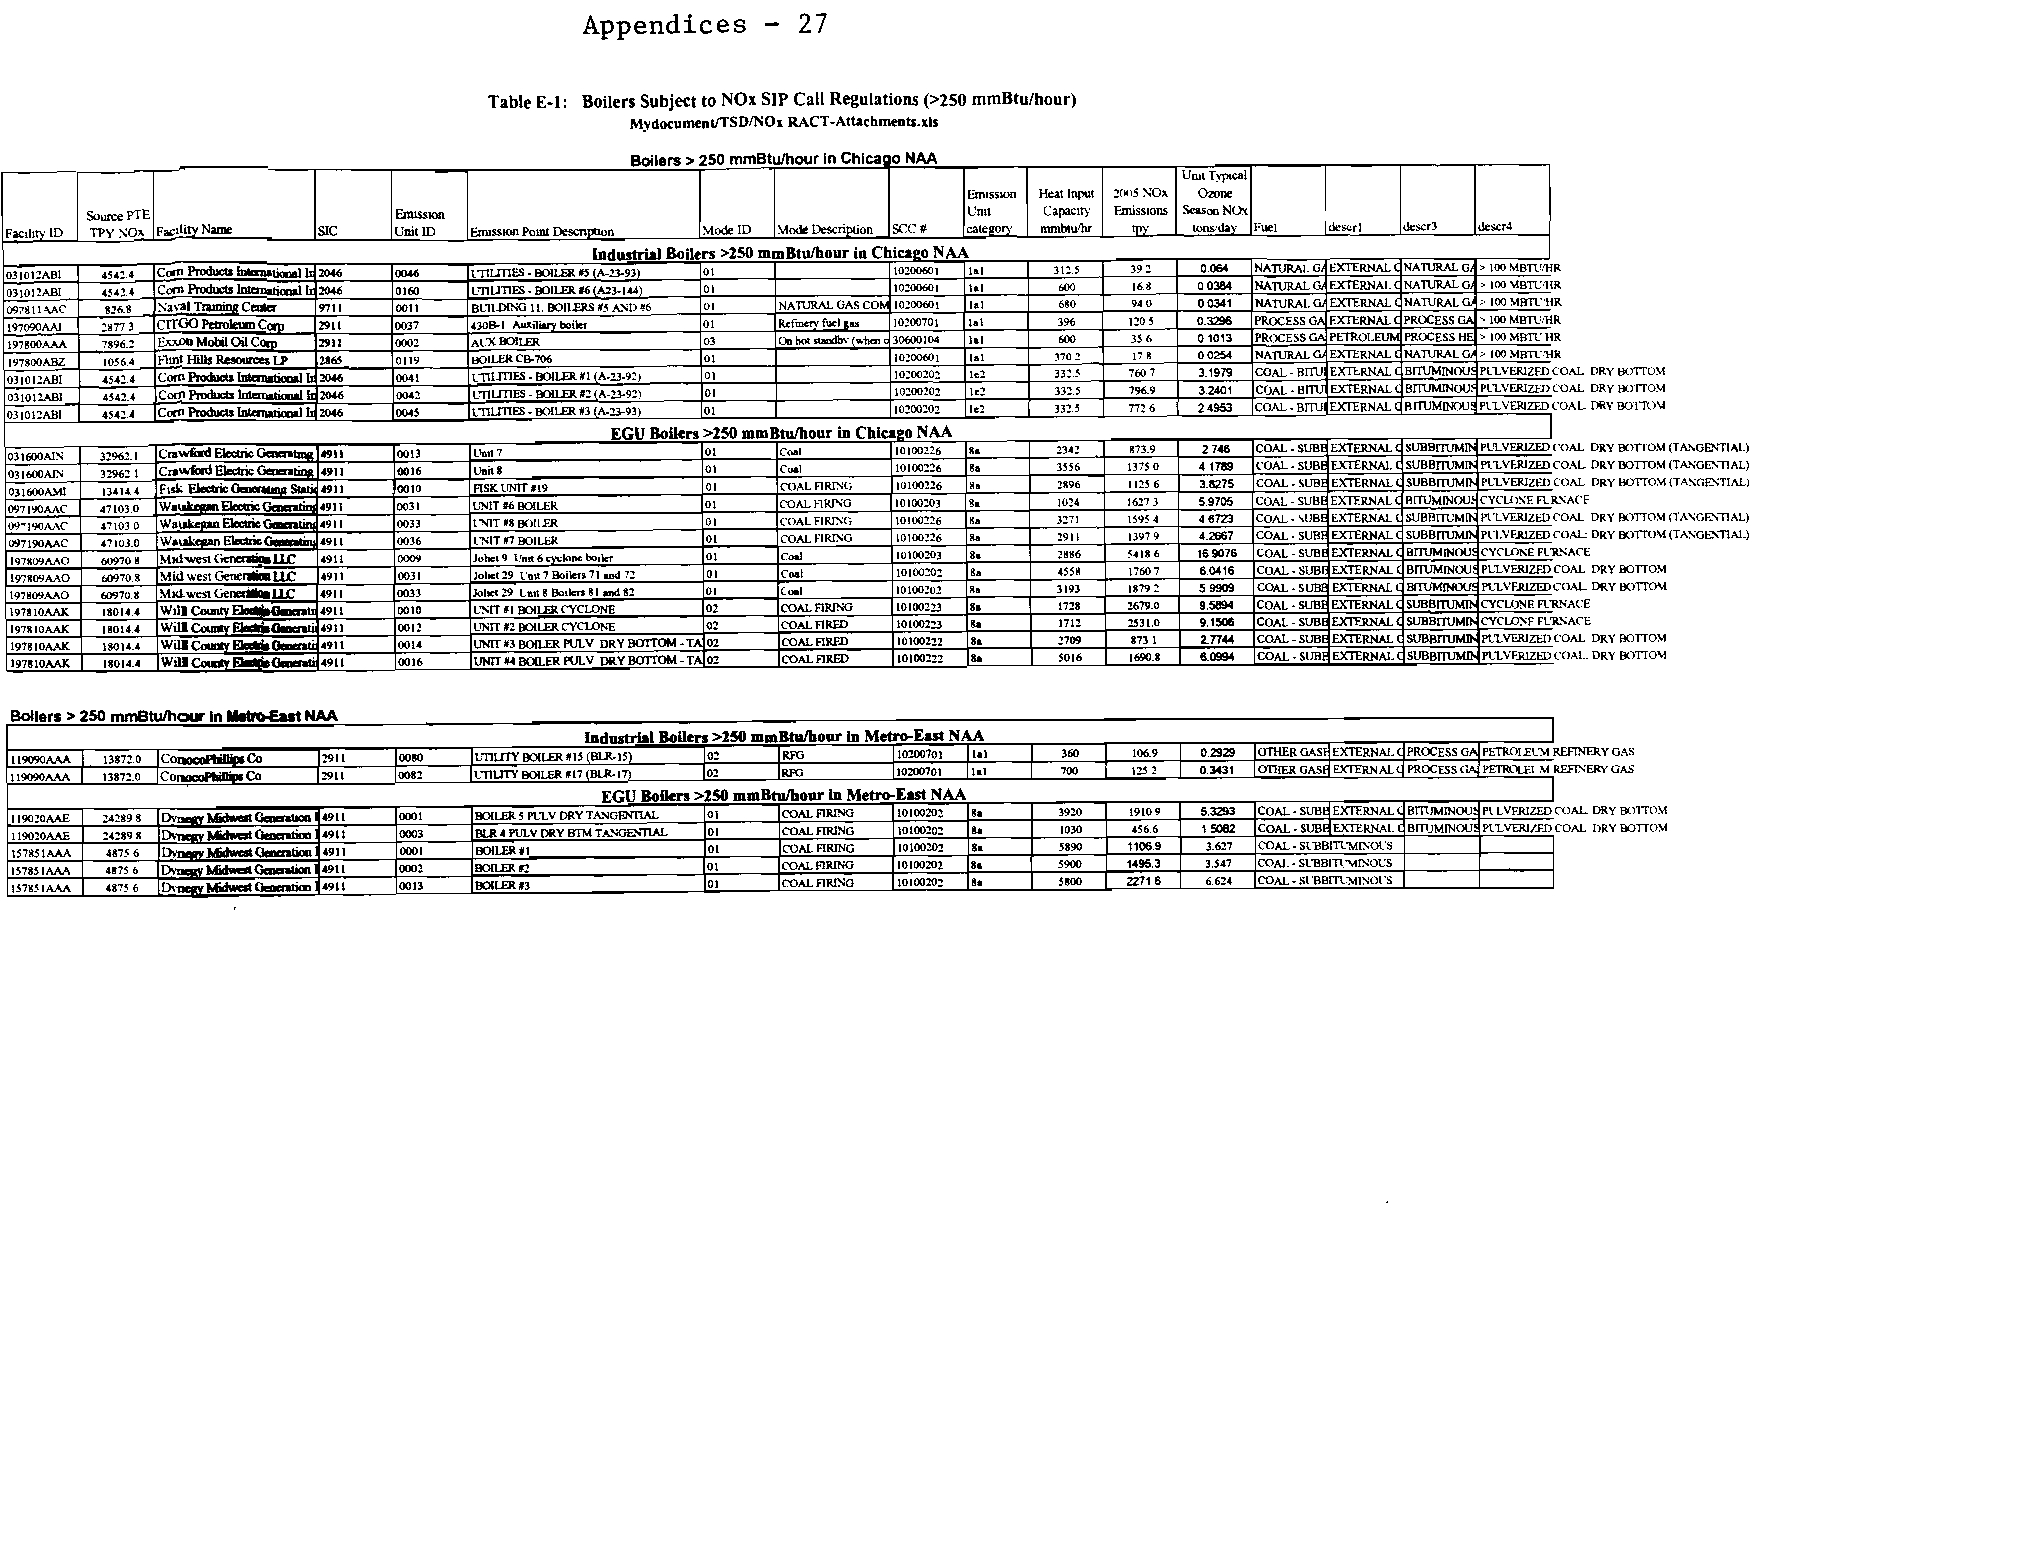
E-1
Boilers Subject to NOx SIP Call Regulations (>250 mmBtu/hour)
A-27
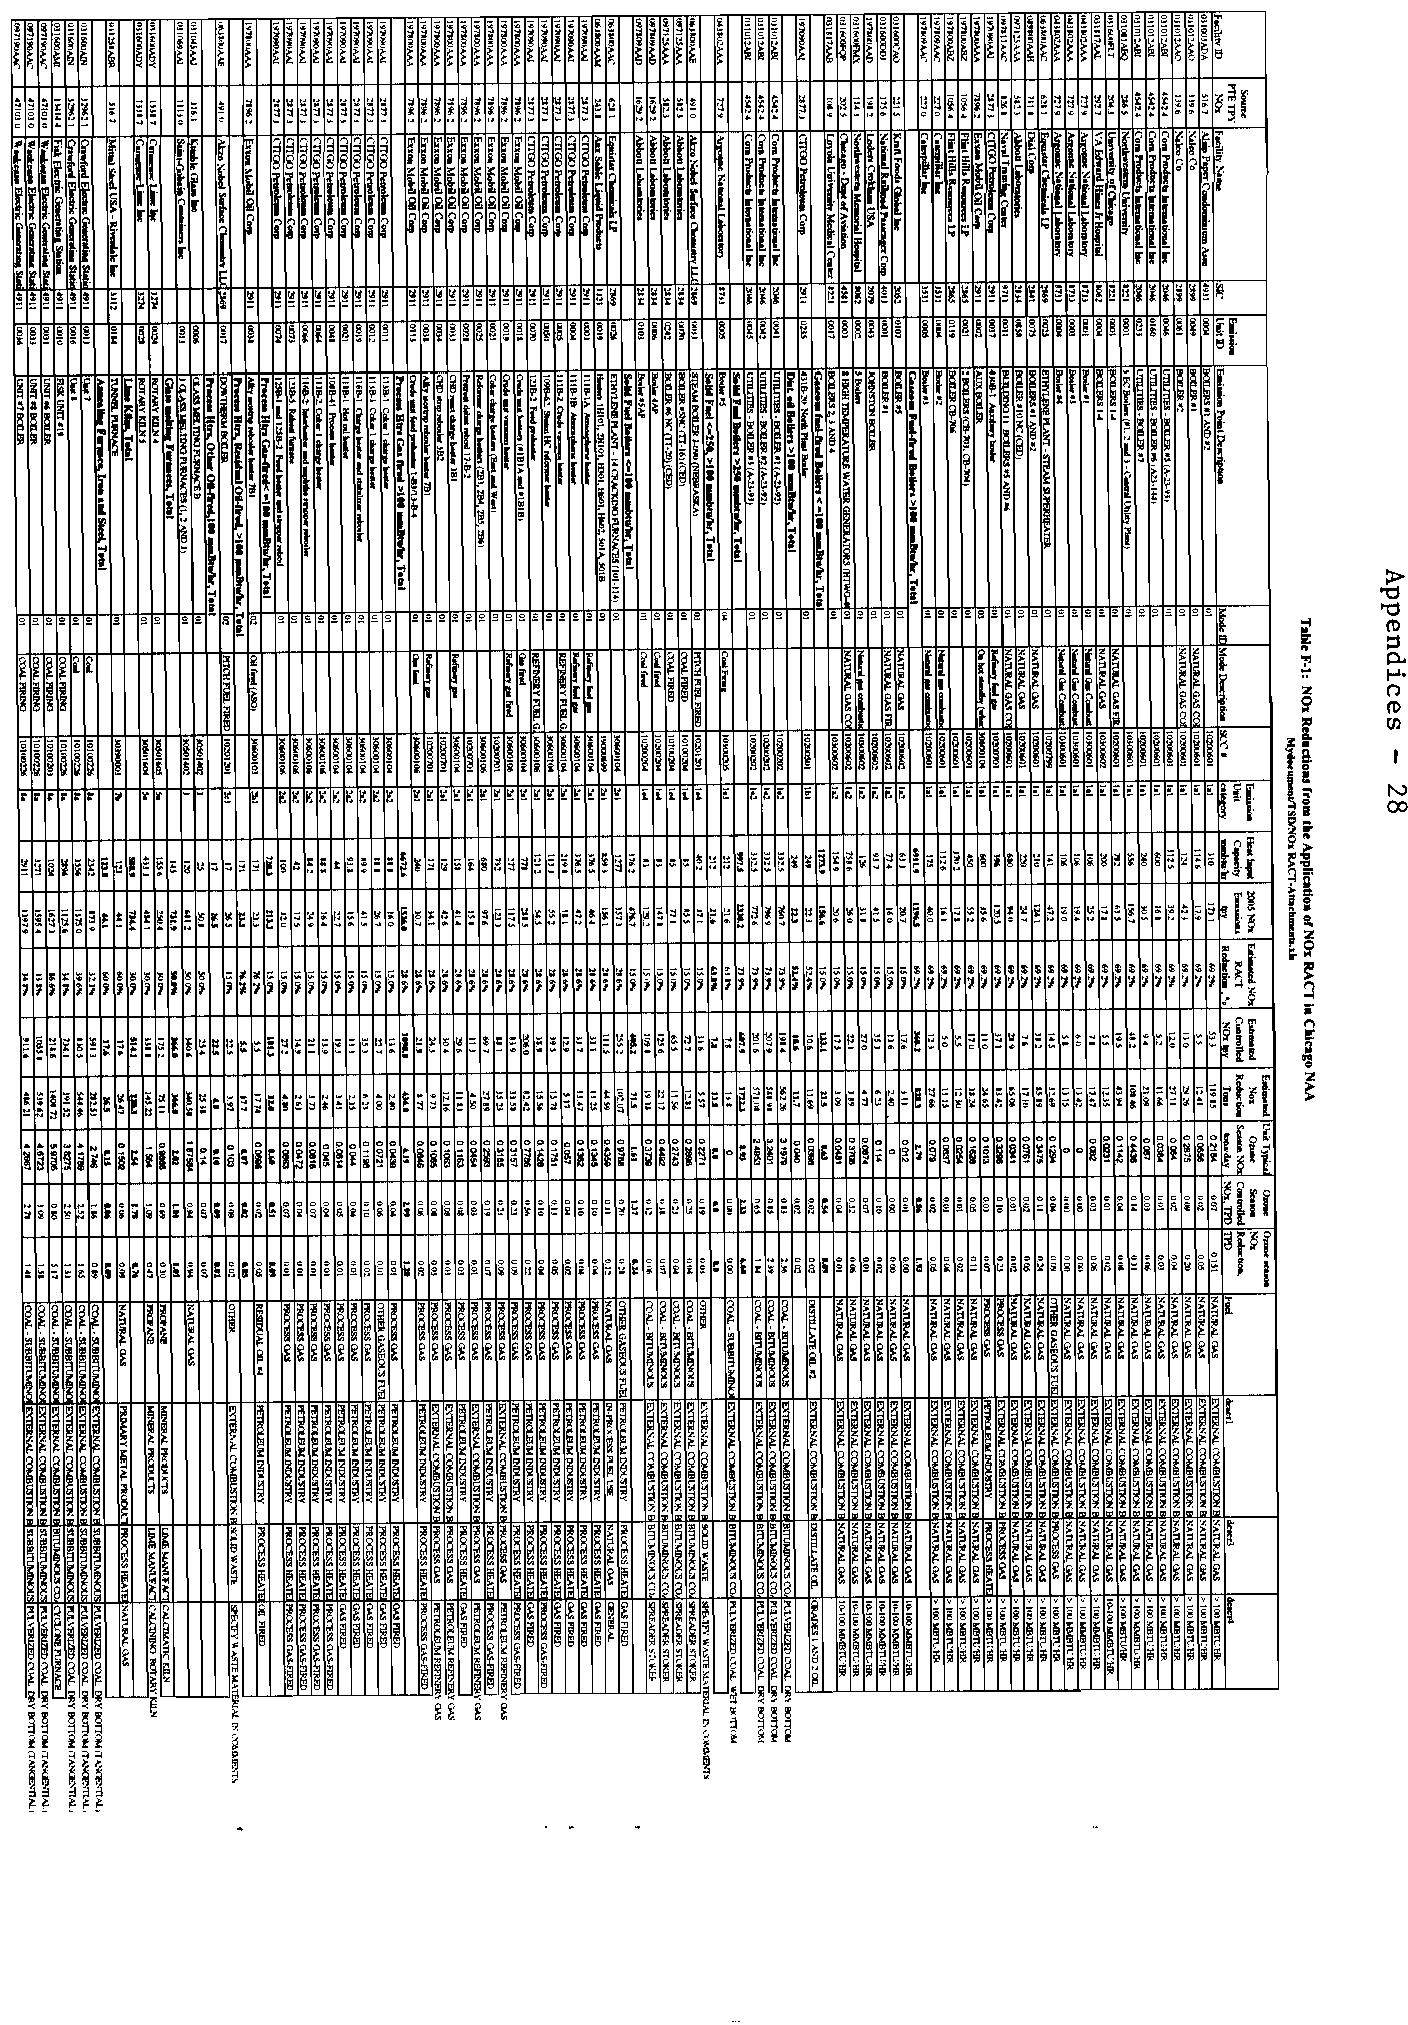
F-1
NOx Reductions from the Application of NOx RACT in Chicago
A-28
NAA
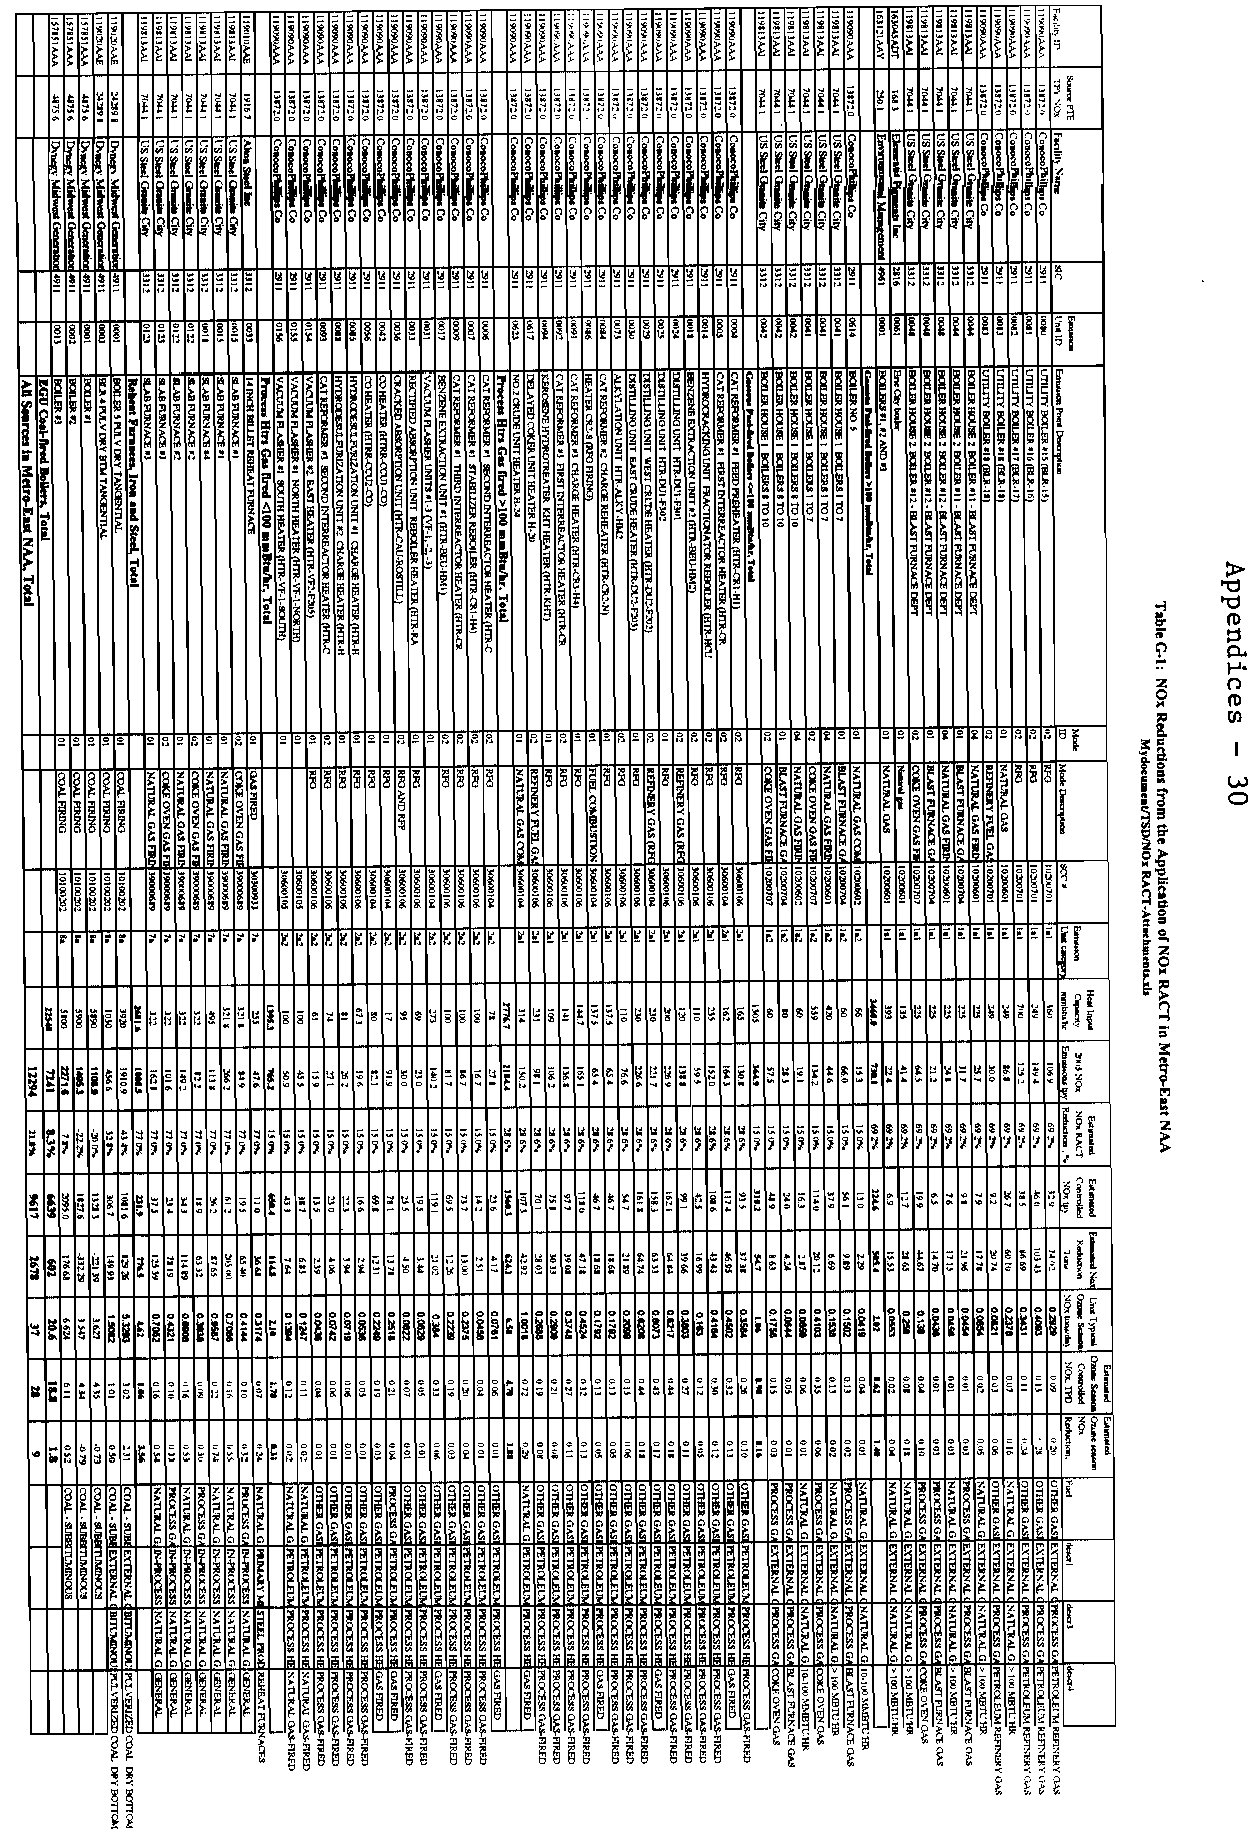
G-1
NOx Reductions from the Application of NOx RACT in Metro-
A-29
East NAA
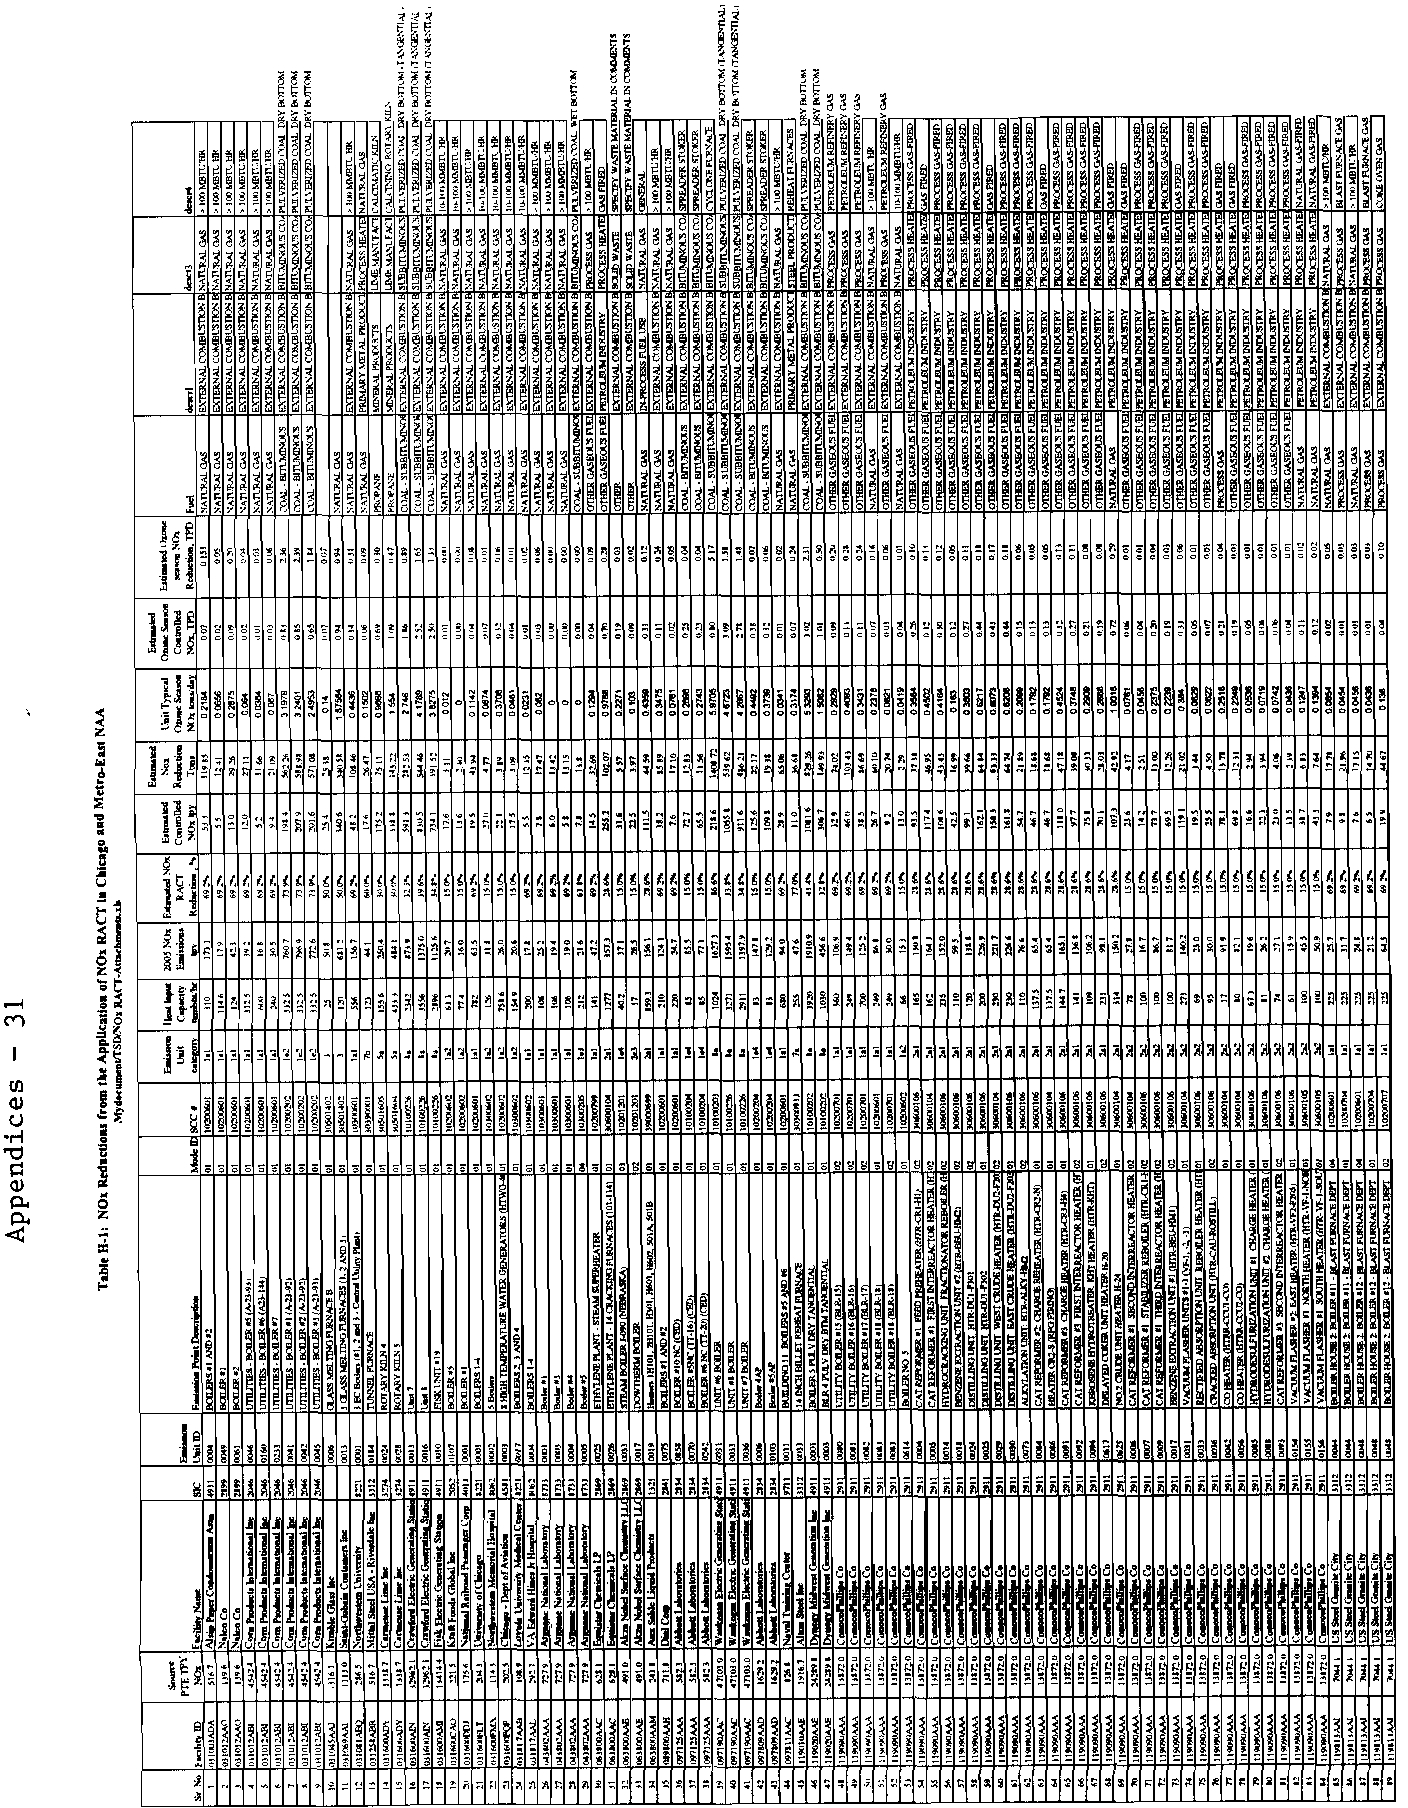
H-1
NOx Reductions from the Application of NOx RACT in Chicago
and Metro-East NAA
A-30
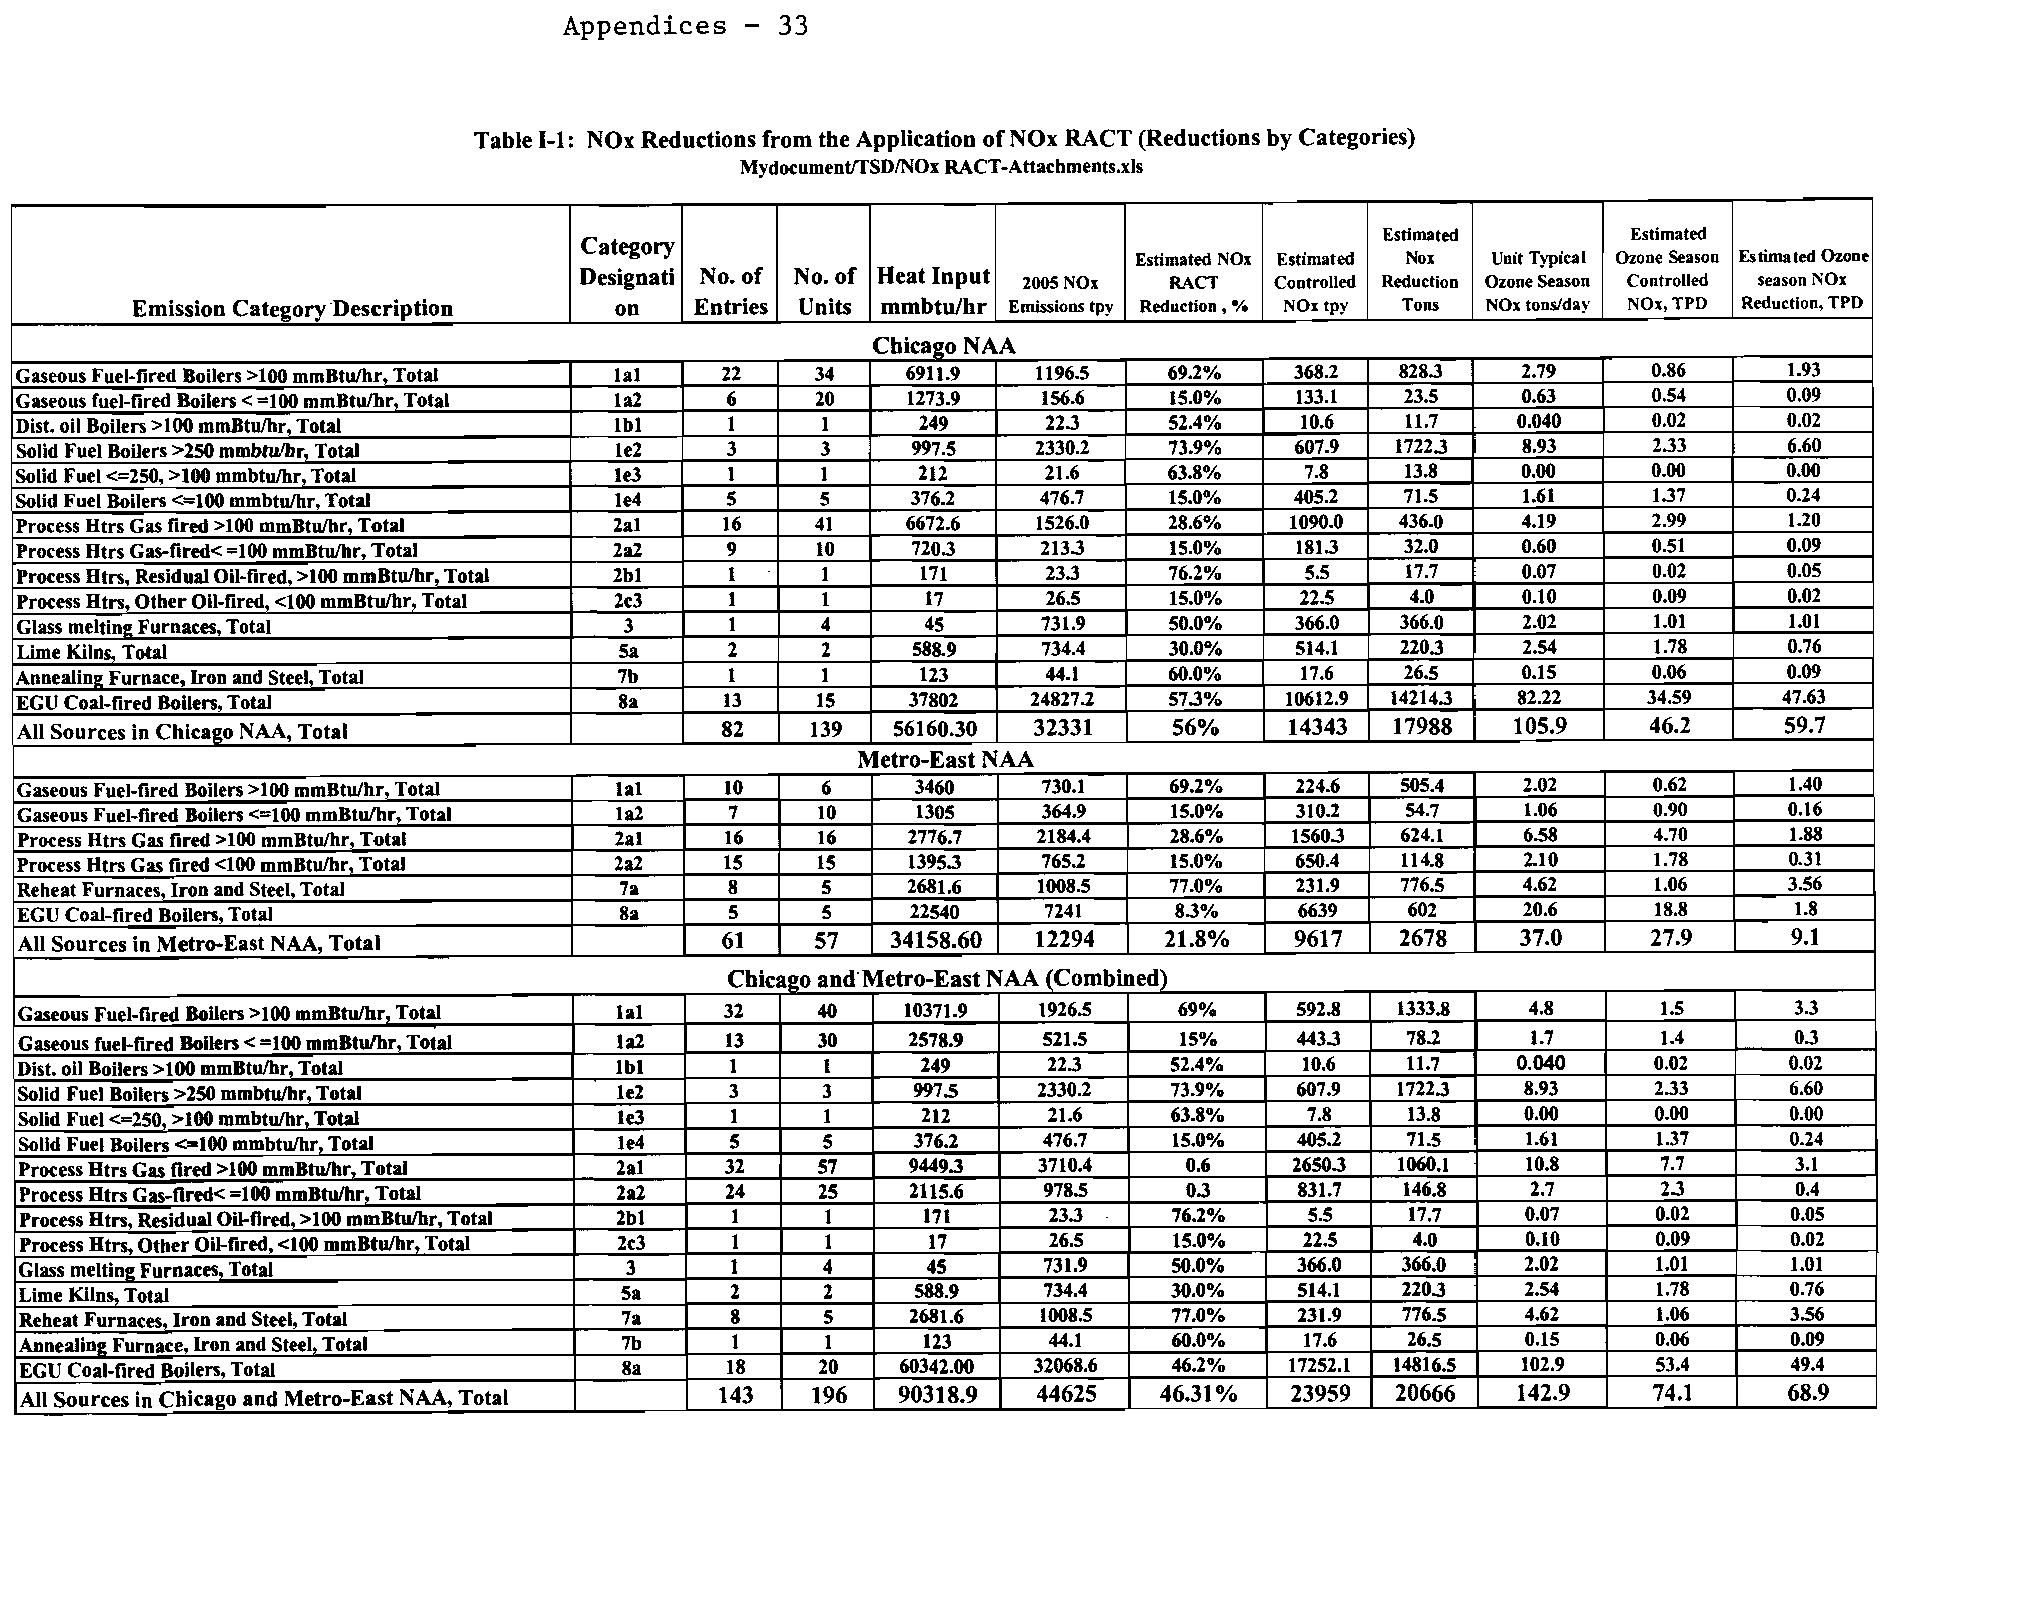
I-1
NOx Reductions from the Application of NOx RACT
A-32
(Reductions by Categories)
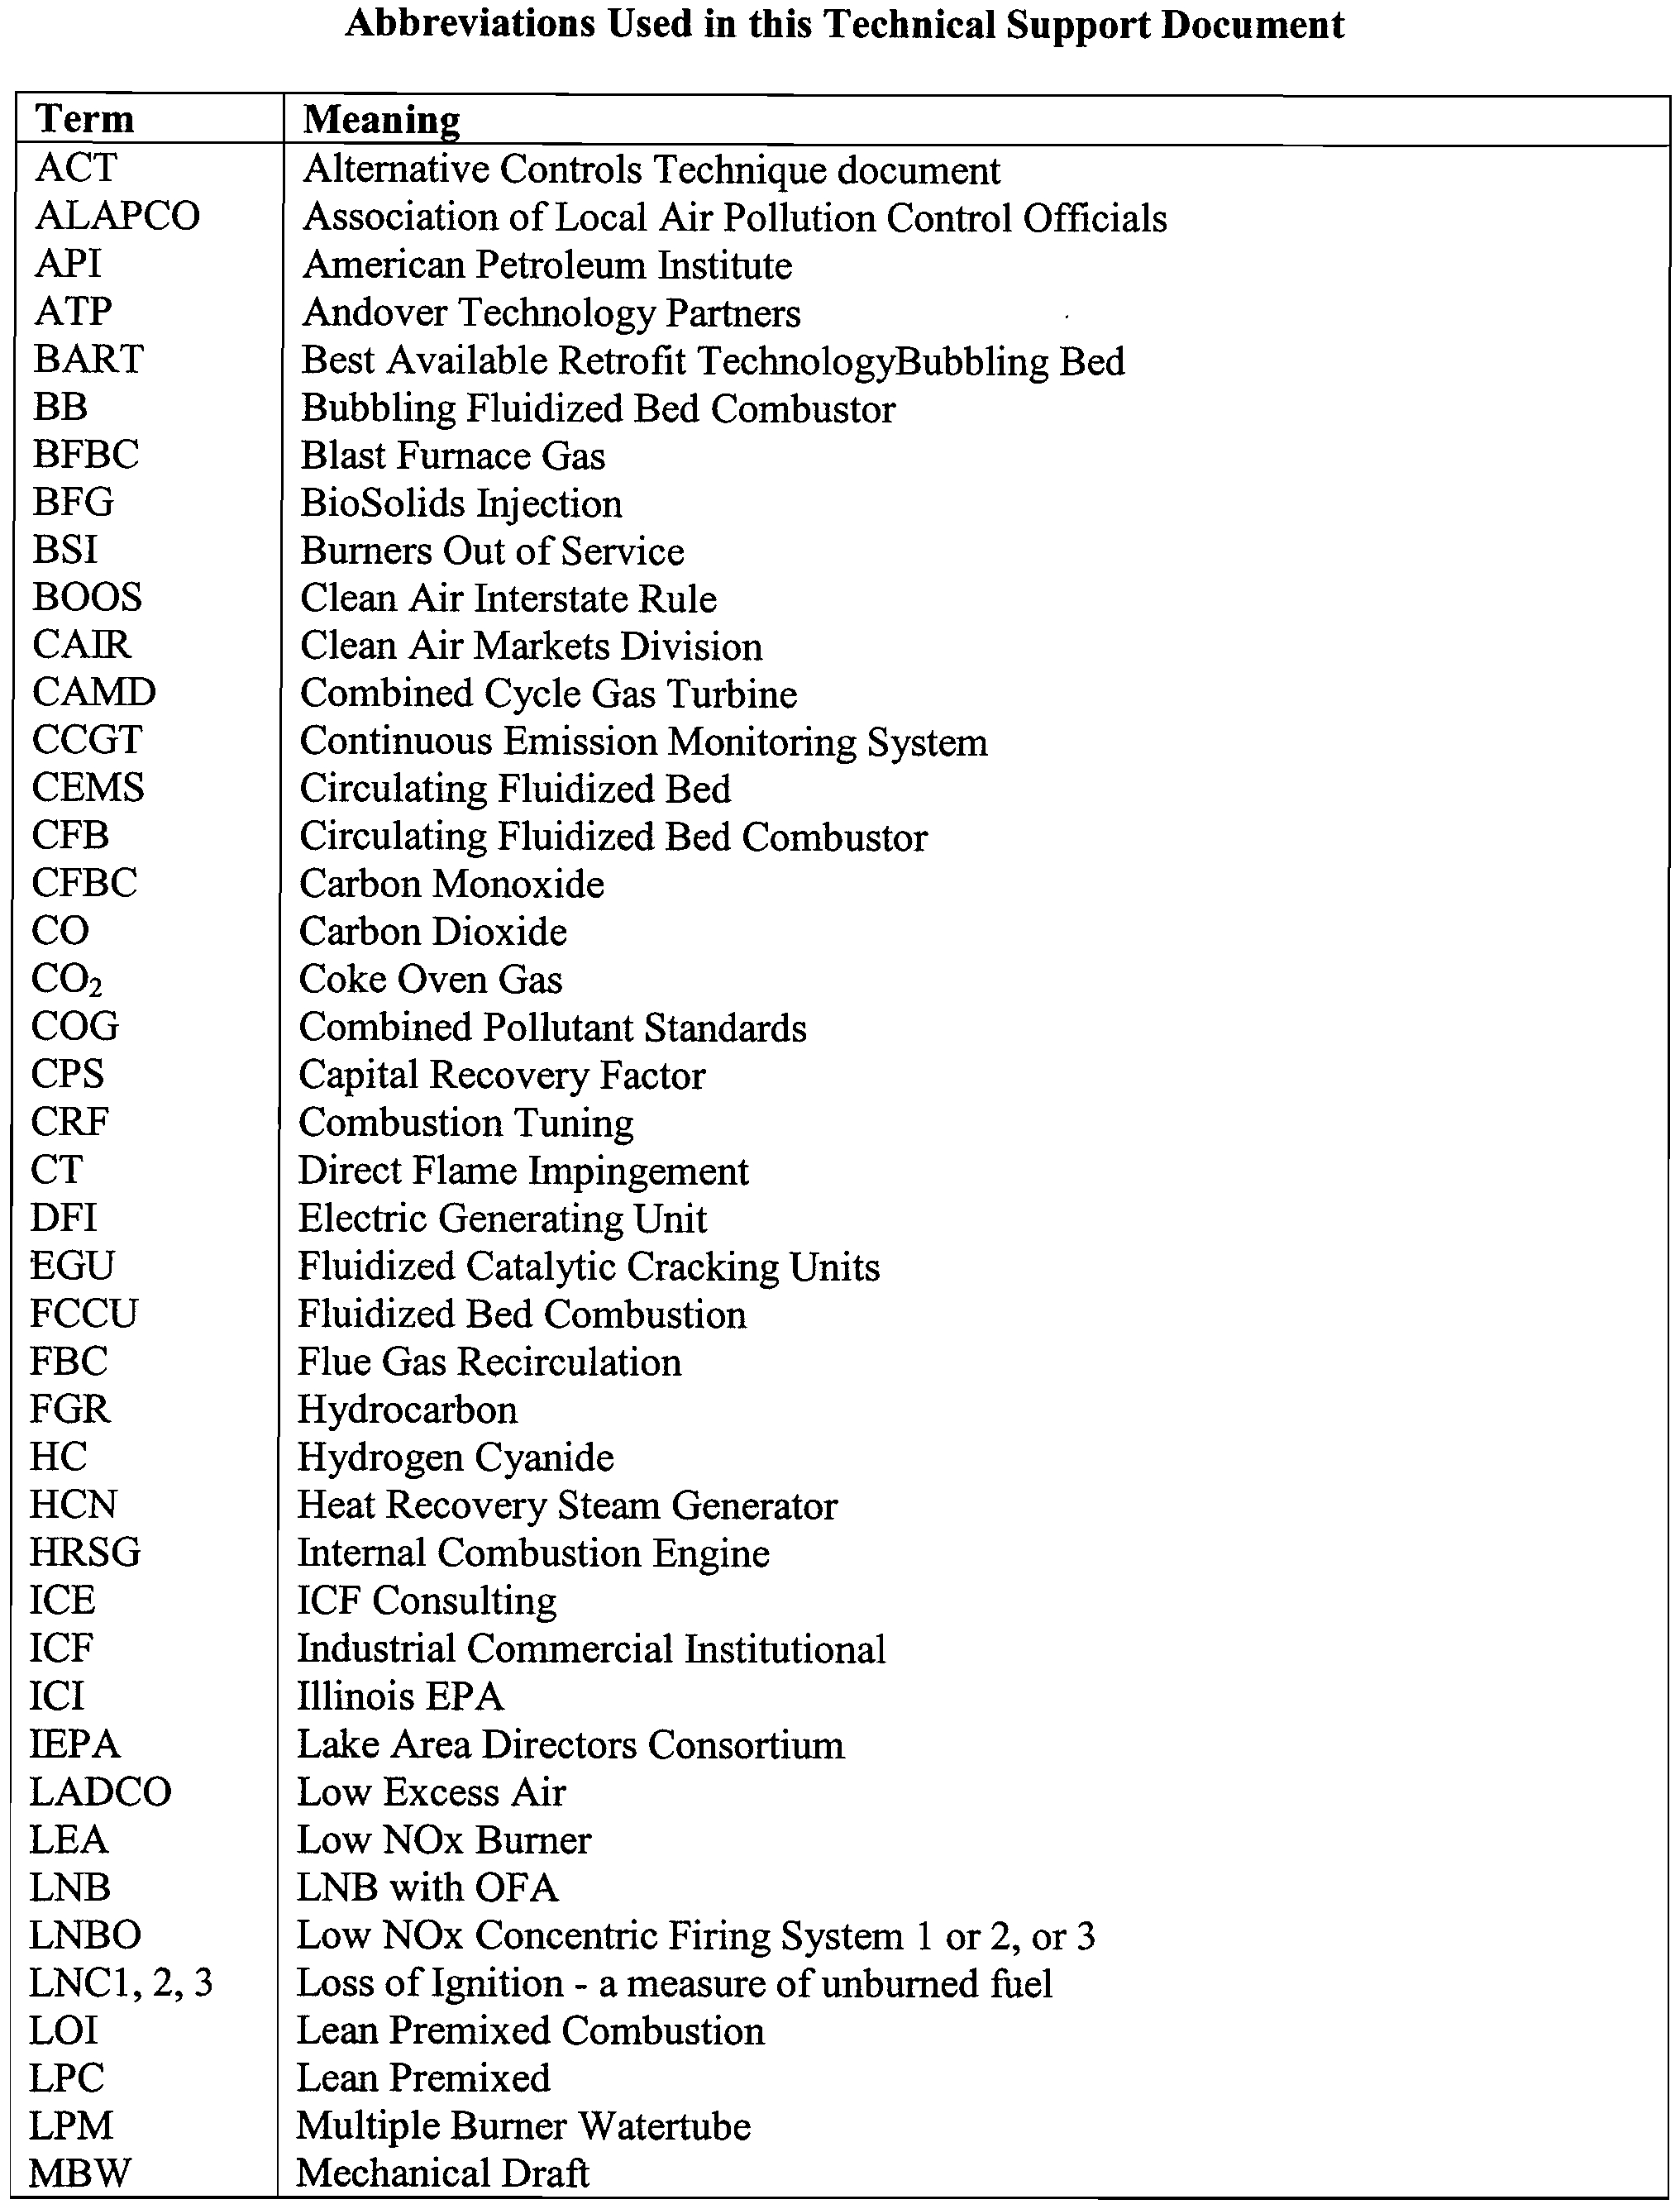
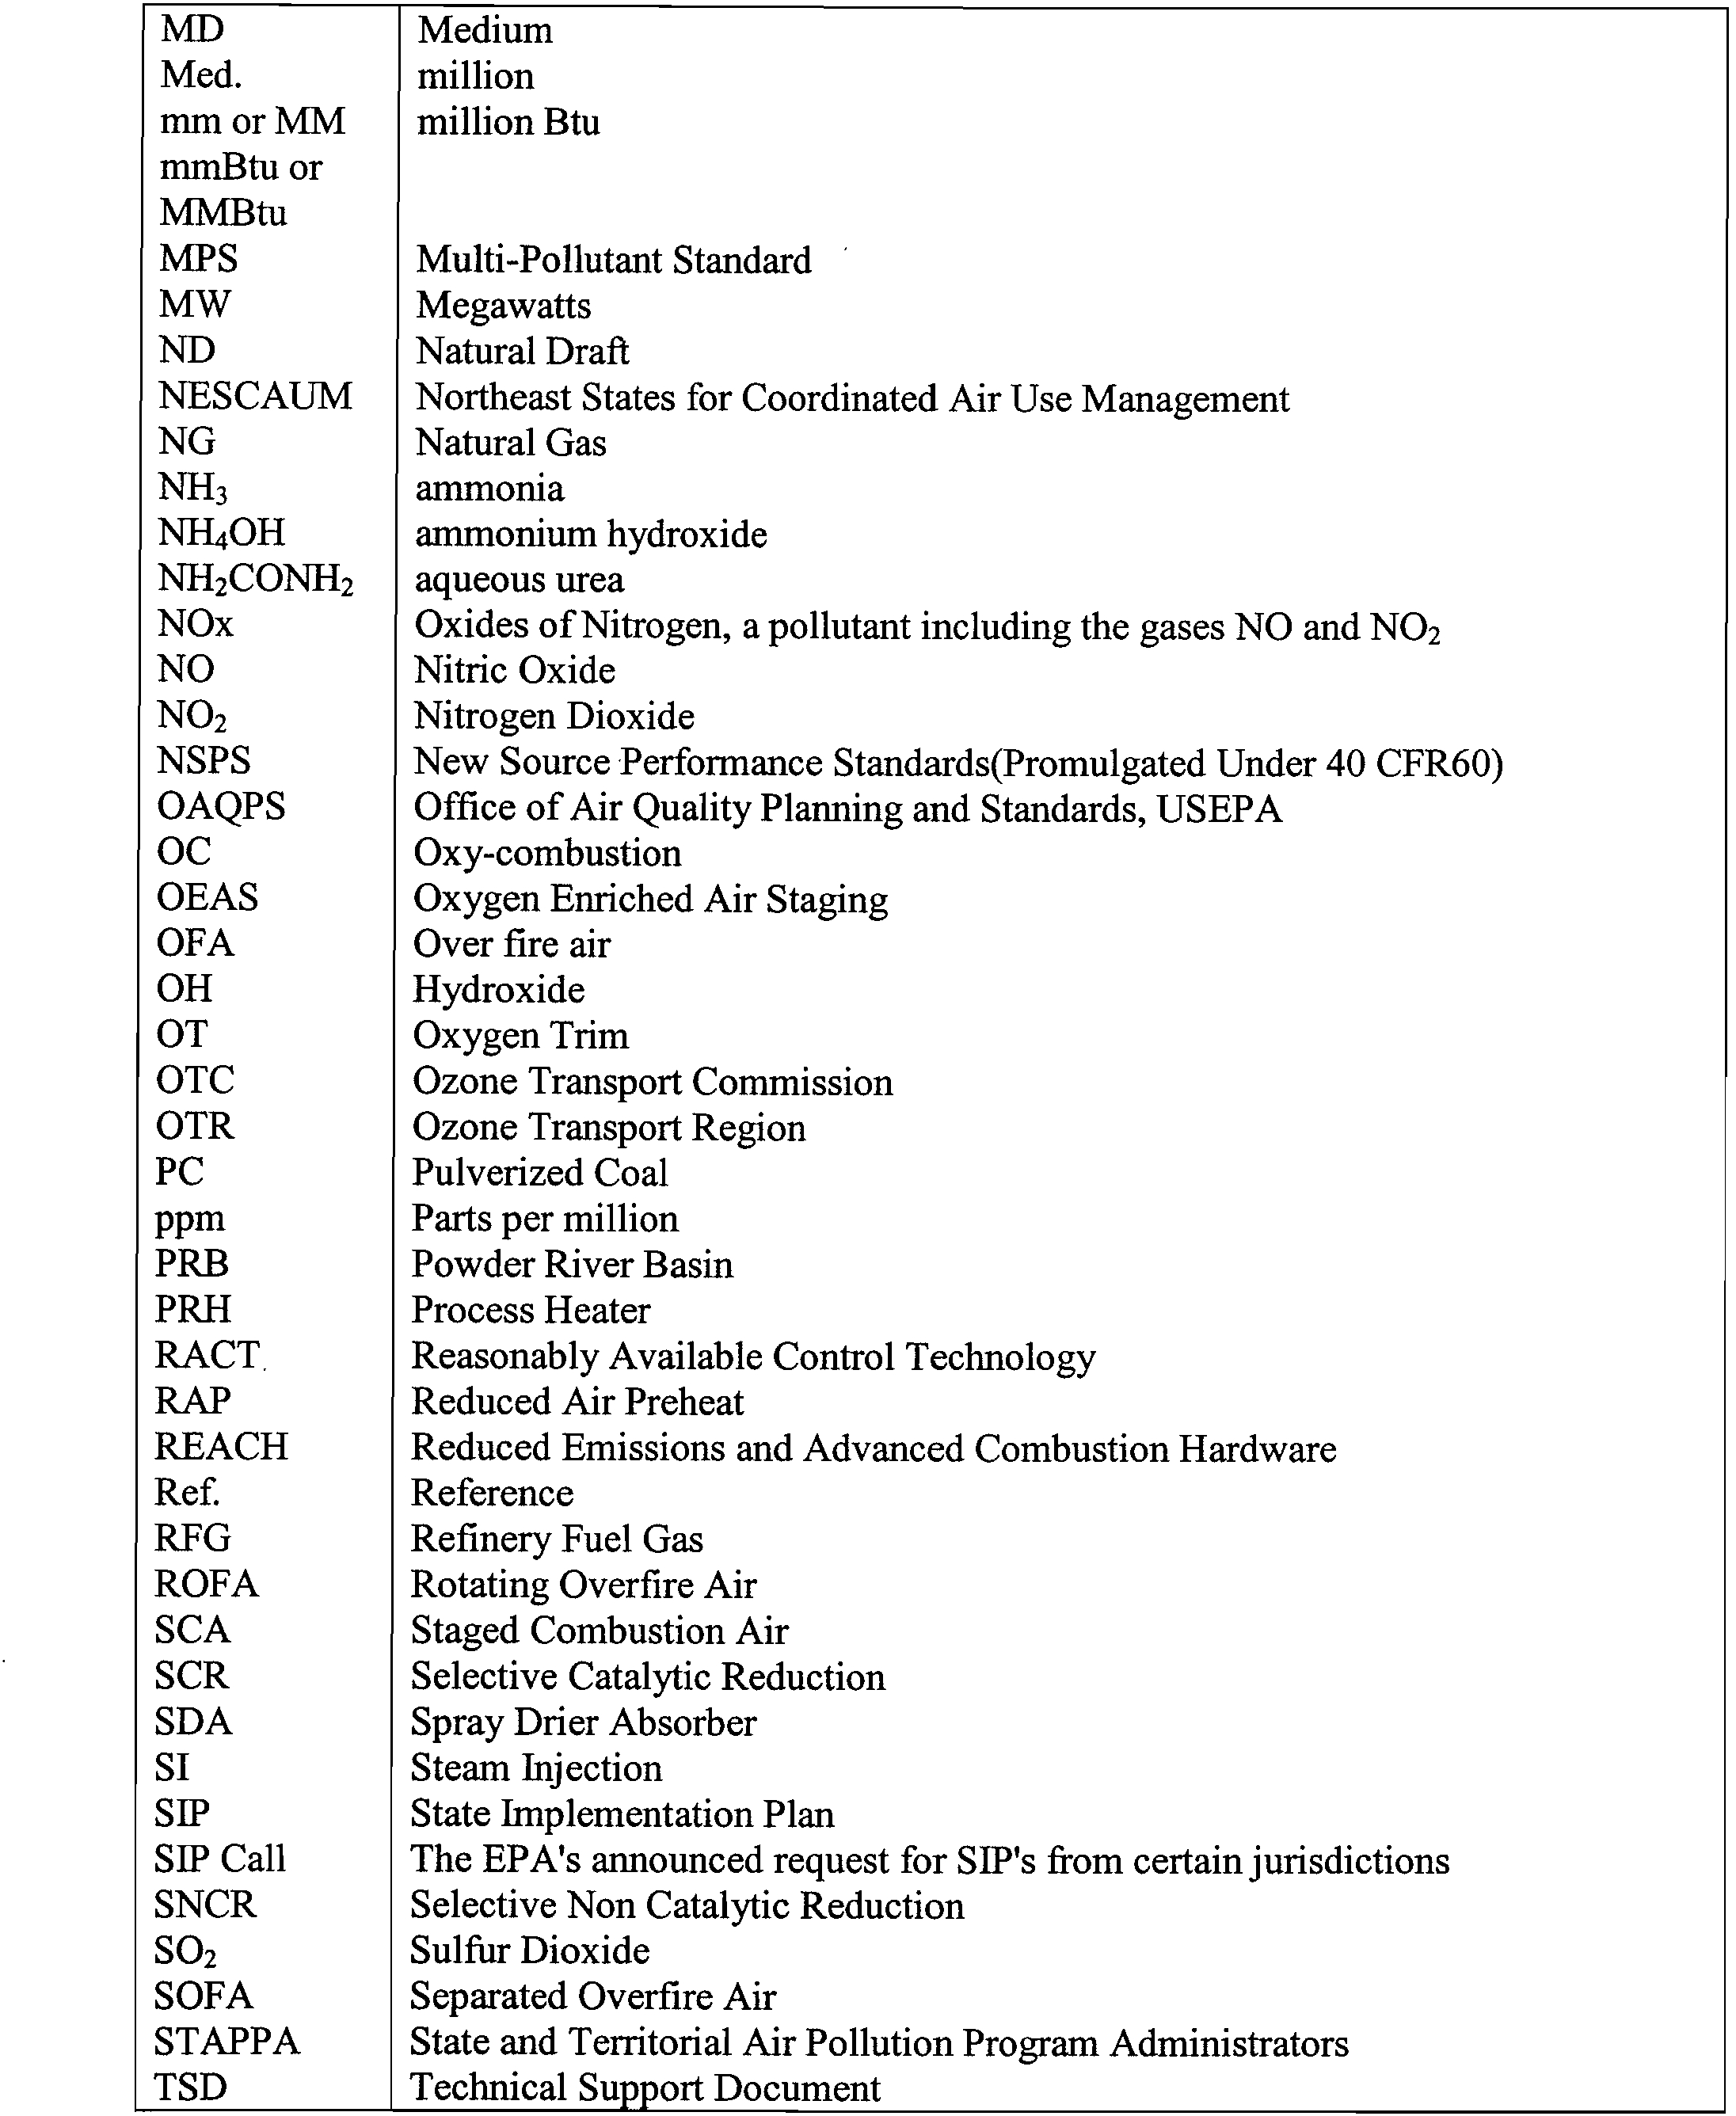
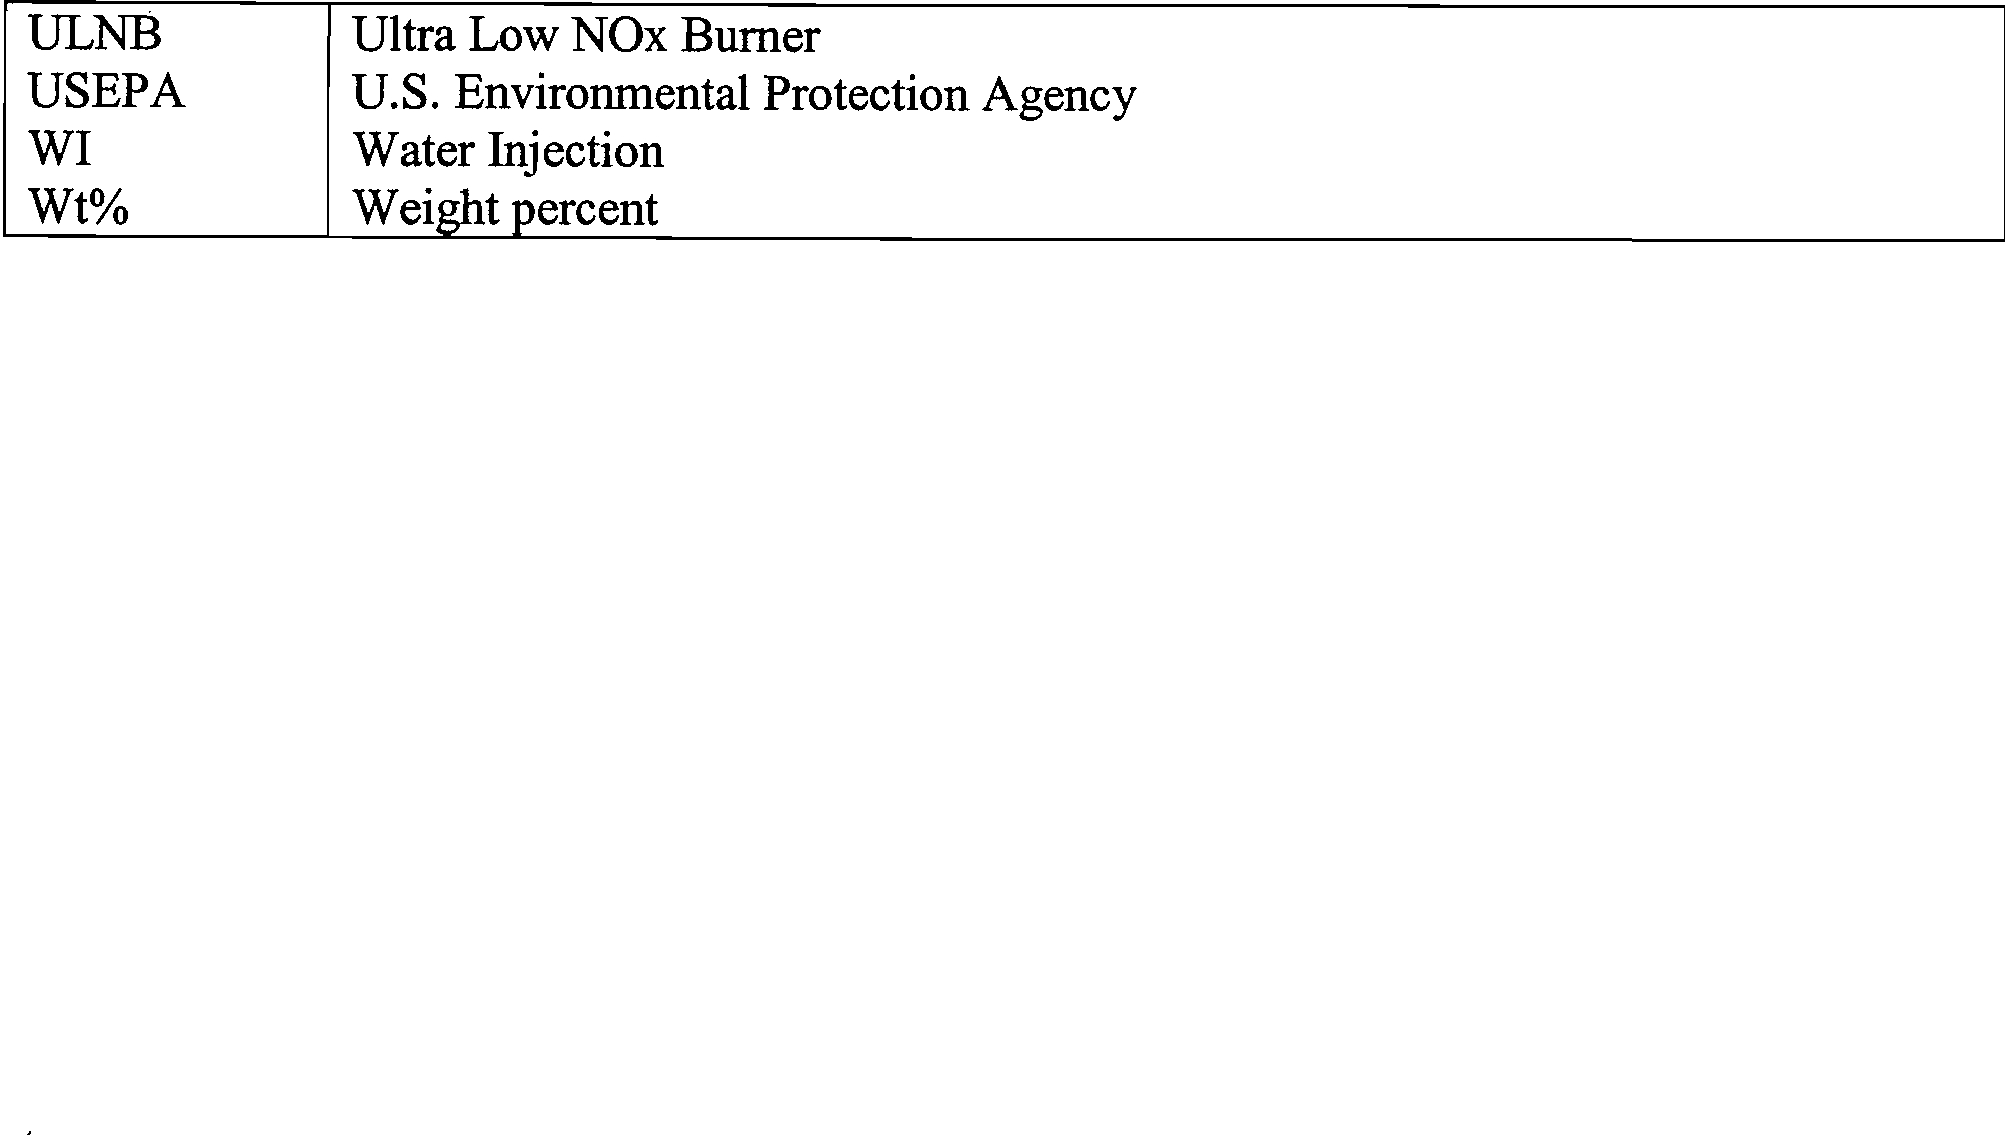
Abbreviations Used in this Technical Support Document
Term
Meaning
ACT
Alternative Controls Technique document
ALAPCO
Association of Local Air Pollution Control Officials
API
American Petroleum Institute
ATP
Andover Technology Partners
BART
Best Available Retrofit TechnologyBubbling Bed
BB
Bubbling Fluidized Bed Combustor
BFBC
Blast Furnace Gas
BFG
BioSolids Injection
BSI
Burners Out of Service
BOOS
Clean Air Interstate Rule
CAIR
Clean Air Markets Division
CAMD
Combined Cycle Gas Turbine
CCGT
Continuous Emission Monitoring System
CEMS
Circulating Fluidized Bed
CFB
Circulating Fluidized Bed Combustor
CFBC
Carbon Monoxide
CO
Carbon Dioxide
CO2
Coke Oven Gas
COG
Combined Pollutant Standards
CPS
Capital Recovery Factor
CRF
Combustion Tuning
CT
Direct Flame Impingement
DFI
Electric Generating Unit
EGU
Fluidized Catalytic Cracking Units
FCCU
Fluidized Bed Combustion
FBC
Flue Gas Recirculation
FGR
Hydrocarbon
HC
Hydrogen Cyanide
HCN
Heat Recovery Steam Generator
HRSG
Internal Combustion Engine
ICE
ICF Consulting
ICF
Industrial Commercial Institutional
ICI
Illinois EPA
IEPA
Lake Area Directors Consortium
LADCO
Low Excess Air
LEA
Low NOx Burner
LNB
LNB with OFA
LNBO
Low NOx Concentric Firing System 1 or 2, or 3
LNC1, 2, 3
Loss of Ignition - a measure of unburned fuel
LOI
Lean Premixed Combustion
LPC
Lean Premixed
LPM
Multiple Burner Watertube
MBW
Mechanical Draft
MD
Med.
mm or MM
mmBtu or
MMBtu
MPS
MW
ND
NESCAUM
NG
NH3
NH4OH
NH2CONH2
NOx
NO
NO2
NSPS
OAQPS
OC
OEAS
OFA
OH
OT
OTC
OTR
PC
ppm
PRB
PRH
RACT
RAP
REACH
Ref.
RFG
ROFA
SCA
SCR
SDA
SI
SIP
SIP Call
SNCR
SO2
SOFA
STAPPA
TSD
Medium
million
million Btu
Multi-Pollutant Standard
Megawatts
Natural Draft
Northeast States for Coordinated Air Use Management
Natural Gas
ammonia
ammonium hydroxide
aqueous urea
Oxides of Nitrogen, a pollutant including the gases NO and NO2
Nitric Oxide
Nitrogen Dioxide
New Source Performance Standards(Promulgated Under 40 CFR60)
Office of Air Quality Planning and Standards, USEPA
Oxy-combustion
Oxygen Enriched Air Staging
Over fire air
Hydroxide
Oxygen Trim
Ozone Transport Commission
Ozone Transport Region
Pulverized Coal
Parts per million
Powder River Basin
Process Heater
Reasonably Available Control Technology
Reduced Air Preheat
Reduced Emissions and Advanced Combustion Hardware
Reference
Refinery Fuel Gas
Rotating Overfire Air
Staged Combustion Air
Selective Catalytic Reduction
Spray Drier Absorber
Steam Injection
State Implementation Plan
The EPA's announced request for SIP's from certain jurisdictions
Selective Non Catalytic Reduction
Sulfur Dioxide
Separated Overfire Air
State and Territorial Air Pollution Program Administrators
Technical Support Document
ULNB
USEPA
WI
Wt%
Ultra Low NOx Burner
U.S. Environmental Protection Agency
Water Injection
Weight percent
1
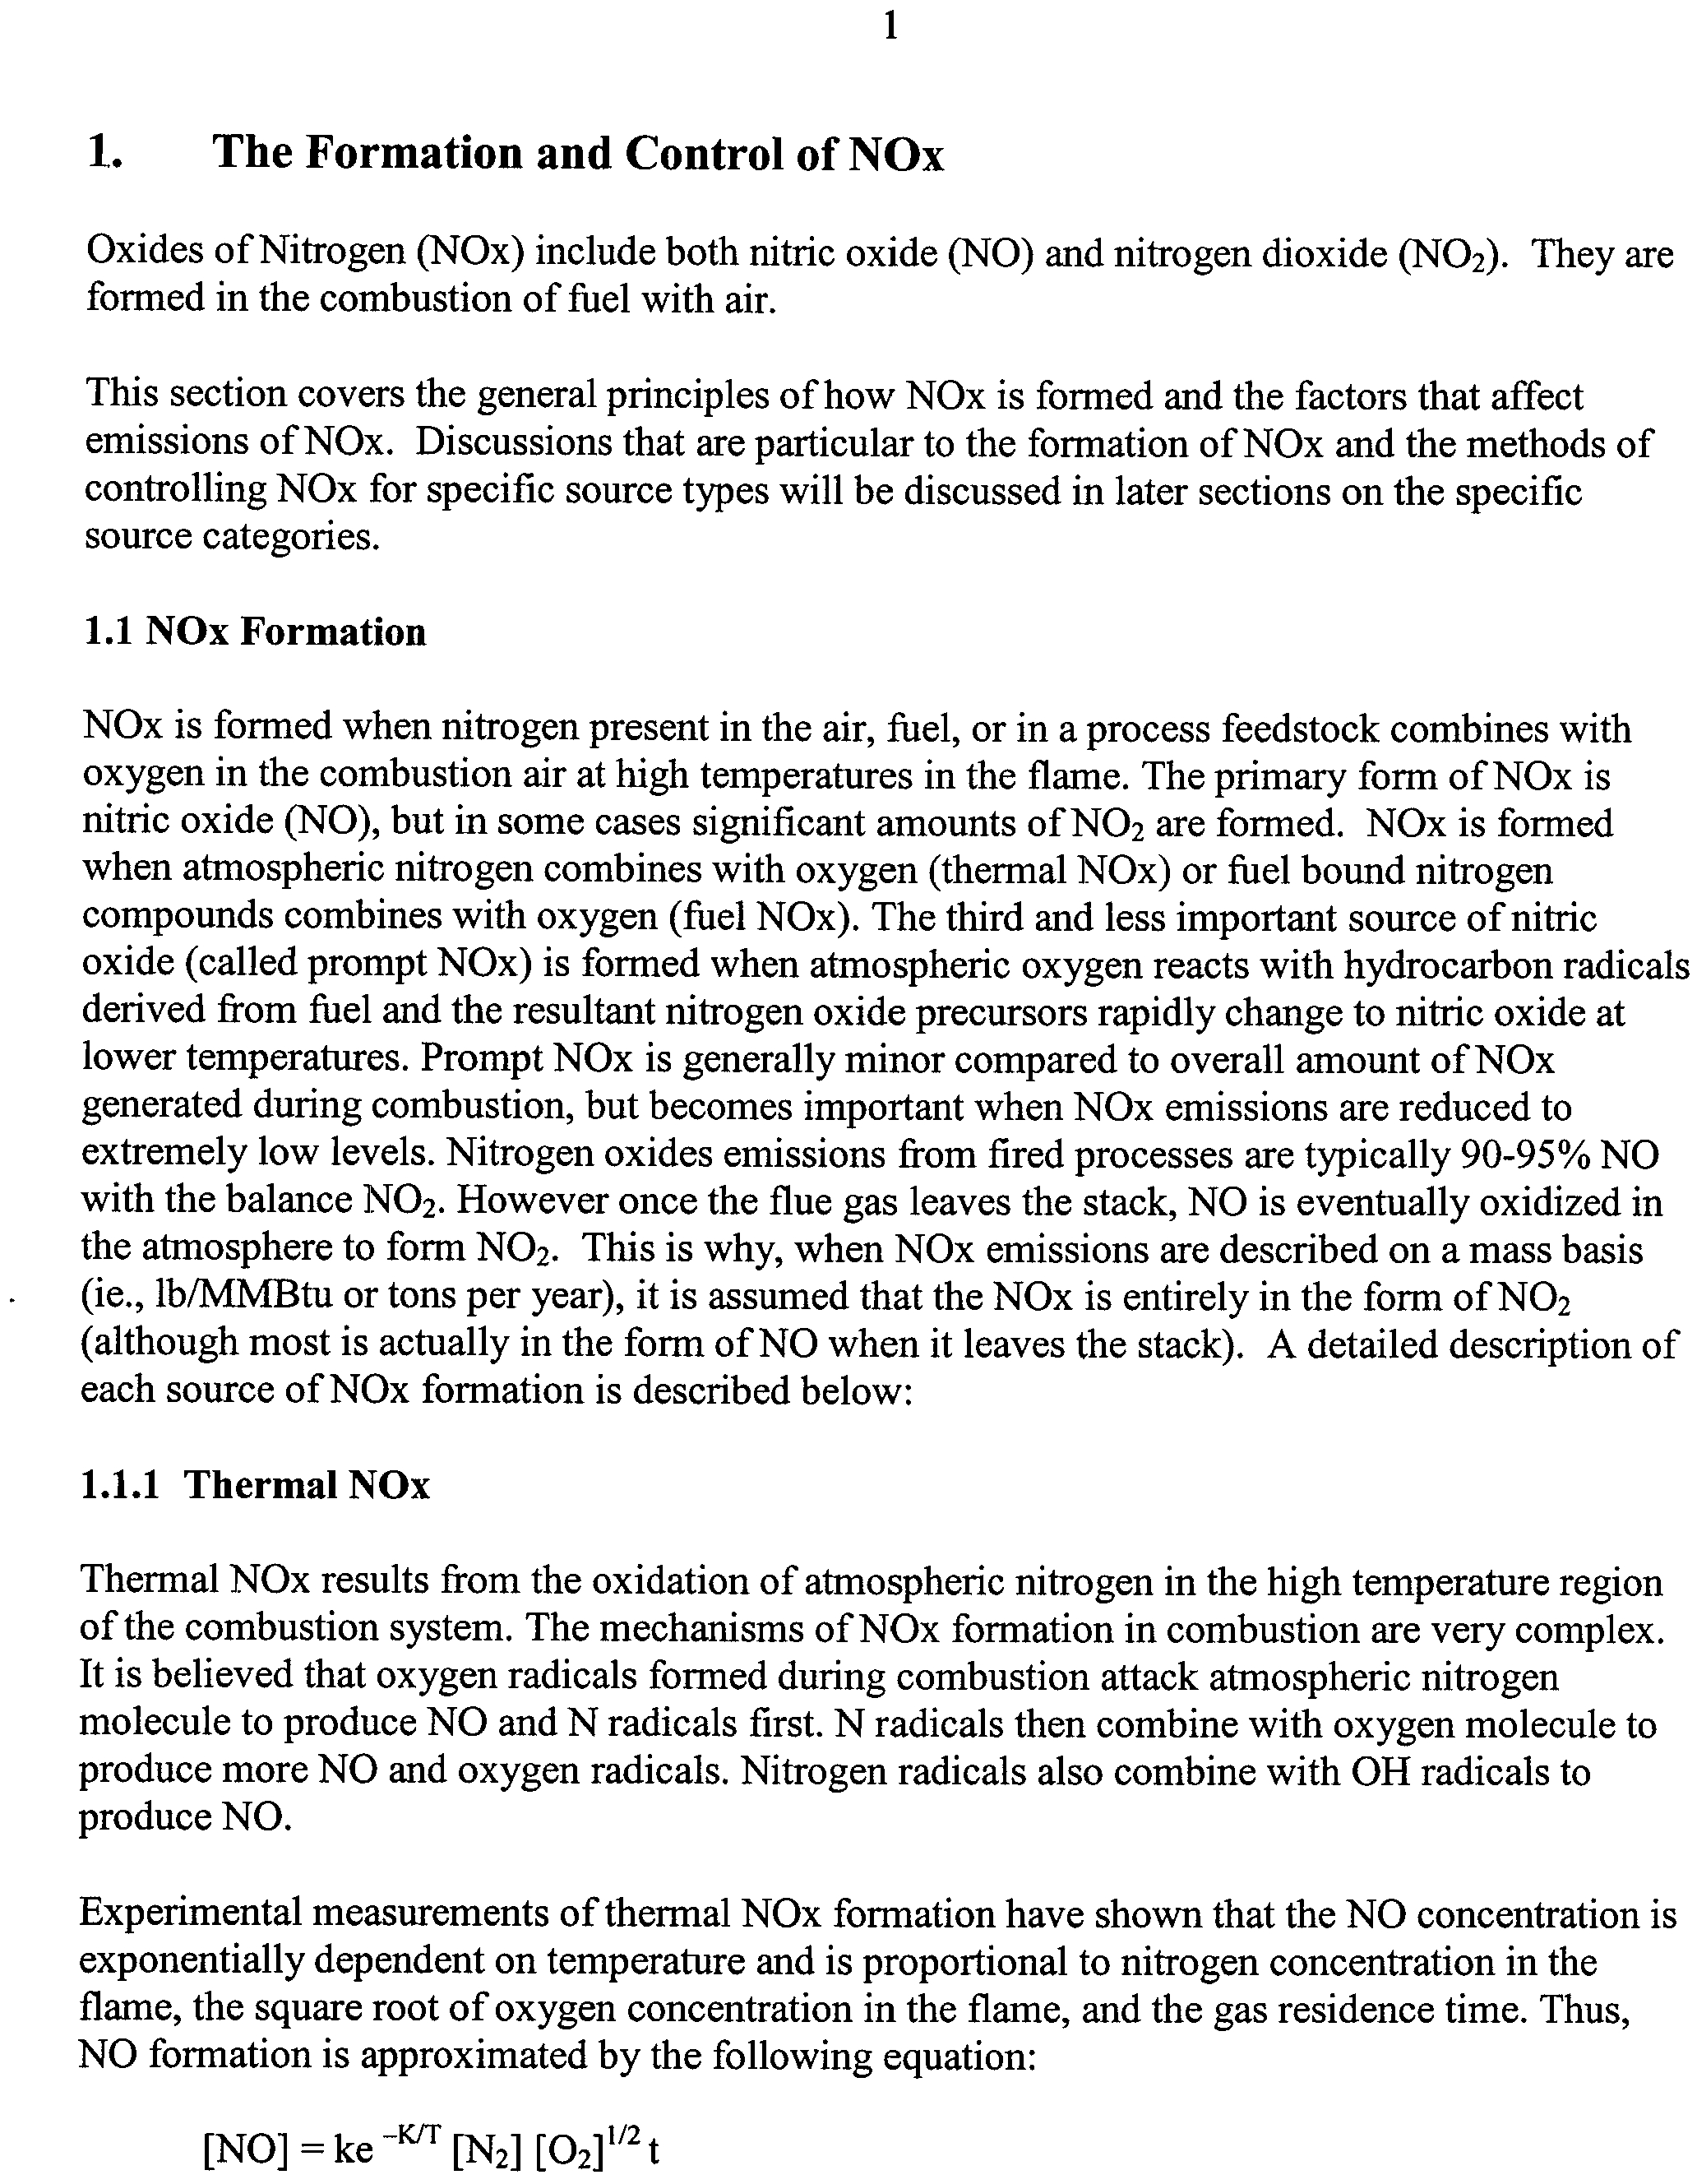
1.
The Formation and Control of NOx
Oxides of Nitrogen (NOx) include both nitric oxide (NO) and nitrogen dioxide (NO
2 ). They are
formed in the combustion of fuel with air.
This section covers the general principles of how NOx is formed and the factors that affect
emissions of NOx. Discussions that are particular to the formation of NOx and the methods of
controlling NOx for specific source types will be discussed in later sections on the specific
source categories.
1.1 NOx Formation
NOx is formed when nitrogen present in the air, fuel, or in a process feedstock combines with
oxygen in the combustion air at high temperatures in the flame. The primary form of NOx is
nitric oxide (NO), but in some cases significant amounts of NO
2
are formed. NOx is formed
when atmospheric nitrogen combines with oxygen (thermal NOx) or fuel bound nitrogen
compounds combines with oxygen (fuel NOx). The third and less important source of nitric
oxide (called prompt NOx) is formed when atmospheric oxygen reacts with hydrocarbon radicals
derived from fuel and the resultant nitrogen oxide precursors rapidly change to nitric oxide at
lower temperatures. Prompt NOx is generally minor compared to overall amount of NOx
generated during combustion, but becomes important when NOx emissions are reduced to
extremely low levels. Nitrogen oxides emissions from fired processes are typically 90-95% NO
with the balance NO
2
. However once the flue gas leaves the stack, NO is eventually oxidized in
the atmosphere to form NO
2
. This is why, when NOx emissions are described on a mass basis
(ie., lb/MMBtu or tons per year), it is assumed that the NOx is entirely in the form of NO2
(although most is actually in the form of NO when it leaves the stack). A detailed description of
each source of NOx formation is described below:
1.1.1 Thermal NOx
Thermal NOx results from the oxidation of atmospheric nitrogen in the high temperature region
of the combustion system. The mechanisms of NOx formation in combustion are very complex.
It is believed that oxygen radicals formed during combustion attack atmospheric nitrogen
molecule to produce NO and N radicals first. N radicals then combine with oxygen molecule to
produce more NO and oxygen radicals. Nitrogen radicals also combine with OH radicals to
produce NO.
Experimental measurements of thermal NOx formation have shown that the NO concentration is
exponentially dependent on temperature and is proportional to nitrogen concentration in the
flame, the square root of oxygen concentration in the flame, and the gas residence time. Thus,
NO formation is approximated by the following equation:
[NO] = ke
-Krr
[N
2] [02]
1/2
t
2
Where:
[ ] are mole fractions
K and k are reaction constants
T is temperature
t is residence time
Significant levels of NOx are usually formed above 2200°F under oxidizing conditions. Higher
heat release rate and preheated combustion air increase the peak temperature of the flame and
contribute to higher baseline NOx levels. Amongst coal-fired boilers, cyclone boilers typically
have higher conversion of nitrogen to NOx because they operate at higher temperature compared
to other types of boilers.
1.1.2 Fuel NOx
Fuel NOx results from the oxidation of fuel bound nitrogen. Higher nitrogen content of fuel will
lead to higher NOx emissions, but the conversion to fuel NOx typically diminishes with
increasing nitrogen concentration. It is believed that fuel bound nitrogen compounds such as
pyridine, picoline, nicotine, and quinoline rapidly decompose to low molecular weight
compounds, such as HCN and which then decay to NO and nitrogen (N
2
). During combustion,
the nitrogen bound in the fuel is released as a free radical and ultimately forms free
N2,
or NO. It
seems that the oxidation of fuel-bound nitrogen compounds to NO is rapid and the reaction
system cannot be quenched as it can be for thermal NOx.
In stoichiometric or fuel-lean situations, the intermediates will generally react to form NO over
N2,
where as in fuel-rich systems, there is evidence that the formation of
N2
is competitive with
the formation of NO. Studies have also shown that under pyrolytic conditions, about 65% of the
fuel nitrogen remained in the coal after heating to 750°C (1380°F), but only 10 percent remained
at 1320°C (2400°F). This suggests that the formation of NOx may depend upon the availability
of oxygen to react with the nitrogen during coal devolitization and the initial stages of
combustion. If the mixture is fuel-rich, the formation of
N2
may compete with the formation of
NO, thus reducing NOx formation.
Fuel NOx can contribute as much as 50% of total emissions when combusting oil and as much as
80% when combusting coal. Generally, about 20-30% fuel-bound nitrogen is converted to NO.
As discussed above, conversion of fuel-bound nitrogen is strongly dependent on the fuel/air
stoichiometry, but is relatively independent of variations in combustion zone temperature.
For industrial manufacturing processes that heat a feedstock (such as glass manufacturing), some
feedstock material may contain some level of nitrogen. This nitrogen will partially oxidize to
form NOx. The degree to which feedstock nitrogen oxidizes to form NOx will depend upon the
form of the nitrogen in the feedstock and the specific conditions (temperature, oxygen
concentration, etc.) that the feedstock material is exposed to.
3
1.1.3 Prompt NOx
Prompt NOx is attributed to the reaction of atmospheric nitrogen,
N2,
with hydrocarbon radicals
such as CH and CH
2
derived from fuel. It is generally believed that the principal product of the
initial reaction is hydrogen cyanide (HCN) or CN radicals. The HCN radical is further reduced to
form NO and other nitrogen oxides. As opposed to the slower thermal NOx formation, prompt
NOx formation is rapid and it is not possible to quench prompt NOx formation in the manner by
which thermal NOx formation is quenched.
Experiments show that maximum prompt NOx is reached on the fuel-rich side of the
stoichiometry. On the fuel-lean side of the stoichiometry, there are fewer free hydrocarbon
fragments (CH, CH
2
etc.) which can react with atmospheric nitrogen to form HCN, the precursor
to prompt NOx. With increasing fuel-lean conditions, an increasing amount of HCN is formed,
creating more NOx. However, above an equivalence ratio of about 1.4, there are not enough 0
radicals to react with HCN, so NO levels decrease. Prompt NOx is most significant for gas-fired
diffusion flame combustion, where CH; fragments are readily available and the contribution of
fuel NOx to total NOx is negligible.
1.2
Controlling NOx emissions
NOx emissions are controlled by either:
•
Using methods to limit the formation of NOx
•
Using methods to reduce or capture the NOx that has been formed
1.2.1 Limiting NOx Formation – Combustion Controls
Because NOx is formed during combustion and heating, the methods used to control NOx
formation are categorized as combustion controls. Using a low nitrogen fuel will help reduce
NOx formation, providing other combustion parameters are not significantly affected. However,
in fuel-air combustion, there are a wide range of technologies to limit the formation of NOx in
specific facilities, including low NOx burners, over-fire air, etc. All of these technologies use one
or more of three general approaches to minimize NOx formation:
Air staging
achieves much of the combustion of fuel in a high-temperature, fuel-rich zone
that is followed by a lower temperature zone with limited excess oxygen where fuel burn-
out is completed. In the fuel-rich zone, fuel nitrogen is released as molecular nitrogen.
In the lower temperature zone with excess oxygen, the temperature is maintained low
enough and excess oxygen is minimized to limit the formation of thermal NOx while the
fuel is burned out as efficiently as possible. Air staging is accomplished within several
NOx control technologies, such as Low NOx Burners (LNB), Burners Out of Service
(BOOS), Overfire Air (OFA), and others that will be described in detail later.
Fuel staging
follows the primary combustion zone (which may use air staging or other
methods) with a fuel-rich zone that reduces the NOx formed in the primary combustion
zone to molecular nitrogen. The fuel-rich zone is followed by an oxygen-rich zone that
allows fuel burnout at lower temperatures, minimizing reformation of NOx. Fuel staging
4
technologies include reburning and gas pods on gas-fired burners.
Lean premixed combustion
is used with volatile fuels that are low in nitrogen content and
inherently have low fuel NOx formation, such as natural gas. In lean premixed
combustion the fuel and air are premixed thoroughly before ignition into a fuel-lean
mixture. Combustion occurs under well-controlled conditions with excess air while
maintaining temperature low. This approach minimizes formation of thermal NOx by
controlling temperature and oxygen carefully. Prompt NOx formation is minimized by
maintaining conditions with excess oxygen.
Another approach to limiting NOx formation is oxygen combustion. Oxygen combustion
reduces thermal NOx formation by mostly eliminating the nitrogen in the combustion air that is
the source of thermal NOx. Oxygen combustion is not as widely used as the above methods due
to the cost of producing oxygen, except in specific applications that will be discussed later. In
each of the following chapters, we will explore the specific combustion control technologies that
utilize these principles for controlling NOx formation.
1.2.2 Reducing NOx that is formed
When NOx must be controlled to levels lower than those possible through combustion controls,
post-combustion controls are necessary. Post-combustion controls are generally divided into the
following approaches:
• Selective reduction
utilizes a nitrogen-containing reducing agent, usually ammonia or
urea, to react selectively with NOx under oxygen rich conditions to reduce the NOx to
molecular nitrogen. Selective reduction is further divided into catalytic or non-catalytic
reduction, depending upon whether or not a catalyst is used.
• Non-selective reduction
reduces the NOx under conditions where little or no oxygen is
available. Non-selective reduction is further divided into catalytic or non-catalytic
reduction, depending upon whether or not a catalyst is used.
• Scrubbing
of NOx is possible if NOx is first oxidized to a water-soluble form and then
captured in a wet scrubber.
Selective reduction is the most commonly used form of post-combustion NOx control for the
types of sources described in this document. This is because all of the combustion applications
described here usually entail operation with excess air, rendering non-selective reduction less
applicable. It is also because these applications usually do not have wet scrubbers, which would
be necessary for scrubbing of NOx. As a result, selective reduction methods tend to be more
appropriate technically and more cost effective in most cases.
5
2. Industrial Boilers and Electrical Generating Unit Boilers
2.1 Introduction and Summary of this Section
The purpose of this section is to provide a description of the source category, the mechanism of
NOx formation, the technical feasibility of controls, the cost effectiveness of controls, the
existing and proposed regulations and the sources affected by the regulations.
Most Industrial, Commercial, and Institutional (ICI) boilers burn clean fuels, such as natural gas
and distillate fuel oil, which are low in fuel nitrogen. Baseline emissions from such boilers are
inherently low. These boilers can be controlled to the target levels by a number of combustion
modification techniques including low NOx burners (LNB) and flue gas recirculation (FGR).
These techniques are often less expensive than post combustion techniques such as selective
catalytic reduction (SCR) and selective non-catalytic reduction (SNCR). However, a
combination of combustion and post-combustion controls can sometimes be the most effective
approach.
Some ICI boilers burn either residual fuel oil or coal which contain significant levels of fuel
nitrogen. To economically control NOx emissions from such boilers, it may be necessary to use
fuel that is low in nitrogen content and choose combustion conditions that generate a lower
amount of NOx during combustion. Stoker and fluidized bed combustion (FBC) boilers operate
at low combustion temperature and generate low levels of NOx emissions. Controlling NOx
emissions from such boilers can be achieved by the use of combustion controls possibly in
combination with SNCR technology. Pulverized coal (PC) fired boilers operate at higher
temperatures and generate higher levels of NOx emissions compared to stoker and FBC boilers.
Controlling NOx emissions from such boilers may involve the use of post-combustion
technologies in combination with combustion controls. NOx emissions from residual fuel oil-
fired boilers can be controlled level by using residual fuel oil which is lower in fuel nitrogen,
switching to distillate fuel oil, or by a combination of combustion and post combustion
technologies.
Wood-fired boilers are inherently low NOx emitters. These boilers can be controlled by SNCR
technology. Currently, there are no wood-fired boilers located at any facility that is a major
source for NOx emissions.
Small electrical generating unit (EGU) boilers (less than or equal to 25 megawatts (MW)
capacity) are similar to ICI boilers and NOx emissions can be controlled by the use of
combustion controls possibly in combination with SNCR technology. Most large EGU boilers in
Illinois burn coal and, to a much lesser extent, natural gas or residual fuel oil. Most of these
facilities are already equipped with some NOx controls that may include NOx burners and/or
post-combustion controls.
The regulations target those boilers in the Chicago and Metro-East non-attainment areas
(Chicago NAA and Metro-East NAA) that are located at a major source of NOx emissions. A
major source is a source that emits or has the potential to emit 100 tons or more of NOx per
year. Boilers regulated under the NOx SIP Call are not exempt from the rule. However, EGU
boilers that are subject to the Multi-Pollutant Standard (MPS) or Combined Pollutant Standards
6
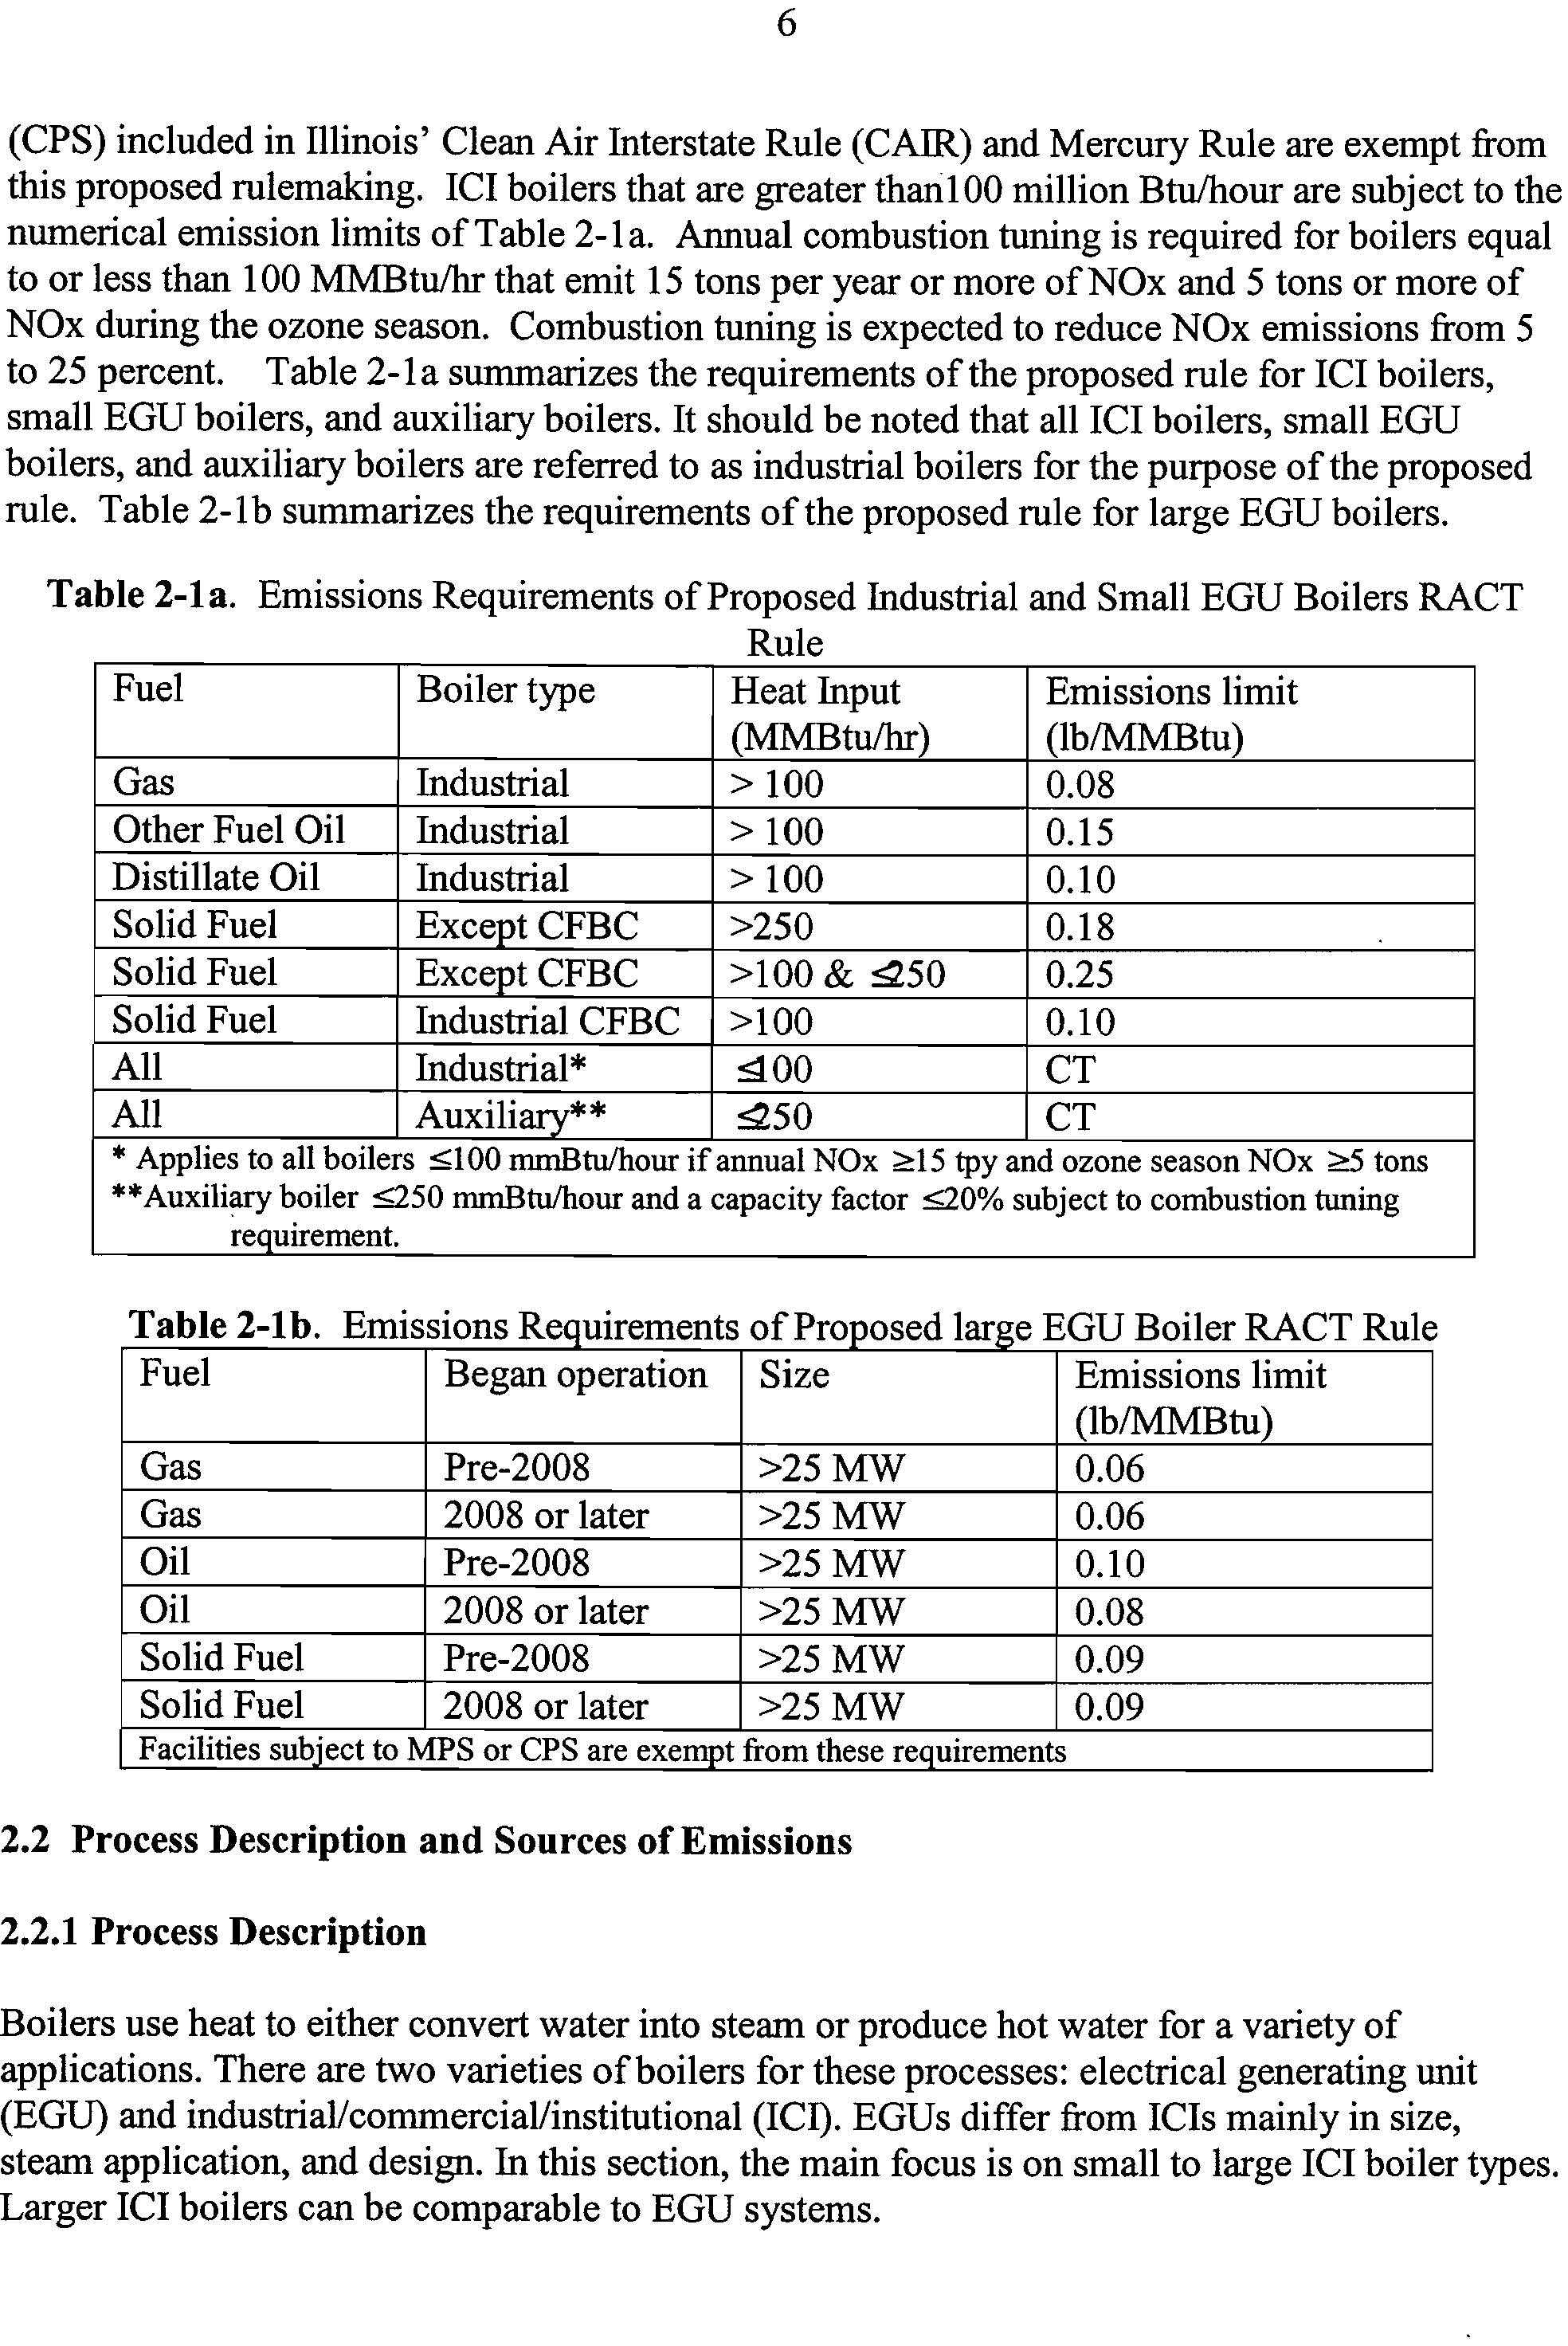
(CPS) included in Illinois' Clean Air Interstate Rule (CAIR) and Mercury Rule are exempt from
this proposed rulemaking. ICI boilers that are greater than100 million Btu/hour are subject to the
numerical emission limits of Table 2-la. Annual combustion tuning is required for boilers equal
to or less than 100 MMBtu/hr that emit 15 tons per year or more of NOx and 5 tons or more of
NOx during the ozone season. Combustion tuning is expected to reduce NOx emissions from 5
to 25 percent. Table 2-la summarizes the requirements of the proposed rule for ICI boilers,
small EGU boilers, and auxiliary boilers. It should be noted that all ICI boilers, small EGU
boilers, and auxiliary boilers are referred to as industrial boilers for the purpose of the proposed
rule. Table 2-lb summarizes the requirements of the proposed rule for large EGU boilers.
Table 2-la.
Emissions Requirements of Proposed Industrial and Small EGU Boilers RACT
Rule
Fuel
Boiler type
Heat Input
(MMBtu/hr)
>
100
Emissions limit
(lb/MMBtu)
Gas
Industrial
0.08
Other Fuel Oil
Industrial
>
100
0.15
Distillate Oil
Industrial
>
100
0.10
Solid Fuel
Except CFBC
>250
0.18
Solid Fuel
Except CFBC
>100
&
�
I50
0.25
Solid Fuel
Industrial CFBC
>100
0.10
All
Industrial*
.00
CT
All
Auxiliary**
,50
CT
*
Applies to all boilers
�
100 mmBtu/hour if annual NOx
�
15 tpy and ozone season NOx
�
5 tons
**Auxiliary boiler X50 mniBtu/hour and a capacity factor
0% subject to combustion tuning
requirement.
Table 2-lb.
Emissions Requirements of Pro
p
osed lar
g
e EGU Boiler RACT Rule
Fuel
Began operation
Size
Emissions limit
(lb/MMBtu)
Gas
Pre-2008
>25 MW
0.06
Gas
2008 or later
>25 MW
0.06
Oil
Pre-2008
>25 MW
0.10
Oil
2008 or later
>25 MW
0.08
Solid Fuel
Pre-2008
>25 MW
0.09
Solid Fuel
2008 or later
>25 MW
0.09
Facilities subject to MPS or CPS are exempt from these requirements
2.2 Process Description and Sources of Emissions
2.2.1 Process Description
Boilers use heat to either convert water into steam or produce hot water for a variety of
applications. There are two varieties of boilers for these processes: electrical generating unit
(EGU) and industrial/commercial/institutional (ICI). EGUs differ from ICIs mainly in size,
steam application, and design. In this section, the main focus is on small to large ICI boiler types.
Larger ICI boilers can be comparable to EGU systems.
7
Heat is provided by the combustion of fuel which may be gaseous, liquid, or solid. The overall
functioning of steam-generating equipment is governed by the thermodynamic properties of the
working fluid. By the simple addition of heat to water in a closed vessel, a vapor is formed which
has greater specific volume than the liquid. If the generated steam is discharged at a controlled
rate, commensurate with the rate of heat addition, the pressure in the vessel can be maintained at
any desired value, and thus be held within the limits of safety of the construction.
Technical and economic factors indicate that the most effective way to produce high pressure
steam is to heat water continuously in small diameter tubes. Two distinct boiling systems are
used to accomplish this task: those that include a steam drum and those that use once through
steam generators. A steam drum system is easier to control than a once through steam generator
system. In both systems, water must continuously pass through, or circulate through, the tubes
for the system to generate steam continuously.
Two different approaches to circulation of water are commonly used: natural or thermal
circulation, and forced or pumped circulation. In natural circulation, the rate of flow or
circulation of water depends upon the difference in average density between the unheated water
and the heated steam-water mixture. In forced or pumped circulation, a mechanical pump is
added to the simple flow loop and the pressure difference created by the pump controls the water
flow rate.
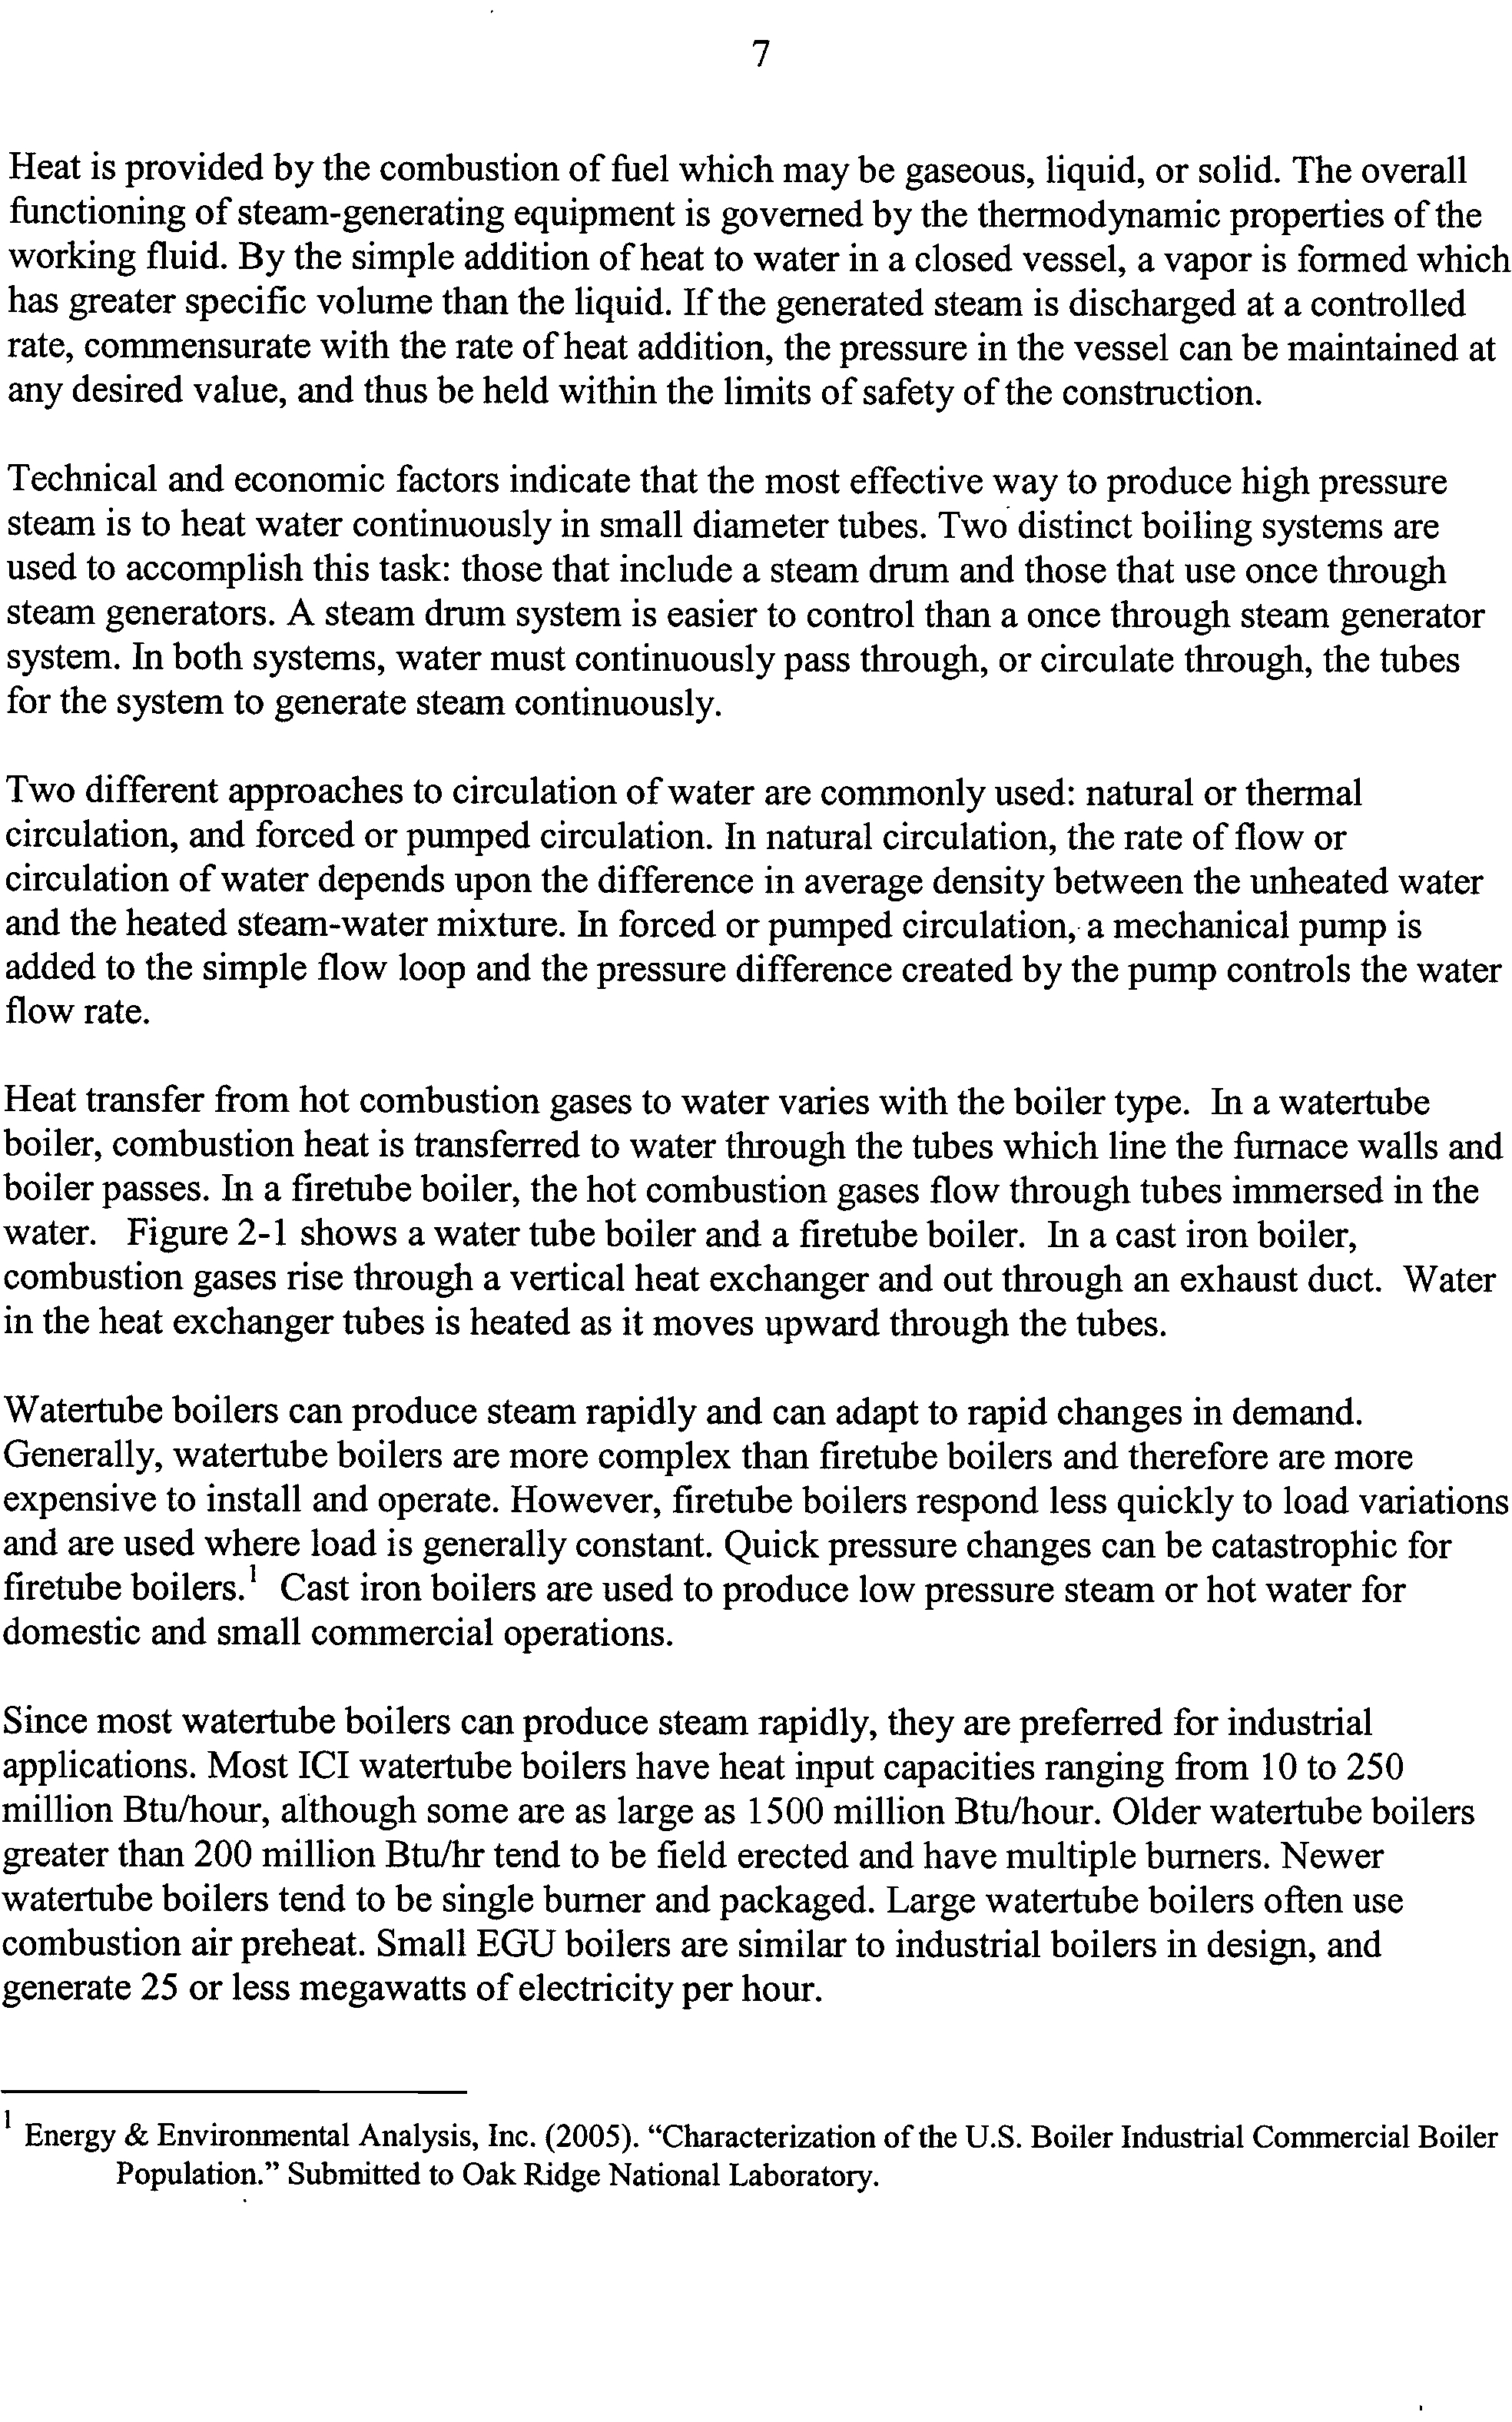
Heat transfer from hot combustion gases to water varies with the boiler type. In a watertube
boiler, combustion heat is transferred to water through the tubes which line the furnace walls and
boiler passes. In a firetube boiler, the hot combustion gases flow through tubes immersed in the
water. Figure 2-1 shows a water tube boiler and a firetube boiler. In a cast iron boiler,
combustion gases rise through a vertical heat exchanger and out through an exhaust duct. Water
in the heat exchanger tubes is heated as it moves upward through the tubes.
Watertube boilers can produce steam rapidly and can adapt to rapid changes in demand.
Generally, watertube boilers are more complex than firetube boilers and therefore are more
expensive to install and operate. However, firetube boilers respond less quickly to load variations
and are used where load is generally constant. Quick pressure changes can be catastrophic for
firetube boilers.' Cast iron boilers are used to produce low pressure steam or hot water for
domestic and small commercial operations.
Since most watertube boilers can produce steam rapidly, they are preferred for industrial
applications. Most ICI watertube boilers have heat input capacities ranging from 10 to 250
million Btu/hour, although some are as large as 1500 million Btu/hour. Older watertube boilers
greater than 200 million Btu/hr tend to be field erected and have multiple burners. Newer
watertube boilers tend to be single burner and packaged. Large watertube boilers often use
combustion air preheat. Small EGU boilers are similar to industrial boilers in design, and
generate 25 or less megawatts of electricity per hour.
Energy & Environmental Analysis, Inc. (2005). "Characterization of the U.S. Boiler Industrial Commercial Boiler
Population." Submitted to Oak Ridge National Laboratory.
Safety
valve
Saturated
steam
Steam
drum
Boiling
water
Downcomer
tube
?
Water
tubes
-4— Water
Feedwater
drum
Fuel
burner
Saturated
steam outlet
Superheated
steam
Exhaust
gasses
Superheater
8
Figure 2-1.
Water-tube boiler (upper) and fire-tube boiler (lower)
(htto://commons.wikimedia.org/wiki/Image:Water tube boiler schematic.png
and
http://en.wikipedia.org/wiki/Image:Locomotive fire tube boiler schematic.png, 2007)
Since firetube boilers respond less
quickly to load variations, their heat
input capacities are limited to less than
50 mmBtu/hr and steam pressures are
limited to 300 pounds per square inch
gauge. Firetube boilers are generally
prefabricated in the shop, shipped by rail
or truck and are thus referred to as
packaged. Combustion air preheat is
never used in firetube boilers. They are
primarily used in commercial and
institutional sectors and used to be
common for locomotives (a locomotive
fire-tube boiler is pictured). Commercial
boilers typically have input capacities
below 15 mmBtu/hr.
Since cast iron boilers produce low
pressure steam or hot water, they are
preferred for domestic and small
commercial operations. All cast iron
boilers are prefabricated in the shop
before shipping. Cast iron boilers are
used primarily in the residential and
commercial sectors, and have heat input
capacities up to10 mmBtu/hr.
Steam
dome
Safety
valve
Large
flues
Small
flues
Fuel
Fire
Grate
Saturated
steam outlet
Exhaust
gasses
Superheater
header
Superheater
elements
Superheated
steam
2.2.2
Furnace Firing Configurations and Factors Affecting Baseline NOx Emissions
There are several factors which affect baseline NOx emissions. These include boiler design, fuel
type, and boiler operation. Since these factors influence each other, baseline emissions vary a lot
from boiler to boiler. This section discusses how boiler design, fuel characteristics, and boiler
operating characteristics can influence baseline (uncontrolled) NOx emissions.
There are several boiler designs available in the market depending on the type of fuel burned.
For combustion of coal, boilers may be tangentially-fired, wall-fired, cyclone-fired, stoker-fired
or fluidized bed-fired. Each type of furnace has specific design characteristics that can influence
NOx emissions levels. For natural gas and fuel oil, ICI boilers may be tangential-fired or wall-
fired. Other designs are available, but are not used as much in the ICI boiler industry.
Convective Heat Exchangers
Post-Flame Zone
Flame Zone
9
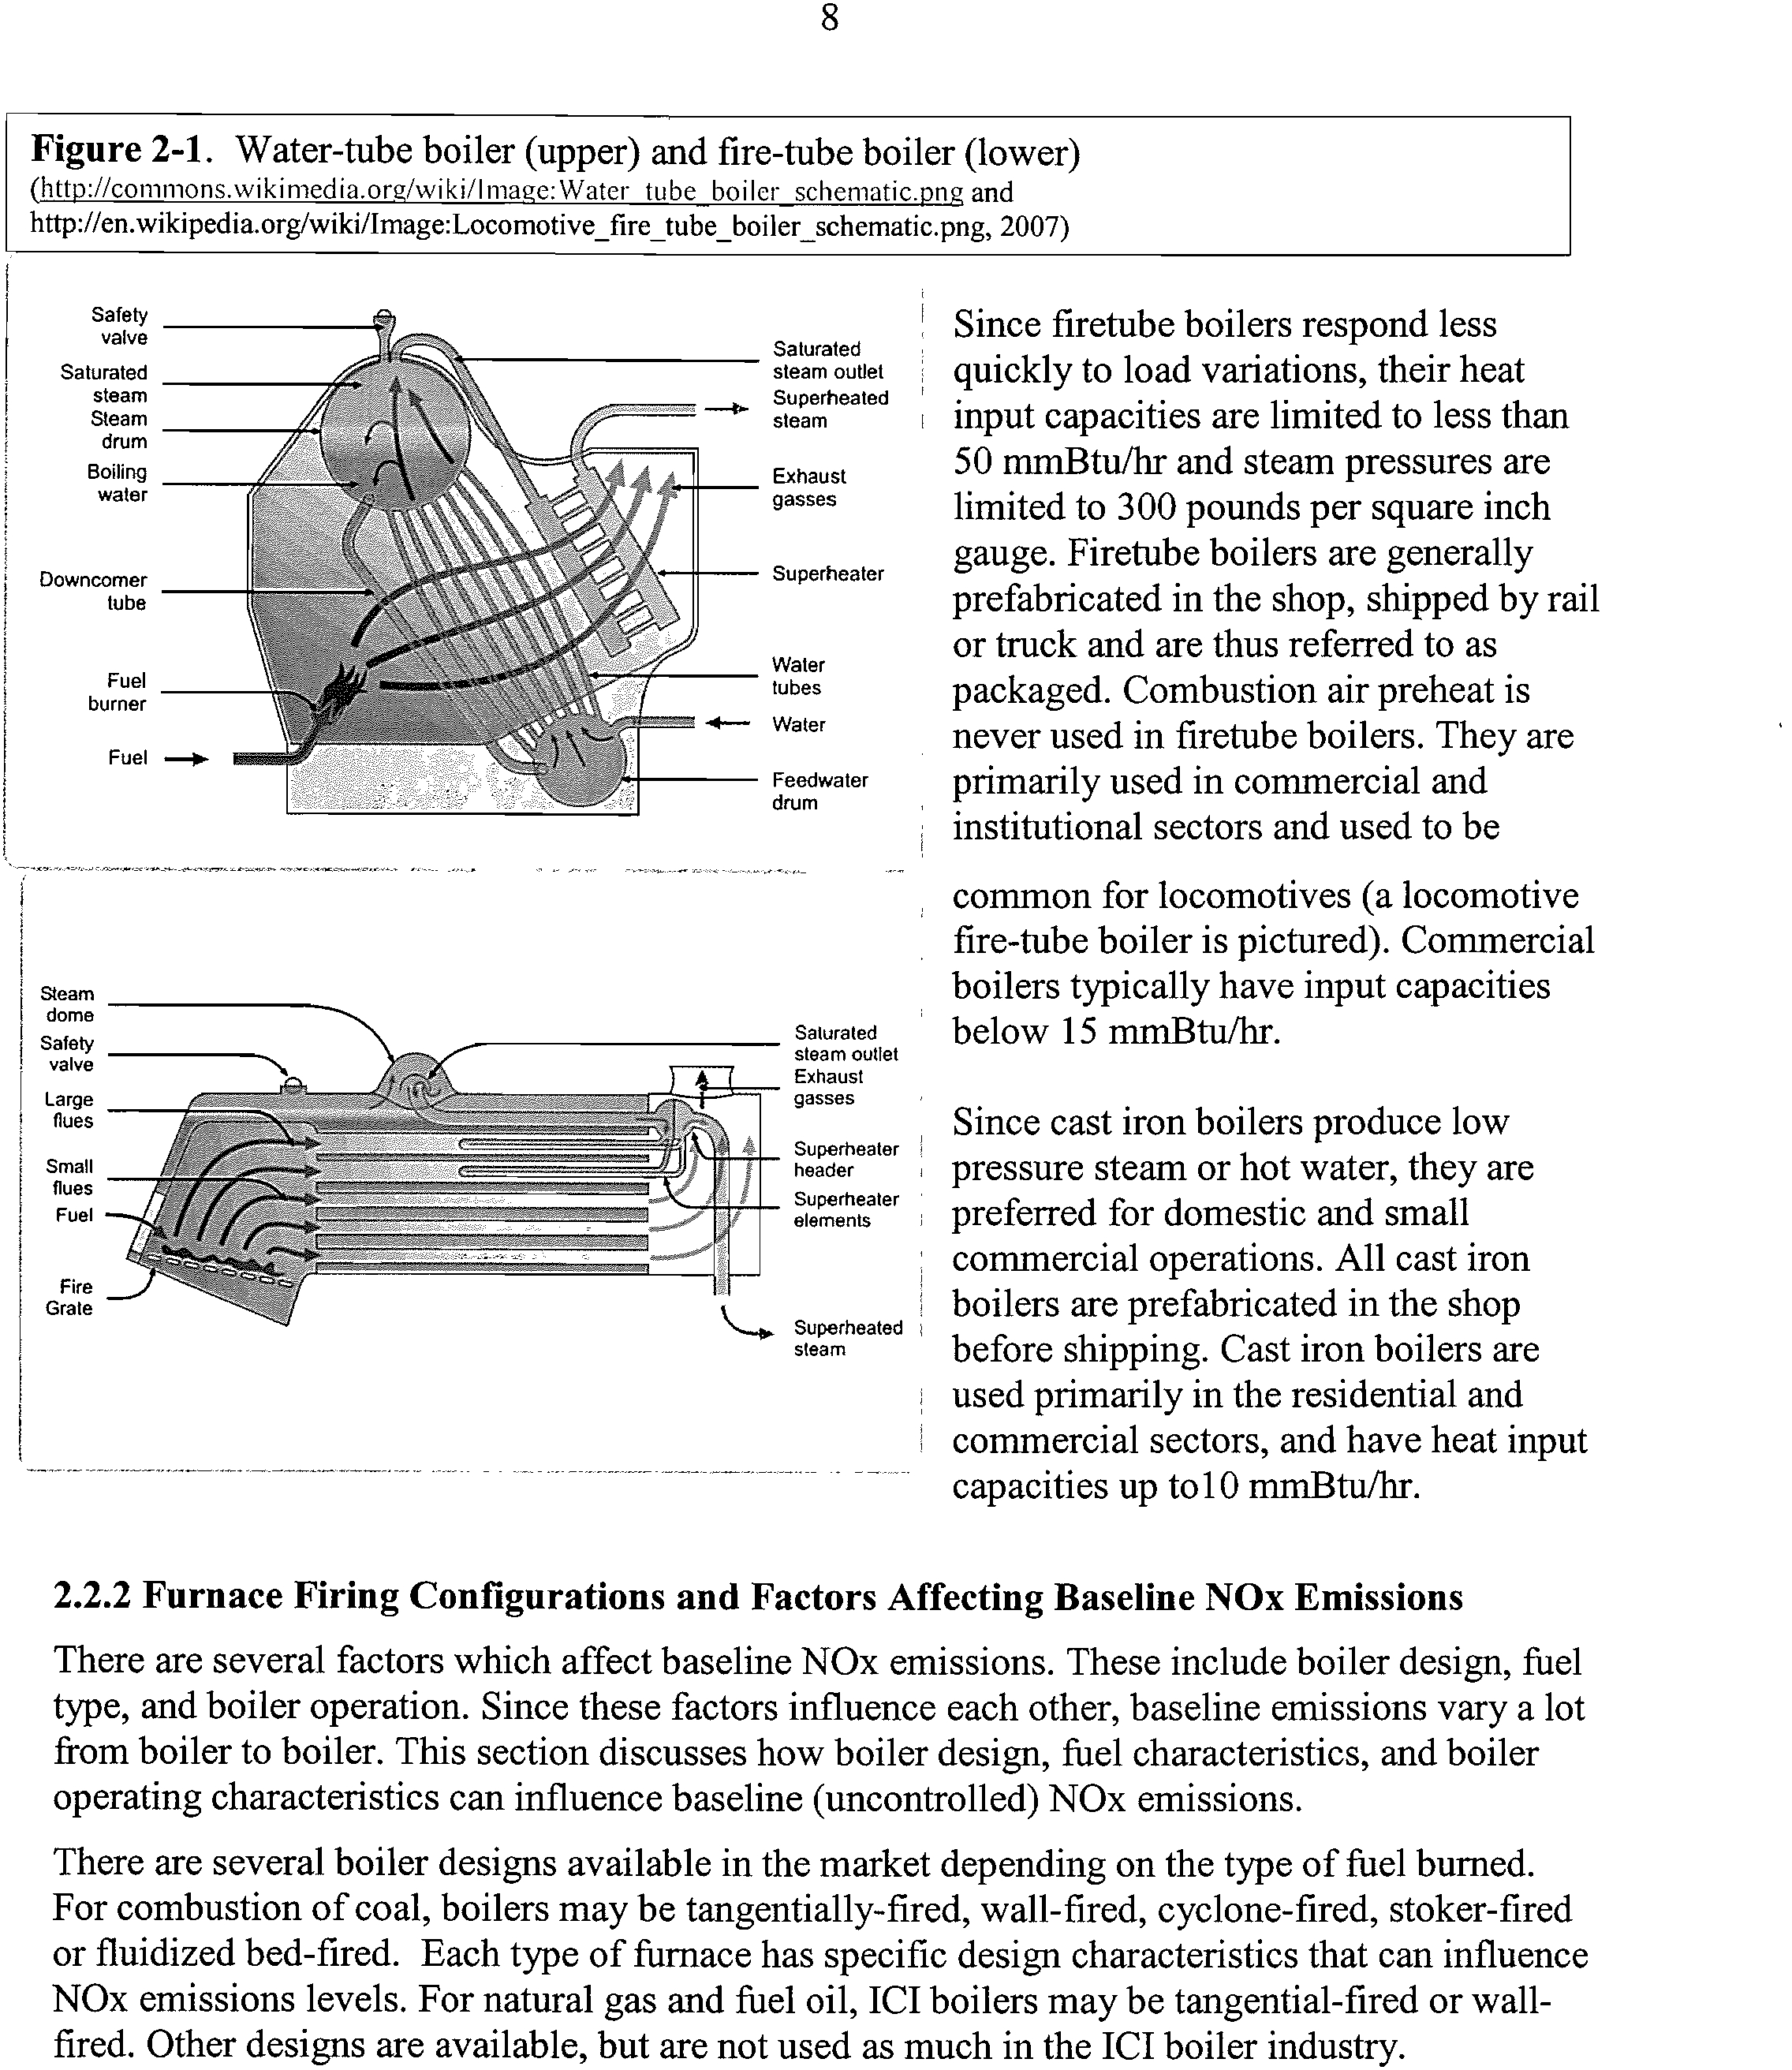
Figure 2-2
Typical configuration for a large industrial or EGU boiler.
In all boilers, the flames and the hot
exhaust gases produced by the
flames heat the water through
radiant heat transfer and convective
heat transfer, as shown in Figure 2-2.
Figure 2-2 is typical of a large
industrial boiler or EGU.
Factors which influence baseline.
NOx emissions include heat release
rate, combustion temperature,
oxygen levels and air-fuel mixing.
Pre-NSPS boilers were not designed
to minimize NOx emissions. Boilers
subject to the subparts D or Da of
NSPS have some type of NOx
control. A brief discussion of boiler
designs for various types of fuels is
provided below.
2.2.2.1 Coal-Fired Boilers
Tangentially-Fired:
Tangentially-fired burners are incorporated into stacked assemblies that
include several layers of primary fuel nozzles interspersed with secondary air supply nozzles.
The stacked assemblies are located in the corners of the boiler and are directed somewhat off-
center to produce a rotating fireball in the center of the furnace. Tangentially-fired boilers tend
to produce somewhat lower uncontrolled NOx emissions than wall or cyclone-fired boilers.
Tangential-firing is quite common in electric utility boilers, but not so common in ICI boilers.
None of the ICI boilers in the Illinois inventory are tangentially fired. However, several of the
large EGU boilers are tangentially fired.
Wall-Fired:
ICI boilers firing pulverized coal are more likely to be wall fired than tangentially
fired. Unlike tangentially-fired units, wall-fired units tend to operate at slightly higher
temperatures and hence generate slightly higher levels of NOx. Only single and opposed wall-
fired units are discussed here as they are often used for ICI boilers. Wall firing is also common
for EGU boilers.
Air Register
Door
Coal
Nozzle
Lighter
10
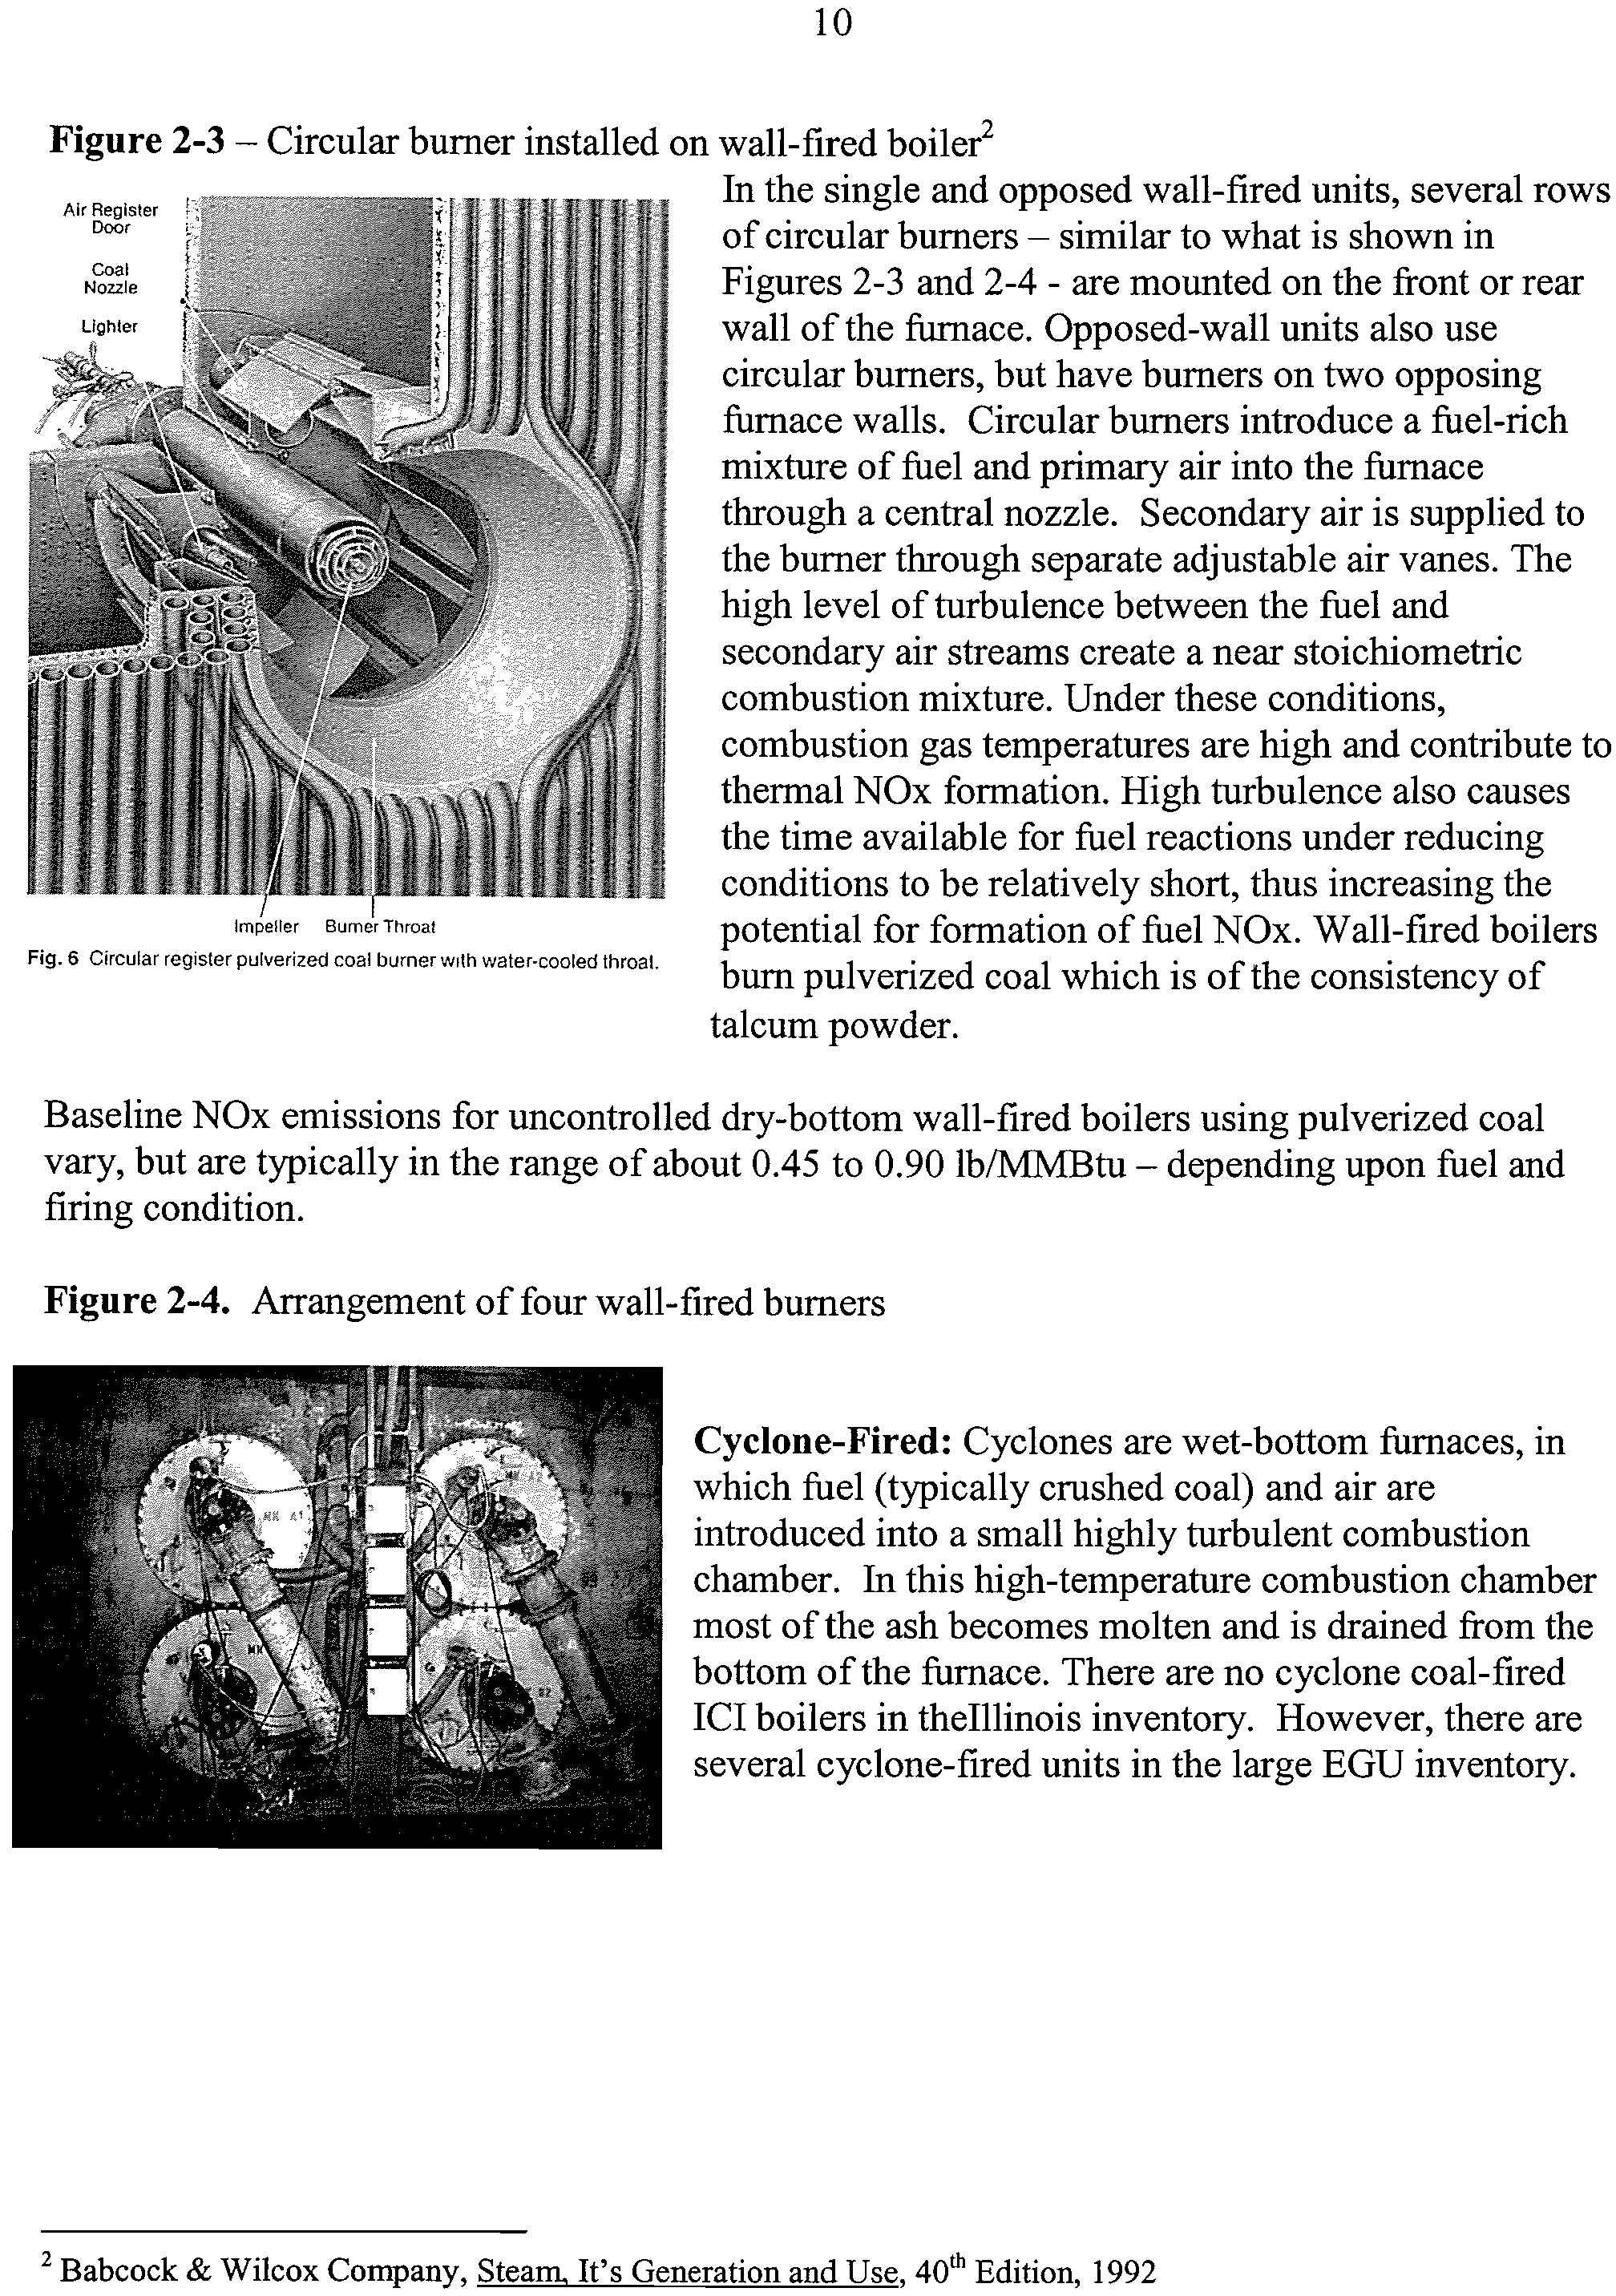
Figure 2-3 –
Circular burner installed on wall-fired boiler2
In the single and opposed wall-fired units, several rows
of circular burners – similar to what is shown in
Figures 2-3 and 2-4 - are mounted on the front or rear
wall of the furnace. Opposed-wall units also use
circular burners, but have burners on two opposing
furnace walls. Circular burners introduce a fuel-rich
mixture of fuel and primary air into the furnace
through a central nozzle. Secondary air is supplied to
the burner through separate adjustable air vanes. The
high level of turbulence between the fuel and
secondary air streams create a near stoichiometric
combustion mixture. Under these conditions,
combustion gas temperatures are high and contribute to
thermal NOx formation. High turbulence also causes
the time available for fuel reactions under reducing
conditions to be relatively short, thus increasing the
Impeller Burner Throat?
potential for formation of fuel NOx. Wall-fired boilers
Fig. 6 Circular register pulverized coal burner with water-cooled throat.
burn pulverized coal which is of the consistency of
talcum powder.
Baseline NOx emissions for uncontrolled dry-bottom wall-fired boilers using pulverized coal
vary, but are typically in the range of about 0.45 to 0.90 lb/MMBtu – depending upon fuel and
firing condition.
Figure 2-4.
Arrangement of four wall-fired burners
Cyclone-Fired:
Cyclones are wet-bottom furnaces, in
which fuel (typically crushed coal) and air are
introduced into a small highly turbulent combustion
chamber. In this high-temperature combustion chamber
most of the ash becomes molten and is drained from the
bottom of the furnace. There are no cyclone coal-fired
ICI boilers in thelllinois inventory. However, there are
several cyclone-fired units in the large EGU inventory.
2
Babcock & Wilcox Company, Steam, It's Generation and Use, 40
th Edition, 1992
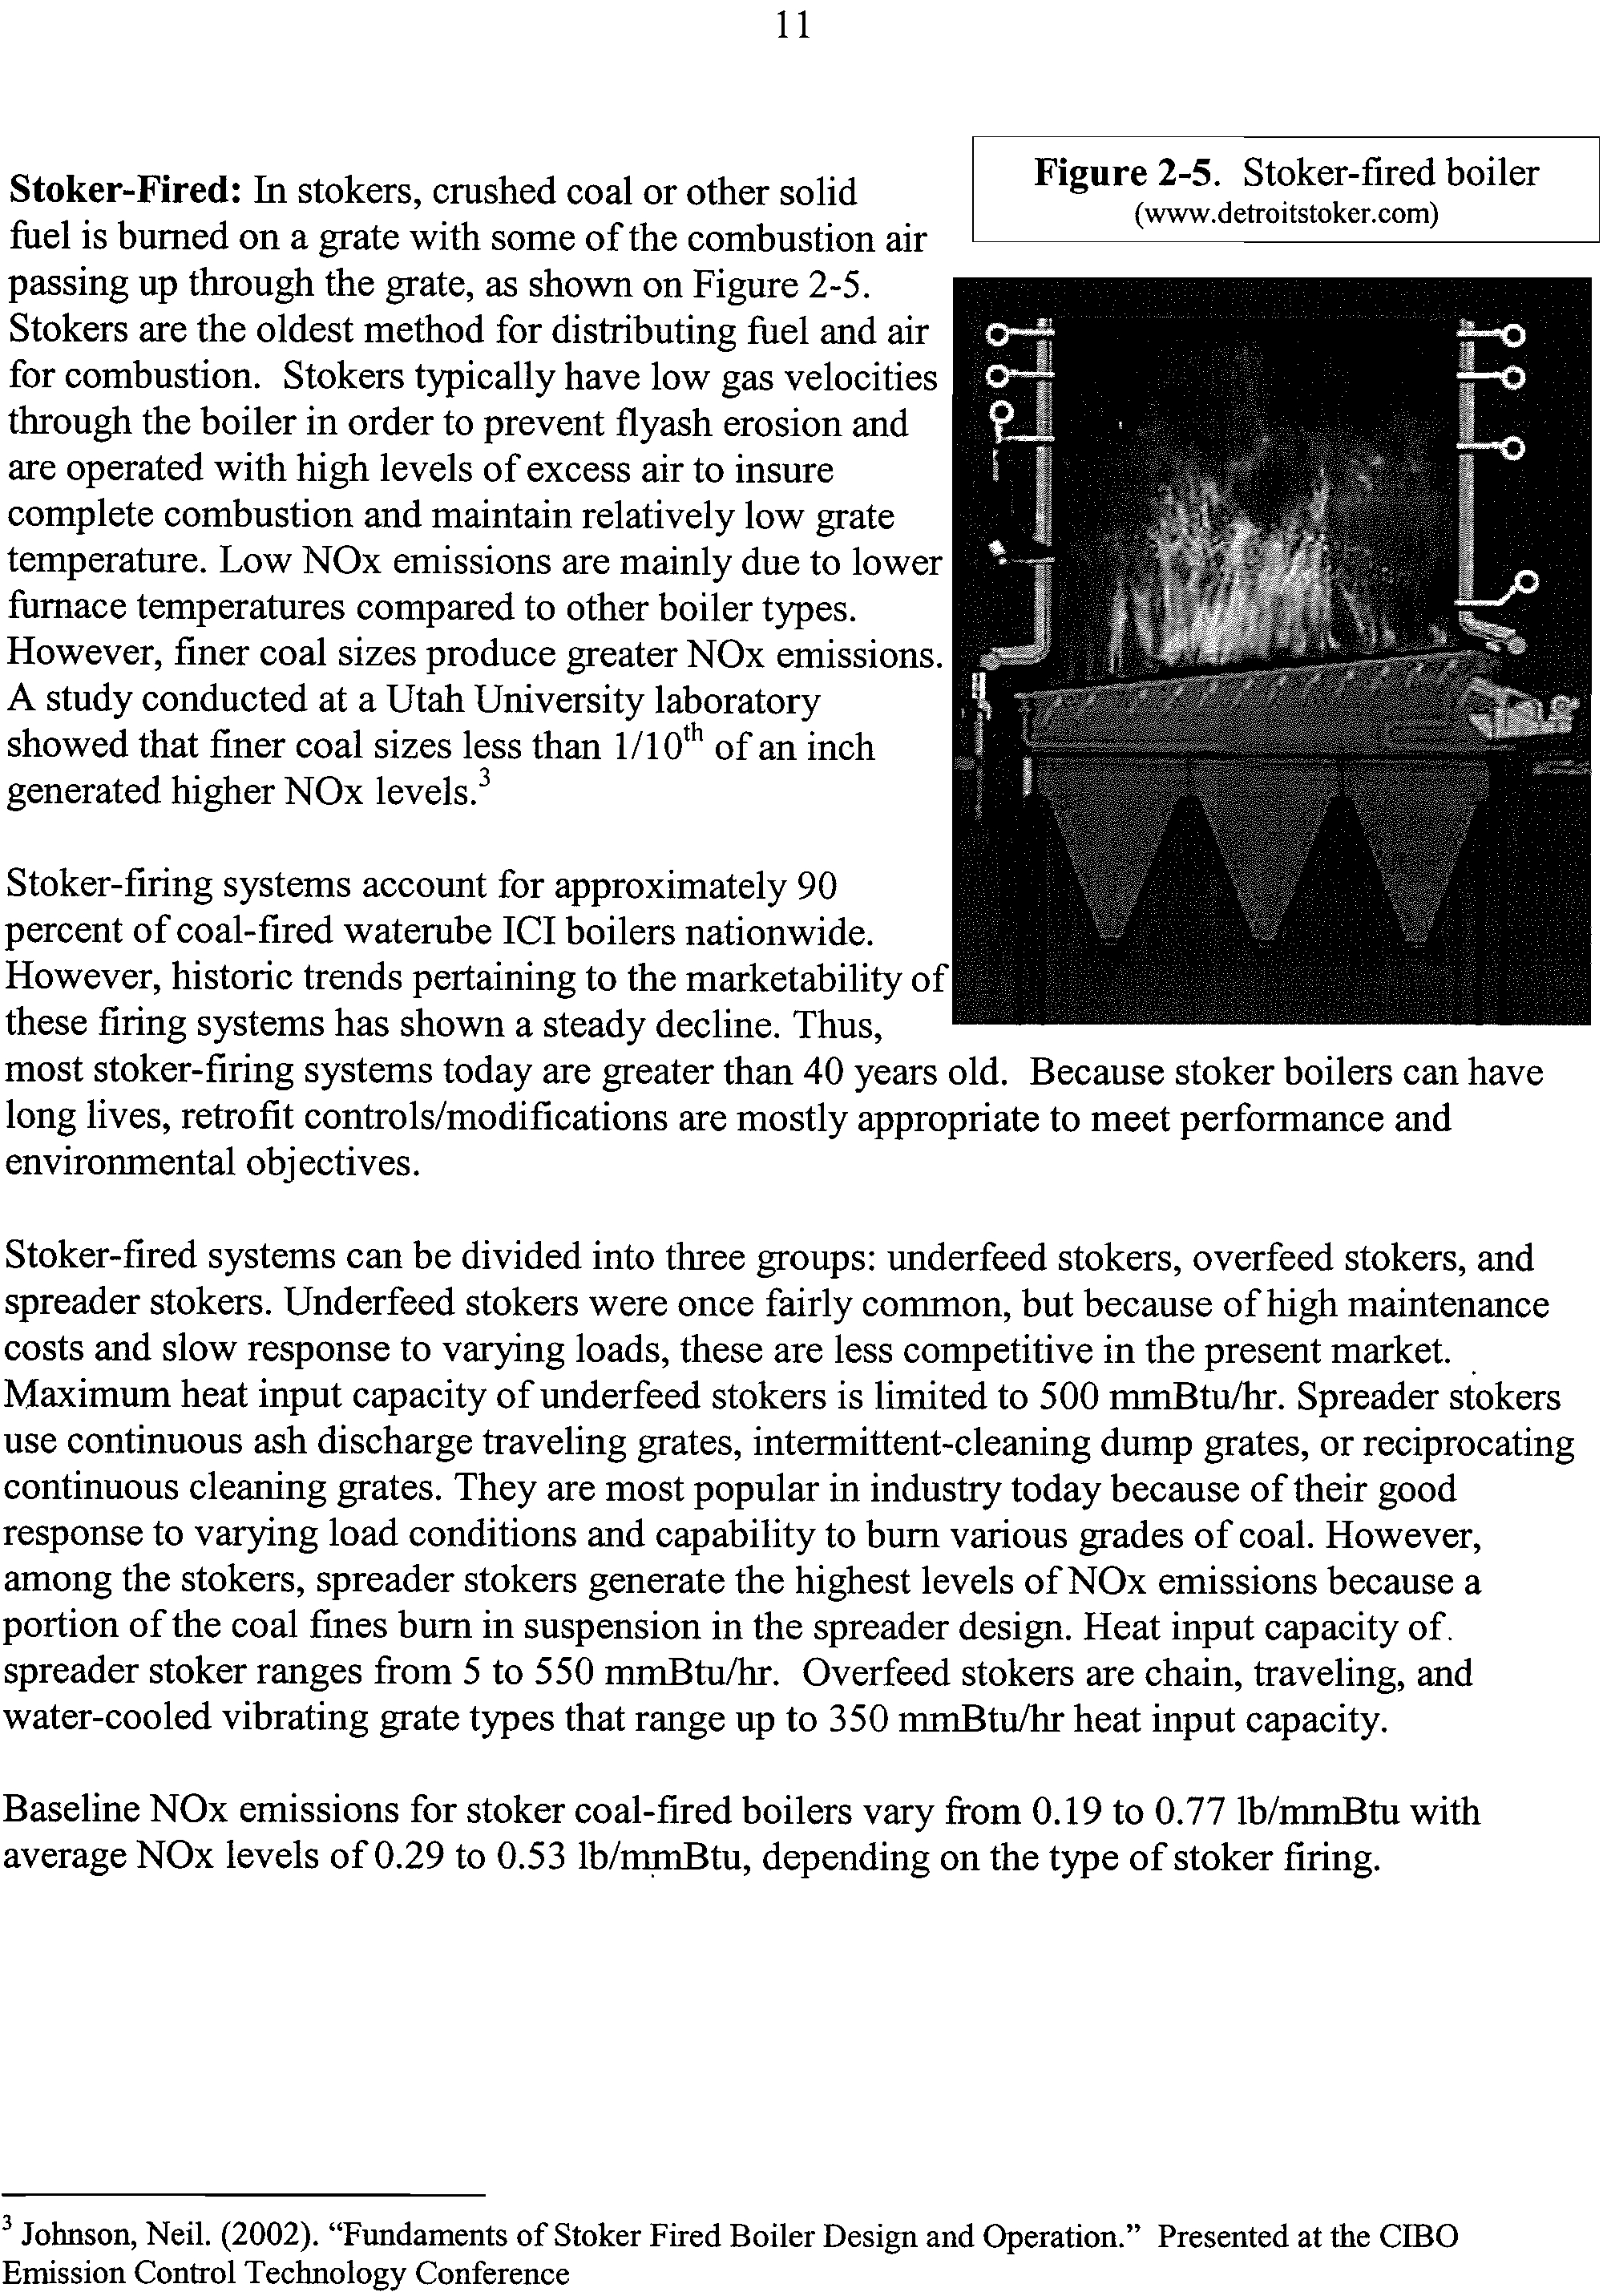
Figure 2-5.
Stoker-fired boiler
(www.detroitstoker.com)
11
Stoker-Fired:
In stokers, crushed coal or other solid
fuel is burned on a grate with some of the combustion air
passing up through the grate, as shown on Figure 2-5.
Stokers are the oldest method for distributing fuel and air
for combustion. Stokers typically have low gas velocities
through the boiler in order to prevent flyash erosion and
are operated with high levels of excess air to insure
complete combustion and maintain relatively low grate
temperature. Low NOx emissions are mainly due to lower
furnace temperatures compared to other boiler types.
However, finer coal sizes produce greater NOx emissions.
A study conducted at a Utah University laboratory
showed that finer coal sizes less than 1/10
th
of an inch
generated higher NOx levels.3
Stoker-firing systems account for approximately 90
percent of coal-fired waterube ICI boilers nationwide.
However, historic trends pertaining to the marketability of
these firing systems has shown a steady decline. Thus,
most stoker-firing systems today are greater than 40 years old. Because stoker boilers can have
long lives, retrofit controls/modifications are mostly appropriate to meet performance and
environmental objectives.
Stoker-fired systems can be divided into three groups: underfeed stokers, overfeed stokers, and
spreader stokers. Underfeed stokers were once fairly common, but because of high maintenance
costs and slow response to varying loads, these are less competitive in the present market.
Maximum heat input capacity of underfeed stokers is limited to 500 mmBtu/hr. Spreader stokers
use continuous ash discharge traveling grates, intermittent-cleaning dump grates, or reciprocating
continuous cleaning grates. They are most popular in industry today because of their good
response to varying load conditions and capability to burn various grades of coal. However,
among the stokers, spreader stokers generate the highest levels of NOx emissions because a
portion of the coal fines burn in suspension in the spreader design. Heat input capacity of.
spreader stoker ranges from 5 to 550 mmBtu/hr. Overfeed stokers are chain, traveling, and
water-cooled vibrating grate types that range up to 350 mmBtu/hr heat input capacity.
Baseline NOx emissions for stoker coal-fired boilers vary from 0.19 to 0.77 lb/mmBtu with
average NOx levels of 0.29 to 0.53 lb/mmBtu, depending on the type of stoker firing.
3
Johnson, Neil. (2002). "Fundaments of Stoker Fired Boiler Design and Operation." Presented at the CIBO
Emission Control Technology Conference
12
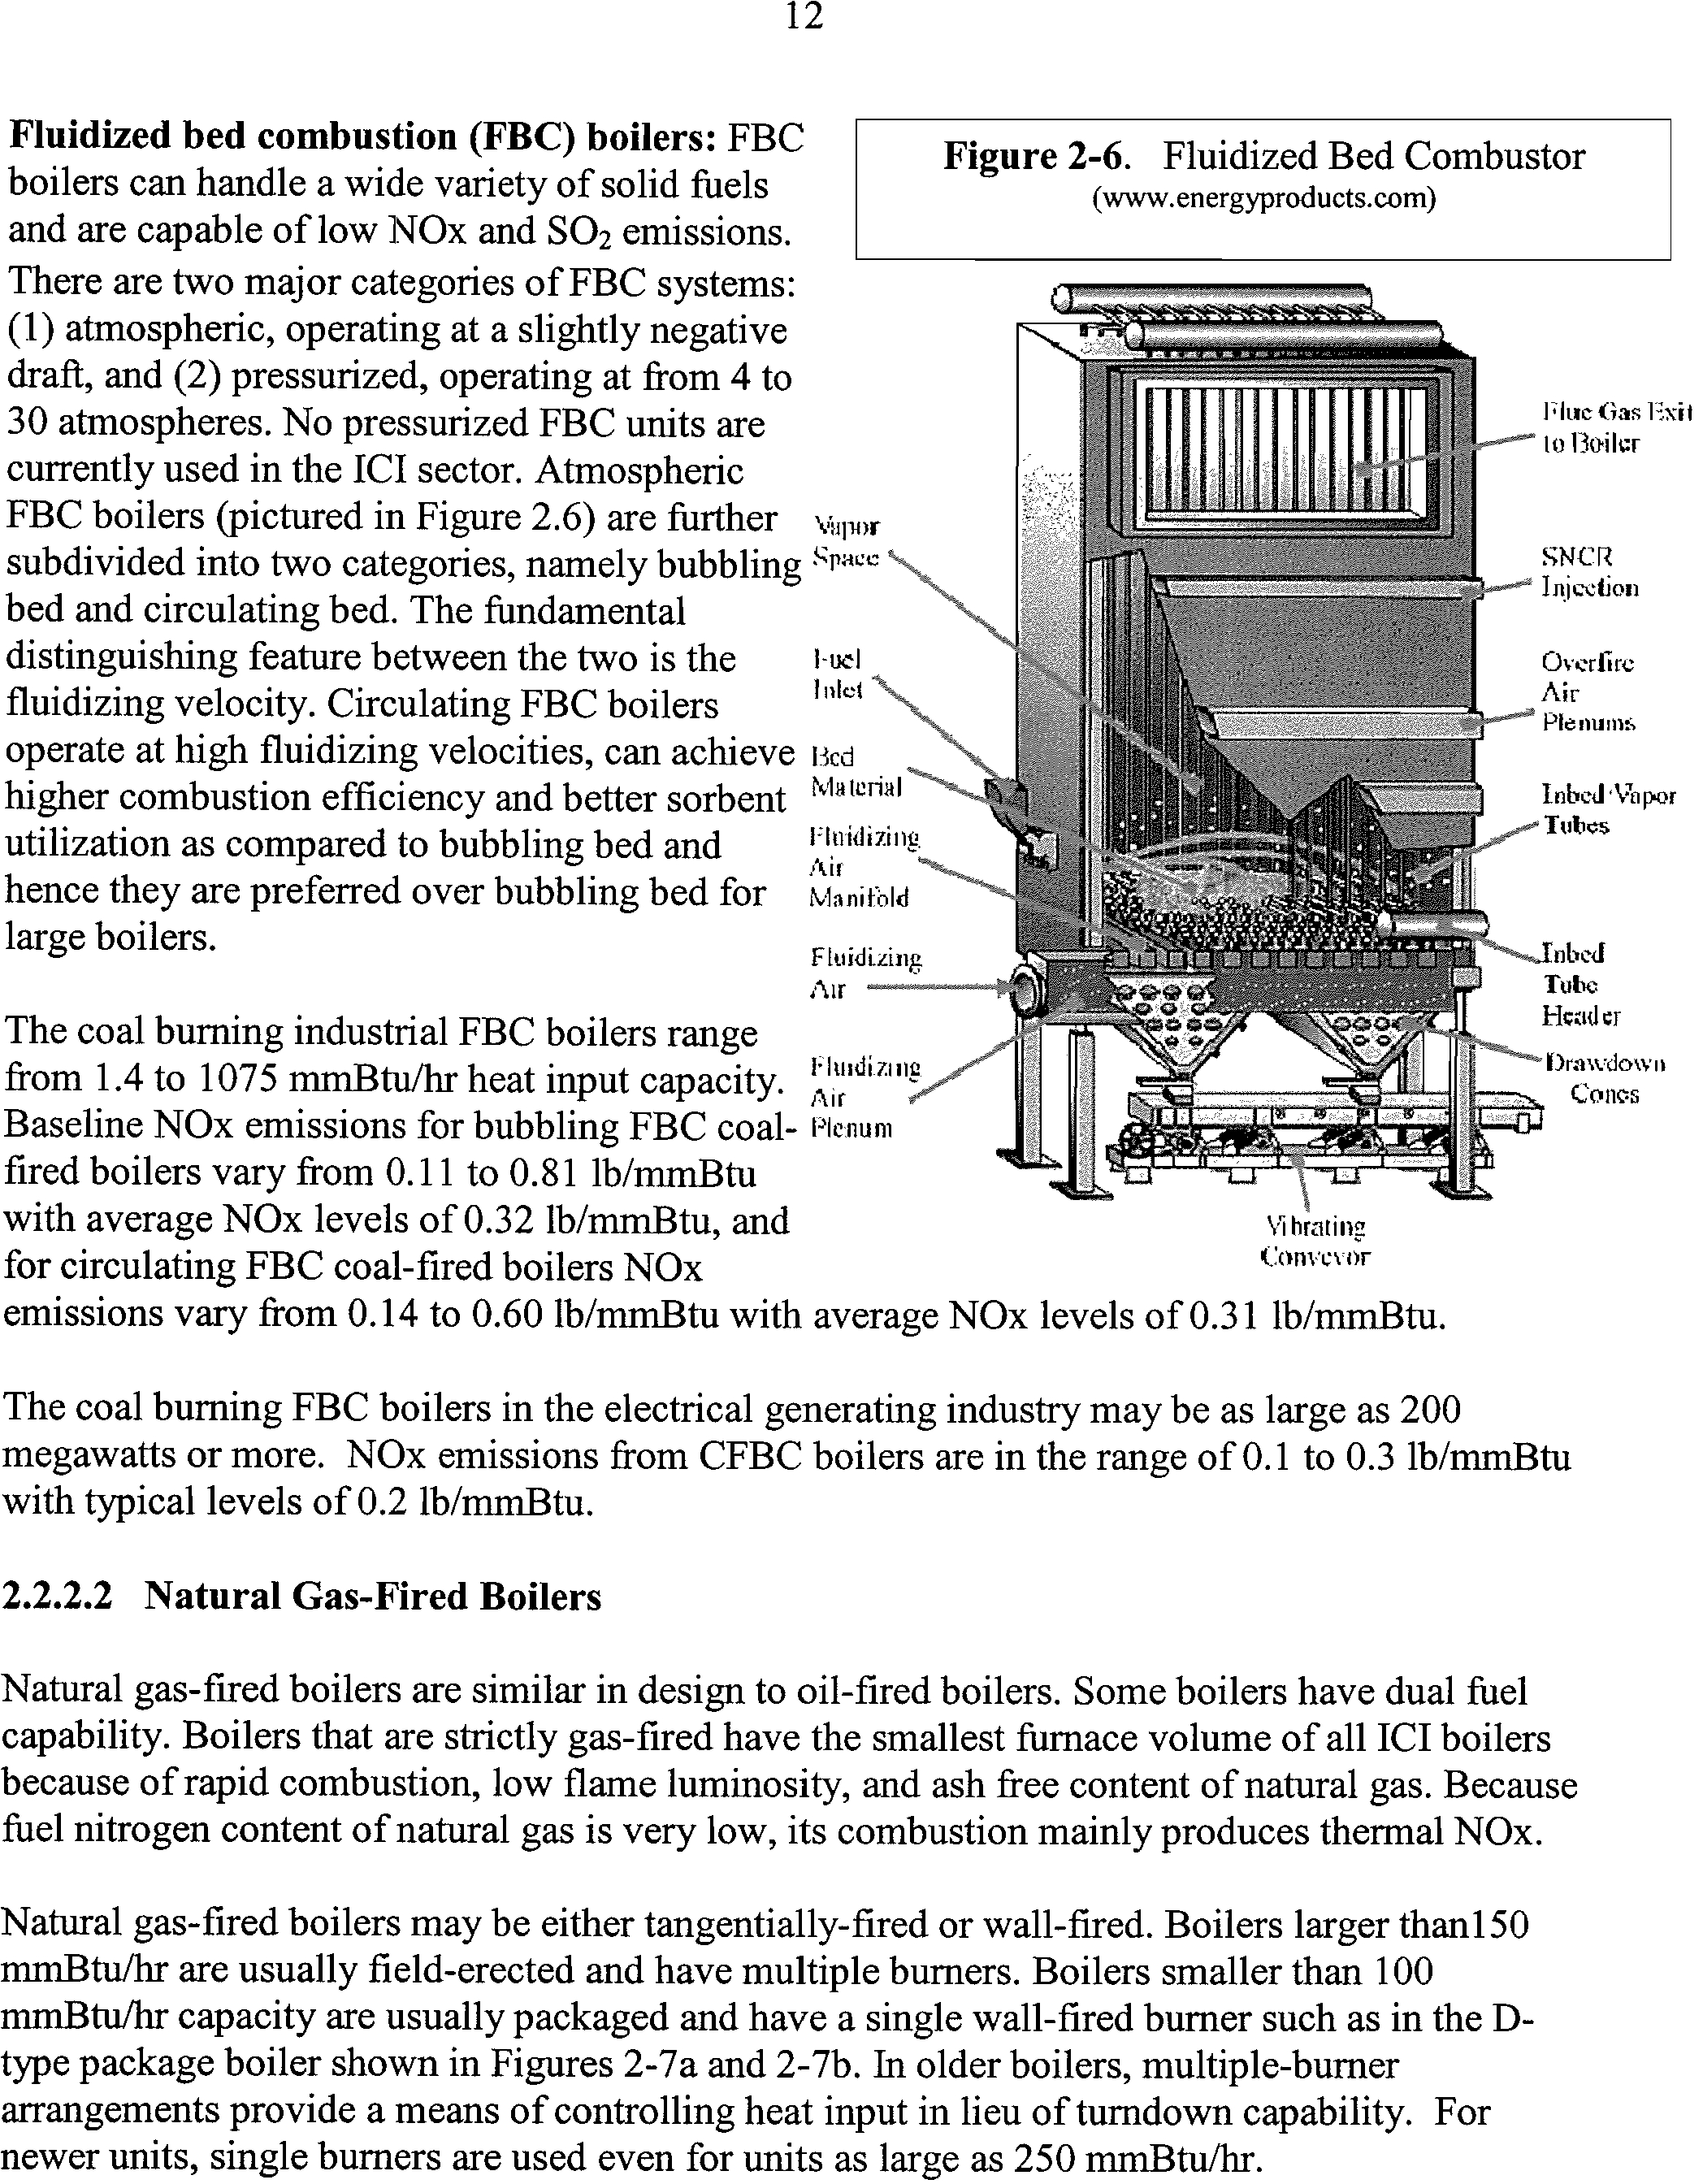
Figure
2-6. Fluidized Bed Combustor
(www.energyproducts.com)
Fluidized bed combustion (FBC) boilers: FBC
boilers can handle a wide variety of solid fuels
and are capable of low NOx and SO
2
emissions.
There are two major categories of FBC systems:
(1) atmospheric, operating at a slightly negative
draft, and (2) pressurized, operating at from 4 to
30 atmospheres. No pressurized FBC units are
currently used in the ICI sector. Atmospheric
FBC boilers (pictured in Figure 2.6) are further vupor
subdivided into two categories, namely bubbling 'I'aec-*
bed and circulating bed. The fundamental
distinguishing feature between the two is the
fluidizing velocity. Circulating FBC boilers
I nlet
operate at high fluidizing velocities, can achieve
I3cd
higher combustion efficiency and better sorbent
utilization as compared to bubbling bed and
hence they are preferred over bubbling bed for
large boilers.
rluc
Cas Exit
- to 13oiler
SNCR
Injection
Overtire
Air
Plenums
InbcJan
por
inbect
Tulle
Head
cr
Drawdow
gongs
VI hutting
Conveyor
levels of 0.31 lb/mmBtu.
Hoidizing
An
Manifold
F lu id iLitvi
The coal burning industrial FBC boilers range
from 1.4 to 1075 mmBtu/hr heat input capacity. lzdump
Baseline NOx emissions for bubbling FBC coal-
Plenum
fired boilers vary from 0.11 to 0.81 lb/mmBtu
with average NOx levels of 0.32 lb/mmBtu, and
for circulating FBC coal-fired boilers NOx
emissions vary from 0.14 to 0.60 lb/mmBtu with average NOx
The coal burning FBC boilers in the electrical generating industry may be as large as 200
megawatts or more. NOx emissions from CFBC boilers are in the range of 0.1 to 0.3 lb/mmBtu
with typical levels of 0.2 lb/mmBtu.
2.2.2.2
Natural Gas-Fired Boilers
Natural gas-fired boilers are similar in design to oil-fired boilers. Some boilers have dual fuel
capability. Boilers that are strictly gas-fired have the smallest furnace volume of all ICI boilers
because of rapid combustion, low flame luminosity, and ash free content of natural gas. Because
fuel nitrogen content of natural gas is very low, its combustion mainly produces thermal NOx.
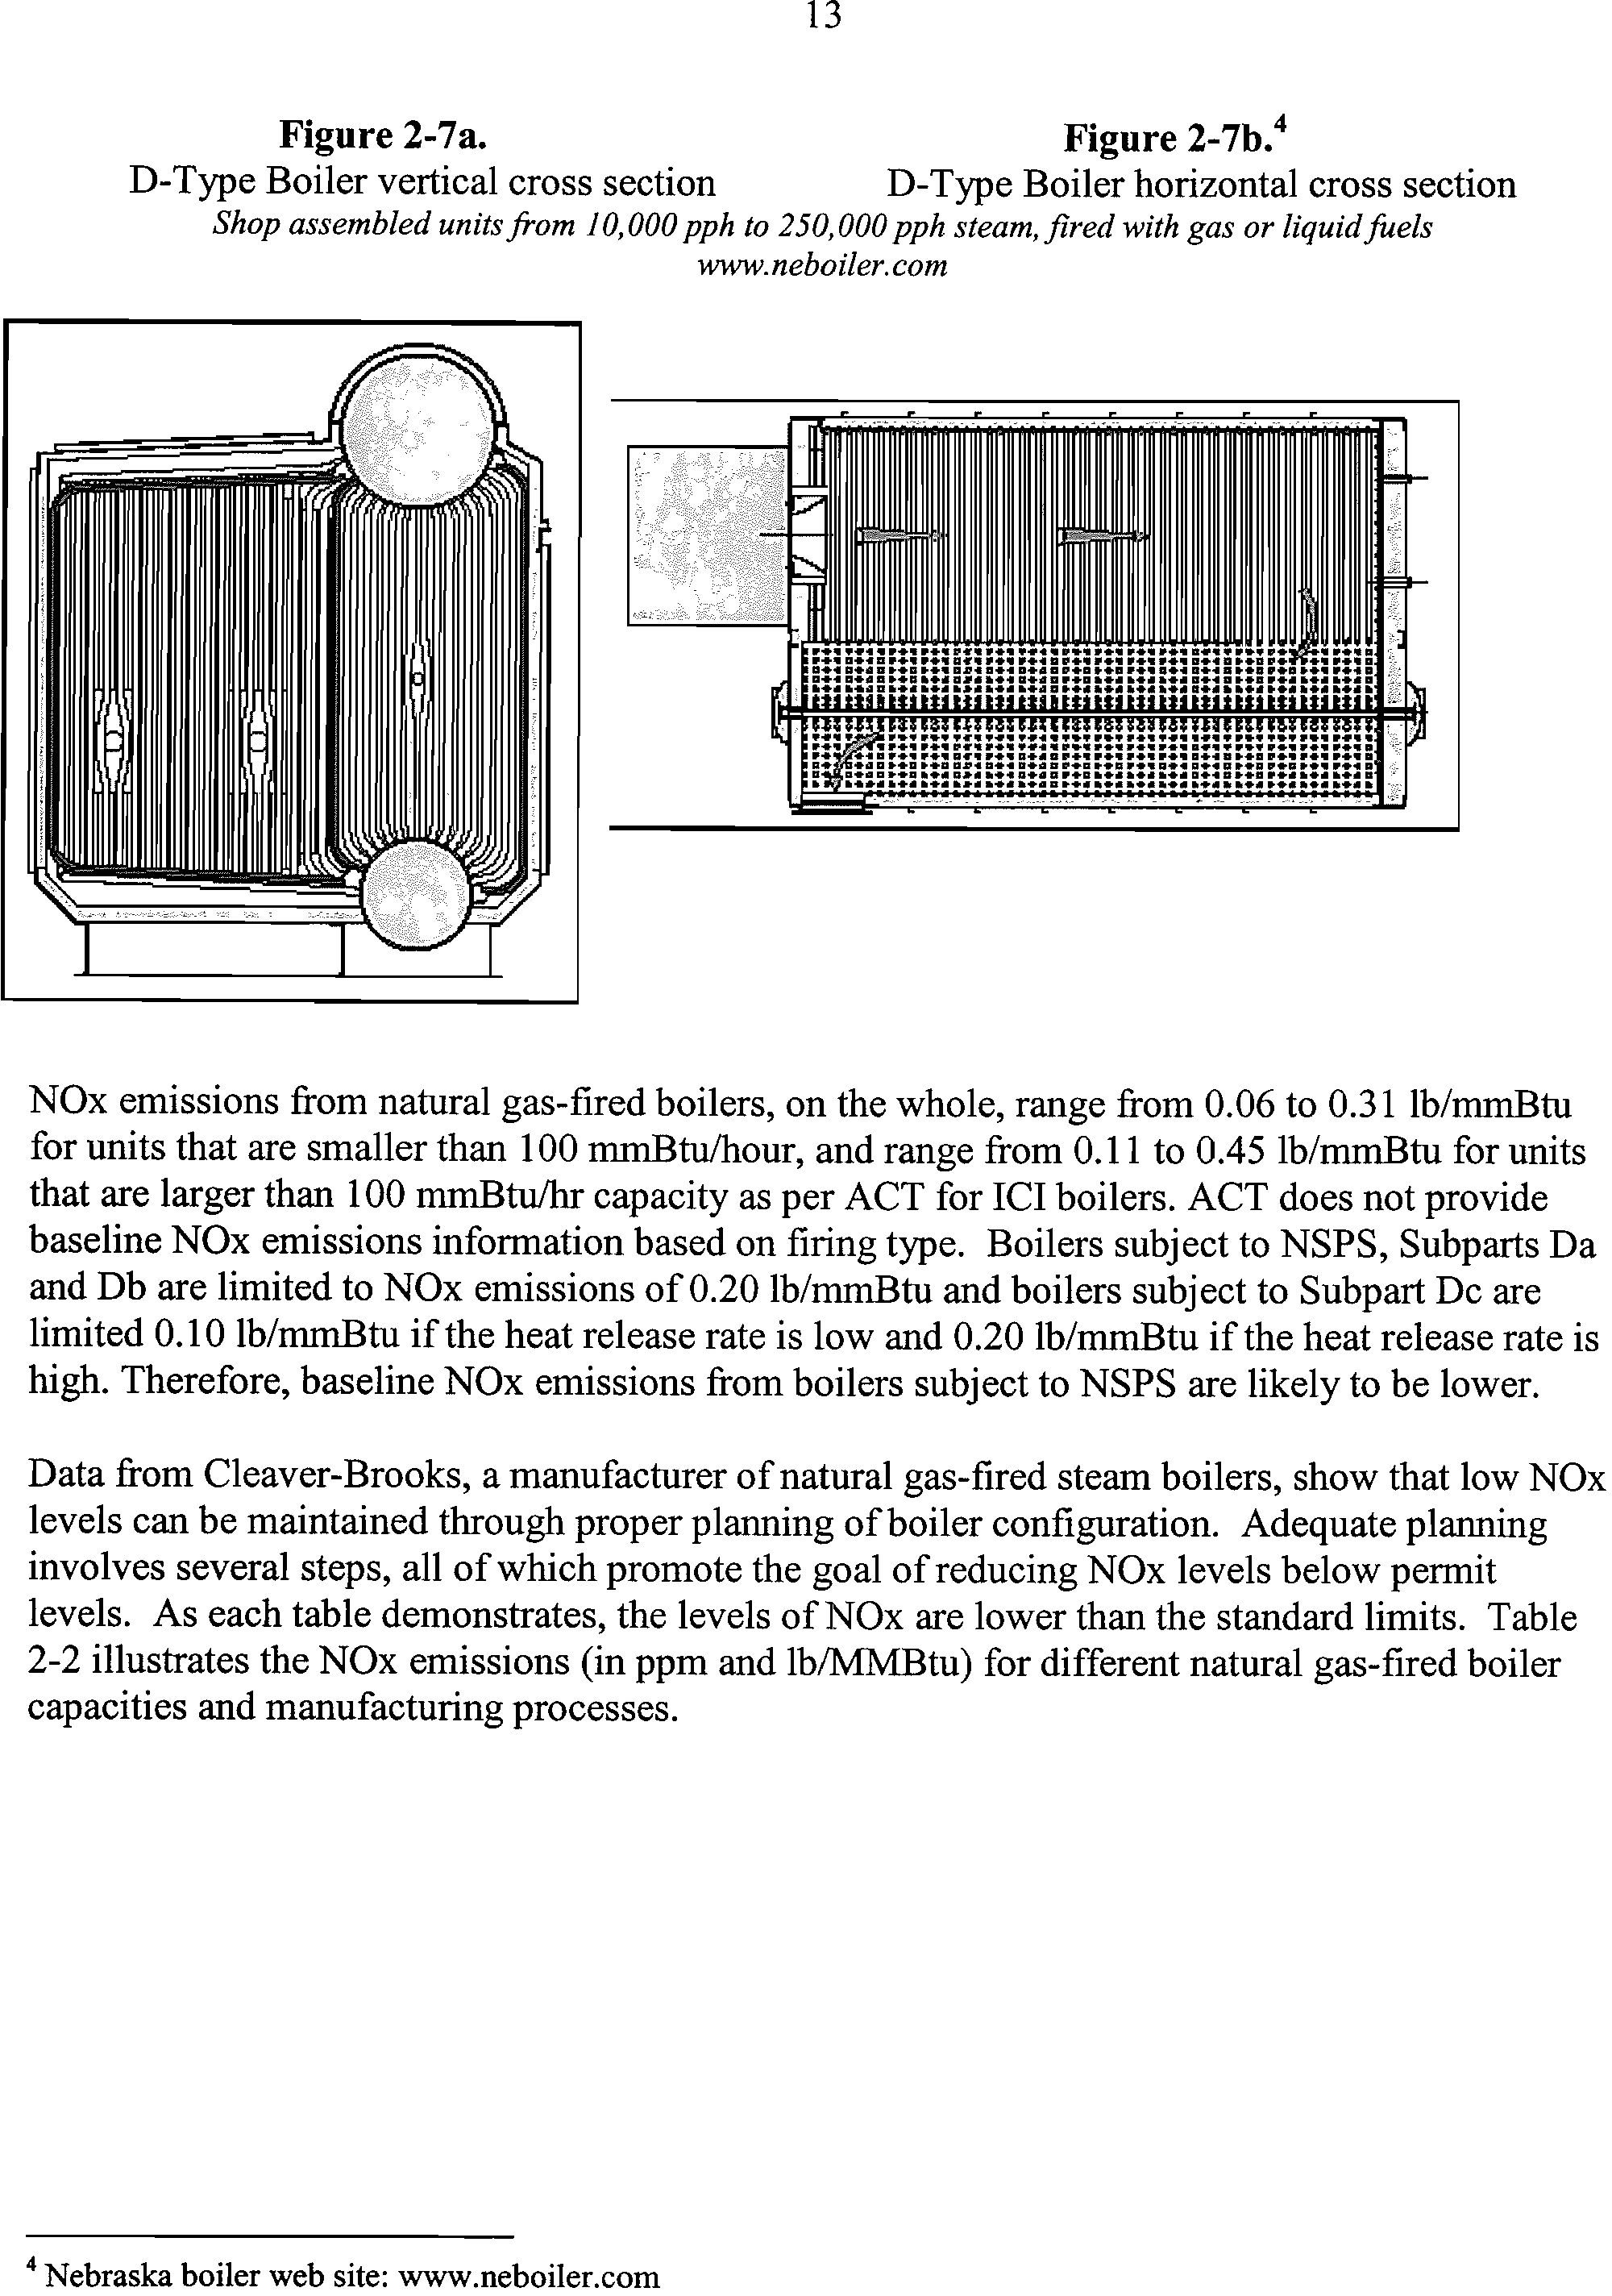
Natural gas-fired boilers may be either tangentially-fired or wall-fired. Boilers larger than150
mmBtu/hr are usually field-erected and have multiple burners. Boilers smaller than 100
mmBtu/hr capacity are usually packaged and have a single wall-fired burner such as in the D-
type package boiler shown in Figures 2-7a and 2-7b. In older boilers, multiple-burner
arrangements provide a means of controlling heat input in lieu of turndown capability. For
newer units, single burners are used even for units as large as 250 mmBtu/hr.
13
Figure 2-7a.
Figure 2-7b.4
D-Type Boiler vertical cross section
D-Type Boiler horizontal cross section
Shop assembled units from 10,000 pph to 250,000 pph steam, fired with gas or liquid fuels
www.neboiler.com
NOx emissions from natural gas-fired boilers, on the whole, range from 0.06 to 0.31 lb/mmBtu
for units that are smaller than 100 mmBtu/hour, and range from 0.11 to 0.45 lb/mmBtu for units
that are larger than 100 mmBtu/hr capacity as per ACT for ICI boilers. ACT does not provide
baseline NOx emissions information based on firing type. Boilers subject to NSPS, Subparts Da
and Db are limited to NOx emissions of 0.20 lb/mmBtu and boilers subject to Subpart Dc are
limited 0.10 lb/mmBtu if the heat release rate is low and 0.20 lb/mmBtu if the heat release rate is
high. Therefore, baseline NOx emissions from boilers subject to NSPS are likely to be lower.
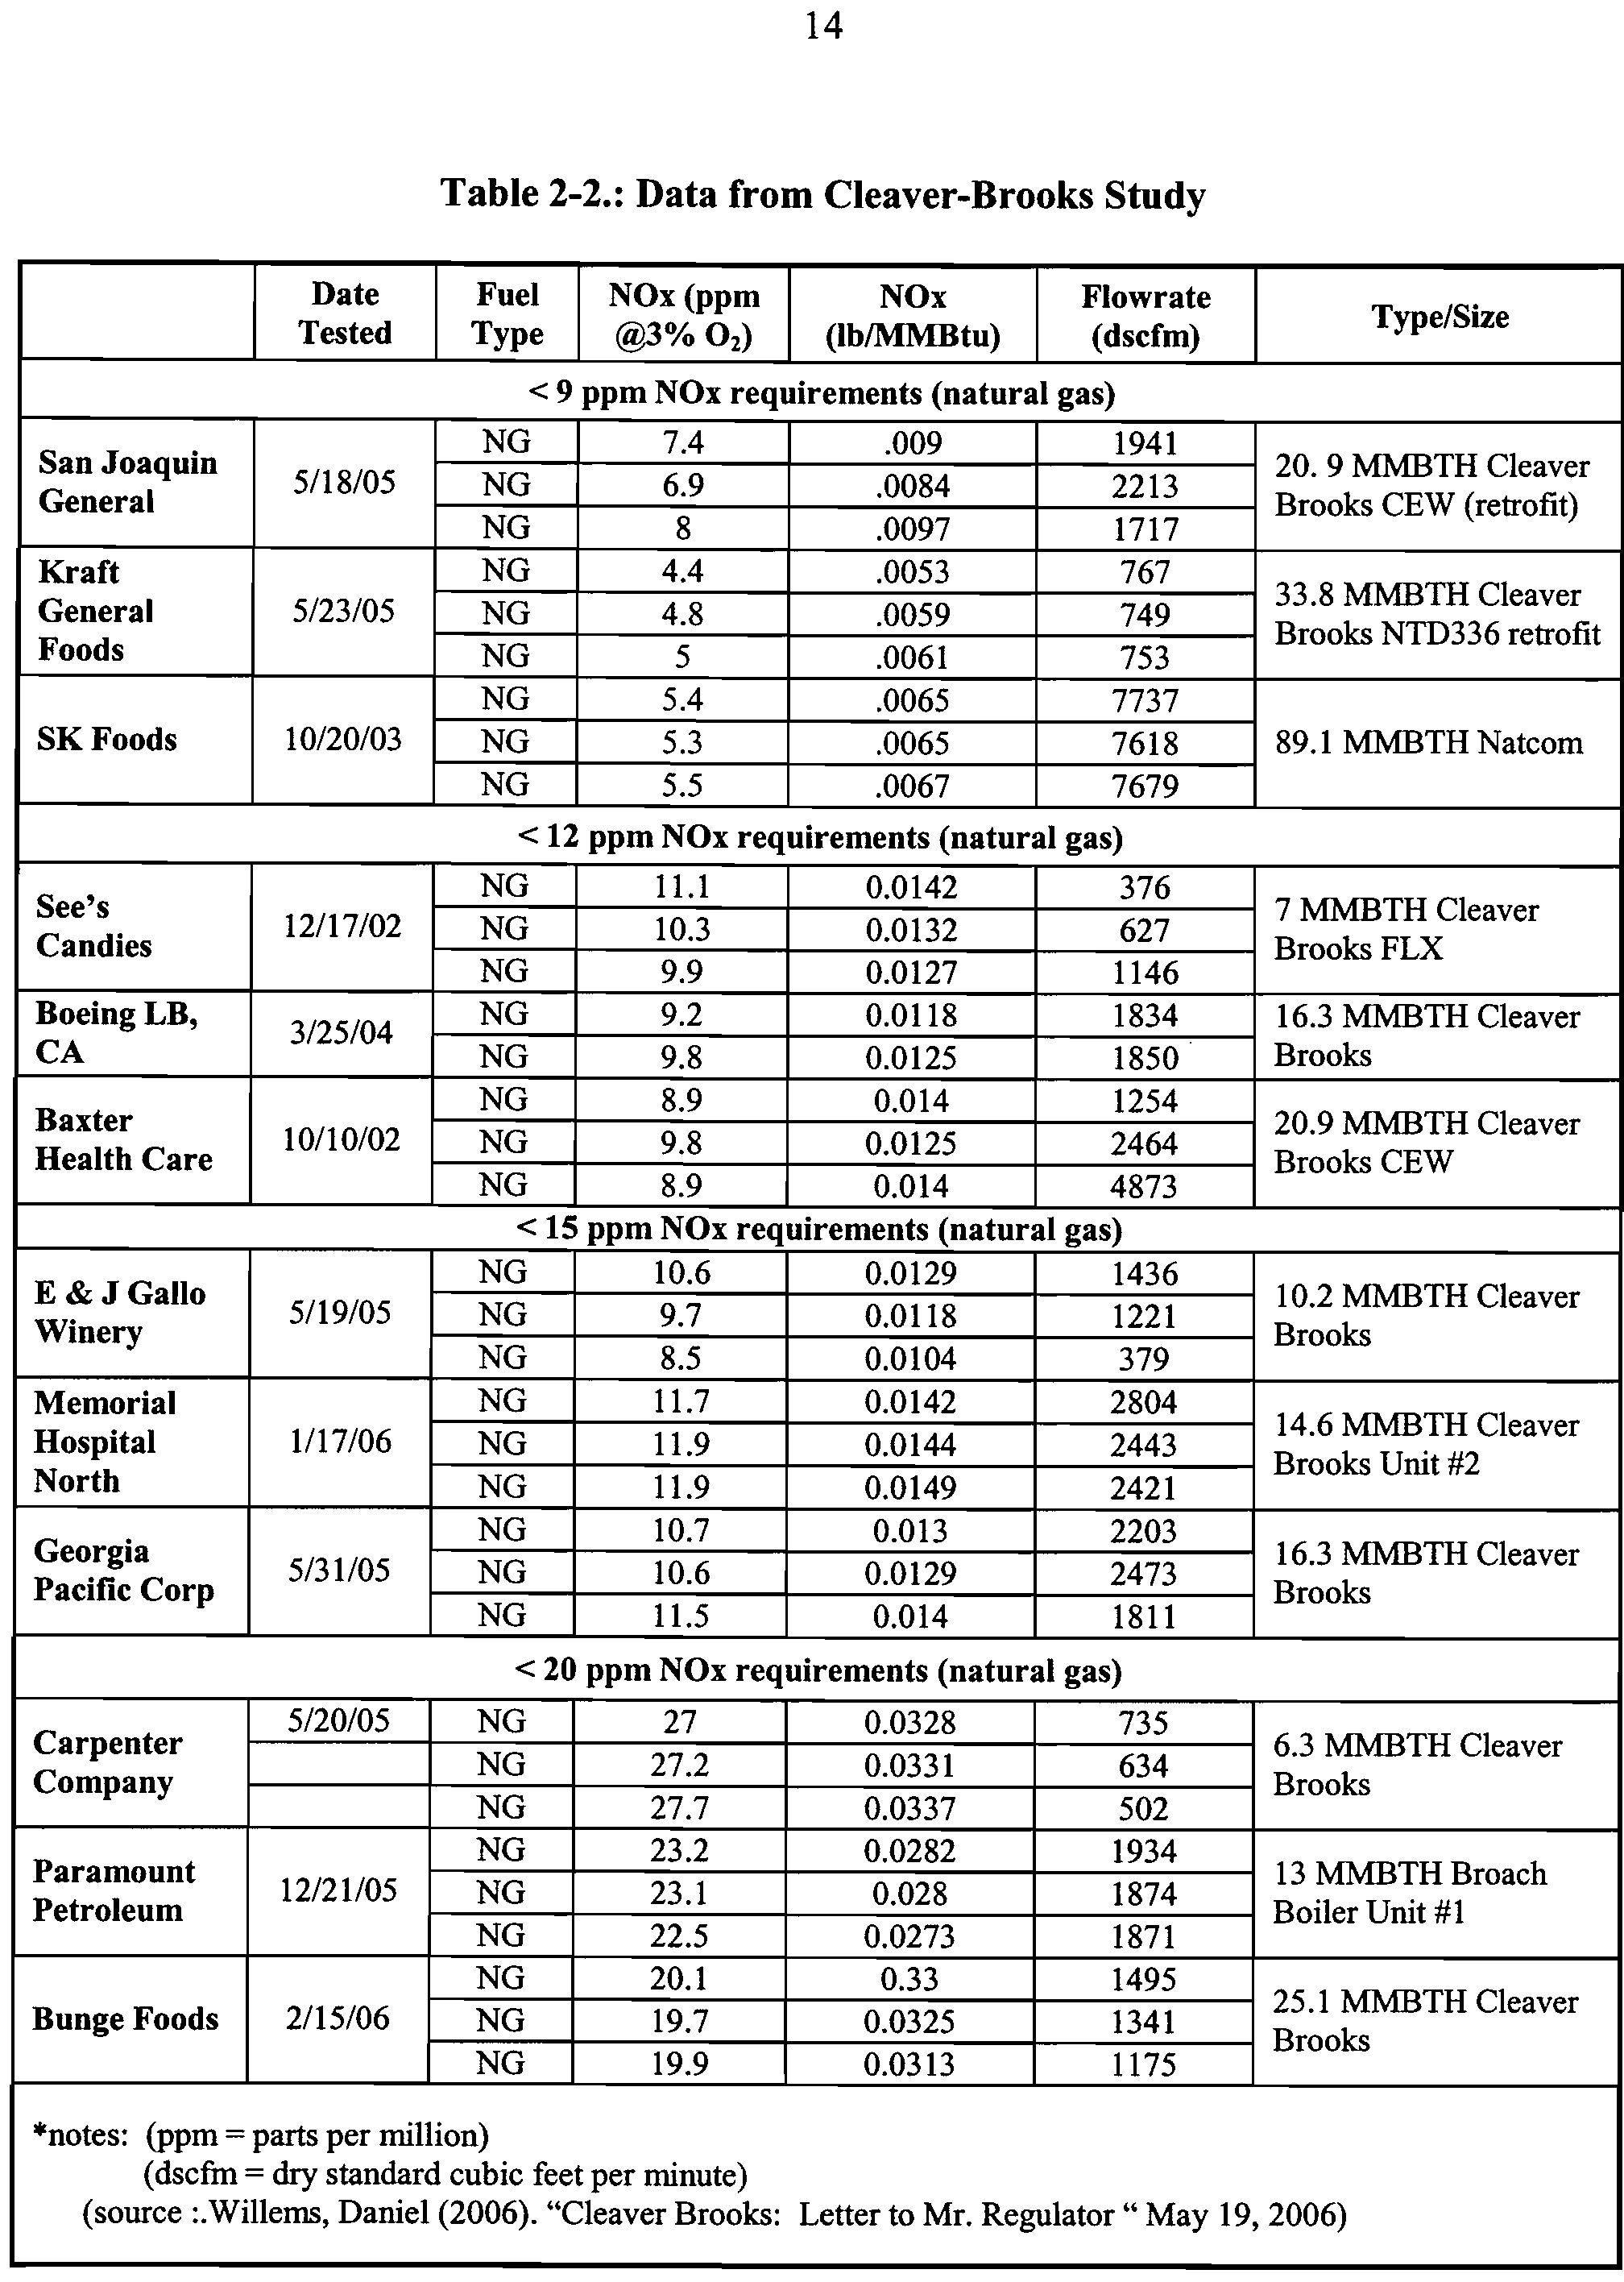
Data from Cleaver-Brooks, a manufacturer of natural gas-fired steam boilers, show that low NOx
levels can be maintained through proper planning of boiler configuration. Adequate planning
involves several steps, all of which promote the goal of reducing NOx levels below permit
levels. As each table demonstrates, the levels of NOx are lower than the standard limits. Table
2-2 illustrates the NOx emissions (in ppm and lb/MMBtu) for different natural gas-fired boiler
capacities and manufacturing processes.
4
Nebraska boiler web site: www.neboiler.com
14
Table 2-2.: Data from Cleaver-Brooks Study
Date
Tested
Fuel
Type
NOx (ppm
@3% 0
2
)
NOx
(lb/MMBtu)
Flowrate
(dscfm)
Type/Size
<
9 ppm
NOx
requirements
(natural gas)
San Joaquin
General
5/18/05
NG
7.4
.009
1941
20. 9 MMBTH Cleaver
Brooks CEW (retrofit)
NG
6.9
.0084
2213
NG
8
.0097
1717
Kraft
NG
4.4
.0053
767
General
Foods
5/23/05
33.8 MMBTH Cleaver
Brooks NTD336 retrofit
NG
4.8
.0059
749
NG
5
.0061
753
NG
5.4
.0065
7737
SK
Foods
10/20/03
NG
5.3
.0065
7618
89.1 MMBTH Natcom
NG
5.5
.0067
7679
<
12
ppm NOx
requirements
(natural gas)
See's
Candies
12/17/02
NG
11.1
0.0142
376
7 MMBTH Cleaver
Brooks FLX
NG
10.3
0.0132
627
NG
9.9
0.0127
1146
Boeing LB,
CA
3/25/04
NG
9.2
0.0118
1834
16.3 MMBTH Cleaver
NG
9.8
0.0125
1850
Brooks
Baxter
Health Care
10/10/02
NG
8.9
0.014
1254
20.9 MMBTH Cleaver
Brooks CEW
NG
9.8
0.0125
2464
NG
8.9
0.014
4873
<
15
ppm NOx requirements (natural gas)
E
&
J Gallo
Winery
5/19/05
NG
10.6
0.0129
1436
10.2 MMBTH Cleaver
Brooks
NG
9.7
0.0118
1221
NG
8.5
0.0104
379
Memorial
NG
11.7
0.0142
2804
Hospital
1/17/06
NG
11.9
0.0144
2443
14.6 MMBTH Cleaver
North
Brooks Unit #2
NG
11.9
0.0149
2421
Georgia
Pacific Corp
5/31/05
NG
10.7
0.013
2203
16.3 MMBTH Cleaver
Brooks
NG
10.6
0.0129
2473
NG
11.5
0.014
1811
<
20 ppm NOx requirements (natural gas)
Carpenter
Company
5/20/05
NG
27
0.0328
735
6.3 MMBTH Cleaver
Brooks
NG
27.2
0.0331
634
NG
27.7
0.0337
502
Paramount
Petroleum
12/21/05
NG
23.2
0.0282
1934
13 MMBTH Broach
Boiler Unit #1
NG
23.1
0.028
1874
NG
22.5
0.0273
1871
NG
20.1
0.33
1495
Bunge Foods
2/15/06
25.1 MMBTH Cleaver
Brooks
NG
19.7
0.0325
1341
NG
19.9
0.0313
1175
*notes: (ppm
=
parts per million)
(dscfin
=
dry standard cubic feet per minute)
(source :.Willems, Daniel (2006). "Cleaver Brooks: Letter to Mr. Regulator " May 19, 2006)
15
2.2.2.3
Oil-Fired Boilers
Oil-fired boilers do not require as large a furnace volume as coal-fired boilers for complete
combustion. Similarly, because the combustion gases contain less entrained ash, the convective
pass of oil-fired boilers can be more compact than coal-fired boilers, but tend to be somewhat
larger than gas-fired boilers. In addition, oil-fired boilers operate at lower excess air levels than
coal-fired boilers. The more compact design of oil-burning furnaces has an impact on NOx
emissions from oil-fired units. Even though the nitrogen content of oil is generally lower than
that of coal, higher flame temperatures result in increased formation of thermal NOx. This
thermal NOx contribution can more than offset the lower fuel NOx contribution from the oil.
Oil-fired boilers may be subdivided into tangential, vertical, and wall-fired units. Boilers larger
than 150 mmBtu/hr capacity are usually field-erected and have multiple burners. Boilers smaller
than 100 mmBtu/hr capacity are usually packaged and have single burners. In older boilers,
multiple-burner arrangements provide a means of controlling heat input in lieu of turndown
capability. For newer units, single burners are used even for units as large as 200 mmBtu/hr.
Among oil-fired boilers, tangentially-fired boilers generate lower NOx emissions compared to
other types of boilers because of lower peak flame temperatures. For distillate oil-fired watertube
boilers NOx emissions range from 0.08 to 0.16 lb/mmBtu for units that are smaller than 100
mmBtu/hour, and range from 0.18 to 0.23 lb/mmBtu for units that are larger than100
mmBtu/hour capacity as per ACT for ICI boilers. For residual oil-fired watertube boilers NOx
emissions range from 0.20 to 0.79 lb/mmBtu for units that are smaller than 100 mmBtu/hour, and
range from 0.31 to 0.60 lb/mmBtu for units that are larger than100 mmBtu/hour capacity as per
ACT for ICI boilers. ACT for ICI boilers does not provide baseline NOx emissions information
based on firing type. NSPS, Subpart Da and Db limit NOx emissions to 0.80 and 0.30
lb/mmBtu, respectively, and boilers subject to Subpart Dc are limited to 0.30 lb/mmBtu if the
heat release rate is low and 0.40 lb/mmBtu if the heat release rate is high. Therefore baseline
NOx emissions from boilers subject to NSPS are likely to be lower.
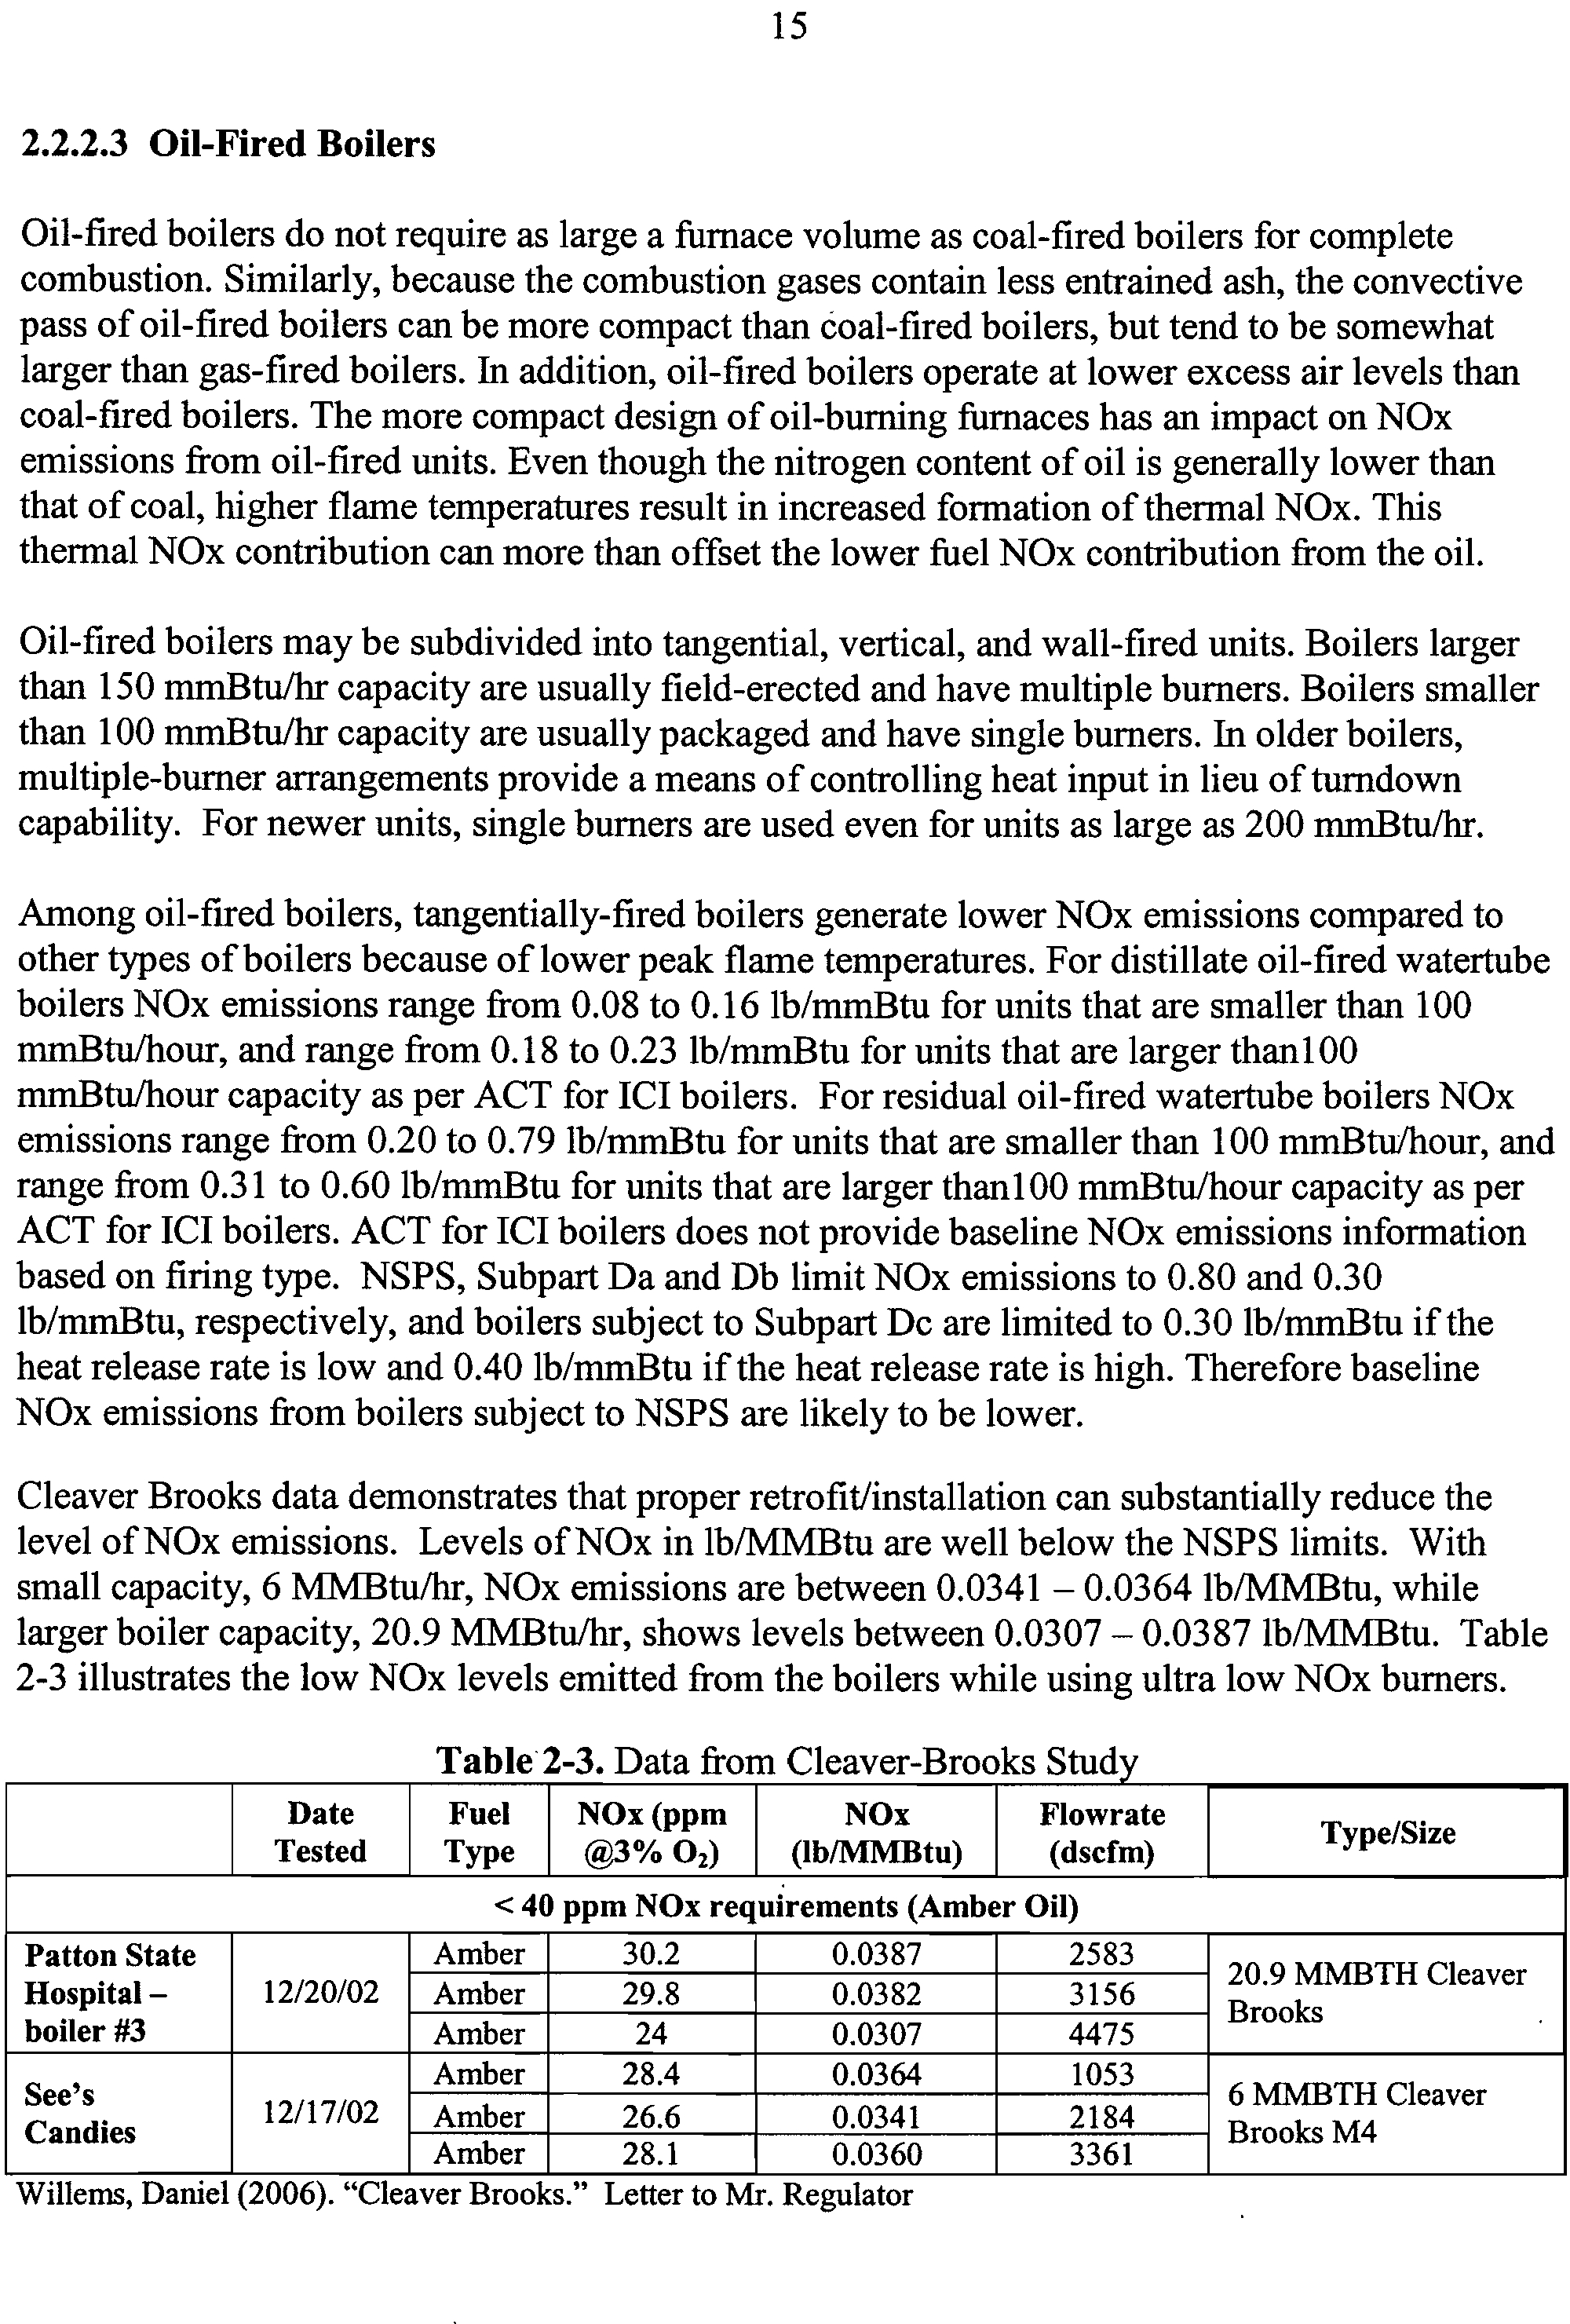
Cleaver Brooks data demonstrates that proper retrofit/installation can substantially reduce the
level of NOx emissions. Levels of NOx in lb/MMBtu are well below the NSPS limits. With
small capacity, 6 MMBtu/hr, NOx emissions are between 0.0341 - 0.0364 lb/MMBtu, while
larger boiler capacity, 20.9 MMBtu/hr, shows levels between 0.0307 - 0.0387 lb/MMBtu. Table
2-3 illustrates the low NOx levels emitted from the boilers while using ultra low NOx burners.
Table
2-3. Data from Cleaver-Brooks Stud
Date
Tested
Fuel
Type
NOx (ppm
@3% 0
2
)
NOx
(lb/MMBtu)
Flowrate
(dscfm)
Type/Size
<
40 ppm NOx requirements (Amber Oil)
Patton State
Hospital -
12/20/02
Amber
30.2
0.0387
2583
20.9 MMBTH Cleaver
Brooks
Amber
29.8
0.0382
3156
Amber
24
0.0307
boiler #3
4475
See's
Candies
12/17/02
Amber
28.4
0.0364
1053
6 MMBTH Cleaver
Brooks M4
Amber
26.6
0.0341
2184
Amber
28.1
0.0360
3361
Wilkins, Daniel (2006). "Cleaver Brooks." Letter to Mr. Regulator
16
2.2.3
Fuel Characteristics
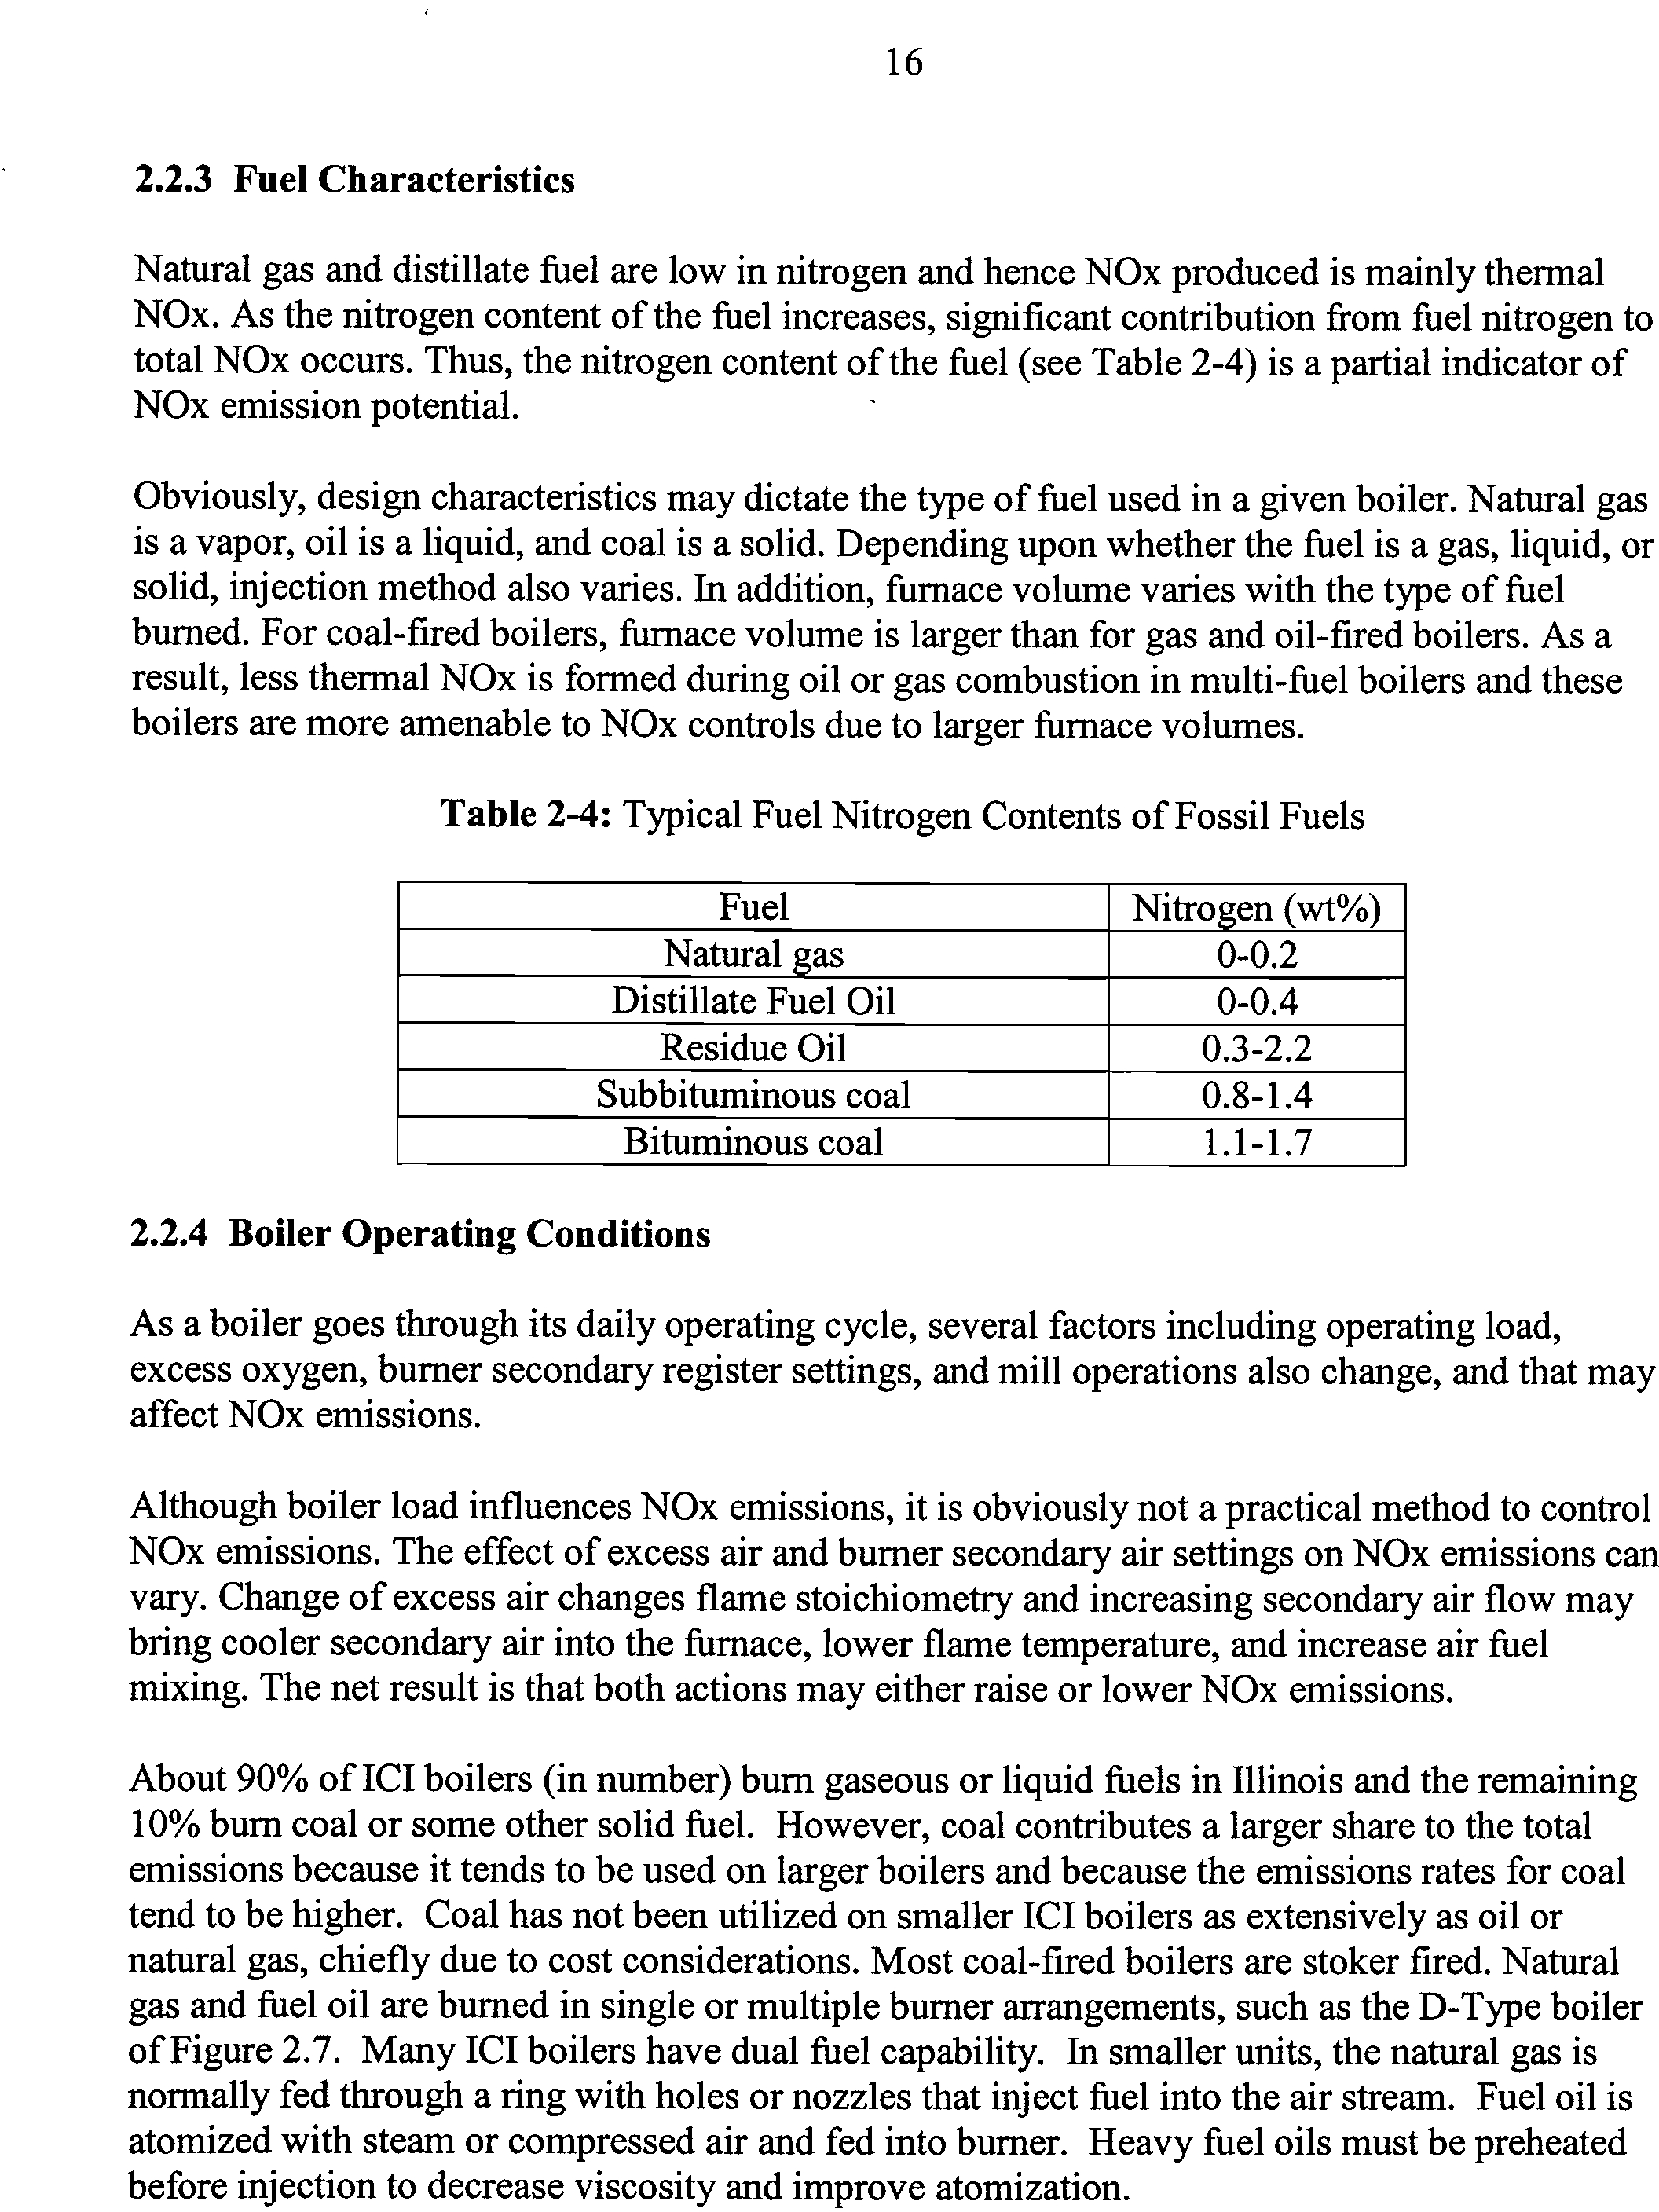
Natural gas and distillate fuel are low in nitrogen and hence NOx produced is mainly thermal
NOx. As the nitrogen content of the fuel increases, significant contribution from fuel nitrogen to
total NOx occurs. Thus, the nitrogen content of the fuel (see Table
2-4)
is a partial indicator of
NOx emission potential.
Obviously, design characteristics may dictate the type of fuel used in a given boiler. Natural gas
is a vapor, oil is a liquid, and coal is a solid. Depending upon whether the fuel is a gas, liquid, or
solid, injection method also varies. In addition, furnace volume varies with the type of fuel
burned. For coal-fired boilers, furnace volume is larger than for gas and oil-fired boilers. As a
result, less thermal NOx is formed during oil or gas combustion in multi-fuel boilers and these
boilers are more amenable to NOx controls due to larger furnace volumes.
Table
2-4: Typical Fuel Nitrogen Contents of Fossil Fuels
Fuel
Nitrogen (wt%)
Natural gas
0-0.2
Distillate Fuel Oil
0-0.4
Residue Oil
0.3-2.2
Subbituminous coal
0.8-1.4
Bituminous coal
1.1-1.7
2.2.4 Boiler Operating Conditions
As a boiler goes through its daily operating cycle, several factors including operating load,
excess oxygen, burner secondary register settings, and mill operations also change, and that may
affect NOx emissions.
Although boiler load influences NOx emissions, it is obviously not a practical method to control
NOx emissions. The effect of excess air and burner secondary air settings on NOx emissions can
vary. Change of excess air changes flame stoichiometry and increasing secondary air flow may
bring cooler secondary air into the furnace, lower flame temperature, and increase air fuel
mixing. The net result is that both actions may either raise or lower NOx emissions.
About 90% of ICI boilers (in number) burn gaseous or liquid fuels in Illinois and the remaining
10% burn coal or some other solid fuel. However, coal contributes a larger share to the total
emissions because it tends to be used on larger boilers and because the emissions rates for coal
tend to be higher. Coal has not been utilized on smaller ICI boilers as extensively as oil or
natural gas, chiefly due to cost considerations. Most coal-fired boilers are stoker fired. Natural
gas and fuel oil are burned in single or multiple burner arrangements, such as the D-Type boiler
of Figure
2.7.
Many ICI boilers have dual fuel capability. In smaller units, the natural gas is
normally fed through a ring with holes or nozzles that inject fuel into the air stream. Fuel oil is
atomized with steam or compressed air and fed into burner. Heavy fuel oils must be preheated
before injection to decrease viscosity and improve atomization.
17
Stoker-firing systems account for approximately 90 percent of coal-fired watertube ICI boilers
nationwide. Coal in crushed form is burned mostly on a grate (moving or vibrating) in stoker-
fired boilers. Stoker systems can be divided into three groups: underfeed stokers, overfeed
stokers and spreader stokers. These systems differ in how fuel is supplied to either a moving or a
vibrating grate for burning. The most popular methods are the spreader and overfeed. All stokers
use underfeed air to combust char on grate, combined with one or more levels of overfire air
introduced above the grate. This helps ensure complete combustion of volatiles and low
combustion emissions.
Pulverized coal is typically burned only in boilers larger than 100 mmBtu/hr. Below this level,
the required coal-handling and pulverizing equipment make pulverized coal uneconomical.
Pulverized coal-burn coal is broken up in a mill to a consistency of talcum powder (i.e., at least
70% of the particles will pass through a 200-mesh sieve). PC-fired boilers account for a small
percentage of the ICI watertube boiler population. However, they tend to be the largest ICI
boilers and therefore the highest emitters.
In fluidized bed combustion (FBC) boilers, crushed coal is burned either in a stationary bubbling
bed or in a circulating fluidized bed. The bed material is often a mixture of sand and limestone
for capturing S0
2
. They operate at much lower temperatures compared to PC boilers. FBC
boilers have become particularly popular because they emit low NOx and S02 emissions and can
burn low grade coals.
Many small boilers operate with little supervision and are fully automated. Industrial boilers may
be located either inside the buildings or outside the buildings. Most commercial and institutional
boilers are fully enclosed inside buildings. The location of these boilers often influences the
feasibility of retrofit for some control technologies because of poor access and limited available
space.
2.2.5
Baseline NOx Emissions
Baseline NOx emissions are strongly influenced by boiler design, type of fuel burned, peak
flame temperature, and oxygen concentration. Coal-fired generally emit higher NOx emissions
than oil-and natural gas-fired boilers because of higher fuel nitrogen contents. Natural gas-fired
boilers emit the lowest NOx emissions because natural gas has very low fuel nitrogen contents.
Among coal-fire boilers, cyclone-fired boilers emit highest NOx emissions because of higher
flame temperature. Among stoker coal-fired boilers, spreader stoker boilers emit the highest NOx
emissions because a portion of coal fines burn in suspension in the spreader design. Fluidized
bed boilers emit significantly lower NOx emissions compared to PC- fired units because they
operate at much lower temperatures. The large variations in baseline NOx emissions from FBC
boilers are due to variations in air distribution amongst FBC units. Newer FBC boilers
incorporate a staged air addition that suppresses NOx levels.
Among oil-fired boilers, distillate oil-fired boilers emit the least amount of NOx emissions
because of lower fuel nitrogen contents. The nitrogen content of residual fuel oils varies from 0.3
to 2.2 percent. This large variation in fuel nitrogen content results in large variations in baseline
NOx emissions from combustion of residual fuel oils.
18
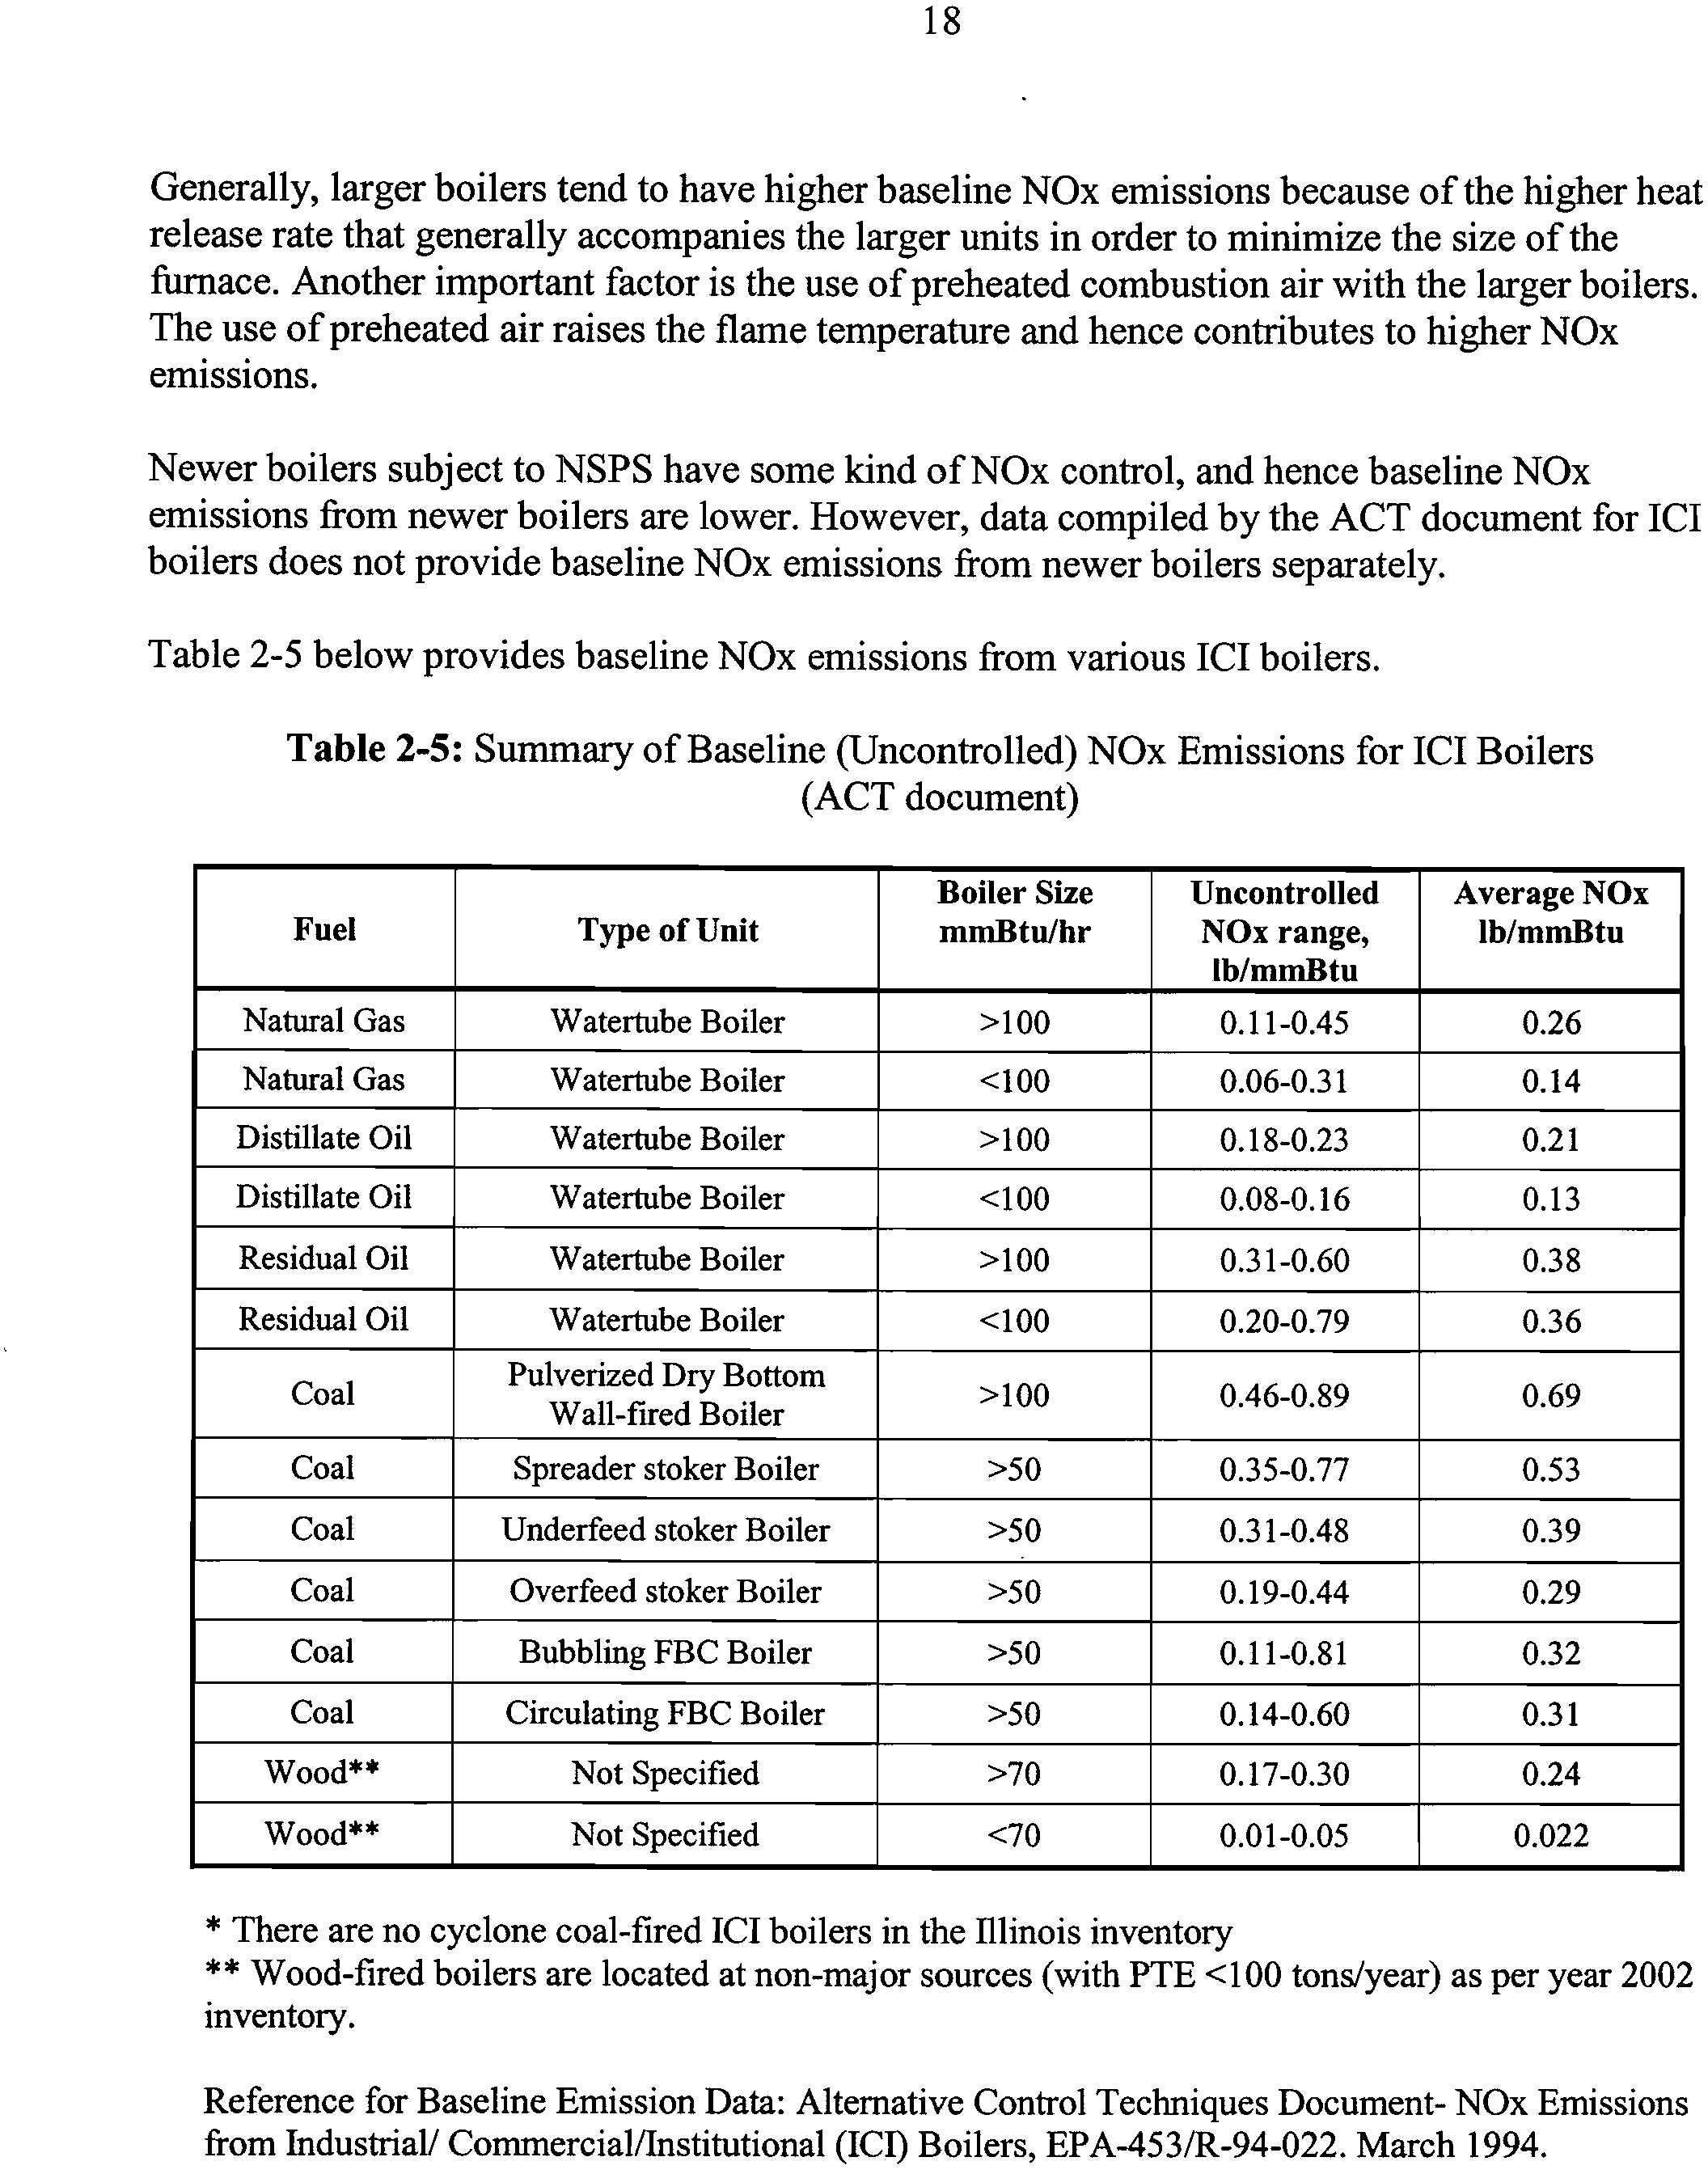
Generally, larger boilers tend to have higher baseline NOx emissions because of the higher heat
release rate that generally accompanies the larger units in order to minimize the size of the
furnace. Another important factor is the use of preheated combustion air with the larger boilers.
The use of preheated air raises the flame temperature and hence contributes to higher NOx
emissions.
Newer boilers subject to NSPS have some kind of NOx control, and hence baseline NOx
emissions from newer boilers are lower. However, data compiled by the ACT document for ICI
boilers does not provide baseline NOx emissions from newer boilers separately.
Table 2-5 below provides baseline NOx emissions from various ICI boilers.
Table
2-5: Summary of Baseline (Uncontrolled) NOx Emissions for ICI Boilers
(ACT document)
Fuel
Type of Unit
Boiler Size
mmBtu/hr
Uncontrolled
NOx range,
lb/mmBtu
Average NOx
lb/mmBtu
Natural Gas
Watertube Boiler
>100
0.11-0.45
0.26
Natural Gas
Watertube Boiler
<100
0.06-0.31
0.14
Distillate Oil
Watertube Boiler
>100
0.18-0.23
0.21
Distillate Oil
Watertube Boiler
<100
0.08-0.16
0.13
Residual Oil
Watertube Boiler
>100
0.31-0.60
0.38
Residual Oil
Watertube Boiler
<100
0.20-0.79
0.36
Coal
Pulverized Dry Bottom
Wall-fired Boiler
>100
0.46-0.89
0.69
Coal
Spreader stoker Boiler
>50
0.35-0.77
0.53
Coal
Underfeed stoker Boiler
>50
0.31-0.48
0.39
Coal
Overfeed stoker Boiler
>50
0.19-0.44
0.29
Coal
Bubbling FBC Boiler
>50
0.11-0.81
0.32
Coal
Circulating FBC Boiler
>50
0.14-0.60
0.31
Wood**
Not Specified
>70
0.17-0.30
0.24
Wood**
Not Specified
<70
0.01-0.05
0.022
* There are no cyclone coal-fired ICI boilers in the Illinois inventory
** Wood-fired boilers are located at non-major sources (with PTE <100 tons/year) as per year 2002
inventory.
Reference for Baseline Emission Data: Alternative Control Techniques Document- NOx Emissions
from Industrial/ Commercial/Institutional (ICI) Boilers, EPA-453/R-94-022. March 1994.
19
2.3 Technical Feasibility of NOx Control
The control of NOx emissions from existing ICI boilers can be accomplished either through
combustion modification controls, flue gas treatment controls, or a combination of these
technologies. In some cases, fuel substitution may be a cheaper alternative to combustion
modification or post combustion controls.
Combustion modification controls such as low excess air, staged combustion air (SCA), low
NOx burner (LNB), and flue gas recirculation (FGR) modify the conditions under which
combustion occurs to reduce NOx formation. Post-combustion controls, such as selective
catalytic reduction (SCR) and selective non-catalytic reduction (SNCR), reduce NOx emissions
after it is formed. Combustion controls are less costly compared to post-combustion controls and
have been widely used to control NOx emissions from ICI boilers. However, post-combustion
controls such as SCR can achieve greater NOx reductions. The combination of combustion
control and post-combustion controls provide even greater reductions than post-combustion
alone.
Although combustion controls are usually the least expensive approach to controlling NOx, in
some cases they may not be adequate or may be more expensive than post-combustion controls.
In such cases, post-combustion controls may be more attractive.
2.3.1 Combustion Control Techniques
NOx is primarily formed by the thermal fixation of atmospheric nitrogen in the combustion air
(thermal NOx) or by conversion of chemical bound nitrogen in the fuel (fuel NOx). Since fuel
nitrogen contents of natural gas and distillate fuel oil are low, NOx emissions from these fuels
can be effectively controlled by controlling thermal NOx. NOx emissions from coal and residual
fuel oil can be reduced by controlling both thermal NOx as well as fuel NOx. Thermal NOx can
be effectively controlled by decreasing the primary flame zone oxygen level or by decreasing
residence time at higher temperature.
The primary flame zone 0
2
level can be decreased by low excess air (LEA), oxygen trim (OT),
and flue gas recirculation (FGR). This results in an overall decrease in the oxygen level and
exposure of fuel nitrogen intermediates to oxygen and reduces high NOx pockets in the flame.
The primary flame zone 0
2
level can also be decreased by delayed mixing of fuel and air as is
done in low NOx burners (LNB). Delayed mixing of fuel and air also results in a reduction of
peak flame temperature. In the absence of oxygen, fuel nitrogen gets converted to
N2.
A related
approach is staged combustion. This approach reduces primary flame zone oxygen level by
staging the amount of combustion air introduced into the burner zone, creating a primary fuel
rich flame zone. Staged combustion air (SCA) can be accomplished by several means. For a
multiple burner boiler, a simple approach is to take certain burners out of service (BOOS) or
biasing the fuel flow to selected burners to obtain a similar staging effect. However, this may be
impractical on some units due to the configuration of the fuel system. A final technique is to
derate the boiler to lower the flame temperature. This approach is not attractive because it
involves reducing steam generation capacity.
20
Low Excess Air (LEA) Firing:
Low excess air (LEA) firing is the most effective boiler
improvement technique one can apply without significant capital cost. As a safety factor to
assure complete combustion, boilers are fired with excess air. High excess air levels may result
in increased NOx formation because the excess nitrogen and oxygen in the combustion entering
the flame will combine to form thermal NOx. Minimizing excess air is normally part of good
combustion air management, in that it reduces the potential to carry away a lot of waste energy,
and hence improves boiler thermal efficiency.
Operation of boilers with low excess air is possible in most cases, and can be applied to boilers
of all sizes. Implementation may be as simple as boiler tuning using standard procedures. If
boilers are operated under varying load conditions, 0
2
and CO monitors can be used to provide
feedback to the combustion air controller that help in refinement of the air/fuel ratio and hence
reduction of heat losses to the atmosphere. Such monitors may be required. Another way to limit
the amount of excess air is by designing a burner that is optimized through the use of oxygen
trim controls.
One problem with low excess air is that when excess air is reduced, CO and hydrocarbon
emissions may increase. In addition, at very low excess air levels, flame instability may occur
and because of reducing atmosphere, accelerated corrosion of boiler tubes may result.
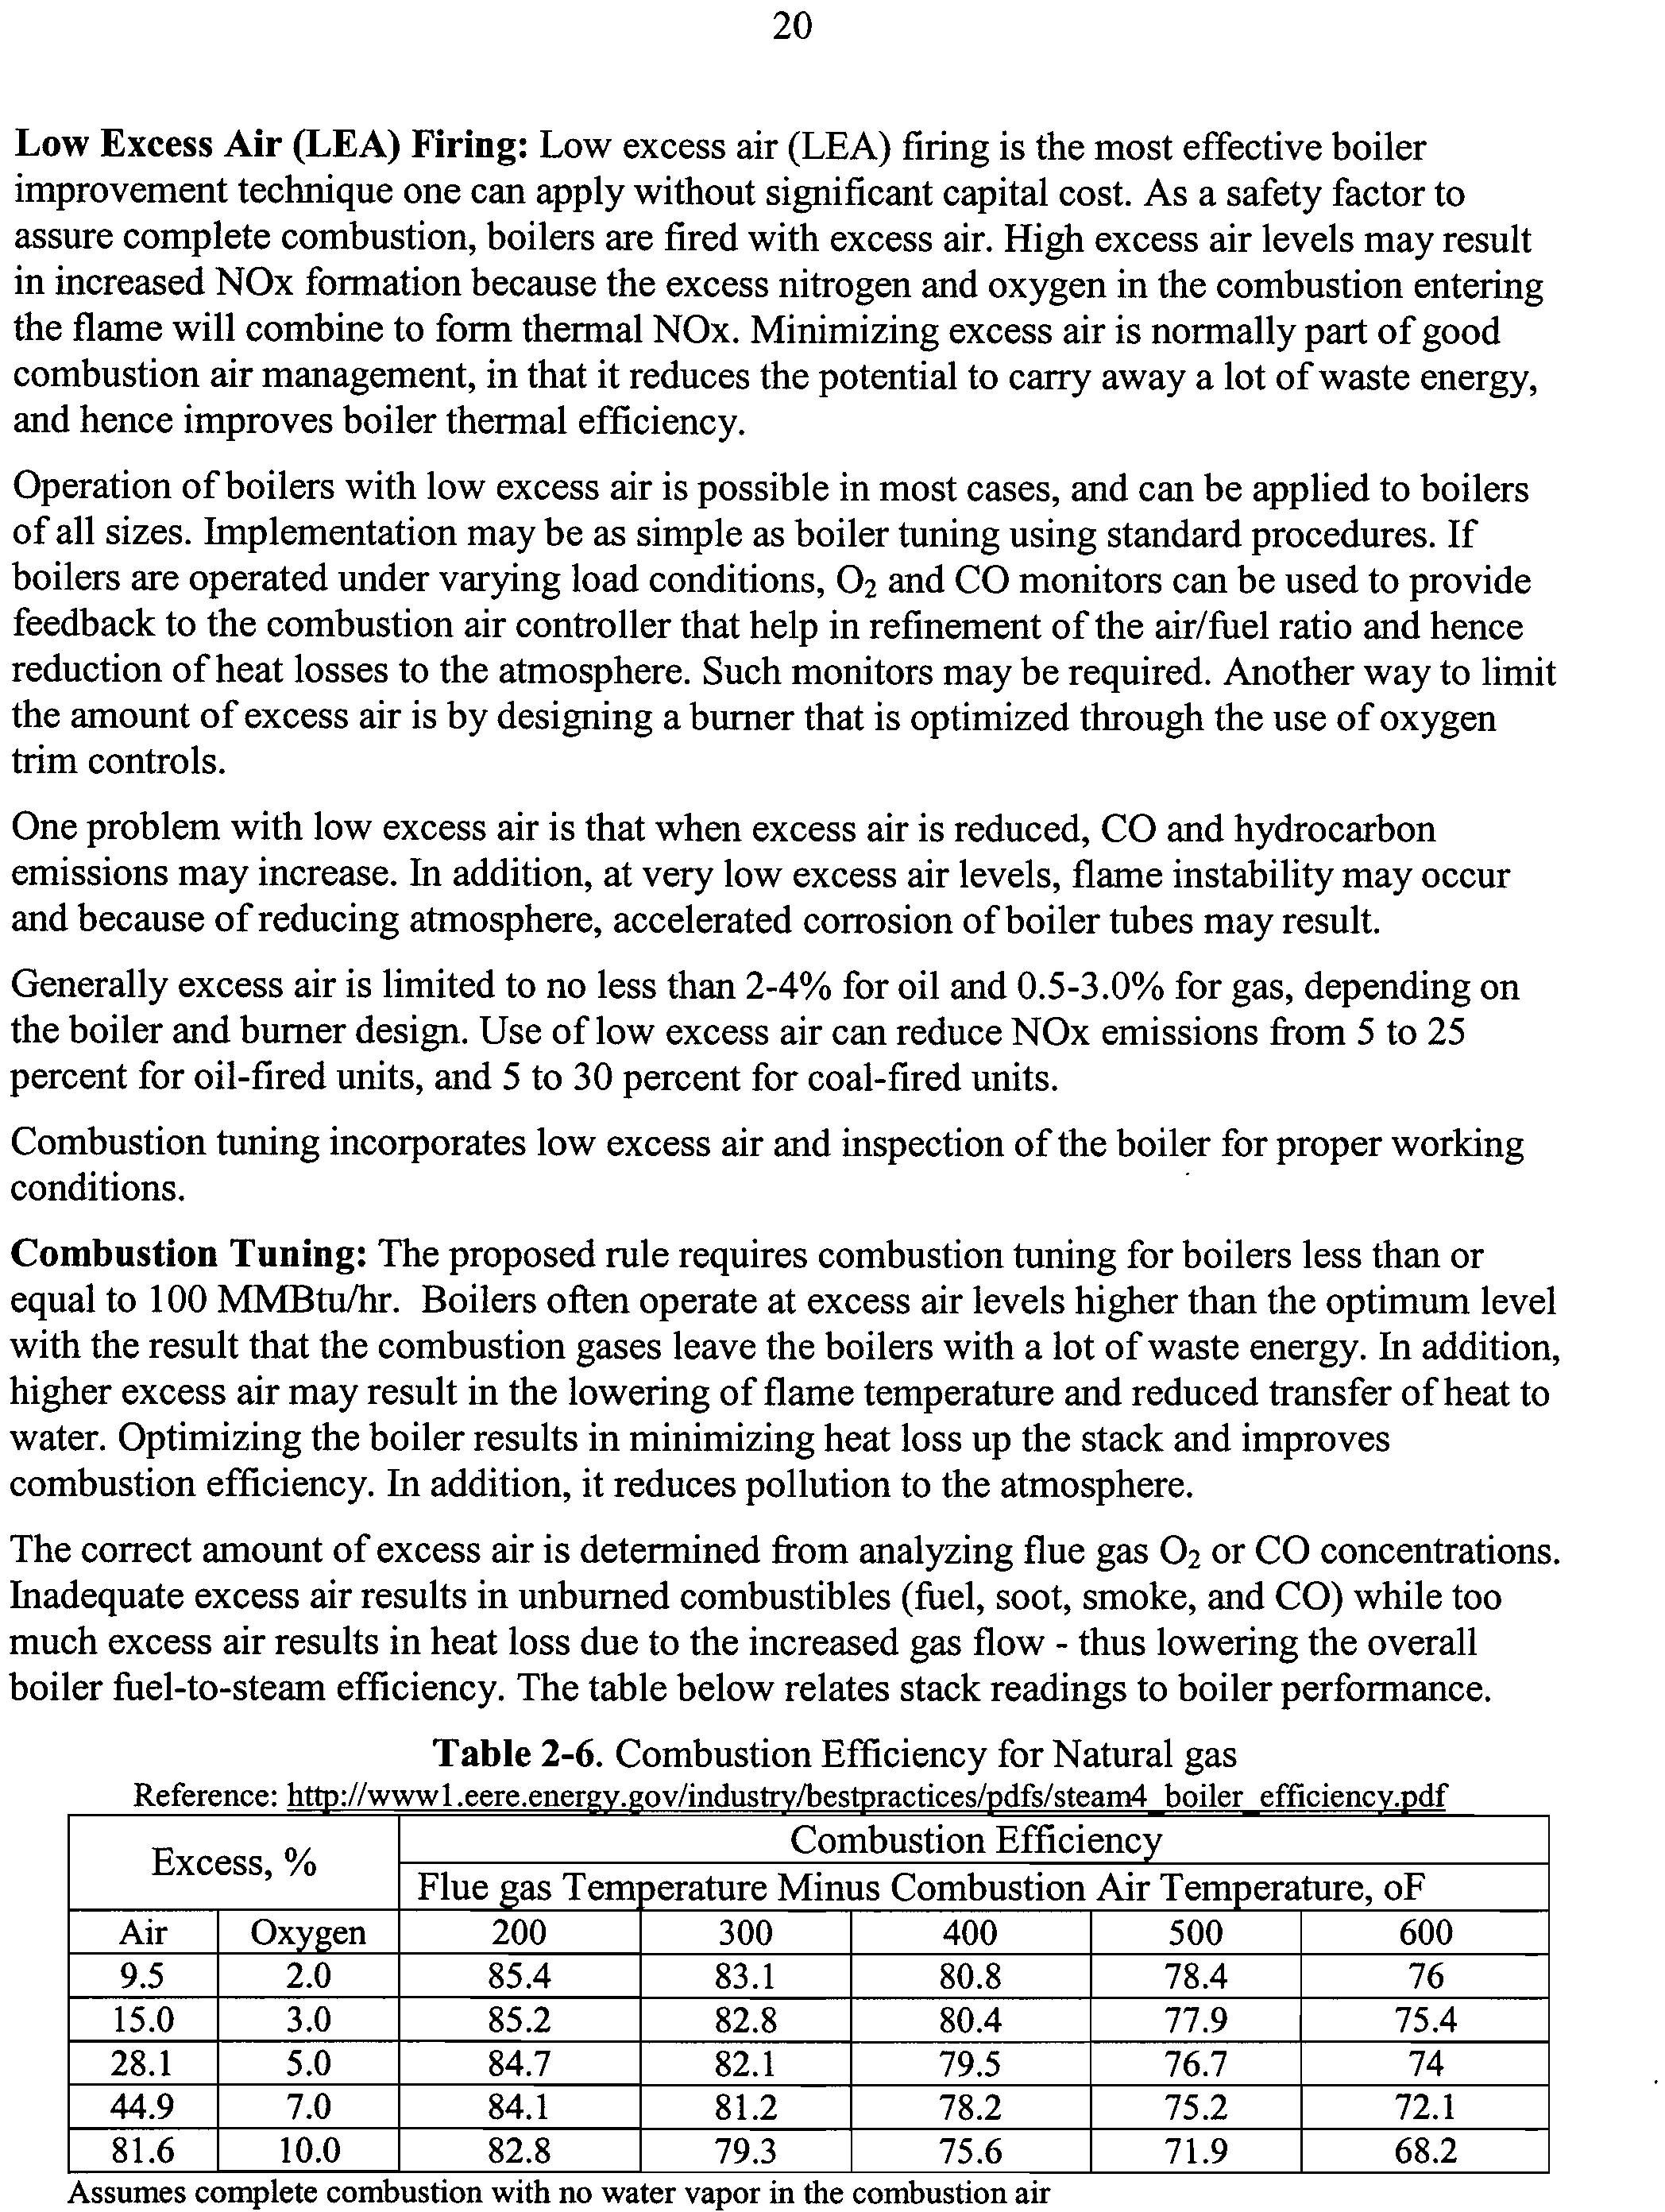
Generally excess air is limited to no less than 2-4% for oil and 0.5-3.0% for gas, depending on
the boiler and burner design. Use of low excess air can reduce NOx emissions from 5 to 25
percent for oil-fired units, and 5 to 30 percent for coal-fired units.
Combustion tuning incorporates low excess air and inspection of the boiler for proper working
conditions.
Combustion Tuning:
The proposed rule requires combustion tuning for boilers less than or
equal to 100 MMBtu/hr. Boilers often operate at excess air levels higher than the optimum level
with the result that the combustion gases leave the boilers with a lot of waste energy. In addition,
higher excess air may result in the lowering of flame temperature and reduced transfer of heat to
water. Optimizing the boiler results in minimizing heat loss up the stack and improves
combustion efficiency. In addition, it reduces pollution to the atmosphere.
The correct amount of excess air is determined from analyzing flue gas 0
2 or CO concentrations.
Inadequate excess air results in unburned combustibles (fuel, soot, smoke, and CO) while too
much excess air results in heat loss due to the increased gas flow - thus lowering the overall
boiler fuel-to-steam efficiency. The table below relates stack readings to boiler performance.
Table
2-6. Combustion Efficiency for Natural gas
Reference: h ://wwwl.eere.ener
?
ov/indus /besturactices/pdfs/steam4 boiler efficienc df
Excess,
%
Combustion Efficiency
Flue gas Temp
erature Minus Combustion
Air Temperature,
500
of
Air
Oxygen
200
300
400
600
9.5
2.0
85.4
83.1
80.8
78.4
76
15.0
3.0
85.2
82.8
80.4
77.9
75.4
28.1
5.0
84.7
82.1
79.5
76.7
74
44.9
7.0
84.1
81.2
78.2
75.2
72.1
81.6
10.0
82.8
79.3
75.6
71.9
68.2
Assumes complete combustion with no water vapor in the combustion air
21
On well-designed natural gas-fired systems, an excess air level of 10% is attainable and for coal
an excess air level of 15% should be achievable. An often-stated rule of thumb is that the boiler
efficiency can be increased by 1% for each 15% reduction in excess air or 40°F reduction in
stack gas temperature. An example of the benefits of low excess air is shown below.
Example
A boiler operates for 8,000 hours per year and consumes 500,000 million Btu (MMBtu)
of natural gas while producing 45,000 lb/hour of 150-psig steam. Stack gas
measurements indicate an excess air level of 44.9% with a flue gas minus combustion air
temperature of 400°F. From the table, the boiler combustion efficiency is 78.2% (E1).
Tuning the boiler reduces the excess air to 9.5% with a flue gas minus combustion air
temperature of 300°F. The boiler combustion efficiency increases to 83.1% (E2).
Assuming a fuel cost of $8.00/MMBtu, the annual savings are:
Annual Savings = Fuel Consumption x (1–E
1
/E
2
) x Fuel Cost
= 29,482 MMBtu/yr x $8.00/MMBtu
= $235,856
Exhaust gas analyzers
are necessary to tune a boiler. They can be portable or on-line. Portable
monitors can be used periodically to monitor flue gas composition and tune boilers. There are
inexpensive gas-absorbing kits available for measuring the percentage of oxygen in the flue gas.
A portable monitor may cost from $500 to $1000. Computer-based analyzers display percent
oxygen, stack gas temperature, and boiler efficiency. They are a recommended investment for
any boiler system with annual fuel costs exceeding $50,000.
http://wwwl.eere.energy.gov/industry/bestpractices/pdfs/steam4 boiler efficiency.pdf
Oxygen Trim Systems
are very useful for good combustion control. When fuel composition is
highly variable (such as refinery gas, or multi- fuel boilers), or where steam flows are highly
variable, an online oxygen analyzer should be considered. The oxygen "trim" system provides
feedback to the burner controls to automatically minimize excess combustion air and optimize
the air-to- fuel ratio.
An oxygen trim system may include hardware for continuous control of reference air, and for
calibration air and test gas. The full initial calibration takes only minutes to complete. Annual
calibration is generally similar to periodic calibration.
An oxygen trim system can be incorporated into single point (jackshaft) positioning as well as
parallel positioning boiler system controls. In a jackshaft control, the steam pressure is sensed as
the basic control signal and this signal regulates the mechanical linkage attached to the fuel valve
and combustion air dampers. The jackshaft control is usually set for a particular operating
condition when the boiler is first installed, and adjustments are made infrequently.
In a parallel positioning control, the steam pressure is sensed as the basic control signal. This
signal regulates pneumatic or electronic drivers which regulate fuel valve and combustion air
dampers. In addition, some provision for operator control is also provided. The most common
method today is parallel positioning.
22
The capital cost of an oxygen trim system for boilers ranging in size from 100 to 600 horsepower
is about $10,000-11,000. The installation cost is about $6000-7000. Startup and training service
costs are about $2500-4000. For larger boilers, equipment and installation costs are somewhat
higher. Payback is about 1- 2 years, depending on the installation costs.
For further information, please refer to the website below:
http://www.energysolutionscenter.org/boilerburner/Eff Improve/Efficiency/Oxygen Control.asp
Operator Training
is necessary to ensure that operators are knowledgeable of the best practices
in boiler operation. It is important that all boiler operators undergo some level of training in safe
and efficient operation of the boiler, and it is a requirement that Licensed Boiler Operators and
Stationary Engineers undergo specific training for their license. On October 4, 1994, USEPA had
published a model state training and certification program in the Federal Register for the training
and certification of solid waste incinerator unit operators and high-capacity fossil fuel-fired plant
operators. In 1994, The American Society of Mechanical Engineers (ASME), at the request of
USEPA, established a committee which developed standards for the qualification and
certification of high capacity fossil fuel-fired plants. The application for an ASME certification
program is available at
http://files.asme.org/asmeorg/Codes/CertifAccred/Personne1/2971.pdf
Also, most of the major boiler manufacturers and the American Boiler Manufacturers
Association (www.abma.org) offer operator training. Training is also available through private
companies (for example, American Trainco). Although Illinois EPA has not developed its own
operator training and certification program; however, the proposed rule requires an employee of
the owner or operator or a contractor who has successfully completed a training course to
perform the combustion tuning.
Boiler Maintenance
is necessary for proper operation of a boiler. All boilers suffer some
degradation in performance as the result of deposits on heat transfer surfaces, corrosion, and
general wear and tear. Boiler manufacturers set year-round maintenance schedules for tuning-up
of boilers. The maintenance is aimed at corrective and preventive measures to maximize boiler
efficiency and reliability. These measures are performed on periodic basis.
It is important that a boiler operator has written procedures for inspection and maintenance/
repair, and testing of the following on a periodic basis:
• Fireside and water-side surfaces: Scale build up on water side and soot build up on gas side.
• Fuel systems: Burners, atomizers, flame pattern, fuel pressure and temperature at the burner,
coal feeders, grates, air-proportioning dampers, coal-size etc.
• Electrical and combustion control systems including safety interlocks, air dampers, control
linkages etc;
• Excess oxygen, CO, and CO2 levels in the exhaust gases, as necessary, to calculate
combustion efficiency and make necessary adjustments to the combustion system;
•
Valves (relief, safety, hydraulic, pneumatic, etc.);
• Refractories;
•
Fan housing, blades, and inlet screens;
•
Feedwater system
23
These procedures must be followed and records must be kept on site. In addition, a boiler
operator must prepare a checklist of items which must be inspected and maintained annually.
Low NOx Burners (LNB)
are the most commonly used technology for NOx control on
pulverized coal, gas and oil fired boilers. Nearly all EGU and over 75% of industrial boilers
have LNB installations for reducing NOx emissions. Figure 2-8 shows a simplified example of
an LNB using air staging. The primary air and fuel are combined in an overall fuel-rich (more
fuel than the air can completely react with) zone. In this oxygen starved zone, fuel nitrogen is
released and is converted primarily to molecular nitrogen. Secondary air is added in a controlled
fashion to complete fuel burn out while maintaining oxygen concentrations and temperatures
low. This limits formation of thermal NOx. Typically, LNB reduce NOx formation by as much
as 65%, depending on the type of fuel used for combustion. As technology has improved, the
control capabilities of LNB have continued to improve over the years, with current burners
capable of much better performance than the LNB employed ten years ago. In fact, it is not
uncommon for companies to replace their ten year old LNB with newer ones that provide
improved performance (lower NOx, better combustion efficiency, etc.). The latest generation of
LNB are capable of much lower emissions than LNB's of ten or so years ago perhaps 50% lower
NOx emissions than first-generation LNB. It is not unusual for pulverized coal facilities firing
PRB coal to have NOx emissions under 0.15 lb/MMBtu on low NOx burners, especially when
combined with overfire air. In fact, several tangential-fired EGUs in Illinois already achieve
these levels or better. On bituminous coal, somewhat higher emissions can result. But, they
nevertheless are significantly improved over older burner designs.
The cost of LNB for reducing NOx generation from ICI boilers is dictated primarily by
retrofit/capital costs. Operation and maintenance (0 & M) cost is generally low.
Figure 2-8.
A Low NOx Burner (LNB) that uses staged combustion air (SCA)
Swirling?
Combustion product
flow?
recirculation zone
Fuel and
primary air
(fuel-rich)
Fuel-rich axial
flame core
Gradual mixing of
partially burned
products and
secondary air
The most effective way of controlling thermal NOx is by controlling peak flame temperature,
which can be controlled by quenching the flame with water or steam injection (WI/SI), or by
reducing air preheat (RAP), or by recycling a portion of flue gas to the burner zone (flue gas
recirculation, or FGR). WI/SI and RAP introduce thermal efficiency penalties, safety, and
burner control problems. So, it is unattractive for large boilers. FGR, on the other hand, is
Figure
2-9. Overfire Air (OFA)
http://www.advancedcombustion.net/overfireair.htm
24
widely used alone or in combination with LNB retrofits on gas or oil-fired boilers where flue gas
does not have a high particle loading. The main disadvantage of FGR is increased capital cost for
external ducting. External FGR also increases the flow rate through the boiler, which may be
limiting. However, newer LNB designs have internal FGR, which achieves much of the same
effect as external FGR, but without the need for external ductwork and increasing flow rate
through the boiler.
Other approaches that provide modest reductions in NOx and may be used alone or in
combination with LNB are oxygen trim (OT) and/or low excess air (LEA). Thermal NOx can be
reduced to some extent by minimizing excess oxygen, delaying the mixing of fuel and air and
reducing the firing capacity of the boiler. By optimizing the burner(s) for minimum excess air, it
is possible to reduce NOx emissions by 5 to 20 percent, but this may increase CO emissions.
This technique is often referred to as OT or LEA and can be attained by optimizing the operation
of the burner(s) for minimum excess air without excessive increase in CO or other combustible
emissions. The effect of lower oxygen concentration on NOx is partially offset by some increase
in thermal NOx because of higher peak temperature with lower gas volume. The rapid increase
in CO emissions is indicative of reduced mixing of fuel and air that result in loss of combustion
efficiency. Boiler operation with LEA is considered an integral part of good combustion air
management that minimizes dry gas heat loss and maximize boiler efficiency. Therefore most
boilers should be operated with LEA regardless of whether NOx reduction is an issue.
The second technique reduces flame temperature and oxygen availability by staging the amount
of combustion air that is introduced in the burner zone.
Staged combustion air ("SCA")
can be
accomplished by several means. For multiple
burner boilers that have the ability to operate with
fewer than all of their burners in operation, one
approach is to take certain burners out of service
("BOOS") or biasing the fuel flow to selected
burners to obtain a similar air staging effect. By
and large, LNB are more effective than BOOS.
And, BOOS can be very limiting on boiler
NGE-1 MOMENTUM
operation.
comusnog Ant MEAZA
Overfire Air (OFA)
is often used to allow deeper
air staging. In OFA the burners are operated
FUEL RICH
with lower excess air, or even fuel rich, and air is
COMBUSTION zon
admitted downstream (typically at a higher point
in the furnace) to burn out the fuel, as shown in
Figure 2-9. OFA is also shown in Figure 2-6 on a CFB boiler. However, OFA cannot be used
on every boiler because some boilers, such as many package boilers, do not have the space
available between the combustion zone and convective heat exchangers to allow for OFA.
Fuel staging,
such as employed in natural gas reburn (NGR – shown in Figure 2-10) and
cofiring, are effective techniques for controlling NOx emissions from coal-fired stokers. By
injecting a portion of total heat input downstream of main combustion zone, hydrocarbon
radicals created by reburning fuel will reduce NOx emissions generated by the combustion of
primary fuel.
Figure
2-10. Natural gas reburning on a
stoker boiler.
http://www.gastechnology.org/webroot/app/xn/xd.aspx?it=e
nweb&xd=4reportspubs%5C4_8focus%5Cmethanedenoxfor
stokerboilersfocus.xml
Overfire ak.
Natural gas/
FGR
Solid Fuel IP-
Eltirkout Zone
NO, and
NO, Precursor
Reduction Zone
NO, Formation Zone
Lkkdergrate air
25
Alternative methods have also been designed to
reduce NOx emissions. Air Liquide devised a fuel
"pulsation" approach that causes alternating fuel
rich/lean mix conditions to occur at the burners.
The lean mix condition reduces flame
temperature and ultimately reduces thermal
NOx. The fuel rich condition produces high
VOC and CO, also minimizing NOx generation.
Air is injected downstream of the flame to
produce complete combustion. The
modification demonstrates reductions of 35 -
65% without the use of FGR. With FGR NOx
emissions below 20 ppm are achieved. Cost
estimates for the modification are claimed to be
30 - 50% lower than installing replacement
burners.
5
Burner Modifications
Burners may be modified to achieve low NOx in lieu of new burners. This is usually much less
expensive than new burners, and this approach has been widely used on oil-fired burners. One
such technology for oil fired burner modifications is Reduced Emissions and Advanced
Combustion Hardware
(REACH), which entails the
Table
2-7 PM and NOx Emissions with REACH Technology
use of new atomizers and
http://www.coen.com/i_html/whitelowcostnoxpmhtml
flame stabilization devices
on the burner. As shown in
Table 2-7, significant
reductions in NOx and
particle matter are possible
through REACH
technology. REACH
technology is estimated to
cost as shown in Figure 2-
11. Assuming about 1200
BTU per pound of steam,
the costs on Figure 2-11
(1998 dollars) should be
divided by 2.4 to arrive at
the approximation for cost
in $/MMBtu/hr. The unit
capacity in t/hr would then
be multiplied by 2.4 to arrive at the capacity in MMBtu/hr. So, a 200 t/hr (or about 500
MMBtu/hr) boiler would be expected to cost in the range of $360/t/hr (or about $150/MMBtu/hr)
5
?•?•
Rajam Varagani (n.d.). "A Cost Effective Low NOx Retrofit Technology for Industrial Boilers." Cited within
CIBO Industrial Emissions Control Technology III, 2005
Unit
Name
REACH
Steam
Gen.
(U)
Firing
Config.
MIA
Before
REACH
ohrmstu)
YIN
After
REACH
(IbillAStu)
PM
%
Change
(1111►43tes)
NCI%
Before
REACH
(IbM113tu)
riVX
After
REACH
(Ib/MBtu)
NOx
%
Change
(113/MBiu)
Al
LN
300
SWF
0.190
0.029
85%
NA
0.375
NA
A2
LN
300
SWF
0.190
0.033
82%
0.488
0.304
38%
A3
LN
495
SWF
0.153
0.061
60%
0.815
0.394
52%
B1
LN
480
SWF
0.272
0.041
85%
0.849
0.329
61%
B2
LN
240
SWF
0.272
0.088
68%
0.849
0.391
54%
C1?
CP?
I
425?
I
TF?
I
0.170
?
1
0.038?
77%?
NA?
I
0.492?
NA
01
CP
185
TF
0.170
0.085
50%
0.496
0.429
13%
D2
CP
185
TF
0.170
0.092
46%
0.496
0.433
13%
E1
CP
155
TF
0.136
0.029
79%
0.408
0.340
16%
E2
CP
155
TF
0.136
0.040
71%
0.408
0.340
16%
E3
CP
580
TF
0.190
0.020
89%
0.441
0.374
15%
E4
LN
495
SWF
0.217
0.061
72%
0.781
0.424
46%
PI
?
LN?
330
?
TF?
0.102?
0.034?
67%?
NA?
0.454
?
NA
Figure
2-11.
REACH Retrofit Cost Versus Steam Capacity
http://www.coen.com/i_html/white_lowcostnoxpm.html
Figure
1
REACH Retrofit Cost vs Steam Capacity
0
?
500
?
1000
?
1500
?
2000
Boller Steam Capacity
(tonihr)
26
to retrofit with REACH technology. Current prices (2007 dollars) would be higher. However,
they would still be well below the cost of new burners (up to about $5000/MMbtu/hr installed in
2007 dollars). The cost of a complete burner retrofit could be three to ten times as expensive as a
retrofit of REACH technology, and the difference would be greater if the greater outage costs of
a burner retrofit were considered.
More recent information
available from Combustion
Components Associates
(CCA) shows that even
better results are possible
with heavy oil firing than
presented above, as shown
in Table 2-8. Cases 6 and 7
are utility units, but they are
shown because some of the
largest industrial units may
approach these in size. For
wall-fired units without
OFA, an average emissions
rate of 0.25 lb/lVIMBtu was
achieved with only burner
modifications (change of
burner atomizers and swirlers, if needed). In all cases opacity dropped significantly as a result of
the retrofit. Addition of OFA on a wall-fired unit enabled an emissions rate of under 0.15
lb/MMBtu. According to information provided by CCA, the total cost of such retrofits would be
in the range of $200/MMBtu/hr to about $500/MMBtu/hr.6
Table 2-8.
Case Studies of No. 6 Oil Fired Boilers'
Case
#
Rating
#
Burners
Init NOx
FinNOx
%
Kpph
--IVfMBTU/hr
lb/MMBtu
Reduction
1*
50
60
1
037
0.27
27%
2*
120
144
1
0.325
0.26
20%
3*
175
210
4
0.34
0.27
21%
4*
425
510
4
0.40-0.45
0.20-0.25
50%
5*
600
720
8
0.35-0.40
0.20-0.25
40%
6*
6**
125 MW
1,250
12
0.43
0.43
0.26
1.145**
40%
66%
7***
160 MW
1,600
12
0.42
0.225
54%
*
wall fired without OFA
** wall fired with OFA added
*** Tangentially Fired, no OFA
6
Based on estimate for a 4-burner project from Combustion Components – e-mail 10/13/03
Combustion Components Associates Website: http://www.ccainc.net/case_study/case_studies.htm
NOx ppm, 02
%
FGR %
10
40
NO:
9
36
8
32
7
FGR
28
6
24
5
20
4
-4-02
16
3
12
2
8
1
4
0
0 20 40
60
80
100 120 140
Load MM131Whr
NOx twa 02%?
FGR%
Figure 2-12
Emissions
Performance of Todd Rapid Mix
Burner at Morningstar Cannery
www. j ohnzink. com
27
Lean Premixed Combustion and Ultra Low NOx
Burners
Gas and volatile fuels offer the potential to use Lean
Premixed Combustion (LPC). LPC is only used with
volatile fuels that are low in nitrogen content and
inherently have low fuel NOx formation, such as natural
gas. In lean premixed combustion the fuel and air are
premixed thoroughly before ignition into a fuel-lean
mixture. Combustion occurs under well-controlled
conditions with excess air while maintaining temperature
low. This approach minimizes formation of thermal NOx
by controlling temperature and oxygen carefully. Prompt
NOx formation is minimized by maintaining conditions
with excess oxygen. This method of combustion is
capable of producing NOx emissions in the single digit
levels, even with air preheat.
Most of the LPC burners that are available have
demonstrated emissions levels near or under 0.01
lb/MMBTU when using flue-gas recirculation. Figure 2-
12 shows the performance of a 130 MMBtu/hr Todd
Combustion Rapid Mix Burner that was retrofit on a
100,000 lb/hr Nebraska water-tube boiler.
8 Some retrofit
applications have already demonstrated under 0.01
lb/MMBtu (about 8 ppm at 3% oxygen with natural gas
fuel) with air preheat while improving boiler efficiency.
9
However, experience at one boiler does not necessarily
translate to similar experience at another. And, 0.01 lb/MMBtu may not always be achievable
with LPC when there is air preheat. This is because factors such as heat release rate of the boiler
and other effects can impact the actual burner performance.
Table 2-9 shows results from three applications of the Todd Rapid Mix Burner.
Another supplier of burners with ultra-low NOx using LPC is Coen. Its burner has been installed
at a California facility with burners permitted for 30 ppm NOx. The boiler was the main boiler
with a continuous rate of 60,000 pph of 250 psig saturate steam. The preheat air is heated up to
425°F and FGR is supplied to side-by-side burners by a forced draft fan.
The results at this site show that the new ULNB system has reduced NOx levels below 7.5 ppm
@ 3% oxygen. Table 2-10 summarizes the pre and post retrofit numbers for NOx, CO, and 02,
while Table 2-11 shows the cost estimates for various parts of the installation and operation of
the Quantum Low NOx (QLA) burners.
8
http://www.johnzink.com/products/burners/html_toddibum_todd_cs_104.htm
9 Sacramento General Services Heating Plant Case Study: COEN web site:
http://www.coen.com/mrIctlitibrochures/pdf/q1a.pdf
28
Table 2-9.
Performance of Todd Burner Using Lean Premixed Combustion at Three facilities
US BORAX TODD ULTRA LOW EMSSIONS BURNER INSTALLATIONS
IO
LOAD
%
02%
CO ppm
NOx ppm
25
3.4
3.0
8.2
53
2.6
0.9
7.1
98
2.7
0.1
6.8
MORNINGSTAR TODD ULTRA LOW EMISSIONS
BURNER INSTALLATION"
LOAD
%
02
%
CO ppm
NOx ppm
25
3.4
<1
8.1
50
3.4
<1
8.2
100
3.2
<1
8.3
TODD ULTRA LOW EMISSIONS BURNER INSTALLATIONI2
LOAD
%
02
%
CO ppm
NOx ppm
20
4.8
2
8
50
3.5
3
7
90
3.4
6
7
Table
2-10. Performance of Coen QLA burner using LPC.
13
Units
Run 1
Run 2
Run 3
Run 4
Stack Levels
02
%
6.0
6.1
6.1
6.1
CO
ppm, 3% 02
3.5
2.7
2.7
2.9
NOx
ppm, 3% 02
7.3
7.6
7.6
7.5
Table 2-11.
Cost estimates for various parts of the installation and operation of the QLA burners
on a 61,000 pph boiler (roughly 80 MMBtu/hr).13
Cost item
Units
QLA
Capital Costs
Hardware Costs
$
170,000
Installation Costs
$
68,000
Installed Capital Cost
$
238,000
Annualized Capital Cost
$/yr
27,955
Operating Cost
Increased Fan Power
$
35,000
Total
$/yr
35,000
Total Annual Cost
$/yr
62,995
Assuming the 60,000 lb/hr boiler is roughly 72 MMBtu/hr, this cost is roughly $3300/MMBtu.
This cost is roughly consistent with other sources that indicate that for large ICI boilers (typically
over 100 MMBtu/hr) the cost of Low NOx burners on industrial boilers will be about
10
Zink, John (2003). "U.S. Borax TODD Ultra Low Emissions Burner Installment."
II Zink, John (2003). "Morningstar TODD Ultra Low Emissions Burner Installment."
12
Zink, John (2003). "TODD Ultra Low Emissions Burner Installment."
13
Coen Company (2000). "Ultra Low NOx Gas-Fired Burner with Air Preheat." Prepared for California Air
Resources Board. CARB Contract #: 94-354, Nov 23, 2000.
29
$2,000/MMBtu/hr to $2,500/MMBM/hr because one would expect a lower cost for the larger
units and especially one without FGR. The burner itself is generally a small part of this cost.
For field-erected boilers that may use multiple stages of Separated Overfire Air (SOFA)
downstream of low NOx diffusion flame burners, and also use FGR, the total cost for all
equipment and boiler modifications could be as high as $3,500/MMBtu/hr.14
2.3.2
Post Combustion Controls:
Selective non-catalytic reduction (SNCR) and selective catalytic reduction (SCR) techniques are
the only two post combustion techniques which have been applied to control NOx emissions
from ICI boilers. In both these techniques, urea or ammonia is injected in a temperature window
where NOx reduction occurs by selective reaction of NH
2
radicals with NO to form water and
nitrogen. By-product emissions of SNCR include ammonia slip and N
2
0. In the SCR process,
ammonia is injected into the flue gas in the presence of a catalyst and NOx is converted to
N2
and H20.
2.3.3 Selective Non-Catalytic Reduction (SNCR)
Figure
2-13. Simplified diagram of an SNCR system.
(www.wapc.com)
SNCR has been widely used on ICI and EGU
boilers, especially boilers with solid fuels.
Delivery
SNCR is a process that uses ammonia or urea
System
reagents to selectively reduce NOx to
Ini
Wien
Tack
?
La %el 3
nitrogen and water without the presence of a
catalyst. Since this technology does not use
any catalyst, it can be implemented at much
lower capital costs compared to catalyst
based technologies. The equipment is
comprised of a storage tank, pumping
+4--
equipment, piping and injectors, as shown in
Pumping
Skld
?
Burnam
Figure 2-13, and it is relatively easy to
retrofit on existing facilities. The reagent is
injected where the gas temperature is optimal to promote the reaction with the minimal amount
of unreacted ammonia. This optimum temperature window varies somewhat based upon the
application. But, it is in the range of 1600° to 2000°F for ammonia based and 1650° to 2100°F
for urea based SNCR.
SNCR applications were first used in 1974 and there are currently 400 systems installed
worldwide. This type of system can be used on a variety of industries such as the pulp/paper,
steel industry, refinery process, cement kilns, municipal waste combustors, process heaters, glass
melting furnaces, wood/coal/oil/gas-fired boilers. 15 Table C-1 in the Appendices is a list of
SNCR systems from only one supplier.
The two principal reagents used in the SNCR process are ammonia (NH
4
OH) and aqueous urea
(NH
2
CONH2
). In large boilers and where load changes significantly, several injection locations
14
(Memo: J. Staudt to Sikander Khan, USEPA, October 24, 2003 comments in response to September 10, 2003
email)
15
Institute of Clean Air Companies (2006). "Selective Non-Catalytic Reduction Technology Costs for Industrial
Sources." Letter from ICAC to OTC [Ozone Transport Commission].
Injection
Level 2
Injection Lesitl 1
30
are necessary in order to inject the reagent into the proper temperature zone. The amount of urea
or ammonia injected in the furnace varies with the NOx reduction target and uncontrolled NOx
level.
Tables 2-12a and 2-12b provide NOx reduction performance information of ammonia and urea
SNCR from the 2000 NESCAUM report on NOx control technologies. As can be seen from the
table, SNCR is quite effective in controlling NOx emissions from a range of industrial boilers.
Table 2-13 shows the cost of SNCR on wood-fired boilers. The capital cost of SNCR on coal-
fired boilers of similar size (MMBtu/hr) as the wood-fired boilers in Table 2-13 would be
expected to be about the same. According to Tables 2-12a and 2-12b, the average NOx
reduction for every boiler category exceeded 50%, with some well over 70%. As a result, it
would be reasonable to expect 50% NOx reduction using SNCR on average.
For EGU's SNCR capital cost is in the range of about $15/KW, and in most cases NOx
reductions in the range of about 30% are possible.I6
Table 2-12a
Statistics Regarding Performance of Industrial Boiler Types Equipped with
Urea SNCR
17
NOx Performance
Statistic
Wood Fired
IPP
Pulp/Paper
Refining
Industrial
Steel Industry
Avg NOx Red
51%
52%
57%
53%
74%
Std Error of Mean
1.9%
2.4%
3.6%
2.8%
6.2%
Pop. Std Dev.
8.3%
7.9%
14.0%
9.7%
20.5%
Min
35%
35%
34%
40%
30%
Max
70%
62%
74%
70%
90%
#
Facilities
19
11
15
12
11
Fuels
Biomass
Wood/Coal
Wood waste,
Wood, pulp, oil,
black liquor
Ref. Gas
Pet Coke
Nat. Gas
Coal,
#6 Fuel Oil
Coal
Nat. Gas
•
•
•
•
•
Avg NOx Red is the arithmetic average of the NOx reductions reported.
Std Error of Mean is the measure of the uncertainty in using the sample mean to estimate the mean of a
large population. When it is small relative to the mean, this indicates that the mean is a good measure.
Pop. Std Dev. Is the estimated standard deviation of a large population - a measure of dispersion
Minimum is the minimum value reported
Maximum is the maximum value reported
16
Northeast States for Coordinated Air Use Management (NESCAUM), "Status Report on NOx — Control
Technologies and Cost Effectiveness for Utility Boilers", 1998
17
Northeast States for Coordinated Air Use Management (NESCAUM), "Status Report on NOx — Control
Technologies and Cost Effectiveness for Industrial Boilers, Gas Turbines, IC Engines, and Cement Kilns", 2000
31
Table 2-12b
Statistics Regarding Performance of Industrial Boiler Types Equipped with
Ammonia SNCR
17
NOx Performance
Statistic
Stoker
Stoker
CFB/BB
Industrial
Refin. Heaters
Avg NOx Red
61.7%
57.5%
78.3%
57.7%
58.75%
Std Error of Mean
2.2
%
3.1%
0.81%
3.5%
3.35%
Std. Dev.
7.3%
8.8%
2.1%
11.7%
9.5%
Min
57%
46%
76%
30%
43%
Max
78%
75%
80%
75%
70%
#
Facilities
11
8
7
11
8
Fuels
Coal
Biomass
Coal, Biomass
Gas/Oil
Refinery Gas, Nat.
Gas, Oil
•
•
•
•
•
•
Avg NOx Red is the arithmetic average of the NOx reductions reported
Std Error of Mean is the measure of the uncertainty in using the sample mean to estimate the mean of a
large population. When it is small relative to the mean, this indicates that the mean is a good measure.
Pop. Std Dev. Is the estimated standard deviation of a large population - a measure of dispersion
Minimum is the minimum value reported
Maximum is the maximum value reported
CFB/BB means Circulating Fluidized Bed or Bubbling Bed boilers
Table 2-13
Reported Cost of Urea SNCR for Wood-Fired Power Boilers"
Size,
MMBTU/hr
Type
%
Reduct.
Capital
$
Estimated Ann.
Oper.
$
Baseline NOx
900
Grate-Fired
Biomass
50%
$1.1 M
$230 K
235 ppm
475
CE Stoker
60%
$700K
$54 K
0.47 lb/MlivIBTU
300
Riley Stoker
30-50%
$600K
$40K
0.25 lb/MIN4BTU
245
Front Fired
Fiber Waste
50%
$390K
$58 K
370 ppm
*
note: Capital cost shown is equipment, engineering, commissioning, but not installation. Installation
typically adds around 20% to 30% to the cost.
Also, coal-fired boilers of similar heat input would be expected to have similar capital cost.
Capital costs, and the resulting impact to cost-effectiveness (in $/ton of NOx removed), are
impacted by facility size. Figures 2-14a and 2-14b illustrate the difference in Cost Effectiveness
(in $/ton of NOx removed – calculated annually and for the ozone season) and capital cost for
fifty industrial installations. Not surprisingly, control is more expensive (normalized to unit size
or in terms of $/ton of NOx removed) for smaller boilers than for larger boilers. Thus, in most
cases NOx can be controlled more cost effectively with SNCR on larger units than smaller units.
The cost curve for the fifty applications analyzed indicates that the majority of the ozone season
applications have cost effectiveness values less than $4000/ton even for smaller units. An even
greater percentage of the applications have cost effectiveness values less than $3000/ton for
annual operation of the SNCR technology. For units over 100 MMBtu/hr, the units generally
have a cost effectiveness of under $2500/ton on an annual basis.
1111
?
111111-111111111111
I
\
0
lllll
?
11? 11111111111
25,000
20,000
E
E
a 15,000
113
0
0
0
-
lo
000
ti)
32
Figure
2-14a. Cost Effectiveness of Fifty SNCR Systems on ICI boilers.
15
10,000
9,000
8,000
7,000
6,000
5,000
4,000
3,000
2,000
1,000
0
CP,
?
tt)
?
U)
?
8? `Ct,),
?
U)
CSI?(N? V)?CI
?
8
?
0
C')
?
co
Unit Size (mmBTU/hr)
Annual ?
Ozone Season — — Log (Annual) — - Log (Ozone Season)
Figure
2-14b. Installed Capital Cost of SNCR on 50 ICI Boilersl5
Cr,?
N'
?U)?0?U)?0?0?
,r)
?<0
0,
""A
CU
`A f4 2
Unit Size (mmBtu/hr)
StNIMBTUitir — — Log. ($4.11ABTU/hr)
33
As shown in Figures 2-14a and 2-14b, for ICI boilers greater than 100 MMBtu/hr, capital cost is
typically $7,500IMMBtu or less, or about $750,000 for a 100 MMBtu/hr boiler. There are
economies of scale inherent to SNCR capital cost on ICI boilers in this size range. On a
$/MIVLBtu/hr basis, larger boilers tend to be less expensive to retrofit with SNCR. For example,
a 900 MMBtu/hr boiler might entail a retrofit cost of $1000-$2000/MIMBtu/hr, or about
$900,000 to $1.8 million – not that much more than the 100 MMBtu/hr boiler, despite the much
larger size.
2.3.4 Selective Catalytic Reduction (SCR)
Interest in SCR for NOx reductions on a variety of combustion sources has grown substantially
in recent years. SCR technology can reduce NOx emissions in excess of 90%. Commercially,
SCR is typically utilized in situations where combustion NOx controls are not adequate to reduce
NOx to the desired emissions levels. The technology has been used for many years on gas, oil,
and coal-fired boilers and gas turbines. There are several SCR installations on utility coal-fired
utility boilers in Illinois. SCR has also been operated on several coal-fired electric utility boilers
in other states.
The SCR process is based on the selective reduction of NOx by NH3
over a catalyst in the
temperature range of 500° to 900°F. The catalyst lowers the activation energy required to drive
the NOx reduction to completion, and therefore decreases the- temperature at which the reaction
occurs. Contrary to the SNCR process, both NO and NO
2
, the two principal forms of NOx from
power plants are reduced to
N2.
In the SNCR process only NO is affected. Also N
20 is not a
significant by-product of the SCR process, where as N
2
0 can be as much as 25 percent of the
NO reduced in the SNCR process. The overall SCR reactions are:
4NH3
+ 4NO +
02 4 4N2 +
6 H20
8NH3 + 6NO2 7N
2 + 121120
These are depicted in Figure 2-15.
Catalysts and substrates are shaped in either parallel or honeycomb modules that are stacked
together in a reactor – in multiple levels in the case of coal boilers as in Figure 2-16 - that must
be placed in the appropriate location where gas temperature matches the catalyst peak
performance temperature. In the utility boiler, this temperature normally corresponds to the inlet
air heater when the boiler is at or near full load. At the lower boiler loads, the temperature at the
air heater inlet may drop sufficiently so that some amount of economizer bypass may be required
to maintain the catalyst at the optimum temperature.
Application of SCR in high sulfur and high dust flue gas has been performed successfully in
numerous utility boiler applications. For this reason, SCR is viewed as technically feasible for
nearly any coal application.
For boilers, the most popular arrangements include: in-duct catalysts and full-scale reactor
catalysts. In coal-fired applications, full-scale SCR reactors have been most common.
2. Ammonia is
added
to the flue gas.
4. The reaction
converts the
nitrogen oxide to
pure nitrogen
and water. The
Flue gas then
continues to
1. Flue gas
containing
nitrogen
oxides is
admitted from
the boiler to
the SCR.
O"."1.-
3. The gas
mixture
flows over
catalyst ele-
ments, which
cause the nitro-
gen oxides
and
ammonia'
to react,
SCR
Reactor
34
Figure
2-15.
Simplified diagram of the SCR process
18
NH3
Injection Nozzle
Flue
Gas
NO),
NH3
NO),
NH3
H2O
-÷ N
2
-÷
H
2
O
2
Cleaned
Gas
The in-duct arrangement of SCR catalyst has been primarily used in boilers firing natural gas.
The approach is to squeeze as much catalyst as possible within the existing duct space between
the economizer and the air heater without having to move any of this equipment.
Full-scale SCR systems have been
applied to numerous utility boilers
Figure
2-16.
An SCR reactor for a coal-fired utility boiler
(Alstom Power SCR brochure)
burning coal and residual oil. There are
three possible arrangements to place a SCR
reactor within the existing equipment
layout of a steam generator. The most
popular arrangement, both in the U.S. and
abroad is the hot side, high dust setup
where the SCR reactor is placed ahead of
the air heater and cold-side ESP. Although
the SCR reactor is exposed to the full dust
loading leaving the boiler, this arrangement
often represents the most economic
operation.
Because of the success of using SCR in
utility boilers, there is good reason to
believe that SCR is technically feasible on
ICI boilers. However, in many cases the
cost of retrofitting SCR on an ICI boiler
will make it less attractive than other
approaches for NOx control.
A-Evr•
1.• /456?
"MAW <c. v., d?
,-.
'Institute to Clean Air Companies, "White Paper: Selective Catalytic Reduction (SCR) Control
of NOx Emissions", November 1997
35
As previously noted, full-scale SCR systems have been applied to numerous utility boilers. SCR
has been applied to a large number of other source categories as well. Table 2-14 displays the
number of SCRs installed on a variety of boiler applications and fuel types for just one major
SCR system supplier.
Table 2-14. SCRs installed on various a
pplications
from one US sunnlier19
Application
Units
Utility
Boilers
189
-Natural Gas Fired
54
-Coal Fired
132
-Oil Fired*
1
-Wood Fired
2
-Demonstration
4
Combustion Turbines
558
Diesel Engines
25
Refinery
&
Industrial
Boilers
165
Total Units
941
http://www.cormetech.com/experience.htm
Preliminary estimates of capital and O&M costs for ICI boilers are highlighted in Table 2-15.
These were developed by USEPA for comment. For coal-fired ICI boilers the capital cost range
is from $3.5 – $5.25 million with an average annual operation cost of $105,000. EGU's, due to
size, obviously cost more and are more expensive to run. ICI boilers that utilize oil, natural gas,
and wood operate for approximately $158,000/year with a capital cost of $1.4 – $2.1 million.
All ICI boiler costs were based on a capacity of 350 mmBtu/hr.
Unfortunately, cost estimates using 1999 base data are not truly accurate. Due to recent
escalation of the cost of capital-intensive emission control technologies, such as SCR and wet
FGD, it is necessary to re-evaluate these costs in light of escalation. Using the Vatavuck index
for wet scrubber costs published in Chemical Engineering magazine as an indicator for
escalation from 1999 to 2007, it is estimated that capital costs have increased roughly by 50%
since 1999.20
19 http://www.cormetech.com/experience.htm
29
"Economic Indicators" Chemical Engineering, September, 2006, p 102, and Vatatuck, William M., "Updating the
CE Plant Cost Index", Chemical Engineering, January 2002, p. 69
36
Table 2-15. Preliminary Capital and Operating Costs (1999 $) for ICI boilers equipped with
SCR21
These results are based u
p
on a preliminaryevaluation by S. Khan of USEPA using AirControl net
Unit Type
Capital Cost
($/MIVIlltu/hr)
O&M
Cost
($/MMI3tti/hr/yr)
$/ton of NOx Removed
Industrial Coal, 350 MMBtu/hr
$10,000-$15,000
$300
$2,000-$3,000
Industrial Oil, 350 MMBtu/hr
$4,000-$6,000
$450
$1,000-$3,000
While there is no doubt that SCR is technically feasible on ICI boilers, there is some uncertainty
regarding the cost because there is no data available on actual retrofit of coal-fired ICI boilers
with SCR. So, it is necessary to rely on estimates. Assuming that costs have escalated 50%
from 1999, this would increase the cost range of Table 2-15 for coal fired ICI boilers from
$10,000-$15,000/M Btu/hr to rouOly $15,000-$22,500/MMBtu/hr. Using this range, an
assumption of 90% NOx removal,
2
and assumptions regarding operating costs, it is possible to
develop a revised, or updated cost estimate. Also, to see the effects of a significantly higher cost
in the event of a very difficult retrofit, a cost estimate was also made assuming a capital cost of
$30,000/MMBtu/hr. This high capital cost is to account for the possibility of an extremely
difficult retrofit. Operating costs assume $400/ton for ammonia used and $7000/m
3
for SCR
catalyst and $100,000/year of Fixed Operating Costs. For a boiler that operates 7000 hours per
year with baseline emissions ranging from 0.40 to 0.60 lb/MMBtu, the costs are estimated to be
per Figure 2-17. As shown in Figure 2-17, costs in $/ton are generally around $2500/ton or less
except for the most conservative capital cost estimate of $30,000/MMBtu/hr where costs in $/ton
are generally near or above that cost. Assuming a power plant heat rate of 10,000 Btu/KWh, a
capital cost of $30,000/MMBtu/hr is roughly equivalent to $300/KW, which is the highest
capital cost reported to be recently incurred for utility applications.
23 As a result, it is reasonable
to use $30,000/MMBtu/hr as an indication of an extremely high cost, with capital cost in most
cases likely to be less. Costs in $/ton of control are also affected by the baseline NOx level.
Higher baseline NOx levels result in lower $/ton estimates.
However, the baseline NOx level has very little impact on actual total cost of SCR on the cost of
owning and operating the facility, as shown in Figure 2-18. As shown in Figure 2-18, roughly a
$0.40-$0.70/MMBtu of fuel input results from addition of SCR. In effect, if an owner is paying
about $2.50/MMBtu for fuel (including all costs to deliver and prepare fuel), a $0.50/MMBtu
cost associated with SCR is similar to a 20% increase in fuel cost for a 90% reduction in NOx
emissions. Moreover, since the proposed rule allows for emissions averaging plans, and an SCR
will provide lower emissions than required by the proposed rule, use of an SCR on a large boiler
can mitigate the need for controls on other units. So, the actual impact when measured over all
of the facilities that may receive the benefit of emission reductions from the SCR will be less
than what is stated above.
21 "Controlling Fine Particulate Matter under the Clean air Act: A Menu of Options" dated March 2006.
STAPPA/ALAPCO.
22
Erickson, C., and Staudt, J., "Selective Catalytic Reduction System Performance and Reliability Review",
presented at the EPRI-EPA-DOE-AWMA Combined Utility Air Pollution Control Conference, the Mega
Conference, Baltimore, August 28-31, 2006
23?
.
Cichanowicz, E.J., "CURRENT CAPITAL COST AND COST-EFFECTIVENESS OF POWER PLANT
EMISSIONS CONTROL TECHNOLOGIES", prepared for Utility Air Regulatory Group, June 2007
> $3,000
cc
$2,500
0
$2,000
$4,000
?
$3,500 L
50% capital escalation
from capital cost
range of Refs. 18 & 20
higher
capital
cost for
very
difficult
retrofit
Baseline NOx, lb/M M Btu
$1,500
—o— 0.4 —N-0.5 --*-- 0.6
$1,000
VT
O
ti
OOO
OOO
Lti
e-I
to
O
O
O
O
O
O
0
tto-
r4
Capital Cost, $/MMBtu
37
For EGUs, there is more data on the cost of SCR. Capital cost may be in the range of $150/KW
for an EGU. However there is a wide variation in cost from unit to unit due to the level of
difficulty associated with the retrofit. So, actual cost experienced for a particular project might
be significantly greater or lesser.
23
Figure
2-17. Estimated cost ($/ton of NOx removed) for a coal-fired ICI Boiler using SCR.
40
o0
0
1
0a0
0o
0
0
o00
in
■
o00
6...
1
o0
co
t• I
-v-,
e.1
,..n.
e■I
-v).
v).
,-.,
-,..0-
m
-v.,-
m
Capital
Cost, S/M MBtu
st.
$0.70
$0.6
$0.60
—
c
?
$0.55
ir■
...c
E?
$0.50
$0.45
0
$0.40
2?
$0.35
$0.30
$0.25
$0.20
50%
capital
higher
capital cost range of
for very
Refs-:18-&-20difficult
retrofit
escalation from
capital cost
Baseline NOx, lb/MMEAtt
40
60
MW
80
100
0.80
0.60
13 0,40
2 0.20
0.00
0
20
83% NOx
reduction
♦ Baseline Nox MiNibtu
■ ROFA N
x #!Pttu
Rotarn4 x Stittlatu
38
Figure 2-18.
Estimated cost ($/MMBtu of fuel input) for a coal-fired ICI Boiler using SCR.
2.3.5 Fuel Switching
As discussed in the previous section, burning of fuel with lower fuel-bound nitrogen will
generate lower NOx emissions. Natural gas and distillate oil have very low fuel-bound nitrogen
content compared to residual fuel oil and hence switching from residual fuel oil to distillate fuel
oil or natural gas will reduce substantially. Similarly, since coal has appreciable fuel-bound
nitrogen, switching from coal to a cleaner burning fuel such as distillate oil or natural gas will
lead to lower NOx emissions. Switching to a cleaner burning fuel, however, might entail
significant capital and will usually increase fuel costs and therefore, fuel switching is likely to be
unattractive.
2.3.6 Combinations of Controls
Figure 2-19.
Rotamix results at Dynegy Vermillion Plant
http://www.mobotecusa.com/projects/vermillion-sellsheet.pdf
Frequently, combustion controls and
post-combustion controls are
combined to provide lower
emissions and more cost-effective
reductions than might be possible
separately. A good example of this
is Mobotec's combination of
rotating overfire air (ROFA) and
SNCR in its Rotamix technology.
By combining these technologies, it
39
is possible to reduce emissions from coal-fired boilers by 70%-80% or more in some cases. At
Dynegy's Vermillion power plant in Illinois NOx emissions as low as 0.10 lb/MMBtu were
achieved as shown in Figure 2-19. This is a small power plant that is similar to a large industrial
boiler in size. Rotamix was also used at Progress Energy's Cape Fear #6 plant to achieve
emissions levels of 0.18 lb/MMBtu or less at all loads, as shown in Table 2-16.
Table 2-16 .
Rotamix results at Cape Fear 6
h ://www.mobotecusa.com/ ro ects/ca efear6-sellsheet. d
Load
NOx (1b/M1VIBtu)
%
Redn
02
CO
NH3
slip
Fuel
(MW)
62
014
82%
7.3%
< 30 pm
< 5 ppm
Bit. Coal
133
0.16
75%
3.4%
< 30 pm
< 5 ppm
Bit. Coal
174
0.18
71%
2.8%
< 30 pm
< 5 ppm
Bit. Coal
If Rotamix costs –$4000/MMBtu in capital and achieves on average 75% reduction from about
0.5 lb/MMBtu, with the first 50% reduction from the combustion controls and the balance from
SNCR, the cost of control is roughly $675/ton of NOx. This low cost is the result of the synergy
of the two control technologies working together. Using a similar analysis for a boiler, perhaps
firing residual fuel oil, with a baseline NOx level of 0.30 lb/MMBtu, it can be shown that NOx
would be reduced at a cost of around $1,000/ton.
2.4 Cost Effectiveness of NOx Controls for ICI Boilers
According to the proposed rule, boilers equal to or smaller than 100 million Btu/hour and the
emit 15 tons per year or more of NOx and 5 tons or more of NOx during the ozone season are
required to perform combustion tuning (CT), which is expected to reduce NOx emissions by 5 to
35 percent. CT helps in fuel saving by improved combustion efficiency and reduced heat loss to
the atmosphere. However, CT is relatively inexpensive.
Therefore, in estimating the costs of controls, attention is focused on boilers larger than 100
MMBtu/hr that are more likely to install control technology in order to comply with this rule.
The cost of NOx control includes capital cost and operating cost. The capital cost is a one-time
cost that is amortized over a period of time. So, a portion of the capital cost is applied to each
year of operation. The operating cost is experienced annually. In calculating the "cost
effectiveness" of removing NOx, the annualized cost of the NOx control is divided by the tons of
NOx reduced over that year. Because there is variability in the capital and operating cost from
one facility to another and there is some variability in the effectiveness of control for a
technology at one facility versus another, there is some variability to be expected in the cost
numbers. Something else that affects cost effectiveness significantly is the baseline NOx level.
The lower the baseline NOx level (NOx prior to adding controls), the higher the cost in $/ton of
NOx reduced. So, if a technology is added to a facility without any NOx control, the cost in
$/ton of removal will be less than for if the same technology were installed on a unit that is
initially better controlled – even if the actual dollars spent are more. Also, capacity factor
impacts cost effectiveness because the annual capital cost amortization does not change even if
the system is not operated much. Therefore, if capacity factor is low, the cost in $/ton of NOx
removed will be very high.
40
Because of all of these factors, the costs in $/ton shown in this report will be shown to vary
widely in some cases. Since the proposed Illinois rule allows averaging at a source, it is
reasonable to expect that facility owners will install technology on units where it will most likely
he used – high capacity factor units. For this reason it is reasonable to assume that the expected
costs for this rule would be near the lower end of the cost ranges shown.
Some of the sources cited in this section on control cost were dated several years ago, such as in
the early 1990's. Although there has been some inflation in the overall economy in that time,
costs for many of these technologies (in terms of $/ton of NOx removed) in nominal dollars have
not changed dramatically because of competition and technical advances have kept prices
relatively low, especially for combustion controls. In fact, the technical advances have also
improved performance, which tends to benefit (reduce) the cost effectiveness (in $/ton of NOx
removed) somewhat.
Tables 2-17a, b and c show a summary of control costs that have been compiled from various
sources.
Cost effectiveness data has been compiled and compared from the following sources:
1.
Alternative Control Techniques Document- NOx Emissions from Industrial/
Commercial/ Institutional (ICI) Boilers. March 1994. USEPA
2.
AirControlNet, Version 4.1, Documentation Report, dated September 2005. USEPA
3.
"Controlling Nitrogen Oxides under the Clean Air Act: A Menu of Options" dated July
1994. STAPPA/ALAPCO. (This document relies on federal ACT document and other
sources for cost effectiveness figures)
4. Khan, S.
Methodology, Assumptions, and References Preliminary NOx Controls Cost
Estimates for Industrial Boilers.
http://cascade.epa.gov/RightSite/dkpublic collection item detail.htm?ObjectType=dk
docket item&cid=0AR-2003-0053-0170&ShowList=xreferences&Action=view (table
is shown as Table III-4 in item 5 below)
Note that these estimates are preliminary
developed from AirControl Net
5. "Controlling Fine Particulate Matter under the Clean air Act: A Menu of Options" dated
March 2006. STAPPA/ALAPCO
6.
"Status Report on NOx Controls", prepared by Andover Technology Partners for the
Northeast States for Coordinated Air Use Management (NESCAUM), December 2000.
(denoted NESCAUM 2000 in this report)
7.
Midwest Regional Planning Organization (RPO) "Petroleum Refinery Best Available
Retrofit Technology (BART) Engineering Analysis Prepared for The Lake Michigan Air
Directors Consortium (LADCO) Prepared by: MACTEC Federal Programs / MACTEC
Engineering and Consulting, Inc. (denoted LADCO 2005)
8. Institute of Clean Air Companies (2006). "Selective Non-Catalytic Reduction
Technology Costs for Industrial Sources." Letter from ICAC to OTC [Ozone Transport
Commission].
9. Bill Neuffer, USEPA,
http://wwvv.epa.gov/air/ozonepollution/SIPToolkit/documents/stationary nox list.pdf
41
The Illinois EPA is relying on these documents to estimate the cost effectiveness of
controlling NOx emissions from ICI boilers in Illinois affected by the Illinois NOx
regulations proposed by this rulemaking.
2.4.1
ACT Cost Effectiveness
Three cost considerations are presented in the ACT document: total capital costs, total annual 0
& M costs, and cost effectiveness. The total capital cost is the sum of the purchased equipment
costs, direct installation costs, indirect installation costs, and contingency costs. Annual costs
consist of the direct operating costs of materials and labor for maintenance, operation, utilities,
and material replacement and disposal and indirect operating charges including plant overhead,
general administration, and capital recovery charges. The total capital investment was
annualized using a 10-percent interest rate and an amortization period of 10 years. Cost
effectiveness, in dollars/ton of NOx removed, is calculated for each control technique by
dividing the total annual cost by the annual tons of NOx removed. The base year for the cost
effectiveness is 1992. See Appendix A-1.
2.4.2 Cost Effectiveness Data from AirControlNet
AirControlNet is a software program from USEPA that is used to estimate control costs. The
document details all the assumption used in calculating control cost effectiveness for various
control technologies. For more information, please review the documentation report referenced
above. Generally a discount rate of 7 percent and a capacity factor of 65 percent are assumed.
Other assumptions include electricity cost of $0.05/kW-hr, coal cost of $1.60/million Btu and
natural gas cost of $2.50/million Btu, equipment life of 15 years for combustion controls and 20
years for post-combustion controls, ammonia cost of $225/ton. All costs are in 1990 dollars. For
more detailed information on assumptions, or any control specific variation in assumptions,
please refer to the documentation report. AirControlNet also provides a model to calculate cost
effectiveness data for any year up to 2004, but the data in the tables are for the year 1990.
2.4.3 Cost Effectiveness Data from STAPPA/ALAPCO document dated July 1994
The document provides a menu of options for controlling NOx emissions under the Clean Air
Act. Cost effectiveness data is generally based on the ACT for ICI boilers. Other sources used
for cost effectiveness data include California Air Resources Board, April 29, 1987 report and
Santa Barbara County, December 1991 report. All costs are in 1993 dollar and are based on 60
percent boiler capacity. For more details, please read this STAPPA/ALAPCO document.
2.4.4 Cost Effectiveness Data from STAPPA/ALAPCO document dated March 2006
The document provides a menu of options for controlling fine particulate matter emissions under
the Clean Air Act. Since NOx emissions are a precursor to fine particulate emissions, the report
also summarizes capital cost of NOx controls and cost effectiveness data. All costs are in 2004
dollar. For more details, please read this STAPPA/ALAPCO document.
2.4.5 Cost Effectiveness Data from NESCAUM 2000 Report.
This document, which was prepared by Andover Technology Partners, provides several cases of
ICI boilers that installed NOx control hardware. Some examples are provided in Table 2.11 and
also in Table A-3 of the Appendices.
42
2.4.6 Cost Effectiveness from Khan 2003
See Appendix A-2. This document, prepared by Sikander Khan of USEPA, documents
preliminary estimates of the cost of controlling NOx emissions on industrial boilers using
AirControlNet. Based upon a telephone conversation with Mr. Khan, this document was
actually developed to solicit comments at a time when USEPA was considering including
industrial boilers as part of the Clean Air Interstate Rule (CAIR). USEPA later decided not to
include ICI boilers in CAIR. So, the results of this study should be regarded as preliminary and
are shown only because there is some consistency with many of the other studies that have final
results. With regard to this study, there is probably greatest concern over the cost estimates of
SCR because of limited data and because of price escalation that has been experienced in recent
years with SCR. The results of calculations that are shown in Figure 2-17 were performed in an
effort to address escalation in SCR costs experienced since the base year 1999$ of this analysis.
2.4.7 Cost Effectiveness Data from LADCO 2005
Tables 2-17a, b, and c include cost effectiveness of NOx controls for oil and gas fired boilers in
the LADCO region that is taken from LADCO 2005. See Appendix A-4.
2.4.8. Cost Effectivenss of SNCR from ICAC
This refers to the data shown in Figure 2-14a.
2.4.9 Cost Effectiveness by Bill Neuffer of USEPA
Mr. Neuffer works for USEPA's Office of Air Quality Planning and Standards (OAQPS). He
prepared a table of control technologies and cost effectiveness in 2006 as part of the SIP Tool Kit
for states.
2.5 Cost Effectiveness of NOx Control for large EGU Boilers
All of the EGUs in the Chicago NAA and Metro-East NAA are currently subject to MPS or CPS
requirements under 35 Ill. Adm. Code Part 225. Therefore, it is not envisioned that this rule will
cause increased cost for facilities over existing requirements.
43
Table 2-17a: Cost Effectiveness Data for Natural Gas-Fired ICI Boilers
Type of Unit
Unit
Capacity,
nunBtu/hr
NOx
Control
Technology
Controlled
NOx Level,
lb/mmBtu
Data
Source
Cost-
Effectiveness,
$/Ton NOx
Removed
Natural Gas-fired
Watertube
Single Burner
150
FGR
0.05
Ref. 1
1390-1670
150
SCR
0.024
Ref. 1
2060-2350
100
SCR
80% Control
Ref. 4
1689-26859
Small*
SCR
80% control
Ref. 4
2230-2860
100
LNB/OFA/FGR
80% Control
Ref. 4
700-12374
100
LNB+FGR
0.07
Ref. 1
1,110-3,090
990-2,730
650-1760
150
LNB+FGR
0.07
Ref. 1
250
LNB+FGR
0.10
Ref. 1
150
WI
0.05
Ref. 1
N/A
50
WI
+
OT
0.06
Ref. 1
710-820
100
WI
+
OT
0.06
Ref. 1
570-650
150
WI
+
OT
0.06
Ref. 1
540-610
50
LNB
0.08
Ref. 1
570-2,390
410-1,670
360-1,450
559-10521
100
LNB
0.09
Ref.1
150
LNB
0.09
Ref
.1
100
LNB+OFA
60% Control
Ref. 4
Natural Gas-fired
-
Watertube
Field-Erected
Multiple Burner
MBWT
SCR
0.024
Ref.1
2060-2350
250
SCR
80% Control
Ref. 4
1354-21095
100
SCR
80% Control
Ref. 6
3100-6100
350
SCR
80% Control
Ref. 6
2000-3600
500
SCR
70-90%
Ref.7
2444-7176
1000
SCR
80% Control
Ref. 4
986-14815
250
LNB/OFA/FGR
80% Control
Ref. 4
543-9415
1000
LNB/OFA/FGR
80% Control
Ref. 4
368-6204
250
BOOS+WI+OT
0.06
Ref.1
530-570
500
BOOS+WI+OT
0.08
Ref.1
400-430
100
BOOS+OT
0.09
Ref. 1
440-510
150
FGR
50-65%
Ref. 2
1390-1670
Large
SNCR
50%
Ref. 9
1600
Large*
SNCR
50% control
Ref. 3
1570
MBWT**
SNCR
0.10
Ref. 1
N/A
250
BOOS+OT
0.12
Ref.1
280-330
250
LNB+OFA
60% Control
Ref. 4
424-7913
1000
LNB+OFA
60% Control
Ref. 4
280-5260
250
LNB
0.12
Ref.1
3,030-6,210
500
786-3841
LNB
40% Control
Ref. 7
500
ULNB
75%-85%
Ref. 7
750-850
500
LNB
0.15
Ref. 1
1,920-3,900
500
LNB+FGR
50-70%
Ref. 7
981-3994
500
LNB+SNCR
50-89%
Ref. 7
1560-3688
500
ULNB+SCR
85-97%
Ref. 7
2925-5836
*
Small means less than 1 ton/day NOx, Large means greater than 1 ton/day NOx
**MBWT means Multiple
Burner Watertube
44
Table 2-17b: Cost Effectiveness Data for Fuel Oil-Fired ICI Boilers
Type of Unit
Unit
Capacity,
,
mmBtu/hr
NOx Control
Technology
Controlled NOx
Level, lb/mmBtu
Data
Source
Cost-
Effectiveness,
$/Ton NOx
Removed
Distillate Oil
Watertube
Single Burner
50
SCR
0.03
Ref.1
1,500-1,900
50
SCR
0.03
Ref.1
2070-2360
150
SCR
0.03
Ref. 1
1560-1780
100
LNB
0.10
Ref. 1
370-1,500
150
LNB
0.10
Ref. 1
600-750
50
LNB+FGR
0.07
Ref. 1
2,100-4,700
100
LNB+FGR
0.08
Ref. 1
800-2,580
250
LNB+FGR
0.08
Ref. 1
580-1,910
Small*
LNB+FGR
60% control
Ref. 3
1090-2490
Small*
SCR
80% control
Ref. 3
2780
Distillate Oil
Watertube
Field-Erected
Multiple Burner
150
LNB
45% control
Ref. 2
600-750
150
SCR
80-90% control
Ref. 2
1560-1780
150
SNCR
30-70%
control
Ref. 2
2450-3060
250
LNB
0.10
Ref. 1
3,630-7,450
500
LNB
0.10
Ref. 1
2,880-5,850
Residual Oil
Watertube
Single Burner
50
SCR
0.06
Ref. 1
2,030-2,900
100
SCR
0.06
Ref. 1
1,440-2,530
250
SCR
0.06
Ref. 1
1,140-2,190
150
SCR
0.06
Ref.1
1,290-1,480
Small*
SCR
80% control
Ref. 3
1480-1910
100
SCR
80% control
Ref. 4
1245-1694
50
LNB
0.19
Ref.1
240-1,010
100
LNB
0.19
Ref. 1
190-790
250
LNB
0.19
Ref. 1
150-580
Residual Oil
Watertube
Field-Erected
Multiple Burner
MBWT
SCR
0.045
Ref. 1
1,140-2,190
150
SCR
0.045
Ref. 1
1,290-1,480
Small*
SCR
80% control
Ref. 3
1480-1910
250
SCR
80% control
Ref. 4
997-1343
350
SCR
80% control
Ref. 5
1000-3000
1000
SCR
80% control
Ref. 4
760-1,017
Large*
SNCR
50% control
Ref. 3
1050
250
LNB
0.19
Ref. 1
1,910-3,920
350
LNB
50%
Ref. 6
1576-2977
350
burner mod
25%
Ref. 6
189-357
350
Rotamix
–75%
Sec 2.3.6
–1,000
500
LNB
0.19
Ref
.1
1,520-3,080
750
LNB
0.19
Ref. 1
1,330-2,680
150
LNB
45% control
Ref. 2
490-610
* Small means less than 1 ton/day NOx, Large means greater than 1 ton/day NOx
MBWT means multiple burner watertube
45
Table 2-17c: Cost Effectiveness Data for Coal and Wood-Fired ICI Boilers
Type of Unit
Unit
Capacity,
mmBtu/hr
NOx Control
Controlled NOx
Level,
lb/mmBtu
,
Data
Source
Cost-
Effectiveness
$/Ton NOx
Removed
Pulverized Coal
Wall-Fired
Boiler
100
SCR
80% control***
Ref. 4
1349-7262
250
SCR
80% control***
Ref. 4
1123-5924
1000
SCR
80% control***
Ref. 4
876-4481
250 - 750
SCR
0.14
Ref. 1
3,000 — 4,800
Large**
SCR
70% control
Ref. 3
1,070
Small**
SCR
70% control
Ref. 3
1,260
350
SCR
80%+
Ref. 5
2000-3000
350
SCR
80%+
Ref. 6
1300-3000
500
SCR
80-90% control
Ref. 2
1,790-2,030
350
SCR
90%
Fig 2-17
$1500-$3500
350
SNCR
35%
Ref. 6
1300-1814
—800
ROTAMIX
70-83%
Sect. 2.3.6
--$675
400
LNB
0.35
Ref. 1
1,170— 1,530
250
LNB
51% control
Ref. 4
389-2305
350
LNB
36%
Ref. 6.
730-1378
100
LNB+OFA
51-65% control*
Ref. 4
593-757
250
LNB+OFA
51-65% control*
Ref. 4
454-581
1000
LNB+OFA
51-65% control*
Ref. 4
306-392
Coal-CFBC
250 - 750
SNCR-Urea
0.08
Ref. 1
810 — 1,130
Large**
SNCR-Urea
40% control
Ref. 3
670
Small**
SNCR-Urea
75% control
Ref. 3
900
N/A
SNCR-NH3
0.04-0.09
Ref. 1
N/A
N/A
SNCR
76-80%
Ref. 5
N/A
N/A
SNCR
40%-75%
Ref.9
700-900
N/A
SCR
0.12
Ref.1
N/A
N/A
SCA+FGR
0.14
Ref.1
N/A
Coal-BFBC
N/A
SNCR-NH3
0.04-0.09
Ref. 1
N/A
N/A
SNCR-Urea
0.03-0.14
Ref. 1
N/A
N/A
SCA
0.10-0.14
Ref. 1
N/A
Coal-Spreader
Stoker
250 - 750
SNCR-Urea
0.22
Ref. 1
1,280 — 1,440
N/A
SNCR-NH3
0.15-0.18
Ref. 1
N/A
N/A
SNCR
57%-80%
Ref. 5
N/A
SNCR
40
Ref.9
700-900
Small**
SNCR
40% control
Ref. 3
873-1015
N/A
Gas Co-firing
0.18-0.20
Ref. 1
N/A
Coal-Stoker
500
SNCR
30-70% control
Ref. 2
940-1,170
Wood
Stoker
150
SNCR
0.11
Ref.1
1,270-2,380
N/A
SNCR
46%-75%
Ref. 5
N/A
250
SNCR
0.11
Ref.1
1,080-2,130
500
SNCR
0.11
Ref.1
890-1,870
Solid Fuel
>100
SNCR
50%+
Ref. 8
1500-2500
* For Bituminous and Sub-Bituminous Coals, control efficiencies are 51% and 65%, respectively Cost data is for
83% capacity factor
** Small means less than 1 ton/day NOx, Large means greater than 1 ton/day NOx
*** 80% control corresponds to 0.14 lb/mmBtu NOx for wall-fired boilers and 0.12 lb/mmBtu for tangential- fired boilers
46
3. Process Heaters
3.1 Introduction and Summary of this Section
This section provides a description of the process heater source category, the mechanism of NOx
formation, the technical feasibility of controls, the cost effectiveness of controls, the existing and
proposed regulations and the sources affected by the regulations.
Most process heaters burn natural gas, refinery fuel gas, or distillate fuel oil which are low in
fuel nitrogen. Baseline emissions from process heaters burning natural gas, refinery fuel gas and
distillate fuel are inherently low because of low fuel nitrogen contents. These process heaters can
be controlled by a number of combustion modification techniques including low NOx burners
(LNB), ultra low NOx burners (ULNB) and flue gas recirculation (FGR), which are often less
expensive than post combustion techniques such as selective catalytic reduction (SCR) and non-
selective catalytic reduction (SNCR). In most cases NOx emissions can be reduced to the target
level by combustion modification only, but in some cases it may be necessary to install a
combination of combustion control and post-combustion control technologies.
Some heaters burn residual fuel oil and or refinery pitch which are high in fuel nitrogen.
Depending on the nitrogen content of the fuel oil and process heater design, baseline NOx
emissions could vary substantially. To economically control NOx emissions from such process
heaters, it may be necessary to use fuel which is low in fuel nitrogen and choose combustion
conditions that generate lower amount of NOx during combustion. Controlling NOx emissions
from such process heaters may involve the use of a combination of combustion and post
combustion controls. Switching to distillate fuel oil may be another option.
The proposed regulations target those process heaters which are located in the Chicago NAA and
Metro-East NAA that are located at a major source of NOx emissions. A major source is a
source that emits or has the potential to emit 100 tons or more of NOx per year. Process heaters
that are greater than100 million Btu/hour capacities are subject to numerical emission limits
shown in Table 3-1. Process heaters that are equal to or less than 100 million Btu/hour with
annual NOx
�
15 tons per year and ozone season NOx
�
5 tons are required to do combustion
tuning (CT) annually. Combustion tuning is expected to reduce NOx emissions from 5 to 25
percent.
Table
34.
Emissions Limits for Process Heaters lar
ger than 100 MMBtu/hr
Fuel
Type
NOx limit (1b/MINIBtu)
Gaseous Fuels
All
0.07
Residual Fuel Oil
Natural Draft
0.10
Residual Fuel Oil
Mechanical Draft
0.15
Other Liquid Fuels
Natural Draft
0.05
Other Liquid Fuels
Mechanical Draft
0.08
47
3.2 Process Description and Sources of Emissions
3.2.1 Process Heater Description
Process heaters are mainly used in petroleum processing and petrochemical industries. Some
process heaters are used in chemical manufacturing, gas processing, and other industries. Process
heaters are also known as process furnaces and direct-fired heaters. There is a broad spectrum of
process heater designs and capacities. They are used where boilers or steam heaters are not
appropriate. Process heaters are used for heating fluids other than water.
The fluid may be heated either to raise temperature of the feed before additional processing or to
initiate a chemical reaction within the tubes. The first category of heaters is called feed heater.
Examples of feed heaters include preheaters and reboilers for distillation columns, hot oil
furnaces, preheaters for catalytic cracking and hydroprocessing etc. They are found both in
petroleum refining and chemical manufacturing industries. The second category is called
reaction feed heater. Some examples
of
reaction feed heaters include steam-hydrocarbon
reformers used in ammonia and methanol manufacturing, pyrolysis furnaces used in ethylene
manufacturing, and thermal cracking used in refining operations.
Regardless of the heater type, combustion air is supplied to the burners in one of two ways: via
natural draft
(ND)
or mechanical draft
(MD)
systems. Natural draft heaters rely on flame
buoyancy to motivate the combustion air, usually introduced at ambient conditions, to the up-
flow burners. Mechanical draft heaters use fan(s) to motivate combustion air. Most process
heaters are natural-draft, vertical-flow, atmospheric combustion systems. Most natural-draft
process heaters have multiple burners under 10 MMBtu/hr each. But, some burners can be
somewhat larger or smaller. Figures 3.1 and 3.2 illustrate two common types of natural draft
process heaters – a natural draft cabin process heater and natural draft box process heater. Other
types are used as well.
The larger process heaters may have air preheaters, which will require a mechanical draft system
to overcome the pressure drop of the air preheater.
Burner selection depends on several factors including process heat requirements, fuel type, and
draft type. Natural draft gas-fired burners may be simpler in operation and design than oil-fired
burners and are classified either as premix or raw gas burners. In premix burners, about 50 to 60
percent of the air necessary for combustion is mixed with the gas prior to combustion at the
burner tip. This air is induced into the gas stream as the gas expands through the orifices in the
burner. The remainder
of
the gas is provided at the burner tip. Raw gas burners receive fuel gas
without any premixed combustion air with diffusion of air and fuel at the flame.
Oil-fired burners are classified according to the method of atomization. Atomization is needed to
increase the mixing of fuel and combustion air. Three types of atomization commonly used are
mechanical, air, and steam.
Stack
Convective
tubes
Horizontal
Wall tubes
Flame
O
O
O
O
Burner Row
and air inlet
Bottom View
48
Combination burners can burn 100 percent oil, 100 percent gas, or any combination of oil and
gas. A burner with this capability generally has a single oil nozzle in the center of a group of gas
nozzles.
The number of burners in a process heater can range from 1 to over 100. In a petroleum refinery,
the average number of burners is estimated at 24 in ND heaters with average heat input capacity
of about 70 million Btu/hour. The average number of burners is estimated at 20 in MD heaters
with ambient combustion air and average heat input for the heaters of 104 million Btu/hour. In
other words, burners in process heaters are typically well below 10 million Btu/hr even for larger
heaters - much smaller in size than burners used in boilers of similar heat input. The reason is
because even heat distribution is essential in fired heaters to avoid damaging the product being
heated.
Figure 3-1.
End and Bottom Views of a Natural-Draft Cabin Process Heater
Burners
Bottom View
49
Figure 3-2. Natural Draft Cylindrical Process Heater
_________._.,.._■ Stack
_.,■ Convective
tubes
Vertical Wall
tubes
Side View
Flames
50
3.2.2
Factors Affecting Uncontrolled NOx Emissions
There are several factors which affect baseline or uncontrolled NOx emissions from process
heaters. These include heater design parameters such as burner design, fuel type, combustion air
preheat, firebox temperature, and draft type, and heater operating parameters such as excess air,
burner flame characterization etc. Since these factors influence each others, uncontrolled
emissions could vary over a wide range. This section discusses how boiler design, fuel
characteristics, and boiler operating characteristics, can influence baseline (uncontrolled) NOx
emissions.
3.2.2.1
Heater Design Parameters
There are several heater designs used in industry depending upon the type of fuel burned. The
heater design parameters that affect the level of NOx emissions include fuel type, burner type,
combustion air preheat, firebox temperature and draft type.
3.2.2.2 Fuel Type
Process heaters burn a variety of gaseous and liquid fuels including natural gas, refinery fuel gas,
hydrogen, butane, pentane, distillate fuels oils and residual fuel oils. In addition, some process
heaters burn refinery pitch. Research shows that combustion of distillate fuel oils generates more
NOx emissions than natural gas under identical operating conditions. Refinery fuel gas (RFG)
usually has trace amounts of HCN, NH
3
, and other nitrogen bearing species that may be oxidized
to NOx, but usually RFG does not contain fuel bound nitrogen. Therefore combustion of RFG
generates somewhat higher NOx emissions as compared to natural gas. Fuel NOx could be a
significant portion of total NOx when high nitrogen fuels such as residual oil are combusted.
Hydrogen content of refinery gas which is burned in low- and medium-temperature process
heaters can vary from 0 to 50 percent. The heating value of such fuels varies from 700 to 2200
Btu/scf depending on hydrogen content. Hydrogen content of refinery gas which is burned in
high-temperature process heaters such as pyrolysis furnaces can be as high as 80 percent. The
heating value of such high hydrogen fuels varies from 400 to 600 Btu/scf depending on hydrogen
content. This variation in fuel hydrogen content causes changes in flame temperature,
propagation, and flame volume. High hydrogen fuels produce hotter flames and hence higher
levels of thermal NOx.
3.2.2.3
Burner Type
Burners use one of two methods for mixing the fuel and air – diffusion or premixing. Diffusion
flame burners – which rely on mixing of fuel and air in the flame zone - were more common in
the past. They tend to have better flame stability and turndown. Natural draft diffusion flame
burners may be called raw-gas burners. Premixed burners premix fuel and air prior to ignition.
Premixed burners – when operated as lean-premixed - can have a significant advantage for NOx
control in some cases, but they tend to produce a less stable flame than diffusion-flame burners •
because the burner stoichiometry of lean-premixed burners must be more carefully controlled.
Figure 3-3a. Callidus Ultra Blue Burner
http://wvvw.callidus.com/pages/next_gen.htm
Internal FGR for Callidus Ultra Blue Burner24
51
Turndown has been improved in recent years through the use of variable geometry on some
burners using lean-premixed combustion.
Diffusion-flame burners generally rely on air staging for NOx control, and to a much lower
extent, fuel staging. Air staging is performed by initially having the fuel and air burn in a fuel
rich zone, where no NOx is formed, and then air is added to burn out the fuel in a controlled
manner to minimize NOx formation. In fuel staging the fuel is added in two stages. The first
combustion zone is lower intensity than if fuel were added in one stage, which helps reduce NOx
formation. The latter stage acts as a "reburn" zone – reducing NOx from the first stage
somewhat.
In addition to better flame stability, another advantage of diffusion-flame burners is that they can
use internal flue gas recirculation (FGR), which
enables NOx reduction with FGR without the
need for external ductwork and fans. Figure 3-
3a is a photo of the flames from Callidus Ultra
Blue Burners, which uses internal FGR and have
been shown to achieve under 10 ppm NOx in
some applications, and 10-20 ppm in typical
applications.
Premixed burners offer the potential for lower
NOx emissions when using low nitrogen fuels
because premixed burners can employ lean-
premixed combustion (LPC) for lower NOx. It is
also possible to use fuel staging with an LPC
burner. However, to practice FGR with an LPC
burner requires external ductwork and fans, which
may significantly increase the cost.
Figure 3-3b.
Some newer burners use a porous surface of
ceramic or metallic fibers to burn gas fuels.
They can only be used in a mechanical draft
configuration. These burners are premix
burners and combustion occurs on the outer
surface of radiant burners. Combustion
occurs at relatively low temperature
(1830°F) with a stable flame. These burners
produce low NOx as well CO and HC
emissions.
Oil-fired burners are diffusion burners and
typically use air staging for NOx control.
24
Heat Input Affects NOx Emissions from Internal Flue Gas Re-Circulation Burners;
http://texasiof.ces.utexas.eduitexasshowcase/pdfs/presentations/c 1 /dbishop.pdf
52
There are differences in performance from one heater to another due to differences in heat
transfer and other effects. The heat transfer in these heaters must be carefully controlled because
improper heat transfer may result in undesirable coking reactions. So, a burner may not be able
to operate at its optimum combustion point, but rather under a combustion condition that works
well with the needs of the fired heater and also provides a stable flame. Although the burners are
normally tested at the manufacturer's test facility in advance of installation, there is occasionally
some difference in performance from what will occur when installed in the actual heater,
especially with regard to NOx emissions. Therefore, there is some uncertainty about how the
burners will perform in place on a day-to-day basis
as
compared to what is shown in testing at
the manufacturer's laboratory.
Another complication is that these burners will often operate on variable fuels. Refineries prefer
to burn gas in the fired heaters that would otherwise be flared off. Natural gas is mostly used to
supplement the fuel that is generated on site. Therefore, the fuel may vary from gas that is mostly
hydrogen, to light hydrocarbons, to natural gas. This makes it more difficult to control a burner
to the very tight combustion conditions necessary for single-digit NOx emissions and low CO
emissions.
Natural draft burners generally are in the size range of 6-12 MMBtu/hr, with about 8-10
MMBtu/hr being most typical. The price for a burner may be in the range of the following:
25
4 MMBTU/hr burner: about $5,000
8 MMBTU/hr burner: about $8,000
or, roughly, $1,000/MMBTU
This is just the burner cost. The total cost of the installed equipment is often several times the
cost of the burner. Frequently, the fuel system will require some modification because the new
burners tend to have finer orifices that can plug without fuel system improvements and the heater
floor will often require modification or even replacement. Other equipment additions may be
necessary as well. The estimated cost of the entire project could be two to five times the price
of the burner itself, sometimes more, resulting in a cost of about $2,000-$5,000/MMBTU.
However, unlike the burners used on boilers, the burners used on natural draft fired heaters
normally do not require external flue gas recirculation. External FGR would add significant cost
due to the additional ductwork and fan.
3.2.2.4
Combustion Air Preheat
Combustion air preheat is an efficient way to save fuel in mechanical draft heaters, but
preheating of air increases the flame temperature and hence higher amounts of NOx are
produced. In mechanical draft process heaters, use of combustion air preheat can increase NOx
emissions by as much as 40% when air preheated to 400°F is used. Combustion air preheat is
not used in natural draft fired heaters.
25 http://www.andovertechnology.com/HGA_MarketReportsecure.pdf
53
3.2.2.5
Firebox Temperature
Firebox temperature is directly related to flame temperature. Higher firebox temperature will
produce more thermal NOx. hi processes requiring high firebox temperatures, such as steam
hydrocarbon reformers and olefins pyrolysis furnaces, higher thermal NOx is produced as
compared to low- and medium-firebox furnaces. Research shows that increasing firebox
temperature from 1300°F to1900°F increases thermal NOx formation by about 50 percent for
gas-fired furnaces. Oil-fired furnaces are less sensitive to firebox temperature increase because
fuel NOx is less sensitive to temperature than thermal NOx.
3.2.2.6
Draft Type
Two basic methods for combustion air supply are natural draft (ND) and mechanical draft (MD).
MD systems can be further subdivided into forced draft, induced draft, and balanced draft. These
three types are distinguished by the location of the fan relative to the heating unit. In forced draft,
a fan is located upstream of the firebox, in induced draft, a fan is located downstream of the
heating unit, and in balanced draft, both forced as well as induced draft fans are used. Balanced
draft is more common with boilers than with process heaters. In ND heaters, the pressure
difference between the hot gases in the stack and the cooler outside air results in a draft which
causes cool combustion air to flow into the burners.
Draft type can influence NOx emissions by affecting the excess air in the combustion zone. By
converting a ND heater to MD heater and lowering the excess air, NOx emissions can be
reduced.
3.2.2.7
Heater Operating Parameters
Some of the operating parameters that affect NOx emissions from process heaters include excess
air and burner adjustments. Excess air is needed to ensure complete combustion of fuel in the
burner. A typical excess air level for a process heater is approximately 15 percent. Excess air
present, of course, will depend on fuel type, draft type, and burner design.
Research has shown that for every 1 percent increase in excess oxygen level, NOx emissions
increase from 6 to 9 percent. Beyond about 6 percent excess oxygen in the flue gas, NOx
formation begins to decrease because of the flame cooling effect. Radiant burners are reported to
be capable of minimizing NOx emissions without sacrificing fuel efficiency, even with excess air
levels of 10 to 20 percent.
Burner adjustments can affect NOx emissions by altering the flame characteristics. By increasing
flame length, the peak flame temperature can be reduced which will affect NOx emissions. On
the other hand, if a flame is compact, it will produce high intensity flame, and hence higher
levels of NOx emissions. The flame length in multi-stage burners can be changed by changing
relative amounts of primary and secondary airs, but such adjustments may not coincide with
optimum NOx control.
54
3.3 Baseline or Uncontrolled NOx Emissions
Baseline NOx emissions are strongly influenced by heater design, type of fuel burned, peak
flame temperature, and oxygen concentration. Uncontrolled NOx emission factors (for units not
equipped with low NOx technology) are listed in USEPA's Compilation of Air Pollutant
Emission Factors: AP-42 and American Petroleum Institute (API) publications. The NOx
emission factors predicted by these publications vary a lot and hence the approach adopted by
the ACT document is to use the model heater approach in order to compare the uncontrolled
NOx emissions from different types of heaters. The same approach has been used for comparing
NOx control techniques.
The uncontrolled NOx emission factors for natural gas-fired, low and medium-temperature
model heaters are 0.098 and 0.197 lb/mmBtu for natural draft (ND) and mechanical draft (MD)
heaters, respectively. The uncontrolled NOx emission factors for the ND oil-fired model heaters
are 0.20 and 0.42 lb/mmBtu for distillate and residual fuel-oil firing, respectively. The distillate
and residual oil-fired MD heaters have uncontrolled NOx emission factors of 0.32 and 0.54,
respectively. The uncontrolled emissions factors for the pyrolysis model heaters 0.135 and 0.162
lb/mmBtu for the natural gas and high-hydrogen fuel gas-fired heaters, respectively.
MD heaters generate more NOx emissions as compared to ND heaters because MD heaters use
combustion air preheat which increases thermal NOx. Oil-fired heaters have higher baseline
NOx emissions because they operate at higher temperature and hence generate more thermal
NOx as compared to gas-fired heaters. Residual oil contains more fuel nitrogen as compared to
distillate fuel oil, and combustion of residual fuel oil generates more fuel NOx as compared to
distillate oil.
The Table 3-2 below gives provides baseline NOx emissions from model process heaters
equipped with conventional (not low NOx) burners.
Table 3-2: Model Heaters: Uncontrolled NOx Emission Factors
Model Heater
Type
Uncontrolled
Emission Factor
Thermal NOx
Fuel NOx
Total NOxa
ND, Natural Gas-Fired
b
0.098
N/A
0.098
MD, Natural Gas-Firedb
0.197
N/A
0.197
ND, Distillate Oil-Fired
0.140
0.06
0.200
ND, Residual Oil-Fired
0.140
0.28
0.420
MD Distillate Oil-Fired
0.260
0.06
0.320
MD, Residual Oil-Fired
0.260
0.28
0.540
ND, Pyrolysis, Natural Gas-Fired
0.135
N/A
0.135
ND, Pyrolysis, High Hydrogen Fuel Gas-Fired'
0.162d
N/A
0.162
'Total NOx = Thermal NOx + Fuel NOx
bHeaters firing refinery fuel gas with up to 50 mole percent hydrogen can have up to 20% higher NOx emissions
than smaller heater firing natural gas
'High hydrogen fuel gas is fuel gas with 50 mole percent or greater hydrogen content
dCalculated assuming 50 mole percent hydrogen
55
N/A = Not applicable
3.4 Technical Feasibility of NOx Control
The control of NOx emissions from process heaters can be accomplished either through
combustion modification controls, flue gas treatment controls, or a combination of these
technologies. Combustion modification controls include low NOx burners (LNB) and ultra low
NOx burners (ULNB). Post-combustion controls include selective catalytic reduction (SCR) and
selective non-catalytic reduction (SNCR). Combination controls include low NOx burners with
flue gas recirculation (FGR), SNCR, and SCR.
3.4.1 Combustion Controls
Combustion controls such as LEA, LNB, ULNB, and FGR inhibit NOx formation by controlling
the combustion process. Low excess air (LEA) firing is the most effective process heater
improvement techniques one can apply without incurring a capital cost. Low excess air lowers
peak flame temperature and produces less oxidizing conditions, thus limiting thermal and fuel
NOx. Many process heaters already minimize excess air levels to increase heater efficiency and
decrease fuel requirement. Excess air levels can be reduced on almost all heaters, but this
approach is most effective on mechanical draft heaters. Very low excess air levels may result in
flame stability, as well as formation of soot and increased emissions of CO and hydrocarbons. A
reducing atmosphere in the heater may also lead to corrosion of heat transfer surfaces. Lowering
of excess air can reduce NOx emissions by 5 to 20 percent.
Combustion tuning incorporates low excess air and inspection of the process heater for proper
working conditions.
Process Heater Tune-Up:
Both natural-draft as well as mechanical draft process heaters can be
made to operate with low excess air, but mechanical draft heaters are more amenable to low
excess air firing.
The tune-up procedure as recommended by the process heater manufacturer should be followed,
wherever possible. If the manufacturer procedure does not involve the use of CO and 02
monitoring during combustion tuning, procedures as described in
http://www.valleyair.org/rules/currntrules/r4304.pdf
may be followed.
Prior to combustion tuning, inspection of all heat transfer surfaces, fuel systems, electric and
combustion control systems, valves, refractories, fan housing, blades etc. should be checked, and
repairs must be made, as needed.
LNB and ULNB:
LNBand ULNB use staging techniques to reduce oxygen in the flame zone or
supply excess air to cool the combustion process. Staged air LNB creates a fuel-rich primary
combustion zone and fuel-lean secondary combustion zone. Staged fuel LNB creates a fuel-lean
fuel-rich primary combustion zone and fuel-rich secondary combustion zone. ULNB uses a
combination of internal FGR and staged-fuel LNB and hence provide lowest emissions amongst
all low NOx burners as shown in Figure 3-4, and Figure 3-5 shows emissions levels for John
Zink burners. Table 3-3 provides typical NOx reductions for different low NOx burners taken
from the ACT document. As shown in the figures as well as Table 3-2, very high NOx
reductions are achievable with low NOx burners (air or fuel gas staging) using FGR.
56
Table 3-3: NOx Reduction Potential for Different Low NOx Burners
Low NOx Burner Type
Typical NOx
Reduction,
%
Staged-air Burner
25-35
Staged-fuel Burner
40-50
Low-Excess Air Burner
20-25
Burner with External FGR
50-60
Burner with Internal FGR
40-50
Air or Fuel-gas Staging with Internal FGR
55-75*
Air or Fuel-gas Staging with External FGR
60-80
* Reductions of up to 90% have been demonstrated
Reference: Nitrogen oxides emissions reduction technologies in the petrochemical and refming industries.
Charles E. Baukal et. al. Environmental Progress, Vol. 23, No. 1, April 2004.
John Zink is not the only supplier of burners with very low NOx emissions. Callidus, Maxum,
Coen, Hamworthy and other companies also offer burner technology that is capable of providing
very low emissions.
Ultra low NOx emissions require low excess oxygen levels and good control of fuel and air.
Retrofit of low NOx burners normally also requires new controls possibly with additional
instrumentation as shown in Figure 3-6. Figure 3-6 shows the use of a CO analyzer, oxygen
analyzer and control of exit duct and inlet registers on a natural draft process heater.
Regulations in the Houston/Galveston Area required large process heaters (over 100 MMBtu/hr)
to emit less than 0.025 lb/MMBtu. As a result, companies have retrofit many existing process
heaters with low-NOx burners, allowing existing units to achieve NOx emissions rates in the
range of 0.015-0.025 lb/MMBtu. New process heaters are capable of NOx emissions rates in
the range of 0.010-0.015 lb/MMBtu.5
57
Figure
3-4: Comparison of an ultra low NOx burner (ULNB) with other burners
(www.johnzink.com)
0
?
2?3
?
4
?
5
EXCESS OXYGEN, %
Figure
3-5. Representative emissions for three different John Zink company burners. SFG -
using fuel staging, QMR - using internal FGR; and LM 300 – which is a lean-premixed burner
with multiple combustion zones
(www.johnzink.com)
NOx by
Type
60
55
50
45
40
c.
SFG'm
(Staged-Fuel
Technology)
0.051
co
a
35
0.041
30
25
20
15
10
OMR'm
INFURNOx
LNI•300T"i
COOLburn
Technology
0.031
0.021
Increasing Severity of Service
High 02, hot fuel, high bridgewall temperature and close
burner spacing adversely affect NOx in all burners.
Actuator
Control
addition
to DCS
0
Heater Limits
CO Analyzer
Draft
Registers
58
Figure 3-6
Low NOx burner controls on a natural draft process heater
www.perforg/ppt/Bishop.ppt
3.4.2 Post-Combustion Controls
Unlike combustion controls, SNCR and SCR do not inhibit NOx formation, but reduce NOx in
the flue gas. These techniques control NOx by using a reactant that reduces NOx to nitrogen (N2)
and water. The reactant, ammonia or urea for SNCR and ammonia for SCR, is injected into the
flue gas stream. The effectiveness of the reactant depends on residence time and temperature.
The optimum temperature window for SNCR effectiveness is about 1600° to 2000°F for
ammonia based and 1650° to 2100°F for urea based SNCR. At temperatures above 2000°F,
ammonia injection becomes counter productive, resulting in additional NO formation. Below
1600°F, the reaction rate drops and undesired amounts of ammonia are carried out in the flue
gas. NESCAUM's 2000 study (See figure 2-1 lb of this report) showed data on eight refinery
heaters equipped with ammonia SNCR that achieved 43% and 70% NOx reduction.
There are several types of SCR catalysts available in the market. These catalysts facilitate the
reaction of ammonia with NOx in the flue gas. The optimum temperature window for SCR
effectiveness using ammonia is 500-900°F.
It should be noted that SCR would require the conversion of a natural draft heater into
mechanical draft. Natural draft-to-MD conversion does not in and of itself reduce NOx
emissions. However, ND to MD conversion makes it possible to take advantage of thermal
59
efficiency gains possible from adding an air preheater. In general studies such as this one, this
efficiency improvement is not factored into the economics of an SCR retrofit, although for a
specific application an owner probably would.
Tables 3-4 and 3-5 provide NOx reduction potential for control technologies for various types of
process heaters taken from the 1993 USEPA Alternative Control Techniques Document- NOx
Emissions from Process Heaters (Revised), EPA-453/R-93-034. Unfortunately, USEPA has not
updated this document since 1993.
As indicated in section
3.4.1 of
this document, current
state-of-the-art combustion controls are much better than shown in Tables
3-3 and 3-4 as a
result of
substantial advancements in combustion controls since
1993.
As an example, Table
3-6 shows the state-of-the-art emissions rates per New Jersey's State of the Art (SOTA) Manual
for Boilers and Process Heaters that was revised in 2004. As shown in the comparison of the NJ
SOTA Manual in 2004 to the 1993 ACT document, the emissions levels possible for burners
have improved dramatically in ten years due to the advancements in combustion controls.
Table 3-4: Model Heaters: Control Technique Effectiveness for Natural Gas- and
Refinery Fuel Gas-fired Process Heaters from 1993 ACT
Process Heater Type
Control Technique
Total Effective NOx
Reduction,
%
LNB
50
ULNB
75
Low and Medium Temperature Heater
SNCR
60
Natural Gas-Fired or Refinery Fuel Gas-Fired
SCR
75
LNB+FGR
55
LNB+SNCR
80
LNB+SCR
88
LNB
25
ULNB
50
Pyrolysis Furnace
SNCR
60
Natural. Gas-Fired or Refinery Fuel Gas-Fired
SCR
75
LNB+FGR
55
LNB+SNCR
70
LNB+SCR
81
Reference: Alternative Control Techniques Document- NOx Emissions from
Process Heaters (Revised), EPA-453/R-93-034, Table 2-2.
60
Table 3-5:
Model Heaters: NOx Control Efficiencies for Distillate and Residual oil-Fired
Process Heaters
Process Heater
Type
Control Technique
Total Effective NOx
Reduction, %
Controlled NOx,
lb/mmBtu
Natural Draft,
Distillate Oil
(ND) LNB
40
0.12
(MD) LNB
43
0.18
(ND) ULNB
76
0.05
(MD) ULNB
74
0.08
SNCR
60
0.08
(MD) SCR
75
0.08
(MD) LNB+FGR
43
0.18
(ND) LNB+SNCR
76
0.05
(MD) LNB+SNCR
77
0.07
(MD) LNB+SCR
86
0.04
Natural Draft,
Residual Oil
(ND) LNB
27
0.31
(MD) LNB
33
0.36
(ND) ULNB
77
0.10
(MD) ULNB
73
0.15
SNCR
60
0.17
(MD) SCR
75
0.14
(MD) LNB+FGR
28
0.23
(ND) LNB+SNCR
71
0.12
(MD) LNB+SNCR
73
0.15
(MD) LNB+SCR
83
0.09
Mechanical Draft,
Distillate Oil
(MD) LNB
45
0.176
(MD) ULNB
74
0.08
SNCR
60
0.13
(MD) SCR
75
0.08
(MD) LNB+FGR
48
0.17
(MD) LNB+SNCR
78
0.07
(MD) LNB+SCR
92
0.03
Mechanical Draft,
Residual Oil
(MD) LNB
37
0.34
(MD) ULNB
73
0.15
SNCR
60
0.22
(MD) SCR
75
0.14
(MD) LNB+FGR
34
0.36
(MD) LNB+SNCR
75
0.14
(MD) LNB+SCR
91
0.05
Reference: Alternative Control Techniques Document- NOx Emissions from
Process Heaters (Revised), EPA-453/R-93-034, Table 2-3.
61
Table 3-6
(from NJ State of the Art Manual
State of the Art Controls for Boilers and Process Heaters
for Boilers and Process Heaters www.state.nj.usidep/aqpp/downloads/sota/sota12.pdf)
Emission Rates in lb/MA/I:Btu
10-50 MMBtu/hr
>50 to 75 MMBtu/hr
>75 MMBtu/hr
NOx (gas)
0.0350
0.0200
0.0100
Tech (gas)
LNB with FGR or
ULNB
LNB with FGR or
ULNB
LNB with FGR and/or
SCR
NOx (distillate oil)
0.0600
0.0600
0.0300
Tech (distillate oil)
LNB with FGR
LNB with FGR
LNB with FGR and
SCR
3.5 Cost Effectiveness of NOx Controls
The proposed rules impose numerical emission limits on only those process heaters that are
greater than100 mmBtu/hour and requires combustion tuning for heaters less than or equal to 100
mmBtu/hr. Combustion tuning is expected to reduce NOx emissions by 5 to 25 percent and
results in better combustion efficiency at very low cost for smaller units affected by this rule.
There are several documents published by USEPA and STAPPA/ALAPCO that describe the cost
effectiveness data for controlling NOx from process heaters. The documents include Alternative
Control Techniques (ACT) Document- NOx Emissions from Process Heaters (Revised),
September 1993, AirControlNet, Version 4.1, Documentation Report, dated September 2005,
Controlling Nitrogen Oxides under the Clean Air Act: A Menu of Options, published in July
1994 by STAPPA/ALAPCO. In 2005 the Midwest Regional Planning Organization and
LADCO published their Petroleum Refinery Best Available Retrofit Technology (BART)
Engineering Analysis. Another recent STAPPA/ALAPCO document entitled "Controlling Fine
Particulate Matter under the Clean air Act: A Menu of Options" dated March 2006 also provides
some cost effectiveness data for process heaters.
Because the costs in $/ton of NOx are impacted by several factors such as baseline NOx level,
capacity factor, retrofit difficulty, etc., the costs in $/ton shown in this report will be shown to
vary widely in some cases. Since the proposed Illinois rule allows averaging, it is reasonable to
expect that facility owners will install technology where it will most likely be used – high
capacity factor units with higher baseline emissions. For this reason it is reasonable to assume
that the expected costs for this rule would be near the lower end of the cost ranges shown.
Some of the sources cited in this section on control cost were dated several years ago, such as in
the early nineties. Although there has been some inflation in the overall economy in that time,
costs for many of these technologies (in terms of $/ton of NOx removed) in nominal dollars have
not changed dramatically because of competition and technical advances have kept prices
relatively low, especially for combustion controls. In fact, the technical advances have also
improved performance, which tends to benefit (reduce) the cost effectiveness (in $/ton of NOx
removed) somewhat.
Cost Effectiveness of Combustion Controls
NOx reduction,
Ili/MM Btu
—1-0.05
—•-- 0.1
0.15
0.2
--+—
0.25
0
?
2000
?
4000?
6000?
8000
?
10000
Capital Cost, $/MMBtu/hr
6000
-o
0
0.•
0
0
"6
C
5000
4000
3000
2000
1000
62
Figure 3-7.
Cost Effectiveness of Combustion Controls on Fired Heaters
In most cases, it is expected
that combustion controls,
especially ultra low NOx
burners, will provide the
necessary reductions at the
lowest cost. In a small
number of other cases, post-
combustion controls may be
more cost effective in
providing the necessary
emission controls. Figure
3-7 shows estimates of cost
effectiveness (in $/ton of
NOx removed) for
combustion controls for
various capital costs and amount of NOx reduced. The results of Figure 3-7 assume 8,000 hours
per year of operation, 13% annual capital recovery factor and negligible incremental O&M cost
(a reasonable assumption for most heaters). As shown, costs are generally well below $2500/ton
unless NOx reduction is fairly low or capital cost is very high. However, using a typical number
for capital cost of $5000/MMBtu/hr or less, under $2500/ton is very achievable in all cases
except where low NOx reduction is achieved. A small amount of NOx reduction may occur in
cases where heaters are already very well controlled. Cost in $/ton will also be higher if a heater
operates less than 8000 hours per year. In general, refineries operate at very high capacity
factors. Estimated cost would be higher at lower capacity factors. But, if a fired heater is
expected to operate much less than 8000 hours per year, due to averaging under the rule, an
owner is more likely to install controls on other heaters that operate at higher capacities. The
results of Figure 3-7 are consistent with those of Tables 3-6a and 3-6b, which come from the
2005 study by LADCO. It is also consistent with a NJ workgroup on fired heater NOx control
that found that retrofitting LNB with ULNB would provide NOx reduction at under $1000/ton.
26
As shown in Tables 3-7a and 3-7b, SCR is more costly than other approaches, and would not
likely be used for compliance with the proposed rule. SNCR, especially in combination with
LNB, may be able to provide NOx reduction at relatively low cost.
Other sources of cost - ACT, AirControlNet, and STAAPA/ALAPCO
USEPA's ACT and AirControlNet data provide detailed analysis on a wide variety of process
heaters. Tables provided in Appendix B show estimates of cost for various model heaters,
including some much smaller than affected by this rule. Generally, the costs shown for the
smaller heaters in these tables will be higher than expected for the proposed Illinois rule due to
the size of the units. The data has been compiled from the AirControlNet Documentation
26 http://www.nj.govidep/airworkgroups/docs/wps/SCS004A fin.pdf
Partha Ganguli. Draft Document
dated
May
11, 2006.
63
Report. As can be seen that cost of control using ULNB is about $1500/ ton NOx reduced.
Tables B-1 through B-5 are from USEPA's ACT document for model heaters. Table B-6 is
developed from AirControlNet. Table B-7 is from a STAAPA/ALAPCO document. Table B-8
is a summary of data from these tables.
Although the costs in Tables B-1 through B-8 are sometimes shown in base years over ten years
old, there has actually been very little cost escalation in combustion control equipment in
particular over that time. This is largely due to competition in the industry along with many
technological developments that have made NOx control less expensive while improving
performance.
For pyrolysis heaters larger than 100 mmBtu/hr, no control cost data has been provided in the
ACT document. However, the cost data for 84 nunBtu/hr ND pyrolysis heaters shows that cost is
well within $2500/ton NOx reduced at a 90% capacity factor.
For ND oil-fired heaters, cost effectiveness data has been provided only for heaters with heat
input of 69 mmBtu/hr. Since costs of NOx control for these process heaters are less than
$2500/ton NOx reduced, it is expected that larger process heaters will also have a cost well
within $2500/ton NOx reduced. For MD oil-fired process heaters, cost data is only provided for
135 mmBtu/hr process heaters. The data shows that the cost of control using LNB and SNCR
will be well within $2500/ton NOx reduced. The AirControlNet data provided for small sources
in Table 10 also shows that cost data for NOx control for oil-fired process heaters are well within
$2500/ton NOx reduced. STAPPA/ALAPCO data for oil-fired heaters show that SCR can be
used to control NOx emissions from oil-fired process heaters cost effectively.
64
Table 3-7a.
Cost of Controls on Natural Gas Fired Heaters
Gas Fired Heater
Uncontrolled emissions (tpy)
379
LNB
Removal Efficiency?
40%
Low Capital Cost
High Capital Cost
Total Capital Investment (ICI)
$292,664
S3,736.339
Total Annual Costs
$187,407
S650,213
Pollutants Removed (tonsJyr)
151
151
Cost per ton pollutant removed
$1,237
$4,292
Gas Fired Heater
Uncontrolled emissions (tpy)
ULNB
Efficiency
Efficiency
379
75%
85%
Total Capital Investment (TCI)
$1,154,628
$1,154,628
Total Annual Costs
$315,255
S315,255
Pollutants Removed (tonslyr)
284
322
Cost per ton pollutant removed
$1,110
$979
Gas Fired Hater
Uncontrolled emissions (tpy)
379
SCR
Efficiency
?70%
Efficiency
?90%
Low Capital Cost
High Capital Cost
Low Capital Cost
High Capital Cost
Total Capital Investment (ICI)
$1,085,350
$9,044,000
$1,085,350
$9,044,000
Total Annual Costs
$892,875
$1,962,462
5892,875
$1,962,462
Pollutants Removed (tonsfyr)
265
265
341
341
Cost per ton pollutant removed
$3,368
57,402
$2,619
$5,757
Gas Fired Heater
Uncontrolled emissions
(tpy)
379
LNB
+ SNCR
Removal Efficiency
?50%
Removal Efficiency?89%
Low Capital Cost
High Capital Cost
Low Capital Cost
High Capital Cost
Total Capital Investment (TCI)
$1,000,300
$6,339,236
$1,000,300
$6,339,236
Total Annual Costs
$627,194
S1,344,709
5627,194
$1,344,709
Pollutants Removed (tons/ r)
189
189
337
337
Cost per ton pollutant removed
$3,312
$7,101
$1,861
$3,989
Gas Fired Heater
Uncontrolled emissions (tpy)
379
ULNB
+
SCR
Removal Efficiency?
85%
Removal Efficiency?97%
Low Capital Cost
High Capital Cost
Low Capital Cost
High Capital Cost
Total Capital Investment (ICI)
$2.239,978
510,198,628
$2,239,978
$10,198,628
Total Annual Costs
$1,208,130
$2,277,717
$1,208,130
52,277,717
Pollutants Removed (tons)yr)
332
322
367
367
Cost per ton pollutant removed
$3,753
57,075
53,289
56,200
65
Table 3-7b.
Cost of Controls on Natural Oil Fired Heaters
Oil Fired Heater
Uncontrolled emissions (tpy)
463
LAB
Removal Efficiency
40%
Low Capital Cost
High Capital Cost
Total Capital Investment (TCI)
$292,664
$3,736,339
Total Annual Costs
$187,407
S650,213
Pollutants Removed (tonsiyr)
185
185
Cost per ton pollutant removed
$1,012
53.509
Oil Fired Heater
Uncontrolled emissions (tpy)
ULNB
Efficiency
Efficiency
463
75%
35%
Total Capital Investment (TCI)
$?
54,628
$1,154,628
Total Annual Costs
$315,255
5315,255
Pollutants Removed (tons/yr)
347
394
Cost per ton pollutant removed
$907
$801
Oil Fired Hater
Uncontrolled emissions (tpy)
463
SCR
Efficiency
70%
Efficiency
90%
Low Capital Cost
High Capital Cost
Low Capital Cost
High Capital Cost
Total Capital Investment (ICI)
$1,085,350
$9,044,000
$1,085,350
$9,044,000
Total Annual Costs
$1,118,413
$2,187,999
$1,118.413
$2,187,999
Pollutants Removed (tons/yr)
324
324
417
417
Cost per ton pollutant removed
$3,449
S6,748
$2,683
$5,249
Oil Fired Heater
Uncontrolled emissions (tpy)
463
LAB
+
SNCR
Removal Efficiency 50%
Removal Efficiency
89%
Low Capital Cost
High Capital Cost
Low Capital Cost
High Capital Cost
Total Capital Investment
(TCI)
$1,000,300
S6,339,236
$1,000,300
$6,339,236
Total Annual Costs
$705,153
51,422,669
S705,153
$1,422,669
Pollutants Removed (tons/yr)
231
232
412
412
Cost per ton pollutant removed
$3,045
$6,143
$1,711
S3,451
Oil Fired Heater
Uncontrolled emissions (tpy)
463
ULNB
+
SCR
Removal Efficiency
85%
Removal Efficiency 97%
Low Capital Cost
High Capital Cost
Low Capital Cost
High Capital Cost
Total Capital Investment (ICI)
$2,239,978
$10,198,628
$2,239,978
$10,198,628
Total Annual Costs
$1,433,668
$2,503,254
$1,433,668
$2,503,254
Pollutants Removed (tons/3:r)
394
394
449
449
Cost per ton pollutant removed
$3,641
$6,358
$3,191
$5,572
Kiln
Hood
Burner Pipe
Flame
Steel Shell
from Cooler
Firebrick
I-lot Air
) I Clinker
to
Cooler
Lining
66
4. Cement Kilns
4.1 Introduction
The purpose of this section is to provide a description of the source category, the mechanism of
NOx formation, the technical feasibility of controls, the cost effectiveness of controls, the
existing and proposed regulations, and the sources affected by the regulations.
There are four companies in Illinois which produce cement in eight kilns, three of which are long
dry kilns, one short dry kiln, three preheater kilns, and one preheater/precalciner kiln. None are
located in the Chicago NAA and Metro-East NAA. However, in the future, cement kilns may
be built in these areas. The emission rates of Table 4-1 are proposed emission rates that apply to
all cement kilns affected by this rule that have NOx emissions of 15 tons per year or more and 5
tons or more during the ozone season.
Table 4-1.
Pro
p
osed Cement Kiln Emission Limits
Kiln Type
NOx (lb/ton of clinker)
Long Dry
5.1
Short Dry
5.1
Preheater
3.8
Preheater/Precalciner
2.8
4.2 Process Description and Sources of Emissions
Cement is used in almost all construction applications, including homes, public buildings, roads,
dams, bridges, tunnels etc. The hydraulic Portland cement, produced by burning a mixture of
limestone, clay, and other ingredients at a high temperature, is the primary product of the cement
industry. Limestone is the single largest ingredient used for making cement.
To make cement, the solid raw materials are heated to their fusion temperature, (which are
typically between 2550 to 2750°F), by burning various fuels, but coal is the main fuel used in
cement manufacturing. The clinkers that are produced are cooled, ground, and blended with
other materials such as calcium sulfate to produce cement of right fineness. The clinkering
process is the main source of NOx emissions from cement kilns.
Figure
4-1. A Rotary Cement Kiln
(Wikipedia)
PREHEATER
TOWER
ROTARY
KILN
67
Most of the cement is produced in large rotary kilns. A rotary kiln is a refractory brick-lined
cylindrical steel shell typically anywhere from about 150 feet long to several hundred feet long
and 10-25 feet in diameter, such as in Figure 4-1. The kiln is slightly inclined to the horizontal
and is rotated slowly at a rate of 1 to 3 revolutions per minute. The feed materials are fed at the
upper end of the kiln and clinker – the product of the kiln – is discharged at the lower end. The
kiln is heated by burners placed at the lower end and the hot gases flow countercurrent to the
flow of raw materials. As the raw materials flow down the kiln they are gradually converted into
clinkers which exit at the lower end of the kiln.
Cement can be produced either by wet process or by dry process. The choice between the wet or
dry process depends upon the moisture content in the raw materials. If the moisture content of
the feed materials exceeds 15 to 20 percent, a wet process is preferred. However, wet processes
are energy intensive, and produce higher amount of NOx emissions per ton of clinker produced.
That is why the recent trend is towards the dry process with preheater/ precalciner systems. As
mentioned previously, there are four cement plants in Illinois with a total of eight kilns. All of
the kilns in Illinois are dry process and four of the eight kilns have preheaters. A preheater uses
the exhaust gases of the rotary kiln to preheat the feed material. Preheaters help to improve the
energy efficiency and the pollutant emissions of the kiln versus kilns without preheaters. In a
precalciner kiln there is fuel added to calcine the feed prior to entering the rotary section of the
kiln where the material is exposed to higher temperatures to produce the clinker.
In the dry process, the raw materials are ground first and then introduced into the kiln. Drying of
raw materials is carried out directly in the kiln (or in the preheater, in the case of preheater kilns).
Early dry process kilns were short, and the substantial quantities of waste heat in the exit gases
from such kilns were frequently used in boilers to generate electricity needed for the plant. Long
dry kilns are capable of better energy efficiency than wet kilns.
For suspension preheater kilns, a roller mill utilizes the exit gas from the preheater to dry the
material in suspension in the mill. The dry, pulverized feed passes through a series of cyclones as
in Figure 4-2, where it is separated and preheated several times, typically in a four-stage cyclone
system. The partially calcined feed exits the preheater tower into the kiln at about 1500-1650°F.
Figure
4-2. A Preheater Kiln
In a precalciner kiln, a second burner is
utilized to carry out calcination in a
separate vessel attached to the preheater.
The flash furnace uses preheated
combustion air taken from the clinker
cooler and the kiln exit gases and burns
about 60 percent of the total kiln fuel.
Coal, chipped tires, and other fuels may be
burned, but coal is most common. The raw
material is calcined about 95 percent and
the gases continue to move upward
through successive cyclone preheater
stages. The precalciner kilns are small
IN= MIMI
11:1111:1111:1111M
MN
?
To coal mills
Preheater
fan
To raw mill
Feed
Alternate
Kiln
feed
a?
Calciner
fuel
IL,
fuel
ILC-E
Preheater/?
. ternat
Kiln primary
air blower
precalciner?
fuel
To clinker storage
11
Unax cooler
1
-1
-1
?
IF
Kiln
68
since only final clinkering is carried out in the rotary kiln. They are the most energy efficient of
all kiln types. The burning process and clinker cooling operations are same as in other kilns. The
precalciner technology is the most modern cement manufacturing technology and almost all new
plants are based on these designs. Figure 4-3 shows a precalciner kiln.
Figure
4-3 A precalciner cement kiln with five-stage cyclonic precalciner
27
4.3 Factors Affecting Uncontrolled NOx Emissions
Because cement kilns use a very high temperature combustion process, the NOx emissions from
cement kilns can be rather high. As discussed earlier, there are four different types of cement
kilns, namely long wet kilns, long dry kilns, preheater kilns, and preheater/precalciner kilns. The
long wet and dry kilns have only one heating zone, whereas preheater and preheater/precalciners
kilns have two heating zones, a primary burning zone and a secondary firing zone. Because these
two zones typically have different temperatures, the factors affecting NOx formation are also
somewhat different. Since Preheater and preheater/precalciner kilns are more fuel efficient, NOx
emissions from such kilns are lower than conventional single burner zone dry and wet kilns.
4.3.1 NOx Formation in the Kiln Burning Zone
There are several factors which affect NOx formation in the burning zone, including combustion
zone temperature, type of firing system, gas-phase residence time and oxygen concentration.
However, due to the very high temperatures in the primary burn zone of a cement kiln, NOx
formation is driven much more by thermal NOx than fuel NOx. Figure 4-4 shows the
relationship between NOx emissions and burn-zone temperature for a kiln. The temperature of
the flame strongly depends on the type of fuel burned and excess air used. While natural gas has
lower fuel nitrogen, natural gas will normally result in much higher NOx than coal because the
27
Sun, W.H., Bisnett, M.J., et al. "Reduction of NOx Emissions from Cement Kiln/Calciner through the Use of the
NOxOUT Process." International Specialty Conference on Waste Combustion in Boilers and Industrial Furnaces.
Air and Waste Management Association. Kansas City, MO: April 21, 1994
69
heat release is in a smaller volume and a gas flame is less luminous than a coal flame – both
contributing to higher flame temperatures and higher thermal NOx formation.
Figure 4-4.
Relationship between NOx emissions and burn zone temperature for a cement kiln
(data provided by Greg Mayes, Texas Industries, February 2000 to J. Staudt, Andover Technology Partners and published in ,
NESCAUM 2000")
Base Case 7/21 to 8/4
Average Temp
=
2618
Average NOx
=
206 pp
•
I
?
--
:$0
_it
?
•
#
?
•
•
•*
.
4:
•
•
416
-
0$
:
416.
?
le
•
$
?
•
•
•
4.41,
•
?
•
40
?•
•
_______.„_•_
: •?
••
t•e*
$
•
?
?
• •
■
■
?
r.
?
4
.
•
-
•
♦.
?
••••
•• •
2300
?
2400
?
2500
?
2600
?
2700
?
2800
?
2900
T2, deg F
The firing system affects the proportion of primary and secondary combustion air. Direct firing
system introduces high amount of excess air and hence produces more NOx. Indirect firing
system uses only a small portion of combustion air to convey fuel and hence uses less amount of
primary air. Most cement kilns in the USA are direct fired. But, many have been retrofit with
indirect fired burners.
Other conditions, such as excess air level, fuel type, and feed material will affect NOx emissions.
The feed material may impact the temperature necessary to produce quality clinker. The dust
level in the kiln will also affect NOx. Higher dust levels will reduce NOx since dust will
increase radiant heat transfer.
4.3.2 NOx Formation in the Secondary Firing Zone
In the secondary firing zone of preheater and precalcining kilns, temperature ranges from 1500 to
2000°F. This temperature is lower than in the primary combustion zone of the kiln by several
hundred degrees. As a result, thermal NOx generation in this zone is not a major concern. The
NOx formed in this zone is largely fuel NOx.
450
400
350
300
.0
O
0-
.
250
0 200
150
100
50
0
70
4.3.3 Suspension Preheater Kilns with Riser Duct Firing
Preheater kilns are more energy efficient than long dry kilns. About 10-20 percent of fuel is fired
into the riser duct. Because of higher energy efficiency and reduction in the amount of fuel
burned at the higher clinker burning temperature, NOx emissions from preheater kilns are lower
as compared to the long dry and wet kilns. Burning of coarse fuels (such as tires) into the kiln
riser duct can further reduce NOx emissions from the kilns.
4.3.4
Precalcining Kiln Systems
Precalcining kilns utilize a second burner to carry out calcination in a separate vessel attached to
the preheater. The flash furnace utilizes preheated combustion air drawn from the clinker cooler
and kiln exhaust gases and burns about 60 percent of the total fuel. The remaining 40 percent of
the fuel is combusted in the primary kiln zone. These furnaces require the least amount of energy
per unit amount of clinker produced. Since the amount of fuel burned at the clinker burning
temperatures is reduced considerably, NOx emissions from such furnaces are the lowest of all
cement kilns. On the other hand, the NOx concentration (in ppm) in the kiln gas may be
considerably higher than in preheater kilns due to longer gas retention times in the precalcining
kiln burning zone combined with a very high secondary air temperature.
4.3.5 Baseline or Uncontrolled NOx Emissions
Baseline NOx emissions are strongly influenced by kiln design, fuel characteristics, peak flame
temperature, and oxygen concentration. The NOx emissions data are available in the ACT
document for four types of cement kilns, namely long wet kilns, long dry kilns, preheater kilns,
and preheater/precalciner kilns. Table 4-1 presents proposed NOx emissions data for these
cement kilns. As can be seen from the table, there are substantial variations in NOx emissions
even for cement kilns of the same type.
As can be seen from Table 4-2, in general, wet kilns produce highest NOx emissions ranging
from 3.6 to 19.5 lb NOx/ton of clinker with an average of 9.7 lb NOx/ton of clinker. Wet kilns
also consume the most energy among different kiln types. It has been found that wet kilns
burning natural gas produce more NOx than those burning coal.
Table 4-2: NOx Emission Factors for Different Kiln Types
Cement Kiln Type
Heat Input
Requirement
(mmBtu/Ton
Clinker)
Average NOx
Emission Rate
(lb/ton
Clinker)
9.7
Range of NOx
Emissions
(lb/Ton of
Clinker)
Long Wet Kiln
6.0
3.6 – 19.5
Long Dry Kiln
4.5
8.6
6.1 – 10.5
Short Dry Kiln*
Not Available
Not Available
Not Available
Preheater Kiln
3.8
5.9
2.5 –11.7
Precalciner Kiln
3.3
3.8
0.9 – 7.0
* For short dry kilns, it is safe to assume that heat input requirements and NOx emissions are
similar as for long dry kilns.
71
As compared to long wet kilns, long dry kilns typically consume about 25 percent less energy.
They also produce typically about 12 percent lower emissions compared to long wet kilns. Since
long wet and long dry kilns are similar in terms of structure and firing of fuels, lower NOx
emission rates for long dry kilns may be partly attributed to differences in energy consumption.
NOx emissions from long dry kilns are in the range of 6.1 to 10.5 lb/ton with an average value of
8.6 lb/ton of clinker produced.
Preheater kilns produce NOx emissions in the range of 2.5 to 11.7 lb/ton with an average value
of 5.9 lb/ton of clinkers produced. The highest NOx rates were found in natural gas burning
kilns. Since combustion of part of the fuel is done in a preheater and total fuel consumption is
lower for a preheater kiln than a long dry kiln, preheater kilns produce lower amount of NOx as
compared to long wet and long dry kilns.
Precalciner kilns produce the least amount of NOx emissions ranging from 0.9 to 7.0 with an
average of 3.8 lb NOx/ton of clinker. These kilns are also the most energy efficient with an
average energy consumption of 3.3 million Btu/ton of clinker. Because of overall lower fuel
consumption and lower fuel consumption in the kiln, these kilns produce lower NOx emissions
as compared to other types of kilns discussed above.
4.4 Technical Feasibility of NOx Controls
For any given type of the cement kiln, the amount of NOx formed is directly related to the
amount of energy consumed in the cement-making process. Thus, the measures that improve the
energy efficiency of this process should reduce NOx emissions in terms of pounds ("1W') of NOx
per ton of product. With rising costs of energy and the very competitive cement market, greater
attention is being paid to reduce over-burning of clinker, improving gas-solids heat transfer and
increasing overall energy efficiency.
In its document Alternative Control Techniques Document--NOx Emissions from Cement
Manufacturing, EPA-453/R-94-004 ("ACT"), March 1994, (See Reference 3) USEPA has
identified control techniques in detail. NOx control approaches applicable to the cement industry
may be grouped into two categories:
•
Combustion control approaches where the emphasis is on reducing NOx formation, and
•
Post-combustion control approaches which destroy the NOx formed in the combustion
process.
4.4.1 Combustion Controls
4.4.1.1 Combustion Zone Control of Temperature and Excess Air
NOx emissions from a cement kiln are mainly a function of temperature and the amount of
nitrogen and oxygen that can react together. Because the high temperature needed to convert the
raw materials into clinker is very conducive to NOx formation, significant NOx reductions can
be obtained by lowering kiln operating temperatures, and by lowering the excess air ratio thus
decreasing the amounts of nitrogen and oxygen available for reacting. On the other hand, a
minimum operating temperature is necessary to maintain the quality of the cement that is being
produced.
The solution to NOx via combustion zone control of temperature and excess air is therefore to
determine the minimum excess air ratio necessary for product quality, to maintain this ratio by
continuously monitoring oxygen and carbon monoxide levels in the exhaust, and to keep the
72
temperature low by also continuously monitoring NOx in order to also maintain low NOx
concentrations. This can be achieved by a monitoring feedback control system for excess air.
According to the ACT, combustion zone control of temperature and excess air can provide
approximately a 15% reduction of NOx from a cement kiln.
4.4.1.2 Process Modifications and Process Control
Process modifications and process control are designed to reduce emissions by minimizing the
amount of heat needed to produce a ton of clinker.
One such technique is a reformulation of kiln feed to obtain lower alkali content in as much as
the necessary removal of alkali by volatilization in clinker production requires heat. This is
achievable with the use of steel-making slag as a feedstock. One such technology is known as
Cemstar and has been shown to reduce NOx about 20%.
17
According to the cement ACT, in
some cases such reformulation has reduced heat requirements by as much as 15%, which
contribute to lower NOx emissions. Reformulation also contributes to lower firing temperature -
reducing NOx further - and will also improve kiln output. Reformulation, however, is dependent
on the availability of a low alkali raw material mix and therefore may not be viable for all kilns.
Reductions of NOx emissions can also be obtained by increasing thermal efficiency. The use of a
good system of chains attached to the kiln walls to transfer heat from the hot gases above to the
process material below as the kiln rotates can significantly improve thermal efficiency, as can
increasing clinker cooler heat recovery by use of additional secondary air. Prevention of the
leaking of cool air into the kiln, and recycling cement dust from the dust collectors are two more
ways to increase thermal efficiency. Increasing thermal efficiency, however, is unlikely to reduce
NOx emissions sufficiently to meet the requirements of the Illinois EPA's regulatory proposal.
Furthermore, most Illinois cement kilns have already optimized thermal efficiency for economic
reasons.
Another way of improving thermal efficiency and NOx emissions is improved process control
using automated controls. Figures 4-5a and 4-5b help explain how use of improved process
control using a Linkman process controller reduced NOx emissions by about 55% for Ash Grove
Cement. As shown in Figure 4-5a, without the process control, the NOx emission rate was
distributed over a very wide distribution (NOx is on the x axis and frequency of NOx is plotted
vertically). In Figure 4-5b, with the process control, NOx emissions are maintained over a much
more narrow range that avoids the very high NOx emissions excursions shown in 4-5a. In the
case of Ash Grove Cement, this project justified itself purely on the basis of improved process
control without the benefit of NOx emissions.'?
4.4.1.3 Changing Kiln Fuel
Coal and natural gas are the most commonly used fuels for cement kilns in the United States.
Although coal contains considerable nitrogen, and natural gas is virtually nitrogen free, NOx
emissions from kilns burning natural gas are much higher than the emissions from kilns burning
coal because in kiln conditions natural gas flames are considerably hotter than coal flames. In
Illinois, however, all cement kilns burn coal rather than natural gas. On the other hand, some
Illinois kilns burn at times other fuels, e.g. petroleum coke that are lower in nitrogen content than
coal, and moreover burn with cooler flame temperatures. Increased use of such fuel will lower
NOx emissions somewhat, but are unlikely to by themselves achieve the reduction required by
the Illinois EPA's proposal.
73
Figure 4-5a.
Baseline at Ash
Grove Cement
100
81M.
sa
505
..
C=1Fr.1...1
Cm taliw
v
%
800
000
Average
Baseline 845 Mir
5
00
„ _______.,.
.
t J1114 JIA
il
A
iliVlbil111,,iloope60.0b
.
s
°
e tf. e e
?
e
=,
4
'
?
e e
NO% (Pounds pa
.
Nour)
Figure 4-5b.
With process control
at Ash Grove Cement
L1,1
11107
•
80%
70%
60%
50%
403.
30%
20%
10%
Iv
=Fcqeny
—.—
Comulmivc %
800
0
Average
oVo Burning Tires 383 8/hr
500
/00
300
200
100
'
4
[lb ....,
r
r
e
e e?
e e eeeee
eeee e
Both Figures from NESCAUM 2000 Report
4.4.1.4
Staging of Combustion
Control of NOx from cement kilns can also be achieved by allowing the combustion to proceed
in two or more stages. In the first stage, there is a shortage of combustion air. This allows a
reaching of the high temperature necessary to complete conversion of the calcined raw materials,
via chemical reactions, into clinker while minimizing NOx formation because of a shortage of
oxygen. (Note that in countercurrent flow the combustion begins at the point where the material
flows through the kiln ends).
In the second and any following stages, additional air is added that allows combustion to proceed
to completion, but at a temperature which is lower, because of dilution of the primary
combustion air with cooler secondary air. Thus in the second stage, NOx is also minimized, this
time by lower temperature in spite of the abundance of both nitrogen and oxygen. This lower
temperature, however, is still sufficient to allow calcination to be completed.
4.4.1.5
Staging Combustion
by
Use of Indirect Firing
In coal-fired kilns, combustion can be staged and NOx reductions achieved by employing
indirect, rather than direct, firing in the kiln. Older kilns use direct firing, where the ground coal
is blown directly from the mill to the kiln flame zone. In indirect firing, the finely ground coal is
collected and then blown into the kiln. This enables lower primary air levels to be used and also
enables low NOx burners in both the primary burn zone as well as in the precalciner (for
preheater/precalciner kilns). Conversion to indirect firing is necessary for the use of low NOx
burners that use air staging. As a result, low NOx burners – using staged air methods – can and
have been employed on kilns using indirect firing.
Moreover, low NOx burners with indirect firing can be combined with other combustion
controls, such as flue gas recirculation and mid-kiln firing. At California Portland Cement, low
74
NOx burners with indirect firing were added to two 1150 TPD long dry kilns. The $7 million
capital project reduced the NOx emissions from 5.4 lb/ton clinker to 2.73 lb/ton of clinker –
roughly 49%.17
4.4.1.6 Flue Gas Recirculation
Flue gas recirculation (FGR) is a method that is effective when combined with low NOx burners
in reducing NOx emissions from preheater/precalciner kilns because a substantial amount of fuel
is used in the precalciner. Also, FGR on such kilns is not difficult since the flue gas ductwork is
in the vicinity of the precalciner. FGR would not likely be employed in the primary firing zone
due to the extent of ductwork needed.
4.4.1.7 Staging Combustion with Low NOx Burners
Use of low NOx burners to reduce NOx is only possible if indirect firing is used; this is a
frequently used approach for NOx control. The ACT gives a NOx removal efficiency of from
20-30% for retrofit installation of low NOx burners on a cement kiln.
4.4.1.8 Staging Combustion by Conversion to Preheater or Preheater/ Precalciner Designs
As explained earlier, preheater and preheater/precalciner kilns have lower NOx emissions. The
emissions decrease for conversion from a long dry design to a preheater design is about 26%
using the average of the emission factors provided in the ACT and AP-42 Compilation of Air
Pollutant Emission Factors (See Reference 4). Similarly, the average decrease for conversion
from a long dry kiln to a preheater/precalciner design is about 45%. Again, according to the same
factors, the average decrease in NOx emissions from a preheater to a preheater/precalciner
design is about 27.5%. Converting to a preheater or preheater/precalciner kiln is a major capital
expense. But, depending upon the expected life of the kiln, the long term savings from the
efficiency benefit could justify the investment.
4.4.1.9 Staging Combustion in Preheater and Preheater/ Precalciner Kilns
Although preheater kilns already employ a degree of combustion staging that lowers NOx
emissions as compared to long dry kilns, a further degree of staging with consequent NOx
reductions can be realized by firing some of the fuel into the riser duct to the preheater.
Similarly, in preheater/precalciner designs further staging can be achieved by injecting part of
the calciner fuel in the kiln exhaust gas entering the calciner. This technique includes use of low
NOx burners and an addition of tertiary air at a later point to complete combustion of the calciner
fuel.
4.4.1.10 Staging Combustion by Mid-Kiln Firing
Combustion can also be staged by mid-kiln injection of some of the fuel needed for the
production of clinker. Such fuel will therefore be burned at the mid-kiln temperature of 1,600-
1,800°F, which is an adequate temperature to allow the completion of calcination, such that the
calcined material is ready to be burned into clinker at the higher temperatures near the discharge
to the clinker cooler. The mid-kiln 1,600-1,800° degree temperatures are not conducive to NOx
formation, so less NOx is formed than when all the fuel is burned at the higher temperatures near
the discharge of the kiln. Additionally, some of the NOx formed near the discharge may be
changed back to nitrogen and oxygen when the combustion gases reach the fuel-rich mid-kiln
conditions.
Mixing Technology
0 42
Fuel Injector
75
Fuel can be introduced into the kiln's mid-section by placing a burner into the kiln's side. The
entrance to the burner is closed, but fitted with a device to open the burner to the fuel supply
when its closed end contacts that supply once per kiln revolution. Since the mid-kiln fuel flow is
therefore intermittent, solid or other slow burning fuel is used to maintain heat continuity. Used
tires are a common fuel for this purpose because they burn slowly and kiln operators may receive
a tipping fee for taking the tires. Figure 4-6 shows a kiln with mid-kiln firing of tires. In this
case the kiln also uses downstream air mixing technology to improve combustion. The ACT
investigated the effects of mid-kiln firing of whole tires on NOx emissions and reported that
NOx emissions reductions of 20 to 40% are possible. Some test results from kilns are shown in
Figure 4-7. In addition to this, some manufacturers and suppliers of mid-kiln firing systems
claim that further NOx emissions reduction can be achieved by installing a mix-air fan
downstream from the fuel injection point, as shown in Figure 4-6.
The addition of mixing air to mid-kiln firing has been shown to improve NOx emissions by
providing more consistent combustion and emissions. Figures 4-8a and 4-8b are a comparison of
the frequency distribution of NOx emissions for a kiln that is equipped with mid-kiln firing
without and with the use of mixing air. As shown in Figure 4-8b, mixing air reduces the
variation in NOx emissions and results in a narrower frequency distribution, avoiding the high
NOx levels that periodically occur without the mixing air that are apparent in Figure 4-8a.
Figure 4-6.
Mid-Kiln Firing of Tires
(http://www.cadencerecycling.com/pdf/6-PageComplete.pdf)
76
Figure
4-7. Comparison of NOx emissions without and with mid-kiln firing at several plants
(Hansen, E., "Staged Combustion for NOx Reduction Using High Pressure Air Injection",
http://www.cadencerecycling.com/pdVIEEE2002.pdt)
,....,,..,,,,
1400
1200
1000
,.,
—
SOO
600
400
')
00
—
—
,..
0
Plant
II
P ant *2
P ant *3
Plant *4
Plant, Kiln *1
Plant *5 Kiha *2
Pl?
ant06
9%
Tires
Plan ?15%
Tires
Plant *6 23% tires
Baseline
1359
1372
936
1342
565
513
1053
1053
949
With Mid-Kiln Fuel
883
994
790
600
488
456
755
562
471
Percent Reduction
35.0%
27.6%
15.6%
55.3%
13.6%
11.1%
28.3%
46.6%
50.4%
0 Baseline
0 With Mid-Kiln Fuel
77
Figure 4-8a
Frequency Histogram of NOx Values on Cement Kiln with Mid-Kiln Tire Injection
(Without Mixing Air)
Letter and enclosed technical data and documents from Eric Hansen, Ash Grove Cement, to J. Staudt, Andover Technology
Partners, January 17, 2000 and later referenced in NESCAUM 2000
Histogram
of NOx Values
With No Mixing Air
°
#
eeee
^5'° •,,`,°
eeee co°
NOX Concentration in PPM
Figure 4-8b
Frequency Histogram of NOx Values for the same Cement Kiln with Mid-Kiln
Tire Injection as in Figure 4-8a (With Mixing Air)
Histogram of NOx Values Using Mixing Air
e e
e
4"
e Oeeeeeeee
cp
°,
e ,e,e,e<e.stF.P.,tt§s4f
250
200
150
LL
100
50
0
250
200
150
LL
1
100
50
0
NOX Concentration in PPM
ir7
Og *
Anhydrous NH3
t
Mixing Technology
Aqueous NH3
78
4.4.2 Post Combustion Controls
Post combustion controls reduce the NOx that is formed in the combustion process. There are
two methods that might be applicable to cement kilns.
4.4.2.1 Selective Catalytic Reduction (SCR)
SCR is a process using ammonia, or some other reducing agent, in the presence of a catalyst to
selectively reduce NOx emissions from exhaust gasses. Usually anhydrous ammonia is injected
through a grid system into the hot flue gas, which is then passed through a catalyst bed wherein
the NOx in the flue gas undergoes reduction. As the two principle components of NOx are nitric
oxide and nitrogen dioxide, the two principle reactions are nitric oxide plus ammonia plus
oxygen yielding nitrogen and water vapor, and nitrogen dioxide plus ammonia plus oxygen
yielding nitrogen and water vapor.
SCR is rarely retrofitted on cement kilns because it tends to cost more than other available
methods. It would not be necessary to achieve the emissions levels of Table 4-1. However,
SCR can provide high levels of NOx reduction. SCR does require installation at a point in the
gas stream where the temperature is in the right range for the catalyst. This makes it more
difficult to install on existing facilities than other approaches. However, the Lake Michigan Air
Director's Consortium (LADCO) has identified it
as a candidate technology for Best Available
Retrofit Technology (BART).28
Figure 4-9.
Example SNCR injection on a
preheater kiln
http://www.cadencerecycling.com/pdf/6-PageComplete.pdf
4.4.2.2 Selective Non-catalytic Reduction
(SNCR)
SNCR accomplishes the same chemical reactions as
SCR in order to reduce NOx to nitrogen. It
accomplishes this by injecting reagent (ammonia or
urea) at higher temperatures. The simplicity of the
equipment makes SNCR relatively easy and
inexpensive to retrofit. However, SNCR requires a
specific temperature window in order to achieve
proper NOx reduction.
SNCR has been used in preheater and precalciner
kilns, which have better access to the proper
temperature window for SNCR NOx reduction, as
shown in Figure 4-9.
29
However, on long kilns,
access to the proper temperature window on the
28
Sabo, E., "Candidate Control Measures for Cement Plants", LADCO/MRPO, Regional Air Quality Workshop
June 28, 2005
29 Sun, W.H., Bisnett, M.J.,
et al. "Reduction of NOx Emissions from Cement Kiln/Calciner through the Use of the
NOxOUT Process." International Specialty Conference on Waste Combustion in Boilers and Industrial Furnaces.
Air and Waste Management Association. Kansas City, MO: April 21, 1994.
79
rotary kiln is more difficult. Some companies have developed approaches for addressing this.
Expected NOx reductions from SNCR range from 30-70% on kilns where there is access to the
proper injection temperature.
A related technology is biosolids injection (BSI). In BSI, sludge is injected into the preheater or
precalciner at a similar point as ammonia would be injected in SNCR. The sludge releases
ammonia and acts as an SNCR reagent. At Mitsubishi Cement in California, BSI provided 50%
NOx reduction (NESCAUM 2000). BSI may not be as easily applied as SNCR because of the
material handling and source of biosolids needed.
17
Table 4-3 summarizes the NOx emissions reductions potential of various control strategies for
cement kilns.
Table 4-3:
Approximate Expected NOx Emissions Reduction with Various NOx Control
Technologies
NOx Control Technology
Expected NOx Emissions
Reduction
(%)
Process Modifications
<25
Indirect Firing with Low - NOx Burner
20-30
Staged Combustion in Precalciner Kilns
30-45
Mid - Kiln Firing of Whole Tires in Long Kiln
20-40
Indirect Firing with Mid Kiln firing
40-60
SNCR in Preheater/Precalciner Kilns
30-70
SCR (based on data from coal - fired boilers)
80-90
4.5 Cost Effectiveness of NOx Controls
The USEPAhas prepared a number of cost effectiveness estimates for controlling NOx emissions
from cement plants. Two of the most recent and significant estimates are contained in the federal
ACT for cement plants and the Regulatory Impact Analysis (RIA) for the NOx SIP Call, FIP,
and Section 126 Petitions (See References 3 and 5). The Illinois EPA is relying on these two
documents to estimate the cost effectiveness of controlling Illinois NOx sources to the level
proposed by this rulemaking. Other studies include NESCAUM's 2000 report and recent work
by LADCO (2005).
Tables 4-4a and 4-4b show the results of cost effectiveness calculations performed in
NESCAUM's 2000 report based upon actual case studies in that report. As shown, indirect
firing with mid-kiln firing provided roughly 50% NOx reduction, and the cost of control was
under $1000/ton. Higher costs would result with lower capacity factors. Generally, cement
kilns operate at high capacity factors. Depending upon the ability to receive a tipping fee for
tires (the most common mid-kiln fuel, but coal can be used), it may be possible to reduce
operating costs through these NOx control measures. CemStar is another technology that may
reduce operating costs while also reducing NOx. Because there are economic benefits even
without accounting for NOx reduction benefits, some facility owners have elected to install
80
CemStar or to install mid-kiln firing systems even absent NOx control requirements. The
economics of CemStar are shown in Table 4-5.
Table 4-4a.
Cost Effectiveness Indirect Firing and Mid Kiln Tire Firing on Long-Dry
Kiln - 49% Reduction from 5.0 lb/ton clinker on two 96 Ton/hr kilns,
(NESCAUM 2000 report)
Capacity Factor
0.65
0.85
No Tipping Fee
Annual Control, $/ton NOx
$1,114
$736
Annual Control, $/ton clinker
$1.48
$0.97
$20/ton Tipping Fee.
Annual Control, $/ton NOx
$891
$513
Annual Control, $/ton clinker
$1.18
$0.68
$75/ton Tipping Fee.
Annual Control, $/ton NOx
$277
($101)
Annual Control, $/ton clinker
$0.37
($0.13)
Notes:
- Values in parentheses indicate a net economic benefit to the user rather than net economic cost for using
this technology
- It is assumed that the technologies do not significantly impact production. This assumption may not be
correct in some cases and this impact should be considered when appropriate.
Table 4-4b.
Cost Effectiveness Mid Kiln Tire Firing on Long-Dry Kiln - 20%
Reduction from 5.0 lb/ton clinker on two 40 Ton/hr Kilns.
Time Period of Control and
Units of Cost
Capacity Factor
0.45
0.65
I
0.85
No tipping fee
Annual Control, $/ton NOx
($969)
($1,435)
($0.72)
($1,681)
Annual Control, $/ton clinker
($0.48)
($0.84)
$20/ton tipping fee.
Seasonal control, $/ton NOx
($5,164)
($1.08)
($6,281)
($1.31)
($6,873)
($1.43)
($2,864)
Seasonal Control, $/ton clinker
Annual Control, $/ton NOx
($2,151)
($2,617)
Annual Control, $/ton clinker
($1.08)
($1.31)
($1.43)
$75/ton tipping fee.
Seasonal control, $/ton NOx
($12,966)
($14,084)
($14,675)
Seasonal Control, $/ton clinker
($2.70)
($2.93)
($3.06)
Annual Control, $/ton NOx
($5,403)
($5,868)
($6,115)
Annual Control, $/ton clinker
($2.70)
($2.93)
($3.06)
cost for
may not be
Notes:
-
Values in parentheses indicate a net economic benefit to the user rather than net economic
using this technology
- It is assumed that the technologies do not significantly impact production. This assumption
correct in some cases and this impact should be considered when appropriate.
81
Table 4-5
Cost Effectiveness of CemStar - 20% reduction from 200 lbNOx/hr/kiln (800
pph total) on four 40-Ton/hr wet process Kilns, (NESCAUM 2000 report)
Units of Cost
Capacity Factor
0.65
I
0.85
net clinker value
=
$15/ton
Annual Control, $/ton NOx
$431
$365
Annual Control, $/ton clinker
$0.22
$0.18
net clinker value
=
$30/ton
Annual Control, $/ton NOx
($1,845)
($1,910)
Annual Control, $/ton clinker
($0.92)
($0.96)
net clinker value
=
$50/ton
Annual Control, $/ton NOx
($4,879)
($4,945)
Annual Control, $/ton clinker
($2.44)
($2.47)
Notes:
- Values in parentheses indicate a net economic benefit to the user rather than net economic
cost for using this technology
SNCR cost effectiveness was assessed in the 2000 report by NESCAUM, including the estimate
in Table 4-6 based upon a case study in that report.
Table 4-6
Cost Effectiveness of SNCR on 150 Ton/hr Precalciner Kiln, 45% NOx
Reduction from 700 pph (NESCAUM 2000 Report)
Units of Cost
Capacity
Factor
0.65
0.85
Annual Control, $/ton NOx
$725
$675
Annual Control, $/ton clinker
$0.76
$0.71
LADCO's analysis
28
showed costs for technologies it classifies as reasonably available. For
NOx, it assumes that sources could combine mid-kiln firing with low-NOx burners or apply
SNCR technologies. These technologies showed average emission reductions about 50 percent
from uncontrolled levels at an estimated control cost of -$310/ton to $2500/ton. By LADCO's
estimate, use of SCR, which would be a BART approach in its analysis, cost would be between
$1500/ton and $2000/ton of NOx.
STAPPA/ALAPCO in 2006 assessed the performance and cost effectiveness of various control
technologies on cement kilns. (See footnote 21). The results are shown in Table 4-7. As shown,
the results are generally consistent with those of the NESCAUM report. Additionally, Table 4-8
shows estimates based upon USEPA estimates made in 1999 and represented in 1990 dollars and
Table 4-9 shows estimates by USEPA in 2006 using AirControlNet. As shown, the costs are
generally very consistent from one estimate to the other.
82
Table
4-7. Cost and Performance of NOx Control Measures on Cement Kilns.21
NOx
Control Technology Performance
Technology
Average
Emissions
Reduction
(%)
Range of
Emissions
Reductions
(%)
Average Annual Cost-
Effectiveness
($
per
Ton NO.
Reduced)'
Range of Annual Cost-
Effectiveness
($
per Ton NO, Reduced),
CemStar
33
25-40
550
ND
Indirect firing with a
low-NO, burner
27
4-47
440
300-620
Long dry kiln with
low-NO. burner
40
ND
ND
166-1,299
Preheater kiln with
low-NO, burner
40
ND
ND
175-1,201
Mid-kiln firing
(wet kilns only)
41
28-59
55
(460)-730
Mid-kiln firing
(dry kilns only)
33
11-55
SNCR'
40
10-50
1,750
1,000-2,500
SNCR•
ND
31-83
ND
605-700
SCR`
90
85-95
2,700
ND
SCR*
ND
31-83
ND
530-1,135
Long dry kiln with
SCR°
ND
70-90
ND
586-1,902
Preheater kiln with
SCR°
ND
70-90
ND
504-1,232
ND = No Data
a.
In 1997S, except where noted.
b.
Converting a direct-fired kiln to an indirect-fired kiln and retrofitting with an LNB roughly doubles the cost effectiveness.
c.
From LADCO, 2005. Cost-effectiveness in 2004$.
d.
These estimates are based on the use of an SNCR technology called
No,-our at three facilities.
e.
From Haug, 2002. Emissions reductions range includes all data from the study. Cost-effectiveness in 2002S. Junker, 2000 supports
SNCR emissions reductions of 80-85%.
f.
From European Commission, 2000; based on one demonstration project in the Netherlands. Cost effectiveness in 2000$.
Table 4-8.
Cost Effectiveness of NOx Controls
(1990 dollars)
USEPA, Nitrogen Oxides - Why and How They are Controlled,
EPA 456/F-99-006R, November 1999,
http://www.ep a.govittn/c atc/dir 1 /fnoxdoc.pdf
Kiln Type
Technology
Red'n
Ozone
Season $/ton
Est. Annual
$/ton*
Cement Manufacturing - Dry
Mid-Kiln Firing
30
1,110
460
Cement Manufacturing - Dry
LNB
30
1,340
560
Cement Manufacturing - Dry
SNCR - Urea Based
50
1,280
770**
Cement Manufacturing - Dry
SNCR - NH3 Based
50
1,490
800**
Cement Manufacturing - Dry
SCR
80
6,850
2970**
*estimated from Ozone Season estimate. Capital
cost contribution of ozone season cost mu
** assumes $300/ton operating cost for NH3 SNCR and $400/ton of NOx operating cost for
$200/ton of NOx for SCR
tiplied by 5/12
urea SNCR and
83
Table 4-9.
2006 Cost Estimates by USEPA Using AirControlNet
8/21/06 -- Bill Neuffer, USEPA
http://www.epa.gov/groundlevelozone/SIPToolkit/clocuments/stationary_nox_list.pdf
Source category
Identified by
Potential
measure/control
technology
Efficiency(%)
Cost effectiveness
(SIT)
Cement plants -existing
LADCO, OTC.
LNB
25-30
300 – 620
kilns – low-NOx
CAN: STAPPA
MKT
30-35
-460 – 720
burners, mid-kiln
firing(MKF).
SNCR +SC
50 -70
770
SNCR may be possible
New kilns – SNCR plus
staged combustion; SCR
may be feasible
4.5.1 ACT Cost Effectiveness
The ACT is an older estimate of costs. However, the results are shown for comparison and for
the technologies of interest, they are generally comparable. Three cost considerations are
presented in the federal ACT document: total capital costs, total annual costs, and cost
effectiveness. The total capital cost is the sum of the purchased equipment costs, direct
installation costs, indirect installation costs, and contingency costs. Annual costs consist of the
direct operating costs of materials and labor for maintenance, operation, utilities, and material
replacement and disposal and indirect operating charges including plant overhead, general
administration, and capital recovery charges. Cost effectiveness, in dollars/ton of NOx removed,
is calculated for each control technique by dividing the total annual cost by the annual tons of
NOx removed.
The ACT describes the costs of various NOx controls applicable to the cement kilns. Depending
on the type and size of the kiln, the cost effectiveness of each control varies from a few hundred
to several thousands dollars per ton of NOx removed. Since the NOx SIP Call was based on
controlling large cement kilns (i.e., a cement kiln that emitted more than one ton of NOx per
1995 average summer day) data for those sizes of kilns were extracted from the ACT.
Table 4-10 summarizes the cost effectiveness of various control options for large cement kilns
from AirControlNet and Table 4-11 shows cost effectiveness numbers from the ACT.
Based on the ACT, there are a number of control options available which achieve the control
levels indicated in Table 4-1. The cost effectiveness ranges from $220 to $4870/ton of NOx
removed, based on the total annual cost divided by total annual NOx reductions.
84
Table 4-10: Cost Effectiveness of Various Control Options for Cement Kilns
(Source: AirControlNet. Cost Year: 1990)
NOx Control
Type
Kiln Type
NOx
Reduction
%
Cost Effectiveness ($/ton
NOx removed)
Range
Typical
Low NOx Burner
Long wet or dry
25
300-620
440
Mid Kiln Firing
Long wet or dry
25
-460 to 730
55*
SNCR
Long dry
50
--
850
SCR
Long wet
80
--
2880
SCR
Long dry
80
--
3370
*The value is reported as $60/ton in (10)Vistas BART Data
Table 4-11: Cost Effectiveness of Various Control Options for Cement Kilns
(Source: ACT. Cost Year: 1992)
NOx Control Type
Kiln Type
Kiln Capacity
(tons
clinker/hr)
NOx
Reduction
%
Cost
Effectiveness
($/ton NOx
removed)
Low NOx Burner
Long wet indirect-fired
30
25
310
Long wet indirect-fired
50
25
230
Long dry indirect-fired
25
25
370
Long dry indirect-fired
40
25
260
Preheater indirect-fired
40
25
370
Preheater indirect-fired
70
25
260
Precalciner indirect-fired
100
25
270
Precalciner indirect-fired
150
25
220
Low NOx Burner
Long wet direct-fired
30
25
1130
Long wet direct-fired
50
25
880
Long dry direct-fired
25
25
1270
Long dry direct-fired
40
25
970
Preheater direct-fired
40
25
1330
Preheater direct-fired
70
25
970
Precalciner direct-fired
100
25
1010
Precalciner direct-fired
150
25
830
Mid-kiln Firing
Long wet
30
25
550
Long wet
50
25
430
Long dry
25
25
610
Long dry
40
25
470
SNCR Urea-Based
Preheater
40
50
930
Preheater
70
50
790
Precalciner
100
50
880
85
Precalciner
150
50
800
SNCR Ammonia-
Preheater
40
50
1110
Based
Preheater
70
50
910
Precalciner
100
50
980
Precalciner
150
50
880
SCR
Long wet
30
80
3600
Long wet
50
80
3100
Long dry
25
80
3630
Long dry
40
80
3170
Preheater
40
80
4120
Preheater
70
80
3490
Precalciner
100
80
4870
Precalciner
150
80
4400
4.5.2.2
OTHER REFERENCES
1)
USEPA, "Finding of Significant Contribution and rulemaking for Certain States in the Ozone
Transport Assessment Group Region for Purposes of Reducing Regional Transport of Ozone;
Rule", 63 FR 57356, October 27, 1998.
2)
State of Michigan v. U.S. Environmental Protection Agency,
213 F.3d 663 (D.C. Cir. 2000).
3)
Alternative Control Techniques Document-NOx Emissions from Cement Manufacturing.
EPA-453/R-94-004, March 1994, USEPA, Research Triangle Park, North Carolina 27711
4)
Section 11.6, Portland Cement Manufacturing, (revised January 1995) AP-42, Compilation of
Air Emission Factors Volume 1: Stationary Point and Area Source. Office of Air Quality
Planning and Standards, USEPA, Research Triangle Park, North Carolina 27711
5)
USEPA "Regulatory Impact Analysis for the NOx SIP Call, FIP, and Section 126 Petition,
Volume 1: Costs and Economic Impact", EPA-452/R-98-003, September 1998, USEPA, Office
of Air and Radiation, Washington, DC 20460
6)
USEPA, "Federal Implementation Plans to Reduce the Regional Transport of Ozone;
Proposed Rule", 63 FR 56394, October 21, 1998.
86
5. Lime Kilns
5.1 Introduction
Lime is produced only in rotary kilns in Illinois, even though other types of lime kilns are
available in the market. The kilns are very similar and the process is very similar to that of
cement kilns. The most significant difference with regard to NOx emissions is that the firing
temperature for lime kilns does not need to be as high as for cement kilns. Therefore, the
contribution of thermal NOx is less. The emissions levels of Table 5-1 are proposed emission
rates for lime kilns located in the Chicago NAA and Metro-East NAA that have NOx emissions
of 15 tons per year or more and 5 tons or more during the ozone season.
Table 5-1.
Proposed emission levels for affected Lime Kilns
Fuel
Lb/ton of lime produced
Gas
2.2
Coal
2.5
5.2 Process Description and Sources of Emissions
5.2.1 Process Description
Lime is manufactured by high temperature calcination of either limestone or dolomite (also
called dolomitic limestone). When limestone is used for calcination, it must contain at least 50
percent calcium carbonate. Dolomitic limestone contains a mixture of calcium carbonate and
magnesium carbonate. Magnesium carbonate content is about 30 to 45 percent. Following
reactions take place during calcination of limestone and dolomite:
CaCO3
+ heat -0 CO
2
+ CaO (high calcium lime)
CaCO3 .MgCO3
+ heat -0 CO
2
+ CaO.MgO (dolomitic lime)
The theoretical temperature required for calcination is about 1650°F (900°C). However, in
practice, calcination is carried out at a much higher temperature depending on the type of kiln
used. A rotary kiln is the most commonly used kiln and it accounts for about 90 percent
production of lime nationwide. In Illinois, lime production is carried out only in rotary kilns.
Since calcination is carried out only in rotary kilns in Illinois, operation of this kiln is discussed
in a little more detail below.
Rotary Kiln
The rotary kilns used in lime calcination are very similar to those used in the cement industry.
The main difference is that the firing temperature does not need to be quite as high for lime
calcinations as for cement production. Feed, of course is different as well. Limestone,
dolomite, or both are the principal feedstock along with fuel.
87
Calcination temperature lies somewhere between 900 and 1500°C (1650 and 2730°F). A typical
calcination temperature is about 2460°F (1,350°C). Calcination temperature depends on the
limestone feed size, final product quality, as well as type of fuel used. When calcination is
carried out at 2460°F, hot lime comes out of the kiln at about 2200°F (1204°C). Most heat
transfer in the calcining zone is by radiation.
The minimum heat requirement to convert 100 percent pure calcium carbonate to lime is about
3.0 million Btu/ton of quicklime or about 5.4 million Btu/ton of limestone. For simple gas fired
kilns, heat usage can be as high as 9200 MJ/metric ton (8.7 million Btu/ton) of quicklime, and
for coal-fired kilns, heat usage as can be as high as 7500 MJ/metric ton (6.5 million Btu/ton).
Preheater Rotary Kiln
Like cement kilns, older lime kilns do not have preheaters. Similar to cement kilns, modern lime
kilns are fitted with preheaters and are generally much shorter than the conventional rotary kilns.
The length of a preheater kiln ranges from 130 feet to 300 feet. The heat use – and therefore the
NOx formation – is reduced in a preheater kiln due to the much more efficient heating and less
combustion needed.
5.2.2 Sources of NOx Emissions
This section covers how NOx is formed during the combustion of fuel in the air, factors that
affect emissions of nitrogen oxides emissions.
The manufacture of lime involves high process temperatures which are favorable for NOx
formation. Essentially all of the NOx is formed in the lime kiln. Although, there are other heating
operations, such as drying of raw feed or coal, often the heat from the kiln exhaust is used for
these operations making their contributions to NOx emissions negligible.
5.2.3 Factors Affecting Uncontrolled NOx Emissions
NOx is formed in the primary burn zone, which is in the rotary section of the kiln. NOx may
also be formed in the preheater section, where fuel may be added and burned.
5.2.4 NOx Formation in the Kiln Burning Zone
Even in preheater kilns, most of the NOx is formed in the primary kiln burning zone where most
of the heat is added and the highest temperatures are experienced. Many of the same factors that
impact NOx formation in cement kilns also impact NOx formation in lime kilns. Like cement
kilns, most lime kilns were originally built as direct fired systems. Therefore, they are not
generally equipped with low NOx burners. Lime kilns do have somewhat different process
conditions – often somewhat lower burn temperatures – so NOx emissions will be somewhat
different. For example, due to the somewhat lower temperature in a lime kiln, the contribution
of thermal NOx to total NOx may be less than in a cement kiln.
88
Process conditions such as temperature stability, size of limestone feed, and moisture content can
also have a significant impact on NOx emissions. The heating value of the fuel burned may also
affect NOx emissions. High heating value fuels, such as petroleum coke, require less combustion
air and produce less NOx per ton of limestone.
5.2.5 Suspension Preheater Kilns with Riser Duct Firing
As discussed earlier, preheater kilns are more energy efficient than kilns without preheaters.
About 10-20 percent of fuel is fired into the riser duct. Because of higher energy efficiency and
reduction in the amount of fuel burned at the higher lime burning temperature, NOx emissions
from preheater kilns are lower as compared to the long dry kilns. Burning of coarse fuels (such
as tires) into the kiln riser duct may further reduce NOx emissions from the kilns. The
effectiveness of this method will vary somewhat from kiln to kiln.
5.3 Baseline or Uncontrolled NOx Emissions
Baseline NOx emissions are strongly influenced by kiln design, fuel characteristics, peak flame
temperature, and oxygen concentration. The NOx emission data of Table 5-2 is shown for lime
kilns based on AP-42.
Table
5-2:
NOx Emission Factors for Different Kiln Types
Lime Kiln Type
SCC
#
NOx Emissions
(lb/Ton Lime)
Source
Coal-Fired Rotary Kiln
30501618
3.1
AP-42, Table 11.17-6
Gas-Fired Rotary Kiln
30501619
3.5
AP-42, Table 11.17-6
Coal and Gas-Fired Rotary Kiln
w/water scrubber
30501620
2.7
AP-42, Table 11.17-6
Gas-Fired Calcimatic Kiln
30501605
0.15
AP-42, Table 11.17-6
Gas-Fired Parallel Flow
Regenerative Kiln w/ Fabric
Filter
30501623
0.24
AP-42, Table 11.17-6
For our purpose, we will restrict our control technology discussion only to rotary kilns as they
are the only one used in lime production in Illinois.
5.4 Technical Feasibility of NOx Controls
For any given type of the lime kiln, energy consumption in the lime-making process directly
influences the amount of NOx formed. Thus, the measures that improve the energy efficiency of
this process should reduce NOx emissions in terms of pounds ("lb") of NOx per ton of product.
Since rotary lime kilns are similar to rotary cement kilns, NOx controls applicable to cement
kilns are generally applicable to lime kilns, while the amount of NOx reduction will vary
somewhat due to the different process conditions. NOx control approaches applicable to the
lime industry may be grouped into two categories:
89
•
Combustion control approaches where the emphasis is on reducing
NOx
formation, and
•
Post-combustion control approaches which destroy the NOx formed in the combustion
process.
5.4.1 Combustion Controls
5.4.1.1
Combustion Zone Control of Temperature and Excess Air
NOx emissions from a lime kiln are mainly a function of temperature and the amount of nitrogen
and oxygen that can react together. Because the high temperature needed to convert the raw
materials into lime is very conducive to NOx formation, significant NOx reductions can be
obtained by lowering kiln operating temperatures, and by lowering the excess air ratio thus
decreasing the amounts of nitrogen and oxygen available for reacting.
On
the other hand, a
minimum operating temperature is necessary to maintain the quality of the lime that is being
produced.
The solution to
NOx
via combustion zone control of temperature and excess air is therefore to
determine the minimum excess air ratio necessary for product quality, to maintain this ratio by
continuously monitoring oxygen and carbon monoxide levels in the exhaust, and to keep the
temperature low by also continuously monitoring NOx in order to also maintain low NOx
concentrations. This can be achieved by a monitoring feedback control system for excess air.
According to the ACT for cement kilns, combustion zone control of temperature and excess air
can provide approximately a 15% reduction of
NOx
from a cement kiln. Similar reduction would
be expected from lime kilns.
5.4.1.2 Changing Kiln Fuel
Coal and natural gas are the most commonly used fuels for lime kilns in the United States.
Although coal contains considerable nitrogen, and natural gas is virtually nitrogen free, NOx
emissions from kilns burning natural gas tend to be somewhat higher than the emissions from
kilns burning coal because in kiln conditions natural gas flames are considerably hotter than coal
flames. However, as shown in Table 5-2, combined gas and coal flames can potentially produce
lower
NOx.
5.4.1.3 Staging of Combustion
Like cement kilns, NOx can be reduced by staging combustion. The following approaches,
which are used in cement kilns and are described in the previous chapter, can also be used in
lime kilns.
•
Staging Combustion by Use of Indirect Firing
• Staging Combustion by Flue Gas Recirculation
•
Staging Combustion with Low NOx Burners
•
Staging Combustion by Mid-Kiln Firing
90
Due to slightly different process conditions – mainly firing temperature – performance may be
somewhat different.
5.4.2 Post-Combustion Control of NOx Emissions
Like cement kilns, there are two forms of post combustion controls that may be employed in
lime kilns, they are:
•
Selective Catalytic Reduction (SCR)
•
Selective Non-Catalytic Reduction (SNCR)
5.4.2.1 Selective Catalytic Reduction (SCR)
SCR would generally be the most costly technology to employ, but would also result in the
highest reduction in NOx emissions. It is expected the companies operating lime kilns will find
less expensive ways to reduce NOx and comply with the proposed rule than use of SCR.
5.4.2.2 Selective Non-catalytic Reduction (SNCR)
SNCR is a less costly method of NOx control than SCR and would face the same issues
regarding application as for cement kilns. Generally, gas in the correct temperature range for
SNCR is more likely to be accessible with a preheater kiln than a simple rotary kiln without a
preheater.
Table 5-3 summarizes the NOx emissions reductions potential of various control strategies for
lime kilns. This information is consistent with AirControlNet.
Table 5-3:
NOx Emissions Reduction from Rotary Lime Kilns with
Various NOx Control Technologies
NOx Control
Technology
Expected NOx
Emissions
Reduction
(%)
Expected Controlled NOx,
lb/ton
Coal-Fired
Gas-Fired
Low - NOx Burner
30
2.17
2.45
Mid - Kiln Firing
30
2.17
2.45
SNCR-Urea
50
1.55
1.75
SNCR-Ammonia
50
1.55
1.75
SCR
80
0.62
0.7
91
5.5 Cost Effectiveness of NOx Controls
Cost effectiveness estimates performed by Illinois EPA using AirControlNet (cost year 1992) are
shown in Table 5-4. These are very consistent with independent estimates performed by
USEPA staff and shown in Tables 5-5 and 5-6. In the case of Table 5-5, USEPA estimated
ozone season cost in $/ton and Andover Technology Partners estimated the annual cost in $/ton
as indicated in the table.
Table 5-4:
Cost Effectiveness of Various Control Options for Rotary Lime Kilns
(Source: AirControlNet. Cost Year 1992)
NOx Control
Technology
Expected NOx
Reduction,
%
Controlled NOx
lb/ton
quicklime
Cost Effectiveness,
$/Ton NOx
Removed
Low - NOx Burner
30
2.17 (Coal)
2.45 (Gas)
560
Mid - Kiln Firing
30
2.17 (Coal)
2.45 (Gas)
460
SNCR-Urea
50
1.55 (Coal)
1.75 (Gas)
770
SNCR- Ammonia
50
1.55 (Coal)
1.75 (Gas)
850
SCR
80
0.62(Coal)
0.7 (Gas)
3370
* The data is from the ACT document for cement kilns. The same data has been used by the
Texas Board in its analysis.
Table 5-5
Estimates From USEPA - 1999
USEPA, Nitrogen Oxides (NOx) Why and How They Are Controlled, Reference: EPA-456/F-99-006R, November
1999, http://www.epa. ov/ttn/c atc/dir 1 /fnoxdoc. df
%
Reduction
Ozone Season $/ton
Est. Annual $/ton*
Lime Kilns
Mid-Kiln Firing
30
1,110
460
Lime Kilns
LNB
30
1,340
560
Lime Kilns
SNCR - Urea Based
50
1,280
770**
Lime Kilns
SNCR - NH3 Based
50
1,490
800**
Lime Kilns
SCR
80
6,850
2970**
*estimated from Ozone Season estimate. Capital cost contribution of ozone season cost multiplied by 5/12
** assumes $300/ton operating cost for NH3 SNCR and $400/ton of NOx operating cost for urea SNCR and
$200/ton of NOx for SCR
Table 5-6.
Cost Estimates from USEPA - 2006
8/21/06 -- Bill Neuffer, USEPA
http://www.epa.gov/groundlevelozone/SIPToolkit/documents/stationary_nox_list.pdf
Source category
Identified by
Potential measure/control technology
Efficiency(%)
Cost effectiveness
(SIT)
Lime kilns
OTC. ACN
Mid kiln firing
30
460
LNB
30
560
92
6.
Reheat, Annealing and Galvanizing Furnaces at Iron/Steel plants
6.1
Introduction
The purpose of this section is to provide a brief description of furnaces used in iron and steel
plants, the sources of NOx emissions, the baseline NOx emissions, the factors affecting baseline
NOx emissions, the available NOx control technologies, and the estimated costs of controls.
Table 6-1 shows emission levels that are proposed for reheat, annealing and galvanizing furnaces
located in the Chicago NAA and Metro-East NAA that have NOx emissions of 15 tons per year
or more and 5 tons or more during the ozone season.
Table 6-1.
Proposed Emission Levels for Reheat, Annealing and Galvanizing Furnaces
type
Limit (lb/MMBtu)
Reheat furnace, regenerative
0.18
Reheat furnace, recuperative
0.05
Reheat furnace, cold air
0.03
Annealing furnace regenerative
0.38
Annealing furnace, recuperative
0.16
Annealing furnace, cold air
0.07
Galvanizing furnace, regenerative
0.46
Galvanizing furnace, recuperative
0.16
Galvanizing furnace, cold air
0.06
6.2 Process Description and Sources of Emissions
6.2.1 Process Description
Reheat, annealing, and galvanizing furnaces are used in integrated iron and steel plants where
steel is produced by reduction of iron ore in a blast furnace. The pig iron that is produced is then
processed in a basic oxygen furnace to remove carbon and other impurities. If iron ore is directly
reduced by a direct reduction process, it is sent either to a basic oxygen furnace or an electric arc
furnace for further purification. Molten steel from either a basic oxygen furnace or electric arc
furnace is typically processed through a continuous caster where it is shaped into slabs, billets, or
blooms. Alternatively, the molten iron can be cast into ingots and stored for subsequent
processing.
Slabs, billets, and blooms from continuous caster are typically reheated to a suitable working
temperature in a reheat furnace prior to further shaping. Ingots are typically heated in soaking
pits prior to further processing. Reheat furnaces and soaking pits are high temperature, fossil fuel
burning furnaces and are sources of NOx emissions.
After steel comes out of a reheat furnace or soaking pit, it is further processed in annealing and
galvanizing furnaces. These finishing operations are conducted at suitable temperatures and are
also sources of NOx emissions.
93
Reheat, annealing, and galvanizing furnaces are also used in mini mills and specialty steel
producing plants. Typically, they receive scrap iron or iron produced at primary iron and steel
facilities. The operations of these furnaces are similar to those at primary iron and steel plants.
Reheat furnaces bring steel to a uniform temperature of about 2150 to 2450°F, a temperature
suitable for hot working. These furnaces are designed to accommodate the steel being processed
at a suitable rate, heat it uniformly, and hold it at a desired temperature for a specified length of
time. These furnaces may be batch-type or continuous-type. In a continuous reheat furnace, there
may be some variations on how the charge moves through it. The variations include roller hearth
furnaces in which the charge moves over the rollers, walking beam furnaces in which material is
moved in a controlled step-wise manner, pusher-type furnaces in which a continuous line of
material is pushed over skids, and rotary hearth furnaces with cellular hearths that rotate in a
horizontal plane. Other variations include the introduction and removal of charge and circulation
of heat. Circulation of heat is accomplished by natural convection and stack drift.
The sizes of reheat furnaces vary. Large reheat furnaces can have a hearth area up to 4000 square
feet. The capacity of a reheat furnace is determined by the surface area of the material to be
heated, the shape, thickness, and composition of the material, and the temperature of the material
and the furnace.
Reheat furnaces may use preheated combustion air or ambient combustion air. Furnaces using
preheated combustion air are equipped with regenerative or recuperative systems to recover heat
from the exhaust gases to improve thermal efficiency. Improved thermal efficiency will
generally reduce total NOx emissions (but, not necessarily emission rates in lb/MMBtu) since
heat input per unit output is reduced.
Flat-rolled steel products such as coils of sheets are sometimes annealed to enhance some
physical properties of the product. It is carried out by subjecting steel to a carefully controlled
thermal cycle to relieve stresses induced by hot and cold working. Only cold-rolled steel coils are
annealed, as hot rolled coils are self-annealed. Annealing is generally done at about 1250°F.
Sometimes higher temperatures may be used for annealing. Annealing may be carried out
continuously or in a batch-type furnace.
Galvanizing or coating with zinc, aluminum, or other alloys is done to protect steel from
corrosion. At iron and steel mills, steel sheets, strips, and other products with a light cross section
are typically galvanized. A typical molten zinc bath temperature is 850°F, requiring a heat
source. Precise temperature control is very important in galvanizing furnaces.
Some galvanizing furnaces employ the use of direct flame impingement (DFI) oxy-fuel
technology. DFI implies that the oxy-fuel flame is in direct contact with the object to be heated.
This drastically increases the heat transfer and when employed in certain existing furnaces it can
result in 50% more throughput capacity.
Both annealing and galvanizing processes can be done in a single continuous facility that
includes a continuous annealing furnace followed by a continuous sheet galvanizing furnace.
Because of lower temperatures used in both annealing as well as galvanizing processes when
94
compared to reheat furnaces, NOx emissions from these processes tend to be lower as compared
to those from reheat furnaces.
In both annealing and galvanizing furnaces, preheated combustion air may be used. Preheating of
air can be carried out in recuperators or regenerators to improve thermal efficiency.
6.2.2 NOx Formation and Sources of NOx Emissions
This section covers how NOx is formed during the combustion of fuel in the air, factors that
affect emissions of nitrogen oxides emissions, and provides a summary of uncontrolled or
baseline NOx emissions from reheat, annealing, and galvanizing furnaces.
6.2.3
NOx Formation
Reheat, annealing, and galvanizing furnaces tend to use gaseous fuels, i.e. natural gas, coke oven
gas (COG), and blast furnace gas (BFG) for heating metal. These fuels contain very small
amounts of fuel nitrogen and hence most of NOx formed is thermal NOx. This is formed when
nitrogen present in the air combines with oxygen in the air. Prompt NOx, which generally is
formed when atmospheric oxygen reacts with hydrocarbon radicals derived from fuel, is not a
major factor. Nitrogen oxides emissions from fired processes are typically 90-95% NO with the
balance NO2 . However once the flue gas leaves the stack, NO is eventually oxidized to NO2.
6.2.4 Baseline or Uncontrolled NOx Emissions
Baseline NOx emissions are strongly influenced by furnace type, fuel characteristics, peak flame
temperature, and oxygen concentration. The NOx emissions data are available in the ACT
document for reheat, annealing, and galvanizing furnaces at iron and steel plants. Table 6-2
presents uncontrolled NOx emissions data for these sources.
Table 6-2: Baseline NOx Emissions for Reheat, Annealing, and Galvanizing Furnaces
Source: Table 2-1, ACT
Furnace Type
Source Type
Baseline NOx
Emissions
ppm
@
3 0
2
Baseline NOx
Emissions
Lb/mmBtu
Reheat Furnaces
Regenerative
650
0.79
Recuperative
220
0.20
Cold-Air
120
0.14
Annealing Furnaces
Regenerative
780
1.15
Recuperative
330
0.40
Cold-Air
120
0.14
Galvanizing Furnaces
Regenerative
9240
1.2
Recuperative
330
0.40
Cold-Air
120
0.14
ti
I
SECONDARY COMBUSTION
\n,
HIGH AIR TO FUEL
RATIO IN PRIMARY ZONE
SECONDARY FUEL
COMBUSTION
AIR
SECONDARY FUEL
CONNECTION
PRIMARY FUEL
CONNECTION
95
6.3 Technical Feasibility of NOx Controls
In its document, Alternative Control Techniques Document--NOx Emissions from Iron and Steel
Mills, EPA-453/R-94-065 ("ACT"), October 1995, USEPA has identified control techniques for
reheat, annealing, and galvanizing furnaces. NOx control approaches applicable to these furnaces
may be grouped into two categories:
•
Combustion control approaches where the emphasis is on reducing NOx formation, and
•
Post-combustion control approaches which destroy the NOx formed in the combustion
process.
Combustion controls such as low NOx burners (LNB) and flue gas recirculation (FGR) fit into
the first category. Sometime FGR is incorporated into their low NOx burner design. Add-on flue
gas treatment controls such as selective catalytic reduction (SCR) and selective non-catalytic
reduction (SNCR) are examples of the second. Wherever practicable, combustion control
techniques should be used as they are generally cheaper compared to post combustion controls.
6.3.1 Combustion Controls
Figure 6-1.
Example of a staged
fuel burner.3°
Several combustion control techniques are
available for NOx emissions from reheat,
annealing, and galvanizing furnaces. They
include low excess air (LEA), LNB, FGR,
or a combination of these techniques. By
limiting the amount of excess air and by
lowering flame temperature, NOx emissions
can be reduced from these furnaces.
Low NOx Burners
LNB employ a variety of principles including
LEA, staged combustion, and FGR. LNB may
be staged air burners or staged fuel burners.
Staged air burners are designed to reduce
turbulence, delay fuel/air mixing, and establish
fuel-rich zone for initial combustion. The
reduced availability of oxygen in the initial or
primary combustion zone inhibits fuel NOx
conversion. During the second stage, partially
combusted gases mix with excess air to complete combustion process. The longer, less intense
flames resulting from air staging leads to lower peak flame temperatures and reduced thermal
NOx formation.
30
Waible, R., Price, D., Tish, P., Halpern, M., "ADVANCED BURNER TECHNOLOGY
FOR STRINGENT NOx REGULATIONS", American Petroleum Institute Midyear Refining Meeting, Orlando, FL,
May 8, 1990
96
Staged fuel burners mix a portion of the fuel and all of the air in the primary combustion zone.
The high level of excess air greatly lowers the peak flame temperature which results in reduced
amount of thermal NOx formation. The secondary fuel is injected at high pressure into the
combustion zone through a series of nozzles that are positioned around the periphery of the
burner, as shown in Figure 6-1. This results in rapid mixing of fuel gas with furnace gases.
Staged fuel burners produce compact flames.
Some burner designs include FGR within the burner. FGR may also be external, which requires
additional ductwork and fans, increasing cost. Either way, FGR enhances NOx reduction of
LNB.
LNB can reduce NOx emissions by 40 to 60 percent. This technology has been applied in reheat,
annealing, and galvanizing furnaces in the United States.
Low NOx Burner plus Flue Gas Recirculation
As discussed earlier, some LNB incorporate flue gas recirculation (FGR) in the burner itself. In
some furnaces, external FGR is added to enhance NOx reduction. Flue gas recirculation is
implemented by recycling a portion of the flue gas to the primary combustion zone. Since flue
gas contains lower concentration of oxygen, its injection dilutes the overall oxygen concentration
at the primary combustion zone, which results in lower peak flame temperature, and hence lower
amount of thermal NOx formation.
Flue gas recirculation has been applied to reheat, annealing, and galvanizing furnaces with LNB.
Gas Reburn
Gas Reburn is a form of fuel staging that reduces the NOx formed in the primary burn zone. Gas
reburn may be applied to reheat furnaces. Concerns relate to potential increases in fuel
consumption as well as increases in furnace exit temperature. Gas reburn may be combined
with oxygen-enriched combustion, as shown in Figure 6-2. Oxygen enrichment can increase
NOx emissions, but also heat flux. Gas reburn can be used to reduce NOx emissions –
regardless of whether oxygen enrichment is used. Pilot tests showed that reburn could reduce
NOx by up to 73%.
Recuperator
Combustion Air
—Now
2
1,000 - 1,090 F
Natural Gas
OFA
Heating Zones
Air ® <1,000 - 1,090F
Oxygen
Soak
Charge
Discharge
115-138TPD
Oxygen
97
Figure
6-2. Natural Gas Reburning with Oxygen Enriched burners.
Advanced Steel Reheat Research and Development, Final Report, DOE/ER/12200—T2
http://www.osti.gov/energycitations/servlets/pur1/362534-YnV6gu/webviewable/
air
® <1,090 F
6.3.2 Post-Combustion Control of NOx Emissions
Post-Combustion Control Technologies that may be used on reheating, annealing or galvanizing
furnaces include:
•
Selective Catalytic Reduction (SCR), and
•
Selective Non-Catalytic Reduction (SNCR)
Selective Catalytic Reduction
SCR is the most advanced of the flue gas treatment methods for reducing NOx emissions. SCR
can reduce NOx emissions by 80 to 90 percent and even higher. However, SCR entails higher
costs than other methods of control due to the capital cost. Some Nucor facilities in the United
States control NOx emissions by the use of SCR alone or by a combination of SNCR and SCR
using an aqueous urea solution. NOx reductions of about 78-86% have been realized.
(Source:
http://www.icac.com/Files/Rowlan.pdf).
Although SCR is a technology that may be
employed, it is not likely to be employed for compliance with the proposed rule because other,
less costly, technologies are available to achieve the NOx emission reductions of this rule.
Selective Non-Catalytic Reduction (SNCR)
SNCR accomplishes the same chemical reactions as SCR in order to reduce NOx to nitrogen. It
avoids the high costs of SCR but requires high temperatures in order to compensate for the lack
98
of catalyst and to prevent emissions of unreacted ammonia. Too high temperatures, however,
cause ammonia to significantly participate in a competing reaction that can actually form more
NOx.
The temperature "window" for effective SNCR is 1600 to 2200°F. Generally, 40 to 70 percent
NOx reduction is achieved with NH3 to NOx molar ratio of 1:1 to 2:1. The wide range of molar
ratio is because of the difficulty of achieving uniform mixing of ammonia with flue gas and
because of variations of flue gas temperature and composition usually present.
Table 6-3 summarizes the NOx emissions reductions potential of various control strategies for
furnaces.
Table 6-3:
Expected NOx Emissions Reduction with NOx Control Technologies
Ref.: Table 2-2, Page 2-8, ACT
Furnace Type
Control
NOx Emissions lb/nunBtu
Percent NOx
Regenerative
Recuperative
Cold-Air
Reduction
Reheat
LEA
0.69
0.17
0.12
13
LNB
0.27
0.068
0.046
66
LNB+FGR
0.18
0.046
0.031
77
Annealing
LNB
0.48
0.20
0.07
50
LNB+FGR
0.38
0.16
0.07
60
SNCR
0.38
0.16
0.07
60
SCR
0.14
0.06
0.02
85
LNB+SNCR
0.19
0.08
0.03
80
LNB+SCR
0.095
0.04
0.015
90
Galvanizing
LNB
0.57
0.20
0.07
50
LNB+FGR
0.46
0.16
0.06
60
Combinations of SCR and SNCR have been employed. For example, as shown in Appendix C-
1, Fuel Tech has supplied combined SNCR and SCR systems to provide on the order of 70-80%
NOx reduction from a number of steel facilities. The advantage of the combined approach is that
it enables a much smaller SCR to be used, which reduces the capital cost of the system.
6.4 Cost Effectiveness of NOx Controls
The USEPA and others have prepared a number of cost effectiveness estimates for controlling
NOx emissions from reheat, annealing, and galvanizing furnaces. Two significant estimates are
contained in the federal ACT for iron and steel plants and AirControlNet. The Illinois EPA is
relying on these and other supporting documents to estimate the cost effectiveness of controlling
Illinois NOx sources to the level proposed by this rulemaking.
Cost Effectiveness of Combustion Controls
6000
5000
4000
cc
z
3000
6 2000
t.
1000
NOx
reduction,
11)/MIABtu
—II-0.1
0.15
0.2
—4-0.25
0?
2000?
4000
?
6000?
8000?
10000
Capital
Cost,
$/MMBtu/hr
99
Figure 6-3.
Cost Effectiveness of Combustion Controls
Figure 6-3 is identical to
Figure 3-7 of this
document, and is a generic
estimate of cost
effectiveness (in $/ton of
NOx removed) for
combustion controls.
Intrinsic to the estimates in
thisfigure are that the
facility operates 8000 hours
per year and that there are
no additional operating
costs. Lower operating
hours would entail higher
costs. The assumption of
no additional operating costs is reasonable, especially for any application without external FGR.
Since $5000/MMBtuihr is toward the high end of the capital cost of combustion controls, for the
levels of NOx reduction envisioned in most cases, costs in $/ton of NOx are typically under
$1000/ton. This is consistent with the results of calculations by USEPA in 2006 shown in Table
6
-4.
Table 6-4.
Cost Estimates from USEPA - 2006
8/21/06 -- Bill Neuffer, USEPA
http://www.epa.gov/groundlevelozone/SIPToollcit/documents/stationary_noxlist.pdf
Source category
Identified by
Potential measure/control technology
Efficiency(%)
Cost
effectiveness
(S/T)
Iron/steel mills
STAPPA, ACN
SNCR
60
1,600
Annealing, furnaces
LNB
50
570
LNB ÷ FGR
60
750
LNB ± SCR
SO
1.700
Galvanizin2 furnaces
LNB ± FGR
60
580
LNB
50
490
Reheatins furnaces
LNB ± FGR
77
380
LNB
50
490
6.4.1 ACT Cost Effectiveness
Three cost considerations are presented in the federal ACT document: total capital costs, total
annual costs, and cost effectiveness. The total capital cost is the sum of the purchased equipment
costs, direct installation costs, indirect installation costs, and contingency costs. Annual costs
consist of the direct operating costs of materials and labor for maintenance, operation, utilities,
and material replacement and disposal and indirect operating charges including plant overhead,
general administration, and capital recovery charges. Cost effectiveness, in dollars/ton of NOx
removed, is calculated for each control technique by dividing the total annual cost by the annual
tons of NOx removed.
100
The ACT describes the costs of various NOx controls applicable to reheat, annealing, and
galvanizing furnaces. Depending on the type of the furnace, the cost effectiveness of each control
varies from a few hundred to several thousands dollars per ton of NOx removed. Low excess air
(LEA) is shown to be very costly on a $/ton basis. However, it should be kept in mind that the
actual cost is low while the reduction is also very low. The high $/ton value associated with
LEA results from the very low NOx reduction possible from LEA.
Table 6-5 summarizes the cost effectiveness of various control options for reheat, annealing, and
galvanizing furnaces used at iron and steel plants.
Table 6-5:
Cost Effectiveness of Various NOx Control Technologies for Reheat, Annealing, and
Galvanizing Furnaces
Source: ACT
Furnace
Type
Control
Furnace
Size
minBtu/hr
Cost Effectiveness,
$/Ton NOx Removed
Regenerative
Recuperative Cold-Air
Reheat
LEA
140
550
2100
3200
LNB
130
510
760
LNB+FGR
160
620
930
LEA
300
410
1600
2400
LNB
90
350
400
LNB+FGR
110
460
690
LEA
520
330
1300
1900
LNB
70
260
390
LNB+FGR
90
340
500
Annealing
LNB+FGR
100
320
750
1900
SNCR
650
1500
3800
SCR
1700
4200
11000
LNB+SNCR
670
1700
5000
LNB+SCR
1800
4300
12000
LNB
200
200
480
1300
LNB+FGR
260
580
1600
SNCR
580
1300
3700
SCR
1200
2900
7200
LNB+SNCR
570
1100
3400
LNB+SCR
1300
3100
7900
LNB+FGR
300
210
490
1500
SNCR
540
1200
3700
SCR
1100
2500
6900
LNB+SNCR
520
1200
3400
LNB+SCR
1100
2600
7100
101
LNB
50
190
530
1500
LNB+FGR
230
640
2000
LNB
100
110
320
900
LNB+FGR
140
410
1200
LNB
150
110
320
900
LNB+FGR
140
400
1100
Galvanizing
102
7. Glass Melting Furnaces
7.1 Introduction
The purpose of this section is to provide a brief description of glass melting furnaces, the sources
of NOx emissions, the baseline NOx emissions, the factors affecting baseline NOx emissions, the
available NOx control technologies, and the estimated costs of controls.
Under the proposed rule, glass melting furnaces located in the Chicago NAA and Metro-East
NAA that have NOx emissions of 15 tons per year or more and 5 tons or more during the ozone
season are subject to the numerical emission limits in Table 7-1.
Table 7-1.
Proposed Numerical Emission Limits for Glass Melting Furnaces
Type
Lb/ton glass produced
Container Glass
5.0
Flat Glass
7.9
Other Glass
11.0
7.2 Process Description and Sources of Emissions
7.2.1 Process Description
Glass melting furnaces are used in the production of flat glass, container glass, and other glass
(which includes, among others, pressed and blown glass). Melting furnaces involved in the
production of fiberglass are not included. Commercially produced glass can be classified as
soda-lime, borosilicate, lead, and fused silica. Soda-lime glass is the most common type of glass
produced by the glass melting furnaces.
Main raw materials for soda-lime glass production include soda ash, limestone, sand, and broken
glass (called cullet). Other ingredients such as sodium and potassium nitrates, sodium sulfite,
boric acid, lead etc. may be added to impart certain qualities to the glass. The first step in the
production of glass is mixing of various ingredients in a batch mixer. The mixture is then fed in a
semi-continuous way to one end of the melting furnace. In the melting furnace chemical
reactions take place between the ingredients. The main reactions are as follows:
o
Na2CO3
+
Si0
2
->
Na
2 0.Si0
2
+
CO2
o CaCO
3
+
Si0
2
CaO.Si02
+
CO2
o Na
2
SO
3
+
Si0
2
-›
Na
2 0.Si0
2
+
SO2
The heat for these chemical reactions is usually supplied by natural gas combustion in burners
positioned over the melt. Heat is transferred by radiation from the flame to the surface of the
melt. A furnace may have either side ports or end ports that connect brick checkers to the inside
of the melter. Figure 7-1 shows a sideport furnace. The purpose of the brick checker is to
conserve fuel by collecting furnace exhaust gas heat, so that when air flow is reversed, it is used
to preheat the furnace combustion air. As a raw material mix enters the furnace through a feeder,
Figure 7-1.
Typical Sideport Glass Melting Furnace
http://www.britannica.com/eb/art-253/Schematic-diagram-of-a-glass-melting-furnace-showing-a-
cross?articleTypeId=1
A
stack
rloor
scrubbers
gas flue
gas regenerator-egenerato
pierspiers
checkerwork
hopper
refractory bricks
'1=1?
-1-11:1-1'.1 - I I'1
-
7 IS;Tit?1"1- ?1?1'1 1 1-I'
fl oor
piers
flue outlet
fining
©1997 Encyclopaedia Britannica, Inc.
melting
?
scrubbers
103
it floats on the top of the melt. While it melts, it passes to the front of the melter and eventually
flows out through a throat to the glass forming and finishing areas. End-port furnaces are usually
used in container and pressed/blown glass industries. Side-port furnaces are usually used in flat
and container glass industries.
104
The combustion air preheat temperatures in flat glass furnaces can reach 2300°F and, because of
that high temperature, a substantial amount of NOx may be formed in the checkers. Lower
preheat is used in container glass furnaces and NOx formed in the checkers is usually small. In
both the end-port and the side-port furnaces, the cycle of air flow from one checker to the other
is reversed after about every 15-30 minutes. The end-port furnaces are usually smaller than side-
port furnaces. For production of flat glass, more even heating is desired and side-ports are
preferred for that. Production capacity of flat glass furnaces can be as large as 800 tons/day. The
end-port furnaces are limited to about 175 tons/day capacity. Pressed and blown glass melting
furnaces are usually the smallest, with production capacity of less than 50 tons/day.
Broken glass (cullet) is used both in container glass as well as flat glass manufacture. Cullet may
be internally recycled glass produced at the plant in some downstream operations or may be
externally recycled glass from glass recycled in recycle operations. Melting of cullet requires as
much as half the energy used in melting of virgin ingredients used in the manufacture of glass.
Use of external cullet is limited to container glass because of high quality requirements.
Glass can also be melted in all-electric furnaces and electric boost can be added to gas-fired
furnaces. However, electric conductivity of the melt limits the size of the melting furnaces.
Almost all electric melters are used in pressed and blown glass manufacture, though some are
also used in container glass manufacture. Electric boost is common in container glass, but is not
common in flat glass furnaces over 100 tons/day capacities.
Energy consumption for melting glass has declined over recent years because of advancement in
better refractory materials. The fuel use for melting operations in the glass melting industries is
approximately as follows:
Total Energy Consumed
Industry
for melting (106 Btu/ton)
Container
8-10
Flat
6-7
Pressed/blown
16
7.2.2 NOx Formation and Sources of NOx Emissions
This section covers how NOx is formed during the combustion of fuel in the air, factors that
affect emissions of nitrogen oxides emissions, and provides a summary of uncontrolled or
baseline NOx emissions from various categories of glass melting furnaces.
Manufacture of glass involves high process temperatures which are favorable for NOx
formation. Most of the NOx is formed in the melter, though some NOx is formed in the brick
checkers depending on the temperature there. Because natural gas is used as a fuel in almost all
glass melters, there is a little contribution of fuel NOx. Some glass raw materials contain nitrates
(niter) which may emit NOx when heated. Uncontrolled NOx emissions depend primarily on
various process parameters including fuel firing rate, furnace geometry, fuels and raw materials
used. Therefore, uncontrolled NOx emissions can vary from site to site.
105
In glass melting furnaces, NOx is formed when nitrogen present in the air or fuel combines with
oxygen in the air. The primary form of NOx is nitric oxide (NO) and is formed when
atmospheric nitrogen combines with oxygen (thermal NOx). As discussed above there may be
some NOx formed from the use of nitrates as feed material. Uncontrolled emissions of thermal
NOx range from 8-10 lb NOx/ton glass produced.
7.2.3 Baseline or Uncontrolled NOx Emissions
Baseline NOx emissions are strongly influenced by furnace design, fuel characteristics, peak
flame temperature, nitrogen and oxygen concentrations. The NOx emissions data are available in
the ACT document for three types of glass melting furnaces, container glass, flat glass, and
pressed/blown glass. Table 7-2 presents uncontrolled NOx emissions data for these furnaces.
These values should be considered typical, with the understanding that there may be some
variation about these values.
Table
7-2: NOx Emission Factors for Different Glass Melting Furnace Types
Glass Melting
Furnace Type
Heat Input
Requirement
(mmBtu/Ton
Glass)
Average NOx
Emission
Rate (lb/ton
Glass)
Average NOx
Emissions
(lb/mmBtu Heat
Input)
Container Glass
6.0
10
1.67
Flat Glass
6.0
15.8
2.63
Pressed/Blown
Glass
6.0
22
3.67
As can be seen from Table 7-2, in general, pressed and blown glass produce highest NOx
emissions of 22.0 lb NOx/ton of glass produced. If the furnace can be made more efficient
without raising the emissions rate (in lb/MMBtu), then there can be a reduction in NOx.
7.3 Technical Feasibility of NOx Controls
In its document, Alternative Control Techniques Document--NOx Emissions from Glass
Manufacturing, EPA-453/R-94-037 ("ACT"), June 1994, USEPA has identified control
techniques in detail. NOx control approaches applicable to the glass melting industry may be
grouped into three categories:
•
Combustion modifications where the emphasis is on reducing NOx formation,
•
Process modifications such as preheating of cullet, use of electric boost, and addition of
feed nitrate (sodium nitrate), and
•
Post-combustion control approaches which destroy the NOx formed in the combustion
process.
In addition to NOx control techniques, several energy saving methods can reduce energy
comsumption and hence reduce NOx emissions.
106
7.3.1 Combustion Modifications
Glass melting furnaces operate at very high combustion air temperatures and excess air levels
compared
to
boilers. In addition, the glass furnaces use high-temperature refractory lined
combustion chambers where NOx formation also occurs. These differences with the boilers
result in high
NOx
emissions from glass melting furnaces.
All combustion modifications are designed to minimize NOx formation by any one or all of the
following:
•
reduce peak flame temperature
•
reduce residence time in the flame zone
•
reduce oxygen concentration in the flame zone
•
reduce nitrogen in the combustion air
All these modifications can reduce NOx emissions, but for combustion with air reducing peak
flame temperature has the greatest effect on thermal
NOx
emissions. Therefore, most
combustion modifications focus on minimizing flame temperature.
Combustion modifications can be grouped as follows:
•
Modification to the existing burner and burner hardware
o
low excess air operation
o
changing air/fuel contacting
• Modified burners
Many modifications which are good for boilers, such as fuel switching, water or steam injection,
reduced air preheat, and derating are impractical for glass melting furnaces.
7.3.1.1 Modification to Existing Burners
Low Excess Air (LEA) Operation
LEA
operation is routine in glass melting furnaces due to its effect on efficiency. LEA is
designed to reduce the oxygen concentration in the flame zone, and thereby reduce
NOx
formation. Tests on a side-port and an end-port furnace show that LEA can reduce
NOx
emissions by 0-28 percent. (Reference: Table
5-1,
page 5-33, ACT). As a result, LEA can
produce some NOx reductions; but, it is not a method for large reductions in
NOx
emissions.
Changing Air/Fuel Contacting
Regenerative furnaces are generally fired by mixing a horizontal stream of preheated
combustion air with a stream of natural gas fuel injected in a much smaller separate port at an
angle. In most regenerative furnaces, natural gas is introduced into the furnace through a port just
under the combustion air port. This type of firing is called under-port firing. In over-port firing,
107
natural gas is introduced above the combustion air port, and in the side-port firing, natural gas is
introduced at the same level as the combustion air. Both over-port as well as side-port firings are
also practiced in glass melting furnaces. The mixing of fuel with air is accomplished by injecting
fuel at a high velocity (typically 500-800 feet/second) and air at a much lower velocity (about
20-30 feet/second).
By changing gas and air velocities, contact angle between the gas and combustion air and
location of natural gas injection (e.g. from under-port to over-port), it may be possible to change
primary variables, such as flame temperature, oxygen concentration, and gas residence time at
peak flame temperature that influence NOx formation. In reality, however, changing these design
features in an existing furnace might be difficult.
(Reference: Page 5-42, ACT)
It has been shown that decreasing fuel injection velocity lowers NOx concentration for a wide
range of contact angles, port configuration, and burner types. It has also been shown that high
combustion air velocity in relatively short ports in the side-port furnaces cause more gas mixing
and higher peak flame temperatures that lead to higher NOx emissions than in the end-port
furnaces. It has also been shown that by reducing contact angle, gas mixing can be reduced
which also leads to lower NOx emissions. (Reference: page 5-48, ACT)
Another type of burner uses methane dissociation and slight oxygen enrichment (20.9 percent to
21.6 percent) to increase flame luminosity in glass furnaces. This increase in luminosity
increases heat transfer from the flame to melt, lowering energy requirements, and decreasing
NOx emissions (lb/ton of glass). One test claims a 35 percent reduction in NOx emissions and 6
percent savings in fuel usage. (Reference: page 5-50, ACT).
Fuel Switching or Co-firing
Because oil has a more luminous flame, which enhances radiant heat transfer, flame temperature
is reduced for oil. This permits oil flames to produce lower NOx despite. having a higher fuel
nitrogen level. Therefore, one option for reducing NOx is through burning some oil in the
furnace. The capital cost of switching will generally be low and there may be an operating cost,
depending upon the differential in fuel costs.
Modified Burners
Low NOx burners (LNB) have been used widely in boilers and process heaters. They are
designed to stage the combustion process in several distinct zones. In a two-stage LNB,
combustion is fuel rich in the first stage and air rich in the second. The purpose is to minimize
the peak flame temperature and corresponding oxygen concentration which help in minimizing
NOx emissions. LNB can also be designed to improve fuel efficiency. NOx reduction of about
30-50 percent is possible with these burners. More recent LNB allow adjustment of air/fuel
velocities, contact angle, flame shape, and injection orifice. These features can further improve
LNB performance.
108
Some LNB can achieve NOx reduction by as much as 60 percent from the uncontrolled levels by
a combination of furnace and burner block sealing to limit air infiltration. Tests conducted in
1991 on Sorg burner (Cascade' burner) installed on two container glass melting furnaces with
under-port firing showed that NOx can be reduced by about 40-60 percent. Since under-port
firing is not typically used in a flat glass furnace, the burner has not been tested on flat glass
melting furnaces. No information is available on the applicability of this burner on
pressed/blown glass furnaces.
(Reference: Table 5-3, pages 5-57 and 5-60, ACT)
The Korting burner, developed by a German firm, incorporates orifice sealing (to prevent in-
leakage of air) and flue gas recirculation in their LNB. This "staged-air" burner injects additional
air into the end of the furnace outside of the burners for completion of combustion. Introduction
of natural gas through a jet nozzle causes atmospheric air to be sucked in by vacuum. Control of
primary air at the burner tip allows enough air so that partial combustion of the gas takes place
between 1470 and 1830°F. This burner has been tested on a 179 tons/day regenerative end-port
gas-fired container furnace. NOx emissions reductions are reported to be around 65 to 70
percent. This burner has not been tested on flat glass furnaces. No information is available on the
applicability of this burner on pressed/blown glass furnaces.
(Reference: Pages 5-64 to 5-69, ACT)
Oxy-firing/ Oxygen Enrichment
The use of an oxidant stream with high or elevated oxygen and low nitrogen content in lieu of
combustion air has been shown to produce a savings in fuel consumption and reduced NOx
emissions. Oxygen enrichment can be anywhere above its level in air (21 percent) up to about 99
percent. Oxygen enrichment above 90 percent is called oxy-firing. Oxy-firing has been used on
container and pressed/blown glass melting furnaces. As per Praxair, about 200 commercial glass
melting furnaces have been converted to or built as oxy-fuel firing over the past 15 years.3I
Increasing oxygen concentration will cause the temperature of the flame to rise, which, absent a
reduction in nitrogen content, would increase the formation of NOx. However, by preventing air
infiltration and by the use of oxy-firing (thereby reducing nitrogen available for thermal NOx
formation), NOx can be reduced by about 85 percent. Fuel savings have been reported to be as
high as 15 percent with oxy-fuel firing.An additional benefit of oxy-firing is additional
throughput of the glass melting furnace due to the higher flame intensity.
Figure 7-2 shows the evolution of the oxy-fuel fired furnace performance on energy and
emissions, based on a few of the Praxair's container glass furnace conversion projects. As
described by Praxair, the first project was the cross fired regenerative furnace at Gallo Glass and
the air baseline data on natural gas consumption and emissions of NOx and particulates in 1990
are compared with those after the conversion to oxyfuel in 1991.
The baseline energy consumption of the 116 m2 (1248 sq ft) furnace was about 935 Kcal/Kg
(3.74 MMbtu HHV/ton) using 152 kwh/ton of electric boost for flint glass with 10% cullet. After
31 Kobayashi, H., "Advances in Oxy-Fuel Fired Glass Melting Technology", XX International Congress on Glass
(ICG), Kyoto, Japan, September 26- October 1, 2004
109
the conversion to oxy-fuel firing, the energy consumption was reduced to 848 Kcal/Kg (3.39
MMbtu/ton) using 111 kwh/ton of electric boost at about the same pull. The approximate fuel
consumption without electric boosting was calculated from a furnace energy balance analysis,
which yielded about 1113 Kcal/Kg (4.45 MMbtu/ton) for the baseline air case and 963 Kcal/Kg
(3.85 MMbtu/ton) for the oxy-fuel firing case. The baseline energy consumption of this furnace
was relatively high because of the relatively low pull for the furnace size, the end of the
campaign regenerator deterioration and the low cullet ratio. The furnace converted in 1996
showed energy consumption of less than 800 Kcal/Kg (3.2 MMBtu/ton) with 60% cullet in a 111
m
2
(1194 sq ft) furnace. The figure also shows the projected performance of 625 Kcal/Kg (2.5
MMBtu/ton) with 60% cullet for a furnace with a fully integrated batch and cullet preheater.31
Figure
7-2. Energy consumption and emissions from oxy-fuel fired container glass furnaces31
(lb/ton)
/
(MMBtu/ton)
5
(g/kg) (kcal/kg)
2.5
?
1250
I
I Energy
Particulates
4-
NOx
2.0
1000
3-
1.5 750
2-
1.0
500
1-
0
s•
0.5
0
250
0
Air
?
Oxy
?
Oxy Low NOx
?
Oxy Batch/
Regen.
?
1991
?
Tall Furnace
?
Gullet PH
1990
?
1996
?
Future
Figure
7-3 NOx Emissions from Glass Furnaces31
NOx EMISSIONS VS. FURNANCE N2 CONTENT
100% OXY-GAS FIRED GLASS MELTERS
1.2
0.8
0.6
0.4
0.2
o
o
(kg/tonne)
NOx EMISSIONS
(lb/ton)
2.4
2
1.6
1.2
0.8
0.4
0
40
(Niter
•
in batch)
/-1—
5
10
15?
20?
25
30
35
N
2
IN FURNACE ATMOSPHERE (%
wet)
■
CONVENTIONAL BURNER?
•
ULTRA-LOW NOx BURNER
The conversion of an air fired
furnace to oxy-fuel firing
typically results in NOx
reduction by 80 to 90% while
the nitrogen concentration in the
furnace is reduced from about
70% in an air-fired furnace to
about 5 to 10% in a typical oxy-
fuel fired furnaces. Results of
NOx emissions tests conducted
on several glass furnaces fired
with natural gas-oxygen are
plotted in Figure 7-3. As shown
in Figure 7-3, NOx emissions
are directly proportional to
nitrogen concentration and are
also affected by the burner
110
design. Burners designed to achieve good combustion with low peak flame temperature will
produce significantly lower NOx emissions than a conventional burner.
Oxygen-Enriched Air Staging (OEAS)
Another technology that can be used to reduce NOx that takes advantage of air staging and
oxygen-enriched combustion is Oxygen-Enriched Air Staging (OEAS). In OEAS, a two-stage
combustion process is used - a fuel-rich stage and an oxygen-rich stage - that is similar in
principle to the air-staging methods used very successfully in other combustion systems to
reduce NOx emissions. The amount of combustion air through the firing ports is reduced to
decrease the oxygen available in the flame's high temperature zone in the first combustion stage.
This reduces NOx formation but leads to higher carbon monoxide (CO) and unburned
hydrocarbon levels. Oxygen-enriched air is injected into the furnace near the exit port(s) to
complete combustion in the second stage within the furnace.
Figure
7-4. Oxygen Enriched Air Staging on a Sideport Glass Furnace
http://wwwl.eere.energy.gov/industry/glass/pdfs/airstaging.pdf
1st STAGE?
-rn--1-1-n-n-i
-rrrn-rrn
I
FIRING SIDE REGENERATOR
r rn-1-1-1-m-
(Reduced
?
-r-r-F1-1-n-1-1-1
(Primary
Combustion Air)
Stoichiometric
1)-
1
?
, .
Ratio)
DODD
FIRING PORTS
2nd STAGE
(Complete
Combustion)
OD
ofn
EXHAUST PORTS
II
11111
4111111111111110
1 I ,it 1 l
?
0-ENRICHED
-
-
-i
T-FrErrrn
i
i--?
'EXHAUST
(Combustion
SIDE
71-r-r
REGENERATOR
Products)
-r -r
?r
?AIR
?
r
rrrri
rrrrEnTh?
S CONDARY
OEAS can operate on sideport furnaces which are used for nearly 65% of U.S. glass production.
It can also be employed on endport furnaces.32
According to the Gas Technology Institute, OEAS has been successfully retrofit to seven endport
container glass furnaces and three sideport container glass furnaces. NOx was reduced 50-70%
on endport furnaces with no adverse impacts on other emissions, furnace performance, or glass
quality. When OEAS technology was applied to a 300 ton/d six-port pair sideport furnace, NOx
decreased by 40% to below 2.5 lb/ton. The system has been operating continuously for 6 years.
OEAS systems subsequently installed on two 320 ton/d sideport furnaces reduced NOx by as
32http://www.gastechnology.org/webroot/app/xn/xd.aspx?it-----enweb&xd=4reportspubs%5C4_8focus%5Coxygenenri
chedairstaging.xml
111
much as 70%. According to the US Department of Energy, the process is the most economical
control technology for NOx emissions because fuel consumption is not increased. The
technology also has no effect upon glass quality or furnace superstructure, and can even increase
furnace productivity.33
Gas Reburn
Gas reburn is a form of fuel staging that reduces the NOx formed in the primary burn zone. Gas
reburn may be applied to glass furnaces, and has been tested on them. Concerns relate to
potential increases in fuel consumption as well as increases in furnace exit temperature. Gas
reburn was tested at Anchor Glass Container's Antioch plant
34
Process Modifications
Process modifications include changes to the furnace, its combustion system, or its heat recovery
system that can lower NOx emissions. In many cases, such modifications are designed to
increase furnace productivity with lower NOx emissions as an added benefit.
Batch Preheat
It is possible to conserve energy as well as reduce NOx emissions significantly by preheating
raw materials and cullet. In both cases, heat in the waste gases from the furnace exhaust can be
used via direct heat transfer (contact with flue gas) or indirect heat transfer (plate heat
exchanger). Alternatively low NOx conventional burners can be used for batch preheat. This
preheating is done at a lower temperature and hence can result in net reduction of NOx
emissions. The use of cullet itself can decrease energy consumption by 10- 12 percent over the
use of virgin raw materials. Use of preheat can reduce energy consumption by 10 to 20 percent
from reduced fuel usage and lower furnace temperatures resulting in corresponding NOx
reductions.
Electric Boost
Some furnaces incorporate electric boost in order to boost the heat input to the melt with radiant
heat transfer. Electric heaters can provide better temperature control and more intense heat input
from radiation heat transfer. Electric boost will also reduce NOx emissions by reducing the
necessary combustion temperature. The electric boost can be applied in a number of ways,
including with electrodes inserted in the preheating end to control glass temperature and
viscosity.
The use of cullet is generally restricted to container and pressed and blown glass production.
http://wi.vwl.eere.energy.gov/industry/glass/pdfs/airstaging.pdf
http://www.osti.gov/energycitations/product.biblio.jsp?osti_id=616314
112
7.3.2
Post Combustion Controls
Post combustion controls are less commonly used on glass melting furnaces. However, controls
that might be contemplated include
•
Selective Catalytic Reduction (SCR)
•
Selective Non-Catalytic Reduction (SNCR)
Selective Catalytic Reduction (SCR)
SCR could be employed on a glass furnace to achieve high levels of NOx removal (75% or
more). Depending upon the exit temperature of the furnace after the checker brick, reheating
might be needed. However, it is not anticipated that SCR would be used since less costly
approaches would likely be employed to comply with the requirements of the proposed rule.
Selective Non-catalytic Reduction (SNCR)
SNCR is another technology that can be installed on glass melting furnaces, provided the correct
temperature window is available for injection of the ammonia or urea reagent. This is difficult in
light of the design of glass furnaces and the use of checker brick.
Table 7-3 summarizes the NOx emissions reductions potential of various control strategies for
glass melting furnaces from the ACT document.
Table
7-3: NOx Emission Reductions for Various Control Technologies
(Table 2-2, page 2-7, ACT, Glass Melting Furnace, except for OEAS)
Technology
NOx Reduction (%)
Combustion Modifications
Low NOx Burners (LNB)
Oxy-firing
40
85
OEAS
40-70
Process Modifications
Modified Furnace
75
Cullet Preheat
25
Electric Boost
10
Post Combustion Modifications
Selective Catalytic Reduction (SCR)
75
Selective non-Catalytic Reduction (SNCR)
40
7.3.3
Energy Saving Techniques
In addition to raw materials and cullet preheat described earlier, energy consumption can be
reduced by refining of grain of raw materials, moisture control of raw materials used,
improvement of fusibility of glass, work standards, prevention of air intrusion, heat insulation of
furnace and other components, reduction of cooling air, waste heat recovery, development of
113
thinner and lighter glass, and stabilization of production processes. Lowering of primary air
pressure for fuel injection can also result in lower NOx emissions. Lowering of standard air
volume can also reduce NOx emissions appreciably.
7.4 Cost Effectiveness of NOx Controls
In the Interim White Paper - Midwest RPO Candidate Control Measures, issued
12/02/2005,
LADCO evaluated controls for glass furnaces and showed the cost effectiveness of controls as
described by various sources. These results are shown in Table
7-4,
and they are consistent
with other estimates shown in Tables
7-5, 7-6, 7-7
and
7-8.
114
Table
7-4. Cost Effectiveness of NOx Controls on Glass
Furnaces
Technology
Description
Applicability
Performance
Cost]. (S/ton)
Low NOx Burners
Use of burner's designed to reduce
peak flame temperature with slower
mixing of fuel and air, minimum
Not all furnace
designs can
accommodate
30 to 40% reduction
in NOx
5.5 lbs NOx/ton for
790 — 1,920
(EPA, 1994)
injection velocities, and higher
longer flame length
end-port furnaces
emissivity flames
created by low-
9 lbs NOx/ton for
323 — 1,045
NOx burners
side-port furnaces
(IPCC, 2001)
Oxy-Firing
Replacing the combustion air with
Oil and gas fired
75 to 85% reduction
2,150 - 4,400
pure (>90%) oxygen thus reducing
the nitrogen levels (thermal NOx)
furnaces.
Currently used iu
in NOx
(EPA, 1994)
during combustion. Reduced air
greater than 25% of
1.25 to 4.1 lbs
1,254 — 2,542
volumes result in higher energy
efficiency.
glass furnaces
NOx/ton
(IPCC, 2001)
2,352
(DOE. 2002)
Oxygen-Enriched
Staged combustion process where in
Successfully
30 to 75% reduction
Air Staging
first stage, reduces amount of
retrofit on endport
in NOx
(OEAS)
primary combustion air entering
and sideport
firing port to reduce NOx formation
regenerative
585
followed by an oxygen-enriched
second stage to complete
combustion with no additional NOx
formed
furnaces
(DOE, 2002)
Batch Preheat
Raw materials and cullet preheated
When 50% or more
10 to 20% energy
before adding to furnace. Heat from
cullet is used in
savings from reduced
890 -1.040
waste heat in furnace exhaust via
feed for fossil fuel-
fuel usage and lower
(EPA. 1994)
direct heat transfer (contact with flue
gas) or indirect heat transfer (plate
heat exchanger). Alternatively, low-
NOx conventional burner used for
preheat. Preheat reduces heat-load
for furnace thereby reducing NOx
emissions.
fired furnaces
furnace temperatures
resulting
resulting in
corresponding
reductions in NOx
5.000
(DOE, 2002)
Electric Boost
Electric current passed through the
Currently used in
10 to 30% reduction
glass mixture in furnace to provide
most container
in NOx
heat. thus reducing fuel requirement
glass plants and in
2.600 — 9.900
and associated NOx generation.
more than one half
of all regenerative
tank glass furnaces.
Not viable for
2.4 to 3.6 lbs
NOx/ton
(EPA. 1994)
7.100
some colored
glasses. Used to
extend life of
furnaces or
increase capacity.
(DOE, 2002)
Fuel Switching —
Oil combustion. while increasing
Many furnaces can
30 to 50% reduction
Gas to Oil
fuel nitrogen, provides a flame
higher in luminosity resulting in
more efficient heat transfer than
when gas is burned
bum both fuels
in NOx
115
Fuel Rebuilt
Injection of fuel post combustion
zone to creating reducing
atmosphere for converting NO to
N2; Includes" Reaction and
Reduction in Regenerators" (3R)
Regenerative
furnaces:
successfully tested
iu wide range of
glass plants
50 to 65% reduction
in NOx
571 – 1,349
(for 3R,
process which is based on injecting
gas or oil into flue gas at regenerator
entrance
IPCC, 2001)
Selective Non
Ammonia injection in furnace
20 to 60% reduction
830 – 2,000
Catalytic Reduction
(SNCR)
exhaust to creating reducing
atmosphere for converting NOx to
in NOx
(EPA, 1994)
N2
840 – 1,617
(IPCC, 2001)
1,382
(DOE, 2002)
Selective Catalytic
Same as SNCR but with use of
75 to 90% reduction
810 – 2,950
Reduction (SCR)
catalyst at lower temperature
in NOx
(EPA, 1994)
727 – 1,941
(IPCC, 2001)
3,000
(DOE, 2002)
1
Cost data from EPA, Alternative Control Techniques Document (EPA, 1994); DOE, Technology Success Story: Glass,
Oxygen-Enriched Air Staging (DOE, 2002); and IPCC, Best Available Techniques in the Glass Manufacturing Industry
(IPCC 2001).
References:
•
USEPA Alternative Control Techniques Document – NOx Emissions from Glass Manufacturing, EPA-453/R-94-037,
June 1994.
•
California Air Resources Board, Sources and Control of Oxides of Nitrogen Emissions, August 1997.
•
New Jersey Department of Environmental Protection, State of Art Manual for the Glass Industry, July 1997.
•
European Commission, Integrated Pollution Prevention and Control (IPPC) Bureau. Reference Document on Best
Available Techniques in the Glass Manufacturing Industry. December 2001.
•
U.S. DOE, Technology Success Story: Glass, Oxygen-Enriched Air Staging, Office of Industrial Technologies,
www.oit.doe.gov/glass, April 2002.
•
Glass Manufacturing Industry Council, Glass Melting Technology: A Technical and Economic
Assessment,
Prepared
for the U.S. DOE Industrial Technologies Program, October 2004.
http://www.ladco.org/reports/rpo/Regional%20Air%20QualiN/White%20Papers%20March%202006/Glass Mf
g Ver2.pdf
Table 7-5.
Cost Estimates from USEPA - 2006
8/21/06 -- Bill Neuffer, USEPA
http://www.epa.gov/groundlevelozone/SIPToolkit/documents/stationary_nox_list.pdf
Source category
Identified
by
Potential
measure/control
technology
Efficiency(%)
Cost
effectiveness
(SIT)
Glass-container
LADCO, OTC.
LNB
40
1,700
ACN
SNCR
40
1,800
Glass – flat
ACN
Oxyfiring
40
700
SCR
75
710(large)
SNCR
40
700
Glass – Pressed
CAN
LNB
40
1.500
SCR
75
2,500
116
Table 7-6: Cost Effectiveness- NOx Control Technologies
For Glass Melting Furnaces (ACT)
Plant Size (tpd)
Cost Effectiveness ($/ton
NOx
Reduced)
(January 1994 $)
LNB
Oxy-
Firing
Cullet
Preheat
Electric
Boost
SCR
SNCR
50
(Pressed/Blown)
1680
4400
890
8900
2950b
1770
b
250
(Container)
1920
5300
1040
8060
2460
2000
750
(Flat)
790
2150
NFa
2600
800
830
b
(990-1700)c
a Not Feasible
b Not demonstrated
Two actual installations at 40 and 30% control, respectively
Table
7-7: NOx Control Cost Effectiveness for Glass Melting Furnaces
(Reference: AirControlNet, Table B-7)
Type of Furnace
Control
Measure
Typical
Reductions
Annual Control
Cost Effectiveness
Container
Cullet Preheat
25
940
Container
Electric Boost
10
7150
Container
LNB
40
1690
Container
SNCR
40
1770
Container
Oxy-Firing
85
4590
Container
SCR
75
2200
Flat Glass
Electric Boost
10
2320
Flat Glass
LNB
40
700
Flat Glass
Oxy-Firing
85
1900
Flat Glass
SNCR
40
740
Flat Glass
SCR
75
710
Pressed and Blown Glass
Oxy-Firing
85
3900
Pressed and Blown Glass
SNCR
40
1640
Pressed and Blown Glass
Electric Boost
10
8760
Pressed and Blown Glass
Cullet Preheat
25
810
Pressed and Blown Glass
SCR
75
2530
117
Table 7-8:
NOx Control Cost Effectiveness Data for Glass Melting Furnaces
Reference: Table 7, Page 93, STAPPA/ALAPCO
NOx Control
Technology
NOx Control Cost Effectiveness, $/Ton NOx Reduced
Flat Glass
750 tons/day*
Container Glass
250 tons/day*
Pressed and
Blown Glass,
50 tons/day*
LNB
790
1920
1680
Oxy-Firing
2150
5300
4400
Cullet Preheat
--
1040
890
Electric Boost
2600
8060
9900
SCR
810
2460
2950
SNCR
830
2000
1770
118
8. Aluminum Melting Furnaces
8.1 Introduction
The purpose of this section is to provide a brief description of aluminum melting furnaces, the
sources of NOx emissions, the baseline NOx emissions, the factors affecting baseline NOx
emissions, the available NOx control technologies, and the estimated costs of controls.
The proposed rule affects aluminum melting furnaces located in the Chicago NAA and Metro-
East NAA that have NOx emissions of 15 tons per year or more and 5 tons or more during the
ozone season .
For those units affected by the rule, the emission limits of Table 8-1 are proposed.
Table 8-1.
Proposed Emission Limit for Affected Aluminum Melting Furnaces
type
Limit lb/MMBtu
Reverberatory furnace
0.08
Crucible furnace
0.16
8.2 Process Description and Sources of Emissions
8.2.1 Process Description
Melting and refining of aluminum is primarily carried out in reverberatory furnaces at secondary
aluminum production facilities. A reverberatory furnace is a metallurgical or process furnace
that isolates the material being processed from contact with the fuel, but not from contact with
combustion gases. The term
reverberation
is used here in a generic sense of rebounding or
reflecting. In these furnaces, heating of charge is carried out by direct-fired wall-mounted
burners. The primary mode of heat transfer is through radiation from refractory walls to the
aluminum as in Figure 8-1, but convective heat transfer also provides additional heating from the
burners. A typical reverberatory furnace has an enclosed melt area where the flame heat source
reflects directly above the molten aluminum. After melting, aluminum flows into a melt area and
then to a charging well and flows back into the
Figure 8-1.
A Reverberatory Furnace.
melt section. Natural gas is the most common
fuel used for melting aluminum. The melting of
charge is carried at about 1200°F. Charge
usually consists of clean aluminum scrap.
www.britannica.com
Hot gases
x
.
Radiant heat
Firebox
?
Hearth
?
Flue
Either cold air or preheated air may be used
for combustion of a fuel in a burner. When
the furnace uses preheated air, it may be
preheated in a regenerative system or
recuperative system. Some regenerative
systems offer air preheats within 300°F of the
furnace temperature. Recuperative systems
offer lower air preheats.
119
Preheated air systems have not been widely used in aluminum melting furnaces because salt
fluxing and impurities in the scrap mix can cause corrosion or fouling of downstream
recuperators which may cause maintenance delays. Maintenance costs for regenerative burners
and heat exchange media can offset the fuel savings, mitigating the advantage. Regenerative
furnaces also have higher initial equipment costs and higher baseline NOx emissions compared
to furnaces that use cold air.
After melting and refming, molten aluminum flows into one or more holding furnaces. Holding
furnaces are suitable for final alloying and for making additional adjustments necessary to ensure
that aluminum meets specifications. After alloying and degassing (if needed), molten aluminum
is heated to casting temperature of about 1380°F. Pouring takes place from holding furnaces,
either into molds or as feedstock for continuous casters.
Melting of aluminum can also be carried out in a crucible furnace, a metallurgical furnace
consisting essentially of a pot of refractory material that can be sealed. The advantages of
crucible furnaces are their ability to change alloys quickly, low oxidation losses, and their low
maintenance costs. Disadvantages include lower efficiency, higher emissions per unit output, and
size limitations. Energy efficiency of a crucible furnace can be improved by adding a ceramic
matrix recuperator to the exhaust system to recover waste heat for preheating the combustion air.
There are two kinds of reverberatory furnaces: Side well reverberatory furnaces and direct
charged furnaces. Side well reverberatory furnaces are equipped with a number of burners firing
inside the hearth and against the furnace hot wall or door. A charging well and a pump well,
when present, are connected to the furnace hot wall on the outside of the furnace. Both wells are
connected to each other and with the furnace hearth by arches, which permit aluminum
circulation between the furnace chambers. In direct charged furnaces, metal is charged directly
into the furnace hearth where it is exposed to the open flames. These furnaces are compact and
have high melting efficiencies and also widely used for melting aluminum.
Several types of burners are used in reverberatory melting furnaces. A brief description of these
burners is given below.
Conventional Burners:
These burners are very common in aluminum melting furnaces. They
are either used to heat the refractory brick which radiates energy to the aluminum charge, or to
transfer heat directly to the aluminum charge through flame impingement. Direct flame
impingement increases the heat transfer efficiency, but also increases the metal oxidation loss.
These burners are typically diffusion burners without air or fuel staging or regeneration.
Immersion Burners:
These burners have been developed for aluminum melting. The burner
housing is immersed in the molten aluminum and a pre-mixed burner provides hot combustion
gases which are circulated through the housing. The combustion gases never come into contact
with the molten aluminum, thus oxidation losses are minimized, and the submerged burner
provides enhanced heat transfer to the molten charge, thus improving efficiency. Aluminum
melting efficiencies are higher with immersion burners. Challenges in using a submersible
burner is associated with its ability to withstand the conditions within the molten aluminum bath.
Oxygen Enriched Burners:
These burners employ pure oxygen or oxygen enriched air which
can significantly increase the combustion temperature of furnace burners. This results in
significant fuel savings. As an example, 7 percent enrichment with pure oxygen can result in
about 27 percent increase in aluminum melting rate, and about 24 percent reduction in gas
120
consumption. Oxygen enhanced combustion can also result in lower NOx emissions through
reduction of nitrogen content provided that flame temperature does not increase too much. The
most common technique for the enrichment of air with oxygen involves mixing pure oxygen
with the combustion air upstream of the burner. This is the most common method used since it
requires no physical changes to the furnace, and is capable of being used on conventional burners
with enrichment levels up to 25 percent. Alternatively, pure oxygen can be used in place of
oxygen enriched air. These oxy-fuel burners are typically water cooled and combust a mixture of
natural gas and pure oxygen. These burners operate at very high temperatures and produce
almost no NOx emissions. These burners are typically not used in the aluminum melting
industries.
Radiant Tube Burners:
These burners are used in applications where reduced metal oxidation
and low emissions are of importance. Radiant tubes burn natural gas inside an inner tube which
then passes the combustion gases across an outer tube. The outer tube is made of high radiation
emitting material, which transfers the heat via radiation to the intended application. The
combustion and combustion gases are contained entirely inside the radiant tube and never come
into contact with the aluminum charge. These burners often have air preheaters built into them
to improve fuel efficiency.
Regenerative Burners:
Regenerative combustion systems alternate combustion and air preheat
through a pair of highly efficient heat storage beds. Combustion air passing through the hot bed
is raised to about 1800°F providing 30-35 percent better efficiency than with conventional
radiant roof-fired reverberatory furnaces. Regenerative ceramic burners produce high levels of
air preheat (about 85% of process temperature), which with a combustion efficiency of up to 75
percent, bring fuel savings of up to 60-65%.
The application of regenerative burners is becoming increasingly common with the rising energy
costs. Regenerative burners can reduce energy costs by 5 to 25 percent. Historical problems with
regenerative systems are high NOx production and high maintenance costs.
Also, a regenerative system can increase the base cost of a furnace by 60 to 80 percent.
8.2.2 NOx Formation and Sources of NOx Emissions
This section covers how NOx is formed during the combustion of fuel in the air, factors that
affect emissions of nitrogen oxides emissions, and provides a summary of uncontrolled or
baseline NOx emissions from reverberatory and crucible furnaces.
8.2.3 Baseline or Uncontrolled NOx Emissions
Most aluminum furnaces use natural gas for heating and melting aluminum scrap. Natural gas
contains very small amount of fuel nitrogen and hence most of NOx formed is thermal NOx.
Thermal NOx is formed when nitrogen present in the air combines with oxygen in the air.
Baseline NOx emissions are influenced by furnace type, fuel characteristics, peak flame
temperature, and oxygen concentration. Reverberatory furnaces used for aluminum melting
either use cold air or preheated air. For preheated air, either regenerative or recuperative furnace
is used, though former is most common. Some regenerative furnaces produce high levels of air
preheat that result in high combustion efficiencies and possibly higher NOx. Table 8-2 on the
following page shows emissions from uncontrolled aluminum melting furnaces.
121
Table 8-2.
Emission Factors for Uncontrolled Aluminum Melting Furnace
"Energy and Environmental Profile
of
the
U.S.
Aluminum Industry" repared
by Energetics -July 1997].
http://wwwl.eere.energy.gov/industry/aluminum/pdfs/aluminum.pdf
Source
NOx,
kg/metric ton, [lb/ton]
Smelting furnace - crucible
0.85 [1.7]
Smelting furnace - reverberatory
0.4 [0.8]
As shown, uncontrolled NOx emissions are about 0.8 lb/ton of hot metal from reverberatory
melting furnaces and 1.7 lb/ton of hot metal from crucible furnaces. Since about 5.5 mmBtu of
energy is consumed to melt a ton of aluminum, uncontrolled NOx emissions are about 0.15
lb/mmBtu (126 ppm at 3% 0
2
) from a reverberatory furnace and 0.31 lb/mmBtu (260 ppm at 3%
0 2) from a crucible furnace.
84 ppmv at 3% 0
2
= 0.10 lb/mmBtu (Bloom Engineering paper on "Next Generation of
Combustion Technology for Aluminum Melting' by David Shalles)
8.3 Technical Feasibility of NOx Controls
There are two approaches to NOx controls:
• Combustion control approaches where the emphasis is on reducing NOx formation, and
•
Post-combustion control approaches which destroy the NOx formed in the combustion
process.
In addition, increase in luminosity of flame helps better heat transfer from the flame to the melt.
Combustion controls such as LNB and flue gas recirculation (FGR) fit into the first category.
Sometimes, FGR is incorporated into the LNB design. Add-on flue gas treatment controls such
as selective catalytic reduction (SCR) and selective non-catalytic reduction (SNCR) are
examples of the second. Wherever practicable, combustion control techniques should be used as
they are generally cheaper compared to post combustion controls.
8.3.1 Combustion Controls
There are a number of types of combustion controls that have been used. Most use a form of air
staging and/or flue gas recirculation. In addition, there are methods that use oxygen enrichment
with air staging. The following are types of combustion controls:
1.
Low NOx regenerative burners with air staging and self recirculation
2. Ultra Low NOx burners with exhaust gas recirculation
3.
Ultra Low NOx burners with internal flue gas recirculation and baffles to create necessary air
and fuel flow jet patterns, and use of high luminosity flame to transfer heat from flame to the
melt.
4.
Oxygen enhanced combustion
5.
Oscillating combustion: It is expected to be used in aluminum melting furnaces.
6.
NOx combustion system integrated with an innovative low-cost vacuum-swing-absorption
(VSA) oxygen system
-••
REACTION
•
alIDATIGIN
ENVELOPE
FUEL
—0.
PRODUCTS OF
CO1IEUS11ON (PDC)
5econ Stage Alr + FOC
Fuel 4 First Stage Air 4
PDC
Second Stage Air+ POO
AIR
AIR
Conventional, Regenerative
O
40 _
Low NOx, No FGR
120 _
C4
20
_
?
Low NOx, FGR with 14.5% 02
umiFlame" 1150 Series
0
1900
2000
2100
2200
2300
2400
2500
1038
1093
1149
1204
1260
1316
1371
Furnace Temperature, °F °C
122
Figure 8-2.
Staged air burner with external FGR
www.bloomeng.com/tmspaper-FINAL.doc
Some suppliers have developed burners
that use air staging in combination with
internal flue gas recirculation. The
principal is shown in Figure 8-2. Fuel is
admitted with primary air in the center
of the burner to form a fuel-rich zone
where NOx is not formed. Secondary
air is admitted at the periphery, through
individual ports to help burn out
remaining fuel. Exhaust gas is entrained into the flame, which helps to reduce oxygen level and
peak flame temperature within the flame, thereby reducing NOx formation in the burn-out zone.
Performance of this burner is shown in Figure 8-3 along with the performance of conventional
burners, LNB, and LNB with external FGR. External FGR is more costly due to the need for
additional fans and ductwork. So, this air staged burner with internal FGR is capable of
achieving similar NOx to LNB with external FGR.
Figure 8-3.
Performance of Bloom Engineering Lumiflame burner
http://www.bloomeng.com/11501umiflame.pdf
Fuel-Rich Zones
Fuel-Lean Zones
123
Figure 8-4.
Oscillating Combustion
http://www.eere.energy.gov/industry/combustion/pdfs/osclIcomb.pdf
Fuel-
Rich
Fuel-
Lean
Distance From Burner
Figure 8-4 shows the
principle of oscillating
combustion, which uses
alternating fuel-rich/fuel-lean
zones to stage combustion
and reduce NOx. This
technology has been used in
steel furnaces and could be
employed in aluminum
furnaces as well.
Table 8-3 shows the performance of NOx controls installed at a number of facilities. As shown
these facilities all achieved NOx emissions below the levels required by this rule.
Table 8-3.
Performance of low NOx combustion controls
Burner Type
Uncontrolled
NOx Control
NOx Emissions
NOx Emissions
Regenerative
As high as 1.0
Air Staging and Self Circulation
<67 ppm @3% 02
Burner
lb/mmBtu
(0.08(1) lb/mmBtu)
Regenerative
As high as 1.0
ULNB w/ baffles to create jet flow
<
50ppm(2) @3%
Burner
lb/mmBtu
of air and fuel, use of luminous
flame, self circulation
02
(<0.06 lb/mmBtu)
Burner with no
Oxygen Enhanced Combustion.
0.323 lb/ton (3)
Preheat
Uses a special air-oxy natural gas
burner. Air enriched with 35-50%
aluminum
(0.04 lb/mmBtu).
Oxygen.
Conventional
Oscillating Combustion. (5)
NOx reduction 55-
Burner
Oscillation of fuel flow
75%.
(4)
(1) The furnace was installed at Ford Motor Co. at its plant in Ypsilanti, MI. The reverberatory
furnace capacity is 40,000 lb of aluminum. Melting efficiency is 1400 Btu/lb. Air is preheated to
1800°F. Natural gas consumption was reduced by 60% compared to the existing furnace.
(2)
ULNB was designed by Bloom Engineering. The ULNB was installed on a 120-ton
aluminum melting furnace at Alcan Rolled Product's Oswego, New York plant.
(3) The system has been installed on Wabash Alloys Furnace #8 in East Syracuse, NY.
(4)
Tested and developed by IGT. Field demonstrations were made on an iron melter in a
foundry, a batch annealing furnace in a steel plant, and on an oxy-fuel-fired melter in a glass
plant. Not tested on any aluminum melter.
Cost Effectiveness of Combustion Controls
6000 ?
0?
2000?
4000?
6000?
8000
?
10000
Capital Cost, VNINIBtu/hr
N Ox reduction,
IIVIVIM Btu
- -0-- 0.05
- -NI—
0.1
--sir—
0.15
0.2
5000
4000
3000
2000
1000
124
(5) Oscillating combustion creates successive NOx formation-retarding fuel-rich, fuel lean zones
within the flame. Heat transfer from the flame to the load is increased due to more luminous fuel-
rich zones and the break-up of thermal boundary layer. The increased heat transfer shortens heat-
up time, thereby increasing thermal efficiency. Fuel efficiency is increased by about 13 percent
and NOx emissions are reduced by about 55-70 percent. Oscillating combustion can also be used
with oxy-fuel burners.
http://www.eere.energy.goy/industry/combustion/pdfs/oscllcomb.pdf
8.3.2 Post-Combustion Controls
Post-combustion controls include SCR and SNCR. These technologies are not generally applied
to aluminum melting facilities. Combustion controls should be adequate to comply with this
proposed rule.
8.4 Cost Effectiveness of NOx Controls
Figure 8-5 –
Cost Effectiveness of Combustion Controls
Figure 8-5 is identical to
Figures 3-7 and 6-3, and
it is a generic figure that
shows cost effectiveness
(in $/ton) for combustion
controls. For a burner
that does not use external
FGR, this figure should
be representative. If a
facility operates less than
8000 hours per year, then
the costs will be
somewhat higher.
Nevertheless, as shown in Figure 8-5, for capital costs in the range of $5000/Mrvffitu/hr (typical,
if not at the high end for a low NOx burner fully installed), costs are generally well below
$1000/ton and, except in the case of very low NOx reductions (or, alternatively very low
operating hours) are below $2500/ton. Even at very high installed costs, NOx reductions are
generally below $2500/ton – except for very small NOx reductions.
In the case of combustion methods that incur additional operating costs, such as oxy-firing,
Figure 8-5 would not apply. Costs similar to those shown for other sources (iron furnaces or
glass melting furnaces) would likely apply.
8.5 Other State Regulations
As a benchmark, other state regulations have been examined, and these are shown below. As
shown, the proposed rules are not more stringent than any of these other rules.
125
California, South Coast
0.300 lb NOx/ ton produced. Year 2000
(Rule 2002)
0.323 lb/ton metal produced. Year 2000
0.055 lb/mmBtu.
Year 2010
Ref: http://www.aqmd.gov/rules/reg/reg20/r2002.pdf
BACT for New Aluminum Furnaces in SCAQMD
NOx limit: 37 ppmvd at3% 0
2
. (about 0.044 lb/MN4Btu) Furnace size: 12.8 mmBtu/hr.
NOx limit: 39 ppmvd at3% 0
2
. Furnace size: 6 mmBtu/hr
NOx limit: 40 ppmvd at3% 0
2
(BACT). Furnace size: 8 mmBtu/hr.
NOx limit: 60 ppmvd at 3% 0
2
. Furnace size: 31.5 mmBtu/hr.
Ohio EPA: Permit issued on 12/21/2004 to General Aluminum Mfg Co., Connecticut
Furnace Size: 7.0 mmBtu/hr, NOx limit: 1.05 lb/hour (Equal to 0.15 lb/mmBtu)
Furnace Size: 10.5 mmBtu/hr, NOx limit: 1.58 lb/hour (Equal to 0.15 lb/mmBtu)
Furnace Size: 5.8 mmBtu/hr, NOx limit: 0.87 lb/hour (Equal to 0.15 lb/mmBtu)
126
9.
Continuous Emissions Monitoring Systems (CEMS)
The proposed rule will require the use of CEMS on all boilers and process heaters with heat
inputs greater than 100 mmBtu/hr or other affected sources with a potential to emit one ton per
day or more of NOx. Large boilers, with heat inputs greater than 250 mmBtu/hr will be required
to install CEMS systems that comply with 40 CFR Part 75, while other boilers and process
heaters with heat inputs greater than 100 mmBtu/hr or other affected sources with a potential to
emit one ton per day or more of NOx will be required to install CEMS systems that comply with
40 CFR Part 60, Subpart A, and Appendix B, Performance Specifications 2 and 3, and Appendix
F, Quality Assurance Procedures. Smaller units that are subject to performance testing
requirements may, however, install and operate a CEMS in accordance with 40 CFR Part 60,
Subpart A, and Appendix B, Performance Specifications 2 and 3, and Appendix F, Quality
Assurance Procedures.
Some of the major differences between Part 60 CEMS and Part 75 CEMS are the following:
•
The requirement to monitor flow with Part 75
• The requirement to monitor opacity with Part 75 (at least on coal and oil)
•
More extensive Q/A and data handling requirements
CEMS are a proven technology. However, they do add cost to the operation of a facility affected
by the rule. To estimate the impact of this cost, USEPA's CEMS cost estimating tool was used.
The CEMS cost model may be downloaded at:
http://www.epa.govittn/emc/cem.html.
It should
be kept in mind that this model was developed primarily with power plants in mind, particularly
Part 75 systems, and the costs are more reflective of a utility CEMS. In fact, the model does not
allow for differences in stack height, or explicitly distinguish between Part 60 and Part 75
systems.
Three types of systems were modeled with this Microsoft Excel workbook:
•
A 40 CFR Part 60 CEMS (NOx CEMS without flow, opacity or SO2)
•
A 40 CFR Part 75 CEMS without SO 2 monitoring (NOx CEMS with flow, opacity but
not SO2)
•
A 40 CFR Part 75 CEMS with SO
2
monitoring (NOx CEMS with flow, opacity and SO2)
In all cases it was assumed that the unit did not have an existing CEMS.
Tables 9-1, 9-2 and 9-3 show the results of the modeling. As shown on these tables, annual costs
range from roughly $55,000 to $100,000. Because this model was developed primarily for
power plants, which have much larger chimneys and are much more costly to install CEMS on,
these costs may be high for industrial facilities that have much smaller chimneys and are
generally much less expensive to install and operate CEMS at.
127
Table 9-1.
Estimated costs for a NOx CEMS without Flow or Opacity using USEPA CEMS
Cost model
First Costs
Labor
Test
ODCs
Total
Planning
2,390
0
0
2,390
Select Equipment
9,123
0
357
9,480
Support Facilities
0
0
28,865
28,865
Purchase CEMS Hardware
0
0
87,969
87,969
Install and Check CEMS
6,852
0
13,088
19,940
Performance Specification Tests
1,958
8,055
275
10,287
QA/QC Plan
2,335
14,039
50
130,604
16,424
22,658
22,093
175,356
Annual Costs
Day-to-Day Activities
8,027
0
2,000
10,027
Annual RATA
1,011
7,668
0
8,679
PM Monitor RCA
0
0
0
0
PM Monitor RRA
0
0
0
0
Cylinder Gas Audits (ACA/SVA for PM)
1,561
0
1,496
3,057
Recordkeeping and Reporting
3,710
0
160
3,870
Annual QA & O&M Review and Update
2,312
0
2,529
4,841
Capital Recovery
3,227
3 146
18,598
24,971
Total w/o capital recovery
16,621
7,668
6,185
30,475
Total with capital recovery
19,848
10,814
24,783
55,445
128
Table 9-2 Estimated cost for a CEMS with Flow and Opacity but without SO2 using USEPA
CEMS Cost model
First Costs
Labor
Test
ODCs
Total
Planning
3,331
0
0
3,331
Select Equipment
14,643
0
377
15,020
Support Facilities
0
0
33,765
33,765
Purchase CEMS Hardware
0
0
154,103
154,103
Install and Check CEMS
9,377
0
15,441
24,818
Performance Specification Tests
2,222
12,068
350
14,640
QA/QC Plan
3,100
18,149
50
21,300
32,674
30,218
204,085
266,977
Annual Costs
Day-to-Day Activities
17,891
0
2,750
20,641
Annual RATA
1,072
11,201
0
12,273
PM Monitor RCA
0
0
0
0
PM Monitor RRA
0
0
0
0
Cylinder Gas Audits (ACA/SVA for PM)
1,699
0
1,710
3,409
Recordkeeping and Reporting
14,702
0
200
14,902
Annual QA & O&M Review and Update
3,392
0
5,468
8,860
Capital Recovery
4,653
4,303
29,062
38.018
Total w/o capital recovery
38,756
11,201
10,128
60,085
Total with capital recovery
43,409
15,504
39,190
98,103
129
Table 9-3. Estimated costs for a NOx CEMS with Flow, Opacity and SO
2
using USEPA CEMS
Cost model
First Costs
Labor
Test
ODCs
Total
Planning
3,475
0
0
3,475
Select Equipment
15,115
0
383
15,499
Support Facilities
0
0
37,265
37,265
Purchase CEMS Hardware
0
0
172,547
172,547
Install and Check CEMS
10,532
0
16,248
26,780
Performance Specification Tests
2,280
12,333
425
15,038
QA/QC Plan
3,271
19.178
50
226,918
22,499
34,674
31,511
293,103
Annual Costs
Day-to-Day Activities
19,138
0
3,250
22,388
Annual RATA
1,137
11,468
0
12,606
PM Monitor RCA
0
0
0
0
PM Monitor RRA
0
0
0
0
Cylinder Gas Audits (ACA/SVA for PM)
1,837
0
1,924
3,761
Recordkeeping and Reporting
15,931
0
200
16,131
Annual QA & O&M Review and Update
3,654
0
6,718
10,372
Capital Recovery
4,938
4,487
32,313
41,738
Total w/o capital recovery
41,698
11,468
12,092
65,258
Total with capital recovery
46,636
15,955
44,405
106,996
130
10. Potentially Affected Sources and Existing Regulations
Affected sources are those that emit or have the potential to emit 100 tons or more of NOx
emissions per year. The NOx RACT emissions limitations apply to only those point sources that
emit 15 tons of NOx per year and 5 tons of NOx during the ozone season. Point sources selected
for NOx control include industrial boilers, process heaters, cement kilns, lime kilns, aluminum
melting furnaces, reheat, annealing, and galvanizing furnaces located at iron and steel plants,
glass melting furnaces, and EGU boilers.
10.1 Description of Affected Sources and Regulations
Industrial boilers larger than 250 mmBtu/hour and all EGU boilers larger than 25 megawatt
capacity are currently subject to the NOx SIP Call regulations promulgated under 35 Ill. Adm.
Code 217, Subparts U and W, respectively, in 2001. A computer search of the 2005 NOx
emissions inventory showed that there are 10 industrial boilers and 13 electric utility boilers
located in the Chicago NAA and two industrial boilers and five EGU boilers in the Metro-East
NAA that are subject to the NOx SIP Call regulations. These boilers are also subject to the NOx
General Requirements under proposed Subpart C of 35 Ill. Adm. Code Part 217.
The NOx SIP Call regulations promulgated under 35 Ill. Adm. Code Part 217, Subpart T, affect
cement kilns, but currently there are no cement kilns in the Chicago NAA and the Metro-East
NAA . A member of the cement industry has initiated discussions pertaining to the construction
of a cement kiln in the Chicago NAA.
There is only one facility producing lime in the Chicago NAA and it has two rotary coal-fired
lime kilns. There are no gas-fired lime kilns in the Chicago NAA and Metro-East NAA.
There are no aluminum melting furnaces currently in operation in non-attainment areas.
Pechiney Rolled Products LLC, located in the Chicago NAA, was shut down recently in 2004.
The company may decide to restart in future or a new aluminum melting furnace may be
constructed in the non-attainment area. These furnaces are not currently subject to NOx control
regulations.
Point sources considered for NOx control at iron and steel plants include reheat, annealing, and
galvanizing furnaces. These sources are not currently subject to NOx control regulations.
There are two glass melting facilities in the Chicago NAA with a total of four glass melting
furnaces producing container glass. There is no flat glass or pressed and blown glass production
facility in either non-attainment area. Currently there are no NOx control regulations for glass
melting facilities.
There are two iron and steel plants in the Chicago NAA and Metro-East NAA that have reheat,
annealing, and galvanizing furnaces. The current galvanizing furnace at U.S. Steel Granite City
Works does not produce 15 tons of NOx annually, and hence is not shown in our inventory.
131
The NOx inventory was generated through the use of year2005 annual emission reports
submitted pursuant to 35 Ill. Adm. Code Part 234. For our purpose, year 2005, instead of year
2002, was selected because some sources have been either shut down or modified since 2002.
This is particularly true concerning steel plants, aluminum melting furnaces, and EGU boilers.
Many EGU boilers have installed NOx controls to meet the stringent Acid Rain regulations.
Boilers and process heaters are encompassed under the proposed rule. They are grouped
together as fuel combustion emission sources. For our purpose, indirect heat transfer from a fuel
combustion source to gaseous or liquid materials other than water is considered a process heater.
Pipeline heaters and storage tank heaters are excluded from this definition.
Fluidized catalytic cracking units (FCCU) at petroleum refineries are large emitters of NOx
emissions, but currently all FCCU units are subject to consent decrees. CO boilers, which are
part of FCCU, are also subject to the consent decrees. To avoid any conflict with the compliance
schedule, these sources are not being considered for NOx controls under this NOx RACT
proposal. Therefore, the proposed rule does not apply to FCCU, their regenerator and associated
CO boiler or boilers and CO furnace or furnaces where present, that commenced operation prior
to January 1, 2008, if such units are located at a petroleum refinery and such units are required to
meet emission limits for NO
x as provided for in an enforceable order.
Table D-1 lists all sources potentially subject to NOx RACT regulations in the Chicago NAA
and Metro-East NAA, respectively. Table E-1 lists only those sources which are subject to
existing SIP Call regulations.
10.2 Estimation of NOx Reductions
An estimation of NOx reductions from industrial boilers was made by using baseline NOx
emission factors as provided for in the ACT document for Industrial/Commercial/Institutional
boilers and proposed NOx RACT limits. As an example, average baseline NOx emissions from
natural gas-fired industrial boilers greater than 100 mmBtu/hour is 0.26 lb/mmBtu and the
proposed NOx RACT limit is 0.08 lb/mmBtu. Hence, an average of 69.2% of NOx emissions has
to be reduced to achieve the proposed emission limit. All stoker boilers were assumed to be
spreader stoker and all pulverized coal-fired boilers were assumed to be dry-bottom wall-fired
for estimation of NOx reductions. There are no tangentially-fired industrial boilers in our
inventory. Combustion tuning for boilers smaller than or equal to 100 mmBtu/hour is assumed
to provide about 15% reduction.
For an estimation of NOx reductions from process heaters, all process heaters were assumed to
be of the natural draft type, since information about draft type is not available. This assumption
is reasonable since, nationwide, about 90% of process heaters are of the natural draft type.
Baseline emissions were taken from the ACT document for process heaters. Uncontrolled NOx
emissions vary significantly with the nitrogen content of the fuel. For our purpose, all gaseous
fuels were assumed to be natural gas, and all liquid fuels were assumed to be distillate fuel.
Combustion tuning for process heaters smaller than or equal to 100 mmBtu/hour is assumed to
provide about 15% reduction.
132
For iron and steel reheat, annealing, and galvanizing furnaces, information about whether the
furnace is regenerative, recuperative, or air heat type is not available in our inventory. For our
estimations of emissions reductions, it was assumed that these furnaces are recuperative type,
based on our discussion with U.S. Steel Granite City Works. For the purpose of calculating
emissions reductions, baseline NOx emissions and average NOx reductions as provided in the
ACT document for low NOx burner and flue gas recirculation control technology were taken.
For aluminum melting furnaces, there is no ACT document available, and hence, baseline NOx
emissions were based on a computer search and 50% NOx reduction was assumed by the NOx
RACT limits for estimation of NOx reductions. Since there are no operating aluminum melting
furnaces in the non-attainment areas, the actual reduction will be zero.
For glass melting furnaces, baseline NOx emissions vary depending upon the type of glass
produced and furnace used. For an estimation of NOx reductions, 50% NOx control was
assumed. Only container glass melting furnaces are located in the non-attainment areas.
Since there are no cement kilns in the non-attainment areas, the actual reduction will be zero. For
lime kilns, 30% NOx control was assumed for the estimation of NOx reduction.
EGU boilers subject to the proposed NOx RACT regulations burn coal as the primary fuel. Some
of these boilers also bum natural gas or fuel oil as a startup fuel or as pilot fuel. Emissions
resulting from natural gas and oil combustion are small as compared to coal-firing. Therefore,
those emissions are ignored for our purpose. Year 2005 baseline emission data was taken from
the USEPA's Clean Air Markets Division (CAMD) website. The NOx control limit was applied
to the baseline emissions to obtain NOx reductions.
Table F-1 provides NOx reductions from the application of the proposed NOx RACT limits to
sources in the Chicago NAA and Table G-1 provides NOx reductions from the application of the
proposed NOx RACT limits to sources in the Metro-East NAA. The tables provide both annual
as well as typical ozone season day NOx emissions.
Table H-1 provides NOx reductions from the application of proposed NOx RACT limits. As can
be seen from Table H-1, overall about 46% of emissions will be reduced by the application of
NOx RACT limits, and the majority of the emissions reduction will come from EGU boilers.
Table I-1 provides category wide NOx reductions from the application of proposed NOx RACT
limits. As can be seen from Table I-1, overall about 46.3% of emissions will be reduced by the
application of NOx RACT limits, and the majority of the emissions reduction will come from
EGU boilers.
Table 10-1 summarizes NOx reduction in the Chicago NAA and Metro-East NAA by category.
133
Table 10-1. Summary of NOx reduction in Chicago and Metro-East Non-Attainment Areas by
Source Category.
Source Category
Size
No.
of
Units
2005 Base
Year
NOx, tpy
Controlled
NOx, tpy
NOx RACT
Reductions,
tpy
NOx
Reduction,
°A
Industrial Boilers
>100 mmEtu/hr
45
4300.1
1219.1
3081.6
71.7
Industrial Boilers
<100 mmBtu/hr
35
998.2
848.4
149.7
15
Process Heaters
>100 mmBtu/hr
58
3733.7
2655.8
1077.9
28.9
Process Heaters
<100 nunBtu/hr
26
1004.95
854.21
150.74
15
Glass Melting Furnaces
>15 tpy NOx
4
732
366
366
50
Lime Kilns
>15 tpy NOx
2
734.4
514.1
220.3
30
.
Iron and Steel Plant Furnaces
>15 tpy NOx
6
1052.6
249.6
803
76.3
EGU Boilers
>25 WV
20
32068.6
17252.1
14816.5
46.2
Grand Total
196
44625
23959
20666
46.3
Appendices to
TECHNICAL SUPPORT DOCUMENT
for
CONTROL OF NITROGEN OXIDE EMISSIONS
from
Industrial Boilers and Electrical Generating Unit Boilers
Process Heaters
Cement Kilns
Lime Kilns
Reheat, Annealing, and Galvanizing Furnaces used at Iron and Steel Plants
Glass Melting Furnaces
Aluminum Melting Furnaces
AQPSTR 07-02
March 2008
Prepared by
Andover Technology Partners and the Illinois Environmental Protection Agency
for
ILLINOIS ENVIRONMENTAL PROTECTION AGENCY
1021 NORTH GRAND AVENUE EAST
P. 0. Box 19276
SPRINGFIELD, ILLINOIS 62794-9276
Table
Page
A-1
Summary of NOx Reduction Performance for ICI Boilers
A-1
A-2
Cost of NOx Controls from Khan, 2003
A-2
A-3
Cost of NOx control for boilers, from NESCAUM 2000
A-3
A-4
Summary of cost of control for gas-fired refinery boilers
A-4
(LADCO 2005)
B-1
Model Heaters: NOx Control Effectiveness, Capital Costs, and
A-5
Cost Effectiveness for natural draft, Natural Gas-Fired
Low and Medium Temperature Process Heaters (1991$)
B-2
Model Heaters: NOx Control Effectiveness, Capital Costs, and
A-7
Cost Effectiveness for mechanical draft, Natural Gas-
Fired Low and Medium Temperature Process Heaters
(1991$)
B-3
Model Heaters: Cost Effectiveness for Oil-Fired natural draft
A-8
Heaters (1991$)
B-4
Model Heaters: Cost Effectiveness for Oil-Fired mechanical draft
A-9
Heaters (1991$)
B-5
Model Heaters: Cost Effectiveness for ND Pyrolysis Heaters
A-9
(1991$)
B-6
NOx Control Cost Data for Process Heaters from AirControlNet
A-10
(1990$)
B-7
Control Cost Effectiveness Data for Process Heaters
@
90%
A-11
Capacity Factor from STAPPA/ ALAPCO Report (Cost
basis: 1993$)
B-8
Summary Table for Evaluation of Economic Reasonableness of
A-12
NOx Control Limits for Various Process Heaters
C-1
Fuel Tech SNCR Installation list
A-13
C-2
NOx Reductions from the Application of NOx RACT
A-23
(Reductions by Categories)
D-1
Year 2005 NOx Inventory of Major Sources in NAAs
A-25
E-1
Boilers Subject to NOx SIP Call Regulations (>250 mmBtulhour)
A-27
F-1
NOx Reductions from the Application of NOx RACT in Chicago
A-28
NAA
G-1
NOx Reductions from the Application of NOx RACT in Metro-
A-30
East NAA
H-1
NOx Reductions from the Application of NOx RACT in Chicago
and Metro-East NAA
A-31
I-1
NOx Reductions from the Application of NOx RACT
A-33
(Reductions by Categories)
Appendices -
1
Table A-1: Summary of NOx Reduction Performance for ICI Boilers
Boiler Type and
Fuel
NOx Control
Range in Performance
Reduction
Efficiency
%
Controlled NOx
lb/mmBtu
N. Gas-fired
Single Burner
Watertube
WI
50-77
0.04-0.056
ULNB+FGR
53-74
0.01-0.08
LNB
46-71
0.03-0.11
LNB+FGR
55-84
0.018-0.09
SCR
80+
0.01-0.06
N. Gas fired
Multi-Burner
Watertube
BOOS+WI+OT
N/A
0.05-0.08
LNB
39-52
0.10-017
SNCR
50-72
0.03-0.19
SCR
N/A
0.024
Distillate Oil
Single Burner
Watertube
LNB
N/A
0.08-0.33
FGR
20-68
0.04-0.15
LNB+FGR
N/A
0.03-0.13
SCR
N/A
0.011
Residual-oil
Single Burner
Watertube
LNB
30-60
0.09-0.23
FGR
4-30
0.12-0.25
SCR
80-90
0.025-0.15
Residual-oil
Multi-Burner
Watertube
LNB
30-60
0.09-0.23
LNB+OFA
N/A
0.22
SCR
58-90
0.025-0.15
Pulverized Coal
Wall
Wall-Fired
-
LNB
49-67
0.11-0.50
SNCR
30-83
0.15-0.40
SCR
80-90
0.08-0.18
Pulverized Coal
Tangentially-Fired*
LNB
LNB+SCA
SCR
80-90
0.06-0.23
Coal -fired
Stokers
Gas Cofiring
20-25
0.18-0.20
RAP
SNCR
40-74
0.11-0.28
Coal-fired
FBC
FGR+OFA
N/A
0.12-0.16
SNCR
76-80
Under 0.10
SCR
80+
Under 0.10
Wood-fired Stoker **
SNCR-Urea
25-80
0.04-0.23
Wood-fired FBC**
SNCR-NH3
44-80
0.035-0.20
* No Tangential-fired boiler in our inventory
** Wood-fired boilers are located at non-major sources (with PTE <100 tons/year)
Reference: Alternative Control Techniques Document- NOx Emissions from Industrial/
Commercial/Institutional (ICI) Boilers, EPA-453/R-94-022
Appendices - 2
Table A-2. Cost of NOx Controls from Khan, 2003
As noted in report, these results are Preliminary, and not Final and are presented for comparison only
NOx Technology Retrofit Costs
COAL-, GAS- & OIL-FIRED INDUSTRIAL BOILERS
Fuel
Technology
NOx Reduction
%
Capacity Factor
%
$/Ton of Pollutant
1000 Mtv1Bturhr
250 MMBtu/hr
100 MMEltuthr
Coal
LNB, sub-bituminous
51
14
1520
2304
3033
50
426
645
849
83
256
389
512
Coal
LNB/OFA, sub-bituminous
65
14
1727
2608
3428
50
496
743
972
83
306
454
593
Coal
LNB/OFA, bituminous
51
14
2197
3317
4358
50
634
947
1239
83
392
581
757
Coal
SCR
80
14
4481
5924
7262
50
1359
1766
2141
83
876
1123
1349
Coal
SNCR
40
14
2962
4015
4970
50
1510
1814
2073
83
1285
1473
1625
Gas
LNB/OFA
60
5
5260
7973
10521
50
526
797
1052
94
280
424
559
Gas
LNB/OFA/GR
80
5
6204
9415
12374
50
656
981
1278
94
368
543
700
Gas
SCR
80
5
14815
21095
26859
50
1670
2330
2933
94
986
1354
1689
Gas
SNCR
40
5
14,165
20,870
27,105
50
2.452
3,116
3,735
94
1.842
2,193
2.521
011
LNB/OFA (0.51b/MMBtu
30
10
2630
3986
5260
inlet NOx)
50
526
797
1052
86
306
464
612
Oil
LNB/OFA/GR (0.5 lb/MMBtu
50
10
2505
3790
4973
Inlet NOx)
50
533
791
1028
86
326
477
615
011
LNB/OFA/GR (0.36 lb/MMBtu
30
10
5694
8613
11303
Inlet NOx)
50
1210
1798
2337
86
741
1085
1399
Oil
SCR (0.36 IbIMMBtu inlet NOx)
80
5
14,601
20,113
25,838
50
1.622
2,178
2,767
86
1.017
1.343
1.694
Oil
SCR (0.5 Ibil
■
AMBtu Inlet NOx)
80
5
10,458
14.443
18,544
50
1,191
1,595
2,014
86
760
997
1,245
011
SNCR (0.5 lb/MMBtu Inlet
40
10
4271
5892
7399
NOx.)
50
1749
2070
2367
86
1485
1670
1840
Oil
SNCR (0.36 lb/MMBtu Inlet
40
10
5497
7753
9842
NOx)
50
1995
2444
2853
86
1628
1889
2123
Khan, S.
Methodology, Assumptions, and References Preliminary NOX Controls Cost
Estimates for Industrial Boilers.
http://cascade.epa.gov/RightSite/dk_public_collection_item_detail.htm?ObjectType=dk_
docketitem&cid=0AR-2003-0053-0170&ShowList=xreferences&Action=view
Appendices -
3
Table A-3.
Cost of NOx control for boilers, from NESCAUM 2000
Cost Effectiveness for NOx Reduction with LNB on a 350 MMBTU/hr Boiler
36% NOx reduction from 0.60 lb/MMBTU and Capital Cost of $5,000/MMBTU/hr
Capacity Factor
0.45
0.65
0.85
$1,378
$954
$730
Cost Effectiveness for NOx Reduction with LNB on a 350 MMBTU/hr Boiler
25% NOx reduction from 0.60 lb/lVIMI3TU and Capital Cost of $5,000/MMBTU/hr
Capacity Factor
0.45
0.65
0.85
$1,985
$1,374
$1,051
Cost Effectiveness for burner modification on two 680 MMBTU/hr Boilers
10% NOx reduction from 0.43 lb/MMBTU and Capital Cost of $30,000, or $22/MMBTU/hr (Case Study BLR-2)
Capacity Factor
0.45
0.65
0.85
$30
$21
$16
Cost Effectiveness for NOx Reduction with LNB on one 350 MMBTU/hr Boilers
50% NOx reduction from 0.20 lb/MMBTU and Capital Cost of $5,000/MMBTU/hr
Capacity Factor
0.45
0.65
0.85
$2,977
$2,061
$1,576
Cost Effectiveness for LNB NOx Reduction on one 350 MMBTU/hr Boilers
25% NOx reduction from 0.20 lb/MMBTU and Capital Cost of $300/MIMBTU/hr
Capacity Factor
0.45
0.65
0.85
$357
$247
$189
Cost Effectiveness for SNCR NOx Reduction on a 350 MMBTU/hr Boiler
35% NOx reduction from 0.45 lb/MMBTU
Capacity Factor
0.45
0.65
0.85
$1,814
$1,470
$1,300
Cost Effectiveness for SCR NOx Reduction on a 350 MMBTU/hr Coal-fired Boiler - 80% NOx reduction from
0.45 lb/MMBTU and Capital Cost of $10,000/MMBTU/hr
Capacity Factor
0.45
0.65
0.85
$2,179
$1,609
$1,307
Cost Effectiveness for SCR NOx Reduction on a 350 MMBTU/hr Coal-fired Boiler - 80% NOx reduction from
0.45 lb/MMBTU and Capital Cost of $15,000/MMBTU/hr
Capacity Factor
0.45
0.65
0.85
$3,006
$2,181
$1,745
Cost Effectiveness for SCR NOx Reduction on a 350 MMBTU/hr Boiler
80% NOx reduction from 0.15 lb/MIVIBTU and Capital Cost of $5,500/MM13TU/hr
Capacity Factor
0.45
0.65
0.85
$3,626
$2,603
$2,062
Cost Effectiveness for SCR NOx Reduction on a 100 MMBTU/hr Boiler
80% NOx reduction from 0.15 lb/MMBTU and Capital Cost of $7,500/MMBTU/hr
Capacity Factor
0.45
0.65
0.85
$6,110
$4,322
$3,376
Appendices -
4
Table A-4.
Summary of cost of control for gas-fired refinery boilers (LADCO 2005)
Midwest Regional Planning Organization(RPO)Petroleum Refinery Best AvailableRetrofit Technology (BART)Engineering Analysis Prepared
for:The Lake Michigan Air Directors Consortium
Gas Fired Boilers
Uncontrolled emissions (spy)
703
L2,13
Removal Efficiency?
4093
Low Capital Cost
High Capital Cost
Total Capital Investment (TC2)
$543,518
56,938,915
Total Annual Costs
$221,120
51,020,616
Pollutants Removed ftortstyr,/
221
251
Cost per ton pollutant removed
5726
53,241
Gas Fired Boilers
Uncontrolled mins
" stoat (y)
703
C1203
Efficiency
75%
Efficiency
55%
Total Capital Investment(ICI)
$2,244,309
52,144,309
Total Annual Costs
$448261
5448,261
Pollutants
Removed
(touttyr)
522
598
Cost
per ton pollutant
removed
5550
$750
Gas Fired Boiler
Uncontrolled emissions (s)y)
703
LNB +
FGR
Removal Efficiency?
50%
Removal Efficiency
?
72%
Low Capital Cost
High Capital Cost
Low Capital Cost
High Capital Cost
Total Capital Investment (ICI)
5877,232
57,633,075
5877,238
57,633,075
Total Annual Costs
5496,832
51,404,769
S19.5,832
51,404,769
Pollutants Removed (tons! r)
352
352
506
506
Cost per ton pollutant
remov
ed
$1,413
53.994
5982
$2,774
Gas
Fired
Boiler
Uncontrolled emissions (tpy)
703
SCR
Efficiency?7095
Efficiency?
9041
Low Capital
Cost
High Capital Cost
Low Capital Cost
High Capital Cost
Total Capital Investment ITCTi
52,015,650
516.796.000
51015,650
516,796,000
Total Annual Costs
S1,547,054
53,533.429
51,547,054
53.533 429
Pollutants Removed (tons/ r)
492
492
633
633
Cost per ton pollutant removed
53.142
57.176
52,444
55.552
Gos Fired Boilers
Uncontrolled eadssions (my)
703
LNB +
SNCR
Removal Efficiency
?
50%
RtMOVA I
Effitlenty
5991
Low Capital Cost
High Capital Cost
Low Capital Cost
High Capital
Cost
Total Capital Invmtment (TCI)
51,557 700
511,772,567
51,557,700
511,772,867
Total Annual Costs
$976,279
52308,502
5976.279
$2305,805
Pollutants Removed (tonsfyr)
352
352
626
626
Cost per ton pollutant removed
52,776
$45,555
$1,560
$3,655
Gas Fired Boiler
Uncontrolled emissions (tpy)
703
VI-NB
+
sae.
Removal Efficiency
?
2591
Removal Eftwiency
?
97%
Law Capital Cost
High Capital Cott
Low Capital
Cost
High Capital
Cost
Total Capital Investment (TCH
$4,159,959
512,940309
54,159959
$12,940,309
Total Annual Costs
$1.995,116
$3,981.590
51,995,316
$3,921,690
Pollutants
Removed (totit
t
yr)
595
598
622
652
Cost per ton pollutant removed
53,337
$6,660
52925
55,836
Appendices - 5
Process Heaters
Table B-1:
Model Heaters: NOx Control Effectiveness, Capital Costs, and Cost Effectiveness
for natural draft, Natural Gas-Fired Low and Medium Temperature Process Heaters (1991$)
Model
Heater
Capacity
mmBtu/hr
Uncontrolled
NOx
Emissions,
lb/mmBtu
NOx Control
Technique
NOx
Reduction
Controlled
NOx,
Lb/mmBtu
Capital Cost,
$
Cost Effectiveness, $/Ton NOx
Reduced @ Capacity Factor
0.10
0.50
0.90
17
0.098
(ND) LNB
50
0.049
58,200
25,400
5,070
2,820
0.197
(MD) LNB
50
0.099
191,000
41,400
8,280
4,600
0.098
(ND) ULNB
75
0.025
62,500
18,200
3,630
2,020
0.197
(MD) ULNB
75
0.049
249,000
36,000
7,200
4,000
0.098
(ND) SNCR
60
0.039
155,000
56,700
11,800
6,770
0.197
(MD) SNCR
60
0.079
258,000
47,100
9,760
5,610
0.197
(MD) SCR
75
0.049
951,000
14,100
28,700
16,200
0.197
(MD) LNB+FGR
55
0.089
253,000
50,000
10,100
5,710
0.098
(ND)
LNB+SNCR
80
0.020
213,000
58,400
12,000
6,840
0.197
MD)
LNB+SNCR
80
0.039
346,000
47,100
9,690
5,530
0.197
(MD) LNB+SCR
88
0.024
995,000
132,000
26,700
15,100
36
0.098
(ND) LNB
50
0.049
92,600
19,100
3,810
2,120
0.197
(MD) LNB
50
0.099
302,000
30,900
6,170
3,430
0.098
(ND) ULNB
75
0.025
96,900
13,300
2,660
1,480
0.197
(MD) ULNB
75
0.049
308,000
21,000
4,200
2,330
0.098
(ND) SNCR
60
0.039
243,000
42,100
8,850
5,150
0.197
(MD) SNCR
60
0.079
405,000
35,000
7,260
4,180
0.197
(MD) SCR
75
0.049
1,500,000
106,000
21,700
12,300
0.197
(MD) LNB+FGR
55
0.089
399,000
37,300
7,590
4,290
0.098
(ND)
LNB+SNCR
80
0.020
335,000
43,500
9,020
5,190
0.197
(MD)
LNB+SNCR
80
0.039
554,000
35,100
7,280
4,190
0.197
(MD) LNB+SCR
88
0.024
1,570,000
99,200
20,200
11,400
77
0.098
(ND) LNB
50
0.049
133,000
12,800
2,570
1,430
0.197
(MD) LNB
50
0.099
45,700
21,900
4,370
2,430
0.098
(ND) ULNB
75
0.025
138,000
8,830
1,770
981
0.197
(MD) ULNB
75
0.049
463,000
14,800
2,950
1,640
0.098
(ND) SNCR
60
0.039
383,000
31,200
6,670
3,940
0.197
(MD) SNCR
60
0.079
639,000
25,900
5,450
3,170
0.197
(MD) SCR
75
0.049
2,390,000
80,100
16,400
9,370
0.197
(MD) LNB+FGR
55
0.089
610,000
26,700
5,480
3,120
0.098
(ND)
LNB+SNCR
80
0.020
516,000
31,400
6,610
3,850
0.197
(MD)
LNB+SNCR
80
0.039
839,000
25,400
5,340
3,119
0.197
(MD) LNB+SCR
88
0.024
2,480,000
74,100
15,200
8,640
121
0.098
(ND) LNB
50
0.049
232,000
14,200
2,840
1,580
0.197
(MD) LNB
50
0.099
685,000
20,900
4,170
2,320
0.098
(ND) ULNB
75
0.025
237,000
9,660
1,930
1,070
0.197
(MD) ULNB
75
0.049
691,000
14,000
2,810
1,560
0.098
(ND) SNCR
60
0.039
502,000
26,100
5,660
3,380
Appendices - 6
Model
Heater
Capacity
mmBtu/hr
Uncontrolled
NOx
Emissions,
lb/mmBtu
NOx Control
Technique
NOx
Reduction
Controlled
NOx,
Lb/mmBtu
Capital Cost,
$
Cost Effectiveness, $/Ton NOx
Reduced @ Capacity Factor
0.10
0.50
0.90
0.197
(MD) SNCR
60
0.079
838,000
21,700
4,610
2,710
0.197
(MD) SCR
75
0.049
3,160,000
67,900
14,000
8,020
0.197
(MD) LNB+FGR
55
0.089
887,000
24,700
5,080
2,890
0.098
(ND)
LNB+SNCR
80
0.020
734,000
28,500
6,02d
3,520
0.197
(MD)
LNB+SNCR
80
0.039
1,190,000
22,900
4,840
2,830
0.197
(MD) LNB+SCR
88
0.024
3,370,000
6.4,300
13,200
7,550
186
0.098
(ND) LNB
50
0.049
346,000
13,800
2,760
1,530
0.197
(MD) LNB
50
0.099
955,000
18,900
3,780
2,100
0.098
(ND) ULNB
75
0.025
351,000
9,310
1,860
1,030
0.197
(MD) ULNB
75
0.049
961,000
12,700
2,540
1,410
0.098
(ND) SNCR
60
0.039
650,000
22,100
4,850
2,930
0.197
(MD) SNCR
60
0.079
1,090,000
18,300
3,930
2,330
0.197
(MD) SCR
75
0.049
4,130,000
58,200
12,100
6,940
0.197
(MD) LNB+FGR
55
0.089
1,220,000
22,100
4,550
2,600
0.098
(ND)
LNB
+SNCR
80
0.020
996,000
25,200
5,360
3,150
0.197
(MD)
LNB+SNCR
80
0.039
1,600,000
20,200
4,300
2,530
0.197
(MD) LNB+SCR
88
0.024
4,460,000
55,700
11,500
6,600
Reference: Alternative Control Techniques Document- NOx Emissions from Process
Heaters
(Revised), EPA-453/R-93-034, Table 2-4
Appendices -
7
Table B-2:
Model Heaters: NOx Control Effectiveness, Capital Costs, and Cost Effectiveness
for mechanical draft, Natural Gas-Fired Low and Medium Temperature Process Heaters (1991$)
Model Heater
Capacity
mmBtu/hr
Uncontrolled
NOx
Emissions,
lb/mmBtu
NOx Control
Technique
NOx
Reduction
Controlled
NOx
lb/mmBtu
Capital
Cost,
$
Reduced
Cost Effectiveness,
@ Capacity
0.50
Won NOx
Factor
0.10
0.90
40
0.197
(MD) LNB
50
0.099?
130,000
12,000
2,390
1,330
0.197
(MD) ULNB
75
0.049?
136,000
8,380
1,680
931
0.197
(MD) SNCR
60
0.079?
258,000
20,300
4,400
2,640
0.197
(MD) SCR
75
0.049?
1,270,000
91,500
1,870
10,600
0.197
(MD) LNB+FGR
55
0.089?
234,000
19,700
4,080
2,340
0.197
(MD) LNB+SNCR
80
0.039?
388,000
22,700
4,790
2,810
0.197
(MD) LNB+SCR
88
0.024?
1,400,000
85,200
17,400
9,880
77
0.197
(MD) LNB
50
0.099?
282,000
13,500
2,700
1,500
0.197
(MD) ULNB
75
0.049?
288,000
9,200
1,840
1,020
0.197
(MD) SNCR
60
0.079?
383,000
15,700
3,480
2,130
0.197
(MD) SCR
75
0.049?
1,900,000 71,900
14,800
8,460
0.197
(MD) LNB+FGR
55
0.089?
436,000
19,100
3,960
2,270
0.197
(MD) LNB+SNCR
80
0.039?
665,000
20,200
4,300
2,530
0.197
(MD) LNB+SCR
88
0.024?
2,180,000
69,300
14,200
8,110
114
0.197
(MD) LNB
50
0.099
?
507,000
16,400
3,280
1,820
0.197
(MD) ULNB
75
0.049?
514,000
11,100
2,210
1,230
0.197
(MD) SNCR
60
0.079?
484,000
13,500
3,040
1,880
0.197
(MD) SCR
75
0.049?
2,420,000
62,800
12,900
7,410
0.197
(MD) LNB+FGR
55
0.089?
702,000
20,800
4,290
2,460
0.197
(MD) LNB+SNCR
80
0.039?
902,000
20,400
4,330
2,550
0.197
(MD) LNB+SCR
88
0.024?
2,930,000
62,800
12,900
7,390
174
0.197
(MD) LNB
50
0.099?
541,000
11,500
2,290
1,270
0.197
(MD) ULNB
75
0.049?
548,000
7,730
1,550
859
0.197
(MD) SNCR
60
0.079?
624,000
11,400
2,630
1,660
0.197
(MD) SCR
75
0.049?
3,150,000
53,700
11,200
6,440
0.197
(MD) LNB+FGR
55
0.089?
792,000
15,400
3,220
1,860
0.197
(MD) LNB+SNCR
80
0.039?
1,170,000
15,700
3,410
2,040
0.197
(MD) LNB+SCR
88
0.024?
3,700,000 52,600
10,900
6,250
263
0.197
(MD) LNB
50
0.099?
777,000
10,900
2,180
1,210
0.197
(MD) ULNB
75
0.049?
783,000
7,310
1,460
813
0.197
(MD) SNCR
60
0.079?
800,000
9,770
2,300
1,470
0.197
(MD) SCR
75
0.049?
4,090,000
46,500
9,730
5,640
0.197
(MD) LNB+FGR
55
0.089?
1,100,000
14,200
2,960
1,720
0.197
(MD) LNB+SNCR
80
0.039?
1,580,000
14,100
3,080
1,860
0.197
(MD) LNB+SCR
88
0.024?
4,860,000 46,100
9,580
5,530
Reference: Alternative Control Techniques Document- NOx Emissions from Process Heaters
(Revised), EPA-453/R-93-034, Table 2-5
Appendices -
8
Table B-3:
Model Heaters: Cost Effectiveness for Oil-Fired natural draft Heaters (1991$)
Model
Heater
Capacity
mmBtu/hr
Uncontrolled
NOx
Emissions,
lb/mmBtu
NOx Control
Technique
NOx
Reduction
,
%
Controlledtro
lled
NOx
lb/mmBtu
Cost Effectiveness, $/Ton NOx
Reduced @ Capacity Factor
0.10
0.50
0.90
69
Distillate Oil-
Fired
0.20
(ND) LNB
40
0.120
15,100
3,030
1,680
0.32
(MD) LNB
45
0.176
21,100
4,220
2,340
0.20
(ND) ULNB
76
0.048
8,030
1,610
892
0.32
(MD) ULNB
74
0.083
13,000
2,600
1,440
0.20
(ND) SNCR
60
0.080
16,300
3,750
2,350
0.32
(MD) SNCR
60
0.128
16,900
3,780
2,330
0.32
(MD) SCR
75
0.080
51,800
11,000
6,490
0.32
(MD) LNB+FGR
48
0.166
25,200
5,140
2,910
0.20
(ND) LNB+SNCR
76
0.048
20,800
4,540
2,740
0.32
(MD) LNB+SNCR
78
0.070
20,200
4,340
2,580
0.32
(MD) LNB+SCR
86
0.045
51,500
10,900
6,360
69
Residual Oil-
Fired
0.42
(ND) LNB
27
0.307
10,700
2,140
1,190
0.54
(MD) LNB
37
0.340
15,300
3,060
1,700
0.42
(ND) ULNB
77
0.097
3,770
753
419
0.54
(MD) ULNB
73
0.146
7,790
1,560
866
0.42
(ND) SNCR
60
0.168
7,880
1,900
1,230
0.54
(MD) SNCR
60
0.216
10,100
2,280
1,420
0.54
(MD) SCR
75
0.135
30,600
6,400
3,710
0.54
(MD) LNB+FGR
34
0.356
20,700
4,220
2,390
0.42
(ND) LNB+SNCR
71
0.122
10,700
2,420
1,490
0.54
(MD) LNB+SNCR
75
0.135
12,500
2,740
1,650
0.54
(MD) LNB+SCR
84
0.086
31,200
6,480
3,740
Reference: Alternative Control Techniques Document- NOx Emissions from Process Heaters
(Revised), EPA-453/R-93-034, Table 6-10.
Appendices -
9
1991
Model
Heater
Capacity
mmBtu/hr
Uncontrolled
NOx
Emissions,
lb/mmBtu
NOx Control
Technique
NOx
Reduction,
%
Controlled
NOx
lb/mmBtu
.
Cost Effectiveness, $/Ton NOx
Reduced @ Capacity Factor
0.10
0.50
0.90
0.32
(MD) LNB
45
0.176
5,920
1,180
658
0.32
(MD) ULNB
74
0.083
3,680
735
408
135
0.32
(MD) SNCR
60
0.128
8,010
2,000
1,340
Distillate Oil-
0.32
(MD) SCR
75
0.080
35,300
7,280
4,160
Fired
0.32
(MD) LNB+FGR
48
0.166
9,570
2,010
1,170
0.32
(MD) LNB+SNCR
78
0.070
9,580
2,230
1,410
0.32
(MD) LNB+SCR
86
0.045
30,800
6,340
3,620
0.54
(MD) LNB
37
0.340
4,290
858
477
135
0.54
(MD) ULNB
Table B-4:
Model Heaters: Cost Effectiveness for Oil-Fired mechanical draft
Heaters
Factor
73
0.146
2,210
442
245
0.54
(MD) SNCR
60
0.216
4,830
1,280
880
Residual Oil-
0.54
(MD) SCR
75
0.135
20,900
43,301,650
2,480
Fired
0.54
(MD) LNB+FGR
34
0.356
7,870
1,450
961
0.54
(MD) LNB+SNCR
75
0.135
6,000
3,820
942
0.54
(MD) LNB+SCR
84
0.086
18,500
6,480
2,190
Reference: ternative Control Techniques Document- NOx Emissions from Process Heaters (Revised),
EPA-453/R-93-034, Table 6-11.
Table B-5:
Model Heaters: Cost Effectiveness for ND Pyrolysis Heaters (1991$)
Model
Heater
Capacity
mmBtu/hr
NOx
Emissions,
lb/mmBtu
NOx Control
Technique
NOx
Reduction,
%
Controlled
NOx
lb/mmBtu
Reduced
Cost Effectiveness,
@Capacity
0.50
Won NOx
0.10
0.90
84
Natural Gas
0.135
(ND) LNB
25
0.101
31,700
6,350
3,530
0.135
(MD) LNB
25
0.101
82,200
16,400
9,130
0.135
(ND) ULNB
50
0.068
16,100
3,230
1,790
0.135
(MD) ULNB
50
0.068
41,500
8,300
4,610
0.135
(ND) SNCR
60
0.054
22,000
4,780
2,870
0.135
(MD) SNCR
60
0.054
36,400
7,660
4,470
0.135
(MD) SCR
75
0.034
113,000
23,400
13,500
0.135
(MD) LNB+FGR
55
0.061
47,000
9,600
5,440
0.135
(ND) LNB+SNCR
70
0.041
30,200
6,360
3,720
0.135
(MD) LNB+SNCR
70
0.041
48,200
9,970
5,720
EPA-453/R
Uncontrolled
-93-034, Table 6-12.
0.135
(MD) LNB+SCR
81
0.026
119,000
24,600
14,100
84
High
Hydrogen
Fuel Gas
0.162
(ND) LNB
25
0.121
26,400
5,250
2,940
0.162
(MD) LNB
25
0.121
68,500
13,700
7,610
0.162
(ND) ULNB
50
0.081
13,400
2,690
1,490
0.162
(MD) ULNB
50
0.081
34,600
6,920
3,840
0.162
(ND) SNCR
60
0.065
18,400
4,040
2,450
0.162
(MD) SNCR
60
0.065
30,400
6,440
3,780
0.162
(MD) SCR
75
0.040
94,300
19,600
11,300
0.162
(MD) LNB+FGR
55
0.073
39,200
8,000
4,530
0.162
(ND) LNB+SNCR
70
0.049
25,200
5,350
3,140
0.162
(MD) LNB+SNCR
70
0.049
40,200
8,350
4,810
0.162
(MD) LNB+SCR
81
0.031
99,500
20,600
11,800
Reference: A ternative Control Techniques Document- NOx Emissions from Process Heaters (Revised),
Appendices - 10
Table B-6:
NOx Control Cost Data for Process Heaters from AirControlNet (1990$)
Fuel
Source Size
NOx Control
Control
Efficiency, %
Annual Cost Effectiveness,
$fTon NOx Controlled
Low
Typical
High
N. gas
Small Source
LNB
50
2200
N. gas
Small Source
SCR
75
12,400
N. gas
Small Source
ULNB
75
1500
N. gas
Small Source
SNCR
60
2850
N. gas
Small Source
LNB+FGR
55
3190
3190
15580
N. gas
Small Source
LNB+ SNCR
80
3520
3520
3520
Distillate oil
Small Source
ULNB
74
2140
Distillate oil
Small Source
SNCR
60
3180
Residual oil
Small Source
LNB+SCR
75
2230
2230
2860
Residual oil
Small Source
SNCR
60
1930
Other Fuel
Small Source
SNCR
60
1930
Other Fuel
Small Source
ULNB
73
1290
Other Fuel
Small Source
LNB+SNCR
75
2230
2300
2860
Reference: AirControlNet Version 4.1, Documentation Report, September 2005. Appendix A
Appendices - 11
Table B-7:
Control Cost Effectiveness Data for ProcessHeaters @.90%.Capacity Factor•from • •
STAPPA/ ALAPCO Report (Cost basis: 1993$)
Fuel
Control
Technology
Unit Size
mmBtu/hour
Control
Efficiency,
ND Heater
MD Heater
N. gas
LNB
25
50-60
2,050-2,560
1,650-2,070
LNB
75
50-60
1,720-2,160
1,390-1,740
LNB
200
50-60
1,100-1,370
890-1110
Radiant Burner
25
90+
Requires Conversion to MD
2,340-2,610
Radiant Burner
75
90+
Requires Conversion to MD
2,210-2,470
Radiant Burner
200
90+
Requires Conversion to MD
2,170-2,420
FGR
25
50-60
Requires Conversion to MD
1,300-1,500
FGR
75
50-60
Requires Conversion to MD
8,70-1,050
FGR
200
50-60
Requires Conversion to MD
630-750
SNCR
25
20-50
8,190-10,920
4,620-6,170
SNCR
75
20-50
5,870-7,820
3,370-4,500
SNCR
200
20-50
4,500-6,000
2,640-3,510
SCR
25
80-90
Requires Conversion to MD
3,300-3,800
SCR
75
80-90
Requires Conversion to MD
2,600-3,500
SCR
200
80-90
Requires Conversion to MD
2,000-2,700
Distillate Oil
LNB
25
30-60
1,430-1,790
1,340-1,680
LNB
75
30-60
1,200-1,510
1,130-1,410
LNB
200
30-60
770-960
720-900
FGR
25
30-50
Requires Conversion to MD
1,580-2,100
FGR
75
30-50
Requires Conversion to MD
1,070-1,420
FGR
200
30-50
Requires Conversion to MD
770-1020
SNCR
25
30-60
4,880-6,100
3,190-3,980
SNCR
75
30-60
3,580-4,470
2,370-2,970
SNCR
200
30-60
2,810-3,510
1,900-2,370
SCR
25
80-90
Requires Conversion to MD
2,920-3,280
SCR
75
80-90
Requires Conversion to MD
2,160-2,430
SCR
200
80-90
Requires Conversion to MD
1,710-1,930
Residual Oil
LNB
25
30-60
680-850
800-1000
LNB
75
30-60
580-720
670-840
LNB
200
30-60
370-460
290-360
FGR
25
30-50
Requires Conversion to MD
930-1250
FGR
75
30-50
Requires Conversion to MD
630-840
FGR
200
30-50
Requires Conversion to MD
450-600
SNCR
25
30-60
2,410-3,010
1,950-2,440
SNCR
75
30-60
1,790-2,230
1,470-1,840
SNCR
200
30-60
1,420-1,780
1,190-1,490
SCR
25
75-90
Requires Conversion to MD
1,630-1,830
SCR
75
75-90
Requires Conversion to MD
1,180-1,330
SCR
200
75-90
Requires Conversion to MD
910-1030
Data Source: Tables 4, 5 and 6 (Pages 49-50) of STAPPA! ALAPCO Report: Controlling
Nitrogen Oxides Under The Clean Air Act: A Menu of Options, July 1993.
Appendices - 12
Table B-s:
Surnmary Table for Evaluation of Economic Reasonableness .of_1\10x_ Control-
Limits fear Various Process Heaters
Fuel
Furnace
ce Type
Heater
Size
Draft
Type
Control
Technology
Controlled
NOx
Cost
Effectiveness
TSD
Reference
Original
Reference
Natural
Low &Nte+:1_.
121-186
ND
LNB
0.049
1530-1580
Table 5
ACT
Gas
'Temperature
121-186
ND/MD
LNB
0.099
2100-2320
Table 5
ACT
121-186
ND
ULNB
0.025
1030-1070
Table 5
ACT
121-186
ND/MD
ULNB
0.049
1410-1560
Table 5
ACT
121-186
ND/MD
LNB+SNCR
0.039
2530-2830
Table 5
ACT
Small
N/A
ULNB
0.025-0.049
1500
Table 10
AirControlNet
200
ND
LNB
0.049
1100-1370
Table 11
STAPPA
200
ND/MD
SCR
0.02-0.04
2000-2700
Table 11
STAPPA
200
ND/MD
RB
0.02
2170-2420
Table 11
STAPPA
Natural
Low
s Med.
114-263
MD
LNB
0.099
1210-1820
Table 6
ACT
Gas
Temperature
114-263
MD
ULNB
0.049
813-1230
Table 6
ACT
114-263
MD
LNB+SNCR
0.04
1860-2550
Table 6
ACT
114-263
MD
LNB+FGR
0.09
1720-2270
Table 6
ACT
200
MD
LNB
0.08-0.099
890-1110
Table 11
STAPPA
Distillate
Low & Med.
69
ND
LNB
0.12
1680
Table 7
ACT
Oil
Temperature
69
ND/MD
LNB
0.176
2340
Table 7
ACT
69
ND
ULNB
0.048
892
Table 7
ACT
69
ND/MD
ULNB
0.083
1440
Table 7
ACT
69
ND
SNCR
0.08
2350
Table 7
ACT
69
ND/MD
SNCR
0.128
2330
Table 7
ACT
Small
N/A
ULNB
0.08
2140
Table 10
AirControlNet
200
ND/MD
SCR
0.032-0.064
1710-1930
Table 11
STAPPA
Distillate
Low & Med.
135
MD
LNB
0.176
658
Table8
ACT
Oil
Temperature
135
MD
ULNB
0.083
408
Table 8
ACT
135
MD
LNB+SNCR
0.07
1410
Table 8
ACT
135
MD
SNCR
0.128
1340
Table 8
ACT
135
MD
LNB+SCR
0.045
3620
Table 8
ACT
200
MD
SCR
0.032-0.064
1710-1930
Table 11
STAPPA
Residual
Low & Med.
69
ND
LNB
0.307
1190
Table 7
ACT
Oil
Temperature
69
ND/MD
LNB
0.340
1700
Table 7
ACT
69
ND
ULNB
0.097
419
Table 7
ACT
69
ND/MD
ULNB
0.146
866
Table 7
ACT
69
ND
SNCR
0.168
1230
Table 7
ACT
69
ND/MD
SNCR
0.216
1420
Table 7
ACT
Small
ND/MD
LNB+SCR
0.135
2230-2860
Table 10
AirControlNet
200
ND/MD
SCR
0.05-0.135
910-1030
Table 11
STAPPA
Residual
Low & Med.
135
MD
LNB
0.340
477
Table8
ACT
Oil
Temperature
135
MD
ULNB
0.146
245
Table 8
ACT
135
MD
LNB-I-SNCR
0.135
942
Table 8
ACT
135
MD
SNCR
0.216
880
Table 8
ACT
135
MD
LNB+SCR
0.086
2190
Table 8
ACT
135
MD
SCR
0.135
2480
Table 8
ACT
200
MD
SCR
0.05-0.135
910-1030
Table 11
STAPPA
Natural
Pyrolysis
84
ND
ULNB
0.068
1790
Table 9
ACT
Gas
Heater
84
MD
ULNB
0.068
4610
Table 9
ACT
84
ND
SNCR
0.054
2870
Table 9
ACT
84
MD
SNCR
0.054
4470
Table 9
ACT
84
MD
SCR
0.034
13500
Table 9
ACT
High
Pyrolysis
84
ND
ULNB
0.081
1490
Table 9
ACT
Hydrogen
Heater
84
MD
ULNB
0.081
3840
Table 9
ACT
Fuel Gas
84
ND
SNCR
0.054
2450
Table 9
ACT
84
MD
SNCR
0.054
3780
Table 9
ACT
84
MD
SCR
0.040
11300
Table 9
ACT
* ACT cost year is 1991, STAPPA cost year is 2003 and AirControlNet cost year is 1990.
Appendices - 13
Table C-1:
Fuel Tech SNCR Installation list (excluding EGU boilers and Waste to Energy)
INDUSTRY
PRODUCT
TYPE
COUNTRY
COMPANY
/
LOCATION
#
of
units
UNIT TYPE
SIZE
(MMBtu/hr)
FUE
NOx BASELINE
(ppm,
*
lb/MMBtu)
RED'N
-1
I
%?
i
Biomass
NOxOUT®
Italy
HRCI
1
Grate-Fired
1 x 10500
Wood Waste
370 mg/Nm3
46
Rende, Italy
Nm3/h
Biomass
SNCR
Italy
C.C.T.
Faenza, Italy
1
Confidential
Confidential
Confidential
Confidential
Confide
ntial
Cement Kiln
NOxOUT®
Switzerland
Winterthur (1)
1
Sludge Incinerator
8.34
Sludge
200-300 mg/ N 3
60 - 73
Cement Kiln
NOxOUT
®
Italy
Italcementi
1
Cement Kiln
270 t/h
Pet Coke
1500 mg/Nm
3
45
Calusco, Italy
r---
Cement Kiln
NOxOUT®
Italy
Italcementi
1
Cement Kiln
60 000
Pet Coke
1000 mg/ Nm3
35
Scala, Italy
Nm3/h
L
Cement Kiln
NOxOUT
®
France
Ciments Calcia
1
Cement Kiln
323 495
Coke
&
767 mg/Nm3
65
Couvrot, France
Nm3/h
Alternative
Fuels
r
Cement Kiln
SNCR
France
Maguin
1
Rotary Kiln
8200 Nm3/h
Animal Waste
300 mg/Nm3
33
La Reunion, France
Products
Cement Kiln
NOxOUT
®
[D]
USA
Ash Grove Cement
Seattle, WA
1
Cement Kiln/
Pre-Calciner
160 tons
solids/hr
Coal, Gas
350 - 600#/hr
.>80
Cement Kiln
NOxOUT
®
USA
Lehigh Portland Cement
1
Cement Kiln/
368
Coal, Gas
0.95-1.35 lb/ MMBtu
25 - 35
[D]
Mason City, IA
Pre-Calciner
Cement Kiln
NOxOUT®
USA
Cemex, Inc.
1
Pre-Calcining Kiln
317
Coal
&
570 ppmd
40
Knoxville, TN
MMBtu/hr
Pet Coke
Cement Kiln
NOxOUT®
Taiwan
Taiwan Cement
3
Cement Kiln/
260
Coal
1.29
50
Units #3, #5,
&
#6
Pre-Calciner
697
Coal
1.58
45
658
Coal
0.92
25
Cement Kiln
NOxOUT
®
Korea
Korean Cement
I
New Suspension
Coal
1.27 lb/MMBtu
45
.
[D]
Dong Yang Cement,
Korea
Calciner
Appendices - 14
INDUSTRY
Cement Kiln
PRODUCT
COUNTRY
TYPE
NOxOUT
®
Germany
[D]
COMPANY
/
LOCATION
WuMuth Cement
-
-- - -
Germany
#
of
units
1- ---
UNIT TYPE
SIZE
(MMBtu./hr)
.
...
.
-
Gern-i-ent Kiln
—
140
FUEL
NOx BASELINE
(ppm,
*
lb/MMBtu)
1000 mg/Nm
3
500
RED'N ]
%?
'
._
.
_
Lignite
90
Chemical
NOxOUTs'
USA
BP Chemicals
AOG Incui.
34
Waste Gas
80 -I-
[D]
Green Lake, TX
HRSG
Chemical
NOxOUT®
USA
BP Chemicals
3
AOG Incin.
398,757 lb/hr
Absorber
238
50
Green Lake, TX
HRSG
Flue Gas
OFF
238
50
398,7571b/hr
Gas
150
50
Flue Gas
238,361 lb/hr
Flue Gas
1
Chemical
NOxOUT®
USA
Miles, Inc.
Carbon Furnace
16
Chemical
150
35
Kansas City, MO
Afterburner
Waste
Chemical
NOxOUT®
USA
N American Chem. Corp.
Trona, CA
1
T-Fired
(2) 75 MWe
Coal
200
40
,
Chemical
'-,
NOxOUT®
Taiwan
Far East Textile
1
—I--
Front-Fired
Coal
50
Chemical
NOxOUT®
Taiwan
Formosa Plastics
Front-Fired
331
Coal
500
60
Kaohsiung
Chemical
NOxOUT®
Taiwan
Formosa Plastics
Front-Fired
331
..,-,
Coal
500 mg/Nm
3
60
Kaohsiung
@
11%
02
Industrial
NOxOUT®
Germany
Hornitex
Incinerator
125
Wood
750 mg/Nm
3
370
43
,
Industrial
NOxOUT®
France
Ciments Calcia
Bussac, France
Cement Kiln
208 060
Nm3/h
Coke
&
Alternative
943 mg/Nm
3
69
,
Fuels
Ind
-
u
-
strial
Noxbut®
-Belgium
ccs
Cement Kiln
137 895
Coke
&
1503 mg/Nin
3
50
Gaurain four 3, Belgium
Nin3/h
Alternative
Fuels
Industrial
NOxOUT®
Belgium
CCB
Gaurain four 4, Belgium
Cement Kiln
394 223
Nm3/h
Coke
&
Alternative
1170 mg/Nm
3
60
,
Fuels
IPP/Co-Gen
N0x0U1'
•
USA
U.S. Sugar Corp.
Gra-te-Ffr-e-d-------
—
8
g
6 - -
—
Bag
-Ws-se -
0.28 lb/MMBtu
50
Clewiston, FL
Appendices - 15
INDUSTRY
PRODUCT
TYPE
COUNTRY
COMPANY
/
LOCATION
#
of
units
UNIT TYPE
1
1
SIZE
(MMBtu/hr)
FUEL
NOx BASELINE
(ppm,
*
lb/MMBtu)
RED'N
IPP/Co-Gen
NOxOUT®
USA
General Electric
...
1
.
__
B&W "D" Type
236
#6 Oil, Gas
0.28-0.31
lb/M Ni3tu
40
-
60
[D]
Lynn, MA
Pkg. Boiler
IPP/Co-Gen
NOxOUT®
USA
Honey Lake Power
Stoker-Fired
480
Wood
0.21 lb/ MMBtu
52
[D]
Susanville, CA
IPP/Co-Gen
NOxOUT®
USA
Oxford Energy
Moving Grate
90
Tires
0.13 lb/MMBtu
40
,_
[D]
Modesto #2,
Wesley, CA
Incinerator
IPP/Co-Gen
NOxOUT
®
USA
Ultrasystems
CFB
280
Wood
150
70
[D]
Fresno, CA
IPP/Co-Gen
NOxOUT®
USA
Yankee Energy
CFB
190
Wood Waste
0.10-0.18 lb/MMBtu
40 - 75
[D]
Dinuba, CA
IPP/Co-Gen
NOxOUT®
USA
ABB Okeelanta
Okeelanta, FL
Grate-Fired Stoker
660
Bagasse Wood,
Coal
0.40-0.20 lb/MMBtu
40 - 60—
IPP/Co-Gen
NOxOUT®
USA
ABB Osceola
Osceola, FL
Grate-Fired Stoker
660
Bagasse Wood,
Coal
0.40-0.20 lb/MMBtu
40 - 60
-
IPP/Co-Gen
NOxOUT®
USA
Alternative Energy, Inc.
Zurn Stoker
500
Wood
0.30 lb/MMBtu
50
Ashland, ME
IPP/Co-Gen
NOxOUT®
USA
Alternative Energy, Inc.
Zurn Stoker
500
Wood
0.30 lb/MMBtu
50
Cadillac, MI
IPP/Co-Gen
NOxOUT®
USA
Alternative Energy, Inc.
Zurn Stoker
500
Wood
0.30 lb/MMBtu
50
Northeast Empire
Livermore
Falls,
ME
IPP/Co-Gen
NOxOUT®
USA
Black
&
Veatch
ABB CE Stoker
473
Wood
0.47 lb/MMBtu
60
Genessee, MI
IPP/Co-Gen
NOxOUT®
USA
Black
&
Veatch
1
Zurn Stoker
440
Biomass
0.26 lb/MMBtu
60
Grayling, MI
IPP/Co-Gen
NOxOUT®
USA
Celanese
1
Front Wall-Fired
315
Coal
.360 lb/MMBtu
35 - 40
Narrows, VA
Appendices - 16
INDUSTRY
PRODUCT
I
COUNTRY
TYPE
COMPANY
/
LOCATION
#
of
units
UNIT TYPE
SIZE
(MMBtu/hr)
FUEL
NOx BASELINE
(ppm,
*
lb/MMBtu)
RED'N
%
IPP/CO-Gen
NOxOUT
®
USA
Chewton Glen Energy
1
Grate-Fired
240
Shredded Tires
0.195 lb/ MMBtu
60
Ford Heights, IL
IPP/Co-Gen
NOxOUT
®
1
USA
Cogentrix
8
CE Stoker
(8) 28 MWe
Coal
350
--1
40
Richmond, VA
IPP/Co-Gen
NOxOUT®
USA
Fibrominn, LLC
1
Grate-Fired
802
Poultry
&
0.32 lb/MMBtu
50
Benson, MN
MMBtu/hr
Natural Gas
r
IPP/Co-Gen
NOxOUT
®
USA
Georgia Pacific
1
Wellons 4-Cell
236
Mixed Wood
0.33 lb/
—
MMBtu
38
Brookneal, VA
IPP/Co-Gen
NOxOUT
®
USA
Georgia Pacific
1
Cell-fired
240
Bark/Dust
0.25 lb/ MMBtu
20
—I
Mt. Hope, WV
IPP/Co-Gen
NOxOUT
®
USA
I.P. Masonite
1
B &W
250
Sludge/Wood
0.4 lb/ MMBtu
50
--I
Towanda, PA
Waste, Coal
IPP/Co-Gen
NOxOUT®
USA
Kenetech Energy
1
Riley Stoker
225
Wood
0.26 lb/MMBtu
47
Fitchburg, MA
IPP/Co-Gen
NOxOUT®?
USA
LFC
I
Grate-Fired
190
Wood
0.22 lb/MMBtu
30
Hillman, MI
IPP/Co-Gen
NOxOUT®
II—?
USA
McMillan Bloedel
1
EPI Fluid Bed
500
Wood Waste/
100
42
Clarion, PA
Combustor
Hog Fuel
IPP/Co-Gen
NOxOUT
®
USA
Michigan State Univ.,
Unit #4
1
CFB
460
Coal
247
57
East Lansing, MI
I-
IPP/Co-Gen
NOxOUT®
USA
Michigan State Univ.,
Units #1-3
3
Wall Fired Boiler
320
320
Coal
0.38-0.40 lb/ MMBtu
34-38
L...
East Lansing, MI
420
[PP/Co
-
Gen
NOxOUT®
USA
Oxford Energy
1
Grate-Fired
(2) 170
Tires
0.15 lb/MMBtu
50
I
Sterling, CT
I
;
IPP/Co-Gen
NOxOUT®
USA
Ridge Generating
1
Zuni Stoker
550
Wood
0.35 lb/MMBtu
57
1
Polk County, FL
Appendices - 17
INDUSTRY
PRODUCT
COUNTRY
TYPE
i
COMPANY
/
LOCATION
#
of
units
UNIT TYPE
SIZE
(MMBtu/hr)
FUEL
NOx BASELINE
(ppm,
*
lbf MMStu)
KED'N
%
IPP/Co-Gen
NOxOUT®
USA
Riley Ultrasystems II
1
Riley
---RiC."".....
Pulv. Coal
0,33 lb/MMBtu
50
Weldon, NC
Front-Fired Boiler
—4
IPP/Co-Gen
NOxOUT®1
USA
Ryegate Power Station
Ryegate, VT
1
Riley Stoker
300
Wood
0.20 lb/MMIitu
30
i,
IPP/Co-Gen
NOxOUT®
USA
Sierra Pacific
1
Cell-Fired
(2) 130
Biomass
0.42 lb/A.1141-n
50
Bohemia Plant
I
1-
Lincoln, CA
IPP/Co-Gen
NOxOUT®
USA
Solvay Chemicals
2
Stoker
155
Coal
0.45 lb/MMI3tii.
35
-1
Units 1
&
2
MMBtu/hr
Green River, WY
IPP/Co-Gen
NOxOUT®
USA
Sonoco
1
FW/
145
Coal
195
67
Huntsville, SC
Pyropower CFB
IPP/Co-Gen
NOxOUT
® USA
Trigen Cinergy
1
Front Wall
555
Wood Waste
0.34 lb/MMBtu
56
St. Paul, MN
Grate-Fired
IPP/Co-Gen
NOxOUT®
USA
Zachry Energy
1
Riley Stoker
(3) 390
Wood
0.20 lb/MMBtu
46
Hurt, VA
IPP/Co-Gen
NOxOUT® E
Taiwan
Far East Textiles
1
Stoker Boiler
190
Coal
550
@
6% 02
50
Hsihpu
1
IPP/Co-Gen
NOxOUT
®
Sweden
Tekniskaverken
1
Stoker
Wood
800mg/Nm3
50
[D]
Linkoping P3
@
11% 02
Sweden
IPP/Co-Gen
NOxOUT®
Sweden
Nykoping, Units 1-3
3
CFB
135
Coal
120-130mg/Nm3
70
Gotaverken Energy
(4) 1% 02
IPP/Co-Gen
NOxOUT®
Sweden
Tekniskaverken
3
Grate-Fired
3 x 12
Coal
400 ing7N
-m
3
-
50
Linkoping P1
@
4% 02
Sweden
IPP/Co-Gen
NOxOUT
®
i?
Puerto Rico
AES
2
CI-, t5
250 MWe
Coal
0.13 lb/MMBtu
23
Guyama, Puerto Rico
IPP/Co-Gen
NOxOUT®
Korea
Hyundai
1
CFB
926
Pulv. Coal
275
56
Korea Kumho
Petrochemical
Appendices - 18
INDUSTRY
PRODUCT
COUNTRY
TYPE
COMPANY
/?
C
LOCATION
#
of
r'
units
UNIT TYPE
' SIZE
(MMBtu/hr)
FUEL
NOx BASELINE
(ppm, " lb/MMBtu)
RED'N
%?
.
IPP/Co-Gen
.
NOxOUT
®
Korea
Korea ICC Units 1 - 3
3
Front Wall-Fired
530
Pub,, Coal
710
53
Kunni. Heat
&
Power
530
Pulv. Coal
700
53
Station
530
Pulv. Coal
710
40
Korea
HIPP/Co-Gen
NOxOUT® Germany
FT GmbH
5
Fire Tube
10 - 20 MWe
Heavy Oil
700-800mg/ Nm
3
40 - 50
Germany
Pkg. Boilers
IPP/Co-Gen
NOxOUT
® Germany
Standardkessel
31
Fire Tube
10 - 20 MWe
Heavy Oil
700-800
mg/Nin.
3
40 - 50
Germany
Pkg. Boilers
IPP/Co-Gen
NOxOUT®
Czech
Strakonice
2
High Front Wall-
36-40
Lignite Brown
600 mg/Nm3
50
Republic
Fired
&
Low Grate
Coal
Fired
IPP/Co-Gen
NOxOUT
®—T— Czech
Deza Vitkovice
1
Wall Fired Boiler
362
Oil/Mazut
700 mg/Nm3
36
Republic
@
11% 02
MP/Co-Gen
NOxOUT®
Czech
Trmice
2
Wall-Fired
490
Lignite
341 ppvd
57
Republic
IPP/ Co-Gen
NOxOUT®
1
Czech
Vitkovice
1
ront Wall-Fired
250
Hard Coal
600 mg/Nm3
50
Republic
@
11% 02
Process Unit
NOxOUT®
USA
Rollins Environmental
1
Haz Waste
185
Chlorinated
60 - 250
35 - 50
[D]
Deer Park, TX
Incinerator
Chemical
Waste, Soil
Process Unit
NOxOUT®
USA
Alcan
Berea, KY
2
Decoater/
Afterburner
30,000 lbs of
aluminum
cans/hr
Gas
90 - 130
50 - 80
+
Process Unit
NOxOUT
®
USA
Allis Minerals
1
Rotary Kiln
60
Paper Sludge
0.48 lb/MMBtu
_
57
Oak Creek, WI
Incinerator
Process Unit
NOxOUT
®
USA
Chambers Medical Waste
2
Simonds Incinerator
21
Medical and
0.48 lb/MMBtu
67.8
Incinerator
Municipal
Chambers County, TX
Process Unit
NOxOUT®
USA
Dow Chemical
Midland, MI
1
Rotary Kiln
w/ Afterburner
145
Haz Waste
720 : 740
40-55
Process Unit
NOxOUT® ;
1--
USA
II
Eli Lilly
Lafayette, IN
I
Haz Waste
E59
Incinerator
Haz Waste
290
70
L
Appendices - 19
INDUSTRY
PRODUCT
li
COUNTRY
TYPE
COMPANY
/
LOCATION
#
of
units
UNIT TYPE
1
SIZE
(MMBtu/hr)
FUEL
NOx BASELINE
(ppm,
*
lb/MMBtu)
RED'N
%
Pulp
&
Paper
NOxOUT® I
USA
Boise Cascade
1
Hydrograte Stoker
395
Bark, Gas
0.14-0.19 lb/MMBtu
25 - 35
[D]
Intl. Falls, MN
1
,
Pulp
&
Paper
NOxOUT® USA
Babcock and Wilcox
1
BFB
1
821
Wood/Sludge
0.35 lb/MMBtu
62
Bowater, Calhoun, TN
Pulp
&
Paper NOxOUT
®
USA
Garden State Paper, Unit
1
Front-Fired
1
110
Fiber Waste
0.30 lb/MMBtu
50
#3
Ind. Boiler
Garfield, NJ
Pulp
&
Paper
NOxOUT® USA
Garden State Paper, Unit
1
Front-Fired
I
172
Fiber Waste
0.20 lb/MMBtu
30–
#4
Ind. Boiler
Garfield, NJ
Pulp
&
Paper
NOxOUT® USA
Jefferson Smurfit
1
CE Grate-Fired
540
Coal, Bark, Oil
0.55-0.70 lb/MMBtu
20 - 35
Jacksonville, FL
r- Pulp
&
Paper
NOxOUT®
USA
McBurney Corp.
1
Biomass Cogen-1—
23 MW
Biomass
0.45 lb/MMBtu
55
Koda Energy, LLC
0.55 lb/MMBtu
64
L_
L
Shakopee, MN
Pulp
&
Paper
NOxOUT®
j
USA
Minergy Fox Valley
1
B
&
W Cyclone
1
350
Paper Sludge/
0.80 lb/MMBtu
62
Aggregate Plant
Natural Gas
Neenah, WI
Pulp
&
Paper NOxOUT
®
i?
USA
P. H. Glatfelter
.
Sludge Combustor
60
Paper Sludge
570
50
Neenah, WI
'--Pulp
&
Paper
NOxOUT®
USA
Potlatch
1
Wellons
j
232
Wood Waste
030 lb/MMBtu
50
—I
Bemidji, MN
4-Cell Burner
Pulp
&
Paper
NOxOUT
®
USA
S. D. Warren
Skowhegan, ME
1
CE Grate-Fired
f
900
Oil, Bark,
Biomass
0.30 lb/MMBtu
46
Pulp
&
Paper
NOxOUT®
USA
Schenecady International
1
Schenecady, NY
L
Pulp
&
Paper
NOxOUT®
USA
Temple-Inland
1
B&W Grate-Fired
548
Bark
0.25 lb/MMBtu
40
Orange, TX
Boiler
Natural Gas
Pulp
&
Paper
NOxOUT®
USA
Westvaco Phase I
B
&
W Cydone
550
Coal
1.15 lb/MMBtu
50
(Lukemill) #24
Luke, MD
Appendices - 20
INDUSTRY
PRODUCT
I
COUNTRY
TYPE
COMPANY
/
LOCATION
#
of
units
UNIT TYPE
SIZE
(MMBtu/hr)
FUEL
NOx BASELINE
(ppm,
*
lb/MMBtit)
RED'N -
%
Pulp
&
Paper
NOxOUT®
Sweden
Sodra Skogsagama
1
Recovery Boiler
900
Black Liquor
60 ing/Nin
3
60
[D]
Sweden
®
3% 02
Pulp
&
Paper
NOxOUT
® Italy
Energy Products of Idaho
1
BFB
70.2
Paper/Landfill
0.587113/14MBtu
60,5
Italy
Sludge
Pulp
&
Paper
Ammonia
Italy
C.C.T.
1
Fluidized Bed
28.8 t/h
Paper Sludge
SNCR
Verzuolo, Italy
Refinery
NOxOUT®
USA
UNOCAL
1
Calciner
Petroleum
45
53
[D]
Los Angeles, CA
HRSG
Coke
Refinery
NOxOUT®
USA
UNOCAL
CO Boiler
400
Refined Gas
140
68
.
[D]
Los Angeles, CA
I
Refinery
—
NOxOUT®
USA
ARCO CQC Kiln
1
Calciner
HRSG
651
Petroleum
.
86
30
Los Angeles, CA
Coke
.
L
Refinery
NOxOUTs
USA
BP
1
CO Boiler
518
Refinery Gas
95
22-35
Toledo, OH
—
-
Refinery
NOxOUT®
USA
MAPCO Petroleum
Memphis, TN
1
Bottom-Fired
Process Htr
177
Refinery Gas,
Natural Gas
75
60
Refinery
NOxOUT® I
USA
MAPCO Petroleum
Memphis, TN
1
Bottom-Fired
Process Htr.
50
Refinery Gas,
Natural Gas
65
50 - 75',
....
—
Refinery
NOxOUT®
USA
Mobil Oil
1
GT - HRSG
.
630
Refinery Gas
75
50
Paulsboro, NJ
•
-4--
Refinery
NOxOUT®
i?
USA
Mobil Oil
1
CO Boiler 614
Refinery Gas
90
65
:
Torrance, CA
Refinery
NOxOUT®
USA
Pennzoil
1
CO Boiler/
CO, Refinery
Shreveport, LA
Thermal Oxidizer
Gas
■
1
?
Refinery
NOxOUT® 7
USA
Pennzoil
1
CO Boiler/
243
Natural Gas
&
0.271b/MMBtu
74
!
i
I
Shreveport, LA
Thermal Oxidizer
Regen. Gas
1
Appendices - 21
INDUSTRY
PRODUCT
COUNTRY
TYPE
COMPANY
/
LOCATION
#
of
units
UNIT TYPE
SIZE
(MMBtu/hr)
FUEL
NOx BASELINE
(ppm, ' lb/MMBtu)
RED'N
%
Refinery
NOxOUT®
USA
Powerine
1
CO Boiler
31 - 62
Refinery Fuel
105
60
Santa Fe Springs, CA
Gas
[
70
-,--,
Refinery
NOxOUT®
USA
Powerine
1
Package Boiler
31 - 62
Refinery Fuel
105
Santa Fe Springs, CA
Gas
Refinery NOxOUT®
USA
Shell Oil
1
CO Boiler (3) 222
Refinery Gas
230
1
6565
Martinez, CA
Refinery
NOxOUT®
USA
Total Petroleum
1
CO Boiler
1
197
CO, Refinery
1.20 lb/MMBtu
67
Alma, MI
Gas
Refinery
NOxOUT® 1
Saudi
Mobil Oil/Macchi
1
Package Boiler
(3) 265
Vacuum Tower
0.40 lb/MMBtu
---,
25
Arabia
Yanbu, Saudi Arabia
Bottoms
Propane
Steel
NOxOUT® ----
USA
AK Steel
1
Annealing Furnace
j
110
Natural Gas
0.12 lb/MMBtu
35 - 45
[DI
Furnace No. 1
MMBtu/hr
Rockport, IN
Steel
NOxOUT®
USA
Plus
Nucor Steel,
Crawfordsville, IN
1
Reheat/
58.8
Radiant 14.3
Natural Gas
0.227 lb/MMBtu
0.581 lb/MMBtu
76
Urea SCR
Steel
NOxOUT®
USA
Plus
Nucor Steel,
Hickman, AR
1
Preheat/
46.7
Radiant
14.6
Natural Gas
0.32 lb/MMBtu
76
0.46 lb/MMBtu
79 .
Urea SCR
„.-.....i
Steel
NOxOUT®
USA
Plus
Nucor Steel,
Hugor, S.C.
I
Preheat/
50.8
Radiant
20
Natural Gas
0.44 lb/MMBtu
82 .
I
0.31 lb/MMBtu
89
I
Urea SCR
Steel
NOxOUT®
Plus
USA
SMS Demag/Nucor Steel,
Decatur, AL
1
Annealing Furnace
98.7
Natural Gas
0.296 lb/MMBtu
77.3 .
Urea SCR
Steel
NOxOUT®
j
USA
Selas/BHP
1
Cont. Galv. Line
29
Natural Gas
105
65
Rancho Cucamonga, CA
----Sieer—
NOxOUT®
USA
WAPC lion 5
-y-namicS
1
Rotary Hearth
435
Natural Gas '
'
0Ib/viM-13-tU------
--3-0
:—
Butler, IN
1?
.
...
?_?
_.....„ .....,
?
.,
Steel
NOxOUT® ;
Taiwan
China Steel
1
+-
CE T-Fired
i?
535
Coal
410 mg/Nm3
43
.
L...... ?
1
Unit 6
w/CCOFA
!
@
11% 02
INDI.Thfl<Y
Steel
Steel
UNIT TYPE
SIZE
FUEL
(MMBtu/hr)
PRODUCT COUNTRY
TYPE
NOxOUT
® Taiwan
LOCATION
China Steel
Units 7 & 8
Taiwan - Republic of
China
C.E. VU 40 156.8
Coal
Coke Oven
6200
Incinerator
Coke Oven
OFF Gas
NOxOUT® Italy
Demag Italimpianti S.p.A.
Trieste, Italy
Appendices - 22
NQx BASELINE
(ppm, *
lb/MMDtu)
0.568
lb/NAM-Btu
1200 mg/Nm3
@11% 02
RED'N
42.9
70
Appendices - 23
Table C-2:
NOx Reductions from the Application of NOx RACT (Reductions
by Categories)
Emission Category Description
Categor
y
Designat
ion
No.
of
Entr
ies
No. of
Units
Heat Input
mmbtu/hr
2005
NOx
Emission
s
tpy
Estimated
NOx RACT
Reduction ,
%
Estimated
Controlled
NOx tpy
Estimat
ed
Nox
Reducti
on Tons
Unit
Typical
Ozone
Season
NOx
tons/day
Estimated
Ozone
Season
Controlled
NOx,
TPD
Estimated
Ozone season
NOx
Reduction,
TPD
Chicago NAA
Gaseous Fuel-fired Boilers >100 mmBtu/hr, Total
lal
22
34
6911.9
1196.5
69.2%
368.2
828.3
2.79
0.86
1.93
Gaseous fuel-fired Boilers
<
=100 mmBtu/hr,
Total
la2
6
20
1273.9
156.6
15.0%
133.1
23.5
0.63
0.54
0.09
Dist. oil Boilers >100 mmBtu/hr, Total
lbl
1
1
249
22.3
52.4%
10.6
11.7
0.040
0.02
0.02
Solid Fuel Boilers >250 mmbtu/hr, Total
le2
3
3
997.5
2330.2
73.9%
607.9
1722.3
8.93
2.33
6.60
Solid Fuel <=250, >100 mmbtu/hr, Total
le3
1
1
212
21.6
63.8%
7.8
13.8
0.00
0.00
0.00
Solid Fuel Boilers <=100 mmbtu/hr, Total
le4
5
5
376.2
476.7
15.0%
405.2
71.5
1.61
1.37
0.24
Process Htrs Gas fired >100 mmBtu/hr, Total
2a1
16
41
6672.6
1526.0
28.6%
1090.0
436.0
4.19
2.99
1.20
Process Htrs Gas-fired< =100 mmBtu/hr, Total
2a2
9
10
720.3
213.3
15.0%
181.3
32.0
0.60
0.51
0.09
Process Htrs, Residual Oil-fired, >100 mmBtu/hr,
Total
2b1
1
1
171
23.3
76.2%
5.5
17.7
0.07
0.02
0.05
Process Htrs, Other Oil-fired, <100 mmBtu/hr,
Total
2c3
I
1
17
26.5
15.0%
22.5
4.0
0.10
0.09
0.02
Glass melting Furnaces, Total
3
1
4
45
731.9
50.0%
366.0
366.0
2.02
1.01
1.01
Lime Kilns, Total
5a
2
2
588.9
734.4
30.0%
514.1
220.3
2.54
1.78
0.76
Annealing Furnace, Iron and Steel, Total
7b
1
1
123
44.1
60.0%
17.6
26.5
0.15
0.06
0.09
EGU Coal-fired Boilers, Total
8a
13
15
37802
24827.2
57.3%
10612.9
14214.3
82.22
34.59
47.63
All Sources in Chicago NAA, Total
82
139
56160.30
32331
56%
14343
17988
105.9
46.2
59.7
Metro-East
NAA
Gaseous Fuel-fired Boilers >100 mmBtu/hr, Total
lal
10
6
3460
730.1
69.2%
224.6
505.4
2.02
0.62
1.40
Gaseous Fuel-fired Boilers <=100 mmBtu/hr,
Total
la2
7
10
1305
364.9
15.0%
310.2
54.7
1.06
0.90
0.16
Process Htrs Gas fired >100 mmBtu/hr, Total
2a1
16
16
2776.7
2184.4
28.6%
1560.3
624.1
6.58
4.70
1.88
Process Htrs Gas fired <100 mmBtu/hr, Total
2a2
15
15
1395.3
765.2
15.0%
650.4
114.8
2.10
1.78
0.31
Reheat Furnaces, Iron and Steel, Total
7a
8
5
2681.6
1008.5
77.0%
231.9
776.5
4.62
1.06
3.56
EGU Coal-fired Boilers, Total
8a
5
5
22540
7241
8.3%
6639
602
20.6
18.8
1.8
All Sources in Metro-East NAA, Total
61
57
34158.60
12294
21.8%
9617
2678
37.0
27.9
9.1
Appendices - 24
Emission Category Description
Categor
Y
Designat
ion
No.
of
Entr
ies
No. of
Units
Heat Input
mmbtu/hr
2005 NOx
Emission
s tpy
Estimated
NOx RACT
Reduction ,
%
Estimated
Controlled
NOx tpy
Estimat
ed Nox
Reducti
on Tons
Unit
Typical
Ozone
Season
NOx
tons/day
Estimated
Ozone
Season
Controlled
NOx, TPD
Estimated
Ozone season
NOx
Reduction,
TPD
Chicago and Metro-East NAA (Combined)
Gaseous Fuel-fired Boilers >100 mmBtu/hr,
Total
lal
32
40
10371.9
1926.5
69%
592.8
1333.8
4.8
1.5
3.3
Gaseous fuel-fired Boilers
<
=100 mmBtu/hr,
Total
1a2
13
30
2578.9
521.5
15%
443.3
78.2
1.7
1.4
0.3
Dist. oil Boilers >100 mmBtu/hr, Total
lbl
1
1
249
22.3
52.4%
10.6
11.7
0.040
0.02
0.02
Solid Fuel Boilers >250 mmbtu/hr, Total
1e2
3
3
997.5
2330.2
73.9%
607.9
1722.3
8.93
2.33
6.60
Solid Fuel <=250, >100 mmbtu/hr, Total
le3
1
1
212
21.6
63.8%
7.8
13.8
0.00
0.00
0.00
Solid Fuel Boilers <=100 mmbtu/hr, Total
le4
5
5
376.2
476.7
15.0%
405.2
71.5
1.61
1.37
0.24
Process Htrs Gas fired >100 mmBtu/hr, Total
2a1
32
57
9449.3
3710.4
0.6
2650.3
1060.1
10.8
7.7
3.1
Process Htrs Gas-fired< =100 mmBtu/hr,
Total
2a2
24
25
2115.6
978.5
0.3
831.7
146.8
2.7
2.3
0.4
Process Htrs, Residual Oil-fired, >100
mmBtu/hr, Total
2b1
1
1
171
23.3
76.2%
5.5
17.7
0.07
0.02
0.05
Process Htrs, Other Oil-fired, <100
mmBtu/hr, Total
2c3
1
1
17
26.5
15.0%
22.5
4.0
0.10
0.09
0.02
Glass melting Furnaces, Total
3
1
4
45
731.9
50.0%
366.0
366.0
2.02
1.01
1.01
Lime Kilns, Total
5a
2
2
588.9
734.4
30.0%
514.1
220.3
2.54
1.78
0.76
Reheat Furnaces, Iron and Steel, Total
7a
8
5
2681.6
1008.5
77.0%
231.9
776.5
4.62
1.06
3.56
Annealing Furnace, Iron and Steel, Total
7b
1
1
123
44.1
60.0%
17.6
26.5
0.15
0.06
0.09
EGU Coal-fired Boilers, Total
8a
18
20
60342.00
32068.6
46.2%
17252.1
14816.5
102.9
53.4
49.4
All Sources in Chicago and Metro-East
NAA, Total
143
196
90318.9
44625
46.31%
23959
20666
142.9
74.1
68.9
y
Y
1
a
2
F
23
ill
fIf
F
B
V
EE
55
p.
E P.
I
I
53
2 2
11
P P
A
I I
?
a
1
1
1
§
1
a —
a
2
2
BB
B
a
PP
y
S
8
B
F
pB
3
B
B
F
1
2
22
8
I
a
A
F.
EE
vE
a
52
Ys
CS
F.8.8.8
?
ZS
85r
ec
ri
dd
B
BEE
'AK
a
i
iv
•
•
-
?
Ng:?
H"
i
?
0.
10Ei
gr
?
iEIE
°I;
?
i „
?
;
1_1111111111
lopollig
°?
" ! ! i l lE (?
Pk
olitimmom
111
11111111111111111
1111
IRENE
II
6.
?
----------
11 WWII"
33
3333
3333333333333iQ4zz4
a§
22
Pg267,:8828869w?
8?
88 6
3
RS?
RS
111111111
1
1 1 1 111 11111111111111111111111111111111
P
;;
111111111111111
-
?1
?
I 11
?
8 ?
15861
I
?
g
111
1
111111111111111 1111111111111
?
111111111111111111
?
1..11? ?
111111111111111111111111111111111111111
?
Fuel
drec
r3
514.414
711PAI.
NADJRAL
Go
F RNAL NATURAL
NATURAL CuI
EXTERNAL NATURAL
PROCESS GA EXTERNAL PROCESS G.X_
PROCESS GA PEIRCE
?
PROCESS HE 100 74971' 11
NATURAL Co EXTERNAL NATITRAL GA?100 ARON
COAL - RIOS EXTERNAL EITUM/NDU PULVERIZED COAL DRY BOTTUM
COAL ,1117111 EXTERNAL B4111
1
1911NOU. PUL 173AL DRY 13017011
C0/1-131111 EXTERNAL armsoNnu P310FRIZFD (DAL ERR 8017034
SUBB1121.115 PULVERIZEDUOAL
DRY
Boll OM (TANGENMALI
SUBBTR/MIXPICIXERIZED COAL DRY BOTTOM ITANGENTIAL)
3111311341
9
117
5
PLVVERIZED COAL DRY BOTTOM 17ANCITNTIALI
FRIUMINOWSLICLONE TERRACE
601391
1
1174IETVLV6JEW COAL DRY BOTTOM (TANGEN1IAL)
SUBBIOJM134 IXINEXLZED COAL DRY
91TroMITANGE511313
EITTUMINOLIXSYCLONE FURNACE
BITIRRINOU PULVERJETT) COAL. INODECTIDM
PITINERLED)COAL DRY norrom
UBBIEUMINCYCLONF FURNACE
SUBBITUMIX CYCLOXF FURNACE
COAL ORS 9011031
UBBTR1MEN FUNFRIZED
COAL ORy BOTTOM
OTHER 43.51EXTERNALJPROCESS GILETROLEEN
077IER GAS EXTERNAL PROCESS(' REMOLD M
REFINERY
GAO
1•EFINER3 GAS
COAL • SUB EXTERNAL t 111114151012
IR INERT.= COAL DRY nelTOM
COAL • SUB EXTERNAL. 13171 MINOU PULVERIZFO CDAL 136713077074
COAL • 3413BITI7MT9
CORM
_
- 5113131171MINOU0
COAL BBTPMINC
CdLL SURE EXTERNAL
COAL • SUB EXTERNAL.
0190 EXTERNAL
COAL - SUBS EXTERNAL
COAL .11.111P EXTERNAL
COAL 51.141
EXTERNAL
COAL
COAL-SUB0 EXTERNAL
COAL. SUB EXTERNAL
COAL
EXTE
Appendices - 27
Table E-I:?
Boilers Subject to NOx SIP
Call
Regulations (>250 mmBtu/hour)
1319d0Cinnenl/T9D
/Nth RACT-AttaChmentnIS
Boilers
>
250 mmBtuThour In Chien o NAA
042133 ID
1
Source PTE.
TOY NO75
—
EarilitY
Name
SIC
11111 ID
1
?
Fins sss Pow De6niryon
MOde ID
Mode DeacrIption
?
502
Ernission
Un7
1.914410TY
21115 NO'
EnTISS10115
my
Dot 39(3.1
015004
Season NO3
Industrial Boilers >250 mmBturhour in Chian
NAA
03 Ol'Al31
orri Products hilemuonal It
2046
0046
Lnum3 • BOILER 43 (A-2193)
01
5114Products?
It 20445
160
111111.37103 BOILER 46 (A234144)
01
0200.i
600
0 0194
0979111AAC
8218
21 Thrift C
0011
BL
01
NATURAL OAS CO
600
9413
0 0341
197090AM
1773
C
RCA Pcirdeum
Cap
1911
.91'37
300-1 Auxiliary toiler
01
Refotor
fuel
BE
0200701
120 5
0 3296
197e00AAA
L3,313510610t1COrp
0002
Al35 BOBER
03
On
64
41056 Innen
0600104
I t
1
33
0013
197800ABZ
10 'AB1
tllnl Film Reed.= LP
Cots Raw, Intensztexal
2165
119
0041
BOILERCP.706
7 1
111.117ES . Boma 11 (A13592)
01
01
0200601
0700202
IS
760 7
0 0254
3 1979
03.1012001
1411111103 - BORA 4' (2149,
01
0209702
133
332
5
7909
3 2401
031012ABI
45421
ern
Polaris Jarmo:l
ord 41046
0045
212.211ES
-130112093
(4-293)
?
10
0200202
la2
33: 5
7716
24%3
EGU Boilers >250 nnolit&hour
w
Chia
o NAA
T31600617
329623
Craw6vd Electric Generatrop
0013
71116
7
01
Crvo
10100726
27/2
031600An3
_
32962 I
Cram40114 Elastic Demoting
4911
5616
Van
01
Cu&
10100226
?
ea
3556
3790
4 1709
031609A511
13414 4
21)10
Eleatic Genaung Swi• 4911
J2610
FISK UNIT 419
01
DIAL Flerst,
10100726
2896
1125 6
]8275
097190AAC
47103 0
WauktfpnEketic
?
•
911
0031
UNIT 46 RORER
01
CTIAL FIRNG
10100203
1074
1627 3
9705
09-190A7C
47103
Walakep•ulEketrierantinE
4911
0033
IND 18
?
.FR
01
Cl/AL FIRINC:
10100226
3271
1595 4
4 4723
097190AAC
♦71010
Waukegan E14936309593.159
4911
0036
UNIT c BOILER
01
COAL FIRING
10100Z26
1911
D97 9
4 2667
1070,„000
khdewsBiOnnerViCaLLC
4911
01
01
Coal
Cool
101E6107
?
8.
10100202?
Se
45011
1760 7
169076
1971109010
609708
Mid west Gen011011110
4911
0031
B4(145471 Bel
6 0414
4911
01173.
9010
3.31R7 29 Len 8 Book
ie II awl 02
C991
10100302
?
04
3193
5
137110AAK
18014 4
Wilk
Count
UNIT SI TOILER CYCLONE
02
COAL FIRING
30100213
Is
D28
1679-0
85934
197810A/4K
11014 4
Will
4911
•
UNIT 12 04020 CYCLONE
0^
COAL
FIRED
10100223
1712
9.1196
197810AAK
18014 4
Will Cony Eledit
4911
0014
UNIT?
BOILER
?
TA 02
COAL FIRED
10100211
8a
7 709
873 1
2-7744
197310AA2
180144
WM County
Rs*.
4911
0016
UN1114
BOILER POLY DRY
FIRED
84
5016
lee 8
60991
Boilers
>
250 mmeturhour In Ihntro-East NAA
Industrial Boilers >250 morlitt
g
bour In Metro-East NAA
Junut
IL111.111
Bala 813
03159 17)?
02
?
I"G
?
1
119090179
?
13$72?
2911
?
r BOILER /OS (KRA,/
?
03
10200701?
181?
03431
13872.0
? FSCo
?
2911
?
10209701
?
1.1
?
232
?
0 3431
ECU Boilers >250 mmBtoisear In Metro-East
NAA
11902004E
119020AAE
242/19 8
24283
133eff VICheellifienarallea
D•?
)1111354Creocretion
14911
0001
BOMBES PL1v DRY TANCIGGIAL
COAL
10100202
ea
3970
D109
5383
4911
BI RA PULO DRY Bold TANGENTIAL
COAL FIRING
10100202
1030
456 6
t 1963
27351 AM
137851A5.3
4875
.
6
4375 6
13Ynepy10dereslOambou
porgy b4chnsteconli91
4911
BOIUR111
01
COAL FIRING
10100202
34
5890
11069
3 627
11
ocoa
901119• 82
01
(VALFIRM°
10190207
5900
3.547
1571151A/A
485 6
!Toed
?
Ot
omepa• ,4911
0013
1304123313
COAL MEND
10100202
5e00
22716
66_4
S
Vi
"
FF
R
t
.
?
i0
g
i
-
?.
-
i
i,
f
ii
1
I.
ir
ii
ri
Iv..
?
?
i
t
-.
fit
ei
"
g iii
III
n 'i
ii.
U.:4.
1
141
""
Ififfil
=
-
Ili
;,[
.
0
r
-ott:
-
If
HI
I"
:
I
?
?
i
I
!
iniui
inii0E,ff,nPMI:00!*
1,4.IPR
-
i
rti
Hi
t
I
(
[
1?
.1ai0P
"it
t
vvu
av
4
'
q
1/
II IM
1
-
?
iii
;
i
t
,
fli
1
?
1?
t?
/
t
fiB9
lillitli
tire
fl'i
.
Ilttattititttlt
VI
I
/Mt
1
.
*
i?
.
I
AA/
MI!
rill:
ii
1
t
tittli
1
g
littAttlt
;19
g
i
,
litlItttli
i
"
H iflP iii
D i
I
ivii'
i i.?
--::
-
i'
r
I
'1p
;
I
I
,
HP
;
;
!
i
i
l
I
4
1
ill
i iiii
m 1 9
"
[
i
1
I
VLg
II
iii
I
1
11
li
I
1
I1
I
?
' ll
111
!!!
ir:
1 1111
I
WHO1
1111/
'
-
II
fe
n
n
1 ;
i
?
'
01
E
E
1
iliflililli
i
I
if“
MO
[E
E
1
11
“
0
i!
1 "
I
lil
Virt
.
4
• Thit.ft:"
.
. :
5EEEEM.J.3rt-:sEsinF
g i..,,Igli
l
t
A:uf
Wfl!EE
p f
.
.1....c.::
.PF.1,2!
elitvlE”q!E:,,ItE!”:w..!1111
ii
7;M; ;;;;
Wii
'III
:ftW3:
103
;ifinmi
.
;3;;;;rniiiiffir,;;;
:.c.y.p..,21::1,-“..,-2.:::::::
",fl)”,4FI
a
!?
Til
:?
!.— --
1
F
=..-0E".!
2E,E
g =
..,...411
NWO Aft
:i7: ; Er4" 4 " 44
:=:.,=;41:j-,;;;“:2EI!,:p...i.
.Ei.;;LuNT
:,..
-
--i
qimilif
iii=i; 16 1
n2;iiiiii
Wiiillif
9
E
ii
iiiiiiEi
c -;iiiii(IW-i
;
5iiiiii
;;iiii
iii• Ui
g AME“
Iiiii:E.EE;; =;“-:::.:EE.;A
.
g EE q ;i1Ea21H;n 2 ;ii.W2=- Riali
--i.;555
;i
5
?
5;1 =— "'
s?
g!Ew;m1;:-.;:liii:;ti;7
g
zs2;;A gg
in
g 2uA,NIxwil
Wi
;?
1
iill
1.
:,,1
11
'xP
I
i
i ill
,7,
I
7
i
2
11
:
1
i
i?
!
ELI
INiii!
EEEEEEE
Eh
1Y/
Wil
EEEE
iMilili
Ei
tEEEEEEEEEEEEE
1
E
1E
;
,
5
00
5
,
:.?
,
51°
a
?
aa?
gEgEi
i EE
FFasF
1
0
I
0
5M
0004
i
I
1 t
?
th
II MIDI
BEBdP
;.
11110111111
E?
/0tEEH
111
OPP
IV it
611?
II
1
ip
!U
i
i r
M i liHr
!! i qi
i JO
H iii
E
1?
$tt
li
Appendices?
29
...).
Ken
h“...tu.......? ,
mi...c.......uc
.,,,
•.■
..
003L
..,....s
.
...A.F.,....
trn
rirrieflrellf
ESEGMCIIMI
Cd7131rOIMIN
.....,
'enc..
Nr 0.
actin.
All Sou
ig
n-
FEpO
Ej
a
kCCYti
g
i;
1111111IiiiIIIIMME
lt
?
?
_
?
gii
tat
s.
?
_ill
I
il
!i4
I
I
Iv
II
I
I
i
'
a
I
:i
-?
?
1„
it
x
.
FY
IIIIMEN!
__
MINE
WEE
1
GY
Fk
1100
r
i i
i ll
I
1 I L
e
i
e
l' '
11
a
lionommismil
Ell'ilil
1?
1 9
Nilo
1 11
1 1
11?
1111
111111
:
I
I 1111011111
?
I
1?
i'll
1111111
11
EL111
il
IIII
i
IIIIIIIIIIIII
fil
il
IIII
iillili1
IIIIII
IIIIIIIII
1
I
11
IIIIIIIIIIII
1111
1111
IIIIII
1
•
, .
RI
II
I
1
11111111
:„
1
11111111
11111111111
111111 111
111111
11111
1111111
1
: ,
II
m
,?-
I
IIIUN
,
E!!!!!!!!!!E
..
A
1
pI
fit
Kg 28
3323
a
i"
f
FF
33
1
01
eSA
2 a
11
1
59
ey
1
a
a
r r
283
iY
a:aa..?
a2v acoaa..a.aaaap.oaaaaaaaaaa.aam
efig1125SMAINEE;Arad2iS:IllialwetilasE453esua5lialisEs
â
i:. 32XP543 942; ::!; e:?
;
:e
a
2
2
:;;;; ;
d9'
°.
“
;
ill H?:
;A
,U
1111
i!
iiiiiiiii
il
111
ITE
411111E1Di
11110
MLA
II
1
1
HD
WW
a
Ili
Whir
'
q;
WI
PH
11 -1/h
il
NIP
M
PEE
EEEti
rilifirEiWEE
r
ill
Offilliii
1
iEil11111111111iiill
1
IT1
1111111qii
II id
as
Appendices - 33
Table I-1: NOx Reductions from the Application of NOx RACT (Reductions by Categories)
Mydocumentif SD/NOT RACT-Attachments.xls
Emission Category Description
Category
Designati
On
No. of
Entries
No. of
Units
Heat Input
mmbtu/hr
2005 NOx
Emissions tpy
Estimated NOx
RACT
Reduction,
%
Estimated
Controlled
NCO
tpy
Estimated
Nox
Reduction
Tons
Unit Typical
Ozone Season
NOx tons/day
Estimated
Ozone Season
Controlled
NOx, TPD
Estimated Ozone
season NOx
Reduction, TPD
Chicago NAA
Gaseous Fuel-fired Boilers >100 mmlstu/hr, Total
lal
22
34
6911.9
1196.5
69.2%
368.2
8283
2.79
0.86
1.93
Gaseous fuel-fired Boilers <
=100 mmBtu/hr, Total
la2
6
20
1273.9
156.6
15.0%
133.1
23.5
0.63
0.54
0.09
Dist. oil Boilers >100 mnsBtuihr, Total
1bl
1
1
249
223
52.4%
10.6
11.7
0.040
0.02
0.02
Solid Fuel Boilers >250 mmbtathr, Total
le2
3
3
997.5
2330.2
73.9%
607.9
17223
8.93
233
6.60
Solid Fuel <=250, >100 mmbtufhr, Total
lea
1
1
212
21.6
63.8%
7.8
13.8
0.00
0.00
0.00
Solid Fuel Boilers <-400 mmbtu/hr, Total
le4
5
5
376.2
476.7
15.0%
405.2
71.5
1.61
137
0.24
Process Htrs Gas fired >100 mmBtulhr, Total
2a1
16
41
6672.6
1526.0
28.6%
1090.0
436.0
4.19
2.99
1.20
Process Htrs Gas-fired< =100 mmiltufhr, Total
2a2
9
10
7203
2133
15.0%
1813
32.0
0.60
0.51
0.09
Process Htrs, Residual Oil-fired, >100 mmBtu/hr, Total
2b1
I
1
171
233
76.2%
5.5
17.7
0.07
0.02
0.05
Process Htrs, Other Oil-fired, <100 mmlitufhr, Total
2c3
1
1
17
26.5
15.0%
22.5
4.0
0.10
0.09
0.02
Glass melting Furnaces, Total
3
1
4
45
731.9
50.0%
366.0
366.0
2.02
1.01
1.01
Lime Kilns, Total
5a
2
2
588.9
734.4
30.0%
514.1
2203
2.54
1.78
0.76
Annealing Furnace, Iron and Steel, Total
7b
t
1
123
44.1
60.0%
17.6
26.5
0.15
0.06
0.09
EGU Coal-fired Boilers, Total
8a
13
15
37802
24827.2
573%
10612.9
142143
82.22
34.59
47.63
All Sources in Chicago NAA, Total
82
139
56160.30
32331
56%
14343
17988
105.9
46.2
59.7
Metro-East NAA
Gaseous Fuel-fired Boilers >100 mmBtu/hr, Total
lal
10
6
3460
730.1
69.2%
224.6
505.4
2.02
0.62
1.40
Gaseous Fuel-fired Boilers <=100 mmBtu/hr, Total
lag
7
10
1305
364.9
15.0%
310.2
54.7
1.06
0.90
0.16
Process Mrs Gas fired >100 mmBtufhr, Total
2a1
16
16
2776.7
2184.4
28.6%
15603
624.1
658
4.70
1.88
Process Htrs Gas fired <100 mmBtu/hr, Total
2a2
15
15
13953
765.2
15.0%
650.4
114.8
2.10
1.78
0.31
Reheat Furnaces, Iron and Steel, Total
7a
8
5
2681.6
1008.5
77.0%
231.9
776.5
4.62
1.06
3.56
ECU Coal-fired Boilers, Total
8a
5
5
22540
7241
83%
6639
602
20.6
18.8
1.8
All
Sources in Metro-East NAA, Total
61
57
34158.60
12294
21.8%
9617
2678
37.0
27.9
9.1
Chic
a
go and Metro-East NAA (Combined)
Gaseous Fuel-fired Boilers >100 mmBtu/hr, Total
lal
32
40
10371.9
19265
69%
592.8
1333.8
4.8
1.5
3.3
Gaseous fuel-fired Boilers
<
=100
mmBtuihr, Total
la2
13
30
2578.9
521.5
15%
4433
78.2
1.7
1.4
03
Dist. oil Boilers >100 mmBtu/hr, Total
1bl
1
I
249
223
52.4%
10.6
11.7
0.040
_
?
0.02
0.02
Solid Fuel Boilers >250 mmbtu/hr, Total
let
3
3
9975
2330.2
73.9%
607.9
17223
8.93
233
6.60
Solid Fuel <=250, >100 mmbtu/hr, Total
1e3
1
1
212
21.6
63.8%
7.8
13.8
0.00
0.00
0.00
Solid Fuel Boilers <-100 mmbtulhr, Total
le4
5
5
376.2
476.7
15.0%
405.2
71.5
1.61
1.37
0.24
Process Htrs Gas fired >100 mmBtu/hr, Total
2a1
32
57
94493
3710.4
0.6
26503
1060.1
10.8
7.7
3.1
Process Htrs Gas-fired< =100 mmIltuihr, Total
2a2
24
25
2115.6
9785
03
831.7
146.8
2.7
23
0.4
Process Htrs, Residual Oil-fired, >100 mmIltufhr, Total
2b1
1
1
171
233
76.2%
5.5
17.7
0.07
0.02
0.05
Process Htrs, Other Oil-fired, <100 mmBtu/hr, Total
2c3
1
1
17
26.5
15.0%
22.5
4.0
0.10
0.09
0.02
Glass melting Furnaces, Total
3
1
4
45
731.9
50.0%
366.0
366.0
2.02
1.01
1.01
Lime Kilns, Total
5a
2
2
588.9
734.4
30.0%
514.1
2203
2.54
1.78
0.76
Reheat Furnaces, Iron and Steel, Total
7a
8
5
2681.6
1008.5
77.0%
231.9
776.5
4.62
1.06
356
Annealing Furnace, Iron and Steel, Total
7b
1
1
123
44.1
60.0%
17.6
26.5
0.15
0.06
0.09
EGU Coal-fired Boilers, Total
8a
18
20
60342.00
32068.6
46.2%
17252.1
14816.5
102.9
53.4
49.4
All
Sources in Chicago
and Metro-
East NAA, Total
143
196
90318.9
44625
46.31%
23959
20666
142.9
74.1
68.9
Appendices - 34
Industrial Boilers
45
4300.68
71.7%
1219.12
3081.56
Industrial Boilers
35
998 2
15.0%
848.4
149.7
Process Heaters
58
37317
28.9%
2655.8
1077 9
Process Heaters
26
1004.95
15.0%
854.21
150.74
Glass Melting Furnaces
4
732
50%
366
366
Lime Kilns, Total
2
734
30%
514
220
Iron and Steel, (reheat, annealing and galvanizing furnaces)
2
1052.6
76.3%
249.6
803.0
EGU Coal-fired Boilers, Total
20
32068.6
46.2%
17252.1
14816.5