Kimber A. Geving
Assist. t Counsel
Division of Legal Counsel
IN THE MATTER OF:
PROPOSED AMENDMENTS TO
GROUNDWATER QUALITY
STANDARDS
(35 Ill. Adm. Code 620)
CLEINK'S
eceivEcto
OFFICE
JUL 1 1 2008
STATE
OF
ILLINOIS
R08-18
Pollution Control Board
(Rulemaking-Public Water Supplies)
BEFORE THE ILLINOIS POLLUTION CONTROL BOARD
NOTICE OF FILING
Dorothy. Gunn, Clerk
Illinois Pollution Control Board
James R. Thompson Center
100 W. Randolph, Suite 11-500
Chicago, Illinois 60601
(Via Federal Express)
Matt Dunn
Environmental Bureau Chief
Office of the Attorney General
James R. Thompson Center
100 W. Randolph, 12
th
Floor
Chicago, Illinois 60601
(Via First Class Mail)
(Service List-Via First Class Mail)
Bill Richardson
Chief Legal Counsel
Illinois Dept. of Natural Resources
One Natural Resources Way
Springfield, Illinois 62702-1271
(Via First Class Mail)
Richard R. McGill, Jr.
Hearing Officer
Illinois Pollution Control Board
James R. Thompson Center
100 W. Randolph, Suite 11-500
Chicago, Illinois 60601
(Via Federal Express)
PLEASE TAKE NOTICE that I have today filed with the Office of the Clerk of the
Illinois Pollution Control Board the Illinois Environmental Protection Agency's
MOTION TO CORRECT THE TRANSCRIPT, ERRATA SHEET NUMBER 3, AND
SUPPLEMENTAL TESTIMONY OF THE ILLINOIS EPA
a copy of each of which is
herewith served upon you.
ILLINOIS EVIRONMENTAL
PROTECTION AGENCY
DATED: July 10, 2008
1021 North Grand Ave. East
P.O. Box 19276
Springfield,' Illinois 62794-9276
(217) 782-5544
BEFORE THE ILLINOIS POLLUTION CONTROL BOARD
"
C
IE
LER
C
K'S
E
OFFICE
V
FFICE
E D
JUL 1 1 2008
R08-18
?
STATE OF ILLINOIS
(Rulemaking-Public 'eaVtgaPiLr
g
jol
Board
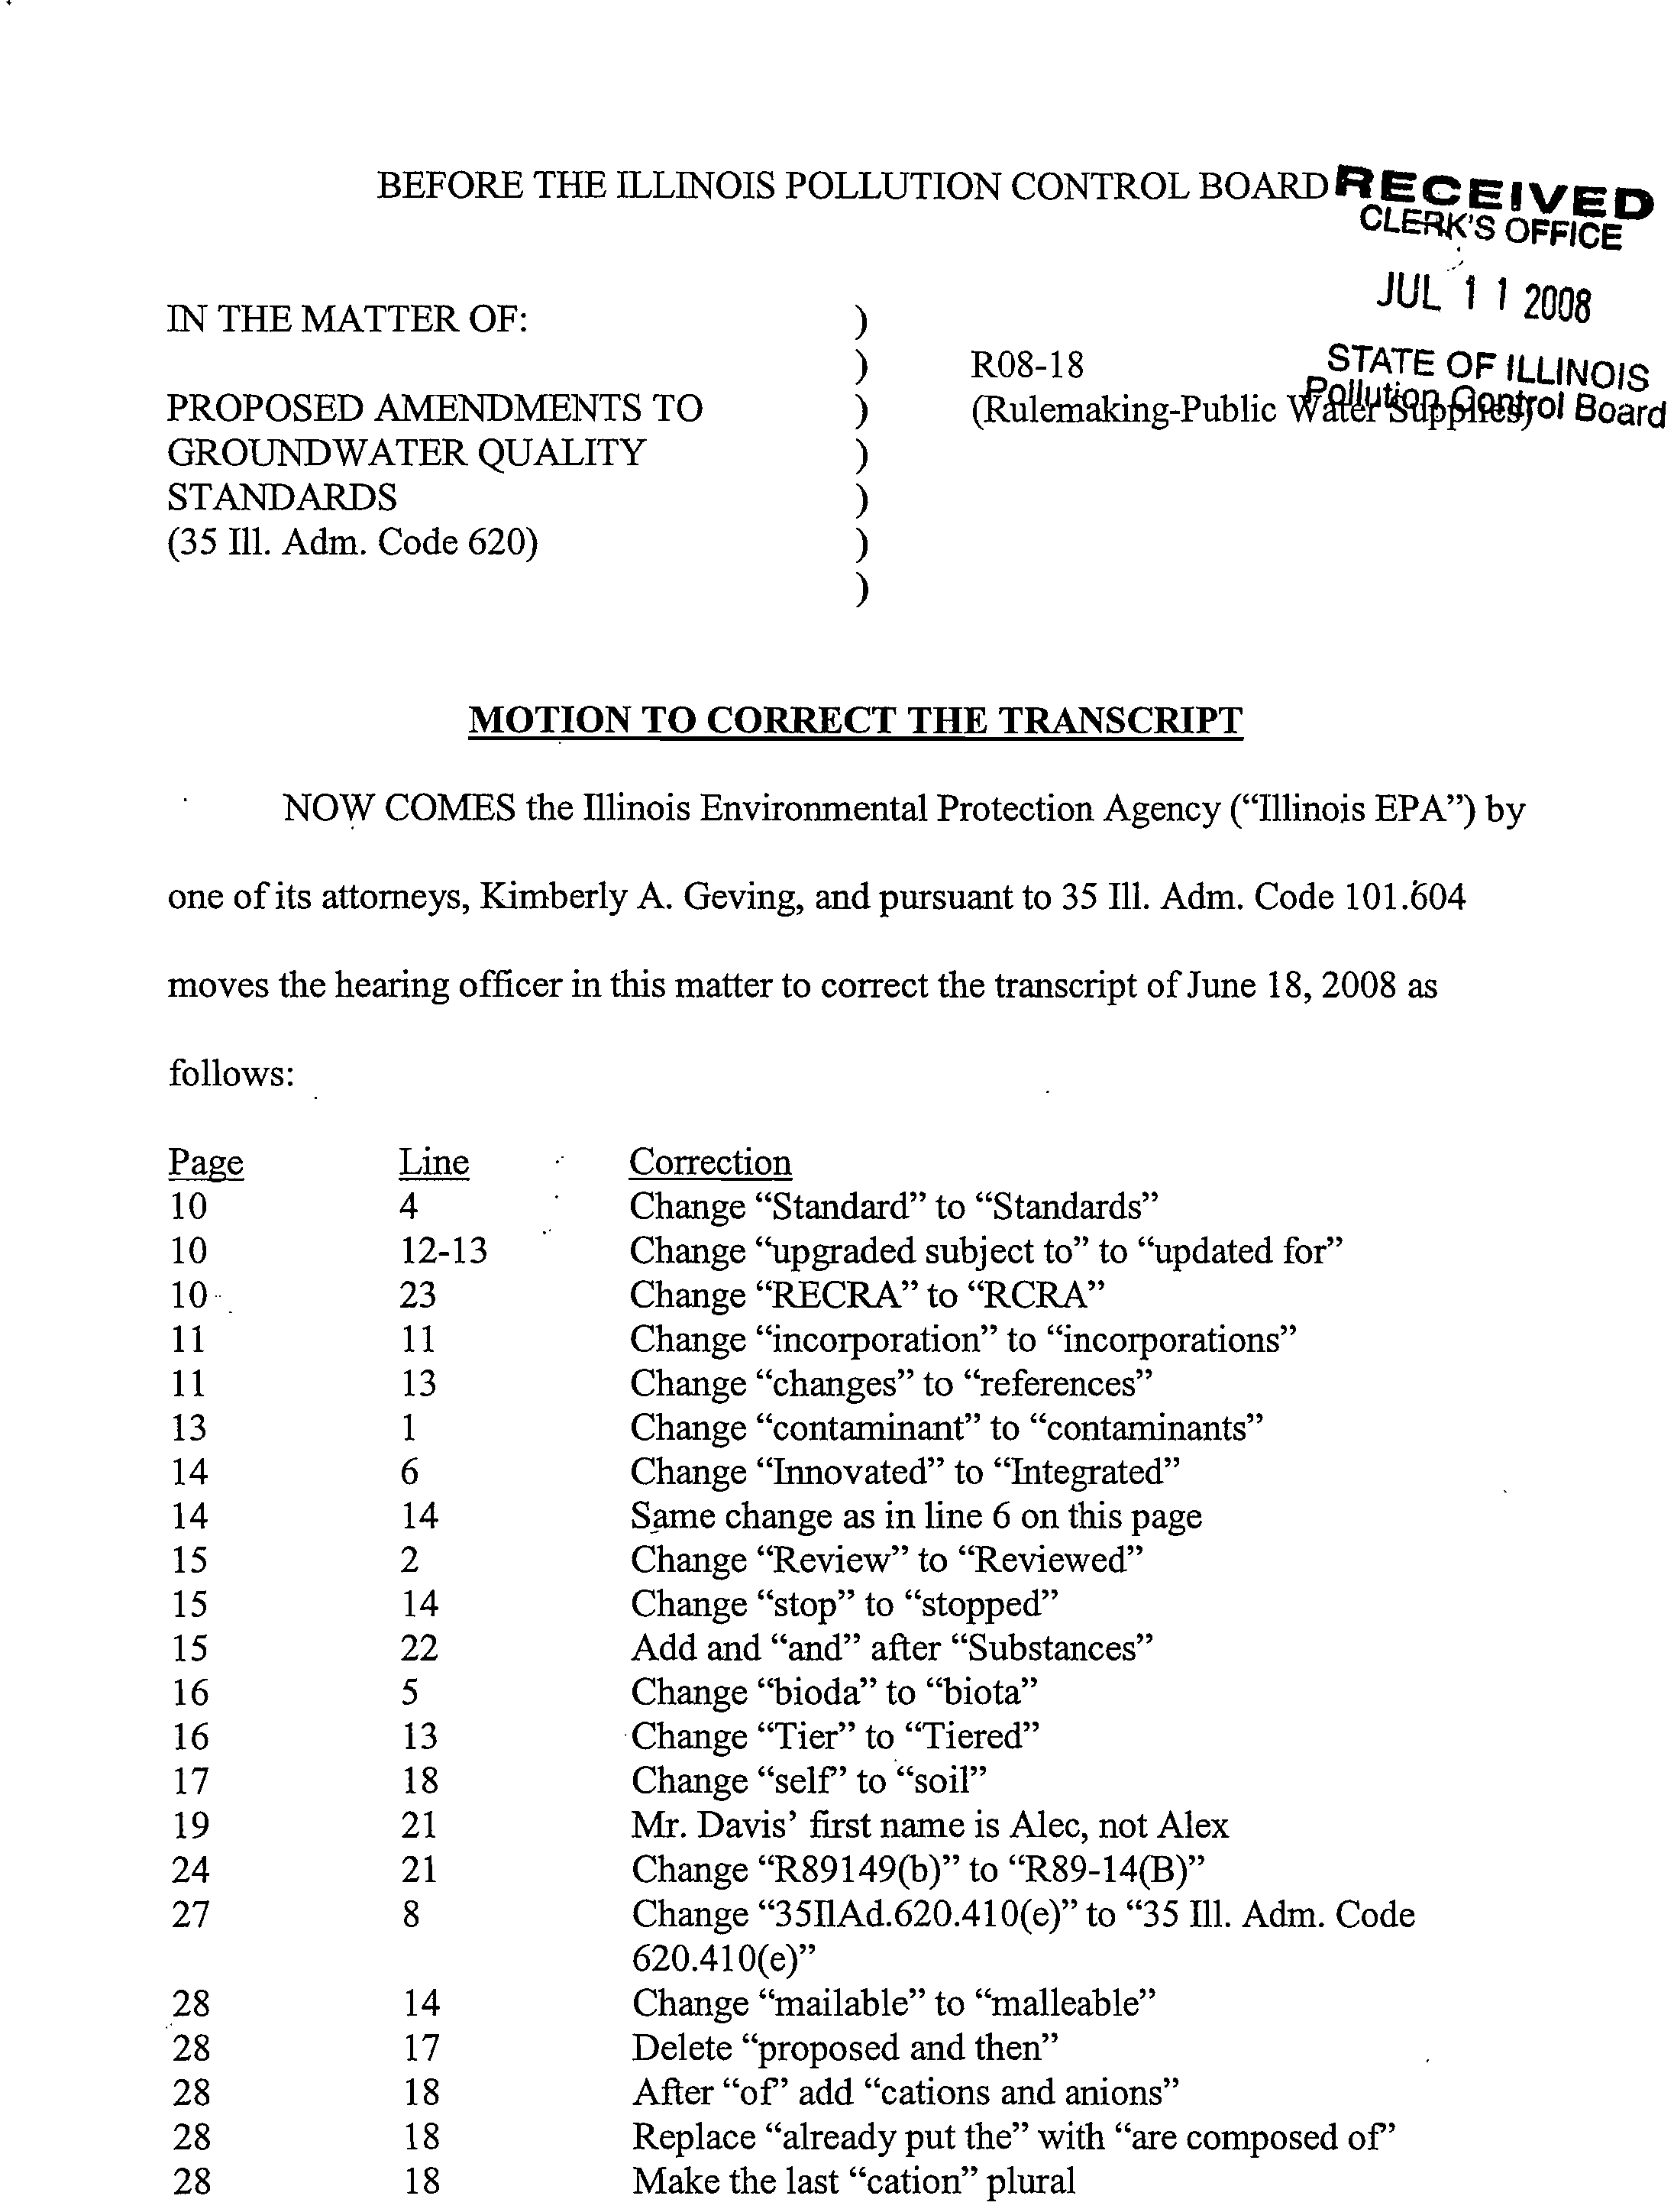
MOTION TO CORRECT THE TRANSCRIPT
NOW COMES the Illinois Environmental Protection Agency ("Illinois EPA") by
one of its attorneys, Kimberly A. Geving, and pursuant to 35 Ill. Adm. Code 101.604
moves the hearing officer in this matter to correct the transcript of June 18, 2008 as
follows:
Page?Line?Correction
10?4?Change "Standard" to "Standards"
10
?
12-13
?
Change "upgraded subject to" to "updated for"
10?23?Change "RECRA" to "RCRA"
11?11?Change "incorporation" to "incorporations"
11?13?Change "changes" to "references"
13?1?Change "contaminant" to "contaminants"
14
?6?
Change "Innovated" to "Integrated"
14?
14?Same change as in line 6 on this page
15
?
2
?
Change "Review" to "Reviewed"
15?14
?Change "stop" to "stopped"
15?
22
?Add and "and" after "Substances"
16?5?
Change "bioda" to "biota"
16?
13?Change "Tier" to "Tiered"
17
?
18?Change "self' to "soil"
19?
21?Mr. Davis' first name is Alec, not Alex
24?
21
?
Change "R89149(b)" to "R89-14(B)"
27
?8?Change "35I1Ad.620.410(e)" to "35 Ill. Adm. Code
620.410(e)"
28?14
?Change "mailable" to "malleable"
28?17?
Delete "proposed and then"
28?
18?After "of' add "cations and anions"
28?
18
?Replace "already put the" with "are composed of
28?
18?Make the last "cation" plural
IN THE MATTER OF:
PROPOSED AMENDMENTS TO
GROUNDWATER QUALITY
STANDARDS
(35 Ill. Adm. Code 620)
28
19
28
21
31
9
31
32 •
32
34
34
36
37
40
40
41
42
42
42
42
43
51
51
51
51
56
58
62
5
17
6
13
23
24
2
12
23
3
14
14
14
21
2
3
19
24
20
19
18
Kimberl A. Geving
Assist. t Counsel
Division of Legal Counsel
Make "anion" plural
Delete "and those"
The reference to "THE COURT" is incorrect
The reference to "Dave" is incorrect. There was no Dave
present at the hearing
Change "instigation" to "removal efficiency of
Change "not" to "none"
Change "carcinogenic" to "carcinogen"
Change "620.10(b)" to "620.410(b)"
Change "043" to ".043"
Change "Qualities" to "Quality's"
Change "contents" to "constants"
Change "rule" to "Board"
Change "R8914(b)" to "R89-14(B)"
Change "basis" to "bases"
Change "to" to "and"
Change "confirm" to "confirmed"
Replace "by the" with "in"
Change "35E.Ad.611" to "35 Ill. Adm. Code 611"
Change "mount" to "melt"
Change "go" to "going"
Change "R914(b)" to "R89-14(B)"
We believe the hearing officer said "R08-18"
Add "addition" after "in" •
Change "prescribes" to "subscribes"
Change "1-dichloroethane" to "1,1,dichloroethane"
Respectfully submitted,
ILLINOIS ENVIRONMENTAL
PROTECTION AGENCY
Dated: July 10, 2008
1021 N. Grand Ave
P.O. Box 19276
Springfield, Illinois
(217) 782-5544
. East
62794-9276
BEFORE THE ILLINOIS POLLUTION CONTROL BOARD
IN THE MATTER OF:
)
)
PROPOSED AMENDMENTS TO
)
R08-18
GROUNDWATER QUALITY
)
(Rulemaking-Public W
elsVE
STANDARDS
S OFFICE
D
)
(35 Ill. Adm. Code 620)
)
)
JUL 1 1 2008
ERRATA SHEET NUMBER 3
Pollution
STATE OF
Control
ILLINOIS
B
oard
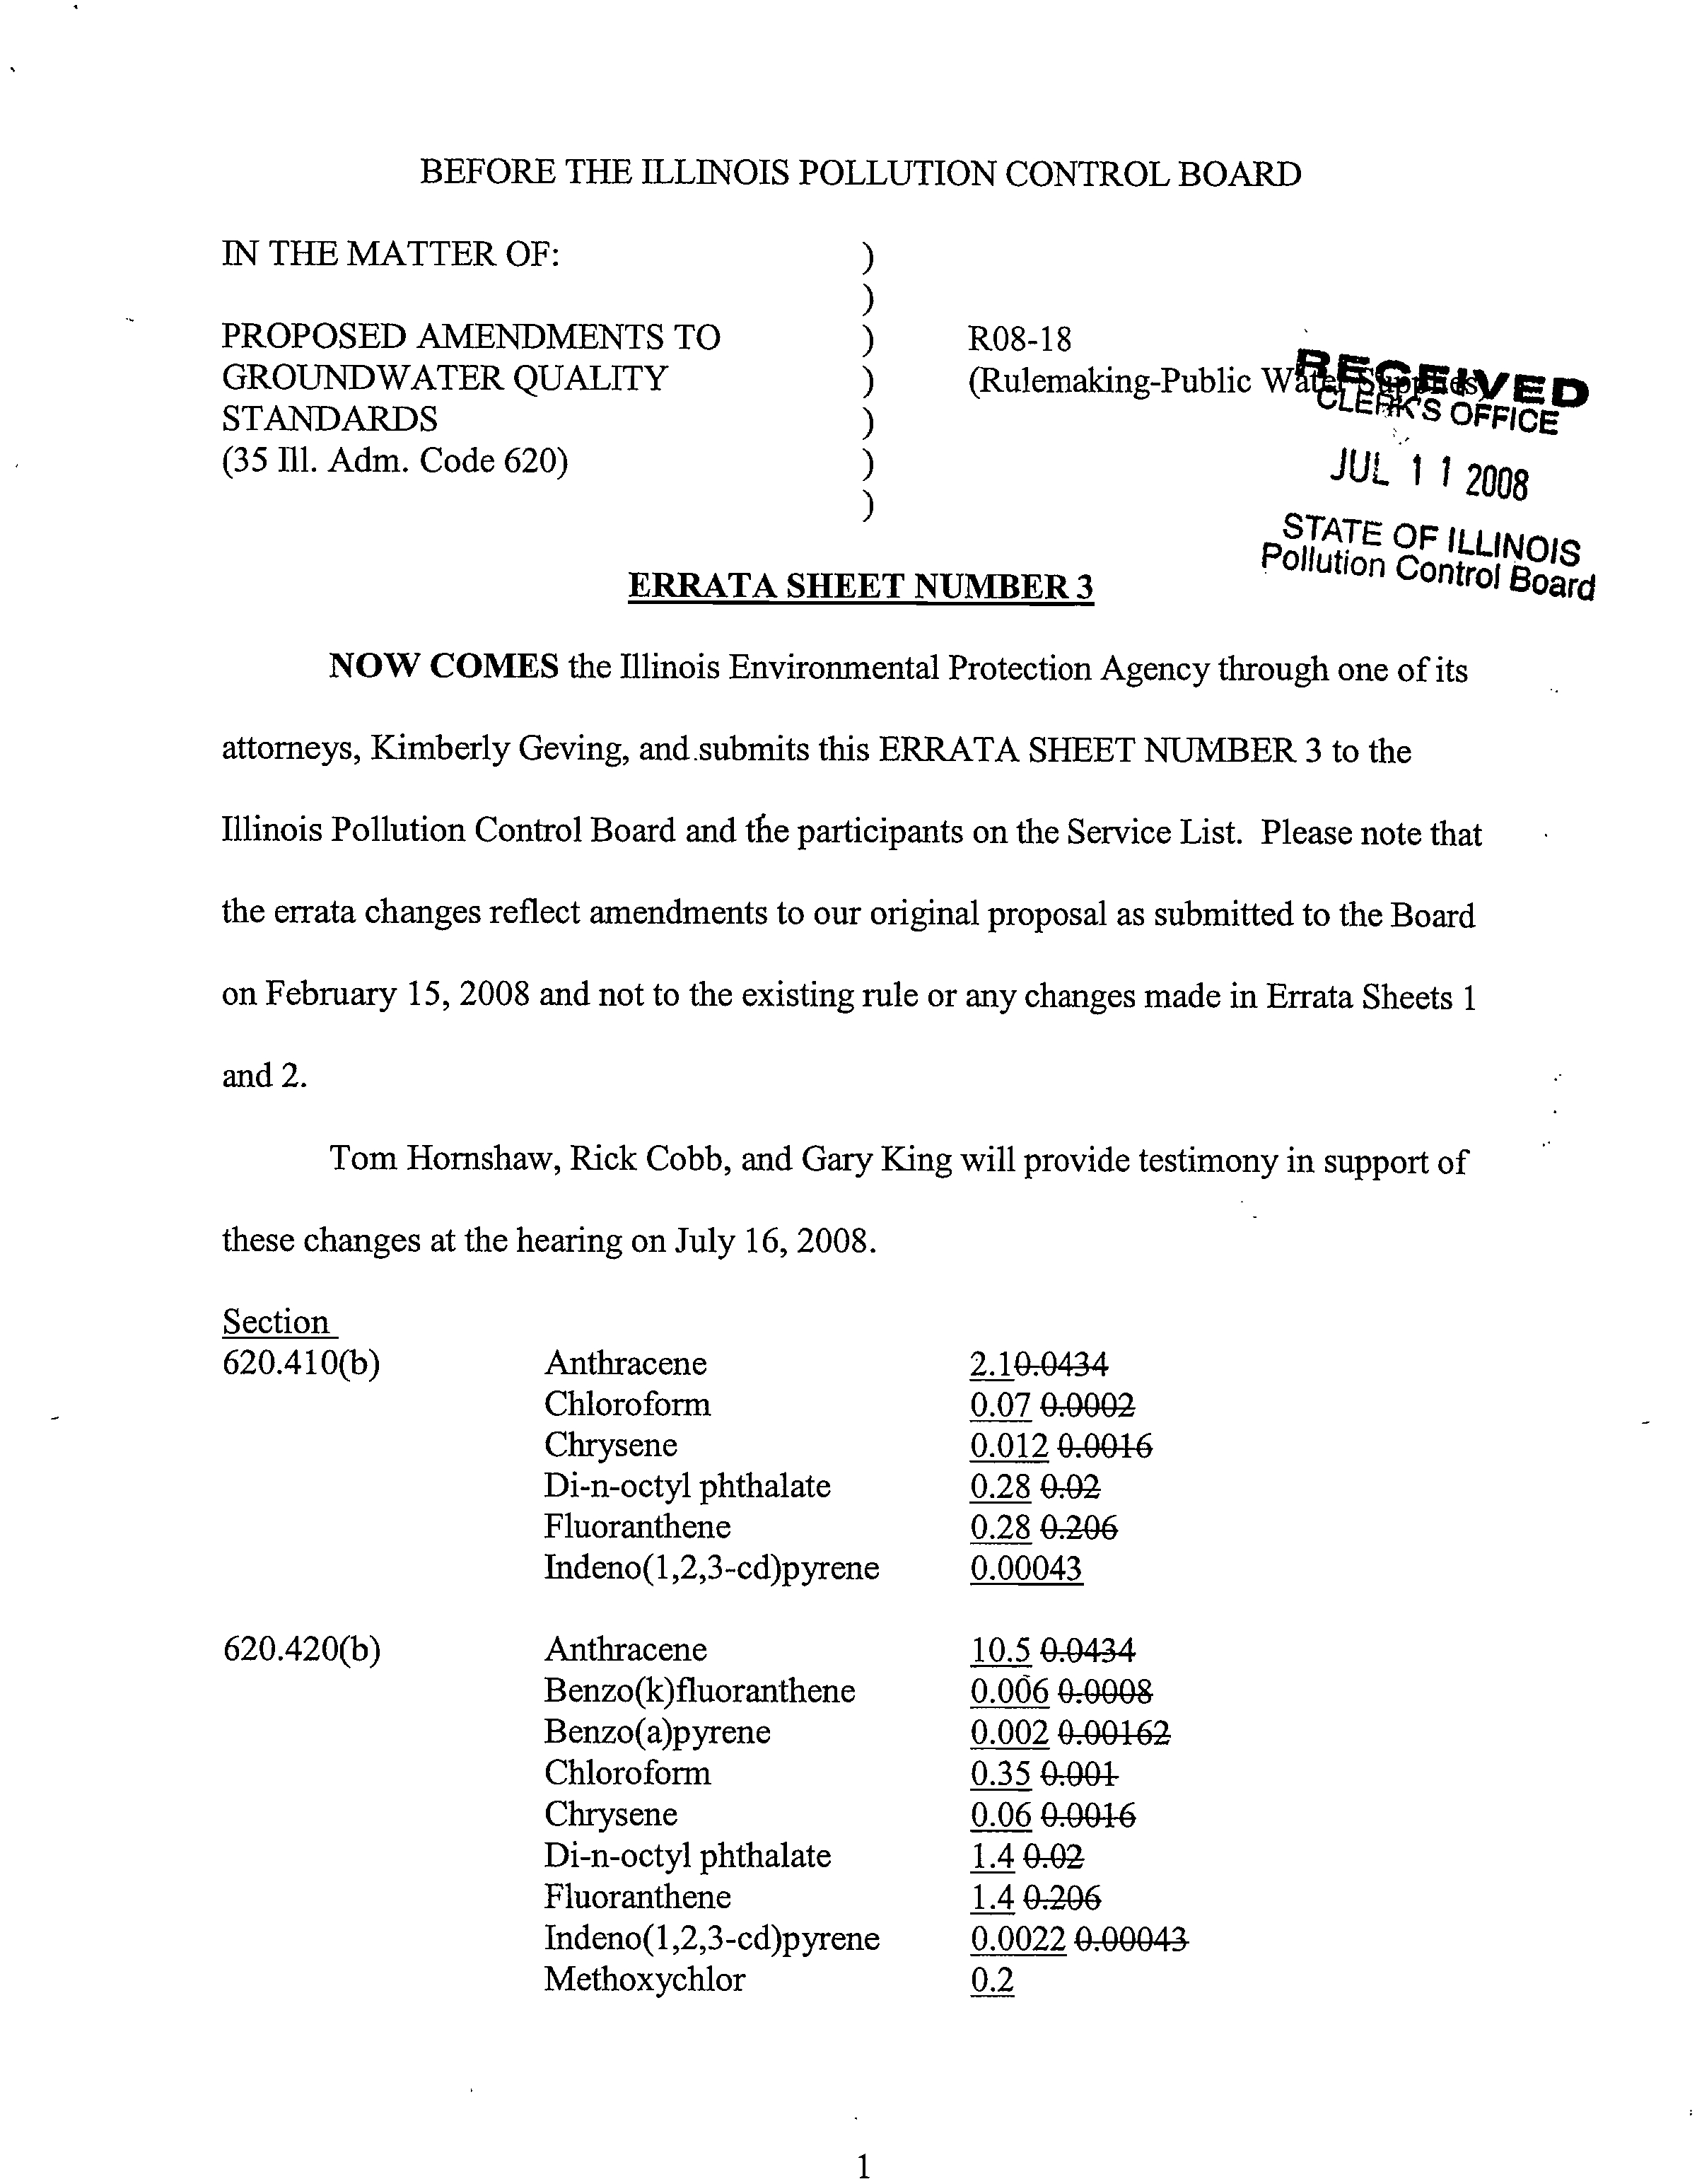
NOW COMES
the Illinois Environmental Protection Agency through one of its
attorneys, Kimberly Geving, and.submits this ERRATA SHEET NUMBER 3 to the
Illinois Pollution Control Board and the participants on the Service List. Please note that
the errata changes reflect amendments to our original proposal as submitted to the Board
on February 15, 2008 and not to the existing rule or any changes made in Errata Sheets 1
and 2.
Tom Hornshaw, Rick Cobb, and Gary King will provide testimony in support of
these changes at the hearing on July 16, 2008.
Section
620.410(b)
Anthracene
2.10,0434
Chloroform
0.07
0.0002
Chrysene
0.012
07004-6
Di-n-octyl phthalate
0.28 0.02
Fluoranthene
0.28
0.206
Indeno(1,2,3-cd)pyrene
0.00043
620.420(b)
Anthracene
10.5
0.0434
Benzo(k)fluoranthene
0.006
0.0008
Benzo(a)pyrene
0.002
0.00162
Chloroform
0.35 0:004-
Chrysene
0.06 0,004-6
Di-n-octyl phthalate
1.4
0.02
Fluoranthene
1.4 0406
Indeno(1,2,3-cd)pyrene
0.0022
0.00043
Methoxychlor
0.2
Kimberl A. Ge mg
Assist. Counsel
Division of Legal Counsel
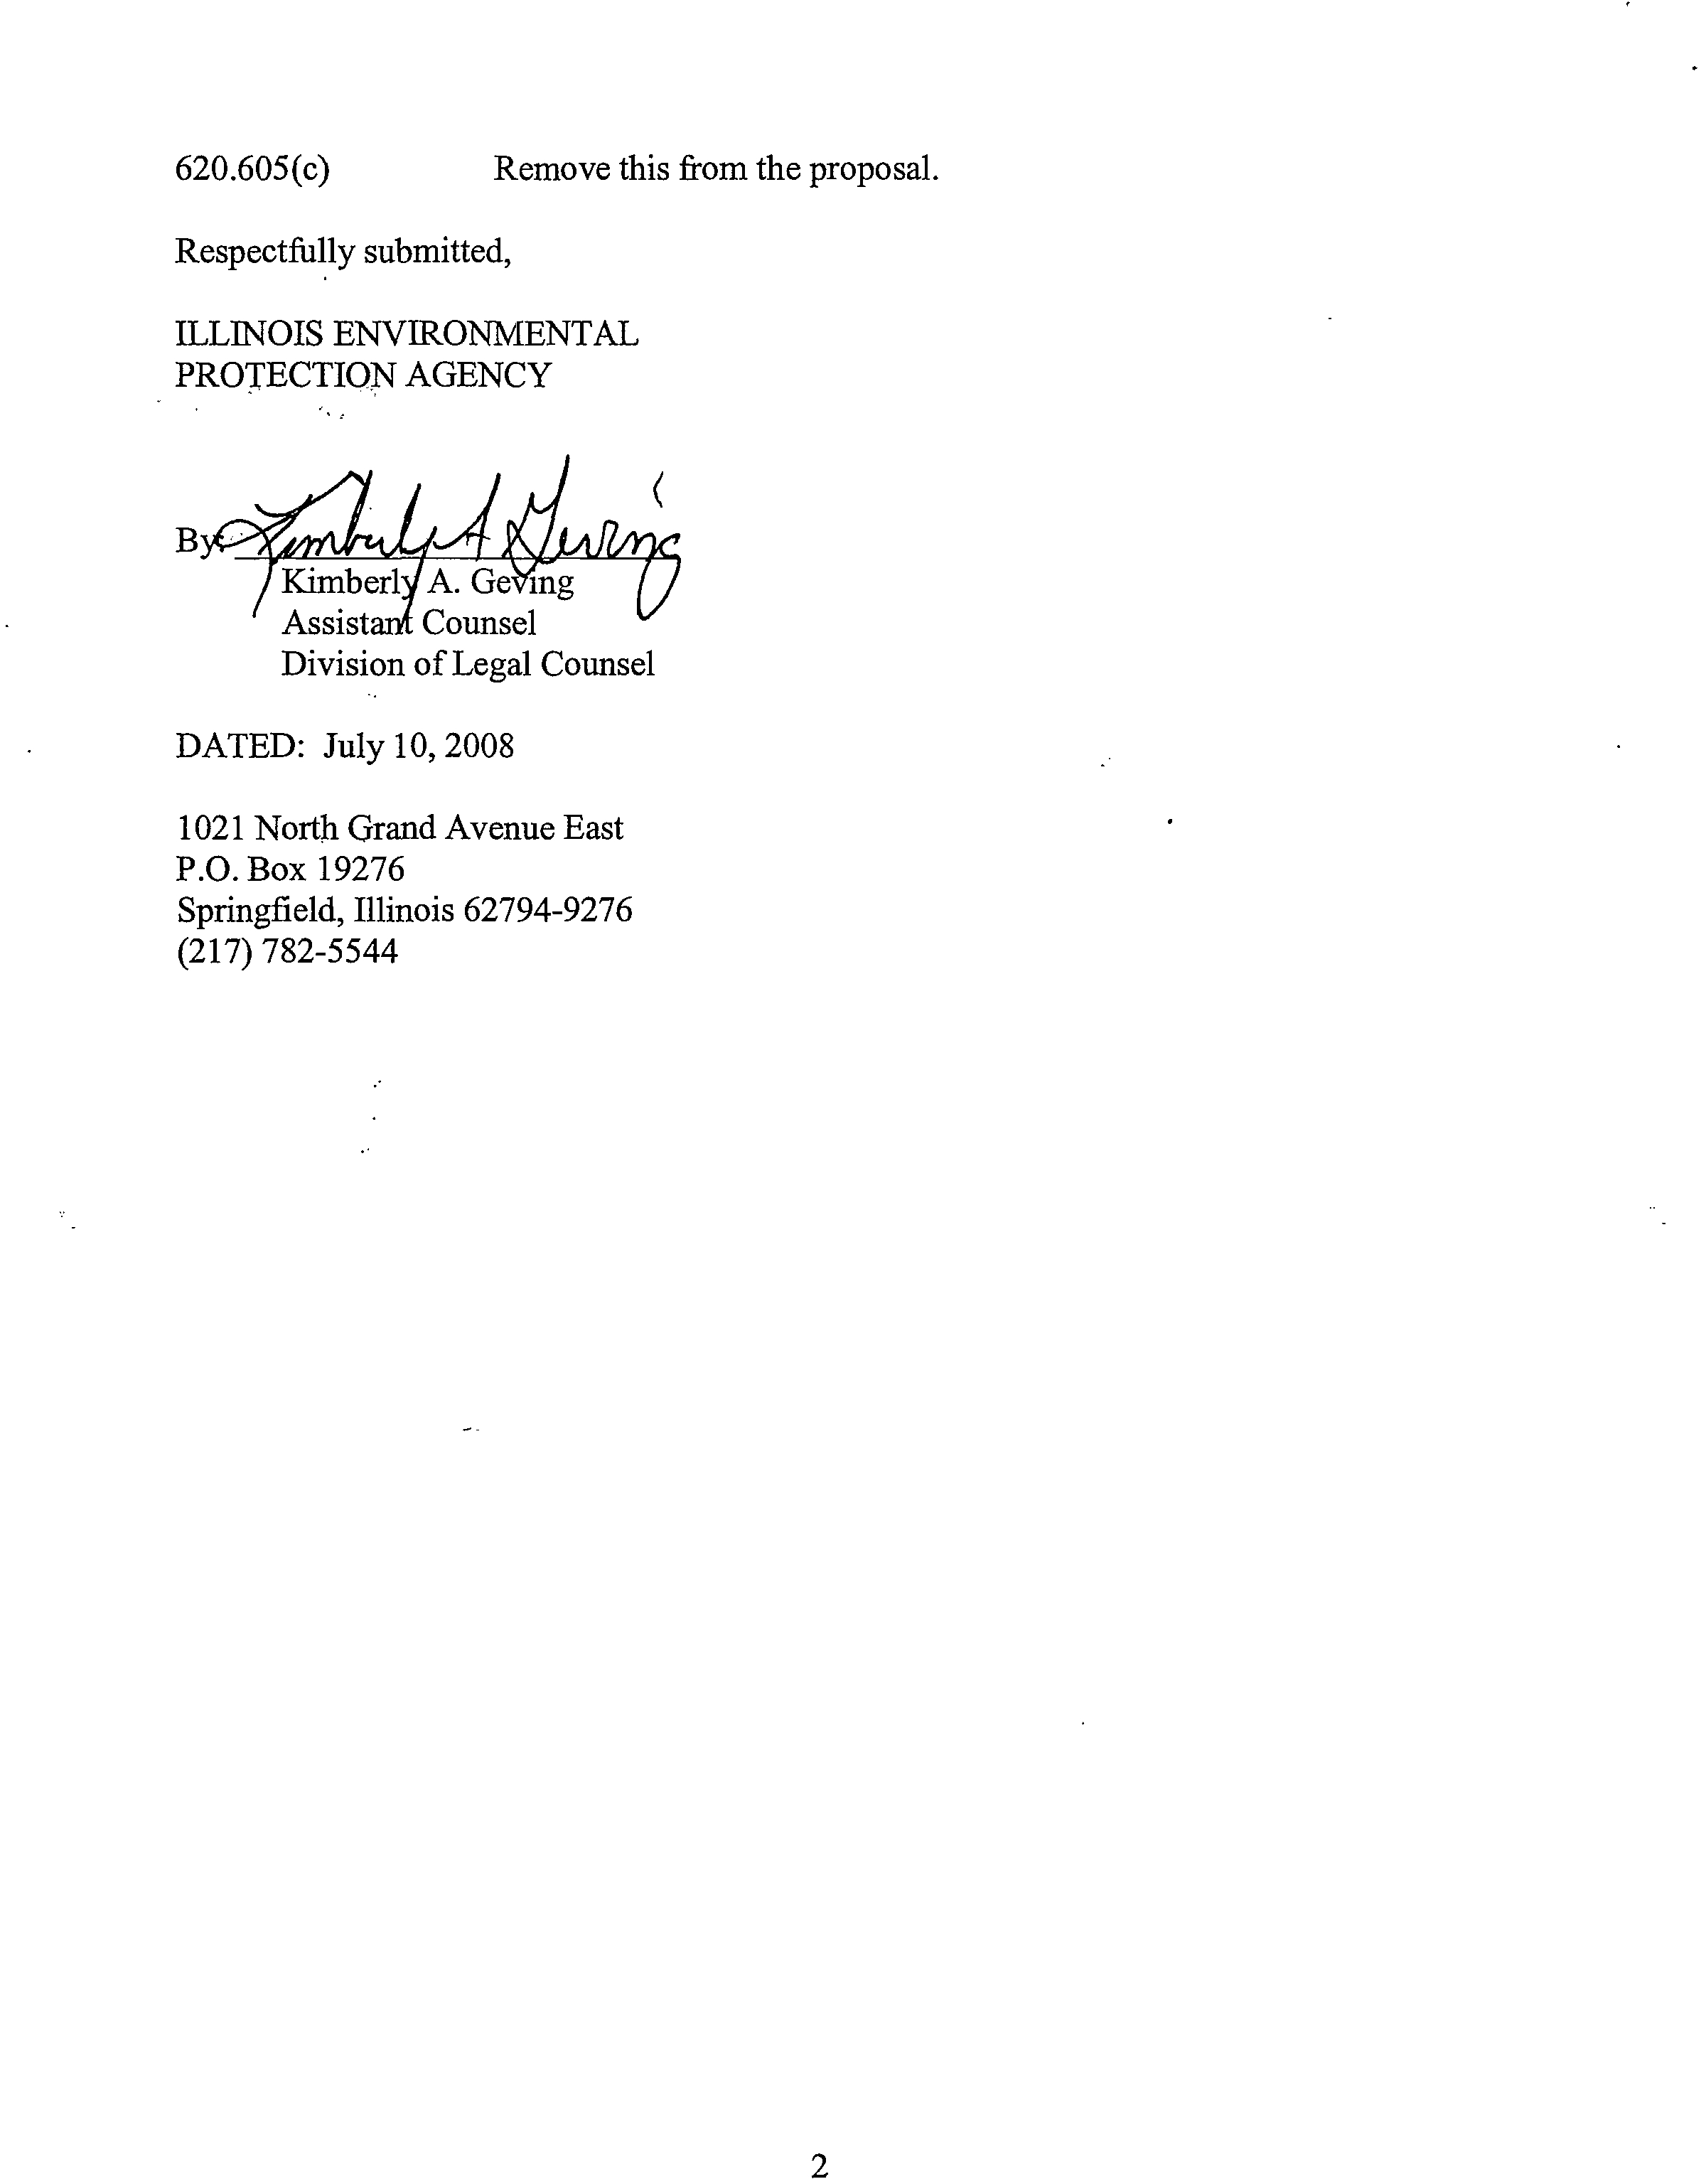
620.605(c)
Remove this from the proposal.
Respectfully submitted,
ILLINOIS ENVIRONMENTAL
PROTECTION AGENCY
DATED: July 10, 2008
1021 North Grand Avenue East
P.O. Box 19276
Springfield, Illinois 62794-9276
(217) 782-5544
2
BEFORE THE ILLINOIS POLLUTION CONTROL BOARD
IN THE MATTER OF:
R08-018
Receive()
(Rulemaking-Public Water Supp
ol7
utio
E
n
R:
OFFICE
STATE OF
SUPPLEMENTAL TESTIMONY OF THE ILLINOIS EPAP
jUL
/ 1 2008
C
ontrol
trol
I
Board
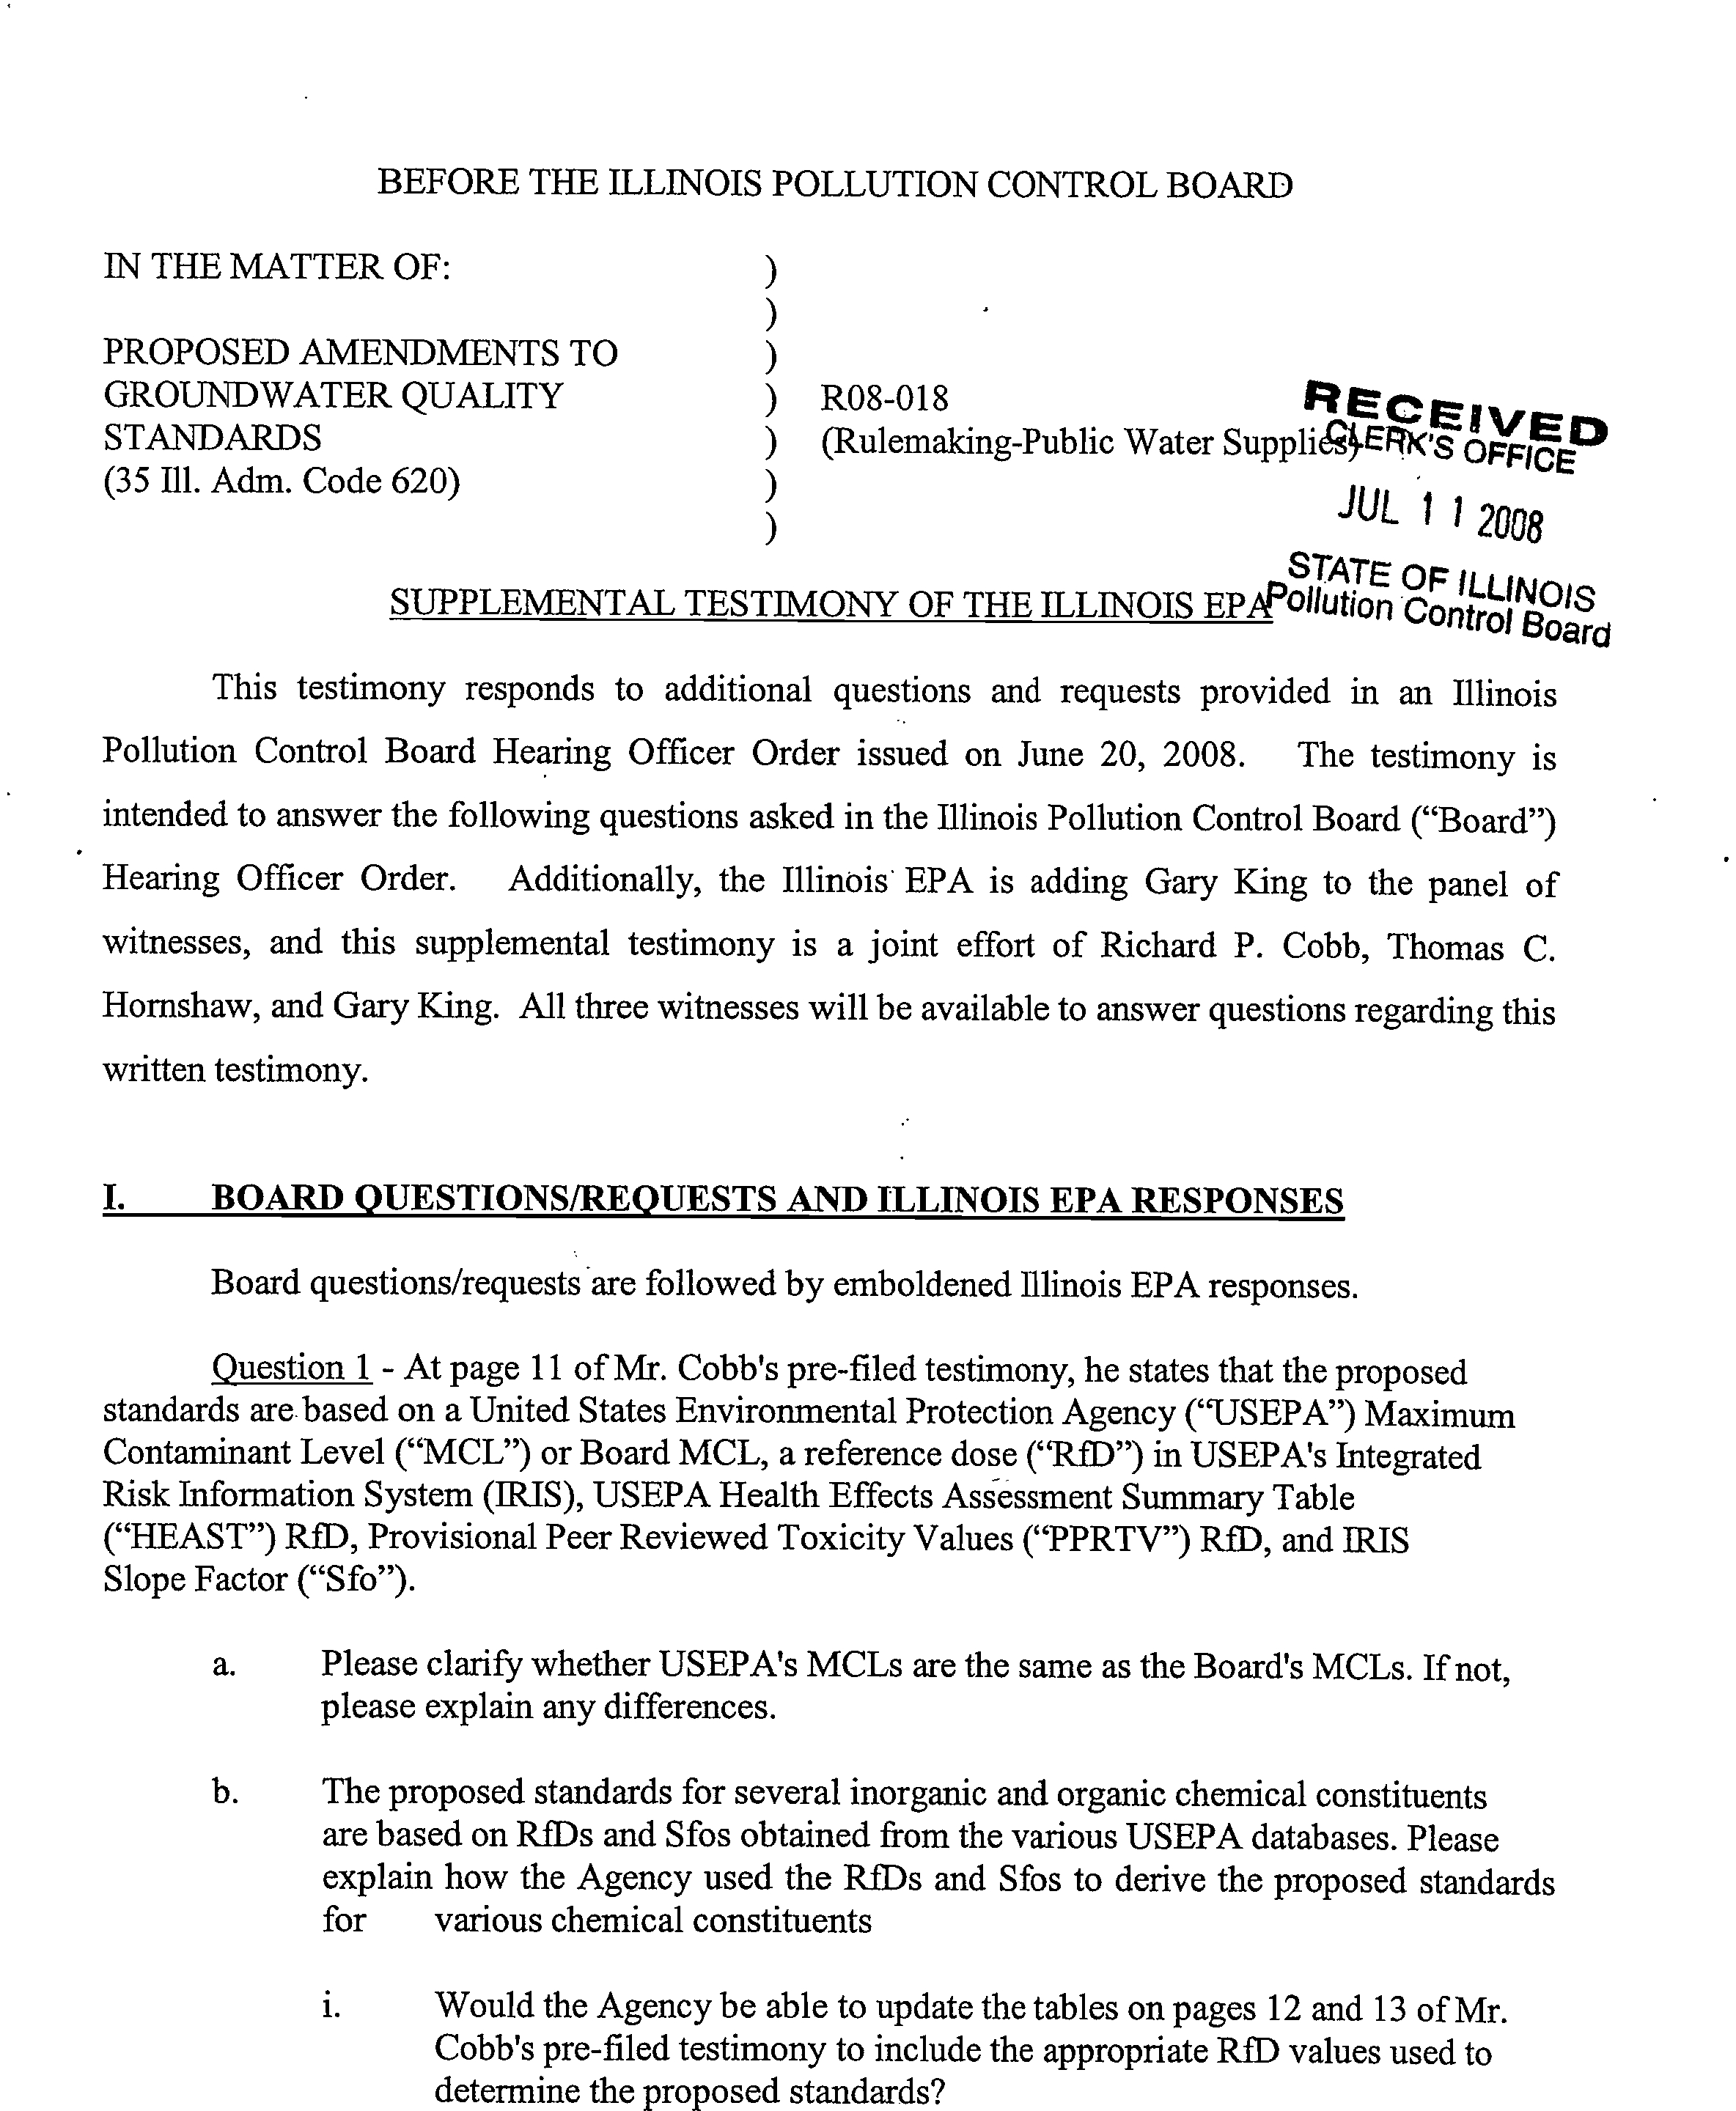
This testimony responds to additional questions and requests provided in an Illinois
Pollution Control Board Hearing Officer Order issued on June 20, 2008. The testimony is
intended to answer the following questions asked in the Illinois Pollution Control Board ("Board")
Hearing Officer Order. Additionally, the Illinois EPA is adding Gary King to the panel of
witnesses, and this supplemental testimony is a joint effort of Richard P. Cobb, Thomas C.
Hornshaw, and Gary King. All three witnesses will be available to answer questions regarding this
written testimony.
I.
?
BOARD QUESTIONS/REQUESTS AND ILLINOIS EPA RESPONSES
Board questions/requests are followed by emboldened Illinois EPA responses.
Question 1 -
At page 11 of Mr. Cobb's pre-filed testimony, he states that the proposed
standards are based on a United States Environmental Protection Agency ("USEPA") Maximum
Contaminant Level ("MCL") or Board MCL, a reference dose ("RfD") in USEPA's Integrated
Risk Information System (IRIS), USEPA Health Effects Assessment Summary Table
("HEAST") RfD, Provisional Peer Reviewed Toxicity Values ("PPRTV") RfD, and IRIS
Slope Factor ("Sfo").
a.
Please clarify whether USEPA's MCLs are the same as the Board's MCLs. If not,
please explain any differences.
b.
The proposed standards for several inorganic and organic chemical constituents
are based on RfDs and Sfos obtained from the various USEPA databases. Please
explain how the Agency used the RfDs and Sfos to derive the proposed standards
for
various chemical constituents
i. Would the Agency be able to update the tables on pages 12 and 13 of Mr.
Cobb's pre-filed testimony to include the appropriate RfD values used to
determine the proposed standards?
PROPOSED AMENDMENTS TO
GROUNDWATER QUALITY
STANDARDS
(35 Ill. Adm. Code 620)
ii.?
Also, would the Agency be able to submit pertinent documentation from
the USEPA databases concerning the RfDs and Sfos used to derive the
proposed standards?
c.?
Please clarify whether any of the proposed Class I standards are based on the
RfDs from USEPA's HEAST database. If so, please submit documentation
concerning the relevant RfDs/Sfos used to derive the proposed standards.
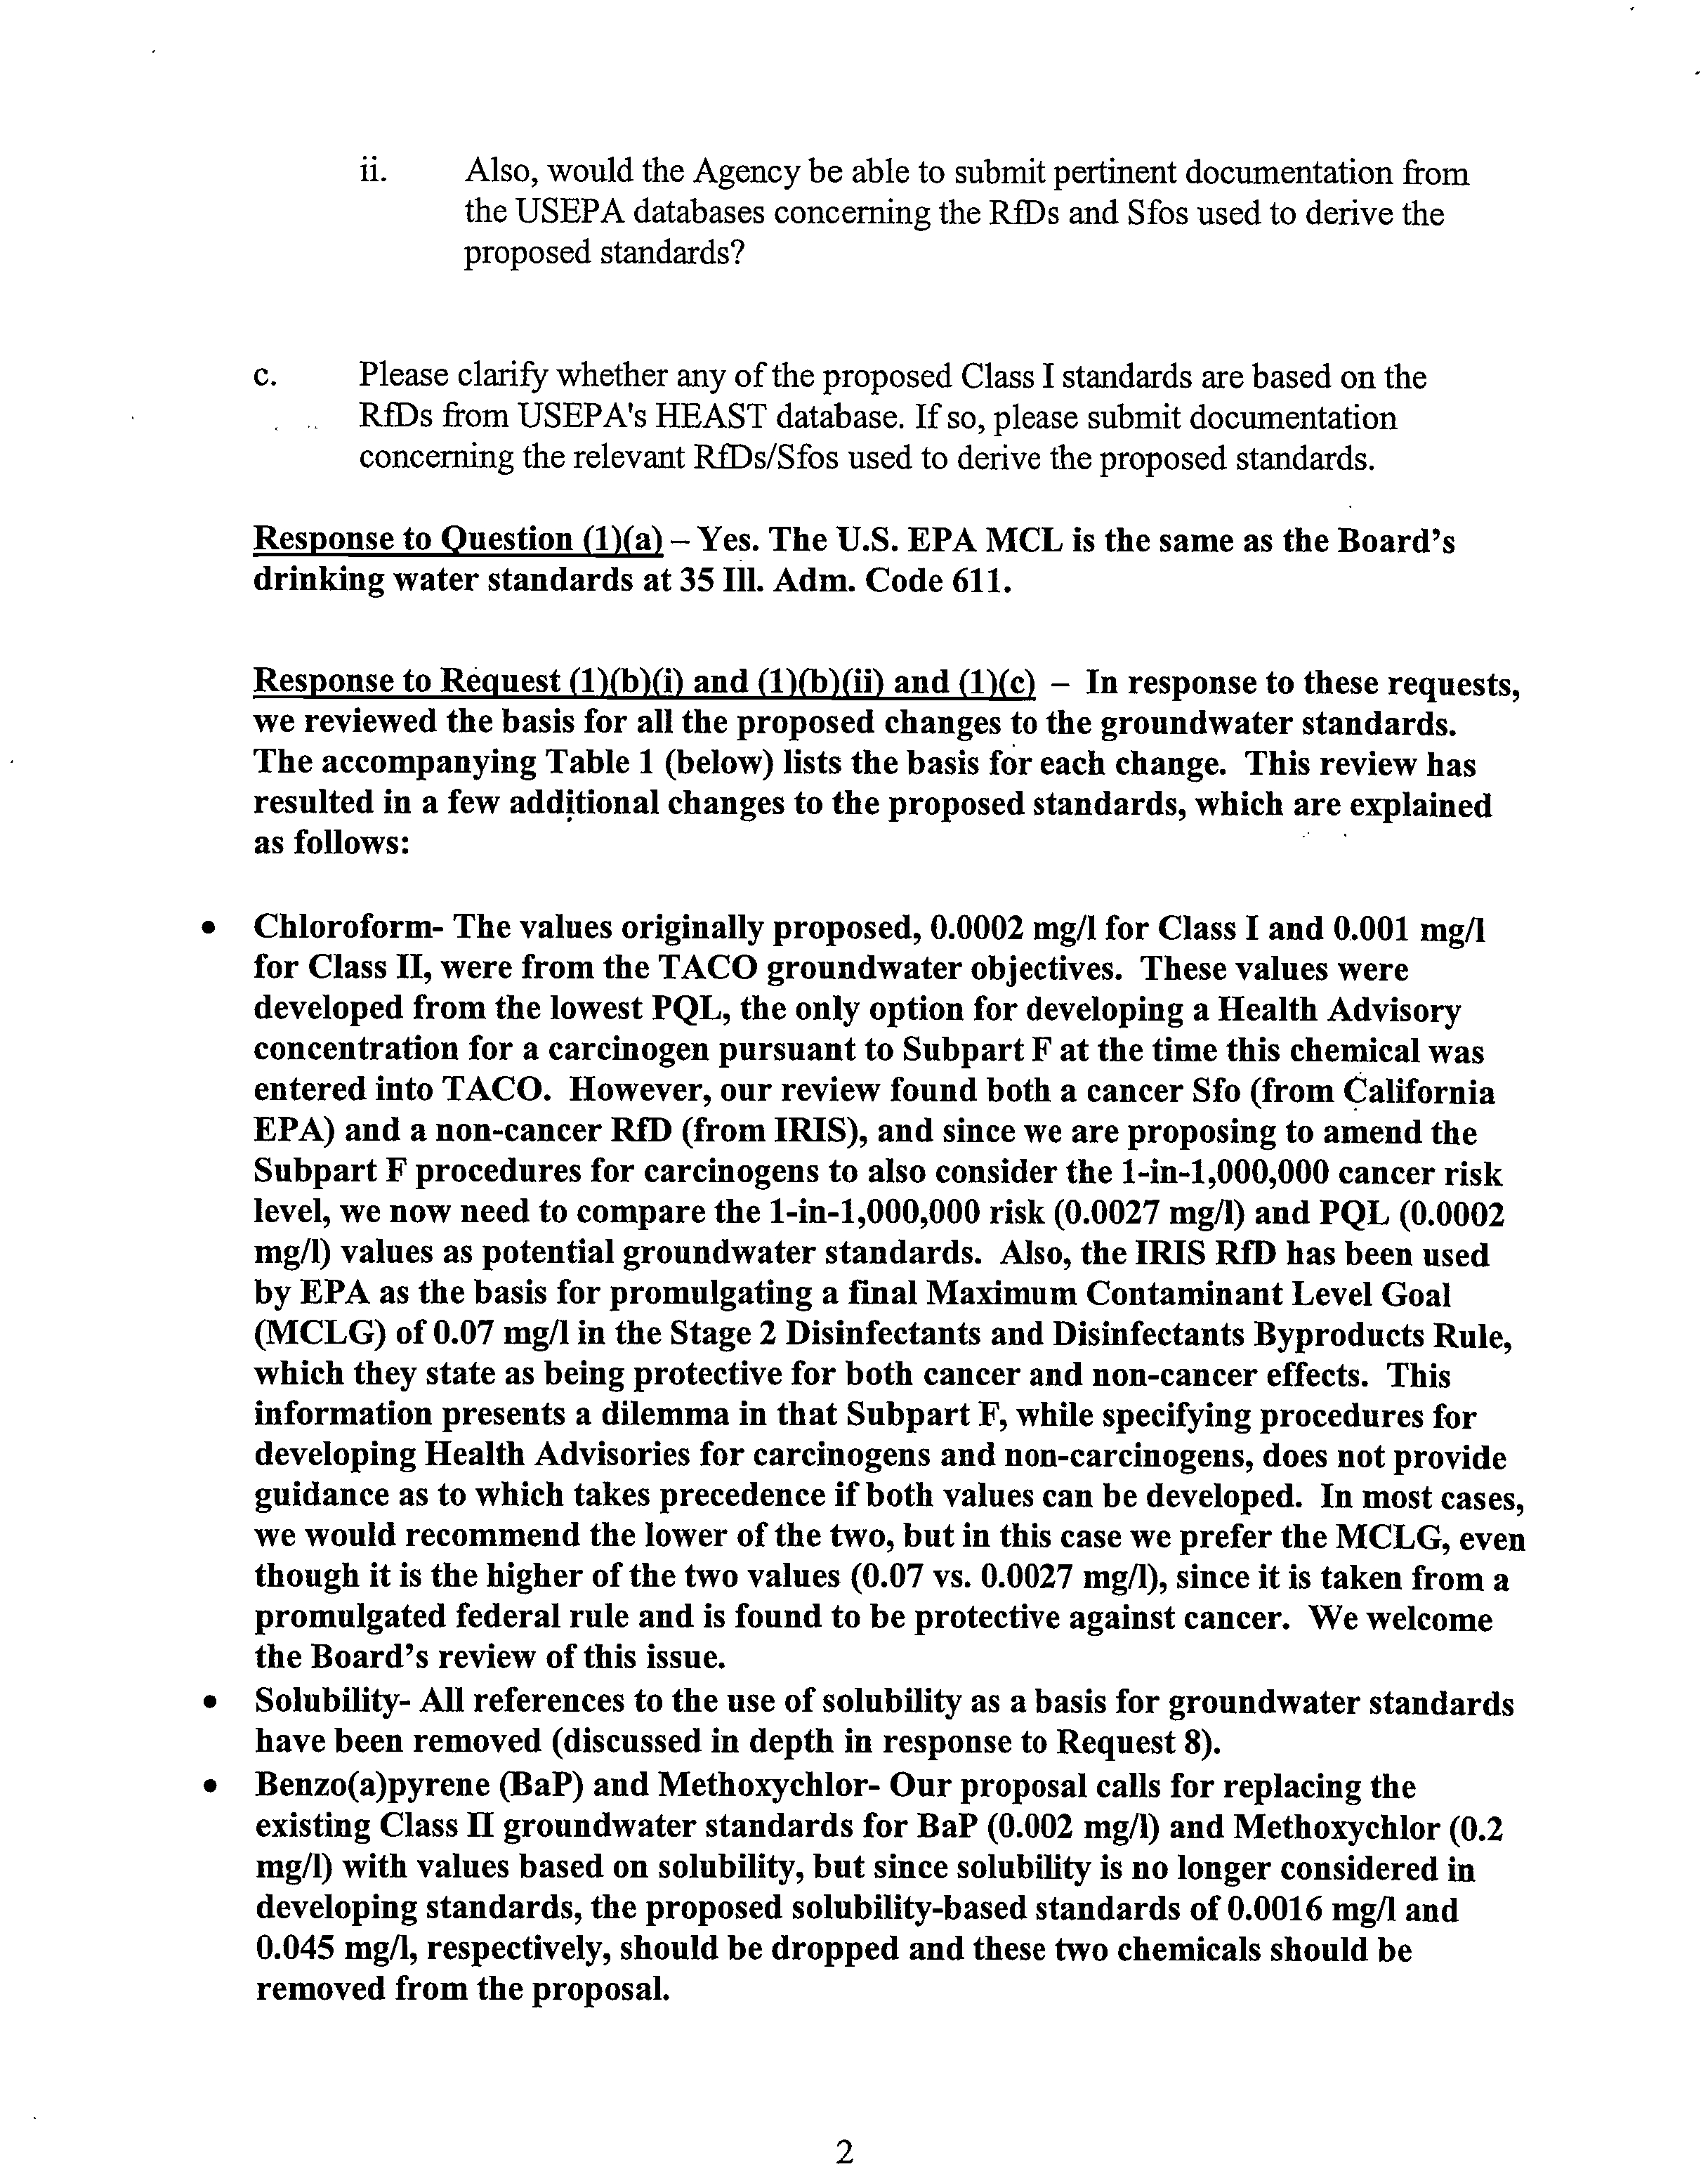
Response to Question (1)(a) – Yes. The U.S. EPA MCL is the same as the Board's
drinking water standards at 35 Ill. Adm. Code 611.
Response to Request (1)(b)(i) and (1)(b)(ii) and (1)(c) – In response to these requests,
we reviewed the basis for all the proposed changes to the groundwater standards.
The accompanying Table 1 (below) lists the basis for each change. This review has
resulted in a few additional changes to the proposed standards, which are explained
as follows:
•
Chloroform- The values originally proposed, 0.0002 mg/1 for Class I and 0.001 mg/1
for Class II, were from the TACO groundwater objectives. These values were
developed from the lowest PQL, the only option for developing a Health Advisory
concentration for a carcinogen pursuant to Subpart F at the time this chemical was
entered into TACO. However, our review found both a cancer Sfo (from California
EPA) and a non-cancer RfD (from IRIS), and since we are proposing to amend the
Subpart F procedures for carcinogens to also consider the 1-in-1,000,000 cancer risk
level, we now need to compare the 1-in-1,000,000 risk (0.0027 mg/1) and PQL (0.0002
mg/1) values as potential groundwater standards. Also, the IRIS RfD has been used
by EPA as the basis for promulgating a final Maximum Contaminant Level Goal
(MCLG) of 0.07 mg/1 in the Stage 2 Disinfectants and Disinfectants Byproducts Rule,
which they state as being protective for both cancer and non-cancer effects. This
information presents a dilemma in that Subpart F, while specifying procedures for
developing Health Advisories for carcinogens and non-carcinogens, does not provide
guidance as to which takes precedence if both values can be developed. In most cases,
we would recommend the lower of the two, but in this case we prefer the MCLG, even
though it is the higher of the two values (0.07 vs. 0.0027 mg/1), since it is taken from a
promulgated federal rule and is found to be protective against cancer. We welcome
the Board's review of this issue.
•
Solubility- All references to the use of solubility as a basis for groundwater standards
have been removed (discussed in depth in response to Request 8).
•
Benzo(a)pyrene (BaP) and Methoxychlor- Our proposal calls for replacing the
existing Class II groundwater standards for BaP (0.002 mg/I) and Methoxychlor (0.2
mg/1) with values based on solubility, but since solubility is no longer considered in
developing standards, the proposed solubility-based standards of 0.0016 mg/1 and
0.045 mg/1, respectively, should be dropped and these two chemicals should be
removed from the proposal.
2
Response to Question (1)(c)- The reference to HEAST should be dropped. HEAST
was used to derive some of the TACO objectives. However, we are now listing the
TACO objective as the basis for some of the proposed new groundwater standards.
TABLE 1: Toxicology Values Used To Develop Proposed 620 Standards
Inorganic Chemicals
Proposed
Class I
Standard
(mg/L)
Basis for
Class I
Standard
Proposed
Class II
Standard
(mg/L)
Basis for
Class
II
Standard
Reference
Dose (RfD)
Oral Slope
Factor
(SFo)
Arsenic*
0.010
Board
and
U.S.EPA MCL
0.20
Irrigation
-
-
Molybdenum
0.035
IRIS RID
0.035
1X Class I
0.005
-
Perchlorate
0.0049
IRIS RfD
0.0049
Treatment
Factor
0.0007
-
Vanadium
0.049
TACO /H
EAST
RfD
0.1
•
Irrigation
0.007
•
-
Volatile Organic
Compounds
Proposed
Class I
Standard
(mg/L)
Basis for
Class I
Standard
Proposed
Class II
Standard
(mg/L)
Basis for
Class II
Standard
Reference
Dose (RfD)
Oral Slope
Factor
(SFo)
Acetone
6.3
TACO/IRI S
RfD
6.3
1X Class I
0.9
-
2-Butanone (MEK)
4.2
IRIS RfD
4.2
1X Class I
0.6
-
Carbon disulfide
0.7
TACO/IRIS
RfD
3.5
5X Class I
0.1
-
Chloroform* (risk-based)
0.0027
10
-6
cancer
risk/CalEPA
SFo
0.014
5X Class I
-
0.031
Chloroform* (criteria-based)
0.07
U.S.EPA
MCLG
0.35
5X Class I
-
-
Dichlorodifluoromethane
1.4
IRIS RID
7.0
5X Class I
0.2
-
1,1-Dichloroethane
1.4
PPRTV RID
7.0
5X Class I
0.2
-
Isopropylbenzene (Cumene)
0.7
IRIS RfD
3.5
5X Class I
0.1
-
Trichlorofluoromethane
2.1
IRIS RfD
10.5
5X Class I
0.3
-
Semivolatile Organic
Compounds
Proposed
Class I
Standard
(mg/L)
Basis for
Class I
Standard
Proposed
Class II
Standard
(mg/L)
Basis for
Class II
Standard
Reference
Dose (RfD)
Oral Slope
Factor
(SFo)
Acenaphthene
0.42
TACO/IRI S
RID
2.1
5X Class I
0.06
-
Anthracene
2.1
TACO/IRI S
RfD
10.5
5X Class I
0.3
-
Benzo(a)anthracene*
0.00013
TACO/ADL
0.00065
5X Class I
-
-
Benzo(b)fluoranthene*
0.00018
TACO/ADL
0.0009
5X Class I
-
-
Benzo(k)fluoranthene*
0.0012
10-6 cancer
risk/IRIS
risk/IRISSFo
0.006
5X Class I
-
0.073
Benzoic acid
28.0
TACO/IRI S
RfD
28.0
1X Class I
4.0
-
Chrysene*
0.012
1 0-6 cancer
0.06
5X Class I
-
0.0073
3
risk/IRIS SFo
Dibenzo(a,h,)anthracene*
0.0003
TACO/ADL
0.0015
5X Class I
-
-
Diethyl phthalate
5.6
TACO/IRIS
RID
5.6
1X Class I
0.8
-
Semivolatile Organic
Compounds (continued)
Proposed
Class I
Standard
(mg/L)
Basis for
Class I
Standard
Proposed
Class
I
Standard
(mg/L)
Basis for
Class H
Standard
Reference
Dose (RfD)
Oral Slope
Factor
(SFo)
Di-n-butyl phthalate
0.7
TACO/IRI S
RID
3.5
5X Class I
0.1
-
Di-n-octyl phthalate
0.28
TACO/
PPRTV RID
1.4
5X Class I
0.04
-
Fluoranthene
0.28
TACO/IRIS
RfD
1.4
5X Class I
0.04
-
Fluorene
0.28
TACO/IRIS
RID
1.4
5X Class I
0.04
-
Indeno(1,2,3-cd)pyrene*
0.00043
TACO/ADL
0.0022
5X Class I
-
.
-
2-Methylnaphthalene
0.028
IRIS RfD
0.14
5X Class I
0.004
-?
.
2-Methylphenol
0.35
TACO/IRI S
RfD
0.35
1X Class I
0.05
Naphthalene
0.14
TACO/IRIS
RID
0.22
TACO/IRIS
RfD
0.02
-
p-Dioxane*
0.0077
10?
-6 cancer
risk/IRIS SFo
0.0077
1X Class I
-
0.011
Pyrene
0.21
TACO/IRIS
RfD
1.05
5X Class I
0.03
-
Pesticide Compounds
Proposed
Class I
Standard
(mg/L)
Basis for
Class
I
Standard
Proposed
Class
II
Standard
(mg/L)
Basis for
Class
H
Standard
Reference
Dose
(RfD)
Oral Slope
Factor
(SFo)
alpha-BHC*
0.00011
TACO/ADL
0.00055
5X Class I
-
Dicamba
0.21
IRIS RID
0.21
1X Class I
0.03
-
MCPP (Mecoprop)
0.007
IRIS RfD
0.035
5X Class I
0.001
-
Explosive Compounds
Proposed
Class I
Standard
(mg/L)
. Basis for
Class I
Standard
Proposed
Class II
Standard
(mga)
Basis for
Class H
Standard
Reference
Dose (RfD)
Oral
Slope
Factor
(SFo)
1,3-Dinitrobenzene
0.0007
IRIS RID
0.0007
1X Class I
0.0001
-
2,4-Dinitrotoluene*
0.0001
l
e cancer
risk/IRIS SFo
0.0001
1X Class I
-
0.68
2,6-Dinitrotoluene*
0.00031
TACO/ADL
0.00031
1X Class I
-
-
HMX•
1.4
IRIS RfD
1.4
1X Class I
0.05
Nitrobenzene
0.0035
TACO/IRIS
RID
0.0035
1X Class I
0.0005
-
RDX
0.084
IRIS RID
0.084
1X Class I
0.003
0.84
-
1,3,5-Trinitrobenzene
IRIS RID
0.84
1X Class I
0.03
-
2,4,6-Trinitrotoluene
0.014
IRIS RID
0.014
1X Class I
0.0005
-
* Denotes a carcinogen.
- Denotes no data or not applicable.
4
Question 2 - On page 11 of Mr. Cobb's pre-filed testimony, he states that some of the
proposed standards are based on Method Detection Limits ("MDLs") used to derive the Part 620,
Subpart F, Appendix A: Human Threshold Toxicant Advisory Concentration for Tiered
Approach to Corrective Action Objectives ("TACO") groundwater objectives under Part
742.
a.
Please clarify whether all of the proposed standards based on TACO groundwater
objectives are based on MDLs.
b.
Also, please explain how MDLs were used to derive the proposed standards for
which TACO groundwater objectives are listed as the basis for the standard.
Response to Question (2)(a) – Referencing the MDL was incorrect. The practical
quantitation limit ("PQL") should have been referenced.
Response to Question (2)(b) - Some of the TACO objectives were based on PQLs (not
MDLs) where the health based numbers were below the PQL.
Question 3 - Also on page 11 of Mr. Cobb's pre-filed testimony, he notes that carcinogens
are denoted in the proposed Class I standard by an asterisk. Please clarify whether
dibenzo(a,h)anthracene should be listed under Section 620.410(b) with an asterisk to
indicate that it is a carcinogen.
Response to Question 3 – Dibenzo (a,h) anthracene is a carcinogen, and should be so
noted.
Request 4 - The proposal lists the acronyms for several chemical constituents in Section
620.410. Please provide the chemical names for alpha-BHC, MCPP, HMX and RDX.
Response to Request 4 – The following provides the chemical, common and
abbreviated names:
Chemical.Naine
onithon Name
Abbreviated
-
'Name
1,2,3,4,5,6-hexachlorocyclohexane
Alpha-Benzene
hexachloride
alpha-BHC
2-(2-Methyl-4-chlorophenoxy)
propionic acid
Mecoprop
MCPP
Octahydro-1,3,5,7-Tetranitro-
1,3,5,7-Tetrazocine
High Melting
Explosive, Octogen
HMX
Hexahydro-1,3,5-trinitro-1,3,5-
triazine
Royal Demolition
Explosive, Cyclonite
RDX
Request 5 - On page 14 of Mr. Cobb's pre-filed testimony, he states that the proposed Class
II standards for inorganic constituents are based on irrigation and livestock watering from a
5
1972 report published by the National Academy of Sciences entitled "Water Quality
Criteria." Would the Agency be able to submit a copy of the NAS report or the relevant
pages of the report?
Response to Request 5 – Per your request a copy of the NAS report is attached.
Question 6 -
On page 14 of Mr. Cobb's pre-filed testimony, the groundwater standards
table lists the basis for the proposed Class II standard for molybdenum as the Class I standard, but
it is
also noted that the irrigation criterion is 10. Please explain the rationale for proposing the
Class II standard for molybdenum at the same level as Class I standard instead of the
irrigation criterion.
Response to Question 6 – The note should have been that the irrigation criterion is
0.01 milligrams per liter ("mg/1"). Therefore, since the magnitude of the proposed
Class I standard at 0.035 mg/1 is not significantly different from 0.01 mg/1, the Illinois
EPA proposed the 0.035 mg/1 as the Class II standard.
Question 7 - On
page 16 of Mr. Cobb's pre-filed testimony, he states that a five-fold
treatment factor was used to derive a Class II standard for organic compounds with a Koc value
greater than that of ethylbenzene or a Henry's Law constant greater than that of methylene
chloride. Please comment on whether the same factors were considered in deriving the
TACO Class II groundwater objectives, which are also being proposed as the Class II
. standards in the Agency's proposal.
Response to Question 7 – Yes.
Request 8 -
Mr. Cobb lists water solubility as the basis for several Class I and Class II
standards. Please provide citations to the publications from which the Agency obtained the water
solubility values to develop the standards.
Response to Request 8 - There has been considerable dialogue recently between the
Agency and the Illinois Environmental Regulatory Group (IERG) regarding the use
of solubility as a limitation on the Class I and Class II groundwater standards. Some
of this dialogue is reflected in a line of questioning initiated by Mr. Davis in the first
hearing in Chicago, and the Agency and IERG continued this dialogue in a July 8
meeting at the Agency. Several key issues were discussed at this meeting.
The Illinois EPA has been administering 35 Ill. Adm. Code 742 "Tiered Approach to
Corrective Action Objectives" ("TACO") since 1998. TACO has proven to be a
complex, but flexible approach to the remediation of contaminated sites in Illinois and
has been a model for the development of similar approaches in several other States.
There are a number of principles that underlie the successes of TACO. Two of those
principles are pertinent to the discussion of water solubility as a basis for
groundwater quality standards in this proceeding: (1) the risk-based principles
6
embodied in Tiers 1,2, and 3 of Part 742 and (2) the "speed bump" principles in
Subpart C. The risk-based methodology allows the development of remediation
objectives that are tailored to the specific contaminant risks pertinent to a site. The
speed bump principles provide a methodology such that the contaminant source
materials are removed from a site. As an example, groundwater cannot be excluded
as a pathway of concern until free product is removed.
There is a close nexus between TACO and the Part 620 standards. The groundwater
remediation objectives in TACO (Appendix B, Table E) were generally either taken
from Part 620 or were developed using Part 620 methodologies to protect
groundwater users. TACO has been updated as the Part 620 standards have changed
over the years. Since the Part 620 standards are primarily health based in origin,
TACO evaluations of the groundwater ingestion exposure route have likewise been
health based in evaluating risk from the site contamination.
The current regulatory proceeding will result in changes to the Part 620 standards.
In due course, TACO will be amended to reflect the Part 620 standards. Currently,
Illinois EPA is working on a significant amendatory proposal to TACO that is
intended to be filed with the Board later this summer. This proposal will incorporate
a new pathway (indoor inhalation) and many changes to the Tier 1 remediation
objectives based on more current toxicological information. We also intend the
proposal to reflect the ongoing changes in this Part 620 proceeding.
As part of Illinois EPA's consultation with the Site Remediation Advisory Committee
("SRAC") with regards to our draft TACO proposal, it was brought to our attention
that some of the proposed changes to the Part 620 standards, namely those based on
solubility of contaminants, would have unintended, but potentially significant
consequences for cleanups under TACO. The concern is that where groundwater
quality standards are based on contaminant solubility rather than contaminant health
risks the TACO groundwater and soil remediation objectives for those contaminants
will no longer have a risk-based approach.
After reviewing the concerns raised by SRAC, we concur that the existing Agency
proposal would have unintended consequences on TACO cleanups and should be
modified. For example, for the contaminant anthracene, the existing Tier 1 soil
remediation objective ("RO") for residential properties for the soil component of the
groundwater ingestion exposure route is 12,000 mg/1, which would protect drinking
water uses in Class I groundwater. If the groundwater quality standard is based on
solubility (.043 mg/I) instead of risk to drinking water users (2.1 mg/1), then the
calculated Tier 1 soil RO would drop two orders of magnitude from 12,000 mg/kg to
43 mg/kg. Illinois EPA believes that TACO should continue the risk-based approach
it has followed to date.
Thus, as a result of the Agency dropping the solubility limitation, this request is now
moot and no citations are provided. Note that where solubility had been listed in Mr.
Cobb's testimony as the basis for a groundwater standard, the standard has been
7
replaced by the appropriate risk-based value in the attached Table 1 for Anthracene,
Benzo(k)fluoranthene, Chrysene, Di-n-octyl phthalate, Fluoranthene, and
Indeno(1,2,3-c,d)pyrene. Note also that for Benzo(a)pyrene and Methoxychlor, which
already have existing standards, Mr. Cobb's testimony on page 17 states that the
Class II standards should be changed to reflect water solubility; since solubility is no
longer a basis for standards, these chemicals' existing Class II standards should not
be changed, and these two chemicals should be removed from the proposal.
Question 9 - All of the proposed Class II standards, which are based on water solubility, are
set at the same level as the Class I standards, except for benzo(a)pyrene, benzo(k)fluoranthene and
methoxychlor. Please explain the Agency's intent.
Response to Question 9 –
The question is now moot, as discussed above.
Question 10 - According to the table on page 16 of Mr. Cobb's pre-filed testimony and
errata
sheet No. 2, the proposed Class II standard for benzo(a)pyrene is 0.0016 mg/L. Further, on
page 17 of Mr. Cobb's pre-filed testimony, he states that the existing Class II standard should be
amended to 0.0002 mg/L based on its water solubility. Please clarify which value
represents the limit based on water solubility of benzo(a)pyrene, 0.0016 mg/L or 0.0002
mg/L.
Response to Question 10 –
The question is now moot, as discussed above.
Question 11 - The proposed Class II standards for explosive
.
compounds at Section
620.420(c) are set at the same levels proposed for Class I groundwater. Please clarify whether the
Koc values or the Henry's Law constants for these compounds are below threshold values
considered by the Agency for setting standards based on treatability.
Response to Question 11 –
The aforementioned thresholds are used when data is
available on best available treatment ("BAT") technology research. Unfortunately no
BAT studies were available for these contaminants. Thus, the proposed Class II
standards were based on a
lx
treatability factor.?
-
Question 12 - On page 18 of Mr. Cobb's pre-filed testimony, regarding the proposed
changes to the Class IV groundwater quality standards pertaining to explosive contaminants, he
states that the designation of a previously mined area is being proposed because it moves the
compliance point from the pit of the mine to the boundary of the permitted area in order
to establish off-site contamination. Please clarify whether the proposed changes are
intended to apply only to a "previously mined area" as defined in Section 620.110, which
limits such area to land disturbed or affected by coal mining operations prior to February
1, 1983.
Response to Question
12 –
Yes, the Illinois EPA intended for the proposed
amendment to Subsection 620.440(d) to apply to a "previously mined area" as defined
in Section 620.110, which limits such area to land disturbed or affected by coal mining
operations prior to Februaryl, 1983. This clarification is needed to reverse part of
8
what I provided in my testimony concerning the boundary of the permitted area.
Since this mining was done pre-1983, there was no permit boundary.
Request 13 - On page 2 of Dr. Hornshaw's pre-filed testimony, he refers to a USEPA
memorandum dated December 5, 2003, concerning Human Health Toxicity Values in Superfund
Risk Assessments. Would the Agency be able to submit a copy of the memorandum?
Response to Request 13 —
See the attached.
Question 14 - On page 3 of Dr. Hornshaw's pre-filed testimony, he notes that one of the
issues concerning the new hierarchy of toxicity values pertains to the retirement of PPRTV by
USEPA.
a.
Please clarify whether retirement of a PPRTV for a chemical means that
USEPA has established a permanent RID for the chemical or just dropped
the value from its database.
b.
Also, does USEPA provide any explanation for retiring a PPRTV?
Response to Question 14(a)—
It is the Toxicity Assessment Unit's understanding that
entries into the PPRTV database have a 6-month time limit, after which the entry is
retired and removed from the database. Since these retirements are not based on the
quality of the data, we have decided to continue using the toxicity information. We
are not aware of EPA's timetable for developing permanent RfDs and Sfos in IRIS or
for "un-retiring" values and adding them back into the PPRTV database.
Response to Question 14(b)-
We have not been provided with any explanations for
retiring chemicals from the PPRTV database other than that there is a 6-month time
limit.
Question 15 - On page 4 of Dr. Hornshaw's pre-filed testimony, regarding subchronic
exposures, he states that the Agency used the IRIS values with the Uncertainty Factor removed for
some of the chemical constituents as the first tier when available. Please identify the chemical
constituents for which this procedure was used to develop the proposed standards.
Response to Question 15 —
None. This was included in testimony only as an example
of the issues that the Toxicity Assessment Unit had to resolve regarding the EPA
hierarchy of toxicity information sources. Subchronic toxicity values are only used in
conjunction with the construction worker soil ingestion exposure route in
.
TACO, so
no subchronic values were used to develop the proposed standards.
Question 16 - Also on page 4 of Dr. Hornshaw's pre-filed testimony, he states that changes
needed in TACO because of the new hierarchy will be addressed when the next revision to the
TACO rules are proposed to the Board. Please clarify whether the TACO groundwater
9
objective for 1,1-Dichloroethane of 0.7 mg/L, which is lower than the proposed Class I
standard of 1.4 mg/L, is one of the needed revisions.
Response to Question 16 – Yes.
Question 17 -
On page 5 of Dr. Hornshaw's pre-filed testimony, he states that the Toxicity
Assessment Unit decided to include in the proposal any chemical from the Bureau of Land's
master list that had a toxicity value in the IRIS database. Please explain the rationale for limiting
the chemicals to only those with IRIS toxicity values instead of considering the USEPA's
three-tier hierarchy.
Response to Question 17 –
As
stated in Dr. Hornshaw's oral testimony in response to
a similar question, the Toxicity Assessment Unit decided to include in the proposal
any of the "new" chemicals (those not already in TACO) for which toxicity data were
available in the IRIS and PPRTV databases. It was reasoned that these two sources
provide nationally-accepted and peer-reviewed criteria as the basis for developing the
new standards.
Question 18 -
On page 7 of Dr. Hornshaw's pre-filed testimony, he states that additional
corrections are necessary for several reasons, including the revision of the selection criteria for
groundwater standards for carcinogenic chemicals. Dr. Hornshaw notes that the revised
criteria require a comparison of each carcinogenic constituent's health based
concentration (1 in million risk level) with its corresponding analytical MDL, the greater
of which is compared with the constituent's reported water solubility.
a.
Please clarify whether the analytical detection limit represents the carcinogenic
constituent's MDL or its lowest Practical Quantitation Limit (PQL).
b.
If the detection limit represents the MDL, should Part 620, Subpart F continue to
refer to PQLs or should it be amended to state MDLs?
Response to Question 18(a)– As discussed above, all references to MDLs should
be
changed to PQLs.
Response to Question 18(b)- Continue to refer to PQLs.
II. CONCLUSION
This concludes the supplemental testimony of the Illinois EPA witnesses. We will be
available to answer any questions.
10
MIV
GueeTO
F;
A Report of the
Committee on Water Quality Criteria
Environmental Studies Board
National Academy of Sciences
National Academy of Engineering
Washington, D.C., 1972
At the request of
and funded by
The Environmental Protection Agency
Washington, D.C., 1972
,••••••,
•
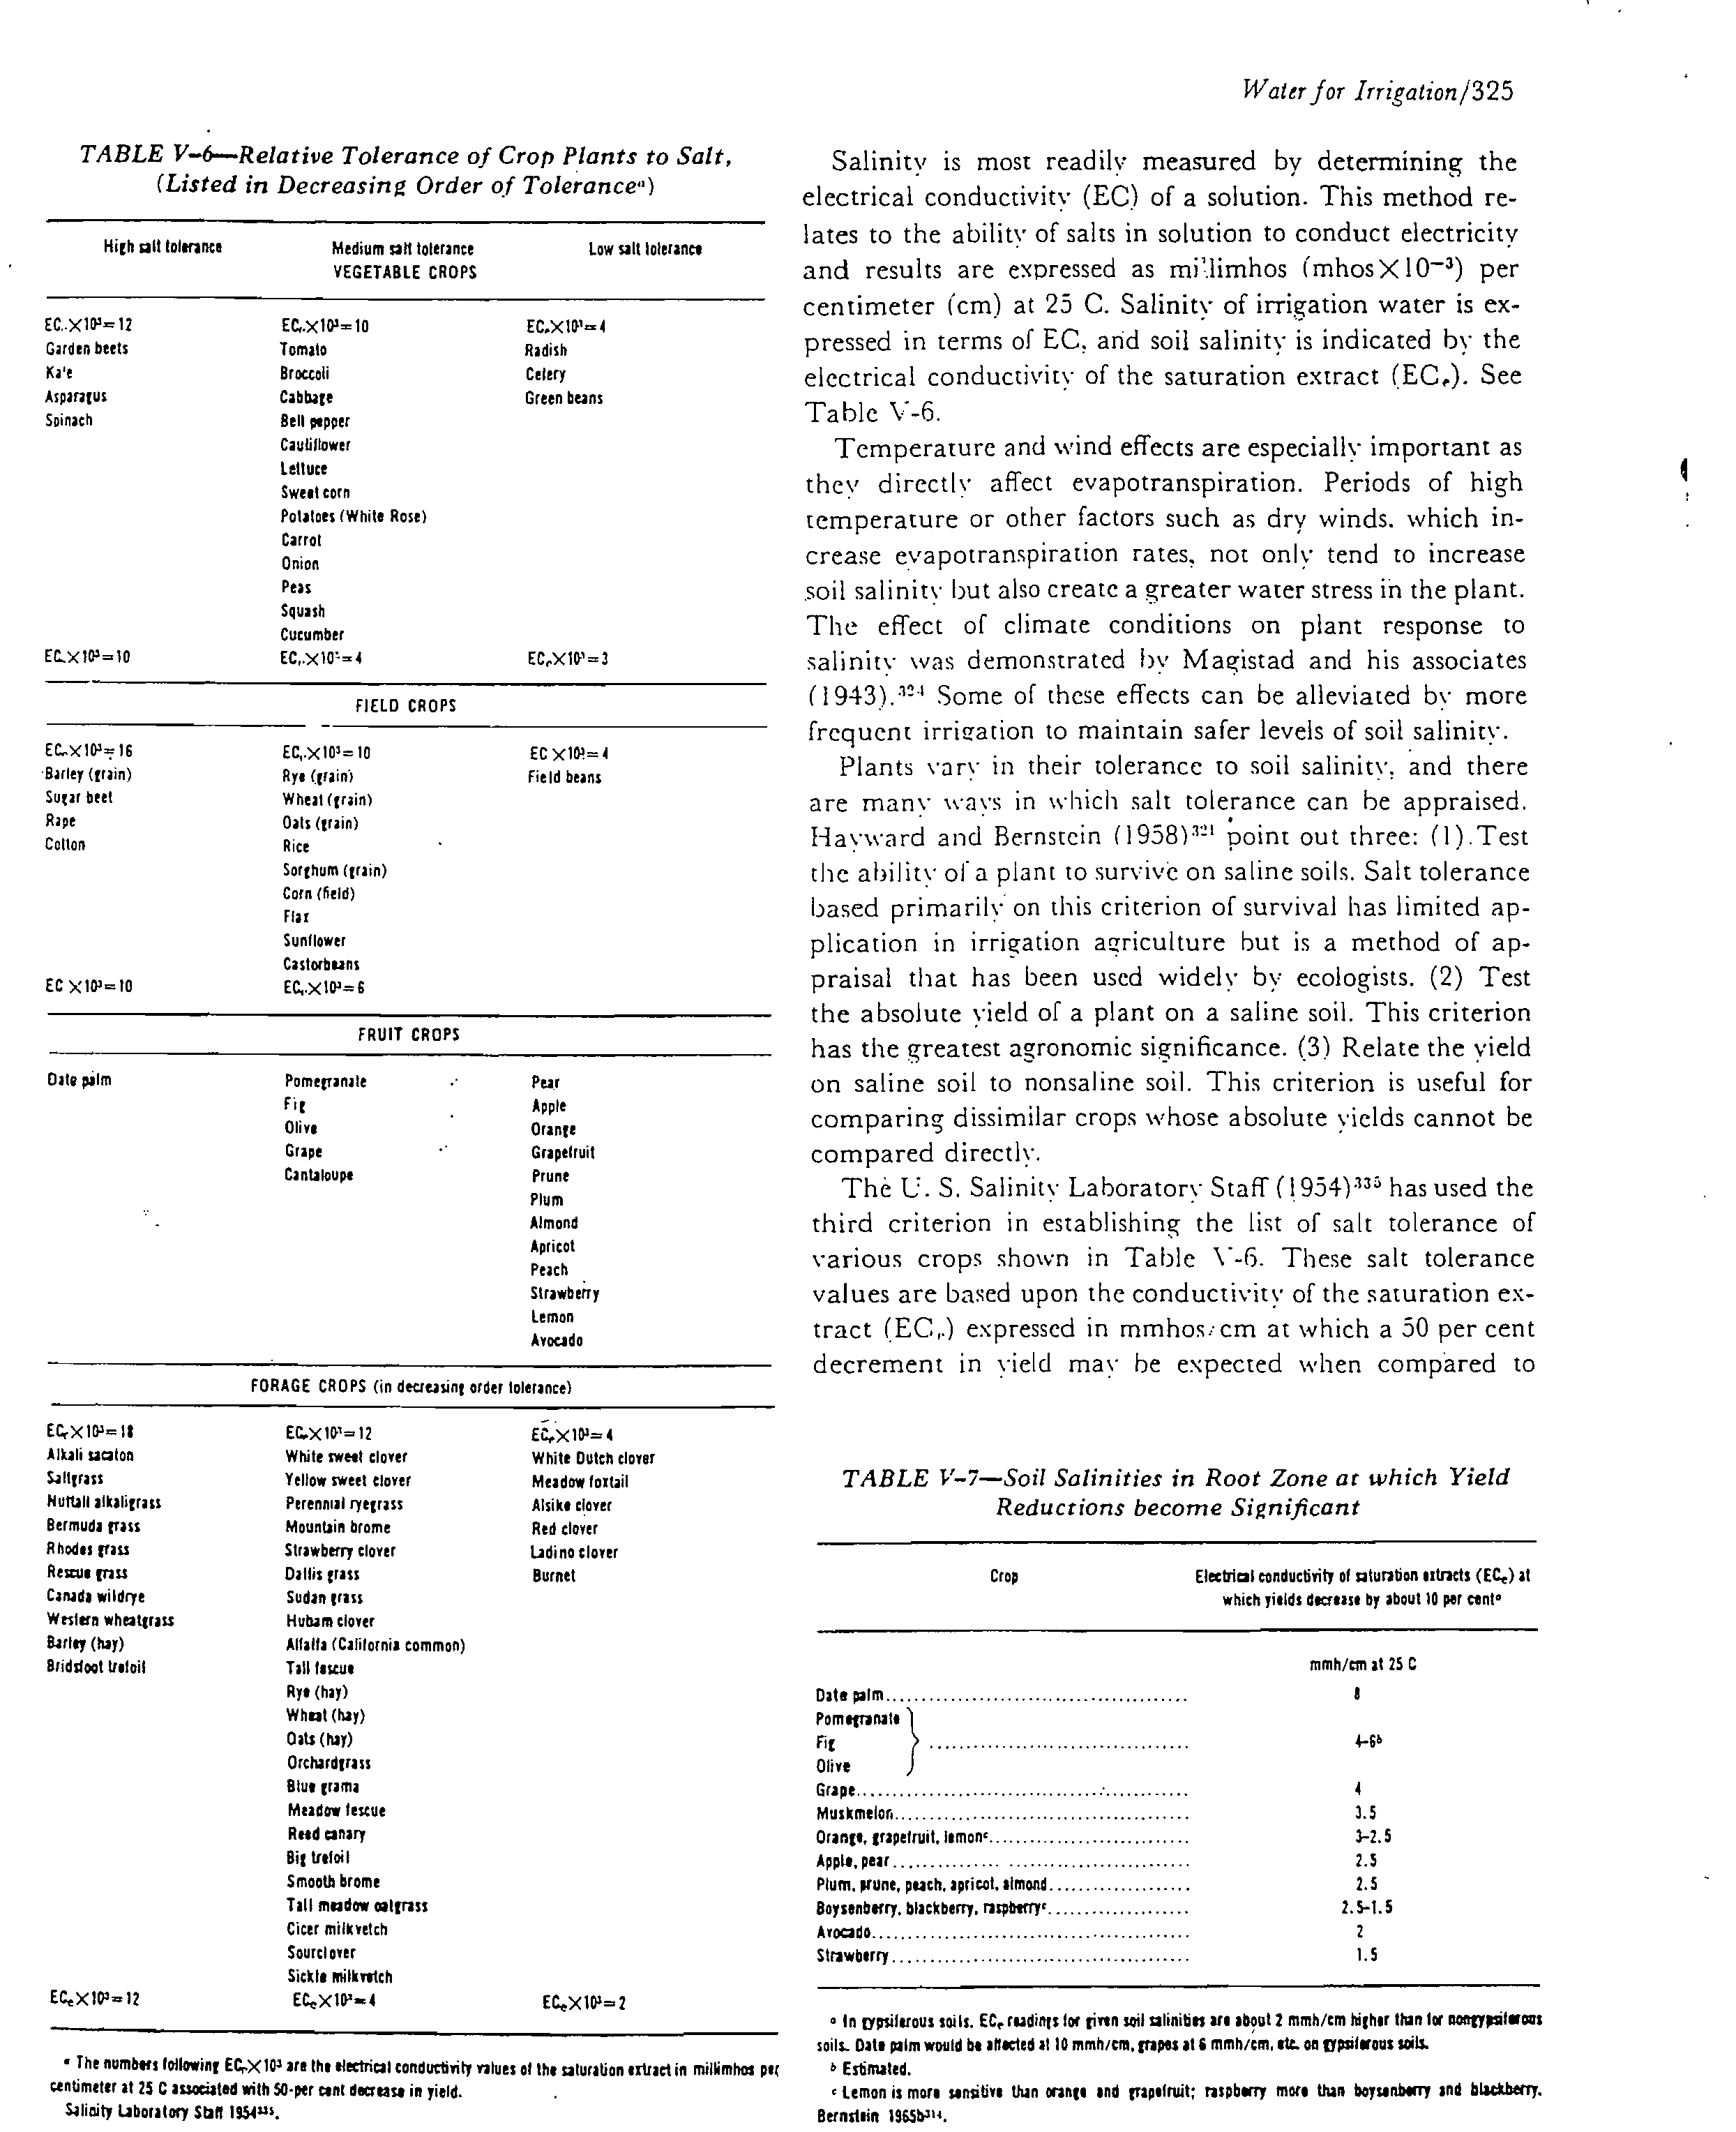
GENERAL TABLE OF CONTENTS
NOTICE ?
LETTER OF TRANSMITTAL
?
?
vi
MEMBERS OF THE ENVIRONMENTAL STUDIES BOARD
?
vii
?
MEMBERS OF THE WATER QUALITY CRITERIA COMMITTEE,
NAS STAFF, AND PANEL MEMBERS, ADVISORS, AND CON-
TRIBUTORS
??
viii
PREFACE
?
xv
?
ACKNOWLEDGMENTS
?
xvii
GENERAL INTRODUCTION
?
?
1
SECTION I RECREATION AND AESTHETICS ?
6
?
SECTION II PUBLIC WATER SUPPLIES
?
48
SECTION III FRESHWATER AQUATIC LIFE AND WILDLIFE
?
106
SECTION IV MARINE AQUATIC LIFE AND WILDLIFE
?
214
SECTION
V
AGRICULTURAL USES OF WATER
?
298
SECTION VI INDUSTRIAL WATER SUPPLIES ?
? 368
APPENDIX I (RECREATION AND AESTHETICS) ?
398
APPENDIX II (FRESHWATER AQUATIC LIFE AND WILDLIFE)
?
402
APPENDIX III (MARINE AQUATIC LIFE AND WILDLIFE)
?
448
GLOSSARY ?
519
CONVERSION" FACTORS
?
524
BIOGRAPHICAL NOTES ON THE WATER QUALITY CRITERIA
COMMITTEE AND THE PANEL MEMBERS
?
? 528
AUTHOR INDEX
?
535
SUBJECT INDEX
?
562
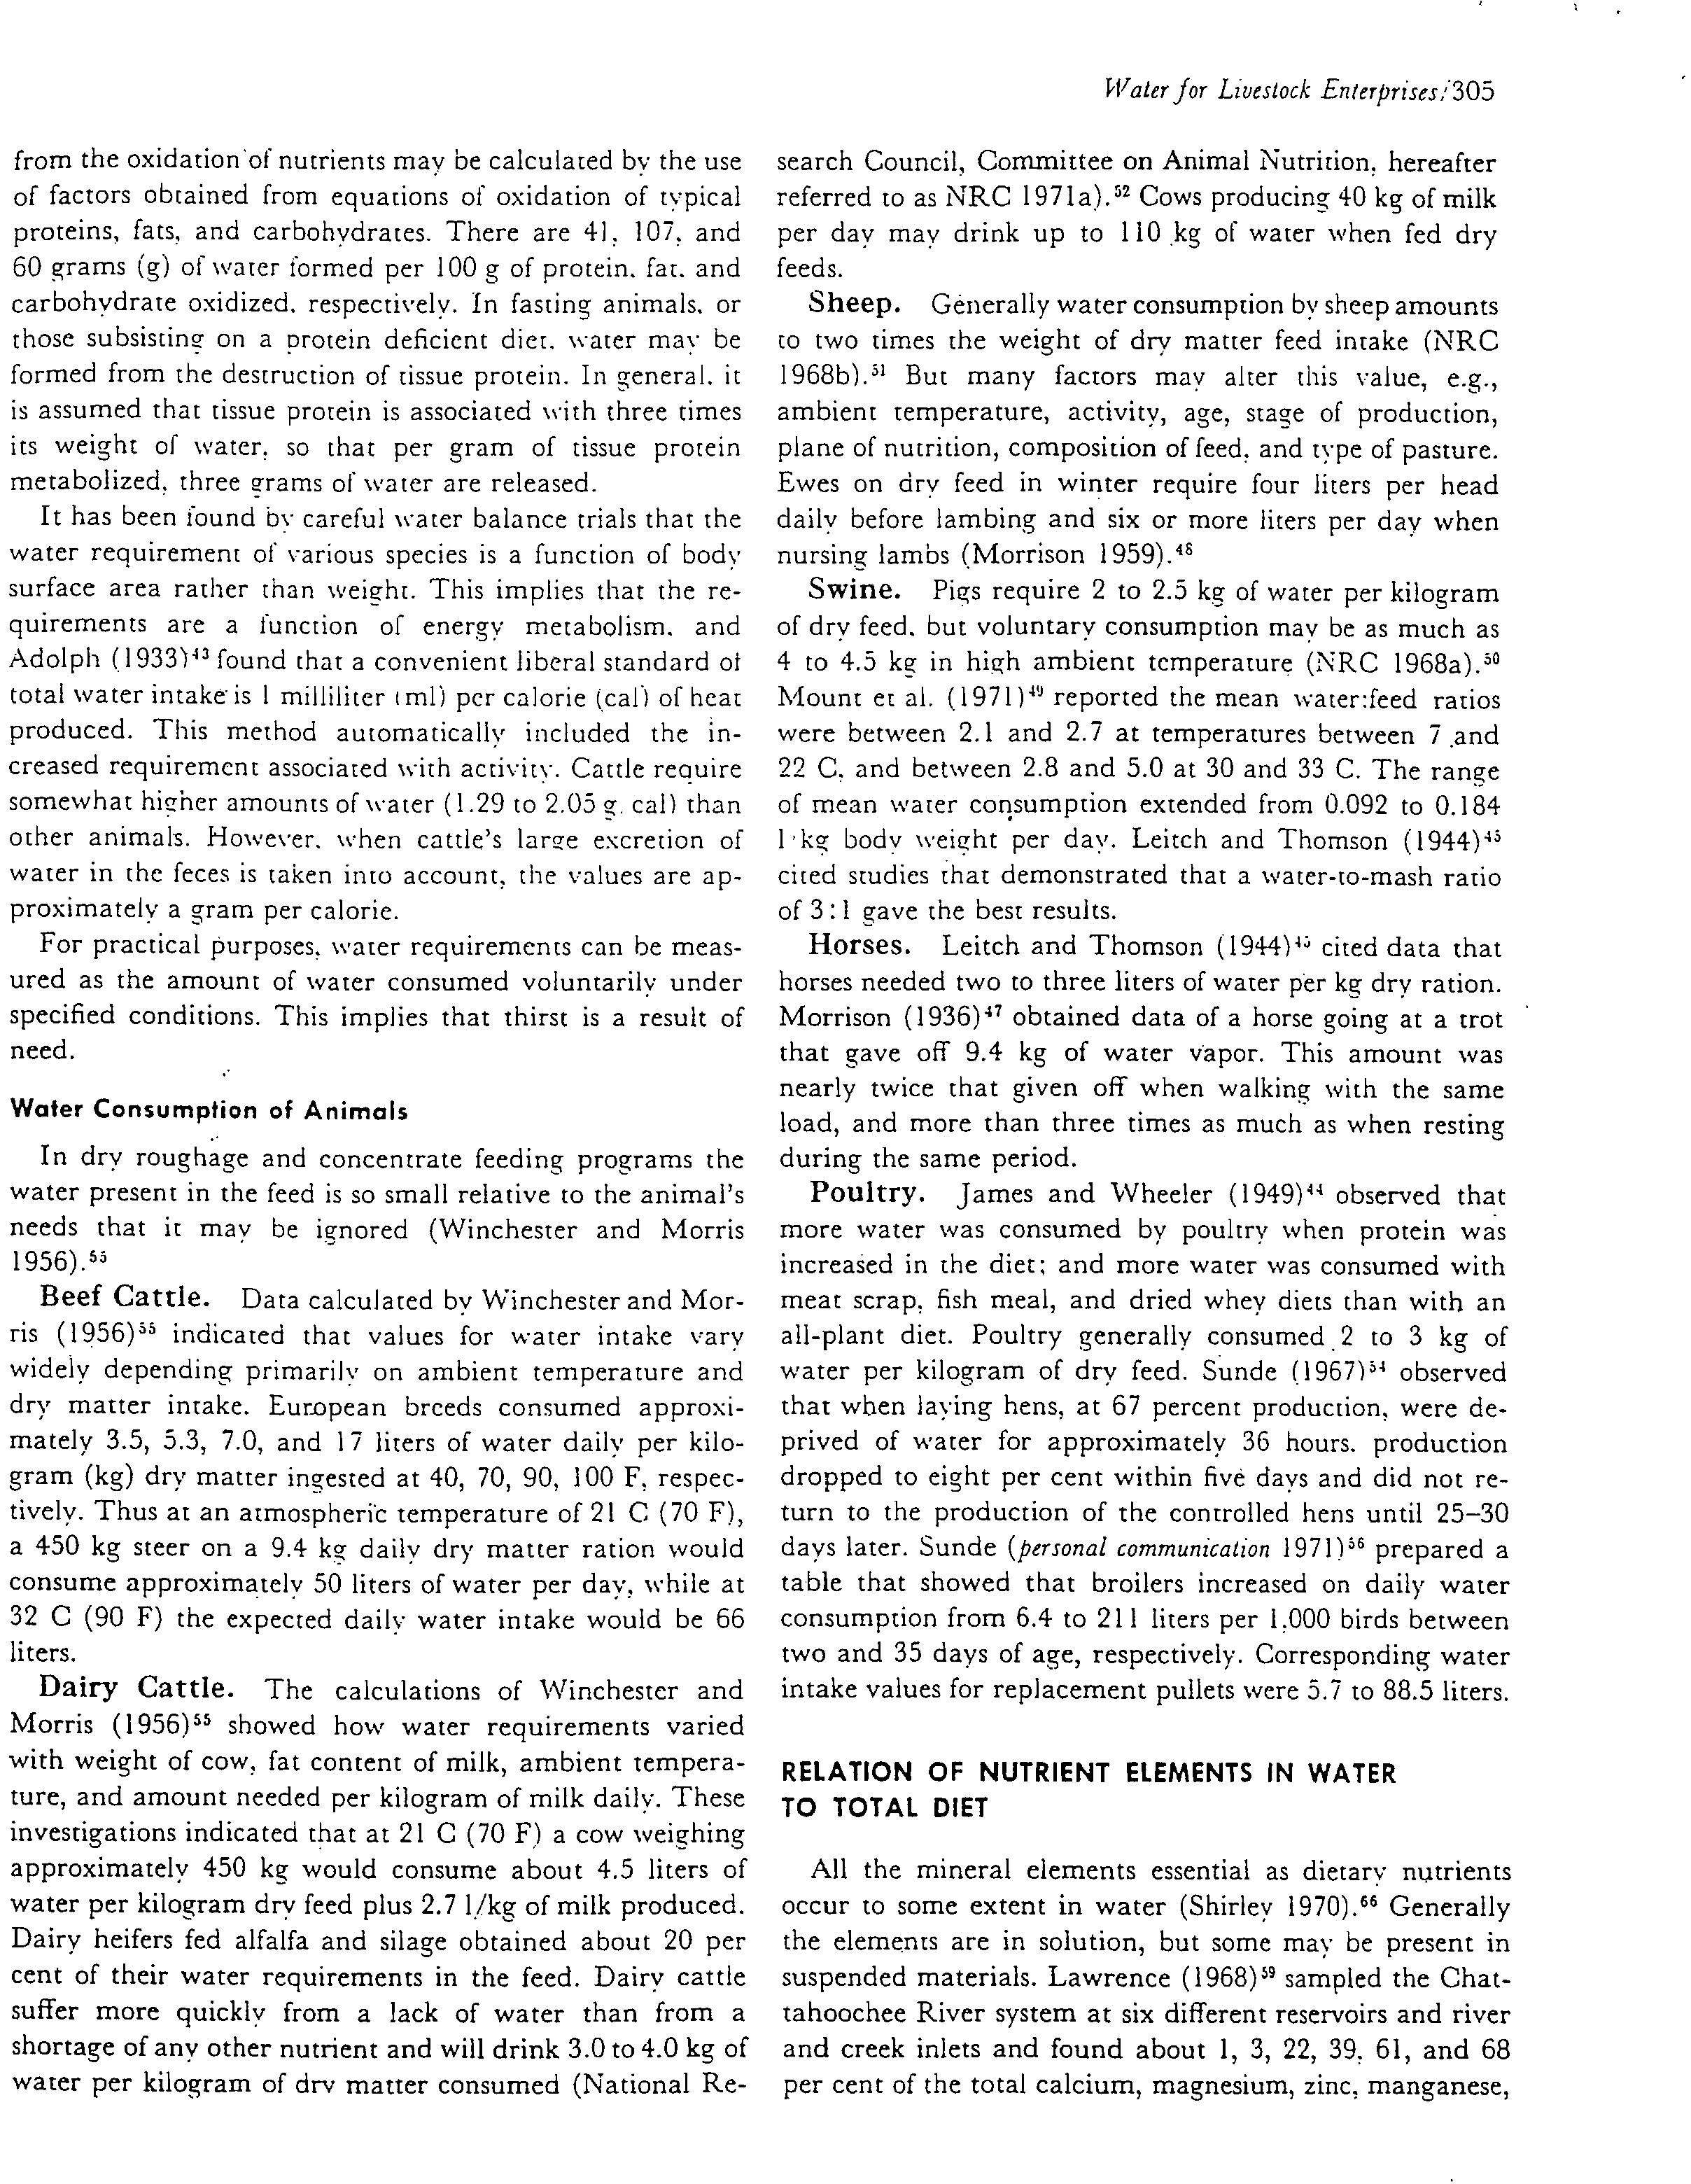
WATER FOR LIVESTOCK ENTERPRISES
Domestic animals represent an important segment of
agriculture and arc a vital source of food. Like man and
many other life forms. they are affected by pollutants in
their environment. This section is concerned primarily
‘vith considerations of livestock water qualit
y and factors
affectin
g
. it. These include the presence of ions causing ex-
cessive salinit
y
, elements and ions which are toxic, bio-
logically produced toxins, radionuclides, pesticide residues,
and pathogenic and parasitic organisms.
Of importance in determining recommendations for these
substances in livestock water supplies are the quantity of
water an animal consumes per day and the concentration
of the mineral elements in the water supply from which he
consumes it. Water is universally needed and consumed by
farm animals, but it does not account for their entire daily
intake of a particular substance. Consequently, tolerance
levels established for many substances in livestock feed do
not accuratel
y take into consideration the tolerance levels
for those substances in water. Concentrations of nutrients
and toxic substances in water affect an animal nn the basis
of the total amount consumed. Because of this. some assess-
ment of the amounts of water consumed b
y live-stock on a
daily basis and a knowledge of the probable quantity of ele-
ments in water and how they satisfy daily nutritional re-
quirements are needed for determining possible toxicity
levels.
WATER REQUIREMENTS FOR LIVESTOCK
The water content of animal bodies is relativel y constant :
68 per cent to 72 per cent of the total weight on a fat-free
basis. The level of water in the body usually cannot change
appreciably without dire consequences to the animal;
therefore, the minimal requirement for water is a reflection
of water excreted from the body plus a component for
growth in young animals (Robinson and McCance 1952,"
Mitchell 196246).
Water is excreted from the body in urine and feces. in
evaporation from the lungs and skin, in sweat, and in pro-
ductive secretions such as milk and eggs. Anything that
influences any of these modes of water loss affects the mini-
mal water requirement of the animal.
The urine contains the soluble products of metaboli
that must be eliminated. The amount of urine excret
dail
y varies with the feed. work, external temperature, wa
consumption. and other factors. The hormone vasopres.
antidiuretic hormone) controls the amount of urine
affecting the reabsorption of water from the kidne
y
tubu
and ducts. Under conditions of water scarcity, an anirr.
may concentrate its urine to some extent by reabsorbing
greater amount of water than usual, thereby lowering t.
animal's requirement for water. This capacity for conce.
tration, however, is usuall y limited. If an animal consum
excess salt or a high protein diet, the excretion of urine
increased to eliminate the salt 'or the end products of pr,
tein metabolism, and the water requirement is theret
increased.
The amount of water lost in the feces varies dependin
upon diet and species. Cattle, for instance, excrete feet
with a high moisture content while sheep, horses, an
chickens excrete relatively dr
y feces. Substances in the die
that have a diuretic effect will increase water loss by thi
route.
Water lost by evaporation from the skin and lungs (in
sensible water loss) may account for a large part of th(
body's water loss approaching, and in some cases exceeding
that lost in the urine. If the environmental temperature i.
increased, the water lost by this route is also increased
Water lost through sweating may be considerable, especiall\
in the case of horses, depending on the environmental tem-
perature and the activity of the animal.
All these factors and their interrelation make a minimal
water requirement difficult to assess. There is also the ad-
ditional complication that a minimal water requirement
does not have to be supplied entirely by drinking water.
The animal has available to it the water contained in
feeds, the metabolic water formed from the oxidation of
nutrients, water liberated by polymerization, dehydration,
or synthesis within the bod y
, and preformed water associ-
ated with nutrients undergoing oxidation when the energy
balance is negative. All of these may vary. The water
available from the feed will vary with the kind of feed and
with the amount consumed. The metabolic water formed
304
Water for Livestock Enterprises/305
from the oxidation'of nutrients may be calculated by the use
of factors obtained from equations of oxidation of typical
proteins, fats, and carboh
ydrates. There are 41. 107, and
60 grams (g) of water formed per 100 g of protein, fat. and
carbohydrate oxidized. respectivel
y
. In fasting animals, or
those subsisting on a
p
rotein deficient diet. water may be
formed from the destruction of tissue protein. In general. it
is assumed that tissue protein is associated with three times
its weight of water, so that per gram of tissue protein
metabolized, three
g
rams of water are released.
It has been found b
y
careful water balance trials that the
water requirement of various species is a function of body
surface area rather than weight. This implies that the re-
quirements are a function of energy metabolism. and
Adolph (19331" found that a convenient liberal standard of
total water intake is 1 milliliter i ml) per calorie (cal) of heat
produced. This method automaticall
y
included the in-
creased requirement associated with activit
y
. Cattle require
somewhat higher amounts of water (1.29 to 2.05 g. cal) than
other animals. However, when cattle's large excretion of
water in the feces is taken into account, the values are ap-
proximately a gram per calorie.
For practical purposes, water requirements can be meas-
ured as the amount of water consumed voluntarily under
specified conditions. This implies that thirst is a result of
need.
Water Consumption of Animals
In dry roughage and concentrate feeding programs the
water present in the feed is so small relative to the animal's
needs that it may be ignored (Winchester and Morris
1956)."
Beef Cattle.
Data calculated b
y
Winchester and Mor-
ris (1956)
55
indicated that values for water intake vary
widely depending primarily on ambient temperature and
dry matter intake. European breeds consumed approxi-
mately 3.5, 5.3, 7.0, and 17 liters of water daily per kilo-
gram (kg) dry matter ingested at 40, 70, 90, 100 F, respec-
tively. Thus at an atmospheric temperature of 21 C (70 F),
a 450 kg steer on a 9.4 kg dail
y dry matter ration would
consume approximatel
y
50 liters of water per day, while at
32 C (90 F) the expected dail
y
water intake would be 66
liters.
Dairy Cattle.
The calculations of Winchester and
Morris (1956)" showed how water requirements varied
with weight of cow, fat content of milk, ambient tempera-
ture, and amount needed per kilogram of milk daily. These
investigations indicated that at 21 C (70 F) a cow weighing
approximately 450 kg would consume about 4.5 liters of
water per kilogram dry feed plus 2.7 1/kg of milk produced.
Dairy heifers fed alfalfa and silage obtained about 20 per
cent of their water requirements in the feed. Dairy cattle
suffer more quickly from a lack of water than from a
shortage of any other nutrient and will drink 3.0 to 4.0 kg of
water per kilogram of dr
y matter consumed (National Re-
search Council, Committee
on
Animal Nutrition, hereafter
referred to as NRC 1971a)." Cows producing 40 kg of milk
per day ma
y
drink up to 110 kg of water when fed dry
feeds.
Sheep.
Generally water consumption by sheep amounts
to two times the weight of dry matter feed intake (NRC
1968b)." But many factors may alter this value, e.g.,
ambient temperature, activity, age, stage of production,
plane of nutrition, composition of feed, and type of pasture.
Ewes on dry feed in winter require four liters per head
daily
before lambing and six or more liters per da
y when
nursing lambs (Morrison 1959).4s
Swine.
Pigs require 2 to 2.5 kg of water per kilogram
of dry
feed, but voluntary consumption ma
y
be as much as
4 to 4.5 kg in high ambient temperature (NRC 1968a)."
Mount et al. (1971)
4
' reported the mean water:feed ratios
were between 2.1 and 2.7 at temperatures between 7 .and
22 C. and between 2.8 and 5.0 at 30 and 33 C. The range
of mean water consumption extended from 0.092 to 0.184
l'kg bod
y
weight per day. Leitch and Thomson 09441"
cited studies that demonstrated that a water-to-mash ratio
of 3:1 gave the best results.
Horses.
Leitch and Thomson (19441" cited data that
horses needed two to three liters of water per kg dry ration.
Morrison (1936) 47
obtained data of a horse going at a trot
that gave off 9.4 kg of water vapor. This amount was
nearly twice that given off when walking with the same
load, and more than three times as much as when resting
during the same period.
Poultry.
James and Wheeler (1949)" observed that
more water was consumed by poultry when protein was
increased in the diet; and more water was consumed with
meat scrap, fish meal, and dried whey diets than with an
all-plant diet. Poultry generally consumed
.
2 to 3 kg of
water per kilogram of dry feed. Sunde (1967)" observed
that when laying hens, at 67 percent production, were de-
prived of water for approximately 36 hours. production
dropped to eight per cent within five days and did not re-
turn to the production of the controlled hens until 25-30
days later. Sunde
(personal communication
19711" prepared a
table that showed that broilers increased on daily water
consumption from 6.4 to 211 liters per 1,000 birds between
two and 35 days of age, respectively. Corresponding water
intake values for replacement pullets were 5.7 to 88.5 liters.
RELATION OF NUTRIENT ELEMENTS IN WATER
TO TOTAL DIET
All the mineral elements essential as dietary nutrients
occur to some extent in water (Shirley 1970).
66 Generally
the elements are in solution, but some may be present in
suspended materials. Lawrence (1968)" sampled the Chat-
tahoochee River system at six different reservoirs and river
and creek inlets and found about 1, 3, 22, 39. 61, and 68
per cent of the total calcium, magnesium, zinc, manganese,
306/Section
V-Agricultural Uses of Water
copper, and iron present in suspended materials, respec-
tively. Any given water supply requires analysis if dietary
decisions are to be most effective.
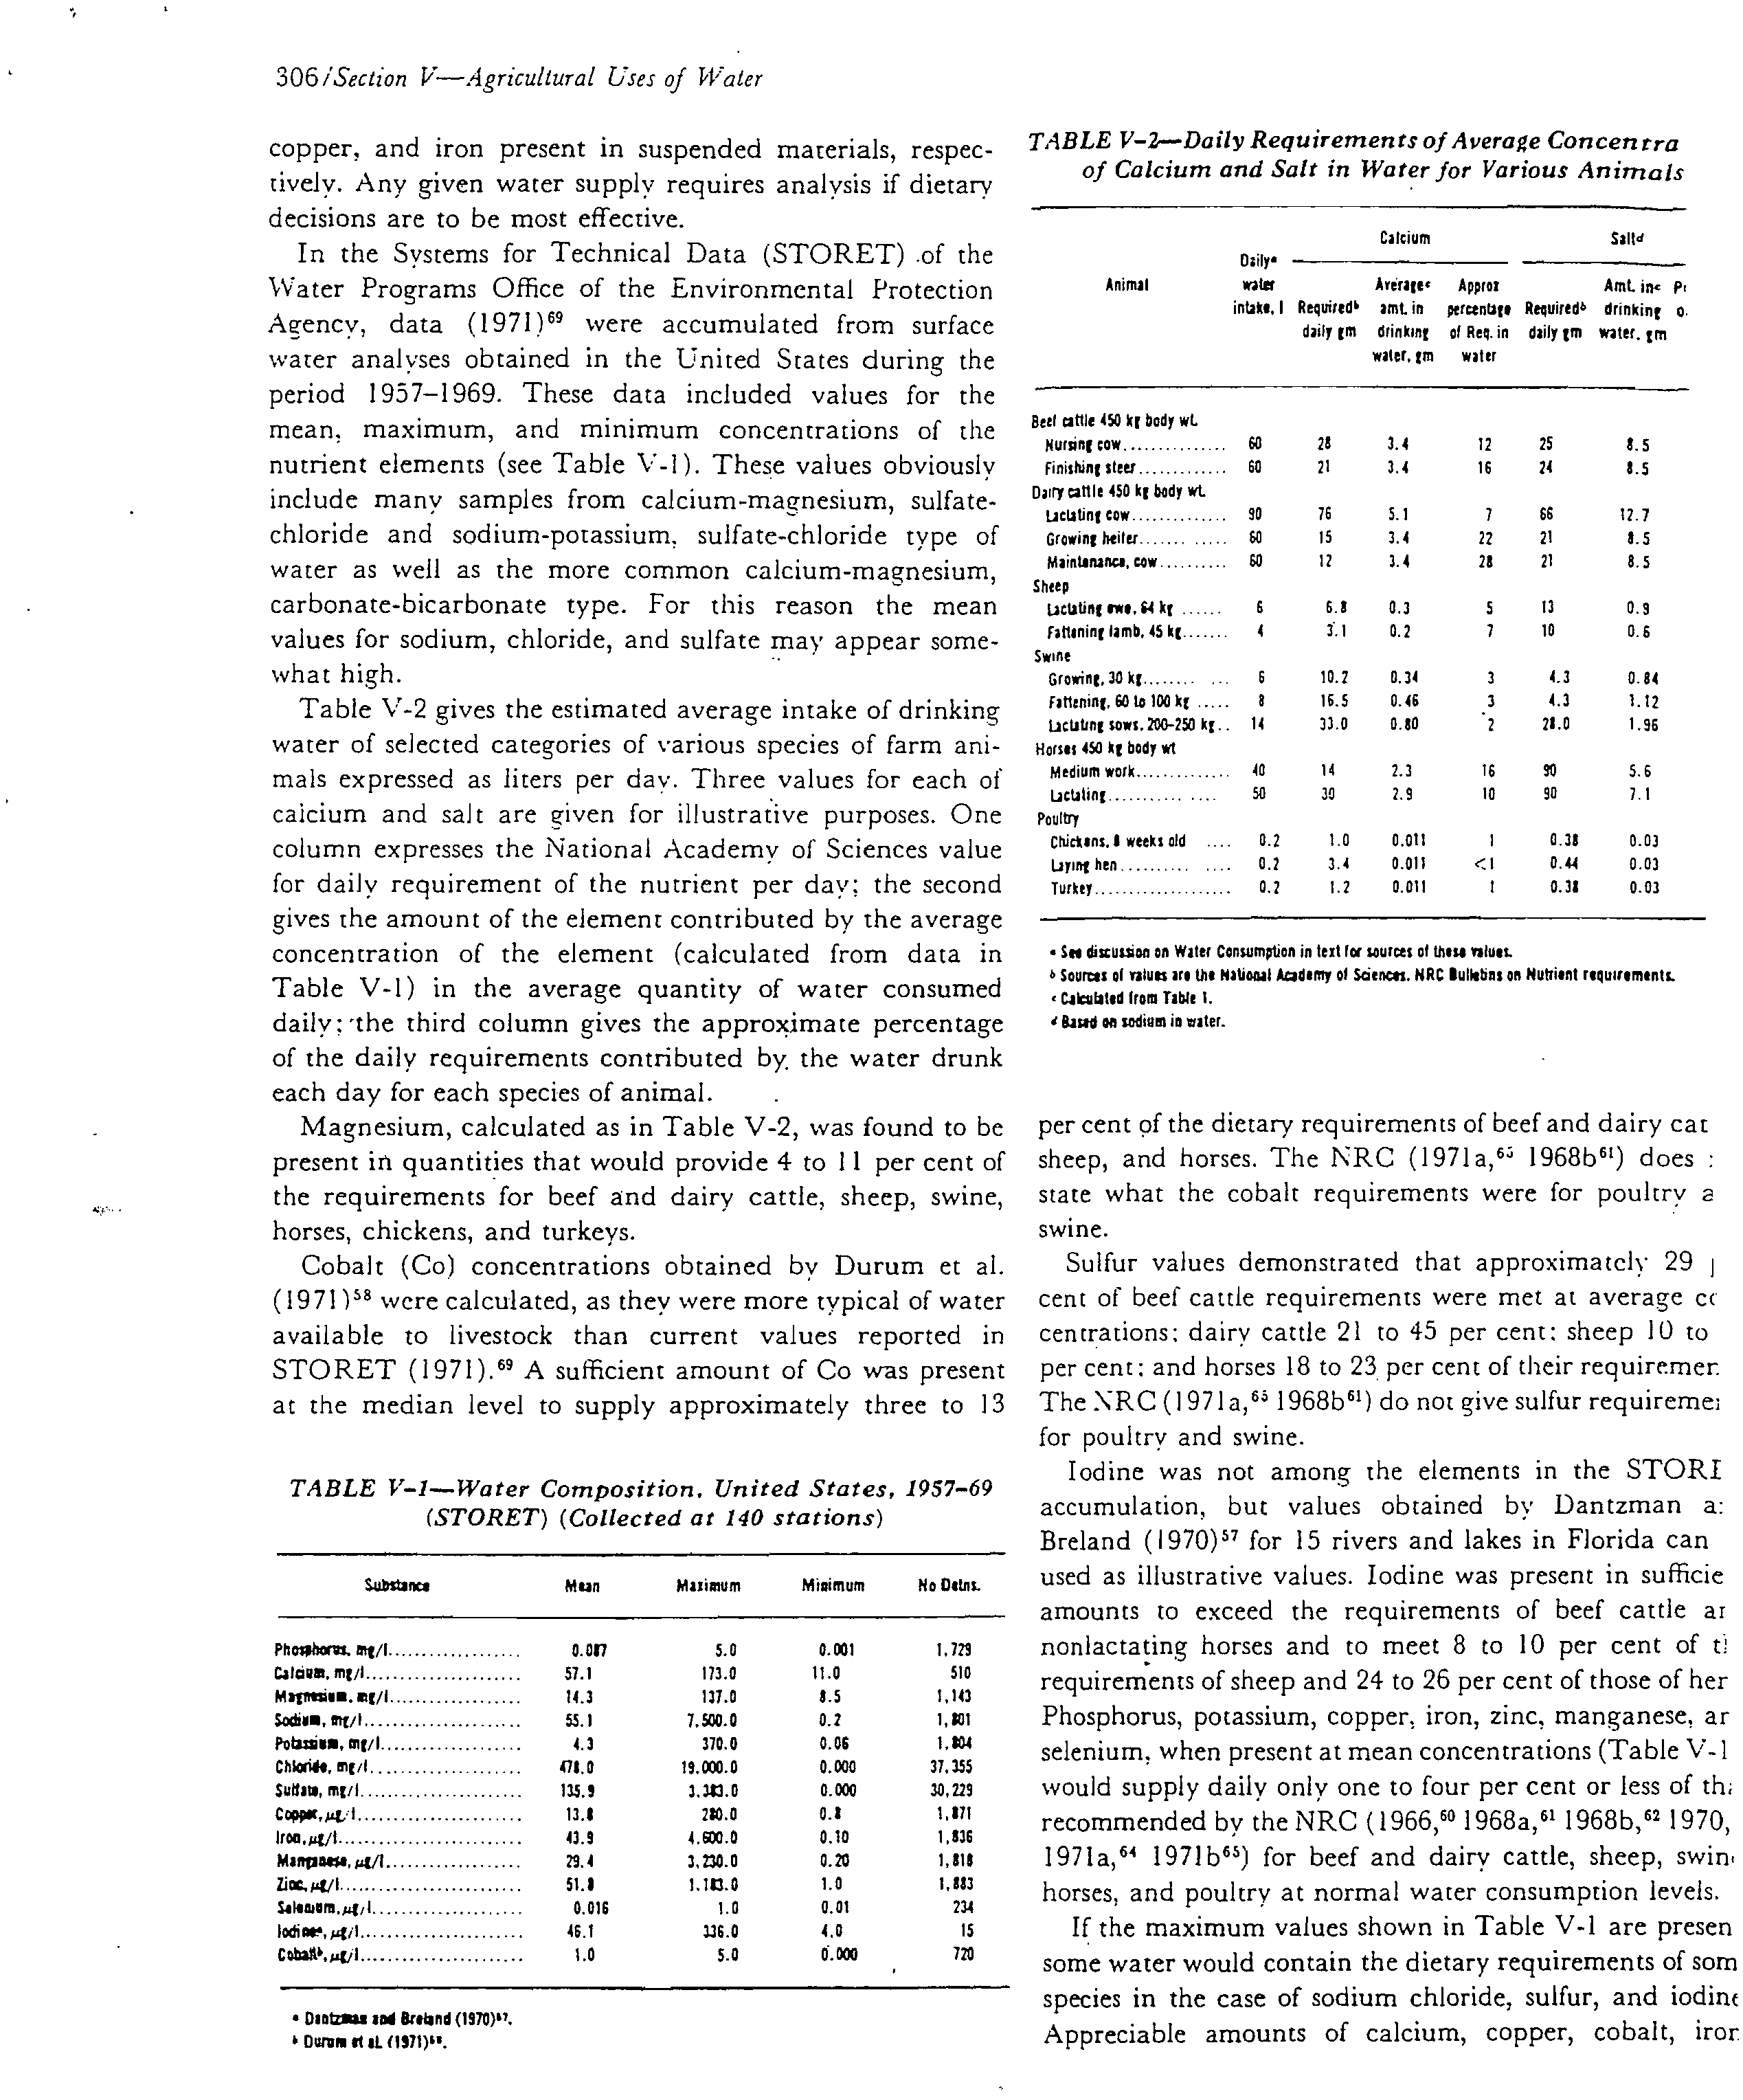
In the Systems for Technical Data (STORET) .of the
Water Programs Office of the Environmental Protection
Agenc
y
, data (1971)" were accumulated from surface
water analyses obtained in the United States during the
period 1957-1969. These data included values for the
mean, maximum, and minimum concentrations of the
nutrient elements (see Table V-I ). These values obviously
include many samples from calcium-magnesium, sulfate-
chloride and sodium-potassium, sulfate-chloride type of
water as well as the more common calcium-magnesium,
carbonate-bicarbonate type. For this reason the mean
values for sodium, chloride, and sulfate may appear some-
what high.
Table V-2 gives the estimated average intake of drinking
water of selected categories of various species of farm ani-
mals expressed as liters per da
y
. Three values for each of
calcium and salt are given for illustrative purposes. One
column expresses the National Academy of Sciences value
for daily requirement of the nutrient per day; the second
gives the amount of the element contributed by the average
concentration of the element (calculated from data in
Table V-1) in the average quantity of water consumed
daily: 'the third column gives the approximate percentage
of the daily requirements contributed by
. the water drunk
each day for each species of animal.
Magnesium, calculated as in Table V-2, was found to be
present in quantities that would provide 4 to 11 per cent of
the requirements for beef and dairy cattle, sheep, swine,
horses, chickens, and turkeys.
Cobalt (Co) concentrations obtained by Durum et al.
(1971)
58
were calculated, as they were more typical of water
available to livestock than current values reported in
STORET (1971)." A sufficient amount of Co was present
at the median level to supply approximately three to 13
TABLE V-1--Water Composition, United States, 1957-69
(STORET) (Collected at 140 stations)
Substance
Man
Maximum
Minimum
No Dens.
Phoselsours. mg/I
?
0.017
5.0
0.001
1.121
Calcium, mg/1
?
57.1
173.0
11.0
510
Mammies. iog/1
?
14.3
131.0
8.5
1,143
Sodie■, Ing/I
?
55.1
7.500.0
0.2
1,131
Polasies,
mgil ?
4.3
370.0
0.06
1,104
Chloride, mg/I.
??
471.0
19.000.0
0.000
37.355
Sulfite, m1(1
?
13.5.9
3.311.0
0.000
30,229
C
Me
i Ai
l
?
13.1
210.0.
0.1
1,1171
Iron.4/1 ?
43.9
4.600.0
0.10
1,836
Marmaraa,r4/1
?
29.4
3, 230.0
0.20
1,811
Iim.;
4
1/1
?
51.1
1.113.0
1.0
1,883
Salemens.4,1
?
0.016
1.0
0.01
234
Iodine, Ail ?
46.1
3.36.0
4.0
IS
Coksal0.4/1
?
1.0
5.0
0.800
720
• tholmsu
mad &Send (1970)".
Duren
et al. (1971)".
TABLE V-2-Daily Requirements of Average Concentra
of Calcium and Salt
in
Water for Various Animals
Calcium?
Sand
Daily. ?
Animal
?
rata?Average.
?
Approt?
AmL iA• Pi
intake. I Required' amt in?
percentage Required •
drinking o.
daily gm?
drinking?
of Req. in daily gm water. gm
water,
gm?
water
Beal
cattle 450 kg body wt.
Nursing cow
?
60
28
3.4
12
25
8.5
Finishing steer ?
60
21
3.4
16
24
8.5
Dairy
cattle 450 kg body wt.
Lactating cow
?
90
76
5.1
7
66
12.7
Growing heifer ?
60
15
3.4
22
21
8.5
Maintarunca cow ?
60
12
3.4
28
21
8.5
Sheep
Lactating
nee,
64 kg ?6
6.8
0.3
5
73
?
.
0.9
Fattening lamb, 45 kg
?4
3.1
0.2
7
10
0.6
Swine
Growing, 30 kg
?
6
10.7
0.31
3
4.3
0.84
Fattening. GO to 100 kg
?
it
16.5
0.46
3
4.3
1.12
Lactating
sows. 200-250 kg ?
14
33.0
0.80
2
21.0
1.96
Horses 450 kg body era
Medium work ?
40
14
2.3
16
90
5.6
Lactating
?
50
30
2.9
10
90
7.1
Poultry
Chickens. 1
weal
old ?0.2
1.0
0.011
1
0.31
0.03
Win hen
?
0.3
3.4
0.011
<I
0.44
0.03
Turkey ?
0.2
1.2
0.011
I
0.31
0.03
•
See disunion on Water
Consumption in text for sources of these vellum
o
Sources ml values are
the National
Academy of Sciences. NRC Bulletins on Nutrient requirements.
Cab:skated Irons Table
1.
Bawd en sodium in water.
per cent of the dietary requirements of beef and dairy cat
sheep, and horses. The NRC (1971a," 196813
6
9 does
state what the cobalt requirements were for poultry
a
swine.
Sulfur values demonstrated that approximately 29
cent of beef cattle requirements were met at average
cc
centrations: dairy cattle 21 to 45 per cent: sheep 10 to
per cent : and horses 18 to 23 per cent of their requiremer.
The NRC (1971a," 1968b
61
) do not give sulfur requiremer
for poultry and swine.
Iodine was not among the elements in the STORI
accumulation, but values obtained by Dantzman a:
Breland (1970)" for 15 rivers and lakes in Florida can
used as illustrative values. Iodine was present in sufficie
amounts to exceed the requirements of beef cattle ar
nonlactating horses and to meet 8 to 10 per cent of t:
requirements of sheep and 24 to 26 per cent of those of her
Phosphorus, potassium, copper, iron, zinc, manganese, ar
selenium, when present at mean concentrations (Table V-1
would supply daily only one to four per cent or less of th,
recommended by the NRC (1966,
60
1968a," 1968b,
62
1970,
1971a,
64
1971b
65
) for beef and dairy cattle, sheep, swim
horses, and poultry at normal water consumption levels.
If the maximum values shown in Table V-1 are presen
some water would contain the dietary requirements of som
species in the case of sodium chloride, sulfur, and iodine
Appreciable amounts of calcium, copper, cobalt, iror
Water for Livestock Enterprises; 307
manganese, zinc, and selenium would be present, if water sodium chloride in the drinking water greatly delayed the
were supplied with the maximum levels present. On the onset of egg production, but 15,000 mg/I or more were re-
other hand, if the water has only the minimum concentra-
quired to affect growth over a 10-week period. In swine,
tion of any of the elements present. it would supply very 15,000 mg/I of sodium chloride in the drinking water
thc.- daL iequitements.
caused death in the smaller animals, some leg stiffness in
It is generally believed that elements in water solution the larger, but 10,000 mg/1 did not appear particularl
y
in-
are available to the animal that consumes the water, at jurious once they became accustomed to it. Sheep existed
least as much as when present in solid feeds or dry salt on water containing 25,000 mg
.
/I of sodium or calcium
mixes. This was indicated when Shirle
y et al. (1951,67 chloride or 30,000 mg/1 of magnesium sulfate but not with-
1957
68 ) found that P" and Ca", dissolved in aqueous solu-
out some deleterious effects. Cattle were somewhat less re-
tion as salts and administered as a drench, were absorbed at sistant, and it was concluded that 10,000 mg ,
1 of total salts
equivalent levels to the isotopes, when the
y were incor- should be considered the upper limit under which their
porated in forage as fertilizer and fed to steers, respectively. maintenance could be expected. A lower limit was suggested
Many isotope studies have demonstrated that minerals in for lactating animals. It was further observed that the ani-
water consumed by animals are readil y
absorbed, deposited mals would not drink highly saline solutions if water of low
in their tissues, and excreted.
salt content was available, and that animals showing ef-
fects of saline waters returned quickly to normal when al-
EFFECT OF SALINITY ON LIVESTOCK
?
lowed a water of low salt content.
Frens (1946)
72
reported that 10,000 mg/1 of sodium
It is well known that excessivel
y
saline waters can cause chloride in the drinkin
g water
of
dairy cattle produced no
physiolczical upset or death of livestock. The ions most s y
mptoms of toxicity, while 15.000 mg; I caused a loss of
commonly involved in causing excessive salinity are calcium, appetite, decreased milk production, and increased water
magnesium, sodium, sulfate, bicarbonate, and chloride. consumption with symptoms of salt poisoning in 12 days.
Others may contribute significantl
y
in unusual situations, In studies with beef heifers, Embry et al. (1959) 7 ' re-
and these may also exert specific toxicities separate from the ported that the addition of 10,000 mg11 of sodium sulfate
osmotic effects of excessive salinity. (See Toxic Elements to the drinking water caused severe reduction in its con-
and Ions below.)
sumption, loss of weight, and 'symptoms of dehydration.
Early in this centur
y
, Larsen and Bailey (1913)
80
re-
Either 4,000 or 7,000 mg/I of added sodium sulfate increased
ported that a natural water varying from 4,546 to 7,369 water intake but had no effect on rate of gain or general
mg/1 of total salts, with sodium and sulfate ions predomi-
health. Similar observations were made using waters with
nating, caused mild diarrhea but no symptoms of toxicity in added sodium chloride or a mixture of salts, except that
dairy cattle over a two-year period. Later, Ramsa
y
(1924)8' symptoms of dehydration were noted, and the mixed salts
reported from his observations that cattle could thrive on caused no increase in water consumption. Levels of up to
water containing 11,400 mg/1 of total salts. that they could 6,300 mg/1 of added mixed salts increased water consump-
live under certain conditions on water containing 17,120 tion in weanling pigs, but no harmful effects were observed
mg/1, and that horses thrived on water with 5,720 mg;1 over a three-month period.
and were sustained when not worked too hard on water
In Australia, Peirce (1957,
63
1959," 1960,
85
1962,86
with 9,140 mg/I.
1963,
87
1966,
38 1968a, 89
1968b
90
) conducted a number of
The first extensive studies of saline water effects on rats experiments on the salt tolerance of Merino wethers. Only
and on livestock were made in Oklahoma (Heller and Lar-
minor harmful effects were observed in these sheep when
wood 1930,
76 Heller 1932, 7 ' 1933).
7
' Rats were fed waters they were confined to waters containing 13,000 mg/1 or
of various sodium chloride concentrations, and it was found less of various salt mixtures.
among other things that (a) water consumption increased Nevada workers have reported several studies on the ef-
with salt concentration but only to a point after which the fects of saline waters on beef heifers. They found that
animals finally refused to drink until thirst drove them to it, 20,000 mg/1 of sodium chloride caused severe anorexia,
at which time they drank a large amount at one time and weight loss, anhydremia, collapse, and certain other symp-
then died; (b) older animals were more_ resistant to the ef-
toms, while 10,000 mg/1 had no effects over a 30-day period
fects of the salt than were the young; (c) the effects of salin-
other than to increase water consumption and decrease
ity were osmotic rather than related to any specific ion; blood urea (Weeth et al. 1960)." Additional experiments
(d) reproduction and lactation were affected before growth (Weeth and Haverland 1961)
98 again showed 10,000 mg/I
effects were noted; (e) there appeared. in time, to be a to cause no symptoms of toxicity: while at 12.000 mg/1
physiological adjustment to saline waters; and (f) 15,000-
adverse effects were noted, and these intensified with in-
17,000 mg/I of total salts seemed the maximum that could creasing salt concentration in the drinking water. At a con-
be tolerated, some adverse effects being noted at concen-
centration of 15,000 mg/1, sodium chloride increased the
trations lower than this. With laying hens, 10,000 mg/1 of ratio of urine excretion to water intake (Weeth and
308/Section V—Agricultural Uses of Water
Lesperance 1965),
100
and a prompt and distinct diuresis
occurred when the heifers consumed water containing 5.000
or 6,000 mgt1 following water deprivation (Weeth et al.
1968).
101
While with waters containing about 5,000 mg
I
(Weeth and Hunter 1971)" or even less Weeth and Capps
1971)" of sodium sulfate no specific ion effects were noted,
heifers drank less, lost weight, and had increased methemo-
globin and sulfhemoglobin levels. A later study (Weeth and
Capps 1972)
96 gave similar results. but
in addition suggested
that the sulfate ion itself, at concentrations as low as 2150
m
g
71 had adverse effects.
In addition to the Oklahoma work, several studies on the
effects of saline water on poultry have been reported.
Selve (1943)" found that chicks 19 days old when placed
on experiment had diarrhea, edema, weakness, and respira-
tory problems during the first 10 days on water containing
9,000 mg.I of sodium chloride. Later, the edema disap-
peared, but nephrosclerotic changes were noted. Water
containing 3,000 mg '1 of sodium chloride was not toxic
to
four-week-old chicks.
Others (hare and Bielv 19481" observed that with two-
day-old chicks on water containing 9,000 mg:1 of added
sodium chloride there were a few deaths, some edema, and
certain other symptoms of toxicity. A solution with 18,000
mg/I of the salt was not toxic; however, when replaced on
alternate days by fresh water, neither was it readily con-
sumed.
Scrivner (1946)" found that sodium chloride in the drink-
ing water of day-old poults at a concentration of 5,000 mg I
caused death and varying degrees of edema and ascites in
over half of the birds in about two weeks. Sodium bicarbo-
nate at a concentration of 1.000 mgil was not toxic, at
3,000 mg caused some deaths and edema: and as the con-
centration increased above this, the effects were more pro-
nounced. A solution containing 1,000 mg 1 of sodium hy-
droxide caused death in two of 31 poults b
y 13 da y s, but the
remainder survived without effects, and 7,500 mgrl of
sodium citrate, iodide, carbonate, or sulfate each caused
edema and many deaths.
South Dakota workers (Krista et al. 1961)" studied the
effects of sodium chloride in water on laying hens, turkey
poults, and ducklings. At 4,000 mgil, the salt caused some
increased water consumption, watery droppings, decreased
feed consumption and growth, and increased mortality.
These effects were more pronounced at a higher concentra-
tion, 10,000 mgil, causing death in all of the turkey poults
at
two
weeks, some symptons of deh y
dration in the chicks,
and decreased egg production in the hens. Experiments with
laying hens restricted to water containing 10,000 mg/1 of
sodium or magnesium sulfate gave results similar to those
for sodium chloride.
In addition to the experimental work, there have been
reports in the literature of field observations relating to the
effects of excessively saline water (Ballantvne 1957,"
Gastler and Olson 1957," Spafford 1941"), and a number
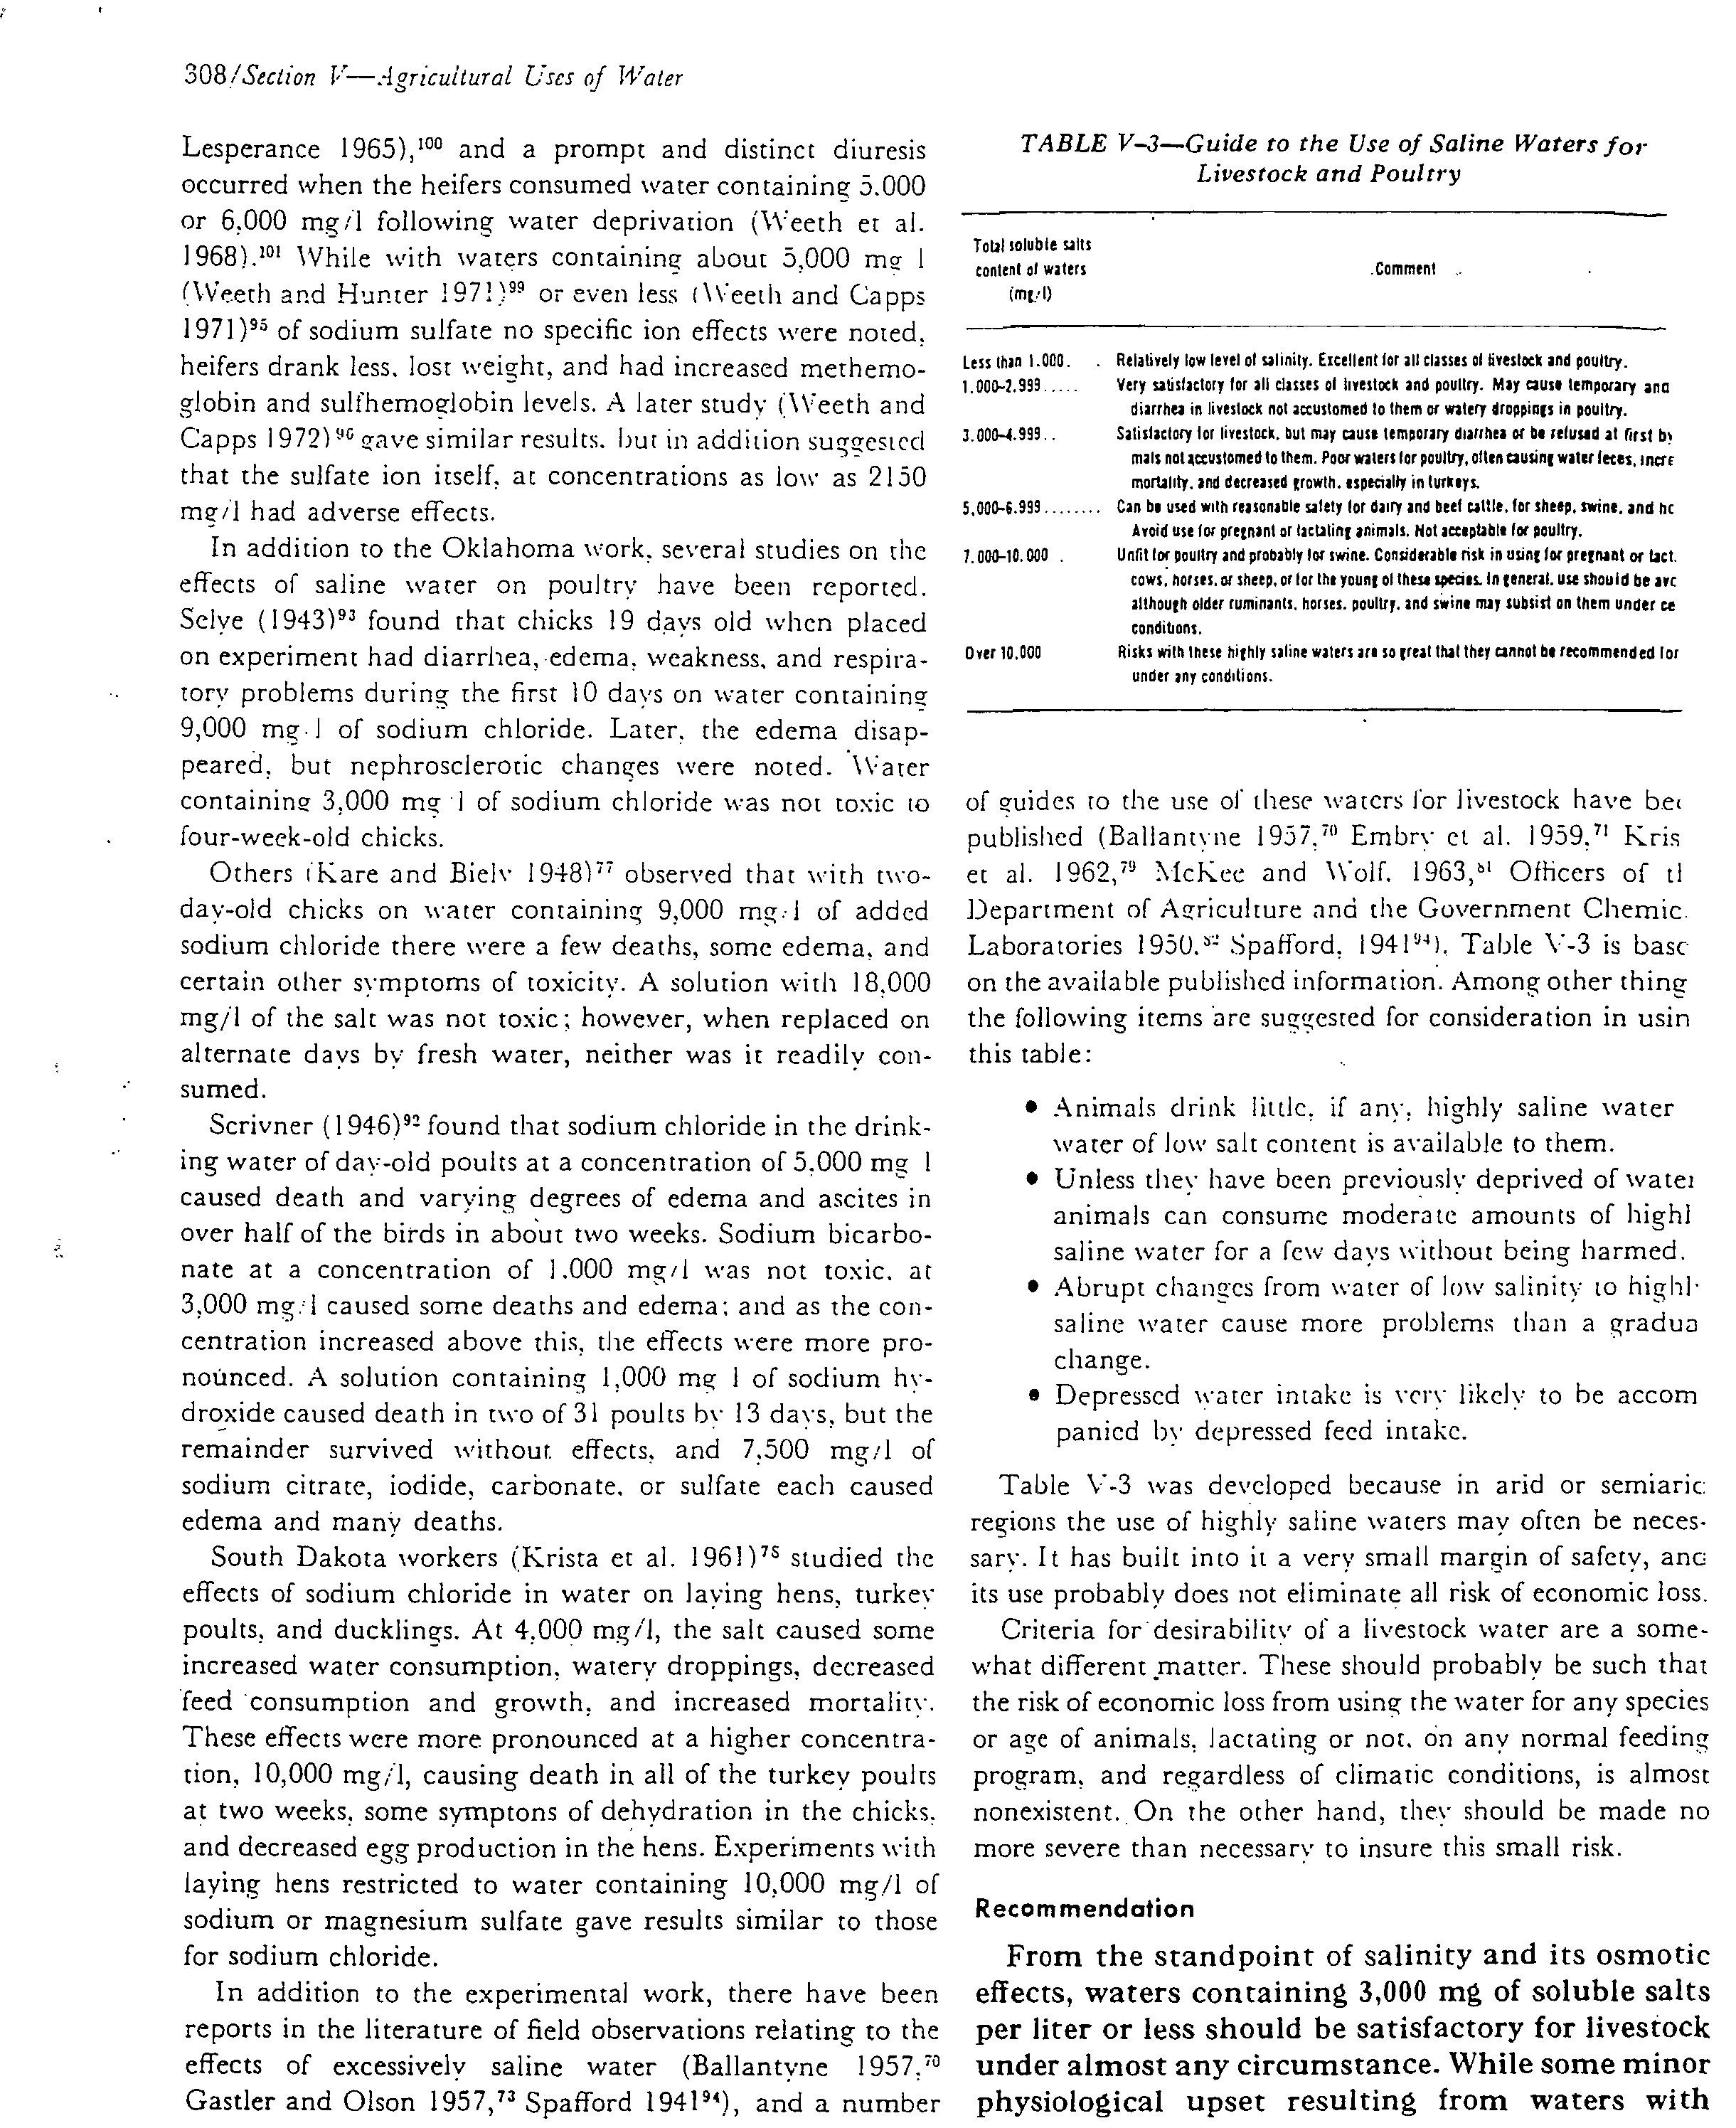
TABLE V-3—Guide to the Use of Saline
Waters
for
Livestock and Poultry
Total soluble salts
content of waters
?
Comment
Less than 1.000.
?
Relatively
low
level of salinity. Excellent for all classes of livestock and poultry.
1.000-2.999
?
?
Very satisfactory for
311
classes of livestock and poultry. May cause temporary and
diarrhea in livestock not accustomed to them or watery droppings in poultry.
3.000-4.999..
?Satisfactory for livestock, but may cause temporary diarrhea or be Mused at first
mals not Accustomed to them. Poor waters for poultry, often causing water feces, two
mortality. and decreased growth. especially in turkeys.
0,000-6.999
?
Can be used with reasonable safety tor dairy and beef cattle, for sheep, swine, and he
Avoid use for pregnant or lactating animals. Not acceptable for poultry.
1.000-10.000 . Unfit for poultry and probably Its swine. Considerable risk
ill using
for pregnant
or
tact.
cows. horses. or sheep, or lot the vouch ol these species. In pineal. use should be arc
although older ruminants. horses. poultry. and swine may subsist on them under re
conditions.
Over 10,000
?
.?
Risks with these highly saline waters are so great that they cannot be recommended for
under any conditions.
of guides to the use of these waters for livestock have be,
published (Ballantyne 1957," Embr y
et al. 1959,
71
Kris
et al. 1962," McKee and Wolf. 1963,
b
' Ofhcers of tl
Department of Agriculture and the Government Chemic.
Laboratories 1950.'2
Spafford, 1941"), Table V-3 is base
on the available published information. Among other thing
the following items are suggested for consideration in usin
this table:
•
Animals drink little, if any, highly saline water
water of low salt content is available to them.
• Unless they have been previously deprived of water
animals can consume moderate amounts of highl
saline water for a few days without being harmed.
•
Abrupt changes from water of low salinity to high]•
saline water cause more problems than a gradua
change.
• Depressed water intake is very likely to he accom
panicd by depressed feed intake.
Table V-3 was developed because in arid or semiarie
regions the use of highly saline waters may often be neces-
sary. It has built into it a very small margin of safety, anc
its use probably does not eliminate all risk of economic loss.
Criteria for desirability of a livestock water are a some-
what different matter. These should probably be such that
the risk of economic loss from using the water for any species
or age of animals, lactating or not, on any normal feeding
program, and regardless of climatic conditions, is almost
nonexistent. On the other hand, they should be made no
more severe than necessary to insure this small risk.
Recommendation
From the standpoint of salinity
and its osmotic
effects, waters containing 3,000 mg of soluble salts
per liter or less should be satisfactory for livestock
under almost any circumstance. While some minor
physiological upset resulting from waters with
Iroter
for Livestock Enterprises '309
salinities near this limit may be observed, eco-
nomic losses or serious physiological disturbances
should rarely, if ever, result from their use.
TOXIC
SUBSTANCES IN LIVESTOCK WATERS
There are many substances dissolved or suspended in
waters that may be toxic. These include inorganic elements
and their salts, certain organic wastes from man's activities,
pathogens and parasitic organisms, herbicide and pesticide
•residues, some biologicall
y
produced toxins, and radio-
nuclides.
For any of the above, the concentrations at which they
render a water undesirable for use for livestock is subject
to a number of variables. These include age, sex, species.
and physiological state of the animals: water intake, diet
and its composition, the chemical form of any .toxic element
present, and the temperature of the environment. Naturally,
if feeds and waters both contain a toxic substance, this must
he taken into account. Both short and long term effects and
interactions with other ions or compounds must also be con-
sidered.
The development of recommendations for safe concentra-
tions of toxic substances in water for livestock is extremely
difficult. Careful attention must be given to the discussion
that follows as well as the recommendations and to any ad-
ditional experimental findings that may develop. Based on
available research, an appropriate margin of safet
y
, under
almost all conditions, of specific toxic substances harmful
to livestock that drink the waters and to man who consumes
the livestock or their products, is reviewed below. Although
the margin of safet
y
recommended is usually large, the cri-
teria suggested cannot be used as a guide in diagnosing
livestock losses, since they are well below toxic levels for
domestic animals.
Toxic Elements and Ions
Those ions largely responsible for salinity in water
(sodium, calcium, magnesium, chloride, sulfate. and bi-
carbonate) are in themselves not very toxic. There are,
however, a number of others that occur naturally or as the
result of man's activities at troublesome concentrations. If
feeds and water both contain a toxic ion, both must be con-
sidered. Interactions with other ions, if known, must be
taken into account. Elements or ions become objectionable
in water when they are at levels toxic to animals, where they
seriously reduce the palatabilit y of the water, or when they
accumulate excessively in tissues or bod
y
fluids, rendering
the meat, milk, eggs, or other edible product unsafe or unfit
for human use.
Aluminum
Soluble aluminum has been found in surface waters of
the United States in amounts to 3 mg/I, but its occurrence
at such concentrations is rare because it readily precipitates
as the hydroxide (Kopp and Kroner 1970).
182
Most edible grasses contain about 15-20 mg: kg of the
element. However, there is no evidence that it is essential
for animal growth, and very little is found deposited in ani-
mal tissues (Underwood 19711.
2
" It is not highl
y
toxic
(McKee and Wolf 1963,"
3
Underwood 19711,
2
" but Deo-
bald and Elvehjem (1935)'" found that a level of 4.000 mg
aluminum per kilogram of diet caused phosphorus de-
ficienc
y
in chicks. Its occurrence in water should not cause
problems for livestock, except under unusual conditions
and with acid waters.
Recommendation.
Livestock
should be protected where natural
drinking waters contain
no more
than 5
mg/1
aluminum.
Arsenic
Arsenic has lon
g been notorious as a poison. Nevertheless.
it is present in all livin
g
tissues in the inorganic and in
certain organic forms. It has also been used Medicinally.
It is accepted as a safe feed additive for certain domestic.
animals. It has not been shown to he a required nutrient
for animals, possibly because its ubiquity has precluded t
hp
compounding of deficient diets (Frost 1967).'"
The toxicity of arsenic can depend on its chemical form.
its inorganic oxides being considerably more toxic than
organic forms occurring in living tissues or used as feed
additives. Differences in toxicities of the various forms are.
clearly related to the rate of their excretion, the least toxic.
being the most rapidly eliminated (Frost 1967, 1
" Under-
wood 1971).
2 " Except in unusual cases. this element should
occur in waters lar
gely as inorganic oxides. In waters carr
y
-ing or in contact with natural colloidal material. the soluble
arsenic content may be decreased to a very low level by ad-
sorption.
Wadsworth (1952)
26
" gave the acute toxicit y of inorganic
arsenic for farm animals as follows: poultry, 0.05-0.10 g per
animal: swine. 0.5-1.0 g per animal; sheep, goats, and
horses, 10.0-15.0 g per animal: and cattle, 15-30 g per
animal. Franke and Moxon (1936) 146 concluded that the
minimum dose 'required to kill 75 per cent of rats given
intraperitoneal injections of arsenate was 14-18 mg arsenic
per kilogram, while for arsenite it was 4.25-4.75 mg; kg of
bod
y
weight.
When mice were given drinking water containing 5 mg/1
of arsenic as arsenite from weaning to natural death, there
was some accumulation of the element in the tissues of
several organs, a somewhat shortened life span, but no
carcinogenic effect (Schroeder and Balassa 1967).
2 " In a
similar study with rats (Schroeder et al. 1968b),
236 neither
toxicit
y
nor carcinogenic effects were observed, but large
amounts accumulated in the tissues.
Peoples (1964)
220 fed arsenic acid at levels up to 1.25 mg/
kg of bod
y
weight per day for eight weeks to lactating
cows. This is equivalent to an intake of 60 liters of water
310,
Section 1
:
—.4gricultural Des of
Water
containing 5.5 mgil of arsenic (10.4 mg of arsenic acid)
daily b
y
a 500 kg animal. His results indicated that this
form of arsenic is absorbed and rapidl y
.
excreted in the
urine. Thus there was little tissue storage of the element:
at no level of the added arsenic was there an increased
arsenic content of the milk. and no toxicit
y
was observed.
According to Frost (19671,
1
" there is no. evidence that
10 parts per million (ppm) of arsenic in the diet is toxic to
any animal.
Arsenicals have been accused of bein
g carcinogenic. This
matter has been thoroughly reviewed b y Frost 119671,149
who concluded that they appear remarkably free of this
property.
Most human foods contain less than 0.5 ppm of arsenic,
but certain marine animals used as human food may con-
centrate it and may contain over 100 ppm (Frost 196711°
Underwood 1971 2
"). Permissible levels of the element in
muscle meats is 0.5 ppm: in edible meat by-products. 1.0
ppm: and in e
g
gs. 0.5 ppm (U.S. Dept. of Health. Educa
tion, and Welfare. Food and Dru
g
Administration 1963.2'5
1964 256
). Federal Drinking Water Standards list 0.05 mg; I as
the upper allowable limit to humans for arsenic, but McKee
and Wolf (19631
1
" suggested 1.0
me I
as the upper limit
for livestock drinking water. The possible role of biological
meth
ylation in increasing the toxicit
y (Chemical Engineer-
ing News 1971)'
2
" suggested added caution, however, and
natural Nvaters seldom contain more than 0.2 mg •1 (Durum
et al. 1971).11'
Recommendation
To provide the necessary caution, and in view of
available data, an upper limit of 0.2 mg/I of
arsenic
in water is recommended.
Beryllium
Bery
llium was found to occur in natural surface waters
only
at ver
y low levels, usually below 1 pg
, 1 (Kopp and
Kroner 1970)." Conceivably, however, it could enter
waters in effluents from certain metallurgical plants. Its
salts are not hi
g
hl
y
toxic, laborator
y
rats having survived
for two
y
ears on a diet that supplied the element at a level
of about 18 mg
, kg of bod y
weight daily. Pomelee (1953) '3
calculated that a cow could drink almost 1.000 liters of
water containing 6,000 mg,
s
l without harm, if these data
for rats are transposable to cattle. This type of extrapolation
must, however, be used with caution, and the paucity of
additional data on the toxicit
y
of beryllium to livestock
precludes recommending at this time a limit for its concen-
tration in livestock waters.
Boron
The toxicit
y of boron, its occurrence in foods and feeds,
and its role in animal nutrition have been reviewed by
McClure (1949),
1
" McKee and Wolf (1963),
m and
Underwood (1971). 254 Although essential for plants, there
is no evidence that boron is required by animals. It h.
relatively low order of toxicity. In the dair
y cow,
of boric acid per day for 40 days produced no ill en
(McKee and Wolf 19631.1"
There is no evidence that boron accumulates Hatt
extent in body tissues. Apparently, most n
waters could be expected to contain concentrations
below the level of 5.0 mg 1. This was the maximum amo
found in 1,546 samples of river and lake waters ft
various parts of the United States, the mean value bc
0.1 mgrl (Kopp and Kroner 1970). 182
Ground waters cc
contain substantiall
y
more than this at certain places.
Recommendation
Experimental evidence concerning the
toxic
of this element is meager. Therefore, to offer
large margin of safety,
an upper limit of 5.0 m
of boron in livestock waters is recommended.
Cadmium
Cadmium (C:d1 is normall
y found in natural
w
aters
ver
y low levels. A nationwide reconnaissance of surf
waters of the United States (Durum et al. 19711
11 ' revea.
that of over 720 samples, about four per cent contained o,
10 pgil of this element, and the highest level was
110
gr,
Ground water on Long Island, New York, contained .
mg•I as the result of contamination by waste from the el,
troplating industr y
, and mine waters in Missouri contain
1,000 mull (McKee and Wolf 1963).1"
Research to date suggests that cadmium is not an essent
element. It is, on the other hand, quite toxic. Man has be
sickened by about 15 ppm in popsicles. 67 ppm in punt
300 ppm in a cold drink. 530 ppm in gelatin, and 14.5 r
taken orall
y
: although a famil
y of four whose drinki:
water was reported to contain 47 ppm had no histor
y of
effects (McKee and Wolf 19631.19'
Extensive tests have been made on the effects of vario
levels of cadmium in the drinking water on rats and do
(McKee and Wolf 19631. 1
" Because of the accumlatic
and retention of the element in the liver and kidne
y
, it w;
recommended that a limit of 100 pgil, or preferably less. i
used for drinkin
g waters.
Parizek (1960)
219
found that a single dose of 4.5 mg Cd k
of body weight produced permanent sterility in male rat
At a level of 5 mgil in the drinking water of rats (Schroede
et al. 1963a)
2
" or mice (Schroeder et al. 1963b),
2 " reduce
longevity was observed. Intravenous injection of cadmiur
sulfate into pregnant hamsters at a level of 2 mg Cd k
of body weight on da
y
ei
g
ht of gestation caused malforma
tions in the fetuses (Mulvihill et al. 1970).21'"
Miller (1971) 1
" studied cadmium absorption and distri
bution in ruminants. He found that only a small part o
ingested cadmium was absorbed, and that most of what Nva
went to the kidne
y
s and liver. Once absorbed, its turnover
rate was ver
y
slow. The cow is very efficient in keeping
Water for Livestock Enterprises; 311
cadmium out of its milk, and Miller concluded that most
major animal products, including meat and milk, seemed
quite well protected a
g
ainst cadmium accumulation.
Interactions of cadmium several_ other trace ele-
ments (Hill et al. 1963, 1
" Gunn and Gould 1967, 159
Mason
and Young 19671
1
" somewhat confuse the matter of estab-
lishing criteria.
Recommendation
From the available data on the occurrence of
cadmium in natural waters, its toxicity, and its
accumulation in body tissues, an upper limit of
50 b
ig/1 allows an adequate margin of safety for
livestock and is recommended.
Chromium
In a five-
y
ear survey of lake and river waters of the
United States (Kopp and Kroner l9701,
15
" the hi
g hest level
found in over 1,500 samples was about 0.1 mg; I. the average
being about 0.001 mg. 1. In another similar surve
y (Durum
et al. 1971)
141
of 700 samples, none contained over 0.05 mg/1
of chromium VI and only 11 contained more than 0.005
mg/l. A number of industrial processes however use the
element, which then ma
y
be discharged as waste into sur-
face waters, possibly at rather high levels.
Even in its most soluble forms, the element is not readily
absorbed by animals, being largely excreted in the feces;
and it does not appear to concentrate in any particular
mammalian tissue or to increase in these tissues with age
(Mertz 1967, 1
" Underwood 197125x).
Hexavalent chromium is generall
y considered more toxic
than the trivalent form (Mertz 1967).
1
" However, in their
review of this element, McKee and Wolf (1963)'" suggested
_that it has a rather low order of toxicit
y
. Further. Gross and
Heller (1946)'" found that for rats the maximum nontoxic
level, based on growth, for chromium VI in the drinking
water was 500 mg I. The
y
also found that this concentration
of the element in the water did not affect feed utilization by
rabbits. Romoser et al. (1961)
2" found that 100 ppm of
chromium VI in chick diets had no effect on the perform-
ance of the birds over a 21-day period.
In a series of experiments. Schroeder et al. (1963a,238
1963b, 2 " 1964, 234
1965
23
') administered water containing
5 mg/1 of chromium III to rats and mice on low-chromium
diets over a life span. At this level, the element was not
toxic, but instead it had some beneficial effects. Tissue levels
did not increase significantly with age.
As a result of their review of chromium toxicity, McKee
and Wolf (1963)
193
suggested that up to 5 mgil of chromium
III or VI in livestock drinking water should not be harm-
ful. While this may be reasonable, it maybe unnecessarily
high when the usual concentrations of the element in nat-
ural waters is considered.
Recommendation
An upper allowable limit of 1.0 mg/1 for livestock
drinking waters is recommended. This provides a
suitable margin of safety.
Cobalt
In a recent survey of surface waters in the United States
(Durum et al. 1971)'" 63 per cent of over 720 samples were
found to contain less than 0.001
m
g/1 of cobalt. One sample
contained 4.5 mg: I, one contained 0.11 mg rl, and three
contained 0.05-0.10 mg; 1.
Underwood (1971)
2
" reviewed the role of cobalt in
animal nutrition. This element is part of the vitamin
B12
molecule. and as such it is an essential nutrient. Ruminants
s
y
nthesized their own vitamin I3
12
if they were given oral
cobalt. For cattle and sheep a diet containing about 0.1 ppm
of the element seemed nutritionally adequate. A wide
margin of safety existed between the required and toxic
levels for sheep and cattle, which were levels of 100 times
those usuall
y
found in adequate diets being well tolerated.
Nonruminants required preformed vitamin
B /2 .
When
administered to these animals in amounts well be
y
ond those
present in foods and feeds, cobalt induced polvcvthemia
(Underwood 1971).
2 " This was also true in calves prior to
rumen development: about 1.1 mg of the element per kg
of body \\Tight administered daily caused depression of ap-
petite and loss of weight.
Cobalt toxicity was also summarized by McKee and
Wolf (1963).'"
Recommendation
In view of the
data available on the occurrence
and toxicity of cobalt, an upper limit for cobalt in
livestock waters of 1.0 mg/I offers a satisfactory
margin of safety, and should be met by most
natural waters.
Copper
The examination of over 1,500 river and lake waters in
the United States (Kopp and Kroner 1970)
1
" yielded, at
the highest. 0.28 mgil of copper and an average value of
0.015 mg 1. These rather low values were probabl
y
due in
part to the relative insolubility of the copper ion in alkaline
medium and to its read y
adsorbability on colloids (McKee
and Wolf 1963).
1 " Where higher values than those reported
above are found, pollution from industrial sources or mines
can be suspected.
Copper is an essential trace element. The requirement for
chicks and turkey poults from zero to eight weeks of age is
4 ppm in the diet (NRC 19716).
206
For beef cattle on
rations low in molybdenum and sulfur, 4 ppm in the diet
is adequate: but when these elements are high, the copper
requirement is doubled or tripled (NRC 1970).
2° 4 A dietary
level of 5 ppm in the forage is suggested for pregnant and
312/Section 1
7
—Agricultural Uses of Mater
lactating ewes and their lambs (NRC 1968b
201 ). A level of
6 ppm in the diet is considered ade
q
uate for swine (NRC
1968a).202
Swine are apparently very tolerant of high leveis of
copper, and 250 ppm or more in the diet have been used
to improve livewei
g
.ht gains and feed efficiency (Nutrition
Reviews 1966a
2 n NRC I 968a).
2 " On the other hand, sheep
were very susceptible to copper poisoning (Underwood
1971),
254
and for these animals a diet containin
g 25 ppm
was considered toxic. About 9 mg per animal per day was
considered the safe tolerance level (NRC 1968b).'"
Several reviews of copper requirements and toxicity have
been presented (McKee and Wolf I963,'" Nutrition Re-
views 1966a.
21 ° Underwood
1971).
2
'
4 There is very little
ex-
perimental data on the effects of copper in the water supply
on animals. and its toxicity
must
be judged largely from the
results of trials where copper was fed. The element does not
appear to accumulate at excessive levels in muscle tissues,
and it is very readil
y
eliminated once its administration is
stopped. While most livestock tolerate rather high levels,
sheep do not (NRC 1968b).="
Recommendation
It is recommended that the upper limit for cop-
per in livestock waters be 0.5 mg/l. Very few natural
waters should fail
to meet this.
Fluorine
-
The role of fluorine as a nutrient and as a toxin has been
thoroughly reviewed
by Underwood (1971).
2
" (Unless
otherwise indicated, the following discussion, exclusive of
the recommendation, is based upon this review.) While
there is no doubt that dietar
y fluoride in appropriate
amounts improved the caries resistance of teeth. the element
has not yet been found essential to animals. If it is a dietary
essential, its requirement must be very low.
Its
ubiquity
probably insures a continuously adequate intake by ani-
mals.
Chronic fluoride poisoning of livestock has, on the other
hand, been observed in several areas of the world, resulting
in some cases from the consumption of waters of high fluoride
content. These waters come from wells in rock from which
the element has been leached, and they often contain
10-15 mg/l. Surface waters, on the other hand, usually con-
tain considerably less than 1 mgil.
Concentrations of 30-50 ppm of fluoride in the total
ration of dairy cows is considered the upper safe limit,
higher values being suggested for other animals (NRC
1971a).2
" Maximum levels of the element in waters that are
tolerated by livestock are difficult to define from available
experimental work. The species, volume, and continuity of
water consumption, other dietar
y
fluoride, and
age of the
animals, all have an effect. It appears, however, that as little
as 2 mg/1 may cause tooth mottling under some circum-
stances. At least a several-fold increase in its concentrat.
seems, however, required to produce other injurious effei
Fluoride from waters apparently does not accumulate
soft tissues to a significant degree. It is transferred to a v,
small extent into the milk and to a somewhat greater deg:
into eggs.
McKee and Wolf (1963) 1
" have also reviewed the mat
of livestock poisoning by fluoride, concluding that 1.0
TM
of the element in their drinking water did not harm th(
animals. Other more recent reports presented data
sugge
ina that even considerably higher concentrations of fluori
in the water may, with the exception of tooth mottlin
caused no animal health problems (Harris et al. 1963,
Shupe et al. 1964,
246
Nutrition Reviews 1966b,"' Savii
1967,
23
' Schroeder et al. 1968a237).
Recommendation
An upper limit
for fluorides in livestock drink in
waters of 2.0 mg/I is recommended. Although thi
level may result in some tooth mottling it shoul
not be excessive from the standpoint of anima
health or the deposition of the element in meat
milk, or eggs.
Iron
It is well known that iron (Fe) is essential to animal life
Further, it has a low order of toxicity. Deobald and Elveh
jem (1935) 138
found that iron salts added at a level o.
9,000 mg Fe/kg of diet caused a phosphorus deficiency ir.
chicks. This could be overcome by adding phosphate to the
diet. Campbell (1961) 124
found that soluble iron salt ad-
ministered to baby pigs by stomach tube at a level of 600 mu
Fe/kg of body weight caused death within siX hours. O'Don-
ovan et al. (1963) 212
found very high levels of iron in the
diet (4,000 and 5,000 mg/kg) to cause phosphorus deficiency
and to be toxic to weanling pigs. Lower levels (3,000
M9:
kg)
apparently were not toxic. The intake of water by livestock
may be inhibited by high levels of this element (Taylor
1935).
25
° However, this should not be a common or a serious
problem. While iron occurs in natural waters as ferrous
salts which are very soluble, on contact with air it is
oxi-
dized
and it precipitates as ferric oxide, rendering it essen-
tially harmless to animal health.
It is not considered necessary to set an upper limit of ac-
ceptability for iron in water. It should be noted, however,
that even a few parts per million of iron can cause clogging
of lines to stock watering equipment or an undesirable stain-
ing and deposit on the equipment itself.
Lead
Lake and river waters of the United States usually contain
less than'0.05 mg/1 of lead (Pb), although concentrations in
excess of this have been reported (Durum et al. 1971.141
Kopp and Kroner 1970).
182
Some natural waters in areas
where galena is found have had as much as 0.8 mg/I of the
Water for Livestock Enterprises,1313
element. It may also be introduced into waters in the ef-
fluents from various industries, as the result of action of the
water on lead pipes (McKee and Wolf 19631, 1
" or by
dennsition from pollt ted air (NRC 1972).2°7
A nutritional need for lead by animals has not been
demonstrated, but its toxicit
y is well known. A rather com-
plete review of the matter of lead poisoning by McKee and
Wolf (19631
1
" suggested that for livestock the toxicit y of
the element had not been clearly established from a quanti-
tative standpoint. Even with more recent data (Donawick
1966,
1
" Link and Pensinger 1966, 186
Harbourne et al.
1968,
160 Damron et al. 1969,
13 ' Hatch and Funneil 1969,1"
Egan and O'Cuill 1970,'" Aronson 1971), 1 " it is difficult to
establish clearl y
at
\chat
level of intake lead becomes toxic,
although a dail
y
intake of 6-7 mg Pb/k, of body weight has
been suggested as the minimum that eventually
g
ave rise
to signs of poisoning in cattle (Hammond and Aronson
1964).
16
' Apparentl
y
. cattle and sheep are considerably
more
resistant to lead toxicosis than are horses, being remarkably
tolerant to"the continuous intake of relativel
y large amounts
of the element ( Hammond and Aronson 1964. 1 " Garner
1967,
1
" Aronson 1971'
1
: NRC 1972 2 ° 7 ). However: there is
some tendency for it to accumulate in tissues and to be
transferred to the milk at levels that could be toxic to man
(Hammond and Aronson 1964).1
64
There is some agreement that 0.5 mg/I of lead in the
drinking water of livestock is a safe level (McKee and Wolf
1963);
193
and the findings of Schroeder and his associates
with laborator
y
animals are in agreement with this (1963a,2"
1963b,
239
1964,2
" 1965
235
). Using 10 times this level, or
5 mgll, of lead in the drinking water of rats and mice over
their life spans, these authors observed no obvious direct
toxic effects but did find an increase in death rates in the
older animals, especiall
y in the males. Schroeder et al.
(1965) 2
", observed that
. the increased mortalit y
was not
caused by overt lead poisoning, but rather by an increased
susceptibility to spontaneous infections. Hemphill et al.
(1971)
171
later reported that mice treated with subclinical
doses of lead nitrate were more susceptible to challenge with
Salmonella typhimurium.
Recommendation
In view of the lack of information concerning
the chronic toxicity of lead, its apparent role in
reducing disease resistance, and the very low inci-
dence in natural waters of lead contents exceeding
the 0.05 mg/I level, an upper
limit of
0.1 mg/1 for
lead in livestock waters is recommended.
Manganese
Like iron. manganese is a required trace element, occurs
in natural waters at only low levels as manganous salts, and
is precipitated in the presence of air as manganic oxide.
While it can be toxic when administered in the feed at high
levels (Underwood l971),
254 it is improbable' that it would
be found at toxic levels in waters.
It is doubtful that setting an upper limit of acceptability
is necessar
y for m ,,
r.garlese, but af: with iron, fc •.v milli-
grams per liter in water can cause objectionable deposits
on stock watering equipment.
Mercury
Natural waters may contain mercur
y originating from
the activities of man or from naturally occurring geological
stores (Wershaw 1970,
262
White et al. 1970).
263
The element
tends to sorb readily on a variety of materials, including the
bottom sediments of streams, greatly reducing the levels
that might otherwise remain in solution (Hem 1970) 17°
Thus, surface waters in the United States have usually
been found to contain much less than 5 A
O
of mercury
(Durum et al. 1971).
1 " In areas harboring mercur
y de-
posits, their biological methvlation occurs in bottom sedi-
ments ( Jensen and Jernelov 1969)
176
resulting in a con-
tinuous presence of the element in solution ( Greeson 1970).156
In comparison to the relative instability of organic com-
pounds such as salts of phenyl mercury and methoxyethyl
mercury (Gage and Swan 1961,
151
Miller et al. 1961,1"
Daniel and Gage 1969,
132
Daniel et al. 1971
1
") alkyl
mercury compounds including methyl mercury (CH3Hg+)
have a high` degree of stabilit
y in the bod
y
(Gage 1964,"°
Miller et al. 1961)' resulting in an accumulative effect.
This relatiVe stability, together with efficient absorption from
the gut, contributes to the somewhat greater toxicity of
orally administered methyl mercury as compared to poorly
absorbed inorganic mercury salts (Swensson et al. 1959).249
The biological half-life of meth y
l mercury varies from
about 20 to 70 da
y
s in most species (Bergrund and Berlin
1969).
1
" Brain, liver, and kidney were the or
g
ans that ac-
cumulated the highest levels of the element, with the distri-
bution of methyl and other alk
y
l mercury compounds favor-
ing nerve tissue and inorganic mercury favoring the kidney
(Malishe
y
skava et al. 1966,'" Platonow 1968,
222 Aberg et al.
1969)."2
Transfer of methyl mercury (Curley et al. 1971),
13
° but
not mercuric mercury (Berlin and Ullberg 1963),
114
to the
fetus has been observed. The element also appeared in the
eggs of poultr
y
(Kiwimae et al. 1969)
1° and wild birds
(Borg et al. 1969, 118
Dustman et al. 1970) 1
" but did not seem
to concentrate there much above levels found in the tissues
of the adult. Data concerning levels of mercury that may be
detrimental to hatchability of eggs are too meager to sup-
port conclusions at this time. Also, data concerning transfer
of mercury
to milk is lacking.
The animal organs representing the principal tissues for
mercury concentration are brain, liver. and kidney. It is
desirable that the maximum allowable limit
,
for mercury in
livestock waters should result in less than 0.5 ppm of ac-
cumulated mercury in these tissues. This is the level now in
3141Section
V—Agricultural Uses of Woier
use as the maximum allowable in fish used for human con-
sumption.
Few data are available quantitatively relating dietary
mercur y
levels with accumulation in animal tissues. The
ratios between blood and brain levels of meth y l mercury
appeared to range from 10 for rats to 0.2 for monkeys and
dogs t International Committee on Maximum Allowable
Concentrations of Mercury Compounds 19691. 1
" In addi-
tion, blood levels of mercury appeared to increase approxi-
matel
y in proportion to increases in dietar
y intake (Birke
ec al. 1967''': Tejning 1967251).
Assuming a 0.2 or more blood-to-tissue (brain or other tis-
sue) ratio for mercury in livestock. the maintenance of less
than 0.5 ppm mercur
y
in all tissues necessitates maintaining
blood mercur
y
levels below 0.1 ppm. This would indicate a
maximum daily intake of 2.3
I
.Lg of mercury per kilogram
body weight: Based upon daily water consumption by meat
animals in the range of up to about eight per cent of body
weight. it is estimated that water rimy contain almost 30
µg • I
of mercury as meth
y
l mercury without the limits of
these criteria being exceeded. Support for this approxima-
tion was provided in part by the calculations of Aber
g, et al.
(1969) lir= showing that after "infinite" time the body burden
of mercury in man will approximate 15.2 times the weekly
intake of methyl mercury. Applying these data to meat ani-
mals consuming water equivalent to eight per cent of body
weight and containing 30
A
O
of mercury would result in
an average of 0.25 ppm mercury in the whole animal body.
Recommendation
Until specific data become available for the vari-
ous species. adherence to an upper limit of
10
of mercury in water for livestock is recommended,
and this limit provides an adequate margin of
safety to humans who will subsequently not be
exposed to as much as 0.5 ppm of mercury through
the consumption of animal tissue.
Molybdenum
Underwood (1971)
254
reviewed the matter of molyb-
denum's role in animal nutrition. While the evidence that
it is an essential element is good, the amount of molybdenum
required has not been established. For cattle, for instance,
no minimum requirement has been set, but it is believed to
be low, possibly less than 0.01 ppm of the dry diet (NRC
1970).20'
McKee and Wolf (1963) 193
reviewed the matter of toxicity
of molybdenum to animals, but Underwood (1971)254
pointed out that many of the studies on its toxicity are of
limited value because a number of factors known to influence
its metabolism were not taken into account in making these
studies. These factors included the chemical form of
molybdenum, the copper status and intake of the animal,
the form and amount of sulfur in the diet, and other less
well defined matters. In spite of these, there are data to
support real species differences in terms of tolerance to
element. Cattle seem the least tolerant, sheep a little m
so, and horses and swine considerably more tolerant.
While Shirley et al. (1950)
245
found that drenching
Ste
daily with sodium molvbdate in an amount equialent
about 200 ppm of molybdenum in the diet for a period
seven months resulted in no marked symptoms of toxici
cattle on pastures where the herbage contained 20-100 p:
of molybdenum on a dry basis developed a toxicosis kno
as teart. Copper additions to the diet have been used
contrn1 this (Underwood 1971)."4
Cox et al. (1960) 127
reported that rats fed diets containi
500 and 800 ppm of added mol
y
bdenum showed toxic
symptoms and had increased levels of the element in th
livers. Some effects of the mol
y bdenum in the diets on li
\
enz
y
mes in the rats were not observed in calves that h
been maintained on diets containing up to 400 ppm of t
element.
Apparently, natural surface waters very rarel
y
contain
levels of this element of over 1 mg.1 (Kopp and Kror
I970),
1
" which seemed to offer no problem.
Conclusion
Because there are many factors influencing to:
icity of molybdenum, setting an upper allowab
limit for its concentration in livestock waters
not possible at this time.
Nitrates and Nitrites
Livestock poisoning by nitrates or nitrites is depende:
upon the intake of these ions from all sources. Thus, wat.
or forage may independently or together contain levels th.
are toxic. Of the two, nitrite is considerabl
y more toxi
Usually it is formed throu
g
h the biological reduction •
nitrate in the rumen of cattle or sheep. in freshly choppe
forage, in moistened feeds, or in waters contaminated wit
organic matter to the extent that they are capable of sul
porting microbial grow t
h. While natural waters often col
tain high levels of nitrate, their nitrite content is usuali
very low.
While some nitrate was transferred to the milk, Daviso
and his associates (1964)"
5
found that for dairy cattle fe
150 mg NO
3
N/kg of body weight the milk contained abou
3 ppm of NO
3
N. They concluded that nitrates in cattl
feeds did not appear to constitute a hazard to huma
health, and that animals fed nitrate continuously developer
some degree of adaptation to it.
The LD50 of nitrate nitro
g
en for ruminants was fount
to be
about
75 mg NO
3 N/k
g
, of body weight when ad
ministered as a drench (Bradley et al. 1940) 119 and abou
255 mg/kg of body weight when spra y
ed on forage ant
feed (Crawford and Kennedy 1960). 1 " Levels of 60 me
NO3 N/kg of body weight as a drench (Sapiro et al. 1949)23
and 150 mg NO
3
N/kg of body weig
ht in the diet (Prewit:
and Merilan 1958;
2'
4
Davison et al. 1964
135
) had no de-
Water for Livestock Enterprises/315
leterious effects. Lewis (1951) 1
" found that 60 per cent con-
version of hemoglobin to methemoglobin occurred in
mature sheep from 4.0 g of NO
3
N or 2.0 g of NO
2
N placed
in the rumen, or 0.4 g NO
2
N injected intravenously. As an
oral drench, 90 mg NO
3
N/kg of body weight gave peak
methemo
g
lobin levels of 5-6 000 ml of blood in sheep,
while intravenous injection of 6 mg NO.,N
.
; kg of body weight
gave similar results (Emerick et al. 1965))44
Nitrate-induced abortions in cattle and sheep have
generally required amounts approaching lethal levels
(Simon et al.. 1959,
247
Davison et al. 1962, 1
" Winter and
Hokanson 1964, 2
" Davison et al. 1965'").
Some experiments have demonstrated reductions in
plasma or liver vitamin A values resulting from the feeding
of nitrate to ruminants ( Jordan et al. 1961,
1
" Goodrich
et al. 1964, 153
Newland
.
and Deans 1964, 2
" Hoar et al.
1968 173
). The destructive effect of nitrites on carotene
(Olson et al. 1963 213
) and vitamin' A (Pugh and Garner
1963 225
) under acid conditions that existed in silage or in
the gastric stomach have also been noted. On the other
hand, nitrate levels of about 0.15 per cent in the feed
(equivalent to about I per cent of potassium nitrate) have
not been shown to influence liver vitamin A levels (Hale
et al. 1962, 161
Weichenthal et al. 1963,
261
Mitchell et al.
1967
197
) nor to have other deleterious effects in controlled
experiments, except for a possible slight decrease in produc-
tion.
Assuming a maximum water consumption in dairy cat-
tle of 3 to 4 times the dry matter intake (NRC 1971a205),
the concentration of nitrate to be tolerated in the water
should be about one-fourth of that tolerated in the feed.
This would be about 300 mgil of NO3N.
Gwatkin and Plummer (1946)
160
drenched pigs with
potassium nitrate solutions. finding that it required in ex-
cess of 300 mg NO 3 N
,
.. kg of bod
y
weight to cause erosion
and hemorrhage of the gastric mucosa and subsequent
death. Lower levels of this salt had no effect when ad-
ministered daily for 30 da
y
s. Losses in swine due to metho-
globinemia have occurred only with the consumption of
preformed nitrite and not with nitrate (McIntosh et al.
1943,
192
Gwatkin and Plummer 1946, 16
° Winks et al.
1950
265
). Nitrate administered orall
y
as a single dose was
found to be acutely toxic at 13 mg NO
2
N/kg of body weight,
8:7 mg/kg of body weight producing moderate methemo-
globinemia (Winks et al. 1950).
2
" Emerick et al. (1965)1"
produced moderate methemoglobinemia in pi
g
s with intra-
venous injections of 6.0 mg NO
2
N, kg of body weight and
found that the animals under one week of age were no more
Susceptible to poisoning than older ones.
Drinking water containing 330 mg/1 NO
3
N fed continu-
ously to growing pigs and to gilts from weaning through two
farrowing seasons had no adverse effects (Seerley et al.
1965). 2
" Further, 100 mg/I of NO
2 N in drinking water
had no effect on performance or liver vitamin A values of
pigs over a 105-day experimental period, and methemo-
globin values remained low. This level of nitrite greatly
exceeded the maximum of 13 mg/1 NO
2
N found to form
in waters in galvanized watering equipment and in the
presence of considerable organic matter containing up to
300 mg/1 NO3N.
In special situations involving the presence of high levels
of nitrates in aqueous slurries of plant or animal tissues,
nitrite accumulation reached a peak of about one-fourth to
one-half the initial nitrate concentration (McIntosh et al.
1943, 192 Winks et al. 1950,
265
Barnett 1952). 109
This situation
was unusual, but since wet mixtures are sometimes used for
swine, it must be considered in establishing criteria for
water.
Levels of nitrate up to 300 mg/1 NO
3
N or of nitrite up to
200 mg/1 of NO
2 N were added to drinking waters without
adverse effects on the growth of chicks or production of
laying hens (Adams et al. 1966).'" At 200 mg/1 NO2N,
nitrite decreased growth in turkey poults and reduced the
liver storage of vitamin A in chicks, laying hens, and
turkeys. At 50 mgt NO
2
N; no effects were observed on any
of the birds. Kienholz et al. (1966)
179
found that 150 mg '1
of NO3 N in the drinking water or in the feed of chicks or
poults had no detrimental effect on growth, feed efficiency,
methemoglobin level, or thyroid weight, while Sell and
Roberts (1963)
243
found that 0.12 per cent (1,200 ppm) of
NO
2
N in chick diets lowered vitamin A stores in the liver
and caused hypertrophy of the thyroid. Other studies have
shown poultry to tolerate levels of nitrate or nitrite similar
to or greater than those mentioned above (Adams et al.
1967,
1 " Crawford et al. 1969
129
). Up to 450 mg/1 of NO3N
in the drinking water of turkeys did not significantly affect
meat color (Mugler et al. 1970).199
Some have suggested that nitrate or nitrite can cause a
chronic or subclinical toxicity (Simon et al. 1959,2"
McLwain and Schipper 1963,'" Pander 1961,
221
Beeson
I964,
11
' Case 1957
1 "). Some degree of thyroid hypertrophy
ma
y
occur in some species with the consumption of subtoxic
levels of nitrate or nitrite (Bloomfield et al. 1961, 11
' Sell and
Roberts 1963),
2
" hut possibly not in all ( Jainudeen et al.
1965))" In the human newborn, a chronic type of methe-
globinemia may result from feeding waters of low NO3N
content (Armstrong et al. 1958).
1 °' It appears, however,
that all classes of livestock and poultry that have been studied
under controlled experimental conditions can tolerate the
continued ingestion of waters containing up to 300 mg .1 of
NO3
N or 100 mg-;1 of NO2N.
Recommendation
In order to provide a reasonable margin of safety
to allow for unusual situations such as extremely
high water intake or nitrite formation in slurries,
the NO3 N plus NO
2
N content in drinking waters
for livestock and poultry should be limited to 100
ppm or less, and the NO 2
N content alone be limited
to 10 ppm or less.
316: Section
1 ---Agricultural Uses of Water
Selenium
Rosenfeld and Beath (1964)
222
have reviewed the prob-
lems of selenium poisoning in livestock. Of the three types
of this poisonin g
; described, the "alkali disease" syndrome
required the lowest level of the element in the feed for its
causation. Moxon (1937)
193
placed this level at about 5 ppm,
and subsequent research confirmed this figure. Later work
established that the toxicity of selenium was very similar
when the element \Yas fed as it occurs in plants, as
. seleno-
methionine or selenocystine. or as inorganic selenite or
selenatc (Halverson et al. 1-962. 162 Rosenfeld and Beath
1964, 227 Halverson et al. 1966
15
'). Ruminant animals may
tolerate more as inorganic salts than do monogastric ani-
mals because of the salts' reduction to insoluble elemental
form by rumen microorganisms (Butler and Peterson
19611.121
.A study with rats (Schroeder 1967)
222
revealed that sele-
nite, but not selenate. in the drinking water caused. deaths
at a level of 2 mg 1 and was somewhat more toxic than
selenite administered in the diet. However, the results of
drenching studies with cattle and sheep (Maag and Glenn
1967)
107
indicated that selenium concentration in the water
should be slight, if it is any more toxic in the same chemical
form administered in the feed. If there arc differences with
respect to the effect of mode of ingestion on toxicity, they are
probably small.
To date, no substantiated cases of selenium poisoning in
livestock by waters have been reported, although some
spring and irrigation waters- have been found to contain
over I mg:1 of the element (B
y
ers 1935,
1 " Williams and
Byers 1935, 2
" Beath 1943
11
"). As a rule, well, surface, and
ocean waters appeared to contain less than 0.05 mg, 1,
usually. considerably less. B yers et al. (19381'
2 " explained
the low selenium content as a result of precipitation of the
selenite ion with ferric h
y
droxide. Microbial activity, how-
ever. removed either selenite or selenatc from water
(Abu-Erreish 19671;
1 " this ma
y
be another explanation.
In addition to its toxicit
y
, the essential role of selenium
in animal nutrition (Thompson and Scott 1970)"
2 must be
considered. Between 0.1 and 0.2 ppm in the diet have been
recommended as necessar
y
to insure against a deiiciency
in
•
poultry (Scott and Thompson 19691,
241 against white
muscle disease in ruminants (Muth 1963),"
1
- and other
diseases in other animals (Hartle
y
and Grant 1961).187
Selenium therapy suggests it as a requirement for livestock
in general. Inorganic selenium was not incorporated into
tissues to the same extent as it occurred in plant tissue
(Halverson et al. 1962,
1
" 1966,
163
Rosenfeld and Beath
1964227
)-. It is doubtful that 0.2 ppm or less of added inor-
ganic selenium appreciabl
y
increased the amount found in
the tissue of animals ingesting it. The data of Kubota et al.
(1967)
183
regarding the occurrence of selenium poisoning
suggested that over a good part of the United States live-
stock were receiving as much as 0.5 ppm or even more of
naturally occurring selenium in their diets continuous
without harm to them and without accumulating levels
the element in their tissues that make meats or livestc
products unfit for human use.
Recommendation
It is recommended
that the
upper limit f
selenium in livestock
waters be
0.05 mg/l.
Vanadium
Vanadium has been present in surface waters in t
United States in concentrations up to 0.3 mg/1, althouE
most of the analyses showed less than 0.05 mg/1 (Kopp at
Kroner 19701.1"
Recently, vanadium was determined essential for ti
growing rat, physiologically required levels appearing
be at or below 0.1 ppm of the diet (Schwarz and Mill
1971).
2
" It became toxic to chicks when incorporated in
the diet as ammonium meta
y
ahadate at concentratiol
over about 10 ppm of the element (Romoser et al. 1961.:
Nelson et al. 1962. 202 Berg 1963,
n2 Hathcock et al. 1964160
Schroeder and Balassa (1967)
233
found that when mice wet
allowed drinking xy
ater containing 5 of vanadium
vanadyl sulfate over a life span, no toxic effects were of
served, but the element did accumulate to some extent i
certain organs.
Recommendation
It
is
recommended that the upper limit fo
vanadium in drinking water- for livestock be
0.
mg
/l.
Zinc
There are many opportunities for the contamination c
waters by zinc. In some areas where it is mined, this meta
has been found in natural waters in concentrations as higl
as 50 mg. 1. It occurs in si
g
nificant amounts in effluent
from certain industries. Galvanized pipes and tanks ma\
also contribute zinc to acidic waters. In a recent survey o.
surface waters, most contained less than 0:05 mg/1 but some
exceeded 5.0 mg: 1, the highest value being 42 mg/1 (Durum
et al. 1971)."
Zinc is relativel
y
nontoxic for animals. Swine have
tolerated 1.000 ppm of dietary zinc (Grimmet et al. 1937,1"
Sampson et al. 1942.
2
" Lewis et al. 1957,
185
Brink et al.
1959 1
"), while 2,000 ppm or more have been found to be
toxic (Brink et al. 1959). 1
" Similar findings have been re-
ported for poultry (Klussendorf and Pensack 1958,
181
John-
son et al. 1962,
1 " Vohra and Kratzer 1968 239 ) where zinc
was added to the feed. Adding 2,320 mg
.
/1 of the element
to water for chickens reduced water consumption, egg pro-
duction, and body weight. After zinc withdrawal there were
no symptoms of toxicit
y in chickens (Sturkie 1956).
2
'8
In a
number of studies with ruminants. Ott et al. (1966a,215
Water for Livestock Enterprises/ 31 7
b
,
216 c,217
d218)
)
found zinc added to diets as the oxide to be
toxic, but at levels over 500 mg, kg of diet.
While an increased zinc intake reflected an increase in
level of the element in the bod
y
tissues, the tendency for its
accumulation was not great (Drinker et al. 1927,
140
Thomp-
son et al. 1927,
2
" Sadasivan 1951,
2's
Lewis et al. 19571.1"
and tissue levels fell rapidl
y
after zinc dosing was stopped
(Drinker et al. 1927,
1
" Johnson et al. 1962177).
Zinc is a dietary requirement of all poultry and livestock.
National Research Council recommendation for poults up
to eight weeks was 7
.
0 me kg of diet; for chicks up to eight
weeks, it was 50 mg/kg of diet (NRC 1971b):
2206
for swine.
50 mg/kg
•
of diet (NRC 1968a).
202
There is no established
requirement for ruminants, but zinc deficiencies were re-
ported in cattle grazing fora
g
e with zinc contents ranging
between 18 and 83 ppm (Underwood 1971).
2
" There is
also no established requirement for sheep, but lambs fed a
purified diet containing 3 ppm of the clement developed
symptoms of a deficiency that were prevented by adding 15
ppm of zinc to the diet: 30 ppm was required to give max-
imum growth (Ott et al. 1965).2'4
Cereal grains contained on the average 30-40 ppm and
protein concentrates from 20 to over 100 ppm (Davis
1966). 134
In view of this, and in view of the low order of
toxicity of zinc and its requirement by animals, a limit in
livestock waters of 25 mg zinc; I would have a very large
margin of safety. A higher limit does not seem necessary,
since there would be few instances where natural waters
would carry in excess of this.
Recommendation
It is recommended that the upper limit for zinc
in livestock waters be 25 mg/l.
Toxic Algae
The term "water bloom" refers to heavy scums of blue-
green algae that form on waters under certain conditions.
Perhaps the first report of livestock poisoning by toxic algae
was that of Francis (18781
1
" who described the problem in
southern Australia. Fitch et al. (1934)
146
reviewed a number
of cases of algal poisoning in farm animals in Minnesota
between 1882 and 1933. All were associated with certain
blue-green algae often concentrated by the wind at one end
of the lake. Losses in cattle. sheep, and poultry were re-
ported. The algae were found toxic to laboratory animals
on ingestion or intraperitoneal injection.
According to Gorham (1964)
1
" six species of blue-green
algae have been incriminated, as follows:
Nodularia spumigena
Micros
y
stis aeruginosa
Coelosphaerium Kuetzingianum
Gloeotrichia echinulata
Anabaena flos-aquae
Aphanizomenon flos-aquae
Of the above, Gorham states that
Microcystis
and
Ana-
baena
have most often been blamed for serious poisonings
and algal blooms consisting of one or more of these species
vary considerabl
y
in their toxicity
(Gorham
1
C
)41:) .155
According to Gorham (1960),'" this variability seems to
depend upon a number of factors, e.g., species and strains
of
algae that are predominant, types and numbers of bac-
terial associates, the conditions of growth, collection and
decomposition, the degree of animal starvation and sus-
ceptibilit
y
, and the amount consumed. To date, onl
y
one
toxin from blue-green algae has been isolated and identified,
onl y
from a few species and streams. This Was a cyclic pol
y
-peptide containing 10 amino acid residues, one of which
was the unnatural amino acid D-serine (Bishop et al.
1959)." This is also referred to as FDF (fast-death factor),
since it causes death more quickly than SDI
?
(slow-death
factor) toxins produced in water blooms.
Shilo (1967)
244 pointed out that the sudden decomposition
of algal blooms often preceded mass mortalit
y
of fish, and
similar observations were made with livestock poisonings.
This suggests that the Isis of the algae may be important
in the release of the toxins, but it also suggests that in some
circumstances botulism may be involved. The lack of oxy-
gen ma
y
have caused the fish kill and must also be con-
sidered.
Predeath symptoms in livestock have not been carefully
observed and described. Post-mortem examination is ap-
parently of no help in diagnosis (Fitch et al. 1934).1"
Feeding or injecting algal suspensions or water from suspect
waters have been used
,
to some extent, but the occasional
fleeting toxicity of these materials makes this procedure of
limited value. Identification of any of the toxic blue-green
algae species in suspect waters does no more than suggest
the possibility that they caused livestock deaths.
In view of the many unknowns and unresolved problems
relating blooms of toxic algae, it is impossible to suggest
an y
recommendations insuring against the occurrence of
toxic algae in livestock waters.
Recommendation
The use for livestock of waters bearing heavy
growths
of blue green algae should be avoided.
Radionuclides
Surface and groundwaters acquire radioactivity from
natural sources, from fallout resulting from atmospheric
nuclear detonations, from mining or processing uranium,
or as the result of the use of isotopes in medicine, scientific
research, or industry.
All radiation is regarded as harmful, and an
y
unnecessary
exposure to it should be avoided. Experimental work on the
biological half-lives of radionuclides and their somatic and
genetic effects on animals have been briefly reviewed by
McKee and Wolf (1963).
1 " Because the rate of decay of a
radionuclide is a physical constant that cannot be changed,
318 /Section
V
—
Agricultural Uses of rFater
radioactive isotopes must be disposed of by dilution or by
storage and natural decay. In view of the variabilit
y in half-
lives of the many radioisotopes, the nature of their radioac-
tive emissions. and the differences in metabolism of various
elements by different animals, the results of animal experi-
mentation do not lend themselves easily to the development
of recommendations.
Based on the recommendations of the U. S. Federal
Radiation 'Council (1960,
2
" 1961"'), the Environmental
Protection Agenc
y
will set drinking water standards for
radionuciidcs (1972)."' to establish the intake of radioac-
tivit
y
from waters that when added to the amount from all
ocher sources
\
611 not likel y
be harmful to man.
Recommendation
In view of the limited knowledge of the effect of
radionuclides in water on domestic animals, it is
recommended that the Federal Drinking Water
Standards he used for farm animals as well as for
man.
PESTICIDES (IN WATER FOR LIVESTOCK)
Pesticides include a large number of organic and inorganic
compounds. The United States production of synthetic
organic pesticides in
1970
was 1,060 million pounds con-
sisting almost entirel y of insecticides (501 million pounds),
herbicides (391 million pounds), and fungicides (168 million
pounds). Production data for inorganic pesticides was
limited. Based on production, acreage treated, and use
patterns, insecticides and herbicides comprise the major
agricultural pesticides. (Fowler 1972).
27
' Of these. some can
be detrimental to livestock. Some have low solubility in
water, but all cause problems if accidental spillage pro-
duces high concentrations in water, or if the
y become ad-
sorbed on- colloidal particles subsequently dispersed in
wa ter.
Insecticides are subdivided into three major classes of
compounds including metbylcarbamates. organopliospha tcs
and chlorinated h ydrocarbons. Nlany of these substances
produce no serious pollution hazards, because they are non-
persistent. Others, such as the chlorinated hydrocarbons,
are quite persistent in the environment and are the pesti-
cides most frequentl
y
encountered in water.
Entry of
Pesticides into Water
Pesticides enter water from soil runoff. direct application,
drift, rainfall, spills, or fault y waste disposal techniques.
Movement by erosion of soil particles with adsorbed pesti-
cides is one of the principal means of entry into water. The
amount carried in runoff water is influenced by rates of ap-
plication, soil type, vegetation, topography, and other
factors. Because of strong binding of some pesticides on soil
particles, water pollution b
y
pesticides is thought to occur
largely through the transport of chemicals adsorbed to soil
particles (Lichtenstein et al. 1966).
281
This mechanism r
not always be a major route. Bradle
y
et al. (1972)269
served that when 13.4 kg/hectare DDT and 26.8 kgthec.
toxophene were applied to cotton fields, only 1.3 and
per cent, respectively, of the amounts applied were detec
in natural runoff water over an 8-month period.
Pesticides can also enter the aquatic environment by di:
application to surface waters. Generally. this use is to c
trol mosquito larvae, nuisance aquatic weeds, and, as
several southern states, to control selected aquatic fat
such as snails (Chesters and Konrad 1971).
27
.
1
Both of th
pathways generall
y result in contamination of surface wa:
rather than groundwaters.
Precipitation. accidental spills. and fault
y
waste dispc
are less important entry routes. Pesticides detected in ra
water include DDT,
DDI),
DDE, dieldrin, alpha-BHC
gamma-RHO in extremel
y
minute concentrations 'i.e..
the order of 10- 12
parts or the nanograms per liter le%
(Weibel et 1966."" Cohen and Pinkerton 1966,
27 ' T
rant and Tatton 1968'"). Spills and fault
y
waste dispo
techniques arc usually responsible for short-term,
high -
le
contamination.
The amount of pesticide actually in solution, howev
is governed be a number of factors, the most importa
probabl y
being the solubility of the molecule. Chlorinat
h
y
drocarbon insecticides, for example, have low solubil:
in water (Freshwater Appendix II-D). Cationic pesticic
(i.e., paraquat and diquat) are rapidl
y and tightly both
to soil particles and are inactivated (Weed Society
America 1970).
2
" Most arsenical pesticides form insoluL
salts and arc inactivated (Woolson et al. 19711."
7
A sure.
of the water and soil la y
ers in farm ponds indicates high
concentrates of pesticides are associated with the soil lave
that interface with water than in the water
per se.
In an c
tensive surve
y
of farm water sources (U. S. Dept. of Agi
culture, Agricultural Research Service 1969a,"
2 hercaft,
referred to as Agriculture. Research Service 1969a"'
anal ysis of sediment showed residues in the magnitude
decimal fractions of a microgram per gram (pg
'g.)
a his
of 4.90 pg g DDT and its DDE and DDD degradatio
compounds. These were the principal pesticides found i
sediment. Dieldrin and endrin were also detected in sed:
ment in two stud
y
areas where surface drainage Ovate
entered farm ponds from an adjacent field.
Pesticides Occurrence in Water
Chlorinated h y
drocarbon insecticides are the pesticide
most frequently encountered in water. The
y include DUI
and its de
g
radation products DDE and DDD, dieldrin.
endrin. chlordane, aldrin, and lindane. In a pesticide moni-
toring program conducted from 1957 to 1965, Breidenbach
et al. (1967) 270
concluded that dieldrin was present in all
sampled river basins at levels from 1 to 22 nanograms
(ng)diter. DDT and its metabolites were found to occur in
most surface waters, while levels of endrin in the lower
Water for Livestock Enterprises/319
Mississippi decreased from a high of 214 ngil in 1963 to a
ran
g
e of 15 to 116 ngil in 1965. Results of monitoring
studies conducted by the U. S. Department of Agriculture
(Agri
,.
.ultural Research Service 1969a) 267 from 1965 to
1967 indicated that only very small amounts of pesticides
were present in any of the sources sampled. The most preva-
lent pesticides in water were DDT, its metabolites DDD and
DDE, and dieldrin. Levels detected were usuall
y
below
one part per billion. The DDT family, dieldrin, endrin,
chlordane, linclane, heptachlor epoxide, trifluralin. and
,4-D, were detected in the range of 0.1 to 0.01 In a
major survey of surface waters in the United States con-
ducted from 1965 to 1968 for chlorinated hydrocarbon pesti-
cides (Lichtenberg et al. 1969),
232 dieldrin and DDT (in-
cludin
g
DDE and DDD) were the compounds most fre-
quently detected throughout the 5-year period. After reach-
ing a peak in 1966. the total number of occurrences of all
chlorinated hydrocarbon pesticides decreased sharpl
y
in
1967 and 1968.
A list of pesticides most likel
y to occur in the environ-
ment and. consequently, recommended for inclusion in
monitoring studies. was developed by the former Federal
Committee on Pesticide Control (now Working Group .on
Pesticides). This list was revised (Schechter 1971)
290 and
expanded to include those compounds (1) whose persistence
is, of relatively lone-term duration; (2) whose use patterns
is large scale in terms of acreage; or (3) whose inherent
toxicity is hazardous enough to merit close surveillance.
The primary list includes 32 pesticides or classes of pesticides
(i.e. arsenical pesticides, mercurial pesticides, and several
dithiocarbamate fungicides) recommended to be monitored
in water. .A secondar
y
list of 17 compounds was developed
for consideration, if monitoring activities are expanded in
the future. The pesticides found on the primar
y list would
be those most likely to be encountered in farm water sup-
plies (see Freshwater Appendix II-D).
Toxicological Effects of Pesticides on Livestock
Mammals generall
y
have a greater tolerance to pesticides
than birds and fish. However, the increased use of pesticides
in agriculture, particularly the insecticides, presents a poten-
tial hazard to livestock. Some compounds such as the or-
g
anophosphorous insecticides can be extremely dangerous,
especially when mishandled or wrongly used. To date, how-
ever, there actually have been very few verified cases of
livestock poisoning from pesticides (Papworth 1967).
2 " In
the few instances reported, the cause of livestock poisoning
usually has been attributed to human negligence. For live-
stock, pesticide classes that may pose possible hazards are
the acaricides, fungicides, herbicides, insecticides, mollus-
cides, and rodenticides (Papworth 1967).287
Acaricides intended for use on crops and trees usually
have low toxicity to livestock. Some, such as technical
chlorobenzilate, have significant toxicity for mammals. The
acute oral LD50 in rats is 0.7 gjkg of body weight (Pap-
worth 1967).287
With fungicides, the main hazard to live-
stock apparentl y
is not from the water route, but from their
use as seed dressings for grain. Of the types used, the organo-
mercur
y
CC.'n
-I
po
r
a
rl
potentially the most
dangerous (McEntee 1950,
2
" Weibel et al. 1966295 ). The
use of all organomercur
y
fungicides is restricted b y the
Environmental Protection Agency (Office of Pesticides,
Pesticides Regulation Division 1972).
277 Consequentl
y, the
possible hazard to livestock from these compounds has, for
most purposes, been eliminated.
Of the herbicides in current use, the dinitro compounds
pose the greatest hazard to livestock. Dinitroorthocresol
(DNC or DNOC) is probably the most used member of
this group. In ruminants, however, DNC is destroyed
rapidl
y
by the rumen organisms (Papworth 1967). 2 " These
compounds are very persistent, up to two years, and for
livestock the greatest hazard is from spilla
ges, contamina-
tion of vegetation. or water. In contrast, the phenoXyacetic
acid derivatives (2 .4-D, MCPA) are comparativel
y
harm-
less. Fertig (19531"
S
states that suspected poisoning of
livestock or wildlife by phenoxy herbicides could not be
substantiated in all cases carefull
y surve
y
ed. The hazards
to livestock from hormone weed killers are discussed by
Rowe and Hymas (1955),
2
" and dinitrocompounds by
McGirr and Papworth (1953)"
4 and Edson (1954).27'
The possible hazards from other herbicides are 'reviewed by
Papworth (1967)
2
" and Radeleff (1970).2"
Of the classes of insecticides in use, some pose a potential
hazard to livestock, while others do not. Insecticides of
vegetable origin such as pyrethrins and rotenones. are prac-
tically non-toxic to livestock. Most chlorinated hydrocarbons
are not highly toxic to livestock, and none is known to ac-
cumulate in vital organs. DDT, DDD, dilan. methoxvchlor,
and perthane are not highly toxic to mammals. but some
other chlorinated h
y
drocarbons are quite toxic (Papworth
1967,
2
" Radeleff 1970283
). The insecticides that are poten-
tiall y
the most hazardous are the organophosphorus com-
pounds causing chlorinesterase inhibition. Some. such as
mipafax, induce pathological changes not directly related
to cholinesterase inhibition (Barnes and Denz 1953).268
Liquid organophosphorus insecticides are absorbed by all
routes, and the lethal dose for most of these compounds is
low (Papworth 1967,
287
Radeleff 1970288).
Pesticides in Drinking Water for Livestock
The subgroup on contamination in the Report of the
Secretary's Commission on Pesticides and Their Relation-
ship to Environmental Health (U.S. Dept. of Health, Edu-
cation, and Welfare 1969)
29
' examined the present knowl-
edge
.on mechanisms for dissemination of pesticides in the
environment, including the water route. There have been
no reported cases of livestock toxicity resulting from pesti-
cides in water. However, they conclude that the possibility
of contamination and toxicit
y
from pesticides is real because
of indiscriminate, uncontrolled and excessive use.
320/Section 17
—Agricultural Uses of Water
Pesticide residues in farm water supplies for livestock and
related enterprises are undesirable and must be reduced or
eliminated whenever possible. The primary problem of
reducing levels of pesticides iri water iS 'to' locate the source
of contamination. Once located, appropriate steps should
be taken to eliminate the source.
Some of the properties and concentrations of pesticides
found in water are shown in Table V-4. Although many
pesticides are readily broken down and eliminated b
y live-
stock with no subsequent toxicological effect, the inherent
problems associated with pesticide use include the accumu-
lation and secretion of either the parent compound or its
degradation products in edible tissues and milk (Butches
et al. 1970). 2
" Consequently, pesticides consumed b
y
live-
stock through drinking water ma
y
result in residues in fat
and certain produce (milk, eggs, wool). depending on the
level of exposure and the nature of the pesticide. There is
also a possibility of interactions between insecticides and
drugs. especially in animal feeds (Connev
.
and Hitchings
1969).2"
Nonpolar lipophilic pesticides such as the chlorinated
hydrocarbon insecticides (DDT, linciane, endrin. and
others) tend to accumulate in fatt
y tissue and ma y re-
sult in measurable residues. Polar, water soluble pesticides
and their metabolic derivatives are generally excreted in
the urine soon after ingestion. Examples of this class would
include most of the phosphate insecticides and the acid
herbicides (2 ,4-D: 2 ,4 ,5-T: and others). Approximately
96 per cent of a dose of 2 ,4-D fed to sheep was excreted
unchanged in the urine and 1.4 per cent in the feces in 72
hours (Clark et al. 1964). 2
" Feeding studies (Claborn et al.
1960) 2
" have shown that when insecticides were fed to beef
cattle and sheep as a contaminant in their feed at dosages
that occur as residues on forage crops, all except methoxy-
chlor were stored in the fat. The levels of these insecticides
in fat decreased after the insecticides were removed from the
animals' diets. When poultr y
were exposed to pesticides
either by ingestion of contaminated food or through the use
of pesticides in poultry houses. Whitehead (1971)
2 " ob-
TABLE V-4—Some Properties, Criteria, and Concentrations
of Pesticides Found in Water
Solubility
A
y/liter?
Toxicity
L050
myike?
Maximum concentration.
AI
aldrin ?
?
38
? 0.015
dieldrin ?
110
?
?
46
? 0.401
endrin
?
160
?
?
10
? 0.133
heptachlor ?
?
56?
130?
0.041
heptachlor Inside ?
350
?
?
0.067
DDT ?
?
1.2
?
113?
0.316
DOE ?
?
0.050
DOD ?
?
0.140
2,4 . 06 ? ?
60,000?300-1000
• Maximum concentratioa 14 pesticide found in surface waters in the United States, from Lichttnbert et al.
(1969r ".
b
Retest to the herbicide family
2,440; 2,4,5•T;
and 2,4,5-TP.
served that the toxicities to birds of the substance
varied greatly. However, nonlethal doses may affect g
rate, feed conversion efficiency, egg production, eg
shell thickness, and viability
of the young. Although
fects of large doses may be considerable. Whitehear
eluded that little is known about the impairment of p
tion at low rates commonly used in agricultural bra(
Elimination of fat soluble pesticides from contam
animals is slow. Urinary excretion is insignifican
elimination
in
feces is slow. The primary route of exc
in a lactating animal is through milk. The lowest cone
Lions of pesticides in feeds that lead to detectable resit
animal tissues or products exceed the amounts fou
\cater by a factor of 10,000. However, at the compar
high dosage rates given in feeds, certain trends are app
Cows fed DDT in their diet at rates of 0.5, 1.0, 2.0, 3.
5.0 mg 'kg exhibited residues in milk at all feeding
except at 0.5 mg: kg. As the DDT feed levels incr
contamination increased (Zweig et al. 1961). 298 \4/her
were removed from contaminated feeds, the amot
time required for several pesticides to reach the non-c
able level was recorded (Moubr y et al. 1968). 2 " Di
had the longest retention time in milk, approximate:
days. DDT and its analogs, BHC, lindane, endrin
methoxychlor followed in that order. It should be er
sized that levels found in farm water supplies do not rr
significant contribution to animal body burdens of pest
compared to amounts accumulated in feeds.
Table V-4 shows the toxicity of some important
cides. Assuming the average concentration of any pes
in water is 0.1
A g/1, and the average daily consumpt
water by dairy or beef cattle is 60 liters per day, the
average dail y intake of DDT would be 0.006 mg. Fu
assumin
g that the avera
g e body weight for dairy or bet
tle is 450 kg and the LD50 for DDT is 113 mg kg
- -4),
then 50 grams would have to he consumed to app
the dose that would be lethal to 50 per cent of the anim
a steer were maintained on this water for 1,000 days, t
would have ingested about I 10.000 of the reported I
For endrin (LD50 10 mg kg), cattle would ingest 1
of the established LD50. The safety margin is pro
greater than indicated, because the calculations assum
all of the insecticide is retained unaltered during the
ingestion period. DDT is known to be degraded to a
HI
extent by bovine rumen fluid and by rumen microo
isms. For sheep, swine, horses, and poultry, the av
daily water intake in liters is about 5, 10, 40, and 0.
spectivelv. Consequently, their intake would be substan
less.
Fish as Indicators of Water Safety
The presence of fish may be an excellent monito
toxic levels of pesticides in livestock water supplies.
are numerous and well documented examples in the li
ture of the biological magnification of persistent pesti
Water for Livestock Enterprises/321
TABLE 17
-5—Examples of Fish as Indicators of Water
Safety for Livestock
Material
Tosic•lerels mg
, ' for fish
Toxic
aliens on animals
Aldrin
0.02?
?
3
mg!kg food (poultry).
Chlordane
1.0
(sunfish)
.
91
mrkg body weight in food (cattle).
Dieldrin
0.025
(Trout).......
25 mgikg food (rats).
.
Dirsteret
10.0 mg 'kg body weight in food (calves).
Endrin
0.003 (bass) .
3.5
nuke body weight in food (chicks).
Ferban. fermate
1.0 )o 4.0
Methorychlor
0.2
(bats)
14 mg allalla hay. not toxic (cattle).
Parathion
2.0 (go)dfishl..
75 mg 'kg body weight in food (cattle).
PenUchloroblunol
0.35
(bloegill) 60
mg
1
drinking water not toxic (cattle).
Pyrethrum (allethrin): .
2.0
to
10.0_?
?
1.400
to
2.800
mg kg body weight in food (rats).
Silver
5.0
?500
to
2.000
mg lc body weight in food (chicks).
Touohene
•
?
0.1
(bass)..
3510 110
mg 'kg body weig
h t in
loon
(cattle).
McKee and
Wol1.196310.
by fish and other aquatic organisms (Sec Sections III and
IV.on Freshwater and Marine Aquatic Life and Wildlife.)
Because of the lower tolerance levels of these aquatic
or
g
anisms for persistent pesticides such as chlorinated hy-
drocarbon insecticides, mercurial compounds, and heavy
metal fun
g
icides. the presence of hying fish in agricultural
water supplies would indicate their safety for livestock
(McKee and Wolf 1963)."' Some examples of individual
effects of pesticides upon fish compared to animal species
are shown in Table V-5. These data indicate that fish gen-
erall
y
.-have much lower tolerance for commonly used pesti-
cides than do livestock and poultry.
Recommendation
Feeding studies
indicate no deleterious effects of
reported pesticide residues in livestock drinking
water on animal health. To prevent unacceptable
residues in animal products, the maximum levels
proposed in the pesticide section of the Panel of
Public Water Supplies are recommended for farm
animal wafer supplies.
PATHOGENS AND PARASITIC ORGANISMS
Microbial Pathogens
One of the most significant factors in the spread of infec-
tious diseases of domesticated animals is the quality of
water which they consume. In man y instances the only
water available to livestock is from surface sources such as
ponds, waterholes, lakes, rivers and creeks. Not infrequently
these sources are contaminated by animals which wade to
drink or stand in them seeking refuge from pests. Con-
tamination with potential disease-producing organisms
comes from surface drainage originating in corrals, feed
lots, or pastures in which either sick or carrier animals are
kept.
Direct evidence relating the occurence of animal patho-
gens in surface waters and disease outbreaks is limited.
However, water ma
y
be a source for listeriosis caused by
Listeria monocytogenes
(Larsen 1964)
3
" and erysipelas caused
by
Erysipelothrix ritusiopalhiae
(Wood and Packer in press
1972)."° Tularemia of animals is not normally waterborne,
but the )i-ganism
Pasteurella tularensis
has been isolated from
waters in the United States (Parker et al. 1951. 3°' Seghetti
19521.
3 °' Enteric microorganisms, including the vibrios
(Wilson and Miles 1966)
309
and amoebae, have a long
record as water polluting agents.
The
Escherichia-Enterobacter-Klebscilla
group of enterics
are widel
y distributed in feed, water, and the general en-
vironment (Breed et al. 1957)."9 They
sometimes cause
urinary
disease. abscesses, and mastitis in livestock.
Sal-
monella
are very invasive and the carrier state is easil
y pro-
duced and persistent, often without any general evidence of
disease. Spread of the enterics outside the
y
ards, pens, or
pastures of infected livestock is a possibility, but the epi-
demiolog y
and ecology of this problem are not clear.
'In the United States, leptospirosis is probabl
y
the most
intimatel
y
water-related disease problem (Gillespie et al.
1957,
3°' C.:rawford et al. (969
3 °0
). The patho
g
enic leptospira
leave the infected host through urine and lack protection
.against dry
ing. Direct animal-to-animal spread can occur
through urine splashed to the eyes and nostrils of another
animal.
Infection by
leptospirosis from water often is direct: that
is, contaminated water infects animals that consume it or
come into contact with it.
Van Thiel (1948)
3 ° s and Gillespie et al. (1957)" 0
pointed
out that mineral composition and pH of water are factors
affecting continued mobilit
y
of voided leptospira. Most
episodes of leptospirosis can he traced to ponds. ricefields,
and natural waters of suitable pH and mineral composition.
For leptospira control, livestock must not be allowed to
wade in contaminated water. Indirect contamination of
water through sewage is unlikely, although free-living
leptospira ma y
occur in such an environment.
The Genus
Clostridium
is comprised of many species
(Breed et al. 1957),2
" some of which have no pathogenic
characteristics. Some such as
Clostridium perfrigens
and
Cl.
tetani
may become adapted to an enteric existence in ani-
mals. Almost all of them are soil adapted. Water has a vital
role in environments favorable for anaerobic infections
caused by
Clostridia.
Management of water to avoid oxygen depletion serves
to control the anaerobic problem. Temporary or permanent
areas of anaerobic water environment are dangerous to
livestock. Domestic animals should be prevented from con-
suming water not adequately oxygenated.
One of the best examples of water-related disease is bacil-
lary hemoglobinuria, caused by an organism
Cl. hemolvticum
found in western areas of North and South America. It has
been linked with liver fluke injury, but is not dependent on
the presence of flukes. Of particular concern has been the
spread of this disease to new areas in the western states. As
described by Van Ness and Erickson (1964)," each new
322/Section V—Agricultural Uses of Water
premise is an endemic area which has an alkaline, anaerobic
soil-water environment suitable for the organism. This
disease has made its appearance in new areas of the West
when these areas are cleared of brush and irrigated. To
avoid this problem, western irri
g
ation waters should be
'mana
ged to avoid cattail marshes. hummock grasses, and
other environments of prolon g
ed saturation.
Anthrax in livestock is a disease of considerable concern.
The organism causing anthrax,
Bacillus anthrocis,
may occur
in soils with pH above 6.0. The organism forms spores
which, in the presence of adeouate soil nutrients, vege-
tate and grow. The spread of disease b
y
drinking water
containing spores has never been
D roved. Bits of hide and
hair waste may be floated by
water downstream from manu-
facturin
g
plants. but very
few outbreaks have been reported
from these sources. The disease is associated with the water
from pastures where the grass has been killed (Van Ness
1971).
3
" The killed grass is brown rather than blackened. a
si g nificant difference from •water drowned vegetation in
general.
The epidemiology of virus infections tends to incriminate
direct contact: e.g., fomites. mechanical. and biological
vectors, but seldom water supplies. Water used to wash
away manure prior to the use of disinfectants or other bio-
logical control procedure ma
y carr
y viruses to the general
environment.
Viruses are classified by size, t
y
pe of nucleic acid, struc-
ture, ether sensitivity, tissue effects (which includes viruses
long known to cause recognizable diseases, such as pox and
hog cholera), and by other criteria. Onl y the ether-resistant
viruses, such as those causing polio and foot and mouth
disease in cattle, appear to present problems in natural
water (Prier
I
966).3"
Parasitic Organisms
Parasitic protozoa include numerous forms which are
capable of causing serious livestock losses. Most
.
outbreaks
follow direct spread among animals. Water contaminated
with these organisms or their cysts becomes an indirect
factor in spread of infection.
Some of the most important parasitic forms are the various
flukes which develop as adult forms in man and livestock.
Important ecological factors include presence of snails and
vegetation in the water, or ve
g
etation covered b
y
intermit-
tent overflow. This problem is very serious in irrigated at
but only when snails or other intermediate hosts are a•
able for the complete life cycle. Fluke eggs passed by
host, usually in the manure (some species, in the ur
enter the water and hatch into
miracidia.
These seek o
snail or other invertebrate host where they develop
sporocvsts.
These transform into redia which in turn
form other redia or several
cercariar.
The cercariae leave
snail and swim about the water where they may find
final host. or ma
y
encvst on vegetation to be eaten h
The life cycle is completed by maturing
in
a suitable
and establishment of an exit for eggs from the site of th(
tachment.
Roundworms include numerous species which may
water pathways in their life c y
cle. Free-living nemat,
can sometimes be found in a piped water supply, but
probabl y of little health -significance. Moisture is art -
portant factor in the life cy cle of many parasitic roundwc
and livestock are maintained in an environment where (
tamina non of water supplies frequentl y
occurs.
1
t is usu
thought that roundworm eggs arc eaten but water-sa
tut-,
environments provideideal conditions for maintaining pc
lations of these organisms and their eggs.
Parasitic roundworms probably evolved through ey
tionar
y
cycles exemplified' by the behavior of the gc
Strongvloides.Stronfvloides
spread along draina
g
,eways thro
the washdown of concrete feeding platforms and o
housing facilities for livestock.
The Guinea worm,
Dracunculus.
is dependent upon wa
because the adult la
y s e
gg
s only when the host come.
contact with water. Man. dogs. cats, or various wild m.
mals ma
y
harbor the adult, and the larvae develoi
C•cloN.
The life c
y
cle is thus maintained in a water envi,
ment when the
&clops
is swallowed by another suitable
Eggs of "horsehair worms" arc laid b
y
the adult in w
or moist soil. The larvae enc y
st and if eaten by an a ppro
ate insect Will continue development to the adult st;
Worms do not leave the insect unless they can enter wa
The prevention of water-borne diseases and parasiti
in domestic animals depends on interruption of the of
nisms' life c
ycle. The most effective means is to keep 1
stock out of contaminated \vater. Treatment for the rem(
of the pathogen or parasite from the host and destructio
the intermediate host are measures of control.
WATER FOR IRRIGATION
Irrigation farming increases productivity of croplands
and provides flexibilit
y
in alternating crops to meet market
demands. Earl y
irrigation developments in the arid and
semiarid West were lar
gel
y
along streams where onl
y
a
small part of the total annual flow was put to use. Such
streams contained dissolved solids accumulated through the
normal leachint-4 and weatherin g
processes with onl
y
slight
additions or increases in concentrations resulting from man's
activities. Additional uses of water resources have in many
cases concentrated the existing dissolved solids, added new
salts, contributed toxic elements, microbiologically polluted
the streams, or in some other way degraded the quality of
the water for irrigation. Water qualit
y criteria for irrigation
has become increasingly significant as new developments in
water resources occur.
Soil, plant. and climate variables and interactions must be
considered in developing criteria for evaluation of irriga--
tion water quality. A wide range of suitable water charac-
teristics is possible even when onl
y
a few variables are con-
sidered. These variables are important in determining the
quality
of water that can be used for irrigation under
specific conditions.
The physicochemical properties of a soil determine the
root environment that a plant encounters following irriga-
tion. The soil consists of an organo-mineral complex that
has the ability to react both physically and chemically with
constituents present in irrigation water. The degree to
which these added constituents will leach out of a soil, re-
main available to plants in the soil, or become fixed and
unavailable to plants, depends largely on the soil charac-
teristics.
Evapotranspiration by plants removes water from the
soil leavin
g
the salts behind. Since uptake b
y
plants is
negligible, salts accumulate in the soil in arid and semiarid
areas. A favorable salt balance in the root zone can be main-
tained by leaching, through the use of irrigation water in
excess of plant needs. Good draina
g
e is essential to prevent
a rising water table and salt accumulation in the soil surface
and to maintain adequate soil aeration.
In irrigated areas, a water frequently exists at some depth
below the
g
round surface, with an unsaturated condition
existin
g
above it. During and immediately following periods
of precipitation or irrigation, water moves downward
through the soil to
the water
table. At other times, water is
lost through evaporation from the soil surface, and trans-
piration from plants (evapotranspiration) ma
y
reverse the
direction of flow in the soil, so that water moves upward
from the water table by capillary Eow. The rate of move-
ment is dependent upon water content, soil texture, and
structure. In humid and subhumid regions, this capillary
rise of water in the soil is a valuable water source for use by
crops during periods of drought.
Even under favorable conditions of soil, drainage, and
environmental factors, too sparing applications of high
quality water with total dissolved solids of less than 100 mg/1
would ultimately damage sensitive crops such as citrus fruit;
whereas with adequate leaching, waters containing 500 to
1.000 mg/1 might be used safely. Under the same conditions,
certain salt-tolerant field crops mi g
ht produce economic re-
turns using water with more than 4,000 mg/l. Criteria for
judging water quality must take these factors into account.
The need for irrigation for optimum plant growth is de-
termined also by rainfall and snow distribution; and by
temperature, radiation, and humidit
y
. Irrigation must be
used for intensive crop production in arid and semiarid
areas and must supplement rainfall in humid areas. (See
Specific Irrig
ation Water Considerations below.)
The effects of water quality characteristics on soils and on
plant growth are directly related to the frequency and
amount of irrigation water applied. The rate at which water
is lost from soils through evapotranspiration is a direct
function of temperature, solar radiation, wind, and humid-
ity. Soil and plant characteristics also influence this water
loss. Aside from water loss considerations, water stress in a
plant, as affected by the rate of evapotranspiration, will
determine the plant's reaction to a given soil condition. For
example. in a saline soil at a given water content, a plant
will usuall
y
suffer more in a hot, dry climate than in a cool,
humid one. Considering the wide variation in the climatic
and soil variables over the United States, it is apparent that
water quality requirements also vary considerably.
Successful sustained irrigated agriculture, whether in arid
323
324/Section V—Agricultural Uses of Water
regions or in subhumid regions, or other areas, requires
skillful water application based upon the characteristics of
the land, water, and the requirements of the crop. Through
proper timing and adjustment of frequenc
y and volumes of
water applied, detrimental effects of poor quality water may
often be mitigated.
WATER QUALITY CONSIDERATIONS
FOR IRRIGATION
Effects on Plant Growth
Plants may be adversel
y
affected directlY b
y
either the
development of high osmotic conditions in the plant sub-
strate or by the presence of a phvtotoxic constituent in the
water. In g
eneral, plants are more susceptible to injury from
dissolved constituents during germination and early growth
than at maturity (Bernstein and Hao.
:
ward 1958).
3
''' Plants
affected during earl
y
growth ma
y result
in
complete crop
failure or severe y
ield reductions. Effects of undesirable
constituents may be manifested in suppressed vegetative
growth, reduced fruit development. impaired qualit
y of the
marketable product, or a combination of these factors.
The presence of sediment. pesticides, or pathogenic or-
ganisms in irrigation water, which may not specifically
affect plant growth, can affect the acceptability of the
product. Another aspect to be considered is the presence of
elements in irrigation water that are not detrimental to
crop production but ma
y
accumulate in crops to levels that
may be harmful to animals or humans.
Where sprinkler irrigation is used, foliar absorption or
adsorption of constituents in the water may be detrimental
to plant growth or to the consumption of affected plants by
man or animals. Where surface or sprinkler irrigation is
practiced, the effect of a
g
iven water quality on plant
growth is determined b
y
the composition of the soil solu-
tion. This is the growth medium available to roots after soil
and water have reacted.
Plant growth may be affected indirectl
y
through the in-
fluence of water qualit
y
on soil. For example, the absorption
by the soil of sodium from water will result in a dispersion
of the clay fraction. The degree of dispersion will depend
on the clay minerals present. This decreases soil permeabil-
ity and often results in a surface crust formation that deters
seed germination and emer
g
ence. Soils irrigated With
highly saline water will tend to be flocculated and have
relatively high infiltration rates (Bower and Wilcox 1965).315
A change to waters of sufficientl
y
lower salt content reduces
soil permeability and rates of infiltration by dispersion of the
clay fraction in the soil. This hazard increases when com-
bined with high sodium content in the water. Much de-
pends upon whether a given irrigation water is used con-
tinuously or occasionally.
Crop Tolerance to Salinity
The effect of salinity, or total dissolved solids, on the os-
motic pressure of the soil solution is one of the most im-
portant water quality considerations. This relates t
availability of water for plant consumption. Plants
been observed to wilt in fields apparentl
y
having ade
water content. This is usually the result of high soil sz
creating a physiological drought condition. Specificall
abilit
y
of a plant to extract water from a soil is deterr
by
the following relationship:
TSS=MS+SS
In this equation. (U.S. Department of Agriculture.
Sa
Laborator
y
Staff 1954
37
hereafter referred to as Sa.
Laboratory 1954 3 ''') the total soil suction (TSS) repro
the force with which water in the soil is withheld from
uptake. In simplified form, this factor is the sum c
matric suction (MS) or the physical attraction of so
water, and the solute suction (SS) or the osmotic pre
of the soil water.
As the water content of the soil decreases due to e
t
ranspiration. the water film surroundin
g the soil par
becomes thinner and the remaining water is held wit
creasingly greater force (NIS). Since only
.
pure Neat
lost to the atmosphere during evapotranspiration, th(
concentration of soil solution increases rapidly cit
the drying process. Since the matric suction of a soi
creases exponentially on drying, the combined effec
these two factors can produce critical conditions wit(
Bard to soil \•ater availability.
In assessing the problem of plant growth, the sal
level of the soil solution must be evaluated. It is diflicu
extract the soil solution from a moist soil within the rant
water content available to plants. It has been demonstra
however, that salinity levels of the soil solution and
resultant effects upon plant growth ma
y
be correlated
salinit
y
levels of soil moisture at saturation. The quantii
water held in the soil between field capacit
y and the "wi
point varies considerably from relativel
y low values
sand
y
soils to high values for soils high in cla
y
content
The U.S. Salinit
y
Laboratory Staff (l954) 3 " clevelo
the technique of using a saturation extract to meet
need. Demineralized water is added to a soil sample
point at which the soil paste glistens as it reflects light .
flows slightly when the container is tipped. The amoun
water added is reasonabl
y
related to the soil texture.
many soils; the water content of the soil paste is roue
twice that of the soil at field capacit
y and four times tha
the wilting point. This water content is called the saturat
percentage. When the saturated paste is filtered, the rest
ant solution is referred to as the saturation extract. The
content of the saturation extract does not give an ex
indication of salinit
y
in the soil solution under field con
dons, because soil structure has been destro
y
ed; nor doe
give a true picture of salinity gradients within the soil rest
ing from water extraction by roots. Although not truly
pitting salinit
y
in the immediate root environment, it d(
give a usable parameter that represents a soil salinit
y
vai
that can be correlated with plant growth.
Water for Irrigation/325
TABLE V-6—Relative Tolerance of
Crop
Plants to Salt,
(Listed in Decreasing Order of Tolerance)
High salt tolerance
?
Medium salt tolerance
?Low salt tolerance
VEGETABLE CROPS
tc..xiv=
12
?
Ec,.xioi= 10
?
EC.X1P=4
Garden beets?
Tomato
?
Radish
Ki'e?
Broccoli?
Cutup
Asparagus
?
Cablute?
Green beans
Spinach Bell pepper
Cauliflower
Lettuce
Sweet corn
Potatoes (White Rose)
Carrot
Onion
Peas
Squash
Cucumber
EC X10s
=f0
?
tc,.x10r=4?
EC,X10` = 3
FIELD CROPS
EC..xl(P= 16?
Ec,.xio3--
?
EC x101.-
-I
.
Barley (train)
?
Rye (grain)
?
Field beans
Sugar beet
?
Wheat (grain)
Rape?
Oats (train)
Colton?
Rice
Sorghum (grain)
Corn (field)
Flu
Sunflower
Castorbeans
EC >,;10,=10
FRUIT CROPS
Date palm
?
Pomegranate
?
Pear •
Fit
?
Apple
Olive
?
Orange
Grape
?
Grapefruit
Cantaloupe Prune
Plum
Almond
Apricot
Peach
Strawberry
Lemon
Avocado
FORAGE CROPS (in decreasing order tolerance)
Ecoow= It?
Ec.x io=
12
?
Eii,XICR=
Alkali salon
?
White sweet clover?
White Dutch clover
Bermuda grass
?
Mountain brome
?
Red clover
Rhodes gnu
?
Strawberry clover
?
Ladino clover
Rescue grass?
Oaths grass?
Burnet
Canada wildrye?
Sudan Fuss
Western whatgrass
?
Holum clover
Barley (hay)?
Alfalfa (California common)
Bridsloot trefoil
?
Tall fescue
Rye (hay)
Wheat (hay)
Oats (hay)
Orchardgrass
Blue grime
Meadow fescue
Reed canary
Big trefoil
Smooth brome
Tall meadow colgrass
Cicer milk vetch
Sours' over
Sickle milkatch
Ec,x10'-12?
EC,X10'..1
?
EG,X10,= 2
• The
numbers
hallowing EC,X10
3
are the electrical conductivity aloes of the saturation triad in rnillimhos pep
centimeter at 25 C associated
with
50•per
ant decease
in yield.
Salinity Laboratory Stahl
1454°s.
Salinity is most
readily measured by determining the
electrical conductivity
(EC) of a solution. This method re-
lates to the ability of salts in solution to conduct electricity
and results are expressed as milimhos (mhos X10-
3
) per
centimeter (cm) at 25 C. Salinit
y
of irrigation water
is
ex-
pressed in terms of EC, and soil salinity is indicated by the
electrical conductivity of the saturation extract (EC,.). See
Table V-6.
Temperature and wind effects are especiall
y
important as
the
y
directl
y
affect evapotranspiration. Periods of high
temperature or other factors such as dry winds. which in-
crease evapotranspiration rates, not onl
y
tend to increase
soil salinit
y
but also create a greater water stress in the plant.
The effect of climate conditions on plant response to
salinity was demonstrated by Magistad and his associates
(l 943).
3
'' Some of these effects can be alleviated b
y
more
frequent irrigation to maintain safer levels of soil salinity.
Plants var
y
in their tolerance to soil salinit
y
, and there
are man
y
ways in which salt tolerance can he appraised.
Ha
y
ward and Bernstein (1958)
32
' point out three: (1).Test
the abilit
y
of a plant to survive on saline soils. Salt tolerance
based primarily on
this criterion of survival has limited ap-
plication in irrigation agriculture but is a method of ap-
praisal that has been used widely by ecologists. (2) Test
the absolute yield of a plant on a saline soil. This criterion
has the greatest agronomic significance. (3) Relate the yield
on saline soil to nonsaline soil. This criterion is useful for
comparing dissimilar crops whose absolute
y
ields cannot be
compared directly.
The U. S. Salinit
y
Laborator
y
Staff (1954)
335
has used the
third criterion in establishing the list of salt tolerance of
various crops shown in Table V-6. These salt tolerance
values are based upon the conductivity of the saturation ex-
tract (EC,.) expressed in mmhos; cm at which a 50 per cent
decrement in yield may he expected when compared to
Crop
Electrical conductivity of saturation
!Hauls (EC,)
at
which yields decrease by about 10 per
ant°
mmh/crn at 25 C
Date palm
I
?manna
Fig
}
4-66
Olive
Grape. ?
4
Muskmelon ?
3.5
Orange, grapefruit, lemon .?
3-2.5
Apple. pear
?
2.5
Plum, pone, peach, apricot. almond
?
2.5
Boysenberry, blackberry, raspberry'
?
2.5-1.5
Avocado ?
2
Strawberry ?
1.5
In Dtisiluous soils. EC, readings
la
given soil silinibn us about 2 mmh/cm higher
then la ocagypsiterons
soils. Date palm would be elected al 10 rnmhicra, grapes ate mmhicen, etc. an
IDIMINOSIS soils.
b
Estimated.
v
Lemon is more sensitive than waste and grapefruit; raspberry more Hun boysenberry and blackberry.
Bernstein 1065b314.
Santos:
?
Yellow sweet clover
?
Meadow Install
?
TABLE V-7—Soil Salinities
in
Root Zone at which Yield
NutUll elkaligra as
?
Perennial ryegrass?
Alsike clover
?
Reductions become Significant
6-10
Carina yrandiflora
(Nats1
plum)
Boupinvill a
spectabilis
(Boyainvillu)
Helium *under
(stupider)
Rosrnarinus kekwoodi
(Rmenary)
Dodoon viscose stropur•
puree
Callistemon viminahs
(bottlebrush)
4-6
-Dracaena endiviss
Thujs orierrblis
(arbor vitae)
Junipecus thinensis
(spreading juniper)
Euenymus japonica
trending('
Lantern Camara
Elaesenus pungens
(silverberry)
Xylesma senticosa
Pitt otporum tobira
Pyraesntha Graberi
ligustrum lutidum
(Toss privet)
Bums mictophylka japonica
(Japanese bowed)
2-4
Hibiscus rote•sinensis
ear. Btiliante
Handles domestics
(flambe bamboo)
Tracheteseertnum jas•
roinMdes (tier jasmine)
Viburmsm onus robustum
2
Ilex cornet' Burford
(Burford holly)
Henna cansiienns
(Simian try)
Feijoa seltiro iana
(pineapple pare)
Rosa sp. (ear. Grenoble
rose on Dr. Huey root)
326/Section V—Agri
c
ultural Uses of Water
TABLE V-8—Salt Tolerance of Ornamental Shrubs
(Maximum EC,t's
Waited)
EC, in mmho/cm. at 25 C
0
?2 4?
6?
8?
10 12 14 16 18
2(
Barle•')
Sugarbectsc
Cotton —
Safflower
Ryc
Wheal b
Oats
.i.7.717:711111
Tolerant
?
Moderately tolerant
?
Sensitive
?
Very sensitive
Sorghum
Soybean
Sesbaniab
Rice
d
—
I?
Corn
?
Bernstein 1965b34.
yields of that plant grown on a nonsaline soil under com-
parable growing conditions. Work has been done by many
investigators, based upon both field and greenhouse re-
search, to evaluate salt tolerance of a broad variet y of plants..
In general, where comparable criteria were used to assess
salt tolerance, results obtained were most often in agreement.
Recent work on the salt tolerance of fruit crops is shown in
Table V-7, and for ornamentals in -Table V-8.
Bernstein (1965a
313
) gave EC, values causing 10, 25, and
50 per cent
yield decrements for a variety of field and forage
crops from late seeding stage to maturity, assuming that
sodium or chloride toxicity was not a growth deterrent.
These values are shown in Figures V-I. V-2, and V-3. The
data suggested that the effects of EC,. values producing 10
to 50 per cent decrements (within a range of EC,. values of
8 to 10 mmhicm for many crops) may be considered ap-
proximately linear, but for nearly all crops the rate of change
A
y
EC,
ECe
decrements
, either steepens or flattens slightly as the yield
decrements increase from less than 25 to more than 25 per
cent. Bernstein (1965a)
313
also pointed out that most fruit
crops were more sensitive to salinity than were field,
forage, or vegetable crops. The data also illustrated the
highly variable effect of EC, values upon different crops
and the nonlinear response of some crops to increasing con-
centrations of salt.
In considering salt tolerances of crops, EC, values were
used. These values were correlated with Yields at field
moisture content. If soils were allowed to dry out excessively
between irrigations, yield reductions were much greater,
since the total soil water stress is a function of both matric
suction and solute suction and increases exponentially on
.
•
?
500
.
Yield Reduction
250
100
I?I?
I?
I?
I?
1?
1?
1
'The indicated salt tolerances appl
y
to the period of rapid plant
g
rowth and maturation. from the late seeding stage upward. Crops in
each category are ranked in order of decreasing salt tolerance. Width of
the bar next to each cro
p
indicates the effect of Increasing salinit
y
on
y
ield. Crosalines are placed at 10. 25. and 50 per cent y
i
eld reductions.
Approximate rank in order of decreasing salt tolerance is indicated for
additional crops
for
most of which complete data are lacking. (Bower
personal communication
1972)238
b
less
tolerant during seettling stage. Salinit
y
at this stage should not
exceed 4 or 5 mmho/cm. ECe.
'Sensitive during germination. Salinit
y
should not exceed 3
mmho/cm during germination.
d
Less tolerant during flowering and seed-set as well as during the
seedling stage. Salinity at sensit
i
ve stages should not exceed 4
mmho/cm. ECe of soil water.
FIGURE V-I—Salt Tolerance of Field
Crops.
drying (Bernstein 1965a).
313
Good irrigation managern,
can minimize this hazard.
Nutritional Effects
Plants require a blanced nutrient content in the
solution to maintain optimum growth. Use of saline wa
for irrigation may or ma
y
not significantly upset this nut
tional balance depending upon the composition, concenti
tion, and volume of irrigation water applied.
Broadbean ?
Flax
Sunflower
Castor bean
Beans
?
Water for Irrigation1327
ECe in mmhojcm at 25 C
0?2 4
?
6?
8 10 12 14 16
Beetsb
?
I
?[II
?
I?
I?11
Asparagus
?
Kale
Spinach
Tomato
Broccoli
Cabbage
Cauliflower
Some of the possible nutritional effects were summarized
by Bernstein (1965a)
a
" as follows:
High concentrations of calcium ions in the solution
ma
y
prevent the piant from absorbing enough pons-
high conconzrazi3ns of
lulls may affxt
the uptake of sufficient calcium.
Different crops var
y
widely in their requirements for
given nutrients and in their ability to absorb them.
Nutritional effects of salinity, therefore, appear only
in certain crops and only when a particular type of
saline condition exists.
Some varieties of a particular crop may be immune
to nutritional disturbances, while other varieties are
severely affected. High levels of soluble sulfate cause
internal browning (a calcium deficiency symptom) in
some lettuce varieties, but not in others. Similarly,
Potato
Corn ?
Sweet potato
Lettuce
?
Bermuda grass
Alkali sacaton. Saltgrass
Nuttallalkali grass
Tall wheatgrass
Crested wheatgrass
Rhodes grass. Rescue grass
Canada wild rye
Western whcatgrass
Tall fescue
Barley hayb
Sweet clovers
Perennial rye
Mounta
i n bromc
Hardinggrass
?
Birdsfoot trefoil
ECe in mmho/cm at 25 C
Bell pepper
0 2?
4 6?
8 10 12 14 16 18 20 22
1?
II?it
?
I
?
I
?
I
?
I
?
I?
I
Onion ?
Carrot
Cucumber,
Squash, Radish
Peas
?
rr*Ima
Celery
Beans ?
50% Yield Reduction
25%
10%
a
See
Figure V-1. (Bower
personal communication
19721338
b
Sensitive during germination. Salinity
should not exceed 3
mmho/cm ECe during germination.
FIGURE V-3—Salt Tolerance of Vegetable Crops•
Beardless wildrve
?
.
?
.
?
.
.
•
Dallis grass. Sudan grass
Strawberry clover
Hubam clover
1111111111MooN
?
ak:a
50% Yield Reduction
25%
I?
I?
t?I?
I?
1
?
1?
I?
J
a
See Figure V-I. (Bower
personal communscation
1972)338
b
Less tolerant during seedling stage. Salinity at this state should
not exceed 4 or S mmhoicm,
ECe.
FIGURE V-2—Salt Tolerance of Forage
Crops.
high levels of calcium cause greater nutritional dis-
turbances in some carrot varieties than in others.
Chemical analysis of the plant is useful in diagnosing
these effects.
At a given level of salinity, growth and yield are
depressed more when nutrition is disturbed than when
nutrition is normal. Nutritional effects, fortunately,
are not important in most crops under saline con-
ditions; when they do occur, the use of better adapted
varieties may be advisable.
Alfalfa
Rye hav,
Oat haV
Wheat hay b
Orchardgrass
Blue grama
Meadow fortail
Rccd canar y . Big trefoil
Smooth brome, Milkvetch
Tall meadow
oatgrass,
Burnet
Recommendation
Crops vary considerably in their tolerance to soil
salinity in the root zone, and the factors affecting
Clovers, alsikc
?
red
328/Section V—Agricultural
Uses
of Water
the soil solution and crop tolerance are varied and
complex. Therefore, no recommendation can be
given for these. For specific crops, however, it is
recommended that the salt tolerance values (ECe)
for a saturation extract established by the U.S.
Salinity Laboratory Staff be used as a guide for
production.
Temperature
The temperature of irrigation water has a direct and
indirect effect on plant growth. Each occurs when plant
ph
y
siological functions are impaired b
y
excessively high or
excessively low temperatures. The exact water temperatures
at which growth is severel
y
restricted depends on method of
water application, atmospheric conditions at the time of
application, frequency of application. and plant species.
All plant species have a tempeature range in which they
develop best. These temperature limits vary with plant
species..
Direct effect on plant growth from extreme temperature
of the irrigation water occurs when the water is first applied.
Plant damage results only from direct contact. Normally,
few problems arise when excessively warm water is applied
by sprinkler irrigation. The effect of the temperature of the
water on the temperature of the soil is negligible. It has
been demonstrated that warm water applied through a
sprinkler system has attained ambient temperatures at the
time it teaches the soil surface (Cline et al. 1969).
3
'
8
Water
as warm as 130 F can be safel
y
used in this manner. Cold
water is harmful to plant growth when applied through a
sprinkler system. It does not change in temperature nearly
so much as the warm water. However, its effect is rarely
lethal.
Surface applied water that is either very cold or very
warm poses greater problems. Excessive warm water can-
not be used for surface irrigation and cold water affects
plant growth. The adverse effects of cold water on the
growth of rice were suddenl
y
brought to the attention of
rice growers when cold water was first released from the
Shasta Reservoir in California (Raney 1963).
332
Summer
water temperatures were suddenl
y
dropped from about
61 F to 45 F. Research is still proceeding, and some of the
available information was recently reviewed by Raney and
Mihara (1967).
334
Dams such as the Oroville Dam are now
being planned so that water can be withdrawn from any
reservoir depth to avoid the cold-water problem. Warming
basins have been used (Rane
y
1959).
333
There are oppor-
tunities in planning to separate waters—the warm waters for
recreation and agriculture, the cold waters for cold-water
fish, salmon spawning, and other uses. The exact nature of
the mechanisms by which damage occurs is not completely
understood.
Indirect effect of the temperature of irrigation water on
plant growth occurs as a result of its influence on the tem-
perature of the soil. The latter affects the rate of water
uptake. nutrient uptake, translocation of metabolites
indirectly, such factors as stomatal opening and plant
stress. All these phenomena are well documented. The
of the temperature of the applied irrigation water
temperature of the soil is not well described. This et
probably quite small.
Conclusion
Present literature does not provide adequate
to establish specific temperature recommenda
for irrigation waters. Therefore, no specific rec
mendations can be made at this time.
Chlorides
Chlorides in irrigation waters arc not generall
y
tw
crops. Certain fruit crops are, however, sensitive to chic)!
Bernstein (1967)
3
" indicated that maximum permi.
chloride concentrations in the soil ran
g
e from 10 I
milliequivalents (meq)
for certain sensitive fruit
(Table V-9). In terms of permissible chloride conce
dons in irrigation water, values up to 20 meq il can be 1
depending upon environmental conditions, crops, and ir
tion management practices.
Foliar absorption of chlorides can be of important
sprinkler irrigation (Eaton and Harding 1959,
3
'
9
Ehlig
Bernstein 1959
3.
'
0
). The adverse effects vary between ev.
TABLE V-9—Salt Tolerance of Fruit
Crop
Varieties
Rootstocks and Tolerable Chloride Levels
in
the Saturat
Extracts
Crop?
Rootstock or variety
Tolerable ler
chloride in salt
extract
Rootstocks
mend
Rangpur lime. Cleopatra mandarin
25
Citrus ?
?
Rough lemon, tangelo, sour orange
15
Sweet orange, citrange
10
Marianna
25
Stone fruit ?
?
Lovell, Shalil
10
1
Yunnan
7
Avocado ?
?
1
West Indian
t Mexican
5
Varieties (V) and Rootstocks (R)
Salt Creek,
1613.3
40
Grape
?
Dog Ridge
30
Thompson Seedless, Perlette
V
20
Cardinal, Black Rose
10
Varieties
f Boysenberry
10
Berries
?
?
blackberry
10
Il
Indian Summer raspberry
5
Strawberry
?
?
J
Lassen
t
Shasta
5
Bernstein 1967.12.
Water for Irrigation/329
rative conditions of day and night and the amount of
evaporation that can occur between successive wettings
(i.e., time after each pass with a slowly revolving sprinkler).
There is less effect with nightime sprinkling and less effect
with fixed sprinklers (applying water at a rapid rate).
Concentrations as low as 3 mec
j
il of chloride in irrigation
water have been found harmful when used on citrus, stone
fruits, and almonds (Bernstein 1967).312
Conclusion
Permissible chloride concentrations depend upon
type of crop,
environmental conditions and man-
agement practices. A single value cannot be given,
and no limits should be established, because detri-
mental effects from salinity per se ordinarily deter
crop growth first.
Bicarbonates
High bicarbonate water ma
y induce iron chlorisis by
making iron unavailable to plants (Brown and Wadleigh
19551.
717
Problems have been noted with apples and pears
(Pratt 1966)
235
and with • some ornamentals (Lunt et al.
1956))2
' Although concentrations of 10 to 20 meq/1 of
bicarbonate can cause chlorosis in some plants, it is of little
concern in the field where precipitation of calcium carbo-
nate minimizes this hazard.
Conclusion
Specific recommendations for bicarbonates can-
not be given
without consideration
of other soil
and
water constituents.
S odium
_ The presence of relatively high concentration of sodium
in irrigation waters affects irrigated crops in man
y ways.
In addition to its effect on soil structure and permeability,
sodium has been found by Lilleland et al. (1945)
322 and
Ayers et al. (1952)
3
" to be absorbed by plants and cause
leaf burn in almonds, avocados. and in stone fruits grown
in culture solutions. Bernstein (1967) 3
' 2
has indicated that
water having SAR* values of four to eight may injure sodium-
sensitive plants. It is difficult to separate the specific toxic
effects of sodium from the effect of adsorbed sodium on soil
structure. (This factor will be discussed later.)
As has been noted, the complex interactions of the total
and relative concentrations of these common ions upon
various crops preclude their consideration as individual
components for general irri g
ation use, except for sodium
and possibl
y chlorides in areas where fruit would be im-
portant.
Nitrate
The presence of nitrate in natural irrigation waters may
be considered an asset rather than a liabilit
y with respect
• For definition of SAR. Sodium Adsorption Ratio, see p. 330.
to plant growth. Concentrations high enough to adversely
affect plant growth or composition are seldom, if ever,
found. In arid regions, high nitrate water ma
y
result in
nitrate accumulations in the soil in much the same manner
as salt accumulates. the same soil and water managemem
practices that minimize salt accumulation will also minimize
nitrate accumulation. There is some concern over the high
nitrate content of food and feed crops. Man y factors such as
plant species characteristics, climate conditions, and
growth stage are just as significant in determining nitrate
accumulations in plants as the amount present in the soil.
It is unlikel
y
that any nitrate added in natural irrigation
water could be a significant factor.
Problems may arise where waste waters containing rela-
tively large amounts of nitrogenous materials are used for
irrigation. Larger amounts are usually applied than that
actuall
y
required for plant growth. These wastes, however,
usuall y
contain nitrogen in a form that is slowl
y
converted
to nitrate. Nevertheless, it is possible that high nitrate ac-
cumulations in plants ma
y occur althou
g
h little evidence is
available to indicate this.
Conclusion
Since nitrate in natural irrigation waters is
usually an asset for plant growth and there is
little evidence indicating that it will accumulate
to toxic levels in irrigated plants consumed by
animals, there appears to be no
need for
a recom-
mendation.
Effects on Soils
Sodium Hazard
Sodium in irrigation water may be-
come a problem in the soil solution as a component of total
salinity, which can increase the osmotic concentration, and
as a specific source of injury to fruits. The problems of
sodium mainl
y occur in soil structure, infiltration, and per-
meability-rates. Since good drainage is essential for manage-
ment of salinity in irrigation and for reclamation of saline
lands, good soil structure and permeabilit
y
must be main-
tained. A high percentage of exchangeable sodium in a soil
containing swelling-type clays results in a dispersed condi-
tion, which is unfavorable for water movement and plant
growth. Anything that alters the composition of the soil
solution, such as irrigation or fertilization, disturbs the
equilibrium and alters the distribution of adsorbed ions in
the soil. When calcium is the predominant cation adsorbed
on the soil exchange complex, the soil tends to have a
granular structure that is easil y worked and readily perme-
eable. When the amount of adsorbed sodium exceeds 10 to
15 per cent of the total cations on the exchange complex,
the clay becomes dispersed and slowly permeable, unless a
high concentration of total salts causes flocculation. Where
soils have a high exchangeable sodium content and are
flocculated because of the presence of free salts in solution,
subsequent removal of salts b
y
leaching will cause sodium
330
/Section 1'—Agricultural Uses of
IVoter
dispersal, unless leaching is accompiished b
y
adding calcium
or calcium-producing amendments.
Adsorption of sodium from a given irrigation water is a
function of the proportion of sodium to divalent cations
(calcium and magnesium) in that water. To estimate the
degree to which sodium will be adsorbed b
y
a soil from a
given water when brought into equilibrium with it. the
Salinit
y
Laboratory (1954)
3
" proposed the sodium adsorp-
tion ratio (SAR):
Na+
i
Ca++-1-Mg++
"\/
2
As soils tend to dry, the SAR value of the soil solution in-
creases even though the relative concentrations of the ca-
tions remain the same. This is apparent from the SAR
equation, where the denominator is a square-root function.
This is a significant factor in estimating sodium effects on
soils.
The SAR value can be related to the amount of ex-
chang
eable cation content. This latter value is called the
exchangeable sodium percentage (ESP). From empirical
determinations, the U. S. Salinit
y
Laboratory (l954)3J'
obtained an equation for predicting a soil ESP value based
on the SAR value of a water in equilibrium with it. This is
expressed as follows:
[100 a+b(SAR)1
ESP-
fl+a+b(SAR))
The constants "a" (intercept representing experimental er-
ror) and "b" (slope of the regression line) were deter-
mined statistically by various investigators who found "a"
to be in the order of —0.06 to 0.01 and "h" to be within the
range of 0.014 to 0.016. This relationship is shown in the
nomogram (Figure V-4) developed b
y the U. S. Salinity
Laboratory (1954).
3
" For sensitive fruits, the tolerance
limit for SAR of irrigation water is about four. For general
crops, a limit of eight to 18 is generall
y
considered within a
usable range, although this depends to some degree on the
type of clay mineral, electrolyte concentration in the water,
and other variables.
The ESP value that significantly affects soil properties
varies according to the proportion of swelling and non-
swelling cla
y
minerals. An ESP of 10 to 15 per cent is
considered excessive, if a high percentage of swelling clay
minerals such as montmorillonite are present. Fair crop
growth of alfalfa, cotton, and even olives, have been ob-
served in soils of the San Joaquin Valley (California) with
ESP values ranging from 60 to 70 percent (Schoonover
1963).3"
Prediction of the equilibrium ESP from SAR values of ir-
rigation waters is complicated by the fact that the salt con-
tent of irrigation water becomes more concentrated in the
soil solution. According to the U. S. Salinity Laboratory
(1954),
33
' shallow ground waters 10 times as saline as
irrigation waters may be found within depths of 10 feet,
a salt concentration two to three times that of irrigat
water ma
y
be reasonably expected in the first-foot der
Under conditions where precipitation of salts and rain
ma y
be neglected, the salt content of irrigation water
increase to higher concentrations in the soil solution with,
change in relative composition. The SAR increases
proportion to the square root of the concentration; the
fore, the SAR applicable for calculating equilibrium E
in the upper root zone may he assumed to be two to th
times that of the irrigation water.
Recommendation
To reduce the sodium hazard in irrigation wat
for a specific crop, it is recommended that the SA
value be within the tolerance limits determined I
the U.S. Soil
Salinity Laboratory ,Staff.
Biochemical Oxygen Demand (BOD) and
Soil Aeration
The need for adequate oxygen in the soil for optimu
plant growth is well recognized. To meet the oxygen r
quirement of the plant, soil structure (porosity) and se
water contents must be adequate to permit good aeratio:
Conditions that develop immediately following irrigatic
are not clearly understood..
Soil aeration and oxygen availability normally present n
problem on well-structured soils with good quality wate:
Where drainage is poor, oxygen may become limitin!
Utilization of waters having high BOD or Chemical Oxyge
Demand (COD) values could aggravate the condition b
further depletin
g
available oxygen. Aside from detrimentz
effects of oxygen deficienc
y
for plant growth, reduction t
elements such as iron and manganese to the more solubl
divalent forms may create toxic conditions. Other biologics
and chemical equilibria may also be affected.
There is very little information regarding the effect c
using irrigation waters with high BOD values on plan
growth. Between source of contamination and point of it
rigation, considerable reduction in BOD value may result
Sprinkler irrigation may further reduce the BOD value o
water. Infiltration into well-drained soils can also decrease
the BOD value of the water without serious depleting the
oxygen available for plant growth.
Acidity and Alkalinity
The pH of normal irrigation water has little direct sig-
nificance. Since water itself is unbuffered, and the soil is a
buffered system (except for extremely sandy soils low in
organic matter), the pH of the soil will not be significantly
affected by application of irrigation water. There are, how-
ever, some extremes and indirect effects.
Water having pH values below 4.8 applied to acid soils
over a period of time ma
y
possibly render soluble iron,
Expressed as mell
Water for Irrigation/331
A
?
B
Salinity Laboratory 1954 335
FIGURE V-4—Nomogram for Determining the SAR Value of Irrigation Water and for Estimating the
Corresponding
ESP
Value of a Soil That is at Equilibrium with the Water
332/Section V—Agricultural Uses
of
Water
aluminum. or manganese in concentrations large enough to
be toxic to plant growth. Similarly, additions of saline
waters to acid soils could result in a decrease in soil pH and
an increase in the solubility of aluminum and manganese.
In some areas where acid mine drainage contaminates water
sources, p H values as low as 1.8 have been reported. Waters
having unusually low pH values such as this would be
strongl
y
suspect of containing toxic quantities of certain
heavy metals or other elements.
Waters having pH values in excess of 8.3 are highly
alkaline and may contain high concentrations of sodium.
carbonates. and bicarbonates. These constituents affect soils
and plant growth directly or indirectly, (see "Effects on
Plant Growth" above).
Recommendation
Because most of the effects of acidity and alka-
linity in irrigation waters on soils and plant growth
are indirect, no specific pH values can be recom-
mended. However, water with pH values in the
range of 4.5 to 9.0 should be usable provided that
care is taken to detect the development of harmful
indirect effects.
Suspended Solids
Deposition of colloidal particles on the soil surface can
produce crusts that inhibit water infiltration and seedling
emergence. This same deposition and crusting can reduce
soil aeration and impede plant development. High col-
loidal content in water used for sprinkler irrigation could
result in deposition of films on leaf surfaces that could re-
duce photosy
nthetic activit y and thereby deter growth.
Where sprinkler irrigation is used for leafy vegetable crops
such as lettuce, sediment ma y accumulate on the growing
plant affecting the marketability of these products.
In surface irrigation, suspended solids can interfere with
the flow of water in conveyance systems and structures.
Deposition of sediment not onl
y reduces the capacity of
these s
y
stems to carry and distribute water but can also
decrease reservoir storage capacity. For sprinkler irrigation,
suspended mineral solids may cause undue wear on irriga-
tion pumps and sprinkler nozzles (as well as plugging up the
latter), thereby reducing irrigation efficiency.
Soils are specificall
y
affected b
y deposition of these sus-
pended solids, especially when they consist primarily of
clays or colloidal material. These cause crust formations
that reduce seedling emergence. In addition, these crusts
reduce infiltration and hinder the leaching of saline soils.
The scouring action of sediment in streams has also been
found to affect soils adversel
y
by
contributing to the dissolu-
tion and increase of salts in some areas (Pillsbur
y
and Blaney
1966).
33
' Conversely, sediment high in silt ma y
improve the
texture, consistency, and water-holding capacit
y
of a sandy
soil.
Effect on Animals or Humans
The effects of irrigation water quality on soils and pi,
has been discussed. However, since the quality of irriga
water is variable and originates from different sources, tl
ma
y
be natural or added substances in the water which I
a hazard to animals or humans consuming irrigated cr
These substances may be accumulated in certain cerc
pasture plants, or fruit and vegetable crops without
apparent injury. Of concern, however, is that the cone
tration of these substances may be toxic or harmful
humans or animals consuming the plants. Many substat
in irrigation waters such as inorganic salts and miner
pesticides, human and animal patho
gens have recommen
tions to protect the desired resource. For radionuclides
such recommendation exists.
Radionuclides
There are no generally accepted standards for contro
radioactive contamination in irri
gation water. For n
radionuclides, the use of federal Drinking Water Standat
should be reasonable for irrigation water.
The limiting factor for radioactive contamination in
rigation is its transfer to foods and eventual intake
humans. Such a level of contamination would be read
long before any damage to plants themselves could be
served. Plants can absorb radionuclides from irrigat
water in two ways: direct contamination of foliage throe
sprinkler irrigation, and indirectly through soil contamit
tion. The latter presents many complex problems sit
eventual concentration in the soil will depend on the r
of water application, the rate of radioactive decay, a
other losses of the radionuclide from the soil. Some stud: •
relating to these factors have been reported (Menzel et
1963. 3 ' 6
Moorbv and Squire 1963,"
s Perrin 1963.'
29 Men
1965,
32
' Milbourn and Ta
y
lor 1965'17).
It is estimated that concentrations of strontium-90 a
radium-226 in fresh produce would approximate those
the irrigation water for the crop if there was negligible
take of these radionuclides from the soil. With flood or ft
row irrigation only, one or more decades of continuous
rigation with contaminated water would be required befc
the concentrations of strontium-90 or radium-226 in t
produce equalled those in the water (Menzel
personal co
munication
1972).3"
Recommendation
In view of the lack of experimental evidence cot
cerning the long-term accumulation and avai
ability of strontium-90 and radium-226 in irrigate
soils and to provide an adequate margin of safet:
it is recommended that Federal Drinking Wat(
Standards be used for irrigation water.
Water
for Irrigation/333
SPECIFIC IRRIGATION WATER CONSIDERATIONS
Irrigation Water Quality for Arid and Semiarid Regions
Climate.
Climatic variability exists in arid and semiarid re-
gions. There can be heavy winter precipitation, generally in-
creasing from south to north and increasing with elevation.
Summer showers are common, increasing north and east
from California. Common throu
g
h the western part of the
country is the inadequacy of precipitation during the grow-
ing season. In most areas of the West, intensive agriculture is
not possible without irrigation. Irrigation must supply at
least one-half of all the soil water required annually for
crops for periods ranging from three to 12 months. •
Annual precipitation varies in the western United States
from practicall
y
zero in the southwestern deserts to more
than 100 inches in the upper western slope of the Pacific
Northwest. The distribution of precipitation throughout the
year also varies, with no rainfall during extended periods in
many locales. Often the rainfall occurs during nongrowing,
seasons.
The amount of precipitation and its distribution is one of
the principal variables in determining the diversion require-
ment or demand for irrigation water.
Land.
Soils in the semiarid and arid regions were developed
under dry climatic conditions with little leaching of weather-
able minerals in the surface horizon. Consequentl
y
, these
soils are better supplied with most nutrient elements. The
pH of these soils varies from being slightly acidic to neutral
or alkaline. The presence of silicate clay minerals of the
montmorillonite and hydrous mica groups in man
y
of these
soils gives them a higher exchange capacity than those of
the southeast, which contain kaolinite minerals of lower ex-
change capacity. However. organic matter and nitrogen
contents of arid soil are usuall
y
lower. Plant deficiencies of
trace elements such as zinc, iron. manganese are more fre-
quently encountered. Because of the less frequent 'passage
of water through arid soils, the
y
are more apt to be saline.
The nature of the surface horizon (plow layer) and the
subsoil is especiall
y
important for irrigation. During soil
formation a profile can develop consisting of various hori-
zons. The horizons consist of geneticall
y
related layers of
soil or soil material parallel to the land surface, and they
differ in their chemical, physical, and biological properties.
The productivity of a soil is lar
g
ely determined b
y
the na-
ture of these horizons. Soils available for irrigation with
restrictive or impervious horizons present management
problems (e.g., drainage, aeration, salt accumulation in
root zone, changes in soil structure) and consequently are
not the best for irrigated agriculture.
Other land and soil factors of importance to irrigation are
topography and slope, which may influence the choice of
irrigation method, and soil characteristics. The latter are
extremely important because they determine the usable
depth of water that can be stored in the root zone of the
crop and the erodability and intake rate of the soil.
Water.
Each river system within the arid and semiarid por-
tion of the United States has quality characteristics peculiar
'to its geologic origin and climatic environment. In consider-
ing water qualit
y
characteristics as related to irrigation, both
historic and current data for the stream and location in
question should be used with care because of the large
seasonal and sporadic variations that occur.
The range of sediment concentrations of a river through-
out the Year is usually much greater than the range of dis-
solved solids concentrations. Maximum sediment concentra-
tions ma
y
range from 10 to more than a thousand times the
minimum concentrations. Usually, the sediment concentra-
tions are higher during high flow than during low flow.
This differs inversely from dissolved-solids concentrations
that are usuall
y
lower during high flows.
Four
g
eneral designations of water have been used
(Rainwater 1962)
35
' based on their chemical composition:
(I) calcium-ma
g
nesium. carbonate-bicarbonate; (2) cal-
cium-ma
g
nesium. sulfate-chloride: (2) sodium-potassium,
carbonate-bicarbonate: and (4) sodium-potassium, stilfate-
chloride. This t
y
pe of classification characterizes the chem-
ical properties of the water and would he indicative of re-
actions that could he expected with soil when used for ir-
rigation. Although a listing of data for each stream and
tributar
y
is beyond the scope of this report, an indication of
ranges in dissolved-solids concentrations, chemical type, and
sediment concentration is given in Table V-10 (Rainwater
1962).35'
Customarily, each irrigation project diverts water at one
point in the river and the return flow comes back into the
mainstream somewhere below the system. This return flow
consists in the main of (I) regulator
y
water, which is the
unused part of the diverted water required so that each
farmer irri
g
ating can have the exact flow he has ordered;
TABLE V-10—Variations
in
Dissolved Solids, Chemical
Type.
and Sediment
in
Rivers
in
Arid and Semiarid United States
Dissolved solids
?
Sediment
Retion
?
concentrations,
?
Prevalent chemical type*
?
concentrations.
mg/1
?
mtllb
From
?
To
?
From
?
To
Columbia River Basin
?
<100?
300 Ca-Mg, C-b ?
<200?
300
Northern Calilorria
?
<100
?
100
Ca-Mg. C-b
?
?
<200?
+500
Southern California.....
?
<100 +2.000
?
Ca•Mt, C•b; Ca-Mg, S-C
?
<200 +15.000
Colorado River Basin
?
<100 +2.500 Ca-Mt, S•C; Ca-Mg, C-b.. .?
<200 +15.000
Rio Grande Basin
?
<100 +2.000 Ca-Mg, C-11; Ca-Mt, S-C
?
+300 +50,000
Pecos River Basin
?
?
100 +3,000 Ca-Mt, S-C ?
+300 +1,000
Western Gulf of Mesita Basins
?
?
100 +3.000 Ca-Mg, C-0; Ca-Mg, S•C; Na-P, S-C
?
<200 +30,000
Red River Basin...
?
<100 +2,500
Ca-Mt, S•C; Na-P,
S-C ?
+300 +25,000
Arkansas River Basin ?
?
100 +2,000 Ca-Mg, S-C; Ca-Mg, C-b; Na-P, S-C ?
+300 +MOOD
Platte Rivet
?
?
100 +1.500 Ca-Mg,
C-b; Ca-Mg,
S-C ?
+300 +7,000
Upper Missouri Rim Basin
?
?
100 +2.000 Ca-Mg, S-C; tia-P, C-b; Na•P. C-b.. . <200 +15.000
Ca -Mf. C-b= Calcium-matnesium. car b onats-bicarbonate. Ca-Mg.
S
. C.. Ca lcium-matne sium. suliste-chlwid
e.
Na-P, C-b=Sothurn-potassium, carbonate-bicarbonate. Na-P, S-C= Sodium-potassium. sullate-chloride.
Annual Load
b
Sediment concentration= ?
Annual Stramflow
Rainwater 1962351.
334/Section •—Agricultural Uses of Water
(2) tail water, which is that portion of the water that runs
off the ends of the .fields; and (3) underground drainage,
required to provide adequate appiication and salt balance
'in all parts of the fields. The initial flush of tail water may
be somewhat more saline than later but rapidly approaches
the same quality as the applied water t Reeve et al. 1955).3"
Drainage and Leaching Requirements.
In all irrigation a
g
ri-
culture some water must pass through the soil to remove
salts brought to the soil in the
w
ater. In semiarid areas. or
in the transition zone between arid and.humid regions, this
drainage water is usually obtained as a result of rainfall
during periods of low evapotranspiration, and no excess
irrigation water is needed to provide the drainage required.
In many
arid regions, the needed leaching must be ob-
tained b
y
adding excess water. In all cases, the required
drainage volume is related to the amount of salt in the ir-
rigation water. That drainage volume is called the leaching
requirement (LR).
It
is possible to predict the approximate salt concentra-
tion that would occur in the soil after a number of irriga-
tions b
y
estimating the proportion of applied water that will
percolate below the root zone. In any stead
y-state leaching
formula, the following assumptions are made:
•
No precipitation of salts occurs in the soil;
•
Ion uptake by plants is negligible;
•
There is uniform distribution of soil moisture through
the profile and uniform concentration of salts in the
soil moisture:
•
Complete and uniform mixing of irrigation water
with soil moisture takes place before an y of the mois-
ture percolates below the root zone and
•
Residual soil moisture is negligible.
A steady state leaching requirement formula has been
developed b
y
the U.S. Salinit y Laborator
y
(1954)"
3 de-
_ signed to estimate that fraction of the irrigation water that
must be leached through the root zone to control soil salin-
ity at any
specified
level. This is given as:
Ddw
?
EC;,,
LR =
—
D
i
,„?
ECaw
where LR is the leaching requirement; Da„., the depth of
draina
ge water; D
1 ,„, the depth of irrigation water;
the salinity of irrigation water; and EC
d „., the salinity of
water percolating past root zone.
Hence, if EC
d
,.., is determined by the salt tolerance of the
crop to be grown, and the salt content of the irrigation
water EC
i
„• is known, the desired LR can be calculated.
This leaching fraction will then be the ratio of depth of
drainage volume to the depth of irrigation water applied.
Because the permissible values for EC d
,• for various yield
decrements for various crops are not known, the EC, for
50 per cent yield reduction has been substituted for ECa••
The actual yield reduction will probably be less than 50
per cent (Bernstein 1966). 3
° This EC. is the assumed aver-
age electrical conductivit y
for the soil water at
saturation
the whole root zone. When it is substituted
for the
E(
the actual EC, encountered in the root zone will be
than this value because, in many near steady state si•
tions, the salinity increases progressively with increase
depth in the profile and is maximum at the bottom of
root zone.
Bernstein (1967)" has developed a leaching frac
formula that takes into consideration factors that con
leaching rates such as infiltration rate, climate (evapotr;
piration), frequency and duration of irrigation, and.
course, the salt tolerance of the crops. He defines
leaching fraction as LF = I — where LF is the lez
ing fraction or proportion of applied water percolal
below the root zone; E, the average rate of evapotransp
tion during the irrigation cycle, T„; and I, the average
filtration rate during the period of infiltration, T
1 : B
y ut:
ing both the required leaching derived from the steady s.
formula
LR =
ECd,,
and the leaching fraction based upon infiltration rates
evapotranspiration during the irrigation cycle,
it
is pons:
to estimate whether adequate leaching can be attained
whether adjustments must be made in the crops to
grown to permit higher salinity concentrations.
•
In addition to determination of crops to be gro,
leaching requirements may be used to indicate the tc
quantities of water required. For example, irrigation
W2
with a conductivit y of two mmhos requires one-sixth m
water to maintain root zone salt concentrations wit
eight mmhos than would water with a salt concentratior.
one mmhos under the same conditions of use.
There arc a number of problems in applying the leach
requirement concept in actual practice. Some of these rel
to the basic assumptions involved and others derive fr,
water application problems and soil variability.
• Considerable precipitation of calcium carbonate
curs as man
y
irrigation waters enter
the soil causin•
reduction in the total soluble salt load. In ma
crops, or crop rotations, crop removal of such it
as chloride was a si g nificant fraction of the to
added in waters of medium to low salinity. (Pr:
et al. 1967)'"
• It is not practical to apply water with complete u:
formity.
•
Soils are far from uniform, particularly with respt
to vertical h ydraulic conductivity.
•
The effluent from tile or ditch drains may not
representative of the salinity of water at the botto
of the root zones.
Also, there is a considerable variation in drainage outfic
that has no relation to leaching requirement when differe:
for Irrigation1335
crops are irrigated (Pillsbur
y
and Johnston 1965).
357
This
results from variations in irrigation practices for the different
crops.
The leaching requirement concept, while ver
y useful.
should not be used as a sole guide in the field. The leaching
requirement is a long-period average value that can be
departed from for short periods with adequately drained
soils to make temporar
y
use of water poorer in quality than
customarily applied.
The exact manner in which leaching occurs and the ap-
propriate values to be used in leaching requirement
formulas require further stud
y . The man
y
variables and as-
sumptions involved preclude a precise determination under
field conditions.
Salinity Hazard.
Waters with total dissolved solids (TDS)
less than about 500 rng;I are usuall
y
used 'b
y farmers with-
out awareness of an
y salinit y
problem, unless, of course,
there is a high water table. .Also, without dilution from
precipitation or an alternative suppl
y
, waters with TDS of
about 5.000 m g.
I usuall
y
have little value for irrigation
(Pillsbur y
and Blaney 19661. 3
" Within these limits, the
value
of the water appears to decrease as the salinity increases.
Where water is to be used regularl
y for the irrigation of
relatively impervious soil, its value is limited if the TDS
is in the range of 2,000 mg
% l or higher.
Recommendation
In spite of the facts that (1) any TDS limits used
in classifying the salinity hazard of waters are
somewhat arbitrary; (2) the hazard is related not
only to the TDS but also to the individual ions
involved;
and (3)
no exact hazard can be assessed
unless the soil, crop, and acceptable yield reduc-
tions are known, Table V-11 suggests classifications
for general purposes for arid and semiarid regions.
Permeability Hazard.
Two criteria used to evaluate the ef-
fect of salts in irrigation water on soil permeability are:
(1) the sodium adsorption ratio (SAR) and its relation to
the exchangeable sodium percentage, and (2) the bicarbo-
nate hazard that is particularly applicable to waters of arid
regions. Another factor related to the permeability hazard
is that the permeability tends to increase, and the stability
of a soil at any exchangeable sodium percentage (ESP)
increases as the salinity of the water increases (Quirk and
Schofield 1955).360
Eaton (l950),
347
Doneen (1959), 346
and Christiansen and
Thorne (1966) 3
" have recognized that the permeability
hazard of irrigation waters containing bicarbonate was
greater than indicated by their SAR values. Bower and
Wilcox (1965)
3
" found that the tendenc
y
for calcium
carbonate to precipitate in soils was related to the Langelier
index (Langelier 1936)
3
" and to the fraction of the irriga-
tion water evapotranspired from the soil. Bower et al.
(1965,
3
" 1968)
3
" modified the Langelier index or precipita-
TABLE V-11—Recommended Guidelines for
Salinity in
Irrigation Water
Classification
TOS try!
EC mmhos/cm
Water for which no deUi mental effects are usually noticed ?
500
0.75
Water that can have detrimental effects
On
sensitive crops
?
500-1.000
0.75-1.50
Water that can hare adverse effects on many crops; requires careful
management practices
1.000-2.000
1.50-3.00
Water that can be used for tolerant Watson permeable soils with care-
ful management practices
2.000-5.000
3.00-1.50
tion index (PI) to the soil system and presented simplified
means for calculation. The PI was 8.4-pH e
, where 8.4 was
the pH of the soil and pH,, the pH that would be found in a
calcium carbonate suspension that would
have
the same
calcium and bicarbonate concentrations as those in the ir-
rigation water. For the soil system
pH,=p1i2—pK.,+p(Ca+Mg)+pAlk
where pK and pK, are the negative logarithms, respec-
tivel
y
, of the second dissociation constant for carbonic acid
and the solubility constant for calcite: piCa+N
.
1g) and
pAlk are the negative logarithms, respectivel
y
, of the molar
concentrations of (Ca+Mg) and the titrable alkalinity.
Magnesium is included primarily because it reacts, through
cation exchange, to maintain the calcium concentration
in
solution. The PI combines empirically with the SAR in the
following equation
SAR„=SAR
iw
A/C(1+PI)
where SAR„ and SAR;,,. are for the saturation extract and
the irrigation water, respectively, C is the concentration
factor or the reciprocal of the leaching fraction, and PI is
8.4--pH,. Bower et al. (1968)
34=
and Pratt and Bair (1969),3"
using Ivsimeter experiments, have shown a high correlation
between the predicted and measured SAR„ with waters of
various bicarbonate concentrations. The information avail-
able suggested a high utility of this equation for calculating
permeability or sodium hazard of waters. In cases where C
is not known, a value of 4, correspondin
g
to
a leaching frac-
tion of 0.25, can be used to give relative comparisons among
waters. In this case the equation is
SAR„ = 2SAR;„(1 + PI).
Data can be used to prepare graphs, from which the
values for phi.,.--pK,, p(Ca+Mg), and pAlk can be ob-
tained for easy calculation of pH,. The calculation of pH,
is described by Bower et al. (1965).344
Soils have individual responses in reduction in permeabil-
it
y
as the SAR or calculated SAR values increase, but ad-
verse effects usually begin to appear as the SAR value
passes through the range from 8 to 18. Above an SAR of
18 the effects are usually adverse.
Suspended Solids.
Suspended organic solids in surface
water supplies seldom give trouble in ditch distribution
336/Section
V—.-1
.
,gricuitural Uses
Of
Water
systems except for occasional clo
gging of gates. They can
also carr
y
weed seeds onto fields where their subsequent
growth can have a severely adverse effect on the crop or
can have a beneficial effect by reducing seepage losses. Where
surface water supplies are distributed through pipelines, it
is often necessary to have self-cleaning screens to prevent
clogging of the pipe system appliances. Finer screening is
usuall y
required where water enters pressure-pipe systems
for sprinkler irrigation.
There are waters diverted for irrigation that carry
heavy
inorganic sediment loads. The effects that these loads
might have depend in part on the particle size and distri-
bution of the suspended material. For example, the ability
of sand
y
soils to store moisture is greatly improved after the
soils are irrigated with muddy water for a period of years.
More commonl
y , sediment tends to fill canals and ditches,
causing serious cleaning and dredging problems. It also
tends to further reduce the alread y low infiltration charac-
teristics of slowl
y
permeable soils.
Irrigation Water Quality For Humid Regions
Climate
The most striking feature of the climate of the
humid region that contrasts with that of the far West and
intermountain areas is the larger amount of and less season-
able distribution of the precipitation. Abundant rainfall,
rather than lack of it, is the normal expectation. Yet,
droughts are common enough to require that attention be
given to supplemental irrigation. These times of shortage of
water for optimum plant growth can occur at irregular in-
tervals and at almost any stage of plant growth.
Water demands per week or day are not as high in
humid as in arid lands. But rainfall is not easily predicted.
Thus a crop may be irrigated and immediatel
y
thereafter
receive a rain of one or two inches. Supplying the proper
amount of supplemental irrigation water at the right time
is not easy even with adequate equipment and a good
water supply. There can be periods of several successive
years when supplemental irrigation is not required for most
crops in the humid areas. There are times however, when
supplemental water can increase yield or avert a crop failure.
Supplemental irrigation for high-value crops will undoubt-
edly increase in humid areas in spite of the fact that much
capital is tied up in irrigation equipment during years in
which little or no use is made of it.
The range of temperatures in the humid region in which
supplemental irrigation is needed is almost as great as that
for arid and semiarid areas. It ran
g
es from that of the short
growing season of upstate New York and Michigan to the
continuous growing season of southern Florida. But in the
whole of this area, the most un
p
redictable factor in crop
production is the need for additional water for optimum
crop production.
Soils
The soils of the humid region contrast with those
of the West primarily in being lower in available nutrients.
They are generally more acid and may have problems
exchangeable aluminum. The texture of soils is simile
that found in the West and ranges from sands to cla
y
s. S
are too permeable, while others take water ver
y
slow'•
Soils of the humid region generally have clay mines
lower exchange capacity than soils of the arid and sem.
regions and hence lower buffer capacity. They arc I
easily saturated with anions and cations. This is an
portant consideration if irrigation with brackish •
vat
necessary to supplement natural rainfall. Organic m
content ranges from practically none on some of the Flc
sands to 50 per cent or more in irrigated peats.
One of the
most
important characteristics of man
y o
soils of the humid Southeast is the unfavorable root envi
merit of the deeper horizons containing exchange
aluminum and hay ing a strong acid reaction. In fact.
lack of root penetration of these horizons b
y
most farm c
is the primary reason for the need for supplemental ir:
tion
during short droughts.
Specific Difference Between Humid and
Regions
The effect of a specific water quality deter
on plant growth is governed by related factors. I
principles involved are almost universally applicable,
the ultimate effect must take into consideration these
sociated variables. Water quality criteria for suppleme
irrigation in humid areas may differ from those indic
for arid and semiarid areas where the water requirerr.
of the growing plant are met almost entirely by irrigat:
When irrigation water containing a deterrent is usec
effect on plant growth may vary, however, with the s
of growth at which the water is applied. In arid areas, pi
may be subjected to the influence of irrigation water qu.
continuously from germination to harvest. Where •at•
used for supplemental irrigation only, the effect on pl
depends not only upon the growth stage at which apo
but to the length of time that the deterrent remains in
root zone (Lunin et al. 1963).
3
" Leaching effects of ir
yening rainfall must be taken into consideration.
Climatic differences between humid and arid regions
influence criteria for use of irrigation water. The amour
rainfall determines in part the degree to which a g:
constituent will accumulate in the soil. Other factors
sociated with salt accumulation in the soil are those ciim
conditions relating to evapotranspiration. In humid ar
evapotranspiration is generally less than in arid regi(
and plants are not as readil
y
subjected to water stress. ".
importance of climatic conditions in relation to salinity
demonstrated b
y
Magistad et al. (1943).
3 " In gene
criteria regarding salinit
y
for supplemental irrigation
humid areas can be more flexible than for arid areas.
Soil characteristics represent another significant differe
between arid and humid regions. These were discus
previously.
Mineralogical composition will also vary. The comp(
Lion of soil water available for absorption by plant rc
Water for Irrigation/337
represents the results of an interaction between the constitu-
ents of the irri
g
ation water and the soil complex. The final
result may be that a given quality deterrent present in the
water could be rendered harmless b
y
the soi' (remaining
readily available), or that the dissolved constituents of a
water may render soluble toxic concentrations of an element
that was not present in the irrigation water. An example of
this would be the addition of a saline water to an acid soil
resulting in a decrease in pH and a possible increase in
solubility of elements such as iron, aluminum, and manga-
nese (Eriksson
1952)."'
General relationships previousl
y derived for SAR and ad-
sorbed sodium in neutral or alkaline soils of arid areas do
not apply equall
y
well to acid soils found in humid
regions (Lunin and Batchelder 19601. •
' Furthermore, the
effect of a given level of adsorbed sodium (ESP) on plant
growth is determined to some degree b
y
the associated
adsorbed cations. The amount of adsorbed calcium and
magnesium relative to adsorbed sodium is of considerable
consequence, especiall y when comparing acidic soils to ones
that are neutral or alkaline. Another example would be
the presence of a trace element in the irrigation water that
might be rendered insoluble when applied to a neutral or
alkaline soil, but retained in a soluble, available form in
acid soils. For these reasons, soil characteristics, which differ
greatly between arid and humid areas, must be taken into
consideration.
Certain economic factors also influence water quality
criteria for supplemental irrigation. Although the ultimate
objective of irrigation is to insure efficient and economic
crop production. there ma
y
be instances where an adequate
supply of good
q uality
water is unavailable to achieve this.
A farmer may be faced with the need to use irri
g
ation water
of inferior qualit
y
to get some economic return and prevent
a complete cro p
failure. This can occur in humid areas •
during periods of prolonged drought. Water quality criteria
are generally designed for optimum production. but con-
sideration must be given also to suppl
y
ing guidelines for use
of water of inferior quality to avert a crop failure.
Specific Quality Criteria for Supplemental Irri-
gation
A
previous discussion (see "Water Quality Con-
siderations for Irrigation" above) of potential quality deter-
rents contained a long list of factors indicating the current
state of our knowledge as to how the
y
might relate to plant
growth. Criteria can be established b
y
determining a con-
centration of a given deterrent, which, when adsorbed on
or absorbed by a leaf during sprinkler irrigation. results in
adverse plant growth, and by evaluating the direct or in-
direct effects (or both) that a given concentration of a qual-
ity deterrent has on the plant root environment as irriga-
tion water enters the soil. Neither evaluation is simple, but
the latter is more complex because so man y
variables are
involved. Since sprinkler application in humid areas is most
common for supplemental irrigation, both t
y
pes of evalua-
tion have considerable significance. The following discus-
lion relates only to those quality criteria that are specifically
applicable to supplemental irrigation.
Salinity.
General concepts regarding soil salinity as pre-
viously
discussed are applicable. Actual levels of salinity
that can be tolerated for supplemental irrigation must take
into consideration the leaching effect of rainfall and the fact
that soils are usually nonsaline at spring planting. The
amount of irrigation water having a given level of salinity
that can be applied to the crop will depend upon the num-
ber of irrigations between leaching rains, the salt tolerance
of the crop, and the salt content of the soil prior to irriga-
tion.
Since it is not realistic to set a single salinit
y value or even
a range that would take these variables into consideration, a
guide was developed to aid farmers in safely using saline or
brackish waters (Lunin and Gallatin 1960).
351
The following
equation was used as a basis for this guide:
n(EC(w)
2
where
EC,, f)
is the electrical conductivity of the saturation
extract after irrigation is completed: EC,.
(i)
, the electrical
conductivity of the soil saturation extract before irrigation:
EC
iw
, the electrical conductivity of the irrigation water;
and n, the number of irrigations.
To utilize this guide, the salt tolerance of the crop to be
grown and the soil salinity level (EC,
(0
) that will result
in a 15 or 50 per cent yield decrement for that crop must be
considered. After evaluating the level of soil salinit y
prior to
irrigation (EC
e(i) ) and the salinity of the irrigation water,
the maximum number of permissible irrigations can be
calculated. These numbers are based on the assumption
that no intervening rainfall occurs in quantities large enough
to leach salts from the root zone. Should leaching rainfall
occur, the situation could be reevaluated using a new value
for EC,(i).
Categorizing the salt tolerance of crops as highly salt
tolerant, moderately salt tolerant, and slightly salt tolerant,
the guide shown in Table V-12 was prepared to indicate
TABLE V-12—Permissible Number of Irrigations in Humid
Areas with Saline Water between Leaching Rains for
Crops
of
Different Salt Tolerance°
Irrigation water?
Number al irrigations for crops
ha*/
Total
lads
mg/1
?
Electrical conductivity?
Low
Ian
tolerance
?
Moderate sail?
High salt
tolerant
mmhosicm it 25 C?
tolerance
640 ?
1?
?
7? 15
1,280 ?
2
?
4?
7
? 11
1,920 ?
3?
?
2?
4-5
? 7
2,560 ?
4
?
?
2?
3? 5
3,200
?
5?
?
1?
2-3?
1
3,140 ?
6
?
1? 2? 3
4,480 ?
7?
?
1-2
? 2-3
5,120 ?
1?
?
1?
2
• lined
on a 50 w cent yield decrement
Lunin et al 1560lm.
EC,(f
= EC em
338/Section
V—Agricultural Uses of Water
the number of permissible irrigations using water of varying
salt concentrations. This guide is based on two assumptions:
• no leaching rainfall occurs between irrigations.
• there is no salt accumulation in the soii at the start
of the irrigation period. If leachin
g rains occur be-
tween irrigations, the effect of the added salt is
minimized. If there is an accumulation of salt in the
soil initially, such as might occur when irrigating a
fall crop on land to which saline water had been ap-
plied. during a spring crop, the soil should be tested
for salt content, and the irrigation recommendations
modified accordingly.
Recommendation
Since it
is not realistic to set a single salinity
value or even a range
that would take all variables
into consideration, Table V-12 developed by Lunin
et al. (1960),
354
should be used
as a guide to aid
farmers in safely using saline or brackish waters
for supplemental irrigation in humid areas.
SAR values and exchangeable sodium.
The principles relating
to SAR values and the degree to which sodium is adsorbed
from water by soils are generally applicable in both arid and
humid regions. Some evidence is available (Lunin and
Batchelder 1960),''
0
however, to indicate that, for a given
water qualit
y
, less sodium was adsorbed by an acid soil
than by a base-saturated soil. For a given level of exchange-
able sodium, preliminary evidence indicated more detri-
mental effects on acid soils than on base-saturated soils
(Lunin et al. 1964).35'
Experimental evidence is not conclusive. so the detri-
mental limits for SAR values listed previously should also
apply to supplemental irrigation in humid regions. (See the
recommendation in this section following the discussion of
sodium hazard under Water Quality Considerations for Ir-
rigation.)
Acidit
y
and alkalinity.
The only consideration not pre-
viously discussed relates to soil acidit y , which is more
prevalent in humid regions where supplemental irrigation
is practiced. An
y
factor that drops the pH below 4.8 may
render soluble toxic concentrations of iron, aluminum, and
man
g
anese. This might result from application of a highly
acidic water or from a saline solution applied to an acidic
soil. (See the recommendation in this section following the
discussion of acidity and alkalinit
y under Water Quality
Considerations for Irrigation.)
Trace elements.
Criteria and related factors discussed in
the section on Phvtotoxic Trace Elements are equally ap-
plicable to supplemental irrigation in humid regions. Cer-
tain related qualifications must be kept in mind, however.
First, foliar absorption of trace elements in toxic amounts is
directly related to sprinkler irrigation. Critical levels estab-
lished for soil or culture solutions would not apply to direct
foliar injury. Regarding trace element concentrations in the
soil resulting from irrigation water application, the vol
of the water applied by sprinkler as supplemental irrigr
is much less than that applied by furrow or flood irrigz
in arid regions.
In assessing trace element concentrations in irrigz
water, total volume of water applied and the physicoch
cal characteristics of the soil must be taken into consic
tion. Both factors could result in different criteria for our
mental irrigation as compared with surface irrigation in
regions.
Suspended solids.
Certain factors re
g
arding suspended s,
must be taken into consideration for sprinkler irriga'
The first deals with the plugging up of sprinkler nozzle
these sediments. Size of sediment is a definite factor,
no specific particle size limit can he established. If
s
larger sediment particles pass through the sprinkler, •
can often be washed off certain leaf
y vegetable crops. S
of the finer fractions, suspended colloidal material, c,
accumulate on the leaves and. once dr
y
, become extrer
difficult to wash off. thereby impairing the quality of
product.
PHYTOTOXIC TRACE ELEMENTS
In addition to the effect of total salinity on plant gro\
individual ions may cause growth reductions. Ions of 1
major and
trace
elements occur in irrigation water. T:
elements arc those that. normally occur in waters or
solutions in concentrations less than a few mg/1 with u•
concentrations less than 100 microgram (µg)/1. Some r
be essential for plant growth. while others are nonessen-
When an element is added to the soil, it ma
y
comb
with it to decrease its concentration and increase the si
of that element in the soil. If the process of adding
irrigat
water containing a
toxic level of the element continues,
capacity of the soil to react with the element will
saturated. A steady state may be approached in which
amount of the element leaving the soil in the drainage
equals the amount added with the irrigation water, with
further change in concentration in the soil. Removai
harvested crops can also be a factor in decreasing the
cumulation of trace elements in soils.
In man
y
cases, soils have high capacities to react vs
trace elements. Therefore, irrigation water containing tc
levels of trace elements ma y
be added for man
y
years bef
a steady state is approached. Thus, a situation exists wh
toxicities ma
y
develop in y
ears. decades, or even centu:
from the continued addition of pollutants to irrigat
waters. The time would depend on soil and plant factor;
well as on the concentration of trace elements in the wal
Variabilit
y
among species is well recognized. Recent
vestigations by Foy et al. (19651,
402
and Berridge et
(1971)"
5
working with soluble aluminum in soils and
nutrient solutions, have demonstrated that there is
variability
among varieties within a given species.
Water for Irrigation/339.
Comprehensive reviews of literature dealing with trace
element effects on plants are provided by McKee and Wolf
(1963),"
6
Bolland and Butler (1966),
36
and Chapman
(1966).
3
" Hodgson (1963)" 7 presented a review dealing
with reactions of trace elements in soils.
In developing a workable program to determine accept-
able limits for trace elements in irrigation waters, three
considerations should be recognized:
•
Many factors affect the uptake of and tolerance to
trace elements. The most important of these are the
natural variability in tolerances of plants and of
animals that consume plants, in reactions within the
soil, and in nutrient interactions, particularly in the
plant.
•
A system of tolerance limits should provide sufficient
flexibility to cope with the more serious factors listed
above.
•
At the same time. restrictions must be defined as
precisely as possible using presently available, but
limited, research information.
Both the concentration of the element in the soil solution.
assuming that steady state ma
y
be approached, and the
total amount of the element added in relation to quantities
that have been shown to produce toxicities were used in ar-
riving at recommended maximum concentrations. A water
application rate of 3 acre feet/acre/year was used to calcu-
late the yearly rate of trace elements added in irrigation
water.
The suggested maximum trace element concentrations
for irrigation waters are shown in Table V-13.-
The suggested maximum concentrations for continuous
use on all soils are set for those sandy soils that have low
capacities to react with the element in question. They are
generally set at levels less than the concentrations that pro-
duce toxicities when the most sensitive plants are grown in
nutrient solutions or sand cultures. This level is set, recog-
nizing that concentration increases in the soil as water is
evapotranspired, and that the effective concentration in the
soil solution, at near steady state, is higher than in the irriga-
tion water. The criteria for short-term use are suggested for
soils that have high capacitites to remove from solution the
element or elements being considered.
The work of Hodgson (1963)"
7 showed that the general
tolerance of the soil-plant s
y
stem to manganese, cobalt,
zinc, copper, and boron increased as the pH increased,
primarily because of the positive correlation between the
capacity of the soil to inactivate these ions and the pH.
This same relationship exists with aluminum and probably
exists with other elements such as nickel (Pratt et al. 1964)e'
and boron (Sims and Bingham 1968).
46
' However, the abil-
ity of the soil to inactivate molybdenum decreases with in-
crease in pH, such that the amount of this element that
could be added without
p
roducing excesses was higher in
acid soils.
TABLE V-13-Recommended Maximum Concentrations of
Trace Elements in Irrigation Waters.
Element?
Far waters used continuously
?
For use up to 20 years on fine
on all soil?
textured soils of pH 6 0 to 1.5
mg/I
Aluminum ?
?
5.0?
20.0
Arsenic ?
?
0.10?
2.0
Beryllium ?
?
0.10?
0.50
Boron ?
?
0.75?
2.0
Cadmium
?
?
0.010
?
0.050
Chromium
?
?
0.10?
1.0
Cobalt ?
?
0.050?
5.0
Copper ?
?
0.20?
5.0
Fluoride ?
?
1.0?
15.0
Iron ?
?
5.0
?
20.0
Lead ?
?
5.0?
10.0
Lithium ?
?
2.56
?
2.5°
Manganese
?
?
10.0
Molybdenum
?
?
0.050d
Nickel ?
?
7.0
Selenium
?
?
0.020
Tin' ?
Titanium'
Tunpten?
Vanadium
'sloe ?
0.10
?
1.0
2.0
?
10.0
•
Thts•le
y
els Will normally not adversely affect plants or soils.
Recommended =mum concentration lot irrigating citrus is 0.075 mg/L
Ste test tor a discussion of these elements.
d
For only acid fine tortured sails or acid soils With relatively high iron oxide contents.
In addition to pH control (i.e., liming acid soils), another
important management factor that has a large effect on the
capacity •of soils to adsorb some trace elements without de-
velopment of plant toxicities is the available phosphorus
level. Large applications of phosphate are known to induce
deficiencies of such elements as copper and zinc and greatly
reduce aluminum toxicity (Chapman 1966).386
The concentrations given in Table V-I3 are for ionic
and soluble forms of the elements. If insoluble forms are
present as particulate matter, these should be removed by
filtration before the water is analyzed.
Aluminum
The toxicit y
of this ion is considered to be one of the main
causes of nonproductivity in acid soils (Coleman and
Thomas 1967, 392
Reeve and Sumner 1970,'" Ho
y t and
Nyborg 1971a419).
At pH values from about 5.5 to 8.0, soils have great
capacities to precipitate soluble aluminum 'and to eliminate
its toxicity. Most irrigated soils are naturally alkaline, and
many are highly buffered with' calcium carbonate. In these
situations aluminum toxicity is effectively prevented.
With only a few exceptions, as soils become more acid
(pH <5.5), exchangeable and soluble aluminum develop by
dissolution of oxides and hydroxides or b
y
decomposition
of clay minerals. Thus, without the introduction of alumi-
num, a toxicity of this element usually develops as soils are
acidified, and limestone must be added to keep the soil
productive.
0.20
0.010
0.20
0.020
340/Section
V
—
Agricultural Uses of Water
In nutrient solutions toxicities are reported for a number
of plants at aluminum concentrations of 1 mg/1 (Pratt
1966)," 8
whereas wheat is reported to show growth reduc-
tions at 0.1 mg/I (Barnette 1923).
3
" Liebig et al. (1942)4"
found
g
rowth depressions of oran g
e seedlings at 0.1 mg/l.
Li g
on and Pierre (1932)
4
" showed growth reductions of
60; 22. and 13 per cent for barley, corn, and sorghum, re-
spectively. at 1 me/I.
In spite of the potential toxicity of aluminum, this is not
the basis for the establishment of maximum concentrations
in irrigation waters, because ground limestone can be added
where needed to control aluminum solubilit
y in soils.
'Nevertheless, two disadvantages remain. One is that the
salts that are the sources of soluble aluminum in waters
acidif
y
the soil and contribute to the requirement for
ground limestone to prevent the accumulation or develop-
ment of soluble aluminum. This is a disadvantage only in
acid soils. The other disadvanta
g
e is a greater fixation of
phosphate fertilizer by freshly precipitated aluminum
hydroxides.
In determining a recommendation for maximum levels
of aluminum in irrigation water using 5.0 mg; I for waters
to be.used continuously on all soils and 20 mg/I for up to
20 years on fine-textured soils, the following was considered.
At rates of 3 acre feet of water per acre per year the calcium
carbonate equivalent of the 5 mg/1 concentration used for
100 years would be 11.5 tons per acre; the 20 meil concen-
tration for 20 years would be equivalent to 9 tons of CaCO3
per acre. In most irrigated soils this amount of limestone
would not have to be added, because the soils have sufficient
buffer capacit
y
to neutralize the aluminum salts. In acid
soils that are alread y
near the pH where limestone should
be used. the aluminum added in the water would contribute
these quantities to the lime requirements.
Amounts of limestone needed for control of soluble alumi-
num in acid soils can be estimated b
y
a method that is based
on pH control (Shoemaker et al. 1961).
4 " A method based
on the amount of soluble and exchangeable aluminum was
developed by Kamprath (1970).471
Recommendations
Recommended maximum concentrations are 5.0
mg/I aluminum for continuous use on all soils and
20 mg/I for use on fine textured neutral to alkaline
soils over a period of 20 years.
Arsenic
Albert and Arndt (1931) 3 " found that arsenic at 0.5 mg/1
in nutrient solutions reduced the growth of roots of cowpeas,
and at 1.0 mg/I it reduced the growth of both roots and tops.
They reported that 1.0 mgil of soluble arsenic was fre-
quently found in the solution obtained from soils with
demonstrated toxic levels of arsenic. Rasmussen and Henry
(1965)
451 found that arsenic at 0.5 mg/1 in nutrient solu-
tions produced toxicit y symptoms in seedlings of the pine-
apple and orange. Below this concentration no symptom
toxicity were found. Clements and Heggeness (1939)390
ported that 0.5 mg/I arsenic as arsenite in nutrient s(
tions produced an 80 per cent yield reduction in tornat
Liebig et al. (1959)
43
' found that 10 me/I of arsenic
arsenate or 5 mg/1 as arsenite caused marked reduct
in growth of tops and roots of citrus grown in nutrient st.
tions. i\4achlis (1941) 4
" found that concentrations of 1.2
12 met I caused growth suppression in beans and sudan g:
respectively.
However, the most definite work with arsenic toxicity
soils has been aimed at determining the amounts that
be added to various types of soils without reduction in vie
of sensitive crops. The experiments of Cooper et al. (1932)
Vandecaveve et al. (1936), 47
" Crafts'and Rosenfels (1939)
Dorman and Colman (19391,
396
Dorman et al. (1939)
Clements and Munson (1947),
791
Benson (1953),
3
" CI
holm et al. (1955). 3
" Jacobs et al. (1970),
422
Woolson et
(1971)
481
showed that the amount-of total arsenic that
duced the initiation of toxicit
y
varied with soil texture a
other factors that influenced the adsorptive capacity. .
suming that the added arsenic is mixed with the surface
inches of soil and that it is in the arsenate form, the amou.
that produce toxicity for sensitive plants vary from 1
pounds (1b)
.
..acre for sandy soils to 300 lb.
:
acre for clay
soils. Data from Crafts and Rosenfels (1939)
394
for 80 sc
showed that for a 50 per cent yield reduction with bad(
120, 190, 230, and 290 lb arsenic
:
acre were required i
sandy foams, foams, clay foams, and clays, respective:
These amounts of arsenic indicated the amounts adsorb
into soils of different adsorptive capacities before the toxici
level was reached.
With long periods of time involved, such as would be
case with accumulations from irrigation water, possib
leaching in sandy soils ( Jacobs et al. 1970)
.
422 and reversic
to less soluble and less toxic forms of arsenic (Crafts at
Rosenfels 1939)
3
" allow extensions of the amounts require
for toxicity
. Perhaps a factor of at least two could be use(
giving a limit of 200 lb in sand
y
soils and a limit of 600
in cla
y ey soils over many years. Using these limits, a col
centration of 0.1 me.'1 could be used for 100 'ears on sanc
soils, and a concentration of 2 mg, I used for a period of 2
y ears or 0.5 m
g. 1 used for 100 years on clayey soils woul
provide an adequate margin of safety. This is assuming
acre feet of water are used per acre per year (1 mg/I equa.
2.71 lb: acre foot of water or 8.13 lb
. 3 acre feet), and tha
the added arsenic becomes mixed in a 6-inch layer of soil
Removal of small amounts in harvested crops provides al
additional safet y factor.
The onl
y
effective management practice known for soil
that have accumulated toxic levels of arsenic is
to
change tt
more tolerant crops. Benson and Reisenauer (1951)37
developed a list of plants of three levels of tolerance.' Worl,
b■.' Reed and Stur
gis (1936)
452 suggested that rice on flooded
soils was extremel y
sensitive to small amounts of arsenic. anc
Water for Irrigation/341
that the sug
g
ested maximum concentrations listed below
were too high for this crop.
Recommendations
Recommendations are that maximum concen-
trations of arsenic in irrigation water be 0.10 mg/1
for continuous use on all soils and 2 mg/1 for use
up to 20 years on fine textured neutral to alkaline
soils.
Beryllium
Haas (1932)
4
°
8
reported that some varieties of citrus seed-
lings showed toxicities at 2.5 mg/1 of beryllium whereas
others showed toxicit
y
at 5 mg/I in nutrient solutions.
Romne
y
et al. (1962)
4 " found that beryllium at 0.5 mg 11
in nutrient solutions reduced the growth of bush beans.
Romney and Childress (1965)
4
" found that 2 moil or
greater in nutrient solutions reduced the growth of toma-
toes, peas, so
y
beans, lettuce. and alfalfa plants. Additions of
soluble ber
y
llium salts at levels equivalent to 4 per cent of
the cation-adsorption capacit y of two acid soils reduced the
yields of ladino clover. Beryllium carbonate and beryllium
oxide at the same levels did not reduce yields. These results
suggest that ber
y
llium in calcareous soils might be much less
active and less toxic than in acid soils. Williams and LeRiche
(1968)
480
found that bery
llium at 2 mg/I in nutrient solu-
tions was toxic to mustard, whereas 5 mg/1 was required for
growth reductions with kale.
It seems reasonable to recommend low levels of beryl-
lium in view of the fact that, at 0.1 mg/I, 80 pounds of
ber
y
llium would be added in 100
y ears using 3 acre feet of
water per acre per year. In 20 years, at 0.5 mg ,
l, water at
the same rate would add 80 pounds.
Recommendations
In view of toxicities in nutrient solutions and in
soils, it is recommended that maximum concen-
trations of beryllium in irrigation waters be 0.10
mg/1 for continuous use on all soils and 0.50 mg/1
for use on neutral to alkaline fine textured soils
for a 20-year period.
Boron
Boron is an essential element for the growth of plants.
Optimum yields of some plants are obtained at concentra-
tions of a few tenths mg
.
,
1 in nutrient solutions. However,
at concentrations of 1 mgil, boron is toxic to a number of
sensitive plants. Eaton (1935,
4 °
1
1944"1
) determined the
boron tolerance of a large number of plants and developed
lists of sensitive, semitolerant. and tolerant species. These
lists, slightl
y modified, are also given in the U.S.D.A.
Handbook 60 (Salinity Laboratory 1954)'" and are pre-
sented in Table V-14.
In
general, sensitive crops showed
toxicities at 1 mg/1 or less, semitolerant crops at I to 2 mg/I,
and tolerant crops at 2 to 4
.
mg/l. At concentrations above
TABLE V-14—Relative Tolerance of Plants to Boron
(In each group the plants first named are considered as being more tolerant and the last named
more sensitive.)
Tolerant
?
Sernitoiennt
Alhel (Tamarix asphylla)
?
Sunfirrew (native)
?
Pecan
Asparagus
?
Potato?
Black Walnut
Palm (Phoenix canariensis)
?
foals cotton
?
Persian (English) walnut
Data palm (P. dactylitera)
?
Pima cotton
?
Jerusalem artichoke
Sugar beet
?
Tomato?
Nary bean
Mongol
?
SW1101)41
American elm
Garden beet
?
Radish?
Plum
Attalla
?
Field pea
?
Pear
Gladiolus
?
Ragged Robin rose
?
Apple
Broadbun
?
Olin
?
Grape (Suttanina and 'Malaga)
Onion
?
Barlry?
Kukla fig
Turnip
?
Wheat
?
Persimmon
Cabbage
?
Corn?
Cherry
Lettuce
?
Milo?
Peach
Carrot
?
Oat?
Apricot
Zinnia
?
Thornless blackberry
Pumpkin
?
Orange
?
.
Bell pepper
?
Ancado
Sweet
p
otato?
Grapelruit
Lima
bean
?
lemon
Salinity Laboratory Stan 195401.
4 mg/1, the irrigation water was generally unsatisfactory for
most crops.
Bradford (1 966),
3 " in a review of boron deficiencies and
toxicities, stated that when the boron content of irrigation
waters was greater than 0.75 mg/1, some sensitive plants,
such as citrus, begin to show injury. Chapman (1968)387
concluded that citrus showed some mild toxicity
symptoms .
when irrigation waters have 0.5 to 1.0 mg '1, and that when
the concentration was greater than 10 mz .
1 pronounced
toxicities were found.
Biggar and Fireman (1960)
37 ' and Hatcher and Bower
(1958) 41 showed that the accumulation of boron in soils is
an adsorption process, and that before soluble levels of 1 or
2 mg..1 can be found, the adsorptive capacity must be
saturated. With neutral and alkaline soils of high adsorption
capacities water of 2
Tr1Q
• I might be used for some time
without injury to sensitive plants.
Recommendations
From the extensive work on citrus, one of the
most sensitive crops, the maximum concentration
of 0.75 mg boron/1 for use on sensitive crops on all
soils seems justified. Recommended maximum
concentrations for semitolerant and tolerant
plants are considered to be 1 and 2 mg/I respec-
tively.
For neutral and alkaline fine textured soils the
recommended maximum concentration of boron
in irrigation water used for a 20-year period on
sensitive crops is 2.0 mg/l. With tolerant plants or
for shorter periods of time higher boron concen-
trations are acceptable.
342/Section F—Agricultural Uses of Water
Cadmium
Data b
y
Page et al.
in press
(1972) 444
showed that the
yields of beans, beets, and turnips were reduced about 25
per cent by
0.10 mg cadmium/I in nutrient solutions:
whereas cabba g
e and barley gave
y
ield decreases of 20 to 50
per cent at 1.0 mg/I. Corn and lettuce were intermediate
in response with less than 25 per cent
y
ield reductions at
0.10 mg.
,
1 and greater than 50 per cent at 1.0 mg/ 1. Cad-
mium contents of plants grown in soils containing 0.11 to
0.56 mg/1 acid extractable cadmium (Lagerwerff 1971)42'
were of the same order of magnitude as the plants grown by
Page et al. in control nutrient solutions.
Because of the phvtotoxicity of cadmium to plants, its
accumulation in plants, lack of soils information, and the
potential problems with this element in foods and feeds, a
conservative approach is taken.
Recommendations
Maximum
concentrations for cadmium in irriga-
tion waters of 0.010 mg/1 for continuous
use on all
soils
and 0.050
mg/1 on neutral and alkaline fine
textured soils for a 20-year period are recom-
mended.
Chromium
Even though a number of investigators have found small
increases in
y
ields with small additions of this element, it
has not become recognized as an essential element. The
primary concern of soil and plant scientists is with its toxic-
ity. Soane and Saunders (1959)
460
found that 10 mg/1 of
chromium in sand cultures was toxic to corn, and that for
tobacco 5 m
g
,
1 of chromium caused reduced growth and
1.0 mg-1 reduced stem elongation. Scharrer and Schropp
0935,
)
461
found that chromium, as chromic sulfate, was
toxic to corn at 5 mg/1 in nutrient solutions. Hewitt
(19531 412 found that 8 mg/1 chromium as chromic or
chromate ions produced iron chlorosis on sugar beets grown
in sand cultures. Hewitt also found that the chromate ion
was more toxic than the chromic ion. Hunter and Vergnano
(1953)"' found that 5 mg/1 of chromium in nutrient solu-
tions produced iron deficiencies in plants. Turner and
Rust (1971) 4
" found that chromium treatments as low as
0.5 mell in water cultures and 10 mg/kg in soil cultures
significantl
y
reduced the
y
ields of two varieties of soybeans.
Because little is known about the accumulation of
chromium in soils in relation to its toxicity, a concentration
of less than 1.0 mg/1 in irrigation waters is desirable. At this
concentration, using 3 acre feet water/acre/yr, more than
80 lb of chromium would be added per acre in 100 years,
and using a concentration of 1.0 mg/I for a period of 20 years
and applying water at the same rate, about 160 pounds of
chromium would be added to the soil.
Recommendations
In view of the lack
of knowledge
concernin
chromium accumulation and toxicity, a ma;zimur
concentration of 0.1 mg/1 is recommended for cor
tinuous use on all soils and 1.0 mg/I on neum-
and alkaline fine textured soils for a 20-year perio
is recommended.
Cobalt
Ahmed and Twyman (19531
165
found that tomato plan
showed toxicity from cobalt at 0.1 mg:1, and Vergnan
and Hunter (1953)
4
" found that cobalt at 5 mg:1 was highi
toxic to oats. Scharrer and Schropp (1933) 1
° found th
cobalt at a few mg.
:
1 in sand and solution cultures was tox:
to peas, beans, oats, rye, wheat, barley, and corn, and thz
the tolerance to cobalt increased in the order
. listed. Vans(
low (1966a) 4
" found additions of 100 mg/kg
to
soils \ver
not toxic to citrus.
The literature indicates that a concentration of 0.10 mg
for cobalt is near the threshold
toxicit
y level in nutrier.
solutions. Thus, a concentration of 0.05 mg:1 appears to b
satisfactory for continuous use on all soils. However. becaus
the reaction of this element with soils is strong at neutra
and alkaline pH values and it increases with time (Hodgso:
l
960),
a1G
a concentration of 5.0 mg 1 might be tolerated b
fine textured neutral and alkaline soils when it is added ii
small
yearly
increments.
Recommendations
Recommended maximum
concentrations for co-
balt are set at 0.050 mg/1 for continuous use on all
soils and 5.0 mg/1
for neutral and alkaline fine
textured soils for a 20-year period.
Copper
Copper concentrations of 0.1 to 1.0 mg/1 in nutrient
solutions have been found to be toxic to a large number o:
plants (Piper 1939,
4 '
7
Liebig et al. 1942,"" Frolich et al.
1966,
401 Nollendorfs 1969,
4
" Struckmeyer et al. 1969,4"
Seillac 1971
462
). Westgate (1952)
1 " found copper toxicit
y
in
soiis that had accumulated 800 lb acre from the use of
Bordeaux sprays. Field studies in sandy soils of Florida
(Reuther and Smith 1954)
4 " showed that toxicity to citrus
resulted when copper levels reached 1.6 mg/meq of cation-
exchange capacity per 100 g of dry soil.
The management procedures that reduce copper toxicity
include liming the soil if it is acid, using ample phosphate
fertilizer, and adding iron salts (Reuther and Labanauskas
1966).4"
Toxicity levels in nutrient solutions and limited data on
soils suggest a concentration of 0.20 mg/1 for continuous
use on all soils. This level used at a rate of 3 acre feet of
water per year would add about 160 pounds of copper in
100 Years, which is approaching the recorded levels of
Water for Irrigation/343
toxicit
y
in acid sandy soils. A safety margin can be obtained
b
y
limin
g these soils. A concentration of copper at 5.0 mg/1
applied in irrigation water at the rate of 3 acre feet of water
per year for a 20-year period would add 800 pounds of
copper in 20 years.
Recommendations
Based on
toxicity levels in nutrient solutions and
the limited soils data available, a maximum con-
centration of 0.20 mg/1 copper is recommended for
continuous use on all soils. On neutral and alkaline
fine textured soils for use over a 20-year period, a
maximum concentration of 5.0
mg/1 is recom-
mended.
Fluoride
Applications of soluble fluoride salts to acid soils can
produce toxicit
y to plants. Prince et al. (1949) 4
" found that
360 pounds fluoride per acre, added as sodium fluoride,
reduced the yields of buckwheat at'pH 4.5, but at pH values
above 5.5 this rate produced no injury.
Maclmire et al: (1942) 4
" found that 1,150 pounds of
fluoride in superphosphate, 575 pounds of fluoride in slag,
or 2,300 pounds of fluoride as calcium fluoride per acre had
no detrimental effects on germination or plant growth on
well-limed neutral soils, and that vegetation grown on these
soils showed only a slight increase in fluoride as compared to
those grown in acid soils. However, Shirle y et al. (1970)464
found that bones of cows that had grazed pastures fertilized
with raw rock and colloidal phosphate, which contained ap-
proximatel
y
two to three per cent fluorides, for seven to 16
years averaged approximately 2,900 and 2,300 mg of
fluorine per kilogram of bone, respectively. The bones of
cows that had grazed on pastures fertilized with relatively
fluorine free superphosphate, concentrated superphosphate,
and basic siag fertilizer contained only 1400 mg/ kg fluorine.
Recommendations
Because of the capacity of neutral and alkaline
soils to inactivate fluoride, a relatively
high maxi-
mum concentration for continuous use on these
soils is
recommended. Recommended maximum
concentrations are 1.0 mg/1 for continuous use on
all soils and 15 mg/1 for use for a 20-year period on
neutral and alkaline fine textured soils.
Iron
Iron in irrigation waters is not likely to create a problem
of plant toxicities. It is so insoluble in aerated soils at all pH
values in which plants grow well, that it is not toxic. In fact,
the problems with this element are deficiencies in alkaline
soils. In reduced (flooded) soils soluble ferrous ions develop
from inherent compounds in soils, so that quantities that
might be added in waters would be of no concern. However,
Rhoads (1971) 456
found large reductions in the quality of
cigar wrapper tobacco when plants were sprinkler irrigated
with water containing 5 or more mg soluble iron/l, because
of precipitation of iron oxides on the leaves. Rhoad's ex-
perience would suggest caution when irrigating an
y
crops
using sprinkler systems and waters having sufficient reducing
conditions to produce reduced and soluble ferrous iron.
The disadvantages of soluble iron salts in waters are that
these would contribute to soil acidification, and the precipi-
tated iron would increase the fixation of such essential ele-
ments as phosphorous and molybdenum.
Recommendations
A maximum concentration of 5.0 mg/1 is recom-
mended for continuous use on all soils, and a
maximum concentration
of 20
mg/1 is recom-
mended on neutral to alkaline soils for a 20-year
period. The use of waters with large concentrations
of suspended freshly precipitated iron oxides and
hydroxides
is not recommended,
because these
materials also increase the
fixation of
phosphorous
and molybdenum.
Lead
The phytotoxicity of lead is relatively low. Berry (1924)34
found that a concentration of lead nitrate of 25 mg/I was
required for toxicity to oats and tomato plants. At a concen-
tration of 50 mg/l, death of plants occurred. Hopper
(1937)" found that 30 mg/I of lead in nutrient solutions
was toxic to bean plants. Wilkins (1957) 4
" found that lead
at 10 mg/1 as lead nitrate reduced root growth. Since soluble
lead contents in soils were usually from 0.05 to 5.0 mg/kg
(Brewer 1966), 38
' little toxicity can be expected. It was
shown that the principal entry of lead into plants was from
aerial deposits rather than from absorption from soils (Page
et al. 1971)
4 " indicating that lead that falls onto the soil is.
not available to plants.
In a summary on the effects of lead on plants, the Com-
mittee on the Biological Effects of Atmosphere Pollutants
(NRC 1972)
44 ' concluded that there is not sufficient evidence
to indicate that lead, as it occurs in nature, is toxic to vege-
tation. However, in studies using roots of some plants and
very high concentrations of lead, this element was reported
to be concentrated in cell walls and nuclei during mitosis
and to inhibit cell proliferation.
Recommendations
Recommended maximum concentrations of lead
are 5.0 mg/1 for continuous use on all soils and 10
mg/1 for a 20-year period on neutral and alkaline
fine textured soils.
Lithium
-Most crops can tolerate lithium in nutrient solutions at
concentrations up to 5 mg/1 (Oertli 1962.
443
Bingham et al.
1964,
377
Bollard and Butler 1966
376). But research revealed
344/Section
11
—Agricultural
Uses of mater
that citrus was more sensitive (Aldrich et al. 1951, 3 " Brad-
ford 19636,
38
' Hilgeman et al. 1970
41s
). Hilgeman et al.
(19701"
5 found that grapefruit developed severe symptoms
of lithium toxicit
y
when irrigated with waters containing
lithium at 0.18 to 0.25 mgil. Bradford (1963a)
38
° reported
that experience in California indicated slight toxicit y of
lithium to citrus at 0.06 to 0.10 m g 1 in the water.
Lithium is one of the most mobile of cations in soils. It
tends to be replaced by other cations in waters or fertilizers
and is removed by leaching. On the other hand, it is not
precipitated by any known process.
Recommendations
Recommendations for maximum concentrations
of lithium, based on its phytotoxicity, are 2.5 mg/1
for continuous use on
all soils,
except for citrus
where the recommended maximum concentration
is 0.075 mg/I for all
soils. For short-term use on
fine textured soils the same maximum concentra-
tions are recommended because of lack of inactiva-
tion in soils.
Manganese
Manganese concentrations at a few tenths to a few milli-
grams per liter in nutrient solutions are toxic to a number of
crops as shown by Morris and Pierre (1949), 4x
° Adams and
Wear (1957),
3
" Hewitt (1965), 4
" and others. However,
toxicities of this element are associated with acid soils, and
applications of proper quantities of ground limestone suc-
cessfully eliminated the problem. Increasing the pH to the
5.5 to 6.0 range usuall
y
reduced the active manganese to
below the toxic level (Adams and Wear 1957).
3
" Hoy t and
Nyborg (1971b)
42 ° found that available manganese in the
soil and manganese content of plants were negatively cor-
related with soil pH. However, the definite association of
toxicity with soil pH as found with aluminum was not found
with manganese, which has a more complex chemistry.
Thus, more care must be taken in setting water quality cri-
teria for manganese than for aluminum (i.e., management
for control of toxicities is not certain).
Recommendations
Recommended maximum
concentrations for
manganese in irrigation waters are set at 0.20 mg/I
for continued use on all soils and 10 mg/1 for use up
to 20 years on neutral and alkaline fine textured
soils. Concentrations for continued use can be in-
creased with alkaline or calcareous soils, and also
with crops that have higher tolerance levels.
Molybdenum
This element presents no problems of toxicity to plants at
concentrations usually found in soils and waters. The prob-
lem is one of toxicity to animals from molybdenum in-
gested from forage that has been
g
rown in soils with rela-
tively high amounts of avaiable molybdenum. Dye
O'Hara (1959)
396
reported that the molybdenum concer
tion in forage that produced toxicity in ruminants was
30 mg/kg. Lesperance and Bohman (1963) 43
° found
toxicity was not simply associated with the molybde:
content of forage but was influenced by the amoun;
other elements, particularl
y
copper. Jensen and Lesperr
(1971)
423 found that the accumulation of molvbdenur
plants was proportional to the amount of the element ac
to the soil.
Kubota et al. (1963)
4
" found that molybdenum con(
trations of 0.01 mgil or greater in soil solutions were
sociated with animal toxicity levels of this element in ai
clover. Bingham et al. (1970)
17 ' reported that molybdosi
cattle was associated with soils that had 0.01 to 0.10 n
of molybdenum in saturation extracts of soils.
Recommendations
The
recommended maximum concentration
molybdenum for continued use of water on
soils, based on animal toxicities from forage,
0.010 mg/l. For short
term use on soils that re:
with this element, a concentration of 0.050 m
is recommended.
Nickel
According to Vanselow (1966b),"
4
many experime
with
sand and solution cultures have shown that nickel
0.5 to 1.0 mg/I is toxic to a number of plants. Chang
a
Sherman (1953)
3 " found that tomato seedlings were
jured by 0.5 mg/1. It iillikan (1949) 4
" found that 0.5 to
mg/1 were toxic to flax. Brenchley (1938) 38
' reported tox
ity to barley and beans from 2 mgil. Crooke (1954
found that 2.5 mgil was toxic to oats. Legg and Ormer
(1958)
429 found that 1.0 mg .1 produced toxicity in
h
plants. Vergnano and Hunter (1953)
4
" found that 1.0 rm
in solutions flushed through sand cultures was toxic to cm
Soane and Saunders (1959)
4
" found • that tobacco pia:
showed no toxicity at 30 mg and that corn showed
toxicity at 2 mg/1 but showed toxicity at 10 mg ."1.
Work by Mizuno (1968) 43
° and Halstead et al. (1969)
and the review of Vanselow (1966b)
471
showed that increr
ing the pH of soils reduces the toxicity of added nickel.
Halstead et al. (1969) 4 " found the greatest capacity to a
sorb nickel without development of toxicity was by a s(
with 21 per cent organic matter.
Recommendations
Based on both toxicity in nutrient solutions an
on quantities that produce toxicities in
soils, th
recommended maximum concentration of nick(
in irrigation waters is 0.20 mg/1 for continued us
on all soils. For neutral fine textured soils for
period up to 20 years, the recommended maximun
is 2.0 mg/1.
Water for Irrigation/345
Selenium
Selenium is toxic at low concentrations in nutrient solu-
tions, and only small amounts added to soils increase the
selenium content of forages to a level toxic tr. 11Yestcc::.
Brover et al. (1966)
384
found that selenium at 0.025 mg/1
in nutrient solutions decreased the vieids of alfalfa.
The best evidence for use in setting water quality criteria
for this element is application rates in relation to toxicit
y in
forages. Amounts of selenium in fora
g
es required to prevent
selenium deficiencies in cattle (Allawav et al. 1967)3"
ranged between 0.03 and 0.10 mg; k
g
. (depending on other
factors), whereas concentrations above 3 or 4 mg; kg were
considered toxic (Underwood 1966).
47
' A number of investi-
gators (Hamilton and Beath 1963,
410
Grant 1965.
407
Allawa■,,
et al. 1966)"7
have shown that small applications of selenium
to soils at a rate of a few kilograms per hectare produced
plant concentrations of selenium that were toxic to animals.
Gissel-Nielson and Bisbjerg (19701
406
found that applica-
tions of approximately 0.2 kg.
,
hectare of selenium produced
from 1.0 to 10.5 mg..kg in tissues of forage and vegetable
crops.
Recommendation
With the low levels of selenium required to pro-
duce toxic levels in forages, the recommended
maximum concentration in irrigation waters is
0.02 mg/I for continuous use on all
soils. At
a rate
of 3 acre feet of water per acre per year this concen-
tration represents 3.2 pounds per acre in 20 years.
The same recommended maximum concentration
should be used on neutral and alkaline fine textured
soils until greater information is obtained on soil
reactions. The relative
mobility of this
element in
soils in comparison
to other trace elements and
slow removal in harvested crops provide
a
sufficient
safety margin.
Tin, Tungsten, and Titanium
Tin, tungsten, and titantium are effectively excluded by
plants. The first two can undoubtedl
y
be introduced to
plants under conditions that can produce specific toxicities.
However, not enough is known at this time about any of the
three to prescribe tolerance limits. (This is true with other
trace elements such as silver.) Titantium is very insoluble,
at present it is not of great concern.
Vanadium
Gericke and Rennenkampff (1939)
4
° found that vanad-
ium at 0.1, 1.0, and 2.0 mgil added to nutrient solutions as
calcium vanadate slightly increased the growth of barley,
whereas at 10 mg/I vanadium was toxic to both tops and
roots and that vanadium chloride at 1:0 mg/1 of vanadium
was toxic. Warington (1954,
476
1956
477 ) found that flax, soy-
beans, and peas showed toxicit
y
to vanadium in the con-
centration range of 0.5 to 2.5 mgil. Chiu (1953)"
9
found
that 560 pounds per acre of vanadium added as ammonium
metavanadate to rice paddy soils produced toxicity to rice.
r,-,cc:r.mandati3ns
Considering the toxicity of vanadium in nutrient
solutions and in soils and the lack of information
on the reaction of this element with soils, a maxi-
mum concentration of 0.10 mg/1 for continued use
on all soils is recommended. For a 20-year period
on neutral and alkaline fine textured the recom-
mended maximum concentration is 1.0 mg/l.
Zinc
Toxicities of zinc in nutrient solutions have been demon-
strated for a number of plants. Hewitt (1948)
4
' 3
found that
zinc at 16 to 32 mgil produced iron deficiencies in sugar
beets. Hunter and Ver
g
nano (1953)'' found toxicit
y
to oats
at 25 mg '1. Millikan (1947) 4
" found that 2.5 mg /1 produced
iron deficienc
y in oats. Earle
y
(1943)
3
" found Mat the
Peking variet y
of soybeans was killed at 0.4 mg
.
/1, whereas
the Manchu variet
y
was killed at 1.6 mgil.
The toxicity of zinc in soils is related to soil pH, and liming
acid soil has a large effect in reducing toxicity (Barnette
1936, 371 Gall and Barnette 1940, 4
° 4 Peech 1941," Staker
and Cummings 1941,
4
" Staker 1942,
467
Lee and Page
1967 4 '3
). Amounts of added zinc that produce toxicit
y are
highest in clay and peat soils and smallest in sands.
On acid sandy soils the amounts required for toxicity
would suggest a recommended maximum concentration of
zinc of 1 mgil for continuous use. This concentration at a
water application rate of 3 acre feetiacreiyear would add
813 pounds per acre in 100 years. However, if acid sandy
soils are limed to pH values of six or above. the tolerance
level is increased by
at least a factor of two (Gall and
Barnette 1940).
404
Recommendations
Assuming adequate use of liming materials to
keep pH values
high
(six or above), the recom-
mended maximum concentration for continuous
use on all soils is 2.0 mg/l. For a 20-year period on
neutral and alkaline soils the recommended maxi-
mum is 10 mg/1. On fine textured calcareous soils
and on organic soils, the concentrations can exceed
this limit
by a
factor of two or three with low
probability of toxicities in a 20-year period.
PESTICIDES
(IN
WATER
FOR IRRIGATION)
Pesticies are used widely in water for irrigation on com-
mercial crops
in
the United States (Sheets 1967).
50
' Figures
on production, acreage treated, and use patterns indicate
insecticides and herbicides comprise the major agricultural
pesticides. There are over 320 insecticides and 127 herbi-
cides registered for agricultural use (Fowler 1972).498
346/Section V—Agricultural Uses of Water
Along with the many benefits to agriculture, pesticides
can have detrimental effects. Of concern for irrigated agri-
culture is the possible effects of pesticide residues in irriga-
tion water on the growth and market qUalit
y
of forages and
crops. Pesticides most likely to he found in agricultural
water supplies are listed in the Freshwater Appendix II-D.
Insecticides in irrigation Water
The route of entr
y
of insecticides into waters is discussed
in the pesticide section under Water for Livestock Enter-
prises. For example. Miller et al. (19671 5
" observed the
movement of parathion from treated cranberr y
bogs into a
nearby irrigation ditch and drainage canal. and Sparr et al.
(1966) 5n
monitored endrin in waste irrigation water used
three days after spra
y ing. In monitoring pesticides in water
used to irrigate areas near Tule Lake and lower Klamath
Lake Wildlife Refuges in northern California. Godsil and
Johnson (19681"
9 detected high levels of endrin compared
to other pesticides. The
y
observed that the concentrations
of.pesticides in irri
g ation waters varied directl
y with agri-
cultural activities.
In monitoring pesticides residues from 1965 to 1967
(Agricultural Research Service 1969a).
483 the U. S. Depart-
ment of Agriculture detected the following pesticides in ir-
rigation waters at a sampling area near Yuma, Arizona:
the DDT complex, dieldrin, meth y
l parathion, endrin,
endosulfan, ethyl parathion, dicofol. s,s,s ,-tributyl phus-
phorotrithiate (DEF), and demeton. Insecticides most com-
monly detected were DDT, endrin. and dieldrin. ..For the
most part, all residues in water were less than 1.0
Ag
1.
A further examination of the irri g
ation water at the Yuma
sampling area showed that water entering it contained rela-
tively low amounts of insecticide residues while water leav-
ing contained greater concentrations. It was concluded that
some insecticides were
p
icked up from the soil by irrigation
water and carried out of the fields.
Crops at the same location were also sampled for insecti-
cide residues. With the exception of somewhat higher con-
centrations of DDT and. dicofol in cotton stalks and canta-
loupe vines, respectively, residues in crop plants were rela-
tively small. The mean concentrations, where detected,
were 2.6
A
g.. g combined DDT, 0.01 mg • g endrin. 0.40 aug, g
dieldrin. 0.05
A
g•g lindane, 5.0 Ag g dicofol, and 1.8 1.(g..g
combined parathion. The larger residues for DDT and
dicofol were apparentl
y from foliage applications. Sampling
of harvested crops showed that residues were generally less
than 0.30
A
gig and occurred primaril
y
in lettuce and in
cantaloupe pulp, seeds, and rind. DDT, dicofol, and endrin
were applied to crops during the surve y
, and from 2.0 to
6.0 lbiacre of DDT were applied to the soil before 1965.
Some crops do not absorb measurable amounts of insecti-
cides but others translocate the chemicals in various
amounts. At the levels (less than 1.0
Algil)
monitored by the
U. S. Department of A
griculture in irrigation waters (Agri-
cultural Research Service 1969a),
183
there is little evidence
indicating that insecticide residues in the water are d
mental to plant growth or accumulate to undesirable c
legal concentrations in food or feed crops.
Herbicides in irrigation Water
In contrast to insecticides, misuse of herbicides can
sent a greater hazard to crop growth. Herbicides are li
to be found in irri
g
ation water under the following circ
stances: (1) during their purposeful introduction into irr
tion water to control submersed weeds
., of (2) incident.;
herbicide treatment for control of weeds on banks of irr
tion canals. Attempts arc seldom made to prevent w
containing herbicides such as xylene or acrolein from b(
diverted onto cropland during irrigation. In most instan
however, water-use restrictions do apply when herbic.
arc used in reservoirs of
.
irrigation water. The herbic:
used in reservoirs are more persistent and inherently rr.
phvtotoxic at low levels than arc NvIene and acrolein.
The tolerances of a number of crops to various herbici
used in and around water arc listed in Table V-15:Resi(
levels tolerated by most crops are usually much higher ti
the concentrations found in water following normal us(
the herbicides. Aromatic solvent ■Kylene
.
) and acrolcin
widel y
used in western states for keeping irrigation car.
free of submersed weeds and algae and are not harmful
crops at concentrations needed for weed control. (U.
Department of Agriculture, Agricultural Research Sery
1963, 5 " hereafter referred to as Agricultural Reseal
Service 1963). 15'' Xylene, which is non-polar, is lost rapi(
from water (50 per cent in 3 to 4 hours) by volatility (Fra
et al. 1970). 1
" Acrolein, a polar compound. may remain
flowing water for periods of 24 hours or more at levels 0
are phytotoxit only to submersed aquatic weeds. Cop1
sulfate is used frequentl y to control algae. It has also be
found effective on submersed vascular weeds when appli
continuously to irrigation water at low levels (Bard
1969). 1
"?
•
The herbicides that have been used most widely on irrie
Lion ditchbanks are 2 .-1-D. dala
p
on. TCA, and silvex. T
application of herbicides may be restricted to a swath of
few feet along the margin of the water, or it may cover
swath 15 feet or more wide. A variable overlap of the sprz
pattern at the water margin is unavoidable and accoun
for most of the herbicide residues that occur in water durir
ditchbank treatments. Rates of application var
y
from 2
per acre for 2 .4-D to 20 lb per acre for dalapon. For e:
ampies of residue levels that occur in water from tlie
treatments see Table V-16. The residues generally occur onl
during the periods when ditchbanks are treated.
The rates of dissipation of herbicides in irri
gation wate
were reported recentl y b
y
Frank et al. (19701.
49
' The herbi
tides and formulations commonl y
used on ditchbanks ar
readily
soluble in water and not extensively sorbed to soi
or other surfaces. Reduction in levels of residues in flowint
irri
gation water is due largel y
to dilution. Irrigation canal
Aromatic solvents (aylene)
??
Flowing water in canals or drains. Emulsifiable liquid
??
S to 10 gal/its (350 to 750 mg/I)
?
700 mg/I
or
less ?
Alfalla>1.600, buns-1.2170. carrots-
applied in 30-60 minutes
?
1.600. corn
.
3. 009 cotton-1.600,
grain sorghum >100, oats-2.400.
potatus•1.300, wheal >1,200.
Copper sulfate
?
?
Canals or reservoirs ?
Pentahydrate crystals.
?
Continuous treatment 0.510 3.0?
0.04 to 0.8 mg/I during first 10
?
Threshold is above these levels.
mgrl, Mir IregMelit• VI to I lb
?
miles, 0.08 to 9.0 mg/1 during
(0.15 to 0.45 kg) per cis water
?
first 10 to 20 miles.
flow
Dalapon ?
Banks
?
ol canals and ditches....?
Water soluble can
?
?
IS to 30 lb/A or 17 to 34 kg/ha..
?
Less than 0.2 mg,/1 ?
Beets>1.0. corn> 0.35
Diqual
?
?
. Injected into water or sprayed
?
Liquid . ,?
3 to 5? 1.11 0 1.5
1.5 lbs/A, or
?
Usually lass than 0.1 mg/I
??
Beans-5.0. corn•125
over surf ace?
1.2 lo 1.7 kg ha
Diuron ?
Banks
?
and bottoms of small dry
?
Wettable powder?
?
Up to 64 113/A or 12 kg/ha ?
No data ?
No data
powder ditches
Dichlobenil
?
?
Bottoms of dry canals..?Granules or wettable x0veler ..
?
7 to 10 lb/A or 7.9 10
12.6 kg/ha
?
No data
?
Alfalfa-10. corn> 10, soybeans-1.0,
sugar beets•1.0 to 10.
Endothall
?
?
Ponds and reservoirs ??
Water soluble boorK
?
• I to 4 mg
?
Absent or only traces
?
Corn-25. field beans-I.0, Attalla?
,
>10.0
Endothall amine salts..
?
Reservoirs and sUtic•water?
Liquid or granules
?
0.510 2.5 mg.! ?
Absent or only traces
?
Corn> 25, soybeans> 25, sugar beets.
canals
?
25
sugar
beets-0.1 to 10.
No data
Fenn
?
Bottoms ?
of dry canals
?
Liquid or granules .
? 10 to 20 lb/A or 12.6 to 25.2
?
Absent or only traces
corn
.
10, soybuns-0.1.
kg,ha
Monuron
?
?
Banks and bottoms of small dry
?
Wettable powder
?
? Up to 64 IIVA or 72 kg/ha
?
No data .
powder ditch.:
Silver
?
Woody plants and brambles on
?
Esters in liquid lam
?
2 to 4 IIVA or 2.2 to 4.4 kg/ha
?
. No date Probably wall under
Iloodways. along canal, strum,?
0.1 mg/I
or reservoir banks
Floating and emend welds in?
?
2 to 1 lb/A or 2.2 to 3.14/ha .... 0.01 to 1.6 mg/1 1 day alter appFi-
southern waterways
?
cation
•
TCA ?
Banks ?
of canals and ditches?
Water soluble fah ?
Up to 64 lb/A or 72 kg/ha
?
Usually less than 0.1 mg/I ?
2.4•D amino
?
On banks of canals and ditches
?
Liquid
?
1 to 4 lb/A or 1.1 to 4/4 kg/ha....
?
0.01 to 0.10 mg/I ?
Corn> 5.0, sugar buts and soybeans
>0.02.
No
injury observed at levels used.
Field beans> 1.0, grapes-0.1, sugar
beets> 0.2. urybeans>0.02, corn-
10. cucumbers, ootatoes, sorghum.
allele,
pippin>
1.0.
Water for Irrigation/347
TABLE V-15-Tolerance of
Crops to Various Herbicides Used In and Around Waters'
Herbicide
?
Sits of use
?
Formulation?
Treatment rate
?
Concentration that may occur in
?
Crop injury threshold in
irrigation watab
?
irrigation water (mg/1)'
Acrolein
?
Irrigation canals ?
Liquid
??
?
15 mg/1 for 4 hours
?
10 to 0.1 mg/I
?
Flood or furrow: beans•60, corn•60,
cotton-10, soybeans•20, sugar beets-
60.
0.6 mg/I for 1 hours ?
0.410 0.02 mg/I
?
Sprinkler: corn•60. soybeans-I5,
sugar beets-1S.
0.1 mg/I tor 411 hours
?
0.05 to 0.1 mg/I
Floating and emersed weeds in?
?
2 to 4 lb/A or 2.2 to 4.4
kg/ha ....
No data. Probably less than
southern canals and ditches?
0.1 mg/1
Piclaram ?
For control of brush on
water-
?
Liquids or granules
?
1 to 3 lb/A or 1.1 to 3.3
kg?
.?
No data ?
Corn> 10. field buns 0.1, sugar
sheds?
beets>1.0
° Sources of
data
included in this table are: U.S. Department of Agriculture. Agricultural Research Service (1969)
m
. Atte and McRae (1959,
f as
1960
0
), Bruns (1954." 1957.
00
1964," 1969
1w
), Bruns and Clore (1958),
11
+ Bruns
and Dawson (1959).."
Brunt
et al. (1955.
01
1964," unpublished data 19)1
001
) Frank et aL (19701.
•
Yee (1959)I01.
b
Herbicide concentrations given in Irus column are the highest
concentrations
that have been found in irrigation
water,
but these levels seldom remain in the water when it reaches the crop.
•
Unless indicated otherwise, all
Crop
tolerance data were obtained by flood or furrow irrigation. Threshold of injury is the lowest concentration causing temporary or permanent injury to crop
,
plants even though, in many instances,
neither crop yield nor quality was attested.
are designed to deliver a certain volume of water to be used
on a specific area of cropland. Water is diverted from the
canals at regular intervals, and this s ystematicall
y reduces
the volume of flow. Consequently, little or no water re-
mains at the ends of most canals where disposal of water
containing herbicides might be troublesome.
Residues in Crops
Successful application of herbicides for control of algae
and submersed vascular weeds in irrigation channels is
dependent upon a continuous flow of water. Because it is
impractical to interrupt the flow and use of water during
the application of herbicides in canals or on canal banks, the
herbicide-bearing water is usually diverted onto croplands.
Under these circumstances, measurable levels of certain
herbicides may occur in crops.
Copper sulfate is used most frequently for control Of
algae at concentrations that are often less than the suggested
tolerance for this herbicide in potable water. Application
rates may range from one third pound of copper sulfate per
cubic-feet-second (cfs) of water flow to two pounds per cfs
of water flow (Agriculture Research Service 1963).
482
Xylene is a common formulating ingredient for many pesti-
cides and as such is often applied directly to crop plants. The
distribution b y
furrow or sprinkler of irrigation water con-
taining acrolein contributes, to the rapid loss of this herbi-
cide. Copper sulfate, xylene, and acrolein are of minor im-
portance as sources of objectionable residues in crops.
Phenox y herbicides, dalapon, TCA, and amitrole are
most persistent in irrigation water (Bartley and Hattrup
19701.
4
" It is possible to calculate the maximum amount of
a herbicide such as 2 ,4-D that might be applied to crop-
348/Section 17—Agricultural Uses of Water
TABLE V-16—Maximum Levels of Herbicide Residues
Found in Irrigation Water as
a Result of
Ditchbank Treatment-
Herbicide and canal tinted
liniment
Mt
lb/A
Water flow in cls
Minimum concentration
of residue.
µt/
I
DALAPON
Fl y
smile
Lateral
?
20
15
365b
Lateral No. 1
6.1
290
23
Menard Lateral
?
9.6
31
39
Solo Lateral ?
'
?
10.5
26
162
TCA
Lateral No.
4 ?
3.1
290
12
Manard Lateral ?
5.4
37
20
Solo Lateral ?
5.9
26
69
2.4
.
0
AMINE SALT
Weill
No. 4
1.9
290
5
Manard Lateral
?
2.7
37
13
Solo
Lateral ?
3.0
26
36
• Fmk
it
aL
(1910),/1.
Hiyh
level
ol
residue probably due to atypical treatment.
land following its use on an irrigation bank. A four-mile-
long body of irrigation water contaminated with 2 ,4-D
and flowin
g
at a velocit
y
of one mile per hour, would be
diverted onto an adjacent field for a period of 4 hours. A
diversion rate of two acre inches of water in 10 hours would
deliver 0.8 inch of contaminated Water per acre. If this
amount of water contained 50 pg
y
I of 2 ,4-D (a higher con-
centration than is usuall
y
observed), it would deposit slightly
less than 0.009 lb of 2 .4-D per acre of cropland. Levels of
2 ,4-D residues of greater magnitude have not caused in-
jury to irri
g
ated crops (see Table V-I 5).
The manner in which irrigation water containing herbi-
cides is applied to croplands may influence the presence
and amounts of residues in crops (Stanford Research Insti-
tute 19701.
5
" For example, residues in leaf
y
crops ma
y
be
greater when sprinkler irrigated- than when furrow irri-
gated. and the converse ma
y
be true with root crops.
If there is accidental contamination of field, forage, or
vegetable crops by polluted irrigation water. the time inter-
val between exposure and harvesting of the crop is im-
portant, especially with crops used for human consumption.
Factors to be considered with those mentioned above in-
clude the intensity of the application, stage of growth, dilu-
tion, and pesticide degradability in order to assess the
amount of pesticide that ma
y
reach the ultimate consumer
(U. S. Department of Health, Education and Welfare
1969).
46
Pesticides applied to growing plants may affect
the market quality by causing chan
g
es in the chemical com-
position, appearance, texture, and flavor of the product
harvested for human consumption (NRC 1968).501
Recommendation
Pesticide residues in irrigation waters are variable
depending upon land and crop management prac-
tices. Recent data indicate pesticide residues are
declining in irrigation waters, with concentrations
less than 1.0 4/1 being detected. To date t
have been no documented toxic effects on (
irrigated with waters containing insecticide
dues. Because of these factors and the ma
variability in crop sensitivity, no recommend
is given for insecticide residues in irrigation wa
For selected herbicides in irrigation water,
recommended that levels at the crop not ex
the recommended maximum concentration 1:
in Table
V-16.
PATHOGENS
Plant Pathogens
The availability of "high qualit
y
" irrigation water
lead to the reuse of runoff water or tailwater and si
quently lead to a serious but
g
enerally
unrecognized
tem. that. of the distribution of plant pathogenic orgar
such as bacteria, fungi. nematodes. and pos
s
ibly vir
This is most serious when it occurs on previously nonfat
lands.
Distribution of Nematodes
Wide distribution
plant-nematodes in irrigation waters of south central IA
ington and the Columbia Basin of eastern Washington
demonstrated by Faulkner and Bolander (1966,
5
" 197(
When surface drainage from agricultural fields is colle
and reintroduced into irrigation systems; without first b
impounded in settling basins, large numbers of nemati
can be transferred. Faulkner and Bolander's data indict
that an acre of land
in
the Lower Yakima Valley max
ceive from 4 million to over 10 million plant-pare
nematodes with each irrigation. Numbers of nemau
transported var
y
with the
g
rowing season, but some
were detectable in irrigation water and demonstrated t(
infective were
Mrloidog i
ne /rap/a. Hrteroth
.
ra schachtil. Prat;
chus
sp., and
Tvlenchori•nchus
sp.
Meagher (19671
520
found that plant-parasitic nematc
such as
.
the citrus nematode,
Tvlenchulus seniipenetrans,
r
be spread by subsoil drainage water reused for irrigatic
Thomason . and Van Gundy t1961)
5
'" showed anot
means by which nematodes may possibly enter irrigat
supplies. Two species of rootknot nematode,
Meloido
incognita
and
M. javanica,
were found reproducing on arrt
weed,
Pluchea sericea,
at the edge of sandbars in the Colorz
River at Bl
y
the, California. No conclusive evidence t:
nematodes entered the river was presented, but infested
and infected roots were in direct contact with the water
Plant-parasitic nematodes are essentially aquatic anim
and ma
y
survive for da
y
s or weeks immersed in wat
Unless provisions are made for excluding them from
settling them out of irrigation water, they may seriou:
deteriorate water quality in areas of the United States c
pendent on irrigation for crop production.
Distribution of Fungi
Surveys were conducted to c
termine the origins and prevalence of
Phytophlhora
sp.,
Water for Irrigation/349
fungus pathogenic to citrus, in open irrigation canals and
reservoirs in five southern California counties by Klotz et
al. (1959).
5 '-
3
Phytophthora
progagules were detected by trap-
ping them on healtl•y lemon fruits suspended in the water.
Of the 12 canals tested from September 1957 to Septem-
ber 1958, all yielded
Phytophthora
sp. at one time or another,
some more consistently than others.
Phytophthora citrophthora
\vas the most common and was recovered from 1 1 canals.
In• the five canals where it was possible to set the lemon
traps at the source of the water, no
Phytophthora
sp. were
recovered. However, as the canals passed through citrus
areas where excess irrigation water or rain runoff could
drain into the canals, the fungi were readil
y
isolated. Soil
samples collected from paths of runoff water that drained
into irrigation canals yielded
P. citrophthora,
indicating that
Phytophthora
zoospores from infested citrus groves can be in-
troduced into canals.
One of three reservoirs was found to be infested with
P.
barasitica.
Application of copper sulfate effectively con-
trolled the fun g
us under the static condition of the water
in the reservoir. Chlorination (2 mg/1 for 2 minutes)
effectivel
y
killed the infective zoospores of
Phytophthora
sp.
under laboratory conditions.
McIntosh (1966) 52
' established that
Phytophthora cacto-
rum,
which causes collar-rot of fruit trees in British Co-
lumbia, contaminates the water of many irrigation systems
in the Okanagan and Similkamen Valleys. The fungus
was isolated from 15 sources including ponds, reservoirs,
rivers, creeks, and canals. It had been established previously
that
P. caclorum
was widespread in irrigated orchard soils
of the area, but could not be readily detected in non-
irrigated soils.
Man y plant-pathogenic fungi normally produce fruiting
bodies that are widely disseminated b y
wind. A number
do not. however, and these could easily be disseminated
by irrigation water.
Distribution of Viruses
Most plant pathogenic vi-
ruses do not remain infestive in the soil outside the host or
vector. Two exceptions may be tobacco mosaic virus
(TMV) and tobacco necrosis virus (TNV). There is some
evidence that these persist in association with soil colloids
and can gain entry to plant roots through wounds. Hewitt
et al. (1958)
5 ""- 0 demonstrated that fan leaf virus of grape
is transmitted by a dagger nematode,
Xiphinema inde.v.
To
date, three genera of nematodes,
Xiphinema, Longidorus,
and
Trichoa'orus
are known to transmit viruses. The first
two of these genera transmit polyhedral viruses of the
Arabis mosaic group.
Trichdorus
spp. transmit tubular
viruses of the Tobacco Rattles group.
Infective viruses are known to persist in the nematode
vector for months in the absence of a host plant. This
information, coupled with Faulkner and Bolander's (1966,5'5
1970)
516 proof of the distribution of nematodes in irrigation
water, suggested the possibility that certain plan
t viruses
could be distributed in their nematode vectors in irrigation
water. To date, no direct evidence for this has been pub
lished.
Several other soil-borne plant-pathogenic viruses are
transmitted
t
o
hnstc hv
soil
,
the fungus
Olpidium brassicae
to carry and transmit Lettuce Big Vein
Virus (LBVV) was recently demonstrated (Grogan et al.
1958,
519 Campbell 1962, 5 " Teakle 1969 529 ). It is carried
within the zoospore into fresh roots and there released.
The most likely vehicle for its distribution in irrigation
water would be resting sporangia carried in runoff water
from infested fields. The resting sporangia are released
into the soil from decaying roots of host plants. Another
economicall
y
important virus transmitted by a soil fungus
is Wheat Mosaic Virus carried by the fungus
Polymvxa
graminis
(Teakle 1969).5"
Another means
. of spread of plant viruses (such as To-
bacco Rattles Virus and Arabis Mosaic Viruses that are
vectored by nematodes) is through virus-infected weed
seed carried in irrigation water.
Distributionof Bacteria
Bacterial plant pathogens
would appear
to
be easily transported in irrigation water.
However, relatively few data have been published con-
cerning these pathogens. Reiman (1953)
522
reported the
spread of the bacterial wilt organism of tobacco in drainage
water from fields and in water from shallow wells. He also
noted spread of the disease along an irrigation canal carry-
ing water from al forested area, but no direct evidence of
the bacterium in the water was presented. Local spread in
runoff water is substantiated but not in major irrigation
systems.
Controlling plant disease organisms in irrigation water
should be preventive rather than an attempt to remove
them once they are introduced. In assuring that irrigation
water does not serve for the dispersal of important plant
pathogens, efforts should be directed to those organisms
that are not readily disseminated by wind, insects, or
other means. Attention should be focused on those soil-
borne nematodes. fungi, viruses, and bacteria that do not
spread rapidly in nature.
Two major means of introduction of plant pathogens
into irrigation systems are apparent. The most common is
natural runoff from infested fields and orchards during
heavy rainfall and floods. The other is collection of irriga-
tion runoff or tailwater and its return to irrigation canals.
If it is necessary to trap surface water, either from rainfall
or irrigation drainage, provisions should be made to im-
pound the water for sufficient time' to allow settling out
of nematodes and possibl y other organisms.
Water may be assayed for plant pathogens, but there
are thousands, or perhaps millions of harmless microorgan-
isms for every one that causes a plant disease. However,
plant pathogenic nematodes, and perhaps certain fungi,
can be readily trapped from irrigation water, easily identi-
fied, and used as indicators of contamination (Klotz et al.
1959,
523
Faulkner and Bolander 1966,
5 " McIntosh 1966525).
350/Section
I
f
—Agricultural Uses of
11"
ater
Plant infection is not considered serious unless an eco-
nomically important percentage of the crop is affected.
The real danger is that a trace of plant disease can be
„
.
•
spread by water to an uninfected area, where it can then
be spread b
y
other means and become important. It is
unlikel
y
that any method of water examination would be
as effective in preventing this as would the prohibitions
such as those suggested above.
Human and Animal Pathogens
Many microorganisms, patho
g
enic for either animals or
humans, or both, may be carried in irrigation water,
particularl
y
that derived from surface sources. The list
comprises a large variety of bacteria. spirochetes, protozoa,
helminths. and viruses which find their wa
y
into irriga-
tion water from municipal and industrial wastes, including
food-processing plants. slaughterhouses. poultry-processing
operations, and feedlots. The diseases associated with these
organisms include bacillar
y and amebic d
y
sentery,
Sal-
monella
gastroenteritis, typhoid and paratyphoid fevers,
leptosoirosis, cholera. vibriosis, and infectious hepatitis.
Other less common infections are tuberculosis, brucellosis,
listeriosis, coccidiosis, swine er
ysipelas, ascariasis, cysti-
cercosis and tapeworm disease, fascioliasis, and schisto-
somiasis.
Of the types of irrigation commonly practiced, sprinkling
requires the best quality of water from a microbiological
point of a view, as the water and organisms are frequently
applied directly to that portion of the plant above the
ground, especially fruits and leafy crops such as straw-
berries, lettuce, cabbage, alfalfa, and clover which may be
consumed raw by humans or animals. Flooding the field
may pose the same microbiological problems if the crop is
eaten without thorough cooking. Subirrigation and furrow
irri
g
ation present fewer problems as the water rarely reaches
the upper portions of the plant: and root crops, as well as
normal leafy crops and fruits, ordinarily do not permit
penetration of the plant by animal and human pathogens.
Criteria for these latter types ma
y
also depend upon the
characteristics of the soil, climate and other variables which
affect survival of the microorganisms.
Benefits can be obtained by coordinating operation of
reservoir releases with downstream inflows to provide
sedimentation and dilution factors to markedly reduce
the concentrations of pathogens in irrigation water (Le-
Bosquet 1945,
52
° Camp et al. 1949512).
The common liver fluke,
Fasciola hepatica,
the ova of
which are spread from the feces of many animals, com-
monly affects cattle and sheep (Allison 1930,
5
" U.S. Dept.
Agriculture 1961 531
), and ma y affect man. The intermediate
hosts, certain species of snails, live in springs, slow-moving
swampy waters, and on the banks of ponds, streams, and
irrigation ditches. After development in the snail, the cer-
carial forms emerge and encvst on gasses. plants. bark, or
soil. Cattle and sheep become infected by ingestion of
grasses, plants, or water in damp or irrigated pas
where vegetation is infested with metacercariae.
contracts the disease by ingesting plants such as water
or lettuce containing the encysted metacercariae.
Ascaris
ova are also spread from the feces of infected
mals and man and are found in irrigation water (Wane
Dunlop 1954).
5
" Cattle and hogs are commonly inlet
where the adult worms mature in the intestinal tract, st
times blocking the bile ducts.
Ascaris
ova have beer
ported to survive for 2 years in irrigated soil and have
found on irrigated vegetables even when chlorinatec
fluent was used for irrigation (Gaertner and Mue
1951)."7
Schistosomiasis, although not yet prevalent in the Un
States except in immigrants from areas where the dis(
exists, should be considered because infected indivicL
may move about the countr y and spread the disease.
life c
ycle
,
of these schistosomes is similar to that of the 1.
fluke, in that eggs from the feces or urine of infected
viduals are spread from domestic wastes and ma y
re.
surface irrigation water where the miracidial forms er
certain snails and multiply, releasing cercariae. Althot
these cercariae may produce disease if ingested by man,
more common method of infection is through the skin
individuals working in infested streams : and irrigat:
ditches. Such infections are most common in Egypt (Bar!
1937)
5
" and other irrigated areas where workers wade in I
water without boots. It is unlikely that the cercariae wot
survive long on plants after harvest.
Little is known of the possibility that enteric viruses su
as polioviruses. Coxsackie, ECHO, and infectious hepati
viruses may be spread through irrigation practices. Murp.
and his co-workers (Murphy et al. 1958) 527
tested the st
vival of polioviruses in the root environment of tomato al
pea plants in modified hydroponic culture. In a secot
paper, Murphy and Syverton (1958) 52s
studied the recove
and distribution of a variety of viruses in growing plan-
The authors conclude that it is unlikely that plants or pla.
fruits serve as reservoirs and carriers of poliovirus. Ho%
ever, their findings of significant absorption of a mammalia
virus in the roots of the plants suggest that more research
needed in this area.
Many microorganisms other than those specifically mer
tioned in this section may be transmitted to plants, animal.
and humans through irrigation practices. One of the mor
serious of these is vibriosis. In some cases, definitive infor
mation on microorganisms is lacking. Although others, sue,
as the cholera organisms, are significant in other parts c
the world, they are no longer important in the Unite(
States.
Direct search for the presence of pathogenic micro-
organisms in streams, reservoirs, irrigation water, or on ir-
rigated plants is too slow and cumbersome for routine con-
trol or assessment • of quality. Instead, accepted index
organisms such as the coliform group and fecal coli (Kabler
Trate,' for Irrigation/351
et al. 19641,
52 ' which are usually far more numerous from
these sources, and ocher biological or chemical tests, are
used to assess water quality.
Recent studies have emphasized the value of the fecal
coliform in assessing the occurrence of s
l
rnovella, the 7.-2,-.:st
common bacterial pathogen in irrigation water. Geldreich
and Bordner (19711
515
reviewed field studies involving ir-
rigation water, field crops, and soils, and stated that when
the fecal coliform density per 100 ml was above 1,000
organisms in various stream waters,
Salmonella
occurrence
reached a frequency of 96.4 per cent. Below 1,000 fecal
coliforms per 100 ml (range 1-1000) the occurence of
Salmonella
was 53.3 per cent.
Further support for the limit of 1,000 fecal coliforms per
100 ml of water is shown in the recent studies of Cheng et al.
(1971).
5
" who reported that as the fecal coliforms density
reached less than 810 per 100 ml. downstream from a sewage
treatment plant.
Salmonella
were not recovered.
Recommendation
Irrigation waters
below the fecal coliform den-
sity
of 1,000/100 ml should contain sufficiently low
concentrations of pathogenic microorganisms that
no hazards to
animals or man result from their
use or from consumption of raw crops irrigated
with such waters.
THE USE OF WASTEWATER FOR IRRIGATION
An expanding population requires new sources of water
for irrigation of crops and development of disposal systems
for municipal and other wastewaters that will not result in
the contamination of streams, lakes, and oceans. Irrigation
of crops with wastewater will probably be widely practiced
because it meets both needs simultaneously.
Wastewater From Municipal Treatment Systems
Various human and animal pathogens carried in munici-
pal wastewater need to be nullified. Pathogens carried in
municipal wastewater include various bacteria, spirochetes,
helminths, protozoa, and viruses (Dunlop 1968).
533 Tanner
(19441
55s
and Rudolfs et al. (1950)"
5 have reviewed the
literature on the occurrence and survival of pathogenic and
nonpathogenic enteric bacteria in soil, water, sewage, and
sludges, and on ve
g
etation irrigated or fertilized with these
materials. It would appear from these reviews that fruits
and ve
g
etables growing in infected soil can become con-
taminated with pathogenic bacteria and that these bacteria
may survive for periods of a few days to several weeks or
more in the soil, depending upon local conditions, weather,
and the degree of contamination. However, Geldreich and
Bordner (1971)
5
" noted that pathogens are seldom detected
on farm produce unless the plant samples are grossly con-
taminated with sewage or are observed to have fecal particles
clinging to them. The level of pathogen recovery depends
upon the incidence of waterborne disease in the area, the
soil type, soil pH, soil moisture content, soil nutrient
levels, antagonistic effects of other organisms, temperature,
humidity, and length of exposure to sunlight.
Nol wan and Ka.-)ler (1953)
5 '1
made coliform and other
bacterial counts in samples of sewa
g
e-contamination river
and ditch waters and of soil and ve
getable samples in the
fields to which these waters were applied. The
y
found that
although the bacterial contents of both river and ditch waters
were very high, both soil and vegetable washings had much
lower counts. For example, where irrigation water had
coliform counts of 230,000
.
/100 ml, leafy 'vegetables had
counts of 39,000
,
/100 grams and smooth ve
g
etables, such as
tomatoes and peppers, only 1,000/100 grams. High entero-
coccus counts accompanied high coliform counts in water
samples, but enterococcus counts did not appear to be cor-
related in any way with coliform counts in soil and vegetable
washings.
Dunlop and Wang (1961)
5
" have also endeavored to
stud y
the problem under actual field conditions in Colorado.
Salmonella, Ascaris
ova, and
Entamoeba coil
cysts were re-
covered from more than 50 per cent of irrigation water
samples contaminated with either raw sewage or primary-
treated, chlorinated effluents. Only one of 97 samples of
vegetables irrigated with this water yielded
Salmonella,
but
Ascaris
ova were recovered from two of 34 of the vegetable
samples. Although cysts of the human pathogen,
Entamoeba
histolytica,
were not recovered in this work, probably due to
a low carrier rate in Colorado: their similar resistance to
the environment would suggest that these organisms would
also survive in irrigation water for a considerable period of
time. It should be pointed out, however, that this work was
done entirely with furrow irrigation on a sandy soil in a
semiarid region, and the low recoveries from vegetables
cannot necessarily be applied to other re
gions or to sprinkler
irrigation of similar crops. In fact, Muller (19571
5 " has re-
ported that two places near Hamburg, Germany, where
sprinkler irrigation was used,
Salmonella
organisms were iso-
lated 40 days after sprinkling on soil and on potatoes, 10
days on carrots, and 5 days on cabbage and gooseberries.
Muller (1955) 5
" has also reported that 69 of 204 grass
samples receiving raw sewage by sprinkling were positive
for organisms of the typhoid-paratyphoid group
(Salmonella).
The bacteria began to die off 3 weeks after sewage applica-
tion; but 6 weeks after application, 5 per cent of the sam-
ples were still infected. These findings emphasize the im-
portance of having good quality water for sprinkler irriga-
tion.
Tubercle bacilli have apparently not been looked for on
irrigated crops in the United States. However, Sepp
(1963)
557
stated that several investigations on tuberculosis
infection of cattle pasturing on sewage-irrigated land have
been carried out in Germany. The investigators are in gen-
eral agreement that if sewage application is stopped 14 days
before pasturing, there is no danger that the cattle will con-.
352/Section V—Agricultural Uses of Water
tract bovine tuberculosis through grazing. In contrast.
Dedie (1955)"' reported that these organisms can remain
infective for 3 months in waste waters and up to 6 months
in soil. The recent findings of a typical mvcobacteria in
intestinal lesions of cattle with concurrent tuberculin sensi-
tivity in the United States ma
y possibly be due to ingestion
of these organisms either from soil or irrigated pastures.
Both animals and human bein
gs are subject to helminth
infections—ascariasis, fascioliasis, cysticerosis and tapeworm
infection, and schistosomiasis—all of which ma
y
be trans-
mitted through surface irrigation water and plants infected
with the ova or intermediate forms of the organisms. The
ova and parasitic worms are quite resistant to sewage
treatment processes as well as to chlorination (Borts 1949)
'33
and have been studied quite extensively in the application
of sewage and irrigation .water to various crops (Otter
1951,
5
" Selitrennikova and Shakhurina 1953,
5
" Wang and
Dunlop 1954
560
). Epidemics have been traced to crop con-
tamination with raw sewage but not to irrigation with
treated effluents (Dunlop 1968).5"
The chances of contamination of crops can be further re-
duced by
using furrow or subirrigation instead of sprinklers.
by stopping irrigation as long as possible before harvest
begins, and by educating farm workers on sanitation prac-
tices for harvest (Geldreich and Bordner 1971).
541
It is
better to restrict irrigation with sewage water to crops.that
are adequately processed before sale and to crops that are
not used for human consumption.
Standards are needed to establish the point where irriga-
tion waters that contain some sewage water must be re-
stricted and to indicate the level to which wastewater must
be treated before it can be used for unrestricted irrigation.
The direct isolation of pathogens is too slow and com-
plicated for routine analyses of water quality (Geldreich
and Bordner 1971).
5
' A quantitative method for
Salmonella
detection has been developed recently (Cheng et al.
1971). 5
" However, the minimum number of
Salmonella
required to cause infection are not known, and data are not
available to correlate incidence of
Salmonella
with the inci-
dence of other pathogens (Geldreich 1970).
8
'° The fecal
coliform group has a high positive correlation with fecal
contamination from warm-blooded animals and should be
used as an indicator of pollution until more direct methods
can be developed.
Information is available indicating the levels of fecal
coliform at which pathogens can no longer be isolated from
irrigation water.
Salmonella
were consistently recovered in
the Red River of the north when fecal coliform levels were
1000/100 ml or higher, but were not detected at fecal coli-
. form levels of 218 and 49/100 ml (ORSANCO Water Users
Committee 1971).
552
Cheng et al. (1971)
536
reported num-
bers of fecal coliform at various distances downstream,
and
Salmonella
was not isolated from samples containing
less than 810 fecal coliforms/100 ml. Geldreich and Bordner
(1971) 51
presented data from nationwide field investiga-
tions showing the relationship between
Salmoneil:
currence and fecal coliform densities.
Salmonella (
rence was 53.5 per cent for streams with less than 1,00(
coliforms per 100 ml and 96.4 per cent for streams
more than 1,000 fecal coliforms per 100 ml. A max:
level of 1,000 fecal coliforms per 100 ml of water aF
to be a realistic standard for water used for unrestrict
rigation.
Secondary sewage effluent can be chlorinated to rc
the fecal coliform bacteria below the 1,000 per ml limi•
viruses may survive chlorination. Wastewater used fo
restricted irrigation should receive at least primary
biological secondary treatment before chlorination. F
tion through soil is another effective way to remove
bacteria (Merrell et al. 1967,
518
Bouwer 1968,
5
" Bo
and Lance 1970,"' Lance and Whisler 1972).54
The elimination of health hazards has been the pril
consideration re
g
ulating the use of sewage water ir.
past. But control of nutrient loads must also be a prime
cern. The nutrients applied to the land must be bala.
against the nutrient removal capacity of the soil-plant
tem to minimize groundwater contamination. Ka
(1968) 5
" reported that various crops removed only 2
60 per cent of the phosphorus applied in sewage water.
the total removal by the soil-plant system was about 99
cent.
Many biological reactions account for nitrogen rem
from wastewater, but heavy applications of sewage w
can result in the movement of nitrogen below the root
(Lance
5
'
3
in press
1972).
Work with a high-rate groundwater recharge system
lizing sewage water resulted in 30 per cent nitrogen rem(
from the sewage water (Lance and •hislcr 1972).54'
Nitrate can accumulate in plants supplied with nitro
-n excess of their needs to the point that they are a haz
to livestock. Nitrate usually accumulates in stems and lea
rather than in seeds (Viets 1965).5"
The concentration of trace elements in sewage water u
for irrigation should meet the general requirements est
lished for other irrigation waters. Damage to plants by tc
elements has not vet been a problem on lands irrigated w
sewage water in the United States. Problems could deve.
in some areas, however, if industries release potentially to
elements such as zinc or copper into sewage treatment s
tems in large quantities. The concentration of boron
sewage water may become a problem if the use of this e
ment in detergents continues to increase. The guidelines •
salinity in irrigation water also apply to sewage water us
for irrigation.
The organic matter content of secondary sewage was
does no't appear to be a problem limiting its use in irrigatio
Secondary sewage effluent has been infiltrated into riv
sand at a rate of 100 meters per year in Arizona (Bouw
and Lance 1970).
5
" The COD of this water was consistent
reduced from 50 mg/1 to 17 mg/1 or the same COD as ti
Water for Irrigation/353
native groundwater of the area. The organic load might be
a factor in causing clogging of soils used for maximum irri-
gation to promote groundwater rechar
ge. Suspended solids
have not been reported to be a problem during irrigation
with treated effluents.
Wastewater From Food Processing Plants and Animal
Waste Disposal Systems
Wastewater from food processing plants, dairy plants,
and lagoons used for treatment of wastes from feedlots,
poultr
y
houses, and swine operations, may also be used for ir-
rigation. Some food processing wastewater is high in salt
content and the guidelines for salinit
y
control concerning
unrestricted irrigation in the Section, Irrigation Quality for
Arid Regions, should be followed (Pearson
in press
19725").
Effluents from plants using a lye-peeling process are gen-
erally unsuitable for irrigation due to their high sodium
content. All of the wastewaters mentioned above are
usually much higher in organic content than secondary
sewage effluent. This can result in clogging of the soil
surface. if application rates are excessive (Lawton et al.
1960,"7
Law 1968, 5
'' Law et al. 1970).
546 Only well
drained soils should be irrigated, and runoff should be pre-
vented unless a closely managed spray-runoff treatment
system is used. The nutrient content of the wastewaters
varies considerably. The nutrient load applied should be
balanced against the nutrient removal capacity of the soil.
Food processing wastes present no pathogenic problem and
may be used for unrestricted irrigation. Since some animal
pathogens also infect humans, water containing animal
wastes should not be applied with sprinkler systems to crops
that are consumed raw.
Recommendations
• Raw sewage should not be used in the United
States for irrigation or land disposal.
•
Sewage water that has received primary treat-
ment may be used on crops not used for human
consumption. Primary effluents should be free
of phytotoxic materials.
•
Sewage water that has received secondary treat-
ment may also be used to irrigate crops that are
canned or similarly processed before sale.
•
Fecal coliform standard for unrestricted irri-
gation water should be a maximum of 1,000/100
ml.
•
The amount of wastewater that can be applied
is determined by balancing the nutrient load of
the wastewater against the nutrient removal
capacity of the soil.
• Phosphorus will probably not limit sewage appli-
cation because of the tremendous adsorption
capacity of the soil.
•
The nitrogen load should be balanced against
crop removal within 30 per cent unless additional
removal can be demonstrated.
LITERATURE CITED
GENERAL FARMSTEAD USES
American Water Works Association. Committee on Tastes and
Odors (1970), Committee report: research on tastes and odors.
3.
Amer. Water. Works Ass.
62(1): 59-62.
2
Atherton, H. V. (1970), Comparison of methods of sanitizing water.
.ASAE Paper 70-759. 1970 Winter Meeting.
Am. Soc. Ag. Eng.
Chicago.
Atherton. H. V., D. A, Klein, and R. N. Mullen (1962),
Symposium
on water treatment and use. Farm water supplies, their influence on milk
quality
[Paper 62-2061 (American Society of Agricultural En-
gineers, St. Joseph, Michigan), 9 p.
' Ayres, J. C. (1963), Low temperature organisms as indexes of
quality of fresh meat, in
Microbiological quality of
.
foods,
L. W.
Slanetz, C.
0.
Chichester, A. R. Gaufin, and Z. J. Ordal, eds.
(Academic Press, New York), pp. 132-148.
6
Baumann, E. R. and D. D. Ludwig (1962), Free available chlorine
residuals for small nonpublic water supplies.
3.
Amer.
Water
Works Ass.
54(10:1379-1388.
6
Bchrman, A. S. (1968),
Water is everybody's business: the chemistry
of
water purification
(Doubleday and Company, Inc., Garden City,
New York), pp. 1-18.
7
Black, A. P., R. N. Kinman, W. C. Thomas, Jr., G. F. Freund, and
E. D. Bird (1965), Use of iodine for disinfection.
3.
Amer. Water
Works Ass.
57(1 0:1401-1421.
"Davis,
J. G. (1960), The microbiological control of water in dairies
and food factories.
II.
Dair y Ind.
25(12):913-918.
g
Dougan, R. S. (1966), The quantity-quality challenge of water in
rural areas, in
Proceedings, Farmstead water quality improvement
seminar
[PROC-167
I (American Society of Agricultural Engineers.
St. Joseph. Michigan), pp. 47-48.
10 Elms, D. R. (1966), Neutralization, sequestration, oxidation and
adsorption, in
Proceedings, farmstead water quality improvement semi-
nar
[PROC-1671 (American Society of Agricultural Engineers.
St. Joseph, Michigan), pp. 24-26, 50.
" Environmental Protection Agency
draft,
Drinking Water Standards,
1972 revision.
Esmay, M. L., B. E. Guyer, M. D. Shanklin, and L. H. Tempel
(1955), Treatment of surface water supplies for the farm home.
Mo. Agr. Exp. Sta. Res. Bull.
no. 589, 36 p.
12
Geldreich, E. E. and R. H. Bordner (1971), Fecal contamination
of fruits and vegetables during cultivation and processing for
market. A review.
3. Milk Food Technol.
34(4):184-l95.
" Huff, C. B., H. F. Smith, W. D. Boring, and N. A. Clark (1965), A
study of ultraviolet disinfection of water and factors in treatment
efficiency.
Public Health Reports
80:695-704.
26
James, G. V. (1965),
Water treatment,
3rd ed. (The Technical Press,
Ltd., London), 307 p.
" Kabler, P. W. and J. F. Kreissl (1966), Biological and radiological
properties of water, in
Proceedings, farmstead water quality improve-
ment seminar
(PROC-1671 (American Society of Agri(
Engineers. St. Joseph, Michigan), pp. 9-11, 17.
" Kjellandcr, J.
0.,
and E. Lund (1965), Sensitivity of esel-
•
coli and poliovirus to different forms of combined chlor
Amer.
Water
Works Ass.
57(7):893-900.
Klurilb, G. H. (1966), Nature of water: physical and el-
properties, in
Proceedings, farmstead water quality improvement
[PROC-167) (American Society of Agricultural Engine,
Joseph, Michigan), pp. 5-8.
" Kristoffersen, T. (1958), A psychrophilic strain relatively r'
to hypochlorite-typc sanitizcrs.
3. Dairy Sci.
41(7):1003.
20
Lamar, W. L. (1968),
Evaluation
of
organic color and iron in natu
face waters
[Geological Survey professional paper 600-D [ (G
ment Printing Office, Washington, D. C.), pp. 24-29.
21 Lamar, W. L. and D. F. Goerlitz (1966),
Organic acids in n
colored surface waters
[Geological Survey water supply
1817-A 1 (Government Printing Office, Washington, D. C.;
22
Laubusch, E. J. (1971), Chlorination and other disinfection
esses, in
Water quality and treatment,
3rd ed., prepared 1
American Water Works Association (McGraw-Hill Boo:
New York), pp. 158-224.
21
Lewis, R. F. (1965), Control of sulfate-reducing bacteria.
3.
Water Works Ass.
57(8):1011-1015.
" Livingstone. D. A. (1963), Chemical composition of river
lakes [Geological Survey professional paper 400-G1, in
L
geochemistr y.
6th ed.,
M.
Fleischer, ed. (Government Pr
Office, Washington, D. C.). 64 p.
Mackenthun, K. M. and L. E. Keup (1970), Biological prc
encountered in water supplies.
3.
Arne.. Water Works
AS
520-526.
" Malaney. G. W.. H. H. Weiser. R.
0.
Turner, and M. Van
(1962), Coliforms, enterocoeci, thcrmophiles, and psychro
in untreated farm pond waters.
Appi.
Alicrobiol.
10(0:44-5
21
Mercer, W. A. (1971), Food processing without pollution. Pres
at the 64th convention of the National Canners Associ.
January 26, 1971.
" Moore, M. J. (1971), Rural water supplies.
Vermont Extensio
145.
"
O'Donovan, D. C. (1965), Treatment with ozone.
3. Amer.
Works Ass.
57(9):1167-1194.
" Oliver, R. P. (1966), Comparison of chlorine, bromine and 14
for use in Farmstead water treatment. A.
S.
A.
E. Conference
ceedings Farmstead Water Qualit y Improvement Seminar, Colu
Ohio.
ASAE. Publ. Proc-167.
Pavelis, G. A. and K. Gertel (1963), The management and
1.:
water, in
A place to live: the
y
earbook of agriculture 7963
(Go,
ment Printing Office, Washington, D. C.), pp. 88, 90.
32
Shaw, M. D. (1966), Water disinfecting processes. Heat, silver,
ultraviolet, in
Proceedings, farmstead water quality improvement
set
354
Literature Cited /355
[PROC-1671 (American Society of Agricultural Engineers, St.
Joseph, Michigan), pp. 18-20.
33
Stover, H. E. (1966), Farm pond water-treatment system, in
Pro-
ceedings, farmstead water quality improvement seminar [
PR 0C-1671
(American Society of Agricultural Engineers. St. Joseph, Mith.; •
gan), p. 49.
"Thomas, S. B. (1949), The types of bacteria commonly found in
farm and creamery water supplies and their action on milk and
milk products.
Soc. Dair y
Technol.
J.
2:224-232.
" Thomas. S. B. (1958), Psychrophilic micro-organisms in milk and
dairy products.
Dairy Sci. Abstr.
20(6):447-468.
36
Thomas, S. B., R. G. Druce, and A. Davies (1966), The signifi-
cance of psychrotrophic bacteria in raw milk.
Dairy Indust.
31(1):
27-32.
37
Thomas, S. B., B. F. Thomas. and P. M. Franklin (1953), Bac-
teriology of farm water supplies: a study of the colony count in
48 hours at 37°.
Proc. Soc.
Appi.
Bact.
14(2):121-130.
U.S. Department of Health. Education and Welfare. Public Health
Service (1963),
Grade "A" pasteurized mild ordinance: 1965 recom-
mendation of the Public Health Service
[PHS Pub. 2291 (Government
Printing Office, Washington, D. C.), 184 p.
" Victoreen, H. T. (1969), Soil bacteria and color problem in dis-
tribution systems.
J.
Amer. Water Works Ass.
61(9):429-431.
.
40
Walters, A. H. (1964). The hidden danger in water.
Dairy Ind.
29
•
(9):678-679.
" Water Systems Council (1965-66),
Water system and treatment hand-
book, 4th
ed. (Water Systems Council, Chicago), 108 p.
45
Wright, F. B. (1956),
Rural water
supply
and sanitation,
2nd ed. (John
Wiley & Sons, Inc., New York), 347 p.
WATER REQUIREMENTS FOR LIVESTOCK
"
Adolph, E. F. (1933), The metabolism and distribution of water in
body and tissues.
Physiol. Rev.
13:336-371.
"James, E. C., Jr. and R. S. Wheeler'(1949), Relation of dietary
protein content to water intake, water elimination and amount
of cloacal excreta produced by growing chickens.
Poultry Sci.
28:
465-467.
"
5
Leitch, I. and J. S. Thomson (1944), The water economy of farm
animals.
Nair. Abstr. Rev.
I4(2):197-223.
" Mitchell, H. H. (1962). The water requirements for maintenance.
in
Comparative nutrition of man and domestic animals
(Academic
Press, New York), vol. I, pp. 192-224.
".Morrison. F. B. (1936),
Feeds and feeding,
20th ed. (The Morrison
Publishing Co., Ithaca. New York), 1959.
65 Morrison, F. B. (1959).
Feeds and feeding
(The Morrison Publishing
Co., Ithaca. Ncw York).
" Mount, L. E., C. W. Holmes, W. H. Close, S. R. Morrison, and
I. B. Start (1971), A note on the consumption of water by the
growing pit at several environmental temperatures and levels
of feeding.
Anim. Prod.
l3(3):561-563.
" National Research Council. Committee on Animal Nutrition
(1968a),
Nutrient requirements of swine,
6th rev. ed. (The National
Academy of Sciences. Washington. D. C.), 69 p.
" National Research Council. Committee on Animal Nutrition
(1968b),
Nutrient requirements of sheep,
4th rev. ed. (The National
Academy of Sciences. Washington, D. C.), 64 p.
52
National Research Council. Committee on Animal Nutrition
(1971a),
Nutrient requirements of dair y
cattle,
4th rev. ed. (The Na-
tional Academy of Sciences, Washington, D. C.), 54 p.
" Robinson. J. R. and R. A. McCance (1952), Water metabolism.
Annu. Rev. Physiol.
14:115-142.
" Sunde, M. L. (1967), Water is important.
Feedstufs
39(5I):32-34.
56
Winchester, C. F. and M. J. Morris (1956), Water intake rates of
cattle.
J.
Anim. Sci.
15:722-740.
References Cited
"
Sunde, M. L. (1971),
personal communications,
Poultry Department,
University of Wisconsin, Madison Wisconsin.
RELATION OF NUTRIENT ELEMENTS IN WATER TO
TOTAL DIET
"
Dantzman, C. L. and H. L. Breland (1970). Chemical status of
some water sources in south central Florida.
Soil Crop Sci. Soc.
Fla. Proc.
29:18-28.
"Durum, W. H.,
J.
D. Hem, and S. G. Heidel (1971),
Reconnais-
sance of selected minor elements in surface waters of the United States,
October 7970
[Geological Survey circular 6431 (Government
Printing Office, Washington, D. C.), 49 p.
56
Lawrence,
,
J. M. (1968), Aquatic weed control in fish ponds, paper
no. E-1 in
Proceedings of the world symposium on warm-water pond
fish cultures
[FAO fisheries report 441 (Food and Agricultural
Organization of the United Nations, Rome), vol. 5, pp. 76-91.
" National Research Council. Committee on Animal Nutrition
(1966),
Nutrient requirements of horses.
(The National Academy of Sciences,
Washington, D. C.), 25 p.
61
National Research Council. Committee on Animal Nutrition
(1968a),
Nutrient requirements of swine,
6th rev. ed. (The National
Academy of Sciences, Washington, D. C.), 69 p.
" National Research Council. Committee on Animal Nutrition
(1968b),
Nutrient requirements of Sheep,
4th rev. ed. (The National
Academy of Sciences, Washington, D. C.), 64 p.
65 National Research Council. Committee on Animal Nutrition
(1970),
Nutrient requirements of beef cattle, 4th
rev. ed. (The Na-
tional Academy of Sciences, Washington, D. C.), 55 p.
" National Research Council. Committee on Animal Nutrition
(1971 a),
Nutrient requirements of dairy cattle,
(The National Academy
of Sciences, Washington, D. C.), 54 p.
" National Research Council. Committee on Animal Nutrition
(1971 b),
Nutrient requirements of poultry,
6th rev.
ed.
(The National
Academy of Sciences, Washington, D. C.), 54 p.
" Shirley, R. L. (1970), Nutrients in water available for economic
animals, in
Proceedings Nutrition Council's 30th annual meeting
(Ameri-
can Feed Manufacturers Association, Chicago), pp. 23-25.
" Shirley, R. L., G. K. Davis, and J. R. Neller (1951), Distribution
of P" in the tissues of a steer fed grass from land that received
libelled fertilizer.
J. Anim. Sri.
10:335-336.
"Shirley, R. L., W. K. Robertson, J. T. McCall, J. R. Neller, and
G. K. Davis (1957); Distribution of Ca" in tissues of a steer fed
grass from land that received labelled fertilizer.
Quart .3. Fla.
Acad. Sci.
20(2) :133-138.
" Systems for Technical Data (STORET) (1971), Water Programs
Office, Environmental Protection Agency, Washington, D. C.
EFFECT OF SALINITY ON LIVESTOCK
" Ballantyne, E. E. (1957), Drinking waters toxic for livestock.
Can.
3.
Comp. Med.
21 (7) :254-257.
" Embry, L. B., M. A. Hoelscher, R. C. Wahlstrom, C. W. Carlson,
L. M. Krista, W. R. Brosz, G. F. Gastler, and 0. E. Olson
(1959), Salinity and livestock water quality.
S. Dak.
Agr.
Exp.
Sta. Bull.
no. 481:1-12.
Frens, A. M. (1946), Salt drinking water for cows.
Tijdschr. Die.-
geneesk.
71(1):6-1l.
" Gastler, G. F. and 0. E. Olson (1957), Dugout water quality.
S.
Dak. Farm Home Res.
8(2):20-23.
"Heller, V. G. (1932), Saline and alkaline drinking waters.
J
.
Nub-.
5:421-429.
76
Heller, V. G. (1933), The effect of saline and alkaline waters on
domestic animals.
Okla. Agr. Exp. Sta. Bull.
no. 217:3-23.
356/Section r—Agricultural Uses of Water
"
Heller. V. G. and C. H. Larwood (1930), Saline drinking water.
Science
71:223-224.
" K are, M. R. and
J.
Biely (1948). The toxicity of sodium chloride
and its relation to water intake in baby chicks.
Poultry Sci.
27:
751-758.
78
K rista. L. M., C. W. Carlson. and 0. E. Olson (1961), Some ef-
fects of saline waters on chicks, laying hens, poults, and ducklings.
Prultry Sci.
40(4):938-944.
79
Krista. L. M.. C. W. Carlson. and 0. E. Olson (1962), Water for
poultry: the effect of saline water on South Dakota chickens.
ducks and turkeys.
S. Dak. Form Home Res.
13(4):15-17.
6
°
Larsen. C. and D. E. Bailey (1913). Effect of alkali water on dairy
cows.
S. Dak. Agr. Exp. Sta. Bull,
no. 147, pp. 300-325.
81
McKee, J. E. and H. W. Wolf. eds. (19631, Irater
oualay criteria,
2nd
ed. (California. State Water Quality Control Board. Sacramento),
548
p.
8`9 Officers of the Department of Agriculture and the Government
Chemical Laboratories (1950). Waters for agricultural purposes
in western Australia.
J. Agr. Western Aust.
27 (ser. 2):156-160. •
Peirce. A. W. (1957), Studies of salt tolerance of sheep. I. The
tolerance of sheep for sodium chloride in the drinking water
Aust.
Res.
8:711-722.
°' Peirce. A. W. (1959). Studies on salt tolerance of sheep. II. The
tolerance of sheep for mixtures of sodium chloride and mag-
nesium chloride in the drinking water.
Aust. 5.
.-1
.
gr.
Res.
10:725-
735.
's Peirce. A.
W .
(1960), Studies on salt tolerance of sheep. III. The
tolerance of sheep for mixtures of sodium chloride and sodium
sulfate in the drinking water.
Aust. J. Agr. Res.
11:548-556.
" Peirce, A. W. (1962), Studies on salt tolerance of sheep. IV. The
tolerance of sheep for mixtures of sodium chloride and calcium
chloride in the drinking water.
Aust. J.
Agr. Res.
13(3):479-486.
"Peirce, A. \V. (1963), Studies on salt tolerance of sheep.
V.
The
tolerance of sheep for mixtures of sodium chloride, sodium car-
bonate, and sodium bicarbonate in the drinking water.
Aust.
5.
Agr. Res.
14(6):815-823.
"Peirce.
A. W. (1966). Studies on salt tolerance of sheep. VI. The
tolerance of wethers in pens for drinking waters of the types ob-
tained from underground sources in Australia.
Aust. 3. Agr. Res.
17:209-218.
69
Peirce. A. V. (1968a), Studies on salt tolerance of sheep. VII. The
tolerance of ewes and their lambs in pens for drinking waters of
the t
y pes obtained from underground sources in Australia.
Aust.
Agr. Re-:.
19:577-587.
°° Peirce. A. NV. (1968), Studies on salt tolerance of sheep. VIII. The
tolerance of grazing ewes and their lambs for drinking waters of
types obtained from underground sources in Australia. Aust.
J.
Agr. Res.
19:589-595.
" Ramsay. A. A. (1924), Waters suitable for livestock. Analyses and
experiences in New South Wales.
Agr. Ga.. N. S.
Ir. 35:339-342.
92
Scrivner. L. H. (1946), Experimental edema and ascites in poults.
J. Amer. Vet. Med. Ass.
108:27-32.
" Selye. H. (1943), Production of nephrosclerosis in the fowl by
sodium chloride.
5. Amer. Vet. Med. Ass.
103:140-143.
Spafford, W.
J.
(1941), South Australian natural waters for farm
livestock.
3. Dep. Agr. South Australia
44:619-628.
Weeth. H. J. and D. L. Capps (1971), Tolerance of cattle for
sulfate-water.
.7. Anim. Sci.
33(1):211-212.
96
Weeth. H. J. and D. L. Capps (1972), Tolerance of growing cattle
for sulfate water.
J.
Anim. Sci.
34:256-260.
97
Weeth, H. J., L. H. Haverland. and D. W. Cassard (1960), Con-
sumption of sodium chloride water by heifers.
J. Anim. Sci.
19(3):
845-851.
" Weeth. H. J. and L. H. Haverland (1961), Tolerance of growing
cattle for drinking water containing sodium chloride.
3.
Anim.
Sci.
20(3):518-521.
" Weeth, H.
J.
and J. E. Hunter (1971), Drinking of sulfate-wate
cattle.
J. Anim. Sci.
32(2):277-281.
25°
Wecth, H. J. and A. L. Lesperance (1965), Renal functio.
cattle under various water and salt loads.
J.
Anim. Sci.
441-447.
101
Weeth, H. J., A. L. Lesperance. and V. R. Bohman (1968),
IT
mittent saline watering of growing beef heifers...
Arlin?.
27(3):739-744.
TOXIC SUBSTANCES IN LIVESTOCK WATERS
2
"
Abcrg, B., L. Ekman, R. Falk, U. Greitz, G. Persson. and J.
Snihs (1969), Metabolism of methyl-mercury (
20
'Hg) compou
in man. Excretion and distribution.
Arch. Environ. Health
19
478-484.
10 '
Abu-Erreish. G. M. (1967),
On the nature of some selenium losses 1
soils and waters [M.S.
thesis South Dakota State Univers
Brookings, 61 p.
'°' Adams. A. W., R. J. Emerick, and C. W. Carlson (1966). Eff
of nitrate and nitrite in the drinking water on chicks, poults ;
laying hens.
Poultry Sri.
45(6):1215-1222.
'" Adams. A. W., A. J. Kahrs, and J. L. West (1967). Effect of sodi
nitrate in the drinking Water on performance of turkeys. Pot;
Sri.
46(5) :1226.
1"
Adams. A. W., J. L. West, and A. J. Kahrs (1969), Some effe
on turkeys of nitrate in the drinking water.
Poultry Sci.
48(
1222-1229.
2"
Armstrong, J. G.,
J.
B. J. McKendry, and K. W. Slemon (195
Methaemoglobinaemia•in infancy.
Can. Med. .4ss.
79(5):3'..'
395.
1
"
Aronson, A. L. (1971),. Lead poisoning in cattle and horses f-
lowing long-term exposure to lead.
J.
Amer. Vet. Med. Ass.
1
(10:1870.
109
Barnett, A. J. C. (1952), Decomposition of nitrate in mixtures
minced grass and water.
Xature
169:459.
"° Beath, 0. A. (1943), Toxic vegetation growing on the Salt Wa
Sandstone member of the Morrison Formation.
Amer. J. list.
3
698-707.
112
Beeson, W. M. (1964), Effect of nitrates on animal metabolisi
Distill. Fred Res. Council Conf. Proc.
19:16-25.
112
Berg, L. R. (1963), Evidence of vanadium toxicity resulting fro
the use of certain commercial phosphorus supplements in chi(
rations.
Poultry Sci.
42(3):766-769.
Bergrund, F. and M. Berlin (1969), Risk of methyl mercury cumu
lation in man and mammals and the relation between boc
burden of methyl mercury and toxic effects, in
Chemical /allot,
M. W. Miller and G. C. Berg. eds. (Charles C. Thomas, Put
fisher, Springfield, Illinois), pp. 258-273.
"' Berlin, M. and S. Ullberg (1963), Accumulation and retention (
mercury in the mouse.
Arch. Environ. Health
6:589-616.
" 5
Birke, G. et. al. (1967), cited in
Arch. Environ. Health
19:891-905.
116
Bishop, C. T., E. F. Anct, and P. R. Gorham (1959), Isolation am
identification of the fast-death factor in
Microcystts aerugtnos
NCR-I.
Can. 5. Biochem. Physiol.
37(3):453-471.
117 Bloomfield, R. A., C. W. Welsch, G. B. Garner, and M. E. Muhre.
(1961), Effect of dietary nitrate on thyroid function.
Science
134
1690.
22
°J3org, K., H. Wanntorp, K. Erne, and E. Hanko (1969). Alky
mercury poisoning in terrestrial Swedish wildlife.
Filtrevy
6(4)
301-379.
"'Bradley, W. B., H. F. Eppson. and 0. A. Beath (1940), Livestock
poisoning by oat hay and other plants containing nitrate.
Agric. Exp. Stn. Bull.
no. 241,20 p.
520
Brink, M. F., D. E. Becker, S. W. Terrill. and A. H. Jensen (1959),
Zinc toxicity in the weanling pig.
5. Anim. Sci.
18:836-842.
Literature Cited/357
121
Butler, G. W. and P. J. Peterson (1961), Faecal excretion of
selenium by sheep.
N. Z.
Agr. Res.
4:484-491.
122
Byers, H. G. (1935), Selenium occurrence in certain soils in the
United States with a discussion of related topics.
U.S. Dep.
.4gr.
Tech. Bull.
no. 482,47 p.
123
Byers, H. G., J. T. Miller, K. T. Williams, and H. W. Lakin (1938),
Selenium occurrence in certain soils in the United States with a
discussion of related topics. III.
U.S. Dep. Agr. Tech. Bull,
no. 601,
74 p.
1
"
Campbell. E. A. (1961), Iron poisoning in the young pig.
,Rust. Vet.
J.
37:78-81.
1
"
Case, A. A. (1957), Some aspects of nitrate intoxication in live-
stock.
5. Amer.
Vet.
Med. Ass.
130(8):323-329.
1
"
Chemical Engineering News (1971), Trace metals: unknown, un-
seen pollution threat.
Chem. Eng. News
49(29):29-33.
1 "
Cox. D. H., G. K. Davis, R. L. Shirley, and F. H. Jack (1960),
Influence of excess dietary molybdenum on rat and calf liver and
heart enzymes.
3
Nub-.
70:63-68.
12
"
Crawford, R. F. and W. K. Kennedy (1960),
Nitrates in forage crops
and silage: benefits, hazards, precautions
[Cornell miscellaneous
bulletin no. 37) (New York. State College of Agriculture, Ithaca),
14 P.
1
"
Crawford, J. S.. C. W. Weber. and B. L. Reid (1969). Nitrate and
nitrite studies in young chicks.
Poultry Sci.
48(5):1798-1799.
13
°
Curley, A., V. A. Sedlak, E. F. Girling, R. E .Hawk, W. F. Barthel,
P. E. Pierce. and W. H. Likosky (1971), Organic mercury identi-
fied as the cause of poisoning in humans and hogs.
Science
172:
65-67.
Damron, B. L., C. F. Simpson, and R. H. Harms (1969), The
effect of feeding various levels of lead on the performance of
broilers.
Poultry Sci.
48:1507-1509.
"'Daniel,
J. W. and
,
J. C. Gage (1969), The metabolism of 2-methoxy
[ 1 ' Crethyl mercury chloride.
Biochem.
y.
111:20 p.
1
"
Daniel, J. W., J. C. Gage, and P. A. Lefevre (1971), The metabo-
lism
bf
methoxyethylmercury salts.
Biochem.
,
7.
121:411-415.
m Davis, G. K. (1966), Toxicity of the essential minerals.
In
Toxi-
cants occurring naturally in foods. National Academy of Sciences,
National Research Council Pub. No. 1354:229-235.
u Davison. K. L., W. Hansel, L. Krook, K. McEntee, and M. J.
Wright (1964), Nitrate toxicity in dairy heifers.
5.
Dairy Sci.
47
(I0):1065-1073.
"'Davison.
K. L.. W. Hansel, M. J. Wright, and K. McEntree (1962),
Adaptation to high nitrate intake by cattle, in
Cornell Nutrition
Conference for Feed Manufacturers Proceedings.
1 "
Davison. K. L., K. McEntee, and M. J. Wright (1965), Responses
in pregnant ewes fed forages containing various levels of nitrate.
5.
Dairy
Sci.
48(7):968-977.
Deobald, H. J. and C. A. Elvehjcm (1935), The effect of feeding
high amounts of soluble iron and aluminum salts.
Amer.
y. Physiol.
111:118-123.
"
9
Donawick,
W.
J. (1966), Chronic lead poisonine in a cow.
3
Amer.
Vet. Med. Ass.
148(6) :655-661.
"° Drinker, K. R., P. K. Thompson, and M. Marsh (1927). Investi-
gation of the effect upon rats of long-continued ingestion of zinc
compounds, with especial reference to the relation of zinc excre-
tion to zinc intake.
Amer.
y.
Physiol.
81:284-306.
1
"
Durum, W. H., J. D. Hem, and S. G. Heide' (1971).
Reconnais-
sance of selected minor elements in surface waters of the United States,
October 7970.
[Geological Survey circular 6431 (Government
Printing Office, Washington, D. C.), 49 p.
I "
Dustman. E. H., L. F. Stickel and J. B. Elder (1970), Mercury in
wild animals. Lake St. Clair, 1970.
Proc. International Conference
on Environmental Mercury Contamination,
Ann Arbor, Mich. Sept.
30-Oct. 2,1970.
1 "
Egan, D. A. and T. O'Cuill (1970), Cumulative lead poisoning in
horses in a mining area contaminated with galena.
Vet. Rec.
86
(25):736-737.
1 " Emerick. R. J., L. B. Embry, and R. W. Seerley (1965), Rate of
formation and reduction of nitrite-induced methemoglobin
in
vi ,
ro
and
in vivo
as influenced by diet of sheep and age of swine.
5.
Anim. Sci.
24(1):221-230.
1 " Environmental Protection Agency
in press,
Drinking Water Stan-
dards, 1972 revision.
1 " Fitch. C. P.. L. M. Bishop, W. L. Boyd, R. A. Gortner, C. F.
Rogers, and J. E. Tilden (1934), "Water bloom" as a cause of
poisoning in domestic animals.
Cornell Vet.
24:30-39.
1 " Francis, G. (1878), Poisonous Australian lake.
Nature
18:11-12.
1 " Franke, K. W. and A. L. Moxon (1936), A comparison of the
minimum fatal doses of selenium, tellurium, arsenic and vana-
dium.
5. Pharmacol. Exp. Ther.
58:454-459.
"'Frost, D. V. (1967), Arsenicals in biology—retrospect and prospect.
Fed. Proc.
26(I):194-208.
l " Gage, J. C. (1964), Distribution and excretion of methyl and
phenyl mercury salts.
Brit.
y.
Indust. Med.
21(3):197-201.
"I Gage, J. C. and A. A. B. Swan (1961), The toxicity of alkyl and
aryl mercury salts (abstract #250).
Biochem. Pharmacol.
8:77.
1 "
Garner. R. J. (1967),
Veterinary toxicology,
3rd ed. (Williams &
Wilkins. Baltimore, Maryland), pp. 91-98.
Goodricli. R. D., R. J. Emerick, and L. B. Embry (1964), Effect
of sodium nitrate on the vitamin A nutrition of sheep.
5. Anim.
Sci.
23(1):100-104.
1 " Gorham, P. R. (1960), Toxic waterblooms of blue-green algae.
Canadian Vet. journ.
1:235-245.
155
Gorham, P. R. (1964), Toxic algae, in
Algae and man,
D. F. Jackson,
ed. (Plenum Press, New York), pp. 307-336.
156
Greeson, P. E. (1970), Biological factor in the chemistry of mercury,
in
Mercur
y in the environment
[Geological Survey professional paper
713) (Government Printing Office, Washington, D. C.), pp. 32-
34.
1 " Grimmett. R. E. R., I. G. McIntosh, E. M. Wall, and C. S. M.
Hapkirk (1937), Chronic zinc poisoning of pigs; results of experi-
mental feeding of pure zinc lactate.
N. Z.
5.
.4gr. 54:216-223.
1 " Gross, W. G. and V. G. Heller (1946), Chromates in animal nu-
trition.
5. Indust. Hq. Toxicol.
28:52-56.
1 "
Gunn, S. A. and T. C. Gould (1967), Specificity of response in
relation to cadmium, zinc and selenium, in
Symposium: selenium
in biomedicine. 0.
H. Muth, J. E. Oldfield, and P. H. Weswig,
eds. (AVI Publishing Co., Inc., Westport, Connecticut), pp.
395-413.
' 6 °
Gwatkin, R. and P. J. G. Plummer (1946), Toxicity of certain
salts of sodium and potassium for swine.
Can. 5. Comp. Med.
10:
183-190.
1
"
Hale, W. H., F. Hubbert, Jr., and R. E. Taylor (1962), Effect of
energy level and nitrate on hepatic vitamin A and performance
of fattening steers.
Proc. Soc. Exp. Biol. Med.
109(2):289-290.
1 " Halverson, A. W., P. L. Guss, and 0. E. Olson (1962), Effect of
sulfur salts on selenium poisoning in the rat.
5
.
Nutr.
77:459-464.
1 "
Halverson. A. W., I. S. Palmer, and P. L. Guss (1966), Toxicity of
selenium to post-weanling rats.
Toxicol. Appi. Pharmacol.
9:477-
484.
164
Hammond. P. B. and A. L. Aronson (1964), Lead poisoning in
cattle and horses in the vicinity of a smelter.
Ann. N. Y. Acad.
Sci.
I I I (2):595-611.
165
Harbourne, J. F., C. T. McCrea. and J. Watkinson (1968), An
unusual outbreak of lead poisoning in calves.
Vet. Rec.
83:515-
517.
1
"
Harris, L. E., R. J. Raleigh, M. A. Madsen, J. L. Shupe, J. E.
Butcher, and D. A. Greenwood (1963), Effect of various levels
of fluorine. stilbestrol, and oxytetracycline, in the fattening ration
of lambs.
5.
Anim. Sci.
22(0:51-55.
1 "
Hartley, W. J. and A. B. Grant (1961), A review of selenium re-
358/Section V—Agricultural Uses of Water
sponsive diseases of New Zealand livestock.
Fed. Proc.
20:679-
688.
1 "
Hatch, R. C. and H. S. Funnell (1969), Lead levels in tissues and
stomach contents of poisoned cattle: a fifteen-year survey.
Can.
Vet. I.
10:258-262.
1 "
Hathcock, J. N., C. H. Hill. and G. Matrone (1964), Vanadium
toxicity and distribution in chicks and rats.
g.Nutr.
82:106-110.
17 " Hem, J. D. (1970), Chemical behavior of mercury in aqueous
media, in
Mercury in the environment
[Geological Survey profes-
sional paper 7131 (Government Printing Office, Washington,
D. C.), pp. 19-24.
In Hemphill, F. E., M. L. Kaeberle; and W. B. Buck (1971), Lead
suppression of mouse resistance to Salmonella typhimurium.
Science
172:1031-1032.
'n
Hill, C. H., G. Matrone, W. L. Payne, and C. W. Barber (1963),
In vivo interactions of cadmium with copper, zinc and iron.
J.
Mar. 80(3):227-235.
17 '
Hoar, D. W., L. B. Embry, and R.. J. Emcrick (1968), Nitrate and
vitamin A interrelationships in sheep.
•
Arm. Sci,
27(6):
1727-1733.
114
International Committee on Maximum Allowable Concentrations
of Mercury Compounds (1969), [Report 1.
Arch. Environ. Health
19:891-905.
17 '
Jainudeen, M. R., W. Hansel, and K. L. Davison (1965), Nitrate
toxicity in dairy heifers. III. Endocrine responses to nitrate in-
gestion during pregnancy.
J.
Dairy Sci.
48(2):217-221.
171 Jensen, S. and A. JernelOy (1969), Biological methylation of mer-
cury in aquatic organisms.
Nature
223:753-754.
177
D., Jr., A. L. Mehring, Jr., F. X. Savino, and
H. W.
Titus (1962), The tolerance of growing chickens for dietary zinc.
Poultry Sci.
41(1):311-317.
1 "
Jordan, H. A., A. L. Neumann, G. S. Smith, J. E. Zimmerman,
and R. J. Vatthauer (1961), Vitamin A status of steers fed "high
nitrate" corn silages, and a study of subsequent effects upon
carotene utilization [abstract #1521.1.
Anim. Sci.
20:937-938.
1 " Kicnholz, E. W., D. K. Schisler, C. F. Nockles, and R. E. Moreng
(1966), Sodium and potassium nitrates in drinking water for
turkeys.
Poultry Sci,
45(5):1097.
10
Kiwimae, A., A. Swensson, U. Ulfarson, and G. Wcstoo (1969),
Methylmercury compounds in eggs from hens after oral adminis-
tration of mercury compounds.
J
•
.
Agr. Food. Chem.
17(5):1014-
1016.
1
"Klussendorf,
R. C. and J. M. Pensack (1958), Newer aspects of
zinc metabolism.
J. Amer. Vet. Med. Ass.
132(10):446-450.
142
J. F. and R. C. Kroner (1970), Trace elements in waters
of the United States, Oct. 1, 1962-Sept. 30,1967. U.S. Depart-
ment of the Interior, Federal Water Pollution Control Adminis-
tration, Division of Pollution Surveillance, Cincinnati. Ohio.
1e'
J., W. H. Allaway, D. L. Carter, E. E. Cary, and V. A.
Lazar (1967), Selenium in crops in the United States in relation
to selenium-responsive diseases of animals.
J. Agr. Food. Chem.
15(3):448-453.
1 " Lewis, D. (1951), The metabolism of nitrate and nitrite in the
sheep. I. The reduction of nitrate in the rumen of the sheep.
Biochem.
j.
48:175-180.
1
"
Lewis, P. K., W. G. Hoekstra, and R. H. Grummer (1957), Re-
stricted calcium feeding versus zinc supplementation for the
control of parakeratosis in swine. J.
Anim. Sci.
16(3):578-588.
1 " Link, R. P. and R. R. Pensfnger (1966), Lead toxicosis in swine.
Amer. 5. Vet. Res.
27(1 18):759-763.
147
Maag, D. D. and M. W. Glenn (1967), Toxicity of selenium: farm
animals, in
Symposium: selenium in biomedicine
0. H. Muth, J. E.
Oldfield, and P. H. Weswig, eds. (AVI Publishing Co., Inc.,
Westport, Connecticut), pp. 127-140.
"
a
Malishevskaya, A. S., L. M. Grudina and M. M. Lassheva (1966),
Distribution of arsenic and mercury in the blood and organs of
animals during acute poisoning.
Tr. Kas. Nauch-Issled.
12:281-284.
1
"
Mason, K. E. and J.
0.
Young (1967), Effectiveness of
and zinc in protecting against cadmium-induced inju;
rat testis, in
S
y
mposium: selenium in biomedicine,
0. H.
Oldfield, and P. H. Weswig. eds. (AVI Publishing
C
Westport, Connecticut), pp. 383-394.
17°
McClure, F. J. (1949), Mineral metabolism (fluorine a
trace elements).
Annu. Rev. Biochem.
18:335-354.
Mcllwain, P. K. and I. A. Schipper (1963), Toxicity
c
nitrogen to cattle.
j.
Amer. Vet. Med. Ass.
142:502-505.
19:
?
I. G., R. L. Nielson, and
W.
D. Robinsor
Mangel poisoning in pigs.
Agr.
66:341-343.
193 McKee, J. E. and H. W. Wolf. eds. (1963), fl
i
citer
<profit
2nd ed. (California. State Water Quality Control Boar(
mento), 548 p.
1 "
Mertz, W. (1967), Biological role of chromium.
Fed. Proc.
193.
191
Miller, V. L., P. A. Klavano, A. C. Jerstad, and E. Csonk:
Absorption, distribution. and excretion of ethylmercuric
Toxicol.
Appi.
Pharmacol.
3:459-468.
1 " Miller, W. J. (1971), Cadmium absorption, tissue and
distribution, toxicity effects and influence on metab
∎
certain essential elements, in
Proceedings Georgia _•utrz,
.ference
(University of Georgia. Athens), pp. 58-69.
197
Mitchell. G. E., C. 0. Little, and B. W. Hayes (1967).
testinal destruction of vitamin A by ruminants fed nil
Anion. Sci.
26(4):827-829.
.
194 Moxon, A. L. (1937), Alkali disease or selenium poisoning.
Agr. Sta. Bull,
no. 311:3-91.
1"
Mugler, D. J., J. D. Mitchell, and A. W. Adams (1970),
affecting turkey meat color.
Poultry Sci.
49(6): 1510-1512
27° Mulvihill, J. E., S. H. Gamrn, and V. H. Fern (1970)
formation in normal and cadmium-treated golden ham:
Embryo!. Exp. Morphol.
24(2):393-403.
1 °' Muth,
0. H. (1963), White muscle disease, a selenium-res
myopathy.
5. Amer. Vet. Med. Ass.
142:272-277.
"7 National Research Council. Committee on Animal N
(1968a),
Nutrient requirements of swine.
6th rev. cd. (The
Academy of Sciences, Washington, D. C.), 69 p.
"
3 National Research Council. Committee on Animal N
(19686),
Nutrient requirements of sheep.
4th rev. ed. (The is:
Academy of Sciences, Washington, D. C.), 64 p.
2" National Research Council. Committee on Animal N
(1970),
Nutrient requirements of beef cattle,
4th rev. ed. (7
tional Academy of Sciences, Washington, D. C.), 55 p.
2"
National Research Council. Committee on Animal N
(1971a),
Nutrient requirements of dairy cattle,
4th
rev. cc
National Academy of Sciences, Washington, D. C.), 54
p
toe
Research Council. Committee on Animal
NI
(1971b),
Nutrient requirements of poultry,
6th rev. ed. (The N
Academy of Sciences, Washington, D. C.), 54 p.
707
National Research Council. Committee on Biologic Eff
Atmospheric Pollutants (1972),
Lead: airborne lead in per
(The National Academy of Sciences, Washington, D. C.),
"a
Nelson, T. S., M. B. Gillis, and H. T. Peeler (1962), Studies
effect of vanadium on chick growth.
Poultry Sci.
41(2):519-
2
"
Newland, H. W. and R. J. Deans (1964), Relationship of r
vitamin A and urea to feedlot performance in fattening
Mich. Agr. Exp. Sta.
Quart.
Bull.
46(4):561-569.
2 "
Nutrition Reviews (1966a), Copper toxicity.
Nutrition Revie
305-308.
"1
Nutrition Reviews (19666), Carbohydrate metabolism
consuming 450 ppm Fluoride.
Nutrition Reviews
24:346-34
n2
O'Donovan, P. B., R. A. Pickett, M. P. Plumlee, and \
Literature Cited/359
Beeson (1963), Iron toxicity in the young pig.
5.
Anim. Sci.
22:
1075-1080.
2 "
Olson, 0. E., D. L. Nelson, and R. J. Emerick (1963), Effect of
nitrate and some of its reduction products on carotene stability.
J. Aar. Food Chem. II (2):1',-0-143.
2 "
Ott, E, A., W. H. Smith, M. Stob, H. E. Parker, R. B. Har-
rington. and W. M. Beeson (1965), Zinc requirement of the
growin
g
lamb fed a purified diet.
J. Mar.
87(4):459-463.
255
Ott. E. A.. W. H. Smith, R. B. Harrington. and W. M. Beeson
(1966a). Zinc toxicity in ruminants. I. Effect of high levels of
dietary zinc on gains. feed consumption and feed efficiency of
lambs. 3.
Anim. Sci.
25:414-418.
2 "
Ott, E. A.. W. H. Smith. R. B. Harrington, and W. M. Beeson
(1966b), Zinc toxicity in ruminants. II. Effect of high levels of
dietary zinc on gains. feed consumption and feed efficiency of
beef cattle.
.7. Anim. Sci.
25:419-423.
"'Ott, E. A., W. H. Smith. R. B. Harrington. M. Stob, H. E. Parker,
and W. M. Beeson (1966c), Zinc toxicity in ruminants. III.
Phy
siolo g ical chan
g
es in tissues and alterations in rumen metabo-
lism in lambs.
?
Anim. Sci.
25:424-431.
2 "
Ott, E. A.. W. H. Smith. R. B. Harrington, H. E. Parker, and W. M.
Beeson (1966d), Zinc toxicity in ruminants. IV. Physiological
changes in tissues of beef cattle.
?
Anim. Sci.
25:432-438.
1 "
Parizek. J. (1960). Sterilization of the male by cadmium salts.
3.
Re
/nod.
Fert.
1(3):294-309.
"° Peoples. S. A. (1964). Arsenic toxicity in cattle.
Ann. N.
Y.
Acad.
Sri.
111 (2):644-649.
Pfander, W. H. (1961), Nitrate toxicity, in
Proceedings- Minnesota
nutrition conference
(University of Minnesota. St. Paul), pp. 30-45.
222
Platonow. N. (1968), A study of the metabolic fate of ethylmercuric
acetate.
Occup.
Health
Rev.
20(I-2):1-8.
223 Pomelee, C. S. (1953), Toxicity of beryllium.
Sewage
Indust.
Wastes
25:1424-1428.
Prewitt, R. D. and C. P. Merilan (1958), Effect of potassium nitrate
intake on dairy calves. 3.
Dairy Sci.
41:807-811.
225
Pugh, D. L. and G. B. Garner (1963), Reaction of carotene with
nitrate solutions.
3.
?
Food Chem.
11(6):528-529.
226
Romoser. G. L.. W. A. Dudley. L. J. Machlin, and L. Loveless
(1961), Toxicity of vanadium and chromium for the growing
chick.
Poultry Sci.
40:1 I 71-1 I 73.
'
1"
Rosenfeld. I. and 0. A. Beath (1964),
Selenium
(Academic Press,
New York), 411 p.
1 "
Sadasivan. V. (1951), The biochemistry of zinc. I. Effect of feeding
zinc on the liver and bones of rats.
Biochem.
3.
48:527-530.
221
Sampson, J., R. Granham. and H. R. Hester (1942), Feeding zinc
to pigs.
Cornell Vet.
32:225-236.
23
°
Sapiro, M. L.. S. Hoflund, R. Clark, and
J.
I. Quin (1949),
Studies on the alimentary tract of the Merino sheep in South
Africa. XVI. The fate of nitrate in ruminal ingesta as studied
in
vitro.
Onderstepoort
3. I'et. Sci. Anim.
Indust.
22:357-372.
231
Saville, P. D. (1967), Water fluoridation: effect on bone fragility
and skeletal calcium content in the rat.
y. Mar.
91:353-357.
232
Schroeder. H. A. (1967). Effects of selenate, selenite and tellurite
on the growth and early survival of mice and rats.
5.
Nutr.
92:
334-338.
233
Schroeder, H. A. and J. J. Balassa (1967), Arsenic, germanium,
tin and vanadium in mice: effects on growth, survival and tissue
levels.
y. ,Vutr.
92:245-252.
"' Schroeder, H. A., J. J. Balassa, and W. H. Vinton, Jr. (1964),
Chromium. lead. cadmium, nickel and titanium in mice: effect
on mortality, tumors and tissue levels.
3. Mar.
83:239-250.
"'Schroeder, H. A., J. J. Balassa, and W. H. Vinton, Jr. (1965),
Chromium, cadmium and lead in rats: effects on life span, tumors
and tissue le
yesl.
y.
Nutr.
86:51-66.
236
Schroeder, H. A., M. Kanisawa, D. V. Frost, and M. Mitchener
(1968b), Germanium, tin and arsenic in rats: effects on growth,
survival, pathological lesions and life span.
1. Nutr.
96:37-45.
232 Schroeder, H. A., M. Mitchener, J. J. Balassa, M. Kanisawa, and
A. P. Nason (1968a), Zirconium, niobium, antimony and
fluorine in mice: effects on growth, survival and tissue levels.
Nutr.
95:95-101.
78 Schroeder. H. A.. W. H. Vinton,
Jr.,
and J. J. Balassa (1963a),
Effects of chromium, cadmium and lead on the growth and
survival of rats.
3. Nutr.
80:48-54.
231 Schroeder. H. A., W. H. Vinton, Jr., and J. J. Balassa (1963b),
Effect of chromium, cadmium and other trace metals on the
growth and survival of mice.
I. Nutr.
80:39-47.
"° Schwarz, K. and D. B. Milne (1971), Growth effects of vanadium
in the rat.
Science
174:426-428.
"' Scott, M. L. and J. N. Thompson (1969), Selenium in nutrition
and metabolism, in
Proceedings
Georgia nutrition conference
(Uni-
versity of Georgia. Athens), pp. 79-85.
242 Seerley, R. W., R. J. Emerick, L. B. Embry, and 0. E. Olson
(1965), Effect of nitrate or nitrite administered continuously in
drinking water for swine and sheep.
3. Anim. Sci.
24(4):1014-
1019.
243
Sell, J. L. and W. K. Roberts (1963), Effects of dietary nitrite on
the chick: growth, liver vitamin A stores and thyroid weight.
3.
Mar.
79:171-178.
244
Shilo, M. (1967), Formation and mode of action of algal toxins.
Bact. Rev.
31:180-193.
1 ' 6
Shirley, R. L., R. D. Owens, and G. K. Davis (1950), Deposition
and alimentary excretion of phosphorus-32 in steers on high
molybdenum and copper diets.
3. Anim. Sci.
9:552-559.
246 Shupe, J. L.. M. L. Miner, and D. A. Greenwood (1964), Clinical
and pathological aspects of fluorine toxicosis in cattle.
Ann. N. Y.
Acad. Sci.
111:618-637.
?
.
2 " Simon, J., and J. M. Sund, F. D. Douglas, M.
J.
Wright, and T.
Kowalczyk (1959), The effect of nitrate or nitrite when placed
in the rumens of pregnant dairy cattle.
3.
Amer. Vet.
Med.
Ass.
135:311-314.
2
"
Sturkie, P. D. (1956), The effects of excess zinc on water con-
sumption in chickens.
Poultry Sci.
35:1123-1124.
2 " Swensson, A., K. D. Lundgren, and 0. Lindstrom (1959), Distri-
bution and excretion of mercury compounds after a single in-
jection. A. M. .4.
Arch.
Indust. Health
20:432-443.
250 Taylor, N. H. (1935),
Water supplies of
. farms and dair
y
factories in
Hamilton Basin and Hauraki Lowland
[Bulletin 48] (Department of
Science and Industrial Research, Wellington), 58 p.
253 Tejning. S. (1967). cited in
Arch.
Environ. Health
19:891-905.
1" Thompson, J. N. and M. L. Scott (1970), Impaired lipid and
vitamin E absorption related to atrophy of the pancreas in
selenium-deficient chicks. 1.
Nutr.
100:797-809.
263
P. K.. M. Marsh, and K. R. Drinker (1927), The ef-
fect of zinc administration upon reproduction and growth in the
albino rat, together with a demonstration of the constant con-
centration of zinc in a given species, regardless of age.
Amer. 3.
Physiol.
80:65-74.
2"
Underwood, E. J. (1971),
Trace elements in human and animal nutri-
tion,
3rd ed. (Academic Press, Inc., New York), 543 p.
255
U.S. Department of Health, Education and Welfare. Food and
Drug Administration (1963), Tolerances and exemptions from
tolerances for pesticide chemicals in or on raw agricultural com-
modities.
Fed.
Reg.
28(198):10869.
266
Department of Health, Education and Welfare. Food and
Drug Administration (1964), Food additives permitted in food
and drinking water of animals or for the treatment of food-pro-
ducing animals.
Fed. Reg.
29(230):15814-l5816.
2 " U.S. Federal Radiation Council (1960),
Background
material for the
development
of radiation protection standards,
staff
report.
May
13, 1960
(Government Printing Office, Washington, D. C.), 39 p.
360 'Section 17—Agricultural Uses of Water
'"
U.S. Federal Radiation Council (1961),
Background material for the
development of radiation protection standards, staff report. September, 1961
(Government Printing Office, Washineton, D. C.), 19 p.
Vohra, P. and F. H. Kratzer (1968), Zinc, copper and manganese
toxicities in turkey poults and their alleviation by EDTA.
Poultry
Sci.
47(3):699-704.
2
"
Wadsworth, J. R. (1952). Brief outline of the toxicity of some com-
mon poisons.
Vet. Med.
47:412-416.
226
Weichenthal, B. A., L. B. Embry, R. J. Emerick, and F. W.
Whetzal (1963), Influence of sodium nitrate, vitamin A and
protein level on feedlot performance and vitamin A status of
fattening cattle.
y .
Anim. Sri.
22(4):979-984.
Wershaw, R. L. (1970), Sources and behavior of mercury in surface
waters, in
Mercury in the environment
(Geological Survey profes-
sional paper 713] (Government Printing Office, Washington,
D. C.), pp. 29-31.
' 6 '
White, D. E., M. E. Hinkle, and I. Barnes (1970), Mercury con-
tents of natural thermal and mineral fluids, in
Mercury in the en-
vironment
(Geological Survey professional paper 713) (Govern-
ment Printing Office, Washington, D. C.), Op. 25-28.
66 "
Williams, K. T. and H. G. Byers (1935), Occurrence of selenium
in the Colorado River and some of its tributarie's.
Indust. Eng.
Chem., Anal. Ed.
7:431-432.
"
5 Winks, W. R., A. K. Sutherland. and R. M. Salisbury (1950),
Nitrite poisoning of pigs.
Queensland j.
Agr.
Sci. 7:1-14.
2 "
Winter, A. J. and J. F. Hokanson (1964), Effects of long-term feed-
ing of nitrate, nitrite, or hydroxylamine on pregnant dairy
heifers.
Amer.
J
.
Vet. Res.
25 :353-361.
PESTICIDES (IN WATER FOR LIVESTOCK)
1'7
Research Service (1969a). U.S. Department of Agri-
culture. Monitoring agricultural pesticide residues 1965-1967
(U.S. Government Printing Office, Washington, D.C.), 97 p.
2 "
Barnes, J. M. and F. A. Denz (1953), Experimental demyclina-
tion with organo-phosphorus compounds.
I. Path. Bact.
65:597-
605.
2 "
Bradley, J. R., T. J. Sheets. and M. D. Jackson (1972), DDT and
toxaphene movement in surface water from cotton plots.
journal
of Environmental Quality
1:102-104.
Breidcnbach, A. W., C. G. Gunnerson, F. K. Kawahara, J. J.
Lichtenberg, and R. S. Green (1967), Chlorinated hydrocarbon
pesticides in major river basins 1957-65.
Pub. Health Rep.
82(2):
139-156.
212
Chesters, G. and J. G. Konrad (1971), Effects of pesticide usage on
water quality.
Bioscience
21:565-569.
" Claborn, H. V., R. D. Radeleff, and R. C. Bushland (1960), Pesti-
cide residues in meat and milk. U.S.D.A, A.R.S. 33-63:46 pp.
2r'
D. E., J. E. Young, R. L. Younger, L. M. Hunt, and J. K.
McLaran (1964), Animal metabolism of herbicides: the fate of
2,4-dichlorophenoxyacetic acid in sheep.
5.
Agr. Food Chem.
12(1):43-45.
7i4 Cohen, J. M. and C. Pinkerton (1966), Widespread translocation
of pesticides by air transport and rainout, in Gould, R. F. (ed.),
Organic pesticides in the environment.
Advances in Chemistry Series
No. 60, American Chemical Society. Washington, D. C., pp.
163-176.
rs Conncy, A. H. and G. H. Hitchings (1969), Combinations of
drugs in animal feeds. In
The Use of Drugs in Animal Feeds,
Pro-
ceedings of a symposium. National Academy of Sciences, Wash-
ington, D. C., Pub. No. 1679:180-192.
22 6
Edson, E. F. (1954), Report to Third Zuckerman Working Party
( January) for the Association of British Insecticide Manufac-
turers.
227
Environmental Protection Agency, Office of Pesticides, p
Regulation Division (1972), Cancellation of registrat
certain products containing mercury. PR Notice 72-5.
22,1972.
112 Fertig, S. N. (1953),
Proc. 7th Ann. Meet. Northeast Weer]
Conf.,
p. 44.
2 "
Fowler. D. L. (1972),
The pesticide review-1972
(Agr. Stab. Q
tion Service: U.S. Department of Agriculture, Wasi
D. C.).
2
"
Kutches, A. J., D. C. Church, and F. L. Duryee (1970),
logical effects of pesticides on rumen in vitro.
5.
.4gr. Fry
18:430433.
251
Lichenstein, E. P., K. R. Shulz, R. F. Skrentny, and Y.
(1966), Toxicity and fate of insecticides in water.
Environmental Health
12:199-122.
262
Lichtenberg, J. J., J. W. Eichelberger, R. C. Dressman. al
Longbottom (1969), Pesticides in surface waters of. the
States: a five year summary, 1964-1968.
Pestic. Alonit.
71-86.
2 "
McEntee, K. (1950), Mercurial poisoning in swine.
Cori.
40:143-147.
1e'
J. L. and D. S. Papworth (1953), Toxic hazards
newer insecticides and herbicides.
Vet. Rec.
65:857-862.
285
J. E. and H. W. Wolf (1963), Water Quality C
2nd edition.
California State
Water
Quality Control Board .
Lion 3.1,
548 p.
Moubry, R. J., G. R. Murdal, and W. E. Lyle (1968), Res
residue amounts of DDT and its analogs in the milk and b
of selected dairy animals.
Pettit. •onil.
5.
2(1):47-50.
287
Papworth, D. S. (1967), Part Four, Organic compounc
Pesticides, in
Garner's Veterinary Toxicology,
3rd edition, E.
Clarke and M. L. Clarke. eds (London: Bailliere,..Tinth
Cassell Ltd.), pp. 209-282.
Radeleff, R. D. (1970),
Veterinary Toxicology,
2nd edition (L.
Febiger, Philadelpha), 352 p.
2 " Rowe, V. K. and T. A. Hymas (1955), Summary of toxico
information on 2,4-D and 2,4,5-T type herbicides a
evaluation of hazards to livestock associated with the:
Amer.
5.
Vet. Res.
15:622-629.
"'Schechter, M. S. (1971), Revised chemicals monitoring gu:
the national pesticide monitoring program.
&clic. Alonit.
68-71.
2 "
Tarrant, K. R. and J. O'G. Tatton (1968), Organochlorine
cidcs in rainwater in the British Isles.
Nature
219:725-727.
In
U.S. Department of Agriculture. Agriculture Research S
(1969), Monitoring agricultural pesticide residues 196;
(U.S. Government Printing Office, Washington, D. C.), 9
2 " U.S. Department of Health, Education and Welfare (196.
port of the Secretary's Commission on Pesticides and their Relation
Environmental Health
(Government Printing Office, Washi:
D. C.), 677 p.
196
Society of America (1970),
Herbicide Handbook.
2nd ed.,
Humphrey Press Inc., Geneva, N. Y.
19s
S. R., R. B. Weidner, J. M. Cohen, and A. G. Christi
(1966), Pesticides and other contaminants in rainfall and r
5.
Amer. Water Works Ass.
58(8):1074-1084.
556
Whitehead, C. C. (1971), The effects of pesticides on prod
in poultry.
Vet Rec.
88:114-117.
257
Woolson, E. A., J. H. Axlev, and P. C. Kearney (1971), Cc
tion between available soil arsenic, estimated by six method
response of corn (.`ea ma
y
s L.).
Soil Sci. Soc. Amer. Proc.
35(1:
105.
196
G., L. M. Smith, S. A. Peoples, and R. Cox (1961),
residues in milk from dairy cows fed low levels of DDT in
daily rations.
5. Agr. Food
Chem. 9(6):481-484.
Literature Cited/361
PATHOGENS AND PARASITIC ORGANISMS
=99
Breed, R. S., E. G. D. Murray, and N. R. Smith (1957),
Bergey's
manual of determinative bacteriology,
7th ed. (Williams & Wilkins
Co.. Baltimore, Maryland). 1049 p.
37,,
Crawford. R. P., W. F. McCulloch, F. H. Top, and S. L. Dicsci,
(1969), Epidemiologic studies of sporadic human cases of lepto-
spirosis in Iowa 1965-1968.
Journal American Veterinary Medical
Association
155:2084.
'
7,1
Gillespie. R. W. H.. S. G. Kenzy, L. M. Ringen. and F. K. Bracken
(1957), Studies on bovine leprospirosis. III. Isolation of
Lepto-
spira
pomana
from surface waters.
Amer. .7.
Vet.
Res.
18(66):76-80.
302
Larsen. H. E. (1964), Investigations on the epidemiology of lis-
teriosis: the distribution of
Listeria monoc y
togines
in environments
in which clinical outbreaks have not been diagnosed.
Nord. Vet.
•led.
16:890-909..
703
Parker. R. R., E. A. Stcinhaus, G. M. Kohls, and W. L. Jellison
(1951), Contamination of natural waters and mud with
Pasteur-
ella tularensis
and tularemia in beavers and muskrats in the
northwestern U. S.
National Institute of Health Bull.
No. 193.
pp 1-61.
304
Prier, J. E., ed. (1966).
Basic medical virology
(The Williams &
Wilkins Co.. Baltimore, Maryland), 715 p.
35
Seghctti. L. (1952). The recovery of
Pasieurella
tularensis from
natural waters by guinea pig inoculation:
Coinell rel.
42:462-463.
306
Van Ness. G. B. (1971), Ecology of anthrax.
Science
172:1303-1307.
3,7
Van Ness. G. B. and K. Erickson (1964). Ecology of bacillary
hemoglobinuria.
Journal of Am. Fel. Med. Assoc.
144:492-496.
3 "
Van Thiel, P. H. (1948), The leptospiroses, Universitaire Pers.
Leiden, The Netherlands.
3°9
Wilson. G. S. and A. A. Miles (1966),
Topley and IVilson's principles
of bacteriology and immunity,
5th ed. 2563 p.
510
Wood, R. L. and R. A. Packer (1972),
in press.;
Isolation of
Erysi-
pelothrix rhusiopathiae
from soil and manure of swine-raising
premises. Amer.
Jour. Vet. Res.
WATER QUALITY CONSIDERATIONS FOR IRRIGATION
"'
Ayres, A. D., J. W. Brown, and C. H. Wadleigh (1952), Salt
tolerance of barley and wheat in soil plots receiving several
salinization regimes.
Agron.
J.
44:307-310.
"" Bernstein. L. (1967),
Quantitative assessment of irrigation water quality
[Special technical publication 4161 (American Society-for testing
and Materials, Philadelphia), pp. 51-65.
73
Bernstein. L. (1965a),
Sall tolerance of plants
(Agricultural informa-
tion bulletin 2831 (Government Printing Office. Washington,
D. C.), 23 p.
314
Bernstein, L.
(19656),
Salt tolerance of fruit crops
[Agricultural in-
formation bulletin 292 l (Government Printing Office, Washing-
ton, D. C.), 8 p.
"' Bernstein, L. and H. E. Hayward (1958), Physiology of salt
tolerance.
Anne. Rev. Plant Physiol.
9:25-46.
316
Bower, C. A. and L. V.
Wilcox
(1965), Precipitation and solution
of calcium carbonate in irrigation operations.
Soil Sci. Soc. Amer.
Proc.
29 (1 ): 93-94.
3 " Brown,
J.
W. and C. W. Wadleigh (1955), Influence of sodium
bicarbonate on the growth and chlorsis of garden beets.
Bot.
Gaz.
116(3 ) :201-209.
"
s
Cline, J. F.. M. A. Wolfe, and F. P. Hungate (1969). Evaporative
cooling of heated irrigation water by sprinkler application.
I
lialer Resources Research
5:401-407.
3 '
9
Eaton, F. M. and R. B. Harding (1959), Foliar uptake of salt
constituents of water by citrus plants during intermittent sprink-
ling and immersion.
Plant Phy
siol.
34:22-26.
"° Ehlig, C. F. and L. Bernstein (1959), Foliar absorption of sodium
and chloride as a factor in sprinkler irrigation.
Proc. Amer. Soc.
Hort. Sci.
74:661-670.
3 "
Hayward, H. E. and L. Bernstein (1958), Plant-growth relation-
ships on salt-affected soils.
Bat. Rev.
24:584-635.
3 "
Lilleland, 0., J. G. Brown, and C. Swanson (1945), Research
shows sodium may cause leaf tip burn.
Almond Facts 9(2):I,
5.
°27 0.
R., H. C. Kohl. and A. M. Kofranek (1956), The effect
of bicarbonate and other constituents of irrigation water on the
growth of azaleas.
Proc. Amer. Soc. Hort. Sci.
68:537-544.
"' Magistad, 0. C., A. D. Ayers, C. H. Wadleigh, and H. G. Gauch
(1943), Effect of salt concentration, kind of salt and climate on
plant growth in sand cultures.
Plant Physiol.
18:151-166.
3 "
Menzel, R. G. (1965), Soil-paint relationships of radioactive ele-
ments.
Health Phys.
11:1325-1332.
"6
Menzel, R. G., H. Roberts, Jr., E. H. Stewart, and A. J. Mac-
Kenzie (1963), Strontium-90 accumulation on plant foliage dur-
ing rainfall.
Science
142:576-577.
"7
Milbourn, G. M. and R. Taylor (1965), The contamination of
grassland with radioactive strontium: I. Initial retention and
loss.
Radial. Bat.
5:337-347.
3 "
Moorby, J. and H. M. Squire (1963), The loss of radioactive iso-
topes from leaves of plants in dry conditions.
Radial. Bot.
3:163-
167.
7
"
9
Perrin. F. (1963), Experimental study of
, the radioactive contami-
nation of cultures, especially by irrigation water.
C. R. Seances
.4cad. Agric. Fr.
49:611-620.
3 "
Pratt, P. F. (1966). Carbonate and bicarbonate, in
Diagnostic
criteria for plants and soils,
H. D. Chapman, ed. (University of
California, Division of Agricultural Science, Berkeley), pp. 93-97.
331
Pillsbury, A. F. and H. F. Blaney (1966), Salinity problems and
management in river-systems.
J. Irr. Drain. Div. Amer. Soc. Civil.
Eng.
92(IR 0:77-90.
°°z
F. C. (1963), Rice water temperature.
Calif. Agr.
17(9), 6-7.
333
Raney, F. C. (1959), Warming basins and water temperature.
California Rice Research Symposium. Proc. Albany, California.
3
"
Raney, F. C. and Y. Mihara (1967), Water and soil temperature.
Amer. Sec. Agron. Agron.
11:1024-1036.
"' Salinity Laboratory (1954). U.S. Department of Agriculture.
Salinity Laboratory Staff (1954), Diagnosis and improvement
of saline and alkali soils [Handbook 60) (Government Printing
- Office, Washington, D. C.), 160 p.
s°6
W. R. (1963), A report on water quality in lower San
Joaquin River as related to agriculture. Report to the U.S.
Bureau of Reclamation.
3 "
U.S. Department of Agriculture. Salinity Laboratory Staff (1954),
Diagnosis and improvement
of
saline and alkali soils
[Handbook 60)
(Government Printing Office, Washington, D. C.), 160 p.
References Cited
""
Bower, C. A. (1972),
personal communications,
U.S. Salinity Labora-
tory, Soil and Water Conservation Research Division, Agri-
cultural Research Service, U.S. Department of Agriculture,
Riverside, California.
339
Menzel, R. G. (1972),
personal communication,
Water Quality Man-
agement Laboratory, Agriculture Research Service, U.S. De-
partment of Agricultural, Durant, Oklahoma.
SPECIFIC IRRIGATION WATER CONSIDERATIONS
7
'
0
Bernstein. L. (1966), Re-use of agricultural waste waters for ir-
rigation in relation to the salt tolerance of crops. Report No. 10:
185-189, Los Angeles.
3 "
Bernstein, L. (1967),
Quantitative assessment of irrigation water quality
(Special technical publication 416) (American Society for testing
and Materials, Philadelphia), pp. 51-65.
362/Section
V—Agricultural Uses of Water
au
Bower, C. A., G. Ogata, and J. M. Tucker (1968), Sodium hazard
of irrigation waters as influenced by leaching fraction and by
precipitation or solution of calcium carbonate.
Soil Sci.
106(1):
29-34.
"3
Bower, C. A. and L. V. Wilcox (1965), Precipitation and solution
of calcium carbonate in irrigation operations.
Soil Sci. Soc. Amer.
Proc.
29(1):93-94.
"4
Bower, C. A., L. V. Wilcox, G. W. Akin, and M. C. Keyes (1965),
An index of the tendency of CaCO, to precipitate from irriga-
tion waters.
Soil Sci. Soc. Amer. Proc.
29(1):91-92.
"6
Christiansen, J. E. and J. P. Thorne (1966), Discussion of Paper,
"Salinity problems and management in river s
ystems." Amer.
Soc. Civil Eng. Proc.
92:84-86.
3 "
Doncen, L. D. (1959), Appendix C. Feasibility of reclamation of
water from wastes in the Los Angeles metropolitan area. Cali-
fornia State Department of Water Resources, Bulletin 80, Depart-
ment of Water Resources Staff, 155 p. and appendixes.
"
7
Eaton, F. M. (1950), Significance of carbonates in irrigation waters.
Soil Sci.
69:123-133.
"' Eriksson, E. (1952), Cation-exchange equilibria on clay minerals.
Soil Sci.
74:103-113.
Langelier, W. F. (1936), The analytical control of anticorrosion
water treatment.
J. Amer.
Water
Works Ass.
28:1500-1521.
Lunin, J. and A. R. Batchelder (1960), Cation exchange in acid
soils upon treatment with saline solutions.
Trans. Int. Conf. Soil
Sci., 7th, Madison, Wisconsin
1:507-515.
"1 Lunin, J. and M. H. Gallatin (1960), Brackish water for irrigation
in humid regions. U.S. Department of Agriculture ARS 41-29.
"3
Lunin, J., M. H. Gallatin, and A. R. Batchelder (1963), Saline
irrigation of several vegetable crops at various growth stages. I.
Effect on yields.
Agron. J.
55(22):107-110.
3 "
Lunin, J., M. H. Gallatin and A. R. Batchelder (1964), Inter-
active effects of base saturation and exchangeable sodium on the
growth and cation composition of beans.
Soil Science
97:25-33.
184
Lunin, J., M. H. Gallatin, C. A. Bower, and L. V. Wilcox (1960),
Brackish water for irrigation in humid regions.
U.S. Dep. Agr.
Agr Inform. Bull.
213:1-5.
"8
Mag stad, 0. C., A. D. Ayers, C. H. Wadleigh, and H. G. Gauch
(1943), Effect of salt concentration. kind of salt and climate on
plant growth in sand cultures.
Plant Physiol.
18:151-166.
'" Pillsbury, A. F. and H..F. Blaney (1966), Salinity problems and
management in river-systems.
J. Irrigation Drainage Div. Amer. Soc.
Civil. Eng.
92(IRI):77-90.
"7
Pillsbury, A. F. and W. R. Johnston (1965),
Tile drainage
in
the San
Joaquin Valley of California
[Contribution 97) (Water Resources
Center, University of California, Los Angeles).
368
Pratt, P. F. and F. L. Bair (1969), Sodium hazard of bicarbonate
irrigation waters.
Soil Sci. Soc. Amer. Proc.
33(6):880-883.
i3 '
Pratt, I"; F., G. H. Cannel!, M. J. Garber, and F. L. Bair (1967),
Effects of three nitrogen fertilizers on gains, losses, and distribu-
tion of various elements in irrigated lysimeters.
Hilgardia
38(8):
265-283.
344
Quirk, J. P. and R. K. Schofield (1955), The effect of electrolyte
concentration on soil permeability.
J. Soil Sci.
6:163-178.
111
Rainwater, F. H. (1962), Stream composition of the conterminous
United States, in
U.S. Geological Survey atlas
(Government Print-
ing Office, Washington, D. C.), plate HA-61. •
"2
Reeve, R. C., A. F. Pillsbury, and L. V. Wilcox (1955), Reclama-
tion of saline and high-boron soil in the Coachella Valley of
California.
Hilgardia
24:69-91.
"1
Salinity Laboratory (1954). U.S. Department of Agriculture.
Salinity Laboratory Staff (1954),
Diagnosis and improvement of
saline and alkali soils
[Handbook 60) (Government Printing Office,
Washington, D.C.), 160 p.
PHYTOTOXIC TRACE ELEMENTS
36'
F. and Wear, J. I. (1957), Manganese toxicity
acidity in relation to crinkle leaf of cotton.
Soil Sci. So
Proc.
21:305-308.
365
M. B. and E. S. Twyman (1953), The relative to:
manganese and cobalt to the tomato plant.
J. Exp. Bot.
172.
363
Allaway, W. H., E. E. Cary, and C. F. Ehlig (1967), The
of low levels of selenium in soils, plants and animals, in
Svn
selenium in biomedicine, 0.
H. Muth, J. E. Oldfield, anc
Weswig, eds. (AVI Publishing CO., Westport, Conne
pp. 273-276.
Allaway, W. H., P. D. Moore, J. E. Oldfield, and 0. H
(1966), Movement of physiological levels of selenium frc
through plants to animals. /../Csitr. 88:41 1-418.
368 Albert, W. B. and C. H. Arndt (1931), Concentrations of
arsenic as an index of arsenic toxicity to plants.
S. Car. A:
Sta. 44th Ann. Rep!.
pp. 47-48.
"9
Aldrich, D. G., A. P. Vansclow, and G. R. Bradford
Lithium toxicity in citrus.
Soil Sri.
71:291-295.
3,8
Barnette. R. M. (1923), The influence of soluble aluminu:
on the growth of wheat seedlings in Shives R
3
C, solution.
Age. Exp. Sta. Annual Rep.
255-258.
"' Barnette, R. M. (1936), The occurrence and behavior
abundant elements in soils.
Florida Univ. Agr. Expl. Sta.
Report.
372 Benson, N. R. (1953), Effect of season, phosphate, and acic
plant growth in arsenic-toxic soils.
Soil Sci.
76:215-224.
373 Benson, N. R. and H. M. Rcisenauer (1951), Use and m:
ment of unproductive "ex-orchard" soils.
Wash Agr. Ex;
Circ.
no. 175,3 p.
3
" Berry, R. A. (1924), The manurial properties of lead nitra
Agr. Sci.
(London) 14:58-65.
"'Biggar, J. W. and M. Fireman (1960), Boron absorption al
lease by soils.
Soil Sci. Soc. Amer. Proc.
24(2):115-120.
76 Bingham, F. T., R. J. Arkley, N. T. Coleman, and G. R. Bra
(1970), Characteristics of high boron soils in western
County.
Hilgardia
40(7):193-204.
m Bingham, F. T., A. L. Page, and G. R. Bradford (1964). Tole
of plants to lithium.
Soil Sci.
98(1):
"I Bollard, E. G. and G. \V. Butler (1966), Mineral nutriti,
plants.
Annu. Rev. Plant Physiol.
17:77-112.
373 Bradford, G. R. (1966), Boron [toxicity, indicator plants
Diagnostic criteria for plants and soils,
H. D. Chapman, cd,
versity of California, Division of Agricultural Science, Berk,
pp. 33-61.
"'Bradford, G. R. (1963a), Lithium in California's water root
Calif. Agr.
17(5):6-8.
•
"'Bradford, G. R. (1963b), Lithium survey of California's s
resources.
Soil Sci.
96(2):77-8l.
72
Brenchicy, W. E. (1938), Comparative effects of cobalt, n
and copper on plant growth.
Ann. Appi. Biol.
25:671-694.
3 " Brewer, R. F. (1966), Lcad [toxicity, indicator plants), in
nostic criteria for plants and soils,
H. D. Chapman, ed. (Unive
of California, Division of Agricultural Science, Berkeley),
213-217.
334 Broyer, T. C., D. C. Lee, and C. J. Asher (1966), Selenium
trition of green plants. Effect of selenite supply on growth
selenium content of alfalfa and subterranean clover.
Plant Phl
41(9):1425-1428.
386
Chang, A. T. and G. D. Sherman (1953), The nickel conten
some Hawaiian soils and plants and the relation of nicke
plant growth.
Hawaii Age. Exp. Sta. Tech. Bull.
19:3-25.
'" Chapman, H. D. (1966),
Diagnostic criteria for plants and soils
(1_
Literature Cited/363
versity of California, Division of Agricultural Science, Berkeley),
794 p.
337
Chapman, H. D. (1968), Mineral nutrition of citrus, in
The citrus
industr
y,
W. Reuther. L. D. Batchelor, and H. J. Webber. eds.
(University of California, Division of Agricultural Science.
1".trht l
r7),
2
r
7
127-0s9
198 Chisholm, D., A. W. MacPhee, and C. R. MacEachern (1955)
Effects of repeated applications of pesticide to soil.
Can.
3.
AEr.
Sci.
35:433-439.
"9
Chiu, T. F. (1953), The effect of vanadium application on paddy
rice.
Agr. Res.
(Formosa) 4(2):48-59.
3 " Clements, H. F. and H. G. Heggeness (1939), Arsenic toxicity to
plants.
Hawaii
Agr.
Exp. Sta. Report.
1940:77-78.
391
Clements. H. F. and J. Munson (1947), Arsenic toxicity studies
in soil and in culture solution.
Par. Sci.
1:151-171.
392
Coleman,
N.
T. and G. W. Thomas (1967), The basic chemistry
of soil acidity, in
Soil acidity and liming,
R. W. Pearson and F.
Adams, eds.
Agronomy
12:1-41.
393
Cooper, H. P., W. R. Paden, E. E. Hall, W. B. Albert, W. B.
Rogers. and J. A. Riley (1932), Soils differ markedly in their
response to additions of calcium arsenate.
394
Crafts, A. S. and R. S. Rosenfels (1939), Toxicity -studies with
arsenic in eighty California soils.
Hilgardia
12:197-199.
795
Crooke, W. M. (1954), Effect of nickel verscnate on oat plants.
Nature
173:403-404.
1"6 Dorman. C. and R. Coleman (1939), The effect of calcium ar-
senate upon the yield of cotton of different soil types.
3.
Amer.
Soc. Agron.
31:966-971.
•
"'Dorman, C., F. H. Tucker, and R. Coleman (1939), The effect
of calcium arsenate upon the productivity of several important
soils of the cotton belt.
3.
Amer. Soc. Agron.
31:1020-1028.
"" Dye, W. B. and J. L. O'Hara (1959), Molybdosis.
Nevada Agr.
Exp. Sta–Bull.
208,32 pp. •
" 4
Earley, E. B. (1943), Minor element studies with soybeans: I.
Varietal reactions to concentrations of zinc in excess of nutrienal
requirements.
J. Amer. Soc. Agron.
35:1012-1023.
4
°° Eaton, F. M. (1935), Boron in soils and irrigation waters and its
effect on plants, with particular reference to the San Joaquin
Valley of California.
U.S. Dep. Agr. Tech. Bull.
no. 448,131 p.
"'Eaton, F. M. (1944), Deficiency, toxicity, and accumulation of
boron in plants. 7.
Agr. Res.
69:237-277.
4112
Foy, C. D., W. H. Armiger, L. W. Briggle, and D. A. Reid (1965),
Differential aluminum tolerance of wheat and barley varieties
in acid soils.
Agron. J.
57(5):413-417.
'
412
Frolich, E., A. Wallace, and 0. R. Lunt (1966), Plant toxicity
resulting from solutions of single salt cations and their ameliora-
tion by calcium.
Carr. Top. Plant. Nutr.
1966:120-126.
401
Gall, 0. E. and R. M. Barnette (1940), Toxic limits of replaceable
zinc to corn and cowpeas grown on three Florida soils.
J.
Amer.
Soc. Agron.
32(I):23-32.
4
°
4
Gericke, S. and E. V. Rennenkarnpff (1939), Effect of the trace
element vanadium on plant growth.
Prakt. Bl. Pflaneenbau
Pfianzenschutz
17:17-22.
4
°' Gissel-Nielson, G. and B. Bisbjerg (1970), The uptake of applied
selenium by agricultural plants. II. Utilization of various selenium
compounds.
Plant Soil
32(2):382-396.
' 07
Grant, A. B. (1965), Pasture top-dressing with selenium.
.A.-
ew Zeal.
J.
Agr. Res.
8(3):681-690.
4
°' Haas, A. R. C. (1932), Nutritional aspects in mottleleaf and other
physiological diseases of citrus.
Hilgardia
6:483-559.
401
Halstead, R. L., B. J. Finn, and A. J. MacLean (1969), Extracta-
bility of nickel added to soils and its concentration in plants.
Can.
7.
Soil Sci.
49(3):335-342.
"° Hamilton, J. W. and 0. A. Beath (1963), Uptake of available
selenium by certain range plants.
7.
Range Manage.
16(5):261-
264.
4
"
Hatcher, J. T. and C. A. Bower (1958), Equilibria and dynamics
of boron absorption by soils.
Soil Sci.
85:319-323.
"'Hewitt, E. J. (1953), Metal interrelationships in plant nutrition.
I.
Effects of some metal toxicitics on sugar beet. tort-1.
'1,
e,at,
potato, and marrowstem kale grown in sand culture.
J. Exp. Bot.
4:59-64.
413
Hewitt, E. J. (1948), Relation of manganese and some other
metals to the iron status of plants.
Nature
161:489-490.
"' Hewitt, E. J. (1965), Sand and water culture methods used in the
study of plant nutrition
Commonwealth Agr. Bur. England Tech.
Com. 22. 2nd Ed.
75 Hilgeman, R. H., W. H. Fuller, L. F. True. G. G. Sharpless, and
P. F. Smith (1970), Lithium toxicity in "marsh" grapefruit in
Arizona.
Proc. Amer. Soc. Hors. Sci.
95(2):248-25l.
4 "
Hodgson, J. F. (1960), Cobalt reactions with montmorillonitc.
Soil Sci. Soc. Amer. Proc.
24(3):165-168.
4 "
Hodgson,
J.
F. (1963), Chemistry of the micronutricnt elements in
soils.
Aduan. Agron.
15:119-159.
"
3
Hopper, M. C. (1937), Effect of lead on plants.
Ann.
Appi.
Biol.
24:690-695.
19
Hoyt, P. B. and M. Nyborg (1971a), Toxic metals in acid soil. I.
Estimation of plant-available aluminum.
Soil Sci. Soc. Amer. Proc.
35(2):236-240.
4 "
Hoyt, P. B. and M. Nyborg (1971b). Toxic metals in acid soils.
II.
Estimation of plant-available manganese.
Soil Sci. Sec.
Amer.
Proc.
35(2):241-244.
"
1
Hunter, J. G. and 0. Vcrgnano (1953), Trace-element toxicities
in oat plants.
Ann. Appi. Biol.
40:761-777.
422
Jacobs, L. W., D. R. Keeney, and L. M. Walsh (1970), Arsenic
residue toxicity to vegetable crops grown on Plainfield sand.
Agron.
3.
62(5):588-59I.
133
Jensen. E. H. and A. L. Lesperance (1971), Molybdenum' ac-
cumulation by forage plants.
Agron.
J.
63(2):201-204.
Kamprath, E. J. (1970), Exchangeable aluminum as a criterion
for liming leached acid mineral soils.
Soil Sci. Soc. Amer. Proc.
34(2).252-254.
Kerridge, P. C.. M. D. Dawson, and D. P. Moore (1971), Separa-
tion of degrees of aluminum tolerance in wheat.
Agron.
J
.
63(4):
586-591.
"6 Kubota, J., E. R. Lemon, and W. H. Allaway (1963), The effect
of soil moisture content upon the uptake of molybdenum, copper,
and cobalt by alsike clover.
Soil Sci. Soc.
Amer.
Proc.
27(6):679-
683.
422
Lagcrwerff, J. V. (1971), Uptake of cadmium, lead and zinc by
radish from soil and air.
Soil Sci.
I 1 1 (2):129-133.
4 "
Lee, C. R. and N. R. Page (1967), Soil factors influencing the
growth of cotton following peach orchards.
Agron. J.
59(3):237-
240.
429
Legg, J. T. and P. J. Ormerod (1958), The nickel content of hop
plants with reference to nettlehead symptoms.
Anna. Rep. East
Mailing Res. Sta.
(England) 45:129-132.
Lesperance, A. L. and V. R. Bohman (1963), Effect of inorganic
molybdenum and type of roughage on the bovine.
5.
Anion. Sci.
22(3):686-694.
431
Liebig, G. F., Jr., G. R. Bradford, and A. P. Vanselow (1959),
Effects of arsenic compounds on citrus plants in solution culture.
Soil Sci.
88:342-348.
432
Licbig, G. F., Jr., A. P. Vanselow, and H. D. Chapman (1942),
Effects of aluminum on copper toxicity, as revealed by solution-
culture and spectrographic studies of citrus.
Soil Sci.
53:341-351.
4
"
Ligon, W. S. and W. H. Pierre (1932), Soluble aluminum studies.
II. minimum concentrations of aluminum found to be toxic to
364/Section 11
—Agricultural Uses of Water
corn. sorghum. and barley in nutrient solutions.
Soil Sci.
34:307-
466
Reuther,
W.
and C. K. Labanauskas (1966), Copper [to
Diagnostic criteria for plants and soils,
H. D. Chapman,
versity
of California, Division of Agricultural Science,
pp. 157-179.
467
Reuther, W. and P. F. Smith (1954), Minor elements in r
soil factors: toxic effects of accumulated copper in Flo
Proc. Soil. Sci. Soc.
Fla. 14:17-23.
468
Rhoads. F. M. (1971), Relations between Fe in irrigat
and leaf quality of cigar wrapper tobacco.
.4gron. join
940.
4
" Salinity Laboratory (1954), U.S. Department of As
Salinity Laboratory Staff (1954),
Diagnosis and imps
saline and alkali soils
[Handbook 601 (Government Pri
ficc, Washington. D.C.), 160 p.
460
Scharrcr, K. and W. Schropp (1933), Sand and water ci
periments with nickel and cobalt..`.
Pflanzenernahr.
denk.
31A:94-113.
461 Scharrer, K. and W. Schropp (1935). The action of chr
chromate ions upon cultivated plants. Z.
Pflanzenerna.
Bodenk.
37:137-149.
462
Scillac, P. (1971), The toxicity of some oligoelements
maritime pine plants cultivated on a liquid medium.
C.
Seances .4cad.
Ser. D Sci.
•
atur.
272(3):411-413.
"3 Shoemaker, H. E.. E. 0. McLean. and P. F. Pratt (196!
methods for determining lime requirements of soils
preciablc amounts of extractable aluminum.
Soil Sci.
Proc.
25(4):274-277.
4 " Shirley, R. L., W. G. Kirk, G. K. Davis, and E. M. Hodge
Phosphorus fertilized pasture and composition of co
Quart. j. Fla. Acad. Sci.
33(2):111-118.
466
Sims, J. R. and F. T. Bingham (1968), Retention of t
layer silicates, scsquioxidcs and soil materials.
Soil Sci.
Proc.
32(3):364-373.
466 Soane, B. K. and D. H. Saunders (1959), Nickel and eh
toxicity of serpentine soils in southern Rhodesia.
Soil Sci.
330.
"7
Staker, E. V. (1942), Progress report on the control of zinc
in peat soils.
Soil Sci. Soc. Amer. Proc.
7:387-392.
"8
Staker, E. V. and R. W. Cummings (1941), The influcnc,
. on the productivity of certain New York peat soils.
Soii
.4mer. Proc.
6:207-214.
4
" Struckme.yer, B. E.. L. A. Peterson. and F. H. Tai (1969)
of copper on the composition and anatomy of tobacco.
61 (6): 932-936.
470 Turner. NI. A. and R. H. Rust (1971), Effects of chrorr
growth and mineral nutrition of soybeans.
Soil Sci. So
Proc.
35:755-758.
471 Underwood, E. J. (1966),
The mineral nutrition of livestock
(C.
wealth Agricultural Bureaux, Aberdeen, Scotland), 237 p
Vandecaveye, S. C., G. M. Homer, and C. M. Keaton
Unproductiveness of certain orchard soils as related
arsenate spray accumulations.
Soil Sci.
42:203-215.
473
Vanselow, A. P. (1966a), Cobalt, in
Diagnostic criteria for
pi
soils, H. D. Chapman, ed. (University of California, Div
Agricultural Science. Berkeley), pp. 142-156.
474
Vanselow, A. P. (1966b), Nickel, in
Diagnostic criteria for
pi
soils,
H. D. Chapman, ed. (University of California, Div
Agricultural Science, Berkeley), pp. 302-309.
476
Vergnano.
0.
and J. G. Hunter (1953), Nickel and cobalt tc
in oat plants.
Ann. Bol.
17:317-328.
476
Warington, K. (1954), The influence of iron supply on tc
fects of managnese, molybdenum, and vanadium on so
∎
peas, and flax.
Ann.
Appi.
Biol.
41:1-22.
477
Warington, K. (1956), Investigations regarding the nature
interaction between iron and molybdenum or vanadi
321.
"4
Machlis, L. (1941), Accumulation of arsenic in the shoots of Sudan
grass and bush bean.
Plant Physiol.
16:521-544.
"' MacIntire. W. H.. S. H. Winterberg, J. G. Thompson. and B. W.
Hatcher (1942), Fluorine content of plants fertilized with phos-
phates and slags carrying fluorides.
Indust. Eng. Chem.
34:1469-
1479.
16 McKee. J. E. and H. W. Wolf. eds. (1963), 'rater
quality criteria,
2nd ed. (California. State Water Quality Control Board. Sacra-
mento), pp. 132.228.
13 ' Millikan. C. R. (1949), Effects on flax of a toxic concentration of
boron, iron, molybdenum. aluminum, copper, zinc, manganese,
cobalt, or nickel in the nutrient solution.
Proc.
Ro y.
Soc. Victoria
61:25-42.
"3
Millikan, C. R. (1947), Effect of molybdenum on the severity of
toxicity symptoms in flax induced by an excess of either man-
ganese. zinc, copper. nickel or cobalt in the nutrient solution. :)".
.lust. Inst. Agr. Sci.
13:180-186.
'" Mizuno. N. (1968). Interaction between iron and nickel and cop-
per and nickel in various plant species.
Nature
219:1271-1272.
", Morris. H. D. and W. H. Pierre (1949), Minimum concentrations
of manganese necessary for injury to various le
g
umes in culture
solutions.
Heron.
3.
41:107-112.
4 " National Research Council. Committee on Biologic Effects of
Atmospheric Pollutants (1972),
Lead: airborne lead in perspective.
(The National Academy of Sciences. Washington, D. C.), 330 p.
'" Nollcndorfs. V. (1969), Effect of various doses of manganese on
the growth of tomatoes in relation to the level of copper in the
nutrient medium.
Lain. Padomju. Soc. Repub. Akad. Vestis.
1969 (5):8.6-92.
4 "
Ocrtli, J. J : (1962), The influence of lithium on pinks (carnations).
Gartenbarizaissenschaft
27(3):269
-
278.
114
Page. A. L., F. T. Bingham, and C. Nelson (1972),
in press,
Cad-
miuin absorption and growth of various plant species as influenced
by solution cadmium concentration.
journal of Environmental
" 5
Page, A. L., T. J. Gange, and M. S. Joshi (1971),
in press,
Lead
quantities in plants. soil and air near some major highways in
Southern California.
Hilgardia
41.
"' Pccch. M. (1941), Availability of ions in light sandy soils as af-
fected by soil reaction.
Soil Sci.
51 :473-486
"7 Piper. C. S. (19:39); Investigation of copper deficiency in plants.
.7. .4gr.
Sci.
32:143-170.
"" Pratt. P. F. (1966), Aluminum [toxicity, indicator plants), in
Diagnostic criteria for plants and soils.
H. D. Chapman, ed. (Uni-
versity of California, Division of Agricultural Science. Berkeley).
pp. 3-12.
"' Pratt. P. F., F. L. Bair, and G. V. McLean (1964), Reactions of
phosphate with soluble and exchangeable nickel.
Soil Sci. Soc.
Amer. Proc.
28(3):363-365.
4 "
Prince, A. L., F. E. Bear, E. G. Brennan.
1.
A. Leone, and R. H.
Dames (1949), Fluorine: its toxicity to plants and its control in
soils.
Soil Sri.
67:269-277.
"' Rasmussen, G. K. and W. H. Henry (1965), Effects of arsenic on
the growth of pineapple and orange seedlings in sand and solu-
tion nutrient cultures.
Citrus Ind.
46(3):22-23.
45
'
Reed, J. F. and M. B. Sturgis (1936). Toxicity from arsenic com-
pounds to rice on flooded soils.
J. Amtr. Soc. Agron.
28:432-436.
45 '
Reeve, N. G. and M. E. Sumner (1970), Effects of aluminum
toxicity and phosphorus fixation on crop growth in Oxisols of
Natal.
Soil Sci. Soc. Amer. Proc.
34(2):263-267.
"' Romney, E. M. and J. D. Childress (1965), Effects of beryllium
in plants and soil.
Soil Sci.
100(3):210-217.
"' Romney, E. M., J. D. Childress, and G. V. Alexander (1962),
Beryllium and the growth of bush beans.
Science
135:786-787.
Literature Cited/365
nutrient solutions, with and without a growing plant.
Ann. App.?.
Biol.
44:535-546.
4 "
Westgate, P. J. (1952), Preliminary report on chelated iron for
vegetables and ornamentals.
Soil Sci. Soc.
Fla. Proc.
12:21-23.
479
Wilkins, D. A. (1957), A technique for the measurement of lead
tolerance i i plants.
Nature
180:37-38.
' 50
Williams, R. J. B. and H. H. LeRiche (1968), The effects of traces
of beryllium on the growth of kale, grass, and mustard.
Plant Soil
29(2):317-326.
"
1
Woolson. E. A., J. H. Axlev, and P. C. Kearney (1971), Correla-
tion between available soil arsenic, estimated by six methods,
and response of corn
(.lea mars L.),
Soil Sci. Soc.
Amer. Proc.
35(1):
101-105.
PESTICIDES (IN WATER FOR IRRIGATIONS)
"2
Agriculture Research Service (1963). U.S. Department of Agri-
culture.
Crops research: chemical control of submersed waterweeds in
western irrigation systems and drainage canals
(Government Printing
Office, Washington, D.C.), 14 p.
•
"' Agricultural Research Service (1969a). U.S. Department of
Agriculture. Agricultural Research Service (1969a), Monitoring
'agricultural pesticide residues 1965-1967 (U.S. Government
Printing Office. Washin
g
ton. D. C.), 97 p.
4 ' 4
Arle, H. F. (1950), The effect of aromatic solvents and other
aquatic herbicides on crop plants and animals.
Proc. West.
Weed
Control Conf.
12:58-60.
4 "
Ark, H. F. and G. N. McRae (1959), Cotton tolerance to ap-
plications of acrolcin in irrigation water. Western Weed Control
Conference Research Progress Report p. 72.
"
8
Ark, H. F. and G. N. McRae (1960), Cotton tolerance to applica-
tions of acrolcin in irrigation water. Western Weed Control
Conference Research Progress Report p. 61.
481
Bartley, T. R. (1969), Copper residues on canals.
Weed Sci. Soc.
Amer. Abstr.
No. 98.
04
Bartley, T. R. and A. R. Hattrup (1970), 2,4-D contamination
and persistence in irrigation water.
Proc. West. Sec. Weed Sci.
23:
10-33.
'69
Bruns, V. F. (1954), The response of certain crops to 2,4-dichloro-
phenoxyacetic acid in irrigation water. I. Red Mexican beans.
Weeds
3:359-376.
•
' 80
Bruns, V. F. (1957). The response of certain crops to 2,4-dichloro-
phenoxyacetic acid in irrigation water. II. Sugar beets.
Weeds
5:250-258.
401
Bruns, V. F. (1964), Crop tolerance to herbicides in irrigation
water.
Calif. Weed Conf. Proc.
16:40-42.
in
Bruns, V. F. (1969), Response of sugarbects, soybeans. and corn
to acrolcin in irrigation water, in
Washington State weed conference
proceedings
(Agricultural Experiment Service, Washington State
University, Pullman), p. 33, mimeograph.
Bruns, V. F. and W. J. Clore (1958), The response of certain crops
to 2,4-dichlorophenoxyacetic acid in irrigation water. III.
Concord grapes.
Weeds
6:187-193.
494
Bruns, V. F. and J. H. Dawson (1959), Effects of DCB. DCB-
xylene mixtures, amitrol, and sodium salt of dalapon in irriga-
tion water on corn and rutabagas.
Weeds
7:333-340.
'96 Bruns, V. F., J. M. Hod
g
son, H. F. Ark, and F. L. Timmons
(1955),
The use of aromatic solvents for control of submersed aquatic
weeds in irrigation channels (U.S.
Department of Agriculture circular
9711 (Government Printing Office. Washington, D. C.), 33 p.
Bruns, V. F., R. R. Yeo, and H. F. Arle (1964),
Tolerance of certain
crops to several aquatic herbicides in irrigation water [U.S.
Department
of Agriculture technical bulletin 1299] (Government Printing
Office, Washington, D. C.), 22 p.
'" Frank, P. A., R. J. Dcmint, and R. D. Comes (I 970)., Herbicides
in irrigation water following canal-bank treatment for weed
•
control.
Weed Sci.
18(6):687-692.
488
Fowler, D. L. (1972),
The pesticide review-1972
(Agr. Stab. Con-
servation Service, U.S. Department of Agriculture, Washington,
D. C.).
"9 Godsil, P. J. and
W.
C. Johnson (1968), Pesticide monitoring of
the aquatic biota at Tule Lake National Wildlife Refuge.
Pesti-
cides Monitoring journal
1
:21-26.
6"
Miller, C. W., W. E. Tomlinson and R. L. Norgen (1967), Persis-
tence and movement of parathion in irrigation waters.
Pesticides
Monitoring journal
1:47-48.
501
National Research Council. Agricultural Board (1968),
Principles
of plant and, animal pest control, Volume 6: Ejects of pesticides on fruit
and vegetable physiology
(The National Academy of Sciences,
Washington, D. C.), 90 p.
602
Sheets, T. J. (1967), The extent and seriousness of pesticide buildup
in soils, in
Agriculture and the Quality of our Environment,
N. C.
Brady, ed. (American Association fix
.
the Advancement of
Science, Washington, D. C.), pp. 311-330.
'
4
"
Sparr, B. I., W. G. Appleby, D. M. DeVries, J. V. Osmun, J. M.
McBride and G. L. Foster (1966), Insecticide residues in wa
t er-
ways from a
g
ricultural use, in Gould. R. F., ed..
Organic Pesti-
cides in the Environment.
Advances in Chemistry Series No. 60.
•
American Chemical Society, Washington. D. C., pp. 146-162.
"' U.S. Department of Agriculture. Agricultural Research Service
(1963),
Crops research: chemical control of submersed waterweeds in
western irrigation s ystems and drainage canals
(Government Printing
Office, Washington, D. C.), 14 p.
6
°
5
U.S. Department of Agriculture, Agriculture Research Service
(1969), Suggested guide for weed control, Agricultural Hand-
book No. 332,70 p.
606
U.S. Department of Health. Education and Welfare (1969),
Re-
port of the Secretary's Commission on Pesticides and their relationship to
environmental
health, Parts I and II (U.S.
Government Printing Of-
fice, Washington, D. C.).
Yeo, R. R. (1959), Response of field crops to acrolcin. Research
Committee, Western Wccd Control Conference. Salt Lake City,
Utah, Research Progress Report, p. 71.
References Cited
108
Bruns. V. F., J. M. Hodgson, and N. F. Arle (1971). Response of
several crops to six herbicides_in irrigation water.
Unpublished
data.?
-
"9
Stanford Research Institute (1970). Investigations of herbicides
in water and crops irrigated with water containing herbicides.
Unpublished Final Report.
66 pp.
PATHOGENS
"° Allison, I. S. (1930), The problem of saline drinking waters.
Science
71:559-360.
6 " Barlow, C. H. (1937), The value of canal clearance in the control
of schistosomiasis in Egypt.
Amer.
3.
Hyg.
25:327-348.
5 '2
Camp, Dresser and McKee (1949), Report on Clarion River pollu-
tion statement. Sanitary Water Board, Commonwealth of
Pennsylvania.
5 "
Campbell, R. N. (1962), Relationship between the lettuce big-
vein virus and its vector
Olpidium brassicae. Nature
195:675-677.
5t'
C. M.. W. C. Boyle and J. M. Goepfert (1971), Rapid
quantitative method for salmonella detection in polluted water.
Appl.
Microbiol.
21(4) :662-667.
615 Faulkner, L. R. and W. J. Bolander (1966), Occurrence of large
nematode populations in irrigation canals of south central
Washington.
Nematologica
12(4):591-600.
616
Faulkner, L. R. and
W. J.
Bolander (1970), Acquisition and
366/Section V—Agricultural Uses of Water
distribution of nematodes in irrigation waterways of the Columbia
basin in eastern Washington.
7.
Nematol.
2(4):363-367.
617 Gaertner, H. and L. Mueting (1951), Depth of soil infiltration by
ascarid ova. Z.
Hyg. Infektionskr.
132:59-63.
"8
Geldreich, E. E. and R. H. Borriner (1971). Fecal contamination
or fruits and vegetables durir.z cultivation and processing for
market. A review.
7.
Milk Food Technol.
34(4):184-195.
679 Gro
g
an, R. G., F. W. Zinc, W. B. Hewitt. and K. A. Kimble
(1958), The association of Olpidium with the big vein disease
of lettuce.
Phytopathology
48(6):292-297.
629
Hewitt. W. B., D. J. Raski, and A. C. Goheen (1958), Nematode
vector of soil-borne fanleaf virus of grapevines.
Phytopathology
48(11):586-595.
Kabler, P. W., H. F. Clark, and E. E. Geldreich (1964), Sanitary
significance of coliform and fecal coliform organisms in surface
water.
Pub. Health Rep.
79:58-60.
67 Neiman, A. (1953), The bacterial wilt caused by
Psuedomonas
solanacearum:
a literature review and bibliography.
N. C. Agr.
Exp. Sta. Tech. Bull.
no. 99,194 p.
"'Klotz, L.' J., P. P. Wong, and T. A. DeWolfe (1959), Survey of
irrigation water for the presence of Phytophthora spp. patho-
genic to citrus.
Plant. Dir. Rep.
43(7):830-832.
524 LeBosquet, M. (1945), Kanawha River inv=tigation. Benefits to
pollution abatement from increased low-water flow. U.S. Public
Health Service.
"6 McIntosh, D. L. (1966), The occurrence of
Phvtophthora
spp. in
irrigation systems in British Columbia.
Can.
7.
Bot.
44:1591-
1596.
626
Meagher, J. W. (1967), Observations on the transport of nema-
todes in subsoil drainage and irrigation water.
Aust.
5.
Exp. Agr.
Anim.
7(29):577-579.
657 Murphy, W. H., 0. R. Eylar, E. L. Schmidt and J. T. Syverton
(1958), Absorption and translocation of mammalian viruses by
plants: II. Recovery
,
and distribution of viruses in plants.
Virology
6:623.
"9
Murphy, W. H., Jr. and J. T. Syverton (1958), Absorption and
translocation of mammalian viruses by plants. II. Recovery and
distribution of viruses in plants.
Virology
6(3):623-636.
529
Teakle, D. S. (1969), Fungi as vectors and hosts of viruses, in
Viruses,
vectors, and vegetation,
K. Maramorosch. ed. ( John Wiley,
& Sons, Inc., New York), pp. 23-54.
"° Thomason, I. J. and
S.
D. Van Gundy (1961), Arrowweed,
Pluchea sericea, on the Colorado River
is
a host for root-know
nematodes.
Plant Dis. Rep.
45(7):577.
6'1 U.S. Department of Agriculture (1961),
Liver flukes in cattle
[Leaflet
493) (Government Printing Office, Washington. D. C.), 8 p.
5 " Wang, W.
L. and S. G. Dunlop (1954), Animal parasites in sewage
and irrigation water.
Sewage Indust.
1Vastes 26:1020-1032.
WASTEWATER FOR IRRIGATION
633
Bons, I. H. (1949), Water-borne diseases.
Amrr.
5.
Pub. Health
39:
974-978.
636
H. (1968), Returning wastes to the land—a new role for
agriculture.
3.
Soil Water Conserv.
23(5):164-165.
636
Bouwer. H. and J. C. Lance (1970), Reclaiming municipal waste-
water by groundwater recharge. Proc. AAAS symposium on
urbanization in the arid lands.
6 "
Cheng, C. M., W. C. Boyle, and J. M. Goepfert (1971), Rapid
quantitative method for salmonella detection in polluted water.
Appl.
Microbiol.
21(4) :662-667.
637
Dedie. K. (1955), [Organisms in sewage pathogenic to animals.)
Siaedtehygiene
6:177-180.
"° Dunlop, S. G. (1968), Survival of pathogens and related disease
hazards, in
Municipal sewage effluent for irrigation,
C. W. Wilson
and F. E. Baked, eds. (Louisiana Tech. Alumni Foundat.
Ruston, Louisiana, p. 192.
639
Dunlop, S. G. and W. L. Wang (1961), Studies on the use
sewage effluent for irrigation of truck crops.
5. Milk Food Teck
24(2):44-47.
Geldreich, E. E. (1970), Applying bacteriological parameter
recreational water quality.
J.
Amer.
Watts Works Ass.
62(2):1
120.
Geldreich, E. E. and R. H. Bordner (1971), Fecal contaminat
of fruits and vegetables during cultivation and processing
market. A review.
5. Milk Food Technol.
34(4):184-195.
"2
Kardos, L. T. (1968), Crop response to sewage effluent, in Mun
pal sewage effluent for irrigation. C. W. Wilson and F. E. Beck
Editors. Louisiana Polytechnic Institute.
5" Lance, J. C. (1972),
in press,
Nitrogen removal from wastewater
chemical and biological reactions in the soil.
5. Water Poi
Contr. Fed.
6"
Lance, J. C., and F. D. Whisler
(102),
in press,
Nitrogen bala;
in soil columns flooded with secondary sewage effluent.
Science Society of American Proceedings.
5
" Law, J. P. (1968), Agricultural utilization of sewage effluent
a
sludge. An annotated bibliography.
Fed. Water Pollution C
Admin.
"'Law, J. P., R. E. Thomas and L. H. Myers (1970), Cannery was
water treatment by high-rate spray on grassland.
5. Water Poll
Con. Fed.
42:1621-1631.
697
G. W., L. E. Engelbcrt and G. A. Rohlich (1960), 1
fectiveness of spray irrigation
as a
method for the disposal
dairy plant wastes.
Ag. Exp. Sta. Report No. 6,
University
Wisconsin.
"
9
Merrell, J. C., W. F. Jopling, R. F. Bott, A. Katko, and H.
Pintler (1967), The Santee Recreation Project, Santee, Ca
fornia. Final Report Publ. No. WP-20-7. Fed. Water Pollutic
Control Administration, Washington, D. C.
"9
Muller, G. (1955), Pollution of irrigated grass with bacteria of tl
typhoid-paratypoid group.
Komm. Wirtschraft
8:409.
514
Muller, G. (1957), The infection of growing vegetables wit
domestic drainage.
Stadtehyg.
8:30-32.
661 Norman, N. N. and P. W. Kabler (1953), Bacteriological study
irrigated vegetables.
Sewage Indust. Wastes
25:605-609.
5
" ORSANCO [Ohio River Valley Sanitation Commission Watt
Users Committee (1971), Total coliform: fecal coliform ratio ft
evaluation of raw water bacterial quality.
5.
Water Pollut. Cons
Fed.
43:630-640.
5 " Otter, H. (1951), Sewage treatment plant of the town of Munste•
Munster, Westphalia.
Wass. V. Boden
3:211.
666
G. A. (1972),
in press
Suitability for irrigation of wastc
water from • food-processing plants.
Journal of Environment,
Quality.
666
W., L. L. Falk, and R. A. Ragotzkie (1950), Literatur
review on the occurrence and survival of enteric, pathogenic, an.
relative organisms in soil, water, sewage, and sludges, and o
vegetation. I. Bacterial and virus diseases.
Sewage Indust. Wait,
22(10):1261-1281.
656
M. B. and E. A. Shakhurina (1953), Result c
organization of fields for sewage in hot climate of Uzbekistan
Gig. Sanit.
7:17-19.
667
E. (1963), The use of sewage for irrigation. A literature re
view. (Bureau of Sanitary Engineering, California State De
partment of Public Health, Berkeley. California), p. 6.
"' Tanner, F. W. (1944),
The microbiology of foods
(Garrad Press.
Champaign, Illinois), pp. 649-664.
369
Viets,
F. G. (1965), The plant's need for and use of nitrogen
Amer. Soc. Agron. Agron.
10:503-549.
664
Wang, W. L. and S. G. Dunlop (1954), Animal parasites in sewage
and irrigation water.
Sewage Indust. Wastes
26:1020-1032-
i
UNITED STATES ENVIRONMENTAL PROTECTION AGENCY
WASHINGTON, D.C. 20460
OFFICE OF
SOLID WASTE AND EMERGENCY
RESPONSE
December 5, 2003
OSWER Directive 9285.7-53
MEMORANDUM
SUBJECT:
Human Health Toxicity Values in Superfund Risk Assessments
FROM:?
Michael B. Cook, Director /s/
Office of Superfund Remediation and Technology Innovation
TO:?
Superfund National Policy Managers, Regions 1 - 10
Purpose
This memorandum revises the hierarchy of human health toxicity values generally
recommended for use in risk assessments, originally presented in Risk Assessment Guidance for
Superfund Volume
I, Part A, Human Health Evaluation Manual (RAGS) (OSWER 9285.7-02B,
EPA/540/1-89/009, December 1989).
(http://www.epa.gov/superfund/programs/risk/ragsa/index.htm)
It updates the hierarchy of human health toxicity values and provides guidance for the
sources of toxicity information that should generally be used in performing human health risk
assessments at Comprehensive Environmental Response Compensation and Liability Act
(CERCLA or "Superfund") sites. It does not address the situation where new toxicity
information is brought to the attention of the U.S. Environmental Protection Agency (EPA). It
also does not provide guidance or address toxicity or reference values for ecological risk.
This memorandum presents current Office of Solid Waste and Emergency Response
(OSWER) technical and policy recommendations regarding human health toxicity values in risk
assessments. EPA and
.
state personnel may use and accept other technically sound approaches,
either on their own initiative, or at the suggestion of potentially responsible parties, or other
interested parties. Therefore, interested parties are free to raise questions and objections about
the substance of this memorandum and the appropriateness of the application of this document to
a particular situation. EPA will, and States should, consider whether the recommendations or
interpretations in this memorandum are appropriate in that situation. This memorandum does
not impose any requirements or obligations on EPA, States, or other federal agencies, or the
regulated community. The sources of authority and requirements in this matter are the relevant
statutes and regulations (e.g., CERCLA, Resource Conservation and Recovery Act). EPA
welcomes public comments on this memorandum at any time and may consider such comments
in future revisions of this memorandum.
Background
Superfund risk assessments are performed for a number of reasons, including to evaluate
whether action is warranted under CERCLA, to establish protective cleanup levels, and to
determine the residual risk posed by response actions. Generally, toxicity assessment is an
integral part of risk assessment. Volume I, Part A of RAGS provides guidance on how to
conduct the human health portion of the risk assessment. Chapter 7.4.1 presents a hierarchy of
human health toxicity values for use in risk assessments at Superfund sites. The hierarchy
presented in RAGS Part A is being updated to reflect that additional sources of peer reviewed
values have become available since 1989. In addition, the EPA Health Effects Assessment
Summary Tables (HEAST) document, which was identified as the second tier of data, has not
been updated since 1997. As a result, HEAST may not provide the most, current source of
information on some contaminants.
This revised hierarchy recognizes that EPA should use the best science available on
which to base risk assessments. In general, if health assessment information is available in the
Integrated Risk Information System ["IRIS," http://www.epa.gov/irisfl for the contaminant under
evaluation, risk assessors normally need not search further for additional sources of information.
Since EPA's development and use of peer review in toxicity assessments, IRIS assessments have
undergone external peer review in accordance with Agency peer review guidance at the time of
the assessment. IRIS health assessments contain Agency consensus toxicity values. If such
information is not available in IRIS, risk assessors should consider other sources of available
data based on the hierarchy presented in this memorandum.
EPA recognizes that there may be other sources of toxicological information. As noted
in the December 1993 memorandum entitled "Use of IRIS Values in Superfund Risk
Assessment" (OSWER Directive 9285.7-16, December 21, 1993):
"...IRIS
is not the only source of toxicology information, and in some cases more recent,
credible and relevant data may come to the Agency's attention. In particular,
toxicological information other than that in IRIS may be brought to the Agency by
outside parties. Such information should be considered along with the data in IRIS in
selecting toxicological values; ultimately, the Agency should evaluate risk based upon its
best scientific judgement and consider all credible and relevant information available to
it.
This memorandum is intended to help regional risk assessors identify appropriate sources
of toxicological information as a means of streamlining decisions. It does not specifically
address the situation where additional scientific information is brought to the attention of EPA.
In those cases, EPA risk assessors and decision makers should consider the information as
appropriate on a case by case basis.
Revised Recommended Human Health Toxicity Value Hierarchy
This memorandum revises the recommended hierarchy of toxicological sources of
information which Regional risk assessors and managers should initially consider for site-
specific risk assessments. The revised recommended toxicity value hierarchy is as follows:
11
2
•
Tier 1- EPA's IRIS
Tier
2-
EPA's Provisional Peer Reviewed Toxicity Values (PPRTVs) –
The Office of
Research and Development/National Center for Environmental Assessment/Superfund
Health Risk Technical Support Center (STSC) develops PPRTVs on a chemical specific
basis when requested by EPA's Superfund program.
Tier 3- Other Toxicity Values –
Tier 3 includes additional EPA and non-EPA sources
of toxicity information. Priority should be given to those sources of information that are
the most current, the basis for which is transparent and publicly available, and which
have been peer reviewed.
IRIS remains in the first tier of the recommended hierarchy as the generally preferred
source of human health toxicity values. IRIS generally contains reference doses (RfDs),
reference concentrations (RfCs), cancer slope factors, drinking water unit risk values, and
inhalation unit risk values that have gone through a peer review and EPA consensus review
process. IRIS normally represents the official Agency scientific position regarding the toxicity
of the chemicals based on the data available at the time of the review.
The second tier is EPA's PPRTVs. Generally, PPRTVs are derived for one of two
reasons. First, the STSC is conducting a batch wise review of the toxicity values in HEAST
(now a Tier 3 source). As such reviews are completed, those toxicity values will be removed
from HEAST, and any new toxicity value developed in such a review will be a PPRTV and
placed in the PPRTV database. Second, Regional Superfund Offices may request a PPRTV for
contaminants lacking a relevant IRIS value. The STSC uses the same methodologies to derive
PPRTVs for both.
The third tier includes other sources of information. Priority should be given to sources
that provide toxicity information based on similar methods and procedures as those used for Tier
I and Tier II, contain values which are peer reviewed, are available to the public, and are
transparent about the methods and processes used to develop the values. Consultation with the
STSC or headquarters program office is recommended regarding the use of the Tier 3 values for
Superfund response decisions when the contaminant appears to be a risk driver for the site. In
general, draft toxicity assessments are not appropriate for use until they have been through peer
review, the peer review comments have been addressed in a revised draft, and the revised draft is
publicly available.
Additional sources may be identified for Tier 3. Toxicity values that fall within the third
tier in the hierarchy include, but need not be limited to, the following sources.
The California Environmental Protection Agency (Cal EPA) toxicity values are peer
reviewed and address both cancer and non-cancer effects. Cal EPA toxicity values are
available on the Cal EPA internet website at
http://www.oehha.ca.gov/risk/chemicalDB//index.asp.
The Agency for Toxic Substances and Disease Registry (ATSDR) Minimal Risk Levels
(MRLs) are estimates of the daily human exposure to a hazardous substance that is likely
to be without appreciable risk of adverse non-cancer health effects over a specified
duration of exposure. The ATSDR MRLs are peer reviewed and are available at
http://www.atsdr.cdc.gov/mrls.html
on the ATSDR website.
3
HEAST toxicity values are Tier 3 values. As noted above, the STSC is conducting a
batch wise review of HEAST toxicity values. The toxicity values remaining in HEAST
are considered Tier 3 values. The radionuclides HEAST toxicity values are available at
http://www.epa.
g
ov/radiation/heast/. The HEAST values on chemical contaminants are
not currently available on an EPA internet site. They may be obtained by contacting a
Superfund risk assessor.
Neither IRIS nor the PPRTV database contains radionuclide slope factors. Because
EPA's Office of Radiation and Indoor Air (ORIA) obtains peer review on the radionuclide slope
factors contained in Table 4 of HEAST (which are available on EPA/ORIA's internet website at
http://www.epa.gov/radiation/heast/download.htm), routine consultation with STSC is generally
not necessary on these values even when they may be a risk driver on a Superfund site. These
radionuclide slope factors have been adopted by EPA in its Preliminary Remediation Goals for
Radionuclide Calculator and are available on EPA's internet website at:
http://epa-prgs.ornl.gov/radionuclides/ and the Soil Screening Guidance for Radionuclide
documents, which are available at: http://www.epa.gov/superfund/resources/radiation/radssg.
Implementation
This memorandum provides a revised recommended hierarchy of human health toxicity
values for Superfund sites and represents a revision of Chapter 7 of RAGS, Volume I, Part A.
Superfund risk assessors should look to this hierarchy when evaluating risk for CERCLA
response actions. Additional sources of toxicity values, which are not specifically referenced in
this recommended hierarchy, can be considered.
Additional Information
Questions regarding this guidance or its use and implementation on a particular site
should be directed to an EPA Regional Superfund risk assessor or toxicologist. Questions of a
more general nature relating to this guidance should be directed to Mr. Dave Crawford of my
staff at (703) 603- 8891, Crawford.Dave(epa.gov.
cc:
Nancy Riveland, Superfund Lead Region Coordinator, USEPA Region 9
NARPM Co-Chairs
Joanna Gibson, OSRTI Documents Coordinator
OSRTI Center Directors and Senior Process Managers
Jim Woolford, FFRRO
Debbie Dietrich, OEPPR
Robert Springer, OSW
Cliff Rothenstein, OUST
Linda Garczynski, OBCR
Sandra Connors, FFEO
Susan Bromm, OSRE
Peter Preuss, NCEA
Charles Openchowski, OGC
John Michaud, OGC
David Kling, FFEO
Stephen Luftig, Senior Advisor to OSWER Assistant Administrator
4
Notary Public
STATE OF ILLINOIS
COUNTY OF SANGAMON
PROOF OF SERVICE
I, the undersigned, on oath state that I have served the attached Motion to Correct
the Transcript, Errata Sheet Number 3, and Supplemental Testimony of the Illinois EPA
upon the persons to whom it is directed, by placing a copy in an envelope addressed to:
Dorothy Gunn, Clerk
Illinois Pollution Control Board
James R. Thompson Center
100 W. Randolph St., Suite 11-500
Chicago, Illinois 60601.
(FEDERAL EXPRESS)
Bill Richardson, Chief Counsel
Illinois Department of Natural Resources
One Natural Resources Way
Springfield, Illinois 62702-1271
(FIRST CLASS MAIL)
(Service List-FIRST CLASS MAIL)
Matthew Dunn, Esq.
Environmental Bureau Chief
Office of the Attorney General
James R. Thompson Center
100 W. Randolph St., 12 th Floor
Chicago, Illinois 60601
(FIRST CLASS MAIL)
Richard McGill
Illinois Pollution Control Board
James R. Thompson Center
100 W. Randolph St., Suite 11-500
Chicago, Illinois 60601
(FEDERAL EXPRESS)
and mailing it from Springfield, Illinois on July 10, 2008 with sufficient postage affixed.
SUBSCRIBED AND SWORN TO BEFORE ME
This 10th day of July, 2008.
BRENDA
OFFICIAL
EIOEHNER
Sim)
Ar.....)4.1-4
•
MY
NOTARY
C
OMMISSION
PUBLIC,
EXPIRES
STATE OF
11ILLINOIS
.
3-2009 st
4:
Chicago
?
312/814-3620
IL 60601?
312/814-3669
Springfield?
217/782-1809
IL 62702-1271 217/524-9640
Chicago
IL 60601
312 795 3707
Chicago
IL 60601
Total number of participants: 8
Printing Service List....
Page 1 of 1
Party Name
IEPA
Petitioner
Kimberly A.Geving, Assistant Counsel
Hodge Dwyer Zeman
Interested Party
Katherine D. Hodge
Monica T. Rios
Illinois Environmental Regulatory Group
Interested Party
?
215 East Adams Street
Alec M. Davis
Illinois Pollution Control Board?
100 W. Randolph St.
Interested Party?
Suite 11-500
Richard McGill, Hearing Officer
Illinois Department of Natural Resources
One Natural Resources Way
Interested Party
William Richardson, Chief Legal Counsel
Environmental Law & Policy Center
?
35 E. Wacker
Interested Party
?
Suite 1300
Albert Ettinger, Senior Staff Attorney
Office of the Attorney General?
James R. Thompson Center
Interested Party?
100 W. Randolph, 12th Floor
Matt Dunn, Environmental Bureau Chief
Springfield?
217/522-5512
IL 62701
?
217/522-5518
Role
? City
&
State Phone/Fax
1021 North Grand Avenue East Springfield?
217/782-5544
P.O. Box 19276?
IL 62794-9276 217/782-9807
3150 Roland Avenue
?
Springfield?
217/523-4900
Post Office Box 5776
?
IL 62705-5776 217/523-4948
http://www.ipcb.state.il.us/cool/external/casenotifyNew.asp?caseid=13396¬ifytype=Ser... 7/9/2008