BEFORE THE ILLINOIS POLLUTION CONTROL BOARD
IN THE MATTER OF:
WATER QUALITY STANDARDS AND
EFFLUENT LIMITATIONS FOR THE
CHICAGO AREA WATERWAY SYSTEM
AND THE LOWER DES PLAINES RIVER:
PROPOSED AMENDMENTS TO 35 Ill.
Adm. Code Parts 301, 302, 303 and 304
R08-9
(Rulemaking
-
Water)
PRE-FILED TESTIMONY OF ADRIENNE D. NEMURA
This report presents the opinions that I
,
Adrienne D. Nemura, P.E., am submitting to the
Illinois Pollution Control Board related to the comprehensive water quality standards proposal by
the Illinois Environmental Protection Agency
(
IEPA
).
IEPA is proposing to update the
designated uses and criteria for the Chicago Area Waterway System
(CAWS).
My opinions
address IEPA's failure to consider the need for wet weather water quality standards for the
CAWS in the agency's proposal.
I am a Vice President and an Owner of LimnoTech, an environmental consulting firm
with headquarters in Ann Arbor
,
Michigan. I am a licensed Civil Engineer and have 24 years of
experience evaluating impacts of pollutant sources on watersheds and waterways
.
Specifically, I
have focused the last 11 years on evaluating the impacts of sewer overflows on water quality and
development of appropriate control measures to meet water quality standards
.
I have worked for
numerous municipalities on combined sewer overflow
(
CSO) control plans and have supported
the United States Environmental Protection Agency
(
US EPA
)
in developing guidance
documents
,
training materials, and Reports to Congress on these issues. This work has included
assessment of CSO impacts
,
evaluation of CSO control alternatives
,
preparation of long-term
1
control plans
,
and review and revision of water quality standards, including use attainability
analyses
(UAAs).
My education
,
registrations, professional appointments, professional affiliations, and
specific projects and publications are included in Attachment 1. My experience includes chairing
a scheduled workshop
at WEFTEC
2008 in Chicago on development of new "pathogen" criteria
and expert assistance to the National Association of Clean
Water
Agencies in the Beach Act
case.
Overview
It is my professional opinion
that IEPA
improperly established standards for aquatic life
and recreational uses in the
CAWS because
the agency did not demonstrate that the uses are
attainable when the system is impacted
by wet
weather discharges
.
The CAWS is
unique as the
system was designed and is operated to receive and transport wet weather discharges including
runoff from
tributaries
,
CSOs,
pump station bypasses
,
and stonnwater
runoff to
prevent flooding
and other impacts in the Chicago metropolitan area.
IEPA
failed to demonstrate that the proposed standards can be met despite wet weather
discharges today and in the future, even if additional treatment is provided. The proposed
standards are therefore premature and if adopted
,
should include a provision for exemptions to
the standards due to wet weather conditions. In particular, a provision is needed to inform the
public that the waterways should not be used for recreation when impacted
by wet
weather
discharges. Furthermore
,
the agency should address the impacts of these discharges on
attainability
of the
proposed aquatic life standards. Specific opinions are provided below.
1.
By deferring promulgation of criteria for recreational uses, Illinois EPA has not
established that the recreational uses will be attained when wet weather discharges occur.
Section 101(a)(2) of the Clean Water Act establishes a national goal that "wherever
attainable", water quality standards shall be set to protect aquatic life and recreational uses.
Section 303(c)(2)(A) directs that new or revised standards "shall consist of the designated uses of
the navigable waters involved and the water quality criteria for such waters based upon such
uses." The criteria are used for decisions about identifying impairments, notification of beach
closures, NPDES permitting, and development of Total Maximum Daily Loads.
The agency did not include "a numeric bacteria standard to protect recreational activity"
(IEPA, 2007, p. 24) and "defer setting numerical standard for bacterial parameters for all three of
the proposed recreational use designations" (IEPA, 2007, p. 42). IEPA instead proposed a
technology-based effluent disinfection requirement to "assure that disinfection technologies are
functioning properly" at wastewater treatment facilities so that the recreational uses can be met
(IEPA, 2007, p. 92). IEPA states, however, that:
"it is clear that as a result of CSOs during wet weather, any level of
recreational activity in the waterway is unhealthy during periods when
raw sewage is present. Until completion and operability of the
reservoir phase of the Tunnel and Reservoir Project system, numerous
CSO discharges will continue to produce highly elevated bacterial
levels that likely create an unacceptably high health risk for
recreational activity during and immediately following these periods.
While there may be an argument that most of the current recreational
activity may be reasonably attained during dry weather, conditions
under wet weather are clearly incompatible with recreational activity
and the recreational use is not being attained during those conditions at
any reasonably acceptable risk level" (IEPA, 2007, p. 45).
IEPA has failed to define "dry weather" or what recreational activity can be attained at
different locations or different times along the CAWS. The agency has not demonstrated that it
assessed how CSOs and other wet weather discharges prevent attainment of the designated uses
along the waterways, during or after a wet weather event. Attachment 2 provides a description of
3
the impact of the CSOs, pump station bypasses, and tributary runoff on bacteria levels in the
CAWS. This information shows that the magnitude, frequency and duration of the CSO impact
on bacteria levels vary from location to location and from storm to storm. In some instances,
these impacts are calculated to last several days after wet weather discharges have ceased.
It should be noted that there has been long-standing concern (as well as confusion) over
the validity and implementation of US EPA's 1986 bacteria criteria (ASIWPCA, 2005).
Nevertheless, States have adopted, with US EPA approval, numeric water quality criteria for
both primary and secondary contact recreation. Several states have retained numeric criteria for
recreational uses while recognizing the need for wet weather exemptions due to CSOs. Examples
are provided in Attachment 3. If no regulatory target is provided to address wet weather
conditions, the public will not know when the water is safe for recreation and when it is not, and
decisions about appropriate levels of control for sources other than wastewater treatment
facilities will be arbitrary. The District has completed a human health risk assessment for
conditions during dry and wet weather and is in the process of completing an epidemiological
study of the waterways. These results should be considered by the agency in any proposed
revisions to the designated uses so that the standards reflect the potential health risks associated
with recreation in the waterways.
2. IEPA
did not evaluate the impact
of wet
weather discharges on aquatic life or
whether
the proposed standards could be met when the
CAWS are impacted by wet weather.
IEPA established two new aquatic life uses (A and B) for the CAWS to maintain
populations "that are adaptive to the unique physical conditions, flow patterns, and operational
controls necessary to maintain navigational use, flood control, and drainage functions of the
waterway system" (IEPA, 2007, p. 46). The distinction between the two definitions is that Use A
waters include "tolerant and intermediately tolerant types" and Use B waters include "tolerant"
4
types that have adapted to "deep-draft, steep-walled shipping channels." For both uses, a daily
minimum dissolved oxygen of 3.5 mg/1 and a 7-day mean of daily minima of 4.0 mg/l is
proposed for when early life stages are absent. For Use A, a daily minimum of 5.0 mg/1 is
proposed as necessary to protect early life stages from March to July.
In establishing these uses and the associated criteria, IEPA (and the UAA upon which the
standards are presumably based) did not address the effects of intermittent low dissolved oxygen
as a result of wet weather discharges, even though these effects were recognized as being present
in the UAA (CDM, 2007). Ample continuous monitoring data and receiving water quality
modeling information exists that shows that wet weather discharges will cause the dissolved
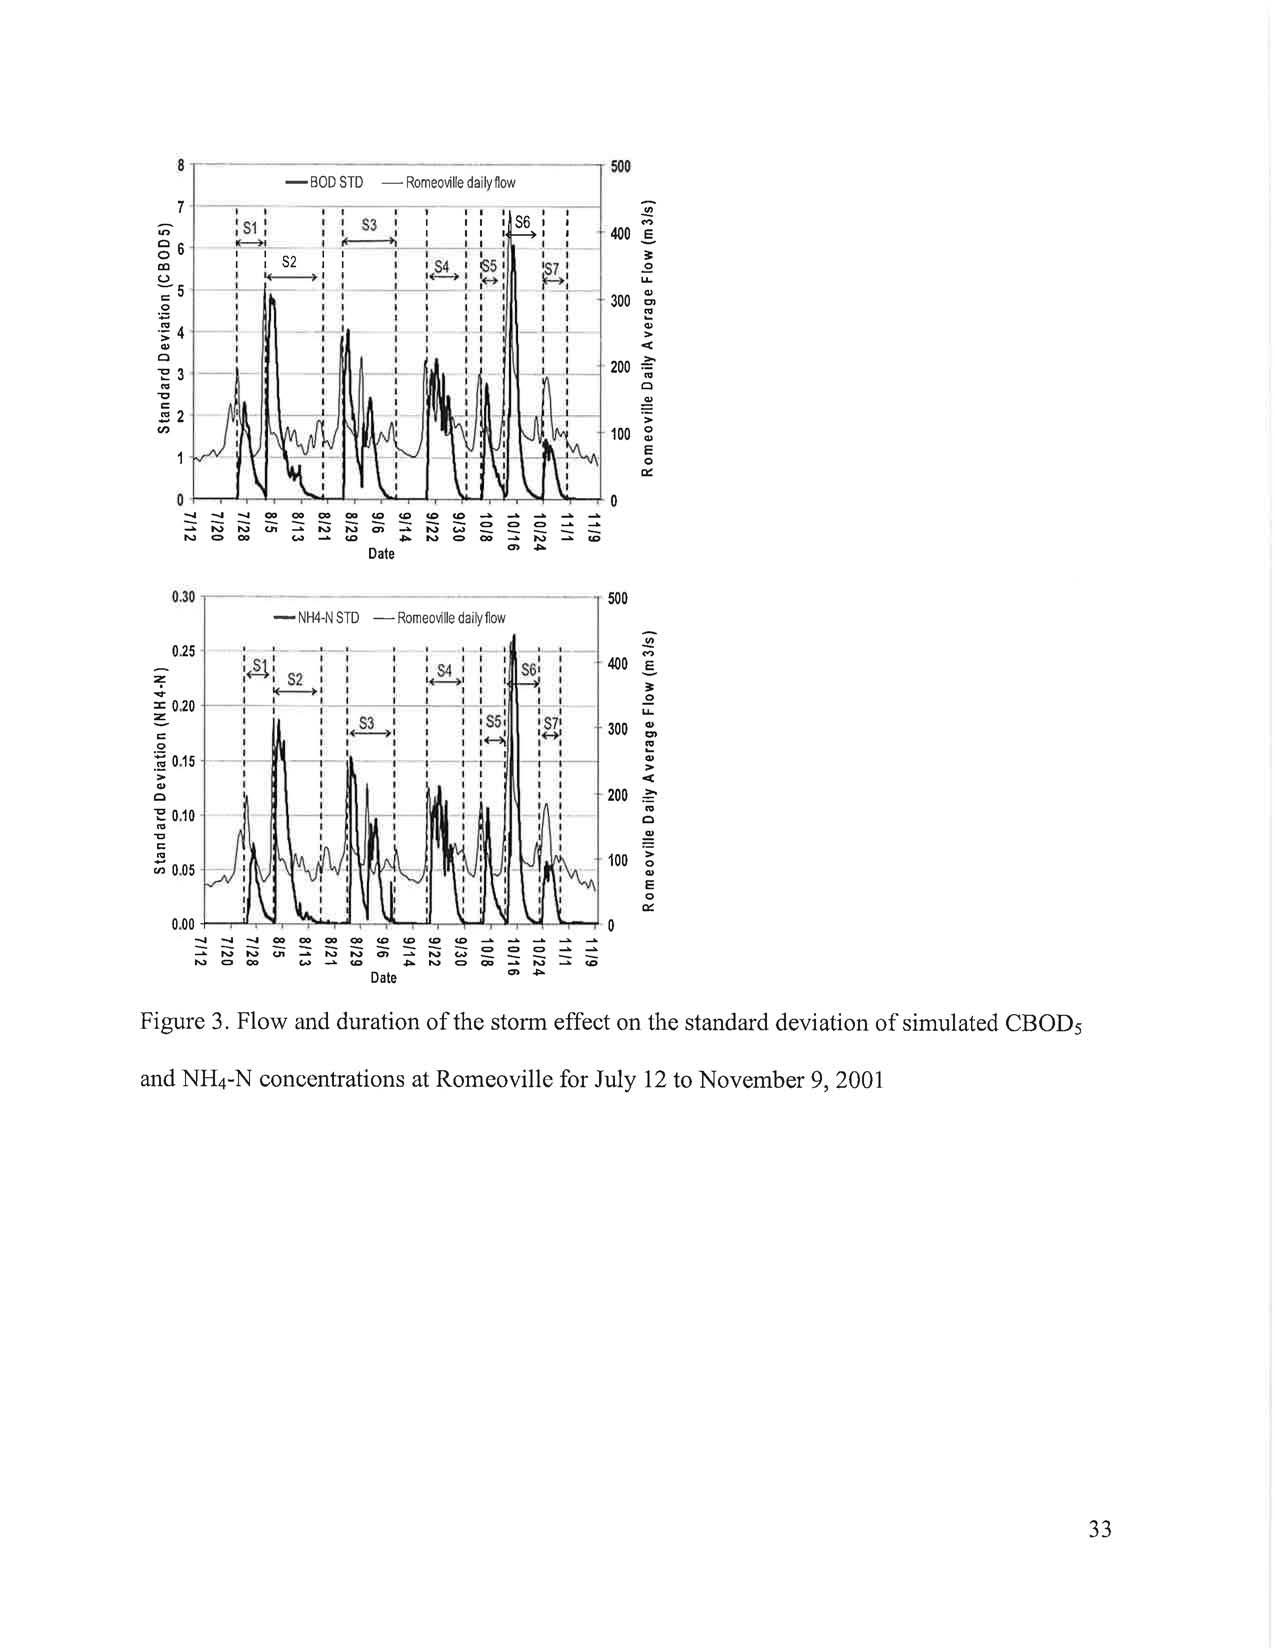
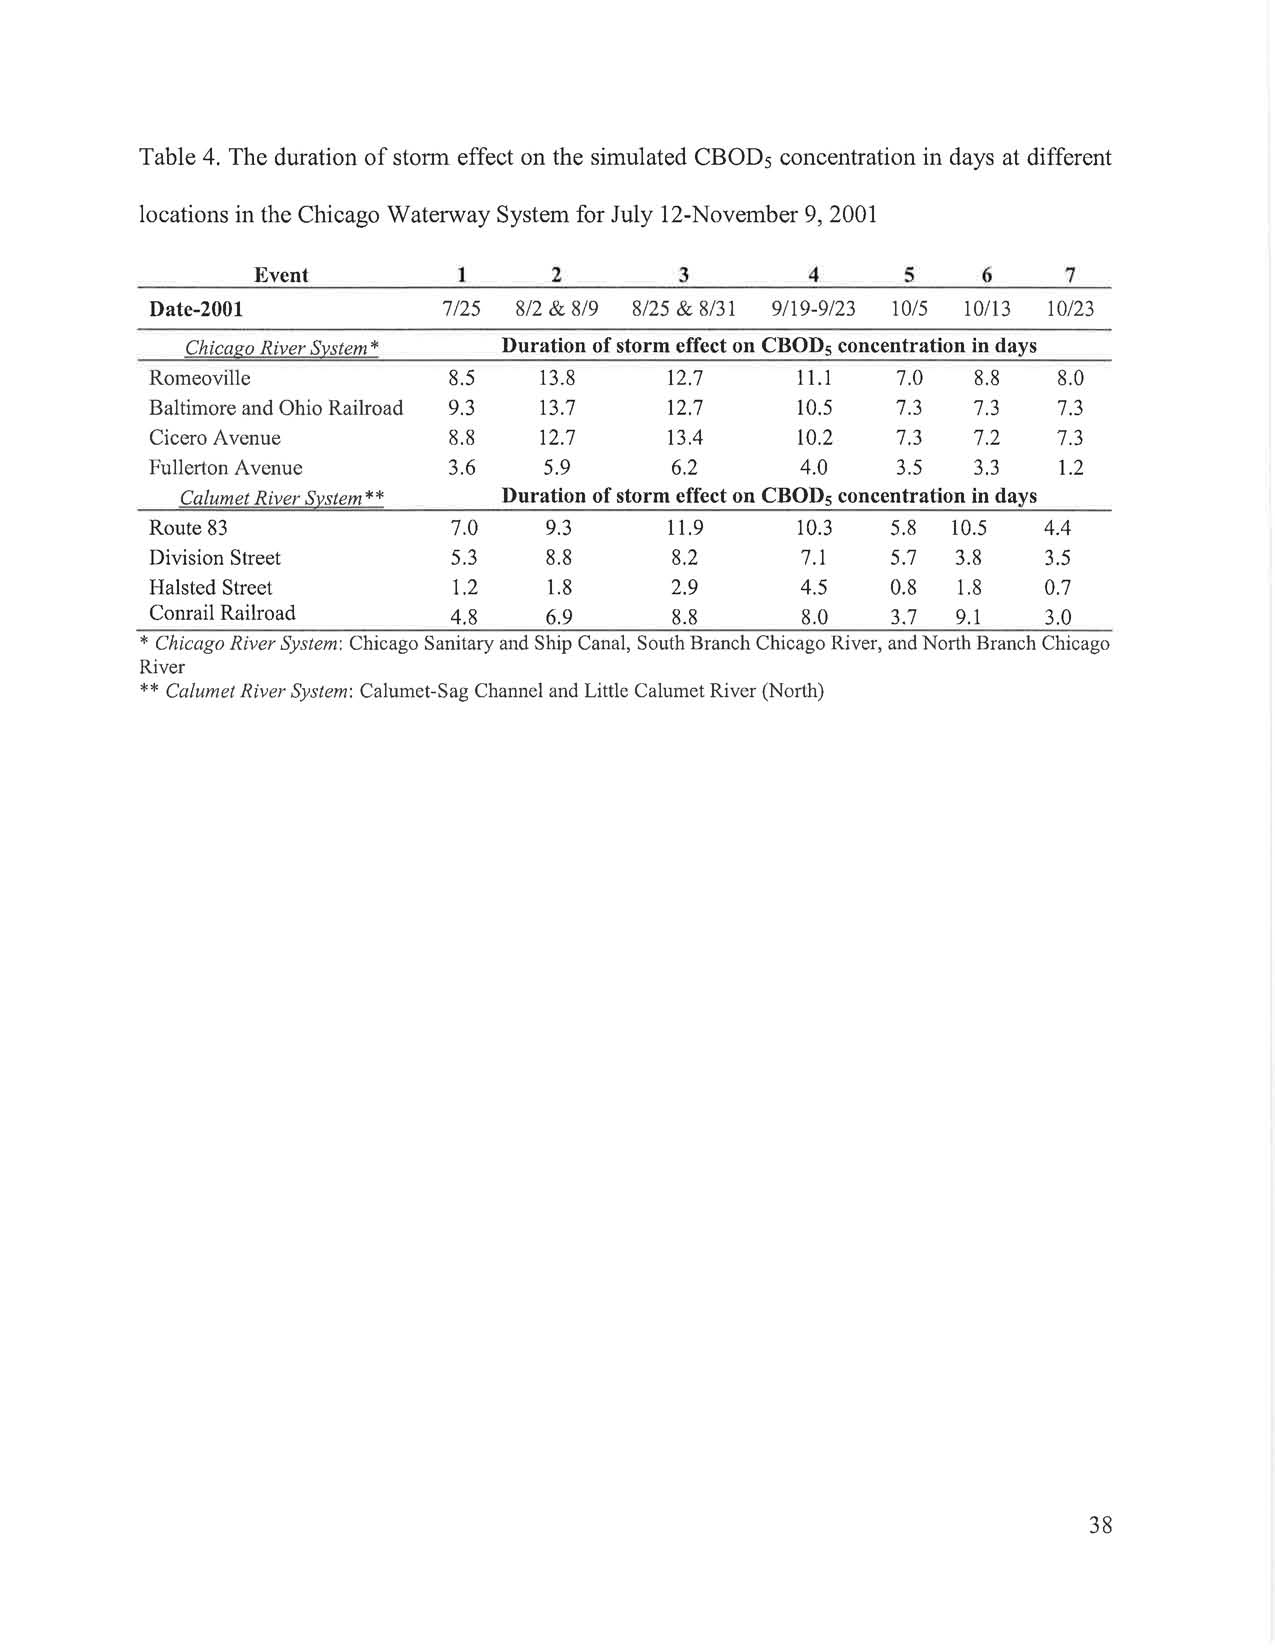
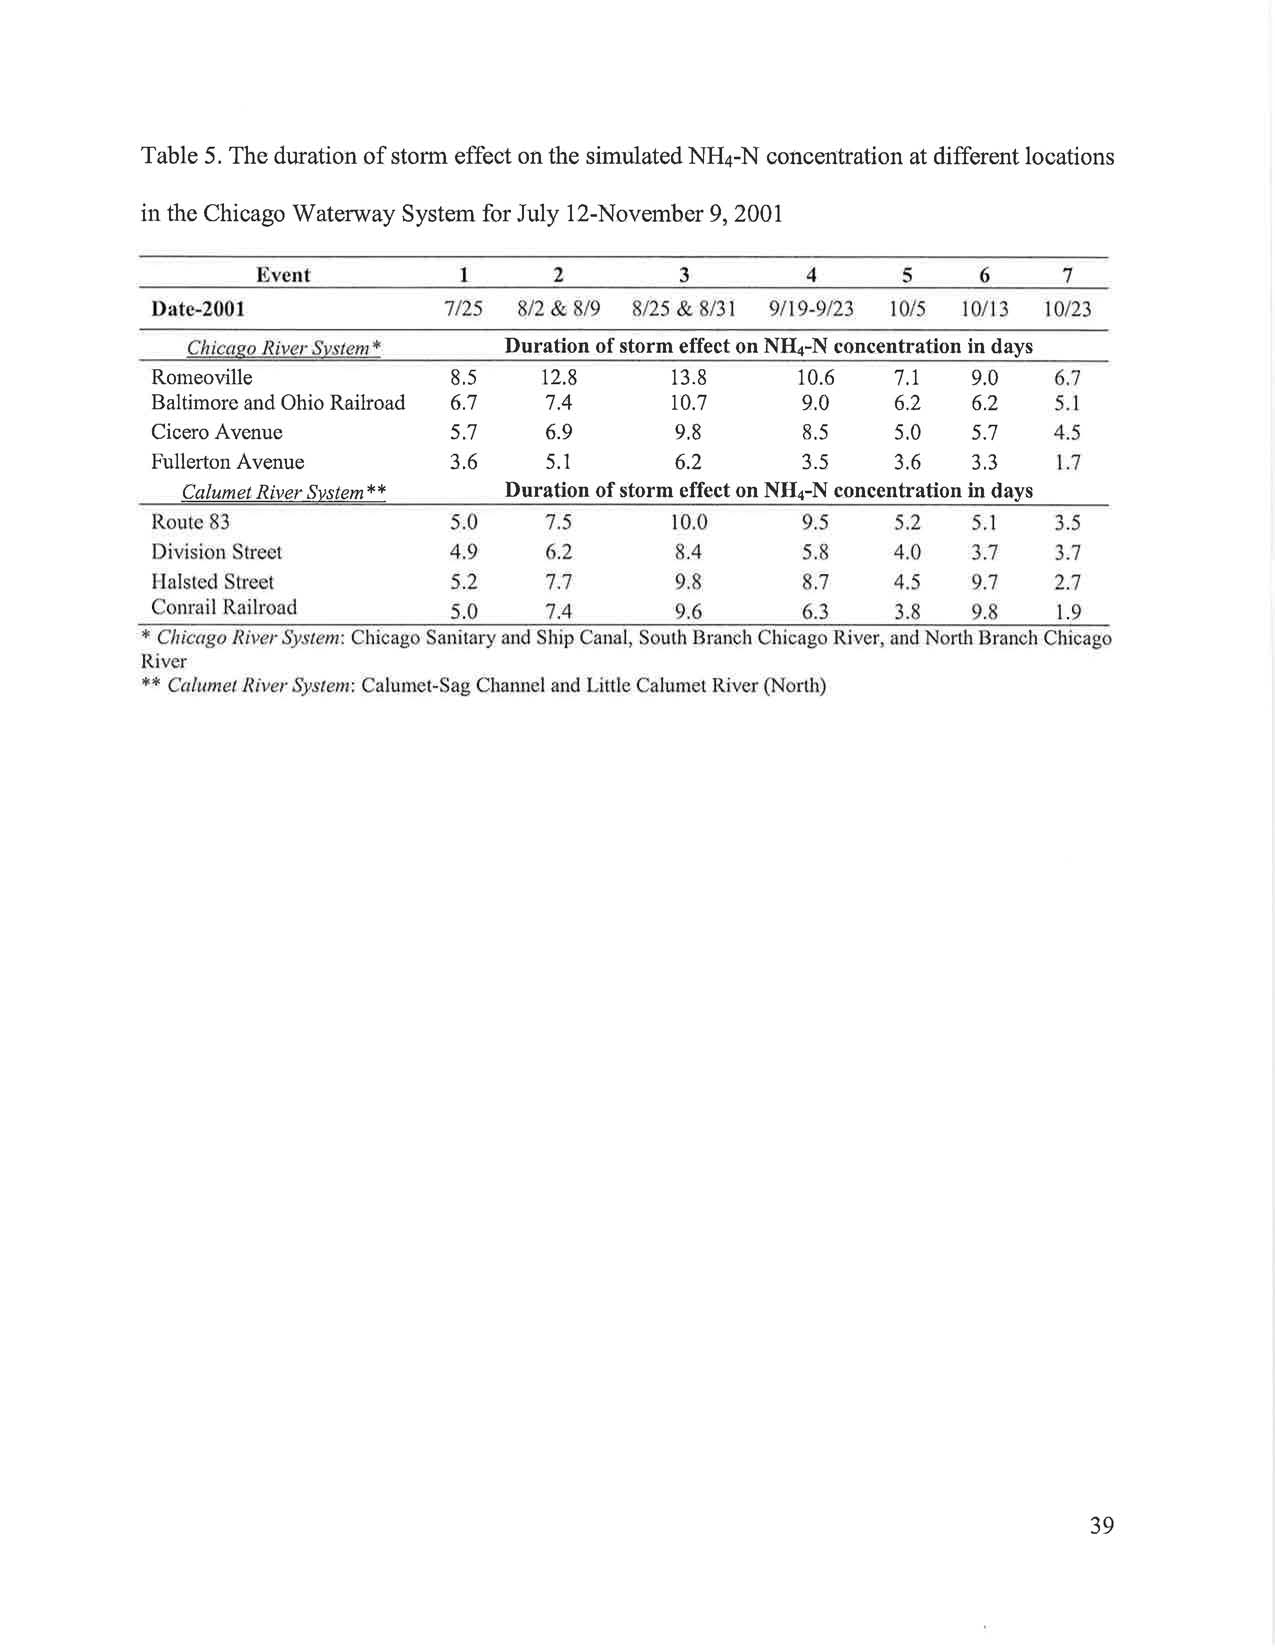
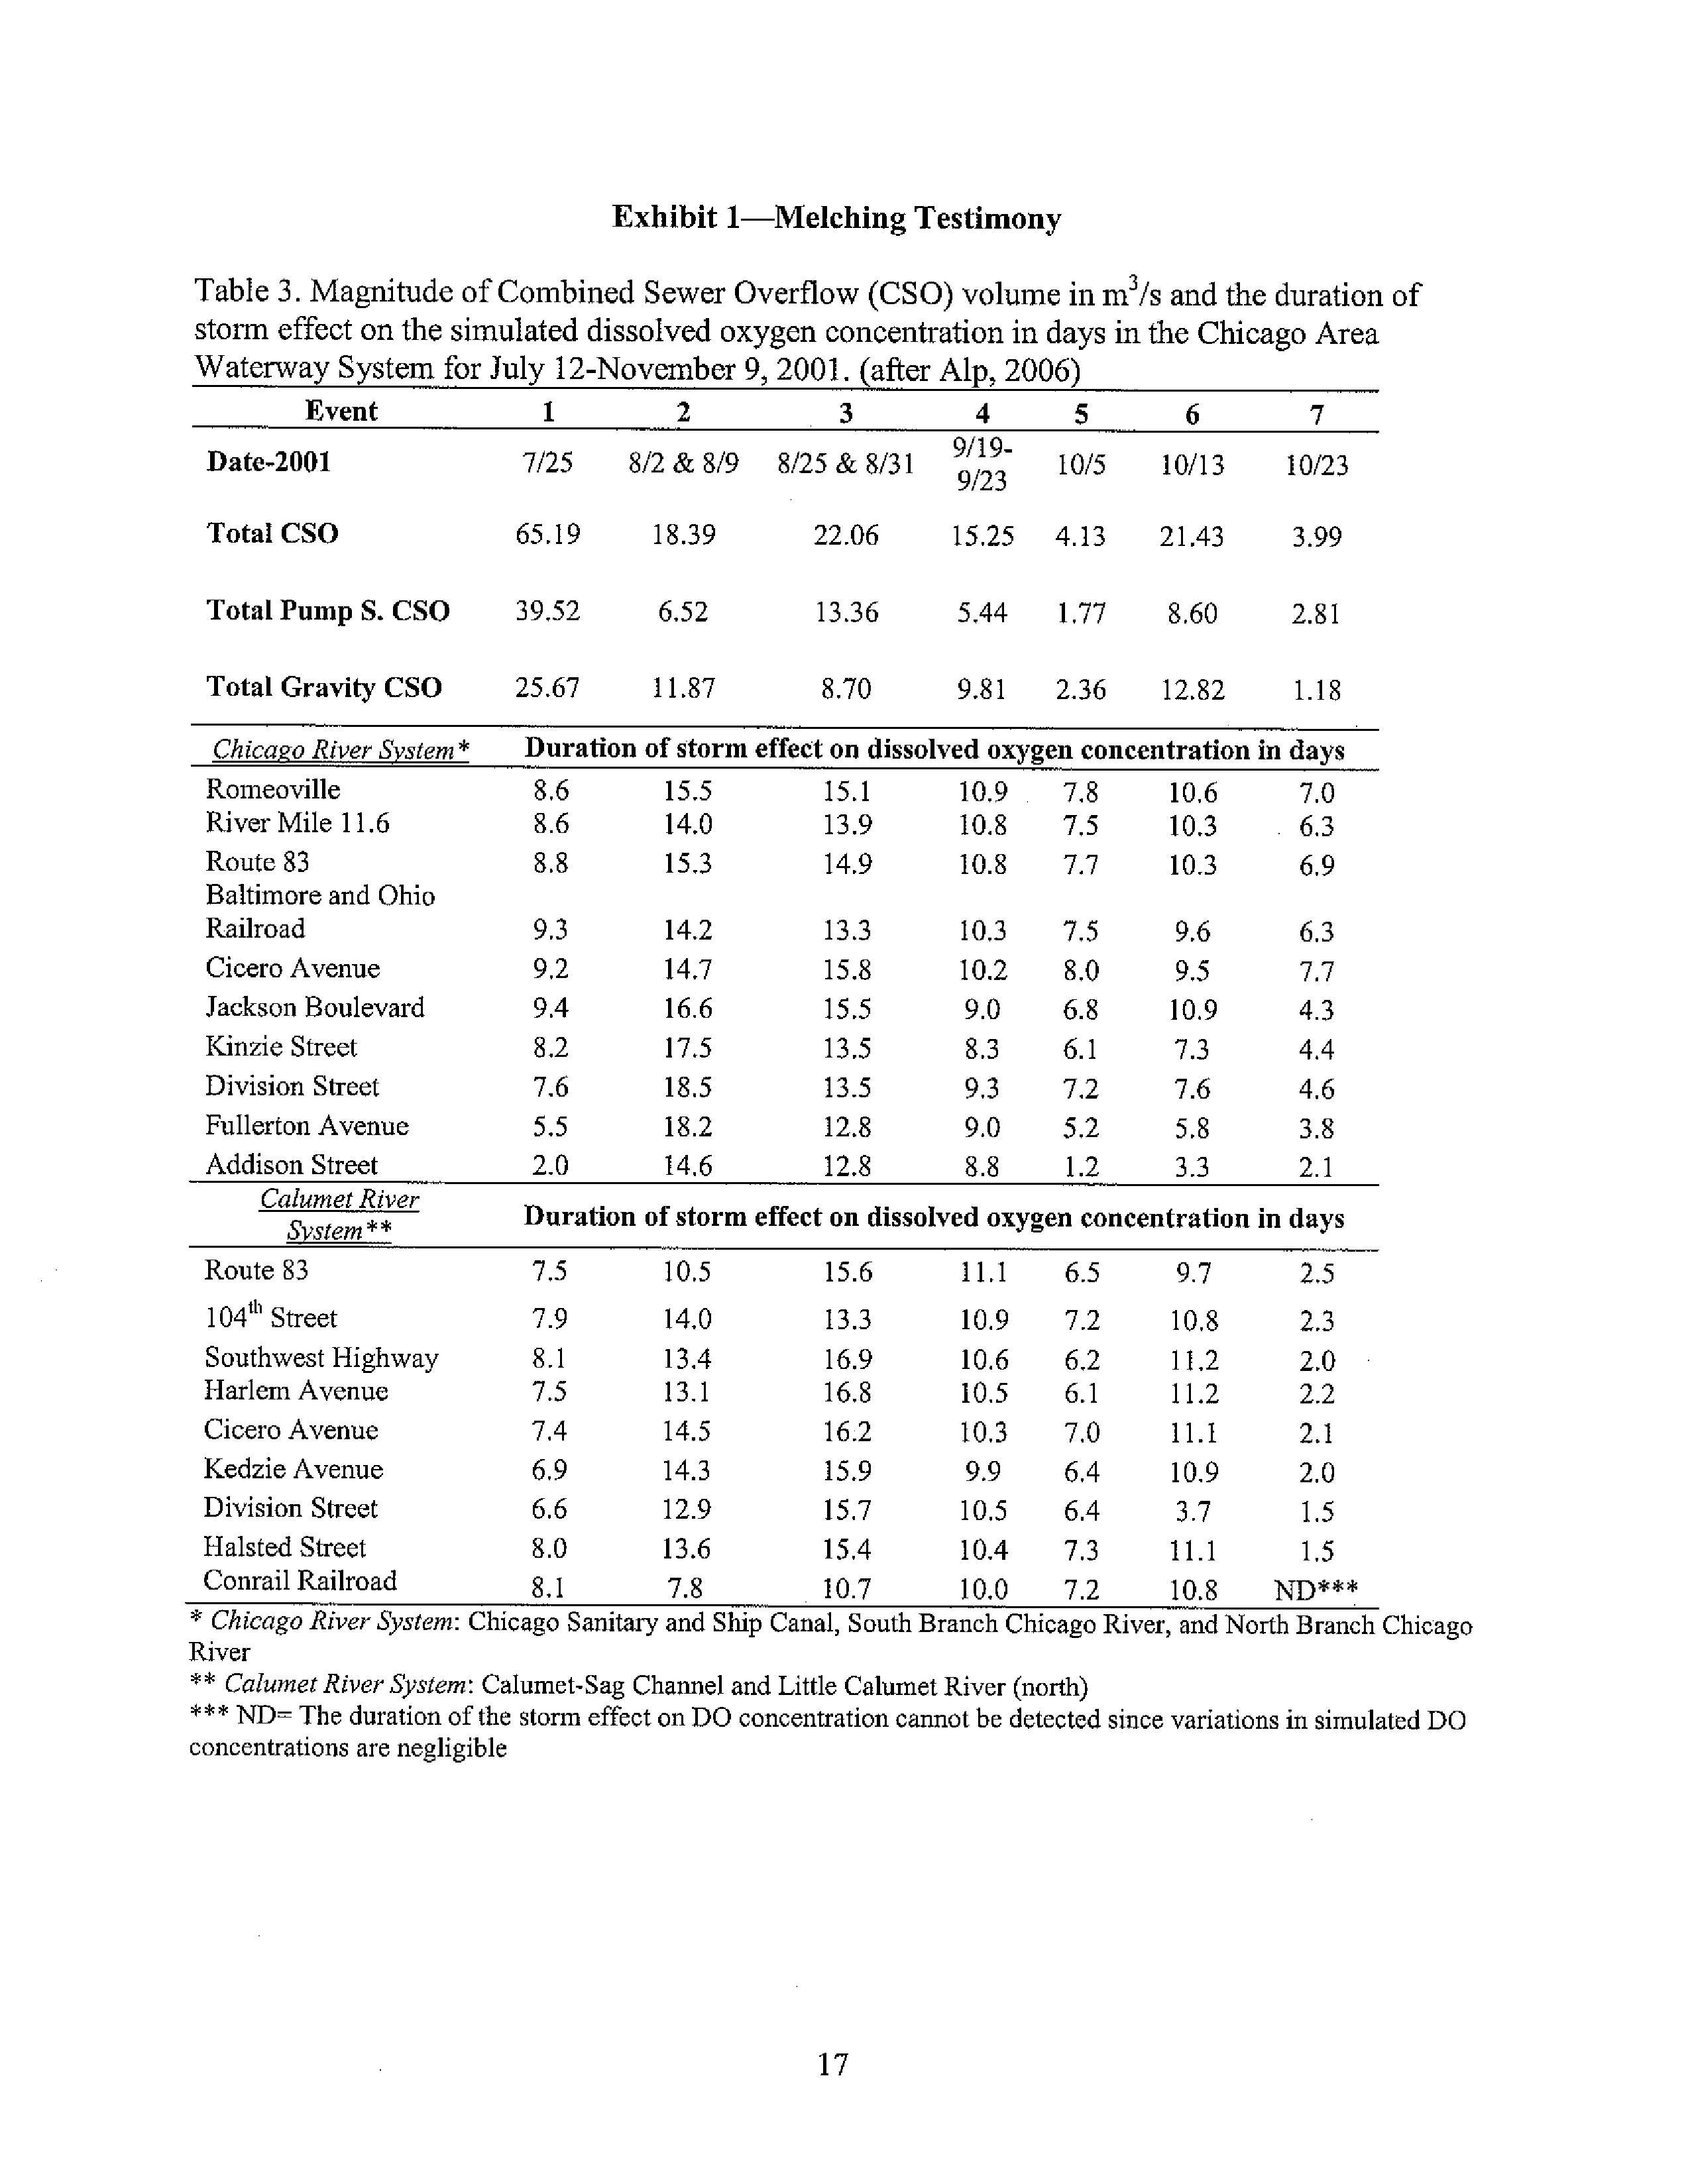
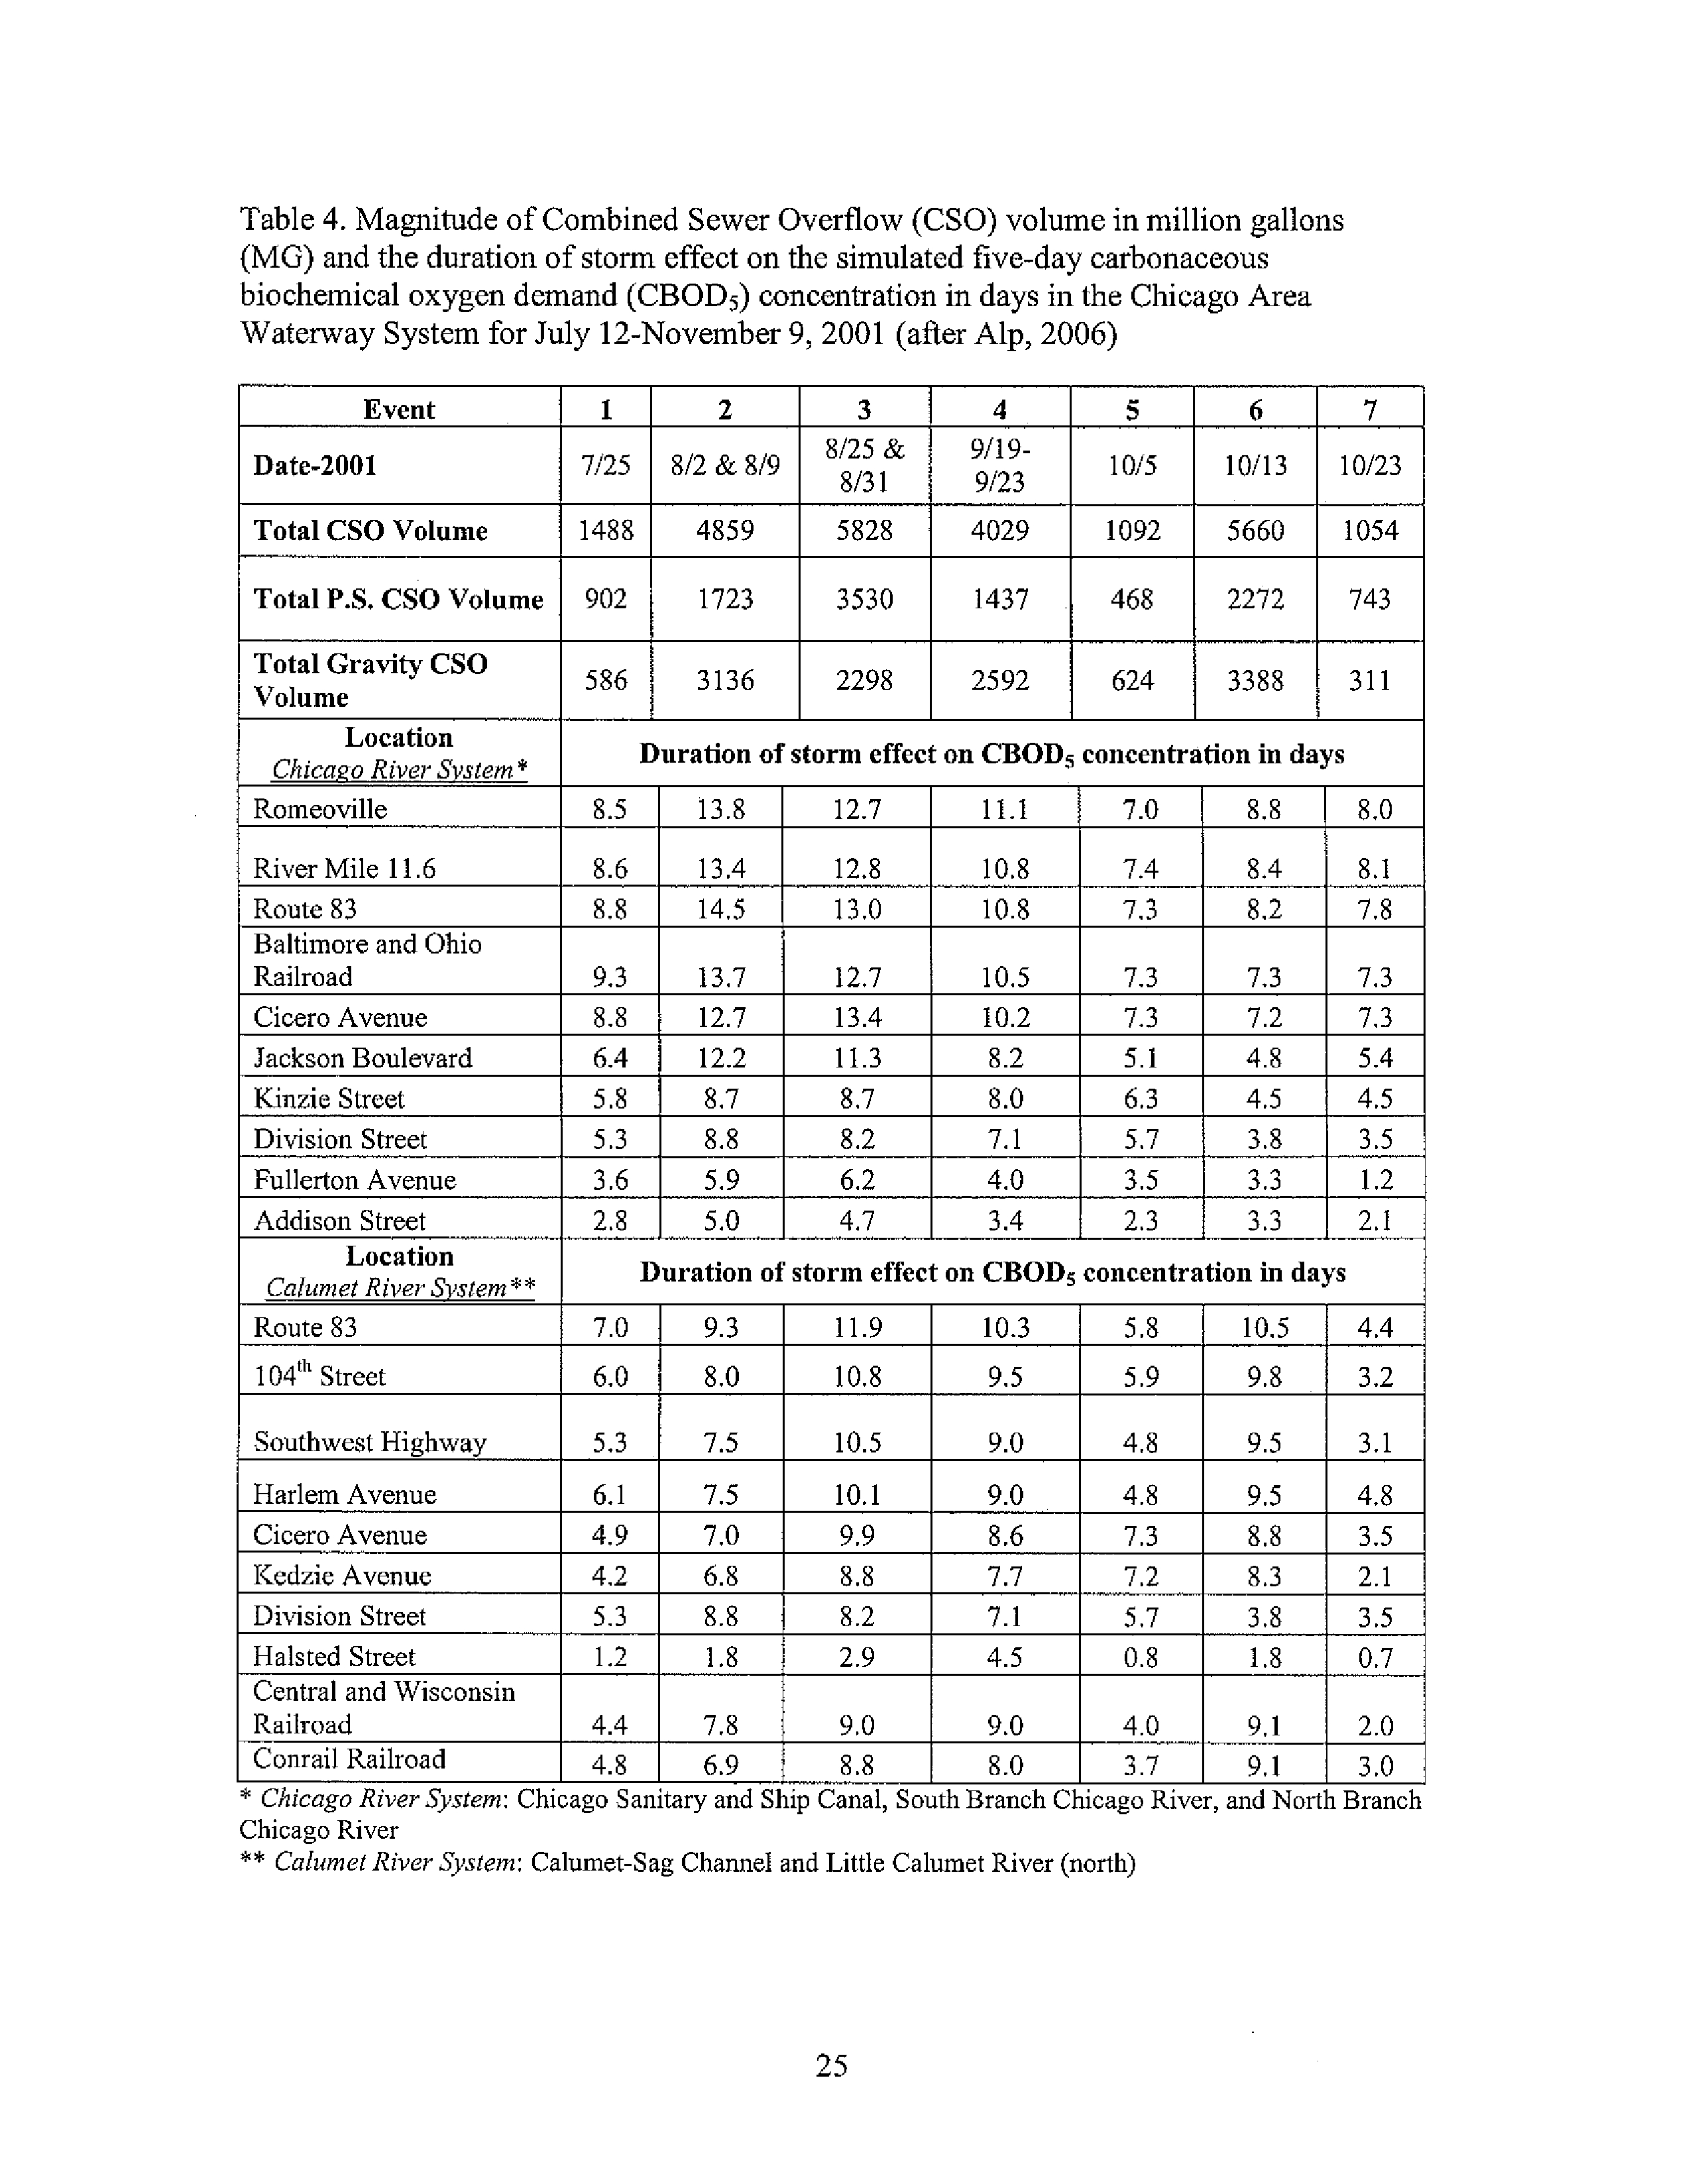
oxygen to drop below the proposed criteria. Alp and Melching (in press) identified that
precipitation and duration of storm effects on low dissolved oxygen levels in the CAWS are well
correlated.
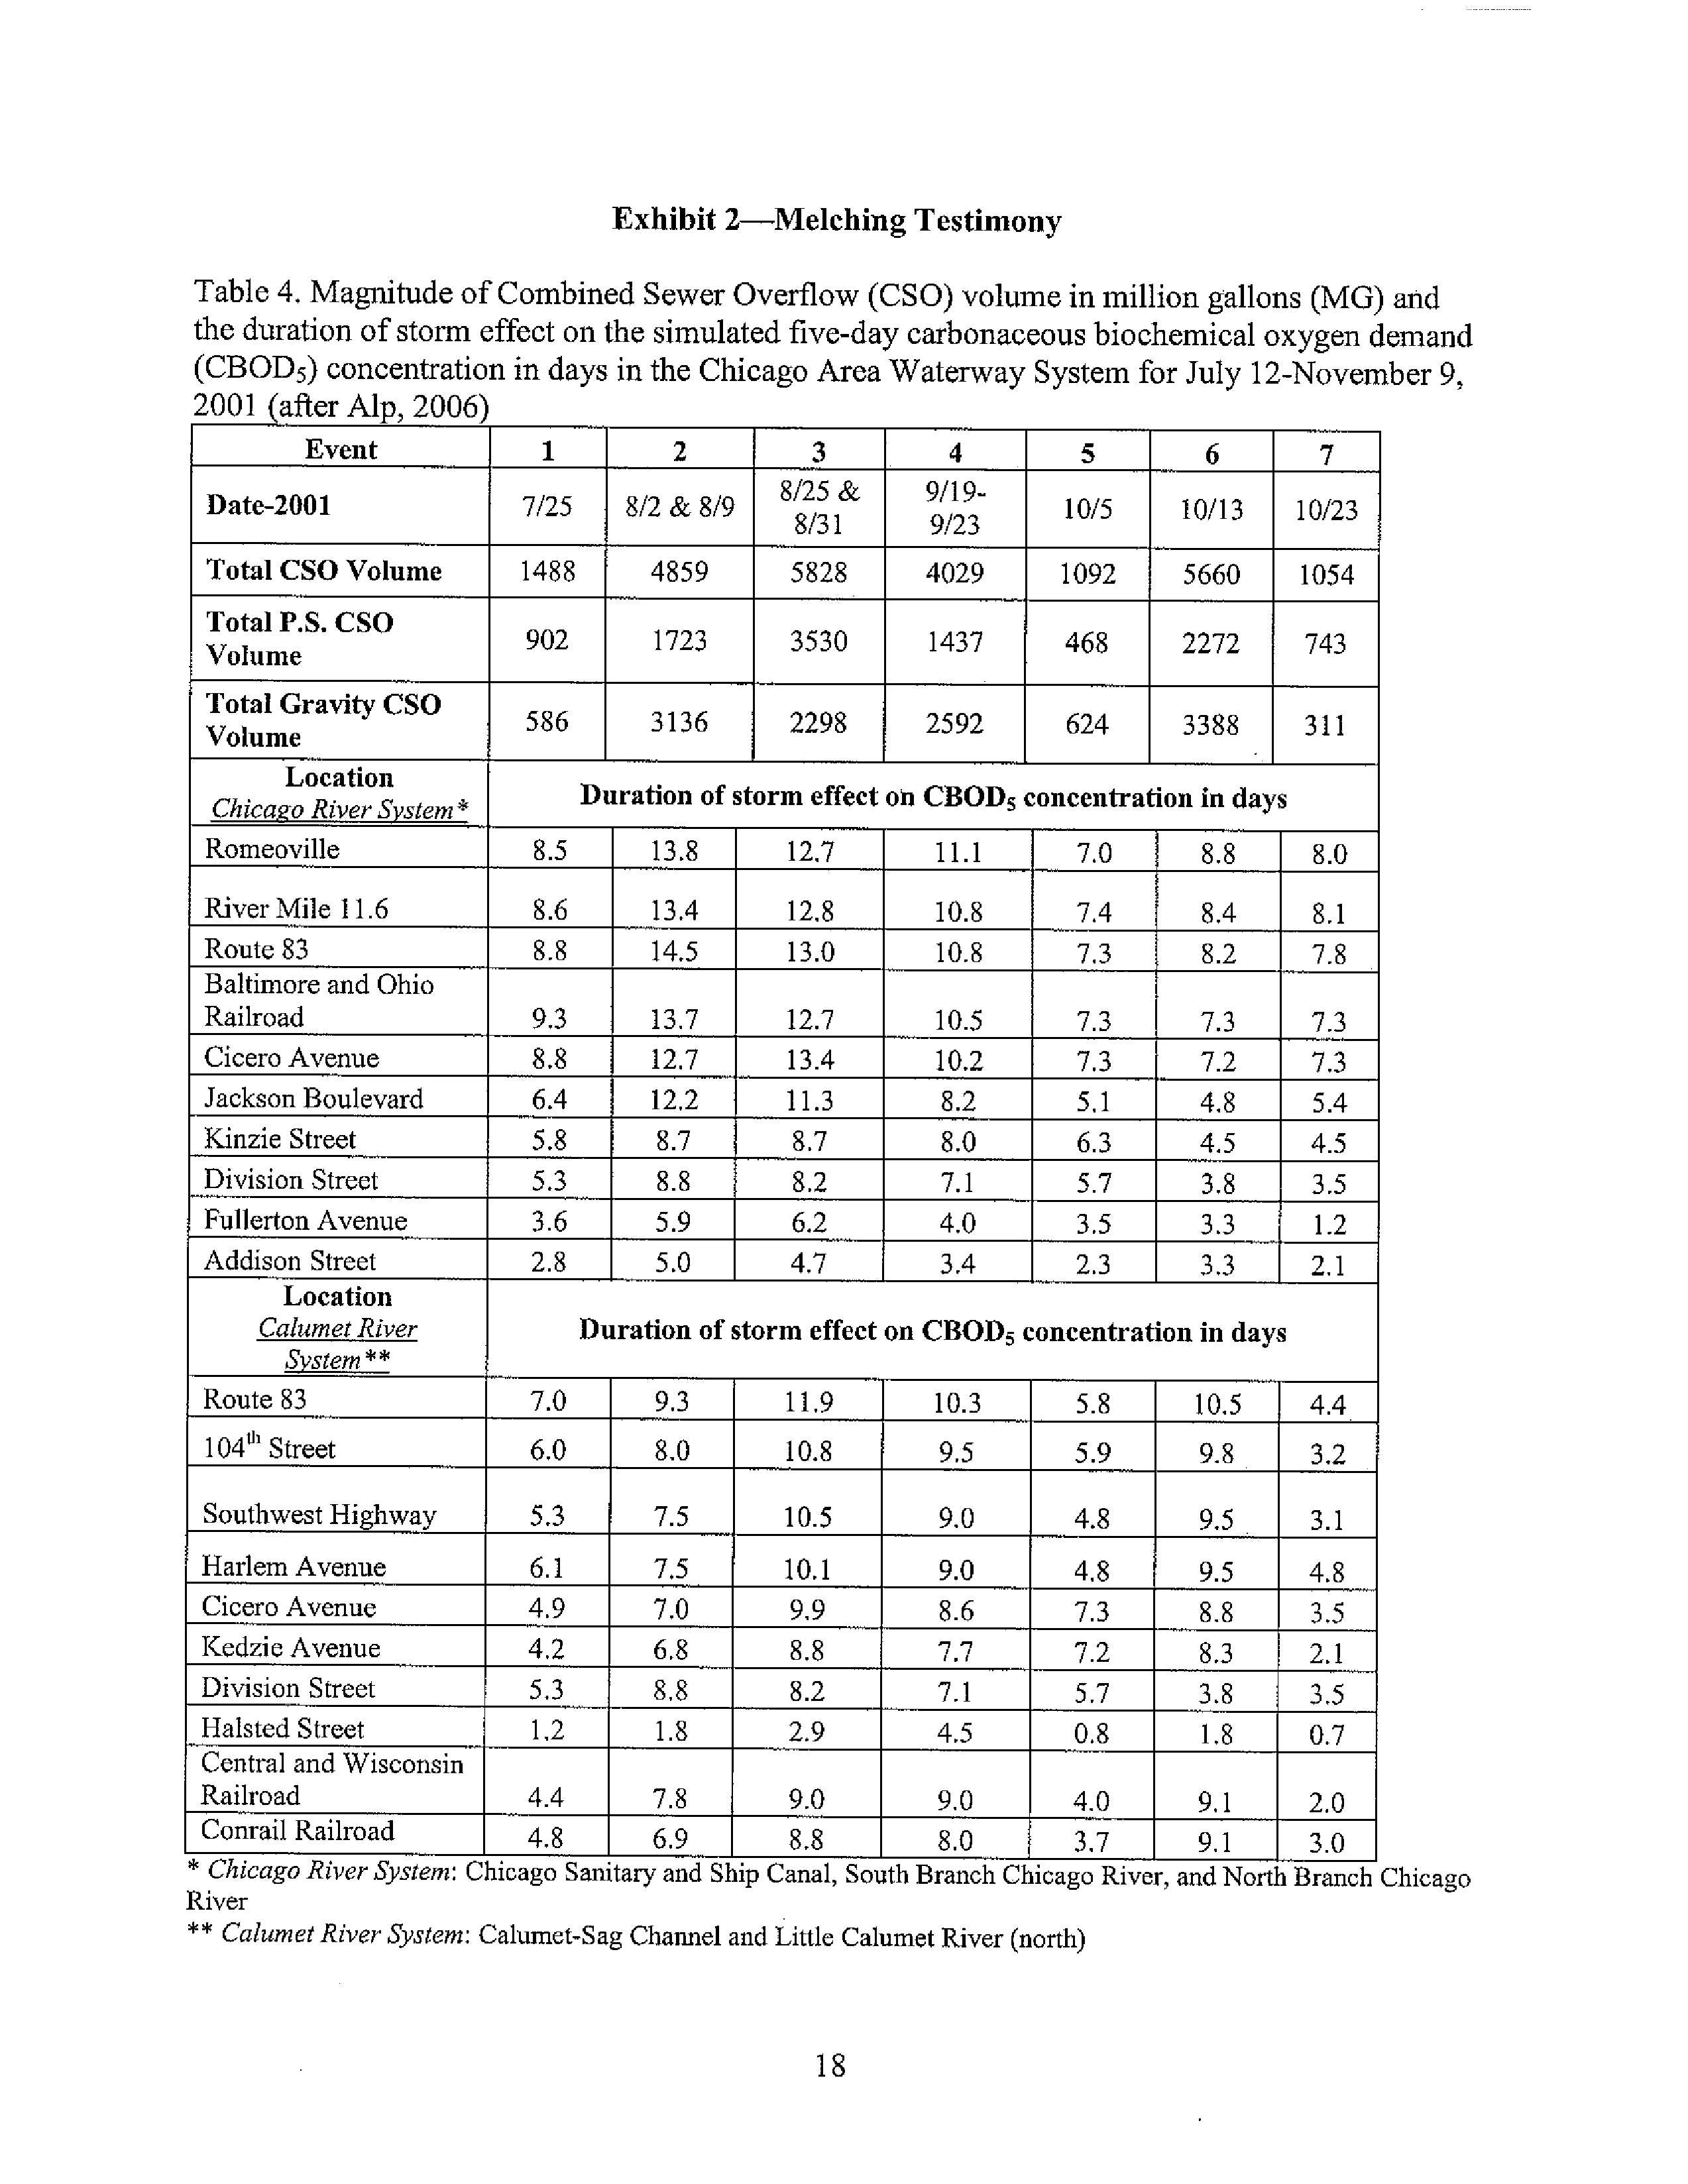
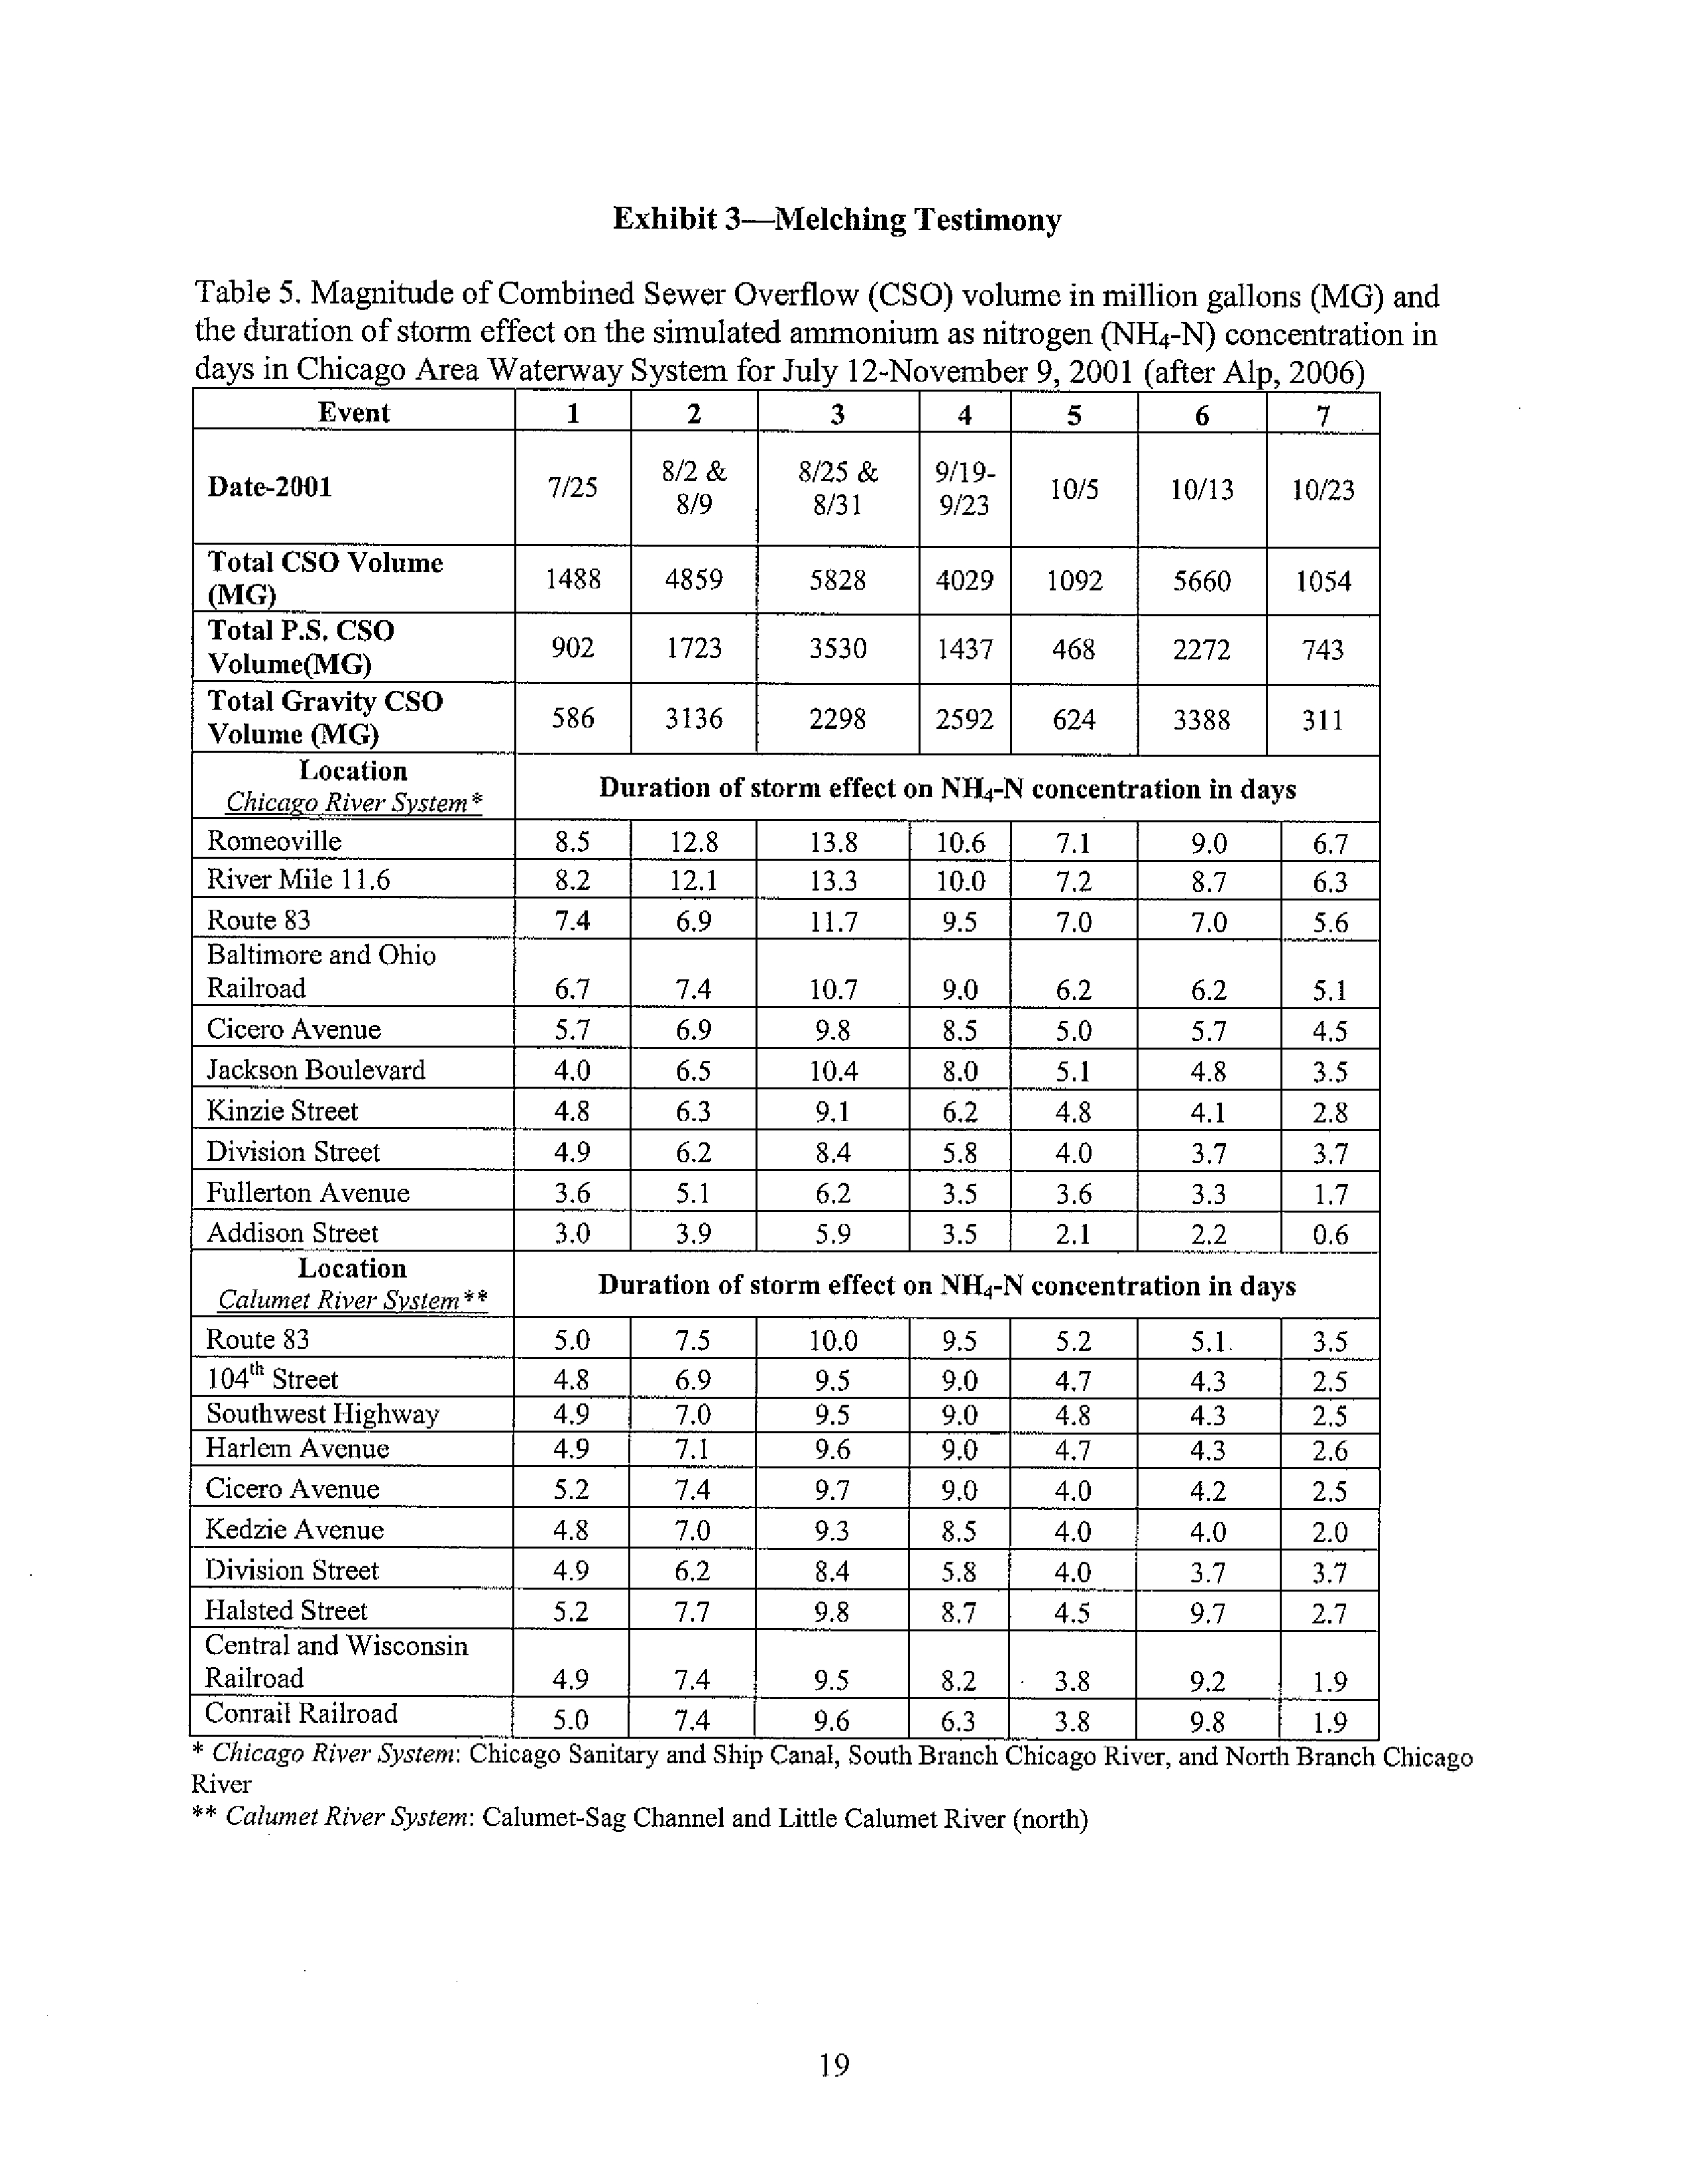
The magnitude, frequency and duration of these low dissolved oxygen conditions
varies from location to location and storm to storm as shown in Attachment 4.
IEPA did not identify the species of fish or benthic organisms that will benefit from the
proposed changes nor did the agency identify whether these species are adversely impacted by
periodic wet weather events. Furthermore, IEPA did not identify the magnitude, frequency or
duration of low dissolved oxygen events that could be tolerated by these species. Data from the
District's continuous dissolved oxygen monitoring network shows that the magnitude, frequency,
and duration of the CSO impacts varies from location to location and from storm to storm. These
data show that the dissolved oxygen can get very low (zero to two milligrams per liter) at times
and these impacts can last several days to a week at some locations.
As stated in testimony of Samuel Dennison, the ability of fish to avoid the low dissolved
oxygen segments may explain the lack of frequent fish kills throughout the system in spite of
dissolved oxygen levels that routinely drop below IEPA's proposed minimum criteria of 3.5
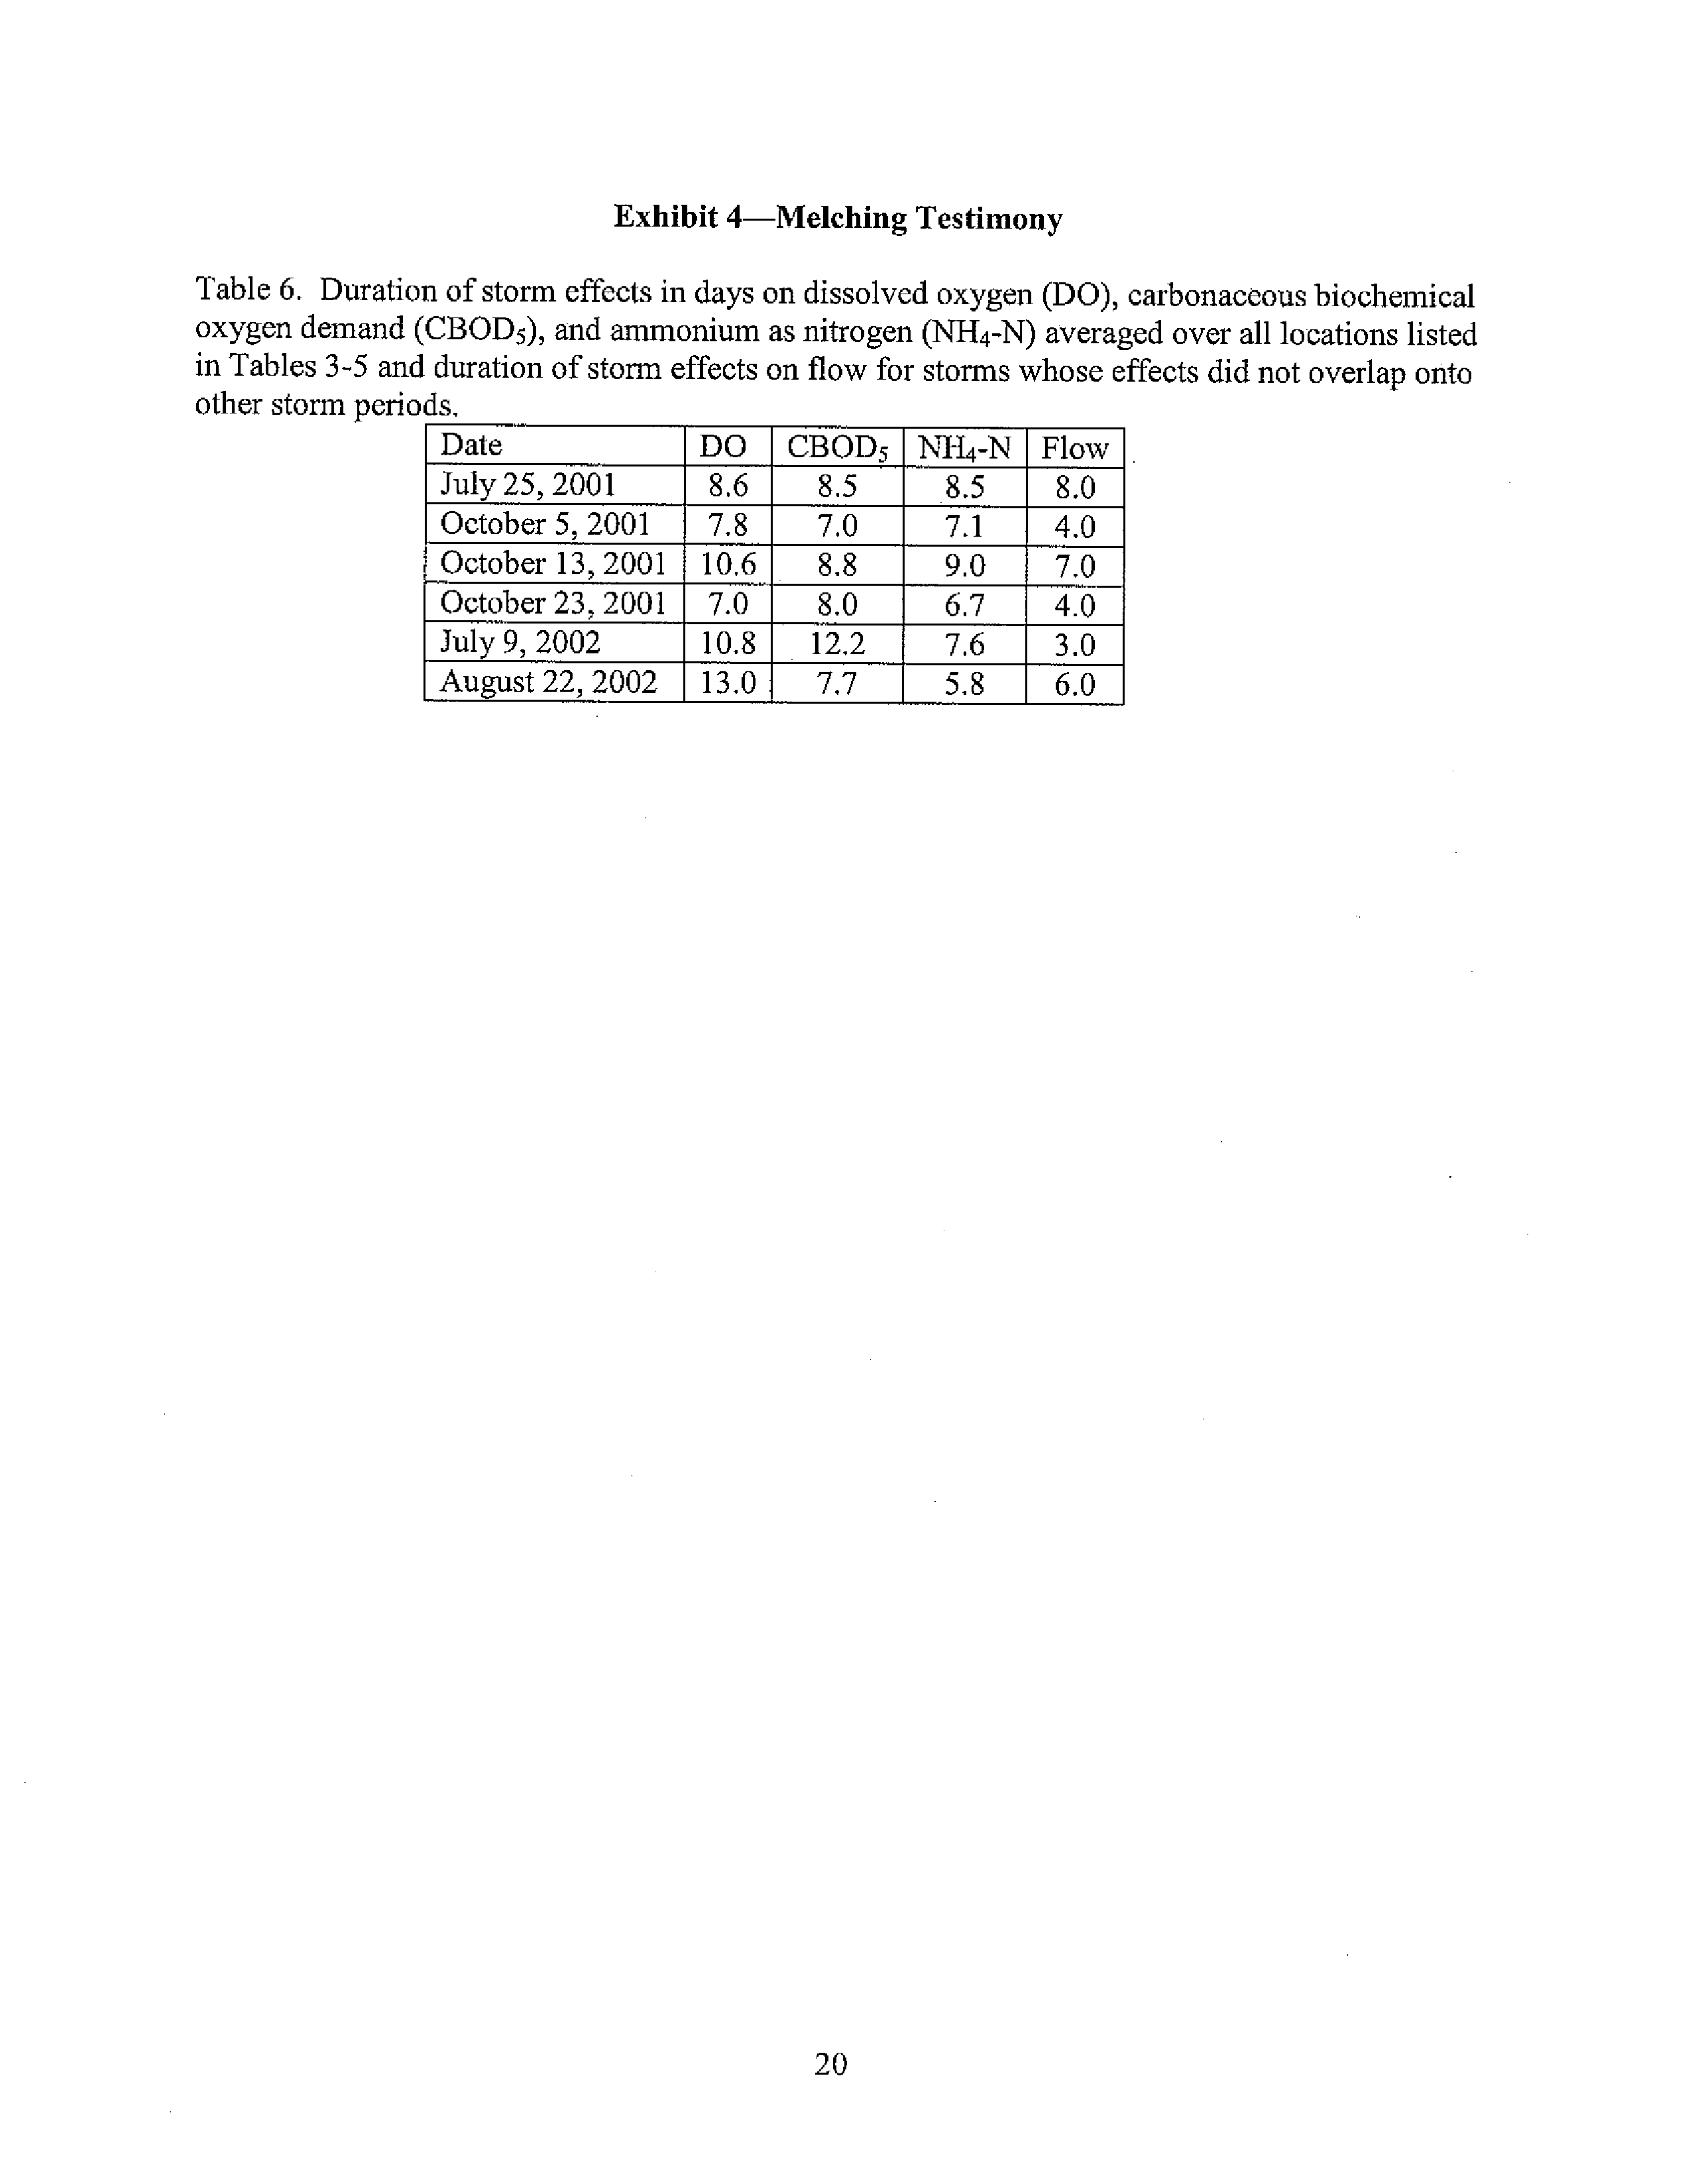
mg/l. These conditions are likely to remain as long as there are wet weather sources. For
example, as shown in Attachment 4, low dissolved oxygen levels are likely to remain even if the
gravity CSOs could be eliminated due to pump station discharges, sediment resuspension,
stormwater runoff, and tributary loads.
3. IEPA did not evaluate whether
provisions
could be
designed
to protect the proposed
aquatic life and recreational uses when
the CAWs are impacted by wet weather.
In research on UAAs, Freedman et al (2007, p. 1-4) notes that wet weather sources
"create unique issues in the context of meeting water quality standards because of the difficulty
of tracking these sources and the expenses associated with controlling them... therefore, having
realistic attainable standards as the regulatory target is critical." US EPA's guidance on using
flow duration curves in Total Maximum Daily Loads, for example, specifically mentions that
criteria could explicitly state applicability under certain conditions (e.g., dry weather or 7Q10
flow) to reduce the importance of the criteria during conditions such as wet weather (US EPA,
2007, p. 12). IEPA did not document that it considered the need to establish realistic attainable
targets for wet weather conditions in its proposed rulemaking.
Furthermore, a key principle of the 1994 CSO Policy is "[r]eview and revision, as
appropriate, of water quality standards and their implementation procedures when developing
CSO control plans to reflect site-specific wet weather impacts of CSOs" (59 FR 18688). In
response to directives from Congress, US EPA developed guidance in 2001 for coordinating
water quality standards reviews for water bodies where long-term CSO control plans will be
implemented because "implementation of this principle has not progressed as quickly as
expected" (US EPA, 2001, p. i).
6
IEPA indicates that the proposed dissolved oxygen criteria cannot be met during wet
weather. IEPA states:
"The existing Secondary Contact and Indigenous Aquatic Life dissolved oxygen
standards applicable to these waters are 3.0 mg/L in the Calumet-Sag Channel and
4.0 m/1 in the rest of the waters, and are frequently violated during wet weather
periods. During periods when wet weather causes CSO discharges to impact the
CAWS and Lower Des Plaines River, dissolved oxygen levels can drop to zero.
Similarly, at least until the Tunnel and Reservoir Project is complete in 2016, it is
highly likely the proposed dissolved oxygen standards will be violated" (IEPA, 2007,
p. 61).
IEPA should have considered the wet weather discharges in this standards review given
that the District has an approved plan -the Tunnel and Reservoir Project - for controlling
CSOs. As described in US EPA (2001), one of US EPA's goals in developing the water quality
standards' review guidance was "for states to review and revise water quality standards as
appropriate to ensure they are attainable." US EPA identifies a number of options that states can
pursue in adopting standards that recognize the impact of wet weather discharges. These
approaches include segmenting the water body; adopting subclasses to recognize intermittent
exceedances of criteria or physical characteristics and/or ecological systems; and high flow
cutoffs.
Several states have modified their water quality standards to reflect the challenges
associated with attaining uses during wet weather (Freedman, 2007, p. ES-5). Examples include
state legislation in Indiana, Maine, and Massachusetts as described in Attachment 3. Indiana
allows for a temporary suspension of the recreational uses if CSO discharges are in accordance
with an approved long-term control plan and a UAA. Massachusetts allows for a partial use
designation for recreational or aquatic life uses with a UAA or a variance. Maine allows for a
CSO subcategory where recreational and aquatic life uses may be temporarily suspended.
7
Several UAAs have also been conducted that allow for suspension of recreational uses due to
wet weather discharges (Attachment 3).
The District has made a significant investment in developing a water quality model that
can he used to assess the atta in ability
of
loth proposed
r
ec
reational us es and aquatic life uses,
and
th
is cnuld readily
b
e applied to ascertain the c onditions that
are caused
by wet weather.
The
appropriate path for establishing attainable uses for the CAWS would be to apply this model to
distinguish the effects of
dry
and wet weather s
ources; us
e
the results of the human health risk
assessment and epidemiological study; assess information Crom ongoing aquatic life and habitat
research; and asscss the economic and social impact to identify the controls necessary to attain
the proposed standards.
8
Respectfully
submitted,
fay:
Adrienne Nen
turca
Testimony Attachments
1.
Adrienne D. Nemura curriculum vita
2.
Description of the impact of the CSOs, pump station bypasses, and tributary runoff on
bacteria levels in the CAWS
3.
Examples of wet weather water quality standards
4.
Description of the impact of gravity CSOs and other wet weather discharges on
dissolved oxygen levels in the CAWS
5.
Alp, E. (2006)
REFERENCES
Alp, E. (2006). "A method to evaluate duration of the storm effects on in-stream water quality."
Ph.D. Thesis, Department of Civil and Environmental Engineering, Marquette University,
Milwaukee, WI.
Association of State and Interstate
Water Pollution Control Agencies (ASIWPCA) (2005).
Pathogen Criteria White Paper. ASIWPCA Water Quality Standards Taskforce. Nov. 4.
CDM. (2007). Chicago Area Waterway System Use Attainability Analysis. 8-01-07 edits
version.
http://www.ipcb.state.il.us/documents/dsweb/Get/Document-59252/
Accessed Jan.
2008.
Freedman, P. and T. Dupuis, et al (2007). Factors for Success in Developing Use Attainability
Analyses.
Water Environment Research Federation. 04-WEM-1.
IEPA. (2007). Statement of Reasons in the Matter of Water Quality Standards and Effluent
Limitations for the Chicago Area Waterway System and the Lower Des Plaines River: Proposed
Amendments to 35 111 Adm. Code Parts 301, 302, 303, and 304.
US EPA (2001) Guidance: Coordinating CSO Long-Term Planning With Water Quality
Standards Reviews. EPA-833-R-01-002.htt-p://www.epa.gov/n-pdes/pubs/wqs guide final.pdf
US EPA (2007) An Approach for Using Load Duration Curves in the Development of TMDLs.
EPA 841-B-07-006. August.
9
A
tt
a
chm
e
nt 1
Adrienne D. Nemura, P.E.
Vice President
LimnoTech
Principal Expertise
•
Tackling Wet Weather Problems (CSO,
SSO, Stormwater, Peak Municipal
Treatment Plant Flows)
•
Expert Monitoring and Modeling for
Water Resource Decisions
•
Developing and Reviewing TMDLs and
Use Attainability Analyses
•
Negotiating Fair & Effective NPDES
Permits
•
Expert Support for Litigation and
Consent Decrees
•
Technical & Policy Support to Local
Governments
Education
MS
Civil Engineering
Virginia Polytechnic
Institute
and State University, Blacksburg, Virginia, 1986
BS
Civil Engineering
Virginia Polytechnic Institute and State University, Blacksburg, Virginia, 1984
Registration
/
Certification
Professional Engineer, Michigan, 1999 (#46150)
National Council of Examiners for Engineering and Surveying (#24958)
Experience Summary
Ms. Nemura manages LimnoTech's services for providing creative solutions for permits and water quality
regulations. She has 24 years of experience evaluating impacts of pollutant sources on watersheds and
waterways, is active in several national organizations, and is a routine speaker at national conferences on
water quality issues.
Ms. Nemura works for municipalities, industries, state and federal regulatory agencies, and attorneys on a
wide variety of environmental engineering projects. For example, she has:
•
Assisted a utility in implementing the country's first wet weather Consent Decree based on the
principles of watershed management;
•
Provided training for US EPA, States, and municipalities on the national Combined Sewer Overflow
(CSO) Policy and provided expert assistance to numerous municipalities in complying with the
Policy;
•
Directed water quality strategy discussions and monitoring and modeling programs for a significant
number of wastewater treatment plants and CSO communities; and
•
Assisted municipal and industrial clients in reviewing TMDLs, assessing water quality standards
compliance, obtaining fair and cost-effective permit limits, and serving as an expert witness in
litigation.
While at the Virginia Water Control Board, Ms. Nemura was responsible for pollution control for the
James and Appomattox Rivers. At the Metropolitan Washington Council of Governments, she
represented a large constituency of regulated parties and directed the region's water resource programs.
Professional and Academic Appointments
Vice President
Apr. 2007 -
Present
LimnoTech
Ann Arbor, Michigan
Senior Manager
Jul. 2003 - Apr. 2007
Senior Environmental Engineer
Aug. 1997 -
Jun. 2003
Water
Resources Program
Director
Jan. 1997 - Aug. 1997
Chief, Water Quality Management &
Administrative & Technical Services
1992 - 1996
Section Manager, Water Quality
Modeling and Technical Support
1991-1992
Senior Environmental Engineer
1990-1991
Environmental Engineer
1988-1990
Water Resources Engineer
1986-1988
Cooperative Education Student
1981-1984
LimnoTech
Ann Arbor, Michigan
Limno-Tech, Inc.
Ann Arbor, Michigan
Metropolitan Washington Council of Governments
Washington, DC
Metropolitan Washington Council of Governments
Washington, DC
Metropolitan Washington Council of Governments
Washington, DC
Metropolitan Washington Council of Governments
Washington, DC
Metropolitan Washington Council of Governments
Washington, DC
Virginia Water Control Board
Richmond, Virginia
GKY and Associates, Inc.
Roanoke and Springfield, Virginia
Professional and Service Organization Affiliations
National Association of Clean Water Agencies (NACWA), 2002 - Present.
NACWA Emerging Contaminants Workgroup, 2006 - Present.
Water Environment Federation (WEF), 1998 - Present.
WEF Secondary Treatment Water Quality Workgroup, 2008 - Present.
American Society of Civil Engineers, 1984 - Present.
Chi Epsilon, 1980 -Present.
Charter Member. Avis Farms Toastmasters, 2001 - Present.
Board Member. Therapeutic Riding, Inc. 2004 - Present.
LimnoTech
Revised
7125108
Adrienne D. Nemura
Page 2
Selected Experience
Regulatory Support
Water Quality Regulations Support for the Chairman of the ORSANCO POTW Committee. Expert
review of proposed revisions to water quality standards and development of a bacterial TMDL for the
Ohio River. (Apr. 2008 - Present, <5%).
Advisory Panel for National Association of Clean Water Agencies v. EPA in the BEACH Act Case.
2:2006cv04843. Assist NACWA's counsel and expert witness in preparing testimony and negotiating a
multi-party settlement agreement (Jul. 2007 - Present, <5%).
Member, Strategic Advisory Team for Sanitation District No. 1 of Northern Kentucky. Provide strategic
advice to the District on development of watershed plans to meet the requirements of the country's first
consent decree for CSOs and SSOs that is based on the watershed approach (Jun. 2006 - Present, <5%).
Expert Witness for Northeast Ohio Regional Sewer District. Successfully represented the client in
demonstrating that an extensive data collection program proposed by EPA was not needed for making
decisions about the adequacy of the District's CSO long-term control plans. Case No. 1:07 CV 23(Feb. to
Mar. 2007, <5%).
Factors for Success in Developing Use Attainability Analyses. Senior engineer on research for the
Water Environment Research Federation on successes and failures associated with UAAs, particularly for
wet weather, urban, effluent dependent and effluent dominated water bodies. (Feb. to Nov. 2006, <5%).
Expert Witness for Colorado Springs Utilities. Analyzed information to assess water quality impacts
associated with SSOs and spills of reclaimed water. (Jun. 2006 - Feb. 2008, <5%).
Review of Proposed Revisions to the District of Columbia's Water Quality Standards. Senior
Manager for review and comment on the proposed changes to water quality standards that address Federal
criteria for bacteria, dissolved oxygen, clarity, and chlorophyll a. (Jan. 2005 to Oct. 2005, <5%)
National Combined Sewer Overflow Policy Support 1999 to Mar. 2007. Senior Engineer involved in
the development of guidance
manuals and training
for the combined sewer overflow policy. Assisted
in the development of the guidance manual Review of Long-Term Control Plans (10/01-2/02, 2%) to
assist federal and state regulatory agencies in approving long-term control plans. Conducted training for
EPA and state water quality agencies in Indianapolis, IN (2/02), Harrisburg, PA (3/02), Chicago, IL
(7/03), Buffalo, NY (10/04), Albany, NY (11/04), Philadelphia (12/04), and Covington, KY (9/05) on
developing and reviewing LTCPs. Reviewed two LTCPs for state regulatory
agencies
in Ohio (8-9/06)
and one for Illinois (3/07). Member of a senior technical team responsible for reviewing development of
the EPA guidance document for Coordinating CSO Long-term Control Planning with Water Quality
Standards Reviews (5/00-6/01, 2%). Presented the receiving water monitoring and modeling chapters of
the EPA guidance manual on CSO Monitoring and Modeling in Washington, PA (9/99). Provided
training on conducting CSO and SSO inspections in Chicago, IL (11/03). Author of a chapter on the
resources spent on sewer overflows for the 2004 Report to Congress on the Impacts of CSOs and
SSOs and senior reviewer of remaining chapters (3/03 - 7/04). Provided senior review of development of
case studies for the EPA Report to Congress on the Status of Long-term Control Plans (4/01-6/01,
2%).
Administrative Record Review for a Draft NPDES Permit for the Washington Aqueduct Water
Treatment Plant in Washington, D.C. Project manager supporting EPA Region 3 in a confidential
administrative project for establishing permit conditions for the Aqueduct for total suspended solids and
aluminum. Managed potential conflict-of-interest issues for LTI. Co-authored a report summarizing
EPA's best professional judgment for establishing permit limits and assisted EPA in responding to
comments. (Oct. 2002 - May 2003, 4%)
LimnoTech
Revised
7125108
Adrienne D. Nemura
Page 3
Mica Bay, Idaho - NPDES Storm
Water Case
Development
Support. Project manager supporting
EPA Region 10 in a confidential enforcement case against the Idaho Transportation Department and its
contractor. Developed an efficient work plan to accommodate limited time and resources, directed work,
and provided senior review of the report. (Nov. 2002 - Jan. 2003, 15%)
Preparation of SSO Case Studies
for EPA
to Assess the Effectiveness of Abatement Efforts and
Regulatory Programs.
Provided senior review and guidance on the development of three case studies on
sanitary sewer overflow (SSO) abatement across the United States. EPA is using the results of the case
studies to formulate an SSO control policy (Oct. 1997 - May 1998, <2%).
Virginia
State
Water
Control Board Pollution Response Team
. 1986-1988. Team member responding
to a variety of water pollution problems ranging from investigation and remediation of oil spills, leaking
underground storage tanks, and fish kills.
Combined Sewer Overflow and Collection System Studies
Development
of a CSO LTCP for the City of Ottawa, IL. Senior manager assisting a small city and
their engineer in updating their LTCP to respond to changing regulatory requirements. Assisting in
regulatory negotiations, development of a receiving water monitoring program, water quality assessment,
collection system model, and LTCP development for a community of 18,000 people. (Nov. 2007 to
present, <5%).
Water
Quality Assessment Services for Updating
the CSO LTCP for the
Louisville Jefferson
County Metropolitan Sewer District
.
Project manager for development of a water quality data report,
Ohio River model update, and development of a water quality compliance strategy. Provide critical
review of a proposed TMDL for a watershed impacted by CSOs and SSOs and lying entirely within a
Phase II municipal separate storm sewer system (MS4) area (Feb. 2007 to present, <5%).
Watershed Characterization and Planning Services for Northern Kentucky in Support of Consent
Decree Requirements
.
Project manager for adaptive watershed planning activities for the Sanitation
District No. 1 to support requirements associated with a draft Consent Decree for combined sewer
overflows (CSOs) and sanitary sewer overflows (SSOs). Oversee development of a framework for
complying with the Consent Decree. Also oversee watershed planning including development of
integrated databases, a Watershed Assessment Tool for assessing pollutant loading potential from all
sources, development of 16 watershed characterization reports, quality assurance of ongoing receiving
water and outfall sampling, and development of more detailed water quality modeling tools to support the
long-term control plans. (Sep. 2006 - Present, 15%).
Strategic
Advisory
Team for the Sanitation District
No. 1. Selected as one of four members of a team
providing strategic advice to the District on issues and approaches associated with implementing the
adaptive watershed approach for infrastructure and watershed management. (May 2006 - Present, <5%).
Update of a Facilities Plan for the North Side Water Reclamation Plant for the Metropolitan Water
Reclamation District of Greater Chicago.
Senior project manager for application of a water quality
model for evaluating decisions associated with disinfection, flow augmentation, supplemental aeration,
and additional CSO control to meet future water quality standards for the Chicago Area Waterways (Dec.
2004 -Feb. 2007, 10%).
Update of
the CSO
Long-term Control Plan for the St
.
Louis Metropolitan Sewer
District. Expert
advisor for response to a Federal 308 letter requiring additional activities for a long-term control plan
(LTCP), development of an integrated watershed monitoring program and receiving water modeling, and
updates of the LTCP. Also assist the utility in reviewing and finalizing Use Attainability Analyses for
CSO-impacted waters (Sep. 2004 -Present, 10%)
LimnoTech
Revised
7125108
Adrienne D. Nemura
Page 4
Update of the CSO Long
-
term Control Plans for New
York City. Expert advisor for review of draft
CSO LTCPs for NYC DEP. (Sep. 2005 -Nov. 2006, <5%)
Water Quality
and Regulatory Support
for the City
of Kansas City, Missouri
. Senior staff member
providing assistance in selection of performance measures and review of water quality regulations and
programs for CSOs, SSOs, and stormwater for the Kansas City Water Services Department. (Nov. 2003 -
Oct. 2005, 1%)
Technical Support on the 2020 Facilities Plan for MMSD
.
Project manager and senior reviewer for
review of water quality reports associated with CSO long-term control plan development for the
Milwaukee Metropolitan Sewer District. (Jun. 2004 -Dec. 2005, 1 %)
Development of a Combined Sewer Collection System Model for St
.
Louis
,
Missouri
.
Project
Manager for development of a detailed collection system model using XP-SWMM of a 2.5-square-mile
sewershed. (Apr. 2004 - Present, 5%)
Wet Weather Water
Quality Standards for the Ohio River
.
Assisted the Ohio River Valley Water
Sanitation Commission's POTW Committee in formulating options for pursuing revision of water quality
standards to address wet weather flows and establishing a process that could be used by an Advisory
Committee to identify and select options. Analyzed Ohio River data and compiled a list of various
approaches that could be used. Co-authored a report on the regulatory options associated with review and
revision of water quality standards for water bodies impacted by wet weather discharges. (Apr. 2003 -
Sep. 2005, <5%).
Update of a Long-term Control Plan for Combined Sewer Overflows
for the City
of South Bend,
IN. Project Manager for development of an update to South Bend's CSO long-term control plan. This
includes customization of a watershed model for the St. Joseph River and pre- and post-processing
software. Oversaw results of several control alternatives and presentation of alternative water quality
standards for E,
coli.
Assisted the City in discussions with EPA, IDEM, and MDEQ regarding updates to
the LTCP. (Oct. 2004 - Present, 10%)
Expert Assistance in Implementation of the CSO Policy for South Bend
, IN. Senior advisor to the
City of South Bend and its engineer at meetings with EPA on water quality issues associated with the
City of South Bend's CSOs. Directed the development of a methodology to select a "typical year" and
development of several chapters of the long-term control and subsequent updates (Sep. 2002 - Sep. 2002,
<5%)
Receiving Water Modeling Program for the West Fork of the White River
,
Indiana.
Senior manager
for the City of Anderson in developing a receiving water characterization and model for the White River
in the vicinity of the City's combined sewer overflows (CSOs) as part of a Consent Decree agreement.
Provided oversight of the data review, design of the sampling program, and development and application
of the model and review of the chapters for the various reports and workplans. Participated in meetings
with EPA and the Indiana Department of Environmental Management on meeting requirements of the
Consent Decree. (Aug. 2002 - present, 5%)
Water Quality
Assessment for the Southerly
,
Easterly, and
Westerly
Districts
'
CSO Phase II
Facilities Plans in Cleveland
,
Ohio. Project Manager for the receiving water assessment portions of
three CSO Phase II facilities plans for the Northeast Ohio Regional Sewer District. Developed receiving
water monitoring and modeling approaches; evaluated existing data; and provided senior review of the
development and application of the receiving water models, include watershed, creek, culverts, two rivers,
and Lake Erie. Project involved monitoring for biological and conventional pollutants and detailed
velocity and temperature monitoring of the harbor, and use of SWMM, WASP, and POM models.
Authored or co-authored several report chapters for the long-term control plans and assisted the District in
preparing their summary report of the three LTCPs. (Sep. 1997 to Mar. 2005, 15%)
LimnoTech
Revised
7125108
Adrienne D. Nemura
Page 5
CSO Water
Quality Monitoring and Assessment
for Three
Counties in Northern
Kentucky:
Evaluation
of CSO Control
Alternatives
.
Project Manager of the water quality analysis that is
supporting the development of a long-term control plan for the Sanitation District No. 1 in Fort Wright,
KY. Co-authored a major report evaluating the water quality impacts of CSOs on Banklick Creek and the
Licking River using data analysis and receiving water models. Facilitated a workshop on preliminary
screening of CSO control technologies, developed water quality objectives, and provided technical
direction in the development of a screening/ranking system for selection of CSO control technologies.
Coordinating application of receiving water models on a continuous basis to project the benefits of Long-
term Control Plan alternatives. Developed a proposed scope of work for a process for ORSANCO to
achieve a revision to the recreational water quality standards for the Ohio River. (Mar. 1998 - Aug. 2006,
<25%).
Water Quality
Model of
E.
Coli
Bacteria
for the St
.
Joseph and Elkhart Rivers for the Cities of
Elkhart,
Mishawaka
,
and South Bend
,
Indiana
.
Project Manager for a development of a regional
watershed model for three communities with combined sewer overflows (CSOs) in EPA Region 5. She
assisted the communities in obtaining two grants to conduct monitoring and develop and refine the model,
which includes a watershed model, hydraulic model, and water quality model of the St. Joseph and
Elkhart Rivers. (Oct. 2002 - Jan. 2006, 5%)
Combined
Sewer Overflow Control for the City of Lafayette, IN. Provided senior oversight of the
development of a Lagrangian transport model to characterize the impacts of CSO and storm water
discharges from two communities on the Wabash River. (Nov. 2001-May 2005, 5%)
Combined Sewer Overflow
Control
for the City of Terre
Haute
, IN. Provided senior oversight of the
development of a receiving water sampling program and a Lagrangian transport model to characterize the
impacts of CSO and storm water discharges on the Wabash River. Evaluated monitoring data, sewer
model results, and receiving water modeling results, and provided senior review of the entire long-term
control plan document and development of the use attainability analysis. Provided presentations at public
meetings. (Nov. 2001-Present, 5%)
Receiving
Water Modeling
of Combined
Sewer Overflow Long Term
Control Plan
for the City of
Elkhart, IN. Provided senior oversight of the development and application of a Lagrangian transport
model to characterize the impacts of CSO and storm water discharges on the Elkhart and St. Joseph
Rivers. Evaluated receiving water modeling results and development of the long-term control plan and
subsequent update (May 2001
Present, <5%).
Engineering Program Management Consultant for Development and Implementation of a Long-
Term
Control Plan
for the
District of Columbia
'
s
Combined Sewer
System. Task Leader for the
development of receiving water models and post-processors for assessing combined sewer overflow
(CSO) impacts on the Anacostia River, the Potomac River, and Rock Creek. Reviewing past modeling
efforts and known receiving water impacts, and recommending a modeling strategy to assist in the
development of a long-term control plan. Providing coordination with other agencies in receiving water
and source monitoring, and development of a Total Maximum Daily Load for the Anacostia River (Aug.
1998-Apr. 2002, 10%).
Water Quality
Benefits of Combined
Sewer Overflow Abatement
in the Tidal
Anacostia River.
Final Report and Data Report
.
Project Manager and Engineer of a wet weather monitoring program and
water quality assessment of the benefits to the tidal Anacostia of the District of Columbia's Phase I CSO
Control Plan. Project included wet weather and continuous monitoring, and evaluation of pollutant loads
and sediment oxygen demand to assist the District in making an $82.4 million decision regarding benefits
of proposed future controls (1987-1991).
LimnoTech
Revised
7125108
Adrienne D
.
Nemura
Page 6
Eutrophication Studies
Spatial Data Analysis for Developing Lake Nutrient Standards for the State of Indiana
. Project
manager for assisting the Indiana Department of Environmental Management with reviewing water
quality, geomorphometric, and biological data to establish proposed nutrient criteria for 2,000 lakes in
Indiana. (Nov. 2005 - Jan. 2007, 2%).
Maryland Nutrient Trading Strategy
.
Project Manager and senior engineer to provide assistance to the
prime contractor developing a nutrient trading strategy for the State of Maryland, under a Water
Environment Research Federation grant. Provided comments on the potential impacts on drinking water
and defined cross-basin trading issues (Feb. 1999-Sep. 2000).
Review of Chesapeake Bay Criteria and Water Quality Modeling for the Potomac Estuary near
Washington
,
D.C. Project Manager of the review and application of proposed designated uses and
criteria for dissolved oxygen, chlorophyll a, and clarity for the Chesapeake Bay system to develop load
allocations for nutrients and solids. Providing assistance to the Metropolitan Washington Council of
Governments in evaluating appropriateness of criteria and the calibration and application of the water
quality model for determining use attainability and load reductions necessary to meet the criteria. (5%,
Sep. 2001 to Jun. 2006, <5%)
Member, Maryland Middle Potomac Tributary
Team. Team member, appointed by the Governor of
Maryland, to oversee implementation of Maryland's Middle Potomac Tributary Strategy to meet
Chesapeake Bay Nutrient Reduction Goals. Provided regional and inter-governmental coordination
between local and state agencies, as well as technical support on wastewater issues (1995-1997).
Expert Assistance on Potomac River Nutrient Reduction Strategy
.
Project Manager and Engineer
providing expert assistance to local governments in reviewing the revised Chesapeake Bay Water Quality
and Watershed Models to support development of a tributary nutrient reduction strategy for the District of
Columbia, Maryland, and Virginia (1994-1997).
Regional Pilot Program for Wastewater Treatment Plants in the Metropolitan Washington Region
to
Meet Chesapeake Bay Restoration Goals.
As Project Manager, assisted in development of an
innovative agreement between local governments to maximize aggregate nitrogen reductions from
wastewater treatment plants in a facilitated environment without unnecessary regulatory burdens (1995-
1996).
Member
,
Potomac River Basin National
Water Quality
Assessment Team
.
Represented local
government members in the Washington metropolitan region on the USGS river basin team. Provided
presentations and analysis of water quality conditions within the region, assisted in the design of a basin-
wide monitoring network, and evaluation of the sources and impacts of nutrients, pesticides, and metals
throughout the basin for surface water and groundwater (1990-1992).
Chain Bridge Automated Storm flow Monitor
.
Project Manager providing oversight of automated
storm flow monitoring of the Potomac River, calculation of daily loads, and trend analyses (1987-1997).
Kingman
Lake. Provided water quality modeling of Kingman Lake using WASPS to evaluate the water
quality impacts of constructed wetlands (1996).
Evaluation of Potential Impacts of Nitrogen Removal on Eutrophication in the Potomac Estuary.
As Project Manager and Engineer, provided consultant oversight, prepared estuarine loads and
environmental conditions, performed water quality model simulations, and committee presentations.
Evaluated the development of a hybrid empirical and deterministic model to evaluate the potential risk of
nuisance bluegreen algal blooms in the Potomac Estuary (1991-1992).
Evaluation of Sediment Oxygen Demand and Nutrient Flux in the Tidal Anacostia River
.
Project
Manager and Engineer overseeing field and laboratory experiments to determine the magnitude of
sediment oxygen demand (SOD) and nutrient fluxes, development of an SOD and nutrient flux model
LimnoTech
Revised
7125108
Adrienne D. Nemura
Page 7
which is linked to a coupled hydrodynamic and water quality model, and application of the model to
determine sediment response to CSO abatement (1991-1992).
Development and Calibration of a Two-Functional
Algal
Group Model of the Potomac Estuary.
Project Manager and contributor to expansion of the Potomac Eutrophication Model to include
phosphorus sorption modeling and effect of wind speed on net Microcystis growth rate. Compiled,
organized, and summarized water quality data and model inputs. Reviewed development of model and
tested sensitivity of model to key parameters. Evaluated alternative treatment scenarios, forecasted water
quality effects, and presented results to wastewater agencies, regulatory agencies, and elected officials
(1989-1992).
NPDES and Special Studies
Review of Permit Limits for Unified Government of Kansas
City and Wyandotte County, KS.
Project manager for applying CORMIX and calculating appropriate seasonal ammonia discharge limits,
and providing comments on proposed permit conditions associated with WET testing, CSO LTCP
development, and nitrogen removal studies. (Feb. to Nov. 2006, <5%).
Development
of Water Quality
Based Effluent Limits for the Chicago O'Hare International
Airport
.
Project manager for the development of a monitoring and modeling program to establish
NPDES limits for O'Hare's discharge basins to a creek and the Des Plaines River. (May to Jun. 2004,
1
%)
Development of a Dissolved Oxygen Model for the Lower Black River from
Elyria,
Ohio
, to Lake
Erie. Project manager responsible for the design of a modeling and monitoring program for the Black
River to develop an understanding of the causes of low dissolved oxygen. Coordinated development of a
monitoring program between Ohio EPA, LTI, USGS, two laboratories, and four clients. Prepared
database of existing data, reviewed earlier studies, and co-authored the Phase 1 report, which addressed
existing data, development and application of a screening level model, and the recommended monitoring
program. Directed the implementation of the coordinated monitoring program, and provided QA/QC of
the data, and senior oversight of the Phase 2 Data Report. For Phase 3, providing senior oversight in the
development of a linked UNET/WASP model of the Black River, and refinement of a
hydrodynamic/water quality model of the navigation channel. Under Phase 4, directed the evaluation of
controls and assimilative capacity of the navigation channel, which showed that increases in WWTP loads
would not adversely affect the dissolved oxygen problem. (Oct. 2000 to Feb. 2004, 10%)
Blue Plains Regional Wastewater Treatment Plant
NPDES
Permit Support.
Project Manager
providing specialized technical and legal support in the District of Columbia's negotiations with the US
EPA Region 3 over permit conditions. Major issues included nitrogen removal, mercury, and combined
sewer overflow requirements. Designed sampling program for before and after testing of receiving water
response to a pilot (half plant) test of nitrogen removal (1995-1997).
Metropolitan Washington Regional Monitoring Program
. Program administrator overseeing
coordination of Federal, state and local monitoring of the Potomac and Anacostia Rivers in the
Washington metropolitan region (1986-1997).
Administrative and Technical Support to the Blue Plains Regional Committee (District of
Columbia
;
Fairfax County, Virginia; and Montgomery and Prince George's Counties
,
Maryland).
Project manager overseeing staff administrative, technical, and secretarial support to the Blue Plains
Regional and Technical Committees which coordinated technical and policy issues for a 370 mgd
regional wastewater plant and a regional composting facility. Provided support to the Blue Plains Chief
Administrative Officers. Blue Plains IMA of 1985 and renegotiation of a MOU on biosolids management
(1995-1997).
LimnoTech
Revised 7125108
Adrienne D. Nemura
Page 8
Development of an Environmental Geographic Information System for the District of Columbia
Environmental Regulatory Administration
.
Co-Project Manager conducting a user requirements
analysis, including the design and implementation of a customized GIS.
Blue Plains Flow Forecast Model
.
Provided project management of the development of a GIS-based
sewershed model to generate flow forecasts for a 370 mgd regional wastewater treatment plant in
Washington, D.C. Provided training of local government staff in operation of the model.
GIS Assistance
to MWCOG
in the Development of Model Inputs for, and Mapping of the Potomac
Interceptor to the Blue Plains Wastewater Treatment Plant
. Project Engineer overseeing consultant
development of an engineering study of the monitoring and capacity of a regional wastewater interceptor
in Washington, D, C. (1992-1994).
Water Quality
Analysis and Modeling in Support
of NPDES
Requirements for the Expansion of the
Lower
Potomac Pollution Control Plant
,
Fairfax Co
.,
Virginia
. Project Manager and Engineer
providing assistance on defining and modeling steady-state summer boundary conditions in the Potomac
Estuary with various assumed levels of nitrogen control for the Washington region's municipal
wastewater treatment plants (1992-1993).
Selected Trace-Element and Organic Contaminants in Streambed Sediments of the Potomac River
Basin
.
As part of the report team for this task of the Potomac National Water Quality Assessment being
conducted by the USGS, provided senior level review and input into the assessment of sediment
contamination in the Potomac River (1991-1992).
Fall-Line Toxics Monitoring
.
Provided oversight of monitoring of the Potomac River fall line for storm
and baseflow monitoring of pesticides, herbicides, and toxic contaminants. Key member of project team
in analysis of the water quality data, generation of annual pollutant load estimates, and comparison with
other tributaries (1991-1992).
TMDL and
Watershed Experience
Critique of a Draft Nutrient
TMDL. Expert review of a draft phosphorus TMDL for an industrial
discharger to an oxbow lake of the Mississippi River (Apr. 2008 - Present, <5%).
Support for a Category 4b Demonstration for the Shawsheen River Headwaters
.
Senior advisor for
evaluating biological impairments to the Shawsheen River for the Massachusetts Port Authority. The
purpose of the evaluation is to support a category 4b demonstration to replace a high-flow TMDL so that
the authority can address biological impairments in an adaptive manner as part of the Stormwater
Pollution Prevention Plan (SWPP). (Dec. 2007 - Present, <5%).
Support to the Yadkin Pee Dee River Basin Association
for Active
Review of the High Rock Lake
TMDL. Project Manager for expert review of NCDEP's plans to develop a water quality model of High
Rock Lake to address turbidity, dissolved oxygen, and eutrophication problems. Assisted the Basin
Association in identifying data collection, watershed, and water quality model needs and secure a grant
for conducting the monitoring to support model development. (Jul. 2005 to Dec. 2006, <5%).
Expert Review of Dissolved Oxygen TMDLs along the East Coast of the United States. Senior
manager providing expert review of example TMDLs dealing with standards revisions for dissolved
oxygen for an attorney (Jan. 2006, <
5%).Environmental and Regulatory Review of Wastewater
Facility
Plan for New
Castle County,
Delaware
.
Project manager and senior engineer evaluating
various disposal and recharge options for treated wastewater in southern New Castle County, DE. (Dec.
2004 to Sep. 2005, 2%).
Expert Review of the Cooper River Water
Quality
Model in South Carolina.
Project Manager for
expert review of development of a water quality model for the Charleston Harbor and advice to the North
LimnoTech
Revised
7125108
Adrienne D. Nemura
Page 9
Charleston Sewer District on application of model to assess compliance with dissolved oxygen standards.
(May 2005 - Present, 5%).
Expert Review
of TMDL
Development for the Reedy River in South Carolina
. Project Manager for
expert review of development of a water quality model of the Reedy River and the Reedy River arm of
Lake Greenville and development of TMDLs for Greenville County, South Carolina (Apr. 2005 -
Present, 5%).
Analysis
,
Identification
,
and Strategies for Urban Wildlife Contamination to Support TMDL
Implementation in Washtenaw County, Michigan
.
Project Manager for a sampling program to
investigate the sources of fecal contamination in storm sewers draining to the Huron River. Development
of a quality assurance project plan, monitoring plan including storm sewer and scat sampling for E.
coli
and bacteria source tracking. (Oct. 2004 - Dec. 2006, 5%)
Development of a Watershed Monitoring Plan for Clean Water Services in Oregon
. Senior staff
developing a monitoring plan to provide a comprehensive characterization of environmental conditions,
and the impacts of a wide range of environmental programs and projects in the Tualatin River watershed.
(Aug. 2004 - Jun. 2006, <5%)
Creating Successful Total Maximum Daily Loads
: An AMSA
Handbook
.
Working group member for
review of the handbook and contributor to the modeling section. (Dec. 2003 - Apr. 2004, <I%).
Review of Nearshore Lake Michigan
E.
coli
TMDL for the Gary
Sanitary District
,
Indiana
. Project
Manager and senior staff reviewing the TMDL which includes water quality model development and
application of an EFDC model of nearshore Lake Michigan for northern Indiana. (Nov. 2003 - Sep. 2004,
5%)
Navigating the TMDL Process: Evaluation and Design
.
Co-author of a section on adaptive watershed
management of a Water Environment Research Federation investigation on a comprehensive study of the
Total Maximum Daily Load (TMDL) program. Researched where adaptive management is currently
being used in developing TMDLs and watershed
plans.
Identified the necessary components of adaptive
management. (Apr. 2002 -Oct. 20025 1 %)
TMDL
Support Activities for Metals and Organics in the Anacostia River, District of Columbia.
Project manager providing peer review and expert
assistance
in hydrodynamic and water/sediment quality
modeling for development of TMDLs for metals and organics in the Anacostia River as part of an EPA
support contract. This project is on a tight timeframe caused by a court-ordered deadline, and requires
that LTI assist the District of Columbia in producing an approvable TMDL. Facilitated discussions
between the District of Columbia and EPA, reviewed model results and 303(d) listing justification, and
directed technical investigations and peer review of product. (Jul. 2002 - Mar. 2003, 5%)
Review of Maryland
'
s
Decision Criteria and Draft 303(d
)
List for the Washington Suburban
Sanitary Commission
.
Senior engineer
assisting
in reviewing Maryland's draft 2001 303(d) list for the
Washington Suburban Sanitary Commission. This includes review of the listing methodology and water
quality analysis for dissolved oxygen, pathogens, nutrients, and sedimentation. (May 2002 - Jul. 2002,
2%)
Action Plan for the Columbia Slough Watershed
,
Oregon
.
Project manager and senior reviewer of a
project to assist the Columbia Slough Watershed Council in developing a 5-year watershed action plan for
the 40,000-acre watershed. The plan recommends projects to improve the health of the watershed and
educational programs to increase awareness of watershed pollution. (May 2002 - Apr. 2003, 3%)
Development and Implementation of a Watershed Protocol for Northern Kentucky
.
Reviewed
applicable state and federal CSO requirements and integrated these requirements for watershed planning
into the draft protocol (Apr. 2002, 1%).
LimnoTech
Revised
7125108
Adrienne D
.
Nemura
Page 10
Review of
draft TMDLs
for the Mountain Run Watershed in Culpepper County, Virginia and the
Manokin River
,
Somerset
County,
Maryland
.
Project manager and senior engineer responsible for
providing comments to municipalities on two draft Total Maximum Daily Loads, one in Virginia for
bacteria based on an HSPF model, and one in Maryland for dissolved oxygen and nutrients based on a
WASP5 model. Identified problems in scarcity of data, inappropriate or incomplete calibration of model,
and implementation
issues
(Jun.-Jul. 2000, <5%).
Anacostia Restoration
Plan. Provided technical review and direction for evaluation of baseline water
quality, identification of pollutant loads on a subwatershed basis, tracking restoration project development
and costs, and determination of environmental indicators to be used in evaluating water quality benefits
(1996-1997).
Richmond
-
Crater Interim
Water Quality
Management Plan: Technical Support Information. As
Project Engineer provided tidally averaged water quality modeling of the James and Appomattox Rivers
near Richmond, Virginia, to develop a two-tiered wasteload allocation under steady-state, low flow
conditions. Results were used to set permit limits for major municipal and industrial wastewater
dischargers. Developed water quality and point source database for the Piedmont Regional Office of the
State
Water Control Board (1986-1988).
Metropolitan Washington Regional Drinking
Water
Summit
.
Provided staff support to over 100
drinking water professionals to examine the monitoring needs and watershed protection and public health
strategies needed to address drinking water contamination by cryptosporidium and other
bacteria/protozoa/viruses (Jan. 1994)
Metropolitan Washington
Water
Supply Emergency
Plan.-Provided staff support on development of a
Federal/state/local government coordination plan for water supply emergencies in the Washington
metropolitan region (1994).
Database and Model Development Support
Development
of TMDLs
for Nine Watersheds in Illinois
.
Senior staff member in the development of a
database of water quality data for use in evaluating listing decisions and development of TMDLs for
Illinois EPA for nine watersheds in southern Illinois (Jun. - Jul. 2004).
Ottawa River
Hot Spot Delineation
&
Risk Assessment
. Senior engineer providing a database design
for a human health and ecological risk assessment for the Ottawa River in Toledo, Ohio (Feb. 2000-Mar,
2000, <5%).
Data Management
for the Fox River PCB
Investigation
.
Senior oversight of the extraction of PCB
congener data for water, sediments, and fish for use in calibration of a fate and transport model of the Fox
River (1999).
Development of a Database to Manage Sewer Information
for the City of Toledo, Ohio. Expert
advisor on water quality and CSO compliance issues. Technical Manager developing a menu-driven data
entry tool for combined sewered areas in Toledo. The tool will be used by the city for future data
management and linked with a hydraulic model of the system (Apr. 1999 - Apr. 2005, <5%).
Linked Database and Visualization
Tool for Lower Fox River
and Green
Bay. Technical Manager
overseeing the development of a large (1.8 million results) ACCESS database of water quality, sediment,
and biota data for the Green Bay watershed in Michigan and Wisconsin. Refined database design,
developed data dictionaries, oversaw processing of data for entry, conducted quality assurance/quality
control checks, and investigated discrepancies and missing information. Provided senior oversight of the
development of a menu system for processing data. Developed the documentation of the database and
record of updates. (Apr. 1998- Apr. 2006, <15%)
LimnoTech
Revised
7125108
Adrienne D. Nemura
Page 11
Technical
Advisor to
the Milwaukee Metropolitan Sewer District
(MMSD)
on a Comprehensive
Modeling Strategy
.
Senior technical advisor as part of an MMSD team. Participated in a strategy
workshop and review of a modeling strategy document. (May to Oct. 2002, 1 %)
Selected Publications
Publications
The Role of Receiving Water Models in CSO Long-Term Control Plan Decision-Making and Water
Quality Standard Revisions. WEFTEC 2008 with C.L. Turner. Chicago, IL. Scheduled for Oct. 18-22,
2008.
Implementing a Sewer Overflow Consent Decree through Watershed Management. WEFTEC 2008 with
C.L. Turner, J.P. Gibson, Jr., J. Turner, B. Vatter, D. Zettler, G.M. Grant, S. Fitzgerald, J. Lyons.
Chicago, IL. Scheduled for Oct. 18-22, 2008.
The Role of Adaptive Watershed Management Concepts in Wet Weather Consent Decrees. WEFTEC
2007 with P.L. Freedman, J.A. Eger, J.P. Gibson Jr., and N. Clements. San Diego, CA. Oct. 13-17, 2007.
A Spatial Tool for Watershed Characterization and Assessment in Northern Kentucky. WEFTEC 2007
with J.P. Gibson, Jr., T.A.D. Slawecki, and D.K. Rucinski. San Diego, CA. Scheduled for Oct. 13-17,
2007.
Maximum Extent Practicable Meets TMDL for Municipal Stormwater Permits: Which Will Prevail?
StormCon 2006 with E. Powers. Denver, CO. Jul. 24-27, 2006.
Making a Case for Site-Specific, Performance-
Based
Water Quality Standards for Pathogens. 2005
TMDL Conference with H.P. Holmberg. WEF Specialty Conference, Philadelphia, PA, Jun. 26-29, 2005.
Emerging Wet Weather Issues for Municipal Permits with J.S. Moore. Collection Systems 2004:
Innovative Approaches to Collection Systems Management. WEF 2004 Specialty Conference
Series,
Milwaukee, WI, Aug. 8-11, 2004.
Tools for the St. Joseph River, Indiana Watershed Initiative for a Safer Environment (WISE) with C.L.
Turner, M.A. Salee, and A.K. Umble. Watershed 2004. WEF 2004 Specialty Conference
Series,
Dearborn, MI, Jul. 11-14, 2004.
Approaching TMDLs Using Aristotle as a Teacher: An Adaptive Watershed Management Approach with
P.L. Freedman and D.W. Dilks. National TMDL Science and Policy 2002 Specialty Conference; Phoenix,
AZ, Nov. 13-16, 2002.
Evolving Wet Weather and Water Quality Standards Issues for CSO Communities with J. J. Slack,
WEFTEC 2000: The 73rd Annual Conference & Exposition on Water Quality and Wastewater Treatment,
WEF, Anaheim, CA, Oct. 14-18, 2000.
The Chesapeake Bay Program: Meeting an "Unfunded Non-mandate" with S.A. Freudberg and K.W.
Berger,
WEFTEC 1995: The 680' Annual Program for Technical Professional Development, WEF, Miami
Beach, FL, Oct. 21-25, 1995.
An Alternative to the NPDES "Command and Control" Approach to Achieve Nitrogen Reductions at
Wastewater Plants with T.T. Spano and S.A. Freudberg, Management of Environmental Problems for
Elected and Public Officials, WEF Specialty Conference
Series,
Richmond, VA, Nov 13-16, 1994.
Presentations and Symposiums
DejA vu: New Recreational Use Criteria. Panel Presentation with M. Tate and M. Pla. NACWA Summer
Conference. Anchorage, AK. Jul. 15-18, 2008.
LimnoTech
Revised
7125108
Adrienne D. Nemura
Page 12
How to Address Daily Load
Issues
in TMDLs with F.P. Andes and L.H. Weintraub. Barnes & Thornburg
Clean Water Workshop. Chicago, IL. Sep. 26-28, 2007.
Use Attainability Analysis (UAA) as a Tool to Meet Clean Water Act Requirements. Panel on UAAs with
F.P. Andes, J.Perras, and J. Rexhausen. Indiana Water Environment Association Government Affairs
Committee CSO Workshop. Indianapolis, IN. Aug. 15, 2007.
The Link between Appropriate Water Quality Standards and Reasonable Total Maximum Daily Loads.
Indiana Water Environment Association. Indianapolis, IN. Nov. 13-15, 2006.
Spatial Data Analysis for Developing Lake Nutrient Standards for the State of Indiana. 26"h International
Symposium, North American Lake Management Association (NALMS) with Carol Newhouse, Indiana
Department of Environmental Management. Indianapolis, IN. Nov. 8-10, 2006.
Challenges
Associated
with Watershed Management for Bacteria
.
NOAA Great
Lakes Environmental
Research
Laboratory
Seminar
, Ann Arbor,
MI. Mar.
17, 2006.
Challenges Associated with Developing Nutrient and Sediment TMDLs for Impoundments in the
Southeastern United States. NALMS: 15"h Annual Southeastern Lake and Watershed Management
Conference with J.V. DePinto and V.J. Bierman. Columbus, GA. Mar. 8-11, 2006.
The Not So Ready for Prime Time Players Visit Indiana
Is the Price Right for Clean Water? Indiana
WEA 2005 Conference with J. Rexhausen and R. Hamilton., Indianapolis, IN. Nov. 14-16, 2005
Application of Modeling Tools for the St. Joseph River to Evaluate Bacteria Source Impacts on Water
Quality. Indiana WEA 2005 Conference with C.L. Turner and M. Salee., Indianapolis, IN. Nov. 14-16,
2005
Sustainable or In-Saneable
? The Wheel of Water Fortune
Debunking the Myths Associated with
Sustainable
Water
Resources
. Skit at the AMSA 2005 Winter Conference, San Antonio, TX. Feb. 2-4,
2005.
Making a Case for Site-Specific, Performance-Based Water Quality Standards for Pathogens. 2005
TMDL Conference with H.P. Holmberg. Indiana WEA 68"h Anniversary Conference, Indianapolis, IN,
Nov. 15-17, 2004.
Tackling the Challenge of Funding Wastewater and Water Supply Infrastructure in the 215` Century. 2004
Annual Conference of the Michigan Water Environment Federation and American Water Works
Association. Grand Rapids, MI. Aug. 11, 2004.
Water Quality Standards and the Use Impasse. Skit at the AMSA 2004 Summer Conference, Denver, CO.
Jul. 21, 2004.
Using Modeling Tools to Present Data to Gain EPA and IDEM Acceptance of Combined Sewer Overflow
Long-Term Control Plans. Indiana Water Environment Association, 67`h Annual Conference.
Indianapolis, IN. Nov. 19, 2003.
Emerging Wet Weather Issues for Municipal Permits with J.S. Moore. Three Rivers Wet Weather
Demonstration Project. Fifth Anniversary Sewer Conference. Four Points Sheraton North. Mars, PA. Sep.
11, 2003.
LimnoTech
Revised
7125108
Adrienne D. Nemura
Page 13
Case Studies in the Use of Adaptive Watershed Management for Total Maximum Daily Loads with P.L.
Freedman and D.W. Dilks. TMDL 2003 Specialty Conference. Water Environment Federation. The
Westin Michigan Avenue. Chicago, IL. Nov. 16-19, 2003.
Emerging Wet Weather Issues for Municipal Permits with J.S. Moore. Louisiana Water Environment
Association's Spring Technical Conference & Crawfish Boil. Gonzales, LA. Apr. 24, 2003
Review Criteria for Combined Sewer Overflow Long-Term Control Plans with J.S. Moore. 66th Annual
IWPCA Conference, Indianapolis, IN. Nov. 18-20, 2002
Evolution of Wet Weather Water Quality Standards for Urban Communities. Presentation to the 3 Rivers
Wet Weather Fourth Annual Sewer Conference, Pittsburgh, PA. Sep. 16-17, 2002.
Presentation to the Virginia Association of Metropolitan Wastewater Agencies on Chesapeake Bay Water
Quality and Watershed Modeling. 1996. Richmond, VA.
Fall-Line Toxics Monitoring to the Potomac National Water Quality Assessment Committee. 1993.
Harrisburg, VA.
Workshops
/
Short Courses
Getting Prepared for "New" Pathogen Standards. Workshop Chair and Presenter on Recreational Use
Attainability Analyses: Need For UAAs and Factors for Success. WEFTEC 2008. Chicago, IL. Scheduled
for Oct 19, 2008.
"Doing Successful Use Attainability Analyses (UAAs)". Panel Symposium with F. Andes, D.Pfeifer, J.
Perras, and J. Rexhausen. Keeping Your Head Above Water in the Regulatory World. Indiana Water
Environment Association. Marriott Indianapolis East. Aug. 15, 2007.
"Long Term Control Plan Issues". Panel Symposium with F. Andes, L. Benfield, and D. Markowitz at the
CSO Control Strategies and Key Developments Among Leading CSO Communities. The Drake Hotel,
Chicago, IL. Apr. 26-27, 2007.
How to be "Passionate about Pathogens" with Water Quality Modeling. 2006 Developments in Clean
Water Law: A Seminar for Public Agency Attorneys & Managers. Boston, MA. Nov. 15-17, 2006
"Getting Nutrient Limits Right." Presentation at the 2004 Barnes & Thornburg Clean Water Workshop,
The Standard Club, Chicago, IL. Jun. 9-11, 2004.
"It's Time to Start Talking TMDLs" with D.W. Dilks. TMDL Informational Seminar. Greenville Soil and
Water Conservation District, et. al. Greenville, SC. May 25, 2004.
EPA CSO / SSO Inspector Training with M.P. Sullivan and B.K. Hazelwood. EPA Region 5. Chicago,
IL. Nov. 12-14, 2003.
Presented at the training workshop for US EPA for the CSO LTCP Review Training for Permit Writers
and EPA Regional Staff. Indianapolis, IN. Feb. 6-7, 2002 and Harrisburg, PA. Mar. 2002.
Presented the receiving water monitoring and modeling chapters of the EPA Guidance Manual on CSO
Modeling and Modeling.
Washington, PA. Sep. 9-10, 1999.
Facilitation of a workshop to define water quality management objectives and evaluate/screen CSO
control technologies for preliminary facilities planning.
Series of workshops on Development of the Chesapeake Bay Water Quality and Watershed Models for
Washington metropolitan region's wastewater treatment plants.
Coordinated workshop on ultra-clean sampling techniques for metals and pesticides.
LimnoTech
Revised
7125108
Adrienne D. Nemura
Page 14
Client Reports and Unpublished Papers
Spatial Data Analysis for Developing Nutrient Standards for Indiana Lakes. Prepared for the Indiana
Department of Environmental Management. Jan. 29, 2007.
Effects of Disinfection at the North Side, Stickney, and Calumet Water Reclamation Plants on Bacteria
Levels in the Chicago Area Waterways. Prepared for the Metropolitan Water Reclamation District of
Greater Chicago under subcontract to Consoer Townsend Envirodyne Engineers, Inc. Dec. 7, 2005.
Nationwide Review of Wet Weather Water Quality Standards. Prepared for the Sanitation District No. 1
of Northern Kentucky. Sep. 2005.
Technical Review of the Katonak-Rose Report on Public Health Risks Associated with Wastewater
Blending (Nov. 17, 2003). Prepared for the National Association of Wastewater Agencies. Mar. 7, 2005.
Interim Water Quality Study Report: CSO Long-Term Control Plan Update. Prepared for Metropolitan St.
Louis Sewer District. Sep. 28, 2005.
Management Applications of the Lower Black River Water Quality Model, Phase 4 Report. Prepared for
the Black River Cooperative Parties under contract to the City of Elyria, Ohio. Feb. 27, 2004.
Draft Lower Black River Water Quality Model, Phase 3 Report. Prepared for the Black River Cooperative
Parties under contract to the City of Elyria, Ohio. Sep. 29, 2003.
Summary of Background Information for the Washington Aqueduct BPJ. Dec. 16, 2002.
2001 Monitoring Data for the Lower Black River Water Quality Model, Phase 2 Report. Prepared for the
Black River Cooperative Parties under contract to the City of Elyria, Ohio. Apr. 2002.
Southerly District Combined Sewer Overflow Phase II Facilities Plan. Submitted by Metcalf & Eddy in
association with CH2MHill. Prepared for the Northeast Ohio Regional Sewer District. Mar. 2002.
Easterly District Combined Sewer Overflow Phase II Facilities Plan. Submitted by Metcalf & Eddy in
association with CH2MHill. Prepared for the Northeast Ohio Regional Sewer District. Mar. 2002.
Design of the Modeling and Monitoring Programs for the Lower Black River Water Quality Model
(LBRWQM) Project. Prepared for the Black River Cooperative Parties under contract to the City of
Elyria, Ohio. Feb. 2001.
Study Memorandum LTCP-6-3: Receiving Water Model Selection. Prepared for District of Columbia
Water and Sewer Authority EPMC III - Sewer Systems. Draft. Dec. 1999.
Study Memorandum LTCP-6-1: Receiving Water - Existing Information. Prepared for District of
Columbia Water and Sewer Authority EPMC 1I1- Sewer Systems. Draft. Dec. 1999.
Northeast Ohio Regional Sewer District Westerly CSO Phase 11 Facilities Plan: Chapters 4 and 7. Water
Quality Analysis. Final Report, Dec. 1999.
Database for Lower Fox River and Green Bay: Database Report, Versions 1.0 to 3.0, Apr. 30, 1999.
Preliminary Control Alternatives Workshop, May 20, 1998.
Water Quality Assessment of Banklick Creek and the Lower Licking River, Mar. 1998.
Northeast Ohio Regional Sewer District Westerly CSO Phase II Facilities Plan: Water Quality Analysis
Interim Draft Report, Oct. 1997.
Wastewater Treatment Plants in the Washington Metropolitan Region, 1993-1994.
Potomac and Anacostia Rivers Water Quality Data Report 1990, Dec. 1992.
Modeling Sediment Oxygen Demand and Nutrient Fluxes in the Tidal Anacostia River, Dec. 1992.
LimnoTech
Revised 7125108
Adrienne D. Nemura
Page 15
Water Quality Benefits of Combined Sewer Overflow Abatement in the Tidal Anacostia River, Nov. 1
1991.
Richmond-Crater Interim Water Quality Management Plan Technical Support Information. Mar. 1988.
Specialized Training and Coursework
Institute on Mathematical Modeling of Water Quality, Manhattan College, New York, 1989.
Workshop on Group Facilitation Training for the "Partnership for Regional Excellence" by Whorton and
Youngquist, Inc. Atlanta, GA. Nov. 1992.
LimnoTech
Revised
7125108
Adrienne D. Nemura
Page 16
Attac
hm
ent 2
BEFORE THE ILLINOIS POLLUTION CONTROL BOARD
IN THE MATTER OF:
WATER QUALITY STANDARDS AND
EFFLUENT LIMITATIONS FOR THE
CHICAGO AREA WATERWAY SYSTEM
AND THE LOWER DES PLAINES RIVER:
PROPOSED AMENDMENTS TO 35 Ill.
Adm. Code Parts 301, 302, 303 and 304
R08-9
(Rulemaking
-
Water)
ATTACHMENT 2 TO
PRE-FILED TESTIMONY OF ADRIENNE D. NEM URA
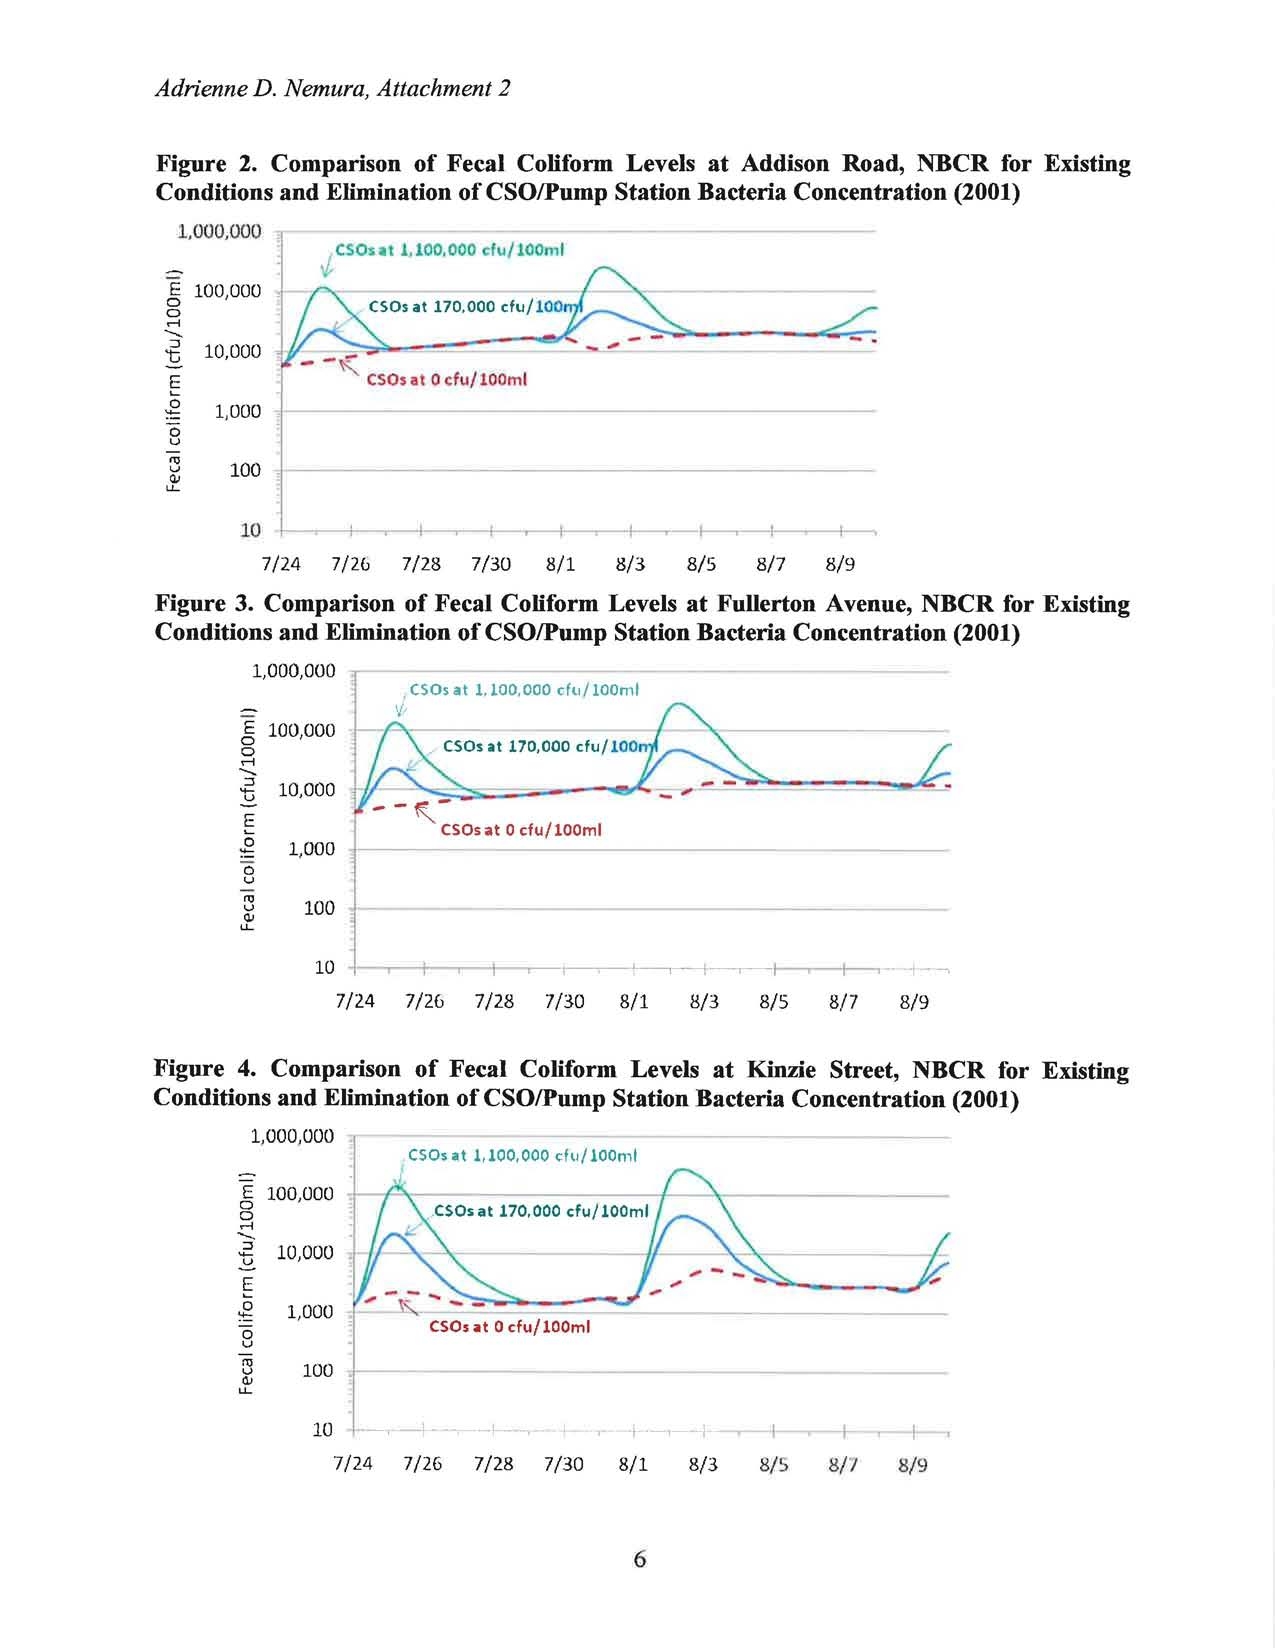
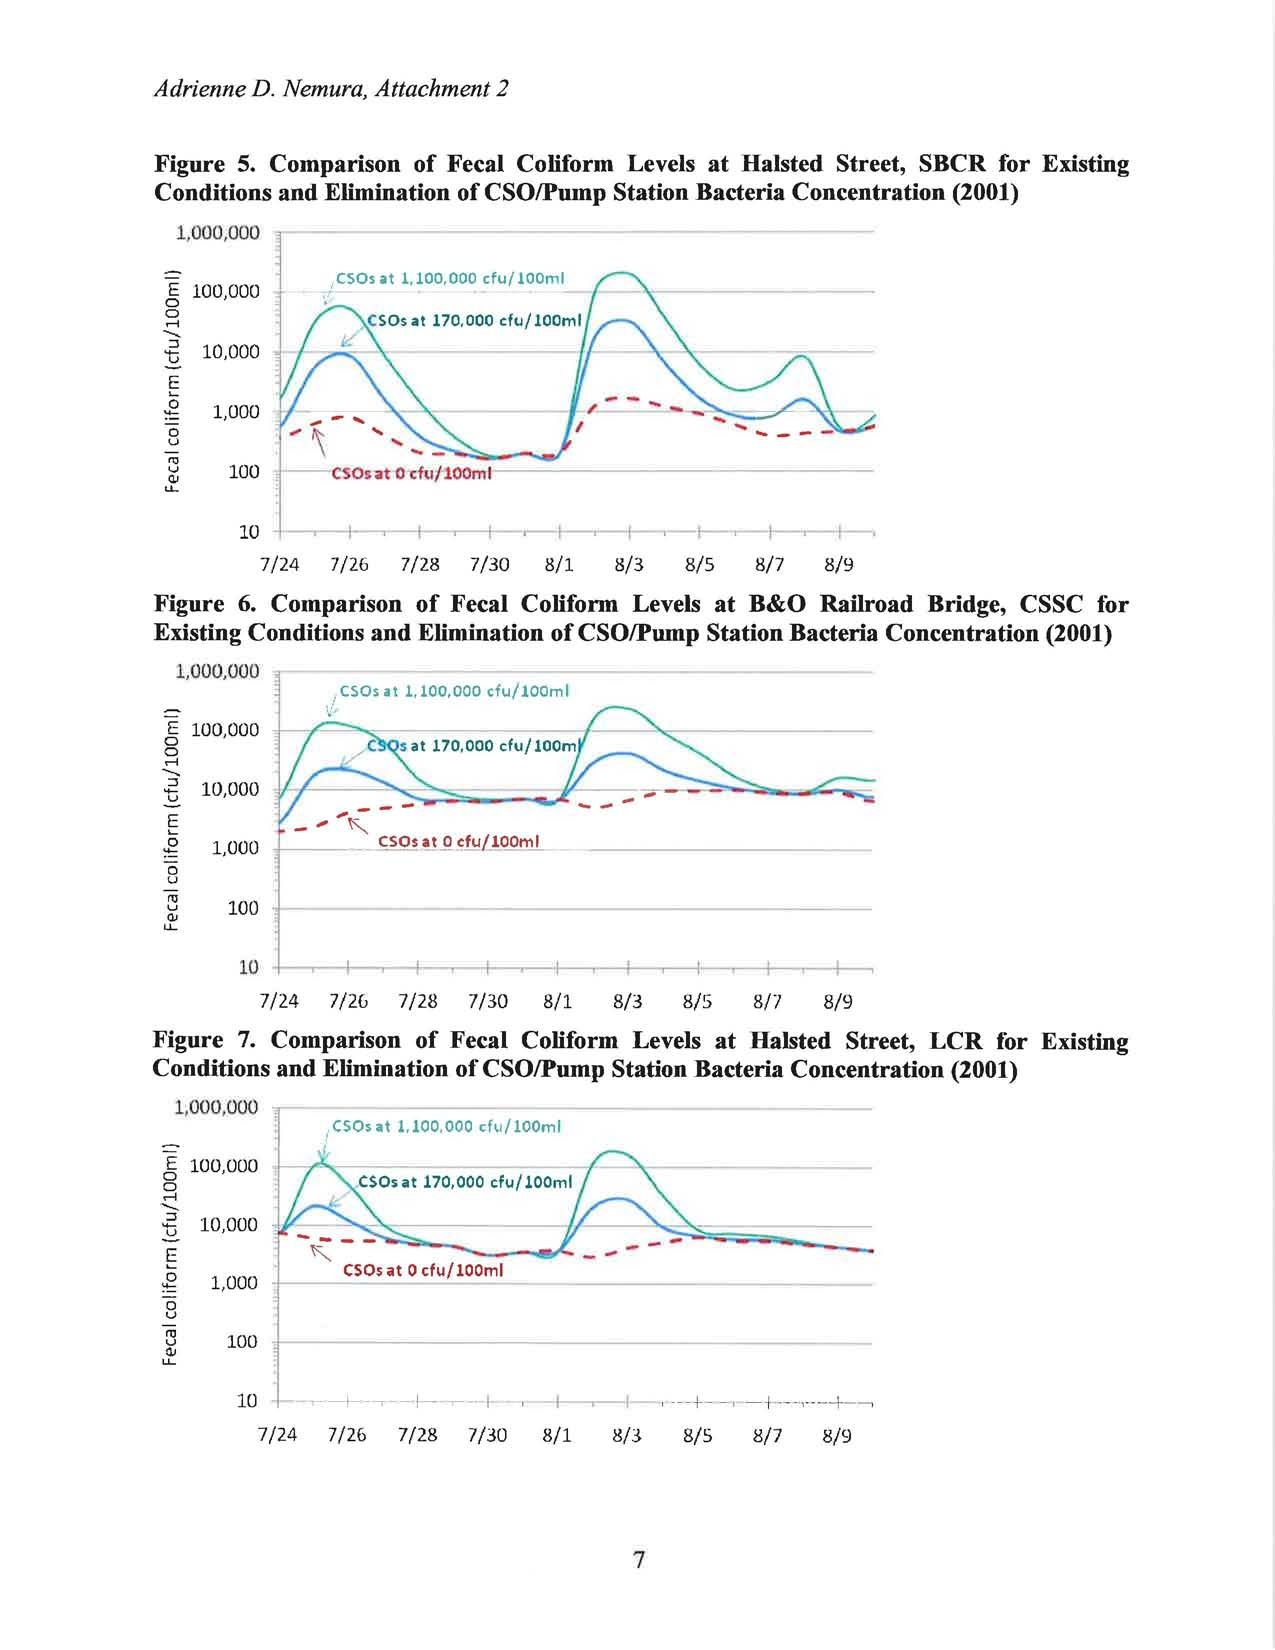
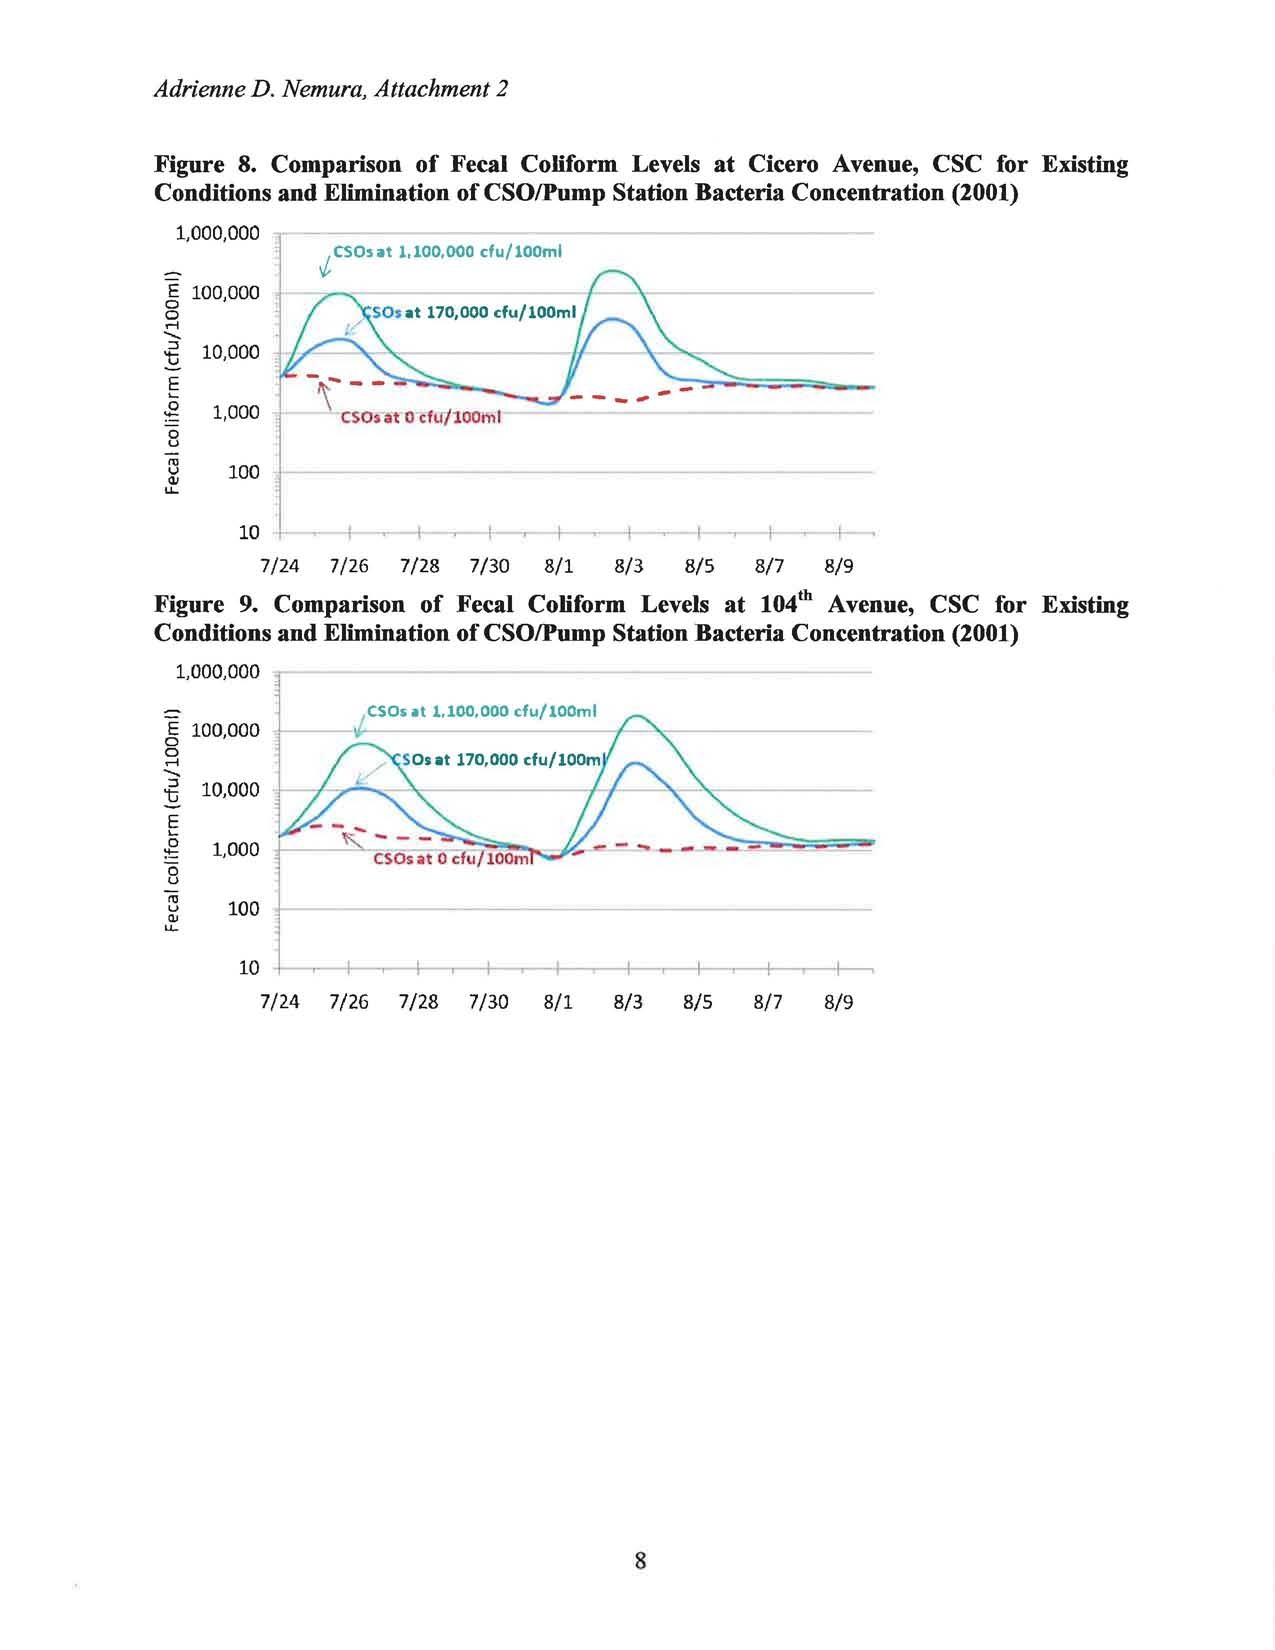
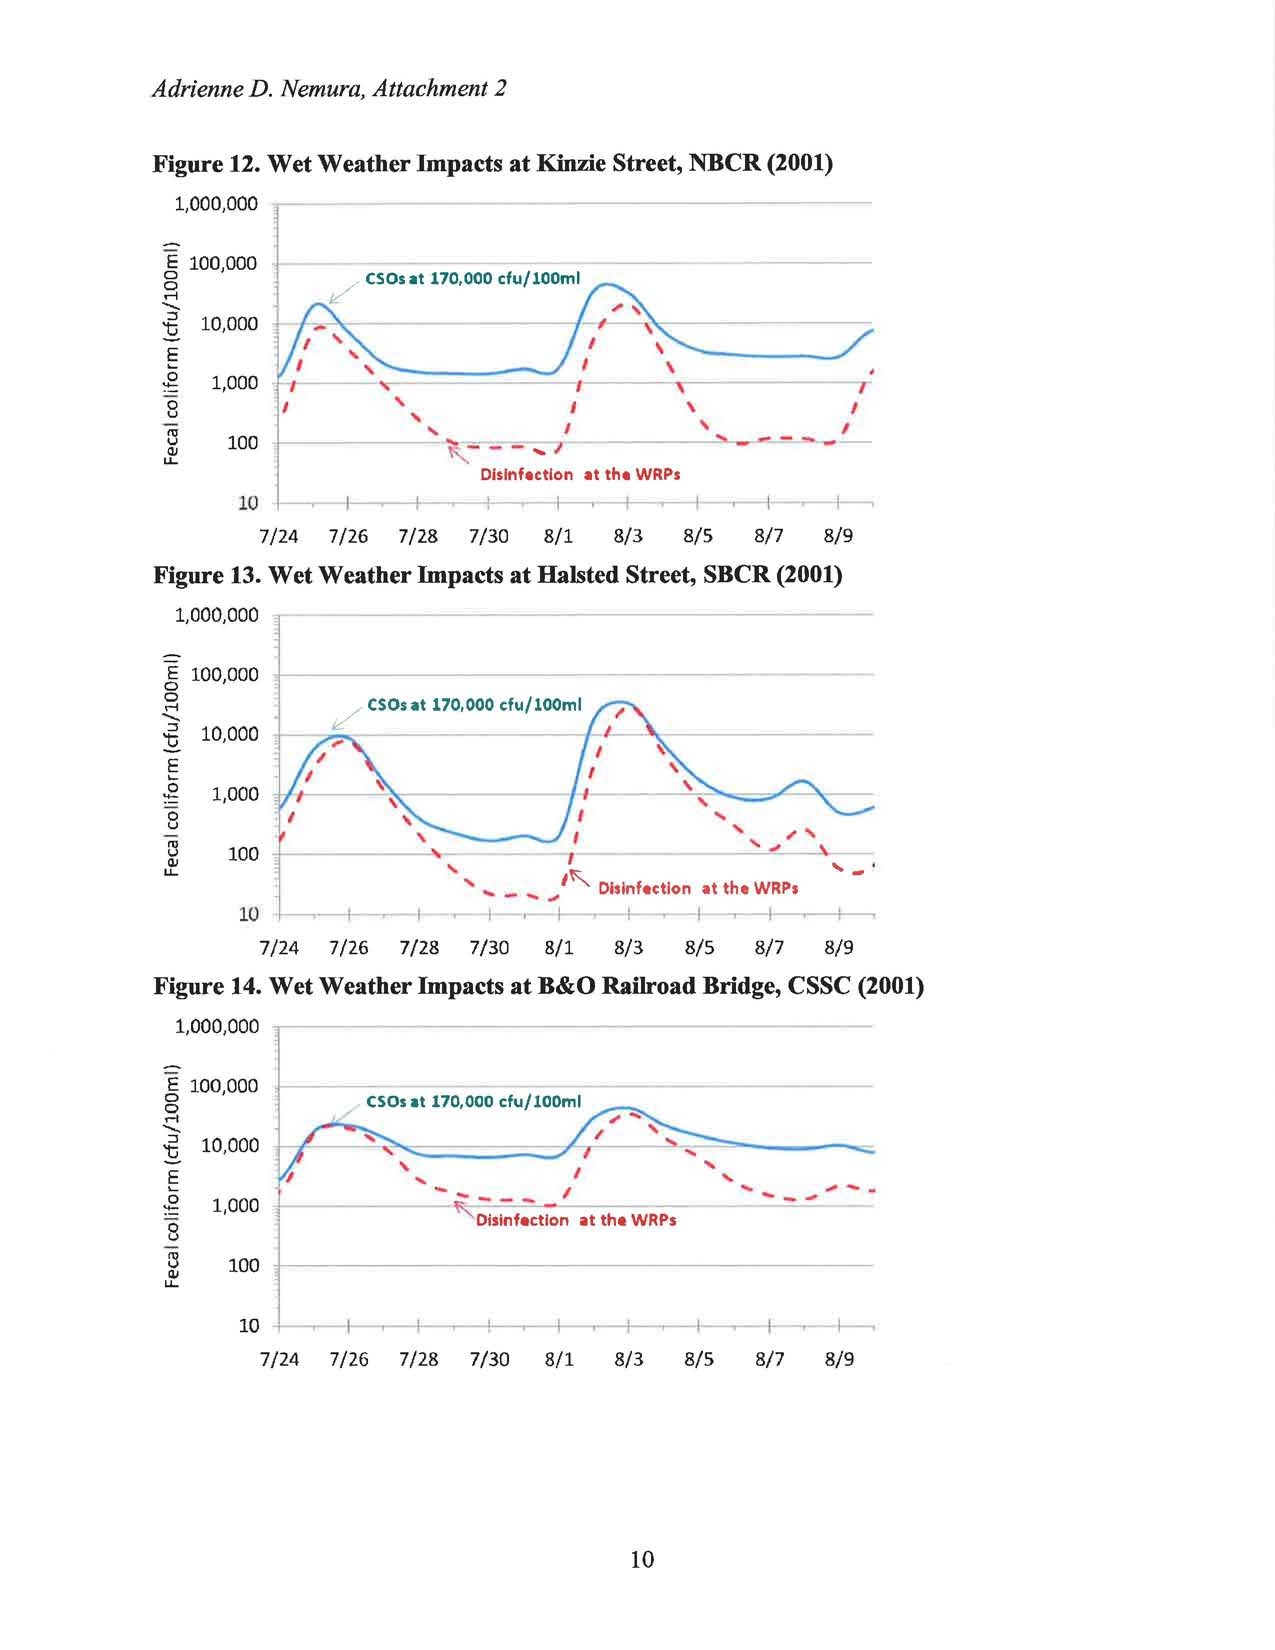
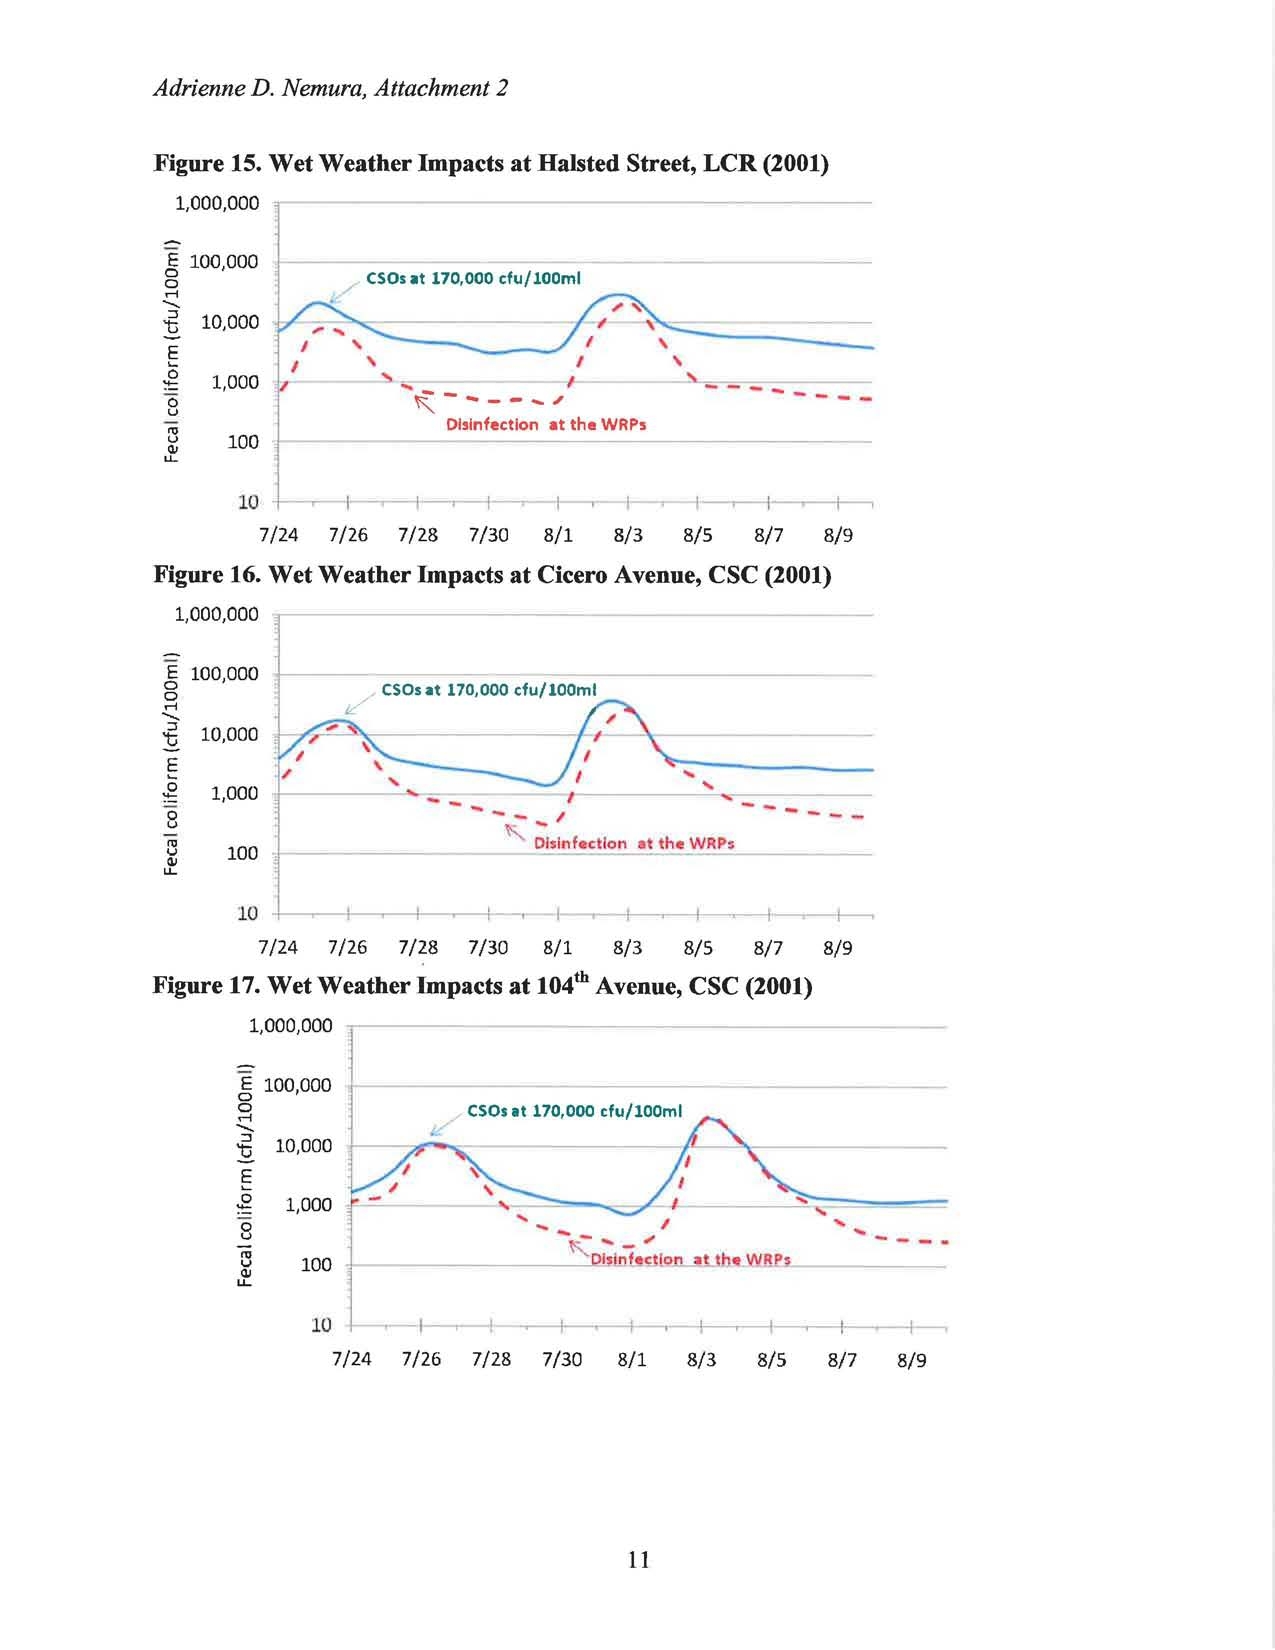
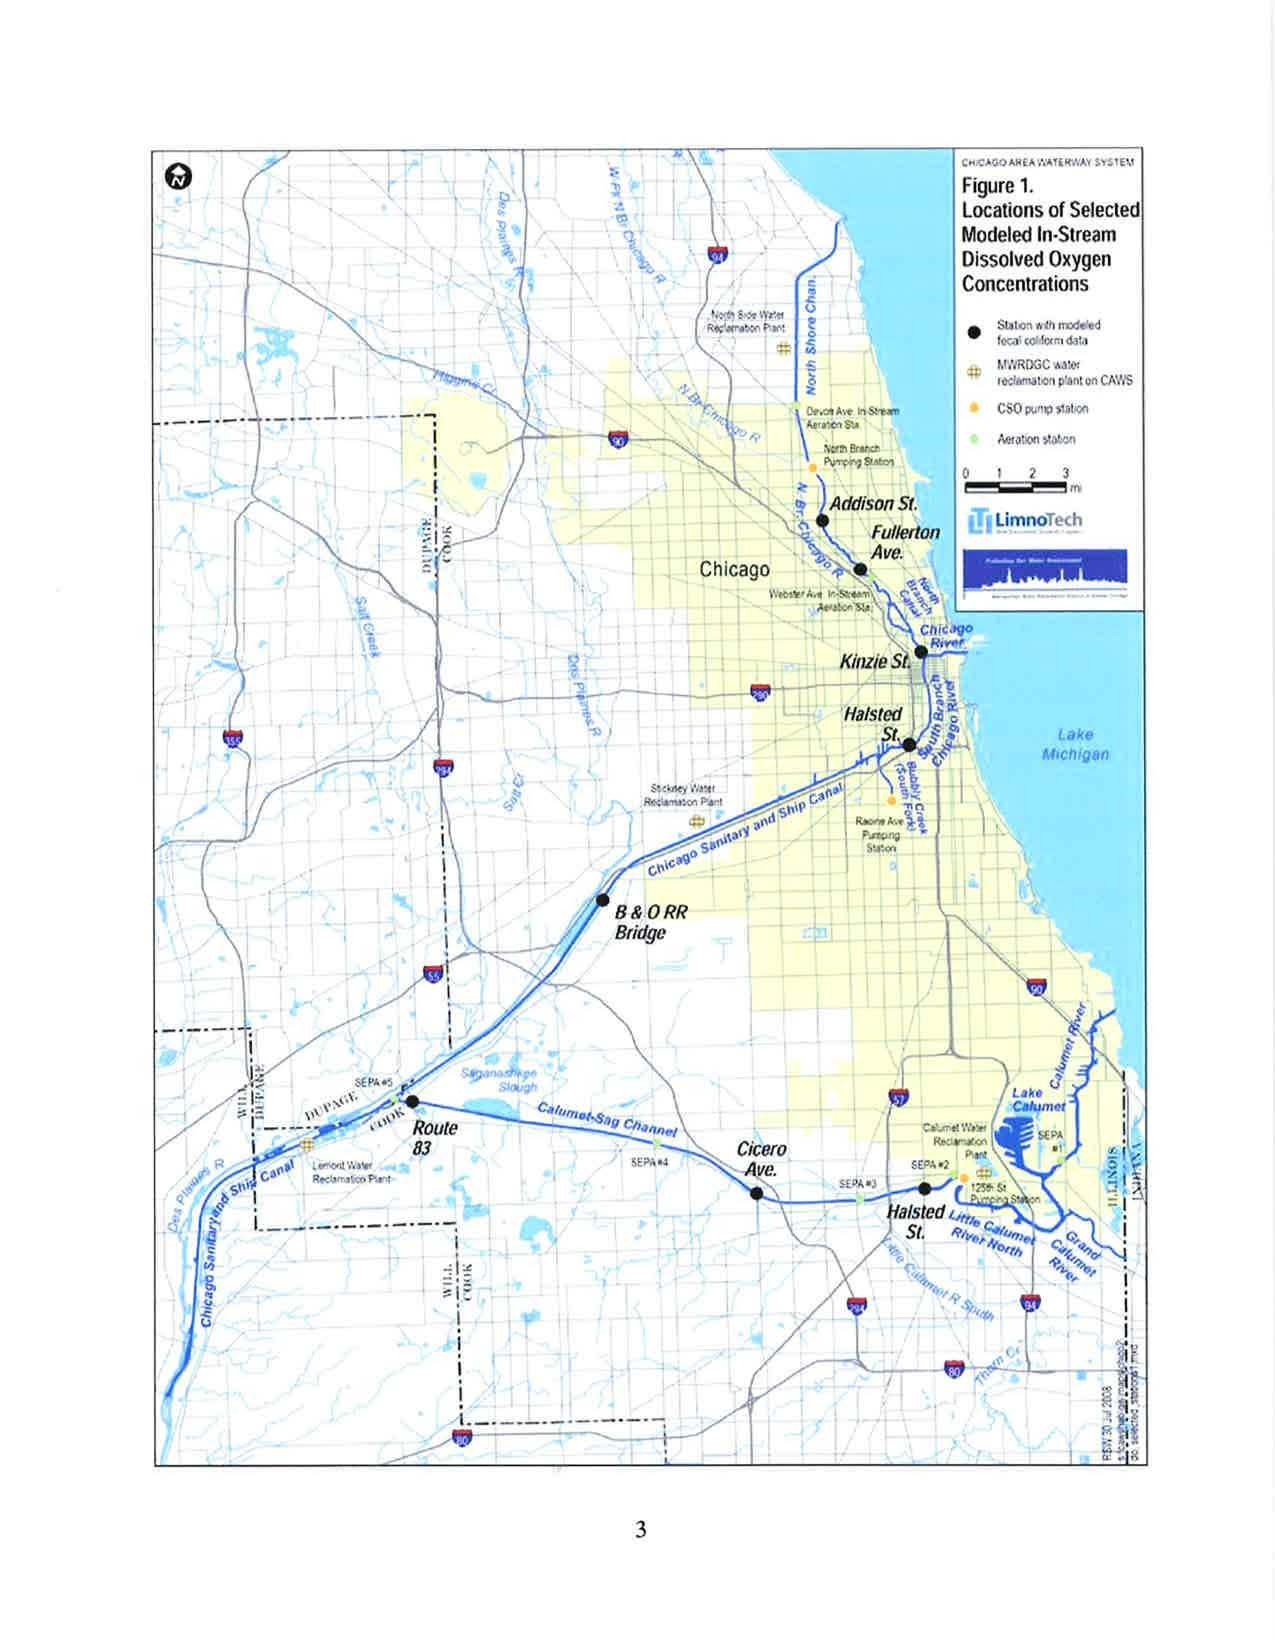
This attachment provides a description of the impact of combined sewer overflows
(CSOs), pump station bypasses, and tributary runoff on bacteria levels in the Chicago Area
Waterway System (CAWS). The information presents fecal coliform results of the District's
water quality model for a simulation from July 12, 2001 to November 10, 2001 for the following
scenarios: (1) Existing Conditions with assumed CSO and pump station bypass concentrations of
1,100,000 colony forming units per 100 milliliters (cfu/100ml); (2) Existing Conditions with
assumed CSO and pump station bypass concentrations of 170,000 cfu/100ml; (3) Elimination of
bacteria in the CSO and pump station bypass discharges (concentration set at 0 cfu/I00ml); and
(4) Disinfection of the Water Reclamation Plants (WRPs). For the WRP disinfection scenario,
the following concentrations were assumed: 1,030 cfu/100m1 at the North Side and Calumet
WRPs and 2,740 cfu/100m1 at the Stickney WRP. These scenarios were conducted in the
summer of 2005 for the North Side WRP Facility Planning effort.
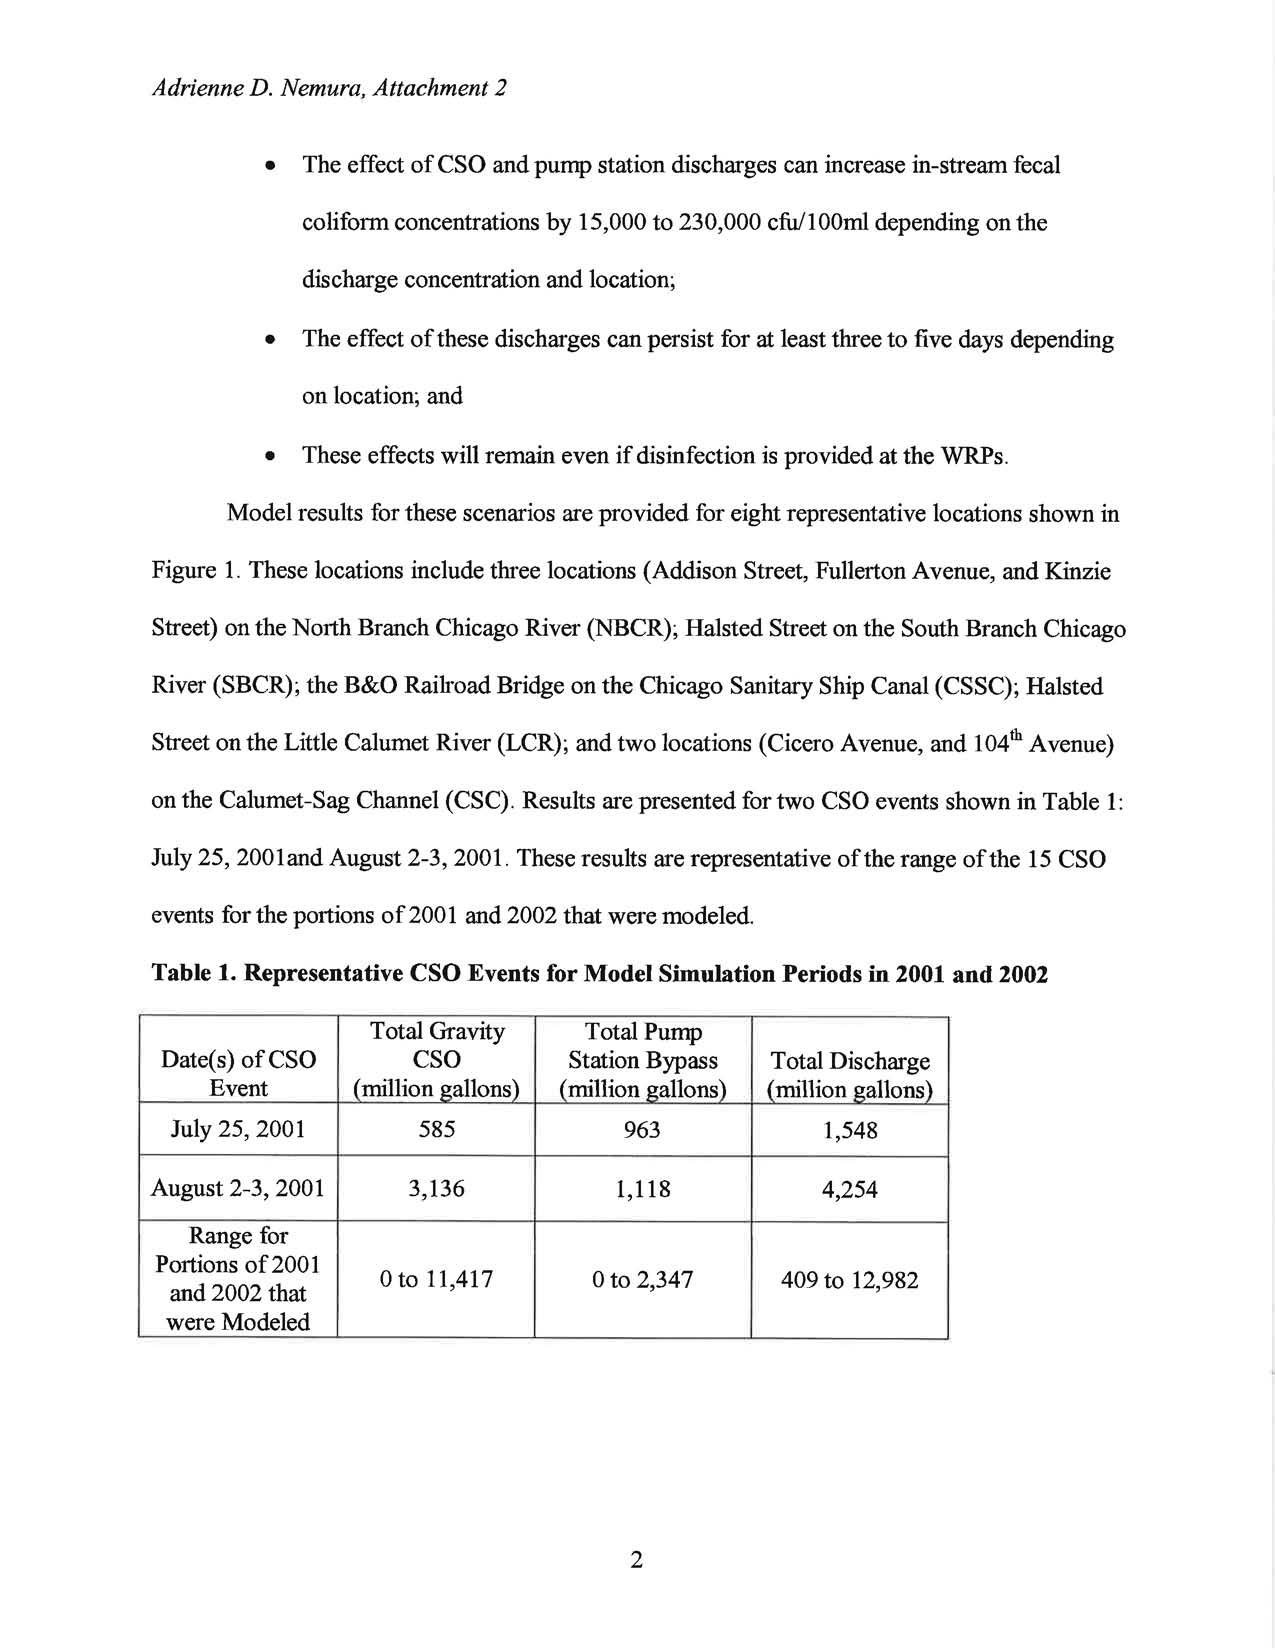
In summary, the results presented in this attachment (based on two representative storms)
show that:
1
Adrienne D. Nemura, Attachment 2
•
The effect of CSO and pump station discharges can increase in-stream fecal
coliform concentrations by 15,000 to 230,000 cfu/100m1 depending on the
discharge concentration and location;
•
The effect of these discharges can persist for at least three to five days depending
on location; and
•
These effects will remain even if disinfection is provided at the WRPs.
Model results for these scenarios are provided for eight representative locations shown in
Figure 1. These locations include three locations (Addison Street, Fullerton Avenue, and Kinzie
Street) on the North Branch Chicago River (NBCR); Halsted Street on the South Branch Chicago
River (SBCR); the B&O Railroad Bridge on the Chicago Sanitary Ship Canal (CSSC); Halsted
Street on the Little Calumet River (LCR); and two locations (Cicero Avenue, and 104th Avenue)
on the Calumet-Sag Channel (CSC). Results are presented for two CSO events shown in Table 1:
July 25, 2001 and August 2-3, 2001. These results are representative of the range of the 15 CSO
events for the portions of 2001 and 2002 that were modeled.
Table 1. Representative
CSO Events
for Model Simulation Periods in 2001 and 2002
Total Gravity
Total Pump
Date
(s) of CSO
CSO
Station
Bypass
Total Discharge
Event
million g
allons
)
(
million
g
allons
)
million
g
allons)
July 25, 2001
585
963
1,548
August 2-3, 2001
3,136
1,118
4,254
Range for
Portions of 2001
and 2002 that
0 to 11,417
0 to 2,347
409 to 12,982
were
Modeled
2
Adricime D. Nemurrr, Attrrchm.eiat
3
Figure 1.
Locations of Selected
Modeled In-Stream
Fecal Coliform
Concentrations
f.
C ad:nr
rorJa^
-
sbu^[ p.^n1
c + r....
Adrienne D. Nemura, Attachment 2
Figures 2 through 9 provide plots of the fecal coliform levels the eight locations for July
24 to August 10, 2001 which includes the two CSO events in Table 1. Results are presented for
existing conditions with the CSO and pump station discharge concentrations set at 1,100,000
cfu/100m1(green line) and 170,000 cfu/100 ml (blue line). This represents the hypothetical range
of CSO impacts as documented by Marquette University (Manache and Melching, 2005).
Bacteria concentrations in these discharges are likely to vary from event to event. The dashed
brown line shows the effect of zeroing out the CSO and pump station discharge concentrations.
This line represents lower concentrations than would be calculated with a scenario of actual
treatment or elimination of CSO because the associated "clean" flow from the CSO discharges is
still entering the CAWS in the simulation and diluting the calculated in-stream concentrations.
The effects of the bacteria loads from the North Side WRP, North Branch Pumping
Station, and the NBCR tributary (which includes storm water runoff and CSOs) can be seen at
Addison Road. If the assumed concentrations for the CSOs and pump station discharges are
1,100,000 cfu/100ml, the maximum difference in in-stream concentration with the scenario
where the fecal coliform is zero is approximately 100,000 cfu/100ml for the first event and
230,000 cfu/100m1 for the second event. If the assumed concentrations for the CSOs and pump
station discharges are 170,000 cfu/100m1, then the maximum in-stream difference is reduced to
16,000 cfu/100m1 and 35,000 cfu/100ml respectively. The effect of the wet weather discharges
lasts approximately three days for the first event and four days for the second event.
The effect of wet weather discharges is similar, and more pronounced, at Fullerton
Avenue and Kinzie Street on the NBCR (Figures 3 and 4). The higher peak concentrations in
these figures show the effect of the additional bacteria load from the CSOs located upstream of
4
Adrienne D. Nemura, Attachment 2
these locations. The effect of the wet weather discharges lasts approximately three to five days at
these locations.
Figure 5 shows the effect of the CSO and pump station discharges at Halsted Street on
the SBCR. Again, the higher peak concentrations and longer duration of the wet weather impacts
resulting from additional CSO is shown. The second event in Figure 5 also shows the effect of
flow reversals caused by the Racine Avenue Pump Station discharge where in-stream bacteria
concentrations increase on August 7 and 8, 2001. A similar effect is seen at the B&O Railroad
Bridge on the CSSC, as shown in Figure 6.
Figure 7 shows the effect of the CSOs, Calumet WRP, 125th Street Pump Station, and
other wet weather discharges on in-stream concentrations at Halsted Street on the Little Calumet
River. For the first event, the difference between the existing situation (with an assumed
discharge concentration of 1,100,000 cfu/100m1 in the CSOs and pump stations) is 100,000
cfu/100ml and 150,000 cf i/100ml for the second event. If the assumed discharge concentration
is 170,000 cfu/100ml, the impact of the CSOs and pump station discharges on in-stream
concentrations is 15,000 cf i/100ml and 23,000 cfu/100ml respectively. The duration of the wet
weather impacts at this location is four to five days.
As shown in Figures 8 and 9, the wet weather effects become more pronounced in the
CSC both in terms of peak concentrations and duration of impact of the wet weather discharges.
This is because of increased wet weather loads along the CSC and longer travel times.
5
Adrienne D. Nemura, Attachment 2
Figure 2. Comparison of Fecal Coliform Levels at Addison Road
, NBCR
for Existing
Conditions and Elimination
of CSO
/Pump Station Bacteria Concentration (2001)
1,000,000
of 100,000
0
r-I
1,000
100
10
C50'5
a1 1.100,000
[fW 1001
1
11
7/24 7/26 7/28
7/30 8/1
8/3
8/5
8/7 8/9
Figure 3. Comparison of Fecal Coliform Levels at Fullerton Avenue
,
NBCR for Existing
Conditions and Elimination
of CSO/
Pump Station Bacteria Concentration (2001)
1,000,000
10 -
7/24 7/26
7/28
7/30 8/1 8/3 8/5
8/7 8/9
Figure 4. Comparison of Fecal Coliform Levels at Kinzie Street, NBCR for Existing
Conditions and Elimination of CSO
/
Pump Station Bacteria Concentration (2001)
1,000,000
100,000
10,000
1,000
100
10
7/24
7
/26
7/28
7
/
30 8/1
8
/
3 8b 8//
8/9
6
Adrienne D. Nemura, Attachment 2
Figure 5
.
Comparison of Fecal Coliform Levels at Halsted Street
,
SBCR for Existing
Conditions and Elimination of CSO
/
Pump Station Bacteria Concentration (2001)
1,000,000 1
,CSOsat 1
,
100,000 cfu/100m1
0 100,000
/ \CSOsat
170,000 cfu/100ml
10,000
1U
7/24 7/26 7/28 7/30
8/1 8/3 8/5 8/7 8/9
Figure 6. Comparison of Fecal Coliform Levels at B&O Railroad Bridge
, CSSC for
Existing Conditions and Elimination of CSO/Pump Station Bacteria Concentration (2001)
1,000,000
--,
vv ^Iw[
AwwlIII
CSO$ at 0 c UAOOm1 _
U
100
10
-
1 , 1
,^- ..1-,_11^-1-
7/24 7/26
7/28
7/30 8/1 8/3 8/5 8/1
8/9
Figure 7. Comparison of Fecal Coliform Levels at Halsted Street
, LCR for
Existing
Conditions and Elimination
of CSO/
Pump Station Bacteria Concentration (2001)
1,000.000
0 100,000
0
10,000
1,000
100
10
C50sat
1,100
,000 du/100m1
CSOs
at 0 cfu/100m1
7/24
7/
26 7/28
7
/
30 8/1
8/3
8/5
8/7
8/9
7
Adrienne D. Nemura, Attachment 2
Figure 8. Comparison of Fecal
Coliform Levels at Cicero Avenue, CSC for Existing
Conditions and Elimination
of CSO/
Pump Station Bacteria Concentration (2001)
1,000,000
0 100,000
0
1,000
100
10
CSOsat 1,
100,000 Cfu/100m1
7/24
7/26
7/28
7/30 8/1 8/3 8/5 8/7 8/9
Figure 9. Comparison of Fecal Coliform Levels at 104th Avenue
,
CSC for Existing
Conditions and Elimination
of CSO
/Pump Station Bacteria Concentration (2001)
1,000,000
100,000
10,000
1,000
100
10
7/24
7/26 7/28 7/30 8/1
8/3 8/5 8/7
8/9
S
Adrienne D. Nemura, Attachment 2
Figures 10 to 17 provide a comparison of the existing condition (with an assumed CSO
and pump station discharge concentration of 170,000 cfu/100ml) to a scenario where the WRP
effluents are disinfected. Along the NBCR (Addison Street, Fullerton Avenue, and Kinzie Street)
there is a slight reduction in peak concentrations during the wet weather events due to
disinfection at the North Side WRP. Concentrations, however
, are still in
excess of 10,000
cfu/100m1. At the other locations, WRP disinfection does not reduce the peak concentrations
during the wet weather events.
Figure 10. Wet Weather Impacts at Addison Road
,
NBCR (2001)
1,000,000
0 100,000
0
CSOs
at 170,000 cfu/100mi
Disinfection at the WRPs
100
10
7/24
7/26
7/28
7/30
8/1
8/3
8/5
8/7
8/9
Figure 11. Wet Weather Impacts at Fullerton Avenue, NBCR (2001)
1,000,000
0 100,000
0
10,000
E
Disinfection at the WRPs
CSOsat 170,000 cfu/100mi
7/24
7/
26
7/28
7/30 8/1
8/3
8/5 8/7 8/9
Adrienne D. Nemura, Attachment 2
Figure
12.
Wet Weather
Impacts at Kinzie
Street, NBCR (2001)
1,000,000
0 100,000
0
10,000
E
100 1
CSOsat 170,
000 cfu/100ml
Disinfection at the WRPs
1U
7/24
7/26
7/28
7/30
8/1
8/3
8/5
8/7
8/9
Figure 13
.
Wet Weather Impacts at Halsted Street, SBCR (2001)
1,000,000
E 100,000
0
z
10,000
E
1,000
100
10
f
7/24
7/26
7/28
7/30
8/1
8/3
8/5
8/7
8/9
Figure
14. Wet Weather
Impacts at B&O Railroad Bridge
, CSSC (2001)
1,000,000
E
1,000
100
I
Disinfection
at the WRPs
10
1^-r-,-i- i- i-,-i- - I
7/24 7/26
7/28
7/30 8/1 8/
3 8/5 8/7 8/9
N,
^J f
r
4
-a
•
l
•
/r-, Disinfection at the WRPs
10
Adrienne D. Nemura, Attachment 2
Figure 15
.
Wet Weather
Impacts at Halsted
Street, LCR (2001)
1,000,000
o
f 100,000
0
-i
10,000
F^
CSOs at 170,
000 cfu/100mi
1,000 >
O
u
m
at
100
LA_
10 i
r7 - + - - - /
Disinfection at the WRPs
1 - _ - - - - -
7/24
7/26
7/28
7/30
8/1
8/3
8/5
8/7
8/9
Figure 16. Wet Weather Impacts at Cicero Avenue
,
CSC (2001)
1,000,000
100,000
10,000
1,000
100
1U
r
IF,
-
Disinfection
at the WRPs
7/24
7/26
7/28
7/30
8/1
8/3
8/5
8/7
8/9
Figure 17. Wet Weather Impacts at 104th Avenue
,
CSC (2001)
1,000,000
0 100,000
0
^ 10,000
a^
^►
LL
10
`Disinfection
at the
VVRPS
7/24
7/26 7/28
7/30 8/1 8/3
8/5
8/7
8/9
CSOsat 170
,
000 cfu/100mt
CSOs at 170,000 cfu/100mi
11
Adrienne D. Nemura, Attachment 2
REFERENCES
Manache, G. and Melching, C.S. (2005) Simulation of fecal coliform concentrations in the
Chicago Waterway System under unsteady flow conditions, "Technical Report 16, Institute of
Urban Environmental Risk
Management
, Marquette
University, Milwaukee, WI, and
Metropolitan
Water Reclamation District of Greater Chicago, Department of Research and
Development Report No. 2005-9, Chicago, IL.
12
A
tt
ac
hm
e
nt
3
BEFORE THE ILLINOIS POLLUTION CONTROL BOARD
IN THE MATTER OF:
WATER QUALITY STANDARDS AND
EFFLUENT LIMITATIONS FOR THE
CHICAGO AREA WATERWAY SYSTEM
AND THE LOWER DES PLAINES RIVER:
PROPOSED AMENDMENTS TO 35 Ill.
Adm. Code Parts 301, 302, 303 and 304
R08-9
(Rulemaking - Water)
ATTACHMENT 3 TO
PRE-FILED TESTIMONY OF ADRIENNE D. NEMURA
This attachment provides examples of wet weather water quality standards for three
states, and an interstate commission that recognized the potential need for wet weather standards,
because of the impact of wet weather discharges, primarily combined sewer overflows (CSOs).
The states of Indiana, Massachusetts, and Maine and the Ohio River Valley Water Sanitation
Commission (ORSANCO) have adopted provisions within their water quality standards to reflect
the challenges associated with meeting water quality standards due to CSOs or stormwater
discharges. Information is also presented on relevant Use Attainability Analyses (UAAs) that
have been conducted with respect to wet weather discharges.
Indiana
The State of Indiana revised its water quality standards to include a CSO wet weather
limited use designation that allows for temporary suspension of the recreational use criteria for
up to four days following a CSO event. This revision also allows the state to incorporate long-
term compliance schedules into NPDES permits for CSO communities. US EPA approved these
revisions on June 9, 2008 (US EPA, 2008). To obtain the limited use designation, CSO
communities must have completed a US EPA- approved UAA and have implemented a long-
term control plan. The state incorporates the long-term control plan into the NPDES permit
l
Adrienne D. Nemura, Attachment 3
(before the long-term control plan is fully implemented) and specifies the water quality based
requirements that apply to the remaining CSO discharges during and immediately following the
CSO events. US EPA indicated that these requirements "should be based upon the engineering
and modeling analyses and assumptions that were used in developing the LTCP and UAA, and
could be expressed in a number of different ways" (US EPA, 2008, p. 2). This includes, but is
not limited to, number of overflows per typical-year, percent capture, or a design-storm event.
Massachusetts
The State of Massachusetts has provisions in its water quality standards to provide for
partial designated use of CSO- or stormwater-imp acted waters. Communities can also obtain a
variance, if needed. The partial use designation indicates that the "criteria may depart from the
criteria assigned to the Class only to the extent necessary to accommodate the technology based
treatment limitations of the CSO or stormwater discharges" (MassDEP, 2007).
Maine
The State of Maine has adopted a variance approach to address CSO conditions during
implementation of an approved long-term control plan (MDEP
,
2003
).
A temporary CSO
subcategory is established after the community submits a long-term control plan, implementation
schedule, and
a UAA. A Citizen
Board may then temporarily suspend or modify the water
quality standards associated with the use (including the extent and duration) for CSO events
beyond a rainfall-selected event size.
ORSANCO
ORSANCO
adopted provision in its water quality standards for the Ohio River allowing
for development and application of alternative criteria if CSO communities have submitted a
long-term CSO control plan and
a UAA (ORSANCO,
2006
).
Several CSO communities along
2
Adrienne D. Nemura, Attachment 3
the Ohio are in the process of developing or updating their long-term control plans, although
none
have submitted UAAs to date.
City
of Indianapolis UAA
The City of Indianapolis incorporated a UAA into its long-term CSO control plan in
accordance with the State's provision for a CSO wet weather limited use designation. On May 7,
2008, the State submitted a proposed rule for public hearing to designate the receiving waters
affected by the City's CSOs for the wet weather limited
use designation
(IDEM, 2008).
Massachusetts Water Resources Authority (Boston)
On March 16, 2006, agreement was reached between the US EPA, Massachusetts
Department of Environmental Protection (MassDEP), the Conservation Law Foundation of New
England, Inc., and the Massachusetts Water Resources Authority (MWRA) on long-term
(through the year 2020) variances for the Charles River, Alewife Brook and East Boston (US
EPA, 2006). This allows MWRA to implement
its long
-term control plan and conduct post-
construction monitoring in 2018 to 2021 to demonstrate that it has achieved compliance with its
long-term control plan.
Santa Ana River UAA, California
A Stormwater Quality Standards Task Force has been meeting monthly since May 2004
to establish appropriate
recreational
uses for the Santa Ana River. A work plan was established
in 2003 to review the beneficial use classifications
and assess
existing conditions (Phase 1);
review and update the water quality objectives (Phase II); and develop permit implementation
and monitoring strategies (Phase III). The workgroup has completed Phase I and is in the process
of completing Phase II. Under Phase 1, it was determined that a high flow suspension of
recreational uses was appropriate along with re-designation of certain
segments
to Limited Rec-1
3
Adrienne D. Nemura, Attachment 3
or a lack of Rec-1 uses, along with revision of the numeric criteria (Bounds, 2008). Phase II
includes completion of a UAA.
Engineered Flood Channels UAA in Ballona
Creek,
California
The Los Angeles Regional Water Quality Control Board in California adopted a high
flow suspension of recreational uses for Ballona Creek, which is a straightened, concrete-lined
channel designed to move floodwaters from urban areas to the ocean (SWRCB, 2003). This
suspension was based on information showing that it is not safe to be in the modified channels
for this waterbody and therefore bacteria criteria for protection of recreational uses do not need
to be met. The suspension applies under the rainfall conditions that trigger swift-water protocols
(i.e., rescue squads are on alert if someone should happen to enter the water).
REFERENCES
Bounds, D. "Science Surrounding Effluent Disinfection and Pathogens in the Environment."
Presentation to the IAWA Technical Committee. Starved Rock Lodge, Utica, IL. Jul. 11, 2008.
Indiana Department of Environmental Management (IDEM
) (
2008
).
TITLE 327 WATER
POLLUTION CONTROL BOARD
Proposed
Rule LSA
Document
#
08-324. May 7, 2008. (3
pp.)
Maine Department of Environmental Protection (MDEP). 2003. 38 MRSA Section 464.
November 10, 2003.
Massachusetts Department of Environmental Protection (MassDEP
) (2007). 314 CMR 4.00:
Massachusetts Surface
Water Quality
Standards.
Ohio River Valley Water Sanitation Commission (ORSANCO) (2006). Pollution Control
Standards for Discharges to the Ohio River: 2006 Revision.
State
Water Resources Control Board (SWRCB) (2003). Ballona Creek Recreational Use
Attainability Analysis. Amendment to Water Quality Control Plan: Los Angeles Region, Basin
Plan for the Coastal Watersheds of Los Angeles and Ventura Counties.
United States Environmental Protection Agency (US EPA) (2008). Letter from B. Mathur to B.
Pigott. June 9, 2008. (3 pp.)
4
Adrienne D. Nemura, Attachment 3
US EPA (2006). Memorandum of the United States of America in Support of Joint Motion to
Amend Schedule Six with Respect to the Charles River, Alewife Brook and East Boston, Civil
Actions No. 85-0489-RGS and No. 83-1614-RGS. March 15, 2006.
5
A
tt
ac
hm
e
nt 4
BEFORE THE ILLINOIS POLLUTION CONTROL BOARD
IN THE MATTER OF:
WATER QUALITY STANDARDS AND
EFFLUENT LIMITATIONS FOR THE
CHICAGO AREA WATERWAY SYSTEM
AND THE LOWER DES PLAINES RIVER:
PROPOSED AMENDMENTS TO 35 Ill.
Adm. Code Parts 301, 302, 303 and 304
R08-9
(Rulemaking - Water)
ATTACHMENT 4 TO
PRE-FILED
TESTIMONY
OF ADRIENNE
D. NEMURA
This attachment provides a description of the impact of gravity combined sewer
overflows (CSOs) and other wet weather discharges on dissolved oxygen (DO) levels in the
Chicago Area Waterway System (CAWS). The information presents selected results of the
District's water quality model for a simulation from July 12, 2001 to November 10, 2001 for the
following
scenarios
: (1) Existing Conditions and (2) Elimination of Gravity CSOs. The
simulations
show that:
•
CSOs have different impacts on in-stream dissolved oxygen depending on
location and the nature of the wet weather event;
•
CSO impacts range from minimal duration to an impact that "could last for
weeks" (Zhang et al, 2007);
•
The impacts can range from less than 1 milligram per liter (mg/1) to more than 3.5
mg/l deficit in in-stream dissolved oxygen concentrations;
•
Elimination of gravity CSOs may not, at varying times at different locations,
result in attainment of the proposed minimum dissolved oxygen criteria; and
•
"Even if all gravity CSOs were eliminated... [a] target DO value of 4 mg/l could
not be satisfied 100 percent of the time at some locations in the CAWS under the
1
Adrienne D. Nemura, Attachment 4
summer conditions of 2001 and 2002" (Zhang et al, 2007) because pump station
discharges, sediment resuspension, stormwater, and tributary runoff will remain
and impact dissolved oxygen.
Model results for these scenarios are provided for eight representative locations shown in
Figure 1. These locations include three locations (Addison Street, Fullerton Avenue, and Kinzie
Street) on the North Branch Chicago River (NBCR); Halsted Street on the South Branch Chicago
River (SBCR); the B&O Railroad Bridge on the Chicago Sanitary Ship Canal (CSSC); Halsted
Street on the Little Calumet River (LCR); and two locations (Cicero Avenue and Route 83) on
the Calumet-Sag Channel (CSC). Results are presented for two CSO events shown in Table 1:
July 25, 2001 and August 2-3, 2001. These results are representative of the range of the 15 CSO
events for the portions of 2001 and 2002 that were modeled.
Table 1. Representative
CSO Events
for Model Simulation Periods in 2001 and 2002
Total Gravity
Total Pump
Date
(s) of CSO
CSO
Station Bypass
Total
Discharge
Event
million g
allons
)
million
g
allons
)
million
g
allons
)
July 25, 2001
585
963
1,548
August 2-3, 2001
3,136
1,118
4,254
Range for
Portions of 2001
0 to 11 417
0 to 2
347
409 to 12 982
and 2002 that
,
,
,
were
Modeled
Figures 2 through 9 provide plots of the dissolved oxygen levels at the eight locations for
July 24 to August 10, 2001 which includes the two CSO events in Table 1. Results are presented
for existing conditions (blue line) and elimination of gravity CSOs (dashed brown line). Oxygen-
demanding pollutant concentrations in these discharges vary from event to event (Zhang et al,
2007).
2
Figure 1.
Locations of Selected
Modeled In-Stream
Dissolved Oxygen
Concentrations
stibal
1, 4h
irade'vd
h Y c: firm Qz!.^
V.'.R1'AC oic,
i^•:rim d!'J.'i pent
un CAWS
C50 pw+p 51skA
Mow Kkan
t23
M
.
LlmnoTech
3
The effects of the oxygen-demanding loads from the North Branch gravity CSOs and
other wet weather sources (including the North Side Pump Station and runoff and CSOs in the
NBCR) on in-stream dissolved oxygen levels at Addison Road are shown in Figure 2. The
gravity CSO loads affect dissolved oxygen concentrations by 0.5 to 1 mg/l for three days for the
first event and 0.5 to 1.5 mg/1 for eight days for the second event. Depressions after the wet
weather events on July 25, 2001 and August 2-3, 2001 are still evident even with the elimination
of the gravity CSOs. These wet weather impacts are more pronounced at Fullerton (Figure 3) and
Kinzie Street (Figure 4).
The effect of the gravity CSOs on dissolved oxygen are also pronounced at Halsted Street
on the SBCR (Figure 5). For the second event, the CSOs depress in-stream dissolved oxygen by
as much as 2 mg/1. This effect is diminished at the B&O Railroad Bridge on the CSSC (Figure
6).
The effect of the gravity CSOs on in-stream dissolved oxygen is also substantial at
Halsted Street on the LCR (Figure 7) for the second event, with impacts lasting for eight days
and a maximum deficit of 1.5 mg/l. This effect is more pronounced tt Cicero Avenue on the
CSC, with a maximum deficit of 2.5 mg/l (Figure 8). The gravity CSOs impact in-stream
dissolved oxygen at Route 83 on the CSC for both the first event (1 mg/1) and the second event.
For the second event, the maximum dissolved oxygen deficit at this location is 3 mg/l and the
CSO effects are calculated to last more than seven days.
4
Adrienne D. Nemura, Attachment 4
Figure 2. Comparison of Dissolved Oxygen
Levels
at Addison Road
,
NBCR for Existing
Conditions and Elimination
of Gravity
CSOs (2001)
7/24 7/26 7/28 7/30 8/1
8/3
8/5
8/7
8/9
Figure 3. Comparison of Dissolved Oxygen Levels at Fullerton Avenue, NBCR for Existing
Conditions and Elimination of Gravity CSOs (2001)
Effect
of Eliminating
Gravity CSO
2
1
0
7/24
7/
26 7/28 7
/
30
8/1
8/3
8/5
8/7
8/9
Figure 4. Comparison of Dissolved
Oxygen Levels
at
Kinzie Street
, NBCR
for Existing
Conditions and Elimination
of Gravity CSOs (2001)
9
8
x
a
5
0 4
0
a
6 3
6 2
1
, Effect
of Eliminating Gravity CSO
RA mini U nl Cflt@I fOn
0
7/24
7/
26 7/28 7/30
8
/
1
8/3
8
/
5
8/7
8/9
5
Adrienne D. Nemura, Attachment 4
Figure 5. Comparison of Dissolved
Oxygen Levels at
Halsted
Street, SBCR
for Existing
Conditions and Elimination
of Gravity CSOs (2001)
9
8
7
6
5
Minimum Criterion
^.
3
2
i
1
ffort of Eliminating
Gravitv CSn
0
7/24 7/26 7/28 7/30 8/1
8/3
8/5
8/7
8/9
Figure 6
.
Comparison of Dissolved
Oxygen Levels at
B&O Railroad Bridge
, CSSC for
Existing Conditions and Elimination
of Gravity CSOs (2001)
1N
7/24 7/26 7/28 7/30
8/1
8/3
8/5
8/7
8/9
Figure 7. Comparison of Dissolved Oxygen Levels at Halsted Street, LCR for Existing
Conditions and Elimination of Gravity CSOs (2001)
Effect of
Eliminating Gravity C50
U
-
r -- f
-I
- -+-- ;- -i-- - -L -
7/24
7/26 7/28 7/30 8/1
8/3
8/5
8/7
8/9
6
Adrienne D. Nemura, Attachment 4
Figure 8. Comparison of Dissolved Oxygen
Levels
at Cicero
Avenue, CSC for
Conditions and Elimination
of Gravity
CSOs (2001)
9
8
7
6
Effect of Eliminating
Gravity C50
7/24
7/
26 7/28 7/30
8
/
1
8/3
8
/
5
8/7
8/9
Existing
Figure 9. Comparison of Dissolved Oxygen Levels at Route 83, CSC for Existing
Conditions and Elimination of Gravity CSOs (2001)
Effect of Eliminating
G ravsty CSD
7/24
7/26
7/28 7/30
8/1
8/3
8/5
8/7
8/9
REFERENCES
Zhang,
H., D. Bernstein
, J.
Kozak, I S. Jain, R. Lanyon, E. Alp, and C. S. Melching. 2007.
Evaluation of Eliminating Gravity CSOs on Water Quality of the Chicago Area Waterways
(CAWS) Using an Unsteady Flow Water Quality Model. WEFTEC 2007
.
San Diego
,
CA. Oct.
13-17, 2007.
7
A
ttachm
e
nt 5
EVALUATION OF THE DURATION OF
STORM
EFFECTS ON IN-STREAM WATER QUALITY
Emre Alp1, Charles S. Melching2
CE DATABASE SUBJECT HEADINGS:
Monte Carlo Method; Models; Watershed
Management; Water Quality; Combined Sewer Overflows
1
Post-Doctoral Researcher, Department of Civil and Environmental Engineering, Marquette
University, P.O. Box 1881, Milwaukee, WI 53201-1881, USA. Tel: 414 2880690, Fax: 414
2887521 ,
e-mail
: emre.alp@marquette.edu
z
Associate Professor, Department of Civil and Environmental Engineering, Marquette
University, P.O. Box 1881, Milwaukee, WI 53201-1881, USA. Tel: 414 2886080, Fax: 414
2887521 ,
e-mail
: charles.melching@marquette.edu
1
Abstract
One of
the primary reasons water
-
quality standards are not met is the effect of storm runoff and
combined sewer overflows
.
A methodology
is presented here to determine the duration of storm
effects on stream water
quality. The
evaluation
of the
duration of storm effects on water quality
involves two steps
.
First
,
calibration of an appropriate water
quality
model that is capable of
simulation
of unsteady-
state conditions
.
Second
,
execution of the calibrated model with a
number of storm loadings randomly sampled
from
a specific
probability
distribution that
represents realistic ranges of pollutant concentrations
.
When the variations in the simulated water
quality variables become negligible
,
it is assumed that the river system goes
back to
pre-storm,
dry-weather
conditions
.
To illustrate this methodology
, the DUFLOW
unsteady-state water
quality
model and Latin Hypercube Sampling are applied to evaluate the duration of storm
effects on water quality in the Chicago
Waterway
System
(CWS). The
duration of the storm
impacts on dissolved oxygen lasts 2
days
to 2 weeks
in the CWS
depending on the location in the
system and the magnitude of the storm
.
Moreover, a strong relation between the precipitation
depth and the duration of the storm effects on in-stream water quality constituents was found in
the CWS.
Outcomes of this research suggest that the duration of the storm effect on water quality
can reasonably be predicted
with
the help of robust unsteady-state water quality models.
Introduction
Because of storm related pollution like combined sewer overflows (CSOs), river systems may
not meet the water quality standards defined by the existing uses of the river system. As the
importance of the effects of CSOs on receiving water bodies is becoming more obvious, CSO
regulations are becoming stricter. In 1994, The U.S Environmental Protection Agency (EPA)
issued the Combined Sewer Overflow Control Policy, which contains provisions for developing
appropriate, site-specific National Pollutant Discharge Elimination System requirements for all
CSOs. Compliance most often takes the form of a long-term control plan, which outlines the
selection and implementation of CSO control alternatives. Current EPA regulations and
guidance, based on the Clean Water Act (CWA) and CSO Policy, are structured to provide States
some flexibility to adapt water quality standards to reflect site-specific conditions, including
those related to CSOs (Slack and Nemura, 2000). However, existing regulations provide that
designated uses can only be removed if there is a reasonable basis for determining that current
designated uses cannot be attained after implementing the technology based controls required by
the CWA. In determining whether a use is attainable, EPA guidance requires the State to conduct
and submit an Use Attainability Analysis (UAA). The methodology of the UAA is described in
related manuals (USEPA, 1983a, Novotny et al., 1995)
If the
problem of concern is a complicated phenomenon such
that the UAA
attributes the water
quality standard violations to the both wet and dry weather periods, it could be necessary to
determine the degree of attainment of the standards during wet and dry weather conditions to
identify the problem precisely
.
By delineating wet and dry weather, it is possible to compare the
3
contribution of both dry and wet weather management alternatives to the overall compliance
with the water quality standards.
If continuous time series of five day carbonaceous biochemical oxygen demand (CBOD5) and
ammonium as nitrogen (NH4-N) concentrations were available at short time steps, it is possible
that the duration of the storm effect on these constituents could be determined from the measured
CBOD5 and NH4-N concentrations. However, such a determination would require that the dry-
weather conditions-temperature, flow from wastewater treatment plants and tributaries,
boundary conditions, etc.-would be essentially the same as before the storm. Since such
continuous data generally are not available, water-quality models must be used to estimate the
duration of the storm effect. The situation for dissolved oxygen (DO) concentrations is much
more complex because DO concentrations are influenced by many conditions and processes
temperature, flow dilution, treatment plant loads, CBOD5, the nitrogen cycle, sediment oxygen
demand (SOD), algal growth and death, etc.-each of which is subject to a different duration of
storm effects. For example, DO recovery to pre-storm conditions does not indicate the end of the
storm effect because the new dry weather DO concentration may have changed because of
changes in temperature, SOD, treatment plant loads, etc. Again water-quality models must be
used to determine the duration of the storm effect.
This paper describes a method for evaluation of the storm effects on in-stream water quality to
define wet weather conditions and illustrates how different storm loadings affect the in-stream
DO, CBOD5, and NH4-N concentrations in the Chicago Waterway System (CWS). A relation
between precipitation and the duration of storm impacts on in-stream water quality is also
4
examined
.
The relation between the precipitation and the duration of the wet weather conditions
can help to estimate the duration of the wet weather conditions for future storms.
Method
Basically, an uncertainty analysis method is used together with an unsteady
-
state water quality
model to determine the duration of wet weather conditions
.
This methodology starts with the
assumption that the wet weather condition can be defined as the duration of storm effects on in-
stream water quality. In this approach
,
a water quality model is successively applied with
different storm loadings randomly sampled from a probability distribution representative of
actual storm loads to the receiving water body using an uncertainty analysis technique
.
Then the
variations in the water quality model output variables among the successive simulations are
observed
.
When the variation in the model output variables approaches zero, it means the river
system has returned to the pre-storm
(
dry weather
)
condition. Therefore, the duration between
the start and the end of the variations in the simulated constituent concentrations can be defined
as the duration of the storm effect on in-stream water quality, or the duration of the wet weather
condition.
Since the purpose of this research is to separate dry weather conditions from wet weather
conditions
,
it is necessary to work with a water quality model which is capable of simulating
flows under unsteady conditions
.
The DUFLOW
(2000
)
unsteady
-
state water
-
quality model
developed in the Netherlands was selected for this study for the following reasons : 1) Several
options are included for the simulation of water quality including a sediment flux model, 2)
Compatibility with Geographical Information Systems, 3) Microsoft Windows based including a
5
powerful graphical user interface
, 4) Low
license cost
,
5) Low computational time, and 6)
Successful application to several European rivers (e.g., Manache and Melching, 2004).
In this study, the DUFLOW water-quality simulation option that adds the DiToro and Fitzpatrick
(1993) sediment flux model to the Water Quality Analysis Simulation Program (WASP4)
(Ambrose et al., 1988) model of constituent interactions in the water column is applied.
DUFLOW distinguishes among transported material that flows with water, bottom materials that
are not transported with the water flow, and pore water in bottom materials that are not
transported but that can be subject to similar water-quality interactions to those for the water
column. Flow movement and constituent transport and transformation are two processes and
constituent transport is defined by advection and dispersion.
The flow simulation in DUFLOW is based on the 1-D partial differential equations that describe
unsteady flow in open channels (de Saint-Venant equations). These equations are the
mathematical translation of the laws of conservation of mass and momentum.
The calibrated DUFLOW unsteady water quality model is successively executed with different
storm loadings randomly sampled from a probability distribution to determine the duration of the
storm effect on water quality. The Latin Hypercube Sampling (LHS) technique (McKay et al.,
1979; McKay, 1988) is used in this study because of its good accuracy for a smaller sample size
compared with Monte Carlo Simulation (MCS). For unsteady water quality models with high
computational time requirements, the use of LHS has been suggested (Aalderink et al., 1996,
Manache and Melching, 2004) because it provides the flexibility of MCS with less
6
computational load. LHS has been used extensively in many studies. Vandenberghe et al. (2005)
focused on diffuse nitrate pollution due to fertilizer use in the Dender River basin (Belgium) and
applied LHS to analyze the uncertainty of water quality predictions caused by uncertainty in the
inputs related to emissions of diffuse pollution. Sieber and Uhlenbrook (2005) used LHS to
determine the most important parameters in a water quality model for the Brugga River basin
and the sub-basin St. Wilhelmer Talbach (Germany). Mukhtasor et al. (2004) described an
Ecological Risk Assessment procedure based on LHS. Sohrabi et al. (2003) used the ARRAMIS
(Advanced Risk & Reliability Assessment Model) software package to apply the LHS scheme to
analyze the uncertainty of the SWAT2000 (Soil and Water Assessment Tool) outputs concerning
nutrients and sediment losses from the Warner Creek watershed, Maryland.
LHS is a type of stratified Monte Carlo sampling in which n different values are selected for
each of
k
variables. The range of each variable is divided into
n
nonoverlapping intervals each
having equal probability. One value from each interval is selected at random. For intervals based
on equal probability, random sampling means random with respect to probability density in the
interval. The
n
values thus obtained for X, are paired in a random manner with the n-values
of X2,
These
n
pairs are combined in a random manner with the
n
values of X3 to form n triplets, and so
on, until n k-tuples are formed (Iman et al., 1981). This is the Latin Hypercube Sample, which is
used as input for the model.
7
Case Study
Modeling Water Quality in the Chicago Waterway System
The Chicago Waterway System (CWS) is located in Northeastern Illinois, USA, and is
composed of the Chicago Sanitary and Ship Canal (CSSC
),
Calumet
-
Sag Channel, North Shore
Channel (NSC), lower portion of the North Branch Chicago River (NBCR), South Branch
Chicago River (SBCR), Chicago River Main
Stem
,
and Little Calumet River (north). The CWS,
used mainly for commercial and recreational navigation and for urban drainage
,
is a 122.8 km
branching network of navigable waterways controlled by hydraulic structures
.
The CWS receives
pollutant loads from 3 of the largest wastewater treatment plants in the world, nearly 240 gravity
CSOs, 3 CSO pumping stations, direct diversions from Lake Michigan
,
and eleven tributary
streams or drainage areas. The water quality in the modeled portion
of the CWS
is also affected
by the operation of four Sidestream Elevated Pool Aeration stations and two in
-
stream aeration
stations
.
The Calumet and Chicago River Systems are shown in Figure 1.
The Illinois
Pollution Control Board
(
IPCB) regulations
(Title
35, Section
302.206 and
Section
302.405)
state that for General Use waters the DO concentration shall not be less than 6 mg/L
during at least 16 hours of
any 24 hour
period
,
nor less than 5 mg
/
L at any time
. In the CWS,
only the upper NSC
and the Chicago River Main Stem are considered General
Use waters. The
remainder
of the CWS
is considered Secondary Use (Indigenous
Aquatic Life)
waters wherein
the DO concentration shall not be less than 4
mg/L at
any time except that the Calumet-Sag
Channel
shall not be less than 3
mg/L at
any time. This regulation was established
in 1972 with
the modification for the Calumet
-
Sag Channel in 1988, and since that time the Metropolitan
8
Water Reclamation District of Greater Chicago (MWRDGC) has made many improvements to
the wastewater treatment plants (water reclamation plants), CSOs, and aeration resources of the
CWS. Thus, in 2003 the Illinois Environmental Protection Agency initiated an UAA for the
CWS to see if DO in the CWS could be brought closer to the General Use standard at a
reasonable cost. In anticipation of this UAA and to meet other water-quality management needs
the MWRDGC began an intensive sampling of hourly DO and temperature throughout the CWS
in 1998, and entered into an agreement with Marquette University in 2000 to develop a water-
quality model for the CWS that was suitable for simulating constituent concentrations during
unsteady-flow conditions. The outcomes of this study and the DUFLOW water quality model for
CWS developed by Marquette University have been supporting the CWS UAA study by
identifying the causes of water quality problems and the effectiveness of management
alternatives to achieve designated uses. The UAA has recommended revised uses of Modified
Warm Water Aquatic Life for the NSC and the NBCR up to Fullerton Avenue and for the
Calumet-Sag Channel and Little Calumet River (north), whereas the use for the rest of the
system will be Limited Warm Water Aquatic Life. The exact DO targets for these uses still are
under consideration by the IPCB.
The DUFLOW water-quality model was calibrated and verified for the periods of July 12-
November 9, 2001, and May 1- September 23, 2002, respectively. 2001 was a relatively wet year
and 2002 was a relatively dry year giving an acceptable variety of flows for the calibration and
verification. Complete details of the calibration and verification are given in Alp and Melching
(2006).
9
The comparison of measured and simulated hourly water-surface elevations at six locations
throughout the CWS were used for hydraulic calibration and verification of the model. Statistical
analysis for the locations used in the verification showed that the difference between the
measured and simulated stages are all below 8.5 % relative to the depth of the water except for
Wilmette. Wilmette is an upstream boundary location of the model located on the North Shore
Channel (NSC) and observed flow was used as the upstream boundary condition. The mean and
median error in water-surface elevation was 7.6 cm. Because of the generally low flows in NSC
and the backwater effect from downstream portions of the CWS, it was difficult to decrease this
error.
This error was considered too small to significantly affect simulated water quality in the
NSC, and so extraordinary means were not taken to improve this part of the hydraulic
simulation. For the other locations, mean and median values of the absolute value of the
difference between the measured and simulated stages are below 3.2 % relative to the depth at all
locations. The simulated water-surface elevations were within 3% relative to depth for 93.7-
99.9% of the measured values at all locations other than Wilmette. These high percentages of
small errors and the high correlation coefficients (0.79-0.98) indicate an excellent hydraulic
verification of the model.
An extensive data set including hourly in-stream DO data at 25 locations, monthly in-stream
water-quality measurements at 18 locations, daily composite treatment plant effluent
measurements, event mean concentrations for storm runoff from major tributaries and CSO
pumping stations determined from multiple samples collected by the MWRDGC during selected
events in 2001, daily solar radiation data, and detailed hydraulic data (at 15-min and 1-hour time
steps) were used to calibrate and verify the water-quality model at a 1-hour output time step. All
10
water quality variables including DO were measured by MWRDGC. The comparisons of the
simulated constituent concentrations (CBOD5, Nitrogen compounds, and Chlorophyll-a) with
long-term mean measured concentrations, one standard deviation confidence bounds, and
concentrations measured between July-November 2001 indicated reasonable simulations. There
are approximately 2900 measured hourly DO data at each location within the calibration period
and throughout the calibration process it was aimed to match hourly measured and simulated DO
concentrations as much as possible. On the other hand, as Harremoes et al. (1996) mentioned, it
is almost impossible to match all the measured hourly data if there are a large number of data to
be fitted to.
Hence, calibration was done manually in a way that the model can capture low DO
concentrations resulting from CSOs and produce similar probability of exceedences for different
DO concentrations. The focus on low concentrations was taken so that reliable management
practices to mitigate the CSO effects could be determined. Comparisons of the percentage of DO
concentrations less than 3, 4, 5, and 6 mg/L at different locations in the CWS for the calibration
period for selected locations are listed in Table 1.
Close agreement between the calibrated and measured DO concentrations were obtained
especially for the lower DO concentrations. The differences between the percentage of DO
concentrations less than 3 mg/L for the calibrated and measured DO concentrations vary 0.0 to
4.5 percentage points at all 25 locations in the CWS except for the upper NSC. The differences
between the percentage of DO concentrations less than 4 mg/L for the calibrated and measured
DO concentrations are less than 10.6 percentage points in the CWS except for the upper NSC.
Along the upper NSC it was difficult to match the measured DO concentrations because of the
hydraulic conditions in the upper NSC, i.e. flow near zero except during CSO events. The
11
differences between the percentage of DO concentrations less than 3 and 4 mg/L for the
calibrated and measured DO concentrations reach up to -30.4 percentage points in the upper
NSC. The overall average of the absolute differences of percentages of DO concentrations less
than 3, 4, 5, and 6 mg/L for the calibrated and measured DO concentrations are 1.7, 4.4, 7.7, and
9.6 percentage points, respectively, in the CWS except for the upper NSC.
For model verification purposes, average values of constituent concentrations in CSOs taken as a
mean from historic measured data were applied, whereas measured event mean concentrations
were available at the CSO pumping stations for the calibration period. Verification of the CWS
DUFLOW model generally shows good agreement between measured and simulated DO
concentrations. For the entire CWS except the upper NSC the average error in daily DO
concentration is 8.3 % and the average absolute percentage error is 26.9 % (Neugebauer and
Melching, 2005). Comparison between the DUFLOW model prediction ability for the
verification and calibration periods indicates that the prediction ability of the DUFLOW model is
comparable for these two periods. It was concluded that, in general, the DUFLOW model
represents water-quality processes in the CWS well enough for simulation of remediation
strategies and to be used in the determination of the duration of the storm effects on water
quality.
12
Duration
of Effects of Combined Sewer Overflows in the Chicago Waterway System
The CWS
receives a high amount
of CSOs
during larger storms
.
Hence the CWS is a good
example study to determine the duration of storm effects on
CBOD5, NH4-N, and DO
concentrations.
Generation of the Latin Hypercube Sample
In this step, random values of the input variables are generated from their assigned distributions.
Pollutant loadings from CSOs are the combination of CSO volume and pollutant concentrations.
In this study, 8 constituents from each of the 3 pumping stations (Table 2) for a total of 24
variables are considered. Uncertainty in the CSO volume could affect the variability in the CSO
loading.
However, in order for the hydraulics of the channel to be properly simulated (i.e. to
maintain the proper system-wide water balance and match the observed stage measurements) the
overall CSO volume cannot vary substantially from the value used. Thus, in this study, the
variation in CSO pollutant loads is considered using a fixed CSO flow and variable event mean
concentrations (EMCs) of pollutants. For this reason, only CSO EMCs were used as input
variables in the LHS simulations to determine the duration of the storm impact on in-stream
water quality.
The flow from CSO drainage areas during storms has a substantial effect on the CWS. There are
nearly 240 CSOs in the CWS drainage area. Since it is practically difficult to introduce all CSO
locations in the modeling, 28 representative CSO locations were identified and flow distribution
was done on the basis of drainage area for each of these locations. The volume of CSO was
13
determined from the system wide flow balance and water level measurements at Romeoville.
Successful results with hydraulic calibration and verification suggest that CSO volumes were
reasonably estimated and distributed along the waterway system. Further, Novotny and Olem
(1994, p. 484) state in most cases, the total load resulting from the runoff event is more important
than the individual concentrations within the event due to the fact that runoff events are
relatively short, the receiving water body provides some mixing, and the concentration in the
receiving water body is a response to the total load rather than the concentration variability
within the event. Similarly, the modeling results in this study have shown that if approximately
the right amount of flow and pollutant loads are input to the CWS at approximately the right time
and right location an acceptable simulation of the pollutant concentrations in the CWS has
resulted. Further, the evaluation of storm durations was done at the DO monitoring locations
which are sufficiently downstream from the representative CSO locations so that sufficient
mixing of the water body has taken effect.
Because of the importance of the total load, the EMC has been found to be the most appropriate
variable for evaluating the impact of urban runoff (U.S. EPA, 1983b). Hence, EMCs were used
to characterize all stones in this study. Historic EMCs were calculated based on the
measurements done by the MWRDGC for each pumping station listed in Table 2. The North
Branch Pumping Station water-quality variables were used for NSC and NBCR CSOs, the
Racine Avenue Pumping Station water-quality variables were used for the Chicago River Main
stem and SBCR CSOs, and 125th Street Pumping Station water-quality variables were used for
the Calumet-Sag Channel and Little Calumet River CSOs. The reasonableness of this approach
was shown statistically in Neugebauer and Melching (2005). There are just 4 and 7 measured
14
events for the 125th Pumping Station and the North Branch Pumping Station, respectively, for the
statistical analysis. Thus, even though different probability distributions were tested, the limited
number of data did not allow a robust conclusion on the appropriate probability distribution.
Novotny (2004) showed that event mean concentrations in runoff follow the log-normal
probability distribution. Therefore, the assumption of a log-normal probability distribution was
made.
Several computer packages that include routines for MCS and LHS methods are available
.
In this
study, the
UNCSAM
program developed by the Dutch Institute for Public Health and the
Environment
(
Janssen et al., 1992) was used to generate 50 sets of random CSO pollution
variables corresponding to the LHS procedure. As a general rule, as the sample size increases,
the model output variability better converges to its true value
.
Because of the long computational
time for the
DUFLOW
Model
,
selection of a reasonable sample size that can lead model output
statistics to converge is an essential part of this step
.
In the literature different sample sizes have
been suggested as varying between 4/3 to 5 times the number of the uncertain input variables
(McKay,
1988; Manache, 2001
).
Since there are 24 input variables
,
fifty sets of random EMCs
are enough to obtain satisfactory results.
Following
the LHS method, fifty sets
of the 8 input constituents were generated for each
pumping station and related
gravity
CSOs and the
DUFLOW model
was run successively for
each
of the fifty
CSO loadings
.
These DUFLOW model
runs generated 50 sets of the
concentrations
of DO, CBOD5, and NH4-N in the CWS.
Simulations
were conducted for the
DUFLOW calibration
and verification periods. Calculations are based on a 15
-
minute
15
computational time step and a 1 hour time step is used for the output variables to match the
availability
of measured DO concentrations.
Duration of the Effects of Combined Sewer Overflows on Dissolved Oxygen for 2001
To determine how long storm loadings affect the DO concentrations in the CWS for each
location, the standard deviation of computed DO concentrations was plotted against time. At
Romeoville the standard deviation was plotted against time together with the flow for the
calibration period (Figure 2). As can be seen in Figure 2, the effects of some storms overlap and
this makes it hard to distinguish the start and end time of the storm effects. Hence, some of the
storms are combined and treated as a single storm.
It is a difficult question to set a rule to determine the start and the end of the storm load effect.
Different approaches were tried to see if a specific rule can be applied to all constituents and
locations. One of the approaches tried was to assume that there is no storm effect if the standard
deviation is smaller than a certain set value. It was found that as this number gets smaller the
system gets more sensitive to the selected set value. So it was difficult to select a number that
works well for all storms at all locations. Another approach assumes that the standard deviations
of simulated DO concentrations follow a statistical distribution (i.e. log-normal, normal) and
there is no storm effect on DO after a specific probability of exceedence. For example, if the
standard deviation of simulated DO concentrations compiled over all time steps follows a normal
distribution with the mean and standard deviation of 0.6 and 0.2, respectively, it can be assumed
that there is no storm effect after the DO standard deviation reduced to 0.27 which corresponds
16
to a 5% probability of exceedence. This approach is problematic because every storm has
different characteristics and each location responds differently to the storms making it difficult to
come up with a specific execeedence probability that can be applied to all storms and locations.
This makes the second approach more complicated than the first. The last approach assumes that
storm effects start with the increase in the DO standard deviation and it ends when there is no
significant change in the DO standard deviation (i.e. once the DO standard deviation reduces and
essentially becomes a constant). Although it is hard to give a quantitative description for the rule
of "no significant change in the DO concentration", since every reach in the CWS responds
differently to a given storm, in general, it can be said that the DO standard deviation tends to
become a constant quickly after the difference between daily average standard deviation of DO
on consecutive days reduces to 15% or less. In this approach some engineering judgment is
necessary to pinpoint the end of the storm event effects on DO, but this approach worked best for
all storms and locations. The duration of the storm effects on DO concentrations was determined
for the CWS using the last approach and the results are listed in Table 3 for the calibration
period.
Substantial impact of storm loading on DO concentration in the CWS on average lasts one day to
a few weeks depending on the location in the CWS (Table 3). For the combined storms
(overlapping storms), the duration of wet weather effects is the result of consecutive storms
hence durations of the effect of overlapping storms on in-stream water quality are longer than for
other storms. Because of the hydraulic characteristics and behavior of the system, for most of the
storms very similar durations are obtained at Cicero Avenue and Baltimore and Ohio Railroad,
which are just upstream and downstream from Stickney Water Reclamation Plant (WRP),
17
respectively. Effluent from the Stickney WRP dominates the hydraulics of the system. Due to
small slopes and velocities (during low flow periods), the Stickney WRP discharge often flows
in two directions: upstream from the plant and downstream towards Romeoville, causing in this
way a "hydraulic dam" for upstream flow. In these sections water becomes practically stagnant.
In such cases, the residence time of storm loads upstream from the plant are greater than
downstream, and intensive self-purification processes consume DO while there is no additional
source of DO other than atmospheric reaeration, which is very low.
For the larger storms (indicated by larger CSO volumes in Table 3) the system tends to respond
very similarly at every location whereas for smaller storms the duration of storm impact is
significantly larger at the downstream locations. For example, for the storms August 2 and 9,
2001, the duration of the storm effect lasts 15.5 and 18.2 days on the CSSC at Romeoville and on
the NBCR at Fullerton Avenue, respectively, whereas for the July 25, 2001 storm, the duration
of the storm effect lasts 8.6 and 5.5 days on the CSSC at Romeoville and on the NBCR at
Fullerton Avenue, respectively. This is because for smaller storms a greater percentage of CSO
flows occur at pumping stations, on the other hand for larger storms a greater percentage of CSO
flows occur at gravity CSOs. Therefore, during larger storms the system receives a more
homogenous CSO load which leads to a homogenous response time over the Chicago River
System (NBCR-SBCR-CSSC). During smaller storms, the pumping stations produce relatively
more CSO volume which leads to different storm impacts over the Chicago River System. The
reason for this CSO flow distribution is twofold. The drainage areas for the pumping stations are
83.89, 40.97, and 15.43 kmz for Racine Avenue, North Branch, and 125th Street, respectively.
These drainage areas are far larger than those for individual gravity CSOs. Thus, because they
18
capture runoff from larger areas the CSO pumping stations are more likely to discharge for
smaller storms than are the gravity CSOs. Further, to avoid flow reversals from the CWS to
Lake Michigan, the MWRDGC prefers to reserve space in the Tunnel and Reservoir Plan
(TARP) tunnels for gravity CSOs at locations closer to the lake, and, thus, diverts relatively
more flow during smaller storms to the CWS at the pumping stations. During larger storms all
drainage areas generate runoff in excess of the interceptor capacity and the TARP tunnels fill
resulting in a more even distribution of CSO flows.
Unlike the Chicago River System, the duration of storm effects for a given storm are very similar
along the Calumet River System (Little Calumet River (north) - Calumet-Sag Channel). Since
there is just one pumping station, 125th Street Pumping Station, and it is located close to
upstream boundary (O'Brien Lock and Dam), differences in the volume of gravity and pumping
station CSOs do not create a big variation in the duration of storm impacts along the river
system.
Duration of the Effects of Combined Sewer Overflows on CBOD5 and NH4-N for 2001
Unlike the storm load effect on DO concentrations, it is relatively easy to pinpoint the end of the
storm effect on CBOD5 and NH4-N concentrations. At Romeoville the standard deviations of
simulated CBOD5 and NH4-N concentrations were plotted against time together with the flow
(Figure 3). As can be seen in Figure 3, the standard deviation clearly decreases almost to zero
except for overlapping storms. Hence, it is assumed that at the point where the CBOD5 and NH4-
N standard deviation approaches zero the storm pollution load does not affect water quality in
the system at that location anymore.
19
The storm effect on CBOD5 and NH4-N lasts from 2 days to 2 weeks depending on the storm and
the location (Tables 4 and 5). In general, the duration of the storm effect on CBOD5 and NH4-N
concentrations along the CSSC lasts 3-4 days longer than on the Calumet-Sag Channel. As
expected, the duration of the storm effect on CBOD5 and NH4-N concentrations decreases
towards upstream locations along CSSC and NBCR. On the other hand, in the Calumet
Waterway System, the response of the river system to storm loading stays almost the same along
the waterway for a given storm.
Duration of the Effects of Combined Sewer Overflows for 2002
The standard deviation of simulated DO concentrations for each location in the CWS, was
plotted against time to determine how long storm loadings affect the 2002 verification period.
The strategy explained in the previous section was followed to determine the duration of the
storm effect on the simulated DO, CBOD5, and NH4-N concentrations. 2002 was a period of
drier weather than was 2001, but the conclusions derived for 2001 are also valid for the 2002
verification period. Details of the 2002 simulations are given in Alp (2006).
Comparison of the duration
of storm effects
on water-quality constituents
Several statistical tests including an Analysis of Variance, Fischer's least significant difference,
and the Kruskal-Wallis test were applied to compare the average of the duration of the storm
impact on in-stream water quality among the studied constituents. For a given constituent, results
for all storms were considered. The mean duration of the storm effects on in-stream DO, CBOD5,
20
and NH4-N concentrations are the variables evaluated in the statistical comparison. A statistically
significant difference amongst the medians was found at the 5 % significance level. Thus, from
these tests it can be concluded that storm effect is longest on DO (on average 9.6 days) followed
by CBOD5 (7.2 days), and is shortest for NH4-N (6.2 days). The duration of the storm effect on
DO concentrations reflects a combination of different factors. Results showed that the storm
effect continues on DO concentrations even though CBOD5 and NH4-N concentrations and flow
go back to dry weather conditions. There are two main types of sinks of DO in the DUFLOW
model, those in the water column and those from the sediments. Oxidation of CBOD5, algal
respiration, and nitrification are oxygen-consuming processes within the water column. The
sediment sink involves diffusion of oxygen between the water body and the sediment layer and
resuspension of oxygen consuming substances. Therefore, even though water column effects on
DO stop, sediment effects on DO continue resulting in the almost constant DO standard
deviations.
Relation between Precipitation and Duration of Storm Impact on Water Quality
It is important to understand the behavior of the CWS under storm loading conditions and to
predict the duration of the storm effect on in-stream water quality constituent concentrations for
future use. It was attempted to estimate the duration of the storm impact on water quality
constituents by examining the precipitation data for the Chicago area.
21
Rainfall Data
A dense network of 25 raingages is operated by Illinois State Water Survey (ISWS) in Cook
County, Ill. Since terrain effects are fairly minimal in northeastern Illinois, gridding which
allows the use of simple arithmetic averaging to compute areal average precipitation depths was
applied in the layout of the network (Westcott, 2003). Average precipitation for storms in 2001
and 2002 were computed using hourly precipitation data provided by the ISWS. Cook County
was divided into several sub-areas to get a better understanding of rainfall distribution over the
CWS drainage area. These included Cook County; the CWS drainage area (hereafter
"Waterway"); the City of Chicago; the NBCR drainage area; the Chicago River main stem,
SBCR, and CSSC drainage area; and the Little Calumet River and Calumet-Sag Channel
drainage area.
Regression
Analysis
Results
Precipitation depth data were regressed against the duration of storm impact on water quality for
all locations for the July 12 - November 9, 2001 and May I - September 23, 2002 periods. The
highest correlation coefficients for DO regressions are obtained for the Chicago and Waterway
sub-areas precipitation data for all locations. The overall average DO concentration correlation
coefficients for the Chicago and Waterway precipitation data are very close at 0.86 and 0.87,
respectively. The highest overall average CBOD5 and NH4-N concentration correlation
coefficients are obtained for the Waterway precipitation data with an overall average of 0.80 for
both CBOD5 and NH4-N concentrations. Results show that there is a strong relation between the
22
total precipitation on the CWS drainage area and the duration of the storm effect on the in-stream
water quality constituent concentrations. The strong relation between the precipitation depth and
the duration of the wet weather effects on water quality also indicates that the hydrologic inputs
to the CWS system have been reasonably estimated since precipitation is an independent variable
that was not used to generate the CSO flows. The strong relations indicate it is possible to predict
the duration of the storm loading effect on in-stream water quality constituent concentrations on
the basis of accurate precipitation data. The regression equation plots and regression equations
for a selected site are shown in Figure 4. It is possible that consideration of the duration of
precipitation in the regression analysis could further improve the relations obtained, but the high
coefficients of determination indicate that precipitation amount is a useful variable for a practical
method to estimate the duration of storm effects for the CWS.
Figure 4 shows a clear relation between the total precipitation on the CWS drainage area and the
duration of the storm effect on water-quality constituents even though a limited number of
storms are used in this analysis. The correlation is the strongest for the DO concentrations and
weakest for the NH4-N concentrations. The practical side of this approach is that local authorities
or decision makers can easily determine the duration of the wet weather conditions by examining
precipitation data. It should be noted that these regression equations are valid for precipitation
between 20.3 to 81.3 mm recorded over the CWS drainage area. For storms that result in
precipitation larger than 81.3 mm, more studies are needed to extend the range of the regression
estimates. The coefficient of determination, RZ, of 0.85 obtained at Romeoville for DO (Figure 4)
indicates that 85% of the variance in the duration of the storm effects on DO concentrations can
be explained by the magnitude of the precipitation. If the probability of occurrence of a certain
23
magnitude of rainfall can be combined with the outcomes of the regression analyses, it may be
possible to obtain generalized probabilistic conclusions about the duration of the storm impact on
in-stream water quality.
Conclusions
Wet weather impacts resulting from urban catchments often create substantial problems for
receiving water quality. One of the questions decision makers are always interested in is "how
long does it take for a river to go back to pre-storm water quality conditions?" In other words,
the question is "what is the duration of the storm effects on water quality?"
The results of this study show that application of a statistical sampling technique with an
unsteady-state water quality model can result in reasonable estimates of the duration of wet
weather conditions. The power of the calibrated water quality model plays an important role in
the accurate determination of the duration of the wet weather period. Estimates of wet weather
conditions may be as robust as the calibrated water quality model.
It
was found that the duration of the wet weather period varies between 2 days to 2 weeks in the
CWS. The magnitude and spatial distribution of the storm are the most important factors that
affect the wet weather conditions in the receiving water body. Regression analysis showed that
there is a strong relation between the precipitation measured in the CWS drainage area and the
duration of the storm effects on in-stream water quality constituents. Regression equations
derived from measured rainfall data and simulation results can be used to predict the duration of
24
the storm effects oil
i
n-stream water quality for future storms so that wet weather periods can be
determined from the total storm precipitation. This information can be useful for future water-
quality management in the CWS
.
It is hoped the procedure illustrated here can be used to
understand wet-weather conditions in other waiter bodies.
25
References
Aalderink, R.H., Zoeteman, A., and Jovin, R. (1996). Effect of input uncertainties upon scenario
predictions for the River Vecht.
Water Science and Technology,
33(2), 107-118.
Alp, E. (2006), "A method
to evaluate duration of the storm effects on in-stream
water quality."
Ph.D. Thesis,
Department
of Civil
and Environmental Engineering
,
Marquette
University,
Milwaukee, WI.
Alp, E. and Melching, C.S. (2006). Calibration of a model for simulation of water quality during
unsteady flow in the Chicago Waterway System and application to evaluate use attainability
analysis remedial actions.
Technical Report 18,
Institute of Urban Environmental Risk
Management, Marquette University, Milwaukee, WI.
Ambrose, R.B., Wool, T.A., Connolly, J.P., and Schanz, R.W. (1988). WASP4, a hydrodynamic
and water quality model-Model theory, User's manual, and programmer's guide. U.S.
Environmental Protection Agency,
EPA160013-87-039,
Athens, GA.
Di Toro, D. M. and Fitzpatrick, J. (1993).
Chesapeake Bay Sediment Flux Model.
HydroQual,
Inc.
Mahwah, NJ. Prepared for U.S. Army Engineer Waterway Experiment Station, Vicksburg,
MS. Contract Report EL-93-2.
DUFLOW (
2000
).
DUFLOWfor
Windows V3
.
3: DUFLOW modelling studio: User's guide,
reference guide DUFLOW, and reference guide RAM,
EDS/STOWA, Utrecht, The Netherlands.
26
Harremoes, P., Napstjert, L., Rye, C., and Larsen, H.O. (1996). "Impact of rain runoff on oxygen
in an urban river."
Water Science and Technology,
34(12), 41-48.
hnan, R.L., Helton, J.C., and Campbell, J.E. (1981). "An approach to sensitivity analysis of
computer
models: Part I-Introduction, input variable selection and preliminary variable
assessment."
Journal of Quality Technology,
13(3), 174-183.
Janssen
,
P.H.M., Heuberger, P.S.C., and Sanders
,
R. (1992
)
UNCSAM 1.1: a Software
Package
for Sensitivity
and Uncertainty Analysis.
Report No. 959101004
.
National Institute of Public
Health and Environmental Protection
,
Bilthoven
,
The Netherlands.
Manache, G. and Melching, C.S. (2004). "Sensitivity analysis of a water-quality model using
Latin hypercube sampling."
Journal of Water Resources Planning and Management,
130(3),
232-242.
Manache, G. (2001). "Sensitivity of a continuous water-quality simulation model to uncertain
input parameters."
Ph.D. Thesis,
Chair of Hydrology and Hydraulics, Vrije Universiteit Brussel,
Brussels, Belgium.
McKay, M.D., Beckman, R.J., and Conover W.J. (1979). "A comparison of three methods for
selecting
values of input variables in the analysis of output from a computer code."
Technometrics,
21(2), 239-245.
27
McKay,
M.D. (1988
). "
Sensitivity and uncertainty analysis using a statistical sample of input
values." in
Uncertainty Analysis, Y.
Ronen, ed., CRC, Boca Raton, FL, p.145-186.
Mukhtasor, Husain, T., Veitch, B., and Bose, N. (2004). "An ecological risk assessment
methodology for screening discharge alternatives of produced water."
Human and Ecological
Risk Assessment,
10(3), 505-524.
Neugebauer, A. and Melching, C.S. (2005). "Verification of a continuous water quality model
under uncertain storm loads in the Chicago Waterway System."
Technical Report 17,
Institute of
Urban Environmental Risk Management, Marquette University, Milwaukee, WI.
Novotny, V.
and Olem
,
H. (1994).
Water Quality: Prevention
,
Identification
,
and Management
of Diffuse
Pollution,
Van Nostrand Reinhold
,
New York.
Novotny, V., Braden, J., White, D., Capadaglio, A., Schonter, R., Larson, R., and Algozin, K.
(1995). "A comprehensive UAA Technical Reference."
Prof. 91-NPS-1,
Water Environment
Research Foundation, Alexandria, VA
Novotny, V. (2004). "
Simplified databased total maximum daily loads
,
or the world is log-
normal."
Journal of Environmental Engineering,
130(6), 674-683.
Sieber, A. and Uhlenbrook, S. (2005). "Sensitivity analyses of a distributed catchment model to
verify the model structure."
Journal of Hydrology,
310(1-4), 216-235.
28
Slack, J. and Nemura, A. (2000). "Evolving wet weather and water quality standards issues for
CSO communities."
WEFTEC 2000: Surface Water Quality and Ecology Symposium I: Wet
Weather CSO Issues,
Water Environment Federation 73rd Annual Conference & Exposition on
Water Quality and Wastewater Treatment, Anaheim, CA, October 14-18, 2000.
Sohrabi, T.M., Shirmohammadi, A., Chu, T.W., Montas, H., and Nejadhashemi, A.P. (2003).
"Uncertainty analysis of hydrologic and water quality predictions for a small watershed using
SWAT2000."
Environmental Forensics,
4(4), 229-238.
U.S Environmental Protection Agency (USEPA). (1983a).
Water Quality Standards Handbook,
Office of Water Regulations
and Standards
, Washington, D.C.
U.S. Environmental Protection Agency (USEPA). (1983b).
Results of the Nationwide Urban
Runoff Program.
Vol.
I.
Final Report, Water Planning Division,
U.S EPA, Washington, D.C.
Vandenberghe, V., van Griensven, A., Bauwens, W., and Vanrolleghem, P.A. (2005).
"Propagation of uncertainty in diffuse pollution into water quality predictions: Application to the
River Dender in Flanders, Belgium."
Water Science and Technology,
51(3-4), 347-354.
Westcott, N.E. (2003). "Continued Operation of a 25-Raingage Network for Collection,
Reduction, and Analysis of Precipitation Data for Lake Michigan Diversion Accounting: Water
Year 2002."
Illinois State
Water Survey Contract Report 2003-01,
35 p.
29
List of Figures:
Fig. 1. Schernatic diagram of the Calunnct and the Chicago River Systems (note: WRP means
Water Reclamation Plant and P.S means Pumping Station)
Fig. 2. Flow and duration of the storm effect on the standard deviation of simulated DO
concentration at Romeoville for July 12 to November 9, 2001
Fig. 3. Flow and duration of the storm effect on the standard deviation of simulated CBOD5 an
NH4-N
concentrations at Romeoville
for July 12 to November 9, 2001
].ig.
4.
Relation between precipitation and the duration of the storm effects on simulated DO,
CBOD
;,
and N1-14-N
concentrations at Romeoville for July 12
-
November 9, 2001 and May 1-
September 23, 2002.
30
4
Cook County
North S
0
WR
Upper
North
Branch
- __
1$
Dupage County
Wilmette
U
per North Shore Channel
-------------
Lo
North
Lower
North Branch
Stickney W.
1
-^I^
a^,d
gr
.q
Lemont WRP
Romeoville
o
Lockport
the Calu
6
Will County
Li.
iver at
South Holland
&
Boundaries
Counties
Chicago Waterway
T Model CSO Locations
_a Major
Inflows
Figure 1. Schematic diagram of the Calumet and the Chicago River Systems (note: WRP means
Water Reclamation Plant and P.S means Pumping Station)
00
------------
r North Shore Channel
F
ranch P.S
cago River Main Stem
- Columbus Drive
th Branch Chicago
R.
er
S
"Line
ve.
.
Calumet-Sag Channel
.- r -A-,
alumet
VVRP;25th
LAKE MICHIGAN
S
rien Lock4and Dam
31
of o m
w
W -
A N G
N
Hate
Figure 2. Flow and duration of the storm effect on the standard deviation of simulated DO
concentration at Romeoville for July 12 to November 9, 2001
32
0.30
0.25
Z
v
= 0.20
Z
0
A 0.15
m
0
0.10
a
N 0.05
0.00
-NH4-NSTD - Romeovilledailyflow
V_ OD OD O O t0 tD tD aD
ao
N V1
w
N
^
N
m
QI
A N
N W
o
Date
S7
H
O O O
W
rn A
N --^ t0
500
3
0
LL
300
Figure 3. Flow and duration of the storm effect on the standard deviation of simulated CBOD5
and NH4-N concentrations at Romeoville for July 12 to November 9, 2001
33
18
16
14
12
10
8
10 20
30 40 50 60 70 80 90
20
30
40
50
60
70
80
90
Precipitation
(
mm) - Waterway average
Figure 4. Relation between precipitation and the duration of the storm effects on simulated DO,
CBOD5, and NH4-N concentrations at Romeoville for July 12-November 9, 2001 and May 1-
September 23, 2002.
16
14
12
10
8
6
4
2
Romeoville
(
Chicago Sanitary and Ship Canal)
y = 0.159x + 2.6273
R' = 0.8506
Precipitation
(
mm) - Waterway average
Romeoville (Chicago Sanitary and Ship Canal)
Y
10
20
30
40
50
60
70
80
90
Precipitation (mm) - Waterway
average
Romeoville
(
Chicago Sanitary and Ship Canal)
34
"fable 1. Comparisons of the percentage DO concentrations less than 3, 4, 5, and 6 ing/1, at
different locations in the Chicago Waterway System fOr July 12-November 9, 2001
Percent
of DO (
Measured and Calibrated
)
less than
3 mg/L
< 4mg/L
< 5 mg/L
< 6 mg/L
Location
Waterway
Meas.*
Sint.**
Meas.
Sim.
Meas.
Sim.
Meas. Sim.
Fullerton Avenue
NBCR
6.3
3.9
20.1
14
49.6
46.5
63.2
77
Cicero Avenue
CSSC
21.1
20.5
483
48.8
77
62.3
86.1
75O
Baltimore and
CSSC
2.5
2.6
93
193
34.6
48.3
65.2
70
Ohio Railroad
Romeoville
CSSC
17.2
17.9
40.8
37.3
77
61.1
87.3
74.6
Ked%]c Street
Cal-Sag
1.1
0
4.7
3.9
15.6
15.1
38.9
51.1
104111 Avenue
Cal-Sag
8.4
8.3
13.6
17
29.1
36.8
55.2
56.5
'Meas.: Measured ; **
S i111.:
S lmll
lated
35
Table 2. The mean values and variances used for the Latin Hypercube Sampling of the event
mean concentrations in milligrams per liter for pumping stations discharging to the Chicago
Waterway System
North Branch
Pumping S.
Racine avenue
125th Steet
Pumping S.**
Pumping S.
Variable
Mean Var.* Mean
Var.
Mean
Var.
DO
4.0
3.6
6.9
8.1
4.3
0.0001
CBOD5
35.4
303.2
51.2
341.8
25.7
262.0
NH4-N
2.9
2.0 1.6
0,7
1.0
0.2
NO3-N
0.7
0.1
0.8
0.04
1.8
0.1
Norg-N
6.1
11.6
4.1
0.9
3.6
1.0
qg
1.0
0.5
0.2
0.003
0.4
0.049
Pin
0.4
0.3
0.7
0.040
1.3
3.1
SS
102
4554
825 241360 76
1634
`Var.: VarMll1Cc, *
*S.: Station
36
Table 3. Magnitude of Combined Sewer Overflow (CSO) volume in m3/s and the duration of
storm effect on the simulated dissolved oxygen concentration in days at different locations in the
Chicago Waterway System for July 12-November 9, 2001.
Event
1
2
3
4
S
6
7
Date-2001
7/25
8/2 & 8/9
8/25 & 8/31
9/19-9/23
1015
10/13
10/23
Total Pump S
.
CSO
39.52
6.52
13.36
5.44
1.77
8.60
2.81
Total
Gravity CSO
25.67
11.87
8.70
9.81
2.36
12.82
1.18
Chicago River System *
Romeoville
Baltimore and Ohio Railroad
Cicero Avenue
Fullerton Avenue
Duration of storm effect on dissolved oxygen concentration in days
8.6
15.5
15.1
10.9
7.8
10.6
7.0
93
14.2
13.3
10.3
7.5
9.6
6.3
9.2
14.7
15.8
10.2
8.0
9.5
7.7
5.5
18.2
12.8
9.0
5.2
5.8
3.8
Calumet River System
Duration of storm effect on dissolved oxygen concentration in days
Route 83
7.5
10.5
15.6
11.1
6.5
9.7
2.5
Division Street
6.6
12.9
15.7
10.5
6.4
3.7
1.5
Halsted Street
8.0
13.6
15.4
10.4
7.3
11.1
1.5
Conrail Railroad
8.1
7.8
10.7
10.0
7.2
10.8
ND***
*
Chicago River System:
Chicago Sanitary and Ship Canal, South Branch Chicago River, and North Branch Chicago
River
** Calumet River System:
Calumet-Sag Channel and Little Calumet River (North)
*** ND= The duration of the storm effect on DO concentration cannot be detected since variations in simulated DO
concentrations are negligible
37
Table 4. The duration of storm effect
on the simulated
CBOD5
concentration
in days at different
locations in the Chicago Waterway System for July 12-November 9, 2001
Event
1
2
3
4
5
6
7
Date-2001
7/25
8/2 & 8/9
8/25 & 8/31
9/19-9/23
1015
10/13
10/23
Chicaco River System *
Duration of storm effect on CBOD5 concentration in days
Romeoville
8.5
13.8
12.7
11.1
7.0
8.8
8.0
Baltimore and Ohio Railroad
9.3
13.7
12.7
10.5
7.3
7.3
7.3
Cicero Avenue
8.8
12.7
13.4
10.2
7.3
7.2
7.3
Fullerton Avenue
3.6
5.9
6.2
4.0
3.5
3.3
1.2
Calumet River System **
Duration of storm effect on CBOD5 concentration in days
Route 83
7.0
9.3
11.9
10.3
5.8
10.5
4.4
Division Street
5.3
8.8
8.2
7.1
5.7
3.8
3.5
Halsted Street
1.2
1.8
2.9
4.5
0.8
1.8
0.7
Conrail Railroad
4.8
6.9
8.8
8.0
3.7
9.1
3.0
* Chicago River System:
Chicago Sanitary and Ship Canal, South Branch Chicago River, and North Branch Chicago
River
** Calumet River System:
Calumet-Sag Channel and Little Calumet River (North)
38
Table 5. The duration of storm effect on the simulated NH4-N concentration at different locations
in the Chicago Waterway System for July 12-November 9, 2001
Evertt
Date-2001
Ch is (go 12i ve)- Svsreni
Romeoville
Baltimore and Ohio Railroad
Cicero Avenue
Fullerton Avenue
Calumet River System"
Routc 83
1]tvlsloii Street
Ilalsted
Street
Ccmrail Railroad
12
3
4567
7125
912 & 819
9125 & 9131
911 L]-9/23
10/5
10113
10123
Duration of storm effect on NH4-N concentration in days
8.5
12.8
13.8
10.6
7.1
9.0
6.7
6.7
7.4
10.7
9.0
6.2
62
5.1
5.7
6.9
9.8
8.5
5.0
5.7
4.5
3.6
5.1
6.2
3.5
3.6
3.3
1.7
Duration of storm effect on NH4
-
N concentration in days
5.0
7.5
10.0
9.5
5.2
5,1
3.5
4,9
6.2
8.4
5.8
4.0
3.7
3.7
5.2
7.7
9.8
8.7
4.5
9.7
2.7
5.0
7.4
9.6
6.3
.3
9.8
1.9
* Clliccrgo River
S)weiri:
Cliicago Sanitary and Ship Canal, South 13ranc11 Chicago River, and North Branch Chicago
River
** Calomel
River
Syslem: Calumct-Sag C:
liawiel
and Little Calumet River ^Norlh)
39
BEFORE THE ILLINOIS POLLUTION CONTROL BOARD
IN THE MATTER OF:
WATER QUALITY STANDARDS AND
EFFLUENT LIMITATIONS FOR THE
CHICAGO AREA WATERWAY SYSTEM
AND THE LOWER DES PLAINES RIVER:
PROPOSED AMENDMENTS TO 35 Ill.
Adm. Code Parts 301, 302, 303 and 304
R08-9
(Rulemaking
-
Water)
PRE-FILED TESTIMONY OF CHARLES S. MELCHING
INTRODUCTION
My name is Charles S. Melching and I am an Associate Professor of Civil and
Environmental Engineering at Marquette University in Milwaukee
,
Wisconsin
.
I hold a
Bachelor of Science degree from Arizona State University and Master of Science and Doctor of
Philosophy degrees from the University of Illinois at Urbana
-
Champaign
.
I am also a licensed
Professional Engineer in Illinois and Arizona.
I have more than 20 years of post
-
doctorate experience in the fields of water resources
and environmental engineering research
(
theoretical and applied
)
and education
.
I have been
awarded the 2001 Walter L. Huber Civil Engineering Research Prize from the American Society
of Civil Engineers and the 2008 Outstanding Researcher Award from the College of Engineering
at
Marquette University
.
My professional experience includes 2
.
5 years as a Visiting Scholar at
the Laboratory of Hydrology at the Vrije Universiteit Brussel in Belgium
;
2.5 years as an
Assistant Professor of Civil and Environmental Engineering at Rutgers University
;
7.5 years as a
Hydraulic Engineer
/
Hydrologist with the U
.
S.
Geological Survey, Illinois District
;
1
year as a
Visiting Professor in the Department of Hydraulic Engineering at Tsinghua University in
Beijing, China
;
and 9 years at Marquette University
.
Details of my work at these places are
given in my curriculum vitae
,
which is Attachment 2 to this testimony.
My experience in water-quality modeling began in 1990 at Rutgers University with an
uncertainty analysis of the QUAL2E model applied to the Passaic River. Other modeling
experience includes developing a QUAL2E model for Salt Creek in Illinois in cooperation with
the Illinois Environmental Protection Agency (IEPA); modeling of streams in Belgium;
modeling the Milwaukee Outer Harbor; and advising the U.S. Geological Survey North Dakota,
Kentucky, Minnesota, and Florida Districts on modeling projects. I also have a long history of
working on the Chicago Area Waterway System (CAWS) beginning in 1992 when I evaluated
the flow measurements at the acoustical velocity meter on the Chicago Sanitary and Ship Canal
at Romeoville. I then assisted U.S. Geological Survey colleagues on the measurement program
done in support of the U.S. Army Corps of Engineers Accounting of Lake Michigan Diversion.
This experience with the CAWS led to my selection as the Hydrologic and Hydraulic Modeling
Expert for the 5t" (2003) and 6th (2008) Technical Committees for the Review of the Lake
Michigan Diversion Accounting selected by the U.S. Army Corps of Engineers, Chicago
District.
This experience with water-quality modeling and the CAWS led to my selection by the
Metropolitan Water Reclamation District of Greater Chicago (District) to develop an unsteady
flow water-quality model of the CAWS (DUFLOW model) in 2000.
OVERVIEW
My opinions are set forth in greater detail in the report provided as Attachment 1 of this
testimony. The purpose of my testimony is threefold. First, my testimony describes the
DUFLOW model developed for the CAWS and its reliability. The model has been used to
evaluate water-quality management scenarios involving (a) supplemental aeration on the North
and South Branches of the Chicago River, (b) flow augmentation on the North Shore Channel,
and (c) a combination of these water-quality improvement technologies for the South Fork of the
South Branch (Bubbly Creek) as described in Attachments 00, PP, and QQ, respectively, of the
2
rulemaking proposal before the Board. The model also was used to determine the
ineffectiveness of pollutant removal at selected gravity combined sewer overflows (CSOs), to
consider supplemental aeration in the Chicago Sanitary and Ship Canal, and to evaluate the
effects of disinfection on fecal coliform concentrations in the CAWS (references are given in
Attachment 1). Finally, the model is currently being refined in order to develop an integrated
strategy combining flow augmentation, supplemental aeration, and perhaps other technologies to
achieve the proposed water-quality standards throughout the CAWS.
Second, my testimony describes unique and complex features of the hydraulics of the
CAWS determined by the modeling studies. A large amount of flow, water-surface elevation,
cross-sectional geometry, aeration, and pollutant load data have been collected for the CAWS by
the District, U.S. Geological Survey, and U.S. Army Corps of Engineers. The model integrates
and interprets these data on the basis of hydraulic theory and well accepted pollutant transport
and transformation concepts, and as such the model can facilitate understanding of the
fundamental operations and flow and pollutant patterns in the CAWS. Third, implications of the
unique and complex hydraulic features of the CAWS are integrated with the results of the
determination of biological potential reported in the Use Attainability Analysis (Attachment B of
the rulemaking proposal before the Board) to discuss reasonable aquatic life use goals for the
CAWS. The second and third issues are the focus of this oral testimony.
HYDRAULICS OF THE CAWS
The following testimony will try to illustrate some key hydraulic features of the CAWS
that influence the biological potential of the CAWS. IEPA indicated on pages 19-20 in its
Statement of Reasons that: "Flow reversal projects, such as this one, place a premium on head
differential.
The entire system has minimum slope and, consequently, low velocity, stagnant
flow conditions." The evaluation of flow and water-surface elevation data used to apply the
3
DUFLOW
model and the hydraulic results of the modeling reveal just how stagnant
the CAWS
is and the potential limitations to the current and future biological community.
Flow reversals
It is well known that large storms can result
i
n flow reversals
from the CAWS to Lake
Michigan
.
The flow
need not result in a reversal to Lake Michigan to have a flow reversal
within
the CAWS.
Because the water-surface slope of the
CAWS
is so small and the flow from
the North Side
,
Stickney
,
and Calumet Water Reclamation Plants is substantially higher than the
flow upstream of these Plants, flow reversals also are common during dry weather flows
upstream of the Plants
.
Figures 4-6 in Attachment 1 show that for each of the Plants, the water-
surface elevations
"
upstream
"
of the Plants frequently are lower than those
"
downstream" of the
Plants.
Thus
,
the outfall of each of the Plants acts as a hydraulic dam inserting treated effluent to
the upstream reaches and then holding it and upstream flows back to truly stagnate in the
upstream reaches. This backflow explains why the upper
North
Shore Channel remains ice free
for many miles north of the North Side Plant.
The bi-
directional flow gives us some impression
of the
unnatural condition
of the CAWS.
Slow travel times
The DUFLOW
model was used to determine average travel times
in the CAWS. Table 2
in Attachment 1 lists the average travel times
,
lengths, and average velocities for several reaches
in the CAWS for the July 12
to September 15, 2001 simulation period
.
The hydraulic dam
upstream from the Stickney Plant is obvious as it takes 2.5 days to go 8 miles from Madison
Street to
Cicero Avenue. The hydraulic
dam upstream from the Calumet Plant also is obvious as
it takes 1.5 days to go 2.3 miles from Indiana
Avenue
to Halsted Street.
Huge travel times and low flow velocities also are apparent upstream from the junction of
the Chicago Sanitary and Ship Canal and the Calumet
-
Sag Channel
.
This is because
when the
4
Chicago Sanitary and Ship
Canal
was originally constructed the Calumet
-
Sag Channel was not
anticipated and the Chicago Sanitary and Ship Canal cross
-
sectional geometry is the same
upstream and downstream from Sag Junction
.
Thus, Sag Junction acts like two lanes narrowing
to one lane on the freeway
with
large backups and long travel times resulting. In total it takes
more than 8 days for water to travel from the upstream ends of
the North
Shore Channel and
Little Calumet River
(
north
)
to Romeoville on the Chicago Sanitary and Ship
Canal. For
perspective
,
we should remember that 5-day biochemical oxygen demand
(
BOD) was originally
taken as the standard measurement because the test was devised in England
,
where the River
Thames has a travel time to the ocean of less than 5 days, so there was no need to consider
oxygen demand at longer times
.
The long travel time gives
us further
impression of the
unnatural condition
of the CAWS. This
feature of the
CAWS contributes
to the lower dissolved
oxygen that is observed
in CAWS
compared to general use rivers because of the reduced natural
reaeration resulting from low velocity and very low slope. Further, this feature
of the CAWS
makes it challenging and costly to disperse dissolved oxygen that is contributed artificially from
engineered aeration stations.
Wet weather effects
IEPA
appears to assume that the duration of storm effects on water quality lasts only as
long as the causative rainfall, or the period of elevated flow rates
.
However, research on the
CAWS
shows that the effect of storm runoff and CSOs on water quality lasts substantially longer
than the hydraulic
effects of
the storm
.
That is, once a load of pollutants is introduced to the
system
,
it takes longer for the system to dissipate the effects of these loads than it does to pass
the high flows.
Merely considering the time for dissolved oxygen (DO) recovery to pre
-
storm levels does
not indicate the end of the storm effect because the new dry weather DO concentration
may have
5
changed because of changes in temperature, sediment oxygen demand, treatment plant loads, etc.
Dr. Emre Alp proposed and tested (on the CAWS) a method to determine the duration storm
effects on water quality. In his approach, the DUFLOW water-quality model was successively
applied with different storm 5-day carbonaceous BOD and ammonium as nitrogen loadings (i.e.
Event Mean Concentrations) randomly sampled from a probability distribution representative of
the Event Mean Concentration data collected by the District at the CSO pump stations using an
uncertainty analysis technique. Then the variations in the DUFLOW model output parameters
among the successive simulations were observed. When the variation in the model output
parameters approaches zero, it means the river system has returned to the pre-storm (dry
weather) condition. Therefore, the duration between the start and the end of the variations in the
simulated DUFLOW model output parameters can be defined as the duration of the storm effect
on in-stream water quality, or the duration of the wet-weather condition. A paper summarizing
this approach was recently accepted for publication in the Journal of Water Resources Planning
and Management, American Society of Civil Engineers validating the approach and the
DUFLOW model of the CAWS through peer review.
Substantial impact of storm loading on DO concentration in the CAWS on average lasts
one day to a few weeks depending on the location in the CAWS (see Exhibit 1, which is Table 3
in Attachment 1). The storm effect on five-day carbonaceous BOD (CBOD5) and ammonium as
nitrogen (NH4-N) lasts from 2 days to 2 weeks depending on the storm and the location (see
Exhibits 2 and 3, which are Tables 4 and 5 in Attachment 1), In general, the duration of the storm
effect on CBOD5 and NH4-N concentrations along the Chicago River System (North Branch
Chicago River-South Branch Chicago River-Chicago Sanitary and Ship Canal) lasts 3-4 days
longer than on the Calumet River System (Little Calumet River (north)-Calumet-Sag Channel).
6
The key point to be derived from Exhibits 1-3 (i.e. Tables 3-5 in Attachment 1) is that
even at upstream locations the CSO loadings can affect water quality for more than a week for
some storms. This long storm effect is related to the hydraulic dams and other stagnant
conditions in the CAWS. Further the long storm effects can negatively impact the aquatic
community, and these long storm effects cannot be reduced until the reservoirs of the Tunnel and
Reservoir Plan are fully on line. Exhibit 4 (Table 6 in Attachment 1) lists the duration of storm
effects on DO, CBOD5, and NH4-N averaged over all locations in Exhibits 1-3 and compares this
with the duration of elevated flows (i.e. greater than 100 m3/s, 3,530 ft3/s) at Romeoville for all
the single storm events in simulated periods of 2001 and 2002. The comparison shows that the
duration of storm effects on water quality can be up to 4 times longer than the duration of
elevated flows at Romeoville. Thus, the effects of storm flows on the ability to meet water
quality standards should not be considered a trivial or insignificant problem for the CAWS. The
long effects of storm flows on water quality also indicate that it may be appropriate to consider
wet weather standards for the CAWS.
In summary, the following hydraulic features of the CAWS distinguish it from natural
systems. The normal flow in the CAWS is bidirectional in places and very slow everywhere, and
as a result wet weather impacts can linger for long periods suggesting that wet weather standards
may be appropriate for the CAWS. Further, the combination of low velocities and very low
slope limits natural reaeration and challenges the effectiveness of supplemental aeration due to
the slow distribution throughout the water body of the artificially introduced oxygen. This
challenge will become greater as DO standards are raised.
RELATIONSHIPS BETWEEN HYDRAULIC AND ECOLOGICAL CONDITIONS
The CAWS effectively is a long, narrow, moderately deep impoundment not at all similar
to natural streams, Even dam impoundments on formerly natural streams have variation in
7
habitat and substrate including shelter areas for fish, whereas these features are generally absent
from the CAWS.
Habitat
(QHEI)
and biological
„
(IBI) scorinjZ
Rankin (1989) examined relations between the Qualitative Habitat Evaluation Index
(QHEI) and the Index of Biological Integrity (IBI) in order to develop a procedure for relating
stream potential to habitat quality that would provide some insight into how habitat might affect
biological expectations in a given water body. The goal of his study was to provide guidance on
the specification of aquatic life uses (i.e. potential aquatic ecological community) for water
bodies that were impaired by pollution impacts. To develop the relations between QHEI and its
subcomponent metrics and life uses Rankin (1989) considered data from a large number and
wide variety of streams in Ohio. This procedure was used by Rankin (2004) [Attachment R to
the proposal before the Board] to estimate life uses of Modified Warmwater Habitat and Limited
Resource Water for the reaches designated Aquatic Life Use A and B water, respectively, in the
proposal before the Board.
The IEPA states that where QHEI is "higher" and IBI is "lower" this indicates that
improvement in water quality is needed to achieve the ecological potential of the "higher"
QHEI.' Rankin (1989, p. 12) noted that "using the QHEI as a site-specific predictor of IBI can
vary widely depending on the predominant character of the habitat of the reach." He also
presented examples that showed that a QHEI of 50 could result in a low or a very high IBI.
Thus, whether the higher QHEI scores found in select portions of the CAWS are truly indicative
of a higher potential ecological community for the CAWS requires further consideration.
April 23, 2008
Hearing, transcript at pp
. 211-216.
8
Effect of p
oor habitat on biolo
One way to determine whether a higher QHEI score truly indicates higher biological
potential is to consider in detail the nature of the key habitat metrics included in the QHEI.
Rankin (1989, p.13) noted "Analysis of the frequency of occurrence of QHEI metric
subcomponents among IBI ranges indicates that "negative" habitat characteristics generally (but
not universally) contribute more to the explanation of deviations from a random distribution with
IBI range than "positive" habitat characteristics." The key metric subcomponents are substrate
quality, pool quality, and channel quality.
Poor habitat
in the CAWS
Rankin (1989, p. 24) noted "The influence of high quality substrates is probably related
to their importance in providing food organisms (macroinvertebrates) to the insectivores and
benthivores that typify midwest streams." Insectivores and benthivores are different groupings of
fish based on the preferred diet of the fish.
The Macroinvertebrate data on the CAWS reported in CDM (2007) [Attachment B of the
proposal before the Board] clearly illustrates the poor quality of the substrate present in the
CAWS. For 17 of the 18 locations sampled with a petite ponar dredge the Macroinvertebrate
Biotic Index (MBI) indicated very poor water-quality whereas at 16 locations where Hester
Dendy samplers were used the MBI indicated that the water quality was fair or good.. Hester
Dendy samplers are plates placed in the water that provide an artificial substrate which can be
colonized by macroinvertebrates. The grab sample reflects conditions in the sediment at a site
whereas the artificial substrate shows/predicts the potential benthic community in the drift that
will settle on the plate. The difference in the sampler results shows that CAWS substrate will
prevent any further improvements in water quality from translating to a better macroinvertebrate
community and will not likely result in improvements in aquatic life use. The fact that the
9
CAWS has a poor substrate is no surprise, because the system is completely human created,
rather than a natural system that was allowed to geologically develop over thousands of years
and, thus, develop appropriately varied substrates. Additional details on what constitutes a
balanced, healthy benthic community and its preferred substrate conditions are presented in the
fact witness testimony of Jennifer Wasik of the District.
With respect to pool quality, Rankin (1989, p. 24) noted sites with fast currents had
higher IBI scores than expected by chance. As noted in Table 2 in Attachment I the average
flow velocity is less than 1 ft/s and for more than 60 percent of the CAWS the average velocity is
less than 0.4 ft/s. These velocities are very low compared to the reach average velocities for the
234 measurements in the U.S. Geological Survey roughness coefficient database for Illinois
(hlip-..//il.water.usgs.gov/proi/i^values/) where only one measurement was less than 0.4 ft/s and
more than 87 percent of the measurements had velocities greater than or equal to 1 ft/s.
With respect to channel quality, Rankin (1989, p. 25 and 29) noted
a)
streams with little or no sinuosity were associated with lower IBI scores,
b) sites with only fair to poor riffle/pool development generally have lower IBI scores and
sites with excellent to good development have higher IBI scores, and
c) lower gradients are generally, but not universally, associated with lower IBI values and
higher gradient scores with higher IBI values.
The CAWS falls at the lower extreme of all these factors.
Rankin (1989, p. 41) listed the key features that result in a stream to be classified as a
Modified Warmwater Stream (the analogue of Warmwater Aquatic Life Use A) noting that
streams with QHEI scores between 45 and 60 should have several of the primary factors to be
considered a Modified Warmwater Stream. Exhibit 5 (Table 7 in Attachment 1) lists the habitat
10
features that distinguish between Modified Warmwater Streams and Warmwater Streams (i.e. the
analogue of General Use waters). Among these primary features for Modified Warmwater
Streams the CAWS has recent channelization (truly permanent channelization), silt/muck
substrates (in many reaches), low-no sinuosity, cover sparse to none (in many reaches), poor
pool and riffle development, and lack of fast current. Thus, there can be no doubt that the
potential ecological community is degraded by habitat impairment in the CAWS. Also, this
analysis indicates that the Calumet-Sag Channel is more of a poor habitat (Warmwater Aquatic
Life Use B) than a fair habitat (Warmwater Aquatic Life Use A). In March 10, 2008, IEPA
testimony it was stated that the Calumet-Sag Channel is different from the Chicago Sanitary and
Ship Cana1.2
While they are different, they are not substantially different. For example,
threadbare tires are different from tires with an eighth of an inch of tread, but both are dangerous
to drive on.
The ecological community in the CAWS is substantially impaired by poor habitat, as
IEPA acknowledged during its testimony.3 The U.S. Environmental Protection Agency (U.S.
EPA) has established a DO criterion of 3.0 mg/L for full attainment of warmwater life uses.
IEPA indicated that it does not expect Aquatic Life Use A waters to meet the Clean Water Act
goals, but is here proposing that both A and B waters achieve DO levels of at least 3.5 mg/L----
even higher than would be required by U.S. EPA.4 Further, IEPA has proposed a DO standard
for Aquatic Life Use A of 5.0 mg/L for March through July to support early life stages, with no
evidence that the habitat and physical characteristics of the CAWS could support such a use or
attain the proposed criterion. Essentially, the rulemaking proposal before the Board is requiring
2
March 10, 2008 Hearing, transcript (morning) at pp. 31-32.
3 January 28, 2008 Hearing, transcript at p. 220; January 29, 2008 Hearing, transcript at p. 104; March 10, 2008
Hearing, transcript (morning) at p. 33.
4
March 10, 2008 Hearing, transcript (morning) at p. 28.
11
that the degraded CAWS meet in certain critical aspects the General Use standards in role R04-
25 that was recently adopted by the Board. A tabular comparison of the rulemaking proposal
before the Board and the General Use standards is included in the expert testimony of Freedman.
Alternative
approaches to DO criteria
In the State of Ohio the DO criteria for Modified Warmwater Streams (the equivalent of
Warmwater Aquatic Life Use A) is a daily minimum of 3.0 mg/L and a daily average of 4.0
mg/L, and the minimum reduces to 2.5 mg/L in the Huron/Eric Lake Plain Ecoregion (Ohio rule
3745-1-07).
Whereas for Limited Resources Waters (the equivalent of Warmwater Aquatic Life
Use B) the criterion for the daily minimum is 2.0 mg/L with a daily average of 3.0 mg/L (Ohio
rule 3745-1-07). Similarly, Novotny et al. (2007) [Attachment WW of the proposal before the
Board] recommended a daily minimum of 3.0 mg/L and a daily mean of 4.0 mg/L for Brandon
Pool, which has been designated Warmwater Aquatic Life Use B.
In the IEPA testimony on April 24, 2008, the partial justification for the selected DO
criteria was the target fish species largemouth bass, smallmouth bass, and channel catfish, whose
protection is sought by the target DO criteria with smallmouth bass and channel catfish as the
targets for the early life stages protection.5
Mr. Roy Smogor characterized channel catfish and
smallmouth bass protection as follows: "For early life stages that are as sensitive as the early life
stages of channel catfish or smallmouth bass, we need to keep the dissolved oxygen levels above
a daily minimum of five in order to protect for those types of early life stages." 6. Consideration
should then be given to whether the CAWS offers suitable habitat for early life stages of these
fish species.
5
March 10, 2008 Hearing, transcript (morning
)
at pp
. 70-71; April 24,
2008 Hearing, transcript at pp, 98-99.
G
April 24, 2008
Hearing, transcript at p. 99,
12
Alternative
analysis
of CAWS
habitat
In the early 1980s, the Fish and Wildlife Service of the U.S. Department of the Interior
did detailed literature reviews seeking to identify the physical and chemical conditions of water
bodies suitable for various fish species. These models are known as Habitat Suitability Indexes
(HSIs), where a value of 1 indicates optimal habitat and 0 indicates unsuitable habitat. These
models are not perfect predictors, and in each report for the species of interest here a statement
appears indicating the species of interest may be present even if the suitability index is 0, and
habitat with a high suitability index may contain few fish. The Fish and Wildlife Service
recommends that the suitability indices should be compared with fish data for the water body of
interest before interpreting the suitability results.
HSI ratings have been developed for each of
the target fish species for the CAWS.
The summary of the Habitat Suitability evaluation detailed in Attachment 1 indicates the
CAWS is poor habitat for adult smallmouth bass and channel catfish, which is consistent with
the low abundance of these fish in the CAWS (see fish relative abundance data in the UAA
report, Attachment B to the rulemaking proposal before the Board). It is, however, near optimal
habitat for adult largemouth bass, which is consistent with the high abundance of this fish in the
CAWS (see fish abundance data in the UAA report, Attachment B to the rulemaking proposal
before the Board). Further, the high abundance of largemouth bass implies that the current water
quality of the CAWS is sufficient for a healthy largemouth bass community and higher standards
are not needed. However, the CAWS is poor habitat for early life stages of all these target fish
species.
The tributaries of the CAWS might have suitable habitat for early life stages of the target
fish species.
However, District fish sampling data from 1995, 1997, and 2001-2005 indicate that
none of these species were found in the lower reaches of the North Branch Chicago River
13
upstream from the junction with the North Shore Channel. Further, District fish sampling data
from 2001-2005 indicate that none of these species were found in the Little Calumet River
(south).
Finally, District fish sampling data from 2001-2005 indicate largemouth and
smallmouth bass are the third and fourth, respectively, most abundant species in the Calumet
River upstream from O'Brien Lock and Dam. Thus, it seems these fish enter the CAWS from
Lake Michigan not the CAWS tributaries. Thus, seeking to protect early life stages for these
species of fish in the CAWS is inconsistent with the habitat suitability and the available fish
abundance data.
CONCLUSIONS
When summarizing the relation between habitat, fish communities, and water-quality
management Rankin (1989, p. 52) offered the following warning:
It
makes little sense to "protect" the biota by multimillion dollar
improvements to a point source discharge while important
biological uses are impaired by habitat modifications for reasons
such as "flood control", construction activities, and waterway
improvements.
Considering the foregoing discussion of habitat
,
the rulemaking proposal before the
Board is contrary to the findings
of the UAA
contractors. For example
,
CDM indicated that
"The data showed that the aquatic habitats were rated from
very
poor to fair with most reaches
having habitat unable to support a diverse aquatic community
." 7
CDM
also stated,
"Improvements to water quality through various technologies, like re-aeration may not improve
the fish communities due to the lack of suitable habitat to support the fish population
."&
Further,
Novotny recommended the previously described lower DO standards
(
relative to the proposal
7
CDM (2007) [Attachment
B to proposed rule R08-91
,
page 1-12.
S
CDM (2007) [
Attachment B to proposed rule R08-91 page 5-3,
14
before the Board) for the Warmwater Aquatic Life Use B waters in the Brandon Pool of a daily
minimum of 3.0 mg/L and a daily mean of 4.0 mg/L.9
I
hope that the Illinois Pollution Control Board will carefully consider this testimony and
other supporting documents, and should not hastily approve the rulemaking proposal before the
Board, when the State of Illinois and the Chicago Area have many other problems requiring
public financing.
9
Novotny et al. (2007) [Attachment WW to proposed rule R08-9].
15
Respectfully
submitted,
CL
4&"^,
7dAA^
,
By:
Charles S. Melching
Testimony
Attachments
T.
Supporting Report for the Pre-Filed Testimony of Charles S. Melching with Respect
to Proposed Rule R08-9
2.
Curriculum Vitae
16
Exhibit 1-Melching Testimony
Table 3. Magnitude of Combined Sewer Overflow (CSO) volume in m3/s and the duration of
storm effect on the simulated dissolved oxygen concentration in days in the Chicago Area
Waterway System for July 12-November 9, 2001. (after Alp, 2006)
Event
1
2
3
4
5
6
7
9/19-
Date-2001
7/25
8/2 & 819
8125
& 8/31
1015
10113
10123
9/23
Total CSO
65.19
18.39
22.06
15.25
4.13
21.43
3.99
Total Pump
S. CSO
39.52
6.52
13.36
5.44
1.77
8.60
2.81
Total Gravity CSO
25.67
11.87
8.70
9.81
2.36
12.82
1.18
Chicago River System
Duration of storm effect on dissolved oxygen concentration in days
Romeoville
8.6
15.5
15.1
10.9
7.8
10.6
7.0
River Mile 11.6
8.6
14.0
13.9
10.8
7.5
10.3
6.3
Route 83
8.8
153
14.9
10.8
7.7
10.3
6.9
Baltimore and Ohio
Railroad
9.3
14.2
13.3
103
7.5
9.6
6.3
Cicero Avenue
9.2
14.7
15.8
10.2
8.0
9.5
7.7
Jackson Boulevard
9.4
16.6
15.5
9.0
6.8
10.9
4.3
Kinzie Street
8.2
17.5
13.5
8.3
6.1
7.3
4.4
Division Street
7.6
18.5
13.5
9.3
7.2
7.6
4.6
Fullerton Avenue
5.5
18.2
12.8
9.0
52
5.8
3.8
Addison
Street
2.0
14.6
12.8
8.8
1.2
3.3
2.1
Calumet River
Svstem * *
Duration of storm effect on dissolved oxygen concentration in days
Route 83
7.5
10.5
15.6
11.1
6.5
9.7
2.5
104th Street
7.9
14.0
13.3
10.9
7.2
10.8
2.3
Southwest Highway
8.1
13.4
16.9
10.6
6.2
11.2
2.0
Harlem Avenue
7.5
13.1
16.8
10.5
6.1
11.2
2.2
Cicero Avenue
7.4
14.5
16.2
10.3
7.0
11.1
2.1
Kedzie Avenue
6.9
14.3
15.9
9.9
6.4
10.9
2.0
Division Street
6.6
129
15.7
10.5
6.4
3.7
1.5
Halsted Street
8.0
13.6
15.4
10.4
7.3
11.1
1.5
Conrail Railroad
8.1
7.8
10.7
10.0
7.2
10.8
ND***
*
Chicago River System:
Chicago Sanitary and Ship Canal, South Branch Chicago River, and North Branch Chicago
River
** Calumet River System:
Calumet-Sag Channel and Little Calumet River (north)
*** ND= The duration of the storm effect on DO concentration cannot be detected since variations in simulated DO
concentrations are negligible
17
Exhibit 2-Melching Testimony
Table 4. Magnitude of Combined Sewer Overflow (CSO) volume in million gallons (MG) and
the duration of storm effect on the simulated five-day carbonaceous biochemical oxygen demand
(CBOD5) concentration in days in the Chicago Area Waterway System for July 12-November 9,
2001 (after Alp, 2006)
Event
1
2
3
4
5
6
7
Date-2001
7125
812 & 819
8/25 &
8131
9119-
9/23
1015
10/13
10123
Total
CSO Volume
1488
4859
5828
4029
1092
5660
1054
Total P
.S.
CSO
Volume
902
1723
3530
1437
468
2272
743
Total
Gravity CSO
Volume
586
3136
2298
2592
624
3388
311
Location
*
Chicago River Svstem
Duration of storm effect on CBODS concentration in days
Romeoville
8.5
13.8
12.7
11.1
7.0
8.8
8.0
River Mile 11.6
8.6
13.4
12.8
10.8
7.4
8.4
8.1
Route 83
8.8
14.5
13.0
10.8
7.3
8.2
7.8
Baltimore and Ohio
Railroad
93
13.7
12.7
10.5
7.3
7.3
7.3
Cicero Avenue
8.8
12.7
13.4
10.2
7.3
7.2
73
Jackson Boulevard
6.4
12.2
11.3
8.2
5.1
4.8
5.4
Kinzie Street
5.8
8.7
8.7
8.0
6.3
4.5
4.5
Division Street
5.3
8.8
8.2
7.1
5.7
3.8
3.5
Fullerton Avenue
3.6
5.9
6.2
4.0
3.5
3.3
1.2
Addison Street
2.8
5.0
4.7
3.4
2.3
3.3
2.1
Location
Calumet River
System
Duration of storm effect on
CBOD5
concentration in days
Route 83
7.0
9.3
11.9
10.3
5.8
10.5
4.4
1040' Street
6.0
8.0
10.8
9.5
5.9
9.8
3.2
Southwest Highway
5.3
7.5
10.5
9.0
4.8
9.5
3.1
Harlem Avenue
6.1
7.5
10.1
9.0
4.8
9.5
4.8
Cicero Avenue
4.9
7.0
9.9
8.6
7.3
8.8
3.5
Kedzie Avenue
4.2
6.8
8.8
7.7
7.2
8.3
2.1
Division Street
5.3
8,8
8.2
7.1
5.7
3.8
3.5
Halsted Street
1.2
1.8
2.9
4.5
0.8
1.8
0.7
Central and Wisconsin
Railroad
4.4
7.8
9.0
9.0
4.0
9.1
2.0
Conrail Railroad
4.8
6.9
8.8
8.0
3.7
9.1
3.0
* Chicago River System:
Chicago Sanitary and Ship Canal, South Branch Chicago River, and North Branch Chicago
River
** Calumet River System:
Calumet-Sag Channel and Little Calumet River (north)
18
Exhibit 3-Melching Testimony
Table 5. Magnitude of Combined Sewer Overflow (CSO) volume
in million gallons
(MG) and
the duration of storm effect on
the simulated ammonium as nitrogen
(NH4-N)
concentration in
days in Chicago Area Waterway System for July 12-November 9, 2001
(after
Alp, 2006)
Event
1
2
3
4
5
6
7
Date-2001
7125
812 &
819
8125 &
8131
9/19-
9123
1015
10113
10123
Total CSO
Volume
(MG)
1488
4859
5828
4029
1092
5660
1054
Total P
.S.
CSO
Volume(MG)
902
1723
3530
1437
468
2272
743
Total
Gravity CSO
Volume (MG)
586
3136
2298
2592
624
3388
311
Location
Chica o River System
*
Duration of storm effect on
NH
a
N concentration in da
y
s
Romeoville
8.5
12.8
13.8
10.6
7.1
9.0
6.7
River Mile 11.6
8.2
12.1
13.3
10.0
7.2
8.7
6.3
Route 83
7.4
6.9
11.7
9.5
7.0
7.0
5.6
Baltimore and Ohio
Railroad
6.7
7.4
10.7
9.0
6.2
6.2
5.1
Cicero Avenue
5.7
6.9
9.8
8.5
5.0
5.7
4.5
Jackson Boulevard
4.0
6.5
10.4
8.0
5.1
4.8
3.5
Kinzie Street
4.8
6.3
9.1
6.2
4.8
4.1
2.8
Division Street
4.9
6.2
8.4
5.8
4.0
3.7
3.7
Fullerton Avenue
3.6
5.1
6.2
3.5
3.6
3.3
1.7
Addison Street
3.0
3.9
5.9
3.5
2.1
2.2
0.6
Location
**
Calumet River System
Duration of storm effect on NH4
-
N concentration in days
Route 83
5.0
7.5
10.0
9.5
5.2
5.1.
3.5
104[4 Street
4.8
6.9
9.5
9.0
4.7
4.3
2.5
Southwest Highway
4.9
7.0
9.5
9.0
4.8
4.3
2.5
Harlem Avenue
4.9
7.1
9.6
9.0
4.7
4.3
2.6
Cicero Avenue
5.2
7.4
9.7
9.0
4.0
4.2
2.5
Kedzie Avenue
4.8
7.0
9.3
8.5
4.0
4.0
2.0
Division Street
4.9
6.2
8.4
5.8
4.0
3.7
3.7
Halsted Street
5.2
7.7
9.8
8.7
4.5
9.7
2.7
Central and Wisconsin
Railroad
4.9
7.4
9.5
8.2
3.8
9.2
1.9
Conrail Railroad
5.0
7.4
9.6
6.3
3.8
9.8
1.9
* Chicago River System:
Chicago Sanitary and Ship Canal, South Branch Chicago River, and North Branch Chicago
River
** Calumet River System:
Calumet-Sag Channel and Little Calumet River (north)
19
Exhibit 4
-
Melching
Testimony
Table 6. Duration of storm effects in days on dissolved oxygen (DO), carbonaceous biochemical
oxygen demand (CBOD5), and ammonium as nitrogen (NH4-N) averaged over all locations listed
in Tables 3-5 and duration of storm effects on flow for storms whose effects did not overlap onto
other storm periods.
Date
DO
CBOD5
NH4-N
Flow
July 25, 2001
8.6
8.5
8.5
8.0
October 5, 2001
7.8
7.0
7.1
4.0
October 13, 2001
10.6
8.8
9.0
7.0
October 23, 2001
7.0
8.0
6.7
4.0
July 9, 2002
10.8
12.2
7.6
3.0
August 22, 2002
13.0
7.7
5.8
6.0
20
Exhibit 5
-
Melching Testimony
Table 7. Habitat Characteristics of Modified Warmwater Streams (Warmwater Aquatic Life Use
A) and Warmwater Streams (General Use Waters) in Ohio. Superscripts for Modified
Warmwater Streams refer to the influence of a particular characteristic in determining the use (1
= high influence, 2 = moderate influence). Characteristics apply to all ecoregions and types
unless otherwise noted. (after Rankin (1989, D. 41)i
Feature
Number
Modified Warmwater Streams
Warmwater Streams
1
Recent channelization or recoverin
No channelization or recovered
2
Silt/muck substrates or heavy to moderate
silt covering other substrates2
Boulder, cobble, or gravel
3
Sand substrates "t,
Hardpan origin
Silt free
4
Fair-poor development
Good-excellent development
5
Low-no sinuosit
-
ea water
Moderate-high sinuosity
6
Only 1-2 cover types 2, Cover sparse to none
Cover extensive to moderate
7
Intermittent or interstitial _w't
poor poo s
Fast currents, eddies
8
Lack or fast current
Low-normal substrate embeddedness
9
Maximum depth < 40 cm - a 'n9' ea water
Maximum depth > 40 cm
10
High embeddedness of substrates
Low/no embeddedness
Note: Development refers to pool and riffle development
21
ATTACHMENT 1
SUPPORTING REPORT FOR THE
PRE-FILED TESTIMONY OF CHARLES S. MELCHING
WITH RESPECT TO PROPOSED RULE R08-9
Summary of Relevant Experience
My name is Charles S. Melching and I am an Associate Professor of Civil and
Environmental Engineering at Marquette University in Milwaukee, Wisconsin. I hold a
Bachelor of Science degree from Arizona State University and Master of Science and
Doctor of Philosophy degrees from the University of Illinois at Urbana-Champaign. I am
also a licensed Professional Engineer in Illinois and Arizona.
I have more than 20 years of post-doctorate experience in the fields of water
resources and environmental engineering research (theoretical and applied) and
education. I have been awarded the 2001 Walter L. Huber Civil Engineering Research
Prize from the American Society of Civil Engineers "For his research on uncertainty and
reliability analysis in water resources and environmental engineering, including
especially uncertainty in rainfall-runoff and stream water-quality modeling." I also
received the Outstanding Researcher Award from the College of Engineering at
Marquette University in 2008.
My professional experience includes 2.5 years as a
Visiting Scholar at the Laboratory of Hydrology at the Vrije Universiteit Brussel in
Belgium; 2.5 years as an Assistant Professor of Civil and Environmental Engineering at
Rutgers University; 7.5 years as a Hydraulic Engineer/Hydrologist with the U.S.
Geological Survey, Illinois District. 1 year as a Visiting Professor in the Department of
Hydraulic Engineering at Tsinghua University in Beijing, China; and 9 years at
Marquette University. Details of my work at these places are given in my curriculum
vitae, which is Attachment 2 to my testimony.
My experience in water-quality modeling began in 1990 at Rutgers University
with an uncertainty analysis of the QUAL2E model applied to the Passaic River
sponsored by the New Jersey Water Resources Research Institute (Melching and Yoon,
1996).
While with the USGS I developed a QUAL2E model for Salt Creek in Illinois
(Melching and Chang, 1996) in cooperation with the Illinois Environmental Protection
Agency in support of the Total Maximum Daily Load (TMDL) analysis for Salt Creek. I
also headed a national project to compile and analyze all stream reaearation-rate
coefficient data collceted by the U.S. Geological Survey (Melching and Flores, 1999). 1
also became a national advisor on water-quality modeling within the U.S. Geological
Survey advising on the application of QUAL2E to the Red River of the North done by the
North Dakota District and to the Middle Fork and South Fork Beargrass Creek done by
the Kentucky District; and of the Hydrological Simulation Program Fortran to the
Minnesota River basin done by the Minnesota District and to the Reedy Creek basin done
by the Florida District. I then did an uncertainty analysis for the watershed and stream
water-quality models applied to the Seine River in Brussels, Belgium, sponsored by the
Research in Brussels Program (Melching and Bauwens, 2000, 2001). The Seine River is
similar to the Chicago Area Waterways in that it is a heavily modified urban stream fed
by a network of combined sewers. I also advised on an uncertainty analysis of water-
quality modeling for the Derider River in Belgium (Manache and Melching, 2004, 2007,
2008).
Because of these past experiences in water-quality modeling, I was selected by
the Metropolitan Water Reclamation District of Greater Chicago (District) in 2000 to
develop a water-quality model (DUFLOW model) of the Chicago Area Waterway
System (CAWS). Also at Marquette University, I developed an unsteady-flow water-
2
quality model to evaluate ammonia toxicity in the Milwaukee Outer Harbor
(
Melching et
al., 2006
) for the
Milwaukee Metropolitan Sewerage District
.
I co-taught with Prof.
Vladimir
Novotny a TMDL training
course for the Illinois Environmental Protection
Agency in July 2002.
Finally, from 2004
to 20071
served on the "Technical
Advisory
Committee on Regional
Water Quality
Management Plan Update for the Greater
Milwaukee Watersheds
"
and "Water Quality Modeling Subcommittee
"
formed by the
Southeastern Wisconsin Regional Planning Commission.
I also have a long history of working on the CAWS beginning in 1992 when I
evaluated the consistency of the flow measurement at the acoustical velocity meter on the
Chicago Sanitary and Ship Canal at Romeoville and developed back
-
up equations for this
meter
(
Melching and Oberg
, 1993).
1 then assisted U.S. Geological
Survey
colleagues on
the measurement program done in support of the
U.S. Army
Corps of Engineers
Accounting of Lake Michigan Diversion
.
This experience with the
CAWS led to my
selection as the Hydrologic and Hydraulic Modeling Expert for the 5t1i
(
2003, see Espey
et al. (2004
))
and 6th
(
2008
)
Technical Committees
for
the Review of the Lake Michigan
Diversion Accounting selected by
the U,S. Army
Corps of Engineers, Chicago District.
This experience with the
CAWS
also contributed to my selection
by the
District to
develop a water-quality model of the Chicago
Area Waterway
System.
Purpose of Testimony
The purpose of my testimony is threefold
.
First
,
my testimony will describe the
DUFLOW model
developed
for the CAWS
and its reliability
.
The model has been used
to evaluate water-quality management scenarios involving (a) supplemental aeration on
the North
and South Branches of the Chicago River
, (
b) flow augmentation
on the North
Shore Channel
,
and (c
)
a combination of these water-quality improvement technologies
for the South
Fork of
the South Branch
(
Bubbly Creek
)
as described in Attachments 00,
PP, and
QQ, respectively, of the
rulemaking proposal before the Board
.
The model also
was used to determine the ineffectiveness of pollutant removal at selected
gravity
combined sewer overflows
(CSOs) (
Alp and Melching
, 2006; Alp et al., 2007), to
consider supplemental aeration in the Chicago Sanitary and Ship Canal
(Alp and
Melching, 2006
),
and to evaluate the effects of disinfection on fecal
coliform
concentrations in the
CAWS (
Manache and Melching, 2005
;
Manache et
al., 2007).
Finally, the model is currently being refined in order to develop an integrated strategy
combining flow augmentation
,
supplemental aeration, and perhaps other technologies to
achieve the proposed water-quality standards throughout
the CAWS.
Second
,
my testimony will describe unique and complex features of the
hydraulics
of the CAWS
determined by the modeling studies. A large amount of flow,
water-surface elevation
,
cross
-
sectional geometry
,
aeration, and pollutant load data have
been collected
for the CAWS by the District, U.
S.
Geological
Survey, and U.S. Army
Corps of Engineers
.
The model
integrates and interprets these data on the basis of
hydraulic theory and
well accepted pollutant transport and transformation concepts, and
as such the model can facilitate understanding of the fundamental operations and flow
and pollutant patterns in the
CAWS
.
Key findings are summarized in my testimony.
Third,
implications of the unique and complex hydraulic features
of the CAWS
will be integrated with the results of the determination of the biological potential reported
3
in the Use Attainability Analysis (Attachment B of the
rulemaking
proposal before the
Board)
to discuss reasonable
aquatic life
use goals for
the CAWS.
Water Quality Model
Basic Features
Because poor water quality in the CAWS results in both dry weather and wet
weather conditions, it is necessary to work with a water-quality model which is capable
of simulating flows under unsteady conditions, particularly those resulting from storm
runoff and CSOs. The DUFLOW (2000) unsteady-state water-quality model developed in
the Netherlands by a joint effort of the Rijkswaterstaat (National Water Authority),
International Institute for Hydraulic and Environmental Engineering of the Delft
University of Technology, STOWA (Foundation for Applied Water Management
Research), and the Agricultural University of Wageningen was selected for this study.
DUFLOW was selected for the following reasons: 1) Several options are included for the
simulation of water quality including a sediment flux model, 2) Compatibility with
Geographical Information Systems, 3) Microsoft Windows based including a powerful
graphical user interface, 4) Low license cost, 5) Low computational time, and f)
Successful application to many European rivers (see the web site http://www.mx-
groep.nl/duflow/, click on the top tab "Projects", then the interior tab "Projects", and
finally on the Dutch flag for a long list of applications in Dutch with some in English; if a
message "Not in English is received" click of the Dutch flag again to see the list in
Dutch). In particular, I had worked with DUFLOW in the modeling of the Derider River
in Belgium (Manache and Melching, 2004). The uncertainty analysis involved hundreds
of simulations for a one year time period with very few computational problems
encountered. This indicated that the model was computationally robust, which is a very
important when simulating a complex system like the CAWS. Finally, because the
hydraulic and water-quality models are directly coupled, DUFLOW offered
computational advantages over the versions of WASP (U.S. Environmental Protection
Agency Water Quality Analysis Simulation Program) available when this project started
in 2000.
In this study, the simulation of dissolved oxygen (DO) was done using the
DUFLOW water-quality simulation option that adds the DiToro and Fitzpatrick (1993)
sediment flux model to the WASP4 model (Ambrose et al., 1988) of constituent
interactions in the water column. DUFLOW distinguishes among transported material
that flows with water, bottom materials that are not transported with the water flow, and
pore water in bottom materials that are not transported but that can be subject to similar
water-quality interactions to those for the water column. Flow movement and constituent
transport and transformation are two processes and constituent transport is defined by
advection and dispersion. The following constituents, represented as both water and
sediment components, are included in the DUFLOW model: algal biomass species,
suspended solids concentration, total inorganic phosphorus, total organic phosphorus,
total organic nitrogen as nitrogen, ammonium as nitrogen (NH4-N), nitrate as nitrogen,
DO, and carbonaceous biochemical oxygen demand (CBOD). The combination of
4
WASP4 and the DiToro and Fitzpatrick sediment flux model represents the state-of-the-
art in stream water-quality modeling.
DUFLOW is written in an open code format that allows users to modify the
existing built-in water-quality models and add new routines. This feature was utilized for
the CAWS to be able to calibrate the reacration-rate coefficient calculations and to add a
simple first-order decay model to represent fecal coliform losses in the CAWS (Manache
and Melching, 2005, Manache et al., 2007).
The flow simulation in DUFLOW is based on the one-dimensional (1-D) partial
differential equations that describe unsteady flow in open channels (de Saint-Venant
equations). These equations are the mathematical translation of the laws of conservation
of mass and momentum. Solution of the de Saint-Venant equations represents the state-
of-the-art in 1-D hydraulic modeling in river systems.
Model Domain GeomeLxy, and In uts
Model Domain----The
DUFLOW model was applied to a portion of the CAWS including
the Chicago Sanitary and Ship Canal (CSSC), Calumet-Sag Channel, North Shore
Channel (NSC), North Branch Chicago River (NBCR), South Branch Chicago River
(SBCR), Chicago River Main Stem, Bubbly Creek, and Little Calumet River (north).
The Grand Calumet River, Lake Calumet, and the Calumet River north of O'Brien Lock
and Dam were not included in the DUFLOW model because of a lack of detailed
hydraulic data to accurately simulate these portions of the CAWS. The simulated portion
of the CAWS is a 76.3 mi branching network of navigable waterways controlled by
hydraulic structures that receives flow and pollutant loads from 3 of the largest
wastewater treatment plants in the world, nearly 240 gravity CSOs, 3 CSO pumping
stations, direct diversions from Lake Michigan, and eleven tributary streams or drainage
areas. The water quality in the modeled portion of the CAWS is also affected by the
operation of four Sidestream Elevated Pool Aeration stations and two in-stream aeration
stations (Devon Avenue and Webster Street). The Calumet and Chicago River Systems
are shown in Figure 1.
Two hundred sixteen measured cross sections at different points along the river
were used to describe the geometry of the river.
Within DUFLOW cross-sections were
interpolated at computational nodes spaced no more than 1,640 ft apart on the basis of the
nearby measured cross sections. In DUFLOW, the hydraulic roughness is computed
from Chezy's equation and Chezy's roughness coefficient was calibrated for all reaches
using data from the period January 7 to February 3, 1999. The reliability of this
calibration is confirmed by the successful application of the model to many other time
periods and to water-surface elevation data collected at locations where data were not
available during the calibration period. Discharges and pollutant loads coming from
tributaries, four
Water Reclamation Plants (North Side, Stickney, Calumet, and Lemont),
pumping stations, and CSOs, are given at the model nodes and schematization points.
There are nearly 240 gravity CSO outfalls draining to the modeled portion of the CAWS.
Since it is practically difficult to include all these locations in the model, 28
representative CSO locations were identified as shown in Figure 2. A computational time
step of 15 minutes was used, and hydraulic and water-quality results were output on a one
hour time step.
5
Cook County
Dupage County
ROrb Sidle CkakkelatWilneffi
ortllSide
Up er North Shore Channel
W
rn thBx
Lower North Branch
o River Me!n Stem
CIzaga Rwratcopmbu
me
8n3
och
p 1
Chi^so^^r
Tlkk.y CreeALLVPaW PaM
c4l^fwxr
M 11
12k CttlfaatO
ak F"s
P s to St.
t USGS gage
Counties
Chicago Waterway
Major Inflows
Figure 1. Schematic diagram of the Calumet and the Chicago
River
Systems
Inflows-The
hydraulic and hydrologic data available for
the CAWS have
been compiled
from different agencies
.
The U.
S. Geological
Survey
previously had discharge and water-
surface elevation gages at three primary locations where water is diverted from Lake
Michigan into the
CAWS
. These locations are:
i)
The Chicago River Main Stem at Columbus Drive (near the Chicago River
Controlling Works) [still operational]
ii)
The Calumet River at the O'Brien Lock and Dam
iii)
The North Shore Channel at Maple Avenue (near the Wilmette Pump Station)
The data from these gages at Columbus Drive and O'Brien Lock and Dam are used as
upstream water-surface elevation versus time (hourly) boundary conditions for the
unsteady-flow water-quality model. At Wilmette, the original hydraulic calibration and
verification used hourly water-surface elevation versus time as a boundary condition, but
Lv+k
North Shore Channel
Counties
Model
CSO Locations
j^\l Chicago
Watenvay
* Inflow locations
StreetMap USA
/V Primary road
Figure 2. Locations of the 28 representative combined sewer overflows (CSOs) used in
this study (note: The location of the Citgo Petroleum plant is shown above, the inflow
location in the model and in reality is downstream from the Lemont WRP.)
7
later when water-quality improvements on the upper NSC were simulated 15-min. flow
data were used as the upstream boundary condition at Wilmette. Flow versus time data
(on a 15-minutes basis) from the U.S. Geological Survey gage on the Chicago Sanitary
and Ship Canal at Romeoville are used as the downstream boundary condition for the
model. The 15-min, data from the U.S. Geological Survey gage on the Little Calumet
River (south) at South Holland provide a flow versus time upstream boundary condition
for the water-quality model. Two tributaries to the Calumet-Sag Channel are gaged by the
U.S. Geological Survey-Tinley Creek near Palos Park and Midlothian Creek at Oak
Forest and the 15-min. data at these sites is input to the model. The U.S. Geological
Survey gage on the Grand Calumet River at Hohman Avenue at Hammond, Ind. is
tributary to the Little Calumet River (north) and hourly data are input at this location.
Fifteen minute flow on the North Branch Chicago River is measured just upstream of its
confluence with the North Shore Channel at the U.S. Geological Survey gage at Albany
Avenue and is input to the model.
There also are inflows coming from District facilities. Hourly flow data are
available from the District for the treated effluent discharged to the CAWS by each of the
North Side, Stickney, Calumet, and Lemont Water Reclamation Plants (daily data were
used for the Lemont Plant). In addition, hourly flows discharged to the CAWS at the
three CSO pump stations-North Branch, Racine Avenue, 1251' Street-were estimated
from operating logs of these stations.
The gravity flow CSO volume was determined from the system-wide flow
balance and water level measurements at Romeoville. It was distributed in space on an
area ratio basis to the 28 representative gravity CSO locations and in time on the basis of
CSO pump station operation time. Successful results with hydraulic calibration and
verification suggest that CSO volumes were reasonably estimated and distributed along
the waterway system. The flows determined by flow balance have also been compared to
CSO flows estimated by the computer models the U.S. Army Corps of Engineers uses to
estimate the Lake Michigan diversion (see Espey et al. (2004) for a description of these
models) for the events resulting in flow reversals to Lake Michigan in 2001 and 2002.
Generally good agreement between the flow balance and U.S. Army Corps of Engineers
models has been found (Alp and Melching, 2008).
Measured flows on Midlothian Creek were used to estimate flows on ungaged
tributaries using drainage area ratios. In total, 15-min. flows from 107.45 mil of ungaged
drainage areas were estimated from Midlothian Creek flows.
Chernical Constituent
Inputs-Measured daily composite constituent concentrations
provided by the District were used in the model for the four Water Reclamation Plants.
For the tributary stream inflows, long-term average values were used for the dry-
weather concentrations. All water-quality data used for dry-weather concentrations were
collected as a part of the District's monthly waterway sampling program. Average
concentrations (2001-2002) for the Little Calumet River at South Holland were
calculated using data from the Little Calumet River at Wentworth Avenue (upstream of
the South Holland gage) and at Ashland Avenue (downstream of the South Holland gage)
and Thorn Creek at 170`' Street (upstream of the South Holland gage). Concentrations
measured (1990-2002) at the Grand Calumet River at Burnham Avenue were used for the
concentrations at the Grand Calumet River at Hohman Avenue gage. Average
8
concentrations (2000-2002) for the North Branch Chicago River at Albany Avenue were
measured directly. Dry-weather concentrations for other tributaries are based on Little
Calumet River concentrations because all of the other gaged and ungaged tributaries are
on the southern portion of the Chicago metropolitan area and were assumed to be similar
to the Little Calumet River drainage basin.
For wet-weather periods, event mean concentrations were calculated using water-
quality data collected during storm events by the District in 2001. In most cases, the total
load resulting
from
the runoff event is more important than the individual concentrations
within the event due to the fact that runoff events are relatively short, the receiving water
body provides some mixing, and the concentration in the receiving water body is a
response to the total load rather than the concentration variability within the event
(Novotny and Olem, 1994, p. 484). Because of the importance of the total load, the event
mean concentration has been found to be the most appropriate variable for evaluating the
impact of urban runoff (U.S. EPA, 1983). Hence, event mean concentrations were used to
characterize all storms at tributaries and CSOs in this study. Hence, event mean
concentrations were used to characterize all storms in this study. Concentrations for the
Little Calumet River at South Holland were calculated using storm data on the Little
Calumet River at Ashland Avenue. Event mean concentrations for the North Branch
Chicago River at Albany Avenue were measured directly. Other tributaries were based
on Little Calumet River event mean concentrations. For the calibration period event
mean concentrations were measured for each storm, while for the verification period
average event mean concentrations based on the 2001 data were used.
For the upstream boundaries in the water-quality model-near the Chicago River
Controlling Works at the Chicago River at Columbus Drive, near the Wilmette Pump
Station at the North Shore Channel at Maple Avenue, and O'Brien Lock and Darn-
historic plots of data (1990-2002) show that there are seasonal and monthly variations at
these locations and nitrogen compound concentrations for the Chicago River at
Columbus Drive changed dramatically after 1997. For this reason monthly averages were
detennined and were used in the water-quality model.
Constituent concentrations were measured by the District at the North Branch and
125th Street Pump Stations for selected storms in 2001. When there were no measured
data for a storm in 2001, the average of all event mean concentrations for storms sampled
in 2001 for the given pumping station were assigned to this storm. For the simulation
period in 2002, none of the pumping stations was sampled. Therefore, average values
from all available historic event mean concentration data were used (2001-2002 and
1995-1999 and 2001-2002 for the North Branch and 125th Street Pumping Stations,
respectively).
Since no measured data are available for the Racine Avenue Pumping Station for
2001, 5-day CBOD (CBOD5) and NH4-N concentrations were determined as a function
of discharge using a regression equation based on event mean concentration data
collected in 1995-1999 and 2002. DO concentrations were determined on the basis of
regression relations between event mean concentration and discharge for the North
Branch Pumping Station.
The North Branch Pumping Station water-quality parameters were used for North
Shore Channel and North Branch Chicago River CSOs, the Racine Avenue Pumping
Station water-quality parameters were used for the Chicago River Main Stem and South
9
Branch Chicago River CSOs,
and the Calumet
-
Sag Channel and Little
Calumet River
CSO water-quality
parameters were determined using concentrations measured at the
125th Street Pumping Station
.
The reasonableness of this approach
was shown in
Neugebauer and Melching
(2005).
The water quality in
the modeled portion
of the CAWS is affected by the
operation
of four
Sidestream Elevated Pool Aeration stations and two instream aeration
stations
(
Devon
Avenue and Webster
Street
).
The oxygen
input from the Sidestream
Elevated Pool Aeration
stations
is computed
as a rate per time on the basis
of the pump
operation records and the oxygen transfer
efficiency
determined
by Butts et
al. (1999,
2000). The oxygen
input
from the
in-stream aeration stations is computed as a rate per
time on the basis of blower operation records and the oxygen transfer
efficiency
determined by Polls et al
. (
1982).
Details on these calculations are provided
in Alp and
Melching (2004)
and Melching
et al. (2004).
Temperature
is a key variable, which affects
reaction
kinetics and the DO
saturation concentration
. Hourly
measured temperature values were input at each
continuous monitoring location
.
Therefore,
temperature varies spatially and temporally in
the DUFLOW model.
Fecal Coliform Inputs-The
fecal coliform concentration in the Water Reclamation Plant
effluents was available for a single sample on a weekly basis
(
i.e. about
four or five
measurements a month
).
Linear interpolation in time between these measurements was
applied in
the DUFLOW
model to estimate coliform concentrations from the Water
Reclamation Plants for each 15 min. computational time point
.
The 15
min. time step is
necessary to simulate unsteady flow in the
CAWS and
is supported by 15 min. flow
and/or water
-
surface elevation values at the boundaries and tributaries and hourly flows
at the Water Reclamation Plants and CSO pumping stations.
Since no bacteriological data on discharges from CSOs were available for the
study area when the model was developed
,
fecal coliform input concentrations to the
DUFLOW
model were estimated
.
The median value of the sampling data available for
CSOs in Milwaukee for the period 2001-2004 was considered as representative of fecal
coliform concentrations at the pumping stations and CSOs because both Milwaukee and
Chicago have deep tunnel systems to intercept and treat the first flush of storm runoff
pollutants from combined sewers. This value is about 170
,000 CFU/100 ml. A
similar
modeling effort has been done to simulate fecal coliform concentrations in the water
courses, harbor, and near shore Lake Michigan in the Milwaukee area. In this modeling
effort,
the geometric
mean of CSO
fecal coliform concentrations of 160
,000 CFU/l00 ml
was used
(
Recktenwalt et al., 2004
). This
further supports the use of
170,000 CFU/100
ml in the simulation
of the CAWS.
There
were four severe rain storms in 2001 and 2002
(
August 2, August 31, and October
13, 2001
;
and August
22, 2002)
that resulted in flow reversals from the
CAWS to Lake
Michigan
.
During periods of flow reversals the District is required to intensively sample
the quality of water going into the Lake
.
These data were used to evaluate fecal
coliform
concentrations in CS Os, and a value of 1,100
,000 CFU/
100 ml was found to give good
results for
3 of the 4 events.
Thus, when disinfection scenarios were evaluated runs with
CSO concentrations
of 170,000 CFU/100
ml and 1,100,000 were made for comparison
(Manache and Melching, 2005
).
In 2006 the District collected fecal coliform
10
data in CSOs and the concentrations were between 400,000 and 500,000 CFU/100
ml confirming the range in the runs reasonably bracketed actual inflow conditions from
the CSOs.
Unlike other studies where relations between flow and coliform loads have been
found for some rivers (e.g., Elshorbagy et al. 2005), no relations between flow and
coliform concentrations were found for the tributaries to the CAWS. Thus, for the gaged
tributaries-North Branch Chicago River, Little Calumet River, and Grand Calumet
River-historical monthly fecal coliform concentrations were used as input with 15 min.
values linearly interpolated in time between the adjacent monthly measurements. For
ungaged tributaries, fecal coliform concentration data were estimated based on data
analysis of Chicago area streams that are not affected by Water Reclamation Plants or
CSOs. Monthly median values of fecal coliform concentration for one representative
stream (Thorn Creek, which is a tributary to the Little Calumet River) were applied to
each 15 min. value for all ungaged tributaries.
Model Calibration and Verification
Hydraulics-The
comparison of measured and simulated hourly water-surface elevations
at seven locations throughout the CAWS-North Shore Channel at Wilmette; North
Branch Chicago River at Lawrence Avenue; Calumet-Sag Channel at Southwest
Highway; and Chicago Sanitary and Ship Canal at Western Avenue, Willow Springs
Road, Sag Junction, and Romeoville--were used for hydraulic calibration and verification
of the model (details in Shrestha and Melching, 2003; Alp and Melching, 2004, 2006;
and Neugebauer and Melching, 2005). Statistical analysis for the locations used in the
verification showed that the difference between the measured and simulated water-
surface elevations are all below 8.5 % relative to the depth of the water except for
Wilmette, an upstream boundary. Mean and median values of the absolute value of the
difference between the measured and simulated water-surface elevations are below 3.2 %
relative to the depth at all locations. The simulated water-surface elevations were within
3% relative to depth for 93.7-99.9% of the measured values at all locations other than
Wilmette. These high percentages of small errors and the high correlation coefficients
(0.79.0.98) indicate an excellent hydraulic calibration and verification of the model.
Dissolved Oxygen and Related Constituents-The
DUFLOW DO model was calibrated
and verified for the periods of July 12-November 9, 2001, and May 1-September 23,
2002, respectively. 2001 was a relatively wet year and 2002 was a relatively dry year
giving an acceptable variety of flows for the calibration and verification (i.e. Thomann
(1982) recommended that the verification data set should represent a sufficiently
perturbed condition to provide an adequate test for the model). Further, the period in
2001 was selected as the calibration period because during this time the District collected
detailed storm loading data for the Little Calumet River and North Branch Chicago River
at Albany Avenue, the two main tributaries to the CAWS, and the North Branch and
125"' Street CSO pumping stations. This allowed the model to be calibrated for the case
with the most detailed knowledge on the pollution loads to the CAWS. Complete details
of the calibration and verification of the DO model are given in Alp and Melching
(2006).
11
An extensive data set including hourly in-stream DO data at 26 locations and
monthly in-stream water-quality measurements at 18 locations were used to calibrate and
verify the water-quality model at a 1-hour output time step. All water quality parameters
including DO were measured by the District. The comparisons of the simulated
constituent concentrations (CBOD5, Nitrogen compounds, and Chlorophyll-a) with long-
term mean measured concentrations, one standard deviation confidence bounds, and
concentrations measured between July-November 2001 indicated reasonable simulations.
There are approximately 2,900 measured hourly DO data at each location within the
calibration period and throughout the calibration process it was aimed to match hourly
measured and simulated DO concentrations as much as possible [see Figures 3.16-3.33 in
Alp and Melching (2006)]. On the other hand, as Harremoes et al. (1996) mentioned, it is
almost impossible to fit all the measured hourly data if there are a large number of data to
be matched. Hence, calibration was done manually in a way that the model can capture
low DO concentrations resulting from CSOs and produce similar probabilities of
exceedence for different DO concentrations. Comparisons of the percentage DO
concentrations less than 3, 4, 5, and 6 mg/L at different locations in the CAWS for the
calibration period for selected locations are listed in Table 1 and for I-55 on Bubbly
Creek are shown in Figure 3.34 of Alp and Melching (2006).
Close agreement between the calibrated and measured DO concentrations was
obtained especially for the lower DO concentrations. The differences between the
percentage of DO concentrations less than 3 mg/L for the calibrated and measured DO
concentrations vary 0.0 to 4.5 percentage points at all 26 locations in the CAWS except
for the upper North Shore Channel and Bubbly Creek. The differences between the
percentage of DO concentrations less than 4 mg/L for the calibrated and measured DO
concentrations are less than 10.6 percentage points in the CAWS except for the upper
North Shore Channel. In the upper North Shore Channel and Bubbly Creek it was
difficult to match the measured DO concentrations because of the hydraulic conditions in
these water bodies, i.e. flow near zero except during CSO events. Thus, the calibration
aimed to match the low DO concentrations resulting from CSOs so that reliable
management practices to mitigate the CSO effects could be determined using the
DUFLOW model. The differences between the percentage of DO concentrations less than
3 and 4 mg/L for the calibrated and measured DO concentrations reach up to -30.4
percentage points in the upper North Shore Channel. The overall average of the absolute
differences of percentages of DO concentrations less than 3, 4, 5, and 6 mg/L for the
calibrated and measured DO concentrations are 1.7, 4.4, 7.7, and 9.6 percentage points,
respectively, in the CAWS except for the upper North Shore Channel and Bubbly Creek.
As described earlier, for model verification purposes, average values of constituent
concentrations in CSOs taken as a mean from historic measured data were applied,
whereas measured event mean concentrations were available at the CSO pumping
stations for the calibration period. Verification of the DUFLOW DO model generally
shows good agreement between measured and simulated DO concentrations. For the
entire CAWS except the upper North Shore Channel the average error in daily DO
concentration is 8.3 % and the average absolute percentage error is 26.9 % (Neugebauer
and Melching, 2005). Comparison between the DUFLOW model prediction ability for
the verification (May 1 to September 23, 2002) and calibration (July 12 to November 9,
2001) periods indicates that the prediction ability of the DUFLOW DO
12
model is comparable for these two periods
.
It
was concluded that, in general, the
DUFLOW
model represents water-quality processes in the
CAWS
well enough for
simulation of water-quality management scenarios.
Table 1
.
Comparison of the percentages of simulated and measured hourly dissolved
oxygen
(
DO) concentrations higher than specified targets for the Chicago Area Waterway
System for July 12-November 9, 2001
(
after Alp, 2006)
Linden Street
Simpson Street
Main Street
Addison Street
Fullerton Avenue
Division Street
Kinzie Street
Chicago River
Controlling Works
Clark Street
Jackson Boulevard
Cicero Avenue
Baltimore and Ohio
Railroad
Route 83
Mile 11.6
Romeoville
Conrail Railroad
Central and
Western Railroad
Halsted Street
Division Street
Kedzie Street
Cicero Avenue
Harlem Avenue
Southwest Highway
1041' Avenue
Route 83
Percentage of DO (Measured and Calibrated) higher than
3 mg/L
4 mg/L
5 mg/L
6 mg/L
Meas.* Sim.** Meas. Sim.
Meas. Sim.
Meas. Sim.
91.4
69.5
90.0
65.5
88.4
61.0
85.3
56.8
75.4
46.0
66.5
36.0
57.3
27.5
50.4
22.6
73.7
39.4
64.9
32.6
49.9
25.3
38.3
8.1
99.5
100.0
98.2
98.4
89.9
82.5
52.0
33.9
93.7
96.1
79.9
86.0
50.4
53.5
36.8
23.0
99.4
95.0
95.2
84.6
84.2
65.6
46.9
36.6
97.3
94.7
91.6
82.2
67.7
66.4
30.9
36.3
98.6
98.0
98.6
97.1
98.6
94.8
97.6
93.0
99.9
98.0
99.9
96.7
99.6
94.4
98.1
86.3
96.1
92.0
87.9
81.1
62.2
66.3
31.9
39.4
78.9
79.5
51.7
51.2
23.0
37.7
13.9
24.4
97.5
97.4
90.7
80.7
65.4
51.2
34.8
30.0
82.0
86.5
66.1
60.5
30.8
37.1
18.0
22.5
87.4
89.0
74.0
71.9
47.0
46.2
25.8
28.6
82.8
82.1
59.2
62.7
23.0
38.9
12.7
25.4
99.4
100
98.7
100
95.8
98.2
88.5
79.1
100
100
99.8
100
98.5
98.7
91.0
81.0
99.9
98.8
99.2
94.1
93.9
77.8
70.3
389
97.1
100
88.7
95.5
69.2
79.2
42.2
43.8
98.9
100
95.3
96.1
84.4
84.9
61.1
48.9
98.6
99.1
94.0
93.2
81.6
74.2
58.4
43.5
97.8
96.2
91.2
889
76.8
70.4
50.8
48.9
98.2
95.6
90.7
86.4
77.4
67.8
58.7
46.0
91.6
91.7
86.4
83.0
70.9
63.2
44.8
43.5
94.8
92.0
88.2
80.8
72.0
65.0
52.1
46.4
* Meas
.:
Measured
; **
Sim.: Calibrated
The application of the
DUFLOW
hydraulic and DO models to the
CAWS has been
subjected to extensive peer review
.
Each of the four modeling reports
(
Shrestha and
Melching, 2003
; Alp and
Melching
, 2004
, 2006
;
Neugebauer and Melching
,
2005) was
reviewed by the Research and Development
,
Engineering
,
and Operations and
Maintenance Departments of the District. Further, because the preliminarily calibrated
DO model was used to simulate the effects of a proposed change in navigational water
level policy on water quality in the
CAWS
, the report
by Alp
and Melching (2004) was
13
also reviewed by three staff members of the U.S. Army Corps of Engineers,
Chicago District. The paper on the model presented at the Watersheds 04 Conference
(Melching et al., 2004) was peer reviewed before being accepted for presentation, and the
paper on the effectiveness of CSO treatment (Alp et al., 2007) also was peer reviewed
before publication in the journal
Water Science and Technology.
These reviews further
support the reliability of the DO model for use in evaluating water-quality management
scenarios in the CAWS.
Fecal Coliforms-
Use
of process
-
based
,
continuous simulation models is highly data
intensive requiring continuous time series of flows or water
-
surface elevations and water-
quality constituent concentrations at the boundaries and for all tributaries
(
streams, CSOs,
etc.) and diffuse lateral loads
(
as described earlier
).
Preparation of this data including
compilation
,
quality assurance
,
filling in missing record, and estimation of ungaged flows
is very time consuming
.
Thus, it is common practice to select a reference period of a
typical year, or in the case of the
CAWS
two representative summer periods one for a
relatively wet
year
(
2001) and the other for a relatively dry year
(
2002).
When
recreational interest in early spring
(
March and April
)
and late fall periods
(
October and
November
)
were identified in the Use Attainability Analysis, periods in 1998 and 1999
were added to the representative periods simulated
.
For the CAWS five 2-4 month
periods concentrated in the recreational season
(
March to early November) were
considered.
During a typical year only 9 or 10 monthly fecal coliform samples may have been
collected and analyzed because samples are not collected in winter months, and for the
five periods a maximum of 16 monthly fecal coliform samples were available at each of
16 sampling locations in the
CAWS.
Thus, traditional calibration wherein the coliform
decay rate
,
k, is adjusted for each reach to obtain a good match between the simulated and
measured concentrations would haven been based on a very small set of measurements.
Thus, an alternative approach for calibration
,
i.e. determination of k, was developed.
The new concept of calibration applied determined the fecal coliform decay rate
on the basis
of 14
years
(
1990-2003
)
of historical
monthly
fecal coliform samples rather
than the limited number of monthly samples collected in the typical calibration period to
which process
-
based, continuous simulation models are commonly applied. The
application of this approach relied on careful evaluation of the historical data for
representative flow and loading conditions
,
which were found for
the CAWS
(Manache
et al., 2007
).
This approach also relies on detailed simulation of travel times in the study
water courses, which was accomplished through DUFLOW's highly accurate simulation
of the hydraulics of the CAWS.
A mean and median value of k was computed for every section as follows:
In
=
co
Ct
t
where Ct
and Co are the fecal coliform concentrations having the same probability of
exceedence
(
quantile
)
at the downstream and upstream locations
(CFU/100 ml),
respectively
,
and t is the mean travel time between upstream and downstream locations
14
(days).
This was done for many selected quantiles
,
and the computed mean and median k
values were found
.
For the
CAWS,
similar mean decay rate values were obtained when
the equation above was applied on the paired data of fecal coliform concentrations
collected at two successive sampling locations on the same date.
The k
values determined above were tested for the period
July 12
to September
15, 2001
,
and values were estimated for reaches including the Water Reclamation Plants
and outside the sampled reaches using data from this same period
.
The model was then
verified for the periods September 11 to December 30, 199
8;
February 5 to May 24,
1999; September 2 to November 10, 2001; and May 5 to September 29, 2002.
The high
quality simulation results are shown in detail in Manache and Melching (2005) and
Manache et
al. (2007). The quality
of the coliform model was confirmed through peer
review by
the District and the Journal of Environmental Engineering of the
American
Society of Civil
Engineers.
HYDRAULICS OF THE CAWS
The Board characterizes its responsibility evaluating the CAWS as follows;
In evaluating these proposed rules, the Board is required to take into account
"the existing physical conditions
,
the character of the area involved including the
character of surrounding land uses, zoning classifications
,
the nature of the
existing air quality
,
or receiving body of water
,
as the case may be
,
and the
technical feasibility and economic reasonableness of reducing the particular type
of pollution."
IEPA
Statement of Reasons p. 2. According
to IEPA,
some of the
key hydraulic
features
of the
CAWS
that influence the biological potential
of the CAWS
are. "Flow reversal
projects, such as this one
,
place a premium on head differential
.
The entire system has
minimum slope and, consequently
, low velocity
, stagnant flow conditions." IEPA
Statement of
Reasons at pp. 19-20. The evaluation of flow and water
-
surface elevation
data used
to apply the DUFLOW model
and the hydraulic results of the modeling reveal
just how stagnant
the CAWS
is and the potential limitations to the current and future
biological community.
Flow Reversals
It is well known that large storms can result in flow reversals from the CAWS to
Lake Michigan
.
Figure 3 shows that during a large storm on August 2, 2001, the water-
surface elevation at Western Avenue was higher than that at the Chicago River
Controlling Works. Figure 4 shows the maximum computed water-surface elevation for
the 50
-
and I00
-
year floods along the path from the Chicago River Controlling Works to
Romeoville
.
These figures were calculated for a study of the hydraulics of the proposed
new bridge over the South Branch Chicago River at Taylor Street done for the Chicago
Department of Transportation using inflow calculated by the U.S. Army Corps of
Engineers
.
These figures show that Cicero Avenue is the approximate flow divide during
15
large storms, and water may flow from the upstream end of the Chicago Sanitary and
Ship Canal toward downtown during large events.
• • • • • Chicago River CW
---Lockport CW
-Western Avenue
- - • -Sag Junction
- - -Willow Springs
-1 Q
811101 12:00 AM
811!01 12:00 PM
812!01 12:00 AM
812101 12:00 PM
813101 12:00 AM
813101 12:00 PM
814!01 12:00 AM
DATE
AN D TI M E
Figure 3. Measured water-surface elevations in the Chicago Area Waterway System
during the flood of August 2, 2001. (note: CW means Controlling Works)
The flow need not result in a reversal to Lake Michigan to have a flow reversal
within the CAWS. Figure 5 shows that the water-surface elevation on the Little Calumet
River (south) at Ashland Avenue during the storm from January 22 to 27, 1999 is higher
than the water-surface elevations at O'Brien Lock and Darn and Sag Junction. Thus,
during storms O'Brien Lock and Dam is downstream of the Little Calumet River (south)
and water backs up the Grand Calumet River until it can flow downstream toward Sag
Junction when the storm flow from the Little Calumet River (south) decreases [note: it
appears the water-surface elevation monitor at Ashland Avenue froze on January 27th]
Because the water-surface slope of the CAWS is so small and the flow from the
North Side, Stickney, and Calumet Water Reclamation Plants is substantially higher than
the flow upstream of these Plants flow reversals also are common during dry weather
flows upstream of the Plants. Figures 6-8 show that for each of the Plants the water-
surface elevations "upstream" of the Plants frequently are lower than those "downstream"
of the Plants. Thus, the outfalls of each of the Plants act as a hydraulic dam inserting
treated effluent to the upstream reaches and then holding it and upstream flows back to
truly stagnate in the upstream reaches. This backflow explains why the upper North
Shore Channel remains ice free for many miles north of the channel. In January 2003
when 1 visited the U.S. Geological Survey gage at Maple Avenue (5 miles from the North
Side Plant) ice was only present upstream from the gage. The bi-directional flow gives
us some impression of the unnatural condition of the CAWS.
16
4
q3
V
V
0
2
V1
L
E
0
V
^
-
1
O
a
-2
m
W
-3
-4
Water-surface elevation for 50-year flood
NCO
N
A
41
^
d
N
.
NA
^
ONO
O
a
Q
a^
U
Miles from CRCW to Romeoville
5
4
3
2
1
0
-1
-2
-3
-4
Water-surface elevation for 100-yearflood
]V
M
OD
m
T^
^O
N
m Ou NO N
.Np
6N]
O
Q
L
U
Miles from CRCW to Romeoville
Figure 4. Computed maximum water-surface elevation from the Chicago River
Controlling Works (CRCW) to Romeoville on the Chicago Sanitary and Ship Canal for
the 50- and 100-year floods (inflows obtained from the U.S. Army Corps of Engineers,
Chicago District)
Slow Travel Times
As mentioned earlier, the DUFLOW model was used to determine average travel
times in the CAWS in the calibration of the fecal coliform model. Table 2 lists the
average travel times, lengths, and average velocities for several reaches in the CAWS for
the July 12 to September 15, 2001 simulation period. The hydraulic dam upstream from
the Stickney Plant is obvious as it takes 2.5 days to go 8 miles from Madison Street to
Cicero Avenue. The hydraulic dam upstream from the Calumet Plant also is obvious as it
takes 1.5 days to go 2.3 miles from Indiana Avenue to Halsted Street.
17
1,5 1-
1.0 4 ............................................................
....... ...-......................
-0.5
Tt"°"
s^`
r y
. ^G
.. s^. q .. d`^.e.P'.
^a •5.
.. . r
U]
-1.0
-}_________________-._.
^ ._.. _. _.. _..
.-....-_
_-- --- -_ . -- -_ -.._.
Cal Sag
• - - • - • O'Brien
Ashland Av.
-l.5
01l07/99
01112199
01!17199
01/22199
01127/94
02101!94
Time, pace and hour
Pigured
,
6.
Measured
stages at Cal-Sag Junction, O'Brien Lock and Dam and the Little Claumet River at Ashland
Avenue for January 7 -February 3, 1999
Figure S. Measured water-surface elevations at Calumet-Sag Junction, O'Brien Lock and
Dam, and the Little Calumet River (south) at Ashland Avenue for January 7 to February
3, 1999 [after Shrestha and Melching (2003)]
North Side WRP'-2001
n
Date
-1.9
X
xxxx
x
x
*
,
xx
x
xxxxx
xxx
x x
xx
x
*.)K
x
*
x* x -
*x
^
x
xx
x>
X X
xx
xx
x
x*
xx
_
*
x X
x
X^_-..
*
X
x
xx
xx
x
0
2 miles upstream
- - - .
0.7 mile Upstream
3VSWRP
x
1 mile Downstream
*
2 mile Downstream
v
hN
Figure 6. Simulated water-surface elevation at, upstream, and downstream of the North
Side Water Reclamation Plant
-2
18
Calumet WRP--2001
-1.55
-1.6
-1.65
-1.7
-1.75
-1.8
-1.85
-1.9
-1.95
.o
^
.
•
,
qo
;tt
o
1.21 miles upstream
Calumet WRP
'Y
x
1.13 mile Downstream
- - - -
0.62 mile Upstream
x
0.6 mile Downstream
N
O
M
O
ON
n
QI
N
^Y
OO
7V
OO
Y
V
i`
Y_
Fz
ti
D ate
Figure 7. Simulated water-surface elevation at, upstream, and downstream of the Calumet
Water Reclamation Plant
Stickney WRP--2001
-1.6
-1.65
-1.7
-1.75
-1.8
-1.85
-1.9
-1.95
-2
Date
V
r
O
O
Zf
ti
Figure 8. Simulated water-surface elevation at, upstream, and downstream of the
Stickney Water Reclamation Plant
Oq
o`
00
d
o
1.92 mile upstream
- - - -0.55 mile Upstream
Stickney WRP
1 36
il D
x
0.68 mile Downstream
.
m e ownstream
19
Table 2. Computed average travel time and velocity for July 12 to September 15, 2001
and distance between selected points in the Chicago Area Waterway System.
Sampling Site
Sampling Site
Waterway
Travel Distance
Average
(Upstream)
(Downstream)
Time
Velocity
(day)
(mi)
(ft/s)
Central Street
Oakton Street
North Shore
0.57
3.2
0.34
Oakton Street
Touhy Avenue
North Shore
0.22
1.0
0.28
Touhy Avenue
Wilson Avenue
North Branch
0.24
3.4
0.87
Wilson Avenue
Diversey Parkway
North Branch
0.25
2.5
0.61
Diversey Parkway
Madison Street
South Branch
1.12
4.8
0.26
Madison Street
Western Avenue
CSSC
1.42
4.7
0.20
Western Avenue
Cicero Avenue
CSSC
1.09
3.3
0.19
Cicero Avenue
Harlem Avenue
CSSC
0.71
3.3
0.28
Harlem Avenue
Route 83
CSSC
1.61
9.9
0.38
Route 83
Romeoville
CSSC
0.94
7.9
0.51
Indiana Avenue
Halsted Street
Little Calumet
1.46
2.3
0.10
Halsted Street
Ashland Avenue
Cal-Sag
1.72
1.0
0.04
Ashland Avenue
Cicero Avenue
Cal-Sag
1.30
4.1
0.19
Cicero Avenue
Route 83
Cal-Sag
2.97
10.7
0.22
Route 83 (Cal-Sag) Romeoville
CSSC
0.95
8.1
0.52
Huge travel times and low flow velocities also are apparent upstream from the junction of
the Chicago Sanitary and Ship Canal and the Calumet-Sag Channel. This is because
when the Chicago Sanitary and Ship Canal was originally constructed the Calumet-Sag
Channel was not anticipated and the Chicago Sanitary and Ship Canal cross-sectional
geometry is the same upstream and downstream from Sag Junction. Thus, Sag Junction
acts like two lanes narrowing to one lane on the freeway with large backups and long
travel times resulting. In total then it takes more than 8 days for water to travel from the
upstream ends of the North Shore Channel and Little Calumet River (north) to
Romeoville on the Chicago Sanitary and Ship Canal. For perspective, we should
remember that 5-day BOD was originally taken as the standard measurement because the
test was devised in England, where the River Thames has a travel time to the ocean of
less than 5 days, so there was no need to consider oxygen demand at longer times (Davis
and Masten, 2004, p. 280). The long travel time gives us further impression of the
unnatural condition of the CAWS. This feature of the CAWS contributes to the lower
dissolved oxygen that is observed in CAWS compared to general use rivers because of
the reduced natural reaeration resulting from low velocity and very low slope. Further,
this feature of the CAWS makes it challenging and costly to disperse dissolved oxygen
that is contributed artificially from engineered aeration stations.
20
Wet Weather Effects
IEPA appears to assume that the duration of storm effects on water quality lasts
only as long as the causative rainfall, or the period of elevated flow rates. However,
research on the CAWS shows that the effect of storm runoff and CSOs on water quality
lasts substantially longer than the hydraulic effects of the storm. That is, once a load of
pollutants is introduced to the system it takes longer for the system to dissipate the effects
of these loads than it does to pass the high flows, similar to the lingering effects of a cold.
If continuous time series of CBOD5 and NH4-N concentrations were available at
short time steps, it is possible that the duration of the storm effect on these constituents
could be determined from the measured CBOD5 and NH4-N concentrations. However,
such a determination would require that the dry-weather conditions-temperature, flow
from wastewater treatment plants and tributaries, boundary conditions, etc.-would be
essentially the same as before the storm. Since such continuous data generally are not
available, water-quality models must be used to estimate the duration of the storm effect.
The situation for DO concentrations is much more complex because DO concentrations
are influenced by many conditions and processes-temperature, flow dilution, changes of
treatment plant loads, CBOD5, the nitrogen cycle, sediment oxygen demand, algal growth
and death, etc.----each of which is subject to a different duration of storm effects. For
example, DO recovery to pre-storm conditions does not indicate the end of the storm
effect because the new dry weather DO concentration may have changed because of
changes in temperature, sediment oxygen demand, treatment plant loads, etc. Again
water-quality models must be used to determine the duration of the storm effect. Alp
(2006) proposed and tested (on the CAWS) a method to determine the duration of storm
effects on water quality.
In his approach, DUFLOW was successively applied with different storm CBOD
and ammonium as nitrogen loadings (i.e. event mean concentrations) randomly sampled
from a probability distribution representative of the event mean concentration data
collected by the District at the CSO pump stations using an uncertainty analysis
technique (Latin Hypercube Sampling, with a sample size of 50 simulations). Then the
variations in the DUFLOW model output parameters among the successive simulations
were observed. When the variation in the model output parameters approaches zero, it
means the river system has returned to the pre-storm (dry weather) condition. Therefore,
the duration between the start and the end of the variations in the simulated DUFLOW
model output parameters can be defined as the duration of the storm effect on in-stream
water quality, or the duration of the wet-weather condition. A paper summarizing this
approach (Alp and Melching, in press) was recently accepted for publication in the
Journal of Water Resources Planning and Management of the American Society of Civil
Engineers validating the approach and DUFLOW model of the CAWS through peer
review.
To determine how long storm loadings affect the DO concentrations in the CAWS
for each location, the standard deviation of the computed DO concentrations was plotted
against time. At Romeoville the standard deviation was plotted against time together with
the flow for the calibration period in Figure 9. As can be seen in Figure 9, the effects of
some storms overlap and this makes it hard to distinguish the start and end time of the
storm effects. Hence, some of the storms are combined and treated as a single storm. For
21
DO the storm effect
was assumed to end
when the
standard deviation in the simulated
concentrations became a constant.
1.4
1.2
1.0
0.8
0.6
0.4
0.2
- DO STD
-
Romeoville daily flow
1
I
EI
EI
1I
1S6
i^>I
SZ
[ I
CE - I^^ I ,SHS 1
E
57 I
iI
1I
1I
1I1
11
1I
1I
1I
1I1
I1
1
1
1I
I11I1
1
I
I1I1
^I
I
I
II11
11
I
I
1
I1
II
I
I
1l
1I
I
-
1
FI
^
1
lII
1
111
I
1
11
I
I
1I
l
1^E
I
I[
I11
^
W
^
^
Rr
ANO
Date
500
400
300
200
100
3J^33
co
N
v
s
lG
Figure 9. Flow and duration of the storm effect on the standard deviation of simulated
dissolved oxygen (DO) concentration at Romeoville for July 12 to November 9, 2001
(after Alp, 2006).
Substantial impact of storm loading on DO concentration in the CAWS on
average lasts one day to a few weeks depending on the location in the CAWS (Table 3).
For the larger storms (indicated by larger CSO volumes in Table 3) the system tends to
respond very similarly at every location whereas for smaller storms the duration of storm
impact is significantly larger at the downstream locations. For example, for the storms
August 2 and 9, 2001, the duration of the storm effect lasts 15.1 and 14.6 days on the
Chicago Sanitary and Ship Canal at Romeoville and on the North Branch Chicago River
at Addison Street, respectively, whereas for the July 25, 2001 storm, the duration of the
storm effect lasts 8.6 and 2 days on the Chicago Sanitary and Ship Canal at Romeoville
and on the North Branch Chicago River at Addison Street, respectively. This is because
for smaller storms a greater percentage of CSO flows occur at pumping stations, on the
other hand for larger storms a greater percentage of CSO flows occur at gravity CSOs.
Therefore, during larger storms the system receives a more homogenous CSO load which
leads to a homogenous response time over the Chicago River System (North Branch
Chicago River-South Branch Chicago River-Chicago Sanitary and Ship Canal). During
smaller storms, the pumping stations produce relatively more CSO volume which leads to
different storm impacts over the Chicago River System.
Unlike the Chicago River System, the duration of storm effects for a given storm
are very similar along the Calumet River System (Little Calumet River (north)-Calumet-
Sag Channel) as shown in Table 4. Since there is just one pumping station, 125th Street
Pumping Station, and it is located close to upstream boundary (O'Brien Lock and Darn),
differences in the volume of gravity and pumping station CSOs do not create a big
variation in the duration of storm impacts along the river system.
22
Table 3. Magnitude of Combined Sewer Overflow (CSO) volume in m3/s and the
duration of storm effect on the simulated dissolved oxygen concentration in days in the
Chicago Area Waterway System for July 12-November 9, 2001. (after Alp, 2006)
Event
1
2
3
4
5
6
7
Date-2001
7125
812 & 8/9
8125 & 8131
9/19
1015
10113
10123
9123
Total
CSO
65.19
18.39
22.06
15.25
4.13
21.43
3.99
Total
Pump S
.
CSO
39.52
6.52
13.36
5.44
1.77
8.60
2.81
Total
Gravity CSO
25.67
11.87
8.70
9.81
2.36
12.82
1.18
Chicago River System *
Duration of storm effect on dissolved oxygen concentration in days
Romeoville
8.6
15.5
15.1
10.9
7.8
10.6
7.0
River Mile 11.6
8.6
14.0
13.9
10.8
7.5
10.3
6.3
Route 83
8.8
15.3
14.9
10.8
73
10.3
6.9
Baltimore and Ohio
Railroad
9.3
14.2
13.3
10.3
7.5
9.6
6.3
Cicero Avenue
9.2
14.7
15.8
10.2
8.0
9.5
7.7
Jackson Boulevard
9.4
16.6
15.5
9.0
6.8
10.9
4.3
Kinzie Street
8.2
17.5
13.5
8.3
6.1
7.3
4.4
Division
Street
7.6
18.5
13.5
9.3
7.2
7.6
4.6
Fullerton Avenue
5.5
18.2
12.8
9.0
5.2
5.8
3.8
Addison Street
2.0
14.6
12.8
8.8
1.2
3.3
2.1
Calumet River
System *
Duration of storm effect on dissolved oxygen concentration in days
Route 83
7.5
10.5
15.6
11.1
6.5
9.7
2.5
104`x' Street
7.9
14.0
13.3
10.9
7.2
10.8
2.3
Southwest Highway
8.1
13.4
16.9
10.6
6.2
11.2
2.0
Harlem Avenue
7.5
13.1
16.8
10.5
6.1
11.2
2.2
Cicero Avenue
7.4
14.5
16.2
103
7.0
11.1
2.1
Kedzie Avenue
6.9
14.3
15.9
9.9
6.4
10.9
2.0
Division Street
6.6
12.9
15.7
10.5
6.4
3.7
1.5
Halsted Street
8.0
13.6
15.4
10.4
7.3
11.1
1.5
Conrail Railroad
8.1
7.8
10.7
10.0
7.2
10.8
ND***
* Chicago River System:
Chicago Sanitary and Ship Canal, South Branch Chicago River, and North Branch
Chicago River
** Calumet River System:
Calumet-Sag Channel and Little Calumet River (north)
* * * ND= The duration of the storm effect on DO concentration cannot be detected since variations in
simulated DO concentrations are negligible
At Romeoville the standard deviations of simulated CBOD5 and NH4-N
concentrations were plotted against time together with the flow (Figure 10). As can be
seen in Figure 10, the standard deviation clearly decreases almost to zero except for
overlapping storms. Hence, it is assumed that at the point where the CBOD5 and NH4-N
standard deviation approaches zero the storm pollution load does not affect water quality
in the system at that location anymore.
23
-BODSTD --
RomeWlledail fow
11
11
1
Si i
S3
IIN r I^'--"-^1
1
1I1
1
SB
is
1
II1
11
I1
E[
1
i.
S2
1
1^
^ 1I
1
1
I11
S5
i
I^^ 1
EH
1
71
i7
i
^
^1
1
IL{
I
1l1
I
1r1
III
11
1!
11
T111
TI--1
1
11
11
11
It
1[
1
II
I
II
II
I1
11
11
1r
1l
11
II
Ii
I
I1
1F
I{
1
1
I
1
11
11
I1
11
I
1
1
1
1
[
r
1
D
Sao
m
W
0.30
0.25
v
x 0.20
z
0.00
-NH4•NSTD - -•- RomeodedaiOow
IO !
1I
]
j
1I
I
S6:
I
S6
I1 S2 1 1
I IHI I 1
1
I
1
1F-^ 1 1
I
1
1]
I
I
I
11
11
1I
11
II
1
1
11
1
1
1+I-II
S3
S7
1
I
1`
1
I
I
li-=h
1^?I
1
II
]
1
I1I
11
1
1
1I1I
11
1
1
7I1I
11
1
1
3
I1
11
1
1
1
11
_1
,
I
1t
I7
_
1
1I
I
1
I
II
1
I
II
II
1I
1
,
I
1
I
]1
1
1I
1
I
I]1
II
1
1
III]
,
II
1
I
I
I11II
1
1
1I
+1
V V W Oo
W W l0
t0 1D
tp
V
W
W
ID [O
[p
U^
'
o
N [l,
s ^
N
41
^
lV
o
d a
4
11
N N f„al
E !
t
N
N
OJ
N
w
0 4 O
N
W
W
i0
AN
W
QI
N
.A
^
ca
NC
W
wsco
ANom
WN
A^
co
Date
Date
Figure 10. Flow and duration of the storm effect on the standard deviation of simulated
carbonaceous biochemical oxygen demand (CBOD5) and ammonium as nitrogen (NH4-
N) concentrations at Romeoville for July 12 to November 9, 2001 (after Alp, 2006).
The storm effect on CBOD5 and NH4-N lasts from 2 days to 2 weeks depending
on the storm and the location (Tables 4 and 5). In general, the duration of the storm effect
on CBOD5 and NH4-N concentrations along the Chicago River System lasts 3-4 days
longer than on the Calumet River System. As expected, the duration of the storm effect
on CBOD5 and NH4-N concentrations decreases towards upstream locations along
Chicago Sanitary and Ship Canal and North Branch Chicago River. On the other hand, in
the Calumet River System, the response of the system to storm loading stays almost the
same along the waterway for a given storm.
The key point to be derived from Tables 3-5 is that even at upstream locations the
CSO loadings can affect water quality for more than a week for some storms. This long
storm effect is related to the hydraulic dams and other stagnant conditions in the CAWS.
Further the long storm effects can negatively impact the aquatic community, and these
long storm effects cannot be reduced until the reservoirs of the Tunnel and Reservoir Plan
are fully on line. Table 6 lists the duration of storm effects on DO, CBOD5, and NH4-N
averaged over all locations in Tables 3-5 and compares this with the duration of elevated
flows (greater than 100 m3/s, 3,530 ft31s) at Romeoville for all the single stonn events in
simulated periods of 2001 and 2002. The comparison shows that the duration of stone
effects on water quality can be up to 4 times longer than the duration of elevated flows at
Romeoville.
In summary, the effects of storm flows on the ability to meet water quality
standards should not be considered a trivial or insignificant problem for the CAWS. The
long effects of stonn flows on water quality also indicate that it may be appropriate to
consider wet weather standards for the CAWS.
501
401
301
201
101
0
24
Table 4. Magnitude of Combined Sewer Overflow (CSO) volume in million gallons
(MG) and the duration of storm effect on the simulated five-day carbonaceous
biochemical oxygen demand (CBOD5) concentration in days in the Chicago Area
Waterway System for July 12-November 9, 2001 (after Alp, 2006)
Event
1
2
3
4
S
6
7
Date-2001
7/25
812 & 819
8/25 &
8/31
9119
9/23
1015
10/13
10/23
Total CSO Volume
1488
4859
5828
4029
1092
5660
1054
Total P
.S. CSO
Volume
902
1723
3530
1437
468
2272
743
Total
Gravity CSO
Volume
586
3136
2298
2592
624
3388
311
Location
*
Chicaco River System
Duration of storm effect on CBOD5 concentration in days
Romeoville
8.5
13.8
12.7
11.1
7.0
8.8
$.0
River Mile 11.6
8.6
13.4
12.8
10.8
7.4
8.4
8.1
Route 83
8.8
14.5
13.0
10.8
7.3
8.2
7.8
Baltimore
and Ohio
Railroad
9.3
13.7
12.7
10.5
7.3
7.3
7.3
Cicero Avenue
8.8
12.7
13.4
10.2
7.3
7.2
73
Jackson Boulevard
6.4
12.2
11.3
8.2
5.1
4.8
5.4
Kinzie Street
5.8
8.7
8.7
8.0
6.3
4.5
4.5
Division Street
5.3
8.8
8.2
7.1
5.7
3.8
3.5
Fullerton Avenue
3.6
5.9
6.2
4.0
3.5
3.3
1.2
Addison Street
2.8
5.0
4.7
3.4
2.3
3.3
2.1
Location
Calumet
River
System
**
Duration of storm effect on CBOD5 concentration in days
Route 83
7.0
9.3
11.9
10.3
5.8
10.5
4.4
104t" Street
6.0
8,0
10.8
9.5
5.9
9.8
3.2
Southwest Highway
5.3
7.5
10.5
9.0
4.8
9.5
3.1
Harlem Avenue
6.1
7.5
10.1
9.0
4.8
9.5
4.8
Cicero Avenue
4.9
7.0
9.9
8.6
7.3
8.8
3.5
Kedzie Avenue
4.2
6.8
8.8
7.7
7.2
8.3
2.1
Division Street
5.3
8.8
8.2
7.1
5.7
3.8
3.5
Halsted Street
1.2
1.8
2.9
4.5
0.8
1.8
0.7
Central and Wisconsin
Railroad
4.4
7.8
9.0
9.0
4.0
9.1
2.0
Conrail Railroad
4.8
6.9
8.8
8.0
3.7
9.1
3.0
* Chicago River System:
Chicago Sanitary and Ship Canal, South Branch Chicago River, and North Branch
Chicago River
** Calumet River System:
Calumet-Sag Channel and Little Calumet River (north)
25
Table 5. Magnitude of Combined Sewer Overflow (CSO) volume in million gallons
(MG) and the duration of storm effect on the simulated ammonium as nitrogen (NH4-N)
concentration in days in Chicago Area Waterway System for July 12-November 9, 2001
(after Alp, 2006)
Event
1
2
3
4
5
6
7
Date-2001
7/25
812 &
819
8125 &
8131
9/19-
9123
1015
10/13
10123
Total CSO Volume
(MG)
1488
4859
5828
4029
1092
5660
1054
Total P.S. CSO
Volume(MG)
902
1723
3530
1437
468
2272
743
Total Gravity CSO
Volume (MG)
586
3136
2298
2592
624
3388
311
Location
Chicago River System *
Duration of storm effect on NH
a
N concentration in da
y
s
Romeoviile
8.5
12.8
13.8
10.6
7.1
9.0
6.7
River Mile 11.6
8.2
12.1
13.3
10.0
7.2
8.7
6.3
Route 83
7.4
6.9
11.7
9.5
7.0
7.0
5.6
Baltimore and Ohio
Railroad
6.7
7.4
10.7
9.0
6.2
6.2
5.1
Cicero Avenue
5.7
6.9
9.8
8.5
5.0
5.7
4.5
Jackson Boulevard
4.0
6.5
10.4
8.0
5.1
4.8
3.5
Kinzie Street
4.8
6.3
9.1
6.2
4.8
4.1
2.8
Division Street
4.9
6.2
8.4
5.8
4.0
3.7
3.7
Fullerton Avenue
3.6
5.1
6.2
3.5
3.6
3.3
1.7
Addison Street
3.0
3.9
5.9
3.5
2.1
2.2
0.6
Location
Calumet River System **
Duration of storm effect on NH
a
N concentration in da
y
s
Route 83
5.0
7.5
10.0
9.5
5.2
5.1
3.5
100' Street
4.8
6.9
9.5
9.0
4.7
4.3
2.5
Southwest Highway
4.9
7.0
9.5
9.0
4.8
4.3
2.5
Harlem Avenue
4.9
7.1
9.6
9.0
4.7
4.3
2.6
Cicero Avenue
5.2
7.4
9.7
9.0
4.0
4.2
2.5
Kedzie Avenue
4.8
7.0
9.3
8.5
4.0
4.0
2.0
Division Street
4.9
6.2
8.4
5.8
4.0
3.7
3.7
Halsted Street
5.2
7.7
9.8
8.7
4.5
9.7
2.7
Central and Wisconsin
Railroad
4.9
7.4
9.5
8.2
3.8
9.2
1.9
Conrail Railroad
5.0
7.4
9.6
6.3
3.8
9.8
1.9
* Chicago River System:
Chicago Sanitary and Ship Canal, South Branch Chicago River, and North Branch
Chicago River
** Calumet River System:
Calumet-Sag Channel and Little Calumet River (north)
26
Table 6. Duration of storm effects in days on dissolved oxygen (DO), carbonaceous
biochemical oxygen demand (CBOD5), and ammonium as nitrogen (NH4-N) averaged
over all locations listed in Tables 3-5 and duration of storm effects on flow for storms
whose effects did not overlap onto other storm periods.
Date
DO
CBOD5
NH4-N Flow
July 25, 2001
8.6
8.5
8.5
8.0
October 5, 2001
7.8
7.0
7.1
4.0
October 13, 2001
10.6
8.8
9.0
7.0
October 23, 2001
7.0
8.0
6.7
4.0
July 9, 2002
10.8
12.2
7.6
3.0
August 22, 2002
13.0
7.7
5.8
6.0
The following hydraulic features of the CAWS distinguish it from natural
systems. The normal flow in the CAWS is bidirectional in places and very slow
everywhere, and as a result wet weather impacts can linger for long periods suggesting
that wet weather standards may be appropriate for the CAWS. Further, the combination
of low velocities and very low slope limits natural reaeration and challenges the
effectiveness of supplemental aeration due to the slow distribution throughout the water
body of the artificially introduced oxygen. This challenge will become greater as DO
standards are raised.
RELATIONS BETWEEN HYDRAULIC AND ECOLOGICAL CONDITIONS
As discussed above, the CAWS effectively is a long, narrow, moderately deep
impoundment not at all similar to natural streams. Even dam impoundments on formerly
natural streams have variation in habitat and substrate including shelter areas for fish,
whereas these features are absent from the CAWS.
Habitat
QHEI)
and Biological
(
IBI) Scoring
Rankin (1989) examined relations between the Qualitative Habitat Evaluation
Index (QHEI) and the Index of Biological Integrity (IBI) in order to develop a procedure
for relating stream potential to habitat quality that would provide some insight into how
habitat might affect biological expectations in a given water body. The goal of his study
was to provide guidance on the specification of aquatic life uses (i.e. potential aquatic
ecological community) for water bodies that were impaired by pollution impacts. Rankin
(1989, p. 2) noted that the procedure developed "needed to be useful enough to separate
the relative effects of habitat versus water quality on fish community structure or at a
minimum determine the baseline community that could be expected in a particular
habitat." To develop the relations between QHEI and its subcomponent metrics and life
uses Rankin (1989) considered data from a large number and wide variety of streams in
Ohio including:
1)
streams that represent sites minimally impacted by chemical water quality or
habitat,
27
2) streams that contain areas that have relatively un-impacted water quality but have
documented habitat impacts ("modified" reference sites), and
3)
within stream basins where the State of Ohio had used the QHEI in some water
quality management decision.
This procedure was used by Rankin (2004) [Attachment R to the rulemaking proposal
before the Board] to estimate life uses of Modified Warmwater Habitat and Limited
Resource Water for the reaches designated Warmwater Aquatic Life Use A and B waters,
respectively, in rulemaking proposal before the Board.
The IEPA testimony in several locations/
cases
indicated that some judgment
guided the final determination of whether a particular QHEI value resulted in a rating of
Aquatic Life Use A or Aquatic Life Use B. For example, Mr. Smogor testified as
follows:
Mr. Smogor: Well, the QHEI in the Cal-Sag - let's say a QHEI score of 40 is kind
of like in between- the waters that - the other CAWS A waters that are scoring
higher QHEI's, and most of the waters that are in the CAWS B group.
Mr. Smogor: It's poor based on Rankin's qualitative cut-offs that are largely in
reference to attaining ability to attain or not attain clean water aquatic life goal.
Now, if we say what's the ability of the CAWS A habitat to attain the goal that
we've set for it, we may slide that qualitative scale from good to fair to poor a
little bit downward, and that might bring a 40 up into the fair category in terms of
how good is it for attaining something less than the Clean Water Act goal.
March 10, 2008 Hearing, transcript (morning) at pp. 32-33.
Essentially then the IEPA is stating that where QHEI is "higher" and IBI is
"lower" this indicates that improvement in water quality is needed to achieve the
ecological potential of the "higher" QHEI. Rankin (1989, p. 12) noted that "using the
QHEI as a site-specific predictor of IBI can vary widely depending on the predominant
character of the habitat of the reach." He also presented examples that showed that a
QHEI of 50 could result in a low or a very high IBI. Thus, whether the higher QHEI
scores found in select portions of the CAWS are truly indicative of a higher potential
ecological community for the CAWS requires further consideration.
Effect of Poor Habitat on Biology
One way to determine whether a higher QHEI score truly indicates higher
biological potential is to consider in detail the nature of the key habitat metrics included
in the QHEI. A number of locations in the IEPA testimony indicate that the IEPA and
Mr. Rankin (2004) [Attachment R to the rulemaking proposal before the Board] looked at
the individual metrics:
Mr. Essig: When Ed Rankin did the analysis using his habitat analysis, he's not just
looking at
the QHEI
total score and where it sits. He's also looking at other
28
types of habitat attributes that are part of the QHEI system; the individual metrics.
March 10, 2008 Hearing, testimony (morning) at p. 35.
Mr. Smogor: To the extent we're not relying solely on the final score to make a
judgment. You can look at how individual metrics score and you can tally
relative numbers of what they call positive metrics versus negative metrics. April
23, 2008 Hearing, testimony at p. 199.
This idea that one can tally the number of positive versus negative metrics and give them
equal weight in trying to decide the dividing line between life uses conflicts with Rankin
(1989).
Rankin (1989, p.13) noted "Analysis of the frequency of occurrence of QHEI
metric subcomponents among IBI ranges indicates that "negative" habitat characteristics
generally (but not universally) contribute more to the explanation of deviations from a
random distribution with 1131 range than "positive" habitat characteristics." Further,
Rankin (1989) found that some metrics were more important than others. The key metric
subcomponents are substrate quality, pool quality, and channel quality.
Poor Habitat in the CAWS
Rankin (1989, p. 24) noted "The influence of high quality substrates is probably
related to their importance in providing food organisms (macroinvertebrates) to the
insectivores and benthivores that typify midwest streams." Insectivores and benthivores
are different groupings of fish based on the preferred diet of the fish. The
macro invertebrate data on the CAWS reported in CDM (2007) [Attachment B of the
rulemaking proposal before the Board] clearly illustrates the poor quality of the substrate
present in the CAWS. For 17 of the 18 locations sampled with a petite ponar dredge the
Macroinvertebrate Biotic Index (MBI) indicated very poor water-quality whereas at 16
locations where Hester Dendy samplers were used the MBI indicated that the water
quality was fair or good. Hester Dendy samplers are plates placed in the water that
provide an artificial substrate which can be colonized by macro invertebrates, The grab
sample reflects conditions in the sediment at a site whereas the artificial substrate
shows/predicts the potential benthic community in the drift that will settle on the plate.
The difference in the sampler results shows that CAWS substrate will prevent any further
improvements in water quality from translating to a better macroinvertebrate community
and will not likely result in improvements in aquatic life use. The fact that the CAWS
has a poor substrate is no surprise, because the system is completely human created,
rather than a natural system that was allowed to geologically develop over thousands of
years and, thus, develop appropriately varied substrates. This indicates that the
macroinvertebrate "non-attainment" discussed in Mr. Essig's testimony may be more due
to poor substrate than poor water quality as hypothesized by IEPA. See March 10, 2008
Hearing, testimony (morning) at pp. 12-13. Additional details on what constitutes a
balanced, healthy benthic community and its preferred substrate conditions are presented
in the fact witness testimony of Jennifer Wasik of the District.
29
With respect to pool quality, Rankin (1989, p. 24) noted sites with fast currents
had higher IBI scores than expected by chance. As noted in Table 2 the average flow
velocity throughout the CAWS is less than 1 ft/s and for more than 60 percent of the
CAWS the average velocity is less than 0.4 ft/s. In contrast, the U.S. Geological Survey,
Illinois District, has been developing a database of roughness coefficient measurements
for nonnal ranges of main channel flows made in streams throughout the State of Illinois.
The database 02Lt]2://il,water.usgs.gov/-Droj/nvalues/ ) includes reach average velocities for
234 flow measurements on 38 reaches of 27 rivers and streams. Only one of the 234
measurements had a velocity less than 0.4 ftls and more than 87 percent of the
measurements had velocities greater than or equal to I ft/s. Thus, the flow velocities in
the CAWS are substantially lower than those for normal flows in streams and rivers
throughout Illinois.
With respect to channel quality, Rankin (1989, p. 25 and 29) noted
a)
streams with little or no sinuosity were associated with lower IBI scores,
b) sites with only fair to poor riffle/pool development generally have lower IBI
scores and sites with excellent to good development have higher IBI scores, and
c) lower gradients are generally, but not universally, associated with lower IBI
values and higher gradient scores with higher IBI values.
The CAWS falls at the lower extreme of all these factors.
Rankin (1989, p. 41) listed the key features that result in a stream to be classified
as a Modified Warmwater Stream (the analogue of Warmwater Aquatic Life Use A)
noting that streams with QHEI scores between 45 and 60 should have several of the
primary factors to be considered a Modified Warmwater Stream. Table 7 lists the habitat
features that distinguish between Modified Warmwater Streams and Warmwater Streams
(i.e. the analogue of General Use waters). Among these primary features for Modified
Warmwater Streams the CAWS has recent channelization (truly permanent
channelization), silt/muck substrates (in many reaches), low-no sinuosity, cover sparse to
none (in many reaches), poor pool and riffle development, and lack of fast current. Thus,
there can be no doubt that the potential ecological community is degraded by habitat
impairment in the CAWS. Also, this analysis indicates that the Calumet-Sag Channel is
more of a poor habitat (Warmwater Aquatic Life Use B) than a fair habitat (Warmwater
Aquatic Life Use A). Mr. Sulski states that "It's
(the Calumet-Sag Channel)
different
than the sanitary ship canal."
March 10, 2008 Hearing, testimony (morning) at pp. 30-31.
While they are different, they are not substantially different. For example, threadbare
tires are different from tires with an eighth of an inch of tread, but both are dangerous to
drive on.
From the foregoing discussion it is clear that the ecological community in the
CAWS is substantially impaired by poor habitat. At several locations in their testimony,
the IEPA concedes this fact, for example:
Mr. Smogor: I mean, we're not saying that it can attain the Clean Water Act goal.
We're saying it attains something less.
30
We're already saying that CAWS A, we don't expect that it can attain that goal
because it has fair and maybe even into poor category qualitatively speaking
habitat.
March 10, 2008 Hearing, testimony (morning) at pp. 28, 33. The U.S. Environmental
Protection Agency (U.S. EPA) has established a DO criterion of 3.0 mg/L for full
attainment of warmwater life uses. IEPA indicated that it does not expect Aquatic Life
Use A waters to meet the Clean Water Act goals, but is here proposing that both A and B
waters achieve DO levels of at least 3.5 mg/ITeven higher than would be required by
U.S. EPA. March 10, 2008 Hearing, transcript (morning) at p. 28. Further, IEPA has
proposed a DO standard for Aquatic Life Use A of 5.0 mglL for March through July to
support early life stages, with no evidence that the habitat and physical characteristics of
the CAWS could support such a use or attain the proposed criterion. Essentially, the
rulemaking proposal before the Board is requiring that the degraded CAWS meet in
certain critical aspects the General Use standards in rule R04-25 that was recently
adopted by the Board. A tabular comparison of the rulemaking proposal before the
Board and the General Use standards is included in the expert testimony of Freedman.
Table 7.
Habitat Characteristics of Modified Warmwater Streams
(
Warmwater Aquatic
Life Use A)
and Warmwater Streams
(
General Use Waters
)
in Ohio. Superscripts for
Modified
Warmwater Streams refer to the influence of a particular characteristic in
detennining the use
(
1
= high influence
,
2 = moderate influence
).
Characteristics apply
to all ecoregions and types unless otherwise noted
. [
after Rankin
(
1989, p. 41)]
Feature
Number
Modified Warmwater Streams
Warmwater Streams
1
Recent channelization or recovering
No channelization or recovered
2
Silt/muck substrates or heavy to
moderate silt covering other substrates2
Boulder, cobble, or gravel
3
Sand substrates
oat,
Hardpan origin
Silt free
4
Fair-poor development
Good-excellent development
5
Low-no sinuosit
ea water
Moderate-high sinuosity
b
Only 1-2 cover types 2, Cover sparse to
none
Cover extensive to moderate
7
Intermittent or interstitial -W"
Poor poo s
Fast currents, eddies
8
Lack or fast current
Low-normal substrate
embeddedness
9
Maximum depth < 40 cm
-W
a
d
ing, 2
-
Headwater
Maximum depth > 40 cm
10
High embeddedness of substrates
Low/no embeddedness
Note
:
Development refers to pool and riffle development
Alternative approaches
to DO criteria
In the State of Ohio the DO criteria for Modified Warmwater Streams (the
analogue of Warmwater Aquatic
Life Use A)
is a daily minimum of 3.0 mg
/
L and a daily
average of 4.0 mg/L, and the minimum reduces to 2.5 mg
/
L in the Huron/Erie Lake Plain
Ecoregion
(
Ohio rule 3745-1
-
07). Whereas for Limited Resources Waters
(
the analogue
of Wannwater Aquatic Life Use B) the criterion for the daily minimum is 2.0 mglL with
31
a daily average of 3.0 mg/L (Ohio rule 3745-1-07). Similarly, Novotny et al.
(2007) [Attachment WW of the proposal before the Board] recommended a daily
minimum of 3.0 mg/L and a daily mean of 4.0 mg/L for Brandon Pool, which has been
designated Warrawater Aquatic Life Use B.
In the IEPA testimony the partial justification for the selected DO standards was
the target fish species as per the following statements:
Mr. Smogor: ...the criteria that we've proposed that are consistent with
Attachment X which is the National Criteria Document are set to protect for early
life stages as sensitive as early life stages of channel catfish, and they're set to
protect for later life stages as sensitive as later life stages of largemouth bass.
March 10, 2008 Hearing, testimony (morning) at p. 71.
Mr. Smogor: In terms of these criteria, if you're going to protect for early life
stages of fish that have early life stages that are as sensitive as channel cat and
probably even small mouth bass, then you have to keep the DO above five if
you're going to protect for those types of early life stages. April 24, 2008
Hearing, testimony at pp. 99.
Thus, the IEPA established largemouth bass, smallmouth bass, and channel catfish as
target fish species whose protection is sought by the target DO criteria with smallmouth
bass and channel catfish as the targets for the early life stages protection.
March 10, 2008
Hearing, transcript (morning) at pp. 70-71; April 24, 2008 Hearing, transcript at pp. 98-
99. Consideration should then be given to whether the CAWS offers suitable habitat for
these fish species.
Alternative Analysis of CAWS Habitat
In the early 1980s, the Fish and Wildlife Service of the U.S. Department of the
Interior did detailed literature reviews seeking to identify the physical and chemical
conditions of water bodies suitable for various fish species. These models are known as
Habitat Suitability Indexes (HSIs), where a value of 1 indicates optimal habitat and 0
indicates unsuitable habitat. These models are not perfect predictors, and in each report
for the species of interest here a statement appears indicating the species of interest may
be present even if the suitability index is 0, and habitat with a high suitability index may
contain few fish. The Fish and Wildlife Service recommends that the suitability indices
should be compared with fish data for the water body of interest before interpreting the
suitability results.
HSI ratings have been completed for each of the target fish species for
the CAWS.
CDM (2007) [Attachment B to the rulemaking proposal before the Board] found
that largemouth bass was a dominant game fish species in each reach of the CAWS. This
agrees very well with the HSI information. Stuber et al. (1982) make the following
statements about the optimal habitat for largemouth bass:
"Lacustrine environments are the preferred habitat of largemouth bass. Optimal
riyerine habitat for largemouth bass is characterized by large slow moving rivers
32
or pools of streams with soft bottoms, some aquatic vegetation, and relatively
clear water."
With the exception of relatively clear water this optimal riverine habitat describes the
CAWS. Eleven of the twenty suitability metrics for largemouth bass in rivers listed by
Stuber et al. (1982) are physical habitat measures whereas the remaining nine are water
chemistry measures. These eleven suitability metrics and their ratings for the CAWS in
general are listed in Table 8.
The results in Table 8 indicate that the CAWS in general is a highly suitable
habitat for adult largemouth bass with 5 of the 6 adult metrics scoring 0.7 or better
throughout the waterways. Thus, the high abundance of largemouth bass in the system
makes complete sense. However, Table 8 also indicates that the CAWS may not be a
good habitat for early life stages of largemouth bass with velocities and percent bottom
cover resulting in scores near zero for much of the CAWS. The tributaries of the CAWS
might have suitable habitat for early life stages of the largemouth bass. However, District
fish sampling data from 1996 and 1997 (Dennison et al., 2001) and 2001-2005
(http://www.mwrd.org/RD/IEPA Reports/Waterways/Biological%20Data/Fish%20Data
%20Chicago%20Area%20Waterways%202001-2005.xls) indicate that largemouth bass
were not found in the lower reaches of the North Branch Chicago River upstream from
the junction with the North Shore Channel. Further, District fish sampling data from
2001-2005 indicate that largemouth bass were not found in the Little Calumet River
(south). Finally, District fish sampling data from 2001-2005 indicate largemouth bass is
the third most abundant species in the Calumet River at 130th Street immediately
upstream from O'Brien Lock and Dam. Thus, it seems these fish enter the CAWS from
Lake Michigan not the CAWS tributaries. Further, the high abundance of largemouth
bass implies that the current water quality of the CAWS is sufficient for a healthy
largemouth bass community and higher standards are not needed.
Table 8. Habitat suitability values for largemouth bass in the Chicago Area Waterways
estimated for general conditions in the waterwav svstem.
Symbol
Description
CAWS
Suitability
Condition
Value
V1
Percent pool and backwater area during average
100%
1.0
summer flow
V3
Percent bottom cover (e.g., aquatic vegetation, logs,
<15%
0.2-0.4
and debris within pools, backwaters, or littoral areas
during summer (Adult, Juvenile)
V4
Percent bottom cover (e.g., aquatic vegetation, logs,
<15%
0.0-0.3
and debris within pools, backwaters, or littoral areas
during summer (Fry)
V15
Substrate composition within riverine pools and
Silt and
0.8
Backwaters
clay
dominates
V 16
Average water level fluctuation during growing
Approx.
1.0
season (Adult, Juvenile)
0 in
V17
Average water level fluctuation during growing
Approx.
1.0
season (Embryo)
0 m
33
V18
Average water level fluctuation during growing
Approx.
1.0
season (Fry)
0 in
V19
Average current velocity at 0.6 depth during summer
< 10 cm/s
0.7-1.0
(Adult, Juvenile)
V20
Maximum current velocity at 0.8 depth within pools
< 10 cm/s
0.0-1.0
or backwaters during spawning (May-June) (Embryo)
V21
Average current velocity at 0.6 depth during summer
< 10 cm/s
0.0*
(Fry)
V22
Stream gradient within representative reach
< 1 m/km
1.0
*Only the reaches of the Little Calumet River (north) and the Calumet-Sag Channel
between Halsted Street and Ashland Avenue are likely to have nonzero values,
CDM (2007) [Attachment
B to the rulemaking proposal before the Board] found
that the abundance of smallmouth bass and channel catfish in
the CAWS is
far less than
that of largemouth bass. Is this due to poor water quality
,
poor habitat
,
or some
combination of the two
?
Six of the thirteen suitability metrics for smallmouth bass in
rivers
listed by Edwards et al. (1983
)
are physical habitat measures whereas the
remaining seven are water chemistry measures. These six suitability metrics and their
ratings
for the CAWS
in general are listed in Table 9.
Table 9. Habitat suitability values for smallmouth bass in the Chicago Area Waterways
estimated for general conditions in the waterway system.
Symbol Description
CAWS
Suitability
Condition
Value
Vi
Dominant substrate type within pool or
Silt and sand and/or
0.2
backwater area
Rooted vegetation
V2
Percent pools
100%
0.2
V4
Average depth of pools during midsummer
4-8 m
0.9-1.0
V5
Percent cover in the form of boulders,
< 15%
0.0-0.5
stumps, dead trees, and crevices (adults)
or vegetation and rocks (fry)
V14
Water level fluctuations during spawning
Slow rise previous
1.0
and for 45 days after spawning
to spawning with
stable levels during
spawning and
afterwards
V15
Stream gradient within representative
<0.1 m/km
0
Reach
The metrics in Table 9 indicate that the CAWS in general is a poor habitat for adult
smallmouth bass, which is consistent with the limited number of smallmouth bass found
in fish sampling reported in CDM (2007).
With respect to early life stages for smallmouth bass, Edwards et al. (1983) offer
the following information.
â
Nests are usually in water from 0.3 to 0.9 in (1 to 3 ft) deep, but may be built in
water up to 7 in (23 ft) deep.
34
â
Nests are commonly in gravel or bedrock; near boulders
,
logs, or other cover.
â
Nests are also made over bedrock, rootlets in silt
,
or sand
,
but these substrates are
less commonly used.
â
Most fry remain in shallow water
,
although some may be found at depths of 4.6 to
6.1 m(15to20ft).
This indicates that much of the CAWS is not a preferred habitat for early life stages of
smallmouth bass. However
,
District fish sampling data from 1996 and 1997 (Dennison et
al, 2001) and 2001-2005 indicate that smallmouth bass were not found in the lower
reaches of the North Branch Chicago River upstream from the junction with the North
Shore Channel
.
Further, District fish sampling data from 2001
-
2005 indicate that
smallmouth bass were not found in the Little Calumet River
(
south
).
Finally, District fish
sampling data from 2001
-
2005 indicate smallmouth bass are the fourth most abundant
species in the Calumet River upstream from O'Brien Lock and Dam. Thus, it seems
these fish enter the CAWS from Lake Michigan not the CAWS tributaries
,
but they find
the CAWS to
be poor living environment for them and their numbers are limited.
Four of the fourteen suitability metrics for channel catfish in rivers listed by
McMahon and Terrell
(
1982) are physical habitat measures whereas the remaining ten are
water chemistry measures
.
These four suitability metrics and their ratings for
the CAWS
in general are listed in Table 10.
Table 10. Habitat suitability values for smallmouth bass in the Chicago Area Waterways
estimated for Reneral conditions in the waterwav svstem.
Symbol
Description
CAWS
Suitability
Condition
Value
V1
Percent
pools during average summer flow
100%
0.5
V2
Percent cover (
logs, boulders
,
cavities
,
<15 %
0.144
brush, debris, or standing timber) during
summer within pools and backwater areas
V4
Food production
potential in river
by
Fines or bedrock
0.2
substrate type
present during average
are the dominant
summer flow
bottom
material.
Little or no
aquatic
vegetation or
rubble present.
V15
Average
current
velocity
in cover areas
< 15 cmis*
1.0
during average summer flow
*Only the North Branch Chicago River is likely to
have velocities higher than this.
The results in Table 10 indicate the CAWS is a fair to poor habitat for channel catfish,
which is consistent with the limited number of channel catfish found in fish sampling
reported in CDM (2007).
With respect to early life stages for channel catfish
,
McMahon and Terrell (1982)
offer the following information.
â
Nests are built in cavities, burrows, under rocks
,
and in other protected places.
â
Catfish in large rivers are likely to move into shallow, flooded areas to spawn.
35
â
Channel catfish fry have strong shelter seeking tendencies, and cover availability
will be important in determining habitat suitability.
â
Fry are commonly found aggregated near cover in protected, slow-flowing areas
of rocky riffles, debris-covered gravel, or sand bars in clear streams.
This indicates that much of the CAWS is not a preferred habitat for early life stages of
channel catfish. The tributaries of the CAWS might have suitable habitat for early life
stages of the target fish species. However, District fish sampling data from 1996 and
1997 (Dennison et al., 2001) and 2001-2005 indicate that channel catfish were not found
in the lower reaches of the North Branch Chicago River upstream from the junction with
the North Shore Channel. Further, District fish sampling data from 2001-2005 indicate
that channel catfish were not found in the Little Calumet River (south). Finally, District
fish sampling data from 2001-2005 indicate that charnel catfish were not found in the
Calumet River upstream from O'Brien Lock and Dam and only 10 were caught in the
Des Plaines River at Material Service Road between 2001 and 2005. Thus, the origin of
channel catfish in the CAWS is unclear, but those who enter find the CAWS to be poor
living environment for them.
In summary, the CAWS provides poor habitat for adult smallmouth bass and
channel catfish, which is consistent with the low abundance of these fish in the CAWS.
It is, however, near optimal habitat for largemouth bass, which is consistent with the high
abundance of this fish in the CAWS. However, the CAWS is poor habitat for early life
stages of all these target fish species. The largemouth and smallmouth bass most likely
spawn and spend their early life stages in Lake Michigan and then colonize the CAWS as
adults.
The origin of channel catfish found in the CAWS is unclear. Thus, seeking to
protect early life stages for these species of fish in the CAWS is inconsistent with the
habitat suitability and the available fish abundance data.
CONCLUSIONS
When summarizing the relation between habitat, fish communities, and water-
quality management Rankin (1989, p. 52) offered the following warning:
It
makes little sense to "protect" the biota by multimillion dollar improvements to
a point source discharge while important biological uses are impaired by habitat
modifications for reasons such as "flood control", construction activities, and
waterway improvements.
Considering the foregoing discussion of habitat and particularly the unsuitable habitat for
the early life stages of the target fish species, the rulemaking proposal before the Board is
contrary to the findings of the UAA contractors. For example, CDM (2007) [Attachment
B to the rulemaking proposal before the Board] indicated on page 1-12 "The data showed
that the aquatic habitats were rated from very poor to fair with most reaches having
habitat unable to support a diverse aquatic community." Later on page 5-3 CDM (2007)
indicated "Improvements to water quality through various technologies, like re-aeration
may not improve the fish communities due to the lack of suitable habitat to support the
fish population." Further, Novotny et al. (2007) (Attachment WW to the rulemaking
proposal before the Board] recommended the previously described lower DO standards
36
(relative to the proposal before the Board) for the Warmwater Aquatic Life Use B waters
in the Brandon Pool of a daily minimum of 3.0 mg/L and a daily mean of 4.0 mg/L.
I hope that the Illinois Pollution Control Board will carefully consider this
testimony, and should not approve the rulemaking proposal before the Board, when the
State of Illinois and the Chicago Area have many other problems requiring public
financing.
References
Alp, E. (2006), A method to
evaluate duration
of the
storm effects on in-stream water
quality.
Ph.D. Thesis,
Department
of Civil
and Environmental Engineering
,
Marquette
University, Milwaukee, WI.
Alp, E. and Melching, C.S. (2004). Preliminary Calibration of a Model for Simulation of
Water Quality During Unsteady Flow in the Chicago Waterway System and Application
to Proposed Changes to the Navigation Make-Up Diversion Procedures,
Institute of
Urban Environmental Risk Management Technical Report No. 15,
Marquette University,
Milwaukee, Wis. and
Research and Development Department Report No. 04-14,
Metropolitan Water Reclamation District of Greater Chicago, Chicago, Ill.
Alp, E. and Melching, C.S. (2006). Calibration of a Model for Simulation of Water
Quality During Unsteady Flow in the Chicago Waterway System and Application to
Evaluate Use Attainability Analysis Remedial Actions,
Institute for Urban
Environmental Risk Management Technical Report No. 18,
Marquette University,
Milwaukee, Wis. and
Research and Development Department Report No. 2006-84,
Metropolitan Water Reclamation District of Greater Chicago, Chicago, Ill.
Alp, E. and Melching, C.S. (2008
). "
Evaluation of Procedures to Prevent Flow Reversals
to Lake Michigan for the Chicago Waterway System
,"
Institute
for Urban
Environmental
Risk Management Technical Report No
.
19,
Marquette University
,
Milwaukee, Wl.
Alp, E. and Melching, C.S. (in press). Evaluation of the Duration of Storm Effects on In-
Stream Water Quality,
Journal of Water Resources Planning and Management,
ASCE.
Alp, E., Melching, C.S., Zhang, H., and Lanyon, R. (2007). Effectiveness of Combined
Sewer Overflow Treatment for Dissolved Oxygen Improvement in the Chicago
Waterways,
Water Science and Technology,
56(1), 215-222.
Ambrose, R.B., Wool, T.A., Connolly, .
I.P., and Schanz
,
R.W. (1988). WASP4, a
hydrodynamic
and water
quality
model
-Model theory, User's
manual, and
programmer
's guide. U.S.
Environmental Protection
Agency,
EPA160013-87-039,
Athens,
GA.
Butts, T.A., Shackleford, D.B, and Bergerhouse, T.R. (1999). Evaluation of reaeration
efficiencies of sidestream elevated pool aeration (SEPA) stations,
Illinois State
Water
Survey Contract Report 653,
Champaign, IL.
37
Butts, T.A., Shackleford D.B., and Bergerhouse
,
T.R. (2000
).
Sidestream elevated pool
aeration (SEPA
)
stations
:
Effect on instream dissolved oxygen,
Illinois State Water
Survey Contract Report 2000
-
02,
Champaign, IL.
Davis, M.L. and Masten
,
S.J. (2004
).
Principles of Environmental Engineering and
Science,
McGraw-Hill
,
New York.
Dennison, S.G., Polls, I., Sawyer
,
B., and Tata, P. (2001
).
Abundance and distribution of
fish in the North Branch of the Chicago River during 1996 and 1997
,
Research and
Development Department Report No. 01-4,
Metropolitan Water Reclamation District of
Greater Chicago, Chicago, Ill.
Di Toro
,
D.M. and Fitzpatrick
,
J. (1993
).
Chesapeake Bay Sediment Flux Model.
HydroQual
,
Inc. Mahwah
,
NJ. Prepared for U
.
S. Army Engineer Waterway Experiment
Station
,
Vicksburg, MS. Contract Report EL-93-2.
DUFLOW (2000).
DUFLOWfor Windows V3.3: DUFLOW modelling studio: User's
guide, reference guide DUFLOW, and reference guide RAM,
EDSISTOWA, Utrecht, The
Netherlands.
Edwards,
E.A., Gebhart,
G., Maughan
, O.E. (1983).
Habitat Suitability Information:
Smallmouth Bass, U.S
.
Department of the Interior, Fish and Wildlife Service
,
FWSIOBS-
82110.36,
47 p.
Elshorbagy
,
A., Teegavarapu
,
R., and Ormsbee
,
L. (2005
).
Framework for assessment of
relative pollutant loads in streams with limited data,
Water International
,
30(4), 477-486.
Espey, W.H
.,
Jr.,
Melching
,
C.S., and Mades
,
D.M. (2004). Lake Michigan Diversion--
Findings of the Fifth Technical Committee for Review of Diversion Flow Measurements
and Accounting Procedures
,
report prepared for the
U.S. Army
Corps of Engineers,
Chicago District, Chicago, Ill.
Harremoes
,
P., Napstjert
,
L., Rye
,
C., and Larsen
,
H.O. (1996
).
Impact of rain runoff on
oxygen in an urban river.
Water Science and Technology
,
34(12), 41-48.
Manache, G. and Melching
,
C. S. (2004
).
Sensitivity
Analysis of a Water-Quality Model
Using Latin
Hypercube
Sampling,
Journal
of Water Resources
Planning and
Management
,
ASCE,
130(3
),
232-242.
Manache, G. and Melching
, C.S. (2005).
Simulation of Fecal Coliform Concentrations in
the Chicago
Waterway
System
Under Unsteady
Flow Conditions
,
Institute
for Urban
Environmental Risk Management Technical
Report No.
16,
Marquette
University,
Milwaukee
,
Wis. and
Research and Development Department
Report No. 2005-9,
Metropolitan Water Reclamation District of Greater Chicago
, Chicago, IL.
38
Manache, G. and Melching, C.S. (2007). Sensitivity of Latin Hypercube Sampling to
Sample Size and Distributional Assumptions,
Proceedings CD-ROM,
32"' Congress of
the International Association of Hydraulic Engineering and Research, Venice, Italy, July
1-6,2007.
Manache, G. and Melching, C.S. (2008). Identification of Reliable Regression- and
Correlation-Based Sensitivity Measures for Importance Ranking of Water-Quality Model
Parameters,
Environmental Modelling do Software,
23(5), 549-562.
Manache, G., Mel ching, C. S., and Lanyon, R. (2007). Calibration of a Continuous
Simulation Fecal Coliform Model Based on Historical Data Analysis,
Journal of
Environmental Engineering,
ASCE, 133(7), 681-691.
McMahon, T.E. and Terrell, J.W. (1982). Habitat Suitability Index Models: Channel
Catfish, U. S. Department of the Interior, Fish and Wildlife Service,
FWS/OBS-82110.2,
29 p.
Melching, C.
S. and Bauwens
,
W. (2000). Comparison of Uncertainty-Analysis Methods
Applied to
Simulation
of Urban Water Quality, in
Stochastic Hydraulics 2000, Z.Y.
Wang
and S.X. Hu, eds., A.A. Balkema, Rotterdam, The Netherlands, p. 717-725.
Melching,
C. S. and Bauwens
,
W. (2001). Uncertainty
in Coupled
Nonpoint
Source and
Stream Water
-Quality
Models,
Journal
of Water
Resources Planning and Management,
ASCE, 127(6),403-413.
Melching, C.S. and Chang, T.J. (1996). Simulation of Water Quality for Salt Creek in
Northeastern Illinois, US,
Geological Survey Open-File Report 96-318.
Melching, C.S. and Flores
,
H.E. (1999). Reaeration Equations Derived from USGS Data
Base,
Journal of Environmental Engineering
,
ASCE,
125(5
), 407-414.
Melching, C. S. and Oberg, K.A. (1993). Comparison, Analysis, and Estimation of
Discharge Data from Two Acoustic Velocity Meters on the Chicago Sanitary and Ship
Canal at Romeoville, Illinois, US
Geological Survey Water Resources Investigations
Report 93-4098.
Melching, C.S. and Yoon, C.G. (1996). Key Sources of Uncertainty in QUAL2E Model of
Passaic River,
Journal of Water Resources Planning and Management,
ASCE, 122(2),
105-113.
Melching, C.S., Novotny, V., and Schilling, J.B. (2006). Probabilistic Evaluation of
Ammonia Toxicity in Milwaukee's Outer Harbor,
Water Science and Technology,
53(1),
109-116.
39
Melching, C.S., Alp, E., Shrestha, R.L., and Lanyon, R. (2004). Simulation of Water
Quality During Unsteady Flow in the Chicago Waterway System,
Proceedings CD-ROM,
Watershed 2004, July 11-14, 2004, Dearborn, Michigan, Water Environment Federation.
Neugebauer, A. and Melching, C.S. (2005). Verification of a Continuous Water Quality
Model Under Uncertain Storm Loads in the Chicago Waterway System,
Institute for
Urban Environmental Risk Management Technical Report No. 17,
Marquette University,
Milwaukee, Wis. and
Research and Development Department Report No. 2005-12,
Metropolitan Water Reclamation District of Greater Chicago, Chicago, IL.
Novotny, V.
and Olem
,
H. (1994
).
Water Quality: Prevention
,
Identification, and
Management
of Diffuse
Pollution
,
Van Nostrand Reinhold
,
New York.
Polls, I.
Washington, B., and Lue-Hing, C. (1982). Improvements in dissolved oxygen
levels by artificial in-stream aeration in Chicago Waterways, Metropolitan Sanitary
District of Greater Chicago,
Department of Research and Development Report No. 82-16,
Chicago, IL.
Rankin, E.T. (1989).
The Qualitative
Habitat Evaluation
Index [QHEI
]: Rationale,
Methods, and Application,
Ecologic Assessment Section
,
Division
of Water Quality
Planning &
Assessment
, Ohio Environmental
Protection
Agency, Columbus, Ohio.
Recktenwalt, M., Nitka, J., Sear, T., and Gerold, L. (2004) Point source loading
calculations for purposes of watercourse modeling, Draft Technical Memorandum,
Milwaukee Metropolitan Sewerage District, Milwaukee, Wis.
Shrestha, R.L. and Melching, C.S. (2003). Hydraulic Calibration of an Unsteady Flow
Model for the Chicago Waterway System,
Institute of Urban Environmental Risk
Management Technical Report No. 14,
Marquette University, Milwaukee, Wis., and
Research and Development Department Report No. 03-18,
Metropolitan Water
Reclamation District of Greater Chicago, Chicago, 111.
Stuber, R.J., Gebhart, G., and Maughan, O.E. (1982). Habitat Suitability Index Models:
Largemouth Bass, U.S. Department of the Interior, Fish and Wildlife Service,
FWSIOBS-
82110.16,
32 p.
Thomann, R
.V. (1982).
Verification of water quality models
.
Journal of the
Environmental Engineering Division
, ASCE,
108(EE5
), 923.940.
U.S. Environmental Protection
Agency (U.S. EPA). (
1983).
Results
of the Nationwide
Urban Runoff Program.
Vol.
I.
Final
Report, Water Planning Division
,
U.S EPA,
Washington, D.C.
40
ATTACHMENT 2
TO PRE
-
FILED TESTIMONY OF CHARLES S. MELCHING
CURRICULUM VITAE OF CHARLES S. MELCHING
CHARLES STEVEN MELCHING
EDUCATION:
Fall 1981-
Summer 1987
Spring 1979-
Summer 1981
Fall 1977-
Summer 1979
University of Illinois, Urbana
, Illinois
Doctor of Philosophy, October 1987
Master of Science, Civil Engineering, January 1983
Arizona State University, Tempe, Arizona
Graduated Summa Cum Laude, August 1981, B.S.E.
Mesa Community College, Mesa, Arizona
PROFESSIONAL REGISTRATION:
Professional Engineer
(Civil) in Arizona
since 1991
,
Registration
No. 25326
Professional Engineer in Illinois since 1992
,
Registration
No. 062-047430
EXPERIENCE:
August 1999-
Marquette University, Department of Civil and Environmental Engineering,
Present
Milwaukee, Wisconsin
Associate Professor
Teaching:
CEEN 032 Elementary Surveying
CEEN 123 Urban Hydrology and Stormwater Management
CEEN 126 Hydraulic Engineering
CEEN 249 Advanced Hydrology
CEEN 251 Water Quality Management and Modeling
CEEN 1221248 River Engineering
Research:
1.
Development and Application of a Water-Quality Model for Unsteady Flow
in the Chicago Waterway System
2.
Evaluation of Procedures to Prevent Backflows to Lake Michigan from the
Chicago Waterway System
3.
Water-Quality Simulation in Support of the Development of an Integrated
Strategy to Meet Dissolved Oxygen Standards for the Chicago Area
Waterways
4.
Des Plaines River Use Attainability Analysis
(supporting modeling and data
analysis)
5.
Estimation of the Allowable Pollutant Loading Margin of Safety for the
Warta River in Poland
6.
Evaluation of Uncertainty in Stream Naturalization Procedures
7.
Hydraulic Investigations for the Reconstructed North Halsted Street Bridge
over the North Branch Canal, Division Street Bridges over the North
Branch Chicago River and North Branch Canal, and the Proposed Bridge
over the South Branch Chicago River at Taylor Street
Consulting:
A. U.S. Geological Survey on HSPF modeling projects in Florida, Minnesota,
Massachusetts, and Wisconsin; and a unit-hydrograph project in Illinois
B.
U.S. Army Corps of Engineers on the aeration design for McCook and
Thornton Reservoirs of the Tunnel and Reservoir Project (TARP), and
Hydrologic Modeling Expert for the 5th and 6th Technical Review
Committees on Lake Michigan Diversion Accounting
C.
Baird Associates on the HSPF sediment transport model of the Menomonee
River
D.
Aqua Nova on ammonia simulation in the Milwaukee Outer Harbor, and
Taught Short Course on Introduction to TMDL Concepts and Water-Quality
Modeling (with V. Novotny) to Illinois Environmental Protection Agency
E.
Brown and Caldwell on project "MMSD Modeling Strategy Advisory
Committee" for Milwaukee Metropolitan Sewerage District
F.
JBA Consulting (United Kingdom) on "Non-invasive Flow Measurement
Techniques Review" for U.K. Environment Agency.
G.
Metropolitan Water Reclamation District of Greater Chicago: Flow
Verification for the Flow Transfer to the Fox River Water Reclamation
District South Plant
Advising:
Ph.D. Thesis of 1 student
Master's Theses of 7 students
Master's Essays of 3 students
Co-promoter of 1 Ph.D. student at the Vrije Universiteit Brussel, Belgium.
August 2005- Visiting Professor, Department of Hydraulic Engineering, Tsinghua University,
July 2006
Beijing, China
Teaching: "Probabilistic Approaches to Water Resources Engineering" and
"Topics in American Water Resources Engineering," Research: proposal
preparation: "A Comparative Evaluation of the Yellow River and Mississippi
River Deltas"; also Visiting Scholar, International Research and Training Center
on Erosion and Sedimentation, Beijing, China
Visiting Chair Professor, College of Resources, Environment & Tourism,
Capital Normal University, Beijing, China
January 1992- U.S. Geological Survey, Water Resources Division, Illinois District, Urbana,
August 1999
Illinois
Hydraulic
Engineer
: Projects-
1.
"Hydraulic Model Verification and Documentation for Unsteady Flow"_
Prepare documentation for the Full EQuations (FEQ) model for one-
dimensional
, unsteady-flow analysis in open channels with Dr. D. Franz of
Linsley, Kraeger Associates.
2.
"Rainfall-Runoff Relations for Three Small Watersheds in Du Page County,
Illinois" and "Rainfall-Runoff Relations in Nine Watersheds in Lake County,
Illinois" - Calibrate and verify the HSPF continuous-simulation, rainfall-
runoff model for use in the subject counties.
3.
"Design Flood Estimation in Illinois Based on a Green and Ampt
Abstraction Procedure with Physically Based Parameters."
4.
"Analysis and Adjustment of Acoustical Velocity Meter measurements on
the Chicago Sanitary and Ship Canal at Romeoville, Illinois for Lake
Michigan Diversion Accounting."
5.
"Statistical Analysis of Concurrent and Split Water-Quality Sampling
Program - U.S. Geological Survey and Illinois Environmental Protection
Agency."
6.
"Affects of Storm Type on Precipitation Quality in Eastern Massachusetts -
1983-85"--Report Completion.
7.
Flood Insurance Study for La Crosse, Wisconsin.
8.
"Determination of Unit Hydrograph Parameters for Small Watersheds in
Lake County, Illinois."
9.
"Calibration and Verification of QUAL2E for Waste-Load Allocation on
Salt Creek in Du Page and Cook Counties, Illinois"
14. "Regional Equations for Estimation of Instream Reaeration-Rate Coefficient
(KJ'--compile all instream measurements of KZ made by the USGS using
gas-tracer methods to develop the subject equations.
11. "Simulation of Runoff from the Proposed Crandon Mine (Wisconsin)
Utilizing HSPF"--Assist the USEPA in the development of an HSPF model
for simulation of the effects of the proposed mine.
12. "Comprehensive Assessment of Risks from Natural Disasters"--Assist
World Meteorological Organization in the completion of a report
summarizing economic consequences (risks) from natural disasters.
13. "Intercomparison of Principal Hydrometric Instruments--Third Phase:
Evaluation of Ultrasonic Velocity Meters for Flow Measurement in Streams
Canals, and Estuaries"--Joint World Meteorological Organization - U.S.
Geological Survey Project
14. Advisor on hydrologic and/or water-quality modeling projects for the
Minnesota River basin and the Heron Lakes basin, southwestern Minnesota
(Minnesota District); Reedy Creek watershed, east-central Florida (Florida
District);
Middle and South Fork of the Beargrass Creek basin, Jefferson
County, Kentucky (Kentucky District); and Red River of the North (North
Dakota District)
Sept. 1998-
Vrije Universiteit Brussel, Laboratory of Hydrology, Brussels, Belgium
February 1999 Visiting Scholar
Project: Uncertainty Analysis for Holistic River Water-Quality Management
Systems sponsored by "Research in Brussels Actions"-Apply uncertainty
analysis to the suite of computer models used to simulate the pollutant loads in
the combined sewers, through the proposed wastewater-treatment plant, and in
the receiving stream to determine the reliability of meeting water-quality
standards.
Teachin&: Water-Quality Modeling
Advising: Ph.D. Thesis of one student (finished 12/01)
May 1996-
Hong Kong University of Science and Technology, Department
June 1996
of Civil and Structural Engineering
Visiting Scholar
Spring 1996
University of Illinois at Urbana-Champaign, Department of Civil Engineering,
and Fall 1997
Urbana, Illinois
Visiting Lecturer - CE 356 Hydraulics of Surface Drainage, CE 255 Introduction
to Hydrosystems Engineering; Adjunct Associate Professor: Spring 1998-Spring
1999
Advisin&: 1 M,S. Thesis and 1 M.S. Essay
July 1989-
Rutgers University, Department of Civil and Enviromrnental Engineering
December 1991
Piscataway, New Jersey
Assistant Professor:
Teaching:
CE 387 Fluid Mechanics
CE 448 Elements of Hydrology
CE 563 Advanced Hydrology
CE 567 Analysis of Receiving Water Quality.
Research:
Application of reliability analysis in water resources engineering including
water-quality modeling, bridge scour, groundwater-remediation design, and
backwater computations.
Consulting:
Developed statistical sampling procedure for determining residential water use
for New Brunswick (NJ) Water Utility
Advising:
Master's projects of 9 students and one Ph.D. student.
October 1987- Interuniversity Post-graduate Programme in Hydrology
,
Vrije
Universiteit
July 1989
Brussel
,
Brussels, Belgium
Visiting Lecturer:
Teaching
-
Full Courses
:
Surface Water Hydrology
,
Probability and Statistics,
General Hydraulics
,
Watershed Management
;
Exercises: Systems Approach to
Water Management Parts I and II, and Statistical Applications in Hydrology.
Advising
-
Master's Theses of 6 students.
Fall 1981-
University of Illinois at Urbana-Champaign, Department of Civil Engineering,
Summer 1987
Urbana, Illinois
Research Assistant - on projects "Application of Simulation Models to Military
Training Site" and "Prioritizing Army Railroad Construction and Repair
Projects";
U.S. Army Corps of Engineers Construction Engineering Research Laboratory.
Teaching Assistant - Spring 1987 taught Introduction to Hydrosystems
Engineering; grader for Water Resources Design and Hydraulics of Surface
Drainage.
Summer 1980
U.S. Water Conservation Laboratory, 4331 E. Broadway, Phoenix, AZ 85040.
Engineering aid -- critical
-depth flume and level
basin irrigation
projects.
Summer 1978-Engineering and Surveying of Arizona, 404 E. 1 st Avenue,
Summer 1979
Mesa, AZ 85204.
Survey crew instrument man and rodman/chainman.
Summer 1977 Giffels and Webster
Engineers
, 2731 N. Adams, Pontiac, MI 48057.
Survey crew
instrument man and rodman
/
chainman.
1972-1977
Charles G. Melching
and Associates
, Inc., 36170 Pound Road, Richmond, MI
48062
Worked and
gained initial training as a rodman
/
chainman.
AWARDS AND HONORS
2008
Marquette University, College of Engineering, 2008 Outstanding Researcher Award
2001
Walter L. Huber Civil
Engineering Research
Prize, American Society of Civil
Engineers
-"
For his research on uncertainty and reliability analysis in water
resources and environmental engineering
,
including especially uncertainty in
rainfall-runoff and stream water
-quality
modeling"
1997 Invited Speaker, International Symposium of Rural Environment Improvement, Korean
Society of Agricultural Engineers, Kon-Kuk University, October 17, 1997
1989
Henry Rutgers Research Fellowship, Rutgers University
1988
Chester P. Seiss Civil Engineering Graduate Student Award for Outstanding Scholastic
Achievement and Promise for Research, University of Illinois
1981
American Society of Civil Engineers - Arizona State University Outstanding Senior
Award for 1981
1981
American Society of Civil Engineers - Pacific Southwest Conference (student) Paper
Contest, 1 st Place 1981 ("Portable Flow Measuring Flumes for Earthen Channels"
unpublished)
1981
University of Illinois Civil Engineering Fellowship, 1981
1981
Phoenix Femineers' Scholarship, 1981
Arizona State University Certificate of Merit for Scholastic Excellence - 1979-1980 and
1980-1981
Arizona State University Dean's List, Spring 1979 through Spring 1981
SOCIETY MEMBERSHIPS:
Tau Beta Pi, Arizona Beta elected May 1980
Phi Kappa Phi, Arizona State Univ, elected May 1981
American Society of Civil Engineers:
Student Activities: Communications Vice President, 1980 (ASU); Hydrosystems
Committee Chairman for Engineering Open House (Illinois) 1982.
Professional Activities: Technical Committee on Probabilistic Approaches,
Water Resources Engineering Division (1991-present, Chairman, 1994-95);
Task Committee on the Use of Appropriate Technology in Hydraulic
Engineering, Hydraulics Division (1991); Student Chapter Faculty Advisor at
Rutgers University (1991).
International
Water Association
International Association for Hydraulic Research
International Association of Hydrologic Sciences
RESEARCH SPONSORS:
New Jersey Water Resources Research Institute
World Meteorological Organization
U.S. National Committee on Scientific Hydrology
Research in Brussels Action, Ministry of Economic Affairs, Brussels Capital Region,
Belgium
Metropolitan Water Reclamation District of Greater Chicago
National Science Foundation
U.S. National Research Council
Illinois Environmental Protection Agency
U.S. Department of Education
Wisconsin Foundation of Independent Colleges
Chicago Department of Transportation through H.W. Lochner Consultants, Parsons
Engineering, and Earthtech
SCHOLARLY ACTIVITIES:
Book Reviewer
American Society of Civil Engineers
McGraw-Hill (review of chapter in Handbook of Water Resources)
Wylie and Sons (review of book proposals)
Kluwer Academic Publishers (review of book proposals)
Journal Referee
Associate Editor, Journal of Hydrologic Engineering, ASCE (2007-present)
Associate Editor, International Journal of Sediment Research (2002-present)
Associate Editor, Journal of Hydraulic Research (20022006)
Journal of Hydraulic Engineering, ASCE
Journal of Hydrologic Engineering, ASCE
Journal of Water Resources Planning and Management, ASCE
Journal of Environmental Engineering, ASCE
Journal of Irrigation and Drainage Engineering, ASCE
Water Resources Research
Water Research
Water International
Journal of Hydrology
Journal of the American Water Resources Association
IEEE Transactions on Systems, Man, and Cybernetics
Structural Safety
Hydrologic Processes
Environmental Fluid Mechanics
Environmental Modeling and Software
Water Science and Technology
Journal of Environmental Management
Stochastic Environmental Research & Risk Analysis
Journal of Hydro-environment Research
Advances in Water Resources
Invited Seminars
Technical University of Vienna (1988)
International Institute for Applied Systems Analysis (1988)
Polish. Academy of Sciences (1988)
Ruhr University Bochum (1988)
Rijkswaterstaat, Utrecht, The Netherlands (1989)
University of Karlsruhe (1989)
U.S. Geological Survey, New Jersey District (1989)
University of Virginia (1990)
New Jersey Department of Environmental Protection (1990)
University of Illinois (1992, 1993, 2000, 2002)
Rutgers University (1993)
Vrije Universiteit Brussel (1993, 1994, 1998, 2001)
Hong Kong University of Science and Technology (1996, 2006)
Rural Development Corporation, South Korea (1997)
Metropolitan Water Reclamation District of Greater Chicago (2000, 2004, 2007)
Poznan University of Technology (2002)
Warsaw University of Technology (2002)
Tianjin University (2005)
Beijing University (2006)
Beijing Institute of Technology (2006, 2007)
Capitol Normal University, Beijing (2006)
China Institute of Water Resources and Hydropower Research (2006)
Northeast Agricultural University, Harbin, China (2006)
Wisconsin Department of Natural Resources (2007)
University of Wisconsin at Milwaukee (2007)
Federation of Environmental Technologists, Southeastern Wisconsin Chapter (2007,
2008)
Review of Research Proposals
Illinois
Water Resources Research Center
New Jersey Sea Grant Program
Petroleum Research Fund (American Chemical Society)
Natural Environment Research Council (United Kingdom)
Fund for Scientific Research (Flanders, Belgium)
Research Grants Council (Hong Kong)
U.S. Geological Survey/National Water Resources Research Institutes
Universita degli Studi della Basilicata, Italy
Italian
Ministry of Education, University and Scientific Research, Committee for
Research Evaluation
Review of Project Products
Board of Experts for the Italian Ministry of Education, University and Scientific
Research, Committee for Research Evaluation
Conference Organization
• Organized
a Session
at Hydraulic Engineering '93, ASCE National Hydraulic
Engineering Conference, San Francisco, California, July 25-30, 1993.
•
Local Organizing Committee, Rivertech'96: 1 st International Conference on New and
Emerging Concepts for Rivers, Chicago,
Illinois,
September 22-25, 1996, sponsored by
the International
Water Resources Association.
•
Organized Session A.15 "Reliability-Based Design and Analysis in Water Resources"
for the XXVII International Association for Hydraulic Research Congress, San
Francisco, California, August 10-15, 1997.
• Organized
Sessions
on "Water Resources in the Geographical Region of China" for the
Chinese American Water Resources Association for inclusion at the ASCE Water
Resources
Engineering
Conference, Seattle, Washington, August 8.11, 1999.
•
Chairman, Local Organizing Committee, 5`h International Conference on
Diffuse/Nonpoint Pollution and Watershed Management, Milwaukee, Wisconsin, June
10-15, 2001, sponsored by the International Water Association
•
Invited Panelist for Session "Information Needs for Improved Watershed Decision-
Making" at the Symposium on Integrated Decision-Making for Watershed
Management, Chevy Chase, MD, January 7-9, Gave presentation on Hydrology
Perspectives and led Hydrology Focus Group.
•
Member, International Scientific Committee, and Convenor of Session of "Stochastic
Hydraulics7-3'd International Conference on Environmental Hydraulics with a Special
Theme in Environmental Fluid Dynamics, Tempe, Arizona, December 5-8, 2001.
•
Organizer, U.S.-Chinese Joint Workshop on Sediment Transport and Environmental
Studies,
Milwaukee, Wisconsin, July 21-28, 2002. (sponsored by the National Science
Foundation)
•
Member, International Program Committee, Watermatex 2004: 6`h International
Symposium on Systems Analysis and Integrated Assessment in Water Management,
International
Water Association, Beijing, China, November 3-5, 2004.
•
Member, Program and Organizing Committees for the Watermatex 2007, 7'h
International Symposium on Systems Analysis and Integrated Assessment,
International
Water Association, Washington, DC, May 7-9, 2007.
•
Member, Organizing Committee, U.S.-China Water Consortium: A Wisconsin Idea
Approach, Madison, Door County, and Milwaukee, Wisconsin, July 18-25, 2008.
Review
Boards and Committees
•
Review Team Member, Milwaukee Metropolitan Sewerage District Corridor Project,
2000-2002
•
Member, Advisory Panel for Modeling of Small Watersheds, Illinois State Water
Survey, 2002-2003
•
Member, "Technical Advisory Committee on the Regional Water Quality Management
Plan Update for the Greater Milwaukee Watersheds" and "Water Quality Modeling
Subcommittee," Southeastern Wisconsin Regional Planning Commission, 2004-2007
•
Member, Water Council Research/Emerging Technologies Committee, Milwaukee 7
(regional economic development agency), 2007-present
LIST OF PUBLICATIONS
Books
/
Reports Edited
1)
Melching, C. S. and Pilon, P.J., eds., 1999.
Comprehensive Risk Assessmentfor Natural
Hazards,
World Meteorological Organization Technical Document No. 955, 92 p.
2)
Melching, C. S. and Liu, C., eds., 2003. Special Issue on Sediment Transport and
Environmental Studies,
International Journal of Sediment Research,
vol. 18, no. 2
(Proceedings, US.-Chinese Joint Workshop on Sediment Transport and
Environmental Studies, Milwaukee, Wis., July 21-24, 2002).
3)
Tung, Y.K., Yen, B.C., and Melching, C.S., 2006.
Hydrosystems Engineering
Reliability Assessment and Risk Analysis,
McGraw-Hill, New York, 495 p.
In Books
1)
Yen, B.C., Cheng, S.T. and Melching, C.S, 1986. "First-Order Reliability Analysis," in
Stochastic and Risk Analysis in Hydraulic Engineering, B.
C. Yen, ed., Water Resources
Publications, Littleton, CO, p. 1-34.
2)
Melching, C. S., 1995. "Reliability Estimation," Chapter 3 in
Computer Models of
Watershed Hydrology, V. P.
Singh, ed., Water Resources Publications, Littleton, CO, p.
69-118.
3)
Melching, C. S. and Pilon, P.J., 1999. "Introduction," Chapter 1 in
Comprehensive Risk
Assessment for Natural Hazards, C.
S. Melching and P. J. Pilon, eds., World
Meteorological Organization, Technical Document No. 955, Geneva, Switzerland, p. 1-
5.
4)
Melching, C. S., 1999. "Economic Aspects of Vulnerability," Chapter 7 in
Comprehensive Risk Assessment for Natural Hazards, C.
S.
Melching and P. J. Pilon,
eds.,
World Meteorological Organization, Technical Document No. 955, Geneva,
Switzerland, p. 66-76.
5)
Melching, C. S., 1999. "Strategies for Risk Assessment-Case Studies," Chapter 8 in
Comprehensive Risk Assessment for Natural Hazards, C.
S.
Melching and P. J. Pilon,
eds., World Meteorological Organization, Technical Document No. 955, Geneva,
Switzerland, 1999, pp. 77-92.
6) Manache, G., Bauwens, W., and Melching, C.S., 2003. "Reliability Analysis of a Water
Quality Model Considering Uncertainty in the Model Parameters," in
Monitoring and
Modeling Catchment Water Quantity and Quality, Proceedings,
8'h Conference of the
European Network of Experimental and Representative Basins (ERB), Ghent, Belgium,
September 27-29, 2000, N. Verhoest, J. Hudson, R. Hoeben, and F.P. De Troch, eds.,
International Hydrological Program, IHP-Vl, Technical Documents in Hydrology No.
66, UNESCO, Paris, p. 53-60.
7)
Melching, C.S., 2006, "Sewer Flow Measurement," Chapter 2.2,
Wastewater Quality
Monitoring and Treatment, P.
Quevauviller, O. Thomas, and A. Van der Beken, eds.,
John Wiley and Sons, London.
In Journals
1)
Melching, C.S. and Liebman, J.S., 1988. "Allocating Railroad Maintenance Funds by
Solving Binary Knapsack Problems with Precedence Constraints,"
Transportation
Research,
22B(3),181-194.
2)
Uzarski, D.R., Melching, C.S. and Liebman, J.S., 1988. "Prioritizing U.S. Army
Railroad Track Segments for Major Maintenance and Repair,"
Transportation
Research Record,
1177, 95-102.
3)
Melching, C. S., Yen, B.C., and Wenzel, H, G., Jr., 1990. "A Reliability Estimation in
Modeling Watershed Runoff with Uncertainties,"
Water Resources Research,
26(10),
2275-2286.
4)
Melching, C.S., Yen, B.C., and Wenzel, H.G., Jr., 1991. "Output Reliability as a Guide
for Selection of Rainfall-Runoff Models,"
Journal of Water Resources Planning and
Management,
ASCE, 117(3),383-398.
5)
Melching, C. S., 1992. "An Improved, First-Order Reliability Approach for Assessing
Uncertainties in Hydrologic Modeling,"
Journal of Hydrology,
132(1-4), 157-177.
6)
Melching, C. S. and Anmangandla, S., 1992. "Improved First-Order Uncertainty Method
for
Water Quality Modeling,"
Journal of Environmental Engineering,
ASCE, 118(5),
791-805.
7)
Melching, C.S. and Yoon, C.G., 1996. "Key Sources of Uncertainty in QUAL2E Model
of Passaic River,"
Journal of Water Resources Planning and Management;
AS CE,
122(2),105-113.
8)
Melching, C.S. and Flores, H.E., 1999. "Reaeration Equations Derived from USGS Data
Base,"
Journal of Environmental Engineering,
ASCE, 125(5),407-414.
9)
Melching, C.S. and Bauwens, W., 2001. "Uncertainty in Coupled Nonpoint Source and
Stream Water-Quality Models,"
Journal of Water Resources Planning and
Management,
ASCE, 127(6), 403-413.
10) Manache, G. and Melching, C. S., 2004. "Sensitivity Analysis of a Water-Quality
Model Using Latin Hypercube Sampling,"
Journal of Water Resources Planning and
Management,
ASCE, 130(3), 232-242.
11) Xiong, Y. and Melching, C.S., 2005. "Comparison of Kinematic-Wave and Nonlinear
Reservoir Routing of Urban Watershed Runoff',
Journal of Hydrologic Engineering,
ASCE, 10(1), 39-49.
12) Melching, C.S., Novotny, V., and Schilling, J.B., 2006. "Probabilistic Evaluation of
Ammonia Toxicity in Milwaukee's Outer Harbor,"
Water Science and Technology,
53(l),109-116.
13) Manache, G., Melching, C.S., and Lanyon, R. 2007. "Calibration of a Continuous
Simulation Fecal Coliform Model Based on Historical Data Analysis,"
Journal of
Environmental Engineering,
ASCE, 133(7), 681-691.
14) Alp, E., Melching, C.S., Zhang, H., and Lanyon, R., 2007. "Effectiveness of
Combined Sewer Overflow Treatment for Dissolved Oxygen Improvement in the
Chicago Waterways,"
Water Science and Technology,
56(1), 215-222.
15) Manache, G. and Melching, C.S., 2008. "Identification of Reliable Regression- and
Correlation-Based Sensitivity Measures for Importance Ranking of Water-Quality
Model Parameters,"
Environmental Modelling & Software,
23(5), 549-562.
16) Booij, M.J. and Melching, C.S. 2008. "Appropriate Spatial Scales to Achieve Model
Output Uncertainty Goals," in Hydrological Sciences for Managing Water Resources
in the Asian Developing World,
International Association of Hydrological Sciences
(IAHS) Publication No. 319.
17) Alp, E. and Melching, C. S. in press, "Evaluation of the Duration of Storm Effects on
In-Stream Water Quality,
Journal of Water Resources Planning and Management,
ASCE.
18) Wang, Z.Y. and Melching, C.S. "Ecological and Hydraulic Studies of Step-Pool
Systems,"
Journal of Hydraulic Engineering,
ASCE, submitted for publication.
19) Xie, X., Wang, Z.Y., and Melching, C.S. "Formation and Evolution of the Jiuduansha
Shoal over the Past 50 Years,"
Journal of Hydraulic Engineering,
ASCE, submitted
for publication.
In Conference Proceedings
1) Melching, C.S. and Yen, B.C., 1986. "Slope Influence on Storm Sewer Risk," in
Stochastic and Risk Analysis in Hydraulic Engineering,
B.C. Yen, ed., Water Resources
Publications, Littleton, CO, p. 79-89.
2)
Melching, C.S., Wenzel, H.G., Jr., and Yen, B.C., 1987. "Application of System
Reliability Analysis to Flood Forecasting," in
Application of Frequency and Risk in
Water Resources,
V.P. Singh, ed., D. Reidel Publications, Dordrecht, The Netherlands,
p. 335-350.
3)
Yen, B.C. and Melching, C. S., 1991. "Reliability Analysis Methods for Sediment
Problems,"
Proceedings,
51h Federal Interagency Sedimentation Conference, Vol. 2, S.-
S. Fan and Y.-H. Kuo, eds., Federal Energy Regulatory Commission, Washington, DC.
4)
Melching, C.S., 1991. "Reliability Assessment Method for Flood Forecasts,"
Proceedings,
1991 ASCE National Conference on Hydraulic Engineering, R.M. Shane,
ed., p. 984-989.
5)
Melching, C.S., 1992. "A Comparison of Methods for Estimating Variance of Water
Resources Model Predictions," in
Stochastic Hydraulics
'92, Proceedings, Sixth 1AHR
International Symposium of Stochastic Hydraulics, Taipei, Taiwan, May 18-20,1992,
J.-T. Kuo and G.-F. Lin, eds., Department of Civil Engineering, National Taiwan
University, Taipei, Taiwan, p.
663-670.
6)
Singh, S. and Melching, C.S., 1993. "Importance of Hydraulic Model Uncertainty in
Flood-Stage Estimation," in
Hydraulic Engineering '93,
Proceedings 1993 AS CE
National Conference on Hydraulic Engineering, H.-W. Shen, S.-T. Su, and F. Wen, eds.,
Vol. 2, p. 1939-1944.
7)
Melching, C.S., 1994. "Sensitivity of Monte Carlo Simulation to the Probability
Distribution of the Input Parameters,"
Proceedings,
International Symposium on Water
Resources Planning in a Changing World, Karlsruhe, Germany, June 28-30, p. II.81-
11.91.
8) Gonzalez, J.A., Melching, C.S., and Oberg, K.A., 1996. "Analysis of Open-Channel
Velocity Measurements Collected with an Acoustic Doppler Current Profiler,"
Proceedings,
Rivertech'96: 1st International Conference On New/Emerging Concepts
for Rivers, W.H.C. Maxwell, H.C. Preul, and G.E. Stout, eds., Chicago, Illinois,
September 22-25, 1996, p. 838-845.
9)
Melching, C.S., 1997. "Effectiveness of Agricultural Best Management Practices for
Control of Nutrients in Runoff,"
Proceedings,
International Symposium on Rural
Environment Improvement, Seoul, Korea, October 17, 1997, S.K. Kwun, C.G. Yoon,
and S.J. Kim, eds. Korean Society of Agricultural Engineers, Seoul, Korea, p. 1-20.
(Invited Paper).
10) Melching, C.S., 1998. "Accuracy of Tracer Measurement of Gas-Desorption Rates," in
Environmental Hydraulics,
J.H.W. Lee, A.W. Jayawardena, and Z.Y. Wang, eds., A.A.
Balkema, Rotterdam, The Netherlands, p. 481-486.
11) Yen, B.C., Soong, T.W., and Melching, C.S., 1999. "Similarities of the 1998 Yangtze
River Flood and 1993 Mississippi River Flood,"
Proceedings,
1999 ASCE Water
Resources Engineering Conference, R. Walton, ed., 1999.
12) Melching, C. S. and Bauwens, W., 2000. "Comparison of Uncertainty-Analysis
Methods Applied to Simulation of Urban Water Quality," in
Stochastic Hydraulics
2000, Z.Y.
Wang and S.X. Hu, eds., A.A. Balkema, Rotterdam, The Netherlands, p.
717-725.
13) Manache, G., Bauwens, W., and Melching, C. S., 2000. "Reliability Analysis of a Water
Quality Model Considering Uncertainty in the Model Parameters,"
Proceedings,
Experimental and Representative Basins (ERB) 2000-Monitoring and Modeling
Catchment Water Quantity and Quality, Ghent, Belgium, September 27-29, 2000, R.
Hoeben, Y. Van Herpe, and F.P. De Troch, eds., Laboratory of Hydrology and Water
Management, Ghent University.
14) Lanyon, R. and Melching, C.S., 2001. "Data Collection for Development of a Water-
Quality Model for Unsteady Flow in the Chicago Waterway System,"
Proceedings,
ASCE Environmental and Water Resources Institute World Water & Environmental
Resource Congress, May 20-24, 2001, Orlando, Florida.
15) Melching, C.S., 2001. "Sensitivity Measures for Evaluating Key Sources of Modeling
Uncertainty,"
Proceedings CD-ROM,
Third International Symposium on Environmental
Hydraulics, Tempe, Arizona, December 5-8, 2001. Mira Digital Publishing.
16) Melching, C.S., Alp, E., Shrestha, R.L., and Lanyon, R., 2004. "Simulation of Water
Quality During Unsteady Flow in the Chicago Waterway System,"
Proceedings CD-
ROM,
Watershed 2004, July 11-14,2004, Dearborn, Michigan, Water Environment
Federation.
17) Melching, C.S., 2004. "Water Quality Management in the Chicago Area,"
Water
Stories,
Proceedings of the Workshop on Occasion of the Retirement of Prof.-cm. Dr.
ir.
Andre Van der Beken, Brussels, Belgium, September 30, 2004,
VUB-Hydrologie
Special Issue,
Vrije Universiteit Bruss el, p. 77-90.
18) Byrd, J.L. and Melching, C.S., 2005. "Uncertainty Evaluation in the Design of
Instream Structures for Stream Restoration,"
Proceedings (CD-ROM),
XXXI
Congress of the International Association for Hydraulic Engineering and Research,
Seoul, Korea, September 11-16, 2005.
19) Manache, G. and Melching, C.S., 2007. "Sensitivity of Latin Hypercube Sampling to
Sample Size and Distributional Assumptions," Proceedings CD-ROM, 32nd Congress
of the International Association of Hydraulic Engineering and Research, Venice, Italy,
July 1-6, 2007.
20) Zhang, H., Bernstein, D., Kozak, J., Jain, J.S., Lanyon, R., Alp, E., and Melching,
C.S., 2007. "Evaluation of Eliminating Gravity CSOs on Water Quality of the
Chicago Waterway System Using an Unsteady Flow Water Quality Model,"
Proceedings CD-ROM, WEFTEC 07, San Diego, CA, October 13-17,2007, p. 5722-
5735.
Technical Reports
1) Wenzel, H.G., Jr. and Melching, C. S., 1983.
Sensitivity of Sediment Yield Simulation
Models to Rainfall Parameters,
Final Report, Contract No. DACA 88-83-M-0199,
Department of Civil Engineering, University of Illinois, August, 1983.
2)
Melching, C.S. and Wenzel, H.G., Jr., 1985. "Calibration Procedure and Improvements
in MULTSED,"
Hydraulic Engineering Series Report No.
38, Department of Civil
Engineering, University of Illinois at Urbana-Champaign, July, 1985.
3) Melching, C.S., 1987. A Reliability Analysis on Flood Event Forecasting with
Uncertainties, Ph. D. Thesis, Department of Civil Engineering, University of Illinois at
Urbana-Champaign.
4) Melching, C.S., Yen, B.C., and Wenzel, H.G., Jr., 1987 "Incorporation of Uncertainties
in Real-Time Catchment Flood Forecasting,"
Water Resources Center Research Report
208, University of Illinois at Urbana-Champaign, September, 1987.
5)
Wenzel, H. G., Jr. and Melching, C.S., 1987. "An Evaluation of the MULTSED
Simulation Model to Predict Sediment Yield,"
USA-CERL Technical Report N-87127,
U.S. Army Construction Engineering Research Laboratory, September, 1987.
6) Uzarski, D.R., Liebman, J.S., Melching, C.S., and Plotkin, D.E., 1988. "FORSCOM
Railroad Project Prioritization Program (FORPROP) for the Railer System:
Development and Testing,"
USA-CERL Technical Report M-88119,
U.S. Army
Construction Engineering Research Laboratory, September, 1988.
7)
Melching, C.S. and Avery, C.C., 1990. "An Introduction to Watershed Management for
Hydrologists,"
Vrije Universiteit Brussel Hydrologie Report No. 18.
8)
Yoon, C.G. and Melching, C.S., 1992. "Sources and Reduction of Uncertainty in Stream
Water Quality Modeling," Final Report to Water Resources Research Institute, Rutgers-
The State University of New Jersey, New Brunswick, NJ, September, 1992.
9)
Melching, C.S. and Oberg, K.A., 1993. "Comparison, Analysis, and Estimation of
Discharge Data from Two Acoustic Velocity Meters on the Chicago Sanitary and Ship
Canal at Romeoville, Illinois," US
Geological Survey Water-Resources Investigations
Report 93-4098.
10) Melching, C. S. and Coupe, R.H., 1995. "Differences in Analytical Results for
Concurrent and Split Stream-Water Samples Collected and Analyzed by the U.S.
Geological Survey and Illinois Environmental Protection Agency, 1985-91," U.S.
Geological Survey Water-Resources Investigations Report 94-4141.
11) Gay, F.B. and Melching, C.S., 1995. "Precipitation Quality Relations to Storm Types
and Constituent Loads in Massachusetts, 1983-85,"
U.S.
Geological Survey Water-
Resources Investigations Report 94-4224.
12) Duncker, J.J., Vail, T.J., and Melching, C.S., 1995. "Regional Rainfall-Runoff Relations
for Simulation of Streamflow for Watersheds in Lake County, Illinois," U.S.
Geological
Survey Water Resources Investigations Report 95-4023.
13) Melching, C.S. and Chang, T.J., 1996. "Simulation of Water Quality for Salt Creek in
Northeastern Illinois," U.S.
Geological Survey Open-File Report 96-318.
14) Melching, C.S. and Marquardt, J.S., 1996. "Equations for Estimating Synthetic Unit-
Hydrograph Parameter Values for Small Watersheds in Lake County, Illinois," U.S.
Geological Survey Open-File Report 96-474.
15) Franz, D.D, and Melching, C.S., 1997. "Full Equations (FEQ) Model for the Solution of
the Full, Dynamic Equations of Motion for One-Dimensional Unsteady Flow in Open
Channels and Through Control Structures,"
U.S. Geological Survey Water Resources
Investigations Report 96-4240.
16) Franz, D.D. and Melching, C.S., 1997. "Full Equations Utilities (FEQUTL) Model for
the Approximation of Hydraulic Characteristics of Open Channels and Control
Structures During Unsteady Flow," U.S.
Geological Survey Water-Resources
Investigations Report 97-4037.
17) Duncker, J.J. and Melching, C.S., 1998. "Regional Rainfall-Runoff Relations for
Simulation of Streamflow for Watersheds in Du Page County, Illinois, U.S.
Geological
Survey Open-File Report 98-4035.
18) Melching, C.S., and Meno, M.W., 1998. "Intercomparison of Principle Hydrometric
Instruments-Third Phase: Evaluation of Ultrasonic Velocity Meters for Flow
Measurement in Streams, Canals, and Estuaries," World Meteorological Organization,
Technical Reports in Hydrology and Water Resources No. 69,
WMO/TD-No. 931,
Geneva, Switzerland.
19) Melching, C.S., 1999. "Uncertainty Analysis for Holistic River Water-Quality
Management Systems," Final Report to the Research in Brussels Action, Ministry of
Economics, Brussels Capital Region, Belgium, May 1999.
20) Straub, T.D., Melching, C.S., and Kocher, K.E., 2000. "Equations for Estimating Clark
Unit-Hydrograph Parameters for Small Rural Watersheds in Illinois," U.S.
Geological
Survey Water-Resources Investigations Report 00-4184.
21) Alp, E., Clark, D., Melching, C.S., and Novotny, V., 2002. "Application of Benefit
Transfer with Contingent Valuation Method to the Root River Watershed,"
Institute of
Urban Environmental Risk Management Technical Report No. 12,
Marquette
University, Milwaukee, Wis.
22) Chriscicki, J.B., Melching, C. S., Bicknell, B.R., Roy, S.D., Manoyan, S., Stewart,
J.S., and Duncker, J.D., 2003. "Simulation of Streamflow, Lake, and Wetland Water-
Surface Elevations in the Swamp and Pickerel Creek Watersheds in the Wolf River
Watershed, Near the Proposed Crandon Mine, Wisconsin," Final Report, U.S.
Environmental Protection Agency, Region 5, Chicago, Ill.
23) Todesco,
D.,
Melching, C.S., and
Novotny, V., 2003. "Analysis of
a Simple
Distributed Sediment and Pollutant
Model Within Areview
GIS Environment,"
Institute
of Urban Environmental
Risk Management
Technical Report No. 13,
Marquette
University,
Milwaukee, Wis.
24) Shrestha
,
R.L. and Melching, C.S., 2003. "Hydraulic
Calibration
of an Unsteady Flow
Model for the Chicago Waterway
System,"
Institute
of Urban
Environmental Risk
Management Technical
Report No.
14,
Marquette
University,
Milwaukee
,
Wis., and
Research and Development Department
Report No. 03-I8,
Metropolitan Water
Reclamation District of Greater Chicago
,
Chicago, Ill.
25) Espey, W.H., Jr.,
Melching
,
C.S., and Mades
,
D.M., 2004. "Lake Michigan
Diversion
---
Findings
of the Fifth Technical
Committee
for Review
of Diversion Flow
Measurements and Accounting Procedures
,"
report prepared
for the U.S. Army Corps
of Engineers
,
Chicago District
,
Chicago, Ill.
26) Alp,
E. and Melching
,
C.S., 2004
. "Preliminary
Calibration
of a Model for Simulation
of Water Quality
During
Unsteady
Flow in the Chicago
Waterway
System and
Application to Proposed Changes to the Navigation
Make-Up Diversion
Procedures,"
Institute
of Urban Environmental
Risk Management Technical
Report No. 15,
Marquette
University,
Milwaukee
,
Wis, and
Research and Development
Department
Report No. 04-14,
Metropolitan Water
Reclamation
District of
Greater
Chicago,
Chicago, Ill.
27) Zaidman, M.D., Lamb, R., Mawdsley, J., Lawless, M.R., Archer,
D.R., and Melching,
C.S., 2005. "Non Invasive Techniques for River
Flow Measurement
,"
Science Report
SC0302031
SR,
Environment
Agency, Bristol, U.K.
28) Manache
,
G. and Melching
,
C.S., 2005. "
Simulation of Fecal
Coliform
Concentrations in the Chicago
Waterway
System Under
Unsteady
Flow Conditions,"
Institute
for Urban
Environmental
Risk Management
Technical
Report No. 16,
Marquette
University,
Milwaukee
,
Wis. and
Research and Development Department
Report No. 2005-9,
Metropolitan Water Reclamation
District of Greater
Chicago,
Chicago, IL.
29) Neugebauer
,
A. and Melching, C.S., 2005. "Verification of a Continuous Water
Quality Model Under
Uncertain Storm Loads
in the Chicago Waterway
System,"
Institute
for Urban
Environmental Risk Management Technical
Report No. 17,
Marquette
University
,
Milwaukee
,
Wis. and
Research and Development
Department
Report No. 2005-12,
Metropolitan Water Reclamation District of Greater Chicago,
Chicago, IL.
30) Alp,
E. and Melching
,
C.S., 2006, "Calibration of a Model for Simulation
of Water
Quality
During Unsteady Flow in the
Chicago Waterway
System and Application to
Evaluate
Use Attainability Analysis
Remedial Actions,"
Institute
for Urban
Environmental Risk Management
Technical Report No. 18,
Marquette University,
Milwaukee
,
Wis, and
Research
and Development Department Report No. 2006-84,
Metropolitan Water Reclamation
District of Greater Chicago, Chicago, III.
31) Alp, E.
and Melching
,
C.S. (2008). "
Evaluation of Procedures
to Prevent Flow
Reversals
to Lake
Michigan
for the Chicago Waterway
System,"
Institute
for Urban
Environmental Risk Management
Technical Report No. 19,
Marquette University,
Milwaukee, WI.
PAPERS
PRESENTED
(not formally published)
1)
Melching, C.S. and Wenzel, H.G., Jr., "Soil Erosion Model Transferability," presented
at 1984 Illinois Conference on Soil Conservation and Water Quality, October 15-19,
1984, Champaign, Ill.
2)
Melching, C.S., Yen, B.C., and Wenzel, H.G., Jr., "Decision Making Considering
Uncertainties of Hydrologic Models," presented at the Fifth IAHR International
Symposium on Stochastic Hydraulics, University of Birmingham, Birmingham, U.K.,
August 2-4, 1988.
3)
Melching, C.S., "An Approach to Determine the Margin of Safety for Nonpoint
Source Load Allocations" presented at the Midcontinent TMDL Practitioners'
Workshop, U.S. Environmental Protection Agency Regions 5 and 7, Chicago,
November 1, 2000.
4)
Melching, C.S., "Statistical Models: Linking Nonpoint Pollution Models to Receiving
Water Standards," presented at the TMDL Science Issues Conference, Water
Environment Federation, March 4-7, 2001, St. Louis.
5)
Aderman, P.C. and Melching, C.S., "Evaluation of the SCS/NRCS Dimensionless
Unit Hydrograph for Small Watersheds in the Midwestern United States," Wisconsin
Association for Floodplain, Stormwater, and Coastal Management, Wisconsin Dells,
Wis., November 13-14,2003.