IN THE MATTER OF
:
)
PROPOSED NEW 35 ILL. ADM. CODE 225
)
CONTROL OF EMISSIONS FROM
)
LARGE COMBUSTION SOURCES (MERCURY) )
NOTICE
TO :
Dorothy Gunn
Clerk
Illinois Pollution Control Board
James R. Thompson Center
100 West Randolph St., Suite 11-500
Chicago, IL 60601-3218
SEE ATTACHED SERVICE LIST
PLEAST TAKE NOTICE that I have today filed with the Office of the Clerk of the
Illinois Pollution control Board the POST-HEARING COMMENTS OF THE ILLINOIS
ENVIRONMENTAL PROTECTION AGENCY a copy of which is herewith served upon you
DATED: July 28, 2006
Illinois Environmental Protection Agency
1021 North Grand Avenue East
P.O. Box 19276
Springfield, Illinois 62794-927
BEFORE THE ILLINOIS POLLUTION CONTROL BOARD
RECEIVED
CLERK'S OFFICE
JUL 3 1 2006
R06-25
STATE OF
ILLINOIS
Pollution Control Board
(Rulemaking - Air)
ILLINO
VIRONMENTAL
PRO
N
olm J .
Managing Attorney
Air Regulatory Unit
Division of Legal Counsel
BEFORE THE ILLINOIS POLLUTION CONTROLBOARD RECEIVED
CLERK'S OFFICE
IN THE MATTER OF :
)
JUL 3 1 2006
R06-25
TE
PROPOSED NEW 35 ILL. ADM. CODE 225
)
(RulemakingATAE
OF ILLINOIS
ion Control Board
CONTROL OF EMISSIONS FROM
)
LARGE COMBUSTION SOURCES (MERCURY) )
POST-HEARING COMMENTS OF THE ILLINOIS ENVIRONMENTAL
PROTECTION AGENCY
NOW COMES the ILLINOIS ENVIRONMENTAL PROTECTION AGENCY (Illinois
EPA), by one of its attorneys, John . J. Kim, and hereby submits comments in the above
rulemaking proceeding. The Illinois EPA appreciates the efforts of the Illinois Pollution Control
Board (Board) in this rulemaking regarding the request to add 35 Ill. Adm. Code Part 225 to
control mercury emissions from coal-fired electric generating unties . Though the Illinois EPA
responded to most every issue raised at the first hearing in this matter on the record during those
proceedings, some outstanding issues remain to be addressed in these post-hearing comments
.
RESPONSES TO QUESTIONS RAISED DURING THE JUNE 12, 2006 HEARING
Question :
Directed to James E. Staudt, Ph.D., CFA question 59 a,b,c from Ameren
:
With reference to page 156 of the technical support document,
a. by unit, what are the coal types (bituminous, sub-bituminous) you are
assuming IL units will be burning in 2009?
b.
by unit, what are the 2009/10 control configuration (S02, NOx and PM
controls) you are assuming?
c .
What is the level of co-benefits are you assuming for the 2009/10 control
configurations (in pounds) and the removal efficiencies of these control
configurations?
Answer:
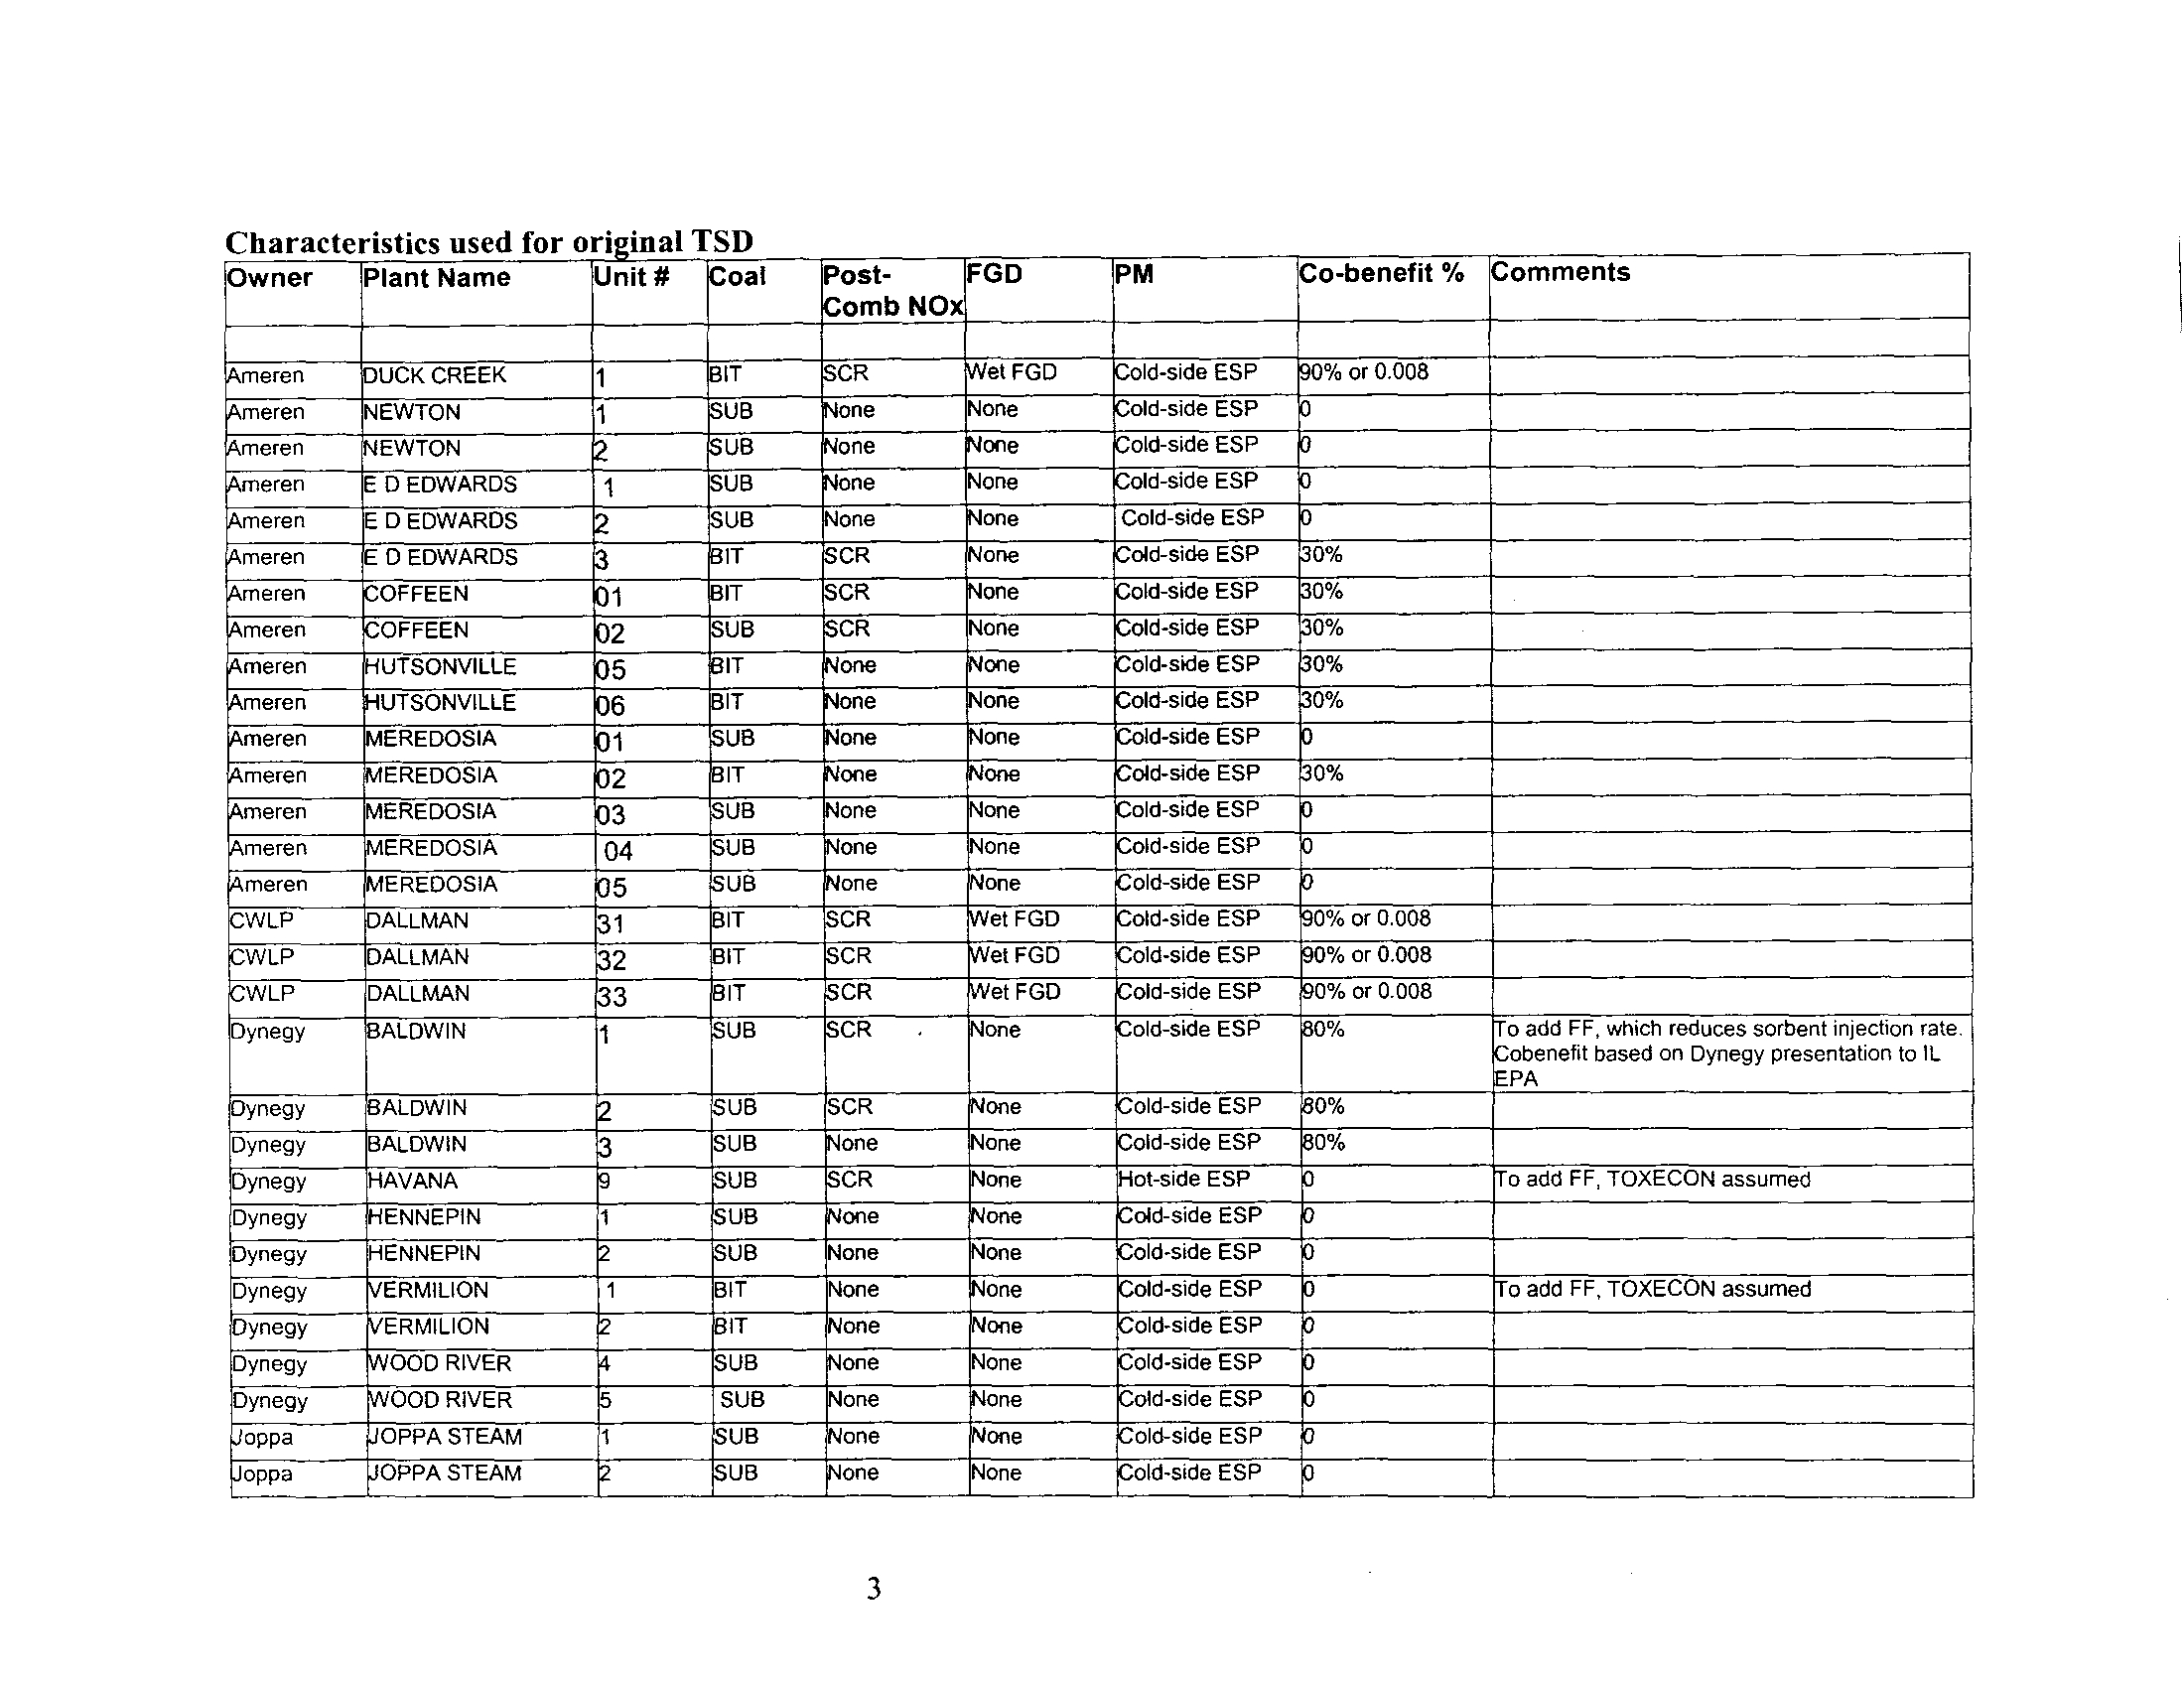
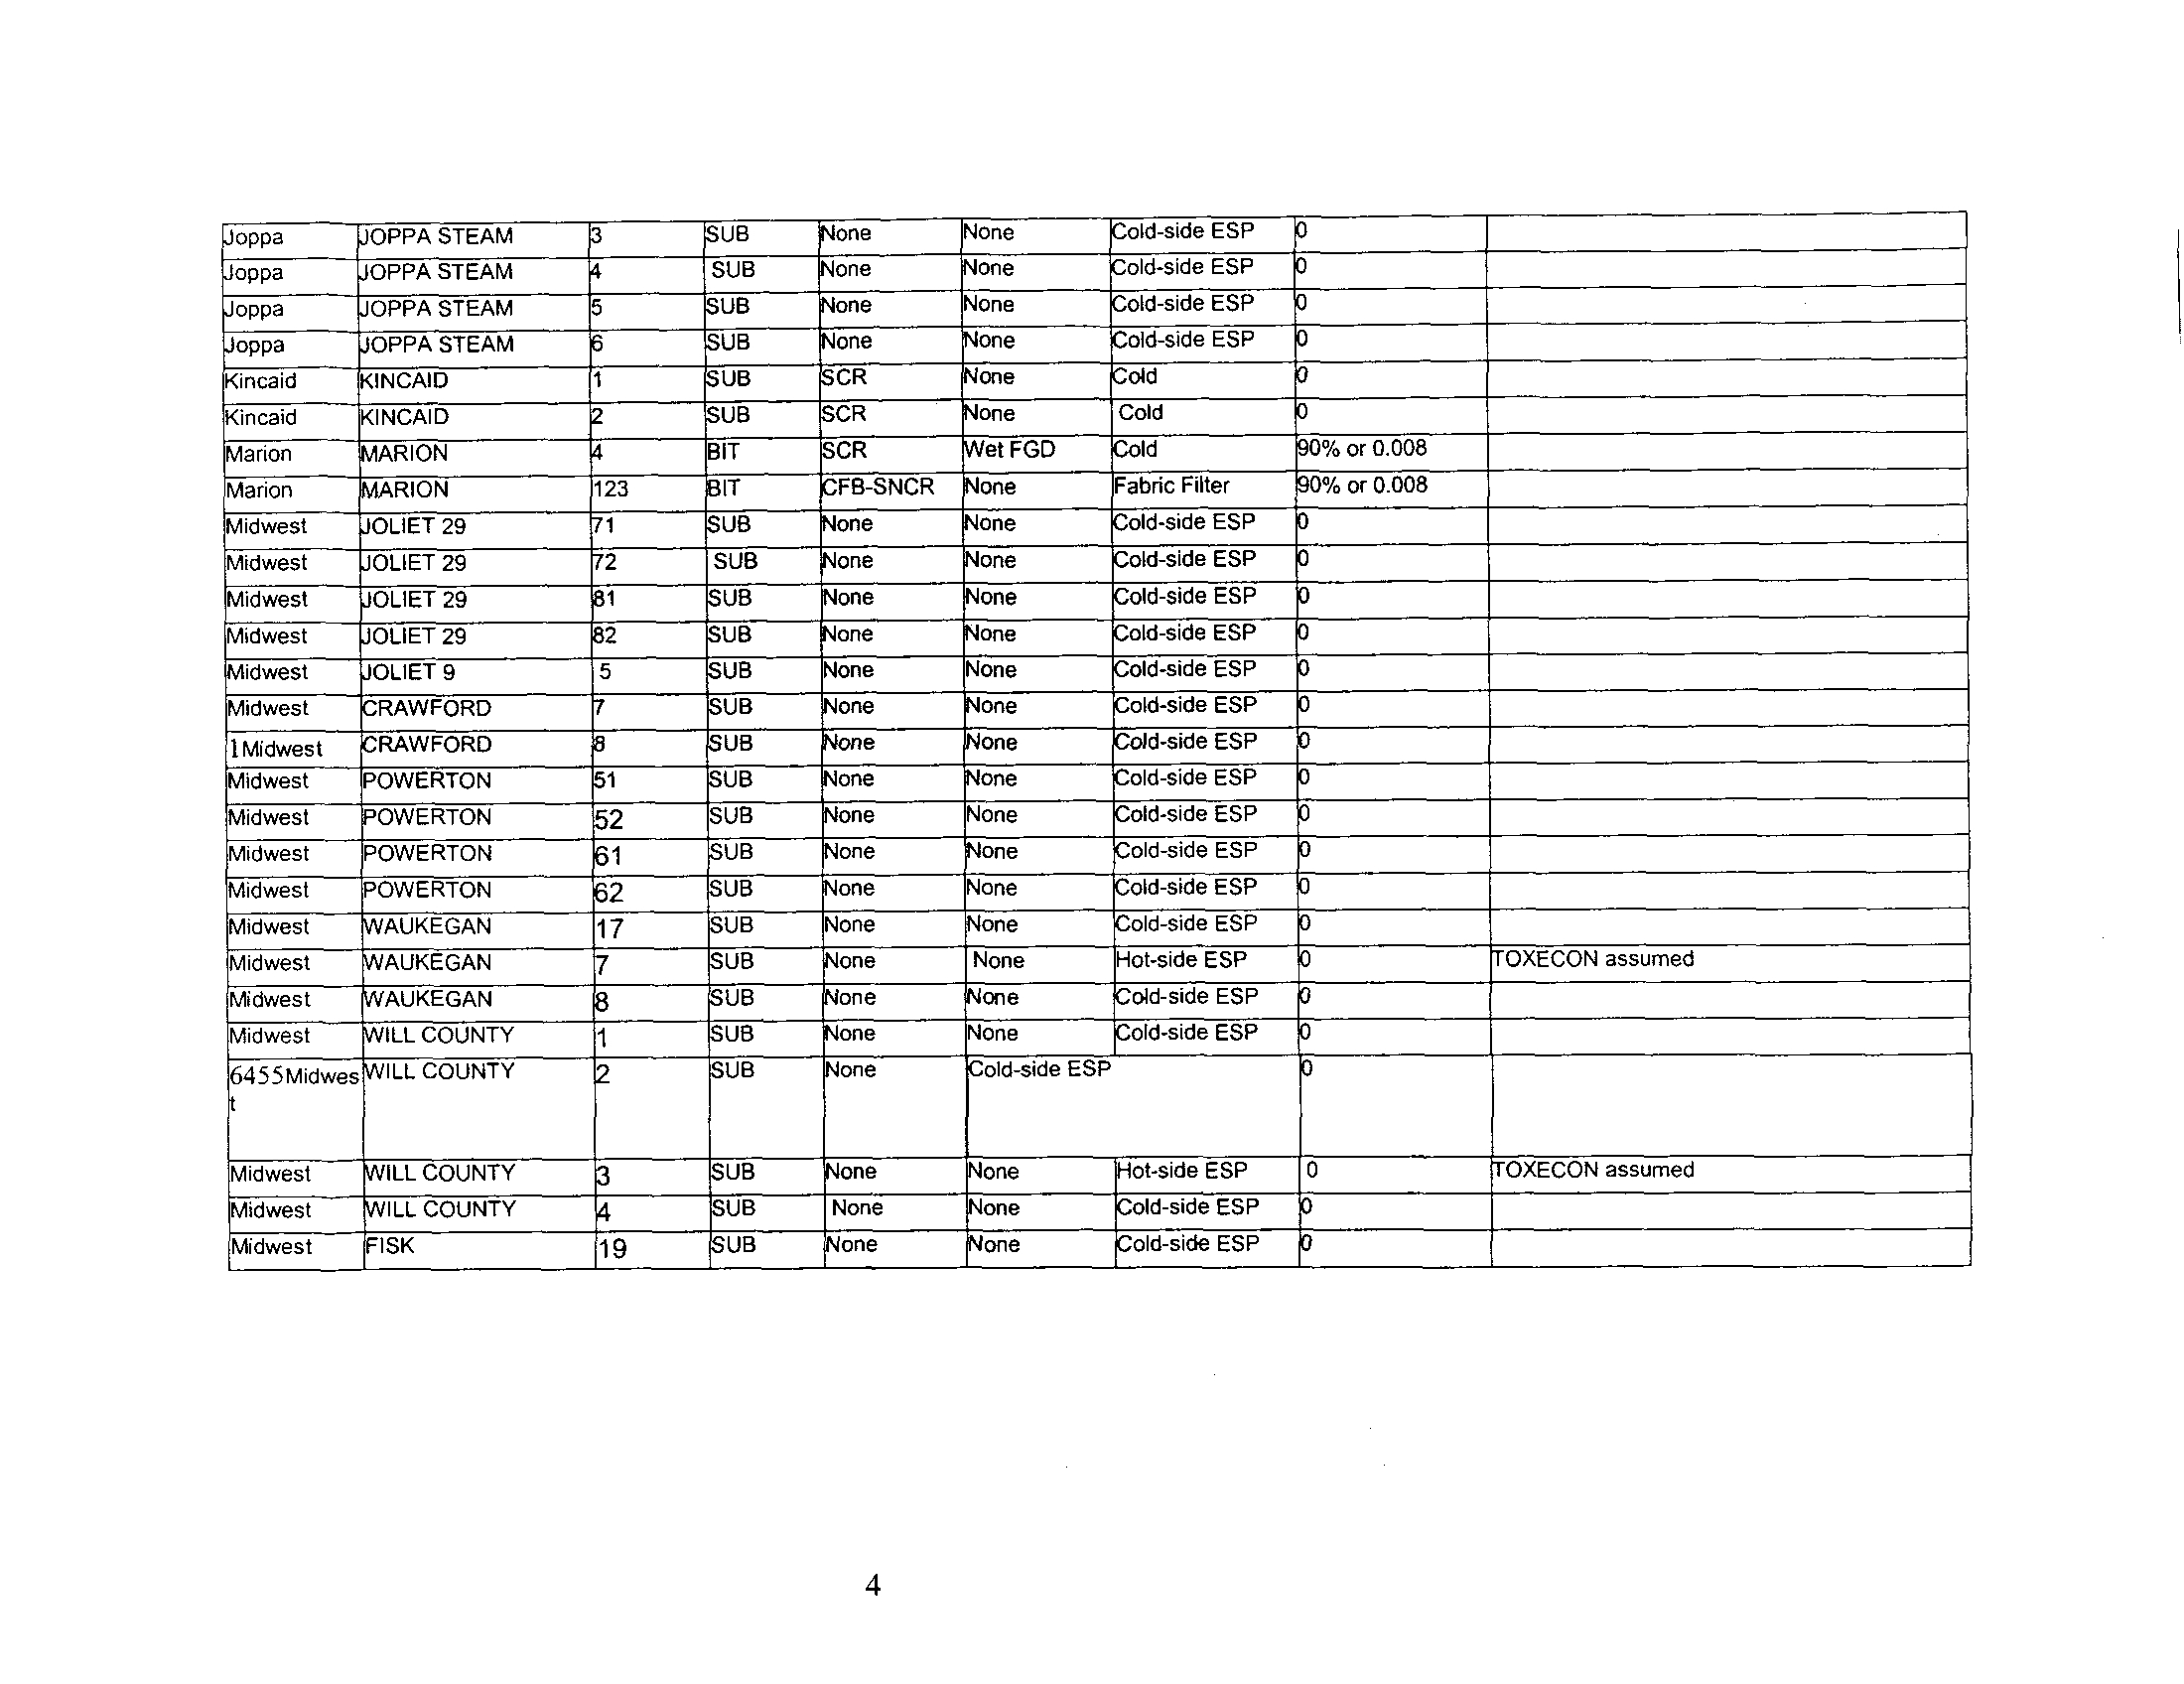
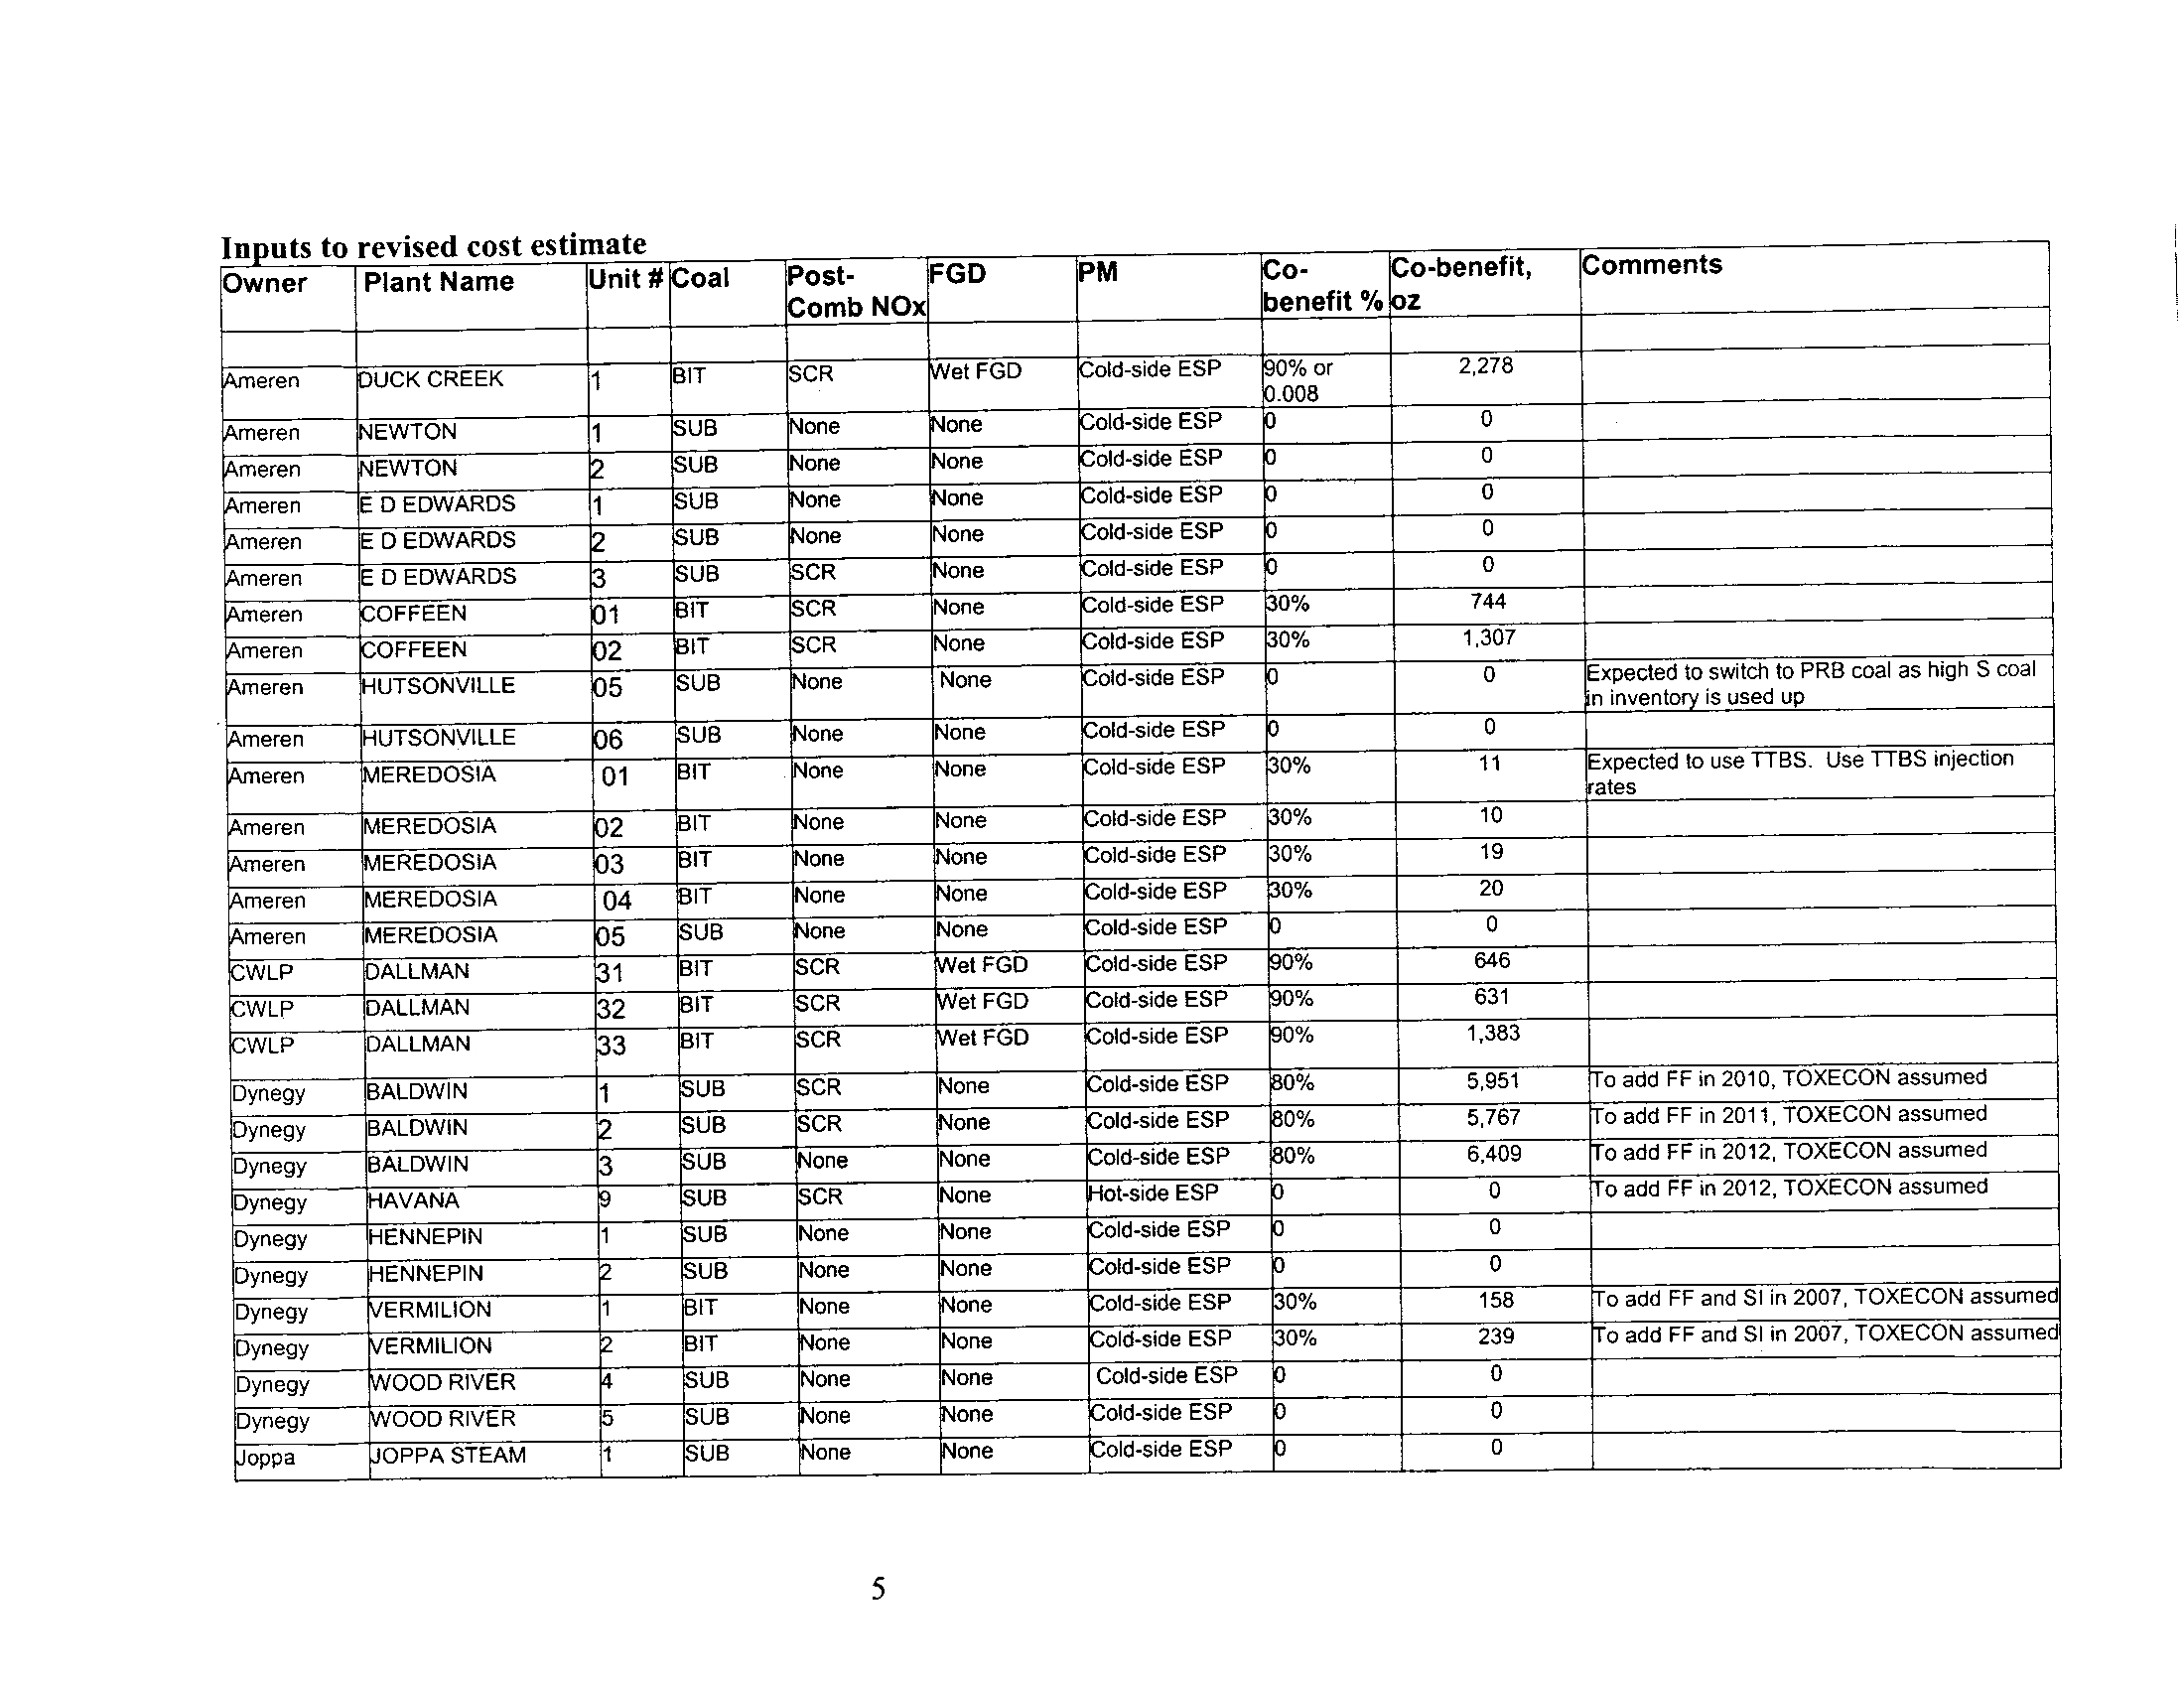
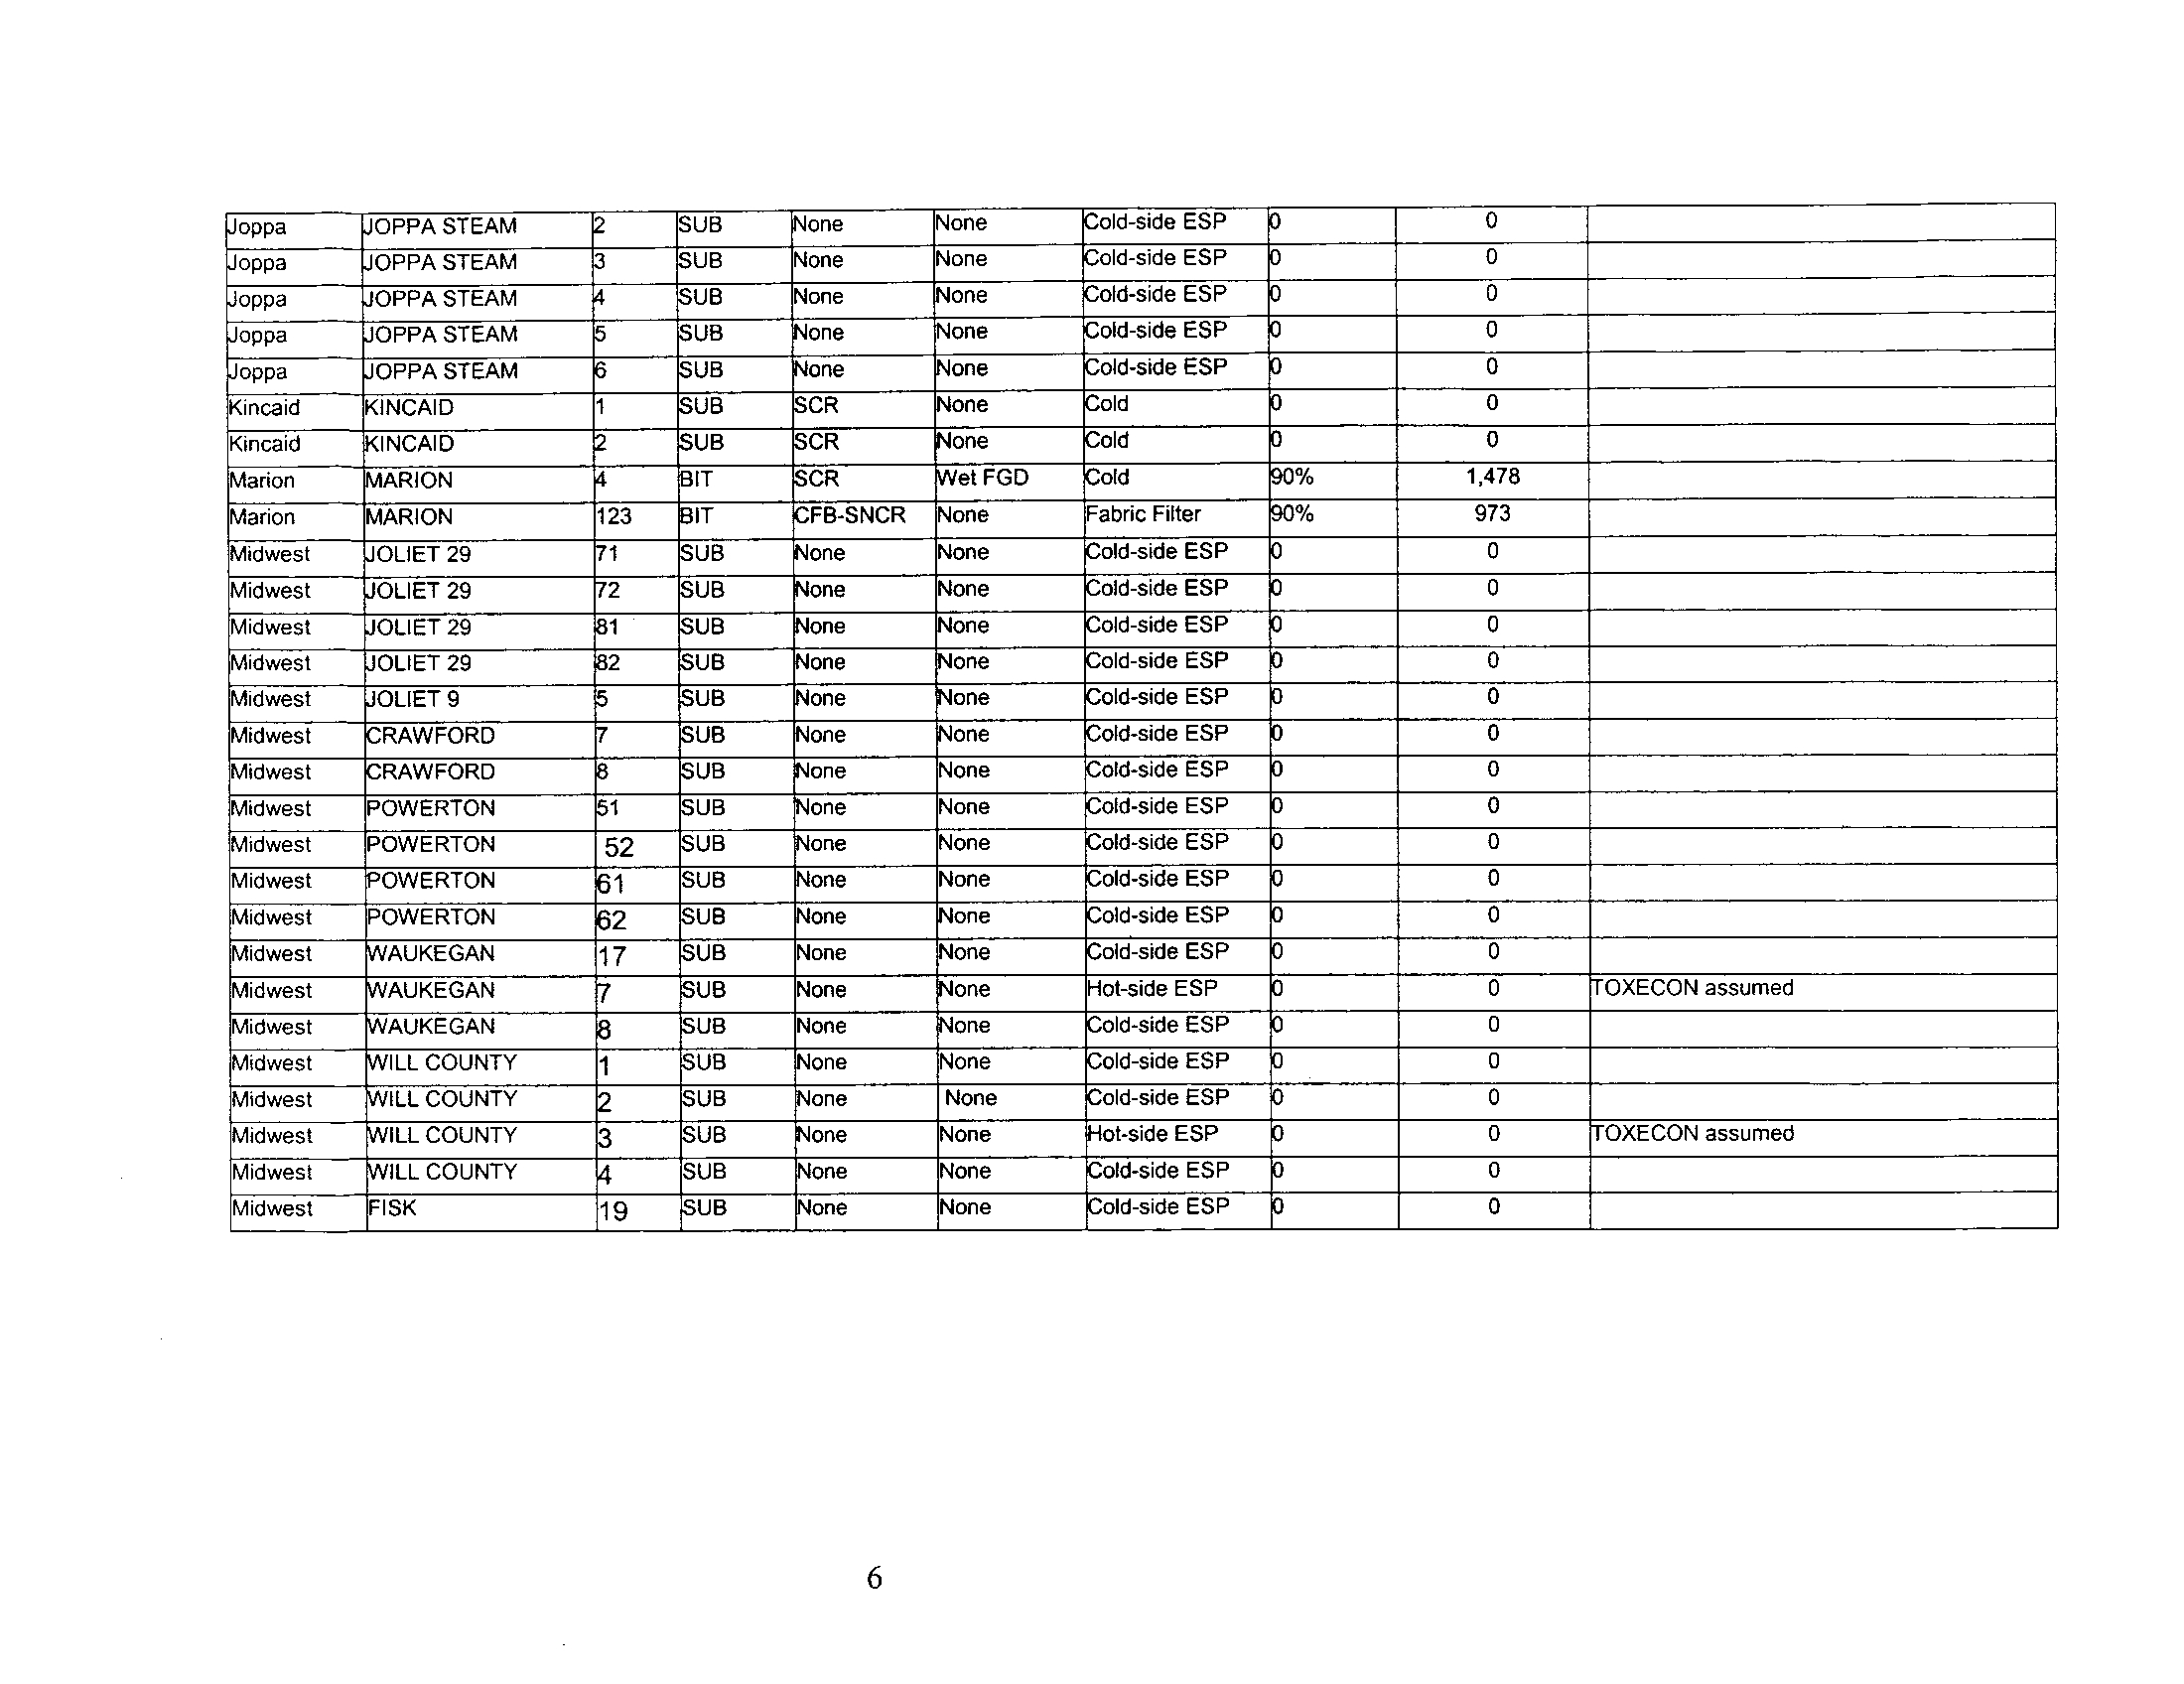
Response from James E. Staudt, Ph.D., CFA :
In response to questions 59 a, b, c, I stated at the hearing that I would
provide a table that includes my assumptions from the TSD . Since preparing the
TSD, my understanding of the configuration of some of the plants has changed
.
Therefore I am presenting two tables - one that shows what was assumed in the
original TSD and the other is based upon my more current understanding . In the
more recent one I show the calculated cobenefit in ounces as well as percentage
.
For the few unscrubbed bituminous units (except for Meredosia), I assumed that
90% removal or 0.008 lb/GWhr was achievable through a combination of
1
cobenefit (around 30-50%) and sorbent injection (additional 85% removal) . I
assumed no cobenefit mercury removal for any of the PRB fired units, except
Baldwin. It is likely that some significant cobenefit removals are achieved at
some of these units . This will have the effect of lowering the cost or increasing
the amount of mercury removed from the estimates shown here
.
2
IT
3
Owner
Plant Name
Unit #
oal
Post-
omb NO
FGD
PM
Co-benefit % Comments
I
lUCK CREEK
t
IT CI
et FGD
old-side ESP
0% or 0.008
-NEWTON
C e~ one
None
old-side ESP
EWTON
one
one
old-side ESP
E D EDWARDS
1
one
None
old-side ESP
E D EDWARDS
one
one
Cold-side ESP
•
0 EDWARDS
IT
+
one
old-side ESP
0%
OFFEEN
IT
one
old-side ESP
0%
OFFEEN ~
~~P
one
old-side ESP
0%
UTSONVILLE
IT
one
one
old-side ESP
0%
UTSONVILLE
6
IT
one
one
old-side ESP
0%
EREDOSIA
~,~-~
one
one
Id-side ESP
EREDOSIA
IT
one
one
old-side ESP
0%
MEREDOSIA
one
one
old-side ESP
EREDOSIA
04
C
::
one
one
old-side ESP
It -~ EREDOSIA
one
one
old-side ESP
PALLMAN
IT C~
et FGD
old-side ESP
0% or 0.008
~DALLMAN
IT
et FGD
old-side ESP
0% or 0.008
DALLMAN
IT
L~
et FGD
old-side ESP
0 % or 0.008
Dynegy
:ALDW IN
old-side ESP
.0%
o add
which reduces sorbent injection rate
.
to IL
obenefit
fit based on Dynegy presentation
to IL
PA
ynegy
:ALDWIN
~
.
:SCR
one
old-side ESP
0%
Dynegy
BALDWIN
:SUB
one
one
old-side ESP
0%
Dynegy
HAVANA
one
of-side ESP
o add FF, TOXECON assumed
Dynegy
ENNEPIN
1
C
::
one
one
old-side ESP
Dynegy
HENNEPIN ::None
one
old-side ESP
ynegy
ERMILION
1
BIT
None
one
old-side ESP
o add FF, TOXECON assumed
ynegy
ERMILION
i
IT
one
one
old-side ESP
Dynegy
ODD RIVER
one
None
old-side ESP
Dynegy
DOD RIVER
SUB
one
one
old-side ESP
oppa
OPPA STEAM
one
one
old-side ESP
oppa
OPPA STEAM :
one
None
old-side ESP
4
oppa
JOPPA STEAM
one
None
old-side ESP
J
=Ci
SUB
one
one
old-side ESP
J
5
C c~ one
None
old-side ESP
J
one
one
old-side ESP
1
one
old
~~
one
Cold
M
BIT
et FGD
Id
0 /o
or 0.008
Marion
123
IT
'
~
one
Fabric Filter
% or 0.008
Midwest
1
C t
one
one
old-side ESP
2
SUB
one
one
old-side ESP
J
1
C e~ one
one
old-side ESP
J
2
C e~ one
one
old-side ESP
5
C:None
None
old-side ESP
C
C c~
one
one
old-side ESP
C
one
d-side ESP
4
e~
one
one
old-side ESP
SUB
one
None
old-side ESP
Midwest
one
one
old-side ESP
Midwest
one
None
old-side ESP
AUKEGAN
UB
TOXECON assumed
Midwest
NAUKEGAN
~
.
:
I
one
one
old-side ESP
ILL COUNTY
1
us
one
None
old-side ESP
I
ILL COUNTY
UB
one
old-side ESP
R
TOXECON assumed
Midwest
None
Midwest
19
+
5
to i uts to revisea cost es tmate
Owner
Plant Name
Unit #
Post-
omb NOx
FGD
PM
o-
benefit %
Comments
~ •
UCK
CREEK
BIT
SCR
et FGD
0% or
.008
2,278
EWTON
1
one
one
old-side ESP
0
•
EWTON i~
one
one
old-side ESP
0
E D EDWARDS
C e~
one
one
old-side ESP
0
s "- -
E D EDWARDS 7~
one
None
old-side ESP
0
I• -E D EDWARDS
one
old-side ESP
0
OFFEEN
a
IT
None
old-side ESP
0%
744
OFFEEN
a
IT
None
old-side ESP
0%
1,307
•
UTSONVILLE
None
0
n in
etn
oto
is used
switch
tup
PRB coal as high S coal
I•HUTSONVILLE
6
one
None
old-side ESP
0
EREDOSIA
01
BIT
0
%
11
Expected to use TTBS. Use TTBS injection
ates
~MEREDOSIA
I
IT
one
None
old-side ESP
0%
10
EREDOSIA
I
IT
one
one
old-side ESP
0%
19
I•
-
m
MEREDOSIA
04
IT
one
one
old-side ESP
0%
20
!~MEREDOSIA
M'
:
one
one
old-side ESP
0
~IALLMAN
BIT
et FGD
old-side ESP
0%
646
'~DALLMAN
IT
et FGD
old-side ESP
0%
631
.~DALLMAN
a
IT
e,
et FGD
old-side ESP
0%
1,383
Dynegy
BALDWIN
t
C
e~
-
:
None
old-side ESP
0%
5,951
o add FF in 2010, TOXECON assumed
Dynegy
BALDWIN
one
old-side ESP
0%
5,767
o add FF in 2011, TOXECON assumed
Dynegy
BALDWIN
~C,31-:
one
None
old-side ESP
0%
6,409
o add FF in 2012, TOXECON assumed
Dynegy
AVANA
one
of-side ESP
0
o add FF in 2012, TOXECON assumed
Dynegy
HENNEPIN
1
C '
.None
one
old-side ESP
0
Dynegy
ENNEPIN
~C eul
one
one
old-side ESP
0
Dynegy
ERMILION
IT
None
one
old-side ESP
0%
158
o add FF and SI in 2007, TOXECON assumed
Dynegy
ERMILION
i
BIT
one
None
old-side ESP
0%
239
o add FF and SI in 2007, TOXECON assumed
Dynegy
ODD RIVER
=C
eJ
None
None
Cold-side ESP
0
Dynegy
ODD RIVER
SUB
one
one
old-side ESP
0
oppa
OPPA STEAM
1
one
one
old-side ESP
0
6
Joppa
JOPPA STEAM
2
SUB
one
None
Cold-side ESP
0
0
Joppa
JOPPA STEAM
3
SUB
None
None
Cold-side ESP
0
0
Joppa
JOPPA STEAM
4
SUB
None
None
Cold-side ESP
0
0
Joppa
JOPPA STEAM
5
SUB
None
None
Cold-side ESP
3
0
Joppa
JOPPA STEAM
3
SUB
None
None
Cold-side ESP
3
0
Kincaid
KINCAID
1
SUB
SCR
None
Cold
0
0
Kincaid
KINCAID
2
SUB
SCR
None
Cold
3
0
Marion
MARION
4
BIT
SCR
Wet FGD
Cold
90%
1,478
Marion
MARION
123
BIT
CFB-SNCR
None
Fabric Filter
90%
973
Midwest
JOLIET 29
71
SUB
None
None
Cold-side ESP
3
0
Midwest
JOLIET 29
72
SUB
None
None
Cold-side ESP
J
0
Midwest
JOLIET 29
81
SUB
None
None
Cold-side ESP
3
0
Midwest
JOLIET 29
82
SUB
None
None
Cold-side ESP
3
0
Midwest
JOLIET 9
5
SUB
None
None
old-side ESP
3
0
Midwest
CRAWFORD
7
SUB
None
None
old-side ESP
3
0
Midwest
CRAWFORD
8
SUB
None
None
old-side ESP
3
0
Midwest
POWERTON
51
SUB
None
None
old-side ESP
3
0
Midwest
POWERTON
52
SUB
None
None
old-side ESP
J
0
Midwest
POWERTON
61
SUB
None
None
old-side ESP
0
0
Midwest
POWERTON
62
SUB
None
None
old-side ESP
0
0
Midwest
WAUKEGAN
17
SUB
None
None
Cold-side ESP
0
0
Midwest
WAUKEGAN
7
SUB
None
None
Hot-side ESP
3
0
TOXECON assumed
Midwest
WAUKEGAN
8
SUB
None
None
Cold-side ESP
0
0
Midwest
WILL COUNTY
1
SUB
None
None
Cold-side ESP
0
Midwest
WILL COUNTY
2
SUB
None
None
Cold-side ESP
3
0
Midwest
WILL COUNTY
3
SUB
None
None
Hot-side ESP
3
0
OXECON assumed
Midwest
'WILL COUNTY
4
SUB
None
None
Cold-side ESP
3
0
Midwest
FISK
19
SUB
None
None
Cold-side ESP
3
0
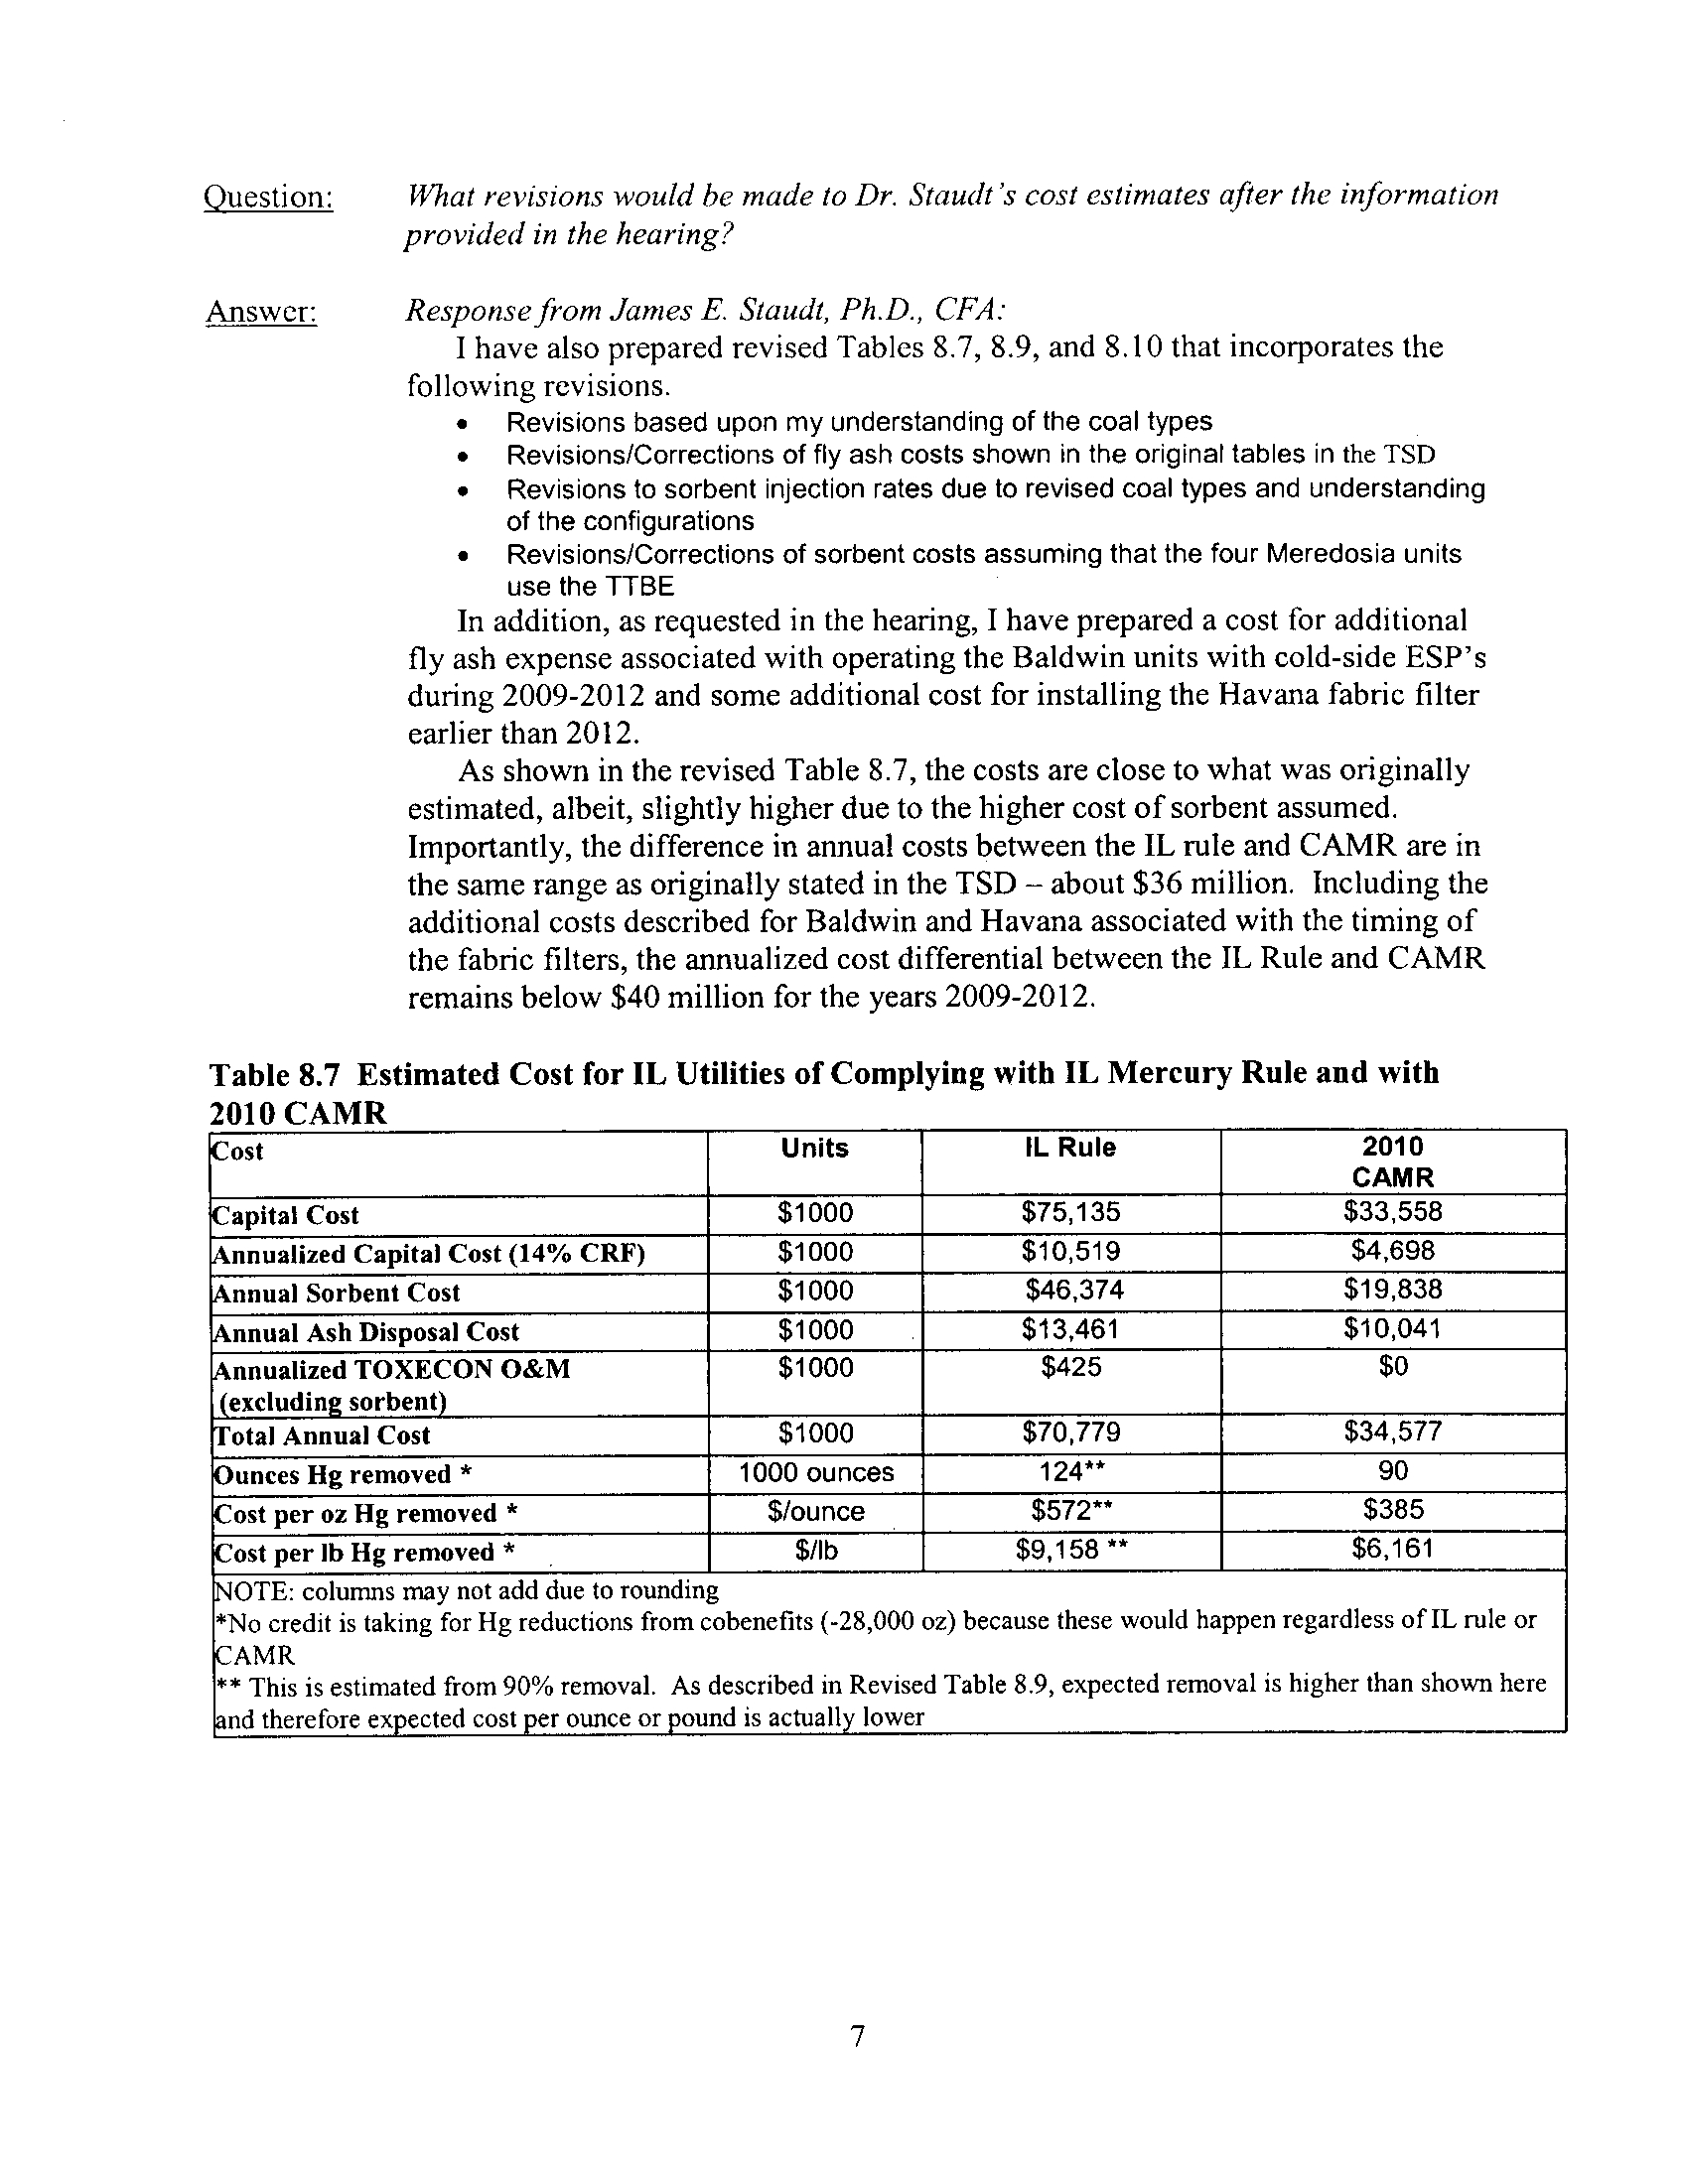
Question :
What revisions would be made to Dr. Staudt's cost estimates after the information
provided in the hearing?
Answer :
Response from James E. Staudt, Ph.D., CFA:
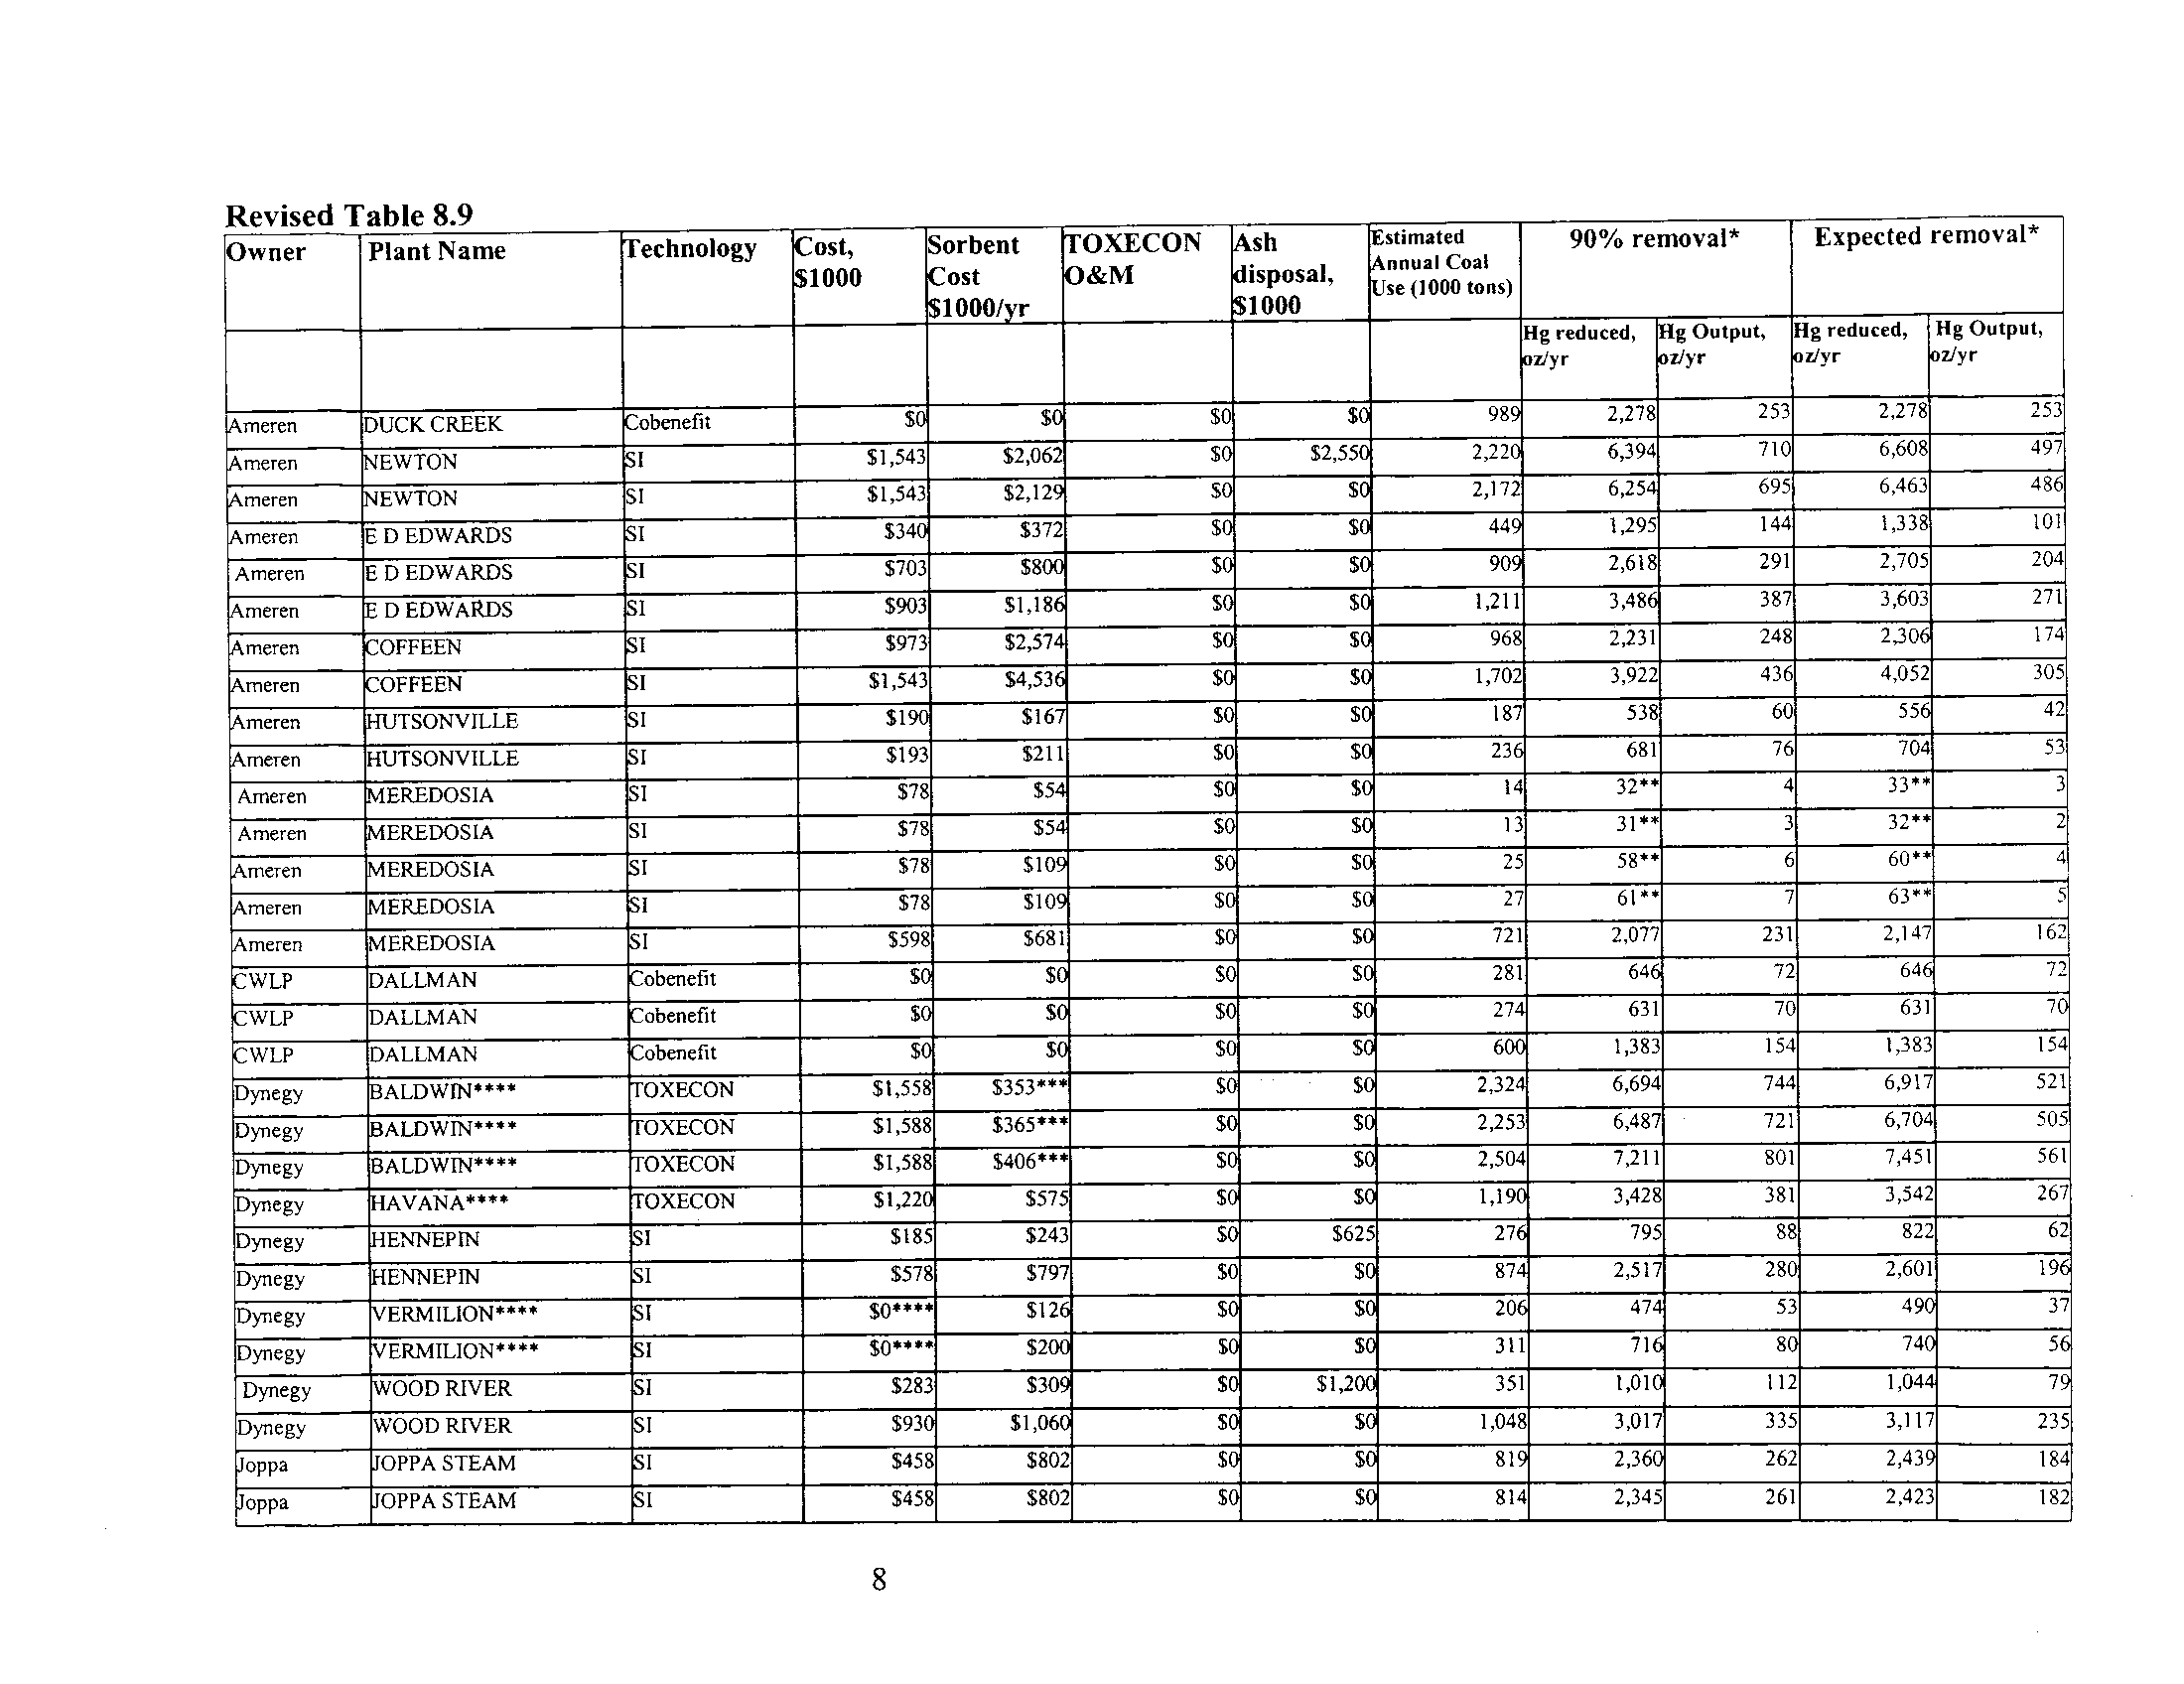
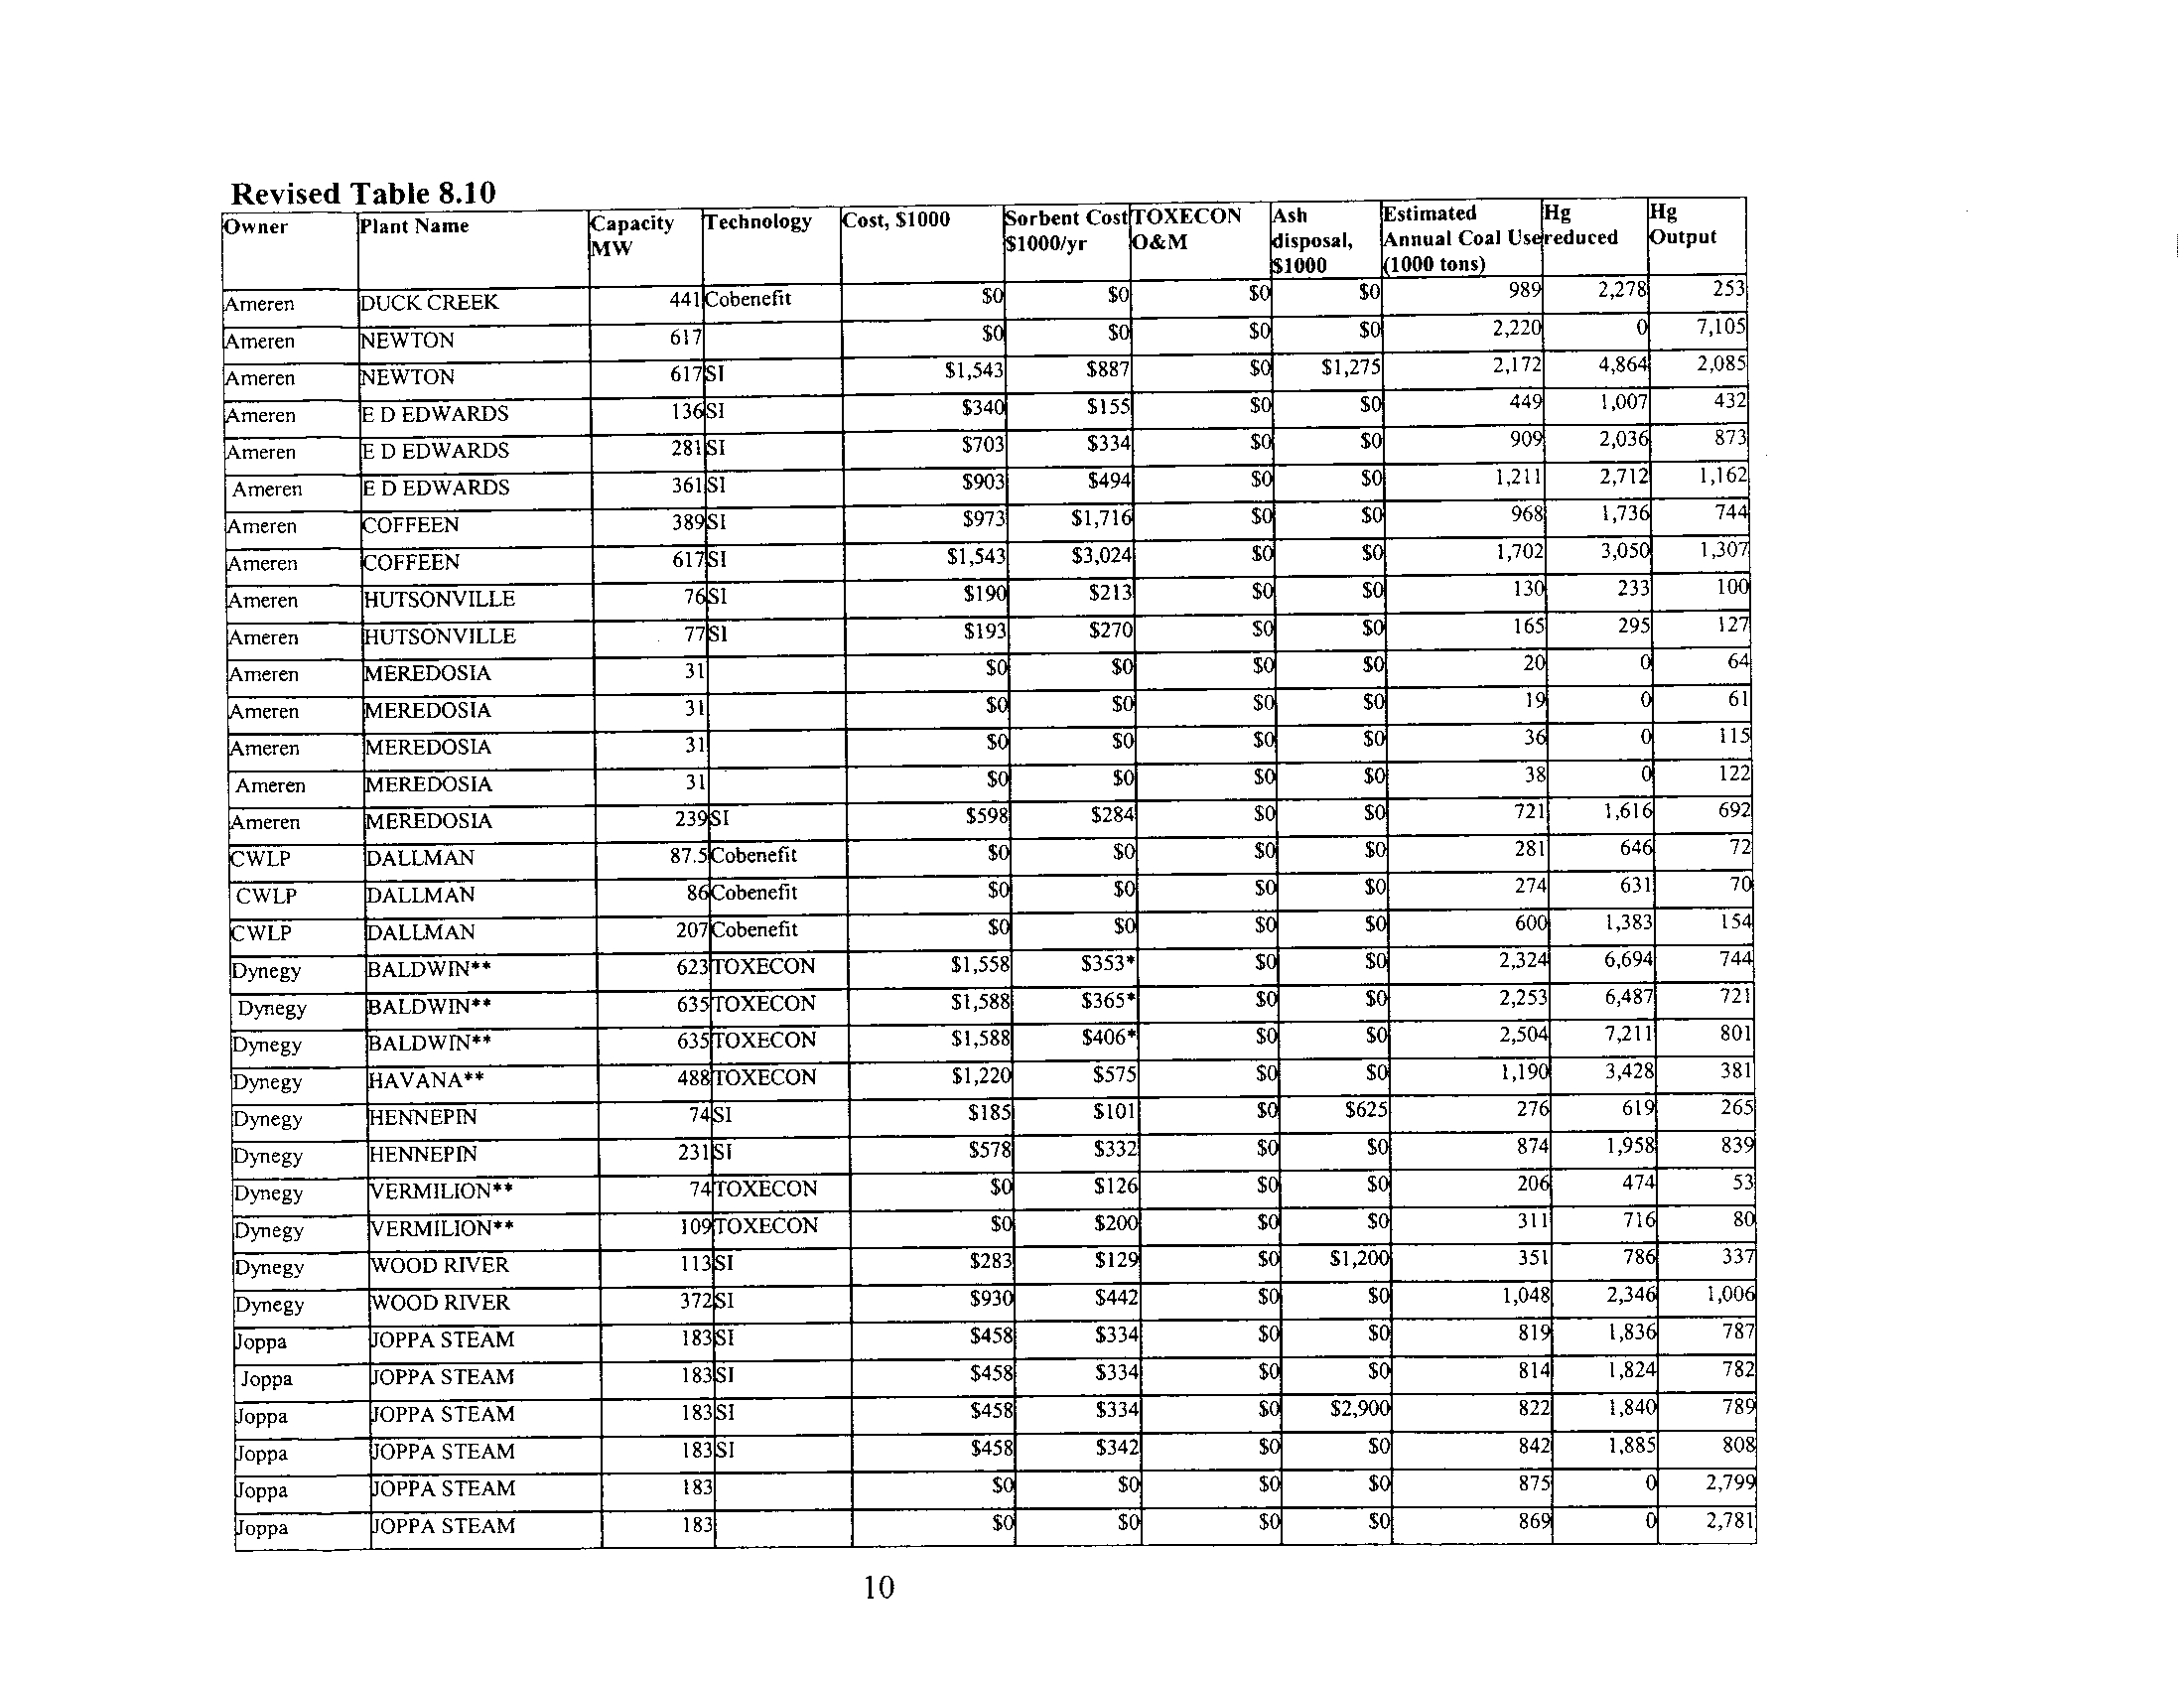
I have also prepared revised Tables 8 .7, 8.9, and 8 .10 that incorporates the
following revisions
.
•
Revisions based upon my understanding of the coal types
•
Revisions/Corrections of fly ash costs shown in the original tables in
the TSD
•
Revisions to sorbent injection rates due to revised coal types and understanding
of the configurations
•
Revisions/Corrections of sorbent costs assuming that the four Meredosia units
use the TTBE
In addition, as requested in the hearing, I have prepared a cost for additional
fly ash expense associated with operating the Baldwin units with cold-side ESP's
during 2009-2012 and some additional cost for installing the Havana fabric filter
earlier than 2012
.
As shown in the revised Table 8 .7, the costs are close to what was originally
estimated, albeit, slightly higher due to the higher cost of sorbent assumed
.
Importantly, the difference in annual costs between the IL rule and CAMR are in
the same range as originally stated in the TSD - about $36 million. Including the
additional costs described for Baldwin and Havana associated with the timing of
the fabric filters, the annualized cost differential between the IL Rule and CAMR
remains below $40 million for the years 2009-2012
.
Table 8.7 Estimated Cost for IL Utilities of Complying with IL Mercury Rule and with
2010 CAMR
7
Cost
Units
IL Rule
2010
CAMR
Capital Cost
$1000
$75,135
$33,558
Annualized Capital Cost (14% CRF)
$1000
$10,519
$4,698
Annual Sorbent Cost
$1000
$46,374
$19,838
Annual Ash Disposal Cost
$1000
$13,461
$10,041
Annualized TOXECON O&M
(excluding sorbent)
$1000
$425
$0
Total Annual Cost
$1000
$70,779
$34,577
Ounces Hg removed *
1000 ounces
124**
90
Cost per oz Hg removed *
$/ounce
$572**
$385
Cost per lb Hg removed *
$/Ib
$9,158 **
$6,161
NOTE: columns may not add due to rounding
*No credit is taking for Hg reductions from cobenefits (-28,000 oz) because these would happen regardless of IL rule or
CAMR
** This is estimated from 90% removal. As described in Revised Table 8 .9, expected removal is higher than shown here
and therefore expected cost per ounce or pound is actually lower
Revised Table 8.9
Owner
Plant Name
ethnology
ost,
Sorbent
OXECON
sh
sfimated
1000
ost
&M
isposal,
nnual Coal
1000/ r
1000
se (1000 tons)
Hg reduced
g Output
Hg reduced,
Hg Output
z/yr
or/yr
az/yr
oLyr
meren
2,278
253
2,278
253
me en
6,394
710
6,608
497
meren
6,254
695
6,463
486
meren
1,295
144
1,338
101
Ameren
2,618
291
2,705
204
DEDWAI2DS
$903
1,211
387
3,603
248
230
436
4,052
538
60
556
681
76
704
53
Ameren
EREDOSIA
$78~
14
4
33**
~~
31
3
32
•'
58'
6
60"
4
$78
27
7
63**
2 07
231
2,147
162
64
72
646
631
70
631
DALLMAN
obenefit
154
1,383
744
6,917
721
6,704
801
7,451
381
3,542
88
822
280
2,601
53
49
80
74
Dyneg
OODA[VER
$283
$30
$
$12
35
1,010
112
1,044
7
Dynegy
WOOD RIVER
$93
$1,06
$
1,048
3,017
335
3,117
235
oppa
OPPA STEAM
$458
$802
$
81
2,360
262
2,439
18
oppa
OPPA STEAM
$458
$802
81
2,345
261
2,423
182
8
9
18
Joppa
OPPA STEAM
$458
$802
$0
1
822
2,36 .
263
2 4 5
Joppa
OPPA S LAM
$458
$822
$0
$1
8 2
2.424
269
2,505
89
Joppa
OPPA STEAM
$458
$852
$0
351
875
2,5
•
280
2,603
196
195'
Joppa
OPPA STEAM
SI
$458
$852
$0
$1
86
•
2,503
278
2 586
Kincaid
INCAID
$1,650
$1,808
$1'
$e
1,824
5,252
58
5,427
408
Kincaid
KINCAID
S1
$ ,651
$216
•
$0
$1
2,122
6,111
679
6,314
75
Marion
ARION
obenefi
$1
$1
$
$1
642
1 78
164
1 78
164
Canon
ARION
obenefi
$0
$1
$
$1
42
973
08
973
108
Midwest
OLIET 29
$825
$723
$0
1
76
2,20
245
1
172
M d est
OLIET 29
$825
$8
$
$
2,703
300
2,793
211
dwest
OLIET 29
S1
$825
$90
$
$
2,758
306'
2,85
215
Mid es
OLIET 29
$825
$90
$
$
2,758
306
2,8
21,
1
Mid est
OL ET 9
S1
$900
$1,578
$
2 62
0
4,089
454
4,225
3181
id e
RA FORD
$598
$66
$0
$825
2,175
242
2,248
169
Midwest
RAWFORD
1
$895
$1,02
$
$
3,223
358
3,331
251
idwest
I-OWERTON
~~
$1,46
$0
1
1,52
.
486
4,522
Mid es
OWERTON
$1,
6
$1,371
$0
$
1
18
4,085
454
4,221
318
Mid est
0 ERTON
$1,1
$1 371
$
1418
4,085
454
4,221
318
Mid es
0
ERTON
$1,116
$1,345
$
1393
4,01
4
4
5
312
id est
AUKEGAN
$303
$398
$0
63
44
1,28
143
2
10
id es
AUKEGA
OXECON
19,68
$53
24
$
1,10
3,185
35
3 8b
35
d est
WAUKEGAN
$888
$1,20
$
$
1,21
3,504
389
3,621
73
idwest
ILLCOUNTY
~~
$257
$
~
~~
824
92
851
64
id es
ILLCOUNTY
*1
$46
$302
$
343
988
110
1,02
7
Mid es
ILL COUNTY
OXECON
$179
40
$183
$
858
2 7
275
2 47
27
Md es
ILLCOUNTY
$1 495
$1,638
$
$
1,653
4 6
529
492
3
idwest
1ISK
$935
11
$0
11
99
2,86
319
2,964
223
otal
1
1
$75,13
$46,374
$425
$13,461
53,95
15 ,65
16,851
156,27
12,230
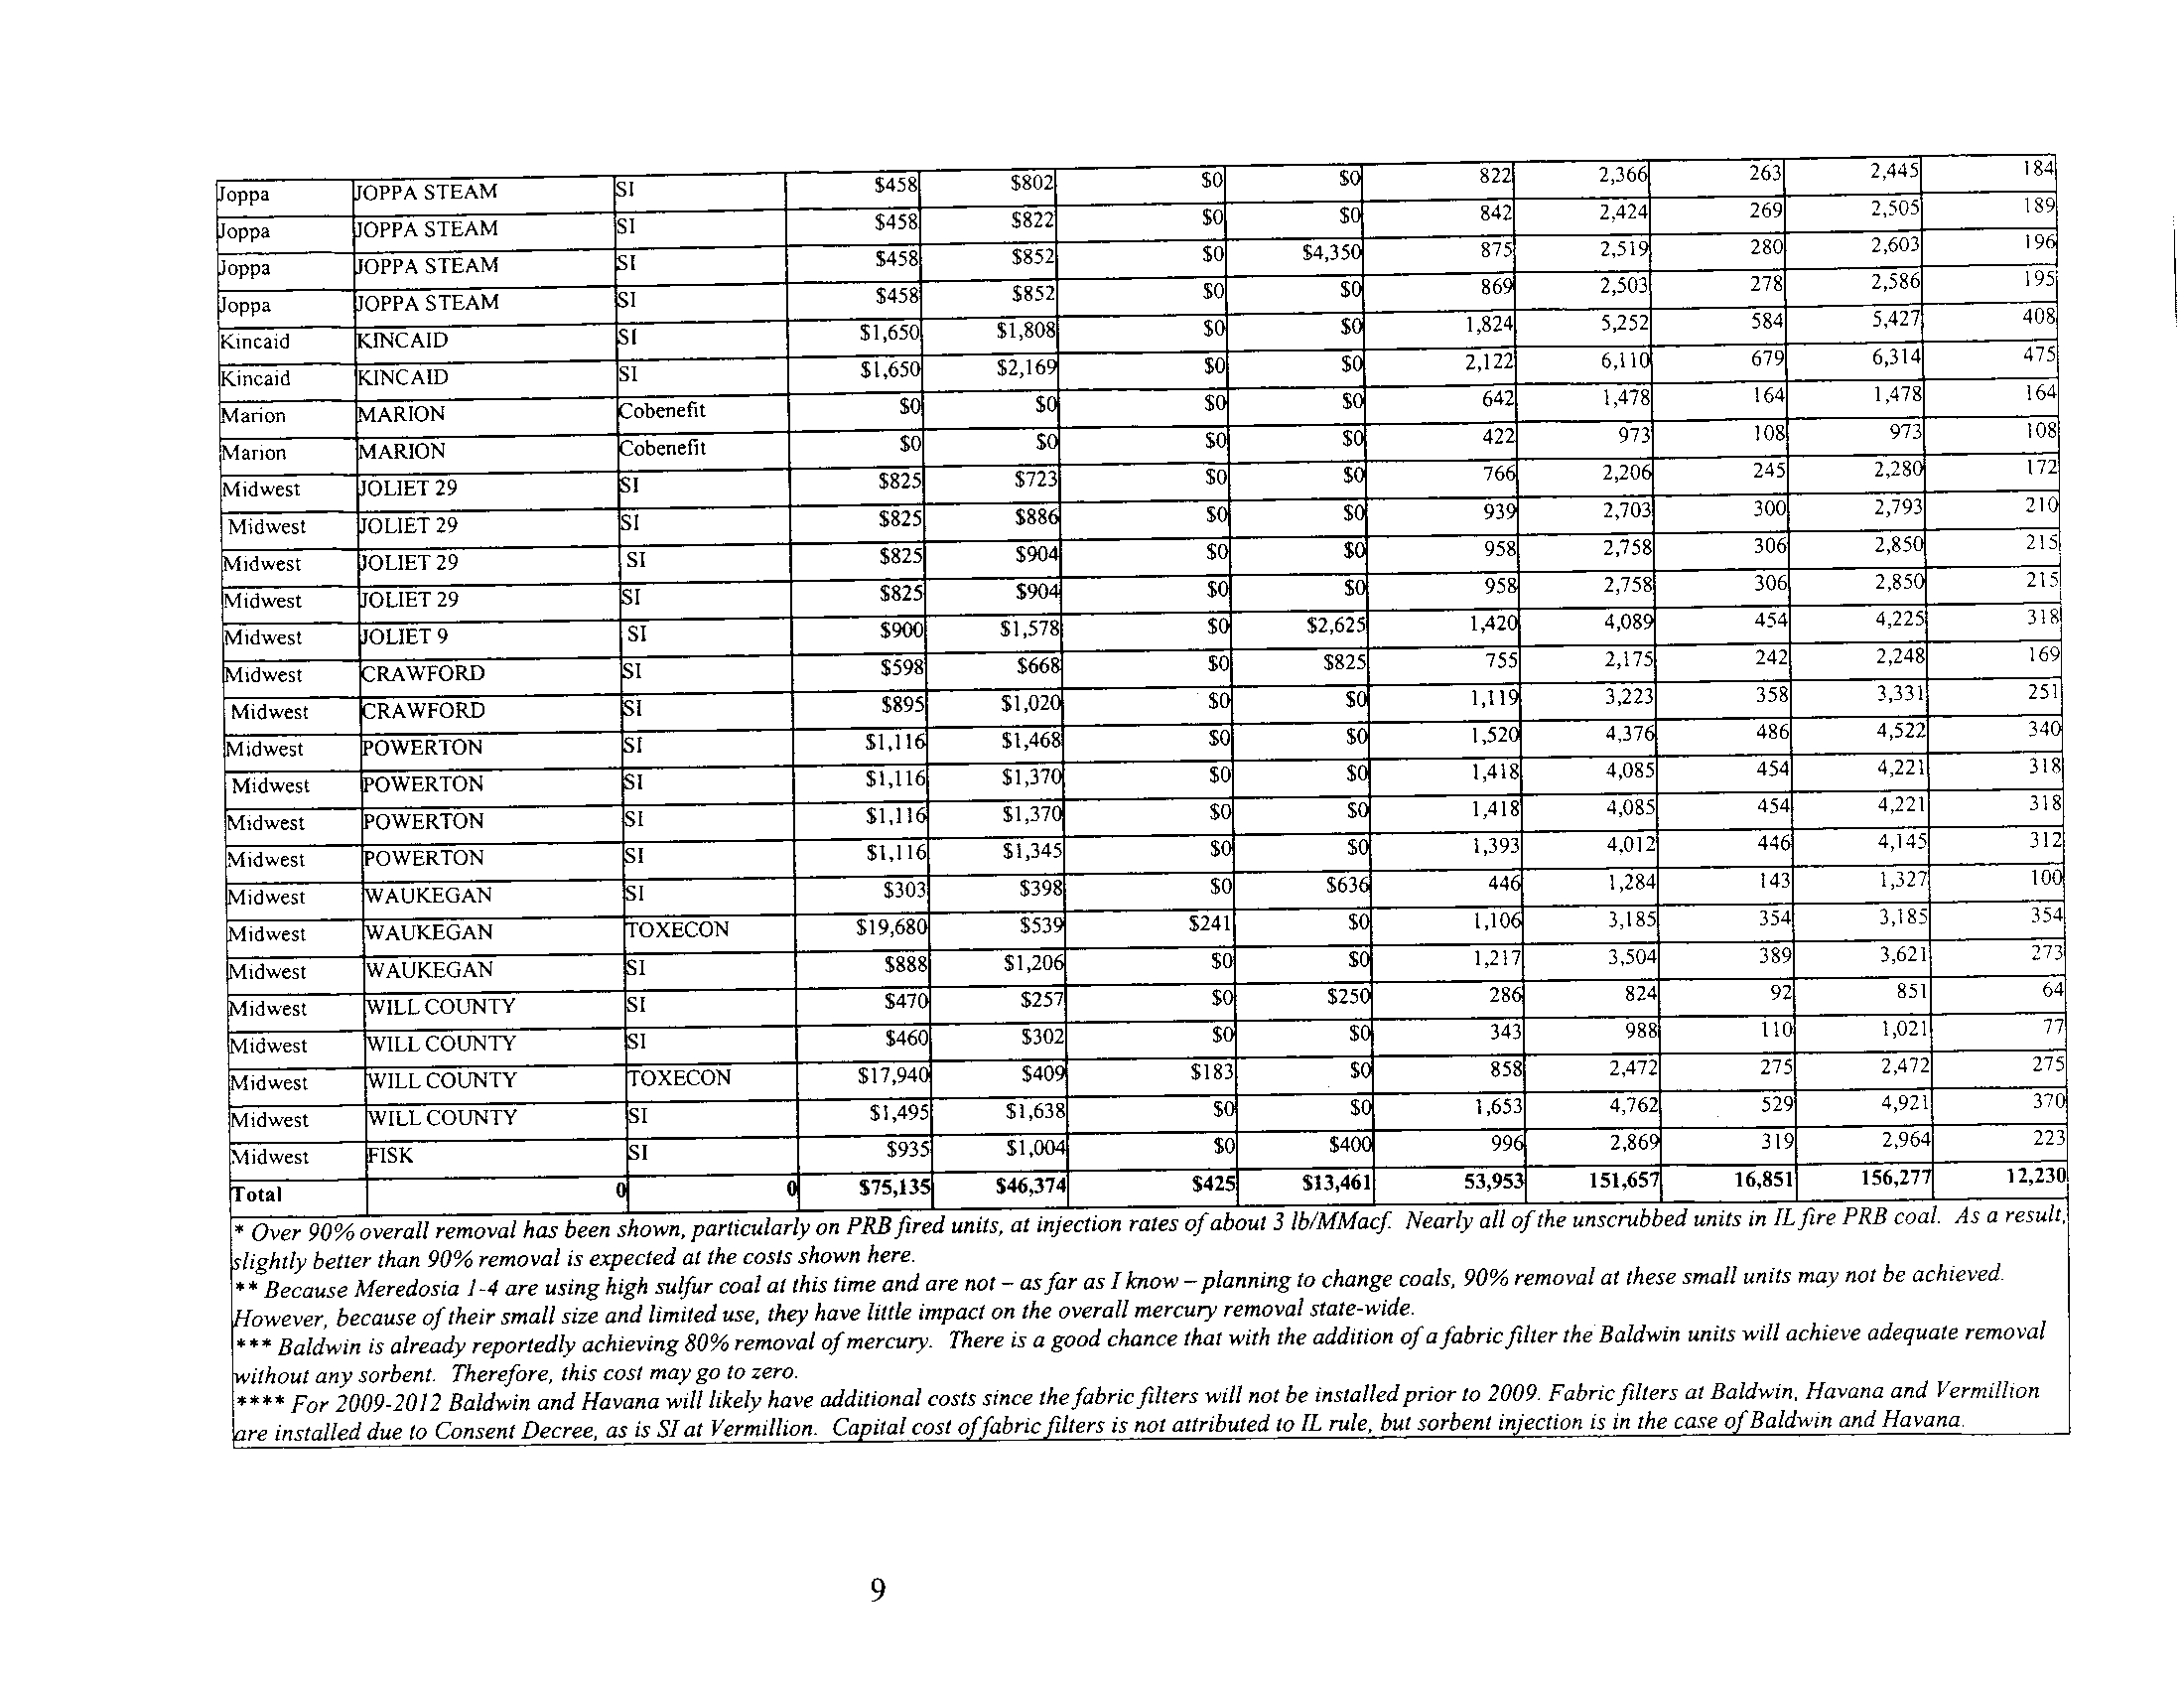
* Over 90% overall removal has been shown, particularly on PRB fired units, at injection rates of about 3 lb/MMacf . Nearly all of the unscrubbed units in IL fire PRB coal. As a result,
lightly better than 90% removal is expected at the costs shown here .
"* Because Meredosta 1-4 are using high sulfur coal at this time and are not - as far as I know -planning to change coals, 90% removal at these small units may not be achieved.
owever, because of their small size and limited use, they have little impact on the overall mercury removal state-wide .
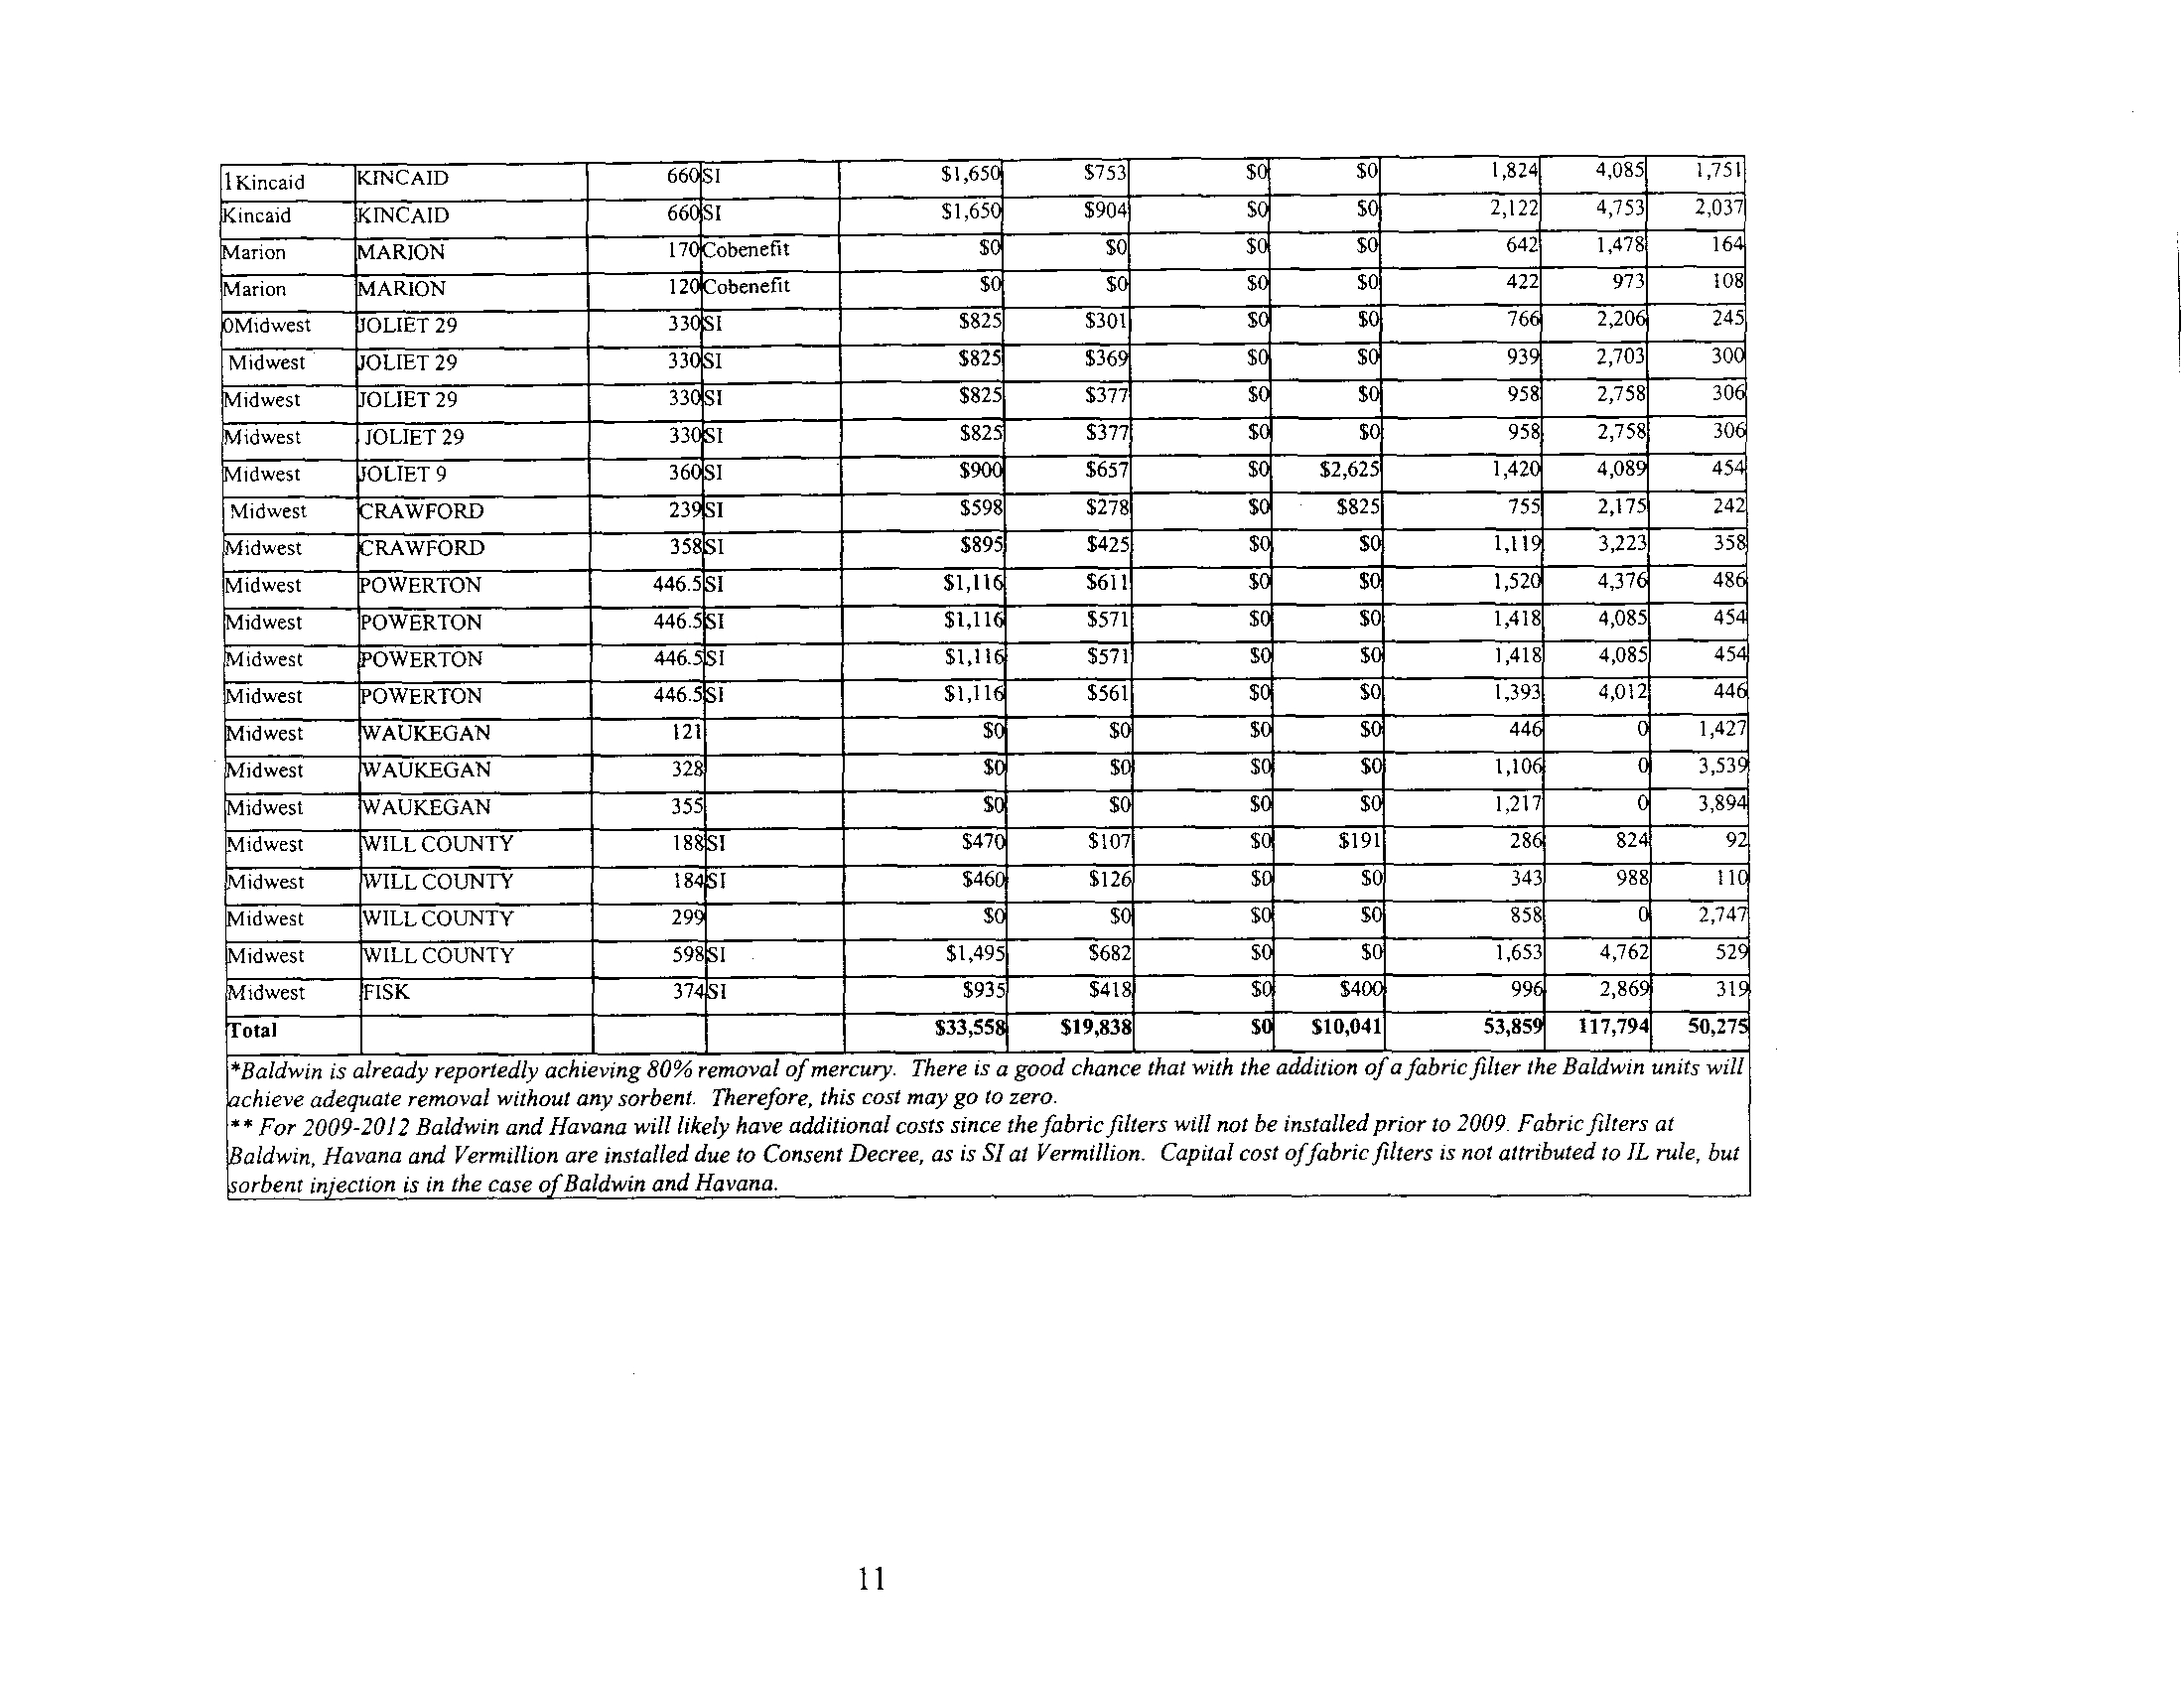
-"Baldwin is already reportedly achieving 80% removal of mercury. There is a good chance that with the addition of a fabric filter the Baldwin units will achieve adequate removal
ithout any sorbent. Therefore, this cost may go to zero
.
**** For 2009-2012 Baldwin and Havana will likely have additional costs since the fabric filters will not be installed prior to 2009 . Fabric filters at Baldwin, Havana and Vermillion
lore installed due to Consent Decree, as is Sl at Vermillion . Capital cost offabric filters is not attributed to IL rule, but sorbent injection is in the case of Baldwin and Havana .
10
AC
I, t1 K auIc V,1 V
Plant Name
apathy
w
ethnology
ost, $1000
OXECON
&M
sh
isposal,
1000
stima
s
all Coal Us
1000 tons
reduced
8
u pu
EDEDWARDS ~~
$34
$~-
1,007
432
D EDWARDS
281
1
$
90
2,03
873
Ameren
EDEDWARDS
361
~~
1,211
2,712
1 62
•
OFFEEN
~
$
$
968
w
OFFEEN
61
~~
1,702
3,05
30
•
HUTSONVILLE
UL
90
$
13
233
m
,
E
0
1
I
t
EREDOSIA
31
C
1
61
MEREDOSIA
31
C
1
$
Ameren
EREDOSIA
31
C
38
C
122
EREDOSIA
721
1,61
692
~aALLMAN
87.5
obenefit
C
281
64
72
CWLP
IIALLMAN
8
obenefit
C
I
$$
$0
274
631
1
IIALLMAN
207
obenefit
C
I
$
1
60
1,383
C
Dynegy
ENNEPIN !I
$
$625
61
265
Dynegy
HENNEPIN
231,
$
874
1,95
Dynegy
ERMILION**
OXECON
C
$
1
20
53
Dynegy
ERMILION**
10
OXECON
C
$
1
311-1
Dynegy
DOD RIVER
113s~
$
II
351
~~
Dynegy
OOD RIVER
~I
C
$
$
1,048
•
1 00
oppa
OPPA STEAM
183.
$
IC
787
Joppa
PPA STEAM
18
I
$458
$334
$1
814
1,82'
78
1
oppa
OPPA STEAM
183
1
$458
$334
I
$2,'11
822
1,8 0
789
oppa
OPPA STEAM
183
1
$45
$342
$I
I
842
1,885
808
oppa
OPPA STEAM
183
$
$1
$1
I
875
1
2,799
oppa
OPPA STEAM
183
$
1
I
I
86'
1
2,781
11
IKincaid
KINCAID
661
$1,651
$753
1
$
1824
4,085
1,75
incatd
INCAID
66 SI
$1,65
$904
1
2,122
4,753
2037
anon
MARION
2
obenefit
$
$0
$
1
642
1,478
16
Marion
ARION
obenefit
$
$
$
$0
422
973
108
Midwest
OLIET 29 ~C
$825
$301
$
76
2,20
245
Midwest
OLIET 29
I i
$825
$36
$
1
93
2,703
30
idwest
OLIET 29
$825
$377
$
$
958
2,758
30
idwest
JOLIET 29
--
1
$377
$
1
958
2,758
30
idwest
OLIET 9
36111
[
$657
$
$2,625
1,42
4,08
Midwest
RAWFORD
'
I
$598
$278
$
$825
755
2,175®
idwest
RAWFORD ~~
$895
$425
$5a
3,223
Midwest
IOWERTON
446.5Ct
$1,11
$611
$
2
1,52~-M
idwest
POWERTON
446.5~~
$571
$
$0
1,418
4,085
idwest
POWERTON
446.L
$1,11
$571
$
1,418
4,085
idwest
IOWERTON
446.5
$1,11
$561
$
$0
1,393
4,012
idwest
121
$
0
$
SI
E
1 427
idwest~~
$
$5
1,10
idwest
355
$
I
$
5
1,217
3 89
Midwest
ILL COUNTY
5C~
$47
$107
$
$191
* 1
9
Midwest
ILL COUNTY
~~
$46
$
$0
343
988
idwest
FISK ~~
$9357
S
11
99
2,86
o al
$3355
$19,83
$1
$ 0,04
53,85
17 79
50,27
*Baldwin is already reportedly achieving 80% removal of mercury . There is a good chance that with the addition of a fabric filter the Baldwin units will
rchieve adequate removal without any sorbent. Therefore, this cost may go to zero .
* For 2009-2012 Baldwin and Havana will likely have additional costs since the fabric filters will not be installed prior to 2009
. Fabric filters at
ialdwin, Havana and Vermillion are installed due to Consent Decree, as is Slat Vermillion. Capital cost offabric filters is not attributed to IL rule, but
orbent injection is in the case of Baldwin and Havana .
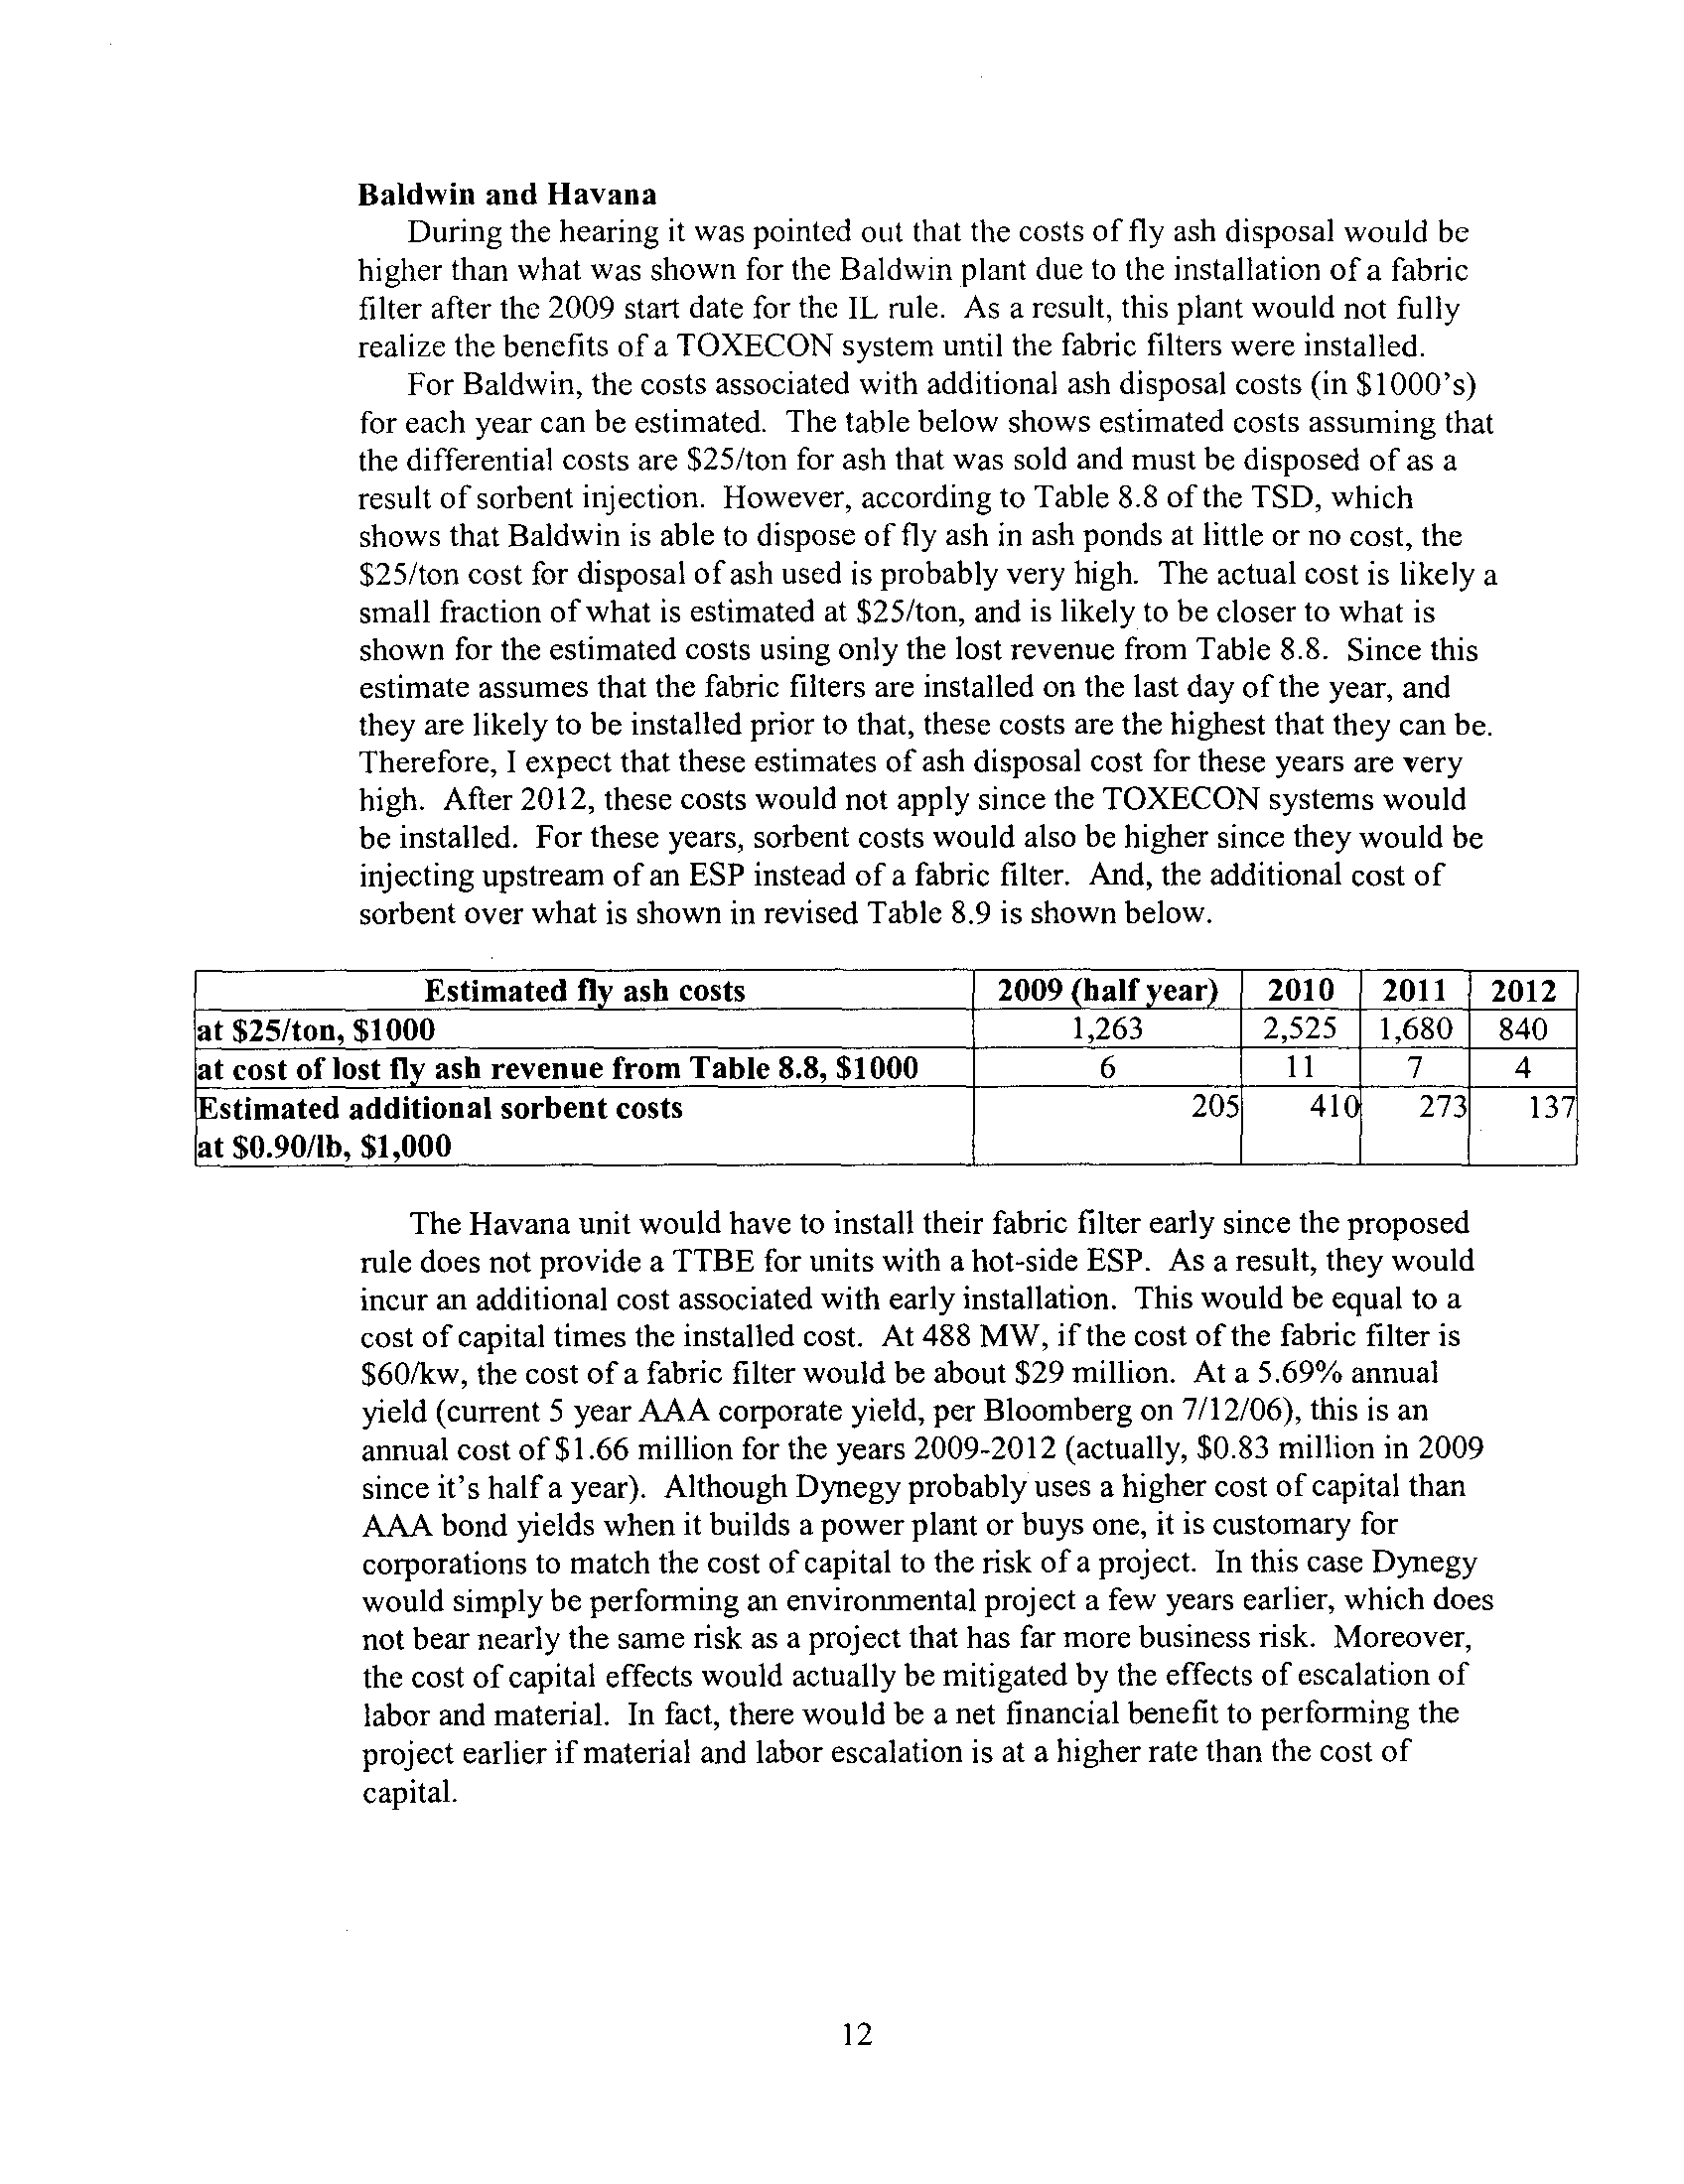
Baldwin and Havana
During the hearing it was pointed out that the costs of fly ash disposal would be
higher than what was shown for the Baldwin plant due to the installation of a fabric
filter after the 2009 start date for the IL rule . As a result, this plant would not fully
realize the benefits of a TOXECON system until the fabric filters were installed
.
For Baldwin, the costs associated with additional ash disposal costs (in $1000's)
for each year can be estimated. The table below shows estimated costs assuming that
the differential costs are $25/ton for ash that was sold and must be disposed of as a
result of sorbent injection . However, according to Table 8 .8 of the TSD, which
shows that Baldwin is able to dispose of fly ash in ash ponds at little or no cost, the
$25/ton cost for disposal of ash used is probably very high . The actual cost is likely a
small fraction of what is estimated at $25/ton, and is likely to be closer to what is
shown for the estimated costs using only the lost revenue from Table 8 .8. Since this
estimate assumes that the fabric filters are installed on the last day of the year, and
they are likely to be installed prior to that, these costs are the highest that they can be
.
Therefore, I expect that these estimates of ash disposal cost for these years are very
high. After 2012, these costs would not apply since the TOXECON systems would
be installed. For these years, sorbent costs would also be higher since they would be
injecting upstream of an ESP instead of a fabric filter . And, the additional cost of
sorbent over what is shown in revised Table 8 .9 is shown below .
The Havana unit would have to install their fabric filter early since the proposed
rule does not provide a TTBE for units with a hot-side ESP. As a result, they would
incur an additional cost associated with early installation . This would be equal to a
cost of capital times the installed cost . At 488 MW, if the cost of the fabric filter is
$60/kw, the cost of a fabric filter would be about $29 million . At a 5.69% annual
yield (current 5 year AAA corporate yield, per Bloomberg on 7/12/06), this is an
annual cost of $1 .66 million for the years 2009-2012 (actually, $0 .83 million in 2009
since it's half a year). Although Dynegy probably uses a higher cost of capital than
AAA bond yields when it builds a power plant or buys one, it is customary for
corporations to match the cost of capital to the risk of a project. In this case Dynegy
would simply be performing an environmental project a few years earlier, which does
not bear nearly the same risk as a project that has far more business risk . Moreover,
the cost of capital effects would actually be mitigated by the effects of escalation of
labor and material. In fact, there would be a net financial benefit to performing the
project earlier if material and labor escalation is at a higher rate than the cost of
capital .
12
Estimated fly ash cos s
2009 (half year)
2010
2011
2012
at $25/ton, $1000
1,263
2,525
1,680
840
at cost of lost fly ash revenue from Table 8.8, $1000
6
11
7
4
Estimated additional sorbent costs
at $0.90/lb, $1,000
205
410
273
137
Further Amendment/Clarification to Hearing testimony from James E . Staudt,
Ph.D., CFA :
During the hearing I was questioned on my contribution to an article
published in Environmental Science and Technology titled "Control of Mercury
Emissions from Coal-Fired Electric Utility Boilers" coauthored with Ravi
Srivastava, Nick Hutson, Blair Martin and Frank Princiotta of US EPA . At the
time of the hearing I did not properly recall when I contributed to this article
.
Since the hearing, I have had the opportunity to check the timing of my work on
this. This article originates from work I performed for US EPA in late 2004 . US
EPA used this work in its White Paper entitled "Control of Mercury Emissions
from Coal Fired Electric Utility Boilers : An Update" issued on February 18,
2005 by US EPA's Office of Research and Development that is referenced in the
TSD. The material in this White Paper as well as work by others at US EPA was
subsequently used to form a basis of the Environmental Science and Technology
journal article that was entered into evidence . That the article took until spring of
2006 to get published probably reflects the slow process of integrating other
peoples work, the slow process of getting an article published in a prestigious
journal and the slow process of getting such an article through US EPA
administrative review on such a sensitive issue as mercury. For this reason, I
believe that the article does not accurately reflect the current state of technology,
which has advanced rapidly in the time since 2004 when I originally did the work
for US EPA .
To be clear, my work with US EPA is specifically limited to technology and
cost studies. Any conclusions of a policy nature in the White Paper or in the
journal article, such as regarding the timing of availability of technology for
complying with regulations, better reflect the official policy position of the US
EPA than my opinion. The section of the journal article "Outlook for technology
availability" clearly states that the opinions expressed regarding technology
availability are those of US EPA . These statements in the article that I coauthored
are correct statements because they are, in fact, US EPA's official policy position .
Whether I agree or disagree with US EPA's policy position is another matter. It
is my opinion that the US EPA positions in the Environmental Science and
Technology article regarding technology availability should not be taken to mean
that technology is not yet available for the applications we are discussing in
Illinois, although technology may or may not currently be available for other
applications. It is my opinion that the technology is available as described in the
TSD and as I have described in my other testimony .
Question
:
What is the average daily flow from all NPDES permits?
Answer :
Based on our information, the average daily flow from all NPDES permittees is
21,140 million gallons per day. This includes cooling water flows from power
plants (they intake river water, run it past hot equipment and then discharge it
back to the river) which are very voluminous
.
13
ADDITIONAL DOCUMENTS REQUESTED DURING THE JUNE12, 2006 HEARING
Attachment 1
:
Scope of Work Proportion from ICF Contract
Attachment 2
:
Scope of Work Proportion from Richard Ayres' Contract
Attachment 3
:
Scope of Work Proportion from Gerald Keeler's Contract
Attachment 4
:
Control Configuration Inspections at Illinois Coal-Fired Power Plants -
2006 (provided to the Board as complete copies and redacted copies for
the public record)
Attachment 5
:
Illinois Environmental Protection Agency comments to the U . S .
Environmental Protection Agency regarding Proposed National Emission
Standards for Hazardous Air Pollutants ; and in the Alternative, Proposed
Standards of Performance for New and Existing Stationary Sources
:
Electric Utility Steam Generating Untis, Proposed Rule; Propose Rule (69
Federal Register 4652, January 30, 2004) ("Proposal") and Supplemental
Notice for the Proposal (69 Federal Register 2397, March 16, 2004)
Attachment 6
:
IPM modeling data (Compact Disk, provided only to Board and Counsel
for: Ameren, Dynegy, Midwest Generation, Kincaid, Chicago Legal
Clinic, and Environmental Law and Policy Center)
Attachment 7 :
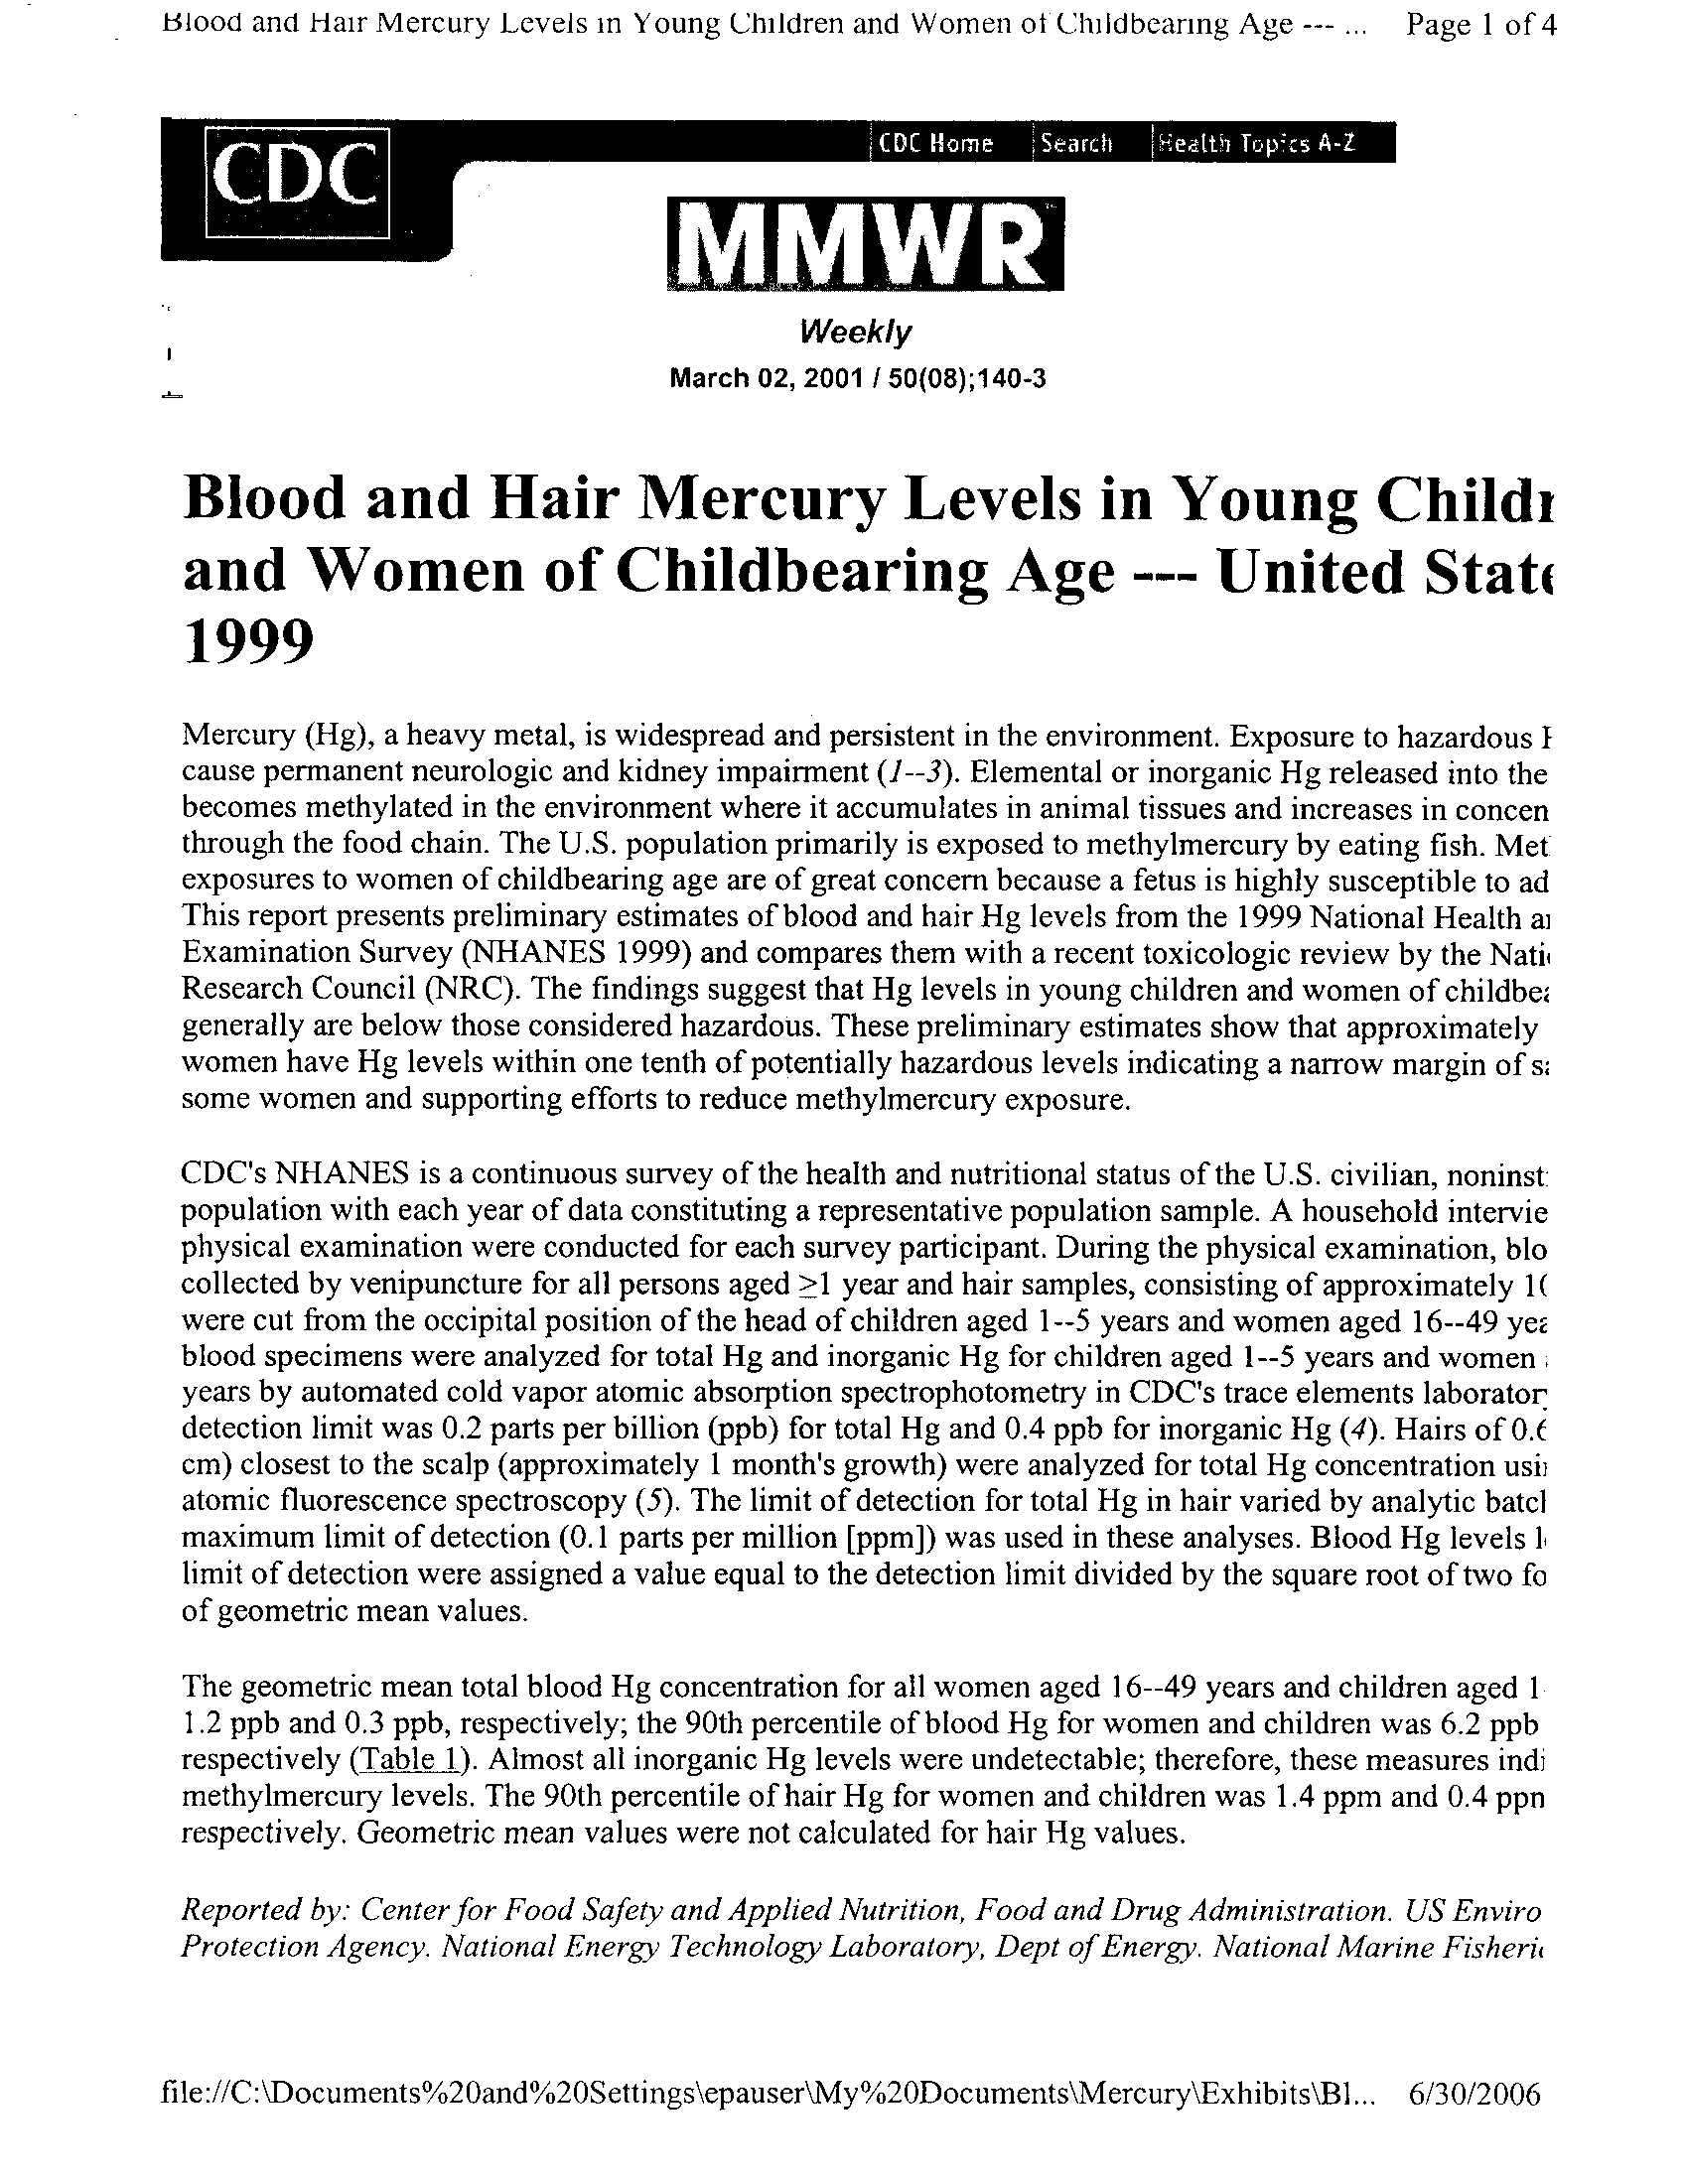
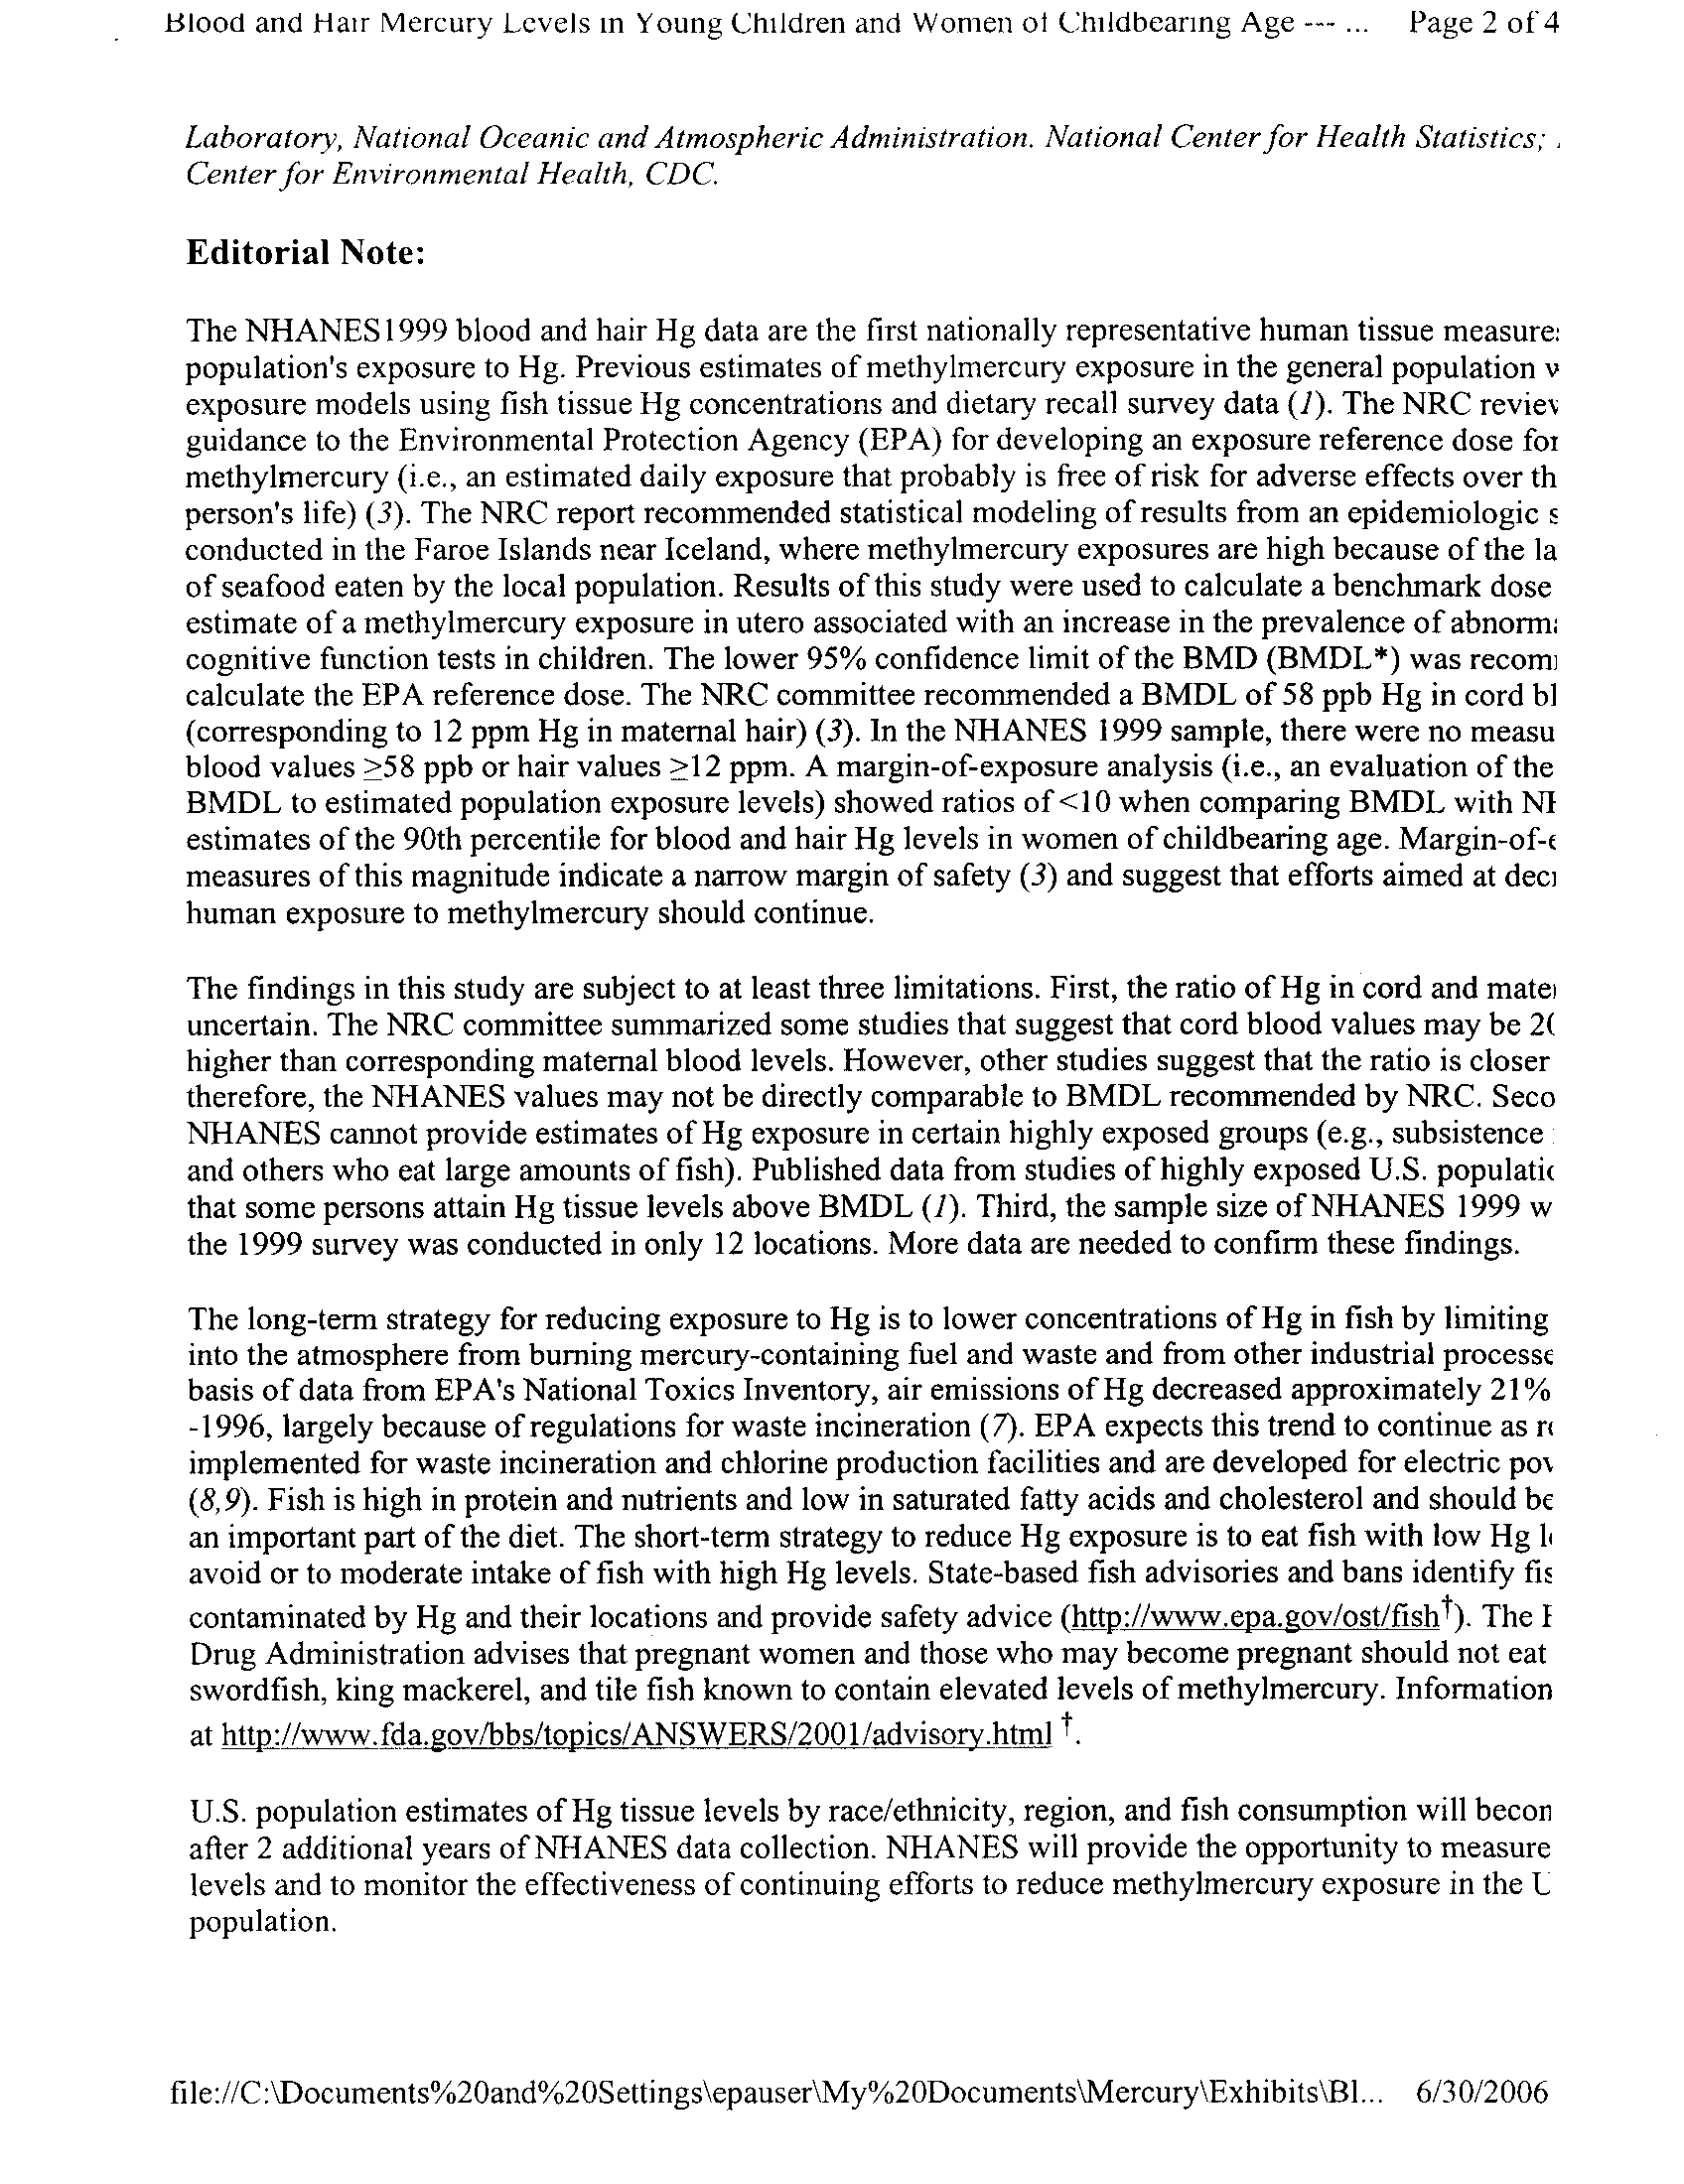
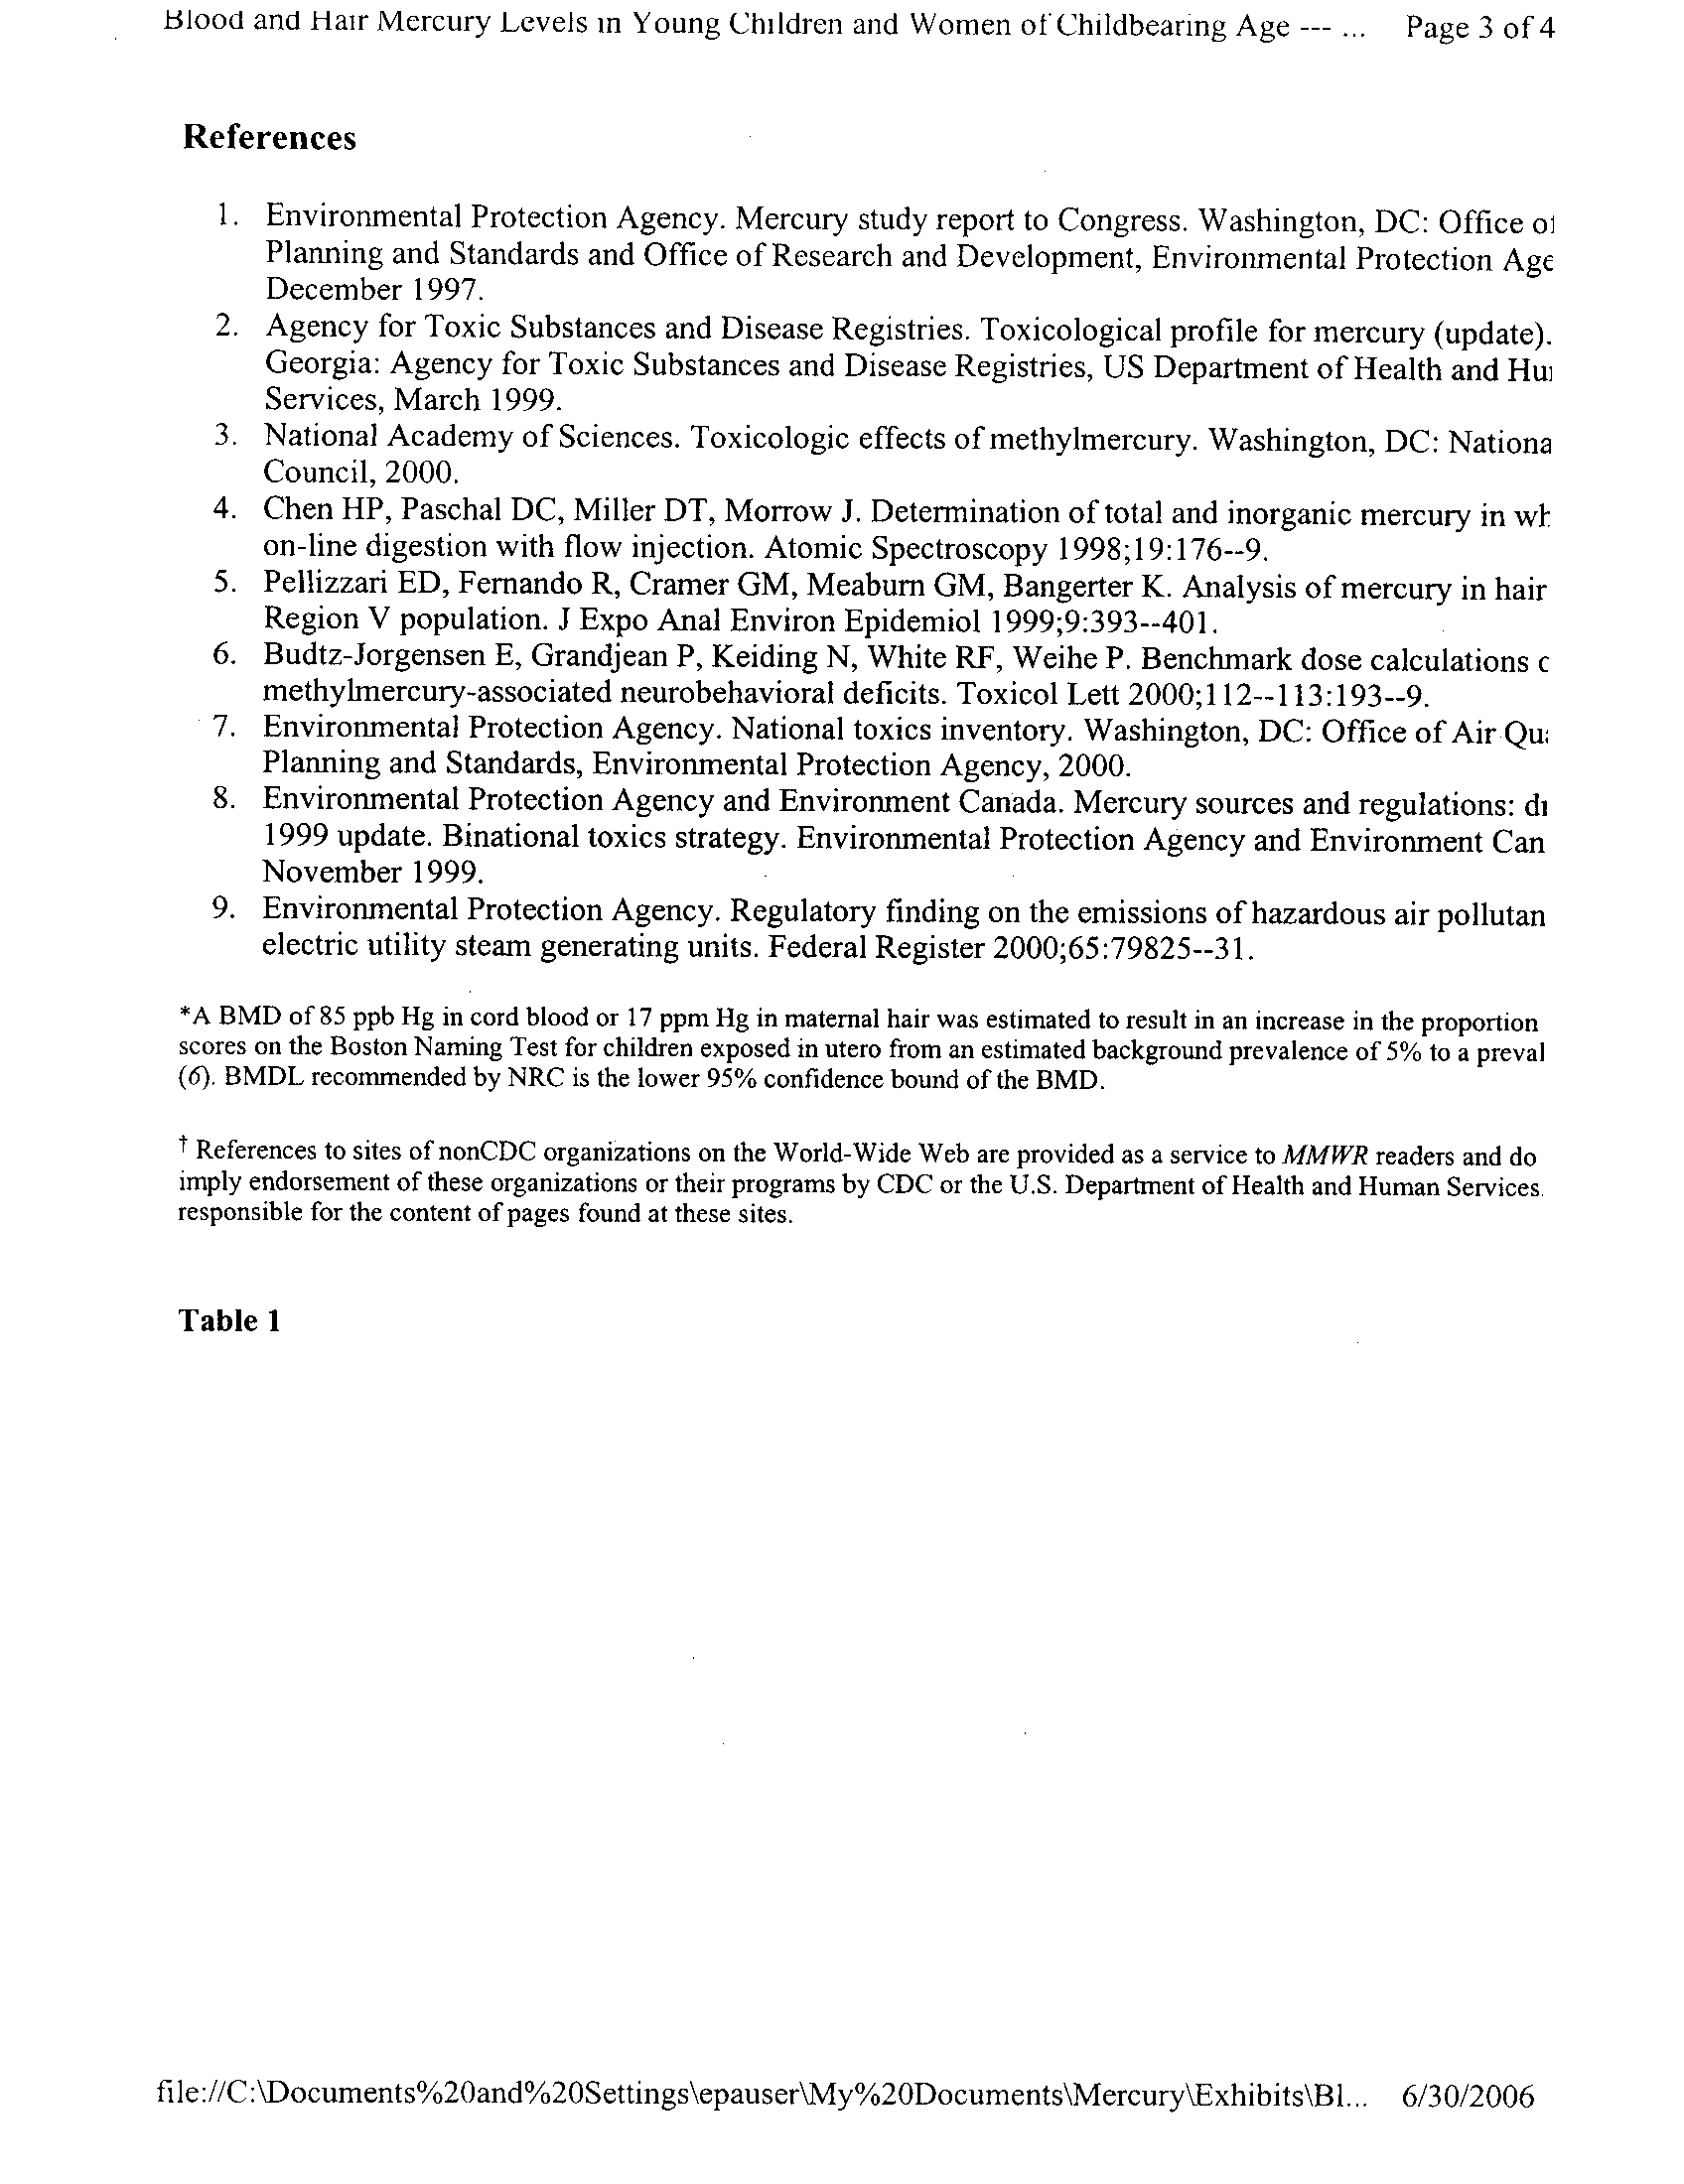
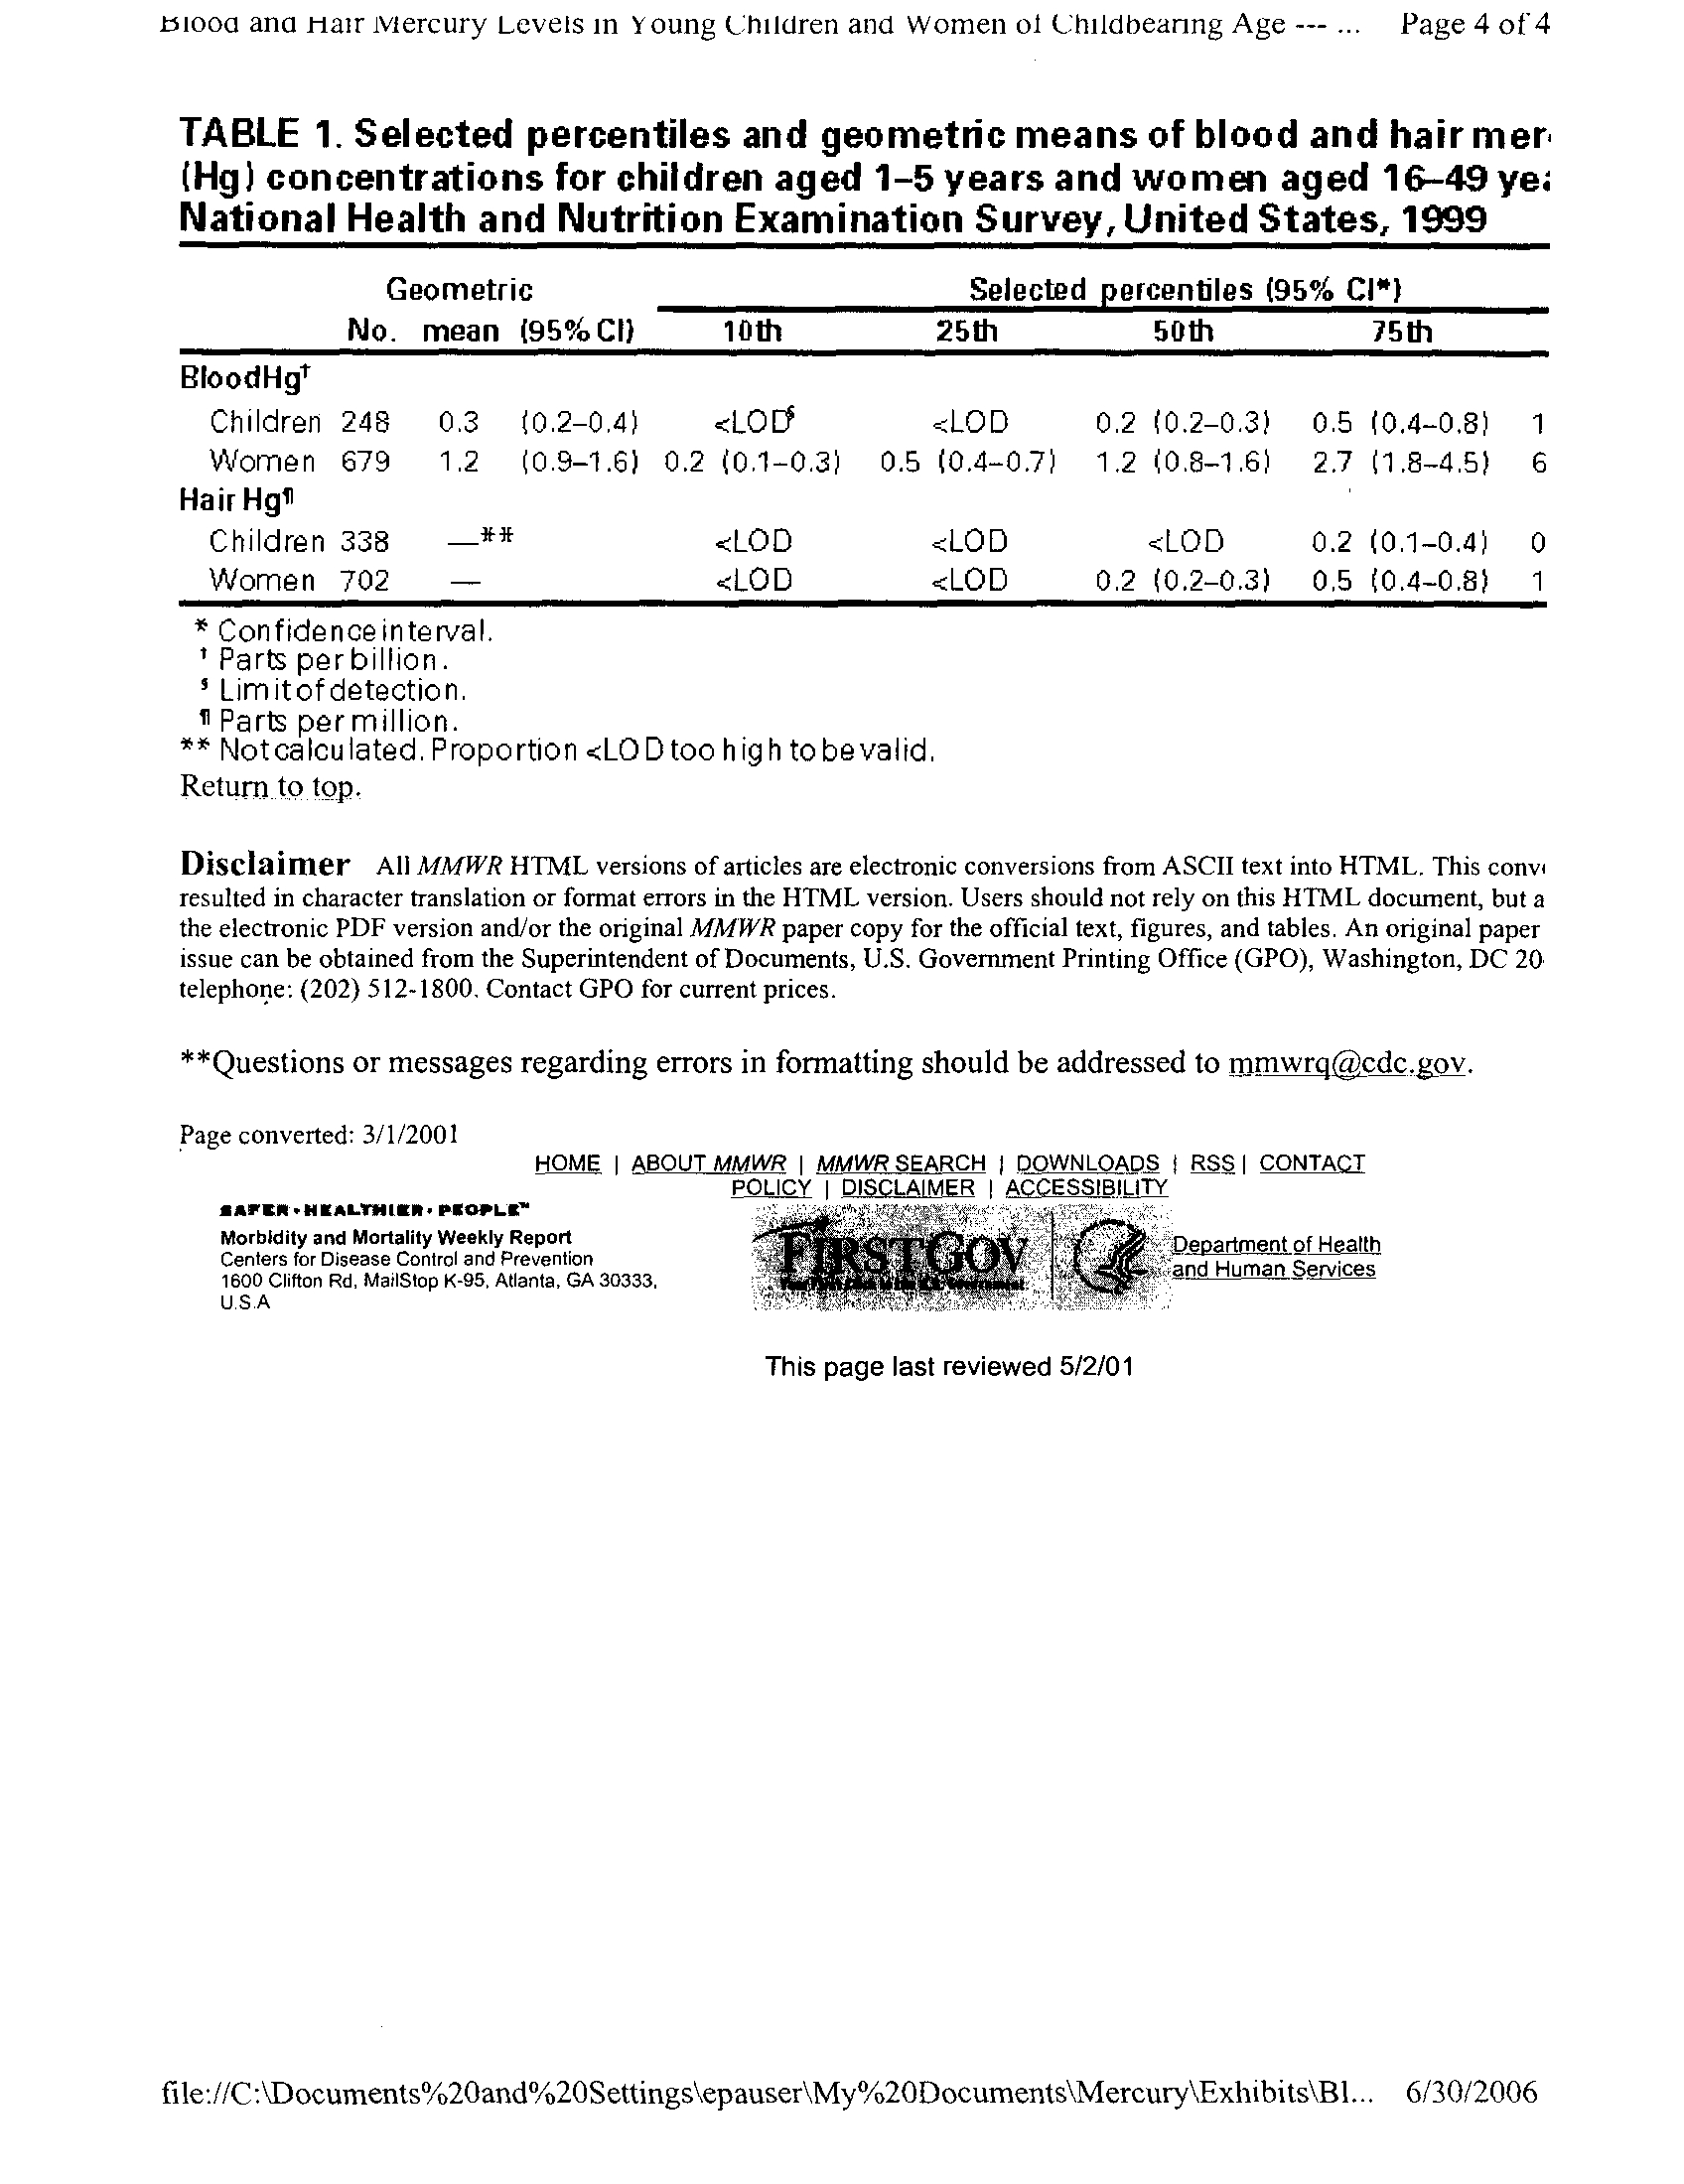
"Blood and Hair Mercury Levels in Young Children and Women of
Childbearing Age --- United States 1999"
Attachment 8
:
Dated: July 28, 2006
Illinois Environmental Protection Agency
1021 North Grand Avenue East
P.O. Box 19276
Springfield, Illinois 62794-9276
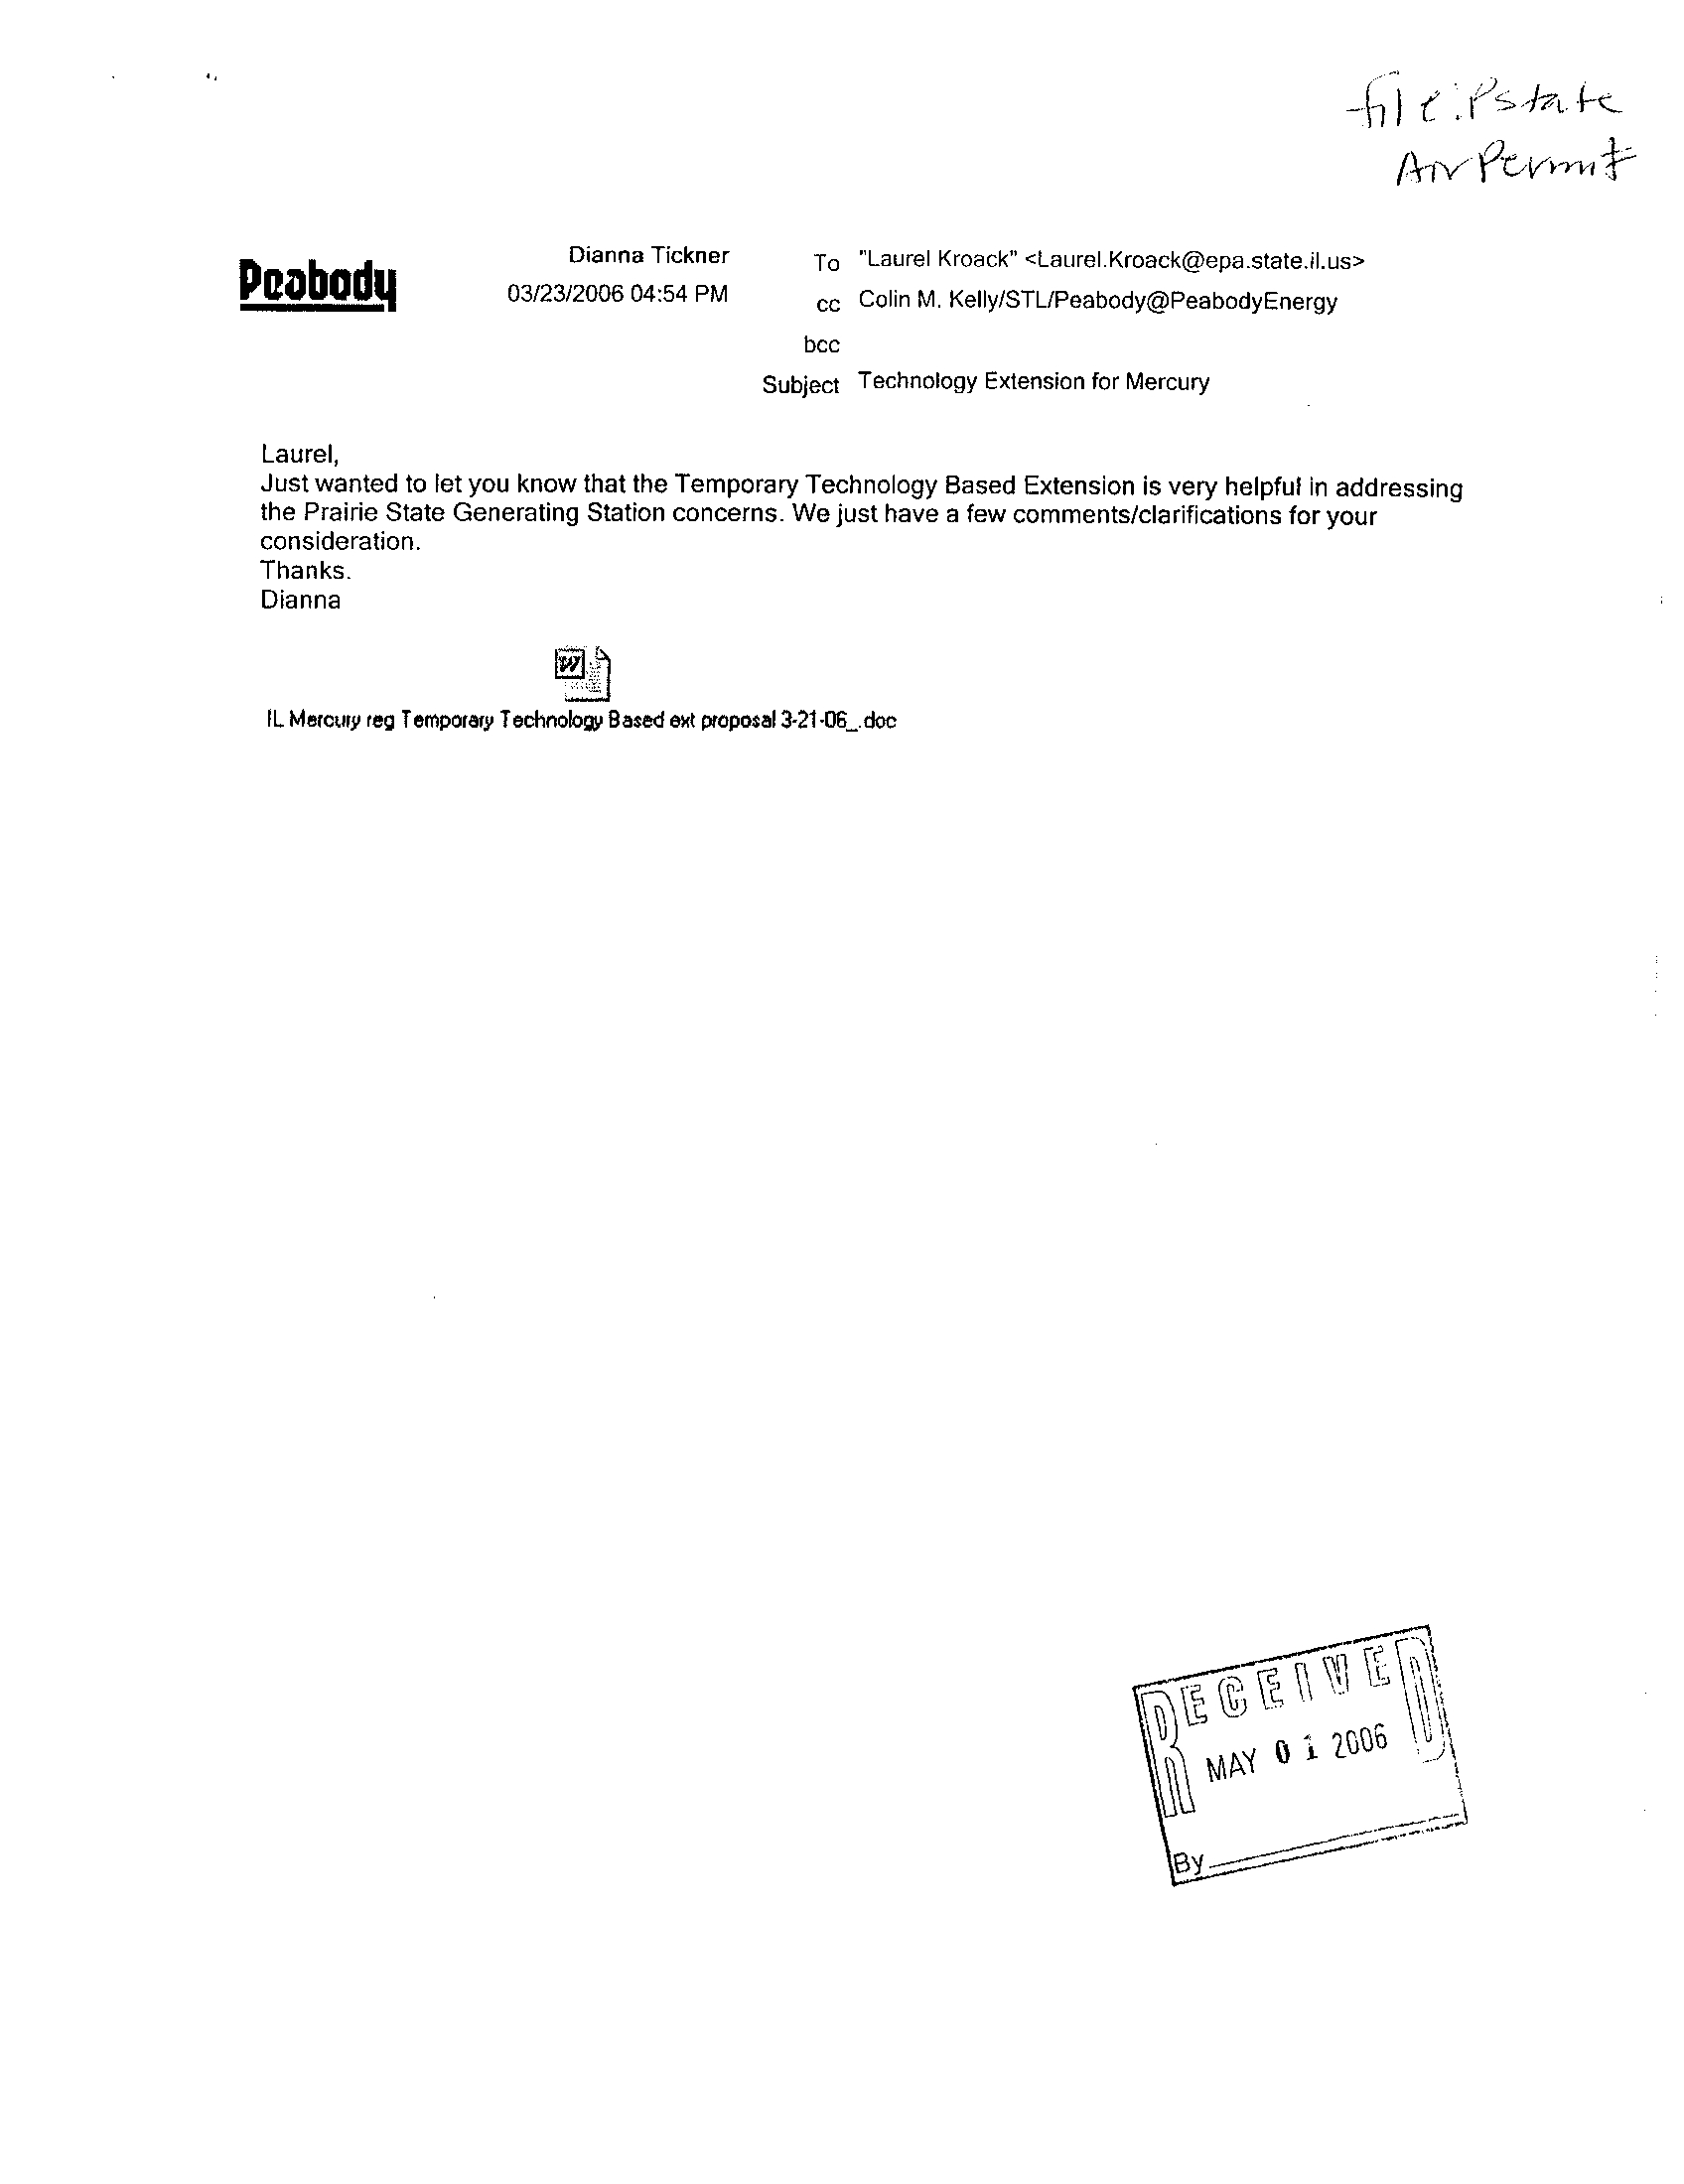
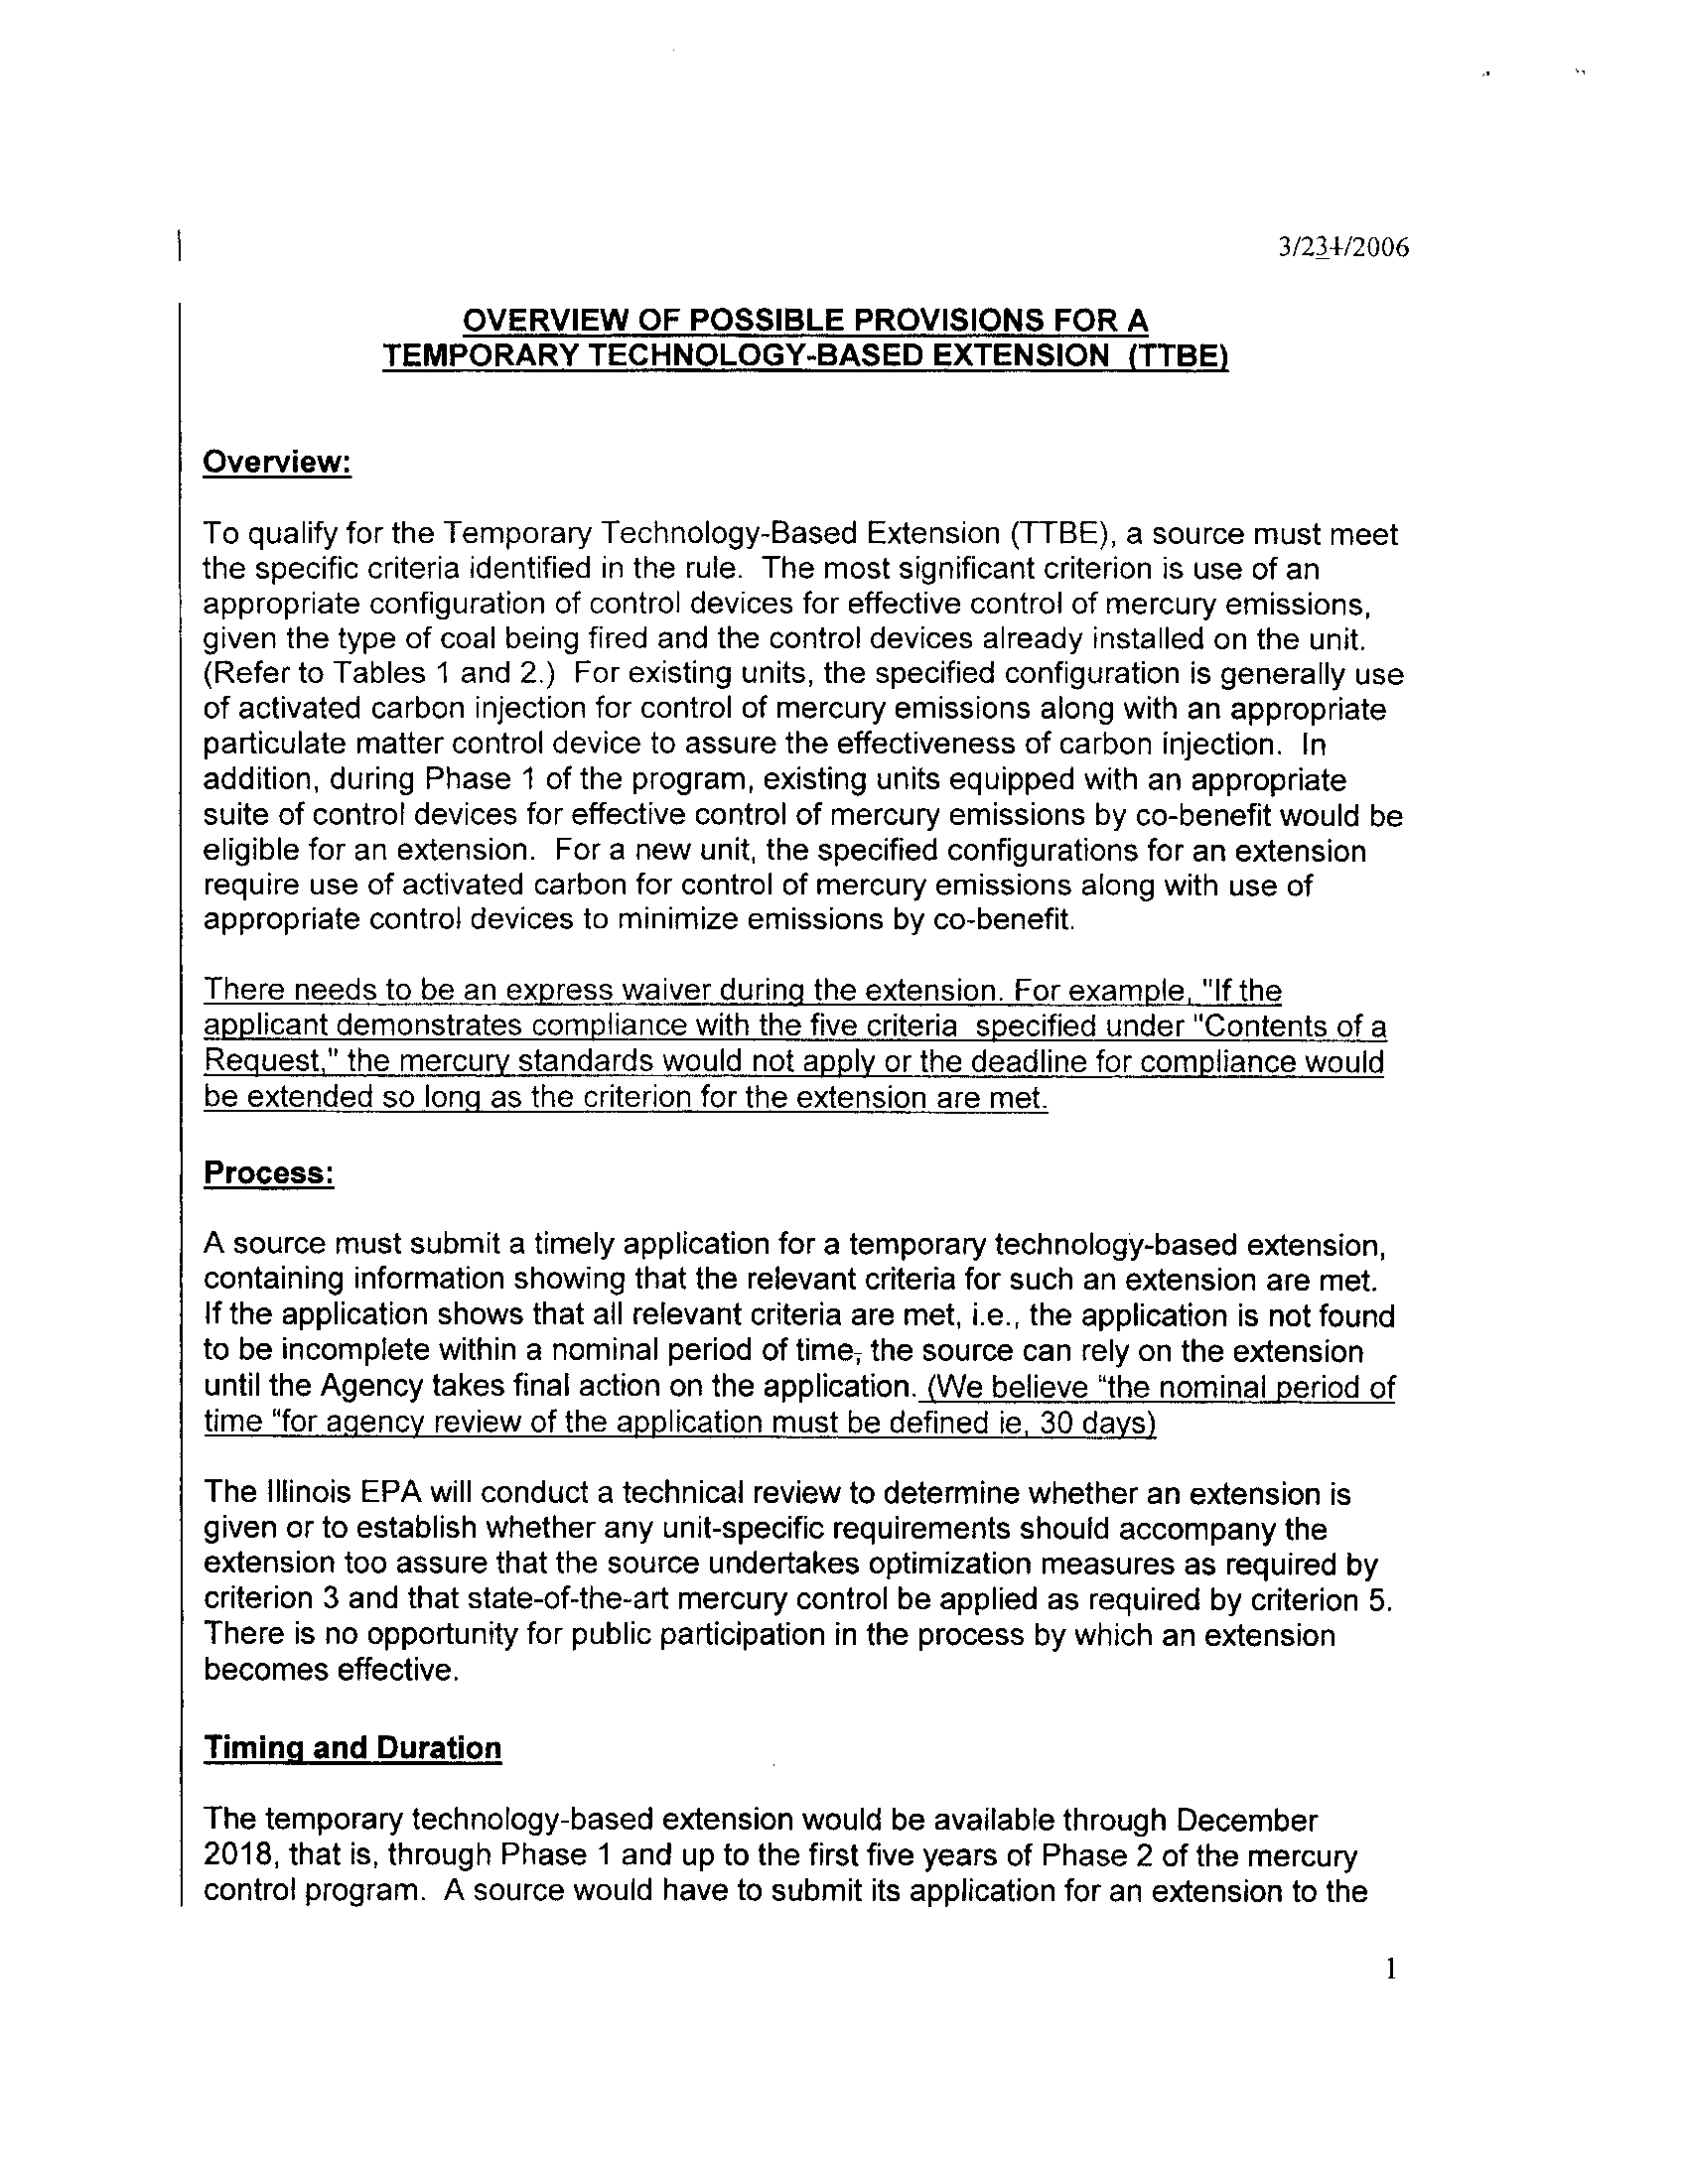
Prairie State comments to the Illinois Environmental Protection Agency
on the Temporary Technology Based Extension - Beginning with email
from Dianna Tickner to Laurel Kroack
Respectfully submitted,
0Ae
~ 110
B ,
E. Matoesi
Assistant Counsel
Division of Legal Counsel
14
STATE OF ILLINOIS
)
COUNTY OF SANGAMON
)
SS
CERTIFICATE OF SERVICE
I, the undersigned, an attorney, state that I have served the attached POST-HEARING
COMMENTS OF THE ILLINOIS ENVIRONMENTAL PROTECTION AGENCY upon the
person to whom it is directed, by placing a copy in an envelope addressed to :
Dorothy Gunn, Clerk
Illinois Pollution Control Board
James R. Thompson Center
100 West Randolph St., Suite 11-500
Chicago, IL 60601-3218
(Overnight Mail)
SEE ATTACHED SERVICE LIST
(First Class Mail)
and mailing it Springfield, Illinois, with sufficient postage affixed, as indicated above
.
DATED: July 28, 2006
Illinois Environmental Protection Agency
1021 North Grand Avenue East
P.O. Box 19276
Springfield, Illinois 62794-9276
ILLINOIS ENVIRONMENTAL
PROTECTION AGENCY
Byx~
Charles E atoesian
Assistant Counsel
Division of Legal Counsel
Marie Tipsord
Hearing Officer
Illinois Pollution Control Board
James R. Thompson Center
100 West Randolph St., Suite 11-500
Chicago, IL 60601-3218
Bill S. Forcade
Katherine M . Rahill
Jenner & Block LLP
One IBM Plaza
Chicago, IL 60611
S. David Farris
Environmental, Health and Safety
Manager
Office of Public Utilities
City of Springfield
201 East Lake Shore Drive
Springfield, IL 62757
Keith I. Harley
Chicago Legal Clinic
205 West Monroe Street, 4th Floor
Chicago, IL 60606
Katherine D. Hodge
N. LaDonna Driver
Hodge Dwyer Zeman
3150 Roland Avenue
Post Office Box 5776
Springfield, IL 62705-5776
Bruce Nilles
Attorney
Sierra Club
122 W. Washington Ave., Suite 830
Madison, WI 53703
Dianna Tickner
Prairie State Generating Company, LLC
701 Market Street
Suite 781
St. Louis, MO 63101
SERVICE LIST 06-25
James T. Harrington
David L. Rieser
Jeremy R. Hojnicki
McGuire Woods LLP
77 West Wacker, Suite 4100
Chicago, IL 60601
William A. Murray
Special Assistant Corporation Counsel
Office of Public Utilities
800 East Monroe
Springfield, IL 62757
Faith E. Bugel
Howard A. Lemer
Meleah Geertsma
Environmental Law and Policy Center
35 East Wacker Drive
Suite 1300
Chicago, IL 60601
Christopher W. Newcomb
Karaganis, White & Magel, Ltd .
414 North Orleans Street
Suite 810
Chicago, IL 60610
Kathleen C . Bassi
Sheldon A. Zabel
Stephen J. Bonebrake
Joshua R. More
Glenna L . Gilbert
Schiff Hardin LLP
6600 Sears Tower
233 South Wacker Drive
Chicago, IL 60606
James W. Ingram
Senior Corporate Counsel
Dynegy Midwest Generation, Inc.
1000 Louisiana, Suite 5800
Houston, TX 77002
Mike Koerber
Executive Director
Lake Michigan Air Directors Consortium/
Midwest Regional Planning Organization
2250 East Devon Avenue, Suite 250
Des Plaines, Illinois 60018
Jim Ross
Division of Air Pollution Control, Bureau of Air
Illinois EPA
P.0. Box 19276,
1021 N. Grand Ave ., East,
Springfield, IL 62794-9276
Re: Request for Proposal: Illinois EPA Modeling of Mercury Rule
Dear Mike and Jim
:
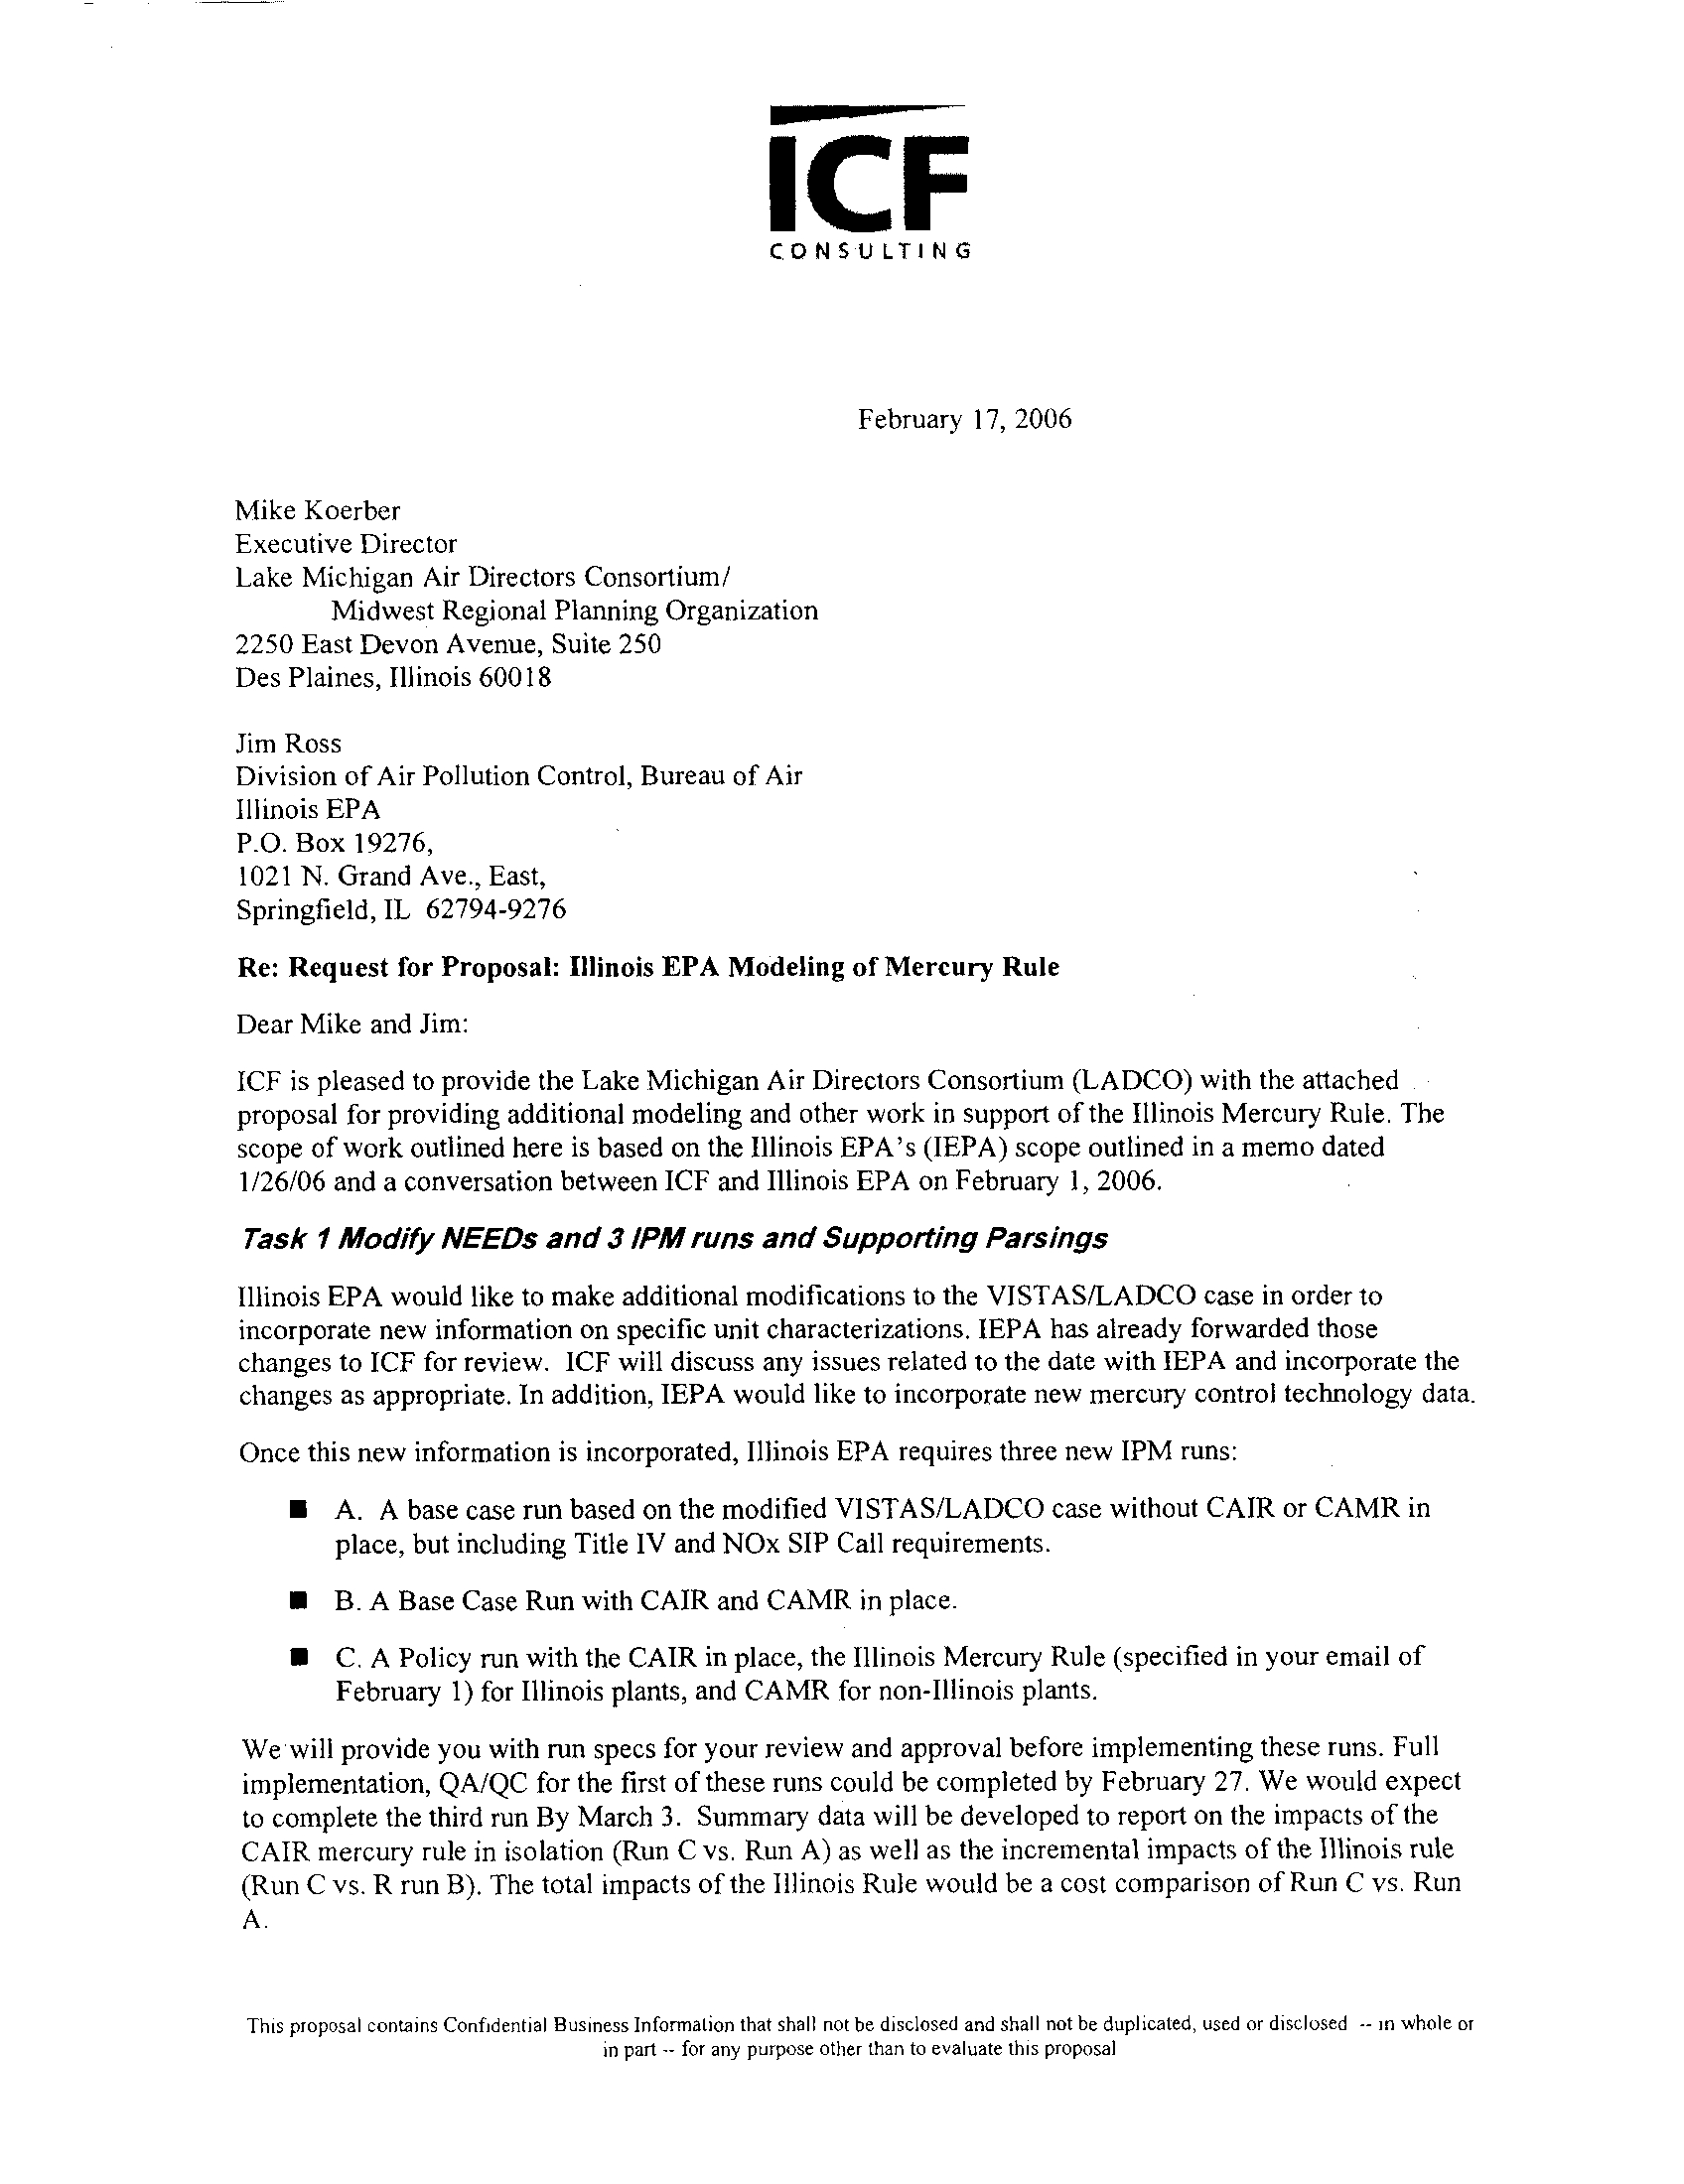
ICF is pleased to provide the Lake Michigan Air Directors Consortium (LADCO) with the attached
proposal for providing additional modeling and other work in support of the Illinois Mercury Rule
. The
scope
of
work outlined here is based on the Illinois EPA's (IEPA) scope outlined in a memo dated
1/26/06 and a conversation between ICF and Illinois EPA on February 1, 2006 .
Task I Modify NEEDS and 3 IPM runs and Supporting Parsings
Illinois EPA would like to make additional modifications to the VISTAS/LADCO case in order to
incorporate new information on specific unit characterizations . IEPA has already forwarded those
changes to ICF for review . ICF will discuss any issues related to the date with IEPA and incorporate the
changes as appropriate. In addition, IEPA would like to incorporate new mercury control technology data
.
Once this new information is incorporated, Illinois EPA requires three new IPM runs
:
•
A. Abase case run based on the modified VISTAS/LADCO case without CAIR or CAMR in
place, but including Title IV and NOx SIP Call requirements
.
•
B. A Base Case Run with CAIR and CAMR in place
.
•
C. A Policy run with the CAIR in place, the Illinois Mercury Rule (specified in your email of
February 1) for Illinois plants, and CAMR for non-Illinois plants
.
We will provide you with run specs for your review and approval before implementing these runs . Full
implementation, QA/QC for the first
of
these runs could be completed by February 27. We would expect
to complete the third run By March 3 . Summary data will be developed to report on the impacts of the
CAIR mercury rule in isolation (Run C vs . Run A) as well as the incremental impacts
of
the Illinois rule
(Run C vs. R run B). The total impacts
of
the Illinois Rule would be a cost comparison of Run C vs . Run
A
.
This proposal contains Confidential Business Information that shall not be disclosed and shall not be duplicated, used or disclosed
-- in whole or
in part
-- for any purpose other than to evaluate this proposal
ICF
CONSULTING
February 17, 2006
M. Koerher/J. Ross
February 17, 2006
Page 2 of 4
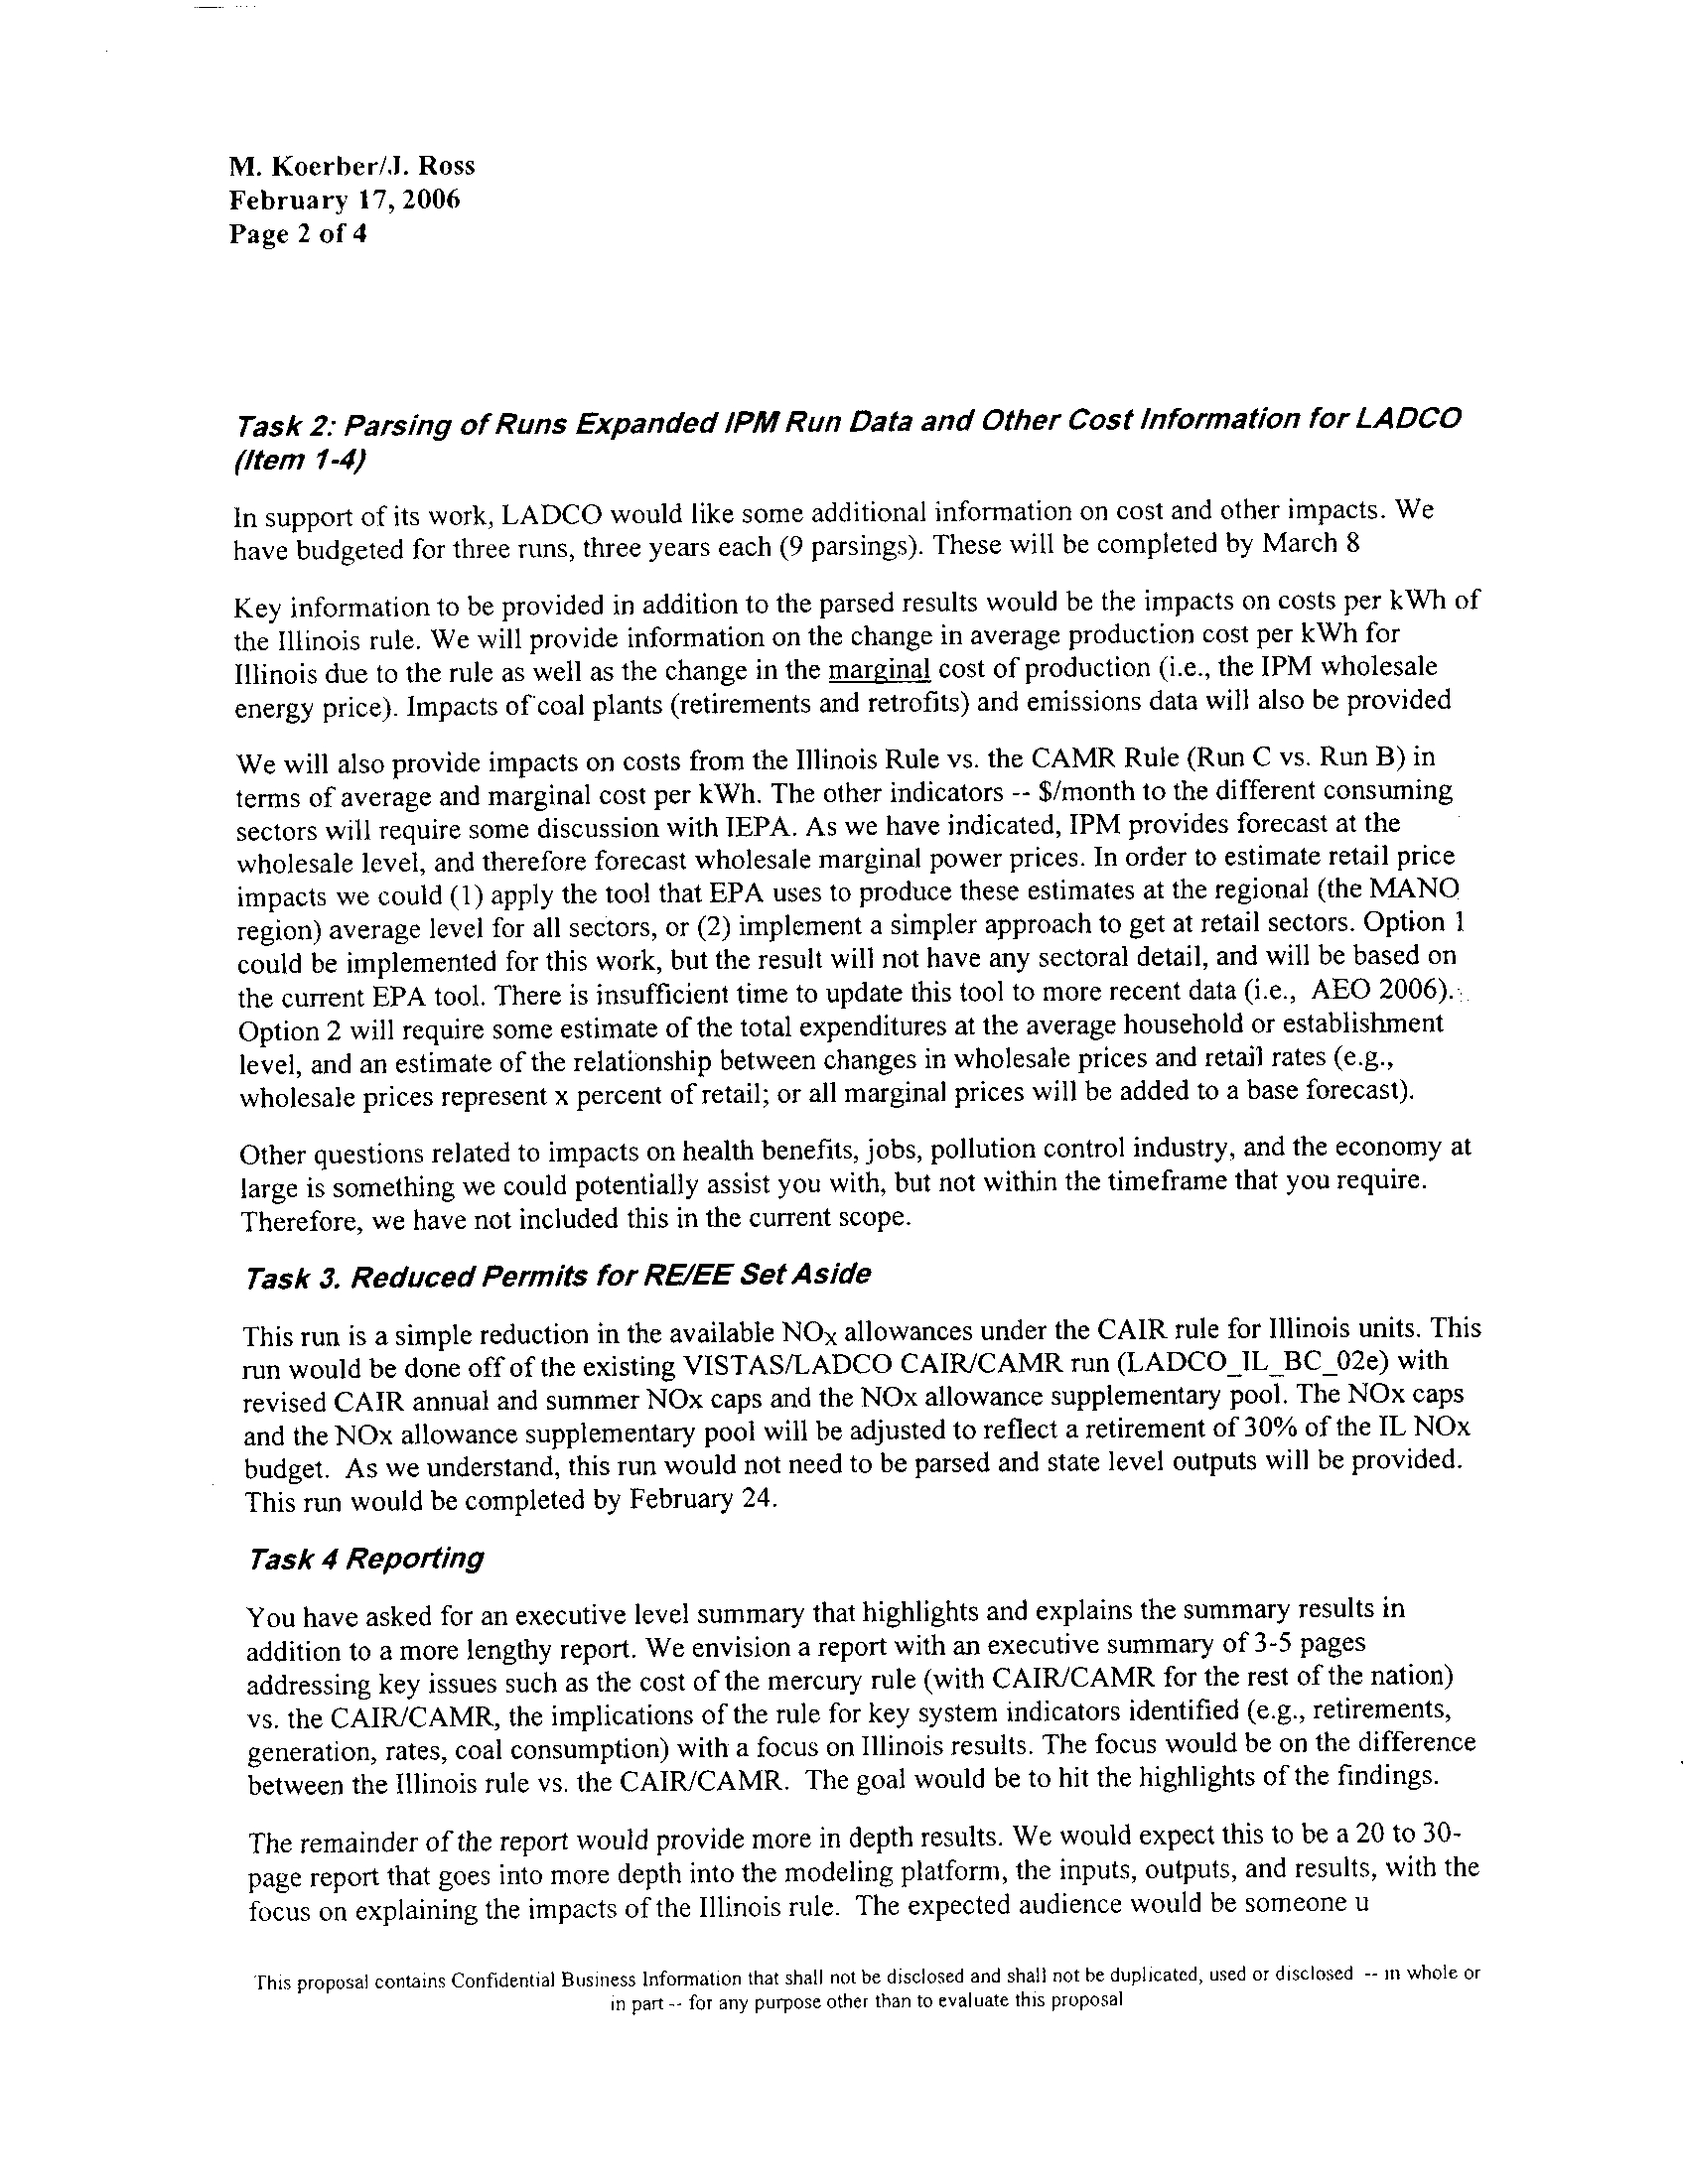
Task 2: Parsing of Runs Expanded IPM Run Data and Other Cost Information for LADCO
(Item 1-4)
In support of its work, LADCO would like some additional information on cost and other impacts. We
have budgeted for three runs, three years each (9 parsings) . These will be completed by March 8
Key information to be provided in addition to the parsed results would be the impacts on costs per kWh of
the Illinois rule. We will provide information on the change in average production cost per kWh for
Illinois due to the rule as well as the change in the marginal cost of production (i .e ., the IPM wholesale
energy price). Impacts of coal plants (retirements and retrofits) and emissions data will also be provided
We will also provide impacts on costs from the Illinois Rule vs. the CAMR Rule (Run C vs. Run B) in
terms of average and marginal cost per kWh. The other indicators -- $/month to the different consuming
sectors will require some discussion with IEPA. As we have indicated, IPM provides forecast at the
wholesale level, and therefore forecast wholesale marginal power prices
. In order to estimate retail price
impacts we could (1) apply the tool that EPA uses to produce these estimates at the regional (the MANO
region) average level for all sectors, or (2) implement a simpler approach to get at retail sectors . Option I
could be implemented for this work, but the result will not have any sectoral detail, and will be based on
the current EPA tool. There is insufficient time to update this tool to more recent data
(i .e ., AEO 2006) .
Option 2 will require some estimate of the total expenditures at the average household or establishment
level, and an estimate of the relationship between changes in wholesale prices and retail rates
(e.g.,
wholesale prices represent x percent of retail ; or all marginal prices will be added to a base forecast) .
Other questions related to impacts on health benefits, jobs, pollution control industry, and the economy at
large is something we could potentially assist you with, but not within the timeframe that you require
.
Therefore, we have not included this in the current scope
.
Task 3. Reduced Permits for RENEE Set Aside
This run is a simple reduction in the available NOx allowances under the CAIR rule for Illinois units . This
run would be done off of the existing VISTAS/LADCO CAIR/CAMR run (LADCO IL _BC_02e) with
revised CAIR annual and summer NOx caps and the NOx allowance supplementary pool . The NOx caps
and the NOx allowance supplementary pool will he adjusted to reflect a retirement of 30% of the IL NOx
budget. As we understand, this run would not need to be parsed and state level outputs will be provided
.
This run would be completed by February 24
.
Task 4 Reporting
You have asked for an executive level summary that highlights and explains the summary results in
addition to a more lengthy report . We envision a report with an executive summary of 3-5 pages
addressing key issues such as the cost of the mercury rule (with CAIR/CAMR for the rest of the nation)
vs. the CAIR/CAMR, the implications of the rule for key system indicators identified
(e.g ., retirements,
generation, rates, coal consumption) with a focus on Illinois results . The focus would be on the difference
between the Illinois rule vs. the CAIR/CAMR. The goal would be to hit the highlights of the findings
.
The remainder of the report would provide more in depth results . We would expect this to be a 20 to 30-
page report that goes into more depth into the modeling platform, the inputs, outputs, and results, with the
focus on explaining the impacts of the Illinois rule . The expected audience would be someone u
this proposal contains Confidential Business Information that shall not be disclosed and shall not he duplicated, used or disclosed
-- in whole or
in pan-- for any purpose other than to evaluate this proposal
M. Koerber/.J. Ross
February 17, 2006
Page 3 of 4
unfamiliar with the modeling and therefore, the need for more detailed discussion of findings and
explanation of the results . We would develop a draft report by March 8 . W e would feed you preliminary
background material as we develop it so you have some time to absorb and process it . However, the first
full draft of a report you would see would be March 8h. I have not budgeted for revisions beyond that
first draft .
This proposal contains Confidential Business Information that shall not be disclosed and shall not be duplicated, used or disclosed - in whole or
in part .- for any purpose other than to evaluate this proposal
M. Koerber/J. Ross
February 17, 2006
Page 4 of 4
Next Steps
Please call if you have questions . If you would like to proceed, you may sign the attached form in
duplicate and return it to my attention. We look forward to working with the LADCO and Illinois EPA on
this project .
Sincerely,
Juanita M. Haydel
Senior Vice President
I hereby authorize ICF Consulting to proceed according to the scope of work described above.
Accepted (including Attachments A and B) for
Accepted for
Lake Michigan Air Directors Consortium
ICF Resources, LLC
Signature :
Signature
Printed Name
:
Printed Name:
Title:
Title :
Date :
Date:
This proposal contains Confidential Business Information that shall not be disclosed and shall not be duplicated, used or disclosed --in whole or
in part-. for any purpose other than to evaluate this proposal
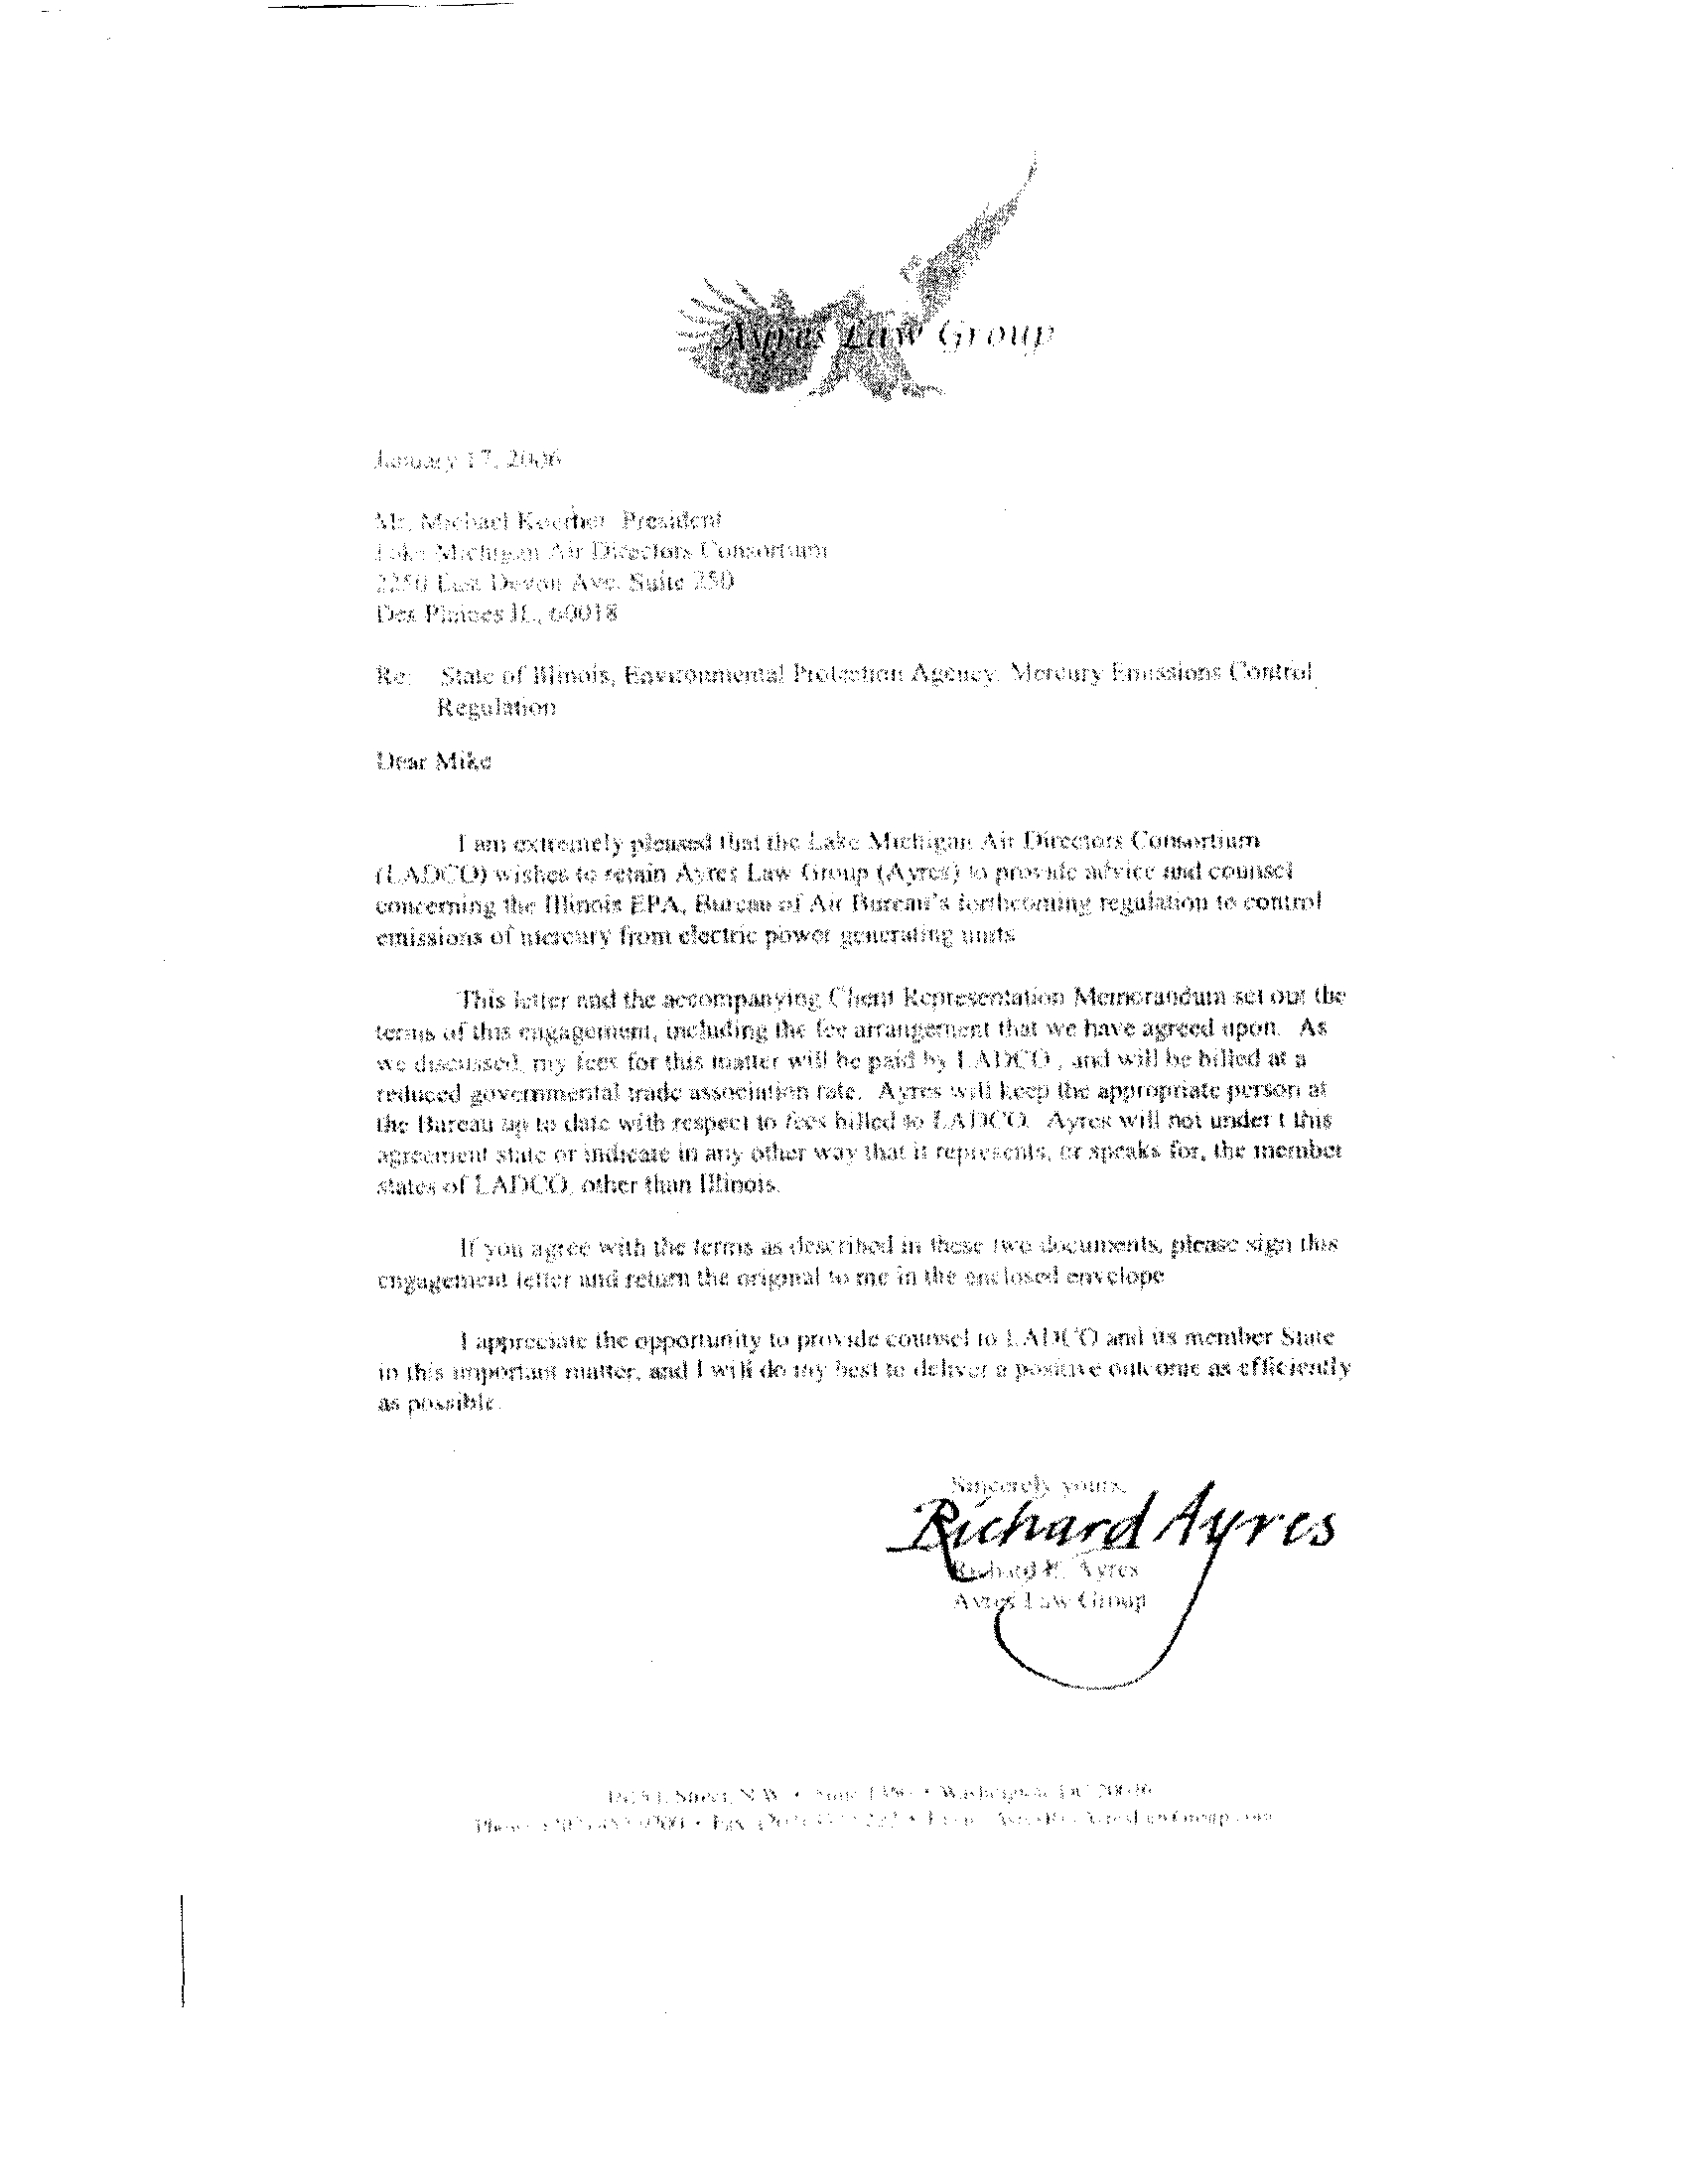
IN
low SIN"
I mn ummuto PIMI,
0 VIC'N
A-,rc
-miq,,
11c ,
Mmml,
FPA, Rwow,-l Air 1t
v himi Wanc pows immlAwc mo .
I
ioi;'mh~ Wleil
IIIIIS
lmd the
( b~ ;i Revn,~F
tntaiioi Mctmraltduni set Gnat tb
o!
aw,
",
:IS
no
WK of 9, "Mmi WQMC pmd 'w
lNkwvd pfv~rrim,'6tal lrakk
tote, Ayle, .%,U lx-p Rm appi
do IM,,,
,
;s chat, with
a, Av, hdkd v- i Al X 1) Age; m
I
'moll
r
,l
tfiali"lo
m all POW1 Wiv edam[
it raf%n+. .cl& ;, of if"-akN fox, Ihr mcnAtc
;a da
ac, of 1 Af Wk) Mr On Mims
Irm
may u.
pn' ule acmeo! to .M )(,
-0 a-nd 9' quml1wr Santa
';dr
swleil
W aw,%l lfw llbul;8 ta
shed in 6e ulxwnvar(%
ts
Dwc,4~q~
Cmywo
Cllbuois LPA')
t
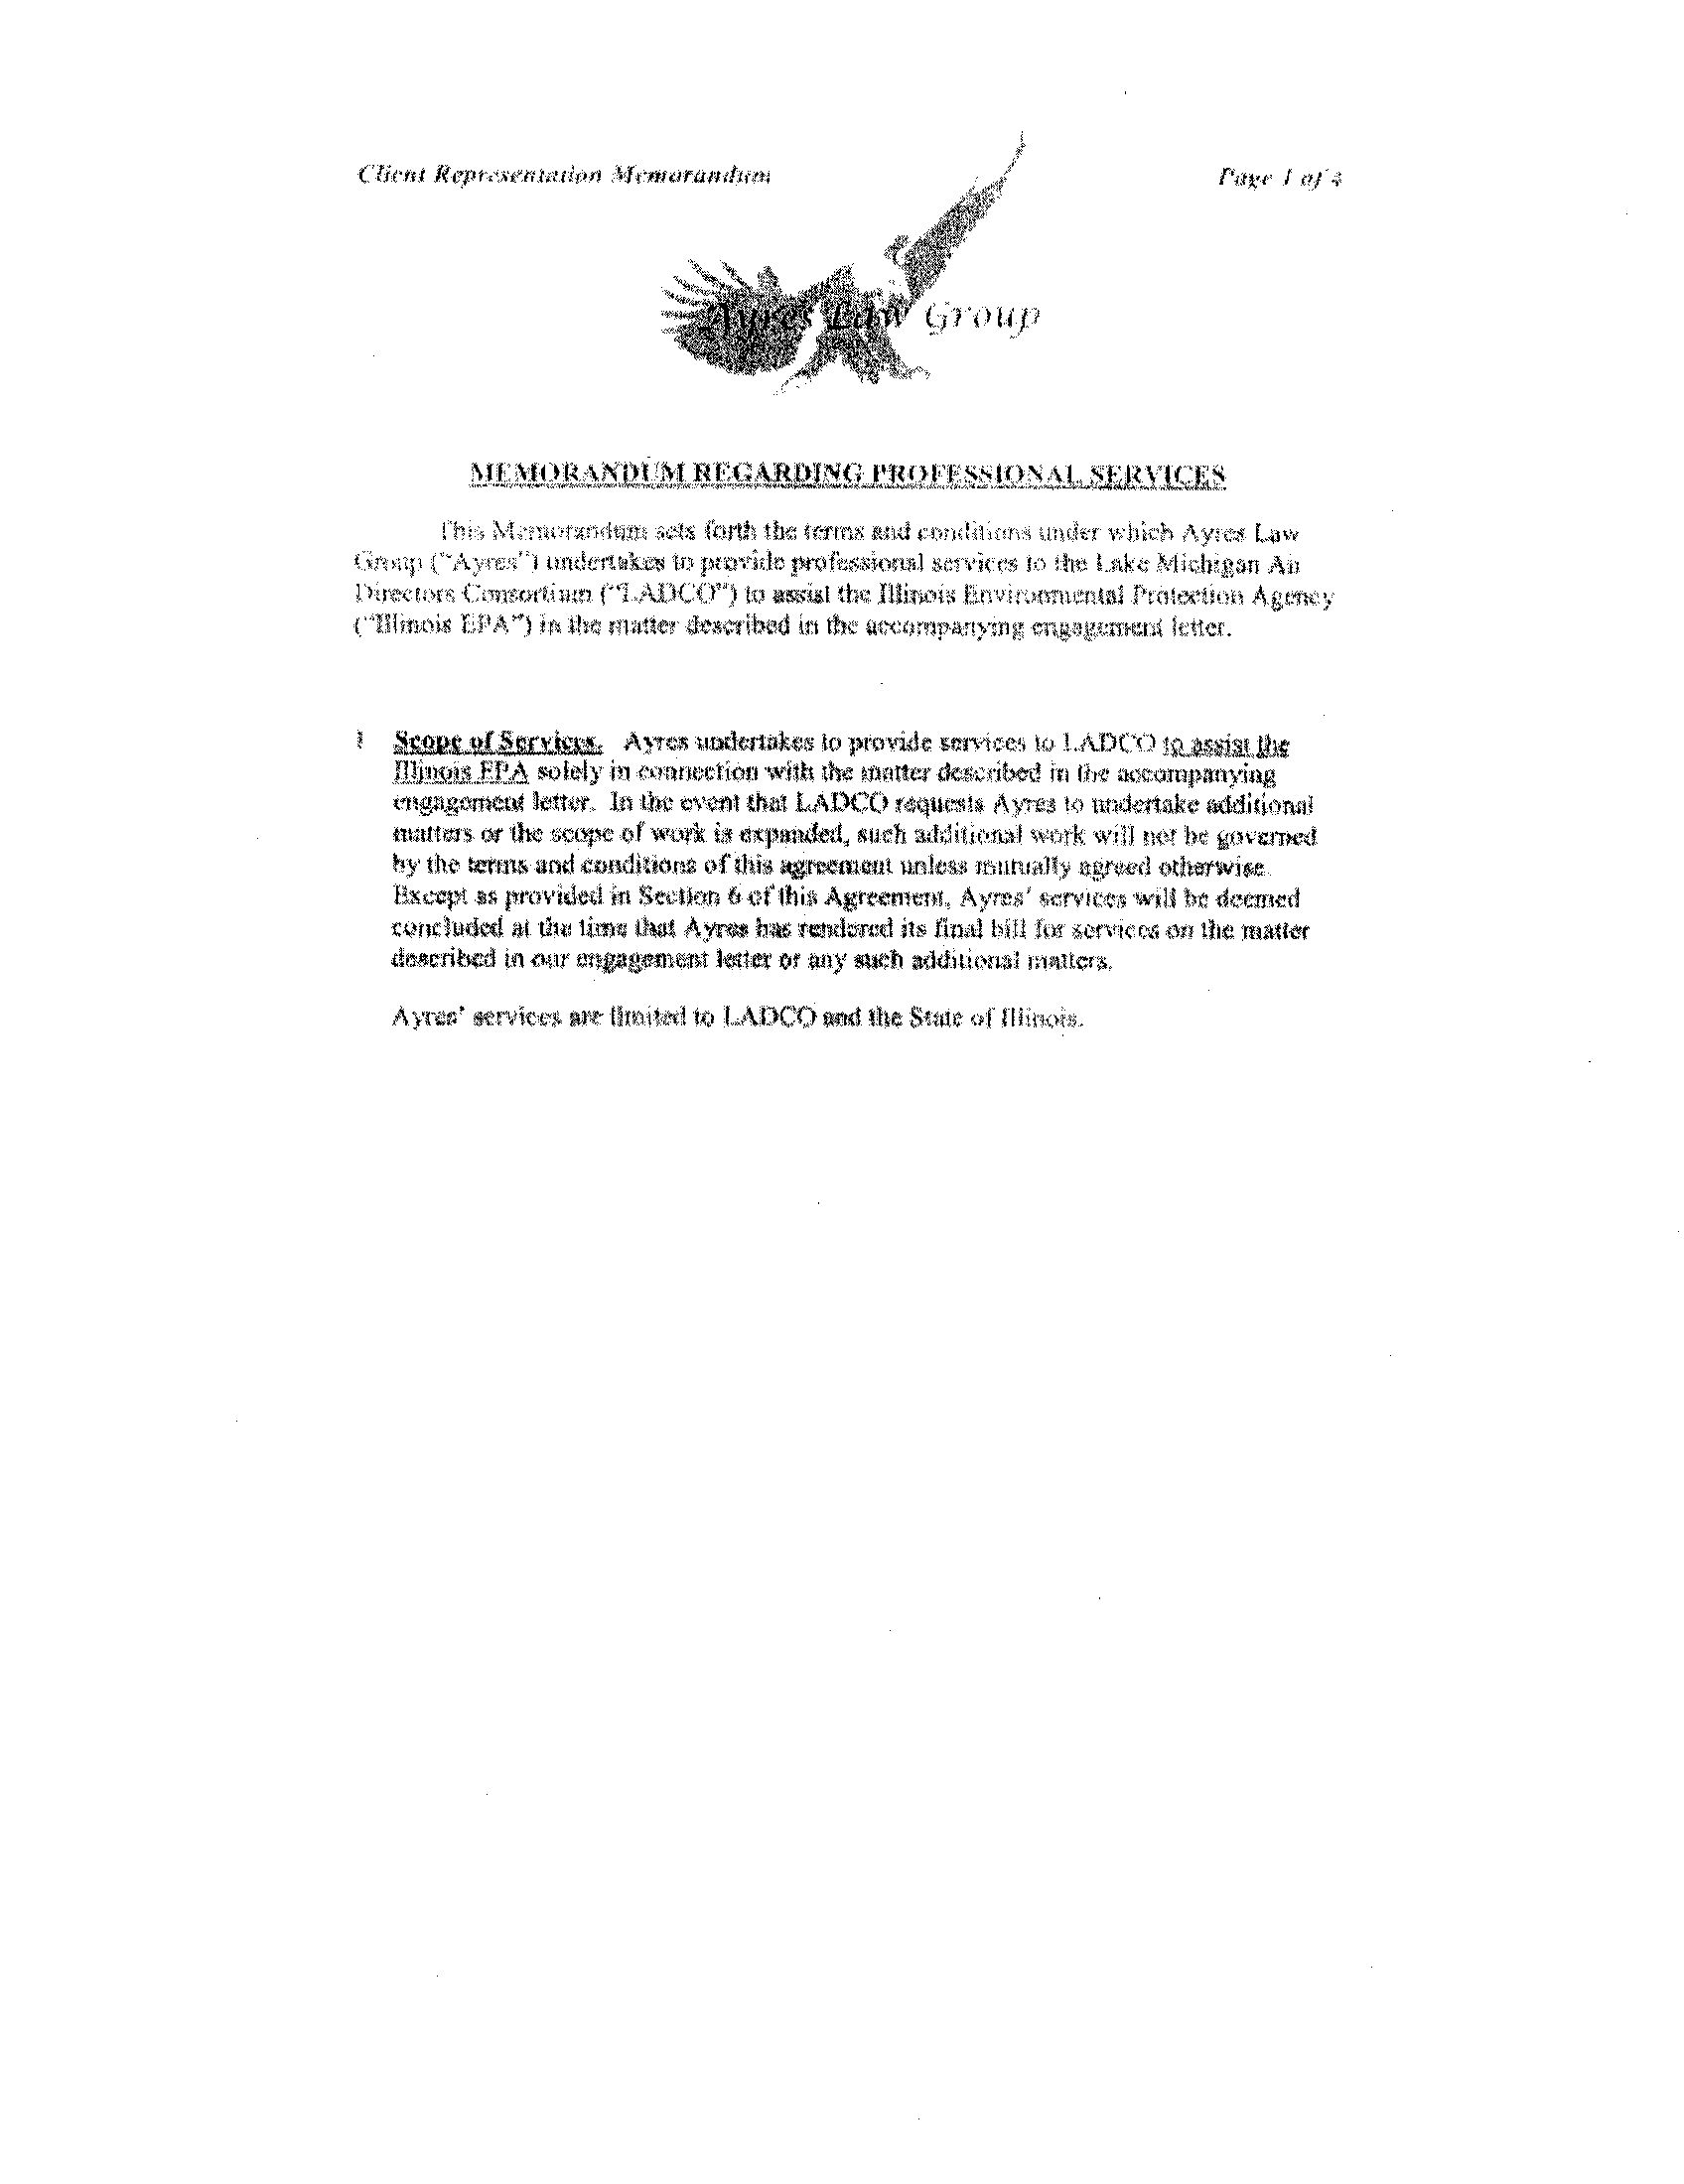
Smamul-sSmkm
tuallmi
Ofthe
wovpc orwoex in axpaukW, such atfidi(joiofl
wcit1k,
will no-? he govri'm
by tht, tours and cbfldkion 1100 Agman"a unless mutwilly agreed othienvise
PXCCar!
u provided
nk
SCO)ftll riot IbisAgrrvrncw, Ayrnq'kevim wild be de med
w
Ow limn
thus
A" hats mulzrud its,
in cur angaganimt kster
of *th
stub ad
xrovid
ii
t
Im
Arcs wx}srttkv; to
xtiol:1 with the
dl
bo
LADCO nn l it
INJA~YY~01
.
February 16, 2006
Gerald Keeler, Ph .D
.
Professor, Environmental Health Sciences
Professor, Atmospheric, Oceanic and Space Sciences
University of Michigan
1530 SPH I
109 South Observatory
Ann Arbor, Michigan 48109-2029
Dear Gerald
:
On behalf of the Lake Michigan Air Directors Consortium (LADCO), I wish to award you
a contract to provide technical support for the State of Illinois
in developing a rule for
controlling mercury emissions from power plants
.
Specific support shall include the
following activities, as directed by the State of Illinois (or LADCO) :
•
preparation and review of technical documents
;
•
participation in stakeholder meetings, as needed ;
•
testimony at hearings
;
•
technical assistance to key staff; and
•
other technical support agreed to by you and Illinois (or LADCO) .
Control Configuration Inspections at Illinois Coal-Fired Power Plants
- 2006
TABLE OF CONTENTS
#1 - Midwest Generation (Fisk)
1
#2-Midwest Generation (Crawford)
4
Addendum
6
#3 - Midwest Generation (Waukegan)
24
#4 - Midwest Generation (Powerton)
27
#5 - Midwest Generation (Will County)
32
#6 - Midwest Generation (Joliet)
37
#7 - Ameren Energy Generating (Hutsonville)
40
#8 - Ameren Energy Generating (Newton)
42
#9 - Ameren Energy Generating (Coffeen)
44
#10 - Ameren Energy Generating (Meredosia)
47
#11 - Ameren Energy Resources (Duck Creek)
51
#12 -Ameren Energy Resources (Edwards)
53
#13 - Dynegy Midwest Generation (Wood River)
57
#14 - Dynegy Midwest Generation (Havana)
59
#15 - Dynegy Midwest Generation (Hennepin)
62
#16 - Dynegy Midwest Generation (Vermilion)
66
#17 - Dynegy Midwest Generation (Baldwin)
70
#18 - Kincaid Generation (Kincaid)
72
#19 -Electric Energy (Joppa)
75
#20 - City of Springfield (CWI,P)
81
#21 - Southern Illinois Power (Marion)
85
2
.
so
3
injection
A pilot SO3 injection project was undertaken in autumn
2004
and abandoned in spring of
2005
.
Midwest Generation official claimed it had no quantifiable results . Another said it
had "mixed results .
.. but they didn't see an impact ." The goal of the project was to reduce
the resistivity of PRB coal . The pipes and headers were abandoned in place. These are
located at the
7"'
floor at approximately the 116-foot elevation . Gaseous SO3 was injected at
the economizer. The S03 generation process was located at ground level
.
Fisk also constructed a polymer injection system, which introduced liquid polymer into the
ducts after the preheater and upstream of the ESP . The polymer injection system included a
header pipe and four spray nozzles installed per duct (16 altogether.) The polymer was
supposed to combine with and agglomerate particles in the flue gas to facilitate collection by
the ESP. This was done in the time period around
2000 .
The project was discontinued as the
injections accumulated in the ducts producing a series of "stalagmites ." The header system
and injection ports are still in place
.
2
.
Flue gas conditioning
No direct flue gas conditioning s performed. Sodium carbonate, anhydrous is added to the
coal at the mine to achieve
3.25-3 .75
wt%. The sodium is added to decrease resistivity of the
fly ash. Wt % sodium is provided in the quarterly coal analysis reports
.
Other Information
Fisk Unit 19 is a
3,379
mmBtu/hr electric generating unit consisting of two boilers, a
superheater boiler (or "furnace") and a reheat boiler (furnace) . This arrangement is known as
a "dual furnace." They are basically identical except for the arrangement of tubes in the
fireboxes. Each furnace cannot be run separately
.
Low sulfur Powder River Basin coal is utilized to achieve sulfur dioxide limits . Unit 19
utilizes low NO, burners and overfire air for NO, control
.
The ESPs are considered "cold side" since they are located after the preheaters
.
2
This is a view of the west ESP at Fisk with breeching exiting the ESP and entering the stack. (In
the background is the bottom of the Sears tower.) The air preheaters are inside the large building
to the right. The preheaters are about 4 feet from the wall at about the same elevation as the
ESP. The section of dark transition before the silver ESP pictured and the building is about 25
feet long. It probably houses perforated plates which distribute air into the ESP in a laminar type
flow. Total distance of ductwork from exit of preheater to ESP is about 29-35 feet
.
3
2
.
S0 3 inecttQn
The facility does not use S03 injection
.
3
.
Flue gas conditioning
No direct flue gas conditioning is performed . Sodium carbonate, anhydrous is added to the coal
at the mine to achieve 3 .25-3.75 wt%. The sodium is added to decrease resistivity of the fly ash
.
Wt % sodium is provided in the quarterly coal analysis reports
.
4
.
Other Information
Crawford Unit 7 is a 216 MW electric generating unit consisting of two boilers, a superheater
boiler (or "furnace") and a reheat boiler (furnace) . This arrangement is known as a "dual
furnace." They are basically identical except for the arrangement of tubes in the fire box . Each
furnace cannot be run separately . The superheater furnace supplies high pressure steam to the
high pressure turbine, the steam is then routed to the reheat furnace . The turbine on the reheat
furnace operates at a lower pressure and utilizes a condenser to extract remaining energy from
the steam
.
Low sulfur Powder River Basin coal is utilized to achieve sulfur dioxide limits . Unit 7 utilizes
low NO, burners and overfire air for NO, control
.
The ESPs are considered "cold side" since they are located after the preheaters
.
ESP collection area is given in what is called "specific collection area," the units of which are
ft2/acfm. The design flow rate (acfm) was not given . The specific collection areas (for units 7
and 8) were taken from stack test reports . Originally the SCA was given as 118 .3 and it was
suggested by Midwest Generation that to get the individual SCA per ESP to divide the number
by two
.
A further note about the ducts : There did not appear to be any obvious large open areas near the
superheater duct. At low elevations, there is a considerable amount of electrical equipment to
the west. At slightly higher elevations, a number of prominent vessels for the feedwater system
are placed close to the duct . Then the wall of the building runs adjacent to the duct on the west
side of it. On the east side, there is not much room between the down coming duct (hot gas to
the air preheater) and the outgoing duct . At one elevation, there did appear to be a large "patch"
placed into the side, approximately 25 feet by 6 foot tall section may have been welded into
place (see photo.) There is also a steel beam truss section which could support a pad at this
approximate 77-foot elevation. We did not see any convenient places in which large equipment
(baghouses/ storage silos) could be easily placed. The reheat furnace duct had an adjacent
approximately 400 sq foot area open to the East and some windows were within 20 feet east
.
5
Date :
May 16, 2005
To
: Ed Bakowski
From: Joe Kotas
RE :
Mercury VIP
SCA CORRECTION
Source
:
I .D
.
#
:
Address
:
Contact/Title
Phone/Fax
:
Inspector(s)
:
ADDENDUM
Midwest Generation,
LLC ;
Crawford Generating Station
031600
AIN
3501
S
.
Pulaski Road ;
Chicago,
IL
60623-4987
Luke
Ford/EH&S
Specialist, John
Kennedy/Station
Director
;
David
Gladem/Production Manager
773-650-5489
Ice Kotas
and Emilio Salis
Following an inquiry,
further information was gathered concerning
the
specific collection area
("SCA")
of the ESPs
at Crawford Unit 7 . The SCA for
Crawford unit 7 was originally given as 59 .15 in the report dated 05/06/06
.
The correct SCA (as provided by contacts at Midwest Generation) for Crawford
Unit #7 is 118 .3 ft'/kacfm . Please adjust your records accordingly
.
6
The facility does not use S03 injection
.
3
.
Flue gas conditioning
No direct flue gas conditioning is performed . Sodium is added at the mine as stated above (which
is true for all Midwest Generation plants in the Chicago area .)
4 .
Other Information
Crawford Unit 8 is a nominal 326 MW electrical generating unit consisting of a dual furnace
arrangement connected to a single stack .
Low Sulfur Powder River Basin coal is utilized to achieve sulfur dioxide limits . Unit 8 utilizes
low NO, burners and overfire air for NO, control
.
The ESPs are considered "cold side" since they are located after the preheaters
.
The preheaters are of a "Ljungstrom" design. They consist of cylindrical metal drums with fins
.
The axis of rotation is between the inlet (cold) and outlet (hot) air streams. The unit rotates to
allow the preheated fins to come in contact with the incoming combustion air . The temperature
of the flue gas is 600-700 degrees F entering the preheater and 300 degrees F out
.
Attachments
a .
Photos. (Midwest Generation Crawford Generating Station photos)
b .
Side view schematic Crawford 7. (Crawford block)
8
\]iJwt~4(imn(,ojoo(`r./«!^)!(~(0cr2\~!l~~t~(ioA
iH!h0()/\~~~
OAT JAW,
YhoN~kv
AV
OfCnawford
powti
,
p
Ian( looking south,
Unit 7 h~ mc, elect
I
prC60iaiclf
(~S'Y\)nVth(I 00f a' V1 an onne and white SUQCd stack The bI(&umek }siUU&'
0
2
.
S03 injection
The facility does not use S03 injection in any of the boilers
.
3
.
Flue gas conditioning
No flue gas conditioning is utilized
.
4 .
Other Information
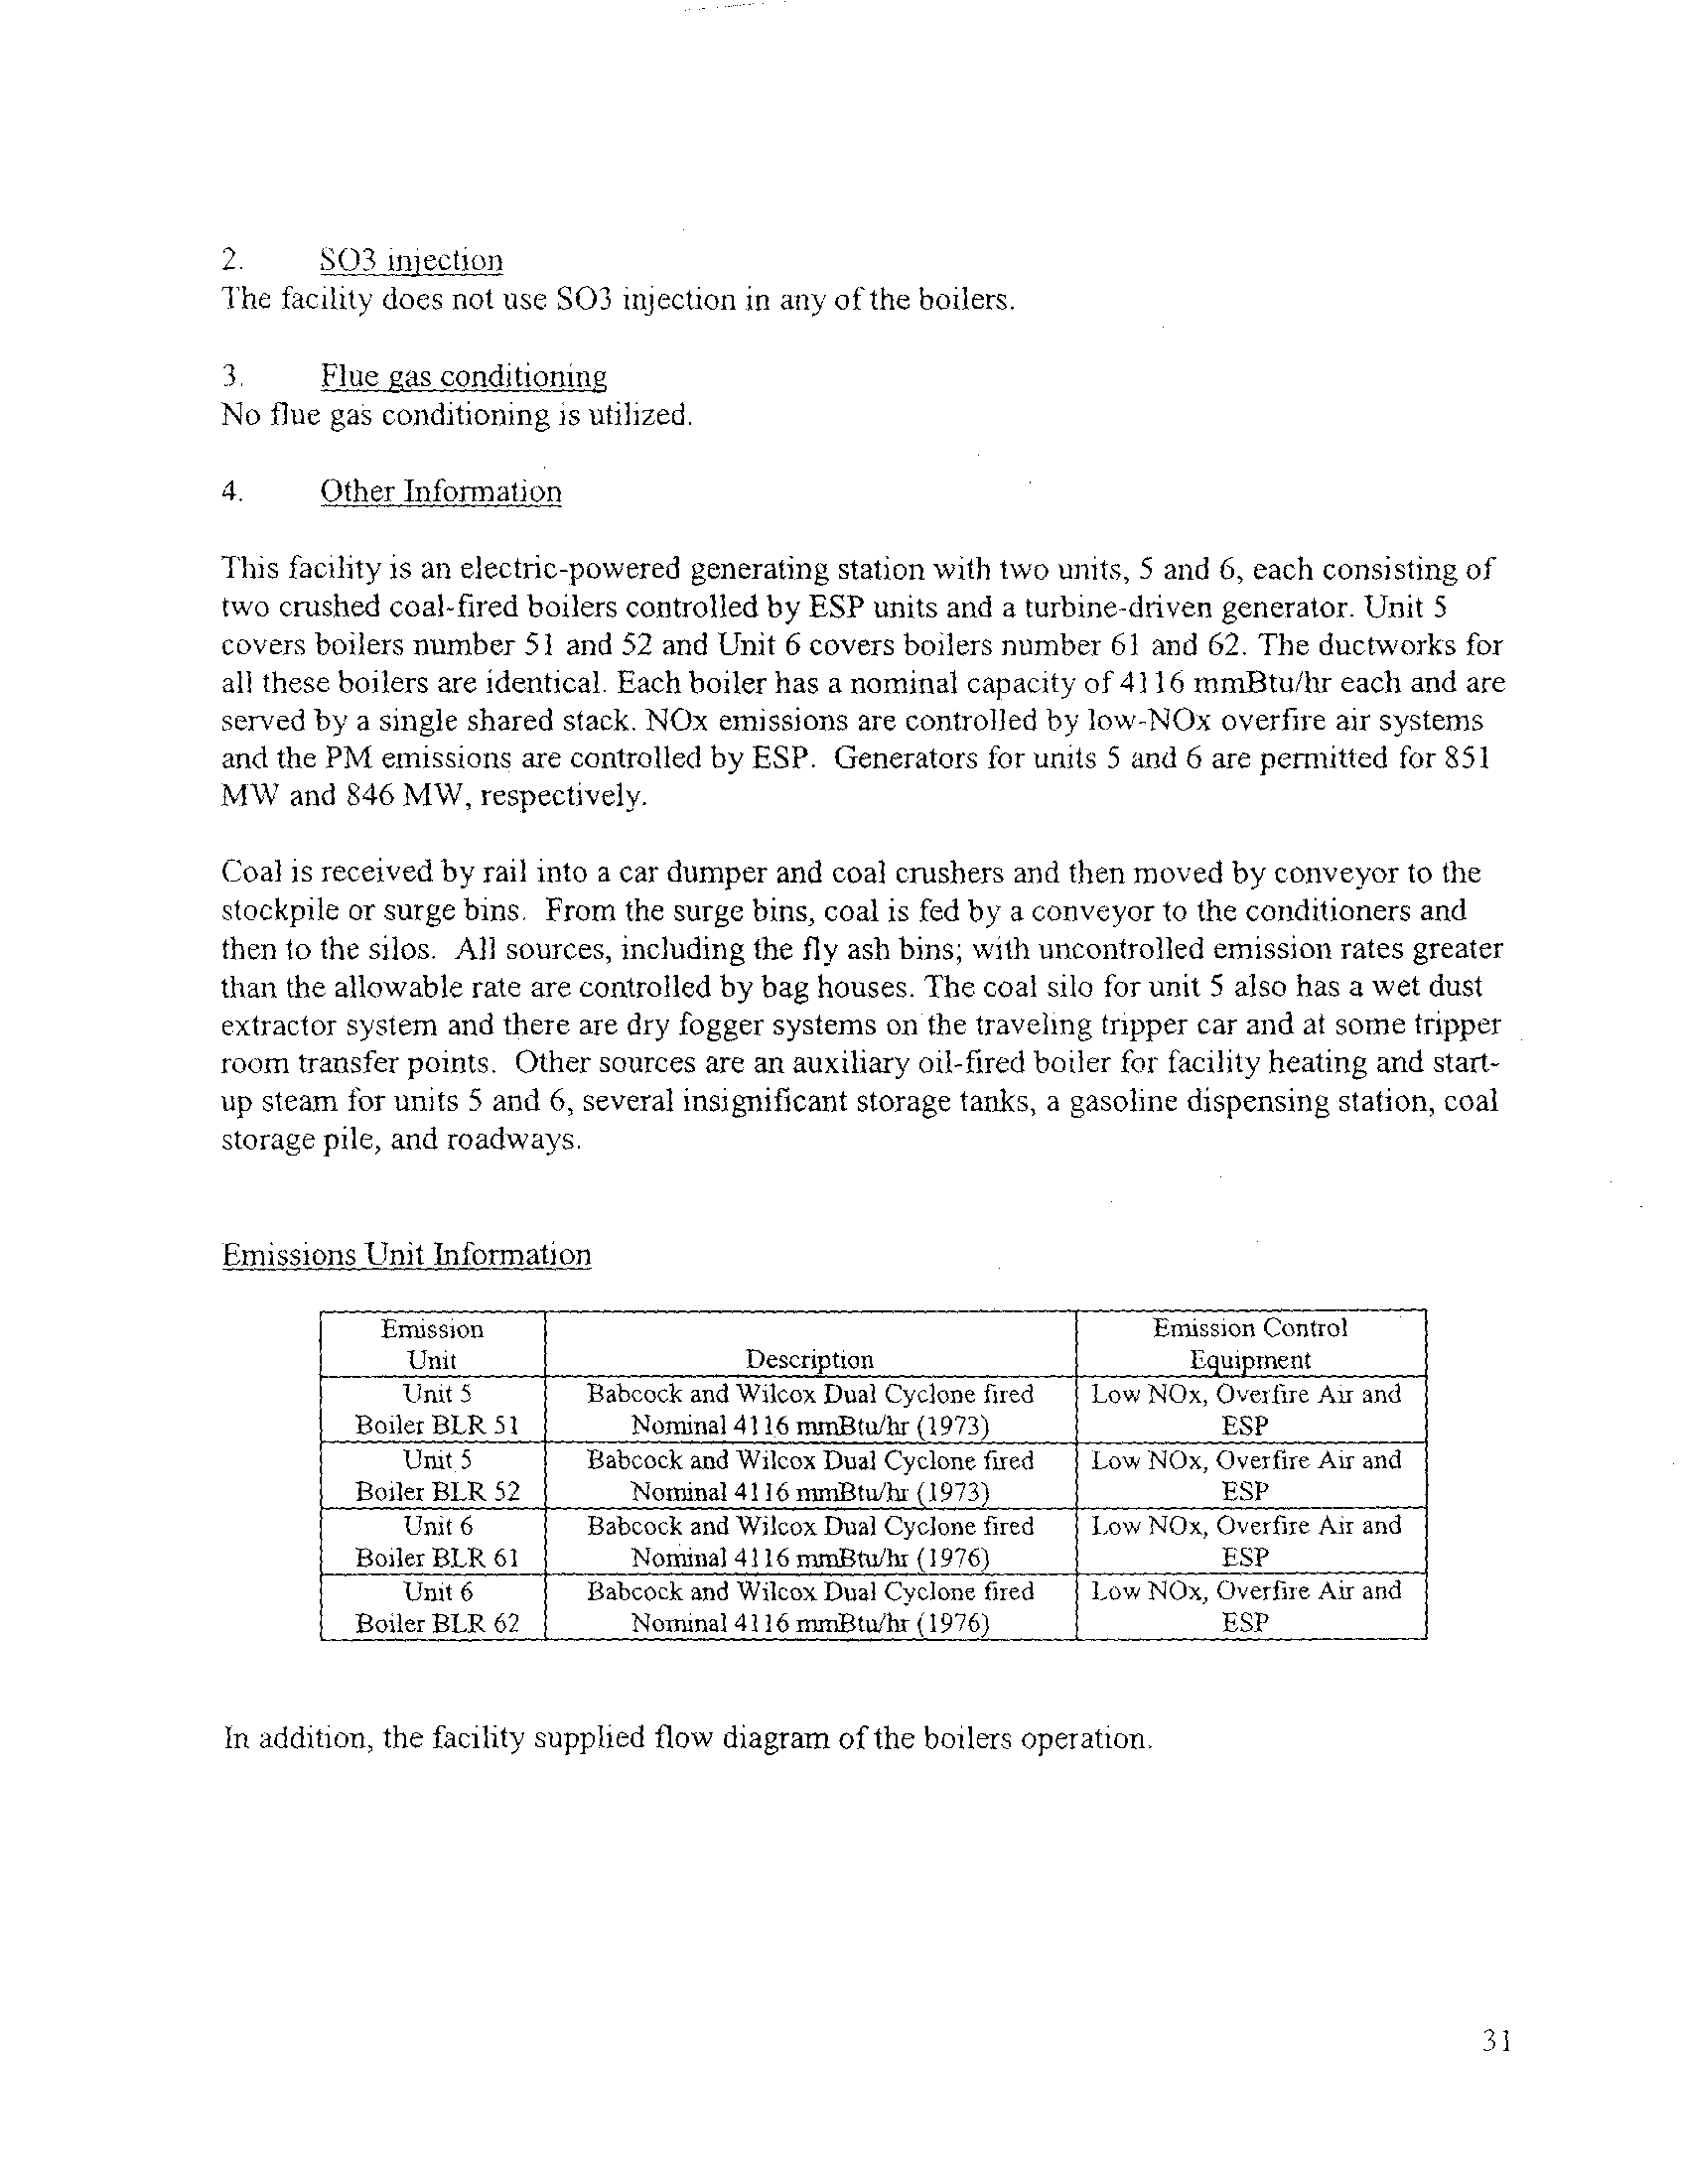
This facility is an electric-powered generating station with two units, 5 and 6, each consisting of
two crushed coal-fired boilers controlled by ESP units and a turbine-driven generator . Unit 5
covers boilers number 51 and 52 and Unit 6 covers boilers number 61 and 62. The ductworks for
all these boilers are identical. Each boiler has a nominal capacity of 4116 mmBtulhr each and are
served by a single shared stack . NOx emissions are controlled by low-NOx overfire air systems
and the PM emissions are controlled by ESP. Generators for units 5 and 6 are permitted for 851
MW and 846 MW, respectively.
Coal is received by rail into a car dumper and coal crushers and then moved by conveyor to the
stockpile or surge bins . From the surge bins, coal is fed by a conveyor to the conditioners and
then to the silos. All sources, including the fly ash bins; with uncontrolled emission rates greater
than the allowable rate are controlled by bag houses . The coal silo for unit 5 also has a wet dust
extractor system and there are dry logger systems on the traveling tripper car and at some tripper
room transfer points . Other sources are an auxiliary oil-fired boiler for facility heating and start-
up steam for units 5 and 6, several insignificant storage tanks, a gasoline dispensing station, coal
storage pile, and roadways
.
Emissions Unit Information
In addition, the facility supplied flow diagram of the boilers operation
.
31
Emission
Unit
Description
Emission Control
Equipment
Unit 5
Boiler BLR 51
Babcock and Wilcox Dual Cyclone fired
Nominal 4116 nunBtulhr (1973)
Low
NOx, Overfire Au and
ESP
Unit 5
Boiler BLR 52
Babcock and Wilcox Dual Cyclone fired
Nominal 4116 mmBtulhr (1973)
Low NOx, Overfire Air and
ESP
Unit 6
Boiler BLR 61
Babcock and Wilcox Dual Cyclone fired
Nominal 4116 nunBtulhr (1976)
Low NOx, Overfre Air and
ESP
Unit 6
Boiler BLR 62
Babcock and Wilcox Dual Cyclone fired
Nominal 4116 mmBtulhr (1976)
Low
NOx, Overfire Air and
ESP
3
.
Flue gas eonditionini
No other flue gas conditioning is utilized
.
4
.
Other Information
Low sulfur coal is utilized . All boilers incorporate low NOx technology and over-fired air
.
35
2 .
An SO, flue gas conditioning system has been installed on Units I and 2
A 3,000 molten
sulfur tank supplies sulfur that is used to make S0 2 for both units . The SO, is forced into SO,
and put into the flue gas . With a letter dated August 2, 2001, Steve Whitworth notified the
Agency that the flue gas conditioning system for Unit 1 was placed into service on July
16,
2001 and released to operations on July 17, 2001 The flue gas conditioning system for Unit 2
was placed in service on July 10, 2001 and released to operations on July 13, 2001
.
During
the inspection, both units were operating and the S0
3 injection rate for Units 1 and 2 was 9ppm
and 10ppm, respectively. The facility burns Powder River Basin coal and East Hornsby Coal
.
The SO, injection system is used for both
.
3
.
No other flue gas conditioning is performed
.
4
.
The coal-fired boilers are designated as Unit 1 (CB-1) and Unit 2 (CB-2) . They have a steam
production capacity of 2.5 million pounds per hour and 4 .159 million pounds per hour,
respectively. Both are Babcox and Wilcox subcritical cyclone-fired units
.
Unit #1 and Unit #2
have overfire air systems for reducing NOx emissions. According to an email from the facility
dated May 16, 2002, "full utilization of the overfire air systems on Unit #1 and Unit #2 was not
realized until late in 2001 and early 2002"
The overfire air systems did not have full capability
until the fine grind crushers were installed. The overfire air systems operate all year
.
The facility installed selective catalytic reduction (SCR) systems on both units
. The
manufacturer will not guarantee the catalyst in the SCR during ozone season while burning
low
sulfur coal. The SCR mixes ammonia with the exhaust gas
.
It is located before the precipitator
on the hot side. There are two 50,000 gallon anhydrous ammonia tanks for supplying the SCR
units. The SCR system operates May through September
.
It needs to operate at about 800
degrees Fahrenheit for optimum performance The SCR on Unit #2 initially started up on April
9, 2002. The SCR on Unit #1 was in service May 1, 2003 .
46
2 .
The facility performs SO, injection on Boiler #5 . Boiler #5 (unit 3) is a 220 MW coal-fired
boiler equipped with a low NOx burner system . It has an electrostatic precipitator and a
sulfur dioxide monitor . The boiler is burning Powder River Basin coal which contains low
sulfur. A flue gas conditioning system was installed on boiler #5
.
It was needed for
burning the low sulfur coal . The flue gas conditioning system burns molten sulfur
making S02 .
The system oxidizes the SO2 into SO3
. The S0 3 is put into the flue gas
which lowers the resistivity of the fly ash making it easier for the precipitator to collect
.
The system was place in service on March 22, 2003 and was operating reliably April 14,
2003. During the inspection, SO, was being injected at a rate of 7 .98 ppm
. The system
has the capability of injecting SO 3 at a rate of 6 to 14 ppm .
3. Flue gas conditioning is also performed on Boiler #4 . A non-sulfur liquid conditioning
agent called Arkay is used. The facility was issued a construction permit (#06010047)
on February 16, 2006 to do a "pilot evaluation of an alternative flue gas conditioning
agent" on Boilers #1-5 . The facility has immediate plans to install the Arkay flue gas
conditioning systems on Boilers #1-3 after receiving the construction permits
. They plan
to make the Arkay system on Boiler #4 a permanent system and no longer a "pilot
evaluation"
.
4. The Meredosia power station has a total of six boilers divided into four units
. There are
two coal-fired boilers (#1 and #2) with a generating capacity of 32 MW each
. There are
also two coal-fired boilers (#3 and #4) with a generating capacity of 30 MW each
. The
boilers #1-#4 have a common stack . The units are equipped with S02, NOx, and
opacity monitors. Boiler #5 (unit 3) is a 220 MW coal-fired boiler
equipped with a low NOx
horner system. It has an electrostatic precpitatoi Boiler #5 has a separate stack
.
50
This facility is an electric generating station with one boiler, a pulverized coal, wall fired
boiler rated at 3,713 million BTU per hour or about 400 MW
.
For NOx control there are low NOx burners on the boiler and a SCR system with
ammonia injection. Particulates are controlled by two parallel, cold side, ESP's with flue
gas conditioning by means of SO3 injection. Sulfur dioxides are controlled by a
limestone wet scrubber system
.
The S03 injection system was just started up in March 2006. The proper permits were
obtained. The coal presently being used can be described as a medium sulfur content
coal of up to 2%. This amount is high enough to continue to require the use of the wet
scrubber for SO 2 control, but low enough to require flue conditioning with S03 injection
for proper ESP performance . The ESP's were designed for use with high sulfur coal,
but with the lower sulfur coal, SO 3 needs to be injected to modify the resistivity of the
flyash particles for proper ESP operation
.
The current scrubber is reaching the end of its life . The company is currently
investigating whether rebuilding the scrubber or replacing the scrubber is most
economic. If the scrubber system needs to be shutdown while a new one is built or
rebuilt, then low sulfur will be temporarily used to meet the SO 2 emission limits
.
The SCR was put into service in about June 2003 and presently operates from May
through September, the ozone season . New rules may require year round operation by
2009. The SCR system produces a little SO 3 so the S03 injection system is operated at
a reduced rate in proportion to the amount from the SCR to maintain about 10 ppm of
SO3 in the flue gas
.
The duct between the air heater and the ESP's is about 212 feet long but is not in a
straight line. The single duct connection at the pre-heater is 14 x 25 feet (352 sq . ft.)
and it splits into two sections, one for each ESP . Each connection to the ESP's is 7 x
33 feet (464 sq . ft.) The specific collection area (both ESP's combined) is 291
.
Rizwan Syed and Wayne Kahila, both from the Peoria Regional Office, did this
inspection
.
cc
:
W.Kahila
R.Syed
ID: 057 801 AAA
52
Sulfur dioxide is controlled by burning coal with the proper sulfur content. The average
S02 emissions from all three boilers are limited to 4.71 lbs. S02/million BTU. Any one
boiler may have up to 6.6 lbs. S0 2/million BTU as long as the overall average is not
exceeded . Also, on a plant wide basis, the 24-hour average for SO2 emissions shall not
exceed 34,613 lbs. SO2/hour. Reports of coal analyses have been submitted to the
Agency in a timely manner. Quarterly reports of the sulfur dioxide monitoring have
been submitted in a timely manner
.
Unit 1
:
The ESP is a cold side one . The duct from the air pre-heater to the ESP is a twin duct
.
Each section is 7 x 20 feet (274 sq
.
ft .)
at the outlet of the pre-heater and 16 x 34 feet
(1088 sq . ft.) at the inlet to the ESP. The total duct length is about 61 feet ; however,
this is not a straight line distance . There are many curves and angles in this length of
duct. The equipment is tightly squeezed together
.
The ESP specific collection area is 138
.
The only flue gas conditioning is S0 3 injection. Elemental sulfur is burned to make S02
and a catalyst converts the SO 2 into SO3
. The injection averages about 10 ppm of 50 3 .
The SO3 system is necessary for the ESP to work properly with low sulfur coal since the
ESP was designed to operate with high sulfur coal
.
Unit 2
:
The ESP is a cold side one . The duct from the air pre-heater to the ESP is a twin duct
leaving the pre-heater but is combined into a single inlet at the ESP. Each section is 11
x 28 feet (612 sq
.
ft .)
at the outlet of the pre-heater and 27 x 74 feet (1968 sq
.
ft .)
at the
inlet to the ESP. The total duct length is about 46 feet; however, this is not a straight
line distance. There are many curves and angles in this length of duct . The equipment
is tightly squeezed together
.
The ESP specific collection area is 170
.
The only flue gas conditioning is S03 injection. Elemental sulfur is burned to make S0 2
and a catalyst converts the SO 2 into SO 3
. The injection averages about 8 ppm of SO 3 .
The SO3 system is necessary for the ESP to work properly with low sulfur coal since the
ESP was designed to operate with high sulfur coal
.
Unit 3
:
The ESP is a cold side one . The duct from the air pre-heater to the ESP is a twin duct
.
Each section is 12 x 29 feet (638 sq
.
ft .)
at the outlet of the pre-heater and 32 x 49 feet
(3056 sq
.
ft.)
at the inlet to the ESP . The total duct length is about 31 feet ; however,
this is not a straight line distance . There are many curves and angles in this length of
duct. The equipment is tightly squeezed together
55
The ESP specific collection area is 178
.
The only flue gas conditioning is S03 injection and SCR system . Elemental sulfur is
burned to make S02 and a catalyst converts the S0 2 into 503 . The injection averages
about 12 ppm of SO3 . The S03 system is necessary for the ESP to work properly with
low sulfur coal since the ESP was designed to operate with high sulfur coal
.
Unit 3 also has a SCR system with ammonia injection . Data from the catalyst
manufacturer indicates that the catalyst in the SCR converts about 1 % of the entering
SO2 into SO3 . The rate of the S0 3 injection system is adjusted to account for the S03
from the SCR system so that the total S03 is about 12 ppm. Presently the SCR system
operates only during the ozone season, which is May through September. It may go to
year round operation in 2009 .
Rizwan Syed and Wayne Kahila, both of the Peoria Regional Office, did this inspection
.
cc
:
W.Kahila
R.Syed
ID: 143 805 AAG
56
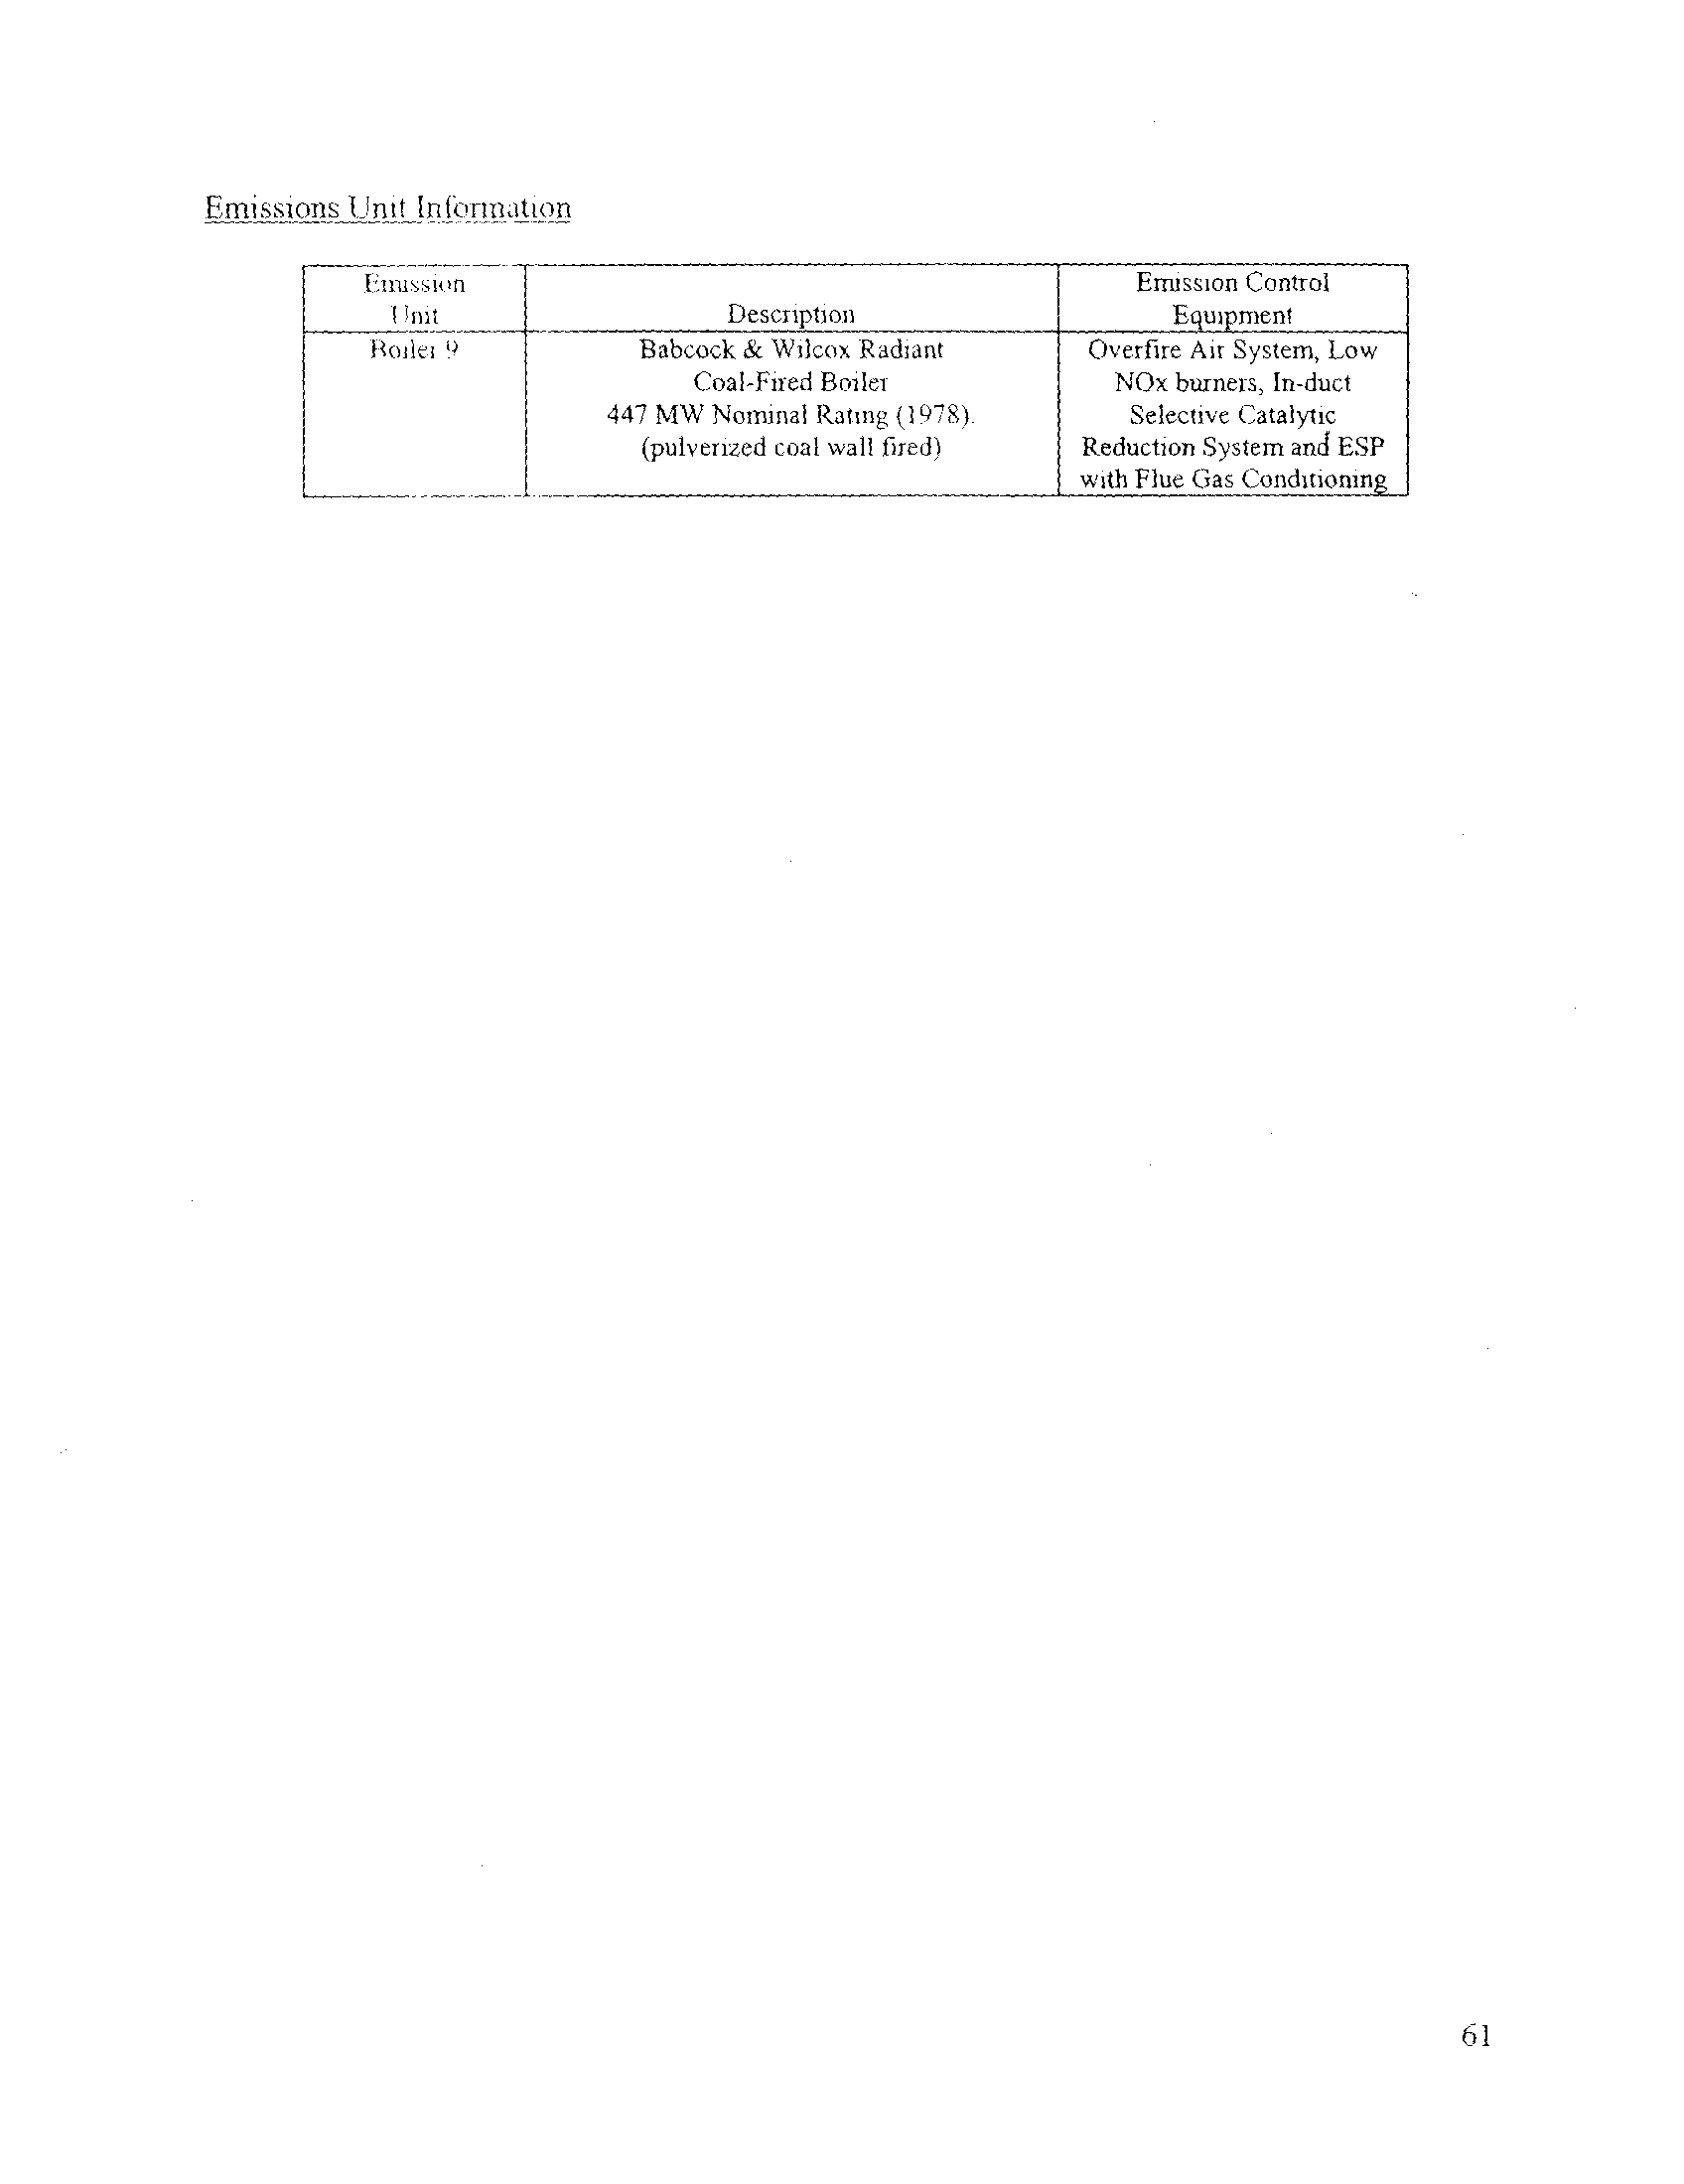
Emissions Unit Information
61
1 iiu swn
Emission Control
1 )nit
Descriptioi
gwpment
Ito.ilei 9
Babcock& Wilcox It3diant
Overfire Air System, Lo
Coal-Fired Boiler
NOx burners, In-duct
447 MW Nominal Rating (1975)
Selective Catalytic
(pulverized coal wall fired)
Reduction System and ESP
with Flue Gas Conditioning
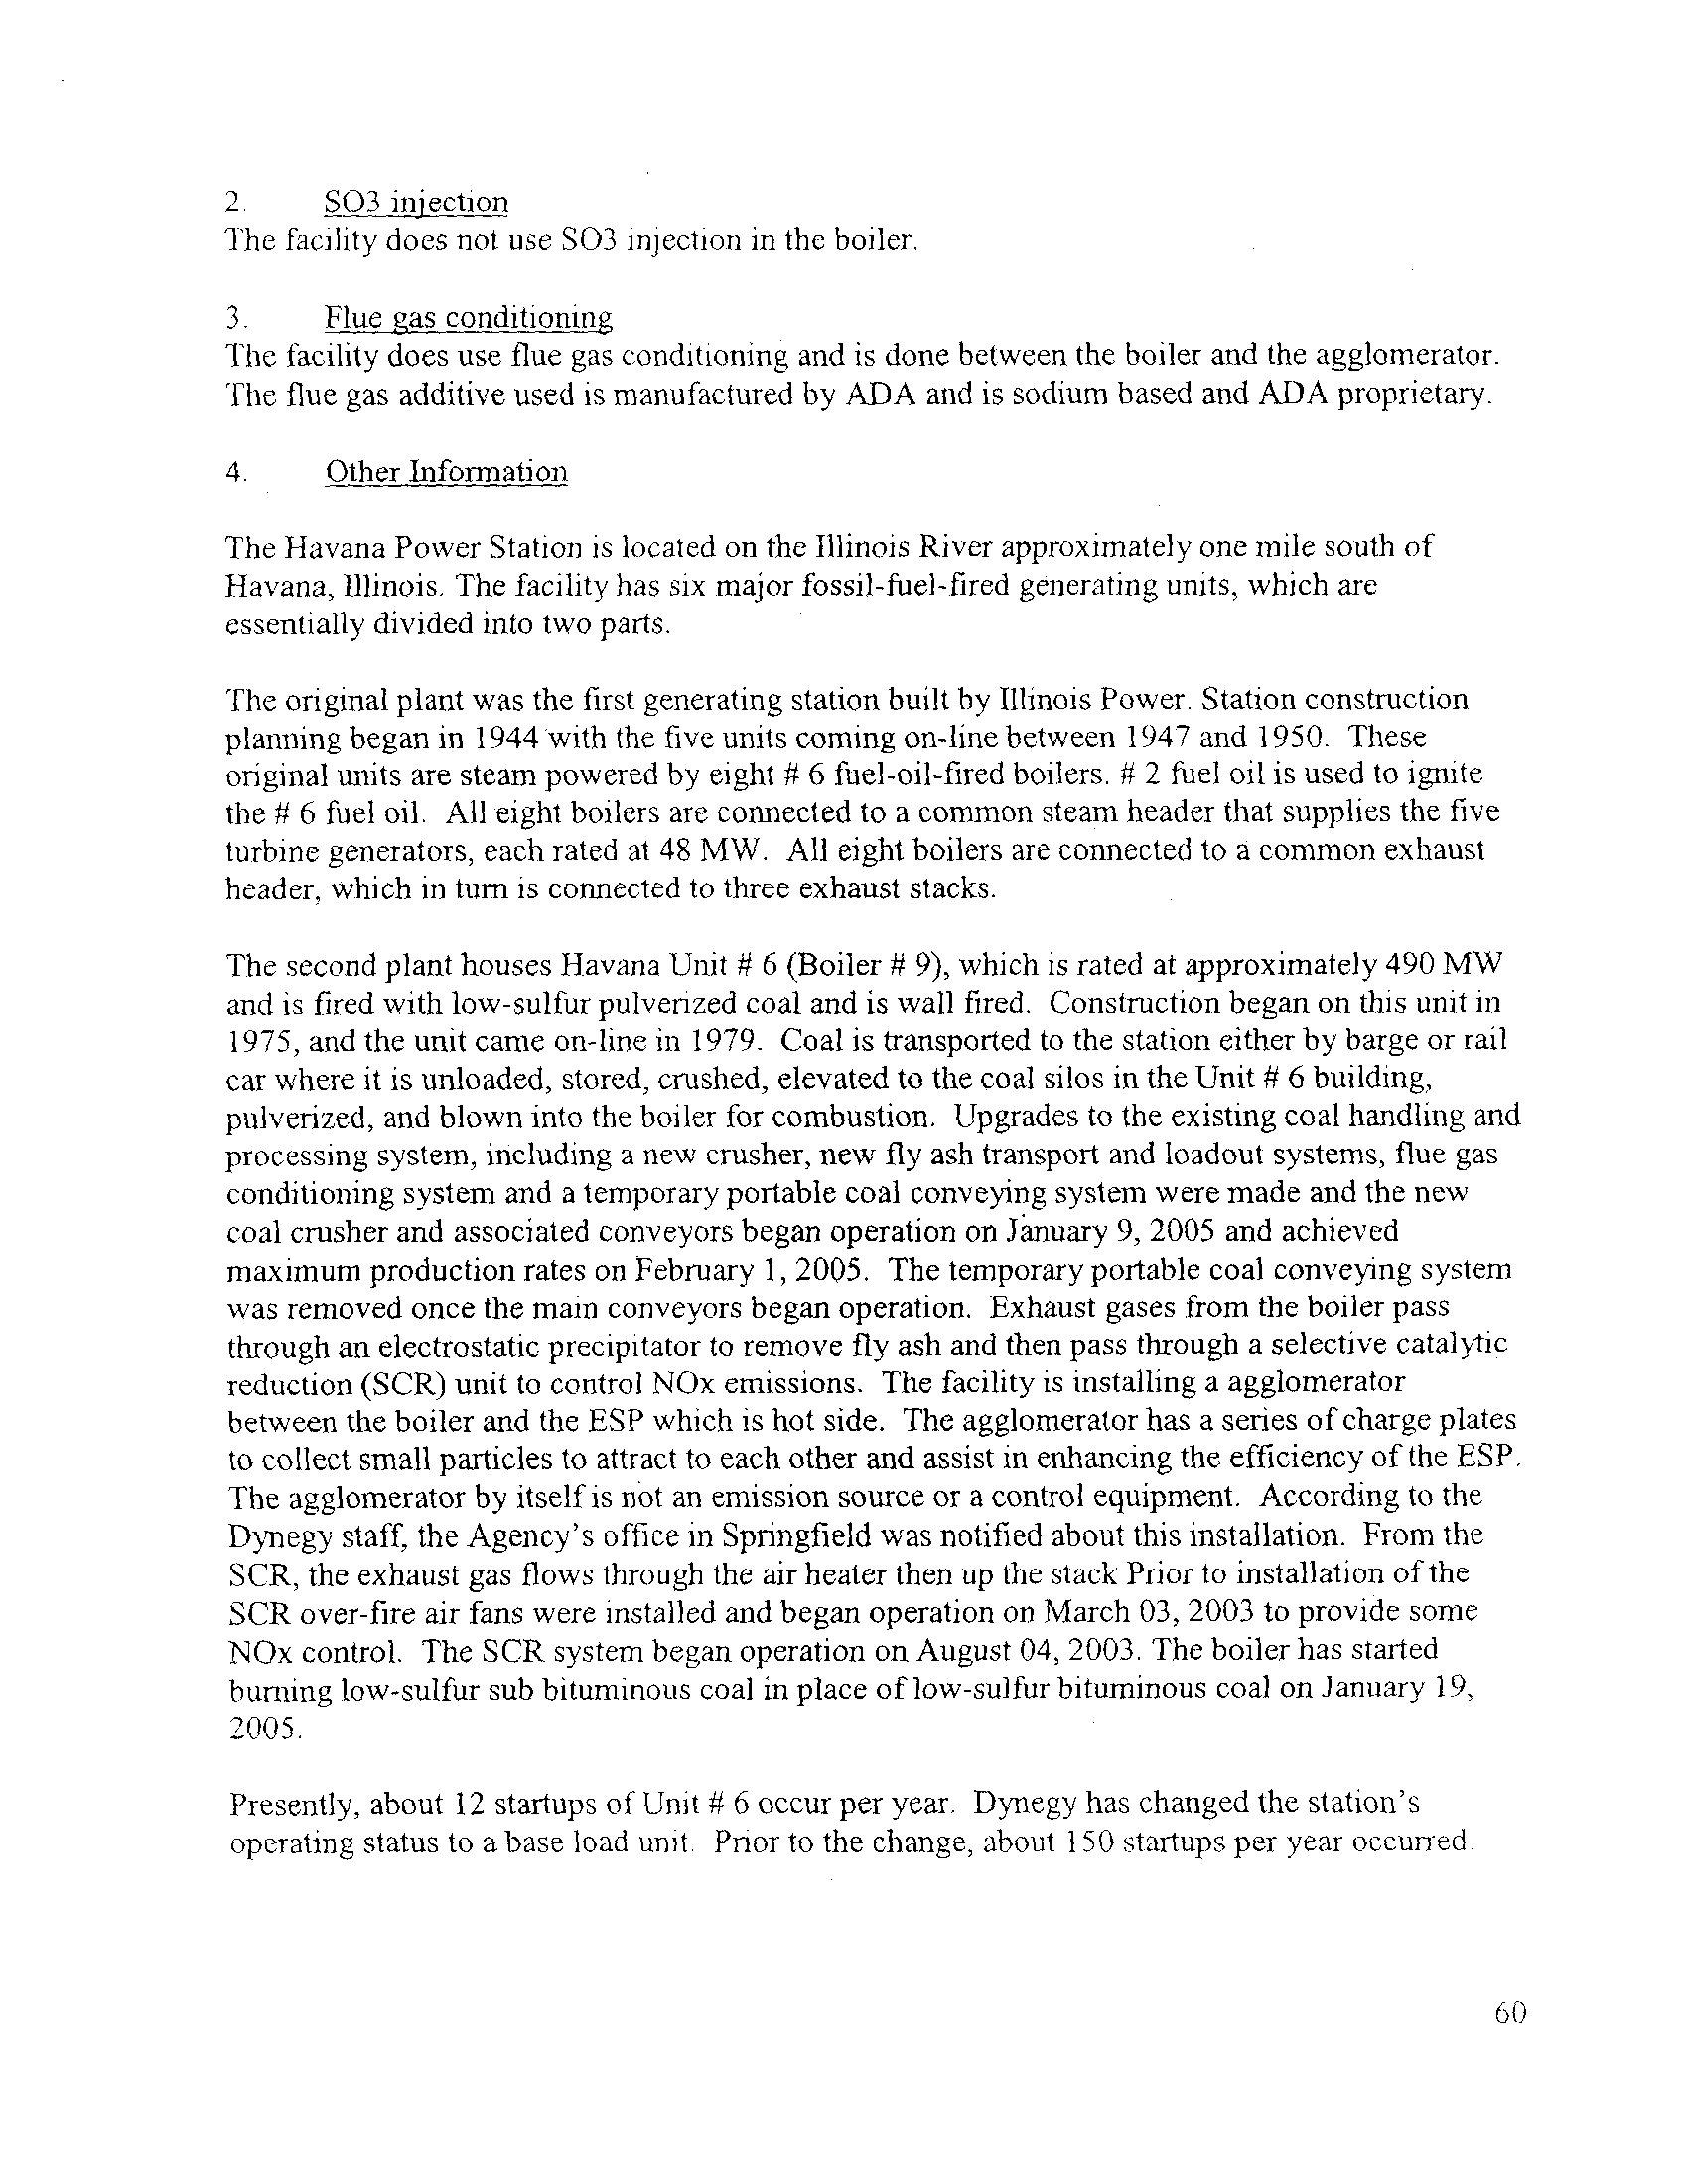
2
.
S03 injection
The facility does not use S03 injection in the boiler
.
3
.
Flue gas conditioning
The facility does use flue gas conditioning and is done between the boiler and the agglomerator
.
The flue gas additive used is manufactured by ADA and is sodium based and ADA proprietary
.
4 .
Other Information
The Havana Power Station is located on the Illinois River approximately one mile south of
Havana, Illinois. The facility has six major fossil-fuel-fired generating units, which are
essentially divided into two parts
.
The original plant was the first generating station built by Illinois Power . Station construction
planning began in 1944 with the five units coming on-line between 1947 and 1950 . These
original units are steam powered by eight # 6 fuel-oil-fired boilers . # 2 fuel oil is used to ignite
the # 6 fuel oil . All eight boilers are connected to a common steam header that supplies the five
turbine generators, each rated at 48 MW . All eight boilers are connected to
a
common exhaust
header, which in turn is connected to three exhaust stacks
.
The second plant houses Havana Unit # 6 (Boiler # 9), which is rated at approximately 490 MW
and is fired with low-sulfur pulverized coal and is wall fired . Construction began on this unit in
1975, and the unit came on-line in 1979 . Coal is transported to the station either by barge or rail
car where it is unloaded, stored, crushed, elevated to the coal silos in the Unit # 6 building,
pulverized, and blown into the boiler for combustion . Upgrades to the existing coal handling and
processing system, including a new crusher, new fly ash transport and loadout systems, flue gas
conditioning system and a temporary portable coal conveying system were made and the new
coal crusher and associated conveyors began operation on January 9, 2005 and achieved
maximum production rates on February 1, 2005 . The temporary portable coal conveying system
was removed once the main conveyors began operation . Exhaust gases from the boiler pass
through an electrostatic precipitator to remove fly ash and then pass through a selective catalytic
reduction (SCR) unit to control NOx emissions. The facility is installing a agglomerator
between the boiler and the ESP which is hot side . The agglomerator has a series of charge plates
to collect small particles to attract to each other and assist in enhancing the efficiency of the ESP
.
The agglomerator by itself is not an emission source or a control equipment . According to the
Dynegy staff, the Agency's office in Springfield was notified about this installation . From the
SCR, the exhaust gas flows through the air heater then up the stack Prior to installation
of
the
SCR over-fire air fans were installed and began operation on March 03, 2003 to provide some
NOx control. The SCR system began operation on August 04, 2003 . The boiler has started
burning low-sulfur sub bituminous coal in place of low-sulfur bituminous coal on January 19,
2005
.
Presently, about 12 startups of Unit # 6 occur per year . Dynegy has changed the station's
operating status to a base load unit. Prior to the change, about 150 startups per year occurs ed
60
Contact: Jim Dodson
Phone: 815-339-9212
Contact: John Augspols
Phone : 815-339-9218
Contact: Michelle Chestnut
Phone: 217-872-2367
Cell : 217-714-4794
#15-Dynegy Midwest Generation (Hennepin)
Division of Air Pollution Control - Field Operations Section
Special Inspection Memorandum
Date : May 4, 2006 (revised)
To: E . Bakowski
From : J. Krolak & W. Kahila
Source: Dynegy Midwest Generation, Inc .
Address : R.R.1, Box 200A, Hennepin, IL 61327
Title: Plant Manager
Fax :
Title: Environmental Coordinator
Fax : 815-339-2772
Title: Environmental Specialist (Decatur)
Fax : 217-876-7475
ID# 155 010 AAA
Dynegy Midwest Gen
.
Field Inspection Report
Date of Inspection : April 28,2006
Last Inspection : not relevant
ID : 155 010 AAA
RID: 203
County : Putnam
SIC: 4911
Description: This facility is a coal-fired electric generating station that now burns
western sub-bituminous low-sulfur coal to meet federal acid-rain prevention
requirements. Dynegy Midwest is the successor (for fossil-fuel power generation) to
Illinois Power Company
.
62
2
SO ,_19iection
Dynegy's Hennepin Station burns only low-sulfur Powder River Basin (PRB) coal, and uses S0
3
injection after the air heater exhaust to enable the ESPs to function properly . The sulfur use rate and
resultant SO3 concentration are not directly measured ; the optimum concentration is dependant on exhaust
gas parameters and is determined by observing the ESP power levels and the plume opacity and
appearance. Inadequate SO, results in excess emissions and opacity, while a slightly bluish plume
indicates too much SO,
3
.
Flue gas conditioning
No other flue gas conditioning is utilized beyond the furnace NO, controls
.
4
.
Other Information
The station is located in an agricultural/ industrial area within the corporate limits of Hennepin in Putnam
County, and is an electric utility . The two coal- or natural gas-fired units at this station are capable of
generating a total of about 316 megawatts . No other commercial generating units are located here
.
Under Board Regulations, the station's combined SO, emission limit is 17,05olbs/hr due to the 264foot
stack height. Burning PRB coal, actual emissions do not approach this limit
.
The station is located on the south bank of the Illinois River, and coal is delivered to the site by barges
.
Construction of Unit I was begun about 1950, followed by the larger Unit 2 about 1956
. Due to the lack
of space at the site, the ESPs for both units are located above the respective ID fans, with the common
stack between them. Unit 2's ESP is located higher above the ID fans to allow space for the larger
ductwork and breeching underneath it
.
When considering how to reduce sulfur emissions to meet acid rain restrictions, the owner (formerly
Illinois Power Company) determined that it was not economically feasible to install additional flue-gas
control systems such as scrubbers, or to increase the size of the ESPs . The only means left was the use of
low-sulfur coal and SO 3 injection
.
It is apparent that emission control systems requiring enlarged or additional structures could not be fitted
between the furnaces and the river . Lateral expansion might be accommodated, probably at a considerable
expense .
The Unit 2 ESP was refurbished in 2003, as described in Dynegy's letter of January 29, 2003 to Don
Sutton of the Agency. The Collection Plate Area and SCA information on form 260-CAAPP, page 164 of
the original CAAPP application submitted in September 1995, is no longer correct
. Information received
from Dynegy on May 4, 2006 states that the collection plate area is now 109,200sq ft, and the Specific
collector Area (SCA) is 125 .5
.
CC: Dean Hayden
Wayne Kahila
65
3_SO3lnigction ;
The facility presently utilizes S() 3 injection, however, the system may or may not be utilized in
conjunction with new mercury/PM baghouse control
.
4. Flu Gas Conditioning
:
The plant previously tried flue gas conditioning when using high sulfur coal. The boilers have
been switched to Powder River Basin coal (PRB) and this system will no longer be used
.
5. General Boiler Description :
3.2 Unit #1 Boiler with ESP and low NOX combination system
Dynegy has two Combustion Engineering tangentially fired pulverized coal boilers (Units #1 and #2)
.
Unit #1 has a maximum rated capacity of 84 MW (785 mmbtu/hr) . Each Unit has 4 pulverizers and 16
burners . Each pulverizer feeds 4 burners that are located at each comer of the boiler . The pulverized coal
is injected at four levels of the boiler. Each pulverizer corresponds to a different height at which coal is
injected into the boiler. The emissions from each unit are exhausted through an electrostatic precipitator
and then through a common stack
.
Electrostatic Precipitators (ESP) control the particulate matter emissions from the boilers . The ESP for
Unit #1 is a Buell with 4 sections (4 TRs) . The ESPs uses a hammer /anvil type rapper to remove
particulate matter from the plates. Particulate matter emissions from Unit I are limited to 0 .12 lhs/mmbtu
per 35 111. Adm. Code 212 .203(b) .
Sulfur dioxide (SO,) emissions from Units #1 are uncontrolled . S02 emissions are limited to 8 .5
Ib/rmnbtu by 35 111 Adm. Code 214.184. In addition, SO2 emissions trout both units #1 and #2 are limited
to 16,805 lbs/hr by permit special condition . Construction permit PN05030030 was granted 4/6/05 to
install new SO, gas conditioning system for ESP unit to bum low-sulfur coal (PRB) and reduce PM and
SO, emissions . S03 concentration in the flue gas will be approximately 20 ppm as needed by volume
.
Carbon monoxide emissions from the boilers are subject to 35 Ill . Adm- Code 216.121 (200 ppm
corrected to 50 percent excess air)
.
Dynegy has SO,, NOX, C0 2, flow and opacity continuous emissions monitors (CEM/COM) located in
the stack. Dynegy installed these monitors because of the Acid Rain regulations, 40 CPR Part 75
.
However, Dynegy is required by permit special condition to submit quarterly reports of excess opacity
and SO 2
.
Unit #1 and its ESP are permitted in CAAPP operating permit 95090050 and state operating permit
73020064 .
3.3 Unit #2 Boiler with ESP and low NOX combination system
Dynegy has two Combustion Engineering tangentially fired pulverized coal boilers (Units #1 and #2)
.
Unit #2 has a maximum rated capacity of 113 MW (1,167 mmbtu/hr) . Fach Unit has 4 pulverizers and 16
burners. Each pulverzer feeds 4 bunicr.s that are located at each corner of the boiler_ The pulverized coal
is injected at four levels of the boiler Each pulverizer corresponds to a different height at which coal is
68
injected into the boiler. Unit #2 is equipped with low NOx burners, installed in 1993 . The burners take a
portion of the airflow that is injected into the bottom and injects the air above the highest burner . The
emissions from each unit are exhausted through an electrostatic precipitator and then through a common
stack
Electrostatic precipitators (ESP) control the particulate matter emissions from the boilers . The ESP for
Unit #2 the ESP is a Western-Precipitation with 10 sections (5 TR=s) . The ESPs uses a hammer/anvil type
rapper to remove particulate matter from the plates
.
Particulate matter emissions from Unit 2 are limited to 0 .1 lbs/mmbtu per 35 111. Adm. Code 212 .202
.
Sulfur dioxide (SO2 ) emissions from Unit #2 are uncontrolled. SO2 emissions are limited to 8 .5 lb/mmbtu
by 35 111. Adm. Code 214.184. In addition, SO2 emissions from both units #1 and #2 are limited to 16,805
lbs/hr by permit special condition . Construction permit PN05030030 was granted 4/6/05 to install new
SO, gas conditioning systems for ESP unit to bum low-sulfur coal (PRB) and reduce PM and SO 2
emissions. SO, concentration in the flue gas will be approximately 20 ppm as needed by volume
.
Carbon monoxide emissions from the boilers are subject to 35 Ill . Adm. Code 216 .121 (200 ppm
corrected to 50 percent excess air)
.
Dynegy has SO 2
, NOX, CO2 , flow and opacity continuous emissions monitors (CEM/COM) located in
the stack. Dynegy installed these monitors because of the Acid Rain regulations, 40 CFR Part 75
.
However, Dynegy is required by permit special condition to submit quarterly reports of excess opacity
and SO, .
Unit #2 and its ESP are permitted in CAAPP operating permit 95090050 and state operating permit
73020063/construction permit PN05030030
.
6. The information concerning ductwork dimensions was received from Dynegy personnel (Rick Dieriex)
and is not listed or documented in any permit application or official Dynegy drawing. The actual layout of
the new construction of mercury baghouse, associated ductwork, and auxiliary equipment may not be as
presented by FOS in this document . The drawings are not to scale
.
69
i18-Kincaid Generation (Kincaid)
TIER
I INSPECTION MEMORANDUM
Date
May 2, 2006
Date of Inspection
:
Marl,
2006
To
:
E Bakow-ki
From
:
E
.
Kierbach
I .D . )$
:
021814AAB
R/D
204
Source
Kincaid Generation,
L .L .C
.
Address
:
PO Box 260 : 4 miles west of Kincaid Rt . 104 Kincaid,
II 62540
Contact/Title Ann Singh, PE/Sr . Environmental Compliance Engineer
Phone
:
217-237-4311 x 2291 /
217 -237-5519
inspector(s) : Steve Youngbiut/Ernie Kierbach
Purpose
:
Coal fired powerpiant equ4ment
verification/clarification
1
.
Block Diagram
The block diagram depicts boilers unit 1 and 2 along with ductwork and
controls
.
Unit I boiler is equipped with over fire air for NOx reduction . The unit
exhausts to an ammonia injection selective catalytic reduction system (SCR)
.
From the SCR exhaust travels thru an air heater to an electrostatic
precipitator (ESP) . The ESP has two main compartments each with a specific
collection area (SCA) of 327 .5 . From the ESP the exhaust travels to a common
stack
Unit 2 boiler is equipped with over fire air for NOx reduction . The unit
exhausts to an ammonia injection selective catalytic reduction system (SCR)
.
From the SCR exhaust travels thru an air heater to an electrostatic
precipitator
(ESP)
.
The ESP has two main compartments each with a specific
collection area (SCA) of 327-5 . From the ESP the exhaust travels to a common
stack
.
In either configuration the estimated distance from the air heater discharge
to the ESP is 325 feet . There would appear to be ample room for add on
control in this section of ductwork
.
72
2
.
S0_3
injection
The
facility
does not use
S03 injection. A S03
injection has never been used
at
the
facility
.
3
.
Flue gasconditioning
No flue gas conditioning
is utilized
.
4
.
other
Information
Kincaid Generation utilizes two coal-fired boilers
in conjunction with steam
turbine generators
to generate electricity
.
Electricity generated by Kincaid
Generation
is sold on the "grid" . Coal combusted at this facility is low
sulfur Powder River Basin coal
(Black Thunder, North Antelope,
and Antelope)
.
The facility,
in general,
consists
of coal receiving/storage, coal
processing/crushing systems, a water treatment plant,
an auxiliary boiler,
and two coal-fired units each controlled by an SCR and electrostatic
precipitator
(ESP)
vented to a common stack
.
Each boiler is also equipped with an over
fire
air system
(OFA)
to reduce
emissions
of
NO, to aid in complying with the Acid Rain Program requirements
of
40 CFR 76
.
In general, this is
accomplished by reducing airflow
(oxygen)
in
the furnace region resulting
in a reduction of NO, formation
.
Additionally,
the facility has installed a selective catalytic reduction
(SCR) system to each unit . The SCR taps in at the economizer exit and vents
to the air heater . The air heater section then vents to the ESP . The SCR
systems provide NO„ reductions during the ozone season . The SCR systems will
utilize ammonia as a reducing agent to convert nitrogen oxide emissions from
the combustion process to nitrogen and water
.
Steam from each boiler is fed to a turbine set . A turbine set consists of
one high-pressure turbine, one intermediate-pressure turbine, and two low-
pressure turbines . The turbine sets are connected to generators that
complete the conversion of chemical energy to electric power
.
Emissions Unit
Information
74
Unit
Manufacturer
Firing Type
Design Heat
Ipput
Control
Equipment
Date
Constructed
Unit
1
Babcock & Wilcox
Cyclone
6,634 mmbtu/hr
OFA,
SCR,
ESP
1967
Unit
2
Babcock & Wilcox
Cyclone
6,406 mmbtu/hr
OFA,
SCR,
ESP
1968
Aux
Unit
Babcock & Wilcox
-
165 mmbtu/hr
-
1984
#19-Electric Energy (Joppa)
ILLINOIS ENVIRONMENTALPROTECTION AGENCY
Division of Air Pollution Control--Field Operations Section
TIER I1 MEMORANDUM
Contact/Title: Bruce Parker, Environment Engineer
FY06 Workplan Inspection. Also witnessed RATA
.
Description
:
Electric Energy's
- Joppa Generating Station, located near Joppa, Illinois consists of six coal-
fired generating units, which supply electricity for the U .S. DOE - Paducah, Kentucky uranium
enrichment facility, as well as supply the grid . The facility is a CAAPP source
.
Units 1-6 are all Combustion Engineering pulverized coal-fired units rated at 181 MW (1653
mmbtu/hr) capacity. The units started operation between 1953 and 1955. The units are each
equipped with Research
- Cottrell 5 section (3 TR's) ESP's installed in 1971 and 1972 . The
ESP's were upgraded in 1993-94 to handle particulate emission from western coal . The units are
vented through three 525' stacks, two units per stack. Continuous emission monitoring
equipment was installed at the station, as per 1990 Clean Air Act amendment
.
The station receives western coal by rail from the Powder River Basin in Wyoming with less
than 1% sulfur- The facility burns approximately 4 .6x
106 tons of coal per year
.
Following is a summary of station design data
75
Date :
February 27, 2006
Date of Inspection: February 9, 2006
To
:
Ed Bakowski, FOS Manager
Last Insp . Date: February 15, 2005
From :
Scott Arnold, FOS
1.D.#: 127 855 AAC
RID: 304
County: Massac
SIC: 4911
Source :
Address :
Electric Energy, Inc
.
Joppa Steam Station, 2100 Portland Rd ., Joppa, IL 62953
Phone :
618/543-7531, Ext . : 458
Fax :
618/543-7420
Purpose.
Unit
MW
MMBTtV/}g
"I'y3)e
Age
Equ-iment
Age
Height
1
181
1053
( C-I/, 11-C
1953
R-C, ESP
1971
525
2
181
1653
C-E,P-C
1953
R-C, ESP
1972
3
181
1653
C-F,P-C
1954
R-C, ESP
1972
525
4
181
1653
( :_F, 11-C
1954
R-C, ESP
1972
5
181
1653
C-F, P-C
1955
R-C, ESP
1972
525
6
181
1653
C-F, P-C
1955
R-C, P.SP
1972
Electric Energy, Inc
.
ID# 127 855 AAC
February 27, 2006
Page 2
The station's SO2 limit is 38,865 lb/hr. based on a 3-hour block average .
Findings
I arrived at Electric Energy, Inc. at roughly 10:25 a.m. on the date of inspection . I met with
Bruce Parker, Environmental Engineer, and Mike Mercer, Chemist . We began the inspection
with a walk through of the facility. On this day, a gas RATA was being finished up on the SO,,
NO, and CO2 monitors on all three stacks . They were presently on stack #3, units #5 and #6 .
Unit #6 was operating at roughly 180 MW . Unit #5 was in start up running at about 100 MW
.
After Unit #5 reached 180 MW, stack #3 would undergo its' RATA . The RATAs on stacks #1
and #2 were done yesterday with both operating at 360 MW . All the boilers operate at about 180
MW or high load normally, and there are two units vented to each stack
.
The RATA was finished yesterday on stacks #1 and #2, Unit #1 and #2 and Units #3 and #4
.
The RATA was being done by G .E. Mostardi Platt. The stack testing crew chief was Greg Rock .
Mr. Rock told me they were doing Methods 6C, 7E and 3A for SO„ NO, and
C02, respectively
.
Mr. Rock said they were using a dilution extraction system for testing, since Electric Energy,
Inc. has the same type CEM system . They were sampling 3 pts ., 7 minutes/pt . For 21 minute
RATA runs. They were using a Teflon probe. They were doing a minimum of 9 runs on each
stack at high load, which is also normal operating conditions
.
We next checked out the coal handling system . I observed the dumping of a train. I noted little,
if any, opacity. Ron Thompson, the coal-handling supervisor stated that the coal being dumped
on this day was going to storage . The #25 stacker was the only one operating. Stackers #23 and
#24 were down at this time. I noted opacity in the 5% range from the #25 slacker. I noted no
other VE from the storage area or coal piles
.
We proceeded to the control room. All units were operating at full load or about 180 MW each,
except the #5 unit which was operating at 100 MW and in start up mode . I asked for an received
a copy of the CEM data for each stack (attached)
.
We returned to the office and Mr. Parker provided me with a copy of the "used oil disposal log"
(copy) and the "used oil" analysis (copy in general file) .
I next asked for coal burned in 2005 (attached). I also asked if any chemical waste had been
burned in 2005. Mr. Parker stated there had. There is a chemical waste quantity and analysis in
the company's general file . They burned roughly 15,000 gallons of chemical cleaning waste in
2005
.
76
Electric Energy, Inc
.
ID# 127 855 AAC
February 27, 2006
Page 3
Finally, I asked for and received a copy of 2004 and 2005 emissions (attached)
.
This completed this inspection. Recommendations will be made
.
SAA:jkb/233x/02-28-06
cc :
BOA/Marion
Electric Energy, Inc
.
77
Electric Energy, Inc
.
ID# 127 855 AAC
February 27, 2006
Page 4
Conclusions & Recommendations
The company appears to be in compliance with Agency regulations . Also, I photographed all
three stacks. There is no equipment after the ESP and before the stack . All three ESPs are cold
side ESP's
.
SAA:jkb/233a/02-28-06
cc :
BOA-Marion
78
is
a
dry
fly ash handling system
.
This system
is controlled by a baghouse
designated as LS BA
-
the Hytem has not been opetated tot several years
.
The Dallman station consists of coal receiving/storage, coal
processing/crushing
:yctem, and three coal-fired boilers (units 31, 32, and
33) . Units 31 and 32
are rack controlled by a separate ESP (EP 31 and EP 32,
respectively) then by a common flue gas desulfurization (FGD) system venting
to a common stack. Exhaust from Unit 33 is first vented to an ESP (EP 33)
then to a FGD system_ From the FGD system the exhaust is directed to the
Unit 33 stack . Additionally, the facility has installed selective catalytic
reduction systems (SCR) to each of the three Dallman Units
.
The FGD systems are used to remove sulfur dioxide from the boiler exhaust
.
Limestone received at the Dallman station is crushed using ball mills . From
the ball mills the crushed limestone is mixed with
water creating slurry
.
The slurry is misted through the boilers exhaust via spray towers . Pumps at
the bottom of the spray
towers move the spent slurry to a settling tank
.
Settled material is pumped to a de-watering station . In the de-watering
stage a rotating vacuum drum is used to pick up the by product (gypsum)
. As
the drum rotates an edge is used to scrape the gypsum from the drum . The de
watered gypsum is conveyed to a temporary storage
area prior to off-site
distribution . The cement and agricultural industries currently use this
material
.
The dry ash handling
located at the Lakeside Station is not currently
utilized . Ash from the slag tank of each unit is dropped to a slag tank
hopper that feeds to a grinder . The ground ash is sluiced to separate
settling ponds located north of the Spaulding Dam . After the ash has settled
the materiall is distributed off-site for use in the construction industry as
backfill or as a component in the manufacturing of roofing materials
.
Currently fly ash and bottom ash are not separated
.
Three diesel generators are located just south of the Lakeside Station
.
These generators were Added to the facility for the purpose of black start
capability (back up power for the stations) . Initial operation began in June
of 2002
.
Emissions Unit Information
In addition, the fa
Y
applied drawings of the exhaust systems
.
84
Unit
Manufacturer
Firing Type
Design Heat
input (Output)
Control
Date of
Equipment Construction
Unit
7
Babcock & VUIco-x
Cyclone
415 mmBtu/hr
(33
MW)
EPLS
1959
Unit
8
Babcock & Wilcox
Cyclone
415 mmBtu/hr
(33
MW)
EPLS
1964
Unit 31
Babcock &
I
Cyclone
882 mmBtu/hr
(88 MW)EP31/FGD/SCR
1967
Unit 32
Babcock & Wilcow
Cyclone
882 mmBtu/hr
(88 MW)EP32/FGD/SCR
1971
Unit 33Combustion Enginee.tog Pulverized2,120
mmBtu/hr
(192 MW)EP33/FGD/SCR
1975
ILLINOIS ENVIRONMENTAL PROTECTION AGENCY
-Gt f
1021
NORTH GRAND AVENUE EAST,
P.O. Box 19276,
SPRINGFIELD, ILLINOIS
62794-9276, 217-782-3397
JAMES R . THOMPSON CENTER, 100 WEST RANDOLPH, SUITE
11-300,
CHICAGO,
IL 60601, 312-814-6026
,
ROD
R
.
BLAGOJEVICH, GOVERNOR
RENEE CIPRIANO, DIRECTOR
N
P
~l-d
•3
-
Oy
(217) 782-3397
(217) 782-9143 TDD
April 22, 2004
EPA Docket Center (Air Docket)
U. S. Environmental Protection Agency West
Mail Code 6102T
Room B-108
1200 Pennsylvania Ave, NW
Washington, DC 20460
Attn: Docket ID No. OAR-2002-0056
Re: Proposed National Emission Standards for Hazardous Air Pollutants ; and, in the
Alternative, Proposed Standards of Performance for New and Existing Stationary Sources :
Electric Utility Steam Generating Units, Proposed Rule ; Proposed Rule (69
Federal
Register
4652, January 30, 2004) ("Proposal") and Supplemental Notice for the Proposal
(69
Federal Register
2397, March 16, 2004)
Ladies and Gentlemen : -
The Illinois Environmental Protection Agency (Illinois EPA) appreciates this opportunity to
comment on the U.S. Environmental Protection Agency's (U.S
. EPA's) "Proposed National
Emission Standards for Hazardous Air Pollutants; and, in the Alternative, Proposed Standards of
Performance for New and Existing Stationary Sources : Electric Utility Steam Generating Units
;
Proposed Rule" referred to herein as the "Mercury Proposal" and the Supplemental Notice to the
Mercury Proposal, referred to as "Supplemental Notice." These comments supplement the
testimony that I presented on behalf of the Illinois EPA at the public hearing held in Chicago on
February 26, 2004
.
We have stated publicly that Illinois is very committed to substantially reducing mercury in the
environment, and the State is aggressively encouraging clean-coal technology that will allow
Illinois' abundant coal reserves to be used in the most environmentally responsible manner . The
proposals as set forth in the January 30, 2004 and March 16, 2004,
Federal Registers will
impede these efforts
.
ROCKFORD-4302 North Main Street, Rockford, IL 61103-(815) 987-7760
DES PLANES-9511 W. Harrison St., Des Plaines, IL 60016-(847) 294-4000
ELaN-595 South State, Elgin, IL 60123
- (847) 608-3131
•
PEORIA-5415 N. University St., Peoria, IL 61614-(309) 693-5463
BUREAU OF LAND -PEORIA-7620 N . University St., Peoria, IL 61614-(309) 693-5462
•
CHAMPAIGN-2125 South First Street, Champaign, IL 61820- (217) 278-5800
SPRINGFIELD-4500 S. Sixth Street Rd., Springfield, IL 62706-(217) 786-6892
•
COLLINSVILLE-2009 Mail Street, Collinsviile, IL 62234 - (618) 346-5120
MARION-2309 W. Main St., Suite 116, Marion, IL 62959-(618) 993-7200
In brief, our comments on the Mercury Proposal will focus on the following : 1) Mercury is a
highly toxic pollutant that needs to be regulated; 2) Mercury must be regulated under the Clean
Air Act (CAA) section 112(d), Maximum Available Control Technology (MACT) standard
;
3)
Under section 112(d), the mercury limits must be more stringent than set forth in the proposals
;
4)
The final rule must be fuel neutral, without favoring coal from any particular region of the
country; 5) Emissions trading of mercury allowances is not appropriate unless each affected unit
involved in a trade can demonstrate that mercury hot spots are prevented ; and
6)
Mercury
emissions can and should occur by
2010,
and section
112
of the Clean Air Act has sufficient
provisions to accommodate this timeframe. Attached please find Illinois EPA's specific
comments on the proposal .
Coal-fired power plants are a major source of air pollutants, but their pollution can be
significantly reduced using cost-effective technology that is available now, and which will be
improved even further in the next few years. Further reductions will reap tremendous benefits in
terms of environmental protection . It is imperative that U.S. EPA promulgate rules that will set
the tone and direction for the power plant emission reductions that are long overdue and put the
Nation on a path to better protect the health of our citizens and its future generations . To shirk
its responsibility in this matter would have devastating consequences that will not be able to be
fully compensated through State action alone
.
If you have any questions regarding our comments, please contact Laurel L. Kroack, Manager of
the Division of Air Pollution Control at
(217) 524-7636
.
Renee Cipriano
Director
Attachment
cc: Bharat Mathur
Acting Regional Administrator
U .S. EPA Region V
2
Comments of the Illinois EPA on the Mercury Proposal
Environmental Concerns
Mercury is a highly toxic, persistent, bioaccumulative pollutant that can cause long lasting health
problems. It is especially harmfid to unborn babies, where exposure can result in a number of
neurological deficiencies, including delayed developmental milestones, reduced test scores and
cerebral palsy. A National Research Council study commissioned by Congress and published in
2000 estimated that each year about 60,000 children born in the United States could have
neurological problems because they were exposed to mercury before birth
.
The high levels of mercury found in fish that populate the waters of our State are also of great
concern to us. Mercury contamination is wjdespread throughout Illinois, causing fish
consumption advisories to be issued for every waterbody in the State . Illinois is counting on a
strong federal mercury reduction program to help us achieve the goal of reducing the amount of
mercury deposited into waterbodies in the State . U.S. EPA's proposed rule is unlikely to realize
either sufficient reductions or reductions in a timely enough manner to protect our citizens
.
The Clean Water Act requires States to identify impaired waters, to determine what reductions in
loading need to occur to restore water quality (i .e., develop a Total Maximum Daily Load or
TMDL) and to develop and implement plans to accomplish that restoration . When fish from a
waterbody are so contaminated with mercury that we must advise our citizens to limit their
consumption of fish or face an increased risk of adverse health consequences, that waterbody
must be listed as impaired . Under the Clean Water Act, States are expected to have clean-up
plans (TMDLs) in place and working by 2015 to address impaired waterbodies . To achieve this
goal, substantial reductions in ambient mercury levels and mercury deposition must be initiated
in 2010. We believe it is only prudent, sensible public policy that this proposal should also
address our obligations under the Clean Water Act
.
Moreover, a strong mercury control program would provide significant co-benefits for sulfur
dioxide and nitrogen oxide reductions, both of which are important in attaining the fine
particulate matter and 8-hour ozone National Ambient Air Quality Standards (NAAQS) . We
encourage U.S. EPA to require substantial mercury control by 2010, when most ozone and fine
particulate nonattainment areas are required to reach attainment under the Clean Air Act
.
Coal-fired electrical generating units (EGUs) represent the largest domestic source of mercury
emissions, as well as the largest source of emissions of nitrogen oxides and sulfur dioxide . In
order to mitigate the significant health impacts of mercury, sulfur dioxide, and nitrogen oxides,
and meet our obligations under the federal Clean Air Act and Clean Water Act, wee urge U.S
.
EPA to adopt a more stringent rule that reduces mercury emissions from coal-fired EGUs to the
greatest possible extent and within the timeframes states are required to address program
compliance under these federal statutes
.
Rulemaking Approach
Although U.S. EPA attempts to justify how it can properly regulate mercury emissions from
EGUs under either sections 111(d) or 112(n) of the Clean Air Act, Illinois EPA believes that
those units must be regulated under section 112(d)
.
U.S. EPA chooses to interpret part of the language in section 112(n), requiring U .S. EPA to
evaluate "alternative control strategies," to justify an approach to regulation of hazardous air
pollutants (HAPs) from EGUs other than a listing under section 112(c), standard setting under
section 112(d), and compliance deadlines established under section 112(g) . U.S. EPA does not
provide legislative history
or
case law that would support such an approach or interpretation
.
Nothing in section 112(n) indicates any intent of Congress to allow U .S. EPA to regulate
emissions of hazardous air pollutants (as opposed to other air contaminants) from EGUs
under any other section than 112, nor does the language in section 112(n) evince any
intent of Congress to allow U.S.EPA to exempt EGUs from the multiple requirements of
other subsections of section 112 . Indeed, if Congress had intended to give U.S. EPA that
authority, it could have done so when it drafted section 112(n)
.
Moreover, regulation under section 111(d) would be inconsistent with the structure of the Clean
Air Act itself, i.e., section 112 for the regulation of hazardous air pollutants, sections 108 to 110
for the regulation of sources as necessary to attain a NAAQS, and section 111 to set standards of
performance for new stationary sources
.
Also, regulation of emissions of hazardous air pollutants from EGUs under section 111(4) would
be inconsistent with U .S. EPA's previous findings . Pursuant to section 112(n) of the CAA,
U .S. EPA was required to study the hazards to public health that result from the emissions of
EGUs and to provide a -report to Congress . If the section 112(n) study and report to Congress
found that regulation of these sources were necessary and appropriate, U .S. EPA is then required
to regulate under section 112. This proposal essentially proposes to rescind the findings U .S .
EPA reported to Congress, which concluded that controlling emissions of hazardous air
pollutants from EGUs are necessary under section 112 . Instead, U.S. EPA now proposes to
change to a section 111 finding that it is only "appropriate" to control emissions from these
sources. After negating its own conclusion, U.S. EPA then, without resubmitting the report to
Congress, has proposed rules pursuant to the authority of section 111, and in the form of a
trading program. To regulate EGUs under a section other than section 112, U .S. EPA would be
required to delist EGUs under section 112(c). U .S. EPA has not undertaken this process, and
cannot, in light of their own report to Congress, do so by claiming they erred in listing under
section l 12(c) initially .
Finally, U .S. EPA's conclusions that it erred in listing EGUs under section 112(c) cannot be
supported by its actions in regards to the proposed maximum achievable control technology
(MACT) standards for industrial boilers "National Emission Standards for Hazardous Air
Pollutants for Industrial Commercial/Institutional Boilers and Process Heaters" (40 CFR part 63,
subpart DDDD) ("Industrial Boiler MACT") . In the Industrial Boiler MACT, U .S. EPA
2
proposes to regulate mercury, nickel and other HAPS from these sources, based on a finding that
exposure to these HAPS have adverse health impacts, even though they emit these HAPS in
smaller quantities than EGUs
.
We do not believe that the rule proposed by U .S. EPA for the control of mercury emissions from
E
GUs tinder section 111(d) or 112(n) complies with the requirements of the Clean Air Act
.
Although U.S. EPA constructs an elaborate interpretation that allows it to promulgate a trading
program under sections 1 11(d) and 112(n), neither section provides specific authority for
promulgating a trading program . Sections 111(b)(1)(B) and (d) and section 112(d) require U.S
.
EPA to promulgate either a "performance standard" or an "emissions standard ." A performance
standard as defined by section 11 I(a)(1) of the CAA means an emissions standard that reflects
the "best system of reduction." And, an "emissions standard" under section 112(d)(2) is required
to reflect "the maximum degree of reduction that is achievable" (MACT). A trading program
does not, by its very structure, require a source to achieve any
particular level of emissions
reduction. U.S. EPA asserts that a cap and trade program is the best system of reduction because
it provides incentives to sources to make early reductions and to go beyond compliance
.
However, the safety valve and banking features without flow control of the proposed trading
program negate the very incentives of a market-based program . For these and other reasons
discussed more thoroughly below, we believe that the appropriate and legally required approach
for regulating mercury is under section 112(d) of the CAA that requires USEPA to set an
emissions standard that each unit would be required to comply with based on MACT, and each
EGU would then be required to meet that standard
.
We are also very concerned that other important section 112 requirements will be avoided under
a section 1 1 1(d) approach . As noted in a publication of the Washington, D.C. law firm of
VanNess Feldman entitled "EPA's December 15, 2003 Proposed Rule to Regulate Mercury
Emissions from Electric Utilities : Summary and Analysis"
:
Also of importance is that the alternative cap-and-trade option (under either
sections 112 or 111) would include the removal of the electric utility steam
generating units from the section 112(c) list. Such an action would shield the
affected utility boilers from the more prescriptive MACT standard-setting process
related to MACT floors, regulation of all HAPs, the form of standards, and unit
specific compliance obligations. In addition, such an action would spare electric
utilities from further regulation under section 112, specifically additional
tightening of the MACT standards under section 112(d)(6) or residual risk
standards under-section 112(1), eight years after promulgation of the initial MACT
standard .
We are concerned that the timeline in the Proposal is too long, and controls must be required
much more quickly. U.S. EPA gives insufficient support for its extended compliance deadline of
2018, which it has acknowledged, based on the elements of the trading program, could extend to
2025 or 2030. Based on the Florida Everglades experience in which stringent controls were
applied to incineration sources in the 1990's, resulting in a steep decline in fish tissue levels of
mercury within less than a decade, we can conclude that the quicker we start a reduction
3
program, the quicker the risk to our citizens can be reduced . A 2018 compliance date under the
section 111(d) proposal would be far, too late for Illinois to use the federal mercury rule
as
part of
a plan to restore an impaired waterbody under the Clean Water Act. And, we would be looking
at 2028 before substantial fish tissue reductions could occur in the best of cases. That's 25 years
before a current public health risk even begins to resolve, and that's too long
.
Under section 112(g), the compliance deadline would be three years after the rule adoption,
likely in 2007 . There is evidence that requiring strict levels of reduction by 2007 would be very
difficult, if not impossible, for all EGUs to meet and still ensure electric reliability . However, we
believe that mercury reductions can and should be required under the timeframes allowed for by
section 112(g), and the final compliance date should be no later than 2010 . Although this date is
three years beyond the date specified under section 112(g)(3)(A), sufficient authority under
section 112 exists to extend this date. The U.S. EPA Administrator, or a State with an approved
program under Title V of the Clean Air Act, may extend the compliance date by one year under
section 112(g)(3)(A)
if
the additional period is necessary for the installation of controls. Under
section 112(g)(4), the President may exempt any stationary source from compliance with any
standard for a period of not more than two years, which period may be extended, if the
technology to implement the standard is not available, and if it is in the national security interest
to extend the date
.
Also as discussed more thoroughly below, we believe that the limits should be much tighter than
those proposed by U .S. EPA and the rule should be fuel neutral, i.e ., it should not set different
reduction levels based on coal type .
Mercury Emission Limits
We believe that for existing coal-fired EGUs an input-based (or input-based equivalent) limit of
two pounds per trillion British Thermal Units (lb/TBTU's) or a reduction of 80% should be the
MACT standard. This limit should be adopted and required within
a
timeframe that is legally
allowed for under section 112 of the CAA. Various studies, including a U .S. EPA report
"Control of Mercury Emissions from Coal-Fired Electric Utility Boilers," which was posted on
U.S. EPA's website on February 27, 2004, indicate that these levels of control have been
achieved and are projected to be achievable for the types of units and types of coal utilized
.
Indeed, if the MACT had been properly set as an average of the best performing 12% of EGUs,
the MACT standard would have been set at 2.0 lbs/TBTU
.
In setting the MACT floor, U.S. EPA looked at emission test results from approximately 80
EGUs. However, there were not enough units tested nor enough test runs to completely rely on
this data. While it may be appropriate to apply a statistical analysis to generate a confidence
level when working with less than an ideal set of data, the statistical analyses used by .U .S. EPA
cannot be completely determined or replicated by Illinois . From what Illinois EPA staff have
been able to determine, the data have been selected to reflect the worst-case scenario, and then
some. This approach is fundamentally inconsistent with MACT standard setting under
section 112(d) which is technology-forcing--hence the requirement that the MACT floor be
based on the best performing 12% of sources
.
4
U.S. EPA has recommended that under section 11 I (d) new EGUs that burn bituminous coals
achieve a 94% removal efficiency for mercury. The recommended efficiencies for sources
burning sub-bituminous and lignite coals are 74% and 68%, respectively
.
We recommend that new EGUs should be required to reduce mercury emissions by 90%
regardless of fuel type. U .S. EPA determined that the average of the best 12% of 411 plants was
94% control and the average of the best 12% of the select 80 test runs was 93%. Notably,
Illinois EPA has recently issued a construction permit for one coal-fired power plant and has
proposed to issue a construction permit for another coal-fired power plant . At this point in time,
Illinois EPA has found that the permittees have not been able to obtain performance guarantees
from equipment manufactures at levels above 90% removal at this time .
The State and local Agency stakeholders, as well as the equipment manufacturers, as part of the
October 2002 FACA report, recommend that 90% removal efficiency was appropriate based on
their review of pilot plant and large unit testing of new technologies
.
Also, various studies, including a U .S. EPA report "Control of Mercury Emissions from Coal-
Fired Electric Utility Boilers," which was posted on U .S. EPA's website on February 27, 2004,
indicate that these levels of control have been achieved and are projected as achievable in 2010
across all types of units and types of coal
.
Rule Should Be Fuel Neutral
We urge U.S. EPA to adopt a rule that treats all types of coal equally in setting the standards for
mercury and that requires state-of-the-art control equipment . While the overarching goal of this
proposed environmental control program is to greatly reduce the emissions of hazardous
mercury, the proposed levels for sub-bituminous and lignite coals would require no, or very
minimal, mercury reduction from EGUs burning these coals . In fact, U.S. EPA's own contractor
(RTI International) has been quoted as admitting that the proposed rule would necessitate
installation of control equipment at 78% of the EGUs using bituminous coal, while only 29% of
the EGUs burning sub-bituminous coal and 21% of those burning lignite coals would have to add
controls. We also note that U .S. EPA's proposed approach in this proposal to require less
mercury reduction from lignite and sub-bituminous coals is counter to the recommendations of
its own working group for this issue that met from August 2001 through March 2003 under the
Federal Advisory Committee Act (FACA). Moreover, we do not believe the approach that
distinguishes between coal rank is either legal or technically supportable . Sections I I I and 112
limit U .S. EPA's authority when developing regulations for a source category to simply
distinguishing between the classes, types, and sizes of boilers, or, in other words, they are
allowed to make a technical distinction . As has already been discussed, an EGU can burn both
the sub-bituminous or bituminous coal with minimal or no change to the boiler . In addition, as
some states have found, mercury emissions from sub-bituminous coal decreases with the
blending of it with bituminous coal . If U.S. EPA's proposal was fuel neutral, users of sub-
bituminous coal may have an incentive to blend with bituminous coal . A similar blending has
taken place for years with respect to the Acid Rain and NOx Trading Programs, where users of
primarily bituminous coal are blending sub-bituminous coal to meet more stringent NOx and
SO2 emission limits
.
5
Moreover, there does not appear to be a technological issue to prevent EGUs that burn
bituminous coal from switching to or blending sub-bituminous coal. Therefore, the proposal
provides an incentive that could result in an overall increase in current mercury levels within the
State . As illustration, the estimate of 2 .99 tons of mercury attributed to the State of Illinois did
not account for blending/mixing of coal types and coal switching that resulted in a substantial
increase in the use of sub-bituminous coals that has occurred since the implementation of the
Acid Rain program. As such, Illinois' mercury emissions from EGUs.are approximately 25%
higher than U.S. EPA's estimate. With different mercury emission standards for each type of
coal, companies will likely continue to experiment with different coal blend scenarios which
could further delay the reduction of mercury to the environment : Furthermore, Illinois' mercury
emissions could actually increase as EGUs take advantage of less stringent emission limits if
they were to switch from bituminous to sub-bituminous coal
.
This rulemaking should not provide a justification for power plants that choose to use lignite or
sub-bituminous coals to continue to pollute . The provisions of the Clean Air Act and U .S. EPA
implementing regulations are basically fuel neutral . Although we note that some minimal attempt
was made in the Clean Air Act Title IV Acid Rain program to give relief for EGUs in states that
relied more heavily on high-sulfur bituminous coals, the Acid Rain program still had an
extremely deleterious effect on bituminous eastern and Mid-western coal industry, although it
achieved significant environmental gains. The U.S. EPA mercury reduction rule must also
provide a fuel neutral approach to reducing the emissions of mercury
.
This approach to fuel neutrality is evidenced by U .S. EPA's recently proposed, but not yet
published, Industrial Boiler MACT, which does not distinguish between coal ranks . (40 CFR
part 63, subpart DDDD)
The U.S. EPA should establish a fuel neutral approach for mercury reductions that achieves
environmental gain without creating additional economic distortions in the coal market . We urge
U .S. EPA to recognize the importance of adopting standards that will result in real reductions of
mercury to the environment without unfairly pitting the regions of the country against each other
.
We strongly oppose the proposed approach in reducing mercury emissions from utility boilers
based on coal types . The mercury proposal should be uniform for all fuel types nationwide,
consistent with the Clean Air Act's policy of fuel neutrality . We urge U.S. EPA to revise the
Proposal, as it appears to indirectly promote certain coal fuel types
.
Determining Compliance
Under the Mercury Proposal, a company could elect to blend coals from different types and
ranks as a means to achieve compliance with the rule. Although, U .S. EPA discussed the
possibility of blending different coal ranks (69 Fed. Reg. 4674), there is no industry-wide
uniform blending procedures. In fact, sources may adopt irregular blending frequencies due to
their own economic situation, the coal quality of their supplies, or to achieve their own
optimization goals. The determination of the weighted mercury allowable emissions limit would
then become a case-by-case compliance determination for most, if not all, EGUs. We believe
this lack of specificity by U.S. EPA will lead to an inaccurate accounting of mercury emissions
r
and may well lead to an increase of uncontrolled mercury emissions to the atmosphere . For the
aforementioned reasons, determining or verifying compliance could be a very cumbersome
procedure. States would face extreme difficulty in enforcing such a rule . Again, Illinois
supports a fuel neutral rule
.
Technical Issues
As stated previously, we found it very difficult to assess the statistical analyses that were used as
the basis for setting the MACT floor values based on the information provided in the Federal
Registers and in the various supporting materials
.
Our concerns regarding the analyses that were used to set the MACT floor include the following
:
1) It has not been established that the best performing 12% of sources were selected to establish
the MACT floor; 2) Since the testing of emissions units was not random, we cannot be sure that
the data used to set the MACT floor properly represents the variability of the mercury emissions
;
3) Only one test per unit does not seem sufficient to use as the basis in setting the MACT floor
;
4) We cannot tell which emissions variables are most sensitive in determining the MACT floor
;
and what the model indicated when variability was accounted for; 5) We question why a hot side
electro-static precipitator (HESP) was selected as one of the best-controlled sources for setting
the MACT floor for sub-bituminous coal; and 6) There was inadequate justification for not
examining more control technologies/options in setting the MACT for new sources . These
concerns add further to the lack of confidence in the MACT levels values that USEPA has
proposed
.
Other Hazardous Air Pollutants
We also urge U.S. EPA to take steps to move forward with emissions standards for all non-
mercury HAPs that are emitted from EGUs . In its December 2000 "Notice of Regulatory finding
for Emissions of HAPs from EGUs", U .S. EPA indicated that a significant number of the 189
HAPs included in the section 112(b) list are being emitted by coal and oil fired utility units
. In
fact, in the final utility report ("Study of Hazardous Air Pollutant Emissions from Electric Utility
Steam Generating Units, Final Report to. Congress, Volume I", referenced as "Utility Report to
Congress") containing the study on exposure and risk assessment from a number of HAPs from
EGUs, U .S. EPA estimated that in addition to mercury and nickel, as much as 143,000 tons of
hydrogen chloride (HCL), 20,000 tons of hydrogen fluoride and an appreciable tonnage of heavy
metals such as arsenic (61 tons), chromium (73 tons), lead (75 tons), acrolein (25 tons) and
manganese (164 tons) were emitted to the atmosphere in 19900 from these units . The same report
predicted that these HAP emissions would increase during the period of 1990 to 2010
.
The Utility Report to Congress recommended that a risk assessment analysis be performed on
emissions from coal combustion for the following HAPs : acrolein, arsenic, beryllium, cadmium,
chromium, dioxin/furans, radionucleides, hydrogen chloride (HCL), hydrogen fluoride (HF),
and
lead. Heavy metals like arsenic, nickel, chromium and cadmium are the heavy metals
prioritized for further risk assessment because of the higher potential concern for carcinogenic
effects. Also recommended for further assessment were hydrogen chloride, hydrogen fluoride
and acrolein because these HAPs are of greatest potential concern for public_ health due to short-
term exposure
.
Although the preliminary screenings indicate that cancer risks are not high, our concern is based
on the fact that U.S. EPA could not eliminate these heavy metals as posing no risk to public
health. We believe that U.S. EPA should include emission standards for acid gases, other HAPs
(notably arsenic, cadmium, chromium, and lead) and organics (dioxin) for the very same reasons
these heavy metals and HAPs were selected as priorities for further risk assessment, i .e., due to
their significant level of emissions, persistency in the environment, tendency to bioaccumulate
and potential health threat due to short term exposures . Such standards have been adopted in
recent Industrial Boiler MACT and MACT standards for municipal solid waste combustors .
Treating EGUs the same as industrial boilers is clearly appropriate and scientifically supportable
.
Emissions Trading
Illinois has been recognized as a leader in the area of emissions trading, and based
on our
experience with a number of emissions trading programs for criteria pollutants, we provided
supportive comments to U .S. EPA on their proposed interstate trading program as part of the
recent Interstate Air Quality Rule (IAQR) proposal . We are very concerned, however, that the
proposed emissions trading program for mercury would cause or perpetuate continued fish
consumption advisories for our waterbodies . Because of these concerns, we urge U.S. EPA to
refrain from including an emissions trading program in its national mercury reduction strategy
for electric generating units, unless EGUs wishing to trade can demonstrate that they do not
cause or allow continuation of a mercury "hot spot," or U .S. EPA otherwise ensures that a
protective base level of mercury reduction from each unit is achieved, and trading only occurs
above this protective limit .
Without strict mercury reduction limits, emissions trading could result in an undetected localized
mercury "hot spot" due to an EGU that elects not to reduce its emissions . Unlike NAAQS for
criteria pollutants (i .e., particulates, nitrogen dioxide, sulfur dioxide, ozone and lead), there are
no NAAQS for mercury that must be maintained to protect against localized atmospheric loading
and deposition. Furthermore, the number of ambient mercury monitors is very,
very
small
compared to the criteria pollutant-monitoring program throughout the Nation. In Illinois, for
example, we are fortunate to have one continuous mercury monitor ; many States do not have
any. Our air-monitoring network is therefore not adequate to detect a localized ambient mercury
"hot spot ."
We have particular concerns about the water quality in our local rivers and streams in the
Midwest, and even greater concerns about mercury levels in the Lake Michigan . High levels of
mercury deposited in our State's waterways have accumulated in fish tissue, resulting in the
issuance of advisories to restrict consumption of predator fish caught from Illinois' lakes and
streams. A soon to be published study, "Modeling the Atmospheric Transport and Deposition of
Mercury to the Great Lakes,"(to be published in "Environmental Research") shows that Midwest
EGUs are substantial contributors to mercury in the Great Lakes . A three-year study of
precipitation samples collected in Indiana and analyzed by the U .S. Geological Survey has
concluded that the mercury concentration in the precipitation is significantly influenced by
8
nearby mercury emitting sources. (Risch, Martin, U .S. Geological Survey, Briefing for Indiana
Department of Environmental Management Mercury Workgroup, "Atmospheric Deposition of
Mercury in Indiana and Nearby Emission Sources", April 2004.) Local sources must achieve
reductions
.
In addition to Illinois' general concerns with a trading program, there are two particular
provisions of the U .S. EPA proposal that further exacerbate our concerns for "hot spots." The
first is the "safety valve" provision that enables sources to buy additional allowances from a
future allocation at a price that is preset in the rule. The proposed rule allows borrowing with no
interest or penalty, requiring only a reduction in the State's mercury budget for fiiture years
.
(See 69 Fed. Reg. 12445, proposed section 60.4143.) A safety valve provision is counter to a
market-based approach to reducing emissions . A local mercury "hot spot" could be the result of
applying the "safety valve" to a particular plant or group of plants
.
The second provision of concern is the one for banking as proposed in section 60.4135. It allows
unlimited banking with no flow control . Such a provision will allow sources that may easily
comply with the "limits" set for 2010 to bank allowances for 8 years and to push the final
compliance date out at least another decade. The federal NOx SIP Call Trading Program
avoided this result by adopting a flow control provision that makes older allowances less
valuable. Such a mechanism is even more appropriate for this progam, where "hot spots" could
appear .
Illinois has these additional concerns about the Supplemental Notice to the U .S. EPA proposal
.
First, it did not include any proposed language for a section 112(n) trading program . Such a
program could be fundamentally different in structure than a program promulgated pursuant to
section 111 . As proposed in the Supplemental Proposal, under section 111 states are given
flexibility over allocation issues as long as they meet their budgets, and so long as they meet
certain parameters,
-but similar authority is not specified under a section 112(n) approach
.
Moreover, it is unclear, given the mandate under section 11 I(b)(1)(B) that U.S. EPA is required
to regulate new sources, how U.S. EPA can require states to regulate "new" EGUs under
section 111(d), because this section requires states to regulate "existing" sources . Illinois prefers
that if there is a trading program promulgated, it would have the authority to develop its own
system for allowance allocation, flow control, banking, and other trading issues
.
Second, the Supplemental Notice provides no State budgets for 2010, nor does it indicate when
such budgets would be promulgated by U .S. EPA. This is a critical piece of a program, as the
State would be required to promulgate rules no later than 2007
.
We ask that U.S. EPA not incorporate mercury emissions trading within its national mercury
reduction program, and in the alternative, that such a trading program be carefully designed so
that U.S. EPA can insure protection of our waters .
Program Consistency
We urge U .S. EPA to make every effort to ensure consistency, especially with respect to
compliance deadlines, between the various federal air quality programs, including the mercury
9
reduction program, the Interstate Air Quality Rule (IAQR), the Regional .Haze program, and the
NAAQS attainment dates. While it is clear that additional reductions from EGUs are warranted
and achievable, we must take all available steps to provide the electric power industry with a
reasonable degree of certainty regarding future regulatory requirements, especially the timing of
these requirements . The industry must be given the opportunity to plan for the most cost-
effective set of compliance options
.
Conclusion
It is disappointing that U.S. EPA is not proposing the kind of strong federal mercury reduction
program that will result in comparable, reliable, equitable and sufficient reductions to allow
States to minimize the risk to their citizens and fulfill their obligations under the Clean Air and
Clean Water Acts. U.S. EPA has ultimate statutory responsibility, along with the State of
Illinois, for assuring that water quality standards are achieved and impaired waters are restored in
a timely manner. If the Mercury Proposal is promulgated as proposed under other section 111(d)
or 112(n), Illinois is concerned that the significant adverse health impacts from mercury would
continue into the next several decades, and we will be unable to provide reasonable assurance
(under the Clean Water Act TMDL vile) that water quality standards will be achieved . Instead,
U.S. EPA will be looking to us for a better demonstration of reasonable assurance, and we will
ultimately need to develop state-level requirements to solve what is
a
national-scale water quality
problem
.
We strongly urge U.S. EPA to establish a mercury reduction program through a MACT standard
under section 112(d) and to adopt a fuel neutral program as mandated by the Clean Air Act . We
urge a strict program, which results in a mercury limit for all existing coal-fired units of 2
lb/TBTU or an 80% reduction in 2010. New sources should be required to reduce emissions by
90% .
h:\kk\Docket ID No Draf.dl-4-04.doc
10
EPA Dockets
- Submit Comment Results
About
EDOCKET
EPA Dockets
Contact
Us
EPA
Home
> EPA
Dockets >
-Submit Comment Results
Submit Comment Results
View Open
Dockets
EPA
Home
I
Submit
Comments
04-22-2004 18:29:07 EST
Search
Submit Comment Results
1J
Your Comment with Title "Illinois EPA Comments on the Mercury Proposal" was Received
.
The Identifier Assigned is "OAR-2002-0056-1967" .
Please note that it may take between 24 and 72 hours for the EDOCKET staff to process
your comment before it is available publicly through EDOCKET . You can use the identifier
noted above to find your comment (document) through the Quick or Advanced Search pages
when it is available . An Electronic File was Attached to this Submission
.
Return to Submit Item Search
I Contact Us
Search
Last updated on Thursday,
April
22nd, 2004
URL : http://cascade.epa.gov/RightSite/dk_public submit comment
results.htm
Page I of I
U.S. Environmental Protection Agency
Quick
Advanced
User
Help
Agreement
http://cascade.epa.gov/16WSite/dk_publi c
su
mit7OTflfl ent resujts:htm-- 4/2212004
Blood and Hair Mercury Levels in Young Children and Women of Childbearing Age
--
CDC
j CDC Home
;Searrh
(t;ezttfi Topics A-2
Weekly
March
02, 2001150(08) ;140-3
Page 1 of 4
Blood and Hair Mercury Levels in Young Childi
and Women of Childbearing Age --- United Stati
1999
Mercury (Hg), a heavy metal, is widespread and persistent in the environment. Exposure to hazardous I
cause permanent neurologic and kidney impairment (1--3) . Elemental or inorganic Hg released into the
becomes methylated in the environment where it accumulates in animal tissues and increases in concen
through the food chain. The U .S. population primarily is exposed to methylmercury by eating fish. Met
exposures to women of childbearing age are of great concern because a fetus is highly susceptible to ad
This report presents preliminary estimates of blood and hair Hg levels from the 1999 National Health ai
Examination Survey (NHANES 1999) and compares them with a recent toxicologic review by the Nati,
Research Council (NRC). The findings suggest that Hg levels in young children and women of childbe~
generally are below those considered hazardous . These preliminary estimates show that approximately
women have Hg levels within one tenth of potentially hazardous levels indicating a narrow margin of s
:
some women and supporting efforts to reduce methylmercury exposure
.
CDC's NHANES is a continuous survey of the health and nutritional status of the U .S. civilian, noninst
:
population with each year of data constituting a representative population sample . A household intervie
physical examination were conducted for each survey participant . During the physical examination, blo
collected by venipuncture for all persons aged >1 year and hair samples, consisting of approximately 1(
were cut from the occipital position of the head of children aged 1--5 years and women aged 16--49 yet
blood specimens were analyzed for total Hg and inorganic Hg for children aged 1--5 years and women
years by automated cold vapor atomic absorption spectrophotometry in CDC's trace elements laborator
detection limit was 0 .2 parts per billion (ppb) for total Hg and 0 .4 ppb for inorganic Hg (4) . Hairs of 0 .(
cm) closest to the scalp (approximately 1 month's growth) were analyzed for total Hg concentration usii
atomic fluorescence spectroscopy (5)
. The limit of detection for total Hg in hair varied by analytic batcl
maximum limit of detection (0.1 parts per million [ppm]) was used in these analyses . Blood Hg levels b
limit of detection were assigned a value equal to the detection limit divided by the square root of two fo
of geometric mean values .
The geometric mean total blood Hg concentration for all women aged 16--49 years and children aged 1
1 .2 ppb and 0.3 ppb, respectively; the 90th percentile of blood Hg for women and children was 6 .2 ppb
respectively (Table 1) . Almost all inorganic Hg levels were undetectable ; therefore, these measures indi
methylmercury levels. The 90th percentile of hair Hg for women and children was 1 .4 ppm and 0.4 ppn
respectively. Geometric mean values were not calculated for hair Hg values
.
Reported by: Center for Food Safety and Applied Nutrition, Food and Drug Administration . US Enviro
Protection Agency. National Energy Technology Laboratory, Dept of Energy . National Marine Fisherii
file://C:\Documents%20and%20Settings\epauser\My%20Documents\Mercury\Exhibits\B1
.
.
.
6/30/2006
Blood and Hair Mercury Levels in Young Children and Women of Childbearing Age
---
.
.
Page 2 of4
Laboratory, National Oceanic and Atmospheric Administration . National Center for Health Statistics;,
Center for Environmental Health, CDC .
Editorial Note :
The NHANES 1999 blood and hair Hg data are the first nationally representative human tissue measure
:
population's exposure to Hg. Previous estimates of methylmercury exposure in the general population v
exposure models using fish tissue Hg concentrations and dietary recall survey data (1) . The NRC reviec
guidance to the Environmental Protection Agency (EPA) for developing an exposure reference dose for
methylmercury
(i .e., an estimated daily exposure that probably is free of risk for adverse effects over th
person's life) (3). The NRC report recommended statistical modeling of results from an epidemiologic s
conducted in the Faroe Islands near Iceland, where methylmercury exposures are high because of the la
of seafood eaten by the local population . Results of this study were used to calculate a benchmark dose
estimate of a methylmercury exposure in utero associated with an increase in the prevalence of abnorm
:
cognitive function tests in children. The lower 95% confidence limit of the BMD (BMDL*) was recom
:
calculate the EPA reference dose. The NRC committee recommended a BMDL of 58 ppb Hg in cord bI
(corresponding to 12 ppm Hg in maternal hair) (3) . In the NHANES 1999 sample, there were no measu
blood values >58 ppb or hair values >12 ppm. A margin-of-exposure analysis (i .e., an evaluation of the
BMDL to estimated population exposure levels) showed ratios of <l0 when comparing BMDL with NI
estimates of the 90th percentile for blood and hair Hg levels in women of childbearing age
. Margin-of-c
measures of this magnitude indicate a narrow margin of safety (3) and suggest that efforts aimed at deci
human exposure to methylmercury should continue
.
The findings in this study are subject to at least three limitations . First, the ratio of Hg in cord and mates
uncertain. The NRC committee summarized some studies that suggest that cord blood values may be 2(
higher than corresponding maternal blood levels . However, other studies suggest that the ratio is closer
therefore, the NHANES values may not be directly comparable to BMDL recommended by NRC . Seen
NHANES cannot provide estimates of Hg exposure in certain highly exposed groups (e.g., subsistence
and others who eat large amounts of fish). Published data from studies of highly exposed U .S. populatic
that some persons attain Hg tissue levels above BMDL (1). Third, the sample size of NHANES 1999 w
the 1999 survey was conducted in only 12 locations . More data are needed to confirm these findings
.
The long-term strategy for reducing exposure to Hg is to lower concentrations of Hg in fish by limiting
into the atmosphere from burning mercury-containing fuel and waste and from other industrial processt
basis of data from EPA's National Toxics Inventory, air emissions of Hg decreased approximately 21
-1996, largely because of regulations for waste incineration (7). EPA expects this trend to continue as n
implemented for waste incineration and chlorine production facilities and are developed for electric poi
(8, 9). Fish is high in protein and nutrients and low in saturated fatty acids and cholesterol and should be
an important part of the diet . The short-term strategy to reduce Hg exposure is to eat fish with low Hg b
avoid or to moderate intake of fish with high Hg levels. State-based fish advisories and bans identify fis
contaminated by Hg and their locations and provide safety advice
(http://www.eva.gov/ost/fisht ) . The I
Drug Administration advises that pregnant women and those who may become pregnant should not eat
swordfish, king mackerel, and tile fish known to contain elevated levels of methylmercury. Information
atht//www.fda.gov/bbs/topics/ANSWERS/2001/advisory.html t
.
U.S. population estimates of Hg tissue levels by race/ethnicity, region, and fish consumption will becon
after 2 additional years of NHANES data collection . NHANES will provide the opportunity to measure
levels and to monitor the effectiveness of continuing efforts to reduce methylmercury exposure in the L
population
.
f le ://C:\Documents%20and%20Settings\epauser\My%20Documents\Mercury\Exhibits\Bl
. . . 6/30/2006
Blood and Hair Mercury Levels in Young Children and Women of Childbearing Age
---
Page 3 of 4
References
1. Environmental Protection Agency. Mercury study report to Congress . Washington, DC : Office
o1
Planning and Standards and Office of Research and Development, Environmental Protection Age
December 1997 .
2. Agency for Toxic Substances and Disease Registries . Toxicological profile for mercury (update)
.
Georgia: Agency for Toxic Substances and Disease Registries, US Department of Health and Hu
:
Services, March 1999 .
3. National Academy of Sciences. Toxicologic effects of methylmercury. Washington, DC: Nationa
Council, 2000
.
4. Chen HP, Paschal DC, Miller DT, Morrow J. Determination of total and inorganic mercury in wI
on-line digestion with flow injection . Atomic Spectroscopy 1998;19:176--9
.
5. Pellizzari ED, Fernando R, Cramer GM, Meaburn GM, Bangerter K . Analysis of mercury in hair
Region V population. J Expo Anal Environ Epidemiol 1999 ;9:393--401 .
6. Budtz-Jorgensen E, Grandjean P, Keiding N, White RF, Weihe P . Benchmark dose calculations c
methylmercury-associated neurobehavioral deficits . Toxicol Lett 2000;112--113 :193--9 .
7. Environmental Protection Agency . National toxics inventory. Washington, DC: Office of Air Qu
;
Planning and Standards, Environmental Protection Agency, 2000 .
8. Environmental Protection Agency and Environment Canada . Mercury sources and regulations : di
1999 update. Binational toxics strategy . Environmental Protection Agency and Environment Can
November 1999 .
9. Environmental Protection Agency . Regulatory finding on the emissions of hazardous air pollutan
electric utility steam generating units. Federal Register 2000;65:79825--31 .
*A BMD of 85 ppb Hg in cord blood or 17 ppm Hg in maternal hair was estimated to result in an increase in the proportion
scores on the Boston Naming Test for children exposed in utero from an estimated background prevalence of 5% to a preval
(6)
. BMDL recommended by NRC is the lower 95% confidence bound of the BMD
.
I References to sites of nonCDC organizations on the World-Wide Web are provided as a service to
MMWR
readers and do
imply endorsement of these organizations or their programs by CDC or the U .S. Department of Health and Human Services
.
responsible for the content of pages found at these sites
.
Table 1
file://C:\Documents%20and%20Settings\epauser\My%20Documents\Mercury\Exhibits\Bl
.
.. 6/30/2006
brood and Hair mercury Levels in Young Children and Women of Childbearing Age
TABLE 1 . Selected percentiles and geometric means of blood and hair meri
(Hg) concentrations for children aged 1-5 years and women aged 16-49 ye
.
National Health and Nutrition Examination Survey, United States, 1999
Geometric
Selected percentiles (95% Cl")
* Confidence interval
.
Parts per billion
.
' Limit of detection
.
a Parts permillion
.
" Notcalculated. Proportion cLODtoo high tobevalid
.
Return_
to
top
. .
Disclaimer
All
MMWR
HTML versions of articles are electronic conversions from ASCII text into HTML . This cony'
resulted in character translation or format errors in the HTML version . Users should not rely on this HTML document, but a
the electronic PDF version and/or the original
MMWR
paper copy for the official text, figures, and tables . An original paper
issue can be obtained from the Superintendent of Documents, U.S. Government Printing Office (GPO), Washington, DC 20
telephone: (202) 512-1800. Contact GPO for current prices
.
**Questions or messages regarding errors in formatting should be addressed to mmwrq crcdc.gov .
Page converted: 3/1/2001
HOME
I
ABOUTMMWR
I MMWRSEARCH
I
DOWNLOADS
(
RSS_
I CONTACT
POLICY
I
DISCLAIMER
I
ACCESSIBILITY
1A?fl .
KALT1lltll
. PtiOPL10"
Morbidity and Mortality Weekly Report
Centers for Disease Control and Prevention
1600 Clifton Rd, MailStop K-95, Atlanta, GA 30333
.
USA
This page last reviewed 5/2/01
Page 4 of 4
`'Dcartment
of
Hgalth
,and Human Services
filed/C:\Documents%20and%20Settings\epauser\My%2ODocuments\Mercury\Exhibits\BI
.
.
.
6/30/2006
10th
25th
50th
75th
<LOCH
<LOD
0 .2
(0 .2-0 .3)
0 .5
(0.4-0 .8)
1
0 .2
(0.1-0 .3)
0 .5
(0.4-0 .7)
1 .2
(0.8-1 .6)
2 .7
(1 .8-4 .5)
6
<LOD
<LOD
¢LOD
0 .2
(0.1-0 .4)
0
<LOD
<LOD
0 .2
(0 .2-0 .3)
0,5
(0.4-0 .8)
1
No. mean
(95%CI)
RioodHgr
Children
248
0 .3
(0.2-0 .4)
Women
679
1 .2
(0.9-1 .6)
Hair Hg
Children
338
**
Women
702
-
Peabodq
Laurel,
Just wanted to letyou know that the Temporary Technology Based Extension is very helpful in addressing
the Prairie State Generating Station concerns . We just have a few comments/clarifications for your
consideration
.
Thanks
.
Dianna
IL Mercury reg Temporary Technology Based ext proposal 3-21 .06_ doc
/~ Iv
~GVr~wi
Dianna Tickner
To
"Laurel Kroack" <Laurel.Kroack@epa .state .il.us>
03/23/2006 04:54 PM
cc
Colin M . Kelly/STL/Peabody@PeabodyEnergy
bcc
Subject Technology Extension for Mercury
i
Overview :
To qualify for the Temporary Technology-Based Extension (TTBE), a source must meet
the specific criteria identified in the rule . The most significant criterion is use of an
appropriate configuration of control devices for effective control of mercury emissions,
given the type of coal being fired and the control devices already installed on the unit .
(Refer to Tables 1 and 2.) For existing units, the specified configuration is generally use
of activated carbon injection for control of mercury emissions along with an appropriate
particulate matter control device to assure the effectiveness of carbon injection . In
addition, during Phase 1 of the program, existing units equipped with an appropriate
suite of control devices for effective control of mercury emissions by co-benefit would be
eligible for an extension . For a new unit, the specified configurations for an extension
require use of activated carbon for control of mercury emissions along with use of
appropriate control devices to minimize emissions by co-benefit .
There needs to be an express waiver durinq the extension. For example, "If the
applicant demonstrates compliance with the five criteria
specified under "Contents of a
Request," the mercury standards would not apply or the deadline for compliance would
be extended so lonq as the criterion for the extension are met-
Process :
A source must submit a timely application for a temporary technology-based extension,
containing information showing that the relevant criteria for such an extension are met
.
If the application shows that all relevant criteria are met, i .e., the application is not found
to be incomplete within a nominal period of time, the source can rely on the extension
until the Agency takes final action on the application
. (We believe "the nominal period of
time "for aqency review of the application must be defined ie, 30 days)
The Illinois EPA will conduct a technical review to determine whether an extension is
given or to establish whether any unit-specific requirements should accompany the
extension too assure that the source undertakes optimization measures as required by
criterion 3 and that state-of-the-art mercury control be applied as required by criterion 5
.
There is no opportunity for public participation in the process by which an extension
becomes effective
.
Timing and Duration
The temporary technology-based extension would be available through December
2018, that is, through Phase 1 and up to the first five years of Phase 2 of the mercury
control program . A source would have to submit its application for an extension to the
OVERVIEW OF POSSIBLE PROVISIONS FOR A
TEMPORARY TECHNOLOGY-BASED EXTENSION (TTBEI
3/23+/2006
1
Illinois EPA no later than three months before compliance needs to be demonstrated
.
Accordingly, an application for an extension for an existing unit must be submitted by no
later than March 31, 2010 for Phase 1 of the mercury control program, and by no later
than September 30, 2012 for Phase 2 of the program
. What happens if the source has
done evervthinq after extension period and still doesn't meet the limits?
If a source obtains an extension for a unit for Phase 1 of the program, the source must
reapply for the extension for Phase 2 . The source must also reapply for the extension if
there will be a change in the control device configuration of the unit and the source
plans to change its practices for control of mercury emissions based on the change to
the control device configuration
.
Contents of a Request
A request for a temporary technology-based extension for a unit must include information
showing that the applicable criteria for such an extension are met for the unit, as follows
:
1 . The owner or operator of the unit submits a formal request for the extension that : 1)
Explains why an extension is being requested : 2) Describes the measures that have
been taken for control of mercury emissions ; 3) Provides a detailed discussion of the
factors that currently prevent more effective control of the mercury emissions of the
unit, with a summary of relevant mercury emission data for the unit ; and 4) Includes a
copy of the current action plan describing the measures that will be taken during the
term of the extension to improve control of mercury emissions
.
2. The configuration of control devices on the unit is one that qualifies for an extension,
as listed in Table 1 or 2, and the activated carbon injection system, if one is required,
has been properly installed . An alternative sorbent may be used in place of the
halogenated activated carbon if the source demonstrates that the alternative sorbent
either: 1) Has at least the same effectiveness for control of mercury as halogenated
activated carbon; or 2) Will be used in a manner to provide equal or better
effectiveness for control of mercury as would be achieved with halogenated
activated carbon .
3. For a unit for which injection of halogenated activated carbon is required, injection is
occurring at optimal rate(s) . For this purpose, a source must either inject
halogenated activated carbon at a rate of at least 3 and 10 pounds per million cubic
feet of actual exhaust for units fired on sub-bituminous and bituminous coal,
respectively, or at rate(s) that reflect the maximum practicable degree of mercury
removal, based upon a unit-specific evaluation of the relationship between the
injection rate and the removal of mercury, to identify the injection rate at which
increased usage of halogenated activated carbon no longer provides proportionate
improvements in mercury removal
.
4. The owner or operator of the unit has an action plan identifying specific measures
that will be taken during the term of the extension to improve control of the mercury
emissions from the unit. This plan shall address measures such as evaluation of
2
alternative forms or sources of activated carbon, changes to the injection system,
changes to operation of the unit that affect the effectiveness of mercury absorption
and collection, changes to the particulate matter control device to improve the
performance of, and changes to other emission control devices
. For each measure
contained in the plan, the plan shall provide a detailed description of the specific
actions that are planned, the reason that the measure is being pursued and the
range of improvement in control of mercury that is expected, and the factors that
affect the timing for carrying out the measure, with the current schedule for the
measure .
5. The owner or operator of a unit utilizing halogenated activated carbon injection
(ACI)
must include a demonstration that halogenated ACI remains the state-of-the-art for
mercury control. If new developments in ACI occur that demonstrate a higher level
of mercury control (e.g., use of more effective sorbents), or if other mercury control
technologies develop that remove mercury at a cost similar to the cost of
halogenated ACI in 2006 dollars, the owner or operator must agree to utilize the
more effective means of ACI or other control technology within a reasonable time
frame.The provision "if other mercury control technoloqies develop" causes us
concern that it could be a continual movinq tarqet and cause qreat concern with the
projects lenders that they could potentially be exposed to hundreds of millions of
costs for retrofit if oriqinal technology does not work to the requlation level . If this
provision is intended just for different sorbents or chemical additives that is
acceptable . However, a requirement to install totally new hardware technologV, for
example if it were determined somethinq like Powerspan was state of the art,
it
miqht be impossible to incorporate that technoloqy into the desiqn once the plant is
constructed with Table 2 required technologV . The costs for the new hardware miqht
be similar, but millions would have already been invested in the original approved
technology increasinq the plants cost dramatically. We recommend removinq
"demonstration of state of the art mercury control" and references to "other mercury
control technoloqies" unless there is further clarification on limitations
.
Consequences of Obtaining an Extension
Sources that obtain a temporary technology-based extension for a unit would have to
continue to operate the unit in accordance with the technology-based criteria that were
the basis of the extension, including implementing an action plan for the unit for the
period of time that extension is in place . Units operating under an extension could not
be included in any compliance demonstrations involving multiple units
. When a source
determines that a unit can comply with the applicable emissions standards for mercury,
the source would notify the Illinois EPA that it is terminating the extension for the unit
.
Thereafter, the source would no longer be required to implement an action plan for the
unit and the unit could be included in compliance demonstrations involving multiple units
in subsequent months
.
A source that is operating a unit under a temporary technology based extension would
be required to submit annual reports describing the activities that are conducted for the
unit to further improve control of mercury emissions, including significant measures that
3
were taken during the past year, significant activities that are planned for the current
year, and any changes to the action plans for the unit, with explanation
.
4
Table 1 : Required Configuration of Control Devices for Existing Units
5
Primary Type
of Coal
Phase of
Program
Minimum
Control Configuration
Subbituminous
Available for
Both Phase 1
and Phase 2
Cold-side Electrostatic Precipitator or Fabric Filter
and Injection of Halogenated Activated Carbon
Bituminous
Available for
Both Phase 1
and Phase 2
Cold-side Electrostatic Precipitator or Fabric Filter
and Injection of Halogenated Activated Carbon
Available for
Phase 1 only
Selective Catalytic Reduction (SCR) System (located
prior to the particulate matter control device) and S02
Scrubber
Fluidized Bed Boiler: Selective Non-Catalytic Reduction
(SNCR) System and Fabric Filter
Table 2 : Required Configuration of Control Devices for New Units
6
Primary
Type
of Coal
Minimum
Control Configuration
Subbituminous
Pulverized Coal Boiler: SCR, SO2 Control Device,
Fabric Filter, and Injection of Halogenated Activated
Carbon
Fluidized Bed Boiler: SNCR, Supplemental SO2
Control System, Fabric Filter and Injection of
Halogenated Activated Carbon
Bituminous
Pulverized Coal Boiler: SCR, High-efficiency PM
Control Device (i.e ., subject to a limit of no more than
0.015 lb/million Btu, as measured by USEPA Method
5), SO2 Scrubber, and Injection of Halogenated
Activated Carbon
Fluidized Bed Boiler: SNCR, Supplemental SO2
Control System, Fabric Filter and Injection of
Halogenated Activated Carbon
Unit Firing Fuel Gas Produced by Coal Gasification:
Processing of the Raw Fuel Gas prior to Combustion
With Systems for PM and Sulfur Removal and with
Activated Carbon for Removal of Mercury
.