BEFORE THE ILLINOIS POLLUTION CONTROL BQ
,S IFFED
S OFFICE
IN THE MATTER OF
:
)
AUG
0 $ 20066
STATE OF
ILLINOIS
PROPOSED NEW 35 ILL. ADM. CODE 225
)
R06ftllution Control Board
CONTROL OF EMISSIONS FROM
)
(Rulemaking - Air)
LARGE COMBUSTION SOURCES (MERCURY)
)
NOTICE OF FILING
PLEASE TAKE NOTICE that the Environmental Law and Policy Center has filed the
attached MICHAEL MURRAY REFERENCES IN SUPPORT OF TESTIMONY
.
DATED: August 8, 2006
Environmental Law and Policy Center
35 E. Wacker Drive, Suite 1300
Chicago, Illinois 60601
312-673-6500
Faith Bagel (Reg. No. 62
685)
Counsel for Environmental Law and Policy Center
BEFORE THE ILLINOIS POLLUTION CONTROL B
C E 1 V E D
RK'S OFFICE
IN THE MATTER OF
:
)
AUG 0 5 2005
PROPOSED NEW 35 ILL. ADM. CODE 225
)
R06-2
STATE OF ILLINOIS
CONTROL OF EMISSIONS FROM
)
(Rulema?
ngIPAWtr
ol Board
LARGE COMBUSTION SOURCES (MERCURY)
)
MICHAEL MURRAY REFERENCES IN SUPPORT OF TESTIMONY
The following documents are references in support of the testimony of Michael Murray
which was filed in PCB R06-25 on July 24, 2006
.
DATED: August 8, 2006
Environmental Law and Policy Center
35 E. Wacker Drive, Suite 1300
Chicago, Illinois 60601
312-673-6500
Faith Bugel (Reg. No. 62556 5)
Counsel `or Environmental Law and Policy Center
Ecotoxicology, 14, 193 221, 2005
V 2005 Springer Science + Business Media, Inc. Manufactured in The Netherlands
.
Patterns and Interpretation of Mercury Exposure in Freshwater Avian
Communities in Northeastern North America
DAVID C. EVERS," NEIL M. BURGESS, LOUISE CHAMPOUX, 3 BART HOSKINS,4 ANDREW MAJOR,'
WING M. GOODALE,' ROBERT J. TAYLOR ,6 ROBERT POPPENGA ° AND THERESA DAIGLE'
'BioDiversity Research Institute, 19 Flaggy Meadow Rd., Gorham, ME, 04038, USA
2Canadian Wildlife Service, Environment Canada, 6 Bruce St ., Mt. Pearl, NL, Canada AIN 4T3
-'Canadian Wildlife Service, Environment Canada, Ste-Foy, Quebec, Canada GI V 4H5
4United States Environmental Protection Agency, II Technology Dr ., N. Chelmsford 01863, MA, USA
5U.S. Fish and Wildlife Service, Concord, NH, 03301, USA
6Texas A &M University, Trace Element Research Lab, College Station, TX, 77843, USA
7University of Pennsylvania, School of Veterinary Medicine, Kennett Square, PA, 19348, USA
Accepted 4 December 2004
Abstract. A large data set of over 4,700 records of avian mercury (Hg) levels in northeastern North
America was compiled and evaluated . As Hg emissions remain poorly regulated in the United States and
Canada, atmospheric deposition patterns and associated ecological responses continue to elicit interest by
landscape managers, conservation biologists, policy makers, and the general public . How avian Hg
exposure is interpreted greatly influences decision-making practices . The geographic extent and size of this
data set is valuable in understanding the factors that affect the exposure of Hg to birds . Featured are
differences found among tissues, major aquatic habitats and geographic areas, between age class and
gender, and among species. While Hg concentrations in egg and blood reflect short-term Hg exposure, Hg
concentrations in liver and feather provide insight into long-term Hg exposure . Blood is a particularly
important matrix for relating site-specific exposure to methylmercury (MeHg) . The level of McHg is
generally 5-10x greater in adults compared to nestlings . Age also influences MeHg bioaccumulation,
particularly for individuals where MeHg intake exceeds elimination . Gender is of interpretive concern when
evaluating Hg exposure for species exhibiting sexual dimorphism and niche partitioning . Based on two
indicator species, the belted kingfisher (Ceryle alcyon) and bald eagle (Haliaeetus leucocephalus), we found
McHg availability increased from marine, to estuarine and riverine systems, and was greatest in lake
habitats. A large sample of > 1,800 blood and egg Hg levels from the common loon
(Gavia immer)
facilitated a suitable comparison of geographic differences . Although some clusters of highly elevated Hg
exposure (i .e ., blood levels > 3 .0 gg/g, ww and egg levels > 1 .3 µg/g, ww) were associated with hydrological
and biogeochemical factors known to increase MeHg production and availability, others were not. Geo-
graphic areas without a relationship between Hg exposure and biogeochemical processes were associated
with emission or waterborne point sources. Differences in Hg exposure among species are primarily cor-
related with trophic position and availability of McHg . Although piscivorous species were repeatedly
'To
whom correspondence should be addressed
:
Tel.: 207-839-7600;
Fax :
207-839-7655 ;
E-mail: david.evers@briloon.org
194
Evers et al .
shown to have some of the highest MeHg levels of the 38 species analyzed, insectivorous birds in both
aquatic and terrestrial habitats (such as montane areas) were also found with elevated McHg levels . A
better understanding of the factors confounding interpretation of Hg exposure provides an effective basis
for choice of indicator species and tissues according to 12 selected scenarios. This and the national need for
spatiotemporal monitoring of McHg availability require careful consideration
of indicator species choice
.
Only then will local, regional, continental, and even global monitoring efforts
be effective .
Keywords : bird; loon; methylmercury; monitoring; indicator species
Introduction
The ecological impact from atmospheric deposition
of mercury (Hg) has emerged as a major global
environmental issue. Global concerns stem from the
broad geographic extent of contamination,
the
increasing global signal of Hg deposition, and, until
recently, a general lack of regulations to control
many uses and the disposal of Hg (United Nations
Environment Programme, 2003) . In North Amer-
ica. decades of increasing Hg deposition appear to
have reversed in some areas (Engstrom and Swain,
1997; Schuster et al ., 2002 ; Fevold et al ., 2003),
including the Northeast (Kamman and Engstrom,
2002), but the need to identify and monitor eco-
logical changes remains a high priority (Mason et
al ., 2005) . Federal, state and/or provincial regula-
tion of atmospheric mercury emissions in the Uni-
ted States and Canada is in place for some industrial
sectors (i.e ., municipal and medical waste incinera-
tion), but is currently lacking for others
(i.e ., coal-
fired electrical generators and mining)
.
Not all
environmental Hg is related to atmospheric depo-
sition. Many past and even current inputs of
waterborne Hg sources occur throughout North
America and the Northeast . These are related to
past improper waste disposal of Hg at weapons
facilities (Halbrook et al ., 1999), chlor-alkali plants
(Fimreite,
1974 ; Gardner et aL, 1978 ; Barr, 1986;
Adair et al ., 2003), mercury, gold, and silver mines
(Elbert and Anderson,
1998 ; Henny et al ., 2002 ;
Seiler et al ., 2004 ; Weech et al ., 2004) and govern-
mental storage facilities (Moore et al ., 1999) as well
as current inputs from wastewater treatment plants
(Glass et al ., 1990)
.
The U.S. Environmental
Protection Agency
(USEPA) investigated the ecological impacts of Hg
based on key wildlife species as a basis for potential
regulatory actions (USEPA 1997) . An outgrowth of
this effort was the development of a generic wildlife
criterion value for bird and mammal species (Nic-
hols and Bradbury, 1999) .Since the USEPA Report
to Congress (U SEPA 1997), scientific investigations
on the biogeochemical process of methylmercury
production and availability have dramatically im-
proved our basic knowledge (Morel et al
.,
1998 ;
Lucotte et al
., 1999 ; Wiener et al ., 2003)
. A better
understanding of the mechanisms of Hg transfer
and fate has improved the ability to predict meth-
ylmercury (MeHg) production and
availability
(USEPA 2002), particularly in freshwater habitats
of northeastern North America (Evers and Clair,
2005) . This has resulted in a greater insight into now
identifying specific geographic areas and biota at
greatest risk to Hg exposure and effects.
Birds are at particularly high risk to Hg toxicity
because many species are at high trophic levels
(e.g .,
susceptible to biomagnification), are long-
lived (e.g., susceptible to bioaccumulation), are
vulnerable to neurological and reproductive im-
pacts from elevated Hg levels, and are frequently
subjected to multiple anthropogenic stressors .
Using birds as bioindicators
of
MeHg availability
The use of piscivorous birds as bioindicators of
Melig availability and risk in freshwater systems is
common (e.g ., Fimreite, 1974 ; Barr, 1986 ; Scheu-
hammer, 1987 ; Wolfe et al ., 1998 ; Rumbold et al .,
2001 ; Henny et al ., 2002 ;
Evers et al .,
2003),
al-
though insectivorous birds are increasingly being
used as well (Wolfe and Norman, 1998 ;Gerrard and
St. Louis, 2001
; Adair et al ., 2003) . Historically, Hg
exposure was primarily determined by killing birds
and was therefore based
on organs analysis
(Thompson,
1996) . Although collection of viable
eggs continues to be a relevant lethal method widely
used (Braune et al ., 2001), non-lethal sampling ef-
forts based on blood (Bowerman et al
.,
2002 ;
Evers et al ., 1998; Fevold et al., 2003), feathers
(Burger, 1993), and abandoned eggs (Scheuhammer
et al., 2001 ; Evers et al., 2003) are increasingly a
more frequently used approach . Since Hg concen-
trations in different avian tissues reflect different
temporal scales of past Hg exposure, care must be
taken in considering Hg pharmacokinetics when
selecting the best avian tissue to match specific bi-
omonitoring objectives .
This paper represents a three-year effort through
the U.S. Department of Agriculture's
North-
eastern States Research Cooperative (NSRC) to
comprehensively compile and synthesize bird Hg
data across northeastern North America. The pa-
per's purpose is to describe this large data set and
use the information to identify . and assess
the
importance of factors that affect exposure
and
bioaccumulation of Hg.
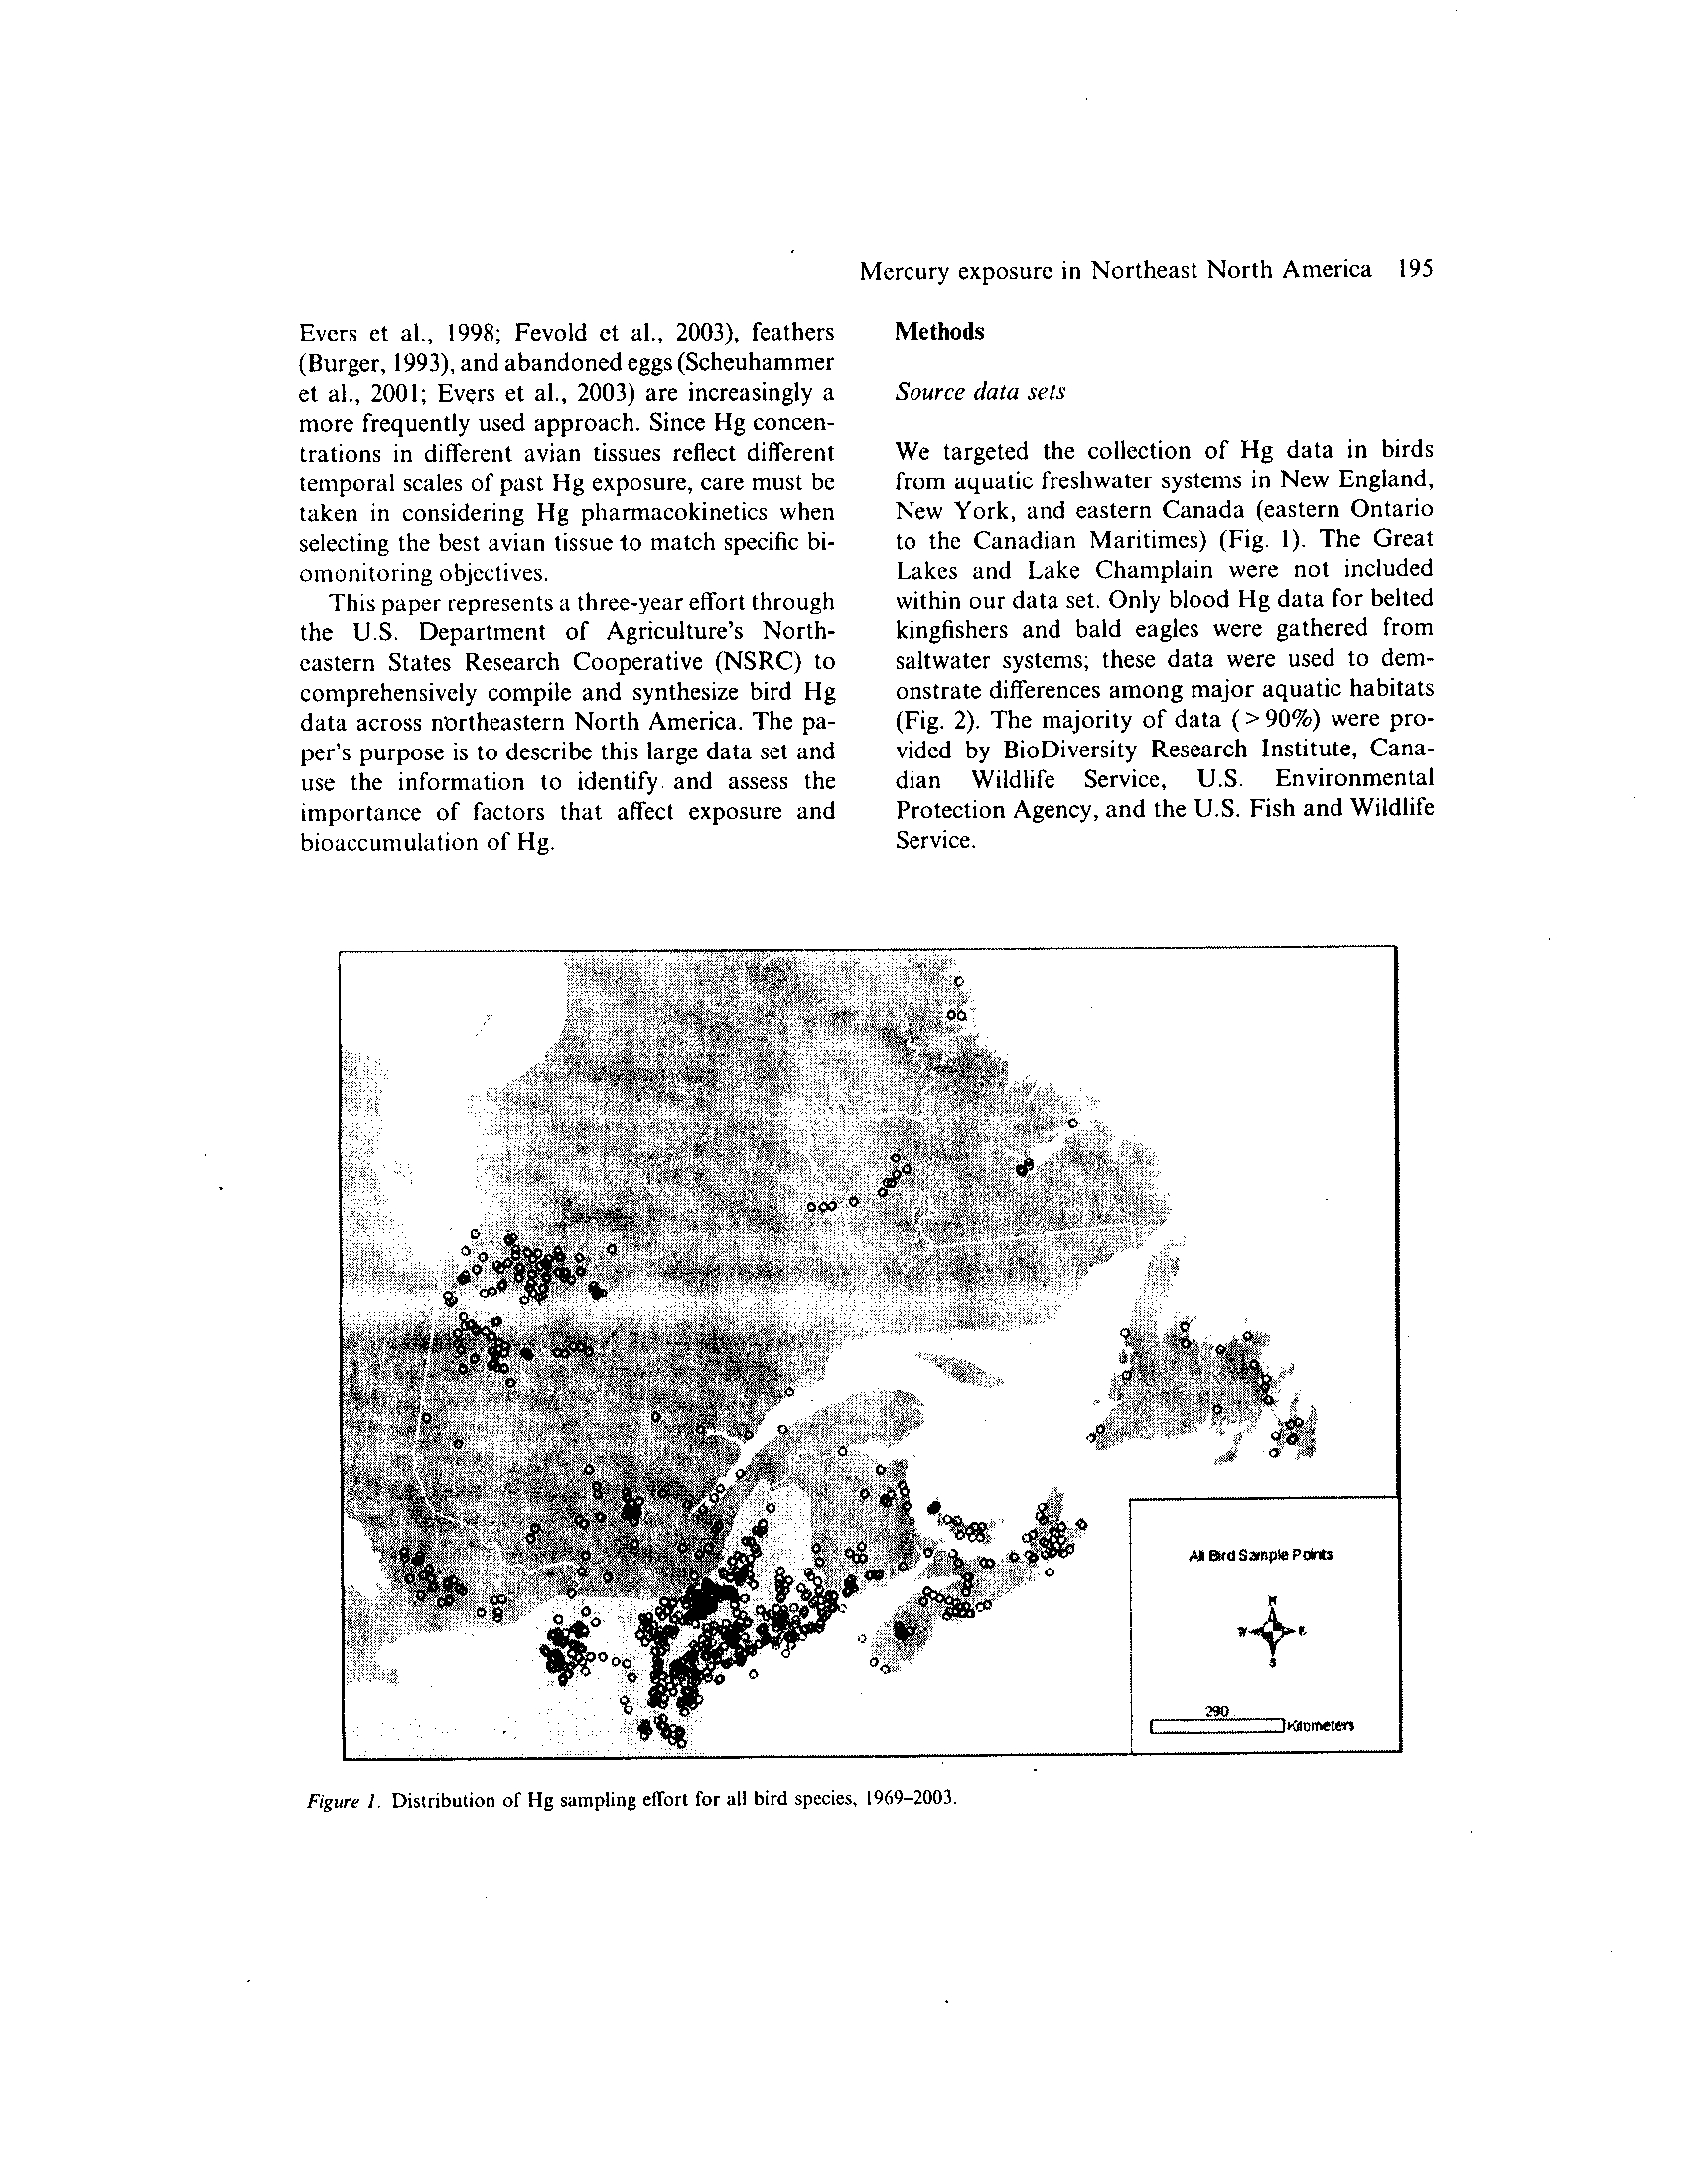
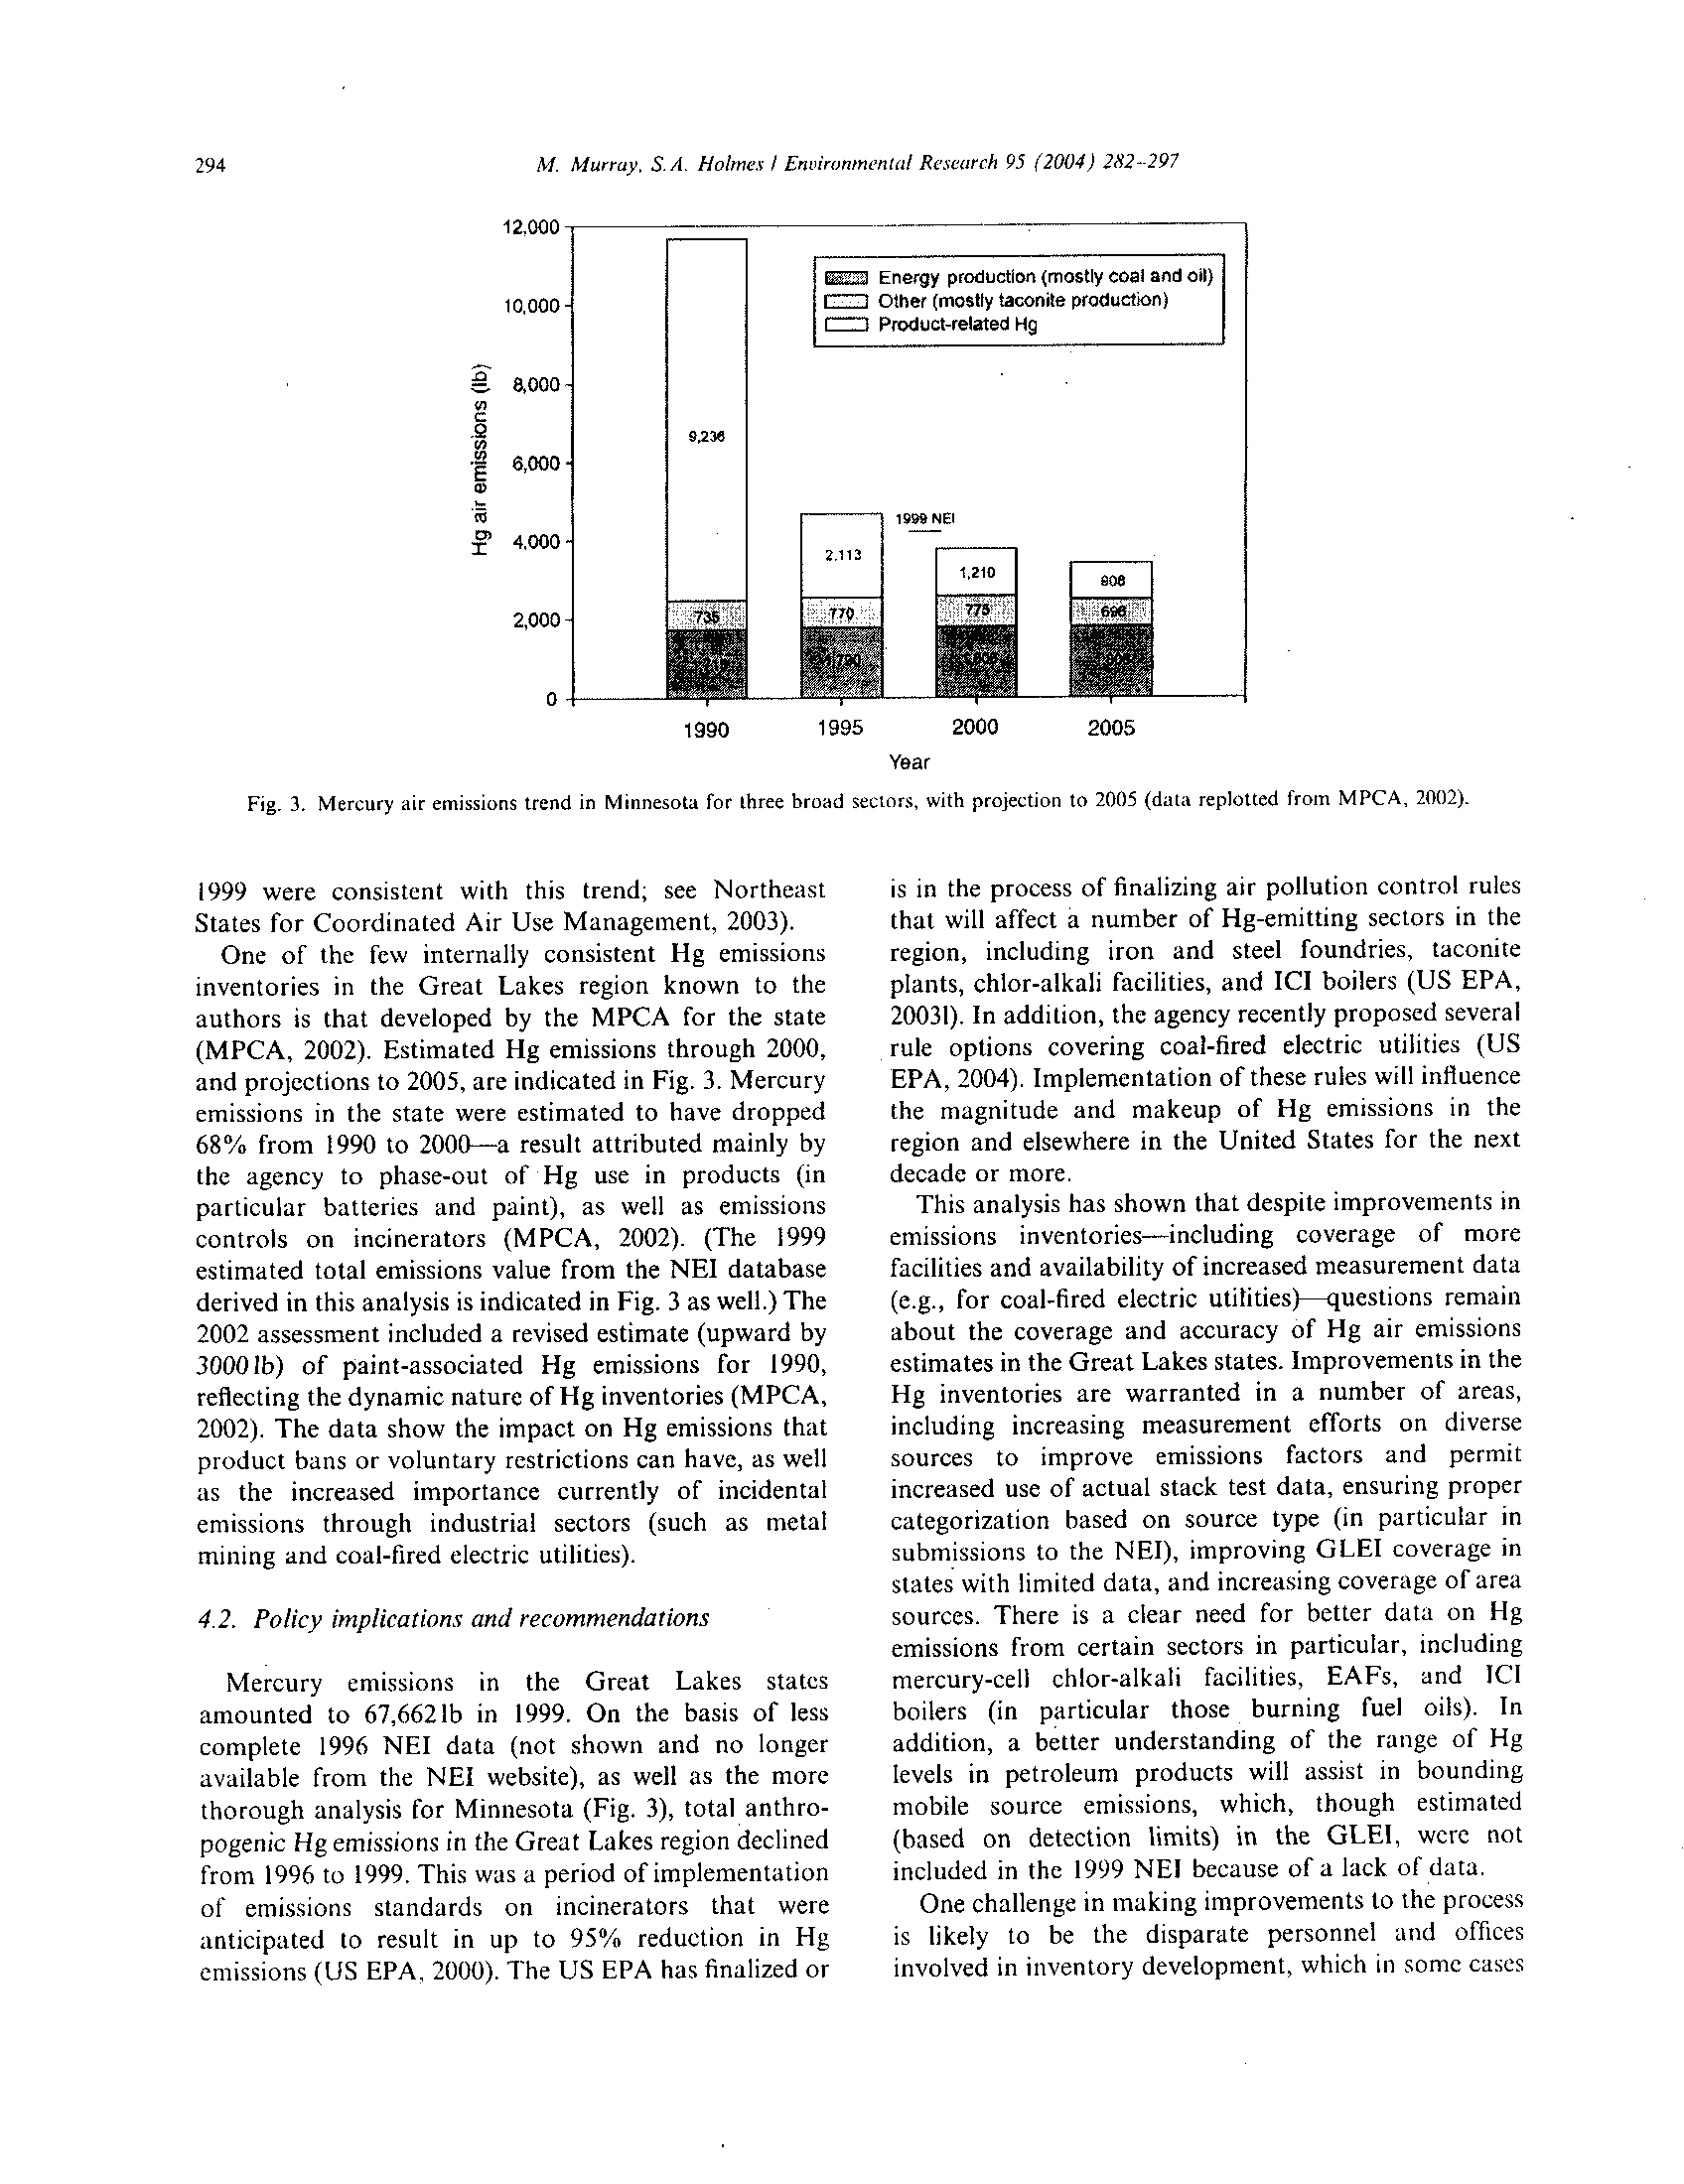
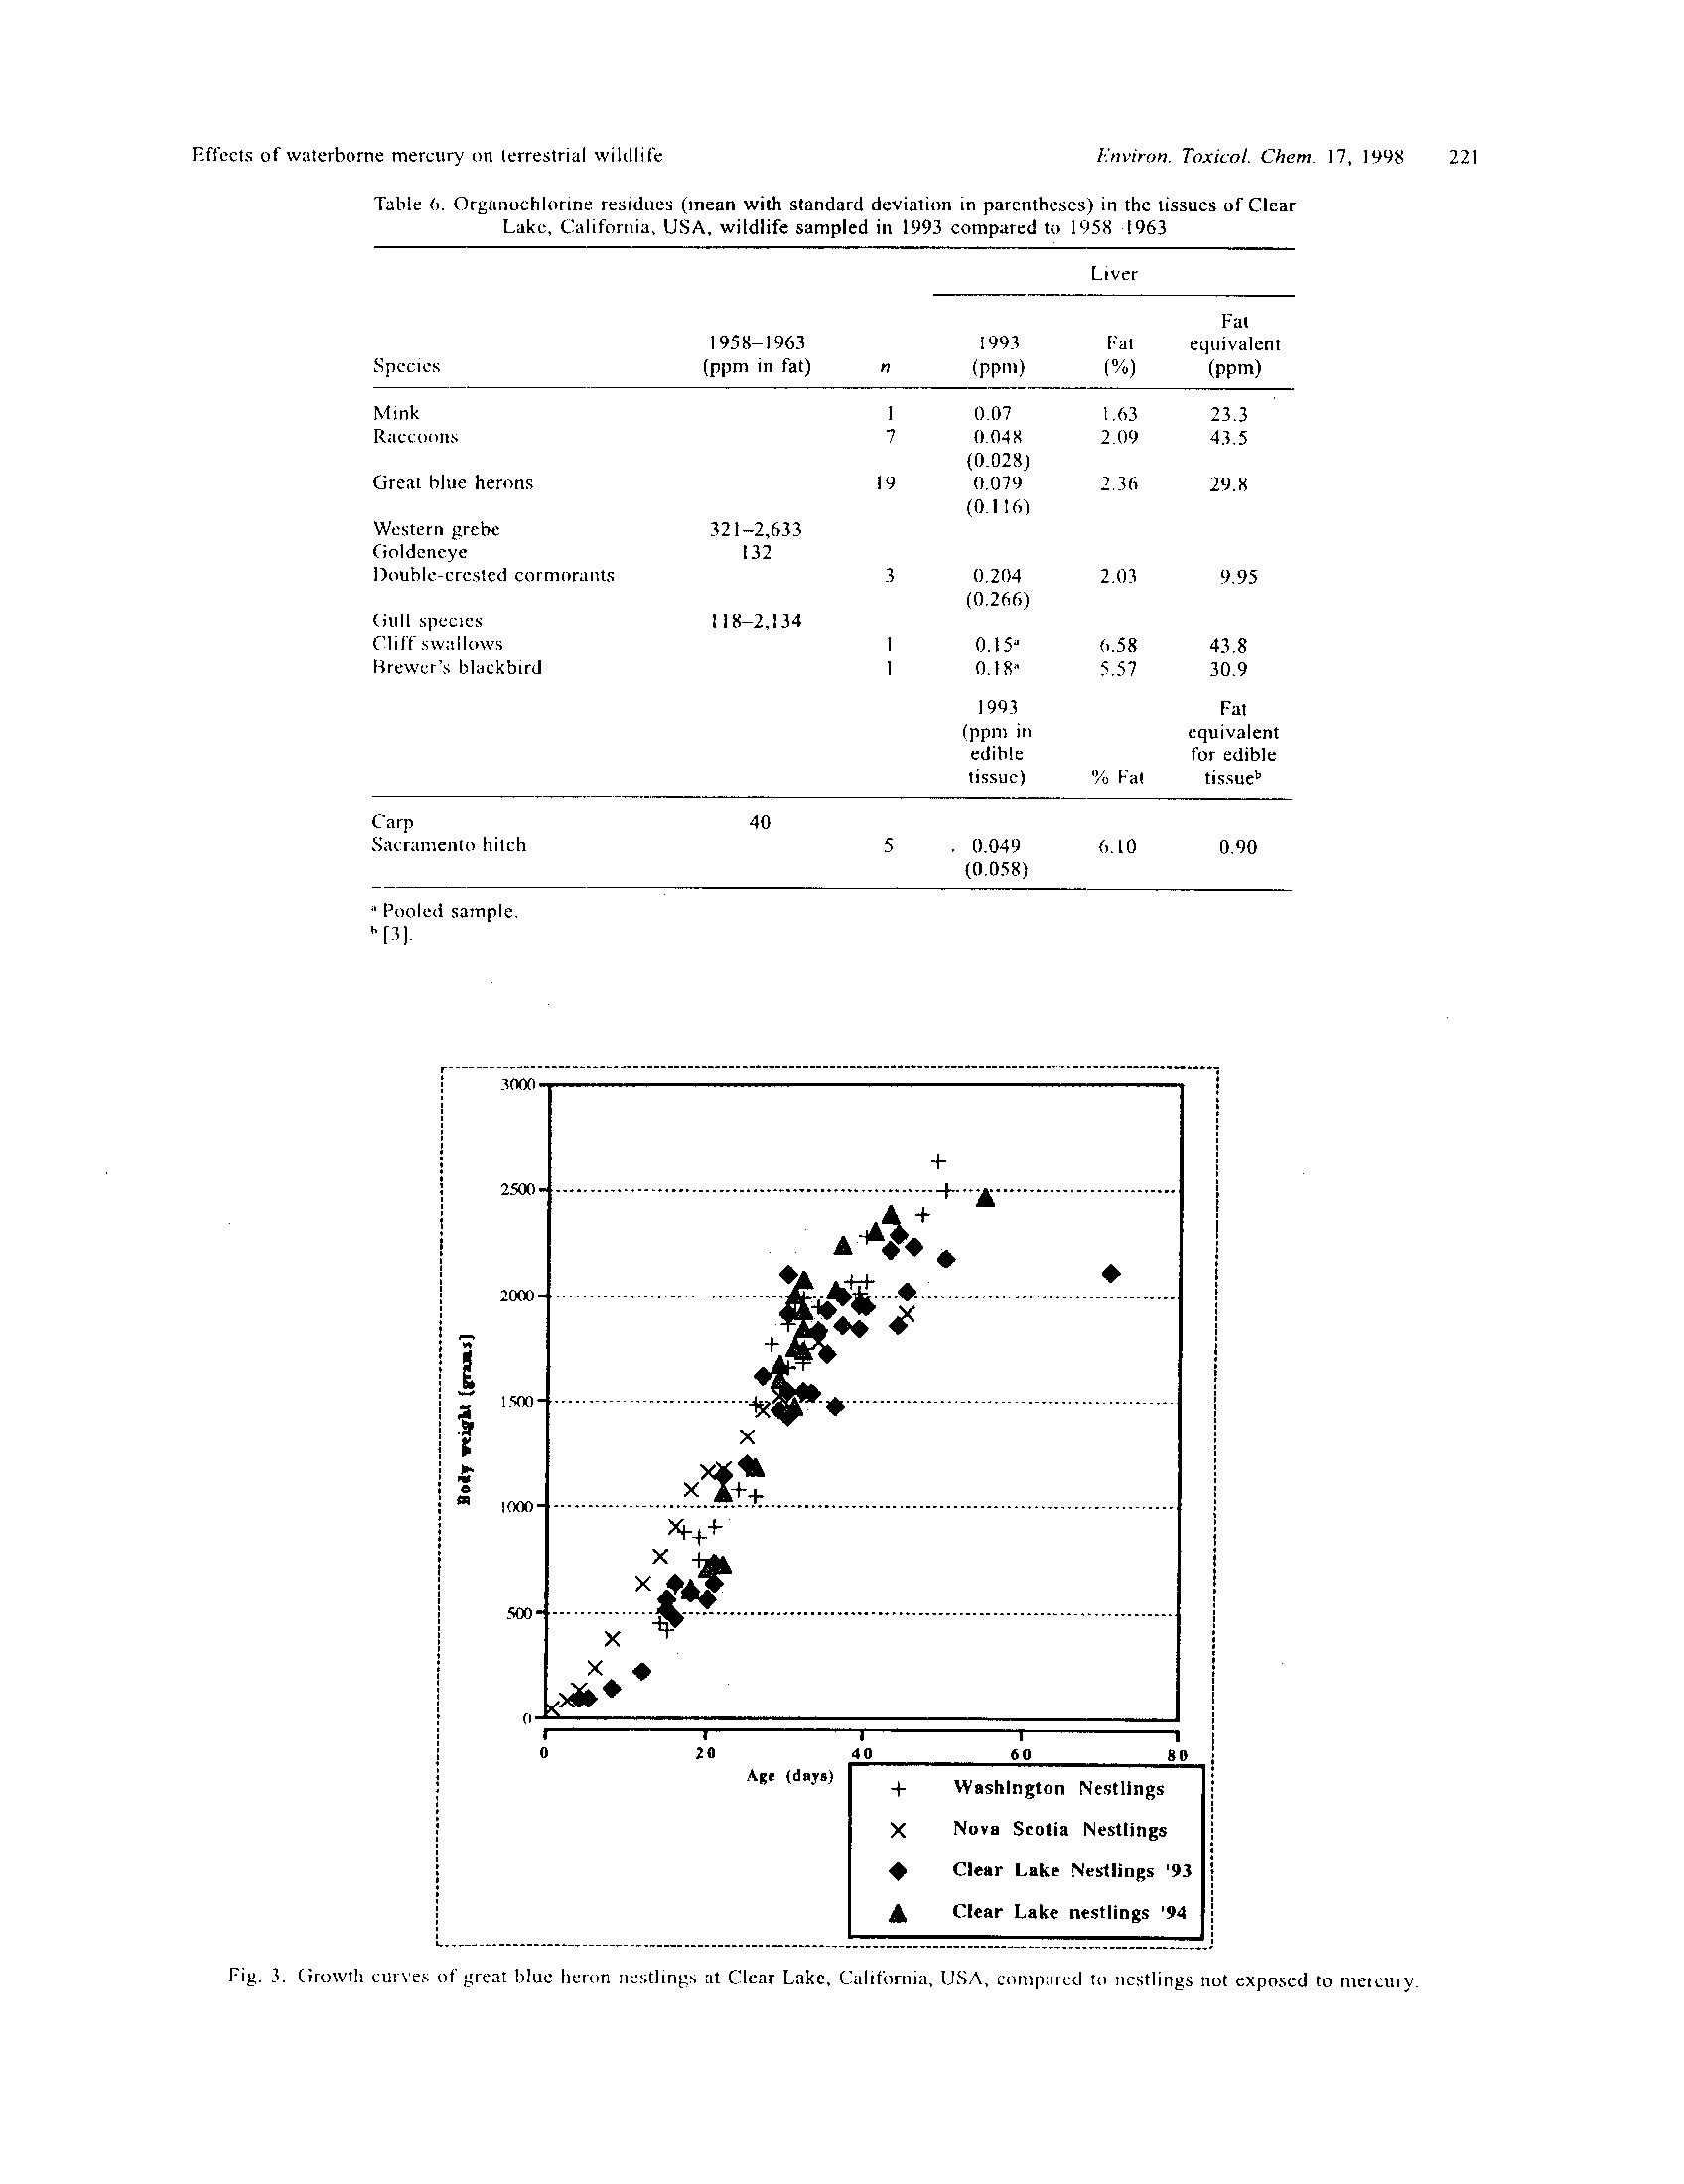
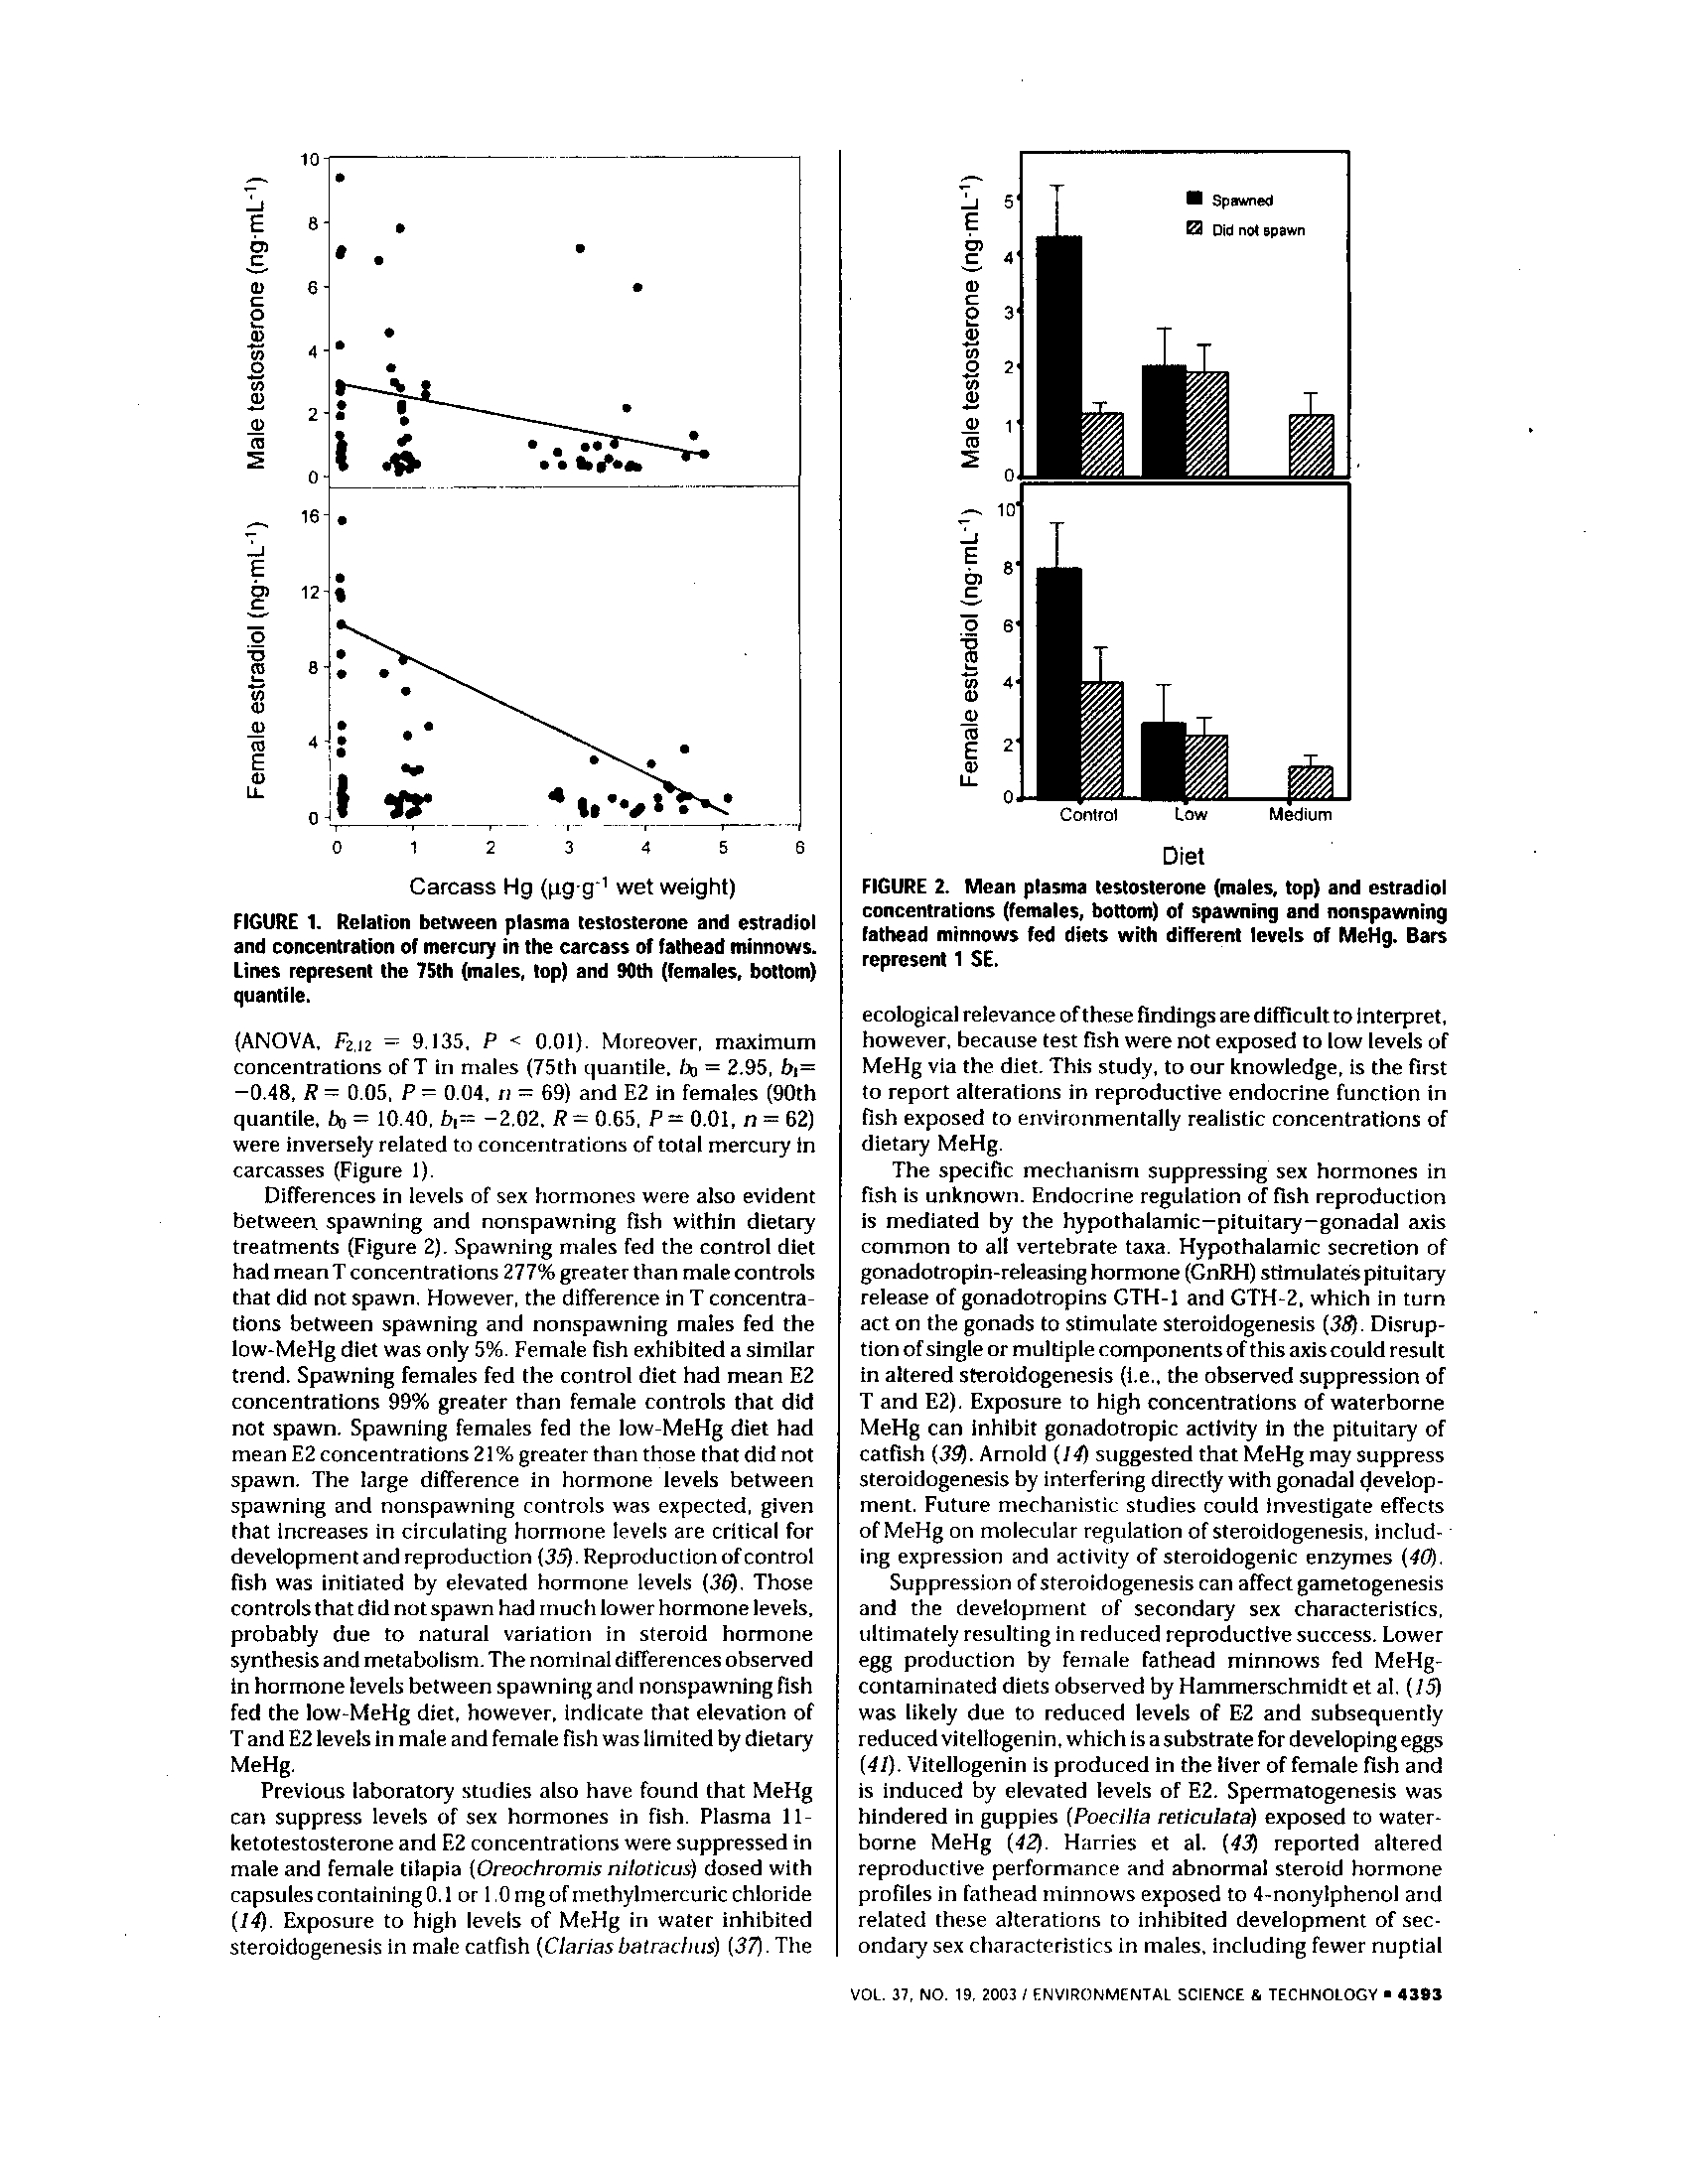
Figure 1
.
Distribution of Hg sampling effort for all bird species, 1969-2003
.
Mercury exposure in Northeast North America
195
Methods
Source data sets
We targeted the collection of Hg data in birds
from aquatic freshwater systems in New England,
New York, and eastern Canada (eastern Ontario
to the Canadian Maritimes) (Fig . 1). The Great
Lakes and Lake Champlain were not included
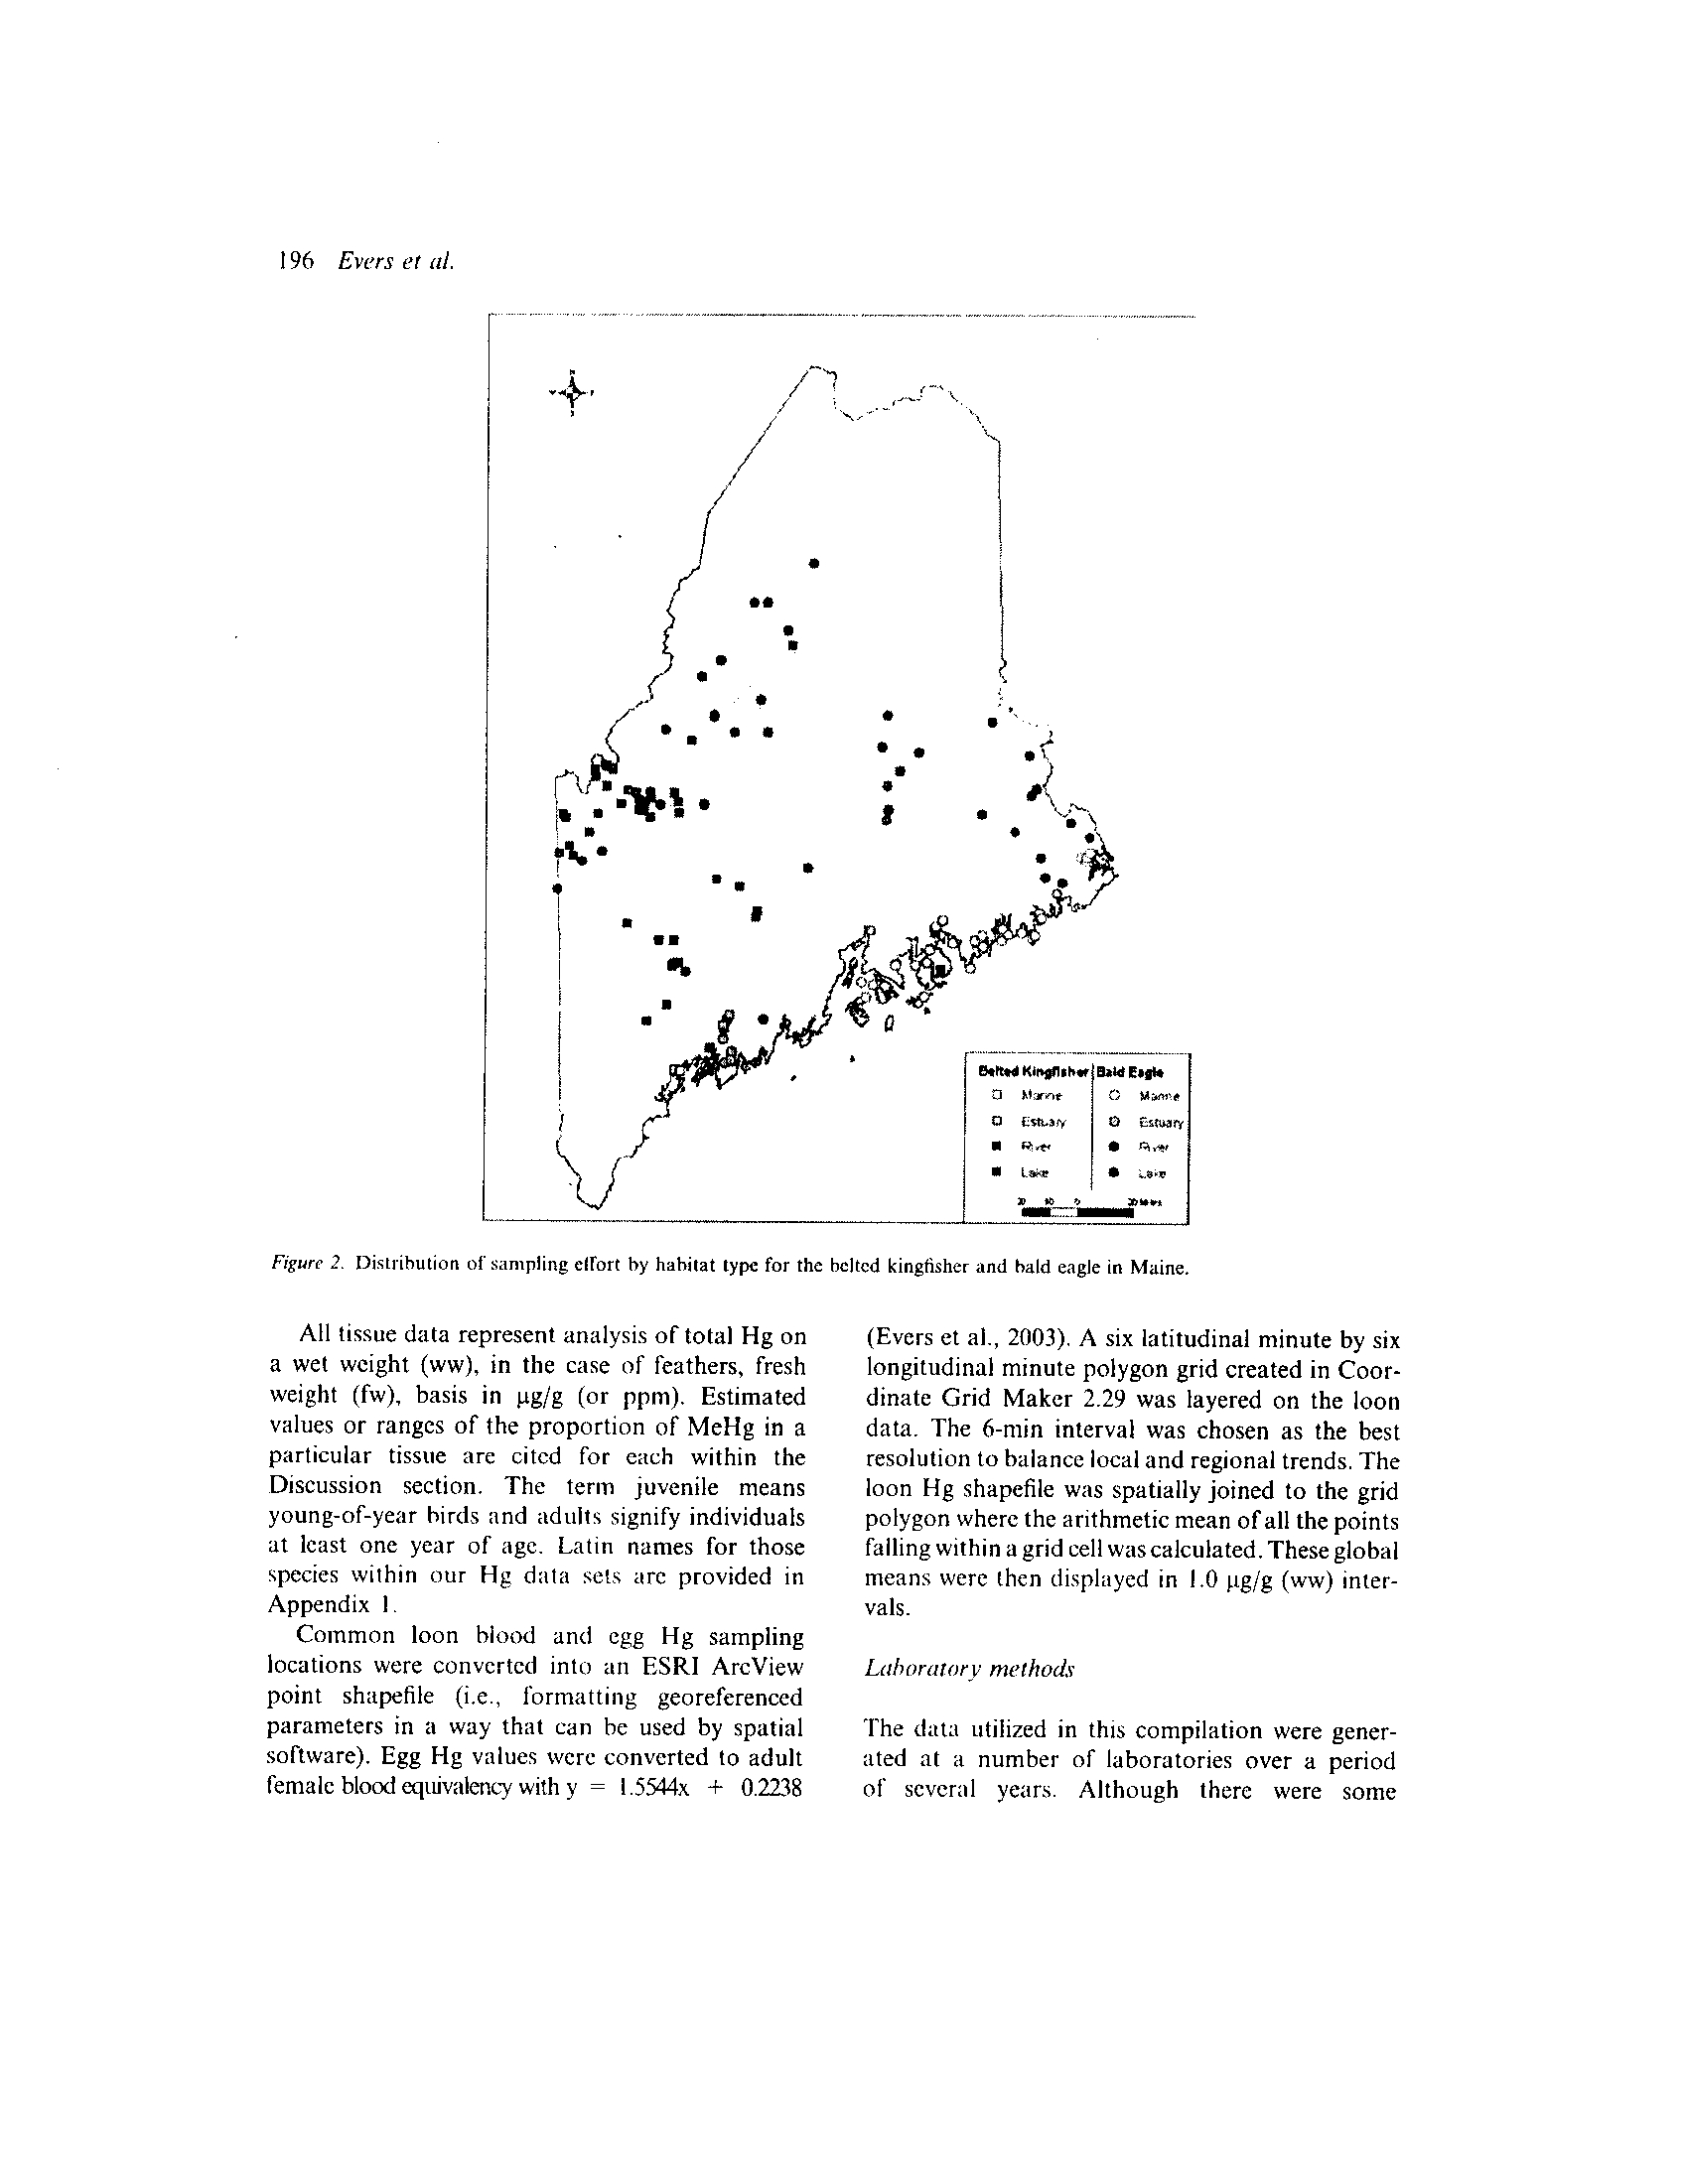
within our data set. Only blood Hg data for belted
kingfishers and bald eagles were gathered
from
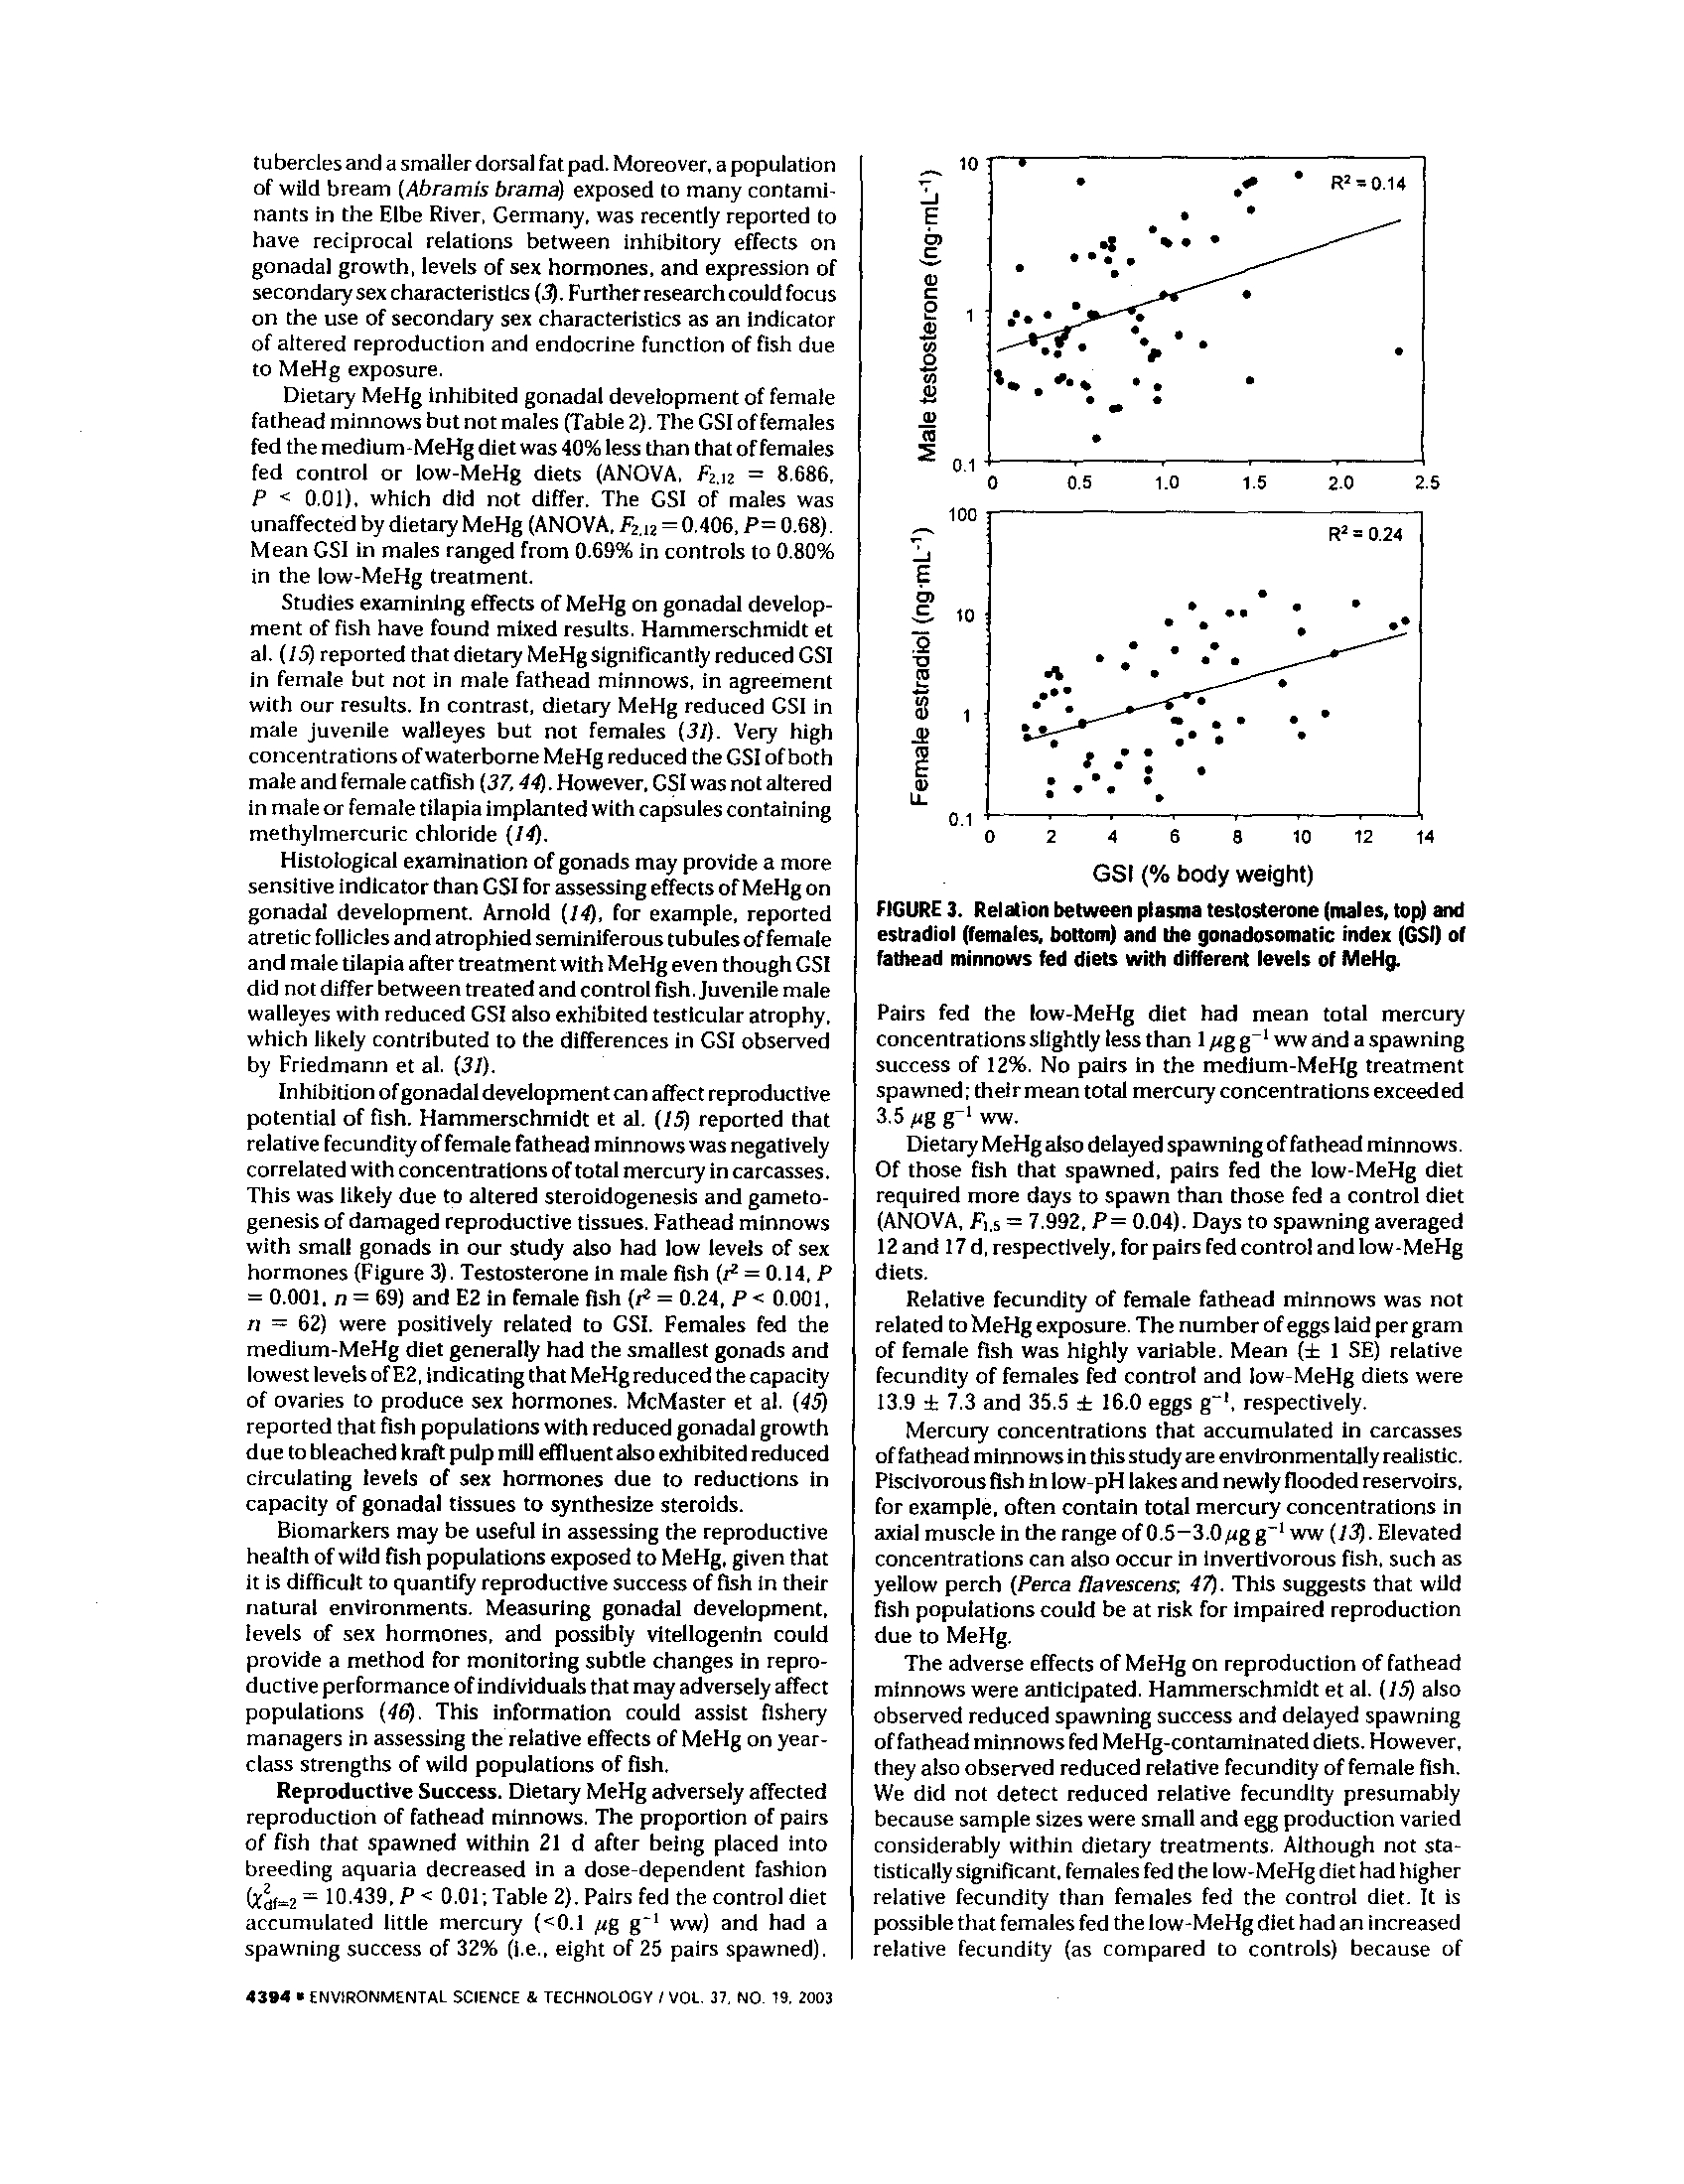
saltwater systems; these data were used to dem-
onstrate differences among major aquatic habitats
(Fig. 2). The majority of data (> 90%) were pro-
vided by BioDiversity Research Institute, Cana-
dian
Wildlife
Service,
U .S .
Environmental
Protection Agency, and the U .S. Fish and Wildlife
Service .
I
lb
omete+s
196
Evers et al .
All tissue data represent analysis of total Hg on
a wet weight (ww), in the case
of
feathers, fresh
weight
(fw), basis in µg/g (or ppm) . Estimated
values or ranges
of
the proportion
of
MeHg in a
particular tissue are cited
for each within the
Discussion
section. The term juvenile
means
young-of-year birds and adults signify individuals
at least one year
of
age. Latin names for those
species within our Hg dala sets arc provided in
Appendix I
.
Common loon blood and egg Hg sampling
locations were converted into an ESRI ArcView
point shapefile
(i.e .,
formatting georeferenced
parameters in a way that can be used by spatial
software). Egg Hg values were converted to adult
female blood equivalency with y = 1 .5544x +
0.2238
&tS
•4
lyllnvr GtidFtl4
O
Abet
C. Wmnn
o
LiriAn
o
emery
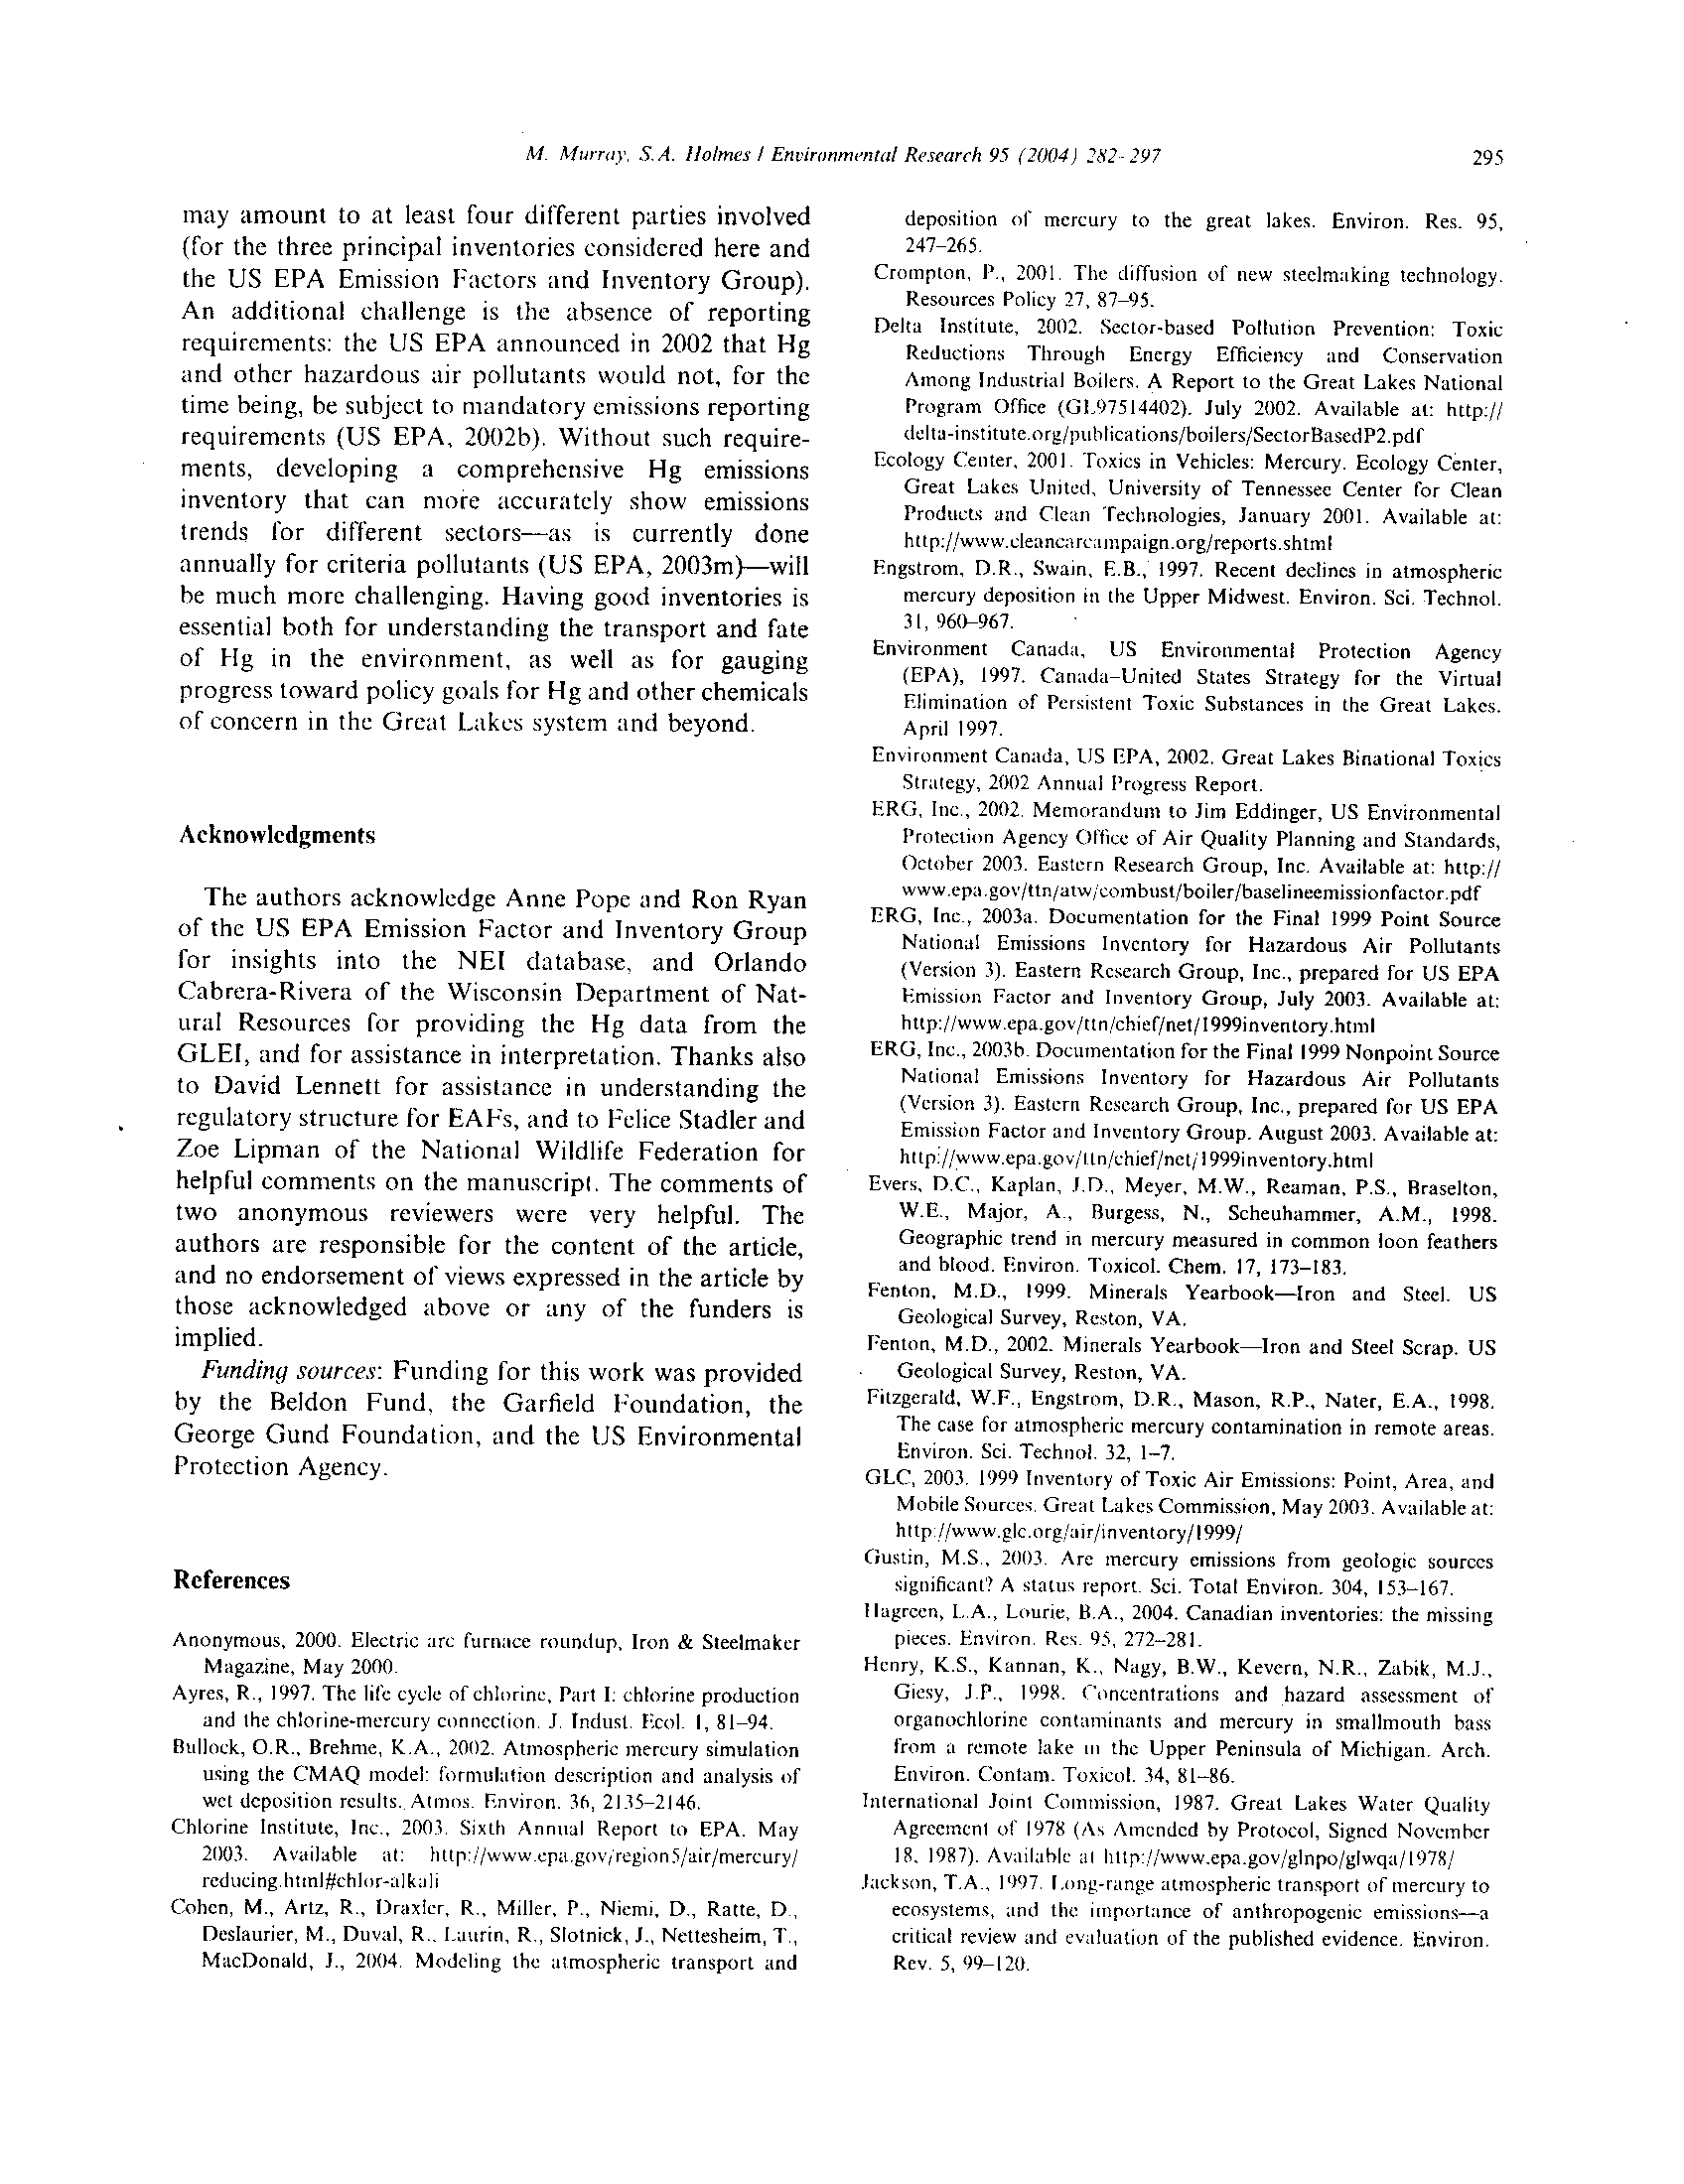
Figure 2.
Distribution of sampling effort by habitat type for the belted kingfisher and bald eagle in Maine .
(Evers et al
.
2003)
.
A six latitudinal minute by six
longitudinal minute polygon grid created in Coor-
dinate Grid Maker
2.29
was layered on the loon
data. The 6-min interval was chosen as the best
resolution to balance local and regional trends . The
loon Hg shapefile was spatially joined to the grid
polygon where the arithmetic mean of all the points
falling within a grid cell was calculated . These global
means were then displayed in 1 .0 pg/g (ww) inter-
vals .
Lahoratorv methods
The data utilized in this compilation were gener-
ated at a number
of
laboratories over a period
of
several years
.
Although there
were some
differences
in sample preparation and analytical
methods, all analyses included
quality control
(QC) samples to allow evaluation of accuracy and
precision, and all laboratories
utilized atomic
absorption spectroscopy to measure Hg concen-
trations .
Sample types collected and submitted to the
laboratories for analysis primarily included avian
blood, feathers, and eggs. Blood samples were
either in sealed capillary tubes or in glass or plastic
vacutainer-type collection
tubes. Samples that
were severely clotted were not analyzed unless the
entire sample could be removed from the collec-
tion tube .
Feather samples were either analyzed whole or
as subsamples following homogenization . Aliquots
of feathers were obtained by reducing individual
feathers to small pieces with either stainless steel
scissors or a Spex 6800 cryomill. '
Egg samples generally required homogeniza-
tion; a task that was sometimes complicated by the
egg samples that were fully formed. Egg samples
that were largely soft tissue were homogenized by
either a Tissuemiser or a small food processor/
blender prior to subsampling. Eggs containing
hard parts and feathers were homogenized with a
blender or with a Spex 6800 cryomill. Only loon
eggs were corrected for moisture loss
Most blood, feather, and egg samples required
digestion prior to analysis. This was accomplished
by following a procedure similar to EPA 245 .6, in
which nitric and sulfuric acids were used in con-
junction
with
potassium
permanganate
and
potassium persulfate to solubilize the tissue and
convert any bound Hg to the free Hg2+
ion
(Lobring and Potter, 1991). Prior to analysis, ex-
cess KMnO4
was reduced with hydroxylamine
hydrochloride and the samples were made to vol-
ume with deionized water
.
Analysis of digest solutions was based on the
"cold vapor" atomic absorption
spectroscopy
method
first introduced
by Hatch and
Ott
(1968). Using either a manual
or automated
approach, Hg` in solution was reduced to Hg °
with SnCl2, the Hg° was transferred to the gas
phase, and the Hg° -containing gas was swept
into an atomic absorption cell
.
Mercury levels
were determined by comparing sample
absor-
bance peak heights with those
of calibration
standards .
Mercury exposure in Northeast North America
197
A subset of samples was analyzed by a direct
determination method that did not require sample
digestion (EPA
7473)
(U .S .
EPA,
1998). A
homogenized, dry sample was placed in a tared
nickel boat, weighed, and then placed into a tube
furnace. A stream of 02 assisted in sample com-
bustion and carried free or organic-bound
Hg
species through a heated catalyst and onto a gold
trap where the free Hg° was collected . When the
sample had been combusted for a sufficient length
of time, the gold trap was heated and the released
Hg°
was carried
through a pair of atomic
absorption cells where it was measured .
This
method required samples that were particularly
well-homogenized because only a small sample
mass could be accommodated in the nickel boats
.
Each batch of samples processed and analyzed
was accompanied by a number of QC samples,
including a method blank, spiked blank, certified
reference material, duplicate sample, and spiked
sample. Typical detection limits for data presented
here were 0.0025 µg/g(ww) . Precision as measured
as relative percent difference of duplicate pairs was
approximately 85% and accuracy as measured by
recovery of certified reference materials and spiked
samples was 80% .
Statistical analysis
Mercury concentrations are expressed as arithme-
tic means with standard deviations (SD) in the
tables
and
geometric
means
with
variation
expressed as standard
error (SE) in figures
.
Arithmetic means and SD are provided for com-
parative
purposes
with
published
literature
.
Because sample sizes were regularly small and were
therefore not normally distributed,
statistical
analysis was conducted on the exponentiated value
of the mean of the log-transformed values. Log-
transformed data were normally distributed based
on normal probability plot residuals . Homosce-
dasticity was checked with Bartlett's test, which is
sensitive to the normality assumption . IMP soft-
ware (SAS Institute Inc., 2001) was used to per-
form statistical analysis. Hypotheses were tested
using one-way analysis of variance (ANOVA) .
Testing was followed by post-hoc tests using Tu-
key-Kramar honestly significant different (Tukey's
test) if the ANOVA demonstrated significant dif-
ferences (Zar, 1999). JMP's Tukey's test output
198
Evers et al .
did not include actual probability values and in-
stead indicated significance when numbers were
positive. Therefore, only probability values "less
than" and "greater than" 0 .05 are shown in the
Results section . Student's t-tests were used when
comparing paired data sets. A non-parametric test,
the Kruskal-Wallis One-Way ANOVA, was used
in some cases to compare multiple independent
groups. JMP software corrected for inequity of
unbalanced data sets . We used an alpha of 0 .05 for
our level of significance
.
Results
A total of 4,769 Hg concentrations representing 38
species and six tissue types are recorded within the
NSRC avian database (Appendix
1-3; Fig. I) .
Samples were collected between
1969 and 2003
with the majority (> 84%) from 1995 to 2003. Six
factors were identified as having significant influ-
ence on the interpretation of avian Hg levels . The
NSRC data set was used to demonstrate how these
factors influence Hg exposure
.
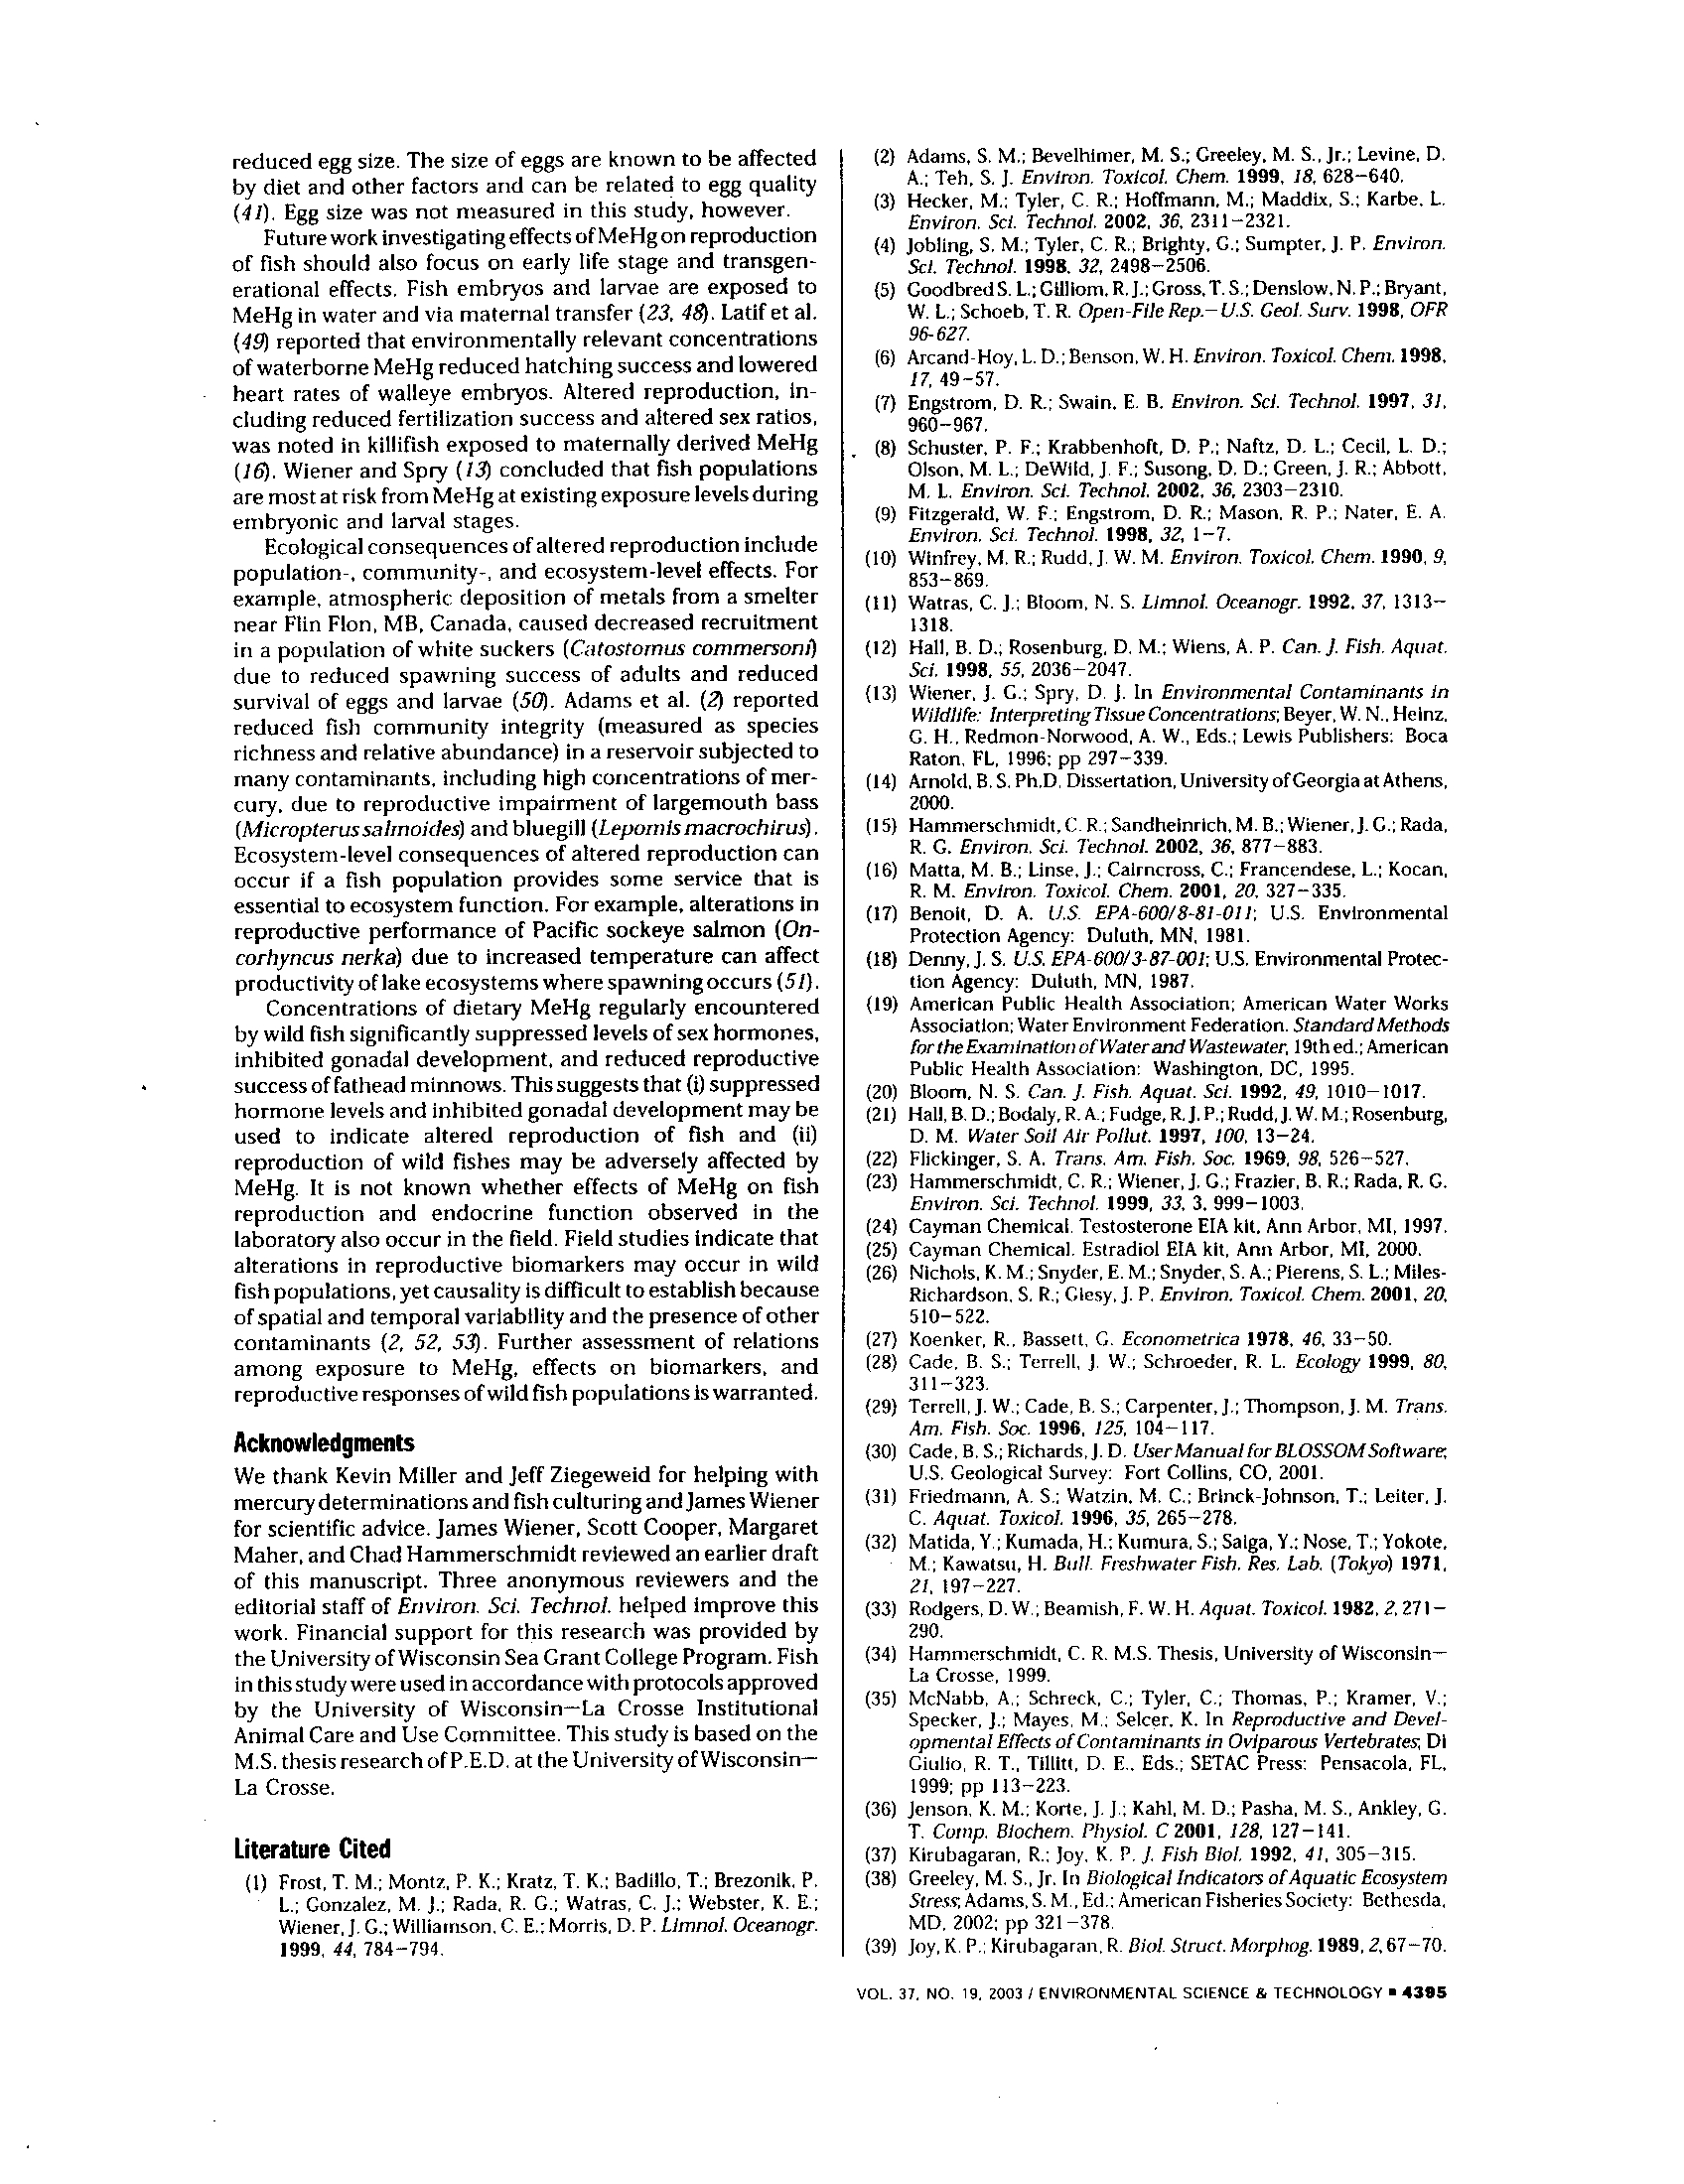
Influences of tissue type
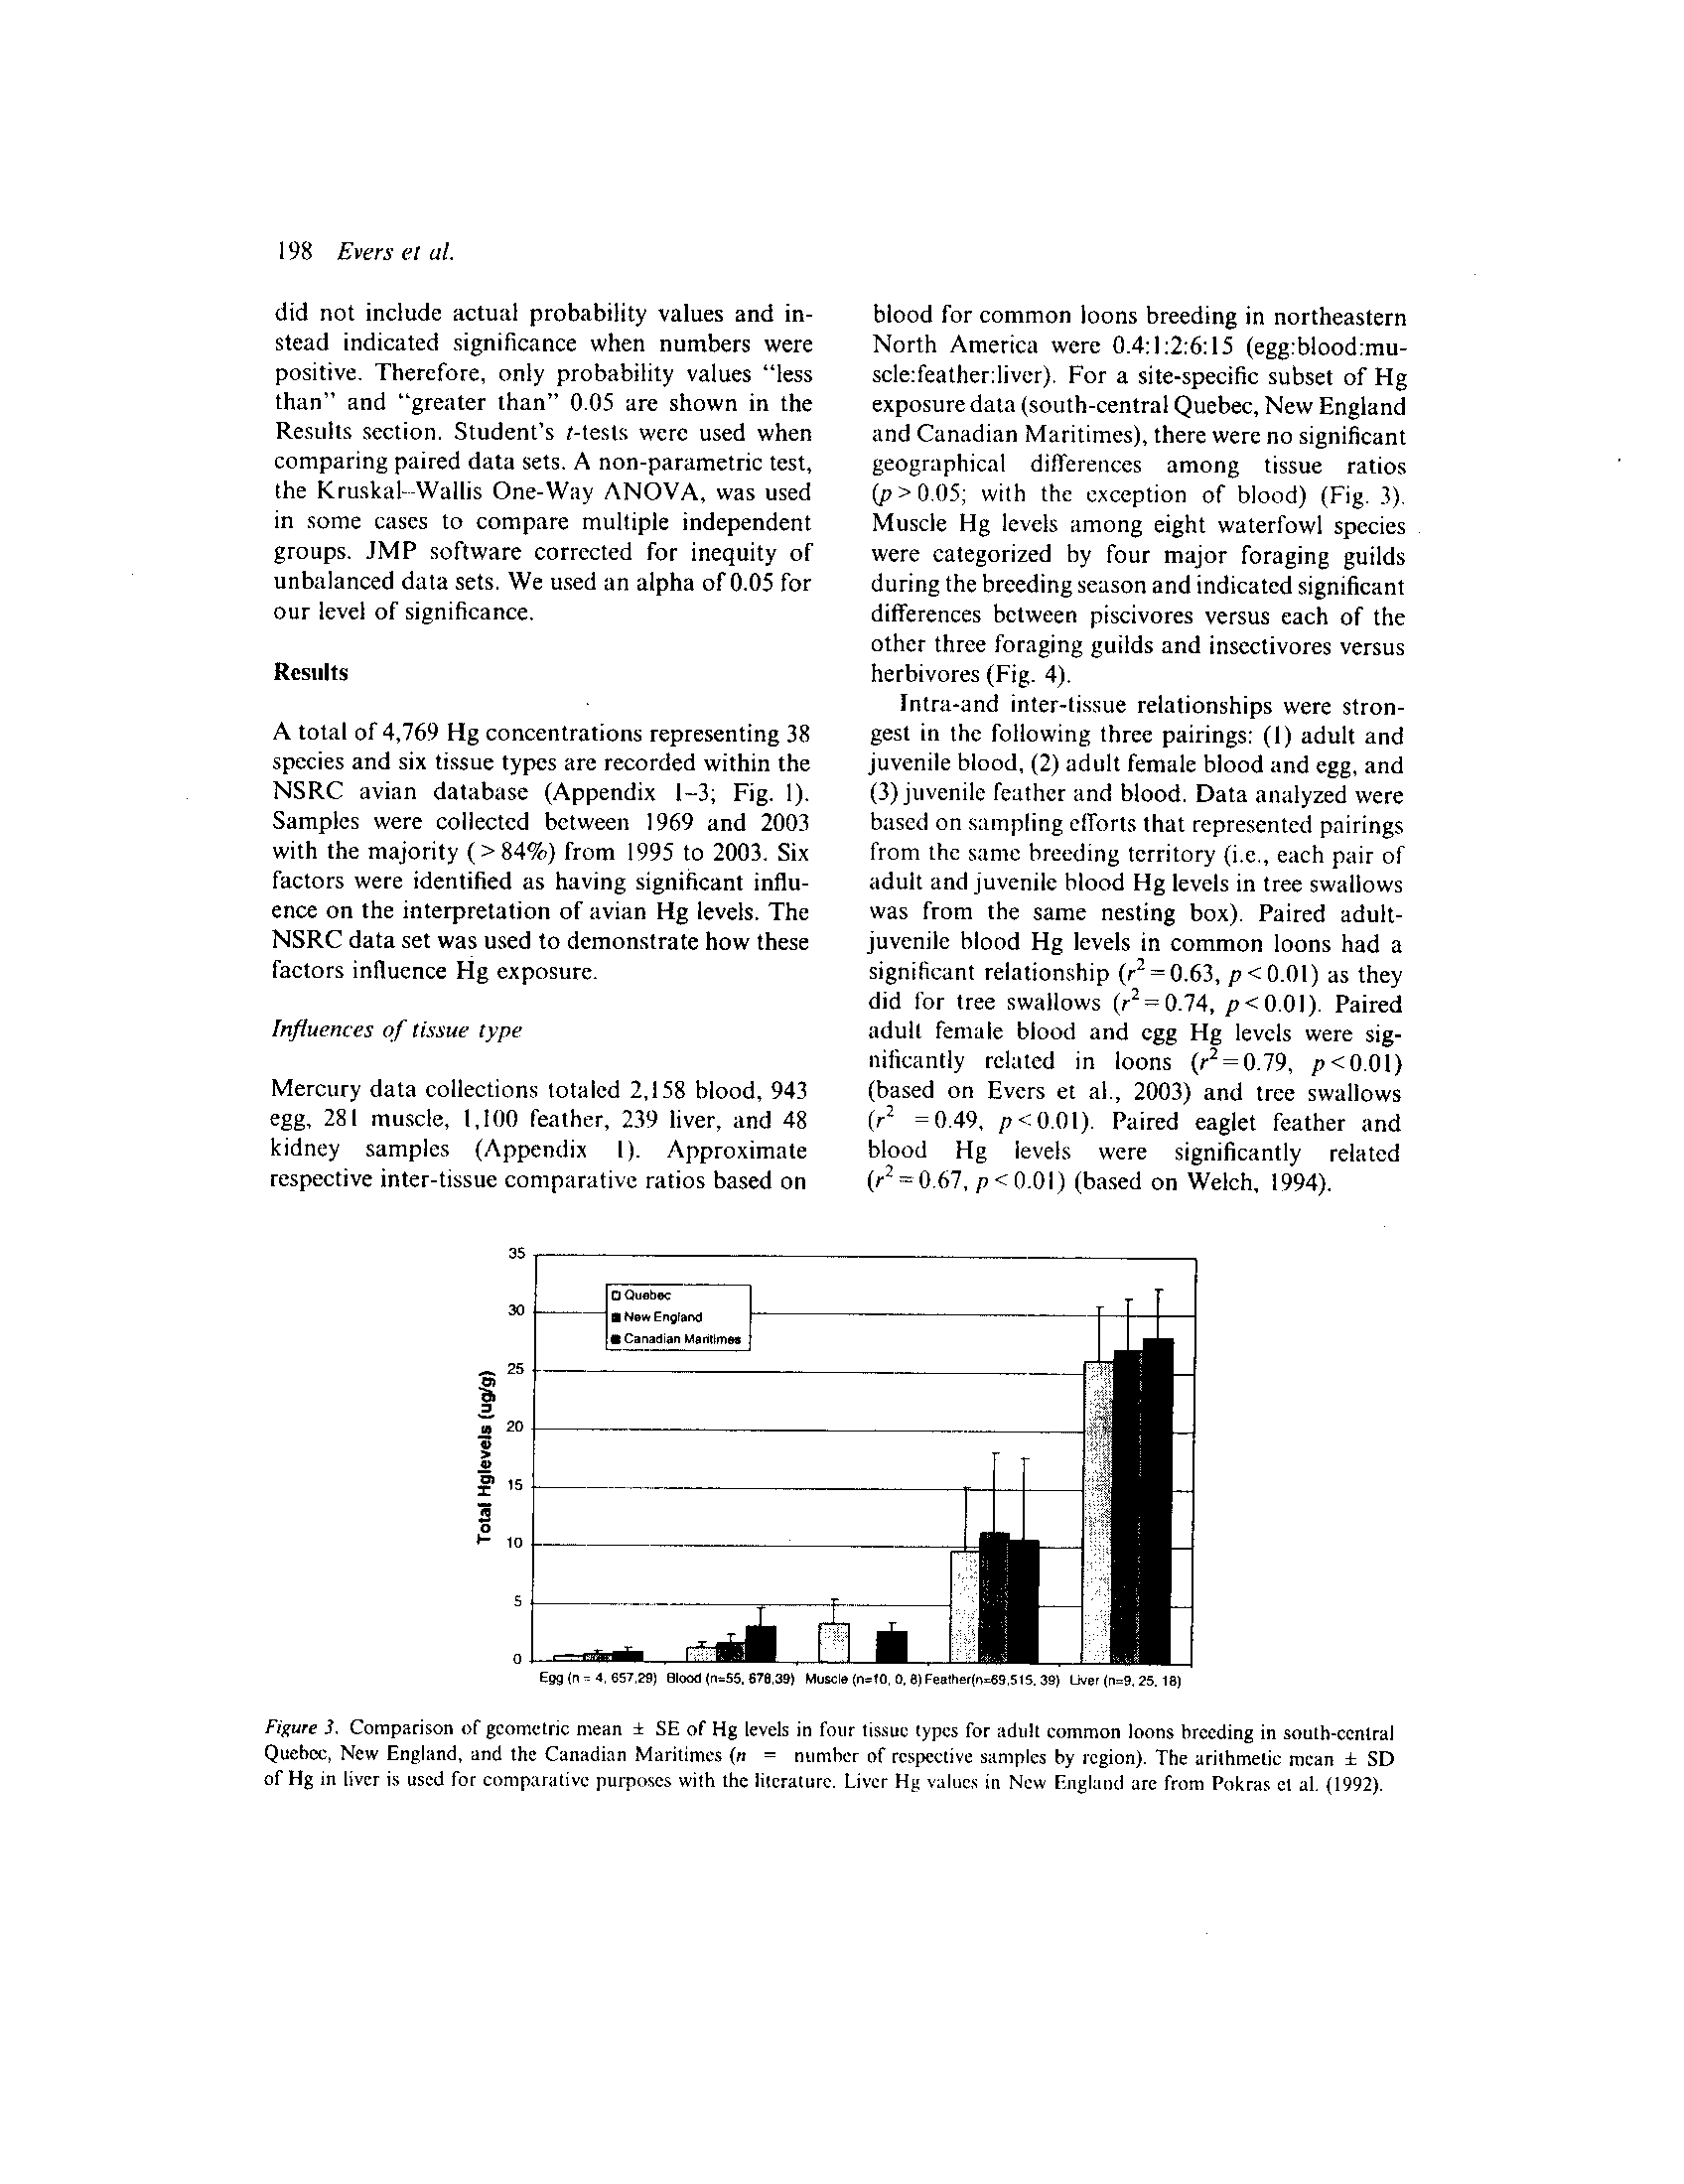
Mercury data collections totaled 2,158 blood, 943
egg, 281 muscle, 1,100 feather, 239 liver, and 48
kidney samples
(Appendix
I) .
Approximate
respective inter-tissue comparative ratios based on
o Qaeeec
a New E, grane
•
Canadian Maallmea
678
Mu
e(5
9,
5
blood for common loons breeding in northeastern
North America were 0 .4:1 :2:6:15 (egg:blood :mu-
scle:feather:liver). For a site-specific subset of Hg
exposure data (south-central Quebec, New England
and Canadian Maritimes), there were no significant
geographical
differences
among
tissue
ratios
(p>0.05; with the exception of blood) (Fig . 3).
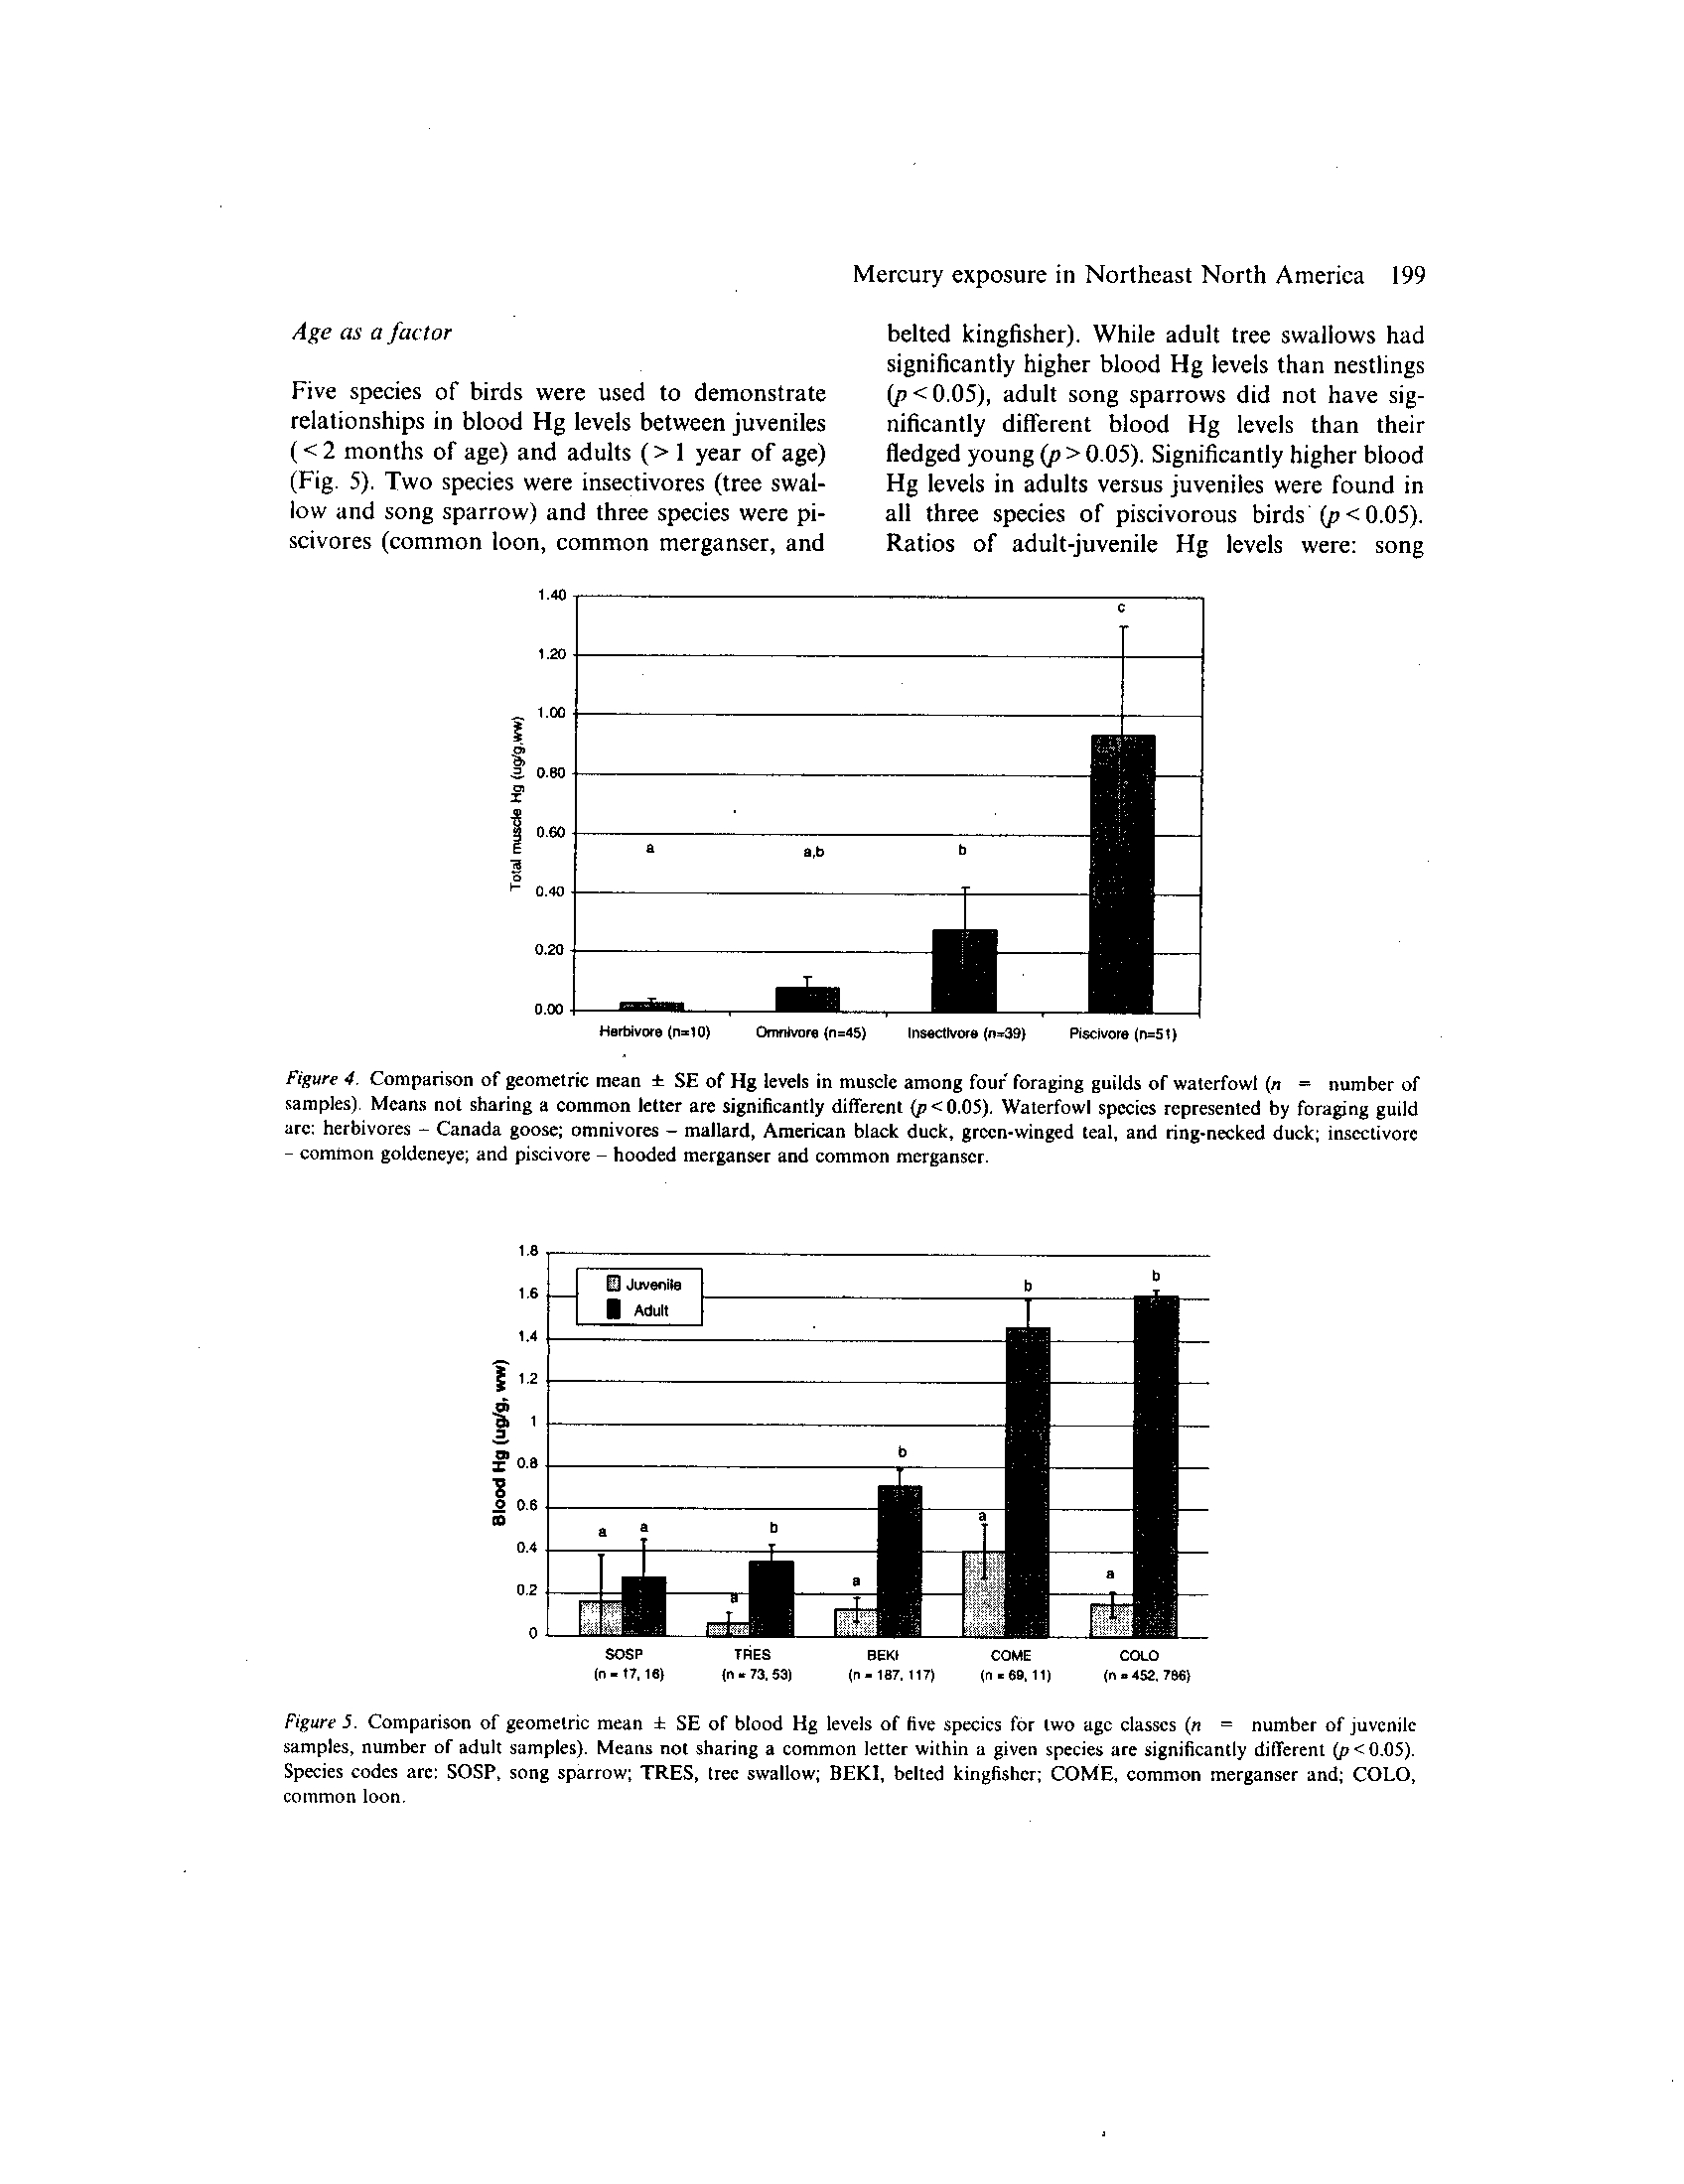
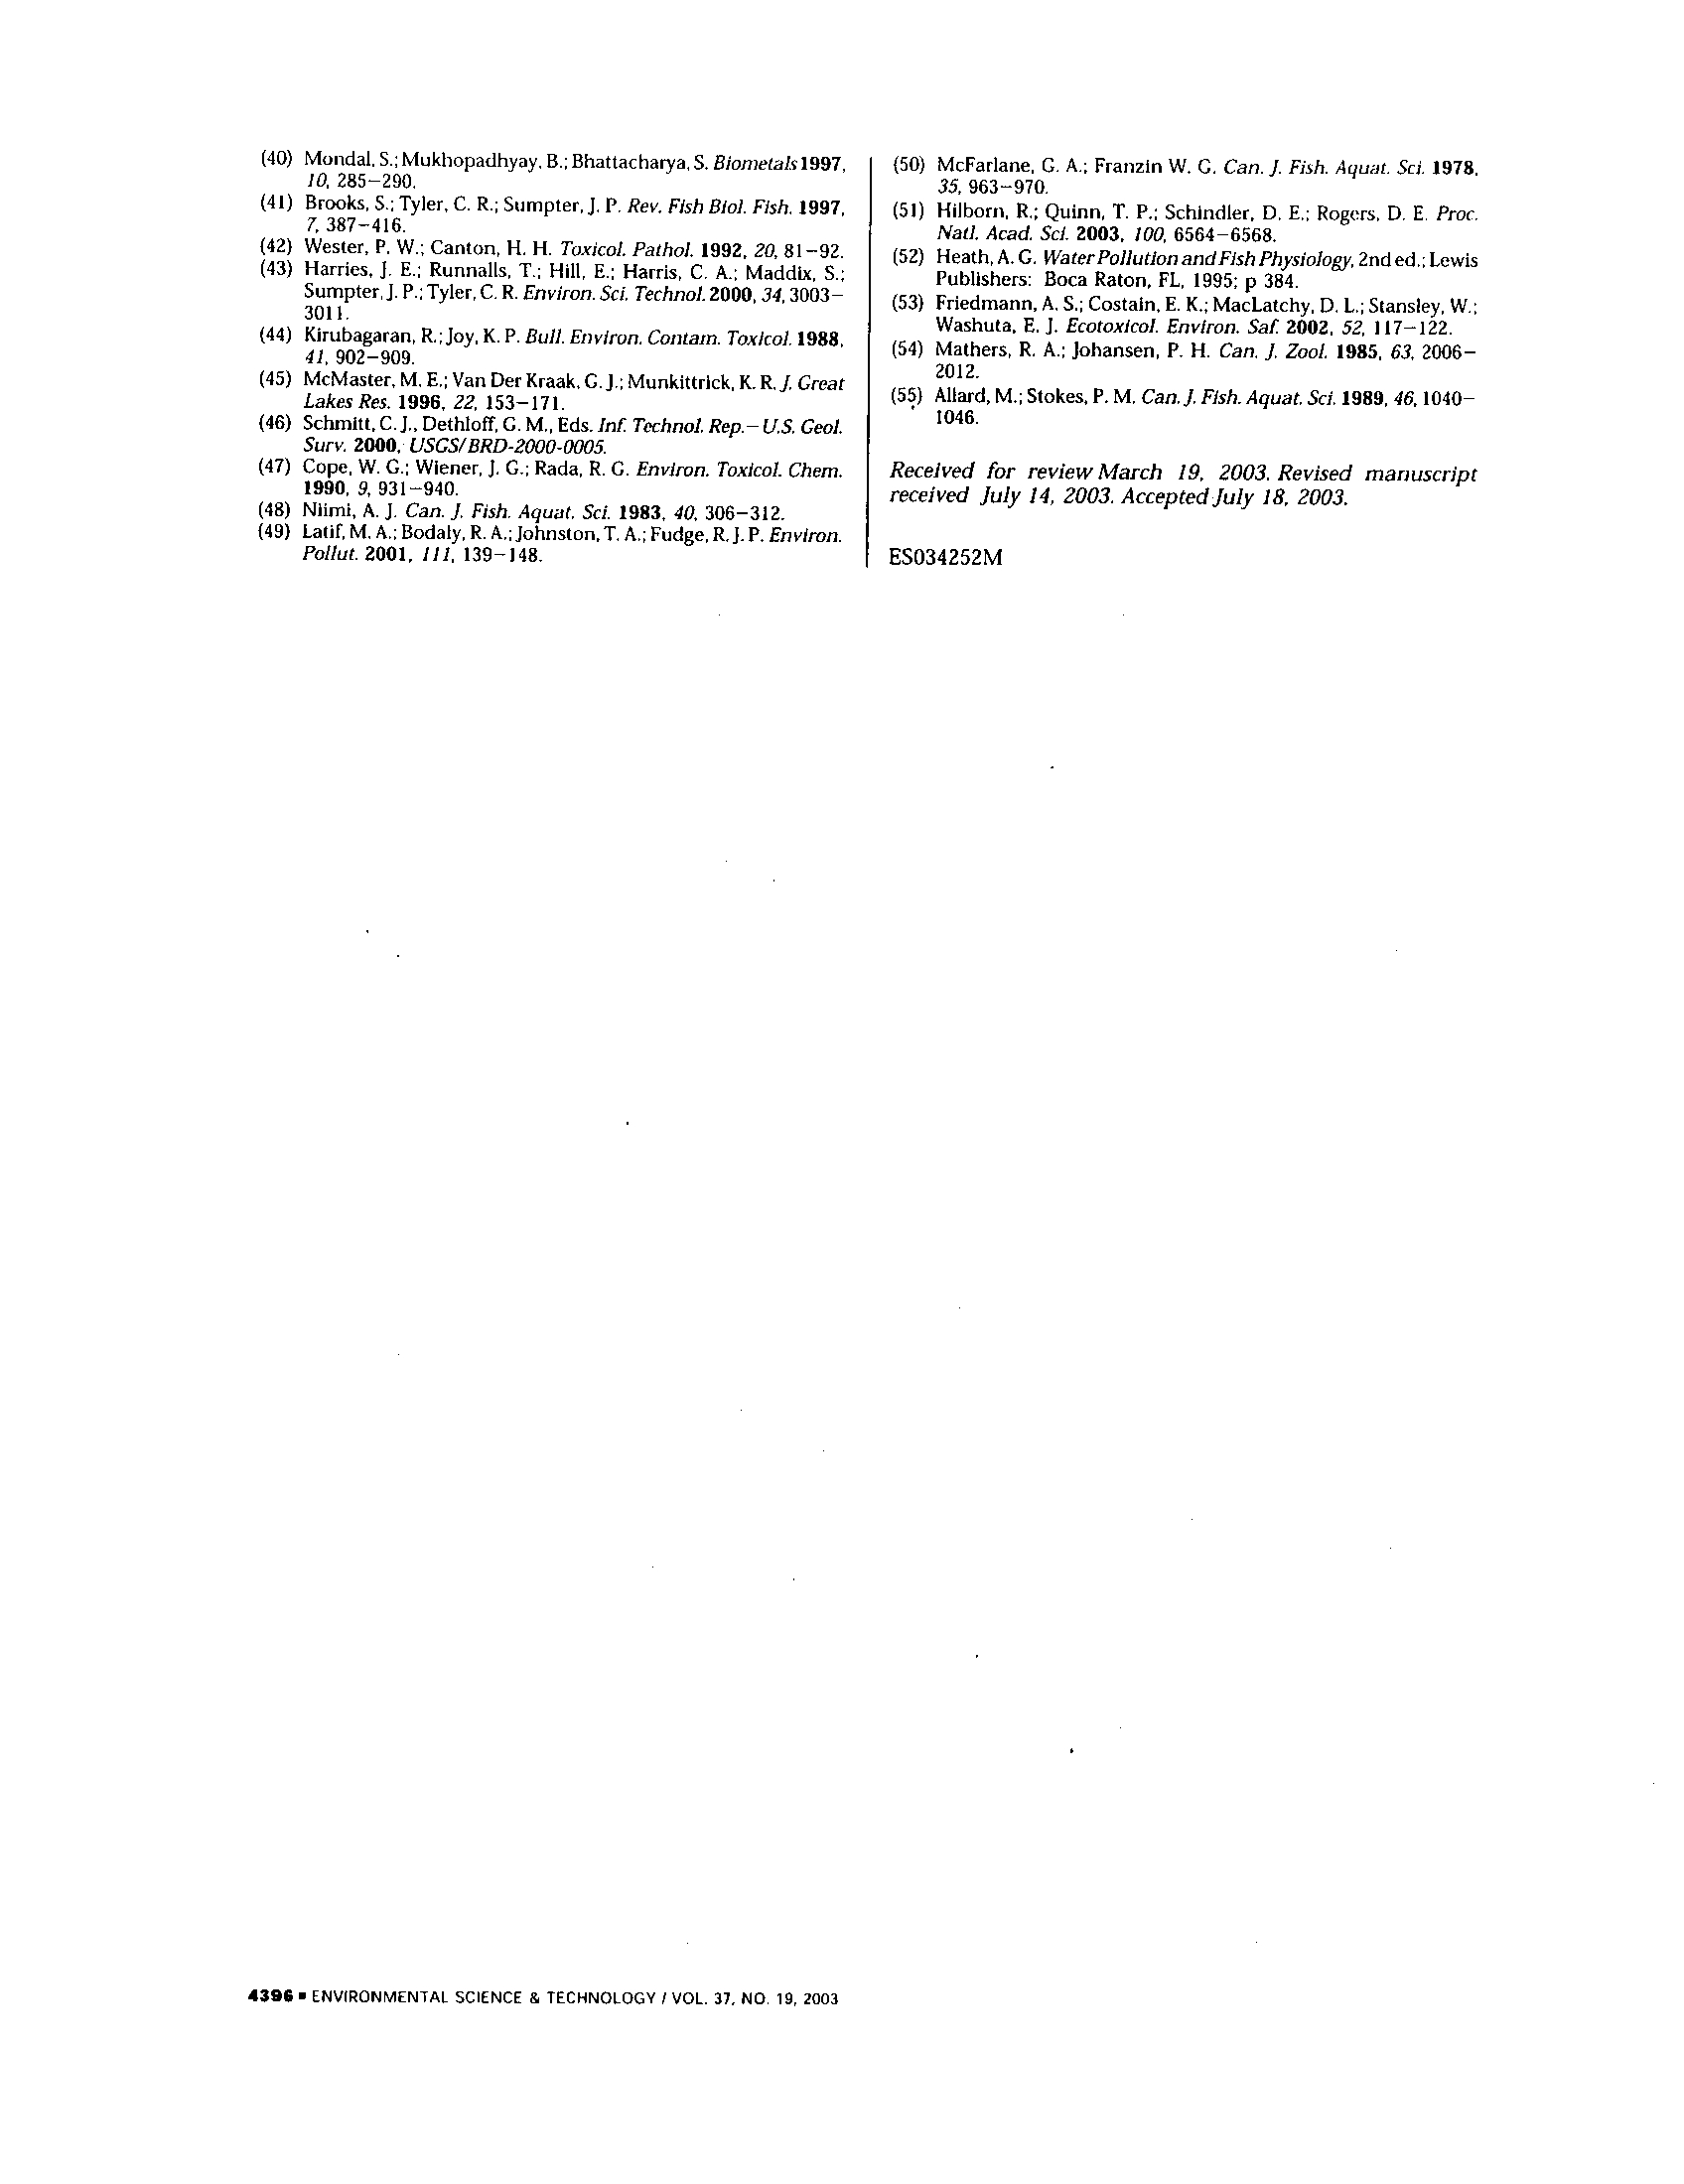
Muscle Hg levels among eight waterfowl species
were categorized by four major foraging guilds
during the breeding season and indicated significant
differences between piscivores versus each of the
other three foraging guilds and insectivores versus
herbivores (Fig. 4)
.
Intra-and inter-tissue relationships were stron-
gest in the following three pairings : (I) adult and
juvenile blood, (2) adult female blood and egg, and
(3) juvenile feather and blood. Data analyzed were
based on sampling efforts that represented pairings
from the same breeding territory (i.e ., each pair of
adult and juvenile blood Hg levels in tree swallows
was from the same nesting box). Paired adult-
juvenile blood Hg levels in common loons had a
significant relationship (r2=0.63, p < 0.01) as they
did for tree swallows
(r 2=0.74, p<0.01). Paired
adult female blood and egg Hg levels were sig-
nificantly related
in loons (r2=0.79, p<0.01)
(based on Evers et al., 2003) and tree swallows
(r2 =0.49, p<0.01). Paired eaglet feather and
blood
Hg
levels
were
significantly
related
(r2=0.67, p<0.01) (based on Welch, 1994) .
Figure 3 . Comparison of geometric mean
3
SE of Hg levels in four tissue types for adult common loons breeding in south-central
Quebce, New England, and the Canadian Maritimes (n = number of respective samples by region). The arithmetic mean t SD
of Hg in liver is used for comparative purposes with the literature . Liver Hg values in New England are from Pokras et al . (1992) .
Age as a factor
Five species of birds were used to demonstrate
relationships in blood Hg levels between juveniles
(< 2 months of age) and adults (> 1 year of age)
(Fig. 5). Two species were insectivores (tree swal-
low and song sparrow) and three species were pi-
scivores (common loon, common merganser, and
1 .21
d
0 .80
Z
060
0.21
0.00
Mercury exposure in Northeast North America
199
belted kingfisher) . While adult tree swallows had
significantly higher blood Hg levels than nestlings
(p<0.05), adult song sparrows did not have sig-
nificantly different blood Hg levels than their
fledged young (p > 0.05). Significantly higher blood
Hg levels in adults versus juveniles were found in
all three species of piscivorous birds (p < 0 .05) .
Ratios of adult-juvenile Hg levels were : song
Hertivwe(n=10)
Ornr9vure(n=e5)
Insectivore (n=39)
Pisdvore(n=51)
Figure 4
.
Comparison of geometric mean t SE of Hg levels in muscle among
foul foraging guilds of waterfowl (n
= number of
samples). Means not sharing a common letter are significantly different (p<0 .05). Waterfowl species represented by foraging guild
arc: herbivores - Canada goose; omnivores - mallard, American black duck, green-winged teal, and ring-necked duck ; insectivore
- common goldeneye; and piscivore - hooded merganser and common merganser
.
SOSP
(0-17,16)
TRES
BENZ
COME
(n..73.53)
(n-187.117)
(1 .69,11)
COi-O
to .452, 766)
Figure 5 .
Comparison of geometric mean + SE of blood Hg levels of five species for two age classes (n
= number of juvenile
samples, number of adult samples) . Means not sharing a common letter within a given species are significantly
different
(p<0.05).
Species codes arc : SOSP, song sparrow; TRES, tree swallow; BEKI, belted kingfisher; COME, common merganser and; COLO,
common loon
.
200
Evers ei a!.
sparrow
1 .7:1, common
merganser
3.6:1,
tree
swallow 5 .9:1, belted kingfisher 5 .6 :1, and common
loon
10.6 :1
.
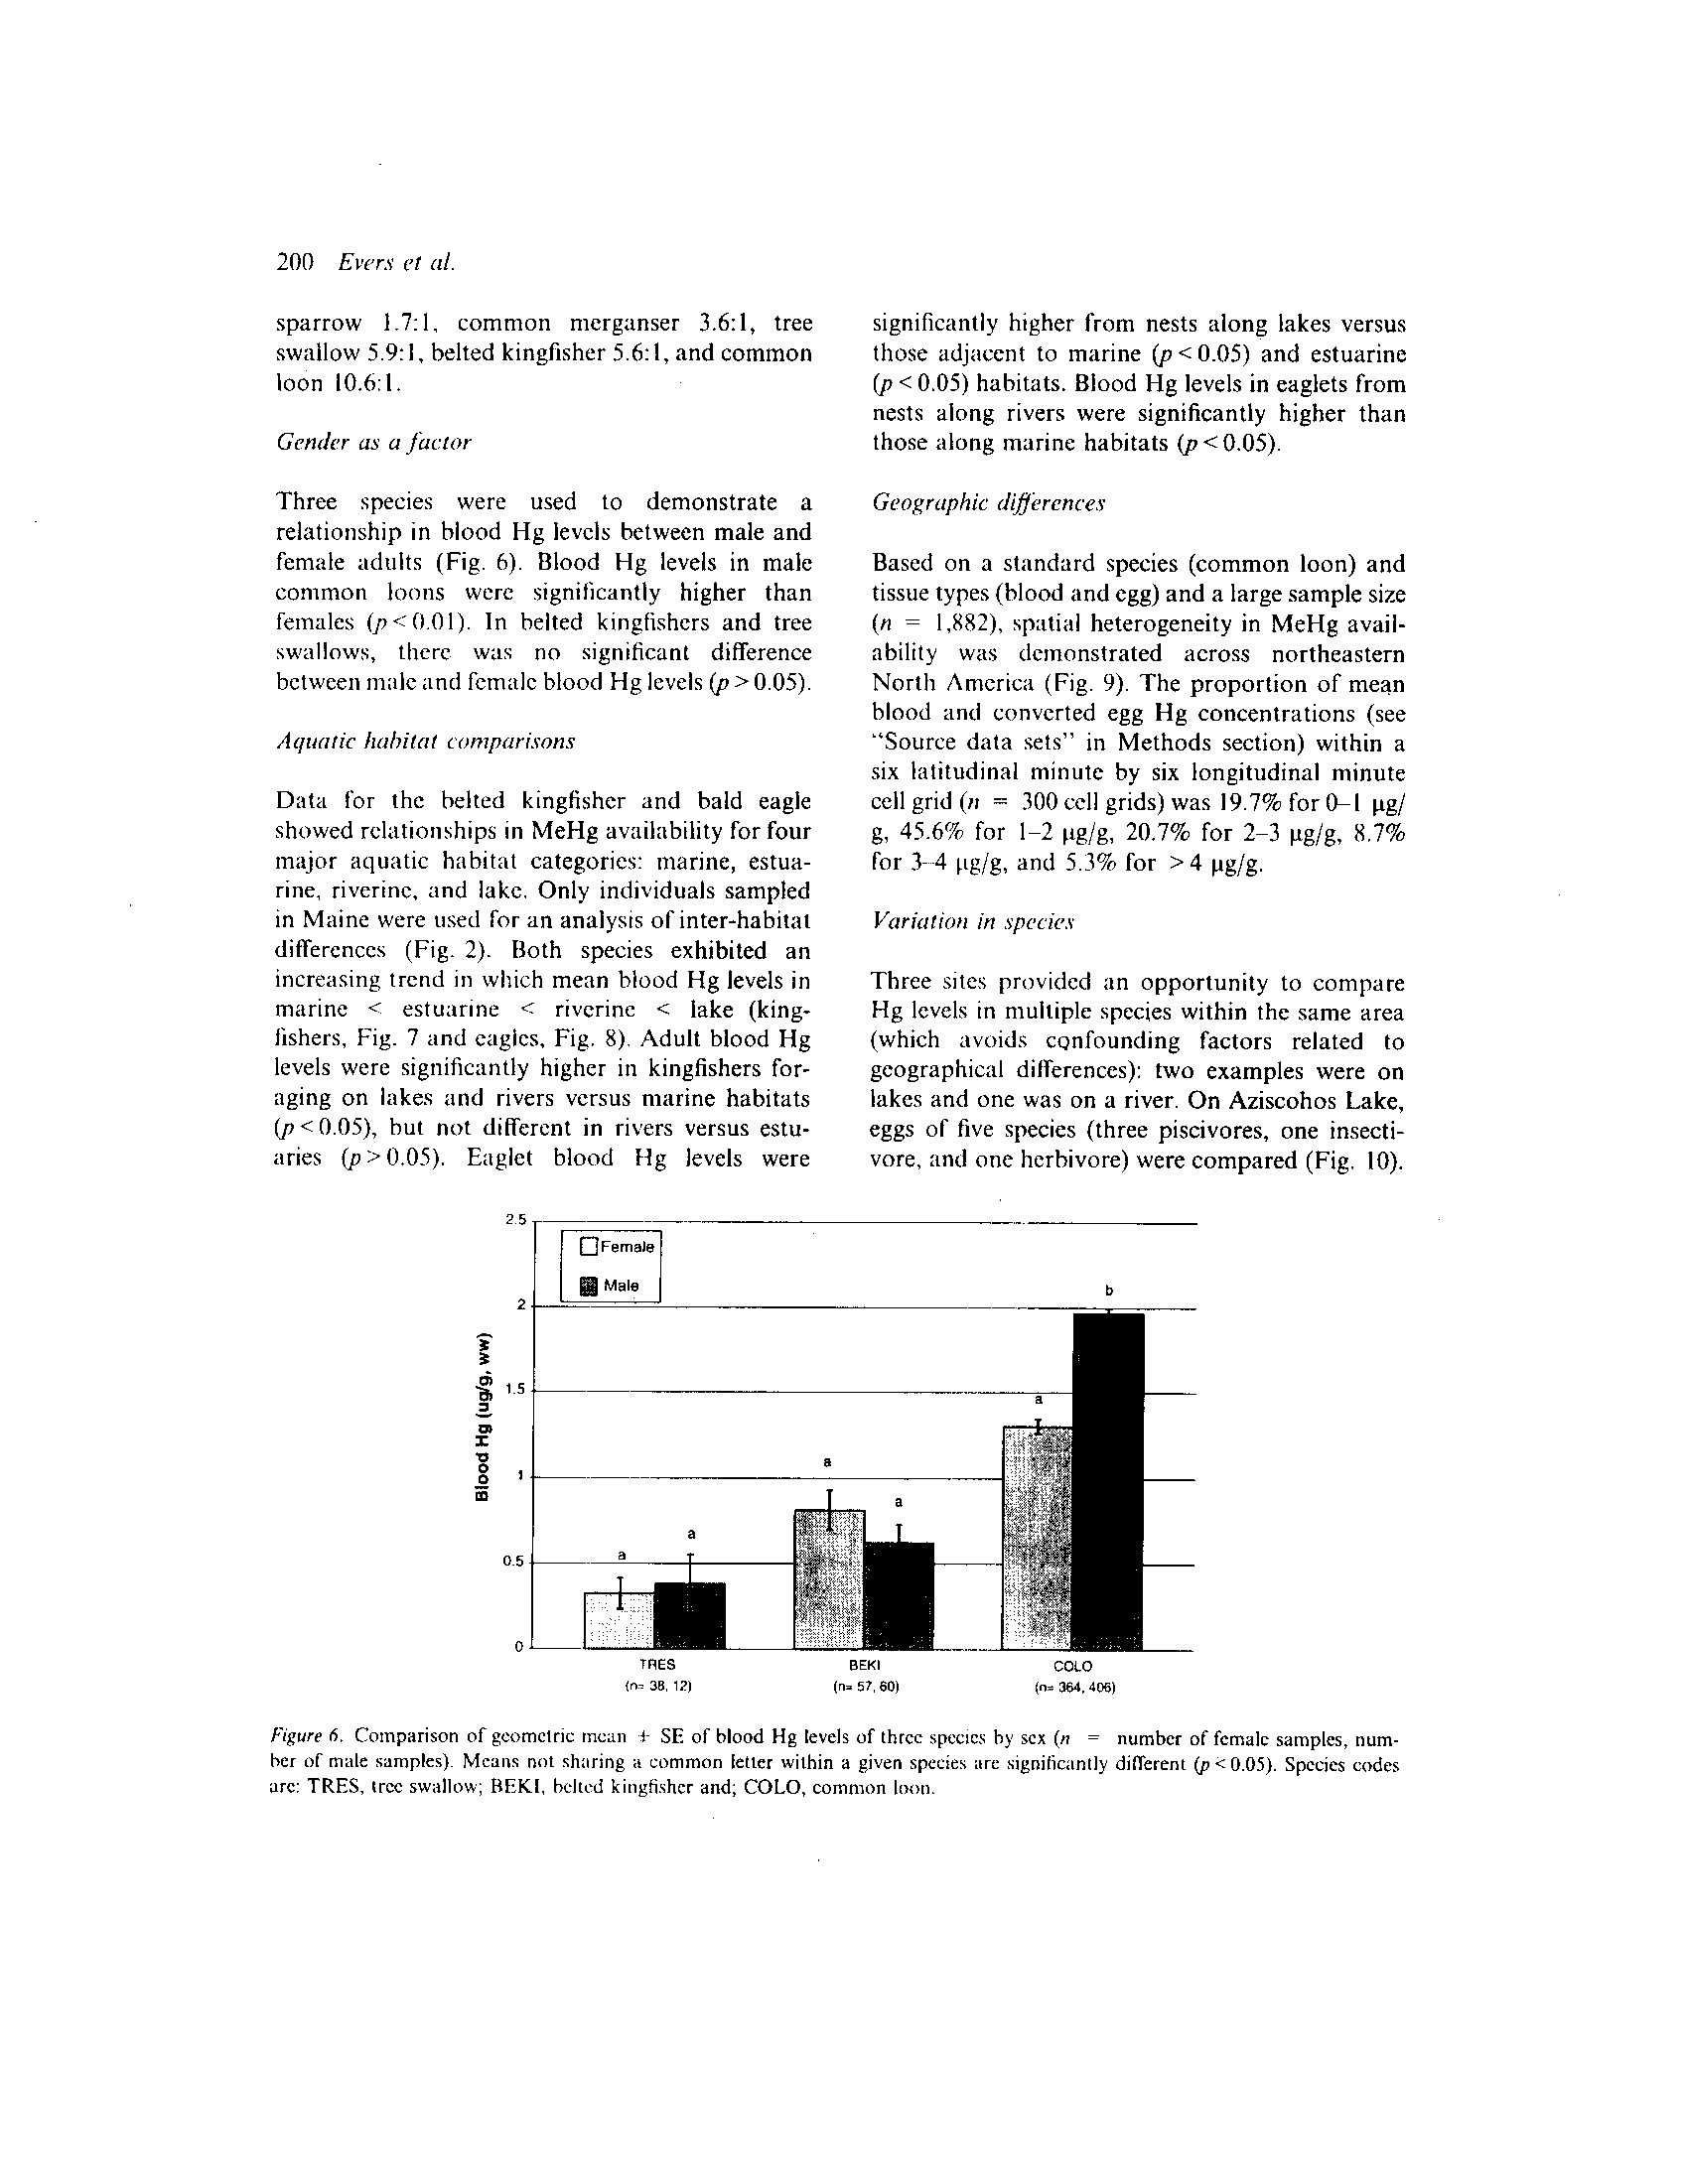
Gender as a factor
Three
species
were
used
to
demonstrate
a
relationship in blood Hg levels between male and
female adults (Fig. 6) . Blood Hg levels in male
common loons were significantly higher than
females (p<0.01). In belted kingfishers and tree
swallows,
there was
no significant difference
between male and female blood Hg levels (p > 0.05)
.
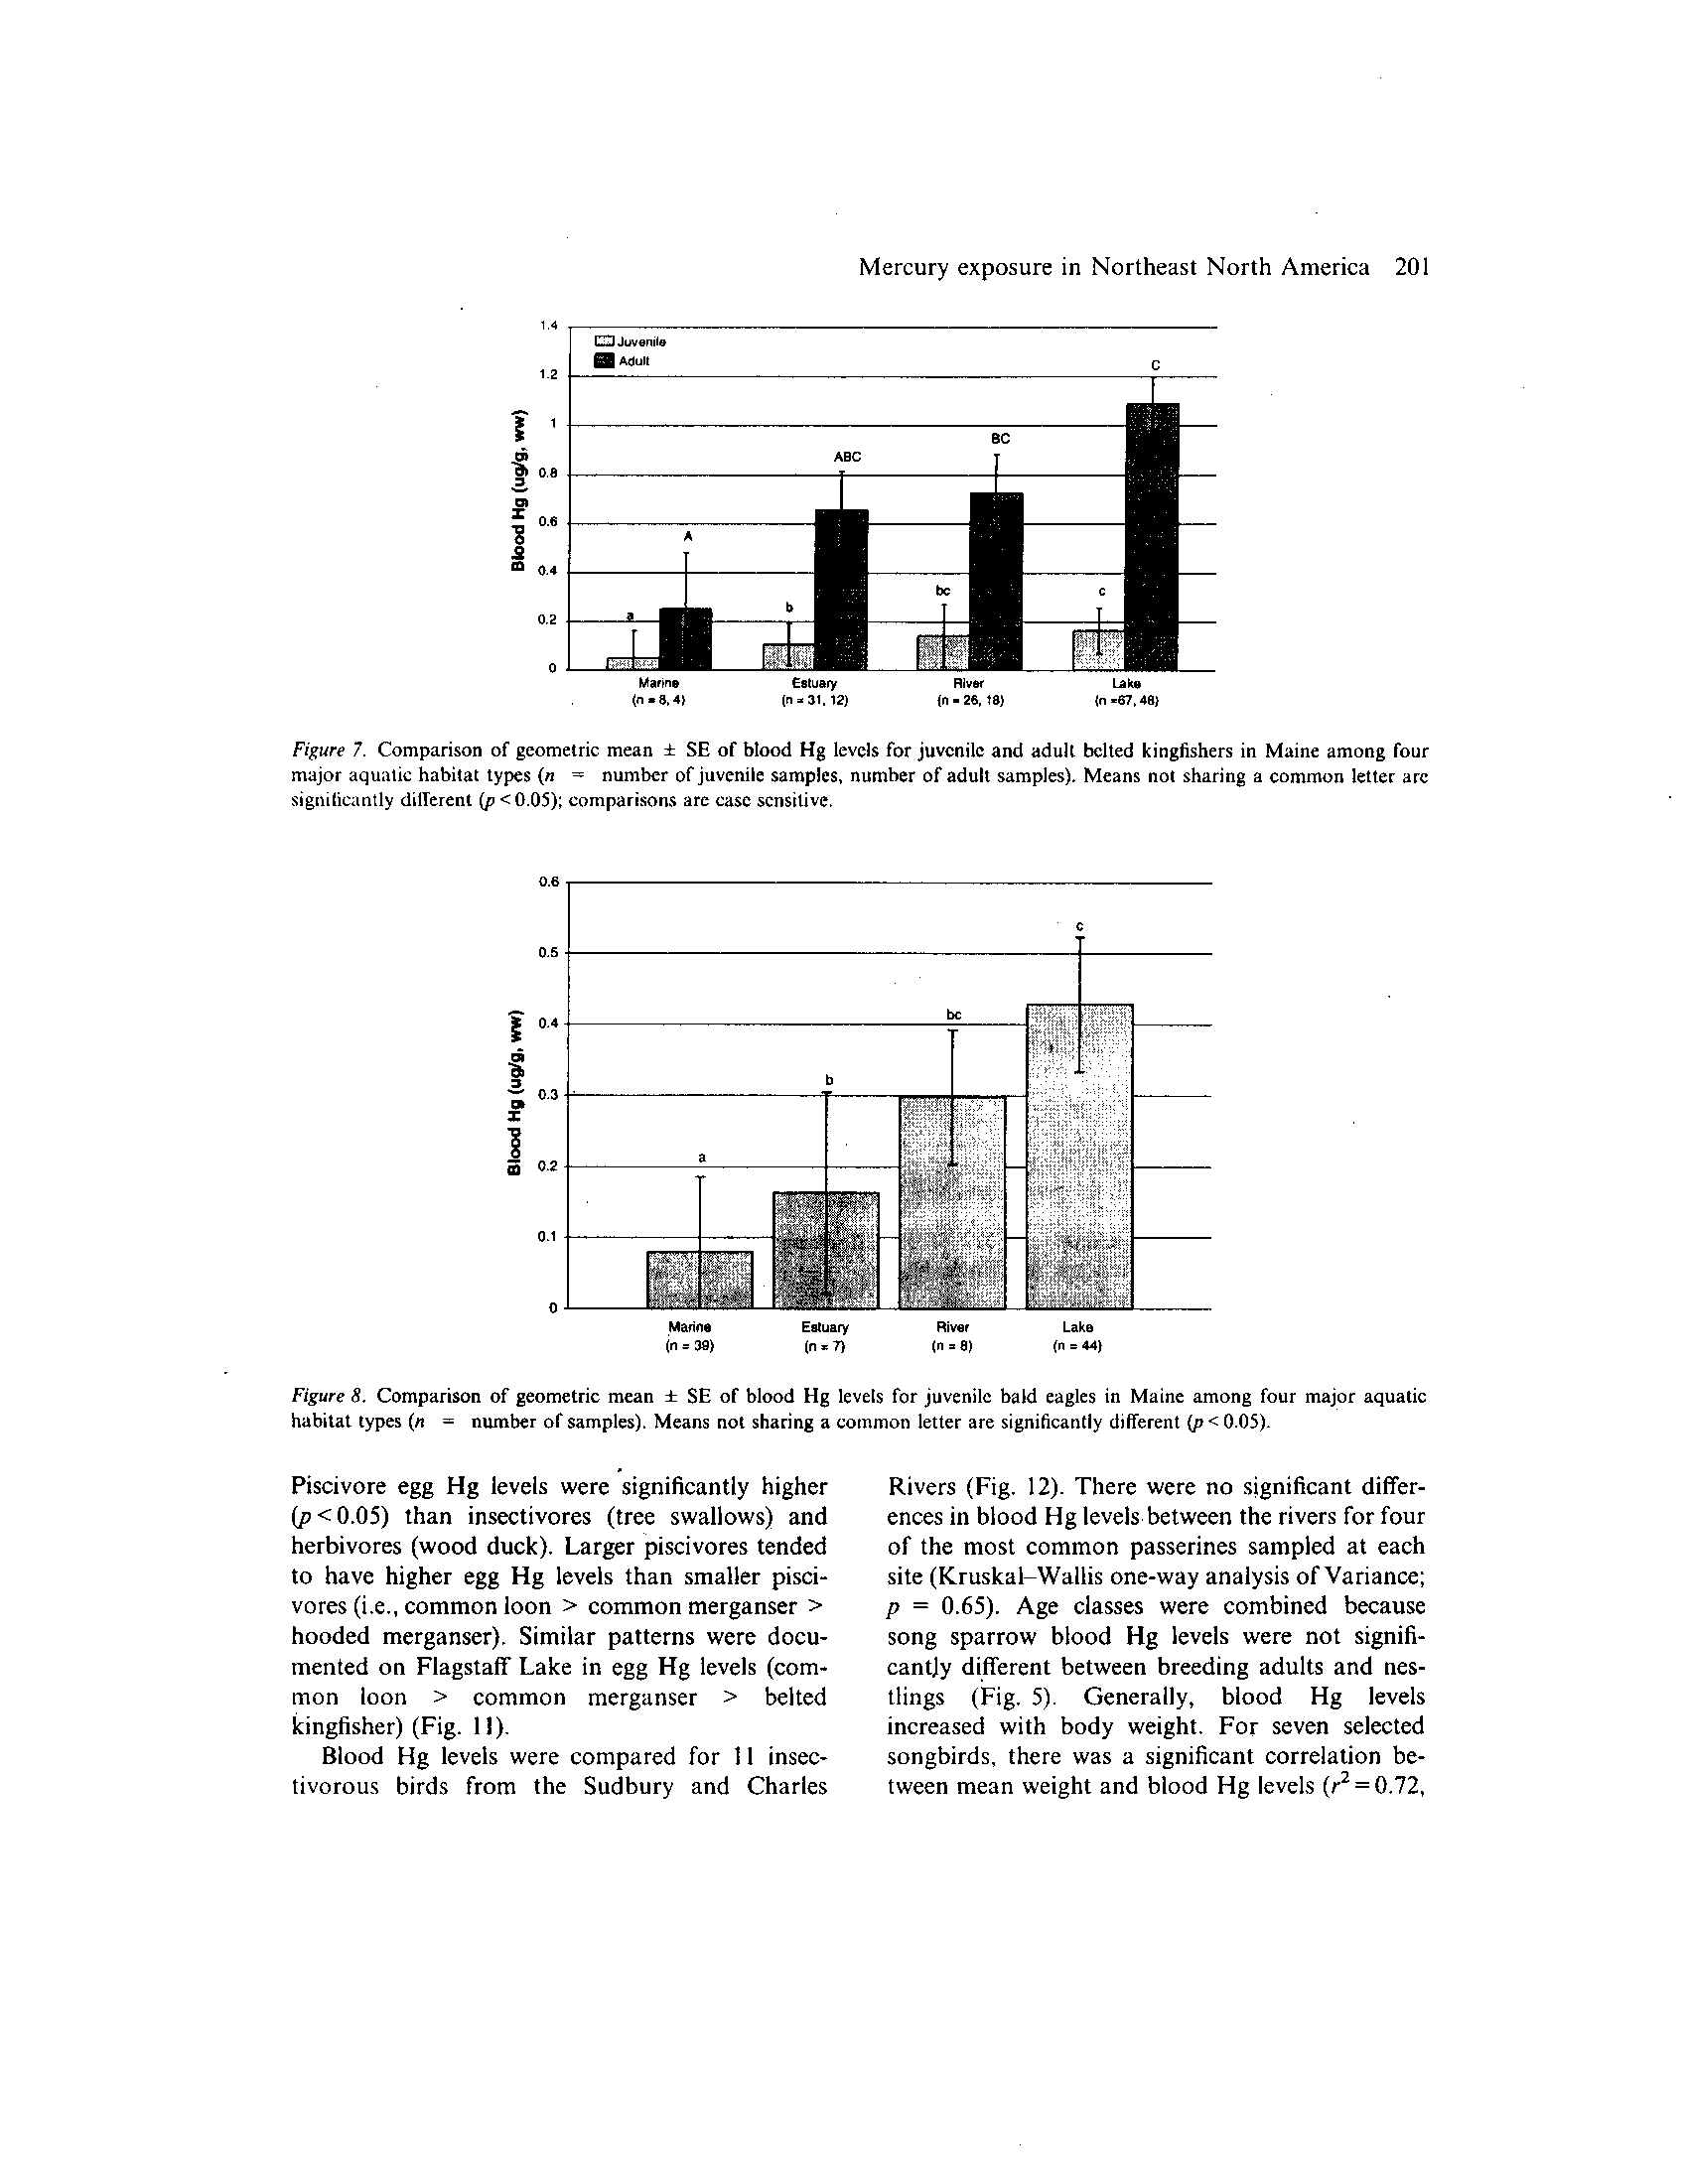
Aquatic habitat comparisons
Data for the belted kingfisher and bald eagle
showed relationships in MeHg availability for four
major aquatic habitat categories: marine, estua-
rine, riverinc, and lake. Only individuals sampled
in Maine were used for an analysis of inter-habitat
differences (Fig
. 2) .
Both species exhibited an
increasing trend in which mean blood Hg levels in
marine <
estuarine
< riverine < lake (king-
fishers, Fig
. 7 and eagles, Fig
. 8) . Adult blood Hg
levels were significantly higher in kingfishers for-
aging on lakes and rivers versus marine habitats
(p < 0.05), but not different in rivers versus estu-
aries (p>0.05)
.
Eaglet blood Hg levels were
oFemale
® Male
TRES
0- 36, 12)
BEKI
pe 51 60)
significantly higher from nests along lakes versus
those adjacent to marine (p<0.05) and estuarine
(p < 0 .05) habitats. Blood Hg levels in eaglets from
nests along rivers were significantly higher than
those along marine habitats (p<0 .05) .
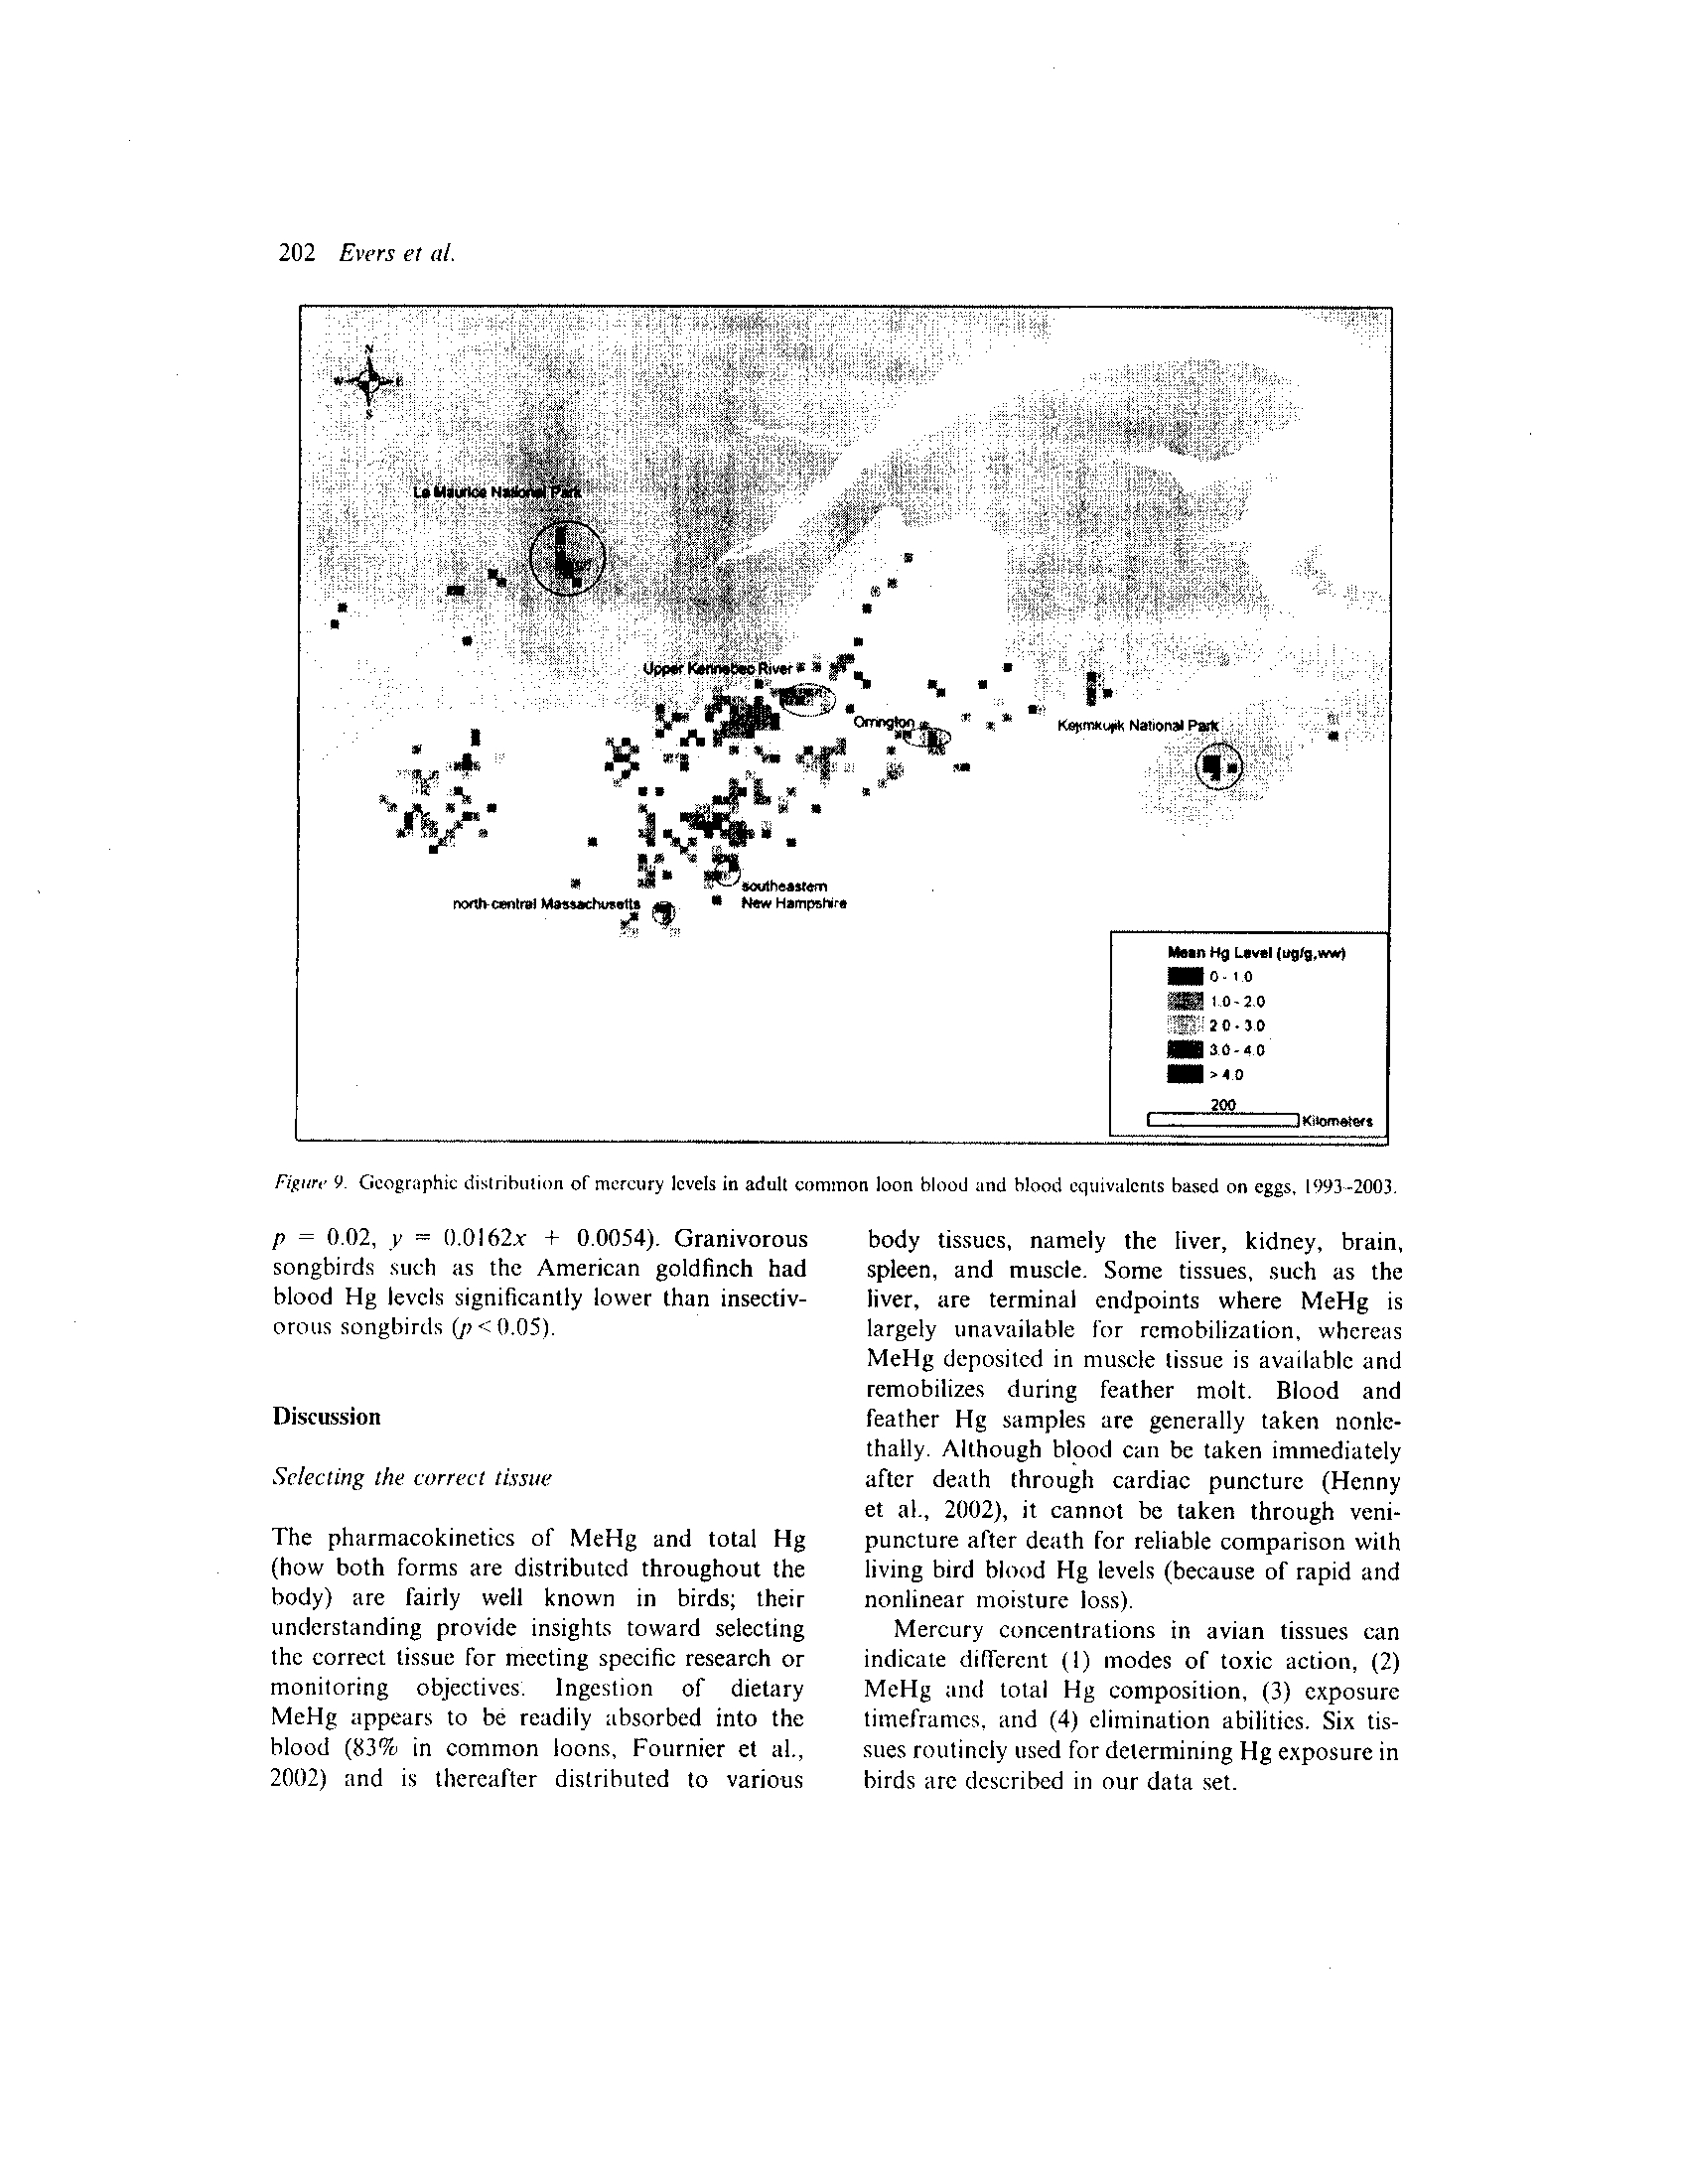
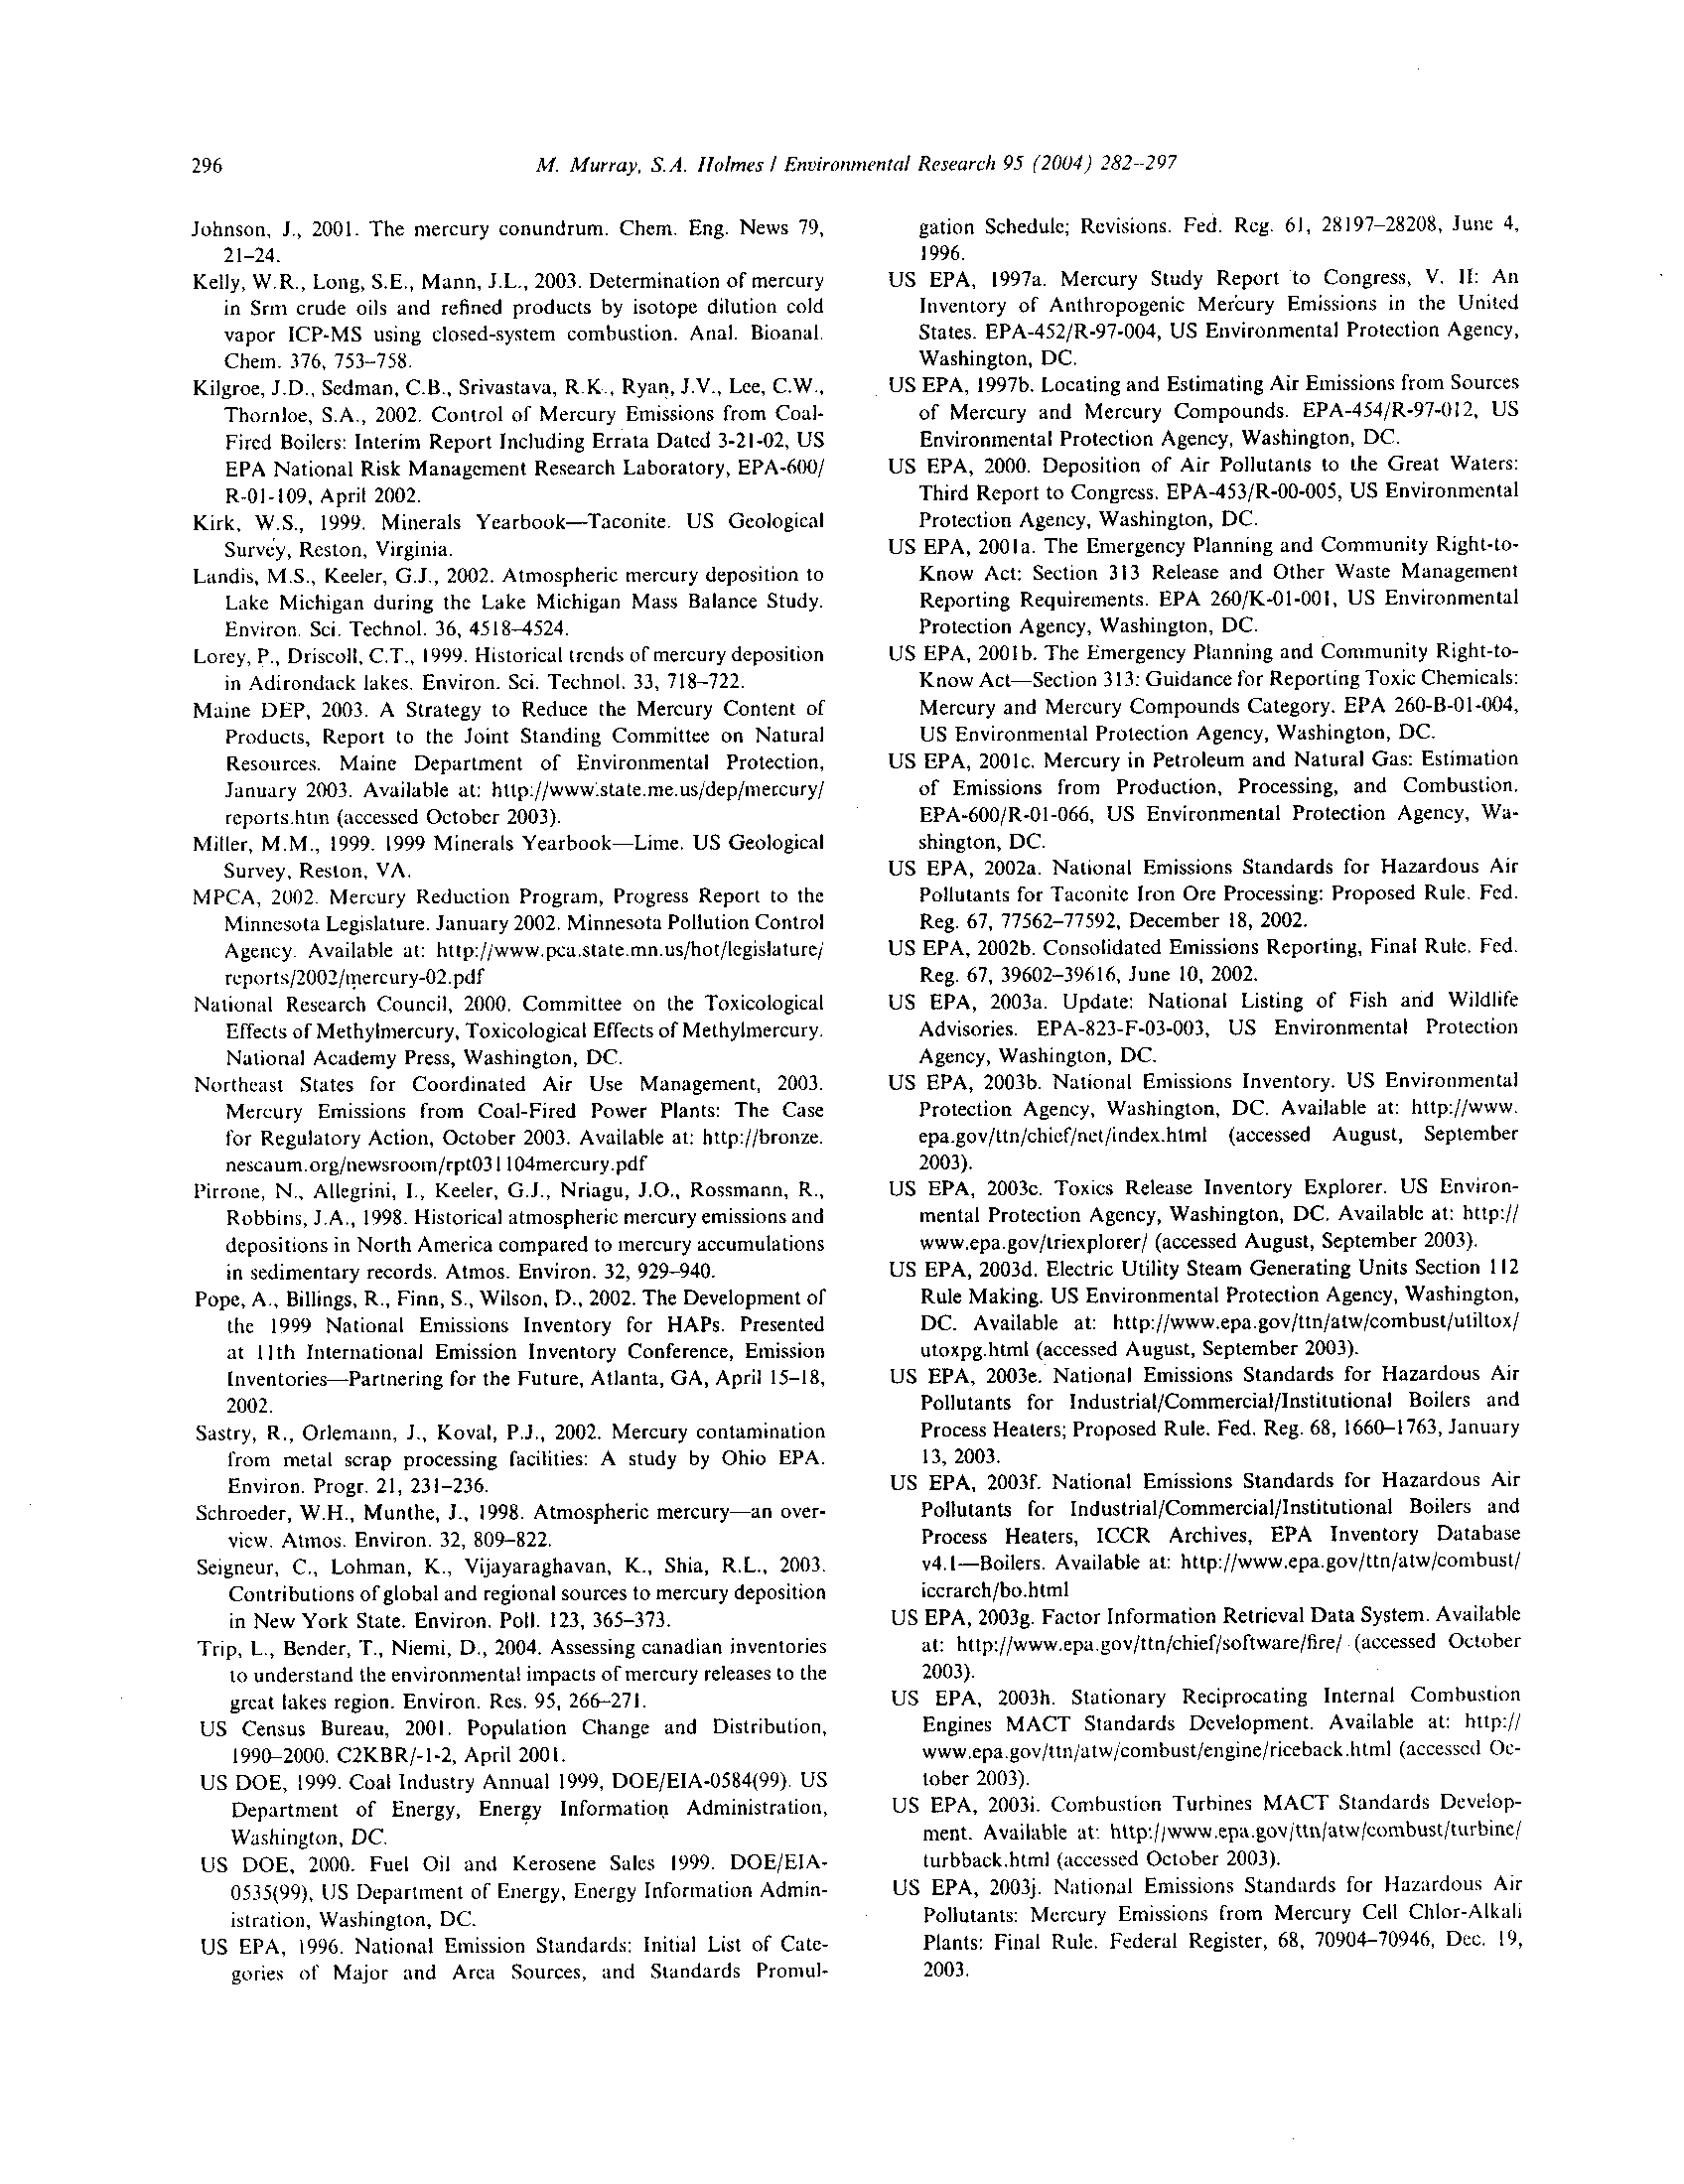
Geographic differences
Based on a standard species (common loon) and
tissue types (blood and egg) and a large sample size
(n = 1,882), spatial heterogeneity in McHg avail-
ability was demonstrated across
northeastern
North America (Fig. 9). The proportion of mean
blood and converted egg Hg concentrations (see
"Source data sets" in Methods section) within a
six latitudinal minute by six longitudinal minute
cell grid (n = 300 cell grids) was 19.7% for 0-I µg/
g, 45.6% for
1-2 fig/g, 20.7% for 2-3 pg/g,
8.7%
for 3-4 pg/g, and 5.3% for > 4 pg/g .
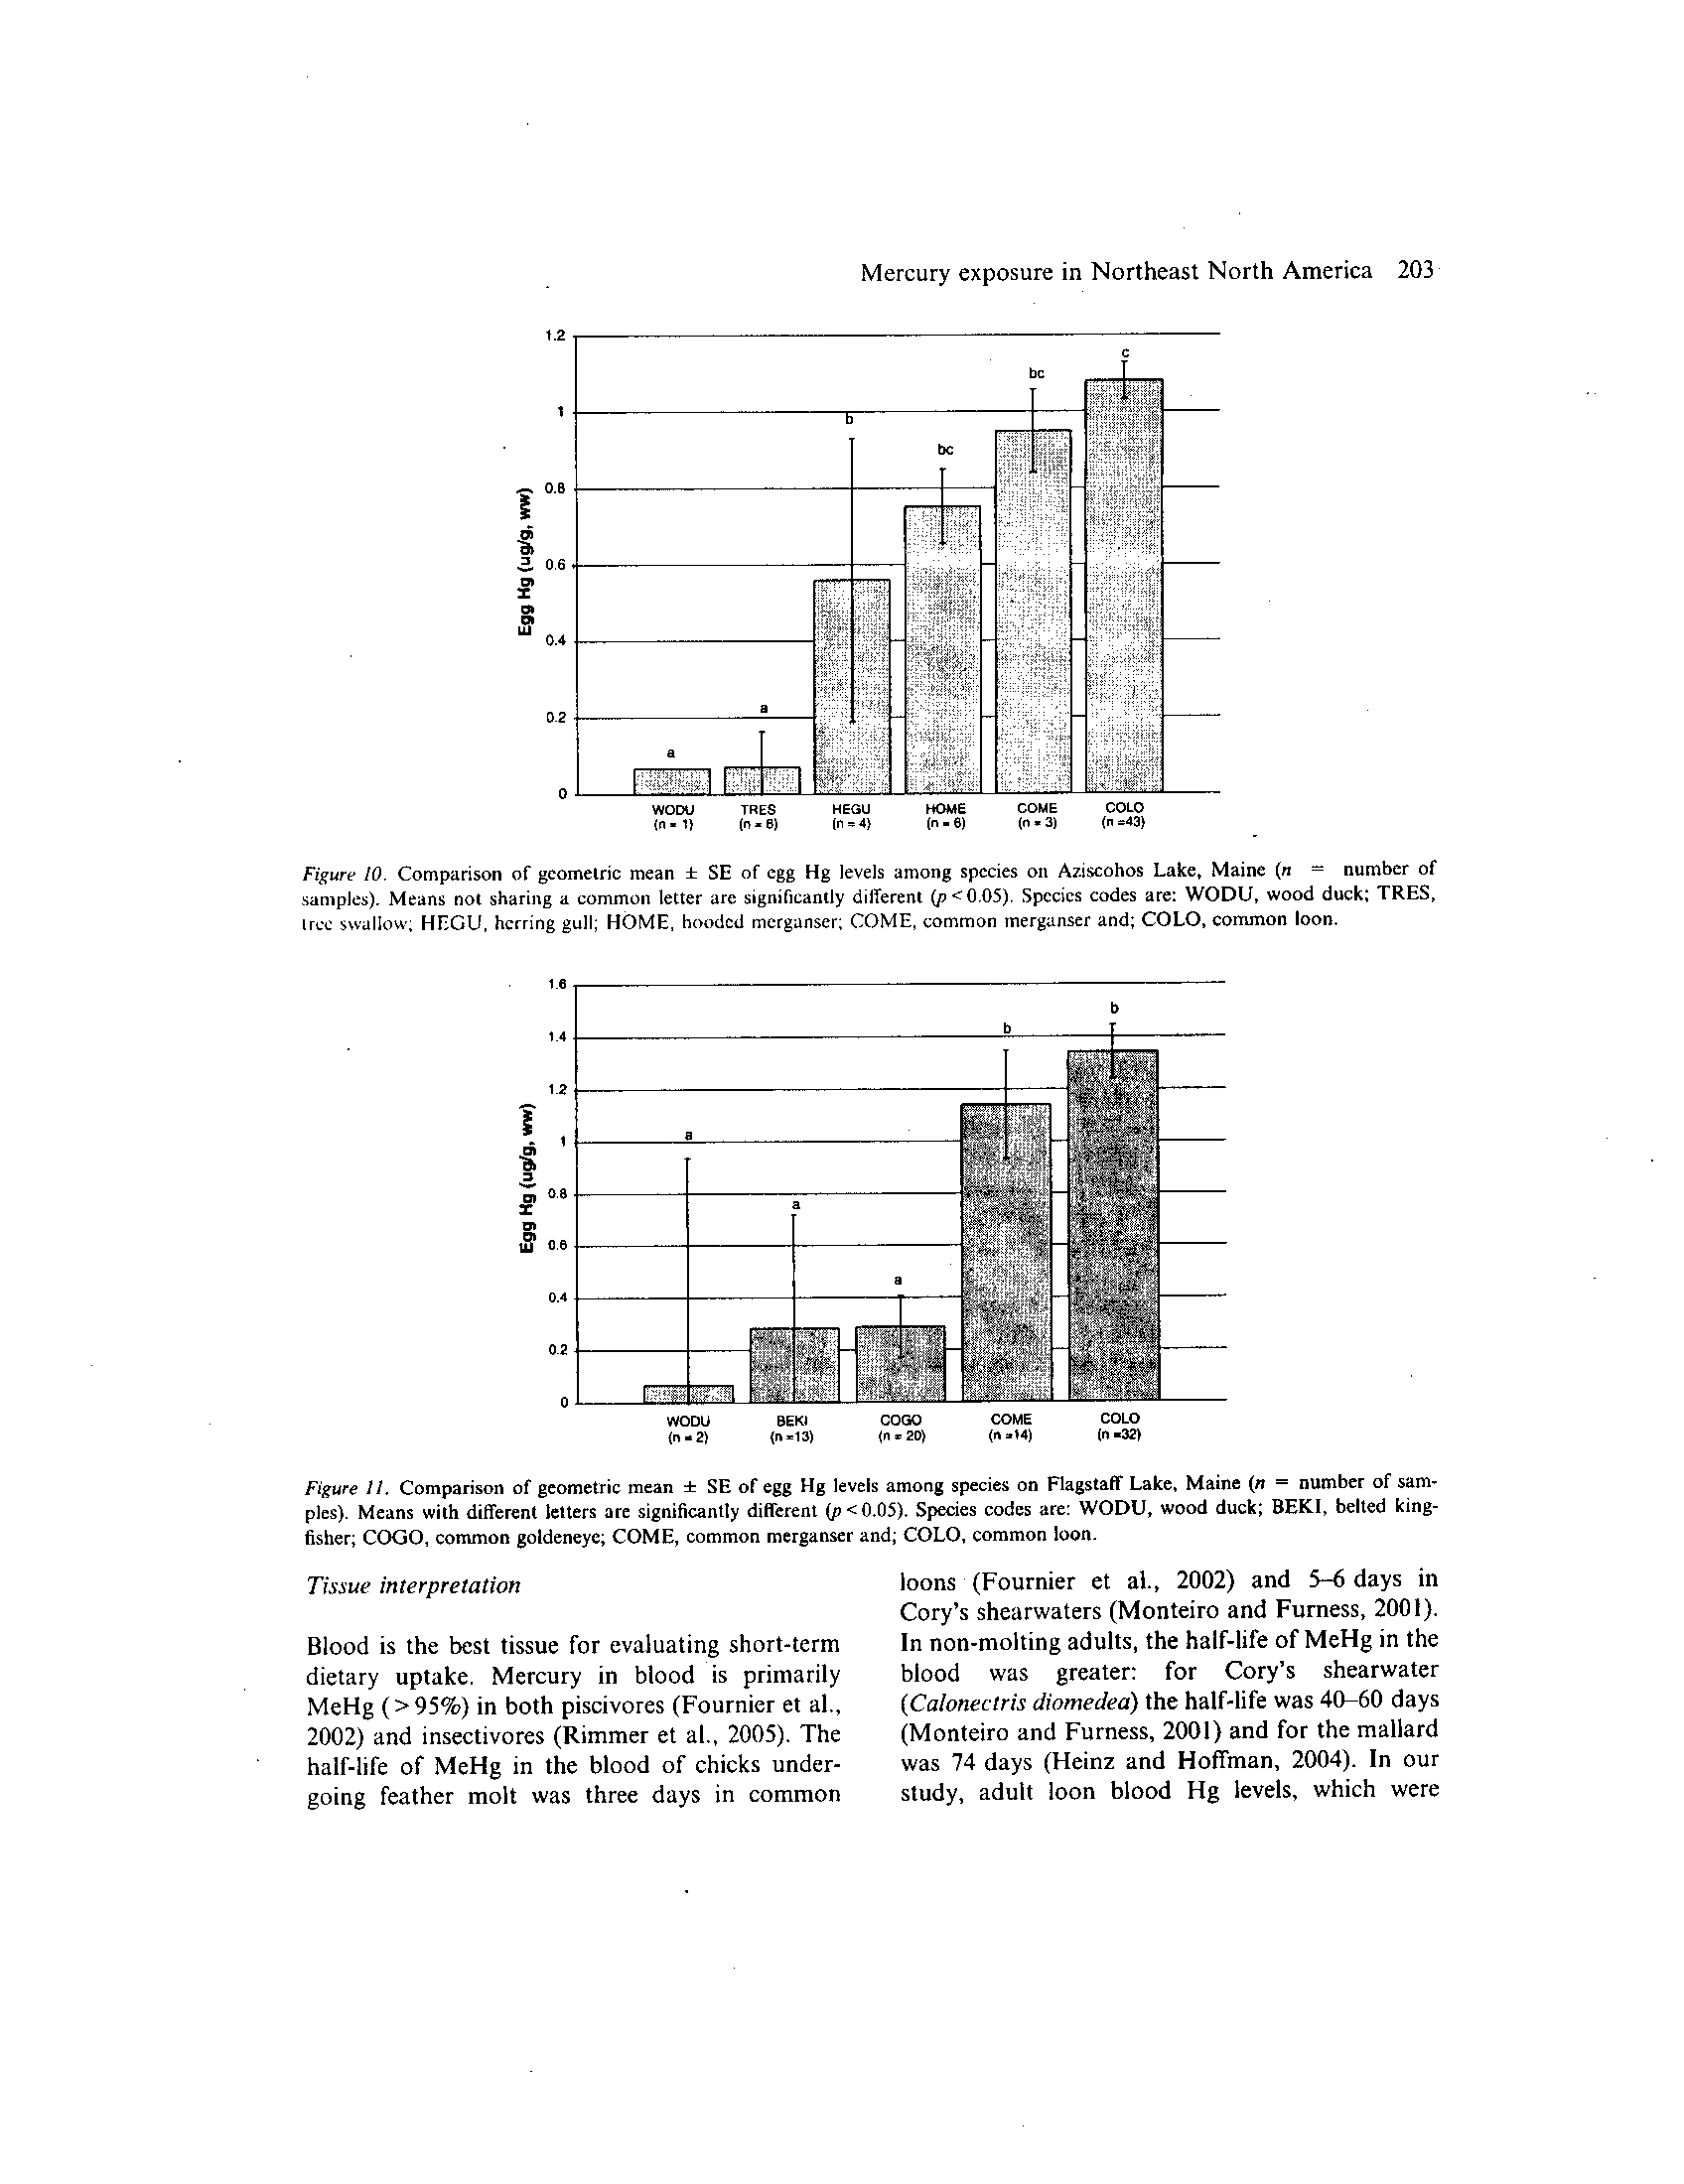
Variation in species
Three sites provided an opportunity to compare
Hg levels in multiple species within the same area
(which avoids confounding factors related to
geographical differences): two examples were on
lakes and one was on a river . On Aziscohos Lake,
eggs of five species (three piscivores, one insecti-
vore, and one herbivore) were compared (Fig . 10) .
COLO
tr 364.406)
Figure 6 .
Comparison
of
geometric mean
i
SE of
blood Hg levels
of
three species by sex
(n =
number
of
female samples, num-
ber
of
male samples)_ Means not sharing a common letter within a given species are significantly different (p
< 0.05).
Species codes
are :
TRES,
tree swallow ;
BEKI,
belted kingfisher and
;
COLO,
common
loon
.
a2
Marine
in =6.41
Estuary
in-31 .12)
Mercury exposure in Northeast North America
201
Rive,
In-26,16)
lake
(n-67,46)
Figure 7.
Comparison
of
geometric mean
± SE of
blood Hg levels for juvenile and adult belted kingfishers in Maine among four
major aquatic habitat types (n = number
of
juvenile samples, number
of
adult samples). Means not sharing a common letter arc
significantly different (p
< 0.05) ;
comparisons are case sensitive.
0.6
0.s
0.4
a
d
0
0.7
P
m
02
0 .1
0
Piscivore egg Hg levels were significantly higher
(p<0.05) than insectivores (tree swallows) and
herbivores (wood duck). Larger piscivores tended
to have higher egg Hg levels than smaller pisci-
votes
(i .e .,common loon > common merganser >
hooded merganser). Similar patterns were docu-
mented on Flagstaff Lake in egg Hg levels (com-
mon
loon
>
common
merganser
>
belted
kingfisher) (Fig. II).
Blood Hg levels were compared for I I insec-
tivorous birds from the Sudbury and Charles
be
Maine
in =30)
Estuary
in =7)
River
in
=6)
Lake
(n=34)
Figure 8 .
Comparison
of
geometric mean ±
SE of
blood Hg levels for juvenile bald eagles in Maine among four major aquatic
habitat types (n = number
of
samples). Means not sharing a common letter are significantly different (p
< 0.05) .
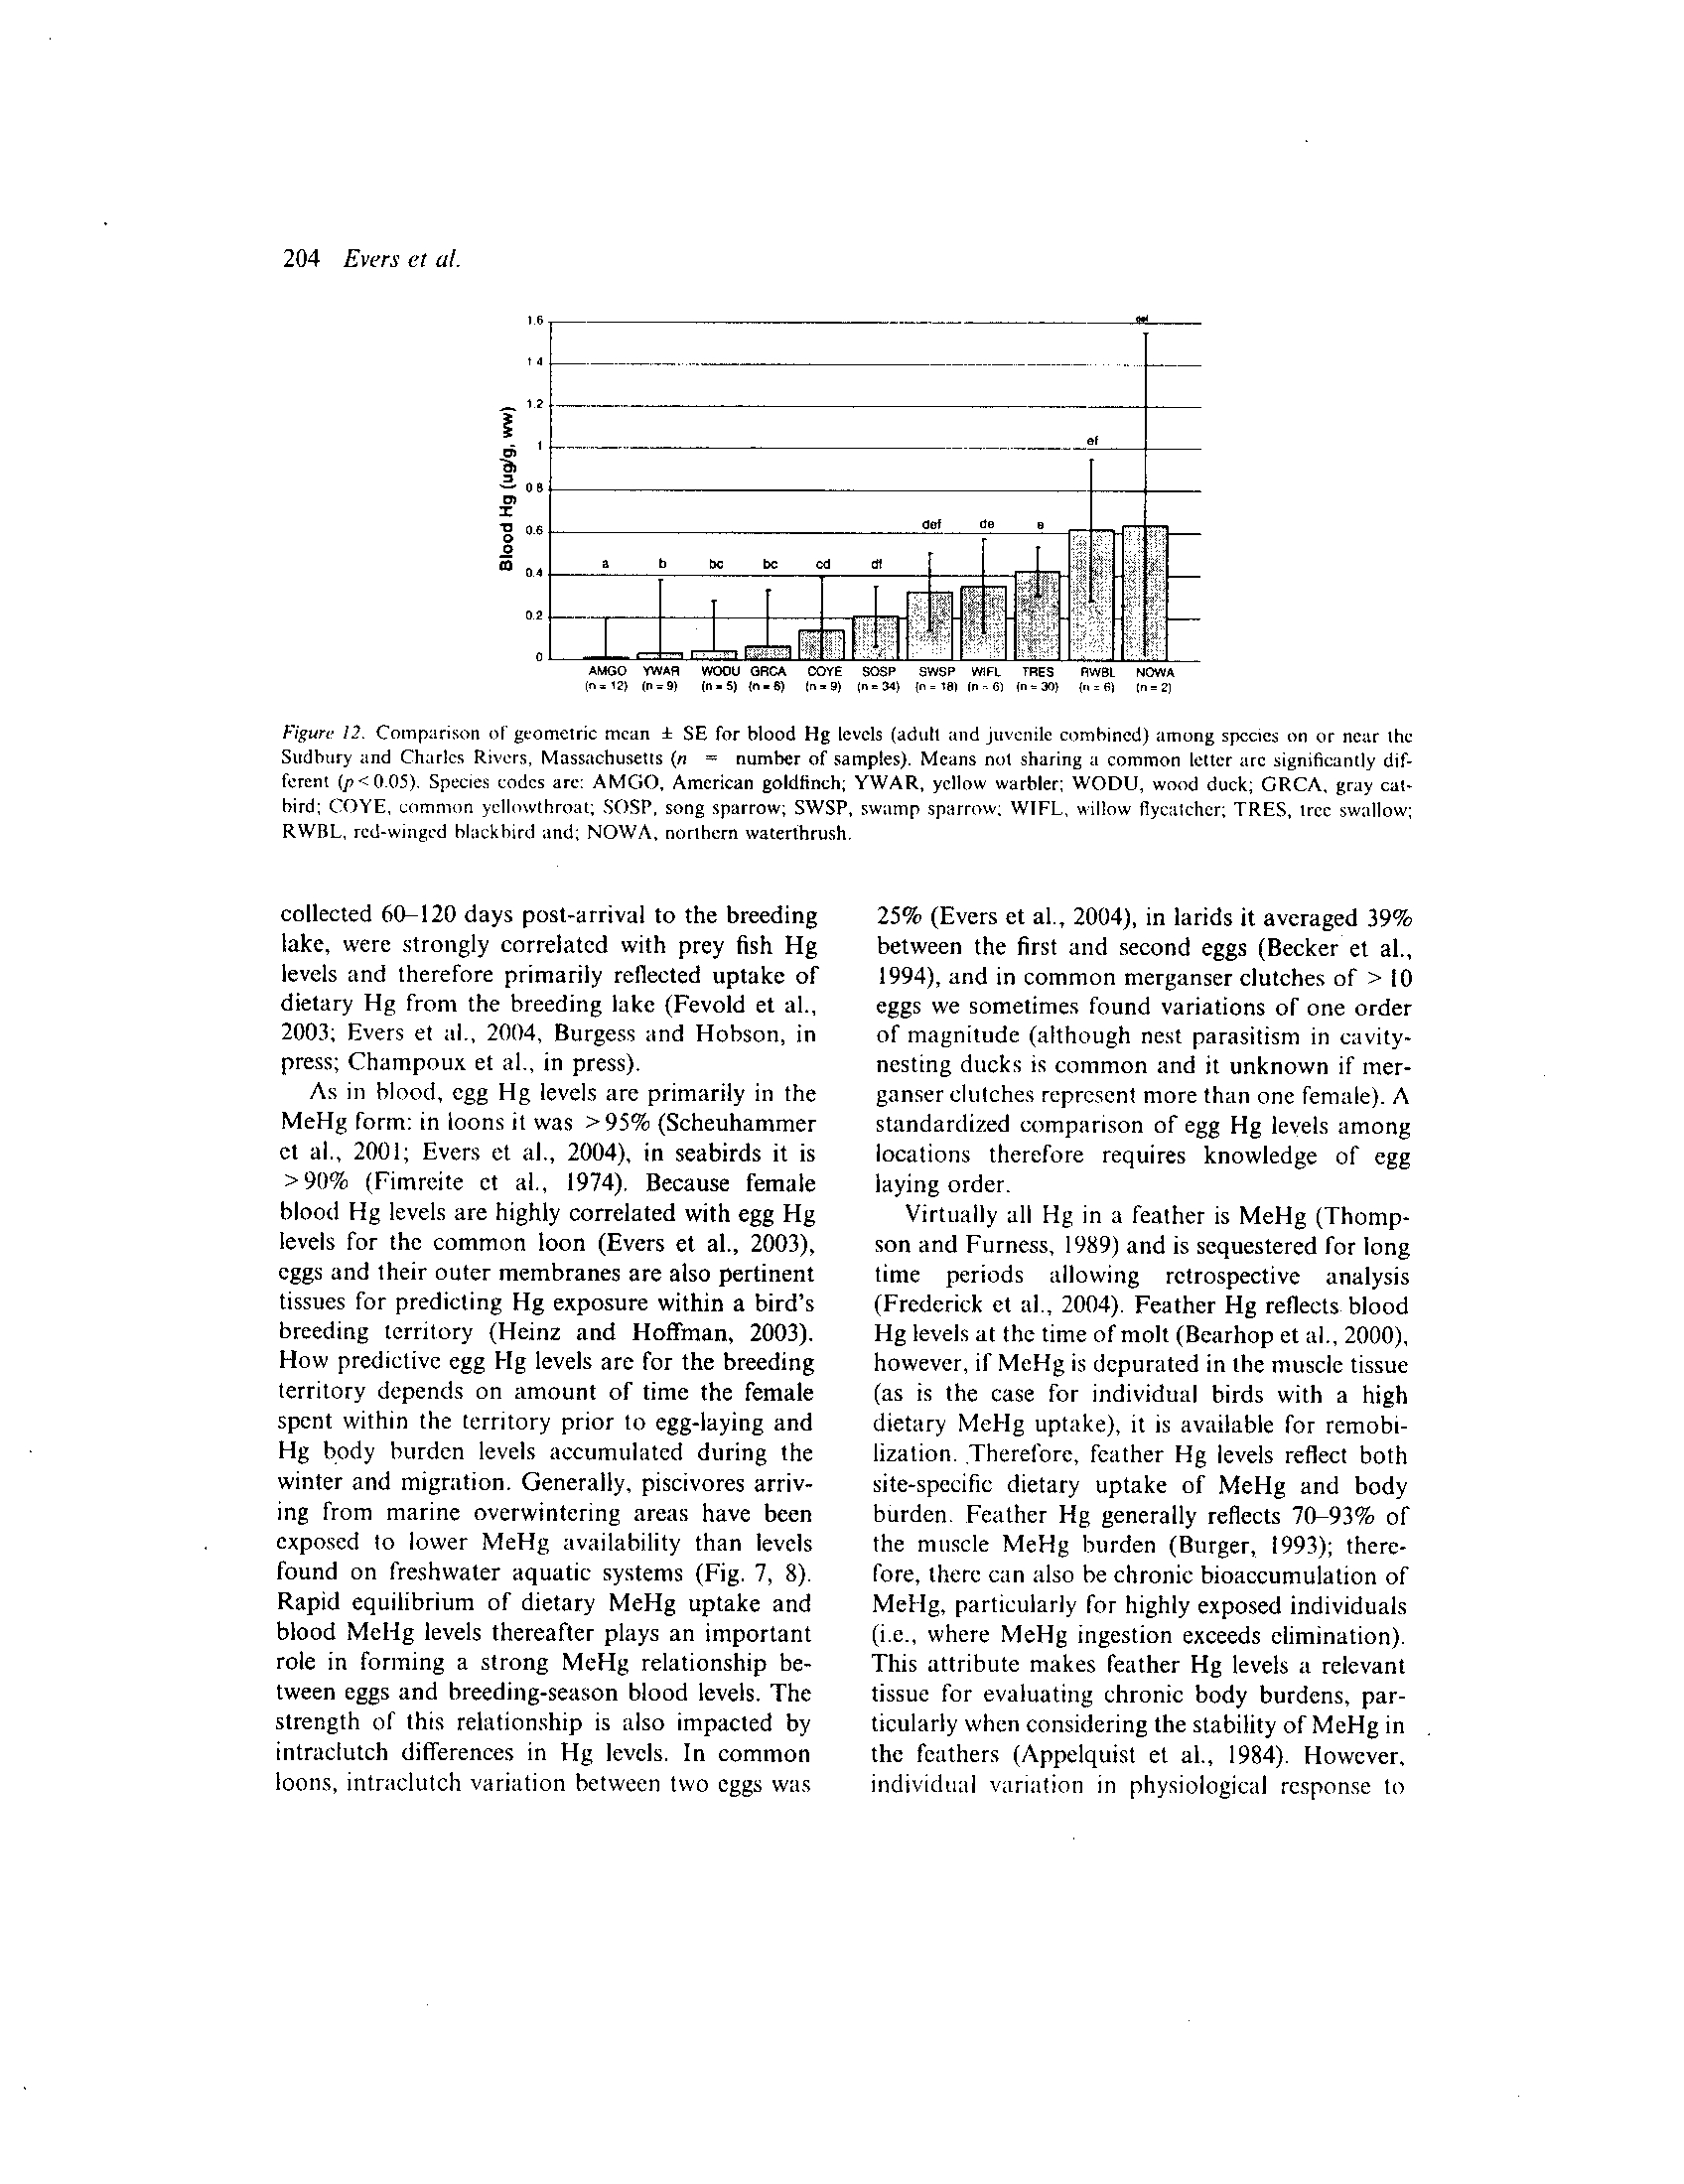
Rivers (Fig. 12). There were no significant differ-
ences in blood Hg levels between the rivers for four
of the most common passerines sampled at each
site (Kruskal-Wallis one-way analysis ofVariance ;
p = 0.65). Age classes were combined because
song sparrow blood Hg levels were not signifi-
cantly different between breeding adults and nes-
tlings
(Fig. 5) .
Generally,
blood
Hg
levels
increased with body weight . For seven selected
songbirds, there was a significant correlation be-
tween mean weight and blood Hg levels (r 2=0.72,
202
Evers et at.
Mean
Hg Level (ugi v.w)
-o-'o
0-20
,` 2
=30-40
M~40
2W
I
Kibme en
Figure 9. Geographic distribution of mercury levels in adult common loon blood and blood equivalents based on eggs, 1993-2003
.
p = 0.02, y =
0.0162x + 0.0054) . Granivorous
songbirds
such
as
the American
goldfinch
had
blood Hg levels significantly lower than insectiv-
orous songbirds
(p<0.05)
.
Discussion
Selecting the correct tissue
The pharmacokinetics of McHg and total Hg
(how both forms are distributed throughout the
body) are fairly well known in birds; their
understanding provide insights toward selecting
the correct tissue for meeting specific research or
monitoring
objectives. Ingestion
of
dietary
MeHg appears to be readily absorbed into the
blood (83% in common loons, Fournier et al .,
2002)
and is thereafter distributed to various
body tissues, namely the liver, kidney, brain,
spleen, and muscle. Some tissues, such as the
liver, are terminal endpoints where McHg is
largely unavailable for remobilization, whereas
MeHg deposited in muscle tissue is available and
remobilizes during feather molt. Blood and
feather Hg samples are generally taken nonle-
thally. Although blood can be taken immediately
after death through cardiac puncture (Henny
et al .,
2002), it cannot be taken through veni-
puncture after death for reliable comparison with
living bird blood Hg levels (because of rapid and
nonlinear moisture loss) .
Mercury concentrations in avian tissues can
indicate different (I) modes of toxic action,
(2)
MeHg and total Hg composition, (3) exposure
timeframes . and
(4) elimination abilities . Six tis-
sues routinely used for determining Hg exposure in
birds are described in our data set
.
Tissue interpretation
Blood is the best tissue for evaluating short-term
dietary uptake. Mercury in blood is primarily
MeHg (>95%) in both piscivores (Fournier et al .,
2002) and insectivores (Rimmer et al., 2005). The
half-life of MeHg in the blood of chicks under-
going feather molt was three days in common
B
.4
WOW
TRES
HEGU
(r . 1)
In-e)
(n=4)
Mercury exposure in Northeast North America 203
HOME
CO
COLO
(n-s)
(n
in
=43)
Figure 10 .
Comparison of geometric mean ± SE of egg Hg levels among species on Aziscohos Lake, Maine (n = number of
samples). Means not sharing a common letter are significantly different (p<005) . Species codes are: WODU, wood duck; TRES,
tree swallow; HEGU, herring gull ; HOME, hooded merganser ; COME, common merganser and; COLO, common loon .
Figure
11 .
Comparison of geometric mean + SE of egg Hg levels among species on Flagstaff Lake, Maine (n = number of sam-
ples). Means with different letters are significantly different (p<0 .05). Species codes are: WODU, wood duck; BEKI, belted king-
fisher; COGO, common goldeneye; COME, common merganser and; COLO, common loon .
loons (Fournier et al., 2002) and 5-6 days in
Cory's shearwaters (Monteiro and Furness, 2001) .
In non-molting adults, the half-life of MeHg in the
blood
was
greater :
for
Cory's
shearwater
(Calonectris diomedea) the half-life was 40-60 days
(Monteiro and Furness, 2001) and for the mallard
was 74 days (Heinz and Hoffman, 2004) . In our
study, adult loon blood Hg levels, which were
204
Evers et at.
wommoreminilli
0
P
IS)
U OF W E
-sl
)
I, 91 In
P
S SP
In
8
FL
SR
A
G
Figure 12 .
Comparison of geometric mean t SE for blood Hg levels (adult and juvenile combined) among species on or near the
Sudbury and Charles Rivers, Massachusetts (n = number of samples) . Means not sharing a common letter are significantly dif-
ferent (p<0-05). Species codes are: AMGO, American goldfinch; YWAR, yellow warbler; WODU, wood duck; GRCA, gray cat-
bird ; COPE, common ycllowthroat ; SOSP, song sparrow; SWSP, swamp sparrow; WIFL, willow flycatcher; TRES, tree swallow ;
RWBL, red-winged blackbird and ; NOWA, northern waterthrush,
collected 60-120 days post-arrival to the breeding
lake, were strongly correlated with prey fish Hg
levels and therefore primarily reflected uptake of
dietary Hg from the breeding lake (Fevold et al .,
2003; Evers et al., 2004, Burgess and Hobson, in
press; Champoux et al., in press)
.
As in blood, egg Hg levels are primarily in the
MeHg form: in loons it was >95% (Scheuhammer
et al., 2001 ; Evers et al ., 2004), in seabirds it is
>90% (Fimreite et al .,
1974). Because female
blood Hg levels are highly correlated with egg Hg
levels for the common loon (Evers et al., 2003),
eggs and their outer membranes are also pertinent
tissues for predicting Hg exposure within a bird's
breeding territory (Heinz and Hoffman,
2003) .
How predictive egg Fig levels are for the breeding
territory depends on amount of time the female
spent within the territory prior to egg-laying and
Hg body burden levels accumulated during the
winter and migration. Generally, piscivores arriv-
ing from marine overwintering areas have been
exposed to lower MeHg availability than levels
found on freshwater aquatic systems (Fig . 7, 8)
.
Rapid equilibrium of dietary MeHg uptake and
blood McHg levels thereafter plays an important
role in forming a strong McHg relationship be-
tween eggs and breeding-season blood levels . The
strength of this relationship is also impacted by
intraclutch differences in Hg levels. In common
loons, intraclutch variation between two eggs was
25% (Evers et al., 2004), in lands it averaged 39%
between the first and second eggs (Becker et al .,
1994), and in common merganser clutches of > 10
eggs we sometimes found variations of one order
of magnitude (although nest parasitism in cavity-
nesting ducks is common and it unknown if mer-
ganser clutches represent more than one female) . A
standardized comparison of egg Hg levels among
locations therefore requires knowledge
of egg
laying order
.
Virtually all Hg in a feather is MeHg (Thomp-
son and Furness, 1989) and is sequestered for long
time
periods
allowing
retrospective
analysis
(Frederick et al., 2004). Feather Hg reflects blood
Hg levels at the time of molt (Bearhop et al ., 2000),
however, if McHg is depurated in the muscle tissue
(as is the case for individual birds with a high
dietary McFlg uptake), it is available for remobi-
lization. Therefore, feather Hg levels reflect both
site-specific dietary uptake of MeHg and body
burden. Feather Hg generally reflects 70-93% of
the muscle MeHg burden (Burger, 1993); there-
fore, there can also be chronic bioaccumulation of
McFlg, particularly for highly exposed individuals
(i .e., where MeHg ingestion exceeds elimination)
.
This attribute makes feather Hg levels a relevant
tissue for evaluating chronic body burdens, par-
ticularly when considering the stability of MeHg in
the feathers (Appelquist et al ., 1984). However,
individual variation in physiological response to
Hg (Bearhop et al., 2000), as well as the broad
differences in inter-species pharmacokinetics,
re-
quires careful evaluation of risk
.
Four internal tissues are commonly used for Hg
exposure investigations: brain, liver, kidney and
muscle. Although MeHg crosses the blood-brain
barrier and can have significant impacts on brain
functions, brain tissue is best harvested from rel-
atively fresh carcasses and therefore is a more
difficult tissue to use in field studies . It is more
commonly used for analysis in experimental stud-
ies (Heinz, 1975; Finley et al., 1979; Scheuhammer,
1988) .
Liver is one of the more commonly analyzed
internal tissues for Hg in birds (Sundlof et al ., 1994 ;
Augspurger et al., 1998; Pokras et al., 1998; Cohen
et al., 2000). Liver and kidney filter toxins such as
MeHg and effectively demethylate MeHg using
selenium (Se) bonds that form a nontoxic Hg-Se
protein complex (Stoewsand et al ., 1974). Scheu-
hammer et al., (1998a) found a nearly 1 :1 molar
ratio of Hg:Se in the liver and kidney of common
loons and common mergansers . He also demon-
strated that the proportion of McHg in the liver
and kidney declined as total Hg concentrations
increased (i.e ., liver and kidney total Hg levels were
independent of MeHg concentrations). Therefore,
determining levels of currently toxic Hg in the liver
and kidney requires analysis of McHg concentra-
tions, while concentrations of Se-bound inorganic
Hg provide an indication of past MeHg exposure .
The "7:3:1 rule" is an often-used conversion
factor for liver (ww), feather (fw), and muscle (ww)
tissue Hg concentrations (Appelquist et al., 1985) .
Although Thompson et al., (1990) demonstrated
the weakness of this conversion approach, these
tissues in common loons of three different regions
in northeastern North America follow the "7:3 :1
rule" (Fig. 3) .
Unlike the liver and kidney, muscle Hg levels
generally have proportionally
higher levels of
MeHg (80-100%) in the common loon and com-
mon merganser (Scheuhammer et
al., 1998a) .
Muscle tissue Hg levels are generally examined in
waterfowl (Pearce et al ., 1976; Braune et al., 1999 ;
Cohen et al., 2000), in part, to determine potential
human health risks. Our data set supports other
findings that muscle Hg levels are generally less
than liver and kidney (Gardiner, 1972 ; Gochfeld,
1980) and that piscivorous waterfowl have muscle
Mercury exposure in Northeast North America
205
Hg levels significantly greater than other foraging
guilds of waterfowl species (Fig . 4) .
Age affects Hg exposure
A potential limitation of using birds as an indica-
tor of Hg is the inability to identify individual age
once breeding begins. The knowledge of a bird's
age is critical for evaluating Hg bioaccumulation .
Marking techniques, such as uniquely numbered
or colored leg bands, provide a reliable method for
tracking individual age and removing this limita-
tion. Such techniques have been used successfully
to evaluate time relationships with Fig. In cases
where
MeHg
ingestion
exceeds
elimination,
feather Hg levels increase with age (Evers et al .,
1998; Rimmer et al., 2005). Scenarios where indi-
viduals can depurate and demethylate ingested
McHg at a similar annual rate of ingestion lack a
positive correlation
with increasing age and
feather Hg .levels (Furness et al ., 1990; Thompson
et al., 1991; Gochfeld et al., 1996; Donaldson et
al., 1997; Fevold et al., 2003)
.
While bioaccumulation of McHg can be a crit-
ical interpretive factor related to age in situations
with high Hg exposure, there is also a common
pattern for adult blood Hg levels to exceed those
of unfledged juveniles in areas with even low Hg
exposure (Fig. 5). Burger and Gochfeld
(1997)
documented adult Franklin's gull (Larus pipixcan)
and herring gull blood Hg levels to be significantly
greater than juveniles from the same colony of the
same year. Differences in Hg levels between age
classes (juvenile vs. adult) is dictated by (1) stage of
juvenile feather molt and (2) partitioning of forage
base by size of potential prey .
A major deputation route for MeHg is via the
feather (Crewther et al .,
1965), and therefore
feathers are a useful indicator for monitoring Hg
body burdens (Burger,
1993) .
However, the
interpretation of feather Hg levels requires
an
understanding of feather-molt chronology (Fur-
ness et al., 1986). Blood and feather McHg levels
are highly correlated when
blood is sampled
during feather molt. Birds have the
ability to
rapidly transfer dietary uptake of MeHg
from
red blood cells to growing feathers
(Fournier
et al ., 2002; Kenow et al., 2003). The physio-
logical capacity of birds to process MeHg this
way appears to be great. Fournier et al., (2002)
206
Evers et al .
found
loon
chicks, experimentally
dosed with
MeHg concentrations substantially greater than
those found in nature, were still able to effec-
tively depurate much of the McHg into emerging
feathers . When juvenile feather molt ends, blood
MeHg levels thereafter increase (Spalding et al .,
2000a; Fournier et al ., 2002). This ability to
rapidly
transfer
blood
MeHg
into
growing
feathers partly accounts for the significant dif-
ference in blood Hg levels between adults and
juveniles prior to fledging. Our data indicate that
this is relevant for piscivorous and insectivorous
birds. For the song sparrow, blood Hg levels of
recently fledged young when compared with lo-
cally breeding adults, demonstrated no signifi-
cant difference between the age classes. However,
difference of age ratios among species (Fig . 5)
indicates Hg differences between age classes are
also dictated by other factors .
Generally, prey choice differs between adults
foraging for themselves versus for their young . For
example, the size of fish prey selected by juvenile
common loons increases as they grow larger (Barr,
1996) . We found adult blood Hg levels of piscivore
species were 3 .6 to 10 .6 times higher than those in
unfledged young (Fig. 5) and that variation sug-
gests that adults are foraging on prey that are larger
and have higher levels of Hg. In agreement, Burgess
and Hobson (in press) found that adult loons fed at
a higher trophic level (as indicated by stable-nitro-
gen isotope ratios) and had higher blood Hg levels
than did juvenile loons. These differences in blood
Hg and trophic levels were related to differences in
body weight in the loons. Blood sampling for belted
kingfishers and tree swallows typically occurs when
the adults are 6 times the weight of the juveniles,
while in common loons, adults are sampled when
they are usually 10 times the weight of juveniles
.
Conversely, common mergansers are usually sam-
pled when the adult females are relatively similar in
size with the young. Such rough correlative rela-
tionships across age classes between body weight
and prey-size selection are likely contributing to age
class differences in Hg exposure
.
Gender affects Hg exposure
Although most studies indicate differences in Hg
levels between male and female birds are not sig-
nificant (Burger, 1993; Burger, 1995; Gochfeld
et al., 1996), there are exceptions (Hoffman and
Curnow, 1979; Braune and Gaskin, 1987; Don-
aldson and Braune, 1999). When there are differ-
ences in Hg levels between sexes they can be
dictated by (I) deputation of Hg in eggs, (2) sexual
dimorphism, and (3) niche partitioning of the
forage base . Although deputation of McHg in eggs
is an important mechanism for elimination, deri-
vation of MeHg from serum proteins and a steady-
state equilibrium with dietary uptake of MeHg
likely compensates for the loss of MeHg from the
body burden within weeks (Furness and Green-
wood, 1993) or possibly days (Kambamandi-Di-
mou et al ., 1991). Differences in blood Hg levels
between sexes of adult loons sampled > 60 days
after eggs are laid regularly demonstrates other
factors are involved, Choice of prey items is likely
the primary factor dictating differences in Hg lev-
els between sexes. Levels of MeHg in prey items
vary according to species, trophic status, age, size,
and habitat associations (Wiener and Spry, 1996)
.
Based on comparisons of three species, the loon
exhibited significant differences of blood Hg
between sexes. Loon Hg levels were also greater in
liver for males vs . females (Pokras et al., 1998).
Common loons are sexually dimorphic. On aver-
age, males are 21% larger than females (Evers,
2005). The larger males apparently forage on larger
prey fish based on the correlative strengths between
favored prey fish Hg levels (yellow perch,
Perca
flavescens)
and their blood Hg levels (Evers et al .,
2004). Larger fish generally have higher Hg levels
than smaller fish of the same species from the same
location (Weiner and Spry, 1996; Drysdale et al ., in
press; Kamman et al., 2005). Therefore, blood Hg
levels are higher in male common loons because
they are foraging on larger fish .
In general, blood Hg differences between male
and female belted kingfishers are not significant,
however, within individual pairs Hg levels are
typically significantly different. Because males and
females are relatively similar in size (females tend
to be slightly heavier), prey size is likely not the
driving factor; rather males and females partition
foraging niches (Albano, 2000) .
Hg patterns in aquatic habitats
Aquatic systems are one of the more at-risk
ecosystems for McHg hioavailability because one
of the better-known methylating organisms, sul-
fate-reducing bacteria, inhabit this environment
(Gilmour et al., 1992). To adequately compare
MeHg bioavailability across four major aquatic
habitat types requires a standard
species, age
class and sampling tissue. Both the bald eagle
and belted kingfisher fit these criteria. A subset
of the blood Hg data from both
species in
Maine
indicates
interspecies
agreement
that
MeHg availability
increases
from marine
to
estuarine to riverine to lake ecosystems . Because
atmospheric deposition of Hg is relatively
uni-
form across the Maine study area (VanArsdale
et al., 2005), with some significant local excep-
tions, interpretation
of the hydrological
and
biogeochemical factors influencing Hg methyla-
tion and availability and their relationships with
bird blood Hg levels is presented
.
Although marine systems are well known for
their elevated biotic MeHg levels,
those levels
primarily represent long-lived species
with top
trophic status (e.g ., swordfish and shark species) .
A standard comparison between freshwater and
in-shore marine systems documents the latter has
significantly lower MeHg availability .
In-shore
marine systems appear to be more effective in
diluting
MeHg production
versus
freshwater
systems, although in-shore
habitats geochemi-
cally greatly vary in MeHg production (Ham-
merschmidt and Fitzgerald, 2004). Estuaries are
dynamic communities that are influenced by tidal
actions and varying volumes of fresh and salt
water. They are generally hydrologically hetero-
geneous landscapes that have less of an ability to
dilute
.Hg inputs than marine systems . Although
tidal exchanges do regularly provide an impor-
tant flushing mechanism
that lowers
McHg
availability (Lamborg et al
.,
In
Press),
tidal re-
sponses vary in magnitude daily,
weekly, and
monthly .
Methlymercury availability
therefore
varies tremendously within and between estuaries
(Shriver et al., 2002) .
Based on our analysis, the ability of inorganic
Hg to be converted to MeHg and become
available to biota is greater in freshwater versus
saltwater habitats. Gariboldi et al., (1998) also
documented prey items were higher in Hg from
freshwater versus saltwater
habitats based on
sampling efforts with the wood stork
(Mycteria
americana).
Riverine habitats tend to have higher
Mercury exposure in Northeast North America
207
levels of MeHg availability than estuaries,
but
tend to have lower levels when compared
to
lakes. Comparisons of MeHg
availability be-
tween adjoining riverine and lake habitats based
on crayfish, fish, and birds consistently
show
greater Hg exposure on lakes (Fimreite,
1974) .
Flushing abilities within riverine systems
are a
driving force for these differences
.
Therefore, in coastal regions, MeHg exposure
arising from atmospheric Hg deposition is gener-
ally greatest in piscivorous birds
foraging on
freshwater lakes. Lake hydrology
and biogeo-
chemistry largely determine the degree of aquatic
McHg exposure. Lakes with low pH (< 6.3, Meyer
et al ., 1995; Burgess and Hobson, in press), large
areas of scrub-shrub
and emergent wetlands
(Kramar et al., 2005), and large areas of exposed
shoreline substrate of organic or sandy soils that
are frequently inundated and dried through the
summer and fall
(i .e., reservoirs; Evers and Re-
aman, 1998) are predictive of elevated blood Hg
levels in the common loon . Although newly cre-
ated reservoirs are well known for their ability to
enhance
McHg
production
and
availability
through the decomposition of vegetation (Jackson,
1988; Lucotte et al., 1999; Gerrard and St. Louis,
2001), this phenomenon is generally viewed as
short-lived (i .e ., < 10 years in secondary consum-
ers) (Lucotte et al., 1999). Some reservoirs have
longer lasting abilities to enhance Hg methylation
and have the potential to be some of the highest
risk aquatic habitats (Evers et al., 2004) .
Geographic differences exist
There are continental patterns in the availability of
MeHg. Long-term sampling efforts across North
America indicate a significant west to east trend
exists with northeastern North America exhibiting
the highest levels (Evers et al ., 1998, 2003; Scheu-
hammer et al., 2001). Significant within-region
differences are primarily driven by hydrological
and biogeochemical
factors and point source
influences. The collection of > 1,800 blood and egg
Hg levels for the common loon across New Eng-
land, New York and eastern Canada enabled us to
effectively evaluate
areas of greatest concern
(Fig. 9). Clusters of elevated MeHg availability
were found in the western Adirondack Mountains
of New
York,
north-central
Massachusetts,
208
Evers et al.
southeastern New Hampshire, western mountains
of Maine, and a small area cast of Orrington,
Maine in the United States (Fig . 9) . In Canada,
areas with high MeHg exposure were in eastern
Ontario, south-central Quebec and southern Nova
Scotia. There did not appear to be smooth spatial
trends in loon Hg levels across northeastern North
America, as highly elevated Hg levels were
scattered among low Fig concentrations in almost
every region sampled
.
In the Adirondack Mountains and eastern
Canada, clusters of elevated MeHg availability
were likely related primarily to lake acidification
.
It is well established that lakes with low pH con-
tain fish with higher levels of Hg than same-size
and species of fish in lakes with more circumneu-
tral pH levels (Wiener et al ., 1990; Winfrey and
Rudd, 1990; Drysdale et al., in press). Oligotroh-
phic lakes in eastern Canada and parts of New
England and New York arc susceptible to in-
creased rates of anthropogenically derived sulphur
deposition
(i.e., acid rain) (Driscoll et al ., 2001) .
Although there is evidence of declining levels of
atmospheric input of sulfur dioxide, base cation
levels are lowered in many systems where re-
sponses in lake pH levels are lagging behind pre-
dictive models. Therefore, these acidified lakes
continue to be a cause of concern for their ability
to enhance McHg productivity. Associations be-
tween lake acidity, fish Hg levels and lower com-
mon loon productivity have been observed in the
U.S. and Canada (Meyer et al., 1998; Burgess et
al., 1998a). Scheuhammer and Blancher (1994)
predicted up to 30% of lakes in central Ontario
have the potential to adversely impact common
loon productivity
.
Other areas of concern are related to topog-
raphy and lake hydrology
(e.g ., western moun-
tains of Maine) and point sources (both airborne
and waterborne). Airborne sources in southern
New England appear to contribute to greater-
than-expected loon Hg levels in southeastern
New Hampshire (Evers, 2001) and Orrington,
Maine .
Waterborne
point
sources
are
well
known in eastern Massachusetts, such as on the
Sudbury River. There, investigations associated
with the Nyanza Superfund Site have docu-
mented associated Hg contamination >25 km
downstream from the point source (Wiener and
Shields, 2000) .
Species Hg exposure patterns
Differences in Hg levels among species are dictated
by trophic level and availability of MeHg
(i.e.,
aquatic vs. terrestrial and marine vs. freshwater
;
low exposure vs. high exposure). Trophic structure
is a primary driver of variability in MeHg bio-
magnification (Cabana et al., 1994). Recent evi-
dence indicates that the trophic status of an
aquatic vertebrate is based primarily on the com-
plexity, both longitudinal and vertical, of the
planktivorous community (Chen et al., 2005) .
Methylmercury can biomagnify several orders of
magnitude in aquatic ecosystems. For example, the
average bioconcentration factor for the common
loon in Maine lakes is 1 .37 x 106
(based on
unfiltered water for total Hg) (Evers et al ., 2004) .
The
degree
of
McHg
biomagnification
through aquatic-based food webs is the primary
reason for the multitude of Hg studies on obli-
gate piscivores. Particular emphasis has been
placed on larger species for which trophic status
is potentially greatest; such species include the
common loon (Meyer et al., 1995, 1998; Burgess
et al .,
1998a,
b ;
Evers et al .,
1998, 2003 ;
Scheuhammer et al., 1998b, 2001 ; Fevold et al .,
2003; Burgess and Hobson, in press; Champoux
et
al .,
in
press),
bald
eagle
(Grier,
1974 ;
Wiemeyer et al ., 1984; Frenzel and Anthony,
1989; Bowerman et al., 1994; Anthony et al .,
1999; Bowerman et al., 2002), osprey (Cahill et
al., 1998; DesGranges et al., 1998), wading birds
(Gariboldi et al., 1998; Bouton et al., 1999;
Spalding et al ., 2000b; Henny et al., 2002), and
seabirds (Braune, 1987; Burger and Gochfeld,
1995; Monteiro and Furness, 1995, 1997; Braune
et al ., 2001). Other foodweb pathways important
for MeHg transfer are generally of lesser concern
because trophic status of the endpoint species is
generally lower than piscivores . Benthic-based
MeHg transfer through bivalves has been investi-
gated using various diving species of waterfowl
(Ohlendorf et al., 1986; Henny et al., 1991 ; Braune
et al., 1999; Cohen et al., 2000; Wayland et al .,
2002), while such transfer through macroinverte-
brates (larval and adults) (Bishop et al ., 1995 ;
Wolfe and Norman, 1998; Reynolds et al ., 2001 ;
Gerrard and St. Louis 2002, Adair et al., 2003) and
vegetation has also been described (Fimreite, 1974 ;
Langis et al., 1999) .
Elevated MeHg bioavailability
in specific ter-
restrial
ecosystems
within
northeastern
North
America has recently been documented. Montane
environments without standing water appear to
have the ability to generate MeHg . Rimmer et al .,
(2005) documented Bicknell's Thrush blood Hg
concentrations for 21 mountain locations (arith-
metic mean of 0. 14 f 0.08 Vg/g, ww with a range of
< 0.01 to 0.70 µg/g, ww) at levels similar to those
found in many of the insectivorous songbirds sam-
pled along rivers in Massachusetts (Fig. 12) .
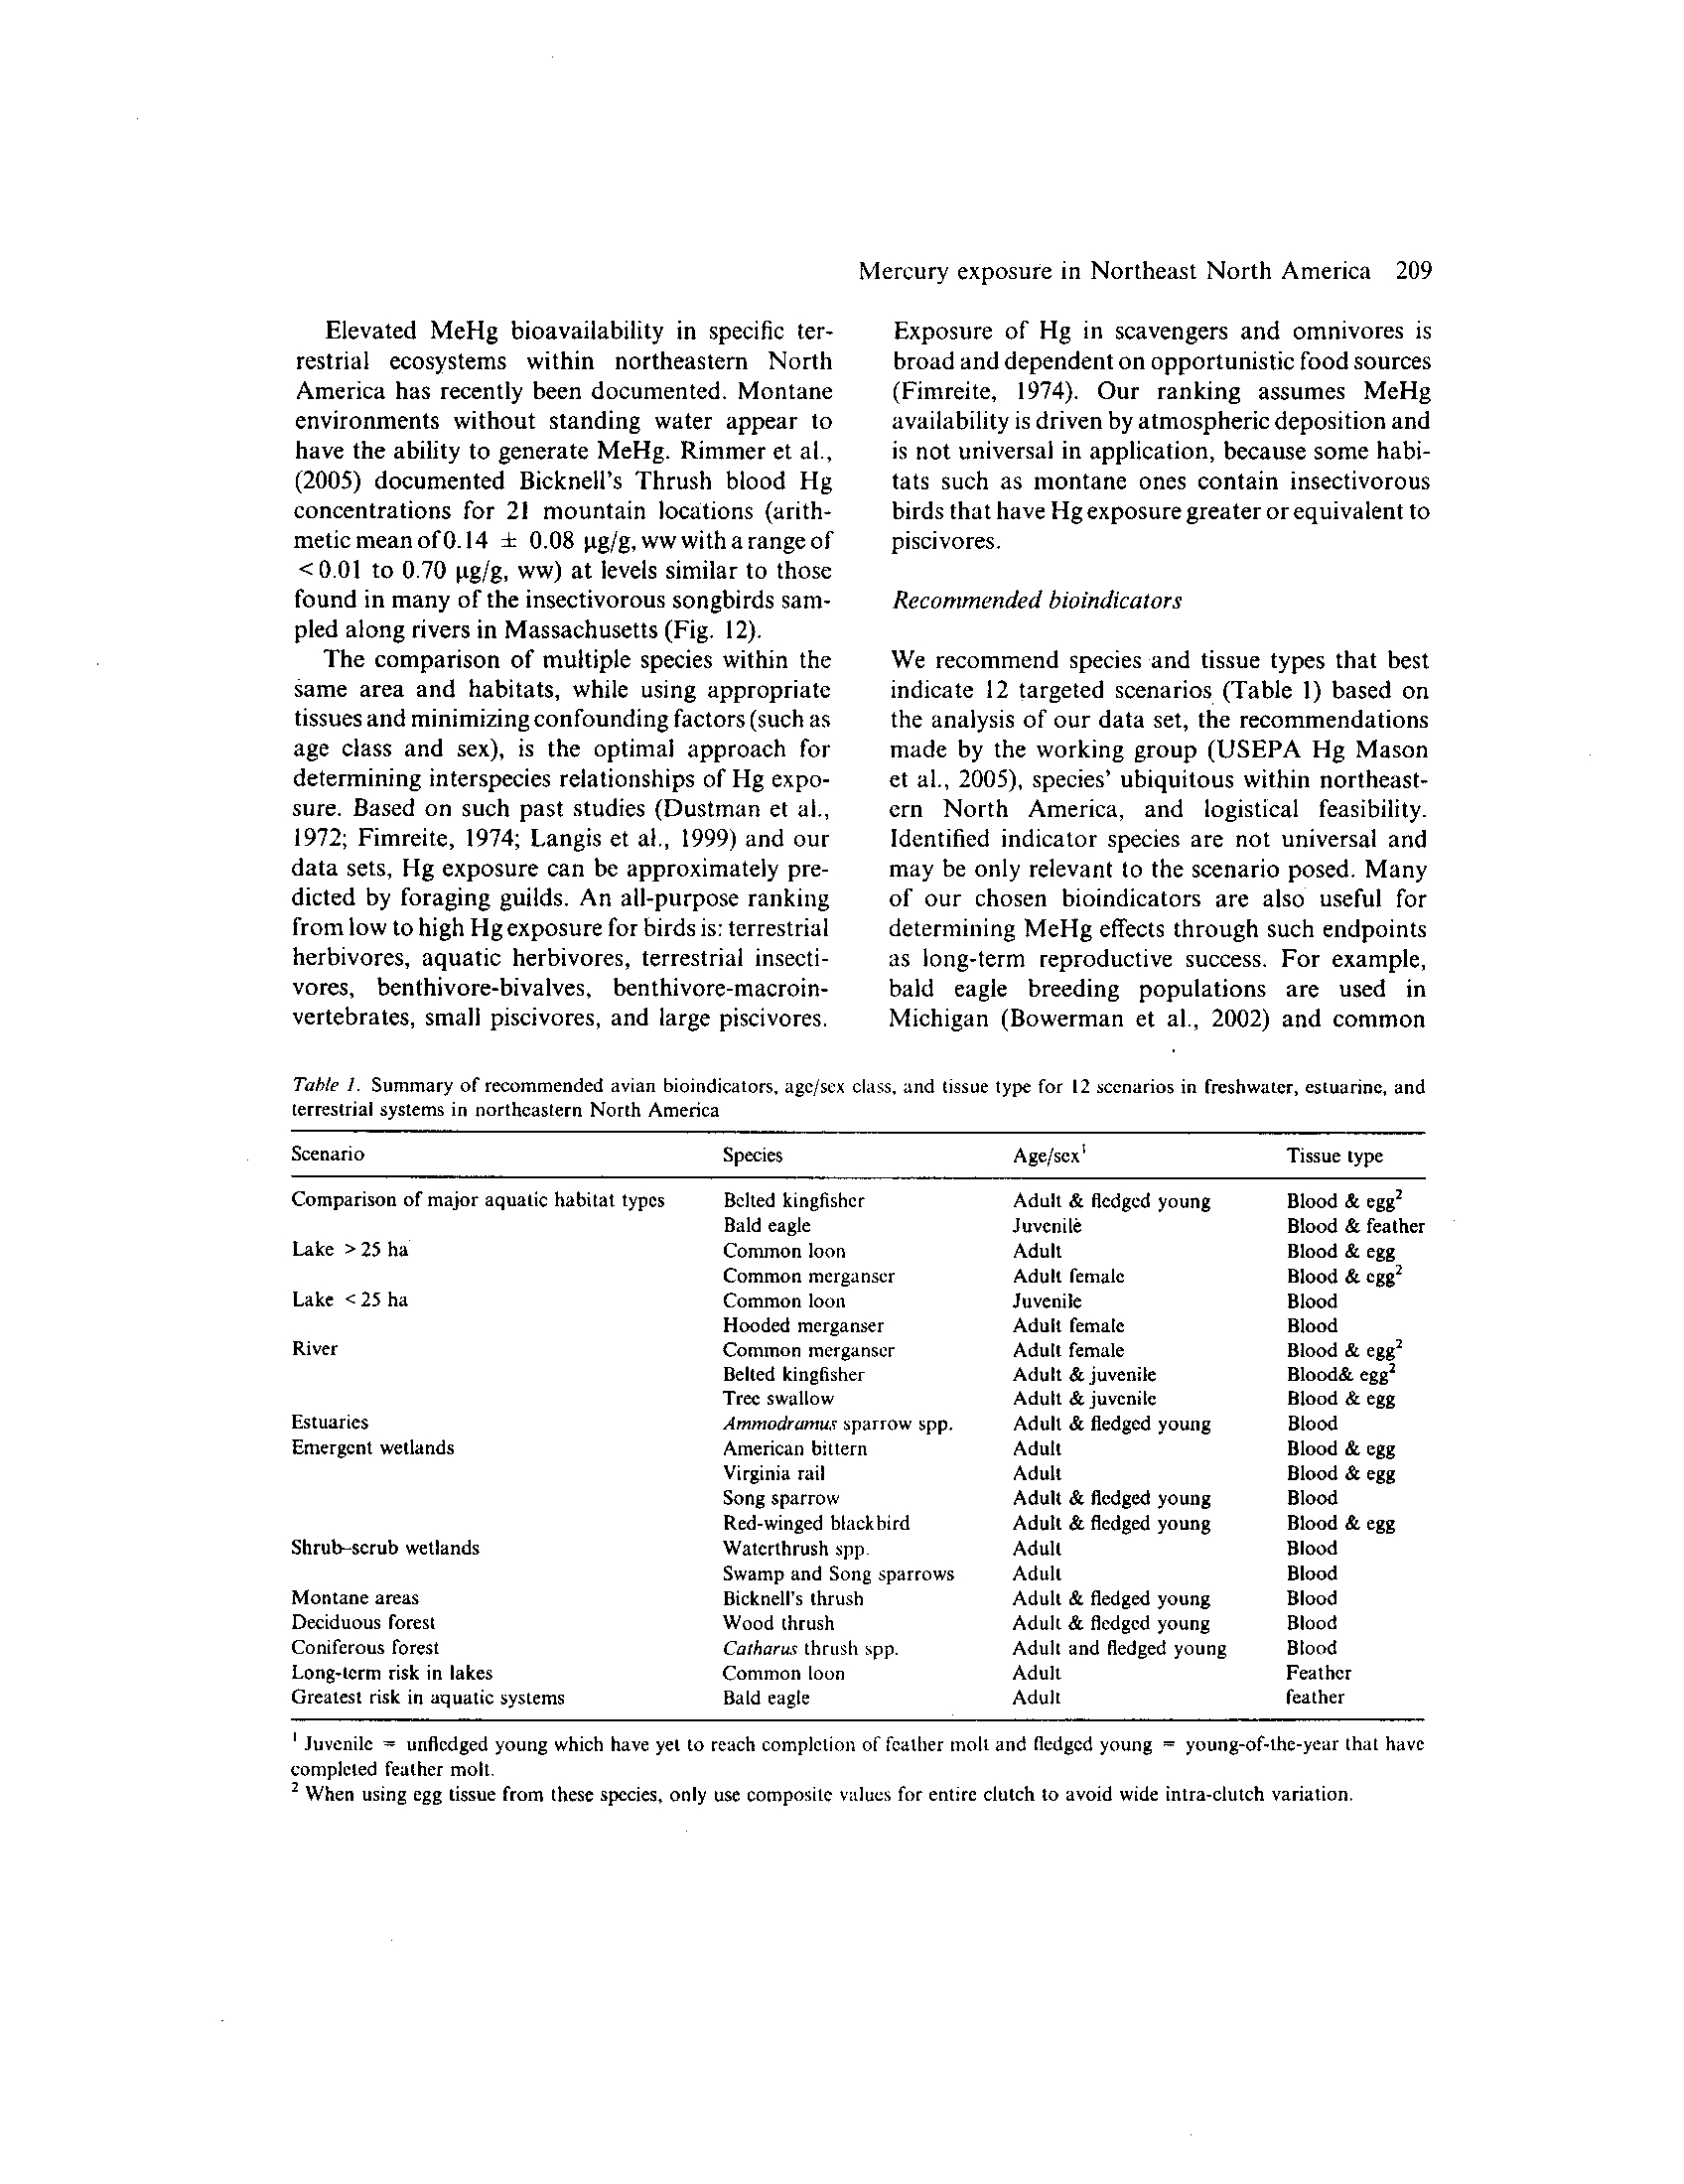
The comparison of multiple species within the
same area and habitats, while using appropriate
tissues and minimizing confounding factors (such as
age class and sex), is the optimal approach for
determining interspecies relationships of Hg expo-
sure. Based on such past studies (Dustman et al .,
1972; Fimreite, 1974; Langis et al ., 1999) and our
data sets, Hg exposure can be approximately pre-
dicted by foraging guilds. An all-purpose ranking
from low to high Hg exposure for birds is : terrestrial
herbivores, aquatic herbivores, terrestrial insecti-
vores, benthivore-bivalves,
benthivore-macroin-
vertebrates, small piscivores, and large piscivores .
Table 1 .
Summary of recommended avian bioindicators, age/sex class, and tissue type for 12 scenarios in freshwater, estuarine, and
terrestrial systems in northeastern North America
Mercury exposure in Northeast North America
209
Exposure of Hg in scavengers and omnivores is
broad and dependent on opportunistic food sources
(Fimreite, 1974). Our ranking assumes MeHg
availability is driven by atmospheric deposition and
is not universal in application, because some habi-
tats such as montane ones contain insectivorous
birds that have Hg exposure greater or equivalent to
piscivores .
Recommended bioindicators
We recommend species and tissue types that best
indicate 12 targeted scenarios (Table 1) based on
the analysis of our data set, the recommendations
made by the working group (USEPA Hg Mason
et al., 2005), species' ubiquitous within northeast-
ern North America,
and logistical feasibility.
Identified indicator species are not universal and
may be only relevant to the scenario posed. Many
of our chosen bioindicators are also useful for
determining McHg effects through such endpoints
as long-term reproductive success. For example,
bald eagle breeding populations
are used in
Michigan (Bowerman et al., 2002) and common
Juvenile = unfledged young which have yet to reach completion of feather molt and fledged young = young-of-the-year that have
completed feather molt
.
2 When using egg tissue from these species, only use composite values for entire clutch to avoid wide intra-clutch variation
.
Scenario
Species
Tissue type
Comparison of mailer aquatic habitat types
Belted kingfisher
Adult & fledged young
Blood & egg'
Bald eagle
Juvenile
Blood & feather
Lake > 25 ha
Common loon
Adult
Blood & egg
Common merganser
Adult female
Blood & egg'
Lake 125 ha
Common loon
Juvenile
Blood
Hooded merganser
Adult female
Blood
River
Common merganser
Adult female
Blood & egg 2
Belted kingfisher
Adult & juvenile
Blood& egg'
Tree swallow
Adult & juvenile
Blood & egg
Estuaries
Ammodramus
sparrow spp .
Adult & fledged young
Blood
Emergent wetlands
American bittern
Adult
Blood & egg
Virginia rail
Adult
Blood & egg
Song sparrow
Adult & fledged young
Blood
Red-winged blackbird
Adult & fledged young
Blood & egg
Shrub-scrub wetlands
Waterthrush spp .
Adult
Blood
Swamp and Song sparrows
Adult
Blood
Montane areas
Bicknell's thrush
Adult & fledged young
Blood
Deciduous forest
Wood thrush
Adult & fledged young
Blood
Coniferous forest
Catharus
thrush spp.
Adult and fledged young
Blood
Long-term risk in lakes
Common loon
Adult
Feather
Greatest risk in aquatic systems
Bald eagle
Adult
feather
210
Evers et a!.
loon
breeding
populations
with
color-marked
individuals
are
monitored
throughout
New
England (Evers et al., 2004) and Wisconsin (Meyer
et al., 1998; Fevold et al ., 2003) .
Our selections are species- and genera-specific
for illustrative purposes, but species with similar
foraging requirements, behavior, and natural
history patterns may be suitable surrogates
;
preferably, trophic status is similar. Evolving
techniques
in
stable
isotope
analysis
offer
numerous applications to matching trophic sta-
tus through analysis of tissues
(e.g .,
blood,
feather, egg, muscle, bone) . Such techniques
provide quantitative measures of trophic position
(Hobson, 1993; Bearhop et al ., 2000; Nisbet et
al., 2002; Dominguez et al ., 2003), dietary
emphasis
(i .e .,
freshwater vs. marine [Hobson,
1990; Mizutani et al., 1990; Bearhop et al .,
1999], marine versus terrestrial [Hobson, 1987 ;
Hobson and Scaly, 1991 ; Schmutz and Hobson,
1998]), contaminant bioaccumulation (Cabana
and Rasmussen, 1994; Kidd, 1998; Atwell et al .,
1998), and nutrient allocation to reproduction
(Hobson et al ., 1997; Hobson et al., 2000). Here
in, scenarios and associated avian selections re-
late primarily to freshwater breeding habitats
.
Selecting a standard species across multiple
aquatic habitats, particularly between freshwater
and saltwater ones, is difficult. The belted king-
fisher is a ubiquitous species that is an obligate
piscivore in all major aquatic habitats . As a
burrow-nesting species, repeated access to young
and adults is feasible for the, kingfisher. Sam-
pling efforts to determine site-specific exposure
should focus on blood. Intraclutch variability in
egg Hg levels appears to he high
(Lane et al .,
2004). Bald eagle pairs also commonly forage
within all major aquatic habitats. Adults are
difficult to capture, therefore, chicks are gener-
ally sampled to determine Hg exposure (Bower-
man et al., 2002). Blood and breast feathers are
the most common sampling tissues. Adult eagle
feathers from the nest site can be useful for
determining Hg exposure (Bowerntan et al .,
1994) and may reflect some of the highest Hg
levels within an aquatic ecosystem . However,
foraging habits of breeding pairs vary dramati-
cally within and between breeding seasons, hab-
itat type, and geographic area (Knight et al .,
1990; Kozie and Anderson, 1991 ; Anthony et al .,
1999). Although either fish or birds can comprise
the majority of prey remains at eagle nests,
Dominguez et al ., (2003) found that stable-
nitrogen isotope ratios showed little difference in
trophic status among nests in Newfoundland
.
The common loon is one of the better bioindi-
cators of lake-specific MeHg availability as it has a
top trophic position in the aquatic food web, is
long-lived, and in most cases remains within its
breeding territory for 4-6 months. Adult blood and
egg Hg levels reflect dietary Hg exposure of breed-
ing loons on lakes >25 ha . Territorial pairs occu-
pying lakes < 25 ha generally maintain and feed on
more than one lake
(i.e .,
multi-lake territories)
(Piper et al ., 1997). Because adult common loons
with multi-lake territories rarely bring food items
back to their natal lake to feed their young, blood
Hg levels of juvenile loons best represent McHg
availability on their natal lake. Common mergan-
sers are also obligate piscivores that can reflect lake-
specific MeHg availability. Sampling efforts for
adult females can be facilitated through the use of
artificial boxes. Similar to kingfishers, intraclutch
variation in egg Hg levels is high for mergansers and
dictates individual egg or composite analysis (ver-
sus selecting one egg). Other high-trophic level pi-
scivores that generally forage on lakes are not
optimal lake-specific indicator candidates because
(1) of their tendency to commonly use multiple
waterbodies within their breeding territory, (2) they
are difficult to efficiently capture and sample (e.g .,
great
blue heron), and (3) they regularly prey on
lower-trophic-level organisms such as benthic-
feeding fish (e.g ., osprey) and terrestrial birds and
mammals (e.g ., bald eagle). Instead, such species
best represent MeHg availability at a watershed
level . Double-crested cormorants
phalacrocorax-
aurltux
may be good indicators of multiple large
lakes and other aquatic systems .
Determining mercury exposure in riverine
habitats is most promising with the common
merganser, hooded merganser, belted kingfisher,
and
tree swallow. The belted kingfisher is
increasingly being used as an indicator for
assessing Hg in riverine systems (Baron et al .,
1997; Moore et al., 1999). Use of artificial
nesting boxes on riverine habitat and experi-
mental design interests for both piscivorous and
insectivorous birds can be achieved with the
hooded merganser and tree swallow .
Although
most
investigations
of
avian Hg
exposure have focused on waterbodies, wetlands
and
strictly
terrestrial
habitats
are
increasingly
being
included
during
risk
assessments .
In
emergent wetlands,
insectivores
best
reflect
MeHg
availability. Larger-bodied
insectivorous
birds
have greater
Hg
exposure
than
their
smaller counterparts (Fig .
12) . The Virginia
rail
(Rallus
limico/a)
is
a good
indicator
candidate
because
it
is more insectivorous than
the
sora
(Porzana carolina) and is more common and less
limited by marsh size than the American bittern
(Botaurus lentiginosus)
.
Clapper
rails
(Ra//us
longirostris) in San Francisco Bay had greater
body burdens of Hg than associated piscivorous
birds, such as terns
(U.S .
Fish and Wildlife
Service, 2003). The red-winged
blackbird had
some of the highest blood Hg levels of songbirds
within
a
Massachusetts
riverine
wetland
(Fig. 12). Although the red-winged blackbird and
sparrow species
(i.e ., song and swamp) are gra-
nivores most of the year, during the breeding
season they are obligate insectivores
.
Based on
limited Hg data, both the Louisiana
(Seiurus
motacilla)
and northern waterthrush
may be
insectivorous passerines at greatest risk in river-
me habitats; waterthrushes forage specifically on
aquatic organisms. Other relatively large-bodied,
insectivorous passerines associated with northern
aquatic systems, such as
the rusty blackbird
(Euphagus carolinus), may also be at risk; specific
Hg-sensitive habitats are acidic headwater areas
(Bank et al ., 2005) draining recently
logged
coniferous catchments (Porvari et al ., 2003) .
Methylmercury availability in terrestrial insec-
tivorous passerines is relatively unknown but a
recent compelling study by Rimmer et al . (2005)
indicates further investigations are needed. That
study documented Hg levels in Bicknell's thrush
and further comparison of the blood Hg level
ranges show an overlap with those of eaglets
;
thereby indicating equivalent trophic status of a
terrestrial-based insectivore with an aquatic-based
piscivore .
Recent investigations have demon-
strated that MeHg is present in foliage (approxi-
mately 1% of the total Hg content) (St
.
Louis
et al., 2001; Ericksen et al., 2003) . Miller et al .,
(2005) estimated MeHg availability to terrestrial
food webs using forest
foliage and modeled
deposition and concentrations of leaf,
litterfall,
Mercury exposure in Northeast North America
211
precipitation (wet and dry), and particulate Hg in
northeastern North America. Litterfall total Hg
concentrations from these models
were signifi-
cantly correlated with the blood Hg levels of Bic-
knell's thrush (Rimmer et al ., 2005). Conceivably
MeHg in litterfall and contributions of foliar total
Hg to saturated soils where potential methylation
environments exist are providing an important
basis for biomagnification of MeHg in inverte-
brates. Acidified environments further enhance
methylation (Furutani and Rudd, 1980 ; Xun et al .,
1987), and with the influence of heavy wet depo-
sition of acid ions
(i.e .,
acid rain), northeastern
North America's landscape
is generally more
acidic than pre-industrial times (Driscoll et al .,
2001). Soil acidification may impact bird popula-
tions in several ways (Graveland, 1998) including
the depletion of
soil
calcium levels. Breeding birds
have high demands of calcium for eggshell for-
mation and proper juvenile growth. The wide-
spread
depletion
of
environmental
calcium
availability in northeastern North America is now
linked to adverse effects on the distribution
of
wood thrush (Hylocichla mustelina) (Hames et al .,
2002). Unfortunately, the strong
link between
environmental acidification with MeHg produc-
tion and calcium depletion may be creating a sce-
nario where their synergy has the potential for
long-term, landscape-level impacts on insectivo-
rous passerine populations across much of north-
eastern North America .
Acknowledgements
We thank the many scientists representing agen-
cies, universities, industry, and organizations for
their data contributions . Several biologists at Bio-
Diversity Research Institute were instrumental in
collecting many of the tissue samples; they include,
Cory Counard, Chris DeSorbo, Joseph Kaplan,
Oksana Lane, James Paruk, Lucas Savoy, Kate
Taylor, Keren Tischler, and Dave Yates. Pierre-
Yves Daoust of the Atlantic Veterinary College
provided all muscle, kidney, and liver tissues ana-
lyzed for Hg by the Canadian Wildlife Service
.
Hydro-Quebec contributed otherwise unavailable
data. Gary Heinz and Stan Wiemeyer graciously
provided rapid reviews that improved the manu-
script. The U .S. Department
of Agriculture's
Northeastern
States
Research
Cooperative
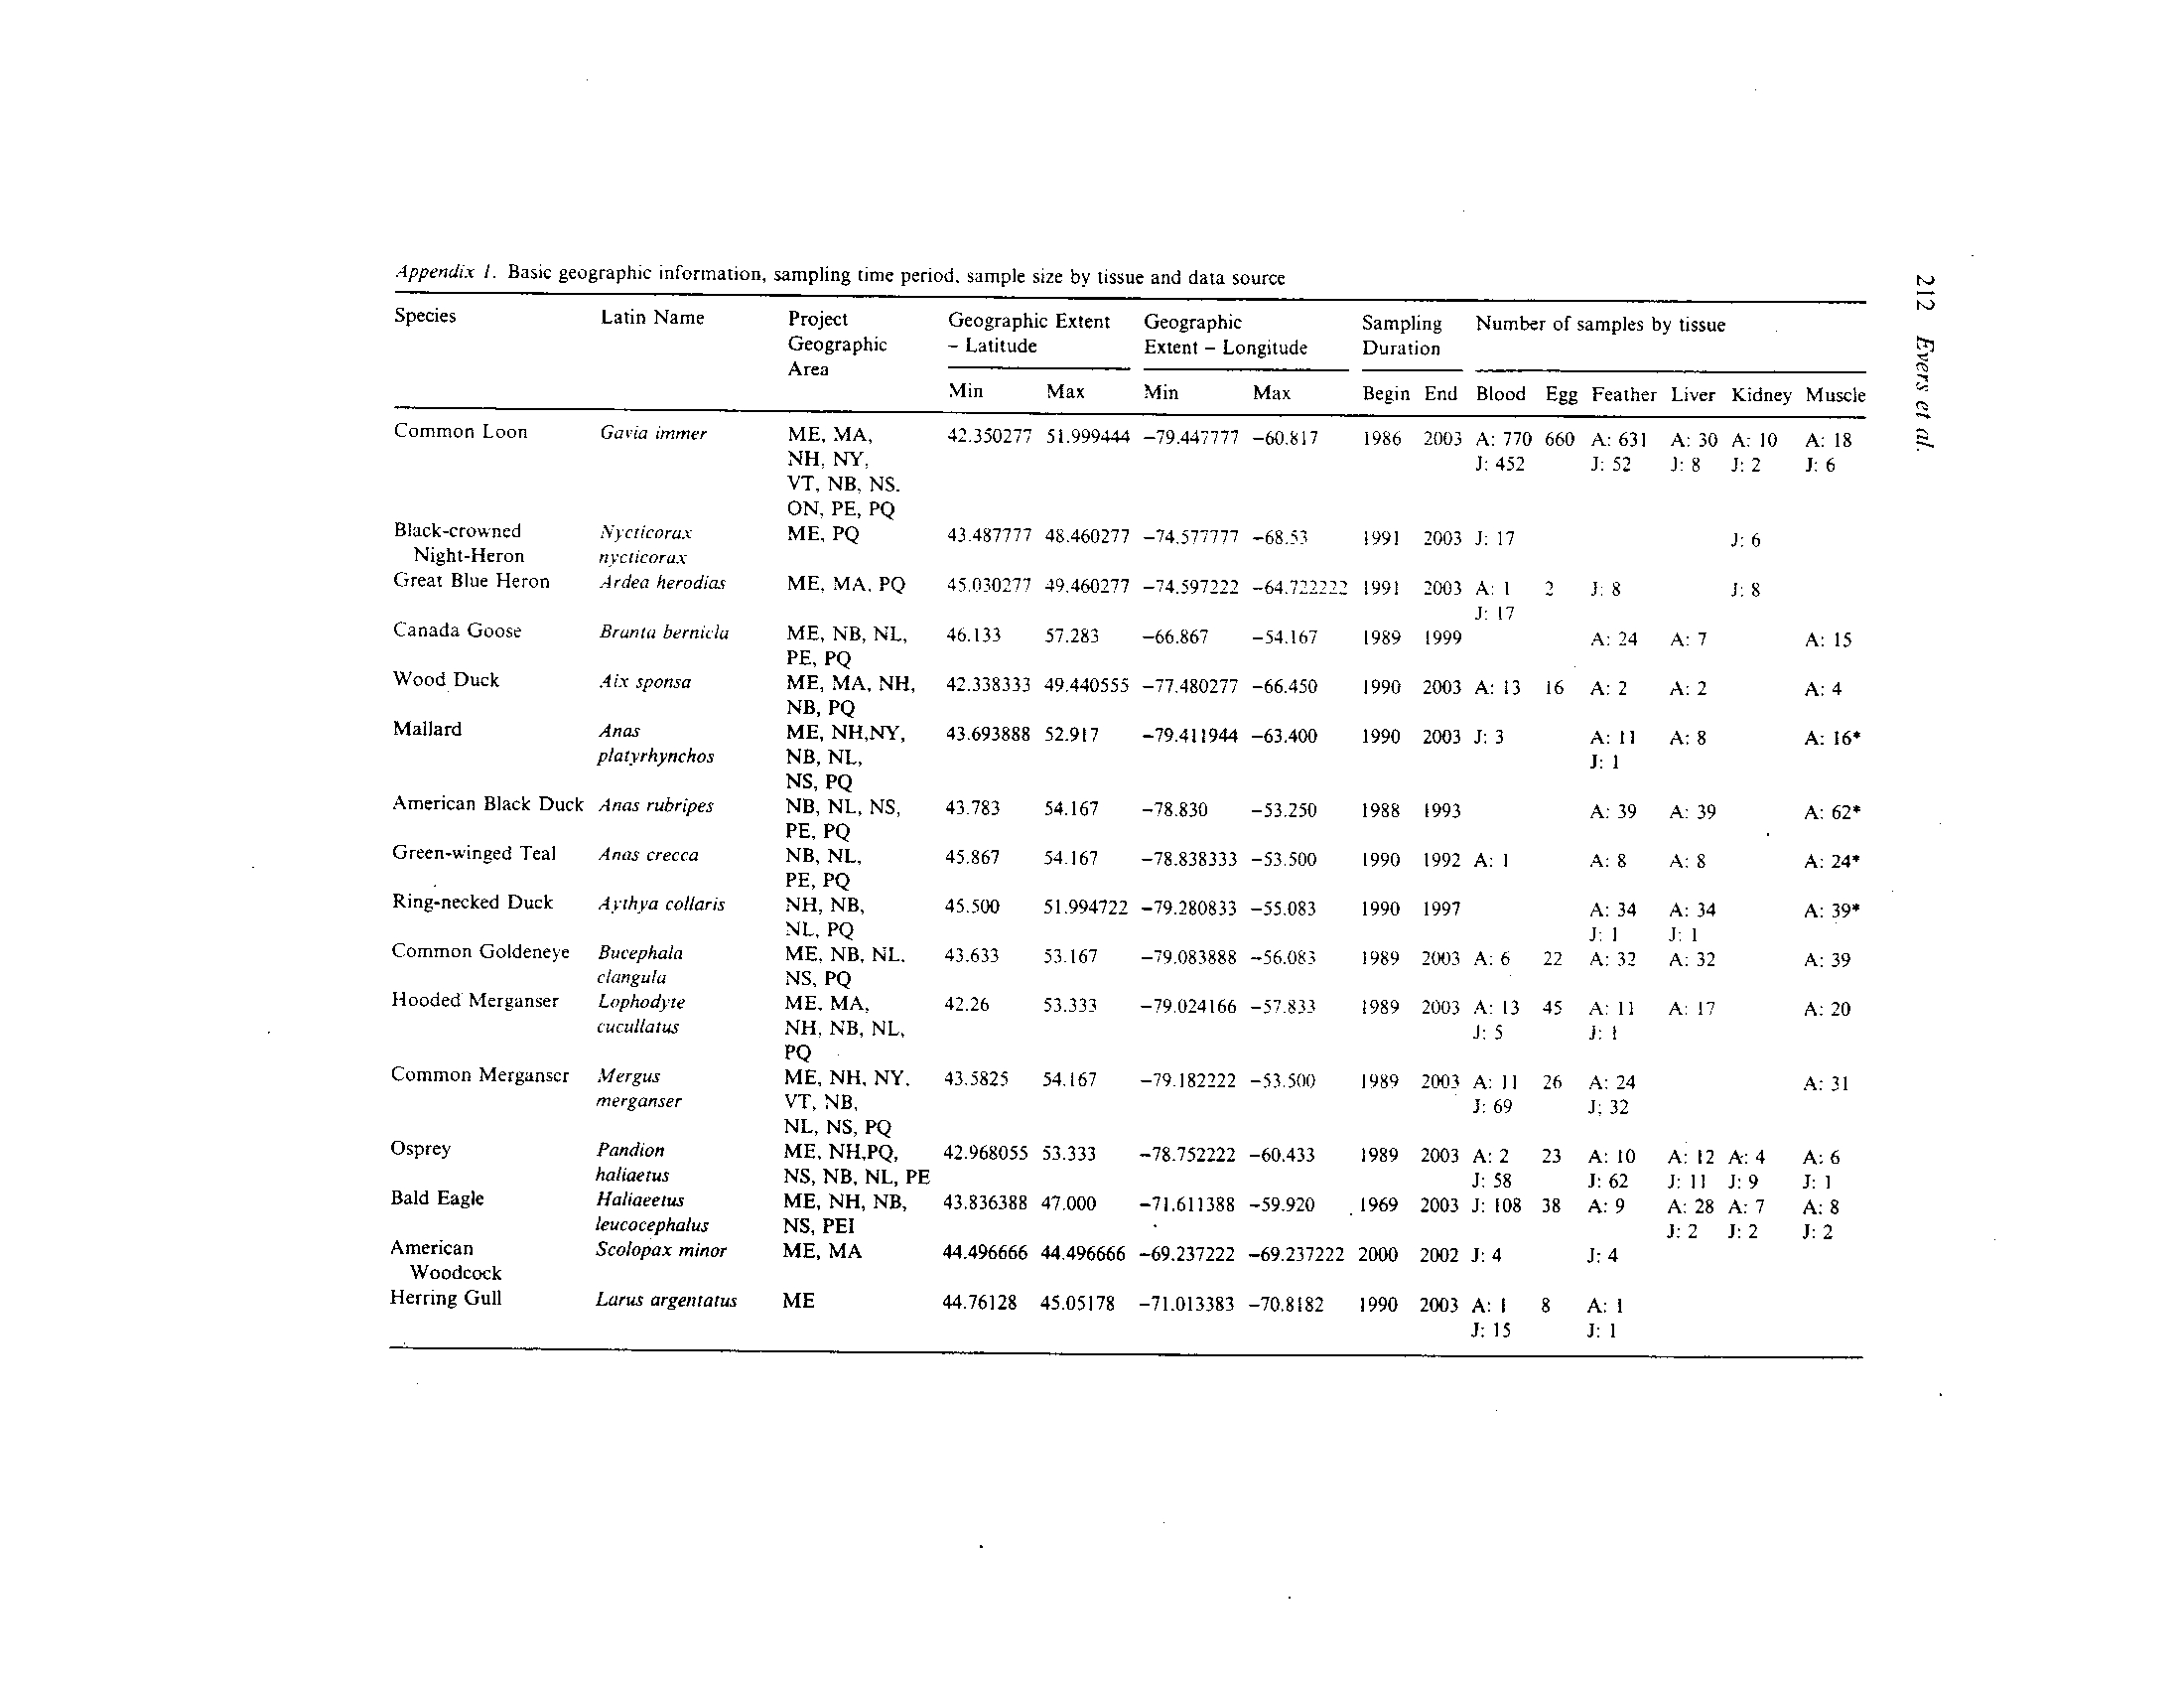
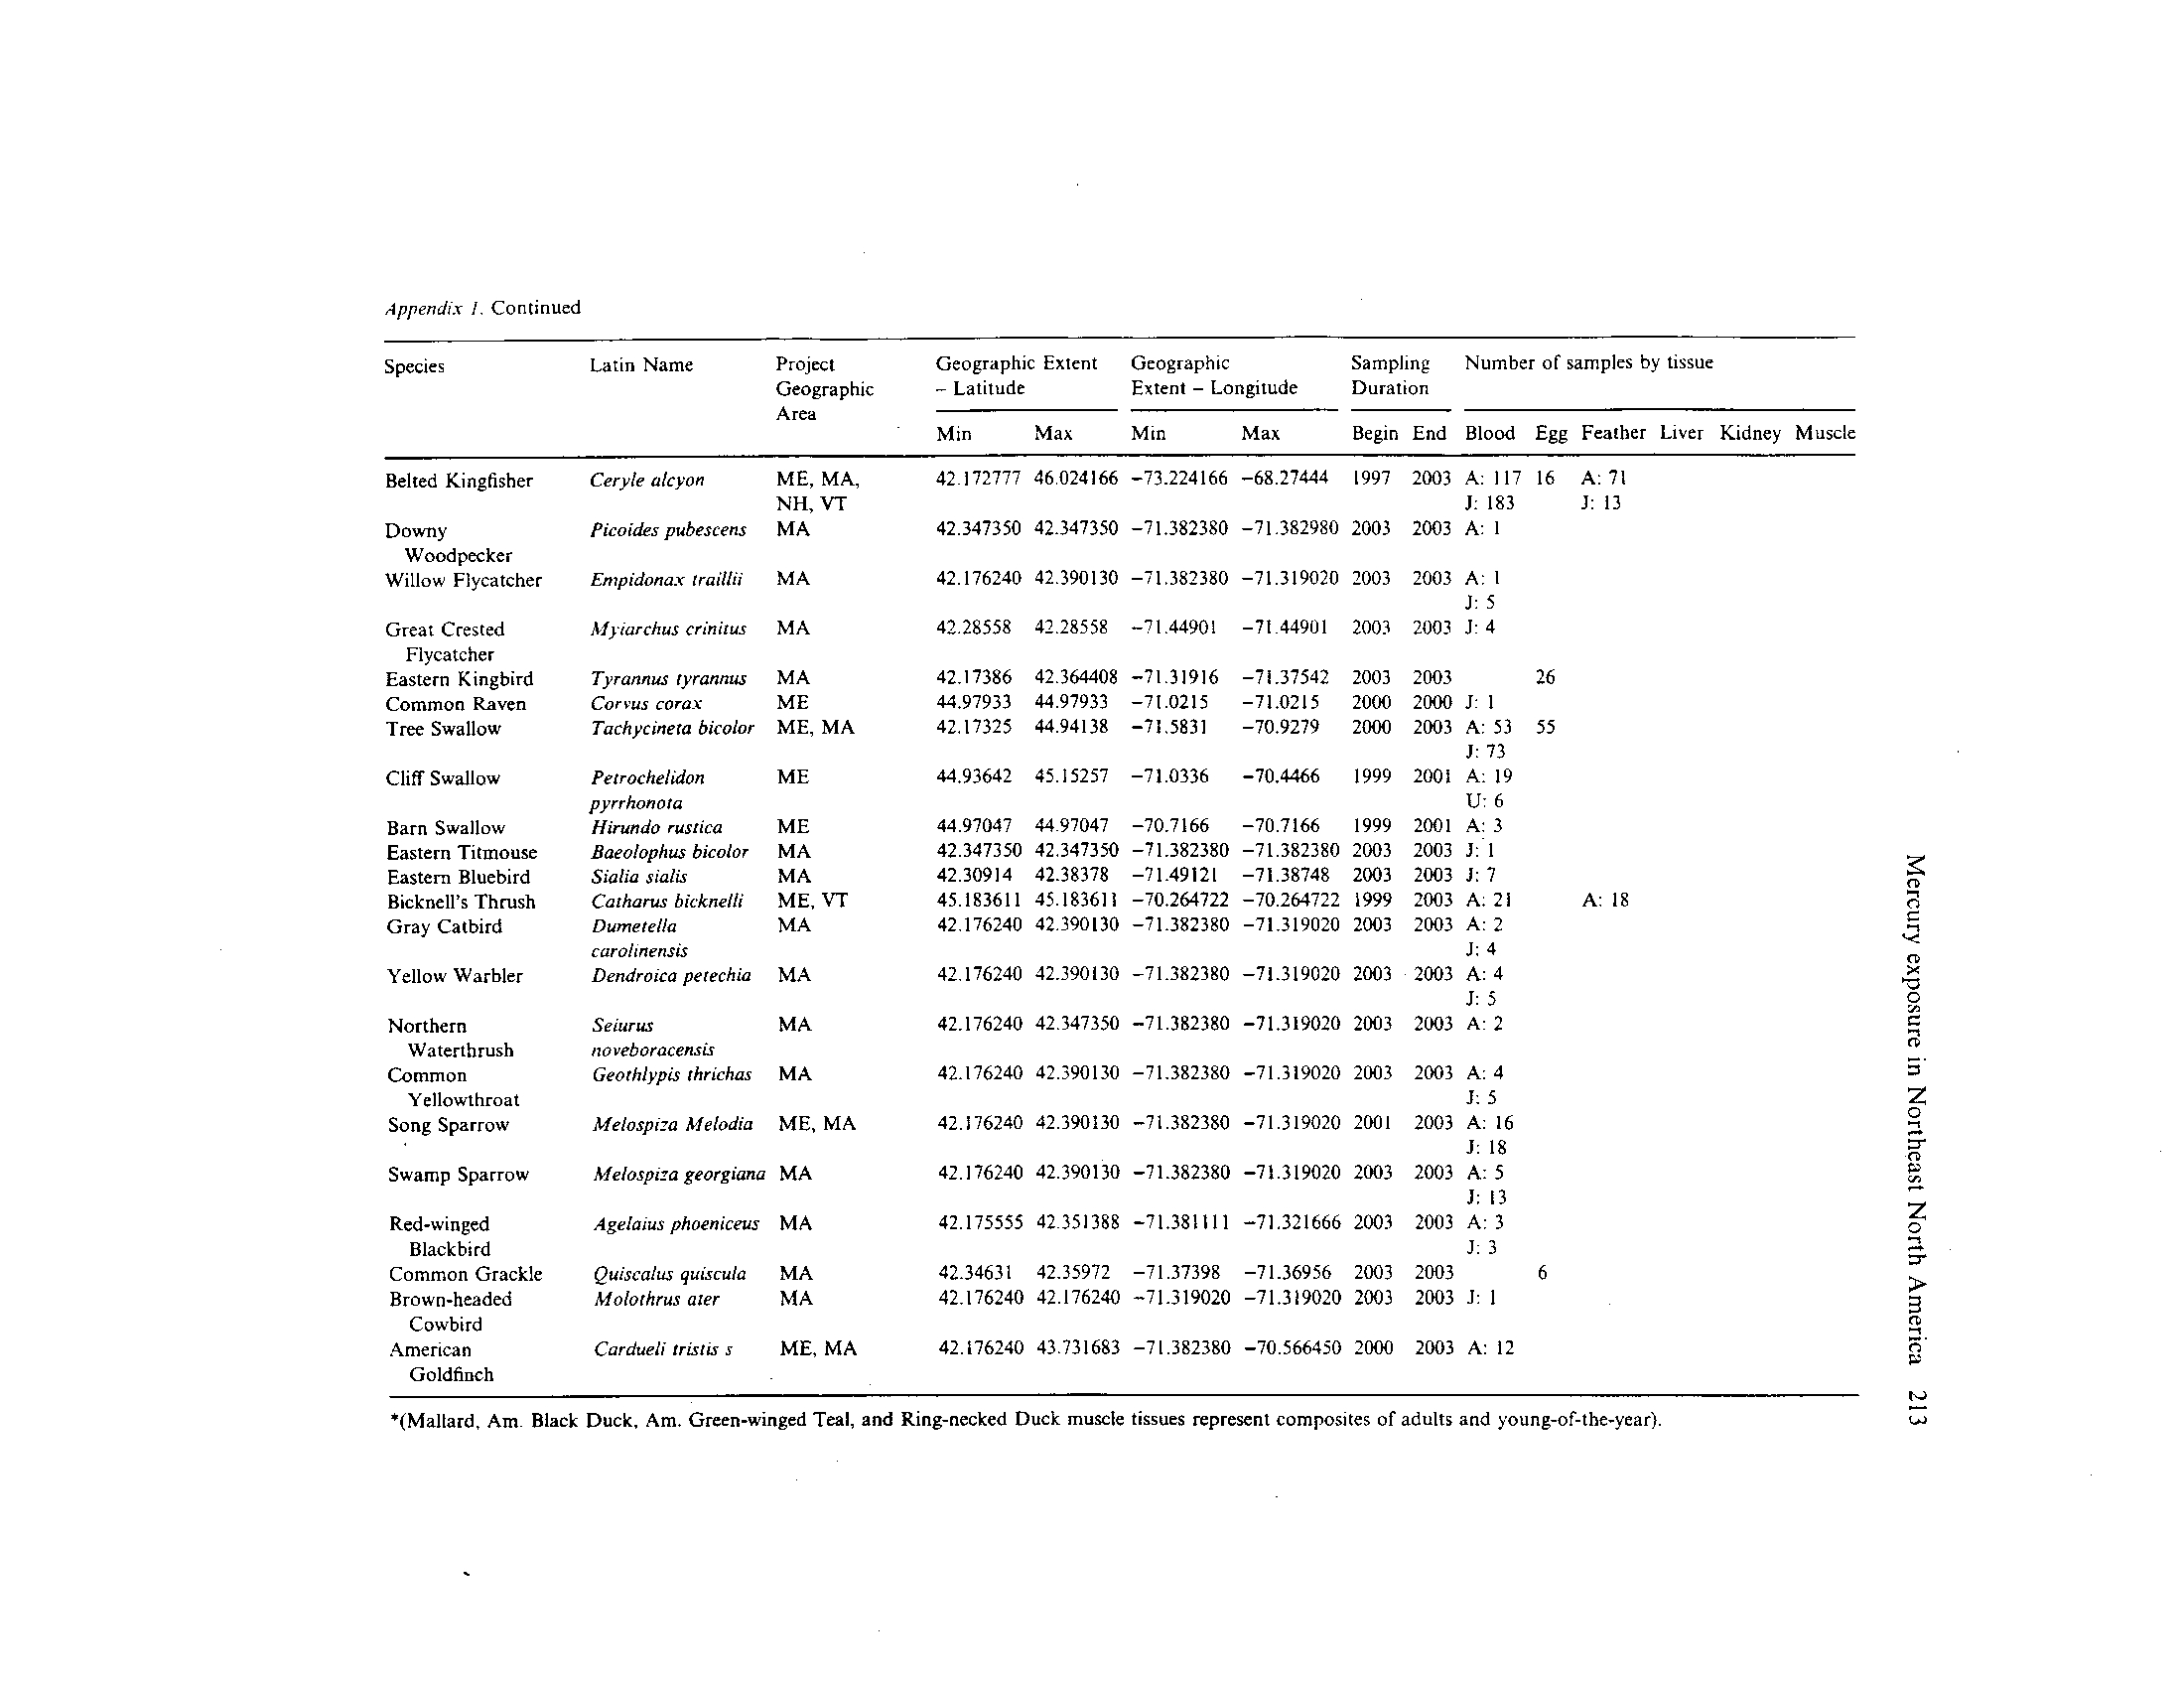
Appendix 1
.
Basic geographic information, sampling time period, sample size by tissue and data source
Species
Latin Name
Project
Geographic
Area
Geographic Extent
Geographic
Extent
- Longitude
Sampling
Number of samples by tissue
Duration
-
Latitude
Min
Max
Min
Max
Begin End Blood
Egg Feather Liver Kidney Muscle
Common Loon
G,, e,
arm,
ME, MA,
42350277
51
.999444
-79
.447777
-60
.817
1986
2003 A
: 770
660
A
:
631
A
: 30 A
: 10
A
: 18
NH
. NY,
1: 452
J: 52
J
: 8
J
: 2
J
: 6
Black-crowned
Nycticorax
VT, NB
. NS
.
ON, PE, PQ
ME, PQ
43 487777
48
.460277
-74577777
-6853
1991
2003 J
: 17
J
: 6
Night-Heron
Great Blue Heron
ncctieorar
Ardeo herodias
ME
. MA, PQ
45
.030277
49
.460277
-74
.597222
-64
.722222
1991
2003 A
. 1
2
3.
. 8
1
: 17
Canada Goose
Brama bernicla
ME, NB, NL,
46
.133
57
.283
-66
.867
-54
.167
1989
1999
A
: 24
A
:7
A
: 15
Wood Duck
.4a sponsa
PE, PQ
ME, MA, NH,
42
.338333
49
.440555
-77
.480277
-66
.450
1990
2003 A
: 13
16
A
: 2
A
: 2
A
: 4
Mallard
Arias
NB, PQ
ME, NH,NY,
43
.693888
52
.917
-79
.411944
-63
.400
1990
2003 J
: 3
A
: 11
A
: 8
A
: 16'
platyrhynchos
NB, NL,
NS, PQ
NB, NL, NS,
43
.783
54
.167
-78
.830
-53
.250
1988
1993
A
: 39
A
:39
A
:62'
American Black Duck
Arias rubripes
PE, PQ
NB, NL,
45
.867
54167
-78
.838333
-53
.500
1990
1992 A
: I
A
: 8
A
: 8
A
: 24'
Green-winged Teal
Arias crecca
Ring-necked Duck
Arthya
collar,,
PE, PQ
NH, NB,
45
.500
51
.994722
-79
.280833
-55
.083
1990
1997
A
: 34
A
: 34
A
:39'
NL, PQ
1:I
P
.1
Common Goldeneye
Bueephala
ME
. NB, NL
.
43
.633
53167
-79
.083888
-56
.083
1989
2003 A
:6
22
A
:32
A
: 32
A
:39
Hooded Merganser
clangula
Lophodyte
NS, PQ
ME
. MA,
42
.26
53
.333
-79
.024166
-57
.833
1989
2003 A
: 13
45
A
: 11
A
. 17
A
:20
cucullatus
NH
. NB, NL,
1: 5
Common Merganser
Mergus
PQME, NH, NY
.
43,5825
54
.167
-79182222
-53
.500
1989
2003 A
: II
26
.A
: 24
A
: 31
merganser
VT, NB,
1: 69
1: 32
Osprey
pandion
NL, NS, PQ
ME, NH,PQ,
42
.968055
53
.333
-78
.752222
-60
.433
1989
2003 A
:2
23
A
: 10
A
: 12 A
: 4
A
: 6
haliaetus
NS, NB, NL, PE
1
: 58
J: 62
1
: 11
1
: 9
1
: 1
Bald Eagle
Ha/iaeetus
ME, NH, NB,
43
.836388
47
.000
-71
.611388
-59
.920
.
1969
2003 1
: 108
38
A
: 9
A
: 28 A
: 7
A
:8
leucocepha/us
NS, PEI
J: 2
J
: 2
J
: 2
American
Scolopax minor
ME, MA
44
.496666
44
.496666
-69
.237222
-69
.237222
2000
2002 J
:4
1
: 4
Woodcock
Herring Gull
Larus argentatus
ME
44
.76128
45
.05178
-71
.013383
-70
.8182
1990
2003 A
: 1
8
A
: I
1
: 15
1
: 1
*(Mallard, Am
. Black Duck, Am
. Green-winged Teal, and Ring-necked Duck muscle tissues represent composites
of adults and young-of-the-year)
.
Appendix
1. Continued
Species
Latin Name
Project
Geographic
Geographic Extent
Geographic
Extent
-
Longitude
Sampling
Duration
Number of samples by tissue
-
Latitude
Area
Min
Max
Min
Max
Begin End
Blood
Egg Feather Liver
Kidney Muscle
Belted Kingfisher
Ceryle
alcyon
ME, MA,
42
.172777
46
.024166
-73
.224166
-68
.27444
1997
2003 A
: 117
16
A
: 71
NH, VT
J: 183
J
: 13
Downy
Picoides
pubescens
MA
42
.347350
42
.347350
-71
.382380
-71
.382980
2003
2003 A
: I
Woodpecker
Willow Flycatcher
Empidonar
traillii
MA
42
.176240
42
.390130
71
.382380
-71
.319020
2003
2003 A
: I
1: 5
Great Crested
Myiorchus
crinitus
MA
42
.28558
42
.28558
-71
.44901
-71 44901
2003
2003 1
:4
Flycatcher
Eastern Kingbird
Tyrannus tyrannus
MA
42
.17386
42
.364408
-71
.31916
-71
.37542
2003
2003
26
Common Raven
Corvus corm
ME
44
.97933
44
.97933
-71
.0215
-71
.0215
2000
2000 J
: I
Tree Swallow
Tachycinem
bicolor
ME, MA
42
.17325
44
.94138
-71
.5831
-70
.9279
2000
2003 A
:53
55
J
: 73
Cliff Swallow
Petrochelidon
ME
44
.93642
45
.15257
-71
.0336
-70
.4466
1999
2001 A
: 19
pyrrhonom
U
: 6
Barn Swallow
Hirundo
rusrica
ME
44
.97047
44
.97047
-70
.7166
-70
.7166
1999
2001 A
: 3
Eastern Titmouse
Baeolophus bicolor
MA
42
.347350
42
.347350
-71
.382380
-71
.382380
2003
2003 J
: 1
Eastern Bluebird
Sialia
sialis
MA
42
.30914
42
.38378
-71
.49121
-71
.38748
2003
2003 J
:7
Bicknell's Thrush
Catharsis bicknelli
ME, VT
45
.183611
45
.183611
-70
.264722
-70
.264722
1999
2003 A
: 21
A
: 18
Gray Catbird
Dumetella
MA
42
.176240
42
.390130
-71
.382380
-71
.319020
2003
2003 A
: 2
carolinensis
1
: 4
Yellow Warbler
Dendroica petechia
MA
42
.176240
42
.390130
-71
.382380
-71
.319020
2003
2003 A
: 4
J
: 5
Northern
Seiurus
MA
42
.176240
42
.347350
-7t
.382380
-71
.319020
2003
2003 A
:2
Waterthrush
Common
noveboracensis
Geothlypis thrichas
MA
42
.176240
42
.390130
-71
.382380
-71
.319020
2003
2003 A
: 4
Yellowthroat
J
: 5
Song Sparrow
Melospiza Melodic
ME, MA
42
.176240
42
.390130
-71
.382380
-71
.319020
2001
2003 A
: 16
J
: 18
Swamp Sparrow
Melospiza
georgiana MA
42
.176240
42
.390130
-71
.382380
-71
.319020
2003
2003 A
: 5
J: 13
Agelaius
phoeniceus
MA
Red-winged
42
.175555
42351388
-71
.381111
-71
.321666
2003
2003 A
: 3
Blackbird
J: 3
Common Grackle
Quiscalus
quiscula
MA
42
.34631
42
.35972
-71
.37398
-71
.36956
2003
2003
6
Brown-headed
Molothrus
ater
MA
42
.176240
42
.176240
-71
.319020
-71
.319020
2003
2003 J
: I
Cowbird
American
C
.rd
.eli
trust
.
ME, MA
42
.176240
43
.731683
-71
.382380
-70
.566450
2000
2003 A
: 12
Goldfinch
Appendix 2
.
Tissue Hg levels (arithmetic mean ± SD and range) from nonlethal sampling efforts
Species
common loon
black-crowned night-heron
great blue heron
Canada goose
wood duck
mallard
American black duck
American green-winged teal
ring-necked duck
common goldeneye
common merganser
hooded merganser
osprey
bald eagle
American woodcock
herring gull
belted kingfisher
willow flycatcher
great crested flycatcher
eastern kingbird
tree swallow
cliff swallow
barn swallow
eastern bluebird
Bicknell's thrush
gray catbird
yellow warbler
northern waterthrush
common yellowthroat
song sparrow
swamp sparrow
red-winged blackbird
common grackle
American goldfinch
Blood (ww) Mean
-
SD (Range)
0
.01 -0
.01(<0
.01-0
.03)
Egg (ww) Mean ± SD (Range) Feather (fw) Mean ± SD (Range)
0
.78 a 0
.60 (0
.01
-
9
.00)
0.09 a 0
.04(0
.05-0
.12)
0
.12 a 0
.23 (0
.01 -0_94)
0
.33 a 0
.18 (0
.09
-
0
.72)
1.43
-
0
.86 (0
.28
-
3
.93)
0
.64
-
0
.44 (0
.15
-
1.90)
0
.19 s 0
.09(006-0
.38)
0
.45
-
0
.29 (0
.03
-
1.29)
0
.63 ± 0
.55 (0
.01
-
1
.63)
0
.56
± 0
.77 (0
.03
-
3
.03)
0
.12 t 0
.04 (0
.04 -
0
.21)
0
.19 a 0
.11 (0
.04
-
0
.64)
0
.04
-
0
.03 (0
.01
-
0
.07)
Adult12
.7
-
6
.6 (2
.2-63
.4)
5
.4
-
4
.8 (0
.3-25
.7)
0
.3 x 0
.1
(0
.3-0
.8)
1.6
-
0.3
(1,4-
1.8)
0
.9
a
0.5(0
.3-h8)
1.8
-
1.2
(0,6-
6
.6)
13
}
1 4
(0
.3-4
.5)
1.5
-
0.8 (0
.3
-
3.0)
2
.8 1 13(0
.8-70)
8
.0±4
.1(3
.3-17
.7)
10
.4 a 3
.8
(2
.7-
18
.0)
15
.6
-
13
.6 (0
.1 -38
.3)
14
.0
-
6
.8 (2
.8-24
.8)
I8
.1 a 15
.1 (4
.4
-
57
.0)
7
.2
-
7
.6 (0
.6
-
46
.1)
Juvenile
5
.2-2
.0(1
.3-6
.9)
8
.8 = 5
.4 (3
.3
-
31
.4)
8
.2-5
.6(0
.1-26
.5)
0
.2
-
0
.1 (0
.1
-
0
.3)
8.0-5
.4(3
.8-19
.8)
Adult
Juvenile
2.04
-
1.39
(0
.05-8
.63)
0
.27 ± 0
.34
(0
.01
-
358)
0
.28
-
0
.13
(0
.11
-
0
.52)
0
.49 ± 0
.56
(0
.03
-
1.76)
0
.05
±
0
.04
(0
.01 -0
.14)
0
.05 ± 0
.03
(0
.03
-
0
.08)
0
.21
-
0
.06
(0
.15-0
.31)
1.57
-
0
.59
(0
.74-2
.35)
0
.60 t 0
.47
(0
.03
-
2
.29)
0
.88
-
0
.55
(0
.07- 1
.91)
0
.68
- 0
.30
(0
.34- 1
.13)
1-42 ± 0
.18
(1
.29- 1
.54)
0
.31 1 0
.20
(0
.03
-
0
.81)
0.30
-
0
.27
(0
.01
-
1.20)
0.03 ± 0
.01
(0
.02- 0
.04)
0.46 ± 0
.13
(0
.28
-
0
.72)
0
.99 a 0
.82
(0
.07-4
.57)
0.17-0
.18(0
.01-1
.35)
0.43 a 0
.25 (0
.20-0
.80)
0.09 ± 0
.02 (0
.07-0
.11)
0
.41 = 0
.21
(0
.11
-
1
.00)
0.07 ± 0
.03 (0
.02-0,16)
0
.22 = 0
.10
(0
.08-0
.47)
0
.13 a 0
.03
(0
.11
-
0
.15)
0
.01
-
0
.01 (0
.01
-
0.02)
0
.29 a 0
.26
(0
.05 -0
.80)
0
.13 a 0
.07
(0
.08-0
.19)
0
.05
-
0
.02 (0
.03
-
0
.07)
0
.04 a 0
.03
(0
.01
-
0
.07)
0
.04
-
0
.03 (0
.01 -0
.08)
0
.92 -
0
.95
(015- 159)
0
.28
a
0
.13
(0
.15-0
.44)
0.10 x 0
.05 (0
.04-0
.17)
0
.35
-
0
.30
(0
.08
-
134)
0
.21
-
0
.14 (0
.01
-
0
.56)
0
.74 a 0
.47
(0
.22- 1
.45)
0
.30
a
0
.14 (0
.07
-
0
.48)
0
.67 a 0
.71
(0
.20- 1
.49)
0
.90 a 0
.38 (0
.46 -
1.13)
Appendix 3 . Tissue Hg levels (arithmetic mean 1 SD and range) from lethal sampling efforts
Species
common loon
- adult
common loon -juvenile
black-crowned night-heron
great blue heron
Canada goose
wood duck
mallard
American black duck
American green-winged teal
ring-necked duck
common goldencyc
common merganser
hooded merganser
osprey - adult
osprey -juvenile
bald eagle - adult
bald eagle - juvenile
herring gull
Liver (ww)
Mean ± SD (Range)
29.7 3 38.5
(1 .9- 154.0)
14.9 ± 25.6 (0 .3 - 92.6)
0.1 3 0.3 (0.1 - 0.2)
0.3 3 < 0 .1 (0.3-0.3)
0.5 3 0.2 (0 .1 - 0.8)
0.6 ± 0.4 (0.1 - 2.0)
0.8 ± 0.3 (0.2 -
1 .3)
0.6 ± 0.3 (0.2 -
1.5)
1 .5 i 1.8 (0 .1 - 8 .2)
4.7±3.0(11-12 .2)
10.6 t 11.2(0 .6-23 .0)
0.9 3 0.4 (0.2 -
1 .5)
2.2 3 2.2(0.6-11 .8)
1.2 3 0.9 (0.6 -
1 .9)
3.6 1 2 .5 (1.0-8 .2)
provided funding to compile and synthesize the
Hg databases .
References
Adair, B.M., Reynolds, K.D., McMurry, S.T. and Cobb, G .P .
(2003). Mercury occurrence in prothonotary warblers
(Protonolaria cinea) inhabiting a national priorities list site
and reference areas in southern Alabama
. Arch. Environ .
Conmm . Toxicol. 44, 265-71
.
Albano, D. (2000). A behavioral ecology of the Belted King-
fisher (Ceryle alcyon). Unpubl. PhD Thesis,
Univ. Mass .,
Amherst, Mass .
Anthony,
R .G .,
Miles, A.K.,
Estes, J.A. and Isaacs, F. B .
(1999). Productivity, diets, and environmental contaminants
in nesting bald eagles from the Aleutian Archipelago
.
Environ. Toxicol. Chem. 18, 2054-62
.
Appelquist, H., Asbirk, S. and Drahaek, I. (1984). Mercury
monitoring: Mercury stability in bird feathers . Mar. Pollut .
Bull. 15, 22-24 .
Appelquist, H., Draback, 1. and Asbirk, S . (1985). Variation in
mercury content of guillemot feathers over 150 years
. Mar.
Pollut Bull. 16, 244-48.
Atwell, L., Hobson K., A. and Welch, H . (1998). Biomagnifi-
cation and bioaccumulation of mercury in an arctic marine
food web: Insights from stable nitrogen isotope analysis
.
Can. J. Aqua± Sci. 55, 1114-21 .
Augspurger, T., Franson,
1.C., Converse, K.A ., Spitzer, P.R
.
and Miller, E.A . (1998). An epizootic of common loons in
coastal waters of North Carolina: Concentrations of
elemental contaminants and results of necropsies
. Environ
.
Toxic
.]. Chem. 17, 205-09 .
Mercury exposure in Northeast North America 215
15.7 t 14.7 (2.3-36 .7)
1.1 1 0.6 (0 .3
- 2.)
9.2 1
12.4 (0 .7 - 33.4)
0.6 ± 0.5 (0 .3 -
1 .0)
0.13 + 0.08 (0.02
- 0.26)
0.16 ± 0.12 (0.03 - 0.45)
0.21 ± 0.15 (0.02 - 0.59)
0.17 ± 0.11 (0.03-0.47)
0.33 + 0.20 (0.05-0.88)
1 .71 ± 1
.71 (0.08-6.77)
0 .96 ± 0.35 (0.04- 1.92)
1 .5 + 1.5 (0.6-4.3)
0 .1
0.430.4(0.2-1 .5)
0.3 3 0 .1
(0.2-0.3)
1 .59 + 1.32 (0.35 - 3.98)
Bank, M.S ., Loftin, C.S. and lung, RE. (2005). Mercury bio-
accumulation in two-lined salamanders from streams in
northeastern United States
. Ecotoxicalogy 14, 181-92 .
Baron, L.A ., Ashwood, T .I., Sample, B.E. and Welsh, C
.
(1997). Monitoring bioaccumulation of contaminants in the
belted kingfisher (Ceryle alcyon). Environ. Monitor. Assess .
47, 153-65 .
Barr, J .F. (1986). Population dynamics of the common loon
(Gavia immer) associated with mercury- contaminated wa-
ters in northwestern Ontario. Can . Wildl. Sem Occar. Pap .
56, Ottawa, Ontario, Canada .
Barr, J.F. (1996). Aspects of common loon
(Gavia immer)
feeding biology on its breeding ground
. Hydrohiologia 32,
119-44
.
Bearhop, S., Waldron, S., Thompson, D. and Furness, R
.
(2000). Bioamplification of mercury in great skua Catha-
racta skua chicks: The influence of trophic status as deter-
mined by stable isotope signatures of blood and feathers
.
Marine Pol/ut Bull. 40, 181-85.
Bearhop, S., Thompson, D.R ., Waldron, S., Russell,
I .C .,
Alexander, G. and Furness, R.W. (1999). Stable isotopes
indicate the extent of freshwater feeding by cormorants
Phalacrocarax carho shot at inland fisheries in England. J.
App!. Ecol. 36, 75-84.
Becker, P.H, Herring, D. and Furness, R.W. (1994). Differ-
ences in mercury contamination and elimination during
feather development in gull and tern broods . Arch. Environ .
Contain. Toxicol. 27, 162-67 .
Bishop, C.A ., Koster, M.D., Click, A.A ., Hassell, D .J.T. and
Jock, K. (1995). Chlorinated hydrocarbons and mercury in
sediments, red-winged blackbirds (Agelaius phoeniceu .s) and
tree swallows (Tachycineta bicolor) from wetlands in the
Great Lakes-St. Lawrence River basin
.
Environ. Toxic,,!.
Chem . 14, 491-501
.
Kidney (ww)
Mean ± SD (Range)
Muscle (ww)
Mean 1 SD (Range)
39.9 ± 25.1 (1.7-79.1)
4 .10 ± 3.40 (0.40 - 15.90)
35.9 t 24.9(11 .0-60 .7)
0 .90 3 0.81
(0.20 - 2.40)
1 .5 1 0.3
(1 .2-
1 .9)
1 .9 ± 0.9 (0 .4-3.3)
0.04 ± 0.03 (0.02-0.14)
216
Every et al .
Bouton, S.N ., Frederick, P. C., Spalding, M.G. and McGill, H .
(1999). Effects of chronic, low concentrations of dietary
methylmereury on the behavior of juvenile great egrets
.
Environ. Tax. Chem. 19, 1934-39
.
Bowerman,W.W., Evans, CD., Giesy, J . P. and Postupalsky, S
.
(1994). Using feathers to assess risk of mercury and sele-
nium to bald eagle reproduction in the Great Lakes Region
.
Arch. Environ. Cannot,. Taxirol
. 27. 294-98 .
Bowerman, W.W ., Roe, A . S., Gilhertson, M .1 ., Best, D.A.,
Sikarskie, J.G ., Mitchell, R.S. and Summer, C.L. (2002)
.
Using bald eagles to indicate the health of the Great Lakes'
environment . Lakes Revere. Res. Manage. 7, 183-87.
Braune, B. M. (1987). Comparison of total mercury levels in
relation to diet and moll for nine species of marine birds .
Arch. Environ . Cantam. To viral. 20, 217-24 .
Braune, B.M. and Gaskin, D.E. (1987). Mercury levels in
Bonaparte's gull (Larus philadelphia) during autumn molt in
the Quoddy region, New Brunswick, Canada
. Arch. Envi-
ron_ Con tam. Tocical . 16. 53'9-49 .
Braune, B .M
., Malone, R.J ., Burgess, N.M .,
Elliott,
1.E ., Gar-
rity, N., Hawkings, J., Hines, 1 .. Marshall, H., Marshall,
W.K ., Rodrigue, l., Wakeford, B., Wayland, M., Weseloh,
1) V. and Whitehead, P E . (1999). Chemical residues in
waterfowl and gamebirds harvested in Canada, 1987-1995
.
(',in . Wilsll Serv.Tech, Relic. Se, 326, Hull, Quebec, Canada .
Bounce, B.M
., Donaldson, G .M . and Hobson, K.A. (2001) .
Contaminant residues in seabird eggs from the Canadian
Arctic. Part I . Temporal trends 1975-1988 . Environ. Patent .
114, 39-54.
Burger, 1 (1993). Metals in avian feathers : Bioindicalors of
environmental pollution. Rev_ Environ . Taxirol. 5, 203-311 .
Burger, J . (1995). Heavy metal, selenium levels in feathers of
herring gulls (Larus argentatus) :
Differences due to year,
gender and age al Capture, Long Island
. Environ. Monitor .
Assess. 38, 37--50.
Burger, 1. and Gochfcld, M . (1995). Biomonitoring of heavy
metals in the Pacific Basin using avian feathers . Environ
.
Toxir,L Chem. 14, 1233-39
.
Burger, 1I and Goehfeld, M . (1997). Age differences in metals in
the blood of herring (Larus urgentatus) and Franklin's (Larus
ptplxmn) gulls . Arch . Environ. Cantam. Toxicol. 33, 436-40
.
Burgess, N. M. and Hobson, K.A. (2005). Bioaccumulation of
mercury in yellow perch and common loons in relation to
lake chemistry in Atlantic Canada
. Hydrobiologia . (in press) .
Burgess, N.M ., Evers, D.C ., Kaplan, 1.D ., Duggan, M. and
Kerekes, J.J (I 998a). Mercury and reproductive success of
common loons breeding in the Maritimes. In N.M. Burgess
led). Mercury in Atlantic Canada: A progress report
., pp
.
104-09. New Brunswick: Environment Canada, Sackville.
Burgess, N M., Evers, D . C. and Kaplan, 1.D. (1998b). Mercury
levels in the blood of common loons breeding in the Mari-
times and their prey. pp. 96-100. In N.M. Burgess (ed .) .
Mercury in Atlantic Canada: A progress report, pp. 96-100.
Environment Canada, Sackville, New Brunswick .
Cabana, GG
and Rasmussen 1, B. (1994). Modeling food chain
structure and contaminant hioaccumulation using stable
nitrogen isotopes
. Nature 372, 255-57.
Cabana, G., Tremblay, A., Kalff,
1I
and Rasmussen, J.R
.
(1994). Pelagic food chain structure in Ontario lakes : A
determinant of mercury levels in lake trout
(Salvelinus no-
maycush). Can. J. Fish. Aquae. Sci. 51, 381-89,
Cahill, T.M., Anderson, D.W ., Elbert, R.A ., Perley, B.P, and
Johnson, D R. (1998). Elemental profiles in feather samples
from a mercury-contaminated lake in central California
.
Arch_ Environ. Cantam. Taxirol. 35, 75-81
.
Champoux, L., Masse, D., Evers, D.C., Lane, 0., Planle, M .,
and Timmerman, S. Assessment of mercury exposure and
potential effects in common Loons in Quebec . Hydra-
hlologia (in press)
.
Chen, C.Y ., Stemberger, R.S ., Kamman, N.C., Mayes, B, and
Foil, C. (2005). Patterns of mercury biorecycrida Lion and
transfer in aquatic food webs across multi-lake studies in the
northeast U . S. Eroeoxiralogy 14, 135A8
.
Cohen, 1 B , Barclay, J .S ., Major. AR. and Fisher, 1 . P. (2000).
Wintering greater scaup as hiomonitors of metal contain,
..lion in federal wildlife refuges in the Long Island Region.
Arch. Environ . Centaur Tosirol . 38, 83-92.
Crewlher, W.G ., Fraser, RD., Leanox, F.G . and Lindley, H .
(1965). The chemistry of kcratins. In C . B. Anifmsen, M .L .
Anson, J.T. Edsoll and F.M. Richards (eds)
. Advances in
Protein Chemistry,
pp. 191-303. New York: Academic
Press
.
DesGranges, 1 . L., Rodrigue, 1., Tardif,
BB
and Laperle, M .
(1998). Mercury accumulation and hiomagnification in os-
prey (Pandion haliaems) in the James Bay and Hudson Bay
regions of Quebec_ Arch. Environ. Content. Taxienl.35 . 330
41
.
Dominguez, L., Monleveechi, W A., Burgess, N.M ., Brazil, 1L
and Hobson, K A . (2003). Reproductive success, environ-
mental contaminants, and trophic status of nesting bald
eagles in eastern Newfoundland, Canada_ J. Raptor Res
. 37,
209- I8
.
Donaldson, G.M . and Braunc, B M . (1999). Sex-related levels
of selenium, heavy metals, and organochlorine compounds
in American white pelicans (Pelecanas
erythrorhynco.s) .
Arch. Environ. Cantam. Taxirol. 37, 110-14 .
Donaldson, G.M
.,
Braune,
B.M
., Gaston, A.J. and Noble,
D.G. (1997). Organodtlorine and heavy metal residues in
breast muscle of known-age thick-killed murres (Uria tom-
via) from the Canadian Arctic. Arch. Environ_ Contain
.
To eicol. 33, 430-35
.
Disco[[, C.T.,
Lawrence, G.B .,
Bulger, A .1.,
Butler, T.J
.,
Cronan, C S., Eagar, C., Lambert, K.F.,
Likens, G.E .,
Stoddard, JL and Weathers, K.C. (2001). Acidic deposi-
tion in the northeastern United States: Sources and inputs,
ecosystem effects, and management strategies
. Biosrience
51, 180-98
.
Drysdale, C., Burgess, N M., Entermont, A ., Carter, 1. and
Brun, G. (2005). Mercury in brook trout, white perch and
yellow perch in Kejimkujik National Park and National
Historic Site. In A Renez and N. O'Driscoll (ads). Mercury
cycling in a wetland dominatedecosystem: a multidisciplinary,
study ., Pensacola Florida : SETAC Press (in press).
Dustman, E.H ., Uickel, L . F. and Elder, J.B. (1972). Mer .
cury in wild animals, Lake St. Clair, 1970. In R. Hartung
and RD Dinman (eds) . Environmental mercury contami-
nation_, pp. 46 52. Ann Arbor Michigan : Ann Arbor Sci
.
Publ .
Elbert, R.A. and Anderson, D.W. (1998). Mercury levels,
reproduction, and hematology in western grebes from
three California takes, USA
.
Environ.
Toxicol. Chem. 17,
210-13 .
Engstrom D, R. and Swain B, B. (1997). Recent declines in
atmospheric mercury deposition in the upper Midwest
.
Environ. Sc, Teahnol . 31,
960-67 .
Ericksen, 1., Gestic, M.S., Schorran, D., Johnson, D ., Lind-
berg, S. and Coleman, J . (2003). Accumulation of atmo-
spheric mercury in forest foliage .
Atm. Environ. 37,
1613-22 .
Evers, D.C. (2001). Assessing the potential impacts of methyl-
mercury on the Common Loon in southern New Hamp-
shire. Unpubl. report BRI-2001-2004 submitted to the New
Hampshire Dept
. Environ. Protection. BioDiversity Res .
Inst., Gorham, Maine
.
Evers, D.C. (2005)
.
Status assessment and conservation plan for
the common loon in North America
.
Final Draft, U .S. Fish
Wildl. Serv. Hadley, Massachusetts .
Evers, D.C. and Clair, T.A. (eds). (2005). Mercury in North-
castcrn North America: A synthesis of existing databases
.
Ecotoxicology
14, 7-13 .
Evers, D.C. and Reaman, P . (1998). A comparison of mercury
exposure and risk between artificial impoundments and
natural lakes measured in Common Loons and their prey,
1996-1997. Unpubl. report BRI 1998-2003 submitted to
Central Maine Power Co . BioDiversity Res . Inst., Gorham,
Maine
.
Evers, D.C., Lane, O.P., Savoy, L. and Goodale, W. (2004)
.
Assessing the impacts of methylmercury on piscivorous
wildlife using a wildlife criterion value based on the Com-
mon Loon, 1998-2003. Unpubl. report BRI 2004-2005
submitted to the Maine Department of Environmental
Protection .
BioDiversity
Research
Institute, Gorham,
Maine .
Evers, D.C., Taylor, K.M ., Major, A., Taylor, R .J ., Poppenga,
R.H. and Scheuhammer, A .M . (2003). Common Loon eggs
as indicators of methylmercury availability in North
America
.
Ecotoxicology 12,
69-81
.
Evers, D.C., Kaplan, J.D., Meyer, M .W., Reaman, P .S ., Bra-
selton, W.E ., Major, A., Burgess, N. and Scheuhammer,
A.M. (1998). A geographic trend in mercury measured in
common loon feather and blood
.
Environ . Toxicol. Chem .
17, 173-83
.
Fevold, B .M ., Meyer, M.W ., Rasmussen, P.W. and Temple,
S.A. (2003). Bioaccumulation patterns and temporal trends
of mercury exposure in Wisconsin common loons
.
Ecotox-
icology 12,
83-93 .
Fimreite, N. (1974). Mercury contamination of aquatic birds in
northwestern Ontario
.
J. Wild!
. Manage
.
38, 120-31
.
Fimreite, N., Brun, E., Froslie, A., Frederichsen, P. and Gun-
dersen, N. (1974). Mercury in eggs of Norwegian seabirds
.
Asiatic
1, 71-75
.
Finley, M.T ., Stickel, W.H. and Christensen, R.E. (1979). Mer-
cury residues in tissues of dead and surviving birds fed
methylmercury
.
Bull
. Environ. Contain. Toxicol. 21,
105-10 .
Frederick, P.C ., Hylton, B., Heath, J.A . and Spalding, M.G .
(2004). A historical record of mercury contamination in
southern Florida (USA) as inferred from avian feather tis-
sue
.
Environ
. Toxicol .
Chem. 23, 1474-78 .
Mercury exposure in Northeast North America
217
Fournier, F., Karasov,W.H ., Kenow, K.P., Meyer, M.W. and
Hines, R.K . (2002). The oral bioavailability and toxicoki-
netics of methylmercury in common loon
(Gavin irmner)
chicks.
Comp . Biochem . Physiol. Part A
133, 703-14 .
Frenzel, R.W. and Anthony, R.G. (1989). Relationship of diets
and environmental contaminants in wintering bald eagles
.
J. Wildl. Manage .
53, 792-802.
Furness, R.W. and Greenwood ., J .J .D. (1993)
.
Birds as mont-
tors
of
environmental change
.
New York, Chapman and
Hall .
Furness, R.W ., Lewis, S.A. and Mills, LA. (1990). Mercury
levels in the plumage of red-billed gulls
Larus novaehollan-
diae scopulinus
of known sex and
age . Environ. Pollut
.
63,
33-39
.
Furness, R.W ., Muirhead, S .J. and Woodburn, M. (1986).
Using bird feathers to measure mercury in the environment :
relationships between mercury content and moult
.
Mar.
Pollut
. Bull.
17, 27-30
.
Furulani, A. and Rudd, J.W.M. (1980). Measurement of mer-
cury methylation in lake water and sediment samples
.
Appl.
Environ. Microbial. 40,
770-76 .
Gardiner, E .E. (1972). Differences between ducks, pheasants,
and chickens in tissue mercury retention, depletion, and
tolerance to increasing levels of dietary mercury
.
Can. J.
Anim. Sri .
52, 419-23
.
Gardner, W.S., Kendall, D.R ., Odom, R.R., Windom, H.L
.
and Stephens, 1 .1. (1978). The distribution of methylmer-
cury in a contaminated salt marsh ecosystem
.
Environ .
Pollut
15, 243-51
.
Garibaldi, J.C., Jagoe, C.H. and Bryan, A.L. Jr. (1998). Dietary
exposure to mercury in nestling wood storks
(Mycleria
americana)
in Georgia .
Arch Environ. Contain. Toxicol
.
34,
398-405 .
Gerrard, P.M. and Louis, V .L.SI. (2001). The effects of exper-
imental reservoir creation on the bioacummulation of
methylmercury and reproductive success of tree swallows
(Tachycineta bicolor). Environ. Sci. Technal. 35,
1329-38 .
Gilmour, C.C., Henry, E.A. and Mitchell, R. (1992). Sulfate
stimulation and mercury methylation in freshwater sedi-
ments
.
Environ. Sci. Technol .'26,
2281-87.
Glass, G .E ., Sorensen, 1.A ., Schmidt, K.W. and Rapp, G.R .
Jr. (1990). New source identification of mercury contami-
nation in the Great Lakes
.
Environ
.
Sci.
Technol. 24,
1059-
69.
Gochfeld, M . (1980). Tissue distribution of mercury in normal
and abnormal young common terns
.
Marine Poll. Bull . 11,
362-77.
Gochfeld, M ., Belant,
1.E ., Shukla, T., Benson, T. and Burger,
J. (1996). Heavy metals in laughing gulls: Gender, age and
tissue differences .
Environ . Toxical. Chem.
15, 2275-83
.
Graveland, J. (1998). Effects of acid rain on bird populations
.
Environ.
Rev. 6, 41-54 .
Grier, J.W. (1974). Reproduction, organochlorines, and mer-
cury in northwestern Ontario bald eagles
.
Can. Field-Nat .
88, 469-75 .
Halbrook, R.S ., Brewer, R.L. Jr. and Buehler, D.A. (1999) .
Ecological risk assessment in a large river- reservoir : 7 .
Environmental contaminant accumulation and effects in
great blue heron.
Environ . Toxicol
Chem. 18, 641-48
.
218
Every el (it.
Hanes, R.S ., Rosenberg, K.V ., Lowe,
1.D ., Barker, S.E. and
Dhondt, A.A. (2002). Adverse effects of acid rain on the
distribution of the wood thrush
Hylocichla mustelina
in
North America
. Proc. Nat!
. Acad. Sci. 99, 11235-240.
Hammerschmidt, C.R. and Fitzgerald, W.F. (2004). Geo-
chemical controls on the production and distribution of
mcthylmercury in near-shore marine sediments
.
Environ.
Sci. Teehnol
. 38,1487-95 .
Hatch, W.R. and Ott, W.L. (1968). Determination of submi-
crogram quantities of mercury by atomic absorption spec-
trophotometry . Anal. Chem. 40, 2085-87
.
Heinz G. (1975). Effects of mcthylmercury on approach and
avoidance behavior of mallard ducklings
.
Bull. Environ .
Contain. Tnxicol. 13, 554.64 .
Heinz, G.11V and Hoffman, D J. (2003). Predicting mercury in
mallard ducklings from mercury in chorioallantoic mem-
branes . Bull. Environ
. Contam- Toxicol. 70, 1242-46 .
Heinz,GA. and Hoffman, D .J. (2004). Mercury accumulation
and loss in mallard eggs
. Environ
. Toxicol. Chem. 23, 222-24 .
Henny, C .1 .,
Blus,
L.J ., Grove, R.A and Thompson, S.P
.
(1991). Accumulation of trace elements and organochlorines
by surf scoters wintering in the Pacific Northwest . North-
wr .rt. Naturalist 72, 43-60
.
Henny, C .J .,
Hill, E.F ., Hoffman, D .J ., Spalding, M .G. and
Grove, R.A (2002). Nineteenth century mercury: Hazard to
wading birds and cormorants of the Carson River, Nevada
.
Ecotoxieology 11, 213--31
.
Hobson, K.A. (1990). Stable isotope analysis of marbled
murrelets: Evidence for freshwater feeding and determina-
tion of trophic level
. Condor 92, 897-903 .
Hohson, K . A. and Scaly, S. (1991). Marine protein contribu-
tions to the diet of Northern Saw-whet Owls on the Queen
Charlotte Islands : A stable isotope approach
.Auk 108, 437-
40 .
Hobson, K.A., Sirois, J. and Gloutney, ML . (2000). Tracing
nutrient allocation to reproduction with stable isotopes: A
preliminary investigation using colonial waterbirds of Great
Slave Lake
. Auk 117, 760-74
.
Hobson, K.A. (1987). Use of stable-carbon isotope analysis to
estimate marine and terrestrial protein content in gull diets
.
Can. J. Zool . 65, 1210-13 .
Hohson, K.A. (1993). Trphic relationships among high Arctic
seabirds: Insights from tissue-dependent stable-isotope
models
. Mar_ Ecol. Prog
. Sec 95, 7-18
.
Hobson, K.A ., Hughes, K.D, and Ewins, P .J. (1997). Using
stable-isotope analysis to identify endogenous and exoge-
nous sources of nutrients in eggs of migratory birds :
Applications to Great Lakes contaminants research
. Auk
114,467-78 .
Hoffman, R.D. and Curnow, R.D. (1979). Mercury in herons,
egrets and their foods. J. Wild(. Manage. 43, 85-93 .
Jackson, T.A. (1988)_ The mercury problem in recently formed
reservoirs of northern Manitoba (Canada): Effects of
impoundment and other factors on the production of
mcthylmercury by tnicoorganisns in sediments
. Can. J.
Fish . Aquat. Sci. 45, 97 121
.
Kambamandi-Dim ou, A., Kamarianos, A. and Kilikidis. S
.
(1991). Transfer of mcthylmercury to hens' eggs after oral
administration
. Bull. En 'iron-Coolant Tnxieol .46, 128-33
.
Kamman, N. and Engstrom, D. (2002). Historical and present
fluxes of mercury to Vermont and New Hampshire lakes
inferred from 21 OPh dated sediment cores . Alm
. Environ
. 36,
1599-1609 .
Kamman, N.C ., Burgess, N.M ., Driscoll, C.T., Simonin, H.A .,
Goodale, W . M., Linchan, J., Estahrook, R ., Hutcheson,
M., Major, A., Scheuhammer, A.M. and Sermon, D.A
.
(2005). Mercury in freshwater fish of northeast North
America - :t geographic perspective based on fish tissue
monitoring databases . Eemovicology 14, 163-80 .
Kenow, K.P .,
Gutreuter, S., Hines, R.K .,
Meyer, M.W.,
Fournier, FF and Karasov, W.H. (2003). Effects of methyl
mercury exposure on the growth ofjuvenile common loons
.
Ecotoxicologr 12, 171-82
.
Ken.. .
K .P .,
Gutrcutcr, S .. Hines,
R.K .,
Meyer, M.W .,
Foamier, F- and Karasov, W.H . (2003). Effects of methyl
mercury exposure on the growth ofjuvenile common loons
.
Eaotoxieologv 12, 171-82
.
Kidd, K . A. (1998). Use of stable isotope ratios in freshwater
and marine biotnagnification studies . In J. Rose (eds).
Environmental toxicology Current developments., pp- 357-
376. Amsterdam: Gordon Breach Science
.
Knight, R . L., Randolph, P .) ., Allen. G . T., Young, L.S. and
Wigen, R .J. (1990) Diets of nesting bald eagles, Haliaeetms
leucocepludus, in western Washington. Can . Field-Nat . 104,
545-51
.
Kozic, KU. and Anderson, R . K. (1991). Productivity, diet, and
environmental contaminants in bald eagles nesting near the
Wisconsin shorelinc of take Superior
. Arch . Environ . Con-
tern- To.dcof 20, 41-48 .
Kramer, D-, Goodale, W., Kennedy,W.L., Carstensen, B, and
Kaur, 1'. (2005). Relating land cover characteristics and
common loon mercury levels using Geographic Information
Systems . Ecrnoxieologv 14, 253-62.
Lamhorg, C.H ., Fitzgerald, W.F., Skoog, A. and Visscher, P.T
.
(2005). The abundance and source of mercury-binding
organic ligands in Long Island Sound
. Marine Chem. (in
press) .
Lane, OP., Evers, D.C ., Alhano, D., Haines, T. and Taylor, R .
(2004). Belted kingfishers
(Ceryle alcyon) as indicators of
mcthylmercury availability in aquatic systems. Unpubl. re-
port BRI 2004-13 submitted to the Maine Department of
Environmental Protection- BioDiversity Res . Inst., Gor-
ham, Maine
.
Langis, R., Langlois, C, and Morneau, F. (1999). Mercury in
birds and mammals. In M. Lucott, R. Schetagne, N. The-
rien, C. Langlois and A- Tremblay (eds)
. Mercury in the
biogeoehemiral cycle ., pp. 131-144. New York: Springer
.
Lobring, L.B& and Potter, B .B. (1991). Method 245.6. Rev. 2 .3
Determination
of
mercury in tissues
by cold vapor atomic
absorption
.spectrometry
.
USEPA/600/4-91/010. Methods
for the determination of metals in environmental samples,
pp. 281-293. Washington, D.C
.
Lucoue, M ., Schetagne, R., Thericn, N„ Langlois, C. and
Tremblay, A., (eds). (1999)- Mercury
in the hiogeodtemical
c-ele- New York, Springer-
Mason, R., Abbot, M., Bodaly, D., Bullock, R ., Driscoll, C .
.
Evers, D., Lindherg, S., Murray, M . and Swain, E. (2005)
.
Monitoring the environmental response to changes in mer-
cury contamination from the atmosphere: A multi-media
challenge .
Environ
. Sci. Technol .
39: 15A-25A
.
Meyer, M.W., Evers, D.C., Daulton, T. and Braselton, W.E
.
(1995). Common loons
(Gavia immer)
nesting on low pH
lakes in northern Wisconsin have elevated blood mercury
content .
Water, Air, Sail Pollut
80, 871-80
.
Meyer, M .W ., Evers, D.C ., Hartigan, J .J. and Rasmussen, P .S .
(1998). Patterns of common loon
(Gavia immer)
mercury
exposure, reproduction, and survival in Wisconsin, USA
.
Environ . Toxicol
.
Chem. 17, 184-90 .
Miller, E.K ., VanArsdale, A ., Keeler,
1 .G., Chalmers, A .,
Puissant, L., Kamman, N. and Brulotte, R. (2005). Esti-
mation and mapping of wet and dry mercury deposition
across northeastern North America
.
Ecatoxicology 14 .
Mizutani, H., Fukuda, M., Kabaya, Y. and Wads, E . (1990) .
Carbon isotope ratio of feathers reveals feeding behavior of
cormorants
.
Auk
107, 400
.37
.
Monteiro, L.R. and Furness, R. W. (1995). Seabirds as monitors
of mercury in the marine environment,
Water Air Soil
Polhrt .
80, 851-70 .
Monteiro,
L.R. and Furness, R. W. (1997). Accelerated increase
in mercury contamination in North Atlantic mesopelagic
food chains as indicated by time series of seabird feathers
.
Environ . Toxicol. Chem.
16,2489-93
.
Monteiro, L.R. and Furness, R.W. (2001). Kinetics, dose-
response, excretion, and toxicity of methylmercury in free-
living Cory's shearwater chicks
.
Environ. Toxicol. Chem .
20,
1816-24.
Moore, D.R .J
., Sample,B.E ., Suter,G.W ., Parkhurst, B.R. and
Teed, R.S. (1999). A probabilistic risk assessment of the
effects of methylmercury and PCBs on mink and kingfishers
along East Fork Poplar Creek, Oak Ridge, Tennessee, USA
.
Environ . Toxicol.
Chem. 18, 2941-53 .
Morel, F.M ., Kraepiel, A.M. and Amyot, M. (1998). The
chemical
cycle
and bioaccumulation of mercury
.
Annu. Rev.
Ecol . Syst
29, 543-66.
Nichols, J. and Bradbury, S. (1999). Derivation of wildlife
values for mercury . J .
Toxicol
. Environ. Health, Part B, 2,
325-55 .
Nisbet, I.C.T., Montoya J, P., Burger, ). and Hatch, J.J. (2002)
.
Use of stable isotopes to investigate individual differences in
diets and mercury exposure among common terns
Sterna
hirundo in
breeding and wintering grounds .
Marine Enrol.
Progress Ser
.
242, 267-74
.
Ohlendorf, H .M
., Lowe, R.W., Kelly, P.R. and Harvey, T.E .
(1986). Selenium and heavy metals in San Francisco Bay
diving ducks .
J. Wild!. Manage .
50, 64-71
.
Pearce, P.A., Price, 1 .M . and Reynolds, L.M . (1976). Mercury
in waterfowl from eastern Canada . J
.
Wildl. Manage .
40,
694-703 .
Piper, W ., Paints,
1.D ., Evers, D.C., Meyer, M.W
., Tishler,
K.B ., Klich, M. and Hartigan, J .J . (1997) . Local movements
of color-marked common loons
.
J.
Wild!. Manage .
61,
1253-61 .
Pokras, M.A ., Hanley, C. and Gordon, Z. (1998). Liver mer-
cury and methylmercury concentrations in New England
common loons
(Gavin immer) . Environ . Toxicol. Chem. 17,
202-04 .
Mercury exposure in Northeast North America 219
Pokras, M.A ., Rohrbach, S., Press, C., Chard, R., Perry, C.
and Burger, J. (1992) .
Environmental pathology of 124
common loons from the northeastern United States 1989-
1992The loan and its ecosystem: Status, management, and
environmental concerns, pp .
20-33. Concord, New Hamp-
shire: U.S. Fish Wildl. Serv .
Porvari, P., Verta, M., Munthe, J. and Haapancn, M . (2003).
Forestry practices increase mercury and methyl mercury
output from boreal forest catchments
.
En viron. Sci. Technol.
37,2389-93 .
Reynolds, K.D .,
Rainwater, T.R., Scollon, E.1 ., Sathe, S.S .,
Adair, B.M. and Dixon, K.R. (2001). Accumulation of
DDT and mercury in prothonotary warblers
(Protonomrio
citrea)
foraging in a heterogeneously contaminated arvi-
ronment.
Environ. Toxicol . Chem .
12, 2903-09.
Rimmer, C.C., McFarland, K.P ., Evers, D.C., Miller, EX
.
Aubry, Y., Busby, D. and Taylor, R
.J . (2005). Mercury
levels in Bicknell's thrush and other insectivorous
passerine
birds in montane forests of the
northeastern
United States
and Canada .
Ecatoxicology
14: 223-40 .
Rumbold, D.G ., Niemczyk, S.L., Fink, L.E., Chandrasckhar,
T., Harkanson, B. and Lane, K.A. (2001). Mercury in
eggs and feathers of great egrets
(Arden alhus)
from the
Florida Everglades
.
Arch .
Environ
.
Contam
.
Toxicol. 41,
501-07 .
Louis, V.L.St., Rudd, JW.M., Kelly, C.A ., Hall, R.D ., Roflus,
K.R., Scott, K .J ., Lindberg, S.E. and Dong, W. (2001).
Importance of the forest canopy to fluxes of methyl mercury
and total mercury to boreal ecosystems .
Environ . Si.
Technol.35,3089-98 .
SAS Institute, Inc. (2001) .
JMP Version 4.01,
Cary, North
Carolina, SAS Institute Inc.
.
Scheuhammer, A.M. (1987). The chronic toxicity of aluminum,
cadmium, mercury, and lead in birds : A review .
Environ.
Pa1lut .
46,263-95 .
Scheuhammer, A.M. (1988). Chronic dietary toxicity of meth-
ylmercury in the zebra finch,
Poephila guffaw. Bull. Environ
.
Conwm. Toxicol .
40, 123-30.
Scheuhammer, A.M. and Blancher, P.) . (1994)
.
Potential
risk
to common loons
(Gavia immer)
from methylmercury
exposure in acidified lakes
.
Mydrohiologia
279/280, 445-
55 .
Scheuhammer, A.M ., Perrault, 1A. and Bond, D . E. (2001)
Mercury, methylmercury, and selenium concentrations in
eggs of common loons
(Gavia immer)
from Canada.
Envi-
ron. Moral. Assess
.
72, 79-84 .
Scheuhammer, A.M ., Wong, A.H.KK and Bond, D. (1998a) .
Mercury and selenium accumulation in common loons
(Gavia
immer) and common mergansers
(Mergus mergan-
ser)
from eastern Canada
.
Environ. Toxicol.
Chem. 17,
197-201
.
Scheuhatmncr, A.M .,
Atchison,
C.M ., Wong, A .H .K. and
Evers, D.C. (1998b). Mercury exposure in breeding com-
mon loons (Gavin
immer)
in central Ontario, Canada .
Environ . Toxicol.
Chem. 17, 191-96
.
Schmutz, 1.A. and Hobson, K .A. (1998). Geographic, tempo-
ral, and age-specific variation
in
diets of glaucous gulls
in
western Alaska
.
Condor 100,
119-30
.
220
Evers et a! .
Schuster, P.F., Krabbenhoft, D.P., Nafiz, D- L., Cecil, L.D .,
Olson, M.L ., Dewild, 1.F., Susong, D.D., Green, J.R. and
Abbott, M.L. (2002) .
Atmospheric mercury
deposition
during the last 270 years : A glacial
ice core record of
natural and anthropogenic sources .
Environ . Sci. Tech.
36,
2303-10 .
Seilcr, R.L., Lico, M .S., Wiemeycr, S.N. and Even, D.C .
(2004). Mercury in the Walker River Basin, Nevada and
California-Sources, distribution, and potential effects on
the ecosystem
.
U.S. Geo. Sure-, Sri. Invest . Rept. 2004-5147 .
Shriver, W . G., Evers, D.C. and Hodgman, T.P. (2002). Mer-
cury exposure profile for Sharp - tailed Sparrows breeding
in coastal Maine salt marshes . Unpuhl . report BRI 2002-I I
submitted to the Maine Dept. Environ- Protection
. BioDi-
versity Res. Inst., Gorham, Maine
.
Spalding, M.G ., Frederick, P.C: ., McGill, H.C., Bouton, S.N.
and McDowell, L .R. (2000a). Methylmercury accumulation
in tissues and its effects on growth and appetite in captive
great egrets.
J. Wild! .
Di.v. 36, 411-22.
Spalding, M.G ., Frederick, P.C ., McGill, H.C ., Bouton, S.N .,
Richey, L .1 ., Schumacher, LM., Blackmore, C-QM. and
Harrison, 1. (2000h). Histological, neurologic, and imuno-
logic effects of methylmercury
in captive great egrets .
J
.
Wild!- Dis.
36, 423-35
.
Stoewsand, G . S., Bache, C .AA
and Lists, D .3. (1974). Dietary
selenium protection of methylmercury intoxication of Jap-
anese quail
.
Bull. Environ . Contam. Toxicol.
11, 152-56.
Sundlof, S . F., Spalding, M.G ., Wentworth, J.D, and Steible,
C.K. (1994). Mercury in livers of wading
birds (Ciconii-
formes) in southern Florida-
Arch. Environ. Contara . Taxi-
col.
27, 299-305 .
Thompson, D.R (1996)-
Mercury in birds and terrestrial
mammals. In W.H. Beyer, G.H-Hcinz and A .W. Redmond-
Norwood (eds)
.
Environm ntal contaminants
in wildlife :
Interpreting !issue concentrations, pp-
341-356. Boca Raton,
Florida: Lewis Publishers
.
Thompson, D.R. and Furness, R . W. (1989)
. Comparison of
total and organic mercury levels in seabird feathers
.
Marine
Pollut. Bull.
20, 577-79.
Thompson, D .R ., Hamer, K.C. and Furness, R.W. (1991)
Mercury accumulation in great skuas
Catharacia skua
of
known age and sex, and its effect upon breeding and
sur-
vival .
J. App!. Ecol
.
28, 672-84 .
Thompson, D.R ., Stewart, F.M. and Furncss, R.W. (1990).
Using seabirds to monitor mercury in marine environments
:
The validity of conversation ratios for tissue comparisons
.
Marine Pollut . Bull
.
21, 339-42 .
United Nations Environment Programme- (2003)
.
Global mer-
cury assessment.
Geneva, Switzerland, UNEP Chemicals
.
U .S. EPA. (1997) .
Mercury study sport to Congress.
EPA-452/
R-97-008. U .S Environ . Protection Agency . Washington,
D.C .
U .S. EPA. (1998) .
Mercury in solid% and solutions by thermal
decomposition, amalgamation, and atrnnic absorption spec-
trophotometry.
Method 7473- U.S
.
Environ. Protection
Agency, Washington, DC-
US. EPA. (2002). Workshop on the fate, transport, and trans-
formation ofmercury in aqua tic and terrestrial environments
.
EPA/625/R-02/005. U .S. Environ. Protection Agency, Cin-
cinnati, OH and U-S . Geological Survey, Reston, Virginia
.
U.S. Fish and Wild life Service (2003).
Evaluation ofthe Clean
Water Act Section
304(a)
human health
criterion for meth-
ylmercury :
Protectiveness for threatened
and endangered
wildlife
in California .
Sacramento, California, U .S .
Fish
Wild[. Serv
.
.
VanArsdale, A ., Weiss, 1., Keeler, G .J ., Miller, E.K ., Boulet,
G., Brulotte, R. and Puissant, L. (2005). Patterns of mer-
cury deposition in northeastern North America
.
Ecotoxi-
cology
14, 37-52 .
Wayland, M., Gilchrist, H.G ., Marchant, T., Keating, J. and
Starts, J.E. (2002)- Immune function, stress
response, and
body condition in arctic-breeding common eiders in relation
to cadmium, mercury, and selenium concentrations
.
Envi-
ron.
Research
Section A
90, 47-60 .
Weech, S . A., Scheuhammer, A .M., Elliot, 1.E. and Cheng,
K.M. (2004)- Mercury in fish from the Pinchi
Lake re-
gion, British Columbia,
Canada .
Environ
.
Pulhu .
131,
275-86 .
Welch, L. (1994)
.
Contaminant hardens and reproductive rates of
bald eagles breeding in Maine .
M.S. thesis, Univ. Maine,
Orono, Main,
.
Wiemeycr, S.N ., Lamont, T.G., Bunck, C.M ., Sindelar, C.R .,
Gramlich, F.J
., Fraser, J. D. and Byrd, M.A. (1984). Orga-
nochlorine pesticide, polychlorobiphenyl, and mercury res-
idues in
bald eagle eggs -
1969-1979
-
and their
relationships to shell
thinning and reproduction
.
Arch
.
Environ. Contain. Toxicol .
13, 529-49.
Wiener, J.G. and Shields, P .1. (2000). Mercury in the Sudbury
River (Massachusetts U.S.A .) : Pollution history and syn-
thesis ofrecent research
.
Can . J . Fish
.
Ayuat.Sci.57,1053-61 .
Wiener, 1G. and Spry- D]- (1996) . Toxicological significance
of mercury in freshwater fish . In W.N. Beyer, G.H
. Heinz
and A W. Redmon-Norwood (eds)
.
Environmental contam-
inants fn mild/ii/cc Interpreting tissue concentrations,
pp. 297-
339. Boca Raton, Florida: Lewis Publishers
.
Wiener, J . G., Martini, R.E .,
Shelly, T.B. and Glass, G.E
.
(1990). Factors influencing mercury concentrations
in
walleyes in northern Wisconsin lakes
.
Trans. Am .
Fish. So,
.
119, 862-70
.
Wiener,
1.G.,
Krabbenhoft, D. P., Heinz, G.H. and Scheu-
hammer, A.M. (2003) .
Ecotoxicology of mercury. In D .J .
Huffman, B.A. Rattner, G.A. Burton Jr. and J. Cairns Jr.
(ads). Handbook of ecotaxieology .,
pp. 409-463. Boca Ra-
ton, Florida: Lewis Publishers
.
Winfrey, M.RR and Rudd, J .W.M . (1990). Environmental
five-
ban
affecting the formation of methylmercury in low pH
lakes .
Environ. Toxicol. Chem
. 9,
853-69 .
Wolfe, M .F . and Norman, D . (1998)
.
Effects of waterborne
mercury on terrestrial wildlife at Clear Lake : Evaluation
and testing of a predictive model .
Environ. Toxicol. Chem
.
17,214-27.
Wolfe, M.F ., Schwarzhaeh, S-and Sulaiman, R-A . (1998). Ef-
fects of mercury on wildlife :
A comprehensive review
.
Environ. Toxicol . Chem .
17, 146-60 .
Xun, L., Campbell, N .E.R. and Rudd, J.W.M
. (1987). Mea-
surement of specific rates of net methy[mercztry production
Mercury exposure in Northeast North America
221
in the water column and surface sediments of acidified and
Zar, J.H. (1999) .
Rio.statistical analysis
.
Prentice Hall, tipper
circumneutral lakes
.
Can. J. Fish. Aquat. Sci. 44, 75(1-57
.
Saddle River, New Jersey
.
Arch. Environ. Contam. Toxicol. 44, 257-264 (2003)
DOI :
10.1007/s00244-002-2021-6
Embryotoxic Thresholds of Mercury : Estimates from Individual Mallard Eggs
G. H. Heinz, D. J. Hoffman
Patuxent Wildlife Research Center, U .S. Geological Survey, 11510 American Holly Drive, Laurel, Maryland 20708-0017,
USA
Received: 9 February 2002/Accepted: 12 June 2002
Abstract. Eighty pairs of mallards (Anas platyrhynchos) were
fed an uncontaminated diet until each female had laid 15 eggs .
After each female had laid her 15th egg, the pair was randomly
assigned to a control diet or diets containing 5, 10, or 20 µg/g
mercury as methylmercury until she had laid a second set of 15
eggs. There were 20 pairs in each group. After the second set
of 15 eggs, the pair was returned to an uncontaminated diet,
and the female was permitted to lay another 30 eggs . For those
pairs fed the mercury diets, the even-numbered eggs were
incubated and the odd-numbered eggs were saved for possible
mercury analysis. Mercury in the even-numbered eggs was
estimated as the average of what was in the neighboring odd-
numbered eggs. Neurological signs of methylmercury poison-
ing were observed in ducklings that hatched from eggs con-
taining as little as 2.3 pg/g estimated mercury on a wet-weight
basis, and deformities were seen in embryos from eggs con-
taining about I p
.g/g estimated mercury . Although embryo
mortality was seen in eggs estimated to contain as little as 0 .74
p
.g/g mercury, there were considerable differences in the sen-
sitivity of mallard embryos, especially from different parents,
with some embryos surviving as much as 30 or more p.g/g
mercury in the egg .
Mercury contamination of eggs has been suspected as a cause
of impaired reproduction in wild birds (Barr 1986 ; Fimreite
1974), but associations between mercury levels in eggs and
reproductive problems in field studies are complicated by the
presence of other environmental stressors that may have an
effect. Consequently, the results from controlled laboratory
studies with mallards, black ducks
(Anus rubripes),
ring-
necked pheasants (Phasianus colchicus), and chickens (Gal-
lus gallus) have been used to help establish the concentrations
of mercury in eggs that are associated with effects on avian
reproduction (Heinz 1974, 1976, 1979; Finley and Stendell
1978; Fimreite 1971 ; Tejning 1967). The laboratory data have
been used as a guideline for whether the mercury concentra-
tions found in the eggs of wild birds might be harmful (Eisler
2000; Henny el al . 2000; Meyer el al. 1998; Scheuhammer
el
Correspondence to: G.
H.
Heinz; email' gary
heinz@usgs.gov
al. 2001; Thompson 1996; Wiemeyer el al. 1984; Wolfe el al
.
1998) .
In past laboratory studies with mallards, groups of breeding
adults were fed different concentrations of methylmercury, and
a mean mercury level was calculated from a sample of eggs
from each group (Heinz 1974, 1976, 1979; Heinz and Hoffman
1998). When reproductive success of a group was significantly
less than that of controls, the mean mercury level in eggs from
that group was judged to be a harmful level . However, indi-
vidual embryos likely differ in their sensitivity to methylmer-
cury. As long as laboratory-generated findings with methyl-
mercury continue to be used to help protect the reproductive
success of wild birds, especially species that cannot tolerate
much reproductive loss because their numbers are already low,
it is important to know how sensitive individual embryos can
be .
Our primary objective was to estimate the lowest concentra-
tions of mercury in mallard eggs that would harm the most
sensitive embryos. Our secondary objective was to determine
how variable individual mallard embryos are in their sensitivity
to methylmercury .
Materials and Methods
Care of Adults and Administration of Mercury Diets
Eighty breeding pairs of I-year-old mallards
(Anas platyrhynchos)
(Kidder Game Farm, Milton, WI) were randomized to I m 2 outdoor
breeding pens on April 15, where they had access to flowing water and
a commercial game bird breeder diet (Purina Mills, St. Louis, MO)
.
The diet contained about 20% crude protein, 2 .5% crude fat, and 7%
crude fiber. On April 24 we began collecting eggs from each pair . Eggs
were labeled, stored in a Kuhl egg cooler (Flemington, NJ) at about
13-14°C, and at weekly intervals incubated in a Kuhl incubator at a
temperature of 37 .5°C and a relative humidity of about 54% . On day
25 of incubation we transferred the eggs to a Kuhl hatcher set at a
temperature of 37 .2°C and a relative humidity of about 70%
.
Each of the 80 pairs was fed the untreated commercial diet until the
female had laid 15 eggs. These first 15 eggs served to establish
baseline data on the hatching success of each pairs' eggs prior to the
start of mercury treatment. On the day a female laid her 15th egg, that
pair was randomly assigned to one of the four treated diets : a control
diet or diets containing 5, 10, or 20 p
.g/g mercury as methyhnercury
chloride. Methylmercury has been shown to be the main form of
A R H I V E S O F
Environmental
Contamination
a n d
Toxicology
0 2003
springer-Verlag New York
Inc.
258
mercury found
in the eggs of wild birds (Rumbold
et at
2001
;
Scheuhammer et a! . 2001). Each treatment had 20 pairs of ducks. The
dietary concentrations of mercury we used, especially the 10 and 20
p-g/g treatments, were higher than had been used in some previous
studies with mallards (Heinz 1974, 1976, 1979), but these concentra-
tions were selected because we wanted mercury levels in eggs to
increase greatly over a short period of time
.
The methylmercury diets were prepared by first dissolving methyl-
mercury in a small amount of acetone and then in a larger volume of
corn oil. These solutions were then mixed with the breeder diet to
make premixes, which were kept frozen until needed . The premixes
were blended into a larger volume of breeder diet to make the final
diets; these final diets contained about 0.2% corn oil. Two samples of
each diet were analyzed to confirm the concentration of mercury . The
samples of control diet were reported to contain less than 0 .02 µg/g
mercury. Recovery of mercury from the three treated diets averaged
89%. Mercury was analyzed .by cold-vapor atomic absorption spec-
trophotometry at the Patuxent Analytical Control Facility, located at
the Patuxent Wildlife Research Center .
For the 20 pairs selected to receive each of the three mercury-treated
diets, only the first 14 eggs were incubated to establish a baseline for
hatching success; the 15th egg was saved for possible mercury anal-
ysis. For the 20 pairs of controls, all of the first 15 eggs, plus all later
eggs, were incubated . Eggs 16 through 30 were collected while the
female was being fed her treated diet. On the day the 30th egg was laid,
the pair was switched back to an untreated diet, and the female was
allowed to lay another 30 eggs or until July 16, when the study was
terminated. For those females switched to one of the three mercury-
containing diets, we only incubated their even-numbered eggs and
saved their odd-numbered eggs for possible mercury analysis .
Determining the concentrations of mercury that harmed individual
eggs required some way of estimating how much mercury was in an
egg while still allowing that egg to go through all the stages of
incubation, hatching, and duckling survival. Our approach to estimat-
ing the mercury concentration in an incubated, even-numbered egg
was to take the average of the mercury in the odd-numbered egg laid
the day before and the odd-numbered egg laid the day after the
even-numbered egg. During the period when an egg-laying female was
on a constant methylmercury diet, mercury levels in eggs would be
increasing; once the mercury diet was stopped mercury in eggs would
decrease. In either case, the average of the mercury between the
previous egg and subsequent egg should give a good estimate of what
was in the unanalyzed egg
.
We examined the fate of all the control eggs and all the even-
numbered eggs of mercury-treated pairs . After eggs hatched, the
ducklings were banded and kept for 6 days in heated pens provided
with flowing water and untreated duck starter diet (Purina Mills)
.
Because many hundreds of odd-numbered eggs were saved for poten-
tial mercury analysis, it was not feasible to have them all analyzed for
mercury. Therefore, after the study of the hatching success of the
even-numbered eggs and the 6-day survival of ducklings was com-
pleted, we carefully examined the fate of the eggs from each of the
mercury-treated females . Some of the pairs had poor hatching success,
even prior to being put on their mercury diets. We did not analyze
many odd-numbered eggs from these poor-achieving pairs because
failure of an egg to hatch could just as easily have been due to chance
as to mercury poisoning. We limited most of our mercury analyses of
odd-numbered eggs to situations where an even numbered egg (I)
produced a deformed embryo, (2) produced a duckling that displayed
neurological signs of methylmercury poisoning, or (3) failed to hatch
when a series of eggs laid before it did hatch . In addition, with a few
exceptions that are noted in the Results and Discussion, we did not
include estimates of mercury in even-numbered eggs when more than
I day
separated the laying of the even-numbered egg from the laying
of the neighboring odd-numbered eggs. Our estimates of mercury in
these selected, even-numbered eggs were most likely to provide in-
formation related to true mercury toxicity, as contrasted to the normal
G . H. Heinz and D. J. Hoffman
amount of embryo mortality that even controls might be expected to
suffer during incubation. Even with these restrictions, we analyzed
over 200 odd-numbered eggs for mercury and related the estimates of
mercury in even-numbered eggs to the toxic effects listed later .
Neurological Signs
The feeding of methylmercury to breeding mallards and black ducks
has been shown to produce neurological signs related to characteristic
brain lesions in some of their ducklings (Heinz and Locke 1976 ; Finley
and Stendell 1978). Affected ducklings may appear normal when
hatched, but within I to 3 days they begin to lose coordination and
stagger about. In several studies, including the current one, we have
never seen a control mallard duckling exhibit these neurological signs
.
Therefore, when ducklings from mercury-treated parents in the current
study began to lose balance and stagger, this was an almost certain sign
that they had been poisoned by methylmercury
.
Deformities
Methylmercury has been reported to cause various kinds of deformi-
ties in mallard embryos, but deformities also occur in a small percent-
age of control ducklings (Heinz and Hoffman 1998; Hoffman and
Moore 1979). In one large study with mallards, 6.1% of 1-week or
older control embryos exhibited some form of deformity, primarily
hydrocephaly (Heinz and Hoffman 1998) . In the same study, 16.4% of
the embryos from parents fed 10 p.g/g mercury as methylmercury were
deformed, many exhibiting deformities not seen in controls . In the
current study, we could not be as certain that deformed embryos were
caused by mercury as we were that neurological signs were the result
of mercury in the egg .
Failure of Eggs to Hatch
Not all eggs, even controls, can be expected to hatch. A hatch of
70-80% of fertile control eggs is a good hatch for mallards (Gile and
Meyers 1986; Heinz 1979; Heinz and Fitzgerald 1993; Heinz and
Hoffman 1998). Therefore, to reduce the likelihood that the failure of
an egg to hatch was unrelated to mercury treatment, we included data
only for those pens that had a proven record of good hatching success
prior to the switch to the mercury diets. After subtracting out the one
or two unusable eggs that were occasionally cracked or infertile among
the first 14 laid by the mercury-treated females, we defined good
hatching success as there being no more than I unhatched egg out of
the first 12, 13, or 14 usable eggs . Although not as certain an indicator
of methylmercury poisoning as the exhibiting of neurological signs,
the failure of an egg to hatch (when other uncontaminated or less
contaminated eggs laid before or after this egg did hatch) provided
information on threshold levels of mercury in mallard eggs that cause
harm.
Mercury in Eggs That Hatched and from Which the
Hatchlings Survived 6 Days
Although the main purpose of our study was to determine the lowest
concentrations of mercury that harmed the most sensitive mallard
embryos, we also were interested in how much embryos could differ
in their sensitivity to mercury. One way to examine this variability was
to determine how much mercury could be in an egg that did hatch and
the duckling survived for the 6-day observation period. When an
Mercury Thresholds in Eggs
embryo died or was deformed, we could not be absolutely certain that
mercury was to blame. In contrast, we did know with absolute cer-
tainty when the estimated level of mercury in an egg did not
kill an
embryo, cause a deformity, or cause neurological signs
in the hatch-
ling. By examining the concentrations of mercury in eggs
that pro-
duced healthy 6-day-old ducklings, we were able to understand how
different mallard embryos can be in their sensitivity to methylmercury
.
Results and Discussion
Neurological Signs
The lowest estimated mercury concentration
in an egg that
produced a duckling with neurological signs was 2.3 pg/g on a
wet-weight basis and the highest value was 30 p.g/g (Table 1) .
Given the specificity of this sign as something seen in previous
studies only in mercury-poisoned ducklings, we believe the
ducklings listed in Table I were poisoned by mercury and the
estimated mercury levels in eggs produced these neurological
problems. There were no control ducklings in this study
that
ever exhibited a loss of balance and staggering
. Also, in the
three groups that were switched to mercury-treated diets, there
were no ducklings that exhibited neurological signs when they
hatched from eggs laid prior to the start of the mercury diets .
Most of the ducklings that exhibited signs of mercury poison-
ing hatched from eggs 22 through 30, which was during the
period when mercury was in the diet of the mothers. Two
ducklings that exhibited neurological signs hatched from eggs
that were laid shortly after the cessation of the mercury diet
.
Deformities
The lowest estimated mercury concentration associated with a
deformed embryo was 0.93 µ.g/g on a wet-weight basis and the
highest value was 18 µg/g (Table 2). The estimate of 0.93 pg/g
for egg number 62-48 (the 48th egg laid by female number 62)
was based on the average between a value of 0.935 for egg 47
and 0.926 for egg 49. Egg 62-46 also produced a deformity and
contained only 1 .0 pg/g mercury, which was the average
between values of 1 .15 pg/g for egg 62-45 and 0.935 pg/g for
egg 62-47. These two estimates seem to be very accurate
averages based on mercury in the neighboring odd-numbered
eggs. Female 62 also produced deformed embryos in her 20th
egg, which contained 3.7 pg/g mercury, and in her 54th egg .
The 54th egg is not listed in Table 2 because the odd-numbered
neighboring eggs were not analyzed for mercury, but we know
that the 54th egg almost certainly contained less mercury than
the value of 0.926 pg/g reported for egg 49. The embryo from
this 54th egg was badly deformed, with short legs, extra toes,
a spoon-shaped upper bill, and an abnormal right wing . An
unusual pattern of embryotoxic responses was seen in the eggs
from female 62 in that, after egg number 20, which had a
deformed embryo, eggs 22, 24, 26, and 30 (which would have
contained more mercury than 22) all hatched . Egg number 28
was infertile. All of the even-numbered eggs from 32 through
44 also hatched, but they would have had more mercury than
egg numbers 46, 48, and 54, which produced deformed em-
Table l. Estimated mercury concentration in eggs that produced
ducklings that exhibited neurological signs of methylmercury poi-
soning
259
:, The pen number of the female that laid the egg, followed by the egg
number (according to the sequence in which the eggs were laid)
.
b The concentration of mercury in the egg producing this duckling was
estimated by taking the average of the mercury in the egg laid the day
before and the egg laid the day after this egg.
bryos. We do not know why, but the embryos from this female
seemed to be very different in their sensitivity to mercury
.
Another female's egg (65-16) also produced
a deformed
embryo and contained an estimate of only 1 .0 pg/g mercury .
The 15th
egg by
female 65 was laid the day before the mercury
treatment was started and was reported to contain 0 .0278 pg/g
mercury. The 17th egg was reported to contain
2.06 pg/g
mercury. The estimate, based on eggs
15 and 17, could be
biased toward the low side because the 15th egg was
a pre-
treatment egg, and mercury could have jumped considerably by
the 16th egg. Like female 62, female 65 also had an unusual
pattern of embryotoxic effects in her eggs, suggesting differ-
ences in sensitivity among siblings . After egg 16, eggs
18, 20,
and 22 all hatched. Thereafter, all of her eggs failed to hatch,
either because they died (in two cases) or were infertile
in all
the rest.
In addition to the deformities listed in Table 2 or discussed
so far, there were four additional embryos
from mercury-
treated parents that exhibited deformities, but either the neigh-
boring eggs were not analyzed or the neighboring eggs were
not laid within I day of the egg that produced the deformed
embryo. One of these deformities, in the 32nd egg laid by a
female fed 5 pg/g mercury was a deformed ball of tissue
without any limbs. Only the 33rd egg from this
female was
analyzed and it contained 1 .1 pg/g mercury; therefore, the
deformed 32nd egg probably contained somewhat more than
1 .1 pg/g mercury because it was laid one day closer to the time
when the female was still being fed mercury
.
A second additional embryo, from the 30th egg laid by
a
female fed 5
tg/g mercury, had a clubbed right foot
that
Concentration of
Mercury in Parents'
Diet (pg/g)
Female's Pen
Number-Egg
Number'
Mercury Estimated to
Have Been in Egg
(µg/g, wet weight)^
10
64-24
10
20
2-24
2.7
20
2-26
4.0
20
6-24
22
20
6-28
22
20
6-30
26
20
9-26
27
20
9-34
24
20
20-24
3 .6
20
20-26
3 .3
20
27-26
5 .4'
20
28-22
2.3
20
45-26
4 .1
20
46-30
8 .1
20
46-32
7.8
20
52-28
30
20
63-22
19
20
77-24
23
260
Table 2. Estimated mercury concentration in eggs that produced embryos with deformities
pointed backward plus rigid joints in its leg. It came from an
egg that was estimated to contain 8 .7 ag/g mercury, but the
estimate was based on the average mercury in the 29th egg
(10.1 log/g), which was laid 2 days prior to the egg with the
deformed embryo, and the 31st egg (7 .29 p.g/g), which was laid
I day after. If anything, the 30th egg may have had slightly
more mercury than the estimate.
A third embryo, from the 32nd egg laid by a female fed 10
p
.g/g mercury, had two heads partially fused together, a twisted
upper bill, and a deformed right wing . Only the 33rd egg was
analyzed for mercury, and it contained 12 p.g/g mercury .
Therefore, the deformed embryo came from an egg that prob-
ably contained somewhat more than 12 p.g/g mercury.
A fourth embryo, from the 16th egg laid by a female fed 5
p.g/g mercury, had a crossed bill and an indentation in the bill
.
The estimated value of only 0 .44 p.g/g mercury in this egg has
to be viewed with caution for a number of reasons . First,
deformities were limited to the bill. Second, the estimated
mercury concentration of 0.44 was arrived at by taking the
average of a value of 0 .87 p.g/g mercury measured in egg
number 17 and a value of 0.01 for egg number 15. Egg 15 was
laid while the female was still on its uncontaminated diet ; it
was reported to contain less than the detection limit of 0 .0198
p
.g/g mercury, and consequently was assigned the value of
0.01, which is one-half the detection limit . Because of the
uncertainty of how quickly mercury would build up in the very
first egg laid after the switch to the mercury-containing diet, it
is possible that the estimate of mercury in egg 16 was some-
what on the low side, but we can say with some assurance that
this egg contained less than the 0.87 p.g/g reported for the egg
laid the following day. Finally, after the deformed embryo from
egg number 16, eggs 18, 20, 22, 26, and 28 all hatched and
eggs 24 and 30 died; therefore, this female also had an irregular
history of embryotoxic effects
.
A total of three embryos from the 20 breeding pairs of
controls also were found to be deformed. Three deformed
embryos is a low number considering that all but 4 of the 20
pairs of controls produced 60 eggs, and the lowest of these 4
G. H. Heinz and
1) . J
.
Hoffman
a The pen number of the female that laid the egg, followed by the egg number (according to the sequence in which the eggs were laid)
.
b The concentration of mercury in the egg with this deformed embryo was estimated by taking the average of the mercury in the egg laid the day
before and the egg laid the day after this egg
.
still produced 48 eggs for incubation. One of the deformed
controls had a slightly shorter lower bill than upper bill, an-
other had a shorter upper bill plus exencephaly, and the third
was a case of conjoined twins with exencephaly and a crossed
bill .
Interpreting the results for deformities is clearly not as
straightforward as for neurological signs. Though we do not
rule out the possibility that as little as I p .g/g or even less
mercury did in fact cause the deformities we saw, at the same
time we believe these estimates should be taken with some
caution.
Failure of Eggs to Hatch
The lowest estimated mercury concentration in an egg that
failed to hatch was 0.74 pg/g on a wet-weight basis and the
highest value was 38 µg/g (Table 3). In addition to the mer-
cury-treated pens listed in Table 3, 10 of the 20 control pens
also met the criterion of having no more than one of their first
12-15 fertile eggs fail to hatch . Because the odd-numbered
eggs from control pens were incubated along with the even-
numbered eggs, there were as many as 15 eggs incubated from
eggs 16 through 30. The mean hatching success of this second
set of 15 eggs from the 10 control females was 89 .2%, with a
range from 80% to 100% . In only I of these 10 control pens did
2 eggs in a row fail to hatch. The uniformly high hatching
success of eggs 16 through 30 for this select group of control
pens suggests that it is unlikely that a series of eggs from the
similarly select group of mercury-treated females in Table 3
would have failed to hatch by chance alone . Almost certainly,
most of the eggs listed in Table 3 did die from mercury
poisoning.
The lowest value in the table, 0 .74 µg/g, came from pen 84,
which hatched all 14 of its first set of eggs and all of the
ducklings survived for 6 days . Based on this pretreatment
success, we would have expected egg 16 to hatch unless
Concentration of
Mercury in Parents'
Diet (pg/g)
Female's Pen
Number-Egg
Number"
Mercury Estimated
to Have Been in Egg
(Vg/g, wet weight) b
Description of Deformity
5
16-26
3.8
Twisted toe on right foot; abnormal right wing; body generally
underdeveloped
5
62-20
3.7
Elongated, spoon-shaped upper bill ; legs and feet abnormal
;
abnormal joint on right wing
5
62-46
1 .0
Spoon-shaped upper bill; hydrocephaly; short legs ; extra toes;
abnormal wings
5
62-48
0.93
Upper bill shorter than lower; short legs; extra toes ; abnormal
right wing
10
89-24
12
Lower bill longer; eyes poorly developed ; stunted body
;
deformed skull
20
52-22
15
Left wing does not extend; foot deformed
20
65-16
1 .0
One body sharing two fused heads; exencephaly; small eyes ;
deformed bill
20
77-22
18
Exencephaly; small right eye; lower bill longer and twisted
Mercury Thresholds in Eggs
Table 3. Estimated mercury concentration in eggs that failed to hatch
The pen number
of
the female that laid the egg, followed by the egg number (according to the sequence in which the eggs were laid)
.
b The numerator is the number
of
eggs that hatched, and the denominator is the number of fertile eggs that were incubated
.
` The concentration of mercury in the egg that failed to hatch was estimated by taking the average of the mercury in the egg laid the day before
and the egg laid the day after this egg
.
mercury killed the embryo. The estimated mercury value for
egg 84-16 was based on the average between the value of 0.009
lcg/g for the 15th egg (mercury was below the detection limit
of 0.0185 p.g/g, and the egg was assigned a value of one-half
the detection limit) and the value of 1 .48 p.g/g reported for the
17th egg. Even if the actual concentration of mercury in the
16th egg was closer to the 17th egg than to the 15th egg, it
would still have been somewhat less than the 1 .48 p
.g/g re-
ported for egg number 17, and this would still be the lowest
value in Table 3. What is peculiar about this pen is that eggs 18,
20, and 30 hatched, and they had estimated mercury values of
8.0, 22, and 31 jig/g. The embryos in eggs 22, 24, 26, and 28
all experienced some form of embryotoxic effect . . Even-num-
bered eggs 32 through 52 all hatched, and only one duckling
(84-32) failed to survive 6 days . The return to perfect hatching
success after the cessation of mercury in the diet of female 84
suggests that the observed failures of eggs during the mercury
treatment were in fact due to the mercury the female deposited
in these eggs. However, it is still uncertain why some eggs laid
after egg 16 but still within the period when the female was
being fed mercury showed no indications of mercury poison-
ing .
If for some reason the estimated mercury level of 0.74 p
.g/g
in egg 84-16 was not the cause of death of this embryo, then the
next lowest value in Table 3 is the 3 .4 p,g/g value for egg
19-34. The fate of the eggs laid before and after egg 19-34
provide especially strong evidence that the embryo in egg
19-34 did die from mercury poisoning. Not only did all 14
eggs collected prior to the start of the mercury treatment for
this female hatch, but egg numbers 16 through 28 (eggs laid
while the female was on the mercury diet) all hatched . Egg 30,
the last laid while on mercury treatment, failed to hatch, and its
estimated concentration of mercury (based on an egg laid 3
days before and another laid 3 days after egg 30) was 4 .8 vg/g .
261
Egg 32 also failed to hatch; egg 31 was not analyzed, but egg
33 contained 4.2 p
.g/g mercury. Egg 32, being closer to the
period when mercury was in the female's diet, should have
contained slightly more than 4.2 p
.g/g. After egg 34, eggs 36
through 44 all hatched, presumably because mercury levels had
declined to a safe level in these eggs that were more removed
from the period when the female was fed mercury .
There were many other eggs from mercury-treated females
that failed to hatch and for which we have estimates of mer-
cury, but the data did not meet the rigorous criteria we im-
posed: (1) no more than one of the fertile pretreatment eggs
failed to hatch and (2) the neighboring eggs analyzed for
mercury had to have been laid no more than I day before and
I day after the egg whose mercury concentration we wished to
estimate. We did examine these data and there were no mer-
cury values lower than even the second lowest value of 3
.4
µ.g/g in Table 3 .
Some of the estimated concentrations listed in Table 3 prob-
ably were higher than what was necessary to kill those em-
bryos. For example, a series of increasing mercury levels is
seen in Table 3 in eggs 63-20, 63-26, 63-28, and 63-30 . In
addition to these embryos that died, 63-16 and 63-18 also died,
but we were only able to estimate that mercury was less than
5.0 p g/g (the level reported in egg 19). Egg 63-22 produced a
duckling that exhibited neurological signs of methylmercury
poisoning (this egg is listed in Table 1). Egg 63-24 hatched, but
the chick was unable to walk normally and died. Egg 63-30, for
example, probably did not require the 38 p.g/g mercury it
contained to kill the embryo ; it probably would have died had
its mercury level been closer to the value of 13 p g/g listed for
egg 63-20. The reason 63-30 had 38 µg/g mercury was because
it was laid later in the period when the female was being fed
mercury; this egg, therefore, probably had more than enough
mercury to kill the embryo
.
Concentration
of
Mercury in Parents'
Diet
(µg/g)
Female's Pen
Number-Egg
Number"
Fraction
of
Fertile Eggs
that Hatched During the
Pretreatment Periods
Mercury Estimated
to Have Been in Egg
(p
.g/g, wet weight)'
5
11-28
13/14
5.2
5
34-26
13/14
7.1
10
82-28
13/14
14
10
82-30
13/14
17
10
89-24
13/14
12
10
89-26
13/14
13
10
89-28
13/14
14
20
19-34
14/14
3.4
20
46-34
14/14
13
20
63-20
I1/12
13
20
63-26
11/12
29
20
63-28
11/12
30
20
63-30
11/12
38
20
65-24
12/13
23
20
84-16
14/14
0.74
20
84-26
14/14
33
20
84-28
14/14
34
262
Mercury in Eggs That Hatched and the Ducklings
Survived
The results in Table 4, showing high levels of mercury that
were not associated with harm, were not clear-cut. Except for
pen number 84, there was not much difference between the
mercury concentrations in eggs from the same female that were
poisoned by mercury and those not poisoned . However, results
discussed for data in the other tables suggest that less contam-
inated eggs may suffer from methylmercury poisoning,
whereas much more contaminated eggs from the same female
may hatch normally .
It addition to the differences in sensitivity that may exist
among embryos from the same parents, it is clear that embryos
from different parents can differ greatly in their sensitivity to
methylmercury. As has been mentioned, the neurological re-
sults in Table I are the most reliable of all our data because we
have never observed control mallard ducklings that exhibited
these signs. Several ducklings hatched from eggs estimated to
contain less than 5 p
.g/g mercury suffered neurological effects
.
For other ducklings, more than 20 p
.g/g mercury in the egg was
needed to cause the same effects. The same observations can be
made with the data in Tables 2 and 3 ; the concentration of
mercury associated with embryotoxic effects can differ by
more than an order of magnitude among the eggs from different
parents .
Considerations of Mercury in Egg White Versus Egg Yolk
One final consideration in interpreting our results deserves
mentioning. Because the egg-laying females in our study were
in the process of building up mercury in their bodies during the
period when mercury was fed and were losing mercury once
they were returned to an uncontaminated diet, mercury in egg
yolks and egg whites were rising and falling during these two
periods.
In our study, when the female mallards were first started on
their mercury-contaminated diets, the first eggs they laid would
have had very little mercury in the yolk because the yolk,
which takes many days to form, would have been almost
completely formed prior to exposure to methylmercury . With
these early eggs, an even greater than normal preponderance of
the mercury would be in the albumen, which forms during the
day the egg is laid. When chickens were fed methylmercury,
about 95% of the mercury in their eggs was found in the
albumen (Tejning 1967). During about the first half of incuba-
tion, an embryo relies almost completely on using the yolk for
food (Freeman and Vince 1974) . The relative contribution of
mercury in the yolk and mercury in the albumen to the toxicity
of mercury to the embryo is not known, but Tejning (1967)
found that about 10 p.g/g mercury in chicken eggs caused
embryonic death before the 10th day of incubation, which is
prior to the utilization of albumen as a food resource by the
chicken embryo (Freeman and Vince, 1974)
.
Nearly all of the deformed embryos that appear in Table 2
were well beyond the stage when they were utilizing only yolk
as a source of food, and nearly all of the embryos that failed to
hatch and are listed in Table 3 were older embryos . Further-
more, most of the embryos that suffered toxic effects were not
G. R Heinz and D . J . Hoffman
from eggs laid shortly after the switch to the mercury diets or
shortly after the switch back to the uncontaminated diet . Con-
sequently, we doubt that shifting ratios of mercury in yolk to
albumen could have complicated our interpretations very
much. However, with wild birds in nature, shifting ratios of
mercury in yolk versus albumen could be common when breed-
ing females move into and out of mercury-contaminated areas
.
Until the relative toxic contributions of mercury in the albumen
versus the yolk are understood, it cannot be known whether
basing toxic mercury thresholds on whole eggs could be mis-
leading .
Conclusions
Our current study with individual eggs provides more reliable
information than our earlier studies if one wishes to discover
the lowest concentrations of mercury in eggs that will harm the
most sensitive mallard embryos .
The findings for neurological signs, which were almost cer-
tainly related to mercury in the eggs, clearly showed that
concentrations of mercury as methylmercury in excess of 2
µg/g on a wet-weight basis will harm sensitive mallard em-
bryos. Data related to deformities and embryo mortality sug-
gest that even lower concentrations of mercury in eggs may
cause harm, but these findings were not as definitive as were
the data for neurological signs. Therefore, we believe it is
wisest to conclude that there is some evidence from deformities
and mortality, although not conclusive, that wet-weight mer-
cury concentrations of about I p
.g/g or perhaps a little below I
p.g/g can harp the most sensitive mallard embryos.
Our conclusions lend more reliability to the findings from
other mercury studies in which thresholds for effects were
expressed as mean concentrations of mercury in sample eggs
from different treatment groups. When mallards were fed 3
Itg/g mercury as methylmercury during two successive breed-
ing seasons, toxic effects on embryos and young were associ-
ated with samples of eggs that contained between about 6 and
9 p
.g/g on a wet-weight basis (Heinz 1974, 1976). These older
studies were different than the current study in that the breed-
ing adults were started on their mercury diets well before the
breeding season, and, consequently, mercury concentrations in
eggs were fairly stable over the time when eggs were collected .
Levels of mercury in eggs much below the 6-9 µg/g range
were not produced in the early studies, so the mean levels of
mercury in eggs were higher than what might have been
minimal to cause harmful effects .
In another earlier study, breeding mallards were fed 0.5 p
.g/g
mercury as methylmercury over three generations (Heinz
1979). When data for all three generations were combined, the
number of I-week-old ducklings produced per breeding pair
was significantly lower for the pairs fed 0.5 µg/g mercury than
for controls. Samples of 9-14 eggs were collected in each of
the three generations for mercury analysis . The mean levels of
mercury in eggs were 0.79, 0.86, and 0.84
sg/g
on a wet-
weight basis in the three generations, respectively . These three
means from this 1979 study were the lowest to have been
associated with reproductive impairment in mallards . Based on
the findings of that study, and lacking mercury toxicity data
specific to the wild birds they studied, some investigators doing
Mercury Thresholds in Eggs
Table 4. Estimated mercury concentration in eggs that hatched and the ducklings survived 6 days
263
a
The pen number of the female that laid the egg, followed by the egg number (according to the sequence in which the eggs were laid)
.
b The concentration of mercury in the egg that hatched was estimated by taking the average of the mercury in the egg laid the day before and the
egg laid the day after this egg
.
`The numerator is the number of eggs that hatched, and the denominator is the number of fertile eggs that were incubated
.
d These eggs were neighboring eggs laid by the same female that produced the eggs listed in the second column that hatched . These eggs failed
to hatch or, if noted in brackets, the embryos were deformed or exhibited neurological signs of mercury poisoning
. The estimated mercury
concentrations are shown in parentheses (a - symbol indicates that the estimate for the even-numbered egg used odd-numbered eggs that were
not always only I day removed from the egg being estimated)
.
field studies have adopted a value of about 0 .8 pg/g mercury on
bryos could be discovered . However, from a practical point of
a wet-weight basis as a best estimate of how much mercury it view, we do not think that mercury levels in mallard eggs of I
might take to harm the reproductive success of the birds they
pg/g or less are likely to harm more than a small percentage of
studied (Henny
et al.
2000; Lonzarich
et al.
1992)
.
embryos. As our data in Table 4 showed, many embryos from
The fact that findings from our recent study, designed spe-
eggs with 10 or more pg/g mercury seem to do well
.
cifically to estimate the least amount of mercury that will harm
an embryo, do not contradict the use of the 0.8 pg/g threshold,
taken from Heinz (1979), raises an interesting question. Why
did the earlier study, which was based on mean mercury levels
in groups of eggs whose individual fate was not even deter-
mined, come up with about the same threshold as the more
carefully designed current study? We believe the answer lies in
the fact that the approximate value of 0.8 pg/g from Heinz
(1979) was an average . The average probably included some
mercury concentrations that were below an effect threshold
plus some that were higher than what was needed to harp the
most sensitive embryos. Even though the older study (Heinz
1979) yielded about the same answer, the findings from the
current study, designed specifically to determine the lowest
concentrations of mercury in mallard eggs that harm the most
sensitive embryos, are more appropriate to establishing a toxic
mercury threshold in eggs that can be used as a default thresh-
old for the eggs of other species. It is important to recognize,
however, that any default threshold assumes that the embryos
of wild birds are of about the same sensitivity to mercury as are
mallards. This may not be true. When results from various lab
and wild birds were compared, there was evidence suggesting
that reproductive success of some species may be more sensi-
tive to methylmercury than it is for other species (Koster
et al.
1996) .
Our study was not designed specifically to determine what
percentages of embryos or ducklings from eggs with varying
amounts of mercury would be banned, but we did gain some
insights. The 60 pairs of mallards fed the three mercury diets
was a large number, but if one were to use even larger numbers
of breeding pairs it is possible that even more sensitive em-
Acknowledgments .
We are grateful to Carol Erwin, Laura Heinz,
Michael Hoffman, and Howard Townsend for help in caring for the
breeding pairs and gathering data
.
References
Bar JF (1986) Population dynamics of the common loon
(Gavin
immer)
associated with mercury-contaminated waters in north-
western Ontario. Can Wildl Serv Occas Pap 56, 23 pp
Eisler R (2000) Handbook of chemical risk assessment: health hazards
to humans, plants, and animals. Volume I, Metals . Lewis, Boca
Raton, FL
Fimreite N (1971) Effects of dietary methylmercury on ring-necked
pheasants. Can Wildl Serv Occas Pap 9, 39 pp
Fimreite N (1974) Mercury contamination of aquatic birds in north-
western Ontario. J Wildl Manage 38:120-131
Finley MT, Stendell RC (1978) Survival and reproductive success of
black ducks fed methylmercury. Environ Pollut 16:51-64
Freeman BM, Vince MA (1974) Development of the avian embryo
.
Chapman and Hall, London
Gile JD, Meyers SM (1986) Effect of adult mallard age on avian
reproductive tests. Arch Environ Contain Toxicol 15 :751-756
Heinz G (1974) Effects of low dietary levels of methyl mercury on
mallard reproduction . Bull Environ Contain Toxicol 11 :386-392
Heinz GH (1976) Methylmercury : second-year feeding effects on
mallard reproduction and duckling behavior . 3 Wildl Manage
40:82-90
Heinz GH (1979) Methylmercury : reproductive and behavioral effects
Concentration
of Mercury in
Parents' Diet
(pg/g)
Female's Pen
Mercury (pg/g, wet
Number-Egg
weight) Estimated to
Number for Eggs
Have Been in Eggs
that Hatched'
That Hatched"
Fraction of Fertile
Eggs That Hatched
During Pretreatment
Periodic
Estimated Mercury in Other Even-Numbered
Eggs That Suffered an Embryotoxic Effect
and Were from the Same Femaled
5
16-28
5.7
11/13
16-26 (3 .8 pg/g), 16-30
(5.7 i4g)
5
34-28
> 7.3
13/14
34-26 (7.1 pg/g)
34-30
> 7.3
10
89-30
> 14
13/14
89-24 (12 pg/g), 89-26 (13 pg/g), 89-28
(14 pg/g)
20
77-26
23
14/14
77-22 [deformed] (18 pg/g), 77-24
77-28
23
[neurological signs] (23 pg/g)
20
84-18
8.0
14/14
84-16 (0.74 pg/g), 84-22 [neurological signs]
84-20
22
(°28 4g), 84-24 [neurological signs]
84-30
31
(m29 jig/g)
264
on three generations of mallard ducks. J Wildl Manage 43:394-
401
Heinz GB, Fitzgerald MA (1993) Reproduction of mallards following
overwinter exposure to selenium . Environ Pollut 81 :117-122
Heinz GH, Hoffman DJ (1998) Methylmercury chloride and sel-
enomethionine interactions on health and reproduction in mal-
lards . Environ Toxicol Chem 17:139-145
Heinz GH, Locke LN (1976) Brain lesions in mallard ducklings from
parents fed methyhnercury . Avian Dis 20:9-17
Henny CJ, Grove RA, Bentley VR (2000) Effects of selenium, mer-
cury, and boron on waterbird egg hatchability at Stillwater, Mal-
heur, Seedskadee, Ouray, and Benton Lake National Wildlife
Refuges and surrounding vicinities . National Irrigation Water
Quality Program Information Report 5, Bureau of Reclamation,
79 pp
Hoffman Dl, Moore JM (1979) Teratogenic effects of external egg
applications of methyl mercury in the mallard,
Anas platyrhyn-
chos
.
Teratology 20:453-462
Koster MD, Ryckman DP, Weseloh DVC, Struger 7 (1996) Mercury
levels in Great Lakes herring gull
(Lams argentafus)
eggs, 1972-
1992- Environ Pollut 93 :261-270
Lonzarich DG, Harvey TE, Takekawa iii (1992) Trace element and
organochlorine concentrations in California clapper rail
(Rallus
longiroslris obsoletus)
eggs. Arch Environ Contam Toxicol 23 :
147-153
Meyer MW, Evers DC, Hartigan JJ, Rasmussen PS (1998) Patterns of
G. H. Heinz and D . J. Hoffman
common loon
(Gavia immer)
mercury exposure, reproduction,
and survival in Wisconsin, USA. Environ Toxicol Chem 17:184-
190
Rumbold DG, Niemczyk SL, Fink LE, Chandrasekhar T, Harkanson
B, Lame KA (2001) Mercury in eggs and feathers of great egrets
(Ardea albus)
from the Florida Everglades. Arch Environ Contain
Toxicol 41 :501-507
Scheuhammer AM, Perrault JA, Bond DE (2001) Mercury, methyl-
mercury, and selenium concentrations in eggs of common loons
(Gavia immer)
from Canada. Environ Monit Assess 72:79-94
Tejning S (1967) Biological effects of methyl mercury dicyandiamide-
treated grain in the domestic fowl
Gallus gallus L
.
Oikos (Suppl
8), 116 pp
Thompson DR (1996) Mercury in birds and terrestrial mammals . In
:
Beyer WN, Heinz GH, Redmon-Norwood AW (eds) Environmen-
tal contaminants in wildlife: interpreting tissue concentrations
.
Lewis, Boca Raton, FL, p 341
Wiemeyer SN, Lamont TG, Bunck CM, Sindelar CR, Gramlich FJ,
Frazer JD, Byrd MA (1984) Organochlorine pesticide, polychlo-
robiphenyl, and mercury residues in bald eagle eggs-1969-79-
and their relationships to shell thinning and reproduction . Arch
Environ Contam Toxicol 13 :529-549
Wolfe ME, Schwarzbach S, Sulaiman RA (1998) Effects of mercury
on wildlife: a comprehensive review. Environ Toxicol Chem
17:146-160
ELSEVIER
Abstract
Anthropogenic mercury (Hg) air emissions for the eight Great Lakes states in 1999-2000 were evaluated by analyzing three
inventories. The US Environmental Protection Agency (EPA) National Emissions Inventory (NEI) had the most complete coverage
for all states, and total Hg emissions ranged from 4226 lb in Minnesota to 15,928lb in Pennsylvania . Coal-fired electric utilities
accounted for 52.7% of the region's Hg emissions, varying from 20 .2% of the total in New York to 67.5% in Ohio. Other important
contributors to regional emissions included municipal waste combustion
(5.6%), mercury-cell chlor-alkali plants and hazardous-
waste incinerators (4% each), stationary internal combustion engines (ICEs)
(3.5%), industrial, commercial, and institutional (ICI)
boilers
(3.3%), and lime manufacturing (3.0%). Although medical waste incineration accounted for just over 1% of regional
emissions using the original classifications, the inclusion of health care facilities that may have been inappropriately identified with
other sectors would increase the sector to 4.5% of regional emissions (and decrease the stationary ICE sector to 1 .4% of the regional
total). There were substantial differences for some sectors between the NEI and the Great Lakes Regional Air Toxics Emissions
Inventory (GLEI), as well as unexplained differences within inventories between states (particularly for the cement, lime, and
asphalt industries, and for lamp breakage) . Toxics Release Inventory data for 2000 mainly covered electric utilities, and differences
from the NEI were significant for several states . An independent assessment indicates the possibility of underestimated Hg emissions
by about twofold for ICI boilers, although data for the sector (in particular concerning fuel oil emissions) are highly uncertain
.
Limited data indicate the likelihood of significant underestimates of electric arc furnace mercury emissions in the NEI and GLEI
inventories. Several measures are here identified for improving the reliability of the inventories, both for modeling of atmospheric
transport and deposition modeling and for tracking progress in Hg reduction initiatives
.
U 2004 Elsevier Inc. All rights reserved
.
Keylvords:
Mercury; Emissions; Inventories ; Great Lakes; Atmospheric deposition
Available online atwww.sciencedirect.com
SCIENCE
C
DIRECT-
Environmental Research 95 (2004) 282-297
Assessment of mercury emissions inventories
for the Great Lakes states
Michael Murray* and Stacie A. Holmes
l
National Wildlife Federation, Great Lakes Natural Resource Center, 213 W. Liberty St., Suite 200, Ann Arbor, M7 48104, USA
Received 20 November 2003 ; received in revised form 5 February 2004 ; accepted I I February 2004
1. Introduction
Mercury (Hg) contamination is widespread in the US
Great Lakes region. Statewide consumption advisories
due to Hg contamination covering at least one fish
species are in place in seven of the eight Great Lakes
states, covering inland lakes (Michigan, Minnesota,
Wisconsin), rivers (Indiana), or both (Illinois, Ohio,
°For the special issue devoted to papers presented at the
International Joint Commission meeting, Workshop on An Ecosystem
Approach to the Health Effects of Mercury in the Great Lakes Basin,
Windsor, Ontario, February 26-27, 2003
.
-Corresponding author. + 1-734-769-3351 .
E-mail
address:
murrayty,) nwf.org (M . Murray) .
'Present address: US Department of Agriculture, APHIS/PPQ-
EAB, 5936 Ford Court., Suite 200, Brighton, MI 48116, USA
.
0013-9351/S-see front matter © 2004 Elsevier Inc . All rights reserved
.
doi:10.1016/jxnvres.2004.02.007
Environmental
Research
hitp://www.elseviecennUlocale/envres
Pennsylvania) (US EPA, 2003a) . In addition to posing
risks to human health (National Research Council,
2000), Hg contamination in the region also threatens
certain fish-consuming wildlife, including loons and
mink (Evers et al ., 1998; Henry et al., 1998) .
Atmospheric deposition has been recognized for some
time as the major pathway by which most aquatic
ecosystems are contaminated by ongoing Hg loadings
(e .g ., Jackson, 1997; Fitzgerald et al., 1998; Schroeder
and Munthe, 1998; US EPA, 2000). For example, results
from the Lake Michigan Mass Balance Study indicated
that in the mid-1990s, 84°/n of total Hg loading to the
lake (considering atmospheric and tributary inputs) was
through atmospheric deposition (Landis and Keeler,
2002). Mercury is released to the atmosphere through
both natural processes and human activities (Gustin,
2003; US EPA, 1997a) . Studies of inland lake sediment
cores, however, show a significant anthropogenic Hg
signal; the modern/preindustrial Hg flux ratios in eight
rural Minnesota lakes ranged from 3 .0 to 6.7 (Engstrom
and Swain, 1997), and a similar range was found in the
Adirondack region of New York (Lorey and Driscoll,
1999). A study of Great Lakes sediment cores showed
significantly higher impact of human activity on Hg
loadings to the lakes, with increases in areal loadings of
up to 336-fold over preindustrial values in Lake
Ontario . The increased loadings were attributed to more
local industrial sources and distinct sediment mixing and
integration processes (Pirrone et al ., 1998). Although
some of the inland lake data indicate that Hg loadings in
the region peaked several decades ago, there is no
indication that loadings have returned to preindustrial
values, and anthropogenic Hg releases in the United
States and other regions of the world are still significant
(United Nations Environment Programme-Chemicals,
2002) .
There have been increasing efforts in the past decade
to develop more comprehensive Hg emissions inven-
tories. Accurate inventory data-including information
on parameters such as source location, stack height, and
Hg emissions amount and speciation-are important as
source terms for atmospheric transport and deposition
models (e.g ., Bullock and Brehme, 2002; Seigneur et al .,
2003; Cohen et al., 2004) . Accurate inventories are also
necessary in the policy context, both in assisting in
regulatory and voluntary program decision making, and
in assessing progress in meeting broader policy goals,
such as the virtual elimination targets for persistent
toxic substances in the Great Lakes Water Quality
Agreement and the Canada-US Binational Taxies
Strategy (International Joint Commission, 1987; Envir-
onment Canada and US EPA, 1997) .
Known historic Hg air emissions sources in the
United States have included coal-fired electric utilities,
certain mining practices, product- or use-related emis-
sions (e.g ., through waste disposal and certain manu-
facturing industries), and other incidental or use-related
emissions. This article presents an overview and analysis
of Hg emissions in the Great Lakes states in 1999, based
on recently released inventories for the region. The
analysis addresses most of the major Hg-emitting
sectors; more detailed analysis of coal-fired electric
utilities in the region will he presented in a separate
article (in preparation)
.
2. Materials and methods
Three inventories covering broad activity sectors and
including emissions data for Hg in the Great Lakes
states were considered in this assessment. Brief over-
M. Murray, S. A. Holmes l Environmental Research 95 (2004) 282-297
283
views of the inventories and the approach used for data
acquisition follow
.
2.1 .
National Emissions Inventory (AEI)
The NEI is an effort by the US Environmental
Protection Agency (EPA) to establish a comprehensive
inventory for both criteria and hazardous air pollutants
(HAPs). Intended uses of NEI data include in the
National, Air Toxics Assessment, in
residual risk
analysis, and in other atmospheric transport modeling
efforts (Pope et al ., 2002 ; ERG, Inc., 2003a). The first
systematic national inventory for HAPs, including Hg,
was compiled in 1990, through what was then termed
the National Toxics Inventory (NTI), and a second NTI
inventory for HAPs was completed for 1996. EPA
released the Final Version 3 .0 of the 1999 NEI in July
2003 (Pope et al., 2002; ERG, Inc., 2003a)
.
The inventory for Hg and other HAPs is divided into
point, nonpoint (NPS), and mobile sources . Point
sources include major and area sources. Major sources,
as defined in the 1990 US Clean Air Act (CAA), are
those facilities that have the potential to emit >_ 10 tons
per year of one HAP or 325 tons per year of any
combination of HAPs . Facilities whose annual emis-
sions are below these thresholds are considered area
sources. Data in the 1999 HAP inventory are derived
from a number of sources, including state, local, and
tribal agencies; industry; EPA data for regulated source
categories,
through
Maximum Achievable Control
Technology (MACT) standards; Toxics Release Inven-
tory (TRI); estimated nonpoint data for sources not
included in state, local, and tribal data; and 1996 NTI
data for sources not otherwise included . For 1999 data,
all Great Lakes states except Ohio had submitted point
source emissions data to the US EPA (Pope et al ., 2002
;
ERG, Inc., 2003a)
.
NPS emissions in the NEI consist of area sources with
smaller and/or more diffuse emissions . In part, the
definition refers to sources that the US EPA would
regulate under provisions other than sections 112 or 129
of the CAA (Pope et al., 2002). Estimates for area
sources are obtained using a 'top-down' approach, in
which national-, regional-, and state-level emissions data
are used to estimate emissions at the local (county) level
.
(Area sources where an individual emissions estimate
can be obtained, but where thee total emissions fall below
the major category thresholds just mentioned, are
considered point sources and are included in the point
source NEI.) The
hierarchy of data compilation
involved state, local, and tribal data, supplemented by
MACT NPS data, supplemented by EPA data based on
emission factors and activity data. Though passed
through quality assurance/quality control measures,
differences in estimation approaches may lead to
different estimates for the same category, limiting
284
between-state comparability. Among the Great Lakes
states, four (Michigan, Minnesota, New York, and
Wisconsin) submitted initial or revised NPS data to
EPA (Pope et al., 2002; ERG, Inc., 2003b). For Ohio,
emissions data for 15 HAPs, not including Hg, were
submitted from the Regional Air Pollution Control
Agency covering six counties in the southern part of the
state (ERG, Inc., 2003a). In cases where no local, tribal,
or state data are submitted, the EPA develops emissions
estimates. Finally, no Hg emissions estimates were made
for mobile sources in any jurisdiction inn the 1999 NEI
.
The data analysis approach for the NEI data was as
follows. NEI point source and NPS state data files for
1999 (in MS Access format) for the eight Great Lakes
states (Illinois, Indiana, Michigan, Minnesota, New
York, Ohio, Pennsylvania, and Wisconsin) were down-
loaded from the NEI website following finalization in
summer 2003 (see US EPA, 2003b). Queries were
developed and applied to each database file to identify
only those facilities/units (point source data) or counties
(NPS data) with reported Hg releases, based on the NEI
pollutant codes for the nine forms of Hg contained in
the 1999 NEI. Speciated Hg emissions
(i.e., elemental
gaseous Hg, gaseous divalent Hg-also known as
reactive gaseous Hg-and particulate divalent Hg) were
given only for coal- and coke-fired electric utilities in the
1999 NEI .
The approach for placing individual facilities in
sectors was based on process characterization . Source
Classification Codes (SCCs) and MACT code identifica-
tions were obtained from the NEI Lookup database
available on the NEI website (US EPA, 2003b). SCCs
were available for all records and were used initially to
categorize all facilities . For cases where the SCC was
nonspecific (e.g ., 39999999, for miscellaneous manufac-
turing industries), MACT codes, if present, were used to
assign facility categorization . Key Hg-emitting sectors
with MACT codes were stationary internal combustion
engines (ICES) (0105) ; industrial/commercial/institu-
tional
(ICI) boilers (0107); stationary combustion
turbines (0108) (which were considered with stationary
ICEs in
this analysis); integrated iron and steel
manufacturing (0305); iron foundries (0308); steel
foundries (0309); lime manufacturing (0408); Portland
cement manufacturing (0410); taconite iron ore proces-
sing (0411); asphalt roofing and processing (0418)
;
hazardous waste incineration (0801
(1-4)) ; municipal
landfills (0802); chlorine production (1403) (limited to
chlor-alkali plants in this analysis) ; medical waste
incineration
(1801) ;
municipal
waste
combustion
(1802); and electric utility boilers (1808 (1-3)) .
A very small fraction of facilities had SCCs and
MACT codes indicating two different sectors ; these were
predominantly in the stationary ICE and the ICI boiler
categories (based on MACT codes). In these cases,
facilities were placed in these two categories based on
M Murray, S.A. Holmes I Environmental Research 95 (2004) 282-297
their respective MACT codes. For facilities with SCCs
indicating ICI boiler or ICEs but a different MACT
code (again, a small number of records, typically
manufacturing sources with lower Hg emissions rather
than any of the MACT categories just listed), the
facilities were maintained in the boiler or ICE cate-
gories. Facilities having neither a specific SCC (e.g .,
39999999 for miscellaneous sources) nor a MACT code
were left in the miscellaneous category
.
2.2 .
Great Lakes Air Toxics Emissions Inventory
(GLEI)
The GLEI is a project of the eight Great Lakes states
and Ontario to compile point, area, and mobile source
emissions for toxic chemicals of concern in the region . A
steering committee made up of representatives from
each state and Ontario used a software tool and a
standardized protocol to develop emissions estimates for
each chemical . Emissions sources are organized by
Standard Industry Classification (SIC) codes, SCCs,
and Area and Mobile Source (AMS) codes . The most
recent inventory, for 1999, consists of 213 HAPs,
including Hg, and estimates foI point, area, and mobile
sources (GLC, 2003)
.
Although a standard protocol is in place, reporting
restrictions and/or unavailability of data can lead to
incomplete coverage of sources in each state . In
addition, choice of emission factors for a specific source
is made by individual state representatives based on
information on the source (including control technolo-
gies in place) (0. Cabrera-Rivera, Wisconsin Depart-
ment of Natural Resources, personal communication)
.
For this analysis, Hg emissions data (aggregated by SIC
codes and SCCs) for the Great Lakes states were
obtained directly from the authors, because sector-
specific Hg data were not yet available via the Internet
(0. Cabrera-Rivera, personal communication). Because
of the paucity of measured emission factor data for
mobile sources (GLC, 2003), Hg emissions estimates for
mobile sources were not considered in this analysis,
although estimates were made in the 1999 GLEI .
2.3. Taxies Release Inventory
The TRI was established under the US Emergency
Planning and Community Right-to-Know Act of 1986,
with the first reporting year in 1987. The requirement
originally applied to industrial facilities falling in SIC
codes 20-39; having >, 10 employees; and meeting a
threshold requirement-either manufacturing or proces-
sing a chemical in excess of 25,000lb/year, or otherwise
using a chemical in excess of 10,000 lb/year (US EPA,
2001a). Reporting requirements have since been ex-
tended to other facilities, including federal facilities in
1994 and electric utilities, coal and metal mining
operations (with several exceptions), and other sectors
for the 1998 reporting year. In 1999, EPA lowered
reporting thresholds for Hg and other persistent,
bioaccumulative toxic chemicals, applicable to the
2000 reporting year. The new requirement stipulated
that any facility that manufactures, processes, or
otherwise uses > 101b of Hg or Hg compounds would
be required to report (US EPA, 2001b)
.
The process involves industry submittal to EPA and
state or tribal governments of chemical data (including
amount and locations of chemicals stored on-site and
estimated release amounts, with no requirement for
measured values), compilation by EPA, and publication
of annual inventories. Data reported include releases to
air, discharges to water, land disposal, underwater
injection, and on-site and off-site transfer (US EPA,
2001a). For this study, TRI air emissions data for Hg
and Hg compounds on a state level for the Great Lakes
states were downloaded via TRI Explorer (US EPA,
2003c) and processed in MS Excel. Because the lower
reporting threshold did not take effect until the 2000
reporting year (and the large majority of Hg-emitting
facilities did not meet the previous
threshold
require-
ments for Hg), this analysis focused on TRI data from
the 2000 reporting year. (Although TRI data are
incorporated into the NEI-unless overridden by other
data-the two databases represent two different data
collection efforts .) Because of the relatively small
number of facilities reporting to TRI even with the
lower threshold, Hg emission comparisons are made
only for electric utilities and state totals
.
2.4. Additional database for coal-fired utility hg
emissions
This analysis also relied upon the 1999 Information
Collection Request (ICR) for coal-fired electric utility
steam-generating units, an effort to gather information
on Hg emissions from the units in support of the US
EPA regulatory determination for these units (US EPA,
2003d). Information derived from this effort included
utility plant configurations and pollution control de-
vices, coal Hg content, and estimated Fig emissions for
all units in the United States. This has been the only
systematic effort thus far to estimate, on the basis of
measurements, Hg emissions from coal-fired utility units
in the United States; data from this effort were
incorporated directly into the 1999 NEI. For this study,
plant and state totals for facilities in the Great Lakes
states were obtained via the EPA Air Toxics website
from the plant-by-plant mercury emission estimates file
(US EPA, 2003d)
.
Because of its breadth of coverage, the US EPA NEI
was the inventory examined in greatest detail in this
assessment. In addition, more detailed comparisons
between inventories were examined for several major
M. Murray, S. A. Holmes / Environmental Research 95 (2004) 282-297
285
sectors, and independent estimates of emissions were
considered for two sectors .
3. Results
A compilation of Hg emissions estimates for the eight
Great Lakes states from the US EPA NEI is given in
Table I . The data are presented in the format
(i .e ., point,
nonpoint) used in the NEI database . A slightly different
breakdown showing sector percentages for the Great
Lakes states is shown in Fig. I . Coal-fired electric
utilities were responsible for 52.7% of the Hg emissions
in the region in 1999, ranging in individual states from
20.2% in New York to 67.5% of the total in Ohio. This
breakdown is quite different from 2000 estimates for
Ontario, where the total fuel combustion sector was
responsible for on the order of 20% of total Hg releases
of 3028 kg (Trip et al., 2004; also see discussion in
Hagreen and Lourie, 2004) . The overall Hg emissions
picture for the Great Lakes states evolved from earlier in
the decade, at which point several other nonulility
sectors were more prominent. The remainder of this
section presents more detailed discussion of Hg emis-
sions characteristics of several major sectors
.
3.1. Electricity generation
Mercury exists naturally in coal and is released upon
combustion. Electric utilities accounted for 85.6% of
total coal consumption in the United States in 1999 (US
DOE, 1999). Variables that influence the amount of Hg
released from coal combustion include the coal rank and
concentrations of other constituents (in particular
chlorine), combustion conditions in the boiler, flue gas
temperature and composition, fly ash properties, and
pollutant controls after combustion (Kilgroe et al
.,
2002). Pollution control devices for other pollutants
(i.e .,
sulfur dioxide, nitrogen oxides, or particulate
matter, PM) can have an impact on Hg emissions from
coal-fired units, although apart from fabric filters (for
PM control),
they are not generally effective at
controlling elemental Hg (Kilgroe et al ., 2002) .
Total Hg emissions from coal-fired electric utilities in
the eight Great Lakes states are given in Table 2 for four
inventories . Although coal-fired utility boiler emissions
data in the NEI were derived directly from the EPA ICR
effort, Table 2 shows minor differences between the NEI
and ICR databases for the eight states . More substantial
differences in electric utility Hg emissions are seen in
comparing 1999 ICR or NEI data to TRI data for 2000
.
These include
-30% and
-12% lower reported
emissions in Illinois and Pennsylvania, respectively,
and -I8%
higher reported emissions in Minnesota
and Ohio, compared with NEI data. Although the
higher 2000 estimates for some states may be due to a
286
M. Murray, S.A. Holmes / Environmental Research 95 (2004) 282-297
Table I
Mercury emissions (lb) for Great Lakes States from US EPA NEI, 1999
Source Data drawn from US EPA, 1999 NEI database (US EPA, 2003b), based on source categories (see text for details), with point/nonpoint
source breakdown retained from EPA inventory .
NA, No data available in the database. Zero values indicate value <0 .5lb. Totals may not add exactly because of independent rounding .
"Includes only facilities with utility MACT code
.
"Includes only facilities with SCCs indicating coal-fired boilers.
`Includes stationary combustion turbines
.
° Detailed breakdown is presented in Table 4
.
`As noted in text, may include facilities that could be considered to fall within specific categories above, but for which specific SCCs or MACT
codes were lacking .
combination of increased reported emissions at indivi-
dual units and TRI coverage of additional facilities not
in the ICR database, the reasons for lower 2000
estimates for Illinois (in particular) and Pennsylvania
are not clear
.
Utility Hg emissions as reported through the GLEI
varied quite considerably from those reported through
the utility ICR, as shown in Table 2 . For New York and
Ohio, no utility Hg emissions estimates were obtained
(on an SCC basis), and for Pennsylvania, utility Hg
emissions were only 28 .1% of the ICR totals (34.1%
when based on SIC codes). Although agreement was
better for four other states, the estimated utility Hg
emissions total for Illinois was nearly double (SCC
basis) the ICR total . Although some states have more
limited ability to collect air toxics emissions data (GLC,
2003), the reasons for the considerable discrepancies in
states where data are available are not clear .
3.2 .
Industrial, commercial, and institutional boilers
ICI boilers involve controlled flame combustion and
provide thermal energy to run processes or machinery or
to produce electricity . Process heaters are units in which
combustion gases do not come into direct contact with
process gases in the combustion chamber . These boilers
and process heaters are used in a variety of ICI settings,
including oil and gas extraction and petroleum refining,
chemicals manufacturing, primary metals industries,
national security operations, health services institutions,
and educational institutions . These boilers can use coal,
oil, natural gas, or other fuels as energy sources (US
EPA, 2003e). Mercury
is
a trace constituent in the fuels
(typically as mercuric sulfide in coal and as elemental Hg
in fuel oil and natural gas) and can be released upon
combustion . On the basis of an analysis of the emissions
inventory database used in development of the MACT
Sectors
Illinois
Indiana
Michigan
Minnesota
New York
Ohio
Pennsylvania
Wisconsin
Regional total
Point sources
Electricity generation
Electric utilities
coal"
6016
4885
3094
1265
1028
7117
9961
2263
35,628
Other electricity generation
26
29
29
3
605
10
710
46
1458
ICI boilers
Coal"
149
189
133
47
86
165
294
122
1187
Other
152
57
98
33
3
25
115
66
549
Stationary ICES`
552
1344
195
39
138
0
118
0
2387
Chlor-alkali plants
-
-
1653
-
1082
2735
Cement manufacturing
1216
298
67
NA
40
38
58
9
1725
Lime manufacturing
1947
NA
NA
NA
NA
NA
42
13
•
2002
Petroleum refining
151
31
NA
NA
NA
189
318
4
692
Primary metal production
NA
NA
60
635
NA
NA
329
NA
1024
Secondary metal production
68
344
258
97
NA
0
NA
60
828
Incineration°
695
641
.
902
1413
1270
593
2289
371
8173
Other point sources`
1453
774
24
495
625
417
962
1091
5841
Nonpolnr .sources
ICI boilers
38
32
52
14
132
90
72
34
464
Residential boilers
13
26
48
68
505
60
378
64
1161
Lamp breakage
82
30
69
27
463
62
49
29
811
Dental preparation and use
61
42
53
48
74
46
44
42
410
Laboratories
80
39
65
32
118
74
79
35
522
Other nonpoint sources
8
3
10
9
13
8
10
4
64
Total point sources
12,424
8592
4861
4029
3795
10,206
15,196
5127
64,229
Total nonpomtsources
282
172
297
197
1305
340
632
208
3433
Overall total
12,705
8764
5158
4226
5100
10,547
15,828
5335
67,662
M.
Afurrny, S A. Holmes / Environmental Research 95
(2004)
282 297
Lamp breakage
Residential boilers
12%
7%
/
CommercialfindustrialrnafitNionaland
sewage sludge incineration
- 1 4 %
Coal-fired electric utility plants
52.7%
Medical waste incineration
1.1 %
Municipal waste combustion
5.6 %
Pdmary/secondary, iron and
.- steel manufacturing
-
1 .6 %
Petroleum refining
Other sources
8,3%
10%
Glass production
12%
Lime manufacturing
3.0
Total
mercury emissions
:
Asphalt roofing and
67,662 In
concrete -
1.7 %
Cement manufacturing
2.6
Other electricity generation
t
Chlor-alkali plants
22%
4.0%
Industrial/commerciallinstitutional boilers Stationary internal combustion engines
33%
3 .5
Fig . I . Source category breakdown of combined 1999 Hg air emissions in the Great Lakes states . Data were compiled from US EPA 1999 NET .
("Total does not add to 1110 .0% its a result of independent rounding)
.
Table 2
Coal-fired electric utility Hg emissions (lb) for Great Lakes states from four inventories, 1999
Hazardous waste incineration
4.0%
287
"Data drawn from US EPA, 1999 NEI database (US EPA, 2003h), as described in text
.
From US EPA Air Toxics website (US EPA, 2003d), plant-by-plant mercury emission estimates' http .//www.epa-gov/ttn/atw/combust/utiltox/
stxstote2 .pdf file .
`Year 2(100 data, for Standard Industrial Classification (SIC) codes 4911, 4931, 4939, from US EPA TRI Explorer (US EPA, 2003c)
.
a 1999 Great Lakes Air Toxics Emissions Inventory, categorization based on SCC (data derived from spreadsheet provided by O . Cabrera-Rivera,
personal communication)
.
eSame us note d, for categorization based on SIC codes 4911, 4931 . Note that SIC codes 4911, 4931, 4939 are not exclusively for coal-fired
electricity generation, but it is assumed that most Hg emissions are associated with coal-fired units .
standard for ICI boilers by the US EPA, -42% of the
inventoried ICI boilers and process heaters in the United
States in the late 1990s were in the Great Lakes states
(US EPA, 2003t)
.
Table 3 indicates Hg emissions estimates from ICI
boilers in the Great Lakes states based on the NEI and
GLEI . Data for the NEI show that for every state but
New York, coal-fired ICI boilers were the largest
subcategory of Hg emissions in the NEI database . The
data also show that emissions from oil-tired boilers and
boilers burning gas or other fuels were also relatively
substantial in most states (as categorized in this
assessment, the "other" category may include boilers
burning a mix of coal and other fuels) . Data from the
GLEI show agreement within a factor of 2 for !CI Hg
totals with data from the NEI database for four of the
five Great Lakes states with available data. However,
coal-fired emissions for Illinois boilers from the GLEI
were eight times higher than the estimate derived from
the NEI database
.
The third set of data in Table 3 indicate Hg emissions
estimates for ICI
boilers based on statewide fuel
Inventory
Illinois
Indiana
Michigan
Minnesota
National Emissions Inventory"
6016
4885
3094
1265
Electric utility information collection request °
5989
4884
3083
1265
Toxics Release Inventory (2000)`
4169
5736
3010
1497
GLEI (SCC)d
11,868
4383
2612
1452
GLEI (SIQe
12,006
4395
2662
1531
2000 TRI % difference from ICR
-30.4
17.4
-2 .3
18 .4
New York
Ohio
Pennsylvania
Wisconsin
1028
7117
9961
2263
1027
7109
9959
2264
1175
8392
8780
2114
NA
NA
2800
2284
100
NA
3400
2577
14.4
18.0
-11,8
-6.6
288
M. Murray, S.A .
Holmes I
Environmental
Research 95 (2004) 282-297
Table 3
ICI boiler Hg emissions (Ib) for Great Lakes states from two inventories and fuel consumption approach, 1999
consumption data and emissions factors (derived for the
US EPA MACT standard development process) for coal
and fuel oil (see footnotes c and d in Table 3). In
deriving these estimates, it was assumed that all such
fuel in each category was consumed at ICI boilers in
each state .
For coal
boilers, data from
the fuel
consumption approach are uniformly higher than NEI
estimates for each state (ranging from 1 .6- to 4.3-fold
higher than the NEI estimates, for Pennsylvania and
Minnesota, respectively), and higher for two of the five
states with available data in the GLEI ; the total regional
emissions in the fuel consumption approach are 2 .3-fold
higher than the total estimate for all eight states in the
more complete NEI. For oil-fired boilers, there are even
greater discrepancies, with the fuel consumption esti-
mate/inventory estimate ratio ranging from 0.3 (Illinois
in the NEI) to 14.7 (Minnesota in the GLEI), and the
fuel consumption approach overall leading to a nearly 2-
fold higher estimate than the NEI for the eight states
combined. Relative to other states, it is likely that the
NEI estimate for New York oil-fired boiler emissions in
particular is low; whereas the state's oil-fired ICI boiler
Hg emissions in the NEI amounted to 22%
of regional
emissions for the sector in 1999, the state accounted for
Overall totals may not add exactly due to independent rounding .
"Data drawn from US EPA NEI database (US EPA, 2003b), as described in text. Space heaters and boilers with SCCs not specifically indicating
coal or
oil
(i.e .,
102001xy-102005xy for industrial, and 103001 xy and 103002xy for commercial/institutional) are included in gas and other category .
1999 Great Lakes Air Taxies Emissions Inventory data. Same category breakdown as for NEI (data derived from spreadsheet provided by (y
Cabrera-Rivera, personal communication)
.
`Statewide coal consumption data for nonutility industrial plants are from DOE (1999) (Table 71, with estimate for New York based on 1998 and
1999 data for three states in that census region); emission factor of 5.43 lb per trillion BTUs from ERG, Inc . (2002) (Appendix A); heat content of
coal from DOE (1999) (Table 107). Mercury emissions calculated as product of coal consumption data (converted to BTU basis from heat content
data) and emission factors .
d Statewide oil sales data for industrial and commercial sectors are from DOE (2000), with adjusted distillate and residual fuel
oil
data from Tables
16, 17, respectively; average heating values for distillate and residual oils of 136,725 and 152,400 BTUs/gal, respectively, derived from US EPA
(1997b) (Table 6-10, averaging No
.
1,
No. 2 fuel
oil
values (distillate) and No .6 (residual) for central and eastern regions for each fuel); Hg emissions
factors of 0.00887 and 8.801b per trillion BTUs, respectively, from ERG, Inc. (2002, Appendix A). Mercury emissions for distillate and residual fuels
calculated as product of oil consumption data (converted to BTU basis from heat content data) and emission factors
. Totals for both fuels are shown
in table.
>65% of industrial and commercial sector residual oil
sales in the eight states (US DOE, 2000) .
Discrepancies in Hg emissions estimates for the three
approaches could be due to a number of variables
(including different coverage in number
of
boilers
between each database), but one important issue is
choice of emission factors. For coal combustion, the
latest version of the US
EPA Factor Information
Retrieval Data System (FIRE 6.23) has Hg emission
factors for bituminous/subbituminous-fired ICI
boilers
of 16 and 3 .21b per trillion BTUs of heat input, for
uncontrolled
and controlled
emissions,
respectively
(US EPA, 2003g; the latter converted based on average
heating values in US EPA, 1997b). The average value
derived by the US EPA in the
ICI boiler MACT
database (used as well in the fuel consumption approach
presented
in Table
3),
which
takes
into account
that some facilities
have pollution control
equip-
ment installed, is 5 .43 lb per trillion BTUs (ERG, Inc .,
2002). This value is in the range of median values
derived from the utility
ICR for bituminous and
subbituminous coals (7.1 and 5 .Olb Hg per trillion
BTUs, respectively) (Kilgroe et al ., 2002) . If emission
factors similar to the lower value from the
FIRE
Inventory/sector
Illinois
Indiana
Michigan
Minnesota
New York
Ohio
Pennsylvania
Wisconsin
Regional total
NEI"
Coal
160
194
134
48
98
169
301
129
1232
Oil
58
35
65
14
116
87
132
27
533
Gas and other
121
49
84
33
7
25
48
67
434
Total
339
278
283
94
222
280
481
223
2199
GLEI"
Coal
1279
89
133
43
NA
NA
NA
220
1764
Oil
34
9
14
2
NA
NA
NA
8
66
Gas and other
83
42
57
33
NA
NA
NA
151
368
Total
1396
140
205
78
NA
NA
NA
379
2198
Estimate based on statewide fuel consumption
205
203
453
496
212
2822
Coal'
449
540
264
Oild
17
23
17
31
645
80
109
66
987
Total
466
563
281
236
849
533
604
278
3809
database
(3.21b
per
trillion BTUs)
were
used
in
development of the NEI and GLEI on a considerable
number of coal-fired ICI boilers in the region, this could
partly explain the lower estimated Fig emissions in the
inventories compared with the fuel consumption ap-
proach
.
For petroleum products, the uncertainties surround-
ing emission factors are even higher than for coal . A US
EPA compilation of estimated Hg concentrations in
crude oils from various regions of the world gave mean
values ranging from 0.1 to 1505 parts per billion (ppb),
and mean Hg concentrations for gas condensates
ranging from 15 to 3964pph (US EPA, 2001c). A
review of petroleum-related Hg emissions indicated
mean Hg levels in distillate and residual fuel oils ranging
from 4 to 400 ppb (Wilhelm, 2001)
.
These wide-ranging values have been mirrored in US
EPA emission factors derived over the past decade
.
Whereas a value of 7 .0 lb Fig per trillion BTUs for
residual and distillate fuel oil was used to estimate
commercial and residential boiler Hg emissions in the
US EPA Mercury Study Report to Congress, an
emission factor of 0.616 Hg per trillion BTUs was
derived from measurements on utility residual fuel oil
(US EPA, 2001c). The latest version of the US EPA
FIRE emission factor database has a distillate oil Hg
emission factor (uncontrolled) of 3 .01b per trillion
BTUs of heat input, or intermediate between the two
values above, while no value was available for residual
fuel oils (US EPA, 2003g). As part of its ICI boiler
MACT standard development, the US EPA derived
emission factors for residual and distillate-fired boilers
of 8.8 and 0.00887 lb Hg per trillion BTUs, respectively
(ERG, Inc., 2002). The distillate factor is nearly 340
times lower than the distillate oil Hg emission factor in
the FIRE database, whereas the residual factor is at the
high end of published emission factors . These latter two
factors were used to obtain the emissions estimates in
the fuel consumption approach given in the last section
of Table 3, and (given the emission factor differences)
most of the Hg emissions were associated with residual
oil . Assuming that the emissions factors from the ICI
boiler MACT standard development are in fact more
appropriate for the Great Lakes boiler population, the
net effect (of a lower distillate factor but a high residual
oil factor) may indicate underestimated total oil-fired
ICI boiler Hg emissions in
the NEI and GLEI
inventories .
However, there is a crucial need to obtain more
accurate data on Hg emissions from a wider variety of
petroleum sources. A recent article reporting analyses of
standard reference materials using a closed-system
combustion
technique
with
cold-vapor
inductively
coupled plasma mass spectrometry analysis noted the
importance of low blanks in analyzing fig concentra-
tions at the low end of the scale in petroleum products
.
M. Murrny, S.A. Holmes / Environmental Research 95 (2004) 282-297
289
These authors found a substantially higher Hg level in
residual fuel (3460pg/g) than distillate fuel, but this
value was still at the low end of other published
data (Kelly et al., 2003) .
Converting to a
heat
content basis (following the approach of US EPA
(2001c), such an Hg concentration would correspond to
an emission factor of -0.21b Hg per trillion BTUs,
or over an order of magnitude lower than most emission
factors most recently used by the US EPA . If this
finding is more typical for residual oils, and if a typical
distillate oil emission factor is indeed much lower than
for residual oils-as found in ERG Inc. (2002)-Hg
emissions associated with ICI oil-fired boilers in the
Great Lakes region would be substantially less than
indicated in the last row of Table 3 (assuming complete
coverage of all such boilers). Such an assessment
would obviously have to be confirmed with Hg
concentration data on residual and distillate fuel oil
known to he burned in a representative fraction of these
boilers
.
Finally, although the statewide fuel consumption
approach yielded higher estimated total Hg emissions
from ICI boilers than the two inventories examined,
the regional estimate based on fuel consumption is
still lower than what would be expected based on
findings from the MACT regulatory development
process (indicating -26,00016 for all fuels for the
entire United States, with no Hg emissions from
natural gas--fired boilers reported) (ERG, Inc ., 2002)
.
This is particularly puzzling given that the MACT
regulatory development process reported a considerable
number of ICI boilers in the Great Lakes region
;
for example, analysis of the inventory indicated that,
on a boiler-per-segment basis (taking into account
different fuels burned, but not boiler capacity), >55%
of the coal-fired boilers were in the Great Lakes states
(US EPA, 20030 . (Though not published in the
literature, an assessment of regional boiler emissions in
this database has been reported; Delta Institute, 2002 .)
The reasons for the lower than expected regional Hg
emissions (or conversely the higher than expected
national emissions from ICI boilers, considering (hat
the fuel consumption approach yielded regional esti-
mates within a factor of 2 of the NEI inventory estimate)
are not clear. Issues to investigate would include
emission
factors,
boiler population, capacity,
and
operational data
.
An additional oil-related source of Hg emissions is
petroleum refining. As shown in Table I, estimated
emissions varied considerably among the states, with no
data available for Michigan, Minnesota, and New York,
and highest emissions in Pennsylvania (318lb) . Much
better information on the Hg content of crude oil, as
well as ensuring complete coverage of all refining
facilities, is necessary to better quantify Hg emissions
from the sector
.
290
M. Murray, S. A. Holmes / Environmental Research 95 (2004) 282-297
3.3 .
Stationary ICEs and combustion turbines
Stationary ICEs range in size from 1 horsepower to
> 10,000 horsepower, and serve to generate mechanical
or electrical power at fixed sites (US
EPA, 2003h) .
Mercury can be present at trace levels in the fuels (e.g .,
gasoline, diesel oil, natural gas)
and released upon
combustion . Combustion turbines work similarly,
by
burning fuels (typically natural gas), and produce
electricity, heat, or shaft power. Combustion turbines
are used by the electric power industry,
independent
power producers, the gas pipeline industry, and chemi-
cal and industrial plants, with sizes ranging from
I to
-200MW (US EPA, 2003i) .
For purposes of this
analysis, the two sectors were considered together
.
Table 1 indicates that Hg emissions from stationary
ICEs and combustion turbines ranged
substantially,
from <0.05lb in Ohio to 13441b in Indiana, and the
total for the eight states accounted for 3 .5%
of the
region's Hg emissions. There was an equally wide range
in the number of emissions records, from 8 in Ohio to
905 in Illinois . However, inspection of SIC, emission
unit, and process codes indicated that 61 .6% of the
emissions for the sector in all states were attributable to
health care facilities, mostly from emissions at facilities
in Indiana (13331b) and Pennsylvania (1181b)
. Con-
sidering the importance of these emissions, two possible
explanations for these results are (1) mistaken placement
of the facilities in the stationary ICE category rather
than the MACT and SCC medical waste incineration
category, or (2) if categorized appropriately as ICEs,
erroneously high Hg emissions estimates . This is an issue
that is easily resolved, and because of the magnitude of
Table 4
Mercury incinerator emissions (lb) for Great Lakes states from two inventories
the emissions estimates and the likelihood
of signifi-
cantly differing Hg control requirements for ICEs
as
compared with existing requirements for medical waste
incinerators (MWIs), it is obviously important for these
facilities to be properly categorized
.
If these facilities
were indeed misclassified,
the stationary ICE Hg
emissions would drop to 9171b in
1999, or 1.4% of
the regional total
.
3.4. Waste incineration
In the mid-1990s, waste incineration accounted
for
34% of the 158 tons of anthropogenic Hg emissions in
the United States, according to the US EPA (1997a)
.
Estimation of incinerator emissions in 1999 is particu-
larly challenging, because it was a period of finalization
and/or state implementation of federal emissions stan-
dards for municipal waste combustors (MWCs), MWIs,
and hazardous waste incinerators (HWIs)
(e.g ., US
EPA, 2000). Given this caveat, estimates for the Great
Lakes states in 1999, derived from the NEI inventory,
indicate that Hg emissions
from incineration were
almost certainly down from the mid-1990s,
but were
still appreciable, at 81741b, or 12 .1% of the regional
emissions total (see Table 4 and Fig
.
1). MWCs were
most prominent, at 5.6% of the regional total, followed
by HWIs (4.0% of the total)
.
Table 4 also shows
the significant variation
in
incinerator Hg emissions among
states for a given
sector. For example, Hg emissions from MWCs in the
NEI ranged from none in Ohio to just over 1000 lb in
Minnesota, New York, and Pennsylvania
.
Emissions
from commercial and industrial solid-waste incinerators
NA, Data not available in databases . Zero values indicated reported values <0-51b. Totals may not add exactly because of independent rounding
.
Data drawn from US EPA NEI database
(US
EPA, 2003b), as described in text
.
1999
Great Lakes Air
Toxics
Emissions Inventory, categorization based on SCC (data derived from spreadsheet provided by 0. Cabrera-Rivera,
personal communication) .
Sectors
Illinois
Indiana
Michigan
Minnesota
New York
Ohio
Pennsylvania
Wisconsin
Total
NEI"
Municipal waste combustion
.28
24
536
1001
1047
NA
1002
132
3770
Medical waste incineration
51
244
50
2
38
17
283
36
721
Sewage sludge incineration
NA
NA
NA
379
3
81
14
NA
476
Hazardous waste incineration
128
372
316
32
182
494
990
194
2709
Commercial and industrial inclusive .
488
I
0
NA
NA
NA
NA
8
496
Total
695
641
902
1413
1270
593
2289
371
8174
GLEIb
Municipal waste combustion
28
128
1295
329
316
NA
400
188
2684
Medical waste incineration
47
921
50
0
242
NA
NA
NA
1260
Sewage sludge incineration
0
118
162
405
3
NA
NA
NA
687
Hazardous waste incineration
Commercial/instil./indust.
NA
702
NA
657
NA
0
NA
NA
NA
348
NA
NA
NA
NA
NA
NA
NA
1707
Total
777
1824
1507
733
909
NA
400
188
6338
(CISWIs) were even more disparate ; Illinois had 223
emissions records with a total of 4881b Hg emissions,
compared with a total of six records and 8.61b Hg for
the other states combined. The differences may be due
to a combination of differential category assignment, as
well as potentially to more comprehensive reporting in
Illinois. Comparison of Hg emissions estimates from
incinerators in the NET database to those in the GLEI
show good agreement in some cases and others that vary
considerably. State totals generally were within a factor
of 2, for the five states with more complete GLEI data
.
Some inconsistencies in reporting codes were also
identified in the incineration sectors in the NEI. As
noted previously in the discussion on stationary ICE
emissions, 1470 lb of Hg emissions that may have been
associated with MWIs were categorized as stationary
ICE sources on the basis of MACT codes and/or SCCs
.
In addition, two health care facilities (one each in
Illinois and Indiana, with emissions of 192 and 6601b,
respectively) were categorized in this analysis in the
"other point source" category, because there were
neither MACT codes nor SCCs for medical waste
incineration. Including all of these facilities (amounting
to 61 emission records) with questionable assignments in
the medical waste category would increase the regional
MWI Hg emissions contribution from 1.1% to 4.5°/n
(i.e .,
to 304416). In addition, the second largest
incineration source of Hg emissions in Michigan-the
Detroit Water and Sewerage District plant at 1621b-
had a MACT code placing it in the HWI category,
rather than the sewage sludge category .
As a result of continuing implementation of incin-
erator regulations and closures of some facilities, it is
probable that Hg emissions from the MWC, MWI,
HWI, and CISWI sectors have decreased-possibly
2500
n
2.000 -
to
0y
0)
a,
S
1.000-
0
m
0n
r
500
-
0
0n
M. Murray, S. A .
Holmes / Environmental
Research 95 (2004) 282-297
291
substantially in some cases-from the 1999 estimates
shown in Table 4. But in light of the discussions above,
substantial reductions would presumably not be ex-
pected at the facilities with conflicting classifications, if
those in question have indeed been improperly classified
as ICE rather than medical waste incineration units,
given that MACT standards for ICE and combustion
turbine units were just being finalized in 2003-2004 (US
EPA, 2003h, i) .
3.5 . Menu/acturiny industries
As shown in.Tahle I and Fig. I, certain manufactur-
ing processes can he significant sources of Hg emissions,
but there are significant variations among states
.
Mercury-cell chlor-alkali plants are one of the largest
Hg-consuming sectors in the United States, and there
has been concern for some time about accounting for
Hg use and releases at such plants, because of the
considerable discrepancies between consumption data
and reported release data (e.g ., Ayres, 1997). The US
Chlorine Institute, in partnership with the US EPA,
developed a voluntary goal of reducing Hg use by 50%
in the mercury-cell chlor-alkali sector by 2005, com-
pared with a 1990-1995 baseline (Chlorine Institute,
Inc., 2003). Annual Hg air emissions (as reported to the
TRI (US EPA, 2003c) for the two mercury-cell chlor-
alkali plants in the Great Lakes region, as well as the Hg
use trend in the sector, are shown in Fig . 2 (Chlorine
Institute, Inc., 2003). The data show the substantial
decline in Hg consumption in the sector nationwide
(86%) that has occurred since 1990 ; this decrease has
been due in part to technology improvements in the cell
room and plant closures (capacity was down 26% in
that period) (Chlorine Institute, Inc ., 2003). However,
•
Oh , Facility
O
Wisconsinlacility
-0- U.SS
chlor alkali
mercury
consumption
C, O
400
300
0
200
E
N
c
}?1
S
Inc
N
a
IW 1989 1990 ISO 1992 '993 1994 INS 1996 107 1908
9 2000 2001 2002
Year
Fig. 2 .
Mercury emissions from chlor-alkali plants in Ohio and Wisconsin
(TRI
data; available through
2001),
and Hg use in the
US
mercury-cell
chlor-alkali industry (from Chlorine Institute
.
2001)
.
292
despite
the
impressive
reductions
sectorwide in Hg
consumption (which is presumably occurring to some
extent at all plants), reported Hg air emissions have not
changed as substantially at the two Great Lakes plants
;
when comparing the 4 years for which data are available
at both plants, 2000-2001 average emissions were 15 .8%
and 3.6% lower compared with 1995-1996 average
emissions, at the Ohio and Wisconsin plants, respec-
tively .
Even with the reductions, at 30 tons/year, mercury-
cell chlor-alkali plants remain one of the largest Hg-
consuming sectors in the United States (Johnson, 2001)
.
The US EPA recently finalized an Hg MACT standard
for mercury-cell chlor-alkali plants that prohibits Hg
emissions from new or reconstructed facilities, and
establishes emissions limits for existing facilities (US
EPA, 2003j). Although the US EPA anticipates con-
tinued Hg reductions from the affected facilities, the
agency notes that a complete understanding of Hg mass
balance in these plants-including the fate of most of
the Hg consumed-remains to be achieved (US EPA,
2003j) .
Another potential manufacturing source of Hg
emissions is cement production . The United States was
the world's third largest cement manufacturer in 1999
(van Oss, 1999). Mercury can be present in both the raw
materials used and in the fossil fuels firing cement kilns,
and emissions can occur during preheating of raw
materials and thermal treatment in the kiln (US EPA,
1997b). (Hazardous waste-burning cement kilns are
grouped under the hazardous waste category .) Esti-
mated Hg emissions from cement manufacturing in the
1999 NEI database are given in Table I . The data
indicate that Illinois was responsible for the large
majority (70.5%) of the region's Hg emissions for the
sector. However, US Geological Survey (USGS) cement
production data for the year indicate that Pennsylvania
was the region's top producer (6690 thousand metric
tons), followed by Michigan (5813), New York and
Maine (data reported together, 3285), and then Illinois
(2939 thousand metric tons) (van Oss, 1999) . Cement
production Hg emissions in the GLEI were substantially
different from NEI values, with Indiana the top state at
308 lb and Illinois fifth in the region at 36 .5 lb. Reasons
for the differences are again not clear, but probably
involve a combination of differences in number of
emission records, capacity and operational information,
and emission factors
.
Two additional manufacturing sources of Hg emis-
sions are lime manufacturing and asphalt production .
At 19471b (97% of regional emissions), Illinois had the
highest
NEI Hg emissions associated with lime manu-
facturing for the region. Whereas the GLEI also listed
Illinois as the largest source of lime manufacturing
emissions, the value was 194.71b, or exactly 10.0% of
the NEI total. USGS lime production data for 1999
M Murray, S.A. Holmes / Enuiro nnental Research 95 (2004) 282-297
indicate that the top-producing states in the Great Lakes
region were Ohio and Pennsylvania (1870 and 1390
thousand metric tons, respectively), whereas Illinois,
Indiana, and Missouri together (data were not available
separately) produced a combined 3930 thousand metric
tons (Miller, 1999). Mercury emissions from asphalt
production (not shown) also differed significantly
among the states, with Illinois accounting for 98.6%
of the regional total of 11171b Hg emissions . The
reasons for the disparate emissions in these manufactur-
ing sectors are not clear, but possible explanations
would include a disproportionate reliance on coal or
coke in the firing process at facilities in Illinois, fewer Hg
co-benefits in control devices in the state, overestimation
of Illinois emissions (e .g., through use of higher emission
factors), underreporting and/or underestimation of
emissions in certain other states, or some combination
of these variables
.
3 .6
.
Primary and secondary metal production
Primary and secondary production of certain metals
can be important sources of Hg releases to the
environment . One such sector is taconite (iron ore)
mining and processing, in which taconite is mined and
processed into iron oxide pellets for use mainly in steel
production. In 1999, nearly all US crude iron ore
production was concentrated at 10 operations in regions
in two Great Lakes states: the Mesabi Iron Range in
northeastern Minnesota and the Marquette Iron Range
in the Upper Peninsula of Michigan (Kirk, 1999) . This
sector was the primary metal manufacturing sector with
the highest Hg emissions in the Great Lakes region in
1999, with 471 lb of emissions in Minnesota according to
the NEI. This was considerably lower than the value of
758 lb estimated by the Minnesota Pollution Control
Agency (MPCA) for the state in 2000 (MPCA, 2002)
.
However, four records in the NEI database with
nonspecific SCCs (39999999) and no MACT code were
in fact taconite processing facilities (with iron ore SIC
codes), and including them leads to a total of 8301b,
much closer to the MPCA estimate for 2000. The two
other US taconite processing plants are in. Michigan (US
EPA, 2002a). However, whereas the 1999 NEI had gas/
oil-fired boiler emission records for these plants (with
low Hg emissions), no other records for the facilities
were identified
.
Iron and steel manufacturing represent additional
sectors of potential Hg emissions. US steel production
can be divided into integrated mills and nonintegrated,
or secondary, steel mills. Integrated producers use blast
furnaces to smelt iron ore, which is then typically
processed in basic
oxygen
furnaces to produce liquid
steel. Secondary production involves 'minimills' and
specialty mills, which use electric arc furnaces (EAFs) to
melt lower cost (mostly scrap) metal, which is then
processed into products such as stainless, alloy-electri-
cal, and tool steel (Fenton,
1999). (Though less
commonly used in the industry now, due to increasing
plant size in some cases,
the term
'minimill' is
retained here.) The major source of scrap metal entering
US EAF mills is the ferrous fraction of scrapped
automobiles. Because of the use of Hg in certain auto
components (in particular lighting switches and antilock
braking systems) and the large number of autos
retired every year, potential mercury emissions from
EAF steel production are substantial (Fenton, 2002
;
Maine DEP, 2003). EAF mills accounted for 46% (or
45 .1 million metric tons) of US steel production in 1999
(Fenton, 1999)
.
Reported Hg emissions from iron and steel manu-
facturing facilities in the Great Lakes states for the NEI
and GLEI inventories (data not shown) ranged from 0
and 31b in Wisconsin to 340 and 3361b in Indiana,
respectively (no data were available for New York and
Ohio). Gray-iron foundries were responsible for 60.6%
of total reported iron- and steel-related emissions in the
NEI for the region (10991b), not counting taconite
production (considered previously). However, missing
from the two inventories are most of the EAFs in the
region. For example, in 1999 there were 92 EAFs in the
Great Lakes states (Anonymous, 2000) ; however, there
were records in the NEI for only 13 EAFs, in place at
either integrated iron and steel producers or iron
foundries in the region . Though limited, data indicate
that EAF minimills that process scrap autos can be
important sources of Hg emissions ; for example, annual
emissions at a single Ohio facility were estimated at
6601b (Sastry et al ., 2002). (Though not in the peer-
reviewed literature, this issue is addressed in detail in
Ecology Center, 2001)
.
The reason for the discrepancy in coverage is that the
US EPA delisted EAF operations at stainless and
nonstainless steel manufacturing facilities from the
MACT source list in 1996, reasoning that the facilities
were not major sources of emissions (as defined in the
Methods section) under the US CAA (US EPA, 1996)
.
In addition, many iron and steel foundries are not major
sources (US EPA, 2003k), and it appears that the
majority of smaller plants are escaping notice in the
inventories. In terms of US steel production, mills using
the EAF technique are expected to account for >50%
of production by 2010 (Crompton, 2001) . Although US
auto manufacturers had phased out Hg use in con-
venience lighting switches by the start of 2003 (Maine
DEP, 2003), the large number of vehicles with such
switches either retired or slated for retirement in the
coming decade indicates a large pool of product Hg
that may he released to the environment, but also for
which a pollution prevention option
(i.e .,
switch
removal prior to shredding and metal reprocessing) is
readily achievable
.
At. Murray, S. A . Hobnes / Environmental Researdi 95 (2004) 282-297
3.7
.
Nonpoint sources
Data in Table I indicate that NPS Hg emissions were
less than point source emissions in the NET database,
but not insignificant . (As noted previously, data for ICI
boilers were considered with the point source data in the
preceding, discussion.) In contrast to the case with many
of the point source sectors just examined, differences in
NPS Hg emissions among states were generally less
pronounced for most sectors. One exception was
residential boilers, where both New York and Pennsyl-
vania had considerably higher estimated emissions in the
NEI (Table I); this probably reflects, for the most part,
increased reliance on fuel oil for home heating in those
states (US DOE, 2000) . Another exception was lamp
breakage, where estimated Hg emissions for New York
accounted for 57% of the regional total for the sector
.
Given that the state's 2000 population was only 23 .3%
of the regional total (US Census Bureau, 2001) and that
estimated emissions from lamp breakage estimates
would typically be made on a county population basis,
the reason for the discrepancy is not clear . On the basis
of apparent missing product-related Hg in Canadian
inventories (Hagreen and Lourie, 2004), it is plausible
that a similar situation might apply to certain area
sources in the NEI and GLEI inventories for the Great
Lakes states .
4. Discussion
4.1. Mercury emissions trends in
the Great Lakes states
The US NEI has evolved from less complete earlier
versions (Pope et al., 2002). Thus drawing solid
conclusions on Hg emissions trends for specific sectors
is difficult using data through 1999, as a result of
changes in protocols and coverage; moreover, similar
constraints apply to the GLEI (GLC, 2003). In addition,
TRI data have been available only for 2 years at the
lower reporting thresholds. Even though TRI data
covered many of the top Hg-emitting sources beginning
in 2000, the discrepancies in total emissions upon
comparison to the 1999 NEI are considerable : 2000
state total TRI Hg emissions ranged from 27% (New
York) to 113% (Ohio) of the 1999 NEI totals (data not
shown) .
In terms of national trends in Hg emissions, on the
basis of an assessment before release of the final 1999
NEI data, US Hg emissions were estimated to have
declined by >40% between 1990 and 2001, in particular
as a result of a combination of use reductions and
emissions control regulations (especially on incinerators)
(Environment Canada and US EPA, 2002) . (An analysis
of final 1999 NEI data on a national basis in a recent
report indicates that the national total emissions for
293
294
1995
2000
Year
Fig. 3 .
Mercury air emissions trend in Minnesota for three broad sectors, with projection to
2005
(data replotted from MPCA,
2002) .
1990
1999 were consistent with this trend ; see Northeast
States for Coordinated Air Use Management, 2003)
.
One of the few internally consistent Hg emissions
inventories in the Great Lakes region known to the
authors is that developed by the MPCA for the state
(MPCA, 2002). Estimated Hg emissions through 2000,
and projections to 2005, are indicated in Fig . 3. Mercury
emissions in the state were estimated to have dropped
68% from 1990 to 2000-a result attributed mainly by
the agency to phase-out of Hg use in products (in
particular batteries and paint), as well as emissions
controls on incinerators (MPCA, 2002). (The 1999
estimated total emissions value from the NEI database
derived in this analysis is indicated in Fig . 3 as well.) The
2002 assessment included a revised estimate (upward by
30001b) of paint-associated Hg emissions for 1990,
reflecting the dynamic nature of Hg inventories (MPCA,
2002). The data show the impact on Hg emissions that
product bans or voluntary restrictions can have, as well
as the increased importance currently of incidental
emissions through industrial sectors (such as metal
mining and coal-fired electric utilities) .
4.2. Policy implications and
recommendations
Mercury
emissions
in
the
Great
Lakes
states
amounted to 67,6621b in 1999. On the basis of less
complete 1996 NEI data (not shown and no longer
available from the NEI website), as well as the more
thorough analysis for Minnesota (Fig. 3), total anthro-
pogenic Hg emissions in the Great Lakes region declined
from 1996 to 1999 . This was a period of implementation
of emissions standards on incinerators that were
anticipated to result in up to 95% reduction in Hg
emissions (US EPA, 2000). The US EPA has finalized or
M. Murray,
S. A .
Holrnes / Environmental Research 95
(2004) 282-297
Energy production (mostly coal and oil)
O
Other (mostly taconite production)
r-
1
Product-related
Hg
2005
is in the process of finalizing air pollution control rules
that will affect a number of Hg-emitting sectors in the
region, including iron and steel foundries, taconite
plants, chlor-alkali facilities, and ICI boilers (US EPA,
20031). In addition, the agency recently proposed several
rule options covering coal-fired electric utilities (US
EPA, 2004) . Implementation of these rules will influence
the magnitude and makeup of Hg emissions in the
region and elsewhere in the United States for the next
decade or more
.
This analysis has shown that despite improvements in
emissions inventories-including coverage of more
facilities and availability of increased measurement data
(e.g ., for coal-fired electric utilities)-questions remain
about the coverage and accuracy of Hg air emissions
estimates in the Great Lakes states . Improvements in the
Hg inventories are warranted in a number of areas,
including increasing measurement efforts on diverse
sources to improve emissions factors and permit
increased use of actual stack test data, ensuring proper
categorization based on source type (in particular in
submissions to the NEI), improving GLEI coverage in
states with limited data, and increasing coverage of area
sources. There is a clear need for better data on Hg
emissions from certain sectors in particular, including
mercury-cell chlor-alkali facilities, EAFs, and ICI
boilers (in particular those burning fuel oils). In
addition, a better understanding of the range of Hg
levels in petroleum products will assist in bounding
mobile source emissions, which, though estimated
(based on detection limits) in the GLEI, were not
included in the 1999 NEI because of a lack of data
.
One challenge in making improvements to the process
is likely to be the disparate personnel and offices
involved in inventory development, which in some cases
12.000
10,000
a
000-
c
4y
E
6,000
v
m
=
4,000
2,000-
may amount to at least four different parties involved
(for the three principal inventories considered here and
the US EPA Emission Factors and Inventory Group)
.
An additional challenge is the absence of reporting
requirements: the US EPA announced in 2002 that Hg
and other hazardous air pollutants would not, for the
time being, be subject to mandatory emissions reporting
requirements (US EPA, 2002b). Without such require-
ments,
developing a comprehensive
Hg emissions
inventory that can more accurately show emissions
trends for different sectors-as is currently done
annually for criteria pollutants (US EPA, 2003m)-will
he much more challenging . Having good inventories is
essential both for understanding the transport and fate
of FIg in the environment, as well as for gauging
progress toward policy goals for Hg and other chemicals
of concern in the Great Lakes system and beyond .
Acknowledgments
The authors acknowledge Anne Pope and Ron Ryan
of the US EPA Emission Factor and Inventory Group
for insights into the NEI database, and Orlando
Cabrera-Rivera of the Wisconsin Department of Nat-
ural Resources for providing the Hg data from the
GLEI, and for assistance in interpretation . Thanks also
to David Lennett for assistance in understanding the
regulatory structure for EAFs, and to Felice Stadler and
Zoe Lipman of the National Wildlife Federation for
helpful comments on the manuscript . The comments of
two anonymous reviewers were very helpful . The
authors are responsible for the content of the article,
and no endorsement of views expressed in the article by
those acknowledged above or any of the funders is
implied .
Funding sources :
Funding for this work was provided
by the Beldon Fund, the Garfield Foundation, the
George Gund Foundation, and the US Environmental
Protection Agency
.
References
Anonymous, 2000. Electric arc furnace roundup, Iron & Steelmaker
Magazine, May 2000-
Ayres, R., 1997. The life cycle of chlorine, Part I: chlorine production
and the chlorine-mercury connection . J . Indust Foodt I, 81-94
.
Bullock, O.R ., Brehme, K .A ., 2002. Atmospheric mercury simulation
using the CMAQ model formulation description and analysis of
wet deposition results
.. Atoms Environ.36,2135-2146
.
Chlorine Institute, Inc., 2003. Sixth Annual Report to EPA. May
2003 .
Available
at :
http://www_ epa.gov/regions/air/mercury/
reducing lund9chlor-alkal,
Cohen, M., Ariz, R ., Draxler, R., Miller, P., Niemi, D., Ratte, D .,
Deslaurier, M., Duval, R_ Laurin, R., Slotnick, J ., Nettesheim, T .,
MacDonald, J., 2004. Modeling the atmospheric transport and
M. Mnrrop, SA. Holmes / Environmental Research 95 (2004) 282-297
295
deposition of mercury to the great lakes. Environ. Res. 95,
247-265 .
Cromnpton, P., 2001 . The diffusion of new steelmaking technology .
Resources Policy 27, 87-95
.
Delta Institute, 2002. Sector-based Pollution Prevention: Toxic
Reductions
Through
Energy
Efficiency
and
Conservation
Among Industrial Boilers. A Report to the Great Lakes National
Program Office (GL97514402). July 2002. Available at: help://
(IeIta-institute.nrg/ptiblica(ions/boilers/SectorBasedP2.pdI
Ecology Center, 2001- Toxics in Vehicles: Mercury. Ecology Center,
Great Lakes United, University of Tennessee Center for Clean
Products and Clean Technologies, January 2001 . Available at
:
http://www.cle,inotrrmipitign.org/reports.shtm l
Engstrom, D .R., Swain, E.B ., 1997. Recent declines in atmospheric
mercury deposition in the Upper Midwest. Environ. Sci. Technol
.
31, 960-967 .
Environment
Canada, US
Environmental
Protection
Agency
(EPA), 1997. Canada-United States Strategy for the Virtual
Elimination of Persistent Toxic Substances in the Great Lakes.
April 1997 .
Environment Canada, US EPA, 2002. Great Lakes Binational Toxics
Strategy, 2002 Annual Progress Report.
ERG, Inc., 2002. Memorandum to Jim Eddinger, US Environmental
Protection Agency Office of Air Quality Planning and Standards,
October 2003. Eastern Research Group, Inc. Available at
: http ://
www.epa .gov/ttn/atw/combust/boiler/baselincemissionfactor .pdf
ERG, Inc, 2003a. Documentation for the Final 1999 Point Source
National Emissions Inventory for Hazardous Air Pollutants
(Version 3). Eastern Research Group, Inc ., prepared for US EPA
Emission Factor and Inventory Group, July 2003 . Available at :
http://www.epa.gov/ttn/chief/net/I999inventory.htm l
ERG, Inc ., 20036 -Documentation for the Final 1999 Nonpoint Source
National Emissions Inventory for Hazardous Air Pollutants
(Version 3). Eastern Research Group, Inc., prepared for US EPA
Emission Factor and Inventory Group. August 2003. Available at:
http://www.epa.gov/tun/chief/net /I 999inventory.html
Evers, D.C ., Kaplan, J.D ., Meyer, M.W., Reaman, P.S., Braselton,
W.E.,
Major, A., Burgess, N., Scheuhammer, A.M .,
1998 .
Geographic trend in mercury measured in common loon feathers
and blood. Environ. Toxicol. Chem. 17, 173-183
.
Fenton, M.D.,
1999. Minerals Yearbook-Iron and Steel. US
Geological Survey, Reston, VA
.
Fenton, M .D ., 2002. Minerals Yearbook-Iron and Steel Scrap. US
Geological Survey, Reston, VA
.
Fitzgerald, W.F., Engstrom, D.R ., Mason, R.P ., Nater, E.A ., 1998 .
The case for atmospheric mercury contamination in remote areas
.
Environ. Sci. Technol. 32, 1-7.
GLC, 2003. 1999 Inventory of Toxic Air Emissions : Point, Area, and
Mobile Sources. Great Lakes Commission, May 2003 . Available at :
http //www.gle.org/air/inventory/1999 /
Gusstin, M .S ., 2003 Are mercury emissions from geologic sources
significant? A status report Sci . Total Environ. 304, 153-167 .
1lagreen, L . A., Lourte, B.A ., 2004. Canadian inventories: the missing
pieces. Environ. Res. 95, 272-281
.
Henry, K.S ., Kannan, K., Nagy, B .W ., Kevern, N.R ., Zabik, M .J .,
Giesy,
1-P .,
1998. Concentrations and hazard assessment of
organochlorine contaminants and mercury in smallmouth bass
from a remote lake in the Upper Peninsula of Michigan . Arch .
Environ. Contain. Toxicol. 34, 8t-86 .
international Joint Commission, 1987. Great Lakes Water Quality
Agreement of 1978 (As Amended by Protocol, Signed November
18. 1987). Available at hop://www.epa.gov/glnpo/glwga/1978/
Jackson, T. A., 1997. Long-range atmospheric transport of mercury to
ecosystems, and the importance of anthropogenic emissions-a
critical review and evaluation of the published evidence . Environ .
Rev. 5, 99-120
.
296
Johnson, J., 2001. The mercury conundrum. Chem. Eng. News 79,
21-24 .
Kelly,W.R ., Long, S.E ., Mann, J.L., 2003. Determination of mercury
in Sun crude oils and refined products by isotope dilution cold
vapor ICP-MS using closed-system combustion . Aria]. Bioanal .
Chem. 376,753-758 .
Kilgroe, J.D ., Sedman, CB., Srivastava, R.K ., Ryan, 1.V ., Lee, C.W .,
Thornloe, S.A ., 2002. Control of Mercury Emissions from Coal-
Fired Boilers: Interim Report Including Errata Dated 3-21-02, US
EPA National Risk Management Research Laboratory, EPA-600/
R-01-109, April 2002
.
Kirk, W.S.,
1999. Minerals Yearbook-Taconite. US
Geological
Survey, Reston, Virginia
.
Landis, M .S ., Keeler, G.J-, 2002. Atmospheric mercury deposition to
Lake Michigan during the Lake Michigan Mass Balance Study
.
Environ. Sci. Technol. 36, 4518-4524
.
Lorey, P., Driscoll, C.T., 1999. Historical trends of mercury deposition
in Adirondack lakes. Environ. Sci. Technol. 33, 718-722 .
Maine DEP, 2003. A Strategy to Reduce the Mercury Content of
Products, Report to the Joint Standing Committee on Natural
Resources
.
Maine Department of Environmental Protection,
January 2003. Available at
:
http://wwwstate.me.us/dep/mercury/
reports.htm (accessed October 2003)
.
Miller, M.M .,
1999. 1999 Minerals Yearbook-Lime. US Geological
Survey, Reston, VA .
MPCA, 2002. Mercury Reduction Program, Progress Report to the
Minnesota Legislature. January 2002 . Minnesota Pollution Control
Agency. Available at : htip ://www.pca.state.mn.us/hot/legislature/
reports/200'_/mercury-02.pdf
National Research Council, 2000 . Committee on the Toxicological
Effects of Methylmercury, Toxicological Effects of Methylmercury
.
National Academy Press, Washington, DC
.
Northeast States for Coordinated Air Use Management, 2003
.
Mercury Emissions from Coal-Fired Power Plants: The Case
for Regulatory Action, October 2003 . Available at : http://bronze .
nescaum.org/newsroom/rptO3IIO4mercury.pdf
Pirrone, N ., Allegrini, I ., Keeler, G.1 ., Nriagu, J.O., Rossmann, R .,
Robbins, J.A ., 1998. Historical atmospheric mercury emissions and
depositions in North America compared to mercury accumulations
in sedimentary records. Atmos. Environ. 32, 929-940
.
Pope, A., Billings, R., Finn, S., Wilson, D., 2002. The Development of
the 1999 National Emissions Inventory for HAPs . Presented
at Ilth International Emission Inventory Conference, Emission
Inventories-Partnering for the Future, Atlanta, GA, April 15-18,
2002 .
Sastry, R., Orlemann, L, Koval, P .J ., 2002. Mercury contamination
from metal scrap processing facilities : A study by Ohio EPA
.
Environ. Progr. 21, 231-236
.
Schroeder,W .H ., Montl e, 1., 1998 . Atmospheric mercury-an over-
view. Antics. Environ. 32, 809-822
.
Seigneur, C., Lohman, K., Vijayaraghavan, K., Shia, R.L ., 2003 .
Contributions of global and regional sources to mercury deposition
in New York State. Environ . Poll. 123, 365-373 .
Trip, L., Bender, T., Niemi, D., 2004. Assessing canadian inventories
to understand the environmental impacts of mercury releases to the
great lakes region . Environ. Res. 95, 266-271
.
US Census Bureau, 2001 . Population Change and Distribution,
1990-2000. C2KBR/-1-2, April 2001
.
US DOE, 1999. Coal Industry Annual 1999, DOE/EIA-0584(99) . US
Department of Energy, Energy Information Administration,
Washington, DC.
US DOE, 2000. Fuel Oil and Kerosene Sales 1999 . DOE/EIA-
0535(99), US Department of Energy, Energy Information Admin-
istration, Washington, DC.
US EPA, 1996. National Emission Standards : Initial List of Cate-
gories of Major and Area Sources, and Standards Promul-
M. Murray, S.A . Ilolmes / Environmental Research 95 (2004) 282-297
gation Schedule; Revisions. Fed. Rcg. 61, 28197-28208, June 4,
1996 .
US EPA, 1997a. Mercury Study Report to Congress, V . II: An
Inventory of Anthropogenic Mercury Emissions in the United
States. EPA-452/R-97-004, US Environmental Protection Agency,
Washington, DC
.
US EPA, 1997b. Locating and Estimating Air Emissions from Sources
of Mercury and Mercury Compounds . EPA-454/R-97-012, US
Environmental Protection Agency, Washington, DC
.
US EPA, 2000. Deposition of Air Pollutants to the Great Waters
:
Third Report to Congress . EPA-453/R-00-005, US Environmental
Protection Agency, Washington, DC
.
US EPA, 2001 a. The Emergency Planning and Community Right-to-
Know Act: Section 313 Release and Other Waste Management
Reporting Requirements. EPA 260/K-01-001, US Environmental
Protection Agency, Washington, DC
.
US EPA, 2001b. The Emergency Planning and Community Right-to-
Know Act-Section 313: Guidance for Reporting Toxic Chemicals
:
Mercury and Mercury Compounds Category. EPA 260-B-01-004,
US Environmental Protection Agency, Washington, DC .
US EPA, 2001c. Mercury in Petroleum and Natural Gas: Estimation
of Emissions from Production, Processing, and Combustion
.
EPA-600/R-01-066, US Environmental Protection Agency, Wa-
shington, DC
.
US EPA, 2002a. National Emissions Standards for Hazardous Air
Pollutants for Taconite Iron Ore Processing : Proposed Rule. Fed .
Reg. 67, 77562-77592, December 18, 2002
.
US EPA, 2002b. Consolidated Emissions Reporting, Final Rule. Fed .
Reg. 67, 39602-39616, June 10, 2002
.
US EPA, 2003a. Update: National Listing of Fish and Wildlife
Advisories.
EPA-823-F-03-003, US Environmental Protection
Agency, Washington, DC.
US EPA, 2003b. National Emissions Inventory. US Environmental
Protection Agency, Washington, DC . Available at
: http://www .
epa.gov/ttn/chief/net/index .html
(accessed
August,
September
2003) .
US EPA, 2003c. Toxics Release Inventory Explorer. US Environ-
mental Protection Agency, Washington, DC. Available at : http ://
www.epa.gov/triexplorer / (accessed August, September 2003)
.
US EPA, 2003d. Electric Utility Steam Generating Units Section 112
Rule Making. US Environmental Protection Agency, Washington,
DC. Available at :
http://www.epa.gov/ttn/atw/combust/utiltox /
utoxpg.html (accessed August, September 2003)
.
US EPA, 2003e. National Emissions Standards for Hazardous Air
Pollutants for Industrial/Commercial/Institutional Boilers and
Process Heaters; Proposed Rule . Fed. Reg. 68, 1660-1763, January
13, 2003 .
US EPA, 2003f. National Emissions Standards for Hazardous Air
Pollutants for Industrial/Commercial/Institutional Boilers and
Process Heaters, ICCR Archives, EPA Inventory Database
v4.1-Boilers . Available at : http://www.epa.gov/ttn/atw/combust /
iccrarch/bo.html
US EPA, 2003g. Factor Information Retrieval Data System . Available
at:
http://www.epagov/ttn/chief/software/fire/(accessed October
2003) .
US EPA, 2003h. Stationary Reciprocating Internal Combustion
Engines MACT Standards Development . Available at :
http ://
www.epa.gov/ttn/atw/combust/engine/riceback .html (accessed Oc-
tober 2003)
.
US EPA, 2003i. Combustion Turbines MACT Standards Develop-
ment. Available at: http:/jwww.epa.govjttn/atw/combust/t ubine/
turbback.html(accessed October 2003) .
US EPA, 2003j. National Emissions Standards for Hazardous Air
Pollutants: Mercury Emissions from Mercury Cell Chlor-Alkali
Plants: Final Rule. Federal Register, 68, 70904-70946, Dec . 19,
2003 .
US
EPA,
2003k .
National
Emissions
Standards
for Hazardous
Air Pollutants for Iron and Steel Foundries : Final Rule (signed
August 2003). Available at : http://wwwepu-gov/Itn/atw/ifoundry/
ifoundrypg.html(accessed October 2003)
.
US EPA, 20031. Table of Final MACT Rules . Available at
:
http://
www.epa.gov/ttn/atw/maclRtlhtml (accessed October 2003)
.
US EPA, 2003m. Latest Findings on National Air Quality: 2002 Status
and Trends, EPA 454/K-03-001, August 2003 .
US EPA, 2004. Proposed National Emission Standards for Hazardous
Air Pollutants; and, in the Alternative, Proposed Standards of
M. Murrap, S. A. /IolnesI Environmental Research 95 (2004) 282-297
297
Performance for New and Existing Stationary Sources : Electric
Utility Steam Generating Units; Proposed Rule, Federal Register,
69, 4652-4750, January 30, 2004
.
United Nations Environment Programme--Chemicals, 2002 . Global
Mercury Assessment. December 2002. Available at
:
http://www .
clieni.unep.ch/mercury/
van Oss, Hendrik G .,
1999 .
Minerals Yearbook-Cement. US
Geological Survey
.
Wilhelm, S.M., 2001. Estimate of mercury emissions to the atmosphere
from petroleum. Environ. Sci. Technol. 35, 4704-4710 .
/SETA
gIPRESS/
EFFECTS OF WATERBORNE MERCURY ON TERRESTRIAL WILDLIFE AT CLEAR
LAKE: EVALUATION AND TESTING OF A PREDICTIVE MODEL
MARTI WOLFE*t and DONALD NORMAN$
}Toxicology Task Force, 1233 West Hills Road, Philomath, Oregon 97370, USA
tNonnan Wildlife Consultants, 2112 199th Street NW, Shoreline, Washington 98177, USA
(Received 19 February 1997 ; Accepted 18 September 1997)
Abstract-Birds and mammals
exposed
to waterborne mercury (Hg) and methylmercury (MeHg)
were
collected and/or sampled
at Clear Lake, California, USA, to field test the
predictive wildlife
criteria model developed for the Great Lakes Water Quality
Initiative (GLWQI) . Tissue samples collected from sampled animals
were
analyzed for Hg and organochlorine residues, and for
selected
physiologic parameters known to be affected by Hg. All mammalian organ tissues analyzed contained less than 12 ppm
total Hg, wet weight . All avian tissue samples analyzed contained less than 3 ppm total Hg, wet weight . No
evidence
of Hg-
associated health
effects
was found . Tissue Hg residues
were
compared with water, sediment, and animal food samples to characterize
bioaccumulation of mercury in the Clear Lake food web. Total Hg bioaccumulation factors for the Clear Lake site closest to the
Hg source
were :
TL-2: 11,100; TL-3 : 31,200; TL-4, 190,000. Our results support the final wildlife criterion (1,300 pg/L) and
suggest that the GLWQI model, with site-specific modifications, is predictive for other Hg-bearing aquatic systems
.
Keywords-Wildlife
Methylmercury
Great blue herons
Trophic transfer
INTRODUCTION
The United States Environmental Protection Agency (U.S .
EPA) Office of Water has undertaken investigations to deter-
mine toxicity thresholds of waterborne contaminants for ter-
restrial wildlife. Upper trophic level piscivores/omnivores ,
such as great blue herons, mink, and raccoons, are at risk from
environmental contaminants that bioaccumulate in aquatic
foods chains. Blackbirds and swallows, which feed on emer-
gent aquatic insects, also may be exposed to waterborne con-
taminants. This study reports the sampling of fish-eating birds
and mammals and insectivorous birds from Clear Lake, Cal-
ifornia, USA, which is presently contaminated with mercury
(Hg) and methylmercury (MeHg), and was historically con-
taminated with organochlorines (OCs) [1-4] . Unless otherwise
noted, Hg refers to total Hg
.
The goals of this project were to test the assumptions and
methods of the Great Lakes Water Quality Initiative (GLWQI)
model by comparing the wildlife criteria derived from the
model with measurements in a Hg-bearing system other than
the Great Lakes, and to suggest modifications to improve the
model's predictive power. The model was developed for es-
timating the threshold concentrations of water borne contam-
inants that constitute a health threat to vertebrate terrestrial
wildlife [5-7]
. Water quality criteria previously published by
the U.S. EPA were based on tests on aquatic organisms and
laboratory animals and were designed to protect humans, fish,
and aquatic invertebrates [8] . Because of distinct physiologic
characteristics and different patterns of exposure, water quality
criteria developed for aquatic organisms and humans may not
be adequately protective of terrestrial wildlife. Therefore, the
GLWQI Committee, under the sponsorship of the U .S. EPA's
* To whom correspondence may be addressed
(mfwolfe(fucdavis.edu )
.
Presented at the Wildlife Mercury Conference, Fairfax, Virginia,
USA, April 12-13, 1996
.
214
Environmental
Toxicology
and Chemistry,
Vol. 17, No. 2, pp. 214-227, 1998
© 1998 SETAC
Printed in the
USA
07307268/48 $6.00 + 00
Office of Water, organized an effort to derive water quality
criteria for wildlife, or wildlife values (WVs) .
Efforts to establish water quality criteria specifically for
wildlife originally followed the general model first employed
the Wisconsin Department of Natural Resources and refined
by Peterson and Nebeker [9] and the GLWQI [10]
. After re-
view and revision, the model adopted for the final rulemaking
was [5-7,11,12]
TD + Wt
W V - UF„ +UFs + UFO
W +Z (FTU + BAFTL;)
where WV is the wildlife value (mg/L)
; TD is the test dose
(mg/kg/d) for the test species, either a no observed adverse
effect level (NOAEL) or a lowest observed adverse effect level
(LOAEL) ; UF„ is the uncertainty factor (UF) for interspecies
extrapolation ; UFs is the uncertainty factor for subchronic to
chronic exposure extrapolation
; UFL is the uncertainty factor
for LOAEL to NOAEL extrapolation ; Wt is the average weight
in kilograms (kg) of the representative species; W is the av-
erage daily volume of water (L/d) consumed by the represen-
tative species ; F, is the average food consumption (kg/d) at
trophic level i by the representative species; and BAFT,; is the
bioaccumulation factor at trophic level i
(i .e ., the ratio of the
toxicant concentration in wildlife food to its concentration in
water; the units of the BAF are L/kg). Given the prominence
of Hg and MeHg as contaminants of concern to wildlife in
the Great Lakes, and because of their propensity to bioaccu-
mulate in food chains, these contaminants were singled out
for special consideration, via a field validation of the method
used to derive the WV. Clear Lake was chosen as the site for
the field validation study because it is contaminated with Hg
and MeHg, and because it is home to species different from
those usedd to derive the GLWQI model, but that also occupy
the upper trophic level piscivore niche . Clear Lake therefore
Fffects of waterborne mercury on terrestrial wildlife
provided an opportunity to test the rigor and transportability
of the model
.
Peterson and Nebeker [9] identified three information def-
icits bearing on hazard assessment for wildlife
: toxicity of
environmental contaminants to wildlife, the dynamics of tox-
icant accumulation in ecosystems, and the relative importance
of various routes of toxicant exposure to wildlife . Therefore,
our objectives
were
to compare the water Hg concentration at
Clear Lake with the toxicity threshold predicted by the GLWQI
model, to compare tissue Hg concentrations of Clear Lake
wildlife to tissue Hg concentrations associated with published
NOAELs and LOAELs, to compare dietary Hg intake of Clear
Lake wildlife with the dietary threshold concentration assumed
by the GLWQI criterion, and to determine whether this level
of Hg exposure affects the health and breeding success of Clear
Lake wildlife. In addition, we compared fig residues in tissues
and samples obtained nonlethally with I Ig residues in tissues
of toxicologic significance to evaluate the suitability
of non-
lethal sampling as a substitute for traditional tissue analysis
.
The first task of the project was to use data derived from
controlled feeding studies in which the contaminant is admin-
istered to the test animals in food or water to
estimate the
NOAEL This NOAEL value, and information on exposure to
the contaminant in nature, were used to estimate the water-
borne concentration causing exposure equivalent
to the ex-
perimentally derived NOAEL
[13] . Using this method, the
GLWQI Committee derived a WV of 1,300 pg/L in the final
GLWQI rulemaking [5]. The second part of the project, re-
ported here, was to evaluate the model's predictive strength
by field testing it with free-living birds and mammals in an
lig-bearing aquatic system, under actual exposure conditions
.
By comparing growth, reproductive success, and other indi-
cators of wildlife health between Clear Lake animals and an-
imals unaffected by Hg, we hoped to further estimate the im-
pact of a known water concentration of Hg, and compare that
concentration with the WV concentration determined
by the
model calculations
.
From previous and concurrent work, we knew that Hg con-
centrations at Clear Lake were low relative to other Hg-bearing
systems for which descriptions have been published
. [14-19]
Therefore, we had reason to anticipate small, sublethal effects
.
For this reason, and because we were limited to small sample
sizes for each species surveyed, we tried
to maximize the
number of parameters assessed, including as many measures
of population and . individual
animal's health as could be
achieved within the time and budget resources available
. Data
presented here include tissue fig concentrations of animals
collected Or sampled at Clear Lake, growth, measures
of re-
productive success, and histologic and hematologic analyses .
These findings were used to critique the GLWQI WV model
in its draft form, and to suggest improvements to the model
.
Ideally, we would also have sampled the species of birds and
mammals that were used to derive the final WV, that is, bald
eagle, herring gull, kingfisher, and otter, as well as mink
. All
these occur at Clear Lake, either seasonally or year-round . In
practice, species selection criteria were availability,
budget,
and logistical and regulatory access
.
Clear Lake and Sulphur Bank Mercury Mine
Clear Lake was chosen as a field-testing site for the GLWQI
wildlife toxicity model because of the abundance and diversity
of terrestrial wildlife there potentially exposed to waterborne
Hg, and because of the concurrent study being conducted on
Prtvirorc. T6xicn1 .
Chem. 17, 1998
215
sediment, water, and lower trophic level organisms by staff
from the University of California at Davis under the sponsor-
ship of U.S. EPA Region 9 Superfund [14,20,21] . Clear Lake
is California's largest natural lake . It lies between the Inner
and Outer Coast Ranges, an area that contains cinnabar-bearing
serpentine soils. Sulphur Bank Mercury Mine (SBMM) is lo-
cated on the Oaks Arm of Clear Lake (Fig
.
1). During past
open-pit cinnabar mining and ore processing activities, Hg-
containing wastes were discarded in Clear Lake
. Erosion of
tailing piles and leaching from the open pit (now filled with
water and referred to as Herman Impoundment) continue to
deposit fig to already contaminated sediments
. Inorganic Hg
is converted to MeHg in Clear Lake sediments by microbial
action. Methylmercury is the contaminant of primary concern
from SBMM, because of its greater rate of absorption (98%)
compared to inorganic tig (1%) [221, and because MeHg bioac-
cumulates and biomagnifies at higher trophic levels
. Methyl-
mercury concentrations in excess of U .S . Food and Drug Ad-
ministration guidelines have been found in
Clear Lake fish,
and have prompted the California Department of Health Ser-
vices to issue a public health advisory recommending a limit
on the consumption of Clear Lake fish, which has remained
in effect since 1986 [20]. Sulphur Bank Mercury Mine became
a Superfund site in 1990. Remediation work is currently under
way, under the direction of U .S. EPA Region 9 .
Historically, Clear Lake was also contaminated with OC
compounds, mostly as a result of a midge control program in
which dichlorodiphenyldichloroethane (DDD) was deposited
directly into the lake . The bioconcentration
of dichlorodi-
phenyltrichloroethane (DDT)/DDD in western grebes was re-
ported by Herman and coworkers shortly thereafter [23] . Be-
cause
of
this potentially confounding source of contaminant
impact on wildlife, we also analyzed a subset of sampled spe-
cies for OC residue .
Mercury concentrations at SBMM, Clear Lake water, sed-
iment, and lower trophic level biota have been sampled in the
course of a concurrent study conducted by members
of the
Institute of Ecology, University of California,
Davis, under
contract to U .S. EPA Region 9 Superfund . Suchanek and co-
workers [24] measured total Hg and MeHg water concentra-
tions monthly at six sampling sites in Clear Lake from
1992
through 1996, collecting samples from both surficial and deep
water layers. six to seven samples per site (concentrations are
yearly averages). Total sediment Hg in Oaks Arm, the site
closest to the mine, was 40 to 370 ppm with an average
of
220 ppm (pg/g); total sediment Hg was 0 to 50 ppm at other
sites sampled throughout the lake. Oaks Arm total fig was 81
ng/L (ppt) in unfiltered deep water and 22 ng/L in unfiltered
surficial water. Unfiltered surficial water generally contains
less than 100 ppt at all sampling sites . Corresponding McHg
measurements for Oaks Arm were 10 ppb (ng/g) in sediment,
and 0.1 to I lift (ng/L) in unfiltered deep water
. Unfiltered
deep water McHg is generally between 0.01 and 0.4 ppt else-
where in the lake. Methylmercury concentrations in Clear Lake
water are therefore close to the limits of detection of the most
sensitive analytical method, 0.05 ppt (ng/L) by cold-vapor
atomic fluorescence spectroscopy [25-27]
.
Great blue herons
(Ardea herodias),
double-crested cor-
morants
(Phalacrocar'ax aurituc),
raccoons
(Procyon lotor),
mink
(Mustela vison),
and river otter
(Luua canadensts)
are
among the upper trophic level piscivores at risk from envi-
ronmental contaminants that bioconcentrate in aquatic foods
chains. Three large heron colonies were located on the shore
21b
Environ
Toxicot Ch,. 17, 1998
nAes
of Clear Lake in 1993, and two in 1994 . Double-crested cor-
morants also nested at one of the three sites (Fig. 1). Great
blue herons are widely distributed and often nest near con-
taminated sites, so
a
substantial
fund
of comparative data is
available [28-33]. Heron colonies in the western coastal states
have been useful for monitoring contaminant concentrations
in lakes, rivers, and estuaries. Mercury levels in heron tissue
have been measured at a number of sites in the United States
and elsewhere, providing a broad basis for comparison [32,34-
36]. Numerous other species of birds breed or winter at Clear
Lake or use the lake as a resting and foraging stop
during
migration. We also collected red-winged blackbird
(Agelaius
phoeniceus),
Brewer's blackbird
(Euphagus cyanocephalus),
and cliff swallow
(Hirundo pyrrhonota)
nestlings, to learn
whether these insectivorous birds were exposed to Hg and
MeHg at lower concentrations and to see if an effect of distance
from the mine was evident at this lower trophic level. Effects
of Hg on raccoons, otters, and mink have been reported
in
numerous studies [37-48], and are summarized in Wolfe et al .
[49]. These studies provide a basis for comparison and inter-
pretation of the tissue Hg residues in animals we sampled at
Clear Lake. Of the other species used in the GLWQI model,
osprey were subject of a concurrent study [50],
bald eagles
arc present at Clear Lake only seasonally and are restricted,
and belted kingfishers are customarily collected by shotgun,
a
difficulty in a populated area. Although the GLWQI model
was developed for a system in which the lig source
is at-
mospheric deposition, the methodology used is independent
of source criteria; therefore, distance from an Hg point source
was not one of the variables of interest. However, because the
relationship between distance from the mine and Hg concen-
tration in the biota was a focus of the U .S . EPA Region Su-
M. Wolfe and
D .
Norman
Sulphur Bank Mercury Mine
Clearlake Highlands
Fig .
1
.
Map of Clear Lake, California, USA, showing Sulphur Bank Mercury Mine (SBMM) and great blue heron colonies
.
perfund/UC-Davis study, we included it in our analysis when-
ever practical. Because the great blue heron colonies occurred
at various distances from SBMM, herons were a particularly
useful species to monitor in support of this secondary objective
as well. Raccoons were usually common all around the
lake
in 1993, although an epizootic of canine distemper in the sum-
mer and fall of 1993' reduced raccoon numbers available
for
sampling in 1994. Mink and otter are found in wetlands and
along creeks and sloughs. Observations by residents and local
biologists suggest that otter and mink populations
have in-
creased during the last 10 years, but no
formal population
studies have been conducted
.
METHODS
Sample collection
All species sampled were collected (or captured, sampled,
and released) under U .S. Fish and Wildlife Service permit PRT-
779203, California Department of Fish and Game (CDF&G)
permit 4017, and Memoranda
of Understanding with the
CDF&G for carnivores
.
We collected heron, cormorant, blackbird, and cliff swallow
nestlings from nests. Recently dead and dying heron and cor-
morant nestlings were salvaged after falling from nests
. Rac-
coons and mink were taken in box traps or padded double-
swivel leg-hold traps and either sacrificed,
or anesthetized,
sampled, recovered in the field, and released
.
Blood, brain, muscle, kidney, liver, claws, and fur or feath-
ers were collected from all animals sacrificed. Blood, claws,
and fur or feathers were collected from live-sampled animals
.
Brains of a subset of animals were separated into
right and
left hemispheres, one half was frozen for Hg analysis, the other
Effects of waterborne mercury on terrestrial wildlife
was preserved in formalin solution and sent to the Veterinary
Pathology Laboratory at Oregon State University (Corvallis,
OR, USA) for histnpathologic examination
.
We sampled food items from the ground below nests (her-
ons and cormorants), from water and air near nests (insectiv-
orous passerines), or from the gastrointestinal
tracts of col-
lected animals. We determined heron food energy requirements
according to the method of Butler [51 ], then used these values
and food item Hg concentration to determine actual Hg
ex-
posure in heron young. We then compared the model's pre-
dicted toxicity threshold water concentration to measured Hg
concentration in Clear Lake water
.
Residue
analysis
Samples for residue analysis were frozen and shipped
to
Brooks-Rand (Seattle, WA, USA) for total Hg or McHg anal-
ysis by cold-vapor atomic absorbance spectroscopy according
to the methods of Bloom and Liang [26,27] . Tissue samples
from passerine birds were prepared for Hg analysis by pooling
tissues from three to six individuals . Feather samples consisted
of flight feathers from the left wing and contour feathers from
the left side of the breast, pooled and digested to homogeneity.
Liver, brain, and feathers or fur were analyzed for total Hg
and/or McHg. A subset of kidney, blood, and muscle samples
also was analyzed for McHg. Because Clear Lake historically
has been contaminated with OCs, we submitted a small subset
of Clear Lake bird and mammal tissues to Columbia Labo-
ratories (Corbett, OR, USA) for OC analysis, to compare pres-
ent-day OC tissue concentrations with those reported histori-
cally. We used fillets for the fish analyses, and liver tissue from
other animals, and fat-normalized the results, thus permitting
comparison between Clear Lake animals and results from pre-
vious work [52)
.
Tissue
calibration
We looked for correlations between tissues that can be ob-
tained nonlethally (feathers or fur, and blood and/or claws as
available) with Hg concentrations
in tissues of toxicologic
interest (brain and liver) via regression analysis and t tests
.
Growth rates and reproductive effects
We observed breeding activities at the Clear Lake heronries
to collect data on incubating nests, young per nest, and young
per successful nest [30] . During the incubation period, we
counted attended nests using a spotting scope from observation
points outside the colonies . Later, when the colonies could be
entered without undue disruption, we counted young in the
nest from the ground beneath trees
[53] .
The professional
climber who collected the nestlings for tissue analysis made
final counts of young in nests on collection
day. We took
morphologic measurements (weight and body length ; and for
herons and cormorants, culmen, wing, and tarsus length) of
collected animals. We calculated heron nestling growth rates
by determining age from culmcn length and plotting body
weights against the resulting age curve to compare
growth
rates of Clear Lake heron chicks to growth rates of chicks
not
exposed to contaminants [29,54]
.
Biomarkers
and hioaccumulation
Mercury and MeHg may inhibit cholinesterase (ChE)
ac-
tivity, or inhance the ChE-inhibiting action of organophos-
phorus (OP) insecticides [55-58] . Because the Quercus Point
rookery was located next to an orchard where guthion
was
Environ. Toxicol. Chczn
17, 1998
217
applied, and exposure from drift was a possibility
[59], we
measured blood and brain ChE activity in nestlings from that
colony, and from Slater Island, a colony with no known
OP
exposure, using the oxime reactivation technique, which al-
lows the animal to serve as its own control [60,61]
. Because
various blood parameters may be affected by exposure to
Melig [62-64], we analyzed white blood cell ratios on a subset
of the animals sampled in 1993 . Suchanek et a] . [14,21] pro-
posed a bioaccumulation scheme for Hg in Clear Lake based
on the compartments they sampled : water, sediment, inverte-
brates, and fish. We modified the scheme to include the species
we sampled, thereby adding two additional trophic levels, and
calculated the bioaccumulation factors for each, using our data
and the measurements of Suehanek and coworkers
.
Statistics
The statistical functions in Excel 4 .0 (Microsoft Corpora-
tion, Redmond, WA, USA) were used for summary statistics,
tests for normal distribution, t tests, and analysis of variance
(ANOVA) Regressions were done in Graph III (Computer
Associates, San Jose, CA, USA) or Excel .
RESULTS
fig residues
Great blue herons and
double-crested
cormorants
. With
few exceptions, all the food items and parts recovered
from
nests, the ground below nests, and the gastrointestinal
tracts
of heron and cormorant young were the Sacramento hitch (Lav-
inia
exilicauda)
.
The mean Hg concentration in whole Sac-
ramento hitch was 0.563 ppm (0 .31-0.87 ppm) . Because 90
to 99% of the Hg in fish tissue is in the methyl form [65], this
is equivalent to a concentration of approximately 0 .3 to 0.85
ppm McHg in the diet of nestlings fed Sacramento hitch . Mean
brain tissue Hg concentration of heron young was 0.35 ppm
(0.3-0.4 ppm). Mean liver Hg concentration of heron young
was 1 .46 ppm (1 .32-1 .71 ppm). For cormorant young the cor-
responding values were brain : 0.63 ppm (0.54-0.72 ppm) and
liver 2 .42 ppm (1 .91
2.94 ppm). These values are well below
tissue Hg concentrations associated with Hg toxicity in .young
birds, I to 10 ppm in brain and 5 to 20 ppm in liver [49,66]
.
No correlation was found between tissue Hg concentration and
distance from the mine. Tissue Hg concentrations
for great
blue heron and double-crested cormorant nestlings and
their
food items are given in Tables I and 2. The relationship be-
tween heron blood Hg and brain, kidney, anti liver Hg was
significant (p = 0 .025). In herons sampled in
1993, no cor-
relation was found between feather Hg and either liver or brain
11g . In 1994, after we improved the feather sampling and anal-
ysis method, we found a correlation between feather Hg and
liver Hg (p -= 0 .01) but not between feather Hg and brain Hg
.
In cormorants, a strong correlation (p =
0.005) was found
between feather Hg and both liver and brain Hg (Fig . 2) . No
correlation was found between age or body weight and Hg
residue in any heron brain or liver.
Insectivorous passerine yozazg
. As anticipated, Hg residues
(0.018-0 03 ppm in brain, 0.094-0.364 ppm in feathers, 0.24-
0.92 in liver) were below known toxicologic benchmarks
for
all ages of all three species- Thresholds for Hg toxicity in adult
birds are 5 to 20 ppm in brain and 9 to 30 ppm in liver [49,66]
.
Samples of insect food collected from passerine foraging areas
contained 0.01 to 0.031 ppm Hg in sweep samples and 0.254
to 0.420 ppm in dip samples . Based on our small sample, the
218
Envirrm. Toxicot. Chem. 17, 1998
M . Wolfe and D. Norman
Table I . Total mercury (ppm wet wt ., mean with standard deviation in parentheses) in tissues of great blue heron young collected at Clear Lake,
California, USA
' Sulphur Bank Mercury Mine .
proportion of McHg in both liver and brain total Hg was ap-
proximately 84%
. Tissue Hg concentrations for red-winged
blackbird, Brewer's blackbird, and cliff swallow young and
their food items are shown in Table
3
. A relationship was
apparent between brain Hg in passerine young and distance
from the mine (rr = 0.54), but sample sizes were too small
for confidence. An apparent correlation exists between feather
Hg and brain and liver Hg, when passerine species were con-
sidered together, but data were insufficient to determine a re-
lationship for individual species
.
.
Raccoons.
Raccoon results were grouped into three sets
based on distance from SBMM (Table 4) . The most notable
characteristic of Hg tissue concentration in Clear Lake rac-
coons is variability, which probably reflects the raccoon's om-
nivorous, opportunistic feeding habits. Brain Hg concentra-
tions (ppm) of all raccoons collected were below NOAELs
and LOAELs reported for wild mammals [46,67,68]
. The high-
est brain and liver Hg concentrations,
1 .15 ppm and 8 .46ppm,
respectively, were found in a raccoon collected
14.5 km (9
miles) from SBMM; surprisingly this animal had only 0.46
ppm Hg in its fur. When this raccoon was included in the tissue
calibration analysis, no correlation was found between fur and
brain Hg concentrations, but removing this animal from the
data set gave a significant fur-brain Hg correlation (p = 0.025) .
We found no correlation between blood or fur Hg concentra-
tions and liver Hg. A strong correlation (p = 0.005) was found
between claw and liver Hg concentrations, but no correlation
was found between claw and brain Hg. Raccoon body burden
of Hg did nut correlate with body weight or with distance from
the mine.
Mink. A total of eight mink were sampled in the 1993 and
1994 field seasons, from approximately 250 trap sets. The
highest brain Hg concentration,
7.1 ppm in a mink collected
at the north end of the lake 22.5 km (14 miles)'from the mine,
is notable (Table 5) . This is the only tissue Hg concentration
collected at Clear Lake that was close to a toxicity threshold
reported for wildlife species. Brain Hg concentrations asso-
ciated with toxic effects in adult mink range from
8 to 30 ppm
(46,49,66]
.
Year
Brain
n
Liver
1993
5
0.72 (0.15)
5
2.94(l .07)
1994
10
0.54 (0.09)
10
1
.91 (0.39)
OC analysis
Thirty-five samples from Clear Lake animals had liver di-
chlorodiphenyldichloroethylene (DDE) residues less than 0.4
ppm. One heron nestling had 2.54 ppm DDE in its liver. Six
herons and four fish also had tetrachlorodiphenylethane (TDB)
residues above the detection limit of 0.3 ppm. Organochlorine
tissue residues from this study are compared with OC tissue
residues from animals measured in the
1950s and
1960s in
Table 6 .
Growth rates and reproductive effects
In 1993, the median age of the nestlings was 29.6 d (20-
71 d). In 1994, the median age of young collected was 31.4
d (18-57 d). This spread of ages permitted construction of
growth curves. No significant difference was found betweenn
growth rates of great blue heron nestlings from Clear Lake
heronries compared with growth rates for nestlings from col-
onies in Washington
[69] and Nova Scotia
[29]
(Fig .
3) .
Growth rate of Clear Lake heron young also did not differ
from herons raised in captivity with unlimited food
[54]
.These
data indicate that heron young sampled at Clear Lake in
1993
or 1994 did not have impaired growth, when compared to the
growth rate of heron young for sites uncontaminated by Hg .
In
1993 we counted 121
active heron nests at Rodman
Slough. Counts of young per successful nest made during the
nesting period and again when chicks were collected yielded
an estimate of more than two fledglings per nest. The Rodman
Slough colony had 93 active nests in March of 1994, but the
colony was abandoned between April 2 and April
15 (the
herons have since returned). The Slater Island colony con-
tained 65 active nests in 1993 but only 45 in 1994, although
the colony has expanded to the west end of the island in recent
years [70]
. In contrast to 1993, when breeding was very syn-
chronous, in 1994 eggs and young were at various stages of
development in the colony at each observation period between
April
2 and May
13
. We estimated two fledglings per suc-
cessful nest in 1993
. In 1994, 1 .55 young were found per active
nest based on a count of nests that could be observed without
Table 2. Total mercury (ppm wet wt ., mean with standard deviation in parentheses) in tissues of double-crested cormorant young collected at
Quercus Point, Clear Lake, California, USA
n
Feathers
Food
5
2.95 (0.31)
3
0.31 (0.16)
10
4.05 (1 .32)
4
0.38 (0.29)
Location
Distance
from
SBMM-
(miles)
Year
n
Brain
n
Liver
n
Feathers
n
Blood
n
Kidney
n
Food
Skater Island
5
1993
8
0.36 (0.15)
8
1 .42 (0.67)
7
2.23 (0
.77)
4
1 .3
(0.23)
5
1:15 (0.10)
3
0 .87 (0.80)
(8 km)
1994
6
0.30 (0.14)
11
1 .39 (0.58)
11
1 .97 (1 .18)
7
0.46 (0.12)
Quercus Point
9
1993
7
0.35 (0.11)
7
1 .71 (0.63)
6
2.43 (0.99)
4
1 .08 (0.32)
3
1 .00 (0.33)
3
0.31 (0.16)
(14 .5 km)
1994
6
0.36(0.15)
1 .46 (0.57)
11
2.01 (1 .18)
4
0.44 (0.17)
Rodman Slough
14
1993
10
0.4 (0.09)
10
1 .32 (0.59)
10
3.16 (0.82)
5
1 .16 (0.33)
7
1 .12 (0.26)
4
0.46 (0.04)
(22.5 km)
log feather [Hgl
Fig. 2. Double-crested connornu feather mercury (Hg) concentration versus bruit and liver Hg concentration .
disturbing the colony and a final count made at the time of
collection . Double-crested cormorants were the most numer-
ous species nesting at Quercus Point, with an estimated 210
nests. More than 130 great blue heron nests, 3 black-crowned
night-heron nests, and an osprey nest were found at Quercus
Point. Heron and cormorant nests were distributed among
mixed oak and cottonwoods; both species often were found
in the same tree. In 1993, more than 100 active heron nests
Table 3. Mercury (Hg) and mdhylmercury (Mellg) residues (ppm wet wt .) in Clear Lake, Caliturnia, USA, insectivorous passerine young and
their food
' Sulphur Bank Mercury Mine
.
s Each tissue value is a single pooled sample consisting of tissues from three to six individuals . Food samples were collected with dip (d) or
sweep (s) nets from areas where birds were observed foraging
.
Species
Distance from
SBMM^
(miles)
Sample/tissue"
Total Ilg
only
(ppm wet wt .)
McHg
Total
(ppm wet wt.) (Mellg + Hgll)
Mellg/total
Hg
Red-winged blackbird
8-12 d
0.5
Pooled brains
0.029
(0.8 km)
Pooled livers
0.092
Pooled feathers
0.094
1-7 d
Pooled brains
0.027
11030
0.90
Pooled livers
0.068
0.082
11.83
Pooled feathers
0.364
Pooled food (d)
0.420
Pooled food (s)
0.031
5
Pooled livers
0.037
(8 km)
Pooled food (d)
0.254
Pooled food (s)
0.012
Brewer's blackbird
5
Pooled brains
(1.023
(8 km)
Pooled livers
0.044
Pooled feathers
0.136
Pooled brains
0.027
0.030
0 .89
Printed livers
0019
0.024
0 .79
Pooled food (s)
0.(110
Cliff swallow (Clear Lake
8
Pooled brains
0.021
State Park)
(12 .9 kin)
Pooled livers
2049
Pooled feathers
0.322
Pooled brains
0.006
0.007
().KI
Pooled livers
0.035
0.042
0.83
K
Pooled food (s)
(1.1)17
12 9 km)
Rodman slough
14
Pooled brains
0.018
(22.5 kin)
Pooled livers
0
.074
Pooled feathers
(1.159
Effects of waterborne mercury on terrestrial mil dl it,
limirnn. Tosi,cl Chem 17, 1998
219
us
y = 0.438x + 0.159
r2 = 0.773
n1-
O
O
0.4-
O
A
A
°°
03-
a
m
0
B
∎
u1-
∎
log brain [Hg]
y = 0.188x + 0.057 r2 = 0.689
a
log liver [Hg]
220
Envirou
. Toxicol.
Ch
em .
17, 1998
° Sulphur Bank Mercury Mine .
and an estimated two to three fledglings per nest were found
.
In 1994, we counted 50 active nests at Quercus Point. The
number of fledging-age young could be confirmed in 21 of
these nests, which yielded a mean of 1 .47 fledglings per active
nest. As with Slater Island, in 1994 breeding was asynchro-
nous, with eggs and young at various stages of development
throughout the observation period . Based on our observations,
the reproductive success rates of great blue herons at Clear
Lake appear to be comparable to success rates of great blue
heron colonies from nearby sites not contaminated with Hg
[71,72] .
Biomarkers and bioaccumulation
Brain of raccoons and mink were examined at Oregon State
University's Veterinary Pathology Laboratory for signs of Hg-
induced lesions . No histopathologic changes were observed
.
Blood cell smears of a subset of bird and mammal blood
samples taken in 1993 did not indicate changes in erythrocyte
morphology [73] or elevations indicative of chronic infection
[74] (Table 7). We did not have blood cell counts for the same
species from reference sites, so no conclusions can be drawn
about Hg-related alterations in white cell proportions [64,75],
but we found no correlation between Hg tissue concentration
and heterophil to lymphocyte ratio, Western grebes sampled
by Elbert [76] at Clear Lake and at Eagle Lake,' a site uncon-
taminated by Hg, did show a difference in white cell popu-
lations between the two sites, but the difference was not sta-
tistically significant. The heterophil to lymphocyte ratio of
herons (approximately seven to three), the reverse of the ratio
in the two passerine species (approximately two to seven for
cliff swallows and two to six for red-winged blackbirds) is
apparently a characteristic of the Ciconiiformes [77] .
Sulphur Bank Mercury Mine
.
Table 4. Mercury (Hg) tissue concentrations (mean with standard deviation in parentheses) in raccoons
collected at Clear Lake, California, USA
Eggshell thickness
Eggshell thickness measurements from Clear Lake heron-
ties and from heronries uncontaminated by Hg, show that egg-
shell thickness was at pre-DDT/DDD levels, suggesting that
Ill; or the combination of Hg and OCs has not caused shell
thinning. Observations under the colonies found no evidence
of hatching failure or predation, and no eggshells collected
were fragile or cracked, findings typical of OC effects .
ChE activity
Brain and plasma ChE activity measurements indicate that
ChE activities were not depressed in either the Quercus colony,
in which nestling herons possibly were exposed to both Hg
and guthion, or at Slater Island where there was no indication
of OP exposure, indicating that neither Hg or the combination
of Hg and possible guthion exposure at the Quercus colony
was sufficient to depress ChE activities . Pre- and postreacti-
vation activities were within 3% . Brain ChE activities of Quer-
cus Point and Slater Island herons were 12 .9 and 11 .4 µmoles
acetylthiocholine (AcThCh) hydrolyzed per gram brain weight,
respectively. Plasma acetylcholinesterase (AChE) activities of
Quercus Point and Slater Island herons were 0 .25 and 0.27
µmoles AcThCh hydrolyzed per ml plasma, respectively
.
Figure 4 shows exposure pathways and associated Hg con-
centrations for a site on Oaks Arm close to SBMM . Trophic
relationships are based on analysis of stomach contents or on
the known biology of the species. Bird and mammal values are
liver Hg concentration, ppb wet weight. The water : hitch (tro-
phic level 2 [TL-2] BAF is 11,100 and the water : heron (TL-
3) BAF is 31,200, based on Oaks Arm water Hg concentration
of 5.08 X 10⁻² ppb, hitch mean Hg of 563 ppb, and heron liver
mean Hg concentration of 1,590 ppb. The water : mink BAF
Table 5 . Mercury (Hg) concentrations in the tissues of mink collected at Clear Lake, California, USA
M. Wolfe and D. Norman
Body
weight
(kg)
Distance from
Tissue total Hg (ppm wet wt.)
SBMM
•
(miles)
Brain
Liver
Fur
Blood
Muscle
Kidney
Claws
145
0
0.12
10 .1
3.28
0.63
10.2
1 .36
7 (11 3 km)
7.49
021
119
0.45
7 (11.3 km)
2.99
0.08
1,74
14 (22.5 km)
7.10
9.25
21 .5
0.18
34 .1
1 .21
14 (22.5 km)
0.24
0.93
7 .99
0.16
0.58
0.67
4.70
0.67
14 (22.5 km)
0.40
2.26
6.38
1,10
1 .30
7.22
1 .15
14 (22.5 km)
0.44
2.13
0.28
0.405
2 .28
1 .06
14 (22.5 km)
0.29
1 .30
7.63
0.15
1 .13
1.03
5 .26
Distance from
SBMM`
(miles)
Total Hg (ppm wet wt .)
Brain
Liver
Fur
Blood
Claws
0.1-0.5
0.67 (0.35)
3.29 (5 .1)
21 .97 (13 .2)
0.40 (0.20)
10.22 (16.7)
(0.2-0.8 km)
6
0.15 (0.08)
1 .02 (0.58)
6.93 (8.4)
0.07 (0.05)
3.74 (2.1)
(9.7 km)
7-10
0.63 (0.56)
7.02 (5 .9)
4.05 (5 .8)
0.24 (0.20)
13.0 (13.1)
(t1 .3-16.1 km)
Effects of waterborne mercury on terrestrial wildlife
9'nviron. lexical. Chem 17, 1998
221
Table 6. Organochlorine residues (mean with standard deviation in parentheses) in the tissues of Clear
Lake, California, USA, wildlife sampled in 1993 compared to 1958 1963
(3
3"
._._
. .- . .
.._
2500-
2an-
Iwa
I(q0
500-
0
+ _
------A
.,+
~ #
LA
X
r
:-
X
X
•'
. . .;
_
.
.
. .
X
X
.
.
0
20
Age (day.)
40
60
so
+
Washington Nestlings
X
Nova Scotia Nestlings
.
Clear Lake Nestlings '93
A
Clear Lake nestlings '94
Fig. 3. Growth curves of great blue heron nestlings at Clear Lake, California, USA, computed to nestlings not exposed to mercury
Liver
1958-1963
1993
Fat
Fat
equivalent
(ppm in fat)
n
(ppm)
(%)
(ppm)
Mink
1
007
1 .63
23.3
Raccoons
7
0048
2 09
43.5
(0_028)
Great blue herons
19
0.079
2.36
29.8
(0.116)
Western grebe
321-2,633
(ioldeneye
132
Double-crested cormorants
3
0.204
2.03
9.95
(0.266)
Gu11 species
118-2,134
('tiffsvaIlow,
I
0.15°
6.58
43 .8
krewcr's blackbird
I
0.18^
5 .57
30.9
1993
Fat
(ppm in
equivalent
edible
for edible
tissue)
% Fat
tissue ,
Carp
40
Sacramento hitch
5
0.049
6.10
0.90
(0.058)
^ Pooled sample.
222
Environ. Toxicol. Chem . 17, 1998
M . Wolfe and D. Norman
Table 7. While blood cell counts (mean with standard deviation in parentheses) of birds collected in Clear Lake, California, USA
Reference site uncontaminated with mercury .
(TL-4) is 190,600. Raccoons, with their opportunistic and vari-
able diet, were assigned to a mixed TL-3/4; the water : raccoon
BAF is 73,500 .
DISCUSSION
Budgetary and logistic constraints imposed several prob-
lems on the study design. (I) The study had no controls, and
no matched reference population. All parameters could be
compared only to conspecifics in uncontaminated sites, and/or
to values reported in the literature . (2) Sample sizes were small
.
Only great blue herons were represented by a sample sufficient
to achieve statistical power. (3) Formal randomization was not
achievable. Although we made efforts to distribute sample sites
throughout the bird colonies, and to trap mammals from mul-
tiple locations around the lake, in practice sampling patterns
and sample sizes were dictated by accessibility, regulatory
constraints, and budget. Therefore, to increase confidence and
help to compensate for these shortcomings, we maximized the
number of parameters assessed, measuring everything that
might reflect a Iig exposure, within the severe constraints of
our budget
. Our reasoning was that, because the sample sizes
collected were necessarily smaller than optimum, we should
obtain the maximum informational benefit from each sample
.
Care must be taken in comparing eggshell thickness mea-
surements between herons from different regions because of
recognized differences in shell thickness among subspecies .
The sample of eggshell thickness measurements we took
served mainly to reinforce our observation that shell breakage
was not a cause of nest failure in Clear Lake heronrics . This
result is consistent with the low OC concentrations found, and
our examination of shells collected in the colonies . Unfortu-
nately, we were unable to obtain OC tissue residue analyses
for the same species and tissues that were measured in the
1950s and 1960s. However, even the across-species compar-
isons in Table 6 show a gratifying decline in OC body burden
during the intervening 25 to 30 years
.
Cahill and coworkers [78] also measured Hg residues in
feathers of Clear Lake birds . They used the distal 7 to 9 cm
Table 8. Great Lakes Water Quality Initiative (GLWQI) parameters compared to Clear Lake, California, USA measurements'
WV = wildlife value, Hg = mercury, NOAEL = no observed adverse effect level,
OF =
uncertainty factor, TL = trophic level, BAF =
bioaccumulation factor .
"GBHE = Great blue heron
.
Sample
n
Heterophils
Lymphocytes
Monocytes
Eosinuphils
Basophils
Total mercury
(liver)
Great blue herons
Quercus Point
9
62.1 (12.6)
34.9 (12.3)
1 .4 (1 .0)
1 .9
(1 .0)
1 .46 (0 .57)
Slater Island
9
71 .8 (9.4)
24.4 (8.1)
2.5 (2.5)
2.4 (0 .7)
1 .39 (0 .58)
Rodman Slough
5
65.3 (3.3)
30.0 (2.9)
3 .0 (0.0)
4.7 (3.1)
1
.63 (0 .84)
Red-winged blackbirds
6
21 .8 (15.2)
59 .3 (16.6)
1 .8 (0.8)
4.0 (1 .1)
39.5 (4.9)
0.070
Cliff swallows
Rodman
23.8 (4.6)
75 .0 (5.6)
1 .3 (0.6)
1
(pooled sample)
0.074
Cliff swallows
Clear Lake State Park
13
23.6 (8.8)
73.2 (8.9)
25(1-1)
2.3(17)
(pooled sample)
0.049
Western grebe
Clear Lake
8
54.4 (10.2)
33 .8 (9.1)
1 .6(l .4)
10.1 (5.3)
(pooled sample)
Eagle Lake'
5
40.4 (14.4)
41
.8 (12.2)
3.8 (2.2)
13.8 (4.1)
GLWQ1
Clear Lake
Clear Lake-
Oaks Arm
(CL-OA)
(pg/L)
Clear Lake-
Lower Arm
(CL-LA)
(pg/L)
CL-OA/
GLWQ1
CL-LA/
GLWQI
WV toxicity threshold,
Hg concentration
water
1,300 pg/L
51,200
6,550
39
5
Avian Hg NOAEL (with
OF
0.0032 mg/kg/d
of 20)
Avian Fig NOAEL (without
UF)
0.064 mg/kg/d
Food Hg concentration
0.56 mg/kg (ppm)
(Sacramento hitch)
(0.3-0.85)
Dietary intake (great blue
0.138 mg/kg/d
heron nestlings)
(0.073-0.21)
TL-2 BAT
Hitch GBIIE'
nestlings
11,000
85,954
TL-3 BAF
27,900 L/kg
28,500
223,000
TL-3/4 FIAT
Raccoon
72,800
570,000
TL-4 BAF
Mink
140,000 L/kg
189,000
1,478,000
Effects
of
waterborne mercury on terrestrial wildlife
FERIPHYTON
6688
141xIC
'
SEDI ENT
7617
001
0006
1
OOPRANKI ON
38
LHA
NIU 1
HITCH
563
LAW H
OLIGOCHAETES
somm~
~
311
350
l"r
0001
RON NESTLI
t
,
~J'
1506
PASSERINES
~
MI`
o~00
r
DONS
4s
3730 ~.
55.4
9675
~EORMORANT NESTLINGS
A E
1 l 2x10 ,
J
10
Fig . 4. Rioaccunmlation
of
total mercury (Hg) in Clear Lake, California, USA, biota .
of a primary flight feather for their analysis, rather than the
pooled flight and contour samples we used, and reported 6 .48
ppm Hg forjuvenile cormorant feathers, compared to our 2 .95
ppm in 1993 and 4 .05 in 1994. The heron feather samples of
Cahill and coworkers contained 7.4 ppm Hg compared to 1 .97
to 3.16 ppm for feathers from herons in our study, in both
years at all three sites . However, Cahill and coworkers col-
lected feather samples from adult herons, whereas we sampled
only young herons
.
Because of the proximity of the Quercus Point heron colony
to an orchard treated with an OP during the nesting season,
we were afforded an opportunity to assess another possible
additive interaction of two contaminants that individually oc-
curred at concentrations too low to cause health effects, and
also to take into account a potentially confounding variable .
Quail receiving the dietary concentration of MeHg (5 ppm)
sutticient to depress ChE activity (without coadministered
parathion) had liver total Hg residues of 35 .8 ppm, wet weight
[55,79] . Clear Lake great blue heron nestlings, fed fish con-
taining 0.3 to 0.9 pinto fig, and accumulating 1 .3 to 1 .7 ppm
Hg in the liver did not exhibit depression
of
ChE activity in
brain or plasma. However, this dietary concentration and liver
residue were, in the study of Dieter and Ludke [55,79], suf-
ficient to potentiate the C'hE-inhibiting action of a carbamate
or OP insecticide to which the quail were simultaneously ex-
posed .
The Hg exposure of young insectivorous passerines feeding
on emergent aquatic insects was low, and resulting tissue res-
idues were also low. However, our interest in insectivorous
passerines arose in part because of what they might reveal
about the exposure of hats, small mammals that share the
aquatic insectivore niche_ Bats were not considered in the
GLWQI model, which regards upper trophic level piscivores
as the species most at risk . We believe that potential damage
HAY,
(PPB
all values ate wet weight
2425
Modified from Stehanek[14 41
Enuiroa. Toxicol. Ch,.
17, 1998
223
to bats should always he considered when assessing risk or
deriving standards for waterborne contaminants, especially
those that bioaccumulate_ Bats are small, with body weights
from 3 to 30 g. They have high food consumption rates to
meet the energy demands of flight. They are long-lived, with
life spans of 10 years or more, and are therefore potentially
at greater risk from contaminants that bioaccumulate and bio-
concentrate . Bats have low reproductive rates, typically one
or two young per year; thus bat populations may be more
severely harmed by reproductive toxicants. A bat of 10 g body
weight, and I g/d food intake rate, if feeding on insects with
total Hg concentrations found in Clear Lake invertebrates,
would be ingesting 5 to 20 times the mammalian Hg NOAEL
used in the GLWQI model [5,80-82] .
The lack of a correlation between raccoon tissue fig con-
centration and feather or fur Hg concentration is quite different
from the findings of Roclke et aL [45]
. In their survey of prey
of the Florida panther, they found a close correlation between
tissue Hg and fir fig concentrations in raccoons . We suggest
that Everglades raccoons occupying the range of the Florida
panther are feeding throughout the year on a more natural diet
of fish, crustaceans, and bird eggs in which Hg is more ho-
mogeneously distributed, whereas Clear Lake raccoons whose
foraging ranges include residential, recreational, and agricul-
tural land consume an opportunistic diet in which Fig content
varies greatly, not only seasonally, but from day to day. The
temporal relationship between fig tissue distribution and time
of exposure has been reported by a number of investigators
[83]
. Raccoons were abundant all around the lake 1993, al-
though an epizootic of canine distemper in the summer and
fall of 1993 reduced raccoon numbers available for sampling
in 1994. The usual abundance of raccoons at Clear Lake and
their ease of capture would make them good candidates for
fig monitoring in Clear Lake mammals, but the variability of
224
Environ. Toxicot Ch,.
17, 1998
Fig exposure and ingestion reflected by our raccoon
data re-
duces their suitability for that purpose
.
Mink and otter are found in wetlands and along creeks and
sloughs. Observations by residents and local biologists suggest
that otter and mink populations have increased during the last
10 years, but no formal population studies have been
con-
ducted. Therefore, mink would be a better choice for moni-
toring Hg in wild mammals at Clear Lake, but unfortunately
are much more difficult to sample . Many more mink were
caught than were sampled, as they often can pull out of the
padded leghold traps. The highest brain Hg concentration
of
an animal at Clear Lake, 7 .1 ppm in an adult mink, falls be-
tween the brain Hg concentrations associated with the dietary
NOAEL and LOAEL reported for mink by Wobeser et
al .
[46,67]. After 120 d on a diet containing 0 .44 mg/kg/d of
McHg, mink exhibited no clinical or pathologic signs of Hg
intoxication and had brain Hg concentrations of 3 .4 ppm. Mink
receiving 1 .1 mg/kg/d for 93 d displayed no clinical signs but
were found on necropsy to have nerve tissue lesions
. Brain
Hg residues in these mink were 8.2 ppm [46,67] .
Tissue calibration results for feathers and blood were prom-
ising. Given the ease with which feathers can be obtained from
birds, their use as a monitoring tool for Hg and other heavy
metals is very attractive . We hope to conduct laboratory
in-
vestigations that will further refine methods for using feathers
as a heavy metal monitoring tool in birds . Our correlations
between blood and body tissues were better, but although blood
can be obtained nonlethally, it is certainly more
invasive a
sample to obtain than feathers
.
The avian species sampled were not the same as those used
in the GLWQI model, belted kingfisher, bald eagle, and herring
gull. The strength of the model is therefore further tested by
applying it to species that share the Hg-exposure niche (upper
level piscivores) but otherwise have different biology than the
model species. Heron and cormorant young were fed almost
exclusively Sacramento hitch
.
Because these fish feed on
Daphnia
(14-98% depending on size) and other zooplankton
[84], they are assigned to TL-2, making Clear Lake heron and
cormorant nestlings TL-3 feeders . The Hg concentration in
Sacramento hitch samples we collected, approximately 0 .3 to
0.85 mg/kg, yields a dietary intake for heron nestlings of 0 .073
to 0.21 mg/kg/d, using a food consumption rate of 0 .245 kg/d
for a chick with 1 .0 kg body weight. The avian LOAEL (TD)
derived from the three-generation mallard feeding study of
Heinz [85] was 0.064 mg/kg/d, which falls within the range
of Hg concentrations in food fed to nestling herons and cor-
morants at Clear Lake. This value, an LOAEL to NOAEL
uncertainty factor (UF,) of 2, and an interspecies extrapolation
factor (UF„) of 10, yielded the NOAEL used in the GLWQI
model, 0 .0032 mg/kg/d. The
UF,i
was incorporated into the
NOAEL because of the limited availability of dose-response
data derived from chronic controlled feeding studies of MeHg
to birds. Given the proximity of the dietary exposure of nest-
lings herons to the experimental LOAEL, use of the two un-
certainty factors would seem justified .
The proposed wildlife criterion for Hg derived from the
original, draft version of the GLWQI model was 180 pg/L (1
.8
X 10
-4 ppb)
fig at the time this study was conducted in 1993 .
Total l ig in water in the Lower Arm of Clear lake, the cleanest
part of Clear Lake, was 6 .5 X 10-3
ppb
(6,550 pg/L), 36 times
greater the initial, proposed GLWQI WV. Total Hg in Oaks
Arm, nearest the mine, was 5 .08 X
10-i ppb
(50,800 pg/L),
282 times greater than the GLWQI WV. The 1993 draft
M. Wolfe and D. Norman
GLWQI model therefore predicted greater exposure in Clear
Lake wildlife than our actual measurements indicated . After
public comment, scientific review, and incorporation of ad-
ditional data, the W V for Hg adopted for final rulemaking was
1,300 pg/L [5]. The Oaks Arm and Lower Arm water Hg
concentrations are therefore 39 times greater and 5 times great-
er, respectively, than the revised, final WV
.
Bioaccumulation dominates the WV for contaminants that
bioaccumulate. Initially, based on data from the 1-month Clear
Lake preliminary study [14], we calculated boaccumulation fac-
tors at Clear Lake that were very different from laboratory-de-
rived values used to calculate the draft GLWQI Hg WV [86]
.
The upper trophic level piscivores in tie GLWQI model were
TL-3 or TL- feeders. The total Hg water : fish BAFs use for the
(haft WV for these levels were WV 60,000 and 130,000, re-
spectively. We assigned heron and cormorant young at Clear
Lake, feeding on Sacramento hitch, to TL 2/3, based on hitch
stomach contents available at the time . The measured water : fish
BAF was 71,400, using the preliminary Oaks Ann total Hg con-
centration of 5 .6
X
10-3 and a mean Sacramento hitch Hg con-
centration of 0.4 ppm. By incorporating data from the expanded
study, we derived a water : fish (TL-2) BAF of 11,100 and a water
:
heron (TL-3) BAF of 31,200, based on Oaks Arm water Hg
concentration of 5.08 X 10⁻² ppb, hitch mean Hg of 563 ppb,
and heron liver mean Hg concentration of 1,590 ppb. Similarly,
we obtained a water : mink (TL-4) BAF of 190,600, and a mixed
TL-314 BAF for water : raccoon of 73,500 .
Bioaccumulation factors used to derive the final GLWQI
Hg W V were revised to 27, 900 for TL-3 and 140,000 for TL-
4. The Clear Lake TL-3 BAF of 31,200 is within 12% of the
final GLWQI TL-3 BAF
. The final GLWQI TL-4 BAF of
140,000 lies between the TL-3/4 BAF of 73,500 and the Clear
Lake TL-4 BAF of 190,600, showing good agreement between
the revised model and actual measurements in the Clear Lake
system (Table 8) .
Although mercury levels are higher in Clear Lake heron
and cormorant nestlings than in nestlings sampled from un-
contaminated sites, the breeding populations of both species
at Clear Lake appear to be stable or increasing . We can make
only qualitative comparisons in the absence of background
reproductive data for the area . We compared productivity with
dozens of other great blue heron colonies [71 ] . Data from these
colonies are limited to young per successful nest, which tends
to overestimate productivity because it eliminates failed nests
.
Our estimates of 1 .5 young per active nest are similar to 1
.9
per active nest in British Columbia [30]. As we were not
monitoring the Rodman Slough herony during the incubation
period, when it was abandoned, we can only speculate on the
cause of abandonment. When working with colonial nesting
birds, protocols for avoiding disturbance while monitoring
must be strictly followed ; some colonies may not be searched
until chicks are 4 to 6 weeks old. We noted that Rodman Slough
herons built nests low in oaks, and were more readily disturbed
than at the other colonies, where the birds were more habit-
uated to human presence . However, the herons returned to
Rodman in 1995 and 1996. Cormorants extended their breed-
ing activities to Rodman in 1995 and 1996 [87]
.
Our results suggested that the model as originally applied
was too conservative for some Hg-bearing aquatic systems,
but modifications adapted for the final W V of 1,300 pg/L have
made the model more predictive. Further, our findings dem-
onstrate the importance of accurate information on the feeding
Effects of waterborne mercury on terrestrial wildlife
and breeding ecology of species of concern in deriving reliable
wildlife values from the model [88-92]
.
Acknowledgement --We thank JeffPeterson and Cynthia Nolt for help-
ful discussions of the model. We also thank Mark Meyers and Anne
Fairbrother for assistance on various phases of the project . We grate-
fully acknowlege the cooperation and assistance of the following in
the field portions of the project : Steve Garonne, Don Manning, Jerry
White, Steve Why, Cat Woodmansee, Laurie Mullen, Tom Suchanek,
Pete Richerson, Tom Nixon, Ernie Barnett, John Kelly, Larry Week,
Lyann Comrack, Caryla Larson, Ed Littrell, David Weiss, Gordon
Wolfe, Ray Bentley, Missy Fix, and Vince Leopold
.
REFERENCES
I Cairns T, Parfitt CH . 1980. Persistence and metabolism of TDE
in Clear Lake fish- Bull Euviron Coolarn Tadcol
24 :504-510 .
2. Home AL 1979. Nitrogen fixation in Clear Lake California 4
.
Diet studies on Aphanizomenmn and Anahacna blooms. Limnol
0
ceanogr 24 :329-341
.
3. Hunt EG, Bischoff At 1960 . Inimical effects on wildlife of pe-
riodic DUD applications to Clear Lake- Calif Dep Fish Game
46:91-105
.
4. Lion JD, Stanley RE. 1969. TDE residues in Clear Lake animals
.
Calif Dep Fish Game 55:164-178-
5. U.S. Environmental Protection Agency . 1995 . Final water quality
guidance for the Great Lakes system . 40 CFR Pans 9, 122, 123,
131, & 132 Fed Rug 60:15366- 15424 .
6- U . S. Environmental Protection Agency- 1995- Great Lakes Water
Quality Initiative criteria document for wildlife for the protection
of wildlife. EPA 820-13-95-008- Office of Water, Washington, DC
.
7 . U.S. Environmental Protection Agency . 1995. Great Lakes Water
Quality Initiative technical support document fur wildlife criteria
.
EPA 820-B-95-009. Washington, DC .
8- Stephan CE, Mount DI, Hansen DJ, Gentile 111. Chapman GA,
Brungs WA. 1985 . Guidelines for deriving numerical national
water quality criteria for the protection of aquatic organisms and
their uses. P1385-227049. National Technical Information Service,
Springfield, VA, USA .
9. Peterson JA, Nebeker AV. 1992- Estimation of waterborne sele-
nium concentrations that are toxicity thresholds for wildlife
. Arch
Euviron Coal,. Toxicol23:154-162 .
10- U.S. Environmental Protection Agency. 1993. Great Lakes Water
Quality Initiative technical support document for the procedure
to determine hioaccumulation factors . EPA 822-R-93-009. Wash-
ington, DC
.
11 . U.S. Environmental Protection Agency. 1993 . Wildlife criteria
portions of the proposed water quality guidance for the Great
Lakes system- EPA 822-R-93-006. Washington, DC
.
12 . U . S . Environmental Protection Agency. 1993 . Ecological fate and
effects of mercury . First Draft. Washington, DC
.
13- Wolfe ME 1993. Estimation ofwaterborne concentrations of con-
taminants that are thresholds for adverse effects in wildlife: Mer-
cury. U.S. Environmental Protection Agency, Washington, DC
.
14. Suchanek TH, Richerson 1'J, Woodward LA, Slotten DG, Holts
L7, Woodmansee CEE. 1993. Preliminary lake study report. A
survey and evaluation of mercury in : Sediment water, plankton,
periphyton, benthic invertebrates and fishes within the aquatic
ecosystem of Clear Lake California . U.S. Environmental Protec-
tion Agency, San Francisco, CA
.
15- Suchanek TH, Richerson P .1, Dolts LJ, Lamphere BA, Wood-
mansee CEE, Slotten DG, Hamer Fl, Woodward LA . 1995 . Im-
pacts of mercury on benthic invertebrate populations and com-
munities within the aquatic ecosystem of Clear Lake California,
Water Air Soil Polhd 80 :951-960-
16. Scheuhammcr AM. 1991- Effects of acidification on the avail-
ability of toxic metals and calcium to wild birds and mammals
.
Environ Pollut 71 :329-375
.
17. Lindgvist O. 1991Mercury in the Swedish environment I I : Mer-
cury in forest lake ecosystems --Bioavailahility, hioaccumulation
and biomagnification
. Wafer Air Soil Polla! 55:131-157 .
18. Parks 1W, Lutz A, Sutton JA . 1989. Water column methylmereury
in Wabigoon/English River-Lake system: Factors controlling
concentrations, speciation and net production. Can
.1 Fish Aquat
Sci 46:2184-2202
.
19. MacCrimmon HR, Wren CD, Gots HL . 1983. Mercury uptake by
lake front (Salvclinus nammrt,sh) relative to age, growth and diet
Environ-Toxicol. Chem. 17, 1998
225
in Tadenac Lake with comparative data from other Precambrian
shield lakes. Can J Fish Aqua! Set 40 :114-120 .
20. d'Almeida C, Lucc) .I, Seidel S, Simpson S, Freitas R, Rosen V .
1991 . Workplan for the EPA Region 9 in-house Remedial Inves-
tigation/Feasibility Study (RI/FS) Sulphur Bank Mercury Mine
Superfund site. U.S . Environmental Protection Agency, San Fran-
cisco, CA .
21 . Suchanek TH, Richerson PL Mullen LH, Brister LL, Becker IC,
Maxson AE, Slotten DG. 1997. Sulphur Bank Mercury Mine
Superfund site, Clear Lake, California . Interim final report . U.S
.
Environmental Protection Agency, San Francisco, CA
.
22. Berlin M, Carlson J, Norseth T 1975 . Dose-dependence ofmethyl
mercury metabolism . Arch Environ Contain Toxicol30:307-3 13
23 . Herman SG, Garrett RE, Rudd RE . 1969. Pesticides and the west-
ern grebe. In Miller MW, Berg GG, eds, Chemical Fallout
. Tho-
mas Books, Springfield, IL, USA, pp 24-51
.
24. Suchanek Tfl, Maxson AE, Mullen ED, Brister LL, Shorten DG
.
1997. Seasonal monitoring program. In Suchanek TH, Richerson
PJ, Mullen LFI, Brister LL, Becker JC, Maxson AE, Slotten DG,
eds, The Role of the Sulphur Bank Mercury Mine Superfund Site,
Clear Lake, California University of California-Davis, Davis,
CA, USA, pp 29-92 .
25. Bloom NS. 1995. Considerations in the analysis ofwater and fish
for mercury. Proceedings, National Forum on Mercury in Fish,
New Orleans, LA, USA, September 27-29, 1994, pp 31-39
.
26. Bloom N. 1989, Determination of picogram levels of methyl-
mercury by aqueous phase ethylation, followed by cryogenic gas
chromatography with cold vapour atomic fluorescence detection
.
Can J Fish Aqua! .Sci 46:1131-1140 .
27. Liang L, Bloom NS, Larval M- 1994. Simultaneousdeterntination
ofmercury speciation in biological materials by GC/CVAFS after
ethylation and mom-temperature precollection . Clln Chem 40
:
602-607 .
2R. Hoffman R17. 1980 . Total mercury in heron and egret eggs and
excreta . Ohio J Set 80:43-45 .
29. Quinney TE, Smith PC. 1978. Reproductive success, growth of
nestlings and foraging behaviour of the great blue heron (Ardea
herodias herodias L .) . KL229-5-7077. Final Contract Report
.
Canadian Wildlife Service, Ottawa, ON
.
30- Butler RW, Whitehead PE, Breault AM, Moul IF. 1995. Colony
effects on fledging success of great blue herons (Ardea herodias)
in British Columbia. Colon Wolerhirds
18:159-165 .
3L Fleming WJ, Pullin RP, Swineherd DM, 1985 . Population trends
and environmental contaminants in herons in the Tennessee Valley
USA 1980-1991
. Colon Walerhirdc 7:63-73 .
32. Elliott JE, Butler RW, Norstrom Rl, Whitehead PE . 1989. En-
vironmental contaminants and reproductive success of great blue
herons, Ardea herodias, in British Columbia, Canada 1986-1987 .
Environ Pallor 59:91- 114 .
33. Block E. 1992. Contaminants in great blue heron eggs and young
from Dumas Bay and Nisqually heronries, Puget Sound, Wash-
ington. OFO-EC93-1- U .S. Fish and Wildlife Service, Washing-
ton, DC
.
34. Blus Ll, Henry CJ, Anderson A, Fitzner RE. 1985. Reproduction,
mortality, and heavy metal concentrations in great blue herons
from three colonies in Washington and Idaho. Colon Waterhirds
8:110-116 .
35 . Van Der Molen El, Blots AA, De Graaf GL 1982. Winter star-
vation and mercury intoxication in grey herons
(Ardea cinerea)
in the Netherlands
. Ardea 70:173-184 .
36. Faber RA, Risebrough RW, Pratt HM . 1972. Organochlorines and
mercury in common egrets and great blue herons . Environ Pollut
3:111-122 .
37. Aulerich RJ, Ringer RK, Iwamoto 5 . 1973. Reproductive failure
and mortality in mink fed on Great Lakes fish . J Reprod Feral
19 (Suppl .):5365-5376
.
38. Aulerich RJ, Ringer RK, Iwamoto S. 1974. Effects of dietary
mercury on mink
. Arch Environ Conlam Toxicol2 :43-51 .
39. Cumbie PM. 1975. Mercury levels in Georgia otter, mink, and
freshwater fish
. Boll Environ Coal,. Toxicol 14:193-196 .
40. Cumbie I'M. 1975. Mercury in hair of bobcats and raccoons . J
Wildl Manage 39.419 425,
41 . Kucera E. 1983 . Mink and titter as indicators of mercury in Man-
itoba waters- Can J Zoo! 61 :2250-2256
.
42 . Mason CE, MacDonald SM. 1986- levels of cadmium, mercury
and lead in otter and mink feces from the UK-
yet Total Environ
53 :139-146 .
226
Environ . Toxicol. Chem. 17, 1998
43
. Norheim G, Kjos-Hanssen B . 1984. Persistent chlorinated hy-
drocarbons and mercury in birds caught off the west coast of
Spitshergen . Environ Pollu! 33:143-152 .
44. O'Connor DJ, Nielsen SW 1981. Environmental survey of meth-
ylmercury levels in wild mink (Mustela vison) and otter (Lalra
conadensi .s) from the northeastern United States and experimental
pathology of methylmercurialism in the otter. Proceedings,
Worldwide Furbearer Conference, Frostburg, MD, USA, August
3-11, 1980, pp 1728-1745
.
45. Ruelke ME, Schultz DP, Faccmirc CF, Sandlot SP Royals HE
.
1991 . Mercury contamination in Florida panthers . Florida Panther
Interagency Committee, Gainesville, FL, USA,
46 . Wobescr G, Nielsen NO, Schiefer B . 1976. Mercury and mink
II. Experimental methyl mercury intoxication . Can J Comp Med
40 :34-45 .
47 . Wren CD. 1984. Distribution of metals in tissues of beaver, rac-
coon and otter from Ontario, Canada . Sci Total Environ 34:177-
184
.
48 . Wren C, MacCrimmon H, Frank R, Suda P. 1980. Total and meth-
ylmcrcury levels in wild mammals from the pre-Cambrian shield
area of south central Ontario, Canada . Bull Environ Contain Tox-
icol 25:100-105.
49. Wolfe MP Schwarzbaeh S, Sulaiman RA. 1998. Effects of mer-
cury on wildlife: A comprehensive review . Environ Toxicol Chem
17:146-160-
50. Anderson DW, Cahill TMJ, Suchanek TH, Elbert RA . 1997. Re-
lationships between mercury and yearly trends in osprey pro-
duction and reproductive status at Clear Lake. In Suchanek TH,
Richerson PJ, Mullen LH, Brister LL, Becker IC, Maxson AE,
Slotten DG, eds, The Role of the Sulphur Bank Mercury Mine
Superfund Site, Clear Lake, California . University of California-
Davis, Davis, CA, USA, pp 195-200.
51 . Butler RW. 1991 . Habitat selection and time of breeding in great
blue herons (Ardea herodias) . PhD thesis . University of British
Columbia, Vancouver, BC, Canada
.
52
. Hebert CE. 1993 . To normalize or not to normalize; fat is the
question -Abstracts, 14th Annual Meeting, SETAC, Houston, TX,
USA, November 14-18, p 232
.
53. Norman DM. 1994. Protocols for monitoring great blue herons
in Puget Sound. U.S. Fish and Wildlife Service, Seattle, WA
.
54. Bennett DC. 1993. Growth and energy requirements of captive
great blue herons (Ardea herodias)
. MSc thesis. University of
British Columbia, Vancouver, BC, Canada .
55. Dieter MP, Ludke 1L . 1975. Studies on the combined effects of
organophosphates and heavy metals in birds . 1. Plasma and brain
cholinesterase in Coturnix quail fed methyl mercury and orally
dosed with parathion
. Bull Environ Contam Toxicol 13 :257-262
.
56. Dieter MP, Ludke JL. 1978. Studies on combined effects of or-
ganophosphates or carbamates and morsodren in birds . II. Plasma
and cholinesterase in quail fed morsodren and orally dosed with
parathion or carbofuran
. Bull Environ Contam Toxicol 19:389-
395
.
57. Petruccioli L, Turillazzi P. 1991 . Effect of methyhnercury on
acetylcholinesterase and serum cholinesterase activity in mon-
keys, Mococa fascicularis. Bull Environ Contam Taxical 46
:
769-773 .
58. Hill EF, Scares
.IUJ. 1987 . Oral and intramuscular toxicity of
inorganic and organic mercury chloride to growing quail .] Tox-
icol Environ Health 20:105-116 .
59. MacCollom GB, Currier WW, Baumann GL. 1985. Pesticide drift
and quantification from air and ground application to a single
orchard site
. Proceedings, Dermal Exposure Related to Pesticide
Use, St. Louis, MO, USA, April 8-13, 1984, pp 189-199
.
60. Hunt KA, Hooper Ml, Littrell EE . 1995. Carbofuran poisoning
in herons: Diagnosis using cholinesterase reactivation techniques .
J Wild! Dis 31:186-192
.
61 . Hunt KA, Hooper ML 1993 . Development and optimization of
reactivation techniques for carbamate-inhibited brain and plasma
cholinesterases in birds and mammals. Anal Biochem 212 :335--
343 .
62. Grissom REJ, Thaxton JP. 1986. Interaction of mercury and water
deprivation on the hematology of chickens . J Toxicol Environ
Health 19:65-74 .
63 . Shaw BP, Dash S, Panigrahi AK . 1991. Effect ofmethyl mercuric
chloride treatment on haematological characteristics and eryth-
rocyte morphology of Swiss mice
. Environ Pollu! 73:43-52
.
64. Niimi AJ, Lowe-Jinde L. 1984. Differential blood cell ratios of
M. Wolfe and D. Norman
rainbow trout (Salmo gairdneri) exposed to methylmercury and
chlombenzenes. Arch Environ Contam Toxicol 13 :303-311
.
65. Bloom NS. 1992. On the chemical form of mercury in edible fish
and marine invertebrate tissue. Can J Fish Aquat Sci 49:1010-
1017 .
66. Heinz G. 1996. Mercury poisoning in wildlife. In Fairbrother A,
Locke LN, Hoff GL, eds, Non Infectious Diseases of Wildlife .
2nd ed. Iowa State University Press, Ames, IA, USA, pp 118-
127
.
67 . Wobcscr 6, Nielsen NO, Schiefer B . 1976. Mercury and mink 1
.
Use of mercury-contaminated fish as a food for ranch mink in-
toxication. Can J Comp Med 40:30-33 .
68. Wren CD. 1986. A review of metal accumulation and toxicity in
wild mammals . 1. Mercury. Environ Res 40:210-244 .
69. Norman DM. 1991 . Organochlorine pesticides and polychlori-
nated biphenyl congeners in great blue herons from the Puget
Sound
ecosystem. MS thesis. Western Washington University,
Bellingham, WA, USA .
70. Nixon T. 1994. Observations on breeding bird populations in the
Clear Lake Basin. California State Parks Department, Kelseyville,
CA, USA .
71 . Kelly JR 1995 . Summary of 1994 heron and egret breeding season
in the northern San Francisco Bay Area, California. Audubon
Canyon Ranch, Stinson Beach, CA, USA .
72. Kelly JP. 1993. The distribution, reproductive success and habitat
characteristics of heron and egret breeding colonies in the San
Francisco Bay Area
. Colon Waterhirds 16:18-27 .
73. Shenker BL Rooney C, Vitale L, Shapiro IM . 1992. Immunotoxic
effects of mercuric compounds on human lymphocytes and mono-
cytes . I. Suppression of T-cell activation
. Immunopharmacol im-
munotoxicol 14:539-553 .
74. White IL, Wolfe ME 1998 . Earthquakes and oil spills; lessons
from the Santa Clara River spill . Proceedings, International Oil
Spill Conference, Fort Lauderdale, FL, USA, April 7-10, 1997
(in press) .
75, Dieter MP, Luster MI, Boorman GA, Jameson CW, Dean 1H, Cox
1W. 1983. Immunological and biochemical responses in mice
treated with mercuric chloride . Toxicol Appl Pharmacol68:218-
228
.
76. Elbert RA. 1996. Reproductive performance and mercury ex-
posure of birds at Clear Lake. MS thesis. University of California-
Davis, Davis, CA, USA .
77. Montesinos A, Sainz A, Pablos MV, Mazzucchelli F, Tesouro MA
.
1997. Hematological and plasma biochemical reference intervals
in young white storks . J Wildl Dis 33 :405-411
.
78. Cahill TMJ, Anderson DW, Perley B, Suchanek TH. 1997. Con-
centrations of mercury and other elements in five species of bird
at Clear Lake. Interim final report. U.S. Environmental Protection
Agency, Davis, CA .
79. Dieter MR 1974 . Plasma enzyme activities in Coturnix quail fed
graded doses of DOE, polychlorinated biphenyl, malathion and
mercury chloride. Toxicol App! Pharmacol 27 :86-98 .
80. Fenton MB. 1992
. Bats
. Facts on File, New York, NY, USA .
81 . U.S. Environmental Protection Agency. 1993 . Wildlife Exposure
Factors Handbook. Vol . I . EPA 600-R-93-187 . Washington, DC
.
82. U.S. Environmental Protection Agency. 1993
. Wildlife Exposure
Factors Handbook, Vol . 2 . EPA 600-R-93-187 . Washington, DC
.
83. Airey D. 1983. Mercury in human hair due to environment and
diet: A review . Environ Health Perspect 52:303-306
.
84. Geary RE, Moyle PB. 1980. Aspects of the ecology of the hitch
Lavinia exilicauda (Cyprinidae), a persistent native cyprinid in
Clear Lake, CA
. Southwest Nat 25:385-390
.
85. Heinz GH. 1979. Methylmercury Reproductive and behavioral
effects on three generations of mallard ducks
. J Wildl Massage
43 :394-401
.
86 . U.S. Environmental Protection Agency . 1993. Bioaccumulation
factor portions of the proposed water quality guidance for the
Great Lakes system. EPA 822-R-93-008. Washington, DC .
87 . Becker JC, Richerson PL Suchanek TH, Hayvaert AC, Slotten
DG, Kim JG, Vaughn CE. 1997 . The history of mercury depo-
sition in the Clear Lake watershed, as deduced from lake sediment
cores. In Suchanek TH, Richerson PJ, Mullen LH, Brister LL,
Becker JC, Maxson AE, Slotten DG, eds, The Role ofthe Sulphur
Bank Mercury Mine Superfund Site, Clear Lake, California Uni-
versity of California-Davis, Davis, CA, USA, pp 183-194
.
88. Ensor KL, Hclwig DD, Wemmer LC. 1992. Mercury and lead in
Effects of walerbome mercury on terrestrial widlifc
Minnesota common loons (Gavia bniner) . Minnesota Pollution
Control Agency, Water Quality Division. St- Paul, MN, USA .
89. Ensor KL, Pitt WC, Helwig DD . 1993 . Contaminants in Min-
nesota wildlife, 1989-1991 . Minnesota Pollution Control Agency,
Water Quality Division, St. Paul, MN, USA
.
90. Meyer MW, Hartigan 1H, Woodford JE, Evers DC, Daulton T
.
1994. Measuring the effect of mercury exposure on breeding
common loons in Wisconsin
. Abstracts, 151h Annual Meeting,
SETAC, Denver, CO, USA, October 30-Novcmher 3, p 224
.
Environ. Tosicot Chem. 17, 1998
227
91 . Meyer M, Hartigan 1H, Woodford JE, Evers DC, Daulton T, Han-
sen HA, Fernandez M. 1994. An investigation into the impact of
fish mercury contamination on common loon productivity in Wis-
consin. 1993 Annual Report_ Wisconsin Department of Natural
Resources, Madison, WI, USA
.
92. Swain EB . 1994. Strategies for reducing mercury in Minnesota
.
Minnesota Pollution Control Agency, Mercury Task Force, Min-
neapolis, MN, USA_
PERGAMON
Abstract
Lakes across the Northern Hemisphere have experienced enhanced atmospheric deposition of anthropogenically
derived Hg for over 100 years. In the present study, we quantified Hg fluxes to the sediments of ten small drainage lakes
across Vermont and New Hampshire, USA, for the period - 1800 to present. Dates were established by "Pb. Total Hg
(HgT) fluxes to sediments ranged from 5 to 17 µgm -2 yr
-1
during pre-industrial times, and from 21 to 83 "gm-2yr
-1
presently. Present-day HgT fluxes are between 2 .1 to 6.9 times greater than pre-1850 fluxes. Current-day direct
atmospheric Hg deposition to the study region was estimated at 21 µgm -2 yr-1 , which agrees well with measured HgT
deposition, when re-evasion of Hg is accounted for. Our data suggest that Hg fluxes to lake sediments have declined in
recent decades, owing to reductions in atmospheric Hg deposition to the lake surface . Watershed export of
atmospherically deposited Hg remains elevated relative to present-day deposition rates, which contributes to the
impression that Hg retention by watershed soils has declined . © 2002 Elsevier Science Ltd. All rights reserved .
Keywords:
Mercury; Paleolimnology; Atmospheric deposition ; Sediment; Watershed
Atmospheric Environment 36 (2002) 1599-1609
ATMOSPHERIC
ENVIRONMENT
www.elsevier.com/locate/atinosenv
Historical and present fluxes of mercury to Vermont and New
Hampshire lakes inferred from
210
Pb dated sediment cores
Neil
C
.
Kammana•* , Daniel
R .
Engstrom b
Vermont Department of Environmental Conservation, 103 S . Main ION, Waterbury, VT 05671-0408 USA
"St. Croix Watershed Research Station, Science Museum of Minnesota, Marine on St. Croix, MN, 55047 USA
Received 22 April 2001 ; accepted 5 November 2001
1 . Introduction
Environmental mercury (Hg) contamination of aqua-
tic ecosystems is a pervasive environmental problem,
with potentially severe toxicological consequences for
humans and piscivorous wildlife (USEPA, 1997 ; Evers
et al., 1998; National Academy of Sciences, 2000) . The
majority of Hg contaminating aquatic ecosystems is
understood to be anthropogenically derived and atmo-
spherically deposited (Fitzgerald et al ., 1998). In poorly
buffered, undisturbed lakes, Hg is transported through
watersheds by high molecular weight dissolved organic
matter, and the proportion of this Hg which is neither
methylated nor re-evaded as Hg° is deposited to the
sediments (Lee and Iverfeldt, 1991 ; Mierle and Ingrain,
1991 ; Driscoll et al., 1994a; Hurley et al., 2000). Several
studies have underscored the importance of watershed
"Corresponding author . Tel : + 1-802-241-3795
.
E-mail addresses :
neil.kamman(q; state.vt.us
( C. Kamman),
dengstrom@smm .org
( R. Engstrom) .
1352-2310/02/$- see front matter
(c)
2002 Elsevier Science Ltd .
All
rights reserved .
P11: 51352-2310(02)00091-2
size in controlling Hg fluxes to sediments (Engstrom
et al., 1994; Mielli, 1995; Lorey and Driscoll, 1999).
Wetland area (Driscoll et al., t994a; St. Louis et al .,
1994), land use (Hurley et al ., 2000), and pH (Rada et al .,
1993) have also been shown to influence delivery of Hg
to sediments.
Paleolimnological studies have been used to estimate
whole-lake surficial sediment Hg burdens (Gilmour et al .,
1992; Rada et al., 1993), and, when coupled with fine-
resolution 210Pb dating, to estimate fluxes of Hg to lake
sediments for both modern and historical time frames
(Ouellet and Jones, 1983; Engstrom et al ., 1994; Von
Gunten et al., 1997; Hermanson, 1998; Lockhart et al .,
1998; Lorey and Driscoll, 1999) . Numerous multiple
lake-sediment studies show anthropogenic Hg contatn-
ination to be a recent phenomenon (.- 1850 to present),
coincident with industrialization, and fossil fuel and
waste combustion (Landers et al ., 1998; Pirrone et al .,
1998). Engstrom and Swain (1997) have shown that Hg
deposition to lakes down-gradient of Midwestern urban
centers is declining in response to recent reductions in
1600
N.C. Kamman, D K Engstrom /Atmospheric Enttrunment 36 (2002)
1599-1609
Hg emissions. While there exists significant uncertainty
in the estimation of Hg fluxes to individual lakes (Mielli,
1995; Gottgens et al ., 1999), the pattern evident in so
many paleolimnological Hg studies is clear: anthropo-
genically derived Hg has increased by a factor of 2-8 x
in the sediments of lakes throughout the Northern
Hemisphere (Landers et a1 ., 1998) .
In the present study, we analyzed a series of single,
short-cores
taken from undisturbed lakes in Northern
New England, to evaluate four specific hypotheses : (1)
that Hg fluxes have increased proportionally to increases
observed in other studies; (2) that fig fluxes have
decreased in recent years; (3) that Hg fluxes increase
with increasing watershed area to lake area ratio ; and,
(4) that paleolimnologically inferred atmospheric total
Hg deposition estimates compare well with measured
total wet+dry Hg deposition
.
2. Methods
2, /, Site characteristics
The lakes selected for this study lie within the borders
of Vermont and New Hampshire, and are characteristic
of undisturbed lakes within the Northeastern Highlands
Ecoregion (Omernik, 1987; USEPA, 2000). All are
small, 8 .1-38.9 hectare drainage lakes occupying un-
disturbed forested catchments, which are a mix of
deciduous or coniferous vegetation overlying soils
ranging from stony to silty loams. Bedrock geology is
largely schistose or granitic, and most watersheds arc
poorly buffered. Some shales and slates are in evidence
near High Pond in Vermont, and the buffering capacity
of this watershed is enhanced accordingly. These water-
sheds have experienced varying degrees of deforestation
during settlement, but have regrown to forest in the past
75-150 years. Limnological attributes of the study lakes
are provided in Table I, and their location across the
study region is shown in Fig . I
.
2.2. Field techniques
Sixty cm by six cm diameter lexan coring tubes were
prepared for sampling by cleaning in a commercial
laboratory dishwasher with Alc nox °',
followed by
soaking in 10% HNO,, copious rinsing with ASTM
Type-II deionized water, and air drying in a metal-free
hood. In the field, two sediment cores were acquired
from the lake's deep hole using a Glew-design gravity
corer (clew, 1989). The core reflecting the least
disturbed stratigraphy and most distinct sediment-water
interface was selected for sectioning immediately in the
field, which minimized
•disturbance. Subsamples were
extruded at I-cm intervals to the core bottom, and split,
with one half used for Hg analysis, and the other for
Fig . 1 . Geographic location and bathymetry of ten Vermont and New Hampshire lakes used to estimate current and historical
mercury deposition . Coring locations are indicated by (0) . Map scales differ, and acreages are shown in Table
I
.
Proctor Maple
Research Center (PMRC), an atmospheric monitoring station located in Underhill, VT, is also shown
.
210Pb
determinations. Mercury-clean sampling proce-
dures (USEPA,
1996)
were used
throughout the
sampling and subsequent sample handling procedures .
Sediment aliquots for Hg determinations were stored
wet in pre-cleaned, lot-certified 250 ml PETE Nalgene®
round vessels, individually bagged in zip-style PETE
bags. Sampling was performed during the summer and
fall of 1998 .
2.3.
Sample processing and analysis procedures
2.3.1
.
21OPb dating
Sediment cores were analyzed for
210Ph activity to
determine age and sediment accumulation rates for the
N.
C. Kanunan, D. R. Engstrom I Atmospheric Environment 36 (2002) 1599-1609
1601
past 150-200 years. Lead-210 was measured at 17-22
depth intervals in each core through its grand-daughter
product
210Po, with
209Po added as an internal yield
tracer. The polonium isotopes were distilled from 0 .3-
2.8 g dry sediment at 550°C following pretreatment with
concentrated HCI and plated directly onto silver
planchets from a 0.5N HCI solution (Eakins and
Morrison, 1978). Activity was measured for 1-8 x 10⁵ s
with ion-implanted or Si-depleted surface barrier detec-
tors and an EG&G Nuclear alpha spectroscopy system
.
Unsupported
210Pb
was calculated by subtracting
supported activity from the total activity measured at
each level; supported
21nPb was estimated from the
asymptotic activity at depth (the mean of the lowermost
1602
N C. Knmrnan, 1) R. Enystrom / Atmospheric Environment 36
(2002) 1599-1609
samples in a core). Supported
210Th values for Spring
Lake were confirmed by gamma spectrometry on an
EG&G Nuclear ultra-low background well-detector
.
Dates and sedimentation rates were determined accord-
ing to the constant rate of supply model (OIdField and
Appleby, 1984) with confidence intervals calculated by
first-order error analysis of counting uncertainty
(Binford, 1990). All dating analyses were performed at
the Science Museum of Minnesota's St . Croix Wa-
tershed Research Station
.
2.3.2. Mercury in sediment
A small aliquot of homogenized wet sediment was
extracted for percent solids determination (APHA, 1999,
method 2540B). The remaining sediment was dried at
60`C, a 0,5 g portion of which was then digested in 5 ml
aqua-regia for 2 min at 95`C, and brought to 55 nil with
ASTM Type-11 deionized water . Hg in the sample was
converted to Hg` by oxidation with 15 in] KMnO
4 ,
and further brought to 110 nil. This aliquot was mixed
with SnCI 2 to reduce fig 2 ` to I Ig°, which was carried by
At into a Leeman" automated cold vapor atomic
absorption spectrometer (USEPA, 1994, method 245.1
and 245.5). Following initial calibration, standards were
run before and after all sample runs, and every tenth
sample during the run, as were reagent blanks and
matrix spikes. Individual samples were run in duplicate .
Standard reference material (SRM, Standard Soil
CRM008-050, Resource Technology Corp ., Laramie,
WY, USA) was analyzed to ensure the completeness
of the digestion process. The method detection limit
for sediment HgT was 0 .05 pg
g-1
.
The analytical
accuracy of the mercury data, estimated as relative
percent difference between duplicates, was ±1 .7%
.
Analytical precision, estimated as the mean percent
recovery for matrix spikes, was 97.4'%_ The average
residual concentration of SRM relative to their
certified values was
f
0
.01 pgg
-1
, representing a mean
relative difference of 3 .4%. These analyses were
performed at the Vermont Department of Environmen-
tal Conservation's (VTDEC) LaRosa Environmental
Laboratory
.
2.3.3. Other parameters
Long-term mean alkalinity values ('Table I) were
calculated from available data within the VTDEC Lake
Inventory Database and the New Hampshire Depart-
ment of Environmental Services Lake Trophic Status
Database. Original samples were analyzed following
standard methods (APHA, 1999). Long-term atmo-
spheric Hg deposition values were measured at the
Proctor Maple Research Center (PMRC), in Underhill,
VT (Fig. I), and taken from Scherhatskoy et al . (1999)
and Shanley et al . (1999) .
2.3.4. Calculations
Fluxes of total Hg to lakes were calculated as the
product of the ""Pb-derived sedimentation rates and
dry-weight total fig concentrations, for each core
interval, and these are assumed to represent net
sedimentation of Hg to the individual lake sediment
focal centers. Background fluxes were estimated as the
average of pre-1850 fluxes . Linear regressions estimating
the relationship between time-averaged Hg fluxes and
the ratio of watcrshed:lake area were calculated using
SAS PROC REG. Watershed retention of atmospheri-
cally deposited Hg was calculated as the ratio of the
regression slope to the regression y-intercept (Engstrom
et al ., 1994) . The variance of this ratio was based on the
following algorithm (Mickey, 2001)
:
var(h/a)
=h
2/a2 {[var(b)/h2] -
[2 cov(a,
b)/ab]
- [var (a)/a2]},
where a is the regression y-intercept, for the indepen-
dent variable value 0: and, h is the regression slope .
3. Results and discussion
3.1 .
-
''
O
Ph
dating and sedimentation rates
For all ten lakes, supported
210Pb
concentrations
ranged from 0 .28 to 2.5 pCig 1, and the number of
deeper core intervals from which supported
210Pb was
estimated ranged from one (McConnell Pond) to six
(Intervale Pond). Inventories of unsupported
210Ph
in
the ten cores ranged from 6 .77 to 22.02 pCi cm 2, which
is equivalent to 210Ph fluxes of 0.22-0.71 pCi cm-eyr
1
(Fig. 2 and Table 2) . These 210Ph fluxes are similar to
regional estimates of atmospheric
210Pb
deposition
(0.5pCicut-2 yr-1 ),
which implies that core-specific
sedimentation rates are not appreciably amplified by
sediment focusing. The underlying assumption for this
conclusion is that direct atmospheric deposition dom-
inates the
2n1Ph
budgets of these lakes
(i.e., little
watershed contribution) (Oldfield and Appleby, 1984)
.
Dates corresponding to the bottom-most unsupported
21oPb strata ranged from 1787 (Wallingford Pond), to
1861 (Spring Lake), with a lake set-wide average value
of 1825 (S.D.=21 yr). Sedimentation rates for strata
below the supported
210Ph horizon were extrapolated
using averaged baseline sedimentation rates
.
Sedimentation rate profiles (Fig .3) are variable in
nature . For Dudley. Intervale, McConnell, Wallingford,
and Wheeler Ponds, sedimentation rates increase with
time, with maximum values near or at the core tops,
indicating possible recent disturbances in these ponds'
watersheds. High and Willard Ponds display mid-core
peak sedimentation, while Sessions Pond shows two
distinct sedimentation peaks at '
1900 and 1970. Spring
N.C. Kamman, D.R. Engstrom /A tmospheric Environment 36 (2002) 1599-1609
High Pond
Intervals Pond
Lake and Gilman Pond have low, nearly flat sedimenta-
tion profiles over the period of record . Standard errors
for baseline sedimentation rates for Sessions and Dudley
Ponds are large
.
3.2.
Hg concentrations and Hg fluxes
Total
Hg concentrations ranged
from
0.06
to
0.66pgg-t (d.w .), with peak concentrations in all cases
coinciding with dates of 1950 or later. Profiles of Hg
concentrations insediment reveal striking similarities
(Fig. 3). For all lakes, baseline Hg concentrations of
Willard Pond
Sessions Pond
Wallingford Pond
I
{
Dudley Pond
Wheeler Pond
10
10
10
10
Total 210
Pb
Activity
(pCi'
g
I )
Fig. 2. Total R10Pb, by depth downcore, for sediments of 10 Vermont and New Hampshire lakes
.
Table 2
Supported and unsupported
2
2 tOPb concentrations, densities, and fluxes, for 10 Vermont and New Hampshire lakes
1603
0.06-0.21 pg g
I d.w. begin to rise circa 1875, and peak
between 1950 and modern times, at between 0 .22 and
0.66 pg g
I d.w. Most of the lakes show a decline in
sediment Hg concentrations in the most recent sedi-
ments. These declines are most pronounced in Spring
Lake, and High and Willard Ponds .
Mercury concentration profiles are strongly influ-
enced by sedimentation rate, in that concentrations of
elemental constituents are accentuated under periods of
reduced sedimentation, and vice versa (Engstrom and
Wright, 1983). Flux rates normalize this covariance,
and permit comparisons across lakes. Examination of
Supported 210Pb,
pCig
' (S.E .)
N supported samples
Cumulative
unsupported
21OP6,
(pCicn2)
Unsupported 210Pb
flux,
(PC,Cal yr
-
')
Dudley
0.28 (0.07)
3
11 .08
0.36
Gilman
0.75 (0.01)
2
6.77
0.22
High
1.88
(0.06)
5
14.73
0.47
Intervate
1.74 (0.06)
6
12.49
0.40
McConnell
1.68 (0.06)
1
11 .32
0.36
Sessions
1.09 (0.06)
5
10.63
0.35
Spring
2.50 (0.05)
4
22.02
0.71
Wallingford
0.64 (0.02)
2
12.34
0.40
Wheeler
0.64 (0.05)
4
10
.54
0.34
Willard
0.85 (0.02)
4
12.60
0.41
10
Spring Lake
I
I
20
I
I
I
a
30
I
I
1
0
c
40
N
Gilman Pond
I
0
10
v
20
0
30
40
I
I
1
I 1
10
1604
HIT (ug 9')
200 00
02
04
0 .6
00
0 .2
0 .4
0.6 0 .0
0 .2
0 .4
0 .6
0 .0
06
0.0
0 .2
0 .4
0 .6
I
r
F
z
0.66
1950
1900
1850
1800
r
I
I
Spring Lake
N C. Kamman, D
.R. Enystrom /
Atmospheric Environment 36 (2002) 1599-1609
High Pond
1850
1
t
McConnell
Gilman Pond
Intervale Pond
I Pond
Dudley Pond
Wheeler Pond
1800
0.00 0.01
0.02 0 03 0 04
000 001 0.02 0.03 0.04 000 0.01 002 003 0.04 0 00 001 0 02 0.03 0.04 0 00 0.01 0.02 0.03 004
Sedimentation Rate (g c.' ' yr')-
Fig_ 3 Total I Ig concentrations and sedimentation rates (estimated using the constant rate of supply dating model), by
2mPh interred
done, for sediment cores from 10 Vermont and New Hampshire lakes . Error bars about sedimentation rates represent standard errors
p roPI1gtued from Counting uncertainty Rates estimated from baseline supported m'Pb are shown only to the year 1800. Lakes are
arrayed in order of increasing watershed :lake area .
Table 3
Total f g fluxes, in fig m
yr
for baseline, peak, and modern time periods, for 10 Vermont and New Hampshire lakes
baseline (pre-1850), peak, and modern (1998) fluxes
(Table
3)
and flux profiles (Fig.4) reveals striking
similarities. For all lakes, there was an increase in Hg
fluxes, beginning by 1875 . The greatest post-industrial
Hg flux enhancement was observed in McConnell Pond,
and the smallest, at Gilman Pond. Averaged pre-1850
Hg flux rates ranged from 5 to 17 pgm
-i
yr-l
. Peak
fluxes, which occurred between 1963 and modern times,
varied from 26 to 106 tgm-2 yr
•
l . Modern flux ratios
(the ratio of modern :haseline
flux) ranged from 2 .1
to
6.9 (Table 3). Seven lakes displayed a continual decline
in Hg flux, across four or more of the most recent core
sections. This pattern has been interpreted by Engstrom
and Swain (1997) as indicating a significant decline in
Modern (1998) Fig
fluxpgIn
2yr '
Peak flux (year of
occurrence)
pgm-2Yr
I
Baseline flux (years
used to estimate)
pgm
e yr
-
'
Ratio of modern to
baseline
Dudley
46
68 (1992)
10 (1777-1860)
4.6
Gilnnn
26
26 (1998)
11 (1863)
2.4
High
23
39 (1979)
5 (1693-1813)
4,6
Intervale
48
55 (1995)
7 (1626-1834)
6 .9
McConnell
83
106 (1992)
13 (1777-1834)
64
Sessions
30
48 (1985)
14 (1766-1848)
21
Spring
25
41 (1963)
11(1755-1808)
2.3
Wallingford
45
66 (1987)
17 (1731-1787)
2.6
Wheeler
78
92 (1990)
16 (1715-1819)
4.9
Willard
21
50 (1968)
10 (1704-1844)
2 .1
Average
42.5
52.9
11 .4
3 .9
2000
Gilman Pond
1950
1900
1850
N.C Kamman, D. R. Enys/rom /A tmospheric Environment 36 (2002) 1599 1609
1605
High Pond
1800
0
20 40 60 60 100120 0 20
Intervals Pond
Willard Pond
Se ions Pond
Wallingford Pond
McconnellPond
Dudley Pond
WheelerPond
0 60 80 100120 0 20 40 60 80 100120 0 20 40 60 80 100120 0 20 40 60 80 100120
HgT Flux lug m'
yr')
Fig .
4.
Total Hg fluxes, by zmPb inferred date, to the sediments of 10 Vermont and New Hampshire lakes . Lakes are arrayed in order
of increasing watershed :lake area .
atmospheric Hg loadings to several Minneapolis area
lakes. Their argument that reductions in atmospheric Hg
emissions from coal combustion, waste incineration, and
industrial sources are responsible for reduced Hg fluxes
may also apply to the present study lakes
.
Our Hg fluxes and flux ratios are in excellent
agreement with those reported for lakes in Northern
Quebec (Encore et al., 1995), and the upper Midwest
(Engstrom and Swain, 1997), for eight ponds and an
ombrotrophic bog in Maine (Norton et al ., 1997; Perry
et al ., 2001), for lakes in Finland, Sweden, and Western
Canada (as compiled by Landers et al ., 1998), and for
Adirondack drainage and seepage lakes (Lorey and
Driscoll,
1999)
.
The average flux ratio (ratio of
modern:baseline) for the entire lake set of 3 .9 suggests
that lakes across Vermont and New Hampshire have
experienced a nearly four-fold increase in Hg fluxes since
before 1850
.
3.3.
Inferring Hg fluxes attributable to atmospheric
loading
Across a set of lakes, the relationship between the
ratio of watershed:lake area and Hg flux can be used to
estimate the proportion of the flux attributable to direct
atmospheric contributions for any given time period
(Swain et al., 1992). By this elegantly simple technique,
an estimated linear function between the watershed:lake
area ratio and Hg flux is backcast to a watershed :lake
area ratio of one, with the corresponding flux providing
an estimate of the direct atmospheric component. This
assumes that evasion of Hg from lake surfaces is
minimal and consistent across lakes, and that, across
watersheds, a consistent proportion of the Hg trans-
ported from upstream is retained within the lake
sediments. While evasion of Hg from lake surfaces has
not completely been studied, the former assumption
appears validated by Fitzgerald et al . (1991), who
estimated that evasion accounted for no more than
10% of the Hg flux from Little Rock Lake, Wisconsin
.
The latter assumption is supported by Hurley et al
.
(2000), and Shanley et al. (2001), who have shown that
the export of particulate-bound Hg varies consistently in
relation to watershed DOC and sediment export, across
multiple watershed scales in the upper Midwest and
Northeast, respectively. However, Driscoll et al. (2001)
indicate that this may not be the case for dissolved Hg
moving through Adirondack systems . Thus, sediment
Hg flux estimates derived by this study most accurately
reflects sedimentation of particulate-bound Hg .
Fig. 5a shows linear regression models for averaged
pre-1850 and modern (1998) times, across our study
1606
N.C. Kamman, D. R
.
Engstrom
1 Atmospheric Environment 36 (2002) 1599-1609
lakes. Prior to 1850, there exists no significant relation-
ship between watershed-lake area ratio and Hg flux . By
contrast, for 1998, (lie relationship is highly significant
(F=14.97, p-0.0047), with the variation in water-
shed:lake area explaining 6Y„ of' the variation in Hg
flux. The estimated Hg flux attributable to direct
atmospheric contributions for the pre-1850 period is
10pgm
-2
yr
i
(S.F.=2.0, p=0.001 for Ho: atmo-
spheric flux
-
-0)
while
the estimate for 1998 is
21 fig in
2
yr
l
(S.E.-7.5,
p--0.032 for Ho: atmo-
spheric flux
-
0). Modern atmospheric fluxes compare
reasonably well to direct measurements made at a
•
1998'. r2 =0.65,p=0.0047
•
Pre-1850 :r2 =0.09,p=0.402
10
20
30
40
50
60
Watershed Area
: Lake Area Ratio
relatively high elevation Vermont site by Scherbatskoy
et al . (1999). Shanley et at . (1999) used these data to
estimate average annual terrestrial atmospheric fluxes
of 46.3, 37.0 pg m
2
yr
i
of which are thought to
be deposited dry. These authors acknowledge that
the proportion of dry-deposited Hg which is re-evaded
as Hg' both from terrestrial and lakewater surfaces
is presently unknown. Thus, our estimated modern
atmospheric flux estimate of 21 µgm
2yt= t
is within
the range of likely values for wet+dry total Hg,
minus that Hg which is re-evaded from the lake
surface .
70
Watershed Area
: Lake Area Ratio
Fig. 5. (a) Linear models describing the relationship between watershed: lake area ratio, and Hg fluxes, for pre-1850 end modern (1998)
time
periods, for 10 Vermont and New Hampshire lakes . (b) Percent of atmospherically deposited Hg retained in these watersheds,
from pre-1850 to present. (c) Linear models for the baseline period, 197o-1980,1980-1990, and 1990-1998. Regressions are backctst to
a ratio of i :1 (shown by the dotted line), which represents the flux attributable to direct atmospheric deposition. Bars represent the
standard error of the watershed retention estimates
.
N. C. Kamman, D. R. Engstrom / Atmospheric Environment 36 (2002) 1599-1609
3.4
.
The role of watershed:lake area ratios in the control
of Hy fluxes to lakes
Models of watershed : lake area in relation to decade-
averaged fluxes from 1950 to present produce intriguing,
although statistically less satisfying results. In these
lakes, the relationships between watershed :lake area and
Hg flux are non-significant
(p > 0.05 for Ho :
b = 0)
except for the periods 1980-1990, and 1990-1998
.
During these periods, 1 .2 and 0.86pgHgm-Z yr- ' were
delivered for each unit of watershed:lake area respec-
tively; rates which are lower than the 3.27 and
1.93ugm-Zyr-' reported by Engstrom et al. (1994)
and Lorey and Driscoll (1999) in the Midwestern and
Adirondack lakes. Thus, even though average fluxes for
the 1950s and subsequent decades are significantly
elevated over pre-1850 levels
(F = 4.13, p<0.02), the
influence of watershed size in controlling Hg flux to this
study set only becomes clear in recent years
.
Viewed from the perspective of Hg retained in the
watersheds (Fig . 5b), our results appear to suggest that
watershed retention of atmospherically deposited Hg
has declined progressively from the 1950s to the present
.
In reality, this trend is more likely a function of
declining atmospheric Hg deposition to lake surfaces
than an actual increase in export of Hg from watershed
soils . A decrease in atmospheric Hg deposition should
be reflected most immediately in the sediments of lakes
with very small watersheds, while lakes with relatively
large watersheds should continue to receive large Hg
inputs (relative to direct Hg deposition to the lake
surface), owing simply to a greater quantity of runoff
from soils that have become saturated with anthropo-
genic Hg. The effect of this lag between declines in direct
Hg deposition and watershed delivery is that watershed
Hg loading as a percent of direct atmospheric deposition
will increase, especially for lakes with large water-
shed :lake area ratios. This point was first proposed by
Mielli (1995), and is well illustrated by the linear
functions describing the relationship of Hg flux to
watershed:lake area for each of the last three decades
(Fig. 5c) . These linear models suggest that the atmo-
spheric component of Hg fluxes derived from larger
watersheds continues to increase, even as the overall
atmospheric deposition rate
(e.g . model prediction at a
watershed:lake area ratio of I) appears to be declining
.
Our estimate of 93.8% atmospheric Hg retention in
the watersheds of the study lakes is significantly elevated
over the 78% reported by both Engstrom et al . (1994)
and Lorey and Driscoll (1999) for their Midwestern and
Adirondack study lakes. The cause of this difference
may relate either to the biogeochemistry of the water-
sheds, or to physical factors. Driscoll et al. (1994a,b,
1998) indicate that Hg delivery through watersheds is
controlled by a variety of factors, including DOC, pH,
alkalinity, and the proportion of wetlands in the
1607
watershed. Other influential factors include bedrock
geology (Coker et al., 1995) and land use (Hurley et al
.,
2000). Alkalinity, taken here as a general indicator of
DOC and pH in the watersheds, varies significantly
between our study lakes, and the Adirondack and
Midwestern ones (F= 6.89, p = 0.005), with log-ad-
justed alkalinity values significantly lower in the
Adirondack lakes. However, there is no significant
relationship between the estimated modern atmospheric
Hg retained in the watersheds, and alkalinity (p>-0 .05,
n =
3). The geology underlying the lakes of all three lake
sets, while varied, does not differ strongly, except by the
presence of two highly alkaline Minnesota lakes cored
by-Engstrom et al . (1994). Land cover in the watersheds
of all three study lake sets is predominantly forested,
however, only the Adirondack lake set may have
escaped the influence of deforestation in the past 150
years. No data are available regarding wetlands for
either the Adirondack or Midwestern study lakes . Thus,
given the available information, variation in watershed
chemistry, bedrock geology, or land use cannot alone
explain the high atmospheric Hg retention observed in
these Vermont and New Hampshire lakes
.
Morphologically, however, the study lakes are differ-
ent. Watershed:lake area ratios vary significantly among
these three studies (F = 7 .098, p = 0.004). The present
study lakes have significantly larger watershed ratios
than the Midwestern sites (p<0.05), which are pre-
dominantly seepage lakes. Watershed ratios for the
Adirondack sites are intermediate in size, and the lakes
are mixed drainage and seepage . Therefore, the larger
watershed:lake area ratios in this study may explain why
these Vermont and New Hampshire lakes display higher
Hg retention than do the Adirondack and Midwestern
study lakes. Our estimate of 93.8% Hg retained in the
watersheds is in good agreement with mass-balance
estimates of 92% to 94% provided by Scherbatskoy et al
.
(1998) for a small forested watershed adjacent to the
PMRC .
4. Summary
Estimated Hg fluxes across the 10 lakes sampled in
this study provide three distinct signals . First, there
exists a synchronous increase in Hg fluxes across all
lakes corresponding to the period 1850-1875, and Hg
fluxes peak between 1955 and the present . Peak Hg
fluxes are on average 3 .9 times greater than average pre-
1850 values, which is attributable to increased atmo-
spheric deposition of Hg over the core record. Second,
the relationship between the watershed:lake area ratio
and Hg flux has become increasingly important in the
past 30 years, and the modern direct atmospheric
estimate of 21 µgm-Z
yr
' is in reasonable agreement
with measured atmospheric fluxes. Finally, watershed
1608
N.C. Kimono,, D,R Enisrrom / Atmospheric Environment 36 (2002) 1599-1609
retention of atmospherically deposited Hg, estimated at
93.8%, is elevated relative to Adirondack and Mid-
western takes, but is in good agreement with mass-
balance measurements made near PMRC. A great deal
of effort is presently being accorded to reduction and
virtual elimination of Hg. Indeed, burning of cleaner
coal and reductions in other industrial emissions may
have resulted in the reduced Hg fluxes observed in this
dataset in recent times. However, high watershed Hg
retention, coupled with a continually increasing influ-
ence of watershed size in the downstream delivery of Hg,
indicate that a significant time lag can be expected
between implementation of Fig use and emission
controls, and significant reductions in Fig accumulation
to lake sediments. Quantification of this lag may be
possible given the number of paleolimnological datasets
presently available across North America, and repre-
sents a fruitful area for further analysis and inquiry .
Acknowledgements
We thank Steve Couture, Bob Estabrook, and Steve
Landry of the NH Department of Environmental
Services for their project support; Ed Glassford, Kate
Peyerl, and Kellie Merrell of the VT Department of
Environmental Conservation, for analytical chemistry,
coordinating both field sampling and lab processing,
and for figure preparation ; Kelly Thommes of the St
.
Croix Watershed Research Station for assistance in the
210Pb dating; and, Dr. Ruth Mickey of the University of
Vermont for assistance with statistics and Dr Mary C .
Watzin, also of UVM, for her thoughtful manuscript
review. We gratefully acknowledge Rochelle Araujo,
Ray Thompson, and Alan VanArsdale of USEPA for
their continued interest and support of this research
.
Finally, we thank our anonymous reviewer for informa-
tive comments to earlier manuscript drafts. This project
was funded largely by USEPA, tinder cooperative
agreement CR-82549501, and the results of this research
do not necessarily reflect the views of USEPA .
References
APHA, 1999. Standard Methods for the Examination of Water
and Wastewater. 19th Edition, American Public Health
Association, Washington, D.C .
Binford, MW., 1990. Calculation and uncertainty analysis of
2toPh dates for PIRLA project lake sediment cores. Journal
of Palcolimnology 3, 253_267_
Coker, W .I) ., Kettles,
I.M ., Shilts, W.W ., 1995 . Comparison of
mercury concentrations in modern lake sediments and
glacial drift in the Canadian shield in the region of
Ottawa/Kingston to Georgian Bay . Out ., Canada. Water,
Air, and Soil Pollution 80. 1025-1029 .
Driscoll, CJ., Blette, V., Yan, C., Schofield, C.L ., Munson, R .,
Iolsapple, J,, 1994a. The role of dissolved organic carbon in
the chemistry and hioavailability of mercury in remote
Adirondack Lakes . Water, Air, and Soil Pollution 80, 499-
508 .
Driscoll,C.T ., Yan, C., Schofield, C.L., Munson, R., Holsapple, J
.,
1994b. The mercury cycle and fish in the Adirondack lakes
.
Environmental Science and Technology 28, 136A-143A
.
Driscoll, CT., Holsapple, J., Schofield, C.L ., Munson, R .,
1998 . The chemistry and transport of mercury in a small
wetland in the Adirondack Region of New York, USA
.
Biogeochemistry 40, 137-146
.
Driscoll, C.T ., Kalicin, M., Lindeman, M., Liuzzi, C., Newton,
R., Munson, R., 2001 . Chemical and biological control of
mercury cycling in Upland, Wetland and Lake Ecosystems
in the Adirondack region of New York, E .O.S. Transac-
tions, American Geophysical Union 82, 20
.
Eakins, 1.D ., Morrison, T., 1978. A new procedure for the
determination of lead 210 in lake and marine sediments_
International Journal of Applied Radiation and Isotopes 29,
531-536 .
Engstrom, D.R., Wright, I
.E
., 1983 . Chemical stratigraphy of
lake sediments as records of environmental change. In :
Haworth, E.Y„ Lund, 1.W . (Eds .),
Lake Sediments and
Environmental History . University of Minnesota Press,
Minneapolis, MN
.
Engstrom, D.R ., Swain, E.B., 1997. Recent declines in atmo-
spheric mercury deposition in the Upper Midwest . Envir-
onmental Science and Technology 31, 96(-967
.
Engstrom, D.R ., Swain, ER, Henning, T.A ., Brigham, M.E.,
Brezonik, P.L., 1994. Atmospheric mercury deposition to
lakes and watersheds: a quantitative reconstruction from
multiple sediment cores. In: Baker, L.A . (Ed .), Environ-
mental Chemistry of Lakes and Reservoirs- American
Chemical Society, Washington, D .C .
Evers, D.C., Kaplan, J., Meyer, M ., Reaman, P., Braselton, W .,
Major,
1.A ., Burgess, N., Sheuhammer, A ., 1998. Geo-
graphic trend in mercury measured in common loon
feathers and blood. Environmental Toxicology and Chem-
istry 17, 173-183
.
Fitzgerald, W.F., Mason, R.P ., Vandal, G.M .,
1991 . Atmo-
spheric cycling and air-water exchange of mercury over
mid-continental lacustrine regions. Water, Air, and Soil
Pollution 56, 745-767
.
Fitzgerald, W.F ., Engstrom, D., Mason, R., Nater, E ., 1998
.
The case for atmospheric mercury contamination in remote
areas. Environmental Science and Technology 32, 1-7.
Gilmour, L.C., Henry, E, Mitchell, R., 1992. Sulfate stimula-
tion of mercury methylation on freshwater sediments
.
Environmental Science and Technology 26, 2281-2287
.
Glew, J., 1989. A new trigger mechanism for sediment samplers
.
Journal of Paleolimnology 2, 241-243
.
Goltgens, 1 .F., Rood, B., Delfino, J., Simmers, B., 1999 .
Uncertainty in paleoecological studies of mercury in
sediment cores. Water- Air, and Soil Pollution 110, 131-333
.
Hermanson, M
, 1998 . Anthropogenic mercury deposition to
arctic lake sediments. Water, Air, and Soil Pollution 101,
30(9-321
.
Hurley,JP
., Barbiaz, C-L, Cleckner, L .B, Rolfhus, K., Shafer,
M . M., Back, R.C., 2000. Partitioning of mercury and
methyhncrcury in Lake Superior tributaries. In Proceedings
N. C. Kamman, D. R. Engstrorn /A /;nosp/eric Environment 36
(2002)
1599-1609
of the 43rd Conference on Great Lakes and St. Lawrence
River Research, 2000 Annual Symposium . International
Association of Great Lakes Research, 2205 Commonwealth
Blvd., Ann Arbor, MI .
Landers, D.H,, Gubala, C., Verta, M ., Lucotte, M., Johansson,
K„ Lockhart, W., 1998. Using lake sediment mercury flux
ratios to evaluate the regional and continental dimensions of
mercury deposition in arctic and boreal ecosystems . Atmo-
spheric Environment 32, 919-928
.
Lee, Y., Iverfeldt, A., 1991 . Measurement of methylmercury
and mercury in run-off, lake, and rain waters. Water, Air,
and Soil Pollution 56, 309-321
.
Lockhart, W.L., Wilkinson, P., Billeck, B., Danell, R., Hunt,
R., Brunskill, G., Delaronde, J., St
. Louis, V., 1998. Fluxes
of mercury to lake sediments in central and Northern
Canada inferred from dated sediment cores. Biogeochem-
istry 40, 163-173 .
Lorry, P., Driscoll, C., 1999. Historical trends of mercury
deposition in Adirondack lakes. Environmental Science and
Technology 33, 718-722.
Lucoue, M ., Mucci, A., Hillaire-Marcel, C., Pichet, P .,
Grondin, A ., 1995. Anthropogenic mercury enrichment in
remote lakes of Northern Quebec. Water, Air, and Soil
Pollution 80, 467-476
.
Mickey, R., 2001 . University of Vermont, Department of
Mathematics and Statistics . Burlington, VT. Personal
communication
.
Mielli, M ., 1995. Preindustrial atmospheric deposition of
mercury: uncertain rates from lake sediment and peat cores
.
Water, Air, and Soil Pollution 80, 637-640
.
Mierle, G., Ingrain, R., 1991 . The role of humic substances in
the mobilization of mercury from watersheds . Water, Air,
and Soil Pollution 56, 349-357
.
National Academy of Sciences, 2000 . Toxicological Profile for
Methylmercury .
National Academy Press, Washington,
D.C .
Norton, S., Evans, G.C ., Kahl,
1.S ., 1997. Comparison of Hg
and Pb fluxes to hummocks and hollows of ombrotrophic
Big Heath bog and to nearby Sargent Mt. Pond, Maine,
USA . Water, Air, and Soil Pollution 100, 271-286 .
Oldfield, F., Appleby, P.G ., 1984. Empirical testing of amoPb-
dating models for lake sediments . In: Haworth, E.Y ., Lard,
1. W.G: (Eds .), Lake Sediments and Environmental History .
University of Minnesota Press, Minneapolis, pp. 93-124.
Onernik,
1.M., 1987. Ecoregions of the conterminous United
States. Map (scale 1 :7,500,000). Annals of the Association
of American Geographers 77, 118-125
.
Ouellet, M., Jones, H., 1983 . Historical changes in acid
precipitation and heavy metals deposition originating from
fossil fuel combustion in eastern North America as revealed
by lake sediment geochemistry . Water Science and Technol-
ogy 15, 115-130 .
Perry, E .R ., Norton, S., Cangelosi, J., Hess, C., Norris, M .,
2001 . Mercury storage, release, and transport in the
watersheds of eight Maine lakes. In: Proceedings of the
1609
2001 Annual Symposium of the Geological Society of
America, Northeastern Section, Burlington, VT. Geological
Society of America, Boulder, CO
.
Pirrone, N., Allegrini, 1., Keeler, G., Nriagu, J., Rossman, R .,
Robbins, J., 1998 . Historical atmospheric mercury emis-
sions and depositions in North America compared to
mercury accumulations in sedimentary records. Atmo-
spheric Environment 32, 929-940
.
Rada, R.G., Powell, D ., Wiener, J., 1993. Whole-lake burdens
and spatial distribution of mercury in surficial sediments in
Wisconsin seepage lakes . Canadian Journal of Fisheries and
Aquatic Sciences 50, 865-873
.
Scherbatskoy, T.D ., Shanley, J.B ., Keeler, G., 1998 . Factors
controlling mercury transport in an upland forested
catchment. Water, Air, and Soil Pollution 105, 427-438 .
Scherbatskoy, T.D ., Poirot, R.L., Stunder, B.J ., Artz, R., 1999.
Current knowledge of air pollution and air resource issues in
the Lake Champlain basin in Lake Champlain in transition
:
from research toward restoration. Water Science Applica-
tions I, 1-23 .
Shanley,
1.B .,
Donlon, A.F .,
Scherbatskoy, T., Keeler, G .,
1999. Mercury cycling and transport in the lake champlain
basin in lake champlain in transition: from research toward
restoration. Water Science Applications I, 1-23
.
Shanley,
1.B .,
Scherbatskoy, T., Schuster, P., Reddy, M .,
Chalmers, A., 2001 . Commonalities in mercury behavior in
contrasting Northeastern USA landscapes. EOS Transac-
tions, American Geophysical Union 82, 20
.
St. Louis, V.L ., Rudd, J ., Kelly, L., Beaty, K., Bloom, N.S .,
Flett, R .l .,
1994. Importance of wetlands as sources of
methylmercury to boreal forest ecosystems . Canadian
Journal of Fisheries and Aquatic Sciences 51 (5), 1065-1076 .
Swain, E.B ., Engstrom, D .R ., Brigham, M.E ., Henning, T.A .,
Brezonik,
P.L .,
1992. Increasing rates of atmospheric
mercury deposition in mid-continental North America
.
Science 257, 784-787 .
United States Environmental Protection Agency, 1994 . Meth-
ods for the determination of metals in environmental
samples. EPA/600/R-94/111, Washington, D.C.
United States Environmental Protection Agency, 1996. Method
1669: Sampling ambient water for determination of trace
metals at water quality criteria levels. EPA/82l/R-96/011,
Washington, D.C .
United States Environmental Protection Agency, 1997. Mer-
cury study report to Congress. EPA 425-R97-003, Wa-
shington, D.C.
US Environmental Protection Agency, 2000 . Level III ecor-
egions of the continental United States (revision of
Omernik, 1987). US Environmental Protection Agency,
National Health and Environmental Effects Research
Laboratory, Western Ecology Division, Corvallis, OR
.
Von Gunten, H.R ., Sturm, M., Moser, R., 1997. 200-Year
record of metals in lake sediments and background
concentrations. Environmental Science and Technology
31, 2193-2197 .
mwcul.OUICAISCIENCES
91(l), 202-209 (2006)
doi : 10. 1093/toxsci/kfj 121
Advance Access publication January 30, 2006
Methylmercury Impairs Components of the Cholinergic System
in Captive Mink (Mustela vison)
Niladri Basu,*'t
11
Anton M. Scheuhammer,lI Kirsti Rouvinen-Watt,$ Nicole Grochowina,§ Kate Klenavic,§
R. Douglas Evans,§ and Hing Man Chan*
.t''I
l
-Department of Natural Resource Sciences, McGill University, Ste . Anne de Bellevue, Quebec, Canada, H9X 3V9; tCenter for Indigenous Peoples'
Nutrition and Environment (CINE), McGill University, Ste . Anne de Bellevue, Quebec, Canada, H9X 3V9; tDepartment ofPlant and Animal Sciences
and Canadian Centre for Fur Animal Research (CCFAR), Nova Scotia Agricultural College, Truro, Nova Scotia, Canada, B2N5E3 ; §Environmental and
Resource Studies. Trent University, Peterborough, Ontario, Canada, K9J 7B8; 'School of Dietetics and Human Nutrition, McGill University,
Ste. Anne de Bellevue, Quebec, Canada,
H9X 3V9;
and ~INalional Wildlife Research Center, Canadian Wildlife Service, Environment Canada, Ottawa,
Ontario, Canada, KIA
0H3
Received December
21, 2005
;
accepted January
23,
2006
Methylmercury (MeHg) is extremely neurotoxic, as it can
readily cross the mammalian blood brain barrier and interact
with protein thiols (ATSDR, 1999; Clarkson, 1997). At sub- to
low-micromolar concentrations MeHg can impede essential
neurophysiological processes, including microtubule forma-
tion and calcium homeostasis (Castoldi et al., 2001). Although
the neurotoxic effects of MeHg are mediated through multiple
mechanisms, studies have shown that specific aspects of cho-
linergic neurotransmission are vulnerable to MeHg . In vitro,
McHg can inhibit the neuronal uptake of choline (Kobayashi
et al .,
1979), activity of choline acetyltransferase (ChAT)
(Dwivedi et al., 1980; Kobayashi
et al., 1979; Omata el al .,
1982), and binding to the muscarinic acetylcholine (mACh)
receptor (Abd-Elfattah and Shamoo, 1981 ; Basu et al., 2005c) .
In vivo, exposure to MeHg has been linked with decreased
activity of ChAT (Dwivedi et a!., 1980; Omata et at, 1982),
increased levels of mACh receptors (Coccini et al., 2000), and
reduced concentrations of acetylcholine (ACh) (Hrdina
et al.,
1976; Kobayashi
et al.,
1980). Furthermore, some of the
clinical outcomes of cholinergic dysfunction
(i.e., anorexia,
salivation, tremors, reduced vision, seizures) (Kobayashi et al .,
1980; Wess, 2004) have also been observed in Hg-poisoned
individuals (ATSDR, 1999 ; Watanabe and Satoh, 1996), thus
suggesting a possible role for this neurotransmission system in
the progression of MeHg toxicosis
.
Mercury (fig) is a contaminant off global concern because
elemental Hg (Hgo )
can undergo long-range atmospheric
transport and later be converted to MeHg, which biomagnifies
through aquatic food webs (Chan et al ., 2003; U.S . EPA, 1997 ;
Wiener et al., 2003). Individuals at greatest risk of MeHg
intoxication are obligate consumers of predatory fish. For
example, ingestion of McHg-contaminated fish by inhabitants
of Minamata Bay and Niigata (Japan) circa 1950-1960 was
implicated as the causative factor of Minamata disease
(Watanabe and Satoh, 1996). Fish-eating wildlife are also
susceptible to McHg intoxication (Chan et a!., 2003; Wiener
The effects of methylmercury (MeHg) on components of the
cholinergic system were evaluated in captive mink
(Mustela
vison). Cholinergic parameters were measured in brain regions
(occipital cortex, cerebellum, brain stem, basal ganglia) and blood
(whole blood, plasma, serum) following an 89-day exposure to
MeHg at dietary concentrations of 0, 0.1, 0.5, 1, and 2 ppm (n = 12
animals per treatment). There were no effects of MeHg on brain
choline acetyltransferase, acetylcholine, and choline transporter.
However, significantly higher densities of muscarinic cholinergic
receptors, as assessed by 'H-quinuclidinyl benzilate binding, were
measured in the occipital cortex (30.2 and 39.0% higher in the I
and 2 ppm groups, respectively), basal ganglia (67 .5 and 69.1%
higher in the 0.5 and 1 ppm groups, respectively), and brain stem
(64.4% higher in the 0.5 ppm group), compared to nonexposed
controls. The calculated positive relationship between MeHg
exposure and muscarinic cholinergic receptor levels in this dosing
study were consistent with observations in wild mink. There were
no McHg-related effects on blood cholinesterase (ChE) activity,
but ChE activity was significantly higher in the occipital cortex
(17.0% in the 1 ppm group) and basal ganglia (34.1% in the 0 .5
ppm group), compared to nonexposed controls. The parallel in-
creases in muscarinic cholinergic receptor levels and ChE activity
following MeHg exposure highlight the autoregulatory nature of
cholinergic neurotransmission. In conclusion, these laboratory
data support findings from wild mink and demonstrate that
ecologically relevant exposures to MeHg
(i.e ., 0.5 ppm in diet)
have the potential to alter the cholinergic system in specific brain
regions.
Key Words: mink; methylmercury; muscarinic receptor; cholin-
esterase; brain; wildlife; neurotoxicology .
'To whom correspondence should be addressed at Community Health
Program, University of Northern British Columbia,
3333
University Way,
Prince George, BC V2N 4Z9, Canada . Fax: (250) 960-5744 . E-mail: Ichan@
unhc .ca .
The Author 2006. Published by Oxford University Press on behalf of the Society of Toxicology . All rights reserved
.
For Permissions, please email:joumals.pennissionsboxfordjoumals .org
MERCURY AFFECTS CHOLINERGIC SYSTEM IN MINK
et al., 2003), and it should be noted that symptoms resembling
Minamata disease were observed in resident animals
(e.g .,
dogs, cats, fish) nearly 4 years before the first documented
human case (Watanabe and Satoh, 1996). Controlled dosing
experiments have demonstrated that piscivorous wildlife, such
as mink
(Mustela vison
;
Aulerich
et al.,
1974; Wobeser
et al .,
1976; Wren
et al.,
1987), river otters
(l ontra canadensis ;
O'Connor and Nielson, 1980), seals
(Phoca
sp
. ; Ronald
et al.,
1977), and loons
(Gavin imnrer;
Kenow
et al.,
2003), are
sensitive to MeHg. Dietary levels as low as I ppm MeHg have
been associated with a range of adverse outcomes at the tissue
(e.g., neuronal lesions), whole-animal (e.g .,
effects on re-
production and neurobehavior), and possibly even population
(e.g., decline in numbers) levels .
While McHg has the potential to affect ecosystem health,
nowadays fish-eating wildlife are seldom exposed to concen-
trations associated with overt toxic effects
(i .e ., > 1 ppm MeHg
in diet). Instead, animals are exposed to lower concentrations
on a continual basis . The subtle biochemical and cellular
perturbations associated with these exposures have gone
largely unstudied . We recently documented that alterations in
mACh receptor density can be associated with MeHg accu-
mulation in the brains of wild mink (Basu
et al .,
2005a)
.
Specifically, animals with higher Melig accumulation in brain
also had greater numbers of mACh receptors. Variations in
neurochernical receptors
(i .e ., mACh and D2 receptors; Basu
et al, 20056) and enzymes (ChE and monoamine oxidase
;
Basu
et al .,
under review) have also been linked with MeHg
exposure in North American river otters . The existence of such
neurochemical changes raises numerous questions regarding
the eeophysiological consequences of MeHg on wildlife
populations. As disruptions to neurochemistry are known to
precede structural and functional damage to the nervous system
(Manzo
et al .,
2001), alterations in brain chemistry may serve
as an early warning for subsequent adverse neurological effects
.
A major limitation in cross-sectional, epidemiological stud-
ies is the influence of multiple factors
(e.g ., co-contaminants,
environmental stressors, and geographic isolation) on expo-
sure-effect outcomes. As a result, before a causal link can be
made between McHg intake and neurochemical changes in
fish-eating mammals, controlled dosing trials are required to
characterize the underlying mechanisms and derive quantita-
tive information. Wildlife are excellent models to validate the
utility of neurochemical approaches, since exposure-response
relationships can be assessed at multiple tiers of biological
organization (i .e .,
laboratory experiments
in vitro,
whole-
animal feeding trials, and field or ecosystem investigations),
and brain tissue can be obtained for detailed analysis. Such
multifaceted approaches are generally not permissible for
rodents or humans . Accordingly, the present study was
conducted to explore the effects of dietary MeHg on compo-
nents of the cholinergic system in captive mink exposed to
ecologically relevant concentrations of
McHg
(i .e .,
0 to 2 ppm)
for 3 months
.
MATERIALS AND METHODS
Chemicals. Methyl Hg chloride (>95% purity) was obtained from Alfa
Aesar (Ward Hill, MA) . 10-Acetyl-3,7-dihydroxyphenoxazine (Amplex Red) was
purchased from Molecular Probes, Inc (Eugene, OR) . 3H-Acetyl CoA (200 Ci/
mmob, 3H-hemicholinium-3 (125 Ci/mmol), and
3H-quinuclidinyl benzilate(3H-
QNB; 42 Ci/mmol) were obtained from NEN/Perkin Elmer (Boston, MA) . All
other laboratory reagents were purchased from Sigma-Aldrich (St . Louis, MO) .
Animals. Because mink are sensitive to many types of pollutants and can
be studied both in captivity and in nature, they have been endorsed as excellent
sentinels
U.S,
EPA, 1997). Juvenile male mink (1763 ± 141 g), approximately
5 months of age at the initiation of study, were obtained from a commercial
rancher and certified disease free . They were housed individually in raised wire
mesh cages with nest boxes attached at the Canadian Centre for Fur Animal
Research (Nova Scotia Agricultural College, Truro, NS, Canada) . Mink were
exposed to a natural photoperiod and temperature and had free access to water
during the acclimation
(-- weeks) and exposure (-13 weeks) periods . Each
animal was checked twice daily, and all aspects of this study were approved by
the Nova Scotia Agricultural College Animal Care and Use Committee and
carried out in strict accordance to Canadian Council on Animal Care (CCAC)
guideline,
.
Experimental design
.
Feed was prepared at the Nova Scotia Agricultural
College and consisted of Atlantic herring (32%), beef tripe and liver (22%), cod
(17%), barley (14%), herring oil
(0.9%), and a preformulated vitamin-mineral
mix. MeHg was incorporated into the diet at nominal concentrations of 0, 0 .1,
0.5, I, and 2 ppm, to reflect levels that would commonly be encountered in their
natural environment (EPA, 1997) . Animals were fed twice daily for a period of
89 days (August to November 2004). This length of exposure was chosen
because it allows for the steady-state accumulation of Hg into (issues (Jernelov
er
al., 1976) and is approximately 10% of a wild mink's lifespan (Lariviere,
1999).
At the termination of the study, each animal was anesthetized with an im
injection of xylazine (2 mg/kg hw) and ketamine hydrochloride (25 mg/kg low)
.
Blood was drawn via cardiac puncture, and the animals were sacrificed with an
overdose of pentobarbital (105 .6 mg/kg bw ic). Blood samples were kept on ice
for approximately 4-6 h before they were separated into plasma and serum as
described by Stamler et al. (2005), and then stored at -80°C . The entire brain
was extracted from the skull, and specific regions (occipital cortex, cerebellum,
brain stem, and basal ganglia) were dissected from the right hemisphere and
stored at -80°C. These regions were studied because their structure and/or
function have previously been shown to be affected by McHg (ATSDR, 1999
;
Clarkson, 1997). Total Hg was measured in the feed and the tissues (brain and
blood) according to Evans
et al
. (2000) .
Neurochemical assays.
Tissues were prepared as described by Stamler
el al
. (2005) with minor modifications . All brain samples were homogenized
for 30 s in cold Na/K buffer (50 mM NaH 2PO4, 5 cast KCI, 120 cast NaCl,
pH
7 .4). For binding assays, cellular membranes were isolated by centrifuging
the homogenate at 32,500
X
g for 15 min at 4°C. The resulting pellet was
washed twice under the same conditions, and the final pellet was resuspended in
Na/K buffer. For ChA'r, ACh, and ChE analyses, Triton-X (final concentration
= 0.1% w/v) was added to the homogenate followed by a 20-s sonication
.
Protein concentration was determined using the Bradford protocol. Samples
were stored at -80°C prior to analysis
.
ChAT activity.
The activity of ChAT was determined by the method of
Former (1975) with modifications. The assay was carried out by incubating
samples (10 jig protein) in 50 mM Na/K buffer containing It) cold EDTA,
10t) pM eserine, 100 niM choline chloride, and (l .2 pCi 3H-acetyl CoA fur 30 mi n
at 37°C. The reaction was terminated by adding an equal volume (200
al)
of
1 .5% tetraphenyl boron, followed by vigorous shaking and centrifugation al
3750 X g (10 min, 25°C) to separate the phases . The activity of ChAT was deter-
mined by measuring ACh in the organic layer, and the results were expressed
as fmnl ACh formed/min/pr protein .
203
204
ACh concentration
.
Concentrations of ACh were quantified using a com-
mercially available kit (Molecular Probes Inc., Eugene, OR) with minor
modifications. Samples (10 pg protein) were incubated
in Na/K buffer
including 100 AM Amplex Red, 200 mU
horseradish peroxidase, 20 mU
choline oxidase, and 5 U acetylcholinesterase (AChE) . Formation of the assay
end-product, rsomfin, from ACh
was determined following a three-step
enzymatic reaction catalyzed
by AChE, choline oxidase,
and hydrogen
peroxidase. Fluorescence of resomfin
O«, =
540,
X
.,,m =
590) was monitored
in a microplate fluorometer (FLUOstar Optima, BMG Laboratories, Offenburg,
Germany) following a 30 min incubation period . The concentration of ACh
was determined from a standard curve (0-2 pM ACh chloride) and expressed as
nM ACh per ntg protein .
mACh
receptor
binding assay.
Binding to the mACh receptor was
performed in a 96-well 1 .0 pM GFB glass filter system (Millipore, Boston,
MA) as previously described (Stamler et al ., 2005). Approximately 20 pg of
membrane preparation in Na/K buffer was incubated with I nM 'H-QNB,
a concentration that is indicative of mACh receptor density in mink (Stamler
er al., 2005). Following a 60-min incubation period under gentle agitation, the
binding assay was terminated by vacuum filtration, and the filters were washed
three times with Na/K buffer and then allowed to soak overnight
in scintillation
cocktail. The radioactivity retained by the
filters was quantified by a liquid
scintillation counter (Beckman L53801, Fullerton, CA) with approximately
60% counting efficiency. Specific binding was defined as the difference in
3H-
QNB bound in the presence and absence of 100 pM atropine sulphate .
To compare the relationship between brain Hg and mACh
receptor levels
from the current study (i .e ., dam for four discrete brain regions) with a prior
cross-sectional field experiment on wild mink
(i.e ., data for whole brains) (Basu
et al., 2005a), receptor data from the current study were normalized to provide
a relative measure of possible levels in the whole brain. This was achieved by
taking into consideration that the average weight of the whole
mink brain was
10.88 ± 0.81 g, and that approximate weights of the
individual regions were :
occipital cortex (1.0 g), cerebellum (1.2 g), brain stem (0.8 g), and basal ganglia
(0.3 g). The weights of these regions were estimated by measuring the amount
of tissue extracted during the necropsy, and the values
compare favorably to
rodents (Scheuhammer and Cherian, 1982) . It should be noted that assumptions
in this approach are that Hg levels are uniformly distributed throughout the
mink brain, and that McHg-related changes in mACh receptor levels are
localized only to the specific brain regions we explored
.
ChE activity.
The activity of ChE in brain and blood samples was
determined according to protocols described by Stamler et a!. (2005). The
assay was carried out by incubating samples (0 .1 pg of brain protein, or 1 :5151
diluted whole blood, plasma, or serum) in Na/K buffer containing 100 pM
Amplex Red, 200 mU horseradish peroxidase, 20 mU choline oxidase, and
100 pM ACh chloride. After a 30-min incubation period, the reaction end-
product, rsorfin, was detected as described in the section ACh concentration
.
The specific activity of ChE was expressed as nmol of resomfin formed per min
per protein (pg) or volume (pl) .
Choline
transporter.
Binding to the high-affinity choline transporter was
based on the method of Vickroy et al .
(1984) and modified for a 96-well
microplate filtration system. Approximately 20 pg of membrane preparation
was preincubated for 30 min in Na/K buffer in filter plates (1
.0 pM GF/B glass
filters, Millipore, Boston, MA) that were presoaked with 0.1% polyethyleni-
mine. Samples were then incubated with 2 nM 'H-hemicholinium-3 for 20 min
al 25"C under gentle agitation. The binding assay was terminated,
and
radioactivity was quantified according to the methods described in the section
±ACh receptor
binding assay. Specific binding was defined as the difference
in 'H-hemicholinium-3 bound in the presence and absence of unlabelled
hemicholinium-3 (10 pM) .
'
Statistical analyses. For
quality control, method blanks and positive con-
trols were included in all biochemical assays . An internal standard was created
by pooling brain tissues from five untreated mink, and this sample was used to
calculate imer- and infra-assay variation . All samples were assayed in triplicate .
BASU ET AL .
.
A p value less than or equal to 0.05 was considered statistically significant in
all analyses. All statistical analyses were performed using SPSS version 11 .5
(Chicago, IL). Data are represented as means ± SD. The difference in the
nominal and actual concentrations of Hg in the diet was assessed by a Mann-
Whitney U test. Concentrations
of McHg in blood and brain were
log-
transformed to satisfy the assumptions of parametric statistics . One-way
analysis of variance (ANOVAs) was used to determine
the effects of dietary
MeHg on the cholinergic parameters and Hg burden
.
When significant
differences were found, post-hoc comparisons
were
performed with Tukey's
HSD. Pearson correlations were used to determine the association between
neurochemical parameters in components of blood and brain regions. The
slopes of the regression plots relating brain Hg with mACh receptor levels from
the laboratory and field study were compared using a general
linear model
.
RESULTS
No
mortalities or obvious
changes to
animal behavior were
evident during the trial. The background level of Hg in the
control diet
(i.e .,
0
ppm MeHg) was
22 ± 7
ng/g, and the
measured concentrations of dietary MeHg
in
the treatments
were not
significantly different from the nominal values
. Given
that mean daily feed intake among all treatments was
313 ± 63
g
feed
per animal,
dietary exposures ranged from
3.3
to
267.8
pg/kg b.w./day (F4
,20=246.2,p < 0.001)
(Table
1). A
significant
exposure-dependent
increase in
total Hg was measured in blood
(F4,55
= 7.9, p < 0.001)
and brain (F4,55 =
597.5, p < 0.001)
(Table
1). There
were no significant MeHg-related changes in
feed
intake, whole body, and brain weight .
Cholinergic Measurements
The inter- and intra-assay variation in all assays was less
than
15%,
except for the measurement of choline transporter
(infra-assay
CV =23.3%). There were
no McHg-related effects
on
ChAT
activity,
ACh concentrations, or choline
transporter in
different regions
of the brain (data not shown). However,
significant
MeHg-dependent increases in
mACh
receptor levels
were measured in all
brain regions studied
except
for the
cerebellum (Fig .
1) .
3
H-QNB binding in
the occipital cortex
was significantly (F4,55
= 3.8, p < 0.01) higher
in the
I
and
2
ppm
dietary groups
(30.2
and
39.0%, respectively),
compared
to
controls (Fig. IA). In the basal ganglia, exposure to
0.5
and
1
ppm MeHg resulted in significantly
(F4 ,55
=
2.8, p < 0.05)
TABLE I
Concentrations of
Total Hg in the Diet and Tissues
Note .
Numbers represent means ± SD,
and letters represent significant
differences within columns .
McHg (ppm)
in diet, nominal
Intake
(pg/kg bw/day)
Whole blood
(ppm w.w.)
Brain
(ppm d.w.)
0
3.3±0.6"
0.14±0.27"
0.41±0.09"
0 .1
17.5 ± 1 .7"
0.60 ± 0.81"
1 .50 ± 0.34"
0 .5
77.4 ± 7.6'
0.68 t 0.72"
4.09 ± 0.98`
1
162.5 x 23.5"
0.68 s 0.475
7.13 ± 0.94"
2
267.8 ± 24 .9'
1.42 ± 0.80"
15.38 x 3.92'
A
a
E
x
c
W
E
o=
O o`
'^
n
a
w
U
u
OL)
U
EE
C
10000
a
E
o
C
a
t
c
n `o
O
n
ut u
A d
m t
U
E
8000
6000
4000
2000
0
MERCURY AFFECTS CHOLINERGIC SYSTEM IN MINK
higher
3
H-QNB binding (67.4 and 69.1%, respectively) com-
pared to controls (Fig . IC). In the brain stem, mean
3
H-QNB
binding was significantly (F4,55 = 2.9,p < 0.05) higher (64.4%)
in the 0.5 ppm dietary group relative to controls (Fig . ID)
.
For ChE activity, MeHg-related increases were measured in
the occipital cortex and basal ganglia (Fig . 2). The activity of
ChE in the occipital cortex was significantly (F4,55 = 3 .2, p <
0.05) higher in the I ppm McHg group, compared to the 0 and
2 ppm dietary groups, by 17.0 and 18.4%, respectively (Fig. 2A).
In the basal ganglia, ChE activity was significantly (F4,55=3 .1,
p < 0.05) higher by 34.1% in the 0.5 ppm group compared to
nonexposed controls (Fig. 2Q .
In the components of bloat tested (i .e ., whole blood, plasma,
serum) there were no effects of MeHg on the activity of ChE
(data not shown). However, there were significant correlations
between enzyme activity in plasma and brain stem
(r =
0.516,
p
-
<
0.0001), plasma and occipital cortex (r=0 .250,
p
< 0.05),
and whole blood and basal ganglia
(r =
--(1.404, p < 0.001) .
Comparison of mACh Receptor Level., between Lab
and Field Studies
The relationship between brain Hg and mACh receptor
levels were compared between the current laboratory study
D
2000
-
a
E
c
1500
-
El
00
c
1000-
c
m
m
500
t U
EE
0
1
b
01
0.5
1
2
McHg (ppm)
205
FIG. I. Muscarinic aeetylcholine (mACh) receptor binding in discrete brain regions (A-occipital cortex; B-cerebellum; C-basal ganglia; D-brain stem)
of captive mink (Marrelu ,-(son) following an 89 day exposure to dietary methylmercury (MeHg). Bars represent means (±standard deviation) from 12 animals
.
Letters denote significant (p < O 05) differences among the treatments following one-way analysis of variance (ANOVA)
.
and a previous field experiment (Fig . 3). By normalizing the
receptor data from the current dataset
(i.e .,
studied in four
discrete brain regions) to reflect values in the entire brain, the
densities of mACh receptor (dependent variable) could be
related to Hg (independent variable) in whole brains according
to the following equation: y = 129.8Ln(x) + 1507.5
(r2
=
0.176, p < 0.001). This exposure-response relationship is
similar to the field study (y = 118 .8Ln(x) + 629.4 ;
r2 =
0.299, p < 0.0001), as no statistically significant differences
were obtained between the slopes of the two regression plots .
DISCUSSION
Studies in wild (Basu
et al.,
2005a,b, under review) and
laboratory (Coccini
et al.,
2000; Dwivedi
et al.,
1980; Hrdina
et al.,
1976; Kohayashi
et a!.,
1980; Omata
et al.,
1982)
animals have shown that MeHg can alter components of the
cholinergic system . The effects on this system are nonspecific
and are caused by the interactions of McHg with sulfhydryl-
containing proteins, which are ubiquitous in all cells . Thus, to
properly evaluate the effect of MeHg on cholinergic neurotrans-
mission, we have systematically investigated the key biochem-
ical parameters in this pathway. While no changes to brain
206
3000-
2500-
M
E
E
2000-
y 1500-
i
1000-
0
E
500
-
A
20
i
c
X
E
of
U S
3
Z'
5.
U U
0,
W
U
U
a
C
400
a
1
E
300
c
rv -
0
Z~ 200
R ,>
w a
mQ
W 100
U
a
0
FIG. 2.
Activity of cholinesterase (ChE) in discrete brain regions (A-occipital cortex ; B-cerebellum; C-basal ganglia ; D-brain stem) of captive mink
(Mustela vison) following an 89-day exposure to dietary methylmercury (MeUg) . Burs represent means (±standard deviation) from 12 animals. Letters denote
significant (p < 0.05) differences among the treatments following one-way analysis of variance (ANOVA)
.
15
10
5
0
0
0
0
0
0
OA
10
100
Total Brain Hg (ppm, d.w .)
FIG.3.
Relationship between concentrations of mercury (Hg) and levels of
muscarinic acetylcholine (mACh) receptors in the brain tissues of captive (open
circles-0) and wild (closed circles-
•)
mink. The data from the laboratory
were normalized from receptor levels measured in four discrete brain regions
(i .e ., occipital cortex, cerebellum, basal ganglia, and brain stem) . The data from
the field were obtained from a previous publication (Basu
et
at .,
2005a). Lines
of best fit were calculated with linear regression modeling
.
BASU ET AL.
B
so
0,
E
60
E
ES
2
40
2 i
a `
.
UQ
W
20
L
U
a
0
D
120
w
Z
100
E
80
c
N
c D 60
A
m Q
40
W
V
20
a
0
ChAT, ACh,
or choline
transporter were
found, significant
increases of mACh receptor levels (Fig. I) and activity of ChE
(Fig .
2)
were related to dietary MeHg intake . The mechanisms
underlying these observations can be attributed to the tightly
regulated and homeostatic controlled cholinergic system
.
Exposure of mammals to MeHg results in a net decrease of
cholinergic signals through the central nervous system
.
In
vitro,
MeHg can inhibit the activity
of ChAT
(i .e .,
decreased
synthesis of ACh; Dwivedi
et al., 1980;
Kobayashi
et a!.,
1979; Omata
et al., 1982),
ligand binding to the mACh receptor
(i.e., reduced signal transduction; Abd-Elfattah and Shamoo,
1981 ; Basu
et al., 2005c),
and reuptake of choline (i .e ., reduced
ACh turnover; Kobayashi
et al., 1979) .
These results are
supported in vivo, as MeHg can reduce ChAT activity (Dwivedi
et al., 1980;
Omata
et al., 1982)
and ACh content (Hrdina
et al.,
1976; Kobayashi
et al., 1980) .
Despite these data, we did not
measure any changes in ChAT activity, ACh concentration, or
levels of choline transporter. Prior documentation of ChAT
inhibition was obtained from acute, high-dose experiments on
rats
(i.e ., 2-10 mg/kg bw/day for 1-4 weeks ; Dwivedi
et a!.,
1980; Omata
et al., 1982)
.
Conversely, our study was designed
to mimic an ecologically relevant scenario
(i .e ., <0.27 mg/kg
bw/day for 12.7 weeks). Perhaps no effects on ChAT were
MERCURY AFFECTS CHOLINERGIC SYSTEM IN MINK
found because the burden of MeHg in the brain was not
sufficiently high to affect enzyme activity, or the animals
adapted to the continuous exposure. While MeHg can inhibit
the reuptake of choline into the neuron
in vitro (Kobayashi
et al ., 1979), to our knowledge, MeHg-induced changes in the
levels of this transport protein have not been observed in vivo
.
Interestingly, the blockage of choline uptake in rats by MeHg
or hemicholinium (a potent inhibitor of choline uptake) results
in similar biochemical (i.e ., reduced ACh content and turnover)
and behavioral (e.g ., tremors, staggered gait, and depression)
outcomes (Kobayashi et
a!.,
1980). It was not possible to
postulate whether the neuronal content of ACh was affected by
MeHg in our study. The accurate estimation of this neuro-
transmitter requires immediate decapitation or microwave
irradiation, as ACh is rapidly hydrolyzed by ChE (turnover
rate = 150 ftsec; Goldberg and Hanin, 1976). Neither method
was an option in the present study because of animal care
protocols. Because chronic exposures to low levels of MeHg
can he related to decreased ACh content in rat brains (Hrdina
et al.,
1976), carefully designed studies will be required to
reconcile this outcome in wildlife
.
The key finding of this study was that the variation in
mACh receptor levels could be related to the intake of MeHg .
The mACh receptor belongs to a highly conserved class of
membrane-spanning proteins that transduce intracellular sig-
nals through a G-protein (Wess, 2004). MeHg can directly
affect this receptor by inhibiting ligand binding (Abd-Elfattah
and Shamoo, 1981). For example, the calculated IC50 in the
cerebral cortex of mink (5.5 µM MeHg) was within four-fold of
values in humans and rodents (Basu
et cit., 2005c). Because Hg
can impair ligand binding, up-regulation of the mACh receptor
is possibly a compensatory mechanism to ensure homeostasis
in cholinergic transmission . Coccini et al . (2000) also found
increased mACh receptors (20 to 44% over controls) in adult
female Sprague-Dawley rats exposed to MeHg (0.5 mg/kg
hw/day) for 16 days. However, these changes were measured
14 days following the termination of treatments and were lo-
calized to the hippocampus and cerebellum . No McHg-related
alterations in mACh receptor levels were found in the cerebral
cortex. Whether there is a species difference in the suscepti-
bility among different brain regions requires further study
.
A similar positive correlation was observed between concen-
trations of brain Hg and mACh receptor levels in wild mink
collected from three study sites across Canada in a cross-
sectional study (Basu et al., 2005a). More importantly, there
was no significant difference in the slopes of the regression
curves obtained from the current laboratory study and the pre-
vious field investigation (Fig . 3). Because consonant exposure-
response relationships infer a common mode of action, these
findings collectively suggest that exposure to ecologically rele-
vant concentrations of MeHg can be related to higher levels of
mACh receptors in populations of wild mink. The existence of
this phenomenon in natural populations is further supported by
considering that Hg-related changes to the cholinergic pathway
207
have also been observed in feral river otters (Basu et al., 20056,
under review)
.
MeHg-related increases of ChE activity were measured in
the occipital cortex and basal ganglia (Fig
. 2). In vitro, MeHg
does not inhibit ChE activity in mink (N . Basu, unpublished
data) or rodents (Kobayashi et
a!.,
1979, 1980). Therefore,
changes in enzyme activity are likely secondary responses
resulting from variations in mACh receptor levels . Several
studies have shown that pharmacological agents and environ-
mental pollutants can induce unidirectional changes to the
mACh receptor and ChE activity. For example, decreases in
both ChE activity and mACh receptors are common outcomes
in animals poisoned by organophosphates (Costa et al., 1982) .
In nature, a positive correlation has been calculated between
mACh receptor levels and ChE activity in wild birds exposed to
pesticides (Bum and Leighton, 1996) and in wild river otters
exposed to Hg (Basu
et al ., under review). These examples
highlight the autoregulatory nature of the cholinergic system
during periods of toxicant stress
.
MeHg causes discrete lesions to the calcarine region of the
occipital cortex and to the granule layer of the cerebellum in
wildlife (Wobeser et al ., 1976; O'Conner and Nielson, 1981),
rodents, and humans (Watanabe and Satoh, 1996), and these
homologous responses in different mammalian species suggest
a common mode of action. While neuroehemical changes would
be expected in the two aforementioned brain regions, alterations
in mACh receptors and ChE activity were measured only in the
occipital cortex (Figs. lA and 2A). The lack of observable
response in the cerebellum (Figs . lB and 2B) is likely due to the
scarcity of eholinergie neurons in this brain region, although
further research is required because prior studies have found
MeHg-related effects on the mACh receptor in this region (Basu
et al ., 2005c ; Coccini et al
., 2000). Changes in cholinergic para-
meters were also measured in the basal ganglia and brain stem,
and some clinical outcomes of MeHg poisoning have been
linked to functional impairments in these brain structures . For
example, MeHg-induced hand tremors (Fawer et al., 1983) and
auditory-evoked potentials (Murata et al ., 1999) can be related
to damage to the basal ganglia and brain stem, respectively
.
Monitoring neurochemistry is a novel approach to predict
and/or detect early nervous system dysfunction, because alter-
ations in cellular biochemistry are known to precede permanent
tissue damage (Manzo et al., 2001). In the current study, a
continuum of McHg-related neurological effects was observed
whereby exposure of mink to the lowest treatment (i.e .,0.1 ppm)
resulted in significant uptakes of Hg into brain (Table 1), but no
significant changes in neurochemistry. With increasing expo-
sure to dietary McHg, neurochemical effects became evident
in animals exposed to 0.5 ppm MeHg (Figs. 1 and 2). Prior
studies have shown the emergence of neuropathology in mink
exposed to I ppm dietary MeHg (Wobeser et al ., 1976; Wren
et al.,
1987). It is interesting to note that alterations in
neurochemistry often subsided in the highest exposure groups
(e.g., mACh receptor levels in the basal ganglia and brain stem,
208
BASU ET AL .
Figs . IC and ID, respectively), and this attenuation may be
related to the animal's inability to maintain cellular homeo-
stasis once cytotoxicity becomes imminent
.
In summary, the present . study demonstrated that MeHg can
affect certain parameters of the cholinergic system in captive
mink. Specifically, McHg-related increases in mACh receptor
levels (Fig. 1) and ChE activity (Fig. 2) were measured in
discrete regions of the brain. Furthermore, the neurochemical
changes occurred at a MeHg exposure level
(i .e., 0.5 ppm) that
is below dietary concentrations (i.e., -I ppm; Wobeser
et al.,
1976; Wren
et al .,
1987) known to cause structural and func-
tional damage. The results from this laboratory study corrob-
orate ecological findings and suggest that high MeHg exposure
is associated with increased mACh receptor density in mink
(Fig. 3). Collectively, the emerging evidence from the labora-
tory and the field demonstrate that ecologically relevant con-
centrations of McHg can affect cholinergic neurotransmission
in fish-eating wildlife .
ACKNOWLEDGMENTS
This study was funded by the Collaborative Mercury Research Network
(COMERN) to A.S., R.D.E ., and H.M.C ., and a Discovery Grant from the
Natural Science and Engineering Research Council of Canada (NSERC) to
H.M.C. N.B. was a recipient of a NSERC Postgraduate Fellowship . We are
thankful to the Canadian Centre for Fur Animal Research, especially Merridy
Rankin, Rena Curie, Sarah Gatti-Yorke, Tanya Morse, Cindy Crossman, Jody
Muise, and Margo White. Technical assistance from Donna Leggee, Chris
Stamler, Sonja Ostertag, and Kimberly Bull is appreciated. No conflict of
interest is declared
.
REFERENCES
ATSDR (1999) .
Toxicological Profile for Mercury. Agency for Toxic Sub-
stances and Disease Registry, U .S. Department of Health and Human
Services, Public Health Service, Atlanta, GA .
Abd-Elfattah, A . S., and Shamuo, A. E. (1981). Regeneration of a functionally
active rat brain muscannic receptor by D-penicillamine after inhibition with
methylmercury and mercuric chloride
. Mot. Pharmacol. 20, 492-497
.
Aulerich, R . 1., Ringer, R. K., and Iwamoto, S. (1974). Effects of dietary
mercury on mink . Arch. Environ
. Contara
. Toxicol. 2, 43-51
.
Basu, N., Klenavic, K., Gamberg, M., O'Brien, M., Evans, R. D., Scheuhammer,
A. M., and Chan, H. M. (2005a). Effects of mercury on neurochemical
receptor binding characteristics in wild mink . Environ. Tnxicol Chem . 24,
1444-1450 .
Basu, N., Scheuhammer, A . M., Grochowina, N . M., Klenavic, K., Evans, R. D .,
O'Brien, M., and Chan, H. M. (2005b). Effects of mercury on neuro-
chemical receptors in wild river otters
(Lonlra canadensis) . Environ. Sci .
Technol. 39,3585-3591
.
Basu, N., Scheuhammer, A. M., Evans, R. D., O'Brien, M., and Chan, H. M .
(2006). Cholinesterase and monoamine oxidase activity in relation to
mercury levels in the cerebral cortex of wild river otters. Hum. Exp. Tnxicol.
(under review)
.
Basu, N., Stamler, C . J., Loua, K . M., and Chan, H. M. (2005c). An inter-
species comparison of mercury inhibition on muscarinic acetylcholine
receptor binding in the cerebral cortex and cerebellum
.
Tnxicol. Appl.
Pharmacol 21)5, 7 1-76
.
Burn, J. D., and Leighton, F. A. (1996). Further studies of brain cholin-
esterase: Cholinergic receptor ratios in the diagnosis of acute lethal poisoning
of birds by anticholinesterase pesticides. J. Wild!. Dis. 32, 216-224 .
Castoldi, A. F., Coccini, T., Ceccatelli, S., and Manzo, L. (2001). Neurotoxicity
and molecular effects of methylmercury . Brain Res. Bull. 55, 197-203 .
Chan, H. M ., Scheuhammer, A. M., Ferran, A., Loupelle, C., Holloway, J., and
Weech, S. (2003). Impacts of mercury on freshwater fish-eating wildlife
and humans. Hum. Ecol. Risk Assess. 9, 867-883 .
Clarkson, T. W- (1997). The toxicology of mercury . Crit. Rev. Clin. Lab. Sci. 34,
369-403 .
Coccini, T., Randine, G., Candura, S. M., Nappi, R. E., Prockop, L. D., and
Manzo, L. (2000). Low-level exposure to methylmercury modifies musca-
rinic cholinergic receptor binding characteristics in rat brain and lympho-
cytes: Physiologic implications and new opportunities in biologic
monitoring. Environ . Health Perspect. 108, 29-33
.
Costa, L. G., Schwab, B. W., and Murphy, S. D. (1982). Differential alterations
of cholinergic muscarinic receptors during chronic and acute tolerance to
organophosphomsinsecticides
. Biochem. Pharmacol. 31,3407-3413 .
Dwivedi, C., Raghunathan, R., Joshi, B. C., and Foster, H . W., Jr. (1980) . Effect
of mercury compounds on cholineacetyl transferase. Res. Common . Chem.
Pathol. Pharmacol
. 30, 381-384 .
Evans, R. D., Addison, E. M., Villeneuve, J. Y., MacDonald, K . S., and
Joachim, D. G. (2000). Distribution of inorganic and methylmercury among
tissues in mink (Mustela vison) and otter (Lutra canadensis)
. Environ. Res.
1541,133-09,
Fawer, R. F, de Ribaupierre, Y., Guillemin, M. P., Berode, M., and Lob, M .
(1983). Measurement of hand tremor induced by industrial exposure to
metallic mercury. Br. J. Ind. Med
. 40,204-209 .
Fortnum, F. (1975). A rapid radiochemical method for the determination of
choline acetyltransferase. J. Neumchem . 24, 407-409 .
Goldberg, A. M., and Hanin, I. (1976). Biology of Cholinergic
Function
Raven Press, New York, 1976 .
Hrdina, P. D., Peters, D. A., and Singhal, R. L. (1976). Effects of chronic
exposure to cadmium, lead and mercury of brain biogenic amines in the rat
.
Res
. Common. Chem. Pathol. Pharmacol . 15, 483-493 .
Jemelov, A., Johansson, A. H., Sorensen, L., and Svenson, A. (1976). Methyl
mercury degradation in mink . Toxicology 6, 315-321 .
Kenow, K. P., Gutreuter, S., Hines, R. K., Meyer, M. W., Fournier, F., and
Karasov, W. H. (2003). Effects of methyl mercury exposure on the growth of
juvenile common loons . Ecoroxicology 12, 171-182
.
Kobayashi, H ., Yuyama, A., Matsusaka, N ., Takeno, K., and Yanagiya, l .
(1979). Effects of methylmercury chloride on various cholinergic parameters
in vilro. J. Tnxicol. Sci. 4, 351-362.
Kobayashi, H., Yuyama, A., Matsusaka, N ., Takeno, K., and Yanagiya, 1 .
(1980). Effect of methylmercury on brain acetylcholine concentration and
turnover in mice . Toxicol. Appl. Pharmacol. 54, 1-8.
Lariviere, S. (1999). Mustela vison . Mammal. Spec. 608, 1-9 .
Manzo, L., Castoldi, A. F., Coccini, T., and Prockop, L. D. (2001) . Assessing
effects of neurotoxic pollutants by biochemical markers. Environ. Res. 85,
31-36 .
Murata, K., Weihe, P., Renzoni, A., Debes, F., Vasconcelos, R., Zino, F.,
Araki, S., Jorgensen, E., White, R. F., and Grandjean, P (1999) . Delayed
evoked potentials in children exposed to methylmercury from seafood
.
Neurotoxieol. Teratol. 21, 343-348 .
O'Connor, D. J., and Nielsen, S. W- (1981). Environmental survey of
methylmercury levels in wild mink (Mustela vison) and otter (Lutra
conadensis) from Northeastern United States and experimental pathology
of methyhnercurialism in the otter. In World
Furhearer Conference
Proceedings (J. D. Chapman and D. Parsley, Eds.), pp. 1728-1745. World
Forbearer Conference, Frostburg, MD
.
MERCURY AFFECTS CHOLINERGIC SYSTEM IN MINK
Omata, S., Hirakawa, E., Daimun, Y., Uchiyama, M., Nakashita, H., Horigome, T.,
Sugano, I., and Sugano, H . (1982). Methylmercury-induced changes in the
activities of neurotransmitter enzymes in nervous tissues of the rat
. Arch.
Toxicol. 51, 285-294 .
Ronald, K., Tessaro, S. V., Uthe, J. F., Freeman, H. C., and Frank, R. (1977).
Methylmercury poisoning in the harp seal (Pagophllus groenlandicus) . Sci.
Total Environ. 8, I-11
.
Schenhammer, A. M., and Cherian, M . G. (1982). The regional distribution of
]cad in normal rat brain . Neuroloxicology 3, 85-92 .
Smmlcr, C . 1., Hasa, N., and Chan, FI. M .
(2(H)5) . Biochemical markers of
neurotoxicity in wildlife and human populations: Considerations for method
development. J. Toxicol. Environ. Health 68, 1413-1429 .
U.S. EPA (1997). Mercury study report to Congress . Vol. VII: Characterization
of human health and wildlife risks from mercury exposure in the United
States. U S. Environmental Protection Agency, Office of Research and
Development, Washington, DC.
Vickroy, T., Roeske, W., and Yamamura, H. (1984). Sodium-dependent
high-affinity binding of I'H]hemicholinium-3 in the rat brain: A poten-
209
tially selective marker for presynaptic cholinergic sites
.
Life Sci.
35,
2335-2343 .
Watanabe, C., and Saloh, H . (1996). Evolution of our understanding of
methylmercury as a health threat
. Environ. Health Perspect. 104(Suppl. 2),
367-379 .
Wess, J. (21)04). Musauinic acetylcholine receptor knockout mice : Novel
phenotypes and clinical implications Annu. Rev. Pharmacol. Toxicol. 44,
423-450 .
Wiener, J. G., Krabbenhoft, D . P., Heinz, G. H., and Schcuhammer, A. M
.
(2003). Ecotoxicology of mercury . In Handbook of Ecofoxicology (D . J
.
Hoffmnn, B . A . Runner, G . A. Burton Jr., and J. Cairns Jr, Eds .), pp. 409-
463. CRC Press, Boca Raton, FL.
Wobeser, G., Nielson, N. 0., and Schiefer, B . (1976). Mercury and mink . 11
.
Experimental methyl mercury intoxication . Can. J. Comp. Med. 40, 34-45
.
Wren, C. D., Hunter, D. B., Leatherland, J. F., and Stokes, P. M. (1987). The
effects of polychlorinated hiphenyls and methylmercury, singly and in
combination on mink. II: Reproduction and kit development . Arch. Environ .
Contam .
Taxi,
1. 16, 449-454
.
y
L1546
-
frame
-
MASTER NA
Page
409 Monday, August 20, 2002 1 37 PM
16.7 .2 Fish
425
16.7.3 Birds
428
16.7 .3.1 Field Studies on Birds
429
16.7 .3.2 Laboratory Experiments on Birds
432
16.7.4 Mammals
434
16.7 .4.1 Effects of Methylmercury in Mammals, and Critical
Concentrations in Tissues and Diets
434
16.7 .4.2 Demet Assessment Relationship with Selenium 435
16.7 .4.3 Hazard
Ass
Assessment Studies
437
16.8 Degradation of Ecosystem Goods and Services
437
16.9 Mercury Pollution- A Continuing Scientific Challenge
439
16.10 Summary
440
Acknowledgments
443
References
443
16.1 INTRODUCTION
This chapter describes selected aspects of the behavior of mercury in the environment and
examines the ecotoxicology of this highly toxic metal . The widespread geographic extent and
409
T
CHAPTER
16
Ecotoxicology of Mercury
James G. Wiener, David P. Krabbenhoft, Gary H. Heinz, and Anton M. Scheuhammer
CONTENTS
16.1
Introduction
409
16.2
Evolution of the Environmental Mercury Problem
410
16.3
Global-Scale Environmental Cycling and Fate
413
16.4 Mercury
tion and Environmental Concentrations
415
16.5
16.4.1 Atmosphere
416
16.4.2 Aquatic Environments
416
16.4.3 Terrestrial Environments
418
Mercury Me
ion in the Environment
418
16.6
Mercury-Sensitive Ecosystems
420
16.7
emulation, Biomagnification, and Biological Effects
421
16 .77
.
.11 Biomagnification in Food Webs
421
6
(ASTER h,s,k Page 410 Munday Au,,, 26, 2m2 1 :37 I'M
410
HANDBOOK OF ECOTOXICOLOGY
adverse consequences of mercury pollution continue to prompt considerable scientific investigation
.
Furthermore, the environmental sources, biogeochemistry, transformations, transport, fate, and
effects of mercury in the environment are subjects of frequent symposia, workshops and a large,
steadily expanding body of scientific literature . We characterize the environmental mercury prob-
lem, critically review the ecotoxicology of mercury, and describe the consequences of methylmer-
cury contamination of food webs . We discuss processes and factors that influence exposure to
methylmercury, the highly neurotoxic form that readily accumulates in exposed organisms and can
hiomagnify in aquatic and terrestrial food webs to concentrations that can adversely affect organisms
in upper trophic levels, including humans. Emphasis is given to aquatic food webs, where the
problem of methylmercury contamination is greatest.' When available, recent reviews have been
cited for readers interested in more detailed coverage
.
Concerns about environmental mercury pollution and contamination of aquatic food webs stem
largely from the human health risks of dietary exposure to methylmercur, the dominant form of
mercury in the edible flesh of fish and aquatic mammals 2-4 The human health risks associated with
mercury in surface waters and aquatic biological resources are not reviewed here but have been
critically examined in several case studies and recent reviews
5
IN
Nonetheless, our discussion of
processes and factors affecting exposure of fish and wildlife to methylmercury is directly relevant
to the issue of human exposure to methylmercury, which results largely from consumption of fish,
shellfish, and aquatic mammals and birds
.10.1217
16.2 EVOLUTION OF THE ENVIRONMENTAL MERCURY PROBLEM
Humans have been using mercury for more than 2000 years for a wide variety of
applications,"19
and centuries of emissions and reemissions of anthropogenic mercury have caused widespread
environmental contamination over large regions of the globe 2021 Cinnabar, HgS tst , the principal
mercury ore, was used as a red pigment long before the process for refining mercury ore to recover
elemental mercury, Hg°, was discovered. Since the advent of refining cinnabar, five mining areas
have dominated the historical global production of elemental mercury : the Almaden district in
Spain, the Idrija district in Slovenia, the Monte Amiata district in Italy, the Huancavelica district
in Peru, and the state of California in the United States
. 18.22 At Almaden, Spain, mercury was first
mined about 430 B .C .,77 and (luring the next 25 centuries the Almaden mines produced more than
280,000 metric tons of the estimated total global production of about 800,000 tons 22 The mining
and smelting of cinnabar and other mercury ores have caused substantial contamination of air, soil,
water, biota, and sediment in the vicinity of such operations, and mercury-containing wastes at
mining and smelting sites continue to emit mercury, including methylmercury, to the environment
for decades or centuries after operations cease
11,14-30
From 1550 to 1930 an estimated 260,000 tons or more of mercury were released globally from
mining operations that used the mercury-amalgamation process to recover gold and silver ." In the
United States, gold mining was the primary use of mercury during the latter half of the 1800s, and
the demand created by gold and silver mining stimulated mining for mercury as well
. 1
A
.
72 The
mining of mercury deposits (primarily cinnabar) along 400 km of the Coast Range of California,
for example, was stimulated by the California gold rush in the mid-1800s
.
28,1134
Gold or silver was mined throughout much of North America, and large quantities of mercury
were used for precious-metal mining in California, Nevada, and South Dakota?" 4 Contaminated
tailings and alluvium originating from mining sites are consequently widespread in North America
and elsewhere .291"Z37 Emissions of mercury from contaminated mine tailings and lands include
volatilization of fig" to the atmosphere, aqueous dissolution by infiltrating water and entrainment
with stream flow, and physical erosion and downstream transport of mercury-enriched geologic
materials
.77-
a
2 Contaminated tailings can remain a source of mercury emissions for decades or
centuries after mining operations have ceased
.717 In some drainage basins, exemplified by the
_ IJ546 frame MASTER .book Page 411
Monday, August 26, 2002 1 :37 PM
ECOTOXICOLOGY OF MERCURY
411
Carson River (Nevada), contaminated sediment originating from historic mining sites has been
transported, deposited, and redistributed far downstream, causing persistent contamination of stream
and river channels, river banks, floodplains, and reservoirs along extensive reaches of the water-
shed
.33,
J
5-38,40,41,4144 The natural burial off such mercury-contaminated deposits by more recent,
"clean" sediments may mitigate these settings only temporarily, given that large floods can reexpose
the underlying, contaminated deposits
.
Since the
early
1970s there has been a resurgence of gold-mining operations that use the
mercury-amalgamation process, particularly in South America, Southeast Asia, China, and parts of
Africa. 31,37,45-07 These ongoing mining activities, which seem to be stimulated partly by economic
recession
m are widely dispersed in hundreds to thousands of operations - often small and in
remote areas- involving millions of people worldwide
31.45,46 Total emissions from these operations
are now and could remain a globally significant source of new anthropogenic mercury for
decades .31.31.39,45 Recent emissions to the global environment from this "new gold rush" may total
as much as 460 metric tons per
year
(about 10% of annual, anthropogenic global emissions), 48 with
roughly two thirds of this total emitted to the atmosphere and one third emitted to land or water."
In Brazil, gold mining has become the major source of anthropogenic mercury emissions
45
Mercury also has a long history of usage in industrial applications, particularly in chlor-alkali
plants and pulp and paper mills, and pollution from these sources has been well documented in
recent decades." 25.49.50 The most publicized industrial releases occurred in Minamata and Niigata,
Japan, in the 1950s and 1960s, when many humans were poisoned by methylmercury after eating
fish that were highly contaminated by mercury from direct industrial sources5.8 These tragedies
focused global attention on environmental mercury pollution 51 and prompted efforts, beginning
around 1970 in the United States, Canada, and many other industrialized countries, to identify
industrial sources of mercury pollution and to reduce intentional discharges of mercury into surface
~t}
waters 25.45 As a result, mercury levels in fish and sediments in such industrially affected waters
typically declined in subsequent years and decades .15,12-b0 In many cases, the concentrations of
mercury in fish decreased by 50% or more during the first decade after discharges were reduced,
and the rate of decrease in concentration then slowed considerably, or concentrations leveled off,
to values that were elevated relative to lesser contaminated waters nearby
.
25,52,53,55 .58 .61
At some
mercury-contaminated sites, however, the decline in concentrations of mercury in fish has been
slow or delayed in the affected aquatic ecosystem
.25 .6 a.63
In industrially polluted Clay Lake, Ontario, mercury concentrations in gamefish have declined
from peak levels but remained substantially above the Canadian mercury limit of 0.5 sg/g wet
weight nearly three decades after operations ceased at the industrial source, a chlor-alkali plant
near Dryden that operated from 1962 to 1970
.5264 Mercury concentrations in axial muscle of 50-cm
walleye
(Stizostedion
vitreum)
from Clay Lake decreased rapidly after operations ceased at the
chlor-alkali plant- from about 15 sg/g wet weight in 1970 to about 7 .5 .tg/g in 1972- and then
declined gradually to about 3 .5 µg/g in 1983
.52 Concentrations apparently declined little during the
next 15 years, given that total mercury averaged
2.7 ltg/g
in a sample of 14 walleyes (mean fork
length, 53 cm) taken from Clay Lake in 1997 and 19985° Persistent problems with methylmercury
contamination of aquatic biota at historically contaminated sites may result from continuing,
unintended emissions of mercury from the source area, from recycling and methylation of the
mercury present in contaminated sediments, from temporal increases in the bioavailability of
mercury or in the habitability of highly contaminated zones within the ecosystem, from changes
in food-web structure, from atmospheric deposition of mercury from other sources, or from a
combination of these and other factors?5.50.62,65-69 Indeed, the physical and chemical properties that
made mercury so useful in industrial applications
(e.g ., liquid state at ambient temperature, high
volatility, and ease of reduction) also make this metal very difficult to contain and recover from
the environment .25
The growing awareness of the hazards of mercury exposure led to widespread discontinuation
or phased reductions in usage of the metal in a variety of applications and consumer goods beginning
t
{L .
L 154fi frame_ AS'r[Rb.x,k P,, 412 NI "Juy . Angu, i 26, 2002 1 :37 PM
412
HANDBOOK OF ECOTOXICOLOGY
in the late 1960s)" ,19.2" For example, the use of mercurial fungicides in seed grain, which began in
the 1940s, had severe consequences for humans and wildlife. Thousands of humans were poisoned,
and hundreds died, when methylmercury-treated grains were eaten (rather than planted) by Iraqi
farmers and their families)''9 Incidents of high mortality of wild birds were reported after planting
of seeds treated with alkyhnercury compounds," and both seed-eating birds and their predators
were poisoned." The use of mercury compounds as seed dressings was decreased or banned in
Sweden, Canada, and the United States in the 1960s and 1970s
.
Mining of mercury decreased abruptly in response to rapidly declining demand and prices
.
Mercury production in the United States, for example, had peaked in 1877 at more than 2700 metric
tons per year, and as recently as 1969 there were more than 100 active mercury mines in the
country." The mercury-mining industry in the United States collapsed in the early 1970s . Fewer
than ten mines remained in production in late 1976, and the last mine in the country to produce
mercury as its principal product closed in November 19901"
In the late 1970s and 1980s, concentrations of mercury exceeding 0 .5 or 1 .0 pg/g wet weight
- sufficient to prompt fish-consumption advisories - were reported in predatory fishes from
aquatic ecosystems lacking substantive, on-site anthropogenic or geologic sources of mercury
.
11-71,
Subsequent investigations have shown that in certain aquatic systems concentrations
of
methyl-
mercury in aquatic invertebrates, fish, and piscivorous wildlife are commonly elevated -a situation
frequently reported for bumic and low-alkalinity lakes (including low-pH lakes)?'-8" newly flooded
reservoirs," -"" and wetlands or wetland-influenced ecosystemsP? "9-9' Many such environments can
be characterized as lightly contaminated systems in which the amount of inorganic Hg(II) being
converted to methylmercury is sufficient to contaminate food webs supporting production
of
fish
and wildlife.J2-
'°°
Reliable records of temporal trends in mercury deposition can be obtained by analyses of dated
cores of depositional sediments from lakes or reservoirs, of peat from ombrotrophic bogs, and, in
some cases, of glacial ice . 21" 9 na -"* At a site in northwestern Spain about 600 km northwest of the
Almaden mines, substantive anthropogenic emissions of mercury to the atmosphere are reflected in
peat deposited more than 1000 years ago in a core from an ombrotrophic bog ." The oldest anthro-
pogenic mercury in this core was deposited about 2500 years ago, coinciding with the start
of
mining
at Almaden and accounting for about 10 to 15% of the total mercury deposited in peat at that time ."
In remote and semiremote areas of North America, Greenland, and Scotland that lack on-site sources
of anthropogenic mercury, the rate of mercury accumulation in many lacustrine sediments has
increased by a factor of 2 to 4 since the mid-1800s or early 1900s, based on analyses of sediment
and peat cores,'('
i.i°2.iw.107-' i°
Moreover, some cores from semiremote sites show evidence of recent
declines in atmospheric mercury deposition associated with decreasing regional emissions of anthro-
pogenic mercury into the environment . 102,103,106,"° Much
of
the mercury deposited onto terrestrial
catchments is stored in soils, and the sediments in lakes that receive substantial inputs of mercury
from their catchments may be slow to reflect declines in rates of atmospheric deposition of mercury . 10
Many remote and semiremote ecosystems are contaminated with anthropogenic mercury depos-
ited after long-range atmospheric transport from source areas
. 0,1W,iu,'a Qualitatively, it can be
reasonably inferred that a significant fraction of the methylmercury in the aquatic biota of remote
or semiremote regions, including marine systems, is derived from anthropogenic mercury entering
the aquatic ecosystem or its watershed in atmospheric deposition 2 1174.
' 0 '
,"' .113- '
1" In northern Wis-
consin, for example, the total annual atmospheric deposition of mercury to an intensively studied,
semiremote seepage lake with no surface inflow and very little groundwater inflow averaged about
0 .1 g/ha during 1988 to 1990, an input sufficient to account for the mass of mercury in water, fish,
and depositing sediment ."'
111,119
Concentrations of methyhnereury in aquatic biota at remote and semiremote sites have probably
increased globally during the past 150 years in response to anthropogenic releases of mercury into
the environment. Substantial increases in methylmercury contamination of marine food webs in
the North Atlantic Ocean, for example, were revealed by analyses of feathers from two fish-eating
LI546_frame_MASTER.Aouk Page 413 Monday, August 26, 2002 137 PM
ECOTOXICOLOGY OF MERCURY
413
0
Petrel
1885-1900
1950-1970
1900-1931
1992-1994
Years
Figure 16.1 Historical trends of increasing methylmercury concentrations (mean x
1
standard error, with sample
size denoted near the bottom of each bar) in feathers of two species of fish-eating seabirds obtained
from the North Atlantic Ocean during
1885
to 1994 .
16
Monteiro and Furness
18
determined organic
mercury in feathers from museum specimens of the birds to avoid potential errors associated with
postmortem contamination of the museum samples with inorganic mercury
.
seabirds sampled from 1885 through 1994 (Figure 16 .1) .
18
The long-term increase in concentration
of methylmercury averaged 1 .9% per year in Cory's shearwater (Calonectris
diomedea borealis)
and 4.8% per year in Bulwer's petrel
(Bulweria bulwerii)
.
1
B
Monteiro and Furness
1
"B
attributed
these increases to global trends in mercury contamination, rather than local or regional sources
.
Mercury concentrations have also increased during the past century in other species of seabirds ."'
Quantitatively assessing the relative contributions of anthropogenic and natural emissions to the
methylmercury burdens accumulated in biota at remote and semiremote sites is an enormous
scientific challenge, partly because of spatial variation in (1) the contribution of natural sources and
(2) the biogeochemical transformations and transport of mercury on the landscape
.d2
The drainage
basins onto which anthropogenic mercury is deposited can vary spatially in many respects . First,
there is variation in the natural geologic abundances of mercury in bedrock, soils, sediments, and
surface waters .'
20
-
122
Second, surface waters within a region can differ spatially and temporally in
the extent to which they receive total mercury and methylmercury exported from the drainage
basin .
2.93.Im3oz108,123-125
Third, the extent to which inorganic mercury present in aquatic ecosystems
is converted to methylmercury can vary considerably, even on spatial scales of a few kilometers to
tens of kilometers .
68.92.9z¢6
To overcome such complexities, new investigations involving the appli-
cation of stable isotopes of mercury
'27.118
are being employed to examine the biogeochemical cycling,
bioaccumulation, and food-web transfer of "old" vs . newly deposited mercury in ecosystems .
129
16.3 GLOBAL-SCALE ENVIRONMENTAL CYCLING AND FATE
Our understanding of the biogeochemical cycling of mercury (sources, pathways, and pools)
in the environment has increased markedly during the past 10 to 15 years, whether considered in
the context of mass balances
'41.130.111
concentrations in environmental media,
20
"
12
"
1 i 3
or important
J
L1346 fr m e MASTERb,ok Page 414 51o...
:, August 26,2002 107 PM
414
HANDBOOK OF ECOTOXICOLOGY
Figure 16.2 A simplified view of the biogeochemical cycling of mercury in an aquatic ecosystem, depicting
pathways and processes that influence exposure of biota to methylmercury in this illustration,
mercury enters the ecosystem largely as inorganic Hg(II) in atmospheric deposition. The mercury
cycle includes a complex set of biogeochemical processes, of which methylation is most important
from an ecotoxicological perspective. Methylmercur is readily bioaccumulaied and transferred in
food webs and can biomagnify to high concentrations in predatory fish and wildlife. Biotic exposure
to methylmercury in the ecosystem is strongly influenced by the net balance between processes
that yield methylmercury and make it available to aquatic biota vs . processes that degrade methyl-
mercury or decrease its bioavailability for uptake
.
chemical reactions and rates
.
177-1d0
The environmental mercury cycle (Figure 16 .2) has four strongly
interconnected compartments : atmospheric, terrestrial, aquatic, and
biotic. The atmospheric com-
partment is dominated by gaseous elemental mercury (Hg°), although Hg(II) dominates
the fluxes
to the aquatic and terrestrial compartments. The terrestrial compartment
is dominated by Hg(II)
sorbed to organic matter in soils . The aquatic compartment is dominated by Hg(II)-ligand pairs in
water and Hg(II) in sediments, and the biotic compartment is dominated by methylmercury
. Mercury
is quite reactive in the environment and cycles readily among compartments
.
At the global scale, atmospheric processes and pathways dominate the transport of mercury from
sources to receptors. The global mercury cycle can be envisioned as a two-way exchange process,
in which sources emit elemental mercury (Hg") in the gas phase and various species of Hg(II) to
LI
_fr me_MASTER.b,wk Page 415 Monday, August 26, 2(i12 137 PM
ECOTOXICOLOGY OF MERCURY
415
the atmosphere and the atmosphere loses mercury via oxidation of Hg° to Hg(II) and the rapid
removal of gaseous and particulate species of Hg(II) by wet and dry deposition
48.139-142
This simple
conceptual model reflects the following understanding of atmospheric pathways and processes : (1)
that many important sources affecting global mercury cycles (including oceans, fossil fuel combus-
tion, and municipal and medical waste incinerators) emit mostly gaseous Hg° and, to a lesser extent,
gaseous and particulate species of Hg(II) ;'0
• 1
4
A .
140 (2) that gaseous and particulate forms of emitted
Hg(II) are subjected to local and regional removal in dry and wet deposition '139-141,145 limiting their
long-range transport; (3) that divalent mercury can be readily reduced to Hg° by natural processes
in both terrestrial and aquatic ecosystems ;135,146
and (4) that Hg° can be oxidized in the atmosphere
to Hg(II), which is efficiently removed in wet and dry atmospheric deposition
.
139-142,145
Mercury deposited onto the land surface in atmospheric deposition is sequestered in terrestrial
soils, largely as species of Hg(II) sorbed to organic matter in the humus layer
.131,147,148 Globally,
the inventory of mercury in surface soils far exceeds that in the aquatic and atmospheric compart-
ments. The vast majority (947 Mmol) of the estimated total mass of mercury released into the
environment during the past century resides in surface soils, compared to 17 Mmol in the atmosphere
and 36 Mmol in the oceans .48 The residence times of mercury in the atmosphere and the oceans
are considerably shorter (a year to a few years) than the residence time of mercury in soils. Yet
soils should be considered a potential long-term source- as well as a sink - for mercury in the
environment, given that the Hg(II) in soils can be reduced and emitted to the atmosphere as Hg°
or slowly exported to aquatic systems located down gradient
.
110,147
Recent advances in our understanding of mercury in the environment have highlighted the
dominant influence of human activities - particularly since the industrial revolution- on the
redistribution of global mercury pools, the size of actively cycling pools, and the importance of
atmospheric pathways to a global pollution problem
0.48 1 W
Anthropogenic emissions have greatly
increased the mass of mercury now cycling at the earth's surface and in the atmosphere ,41,
M.
107,108
causing widespread contamination of terrestrial soils and aquatic sediments .48.102,133,L48,149 Mason
et al 4 8 estimate that two thirds of the mercury in modem global fluxes is from anthropogenic
sources, and the remaining one third is from natural emissions . Soil and sediment are considered
to be the dominant sinks for atmospherically derived mercury ; however, detailed studies have shown
that these enriched pools are susceptible to remobilization via volatilization, leaching, or ero-
sion .
.50.69,1°uu0,141
Investigators often find that the more closely they look, the more reactive the
existing mercury pools appear to be ; for example, St. Louis et al .150 found that soil-canopy-atmo-
sphere transfer rates were up to three times greater than prior estimates, Friedli et
al."' showed
that forest fires can release mercury from burned areas, and Lalonde et al
.152 showed that recently
deposited snow can rapidly lose mercury via reevasion to the atmosphere
.
The importance of apportioning between natural and anthropogenic mercury emissions is
recognized but very difficult to achieve
.20,48,131,141,153 Initially, the estimated ratio of natural to
anthropogenic emissions of mercury may have been underestimated .141 In Europe, for example,
estimated natural emissions of mercury during 1995 were in the range of 250 to 300 tons, only
slightly less than the estimate of 342 tons for anthropogenic emissions .'" In addition, emissions
of Hg° from areas that are geologically enriched with mercury or affected by mining activities can
be substantial
42.153 The estimation of natural emissions from diffuse sources is greatly complicated
by the fact that original sources - whether natural or anthropogenic - cannot presently be
distinguished after mercury has been released into the atmosphere and has entered the global
biogeochemical cycle . 21 "41
16.4 MERCURY SPECIATION AND ENVIRONMENTAL CONCENTRATIONS
Scientific understanding of mercury speciation in the environment, although far from complete,
has increased considerably because of steadily improving analytical and field methods during the
1 .
46
In
NIASTER.book Page 416 Monday.Angusl26,20n2 137 PM
416
HANDBOOK OF ECOTOXICOLOGY
past two decades. Mercury exists in the environment in three oxidation slates - Hg(0), Hg(I), and
Hg(ll)- and for each valence many chemical forms can occur in the solid, aqueous, and gaseous
phases. The environmental chemistry of mercury is very complex, and subtle changes in chemical,
physical, biological, and hydrologic conditions can cause substantial shifts in its physical form and
valence state over time scales ranging from hourly to seasonal
36 .11X .111
Here we briefly summarize
selective aspects of mercury speciation in the atmospheric, aquatic, and terrestrial environments,
focusing on aspects most pertinent to the ecotoxicology of mercury, such as the formation and
abundance of methylmercury
.
16.4.1
Atmosphere
In most locations, mercury in the atmosphere is mostly (> 95%) gaseous elemental Hg°, with the
remainder composed largely of particulate ionic Hg(Il), gaseous divalent mercury (commonly
termed "reactive gaseous mercury"), and, on occasion, trace amounts of methylmercury .
141 .145
Particulate and reactive gaseous mercury have relatively short travel distances (up to tens of
kilometers) and residence times in the atmosphere, whereas gaseous elemental mercury has global-
scale transport and an average atmospheric residence time of about I year's Recent analyses of air
in northern Europe showed that total gaseous mercury averaged 1 .98 ng/m
3
, whereas particulate
mercury and reactive gaseous mercury averaged 56 and 22 pg/m
3
, respectively .
154 . 151
Monovalent
mercury is stable only as the dimer (Hg 2
2
~), which rapidly disproportionates to Hg° and Hg
2+
and
is probably only detectable in atmospheric samples at extremely low levels .O' Over the open oceans
concentrations of gaseous elemental mercury increase from the southern hemisphere (-1 ng/m
3
at
60° south) to the northern hemisphere (-3 ng/m
3
at 60° north),
156.
w reflecting the stronger sources
of mercury in the northern hemisphere, which is more industrialized and heavily populated than
the southern hemisphere .
Reactive gaseous mercury is generally assumed to be HgCl 2 , although recent research has shown
the existence of Hg(N03 ) 2y11 20 in the gas phase."' After polar sunrise gaseous Hg° in the Arctic
anti Antarctic atmospheres is rapidly depleted via oxidation to reactive gaseous mercury, which
increases rapidly in abundance as Hg° is depleted ."'
140,159,160
During April and May 2000, reactive
gaseous mercury often comprised more than 60% of the total gaseous mercury measured in air
over Barrow, Alaska.
16
° Reactive gaseous mercury is rapidly removed front the atmosphere via both
wet and dry deposition
140,155,'U)
and is considered to be available for methylation once deposited
.
140
16.4.2 Aquatic Environments
The methylation of mercury and subsequent exposure of biota to methylmercury are greater in
aquatic environments than in terrestrial environments . Many recent investigations of mercury in
surface waters have determined methylmercury, gaseous elemental mercury (Hg°), and total mercury
(defined as the sum of all mercury species recovered from a strongly oxidized sample)
.
161
A fraction
termed "reactive mercury," which is generally equivalent to mercury reducible by stannous chloride,
has also been measured; however, such fractions are often poorly defined and difficult to relate to
other environmental factors or processes . The recent development of methods for separating col-
loidal and truly dissolved fractions of inorganic mercury and methylmercury should advance
understanding of aqueous-solid phase partitioning of mercury species and possibly bioavailable
fractions .'
62
Dimethylmcrcury has been observed in the marine environment, but only at extremely
small concentrations (averaging 0.016 ng/I, in the North Atlantic)
.
16
' Dimethylmcrcury has not
been confirmed in fresh waters, however, and its overall importance in the mercury cycle is
unknown. We limit this discussion to the three fractions - total mercury, Hg°, and methylmercury
- that are most commonly reported for water .
Except under rare geochemical conditions, or in the vicinity of strong geologic or anthropogenic
mercury sources, the concentrations of all forms of mercury in most natural waters are very low
O
bi
':
l
~ LI546
I, a
MASTER.buok
Pa,
417 Monday,August26,2002 137 PM
ECOTOXICOLOGY OF MERCURY
417
(picograms to nanograms per liter). Most naturally occurring mercury compounds have very low
solubility, although mercury complexes with dissolved organic matter are much more soluble .'M
Among surface waters or within a given lake or stream, the abundances of methylmercury and total
mercury can vary widely, and the accurate quantification of their aqueous concentrations requires
the steadfast application of trace-metal clean techniques to minimize sample contamination during
collection, handling, and analysis, coupled with the application of highly sensitive analytical
methods . 1
i
2.165
When proper sample collection and preservation protocols are followed, inter-
comparisons among laboratories that use accepted analytical methods for total mercury and meth-
ylmercury yield similar results .'66
The speciation of mercury in water is most strongly influenced by the aqueous chemical
conditions- most notably redox, pH, organic ligands, and inorganic ligands
. 165 Inorganic divalent
mercury, Hg(II), and methylmercury are strongly influenced by the chemical makeup of the host
water and almost entirely form ion pairs with ligands in the aquatic environment
.
67 In most oxic,
circumneutral surface waters, ion-pair formation for Hg(II) and methylmercury is dominated by
dissolved organic matter and chloride .'68,169
Under anoxic conditions, which can occur in sediment
porewaters and in the hypoliminia of certain lakes, or anywhere reduced sulfur species are appre-
ciable, inorganic Hg(II) and methylmercury will dominantly be present as sulfide or sulfhydryl
complex ion pairs . 5°" 6 e,°° The complexation of Hg(II) with sulfide can substantially affect the
availability of mercury for methylation by microbes . 171
Concentrations of total mercury in unfiltered water samples from lakes and streams lacking
substantive, on-site anthropogenic or geologic sources are usually in the range of 0.3 to
8 ng/L 133,172,173 In waters influenced by mercury mining or industrial pollution, concentrations of
total mercury are greater, often in the range of 10 to 40 ng/L.33,133,173_175 Surface waters with high
concentrations of humic substances can also have high concentrations of total mercury, demon-
strating the importance of natural organic material on solubility and aqueous transport of the
metal .' 15.123.127,176,177 Surface waters draining areas with high geologic abundances of mercury or
with contaminated tailings from mercury or gold mining can exceed 100 or even 1000 ng/L in total
mercury. 3,26-28,33,38,41.165.178
In oxic waters, concentrations of methylmercury are typically within the range of 0 .04 to 0.8 ng
Hg/L.33,41,6N.93.97.123.124,133,173,179
.IN However, concentrations of I to 2 ng Hg/L can occur in surface
waters affected by either industrial pollution (e .g., chlor-alkali plants)174,111 or mercury mine drain-
age 28,111 The fraction of total mercury present as methylmercury is generally higher in fresh waters
than in estuarine or marine systems, 182 which may result from inhibition of methylation by the
abundant sulfide in pore waters of brackish water systems 171 or from the generally low level of
dissolved organic matter in marine settings .127 Within a given drainage basin or geographic area
the concentrations and yields of methylmercury, as well as the fraction of total mercury present as
methylmercury, are typically highest in surface waters that drain wetlands
.68,93,12"25,133.18.1 The
biogeochemical processes contributing to the methylmercury-wetland association are under inves-
tigation; however, it is evident that biogeochemical conditions in wetlands are favorable for meth-
ylation and that complexation of methylmercury with the abundant natural organic matter in
wetlands can facilitate its export to waters downstream. Methylmercury generally accounts for
about 0.1 to 5% and seldom exceeds 10% of the total mercury present in oxic surface water. 113,131,119
Under anoxic conditions, however, methylmercury can be one of the dominant species of mercury
present, and concentrations can exceed 5 ng Hg/L .96,1°ar 9"
Early measurements of Hg° in fresh waters showed concentrations ranging from about 0 .01 to
0.10 ng/L, which led to a conclusion of pronounced super saturation of Hg° in the water column,
usually by a factor of 100 to 500, relative to the overlying air, 185 yielding high estimated rates of
Hg° volatilization to the atmosphere. More recent investigations involving diel measurements have
generally shown strong correlations between, on the one hand, instantaneous Hg° in the water
column and solar intensity and, on the other, a reequilibration with the atmosphere after sundown,
with much lower concentrations of Hg° in water at night (about 0.005 ng/L)
. 138.186 Moreover, the
-
0-
-
154M1 frameMAS II:A hook Page 419 Monday, August 26, 2002 137 PM
418
HANDBOOK OF ECOTOXICOLOGY
rapid reoxidation of Hg° in surface water has also been demonstrated
1%' and, when taken into
account, greatly decreases estimated volatilization rates of Hg° from surface waters ."' In marine
ecosystems, the evasion of Hg° appears to be a geochemically significant efflux of mercury
.4n,189
16.4.3 Terrestrial Environments
Comparatively few data are available on the abundances of total mercury and methylmercury
in soils and groundwater in upland settings relative to the substantive information available for
surface water, sediment, and peat in aquatic environments, Yet recent estimates indicate that
terrestrial soils contain the largest inventories of mercury from natural and anthropogenic emis-
sions 4""'
In addition, the toxicity, solubility, and volatility of mercury depend highly on its
speciation, and such information for soils is scant . Various reductive processes can yield appreciable
emissions of Hg° from contaminated soils, and the mercury in soils may be cycling more actively
than previously thought
.
147,153,190,191
The speciation of mercury in most upland soils is probably dominated by divalent mercury
species that are sorbed primarily to organic matter in the humus layer and secondarily to mineral
constituents in
Soil. "',177
Nater and Grigal,'
48
who studied forest soils across the upper Midwest of
the United States, found that concentrations of total mercury in humus ranged from about 100 to
250 ng/g dry weight, whereas the mineral horizon justt below the humus layer contained about 15
to 30 ng/g. In locations near point sources, especially cinnabar (HgS,) deposits or abandoned placer
mines, mercury concentrations can be considerably higher - generally in the µg/g range
.26-153,192,193
The speciation .of mercury in such highly contaminated soils depends on the origin of the mercury
itself (most likely Hg° used for placer mining and chlor-alkali plants, or HgS,) as well as the
chemistry and texture of the soil. Barnett et al
94
.
for example, observed that liquid Hg0 released
to anaerobic, hydric soils resulted in the formation and long-term stabilization of mercuric sulfide
.
Cinnabar, on the other hand, seems to be more stable when exposed to the surface as mine tailings
or transported down gradient from mining operations, generally maintaining its HgS, stoichiometry,
although surface coatings of secondary mercury compounds have also been observed on weathered
cinnabar."" Little is known about the relative stability and reactivity of mercury amalgam; however,
it probably behaves similarly to elemental mercury in the environment
.
Published information on concentrations and speciation of mercury in upland soils is sparse,
especially for methylmercury. Forest soils have been rarely analyzed for methylmercury, and
reported concentrations are generally low- about 0.2 to 0.5 ng/g in the humus layer and < 0.05 ng/g
in the mineral-trophic layer
.110,116,197 Although data are few, the very low concentrations of methyl-
mercury in soils, mnoff, and groundwater in upland environments suggest that little methylmercury
is produced in upland landscapes,
125,13'.198
16.5 MERCURY METHYLATION IN THE ENVIRONMENT
The methylation of inorganic Hg(II) is the most toxicologically significant transformation in
the environmental mercury cycle because it greatly increases the bioavailability and toxicity of
mercury and increases the exposure of wildlife and humans to methylmercury. It is not surprising
that variation in mercury concentrations in fish of a given size (or age) and trophic level among
surface waters lacking direct, on-site sources of mercury can be attributed largely to processes and
factors that affect the net production and abundance of methylmercury
.92
'Y6,
'
7 126
Mercury methylation
is the conversion of inorganic Hg(II) to methylmercury by a methyl-group donor, The conversion
of methylmercury to inorganic mercury, regardless of the mechanism, is termed
demethylation . In
general, both of these processes (methylation and demethylation) operate simultaneously in aquatic
systems. The detection of methylmercury in sediment samples generally indicates a positive net
rate of methylation,
i .e ., the rate of methylation exceeds that of demethylation ; however, the
-Go
1546 frame MASTER Ixx,k Page 419 Monday, August 26, 2(512 1 :37 PM
ECOTOXICOLOGY OF MERCURY
419
abundance of methylmercury is not necessarily a good predictor of in situ methylation rate, given
that influxes of methylmercury from external sources can be significant in some settings . In this
section, we review the current understanding of methylating and demethylating agents as well as
the locations where these processes operate in the environment
.
Mercury can be methylated through biotic and abiotic pathways, although microbial methylation
is generally regarded as the dominant pathway in the environment, 134,199,2W More specifically,
sulfate-reducing bacteria are considered to be the most important methylating agents in aquatic
environments ,97"
"99-202 and the most important sites of methylation by sulfate-reducing bacteria
are thought to be oxic-anoxic interfaces in sediments20
J
,204 and wetlands9397.121,"1.20 Methylation
also occurs in aerobic marine and freshwaters, 206'207 floating periphyton mats and the roots of some
floating aquatic plants, 208,2
°
9 the intestines of fish ,210 and the mucosal slime layer of fish
; 2" however,
these sites are considered to be much less important quatititatively than are anaerobic sediments
and wetlands 3 12 In sediments, the microbial methylation of mercury is most rapid in the uppermost
5 cm of the sediment profile, where the rate of sulfate reduction is typically greatest ; comparatively
little methylmercury is produced in deeper sediments
27.65.97,202.2'3,214
To be methylated by sulfate-reducing bacteria Hg(II) must first cross the cell membrane of a
methylating bacterium, presumably as a neutral dissolved species . 170,171 Thus, the speciation of
inorganic mercury in aqueous and solid phases controls the fraction of the total mercury pool that
is available for microbial methylation
. 170 .191 At certain concentrations, for example, chloride and
sulfide seem to increase bioavailability because they bind Hg2* as the neutrally charged species
HgCI 2 or HgS
;170
•2
15 however, at higher ligand concentrations these ion pairs become charged (e.g .,
HgCl 3), and availability for methylation is decreased. Likewise, when Hg2
*
is bound to large
molecules of dissolved organic matter or to particulates (either organic matter or clay), it is
considered unavailable for biotic methylation
.65 Within microbial cells methylation can be facilitated
through enzymatic and nonenzymatic pathways, which are distinguished by the presence or absence
of active microbial metabolism, although both pathways call upon methylcobalamine as the active
methyl donor to the Hg 2
s
ion
.
31
6
,
217
Methylcobalamine is produced by many microbes in the
environment and reacts with Hg(H) to form methylmercury outside of cells in anaerobic or aerobic
conditions ,218 although Choi et al 219 found that the process is catalyzed enzymatically and that
production rates are much higher within cells
.
Comparatively little is known about abiotic methylation, which in simple chemical terms implies
the existence in the environment of a methyl donor. Several methyl-donating compounds that are
attributed largely to industrial sources can methylate mercury abiotically, 22o,22 ' but anthropogenic
methyl donors have been documented for few environmental settings . At high concentrations
methylated tin and lead compounds can transfer a methyl group to Hg(II) to produce methylmer-
cury,222 but these situations
are very
limited in extent. Most of the literature on abiotic methylation
consequently suggests that the most important methyl donors in the environment are humic
acids,223.224 although this topic has been studied little. In most cases, abiotic formation of methyl-
mercury has been strongly linked to temperature, and at ambient conditions the methylation rates
reported for most abiotic pathways are small. Falter and Wilken225 have shown that small amounts
of methylmercury can be formed abiotically in sediments at ambient temperatures . Their results
have had implications for the analytical procedures being used in many laboratories to determine
methylmercury because methylmercury can be formed as an artifact while processing samples with
high concentrations (generally in the .tg/g range) of inorganic Hg(II)2 2a227
Although two processes- methylation and demethylation - ultimately control the abundance
of methylmercury, the process of demethylation has received comparatively little study
.228 Deme-
thylation, or methylmercury degradation, can occur via a number of abiotic and biotic pathways
in the environment. Like methylation, demethylation can occur in near-surface sediments via
microbial pathways229 and in the water column via microbial and abiotic pathways
.
137,199
Much of the early literature suggested that the microbial degradation of methylmercury involved
a two-step, enzyme-catalyzed process by microbes encoded with the mer-operon gene sequence,
i
LI54fiframe MASTCRhunk P., 420 Mnuduy,August26,2032 1 :37 PM
420
HANDBOOK OF ECOTOXICOLOGY
also referred to as the mer detoxification pathway. The mer-operon is widespread in nature and has
been found for both Gram-negative and Gram-positive bacteria and under both aerobic and anaer-
obic conditions, 2
J
0 although most investigators have found that this process operates in aerobic
condition S.121 The first step of the mer pathway involves cleavage of the carbon-mercury bond by
the organomercurial lyase enzyme (encoded by the mer B gene) to yield methane and Hg 2'. A
second step involving the mercury-reductase enzyme (mer B encoded) reduces Hg 2
t
to Hg°, yielding
a mercury species that can evade from the system
228,23'
More recently, an oxidative demethylation pathway has been proposed and confirmed by the
presence of CO2 as the end product of the methyl-group breakdown and does not appear to involve
the secondary mercury-reductive step .22a232 These authors229.232 have proposed that this pathway is
similar to the degradation of methanol or monomethylamine by methanogens . The oxidative
pathway has been demonstrated in a wide range of environments including freshwater, estuarine,
and alkaline-hypersaline sediments and in both aerobic and anaerobic conditions
.233 In anaerobic
sediments of the Everglades, methanogens and sulfate reducers have been identified as the principal
anaerobes in the oxidative-demethylation process, and maximal rates are observed in near-surficial
sediments, where maximal methylation rates are colocated233 The precise mechanisms and triggers
that induce the oxidative-demethylation pathway remain unclear because demonstration of the
process in pure culture remains elusive. However, examination of both the mer-detoxification and
the oxidative demethylation pathways across a wide range of mercury-contamination gradients
suggest that the mer-detoxification pathway predominates in severely contaminated systems,
whereas the oxidative pathway is more important in lightly contaminated environments
.
The abiotic process of photodegradation of methylmercury in surface waters has been recently
examined at a few sites
.125.137,234 It has long been known that methylmercury ion pairs are capable of
adsorbing light at appreciable levels and are subject to photolytic breakdown
23s however, the signif-
icance of the photodemethylation process was not recognized until photodemethylation was shown
to be quantitatively important in the methylmercury budgets of lakes
. 125,23a23s The specific mechanisms
causing the degradation of methylmercury in surface waters as well as the factors limiting this process,
are unknown, but experimental work suggests that singlet oxygen and peroxide radicals are respon-
sible for the reaction 3 37 The mercury end products of photodemethylation have not been determined,
and theoretical considerations indicate that any of the three oxidation states are possible
.135,111 Iden-
tification of mercury end products is needed to assess the overall effect of photodegradation, given
that Hg(H) could be methylated again, whereas Hg° could evade from the lake to the atmosphere
.
16.6 MERCURY-SENSITIVE ECOSYSTEMS
Some aquatic ecosystems can be classified as mercury-sensitive because seemingly small inputs
or inventories of total mercury (e.g ., in the range of < I to 10 g Hg/ha) can cause significant
contamination of fish and wildlife in upper trophic levels with methylmercury . Known mercury-sen-
sitive ecosystems include most wetlands? 3,97 .124 low-alkalinity or low-pH lakes ;9,92,94,238 surface
waters with upstream or adjoining wetlands, 3.124,239 waters with adjoining or upstream terrestrial
areas subjected to flooding 8&859.240 and dark-water lakes and streams Y243 One common attribute
of mercury-sensitive systems is the efficient conversion of inorganic Hg(II) to methylmer-
cury .85
4
296.97.133 .241 In some cases, concentrations of mercury in game fish inhabiting such ecosystems
can equal or exceed concentrations observed in fish from waters heavily contaminated by wastes
from industrial point sources such as chlor-alkali plants (Table 16 .1) .
A recent, but growing, body of evidence indicates that wetlands are mercury-sensitive ecosys-
tems. Wetlands can be important sources of methylmercury on the landscape, given that production
and yields of methylmercury in wetland areas can greatly exceed that in other aquatic and terrestrial
habitats
.111.114 The production of methylmercury in wetlands can increase greatly during flooding '
96
a periodic event in many wetland systems . A number of ecosystem characteristics probably enhance
4
*-L
6_frame_MASTER book Page 421 Monday, August 26, 2002 107 I'M
ECOTOXICOLOGY OF MERCURY
421
Table
16.1
Elevated Mercury Concentrations in Axial Muscle Tissue of
Selected Freshwater Game Fishes In North American Waters
Note :
Values shown are based on data reported for northern pike
(Esox lucius),
walleye (Stizostedion vitreum), largemouth bass (Micropterus salmoides),
and smallmouth bass (Micropterus dolomieu) .
a
From values summarized by Wiener and Spry 173
b
Data for largemouth bass from
T.
R. Lange (Florida Fish and Wildlife Conserva-
tion Commission, Eustis, Florida, USA, personal communication)
.
the microbial methylation of inorganic Hg(II) in wetlands, including an abundance of labile carbon
substrates and dissolved organic matter, anaerobic sediments, high microbial activity, and seasonal
water-level fluctuations that can cause oscillating redox cycles
85.92.96.123 .126 .133.179.242.24 3 Yet the quan-
titative effect of methylmercury production and export from wetland areas on contamination of
aquatic food webs in downstream waters supporting fish production, piscivorous wildlife, and
recreational fisheries has received little study . Wetlands may differ considerably in their methyl-
mercury-producing potential, and the influence of wetland type on methylmercury yield and the
identification of associated controlling mechanisms are areas of needed investigation
.
Variation in ecosystem sensitivity to mercury inputs is exemplified in Figure 16 .3 which depicts
tenfold variation in the mercury content of whole yellow perch (Perca flavescens) sampled in 1989
from three nearby lakes in northcentral Wisconsin . The three lakes differed chemically, spanning a
spatial gradient in mean pH from about 5 to 7, reflecting the variation in the chemistry of lakes in
northcentral Wisconsin, an area with hundreds of lakes with low acid-neutralizing capacity
.2" The
three lakes were small seepage basins (no surface inlets or outlets) in rural, mostly forest-covered
watersheds having no identifiable on-site anthropogenic or enriched geologic sources of mercury
.
The low-pH seepage lakes in this area receive very little groundwater inflow ; rather, nearly all (>
95%) of their hydrologic inflow is from precipitation falling directly onto the lake surface 2 49 Surficial
sediments in lakes of the area are enriched with mercury, relative to deeper preindustrial sediments,246
and the mercury-accumulation rate in sediments deposited about 1990 was three to four times that
in the mid-1800s . 107 The three lakes can be regarded as lightly contaminated, with inventories of
total mercury in surficial sediments (uppermost 5 cm) ranging from 1 .6 to 5.8 g/ha247 and annual
atmospheric inputs of mercury (wet plus dry deposition) averaging about 0.1 g/ha from 1988 to
1990.114 The yellow perch is one of the more widespread and abundant fishes in area lakes and is
an important link in the trophic transfer of mercury in lakes of the region
.248.249 Mercury concen-
trations in walleyes (a regionally important gamefish) and chicks of common loons
(Gavia immer,
a fish-eating bird) are elevated in area lakes with low pH or low acid-neutralizing capacity,
78.23
u
.25
°
reflecting variation among lakes in contamination of yellow perch, their preferred prey .
251.252
16.7 BIOACCUMULATION, BIOMAGNIFICATION, AND BIOLOGICAL EFFECTS
16.7.1
Blomagnlfication In Food Webs
Aquatic organisms can obtain methylmercury from food, water, and sediment, and they bioac-
cumulate methylmercury with continued exposure because elimination is very slow relative to the
rate of uptake .253 Methylmercury readily crosses biological membranes and can biomagnify to high
Mercury Concentration
().I.g/g wet weight)
Aquatic Environment
Range In Means
Range In Maxima
Waters polluted by chlor-alkali plants'
1-5
2-15
Newly flooded reservoirs-
0.7-3
2-6
South Florida wetlands°
0.4-1 .4
2-4
Low-alkalinity lakes'
0.5-0.9
1-3
C
{
LI54fi frame_MASTGR hook Page 422 Monday . August 26, 2002 1:37 PM
422
HANDBOOK OF ECOTOXICOLOGY
_
70D
d
600
a
500
$
400
C
4
300
200
c
100
0
0
M
50
100
150
200
250
300
Max Lake (pH 5 .2)
•
PalletleLake(PH72)
•
VenderwokL.(pH6 .1)
Total Length (mm)
Figure
16.3
Variation in ecosystem sensitivity to mercury inputs, illustrated by differing concentrations (upper
panel) and burdens (lower panel, in logarithmic scale) of mercury in whole yellow perch from three
nearby seepage lakes in forest-covered -watersheds in Vilas County, Wisconsin. Fish in low-pH
lakes in this and many other geographic areas have much higher concentrations of mercury than
fish in nearby circumneutral-pH lakes that receive similar inputs of mercury in atmospheric depo-
sition. (From: unpublished data for fish sampled in May 1989 by J . G. Wiener, R. G. Bade, and D .
E. Powell, University of Wisconsin-La Crosse, River Studies Center,
La
Crosse, Wisconsin .)
concentrations in aquatic food webs, despite its seemingly low concentrations (< 1 ng Hg/L) in
most surface waters .57.173.254-266 Concentrations of methylmercury in fish, for example, commonly
exceed those in ambient surface water by a factor of 106 to
107 .94.254,256,257
Most of the mercury in surface waters and sediments is typically inorganic Hg(II), yet the
mercury accumulated in fish and higher trophic levels of aquatic food webs is almost entirely
methylmercury
.2-4.268-26u Some species of fish-eating seabirds and aquatic mammals exhibit highly
variable amounts of inorganic mercury in their internal organs, particularly the liver and kid-
neys .
58.260-263
The presence of inorganic mercury in piscivorous birds and mammals is generally
attributed to the ability of these species to convert methylmercury to the less toxic inorganic mercury
via demethylation
.260
.263 The presence of inorganic mercury in internal organs and tissues does not
indicate dietary uptake or bioaccumulation of inorganic mercury by these organisms
.
Biomagnification,
defined as the increasing concentration of a contaminant with increasing
trophic level in a food web, has been widely documented for methylmercury in aquatic ecosys-
tems57,257.264 Patterns of methylmercury biomagnification in aquatic food webs are similar, even
among aquatic systems that differ in ecosystem type, mercury source, and pollution intensity . This
is illustrated in Table 16.2, which summarizes information from three geographically distant,
markedly different aquatic environments: one a coastal marine embayment in Western Australia
that was contaminated with mercury from a point source, the second a small seepage lake in northern
Wisconsin that received mercury almost entirely via atmospheric deposition, and the third a tropical
lake in a remote area of New Guinea . Two patterns characteristic of mercury concentrations in food
350
Table 16
.2 Blomagnificatlon of Methylmercury (MeHg) in Food Webs
in Three Substantially Different Aquatic Environments
:
Princess Royal Harbor, a marine embayment on the south coast of Western
Australia that was contaminated with
mercury from a super-phosphate plant over a 30-year pefod
;"
.'
Little Rock Lake, a small, temperate seepage
lake (no inflowing or outflowing streams) in northern Wisconsin
(USA) that received mercury largely from
atmospheric deposition directly onto the lake surface
;" and
Lake Murray, a tropical lake in the remote Western
Province of Papau New Guinea'
Based on data from Francesconi and Lenanton
."
•
Data for the planktonic food web in the untreated
reference basin
.R" The McHg value for piscivorous
fish was the estimated
concentration in a hypothetical 5-year-old walleye feeding on
yellow perch (the prey fish), based on a regression for nearby lakesP
6
•
Data for the planktonic food web, from Bowles et al
.~
rL
Food-Web
Component
Australian Marine Embayment
•
Wisconsin Seepage Lakeb
Tropical Lake-
MeHg
(nglg wet wt)
Total Hg present
as MeHg (%)
MeHg
(ng/g wet wt)
Total Hg present
as MeHg (%)
MeHg
Total Hg present
(ng/g wet wt)
as MeHg (%)
Piscivorous fish
2300
>95
650
>95
392
87
Prey fish
450
93
100
>90
26
55
Invertebrates
150
45
20
29
-
-
Algae
7
10
4
13
<0
.3
<1
Water
nd
nd
0
.00005
5
0
.000067
5
4
P
L
1546_frume_MAS'I
LRbwk Page
424
Mnnduy. Augusi
26,
2002
137
PM
424
HANDBOOK OF ECOTOXICOLOGY
webs are evident in Table 16 .2. First, the concentration of methybnercur increases up the food
web from water and lower trophic levels to fish. Second, the fraction of mercury present as
methylmercury increases with increasing trophic level
.
In aquatic invertebrates, methylmercury is much more readily assimilated and bioaccumulated
than is inorganic mercury
.2M15u69 In aquatic organisms in trophic levels below fish, the fraction of
total mercury present as methylmercury can vary considerably- 67,87 .264.270,271 In 15 northern Wisconsin
lakes, for example, percent methylmercury ranged from 9 to 82% in aquatic insects and from 46
to 97% in five taxa of crustacean zooplankton .'M Mean percent methylmercury varied seasonally
in net plankton from 12 lakes in northeastern Minnesota (U.S .), increasing from 20% in spring to
52% in autumn272 Percent methylmercury in benthic aquatic insects in two hydroelectric reservoirs
in northern Quebec, classified by diet, ranged from 20-25% in detritivores, 30-40% in grazers,
60-85% in grazers-predators, and 95% in predatory dragonflies? 70
The greatest increase in methylmercury concentration in pelagic food webs, relative to concen-
trations in water, occurs in the phytoplankton or seston (small living plankton and nonliving
particulate matter)2402572M,273
Bioaccumulation factors for methylmercury between seston and
water, for example, ranged from 10 49 to 10S 6 in tropical Lake Murray, New Guinea,257 and from
104-" to 1062 in 15 northern Wisconsin lakes264 Bioaccumulation factors for methylmercury between
herbivorous zooplankton and seston are much smaller, averaging 2.5 (1000) in 12 northern Wisconsin
lakes266 and about 9 (10095 ) in natural lakes and the La Grande 2 reservoir in northern Quebec2 40
Bioaccumulation factors between concentrations of mercury (largely methylmercury) between
piscivorous fish and their prey are also small relative to the orders-of-magnitude increases in
methylmercury concentration between seston and water . Ratios of mercury concentrations in pis-
civorous fish (axial muscle) to those in coexisting prey (whole fish) are typically less than 10, with
-
values ranging from -4 to 9 in freshwater lakes250,274
276 Bioac~cu ula b
m
h
n factors for mercury
reported for seabirds (from analysis of contour feathers) and their prey (from analysis of regurgitated
food) are considerably greater, ranging from 125 to 225 and averaging more than 150 in six species
of seabirds from the Azores archipelago
.277
The entry of methylmercury into the base of the food web and its subsequent trophic transfer
in the lowest levels are poorly understood . The uptake of inorganic mercury by sulfate-reducing
bacteria in the ecosystem is an essential step in the methylation of mercury and a prerequisite to
the bioaccumulation and trophic transfer of methylmercury
.255,27 "The abundance of methylmercury
in the lower trophic levels appears to be strongly linked to the net production or supply of
methylmercury
(i.e ., methylation minus demethylation), with the production of methylmercury
being tightly coupled to the rate of sulfate reduction by sulfate-reducing bacteria? 7,202.279
The dominating influence of methylmercury supply on the contamination of an aquatic food
web was illustrated by a flooding experiment in the Experimental Lakes Area of Ontario,
Can-
ada
.*","' Experimental flooding of the wetland surrounding Lake 979 was followed by decom-
position of inundated vegetation,"' which rapidly depleted dissolved oxygen and imposed anoxic
conditions over the inundated wetland surface, stimulating microbial sulfate reduction and mercury
methylation .96,1°° The abundance of methylmercury in surface water, seston, and zooplankton in
the lake increased rapidly and markedly (tenfold or greater) in response to increased methylmercury
production "69" Concentrations of methylmercury in seston and zooplankton were strongly corre-
lated with those in water, and concentrations in zooplankton were strongly correlated with those
in seston as well (all r 2
2 0.85)9"
Bioaccumulation factors for methylmercury in zooplankton (ratio
to concentrations in wafer) were similar before and after flooding, despite the large changes that
occurred in waterchemistry, waterborne methylmercury concentration, and zooplankton community
structure, 9
N
indicating that the increased contamination of the planktonic food web resulted directly
from the increased supply of inethylmercury . This conclusion is further supported by a comparison
of the biomagnification of methylmercury in planktonic food webs in the La Grande 2 reservoir
to that in natural lakes in northern Quebec
.24° In Lake 979, concentrations of methylmercury also
increased after flooding in henthic insects, caged fish (finescale dace,
Pharinus neogaeus,
which
S
6_f m_MASTFR.b,wk Page
425
Monday, August
26, 2(X)2 1 :37
PM
ECOTOXICOLOGY OF MERCURY
425
fed primarily on benthic invertebrates), and nestling tree swallows (Tachycineta bicolor, which fed
primarily on emergent dipterans)
.87 .99.281
Within a given fish population or community, variation in trophic position accounts for much
of the variation in methylmercury concentration, both within and among species257.282.283 In species
with omnivorous feeding habits, such as adult lake trout (Salvelinus namaycush), trophic position
can vary substantially- even within a single life stage .284 Thus, concentrations of methylmercury
in adult lake trout are strongly correlated with the trophic position in the pelagic food web
.282,283
Moreover, concentrations of methylmercury in organisms at the top of aquatic food webs increase
concomitantly with increasing length (number of trophic levels) of the food chain below.
Unlike methylmercury, inorganic mercury is not readily transferred through successive trophic
levels and does not biomagnify in aquatic or terrestrial food webs
. 254.w ,2ss,285 Consequently, reliance
on data from total-mercury determinations for trophic levels below fish (including water, seston,
plants, and invertebrates) can produce misleading assessments of food-web contamination and erro-
neous estimates of potential methylmercury transfer to fish and higher trophic levels 57,265,286
16.7.2 Fish
The bioaccumulation of mercury has been more intensively studied in fish than in other aquatic
organisms, probably because fish are the primary source of methylmercury in the human diet.6"12
Nearly all of the mercury in fish muscle and in whole fish is methylmercury
. 2 .3.57.n
.287 There is very
little inorganic mercury in either freshwater or marine fish
2 .3.57,77,287 even in aquatic ecosystems
with high concentrations of dissolved inorganic mercury
.288 Fish assimilate inorganic mercury much
less efficiently than methylmercury from both food and water, and if absorbed, inorganic mercury
is eliminated much more rapidly than is methylmercury
.253 289-294
Dietary uptake probably accounts for more than 90% of the total uptake of methylmercury in
wild fishes295298
and fish probably assimilate from 65 to 80% or more of the methylmercury present
in the food they eat
.291,294 .296
In the laboratory, fish can accumulate high concentrations of meth-
ylmercury directly across the gills when exposed to abnormally high concentrations of waterborne
methylmercury.292,299,30
Many of the published laboratory studies on bioaccumulation have exposed
test fish to methylmercury concentrations that greatly exceed concentrations of methylmercury in
surface waters .",171
The mode of uptake (food vs. water) in bioaccumulation experiments, however,
seems to have little influence on the distribution of methylmercury among most internal organs
and tissues, except that concentrations in the gills are much higher after waterborne (than dietary)
exposure and concentrations in the intestines are higher after dietary exposure
. 253.3ua302
After crossing the fish gut, methylmercury binds to red blood cells and is transported via the
circulatory system, to all organs and tissues, readily crossing internal membranes 3Y4
•3
00,301,303 There
is a dynamic internal redistribution of assimilated methylmercury among the tissues and organs of
fish exposed to methylmercury in both laboratory and field studies . The masses in the blood, spleen,
kidney, liver, and brain decline after exposure to either waterborne or dietary methylmercury ceases,
and much of the methylmercury in the body eventually relocates to skeletal muscle, where it
accumulates bound to sulthydryl groups in protein .29o.3m-303 Wiener and Spry 173 hypothesized that
storage of methylmercury in skeletal muscle serves as a protective mechanism in fishes, given that
sequestration in muscle reduces the exposure of the central nervous system to methylmercury .
Within a given fish population, concentrations of methylmercury in muscle tissue or whole fish
typically increase with increasing age or body size, a pattern that has been observed repeatedly in
surveys of mercury in fishes .173.253 The increasing concentration with size or age results from the
very slow rate of elimination of methylmercury by fish relative to its rapid rate of uptake 253.293 In
a critical analysis of experimental data on methylmercury elimination by fish, Trudel and
Rasmussen293
showed (I) that short-term experiments (< 90 days) substantially overestimate elim-
ination rate, (2) that elimination rate is negatively correlated with body size (r = -0.65), (3) that
4
p
L1546_ru _MASILRb.wkPagc426Mond ;y.August26.20021 :37I'M
426
HANDBOOK OF ECOTOXICOLOGY
elimination rate is positively correlated with water temperature (r = 0.77) in long-term (> 90 days)
experiments, with a Q 10 of 1 .9, and (4) that the concentration or burden of methylmercury in the
fish does not influence the rate of elimination .
The bioaccumulation of methylmercury in fish is influenced by an array of biotic, ecological,
and environmental variables. Much of the modem spatial variation in fish mercury levels (within a
given trophic level) is attributed to differences among lakes and their watersheds in biogeochemical
processes and transformations that control the abundance of methylmercury . The production of
methylmercury via the microbial methylation of inorganic Hg(lI) in the environment is a key process
affecting mercury concentrations in
fish.16s2.97.126,242 It follows logically that factors and processes
affecting the microbial production of methylmercury on the landscape will also influence the
methylmercury content of fish residing in the ecosystem. Some of the variation in mercury concen-
trations in fish among northwestern Ontario lakes, for example, is caused by the effect of temperature,
or lake size, on the microbial net production of methylmercury in the epilimnia .'26 Mean concen-
trations in axial muscle of walleye and northern pike (Esox
lucius)
ranged from about 0.7 to 1 .1
p.g Hg/g wet weight in small (89-706 ha) lakes but were less than 0 .4 Rg/g in nearby lakes that
were larger (2219-34,690 ha) and colder
. 126 Specific rates of mercury methylation in the lakes were
positively correlated with water temperature, whereas specific rates of methylmercury demethylation
(microbial destruction of methylmercury) were negatively correlated with temperature
. 04
The dietary uptake of methylmercury in fish is influenced by their size, diet, and trophic posi-
tion .
4,281,'03307 In piscivorous species, such as the walleye and lake trout, the methylmercury content
of the diet and associated rate of mercury accumulation can increase with age, accelerating abruptly
when the fish become large enough to switch from a diet of invertebrates to prey fish ."' 30 fi In adult
fish, females often contain higher mercury concentrations than males because they must consume
more food than males to support the energy requirements of egg production
01
309
.
The increased
feeding rates in females cause greater dietary uptake of mcthylmercury, and only a small fraction of
the accumulated methylmercury is transferred to the egg mass and eliminated during spawning
.212a10311
The relative contamination of aquatic food webs with methylmercury can be assessed with
information on mercury concentrations in fish of a given species and age,' 7,80,81,312-314 particularly
if the trophic position of the fish analyzed varies little among the water bodies studied . Within a
number of geographic areas of North America, mean concentrations of mercury in same-age yellow
perch, for example, vary several fold among midcontinental lakes (and presumably receiving similar
rates of mercury deposition). Moreover, mean concentrations of mercury in yellow perch are
inversely correlated with lake pH and related chemical variables 77.81,313.315 Similarly, estimated
mercury concentrations in 3-year-old largemouth bass
(Micropterus salmoides)
from 53 Florida
lakes varied from 0.04 to 1 .53 µg/g wet weight and were correlated with lake pH and related
chemical factors ."'
Methylmercury is neurotoxic and can be
very
harmful to the central nervous system. In the
laboratory, long-term dietary exposure of fishes to methylmercury has caused incoordination,
diminished appetite or inability to feed, diminished responsiveness and swimming activity, starva-
tion, and mortality .173,316,117 Adult fishes were adversely affected in at least two cases of extreme
industrial mercury pollution during the past century - Minamata Bay (Japan) and Clay Lake
(Ontario). In Minamata Bay, coincident with the poisonings of humans and other organisms, resident
fish exhibited symptoms of methylmercury intoxication"""' that have been subsequently reported
in laboratory experiments ?00316117 These symptoms included mortality, severely diminished loco-
motor activity, impaired escape behavior, emaciated condition, and lesions in the brain3
19 Mercury
concentrations in axial muscle of "enfeebled" fishes found floating in seawater in the bay averaged
15 pg/g wet weight and ranged from 8 .4 to 24 ftg/g in six species."
In grossly polluted Clay Lake in the English-Wabigoon River system (northwestern Ontario),
northern pike varying in age from 3 to 8 years had mercury concentrations ranging from 6 to 16
pg/g wet weight in axial muscle tissue320 Compared with northern pike from a relatively uncon-
taminated reference lake, fish from Clay Lake were emaciated, had low hepatic fat stores, exhibited
4
61
1,1546 frame MASTER, huuk Page 427 Monday, August 26,2002 137 PM
ECOTOXICOLOGY OF MERCURY
427
symptoms of starvation (low levels of total protein, glucose, and alkaline phosphatase in blood
serum), and had low serum cortisol level S.320 After 1 year, contaminated northern pike transplanted
from Clay Lake into the reference lake had serum concentrations of total protein, alkaline phos-
phatase, and cortisol intermediate to those in Clay Lake and reference-lake fish, suggesting partial
recovery. Lockhart et al .720 did not attribute the poor condition of Clay Lake fish directly to effects
of methylmercury; however, similar symptoms have subsequently been observed in fish exposed
to dietary methylmercury in a laboratory experiment ."'
Wiener and Spry 173 derived the following critical tissue concentrations in adult fish, based on
a review of mercury concentrations associated with toxic effects in freshwater fish . In the brain,
concentrations of 7 tg/g wet weight or greater probably cause severe, potentially lethal, effects . In
mercury-sensitive species, brain-tissue concentrations of 3 tg/g wet weight or greater probably
indicate significant toxic effects . For axial muscle tissue, field studies indicate that concentrations
of 6 to 20 pg/g wet weight are associated with toxicity. The range for laboratory studies is similar,
with sublethal effects or death associated with concentrations in muscle of 5-8 µg/g in walleyes
and 10-20 µg/g in salmonid species . Whole-body concentrations associated with sublethal or lethal
effects are about 5 sg/g wet weight for brook trout (Salvelinus fontinalis) and 10µg/g for rainbow
trout
(Oncorhynchus mykiss),
whereas estimated no-observed-effect concentrations in salmonid
species are 3 µg/g for the whole body and 5 pg/g for brain or axial muscle tissue. However, Wiener
and Spry173 cautioned that the toxicity of methylmercury to fish is influenced by factors such as
interspecific and intraspecific variation in sensitivity to methylmercury that contribute uncertainty
to estimates of critical tissue concentrations. Moreover, the rate of accumulation seems to affect
the toxicity of methylmercury in fish 2 92 If methylmercury is accumulated slowly, fish can clearly
tolerate higher tissue concentrations of mercury, presumably due to the internal transfer and binding
of methylmercury to proteins in skeletal muscle (the primary storage site), which decreases exposure
of the central nervous system .
171
Given the high neurotoxicity of methylmercury, the exposure levels causing adverse behavioral
effects are probably much lower than exposure levels associated with overt toxicity .17
J
Many fish
behaviors are sensitive and ecologically relevant indicators of contaminant toxicity, affected at
exposure levels much lower than those causing direct mortality ."1-113 The ability of mosquitofish
(Gambusia affinis) to avoid predation by largemouth bass, for example, was greatly diminished by
aqueous exposure to 10, 50, and 100 µg Hg/L (administered as mercuric chloride), concentrations
that otherwise did not influence mortality .321
The neurotoxic effects of exposure to sublethal
concentrations of methylmercury can impair the ability of fish to locate, capture, and ingest prey
and to avoid predators .32
s
-32e For example, Fjeld et a1 325 showed that the feeding efficiency and
competitive ability of grayling (Thymallus thyrnallus), exposed as eggs to waterborne methylmer-
curic chloride for 10 days and having yolk-fry with mercury concentrations of 0.27 µg/g wet weight
or greater, were impaired when fish were tested 3 years later.
In a critical review, Wiener and Spry 173 concluded that reduced reproductive success was the
most plausible effect of mercury on wild fish populations at contemporary exposure levels in aquatic
ecosystems with methylmercury-contaminated food webs . They also suggested, based on the limited
information available, that the margin of safety between existing and harmful exposure levels may
be small for some fish populations . Methylmercury can impair reproduction of fishes by affecting
gonadal development or spawning success in the adults or by reducing the hatching success of eggs
and the health and survival of embryolarval stages .",2100.327.328 The embryolarval and early juvenile
life stages of fish are typically most sensitive to toxic contaminants, 300 and exposure of embryos
to methylmercury can impair competitive ability and foraging efficiency throughout the lifetime of
the fish .325
Nearly all of the mercury in the developing eggs of fish is methylmercury derived from maternal
transferP^ .2 "73° The amount of methylmercury transferred from the female to the developing egg
is small relative to the burden of the metal in the adult, yet the methylmercury content of eggs is
strongly related to that of the maternal fish
641C7,3t1
LI546_fram=MASTER.book I'age428 Munday.Augns26,2 32 1 :37 I'M
428
HANDBOOK OF ECOTOXICOLOGY
Recent experiments showing diminished reproductive success or fitness of fish exposed to
environmentally realistic concentrations of methylmercury indicate that some fish populations may
be adversely affected by methylmercury.M .' 2 ' Latif et al 64 examined the effects of both maternally
transferred and waterborne methylmercury on embryos and larvae of walleyes from industrially
polluted Clay Lake and two atmospherically contaminated lakes in Manitoba . In their study, the
hatching success of eggs and the heart rate of embryos decreased with increasing environmentally
realistic concentrations of waterborne methylmercury (range, 0 .1-7.8 ng/L), whereas methylmer-
cury concentrations in eggs from maternal transfer did not significantly affect egg-fertilization
success, egg-hatching success, or the heart rate of embryos. The growth of larval walleyes (measured
8 days after hatching) and the incidence of larval deformities were unrelated to either maternal or
waterborne methylmercury in their study .T
Hammerschmidt et al
328 fed fathead minnows
(Pimephales pramelas)
diets containing concen-
trations of methylmercury present in contaminated food webs, maintained the fish through sexual
maturity, and examined the effects of dietary and maternally transferred methylmercury on several
reproductive variables . In their study, dietary methylmercury affected the overall reproductive
performance of adult fathead minnows, whereas maternally transferred methylmercury did not
measurably affect the embryos and larvae produced . In the adults, exposure to dietary methylmer-
cury reduced spawning success, delayed spawning, decreased the instantaneous rate of reproduction,
and reduced gonadal development (as reflected by the gonadosomatic index) and reproductive effort
of females. These responses were caused by dietary concentrations of methylmercury that are
equaled or exceeded in the prey of some piscivorous and invertivorous fish inhabiting low-alkalinity
lakes and flooded reservoirs
.921 In contrast, the growth and survival of adult fathead minnows in
this study were unrelated to dietary methylmercury . Fertilization success, hatching success, 7-day
survival, and 7-day weight of larval fathead minnows varied considerably, but these biological
endpoints were not correlated with concentrations of mercury in either the diets or carcasses of
parental fish."'
16.7.3 Birds
The threat of mercury to birds is now largely an aquatic one, given that the probability of
exposure of terrestrial birds to high concentrations of organomercurials has diminished substantially
since the use of mercury compounds in seed dressings was discontinued . Fimreite7 ' reviewed
information on bird poisonings caused by mercurial seed dressings. The bioaccumulation and toxic
effects of mercury in birds have been reviewed more recently
.329-331 The biomagnification of mercury
in aquatic food webs often leads to high concentrations in fish-eating birds
161,332 -334 Moreover, there
is evidence that concentrations of methylmercury have increased in some seabirds during the past
century and in the past few decades (Figure 16 .1) .06118
Consumption of fish is the main pathway of methylmercury exposure for birds
335 Methylmer-
cury, one of the most harmful of contaminants to birds, can adversely affect adult survival,
reproductive success, behavior, and cell development .336 It can also cause teratogenic effects 737,3
3
8
Methylmercur readily crosses the blood-brain barrier 139.140 and is passed from the mother to the
eggs . 41-747 When transferred to eggs, nearly 100% of the mercury remains in the methylmercury
form and about 85 to 95% is deposited into the albumen
.341
Incorporation of methylmercury into growing feathers and excretion in the feces are the major
routes of mercury elimination in birds,344 although deposition of mercury into eggs is also an
important route for reproducing adult females .141,343,345 Stickel et al . 3a'reported a half-life of mercury
in whole bodies of adult male mallards
(Anas platyrhynchos)
of about 12 weeks, and the growth
of new feathers toward the end of their 12-week period of study seemed to be responsible for most
of the loss. Young birds also excrete methylmercury into their developing feathers
.147
The concentration of mercury in feathers has been advocated as an indicator of mercury in
other avian tissues 3 48 Scheuhammer et al .149 reported significant correlations between mercury in
O
L1546 frame_MASTCRbuuk
Page 429 Monday, August 26.2002 1 37 PM
ECOTOXICOLOGY OF MERCURY
429
the feathers and blood of chicks of common loons . Caldwell et at .,"' who failed to find good
correlations between mercury concentrations in chick feathers with those in blood, other tissues,
and eggs of double-crested cormorants (Phalacrocorax auritus), suggested that more information
is needed to establish the dynamics of mercury in feathers vs. other tissues. Unlike fish, in which
older, larger individuals tend to have higher concentrations of mercury,
103 birds can annually
eliminate much of their body burden of methylmercury through the formation of new feathers3 5o
Fish-eating seabirds seem to be able to demethylate methylmercury, mainly in the liver
.262 The
rank order of concentrations of methylmercury in various tissues, averaged over several species of
seabirds, was liver > kidney > muscle, and the mean percentages of total mercury present as
methylmercury were 35% in liver, 36% in kidney, and 66% in muscle. Furthermore, the percentage
of total mercury present as methylmercury decreases as the concentration of total mercury increases
.
In double-crested cormorants from Caballo reservoir in New Mexico, where
prey
fish contained
from 0.05 to 0.21 µg Hg/g wet weight, cormorant eggs contained a mean of 0.30 µg Hg/g wet
weight, and nestlings that were about 7 to 10 days old had concentrations of 0.36, 0.40, 0.18, and
3.54 xg/g wet weight in blood, liver, muscle, and primary feathers, respectively
.335 Kim et al
.,262
who studied nine species of seabirds, found that both total mercury and methylmercury in nearly
all species were higher in liver than in feathers, kidney, and muscle ; among these latter three tissues
there were no consistent relations . With feathers, it is desirable to know when new feathers were
formed because mercury in the diet and body burdens at that time seem to control the deposition
of methylmercury into developing feathers, 350 In controlled laboratory studies, where continuous
methylmercury diets have been fed, species such as chickens
(Gallus gallus), ring-necked pheasants
(Phasianus colchicus), and mallards tend to accumulate the highest concentrations of mercury in
liver and kidney, with muscle and brain containing lesser concentrations,M3.35
L
352
16.7.3.1
Field Studies on Birds
Observations of high concentrations of mercury in fish-eating birds have prompted field studies
to assess effects of methylmercury exposure in wild birds . Mortality and impaired reproduction are
two effects observed in controlled laboratory experiments with methylmercury that could decrease
exposed populations of wild birds. A number of field studies have shown associations between high
mercury levels in the diets or tissues of fish-eating birds and suspected harm. In southern Florida,
for example, methylmercury exposure may have contributed to deaths from chronic diseases in great
white herons (Ardea herodias occidentalis) .J53 The livers of herons that died of acute causes, such
as collisions with power lines or vehicles, had a mean mercury concentration of
1.77 µg/g wet
weight, whereas birds that died showing signs of chronic disease had livers with a mean of 9 .76
tg/g mercury. Spalding et al .153 cautioned that little was known about the history of methylmercury
exposure in the dead birds examined in their study. In such cases, the wasting of muscle in sick
birds could result in the release of mercury from muscle and its further accumulation in liver
.263
In the Netherlands, many grey herons (Ardea cinerea) died during the winter of 1976J50 The
mercury concentration in the livers of 41 of these dead herons averaged 95 .5 µg/g dry weight
(-27 tg/g wet weight), with a maximum of 773 gg/g dry weight . Necropsies were performed on
26 of the dead herons, and most were severely emaciated . Van der Molen et al
.
54 experimentally
exposed herons to methylmercury, and lethality was associated with mercury concentrations in the
liver that averaged 500 µg/g and ranged from 415 to 752 µg/g dry weight . Only two of the analyzed
dead herons from the field had hepatic mercury levels within this lethal range ; however, van der
Molen et al 354 postulated that the observed mortality was caused by the sublethal effects of mercury
combined with the stress of cold weather and undernourishment. The authors estimated that mercury
levels in livers of 20% of the 26 herons examined were sufficiently high to have caused either lethal
or serious sublethal effects . In eastern Canada, Scheuhammer et al 263 reported that the livers and
kidneys of common loons found dead or in a weakened, emaciated condition contained levels of
mercury that were high enough to have contributed to their ill health, although the authors noted
4
1
.1546
frame _MASTER.bnnk N, 430 Mun 1
,
Y, Wgust 26, 2002 1 :37 PM
430
HANDBOOK OF ECOTOXICOLOGY
that the wasting of muscle and other tissue in the sick and dead loons could have increased the
concentrations of mercury in the remaining tissue. The authors also pointed out that, because only
low levels of the mercury in the liver were in the methylmercury form, it was questionable whether
the loons were affected by methylmercury toxicity
.
The embryos of birds and other vertebrate organisms are much more sensitive than the adult
to methylmercury exposure 6,311 The dietary concentrations of methylmercury that significantly
impair avian reproduction are only one-fifth of those that produce overt toxicity in the adult,
75
S
and
possible reproductive impairment of wild birds has been reported in a number of field studies
.
Newton and HaasJ56 examined the levels of several pollutants, including mercury, in eggs of
the merlin (Falco columbarius) . Concentrations of mercury in eggs from wild merlins were related
to the number of young raised by the adults, and higher concentrations were associated with fewer
young. Nearly all of the mercury in eggs is methylmercury . 3
g
1157,358 The relation between production
of young merlins, and mercury exposure was statistically significant but not clear-cut; for example,
some of the most contaminated clutches produced 3 or 4 young, whereas some of the nests with
low concentrations of mercury in eggs failed completely. Newton and Haas356 attributed such
variable results to variation in individual sensitivity to methylmercury and to the influences of other
environmental factors on reproductive success
.
Reproductive failure in common loons, a piscivorous aquatic bird, was attributed to dietary
mercury exposure linked to contamination of food webs from industrial mercury pollution of the
English-Wabigoon River system . Fimreite332 observed that young common loons were absent along
highly contaminated reaches where mercury concentrations were high in adult loons and other
aquatic birds. In a comprehensive field study in the same river system, BanJ$7 showed a strong
negative correlation between the successful use of breeding territories by common loons and
mercury concentrations in lakes in a 160-km reach downstream from a chlor- alkali plant. Barr
5,
observed that reductions in egg laying and territorial fidelity were associated with mean mercury
concentrations of 0.3 to 0.4 pg/g wet weight in prey organisms and with mean concentrations of
2 to 3 µg/g wet weight in loon eggs and the adult brain. Reproductive effects were more severe
when concentrations of mercury in prey fish exceeded 0 .4 µg/g wet weight.357
The North American breeding range of the common loon includes many semiremote and remote
lakes in regions where reported mercury concentrations in fish commonly exceed 0 .3 to 0.4 Rg/g
wet weight, the dietary threshold values for reproductive effects estimated by Barr .JS' These regions
include the northcentral and northeastern United States and the eastern Canadian provinces of
Ontario, Quebec, New Brunswick, and Nova Scotia . Scheuhammer and Blancher, 35
Y
for example,
estimated that as many as 30% of the lakes in central Ontario contained prey fish with mercury
levels high enough to impair reproduction in common loons, based on the dietary threshold of 0.3
to 0.4 gg/g estimated by Barr.JS'
In northern Wisconsin, another area with many methylmercury-contaminated fish populations,
Meyer et al s2 examined reproductive success of common loons in relation to mercury levels in
blood and feathers . Adults and chicks were studied on 45 lakes (mostly seepage lakes) in an area
where atmospheric deposition is the dominant mercury source ." The mean concentration of
mercury in eggs sampled from nests at these lakes was 0.9 µg/g wet weight,%2 an exposure level
that has been associated with reproductive impairment in laboratory experiments with mallards
.341
Production of loon chicks was lowest at the lakes where mercury in the blood of chicks was highest
.
The concentration in chick blood was negatively correlated (r 2 = 0.56) with lake pH,A 2 a pattern
also observed in the methylmercury content of prey fish (Figure 16 .3) and game fish in small lakes
of the study area
.78,250
Descriptive field studies typically yield correlational results, which alone are generally insuf-
ficient for establishing a causal linkage between toxicant exposure and a biological response, such
as reproductive success, because of the potential confounding influence of other, covarying fac-
tors761-363 For this reason, Meyer et al 8 2 did not conclude a cause-and-effect relation between high
methylmercury exposure and low production of loon chicks on northern Wisconsin lakes . They
Y
t7 LI54fi
frame_MASrFR
ba,k
Page 431 Monday. August 26,2(X)2 107 PM
ECOTOXICOLOGY OF MERCURY
431
indicated the need to first critically test an alternative hypothesis concerning reproductive success
of common loons in northern Wisconsin lakes : that the lower production of loon chicks on low-pH
lakes resulted from lesser prey abundance in the low-pH lakes
.
Fish assemblages of small seepage lakes used by nesting loons in northern Wisconsin are
characterized by low species richness and numerical dominance by a few species, particularly
sunfishes (Lepomis spp.) and yellow perch74.248249.3
M
.36 s The yellow perch, the preferred prey of the
common loon, 252 is ubiquitous and typically abundant in these seepage lakes, ranking second in
relative numerical abundance (based on catch per unit of effort) only to the bluegill
(Lepomis
macrochirus)74,248 .249.165 Moreover, the yellow perch is an acid-tolerant species, and self-sustaining
populations occur in Wisconsin lakes with pH as low as 4 .4 standard units
.3
d
9 -
4 Intensive, standard-
ized fish surveys in 12 small lakes in northcentral Wisconsin (fixed sampling effort per lake with
four gear types) yielded catches of yellow perch ranging from 285 to 969 fish (mean, 597) in six
lakes with low pH (range, 5.1-6.0) and catches ranging from 38-1030 fish (mean, 370) in six lakes
with circumneutral pH (range, 6.7-7.5)74 Two other potential prey-fish species, bluegill and pump-
kinseed (Lepomis gibbosus), are also abundant in the low-pH lakes
.74 Thus, it is highly improbable
that the low production of loon chicks observed by Meyer et al .82 on low-pH lakes in northern
Wisconsin resulted from lesser prey-fish abundance in such lakes . We infer that high methylmercury
exposure is a more defensible explanation for the low production of loon chicks on these low-pH lakes
.
In Georgia (U.S .), Gariboldi et al .366 measured mercury levels in prey items regurgitated by
nestling wood storks (Mycteria americana) at four colonies. The estimated mean concentration in
the diet of nestlings at individual colonies ranged from 0 .10 to 0.28 .tg/g wet weight, equaling or
exceeding a lowest observed adverse effect concentration (LOAEC) of 0 .1 sg/g wet weight, a value
recommended by Eisler36 as a maximum tolerable dietary concentration for sensitive avian species.
The LOAEC of 0.1 µgig wet weight was derived from laboratory experiments showing that the
reproduction and behavior of mallards were affected by a diet containing 0.5 tg Hg/g dry weight
(-0.1 gg/g wet weight), administered as methylmercury dicyandiamide . The mean concentration
in prey of nestling wood storks was highest (0 .28 .tg/g wet weight) in an inland colony, where an
average .of 1 .9 young wood storks were fledged per nest - lower than the averages of 2.6 and 2.5
birds fledged per nest at the two coastal colonies, where mean dietary mercury concentrations were
0.10 and 0.19 pg/g wet weight, respectively. 3
M
Gariboldi et al
.366 stated that it was difficult to
separate the effects of dietary mercury exposure from other potential stressors on wood storks such
as differences in the abundance of prey among colonies. These authors also noted the uncertainty
associated with extrapolating a LOAEC derived from laboratory studies with mallards to wild,
fish-eating wood storks. Mercury levels in eggs of wood storks were not measured in this study
.
In the English-Wabigoon River system, Fimreite32 reported a mercury concentration of 3 .65
µg/g wet weight in eggs of common terns (Sterna hirundo) nesting in Ball Lake, Ontario, where
estimated hatching success was less than 27%. In lesser contaminated Wabigoon Lake, mercury
averaged 1.0 pg/g in eggs of terns, only seven unhatched eggs were found, and a "large number
of fledged young" were observed. The reproductive measurements in this study were made during
two visits to each colony and were not systematically collected ; however, Fimreite332 associated
the impaired reproduction in terns from Ball Lake with high methylmercury exposure
.
The embryos of herring gulls (Larus argentatus) seem to be much less sensitive than embryos
of the common tern to methylmercury, based on results of Vermeer et al .,367 who measured mercury
in a single egg taken from each of 18 herring gull nests and monitored the subsequent hatching
success of the remaining eggs. Mercury levels in whole eggs varied from 2.3 to 15.8 99/g wet
weight. In four eggs, yolk and albumen were analyzed separately, yielding concentrations ranging
from 0.9 to 3.5 µg/g in the yolk and from 3.5 to 22.7 gg/g in the albumen. All but two of the
remaining eggs in the 18 nests hatched, and those two eggs were in nests where the sampled eggs
contained 7.9 and 8 .1 .tg/g of mercury .367
Henny et al 368 assessed the influence of high concentrations of mercury in eggs on bird
reproduction at five national wildlife refuges in the western United States . Concentrations in some
0
L1
-frame-MASTha.buuk
Page 432 Monday, August 26, 21x12 1 :37 PM
432
HANDBOOK OF ECOTOXICOLOGY
eggs of ducks exceeded 3 pg/g dry weight (-0.6 to 0.8 µg/g wet weight), a concentration near that
causing reproductive impairment in laboratory studies with mallard s
.343 It was not feasible to relate
mercury residues measured in a single egg taken from each duck nest to hatching success of the
remaining eggs because of heavy predation on the nests . A small sample of eggs from the nests
was, therefore, incubated in the laboratory; eggs with more than 3 µg Hg/g (dry weight) hatched
as well as eggs with concentrations less than 3 pg/g 36t
16.7.3.2
Laboratory Experiments on Birds
An inherent limitation of ecotoxicological field studies stems from the difficulty in isolating
the biological effects of methylmercury exposure from the effects of other variables. The presence
of other environmental contaminants, for example, can complicate the identification of biological
responses to methylmercury. Controlled laboratory experiments are useful for addressing the uncer-
tainties inherent in even the best field studies. A principal objective of many laboratory experiments
has been to determine the concentrations of methylmercury in the avian diet or in avian tissues
and eggs that are associated with mortality or reproductive failure
.
Koeman et a1 3fi 9 dosed mice with methylmercury dicyandiamide and fed the mice, which
contained about 13 µg Hg/g wet weight, to Eurasian kestrels (Falco
tinnunculus)
.
Methylmercury
poisoning in the kestrels became evident after about 15 (lays, and mortality began after 21 days
.
The kestrels suffered demyelinization of the spinal cord, a symptom of methylmercury poisoning
.
Concentrations of mercury in the kestrels that died or were sacrificed after showing signs of mercury
poisoning ranged from 49 to 122 µg/g wet weight in the liver and from 20 to 33 pg/g in the brain
.369
Methylmercury poisoning and mortality also occurred in goshawks
(Aceipiter gentilis) and red-
tailed hawks (luteo
jamaicencis)
fed chicken flesh containing about 4 to 13 pg Hg/g on a wet-
weight basis, as methylmercury.37u37
' Livers of the dead goshawks contained from 103 to 144 pg
Hg/g wet weight, and brains contained 36 to 51 pg/g370 Livers of poisoned red-tailed hawks
contained about 19 to 20 pg/g of mercury .791
Finley et al J72 estimated the concentrations of mercury in tissues associated with the death of
birds by feeding 40 Vg Hg/g, as methylmercuric dicyandiamide, to European starlings (Sturnus
vulgaris), common grackles (Quiscalus quiscula), red-winged blackbirds (Agelaius phoeniceus),
and brown-headed cowbirds (Molothrus ater) . After 5 of the 14 birds of each species had died
from methylmercury poisoning, 5 survivors were sacrificed, and mercury concentrations in tissues
of the dead and surviving birds were compared . The sacrificed birds showed no overt symptoms
of methylmercury intoxication. Concentrations in tissues of most dead birds exceeded, but did not
differ statistically from, concentrations in the survivors . This study suggested that there is no
specific, single concentration of methylmercury in tissues associated with death of the organism
.
Although no such threshold concentration was evident in their study, Finley et al .372 considered 20
µg Hg/g wet weight in the tissues as a hazardous concentration
.
In another study to determine harmful tissue levels of mercury, Scheuhammer 173 fed diets
containing 5 pg Hg/g dry weight, as methylmereuric chloride, to zebra finches (Poephila guttata)
for 76 days. One fourth of the birds died, and 40% of the survivors exhibited overt neurological
signs of methylmercury poisoning including lethargy and difficulty in balancing on their perches
.
Mercury levels in the brains of finches that died were no higher than levels in birds that showed
overt signs of poisoning but did not die . Finches that survived the 76-clay exposure period without
exhibiting overt symptoms of methylmercury poisoning typically had less than 15 µg Hg/g wet
weight in the brain, whereas birds with symptoms had at least 15 pg/g in the brain . Scheuhammer173
concluded from these and other data that tissue levels of methyl mercury associated with neurological
effects are similar in birds of different species, size, and dietary mercury level
.
In Pekin clucks (Anal
plaryrhynchos)
fed 15 fig Hg/g (as methylmereuric chloride), overt signs
of mercury poisoning (loss of appetite, decreased mobility, and leg paralysis) appeared in males
i%
N
J L1546-frame MASTER.bouk Page 433 Monday, August 26, 2002 1:37 PM
ECOTOXICOLOGY OF MERCURY
433
after 5 weeks and in females after 8 weeks .374 Mercury concentrations did not differ between the
sexes at death or at the end of the 12-week exposure period; livers of males and females contained
88 and 92 .tglg wet weight, respectively, and brains contained 20 and 23 ltg/g
.374 In mallards fed
methylmercuric chloride, Pass et al.171 saw no clear delineation between mercury concentrations in
the brains of birds that had developed microscopic lesions in the brain (range, 3 .2 to 27.2 gg/g wet
weight) and those without detectable lesions (1.8 to 22 .tg/g) .
Heinz376 tabulated published concentrations of mercury in the internal tissues of birds that were
poisoned, dead, or asymptomatic. He estimated that wet-weight concentrations of mercury associ-
ated with harmful methylmercury exposure in adult birds were 15 to 20
.tg/g in the brain, 20 to
60 .tg/g in the liver, 20 to 60
gig in the kidney, and 15 to 30 µg/g in muscle tissue .
The embryos and young of birds are more sensitive to methylmercury than are the adults . Heinz
and Locke74° fed breeding mallards 3 .tg Hg/g as methylmercury dicyandiamide, and mercury was
accumulated in eggs to mean concentrations between -5 .5 and 7.2 gg/g wet weight in 2 consecutive
years. Reproductive success was impaired, and some ducklings died from methylmercury poisoning
after hatching. The brains of dead ducklings had mercury concentrations ranging from -4
.9 to 8.7
µg/g wet weight and exhibited demyelination and necrosis characteristic of methylmercury poi-
soning .340 Reproduction of black ducks (Anus rubripes) fed 3 µg Hg/g as methylmercury dicyan-
diamide was similarly impaired, with post-hatching mortality of ducklings associated with mercury
concentrations between 3.2 and 7 .0 sg/g wet weight in the brain
377
Concentrations of methylmercury in the maternal diet and in eggs associated with adverse
reproductive effects in birds have also been estimated in laboratory studies . Tejning341 fed chickens
a diet containing about 9 .2 .tg Hg/g dry weight as methylmercury dicyandiamide . Within 3 weeks
mercury concentrations in eggs increased to about 25 gg/g wet weight in egg whites and 2 µg/g
in egg yolk, and hatching success of exposed eggs decreased to about 10%, relative to about 60%
in unexposed controls . When the maternal diet contained about 4 .8 µg/g of mercury, administered
as methylmercury dicyandiamide, egg whites and yolks contained about 17 and 2 µg/g, and hatching
success was 17%3 01 Finveite342 fed ring-necked pheasants a diet containing about 3 .7 µg Hg/g as
methylmercury dicyandiamide . After 12 weeks hatching success was about 10%, compared to about
50 to 55% for controls. In eggs, decreased hatchability was associated with mercury concentrations
between 0.5 and 1 .5 µg/g wet weight 302 Borg et al.," who fed breeding pheasants a diet with 15
to 20 .tg Hg/g dry weight as methylmercury for 9 days, observed a significant decline in hatching
success (55%) relative to controls (74%) . Mercury residues in whole eggs associated with this
decline ranged from 1 .3 to 2 .0 µg/g wet weight,70 in close agreement with the findings of Fimreite
342
The diagnosis of methylmercury poisoning in birds based on measured residues of mercury in
tissues may be complicated by the influence of other, co-occurring elements that alter the toxicity
of methylmercury.37s In particular, it has been generally believed that selenium protects vertebrate
organisms against methylmercury poisoning, even though mercury accumulation in tissues may be
increased by selenium .179
A notable exception to the presumed protective action of selenium against methylmercury
poisoning in wildlife was observed in mallards fed a combination of selenomethionine and meth-
ylmercuric chloride 338 In this experiment, Heinz and Hoffman338 showed that the toxic effects on
the developing bird embryo were much greater when selenium and methylmercury were added
jointly to the maternal diet than when methylmercury was added without selenium . In the same
experiment, dietary selenium decreased methylmercury toxicity in the adult mallard
338 Thus,
selenium does not seem to protect against reproductive effects of methylmercury.
Few controlled laboratory experiments have been done on the fish-eating birds that are at greatest
risk due to methylmercury exposure in the wild. Reproductive experiments with fish-eating birds
exposed to dietary methylmercury are urgently needed, given the uncertainties in extending exper-
imental results for laboratory test species to wild, fish-eating birds . Even with laboratory species
(such as the mallard, pheasant, and chicken), there is much uncertainty in the threshold concentra-
1,1546-frame-MASTER hook
Page 434 Monday,
August 26.2m2 1,37 PM
434
HANDBOOK OF ECOTOXICOLOGY
tions of methylmercury in the maternal diet and in the eggs that elicit reproductive problems
.
Obtaining information on the reproductive sensitivity of wild, fish-eating birds to methylmercury
exposure is perhaps the most pressing research need concerning the avian ecotoxicology of mercury
.
The combined effects of exposure to methylmercury and other contaminants (particularly selenium
and organochlorines), as well as other environmental stressors encountered by wild birds, also merit
critical study .
16.7.4 Mammals
Mercury intoxication in wild mammals was first reported in association with the widespread
use of organomercurial fungicides as seed dressings during the 1950s and 1960s, when individuals
of various wild avian and mammalian species, particularly granivores and their predators, were
killed from dietary exposure to high concentrations of mercury
.70 Later, methylmercury intoxication
was reported as the cause of death of a wild mink (Mustela vison) near a mercury-contaminated
river"' and of a wild otter (Lutra canadensis) near a lake contaminated with mercury from a chlor-
alkali plant."' These cases involved outright mortality of adult mammals, probably in response to
high dietary exposure to methylmercury. The sources of mercury that caused these past exposures
(i.e., emissions from pulp and paper mills and chlor-alkali plants and usage as seed dressings) have
largely been discontinued or greatly reduced. As described earlier in this chapter, however, other
regionally and globally significant sources of anthropogenic mercury remain, and the methylation
of mercury in the environment and biomagnification of methylmercury to high concentrations in
food webs continue. Consequently, piscivorous and other top predatory mammals still risk elevated
methylmercury exposure in some aquatic environments
.
In this section we review the effects of dietary methylmercury exposure inwild mammals, the
in viva demethylation of methylmercury, and interactions between mercury and selenium in mam-
mals. We discuss evidence linking recent methylmercury exposure to toxic effects in certain wild
mammal species and in certain environments of North America . For earlier reviews of mercury
toxicology in wild mammals, the reader is referred to Wren, 362 Heinz,176 Thompson,329 and Wolf
et a1730
16.7.4.1 Effects of Methylmercury In Mammals, and Critical Concentrations In
Tissues and Diets
Data on tissue concentrations of mercury and methylmercury toxicity are more plentiful for
otter and mink than other wild mammals . Combined evidence from wild otter and mink that died
after exhibiting signs of methylmercury poisoning 7
N
111
M
1 and from controlled, dietary-dosing exper-
iments on these two species"'
"I
indicate that total mercury concentrations in the range of 20 to
100 gg/g wet weight in liver, or > 10 gg/g wet weight in brain, indicate potentially lethal exposure
to methylmercury. Reported values for other predatory mammals also fall within these ranges . For
example, a fox (Vu/pes mdpes) that was found staggering and running in circles and that later died
had 30 gg/g wet weight of total mercury in its liver and kidneys, and a marten (Manes marrtes)
with similar symptoms of methylmercury intoxication had 40 gg Hg/g wet weight in its liver and
kidneys.") Liver tissue from a Florida panther
(Felis (oncolor coryi) suspected of dying of meth-
ylmercury poisoning had 110 gg/g wet weight of total mercury3N 6 Total mercury concentrations
ranging from 37 to 145 gg/g wet weight were found in the livers of feral, domestic cats that died
from methylmercury toxieosis 3" 7 Generally, in the studies cited above only total mercury in tissue
was measured, and it was assumed that all or most of the mercury was present as methylmercury,
the dominant form to which the animals were exposed . Mammals that die from methylmercury
intoxication first exhibit characteristic neurological signs, including some combination of lethargy,
weakness, ataxia, paralysis of limbs, tremors, convulsions, and visual impairment
.
t
tJ LI546_frame_MASTER.bex,k
Page
415 Monday,
August 26, 2(X)2 1 37 PM
ECOTOXICOLOGY OF MERCURY
435
Chronic exposure to dietary methylmercury concentrations of I µg/g wet weight or greater
causes neurotoxicity and mortality in adult mink3s4.3s5asn and otter.389 Mink die after 3 to I I months
of exposure to 1 pg Hg/g wet weight of methylmercury in the diet
3x4-385 Higher dietary concen-
trations (> 2 gg/g wet weight) hasten the appearance of toxic signs and mortality ; however, tissue
concentrations of individual mink and otter dying of methylmercury exposure were similar regard-
less of the methylmercury concentration in the diet, and higher dietary methylmercury concentra-
tions mainly influenced the time required to accumulate toxic tissue concentrations
.388389 Dietary
methylmercury levels of <_ 0.5 µg Hg/g wet weight are generally not lethal to mink, and consumption
of such diets has not caused obvious neurological signs of methylmercury intoxication in mink in
controlled feeding experiments
.3e4.3s5.3so.391
Comparatively few studies have examined more subtle, sublethal effects of methylmercury in
wild mammals. Two studies that examined the effects of dietary methylmercury on reproduction
in mink concluded that sublethal exposures (dietary concentrations <_ 0 .5 µg Hg/g) did not adversely
affect reproductive variables such as fertility, number of kits born per female, and the survival and
growth rates of kits.3s5.392 We are unaware of any studies of subtle neurological or neurobehavioral
effects of low-level methylmercury exposure in wild mammals such as mink or otter ; however,
such studies have been done on small mammals used in medical research . Burbacher et al .393 who
reviewed the medical toxicological literature, concluded that brain-mercury concentrations of 12
to 20 .tg/g wet weight during postnatal development are associated with blindness, spasticity, and
seizures in small mammals (e.g ., rats, mice, and guinea pigs) experimentally exposed to methyl-
mercury; these effects have also been reported in methylmercury-intoxicated mink and otter with
similar concentrations in the brain. Lower mercury concentrations (3 to 11 Itg/g wet weight) in the
brains of small experimental mammals cause behavioral deficits during postnatal development,
such as increased activit
y, p
oorer maze performance, abnormal auditory
startle reflex, impaired
escape and avoidance behavior, abnormal visual evoked potentials, and abnormal performance on
learning tasks
.393 Similarly, Wobeser et al .381 concluded that mercury concentrations exceeding 5
µg/g wet weight in the brain, when combined with neurological signs, were consistent with
methylmercury toxicity in mink . Mercury concentrations in the brains of free-living otter and mink
trapped in Wisconsin and in Manitoba, Ontario, and Quebec were generally in the range of 0 .1 to
1 .0 ltg/g wet weight, although some individuals had 5 to 10 µgig wet weight .260'39a-397 Results from
medical toxicological studies with small mammals indicate that such concentrations in the brain
may cause subtle visual, cognitive, or neurobehavioral deficits . Impaired vision and learning ability
could be life-threatening to wild, visual predators, given that such dysfunctions could significantly
impair ability to catch prey, causing malnutrition, increased susceptibility to disease, or reduced
reproductive success
.
16.7.4.2 Demethy/ation and Relationship with Selenium
Information on concentrations of total mercury in certain commonly analyzed tissues, such as
the liver, is not sufficient for diagnosing methylmercury toxicity in wild mammals . Methylmercury
is the primary and most toxic form of mercury in the diets of piscivores and other top mammalian
predators that are associated with aquatic food webs . However, some wild mammals can demeth-
ylate methylmercury to varying degrees, and inorganic mercury often accounts for a significant
and highly variable fraction of the total mercury present in the liver, kidney, and brain in such
species.2«,.389.39s Mammals have also been shown to demethylate methylmercury in controlled
experiments. In guinea pigs
(Cavia porcellus),
for example, inorganic mercury accounted for 30
and 60% of total mercury in the liver and kidneys, respectively, after 3 weeks of administration of
methylmercury.39 s
The inorganic mercury produced by in
vivo
demethylation of methylmercury can gradually
accumulate to very high concentrations in association with selenium in certain tissues without
) LIS46Jmm_MASTER
hook P,,
416
Monday, Auguo
2 6,
2(X)2 1 :37 PM
436
HANDBOOK OF ECOTOXICOLOGY
causing any apparent toxicity. Thus, liver-mercury concentrations that would probably be toxic if
composed mainly of methylmercury (> 20 .tg/g wet weight) may not be toxic if present primarily
as Hg-Se complexes, Methylmercury generally predominates when total mercury concentrations
in livers of predatory mammals are less than -9 µg/g wet weight ; however, with greater mercury
accumulation, an increasingly high proportion of total mercury is often present as inorganic mercury
.
In marine mammals and aquatic birds that have accumulated high concentrations of mercury in
the liver (10 to > 30 µg/g wet weight), more than 85% of total mercury is typically present as
inorganic mercury associated with selenium in a molarr ratio approximating 1 :1 263,399 Thus, obser-
vations of elevated concentrations of total mercury in the liver or kidneys of dead mammals are
not sufficient for diagnosing methylmercury intoxication because of demethylation and the subse-
quent formation of Hg-Se complexes that have relatively low toxicity . Ideally, such diagnoses should
be based on information on total mercury, methylmercury, and selenium in the liver, kidneys, and
brain. Determination of total mercury in skeletal muscle would also be useful in such assessments
because very little demethylation occurs in muscle tissue . In the absence of clinical signs of
methylmercury intoxication (e.g ., for animals found dead), a mercury concentration exceeding 20
.tg/g wet weight in the liver, combined with a concentration exceeding 12 Rg/g wet weight in
muscle, indicates probable methylmercury intoxication?83,388e89 Conversely, the same or higher
mercury concentration in the liver, in conjunction with low mercury concentrations in muscle,
would not be indicative of methylmercury intoxication .
The antagonistic relation between mercury and selenium in biological systems is well known;79
however, the biochemical mechanisms underlying this antagonism are poorly understood . Studies
with rats have demonstrated that selenium protects against or delays the toxicity of methylmercury
.
Animals that received co-administration of selenium salts with methyhnercury had lower mortality,
fewer neurological signs of m ethylmercury intoxication, and better growth rate and weight gain
than animals given only melhylmercury
.4°a"04
In wild mammals, the association between mercury and selenium has been most intensively
studied in dolphins. Rawson et al
.415 described pigment granules containing high concentrations of
mercury in lysosomes of liver cells of Atlantic bottlenose dolphins (Tursiops truncates), All animals
with mercury-containing granules had concentrations of total mercury in the liver exceeding 61
gg/g wet weight, whereas animals without pigment had concentrations of less than 50 µg/g . Rawson
et al.405 did not suggest that these mercury-containing pigments were composed of Hg-Se-protein
complexes; however, other studies have demonstrated the presence of such compounds, both as
Hg-Se-protein complexes and as insoluble HgSe (tiemannite) granules, in liver cells of dol-
phins406
-t
1 " As reported for other mammals with high mercury accumulation, dolphins with the
highest concentrations of total mercury in the liver (> 100 ftg/g wet weight) typically have the
lowest percentages of methylmercury (<10 percent of total mercury) and also have high selenium
concentrations in the liver .410 These Hg-Se compounds, which are much less toxic than methyl-
mercury, are very stable and have a long biological half-life, accumulating to high concentrations
in older individualS .401 .41
1 Low concentrations of mercury in the liver of dolphins, and perhaps other
marine mammals, are present primarily as methylmercury; however, there is an apparent threshold
above which the speciation of mercury is altered by
in vivo demethylation and concurrent accu-
mulation of selenium with mercury in stable, insoluble complexes 4 09 Such Hg-Se complexes have
apparently not been reported or studied in otter or mink .
Evans et a1 261 measured concentrations of total mercury and methylmercury in the brain, kidney,
liver, and fur of apparently healthy wild otter and mink from Ontario, Canada and reported a greater
percent of inorganic mercury in otter than in the same tissues in mink . Mink and otter had
comparable levels of total mercury (e.g ., in liver, 0.85 to 3 .5 l1g/g wet weight in mink and 0.87 to
2.3 µg/g in otter), but the mercury in soft tissues of mink was from 80 to 90% methylmercury,
whereas the methylmercury fraction ranged from 56 to 81% in otter, leading Evans et al
.26° to
suggest that otter are more able than mink to demethylate methylmercury . Wren et al 396 also
reported higher proportions of methylmercury in liver tissue of otter, relative to mink, in animals
L1546_fmmv_MASTER.book Page437 Monday,August26,2002 1:37PM
ECOTOXICOLOGY OF MERCURY
437
collected throughout Ontario . Concentrations of mercury and selenium were not correlated in the
livers of Ontario otter 396
16.7.4.3
Hazard Assessment Studies
Environmental mercury exposure has occasionally been implicated as a possible contributing
factor to population declines in mink and otter. Osowski et al .,412 who noted that mink were
completely absent in parts of the Atlantic coastal plain of Georgia, North Carolina, and South
Carolina (southeastern United States), where they were historically abundant and where high-quality
habitat remained available, assessed the potential role of 17 environmental contaminants in popu-
lation declines of mink. Mercury (along with PCBs, DDE, and dieldrin) emerged as a potentially
important contaminant influencing mink populations . Concentrations of total mercury in kidneys
of mink from areas of concern were as high as 25 µgig wet weight, compared to < 4 µgig wet
weight in reference areas i 12 Notably, the higher mercury levels reported in this study were toxic
to mink in controlled feeding experiments
. 3
Xs
Giesy et al 413 conducted a hazard assessment of mercury and other contaminants in mink above
and below hydroelectric dams on three rivers flowing into the North American Great Lakes . Based
on an assumed dietary no-observed-adverse-effect concentration of 0.05 gg Hg/g wet weight for
mink, the hazard assessment concluded that the calculated hazard indices were not high, although
mercury levels in fish upstream from the dams were higher than those downstream . Mercury was
deemed to be less important than PCBs as a factor potentially affecting Great Lakes mink popu-
lations, and Giesy et al 413 concluded that concentrations of mercury in fish in the rivers examined
were probably too low to cause any population-level effect on mink
.
Two studies have attempted to assess the risk of adverse effects in otter and mink from
environmental mercury and PCB contamination in the Clinch River and Poplar Creek watersheds
in Tennessee414411 Mercury in small fish collected in areas of concern averaged about 0.2 to 0.4
gg/g wet weight.415 Results of Monte Carlo simulations estimating total daily intakes of mercury,
integrated with dose-response curves to estimate risks, led Moore et a10 15 to conclude that dietary
methylmercury exposure posed a moderate risk to female mink (a 24% probability of at least 15%
mortality) within the areas of concern . Similarly, Sample and Suter414 concluded that there was an
85% probability that mercury exposure in otter in some of the affected sites exceeded the estimated
lowest observed adverse effect level for methylmercury .
16.8 DEGRADATION OF ECOSYSTEM GOODS AND SERVICES
As a "good" produced by aquatic ecosystems, fish are a high-quality food resource - high in
protein, low in saturated fat, and a source of beneficial omega-3 polyunsaturated fatty acids and
antioxidants such as vitamin E
.416 Mercury contamination has clearly diminished the economic,
nutritional, and cultural values of the fishery resources produced by many freshwater and marine
ecosystems 017-02° The growing awareness of the mercury problem has prompted increasing efforts
to survey mercury contamination of fish, producing information that has, in turn, prompted issuance
of additional advisories concerning the consumption of sport fish. In Canada, mercury contamination
accounted for more than 97% (2572) of all fish-consumption advisories listed in 1997
.4 21 Most of
the Canadian advisories pertained to surface waters in Quebec and Ontario, whereas New Brunswick
and Nova Scotia had province-wide advisories in effect for mercury. In the United States, methylm-
ercury contamination accounted for 79% of all fish- and wildlife-consumption advisories in 2000
.421
Out of 50 states, 41 had advisories attributed to mercury, and the number of statewide fish-consump-
tion advisories issued for lakes, rivers, or coastal waters increased substantially during 1993-2000
(Figure 16 .4). In Sweden, an estimated 40,000 of the country's 83,000 lakes contained I-kg northern
pike with mercury concentrations higher than the national guideline of 0.5 gg/g wet weight, and an
Gamc_MAS I ER hook rage 438 Monday, August 26, 2002 I'37 PM
436
HANDBOOK OF ECOTOXICOLOGY
2500
-
Total number of advlaorles
2000
1500
2
1000
7
u
`y 505
3
n
45
Number
or
states
C
40
0
35
v
'
00
25
`o
20
m
g
25
E
2
20
statewide advisories
2
15
10
1993
1994
1996 1996 1997
1998
1999
2660
Year
Figure
16.4
Recent trends in the issuance of consumption advisories in the United States caused by mercury
in fish and wildlife . Shown are the total number of advisories for mercury (top panel), the number
of states issuing advisories (center), and the total number of statewide advisories for surface waters
of a given type (bottom), such as coastal waters, lakes, and rivers . Data reflect the status of
advisories through the year
2000. 421
In
2001,
the states
of
Pennsylvania and Maryland each issued
a statewide advisory (not included above) for mercury in fish .
estimated 10,000 of these lakes contained 1-kg pike with mercury concentrations exceeding the
"blacklisting" limit of 1 .O µg/g.
418
In Uppsala County, Sweden, pollution by toxic substances (spe-
cifically mercury and cesium-137) ranked as the second greatest anthropogenic threat to lakes
422
The economic losses caused by mercury contamination of fishery resources are largely
unknown, having been estimated for only a few cases
4t7
The adverse impacts of mercury pollution
on some indigenous, or aboriginal, peoples who relied on aquatic ecosystems for subsistence via
fishing and hunting are multidimensional, encompassing cultural, social, and health effects as well
as economic consequences
419420 .423
For some of these peoples, the consequences of abandoning
subsistence fishing and switching to alternative diets, combined with the social and cultural effects
of a disrupted lifestyle, have presented a much more severe overall problem than the direct, clinical
effects of exposure to methylmercury via consumption of contaminated fish or wildlife .
4
t9
'
420,423
The presence of inorganic mercury on the landscape, whether from anthropogenic or natural
sources, can devalue some of the services performed by aquatic ecosystems . Much of the inorganic
Hg(II) present on vegetated terrestrial areas inundated to create reservoirs for hydropower devel-
opment, for example, is methylated after flooding and enters the food chain, accumulating to high
concentrations in fish in the reservoirs and riverine reaches downstream
.64,6s.ux 24g242'42a-127
In a new
reservoir, the inundation of vegetated landscapes is rapidly followed by a rapid transition to
anaerobic conditions caused by rapid decomposition of inundated organic matter and the associated
depletion of dissolved oxygen near the soil-water interface . After this redox shift, anaerobic
microbial communities (including sulfate reducers) proliferate, and the net rate of methylmercury
production increases rapidly.'"' In the first 9 years after creation of the La Grande 2 reservoir (part
of the La Grande hydroelectric complex in the Canadian province of Quebec), concentrations of
mercury increased from -0 .6 to 3.0 .tg/g wet weight in 70-cm northern pike and from -0.7 to
t
1
L
1546_Gume_MASTER.bwk
Page
439 Monday, August 26, 2002
1:37
PM
ECOTOXICOLOGY OF MERCURY
439
2.8 xg/g in 40-cm walleye." In some cases, mercury levels in fish from recently flooded reservoirs
have equaled or exceeded levels in fish from surface waters that were heavily contaminated by
direct industrial discharges
242,428 Moreover, the mercury concentrations in the fishery resources of
new impoundments may remain substantially elevated for decades after flooding
. M,242,426,429
The ecosystem services performed by natural *and constructed wetlands can also be devalued
by mercury. Freshwater wetlands improve water quality by retaining or partially removing many
of the constituents from water passing through the wetland system, including suspended solids,
bacteria, biological oxygen demand, chemical oxygen demand, certain heavy metals, phosphorus,
and nitrogen 430433 Constructed wetlands have been widely used for water treatment and are effective
at improving water quality in a variety of situations 4 32 .433 However, wetlands are also quantitatively
important on the landscape as sites of methylmercury production, and they can be important sources
of methylmercury for downstream surface waters 88,
140.123-125 .133.179.183.196.205.434
The production and export of methylmercury, particularly in wetland systems where the abun-
dance of mercury has been significantly increased by local anthropogenic sources or atmospheric
deposition, can impair the water-treatment function and degrade the biological resources of wetlands
and downstream waters. In riparian wetlands adjoining the Sudbury River in Massachusetts, for
example, contaminated overbank sediments on the floodplain remained an active source of meth-
ylmercury for aquatic biota and downstream riverine reaches long after the primary anthropogenic
source of mercury was controlled 60.67-69 In parts of the Florida Everglades, a nationally renowned
wetland ecosystem receiving anthropogenic mercury in atmospheric deposition,435r37 the rates of
methylmercury production are very rapid.97 The fish and wildlife resources in areas of the Everglades
having high methylation rates contain high levels of methylmercury, 89.438-04' diminishing the value
of the fishery and posing a threat to wildlife in upper trophic levels 438,442-444
16.9 MERCURY POLLUTION- A CONTINUING SCIENTIFIC CHALLENGE
Environmental mercury research, remains an area of substantive scientific progress and discov-
ery. Virtually hundreds of studies have examined sources, environmental transport, biogeochemical
transformations and cycling, bioaccumulation, and biological effects of the metal since global
attention first focused on environmental mercury pollution . Amazingly, a variety of recent landmark
discoveries indicate that environmental mercury research can be characterized as a relatively
"young" field of scientific endeavor .
Examples of recent prominent advances in mercury research include, but certainly are not
limited to, the following: (1) the discovery of mercury-sensitive ecosystems characterized by small
inventories of total mercury, high rates of mercury methylation, and high concentrations of
methylmercury in piscivorous fish and wildlife, (2) the observation that perturbations of the
landscape by humans or natural processes (e.g ., reservoir creation and prolonged flooding) can
markedly increase methylmercury production and contamination of aquatic food webs, (3) the
discovery of wetlands as important sites of mercury methylation and export on the landscape, (4)
the observation of significant photodegradation of methylmercury in some surface waters, (5) the
observation that selenium can worsen- rather than protect against- effects of methylmercury
on avian reproduction and developing young, (6) the discovery of highly reactive, gaseous forms
of Hg(II) that are rapidly removed from the atmosphere in wet and dry deposition, and (7) obser-
vation of the rapid conversion after polar sunrise of gaseous Hg° in the polar atmospheres to
reactive gaseous Hg(II) .
Despite this impressive progress, many significant questions remain concerning the exposure
and ecotoxicological effects of mercury in the environment . Our collective appraisal is that progress
in assessing the biological and ecotoxicological effects of methylmercury exposure is lagging far
behind progress in understanding biogeochemical processes and environmental factors that influ-
C>
~i LL
Gwne_MASTLRhcn,kPage 440Munday.Augus,26.20021:37PM
440
HANDBOOK OF ECOTOXICOLOGY
ence biological
exposure
to methylmercury. In particular, the following topics pertaining to the
ecotoxicology of mercury in biota atop aquatic food webs merit intensive scientific study
.
•
Critical examination
of
the reproductive effects
of
methylmercury on fish, birds, and mammals :
Which, if any, species and populations are being affected by dietary exposure to methylmercury?
Is the vertebrate embryo the weak link in reproductive effects in exposed populations, or are other
reproductive endpoints (such as territorial fidelity, courtship and other reproductive behaviors,
gonadal development, and spawning success) more sensitive?
•
Variation among taxa
of
piscivorous fish, birds, and mammals in reproductive and early-life
sensitivity to methylmercury :
Are fish-eating marine mammals and seabirds protected against the
adverse effects of methylmercury exposure, given their apparent abilities to demethylate methyl-
mercury and subsequently store or eliminate the resulting inorganic mercury? Are fish-eating
mammals less vulnerable to methylmercury than fish-eating birds?
•
The combined effects
of
methylmercury and other co-occurring environmental stressors: How
does
mercury interact, in an ecotoxicological sense, with other persistent toxic contaminants that bio-
accumulate and biomagnify in food webs?
The modern environmental mercury problem, characterized by large geographic scale and
enormous complexity, remains a serious challenge to environmental managers and scientists alike
.
In an ecoloxicologieal sense, the modern mercury problem can be viewed rather simply as
biotic
exposure
to
methylmercury.
Given this view, the extraordinary challenge facing scientists and
environmental managers is to identify approaches that can decrease biotic exposure to methyl-
mercury. Clearly, a sustained, interdisciplinary effort will be needed to address critical questions
concerning methylmercury exposure and the associated risks to wildlife and humans dependent on
aquatic food webs .
16.10 SUMMARY
Growing awareness of the hazards of mercury exposure prompted widespread reductions in
usage and discharges of the metal to many surface waters beginning in the late 1960s . Mercury
concentrations in fish and other aquatic biota typically declined in the years and decades following
reductions in discharges to industrially polluted waters, although contamination at some sites has
decreased slowly and high concentrations persist in fish . Contaminated tailings and alluvium from
mining operations are widespread and can remain a source of mercury emissions for decades or
centuries. In some basins, contaminated sediment from historic mining sites has been transported
to aquatic and floodplain habitats far downstream. Gold mining with the mercury-amalgamation
process has resurged in South America, Southeast Asia, China, and Africa in widely dispersed
operations that may contribute 10% of modem anthropogenic emissions worldwide
.
Since the late 1970s, unexpectedly high concentrations of mercury have been observed in fish
from waters lacking on-site anthropogenic or geologic sources of mercury, including low-alkalinity
and humic lakes, wetlands, surface waters with adjoining wetlands, waters with adjoining or
upstream areas subjected to inundation, and dark-water streams. We classify such systems as
mercury-sensitive because seemingly small inputs or inventories of total mercury can cause signif-
icant methylmercury contamination in fish and wildlife in upper trophic levels . A common attribute
of mercury-sensitive ecosystems is the efficient conversion of inorganic mercury to methylmercury
.
Concentrations of methylmercury in fish in mercury-sensitive ecosystems can equal or exceed those
in fish from industrially contaminated waters
.
The modern mercury problem is greatest in aquatic environments, where inorganic Hg(II) can
be methylated to methylmercury, the highly toxic form that readily bioaccumulates in exposed
organisms and biomagnifics to high concentrations in food webs . Methylation by sulfate-reducing
bacteria at oxic-anoxic interfaces in sediments and wetlands is probably the dominant methylation
pathway in the environment . Demethylation, or degradation of methylmercury, can occur via a
0
4
L1546 frame-MASTER honk Page 44I Monday, Auguai 26, 2(X)2 1 :37 PM
ECOTOXICOLOGY OF MERCURY
441
number of abiotic and biotic pathways in the environment, and photodemethylation can significantly
affect methylmercury budgets of lakes
.
Emissions from anthropogenic sources and long-range atmospheric transport of mercury have
contaminated terrestrial and aquatic environments on a global scale. Analyses of sediment, peat,
and glacial ice show that the rate of mercury accumulation at semiremote and remote sites has
increased substantially (often by two- to fourfold) since the mid-1800s or early 1900s. It can be
reasonably inferred that a significant fraction of the methylmercury in aquatic biota in remote or
semiremote waters, including marine systems, is derived from anthropogenic mercury in deposition
.
In the North Atlantic, for example, concentrations of methylmercury in fish-eating seabirds (and
their supporting food webs) increased substantially from 1885 through 1994
.
Four compartments- atmospheric, terrestrial, aquatic, and biotic - are interconnected in the
global mercury cycle. The atmosphere is dominated by gaseous elemental mercury (Hg°), but the
fluxes between. the atmosphere and both aquatic and terrestrial compartments are dominated by
Hg(II). The terrestrial compartment is dominated by Hg(II) in soils, the aquatic compartment by
Hg(II)-ligand pairs in water and Hg(II) in sediments, and the biotic compartment by methylmercury
.
Mercury is reactive and moves readily between compartments . Atmospheric processes and pathways
dominate global-scale transport from sources to receptors. The global cycle can be envisioned as
a two-way exchange, in which sources emit Hg° and various species of Hg(II) to the atmosphere
and the atmosphere loses mercury via oxidation of Hg° to Hg(II) and the rapid removal of gaseous
and particulate species of Hg(II) in wet and dry deposition . Mercury deposited onto the land is
sequestered in soils, largely as Hg(H) sorbed to organic matter in the humus layer. The global
inventory of mercury in soils greatly exceeds that in the aquatic and atmospheric compartments
.
The Hg(H) in soils can be reduced and emitted to the atmosphere as Hg° or slowly transported
down gradient; thus, soils are both a sink and a potential long-term source of mercury . Anthropo-
genic emissions, particularly since the industrial revolution, have greatly increased the size of
cycling mercury pools and the importance of atmospheric pathways to a global pollution problem,
increasing the abundance of mercury in the atmosphere, soil, sediment, and biota . Natural emissions
of Hg° can be substantial in areas that are geologically enriched with mercury .
The aqueous abundances of methylmercury and total mercury vary widely . Total mercury in
water (unfiltered) ranges 0.3 to 8 ngfL in aquatic systems lacking substantive, on-site anthropogenic
or geologic sources, 10 to 40 ng/L in systems influenced by mercury mining or industrial pollution,
and can exceed 100 or even 1000 ng/L in systems draining areas with substantive geologic sources
or contaminated mine tailings. Methylmercury generally accounts for about 0.1 to 5% of the total
mercury in oxic surface water, seldom exceeding 10% . In oxic waters, concentrations of methyl-
mercury are typically in the range of 0 .04 to 0.8 ng Hg/L, but can be 1 to 2 ng Hg/L in systems
affected by industrial pollution or mercury mine drainage. Methylmercury can be the dominant
species under anoxic conditions, and concentrations can exceed 5 ng Hg/L
.
Methylmercury readily crosses biological membranes and accumulates in aquatic organisms to
concentrations that vastly exceed those in water. Patterns of biomagnification of methylmercury in
food webs are similar, even among aquatic systems that differ in ecosystem type, mercury source,
and intensity of pollution . The entry of methylmercury into the food web and its concentrations in
lower trophic levels are influenced strongly by the supply from methylating environments. Meth-
ylmercury concentration increases up the food web from water and lower trophic levels to fish and
piscivores. The ratio of methylmercury to total mercury increases with ascending trophic level
through fish and can vary greatly in trophic levels below fish, In pelagic food webs, the greatest
increase in methylmercury concentration, relative to that in water, occurs between sexton and water
.
Fish accumulate methylmercury mostly via the diet, to concentrations that commonly exceed those
in water by 10°- to 10 7-fold. Inorganic mercury, in contrast to methylmercury, is not readily
transferred in food webs and does not biomagnify
.
In fish, concentrations of methylmercury increase with increasing trophic position and with
increasing age or size, because the rate of elimination is very slow relative to uptake. Much of the
L1546 Iiame MASIFA,b,mk Page 442 Monday,August26,2(X)2 117 PM
442
HANDBOOK OF ECOTOXICOLOGY
methylmercury in fish is eventually stored in skeletal muscle, bound to sulfhydryl groups in protein
;
this may serve as a protective mechanism, given that sequestration in muscle reduces exposure of
the central nervous system to methylmercury. In the laboratory, long-term dietary exposure of fish
to methylmercury causes incoordination, diminished appetite or inability to feed, diminished
responsiveness and swimming activity, starvation, and mortality . Fish inhabiting Minamata Bay
(Japan) and Clay Lake (Ontario) - both extreme cases of industrial pollution - had very high
mercury concentrations and exhibited multiple symptoms of methylmercury intoxication . In labo-
ratory studies, sublethal exposure to waterborne methylmercury can impair the ability of test fish
to locate, capture, and ingest prey and to avoid predators . Methylmercur can impair reproduction
by affecting gonadal development or spawning success of adult fish, or by reducing the hatching
success of eggs and the health and survival of embryolarval stages . Recent experiments have shown
diminished foraging efficiency, reproductive success, health, and fitness in fish exposed to environ-
mentally realistic concentrations of methylmercury, indicating that some fish populations may be
adversely affected by existing exposure levels
.
The sources of mercury responsible for reported deaths of wild birds and mammals (usage in
seed grain and emissions from pulp and paper mills and chlor-alkali plants) have been greatly
reduced or largely discontinued, yet methylmercury remains a threat to wildlife in upper trophic
levels in many aquatic ecosystems. The present pathway of exposure to methylmercury is largely
an aquatic one, and reptiles, birds, and mammals atop aquatic food webs often bioaccumulate high
concentrations of methylmercury - even at semiremote or remote sites . The principal routes of
elimination in birds and mammals are incorporation of methylmercury into growing feathers or
hair and excretion in the feces. Some fish-eating birds (particularly seabirds) and mammals can
demethylate methylmercury, and inorganic mercury can account for a significant fraction of the
total mercury present in the liver, kidneY, and brain in such species
.
In laboratory experiments with birds and mammals, methylmercury adversely affects survival,
reproduction, behavior, and cellular development and causes teratogenic effects . Animals dying from
methylmercury intoxication exhibit characteristic neurological signs, including some combination of
lethargy, weakness, ataxia, paralysis of limbs, tremors, convulsions, and impaired vision. In adult
mink and otter, chronic exposure to dietary methylmercury of I µg/g wet weight or greater causes
neurotoxicity and mortality. Mortality and impaired reproduction, two endpoints observed in labo-
ratory experiments, could affect populations of birds and mammals exposed to high levels of meth-
ylmercury. In field studies, exposure to high levels of methylmercury was a suspected cause of ill
health, emaciation, and mortality in studies of wild white herons, grey herons, and common loons
.
In these cases, the observed mortality may have resulted from the combined effects of sublethal
methylmercury exposure and other stressors . In field studies, it is often difficult to isolate the biological
effects of methylmercury exposure from those of co-occurring toxic contaminants or other stressors
.
In birds and mammals, early life stages are much more sensitive than the adult to methylmercury
.
Avian reproduction, for example, is significantly impaired at (maternal) dietary concentrations that
are only one fifth of those that produce overt toxicity in the adult . In field studies, impaired
reproduction has been associated with high mercury exposure in piscivorous birds, including wild
merlins, common loons, wood storks, and common terns . In common loons, reductions in egg
laying and territorial fidelity have been associated with mercury concentrations averaging 0.3-0.4
pg/g wet weight in prey organisms, and many lakes in the breeding range of this species contain
prey-size fish with concentrations equaling or exceeding this estimated threshold value . Reproduc-
tive experiments with fish-eating birds exposed to dietary methylmercury are urgently needed, given
the uncertainties in extrapolating results from laboratory test species, such as the mallard, to wild
piscivorous birds
.
Few studies have examined subtle, sublethal effects of methylmercury in wild, piscivorous
mammals. Yet medical studies with small mammals have shown that sublethal exposure to meth-
ylmercury can cause subtle visual, cognitive, or neurobehavioral deficits that could indirectly affect
the survival and reproductive success of visual predators in the wild
.
LI546 frame MAS IFRbouk Page 443 Monday. August 26, 2002
1
PM
ECOTOXICOLOGY OF MERCURY
443
The antagonistic relation between mercury and selenium is well known in toxicology, but the
biochemical mechanisms are poorly understood . In dolphins, there is an apparent threshold con-
centration in the liver above which the speciation of mercury is altered by
in vivo
demethylation
followed by storage with selenium in insoluble, stable Hg-Se complexes. Dietary exposure of
mallards to selenomethionine and methylmercuric chloride, separately and in combination, showed
that selenium decreased methylmercury toxicity in adults. Yet in the same experiment, the adverse
effects on the developing mallard embryo were much greater when selenomethionine and meth-
ylmercury were added jointly to the maternal diet than when only methylmercury was added
.
Mercury contamination is adversely affecting a number of ecosystem goods and services . The
most notable of these is the degradation of fishery resources that have substantial economic,
nutritional, and cultural value. The economic losses caused by the widespread contamination of
fishery resources have apparently not been estimated. For some aboriginal communities in Canada
that once relied on subsistence fishing, the impacts of mercury pollution have encompassed adverse
cultural, social, and health effects, as well as economic impacts . For some communities, abandon-
ment of subsistence fishing and a change to less healthy diets, combined with the social and cultural
effects of disrupted lifestyle, have presented a more severe overall problem than the direct, clinical
effects of exposure to methylmercury via consumption of contaminated fish
.
Mercury on the landscape can also devalue services performed by aquatic ecosystems . Much
of the inorganic Hg(II) on land inundated to create reservoirs for hydropower is methylated after
flooding to methylmercury, which rapidly enters the food web and substantively contaminates fish
in the reservoirs and reaches downstream for decades. Mercury also devalues the ecosystem services
performed by wetlands, which improve the quality of water passing through the wetland system
by partial removal of nutrients and certain other constituents . Wetlands are also sites of mercury
methylation, and the production and export of methylmercury can impair their water-treatment
function and degrade the biological resources in wetlands and downstream waters .
Environmental mercury research is an area of substantive scientific discovery that can be
characterized as a relatively young field of scientific endeavor. Our collective appraisal
is
that
progress in assessing the biological and ecotoxicological
effects
of methylmercury exposure is
lagging far behind the recent, impressive advances in our understanding of biogeochemical pro-
cesses and environmental factors that influence biological
exposure
to methylmercury
.
In particular, many questions concerning the ecotoxicology of mercury need to be addressed
before the population-level effects of methylmercury exposure in fish and wildlife species atop
aquatic food webs are fully understood. The modem environmental mercury problem, large in
geographic scale and enormous in complexity, remains a daunting challenge for environmental
scientists and managers alike .
ACKNOWLEDGMENTS
The lead author (JGW) gratefully acknowledges the support provided by the College of Science
and Allied Health and the UWL Foundation at the University of Wisconsin-La Crosse during
preparation of this chapter. We thank Jeffrey Ziegeweid for assistance with preparation of the figures
and the bibliography. Dr. Kristofer Rolfhus and Dr. Mark Sandheinrich provided constructive
comments on a draft of the manuscript
.
REFERENCES
1 . Wren, C. D., Harris, S., and Harttrup, N., Ecotoxicology of mercury and cadmium, in
Handbook of
Ecotoxicology,
Hoffman, D. J., Rattner, B . A., Burton, G. A., Jr., and Calms, J., Jr., Eds., CRC Press,
Boca Raton, FL, 1995, 392-423
.
LI546-Gmne MASTERh.wk Page444 51nnday,August2e,21X12
1 :37 PM
444
HANDBOOK OF ECOTOXICOLOGY
2. Bloom, N. S., On the chemical form of mercury in edible fish and marine invertebrate tissue, Can .
J. Fish .
Aquat . Sci., 49, 1010-1017, 1992
.
3. Kim, J . P., Methylmercury in rainbow trout
(Oncorhynchus
mykiss) from lakes Okareka, Okaro, Roto-
mahana, Rotorua, and Tarawera, North Island, New Zealand,
Sci. Total
Environ .,
164, 209-219, 1995 .
4. Wagemann, R., Trebacz, E., Boila, G ., and Lockhart, W . L., Methylmercury and total mercury in
tissues of arctic marine mammals,
Sci. Total Environ ., 218, 19-31, 1998 .
5. Tsubaki, T. and Irukayama, K ., Eds .,
Minamata
Disease: Methylmercury Poisoning in Minamata and
Niigata, Japan, Elsevier, Amsterdam, 1977 .
6. Clarkson, T. W., Mercury: Major issues in environmental health, Environ. Health Perspect.,
100,
31-38,1992.
7. Gilbert, S. G. and Grant-Webster, K. S ., Neurobehavioral effects of developmental methylmercury
exposure, Environ. Health Perspect., 103 (Suppl. 6), 135-142, 1995
.
8. Hamada, R. and Osame, M., Minamata disease and other mercury syndromes, in Toxicology ofMetals,
Chang, L. W., Magos, L., and Suzuki, T., Eds., Lewis Publishers, Boca Raton, FL, 1996, 337-351
.
9- Watanabe, C. and Satoh, H., Evolution of our understanding of methylmercury as a health threat,
Environ. Health Perspect ., 104 (Suppl. 2), 367-379, 1996,
10. United States Environmental Protection Agency, Mercury Study Report to Congress, USEPA Publ
.
452R-97-004, Washington, D.C ., 1997 .
11 . Myers, G . J. and Davidson, P. W., Prenatal methylmercury exposure and children: Neurologic, devel-
opmental, and behavioral research, Environ. Health Perspect., 106 (Suppl. 3), 841-847, 1998
.
12. National Research Council Committee on the Toxicological Effects of Methylmercury, Toxicological
Effects of Methylmercury, Nat. Acad. Press, Washington, D.C ., 2000 .
13. Mahaffey, K. R., Recent advances in recognition of low-level methylmercury poisoning, Curr Opinion
NeuraL, 13, 699-707, 2000.
14. Takizawa, Y., Minamata disease in retrospect, World Resour Rev, 12, 211-223, 2000 .
15. Harada, M., Nakanishi, J ., Yasoda, E., Pinheiro, M. D. N., Oikawa, T., Guimaraes, G. D., Cardoso,
B . D., Kizaki, T., and Ohno, H., Mercury pollution in the Tapajos River basin, Amazon : Mercury
level of head hair and health effects,
Environ .
Int., 27, 285 290, 2001
.
16. Clarkson, T. W., The three modern faces of mercury,
Environ. Health
Perspec'i., 110 (Suppl. 1), 11-23,
2002
.
17- Richardson, M., Mitchell, M., Coad, S., and Raphael, R., Exposure to mercury in Canada : A multi-
media analysis, Water Air Soil Pollut., 80, 21-30, 1995,
18. Jasinski, S. M., The materials flow of mercury in the United States . Resour. Conserv
Recycling,
15,
145-179,1995
.
19. Sunderland, E. M. and Chmura, G. L., An inventory of historical mercury emissions in Maritime
Canada: Implications for present and future contamination, Sri, Total Environ ., 256, 39-57, 2000.
20. Fitzgerald, W. F, Engstrom, D . R., Mason, R. P., and Nater, E. A., The case for atmospheric mercury
contamination in remote areas, Environ. Sci. TechnoL, 32, 1-7, 1998 .
21. Ebinghaus, R., Tripathi, R. M., Wallschlager, D., and Lindberg, S. E., Natural and anthropogenic
mercury sources and their impact on the air-surface exchange of mercury on regional and global
scales, in Mercury
Contaminated
Sites, Ebinghaus, R., Turner, R. R., Lacerda, L. D., Vasiliev, 0., and
Salomons, W., Eds., Springer, Berlin, 1999, 3-50 .
22. Ferrara, R., Mercury mines in Europe: Assessment of emissions and environmental contamination, in
Mercury Contaminated
Sites, Ebinghaus, R., Turner, R.R ., Lacerda, LD., Vasiliev, 0., and Salomons,
W., Eds., Springer, Berlin, 1999, 51-72.
23. Martinez-Cortizas, A., Pontevedra-Pombal, X., Garcia-Rodeja, E., N6voa-Munoz, J. C., and Shotyk,
W., Mercury in a Spanish peat bog : Archive of climate change and atmospheric metal deposition,
Science, 284, 939-942, 1999
.
24. Gosar, M., Pirc, S., and Bidovec, M., Mercury in the ldrijca River sediments as a reflection of mining
and smelting activities of the Idrija mercury mine, J. Geochem, Erplor„ 58, 125-131, 1997
.
25. Turner, R. R. and Southworth, G. W., Mercury-contaminated industrial and mining sites in North
America: An overview with selected case studies, in
Mercury Contaminated Sites, Ebinghaus, R .,
Turner, R. R., Lacerda, L. D ., Vasiliev, 0., and Salomons, W., Eds., Springer, Berlin, 1999, 89-112 .
26. Ganguli, P. M., Mason, R. P, Abu-Saba, K. E., Anderson, R. S., and Flegal, A. R., Mercury speciation
in drainage from the New Idria mercury mine, California, Environ. Sci. TechnoL, 34, 47732779, 2000
.
L1546_irume_MASTER.bu,k Pvgc 445 Monday, August 26, 2002 1 :37 PM
ECOTOXICOLOGY OF MERCURY
445
27 .
Hines, M. E., Horvat, M., Faganeli, J., Bonzongo, J. C. J., Barkay, T., Major, E. B., Scott, K. 1 .,
Bailey, E. A., Warwick, J . J., and Lyons, W. B., Mercury biogeochemistry in the Idrija River, Slovenia,
from above the mine into the Gulf of Trieste, Environ
.
Res .
(Sect. A), 83, 129-139, 2000 .
28. Rytuba, J. J., Mercury mine drainage and processes that control its environmental impact, Sci
. Total
Environ., 260, 57-71, 2000.
29. Trip, L. and Allan, R . J., Sources, trends, implications and remediation of mercury contamination of
lakes in remote areas of Canada, Water Sci.
TechnoL,
42, 171-176, 2000 .
30. Covelli, S ., Faganeli, 1., Horvat, M., and Brambati, A., Mercury contamination of coastal sediments
as the result of long-term cinnabar mining activity (Gulf of Trieste, northern Adriatic Sea), AppL
Geochem.,
16,541-558,2001
.
31. Lacerda, L. D., Global mercury emissions from gold and silver mining,
Water Air Soil Pollut., 97,
209-221,1997 .
32. Averill, C . V., Placer Mining for Gold in California, Calif. State Div. Mines Geol. Bull., 135, 1946 .
33. Domagalski, J., Occurrence and transport of total mercury and methyl mercury in the Sacramento
River Basin, California, J . Geochem. Explor., 64, 277-291, 1998
.
34. Alpers, C. N. and Hunerlach, M. P, Mercury contamination from historic gold mining in California,
U.S. Geol. Sum., Fact Sheet FS-061-00, Sacramento, CA, 2000 .
35. Leigh, D. S., Mercury-tainted overbank sediment from past gold mining in north Georgia, USA,
Environ. Geol., 30, 244-251, 1997
.
36. Miller, J: R., Lechler, P. 1., and Desilets, M., The role of geomorphic processes in the transport and
fate of mercury in the Carson River basin, west-central Nevada, Environ. Geol., 33, 249-262, 1998
.
37. Lacerda, L. D. and Salomons, W., Mercury contamination from New World gold and silver mine
tailings, in Mercury Contaminated Sites, Ebinghaus, R., Turner, R. R., Lacerda, L. D., Vasiliev, 0
.,
and Salomons, W., Eds., Springer, Berlin, 1999, 73-87 .
38. Wayne, D. M., Warwick, J . J., Lechler, P. J., Gill, G. A., and Lyons, W. B., Mercury contamination
in the Carson River, Nevada: A preliminary study of the impact of mining wastes,
Water Air Soil
Pollut., 92, 391-408, 1996
.
39. Artaxo, P., Campos, R. C., Fernandes, E. T., Martins, J. V., Xiao, Z., Lindqvist, 0., Fernandez-Jimenez,
M. T., and Maenhaut, W., Large scale mercury and trace element measurements in the Amazon basin,
Arms.
Environ.,
34, 4085-4096, 2000.
40. Blum, M., Gustin, M. S., Swanson, S., and Donaldson, S. G., Mercury in water and sediment of
Steamboat Creek, Nevada : Implications for stream restoration, J. Am . Water Resour Assoc., 37,
795-804,2001 .
41 . Domagalski, J., Mercury and methylmercury in water and sediment of the Sacramento River Basin,
California, Appl.
Geochem.,
16, 1677-1691, 2001 .
42. Engle, M. A., Gustin, M. S., and Hong Zhang, H., Quantifying natural source mercury emissions
from the Ivanhoe Mining District, north-central Nevada, USA, Atmos
. Environ., 35, 3987-3997, 2001
.
43. Bonzongo, J. C., Heim, K. J., Warwick, J . J., and Lyons, W. B., Mercury levels in surface waters of
the Carson River-Lahontan Reservoir System, Nevada : Influence of historic mining activities, Environ.
Pollut., 92, 193-201, 1996 .
44. Chen, Y., Bonzongo, J. C., and Miller, G. C., Levels of methylmercury and controlling factors in
surface sediments of the Carson River system, Nevada, Environ. Pollut., 92, 281-287, 1996
.
45. Lacerda, L. D., Evolution of mercury contamination in Brazil,
Water Air Soil Pollut., 97, 247-255,
1997 .
46. Heemskerk, M., Do international commodity prices drive natural resource booms? An empirical
analysis of small-scale gold mining in Suriname, Ecol. Econ., 39, 295-308, 2001
.
47. Kambey, J. L., Farrell, A. P., and Bendell-Young, L. I., Influence of illegal gold mining on mercury
levels in fish of North Sulawesi's Minahasa Peninsula (Indonesia),
Environ. Pollut., 114,299-302,2001
.
48. Mason, R. P., Fitzgerald, W. F., and Morel, F. M. M., The biogeochemical cycling of elemental
mercury: Anthropogenic influences, Geochim. Cosmochim. Acta, 58, 3191-3198, 1994
.
49. Lodenius, M., Dry and wet deposition of mercury near a chlor-alkali plant, Sci
. Total Environ., 213,
53-56,1998 .
50. Gill, G. A., Bloom, N. S., Cappellino, S ., Driscoll, C . T., Dobbs, C., McShea, L., Mason, R., and
Rudd, J. W. M., Sediment-water fluxes of mercury in Lavaca Bay, Texas, Environ
. Sci. Technol
., 33,
663-669,1999
.
0
L1546
frame-MASTERhtx,k
Page 446 Monday, August 26, 2002 1'.17 PM
446
HANDBOOK OF ECOTOXICOLOGY
51. Kudo, A. and Turner, R. R., Mercury contamination of Minamata Bay: Historical overview and
progress towards recovery, in
Mercury Contaminated
Sites, Ebinghaus, R., Turner, R. R., Lacerda,
L. D., Vasiliev, 0., and Salomons, W., Eds., Springer, Berlin, 1999, 143-158.
52. Parks, J. W. and Hamilton, A. L., Accelerating recovery of the mercury-contaminated Wabi-
goon/English River system,
Flydrobiologia,
149, 159-188, 1987
.
53. Borgmann, U. and Whittle, D. M., Contaminant concentration trends in Lake Ontario lake trout
(Salvelinus nanury(ush):
1977 to 1988, J.
Great
Lakes Res.,
17, 368-381, 1991
.
54. Borgmann, U. and Whittle, D. M., DOE, PCB, and mercury concentration trends in Lake Ontario
rainbow smelt (Osmerus rnardax) and slimy sculpin (Coons cognotu) : 1977 to 1988, J. Great
Lakes
Res .,
18, 298-308, 1992 .
55 . Lodenius, M., Mercury concentrations in an aquatic ecosystem during twenty years following abate-
ment (of) the pollution source,
Water Air Soil Pollut .,
56,323-332, 1991
.
56. Becker, D. S. and Bigham, G. N., Distribution of mercury in the aquatic food web of Onondaga Lake,
New York,
Water Air Soil Pallut.,
80,563-571, 1995
.
57 . Francesconi, K . A. and Lenanton, R. C. J., Mercury contamination in a semi-enclosed marine embay-
ment: Organic and inorganic mercury content of biota, and factors influencing mercury levels in fish,
Mar
Environ. Res.,
33, 189-212, 1992
.
58 . Scheider, W. A., Cox, C., Hayton, A., Hitchin, G., Vaillancourt, A„ Current status and temporal trends
in concentrations of persistent toxic substances in sport fish and juvenile forage fish in the Canadian
waters of the Great Lakes,
Environ. Monit. Assess.,
53, 57-76, 1998 .
59. Balogh, S. J., Engstrom, D. R., Almendinger, J . E., Meyer, M. L., and Johnson, D . K., History of
mercury loading in the Upper Mississippi River reconstructed from the sediments of Lake Pepin,
Environ.
Sci. lechnol., 33, 3297-3302, 1999
.
60
. Frazier, B . E., Wiener, J. G., Rada, R. G., and Engstrom, D. R., Stratigraphy and historic accumulation
of mercury in recent depositional sediments in the Sudbury River, Massachusetts, U.S.A .,Can. J
Fish .
Aqua!. Sci., 57,
1062-1072, 2000.
61 . Francesconi, K. A ., Lenanton, R. C. J., Caputi, N., and Jones, S., Long-term
study
of mercury
concentrations in fish following cessation of a mercury-containing discharge, Mar.
Environ .
Res., 43,
27-40,1997 .
62. Southworth, G. R., Turner, R. R., Peterson, M . J., Bogle, M . A., and Ryon, M. G., Response of
mercury contamination in fish to decreased aqueous concentrations and loading of inorganic mercury
in a small stream,
Environ.
Monit. Assess., 63, 481-494, 2000
.
63. Lindestrom, L., Mercury in sediment and fish communities of Lake Vanern, Sweden : Recovery from
contamination,
Ambio,
30, 538-544, 2001
.
64. Latif, M. A., Bodaly, R, A., Johnston, T. A., and Fudge, R . J. P., Effects of environmental and maternally
derived methylmercury on the embryonic and larval stages of walleye
(Stizostedion
vitreum),
Environ .
Pallut., 11
1, 139-148, 2001
.
65. Rudd, J. W. M., Turner, M. A ., Furutani, A., Swick, A. L., and Townsend, B. E., The English-Wabigoon
River system : 1 . A synthesis of recent research with a view Inwards mercury amelioration, Can
. J
Fish
.
Aqua! .
Sci., 40, 22062217, 1983
.
66. Rule, J . H. and Iwashchenko, M . S., Mercury concentrations in soils adjacent to a former ehlor-alkali
plant, J.
Environ.
Qual., 27, 31-37, 1998
.
67. Naimo, T. J., Wiener, J. G., Cope, W. G-, and Bloom, N. S., Bioavailability of sediment-associated
mercury to
Hexogenia
mayflies in a contaminated floodplain river, Can . I
Fish
Aquat Sci., 57,
1092-1102,2000.
68 . Waldron, M. C., Colman, J. A., and Breault, R . F., Distribution, hydrologic transport, and cycling of
total mercury and methyl mercury in a contaminated river-reservoir-wetland system (Sudbury River,
eastern Massachusetts), Can. J
.
Fish.
Aquat. Sci., 57, 1080-1091, 2000
.
69. Wiener, J. G. and Shields, P. J., Mercury in the Sudbury River (Massachusetts, USA) : Pollution history
and a synthesis of recent research, Can. I
Fish.
Aquat. Sci., 57, 1053-1061, 2000
.
70. Borg, K., Wamtorp, Fl., Eme, K„ and Hanko, E., Alkyl mercury poisoning in terrestrial Swedish
wildlife,
Viltrevy, 6,
301-379, 1969 .
71 . Fimreite, N .. Accumulation and effects of mercury on birds, in
77re Biogeochemistry of Mercury in
the
Environment,
Nriagu, 1. 0, Ed., Elsevier, Amsterdam, 1979, 601-627
.
LI546_rrame_MASTER.b,xrk Page 44 7 Monday
.Augus126,2002 1 :37 PM
ECOTOXICOLOGY OF MERCURY
447
72. Abernathy, A. R. and Cumbie, P. M ., Mercury accumulation by largemouth bass (Micropterus
salmo-
ides) in recently impounded reservoirs,
Bull
.
Environ. Contam .
Toxicol .,
17, 595-602, 1977.
73. Scheider, W. A., Jeffries, D. S., and Dillon, P. 1., Effects of acidic precipitation on Precambian
freshwaters in southern Ontario, J
Great
Lakes Res ., 5, 45-51, 1979
.
74. Wiener, J. G., Comparative analyses of fish populations in naturally acidic and circumneutral lakes in
northern Wisconsin, U.S. Fish Wildl. Serv. Rep. FWS/OBS-80/40.16, La Crosse, WI, 41-56, 1983
.
75 . BjOrklund, I., Borg, H., and Johansson, K., Mercury in Swedish lakes - Its regional distribution and
causes,
Ambio,
13, 118-121, 1984 .
76. Bodaly, R. A., Hecky, R, E., and Fudge, R . J. P., Increases in fish mercury levels in lakes flooded by
the Churchill River Diversion, northern Manitoba,
Can. J.
Fish.
Aquat. Sci.,
41, 682-691, 1984
.
77. Grieb, T. M., Driscoll, C. T., Gloss, S. P, Schofield, C . L., Bowie, G. L., and Porcella, D. B ., Factors
affecting mercury accumulation in fish in the upper Michigan peninsula, Environ .
Toxicol.
Chem., 9,
919-930,1990.
78. Lathrop, R. C., Rasmussen, P. W., and Knauer, D. R., Mercury concentrations in walleyes from
Wisconsin (USA) lakes,
Water Air Soil Pollut.,
56, 295-307, 1991
.
79. Spry, D. J. and Wiener, J. G., Metal bioavailability and toxicity to fish in low-alkalinity lakes : A
critical review, Environ.
Pollut., 71,
243-304, 1991 .
80. Lange, T. R., Royals, H. E., and Connor, L. L., Influence of water chemistry on mercury concentration
in largemouth bass from Florida lakes,
Trans. Am .
Fish .
Sec .,
122, 74-84, 1993 .
81 . Simonin, H. A., Gloss, S. P., Driscoll, C. T., Schofield, C. L., Kretser, W. A., Karcher, R. W., and
Symula, J., Mercury in yellow perch from Adirondack drainage lakes (New York, U.S .), in Mercury
Pollution :
Integration and Synthesis, Watras, C. J. and Huckabee, J. W., Eds., Lewis Publisher, Boca
Raton, FL, 1994, 457-469.
82. Meyer, M. W., Even, D. C., Hartigan, J. J., and Rasmussen, P. S., Patterns of common loon
(Gavia
immer) mercury exposure, reproduction, and survival in Wisconsin, USA, Environ. Toxicol. Chem.,
17,184-190,1998 .
83. Mierle, G., Addison, E. M., MacDonald, K . S., and Joachim, D. G., Mercury levels in tissues of otters
from Ontario, Canada: Variation with age, sex, and location, Environ.
Toxicol. Chem.,
19, 3044-3051,
2000 .
84. Verdon, R., Brouard, D., Demers, C., Lalumiere, R., Laperle, M ., and Schetagne, R., Mercury evolution
(1978-1988) in fishes of the La Grande hydroelectric complex, Quebec, Canada,
Water Air Soil Pollut .,
56,405-417,1991 .
85. Bodaly, R. A., St. Louis, V. L., Paterson, M . J., Fudge, R. J. P., Hall, B. D., Rosenberg, D. M., and
Rudd, J. W. M ., Bioaccumulation of mercury in the aquatic food chain in newly flooded areas, in
Metal Ions in
Biological
Systems, Vol. 34, Mercury and
Its Effects on
Environment and
Biology,
Sigel,
A. and Sigel, H., Eds., Marcel Dekker, New York, 1997, 259-287 .
86. Rosenberg, D. M., Berkes, E, Bodaly, R . A., Hecky, R. E., Kelly, C. A., and Rudd, J. W. M., Large-
scale impacts of hydroelectric development, Environ. Rev., 5, 27-54, 1997 .
87. Hall, B. D., Rosenberg, D. M., and Wiens, A. P., Methyl mercury in aquatic insects from an experi-
mental reservoir, Can .
J
Fish. Aquat. Sci., 55, 2036-2047, 1998.
88. Porvari, P., Development of fish mercury concentrations in Finnish reservoirs from 1979 to 1994, Sci
.
Total
Environ ., 213, 279-290, 1998
.
89. Ware, F. J„ Royals, H., and Lange, T., Mercury contamination in Florida largemouth bass, Proc. Annu
.
Conf. Southeast. Assoc.
Fish
Wildl
.
Agencies, 44, 5-12, 1991
.
90. Khan, B. and Tansel, B., Mercury bioconcentration factors in American alligators
(Alligator
missis-
sippiensis) in the Florida Everglades,
Ecotoxicol.
Environ . Saf., 47, 54-58, 2000 .
91. Brumbaugh, W. G., Krabbenhoft, D. P, Helsel, D. R., Wiener, J. G., and Echols, K. R., A National
Pilot Study of Mercury Contamination of Aquatic Ecosystems along Multiple Gradients : Bioaccumu-
lation in Fish, Biol. Sci . Rep. USGS/BRDIBSR-2001-0009, U.S. Geol. Surv., Reston, VA, 2001
.
92. Miskimmin, B. M., Rudd, J . W. M., and Kelly, C. A., Influence of dissolved organic carbon, pH, and
microbial respiration rates on mercury methylation and demethylation in lake water,
Can.
J. Fish .
Aquat.
Sci., 49, 17-22, 1992 .
93. St. Louis, V. L., Rudd, 3. W. M., Kelly, C. A., Beaty, K. G., Bloom, N . S ., and Fletl, R . 1., Importance
of wetlands as sources of methyl mercury to boreal forest ecosystems, Can .
J. Fish .
Aquat. Sci., 51,
1065-1076,1994
.
_frame MAS'I'f:R.b,wk Page a4 August26,2W2 137 PM
448
HANDBOOK OF ECOTOXICOLOGY
94. Watras, C . J., Bloom, N . S ., Hudson, R . J. M., Gherini, S ., Munson, R., Claas, S . A., Morrison, K . A .,
Hurley, J., Wiener, J . G., Fitzgerald, W. F., Mason, R., Vandal, G., Powell, D., Rada, R ., Rislove, L .,
Winfrey, M ., Elder, J., Krabbenhoft, D ., Andren, A. W., Babiarz, C ., Porcella, D. B., and Huckabee,
J. W., Sources and fates of mercury and methylmercury in Wisconsin lakes, in Mercury Pollution :
Integration and Synthesis, Watras, C . J. and Huckabee, 1 . W., Eds ., Lewis Publishers, Boca Raton,
FL, 1994, 153-177
.
95. Porvari, P. and Verta, M., Methylmercury.production in flooded soils : A laboratory study, Water Air
Soil Pollut., 80, 765-773, 1995 .
96. Kelly, C. A., Rudd, J. W. M., Bodaly, R. A ., Roulet, N . P., St. Louis, V. L., Heyes, A., Moore, T. R .,
Schiff, S., Aravena, R., Scott, K . J., Dyck, B., Harris, R., Warner, B ., and Edwards, G ., Increases in
fluxes of greenhouse gases and methyl mercury following flooding of an experimental reservoir,
Environ. Sri. Technol., 31, 1334-1344, 1997
.
97. Gilmour, C . C., Riedel, G. S., Ederington, M. C., Bell, J . T., Benoit, J. M., Gill, G . A., and Stordal,
M. C., Mcthylmercury concentrations and production rates across a trophic gradient in the northern
Everglades, Biogeochemistry, 40, 327-345, 1998
.
98. Paterson, M . J., Rudd,1. W. M ., and St. Louis, V., Increases in total and methylmercury in zooplankton
following flooding of a peatland reservoir, Environ. Sci. Technol., 32, 3868-3874, 1998.
99. Bodaly, R. A. and Fudge, R. J. V, Uptake of mercury by fish in an experimental boreal reservoir,
Arch. Environ. Contain. Toxicol., 37,103-109, 1999 .
100. Heyes. A., Moore, 1'. R., Rudd, J. W. M., and Dugoua, J . J ., Methyl mercury in pristine and impounded
boreal peadands, Experimental Lakes Area, Ontario, Can . J. Fish. Aquat. Sri., 57, 2211-2222, 2000 .
101 . Lucotte, M., Mucci, A., Hillaire-Marcel, C ., Pichet, P., and Gremlin, A., Anthropogenic mercury
enrichment in remote lakes of northern Quebec (Canada), Water Air Soil Pollut, 80, 467-476, 1995
.
102. Engstrom, D. R. and Swain, E. B., Recent declines in atmospheric mercury deposition in the Upper
Midwest, Environ . Set. TechnoL, 31, 960-967, 1997
.
10.3. Benoit, J. M., Fitz6erald W F, and Damman A W. H. The biogeoc
. hemlslry of an ombrotrophic
hog: Evaluation of use as an archive of atmospheric mercury deposition, Environ. Res. (Sect. A), 78,
118-133,1998 .
104. Lockhart, W. L., Wilkinson, P., Billeck, B . N., Danell, R. A., Hunt, R. V., Brunskill, G . J., DeLaronde,
J., and St. Louis, V., Fluxes of mercury to lake sediments in central and northern Canada inferred
from dated sediment cores, Biogeochemistry, 40, 163-173, 1998
.
105 . Lockhart, W. L., Macdonald, R. W., Outridge, P. M., Wilkinson, P., DeLaronde, J . B., and Rudd, J.
W. M., Tests of the fidelity of lake sediment core records of mercury deposition to known histories
of mercury contamination, Sci. Total Environ., 260, 171-180, 2000
.
106. Schuster, P. F., Krabbenhoft, D . P., Naftz, D. L., Cecil, L . D., Olson, M . L., DeWild, J . F., Susong, D. D .,
Green, J. R., and Abbott, M. L., Atmospheric mercury deposition during the last 270 years : A glacial
ice core record of natural and anthropogenic sources, Environ . Sci. Technol., 36, 2303-2310, 2002.
107. Swain, E . B ., Engstrom, D. R., Brigham, M . E., Henning, T. A., and Brezonik, P. L., Increasing
rates of atmospheric mercury deposition in midcontinental North America, Science, 257, 784-787,
1992
.
108. Lorey, P. and Driscoll, C . T., Historical trends of mercury deposition in Adirondack lakes, Environ
.
Sci. Technol., 33, 718-722, 1999
.
109. Bindler, R., Renberg, I., Appleby, P. G., Anderson, N . J., and Rose, N . L., Mercury accumulation rates
and spatial patterns in lake sediments from West Greenland : A coast to ice margin transect, Environ
.
Sci. Technol., 35, 1736-1741, 2001
.
110. Yang, H., Rose, N. L., Battarbee, R. W., and Boyle, J . F, Mercury and lead budgets for Lochnagar,
a Scottish mountain lake and its catchment, Environ . Sci. TechnoL, 36, 1383-1388, 2002 .
111 . Downs, S. G ., Macleod, C . L., and Lester, 1. N., Mercury in precipitation and its relation to bioaccu-
mulation in fish: A literature review, Water Air Soil Pollut ., 108, 149-187, 1998
.
112. Lin, C. 1., Cheng, M. D., and Schroeder, W. H., Transport patterns and potential sources of total
gaseous mercury measured in Canadian high Arctic in 1995, Atmos. Environ., 35, 1141-1154, 2001
.
113. Mierle, G., Aqueous inputs of mercury to Precambrian Shield lakes in Ontario, Environ . Toxicol.
Chem., 9, 843-851, 1990 .
114. Fitzgerald, W. F., Mason, R. P., and Vandal, G. M., Atmospheric cycling and air-water exchange of
mercury over mid-continental lacustrine regions, Water Air Soil Pollut ., 56, 745-767, 1991
.
LI546_frame MASTERb,x,k Page449 Monday,August26,2(X)2 1'.37 PM
ECOTOXICOLOGY OF MERCURY
449
115. Johansson, K., Aastrup, M., Andersson, A., Bringmark, L., and Iverfeldt,
A .,
Mercury in Swedish
forest soils and waters - assessment of critical load,
Water Air Soil Pollut.,
56, 267-281, 1991 .
116. Thompson, D. R., Fumess, R. W., and Walsh, P. M., Historical changes in mercury concentrations in
the marine ecosystem of the north and north-east Atlantic ocean as indicated by seabird feathers,
J. Appl. Ecol.,
29, 79-84, 1992 .
117. Rolfhus, K. R. and Fitzgerald, W. F., Linkages between atmospheric mercury deposition and the
methylmercury content of marine fish,
Water Air Soil Pollut.,
80, 291-297, 1995 .
118. Monteiro, L. R. and Furness, R. W., Accelerated increase in mercury contamination in North Atlantic
mesopelagic food chains as indicated by time series of seabird feathers,
Environ. Toxicol.
Chem ., 16,
2489-2493,1997 .
119. Wiener, J. G., Fitzgerald, W. F., Watras, C. I, and Rada, R. G., Partitioning and bioavailability of
mercury in an experimentally acidified Wisconsin lake,
Environ. Toxicol.
Chem., 9, 909-918, 1990 .
120. United States Geological
Survey,
Mercury in the environment, U.S. Geol. Surv. Professional Pap .
713, U.S. Gov. Printing Office, Washington, D.C., 1970.
121 . Friske, P. W. B. and Coker, W. B., The importance of geological controls on the natural distribution
of mercury in lake and stream sediments across Canada,
Water Air Soil Pollut,
80, 1047-1051, 1995 .
122. Rasmussen, P. E., Friske, P W. B., Azzaria, L. M., and Garrett, R. G., Mercury in the Canadian
environment: Current research challenges,
Geosci. Can., 25,
1-13, 1998 .
123 . Hurley, J. P., Benoit, J. M., Babiarz, C. L., Shafer, M. M., Andren, A. W., Sullivan, ) . R., Hammond,
R., and Webb, D. A., Influences of watershed characteristics on mercury levels in Wisconsin rivers,
Environ. Sci.
Technol., 29, 1867-1875, 1995 .
124. St. Louis, V. L., Rudd, J . W. M., Kelly, C. A., Beaty, K. G., Flett, R . 1., and Roulet, N . T., Production
and loss of methylmercury and loss of total mercury from boreal forest catchments containing different
types of wetlands,
Environ .
Sci. Technol., 30, 2719-2729, 1996 .
125 . Sellers, P., Kelly, C. A., and Rudd, J. W. M., Fluxes of methylmercury to the water column of a
drainage lake: The relative importance of internal and external sources,
Limnol .
Oceanogr, 46,
623-631, 2001
.
126. Bodaly, R. A., Rudd, J . W. M., Fudge, R . J. P., and Kelly, C. A., Mercury concentrations in fish related
to size of remote Canadian Shield lakes,
Can
.
J. Fish.
Aquat.
Sci., 50, 980-987, 1993
.
127. Hintelmann, H. and Evans, R. D., Application of stable isotopes in environmental tracer studies
:
Measurement of monomethylmercury (CH 3Hg
•)
by isotope dilution ICP-MS and detection of species
transformation,
Fresenius
J. Anal.
Chem ., 358, 378-385, 1997
.
128. Hintelmann, H., Keppel-Jones, K., and Evans, R. D., Constants of mercury methylation and demeth-
ylation rates in sediments and comparison of tracer and ambient mercury availability,
Environ. Toxicol.
Chem ., 19, 2204-2211, 2000 .
129. Renner, R., Follow the mercury,
Environ. Sci .
Technol., 35(11), 229A-230A, 2001 .
130. Nriagu, J. 0., A global assessment of natural sources of atmospheric metals,
Nature,
338, 47-49, 1989
.
131 . Lindqvist, 0., Mercury in the Swedish environment,
Water Air Soil Pollut.,
55, 1-261, 1991
.
132. Gill, G. A. and Fitzgerald, W. F., Mercury in surface water of the open ocean,
Global
Biogeochem .
Cycles, 3,
199-212, 1987 .
133. Krabbenhoft, D. P., Wiener, J. G., Brumbaugh, W. G., Olson, M. L., DeWild, J . F., and Sabin, T. ) .,
A national pilot study of mercury contamination of aquatic ecosystems along multiple gradients, in
U.S. Geol. Surv. Toxic Substances Hydrol . Program- Proc. Tech. Meeting, Vol. 2, Contamination
of Hydrologic Systems and Related Ecosystems, Morganwalp, D . W. and Buxton, H. T., Eds., U.S .
Geol. Surv. Water-Resour. Invest. Rep. 99140188, 1999, 147-160
.
134. Campeau, G. C, and Bartha, R ., Sulfate-reducing bacteria: Principal methylators of mercury in anoxic
estuarine sediment,
Appl. Environ.
Microbial ., 50, 498-502, 1985
.
135. Schroeder, W. H ., Yarwood, G., and Niki, H., Transformation processes involving mercury species in
the atmosphere: Results from a literature survey,
Water Air
Soil
Pollut,
56, 653-666, 1991
.
136. Amyot, M., Mierle, G., Lean, D. R. S., and McQueen, D . J., Sunlight-induced formation of dissolved
gaseous mercury in lake waters,
Environ. Sci.
Technol., 28, 2366-2371, 1994 .
137. Sellers, P., Kelly, C. A., Rudd, J. W. M., and MacHutchon, A. R ., Photodegradation of methylmercury
in lakes, Nature, 380, 694-697, 1996
.
138. Krabbenhoft, D. P, Hurley, J . P., Olson, M. L., and Cleckner, L. B ., Diel variability of mercury phase
and species distributions in the Florida Everglades, Biogeochemistry, 40, 311-325, 1998 .
f
t
L1546_trame MASTERR hook Raye450 51outay .August26,2002 1 :37 I'M
450
HANDBOOK OF ECOTOXICOLOGY
139. Ebinghaus, R., Kock, H. H., Temme, C., Einax, 1. W., Lowe, A. G., Richter, A., Burrows, J. P., and
Schroeder, W. H., Antarctic springtime depletion of atmospheric mercury, Environ
. Sci. Technol., 36,
1238-1244,2002 .
140. Lindberg, S. E., Brooks, S., Lin, C . 1 ., Scott, K . J ., Landis, M. S., Stevens, R. K., Goodsite, M., and
Richter, A., Dynamic oxidation of gaseous mercury in the Arctic troposphere at polar sunrise, Environ.
Sci. Technol., 36, 1245-1256, 2002 .
141 . Schroeder, W. H. and Munthe, J., Atmospheric mercury-an overview, Atoms. Environ., 32, 809-822, 1998 .
142 . Sommar, J., Feng, X., Gardfeldt, K., and Lindqvist, 0 ., Measurements of fractionated gaseous mercury
concentrations over northwestern and central Europe, 1995-99, J . Environ. Monit ., 1, 435-439, 1999
.
143 . Mason, R . P. and Fitzgerald, W. F., The distribution and biogeochemical cycling of mercury in the
equatorial Pacific Ocean, Deep-Sea Res., 40, 1897-1924, 1993
.
144 . Pacyna, E. G., Pacyna 1. M., and Pirrone, N ., European emissions of atmospheric mercury from
anthropogenic sources in 1995, Atmos. Environ ., 35, 2987-2996, 2001 .
145. Lindberg, S . E . and Stratton, W. J., Atmospheric mercury speciation : Concentrations and behavior of
reactive gaseous mercury in ambient air, Environ. Sri. Technol., 32, 49-57, 1998 .
146. Zhang, H . and Lindberg, S . E., Sunlight and iron(III)-induced photochemical production of dissolved
gaseous mercury in freshwater, Environ. Sci. Technol., 35, 928-935, 2001 .
147. Kim, K. H., Hanson, P. J., Barnett, M. 0., and Lindberg, S. E., Biogeochemistry of mercury in the
air-soil-plant system, in
Metal tons in
Biological Systems, Vol. 34, Mercury and Its Effects on
Environment and Biology, Sigel, A. and Sigel, H., Eds., Marcel Dekker, New York, 1997, 185-212
.
148. Nater, E. A. and Grigal, D. F., Regional trends in mercury distribution across the Great Lakes states,
north central USA, Nature, 358, 139-141, 1992
.
149. Rice, K., Trace element concentrations in streambed sediment across the conterminous United States,
Environ. Sci. Technol., 33, 2499-2504, 1999 .
150 .
St. Louis, V. L., Rudd, J. W. M., Kelly, C. A, Hall, B. D., Rolfhus, K. R., Scott, K . 1., Lindberg, S. E .,
and Dong, W., Importance of the forest canopy to fluxes of methyl mercury and total mercury to
boreal ecosystems, Environ. Sri. Technol., 35, 3089-3098, 2001
.
151 . Friedli, H. R., Radke, L. F., and Lu, 1. Y., Mercury in smoke from biomass fires, Geophys. Res. Lett.,
28,3223-3226,2001
.
152. Lalonde, J. D., Poulain, A . J., and Amyot, M., The role of mercury redox reactions in snow on snow-
to-air mercury transfer, Environ. Sci. Technol., 36, 174-178, 2002 .
153. Gustin, M. S., Lindberg, S., Austin, K., Coolbaugh, M., Vetter, A., and Shang, Z., Assessing the
contribution of natural sources to regional atmospheric mercury budgets,
Sci. Total Environ.,
25,
961-971,2000 .
154. Hedgecock, I. M. and Pirrone, N., Mercury and photochemistry in the marine boundary layer-
Modelling studies suggest the in situ production of reactive gas phase mercury, Atmos. Environ., .35,
3055-3062,200L
155 . Munthe, J., Wangberg, I., Pirrone, N., Iverfeld, A., Ferrara, R., Ebinghaus, R., Feng, X., Gardfeldt,
K., Keeler, G., Lanzillotta, E., Lindberg, S ., Lu, J ., Mamane, Y., Prestbo, E., Schmolke, S., Schroeder,
W. H., Sommar, J., Sprovieri, F., Stevens, R . K., Stratton, W., Tuncel, G., and Urba, A., Intercomparison
of methods for sampling and analysis of atmospheric mercury species, Atmos
. Em,iron.,
35,
3007-3017,2001
.
156. Fitzgerald, W. F., Is mercury increasing in the atmosphere? The need for an atmospheric mercury
network (AMNET), Water Air Soil Pollut., 80, 245-254, 1995
.
157. lamborg, C. H ., RolOms, K. R., Fitzgerald, W. F., and Kim, G., The atmospheric cycling and air-sea
exchange of mercury species in the South and equatorial Atlantic Ocean,
Deep-Sea Res.
II, 46,
957-977,1999,
158. Stratton, W. J., Lindberg, S., and Perry, C. J., Atmospheric mercury speciation: Laboratory and field
evaluation of a mist chamber method for measuring reactive gaseous mercury, Environ. Toxieol. Chem .,
35, 170-177, 2001
.
159. Schroeder, W. H., Anlauf, K. G., Barrie, L. A., Lu, J. Y., Steffen, A., Schneeberger, D. R., and Berg,
T., Arctic springtime depletion of mercury, Nature, 394, 331-332, 1998
.
160. Lindberg, S., Landis, M. S., Stevens, R. K., and Brooks, S., Comments on "Atmospheric mercury
species in the European Arctic : Measurements and modeling" by Berg et al ., Atmos . Environ., 14
(2001), 2569-2582, Atmos . Environ., 35, 5377-5378, 2(X)1
.
L1546_frnme_MASTER.book Page 451 Monday, August 26 .2002 107 PM
ECOTOXICOLOGY OF MERCURY
451
161. Bloom, N. S. and Crecelius, E. A., Determination of mercury in seawater at sub nanogram per liter
levels, Mar Chem., 14, 49-59, 1983
.
162. Babiarz, C. L., Hurley, 1. P., Hoffmann, S. R., Andren, A. W., Shafer, M. M., and Armstrong, D. E .,
Partitioning of total mercury and methylmercury to the colloidal phase in freshwaters,
Environ. Sci.
Technol., 35, 4773-4782, 2001
.
163. Mason, R. P., Rolthus, K. R., and Fitzgerald, W. F., Mercury in the North Atlantic, Mar Chem., 61,
37-53,1998
.
164. Ravichandran, M., Aiken, G. R., Reddy, M. M., and Ryan, J. N., Enhanced dissolution of cinnabar
(mercuric sulfide) by organic matter from the Florida Everglades,
Environ. Sci.
TechnoL,
32,
3305-3311,1998
.
165 . Gill, G. A. and Bruland, K. W., Mercury speciation in surface freshwater systems in California and
other areas, Environ. Sci. Technol ., 24, 1392-1400, 1990.
166. Bloom, N. S ., Horvat, M., and Watras, C. J., Results of the international aqueous mercury specialion
intercomparison exercise, Water Air Soil Pollut., 80, 1257-1268, 1995
.
167 . Dyrssen, D. and Wedborg, M., The sulphur-mercury (II) system in natural waters,
Water Air Soil
Pollut., 56, 507-517, 1991
.
168. Paquette, K. E. and Hclz, G. R., Inorganic speciation of mercury in sulfidic waters : The importance
of zero-valent sulfur, Environ. Sci. Technol., 31, 2148-2153, 1997 .
169. Ravichandran, M., Aiken, G. R., Ryan, J . N., and Reddy, M. M., Inhibition of precipitation and
aggregation of metacinnabar (mercury sulfide) by dissolved organic matter isolated from the Florida
Everglades, Environ. Sei. TechnoL, 33, 1418-1423, 1999
.
170. Benoit, J. M., Gilmour, C. C., Mason, R. P., and Heyes, A., Sulfide controls on mercury speciation
and bioavailability to methylating bacteria in sediment and pore waters, Environ. Sci. TechnoL, 33,
951-957,1999 .
171 . Benoit, J. M., Mason, R. P, and Gilmour, C. C., Estimation of mercury-sulfide speciation and
bioavailability in sediment pore waters using octanol-water partitioning, Environ. Toxicol. Chem., 18,
2138-2141,1999 .
172. Babiarz, C. L. and Andren, A. W., Total concentrations of mercury in Wisconsin (USA) lakes and
rivers, Water Air Soil Pollut ., 83, 173-183, 1995 .
173. Wiener, J. G. and Spry, D . J., Toxicological significance of mercury in freshwater fish, in Environmental
Contaminants in Wildlife: Interpreting Tissue Concentrations, Beyer, W. N ., Heinz, G. H., and Red-
mon-Norwood, A. W., Eds., Lewis Publishers, Boca Raton, FL, 1996, 297-339
.
174. Bigham, G. N. and Vandal, G. M., A drainage basin perspective of mercury transport and bioaccu-
mulation: Onondaga Lake, New York, NeuroToxicology,
17, 279-290, 1996 .
175. Wang, W. and Driscoll, C . T., Patterns of total mercury concentrations in Onondaga Lake, New York,
Environ. Sci. TechnoL, 29, 2261-2266, 1995.
176. Mierle, G. and Ingram, R., The role of humic substances in the mobilization of mercury from
watersheds, Water Air Soil Pollut., 56, 349-357, 1991
.
177. Kolka, R. K., Grigal, D. F., Verry, E. S., and Nater, E. A., Mercury and organic carbon relationships
in streams draining forested upland/peatland watersheds, J. Environ . Qual., 28, 766-775, 1999
.
178. Gray, J. E., Theodorakos, P. M, Bailey, E. A., and Turner, R. R., Distribution, speciation, and transport
of mercury in stream-sediment, stream-water, and fish collected near abandoned mercury mines in
southwestern Alaska, USA, Sci. Total Environ., 260, 21-33, 2000 .
179. Babiarz, C. L., Hurley, J. P., Benoit, J. M., Shafer, M. M., Andrea, A. W., and Webb, D. A., Seasonal
influences on partitioning and transport of total and methylmercury in rivers from contrasting water-
sheds, Biogeochemistry, 41, 237-257, 1998 .
180. Bodaly, R. A., Rudd, 1. W. M., and Flett, R. J., Effect of urban sewage treatment on total and methyl
mercury concentrations in effluents, Biogeochemistry, 40, 279-291, 1998
.
181. Bloom, N. S. and Effler, S. W., Seasonal variability in the mercury speciation of Onondaga Lake
(New York), Water Air Soil Pollut., 53, 251-265, 1990 .
182. Coquery, M., Cossa, D., and Martin, J. M., The distribution of dissolved and particulate mercury in
three Siberian estuaries and adjacent arctic coastal waters, Water Air Soil Pollut., 80, 653-664, 1995 .
183. Lee, Y. H., Bishop, K. H., Munthe, J., Iverfeldt,
A .,
Verta, M., Parkman, H., and Hallberg, H., An
examination of current Hg deposition and export in Fenno-Scandian catchments,
Biogeochemistry,
40,125-135,1998 .
LI546
frame_MASTER
bw,k
Page
492
Monday, Angun
26,2M2 1:37
PM
452
HANDBOOK OF ECOTOXICOLOGY
184. Krabbenhoft, D . P., Gilmour, C. C., Benoit, J. M ., Babiarz, C. L., Andren, A. W., and Hurley, J . P.,
Methylmercury dynamics in littoral sediments of a temperate seepage lake, Can . J.
Fish.
Aquat. Sci.,
55,835-844,1998
.
185. Vandal, G. M., Mason, R. P, and Fitzgerald, W. F., Cycling of volatile mercury in temperate lakes,
Water Air
Soil
Pollut.,
56, 791-803, 1991
.
186. Poissant, L., Amyot, M., Pilate, M., and Lean, D., Mercury water-air exchange over the upper St
.
Lawrence River and Lake Ontario,
Sri. Total Environ.,
34, 3069-3078, 2001
.
187. Amyot, M., Gill, G. A ., and Morel, F M. M., Production and loss of dissolved gaseous mercury in
coastal seawater, Environ. Sci
.
Technol.,
31, 3606-2611, 1997
.
188. Lalonde, J. D., Amyot, M., Kraepiel, A . M. L., and Morel, F. M. M., Photo-oxidation of Hg(0) in
artificial and natural waters, Environ. Sci.
Technol .,
35, 1367-1372, 2001
.
189. Rolfhus, K . R . and Fitzgerald, W. F., The evasion and spatial/temporal distribution of mercury species
in Long Island Sound, CF-NY,
Geochim .
Cosmoehim. Acta, 65, 407-418, 2001
.
190. Lindberg, S. E., Kim, K. H., Meyers, T. P., and Owens, J. G., A micrometeorological gradient approach
for quantifying air/surface exchange of mercury vapor: Tests over contaminated soils,
Environ
.
Sci.
Technol., 29,
126-135, 1995 .
191 . Hong, Z. and Lindberg, S. L., Processes influencing the emission of mercury from soils : A conceptual
model, J.
Geophys. Res.,
104, 889-896, 1999.
192. Biester, H., Gosar, M., and Covelli, S., Mercury speciation in sediment affected by dumped mining
residues in the drainage area of the Idrija Mercury Mine, Slovenia,
Environ. Sci. Technol., 34,
3330-3336,2000 .
193. Van Straaten, P., Mercury contamination associated with small-scale gold mining in Tanzania and
Zimbabwe, Sci
.
Total Environ .,
259, 105-113, 2000 .
194. Barnett, M . 0., Harris, L. A., Turner, R. R., Stevenson, R . J., Henson, T. J., Melton, R. C., and
Hoffman, D. P., Formation of mercuric sulfide in soil, Environ. Sci .
Technol.,
31, 3037-3043, 1997 .
195. Baily, E. H. Hildebranti , F. A., Christ, C. L., and Fahey, 1 . 1., Schuetteite, a new supergene mercury
mineral, Am.
Mineral., 44,
1026-1038, 1959
.
196. Schwesig, D., Ilgen, G., and Matzner, E., Mercury and methylmercury in upland and wetland acid
forest soils of a watershed in NE-Bavaria, Germany,
Water Air Soil Pollut.,
113, 141-154, 1999
.
197. Branfireun, B . A . and Roulet, N. T., Controls on the fate and transport of methylmercury in a boreal
catchment hydrological cascade,
Hydrol. Earth Systems Sci .,
2002, in press
.
198. Krabbenhoft, D. P., Benoit, J. M ., Babiarz, C. L., Hurley, J. P., and Andren, A. W., Mercury cycling
in the Allequash Creek watershed,
Water Air Soil Pollut.,
80, 425-433, 1995
.
199. Winfrey, M. R. and Rudd, J. W. M., Environmental factors affecting the formation of methylmercury
in low pH lakes, Environ. Toxicol.
Chem .,
9, 853-869, 1990.
200. Gilmour, C. C., Henry, E. A, and Mitchell, R ., Sulfate stimulation of mercury methylation in freshwater
sediments,
Environ. Sri. Technol.,
26, 2281-2287, 1992 .
201. Holmer, M. and Storkholm, P., Sulphate reduction and sulphur cycling in lake sediments : A review,
Freshwat. Riot., 46,
431-451, 2001
.
202. King, J. K., Kostka, J . E., Frischer, M . E., Saunders, F. M., and Jahnke, R . A., A quantitative relationship
that demonstrates mercury methylation rates in manne sediments are based on the community com-
position and activity of sulfate-reducing bacteria, Environ. Sri.
Technol.,
35, 2491-2496, 2001
.
203. Jensen, S. and Jemelov, A., Biological methylation of mercury in aquatic organisms,
Nature, 223,
753-754,1967 .
204. Pak, K- R. and Bartha, R., Mercury methylation and demethylation in anoxic lake sediments and by
strictly anaerobic bacteria,
Appl. Environ. Microbiol.,
64, 1013-1017, 1998 .
205. Branfireun, B . A., Heyes, A., and Roulet, N. T., The hydrology and methylmercury dynamics of a
Precambrian shield headwater pentland,
Water Resour Res.,
32, 1785-1794, 1996 .
206. Furutani, A. and Rudd, J . W. M., Measurement of mercury methylation in lake water and sediment
samples,
AppL Environ. Microbial., 40,
770-776, 1980.
207. Topping, G. and Davis, 1 . M., Methylmercury production in the marine water column,
Nature,
290,
243-244,1981
.
208. Cleckner, L. B ., Gilmour, C. C., Hurley, J. P., and Krabbenhoti, D. P., Mercury methylation by
periphyton in the Florida Everglades,
Limnol. Oeeanogr., 44,
18 15-1825, 1999 .
O
Y'
LI54t fmn1e MASTER b,wk Page 453 Monday, August 26, 2002 1 :37 PM'
ECOTOXICOLOGY OF MERCURY
453
209 .
Guimaraes, J. R. D., Meili, M., Hylander, L. D., Silva, E. D. E., Roulet, M., Mauro, J. B. N., and de
Lemos, R. A., Mercury net methylation in five tropical flood plain regions of Brazil : High in the root
zone of floating macrophyte mats but low in surface sediments and flooded soils, Sci. Total Environ .,
261,99-108,2000.
210. Rudd, J. W. M., Furutani, A., and Turner, M. A., Mercury methylation by fish intestinal contents,
Appl. Environ. Microbial ., 40, 777-782, 1980
.
211 . Jernelov, A., Mercury and food chains, in Environmental Mercury Contamination, Hartung, R. and
Dinman, B. D., Eds., Ann Arbor Sci. Publishers, Ann Arbor, MI, 174-177, 1972 .
212. Ulbich, S. M., Tanton, T. W., and Abdrashitova, S . A., Mercury in the aquatic environment: A review
of factors affecting methylation, Crit. Rev. Environ. Sci. Technol., 31, 241-293, 2001
.
213 . Korthals, E. T. and Winfrey, M. R., Seasonal and spatial variations in mercury methylation and
demethylation in an oligotrophic lake, Appl. Environ. Microbial., 53, 2397-2404, 1987 .
214. Bloom, N. S., Gill, G. A., Cappellino, S., Dobbs, C., McShea, L., Driscoll, C., Mason, R., and Rudd,
J., Speciation and cycling of mercury in Lavaca Bay, Texas, sediments, Environ. Sci. Technol ., 33,
7-13,1999 .
215. Barkay, T., Turner, R. R., Rasmussen, L. D., Kelly, C. A., and Rudd, J. W. M., Luminescence facilitated
detection of bioavailable mercury in natural waters, in Bioluminescence Methods and Protocols,
LaRossa, R. A., Ed ., Methods in Microbiology, 102, 231-246, Humana Press, Totowa, NJ, 1998 .
216. Ridley, W. P., Dizikes, L . J., and Wood, 1. M., Biomethylation of toxic elements in the environment,
Science, 197, 329-330, 1977
.
217. Wood, J. M., Alkylation of metals and the activity of metal-alkyls, Tosicol
. Environ . Chem., 7,229-240,
1984 .
218. [mum, N., Sukegawa, E., Pan, S., Nagao, K., Kim, J., Kwan, T., and Ukita, T., Chemical methylation
of inorganic mercury with methylcobalamin, a vitamin B12 analog,
Science, 172, 1248-1249, 1971
.
219, Choi, S. C., Chase, T., and Bartha, R., Enzymatic catalysis of mercury methylation by Desulfovibrio
desulfuricans LS, Appl. Environ. Microbial., 60, 1342-1346, 1994 .
220. Akagi, H., Miller, D. R., and Kudo, A., Photochemical transformation of mercury, in Distribution and
Transport of Pollutants in Flowing Water Ecosystems, Final Rep., Ottawa River Project, Univ. Ottawa,
Nat. Res. Council Can., 1977 .
221 . Nagase, H., Ose, Y., and Sato, T., Possible methylation of inorganic mercury by silicones in the
environment, Sci. Total Environ ., 73, 29-36, 1988
.
222. Jewett, K. L., Brinckman, F. E., and Bellama, J. M., Chemical factors influencing metal alkylation in
water, in Marine Chemistry in the Coastal Environment,
Church, T. M., Ed., Am. Chem. Soc .,
Washington, D.C ., 1975, 304-318 .
223. Nagase, H., Ose, Y., Sato, T., and Ishikawa, T., Methylation of mercury by humic substances in an
aquatic environment, Sci. Total Environ ., 24, 133-142, 1982.
224. Weber, 1. H., Review of possible paths for abiotic methylation of mercury([[) in the aquatic environ-
ment, Chemosphere, 26, 2063-2070, 1993 .
225. Falter, R. and Wilken, R . D., Isotope experiments for the determination of abiotic mercury methylation
potential of a River Rhine sediment, Yom Wasser, 90, 217-232, 1998
.
226. Horvat, M., Bloom, N. S., and Liang, L., Comparison of distillation with other current isolation
methods for the determination of MeHg compounds in low level environmental samples . Part I .
Sediment, Anal. Chim. Acta, 282, 135-152, 1993
.
227. Hammerschmidt, C. R. and Fitzgerald, W. F., Formation of artifact methylmercury during extraction
from a sediment reference material, Anal. Chem., 73, 5930-5936, 2001
.
228. Campeau, G. and Bartha, R., Methylation and demethylation of mercury under controlled redox, pH
and salinity conditions, Appl. Environ. Microbial., 48, 1203-1214, 1984 .
229. Oremland, R . S., Culbertson, C. W., and Winfrey, M. R., Methylmercury decomposition in sediments
and bacterial cultures- involvement of methanogens and sulfate reducers in oxidative demethylation,
Appl. Environ. Microbial ., 57, 130-140, 1991
.
230. Robinson, J. B. and Tuovinen, O. H., Mechanisms of microbial resistance and detoxification of
mercury and organomercury compounds - Physiological, biochemical and genetic analyses, Micro-
biol. Rev., 48, 95-125, 1984 .
231 . Summers, A. 0., Organization, expression and evolution of genes for mercury resistance, Anna. Rev
.
Microbiol., 40, 607-612, 1986 .
t,/
1.1546_franc MASTER book Page 454 Monday, August 26. 2002 1 :37 I'M
454
HANDBOOK OF ECOTOXICOLOGY
232. Marvin-DiPasquale, M. and Oremland, R . S., Bacterial methylmercury degradation in Florida Ever-
glades sediment and periphyton,
Environ. Sci. Technol.,
32, 2556-2563, 1998.
233 . Marvin-DiPasquale, M., Agee, J., McGowan, C., Oremland, R . S., Thomas, M., Krabbenhoft, D. P.,
and Gilmour, C. C., Methyl-mercury degradation pathways - A comparison among three mercury
impacted ecosystems,
Environ. Sci. TechnoL,
34, 4908-4916, 2000 .
234. Krabbenhoft, D. P., Olson, M. L., Dewild, J. F, Clow, D. W., Striegl, R . S., Dornblaser, M. M., and
Van Metre, P., Mercury loading and methylmercury production and cycling in high-altitude lakes from
the western United States, Water Air
Soil Pollut. Focus, 2(2),
233-249, 2002 .
235 . Baughman, G. L., Gordon, J. A., Wolfe, N. L., and Zepp, R. G., Chemistry of organomercurials in
aquatic ecosystems, Rep. EPA-660/3-73-012, U.S. Environ. Protect. Agency, Office of Research and
Development, Washington, D.C., 1973 .
236. Branfireun, B . A., Hilbert, D., and Roulet, N . T., Sinks and sources of methylmercury in a boreal
catchment,
Biogeochemisstry,
41, 277-291, 1998
.
237. Suda, I., Suda, M ., and Hirayama, K., Degradation of methyl and ethyl mercury by singlet oxygen
generated from sea water exposed to sunlight or ultraviolet light,
Arch. Toxicol,
67, 365-371, 1993.
238. Meyer, M . W., Evers, D . C., Daulton, T., and Braselton, W.E ., Common loons (Gavia
immer)
nesting
on low pH lakes in northern Wisconsin have elevated blood mercury content,
Water Air Soil Poll iii.,
90,871-880,1995
.
239. Westcott, K. and Kalff, J., Environmental factors affecting methyl mercury accumulation in zooplank-
ton,
Can. J. Fish.
Aquat.
Sri., 53, 2221-2228, 1996 .
240. Plourde, Y., Lucerne, M., and Pichet, P., Contribution of suspended particulate matter and zooplankton
to MeHg contamination of the food chain in midnorthern Quebec (Canada) reservoirs, Can
. J
Fish .
Aquat. Set.,
54, 821-831, 1997
.
241. Xun, L., Campbell, N. E. R., and Rudd, J. W. M., Measurements of specific rates of net methyl
mercury production in the water column and surface sediments of acidified and circumneutral lakes,
Can.
J. Fish.
Aquat. Sci.,
44,
750-757,
1987 .
242. Hecky, R. E., Ramsey, D . J., Bodaly, R. A., and Strange, N. E., Increased methylmercury contamination
in fish in newly formed freshwater reservoirs, in
Advances in Mercury Toxicology,
Suzuki, T. et al .,
Eds., Plenum Press, New York, 1991, 33-52
.
243. Hurley, J. P., Krabbenhoft, D. P., Cleckner, L. B., Olson, M. L., Aiken, G. R., and Rawlik, P. S .,
System controls on the aqueous distribution of mercury in the northern Florida Everglades,
Bio-
geochemistry,
40, 293-311, 1998
.
244. Filers, J. M., Brakke, D. F., and Landers, D. H., Chemical and physical characteristics of lakes in the
Upper Midwest, United States,
Environ. Sci. Technot.,
22, 164-172, 1988 .
245. Krabbenhoft, D . P. and Babiarz, C. L., The role of groundwater transport in aquatic mercury cycling,
Water
Resour. Res ., 28, 3119-3128, 1992 .
246. Rada, R. G., Wiener, 3. G., Winfrey, M. R., and Powell, D . E., Recent increases in atmospheric
deposition of mercury to north-central Wisconsin lakes inferred from sediment analyses,
Arch. Environ.
Contam. Toxicol .,
18, 175-181, 1989 .
247. Rada, R. G., Powell, D . E., and Wiener, J. G., Whole-lake burdens and spatial distribution of mercury
in surficial sediments in Wisconsin seepage lakes,
Can. J. Fish. Aqua[. Sci.,
50, 865-873, 1993
.
248. Wiener, J. G., Rago, P. 1., and Eilers, J. M., Species composition of fish communities in northern
Wisconsin lakes: Relation to pH, in
Early Biotic
Responses
to Advancing
Lake Acidification,
Hendrey,
G. R., Ed., Butterworth Publishers, Boston, 1984, 133-146
.
249. Wiener, 1. G. and Filers, J. M., Chemical and biological status of lakes and streams in the Upper
Midwest: Assessment of acidic deposition effects,
lake Reservoir Manage.,
3, 365-378, 1987 .
250. Wiener, J. G., Martini, R. E., Sheffy, T. B., and Glass, G. E., Factors influencing mercury concentrations
in walleyes in northern Wisconsin lakes,
Trans. Am. Fish. Soc .,
119, 862-870, 1990
.
251 . Colby, P. J., McNicol, R. E., and Ryder, R . A., Synopsis of biological data on the walleye
Stizostedion v
.
vitreurn
(Mitchill 1818). FAD Fish. Synopsis No. 119, Food Agric . Org. United Nations, Rome, Italy, 1979
.
252. Barr, 1. F., Aspects of common loon
(Gavia immer)
feeding biology on its breeding ground,
Hydro-
biologia,
321,
119-144, 1996 .
253. Huekabee, 1. W., Elwood, J. W., and Hildebrand, S . G., Accumulation of mercury in freshwater biota,
in
Biogeochemistry
of
Mercury in
the
Environment,
Nriagu, J. 0., Ed., Elsevier/North-Holland Bio-
medical Press, New York, 1979, 277-302 .
h.1546_rwne_MASJIR.book Page 455 Monday, August 26, 2002 107 PM
ECOTOXICOLOGY OF MERCURY
455
254.
Boudou, A . and Ribeyre, F., Mercury in the food web: Accumulation and transfer mechanisms, in
Metal Ions in Biological Systems,
Vol. 34, Mercury
and
Its
Effects on Environment and Biology, Sigel,
A. and Sigel, H., Eds., Marcel Dekker, New York,
1997, 289-319.
255 .
Morel, F. M. M., Kraepiel, A. M. L., and Amyot, M., The chemical cycle and bioaccumulation of
mercury, Annu. Rev. Ecol.
Systemat.,
29, 543-566, 1998 .
256 .
Kim, J. P. and Burggraaf, S., Mercury bioaccumulation in rainbow trout (Oncorhynchus
mykiss)
and
the trout food web in lakes Okareka, Okaro, Tarawera, Rotomahana and Rotorua, New Zealand,
Water
Air Soil Pollut,
115, 535-546, 1999 .
257 .
Bowles, K. C., Apte, S. C., Maher, W. A., Kawei, M., and Smith, R., Bioaccumulation and biomag-
nification of mercury in Lake Murray, Papua New Guinea,
Can.
J. Fish.
Aquat.
Sci.,
58,888-897,2001
.
258 .
Thompson, D. R., Hamer, K. C., and Furness, R. W., Mercury accumulation in Great Skuas
Catharacta
skua of known age and sex, and its effects upon breeding and survival,
J.
Appl. Ecol.,
28, 672-684,1991
.
259
.
Furness, R. W., Thompson, D. R., and Becker, P. H., Spatial and temporal variation in mercury
contamination of seabirds in the North Sea, Helgolander Meeresunters,
49, 605-615, 1995 .
260.
Evans, R. D., Addison, E. M., Villeneuve, J. Y, MacDonald, K. S., and Joachim, D. G., Distribution
of inorganic and methylmercury among tissues in mink (Mustela
vison)
and otter
(Lutra canadensis),
Environ. Res. (Sect
. A),
84,133-139, 2000.
261 .
Thompson, D. R. and Furness, R. W., The chemical form of mercury stored in South Atlantic seabirds,
Environ.
Pollut.,
60, 305-317, 1989 .
262 .
Kim, E. Y., Murakami, T., Saeki, K., and Tatsukawa, R., Mercury levels and its chemical form in
tissues and organs of seabirds, Arch . Environ.
Contain. Toxicol.,
30, 259-266, 1996.
263 .
Scheuhammer, A. M., Wong, A. H. K., and Bond, D., Mercury and selenium accumulation in common
loons
(Gavia immer)
and common mergansers (Merges merganser) from eastern Canada,
Environ.
Toxicol. Chem.,
17, 197-201, 1998 .
264.
Watras, C. J., Back, R. C., Halvorsen, S., Hudson, R. J. M., Morrison, K. A., and Wente, S. P.,
Bioaccumulation of mercury in pelagic freshwater food webs, Sci.
Total
Environ .,
219, 183-208, 1998 .
265 .
RiisgArd, H. U. and Famme, P., Accumulation of inorganic and organic mercury in shrimp, Crangon
crangon,
Mar. Pollut.
Bull.,
17, 255-257, 1986 .
266 .
Back, R. C. and Watras, C. J., Mercury in zooplankton of northern Wisconsin lakes : Taxonomic and
site-specific trends,
Water Air Soil Pollut.,
80, 931-938, 1995 .
267 .
Lawson, N. M. and Mason, R . P., Accumulation of mercury in estuarine food chains, Biogeochemistry,
40,235-247,1998 .
268 .
Lawrence, A. L. and Mason, R . P., Factors controlling the bioaccumulation of mercury and methyl-
mercury by the estuarine amphipod Leptocheirus plumulosus, Environ. Pollut., 111,
217-231, 2001
.
269 .
Simon, O. and Boudon, A., Simultaneous experimental study of direct and direct plus trophic con-
tamination of the crayfish
Astacus astacus by
inorganic mercury and methylmercury, Environ. Toxicol.
Chem.,
20, 1206-1215, 2001
.
270 .
Tremblay, A., Lucotte, M., and Rheault, L, Methylmercury in a benthic food web of two hydroelectric
reservoirs and a natural lake of northern Quebec (Canada),
Water Air Soil Pollut .,
91, 255-269, 1996 .
271
.
Claisse, D., Cossa, D., Bretaudeau-Sanjuan, J., Touchard, G., and Bobled, B., Methylmercury in
molluscs along the French coast,
Mar. Pollut. Bull.,
42,
329-332, 2001 .
272
.
Monson, B. A. and Brezonik, P. L., Seasonal patterns of mercury species in water and plankton from
sofiwater lakes in northeastern Minnesota, Biogeochemistry, 40,
147-162, 1998 .
273
.
Miles, C . J., Moye, H. A., Phlips, E. J., and Sargent, B., Partitioning of monomethylmercury between
freshwater algae and water, Environ. Sci. Technol.,
35, 4277-4282, 2001
.
274.
MacCrimmon, H. R., Wren, . C. D., and Gots, B. L., Mercury uptake by lake trout,
Salvelinus
namaycush, relative to age, growth, and diet in Tadenac Lake with comparative data from other
Precambrian Shield lakes,
Can .
J.
Fish
.
Aquat. Sci.,
40, 114-120, 1983 .
275 .
Suns, K., Hitchin, G., Loescher, B., Pastorek, E., and Pearce, R., Metal accumulations in fishes from
Muskoka-Haliburton lakes in Ontario
(1978-1984),
Ontario Ministry of the Environment, Rexdale,
Ontario,
1987.
276.
Cope, W. G., Wiener, J. G., and Rada, R. G., Mercury accumulation in yellow perch in Wisconsin
seepage lakes: Relation to lake characteristics, Environ. Toxicol. Chem .,
9, 931-940, 1990 .
277 .
Monteiro, L. R., Granadeiro, J . P., and Furness, R. W., Relationship between mercury levels and diet
in Azores seabirds, Mar. Ecol. Prog. Set .,
166, 259-265, 1998 .
4
L1546 frame MA.STERbook Page 456 Mnnduy,Nignsi26,2012 1:37 PM
456
HANDBOOK OF ECOTOXICOLOGY
278. Benoit, J. M ., Gilmour, C. C., and Mason, R. P, The influence of sulfide on solid-phase mercury
bioavailability for methylation by pure cultures of Desuifobulbus pmpionicus (Ipr3), Environ. Sci.
Technol., 35, 127-132, 2001
.
279. King, J. K., Kostka, 1. E., Frischer, M. E., and Saunders, E M., Sulfate-reducing bacteria methylate
mercury at variable rates in pure culture and in marine sediments, Appl
. Environ. Microhiol., 66,
2430-2437,2000 .
280. Heyes, A., Moore, T. R., and Rudd, J. W. M., Mercury and methylmercury in decomposing vegetation
of a pristine and impounded wetland, J. Environ . QuaL, 27, 591-599, 1998
.
281 . Gerrard, P. M. and St. Louis, V. L., The effects of experimental reservoir creation on the bioaccumu-
lation of methylmercury and reproductive success of tree swallows (7achycineta bicolor), Environ.
Sci. Technol., 35, 1329-1338, 2001
.
282. Cabana, G. and Rasmussen, J. B., Modelling food chain structure and contaminant bioaccumulation
using stable nitrogen isotopes, Nature, 372, 255-257, 1994,
283. Cabana, G., Tremblay, A., Kalff, 1., and Rasmussen, J. B., Pelagic food chain structure in Ontario
lakes: A determinant of mercury levels in lake trout (Salvelinus namay(ush), Can . J. Fish. Aquat. Sci .,
51,381-389,199 ,L
284. Vander Zanden, M . J. and Rasmussen, J . B., A trophic position model of pelagic food webs : Impact
on contaminant bioaccumulation in lake trout, Ecol. Monogr., 66, 451-477, 1996 .
285. Gnamus, A., Byrne, A. R., and Horvat, M., Mercury in the soil-plant-deer-predator food chain of a
temperate forest in Slovenia, Environ
. Sci. Technol ., 34, 3337-3345, 2000 .
286. Watras, C. 1. and Bloom, N . S., Mercury and methylmercury in individual zooplankton : Implications
for bioaccumulation, LimnoL Oceanogr., 37, 1313-1318, 1992.
287. Hammerschmidt, C. R., Wiener, J. G., Frazier, B. E., and Rada, R . G ., Methylmereury content of eggs
in yellow perch related to maternal exposure in four Wisconsin lakes, Environ.
Sci. Technol., 33,
999-1003,1999 .
288. Southworth G. R. Turner R. R. Peterson, M. 1, and Bo Ie M A. Form of mercury in stream fish
exposed to high concentrations of dissolved inorganic mercury, Chemosphere, 30, 779-787, 1995 .
289. Ribeyre,F.andBoudou,A.,Bioaccumulationetrepartitiontissulairedumercure-HgCI,etCH,HgCI
- Chez Salmo gairdneri apres contamination par vole directe, Water Air Soil Pollut, 23, 169-186,
1984 .
290. Ribeyre, F. and Boudon, A., Etude experimentale des processes de decontamination chez Salmo
gairdneri, apres contamination par voie directe avec deux derives du mercure (HgClt et CH,HgCI)
- Analyse des transferts aux niveaux "organisme" et "organs,"
Environ .
Pollut.
(Series A),
35,
203-228,1984 .
291 . Boudou, A . and Ribeyre, F., Experimental study of trophic contamination of Salmo gairdneri by two
mercury compounds - HgC I, and CH,HgCI - Analysis at the organism and organ levels, Water
Air Soil Pollut., 26, 137-148, 1985
.
292. Niimi, A. JL and Kissoon, G . P., Evaluation of the critical body burden concept based on inorganic
and organic mercury toxicity to rainbow trout (Oncorhynchus mykiss), Arch
. Environ . Contain. Tox-
icol., 26, 169-178, 1994 .
293. Trudel, M. and Rasmussen, J. B ., Modeling the elimination of mercury by fish, Environ. Sci. Technol.,
31,1716-1722,1997 .
294. Rihciro, C. A. 0., Rouleau, C ., Pelletier,
E` ., Audet, C., and Tjdlve, H., Distribution kinetics of dietary
methylmercury in the Arctic chary (Salvelinus alpinus), Environ . Sci. Technol ., 33, 902-907, 1999
.
295. Harris, R . C. and Snodgrass, W. J., Bioenergetic simulations of mercury uptake and retention in
walleye (Stizostedion vitreum) and yellow perch (Perca flavescens), Water Pollut. Res. J. Can., 28,
217-236,1993 .
296. Rodgers, D. W., You arc what you eat and a little bit more: Bioenergetics-based models of methyl-
mercury accumulation in fish revisited, in Mercury Pollution: Integration and Synthesis, Walrus,
C . J . and Huckabee, J . W., Eds ., Lewis Publishers, Boca Raton, FL, 1994, 427-439
.
297. Hall, B. D., Bodaly, R. A., Fudge, R. J. P., Rudd, J. W. M ., and Rosenberg, D. M., Food as the
dominant pathway of methylmercury uptake by fish, Water Air Soil Pollut ., 100, 13-24, 1997
.
298. Harris, R. C. and Bodaly, R . A., Temperature, growth and dietary effects on fish mercury dynamics
in two Ontario lakes, Biogeochemistry, 40, 175-187, 1998,
0
O
MAST1:Rbook
Page 457 Monday, August 26, 2002 1 J7 PM
ECOTOXICOLOGY OF MERCURY
457
299 .
Olson, G. F., Mount, D. 1., Snarski, V. M., and Thorslund, T. W., Mercury residues in fathead minnows,
Pimephales promelas Rafinesque, chronically exposed to methylmercury in water,
Bull. Environ .
Contain. Toxicol.,
14, 129-134, 1975 .
300
.
McKim, J. M., Olson, G. F., Holcombe, G. W., and Hunt, E. P, Long-term effects of methylmercuric
chloride on three generations of brook trout (Salvelinus fontinalis) : Toxicity, accumulation, distribu-
tion, and elimination, J.
Fish .
Res . Board Can .,
33, 2726-2739, 1976 .
301.
Boudon, A. and Ribeyre, F., Contamination of aquatic biocenoses by mercury compounds: An exper-
imental ecotoxicological approach, in Aquatic Toxicology, Nriagu,
1.0., Ed., John Wiley and Sons,
New York,
1983, 73-116 .
302
.
Harrison, S. E., Klaverkamp, J. F., and Hesslein, R. H., Fates of metal radiotracers added to a whole
lake: Accumulation in fathead minnow (Pimephales promelas) and lake trout (Salvelinus namaycush),
Water Air Soil Pollut.,
52, 277-293, 1990.
303
.
Giblirr F. J. and Massaro, E . J., Pharmacodynamics of methyl mercury in the rainbow trout (Salmo
gairdneri): Tissue uptake, distribution and excretion, Toxicol. Appl . Pharmacol .,
24, 81-91, 1973 .
304 .
Ramlal, P. S., Kelly, C. A., Rudd, 1. W. M ., and Furutani, A., Sites of methyl mercury production in
remote Canadian Shield lakes, Can. J
. Fish. Aquat. Sci .,
50, 972-979, 1993 .
305
.
Rask, M. and Metsala, T. R., Mercury concentrations in northern pike, Esox lucius L ., in small lakes
of Evo area, southern Finland, Water Air Soil Pollut.,
56, 369-378, 1991
.
306 .
Mathers, R. A. and Johansen, P. H., The effects of feeding ecology on mercury accumulation in walleyc
(Stizostedion vitreum) and pike (Esox lucius) in Lake Simcoe, Can
. J. Zool.,
63, 2006-2012, 1985 .
307
.
Kidd, K. A., Hesslein, R. H., Fudge, R. J. P., and Hallard, K . A., The influence of trophic level as
measured by 515N on mercury concentrations in freshwater organisms,
Water Air Soil Pollut.,
80,
1011-1015,1995 .
308 .
Nicoletto, P. F. and Hendricks, A. C., Sexual differences in accumulation of mercury in four species
of centrarchid fishes, Can. J. Zoo[.,
66, 944-949, 1988 .
309 .
Trudel, M., Tremblay, A., Schetagne, R., and Rasmussen, J. B., Estimating food consumption rates
of fish using a mercury mass balance model, Can. J. Fish. Aquat. Sci .,
57, 414-428, 2000 .
310 .
Niimi, A. J., Biological and toxicological effects of environmental contaminants in fish and their eggs,
Can . J. Fish. Aquat Sci.,
40, 306-312, 1983
.
311
.
Johnston, T. A., Bodaly, R. A., Latif, M. A., Fudge, R . J. P., and Strange, N. E., Intra- and inter-
population variability in maternal transfer of mercury to eggs of walleye
(Stizostedion vitreum), Aquat .
Toxicol .,
52, 73-85, 2001 .
312
.
Wren, C. D. and MacCrimmon, H. R., Mercury levels in the sunfish, Lepomis gibbosus, relative to
pH and other environmental variables of Precambrian Shield lakes, Can
. J. Fish. Aquat.
Sci.,
40,
1737-1744,1983 .
313
.
Suns, K. and Hitchin, G., Interrelationships between mercury levels in yearling yellow perch, fish
condition and water quality, Water Air Soil Pollut.,
50, 255-265, 1990.
314 .
Frost, T. M., Mentz, P. K., Kratz, T. K., Badillo, T., Brezonik, P. L., Gonzalez, M. J., Rada, R. G .,
Watras, C. J., Webster, K. E., Wiener, J . G., Williamson, C . E., and Morris, D. P., Multiple stresses
from a single agent: Diverse responses to the experimental acidification of Little Rock Lake, Wis-
consin, Limnol. Oceanogr.-
44(3,
part
2), 784-794, 1999 .
315
.
Greenfield, B. K., Hrabik, T. R., Harvey, C. J., and Carpenter, S. R., Predicting mercury levels in
yellow perch: Use of water chemistry, trophic ecology, and spatial traits, Can . J. Fish. Aquat. Sci.,
58,1419-1429,2001
.
316 .
Rodgers, D. W. and Beamish, F. W. H., Dynamics of dietary methylmercury in rainbow trout, Salmo
gairdneri, Aquat Toxicol.,
2,
271-290, 1982 .
317 .
Scherer, E., Armstrong, F. A. J., and Nowak, S. H., Effects of mercury-contaminated diet upon
walleyes, Stizostedion vitreum vitreum (Mitchill), Fish. Marine Serv. Res. Development Tech. Rep.
No
.
597,
Winnipeg, Manitoba,
1975 .
318 .
Kitamura, S., Determination on mercury content in bodies of inhabitants, cats, fishes and shells in
Minamata District and in the mud of Minamata Bay, Chapter
7
in Minamata Disease, Study Group
of Minamata Disease, Kumamoto Univ ., Japan,
1968, 257-266 .
319 .
Takeuchi, T., Pathology of Minamata Disease, in Minamata Disease, Study group of Minamata
Disease, Kumamoto Univ., Japan,
1968, 211-216 .
1.1546-rrame_MASTERhtsk Page 455 M"mdny,August26,2002 1:37PM
458
HANDBOOK OF ECOTOXICOLOGY
320. Lockhart, W. L., Uthe, 1. F., Kenney, A. R., and Mehrle, P. M., Methylmercury in northern pike (Esox
lucius) : Distribution, elimination, and some biochemical characteristics of contaminated fish, J
.
Fish .
Res
.
Board Can ., 29, 1519-1523, 1972 .
321 . Kania, H . 1. and O'Hara, J., Behavioral alterations in a simple predator-prey system due to sublethal
exposure to mercury, Trans. Am.
Fish. Soc.,
103, 134-136, 1974 .
322. Little, E. E. and Finger, S. E., Swimming behavior as an indicator of sublethal toxicity in fish,
Environ .
Toxicol.
Chem.,
9, 13-19, 1990
.
323. Sandheinrich, M . B. and Atchison,G.1., Sublethal toxicant effects on fish foraging behavior: Empirical
vs. mechanistic approaches,
Environ. Toxicol Chem .,
9, 107-119, 1990
.
324. Weis, J . S. and Weis, P., Swimming performance and predator avoidance by mummichog
(Fundulus
heteroclirus)
larvae after embryonic or larval exposure to methylmercury,
Can.
J.
Fish.
Aquar. Sci .,
52,2168-2173,1995 .
325 . Fjeld, E., Haugen, T. 0., and Vgllestad, L. A., permanent impairment in the feeding behavior of
grayling (Thymallus tymallus) exposed to methylmercury during embryogenesis, Sci. Total Environ .,
213,247-254,1998
.
326. Samson, J . C., Goodridge, R., Olobatuyi, F., and Weis, J . S., Delayed effects of embryonic exposure
of zebrafish (Danio rerio) to methylmercury (MeHg), Aquat.
Toxicol.,
51, 369-376, 2001
.
327. Friedmann, A. S ., Watzin, M. C., Brinck-Johnsen, T., and Leiter, 1. C., Low levels of dietary meth-
ylmercury inhibit growth and gonadal development in juvenile walleye
(Stizostedion
vitreum), Aquat.
Toxicol., 35, 265-278, 1996 .
328. Hammerschmidt, C. R., Sandheinrich, M. B., Wiener, J. G., and Rada, R. G., Effects of dietary
methylmercury on reproduction of fathead minnows,
Environ.
Sci. Technot, 36, 877-883, 2002 .
329. Thompson, D. R., Mercury in birds and terrestrial mammals, in
Environmental Contaminants in
Wildlife: Interpreting Tissue Concentrations,
Beyer, W. N., Heinz, G. H., and Redmond-Norwood,
A. W., Eds., Lewis Publishers, Boca Raton, FL, 1996, 341-356 .
330. Wolfe M. F. Schwarzbach S, and Sulaiman R . A. Effects of mercury on wildlife: A comprehensive
review,
Environ. Toxicol. Chem.,
17, 146-160, 1998 .
331 . Eisler, R .,
Handbook
of
Chemical Risk Assessment: Health Hazards to Humans, Plants, and Animals,
Vol. l,
Metals,
Lewis Publishers, Boca Raton, FL, 2000.
332. Fimreite, N., Mercury contamination of aquatic birds in northwestern Ontario, J .
Wildl. Manage.,
38,
120-131,1974
.
333. Hesse, L. W., Brown, R. L., and Heisinger, J. F., Mercury contamination of birds from a polluted
watershed, J
.
Wildl. Manage .,
39, 299-304, 1975
.
334. Sepulveda, M. S., Frederick, P. C., Spalding, M. G., and Williams, G. E., Jr., Mercury contamination
in free-ranging great egret nestlings (Arden
albus)
from southern Florida, USA,
Environ. Toxicol.
Chem.,
18, 985-992, 1999
.
335. Caldwell, C. A., Arnold, M. A., and Gould, W. R., Mercury distribution in blood, tissues, and feathers
of double-crested cormorant nestlings from arid-lands reservoirs in south central New Mexico, Arch
.
Environ. Contam. Toxicol.,
36, 456-461, 1999 .
336. Eisler, R., Mercury hazards to fish, wildlife, and invertebrates: A synoptic review, U.S. Fish Wildl .
Scrv. Biol. Rep. 85
(1 .10), 1987 .
337. Hoffman, D . J. and Moore, J. M., Teratogenic effects of external egg applications of methyl mercury,
Teratology, 20, 453-462, 1979
.
338. Heinz, G. H. and Hoffman,D.1., Methylmercury chloride and selenomethionine interactions on health
and reproduction in mallards,
Environ
.
Toxicol. Chem., 17, 139-145, 1998 .
339. Backstrom, 1., Distribution studies of mercuric pesticides in quail and some freshwater fishes, Acta
Pharmacol. Toxicol ., 27 (Suppl. 3), 103 pp., 1969 .
340. Heinz, G . H. and Locke, L. N., Brain lesions in mallard ducklings from parents fed methylmercury,
Avian Dis., 20, 9-17, 1976 .
341. Tejning, S., Biological effects of methyl mercury dicyandiamide-treated grain in the domestic fowl
Gallus gallus L., Oikos Suppl. 8, 116 pp., 1967 .
342. Fimmite, N., Effects of dietary methylmercury on ring-necked pheasants, Occas
. Pap. No . 9, Can .
Wild]. Serv., Ottawa, 39 pp., 1971
.
343. Heinz, G. H., Methylinercury: Reproductive and behavioral effects on three generations of mallard
ducks, J.
Wildl. Manage .,
43, 394-401, 1979 .
6 crane MASTER.book Page 459 Monday, August 26, 2(X)2 1,37 PM
ECOTOXICOLOGY OF MERCURY
459
344 .
Lewis, S. A. and Fastness, R. W., Mercury accumulation and excretion in laboratory-reared black-
headed gull Larus ridibundus chicks, Arch. Environ
. Contam . Toxicol .,
21, 316-320, 1991
.
345 .
Monteiro, L. R. and Fumess, R. W., Kinetics, dose-response, and excretion
of
methylmercury in free-
living adult Cory's shearwaters, Environ. Sci. Technol.,
35, 739-746, 2001 .
346 .
Stickel, L. F., Stickel, W. H., McLane, M. A. R., and Bruns, M., Prolonged retention of methyl mercury
by mallard drakes, Bull. Environ . Contam. Toxicol.,
18, 393-400, 1977 .
347 .
Monteiro, L. R. and Furness, R. W., Kinetics, dose-response, excretion, and toxicity of methylmercury
in free-living Cory's shearwater chicks, Environ. Toxicol. Chem.,
20, 1816-1823, 2001
.
348 .
Burger, J., Metals in avian feathers: Bioindicators of environmental pollution, Rev. Environ. Contam.
Toxicol ., 5, 203-311, 1993
.
349 .
Scheuhammer, A. M., Atchison, C. M., Wong, A. H. K., and Even, D. C., Mercury exposure in breeding
common loons (Gavia immer) in central Ontario, Canada, Environ. Toxicol. Chem .,
17, 191-196, 1998 .
350.
Braun, B. M. and Gaskin, D. E., Mercury levels in Bonaparte's gulls (Larus philadelphia) during
autumn molt in the Quoddy region, New Brunswick, Canada, Arch. Environ. Contam. Toxicol.,
16,
539-549,1987 .
351 .
Wright, F. C., Younger, R. L., and Riner, 1. C., Residues of mercury in tissues and eggs of chickens
given oral doses of Panogen
15,
Bull. Environ. Contam. Toxicol.,
12, 366-372,1974.
352.
Adams, W. J. and Prince, H. H., Mercury levels in the tissues of ring-necked pheasants fed two
mercurial fungicides, Bull. Environ. Contam. Toxicol .,
15, 316-323, 1976 .
353 .
Spalding, M. G., Bjork, R. D., Powell, G. V. N., and Sundlof, S . F., Mercury and cause of death in
great white herons, J . Wildl . Manage.,
58, 735-739, 1994 .
354.
Van der Molest, E. J., Blok, A. A., and de Graaf, G. J., Winter starvation and mercury intoxication in
grey herons (Ardea cinerea) in the Netherlands, Amen,
70, 173-184, 1982 .
355 .
Scheuhammer, A. M., Effects of acidification on the availability of toxic metals and calcium to wild
birds and mammals, Environ . Pollut.,
71, 329-375, 1991
.
356.
Newton, 1. and Haas, M. B., Pollutants in merlin eggs and their effects on breeding, Br Birds,
81,
258-269,1988 .
357 .
Barr, 1. F., Population dynamics of the common loon (Gavia immer) associated with mercury-
contaminated waters in northwestern Ontario, Occas . Pap .
56,
Can. Wildl. Sm., Ottawa, Ontario,
1986 .
358 .
Scheuhammer, A. M., Perrault, 1. A ., and Bond, D. E., Mercury, methylmercury, and selenium
concentrations in eggs of common loons (Gavia immer) from Canada, Environ . Monit. Assess.,
72,
79-94,2001
.
359.
Scheuhammer, A. M. and Blancher, P. 1., Potential risk to common loons (Gavia immer) from
methylmercury exposure in acidified lakes, Hydrobiologia,
278/280, 445-455, 1994 .
360.
Lamborg, C. H., Fitzgerald, W. F., Vandal, G. M., and Rolfhus, K . R ., Atmospheric mercury in northern
Wisconsin: Sources and species, Water Air Soil Pollut.,
80, 189-198, 1995 .
361
.
Rago, P. J. and Wiener, J. G ., Does pH affect fish species richness when lake area is considered, Trans
.
Am. Fish . Soc .,
115, 438-447, 1986 .
362 .
Custer, T. W., Custer, C. M., Hines, R. K., Gutreuter, S., Stromborg, K. L., Allen, P. D., and Melancon,
M. J., Organochlorine contaminants and reproductive success of double-crested cormorants from
Green Bay, Wisconsin, USA, Environ. Toxicol. Chem .,
18, 1209-1217, 1999
.
363 .
Karasov, W. H. and Meyer, M. W., Testing the role of contaminants in depressing avian numbers,
Revista Chilena
Hist Nat,
73, 461-471, 2000 .
364 .
Rahel, F. 1. and Magnuson, J . J., Low pH and the absence of fish species in naturally acidic Wisconsin
lakes: Inferences for cultural acidification, Can . J. Fish . Aquat Sci.,
40, 3-9, 1983 .
365 .
Rahel, F. J., Biogeographic influences on fish species composition of northern Wisconsin lakes with
applications for lake acidification studies, Can. J Fish . Aquat Sci.,
43, 124-134, 1986 .
366 .
Garibaldi, J. C., Jagoe, C. H., and Bryan, A. L., Jr., Dietary exposure to mercury in nestling wood
storks (Mycreria americana) in Georgia, Arch. Environ. Contam. Toxicol.,
34, 398-405, 1998 .
367 .
Vermeer, K., Armstrong, F. A . 1., and Hatch, D. R. M., Mercury in aquatic birds at Clay Lake, western
Ontario, J. Wildl. Manage.,
37, 58-61, 1973 .
368 .
Hearty, C. J., Grove, R. A., and Bentley, V. R., Effects of selenium, mercury, and boron on waterbird
egg hatchability at Stillwater, Malheur, Seedskadee, Ouray, and Benton Lake National Wildlife
Refuges and surrounding vicinities, Bureau of Reclamation, Nat. Irrigation Water Qual . Program
Information Rep. No .
5, 2000
.
rune-
SIER.hook Pare 460 Monday, August 26, 2002 1 37 PM
460
HANDBOOK OF ECOTOXICOLOGY
369. Koeman, J. H., Garssen-Hoekstra, J., Pels, E., and de Goeij, J . J. M., Poisoning of birds of
prey
by
methyl mercury compounds,
Mededelingen Fakulteit Landbouw-wetenschappen Gent,
36, 43-49,
1971
.
370. Borg, K., Forte, K., Hanko, E., and Wanntorp, H., Experimental secondary methyl mercury poisoning
in the goshawk
(At cipiter g. gentilis L .), Environ. Pollut ., 1,
91-104, 1970 .
371
.
Fimreite, N. and Karstad, L., Effects of dietary methyl mercury on red-tailed hawks, J
.
Wildl. Manage.,
35,293-300,1971
.
372. Finley, M. T., Stickel, W. H., and Christensen, R.E ., Mercury residues in tissues of dead and surviving
birds fed methylmercury,
Bull. Environ. Contain. Toxicol.,
21, 105-110, 1979
.
373. Scheuhammer, A. M., Chronic dietary toxicity of methylmercury in the zebra finch,
Poephila guttata,
Bull. Environ. Contain. Toxicol.,
40,
123-130, 1988 .
374. Bhatnagar, M . K., Vrablic, O . E., and Yamashiro, S., Ultrastructural alterations of the liver of Pekin
ducks fed methyl mercury-containing diets, J. Toxicol .
Environ. Health,
10, 981-1003, 1982
.
375. Pass, D. A., Little, P. B., and Karstad, L . H., The pathology of subacute and chronic methyl mercury
poisoning of the mallard duck
(Anas platyrhynchos),
J.
Comp. Pathol .,
85, 7-21, 1975 .
376. Heinz, G. H., Mercury poisoning in wildlife, in
Noninfectious Diseases of Wildlife, 2nd ed
.,
Fairbrother,
A., Locke, L. N., and Hoff, G. L., Eds., Iowa State Univ. Press, Ames, 1996, 118-127
.
377. Finley. M . T. and Stendell, R. C., Survival and reproductive success of black ducks fed methyl mercury,
Environ. Pollut,
16, 51-64, 1978
.
378. Norheim, G., Levels and interactions of heavy metals in sea birds from Svalbard and the Antarctic,
Environ. Pollut.,
47,
83-94, 1987 .
379. Cuvin-Aralar, M. L. A. and Fumess, R . W., Mercury and selenium interaction: A review,
Ecotoxicol.
Environ .
Saf., 21, 348-364, 1991 .
380. Wobeser, G. and Swift, M„ Mercury poisoning in a wild mink, J
.
Wild[. Dis .,
12, 335-340, 1976 .
381. Wren, C. D., Probable case of mercury poisoning in a wild otter,
Lutra canadensis,
in northwestern
Ontario, Can .
Field-Nat,
99, 112-114, 1985 .
382. Wren, C. D., A review of metal accumulation and toxicity in wild mammals . I. Mercury,
Environ .
Res.,
40, 210-244, 1986
.
383. Aulerich, R. 1., Ringer, R. K., and Iwamota, J., Effects of dietary mercury on mink,
Arch. Environ .
Contain
.
Toxicol .,
2, 43-51, 1974 .
384. Wren, C. D., Hunter, D. B., Leatherland, J. F, and Stokes, P. M., The effects of polychlorinated
biphenyls and methylmercury, singly and in combination, on mink, 1: Uptake and toxic responses,
Arch. Fnviron. Contain. Toxicol.,
16, 441-447, 1987 .
385. Dansereau, M., Lariviere, N., Tremblay, D. D., and Belanger, D ., Reproductive performance of two
generations of female semidomesticated mink fed diets containing organic mercury contaminated
freshwater fish,
Arch. Environ. Contam. Toxicol.,
36, 221-226. 1999
.
386. Roelke, M, E., Schultz, D . P., Facemire, C. F, and Sundlof, S . F., Mercury contamination in the free-
ranging
ranging endangered Florida panther
(Felis concolor coryi), Prow Am. Assoc. Zoo Vet .,
20, 277-283,
1991
.
387. Harada, M. and Smith, A ., Minamata disease: A medical report, in
Minamata,
Smith, W. E. and Smith,
A. M ., Eds., Holt, Rinehart and Winston, New York, 1975, 180-192
.
388. Wobeser, G. A., Nielsen, N . 0., and Scheifer, B ., Mercury and mink . II. Experimental methyl mercury
intoxication,
Can .
J.
Comp. Med.,
40, 34-45, 1976
.
389. O'Connor, D. J. and Nielson, S. W., Environmental survey of methylmercury levels in the wild mink
and otter from the north-eastern United States and experimental pathology of methylmercurialism in
the otter, in
Worldwide Furbearer Conf. Proc .,
Chapman, J. A. and Parsley, D., Eds., Frostburg, MD,
1981,1725-1745 .
390. Wobeser, G. A., Nielsen, N. 0., and Scheifer, B., Mercury and mink . I. The use of mercury contam-
inated fish as a food for ranch mink,
Can.
J.
Comp. Med.,
40, 30-33, 1976 .
391 . Halbrook, R. S., Lewis, L. A ., Aulerich, R . I., and Bursian, S . J ., Mercury accumulation in mink fed
fish collected from streams on the Oak Ridge Reservation,
Arch. Environ. Contain. Toxicol„
33,
312-316,1997 .
392- Wren, C. D., Hunter, D. B., Leatherland, J. F., and Stokes, P. M., The effects of polychlorinated
biphenyls and methylmercury, singly and in combination on mink. II. Reproduction and kit develop-
ment,
Arch. Environ. Contain. Toxicol.,
16, 449-454, 1987
.
4
*L1546_Game MASTERbouk Page 461 Monday. August 26,2002 1 :37 PM
ECOTOXICOLOGY OF MERCURY
461
393 .
Burbacher, T. M., Rodier, P. M., and Weiss, B., Methylmercury developmental neurotoxicity: A
comparison of effects in humans and animals, Neurotoxicol.
Teratol.,
12, 191-202, 1990 .
394. Shelly, T. B. and St. Amant, J. R., Mercury burdens in furbearers in Wisconsin,
J.
Wilds . Manage.,
46,1117-1120,1981
395. Kucera, E., Mink and otter as indicators of mercury in Manitoba waters,Can. J Zool ., 61, 2250-2256,
1983 .
396. Wren, C. D., Stokes, P. M., and Fischer, K . L., Mercury levels in Ontario mink and otter relative to
food levels and environmental acidification, Can .
J. Zool., 64,
2854-2859, 1986 .
397. Fortin, C., Beauchamp, G., Dansereau, M ., Lariviere, N., and Belanger, D ., Spatial variation in mercury
concentrations in wild mink and river otter carcasses from the James Bay Territory, Quebec, Canada,
Arch . Environ.
Contam. Toxicol., 40,
121-127, 2001 .
398. Komsta-Szumska, E., Czuba, M., Reuhl, K. R., and Miller, D. R., Demethylation and excretion of
methyl mercury by the guinea pig, Environ. Res ., 32, 247-257, 1983 .
399. Dietz, R., Nielsen, C. 0., Hansen, M. M., and Hansen, C. T., Organic mercury in Greenland birds
and mammals,
Sci. Total
Environ ., 95, 41-51, 1990 .
400. Ganther, H. E., Goodie, C., Sunde, M. L., Kopecky, M. 1., Wagner, P., Oh, S. H., and Hoekstra, W .
G., Selenium: Relation to decreased toxicity of methylmercury added to diets containing tuna, Science,
175,1122-1124,1972,
401 . Stillings, B., Lagally, H., Baurersfeld, P., and Snares, 1., Effect of cystine, selenium and fish protein
on the toxicity and metabolism of methyl mercury in rats,
Toxicant,
AppL Pharmacol.,
30,243-254,1974 .
402. Potter, S. and Matrone, G., Effect of selenite on the toxicity of dietary methyl mercury and mercuric
chloride in the rat,
J. Nutr.,
104, 638-647, 1974 .
403 . Chang, L. W. and Suber, R., Protective effect of selenium on methylmercury toxicity : A possible
mechanism,
Bull.
Environ. Contam.
Toxicol.,
29, 285-289, 1982 .
404 . Miyama, T., Minowa, K., Seki, H ., Tamura, Y., Mizoguchi, J., Ohi, G., and Suzuki, T., Chronological
relationship between neurological signs and electrophy
'
slologscat changes in rats with methylmercury
poisoning: Special reference to selenium protection,
Arch. Toxicol.,
52, 173-181, 1983
.
405. Rawson, A . 1., Patton, G. W., Hofmann, S., Pietra, G. G., and Johns, L., Liver abnormalities associated
with chronic mercury accumulation in stranded Atlantic bottlenose dolphins,
Ecotoxicol .
Environ .
Saf.,
25, 41-47, 1993
.
406. Martoja, R . and Berry, 1. F, Identification of tiemannite as a probable product of demethylation of
mercury by selenium in cetaceans,
Vie Milieu, 30, 7-10, 1980
.
407. Nigro, M., Mercury and selenium localization in macrophages of the striped dolphin,
Stenella
coer-
uleoalba, J. Mar
Biol.
Assoc. U.K.,
74, 975-978, 1994 .
408. Cavalli, S. and Cardellicchio, N., Direct determination of seleno-amino acids in biological tissues by
anion-exchange separation and electrochemical detection, J .
Chromatogr.,
706(A), 429-436, 1995
.
409. Palmisano, F., Cardellicchio, N., and Zambonin, P. G., Speciation of mercury in dolphin liver: A two-
stage mechanism for the demethylation accumulation process and role of selenium,
Mar.
Environ .
Res ., 40, 109-121, 1995
.
410. Cardellicchio, N., Decataldo, A., Di Leo, A., and Misino, A., Accumulation and tissue distribution of
mercury and selenium in striped dolphins (Stenella coeruleoalba) from the Mediterranean Sea (south-
ern Italy), Environ. Pollut., 116, 265-271, 2002 .
411. Honda, K., Tatsukava, R., ltano,- K., Miyazaki, N., and Fujiyama, T., Heavy metals concentration in
muscle, liver and kidney tissue of striped dolphin Stenella
coeruleoabla
and their variation with body
length, weight, age and sex,
Agric.
Blot. Chem.,
47,
1219-1228, 1983 .
412. Osowski, S. L., Brewer, L. W., Baker, O. E., and Cobb, G. P., The decline of mink in Georgia, North
Carolina, and South Carolina : The role of contaminants, Arch. Environ .
Contam. Toxicol.,
29,41 8-423,
1995 .
413. Giesy, J. P., Verbrugge, D . A., Othout, R. A., Bowerman, W. W., Mora, M. A., Jones, P. D., Newsted,
1. L., Vandervoort, C., Heaton, S. N., Aulerich, R. J., Bursian, S . J., Ludwig, J. P., Dawson, G. A .,
Kubiak, T. J., Best, D. A., and Tillitt, D. E., Contaminants in fishes from Great Lakes-influenced
sections and above dams of three Michigan rivers . 11 : Implications for health of mink,
Arch.
Environ.
Contam. Toxicol
.,
27, 213-223, 1994 .
414. Sample, B . E. and Suter, G. W., Ecological risk assessment in a large river-reservoir : 4. piscivorous
wildlife, Environ .
Toxicol. Chem .,
18, 610-620, 1999 .
t
ne_MASTER hook Page 462 Monday . August 26, 21X32 1 :37 PM
462
415. Moore, D. R. J., Sample, B. E., Suter, G. W., Parkhurst, B. R., and Teed, R. S., A probabilistic risk
assessment of the effects of methylmercury and PCBs on mink and kingfishers along East Fork Poplar
Creek, Oak Ridge, Tennessee, USA, Environ. Toxicol. Chem., 18, 2941-2953, 1999 .
416. Egeland, G. M . and Middaugh, 1. P., Balancing fish consumption benefits with mercury exposure,
Science, 278, 1904-1905, 1997
.
417. Lodenius, M., The mercury problem and fishing in Finland, in Economics of Ecosystems Management,
Hall, D. 0., Myers, N., and Margaris, N . S., Eds., W. Junk Publishers, Dordrecht, 1985, 99-103
.
418. H3kanson, L., A simple model to predict the duration of the mercury problem in Sweden, Ecol.
Modeling, 93, 251-262, 1996 .
419. Wheatley, M. A., Social and cultural impacts of mercury pollution on Aboriginal peoples of Canada,
Water Air Soil Pol ut, 97, 85-90, 1997 .
420. Wheatley, B., Paradis, S., Lassonde, M ., Giguere, M . F., and Tanguay, S., Exposure patterns and long
term sequelae on adults and children in two Canadian indigenous communities exposed to methyl-
mercury, Water Air Soil Pollut., 97, 63-73, 1997
.
421 . United States Environmental Protection Agency, Update: National Listing of Fish and Wildlife Advi-
sories, Fact Sheet EPA-823-F-01-010, Office of Water, Washington, D.C ., 2001
.
422. Brunberg, A. K. and Blomqvist, P., Quantification of anthropogenic threats to lakes in a lowland
county of central Sweden, Ambio, 30, 127-134, 2001
.
423. Chan, H. M. and Receveur, 0., Mercury in the traditional diet of indigenous peoples in Canada,
Environ. Pallor., 110, 1-2, 2000 .
424. Verta, M., Rekolainen, S., and Kinnunen, K., Causes of increased fish mercury levels in Finnish
reservoirs, Publ. No. 65, Water Res . Inst., Nat. Board Waters, Helsinki, Finland, 1986, 44-58
.
425. Jackson, T. A., The mercury problem in recently formed reservoirs of northern Manitoba (Canada)
:
Effects of impoundment and other factors on the production of methyl mercury by microorganisms
in sediments, Can . J.
Fish
.
Aquat. Sci., 45, 97-121, 1988 .
426- Ramsey, D . J., Experimental studies of mercury dynamics in the Churchill River diversion, Manitoba,
Collect
. Environ
. Geol., 9, 147-173, 1990 .
427. Yingcharocn, D. and Bodaly, R. A., Elevated mercury levels in fish resulting from reservoir flooding
in Thailand, Asian
Fish
.
.Sci .,
6, 73-80, 1993 .
428. Surma-Aho, K ., Paasivirta, J., Rekolainen, S ., and Verta, M ., Organic and inorganic mercury in the
food chain of some lakes and reservoirs in Finland, Chemosphere, 15, 353-372, 1986.
429. Bodaly, R. A. and Johnston, T. A., The mercury problem in hydroelectric reservoirs with predictions
of mercury burdens in fish in the proposed Grande Baleine Complex, Quebec, James Bay Publ . Series,
Hydro-Electric Development Environmental Impacts, Paper No . 3, North Wind Information Serv .,
Inc., Montreal, Quebec, 1992
.
430. Carter, V., Wetland hydrology, water quality, and associated functions, in National Water Summary
on Wetland Resources, U.S. Geol. Surv. Water-Supply Pap. 2425, 1996, 35-48
.
431 . Novitzki, R. P., Smith, R. D., and Fretwell, J. D., Wetland functions, values, and assessment, in
National Water Summary on Wetland Resources, U .S. Geol . Surv. Water-Supply Pap. 2425, 1996,
79-86
.
432. Verhoeven, J. T. A. and Mueleman, A. F. M ., Wetlands for wastewater treatment : Opportunities and
limitations, Fcol. Eng ., 12, 5-12, 1999
.
433. Kivaisi, A. K., The potential for constructed wetlands for wastewater treatment and reuse in developing
countries: A review, Ecol. Eng., 16, 545-560, 2001
.
434. Driscoll, C. T., Holsapple, J., Schofield, C . L., and Munson, R., The chemistry and transport of mercury
in a small wetland in the Adirondack region of New York, USA, Biogeochemistry, 40, 137-146, 1998 .
435. Guentzel, J . L., Landing, W. M ., Gill, G. A., and Pollman, C. D., Atmospheric deposition of mercury
in Florida: The FAMS Project (1992-1994), Water Air Soil Pollue, 80, 393-402, 1995 .
436. Dvonch, J. T., Graney, J. R., Keeler, G. J., and Stevens, R. K., Use of elemental tracers to source
apportion mercury in south Florida precipitation, Environ. Sci.7eehnoL, 33, 4522-4527, 1999 .
437. Guentzel, J. L., Landing, W. M., Gill, G. A., and Pullman, C. D., Processes influencing rainfall
deposition of mercury in Florida, Environ. Sci. 7eehnol., 35, 863-873, 2001
.
438- Facemire, C . F., Gross, T. S ., and Guillette, L . J., Jr., Reproductive impairment in the Florida panther :
Nature or nurture, Environ. Health Perspect., 103, 79-86, 1995
.
HANDBOOK OF ECOTOXICOLOGY
LI546_fmme_MASTERN.,k Puge463 Monday,August26,2002 1:37 PM
ECOTOXICOLOGY OF MERCURY
463
439
.
Beyer, W. N., Spalding, M., and Morrison, D., Mercury concentrations in feathers of wading birds
from Florida, Ambio, 26, 97-100, 1997
.
440. Heaton-Jones, T. G., Homer, B. L., Heaton-Jones, D. L., and Supdlof, S . F., Mercury distribution in
American alligators (Alligator mississippiensis) in Florida, I Zoo Wild!. Med., 28, 62-70, 1997 .
441 . Yanochko, G. M., Jagoe, C. H., and Brisbin, l . L., Tissue mercury concentrations in alligators (Alligator
mississippiensis) from the Florida Everglades and the Savannah River Site, South Carolina, Arch .
Environ. Comma. Taxi col., 32, 323-328, 1997
.
442. Frederick, P. C., Spalding, M. G., Sepulveda, M. S., Williams, G. E., Nico, L., and Robins, R .,
Exposure of great egret (Ardea albus) nestlings to mercury through diet in the Everglades ecosystem,
Environ . Toxicot Chem., 18, 1940-1947, 1999
.
443. Duvall, S. E. and Barron, M. G., A screening level probabilistic risk assessment of mercury in Florida
Everglades food webs, Ecotoxicol. Environ. Saf., 47, 298-305, 2000 .
444. Spalding, M. G., Frederick, P. C., McGill, H. C., Bouton, S. N., Richey, L. J., Schumacher, 1. M
.,
Blackmore, C. G. M., and Harrison, J ., Histologic, neurologic, and immunologic effects of methyl-
mercury in captive great egrets, J . Wildl. Dis ., 36, 423-435, 2000 .
(SE%PAESS/
EFFECTS OF MERCURY ON NEUROCHEMICAL RECEPTOR-BINDING
CHARACTERISTICS IN WILD MINK
NILADRI BASU,tI KATE KLENAVIC,§ MARY GAMBERG,II MIKE O'HRIEN,#tt DOUG EVANS,§
ANTON
M .
SCHEUHAMMER,tt and RING MAN CHAN*J§§
tDepartment of Natural Resource Sciences,
tCenter for Indigenous Peoples' Nutrition and Environment, McGill University, Sainte Anne de Bellevue, Quebec H9X 3V9, Canada
§Environmental and Resource Studies, Trent University, Peterborough, Ontario K9J 7B8, Canada
IlGamberg Consulting, Box 10460, Whitehorse, Yukon Territory YIA 7A1, Canada
#Nova Scotia Department of Natural Resources, Kerrville, Nova Scotia B4N 4E5, Canada
ttDepartment of Biology, Acadia University, Wolfville, Nova Scotia BOP IXO, Canada
tlCanadian Wildlife Service, Ottawa, Ontario KIA 0113, Canada
§§School of Dietetics and Human Nutrition, McGill University, Sainte Anne de Bellevue, Quebec H9X 3V9, Canada
(Received 28 January 2004 ; Accepted 30 November 2004)
Abstract-Piscivorous wildlife, such as mink (Mu.stela vison), routinely are exposed to mercury (Hg) in their natural environment
at levels that may cause adverse behavioral outcomes. The purpose of this study was to determine if a correlation exists between
neurochemical receptors and concentrations of Hg in the brains of wild mink . Specifically, receptor-binding assays were conducted
to characterize the muscarinic cholinergic (mACh) and dopaminergic-2 (D2) systems in brain tissues collected from mink trapped
in the Yukon Territory, Ontario, and Nova Scotia (Canada), and values were correlated with total Hg and methyl Hg (MeHg)
concentrations in the brains. A significant correlation was found between Hg (total III; and MeHg) and mACh receptor density
(r = 0.546 ; r = 0 .596, respectively) or ligand affinity (r = 0.413; r = 0.474, respectively) . A significant negative correlation was
found between total Hg and D2 receptor density (r = - 0.340) or ligand affinity (r = -0.346). These correlations suggest that
environmentally relevant concentrations of Hg may alter neurochcmical function in wild mink, and that neurochemical receptor-
binding characteristics can be used as a novel biomarker to assess Hg's effects on wildlife. Given the importance of the muscarinic
cholinergic and dopaminergic pathways in animal behavior, further studies are required to explore the physiological and ecological
significance of these findings .
Keywords-Wildlife toxicology
Neurotoxicology
Biomarkers
Mercury
Mink
INTRODUCTION
Mercury (Hg) is a ubiquitous neurotoxicant and naturally
occurring element that exists in multiple allotropic forms
[1,2]
.
Methylmercury (MeHg), the primary organic species of Hg,
can readily traverse biological membranes and biomagnify
through the aquatic food chain. Consequently, MeHg is a po-
tential risk to high trophic-level piscivorous wildlife, such as
mink
(Mustela vison) [3] .
Historical declines
of
some wild
populations of mink are thought to be associated with Hg
exposure
[4,5] . Additionally, controlled feeding experiments
have demonstrated that ranch mink ingesting as little as I µg/
g dietary MeHg display clinical signs of toxicosis, such as
reproductive impairment
[6], behavioral changes [7,8], and
lethality [7,8]
. The effects of Hg on wildlife and ecosystem
health is a growing concern because concentrations of Hg
measured in the brains of wild mink (range : 0.11-13.4 pg/g
wet wt total Hg) [9-11] generally are within one order of
concentrations that may cause ill effects
(i.e., greater than 5
µg/g wet wt total.Hg) [7,12], and global concentrations con-
tinue to rise due to industrial activities and long-range at-
mospheric transport [13-16] .
To understand the physiological and ecological risks as-
sociated with Hg exposure, feeding trials have been conducted
in a variety of avian and mammalian wildlife species [12,17-
To whom correspondence may be addressed
( laurie.chan@mcgill .ca) .
1444
Environ neural Toxicology and Chemistry, Vol. 24, No. 6, pp. 1444-1450, 2005
© 2005 SETAC
Printed in the USA
0730-7268/05 $12.00 +
.00
19). The endpoints tested in a majority of these studies in-
cluded bioindicators of health that may be classified as irre-
versible, such as ataxia and brain lesions. Although these data
increase our basic understanding of Hg toxicity, there is a need
to develop specific biomarkers to predict the adverse risks
associated with chronic exposure to low concentrations of Hg
by individuals and populations. Assuming that molecular
events at the cellular level precede functional impairments at
the organ level, monitoring biochemical changes in the ner-
vous system represents a unique tool to predict possible neu-
robehavioral outcomes associated with Hg exposure in organ-
isms [20-22]
.
The ability of wildlife to survive in the environment re-
quires a functional neurological signaling pathway whereby
the animal can receive, process, and store information . Two
major pathways in neurotransmission are the cholinergic and
dopaminergic systems that play critical roles in cognition, so-
matosensory, and motor function [23,24] . Rodent studies have
shown that Hg can disrupt multiple aspects of these pathways
including the synthesis, storage, or release of neurotransmitters
[25-29], receptor-binding events [30-32], and re-uptake or
clearance mechanisms [25,26,28] . Furthermore, studies on fish
have shown that exposure of animals to pesticides and heavy
metals altered components of the cholinergic [33] and dopa-
minergic [34] system, which were related to behavioral out-
comes. Collectively, these findings suggest that prolonged dis-
ruptions in neurotransmission ultimately may alter animal he-
Mercury-related neurochemical changes in wild mink
havior and lend support to the idea that neurochemical changes
may be used as biomarkers to study the neurotoxic effects of
Hg and other toxicants on wildlife
.
Recently, we have demonstrated the versatility and dis-
cussed the applications of receptor-binding characteristics to
study neurochemistry in epidemiological studies of humans
and wildlife [35]
. The purpose of the present study is to in-
vestigate if there is a correlation between neurochemistry and
brain Hg concentrations in wildlife. Specifically, muscarinic
cholinergic (mACh) and dopaminergic (D2) receptor-binding
characteristics were measured in whole brains of mink col-
lected from different geographical regions of Canada . Receptor
data were correlated with concentrations of brain Hg (total and
Mellg) to test the following null hypothesis: There is no as-
sociation between Hg exposure and neurochemical function in
wild animals
.
METHODS
Chemicals
Radioligands,
[ 3H]-quinuclidinyl benzilate
([ 3H]-QNB; 42
Ci/mmol) and
[3H)-spiperone (15.7 Ci/mmol), were obtained
from NEN/Perkin-Elmer (Boston, MA, USA). Atropine, bo-
vine serum albumin, (+)-butaclamol, ketanserin, and poly-
ethylenimine were purchased from Sigma-Aldrich (St . Louis,
MO, USA) .
Sample
collection
Animals were collected from licensed trappers during the
2002 to 2003 trapping season from the Yukon Territory (Wat-
son Lake), Southern Ontario (Peterborough and Parry Sound
areas), and Nova Scotia, Canada. The gender of each animal
was noted and all carcasses were stored at -20 °C until pro-
cessed. The lower jaw was removed to age each animal using
cementum annuli readings (Matson's Laboratory, Milltown,
MT, USA) .
Hg analysis
Concentrations of total Hg and MeHg were quantified as
described by Scheuhammer et al. [36] . To quantify total Hg,
approximately 0.35 g of freeze-dried brain tissue was digested
overnight in concentrated nitric acid, heated for 5 h at 105°C,
and diluted eightfold with distilled water. For MeHg analysis,
acidic sodium bromide was used to extract the MeHg from a
tissue sample into toluene. The Hg complex then was reverse-
extracted into the aqueous phase as a thiosulfate conjugate,
and this sample was digested and stored in a mixture of strong
acids. Concentrations of total Hg and McHg were measured
in the digests using cold vapor atomic absorption spectropho-
tometry (Hitachi Atomic Absorption Spectrophotometer model
Z8200, Tokyo, Japan) at a wavelength of 253 .7 nM. Certified
reference materials (Dogfish Muscle Certified Reference Ma-
terial for Trace Metals [DORM-2], Analytical Chemistry Unit,
National Research Council, Ottawa, ON, Canada) and sample
blanks were included in all analyses for quality control pur-
poses, and all data are expressed as dry weight concentrations,
unless otherwise indicated
.
Preparation
of
brain
membranes
Brains were excised from each animal and stored at -80°C
until membranes were prepared. Frozen tissues were homog-
enized for 30 s in ice-cold NaK buffer (50 mM NaH
1PO4, 5
mM KCI, 120 mM NaCl, pH
7.4). The homogenate was cen-
trifuged at 16,500 g for 15 min at 4°C, and the resulting pellet
Envfron. Toxieol.
Chem .
24, 2005
1 445
was washed twice under the same conditions. The final pellet
was resuspended in NaK buffer and aliquots were frozen im-
mediately in liquid nitrogen and stored at -80 °C until required .
The concentration of protein in the membrane preparation was
determined with the Bradford assay [37] using bovine serum
albumin as the standard
.
mACh
receptor-binding
assay
One hundred micrograms of membrane preparation were
preincubated in NaK buffer for 30 min at 25°C in duplicate .
Samples then were mixed with various concentrations (0.01-
3.2 nM) of
[ 3H]-QNB, a mACh receptor-specific radioligand,
for 60 min at 25°C under constant agitation . The incubation
was terminated by rapid vacuum filtration through 1 .2-pM
glass fiber filters (Millipore, Boston, MA, USA) . The filters
were washed three times with 3 ml of ice-cold NaK buffer
and placed into glass vials. The filters
were
allowed to dissolve
overnight in 5-ml liquid scintillation cocktail (ICN Biomedi-
cals, Aurora, OH, USA) . Radioactivity retained by the filters
was quantified by a liquid scintillation counter (LKB Wallac
1209 Rackbeta, Turku, Finland) with approximately 68%
counting efficiency. Specific binding was defined as the dif-
ference in ['H]-QNB bound in the presence and absence of
100 µM atropine, and the total volume in each tube was 1 ml
.
To reduce nonspecific binding of the radioligand to the filters,
filters were soaked for 30 min in 0 .1% (weight/volume) po-
lyethylenimine before use
.
D2
receptor-binding
assay
The receptor-binding assay for the D2 receptor was mod-
ified for a 96-well microplate filter system. Twenty micrograms
of membrane preparation were preincubated in Tris buffer (50
mM Tris, 5 mM KCI, 2 mM MgCI„ pH 7.4) for 30 min at
25 °C in triplicate. Samples then were mixed with various con-
centrations (0.1-5.6 nM) of
[ 3H]-spiperone, a D2-specific ra-
dioligand, for 90 min at 25 °C under constant agitation. The
incubation was terminated by rapid vacuum filtration through
I .0-pM glass fiber filters (Millipore). Filters were washed three
times with 200 pl Tris buffer and placed into glass scintillation
vials. The filters were allowed to dissolve overnight in 5-ml
liquid scintillation cocktail . Radioactivity retained by the filters
was determined as described earlier. Specific binding was de-
fined as the difference in ['H]-spiperone bound in the presence
and absence of 100 µM (+)-butaclamol. To reduce nonspecific
binding of the radioligand to the filters, filters were soaked for
30 min in
0 5%
(weighUvolume) polyethylenimine before use,
and 50 pM ketanserin (5-HT, receptor antagonist) was added
to each well to prevent binding of ['H]-spiperone to 5-HT,
receptors
.
Statistical analysis
The critical significance value for all statistical analyses
was set at a = 0.05 . All data are represented as mean ±
standard deviation. Data from all receptor-binding studies were
curve-fitted using GraphPad Prism (Ver 3.02, GraphPad Soft-
ware, San Diego, CA, USA) to calculate receptor density
(Burns) and ligand affinity
(Kd) . To minimize the sum of
squares, an F-test determined that mACh binding was best fit
with a rectangular hyperbolic equation and D2 binding was
best fit with a three-parameter logistic equation
.
Mercury (total and McHg) data were log-transformed for
statistical analysis (SigmaStat Ver 2.03, SPSS, San Rafael, CA,
1 446
Emviron. Toxicol. Chem.
24, 2005
Table 1 . Mean (±standard deviation) values of Hg levels in mink
brains collected across Canada, 2002 to 2003 . Values are expressed
as a dry weight concentration assuming brain moisture content of
74.6'- 1 .2%
' Significant (p < 0.05) differences among groups .
USA) because the distribution of Hg data were non-Gaussian
as determined by the Kolmogorov-Smimov test . A Pearson
correlation was conducted to explore the relationship between
brain Hg (total and MeHg) and neurochemical receptor-bind-
ing characteristics (receptor density and ligand affinity). One-
way analysis of variance was conducted to examine the re-
lationship between Hg and receptor-binding characteristics
among the study regions . Analysis of covariance was con-
ducted to evaluate if any effects were related to age or gender
of mink .
RESULTS
Hg
analysis
Concentrations of total Hg were measured in two indepen-
dent laboratories at McGill University (Montreal, QC, Canada)
and Trent University (Peterborough, ON, Canada) . The mean
difference in values was 6 .6 '_ 4.8% and the cold-vapor atomic
absorption spectrophotometry detection limit was 1 p.g/L Hg .
Mean recovery of Dogfish Muscle Certified Reference Material
for Trace Metals (DORM-2) standard reference material was
94.0 ± 4.9% and 93.4 ± 4 .3% of the expected value for total
Hg and MeHg, respectively. Concentrations of total Hg in the
mink brain ranged between 0 .27 and 18.84 p-g/g and concen-
trations of McHg ranged between 0.26 and 13 .52 p.g/g (Table
I). Concentrations of Hg (total and MeHg) were significantly
(p < 0.001) higher in Nova Scotia samples compared to those
collected from Ontario and the Yukon Territory (Table 1)
.
Methylmercury was measured only at McGill University and
accounted for 88.8 ± 15.4% of the total Hg (Table 1). The
relationship between total Hg and MeHg was significant (r =
0.966, p < 0.0001, n = 44). Mean moisture content of brain
tissue was 74 .6 ± 1.2%. No effect of age or gender was found
on the concentrations of brain Hg
.
Receptor-binding characteristics
Analysis of all mACh receptor-binding data revealed a
mean receptor density and ligand affinity of 721 .5 ± 227.2
fmol/mg protein and 0.11 ± 0.02 nM, respectively, with high-
Table 2. Mean (±standard deviation) values of neurochemical receptor-binding characteristics (Bmax = receptor density ; Kit = ligand affinity)
in brain membrane preparations from mink collected across Canada, 2002 to 2003
Muscarinie cholinergic receptor-binding characteristics
Sampling region
Nova Scotia
Ontario
Yukon Territory
-A, B = significant (p < 0.05) differences among groups .
N. Basu et al,
est values recorded in the samples from Nova Scotia (Table
2). Nonspecific binding, as determined by incubation of sam-
pies with atropine was less than 5% of total binding at I nM
['H]-QNB . Analysis of all D2 receptor-binding data revealed
a mean receptor density and ligand affinity of 112 .2 ± 32.8
fmol/mg/protein and 1 .64 ± 0.33 nM, respectively (Table 2)
.
Although significantly higher D2 receptor density was mea-
sured in samples from the Yukon Territory, there were no
significant differences in D2 ligand affinity among mink col-
lected from different regions. Nonspecific binding, as deter-
mined by incubation of samples with (+)-butaclamol, was 50
to 55% of total binding at 1 .8 nM [ 3H]-spiperone. No effects
of age or gender were found on mACh and D2 receptor-binding
characteristics
.
Correlation of
Hg
with receptor-binding characteristics
A significant positive correlation was found between total
Hg and mACh receptor density (r = 0 .546, p < 0.0001, n =
47; Fig. IA) and ligand affinity (r = 0.413, p < 0:05, n =
47; Fig. 2A). Similar to total Hg, a significant positive cor-
relation was found between brain MeHg and mACh receptor
density (r = 0.596, p < 0.0001, n = 43; Fig. I B) and ligand
affinity (r = 0.474; p < 0.001, n = 43; Fig. 2B) .
Contrary to the mACh receptor data, a significant negative
correlation was found between total Hg and D2 receptor den-
sity (r = -0.340,p < 0.05, n =48; Fig. 3A) and ligand affinity
(r = -0.346,p < 0.05, n = 48; Fig. 4A). Correlation of McHg
with D2 receptor density (Fig. 3B) and ligand affinity (Fig
.
4B) also was negative, but this association was not statistically
significant (p > 0 .05) .
DISCUSSION
Multiple studies have demonstrated that piscivorous wild-
life are exposed to fig via their natural diet, but little is known
regarding the physiological and ecological consequences of
this long-term exposure. The major finding of this study is
that significant differences in mACh and D2 receptor-binding
characteristics (receptor density and ligand affinity) can be
correlated to concentrations of Hg (total and McHg) in the
brains of wild mink collected across Canada (Figs .
1-4), thus
rejecting our null hypothesis . Given the importance of the
cholinergic and dopaminergic systems in cognitive processes
and motor function, prolonged alterations in receptor prop-
erties may precede, and even be used to predict, adverse chang-
es in neurobehavior and animal health .
Concentrations of brain Hg (total and McHg) measured in
this study correspond well with previously published values
for mink collected in Ontario [11,381 and Yukon Territory [39] .
This is the first report to publish brain Hg concentrations in
mink collected from Nova Scotia (Table 1). Significantly high-
er concentrations of brain Hg (total and MeHg) were measured
Dopamine-2 receptor-binding characteristics
Bmax
(fool/mg protein)
Kit
(nM)
Bmax
(tnol/mg protein)
Kd
(nM)
1,269.9 ± 378.IA'
0.12 ± 0.02A
108.3±30.0
1.59±0.36
598.9 ± 203 .4
0.11 ± 0.02AB
98.2±40 .1
1.69±0.38
550.6 ± 88.8
0.09 ± 0.0113
134 .5! 21 .7A
1.74±0.15
Sampling region
n
Total Hg
Mellg
McHg
(pg/g dry wt) (pg/g dry w0
(% of total Hg)
Nova Scotia
27
5.7 t 5 .2°
4.9 ± 4.1°
90.0 ± 14.9
Ontario
10
1 4 ± 0.6
1 .2 ± 0.7
86.8 `± 19.7
Yukon Territory
11
1 .2 ± 0.8
1 .1 ± 0.8
86.8 ± 14 .1
Mercury-related neurochemical changes in wild mink
v
v
0.1
1
v
°
vv
0
9
v
v
r
0
0
8 g
-b
°
v
0
ow
o
O
0 0
0
0
v
Total Hg (gg/g c1m .)
v
v
r-0.546, p<0.0001
10
r-0.596. p<0.0001
MeHg (µg/g d.w.)
Fig. I . Relationship between cholinergic muscarinic acetylcholine
(mACh) receptor density (Bmax) and levels of total Hg (A) and McHg
(B) in brains of wild mink
(Musrela
vison)
collected from Nova Scotia
('7), Ontario (0), and the Yukon Territory
(0)
in Canada during 2002
to 2003 ; d.w. = dry weight .
in mink from Nova Scotia, relative to the Yukon Territory and
Ontario, which can be attributed to both the geochemistry of
this region [40] and its proximity to industrial point sources
that emit Hg [3,41)
. Wildlife inhabiting low-alkaline regions,
such as Nova Scotia, generally have higher Ill; tissue burdens
because methylation of inorganic Hg is enhanced under acidic
conditions [151. Mean concentrations of brain MeHg, as a
percentage of total Fig, were consistent across the study regions
(Table I) and support previous observations that mink have a
limited capacity to de-methylate Hg compared to other pi-
scivorous wildlife [11,42]
.
Historical reports of Hg poisoning
[5,9]
and controlled
feeding studies [6-8,43] have demonstrated that mink are sen-
sitive to chronic Hg exposure [44] . Given that average con-
centrations of Hg in North American mink arc within one order
of magnitude of concentrations measured in severely poisoned
mink [3], and McHg concentrations in many aquatic ecosys-
tems may exceed the U.S. Environmental Protection Agency's
(U.S
. EPA) derived mammalian wildlife criteria for mink (57
pg MeHg/L) [19], there is a need to explore the subtle effects
associated with Hg exposure in the natural environment . After
reviewing the available literature, the U .S . EPA [3] recom-
mended a lowest-observable-adverse-effects level of 1 .1
u,g/g dietary McHg. This criterion largely was derived from
observations that mink fed this ration had brain concentrations
McHg (pg/g d.w.)
Fig. 2. Relationship between cholinergic muscarinic acetylcholine
(mACh) receptor ligand affinity (Kd) and levels of total Hg (A) and
McHg (B) in brains of wild mink
(Mus/e/a
v/son)
collected from
Nova Scotia ('7), Ontario (0), and the Yukon Territory
(0)
in Canada
during 2002 to 2003 ; d.w. = dry weight
.
of 7.1 to 9.3 pg/g wet weight Hg and resulting neuronal lesions
[7] . Others [12] have suggested that brain concentrations of 5
pg/g wet weight MeHg (--19.7 sg/g dry weight MeHg, as-
suming moisture content of brain to equal 74 .6%), may be low
enough to cause subtle neurological effects . However, our data
demonstrate that significant neurochemical changes exist in
wild mink (Figs
.
1--4), and levels of Hg (total and MeHg)
measured in the brains of these animals were below the con-
centrations proposed by the U.S. EPA [3] and Wolfe et al . [12]
that may cause adverse effects
.
Despite several decades of research on the ecotoxological
effects of Hg, the only acceptable biomarker for Hg is to
quantify exposure by measuring concentrations of Hg in blood,
fur, or organs. Although this type of information is necessary
for risk assessment, it does not provide much information
about the cellular changes that precede functional impairment .
A major limitation in wildlife studies is the rapid postmortem
degradation of cellular components, such as enzymes and
genes, which may he used as possible biomarkers of I Ig effect
.
We have demonstrated recently the versatility of neurochem-
ical receptors in field-based wildlife studies because receptor-
binding characteristics were minimally affected by tissue stor-
age temperatures and multiple freeze thaw cycles [35]
. These
findings, in addition to the results from the currentt study, lend
support to the idea that neurochemical receptor-binding char-
Fnvfrno. Toxicol. Chem .
24, 2005
1447
0.20
A
V
v
Y
0.15
v
v
0
V
v9 v~
is
U
E
0.10
p
v
0
° v
e
v
v
0
o v
0.05
x-0.413, p<0.01
0.00
0.1
1
Total Hg (pg/g d.w.)
10
0.20
-
B
v
v
0.15
-
Y
v 0
O
On 8~
°
°
V
~-
o
~ ~
0.10
-
a
E
n
0
0.05
-
x0.474,
p<0.01
0.00
0 .1
10
1400
A
x
1200
Em y
1000
2
o
`n
v
800
U
E
600
E _'
400
200
0
0 .1
1400- B
m
1200-
1000-
0
0 2
n
E
800
-
E
600 -
EE
400-
200
,
0
McH9 (pg/g d.w .)
Fig. 3. Relationship between dopamine-2 (D2) receptor density
(Bmax) and levels of total Hg (A) and MeHg (B) in brains of wild
mink (Musie/a vison) collected from Nova Scotia (V), Ontario (0),
and the Yukon Territory (0) in Canada during 2002 to 2003 ; d.w. _
dry weight .
acteristics are a novel biomarker to assess Hg's neurotoxic
effects in wildlife .
It is well-established that Hg can alter neurobehavior in
wildlife [12,17,19], but little is known about the mechanisms
that mediate these physiological changes. The proper trans-
mission of signals between the animal's external environment
and its nervous system is necessary for survival . Mercury is
a nonspecific cytotoxic compound [45,46] and rodent studies
have shown that organic and inorganic Hg can impair various
aspects of neurotransmission . For example, laboratory rats [47]
and mice [48] exposed to MeHg had decreased concentrations
of brain acetylcholine, the primary agonist of the mACh re-
ceptor. Reduced acetylcholine levels, as a result of MeHg ex-
posure, are supported by mechanistic studies demonstrating
that McHg can suppress the activity of choline acetyltrans-
ferase [25,26], inhibit the voltage-gated entry of acetylcholine
into pre- and postsynaptic nerve endings [49,50], and impair
the binding of [3H]-QNB to the mACh receptor [31] . Because
Hg may reduce the cellular pool of acetylcholine, up-regulation
of the mACh receptor in Hg-exposed mink (Figs. I and 2)
may represent an adaptive response by these animals to ensure
that cholinergic neurotransmission occurs within a normal
physiological range. However, the duration an animal can sus-
tain changes in neurochemistry needs to be studied because
behavioral changes (e .g., impaired ability to hunt, breed, mi-
0.5
0.0
Total Hg (p9/g d .w.)
2.5
2.0
B
0
V
0
V
0 7 0 0 ° v
° v
v
v v v
0 o 0
V
v
O
°° ~~~ ~8
Co 0
v
7
0
v0
v
v
v v
0.5 -
r--0.226, p>0.05
0.0
V v
N. Basu et al .
2.0
v
O
r--0.346, p<0.05
McHg (pg/g d.w.)
Fig. 4. Relationship between dopamine-2 (D2) receptor ligand affinity
(Kd) and levels of total Hg (A) and MeHg (B) in brains of wild mink
(Musiela vison) collected from Nova Scotia ('7), Ontario (0), and
the Yukon Territory (O) in Canada during 2002 to 2003 ; d.w. = dry
weight .
grate) may become evident once this latency period is ex-
ceeded .
In contrast to the muscarinic cholinergic receptor data, a
negative correlation was calculated between Hg and D2 re-
ceptor-binding characteristics (Figs. 3 and 4). Mercury has
been demonstrated to affect the dopaminergic system in lab-
oratory animals by causing a net increase in cellular levels of
dopamine as a result of decreased monoamine oxidase activity
[26,51], increased tyrosine hydroxylase activity [25], and
spontaneous release of dopamine from neurons (27,29] . In the
field, larval mummichogs (Fundulus hereroclirus) residing in
Hg-contaminated waters had higher levels of dopamine, rel-
ative to controls [34]. Knowing that Hg can increase cellular -
dopamine levels, down-regulation of D2 receptors in high Hg-
exposed mink may represent an adaptive mechanism to prevent
the hyperstimulation of the dopaminergic system by the ani-
mal .
In conclusion, significant Hg-related changes in neuro-
chemistry are measurable in wild mink collected across Can-
ada, and these changes occur at concentrations of brain Hg
below values known to cause adverse clinical effects . Because
mink are exposed routinely to potentially harmful concentra-
tions of fig in their natural environment and a functional neu-
rological signaling pathway is essential for animal behavior
1448
Environ. Toxicol. Chem. 24, 2005
200
A
°
150
o° V
0g °
Em
`o
vU
m
$
100
°
V° V
nv~
N
EE
v
0
V V
7
O v
0
0
50
0
v
v
r--0.340, p<0.05
0
0.1
1
10
Total Hg (pgl9 d.w .)
200
B
0
0,
150
V
E
'a
0 ip7 v9 V v
0 8v V
77 v
O
v ° ~-
n a
100-
0
NN
E
a
E
v
V V
0,
V
0
0
50
0 v
0
r--0.276, p>0.05
0
0.1
1
10
Mercury-related neurochcmical changes in wild mink
and survival, further studies are required to resolve the phys-
iological and ecological significance of these neurochemical
changes to individuals and populations. These data also dem-
onstrate that receptor-binding characteristics represent a novel
tool to assess the ecotoxicological risks of Jig
.
Acknowledgement-This work was supported by operating grants
from the Collaborative Mercury Research Network, Natural Sciences
and Engineering Research Council of Canada to H.M. Chan and A.M .
Scheuhammer. Niladri Basu was funded by a Natural Sciences and
Engineering Research Council and Hydro-Quehec postgraduate fel-
lowship. The authors are grateful to the Ontario Fur Managers Fed-
eration, Nova Scotia Trappers Association, and the Yukon Territory
trappers for providing samples, and to D. Leggee, C. Stamler, M .1 .
Boudreau, H. Broadbent, L. Tivoli, and K . Marcel Loua for technical
assistance and critical discussion
.
REFERENCES
1 . Agency for Toxic Substances and Disease Registry . 1999 . Tox-
icological Profile jor Mercury- U.S Department of Health and
Human Services, Atlanta, GA .
2 . Clarkson TW. 1997. The toxicology of mercury
. Grit Rev Clin
Lab
Sci 34:369-403
.
3 . U.S. Environmental Protection Agency. 1997 . Mercury study re-
port to Congress. Volume VII : Characterization of human health
and wildlife risks from mercury exposure in the United States
.
EPA-452/R-97-007. Final Report. Office of Research and De-
velopment, Washington, DC
.
4. Osowski SL, Brewer LW, Baker OE, Cobb GP. 1995 . The decline
of mink in Georgia, North Carolina, and South Carolina : The role
of contaminants . Arch
Environ Contain Toxico!
29:418-423 .
5 . Fimreite N, Reynolds LM . 1974. Mercury contamination of fish
in northwestern Ontario
. J
JUdd1
Manog 37:120-131-
6 . Dansereau M, Lariviere N, Do'rremblay D, Belanger D. 1999 .
Reproductive performance of two generations of female semi-
domesticated mink fed diets containing organic mercury-contam-
inated freshwater fish
. Arch Environ C'unmm Toxicol 36:221-
226 .
7. Wobeser G, Nielson NO, Schiefer B . 1976. Mercury and mink
11. Experimental methylmercury intoxication
.
Can J Comp Med
40:34-45 .
8. Wren CD, Hunter DE, Leatherland 1F, Stokes PM. 1987. The
effects of polychlorinated biphenyls and methylmercury, singly
and in combination, on mink . I . Uptake and toxic responses . Arch
Environ
Coal,. Turicol 16:441-447.
9. Wobeser G, Swift M. 1976. Mercury poisoning in a wild mink
.
J Wildl Dis
12 :335-340 .
10. Kueera E. 1983. Mink and otter as indicators of mercury in Man-
itoba waters
.
Can
J Zool 61 :2250-2256
.
11 . Evans RD, Addison EM, Villeneuve JY, MacDonald KS, Joachim
DG. 2000. Distribution of inorganic and methylmercury among
tissues in mink
(Mustela vision)
and otter (Lutra canadensis)
.
Environ Res 84:133-139 .
12. Wolfe ME Schwarzbach 5, Sulaiman RA . 1998. Effects of mer-
cury on wildlife: A comprehensive review
. Environ
ToxieolChem
17:146-160.
13. Nriagu JO, Pacyna JM . 1988 . Quantitative assessment ofworld-
wide contamination of air, water, and soils by trace metals
. Nature
333:134-139 .
14. Downs SG, Macleod CL, Lester 1N. 1998 . Mercury in precipi-
tation and its relation to biuaccumulaton in fish : A literature
review. Water Air Soil Pollut 108 :149-187 .
15. Morel FMM, Kraepiel AML, Amyot M . 1998 . The chemical cycle
and bioaccumulation of mercury . Anna
Rev
Ecol Syst 29:543-
566 .
16. Swain EB, Engstrom DR, Brigham ME, Ilenning TA, Brezonik
PL. 1992 . Increasing rates of atmospheric mercury deposition in
mideontinental North America
.
Science
257:784-787
.
17. Wiener JO, Krabbenhoft DI', Heinz GB, Scheuhaminer AM . 2003
.
Ecotoxicology of mercury . In Hoffman DJ, Rattner BA, Burton
GA Jr, Cairns J Jr, ads,
Handbook
of Ecotoxicology, 2nd ed. CRC,
Boca Raton, FL, USA, pp 409-463
.
18. Boening DW. 2000. Ecological effects, transport, and fate ofmer-
cury: A general review .
Chemosphere
40:1335-1351
.
19. (,ban HM,
Scheuhammer
AM, Ferran A, Loupclle C, I lolloway
Environ. Toxicol
.
Chem .
24, 2005
1449
J, Weech S . 2003. Impacts of mercury on freshwater fish-eating
wildlife and humans . Human and Ecological Risk
Assessment
9
:
867-883 .
20. Silbergeld EK. 1993 . Ncurochemical approaches to developing
biochemical markers of neurotoxicity: Review of current slang ;
and evaluation of future prospects . Environ Res 63:274-286
.
21. Manzo L, Artigas F, Martinez E, Moth A, Bergamaschi E, Ni-
cotera P, Tonini M, Candura SM, Ray DE, Costa LG . 1996. Bio-
chemical markers of neurutoxicit . A review of mechanistic stud-
ies and applications
. Hum Exp Toxicol IS:S20- S35 .
22. Costa LG, Manzo L . 1995. Biochemical markers ofneurotoxicity
:
Research strategies and epidemiological applications
. Toxicol Lett
77:137-144 .
23. Caulfield MP, Birdsall NJ . 1998 . International Union of Phar-
macology- XVII- Classification of muscarinic acetylcholine re-
ceptors . Pharmacol Rev 50:279-290 .
24. Missale C, Nash SR, Robinson SW, Jaber M, Caron MG . 1998,
Dopamine receptors: From structure to function . Physio!
Rev
78 :
189-225
.
25. Omata S, Hirakawa F, Daimon Y, Uchiyama M, Nakashita H,
Horigome T, Sugano I, Sugano H . 1982. Methylmercury-induced
changes in the activities of neurotransmitter enzymes in nervous
tissues of the rat . Arch Toxicol 51 :285-294.
26. Tsuzuki Y. 1981 . Effect of chronic methylmercury exposure on
activities of neurotransmitter enzymes in rat cerebellum
. Toxicol
Appl Pharmacol 60:379-381
.
27. Minnema DJ, Cooper GP, Greenland RD. 1989. Effects of meth-
ylmercury on neurotransmitter release from rat brain synapto-
sontes . Taxis ol .4pp1 Pharmacol 99:510-521
.
28. Tuomisto J, Komulainen H . 1983. Release and inhibition of up-
take of 5-hydroxytryptamine in blood platelets in vitro by copper
and methylmercury
. Acta Pharmacol Taxicol 52:292-297 .
29. Faro LRF, do Nascimento JLM, Alfonso M, Duran R . 2001 . In
vivo effects of inorganic mercury (HgCl,) on striatal dopami-
nergie system- Ecotoxicol Environ Saj48:263-267 .
30. Coccini
T
Randinc G, Candura SM, Nappi RE, Prockop LD, Manzo
L. 2000. Low-level exposure to methylmercury modifies rnusca-
rinic cholinergic receptor-binding characteristics in rat brain and
lymphocytes: Physiologic implications and new opportunities in
biologic monitoring Environ
Health
Perspect 10829-33 .
31 . Von Burg R, Northington FK, Shaman A. 1980. Methylmercury
inhibition of rat brain muscarnie receptors
. Toxicol App! Phar-
macol 53 :285-292 .
32. Castoldi AF, Candura SM, Costa P, Manzo L, Costa LG . 1996.
Interaction of mercury compounds with muscarinic receptor sub-
types in the rat brain
. Neurotoxicology 17:735-742 .
33. Beauvais SL, Jones SB, Parris 1T, Brewer SK, Little EE . 2001
.
Cholinergic and behavioral neurotoxicity , of carbaryl and cad-
mium to larval rainbow trout (Oncorhynchus mykiss)
. Ecotoxicol
Environ
Saf 49:84-90 .
34. Zhou T, Rademacher OF, Steinpreis RE, Weis IS . 1999. Neuro-
transmitter levels in two populations of larval
Fundulus
heler-
oclitus after methylmercury exposure . Comp
Riochem
Physio! C
124:287-294 .
35. Stamler CJ, Faso N, Chan. HM 2005. Biochemical markers of
neurotoxicity in wildlife and human populations: Considerations
for method development . J Toxicol
Environ Health
(in press).
36. Scheuhammer AM, Atchison CM, Wong AHK, Evers DC. 1998 .
Mercury exposure in breeding common loons (Gavin immer) in
central Ontario, Canada
. Environ Toxicol
Chem
17:191-196
.
37. Bradford MM . 1976. A rapid and sensitive method for the quan-
tification of microgram quantities of protein utilizing the principle
of protein-dye binding, Anal
Biochem
72:248-254 .
38. Wren CD, Stokes PM, Fischer KL. 1986. Mercury levels in On-
tado mink and otter relative to food levels and environmental
acidification
. Can J Zoo! 64:2854-2859
.
39. Gamberg M, Roach P, Stern G. 2003. Selenium and cadmium
concentrations in wild Yukon mink. In Synopsis of
Research
Conducted under
the 2001-2003 Northern Contaminants Pro-
gram
. Department of Indian and Northern Affairs, Ottawa, ON,
Canada, pp 283-287 .
40. Siciliano SD, Songster A, Daughney C), Loseto L, Gemiida JJ, Rencz
AN, O'Driscoll NJ, Lean DR. 2003. Are methylmercury concentra-
tions
in
the wetlands of Kejimkujik National Park, Nova Scotia,
Canada, dependent on geology? .1 Environ Qual 32:2085-2094
.
145 0
Environ. Toxicol. Chew
.
24, 2005
41 . Sunderlan EM, Chmura GL . 2000 . An inventory of historical
mercury emissions in Maritime Canada: Implications for present
and future contamination .
Sri Total Environ
256:39-57 .
42. Jernelov A,Johansson AH, Sorensen L, Svenson A .1976. Meth-
ylmercury degradation in mink
.
Toxicology
6:315-321
.
43. Aulerich RI, Ringer RK, Iwamoto 5. 1974. Effects of dietary
mercury on mink .
Arch Environ Contain Toxicol
2:43-51
.
44. Calabrese El, Aulerich RI, Padgett GA . 1992. Mink as a predic-
tive model in toxicology
.
Drug Memb
Rev 24:559-578 .
45. Atchison WD, Hare ME 1994. Mechanisms of methylmercury-
induced neurotoxicity
.
FASEB
J 8 :622-629 .
46. Castoldi AF, Coccini T, Ceccatelli S, Manzo L . 2001 . Neurotox-
icity and molecular effects of methylmercury.
Brain Res Bull 55
:
197-203 .
N . Rasu ct al,
47. Hrdina PD, Peters DA, Singhal RL . 1976. Effects of chronic
exposure to cadmium, lead, and mercury on brain biogenic amines
in the at .
Res Commun Chem Parhol Pharmacol
15 :483-493 .
48. Kobayashi H, Yuyama A, Matsusaka N, Takeno K, Yanagiya I
.
1980. Effect of methylmercury on brain acetyl choline concentra-
tion and turnover in mice .
Toxicol Appl Pharmacol
54:1-8.
49. Sirois JE, Atchison WD . 1996. Effects of mercurials on ligand-
'and voltage-gated ion channels: A review.
Neurotoxicology 17
:
63-84 .
50. Cooper GP, Manalis RS. 1983. Influence of heavy metals on syn-
aptic transmission: A review .
Neurotoxicology
4:69-83
.
51 . Kimbagaran R, Joy KP. 1990. Changes in brain monoamine levels
and monoamine oxidasc activity in the catfish,
Clarias batrachus,
during chronic treatments with mercurials
.
Bull Environ Contam
Toxicol
45:88-93 .
Effects of Dietary Methylmercury on
Reproduction of Fathead Minnows
CHAD
R
. HAMMERSCHMIDT,
1
MARK B. SANDHEINRICH,"
JAMES G . WIENER, AND
RONALD G . RADA
University
of Wisconsin-La Crosse,
River Studies Center,
Department of Biology, La Crosse, Wisconsin 54601
We examined effects of dietary methylmercury (MeHg) on
reproduction of fathead minnows (Pimephales promelas) .
Juvenile fish were fed one of four diets until sexual maturity
(phase 1): a control diet (0.06 µg Hg g-
I
dry weight)
and three diets contaminated with MeHg at 0 .88 (low),
4.11 (medium), and 8.46µg Hg g-1 dry weight (high). At sexual
maturity, male and female fish were paired, again fed
one of the four diets, and allowed to reproduce (phase 2) .
To assess effects of MeHg during gametogenesis, some
fish were fed diets during phase 2 that differed from those
during phase 1 . Spawning success of pairs fed the same
diet during phases 1 and 2 was 75% for controls and 46%,
50%, and 36% for the low-, medium-, and high-MeHg
treatments, respectively. Spawning success of pairs fed a
contaminated diet during phase 1 and a control diet
during phase 2 was 63%,40%, and 14% for the low-, medium-,
and high-MeHg treatments, respectively, whereas
exposure to dietary MeHg only during phase 2 did not
reduce spawning success. Dietary MeHg delayed spawning,
and days to spawning was positively correlated with
concentration of total mercury in the carcasses of test
fish. MeHg reduced the instantaneous rate of reproduction
of fish fed the same diets during phases 1 and 2 . Both
the gonadosomatic index and reproductive effort of female
fish were inversely correlated with mercury in carcasses,
whereas developmental and hatching success of
embryos, 7-d survival, and 7-d growth of larvae were
unrelated to mercury concentrations in parental fish or
their diets. MeHg decreased reproduction of adult fathead
minnows at dietary concentrations encountered by
predatory fishes in aquatic systems with MeHg-contaminated
'food webs, implying that exposed fish populations could
be adversely affected by this widespread contaminant
.
Introduction
Little is known about the toxicological effects of methyl-
mercury (MeHg) on the reproduction, growth, and survival
of wild fishes (1-3)
. Nearly all of the mercury in adult fish
and their eggs is MeHg (4-2
. MeHg may decrease overall
reproductive success of fish by altering gametogenesis and
gonadal development of adults or by reducing the hatching
success of eggs and the survival of embryolarval stages (3,
8-11) . Birge et al .
(12), for example, found that mercury
Correspondingauthorphone:
(608)785-8261
;
fax :
(608)785-6959 ;
e-mail: sandhein.mark@uwlax.edu .
1 Present address: Department of Marine Sciences, University of
Connecticut, Groton,
CT 06340 .
10.1021/es011120p CCC: $22.00
® 2002 American Chemical Society
Published on Web 01130/2002
Environ. Sci. Technol. 2002, 36,877-883
concentrations as low as 0.07-0.10µg g l wet weight in eggs
of rainbow trout Oncorhynchus mykisswere associated with
increased mortality; these concentrations are only six to nine
times those measured in eggs of rainbow trout from Lake
Ontario (13) and are within the range measured in eggs of
yellow perch Perm flavescens from low-alkalinity lakes in
northern Wisconsin
(6)
.
Few laboratory studies of the effects of MeHg on fish have
mimicked exposure conditions in natural waters . Many
studies, forexample, have used unrealistically high exposures
to waterborne McHg
(2) . More recent investigations have
shown that diet is the primary source of MeHg for fish in
natural waters (14, 15) and that maternal transfer is an
important pathway of MeHg exposure for fish embryos (3,
16)
. The amount of mercury transferred from the female to
the developing egg is small, yet the mercury content of eggs
is strongly related to that of the maternal fish (6, 7)
.
We fed fathead minnows Pimephales promelas diets
containing concentrations of MeHg present in some aquatic
food webs, maintained the fish through sexual maturity, and
examined the effects of dietary or maternally transferred
McHg on several reproductive variables. Our principal
objective was to examine the effects of MeHg administered
via the diet of parental fish on the overall reproductive success
of fathead minnows .
Experimental Section
Study Design. The study included four sequential phases
corresponding to life stages of the fathead minnow: (phase
1) the juvenile stage until sexual maturity. (phase 2) spawning
of mature fish, (phase 3) embryogenesis, and (phase 4) growth
of larval progeny. During each phase, we examined effects
of either dietary or maternally transferred MeHg on fathead
minnows
.
Throughout the study, fathead minnows were cultured
with methods described by others (17-19)
. Larvae were fed
brine shrimp nauplii (Artemia sp.) until 45-d post hatch and
then fed Starter soft-moist fish food (Nelson and Sons. Inc
.
.
Murray, UT) . About 3 months after hatching, about 1400
juveniles were randomly placed into each of four 500-L flow-
through tanks receiving well water (Figure 1, phase 1)
.
Phase 1 . Juvenile fathead minnows were fed
ad libiturn
one of four phase-I diets, three of which were contaminated
with methylmercuric chloride. Mean concentrations (ug g
1
dry weight) ± 1 SE of total mercury in the diets were 0 .060
f 0.003 (control), 0.88 ± 0.02 (low), 4.11 ± 0.08 (medium),
and 8.46 ± 0.17 (high) . Normalized to caloric density, levels
of mercury in the test diets spanned those in zooplankton,
benthic invertebrates, and small forage fish from low-
alkalinity lakes in North America (Table 1). Hence, these
dietary concentrations are environmentally realistic and
reflect potential dietary exposures of fish in many aquatic
systems with MeHg-contaminated food webs
.
Phase 2. After fathead minnows became sexually dimor-
phic (about 240 d post-hatch), mature males and females
were paired randomly and assigned to quadrants in one of
15 50-L flow-through breeding aquaria receiving well water
(Figure 1) . Breeding aquariawere arranged randomly within
a large water bath, and each aquarium was partitioned into
quadrants with plastic screen. One pair of fish inhabited each
quadrant with an acid-cleaned spawning substrate (a half
cylinder of PVC pipe) . Pairs were fed a phase-2 diet with one
of four concentrations of MeHg . To evaluate the effects of
dietary MeHg during gametogenesis on reproduction, some
fish were fed phase-2 diets that differed from those fed during
VOL. 36, NO . 5. 2002 / ENVIRONMENTAL SCIENCE & TECHNOLOGY
•
877
TABLE 1. Mercury Concentrations in Diets Used in This Study in Relation to Those in Zooplankton, Benthic Invertebrates, and
Small Prey Fish in Low-Alkalinity Lakes'
control diet
zooplankton
zooplankton 6
benthicinvertebratesh
low diet
whole yellow perch (age-2)
whole smelt
(Osmerus mordax)
crayfish abdominal muscle
medium diet
high diet
'Determined by bomb calorimetry . 'From Lake
632
(reference site).' Estimated dry-weight value assuming a whole-body water content of
75% . a
Based on value reported by Craig (47) .
e
Based on value reported for fish less than
140
mm standard length (48)
.
r
Unless noted otherwise,
caloric densities are based on values reported by Cummins and Wuycheck
(41) .
Juvenile Fathead Minnows
((U /
/
\
\
CL 04t CONTROL
LOW
MEDIUM HIGH
ao
McHg
McHg
MeHg
____--_______________-__-__________________
m
LOW
MEDIUM
HIGH
ww
CONTROL
McHg
MeHg MeHg
a
N
N
m
L
U-
7
d
N
L
Q_
ME
][
LSC11E
M IM
ME
ed
am
item
MHd
MEW
E
7
C4
RIM
MM
M
M
m
[a~]
E
9.1 N
ME
ERR
IRMO
ME
IN PH
rem
:ON
MEN
-------------------------------------------
2
a
___________________________________________
d
FIGURE 1. Experimental design used to evaluate effects of dietary
methylmercury (MeHg) on reproduction of fathead minnows . Letters
in quadrants of breeding aquaria (phase 2) represent the McHg-
contaminated diet fed to female (circle over plus sign) and male
(circle and arrow) fish during phase 1 of the study (C =control diet
with no added McHg, L = low, M = medium, and H = high)
.
phase 1 . To examine the relative effects of either male or
female exposure to dietary McHg during phase 1, some fish
fed a contaminated diet (luring phase I were paired with fish
fed the control diet in phase 1. Male and female fish were
paired so that every treatment
(i.e ., phase-I diet of male x
phase-1 diet of female x phase-2 diet of pair) was replicated
concurrently and over the 136-d period of phase-2 observa-
tion with replacement pairs of fish . Male and female fathead
minnows were capable or nearly capable of reproducingwhen
placed into breeding aquaria. The ovaries of female fathead
minnows contain eggs in all stages of development, and they
spawn repeatedly as the eggs mature
(19). Male fathead
878 -ENVIRONMENTAL SCIENCE 5 TECHNOLOGY / VOL . 36. NO. 5, 2002
minnows initiate spawning by courting a receptive female
to deposit adhesive eggs on the underside of a floating or
submerged substrate (19, 29) . Oviposited eggs are subse-
quently fertilized, aerated, and kept clear of detritus by the
male fish .
Phase 3. Spawning substrates were examined daily for
eggs. Each substrate with eggs was transferred to a I-L beaker
containing aquarium water (Figure 1) . Water in the beakers
was aerated gently and maintained at 25 ± I 'C with a
photoperiod of 16 h Iight :8 h dark. To ensure that the gametes
were produced or matured while the fish were fed the phase-2
diet, a second clutch of eggs was collected when the phase-2
diet was different from the phase-1 diet of either test fish
.
Phase 4. The 7-d survival and growth of fathead minnow
progeny were determined. After hatching, 10 embryos were
transferred to a I -L beaker (Figure 1) . When a clutch had 30
or more embryos, three beakers with 10 embryos each were
used. The beakers were maintained at 25
1- 1 "C with a
photoperiod of 16 h light :8 h dark . Larvae were fed newly
hatched brine shrimp nauplii three times daily until day 7,
when they were sacrificed, dried in an oven at 65 "C for 24
h, and weighed (± 0.1 mg) .
Reproductive Endpoints. Multiple endpoints of repro-
ductive success were measured . including (1) gonadal
development of females and males, (2) spawning success,
(3) days to spawning, (4) reproductive effort of female fish,
(5) developmental success of embryos, (6) hatching success
of embryos, (7) survival of larvae . and (8) growth of larvae .
Gonadal development
was
quantified for each adult fish,
whether or not it spawned, as the gonadosomatic index (GSI),
the percentage of the whole-body weight contributed by the
gonads. Spa
wrong success
was the percentage of pairs within
a dietary treatment that spawned a clutch of eggs within 21
d after placement in the breeding aquaria . A clutch of eggs
was defined a priori as more than five eggs oviposited between
daily examinations of a spawning substrate
.
Days to
spawning
was the number of days elapsed before a pair of fish spawned
a clutch of eggs. Although a clutch of five eggs was used as
the criterion for days to spawning, pairs of fish were kept in
phase-2 aquaria until they spawned 30 or more eggs, a
number sufficient for measurement of the other reproductive
variables (e .g ., hatching success) . Reproductive effort of
female fish was the total number of eggs laid (until spawning
30 eggs) per gram of fish, a ratio that accounts for the
bionmass of the female from which energy and nutrients are
allocated for the production of eggs (21) .
Daily reproductive
effort
(i.e.,
eggs g -1
(1
I)
was estimated by normalizing
reproductive effort to the number of days a female was kept
in a phase-2 aquarium .
Developmental
success was the
percentage of embryos in each clutch that reached the "eyed"
stage
.
Hatching
success
was the percentage of "eyed" eggs
caloric density
(Kcal g -1 dry wt)
concentration of mercury
determined, or probable
dominant form, of mercury
ref
(ug 9 dry wt)
(pg Kcal
)
5.16'
0.06
0.01
total
this study
5.24
0.06-0.28
0.011-0.053
methyl
(42)
5.24
0.007-0.29
0.001-0.056
methyl
(35)
4.82
0.001-1 .0
<0.001-0.21
methyl
(43)
5.16'
0.88
0.17
methyl
this study
4.3-5.6cd
0.12-1 .2'
0.02-0.27
methyl
(44)
3.1-5.0^-e
0.20-2.3'
0.04-0.75
methyl
(45)
3.3'
0.84-2.5'
0.26-0.75
methyl
(46)
5.16'
4.11
0.80
methyl
this study
5.16 8
8.46
1 .64
methyl
this study
that hatched.
Survival of larvae
was the percentage of the
initial number of hatched larvae that was surviving In a beaker
on day 7 (post hatch) .
Growth of larvae
was the mean dry
weight of surviving larvae on day 7 . Breeding pairs were
sacrificed on the day that they spawned more than a
cumulative total of 30 eggs or after 21 d if they did not spawn
.
Each adult fish was placed in a food-grade plastic bag,
anesthetized in a refrigerator, blotted dry, measured (f I
mm total length), weighed (± 0 .1 mg), and dissected to
remove the gonads, which were also weighed (± 0.1 mg)
.
Carcasses
(i.e ., whole fish minus gonads) were promptly
frozen at <- -30 °C until lyophilization .
We took steps to minimize contamination offish carcasses
during dissection. Fish were dissected with stainless steel
implements on the inner surface of a food-grade plastic bag
inside a laminar-flow hood . Between fish, dissection equip-
ment was rigorously cleaned with detergent and rinsed with
reagent-grade water, dissection surfaces were changed, and
gloves were cleaned or changed
.
McHg-Contaminated Diets . Phase-I and phase-2 diets
were prepared by mixing fish food (Soft-moist fish food,
Nelson and Sons, Inc.) with reagent alcohol (Fisher) con-
taining dissolved methylmercuric chloride (Alfa Chemical)
.
Control diets were prepared similarly by mixing fish food
with alcohol only. Alcohol was evaporated from the mixtures
in acid-cleaned, glass pans in a fume hood . Diets were
prepared about every 2 weeks and frozen until use . Samples
of each diet from each preparation batch were analyzed for
total mercury. The mean caloric density of diets, determined
by bomb calorimetry, was 5.16 Kcal g-
' dry weight (relative
standard deviation, 0.5%) .
Estimated Exposure to Waterborne MeHg. We did not
measure MeHg in aquarium water but did examine dis-
sociation of McHg from contaminated food in well water to
estimate the associated potential exposure of fathead min-
nows to waterborne MeHg. Samples of each diet were soaked
in well water for 10 min or 22 h and collected on acid-cleaned
Gelman Type A/E filters . Both diet sample and filter were
acid-digested and analyzed for total mercury
.
Little MeHg dissociated from contaminated diets in well
water. Samples of contaminated diets that had soaked for 10
min lost from 2.7% to 5.2% of the mercury measured in
unsoaked samples. Loss of MeHg from contaminated diets
soaked for 22 h ranged from 7.6% to 10%. Total mercury
concentrations in soaked samples of the control diet were
similar to those in unsoaked samples
.
Potential concentrations of MeHg in culture water were
estimated from (1) the amount of food put into the tanks
daily, (2) the approximate amount of food consumed, (3) the
dissociation of McHg from the diets, and (4) the volume and
rate of water replacement in the tanks. Fathead minnows in
the 500-L tanks (phase 1) were fed intermittently a maximum
of 36 g of food per day, more than half of which was consumed
within 10 min after each feeding. Based on the volume and
average inflow of water to the tanks (30 L h - '), about 80%
of the tank volume was replaced every 24 h (22) . We estimate
that maximal levels of waterborne MeHg could have ranged
from I ng L -
' in the low-MeHg tank to 8 ng L- ' in the high-
MeHg tank, assuming that (1) half of the food was consumed,
(2) the billowing water contained no MeHg, (3) 10% of the
MeHg dissociated from uneaten food during a 24-h period,
and (4) all of the dissociated MeHg remained dissolved . These
MeHg concentrations are 10-10 2 fold greater than those In
oxic waters of low-alkalinity lakes in northern Wisconsin
(0.05-0.33 ng Hg L -
' (2M) but are considerably (102-10 3
fold) less than the waterborne concentrations known to affect
the survival, development, reproduction, physiology, and
behavior of juvenile and adult fishes
(2) . Moreover, the
concentrations of MeHg in our contaminated diets exceeded
the estimated maximal concentrations in water by about
10 6. Thus, it can be reasonably inferred that the effects of
MeHg on reproduction of fathead minnows in this study
resulted from dietary exposure .
Mercury Determinations. Diets and carcasses of adult
fish were analyzed individually for total mercury . Frozen
carcasses were lyophilized to a constant dry weight in food-
grade plastic bags for 102-168 h at <- -50 °C. Lyophilized
carcasses weighing 0.5 g or more were pulverized and
homogenized inside their plastic bags . We acid-digested
whole, lyophilized carcasses of fish weighing less than 0 .5 g,
0.4-g subsamples of lyophilized carcasses weighing ? 0.5 g,
and 0.25-g subsamples of diets following the methods of
Hammerschmidt et al
. (6) . Each digestate was analyzed by
flow injection cold-vapor atomic absorption spectroscopy
with a Perkin-Elmer FIMS 100.
Quality Assurance. All equipment used to culture fathead
minnows was acid cleaned and rinsed with either reagent-
grade water (nominal resistance a 15 MQ cm - ') or well water
.
For determinations of total mercury, glassware and equip-
ment were acid cleaned and rinsed with reagent-grade water .
All acids and reagents used in digestions and analyses were
suitable for use in mercury determinations
U .
T. Baker) .
Mercury standards were prepared from a 1000-mg L- '
certified standard
U
.
T. Baker) .
Accuracy of determinations of total mercury for each
analytical batch of samples was quantified by analyses of (1)
certified reference materials from the National Research
Council of Canada and the U .S . National Institute of
Standards and Technology. (2) replicate subsamples of
homogenized fish and test diets, (3) spiked (before digestion)
subsamples of homogenized fish and diets, and (4) blanks
and standards taken through the digestion procedures. Mean
measured concentrations and 95% confidence intervals (CI)
of total mercury in the four reference materials analyzed
were within the certified ranges, which ranged from 0 .27-
0.39/ig g
' to 4.38-4.90µg g-1 dry weight. Method precision
(relative standard deviation) for determinations of total
mercury, estimated from analyses of duplicate and triplicate
subsamples, averaged 4.7% (range, 0.2-17.9%) for fish and
4.1% (range, 1 .3-9.1%) for diets. Mean recovery of total
mercury was 98% (95% CI, 97-100%) for Ill spiked sub-
samples of fish and 96% (CI, 93-100%) for 36 spiked
subsamples of diets. Our estimated method detection limit
(24) for total mercury In a 0.25-g sample of homogenized
fish was 0.004 jig Hg g-1 dry weight
.
Statistical Analyses. Data were analyzed with a micro-
computer and SPSS for Windows software (version 8.0) . Least-
squares linear regression models were used to describe
relations between (1) measures of reproductive success and
total mercury in fish carcasses and (2) the different repro-
ductive variables measured. Spawning success, develop-
mental and hatching success of embryos, and survival and
growth of larvae were examined only for eggs and progeny
from the 100 pairs of adult fish for which both parents were
fed the same diet during each phase throughout the study,
although the diet of both fish may have changed from one
phase to another (e .g., male and female fed the medium-
McHg diet during phase I and the control diet during phase
2). Only data from the 50 pairs of fish fed the same diet
during phases I and 2
(e.g., male and female fed medium
diet during both phase I and 2) were used in regression
analyses of days to spawning . All spawning females (n= 52)
and males(n= 47) fed a single diet during both phases 1 and
2, regardless of the exposure of their mate, were used in
statistical analyses of the effects of MeHg on gonadal
development. Measurements from all spawning females (n
= 52) fed the same diet during both phases I and 2 were used
to assess the effects of MeHg on reproductive effort . For
measures of reproductive success that were related to parental
exposure to dietary MeHg, a Wilcoxon rank sum test was
VOL. 36, NO. 5, 20021 ENVIRONMENTAL SCIENCE & TECHNOLOGY
•
879
TABLE 2. Wet Weight, Spawning Success, and Total Mercury in Carcasses of Male and Female Fathead Minnows Fed Diets with
Different levels of Methylmercuryb
an wet weight
(g)
spawning
man
success
burden (r9 Hg fish -
') concentration W9 Hg 9' dry
)
diet
male
female
le
(%)
male
Female
male
Female
a
Number of pairs of fathead minnows examined . ° Ranges are given in parentheses .
used to contrast the relative effect of either male or female
exposure to MeHg.
The number of days until each pair of fish spawned a
clutch of eggs may have exceeded the period of time that the
fish were in the breeding quadrants (21 d), and, therefore,
reproduction went unobserved . These data are said to be
right-censored (25), and the statistical analysis must account
for the censoring. We used a Cox regression model for time-
dependent variables (25) to assess the effect of MeHg in
females on days to spawning of the 50 pairs of fish fed the
same diet during both phases I and 2 . This is an extension
of the Cox proportional hazards model of the distributions
of times until a single event, such as mortality. The
instantaneous rate of reproduction generated by the regres-
sion model, denoted by the hazard function
h(d,
is an
estimate of the potential for reproduction per unit time at
a particular instant, given that reproduction has not already
occurred and can be defined as
h(t) = [ho(t)]
exp]fC+ dC x
t]
(1)
where
ho(t) is
an unknown baseline hazard function . # and
d are regression coefficients, Cis the mercury concentration
of the female carcass (ug Hg g-1 dry weight), and
t
(time)
ranged from I to 21 d. Therefore, the potential for spawning
by a pair of fathead minnows, given that they have not already
spawned, is a function of some baseline reproduction rate
;
the potential Is increased (exp term > 1) or decreased (exp
term < 1) by mercury in the female and is not constant with
time .
The ratio of the potential for reproduction between two
groups of fathead minnows with different mercury concen-
trations can be calculated as
relative reproductive potential =
exp(Q(C, -
G2) + d((C, x
t) - (C2 x t))]
(2)
where C, and C2 are the mean mercury concentrations in
female fathead minnows of the two groups. We fitted eq 1
to the reproduction data
(i.e
., days to spawning) by maxi-
mizing the partial likelihood and constructed Wald g-square
tests for each parameter
(25) .
Results and Discussion
Dietary MeHg did not reduce the growth and survival of
adult fathead minnows in our study. There was considerable
overlap in wet weights of fathead minnows of each sex among
the four phase-1 diets (Table 2). Mean wet weight ranged
from 3.70 g (low MeHg) to 5.12 g (high MeHg) in males and
880 -ENVIRONMENTAL SCIENCE & rECHNO[OGV I VOL . 36. NO. 5. 2002
from 1 .89 g (controls) to 2.50 g (high MeHg) in females . Wet
weights of spawning and nonspawning fish were positively
related to mercury burdens for all males (12=0 .19, p < 0.001,
n=
179) and females (r2=0.23. p < 0.001,
n=
188) combined .
suggesting that exposure to dietary McHg, at levels that were
not overtly toxic to the fish, stimulated somatic growth
(i.e .,
hormesis) . Mortality of adult fish was small and unrelated
to dietary MeHg, ranging from 0 .07% for fish fed the low-
MeHg diet to about 0.4% for fish fed the control and high-
McHg diets during phase 1 . Only one fish died during phase
2, a male fed the medium-MeHg diet during both phases I
and 2. These results were unexpected . given previous
investigations showing decreased survival and growth of adult
and juvenile fishes exposed to dietary MeHg
(11, 26, 27) .
Concentrations of mercury were notably higher in female
fathead minnows than in males fed the same diet (Table 2),
probably because female fish consume more food than males
to supportt the energy requirements of egg production
(28,
29). The increased feeding rates in females cause greater
dietary uptake of methylmercury, and only a small fraction
of the accumulated methylmercury is transferred to the egg
mass and eliminated (luring spawning (6, 7,
13) .
Dietary MeHg reduced gonadal development of female
fathead minnows. The CSI of spawning females fed the same
diet during phases I and 2 ranged from 3 .0% to 16.4% and
was related inversely to the concentration of total mercury
in carcasses (r2 = 0.15, p=0.005,
n=
52) . The GSI of females
fed a contaminated diet during phase I and the control diet
during phase 2 was not correlated with total mercury in
carcasses (p = 0.54,
n=
25) . Likewise, the GSI of females fed
the control diet during phase 1 and a contaminated diet
during phase 2 was not correlated with total mercury in
carcasses (p = 0.65,
n
= 25), even though fish fed contami-
nated diets during phase 2 readily accumulated MeHg (Table
2) . Insufficient samples sizes may have precluded detection
of the effects of mercury on CSI when diets differed between
phases I and 2 .
Dietary MeHg also reduced the daily reproductive effort
of female fathead minnows (Figure 2). The average daily
number of eggs laid per gram of female carcass was highly
variable but was correlated negatively with concentrations
of total mercury in carcasses of females fed the same diet
during both phases 1 and 2 (r2 = 0. 14, p= 0.01, n= 46). The
total number of eggs laid per gram of carcass was correlated
positively with GSI (r2=0.21,0
.21,p=0,001); hence, dietary MeHg
reduced gonadal development of female fish, and this effect
was linked to lower egg production . Exposure of female fish
to MeHg can interfere
with
the production of estrogen,
thereby reducing the number, size, or quality of eggs
Same Diet during Phases 1 and 2
control
4.44 (2.94-6.83)
1 .89
(1 .48-2.48)
16
75
0.36 (0.18-0.56)
0.21 (0.11-0.43)
0.32 (0.20-0.43)
0.48 (0.27-0.43)
low
3.70 (2.78-4.26)
1 .94
(1 .16-2.57)
13
46
1.51 (0.66-2.11)
1 .51 (0.66-2.11)
2.83 (2.13-3.87)
3.40 (2.23-4.54)
medium
4.79 (2.51-6.14)
2.12
(1 .73-2.74)
10
50
13.5 (9.00-1 .6)
7.4 (5.15-9.54)
11 .7 (9.98-13 .8)
14.0 (9.78-20.9)
high
5.12 (3.81-8.54)
2.50
(1 .33-3.67)
11
36
25.5 (18.9-38.2)
14.2 (7.40-22 .2)
18.4 (14.B-25 .0)
22.2 (15.1-26 .4)
Contaminated Diet during Phase 1 and Control Diet during Phase 2
low
4.26 (3.28-5.40)
1 .83
(1 .39-2.25)
8
63
2.02 (1 .69-2.27)
1 .07 (0.84-1.23)
1 .97 (1 .38-2.61)
2.59 (1 .95-3.57)
medium
4.35 (3.51-5.47)
2.29
(1 .70-2.76)
10
40
7.05 (3.99-9.68)
4.17 (3.30-5.45)
6.64 (2.50-10 .4)
7.51 (5.88-9.70)
high
4.51
(3.58-6.20)
2.27 (1 .66-3.30)
7
14
14.8 (8.50-20.3)
6.93 (4.06-9.17)
11 .6 (10.3-13 .4)
12.1 (9.18-17 .6)
Control Diet during Phase 1 and Contaminated Diet during Phase 2
low
4.38 (3.36-6,42)
2.07 (1 .18-2.91)
11
55
1 .06 (0.40-1.91)
0.69 (0.25-1.44)
1 .02 (0.45-2.29)
1 .41 (0.52-2.40)
medium
3.39 (2.34-3.94)
1.79 (1 .49-2.28)
7
86
4.03 (1 .73-6.74)
2.66 (1 .09-4.65)
4.92 (2.51-8.80)
6.57 (2.90-11 .8)
high
4.89 (3.67-6.83)
1.99 (1.41-2.53)
7
100
8.36 (2.64-19 .7)
5.17 (1.46-10.1)
6.48 (2.34-11 .2)
11 .2 (2.69-21 .6)
150
r
r'=0.14
7 %
0
5
10
15
20
25
30
Total Hg in carcass (pg g' dry wt)
FIGURE2. Relation between reproductive effort and concentration
of total mercury in carcasses of female fathead minnows fed live
same diet during phases 1 and 2
.
produced. Estrogen stimulates the liver to produce vitello-
genin, a macromolecule that is a substrate for developing
eggs
(30)
. Intraperitoneal exposure to MeHg depressed
estrogen levels in female tilapia Oreochromis niloticus (31),
and prolonged exposure to a high concentration of aqueous
MeHg interfered with vitellogenesis in catfish Clarlas batra-
chus (8) .
In male fathead minnows fed the same diet during phases
I and 2, the CSI ranged from 0.4% to 2.3% and was unrelated
to total mercury in carcasses. The GSI may not, however, be
a sensitive measure of gonadal development in male fish
exposed to MeHg. For example, the GSI of male walleye
Stizostedion
vitreum fed a MeHg-contaminated diet con-
taining about 1 .0 pg Hg g-' wet weight did not differ from
that of controls, but histological examination showed dis-
ruption of the normal architecture of the testes (11) . Hence,
gonadal development of male fish exposed to MeHg might
be better evaluated by histological examination than with
GSI (11) .
Dietary MeHg reduced the spawning success of fathead
minnows (Table 2) . Spawning success of pairs fed the control
diet during phases I and 2 was 75%
(i.e., 12 of 16 pairs
spawned). Although fish fed contaminated diets were gener-
ally larger than those fed the control diet, their spawning
success was less: 46%.50%. and 36%, respectively, for pairs
fed the low-, medium-, and high-MeHg diets during both
phases 1 and 2 .
The influence of dietary MeHg on spawning apparently
was in response to phase 1 exposure
(i.e., asJuveniles), given
that spawning success of contaminated fish was not improved
by a shift to the control diet during phase 2 (Table 2)
.
Spawning success was 63%,40%, and 14%, respectively, for
pairs fed the low-, medium-, and high-MeHg diets during
phase I and the control diet during phase 2. After spawning
their final clutch of eggs, mean concentrations and burdens
of total mercury in carcasses of contaminated fish fed the
control diet during phase 2 were less than those in fish fed
a contaminated diet during both phases 1 and 2 (Table 2) .
Interestingly, exposure to dietary MeHg during phase 2
did not reduce the spawning success of fish fed the control
diet during phase 1 (Table 2) . Spawning success was 55%,
86%, and 100% for pairs fed the low-, medium-, and high-
McHg diets during phase 2. Concentrations and burdens of
mercury were clearly elevated in fish fed the medium- and
high-MeHg diets during phase 2, yet their spawning success
exceeded that of pairs fed the control diet during both phases
I and 2 (75%). A reason for enhanced spawning success of
these fish is unknown, but the mechanism by which phase-2
dietary MeHg elicited this effect likely is neurological
(e.g.,
perception of mate) rather than hormonal (e.g., heightened
gonadal maturation), given that the fish were sexually mature
when placed into the breeding aquaria
.
Spawning success of pairs was similar whether only males
or only females were exposed to dietary MeHg during phase
1 . Regardless of the diet in phase 2, the spawning success of
pairs with females fed any of the three contaminated diets
and males fed the control diet during phase I was 40%, similar
to that of pairs with females fed the control diet and males
fed a contaminated diet (51%; Fisher's exact test, p= 0.397)
.
Spawning success of fathead minnows was related to
gonadal development of female fish . For females fed the same
diet during both phases I and 2, the mean GSI of spawning
fish was greater than the GSI of fish that failed to spawn
within 21 d (Wilcoxon rank sum test, p < 0 .001), averaging
9.1% and 6.3% for spawning and nonspawning females fed
the control diet, 11 .1% and 6.3% for fish fed the low-MeHg
diet, 8.2% and 4.5% for fish fed the medium-MeHg diet, and
6.2% and 5.2% for fish fed the high-MeHg diet. Thus, reduced
gonadal development of female fathead minnows, an effect
elicited by dietary MeHg in spawning females, diminishes
the capacity of individual fish to spawn, subsequently
reducing the spawning success of the population
.
Concentrations of total mercury in fathead minnows fed
the low-MeHg diet (Table 2) were similar to those in some
piscivorous fish in low-alkalinity lakes and newly flooded
reservoirs having elevated MeHg in food webs (2, 32-34)
.
Relative to controls, the spawning success of our test fish
was reduced by dietary concentrations of MeHg of 0 .17 pg
Hg Kcal- ' (low-MeHg diet) or greater, a concentration equaled
or exceeded in the prey of some piscivorous and invertivorous
fish in low-alkalinity lakes and flooded reservoirs (Table 1)
.
Moreover. Paterson et al. (35) found MeHg in zooplankton
as high as 1.09pg Hg g
' dry weight (about 0 .21 pg Hg Kcal- ')
after flooding of a peatland reservoir in northwestern Ontario,
suggesting that even zooplanktivorous fish could be exposed
to dietary MeHg high enough to alter reproduction in aquatic
systems with very high rates of MeHg production
.
MeHg also delayed spawning of fathead minnows . Days
to spawning was correlated positively with the concentration
of total mercury in carcasses of both females (r2 = 0.33, p=
0.002) and males (r2 = 0.33, p = 0.002) fed the same diet
during both phases I and 2. In females, days to spawning
also was related inversely to the GSI (r 2 = 0.22, p = 0.014) .
Days to spawning of pairs with females fed a contaminated
diet and males fed the control diet during phase 1 averaged
10 d, exceeding that for pairs with females fed the control
diet and males fed a contaminated diet (mean, 7 d: Wilcoxon
rank sum test, p = 0.05 1)
.
MeHg decreased the instantaneous rate of reproduction
for female fathead minnows fed the same diet during both
phases 1 and 2 (8 [SE[ = -0.126 [0.0481, Wald
x
2
=
7.02, Elf
= 1, p= 0.008), and the effect changed with time (6 [SE[ =
0.009 (0.005), Waldx2 =4.00, df= 1,p=0.045). Consequently,
on day I the relative reproductive potential of female fathead
minnows with total mercury in carcasses averaging 0 .48 pg
Hg g -
' dry weight (control diet ; Table 2) was 1.4 times that
for fish averaging 3.4 pg Hg g -
I
dry weight (low-MeHg diet),
4.9 times that for fish averaging 14 pg Hg g '(medium-MeHg
diet), and 12.7 times that for fish averaging 22 pg Hg g
'
(high-MeHg diet)
.
Complete inhibition of reproduction has obvious con-
sequences, but delayed reproductive activity also can reduce
survival and recruitment in fish populations . Fathead min-
nows are almost in reproductive condition when they become
sexually dimorphic ; therefore, our test fish were presumably
capable or nearly capable of spawning when they were placed
into the breeding aquaria. However, many pairs of pheno-
typically mature fish fed a contaminated diet during phase
I did not spawn within 21 d, whereas 92% of the pairs fed
the control diet during both phases 1 and 2 spawned within
6 d. Under natural conditions, many fishes reproduce for
only a brief period in late spring or early summer . Delayed
VOL. 36, NO. 5,2M2 1 ENVIRONMENTAL SCIENCE & TECHNOLOGY
•
881
TABLE 3. Developmental and Hatching Success of Embryos
and Survival and Weight of Larval Fathead Minnows Measured
7 d after Hatching'
mean (range)
mass of
developmental
hatching
larval
individual
diet
success (%)
success (%)
survival (%)
larvae (mg)
Same Diet during Phases 1 and 2
60
91
78
0.6
control
(0-100)
(65-100)
(0-100)
(0.2-0.9)
54
76
85
0.9
low
(2-100)
(36-100)
(30-100)
(0.5-1 .3)
73
59
79
0 .7
medium
(54-93)
(6-99)
(57-96)
(0.7-0.8)
43
99
85
0.6
high
(21-72)
(96-100)
(80-90)
Contaminated Diet during Phase 1 and Control Diet during Phase 2
43
50
90
0.6
low
(11-90)
(0-93)
(65-100)
(0.2-1 .0)
65
90
88
0.8
medium
(0-96)
(79-100)
(83-93)
(0.6-0.9)
high
0
Control Diet during Phase 1 and Contaminated Diet during Phase 2
50
89
93
0.8
low
(0-88)
(78-96)
(90-97)
(0.7-0.9)
60
91
89
0 .7
medium
(0-100)
(83-100)
(85-97)
(0.5-1 .2)
49
74
69
0 .7
high
(0-91)
(4-100)
(0-95)
(0.5-0.9)
•
Parental fish were fed one of four diets during phases 1 and 2
.
spawning can reduce the survival
of young fishes by
disrupting the timing of endogenous to exogenous feeding
relative to seasonally abundant food resources, such as
plankton and small prey fish . Failure of young fish to exploit
such resources can result in decreased growth-a factor that
can increase the susceptibility of young-of-the-year fish
to
predation (36) and reduce their over-winter survival
(37)
.
Developmental and hatching success of embryos and 7-d
survival and weight of larvae varied considerably in our study
(Table 3) but were not correlated with concentrations
of
mercury in either the diets or carcasses of parental fish . No
significant effect on either fertilization success, hatching
success, or larval survival also was observed when adult
killifish Fundulusheteroclituswere exposed to similar dietary
levels of MeHg and contained similar whole-body concen-
trations of mercury (38)
. Sample size in our study may have
been too small to detect effects of Mel Ig on these variables,
given their high variation within dietary test groups. For these
measures, we examined 100 pairs of fish, of these, only about
half spawned and fewer produced viable embryos, and even
fewer produced larvae . In addition. an increased duration of
observation for larval survival and growth, far beyond
7 d
post-hatch, could have been more effective for identifying
effects of maternally transferred MeHg (38, 39) . Fjeld et al
.
(40) for example. observed impaired feeding efficiency and
reduced competitive ability in 3-year-old grayling
(Thymall us
thymallus)
that had been exposed as eggs to waterborne
MeHg for 10 d during ernbryogenesis
.
Latif et al .
(3) examined the effects of both maternally
transferred and waterborne Meflg on embryos and larvae of
walleye from industrially polluted Clay Lake and two remote
lakes in Manitoba. In their study, the hatching success of
eggs and heart rate of embryos decreased with increasing,
environmentally relevant concentrations of waterborne
MeHg (range, 0.1-7.8 rig L
'), whereas Met Ig in eggs from
maternal transfer did not affect either hatching success or
heart rate. The growth of larval walleye, measured 8 d after
882 -ENVIRONMENTAL SCIENCE & TECHNOLOGY / VOL. 36, NO. 5, 2002
hatching, was not affected by either maternal or waterborne
MeHg
(3) .
Dietary McHg affected the overall reproductive perfor-
mance of adult fathead minnows but maternally transferred
MeHg did not measurably affect the embryos and larvae
produced . Previous studies (12) have shown that MeHg
reduces the survival and growth of embryo and larval fish,
yet few have examined reproductive effects of MeHg on
mature fishes, a life stage that is generally less sensitive
to
MeHg
(2) . In our study, dietary MeHg reduced gonadal
development of female fathead minnows, which may explain
the reduced proportion of spawning fish, delayed spawning,
and low reproductive effort of contaminated pairs of fish
.
Any of these reproductive effects alone can have serious
consequences for the survival
and recruitment of fish
populations. Yet, we observed a cumulative sequence of
effects in fish exposed to dietary McHg
. Moreover, the
concentrations of dietary McHg that adversely
affected
reproductive success of the fathead minnows are encountered
in aquatic food webs of many surface waters .
Acknowledgments
We are grateful to Rachel Hoffman for helping with mercury
determinations and performing bomb calorimetry and thank
Joshua Duerst. Rice Stevenson, and Roger Yee for help with
fish cultures. Steve Gutreuter provided
assistance with
analysis of statistical models. Constructive reviews of a draft
manuscript were provided by Gary Atchison, Drew Bodaly,
Charles Jagoe, and three anonymous reviewers . Financial
support for this study was provided by the University of
Wisconsin Sea Grant College Program and the University of
Wisconsin-La Crosse River Studies Center.
literature Cited
(1) Armstrong, F. A. J. In
Biogeochemistry of mercury in the
environment Nriagu, J . O., Ed.; Elsevier: New York, 1979 ; pp
657-670 .
(2) Wiener, J . G .; Spry, D . J. In Environmental contaminants in
wildlife:
Interpreting tissue
concentrations;
Beyer, W. N., Heinz,
C. H., Redmon-Norwood, A. W., Eds .; Lewis Publishers
: Boca
Raton, FL, 1996; pp 297-339 .
(3) Latif, M. A .; Bodaly, R . A
.; Johnston,T. A .; Fudge, R . J . P . Environ
.
Pollut
.
2001,
111,
139-148
.
(4) Crieb, T. M
. ; Driscoll, C. T .; Gloss, S. P.; Schofield, C . L.; Bowie .
C . L
. ; Porcella, D. B
. Environ. Toxicol. Chem. 1990, 9, 919-930
.
(5) Bloom, N . S. Can. J
. Fish. Aquat. Sci. 1992, 49, 1010-1017.
(6) Hammerschrnidt C. R
.; Wiener, J . G
.; Frazier . B. E.; Rada, R . C .
Environ. Set Technol. 1999, 33, 999-1003 .
(7) Johnston, T.A.;Bodaly,R.A .;LatlfM .A .;Fudge . R .J.P .;Strange .
N . E. Aquar.
Toxicol.
2001, 52, 73-85
.
(8) Kirubagaran, R .: Joy, K . P. Bull. Environ.Contam. Toxicol. 1988,
41, 902-909,
(9) Wester. P- W. Comp. Blochem . Physiof. 1991, 1000. 237-239 .
(10) Wester, P. W ., Canton, H. H.'Toxicol. Pathol. 1992, 20,81-92 .
(11) Frledmann, A . S
.: Watzin, M. C .; Brinck-Johnson, T .; Leiter, J .
C. Aquat. Toxicol.
1996, 35.265-278 .
(12) Birge, W. J
.: Black, J . A, ; Westerman, A . G
.; Hudson, J. E. In
Biogeochernistry (if mercury in the environment Nriagu, J. O .,
Ed.; Elsevier. New York, 1979; pp 629-655
.
(13) Nlimi. A. J. Can. J
. Fish. Aquat. Sci. 1983, 40,306-312,
(14) Rodgers, D . W, In Men'uzypollution: Integration and synthesir
Watras, C . J., Huckabee, J. W., Eds .; Lewis Publishers:
Boca
Raton, FL, 1994 ; pp 427-439 .
(15) Hall . B. D.; Bodaly, R . A .; Fudge, R . J . P .; Rudd, J. W. M: Rosenberg,
D. M .
Water. Air, Soil Pollut
.
1997,
100,
13-24 .
(16) Wels, P.; Weis. J. S In Metal ecotoxlcology-Concepts and
applications
Newman, M. C., McIntosh. A. W., Eds.l Lewis
Publishers: Boca Raton, FL, 1991 ; pp 145-169 .
(17) Benoit,
D. A. U.S. EPA-600/8-81-011
; U.S. Environmental
Protection Agency: Duluth, MN, 1981
.
(18) Denny,
J. S. U.S. EPA/600/3-87/011
; U.S. Environmental Pro-
tection Agency: Duluth, MN, 1987
.
(19) Lewis, P . A .: Klemm. D . J
.: Lazorchak, J . M .; Norberg-King
.T.
J .; Peltier, W. H .; Herber, M. A. U.S. EPA/600/4-91/002
; U .S .
Environmental Protection Agency: Cincinnati, OH, 1994 .
(20) Cole, K. S
. : Smith, J. F
. Environ
. Biol. Fish. 1987, 18, 235-239 .
(21) Kamler, E. Early life history of fish: An energetics approach ;
Chapman & Hall: London, 1992; p 267
.
(22) Weber, C. I. U.S. EPA/600/4-90/027F . ; U.S. Environmental
Protection Agency; Cincinnati, OH, 1993
.
(23) Watras,C .J.;Bloom ,N.S .;Hudson, R.J.M
.;Gherlni,S.;Munson,
R
. ; Claas. S . A .; Morrison, K. A.; Hurley, J
.; Wiener. J. G
.; Fitzgerald,
W. F .; Mason, R.; Vandal, G .; Powell, D
.; Rada, R.; Rislove. L
.;
Winfrey. M.; Elder, J
. ; Krabbenhoft . D .; Andrea, A. W.; Babiarz,
C .; Porcella, D. B .; Huckabee, J. W. In Mercury pollution:
Integration and synthesis. Watras, C . J., Huckabee, J. W., Eds. ;
Lewis Publishers: Boca Raton, FL, 1994 ; pp 153-177 .
(24) American Public Health Association, American Water Works
Association, and Water Environment Federation . Standard
Methods for the Examination of Water and Wastewater,
19th
ed ; American Public Health Association : Washington, DC, 1995,
(25) Kleinbaum.D.G.Survivalanalysis: Aself-learningtextSpringer-
Verlag: New York, 1996
.
(26) Scherer, E.; Armstrong, F. A. J .; Nowak, S. H. Can. Fish. Mar.
Sere. Rescue. Dev Branch Winnipeg Tech. Rep. No. 597,1975 ;
p 21
.
(27) Rodgers, D. W .; Beamish, F. W. H. Actual. Toxicol
. 1982, 2,27 1-
290 .
(28) Nicoletto, P. F.; Hendricks, A. C. Can. J Zoo]. 1988, 66.944-949
.
(29) Trudel, M
.; Tremblay, A .; Schetagne, R .; Rasmussen, J. B. Can
I Fish. Aquat. Sci. 2000,
57, 414-428 .
(30) Brooks, S .; Tyler, C. R .; Sumpter, J. P . Rev. Fish. Blol. Fish
. 1997,
7,387-416.
(31) Arnold, B.S. PlcD. Dissertation, University of Georgia at Athens.
2000
.
(32) Bodaly. R. A.; Hecky, R. E .; Fudge, R. J. P . Can. J Fish
. Aquat.
Sci. 1984 . 41, 682-691
.
(33) Verdon, R .; Brouard, D.; Demers, C .; Lalumlere, R . ; Laperie,M . ;
Schetagne, R
.
Water, Air, Soil Pollut . 1991,
56, 405-417
.
(34) Wiener,J. C.: Kiabbenhoft . U. P. In Contamination of hydrologic
systems and related ecosystems; Morganwaip, D. W., Buxton, H .
T., Eds .; U.S. Geol. Surv. Water-Res urc. Invest. Rep. 99'4018B;
Vol. 2, 1999; pp 161-170.
(35) Paterson, M . J. ; Rudd, J. W. M .; St. Louis, V. Environ . Sci. Technol.
1998, 32, 3868-3874
.
(36) Forney, J . L . J. Fish. Res. Board Can. 1976, 33, 783-792 .
(37) Miranda, L. E .: Hubbard, W. D . N. Am. J. Fish. Manage
. 1994,
14, 790-796 .
(38) Matta. M. B.; Linse, J
.; Cairncross, C .: Francendese, L .; Kocan .
R. M . Environ. Toxicol
. Chem. 2001, 20,327-335,
(39) Samson . J. C
.: Goodrldge, R .; Olobatuyi. F
. ; Weis, J . S . Aquat.
Toxicol. 2001, 51, 369-376 .
(40) FJeld, E
.; Haugen, T. 0
. ; Vollestad, I . A
. Set ToodEnvicon. 1998,
213. 247-254 .
(41) Cummins, K. W .; Wuycheck. J. C
. for . Ver Theor. Angew. Limnol
.
Muted
. 1971,
18, 1-158.
(42) Watras. C . J.; Bloom, N . S
. Limnol Oceanogr. 1992, 37, 1313-
1318 .
(43) Hall, B. D .; Rosenberg, D. M ., Wiens. A. P. Can. J. Fish .Aquat.
Sci. 1998, 55, 2036-2047 .
(44) Cope, W. C .; Wiener, J . C .; Rada, R. G
. Environ . Toxicol. Chem.
1990, 9, 931-940
.
(45) Mathers, R. A .: Johansen, P. H
. Can. J Zool. 1985. 63, 2006-
2012
.
(46) Allard, M
. ; Stokes, P. M
. Can . J. Fish. Aquat. Sci. 1989, 46,1040-
1046
.
(47) Craig, J. E
. J. Anim . Ecol. 1977, 46,617-632 .
(48) Lantry, B . F .; Stewart, D . J
. Trans. Am. Fish, Soc. 1993 . 112, 951-
976
.
Received for
review July6
. 2001. Revisedmanuscript received
November 2. 2001. Accepted November 5, 2001 .
ES01IIMP
VOL. 36, NO . 5. 20021 ENVIRONMENTAL SCIENCE & TECHNOLOGY
•
883
Effects of Dietary Methylmercury on
Reproductive Endocrinology of
Fathead Minnows
PAUL
E
. DREVNICKt AND
MARK
B
. SANDHEINRICH'
Department of Biology, River
Studies Center, University
of
Wisconsin-La Crosse, La Crosse, Wisconsin 54601
Recent laboratory studies have demonstrated that
environmentally realistic concentrations of dietary methyl-
mercury can impair reproduction of fish . To evaluate
relations between reproductive success and biomarkers
of methylmercury exposure, we fedjuvenile fathead minnows
(Pimephales promelas) one of three diets contaminated
with methylmercury:
0.06 (control), 0.87 (low), and
3.93 (medium) µg of Hg g-1 dry weight. At sexual maturity,
fish were paired, allowed to reproduce, and then analyzed
for total mercury, plasma testosterone
(T), and 17fl-
estradiol (E2) . Diets did not affect survival or growth of
fathead minnows. Methylmercury suppressed levels of T
in males and E2 in females. Male fathead minnows fed the
control diet had mean T concentrations 20% and 106%
greater than those fed the low and medium diets; control
females had mean E2 concentrations 149% and 402%
greater than those fed the low and medium diets .
Methylmercury also inhibited gonadal development of
females; the gonadosomatic index (GSI) of females fed
the medium diet was 40% less than that of females fed
control or low diets. Plasma levels of T in males and E2 in
females were positively related to GSI. Methylmercury
reduced the reproductive success of fathead minnows
.
Spawning success was 32% for pairs fed the control diet,
12% for pairs fed the low diet, and 0% for pairs fed the
medium diet. Pairs fed the low diet required, on average,
5 d longer to spawn a clutch of eggs than the controls
.
Concentrations of methylmercury fed to fathead minnows
in this study are also encountered by invertivorous and
piscivorous fsh in some methylmercury-contaminated aquatic
ecosystems. This suggests that reproduction of wild
fishes may be adversely affected by methylmercury and
that suppressed hormone levels may be used to indicate
diminished reproduction of fish .
Introduction
Few studies have demonstrated a direct relation between
exposure to contaminants and subsequent adverse efects
on wild populations of fsh. Diffculties in documenting efects
of contaminant exposure arise from natural fluctuations in
population demographics as well as synergistic and cumula-
tive efects of natural and other anthropogenic stressors (1) .
Recent field studies investigating efects of endocrine-
*Correspondingauthorphone :
(608)785-8261 ;
fax :
(608)785-6959 ;
e-mail: sandhein .mark@uwlax,edu
.
1
Present address: Department of Zoology, Miami University,
Oxford, OH
45056.
4390
•
ENVIRONMENTAL SCIENCE & TECHNOLOGY / VOL . 37, NO. 19. 2003
Environ.
Sci. Technol. 2003, 37, 4390-4396
disrupting chemicals on reproduction of wild populations of
fish have emphasized the use of reproductive biomarkers to
provide quantifiable measures of molecular and physiological
change (e.g.
. refs 2 and 3). Reproductive biomarkers can
include induced production of the yolk-precursorvitellogenin
in males, circulating levels of sex hormones such as test-
osterone (T) and 17$-estradiol (E2),indices of gonadal status,
and expression of secondary sex characteristics. Little
evidence exists, however, to indicate that alterations in
reproductive biomarkers result in population-level effects
.
For example, eff uents containing environmental estrogens
in rivers of the U.K. (4) and United States
(5)
cause widespread
disruption in gonadal development and alteration of sex
hormone profles in cyprinid fishes, yet effects on fsh
recruitment have not been detected . Arcand-Hoy and Benson
(6)
stress the importance of establishing relations between
reproductive biomarkers and effects on populations
(e.g .,
reproductive success) through the use of experimental
laboratory studies .
Mercury contamination of the environment is a problem
of global concern. Globally increasing concentrations of
atmospheric mercury from anthropogenic sources have led
to increased mercury deposition (7, 8), which is the principal
source of mercury for many surface waters
(9)) . In the aquatic
environment, bacteria can transform inorganic mercury into
methylmercury (MeHg ; 10), which is highly toxic and readily
bioaccumulates in exposed organisms, biomagnifying in
aquatic food webs
(l1, 12) . The ecological implications of
MeHg in aquatic food webs have focused primarily on health
and reproductive risks associated with consumption of
contaminated fsh tissue by humans and piscivorous birds
and mammals. To date, few studies have focused on the
population-level efects of McHg on the fish themselves (13) .
Methylmercury can disrupt endocrine function of fish
.
Arnold (14) reported gonadal lesions and abnormal levels of
II-ketotestosterone and E2 in laboratory fsh exposed to
MeHg. Moreover, elevated concentrations of McHg in aquatic
food webs may adversely afect reproduction of some wild
fsh. Levels of dietary MeHg that reduced reproductive success
of fathead minnows
(Pimephales
promelas;
15)
and killifsh
(Fundulus
heteroclitus, 16) in laboratory studies are also
encountered by fsh in some surface waters. The relation has
not been established, however, between reproductive bio-
markers and reproduction altered by MeHg
.
The primary objective of this research was to determine
relations among concentrations of plasma T and E2, gonad
weight, and reproductive success of fsh exposed to dietary
MeHg. We fed Juvenile fathead minnows diets contaminated
with concentrations of MeHg encountered by some fsh in
the environment, maintained the fsh through sexual ma-
turity, and evaluated the efects of dietary MeHg on endocrine
function and reproductive success .
Experimental Section
Fish. Fathead minnows were obtained as embryos from the
Upper Midwest Environmental Sciences Center (U.S . Geo-
logical Survey, La Crosse, WI) and raised to sexual maturity
.
Embryos were collected from outdoor ponds and placed In
a single hatching jar with flowing water in the laboratory .
Hatched larvae were then allowed to swim out into two 500-L
f ow-through aquaria. Larvae were fed brine shrimp (Artemia
nauplh)
for 60 d and gradually acclimated to a diet of Sterling
Silver Cup Fish Food (Nelson and Sons, Inc ., Murray, UT) for
30 d. Ninety days after hatching, 200 fathead minnows were
transferred to each of fifteen 180-L fow-through aquaria
.
101021/es034252m
eee :
$25.00
0 2003 American Chemical Sodety
Published on Web OW05/2003
TABLE 1. Mercury Concentrations in Diets Fed To Test
Fish in
This Study in Comparison to Concentrations of Mercury
in
Zooplankton, Benthic Invertebrates, and Forage Fish in
Low-Alkalinity Lakes and Newly Flooded Reservoirs'
item
control diet
zooplankton
benthic invertebrates
low diet
whole yellow perch
rainbow smelt
crayfish
medium diet
•
Adapted
from
rat
15
.
Hg concn (pg g - ' dw)
rat
0.06
this study
0.06-0.28
11
<0.01-1 .02
12
0.87
this study
0.12-1 .16
47
0.20-2.28
54
0.84-2.46
55
3.93
this study
Fish were exposed to MeHg in these aquaria until sexual
maturity .
Fish were cultured according to standard methods for
toxicity testing (17,
18)
. Fathead minnows were maintained
in aquaria receiving well water with a 16:8-h light:dark cycle .
Water quality characteristics were measured daily (temper-
ature 23.6 ± 0.1 'C, dissolved oxygen 6.70 ± 0.01 mg L- ') or
weekly (alkalinity 300 ± 2 mg L -
' as CaCO,, pH 8.06 ± 0.01,
hardness 348 1- 3 mg L
' as CaCO 3, ammonia 0.2 ± 0.0 mg
L-
I
as NH3-N; 19). Deposited and suspended wastes were
siphoned daily from each aquarium, and residue on aquaria
was removed weekly by scraping. All aquaria and equipment
were acid-cleaned before use ; separate cleaning equipment
was used for each aquarium to avoid possible transmission
of pathogens
.
MeHg Exposure. Fathead minnows were fed MeHg
contaminated food (5% of body mass per day) to increase
burdens of MeHg in fish . Nearly all (95-99%) mercury in fish
is MeHg (2), and it accumulates almost entirely via dietary
uptake (21) . Fish were fed a contaminated diet with one of
three concentrations of total mercury (mean ± I SE) : 0.058
f 0.004 (control), 0.87 ± 0.02 (low McHg), and 3.93 ± 0.08
(medium McHg) pg g ' dry weight (dw) . These concentrations
approximate MeHg concentrations in the diets of Invertivo-
rousand piscivorous fish from midcontinental low-alkalinity
lakes (Table I) and replicate the diets (control, low, medium)
fed to fathead minnows by Hammerschmidt et al
. (15)
.Each
180-L aquarium was randomly assigned one of the three
diets to yield five aquaria per dietary treatment. Fish were
fed McHg-contaminated food for about 250 d (from 90 d
post-hatch until termination of experiment)
.
Contaminated diets were prepared by mixing fish food
with reagent alcohol containing dissolved methylmercuric
chloride (15) . Control diets were prepared by mixing fish
food with alcohol only . Alcohol was evaporated overnight
from the fish food In acid-washed glass pans in a fume hood
.
Diets were prepared as needed and frozen until use. Samples
from each batch were analyzed for total mercury
.
ReproductiveTests . Adult fathead minnows display strong
sexual dimorphism during breeding. Sexual maturity of males
is denoted by the development of spawning color, rostra)
tubercles, and a soft mucus-secreting dorsal fat pad
(17) .
Females exhibit an extended
tit
ogenital papilla when mature
(22)
.
After fathead minnows became sexually dimorphic (ap-
proximately 300-320 d after hatching), rive breeding pairs
from each 180-L aquarium were selected and randomly
assigned to quadrants, within treatment, to one of fifteen
50-L breeding aquaria receiving well water . Fish in the 50-1-
breeding aquaria received the same diet they were fed in the
180-L aquaria. One acid-washed spawning substrate (a half
cylinder of PVC pipe) was placed into each quadrant and
examined daily for eggs .
End points of reproductive success measured in fish
included spawning success, days to spawning, and relative
fecundity of female fish. Spawning success was the percentage
of pairs within a dietary treatment that spawned a clutch of
eggs within 21 d after placement in breeding aquaria . A clutch
of eggs was defined a priori as six or more eggs. Days to
spawning was the number of days required for a pair of fish
to spawn a clutch of eggs . Relative fecundity of female fish
was calculated as the number of eggs laid per gram of fish
.
Days to spawning and relative fecundity of female fish were
measured only for pairs that spawned a clutch of eggs .
Sample Collection. After spawning or after 21 d If no
spawning occurred, adult fathead minnows were euthanized
with an excess of MS-222 (Sigma-Aldrich) . Blood was collected
from the caudal vein in heparinized hematocrit capillary tubes
(Fisher Scientific) by severing the caudal peduncle . Because
hormone levels in fish may vary diurnally, blood samples
were collected from all fish between 0900 and 1200 h and
were centrifuged for 10 min at 4 'C . Plasma was drawn from
the capillary tubes and stored at -80 °C until analysis of sex
hormones. The weight (± 0.1 mg), total length (t 1 mm),
and sex of each fish were recorded, Gonads were dissected
from the fish and weighed (± 0 .1 mg) . To minimize mercury
contamination of carcasses, fish were dissected inside a
laminar-flow hood with soap-washed stainless steel scalpels
on the inner surface of separate food-grade plastic bags .
Carcasses were frozen (-30 'C) until lyophilization and
analysis of total mercury
.
Mercury Determination . Diets and lyophilized carcasses
of adult fathead minnows were analyzed for total mercury
by cold-vapor atomic absorption spectroscopy . Lyophilized
carcasses weighing less than 0 .5 g. 0.4-g subsamples of
lyophilized carcasses weighing 0 .5 g or greater, and 0.25-g
subsamples of diets were acid-digested (23) and analyzed
with a Perkin-Elmer FIMS 100. Glassware used in analyses
were acid-cleaned and rinsed with reagent-grade water
(nominal resistance > 15 MQ cm-'), Acids and reagents used
in digestions and analyses were suitable for trace metal
analysis
a
.
T. Baker) .
The accuracy of mercury determinations for each ana-
lytical batch was determined by analyses of (I) certified
reference materials (National Research Council of Canada),
(ii) triplicate subsamples of homogenized fish and diets, (iii)
spiked samples of homogenized fish and diets, and (iv)
procedural blanks and calibration standards. Mean measured
concentrations of total mercury in the three reference
materials analyzed were within certified ranges, which ranged
from 0.21-0.33 to 4.38-4.90 pg g-' dw. Method precision
(relative standard deviation) of mercury determinations,
estimated front triplicate analyses of fish and diets, averaged
4.0%. Mean recovery of mercury from spiked samples was
98%. The method detection limit (19) for total mercury in a
0.25-g sample of fish food was 0 .001 jig g-1 dw .
Reproductive Biomarkers. Plasma T and E2 were quan-
tified by competitive enzyme immunoassay with Cayman
Chernical EIA kits. Assay procedures used were specified by
the manufacturer (24, 25), with two exceptions: (i) due to
small sample volume, reagent and sample volumes used in
the assays were reduced by half
(i.e ., to 25 pL of plasma) and
(ii) standard curves were established with linear regression
by plotting absorbance units as a function of analyte
concentration (26) . Hormones were extracted from plasma
with ether before analysis. A 5-mL aliquot of diethyl ether
was added to each plasma sample in a glass tube . Each tube
was vortexed for 60 s, and the ether layer was transferred to
a clean tube with a pasteur pipet . This process was repeated
twice with 3-nil, ether aliquots. The final extraction step,
however, was done by freezing the plasma layer in a dry
ice-ethanol bath and decanting off the ether layer . Ether
was evaporated from each test tube overnight in a fume hood
VOL. 37, NO. t9, 2003 1 ENVIRONMENTAL SCIENCE & TECHNOLOGY
•
4391
TABLE
2.
Results of Exposure to Dietary Methlmercury in Fathead Minnows'
' Numbers in parentheses represent 1 SE based on
5
tanks of fish per dietary treatment with
5
male and
5
female fish from each tank .
at 30 °C. Extracts were reconstituted In assay buffer
for
analysis. Testosterone and E2 calibration standards were also
extracted (front solvent) and reconstituted in assay buffer
with this procedure. Mean (± 1 SD) recovery of T and E2
from calibration standards was 91 .4 (± 11 .0)% and 97.4 (±
9.6)%. Samples were analyzed in duplicate and re-assayed
if the coefficient of variation between duplicates exceeded
20%. Due to limited sample volumes, T was determined only
for males, and E2 was determined only for females
.
The accuracy of sex hormone assays was determined by
triplicate analysis of a standard plasma sample from common
carp
(Cyprinuscarpio)
with each plate . Intra-assay coefficients
of variation were 14 .6% for T and 16.9% for E2. Inter-assay
coefficients of variation were 23 .6% for T and 26.6% for E2 .
Mean percent recoveries of triplicate spiked samples of carp
plasma were 109.7% for T and 99.3% for E2. Method detection
limits (19) of assays were estimated to be 0.028 ng mL- ' for
T and 0.043 ng mL- ' for E2. Glassware used in assays was
soap-washed and rinsed with reagent-grade water. Assay
reagents and buffers were prepared with reagent-grade water
.
Gonadal development of fathead minnows was used as
an additional reproductive biomarker of MeHg exposure .
Gonadal development was measured for each adult fish,
regardless of whether it spawned, with the gonadosomatic
index (GSI) expressed as the percentage of total body weight
contributed by the gonads
.
Statistical Analyses. For all variables except spawning
success, repeated measures one-way analysis of variance
(ANOVA) was performed to detect differences among treat-
ments; each of the 15 exposure aquaria was considered as
an experimental unit. Bonferroni post-hoc tests were used
to determine differences between specific treatments . Dif-
ferences in spawning success among
treatments were
detected with a x2 test. Ordinary least-squares regression
models were used to assess relations between levels of sex
hormones and gonadal development
. Data were log-
transformed, when appropriate . to meet the assumptions of
parametric tests and were analyzed with SPSS for Windows
software (version 10.1). In addition, quantile
regression
analysis
(27)
was used to estimate relations between con-
centrations of total mercury in fish carcasses and levels of
sex hormones. Quantile regressions are
appropriate for
modeling the effects of limiting factors, such as toxicants, on
biological responses (28) . especially for relationships where
heterogeneous responses result in "wedge-shaped" patterns
of data that are heteroscedastic and violate assumptions of
ordinaryleast-squares regression (29)
. Unlike ordinary least-
squares regression, which estimates model functions through
the center of data distributions
(i.e ., mean response), the
upper regression quantiles (e.g., 90th) have slope estimates
that are most consistent with the relation expected if mercury
is actively limiting the maximum concentration of sex
hormones in fish
(28) . The 75th, 80th, 85th, 90th, and 95th
quantiles were estimated for the relation
between total
mercury in fish carcasses and concentration of T or E2 with
the program BLOSSOM (3)
. The largest quantile for which
the slope parameter was significant was used
as a best
estimate of the change in hormone concentration when
4392 -ENVIRONMENTAL SCIENCE & TECHNOLOGY / VOL . 37, NO. 19, 2003
mercury is the active limiting factor . A type I error (a) of 0.05
was used to judge the significance of all statistical tests
.
Results and Discussion
Survival and Growth. Diets with elevated concentrations of
MeHg were not lethal to fathead minnows. Mean survival of
juvenile fathead minnows in 180-L aquaria ranged from 85%
for fish fed the low-MeHg diet to 88% for fish fed the control
and medium-MeHg diets. Most mortality was associated with
deformities of unknown origin of the head or axial skeleton
.
Three adult male fish (one from each treatment) died of
unknown causes while in the 50-L breeding aquaria
.
Growth of fathead minnows was also unaffected by MeHg
(Table 2) . Mean wet weight (ww) and total length of test fish
did not differ among treatments . Mean ww ranged from 3 .23
(control) to 3.64 g (medium MeHg) in males (ANOVA,
F211
=0.750,
P
= 0.49) and from 1 .79 (medium MeHg) to 1 .92 g
(low MeHg) in females (ANOVA, F2.1z= 0.224, P= 0.80) . Mean
total length of male fish did not vary among treatments,
averaging 68 mm in control and low-MeHg diets and 69 mm
in the medium-MeHg diet (ANOVA,
F2 .iz
= 0.104 . P= 0.90) .
Females from all dietary treatments averaged 59 mm total
length (ANOVA, IF,, = 0.143. P = 0.87)
.
Recent investigations of the effects of environmentally
realistic concentrations of dietary MeHg on fish survival and
growth. however, are equivocal. Methylmercury-contami-
nated diets reduced growth of malef uvenile walleye but did
not affect the survival of either sex (31) . Likewise, Hammer-
Schmidt et al .
(15)
observed no effect of diets artificially
contaminated with MeHg on the survival of juvenile and
adult fathead minnows ; however, Increased growth
(i.e.,
hormesis) of male and female fathead minnows was reported
.
Furthermore, there was no effect of 0.514g g-1 ww of dietary
MeHg on weight of adult killifish, but male fish had increased
mortality (16) .
Dietary MeHg may affect survival and growth of fish as
a result of behavioral alterations. Methylmercury is neuro-
toxic, yet its actions on the central nervous system of fish are
poorly understood (13) . Many studies with high concentra-
tions of dietary MeHg (e.g ., refs 32and 33) have documented
suppression of appetite in fish followed by reduced growth
and mortality. Hammerschmidt (34) noted increased vigor
in fathead minnows exposed to low levels of dietary MeHg,
possibly leading to the increased growth of fish . We observed
no overt modifications of behavior of fathead minnows in
this study, which may account for the lack of significant
differences in survival and growth of fish among treatments
.
Reproductive Biomarkers. Methylmercury suppressed
levels of Tin males and E2 in females (Table 2) . Males fed
the control diet had mean T concentrations that were 20%
and 116% greater, respectively, than those fed the low- and
medium-MeHg diets. Differences in T concentrations be-
tween males fed the control diet and those fed the medium-
MeHg diet were statistically significant (ANOVA,
F2,,2
= 4.94 1,
P= 0.03). Control females had mean E2 concentrations that
were 164% and 416% greater than those fed the low- and
medium-MeHg diets. Significant suppression of E2 levels
occurred in females fed both low- and medium-MeHg diets
diet
mean ww (g)
mean total Hg in
carcass (pg-g t ww)
mean GSI (%)
male T
(rigml-')
female E2
(ng mL- ')
spawning
success (%)
male
female
male
female
male
female
control
3.23 (0.28)
1 .85 (0.07)
0.071 (0.001)
0.079 (0.002)
0.69 (0.36)
6.46 (0.53)
2.29 (0.60)
5 .57 (1 .27)
32 (10.2)
low
3.41 (0.22)
1 .92 (0.15)
0 .864 (0.038)
0.917 (0.027)
0.80 (0.06)
6.38 (0 .60)
1 .90 (0.33)
2 .11 (0.52)
12 (4.9)
medium
3.64 (0.33)
1 .79 (0.12)
3 .557 (0.188)
3.842 (0.146)
0.74 (0.11)
3.82 (0.34)
1 .06 (0.45)
1 .08 (0.17)
0
Carcass Hg (pg'g
1 wet weight)
FIGURE 1. Relation between plasma testosterone and estradiol
and concentration of mercury in the carcass of fathead minnows
.
Lines represent the 75th (males, top) and 90th (females, bottom)
quantile .
(ANOVA,
F2,12
= 9.135, P < 0.01) . Moreover, maximum
concentrations of T in males (75th quantile. IA = 2.95, b,=
-0.48, R
= 0.05, P =
0.04,
n = 69) and E2 in females (90th
quantile, 60 =
10.40,
b1
=
-2.02 .
R =
0.65
.
P = 0.01,
n = 62)
were inversely related to concentrations of total mercury in
carcasses (Figure 1)
.
Differences in levels of sex hormones were also evident
between spawning and nonspawning fish within
dietary
treatments (Figure 2). Spawning males fed the control diet
had mean T concentrations 277% greater than male controls
that did not spawn . However, the difference in T concentra-
tions between spawning and nonspawning males fed the
low-MeHg diet was only 5% . Female fish exhibited a similar
trend . Spawning females fed the control diet had mean E2
concentrations 99% greater than female controls that did
not spawn. Spawning females fed the low-MeHg diet had
mean E2 concentrations 21% greater than those that did not
spawn. The large difference in hormone levels between
spawning and nonspawning controls was expected, given
that Increases in circulating hormone levels are critical for
development and reproduction (35) . Reproduction of control
fish was initiated by elevated hormone levels (36) . Those
controls that did not spawn had much lower hormone levels,
probably due to natural variation in steroid hormone
synthesis and metabolism. The nominal differences observed
in hormone levels between spawning and nonspawning fish
fed the low-MeHg diet, however, Indicate that elevation of
T and E2 levels in male and female fish was limited by dietary
MeHg.
Previous laboratory studies also have found that MeHg
can suppress levels of sex hormones in fish . Plasma
11-
ketotestosterone and E2 concentrations were suppressed in
male and female tiiapia
(Oreochromis niloticus)
dosed with
capsules containing 0.1 or 1 .0 mg of methylmercuric chloride
(14) . Exposure to high levels of MeHg in water inhibited
steroidogenesis in male catfish
(Clariasbatraclius) (37)
.
The
of
C
4
a1
C
O 3
a>
In
0 2
0
a,
N 1
m
0
10
E
E a
C
o
6
m
`o
z
0
control
Low
Medium
Diet
FIGURE 2. Mean plasma testosterone (males, top) and estradiol
concentrations (females, bottom) of spawning and nonspawning
lathead minnows fed diets with different levels of MeHg
. Bars
represent 1 SE.
ecological relevance of these findings are difficult to interpret,
however, because test fish were not exposed to low levels of
MeHg via the diet. This study, to our knowledge, is the first
to report alterations in reproductive endocrine function in
fish exposed to environmentally realistic concentrations of
dietary MeHg .
The specific mechanism suppressing sex hormones in
fish is unknown. Endocrine regulation of fish reproduction
is mediated by the hypothalamic-pituitary-gonadal axis
common to all vertebrate taxa. Hypothalamic secretion of
gonadotropin-releasing hormone (CnRH) stimulates pituitary
release of gonadotropins CTH-I and CTH-2, which in turn
act on the gonads to stimulate steroidogenesis (38). Disrup-
tion of single or multiple components of this axis could result
in altered steroldogenesis
(i.e ., the observed suppression of
T and E2). Exposure to high concentrations of waterborne
MeHg can Inhibit gonadotropic activity in the pituitary of
catfish (39). Arnold (14) suggested that MeHg may suppress
steroidogenesis by interfering directly with gonadal develop-
ment. Future mechanistic studies could investigate effects
of MeHg on molecular regulation of steroidogenesis, includ-
ing expression and activity of steroidogenic enzymes
(40)
.
Suppression of steroidogenesis can affect gametogenesis
and the development of secondary sex
characteristics,
ultimately resulting in reduced reproductive success. Lower
egg production by female fathead minnows fed MeHg-
contaminated diets observed by Hammerschmidt et al
.
(15)
was likely due to reduced levels of E2 and subsequently
reduced vitellogenin, which is a substrate for developing eggs
(41) . Vitellogenin is produced in the liver of female fish and
is induced by elevated levels of E2 . Spermatogenesis was
hindered in guppies
(Poecilia reticulata)
exposed to water-
borne MeHg
(42)
.
Harries et al. (43) reported
altered
reproductive performance and abnormal steroid hormone
profiles in fathead minnows exposed to 4-nonylphenol and
related these alterations to inhibited development of sec-
ondary sex characteristics in males, including fewer nuptial
VOL. 37, NO. 19. 2003 / ENVIRONMENTAL SCIENCE & TECHNOLOGY
•
4393
tubercles and a smaller dorsal fat pad . Moreover, a population
of wild bream
(Abramis brama)
exposed to many contami-
nants in the Elbe River, Germany, was recently reported to
have reciprocal relations between inhibitory effects on
gonadal growth, levels of sex hormones, and expression of
secondary sex characteristics
(.?l
. Further research could focus
on the use of secondary sex characteristics as an indicator
of altered reproduction and endocrine function of fish due
to MeHg exposure
.
Dietary MeHg inhibited gonadal development of female
fathead minnows but not males (Table 2) . The GSI of females
fed the medium-MeHg diet was 40% less than that of females
fed control or low-MeHg diets (ANOVA, Fz.,2 = 8,686,
P < 0.01), which did not differ. The GSI of males was
unaffected by dietary MeHg (ANOVA, F2.12 =0.406, P= 0 .68) .
Mean GSI in males ranged from 0.69% in controls to 0.80%
in the low-MeHg treatment.
Studies examining effects of MeHg on gonadal develop-
ment of fish have found mixed results . Hammerschmidt et
al. (15) reported that dietary MeHg significantly reduced GSI
in female but not in male fathead minnows, in agreement
with our results. In contrast, dietary MeHg reduced GSI in
male juvenile walleyes but not females (31). Very high
concentrations of waterborne MeHg reduced the GS1 of both
male and female catfish
(37,
44) . However. CS1 was not altered
in male or female tilapia implanted with capsules containing
methylmercuric chloride (14) .
Histological examination of gonads may provide a more
sensitive indicator than GSI for assessing effects of MeHg on
gonadal development. Arnold (14), for example, reported
atretic follicles and atrophied seminiferous tubules of female
and male tilapia after treatment with MeHg even though GSI
did not differ between treated and control fish . Juvenile male
walleyes with reduced GSI also exhibited testicular atrophy,
which likely contributed to the differences in GSI observed
by Friedmann et al . (31) .
Inhibition of gonadal development can affect reproductive
potential of fish. Hammerschmidt et al .
(15)
reported that
relative fecundity of female fathead minnows was negatively
correlated with concentrations of total mercury in carcasses
.
This was likely due to altered steroidogenesis and gameto-
genesis of damaged reproductive tissues. Fathead minnows
with small gonads in our study also had low levels of sex
hormones (Figure 3) . Testosterone In male fish (r2 = 0.14, P
= 0.001, n = 69) and E2 in female fish (r 2 = 0.24, P < 0.001,
n = 62) were positively related to GSI . Females fed the
medium-MeHg diet generally had the smallest gonads and
lowest levels of E2, indicating that MeHg reduced the capacity
of ovaries to produce sex hormones . McMaster et al. (45)
reported that fish populations with reduced gonadal growth
due to bleached kraft pulp mill effluent also exhibited reduced
circulating levels of sex hormones due to reductions In
capacity of gonadal tissues to synthesize steroids
.
Biomarkers may be useful in assessing the reproductive
health of wild fish populations exposed to MeHg, given that
it is difficult to quantify reproductive success of fish In their
natural environments. Measuring gonadal development,
levels of sex hormones, and possibly vitellogenin could
provide a method for monitoring subtle changes in repro-
ductive performance of individuals that may adversely affect
populations
(46) .
This information could assist fishery
managers in assessing the relative effects of MeHg on year-
class strengths of wild populations of fish,
Reproductive Success. Dietary MeHg adversely affected
reproduction of fathead minnows . The proportion of pairs
of fish that spawned within 21 d after being placed into
breeding aquaria decreased in a dose-dependent fashion
(yar=2 = 10.439, P < 0.01; Table 2). Pairs fed the control diet
accumulated little mercury (<0 .1 pg g -
' ww) and had a
spawning success of 32% (i .e ., eight of 25 pairs spawned)
.
4394
•
ENVIRONMENTAL SCIENCE & TECHNOLOGY / VOL. 37, N0. 19. 2003
4
6
a
10
GSI (% body weight)
FIGURE 3. Relation between plasma testosterone (males, top) and
estadiol (females, bottom) and the gonadosomatic index (GSI) of
fathead minnows fed diets with different levels of MeHg
.
Pairs fed the low-MeHg diet had mean total mercury
concentrations slightly less than 1 pg g -
I
ww and a spawning
success of 12%. No pairs in the medium-MeHg treatment
spawned ; their mean total mercury concentrations exceeded
3.5 pg g' ww.
Dietary MeHg also delayed spawning of fathead minnows
.
Of those fish that spawned, pairs fed the low-MeHg diet
required more
days
to spawn than those fed a control diet
(ANOVA, F,.s = 7.992, P= 0.04). Days to spawning averaged
12 and 17 d, respectively, for pairs fed control and low-MeHg
diets .
Relative fecundity of female fathead minnows was not
related to MeHg exposure. The number of eggs laid per gram
of female fish was highly variable . Mean (± I SE) relative
fecundity of females fed control and low-MeHg diets were
13.9 ± 7.3 and 35.5 ± 16.0 eggs g-
I,
respectively
.
Mercury concentrations that accumulated in carcasses
of fathead minnows in this study are environmentally realistic.
Piscivorous fish in low-pH lakes and newly flooded reservoirs,
for example, often contain total mercury concentrations in
axial muscle in the range of 0 .5-3.0pg g
'ww (13)
. Elevated
concentrations can also occur in invertivorous fish, such as
yellow perch
(Perca Ilavescens 47)
.
This suggests that wild
fish populations could be at risk for impaired reproduction
due to MeHg.
The adverse effects of MeHg on reproduction of fathead
minnows were anticipated. Hammerschmidt et al .
(15)
also
observed reduced spawning success and delayed spawning
of fathead minnows fed MeHg-contaminated diets . However,
they also observed reduced relative fecundity of female fish
.
We did not detect reduced relative fecundity presumably
because sample sizes were small and egg production varied
considerably within dietary treatments. Although not sta-
tistically signif cant, females fed the low-MeHg diet had higher
relative fecundity than females fed the control diet . It is
possible that females fed the low-MeHg diet had an increased
relative fecundity (as compared to controls) because of
14
reduced egg size . The size of eggs are known to be affected
by diet and other factors and can be related to egg quality
(41) . Egg size was not measured in this study, however .
Future work investigating effects of McHg on reproduction
of fish should also focus on early life stage and transgen-
erational effects, Fish embryos and larvae are exposed to
MeHg in water and via maternal transfer (23. 4)
. Latif et al .
(49 reported that environmentally relevant concentrations
of waterborne MeHg reduced hatching success and lowered
heart rates of walleye embryos . Altered reproduction, In-
cluding reduced fertilization success and altered sex ratios,
was noted in killifish exposed to maternally derived MeHg
(16)
. Wiener and Spry (L3) concluded that fish populations
are most at risk from MeHg at existing exposure levels during
embryonic and larval stages
.
Ecological consequences of altered reproduction include
population-, community-, and ecosystem-level effects . For
example, atmospheric deposition of metals from a smelter
near Flirt Flon, MB, Canada, caused decreased recruitment
in a population of white suckers (Catostomus commerson)
due to reduced spawning success of adults and reduced
survival of eggs and larvae
(50) . Adams et al. (2) reported
reduced fish community integrity (measured as species
richness and relative abundance) in a reservoir subjected to
many contaminants, including high concentrations of mer-
cury. due to reproductive impairment of largemouth bass
(Micropterussalmoides) and bluegill (Lepornismacrochirus)
.
Ecosystem-level consequences of altered reproduction can
occur if a fish population provides some service that is
essential to ecosystem function. For example, alterations in
reproductive performance of Pacific sockeye salmon (On-
corhyncus nerka) due to increased temperature can affect
productivity of lake ecosystems where spawning occurs (51) .
Concentrations of dietary MeHg regularly encountered
by wild fish significantly suppressed levels of sex hormones,
inhibited gonadal development, and reduced reproductive
success of fathead minnows. This suggests that (i) suppressed
hormone levels and inhibited gonadal development may be
used to indicate altered reproduction of fish and (ii)
reproduction of wild fishes may be adversely affected by
MeHg. It is not known whether effects of McHg on fish
reproduction and endocrine function observed in the
laboratory also occur in the field . Field studies indicate that
alterations in reproductive biomarkers may occur in wild
fish populations, yet causality is difficult to establish because
of spatial and temporal variability and the presence of other
contaminants (2, 52, 53)
. Further assessment of relations
among exposure to McHg, effects on biounarkers. and
reproductive responses of wild fish populations is warranted .
Acknowledgments
We thank Kevin Miller and Jeff Ziegeweid for helping with
mercury determinations and fish culturing and James Wiener
for scientific advice. James Wiener, Scott Cooper, Margaret
Maher, and Chad Hammerschmidt reviewed an earlier draft
of this manuscript. Three anonymous reviewers and the
editorial staff of Environ. Sci. Technol. helped Improve this
work. Financial support for this research was provided by
the University of Wisconsin Sea Grant College Program . Fish
in this study were used in accordance with protocols approved
by the University of Wisconsin-La Crosse Institutional
Animal Care and Use Committee . This study is based on the
M.S. thesis research of P.E.D. at (he University of W isconsin-
La Crosse
.
Literature Cited
(1) Frost, T. M .; Montz . P. K .; Kratz, T. K .: Badillo, T.; Brezonik, P .
L .; Gonzalez, M . J .; Rada, R. G .; Watras, C. J.: Webster, K. E. ;
Wiener. J. G .; Williamson, C. E,: Morris, D . P. Limnol Oceanogr.
1999, 44, 784-794
.
(2) Adams, S. M
.; Bevelhimer, M. S .; Greeley. M. S., Jr.; Levine. D
.
A.; Teh, S. J . Environ. Toxicol. Chem. 1999, 18,628-640,
(3) Hecker, M .; Tyler, C. R .; Hoffmann, M .; Maddix, S.; Karbe. L
.
Environ, Sd. Technol. 2002. 36, 2311-2321 .
(4) Jobling, S. M
.; Tyler, C. R,; Brighty, C .; Sumpter, J . P . Environ
.
Scl. Technol. 1998. 32,2498-2506.
(5) Goodbred S. L,; Gilliom, R . J .; Gross, T . S
.; Denslow. N . P .: Bryant,
W. L .; Schoeb, T. R. Open-File Rep.-U.S. Geol. Sure.. 1998, OFR
96-627.
(6) Arcand-Hoy, L. D
. ; Benson, W . H . Environ. Toxicol. Chem. 1998,
17,49-57 .
(7) Engstrom, D. R.; Swain. E. B . Environ. Sd. Technol
. 1997, 31,
960-967,
(8) Schuster, P. F
.; Krabbenhoft, D. P
. ; Naftz, D. L.; Cecil, L. D . ;
Olson, M. L .; DeWild, J . F .; Susong, D. D .; Creen, J. R
.; Abbott,
M. L
. Environ. Sci. Technol. 2002, 36,2303-2310
.
(9) Fitzgerald, W . F .: Engstrom. D. R .; Mason. R. P .; Nater. E. A
.
Environ. Sci. Technol
. 1998. 32, 1-7.
(10) Winfrey, M . R .; Rudd, J . W. M . Environ. Toxicol, Chem . 1990, 9,
853-869 .
(I I) Watras, C . J .; Bloom. N. S . Limnol. Oceanogr. 1992. 37, 1313-
1318 .
(12) Hall, B. D .; Rosenburg, D. M.: Wiens, A . P
. Can. J. Fish. Aquat.
Sci. 1998, 55, 2036-2047 .
(13) Wiener, J. C .; Spry, D . J. In Environmental Contaminants in
Wildlife' Interpreting TissueConcentrations ; Beyer, W. N.. Heinz.
C. H., Redman-Norwood, A. W., Eds .; Lewis Publishers: Boca
Raton, FL, 1996; pp 297-339 .
(14) Arnold, B . S. Ph.D. Dissertation, University of Georgia atAthens,
2000.
(15) Hamnierschniidt, C . R .; Sandheinrlch . M . B,; Wiener,]. C .; Rada,
R. G. Environ, Sci. Technol. 2002, 36,877-883 .
(16) Matta, M . B .; Linse. J .: Calrncross, C
. : Francendese, L
. ; Kocan,
R. M . Environ. Toxicol. Chem. 2001, 20.327-335
.
(17) Benok, D. A .
[LS EPA-600/8-81-011 ; U.S. Environmental
Protection Agency: Duluth, MN, 1981
.
(18) Denny, J. S. U.S. EPA-600/3-87-001 ;U.S. Environmental Protec-
tion Agency: Duluth, MN, 1987
.
(19) American Public Health Association ; American Water Works
Association; Water Environment Federation
. Standard Methods
for the Examination of WarerandWastewater, Ifthed .; American
Public Health Association : Washington, DC, 1995 .
(20) Bloom, N. S . Can. J. Fish. Aquat. Sd. 1992, 49, 1010-1017.
(21) Hall, B. D.; Bodaly, R. A; Fudge, R. J . P
.; Rudd, J, W. M;Rosenburg,
D. M . Water Soil Air Pollut. 1997, 100, 13-24 .
(22) Flickinger, S. A
. Trans. Am. Fish, Soc. 1969, 98. 526-527.
(23) Hammerschmidt, C . R .; Wiener, J, G,; Frazier . B. R
.: Rada, R. G .
Environ. Sci. Technol. 1999, 33.3.999-1003 .
(24) Cayman Chemical. Testosterone EtA kit. Ann Arbor, MI, 1997
.
(25) Cayman Chemical. Estradiol EIA kit, Ann Arbor, ME 2000 .
(26) Nichols. K. M.; Snyder, E. M
.; Snyder, S . A.; Pierens, S . L.; Miles-
Richardson, S . R. ; Clesy, J . P
. Environ. Toxicol. Chem. 2001, 20,
510-522 .
(27) Koenker, R., Bassett, G. Econometrica 1978, 46,33-50 .
(28) Cade, B. S .; Terrell, I. W.; Schroeder, R. L
. Ecology 1999 .
80,
311-323 .
(29) Terrell, J. W.; Cade, B . S
. ; Carpenter, J .; Thompson, J. M
. Trans.
Am, Fish. Soc. 1996 . 125, 104-117
.
(30) Cade, B. S.; Richards, J. D . UserManualforBLOSSOMSoilware ;
U.S. Geological Survey : Fort Collins, CO, 2001 .
(31) Friedmann, A . S .; Watzin, M . C,; Brinck-Johnson . T.; Leiter, J .
C. Aquat. Toxicol. 1996, 35, 265-278,
(32) Matida, Y
.; Kumada, H .; Kumura, S .; Salga, Y .: Now. T,; Yokote .
M
. ; Kawatsu, H. Bull Freshwater Fish, Res . Lab,
(Tokyo) 1971,
21, 197-227
.
(33) Rodgers, D. W
.; Beamish, F. W. H . AquatToxicol.1982, 2, 271-
290.
(34) Hammerschmidt, C . R. M.S. Thesis, University of Wisconsin-
La Crosse, 1999.
(35) McNabb, A,; Schreck, C .; Tyler, C .; Thomas, P .; Kramer, V. ;
Specker, J .; Mayes, M
.: Select . K. In Reproductive and Devel-
opmentalEffects of Contaminants in Oviparous Vertebrates, DI
Giullo, R. T.. Tillitt, D . E
. . Eds
. ; SETAC Press: Pensacola, FL .
1999; pp 113-223
.
(36) Jenson, K. M .: gone, J . J .; Kahl. M. D.; Pasha. M. S., Ankley, G .
T. Cutup. Biochem. Physic]. C2001, 128, 127-141 .
(37) Kirubagaran, R
.: Joy, K . P . J, Fish Blol. 1992, 41 . 305-315 .
(38) Greeley, M. S ., Jr. In Biological Indicators ofAquatic Ecosystem
Stre,c.cAdams. S. M., Ed
.; American FisheriesSociety ; Bethesda,
MD, 2002; pp 321-378
.
(39) Joy, K . P. Kirubagaran,R-BiokStruct.Morphog.1989,2,67-70 .
VOL. 37, NO. 19. 2003 / ENVIRONMENTAL SCIENCE & TECHNOLOGY
•
4395
(40) Mondal .S .;Mukhopadhyay.B
.;Bhattacharya,S.Biometals1997,
10. 285-290.
(41) Brooks, S
.; Tyler, C. R.; Sumpter, J. P. Rev. Fish Biol. Fish, 1997,
7, 387-416
.
(42) Wester, P. W.; Canton, H. H
. Toxicol. Pathol. 1992. 20,81-92.
(43) Harries, J . E.; Runnalls, T
.; Hill, E.; Harris, C. A .; Maddix, S
.;
Sumpter, J . P .; Tyler, C. R. Environ. Scl. Technol.2000, 34,3003-
3011,
(44) Kirubagaran, R .; Joy. K . P . Bull. Environ. Contain. Toxicol
. 1988,
41,902-909 .
(45) McMaster, M. E .; Van Der Kraak, G . J
. ; Munkittrick, K. R.J. Great
Lakes Res. 1996, 22, 153-171 .
(46) Schmitt . C . J., Dethloff, G. M., Eds. In! Technol . Rep.- US. Geol.
Surv. 2000, USGS/BRD-2000-0005.
(47) Cope, W. G .; Wiener, J . G .; Rada, R. C
. Environ. Toxicol. Chem .
1990, 9, 931-940
.
(48) Niimi, A . J. Can
. J. Fish . Aquat. Sci. 1983, 40. 306-312 .
(49) Latif, M. A
.; Bodaly, R . A.; Johnston,T. A .; Fudge, R . J. P. Environ
.
Pollut.2001, 111, 139-148 .
4396
•
ENVIRONMENTAL SCIENCE & TECHNOLOGY I VOL. 37. NO. 19, 2003
(50) McFarlane, G . A .; FranzinW. G. Can
. J. Fish. Aquat. Sri. 1978.
35. 963-970
.
(51) Hilborn, R .; Quinn, T. P.; Schindler. D. E.; Rogers, D. E . Proc.
Nall. Acad. Sci. 2003, 100, 6564-6568.
(52) Heath,A.G.WaterPollutionandFishPhysiology, 2nded
. ; Lewis
Publishers: Boca Raton, FL, 1995: p 384 .
(53) Friedmann, A . S.; Contain. E. K.; MacLatchy, D . L.; Stansley, W. ;
Washuta, E. J. Ecotoxicol
. Environ . Sal 2002. 52, 117-122 .
(54) Mathers, R. A .; Johansen, P. H. Can, J. Zool. 1985, 63. 2006-
2012.
(55) Allard, M
.; Stokes, P. M. Can. J. Fish.Aquat. Sci.1989, 46,1040-
1046.
Received for reviewMarch
19, 2003. Revised manuscript
received July 14, 2003. Accepted July 18, 2003.
ES034252M
CERTIFICATE OF SERVICE
I, Faith Bugel, certify that on August 8, 2006, I filed the attached MICHAEL MURRAY
REFERENCES IN SUPPORT OF TESTIMONY . An original and 9 copies were filed, on
recycled paper, with the Illinois Pollution Control Board, James R. Thompson Center, 100 West
Randolph, Suite 11-500, Chicago, IL 60601, and copies were served via United States Mail to
those individuals on the included service list .
1
Faith Buget (Reg. No. 625-*,85)
Counsel for Environmental Law and Policy Center
DATED: August 8, 2006
Environmental Law and Policy Center
35 E. Wacker Drive, Suite 1300
Chicago, Illinois 60601
312-673-6500
Chicago Legal Clinic, Inc
Keith I. Harley
205 W. Monroe St., 4th Floor
Chicago, IL 60606
Dynegy Midwest Generation, Inc .
James W. Ingram, Senior Corporate Council
1000 Louisiana, Ste . 5800
Houston, TX 77002
Hodge Dwyer Zeman
N. Ladonna Driver
Katherine D. Hodge
3150 Roland Ave
.
P.O. Box 5776
Springfield, IL 62705-5776
IEPA
John J. Kim, Assistant Council
Charles E. Matoesan, Assistant Council
Gina Roccaforte
1021 N. Grand Ave. East
P.O. Box 19276
Springfield, IL 62794-9276
Jenner & Block
Bill S. Forcade
Katherine M. Rahill
One IBM Plaza, 40th Floor
Chicago, IL 60611
Kardganis, White & Magel, Ltd
.
Christopher W. Newcomb
414 N. Orleans St., Ste. 810
Chicago, IL 60610
McGuire Woods LLP
James T. Harrington
Jeremy R. Hojnicki
David Rieser
77 W. Wacker Dr., Ste. 4100
Chicago, IL 60601
SERVICE LIST R06-25
Office of Public Utilities
William A. Murray, Regulatory Affairs
Manager
800 East Monroe
Springfield, IL 62757
Office of Public Utilities, City of Springfield
S. David Farris, Manager, Environmental
Health and Safety
201 E. Lake Shore Dr
.
Springfield, IL 62757
Prairie State Generating Company, LLC
Dianna Tickner
701 Market St., Ste. 781
St. Louis, MO 63101
Schiff Hardin, LLP
Kathleen C. Bassi
Stephen J. Bonebrake
Glenna L. Gilbert
Joshua R. More
Sheldon A. Zabel
6600 Sears Tower
233 South Wacker Dr.
Chicago, IL 60606-6473
Sierra Club
Bruce Nilles, Attorney
122 W. Washington Ave., Ste. 830
Madison, Wl 53703