TECHNICAL SUPPORT DOCUMENT
FOR
REDUCING MERCURY EMISSIONS FROM
COAL-FIRED ELECTRIC GENERATING UNITS
AQPSTR 06-02
MARCH 14, 2006
AIR QUALITY PLANNING SECTION
DIVISION OF AIR POLLUTION CONTROL
BUREAU OF AIR
ILLINOIS ENVIRONMENTAL PROTECTION AGENCY
SPRINGFIELD, IL
Table of Contents
List Acronyms
8
Figures
12
Tables
15
Executive Summary
18
1.0 Introduction
26
2.0 Background Information on Mercury
29
2.1 What is Mercury?
29
2.2 Sources and Uses of Mercury
30
2.2.1
U.S. Anthropogenic Sources of Mercury Emissions 31
2 .2 .2
Illinois Sources of Mercury Emissions 33
2 .2.3 Mercury Emissions from Illinois' Electric Generating
Units
34
3.0 Mercury Impacts on Human Health
37
3.1 Quantifying and Monetizing Impacts of Mercury in Illinois 41
4.0 Mercury Impaired Waters in Illinois
48
4.1 Background on Clean Water Act Requirements 48
4.1 .1
Water Pollution Control Regulatory Scheme/Water
Quality Standards
48
4.1 .2
Point Source Pollution Control 50
4.1 .3
Non-Point Source Pollution Control 51
4.1 .4
Requirements to Report on Conditions of State Waters
.
.
.
51
4.1 .5
303(d)/Total Maximum Daily Load Program (TMDL)
. .
.
52
4.2 Identification of Mercury Impaired Waters in Illinois 53
4.2 .1
Fish Consumption Advisories 53
4.2.2
Assessment of Fish Consumption Advisories 58
4.2.3
Waters in Illinois Currently Impaired for Fish
Consumption Use Due to Mercury 59
4.3 Reductions in Fish Tissue Mercury Levels Needed to Address
Impairment
61
2
4.3.1
Description of Data
61
4 .3.2 Analysis
62
4.4 Inputs of Mercury to Illinois Waters
64
4.4.1
Fate of Mercury in the Environment
64
4.4.2
Loading of Mercury to Illinois Waters from Wastewater
68
Discharges
4.4.3
Study of Mercury Concentrations in Ambient Water
69
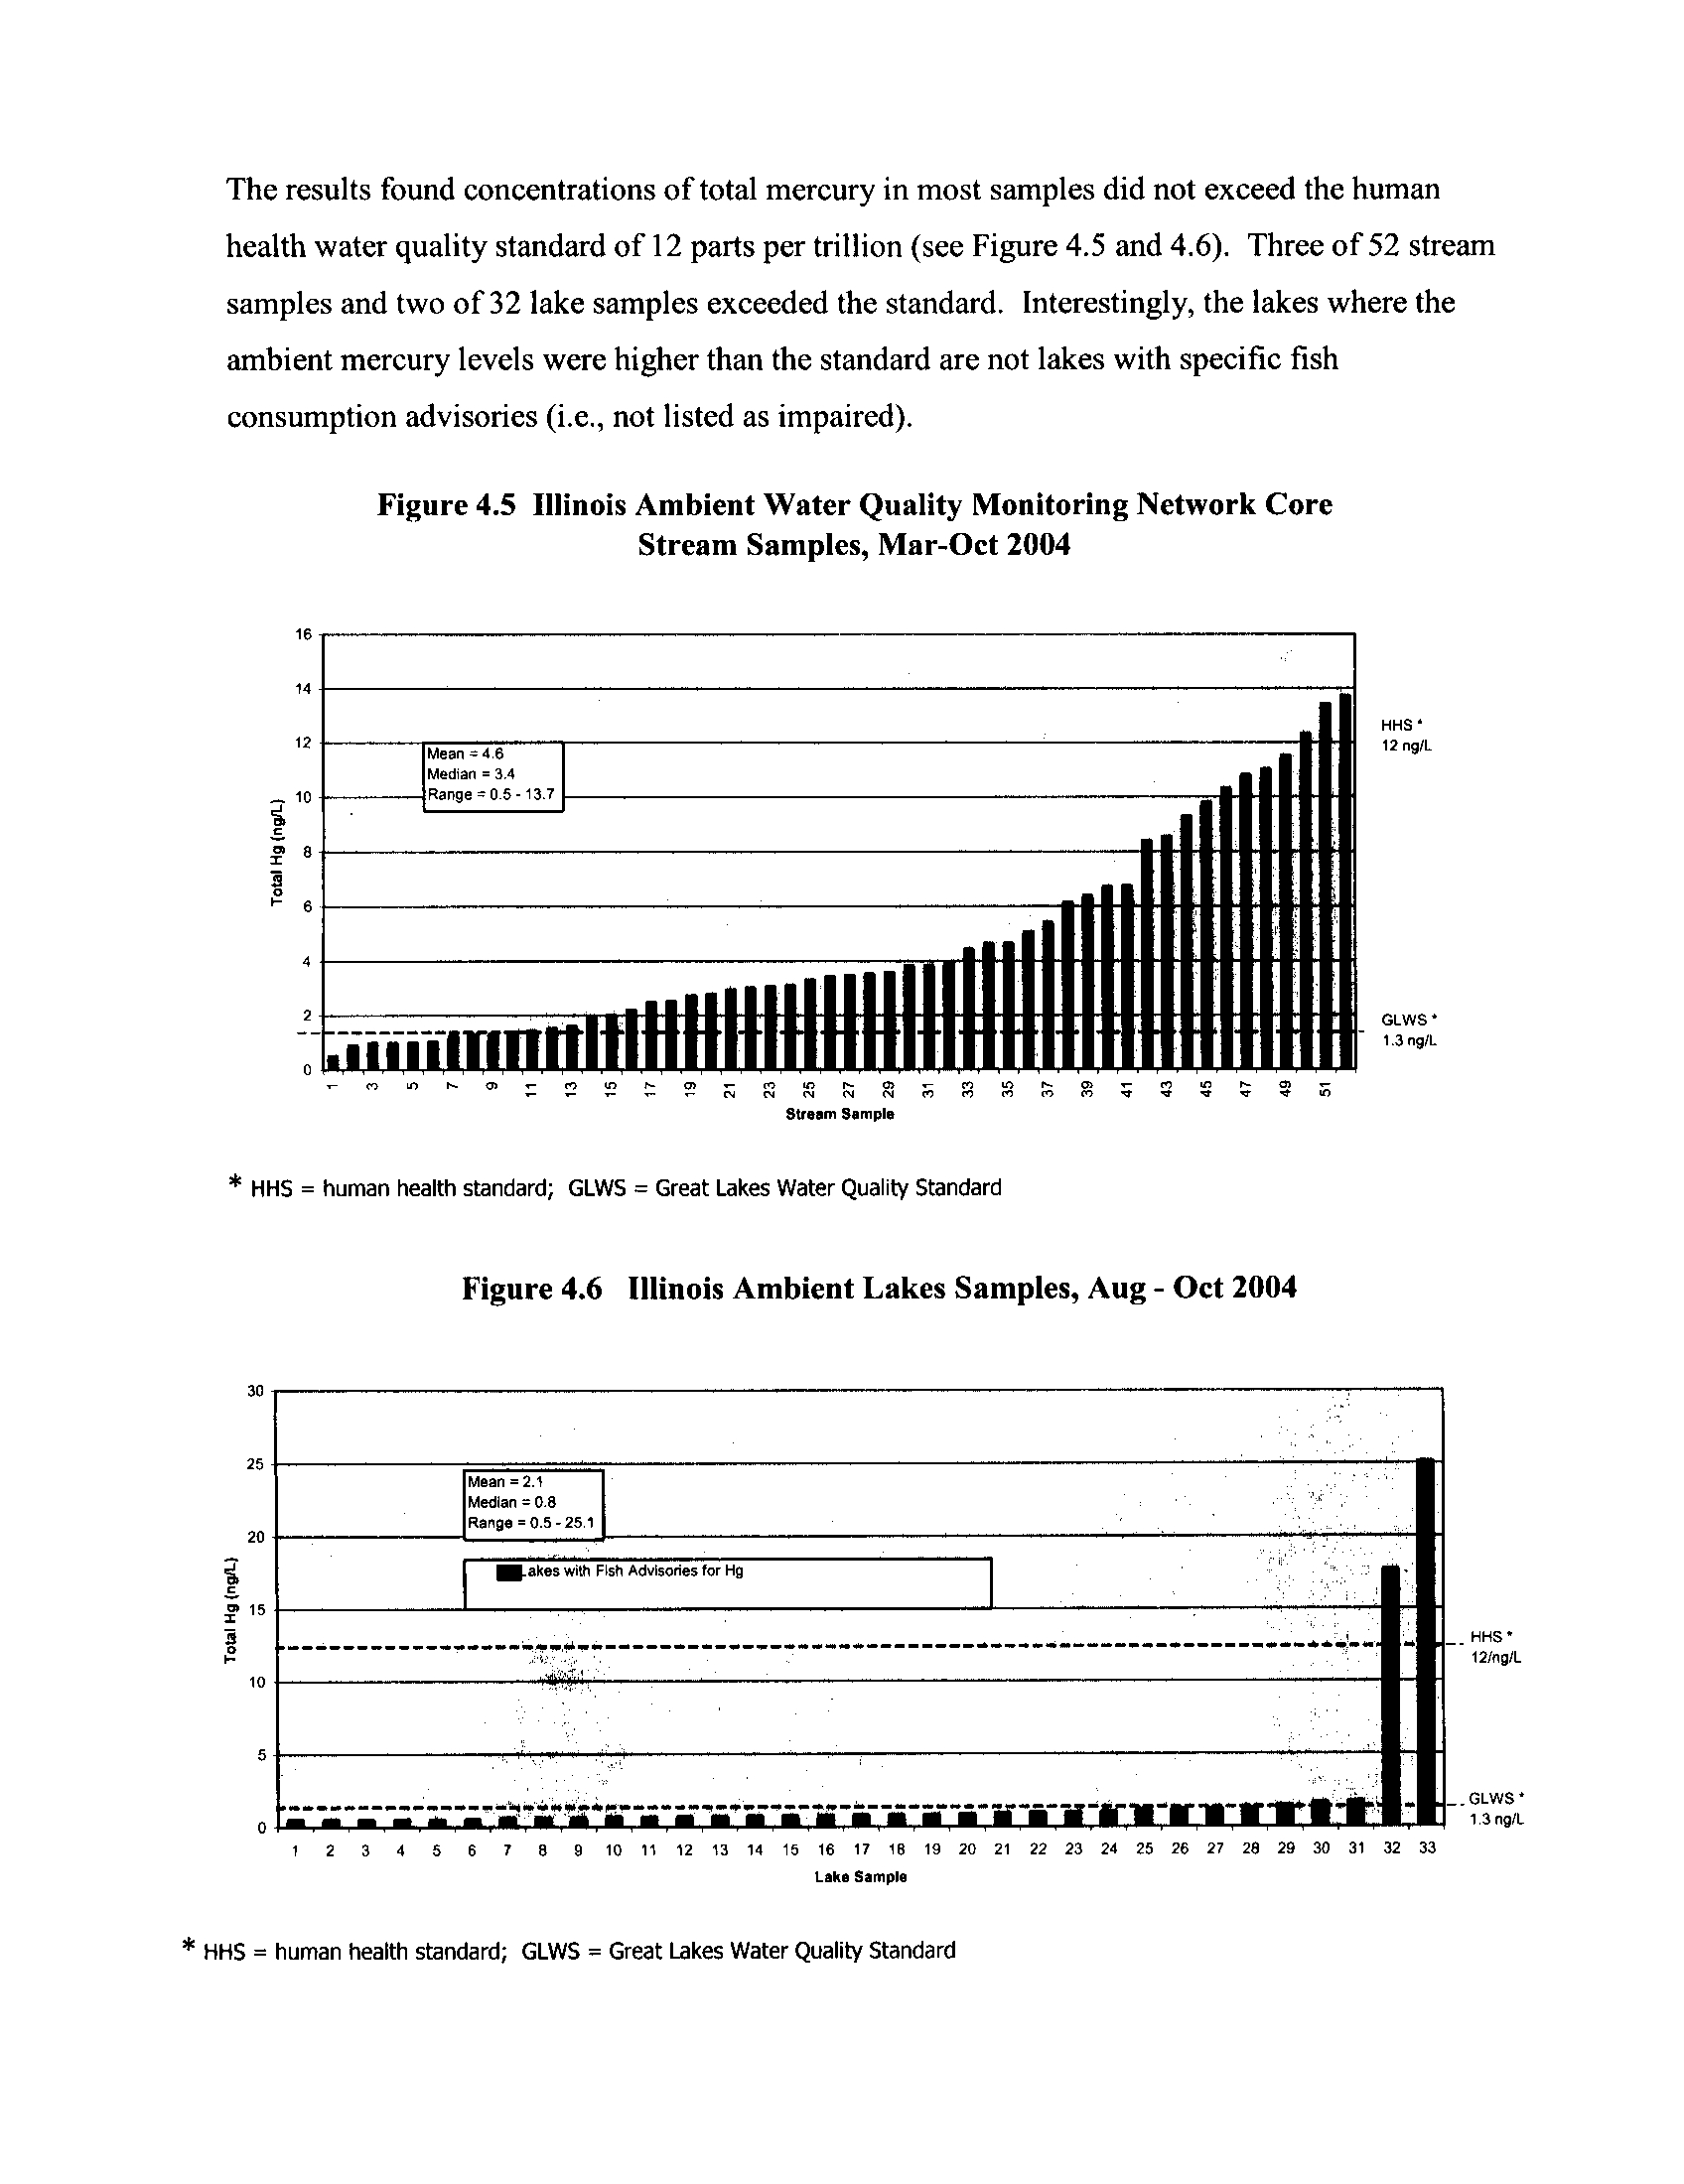
4.5 Fish Consumption and At-Risk Anglers
74
5.0 Deposition of Mercury
77
5.1 Mercury in the Atmosphere
77
5.2 Response of Fish Tissue Mercury Levels in Key Waterbodies
81
In Florida and Massachusetts to Local Reductions in Mercury
Emissions
5 .2.1
Florida Experience
81
5 .2.2 Massachusetts Experience
86
6.0 Regulatory Activities - Federal and Other States
87
6.1 Federal Actions
87
6 .1 .1
Mercury Study Report to Congress
87
6.1 .2
Utility Electric Generating Units Toxics Study
87
6.1 .3
Utility Air Toxics Determination
88
6.1 .4
Clean Air Mercury Rule (CAMR)
88
6.1 .5
Other Federal Actions
90
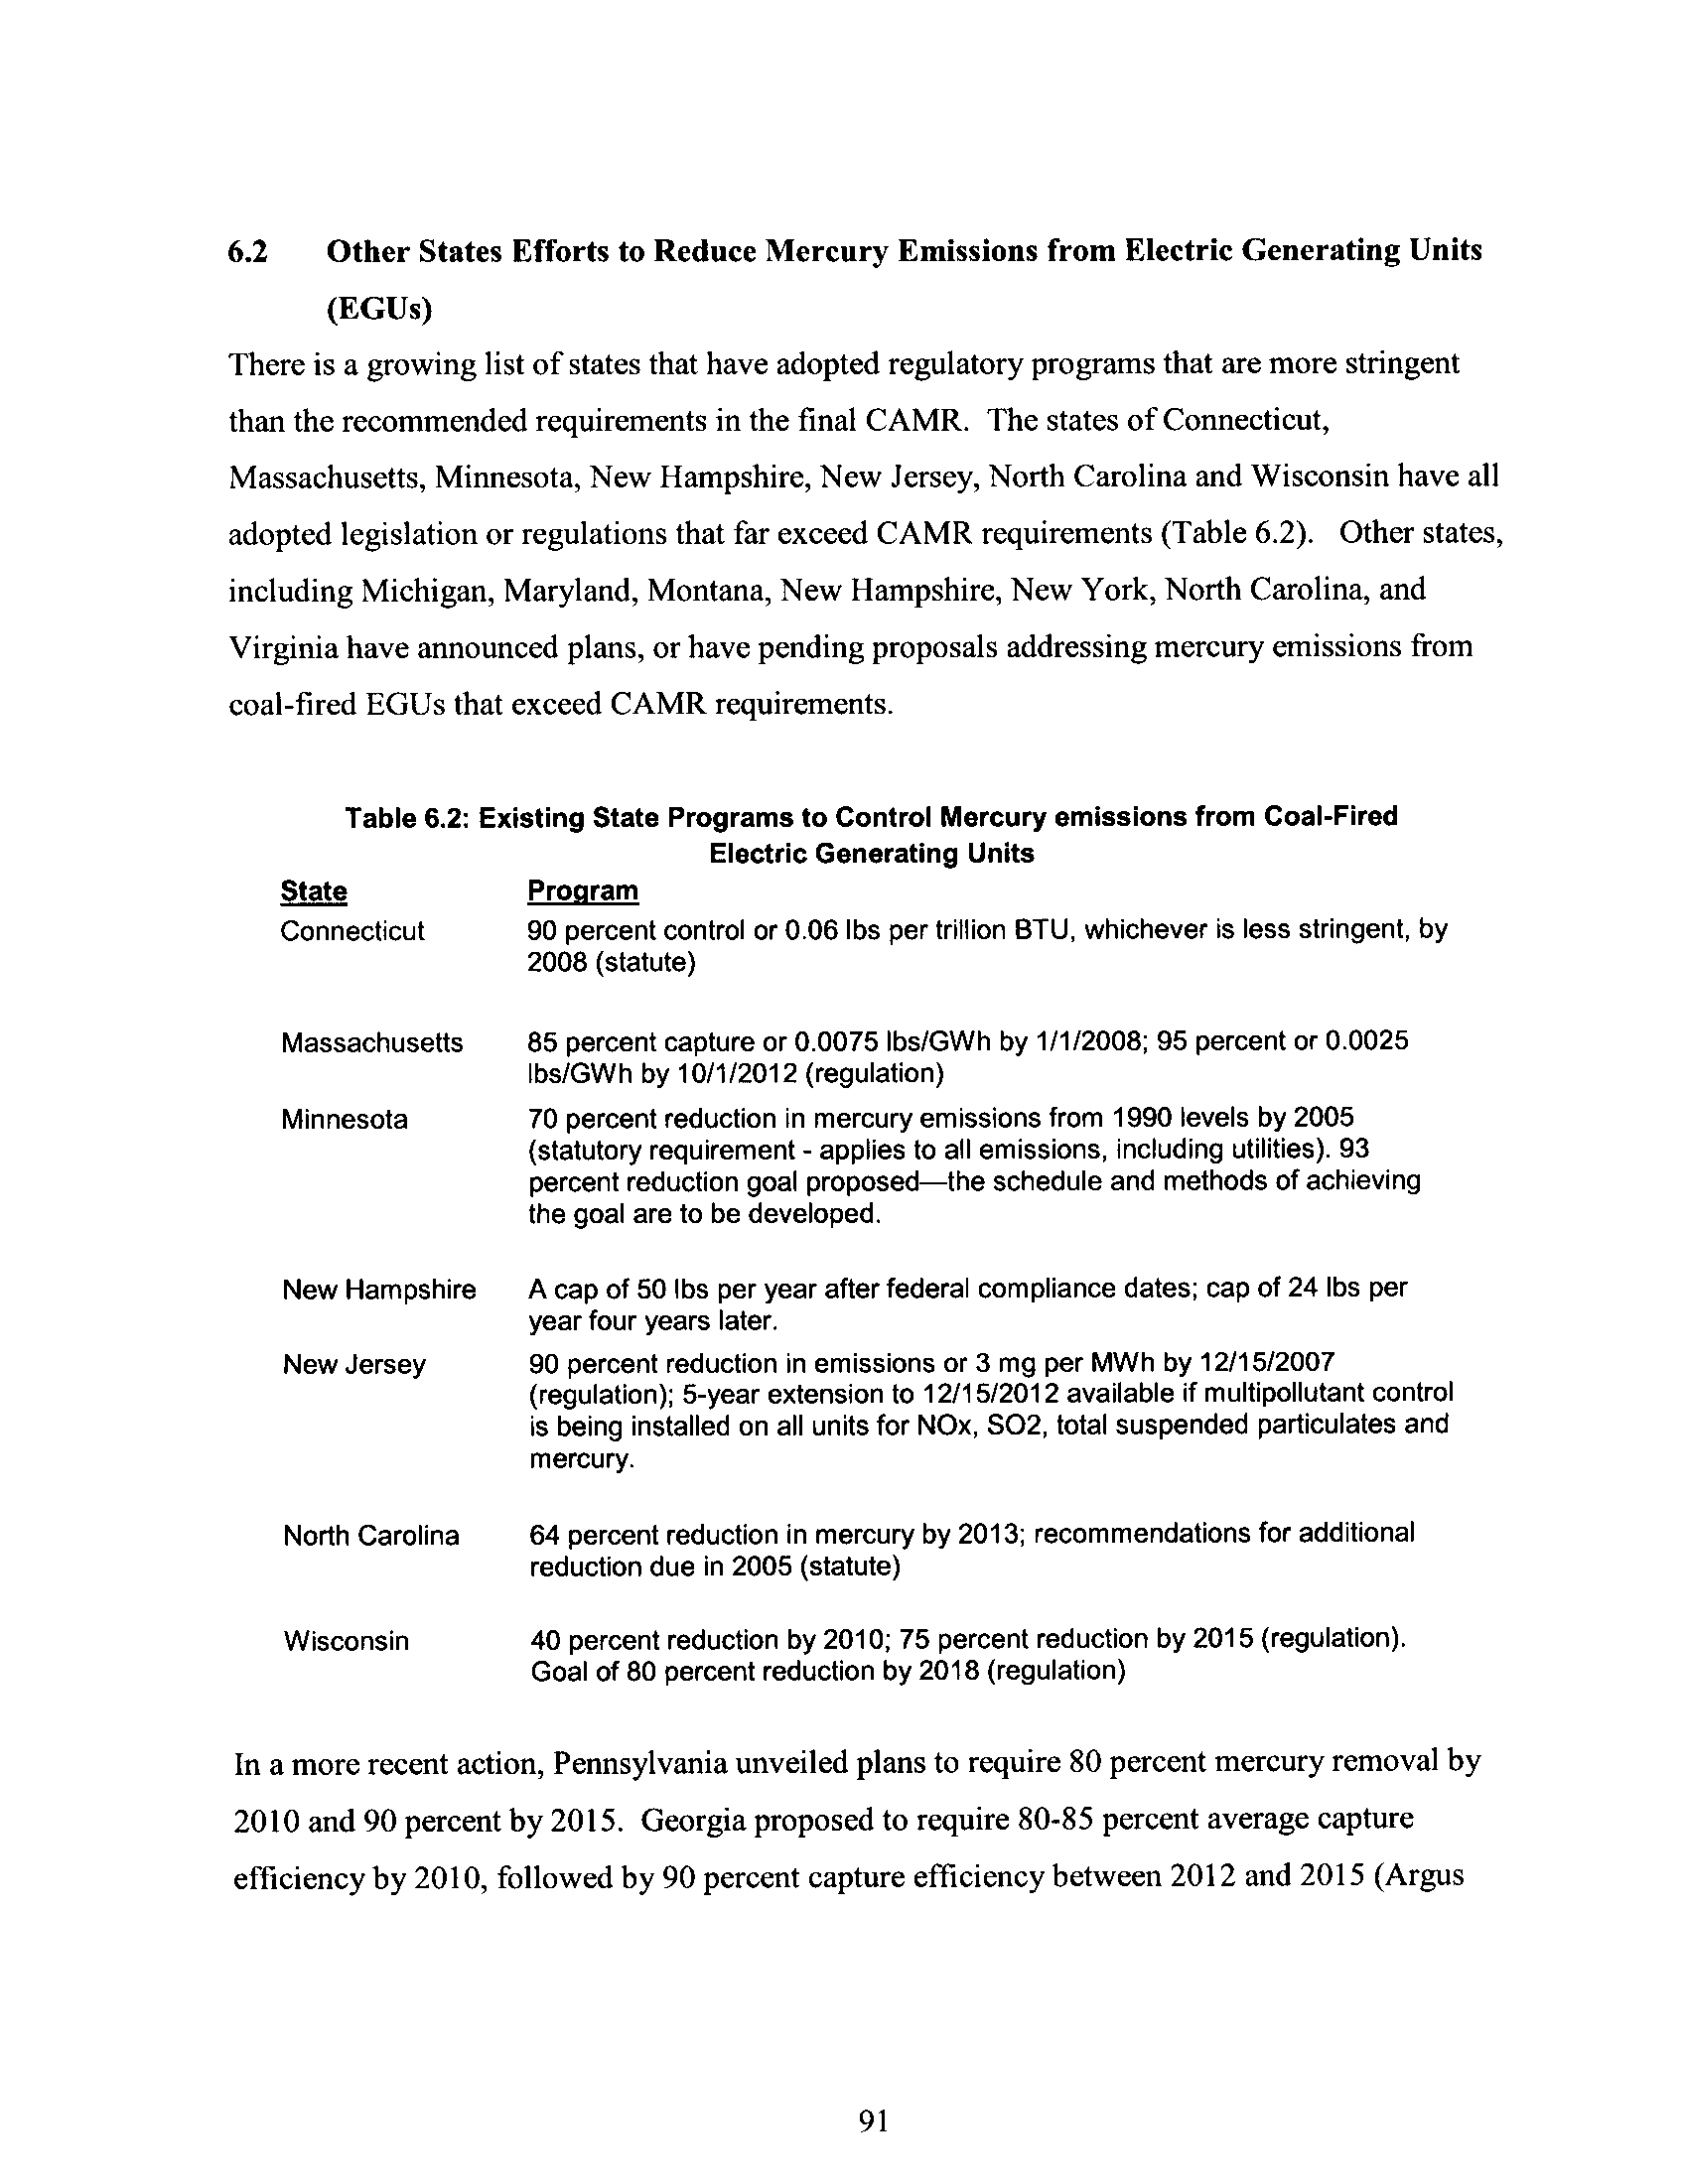
6.2 Other States Efforts to Reduce Mercury Emissions from Electric
91
Generating Units (EGUs)
6.3 Illinois Mercury Reduction Programs
92
6.3 .1
Existing Programs
92
6.3 .1 .1 Mercury Switches, Relays and School Use of
Mercury
92
4
6 .3 .1 .2 Mercury Switch Thermostats and Vehicle
Components
92
6.3 .1 .3 School Chemical Collections
93
6.3 .1 .4 Household Hazardous Waste Collections
93
6.3 .1 .5 Mercury Monitoring
94
6.3 .1 .6 Quicksilver Caucus Participation
94
6.3 .1.7 Dental Amalgam Partnership
94
6.3.1.8 Mercury Thermostat Workgroup
94
6.3.1.9 Outreach and Education
95
6 .3 .2
Mercury Reductions from Municipal Waste Combustion
95
Source
6.3 .3
Mercury Reductions from Medical Waste Incinerator
96
Sources
7.0 Illinois Mercury Emissions Standards for Coal-fired Electric
Generating Units
96
7.1 Rule Development Considerations
96
7 .1 .1
Basic Guiding Principles
96
7 .1 .2
Other Rule Development Considerations
97
7 .1 .2.1 Selecting an Achievable ; Reasonable; and
Cost -Effective Level of Mercury Control
99
7 .1 .2.2 Rule Flexibility
99
7.2 Proposed Illinois Mercury Standards
100
7.2.1
Applicability
100
7.2.2
Proposed Mercury Standards and Emissions Limits
100
7.2 .2.1 Input Mercury Reductions or Output-Based
Emissions Limit
100
7 .2 .2.2 Rationale for the Proposed Mercury Standards
.
.
.
.
101
7.2 .2.3 Averaging Demonstration
104
7.2 .3
Monitoring Requirements
105
7.2 .3.1 Illinois Electric Generating Units
106
8.0 Technological Feasibility of Controlling Mercury Emissions from
8.4.5.1 Time and Materials to Engineer, Procure Install Sorbent
Injection Systems
139
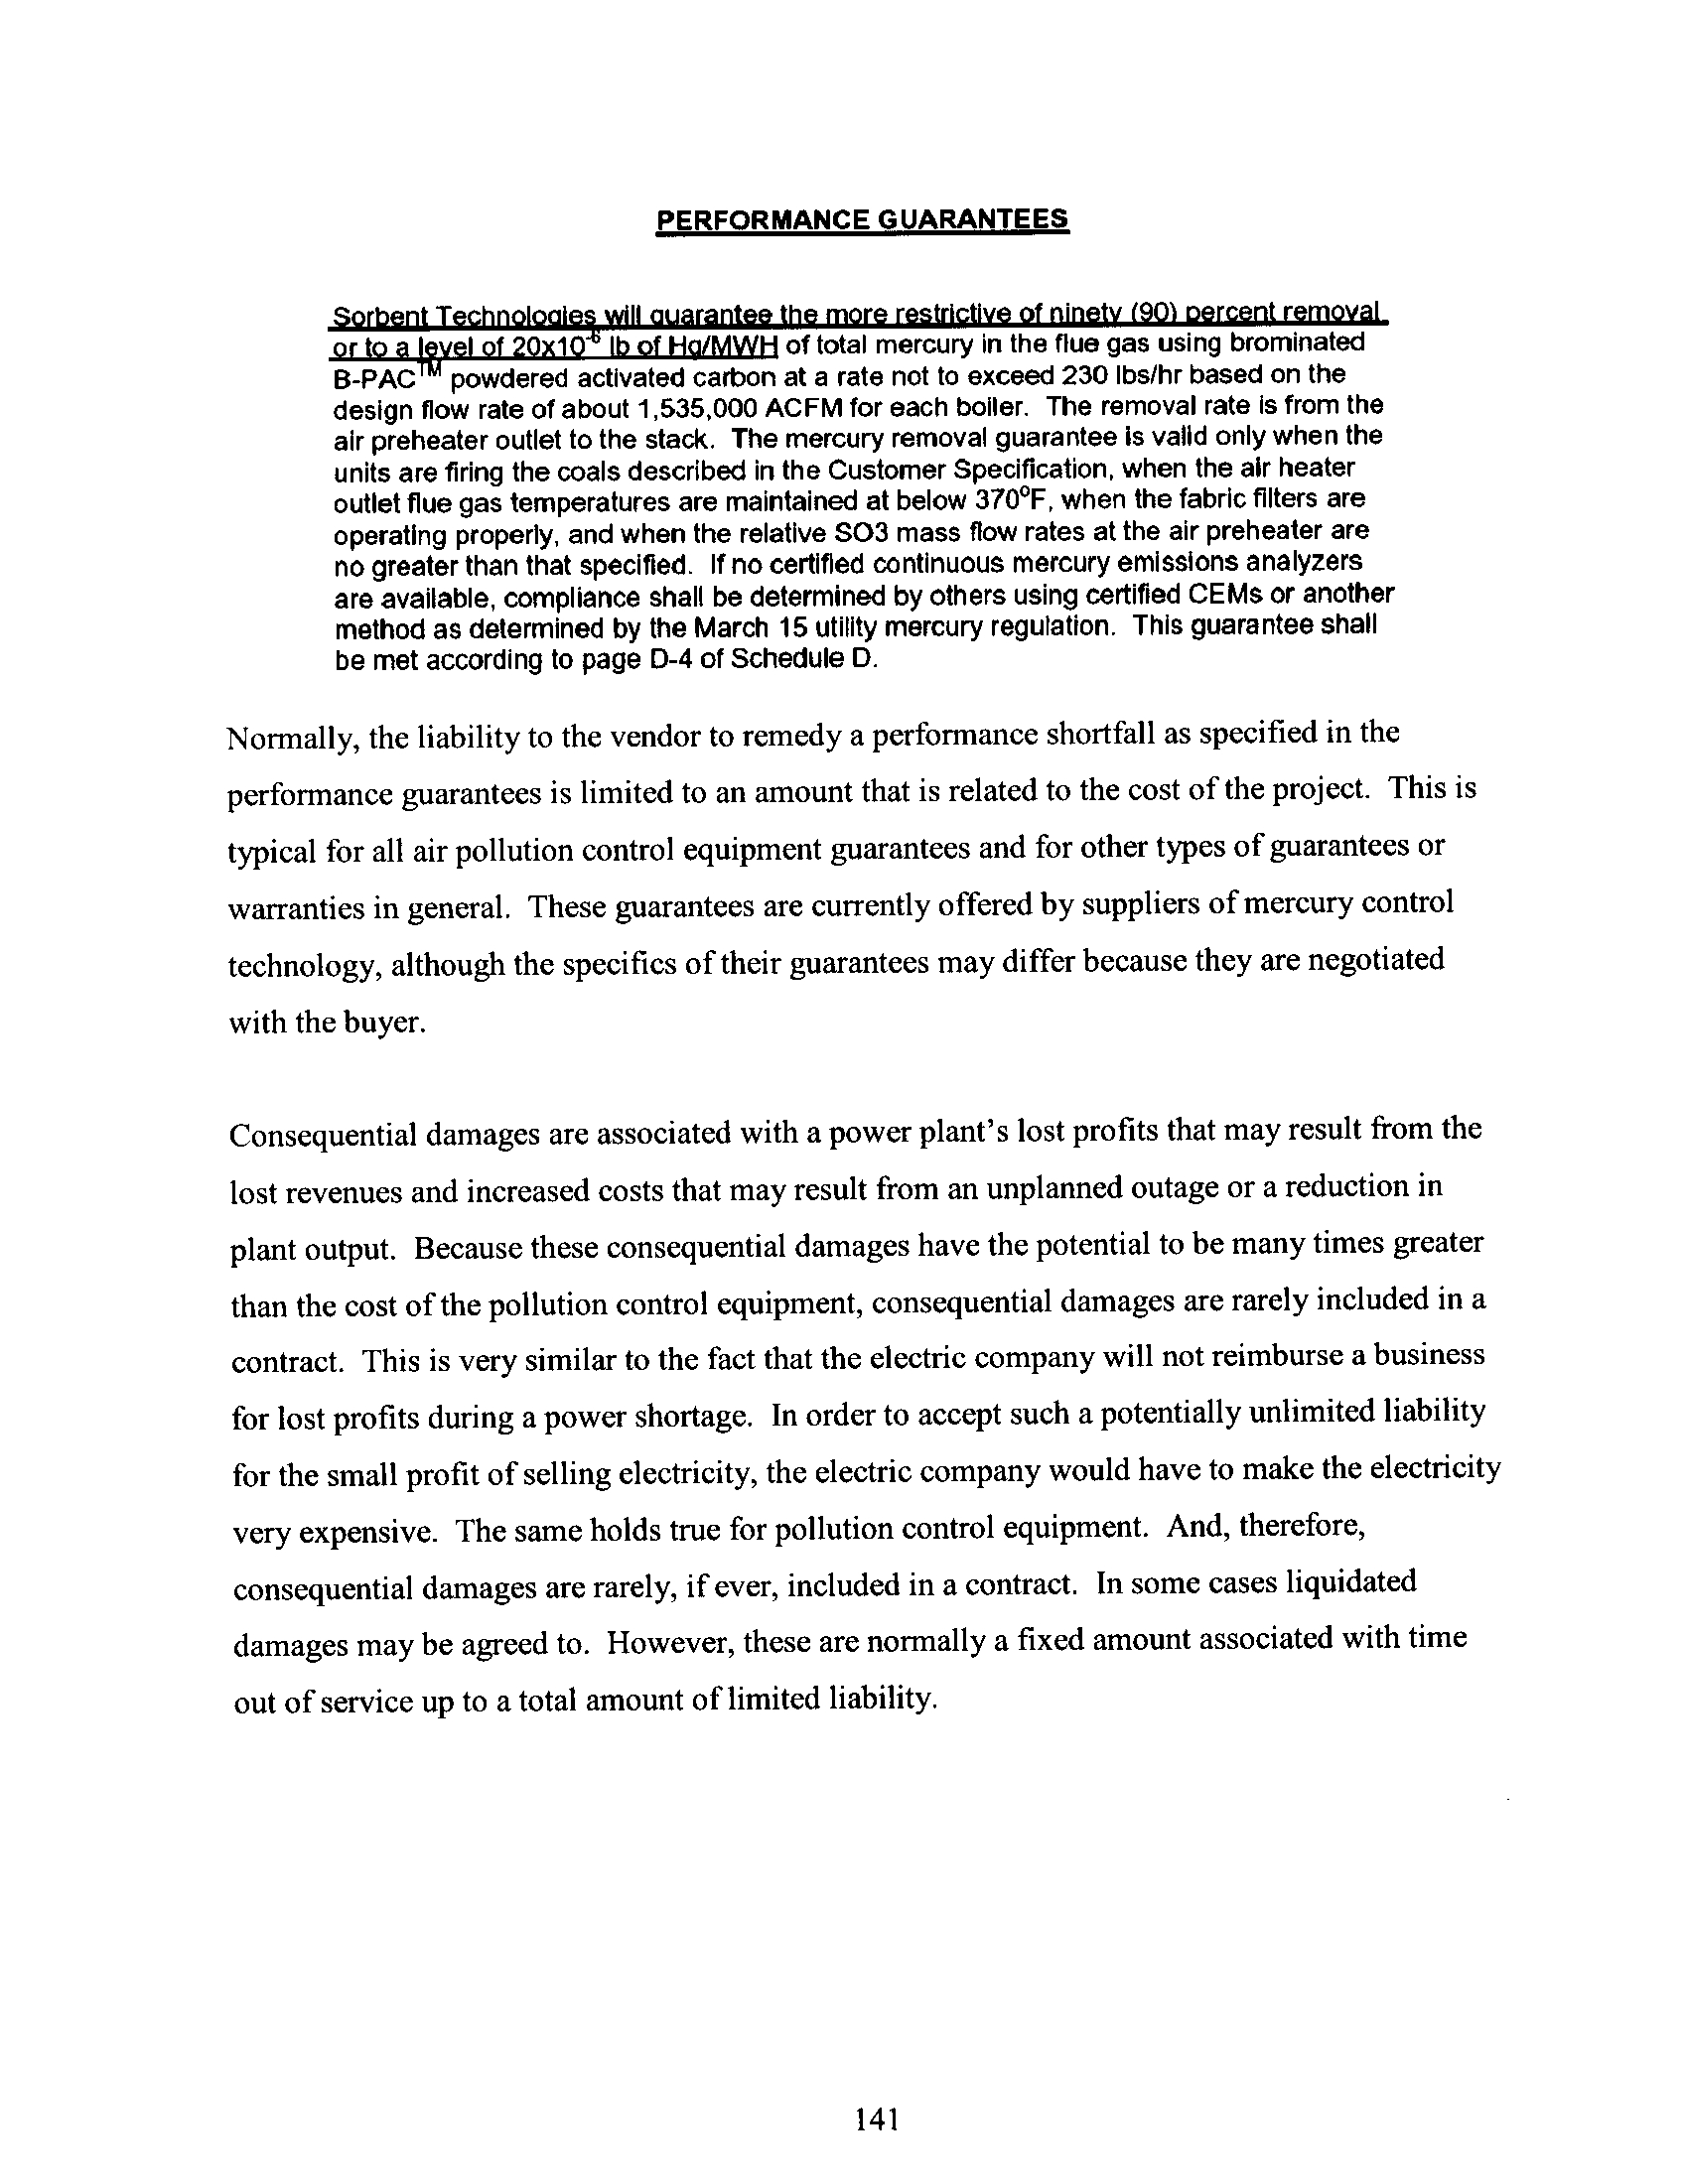
8 .4.5.2 Guarantees
140
8 .4.5.3 Supply of Sorbent
142
8.4.5.4 Long-Term Experience 142
8.5 Other Emerging Control Technologies
143
8.5 .1
Improved Sorbents and Sorbent-Related Technology
.
.
. .
143
5
Coal-fired Power Plants in Illinois
109
8.1 Mercury Removal from Coal
109
8.1 .1
Wastewater Issues in Coal Washing
110
8.2 The Fate of Mercury During Coal Combustion
112
8.3 Mercury Removal by Co-Benefit from PM, NOx and SO 2 Controls .
113
8 .3 .1
Methods to Optimize Co-Benefit Controls
116
8.4 Mercury Specific Controls
118
8 .4.1
Early Field Testing Experience with Sorbent Injection
.
.
.
122
8 .4.2
Results of Additional Field Testing
124
8 .4.2.1 In-Flight Mercury Removal
126
8 .4 .2.2 TOXECON and Fabric Filters
129
8 .4 .3
Costs of Sorbent Injection Systems
130
8 .4 .3.1 Capital Costs
130
8 .4 .3.2 Operating Costs
131
8 .4.4
Balance of Plant Issues
134
8 .4.4.1 Impact on Other Equipment
134
8.4.4.2 Environmental Impact of Sorbent Disposal
135
8 .4.4.3 Impact on Coal Combustion Product Utilization
.
136
8 .4 .4.4 Environmental Impacts of Brominated Sorbents
.
138
8 .4.4.5 Impacts on Selective Catalytic Reduction
138
8 .4.4.6 Performance Over Various Temperature Ranges .
139
8.4.5
Issues Relating to Commercial Availability and Impact to
the Utility Sector
139
6
8.5 .2
8.5.3
Advanced Fuel Beneficiation
Multi-pollutant Controls
144
145
147
147
149
152
167
168
170
184
185
185
186
189
8.6 Control Options for Coal-Fired Boilers in Illinois
8 .6 .1
8 .6 .2
Control Options for Boilers Firing Bituminous Coals
. . .
Control Options for Boilers Firing Subbituminous Coals
.
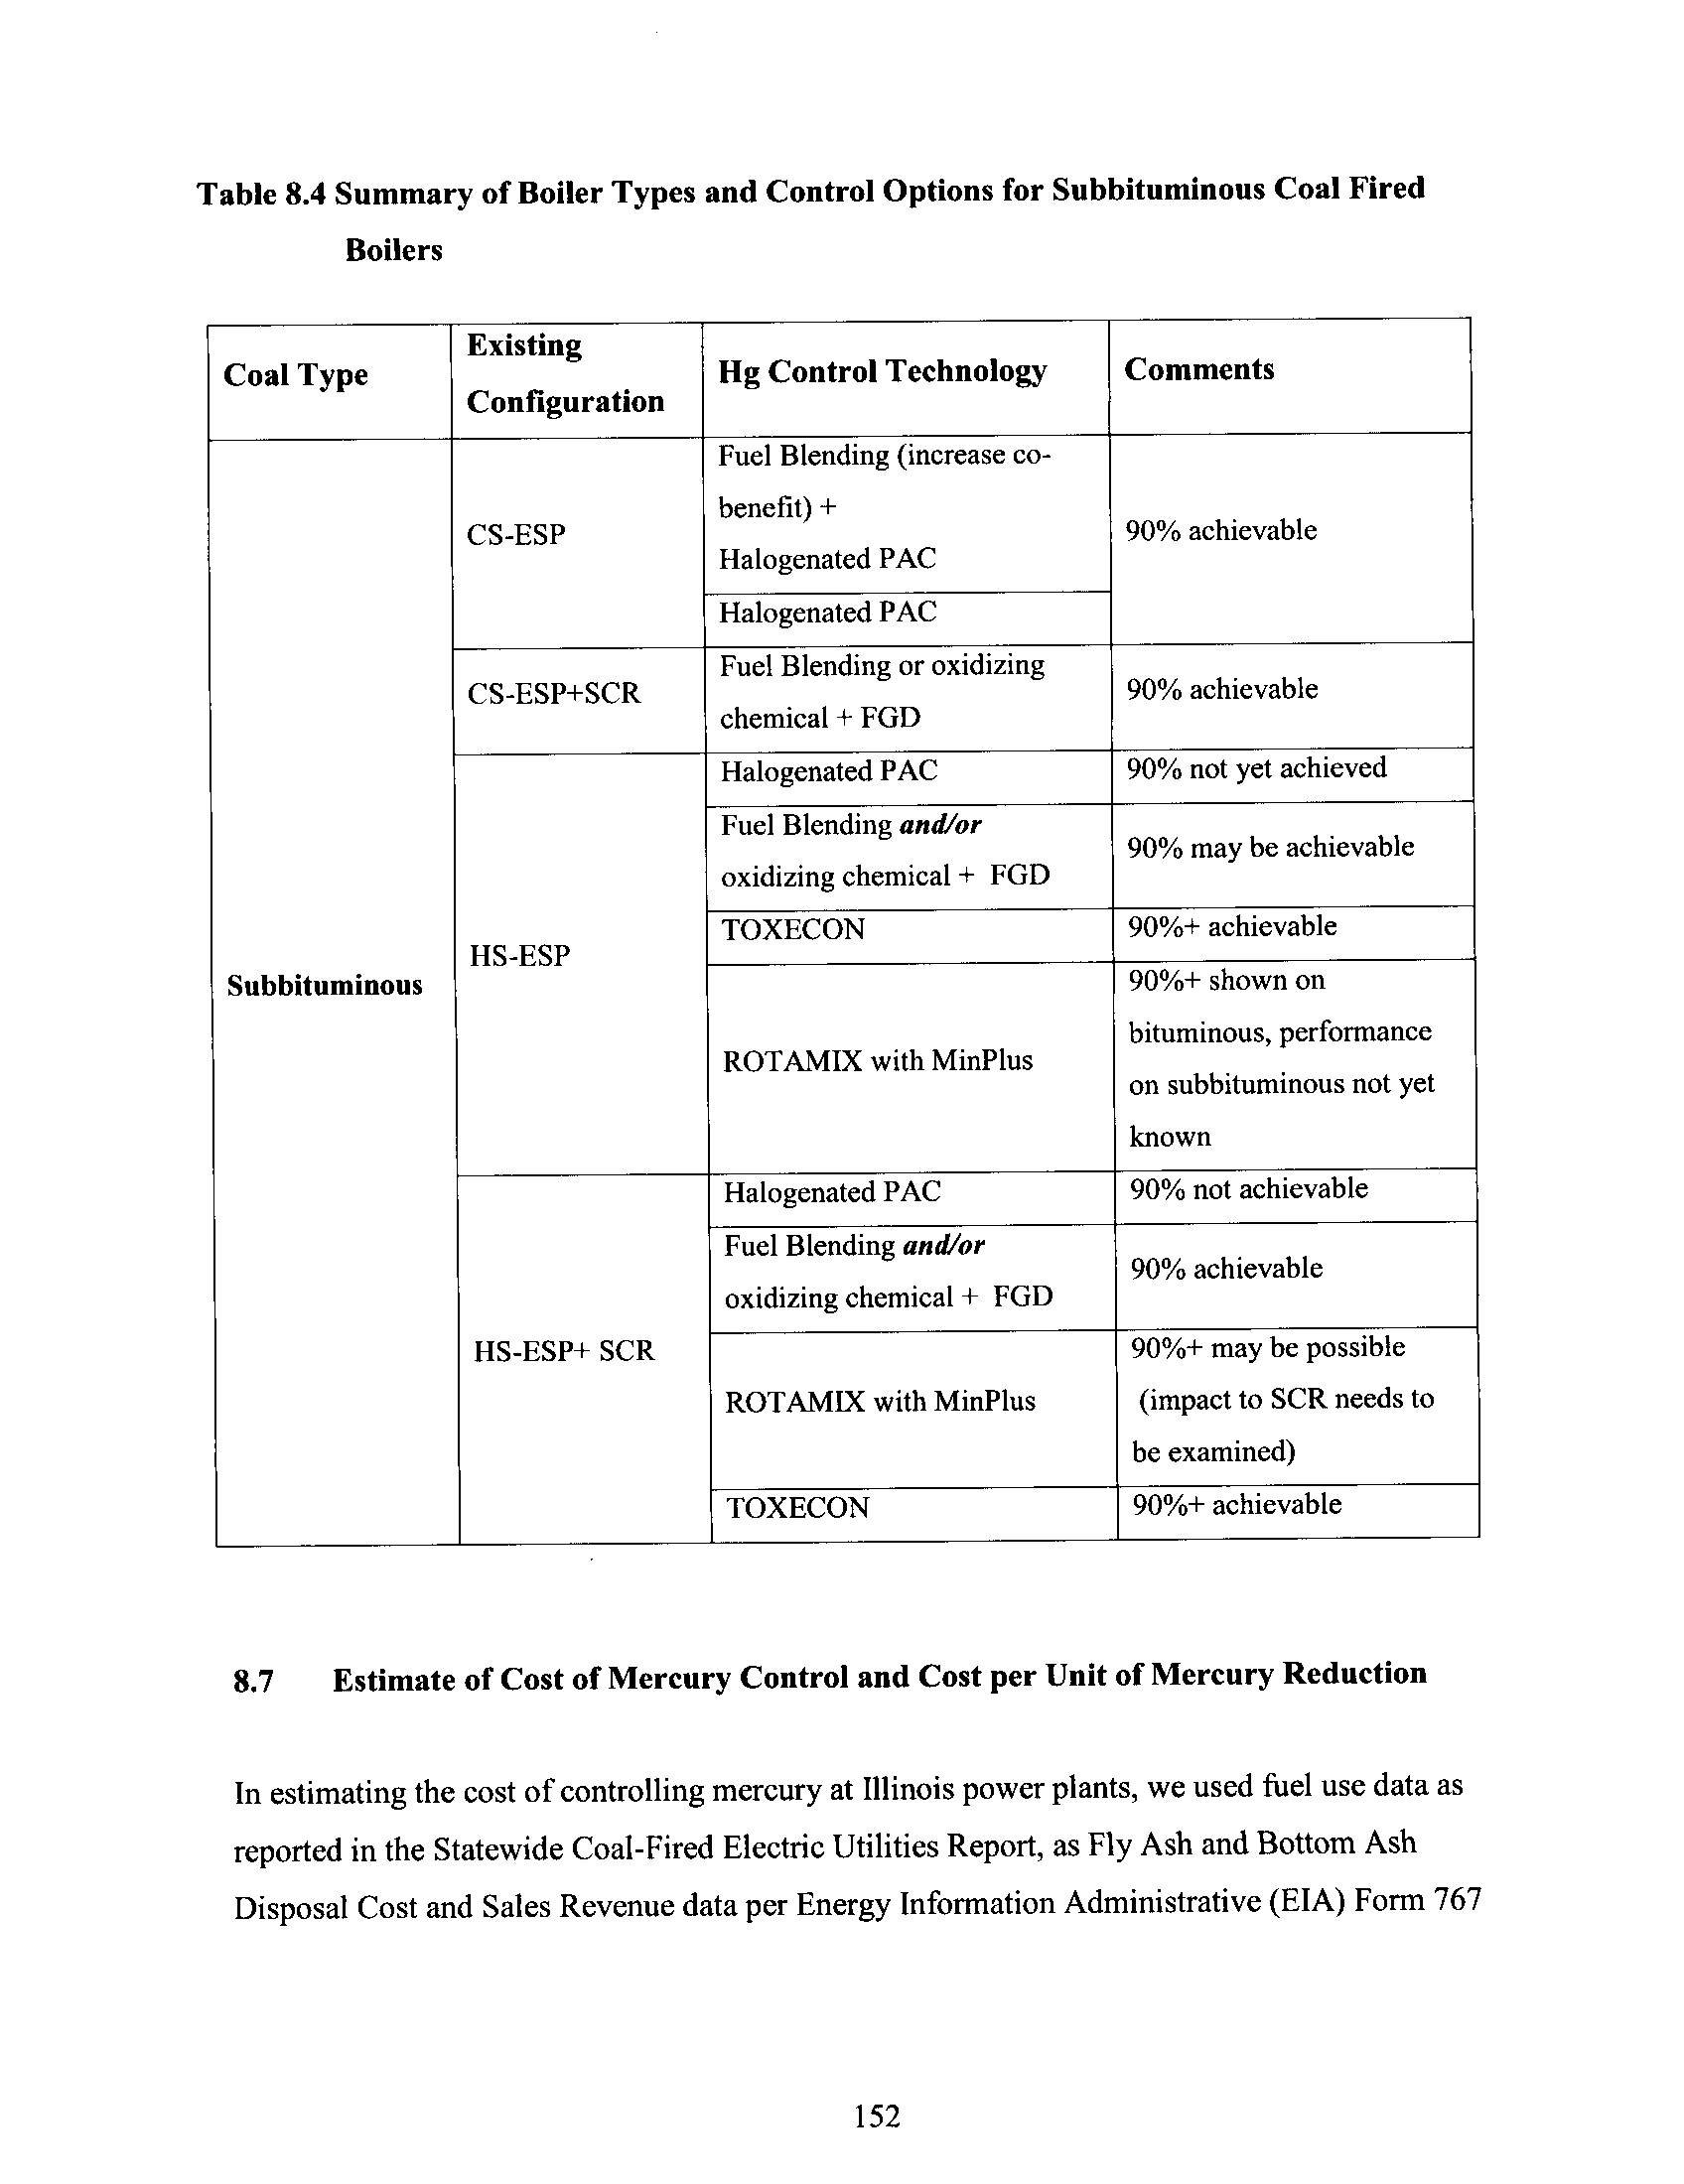
8.7 Estimate of Costs of Mercury Control and Cost Per Unit of Mercury
Reduction
9.0 Economic Modeling
9.1 Scenarios Examined
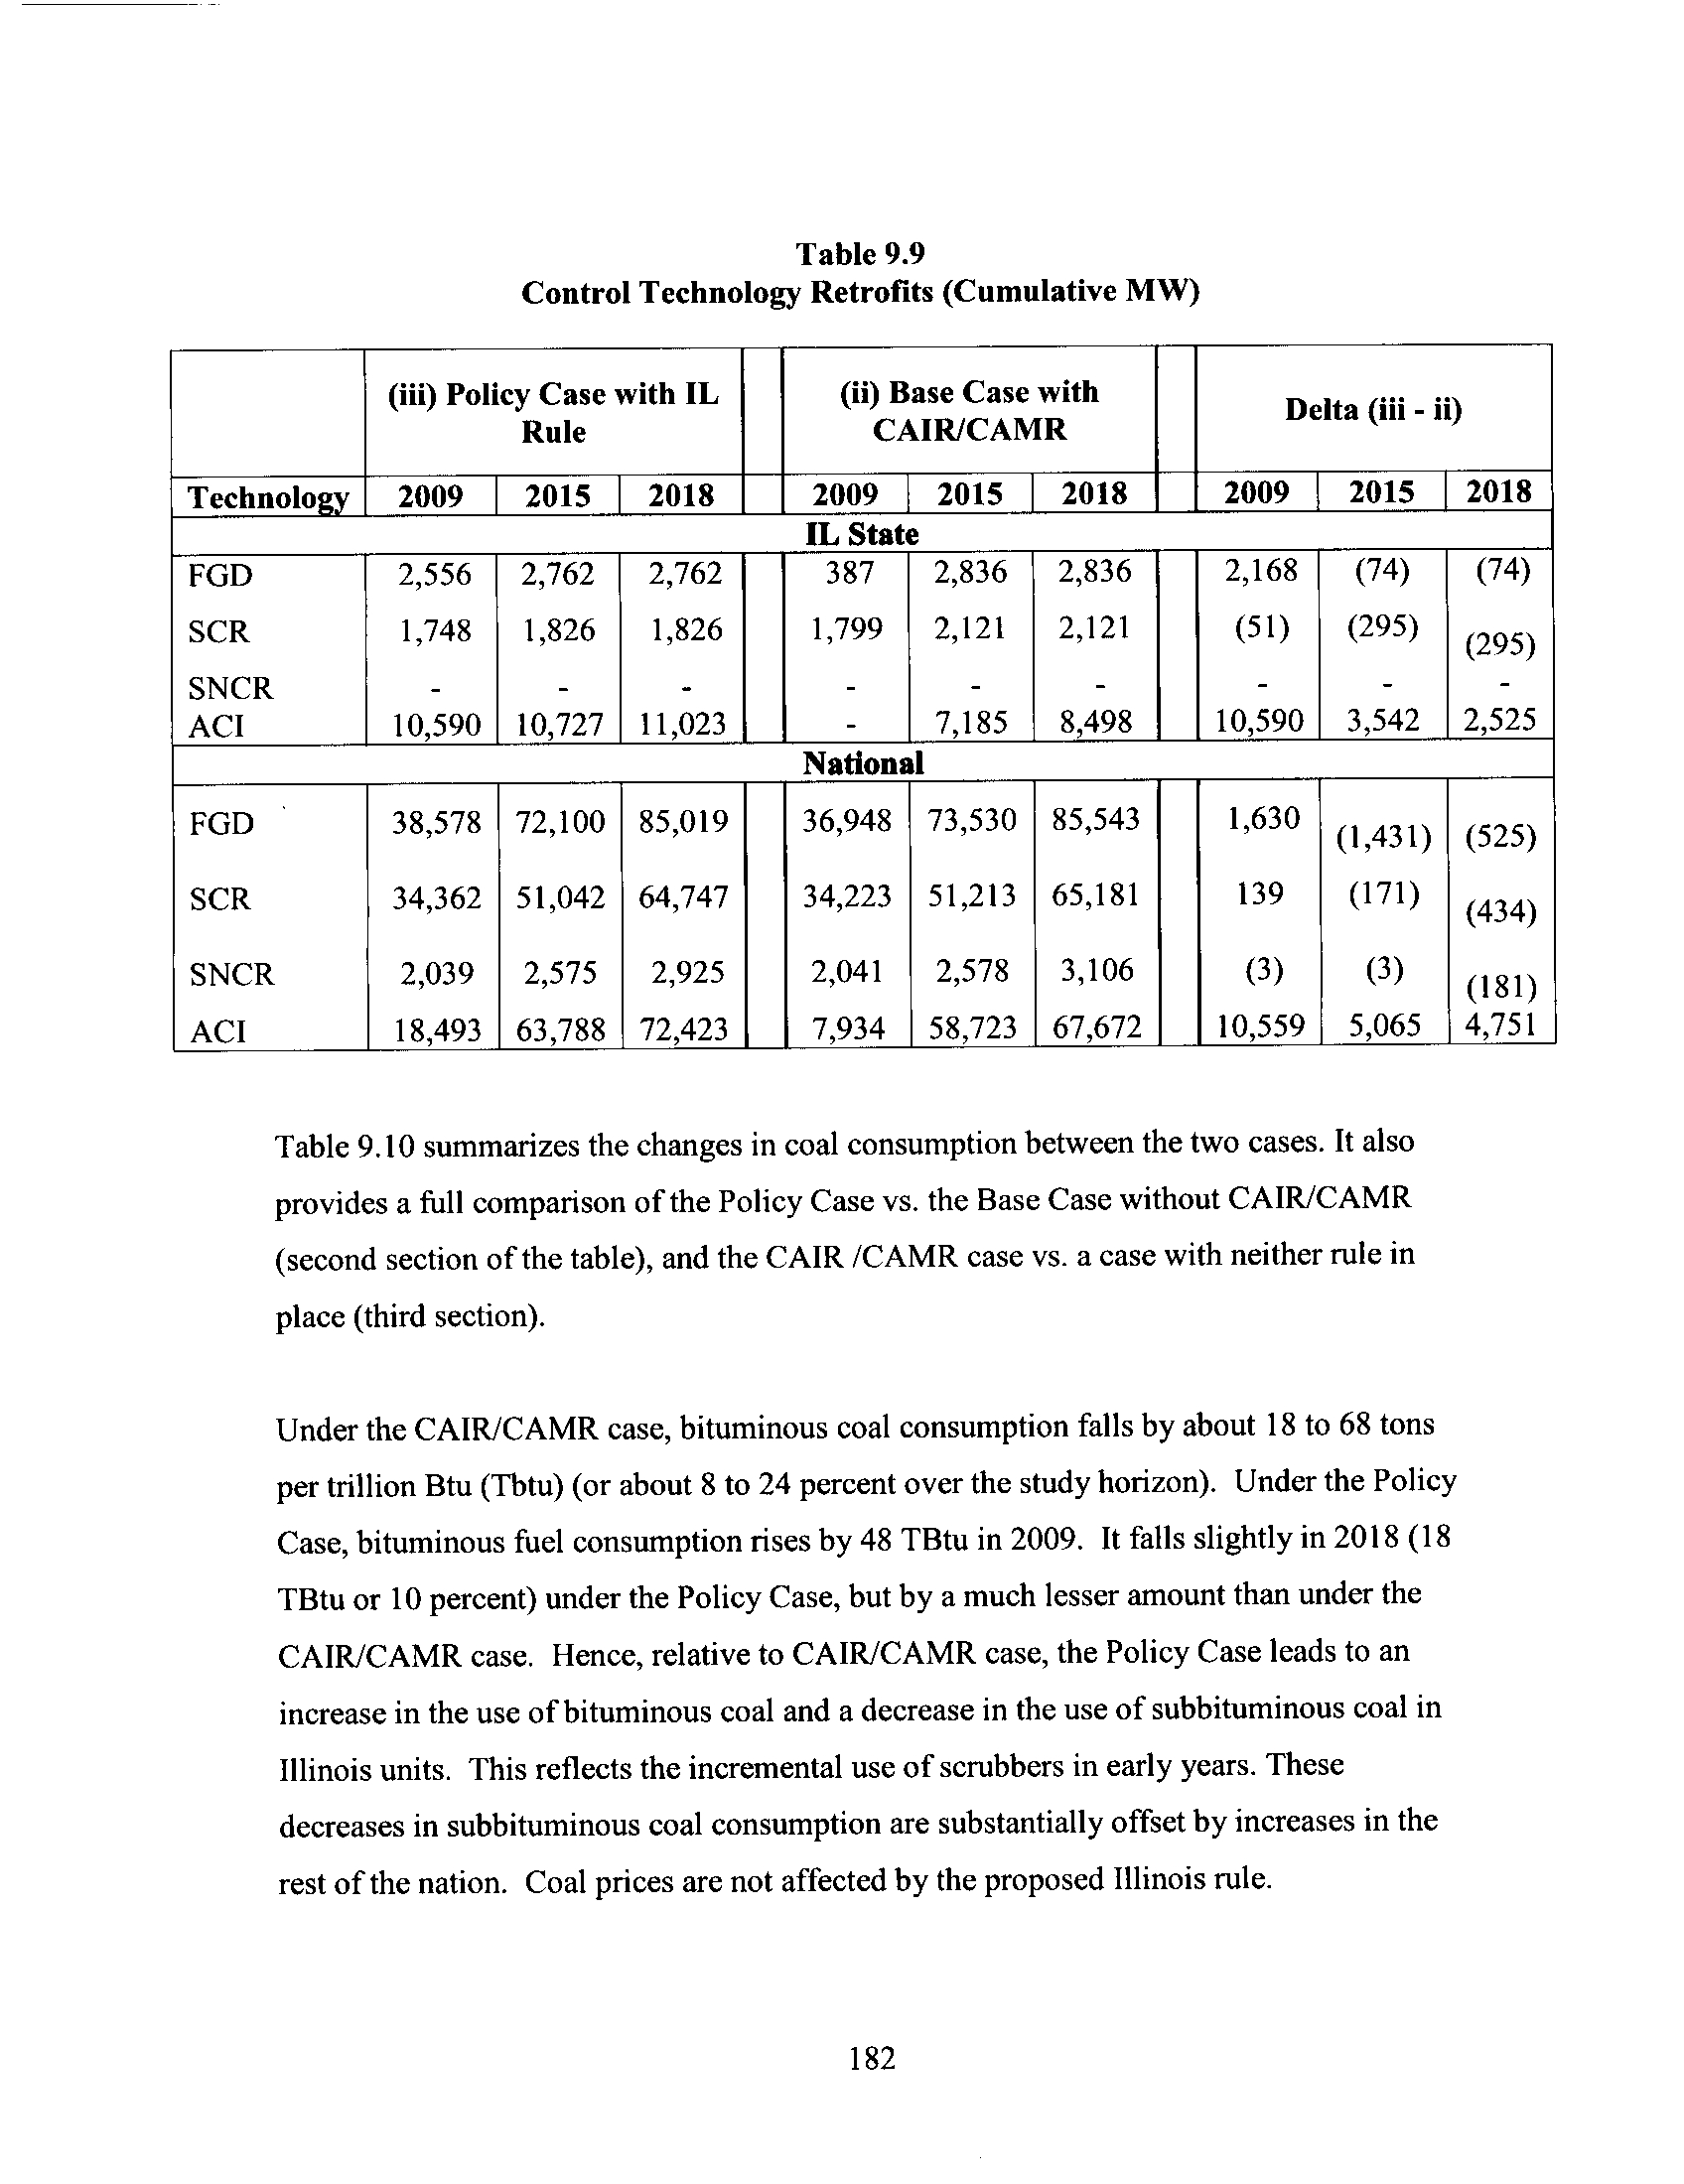
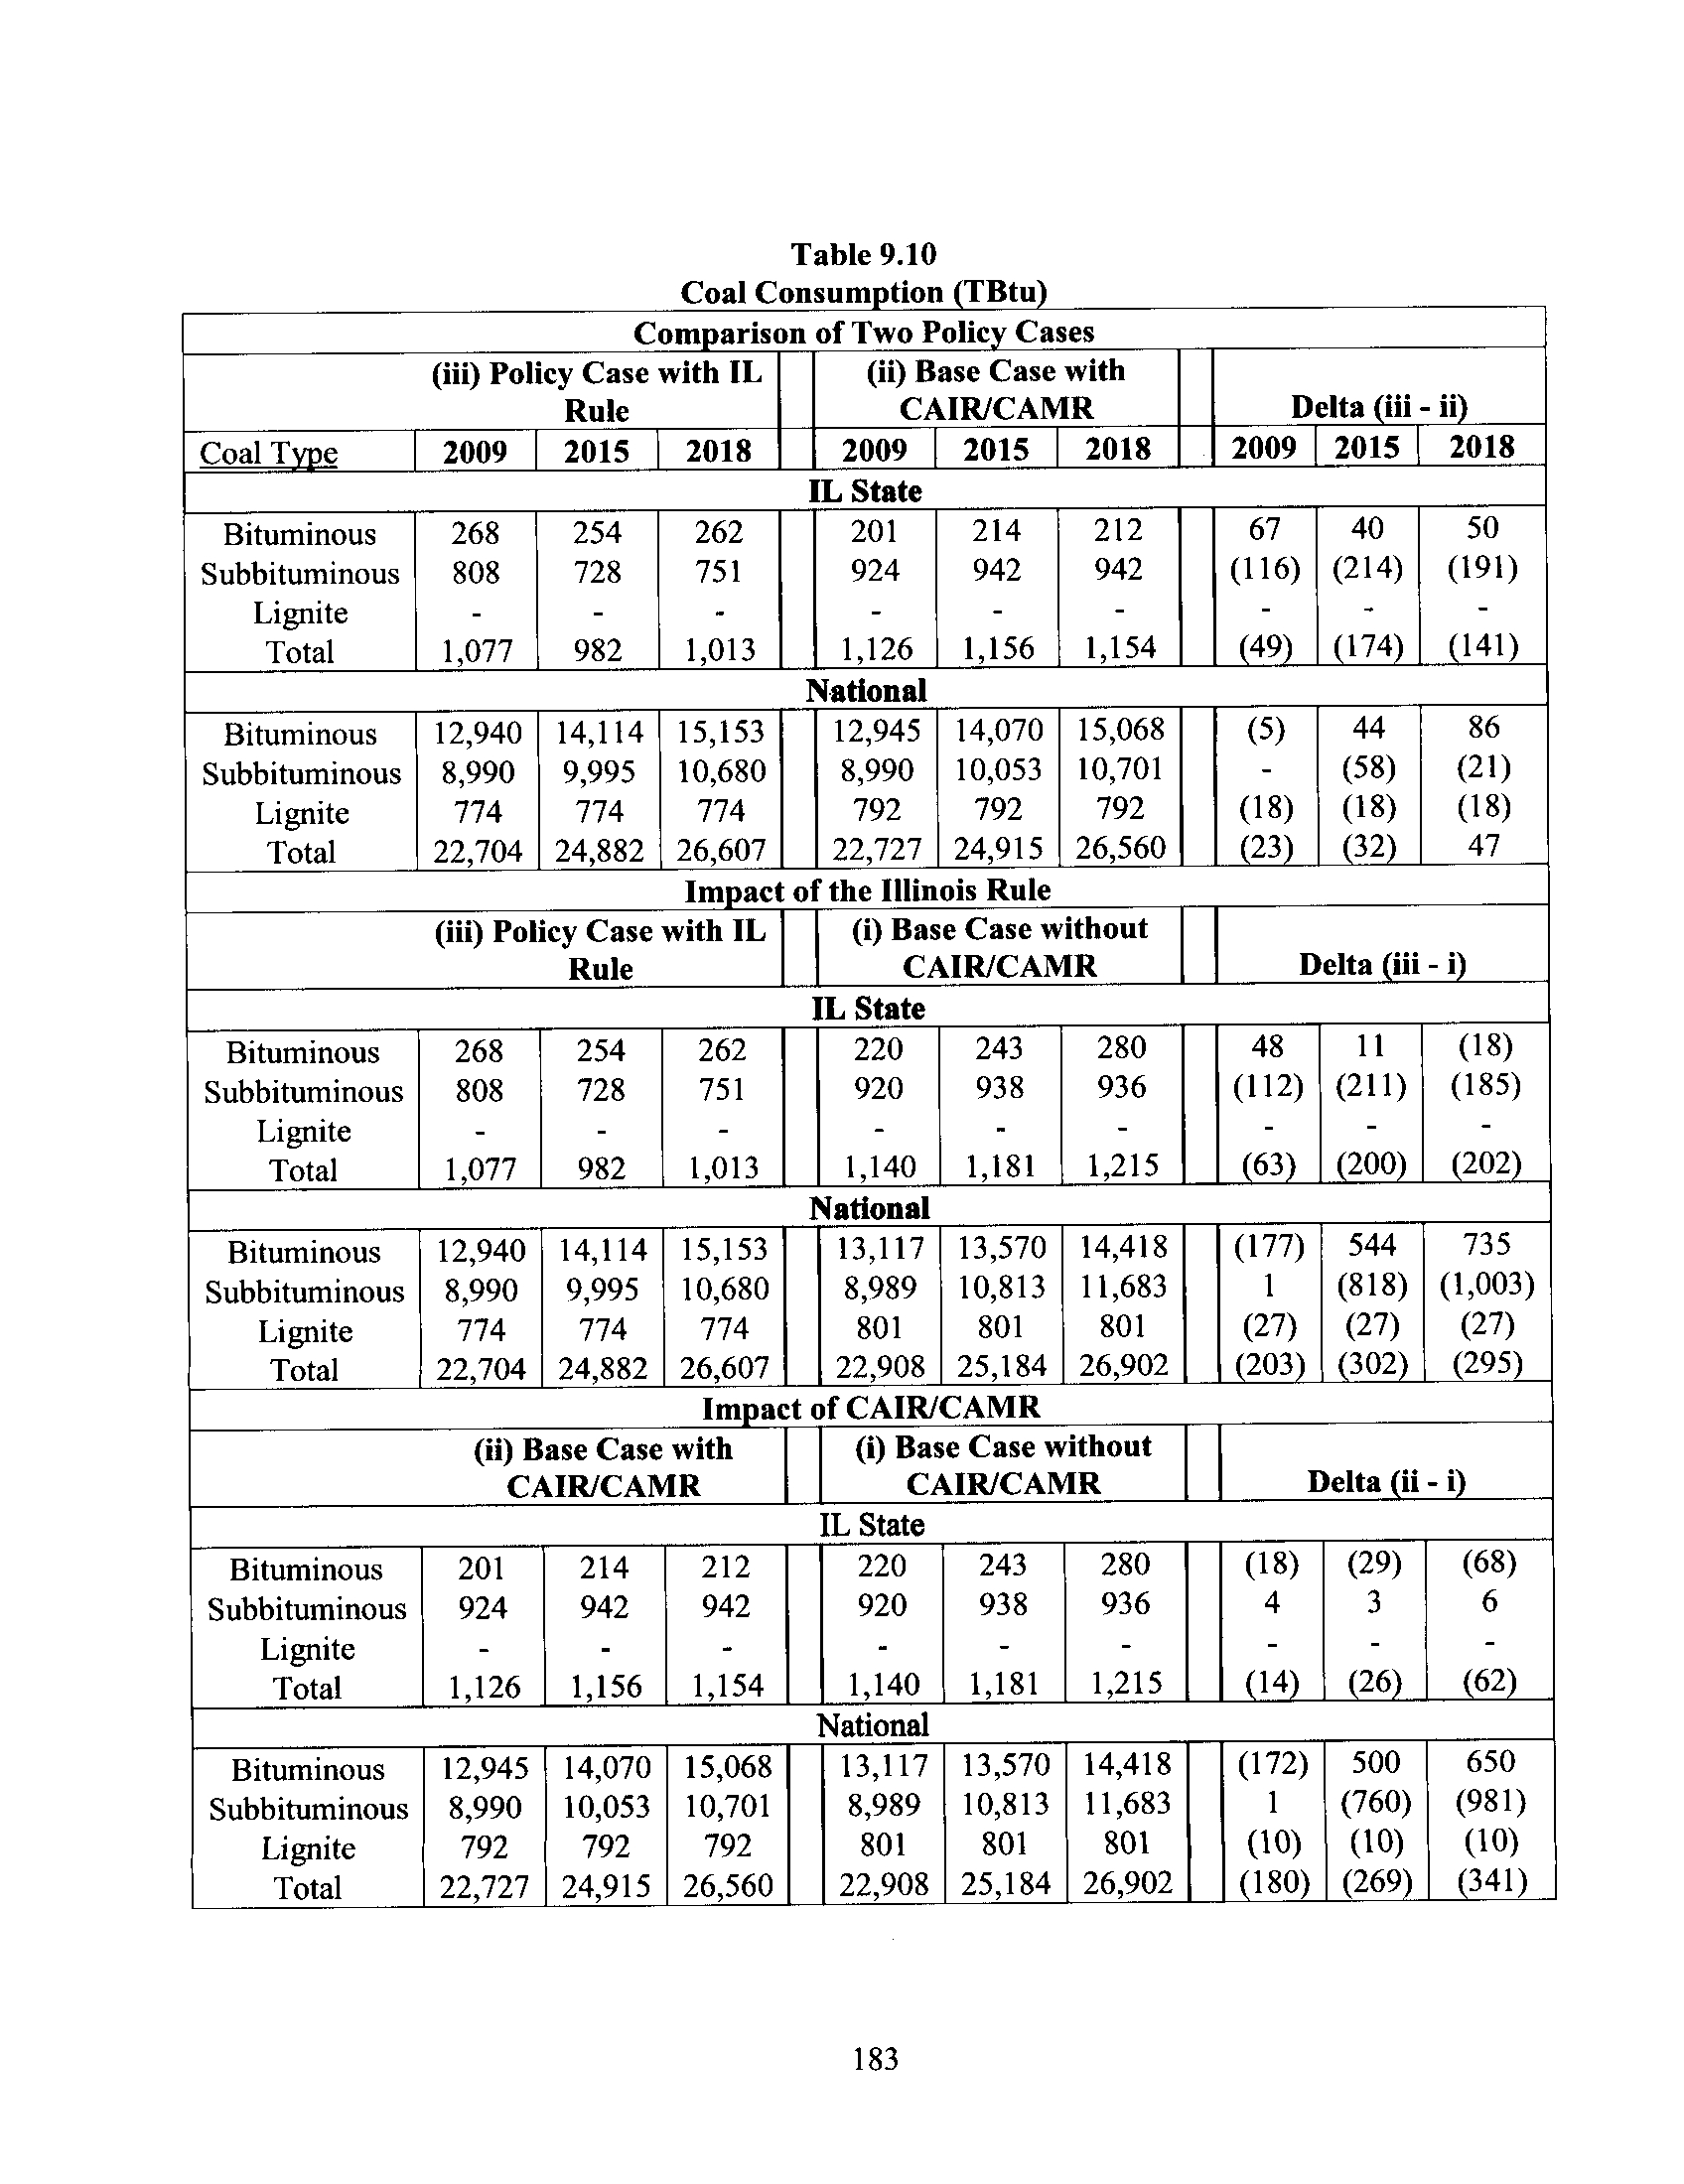
9.2 Results
10.0
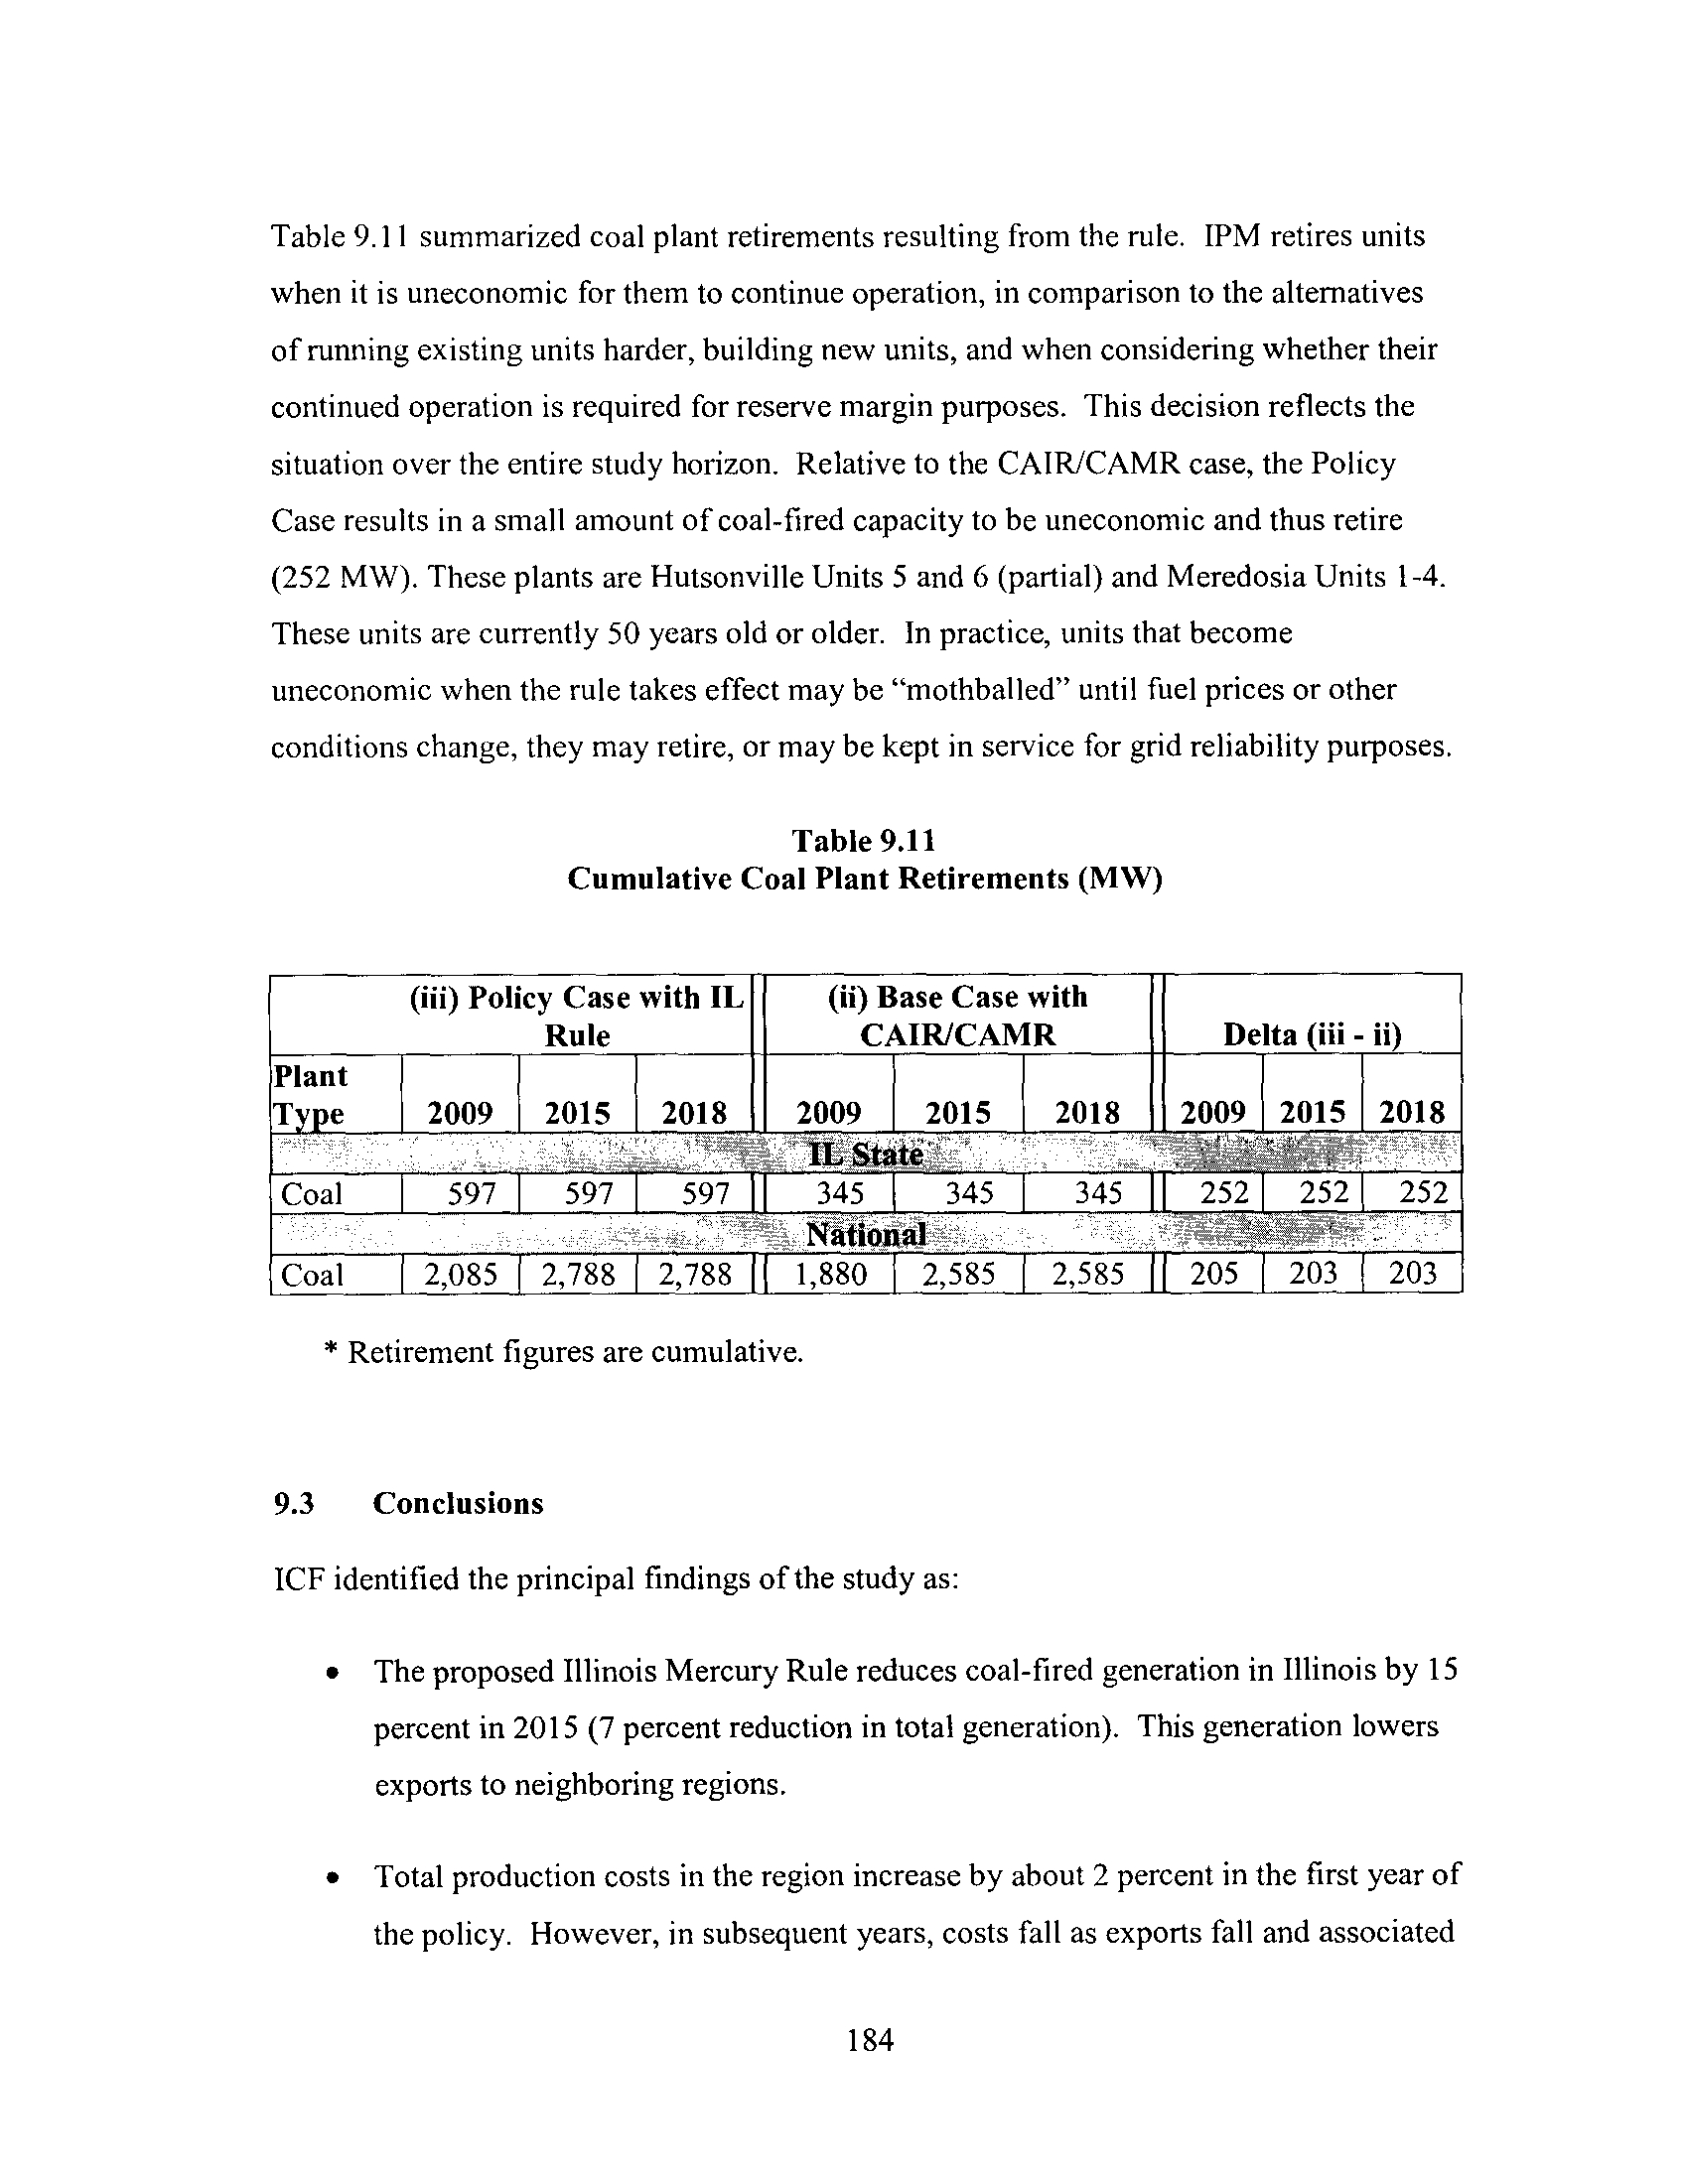
9.3 Conclusions
Other Relevant Issues and Additional Considerations
10.1
Clean Air Interstate Rule (CAIR)
10.2
Safety and Reliability of the Electricity Distribution Grid
10.3
Potential Economic Benefits Other Than Health Related
10 .4
Potential Effect of Activated Carbon Injection (ACI) on Particulate Matter
(PM) Emissions
190
10.5
Illinois Coal Industry Considerations
192
10.6
Effect on Other Pollutants and Upcoming Regulations
194
10.7 Shutdown and Replacements
194
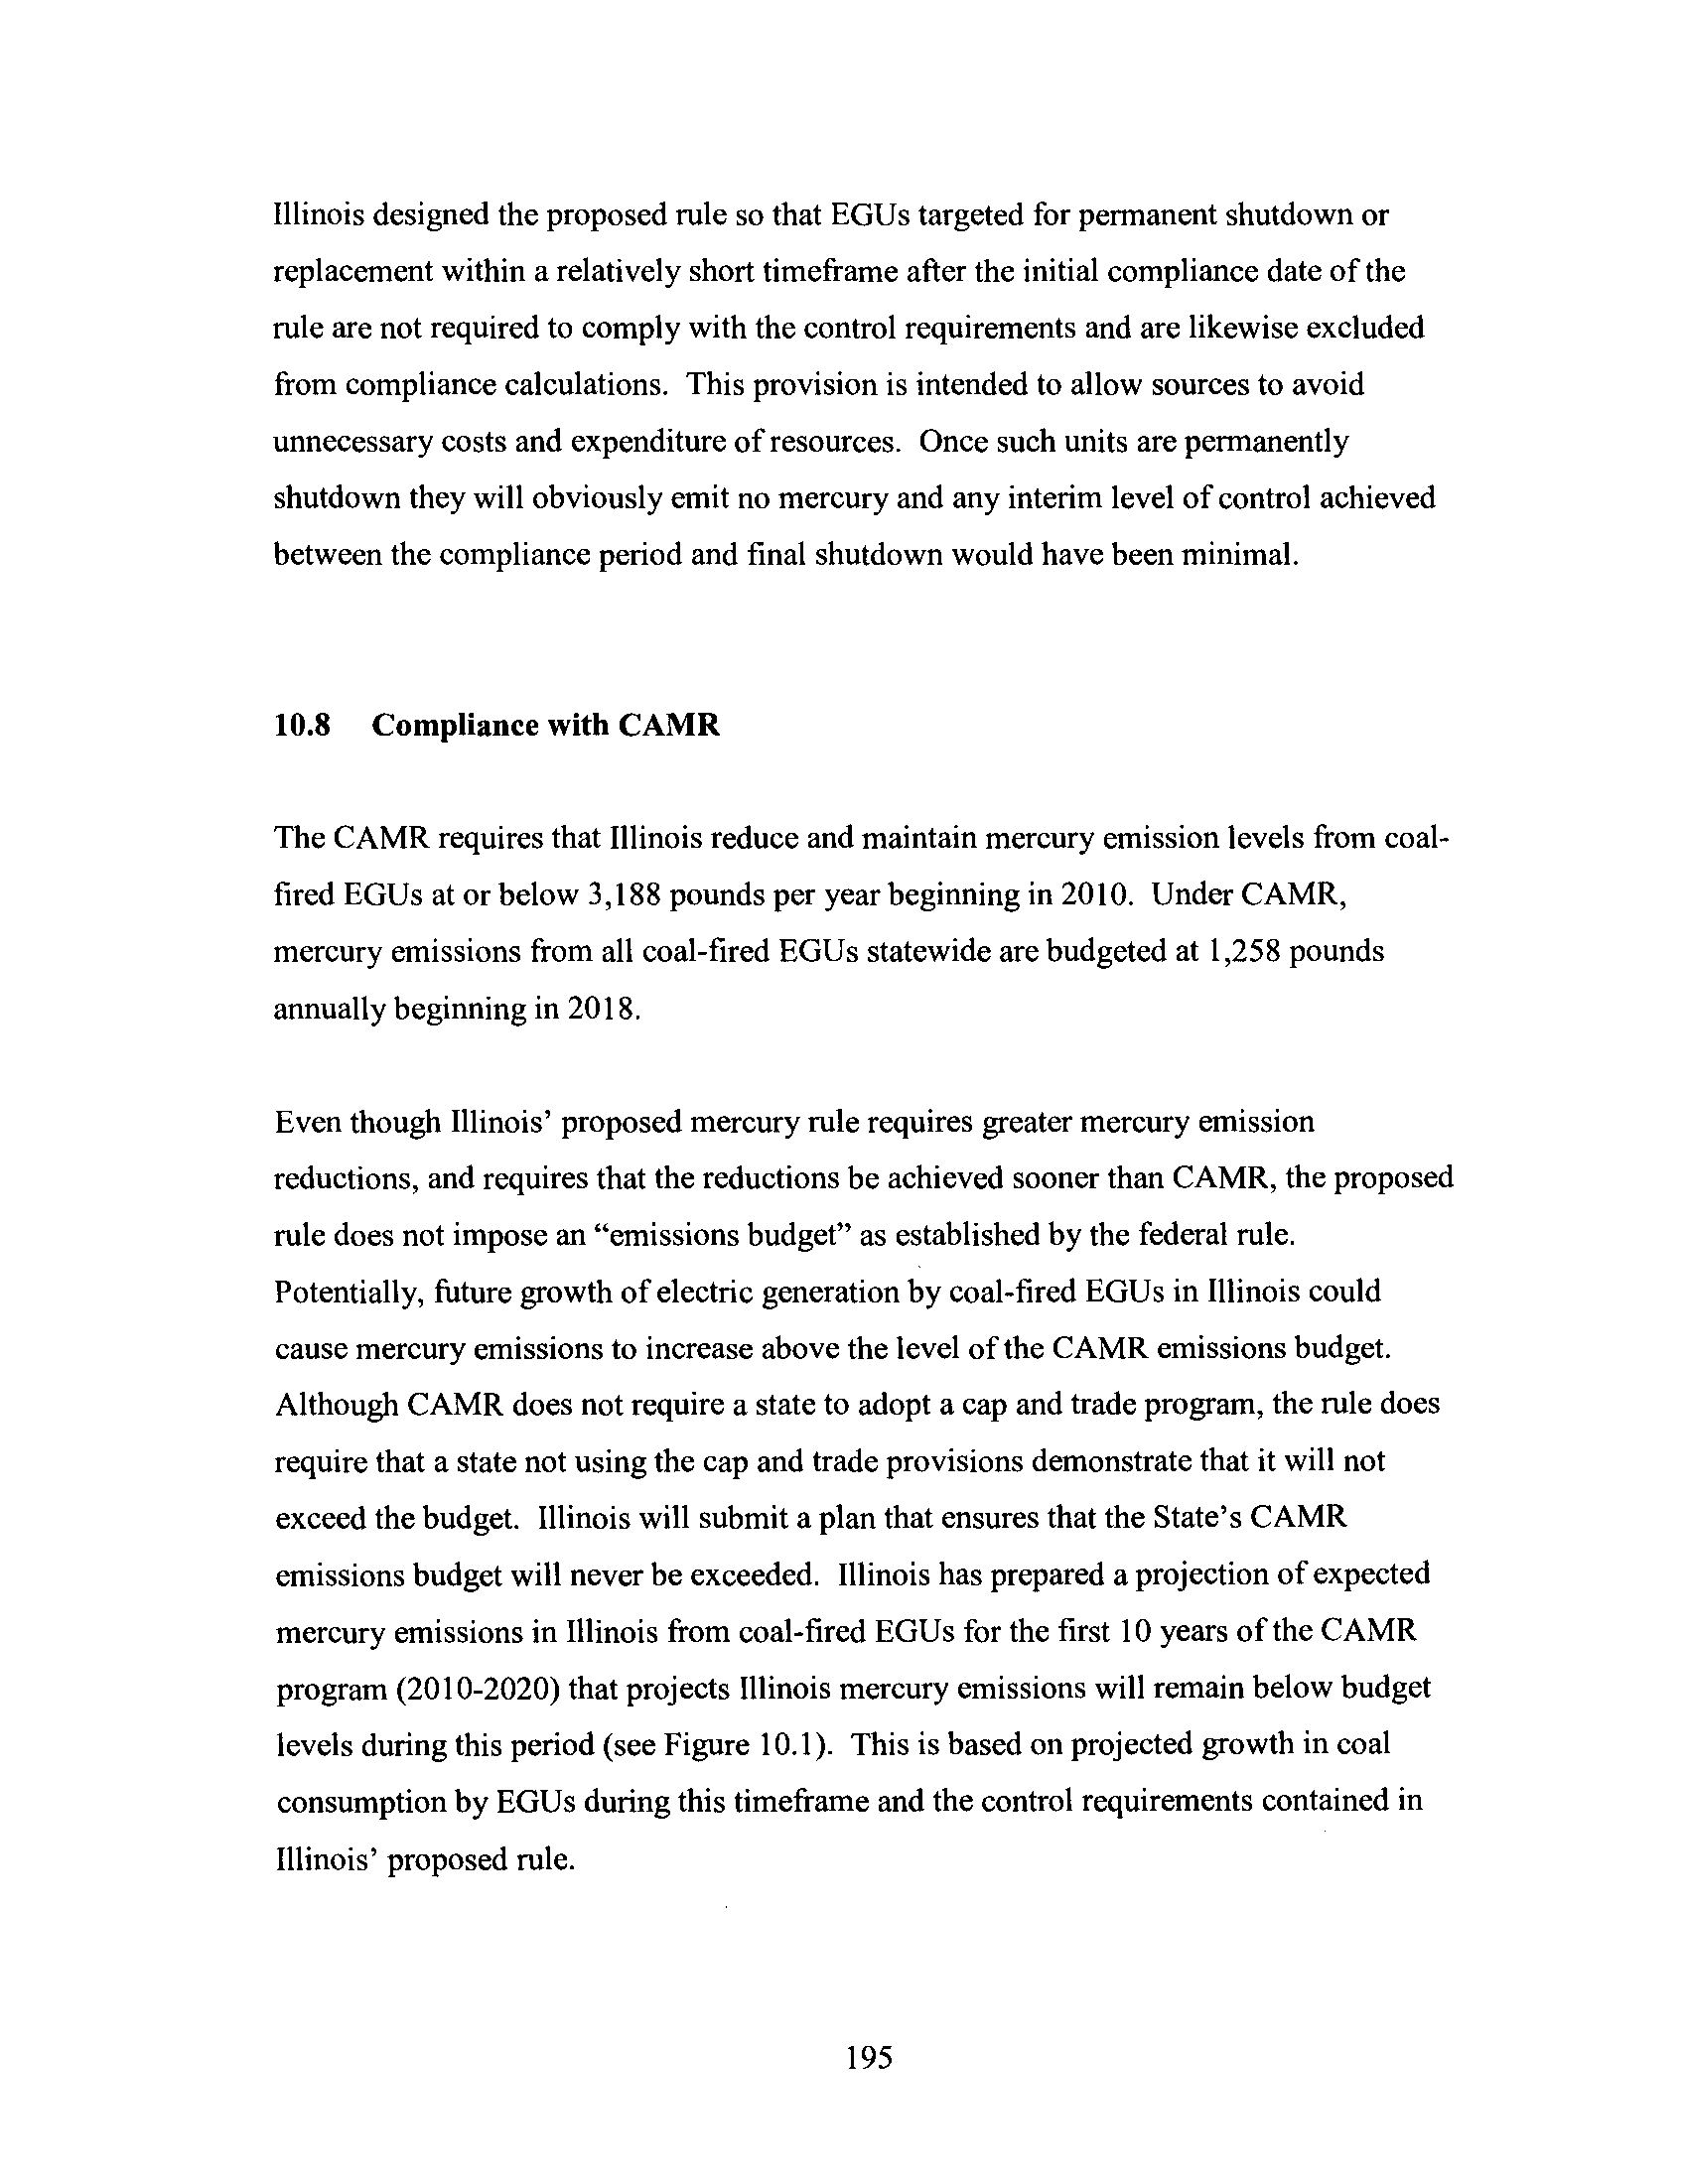
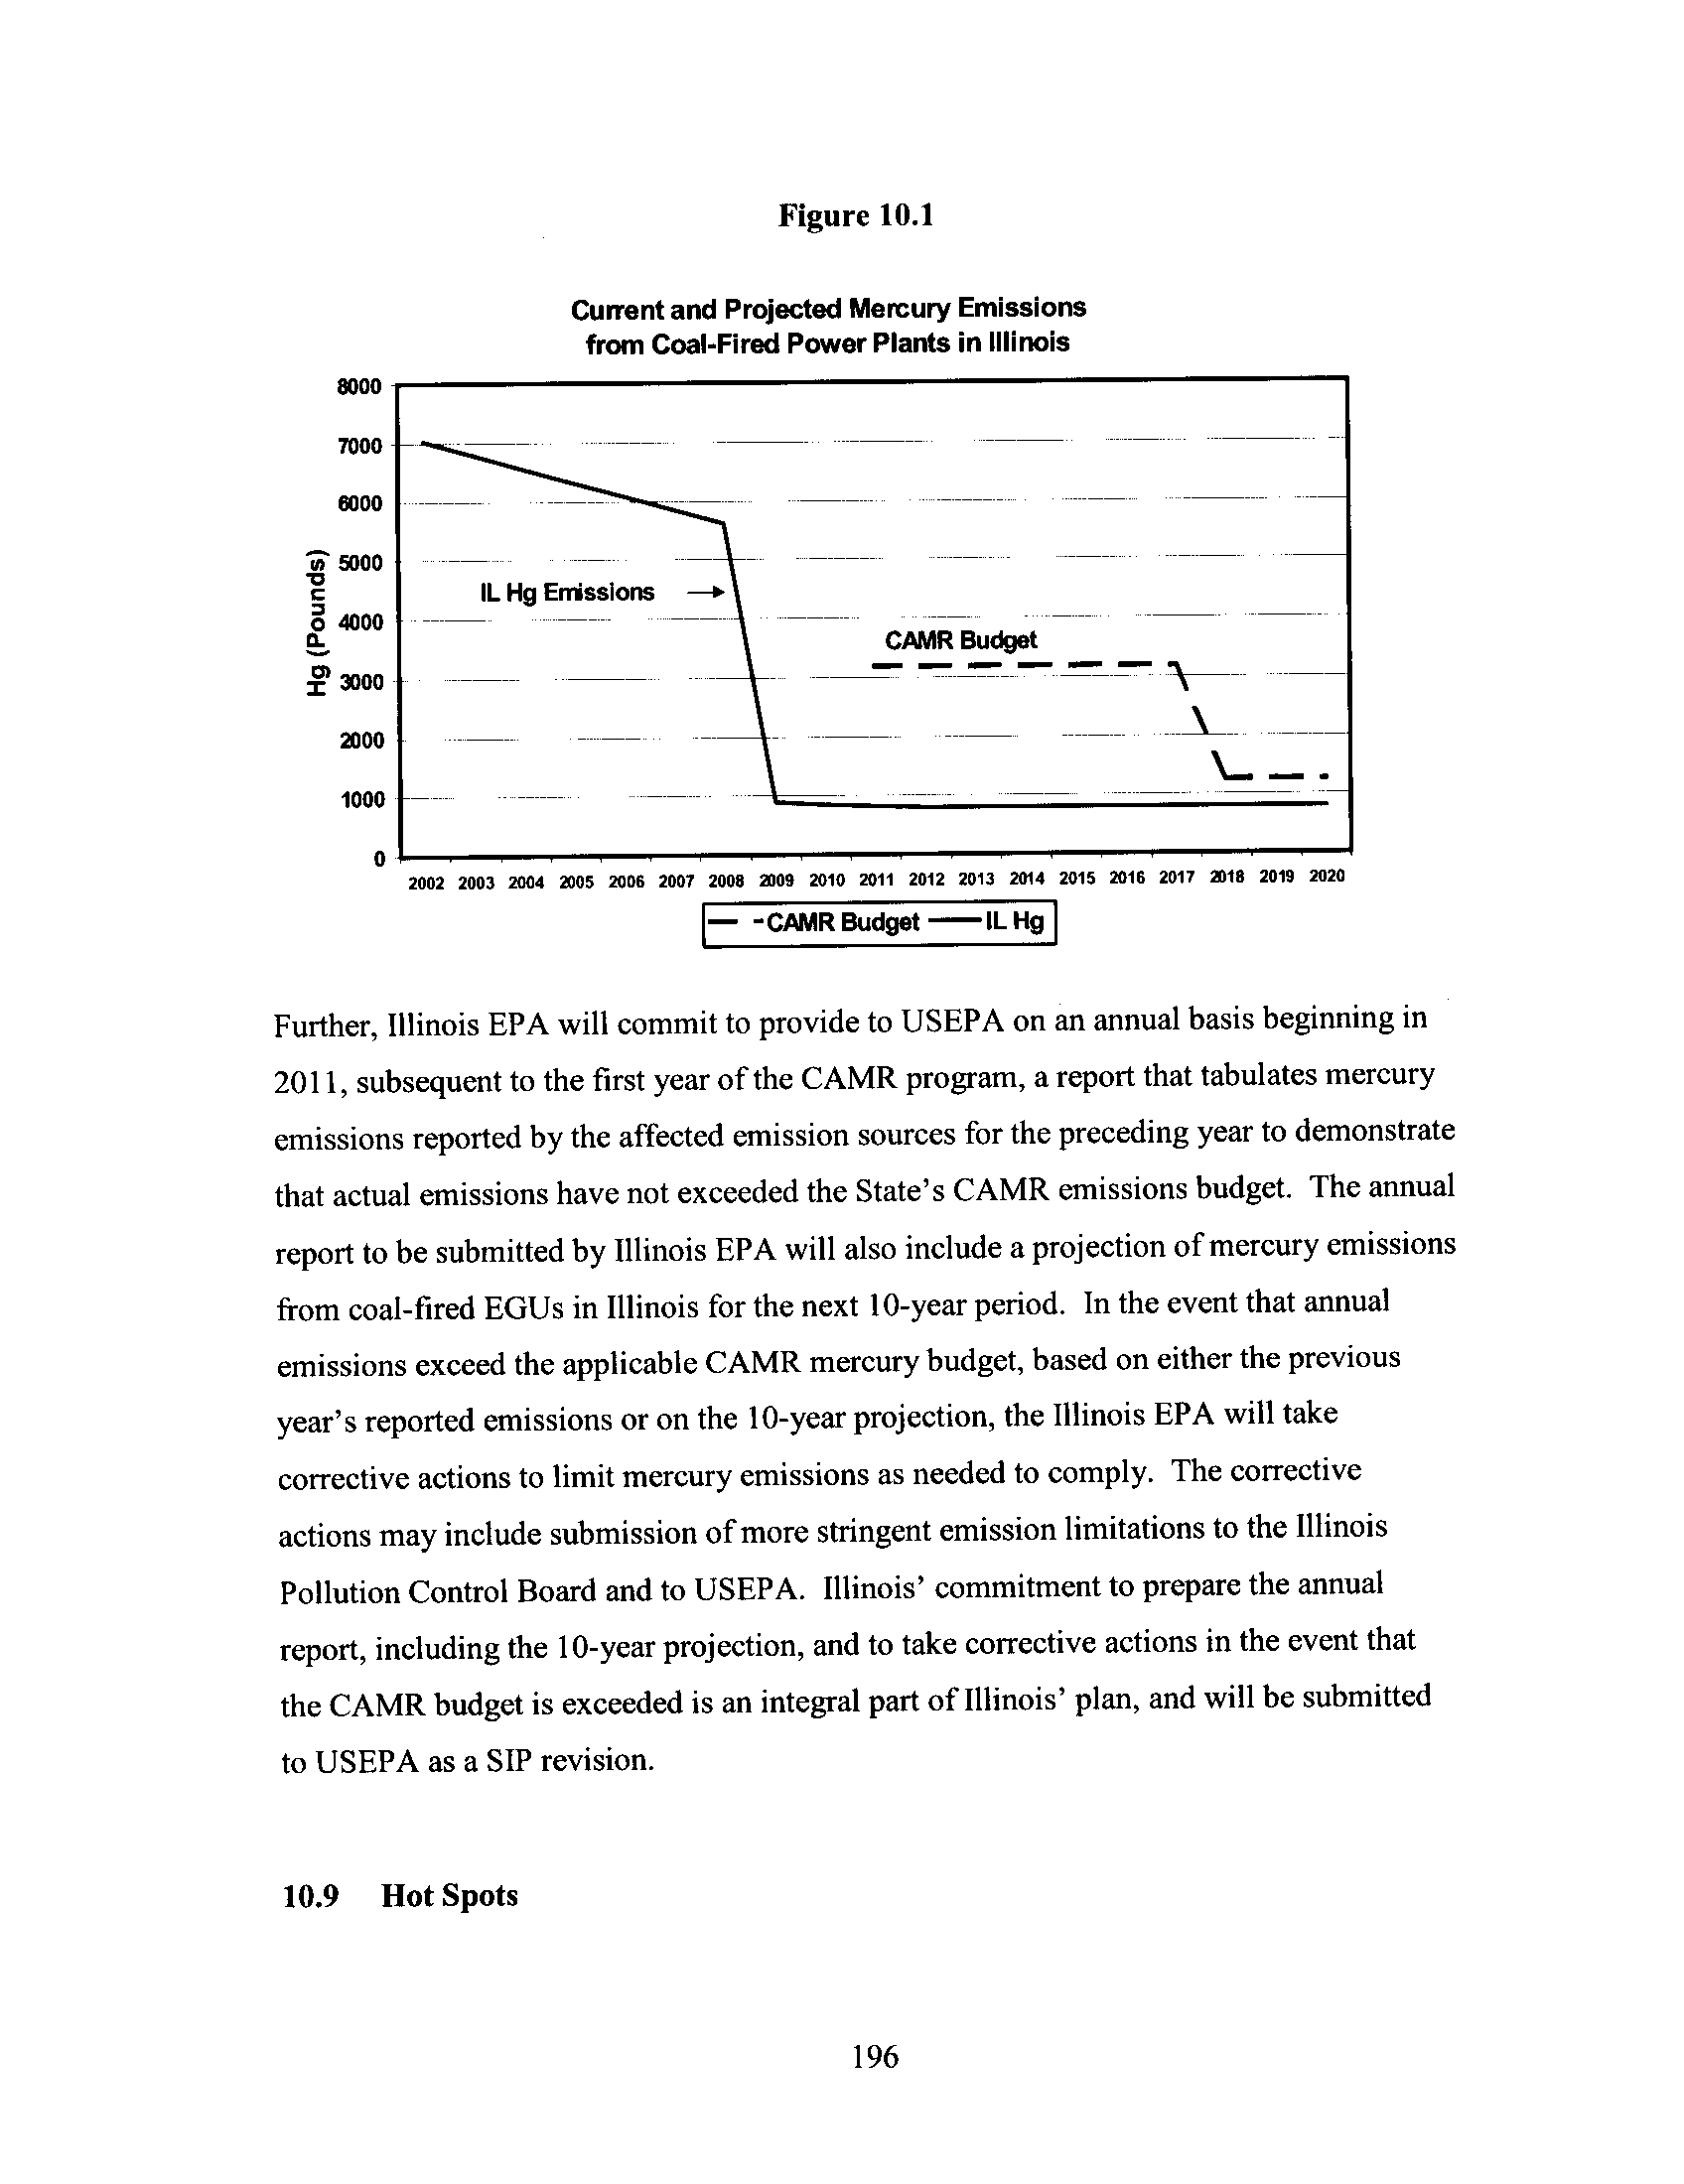
10.8 Compliance with CAMR
195
10.9
Hot Spots
196
10.10 Temporary Technology Based Standard (TTBS)
197
10.11 Effect on Illinois Jobs
198
10.11 .1
Power Sector Jobs
198
10 .11 .2
Coal Industry Jobs
200
10 .11 .3 Other Jobs
201
10.12
Effect of Rule on Electricity Rates
202
10.13
Other Considerations and Influencing Factors on the Costs of
Electricity
204
10.13.1 Lifting of Rate Freeze and Deregulation
204
Appendix A. "Review of the Nervous System and Cardiovascular Effects of
Methylmercury Exposure" Dr. Deborah Rice (March, 2006)
Appendix B. "Atmospheric Deposition of Mercury," GF Keeler, Ph.D. (March 2006)
Appendix C. "Analysis of the Proposed Illinois Mercury Rule," ICF Resources, LLC
(March 2006)
7
10.13 .2
Power Generation from Sources Other than Coal-Fired
Utilities
204
10.13.3
Interstate Competition
205
10.13.4 Clean Air Interstate Rule
206
References
209
ACFM
ADL
ADL
AEA
AMI
APC
ARP
ATSDR
BDL
BMD
BMDL
BMP
BMR
BNT
BSID
Btu
CAA
CAIR
CAMR
CEC
CHD
C02
CPT
CS-ESP
CSO
CV
CVLT
CWA
DDST
DOE
DOE/NETL
DRH
ECO
ECOS
EG
eGrid
EGU
List of Acronyms Used
actual cubic feet per minute
Activities of Daily Living
Above Detection Limits
Air Entrainment Admixture
Acute Myocardial Infarction
Air Pollution Control
Acid Rain Program
Agency for Toxic Substance and Disease Registry
Below Detection Limits
Bench Mark Dose
Bench Mark Dose Limit
Best Management Practices
Bench Mark Response
Boston Naming Test
Bayley Scales of Infant Development
British Thermal Unit
Clean Air Act
Clean Air Interstate Rule
Clean Air Mercury Rule
Commission for Environmental Cooperation
Coronary Heart Disease
Carbon Dioxide
Continuous Performance Test
Cold-side Electrostatic Precipitator
Combined Sewer Overflows
Cardiovascular
California Verbal Learning Test
Clean Water Act
Denver Developmental Screening Test
U.S. Department of Energy
DOE National Energy Technology Laboratory
Differential Reinforcement of Higher Rates of Behavior
Electro-Catalytic Oxidation
Environmental Council of States
Emissions Guidelines
Emissions and Generation Resource Integrated Database
Electrical Generating Unit
8
EIA
ESP
FERC
FF
FGD
FI
GW
GWh or GWhr
Hg
Hg(II)
Hg(p)
HgO
HPV
HS-ESP
ICAC
ICC
ICR
IFCMP
Illinois EPA
IPM
JBR
kg
KW
L
LADCO
lb
LDL
LMB
LSFO
LSNO
MACT
MAIN
MEL
mg
MI
mills
MISO
MMacf
MOA
Energy Information Administration
Electrostatic Precipitator
Federal Energy Regulatory Commission
Fabric Filter
Flue Gas Desulphurization Scrubber
Fixed Interval
Gigawatt
Gigawatt Hour
Mercury
Oxidized Gaseous Mercury
Particulate Mercury
Elemental Mercury
Health Protection Value
Hot-side Electrostatic Precipitator
Institute of Clean Air Companies
Illinois Commerce Commission
Information Collection Request
Illinois Fish Contaminant Monitoring Program
Illinois Environmental Protection Agency
Integrated Planning Model
Jet Bubbling Reactor
Kilogram
Kilowatt
Liter
Lake Michigan Air Directors Consortium
Pound
Low Density Lipids
Largemouth Bass
Limestone Forced Oxidation
Limestone Natural Oxidation
Maximum Achievable Control Technology
Mid-America Interconnected Network
Magnesium Enhanced Lime
Milligram
Myocardial Infarction
Millidollars
Midwest Independent System Operator
million actual cubic feet
Memorandum of Agreement
9
MR
MW
MWC
MWh or MWhr
NAS
NEI
NESCAUM
NHANES
NIEHS
NOAEL
NOx
NPDES
NRC
NSPS
NWF
NYSY
OR
ORD
OSHA
oz .
PAC
PB
PBrDD
PBrDF
PCB
PCDD
PCDF
PCs
PK
Plan
PM
ppm
ppt
PRB
PS
QALY
RID
RGM
ROFA
Mental Retardation
Megawatt
Municipal Waste Combustors
Megawatt Hour
National Academy of Sciences
National Emissions Inventory
Northeast States for Coordinated Air Use Management
National Health and Nutrition Examination Survey
National Institute of Environmental Health Sciences
No Observed Adverse Effect Level
Nitrogen Oxides
National Pollutant Discharge Elimination System
National Research Council
New Source Performance Standards
Nation Wildlife Federation
National Longitudinal Survey of Youth
Odds Ratio
USEPA Office of Research and Development
Occupation Safety and Health Administration
Ounce
Powdered Activated Carbon
Physiologically Based
Polybromininated dibenzo p-dioxin
Polybrominated dibenzofuran
Polychlorinated Biphenyls
Polychlorinated dibenzo p-dioxin
Polychlorinated dibenzofuran
Permit Compliance System
Pharmacokinetic
State Implementation Plan
Particulate Matter
parts per million
parts per trillion
Powder River Basin
Particulate Scrubber
Quality Adjusted Life Years
Referenced Dose
Reactive Gaseous Mercury
Rotating Over-fired Air
10
ROM
ROS
RR
RTO
SCR
SDA
SI
SIP
S02
S03
Tbtu
TMDL
TOLD-SL
TSD
TTBS
TWh or TWhr
UBC
OF
ug
USEPA
WHO
WISC-R
Run of Mine
Reactive Oxygen Species
Relative Risk
Region Transmission Organizations
Selective Catalytic Reduction
Spray Dryer Absorber
Sorbent Injection
State Implementation Plan
Sulfur Dioxide
Sulfur Trioxide
Trillion British Thermal Units
Total Maximum Daily Load
Test of Language Development Spoken Language Quotient
Technical Support Document
Temporary Technology Based Standard
Terawatt Hour
Unburned Carbon
Uncertainty Factor
Microgram
United States Environmental Protection Agency
World Health Organization
Wechsler Intelligence Scale for Children Revised
1
1
12
Figures
Figure 2.1
U .S. Anthropogenic Emissions 1994-1995
32
Figure 2 .2
U .S. Anthropogenic Emissions 2002
33
Figure 2 .3
2002 Illinois Anthropogenic Sources of Mercury Emissions
34
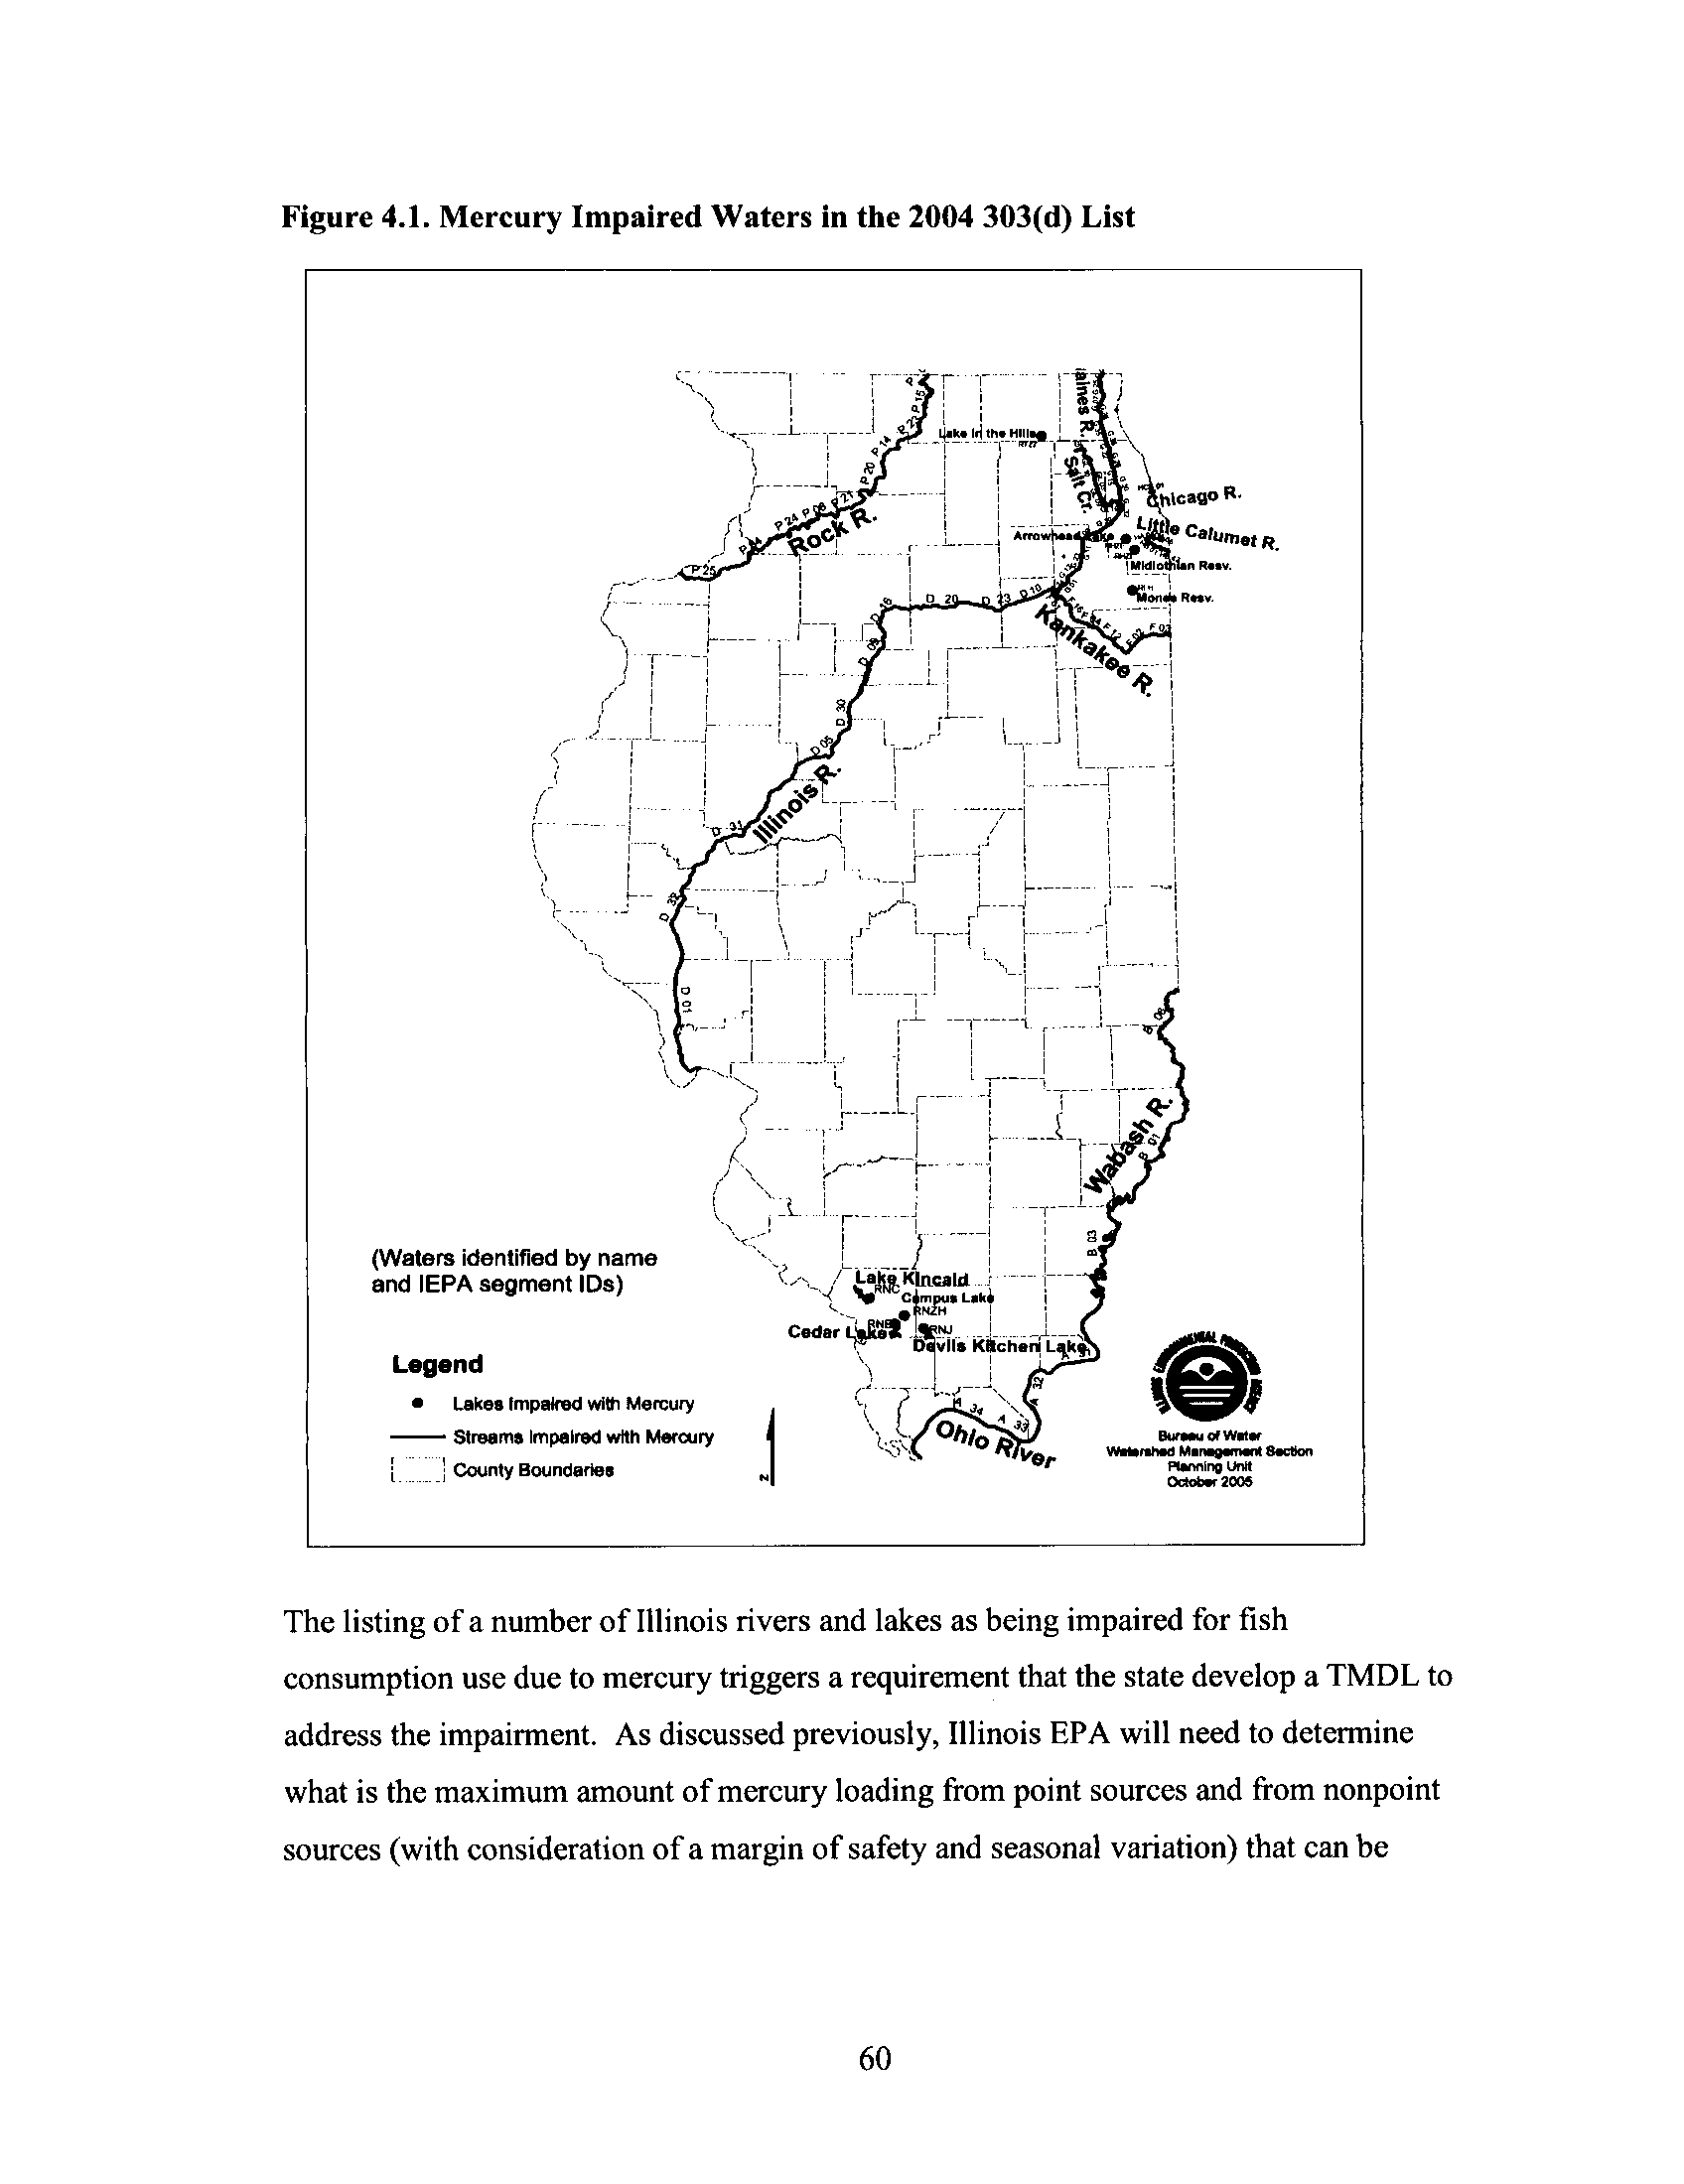
Figure 4 .1
Mercury Impaired Waters in the 2004 303(d) List
60
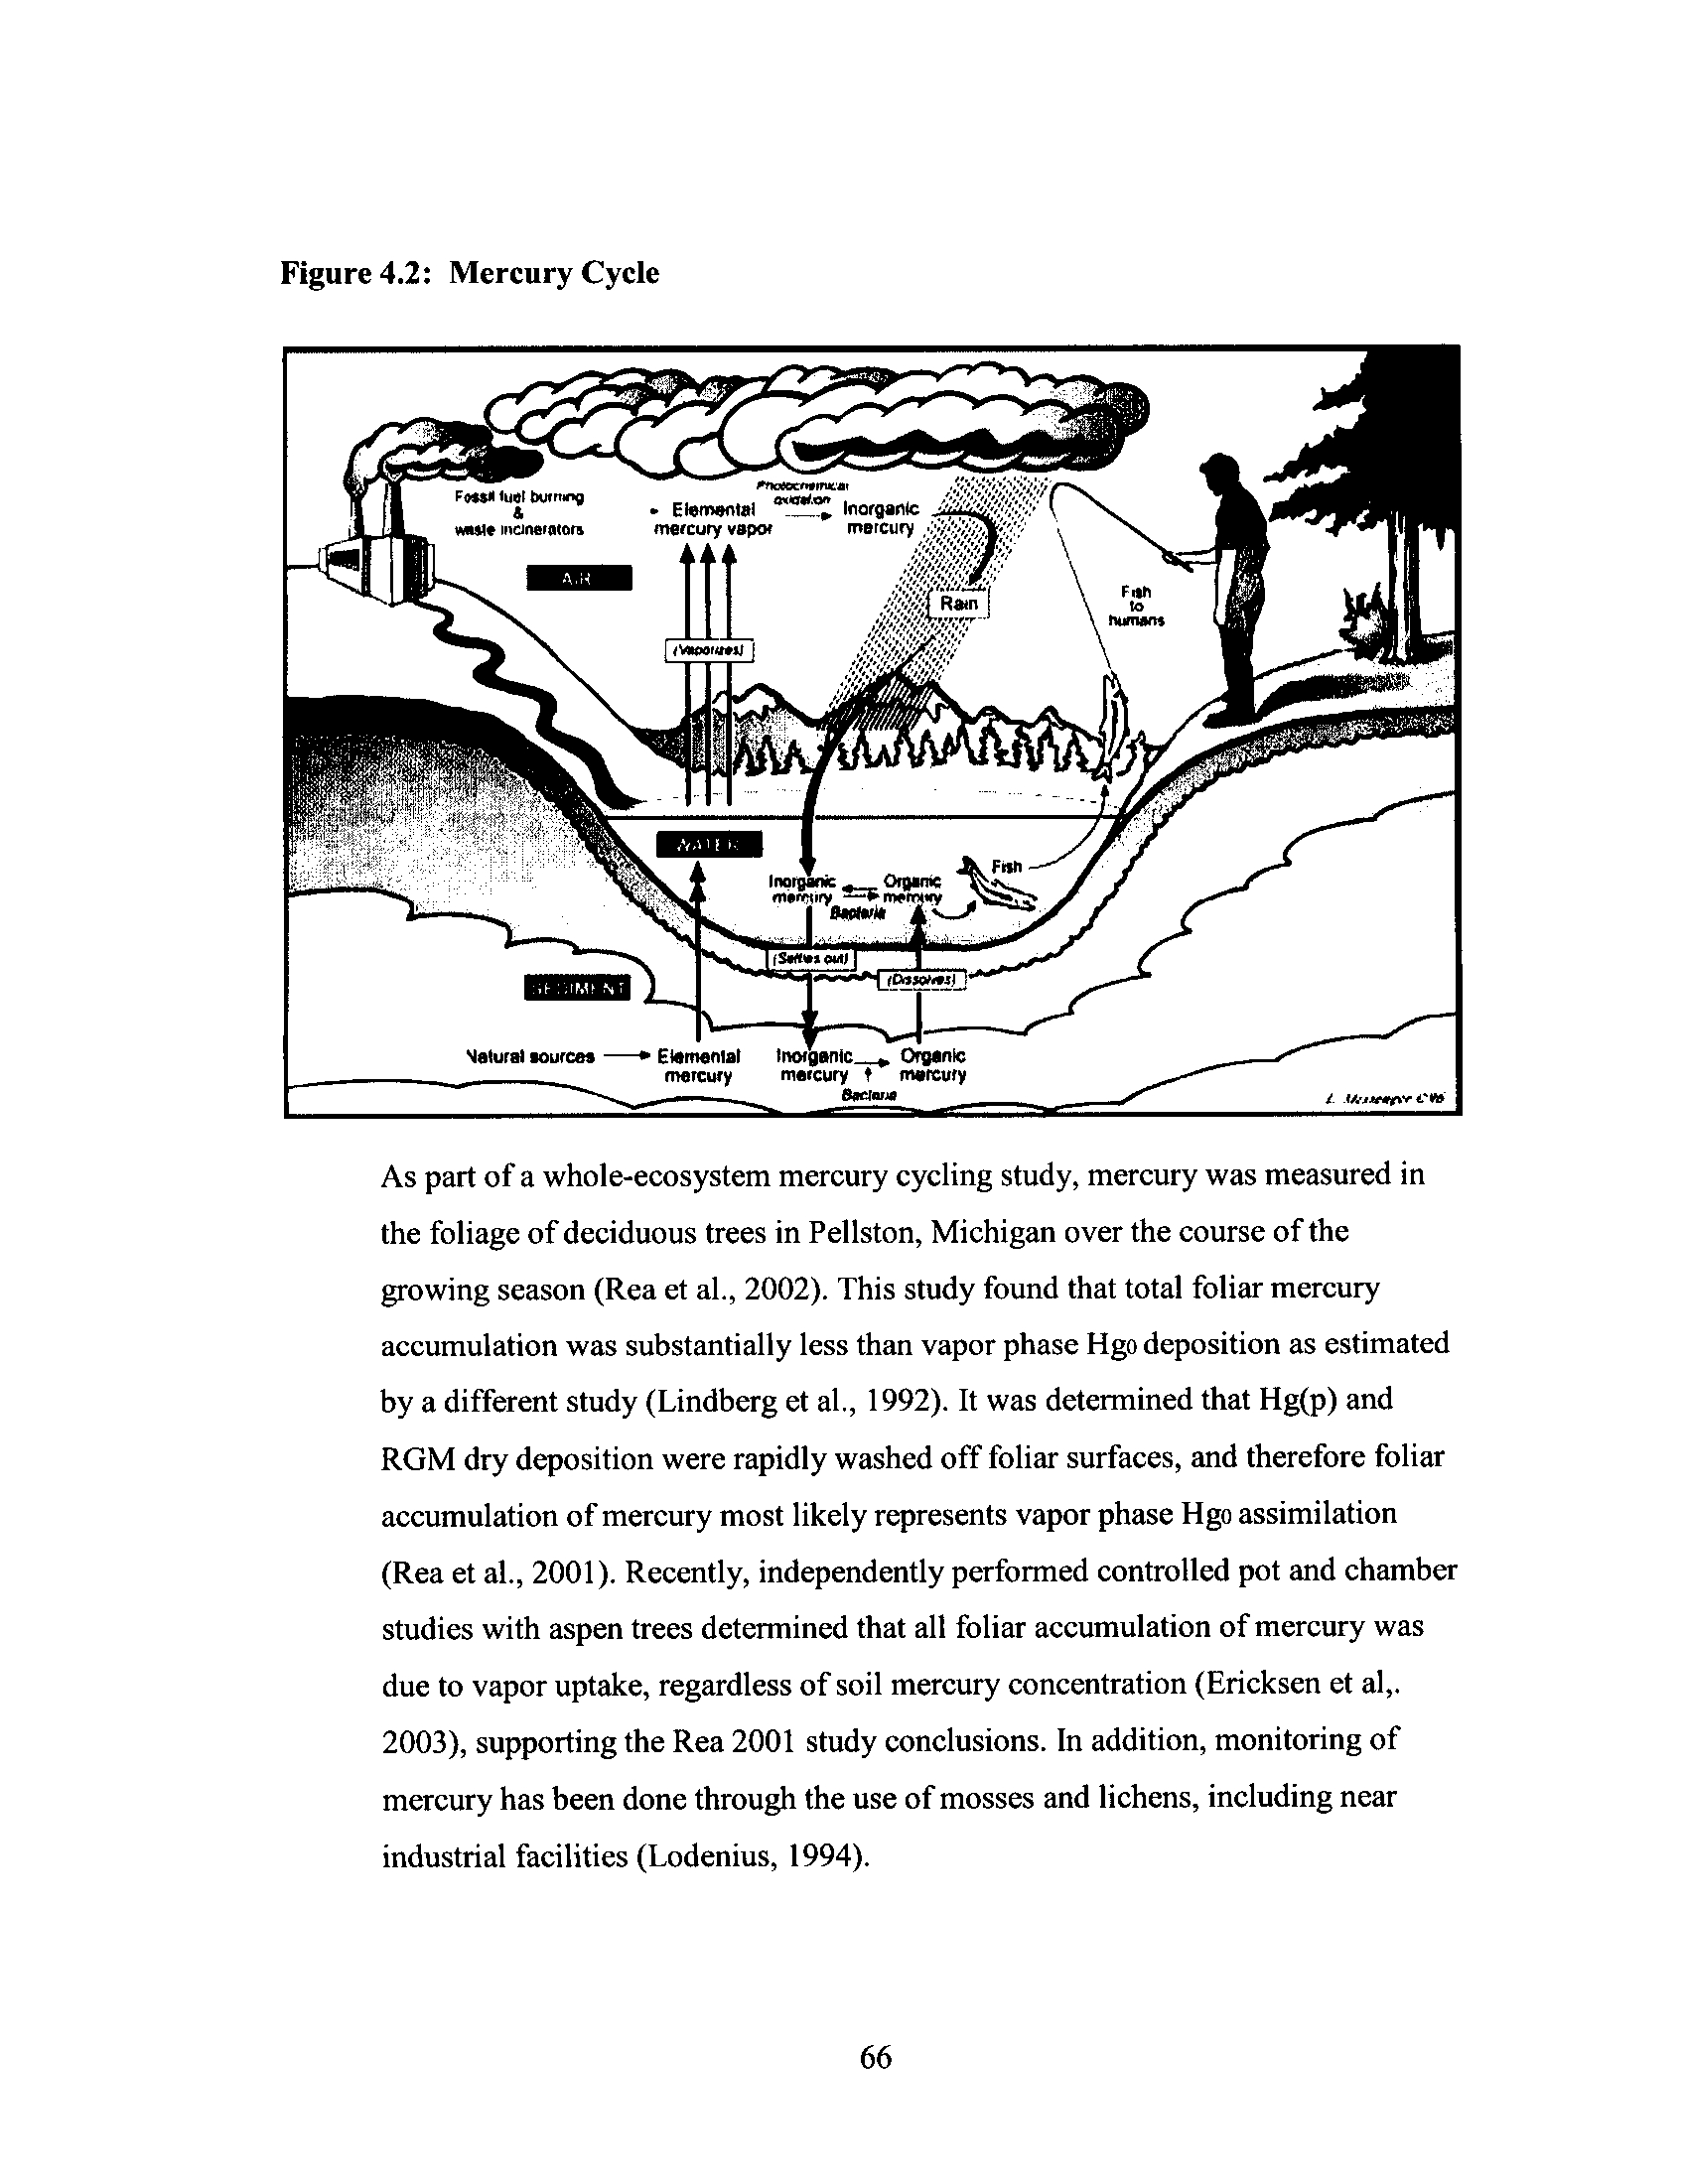
Figure 4 .2
Mercury Cycle
66
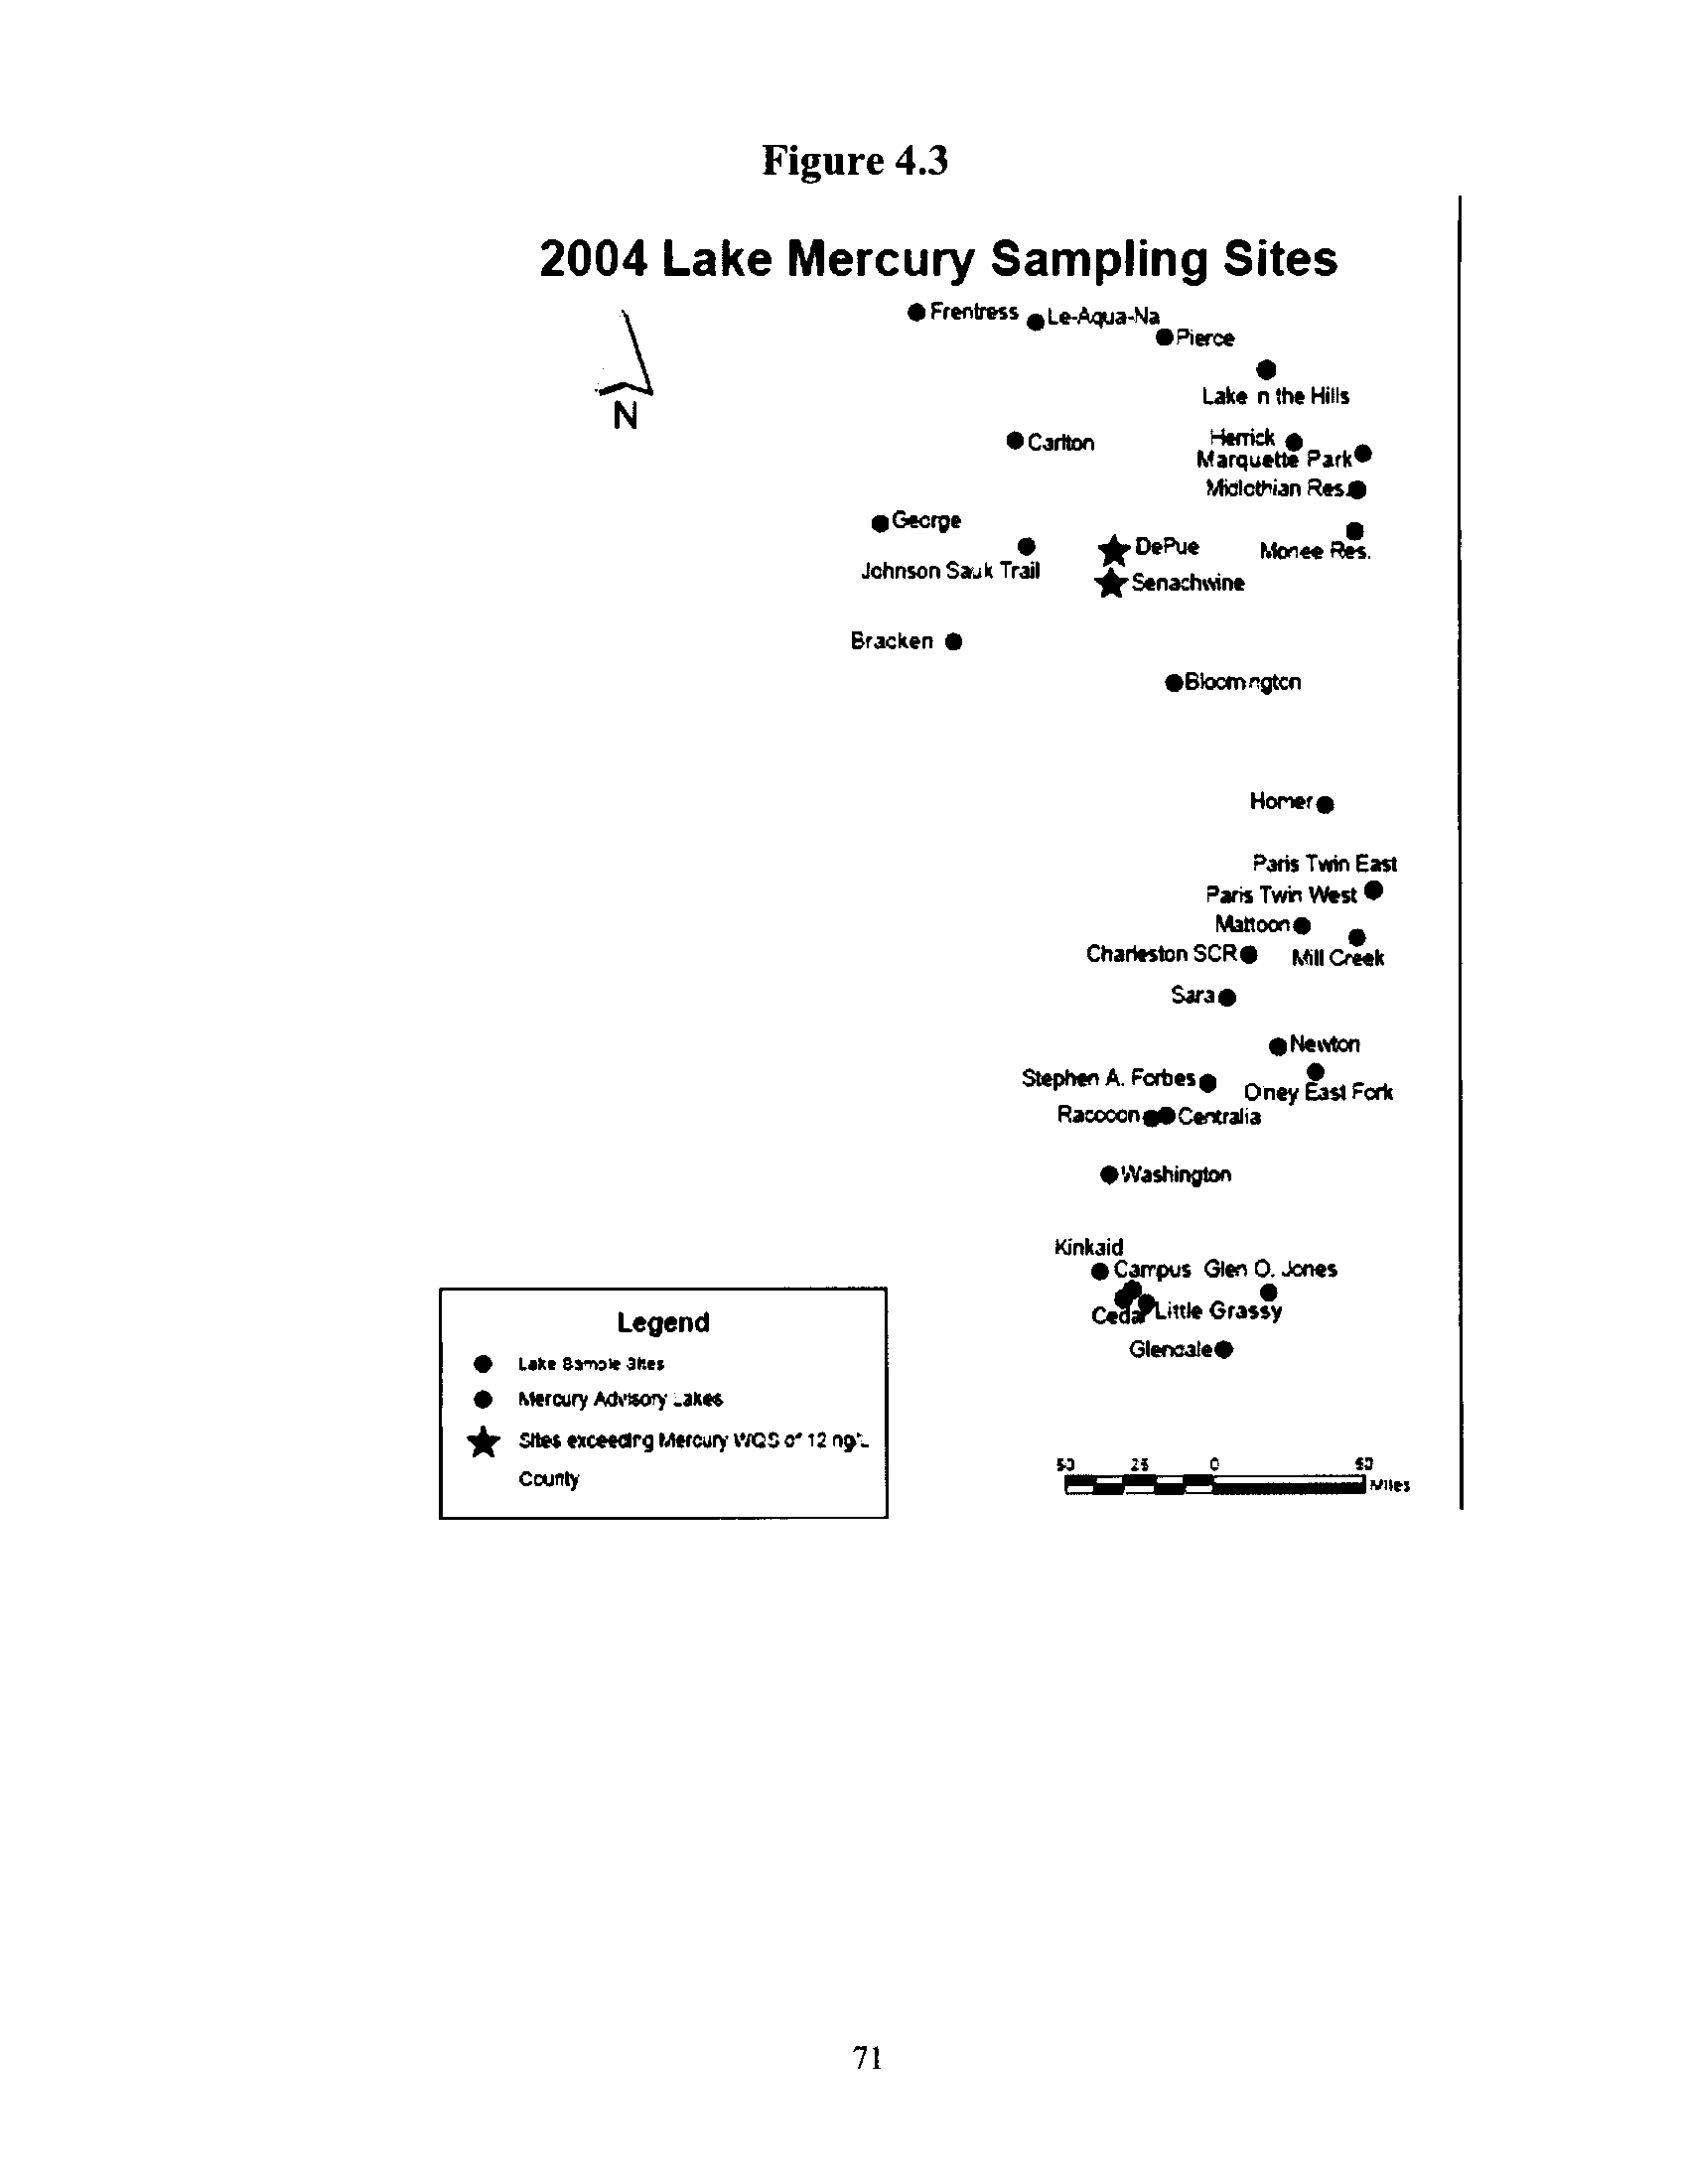
Figure 4 .3
2004 Lake Mercury Sampling Sites
71
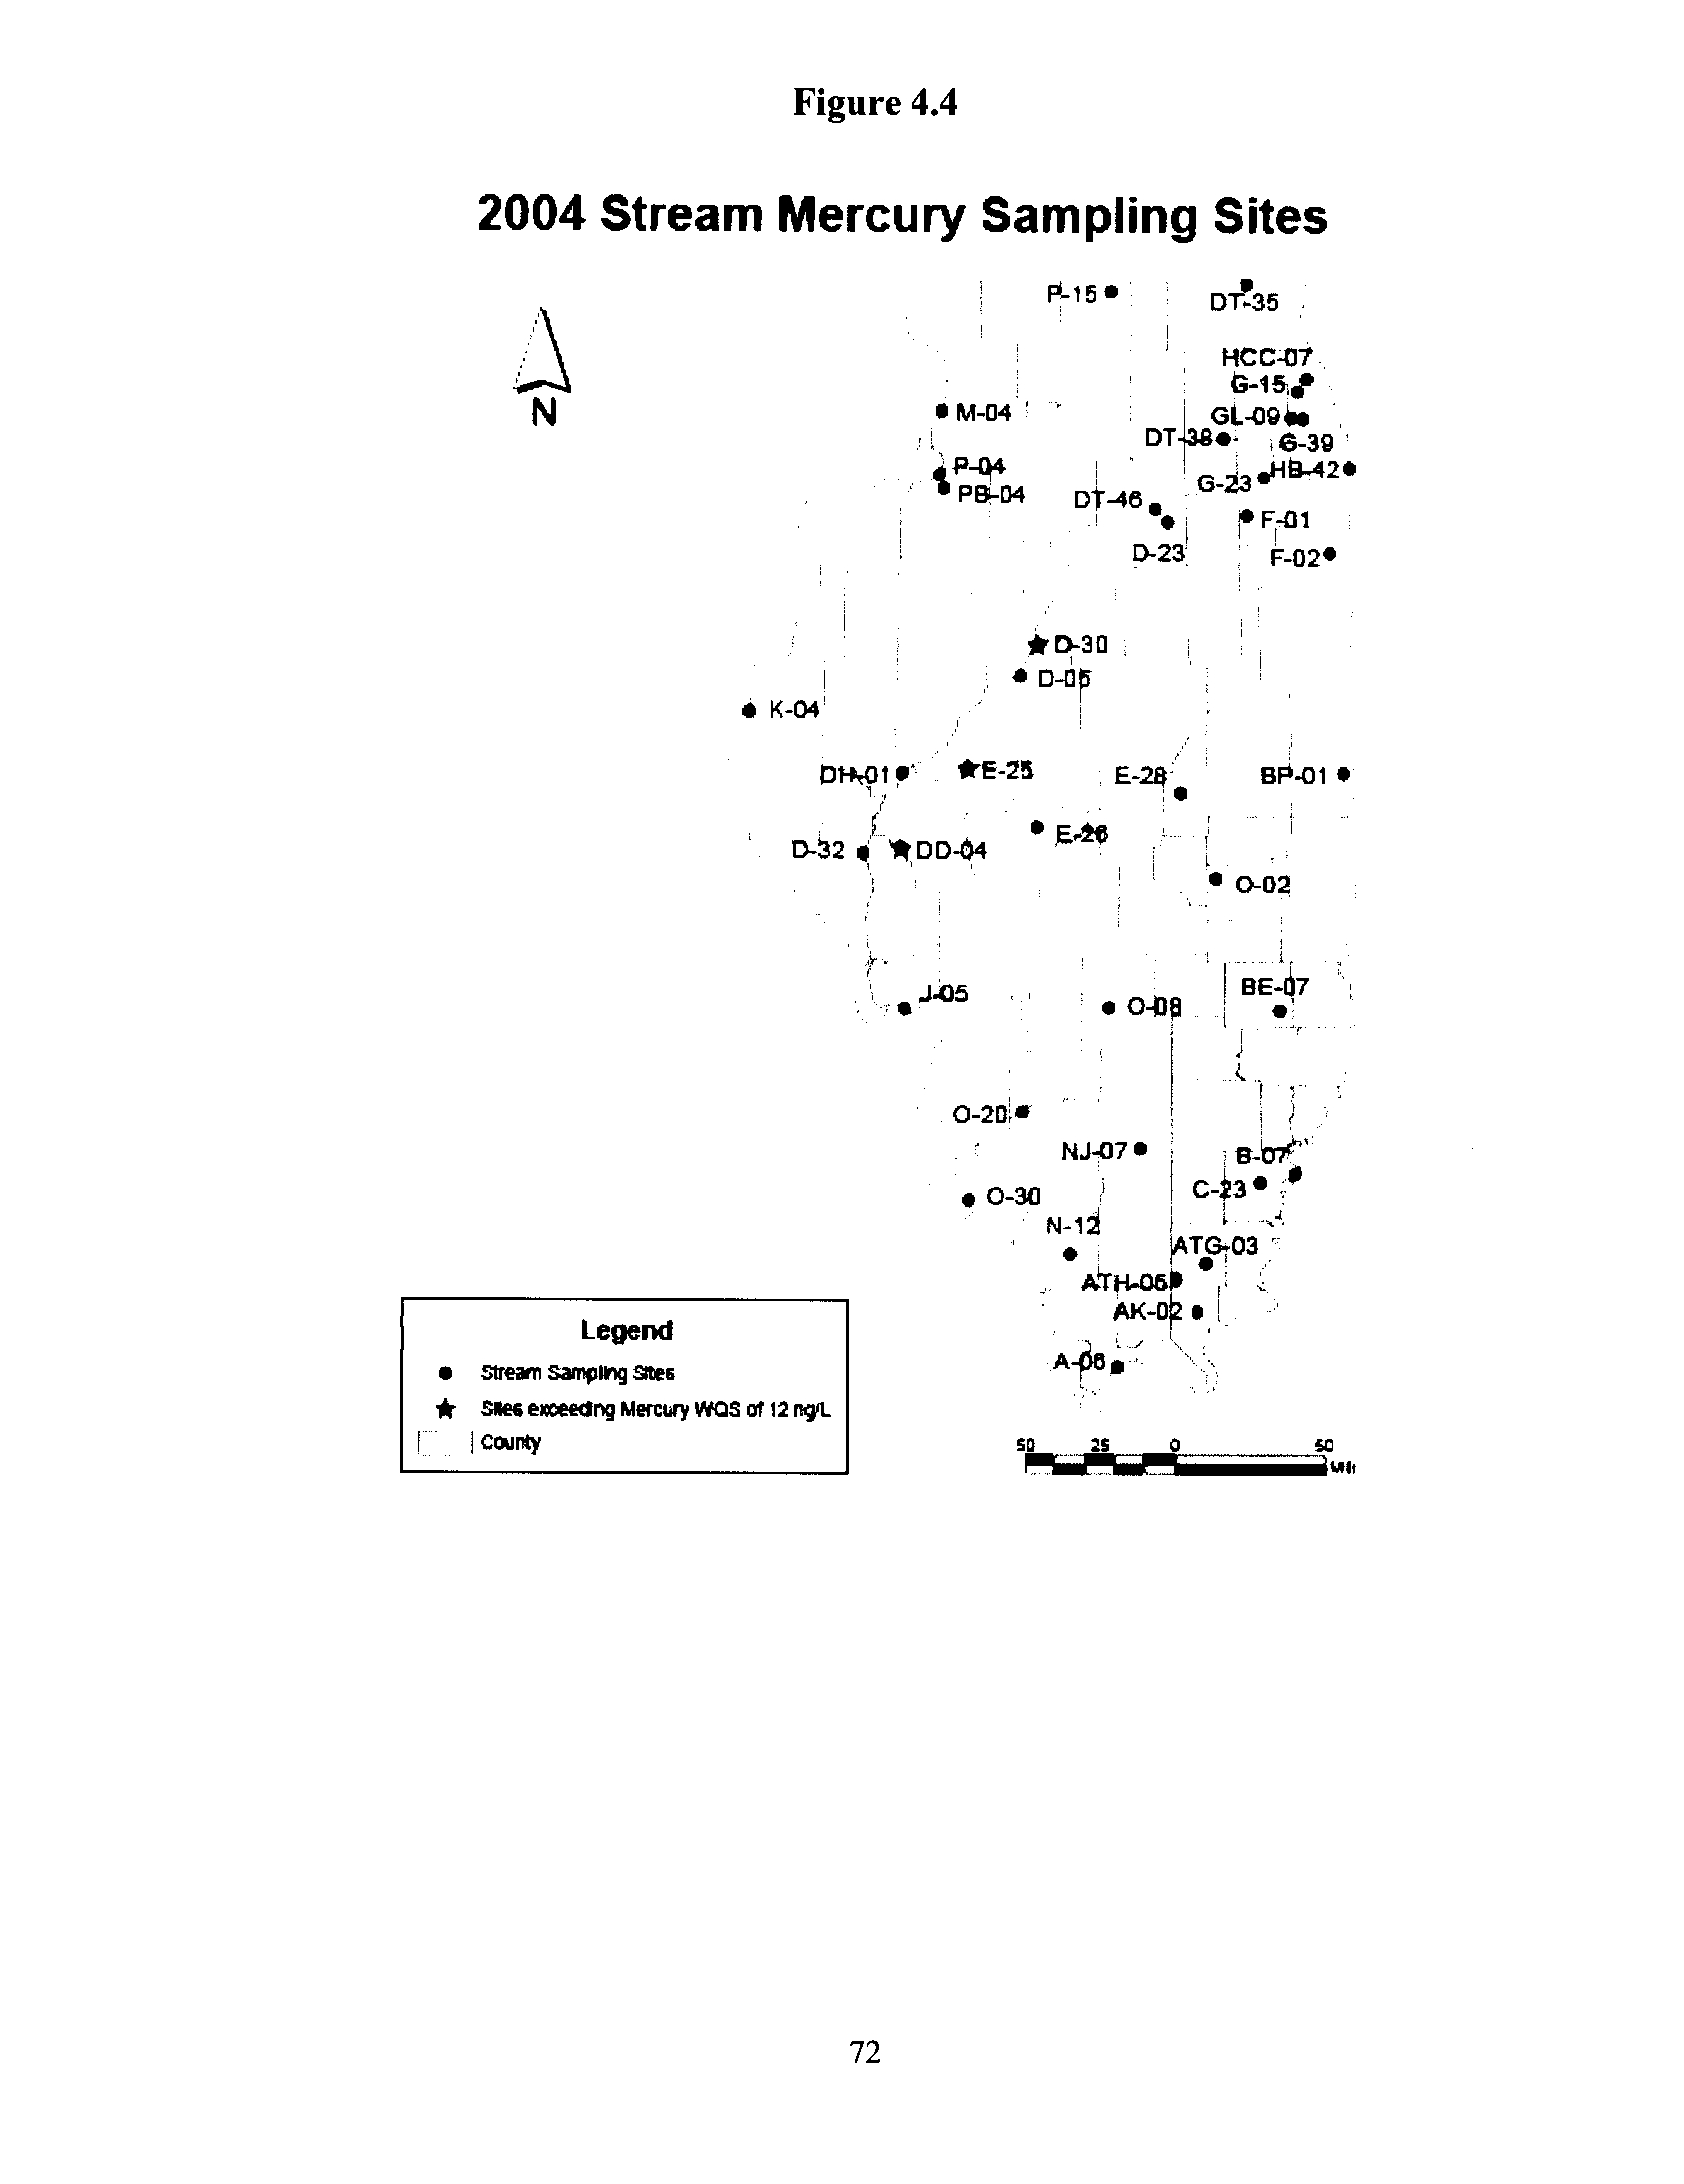
Figure 4 .4
2004 Stream Mercury Sampling Sites
72
Figure 4.5
Illinois Ambient Water Quality Monitoring Network Core
Stream Samples, March - Oct. 2004
73
Figure 4.6
Illinois Ambient Lakes Samples, August - Oct. 2004
73
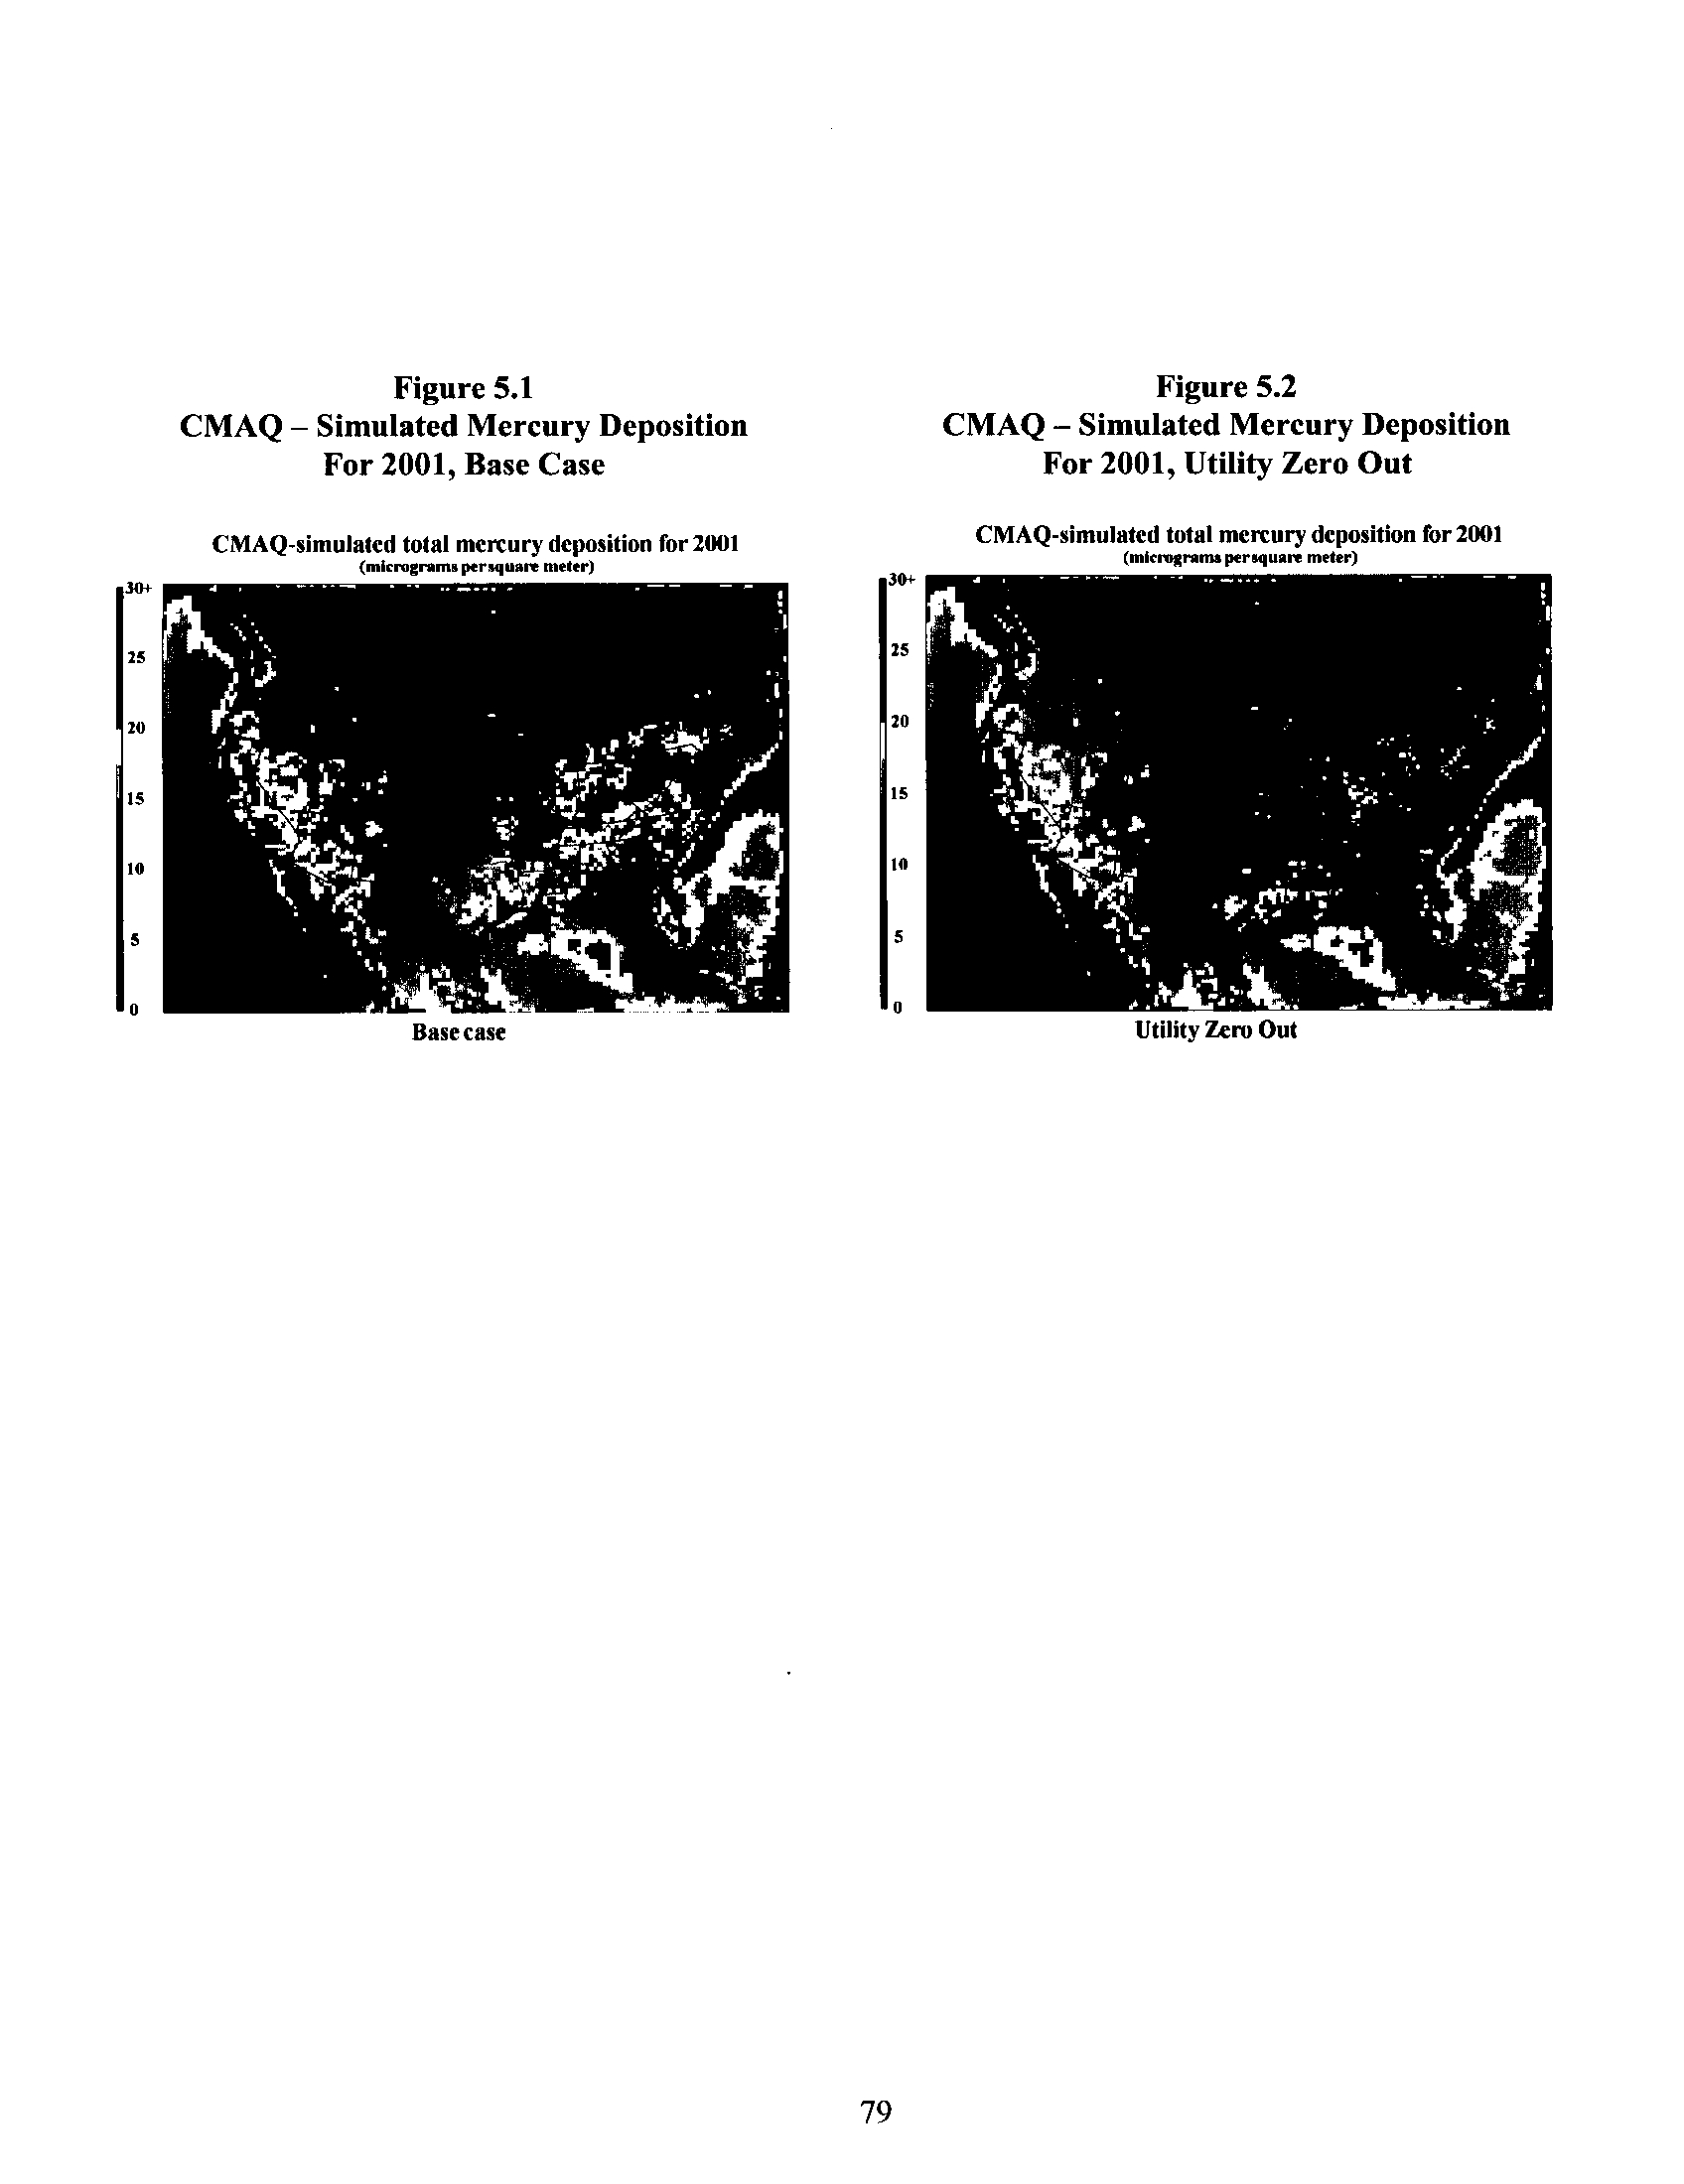
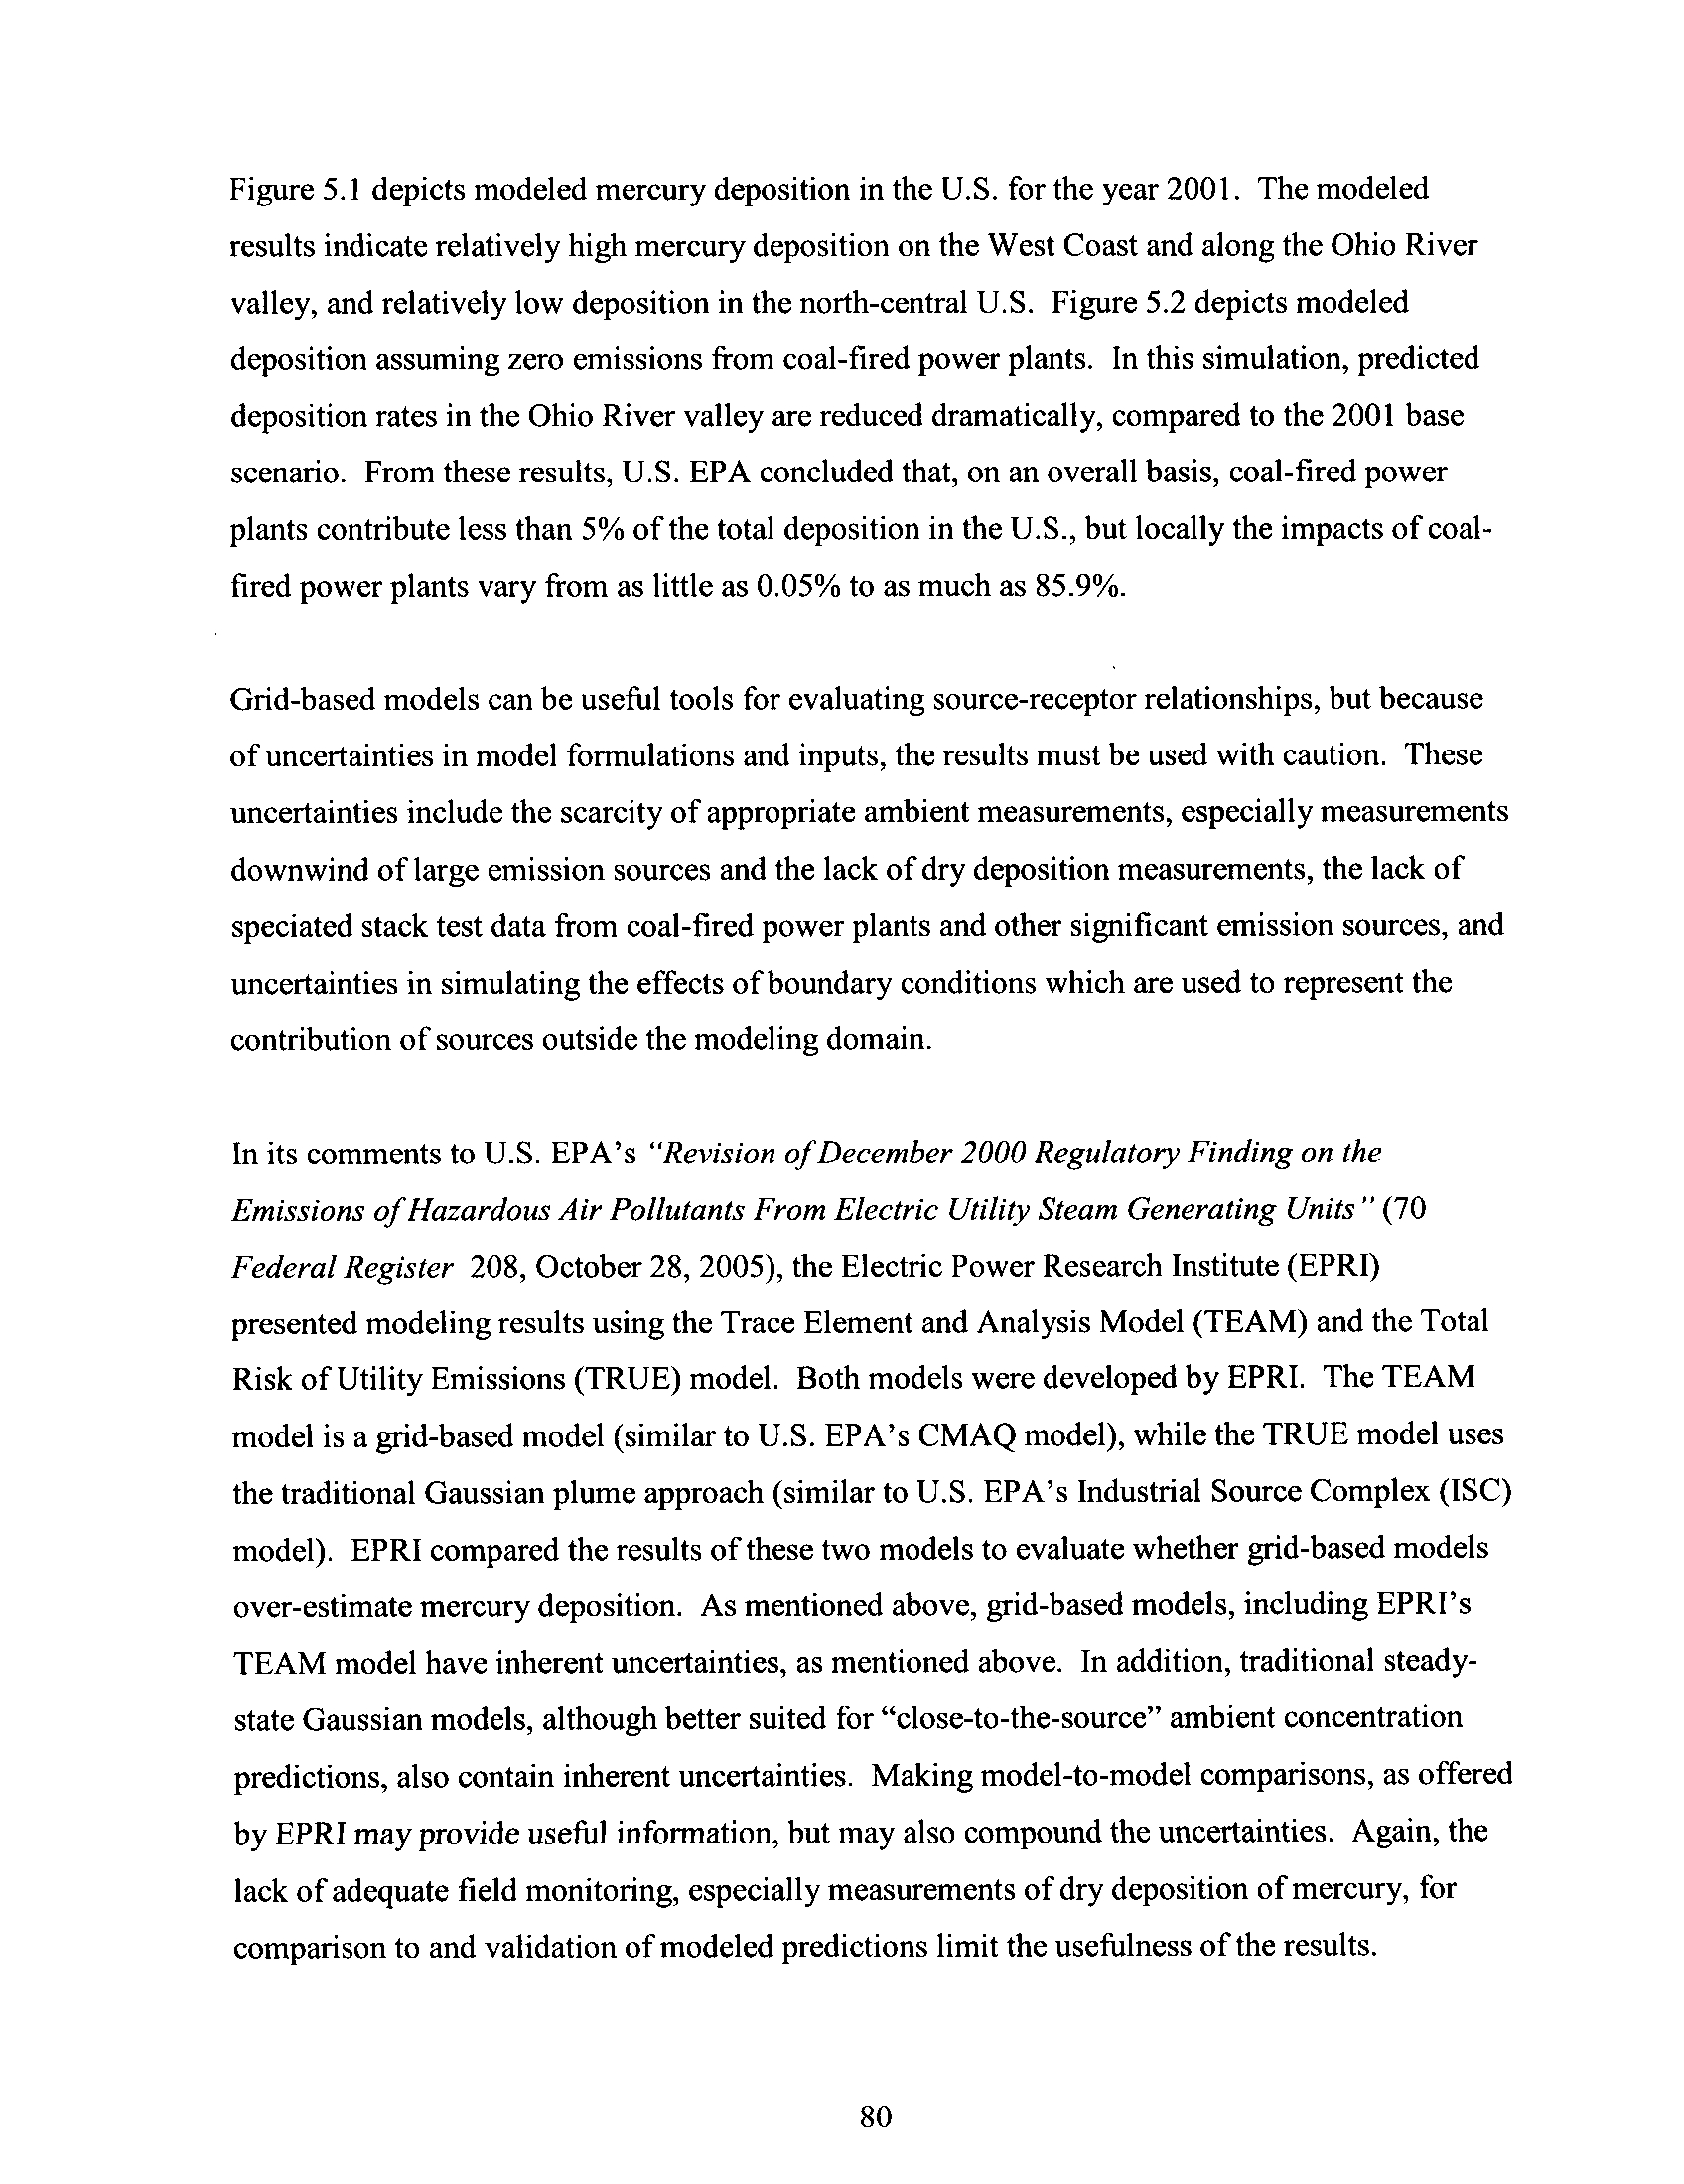
Figure 5 .1
CMAQ - Simulated Mercury Deposition for 2001, Base Case
79
Figure 5 .2
CMAQ- Simulated Mercury Deposition for 2001, Utility
Zero Out
79
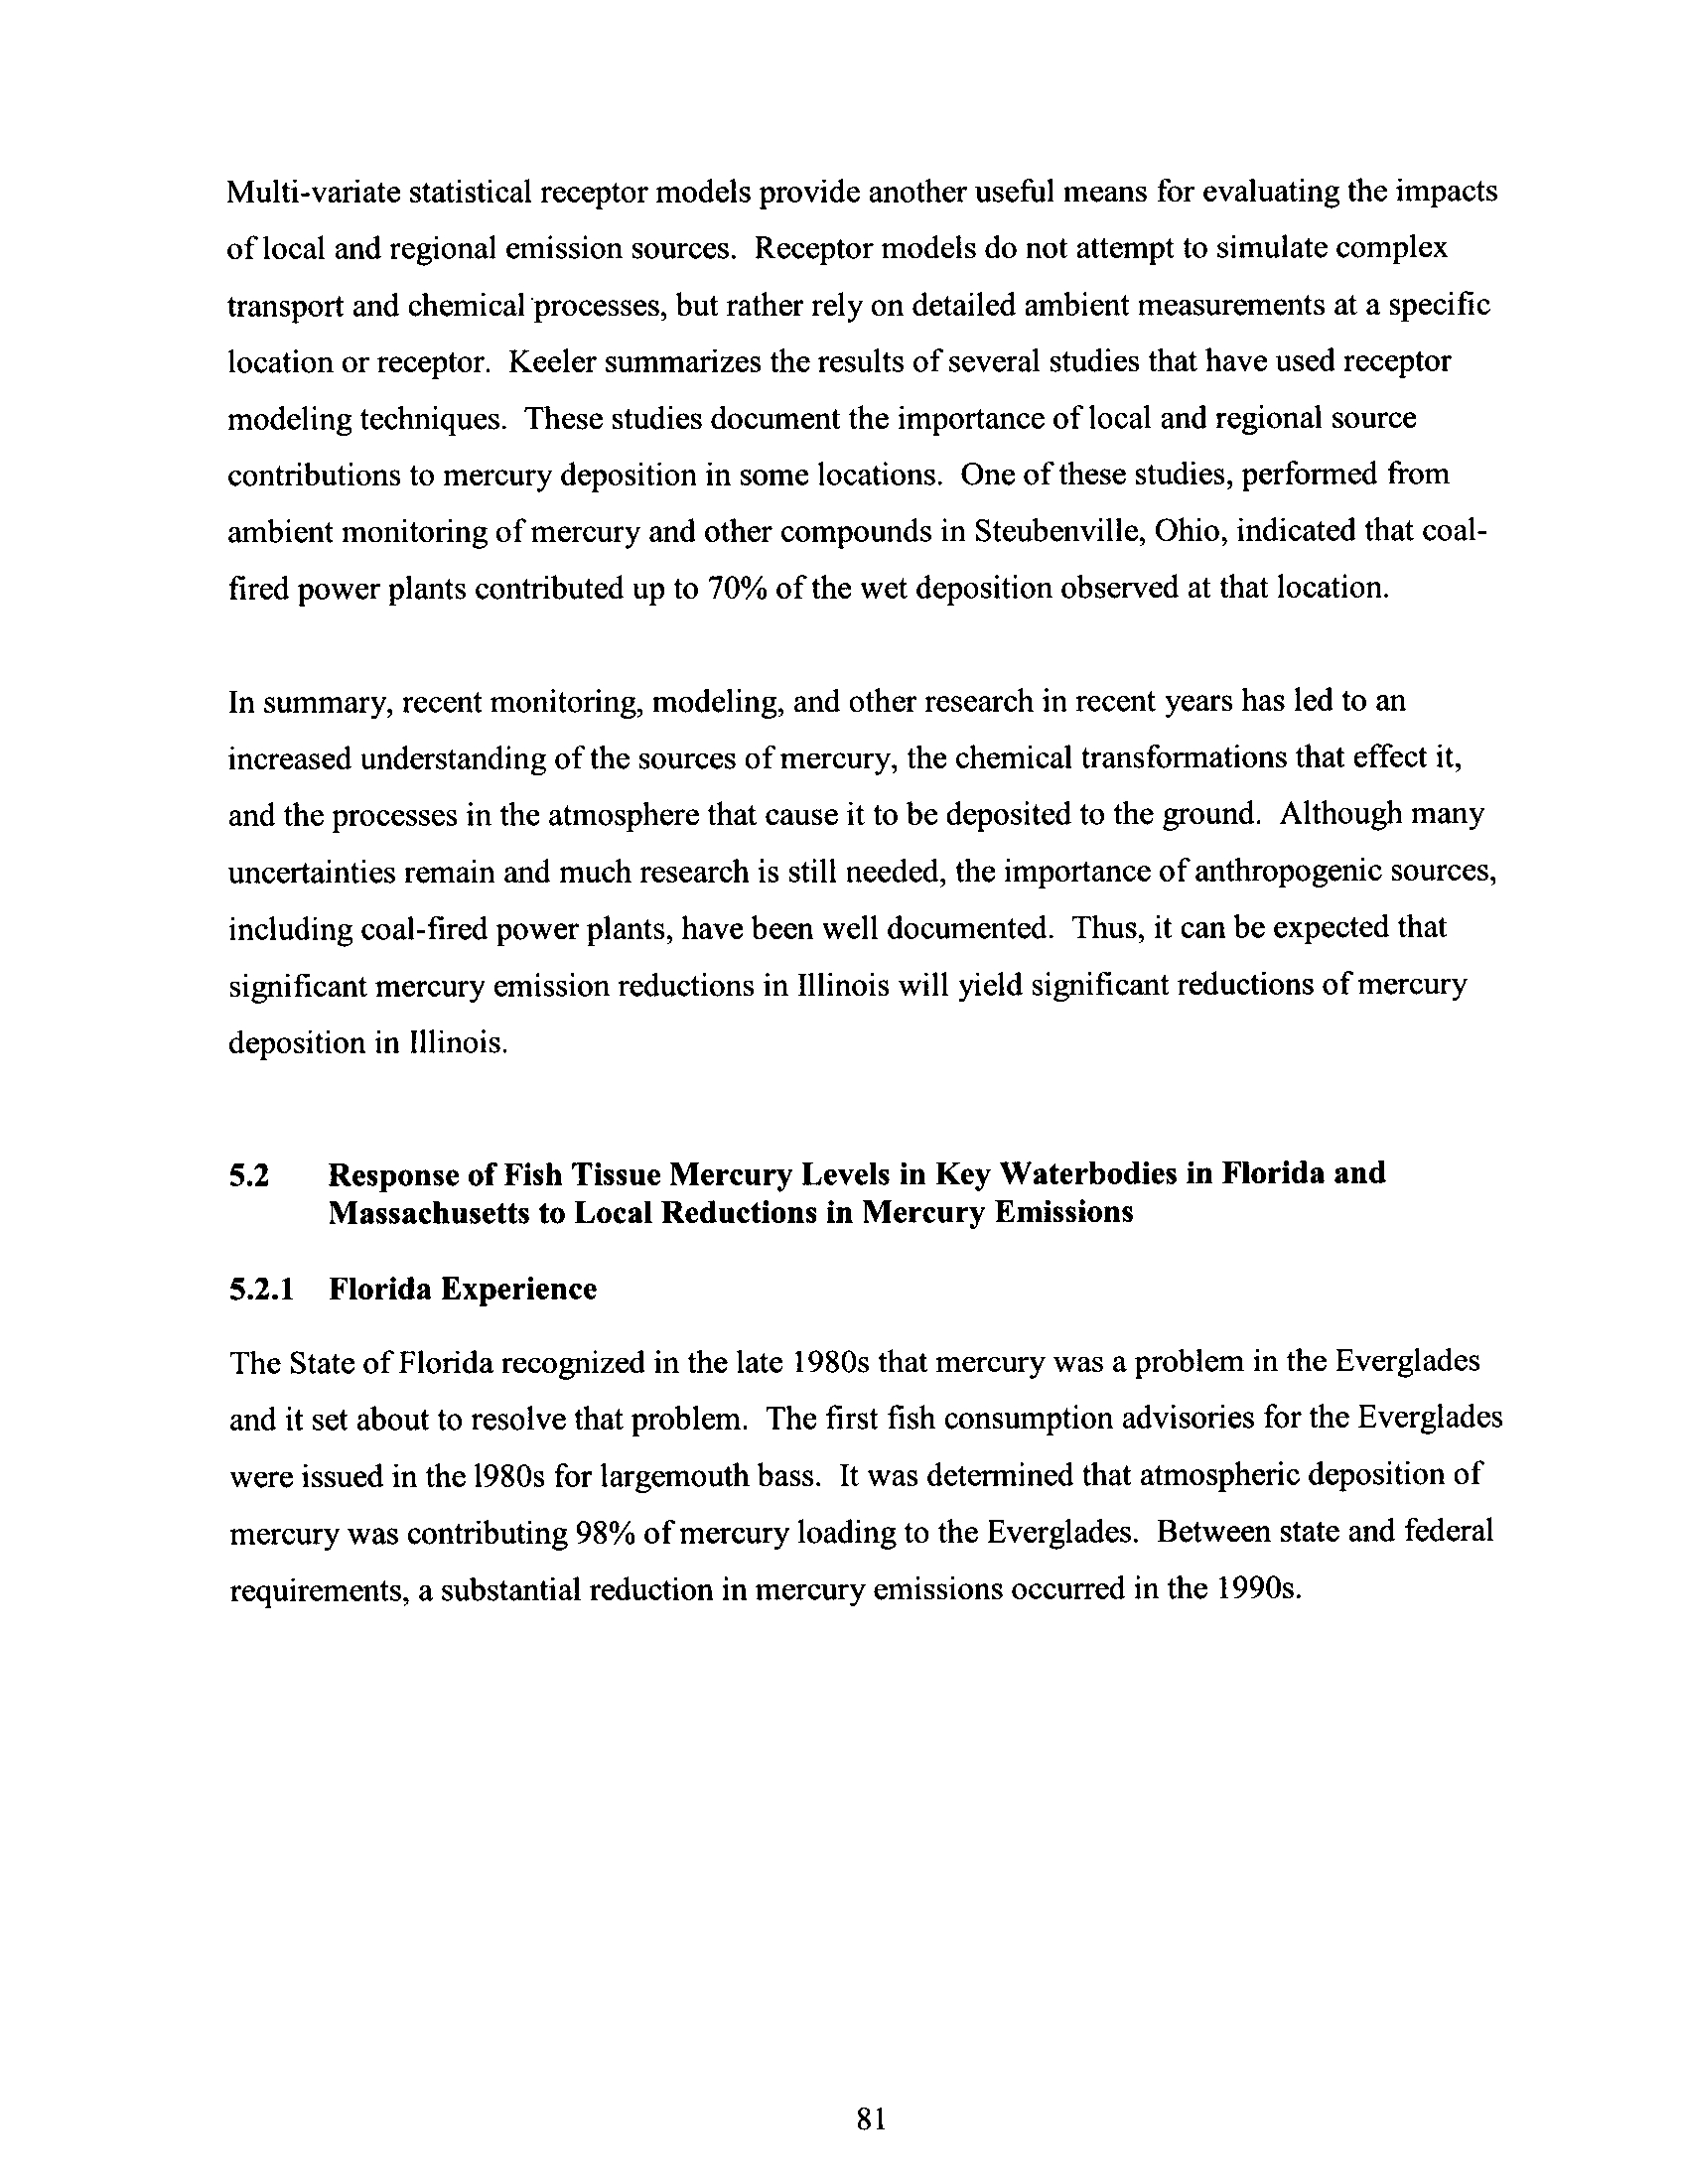
Figure 5 .3
Emissions of Total Mercury by Major Source Category for
Dade, Broward, and Palm Beach Counties
82
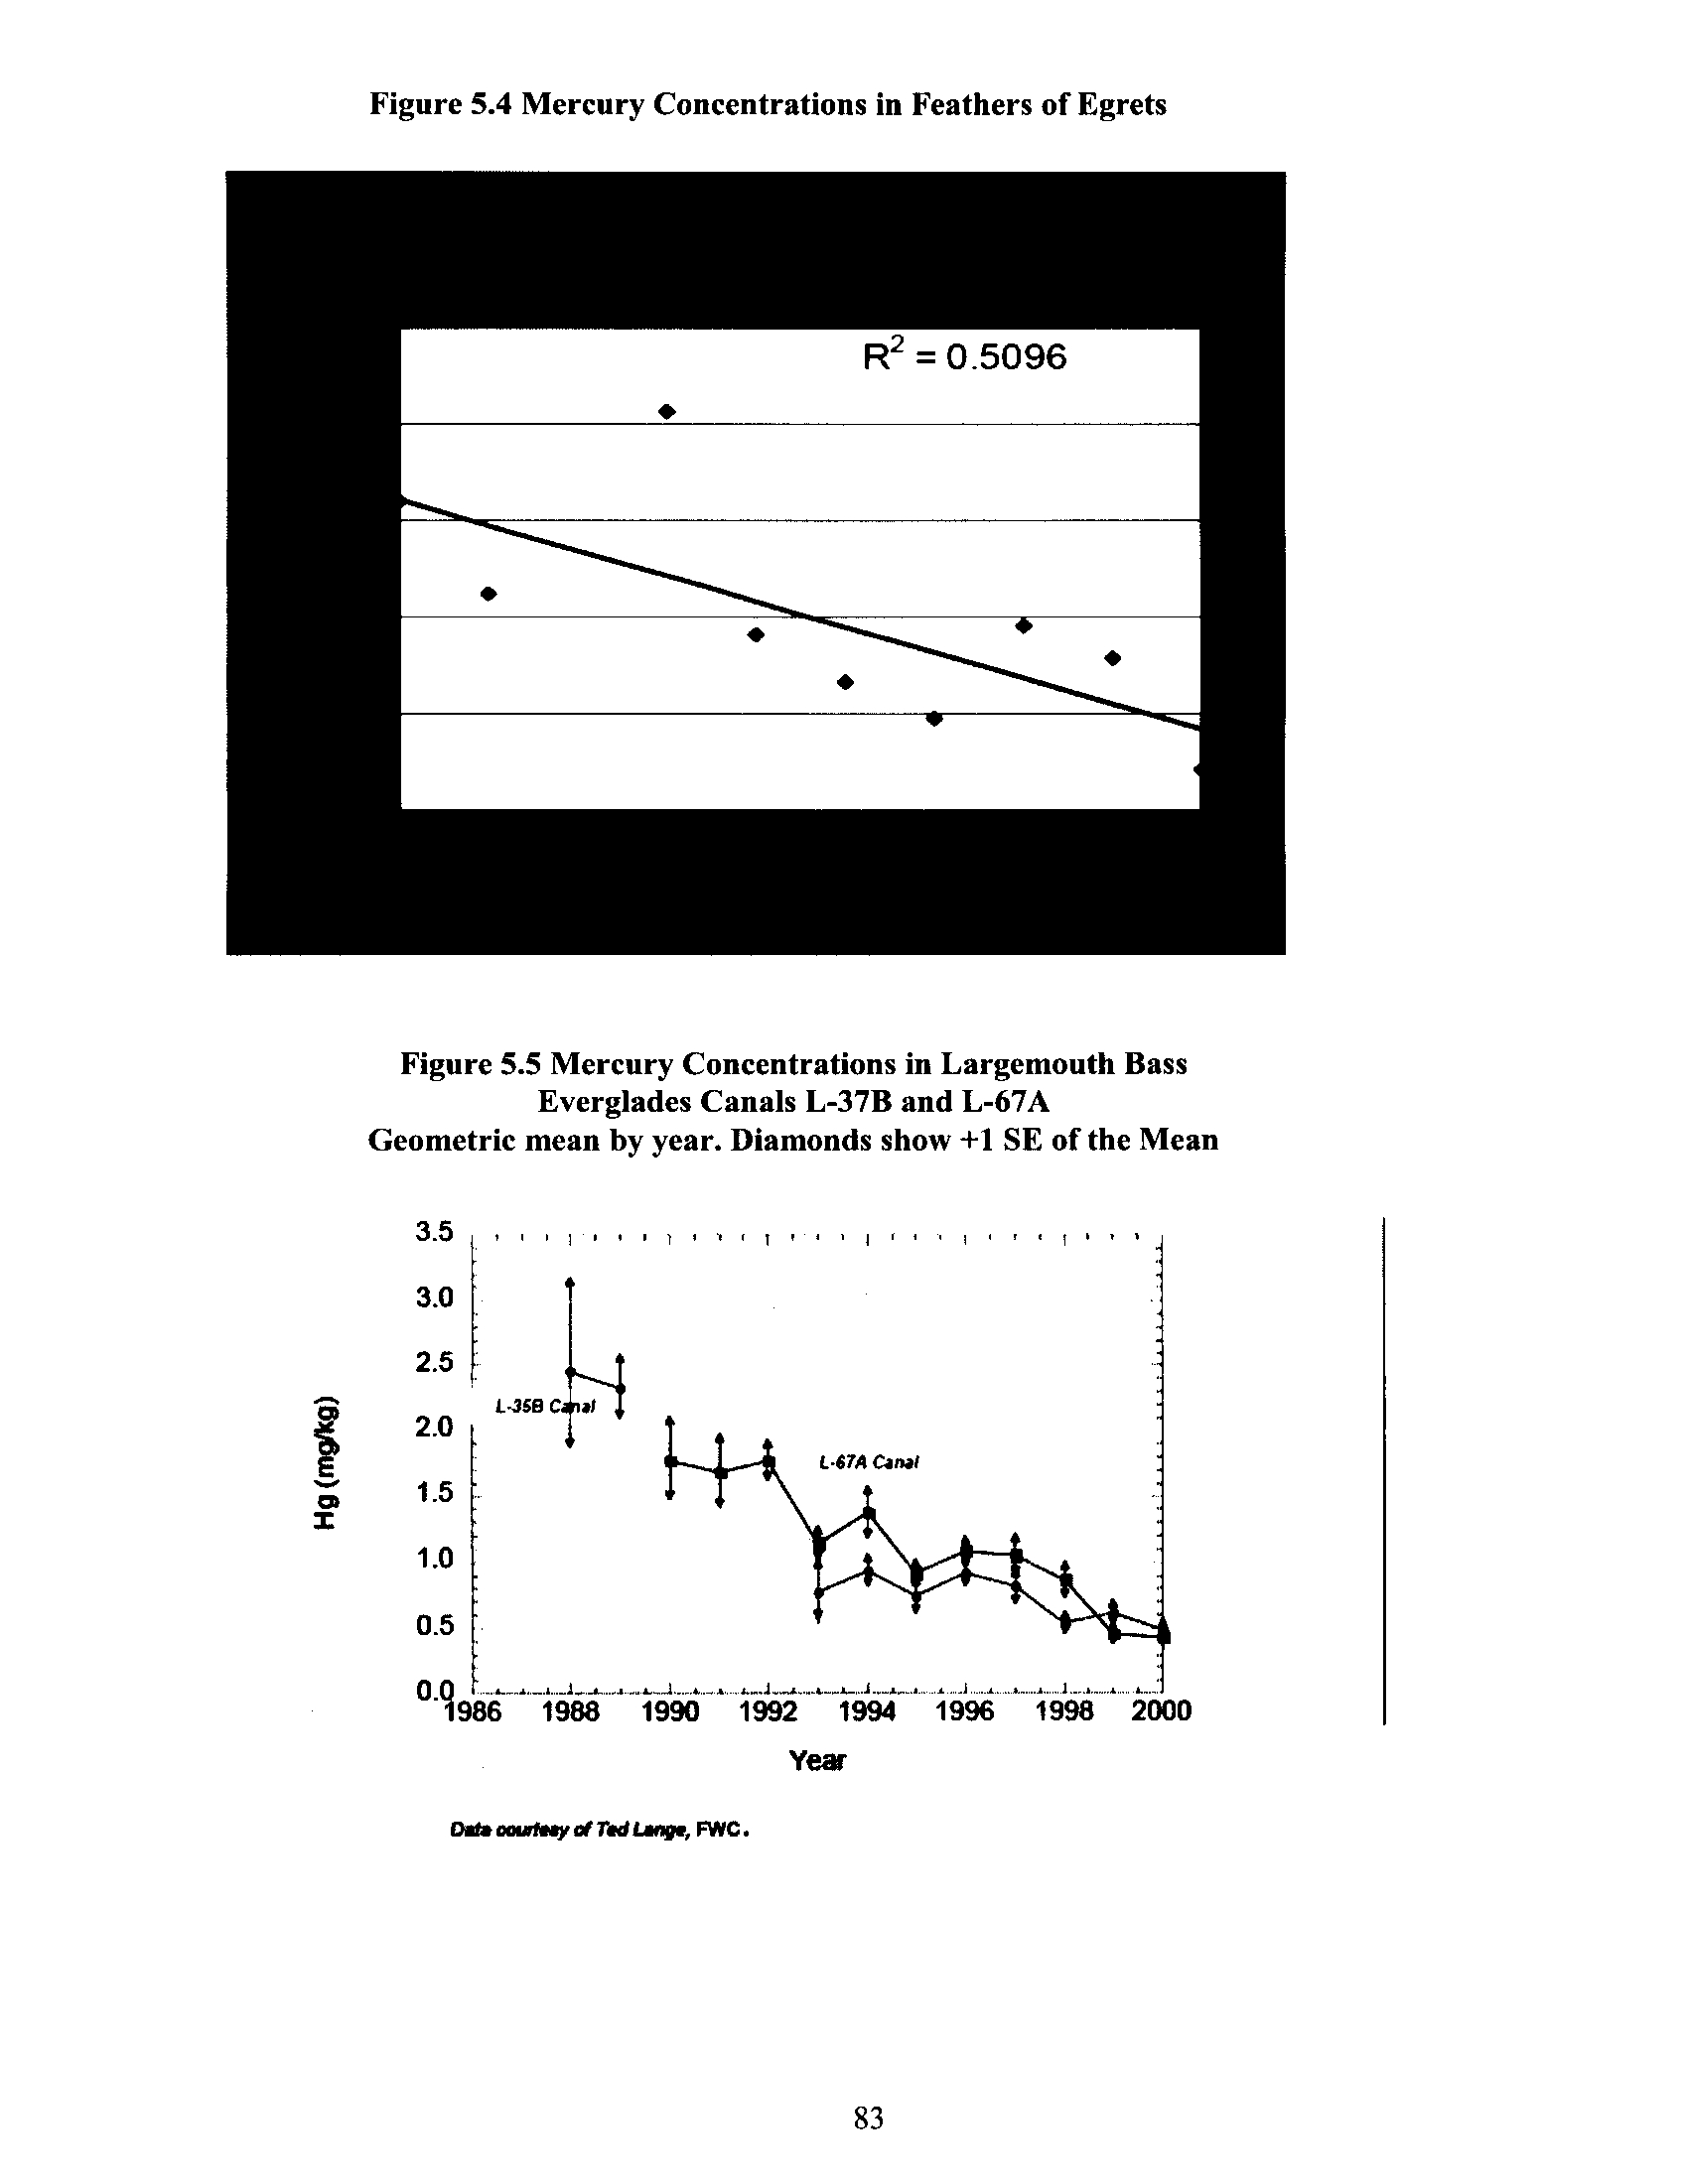
Figure 5 .4
Mercury Concentrations in Feathers of Egrets
83
Figure 5 .5
Mercury Concentrations in Largemouth Bass Everglades Canals
L-37B and L-67A Geometric mean by Year
83
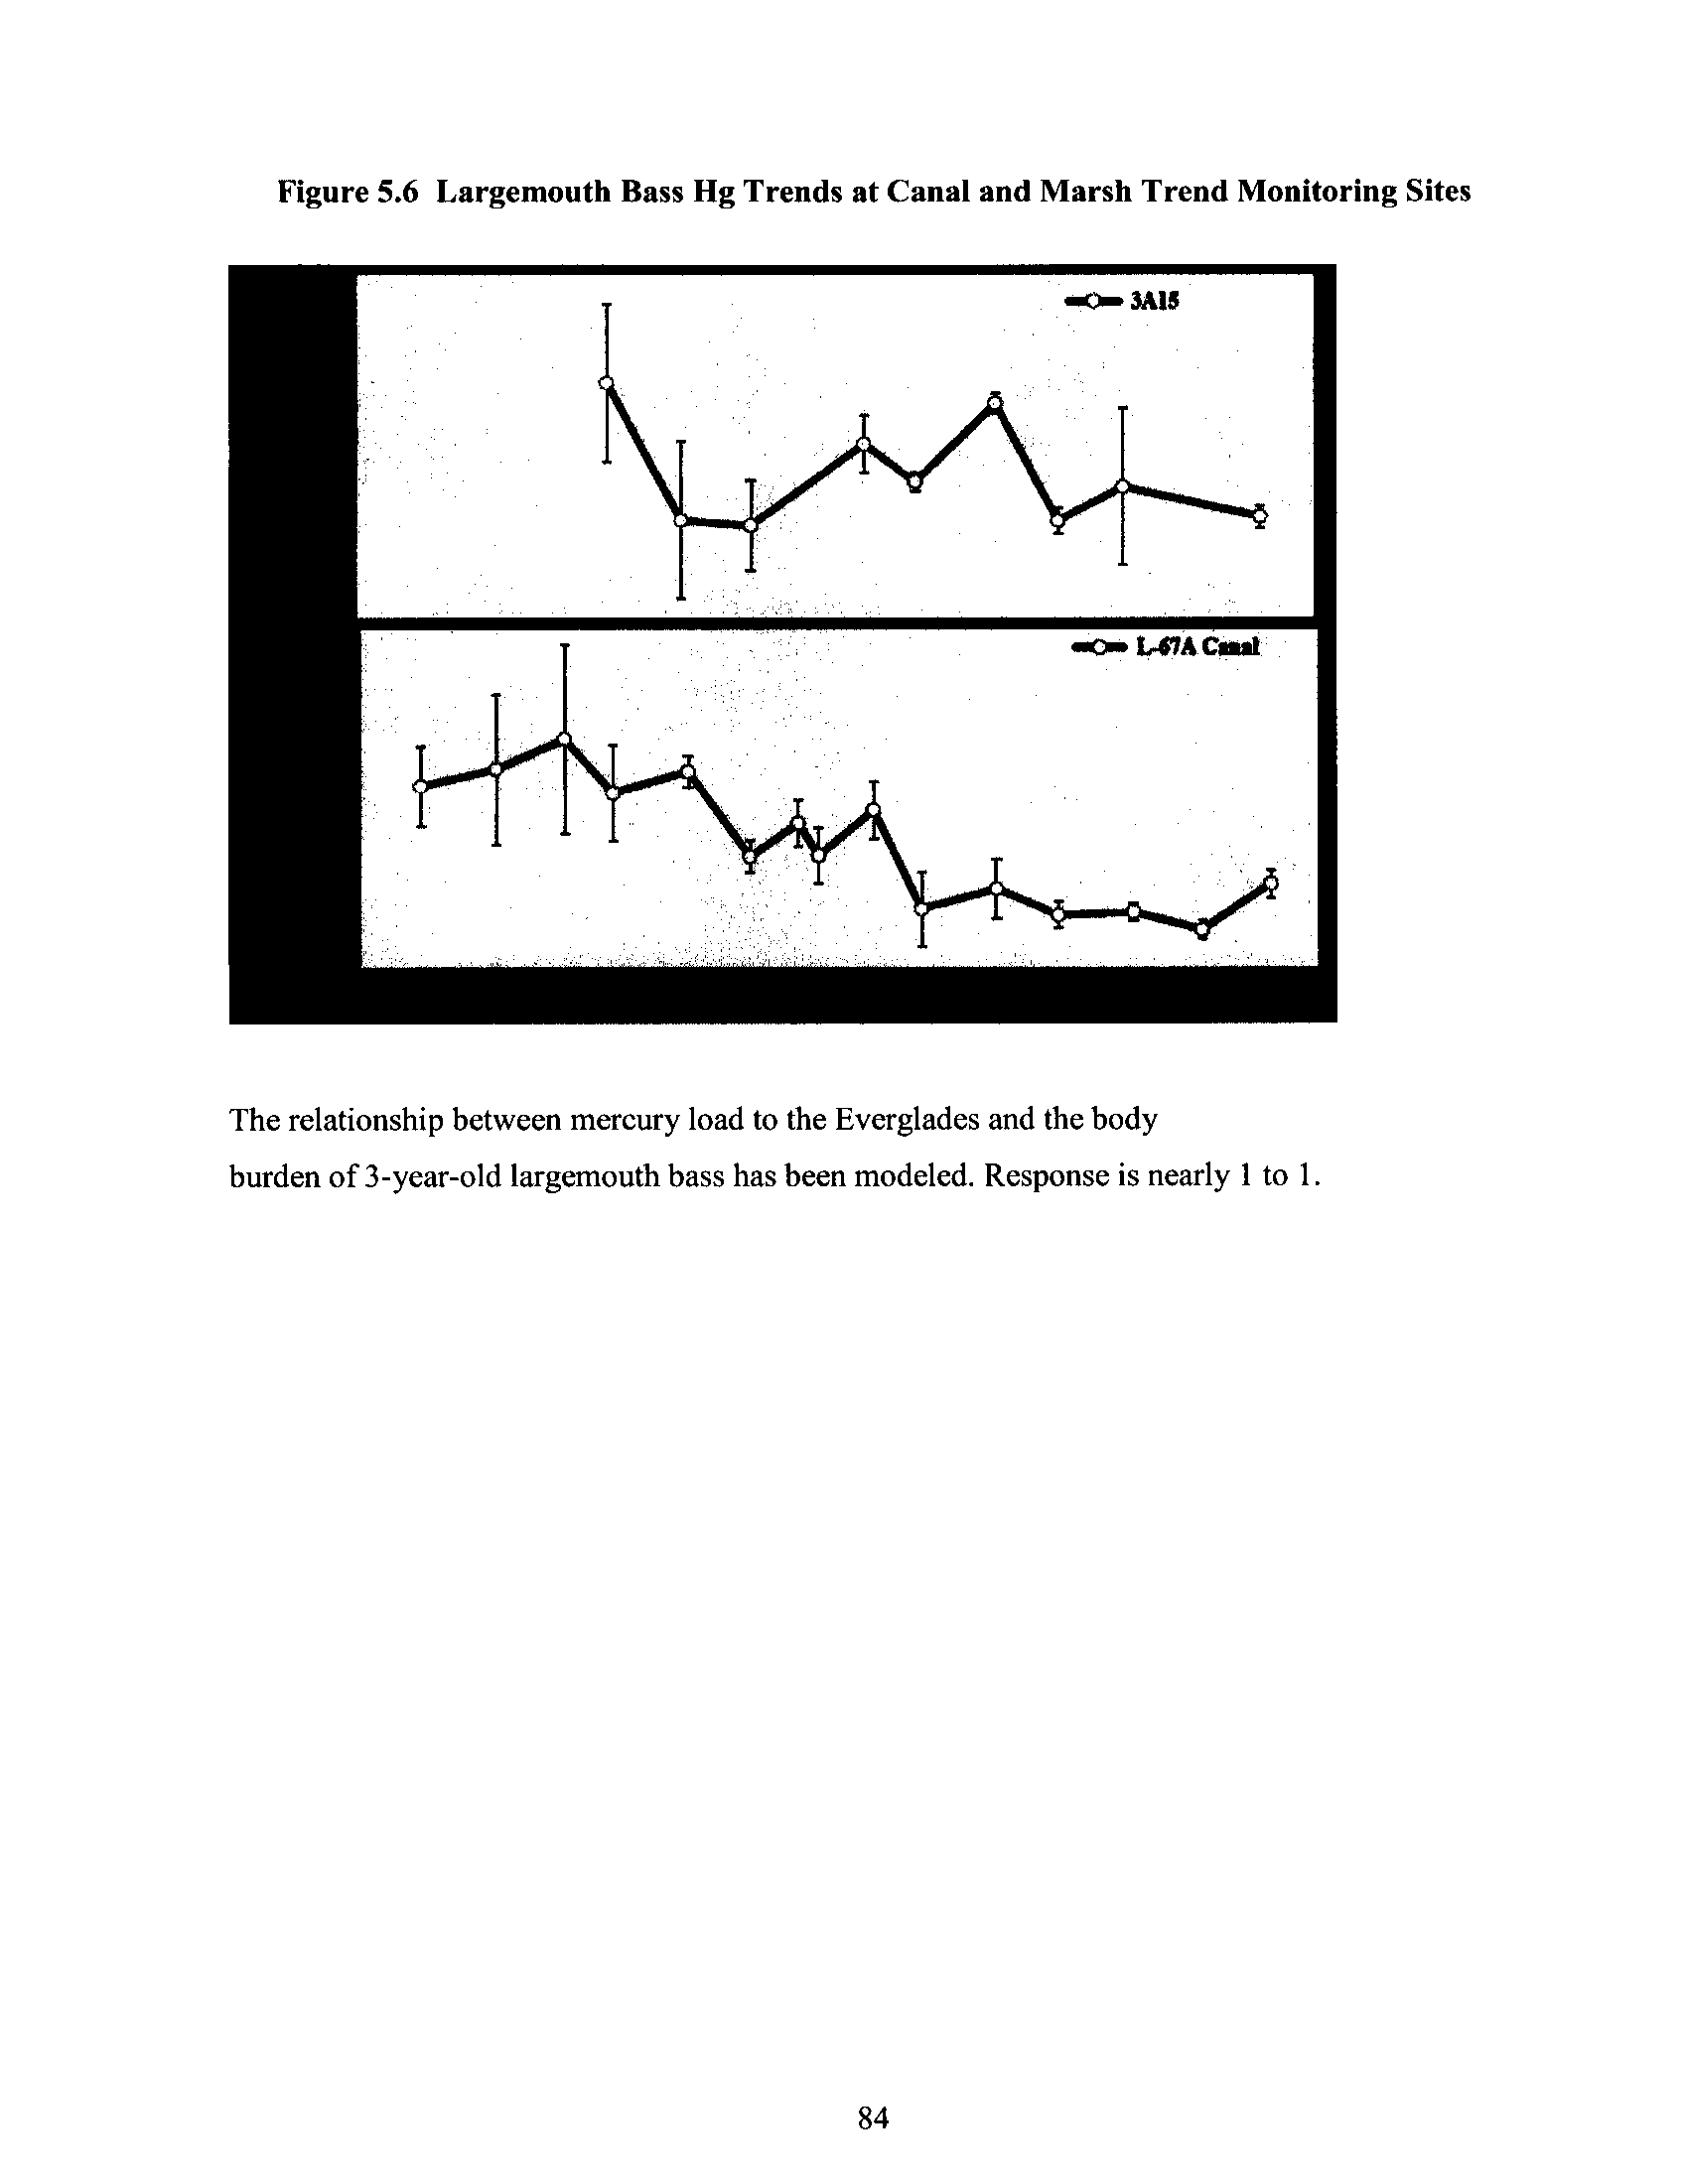
Figure 5.6
Largemouth Bass Hg Trends at Canal and Marsh Trend
Monitoring Sites
84
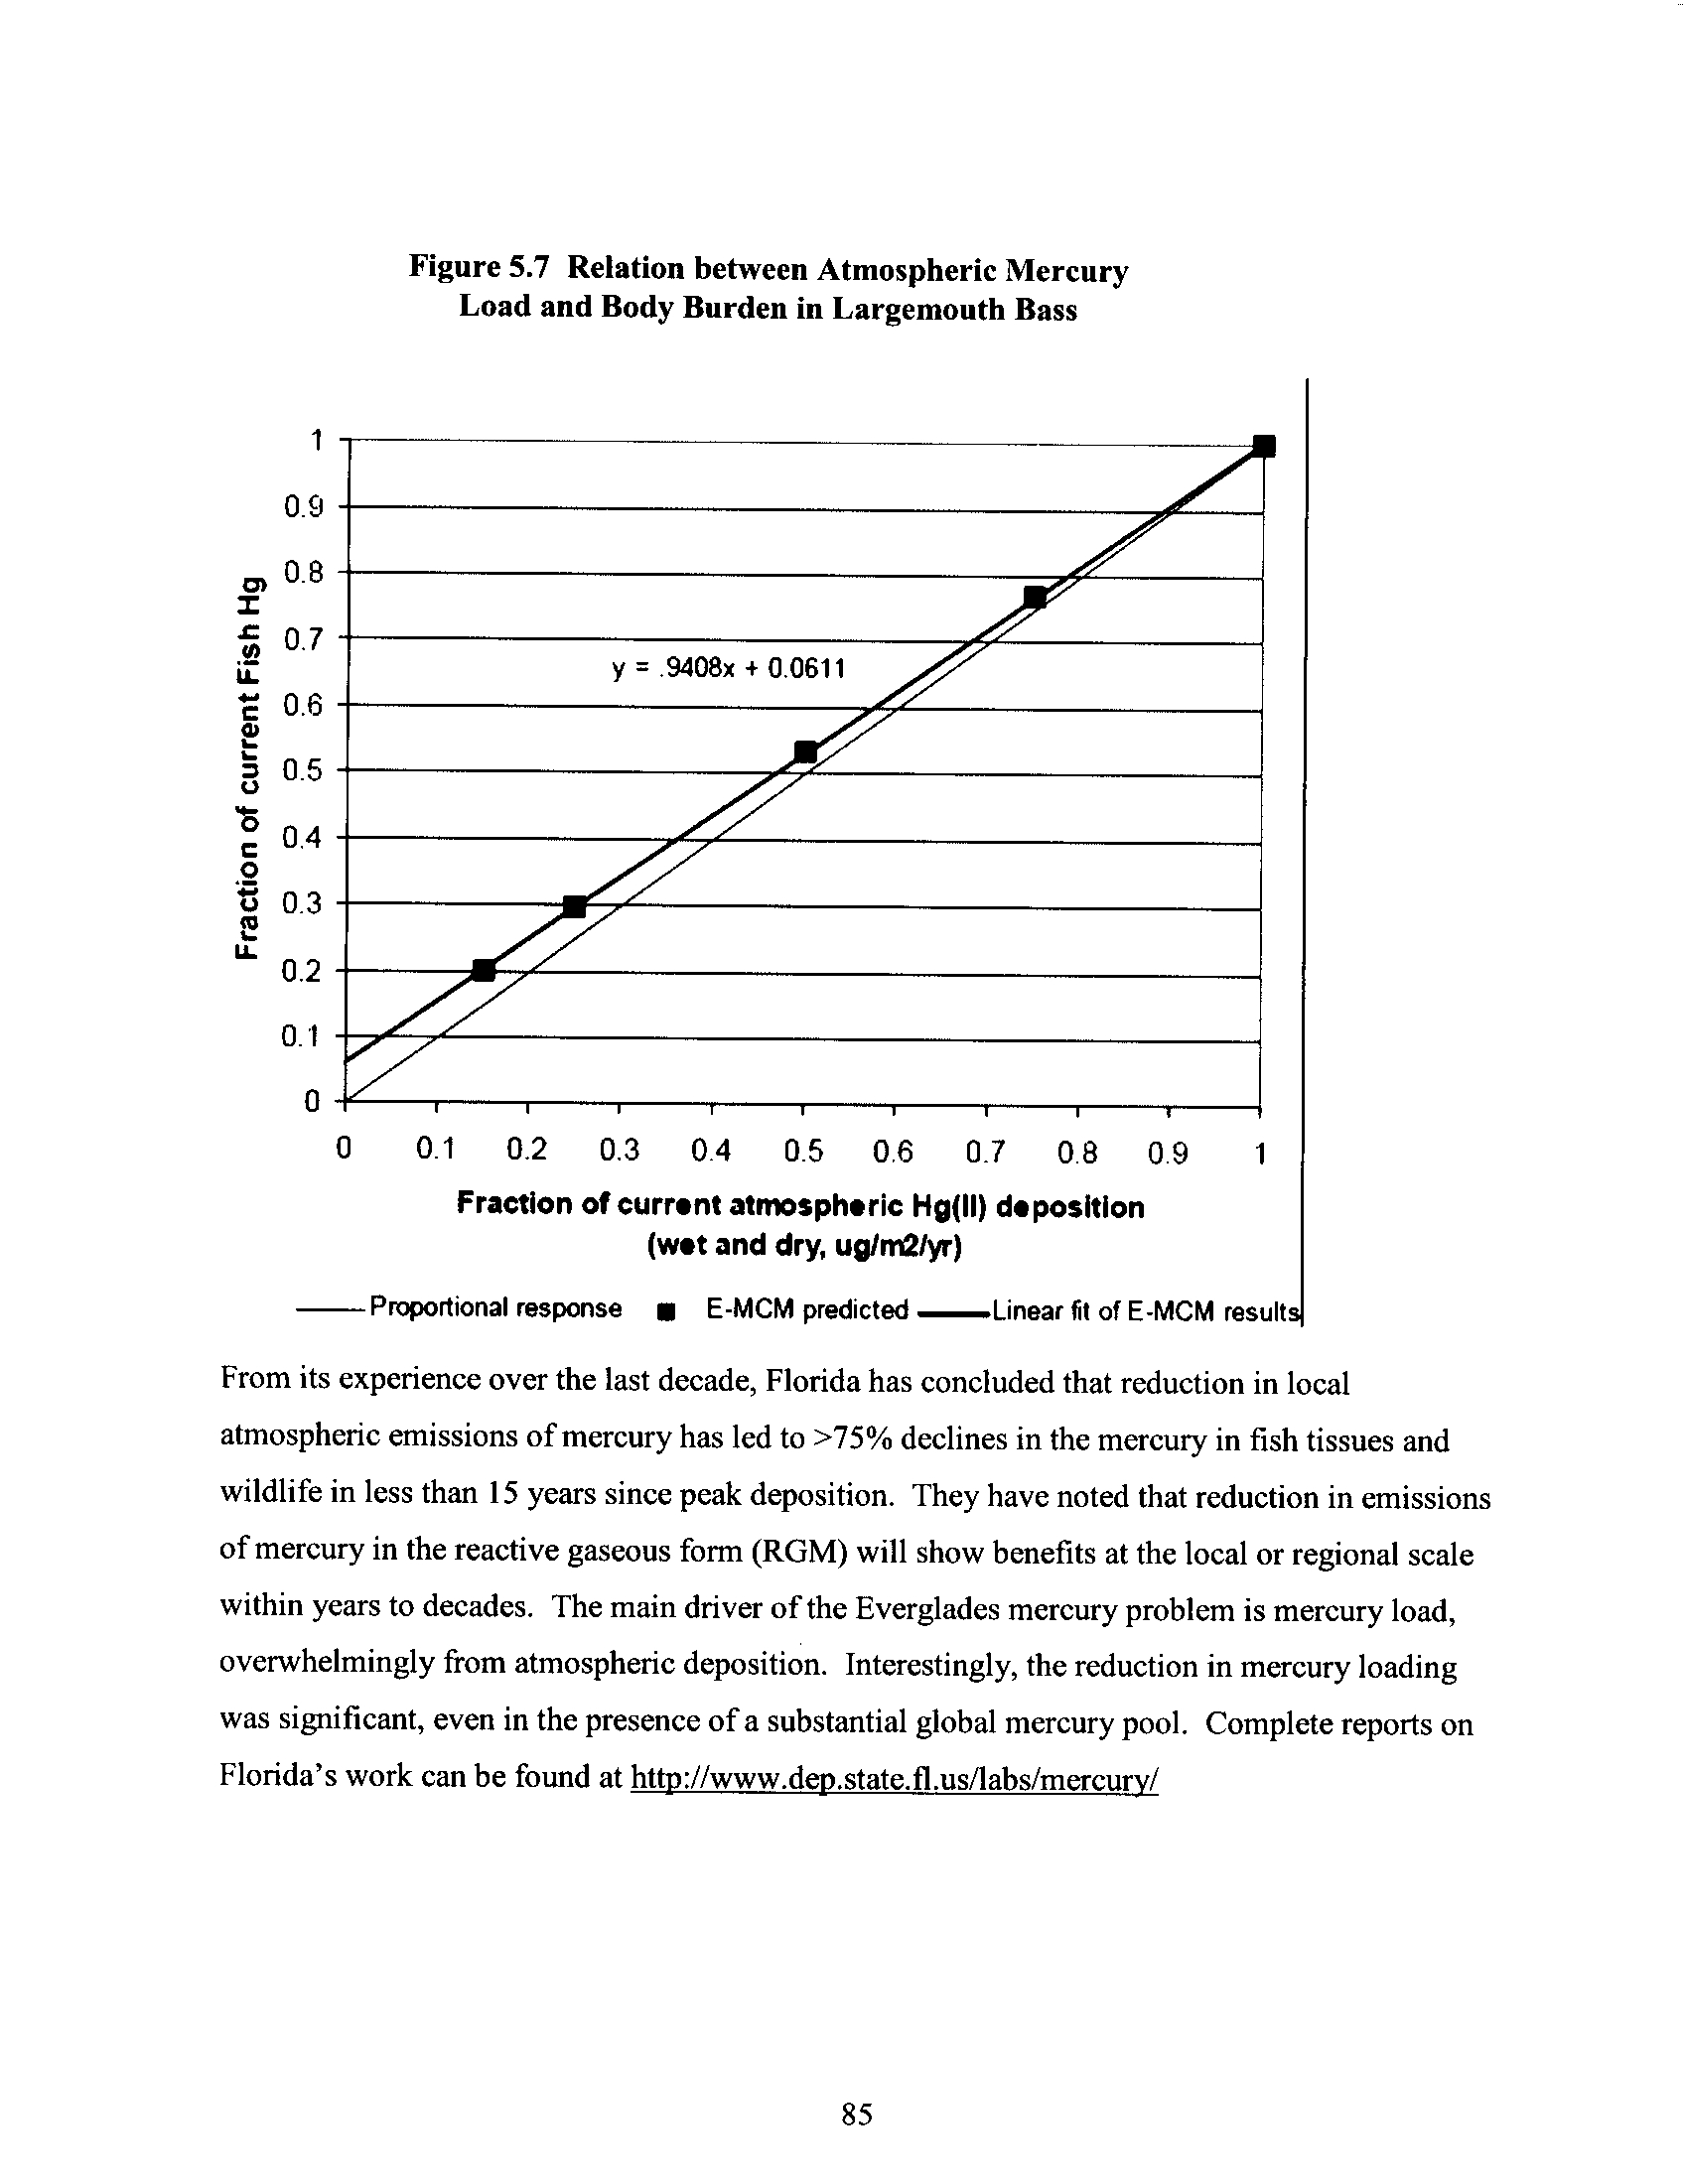
Figure 5 .7
Relation between Atmospheric Mercury Load and Body
Burden in Largemouth Bass
85
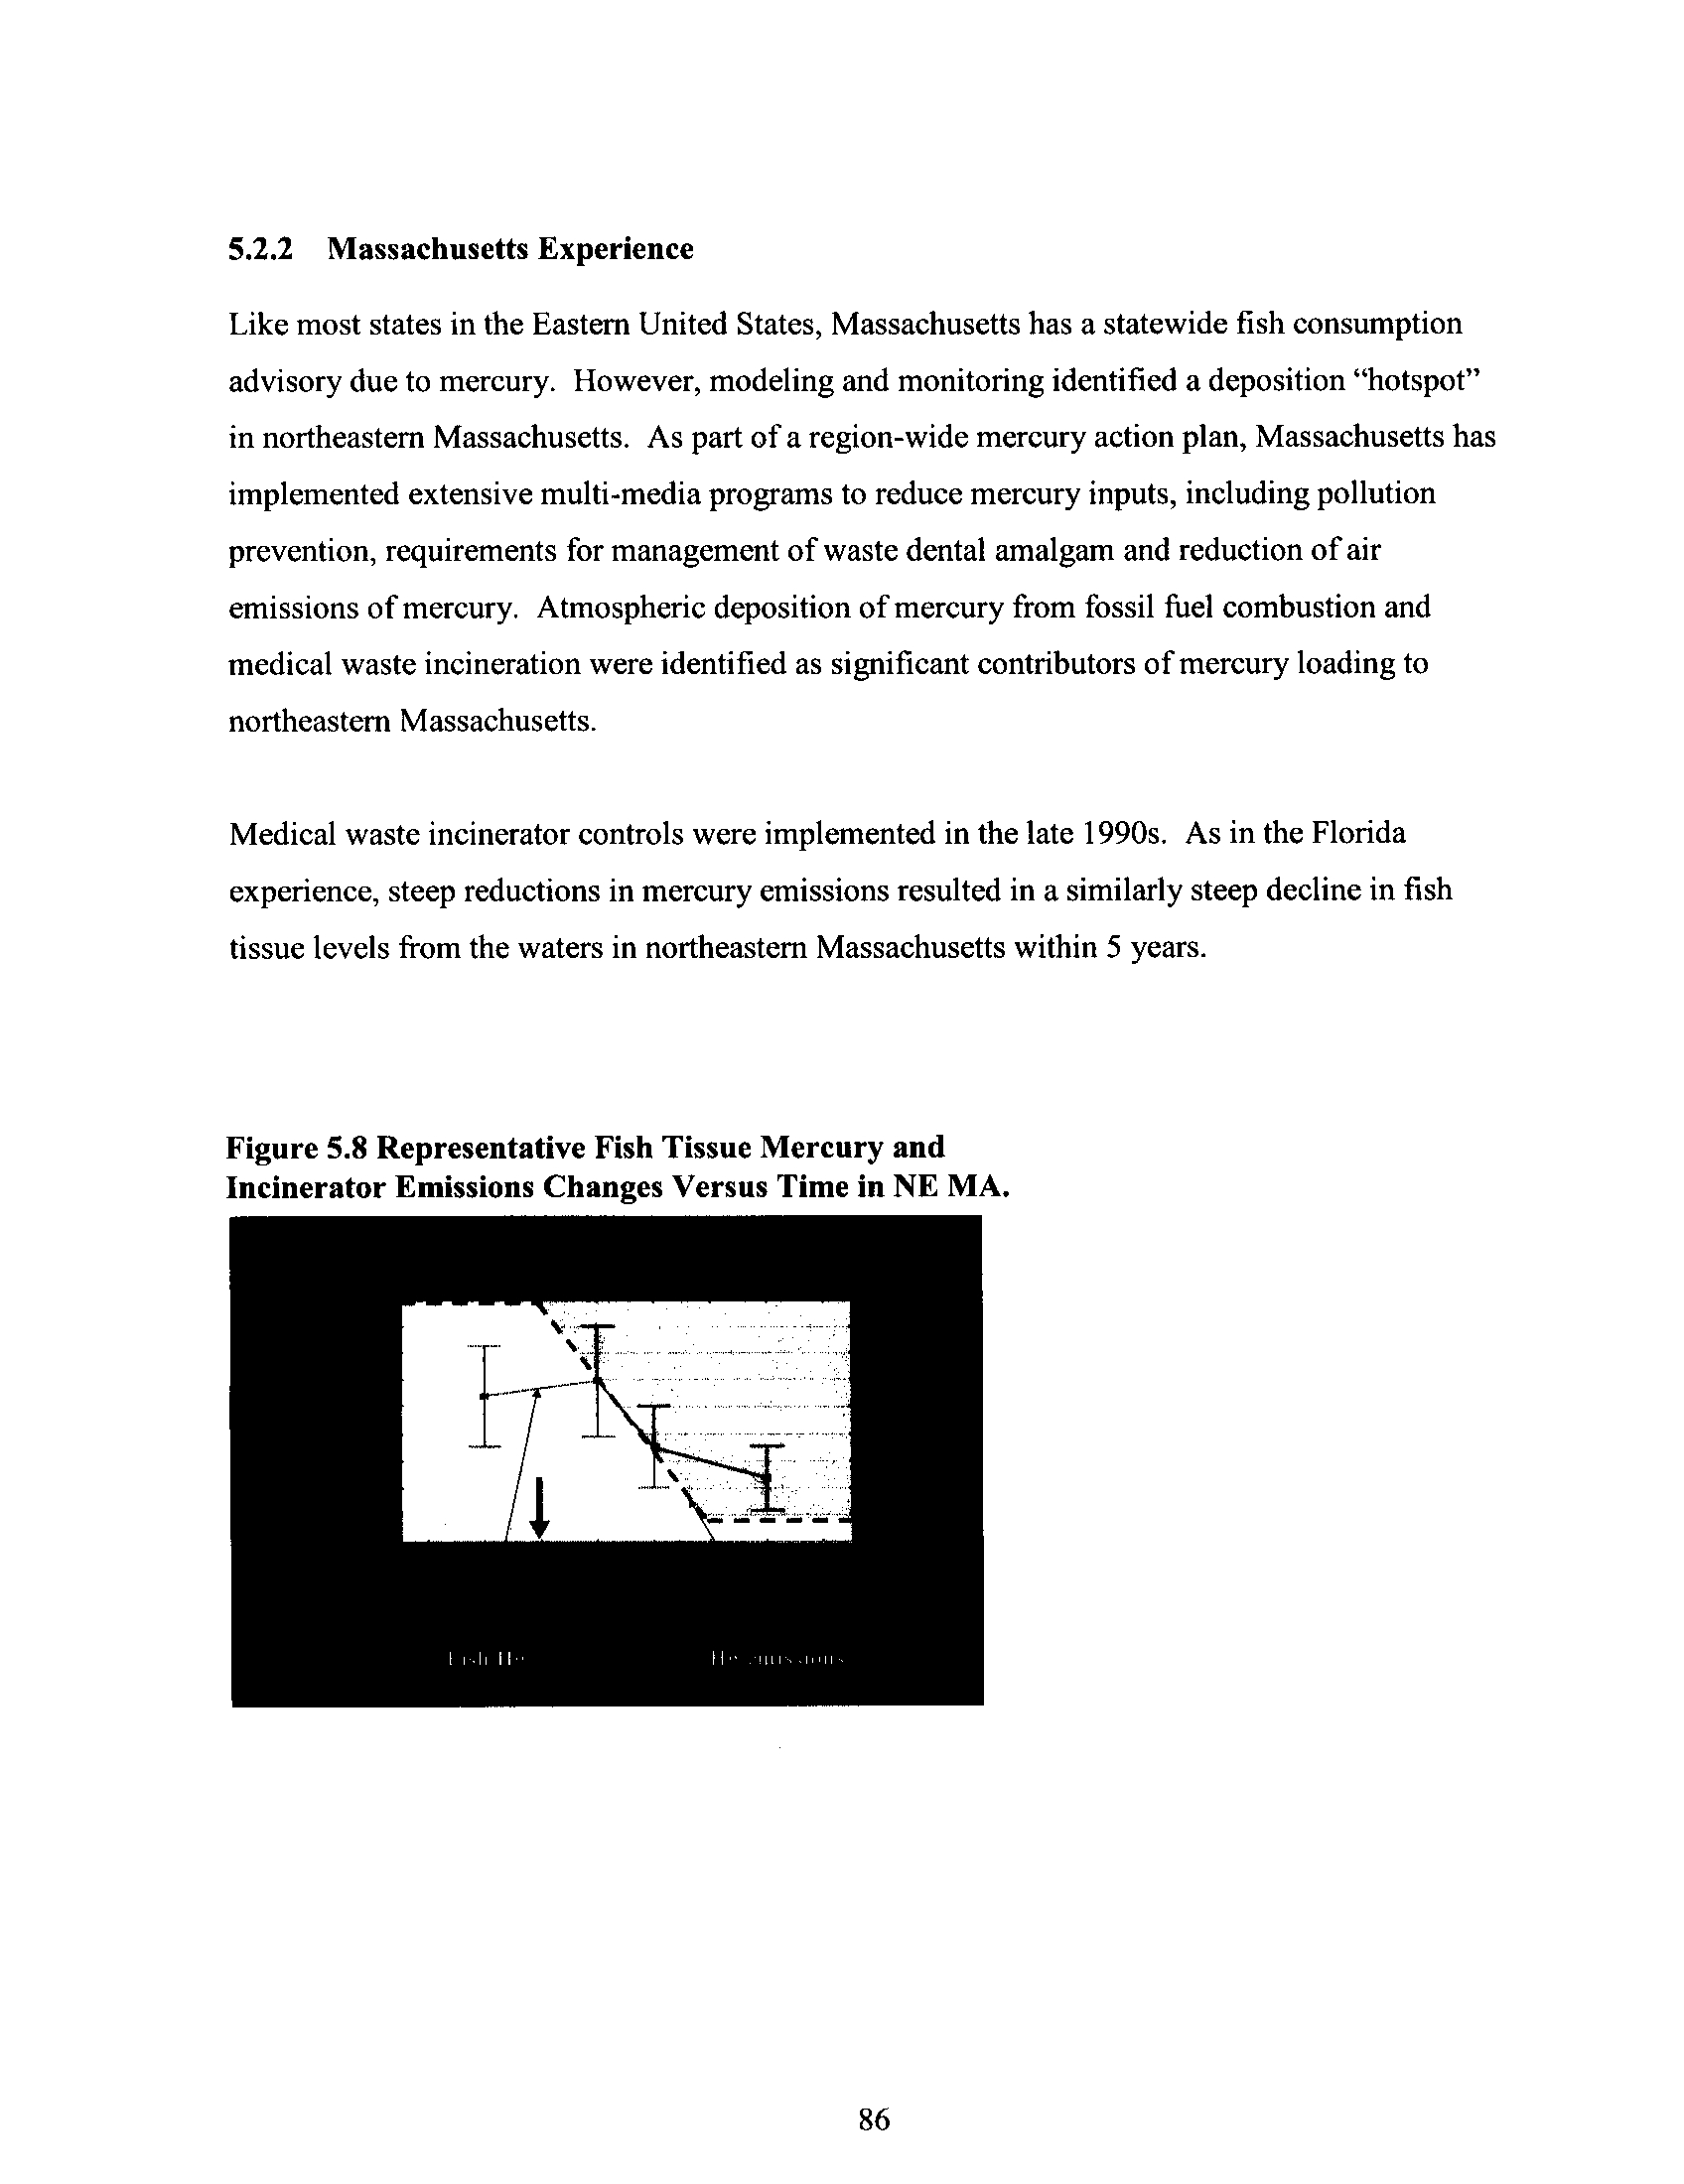
Figure 5 .8
Representative Fish Tissue Mercury and Incinerator Emissions
Changes Versus Time in NE MA
86
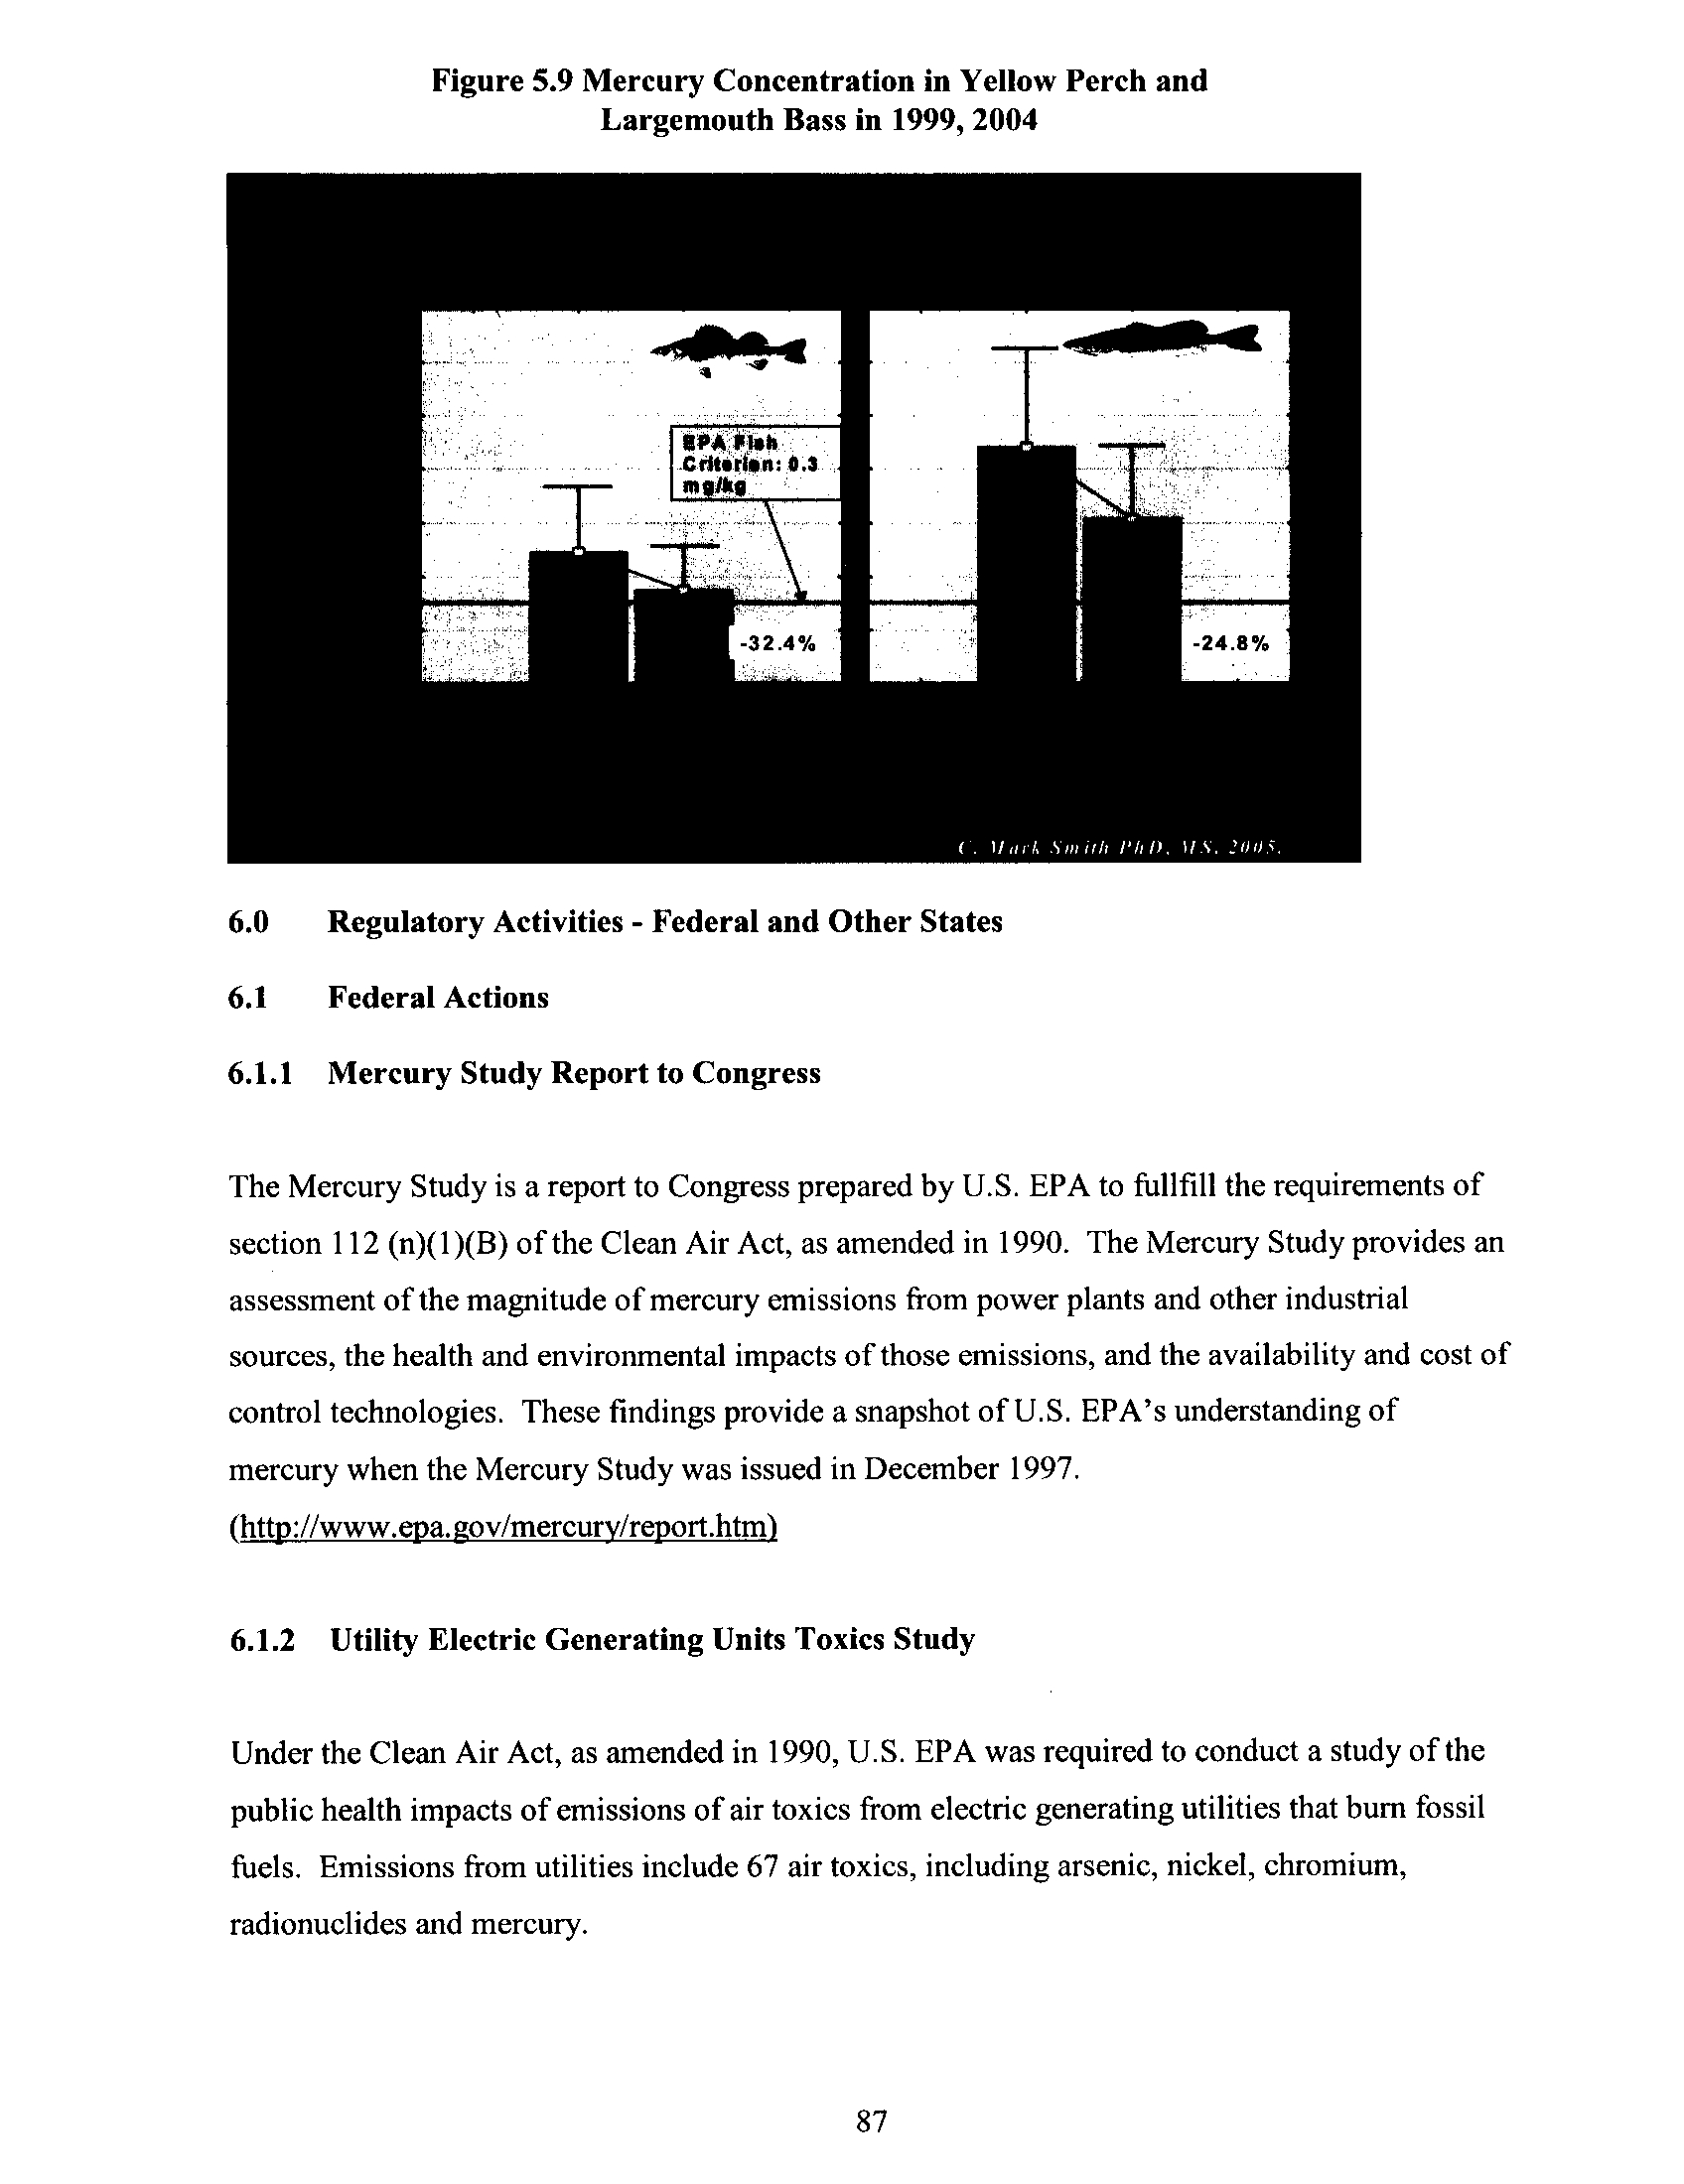
Figure 5 .9
Mercury Concentration in Yellow Perch and Largemouth
Bass in 1999, 2004
87
1 3
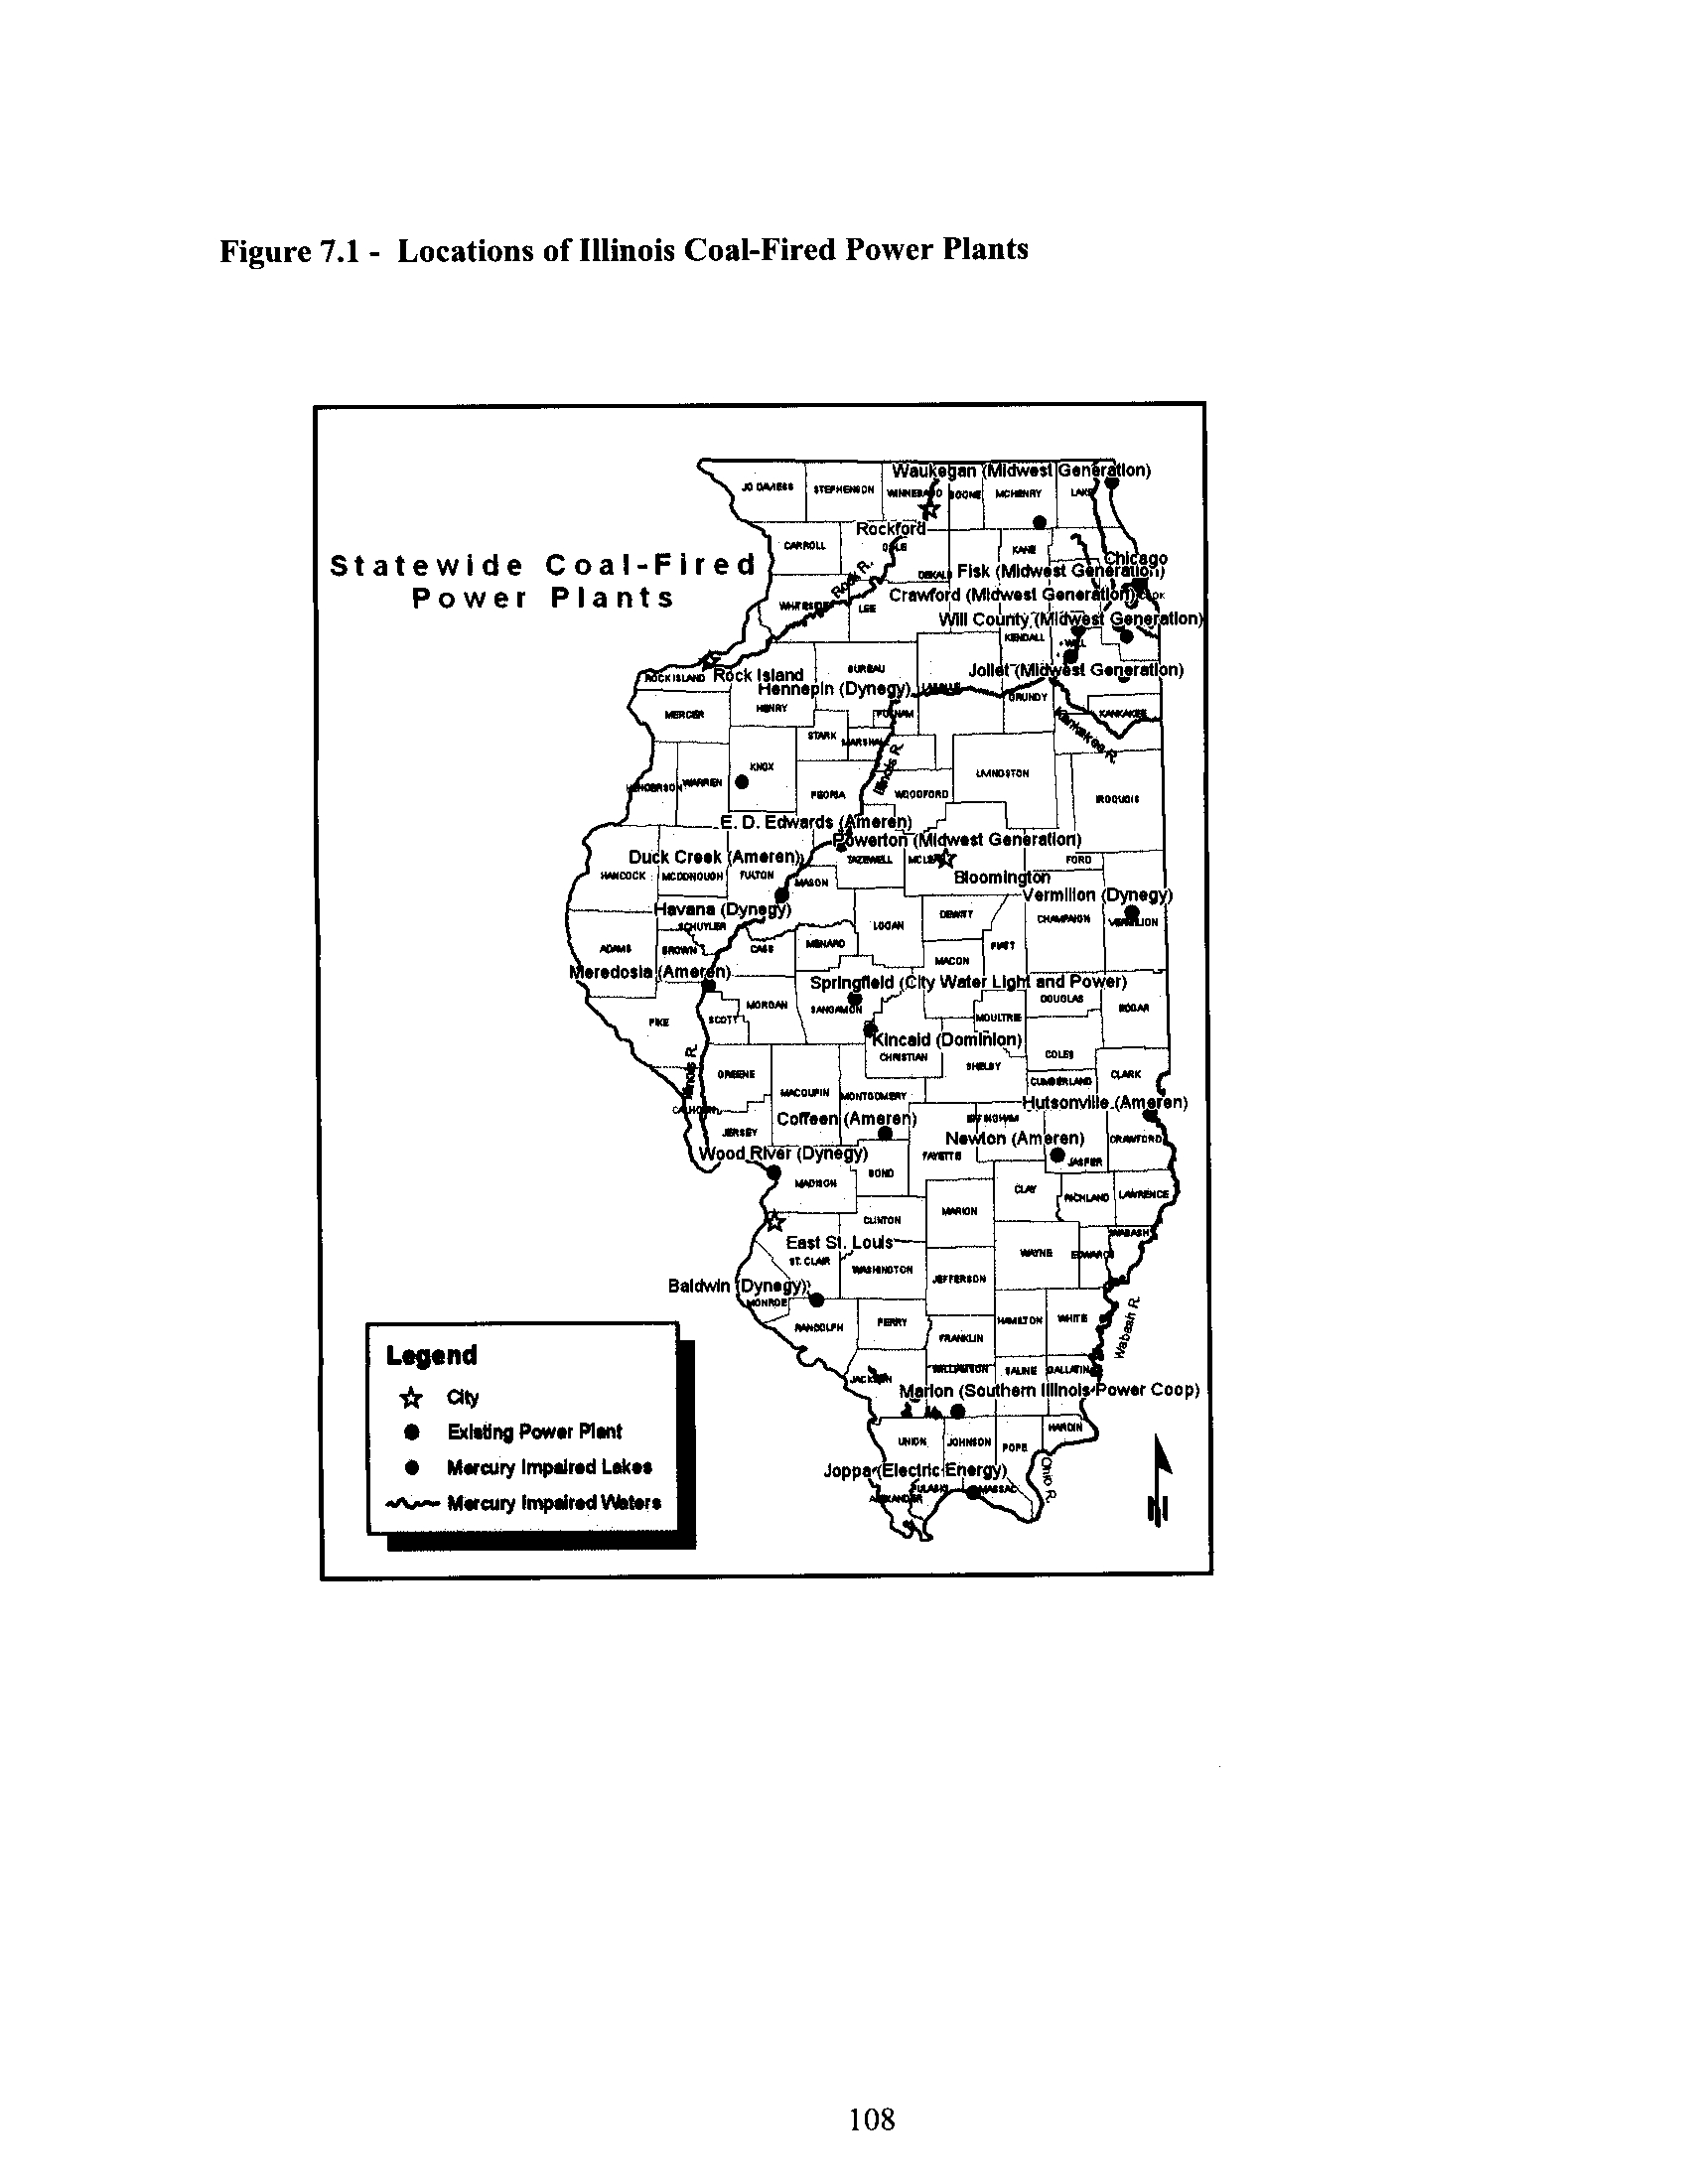
Figure 7.1
Locations of Illinois Coal-Fired Power Plants
108
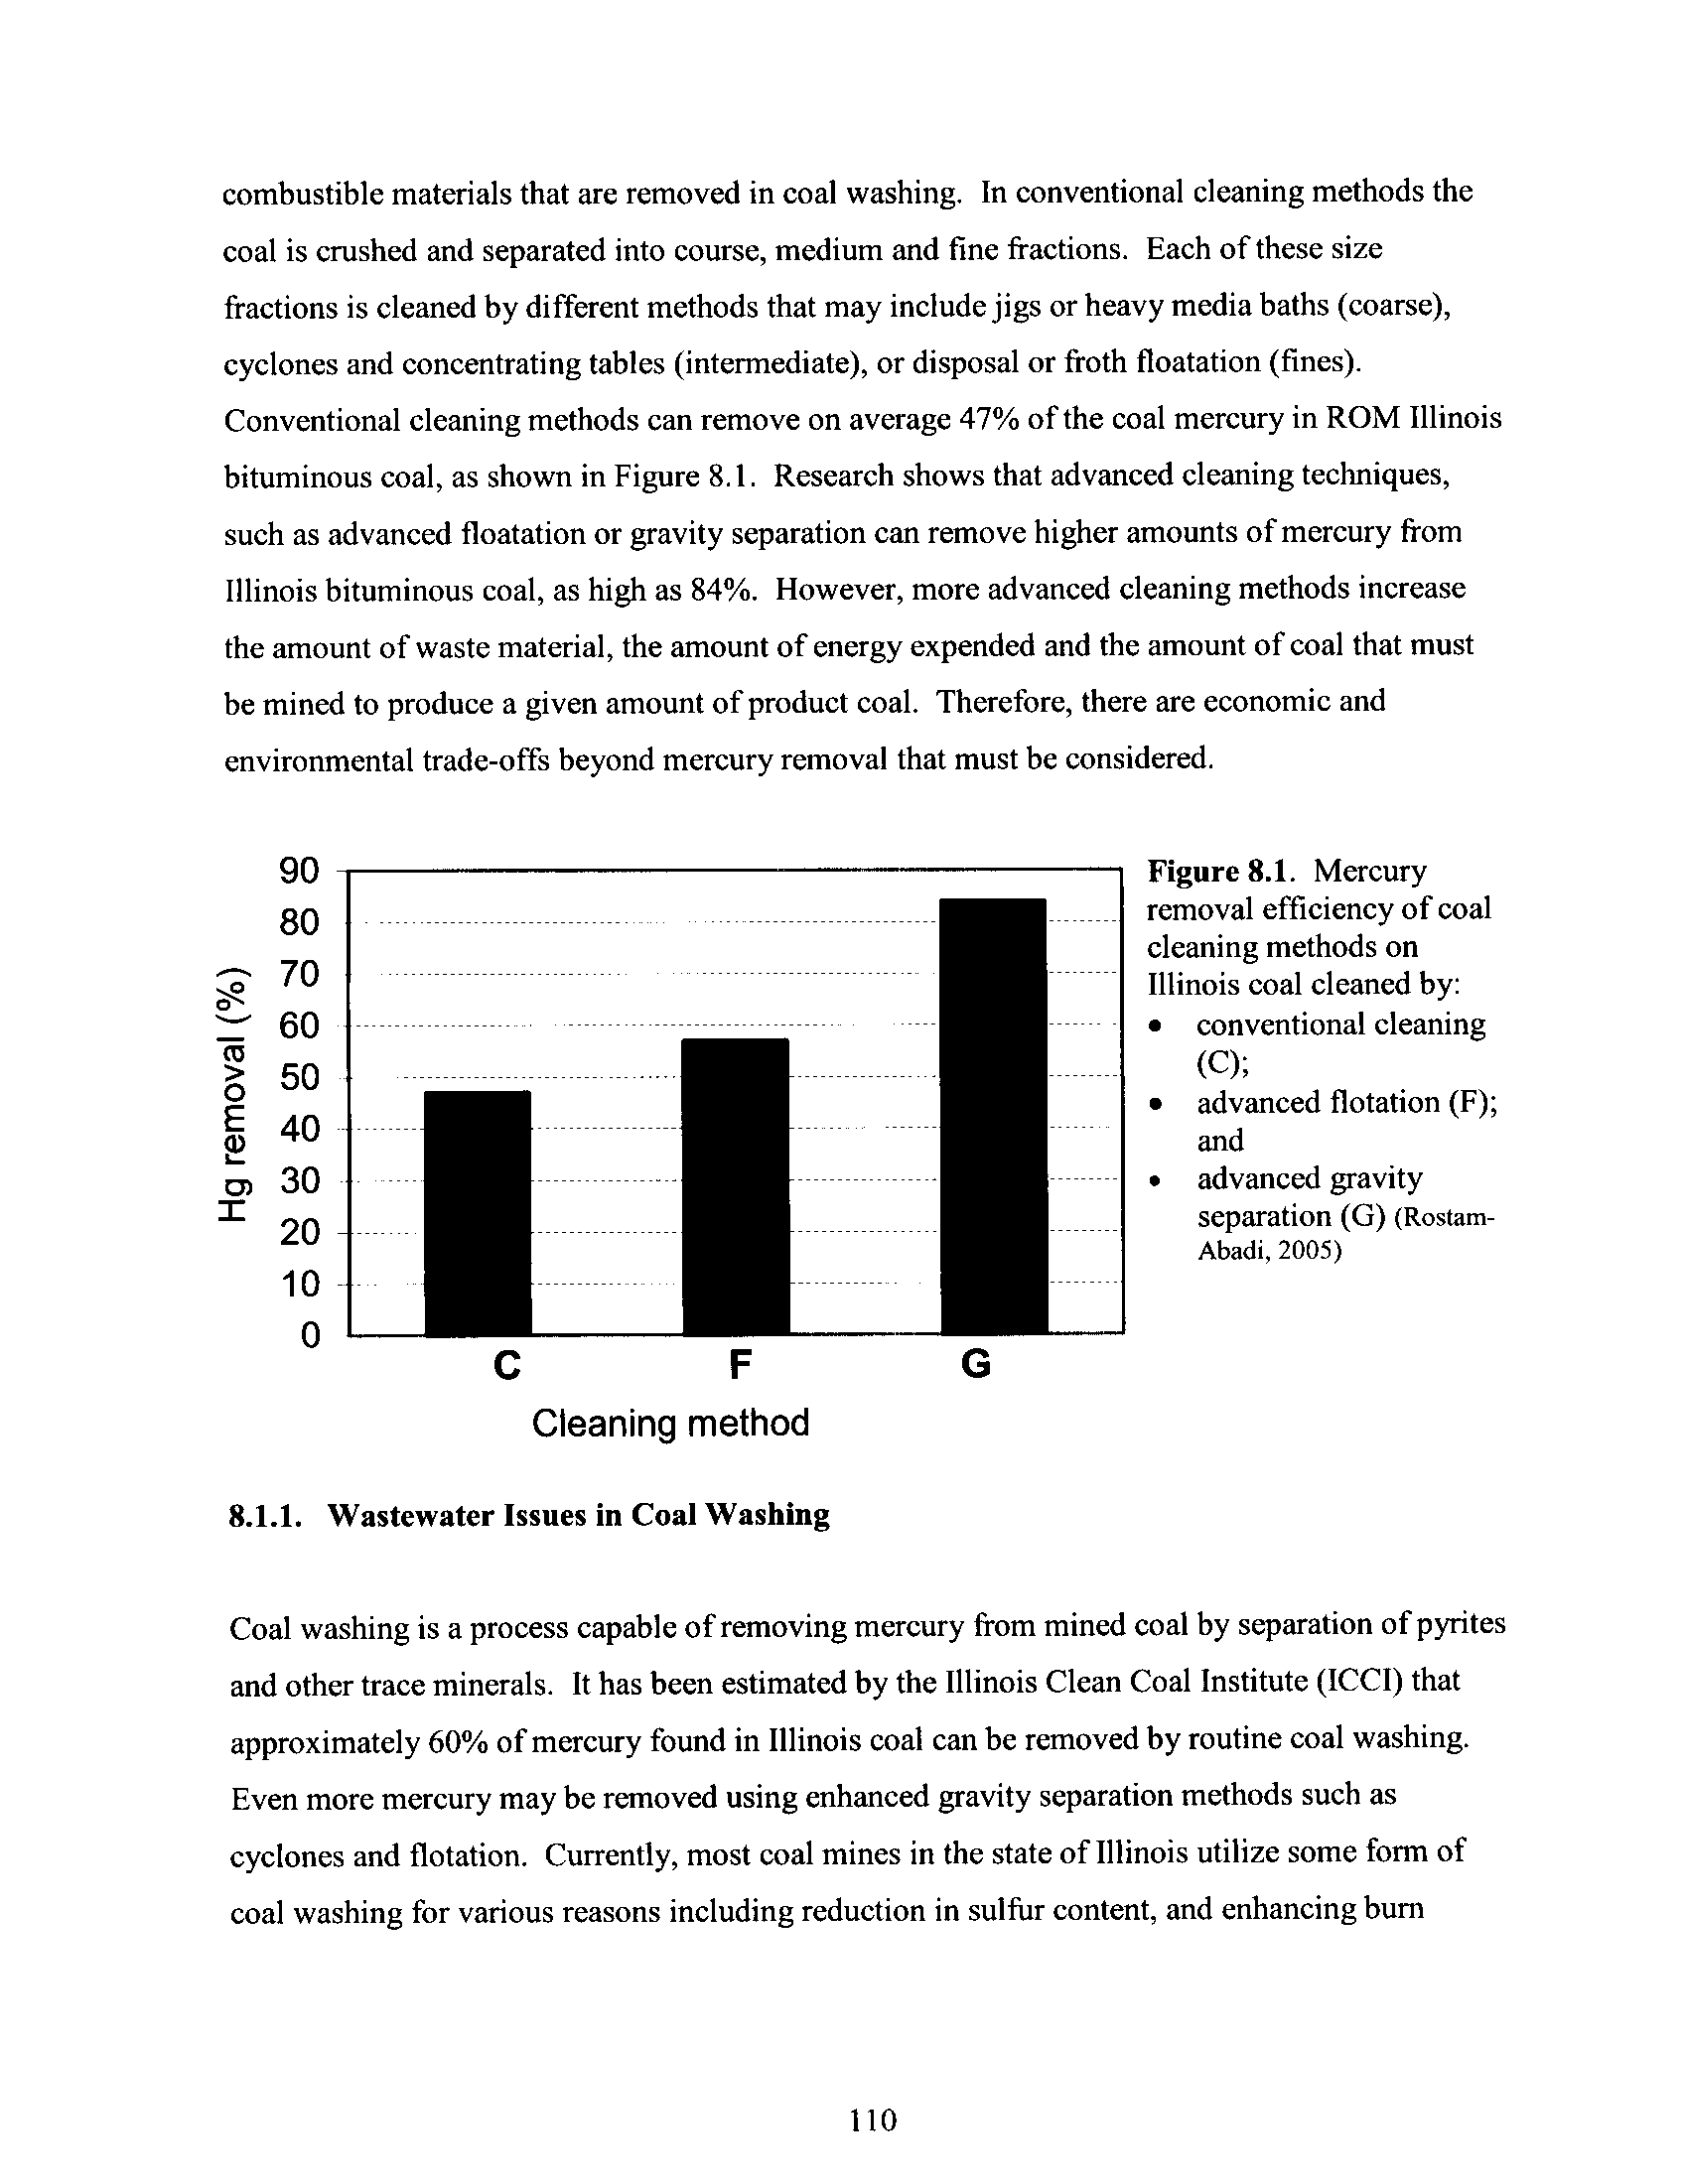
Figure 8.1
Mercury Removal Efficiency of Coal Cleaning Methods for IL
Coal
110
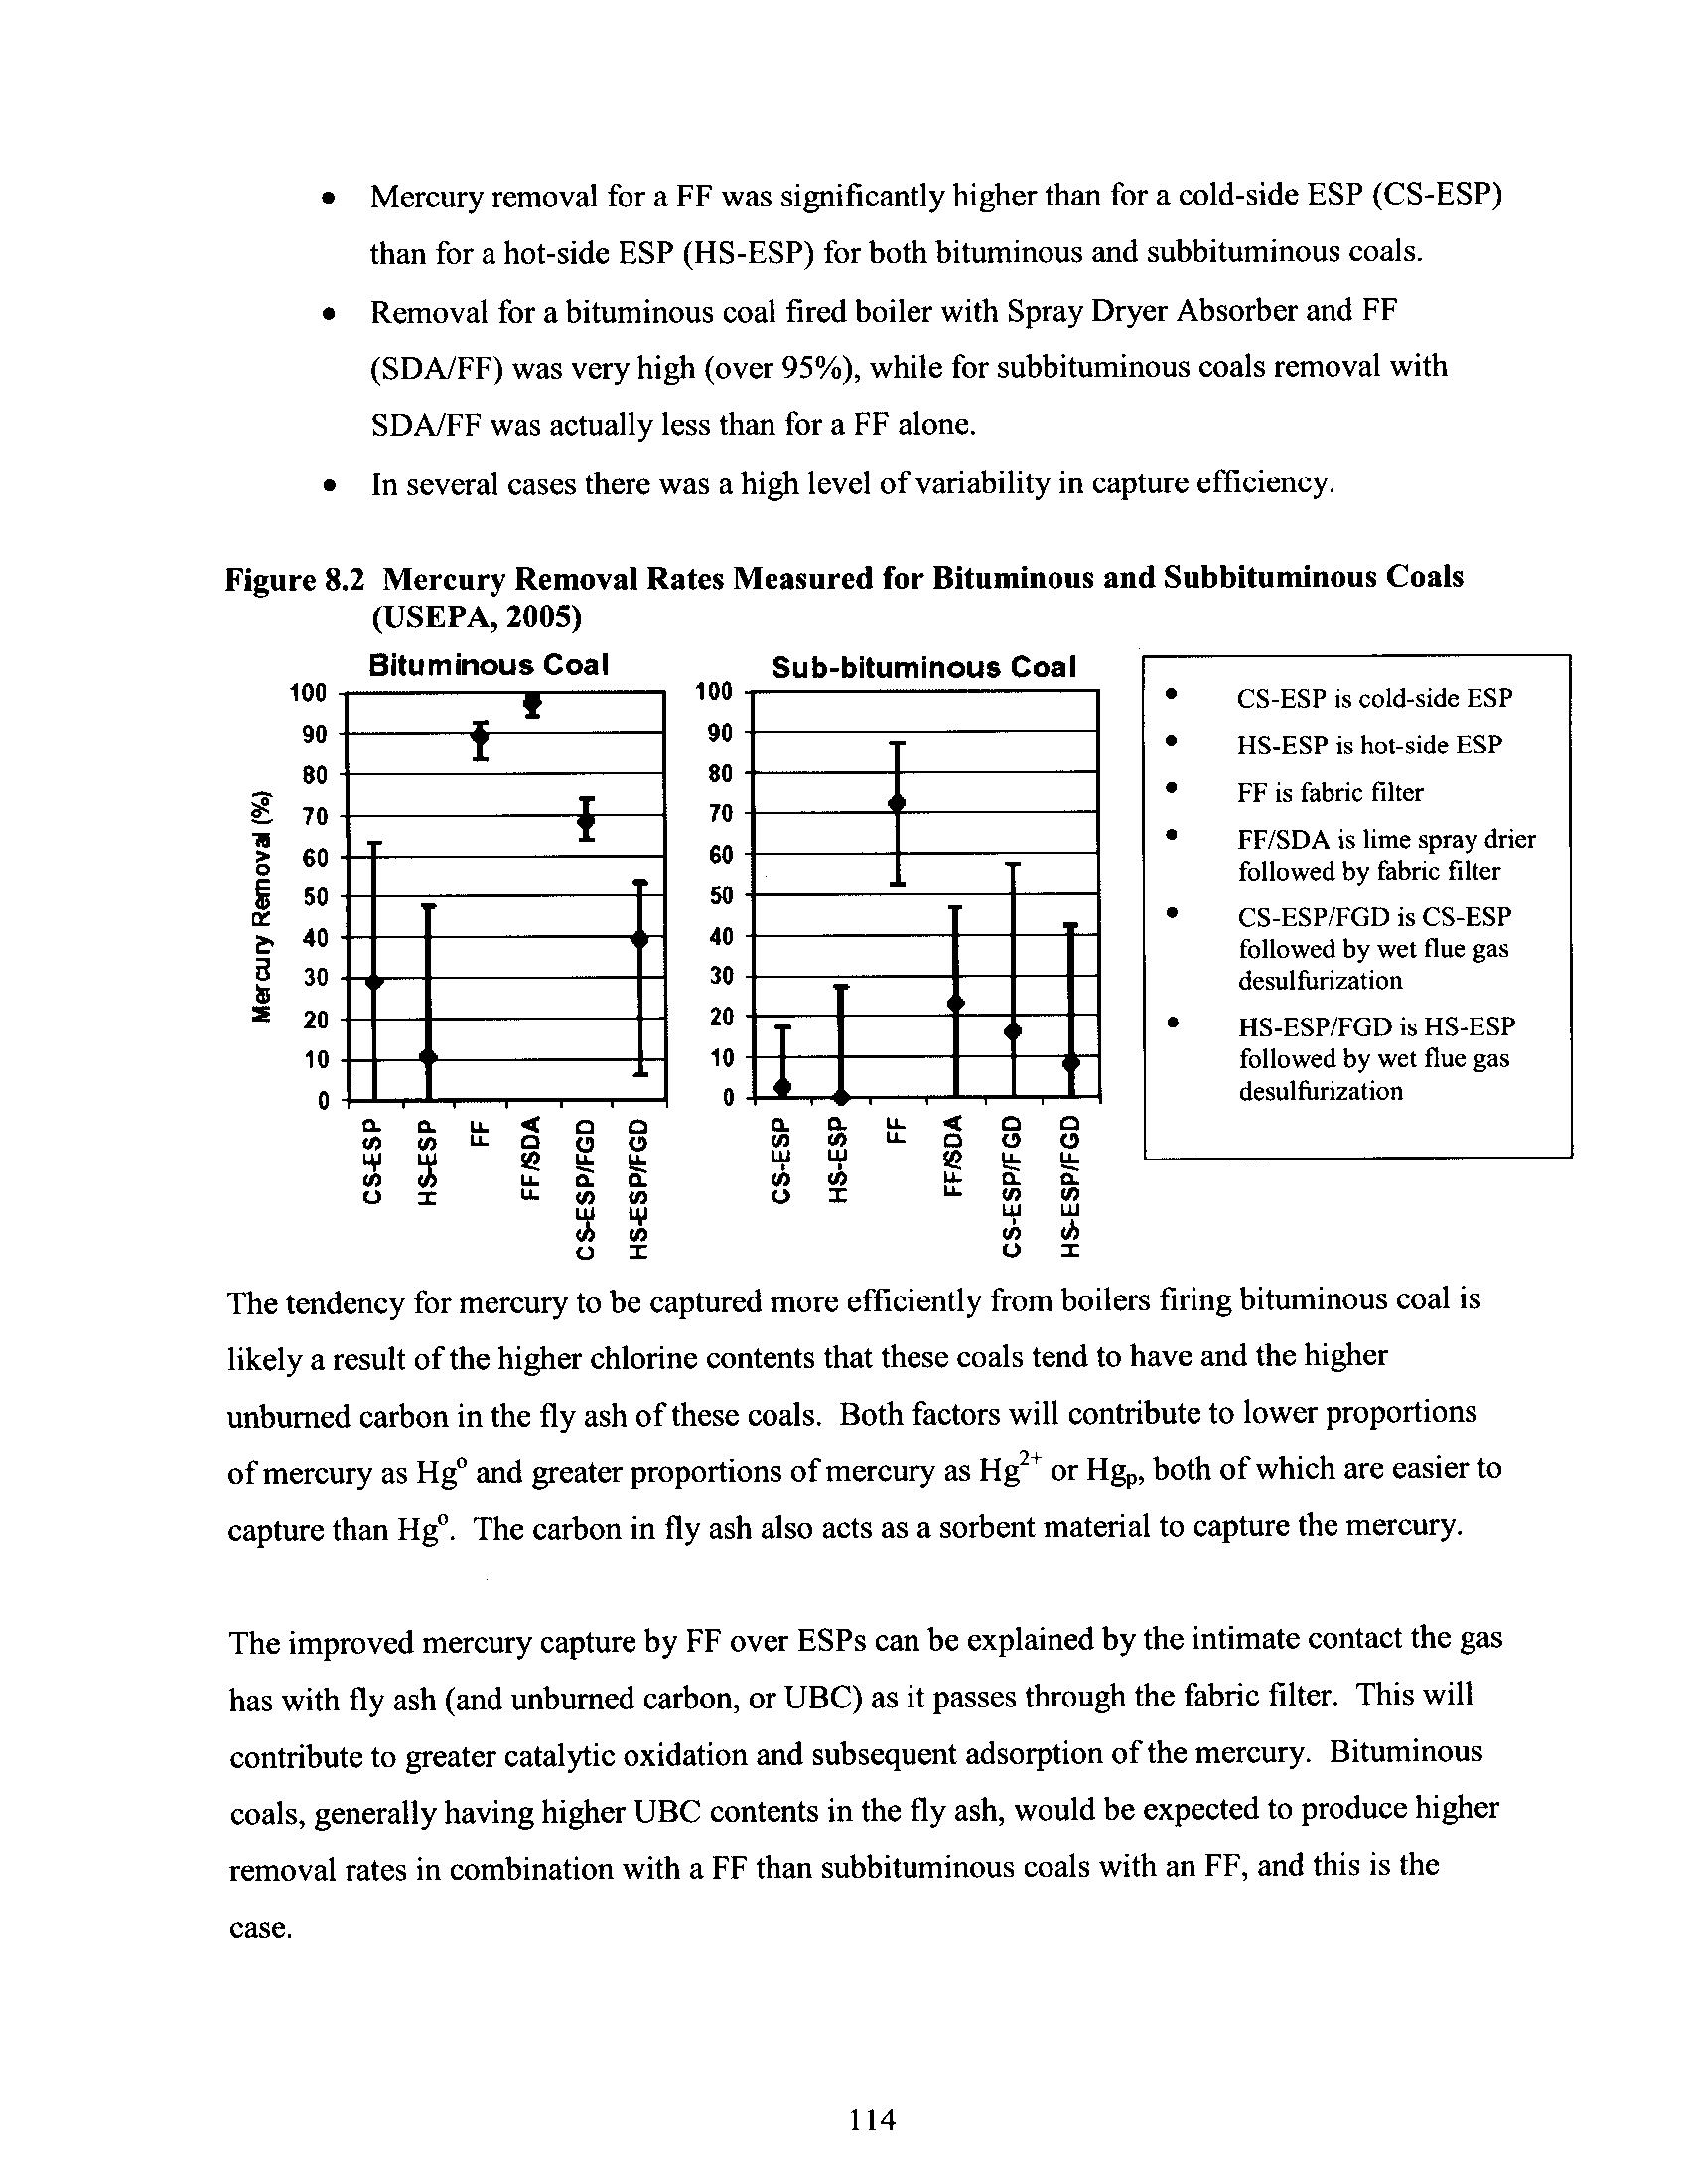
Figure 8 .2
Mercury Removal Rates Measured for Bituminous and
Subbituminous Coals (USEPA, 2005)
114
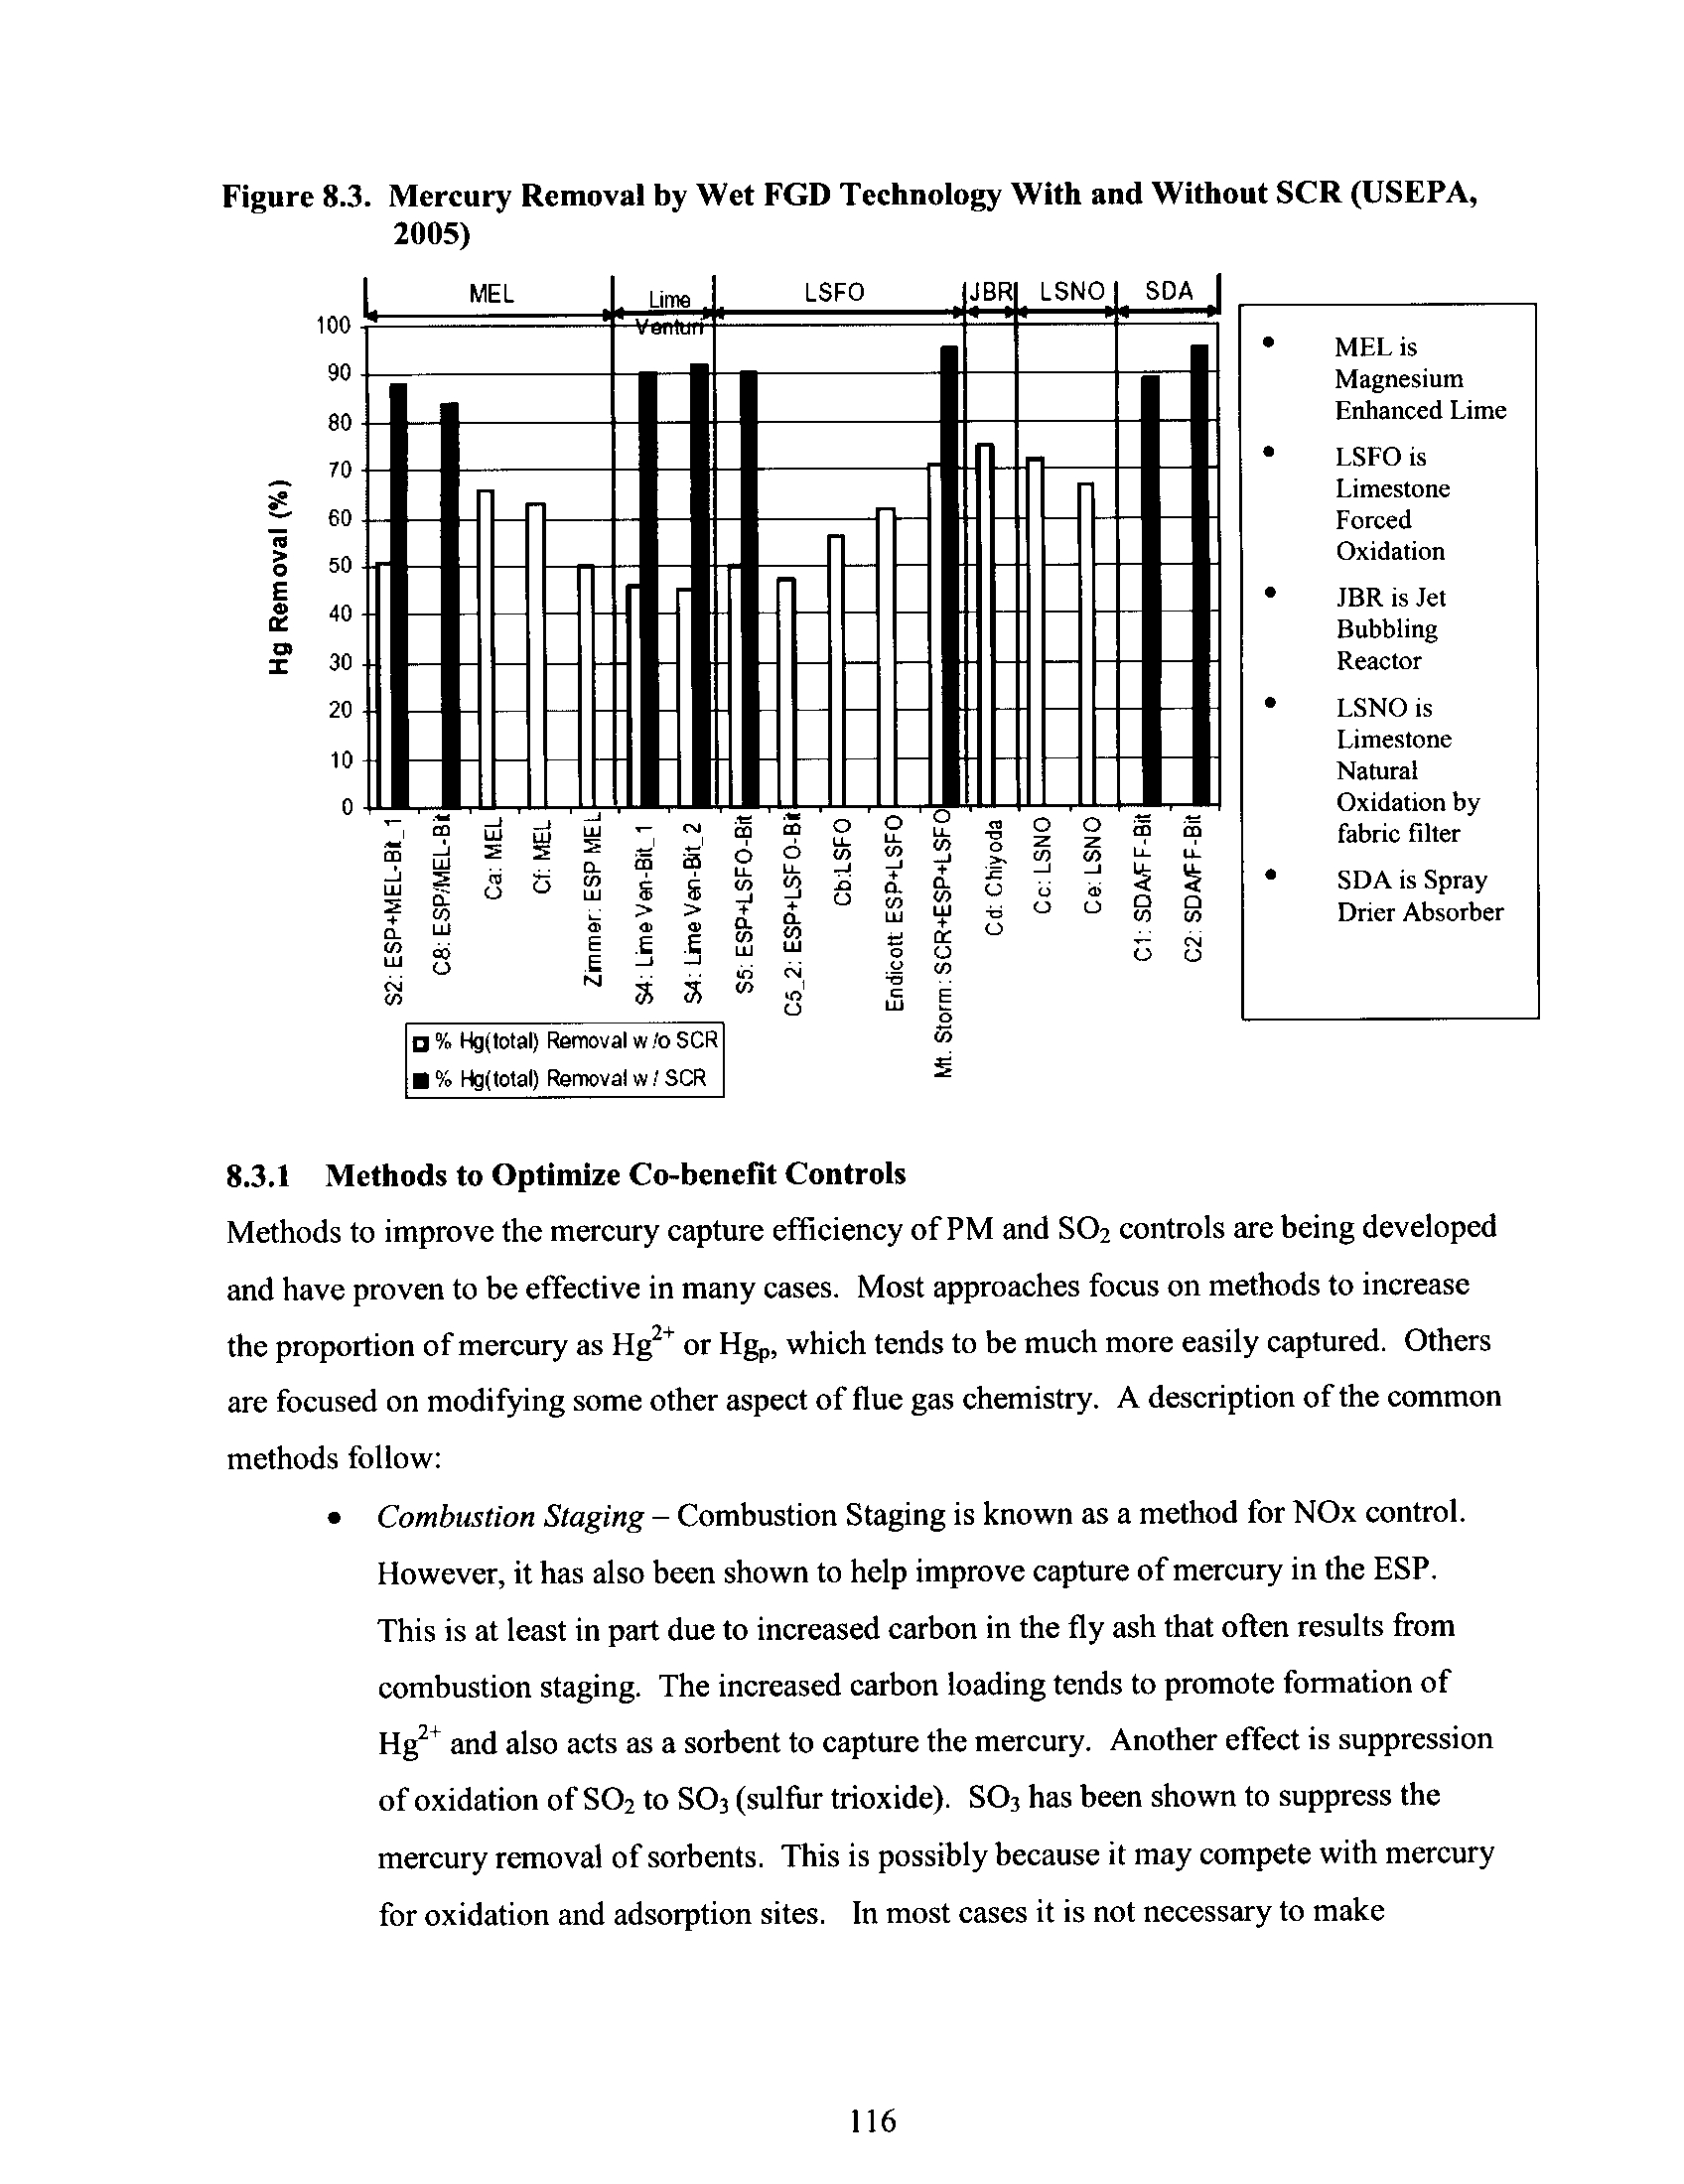
Figure 8 .3
Mercury Removal by Wet FGD Technology With and Without
SCR (USEPA, 2005)
116
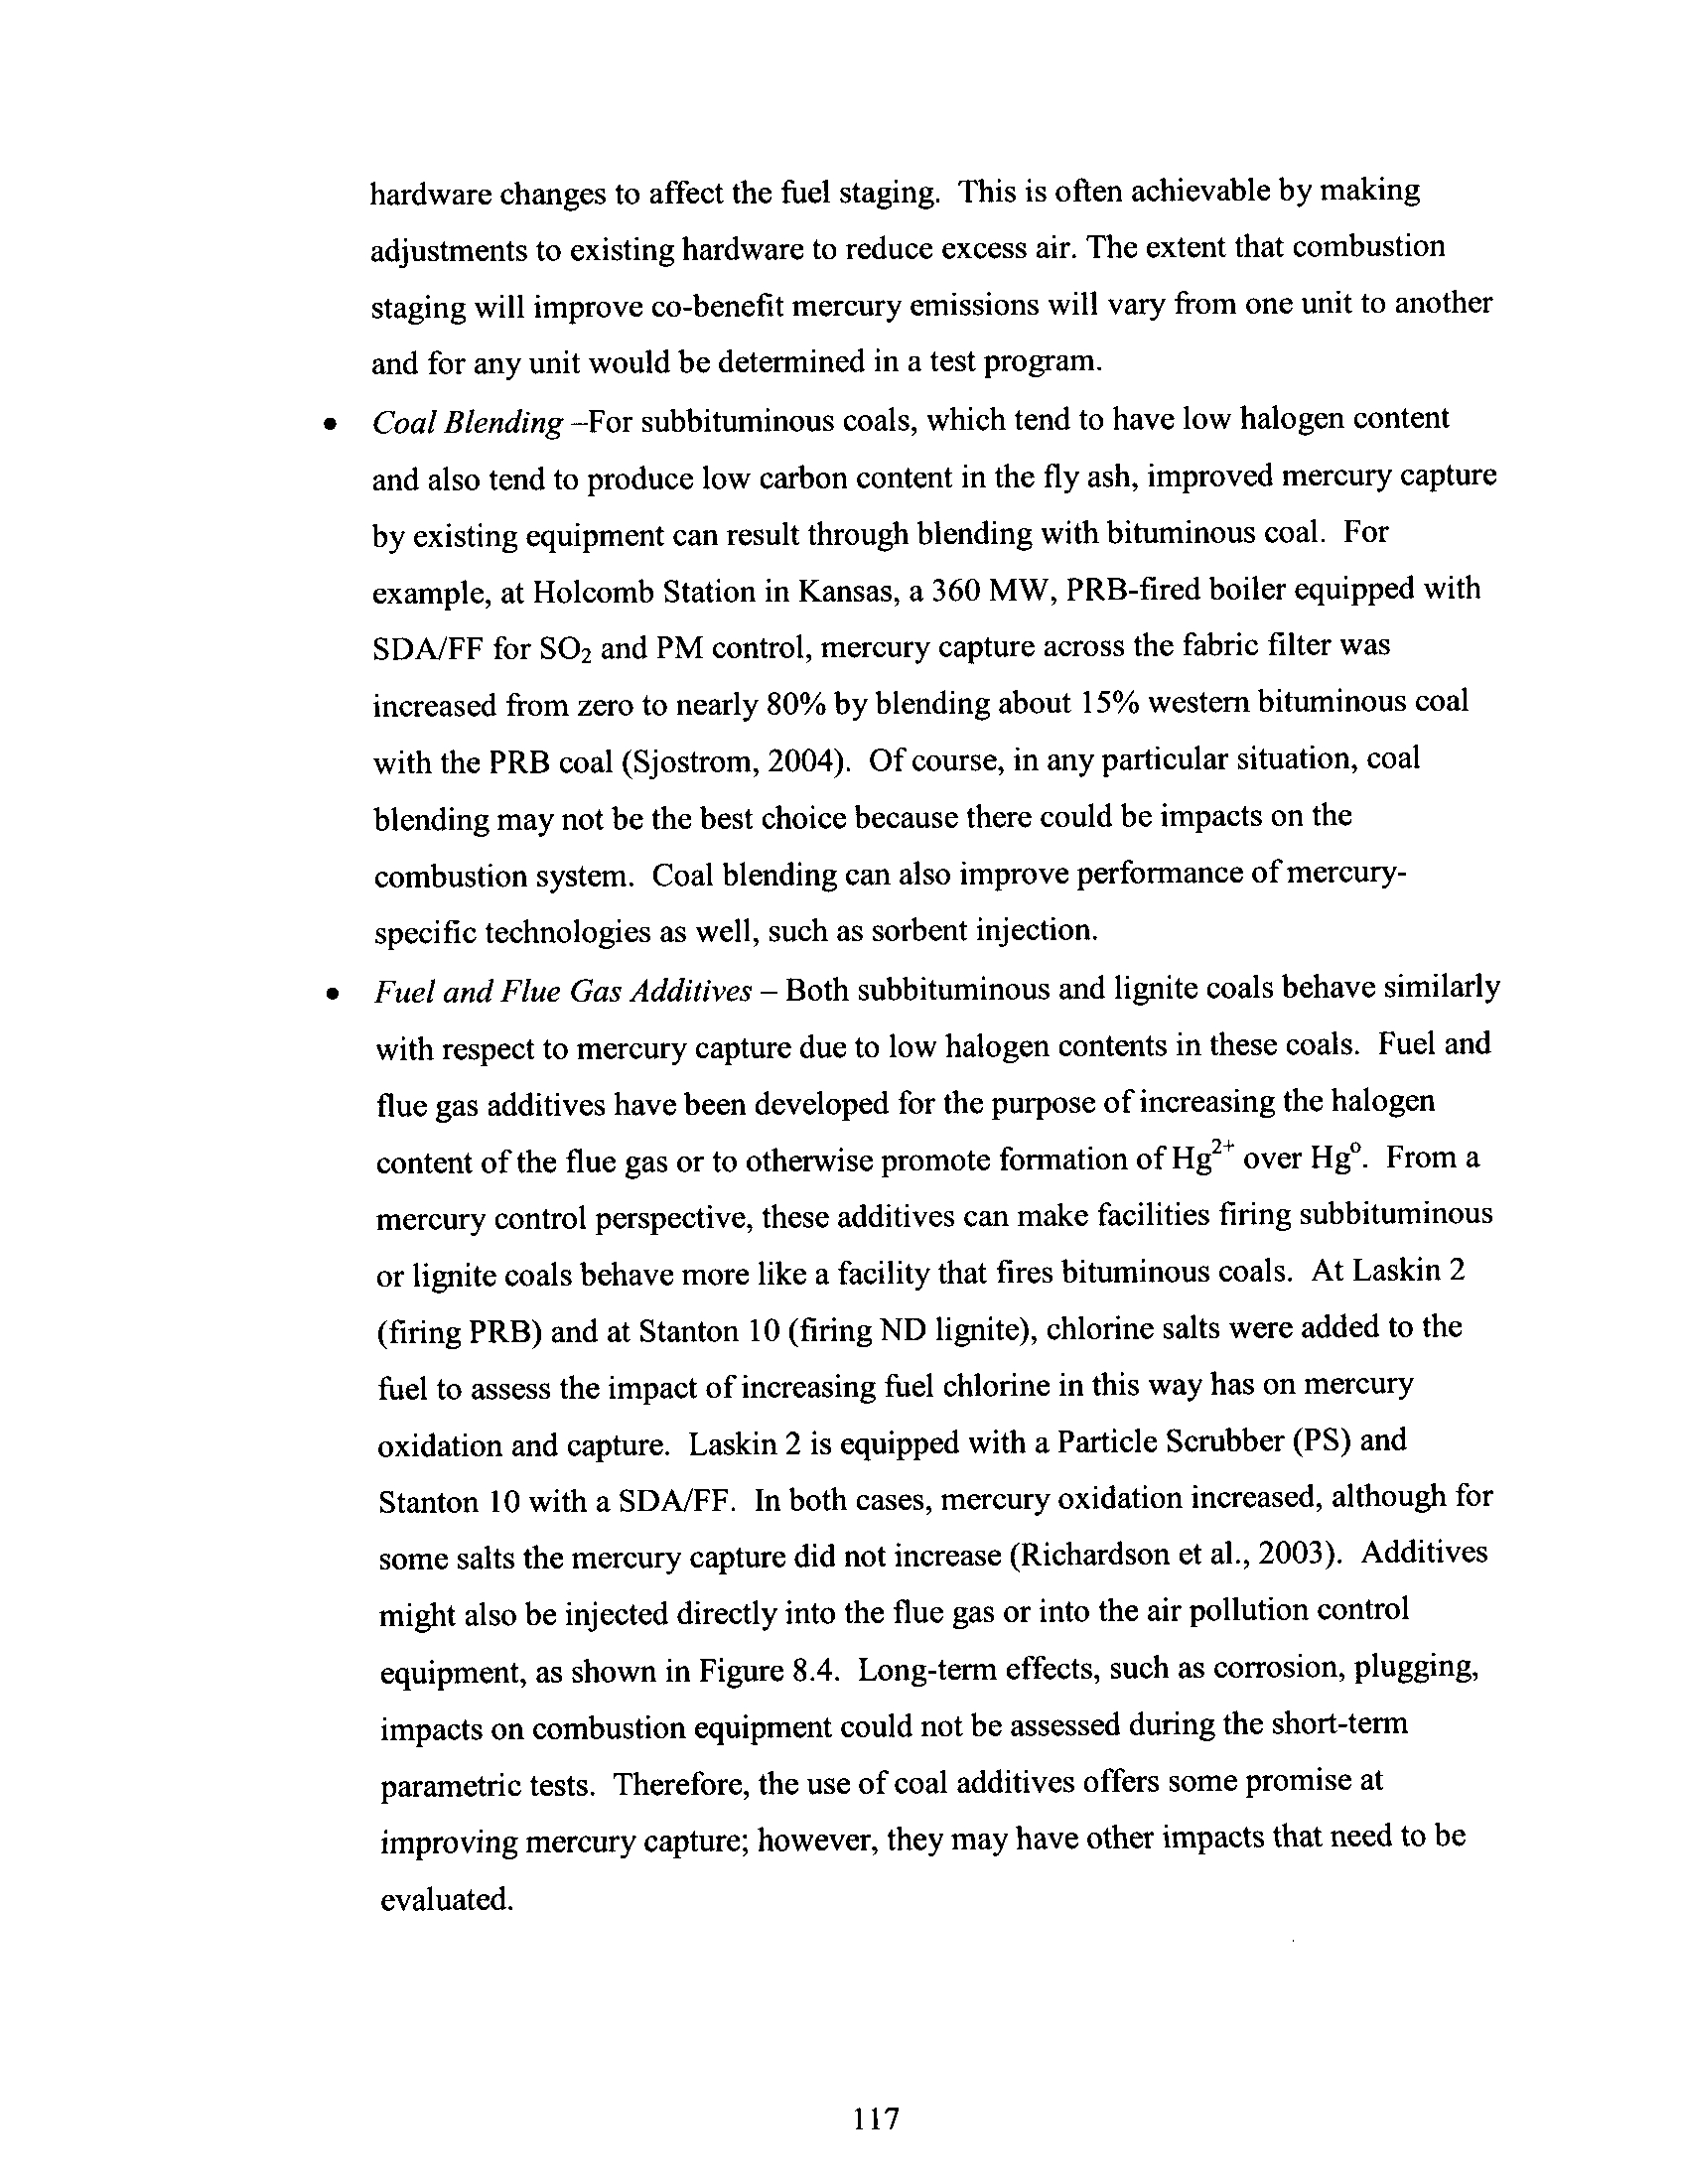
Figure 8 .4
Locations for Addition of Oxidizing Chemicals or Oxidizing
Catalysts
118
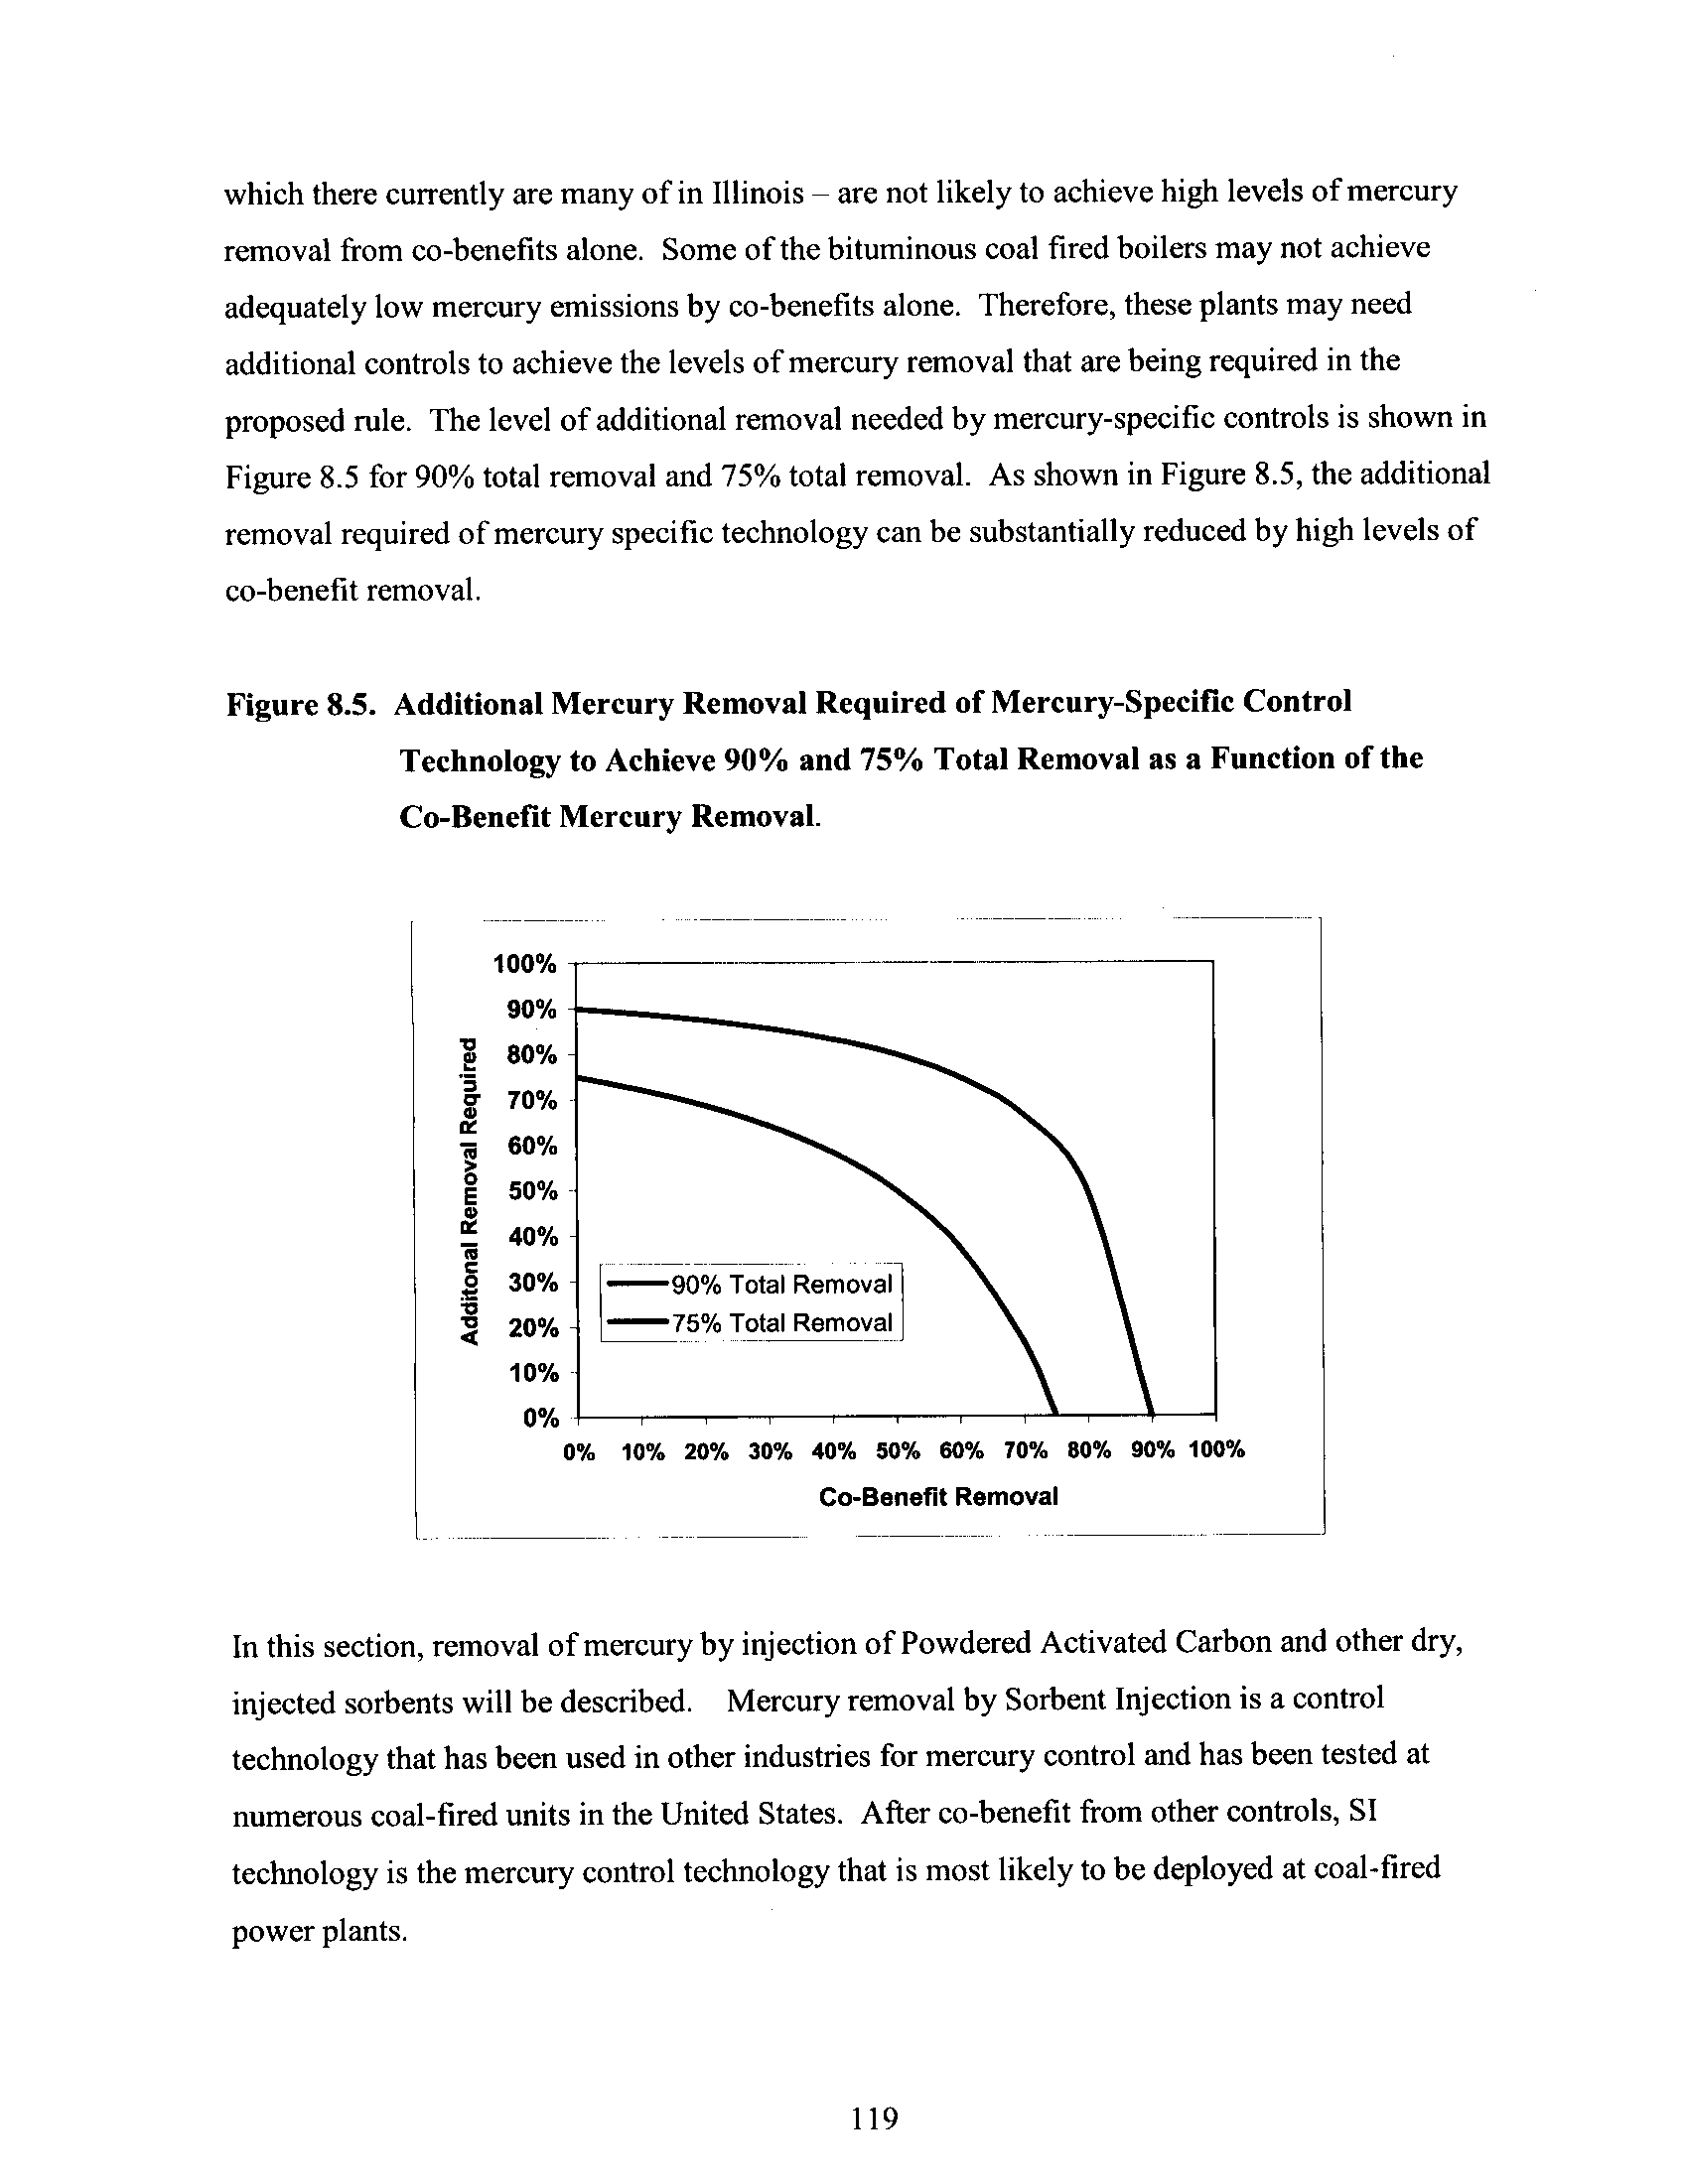
Figure 8.5
Additional Mercury Removal Required of Mercury-Specific
Control Technology to Achieve 90% and 75% Total
Removal as a Function of the Cobenefit Mercury Removal
119
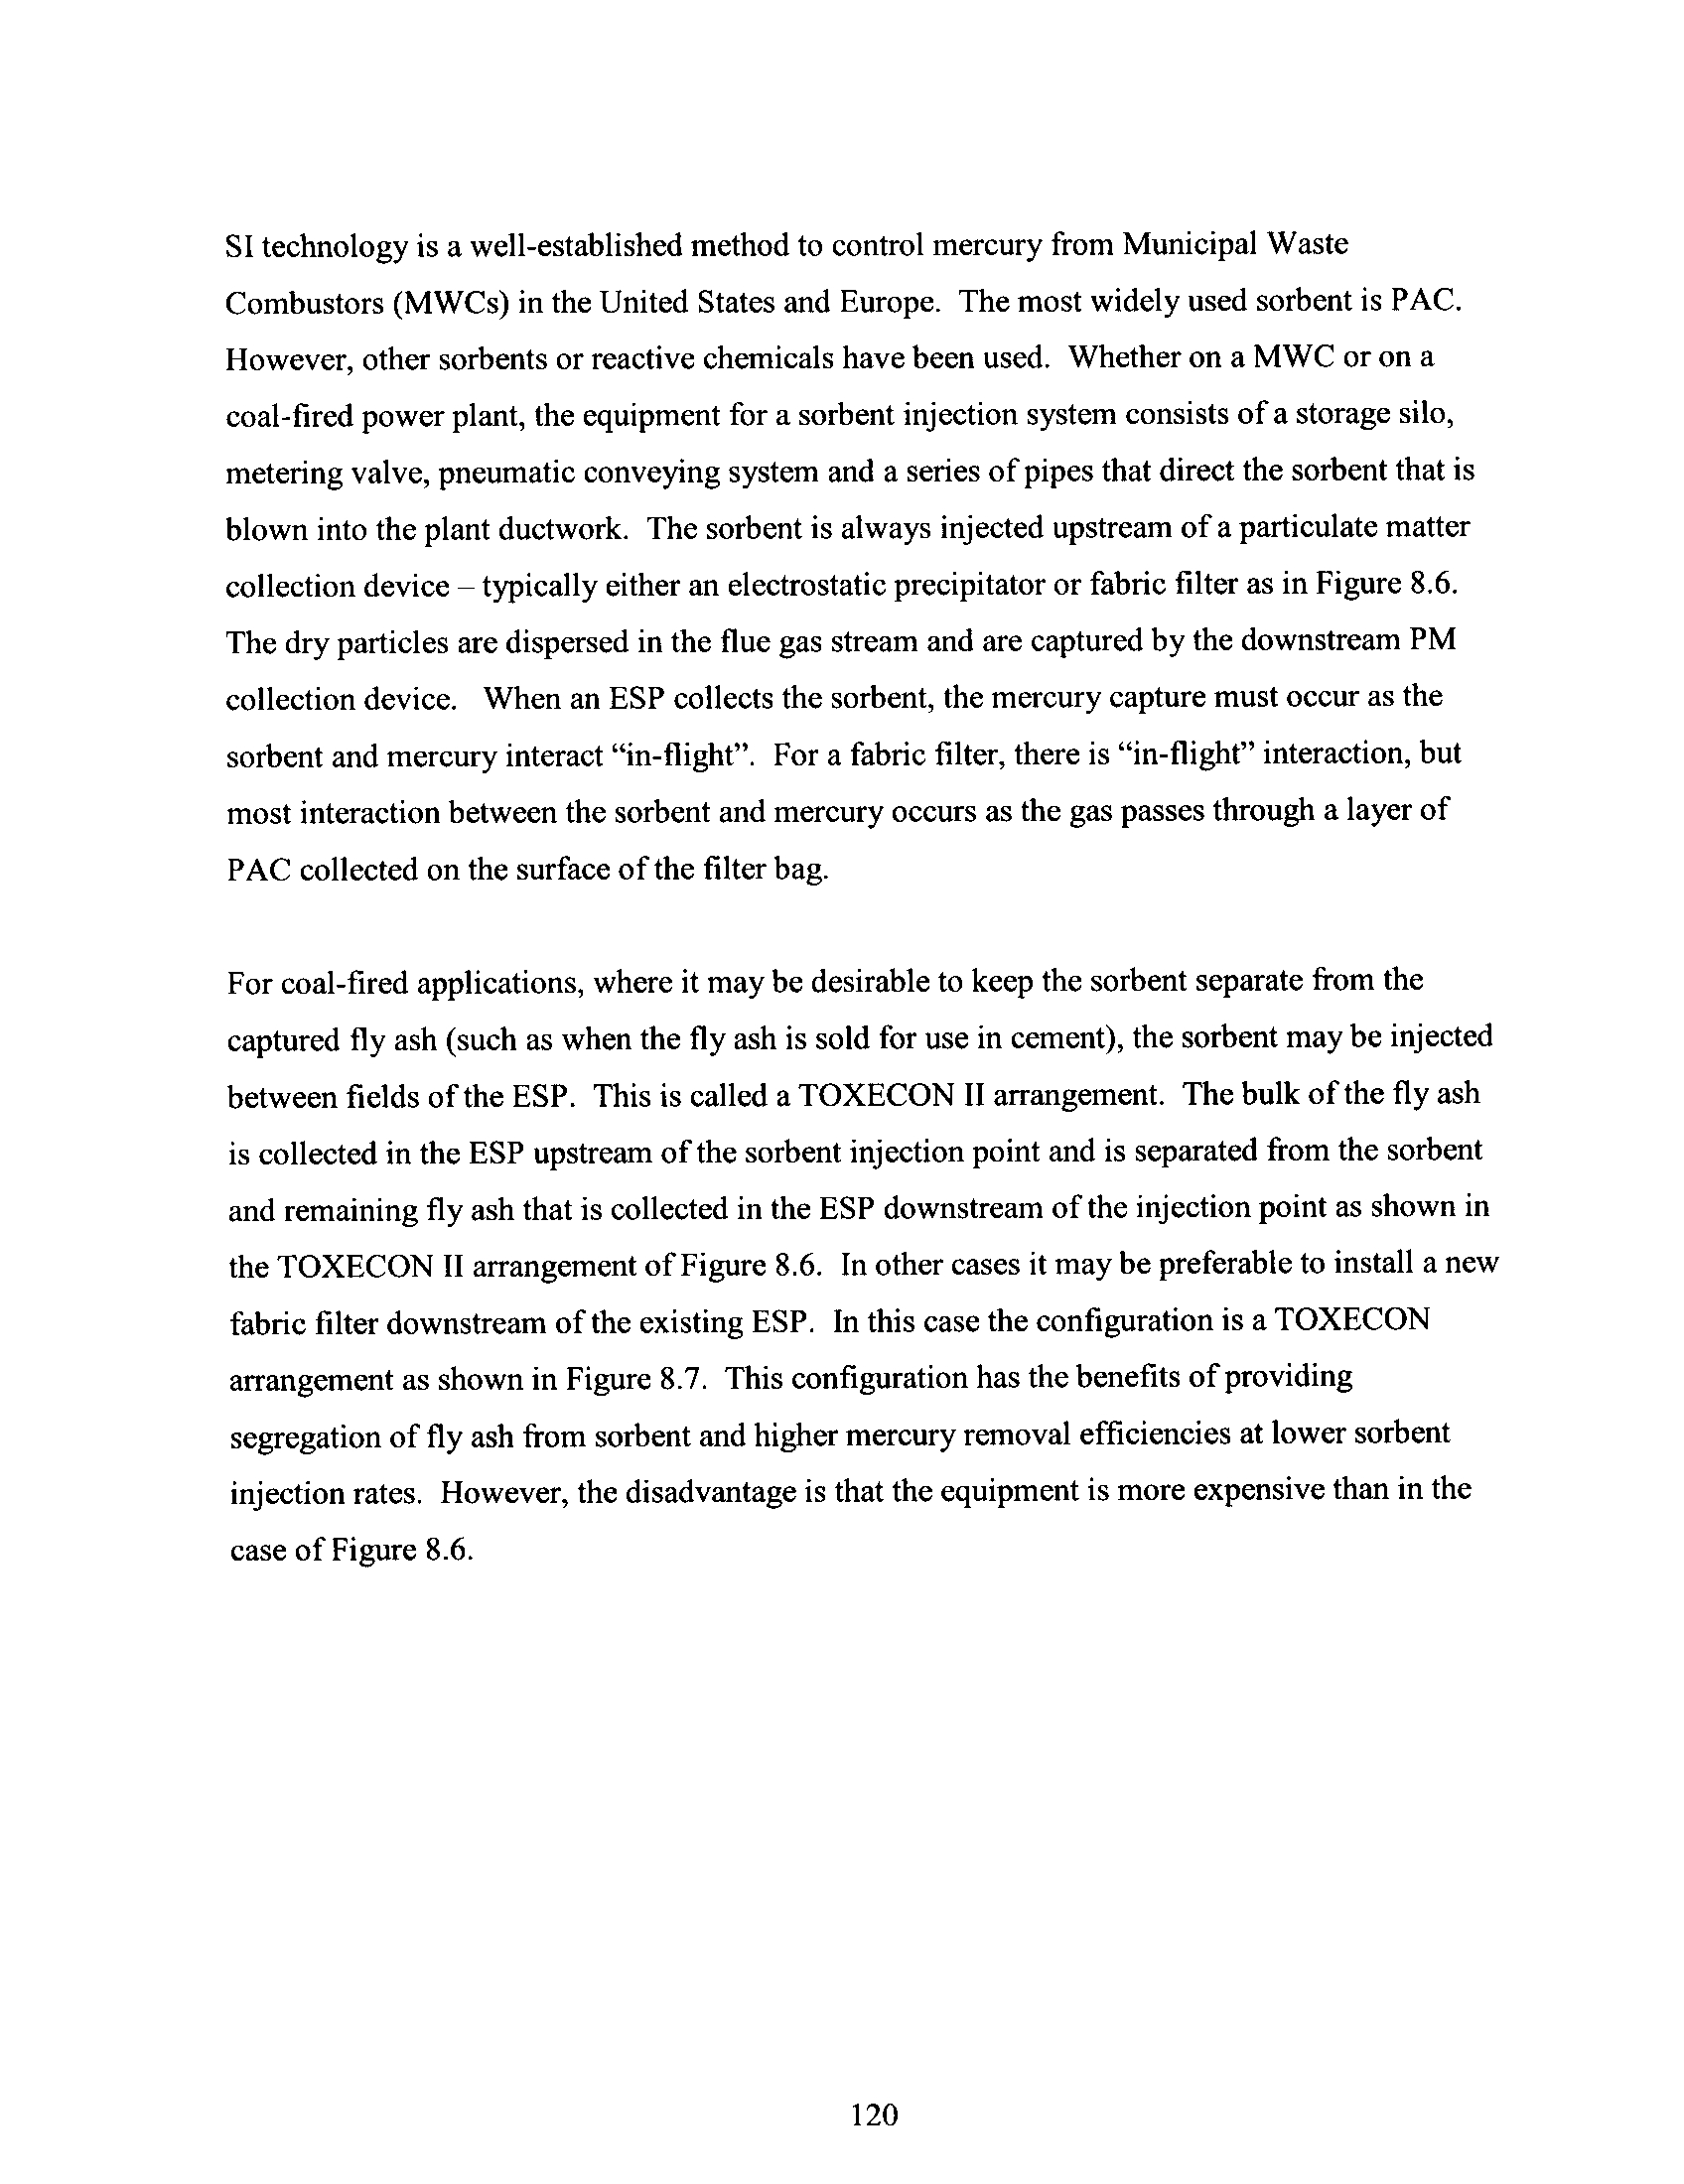
Figure 8 .6
Arrangement for a Typical Sorbent Injection System
121
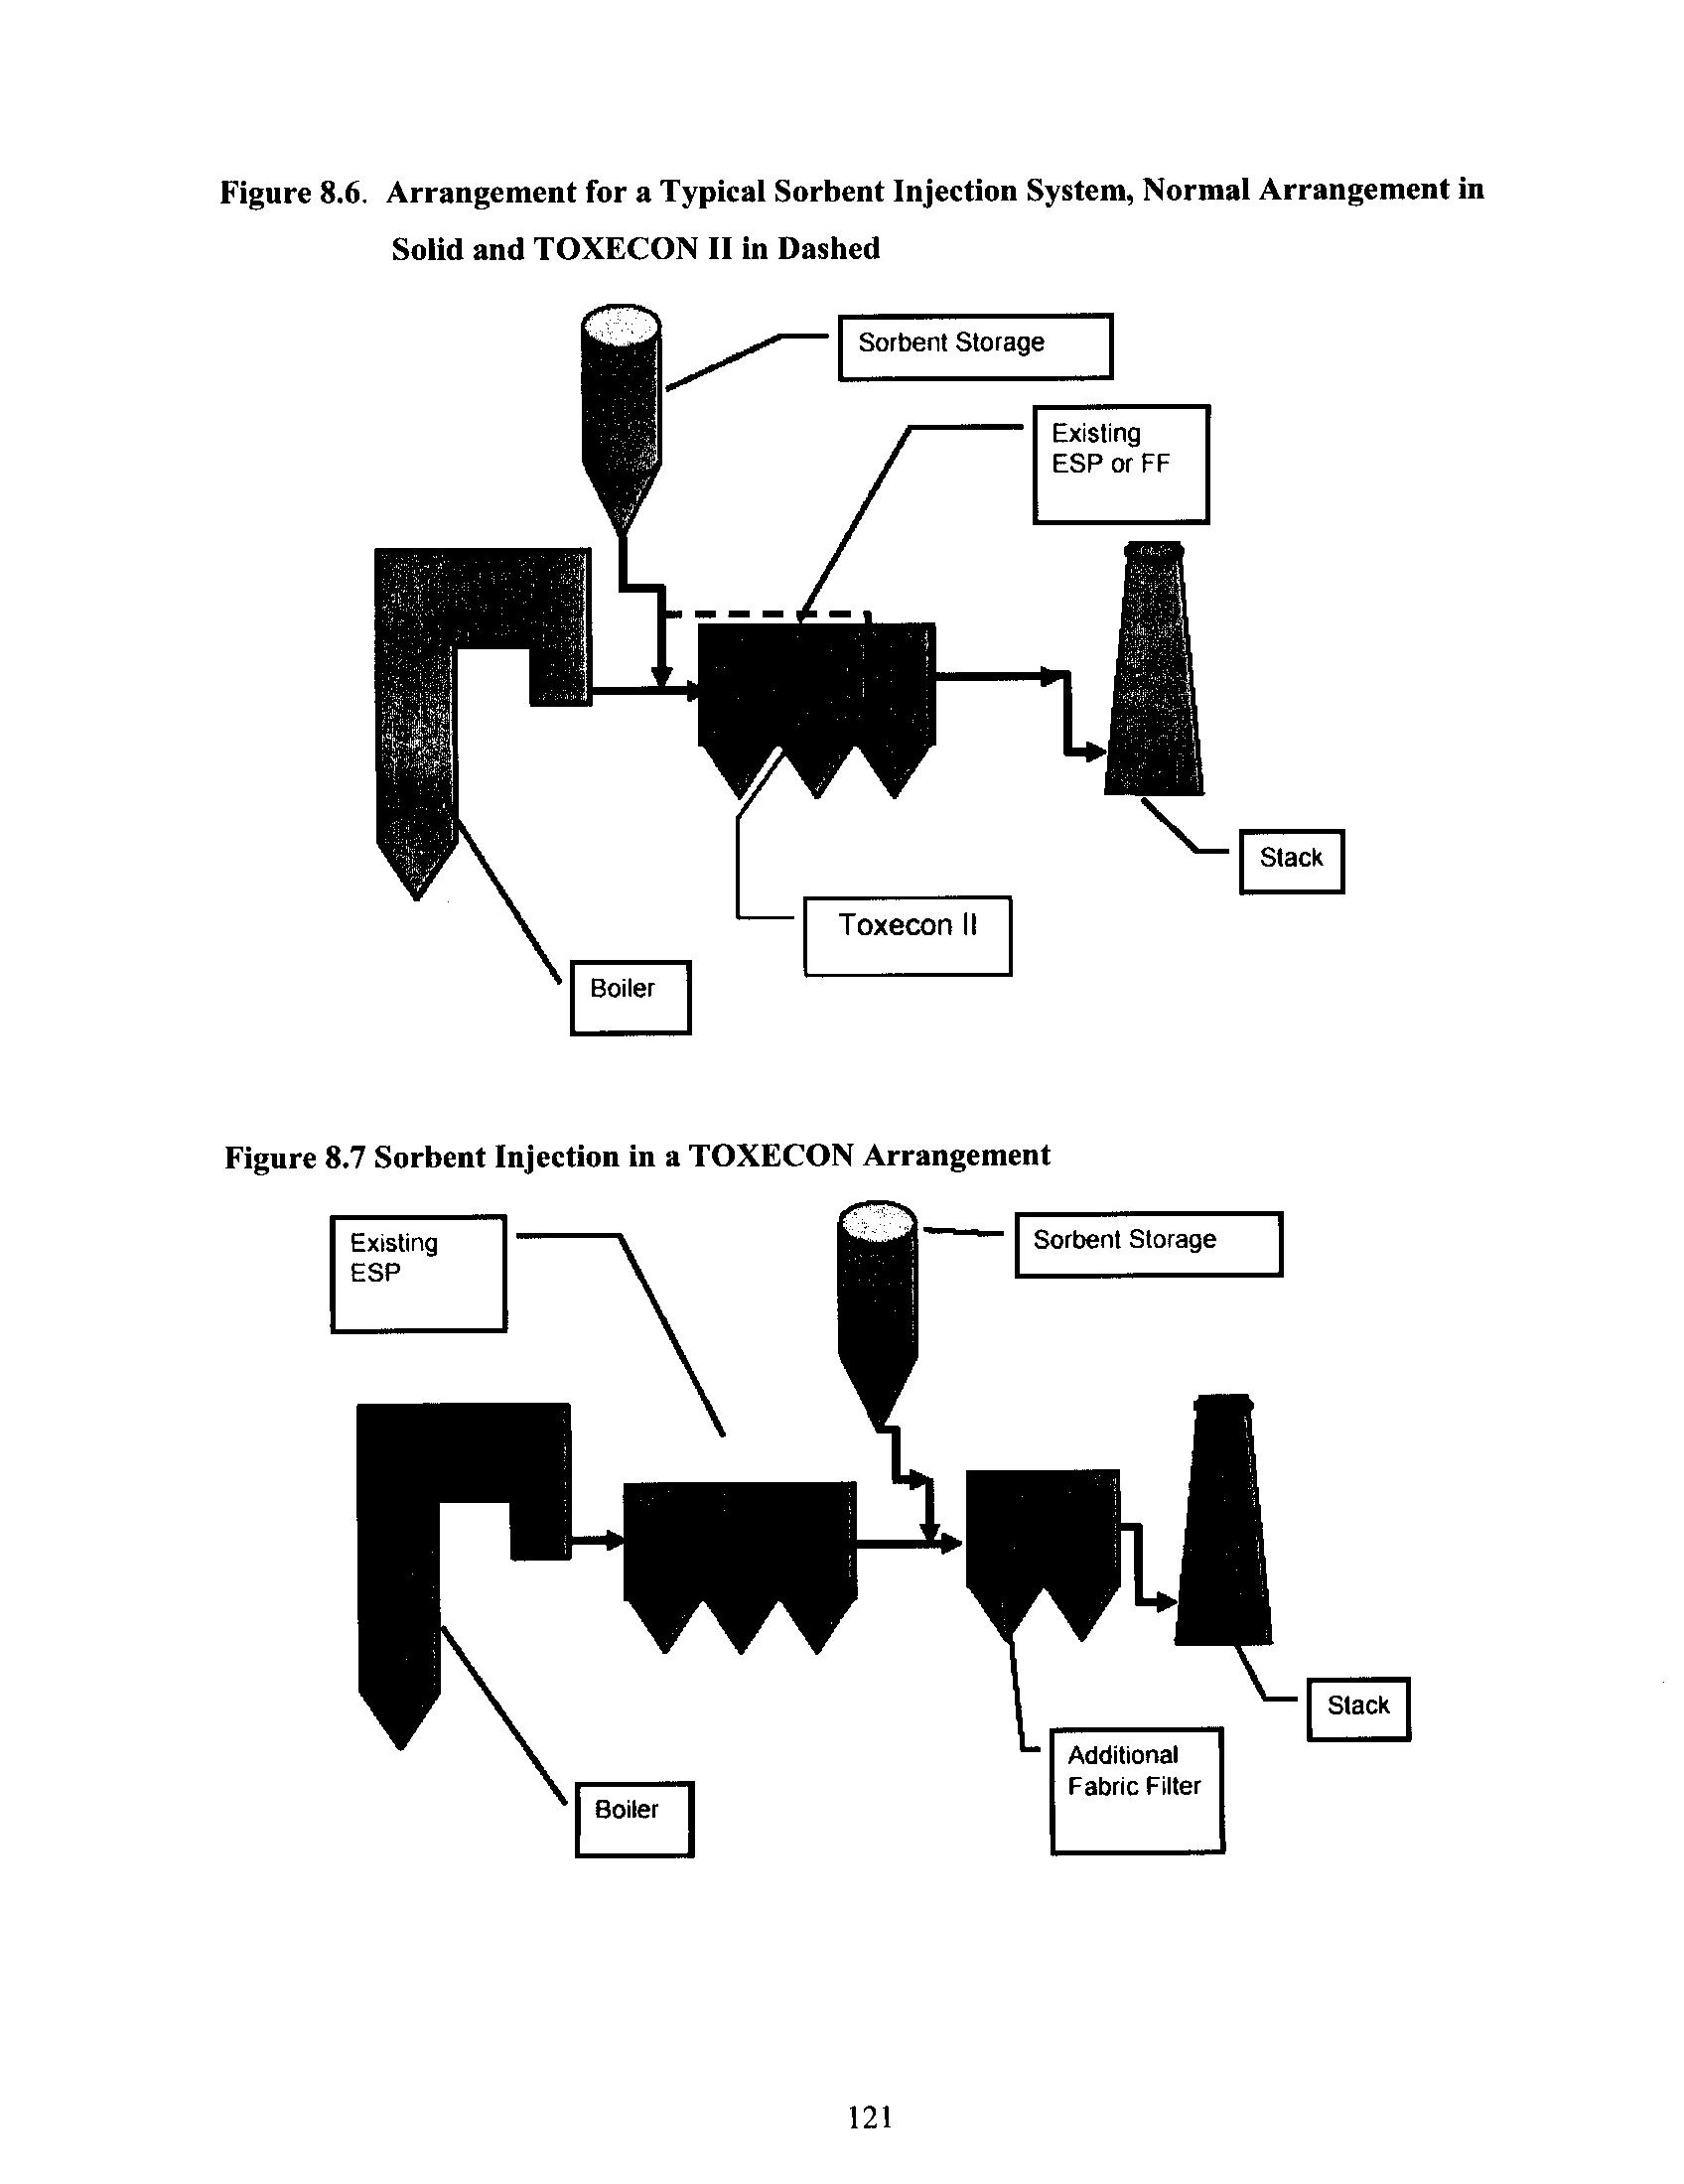
Figure 8 .7
Sorbent Injection in a TOXECON Arrangement
121
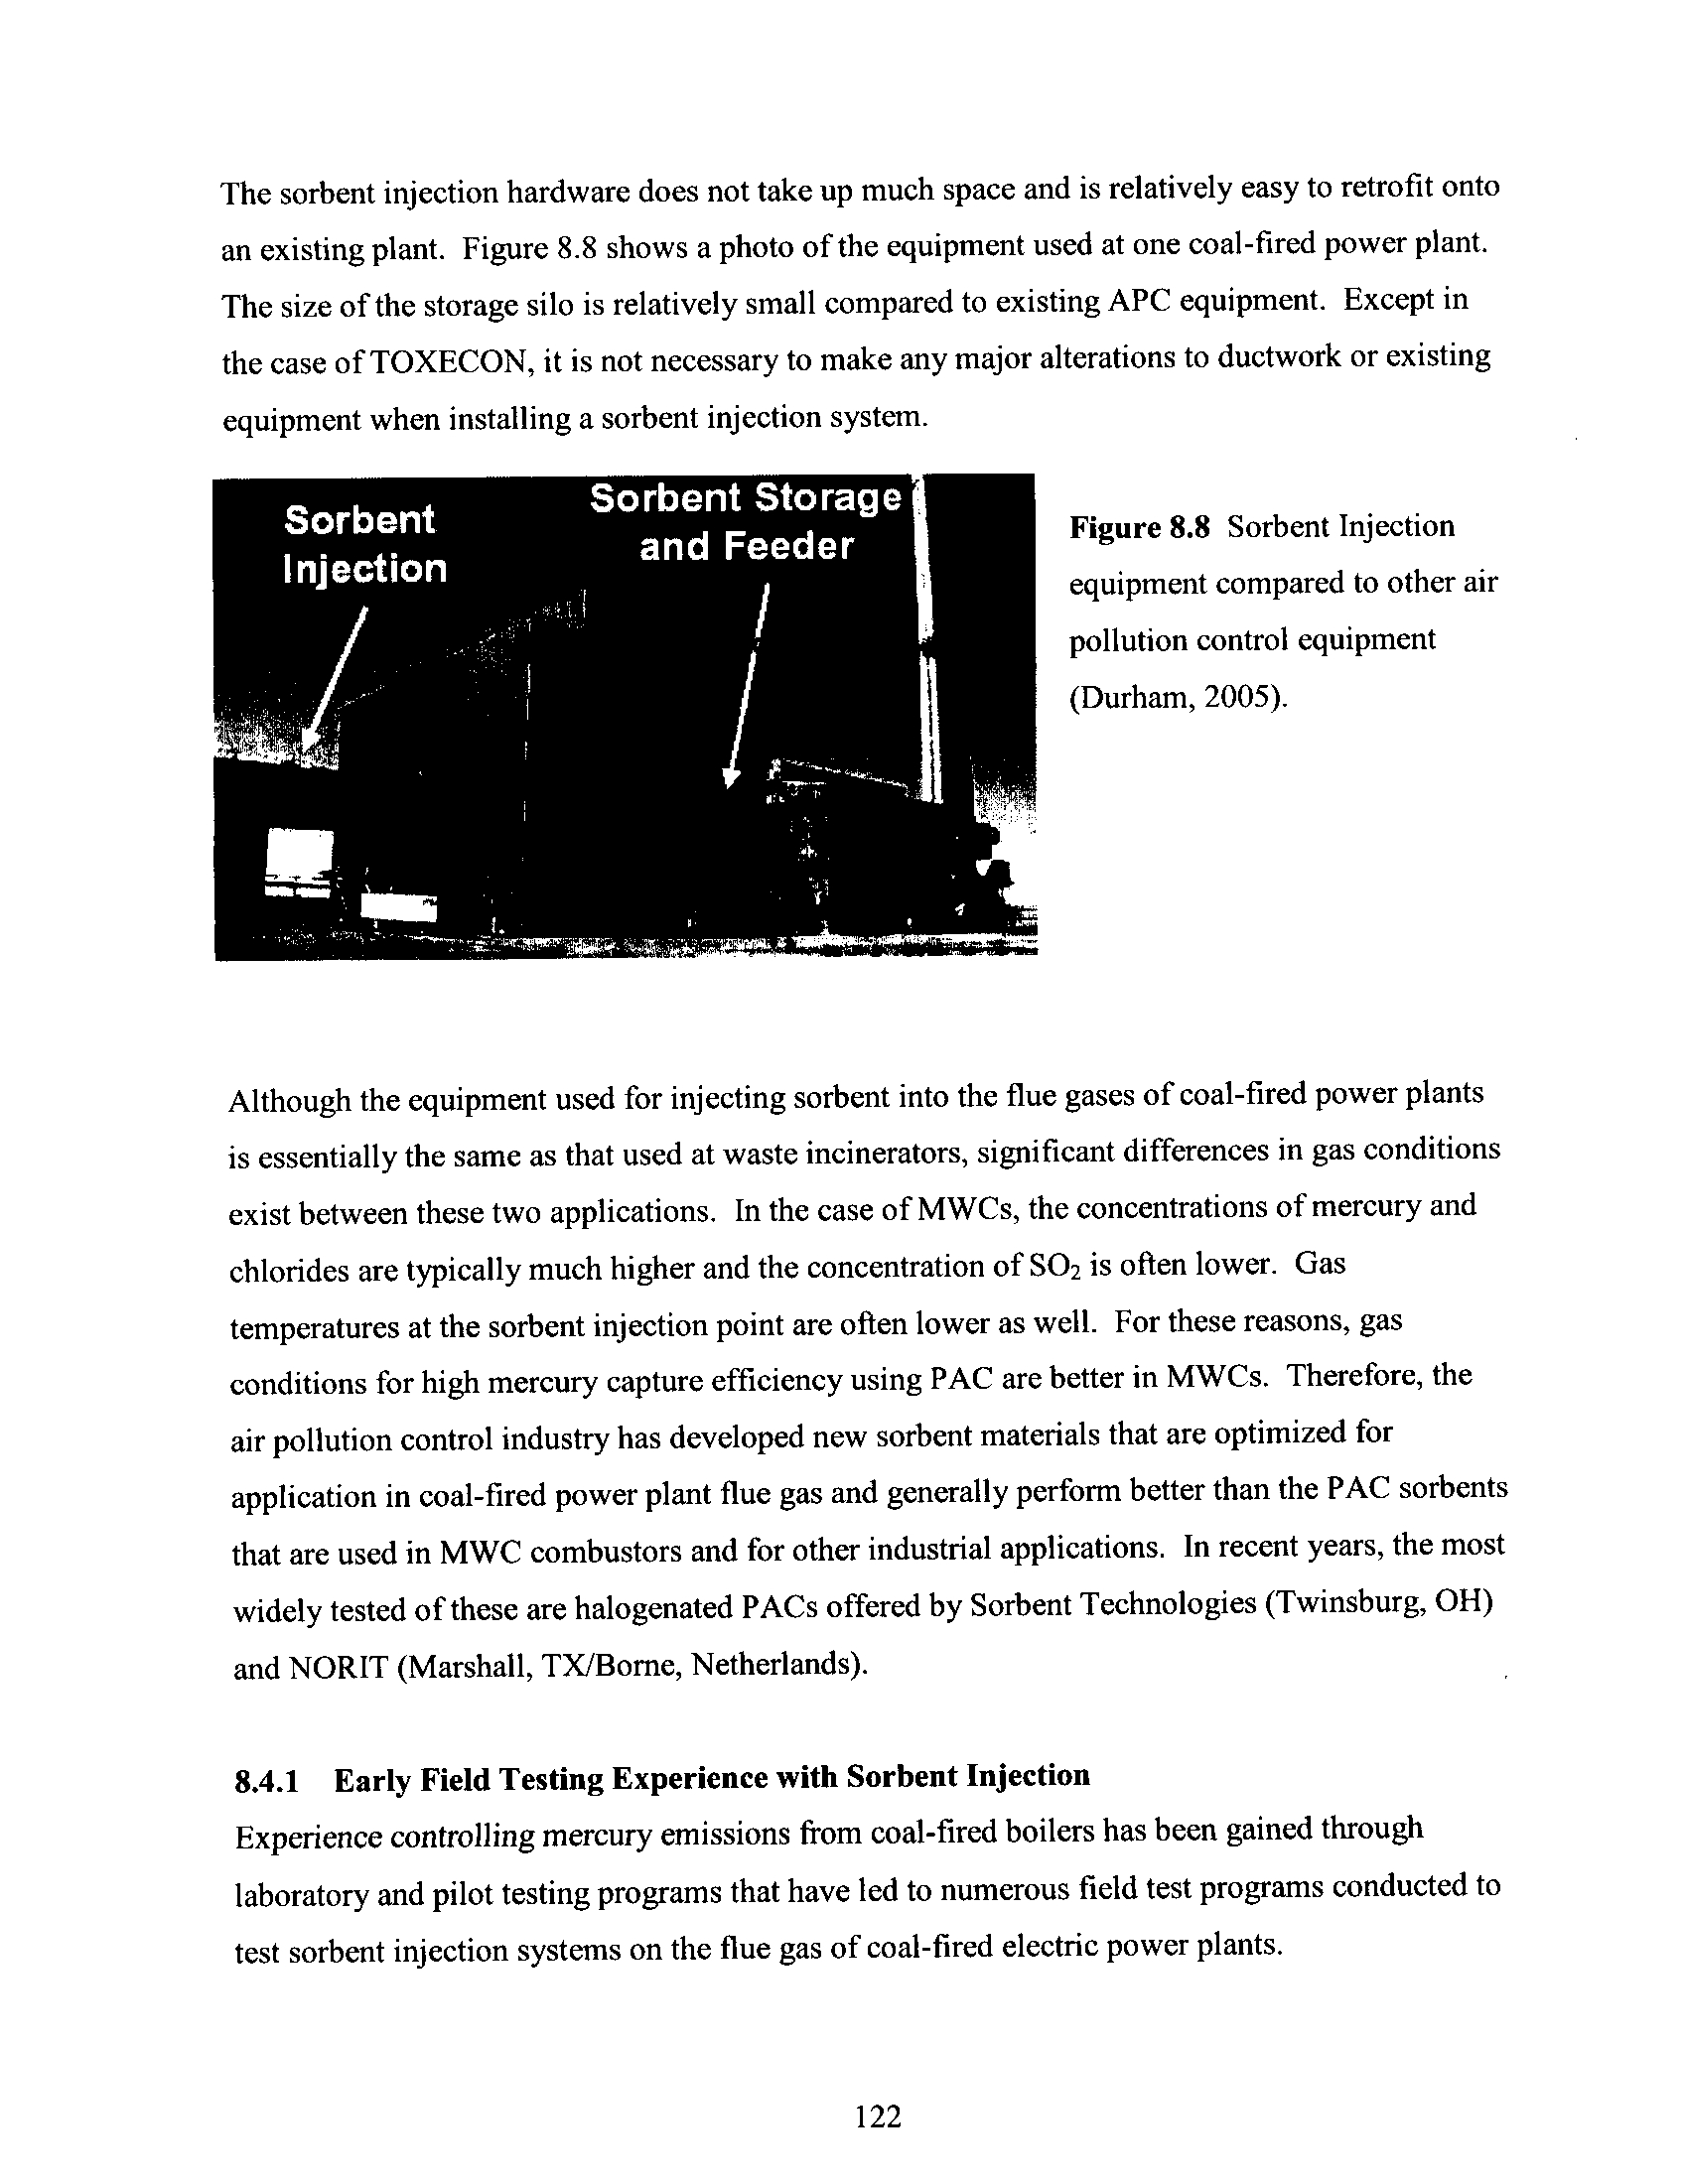
Figure 8 .8
Sorbent Injection Equipment compared to ther Air Pollution
Control Equipment
122
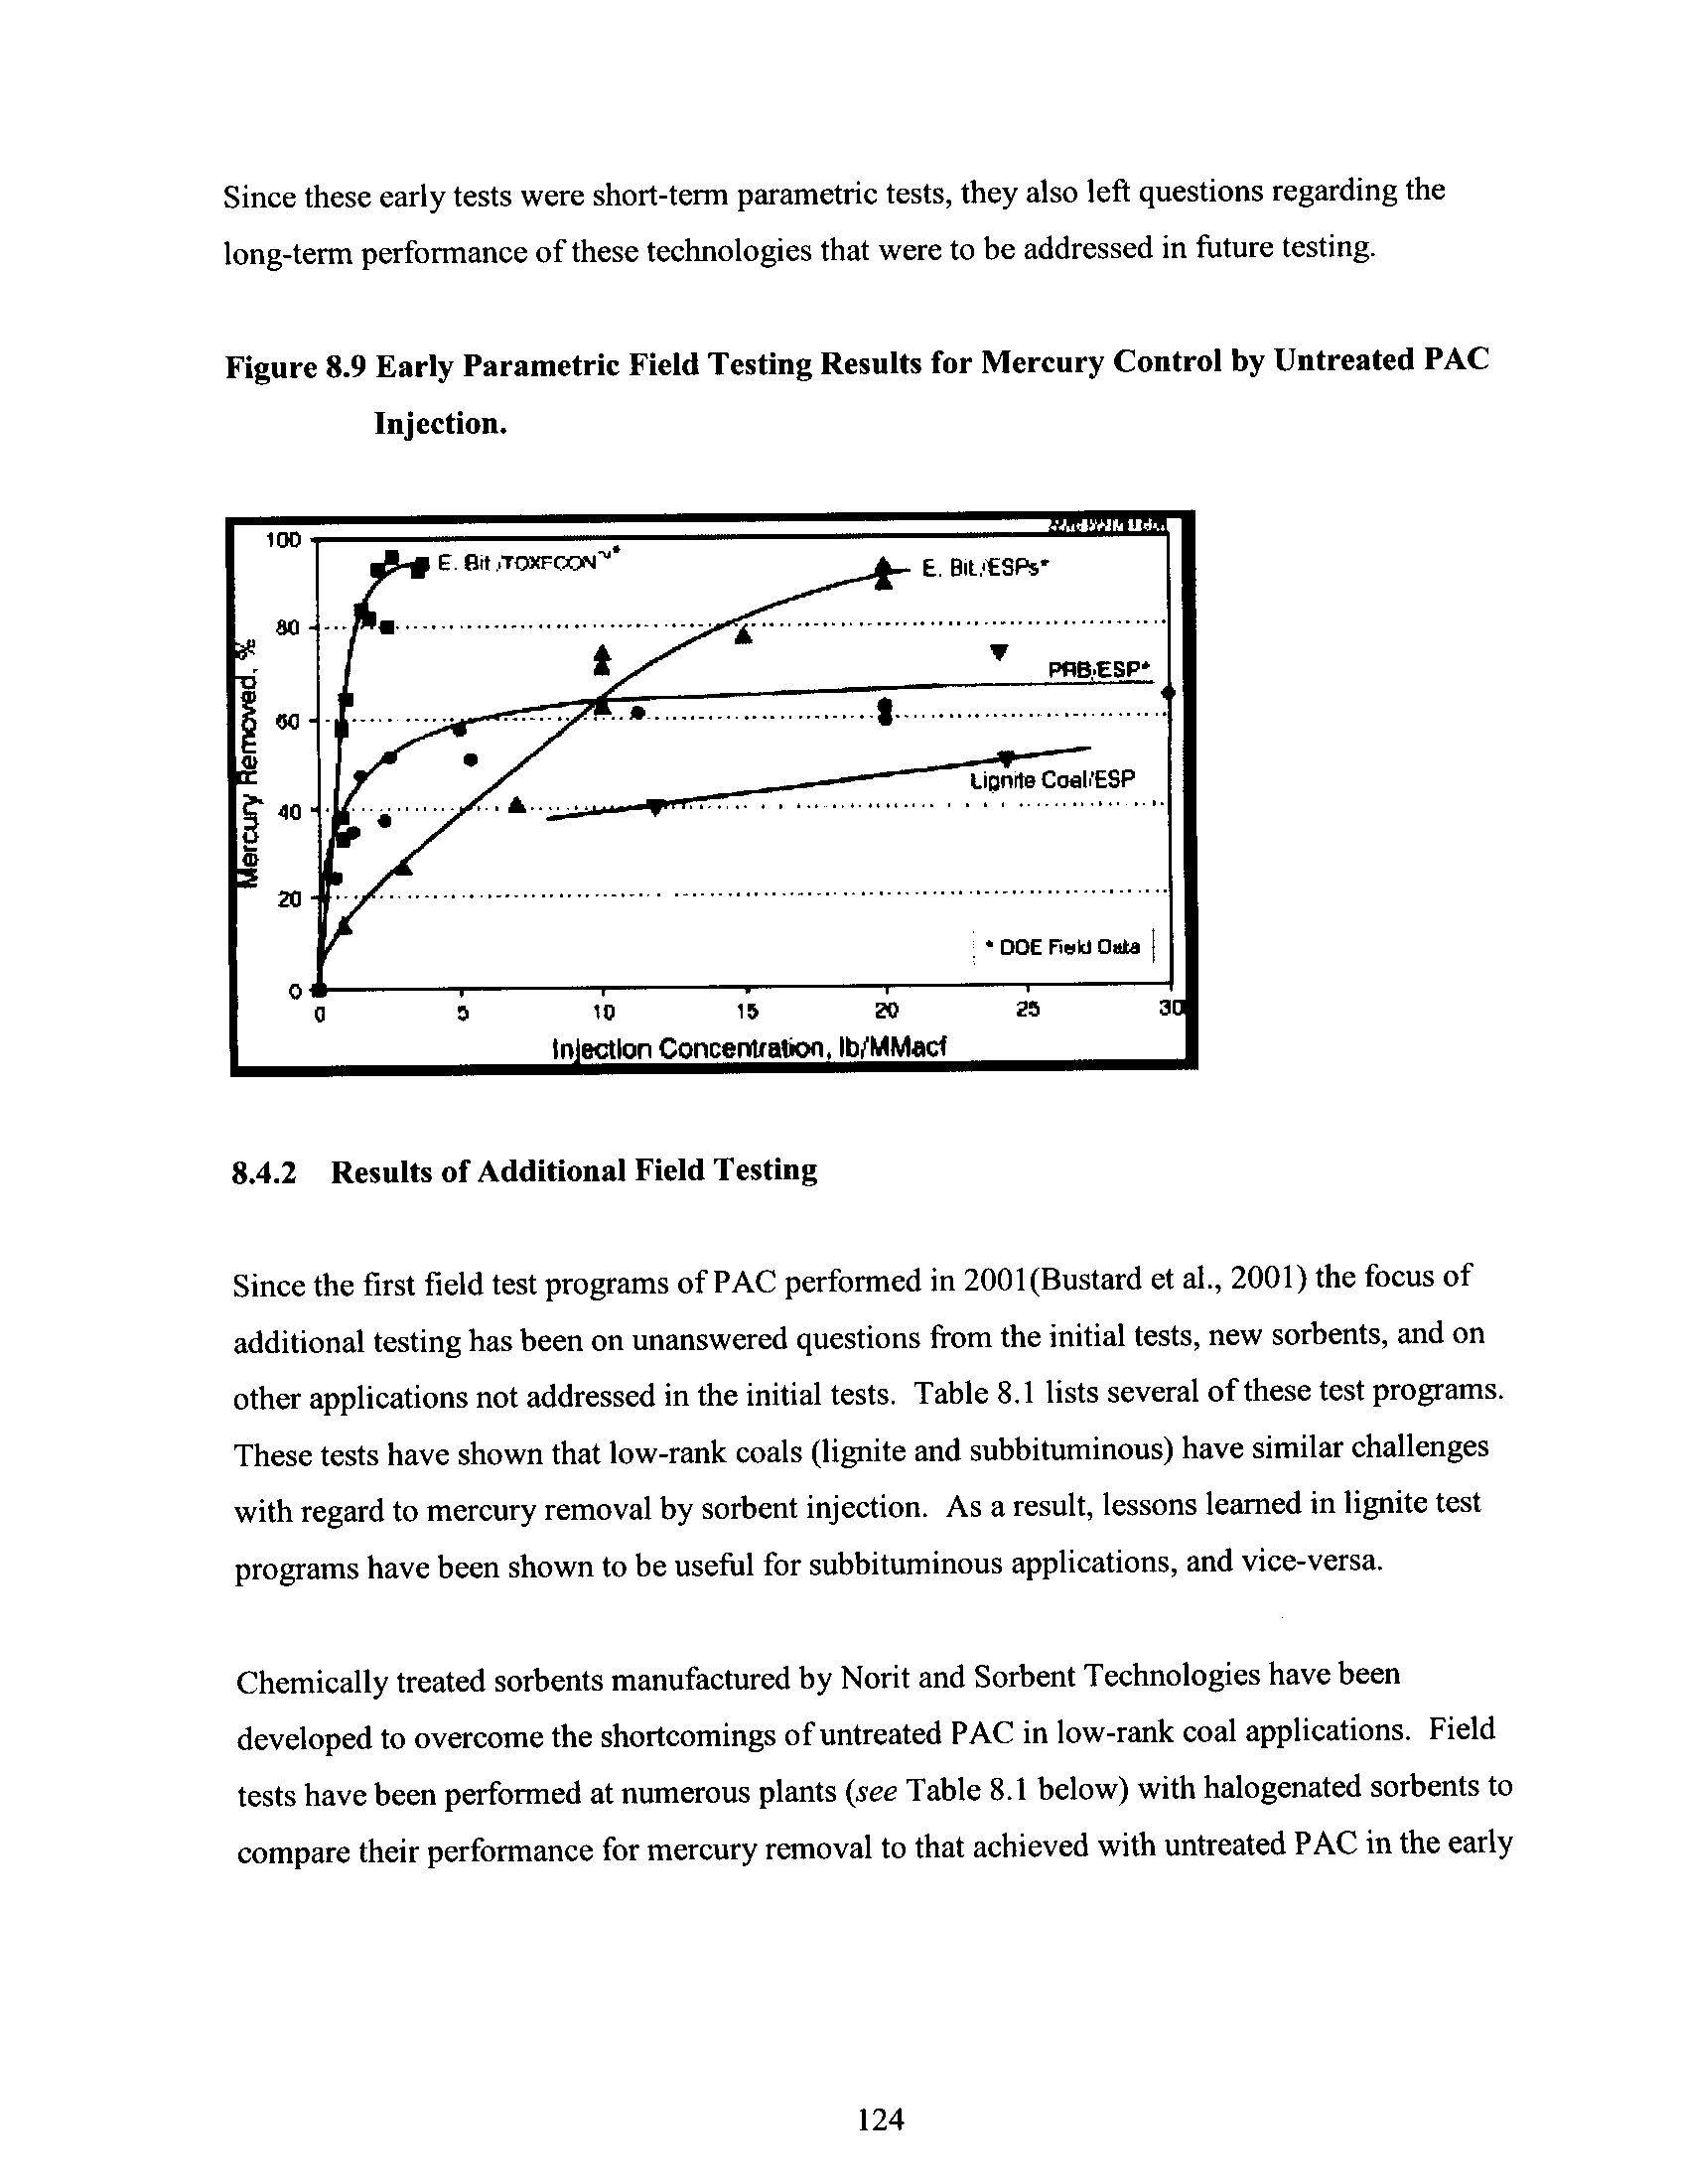
Figure 8.9
Early Parametric Field Testing Results for Mercury Control by
Untreated PAC Injection
124
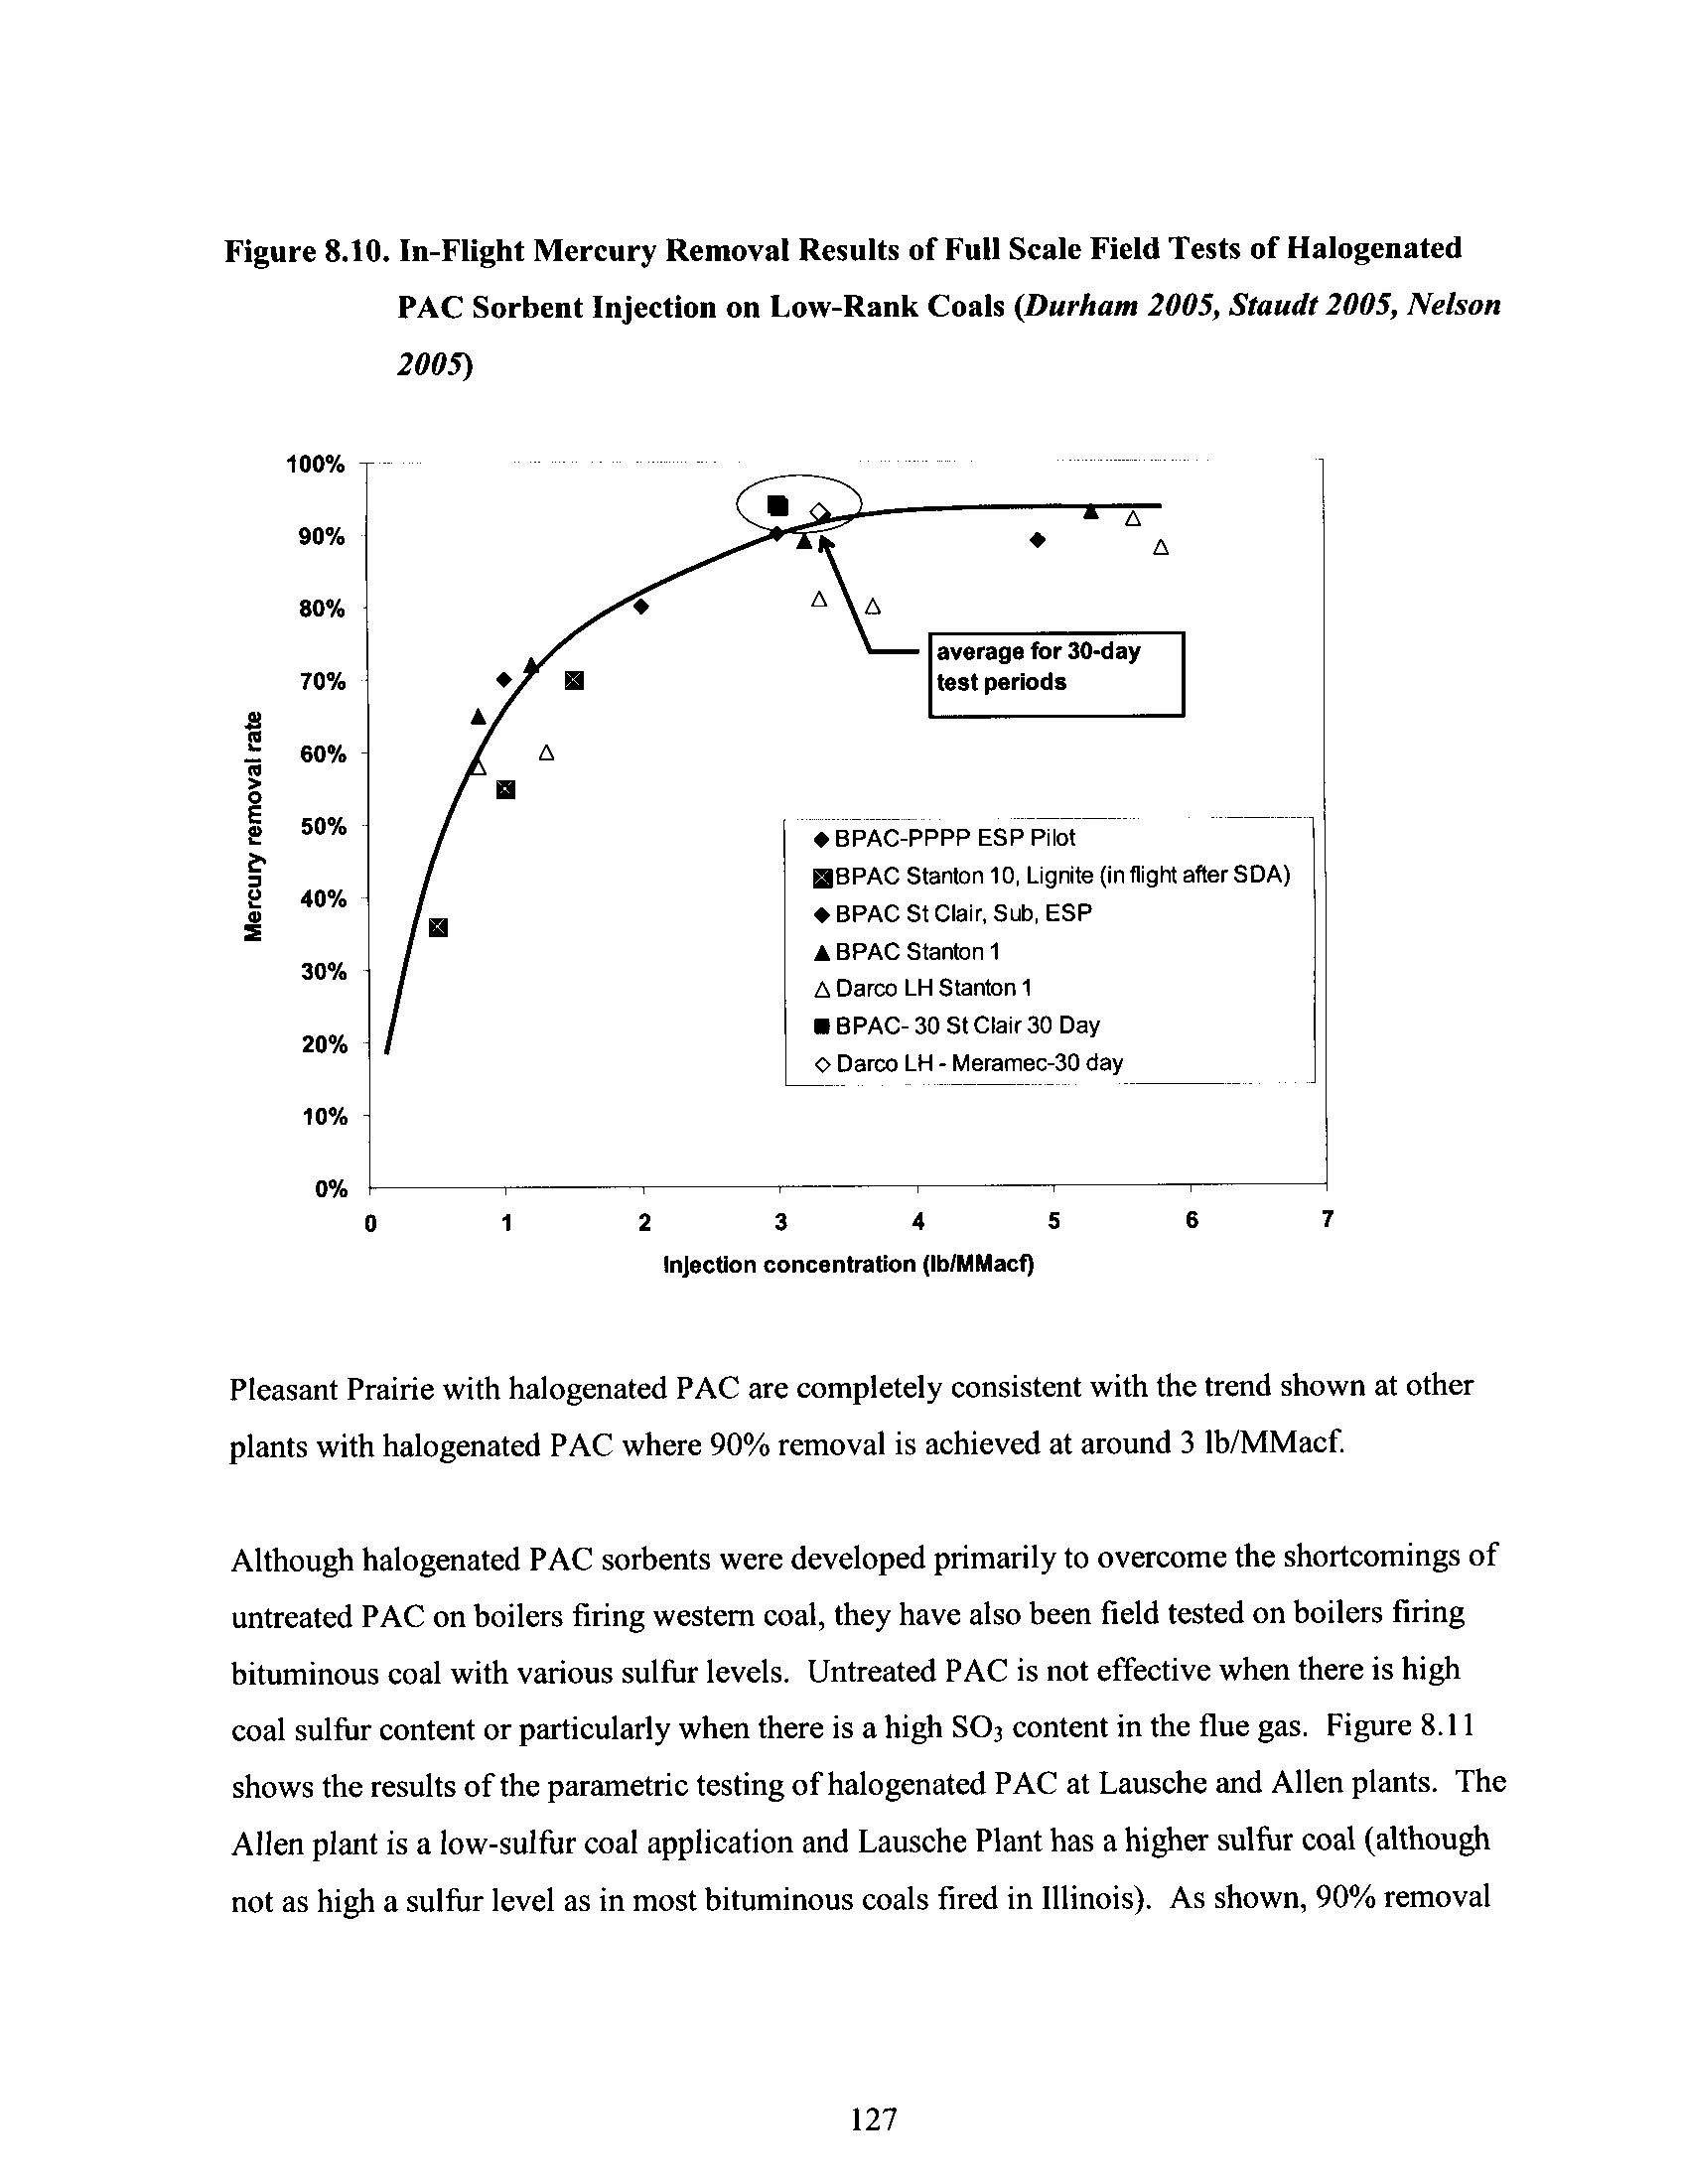
Figure 8 .10
In-Flight Mercury Removal Results of Full Scale Field Tests of
Halogenated PAC Sorbent Injection on Low-Rank Coals
127
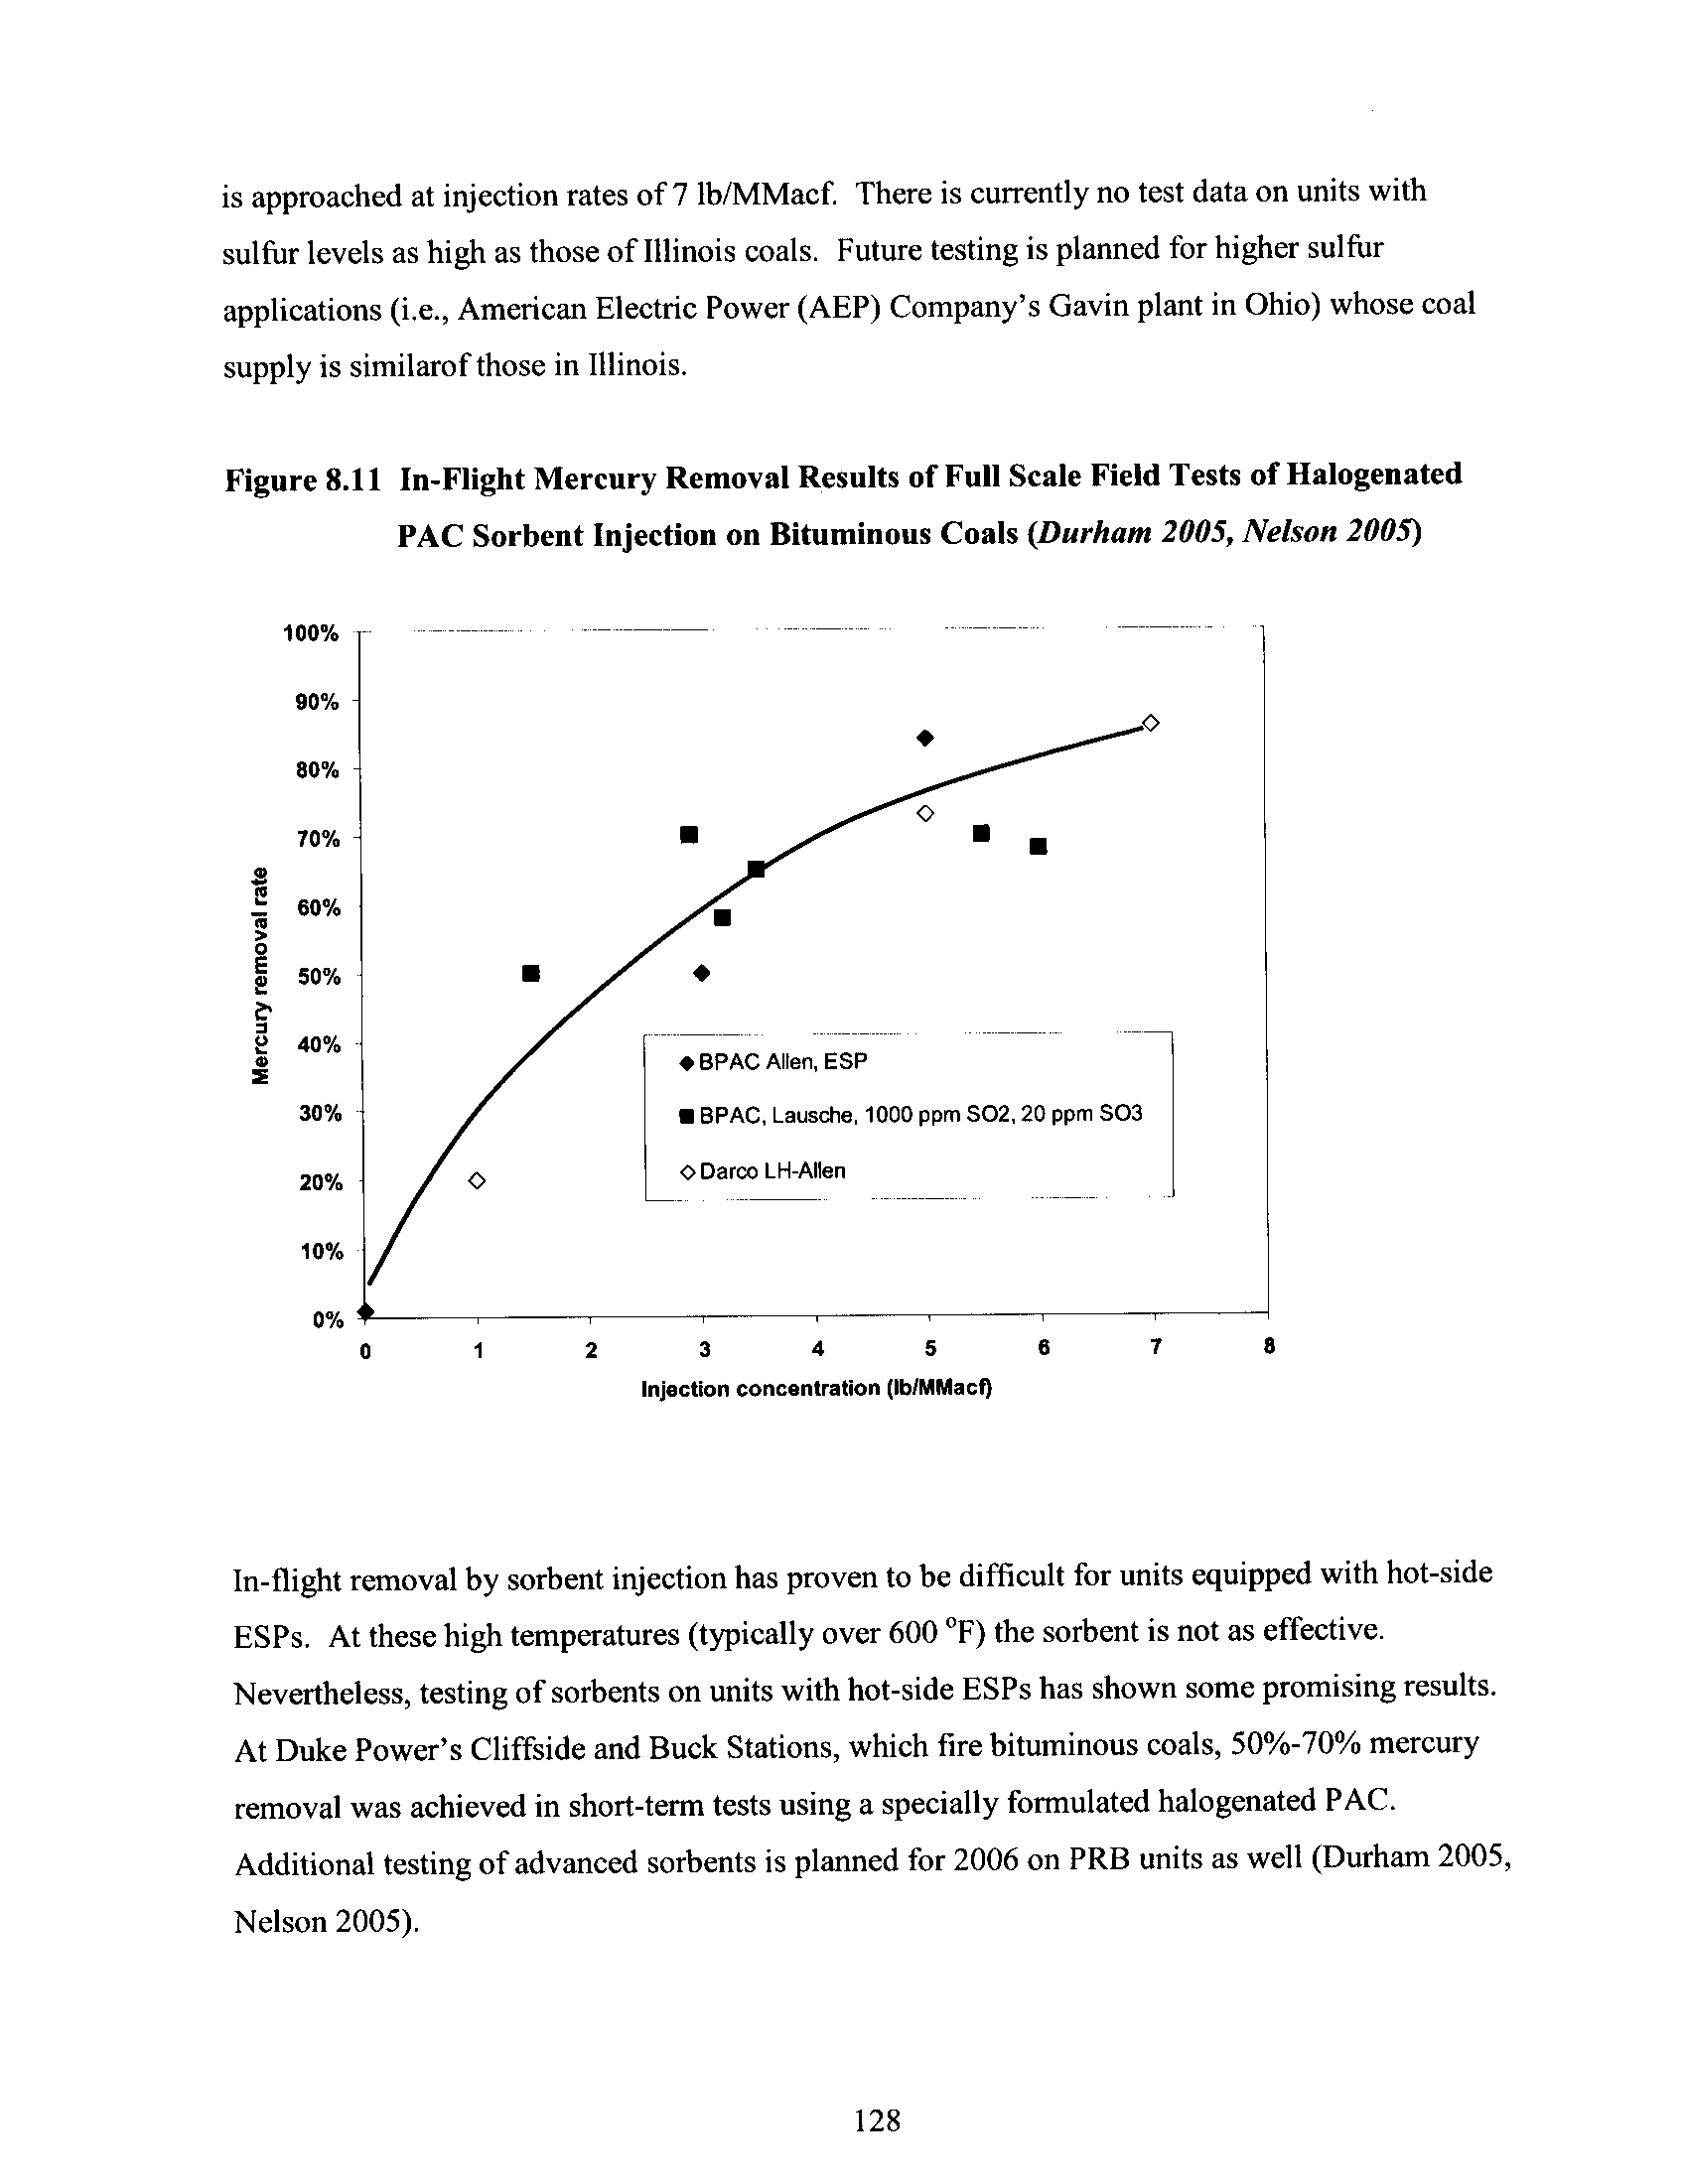
Figure 8 .11
In-Flight Mercury Removal Results of Full Scale Field Tests of
Halogenated PAC Sorbent Injection on Bituminous Coals
128
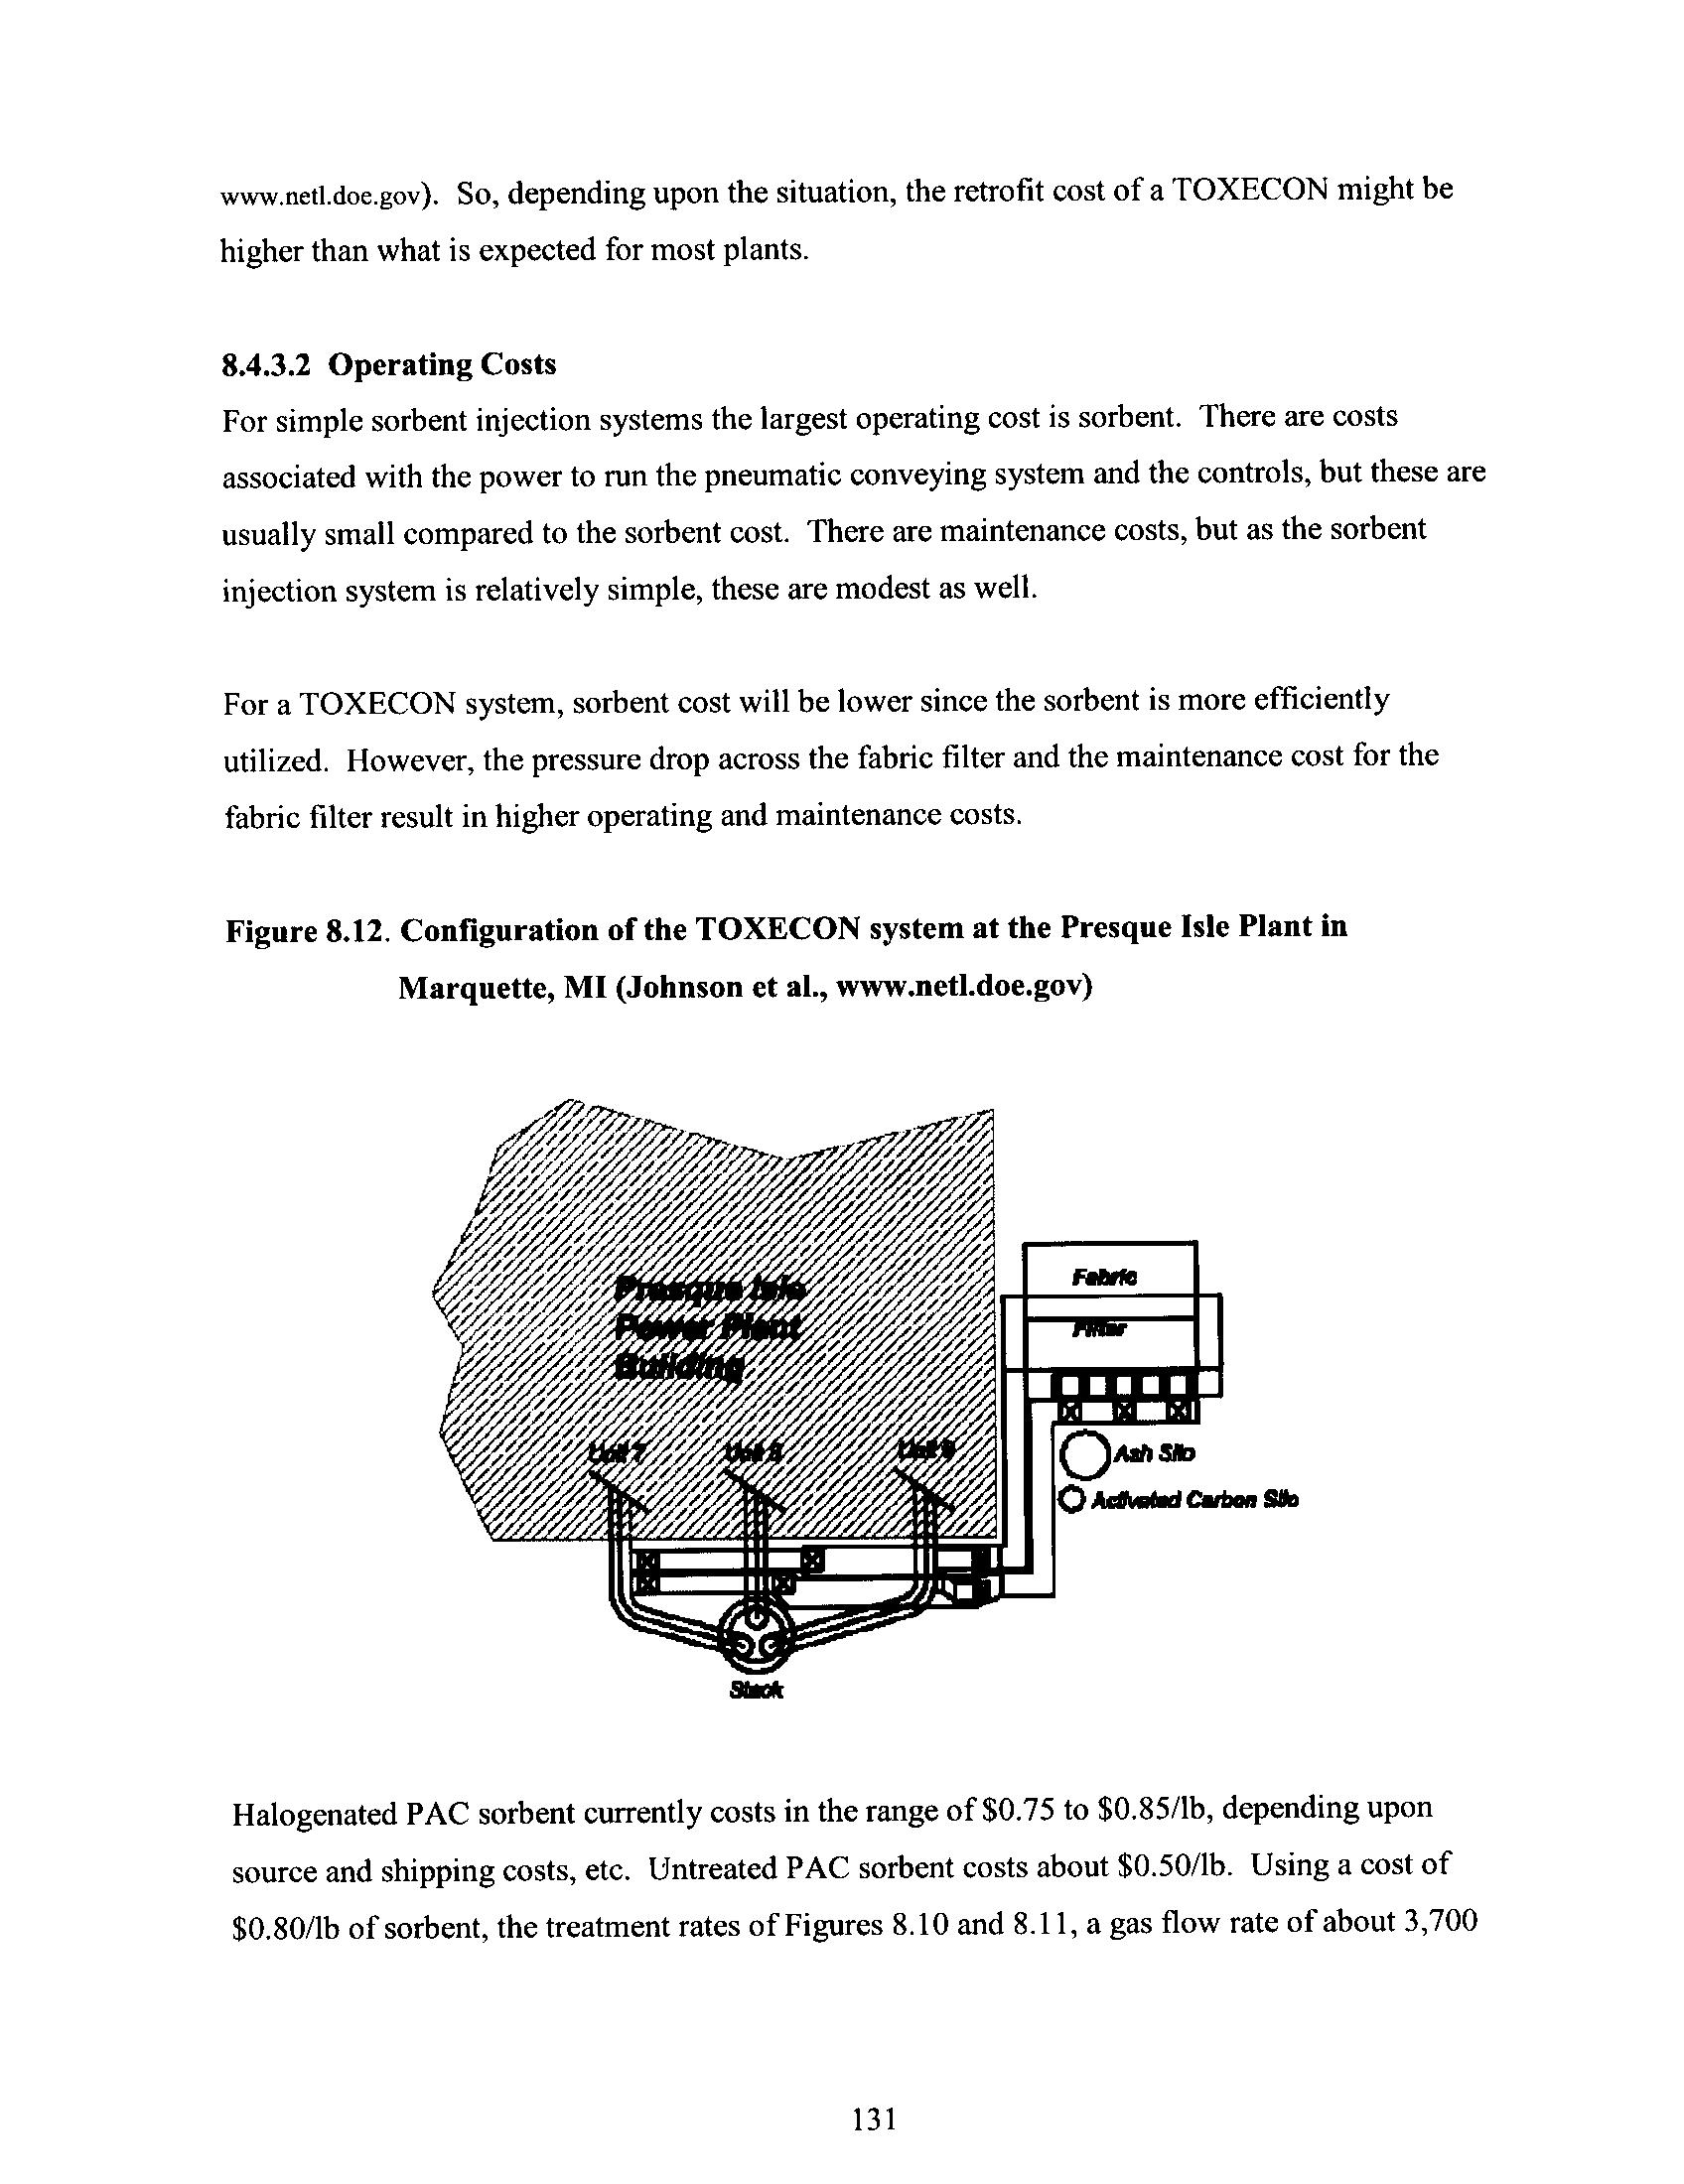
Figure 8.12
Configuration of the TOXECON System at the Presque Isle
Plant in Marquette, MI
131
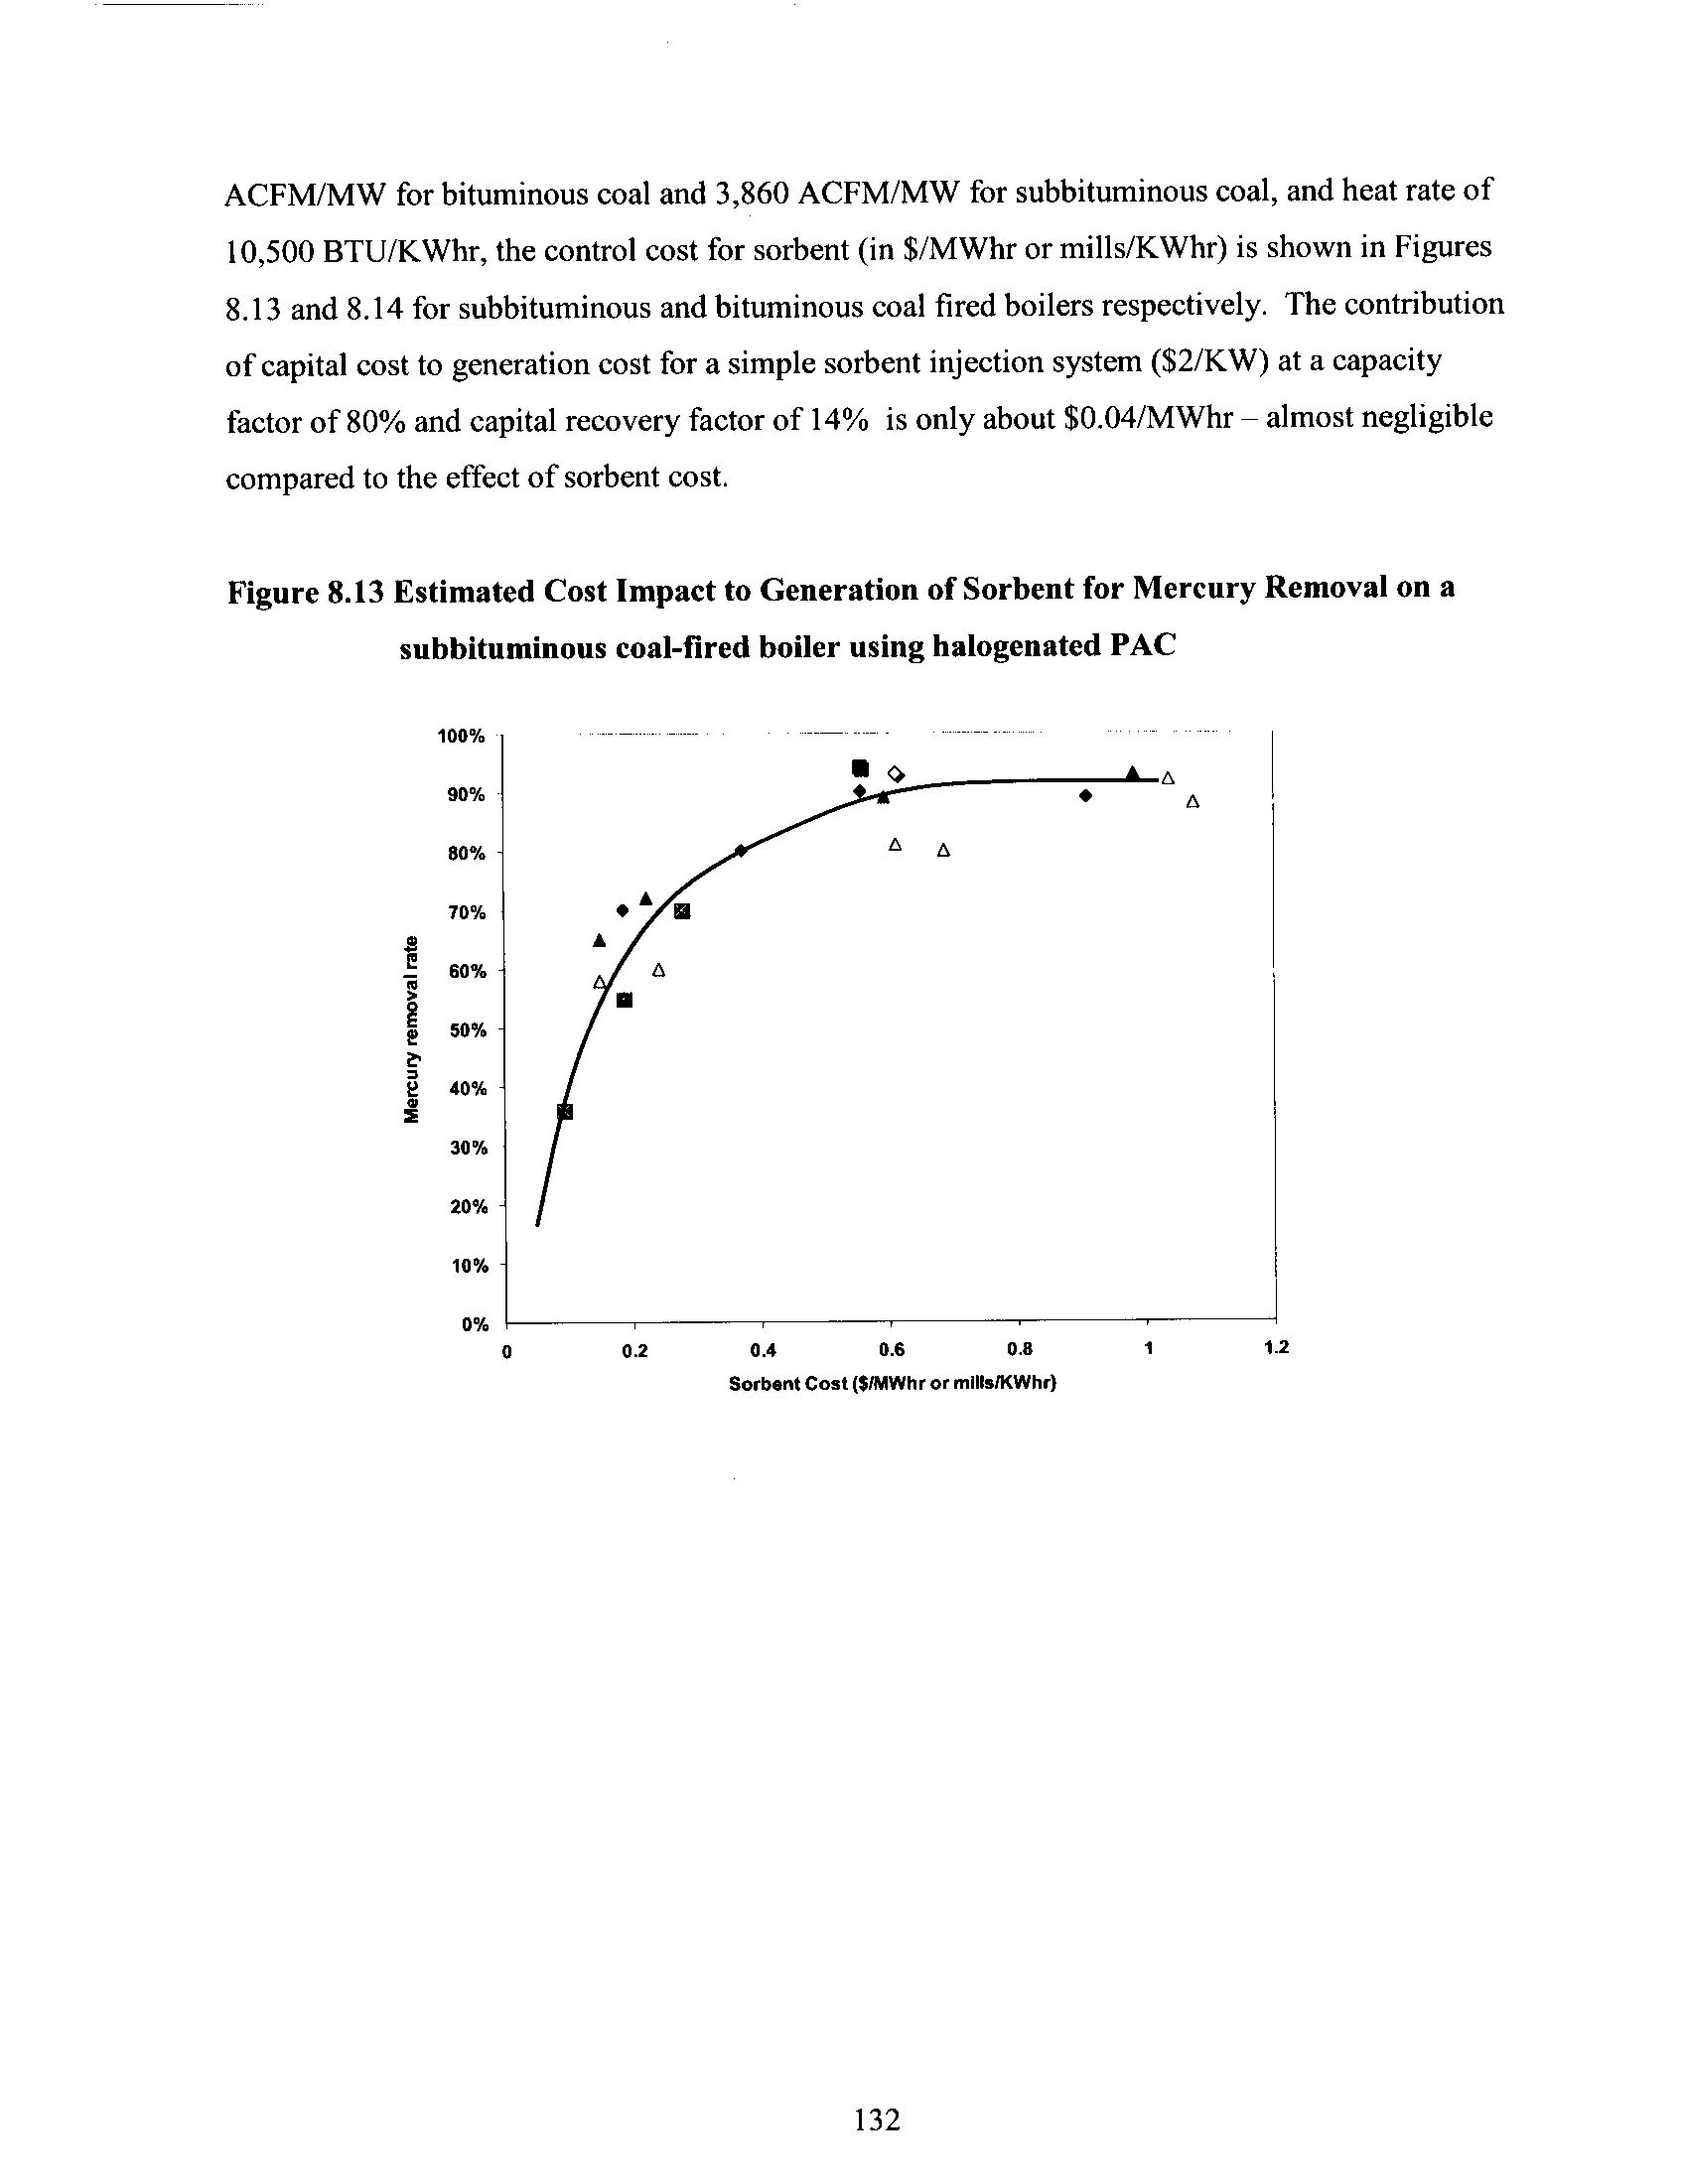
Figure 8 .13
Estimated Cost Impact to Generation of Sorbent for Mercury
Removal on a Subbituminous Coal-Fired Boiler Using
Halogenated PAC
132
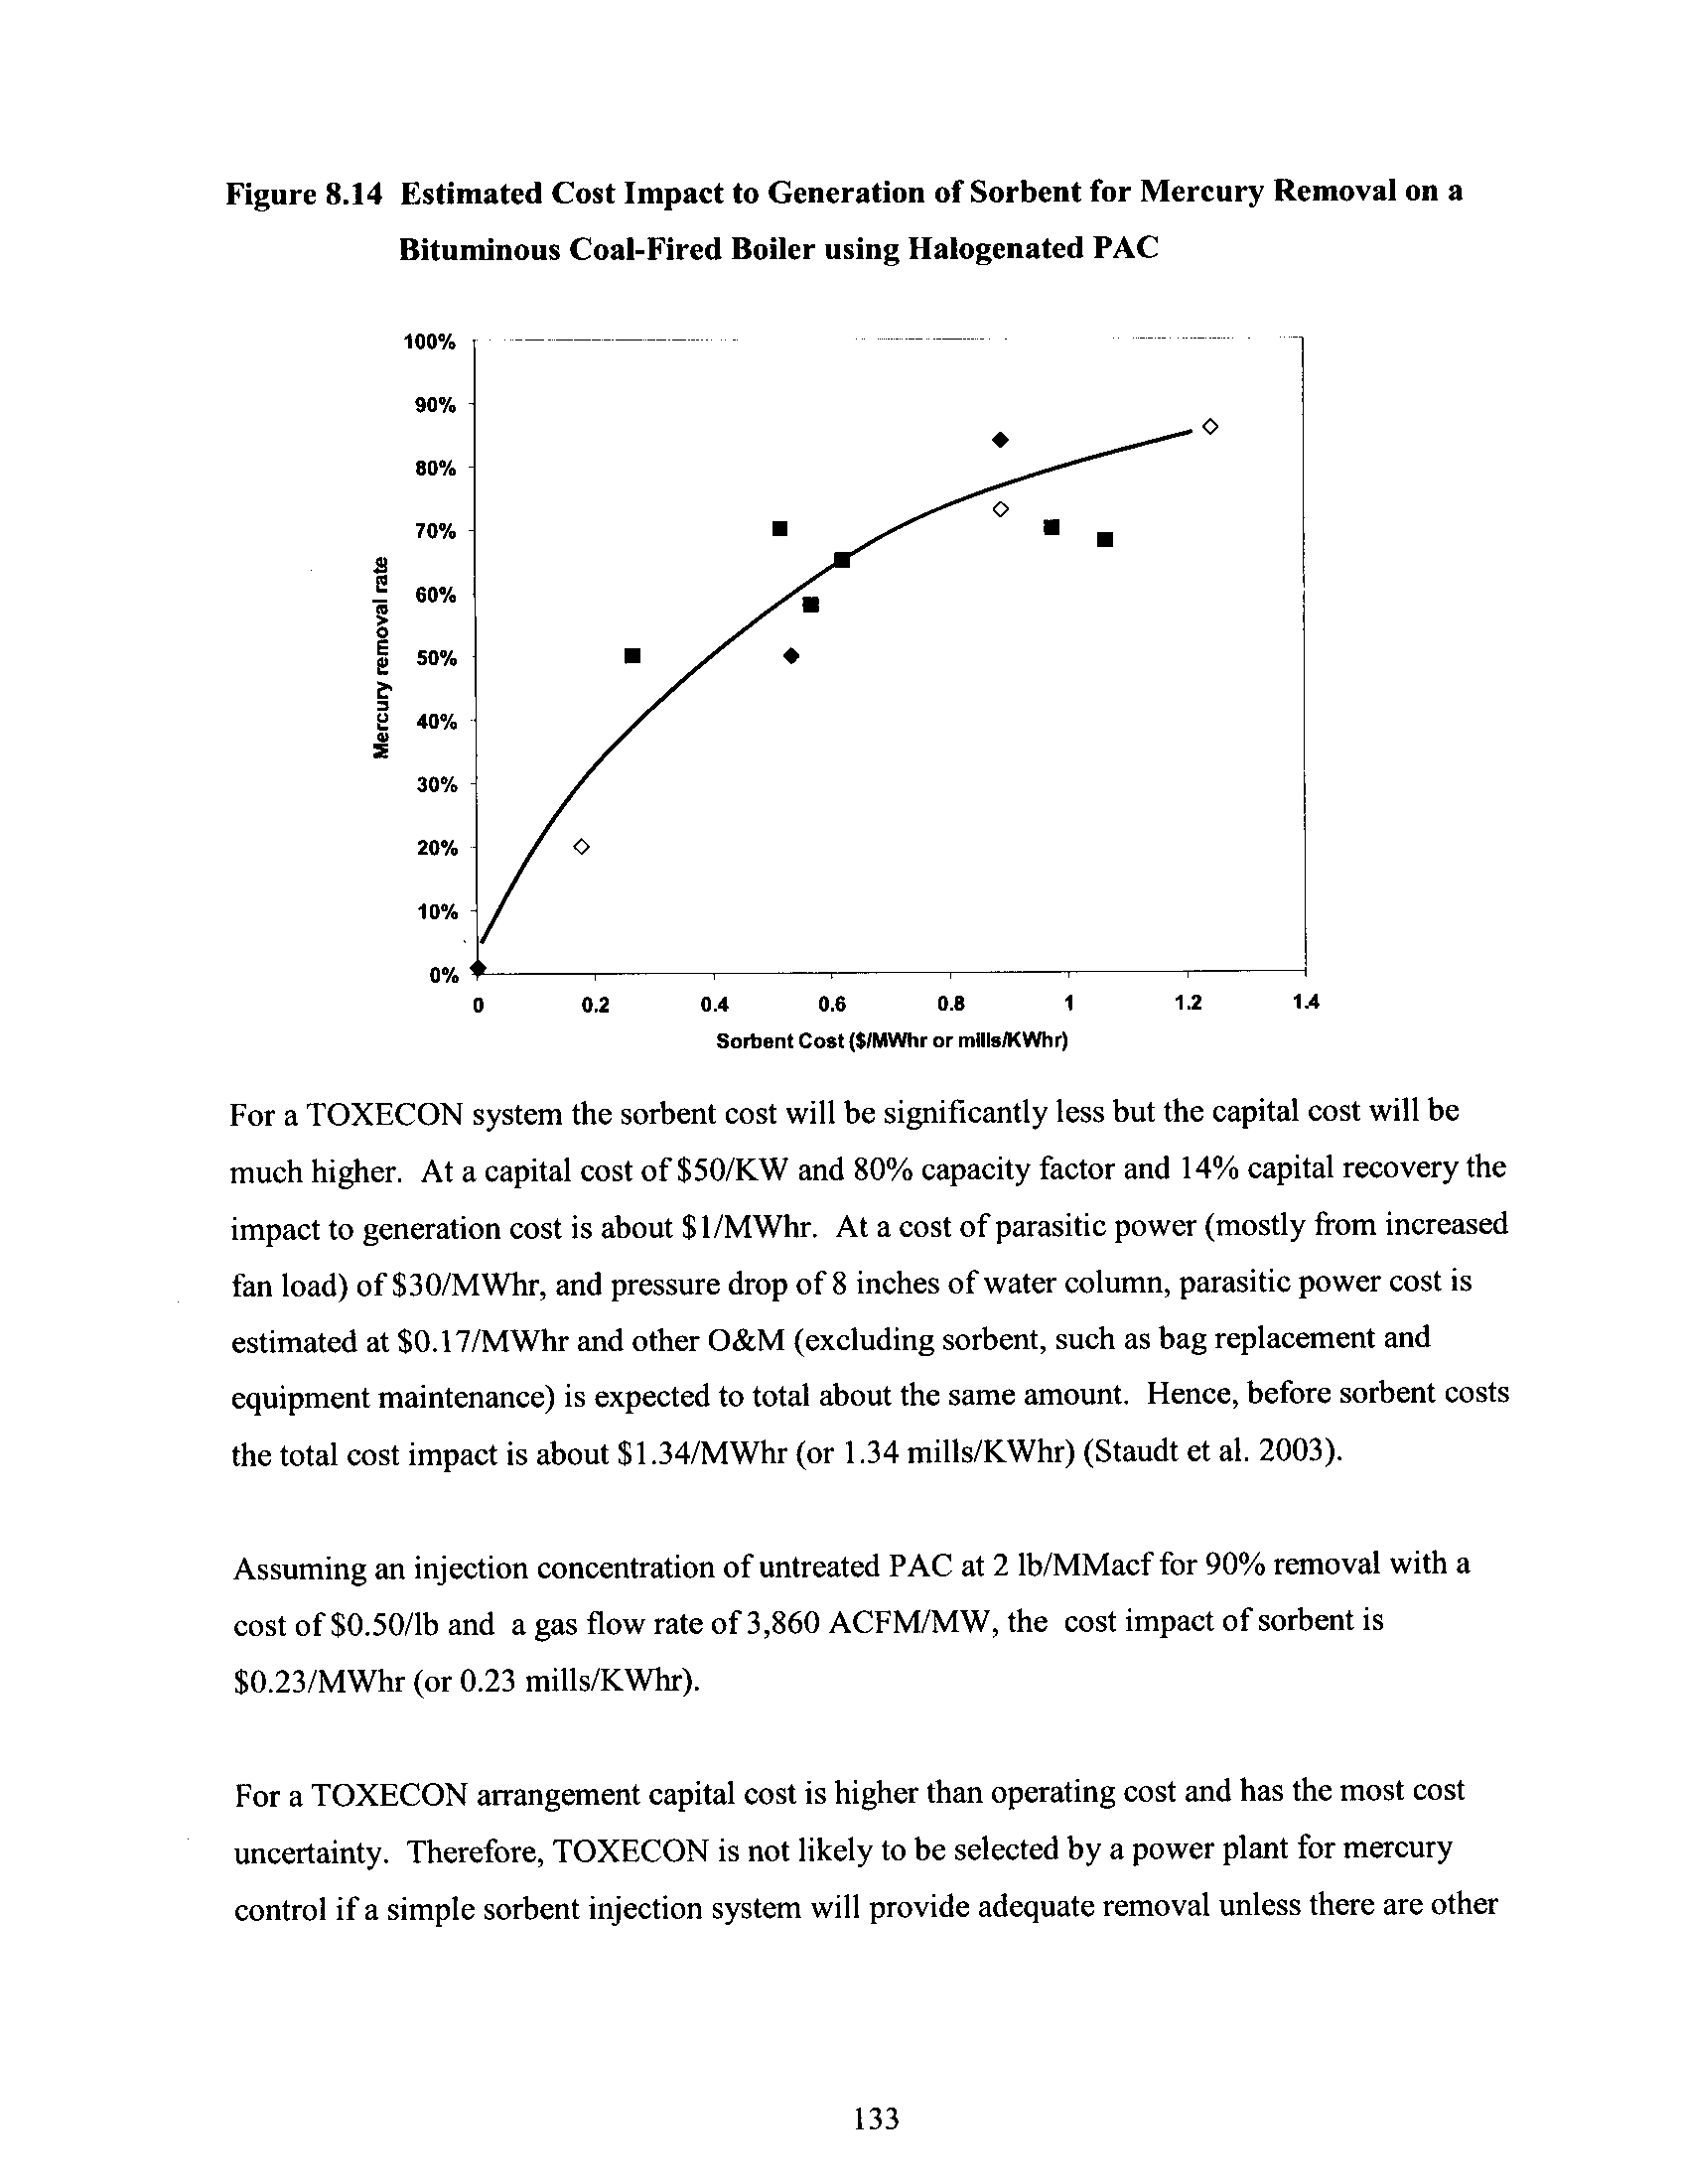
Figure 8.14
Estimated Cost Impact to Generation of Sorbent for Mercury
Removal on a Bituminous Coal-Fired Boiler Using
Halogenated PAC
133
14
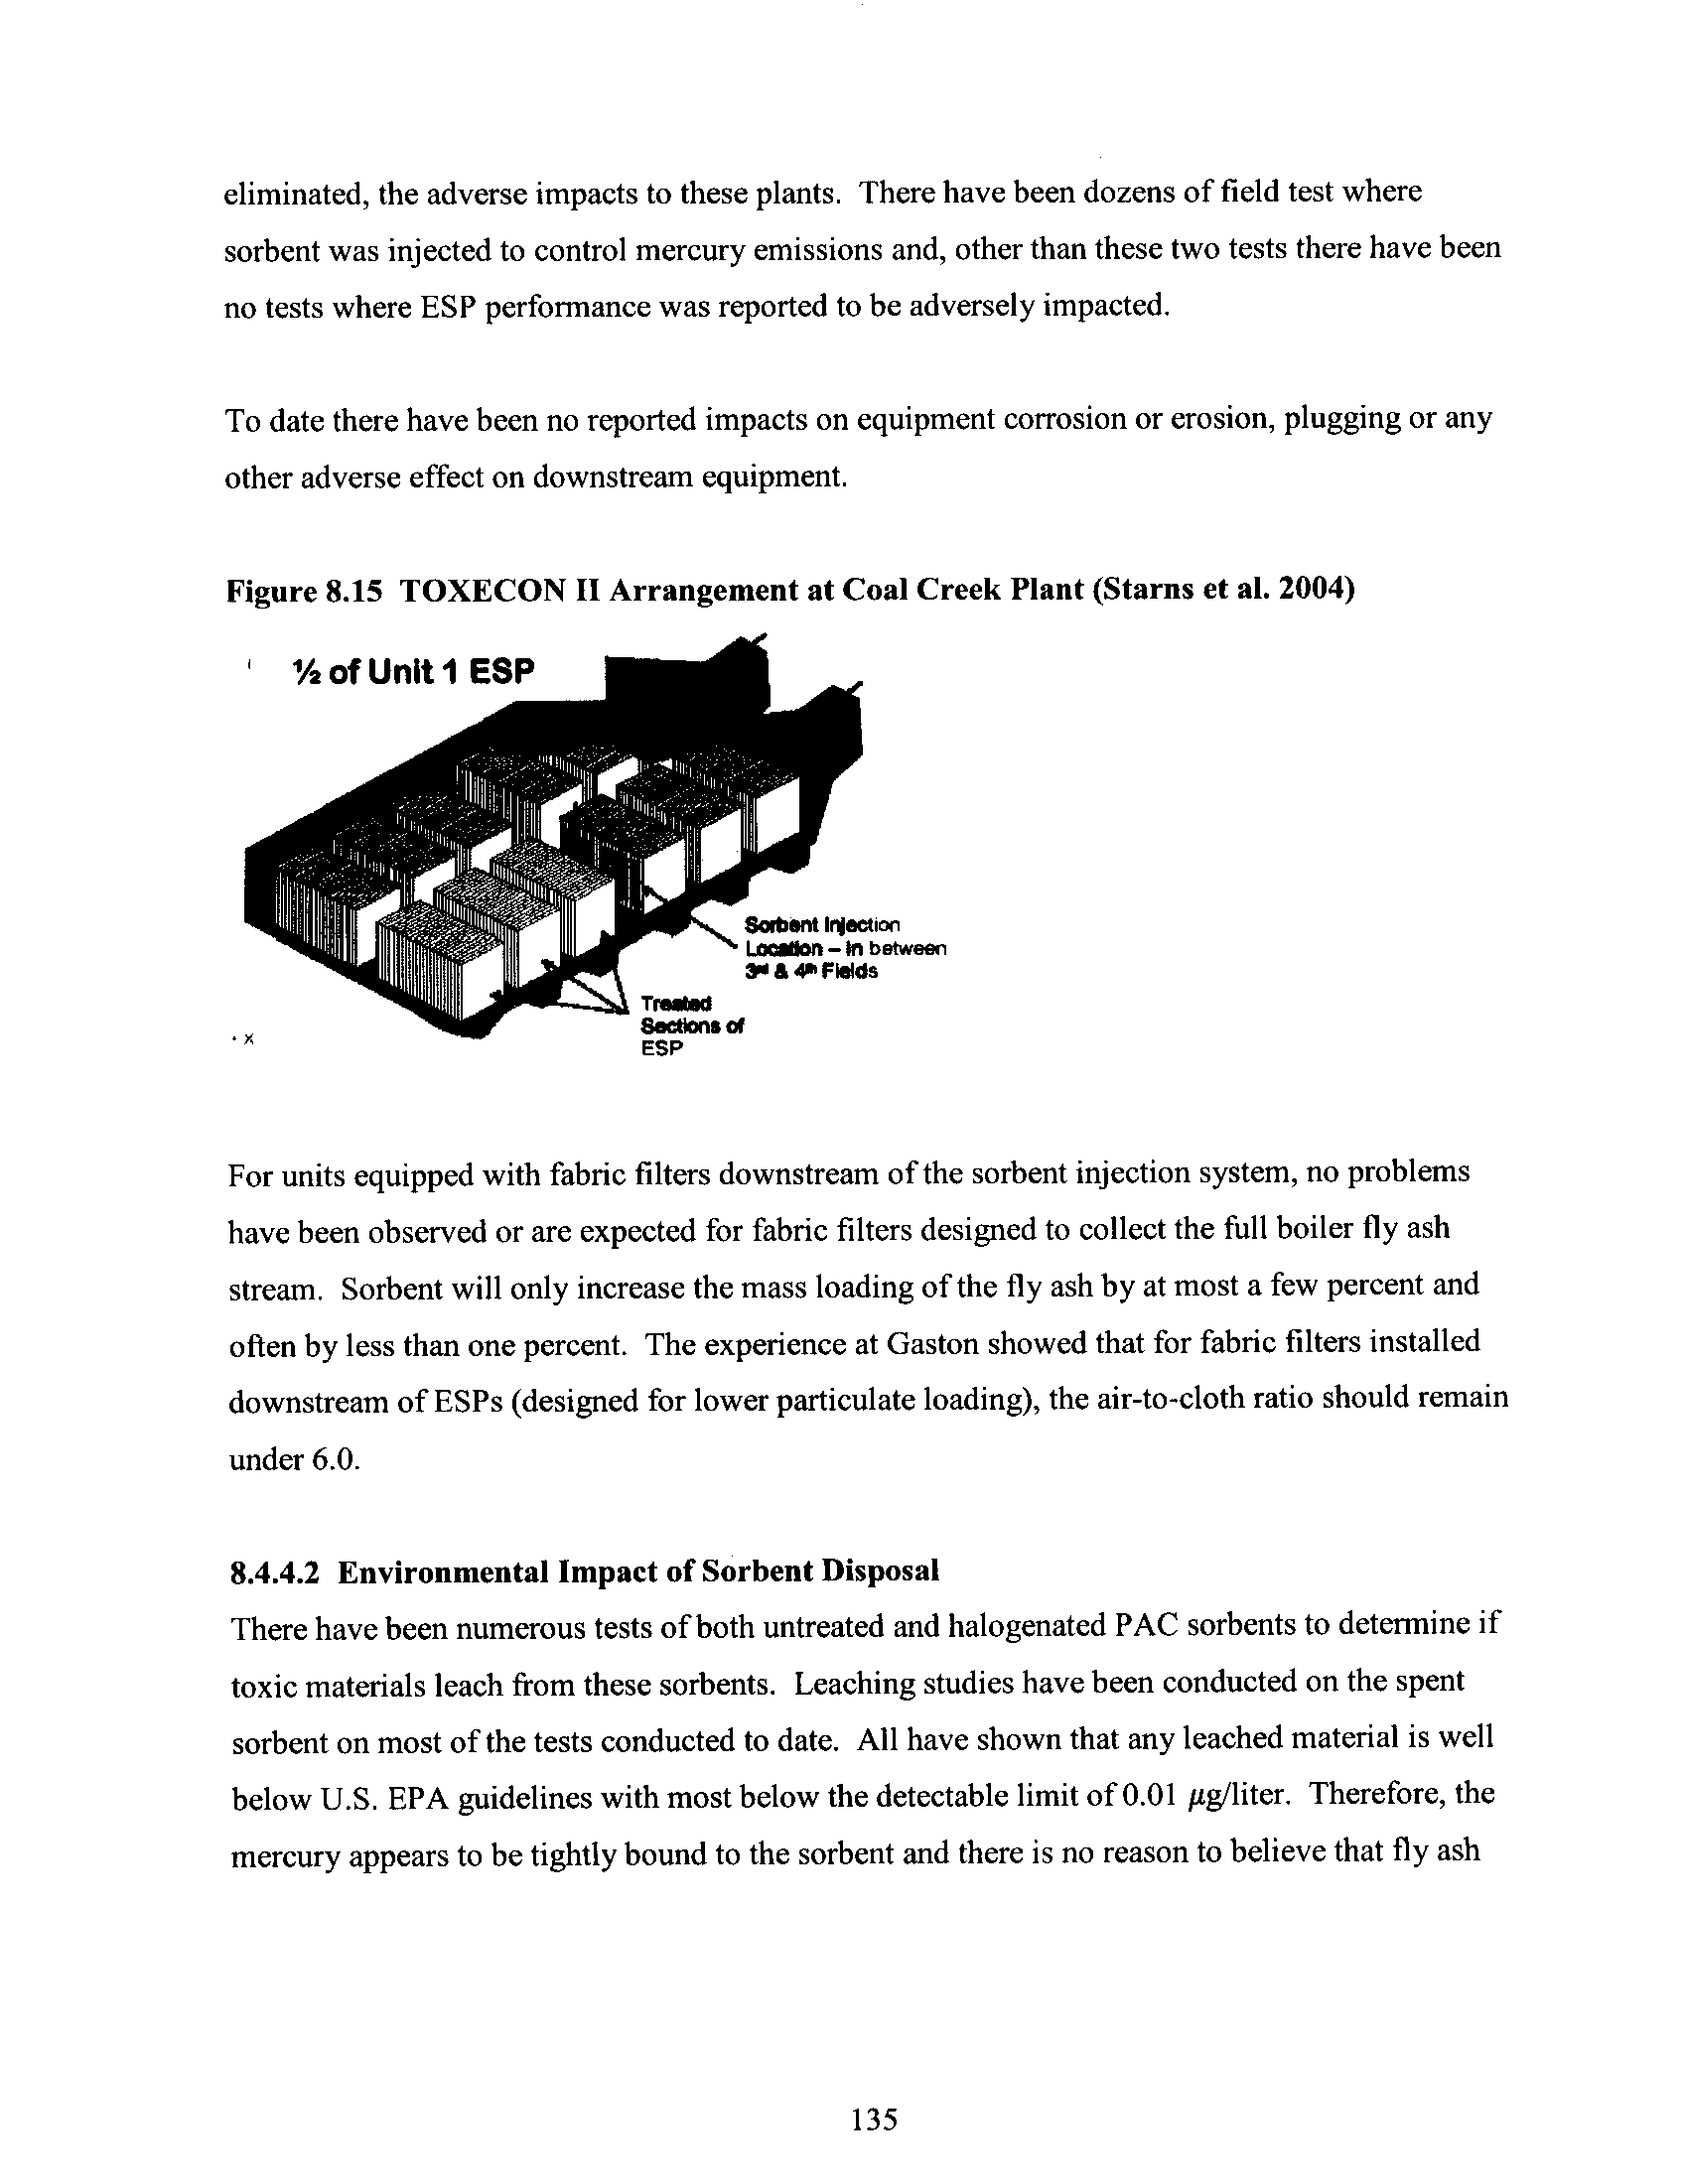
Figure 8 .15
TOXECON 11 Arrangement at Coal Creek Plant
135
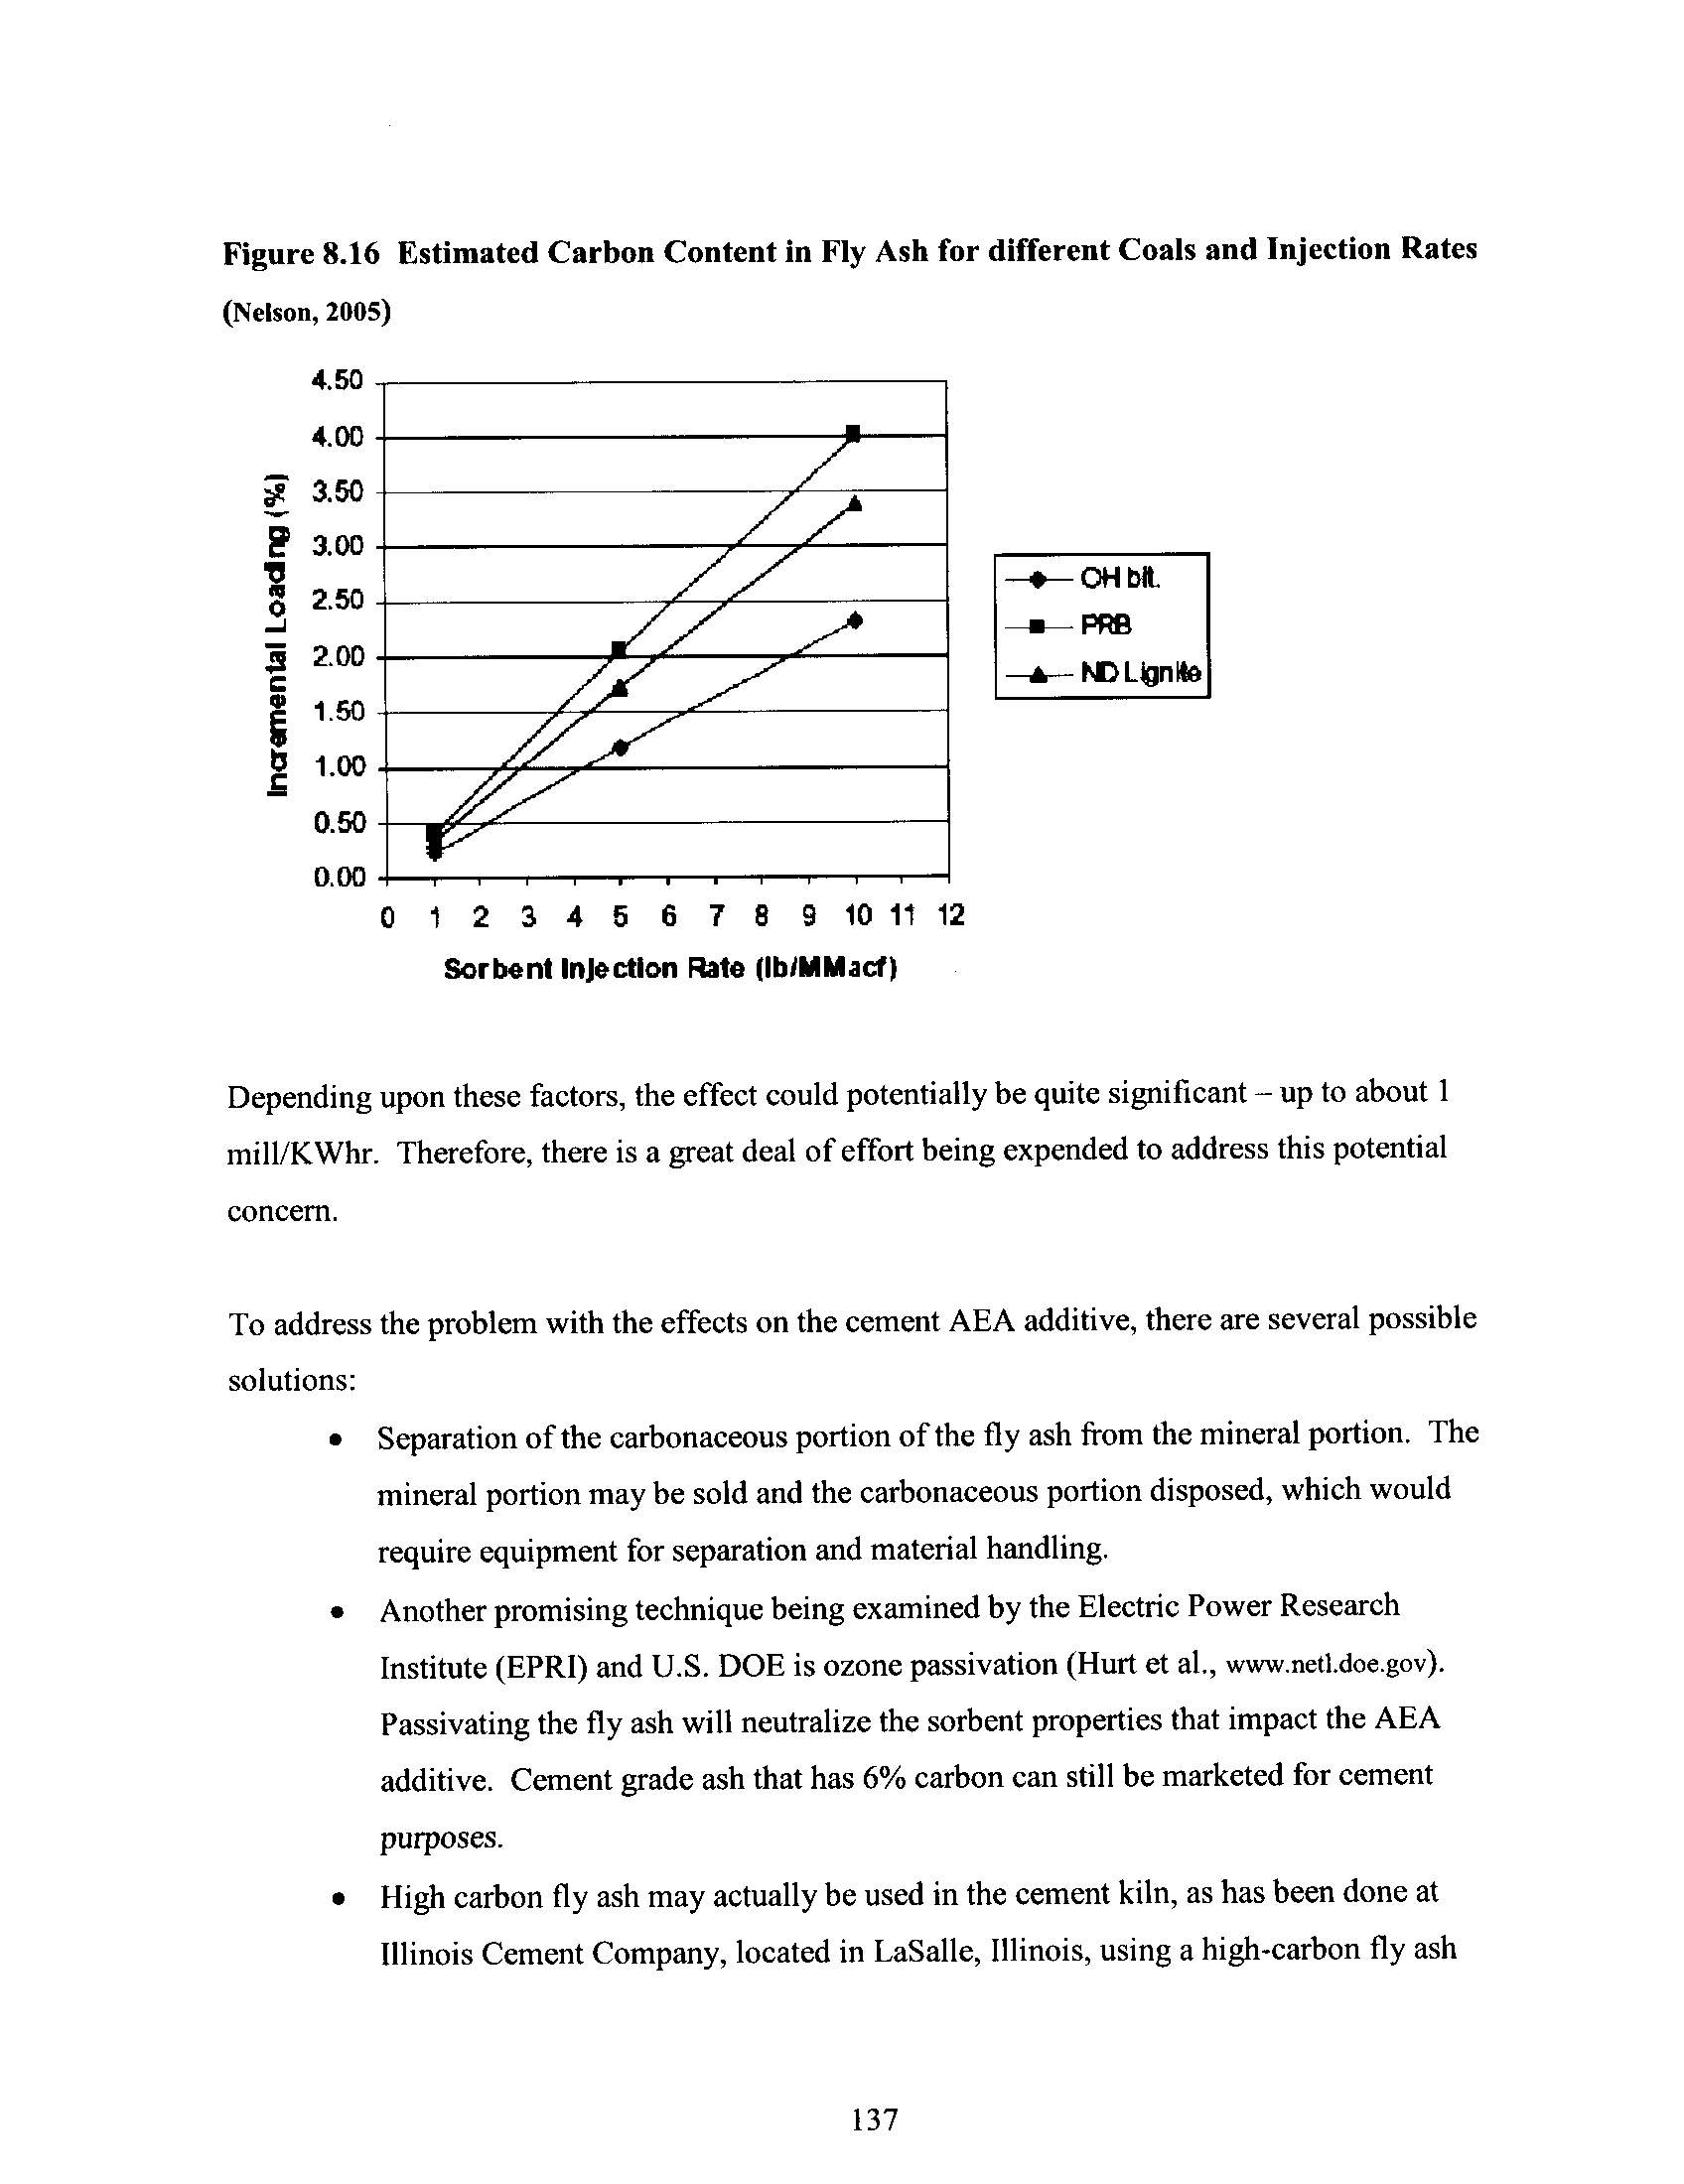
Figure 8 .16
Estimated Carbon Content in Fly Ash for Different Coals and
Injection Rates
137
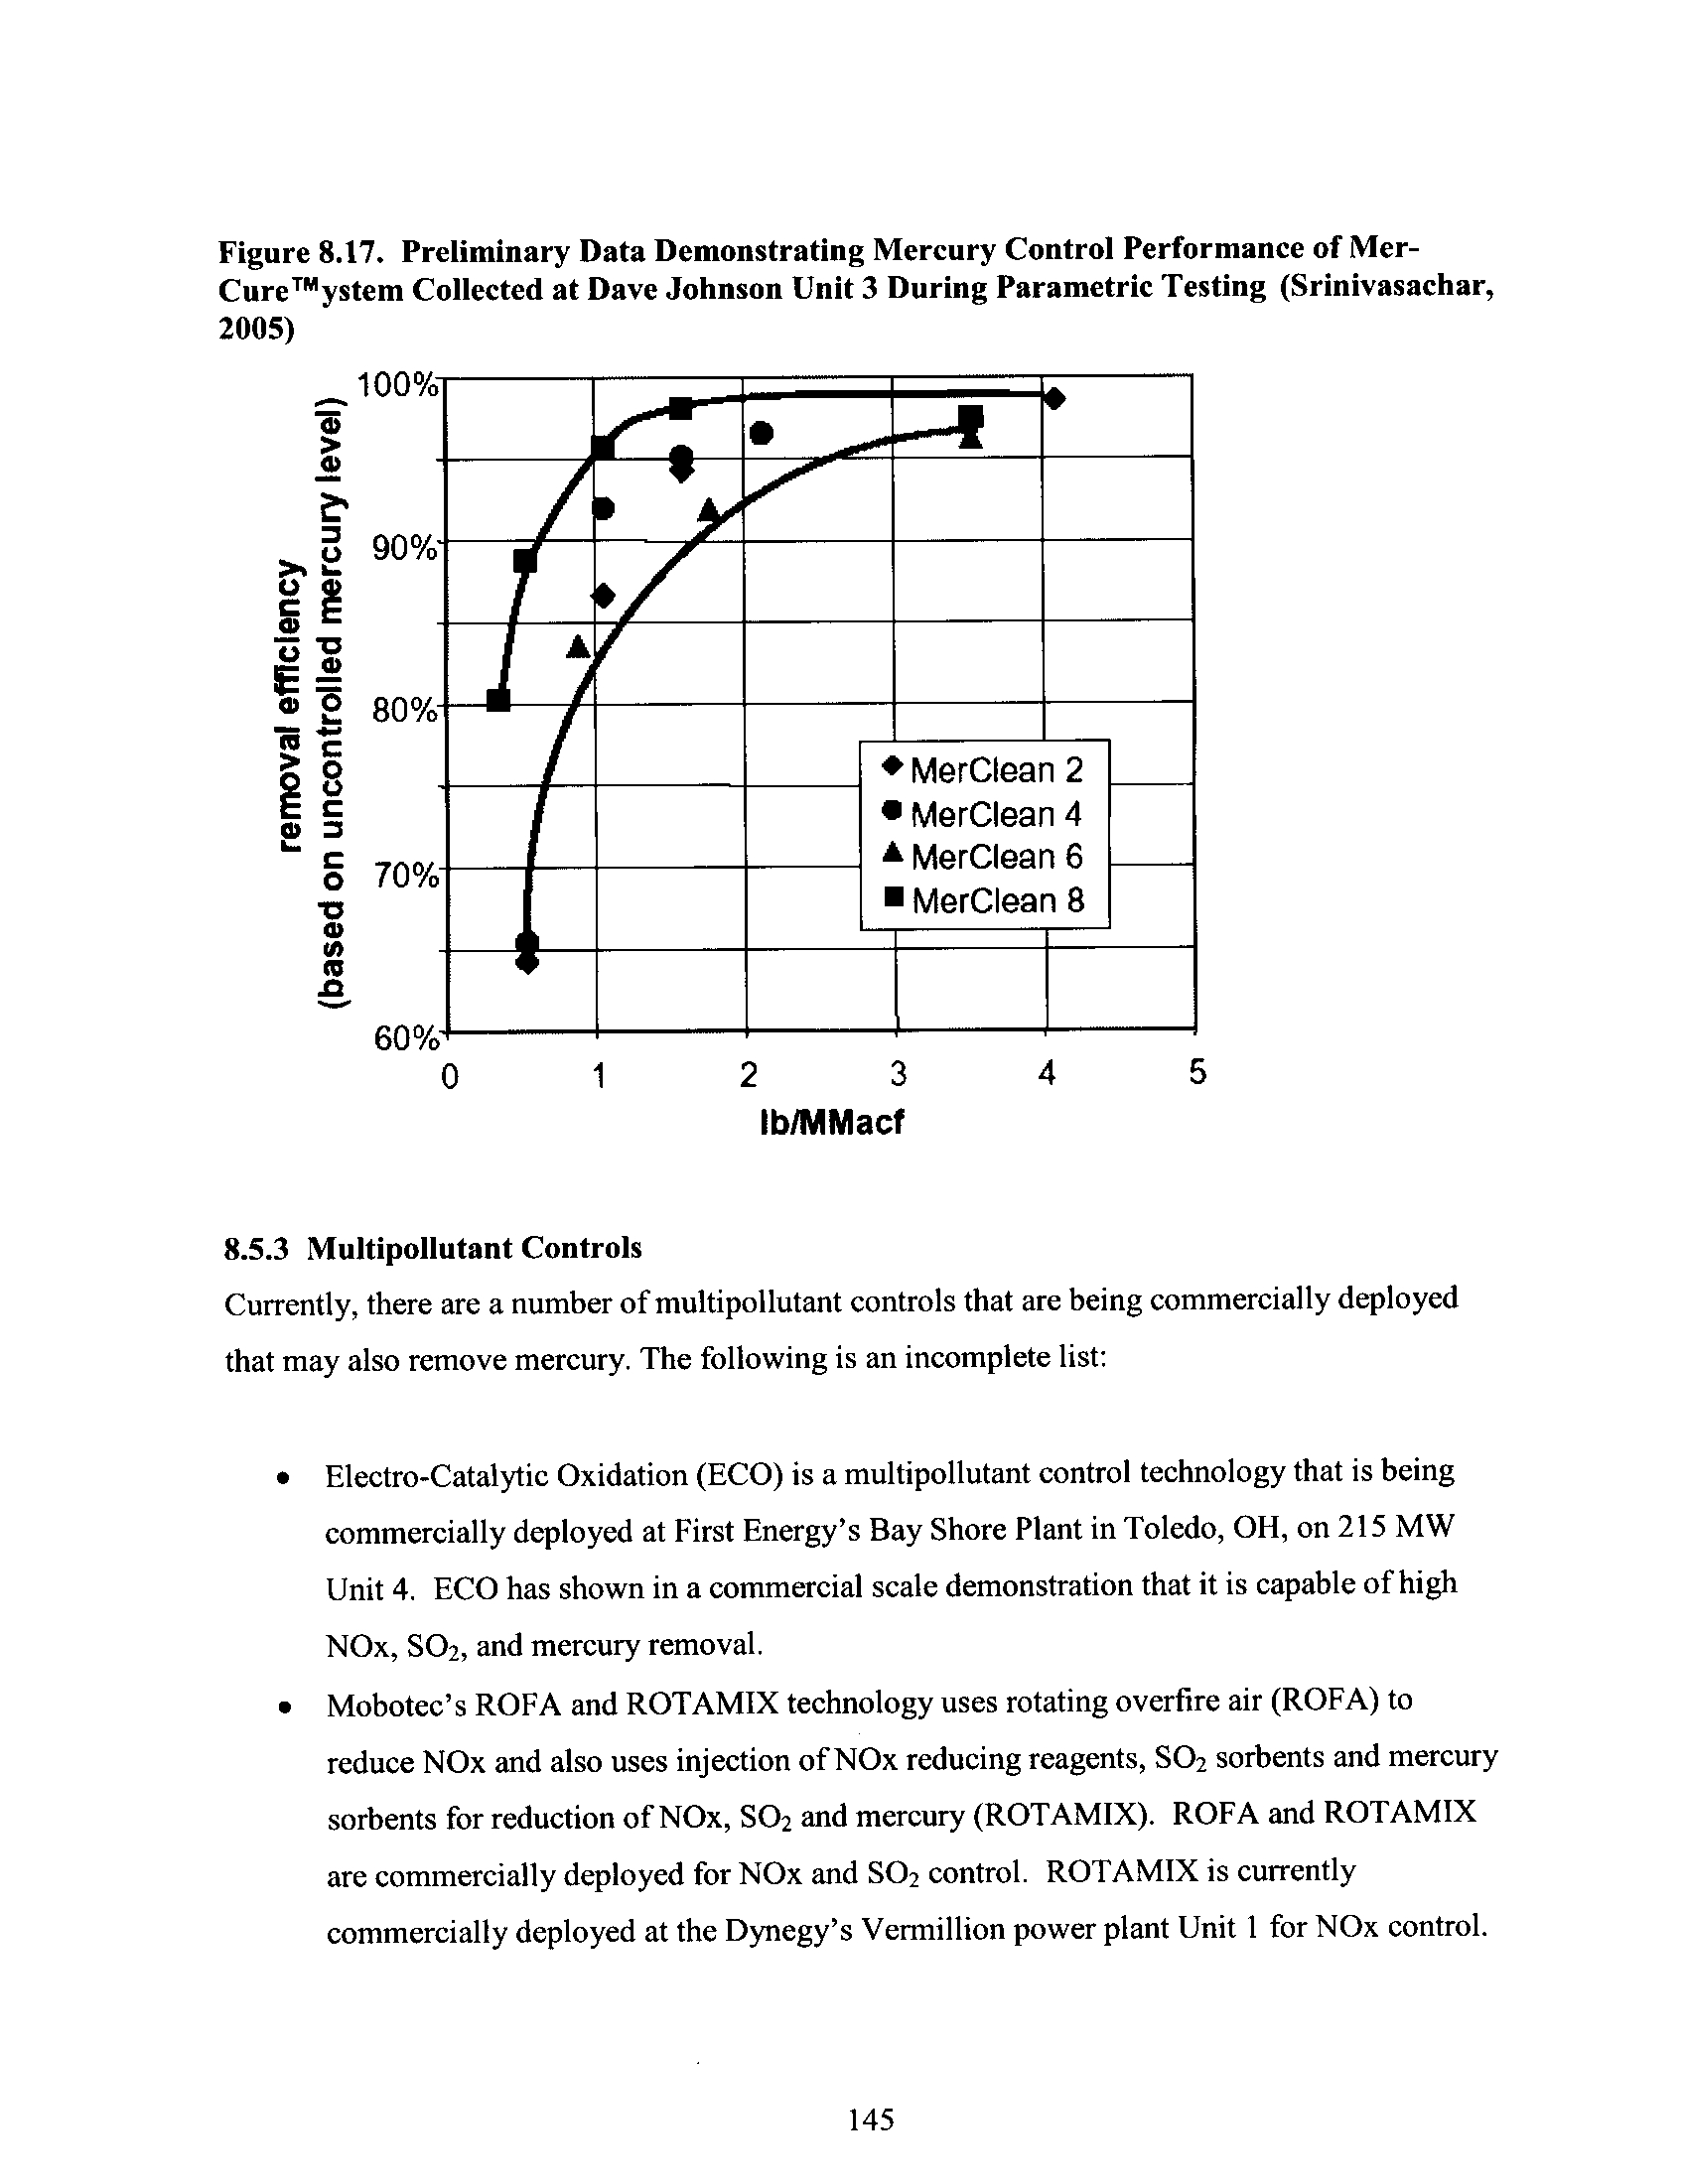
Figure 8.17
Preliminary Data Demonstrating Mercury Control Performance
of MerCure System Collected at Dave Johnson Unit 3
During Parametric Testing (Srinivasachar, 2005)
145
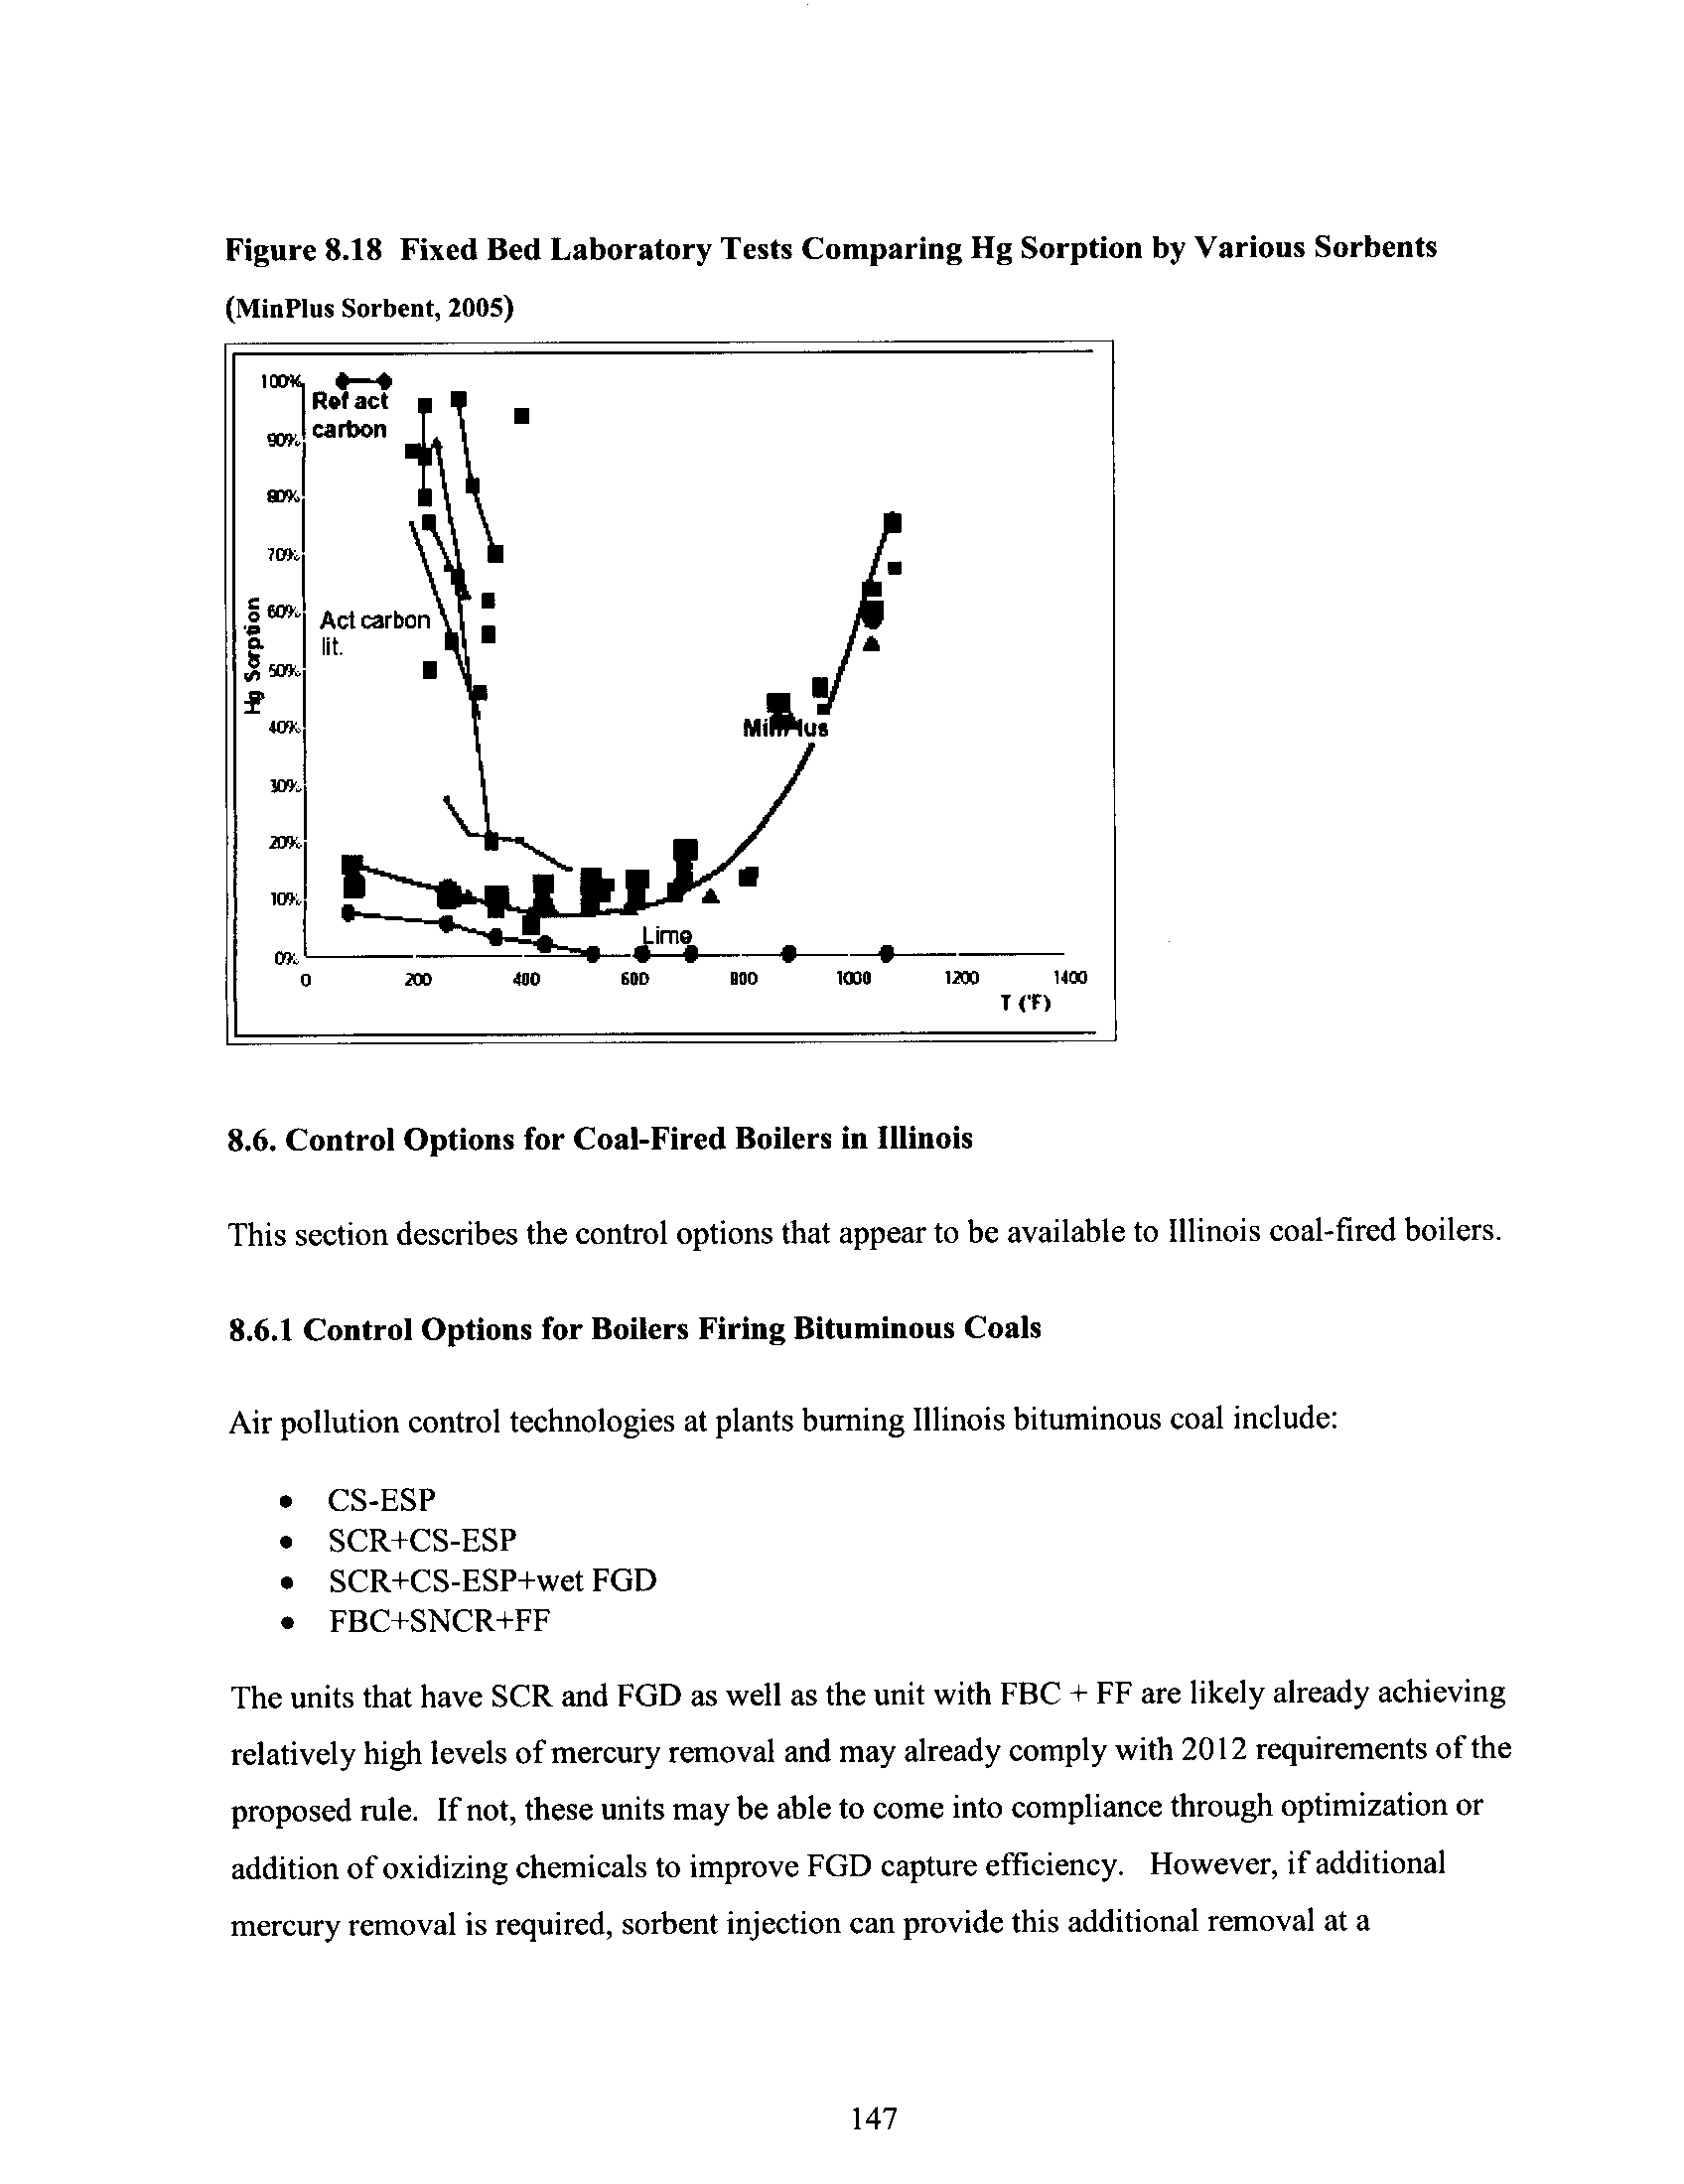
Figure 8.18
Fixed Bed Laboratory Tests Comparing Hg Sorption by
Various Sorbents
147
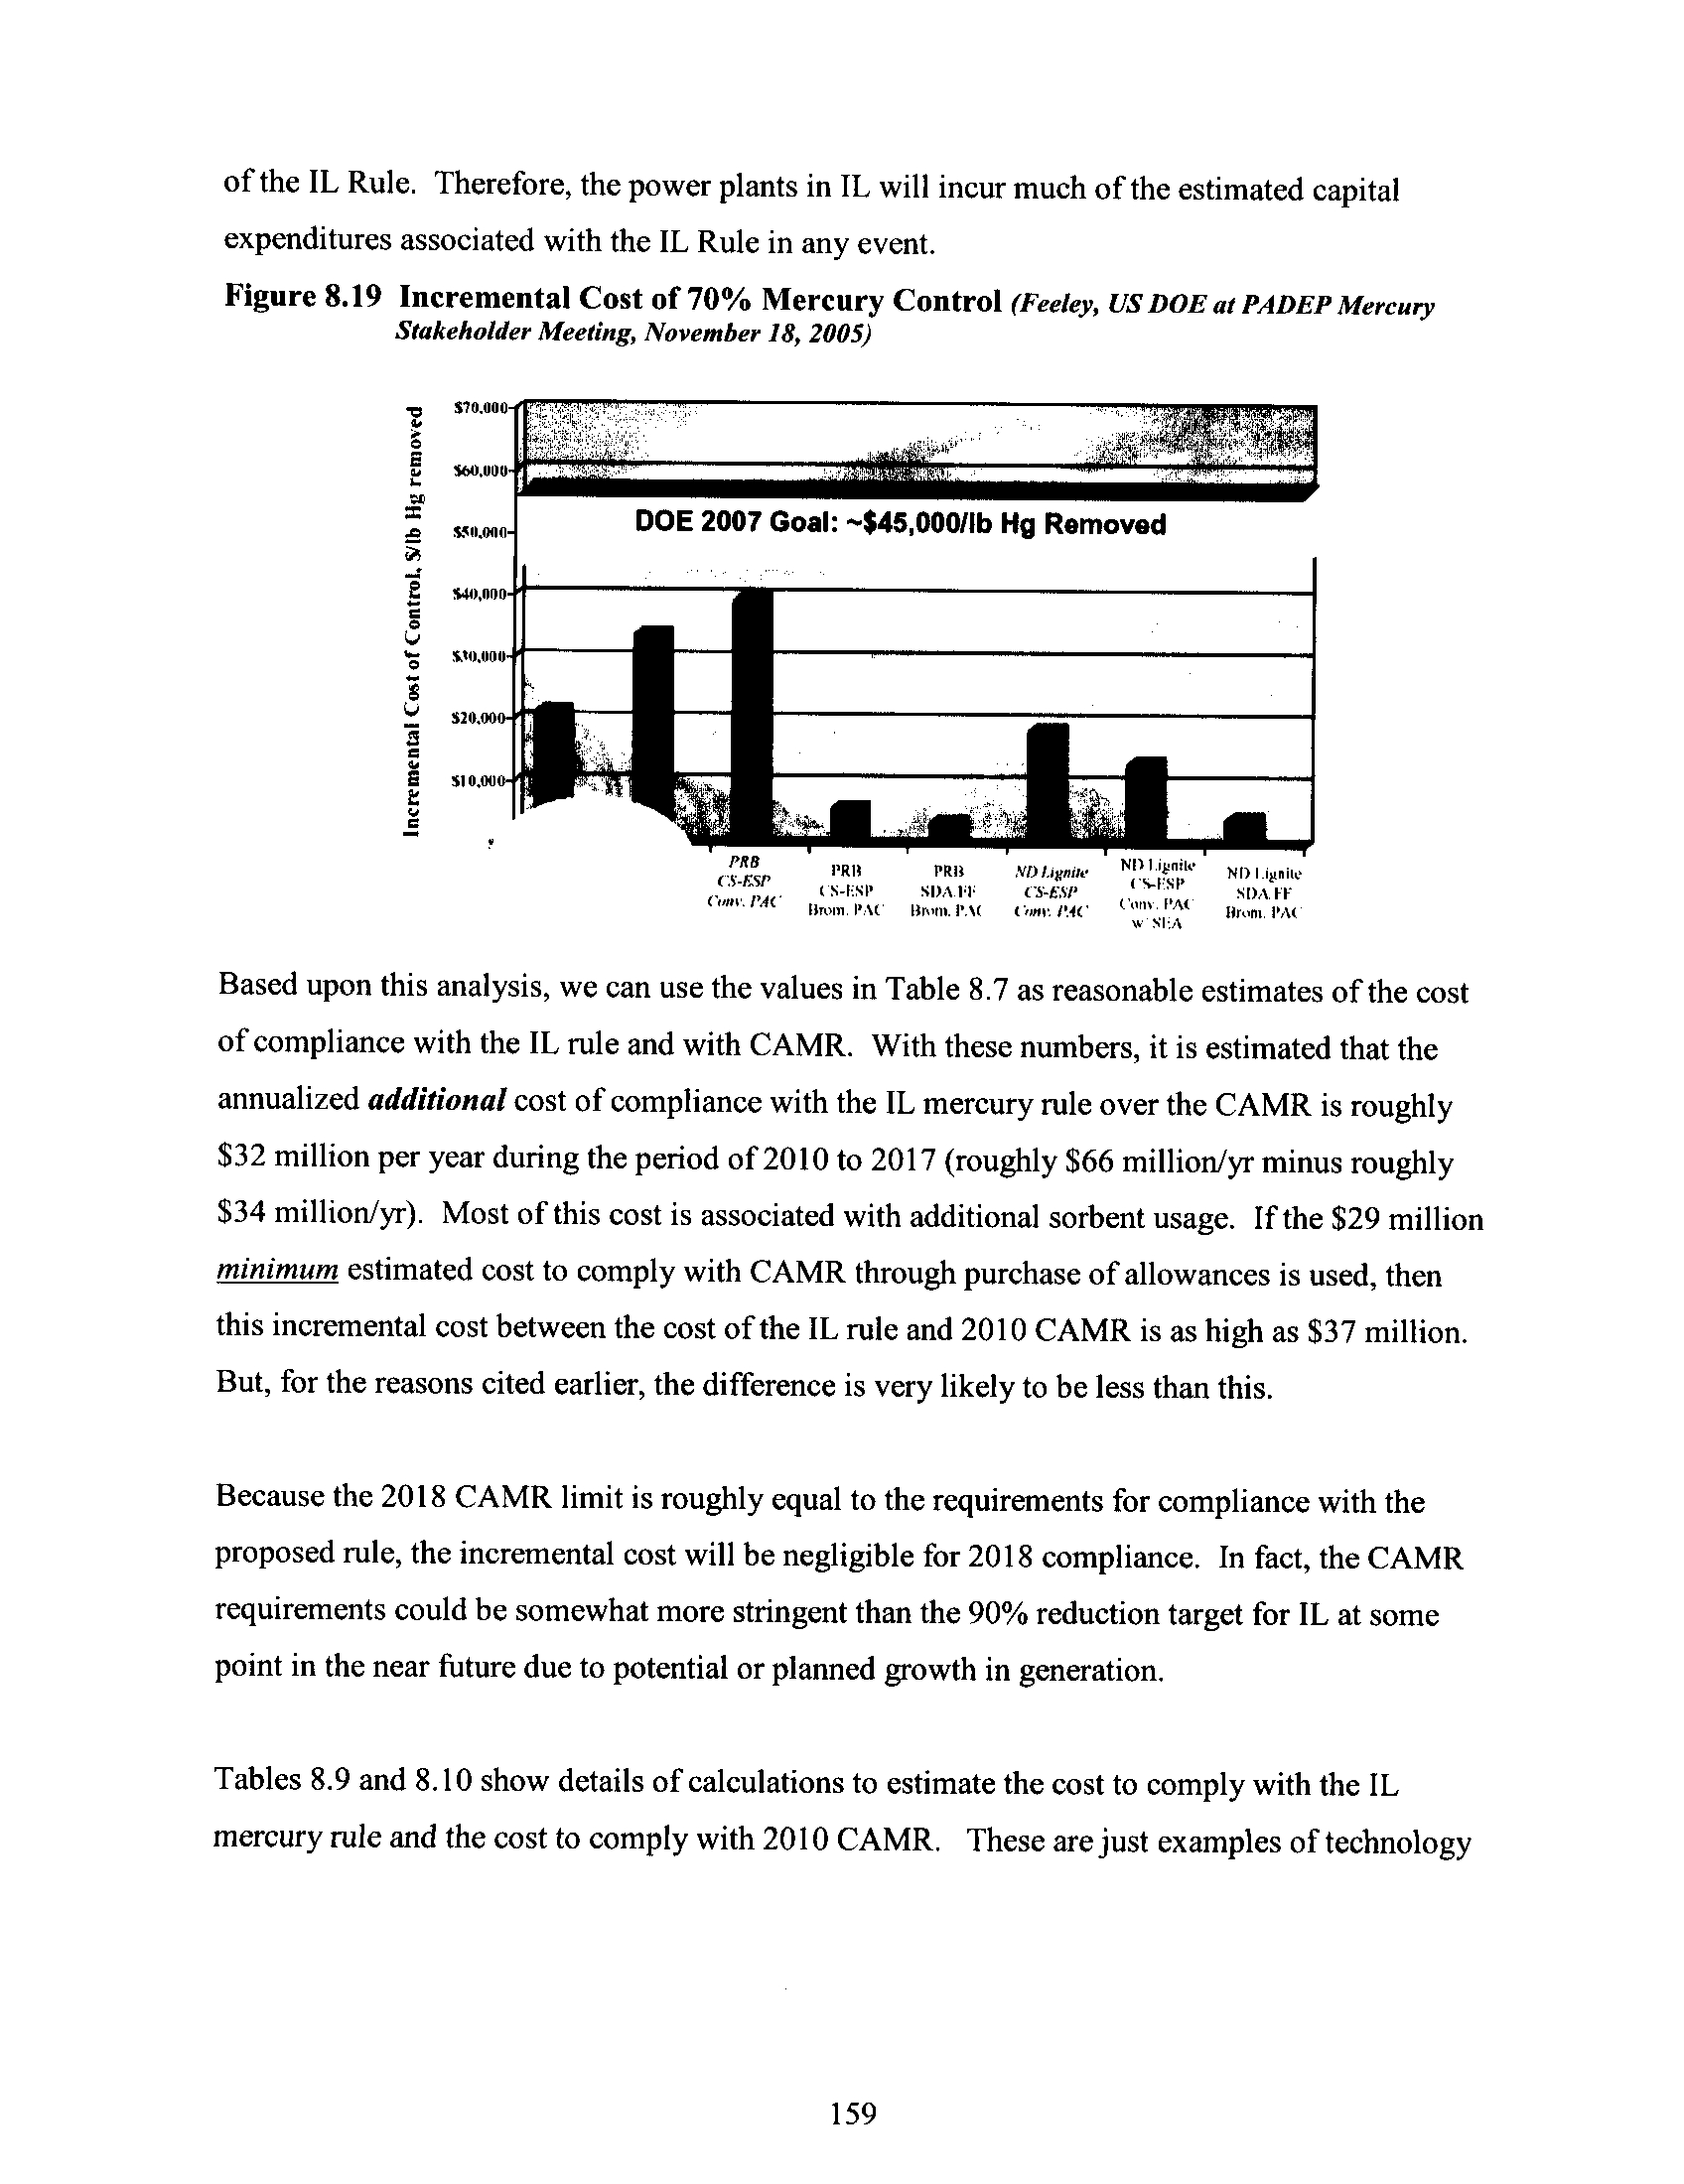
Figure 8.19
Incremental Cost of 70% Mercury Control
159
Figure 10.1
Current and Projected Mercury Emissions from Coal-Fired
Powers Plants in Illinois
196
Figure 10 .2
Power Generation from Sources Other Than Coal-Fired
Utilities
205
1 5
Tables
Table 2.1
1999 Information Collection Request (ICR) Illinois Coal Fired
Electric Generating Units
35
Table 3 .1
Comparison of Benefits Analyses for Neurological Effects
In the U.S
47
Table 4.1
Illinois Designated Uses and Applicable Water Quality Stnds
.
. .
.
49
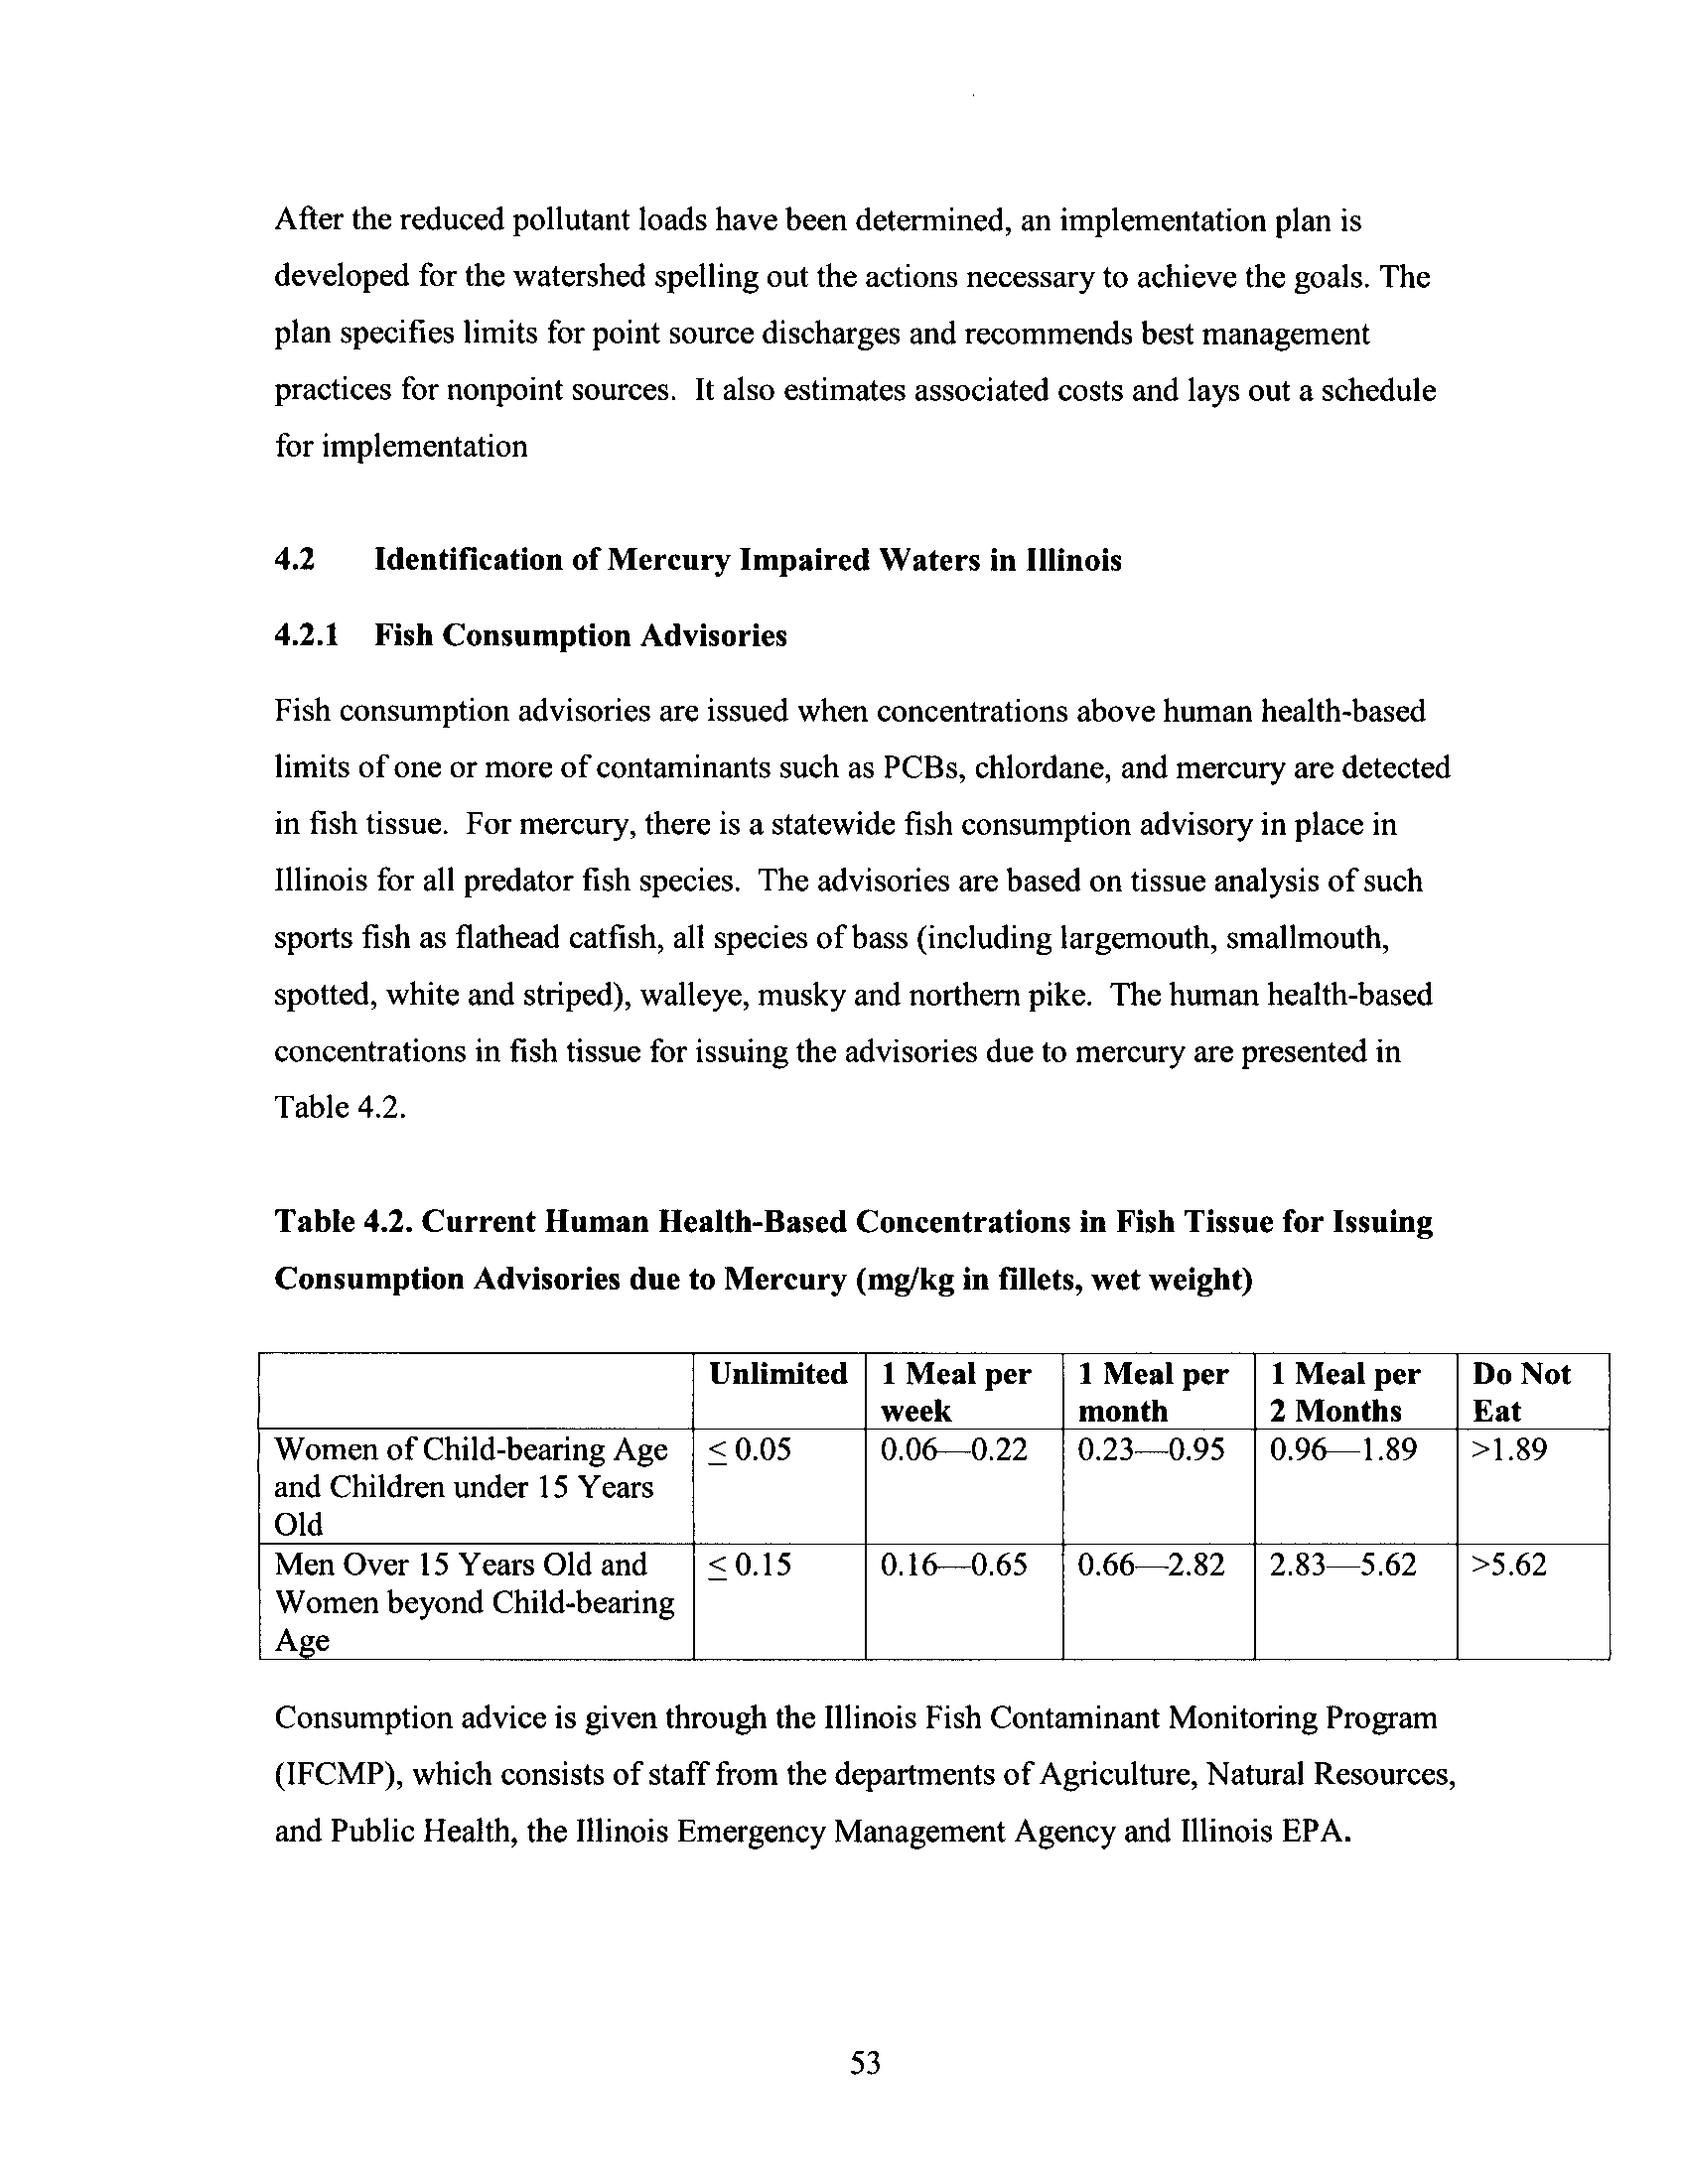
Table 4 .2
Current Human Health-Based Concentrations in Fish Tissue
For Issuing Consumption Advisories due to Mercury
53
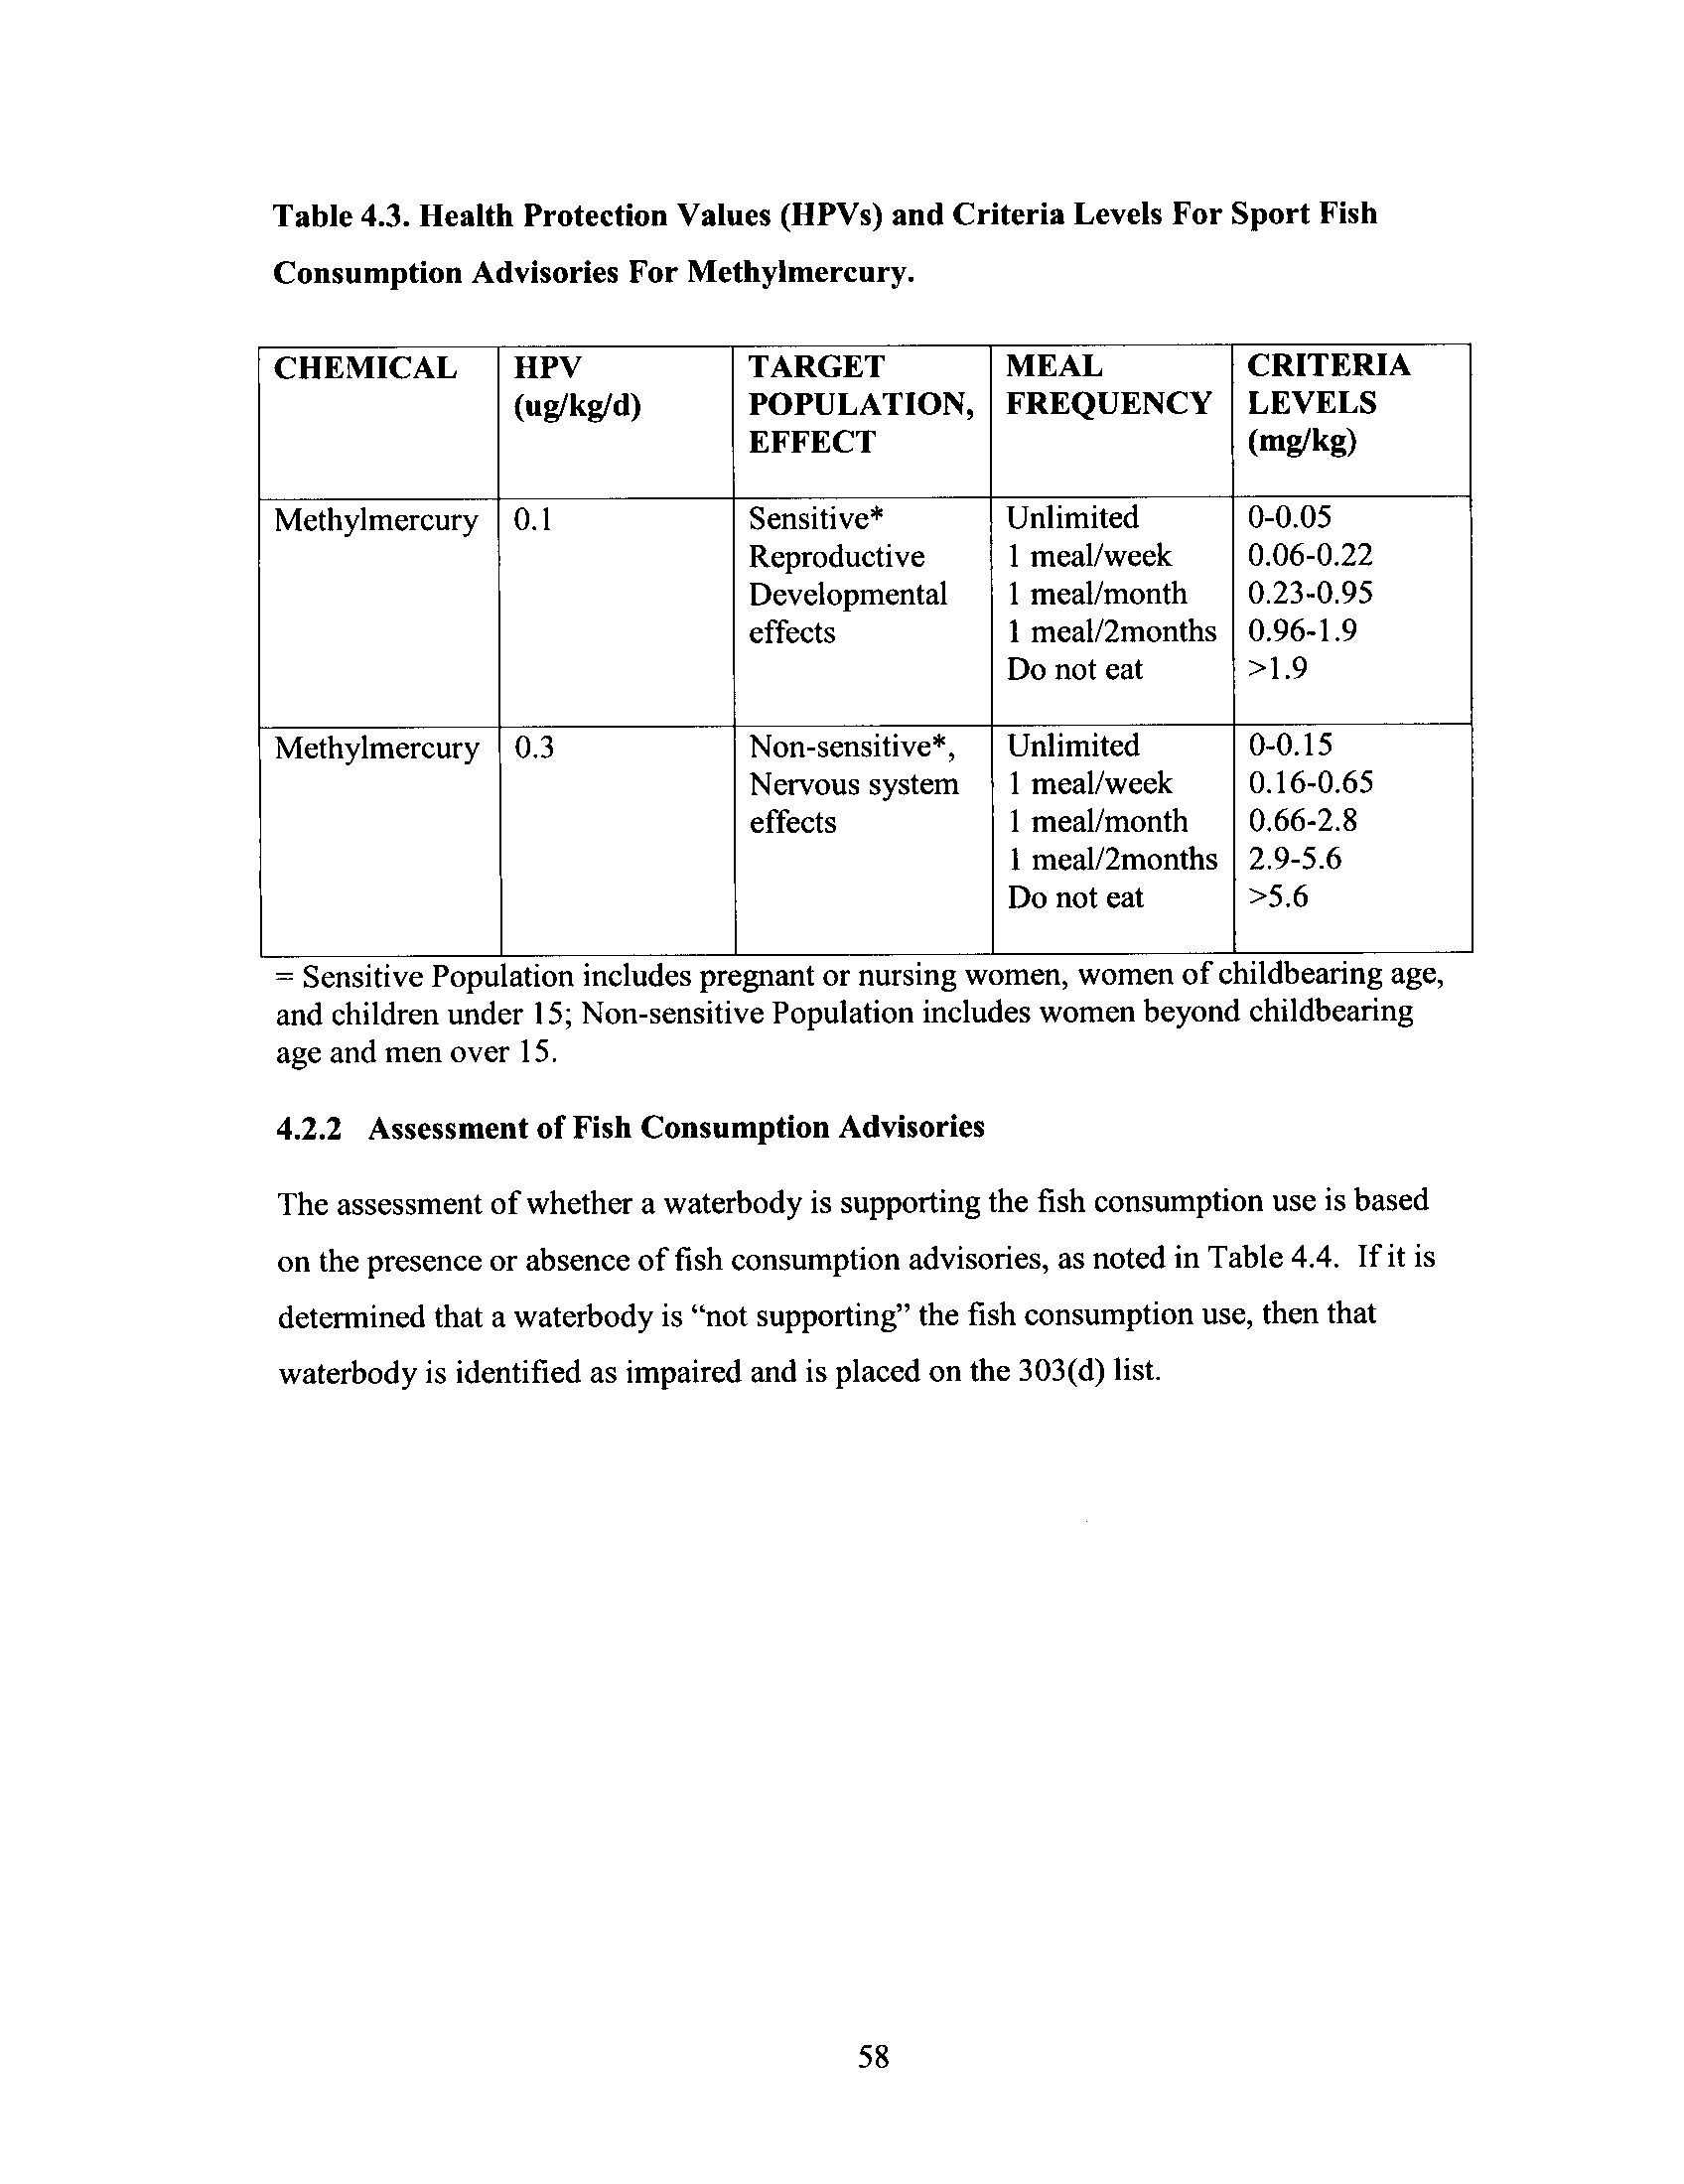
Table 4 .3
Health Protection Values (HPVs) and Criteria Levels for Sport
Fish Consumption Advisories for Methylmercury
58
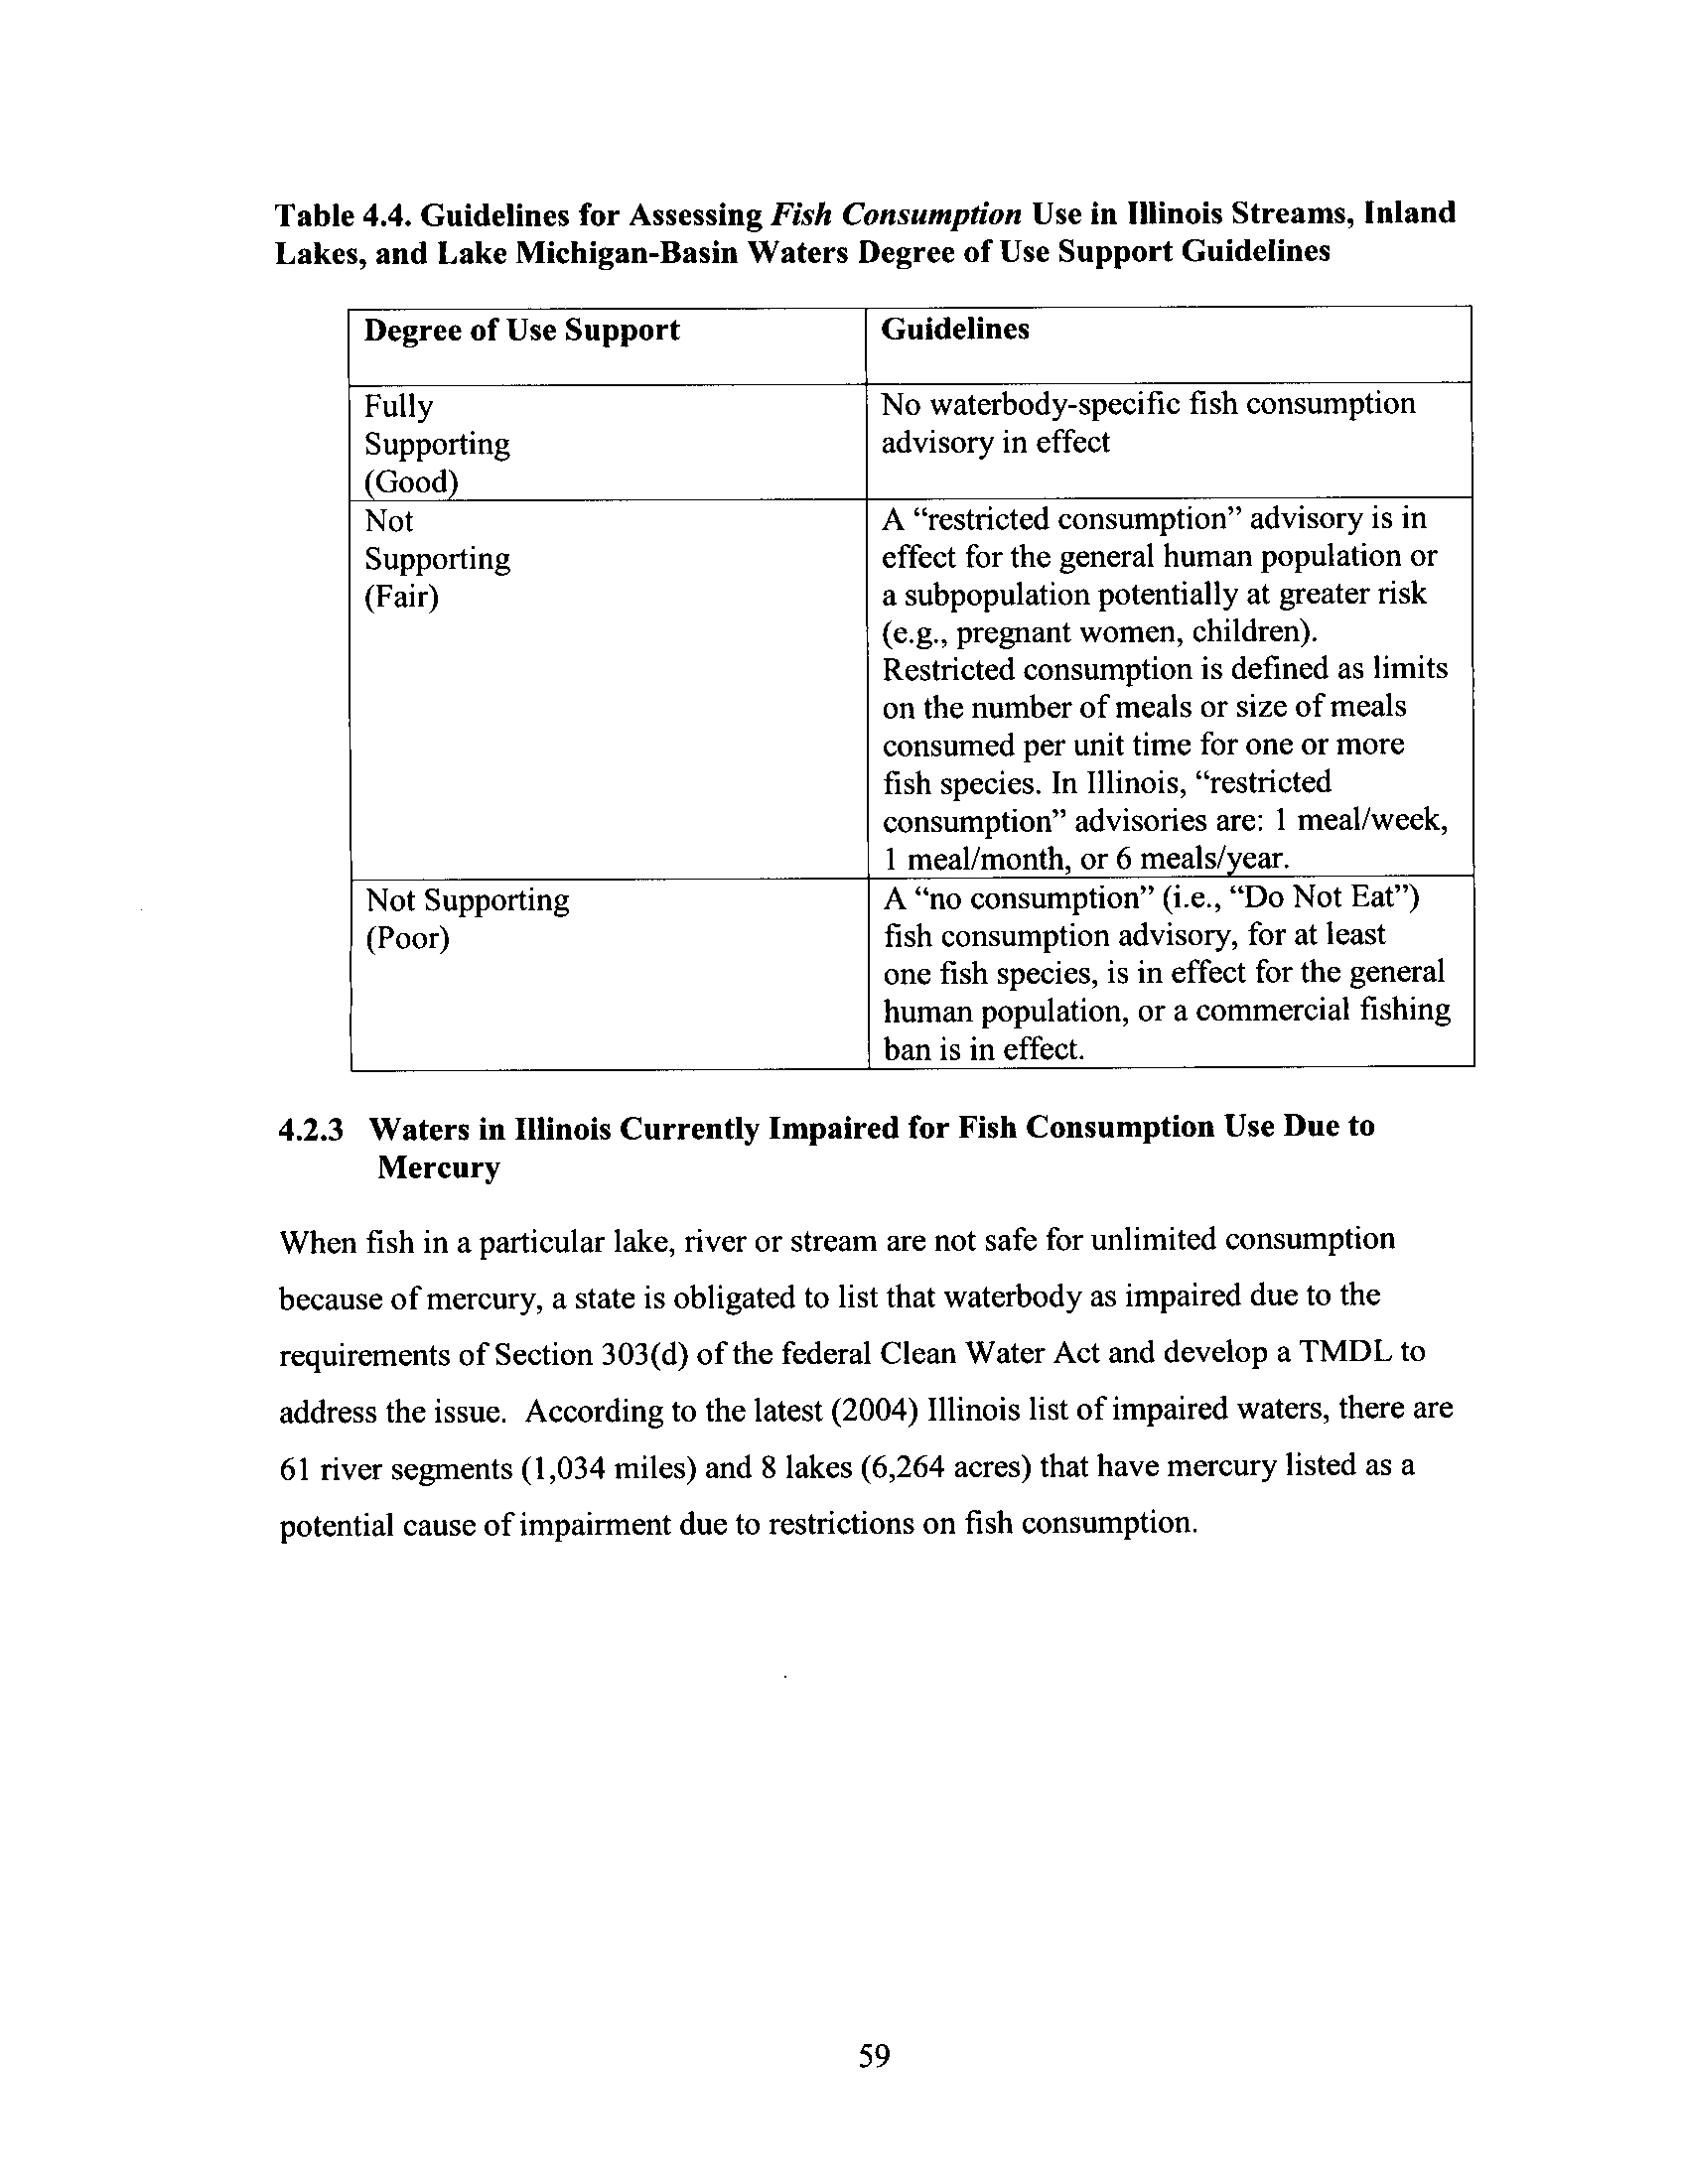
Table 4.4
Guidelines for Assessing Fish Consumption Use in Illinois
Streams, Inland Lakes, and Lake Michigan-Basin Waters
Degree of Use Support Guidelines
59
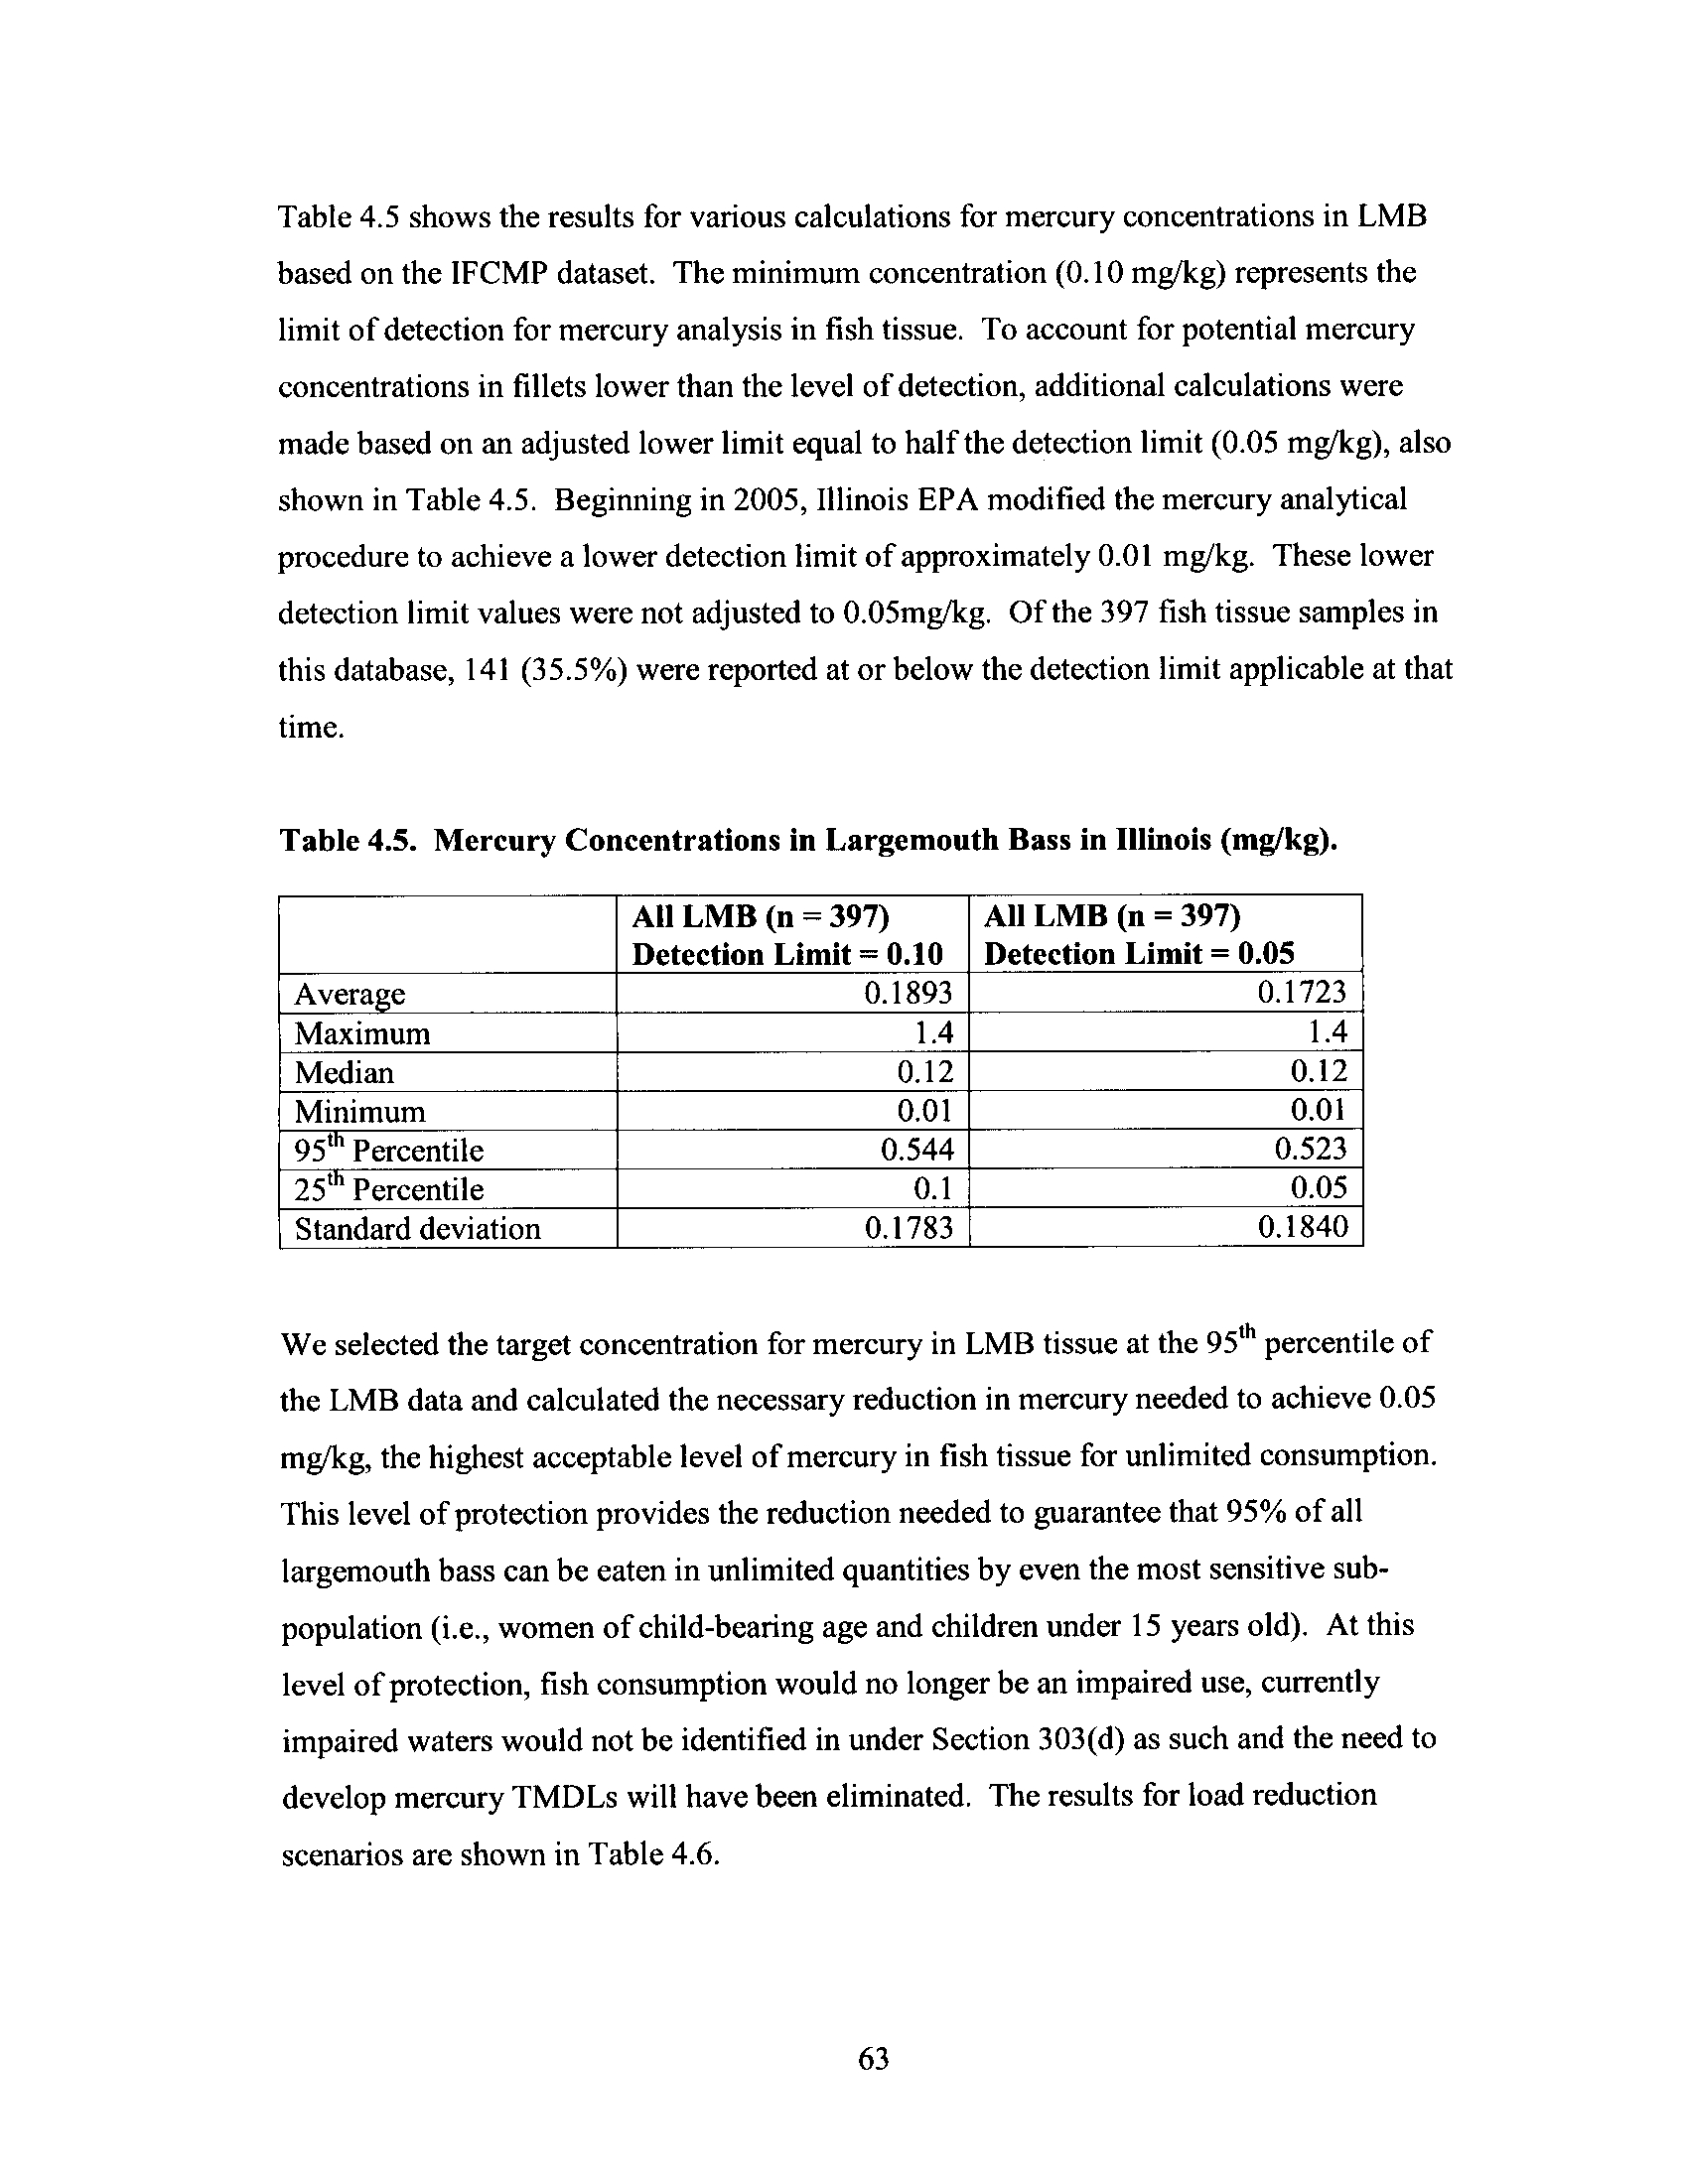
Table 4 .5
Mercury Concentrations in Largemouth Bass in Illinois
63
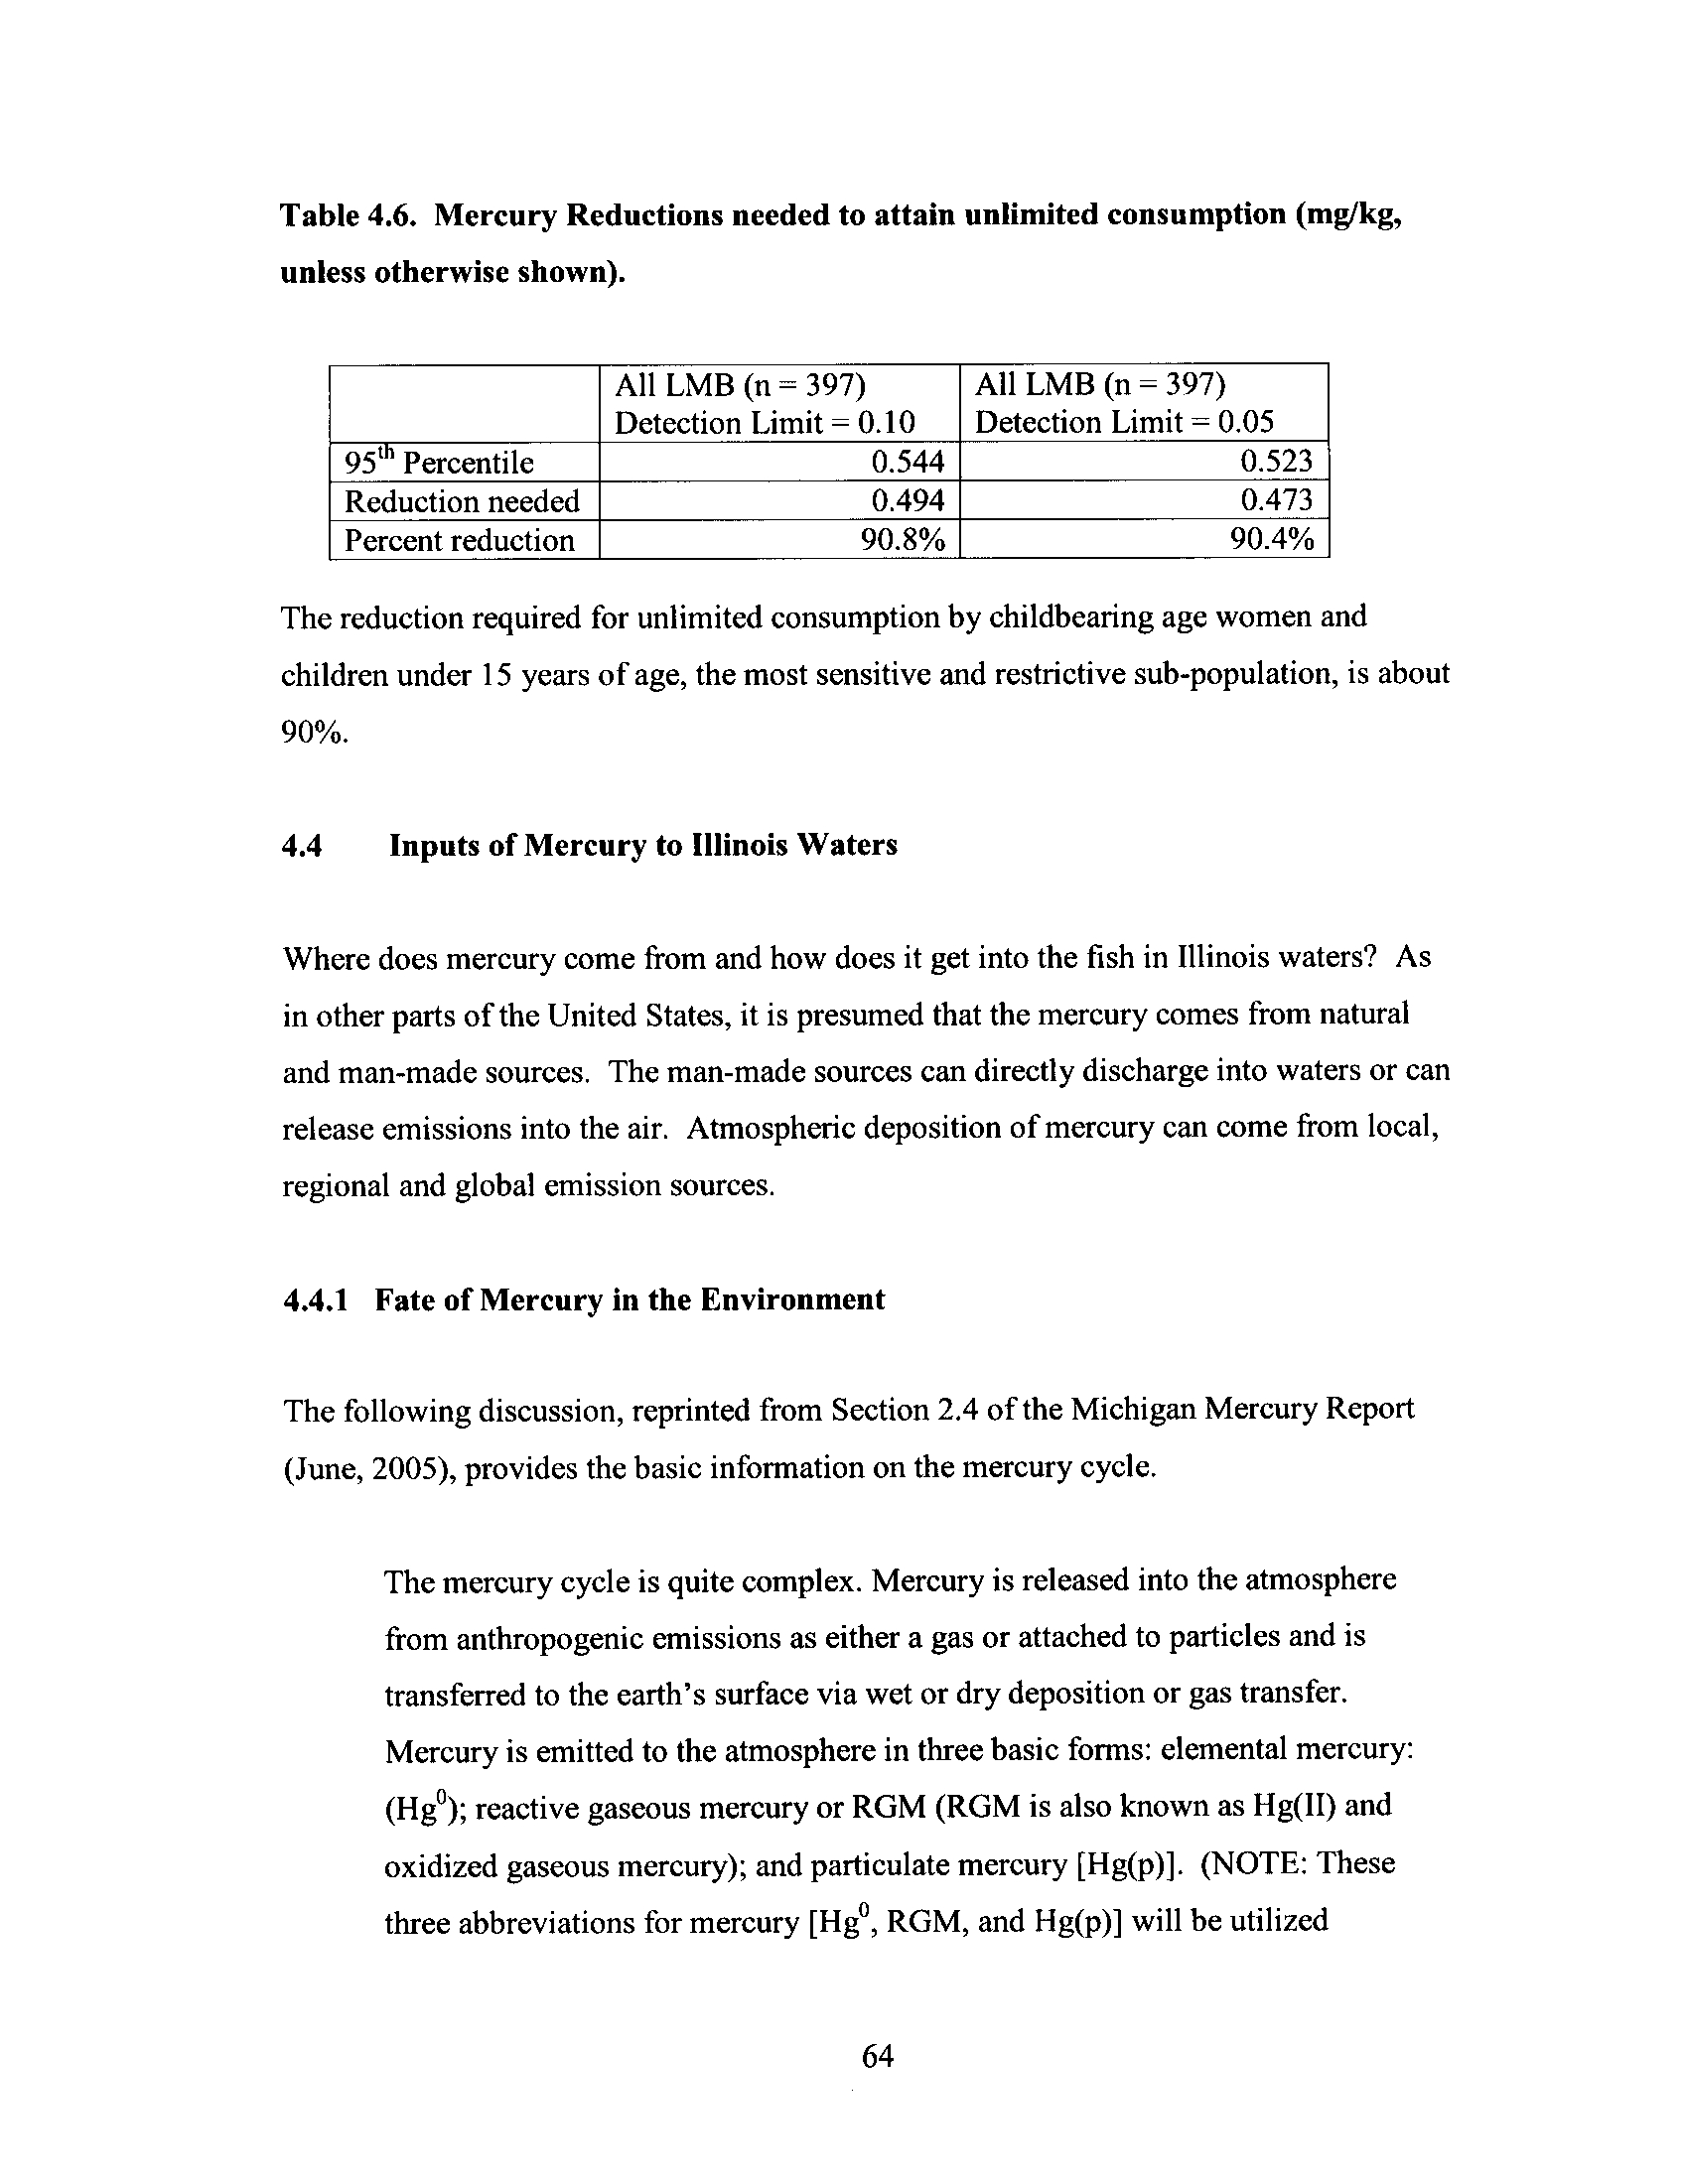
Table 4.6
Mercury Reductions Needed to Attain Unlimited Consumption
.
.
64
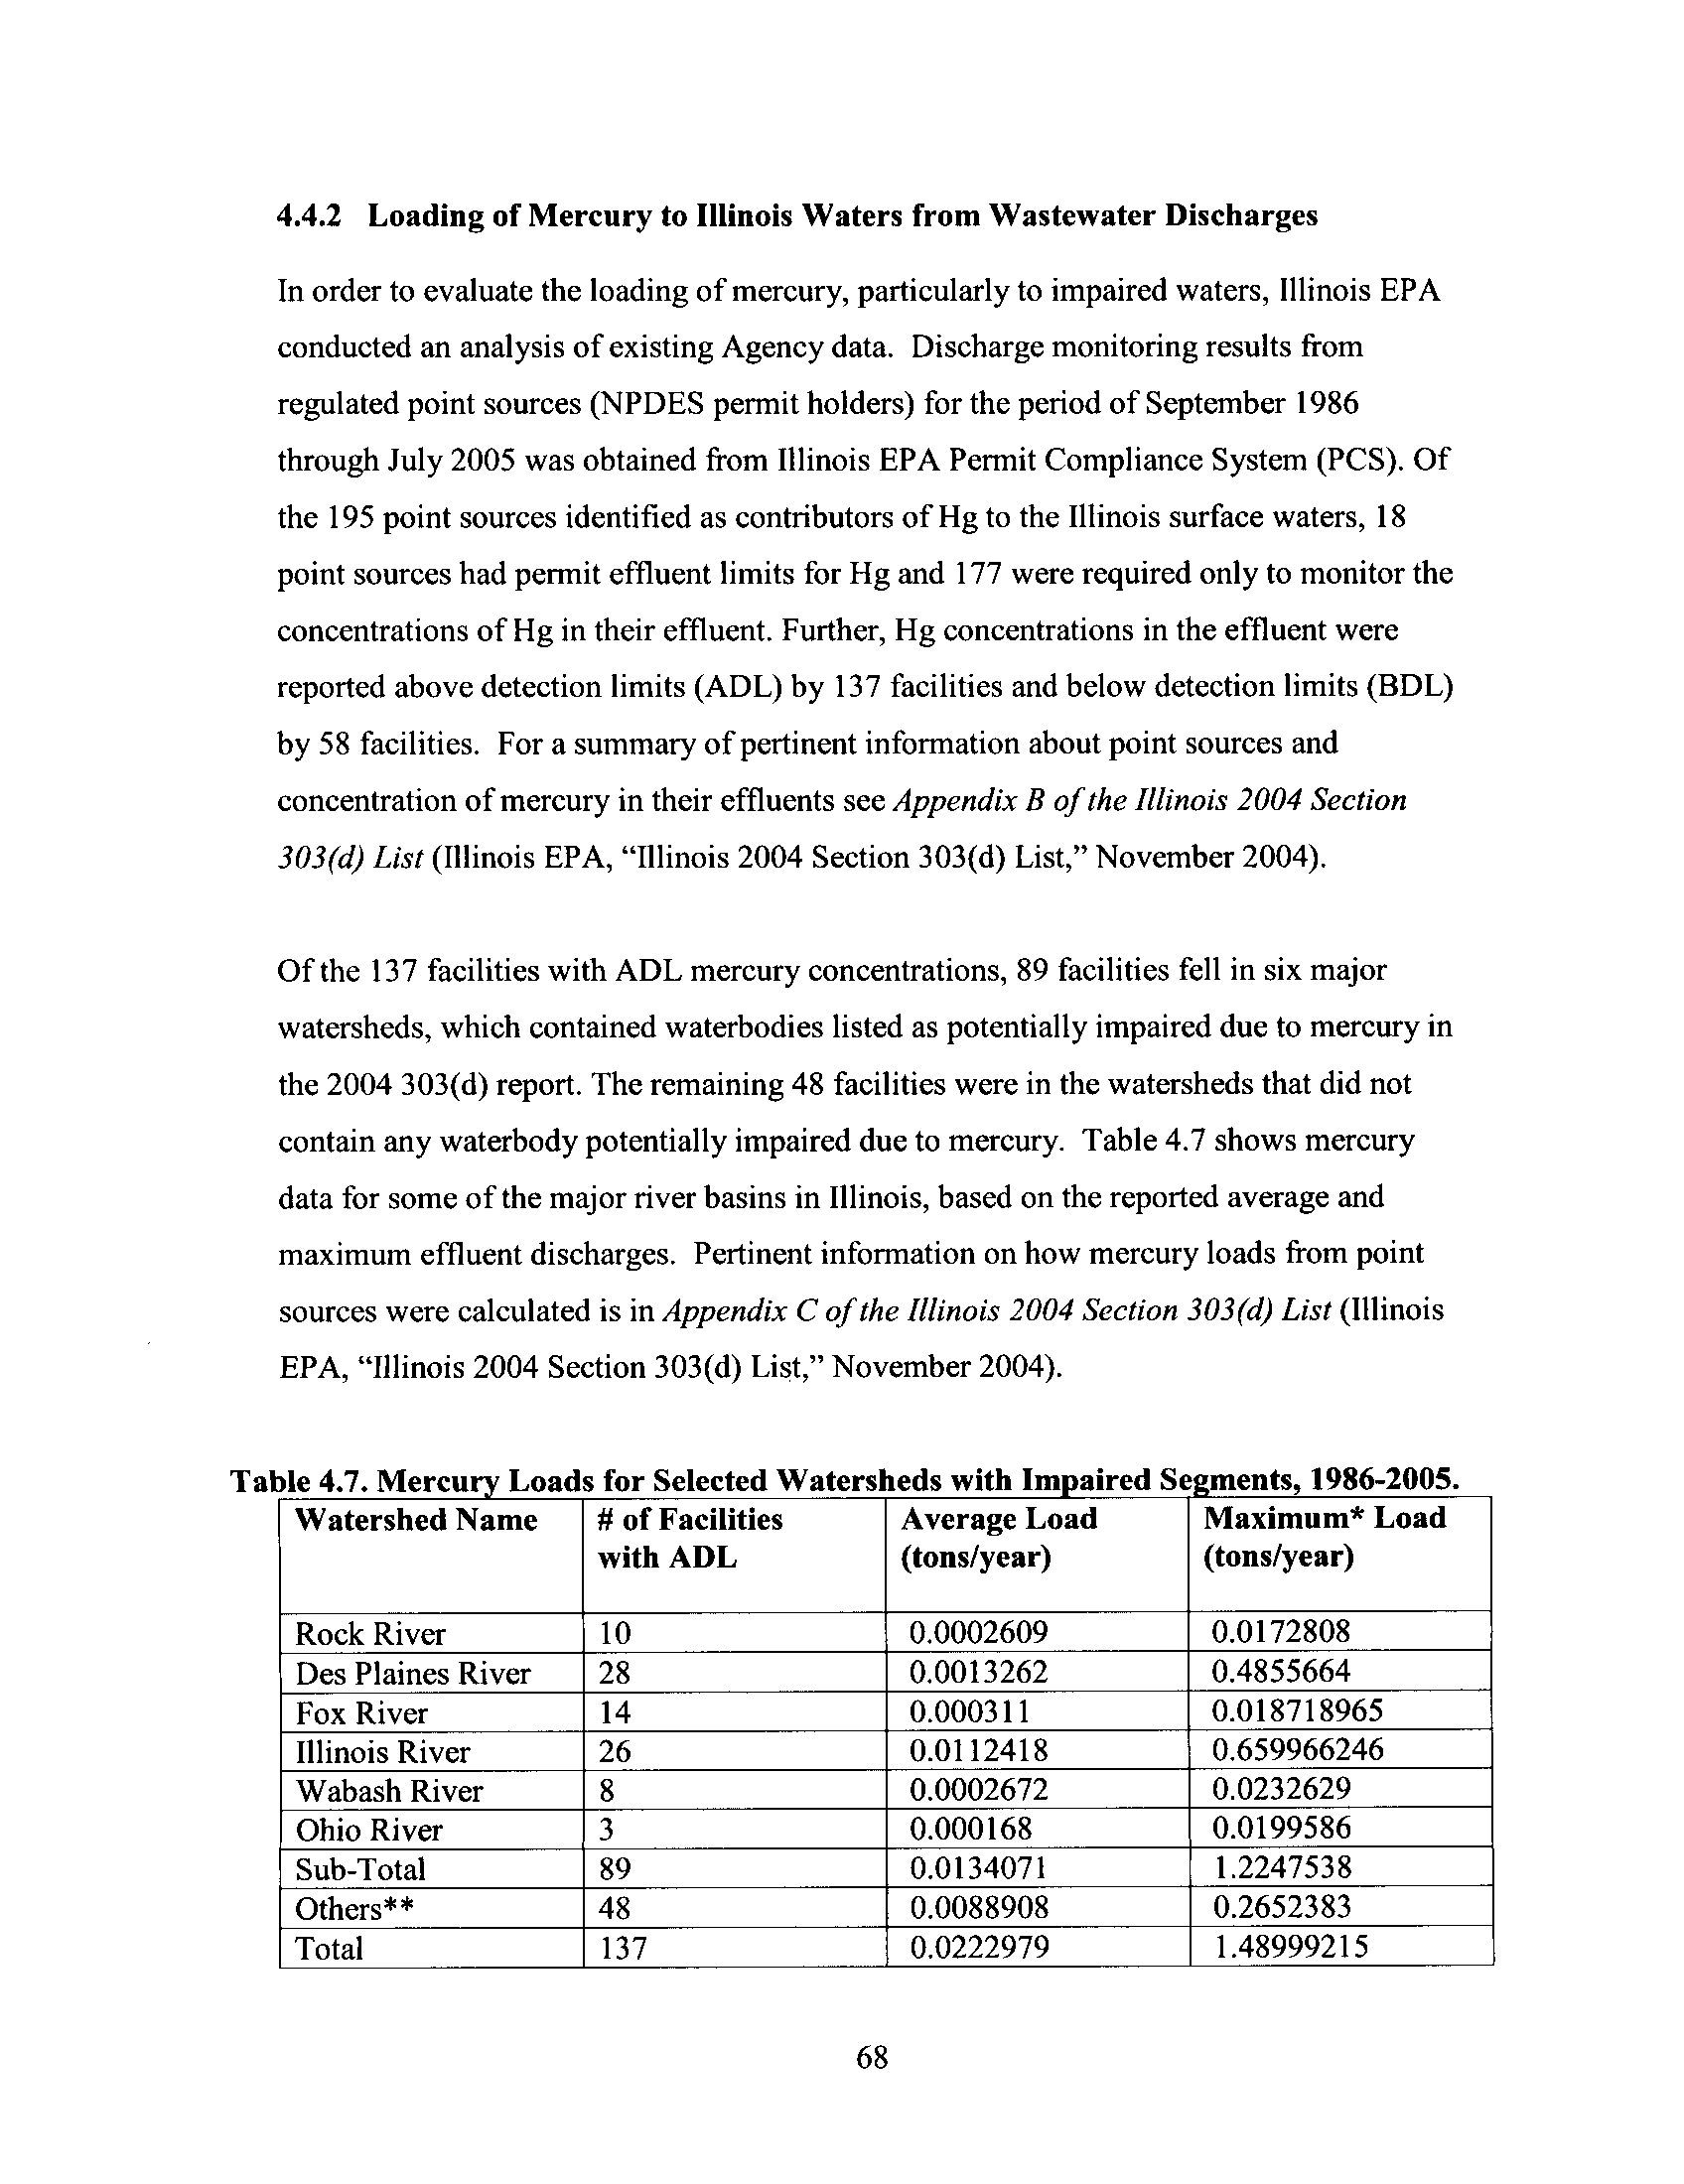
Table 4.7
Mercury Loads for Selected Watersheds of the Impaired Segments
1996-2005
68
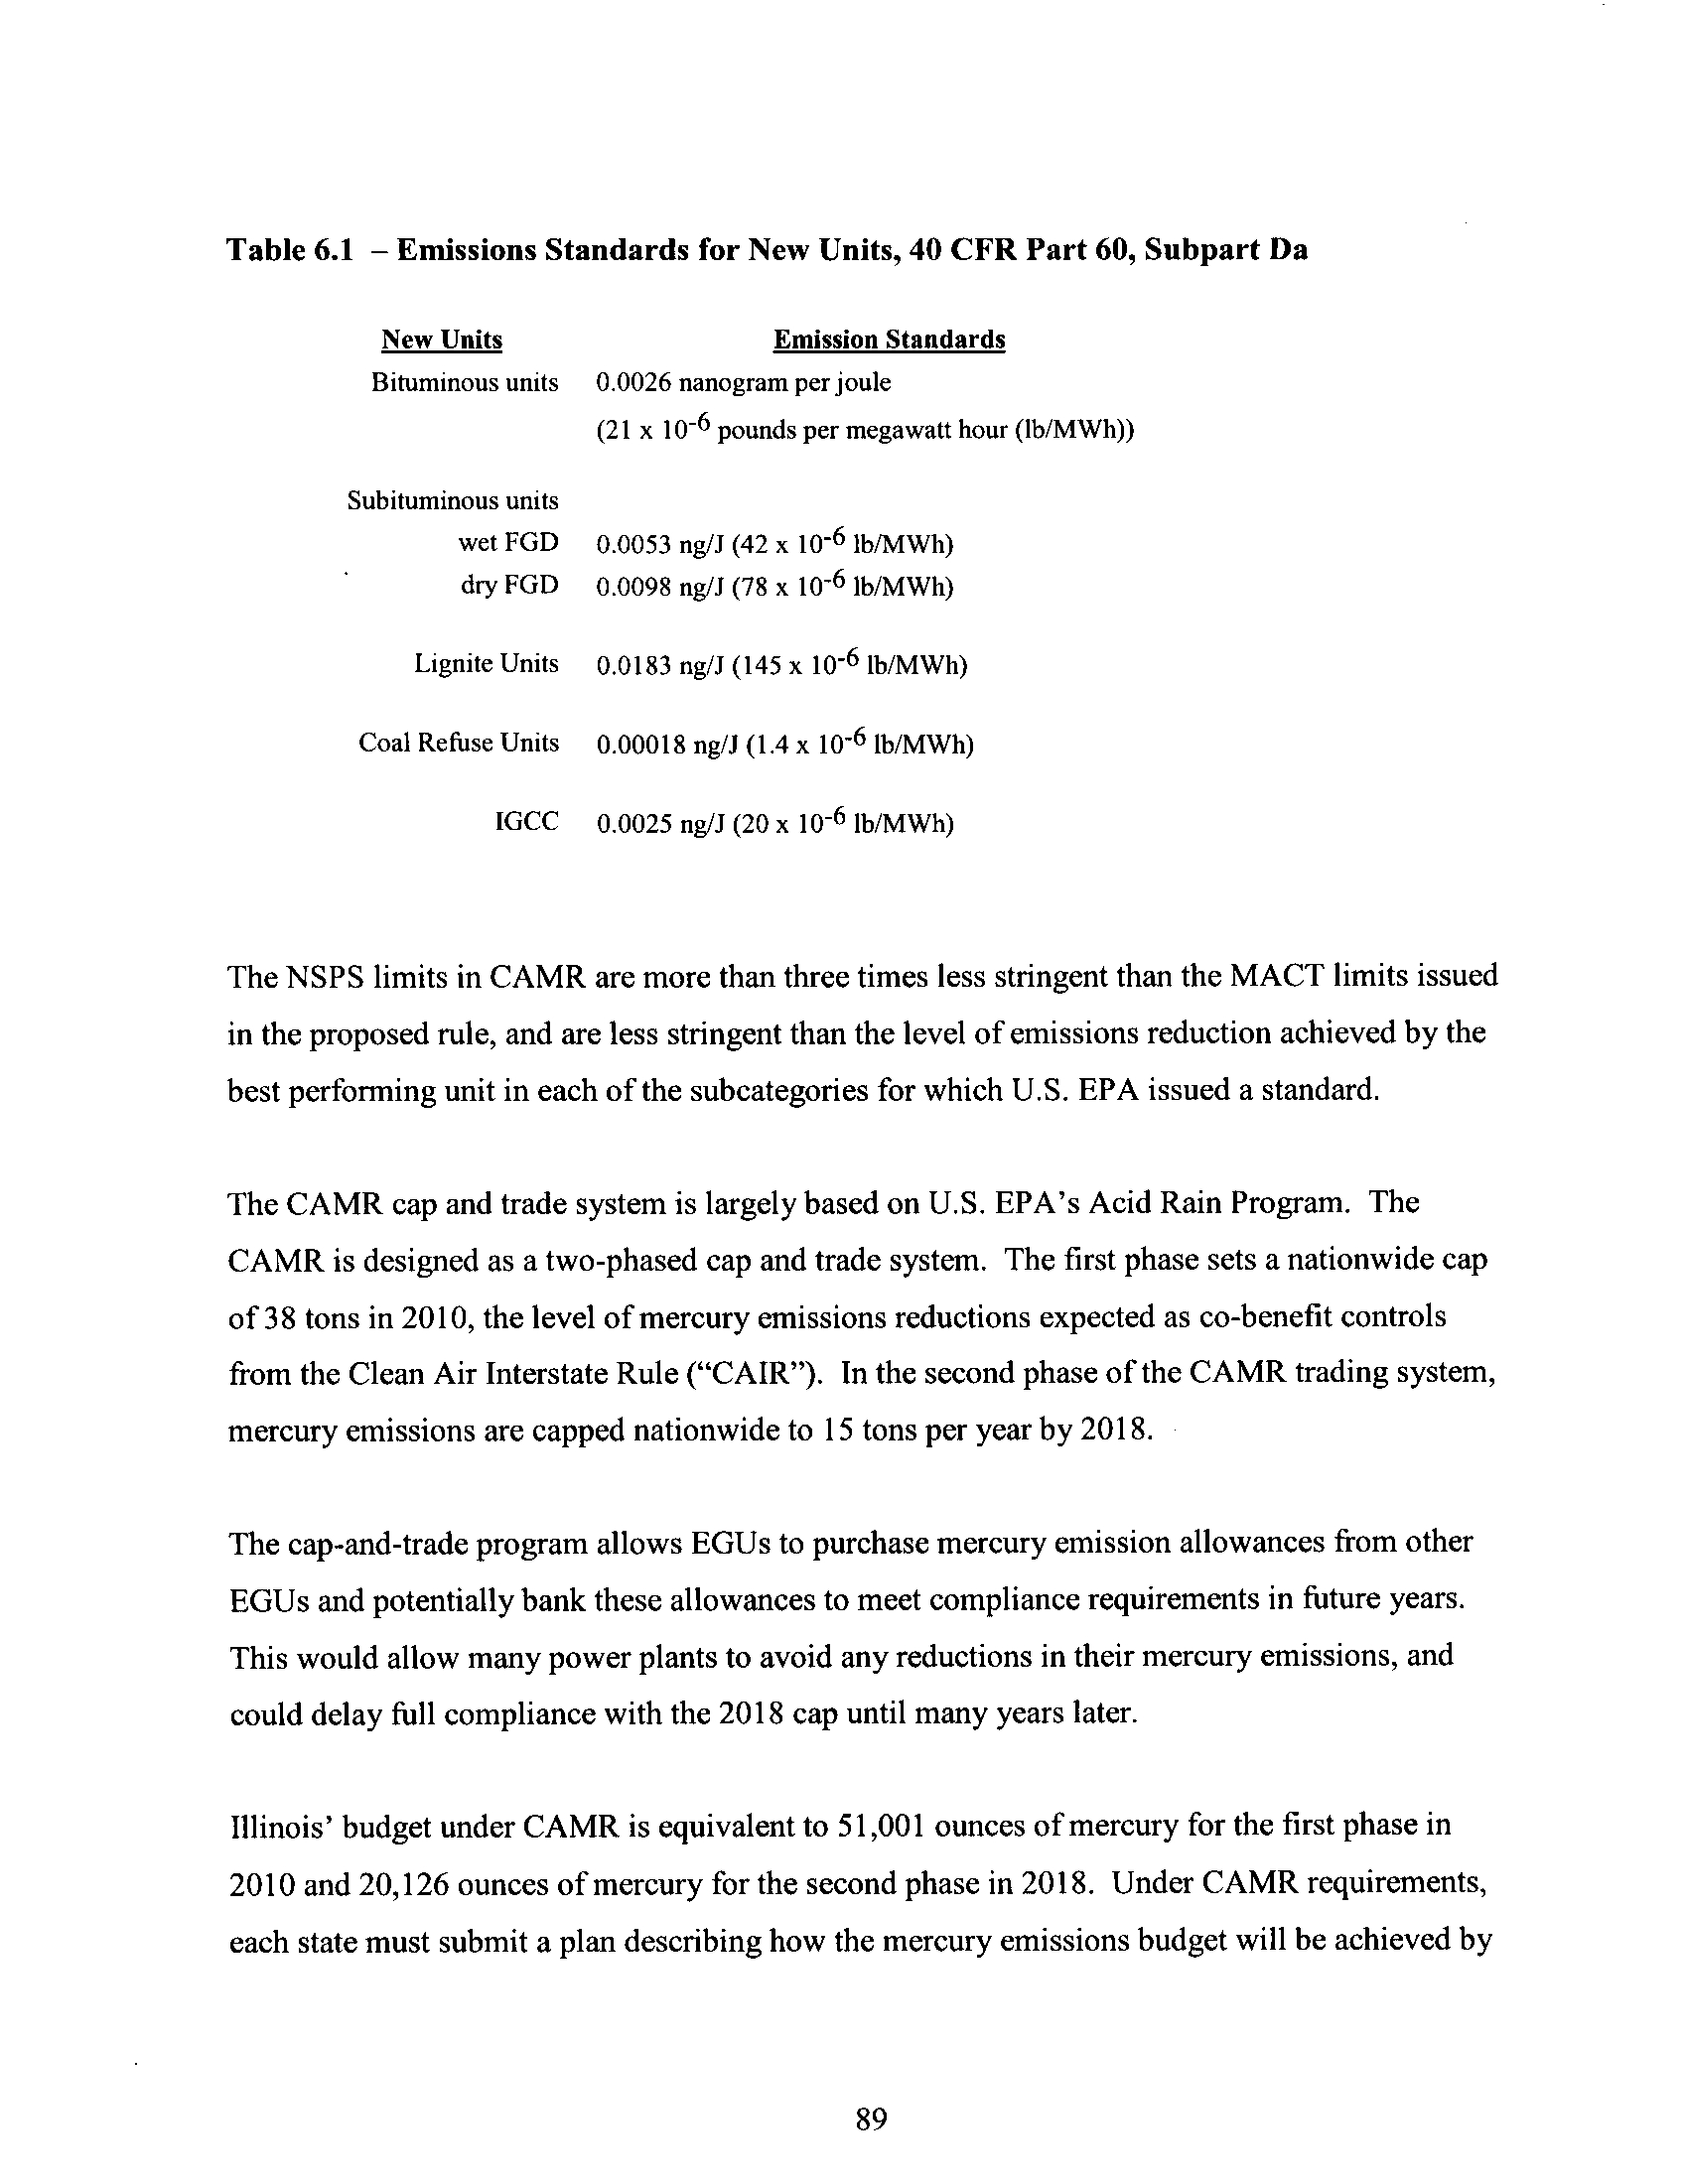
Table 6.1
Emissions Standards for New Units, 40 CFR Part 60, Subpart Da.. 89
Table 6 .2
Existing State Programs to Control Mercury Emissions from
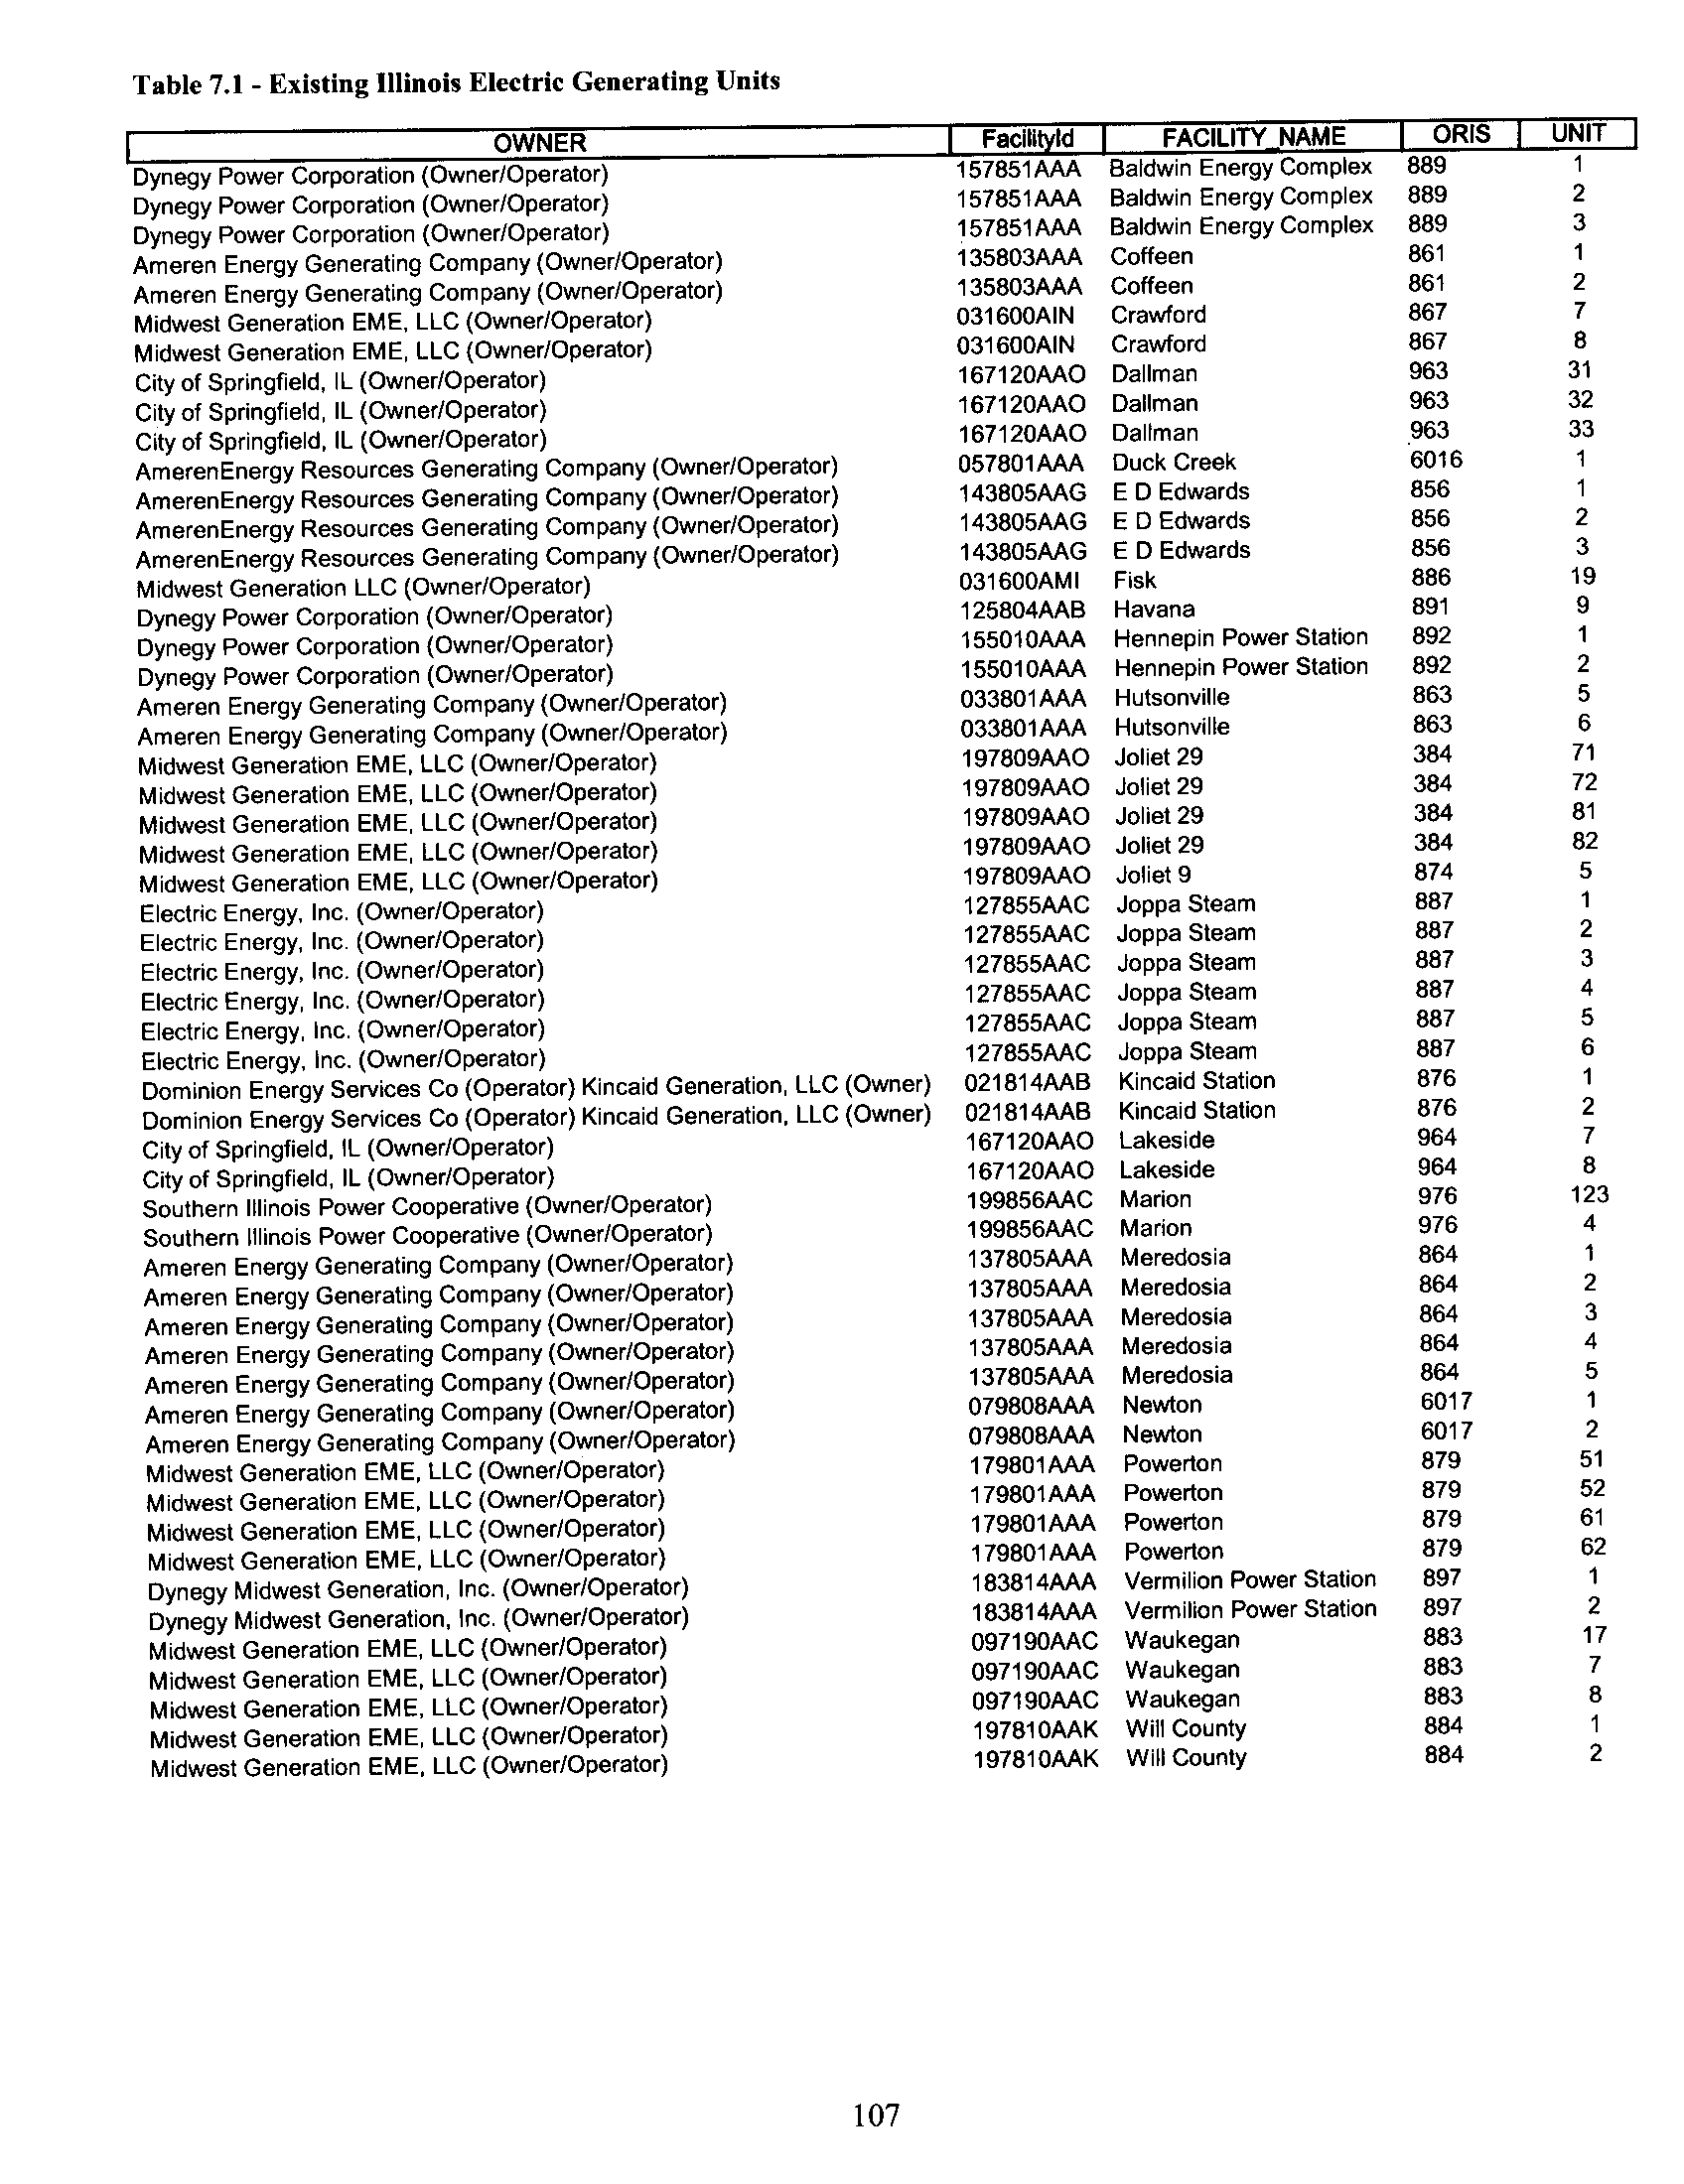
Table 7.1
Coal-Fired Electric Generating Units 91
Existing Illinois Electric Generating Units 107
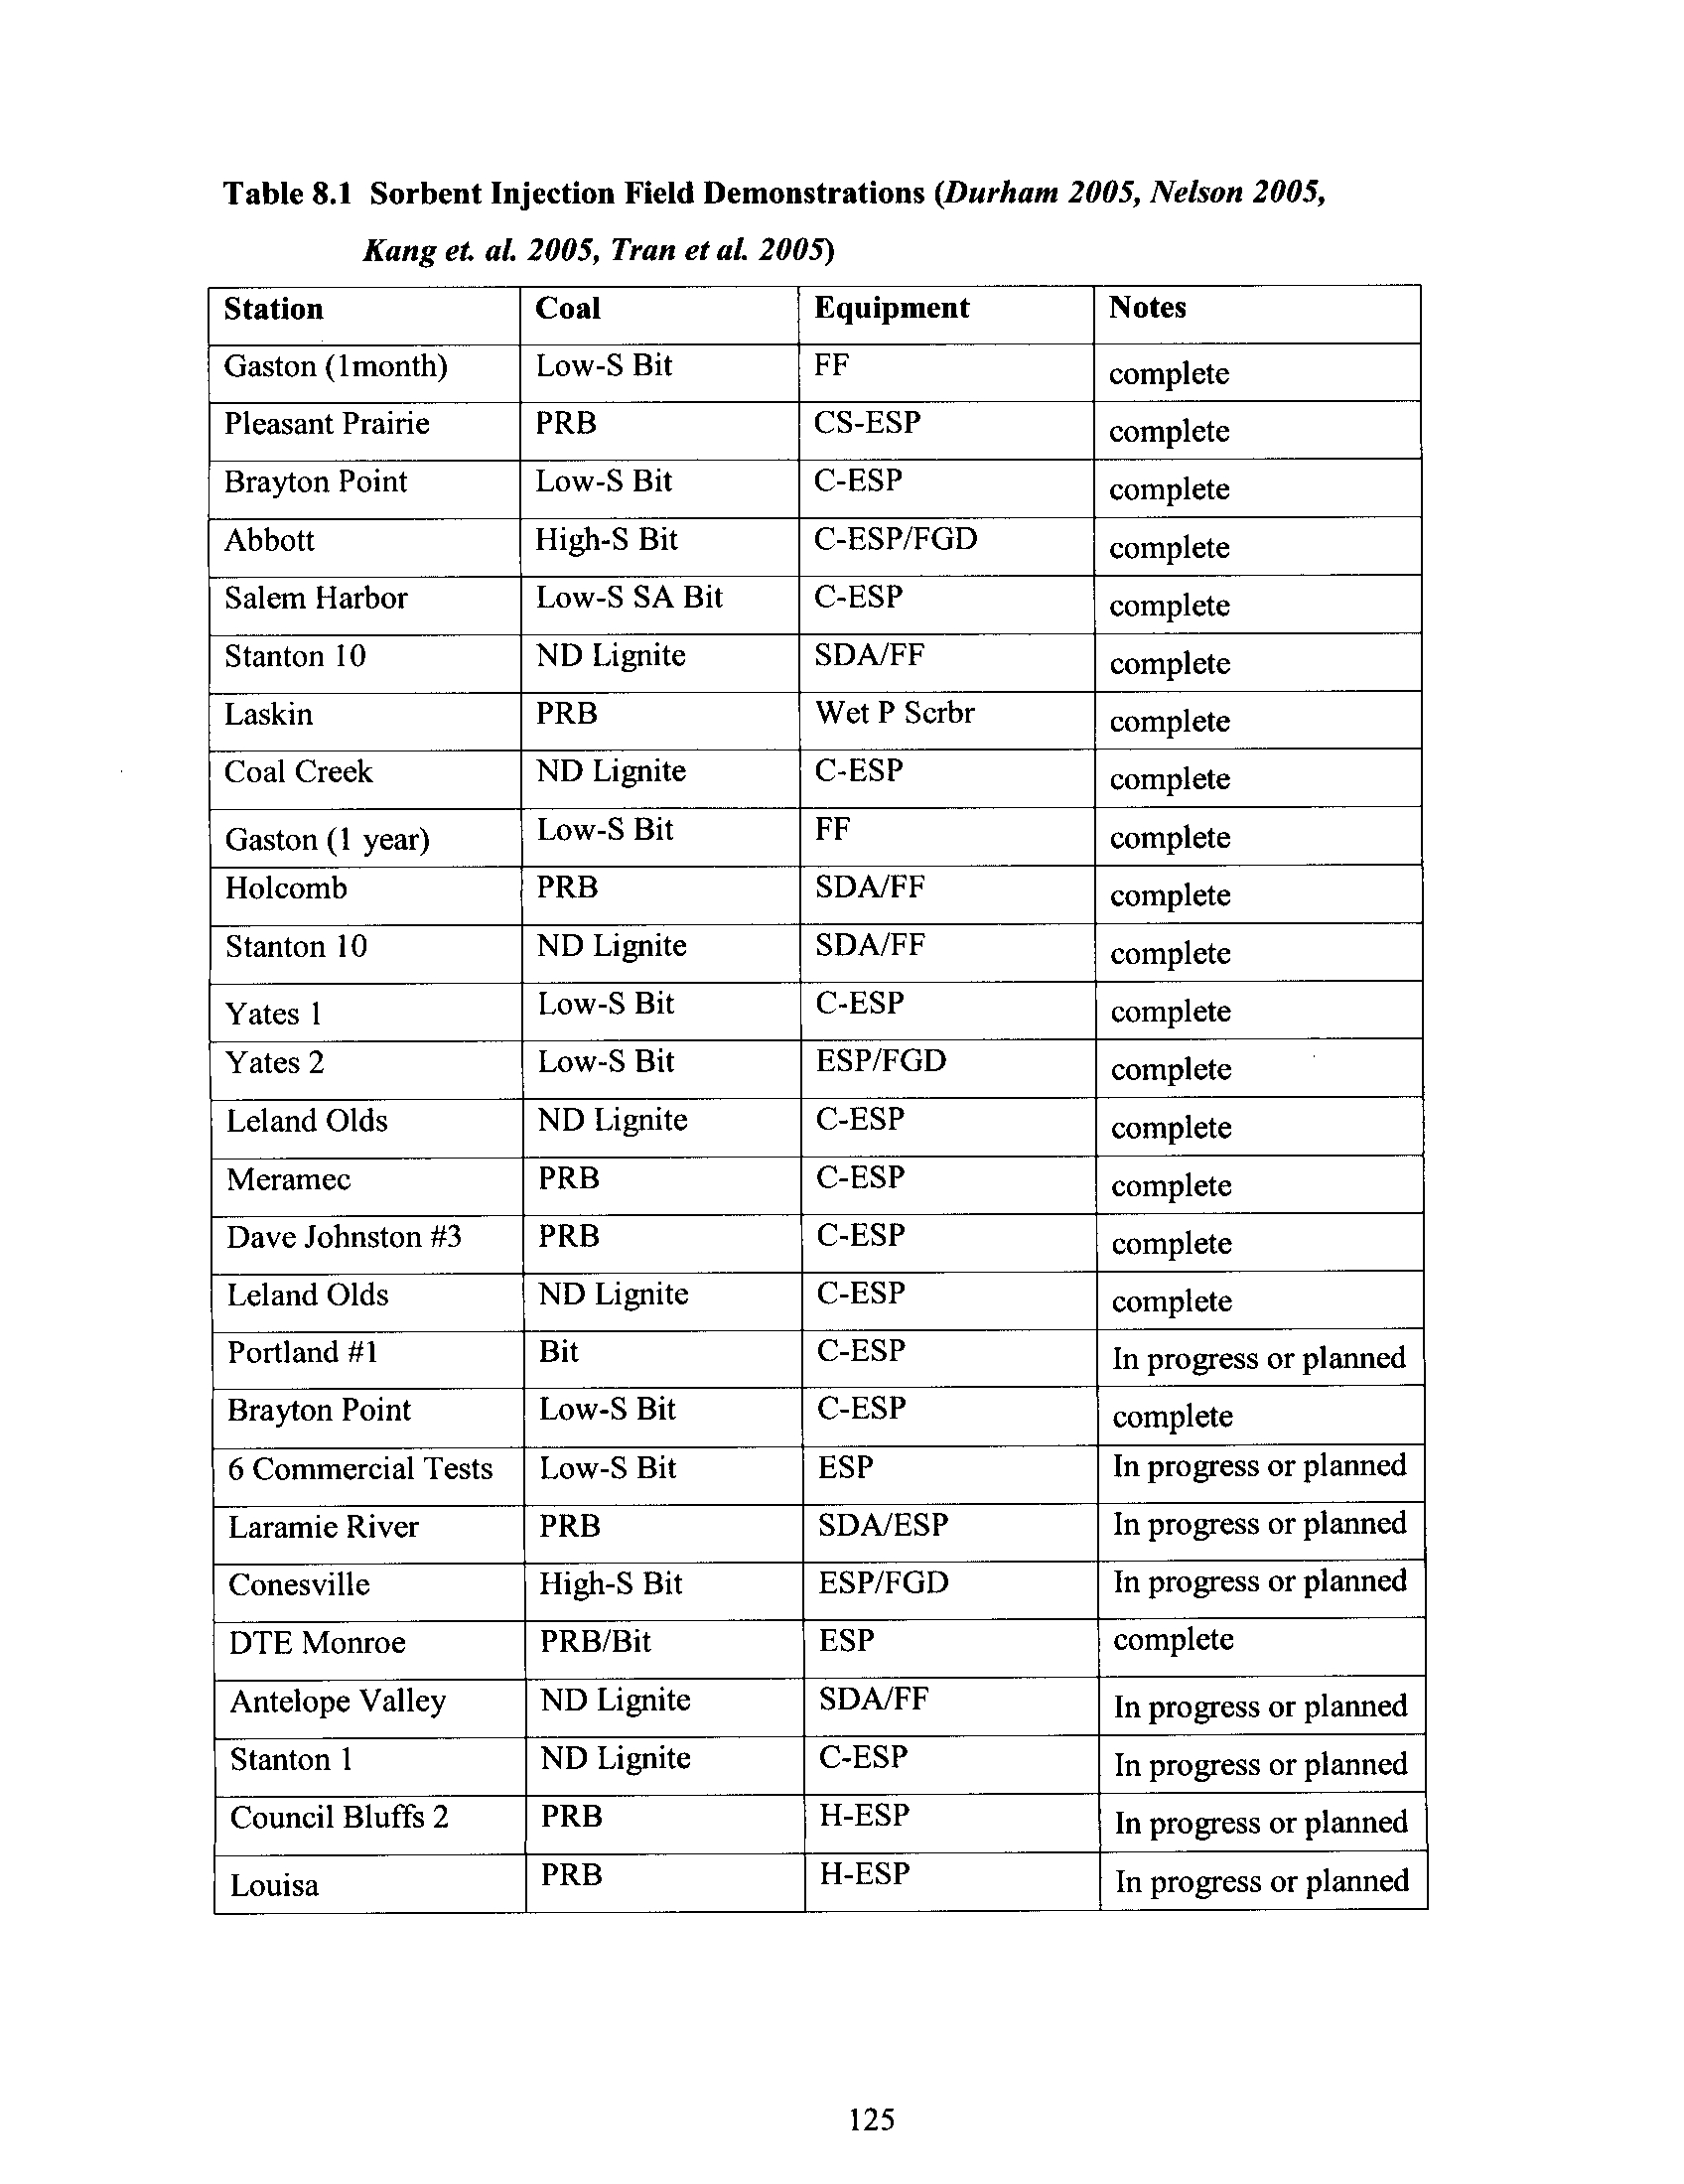
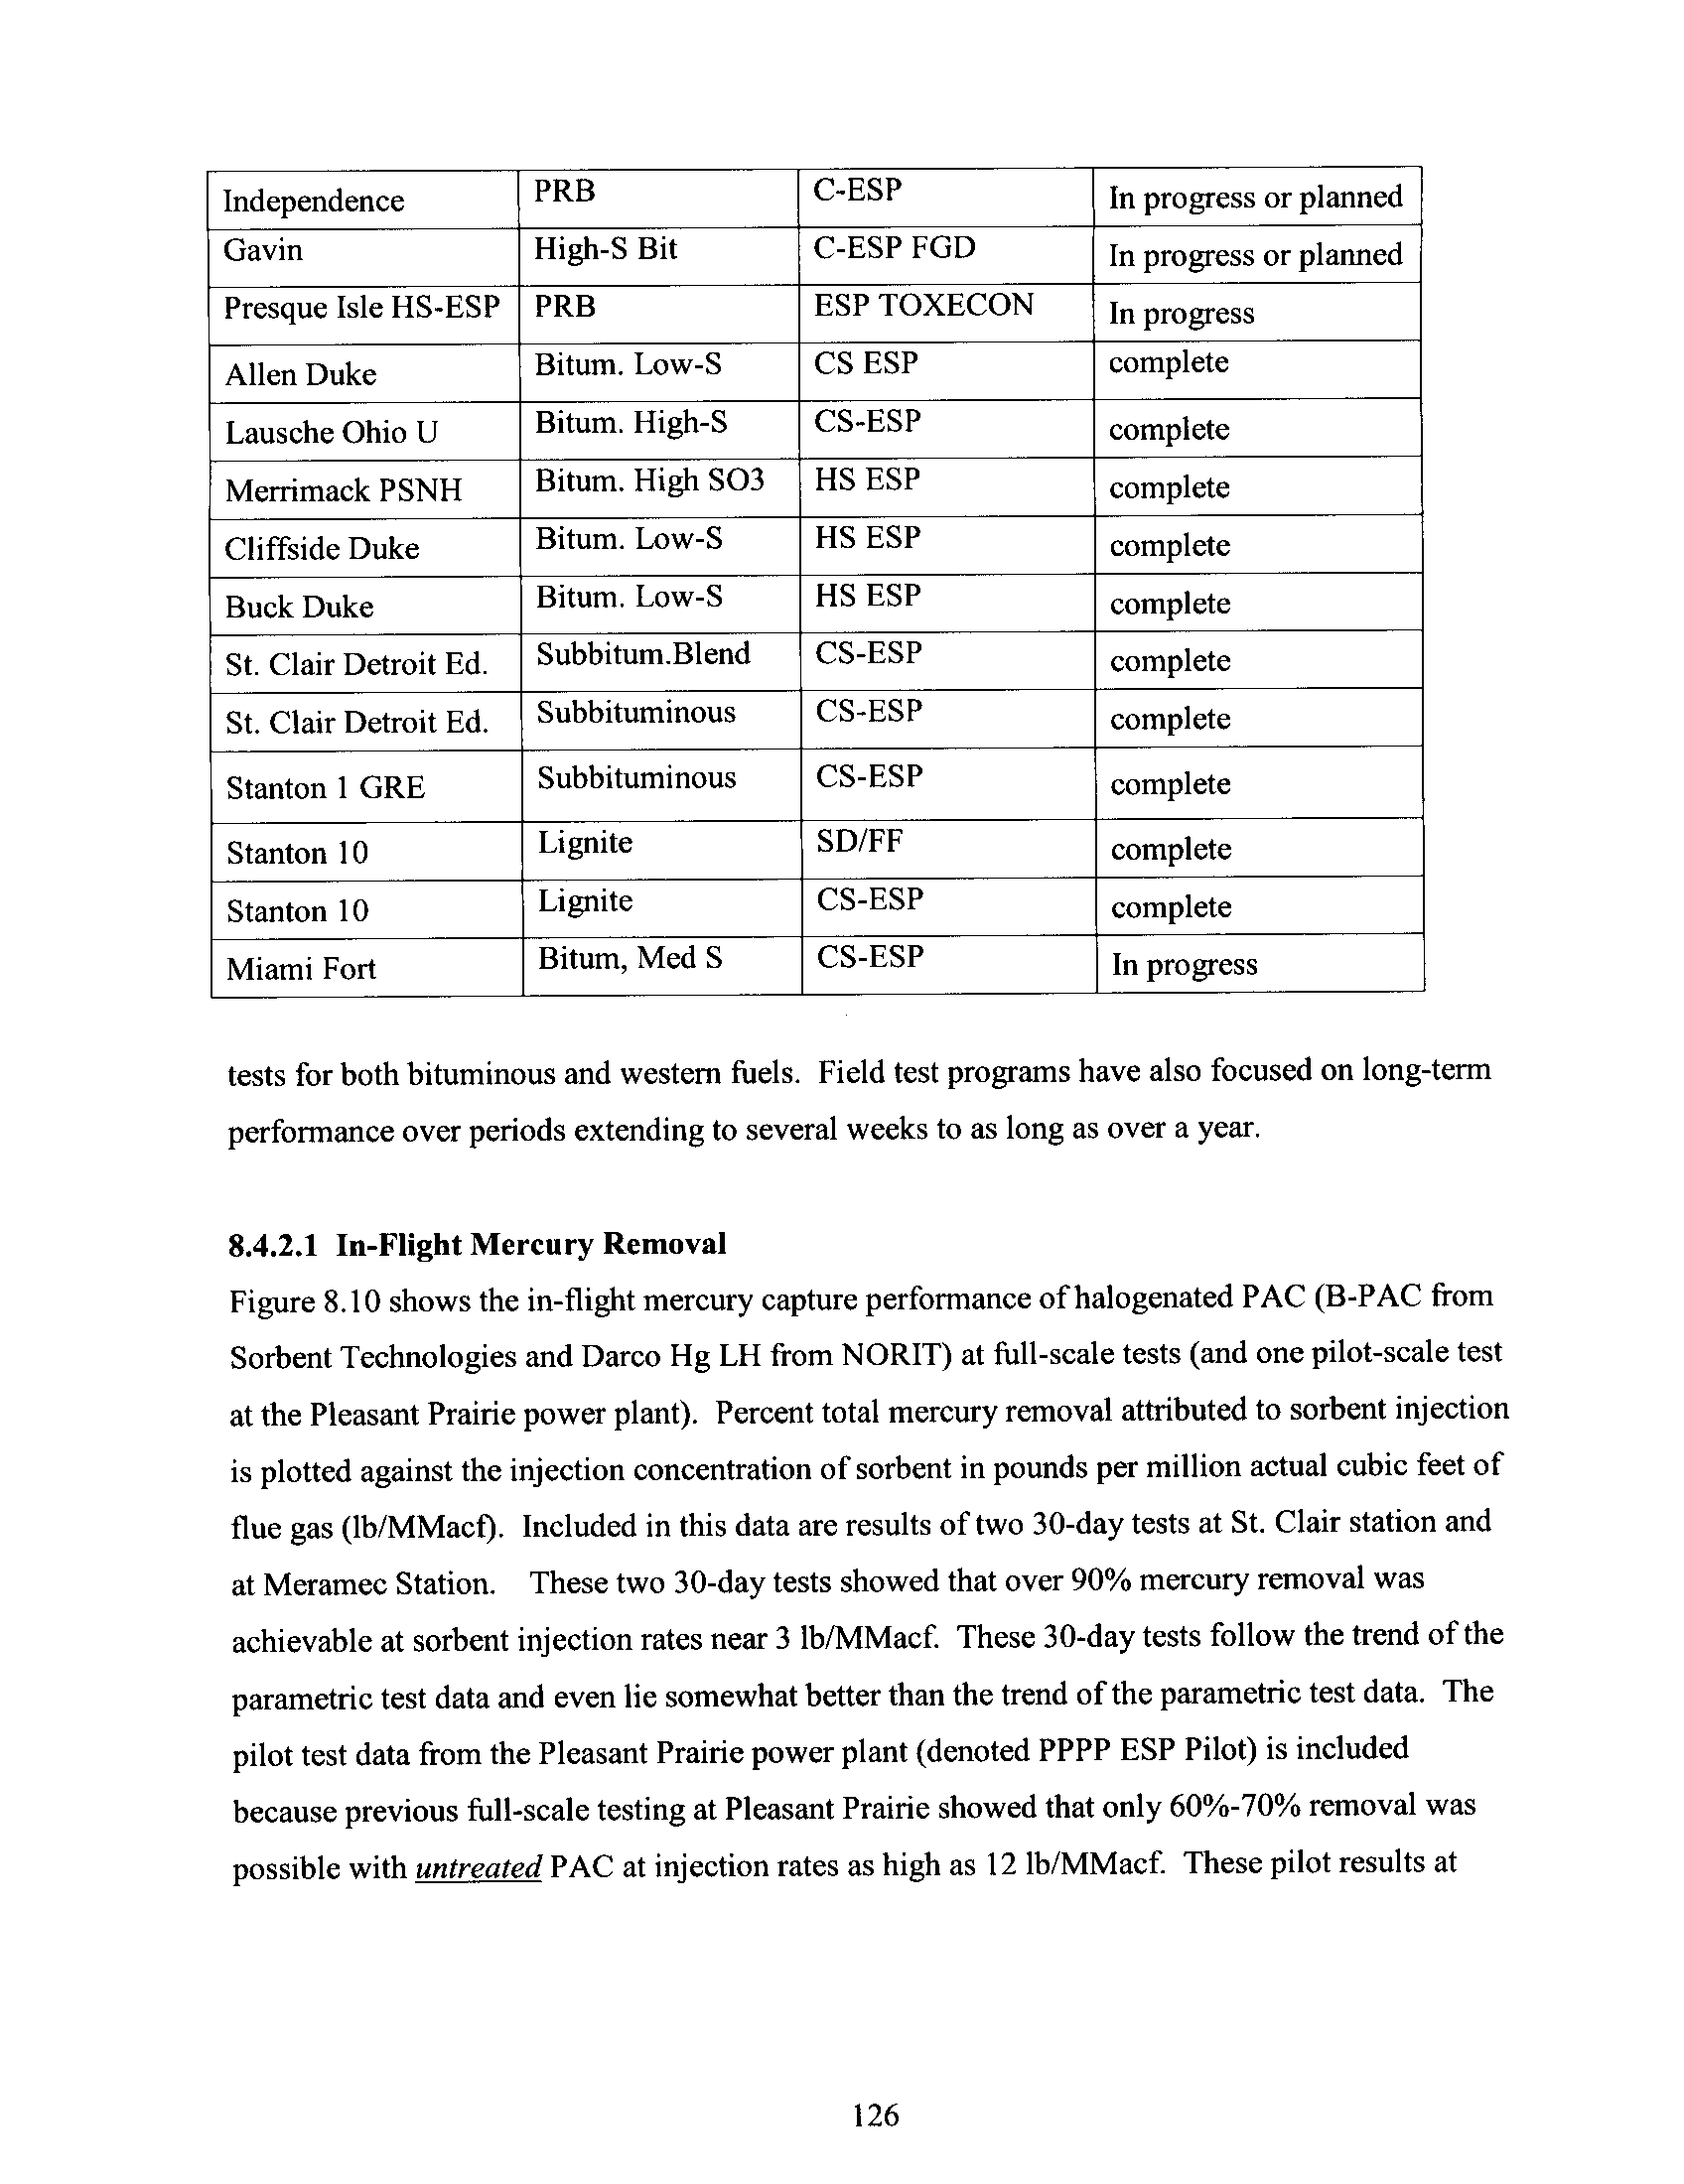
Table 8.1
Sorbent Injection Field Demonstrations
125
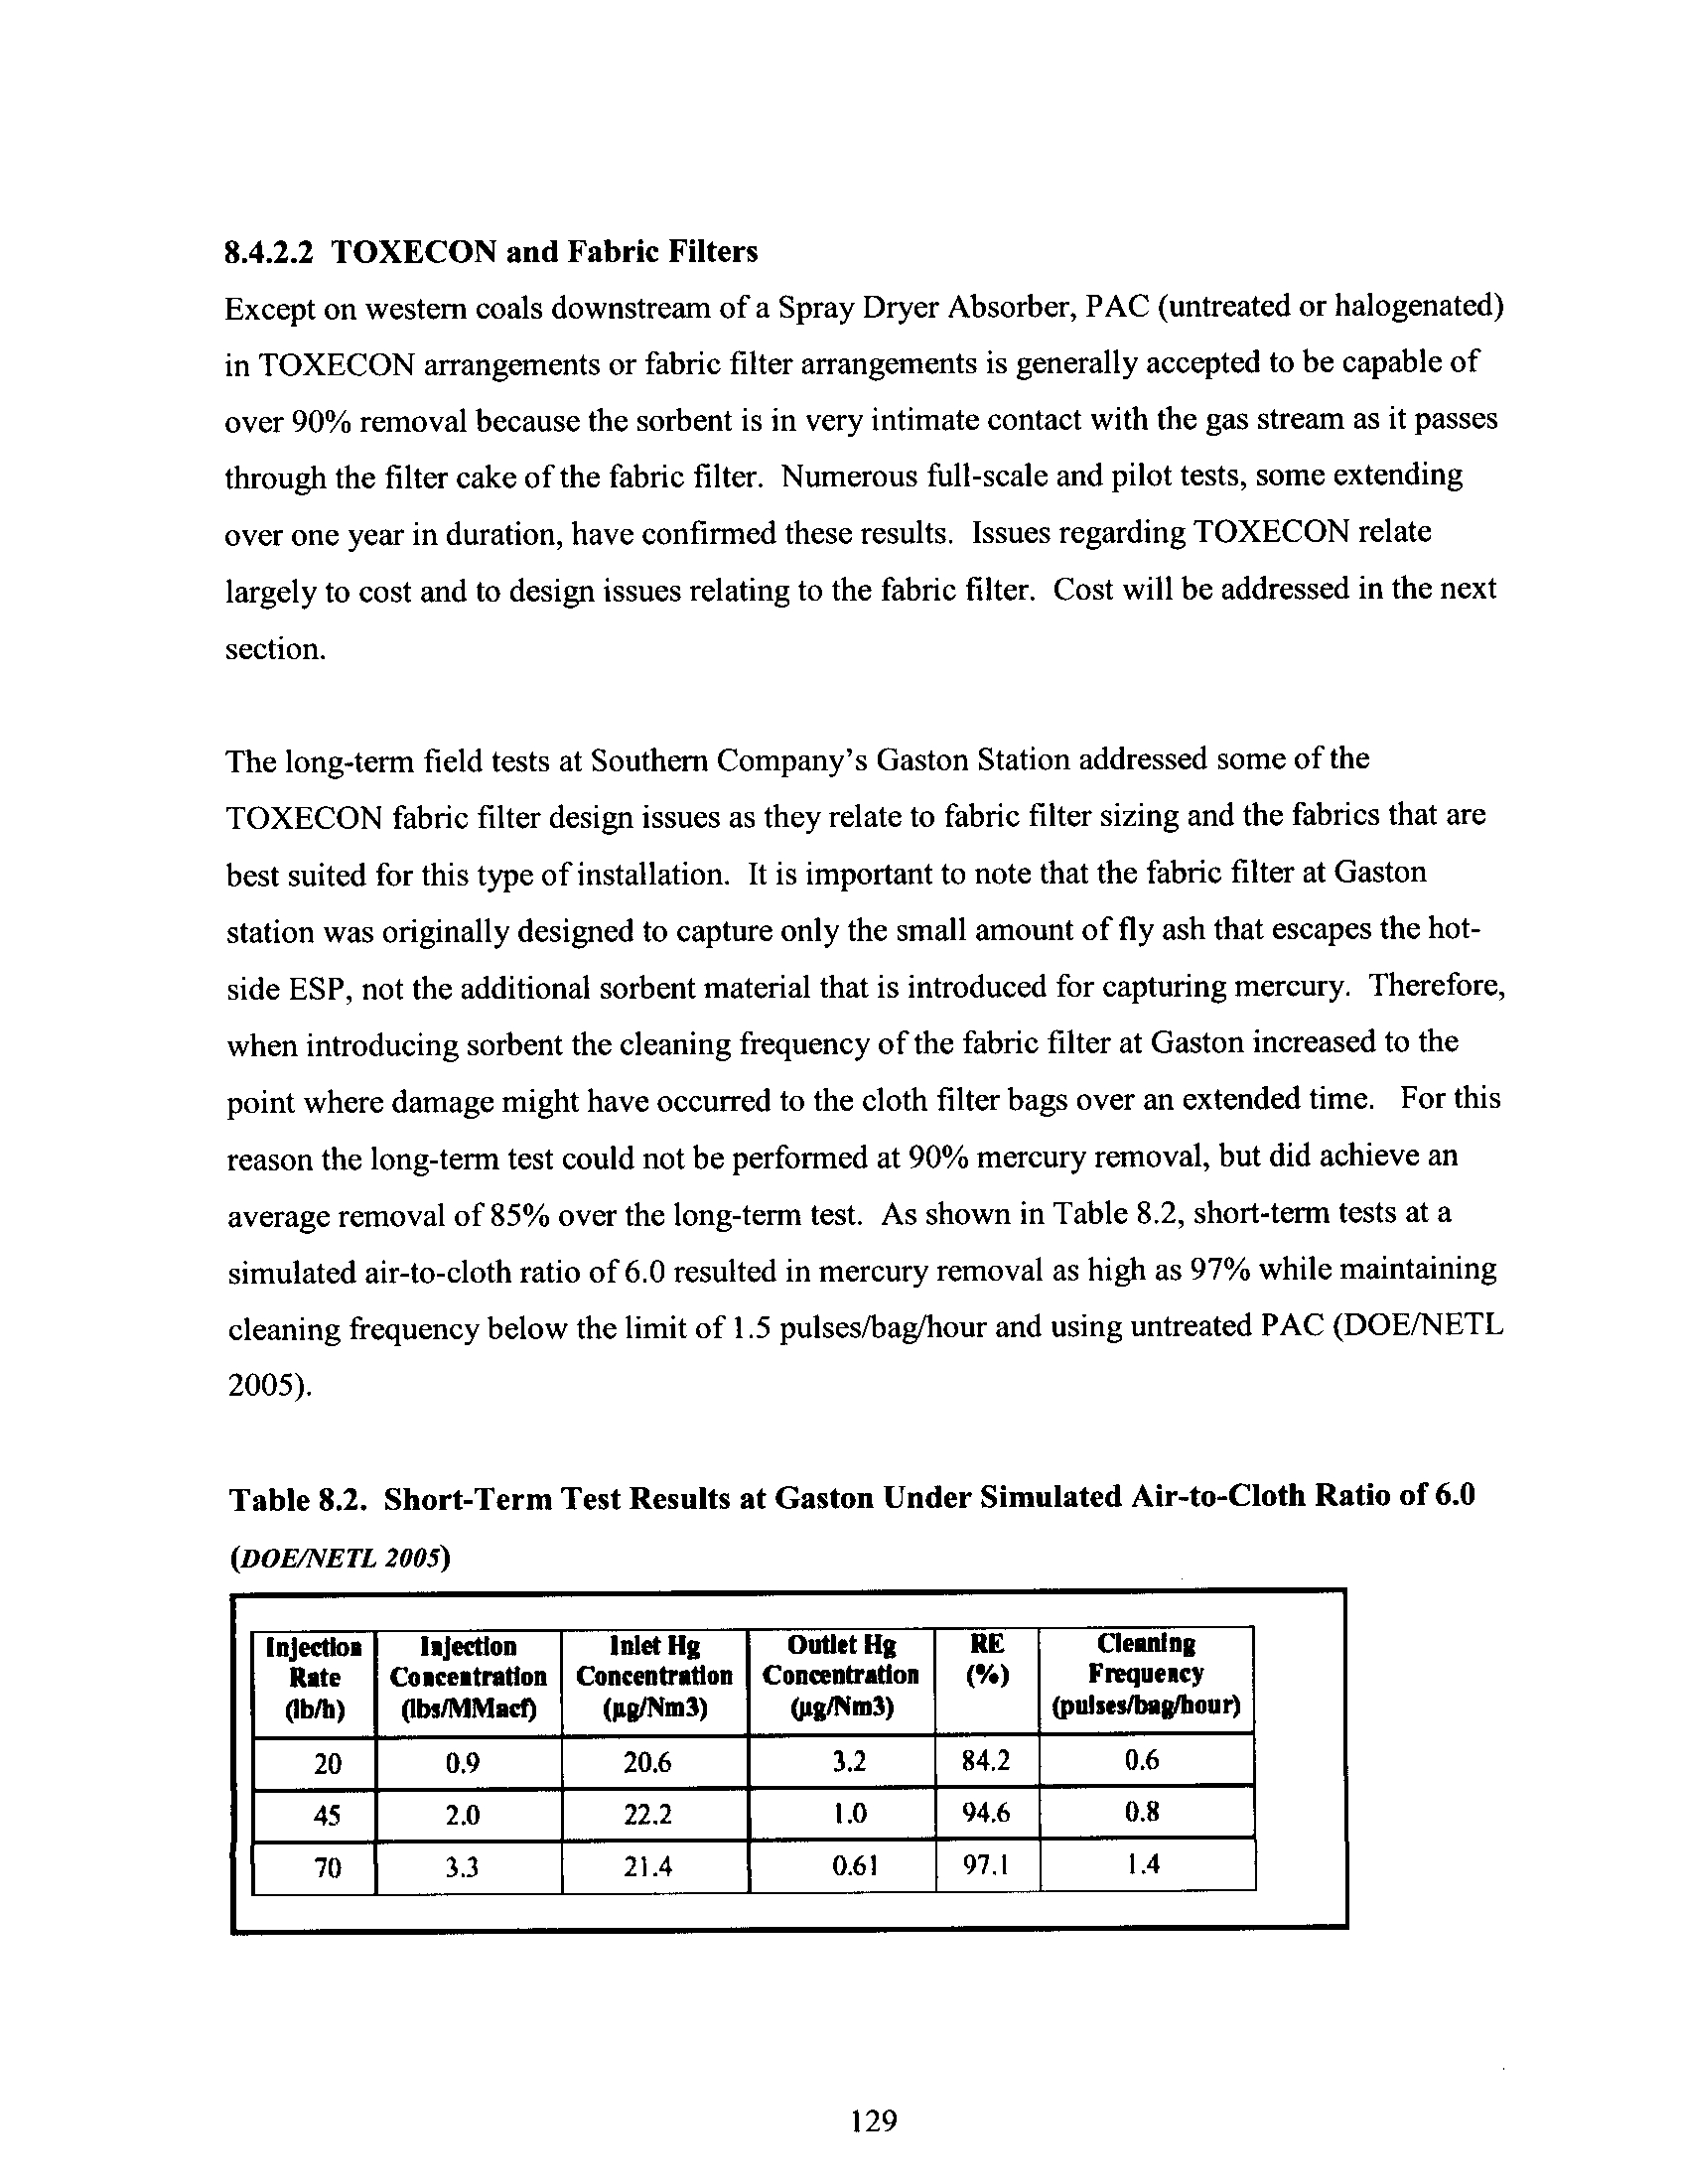
Table 8.2
Short-Term Test Results at Gaston Under Simulated
Air-to-Cloth Ratio of 6.0
129
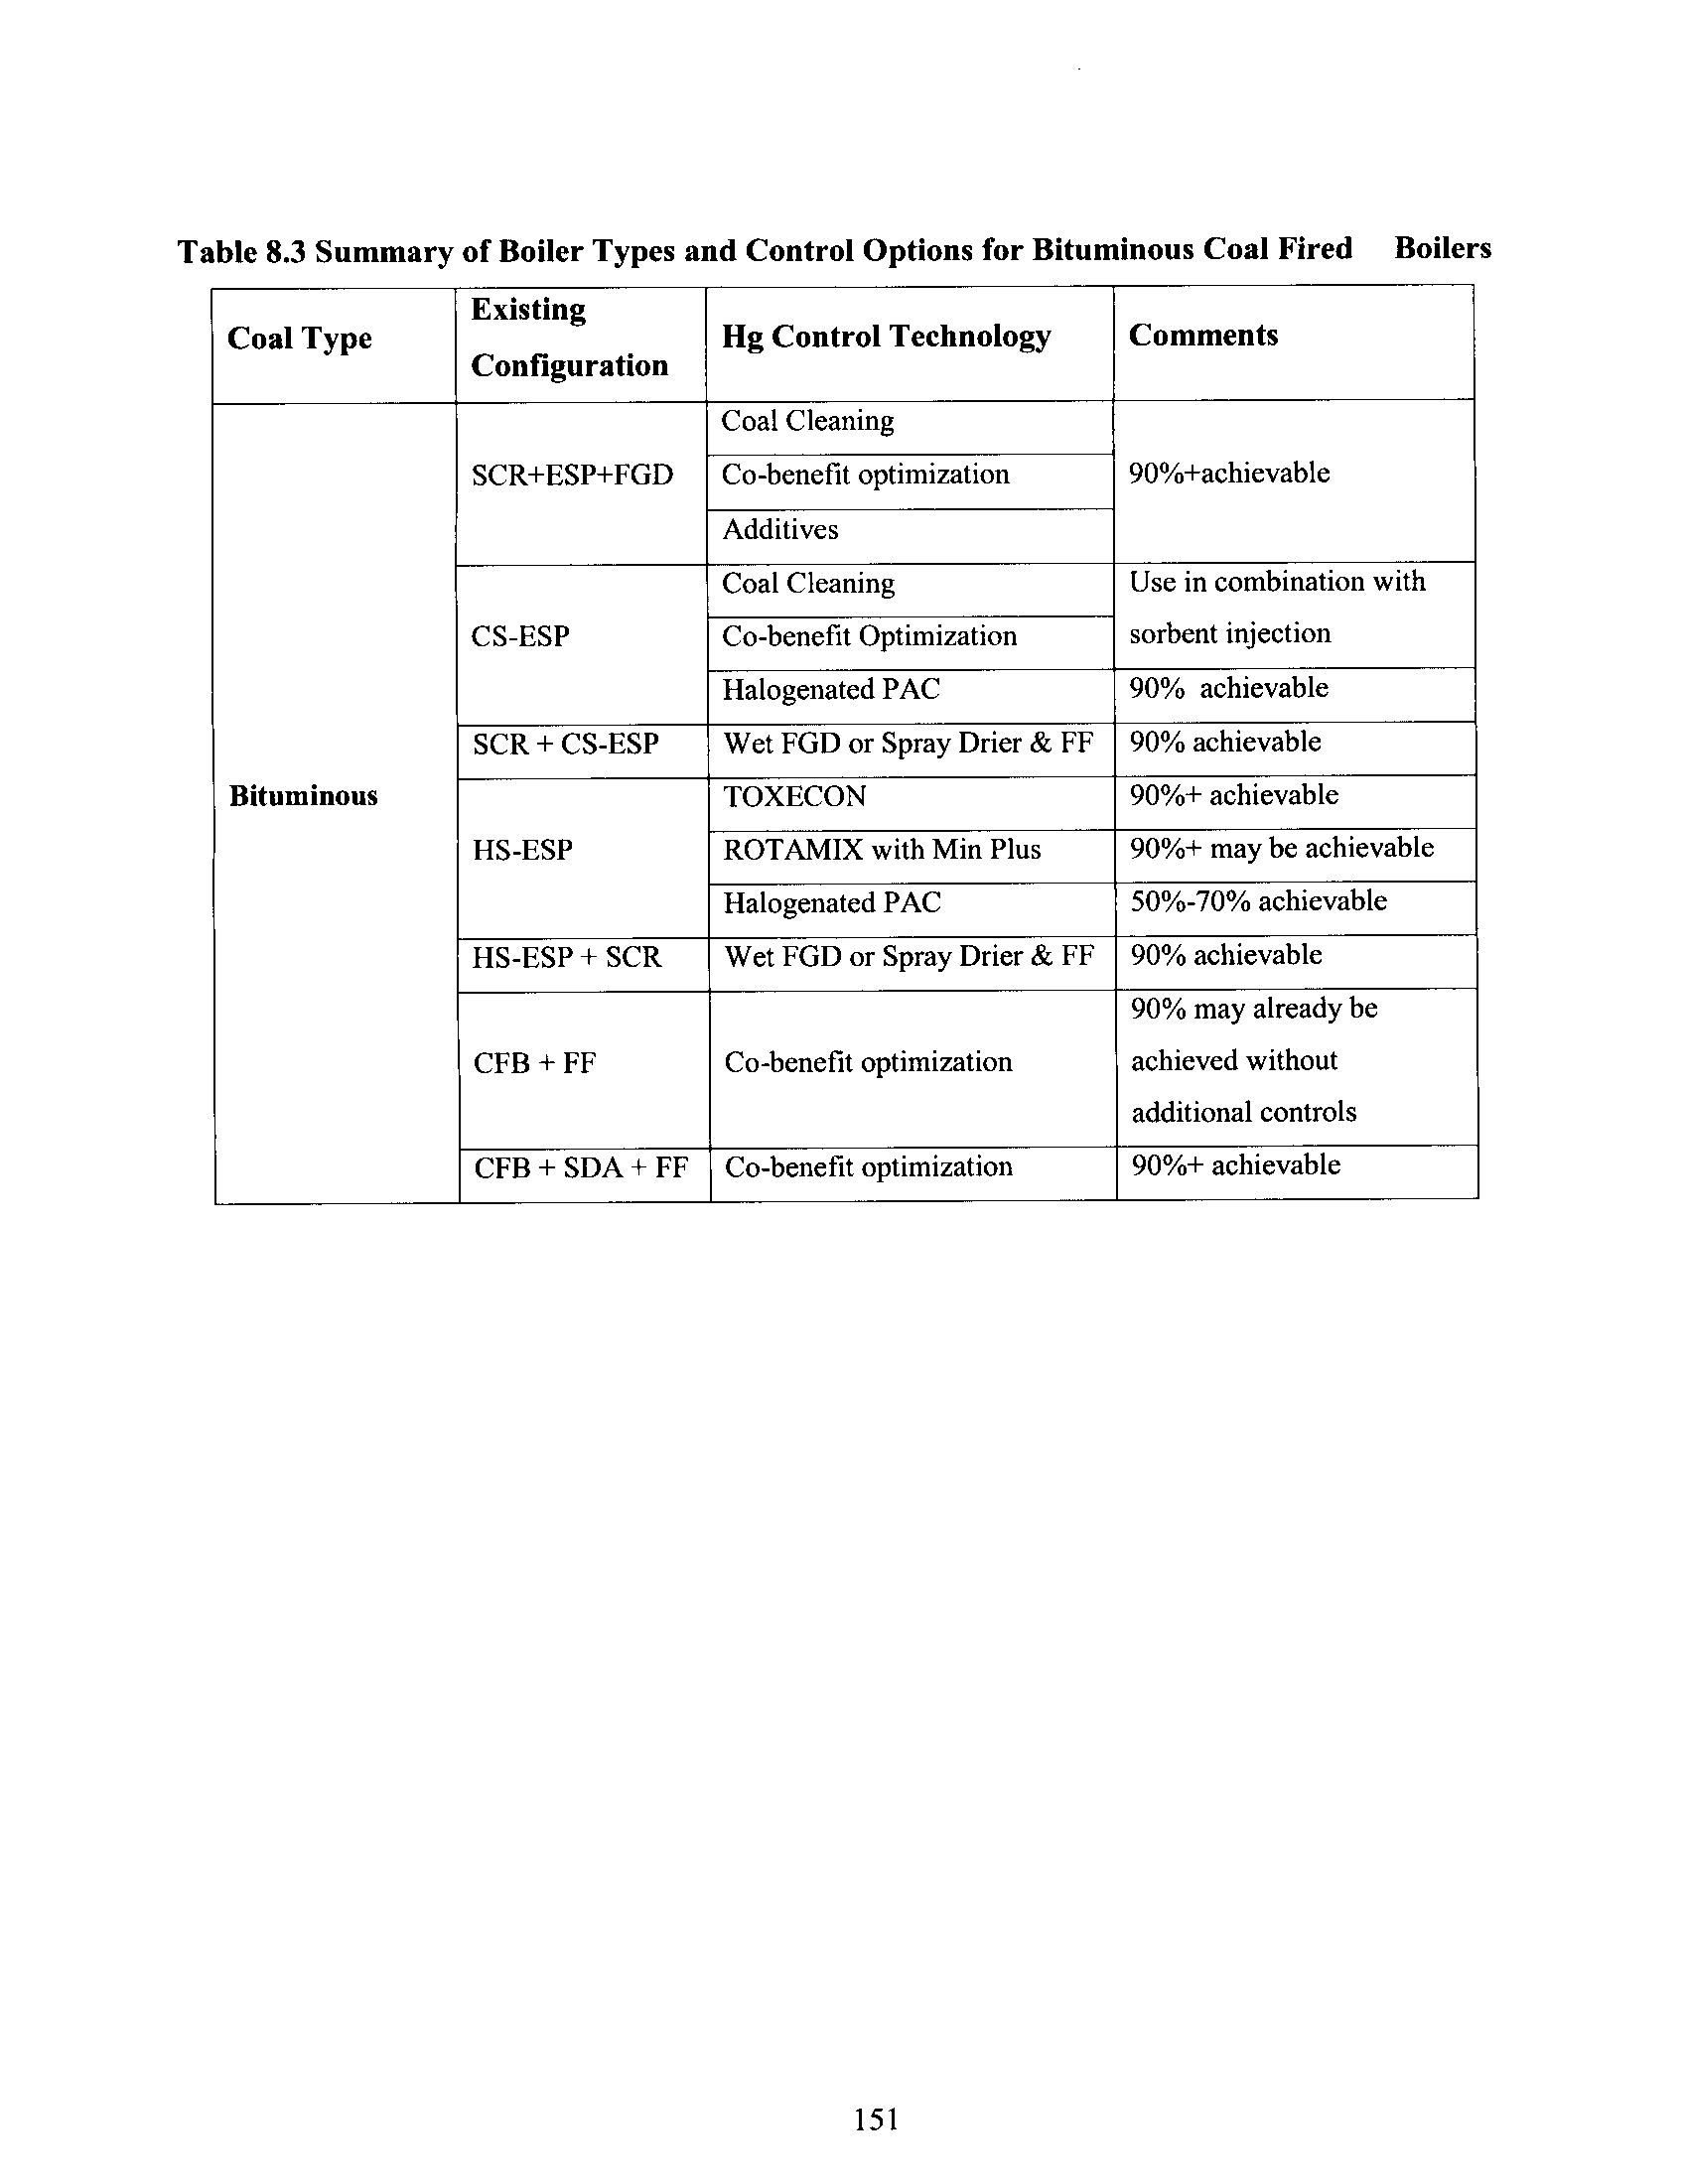
Table 8.3
Summary of Boiler Types and Control Options for Bituminous
Coal Fired Boilers
151
Table 8.4
Summary of Boiler Types and Control Options for Subbituminous
Coal Fired Boilers
152
16
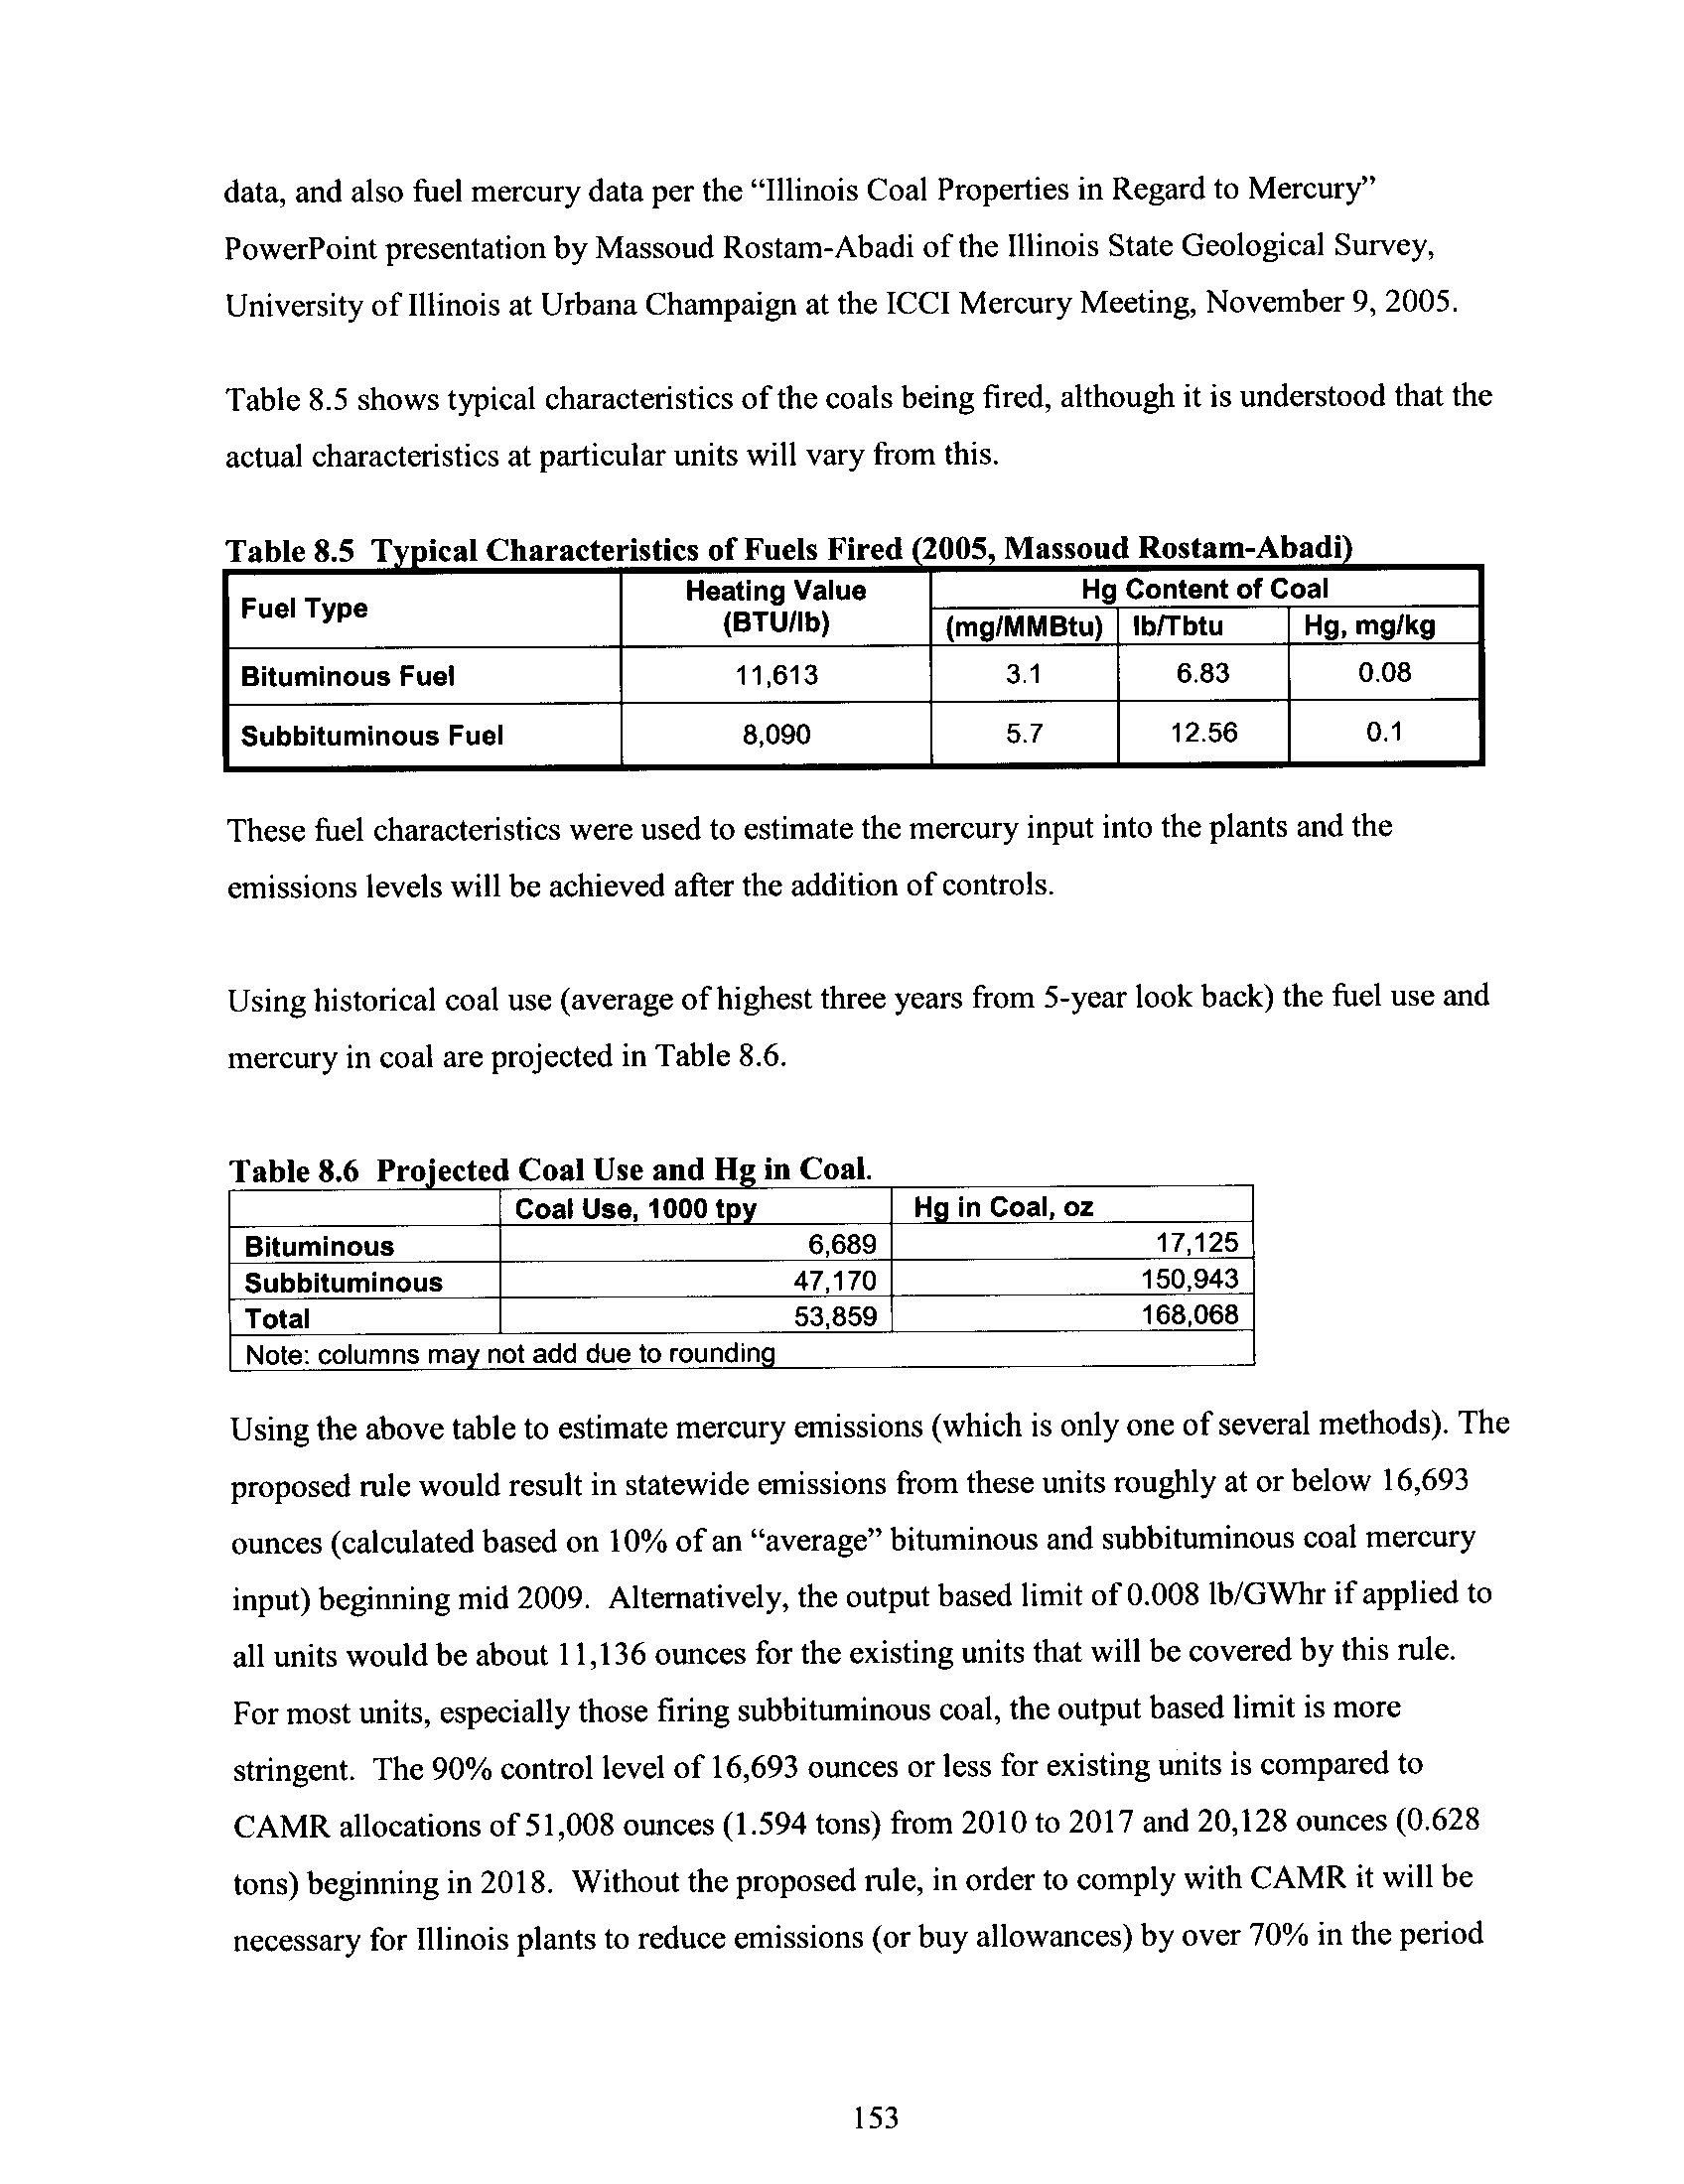
Table 8 .5
Typical Characteristics of Fuels Fired (2005, Massound
Rostam-Abadi)
153
Table 8 .6
Projected Coal Use and Hg in Coal
153
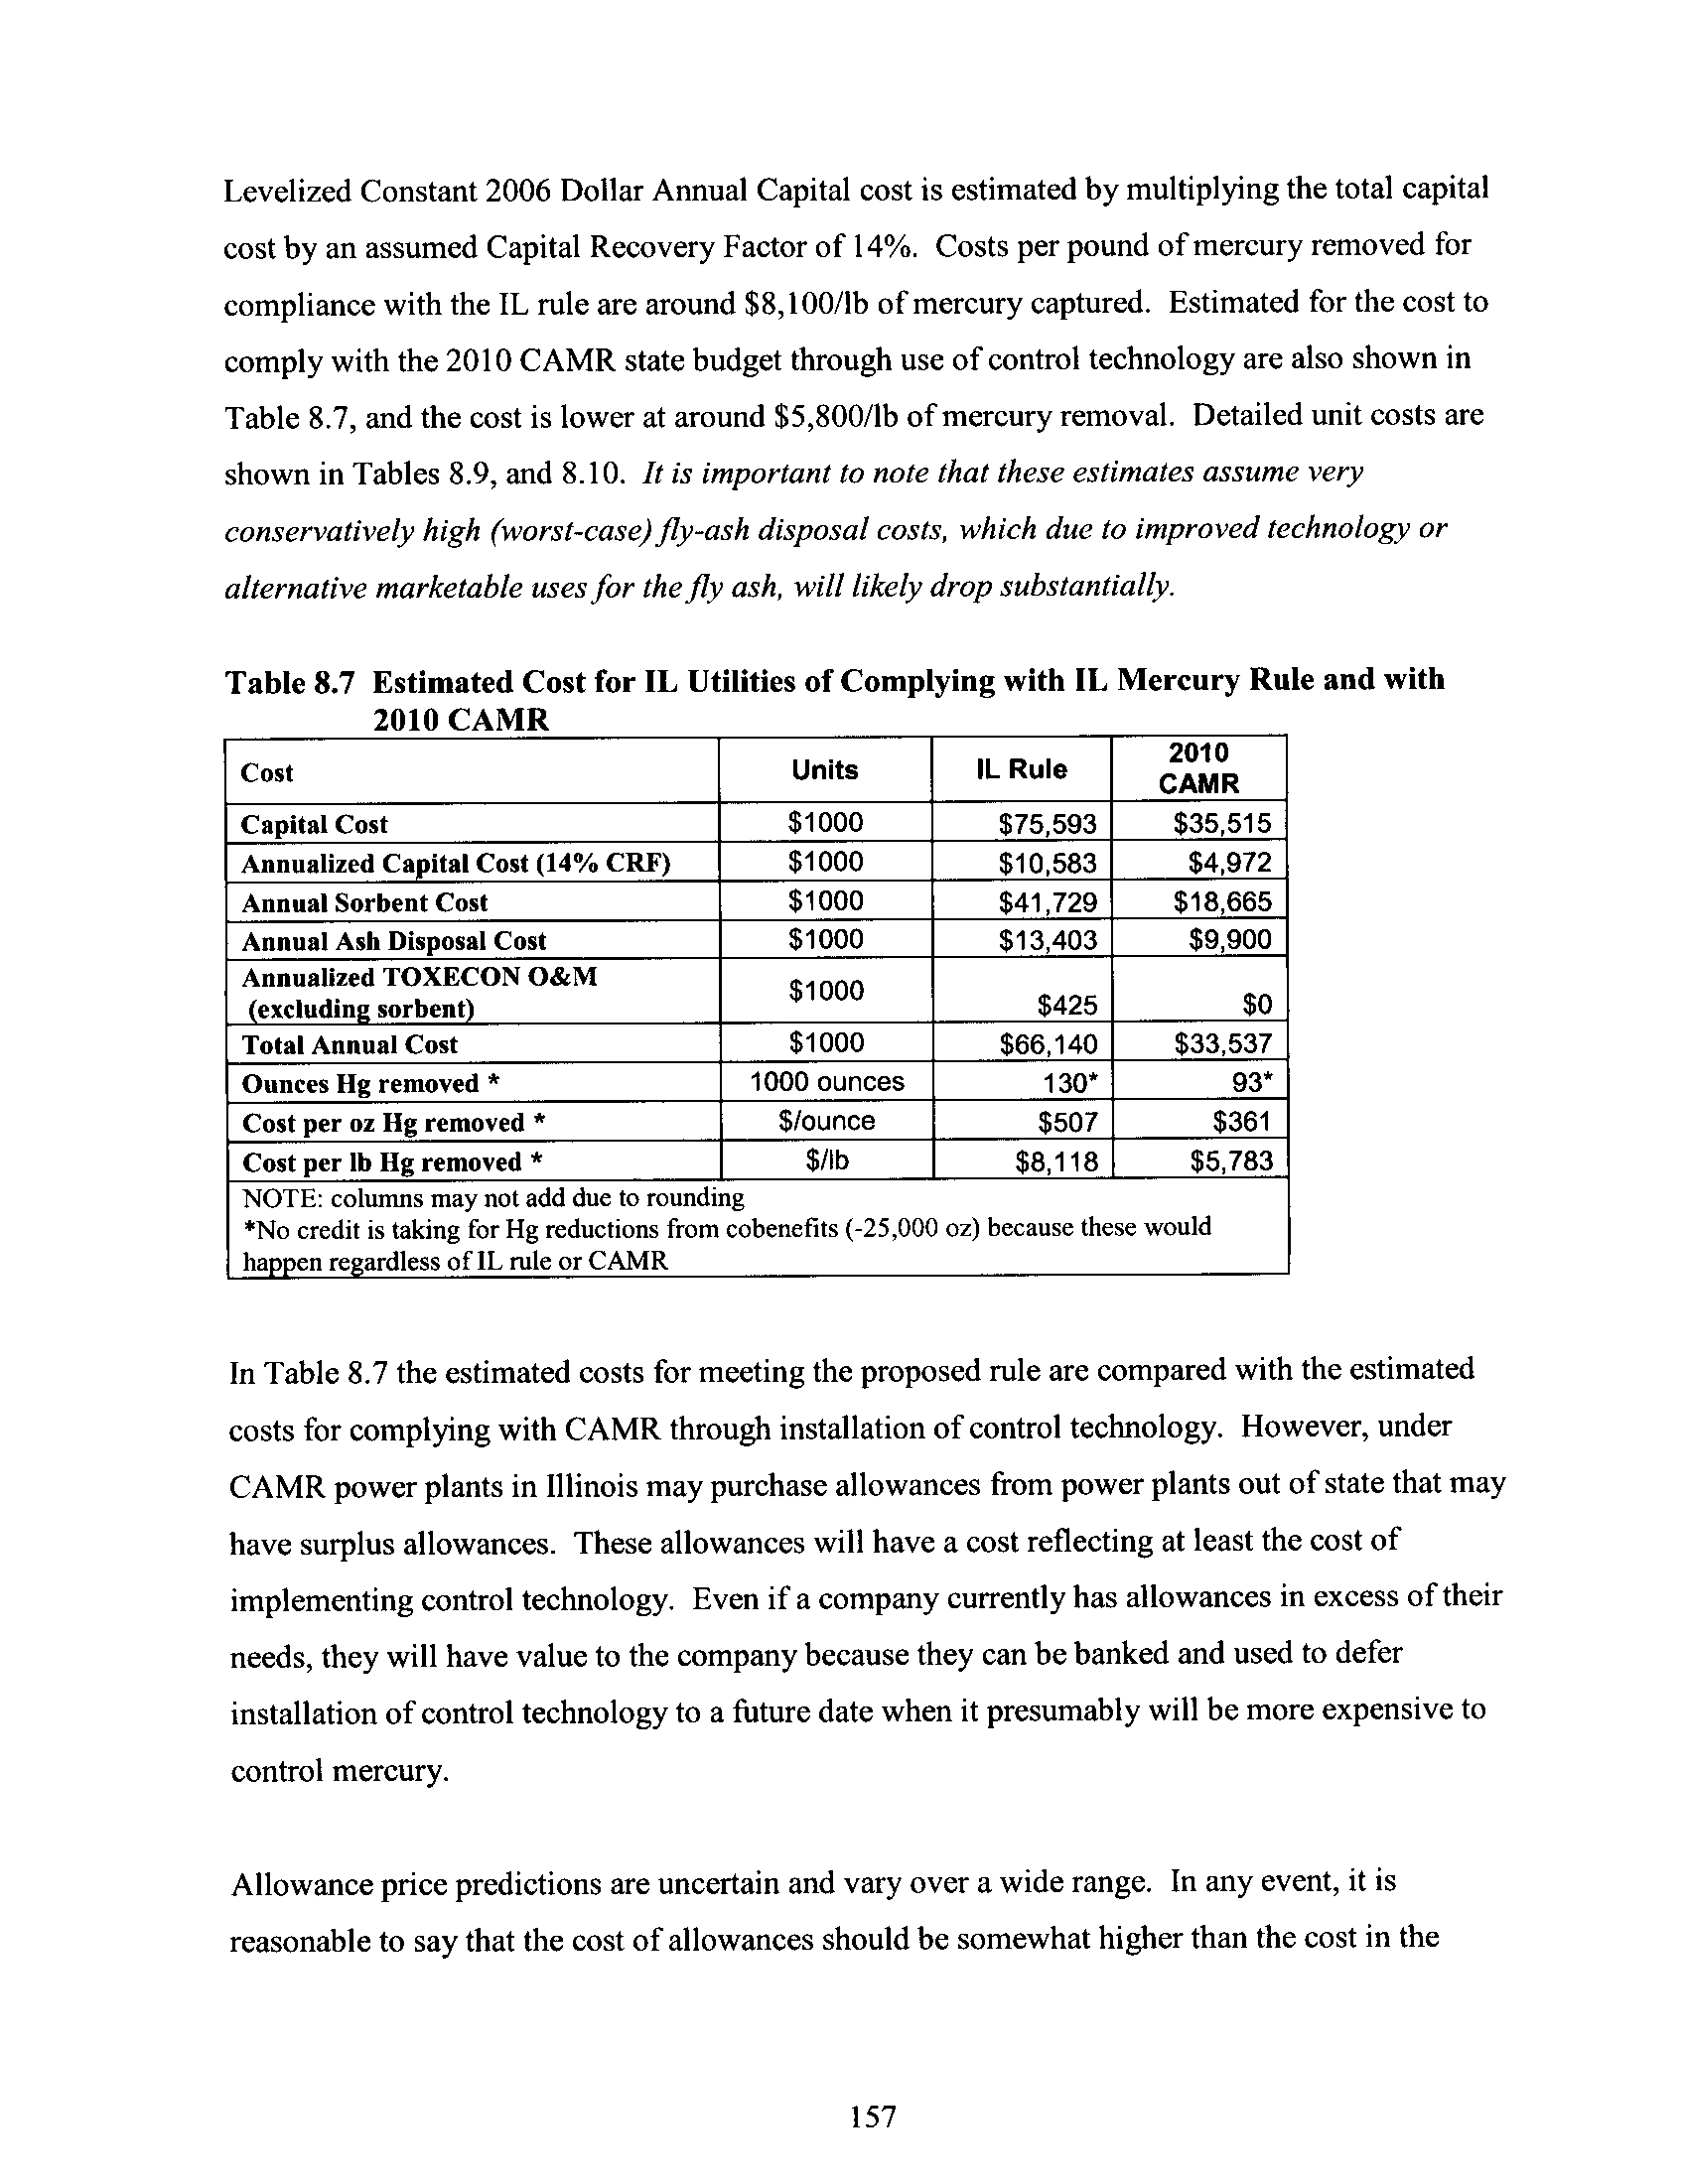
Table 8.7
Estimated Cost for Illinois Utilities of Complying with Illinois
Mercury Rule and with 2010 CAMR
157
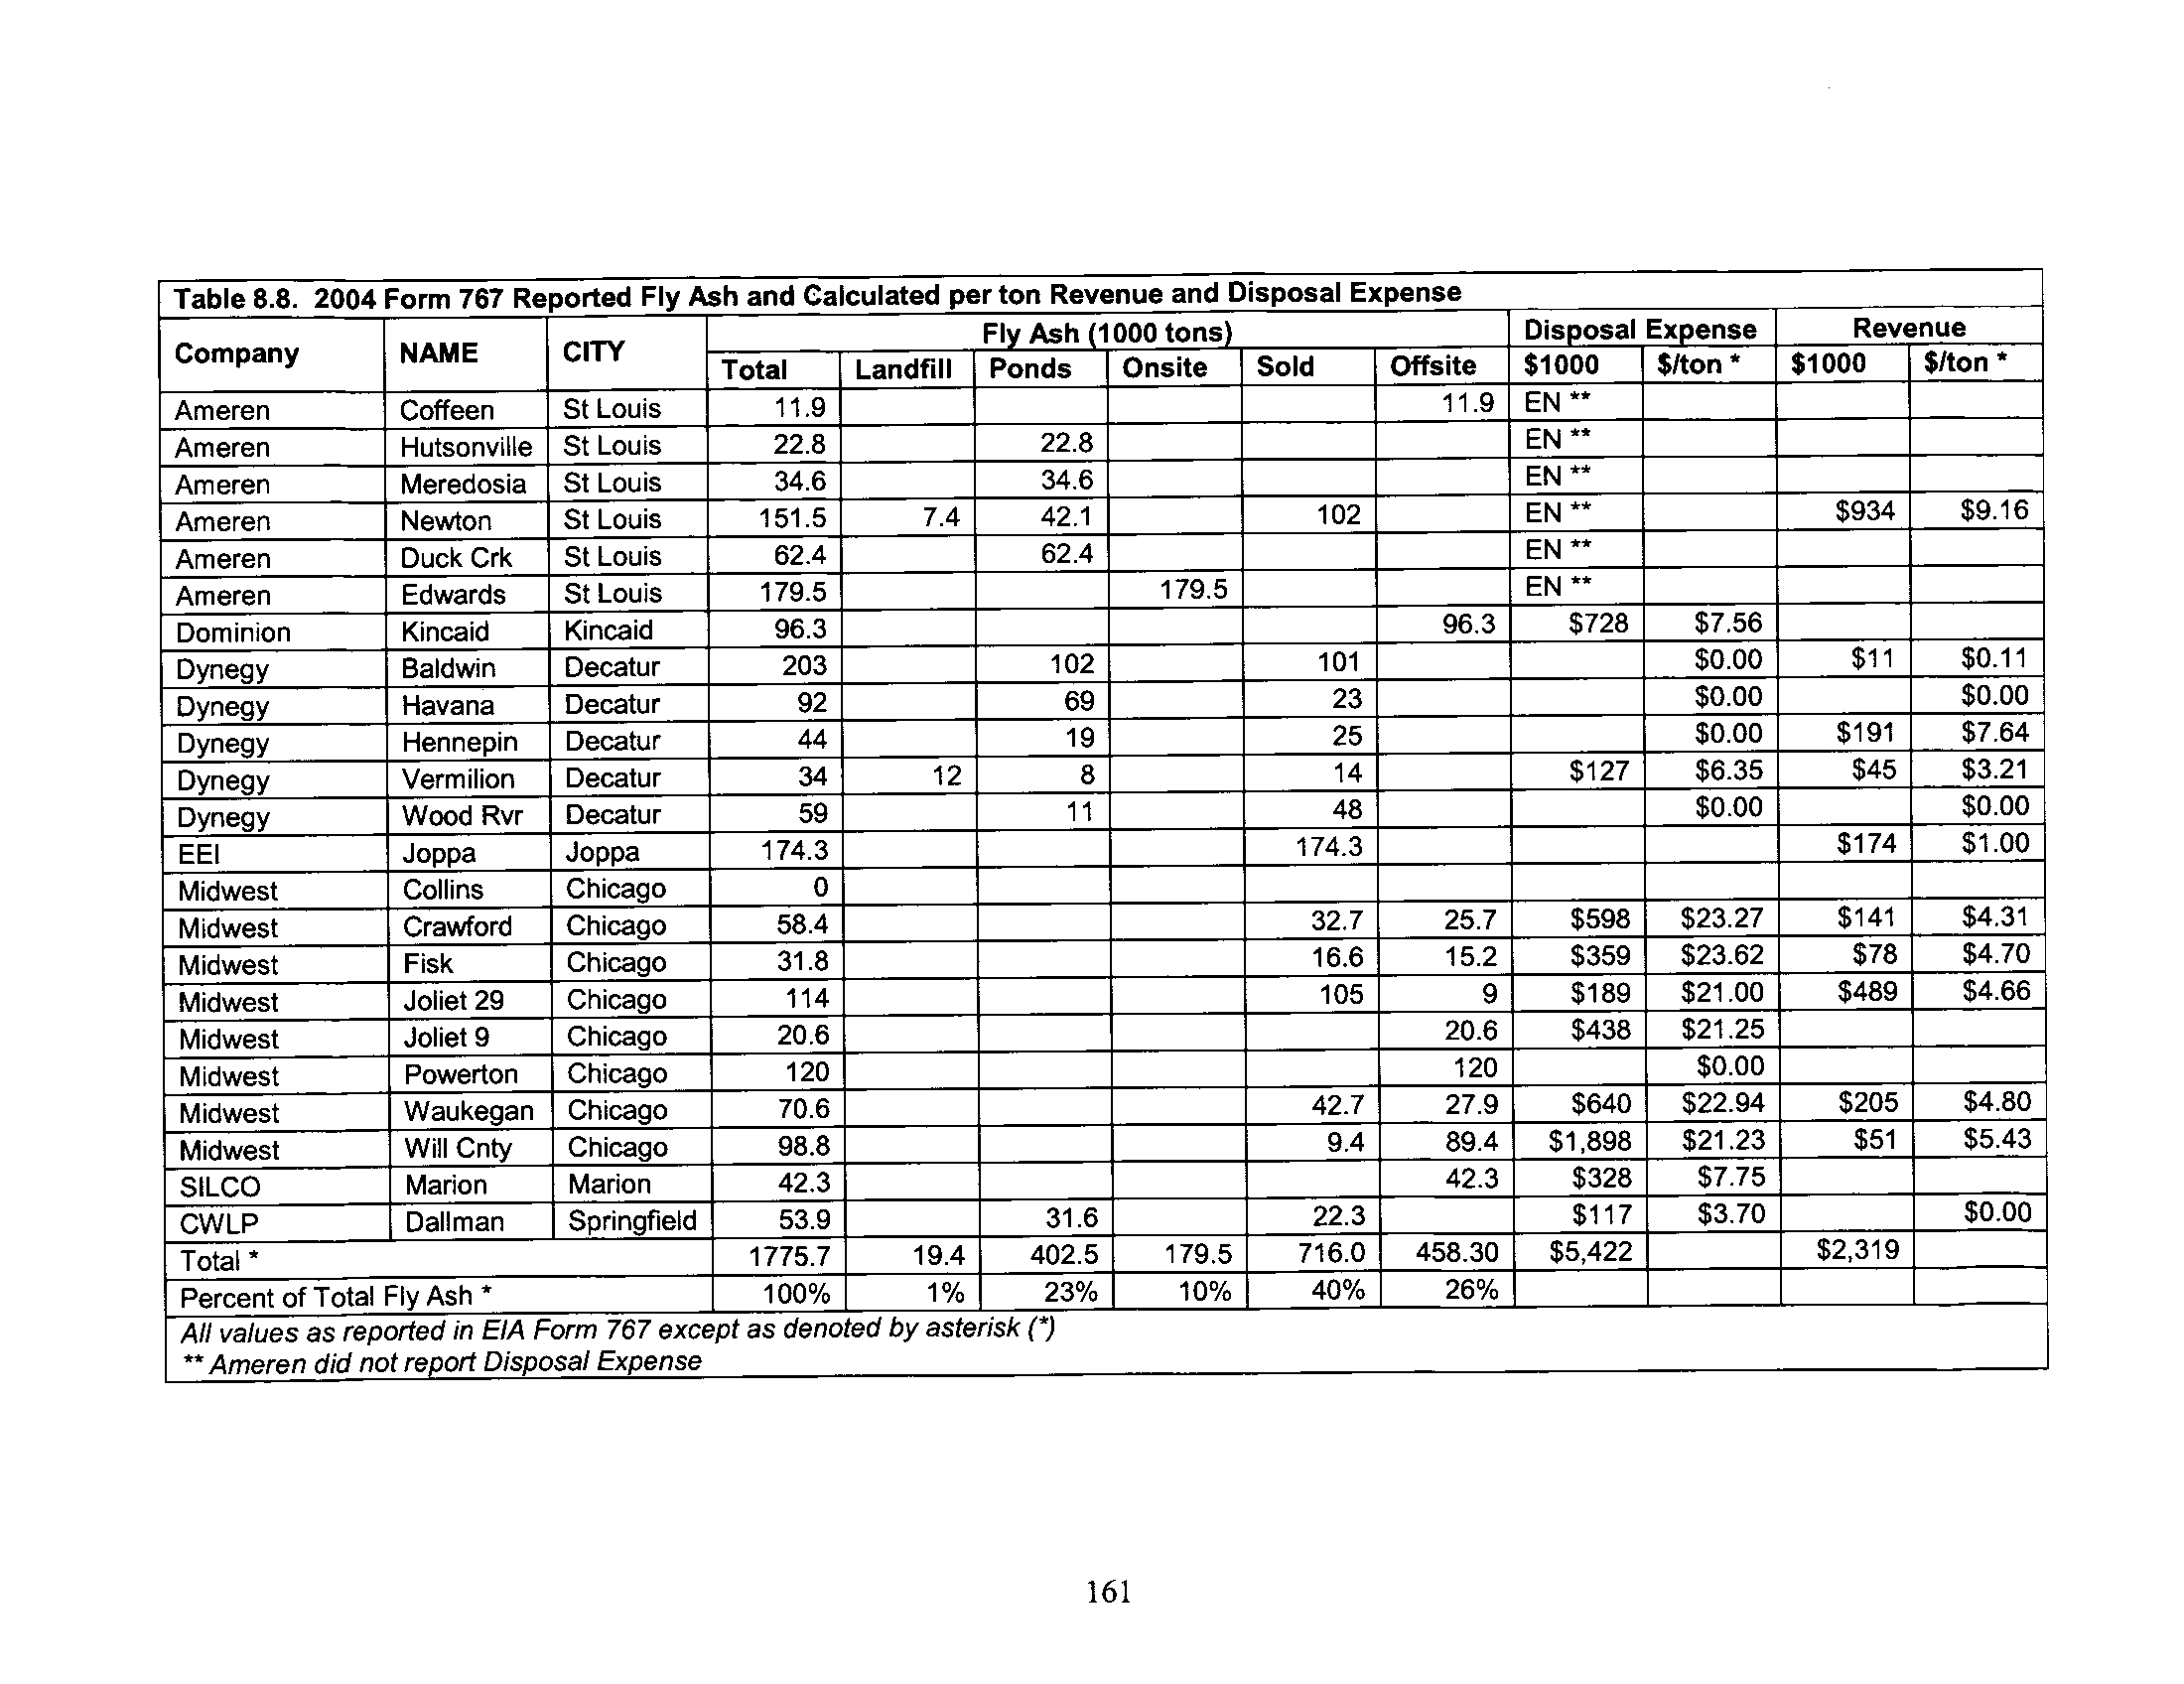
Table 8.8
2004 Form 767 Report Fly Ash and Calculated per ton Revenue
and Disposal Expense
161
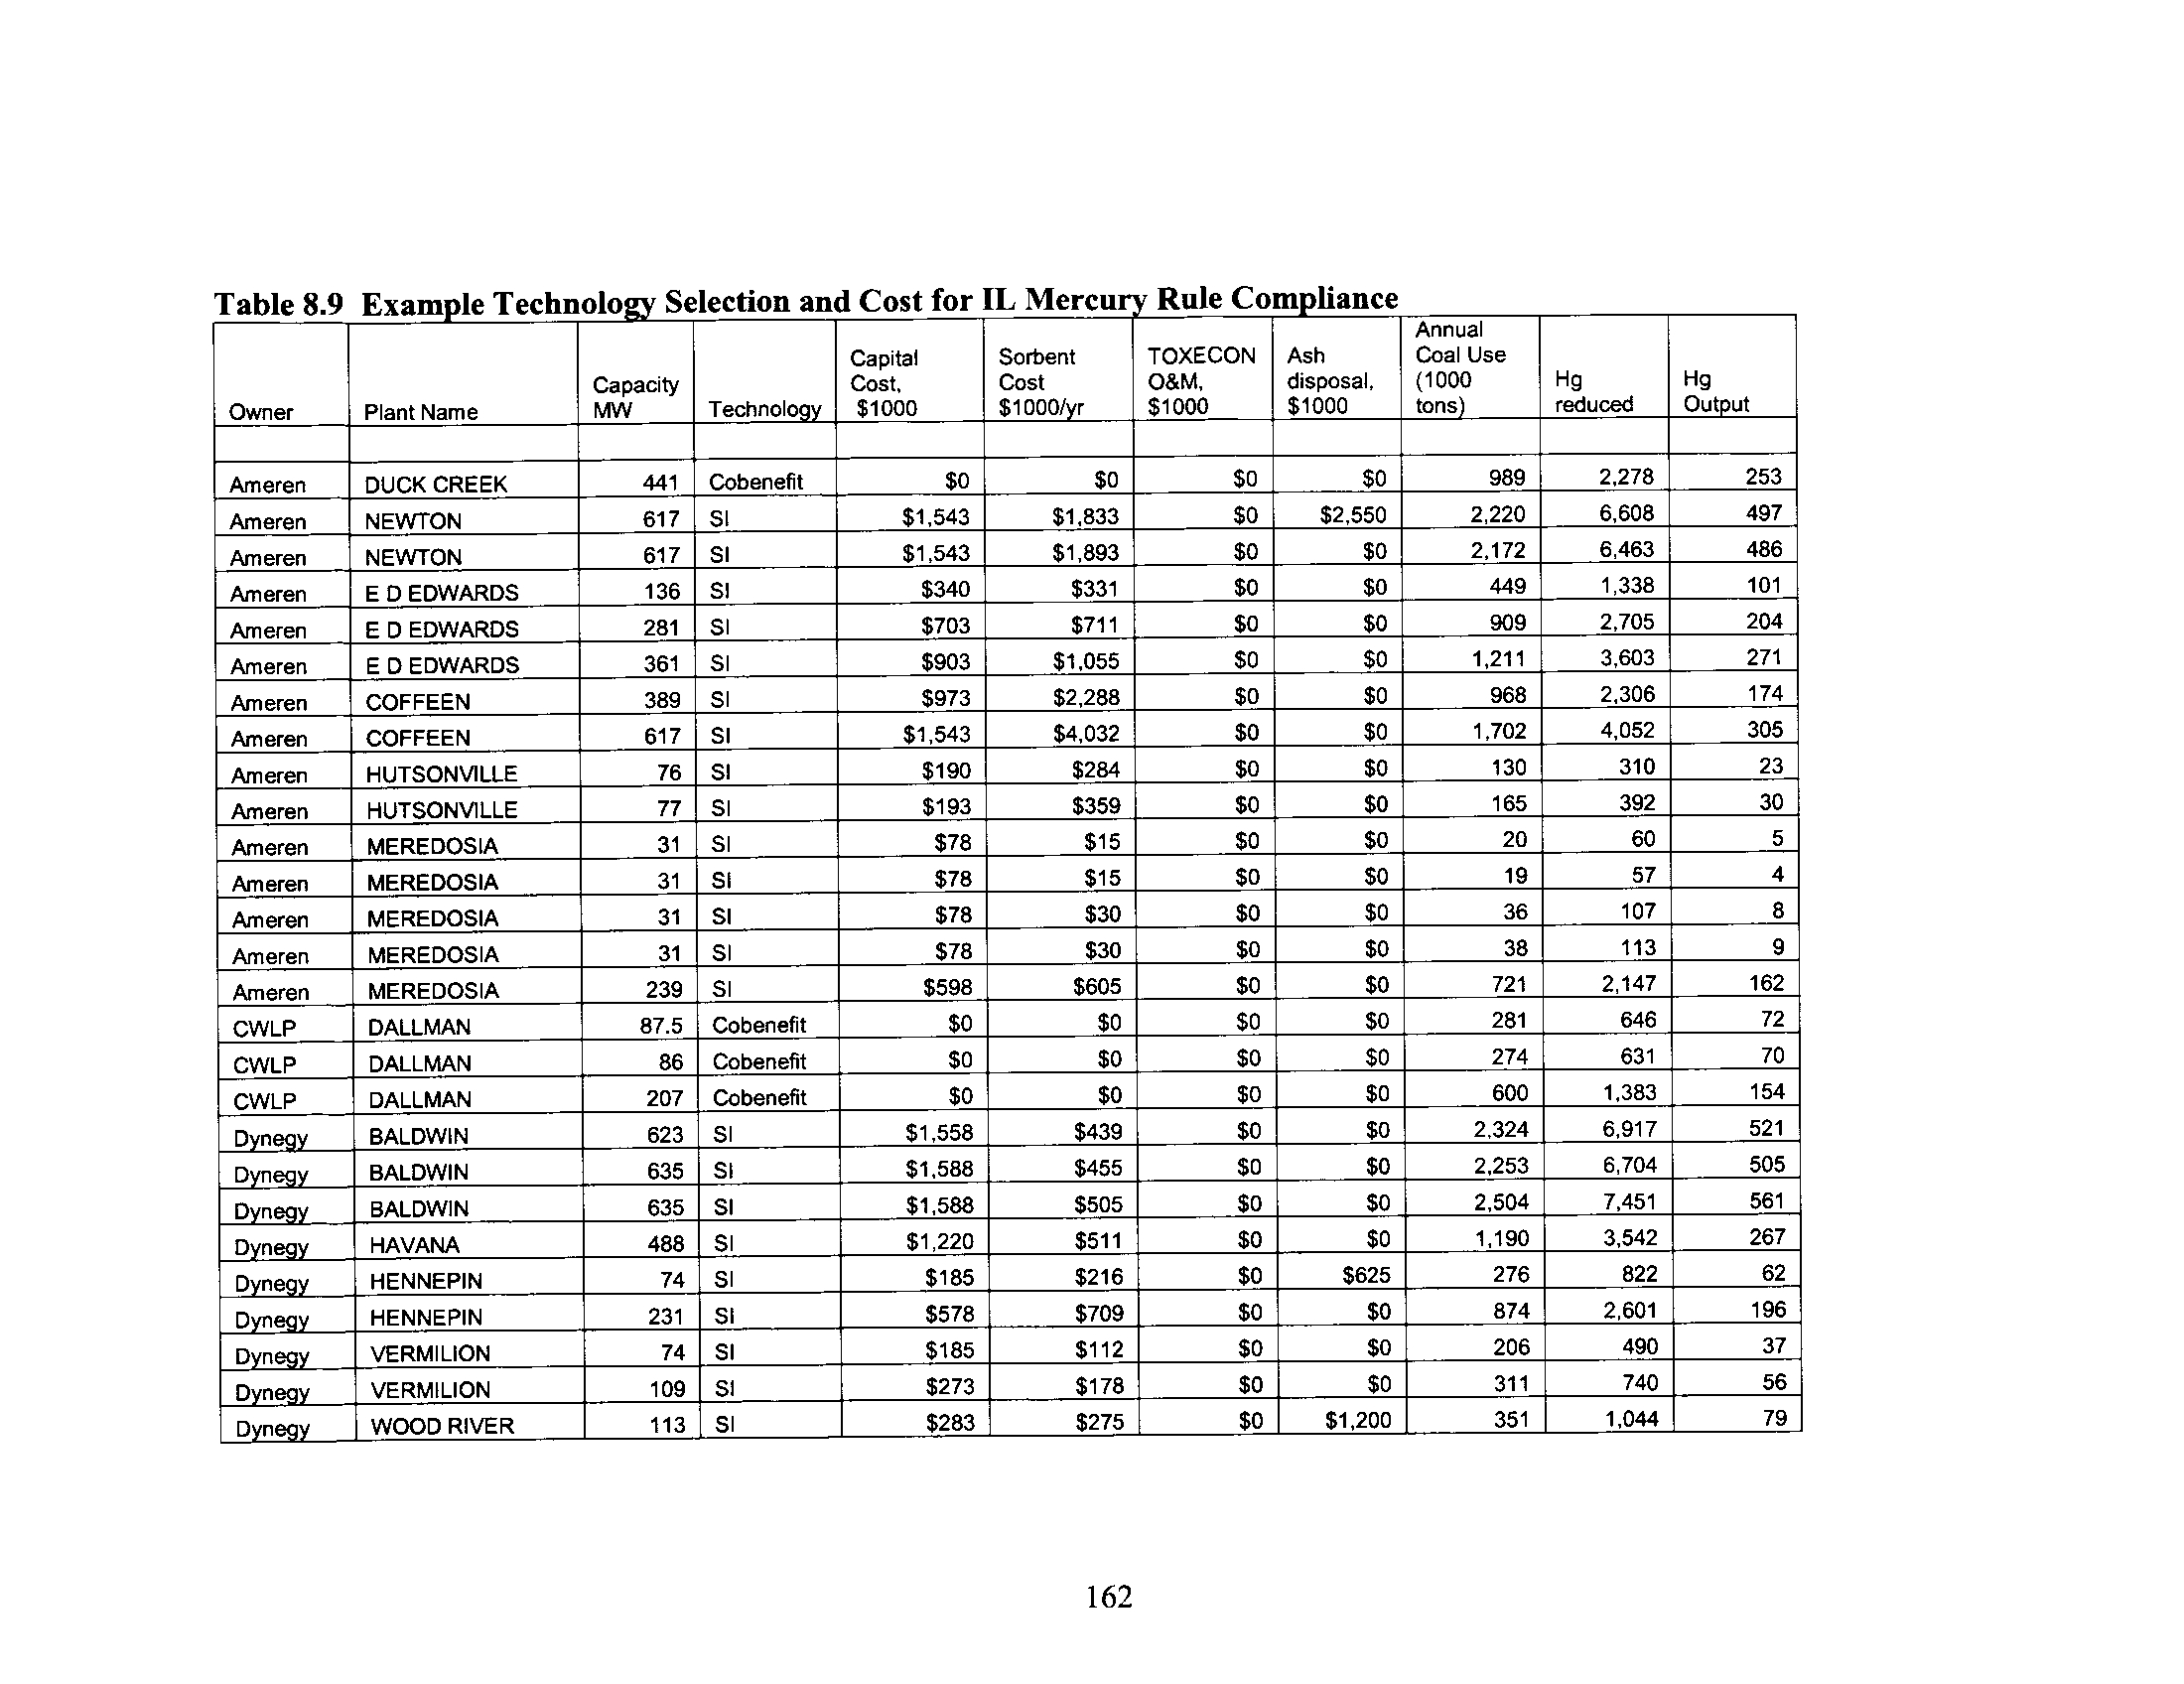
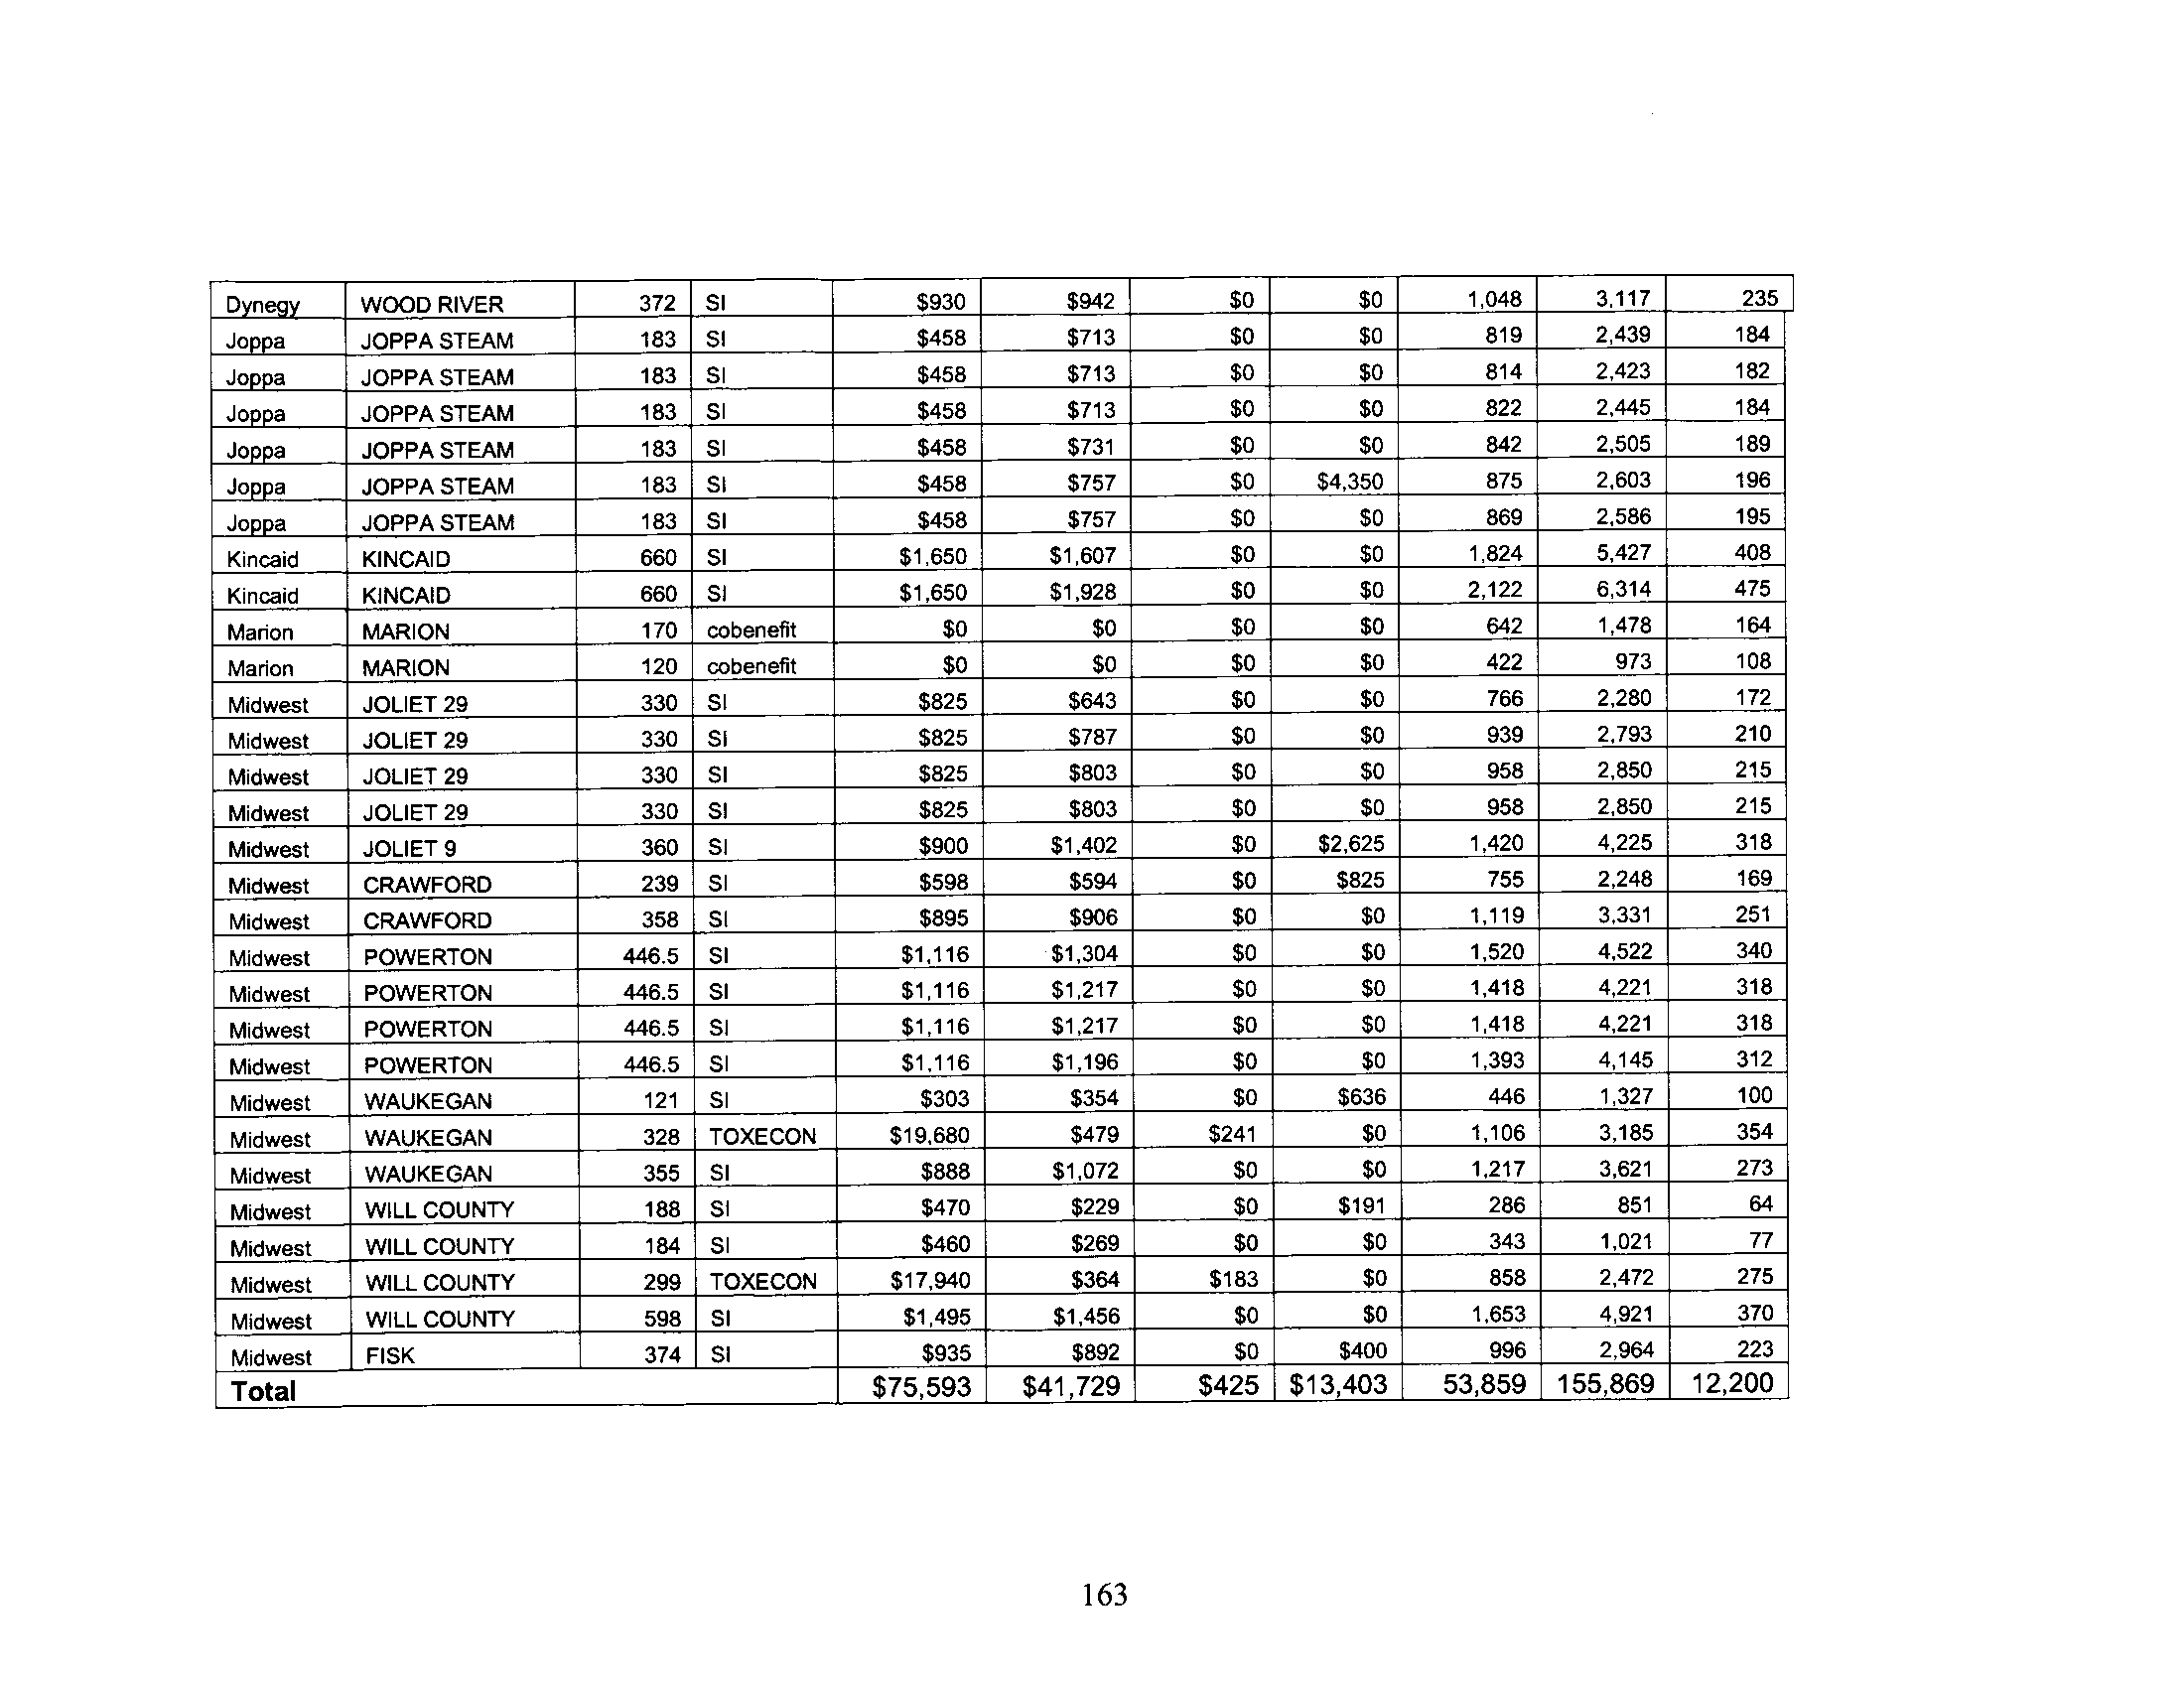
Table 8.9
Example Technology Selection and Cost for Illinois Mercury
Rule Compliance
162
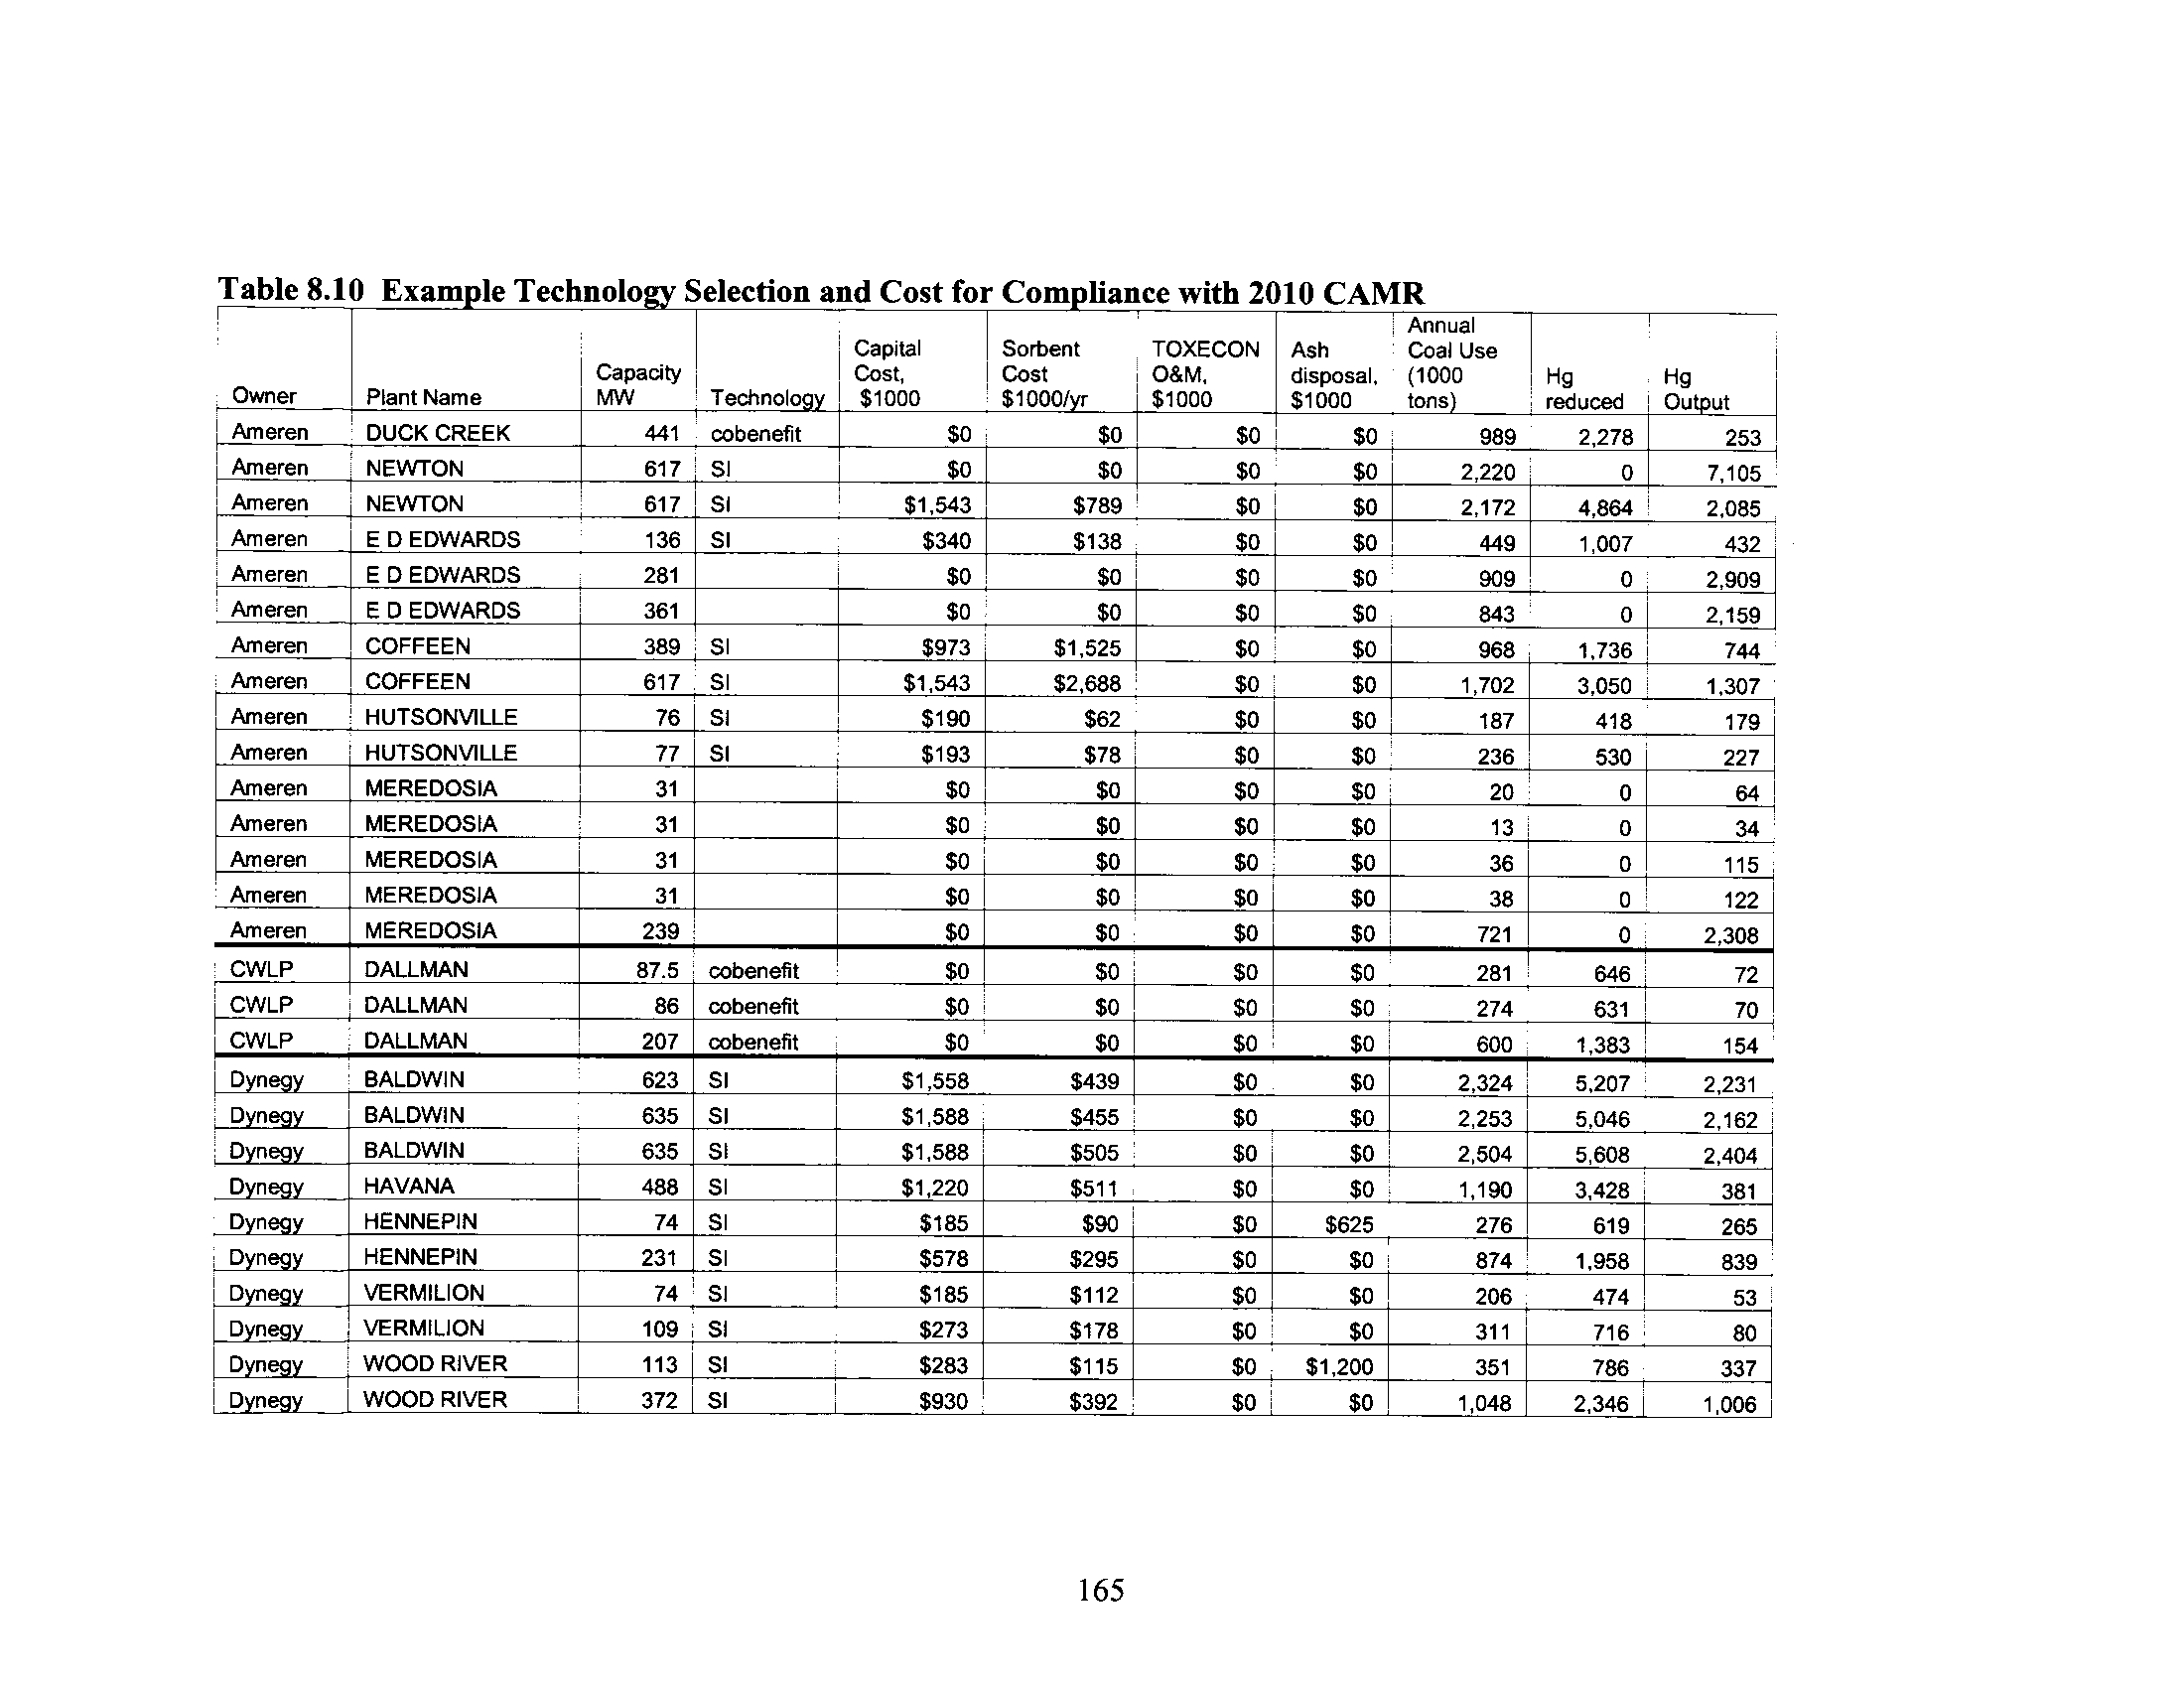
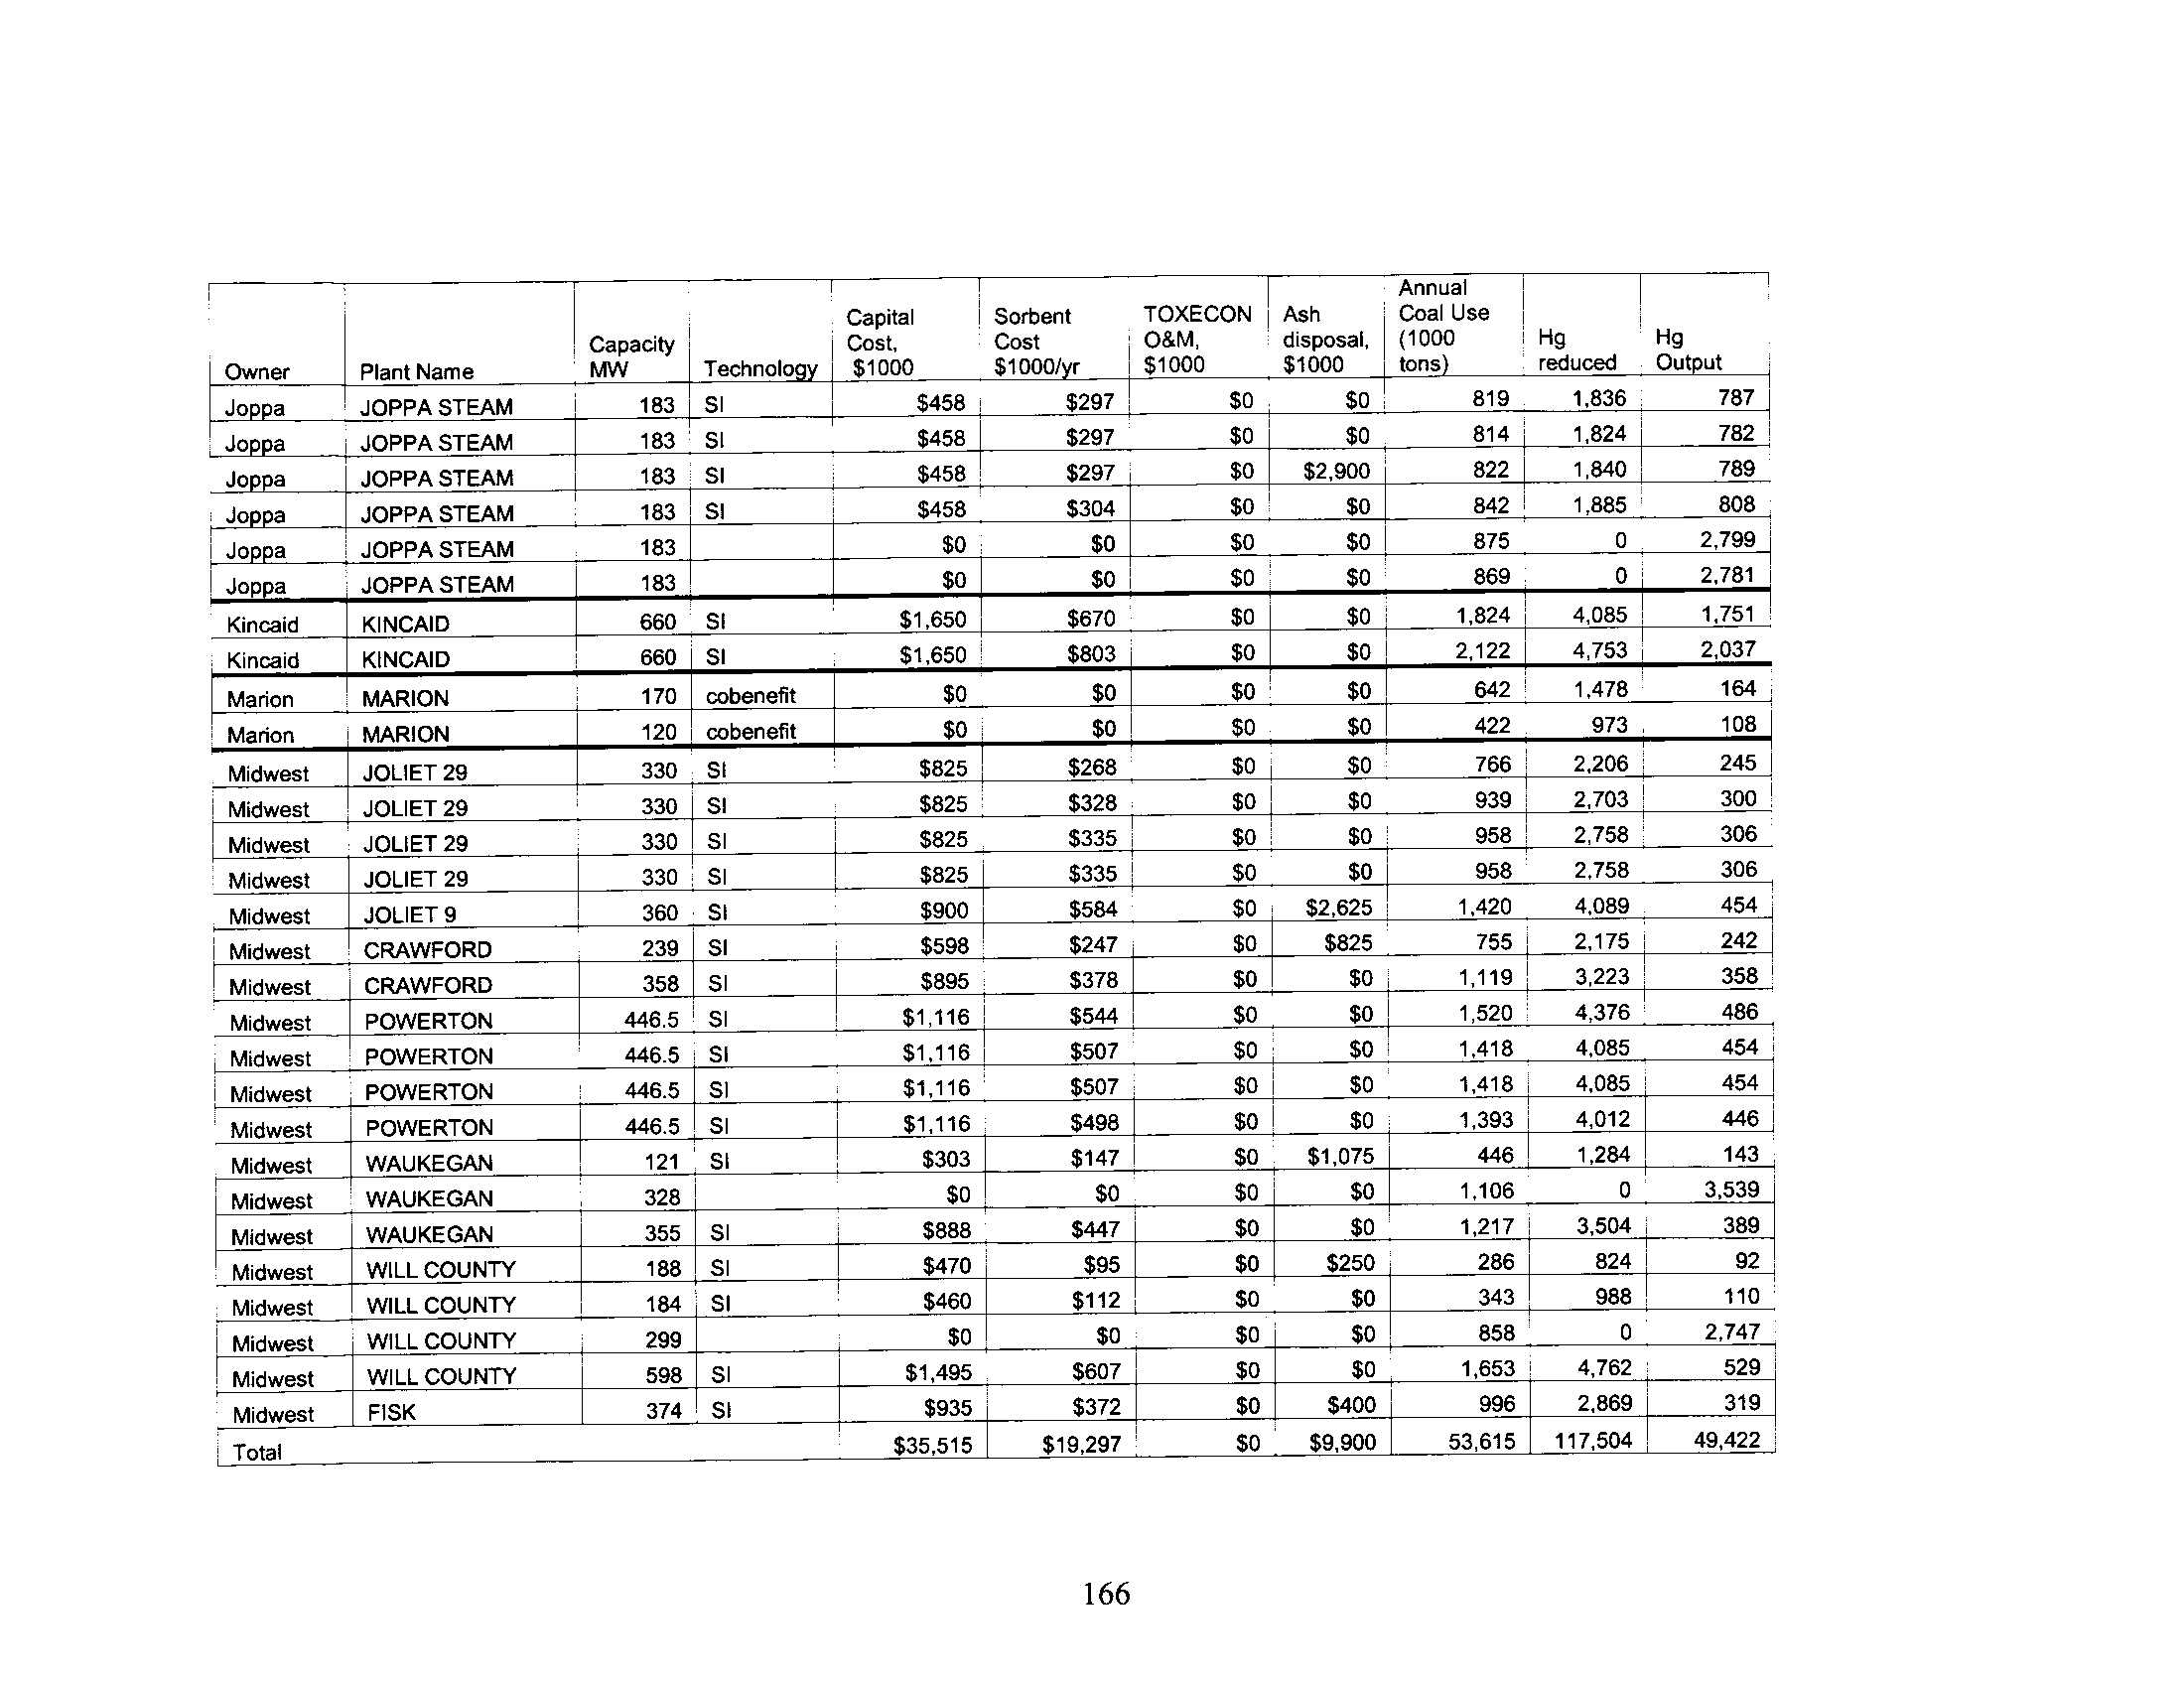
Table 8 .10
Example Technology Selection and Cost for Compliance with
2010 CAMR
165
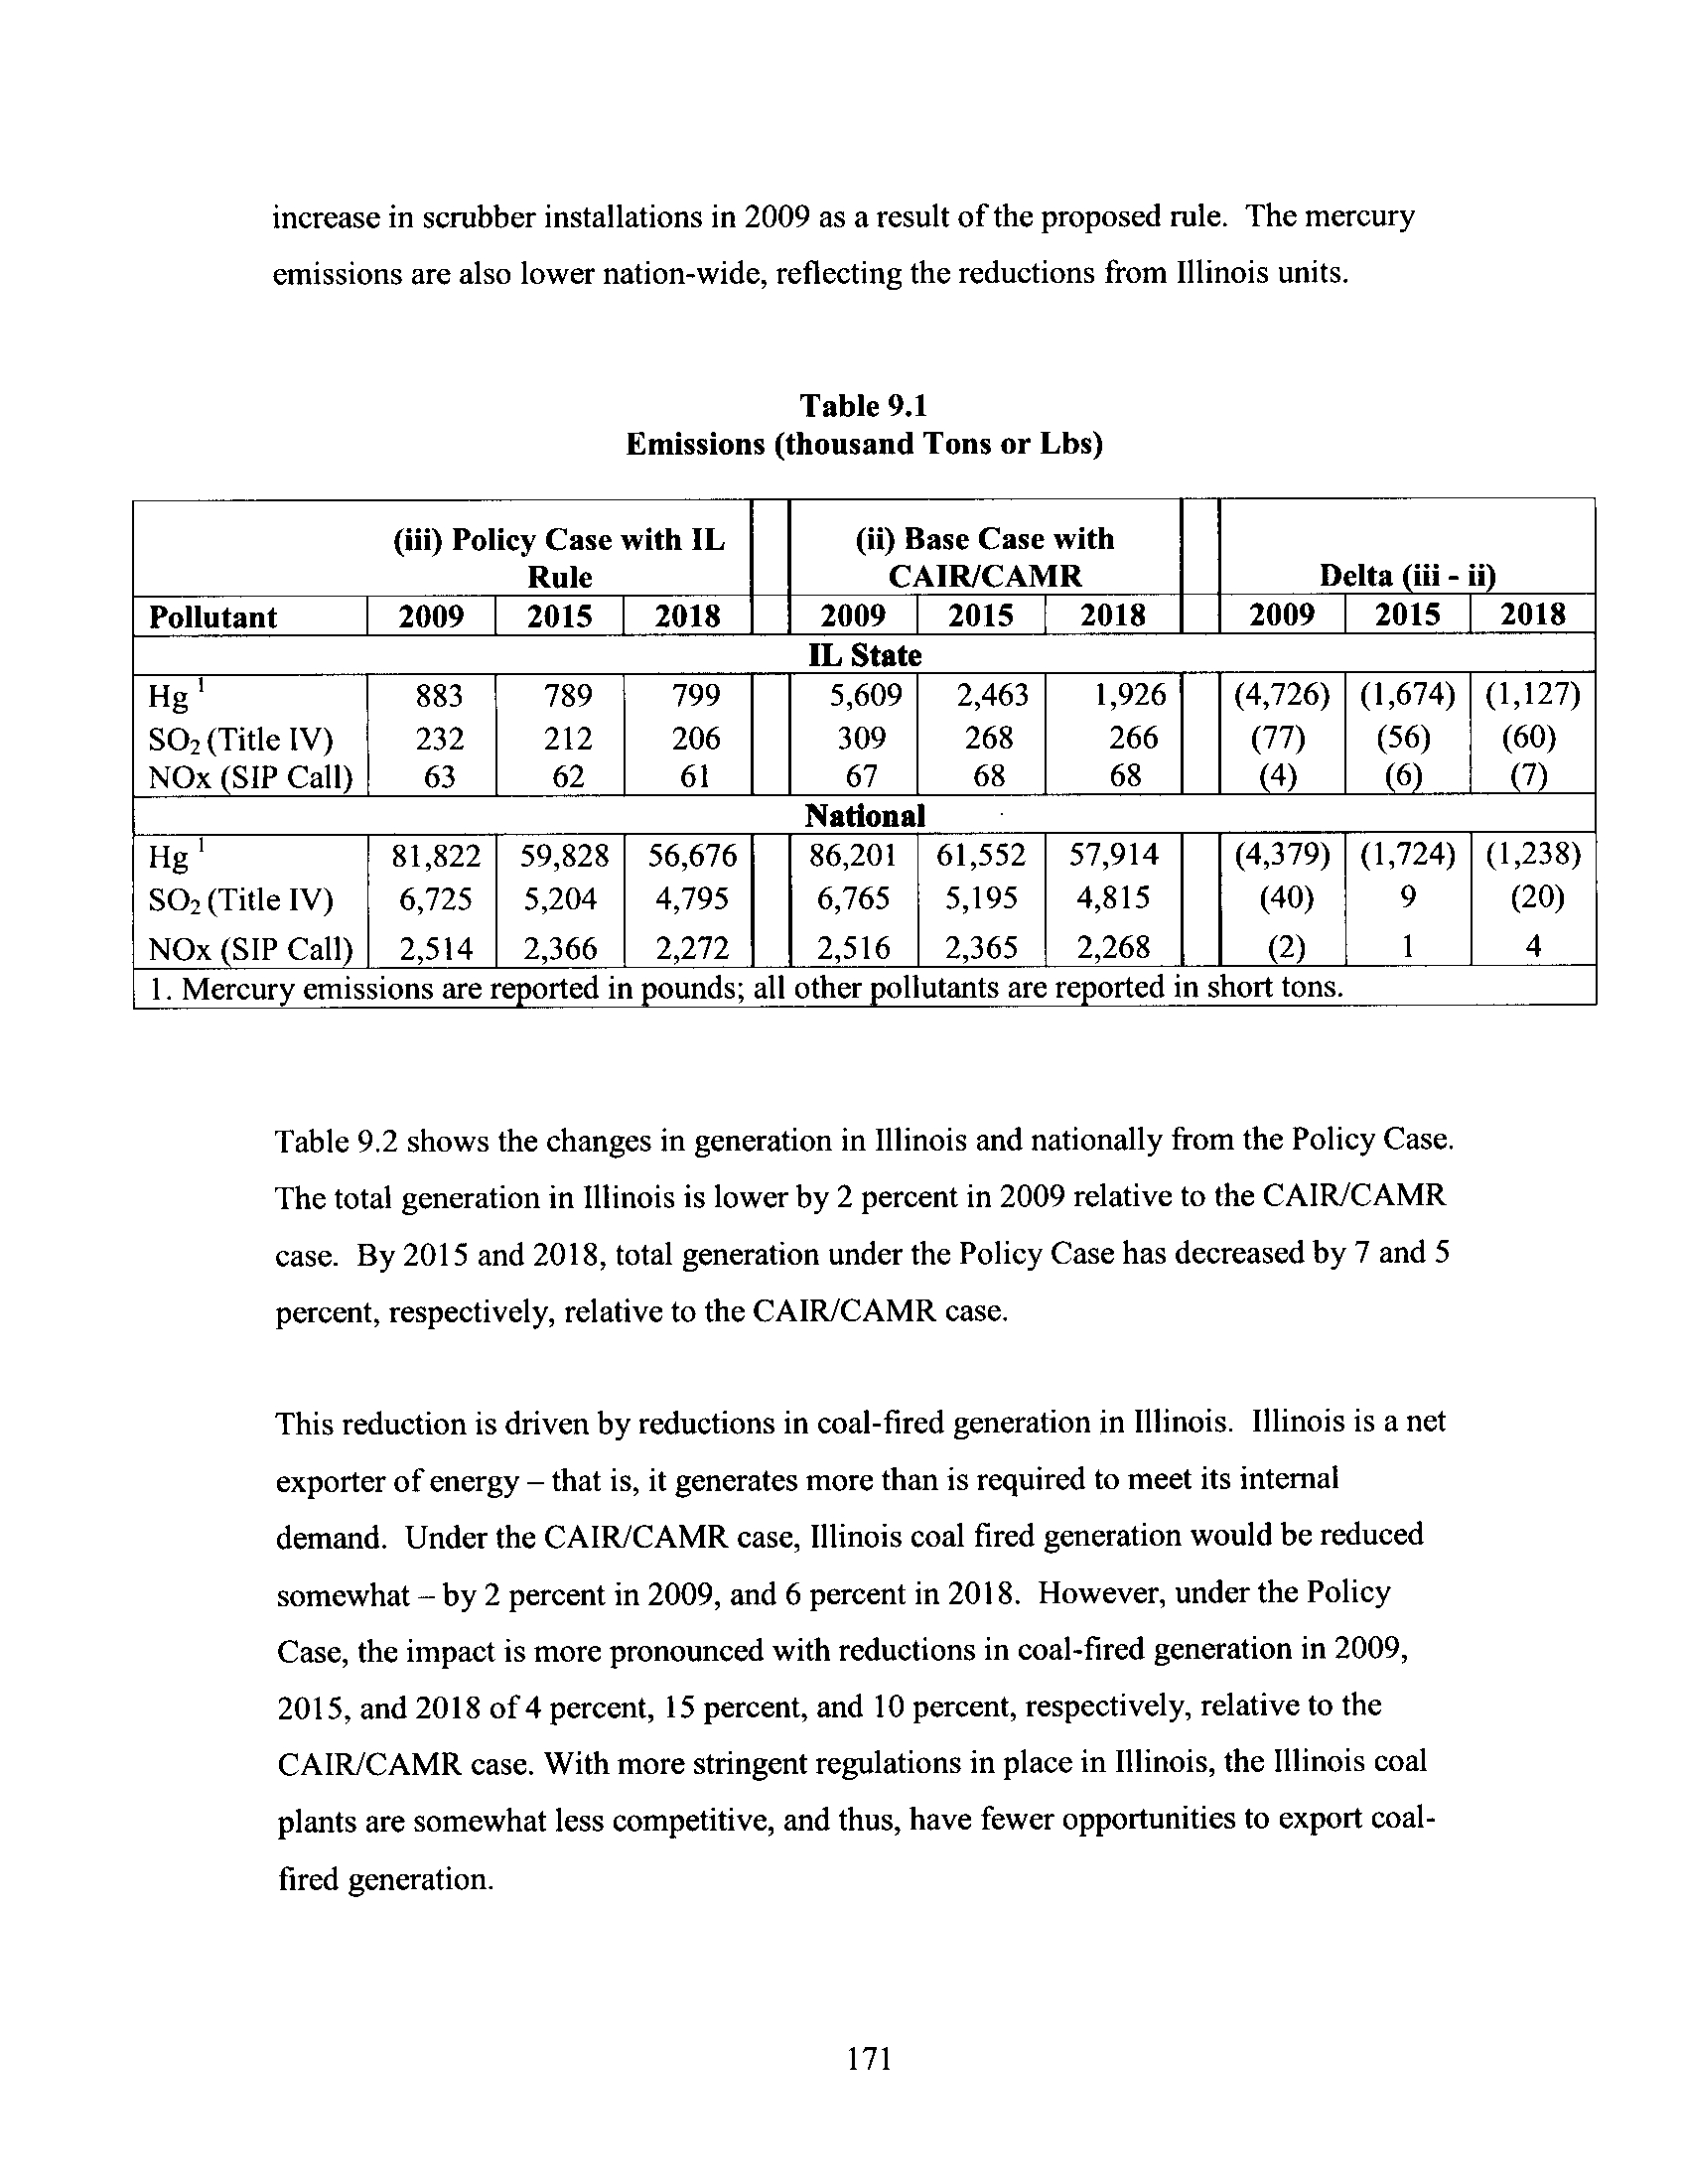
Table 9.1
Emissions (thousand Tons or Lbs)
171
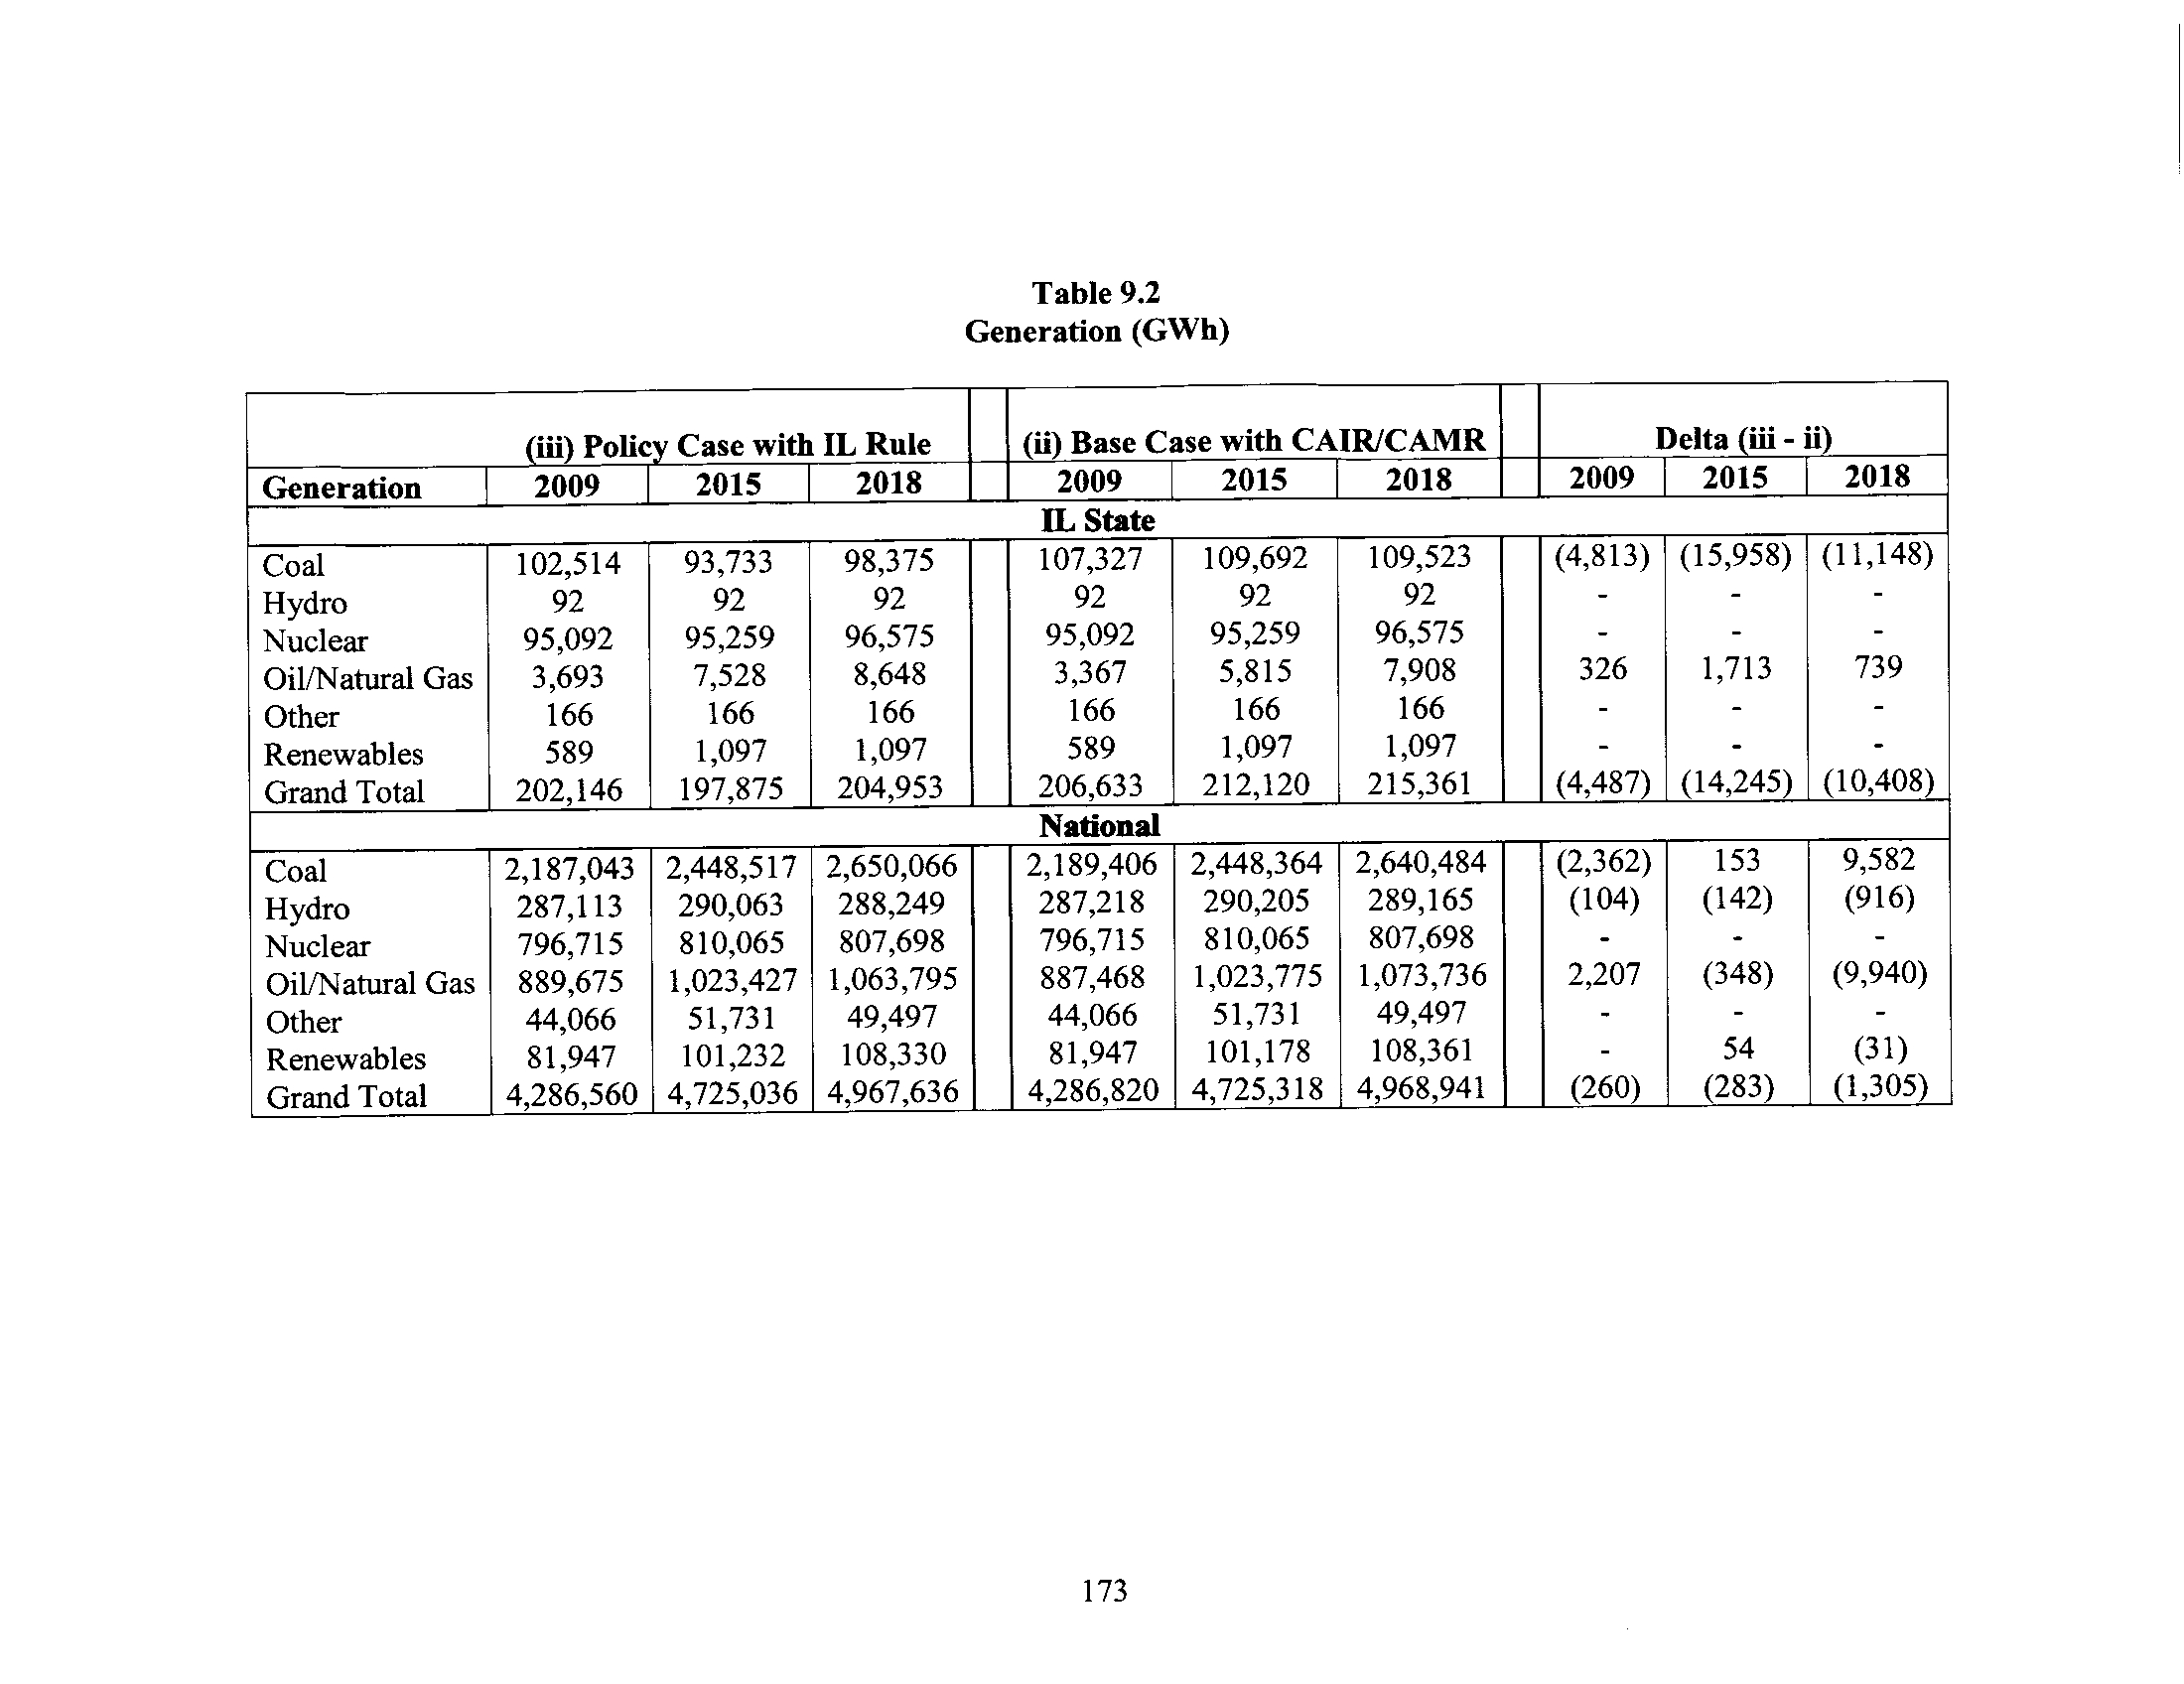
Table 9.2
Generation (GWh)
173
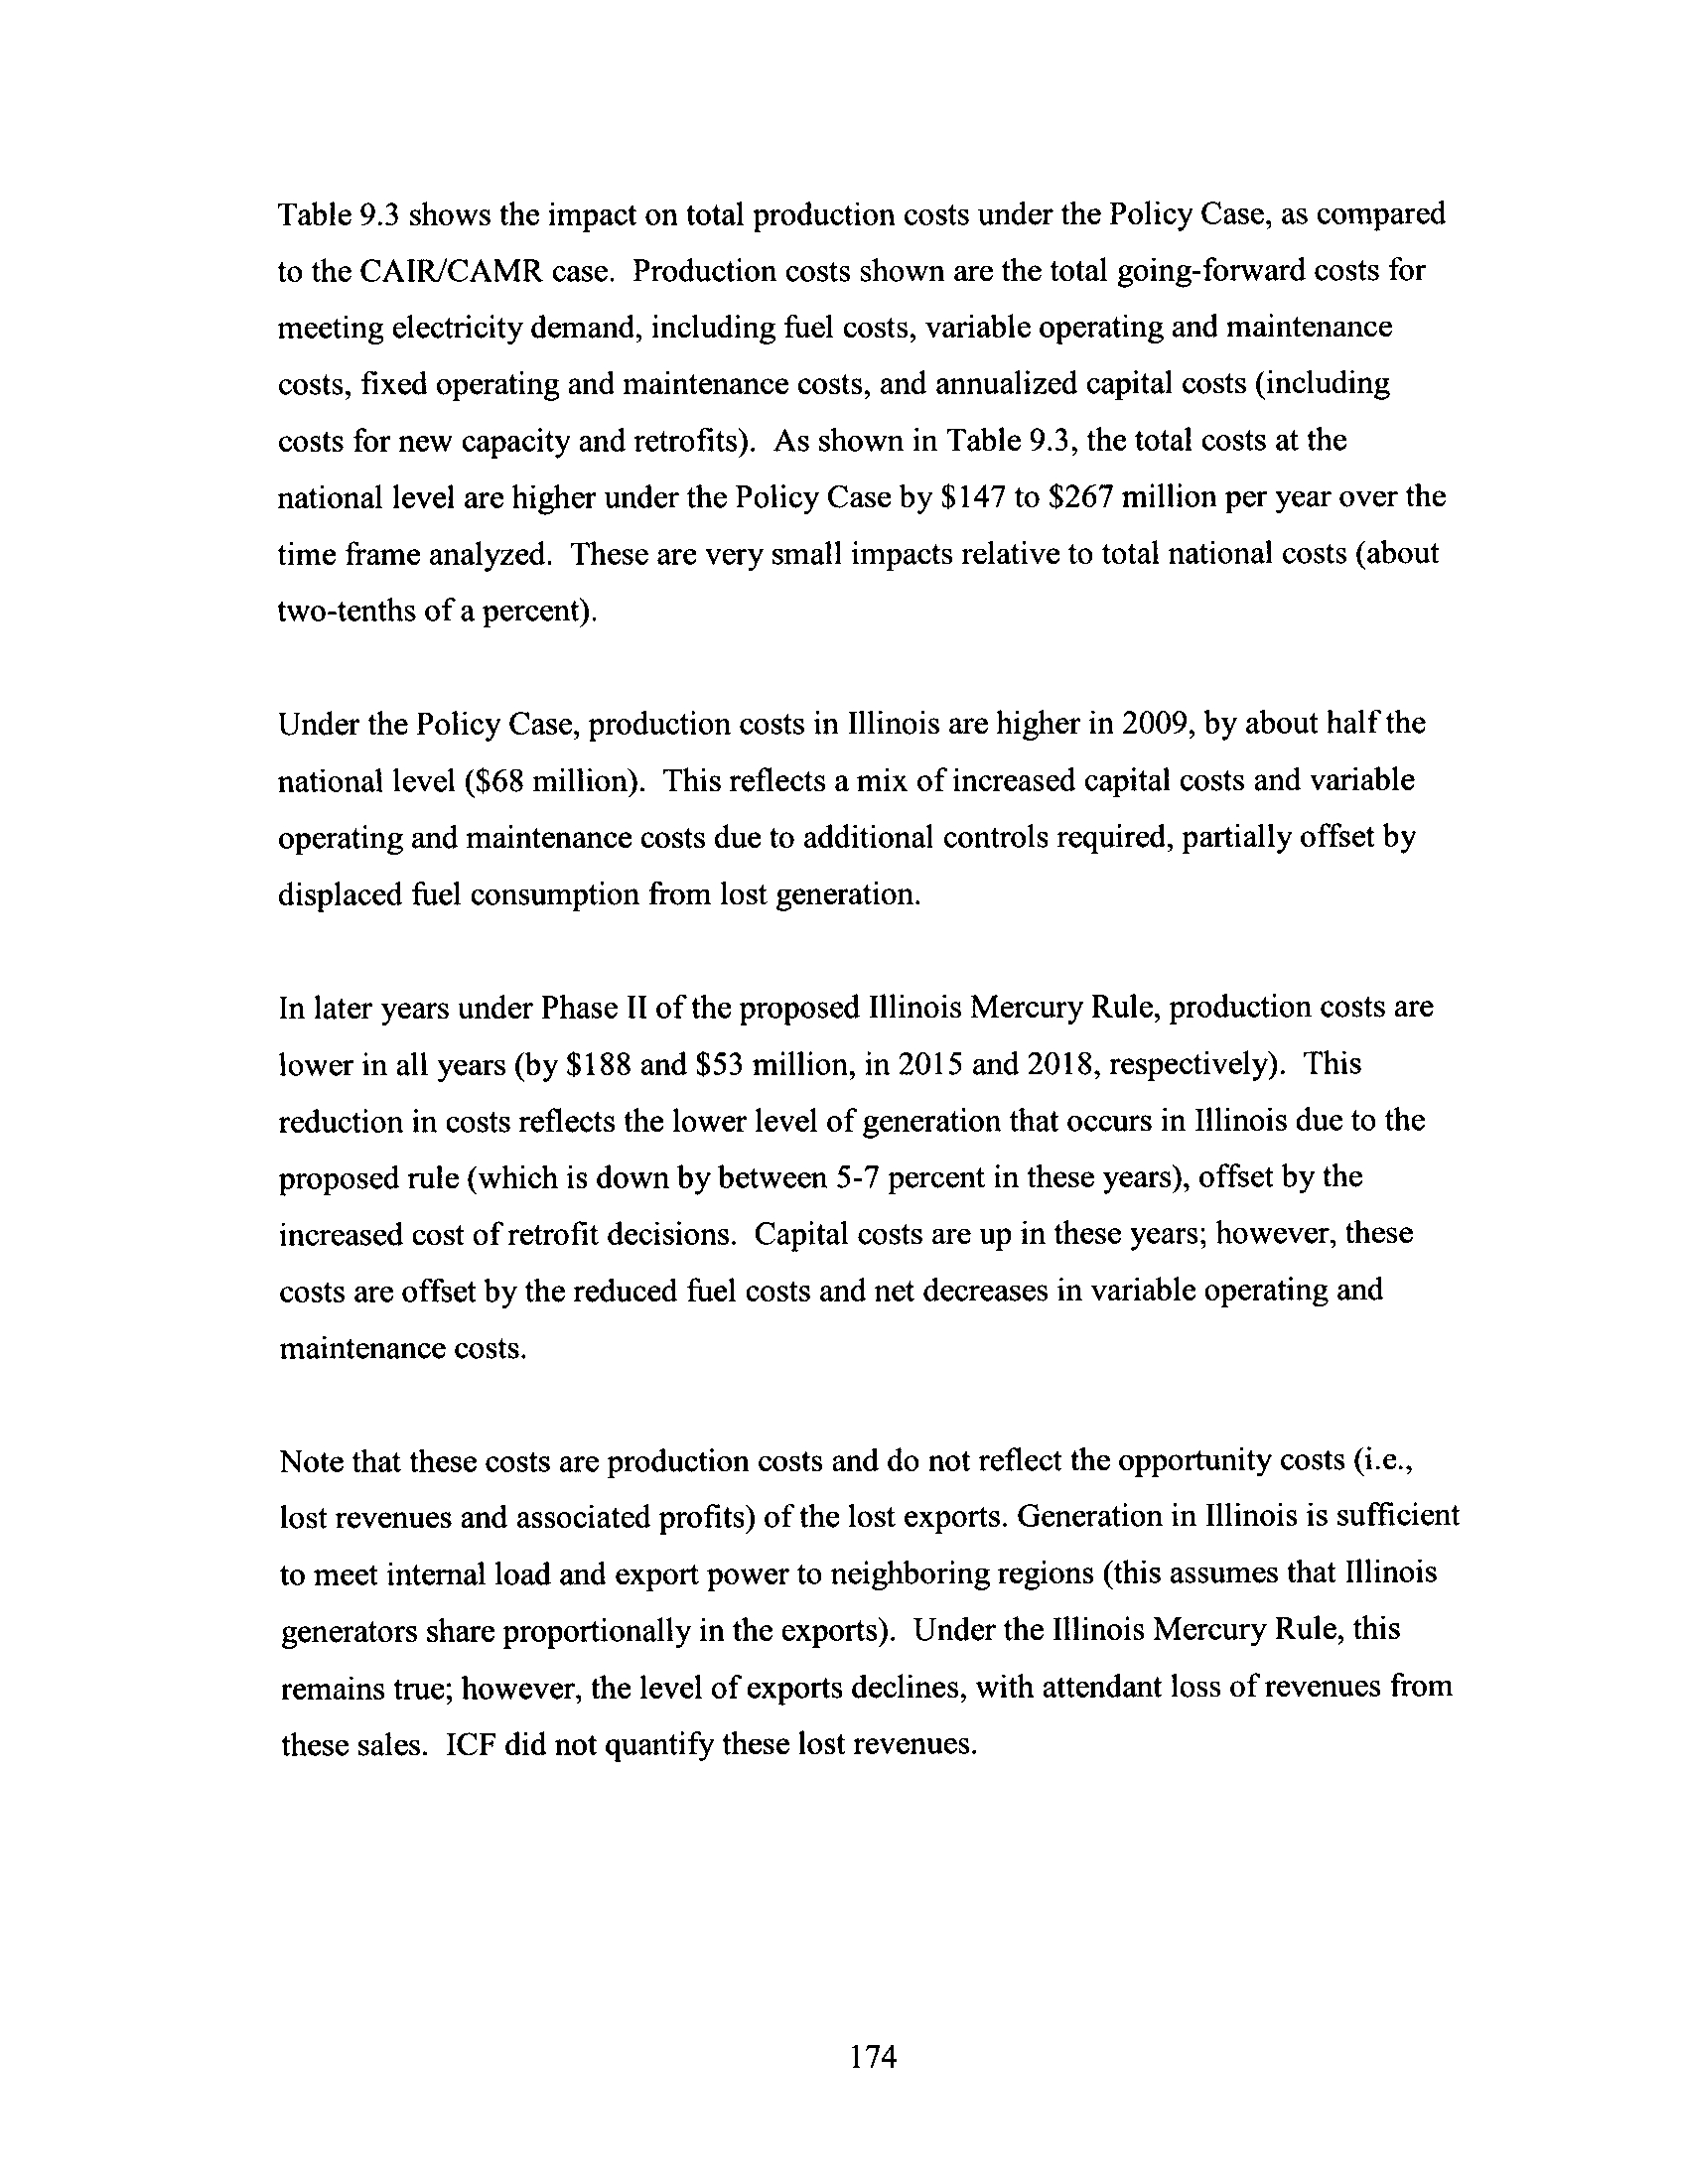
Table 9 .3
Total Production Costs (1999 million dollars) Impacts of the
Illinois Mercury Rule
175
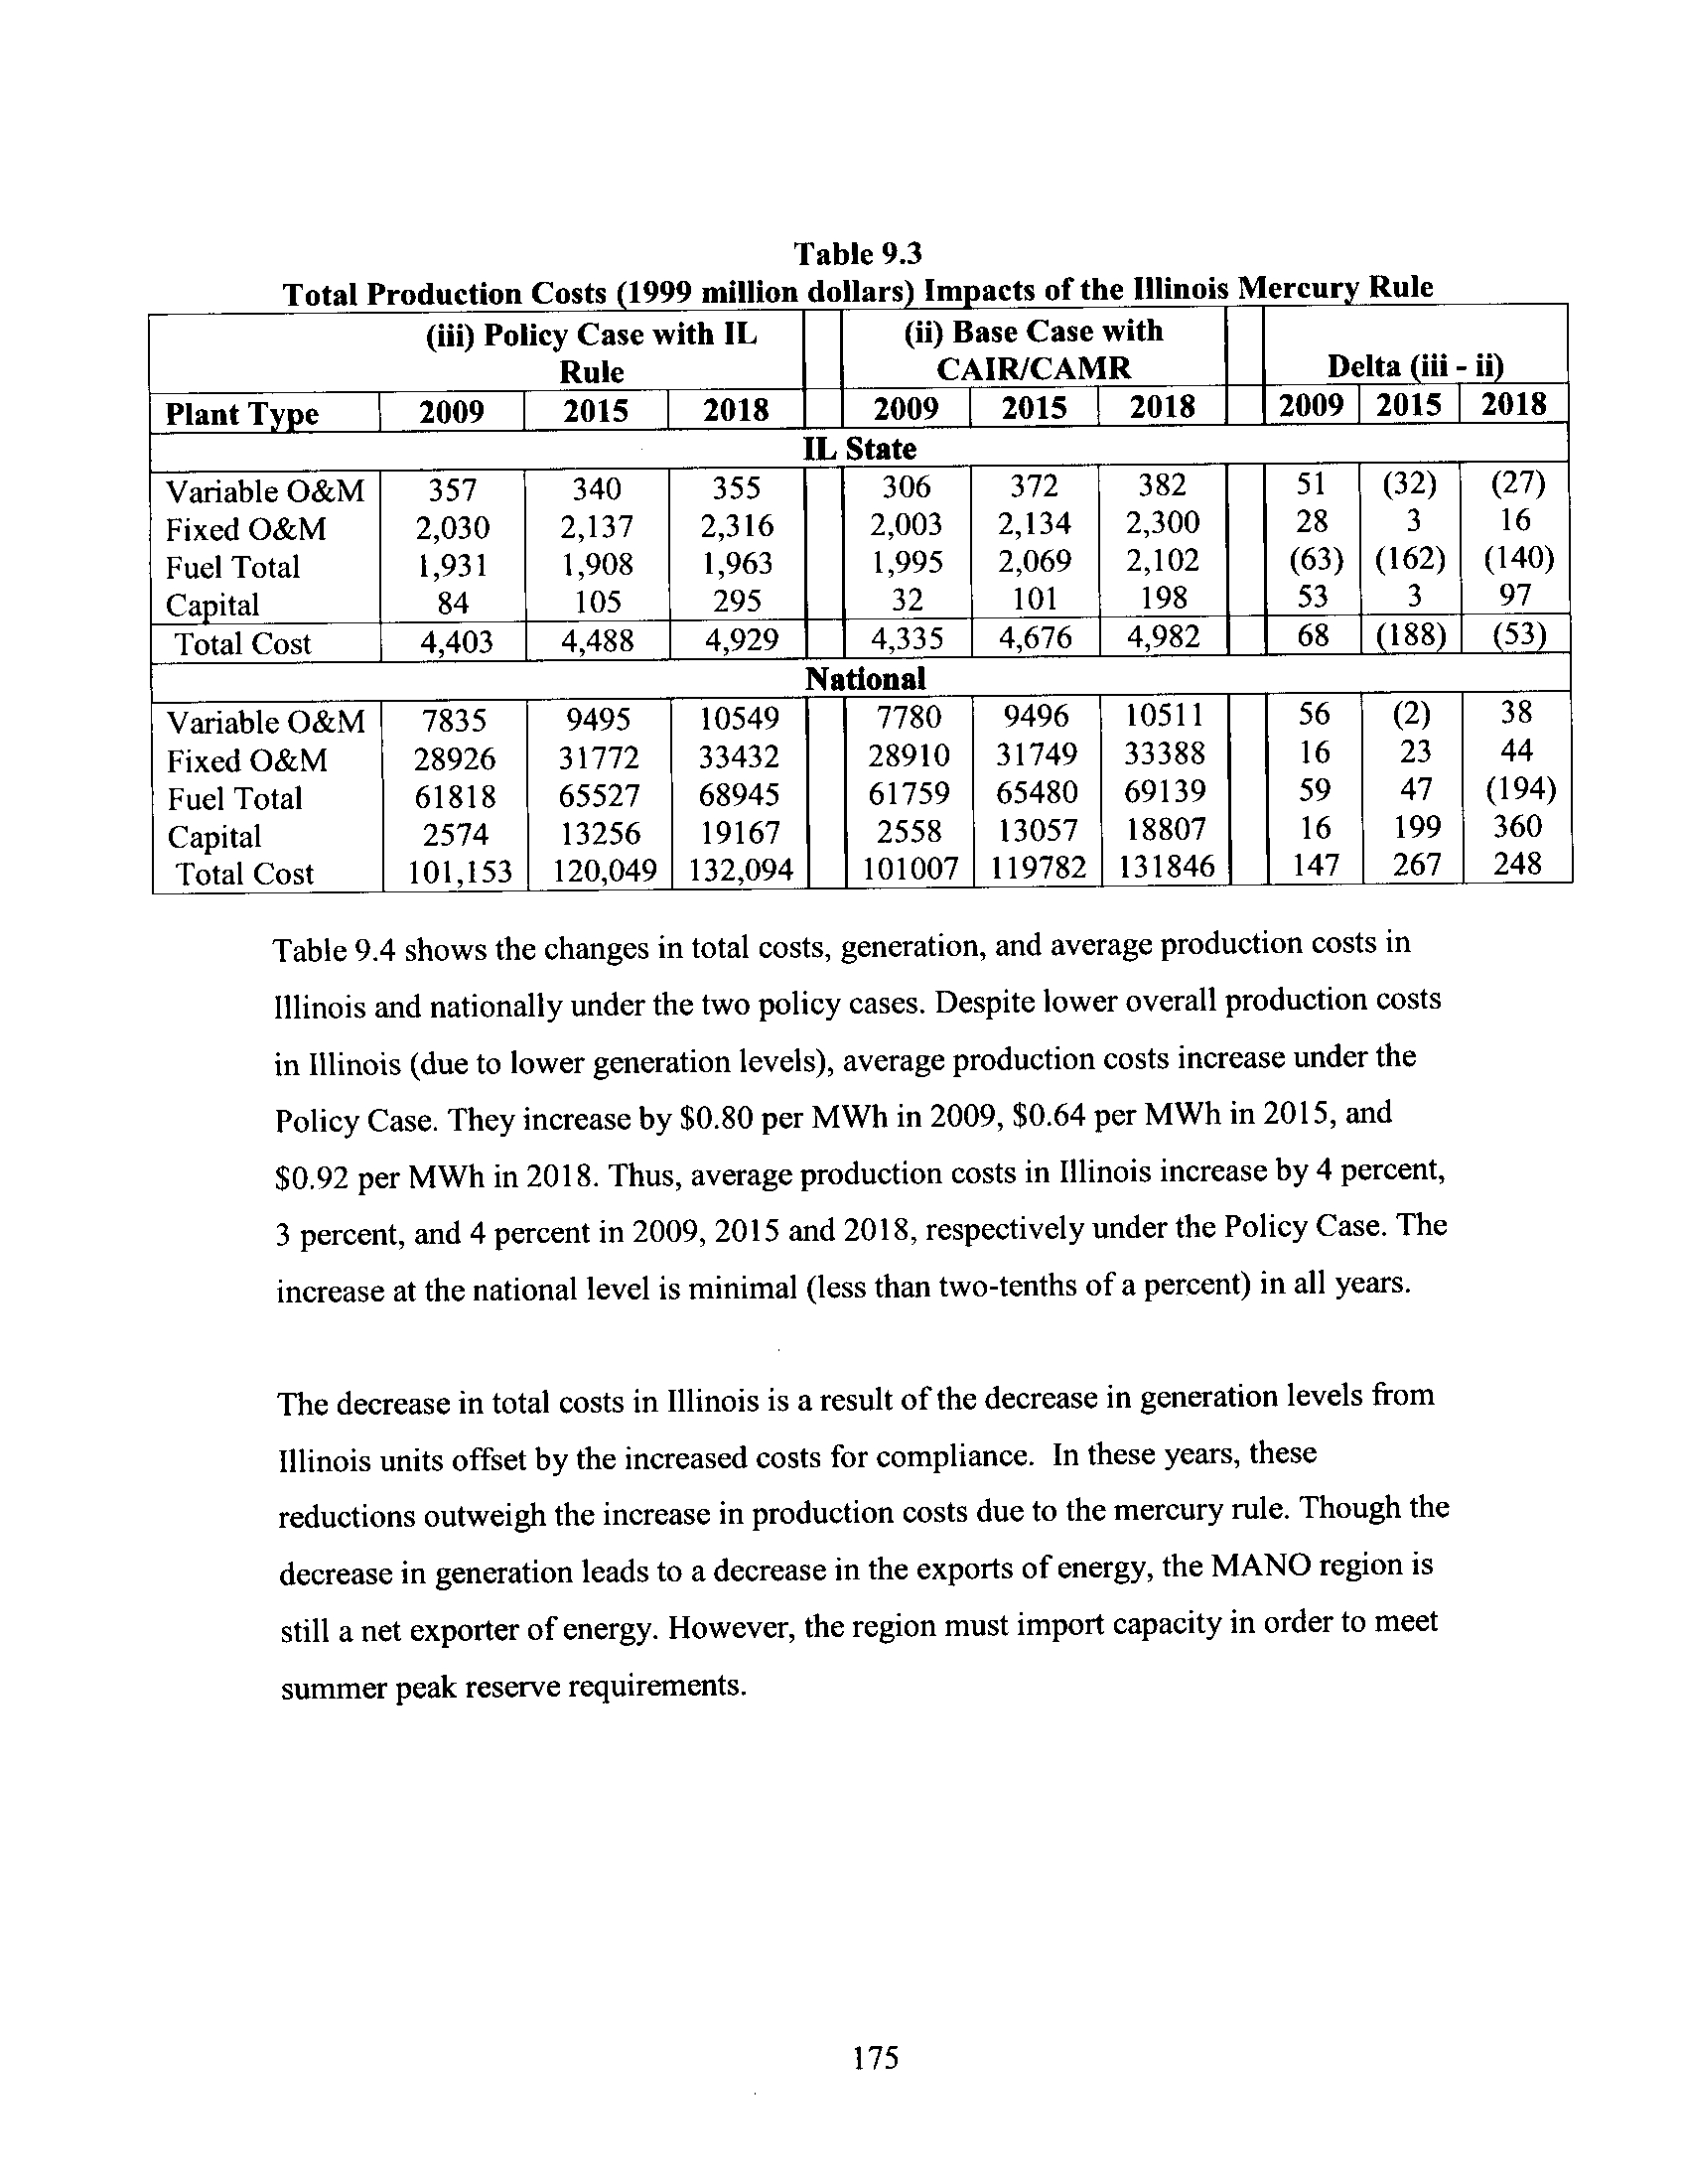
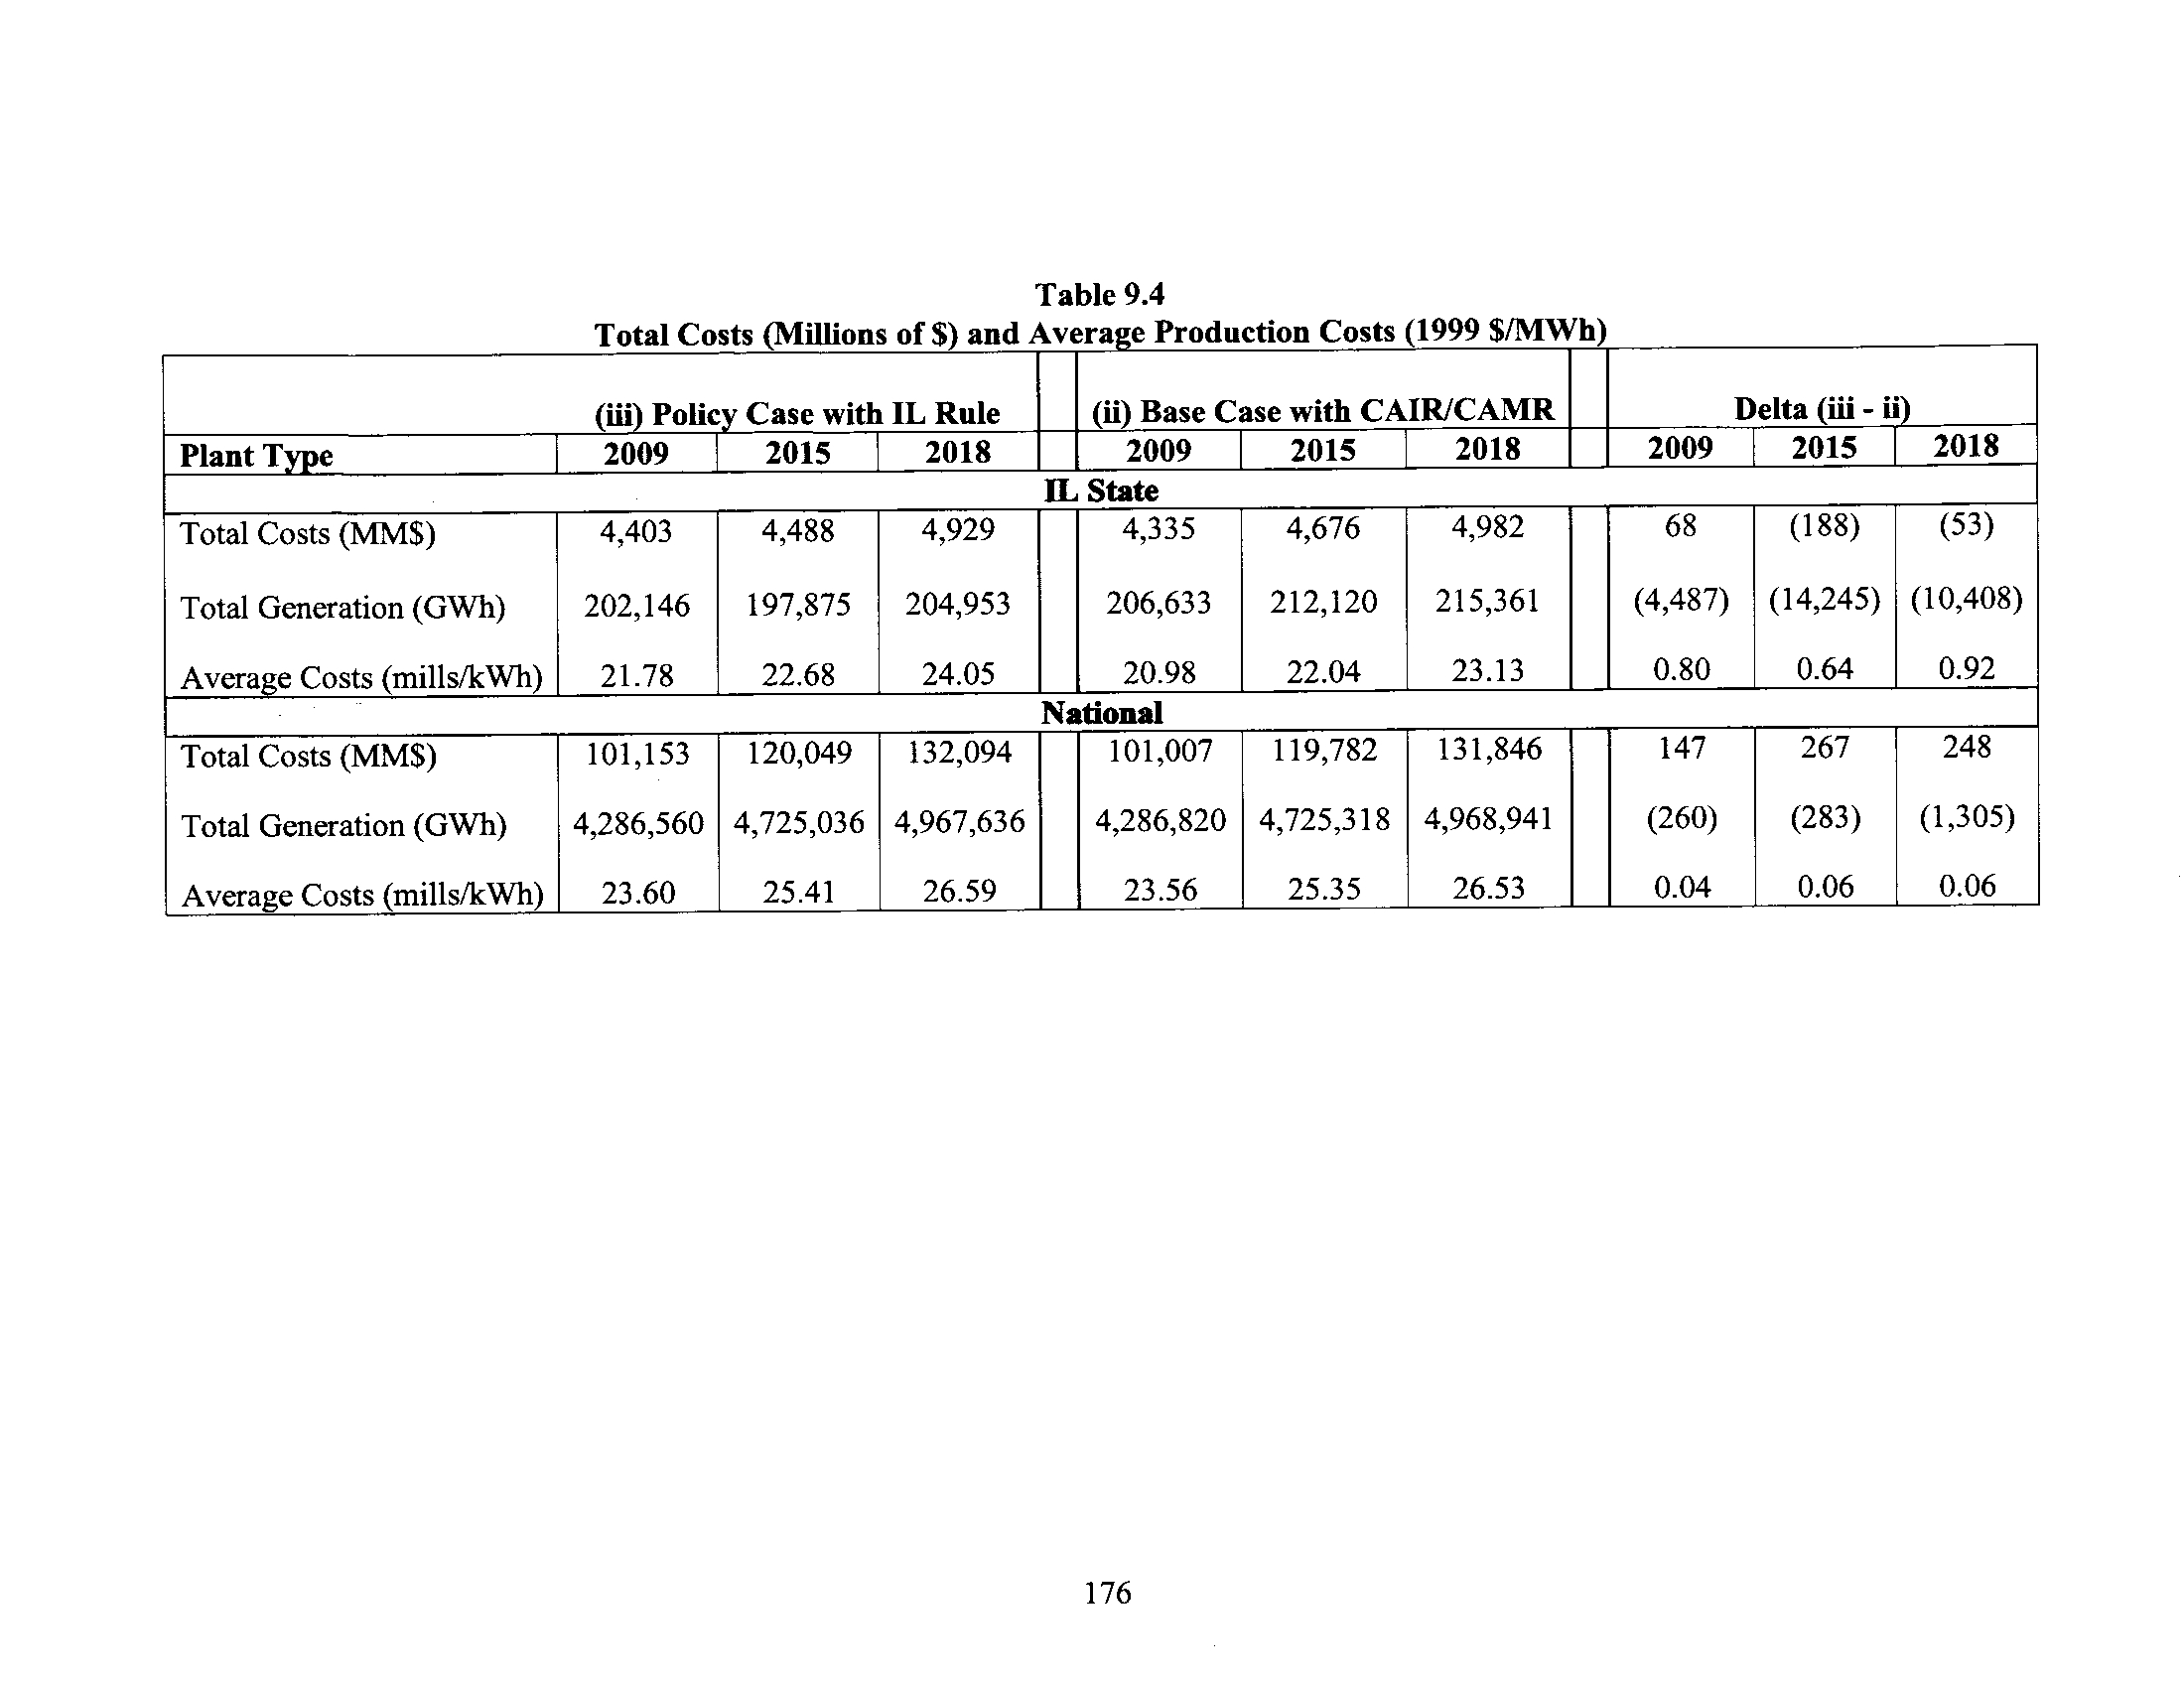
Table 9 .4
Total Costs (Millions of $) and Average Production Costs
(1999 $/MWh)
176
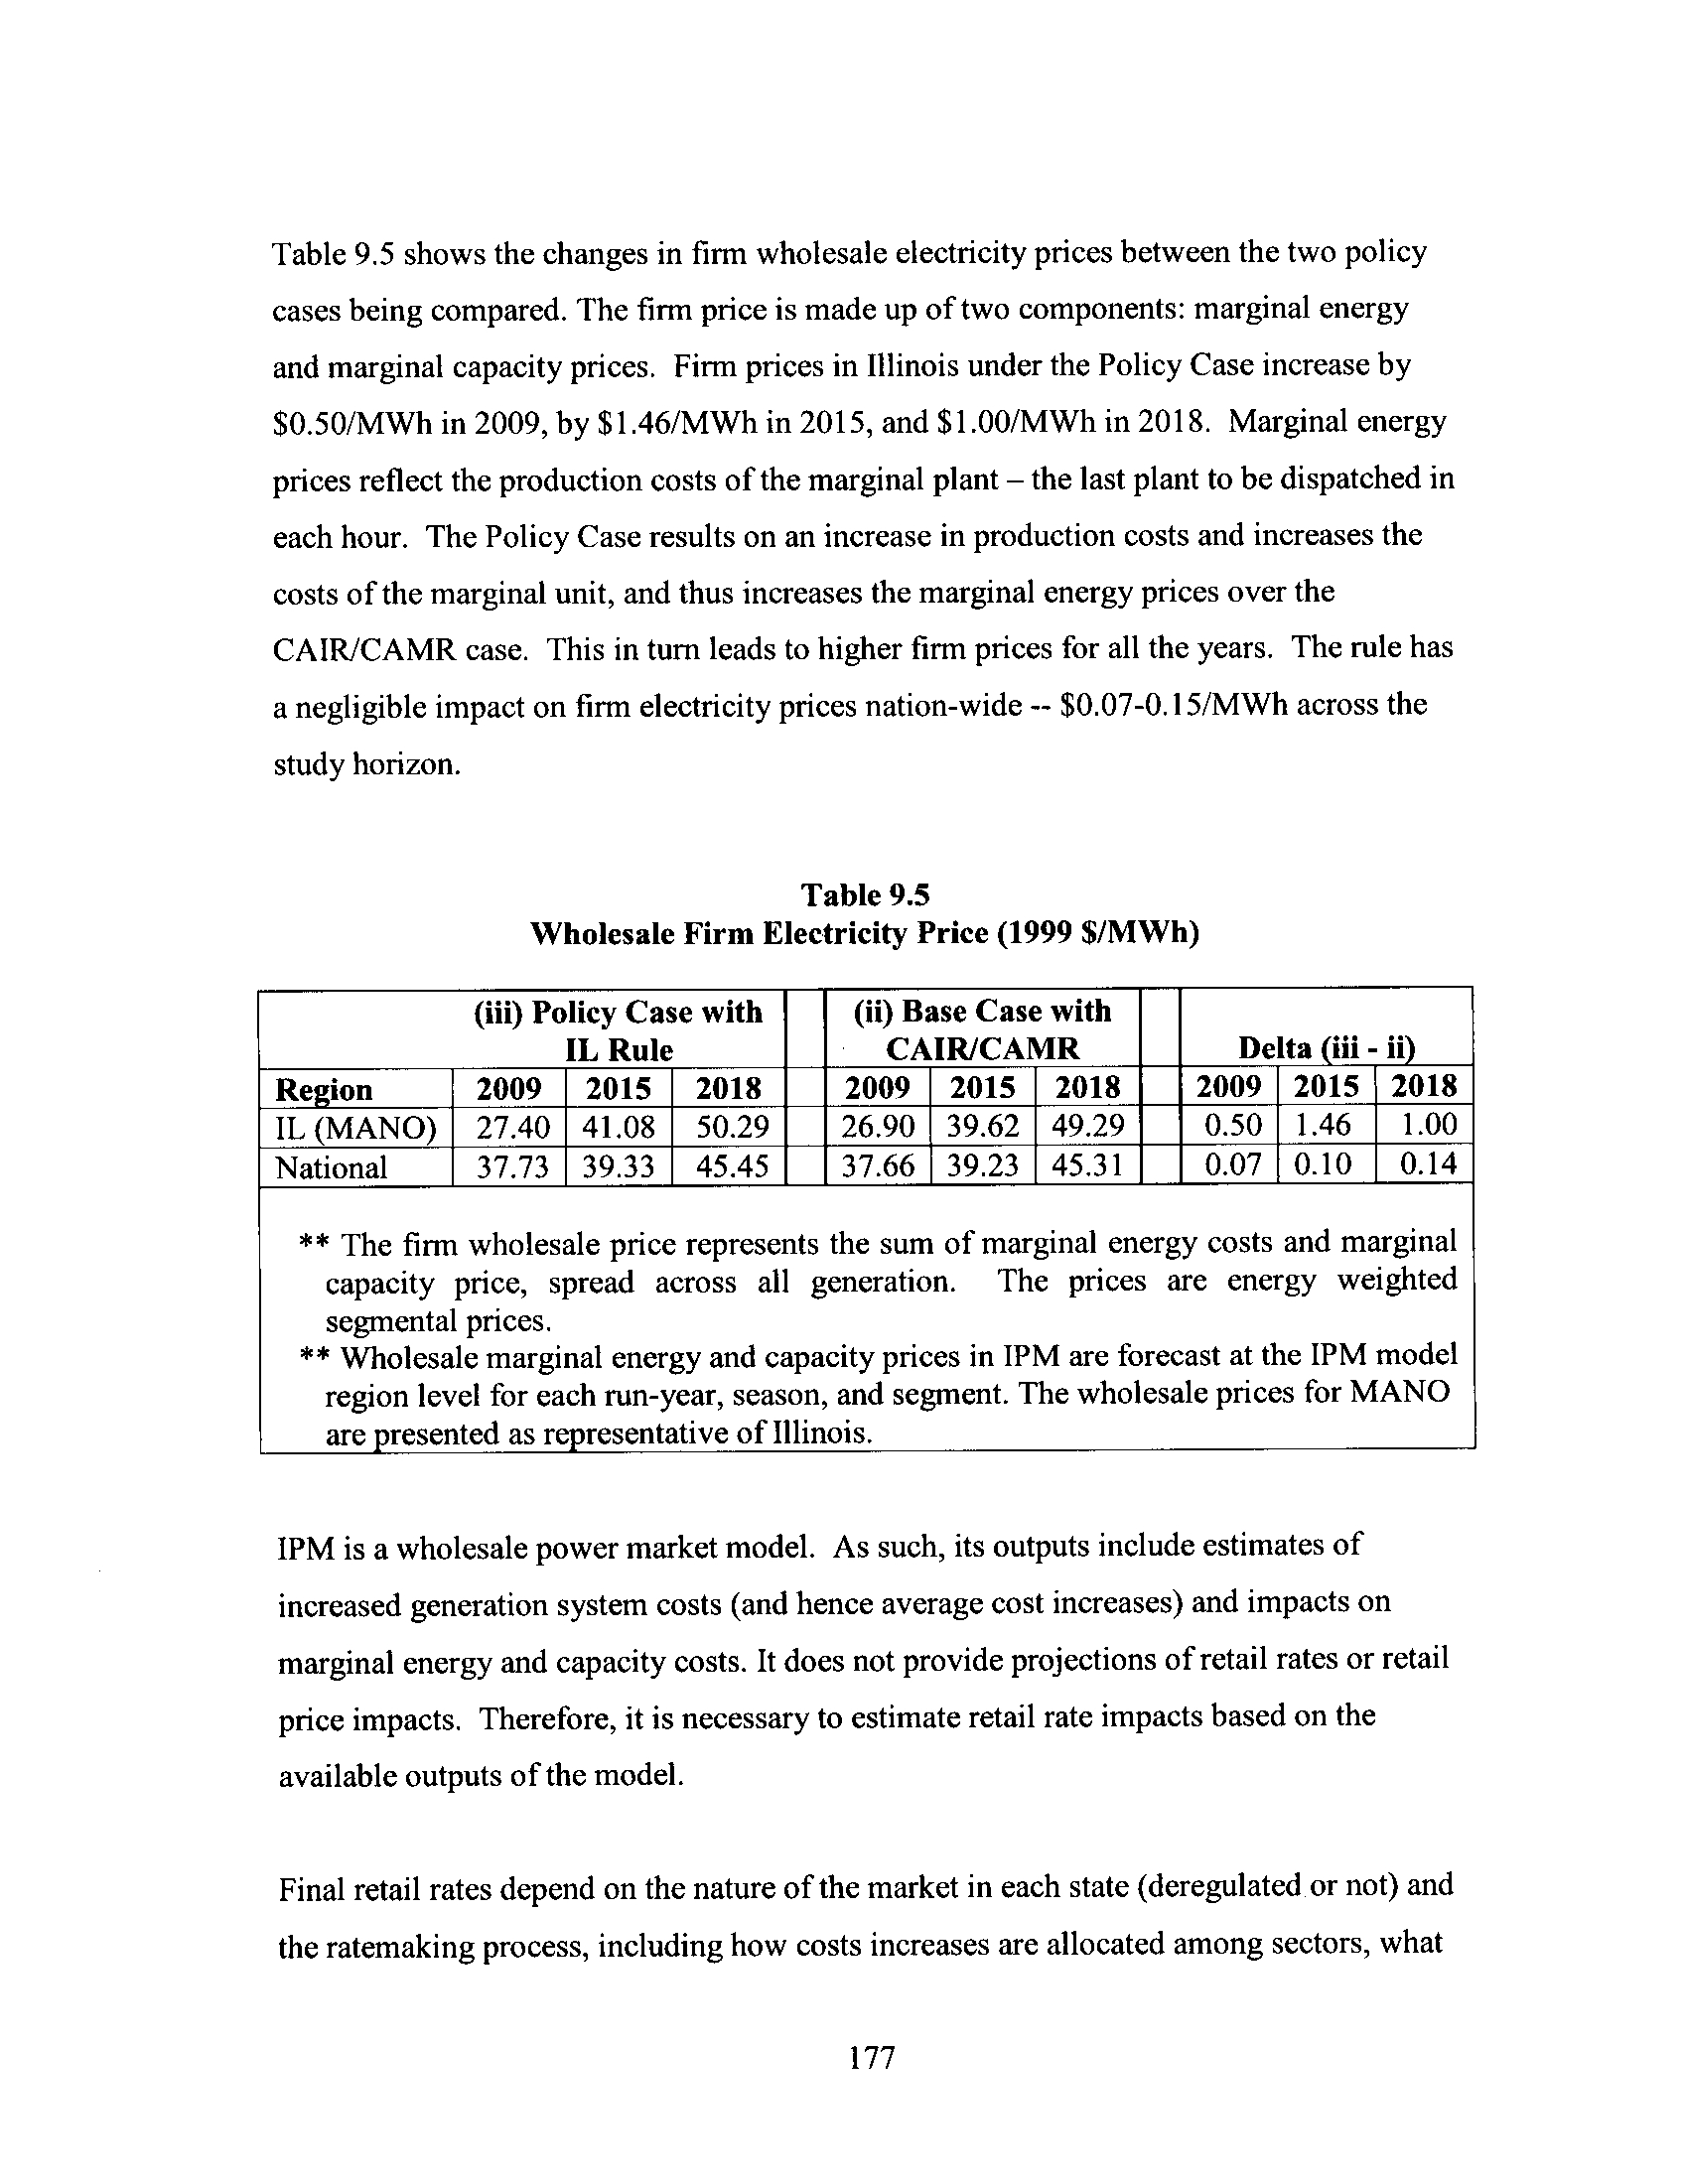
Table 9.5
Wholesale Firm Electricty Price (1999 $/MWh)
177
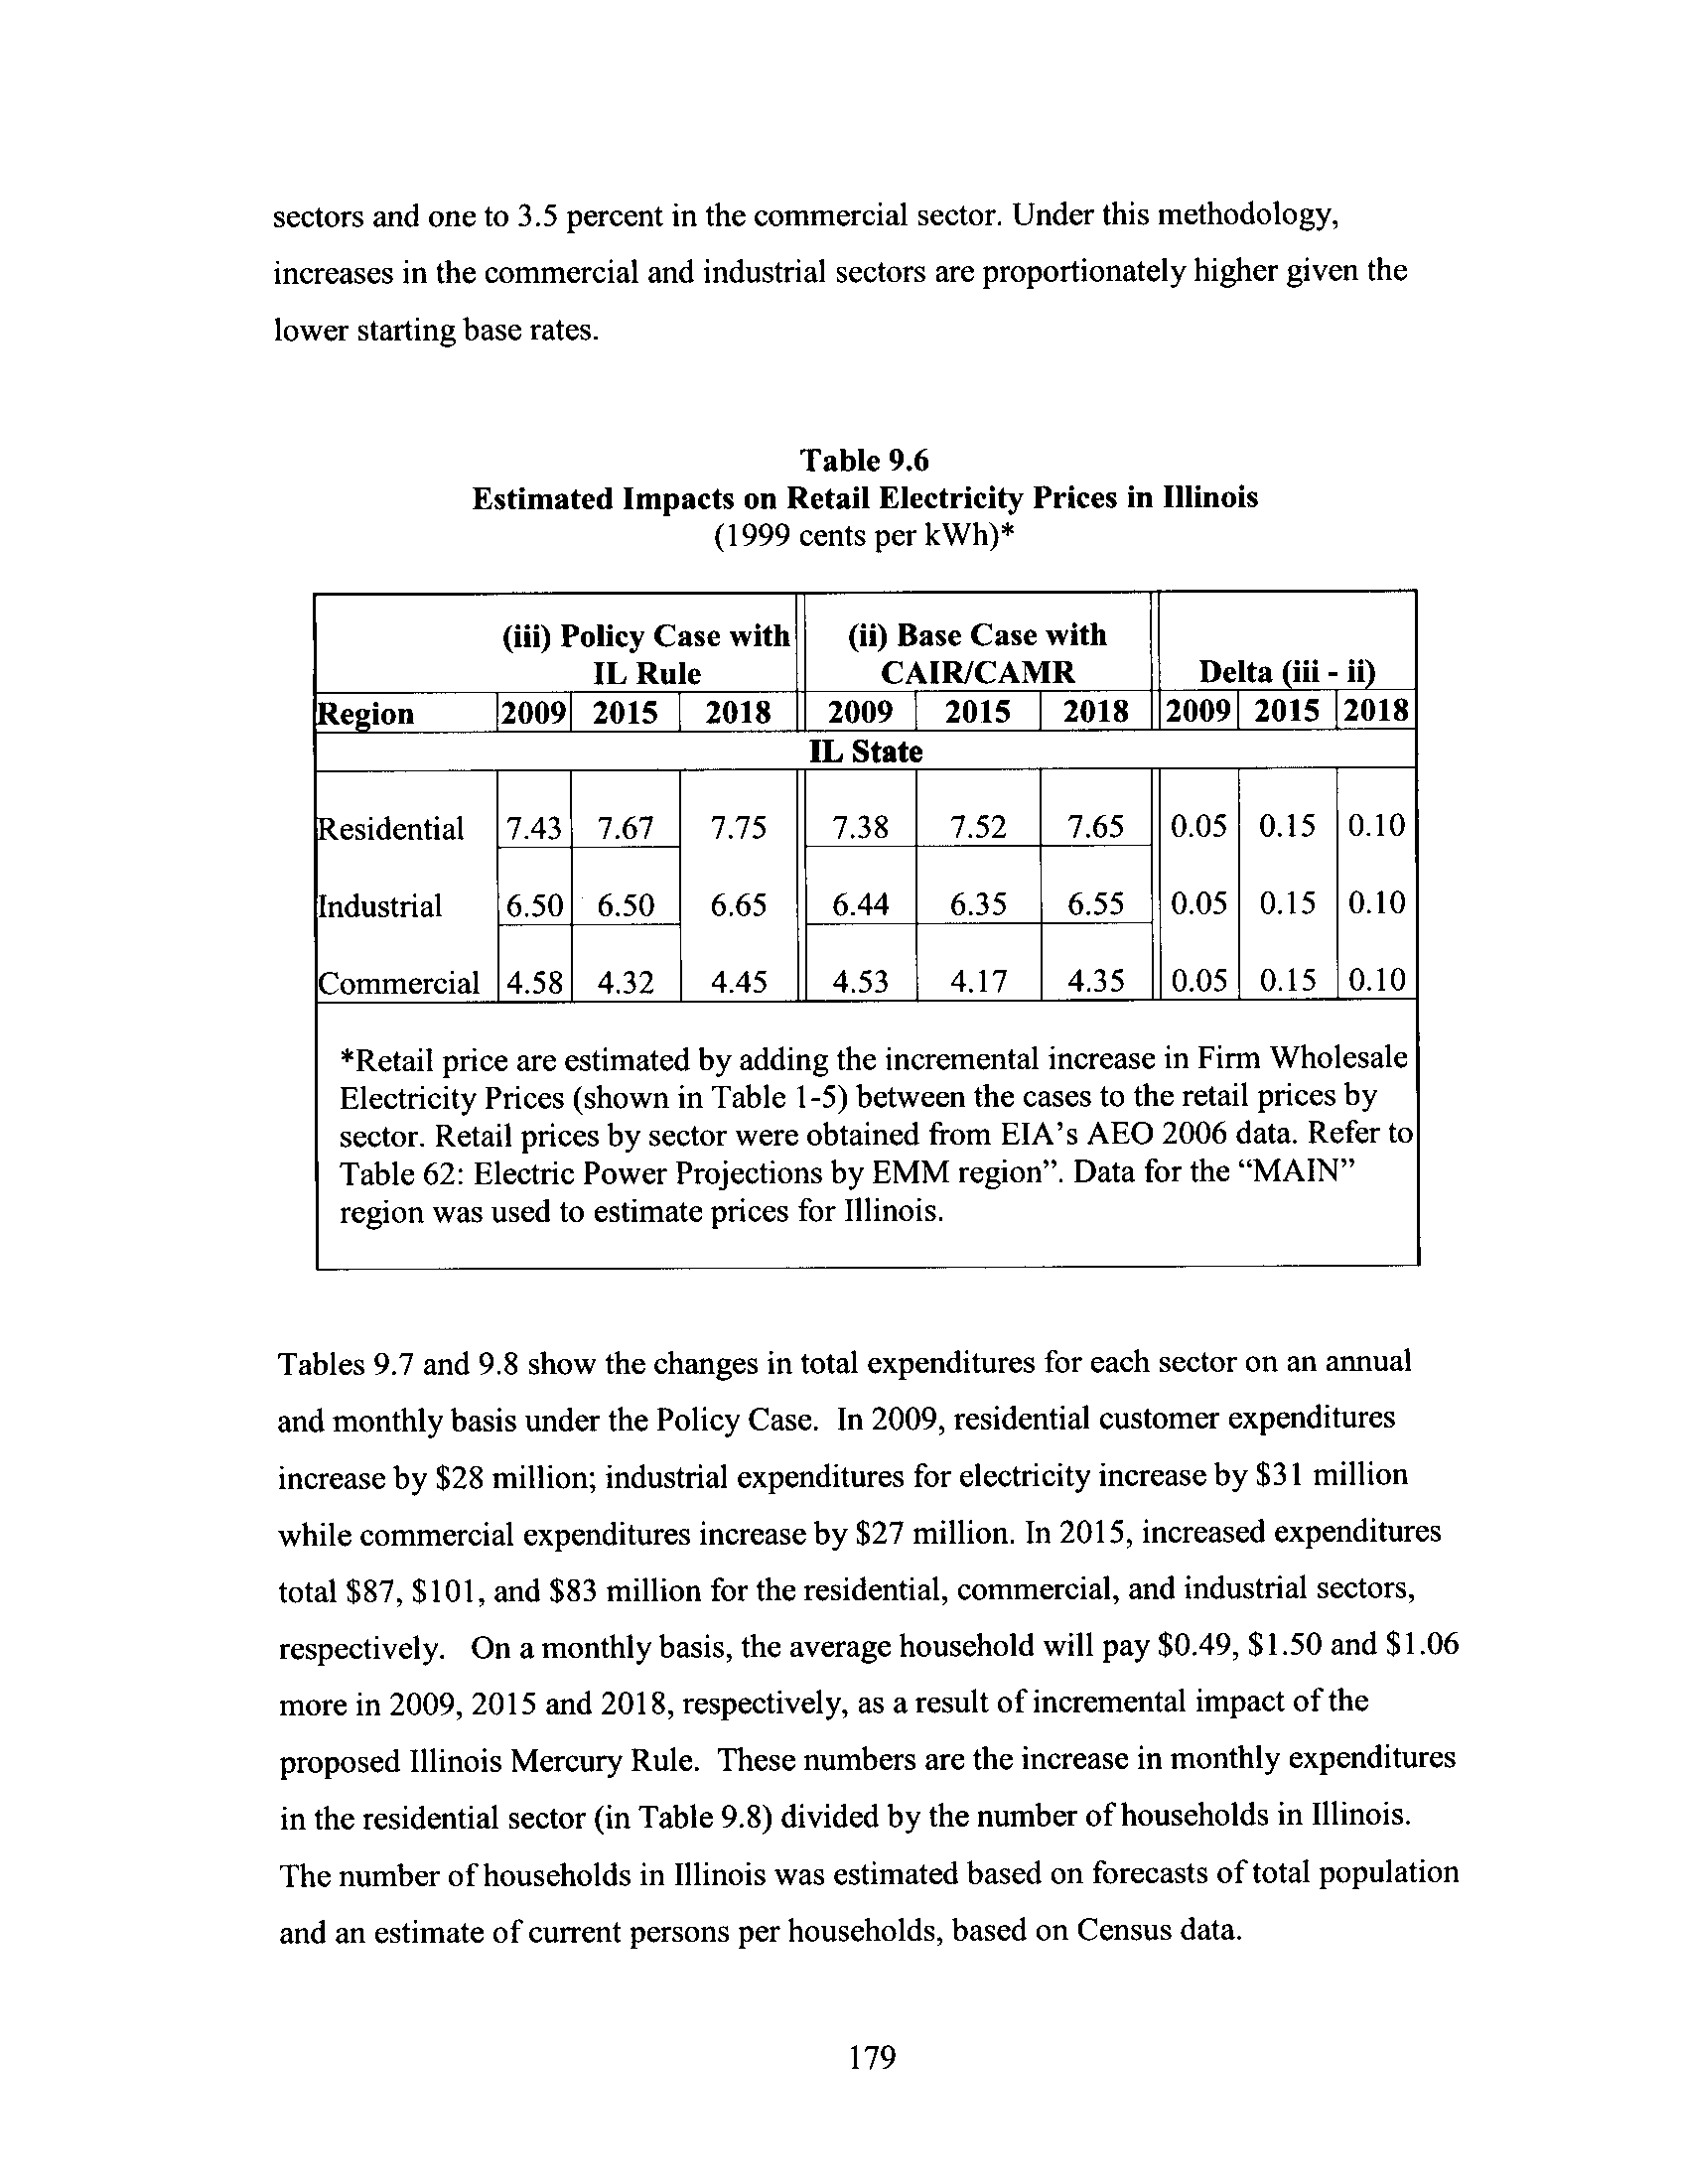
Table 9.6
Estimated Impacts on Retail Electricity Prices in Illinois
179
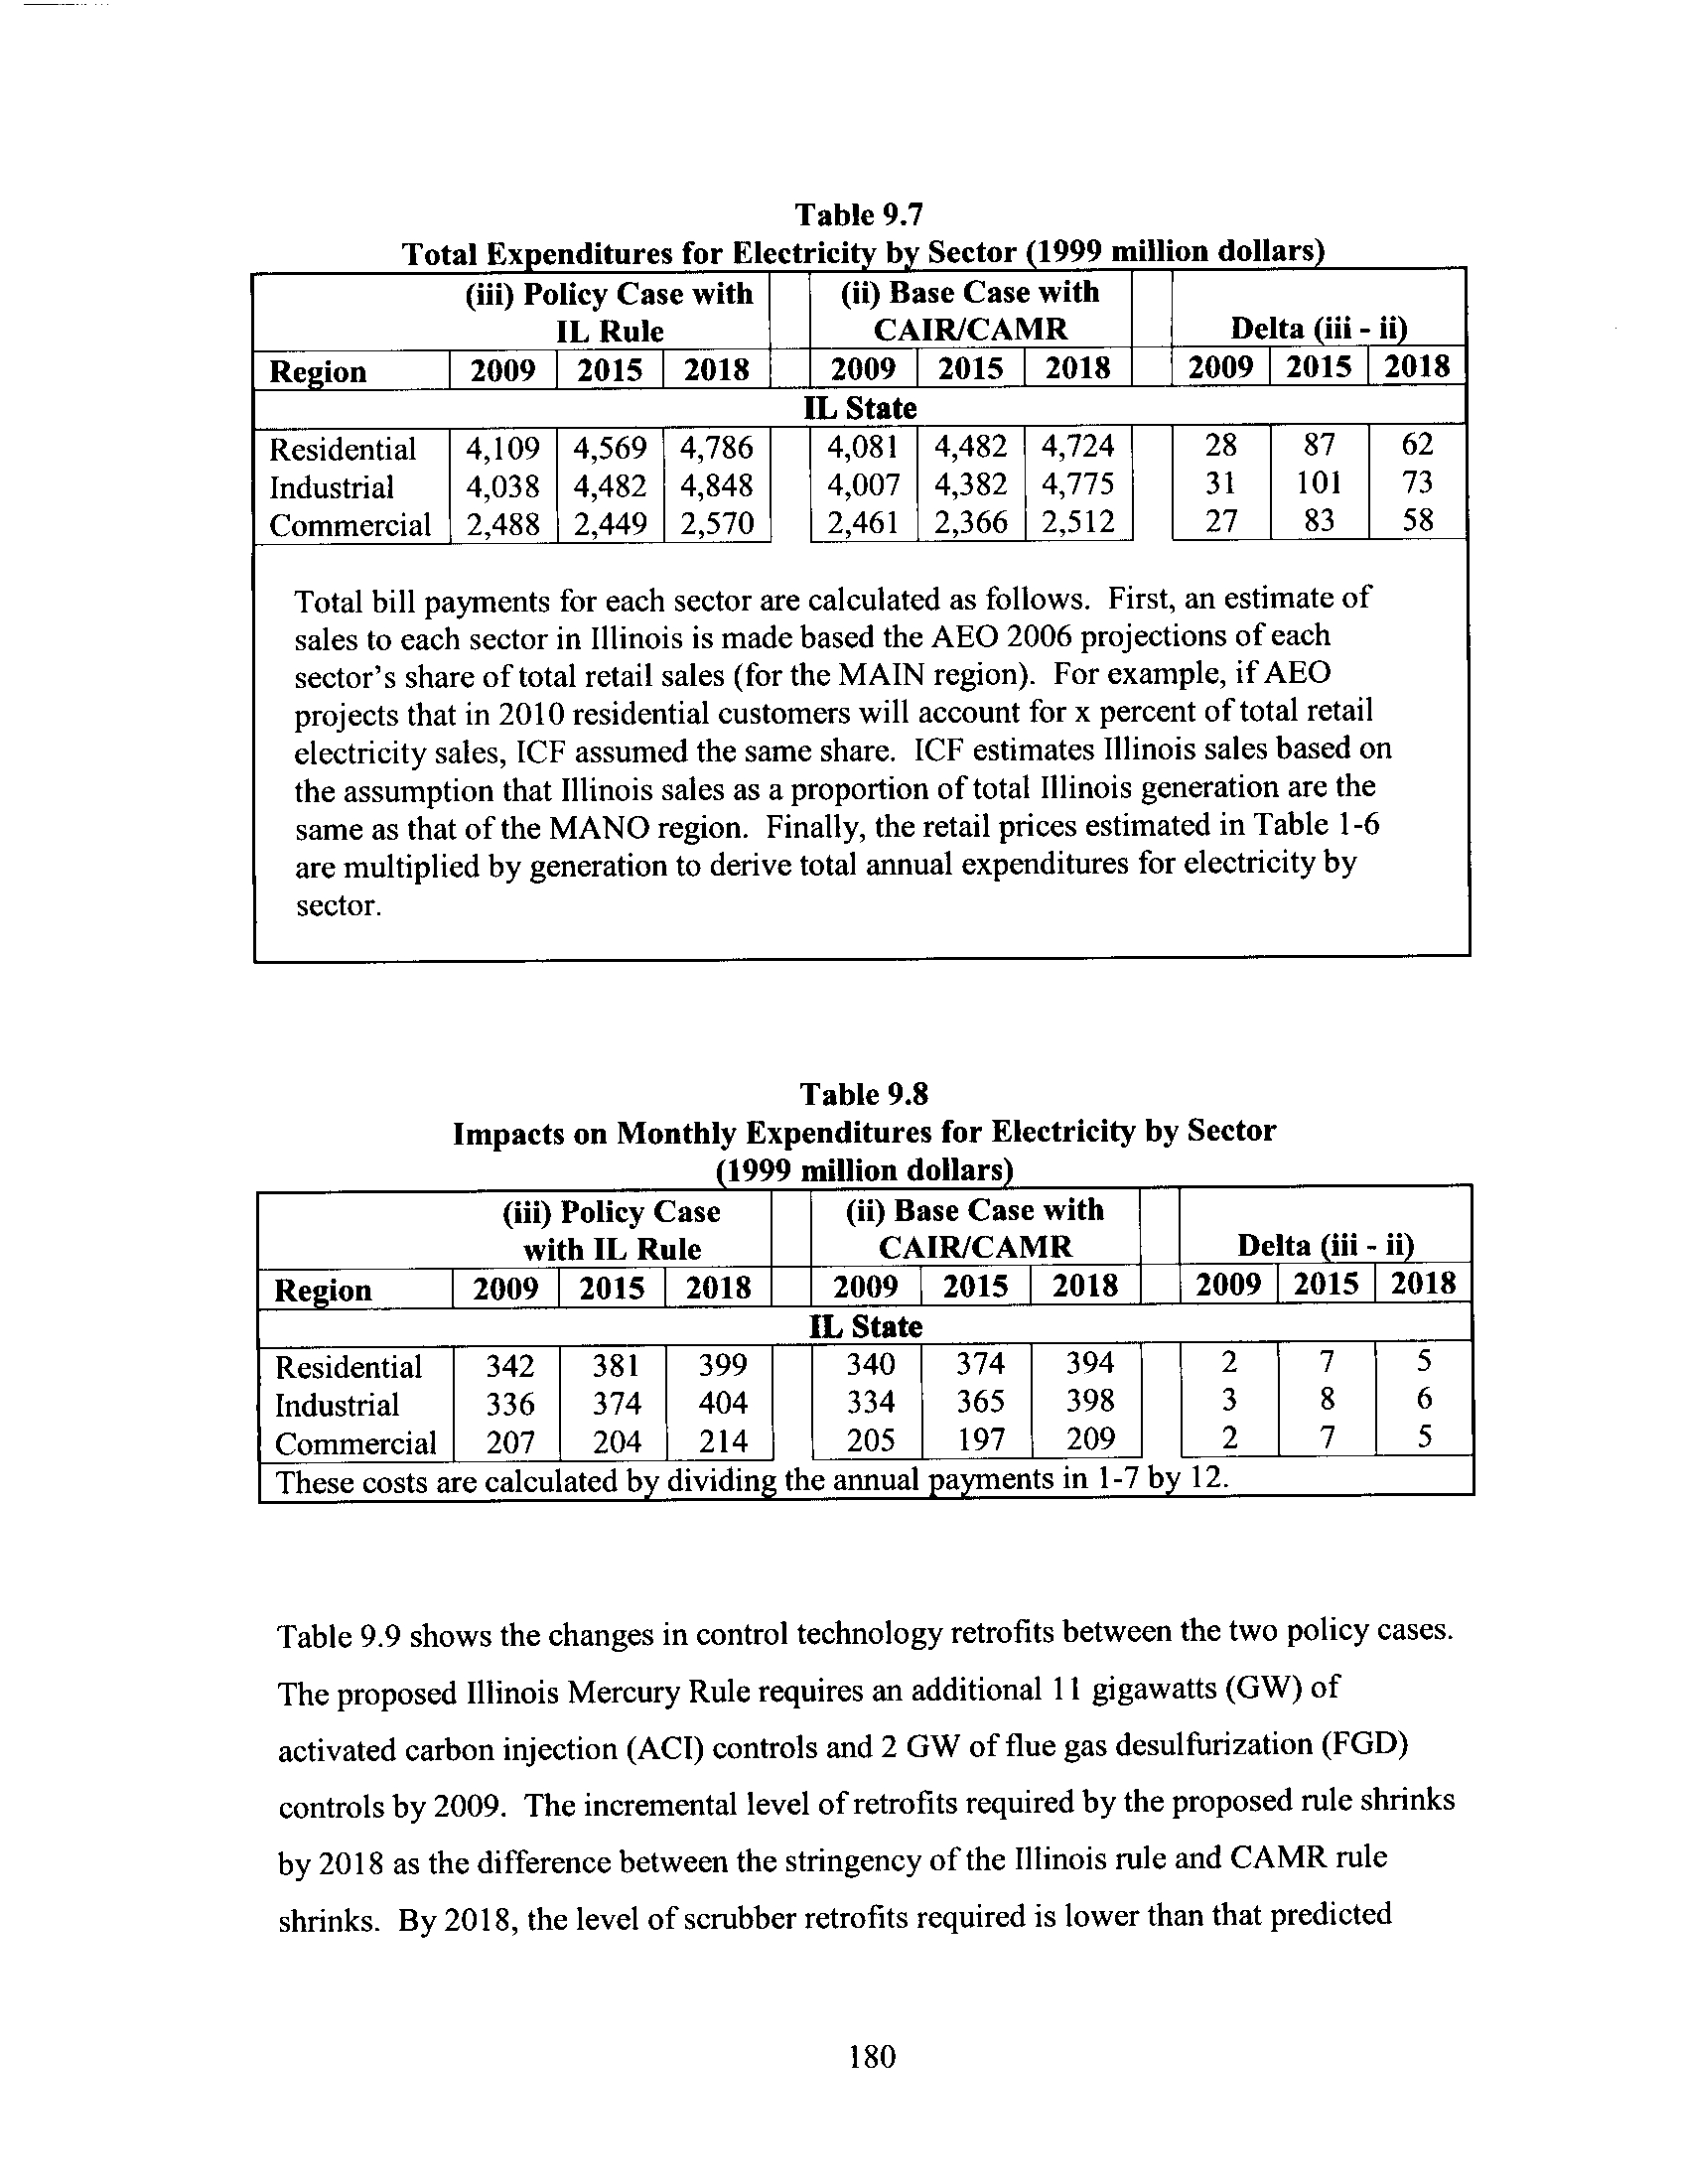
Table 9 .7
Total Expenditures for Electricity by Sector (1999 Million
Dollars)
180
Table 9.8
Impacts on Monthly Expenditures for Electricity by Sector
(1999 Million Dollars)
180
Table 9.9
Control Technology Retrofits (Cumulative MW)
182
Table 9.10
Coal Consumption (TBtu)
183
Table 9.11
Cumulative Coal Plant Retirement (MW)
184
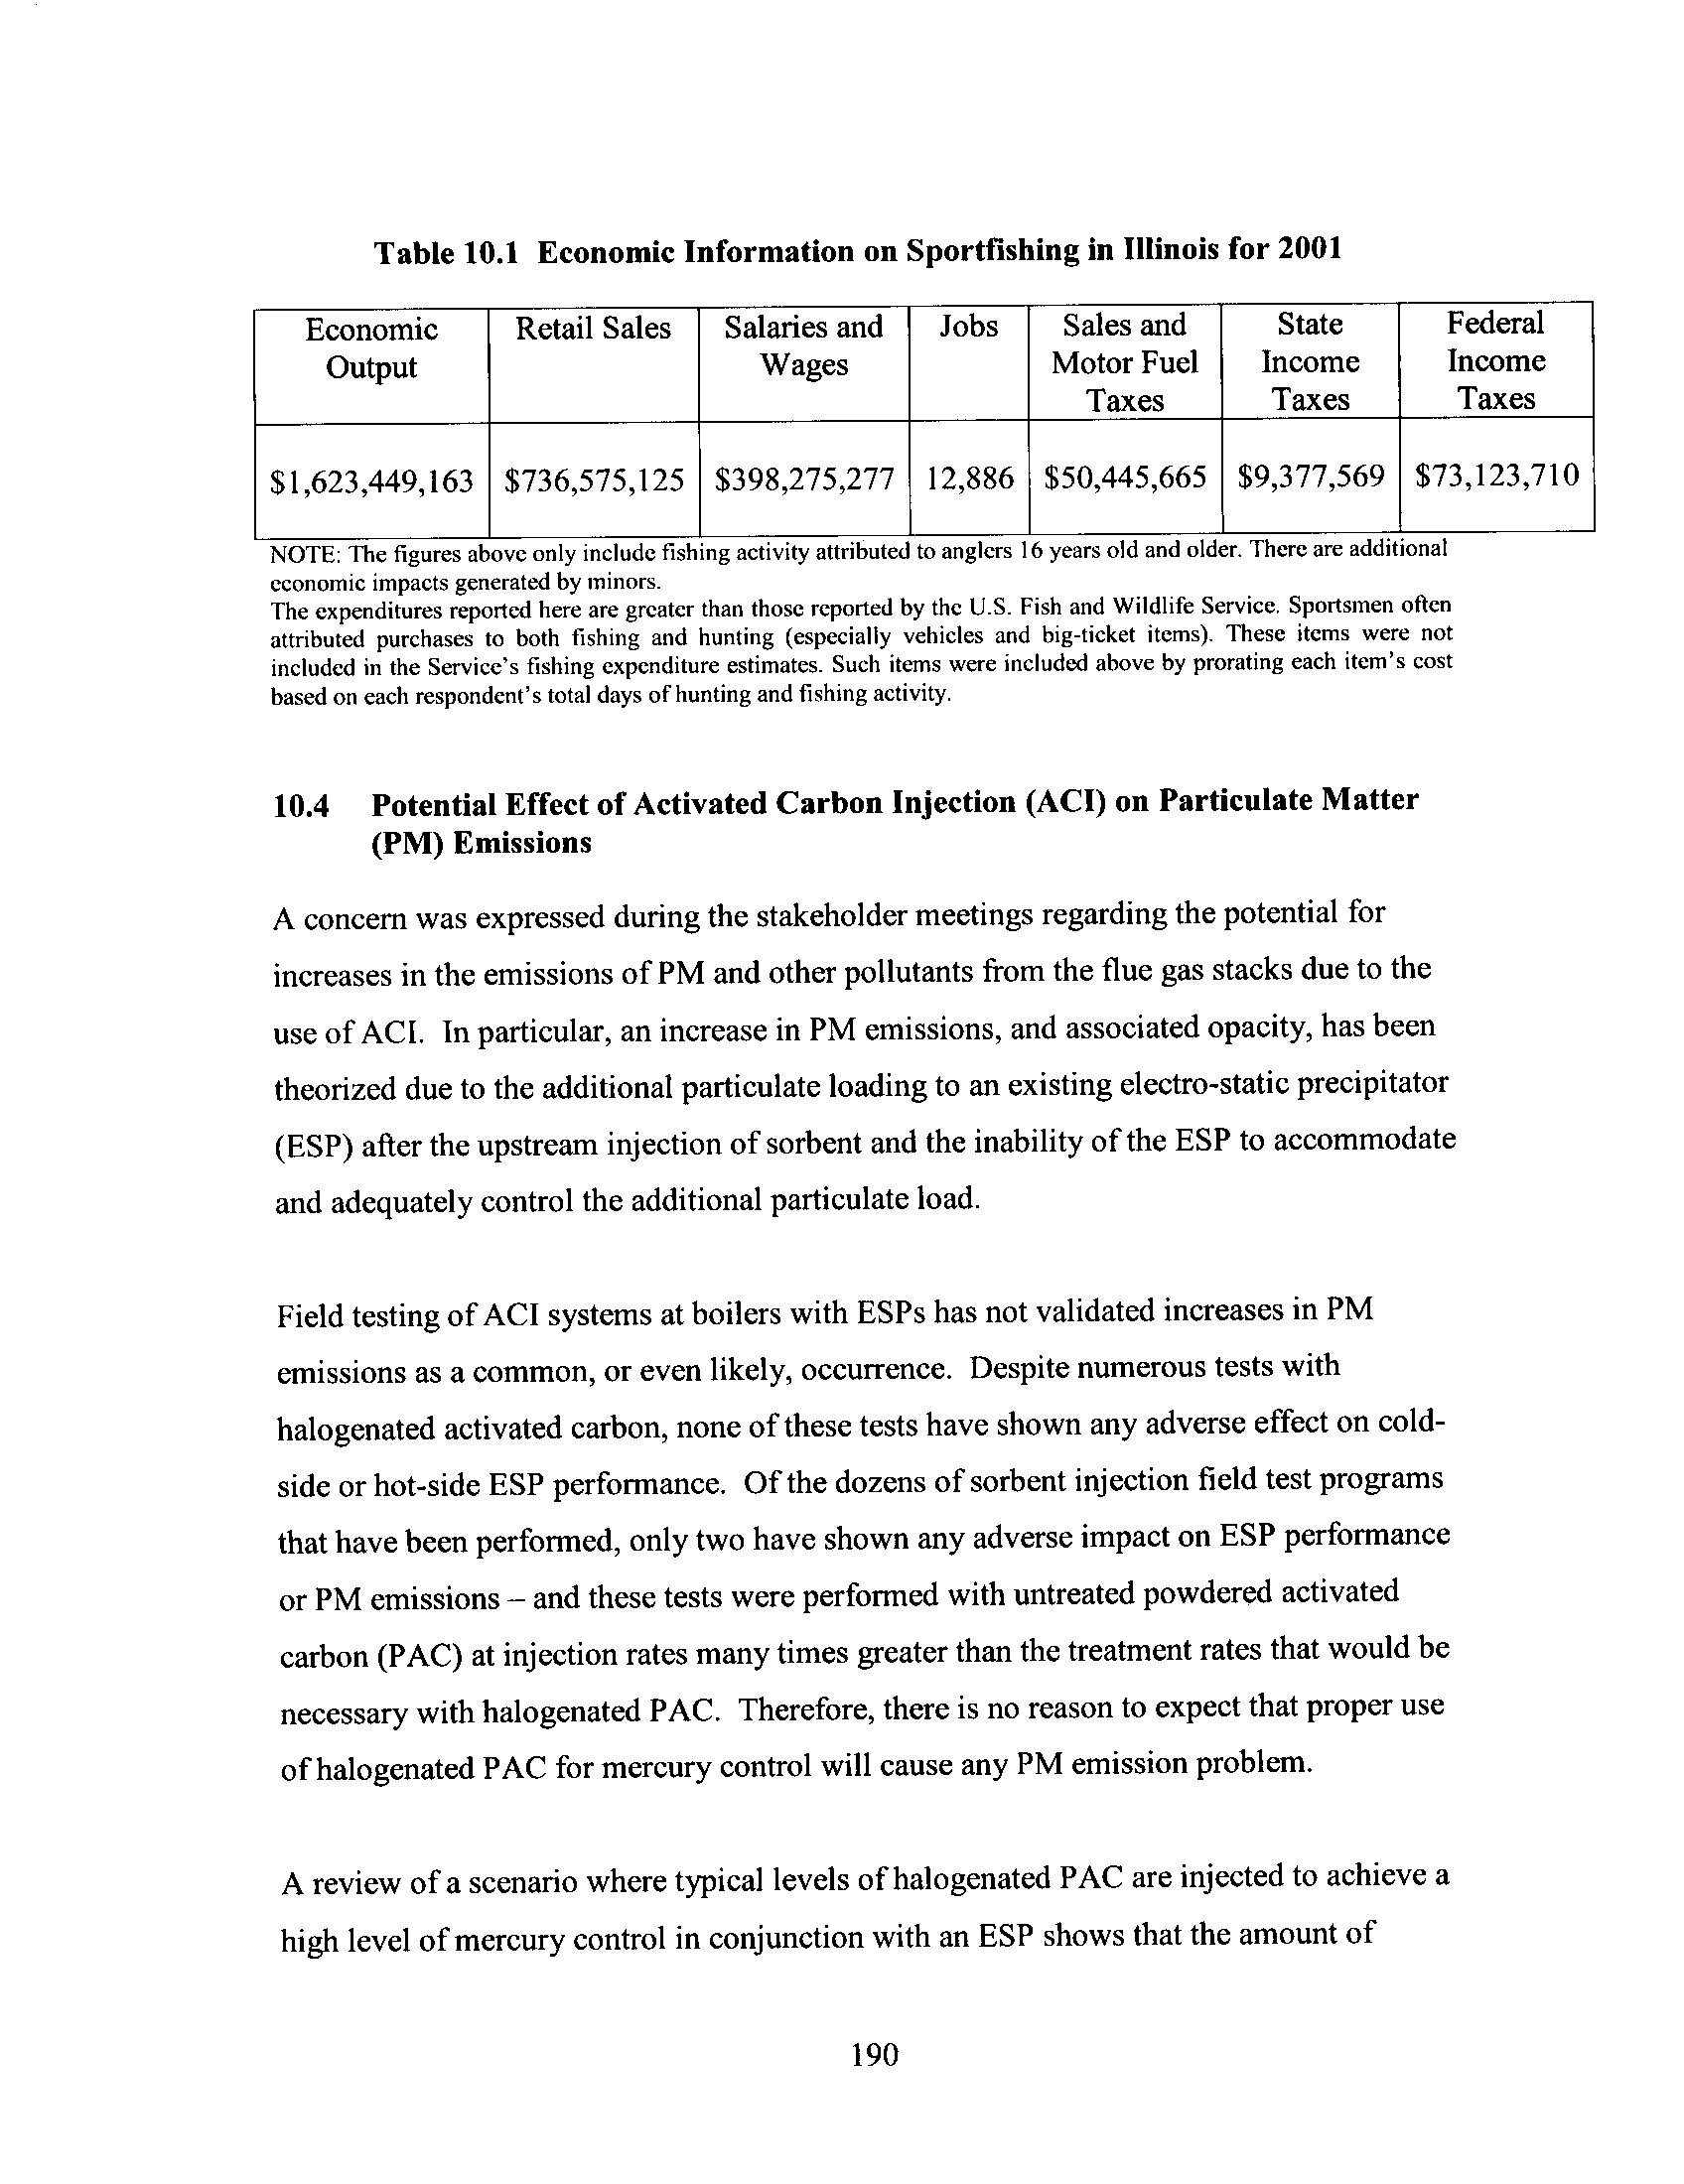
Table 10 .1
Economic Information on Sportfishing in Illnois for 2001
190
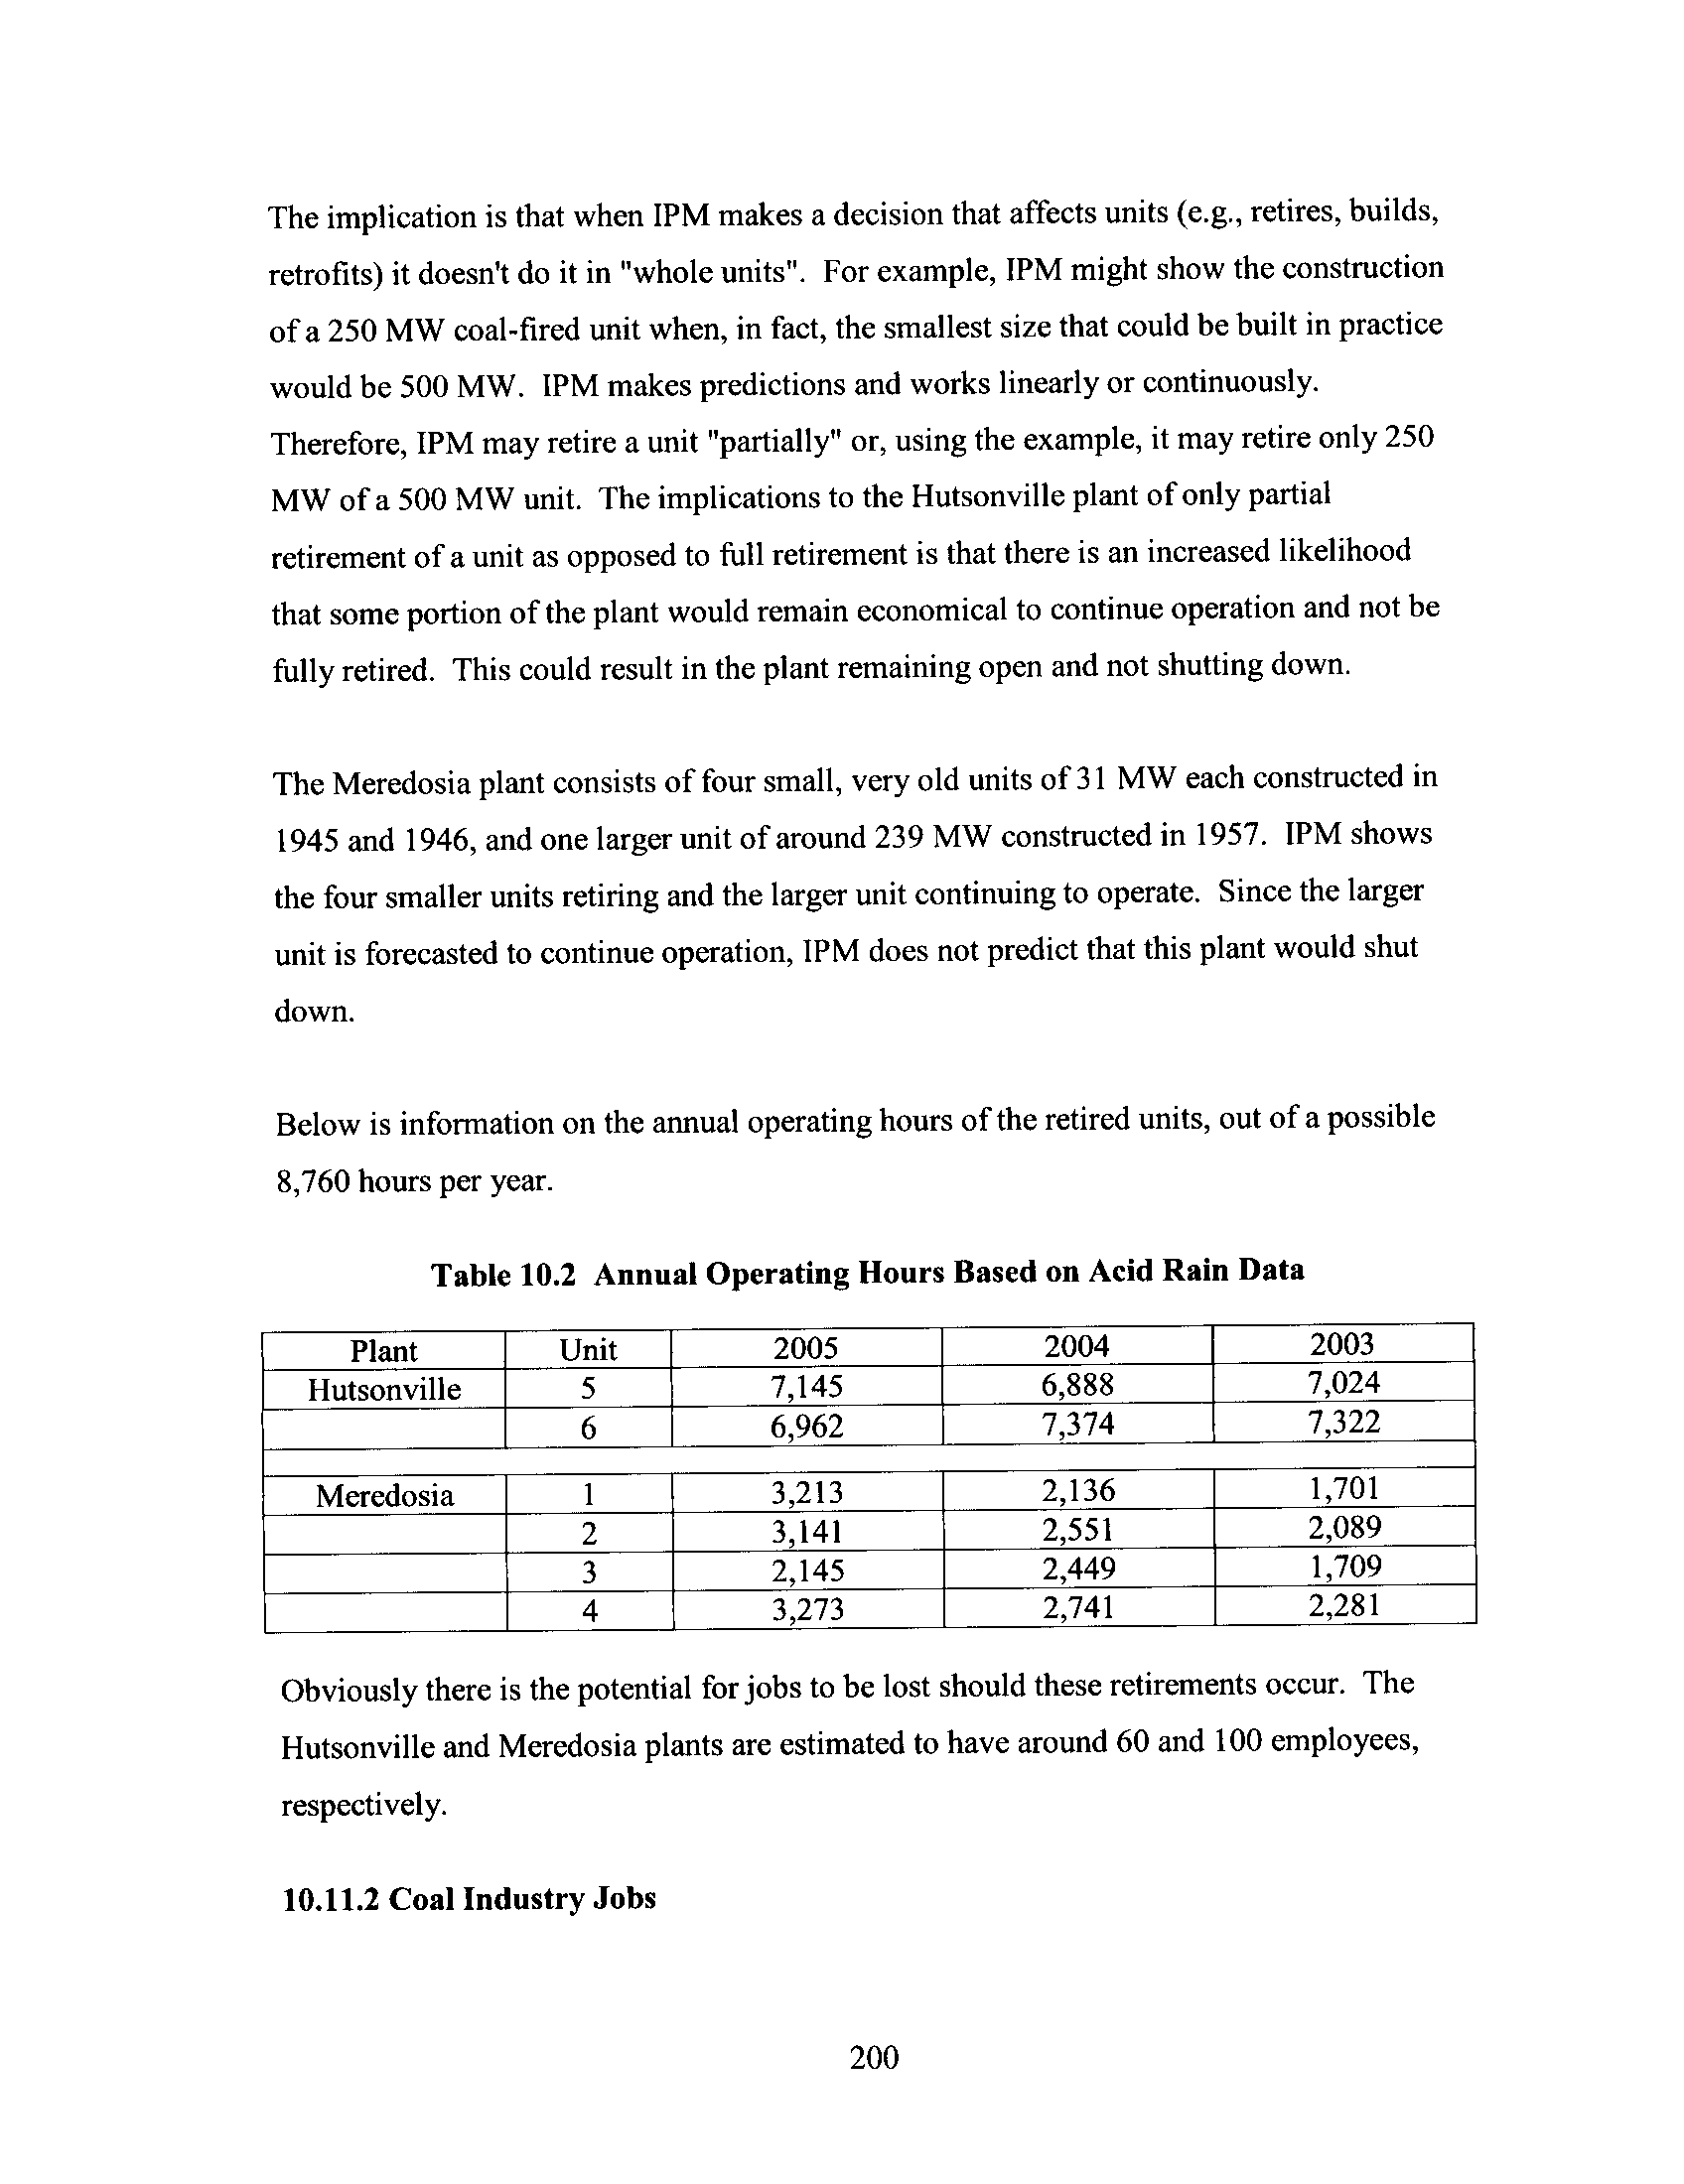
Table 10.2
Annual Operating Hours Based on Acid Rain Data
200
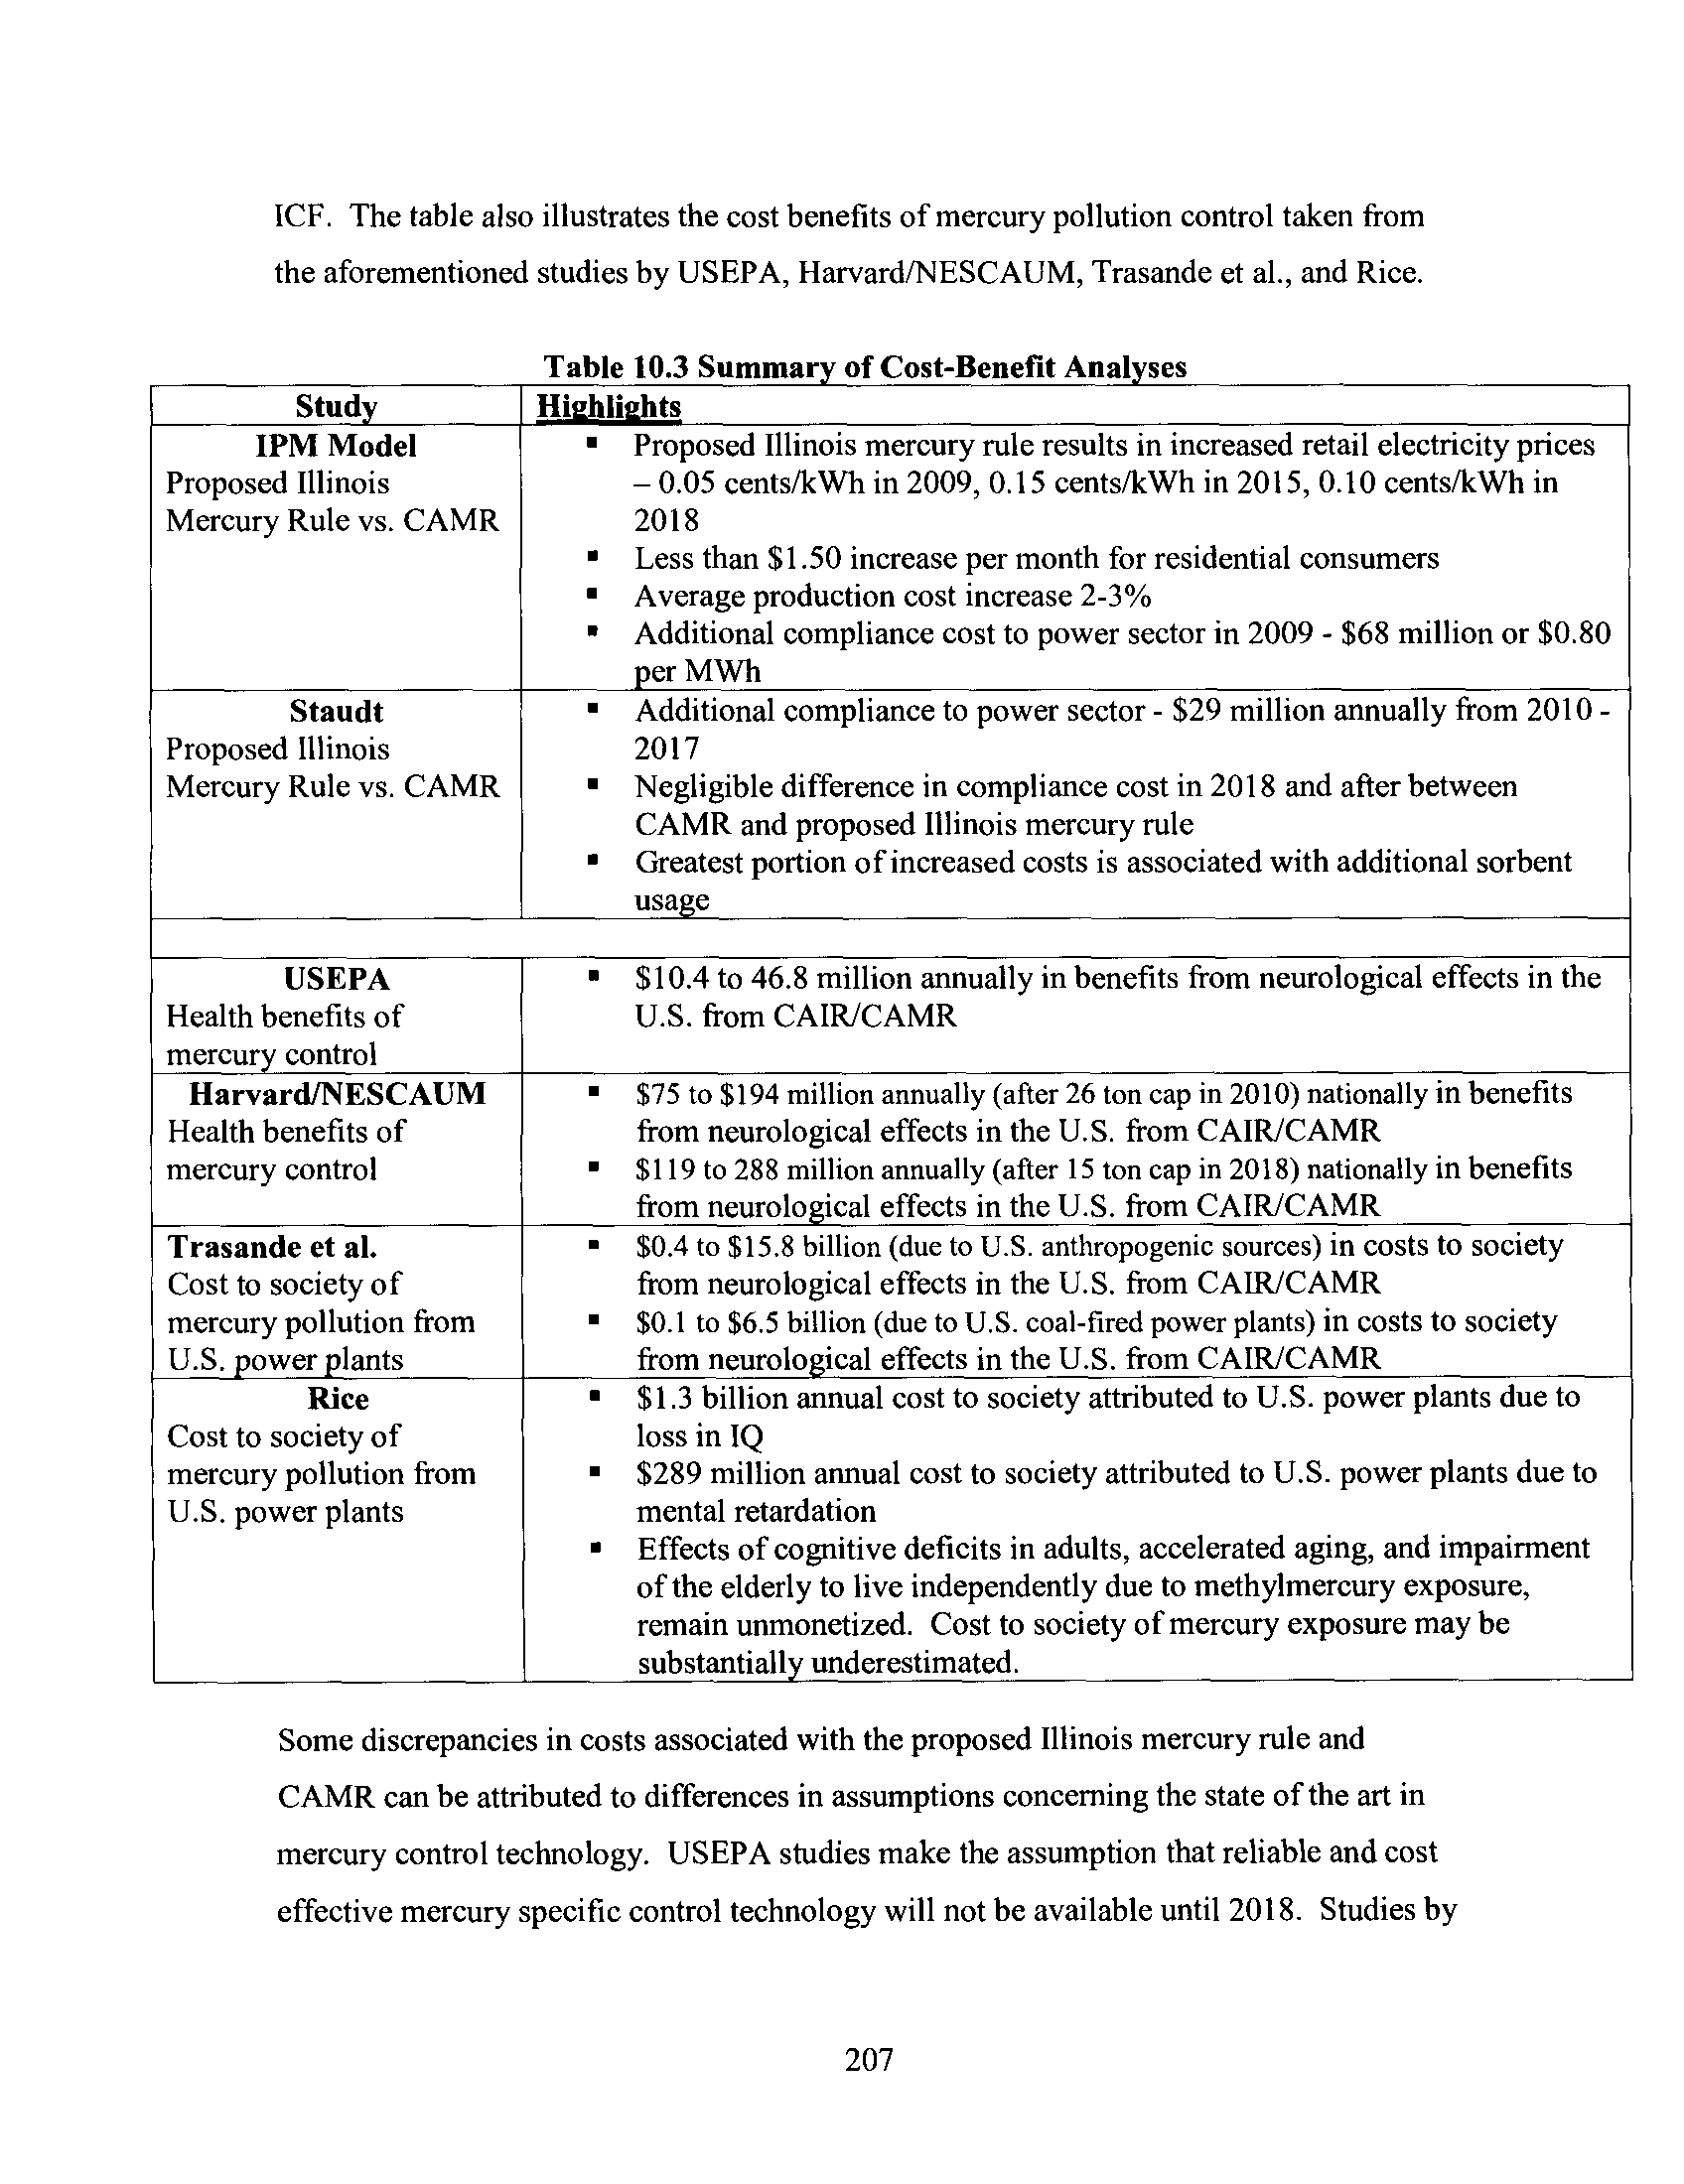
Table 10.3
Summary of Cost-Benefit Analyses
207
1 7
Executive Summary
Introduction
On January 5, 2006, Illinois Governor Rod R . Blagojevich announced an aggressive
proposal to reduce mercury emissions from Illinois coal-fired power plants by 90 percent
beginning mid 2009. The Governor's proposal is intended to require coal-fired power
plants in Illinois to achieve greater reductions of mercury more quickly than that
proposed by the United States Environmental Protection Agency (U.S . EPA) under the
federal Clean Air Mercury Rule (CAMR) in May 2005. Mercury is a persistent,
bioaccumulative neurotoxin that presents a serious threat to the health and welfare of the
citizens of Illinois and nationwide . The Governor's proposal would achieve the largest
reductions of mercury emissions from coal-fired power plants of any state in the country
.
Other states have made similar decisions . Five states have adopted mercury reduction
programs that "go beyond" CAMR in their reduction target or timeframe for obtaining
reductions, and a number of other states have announced their intentions to do so as well .
Fate of Mercury in the Environment and Health Impacts of Mercury
Mercury is both a naturally occurring trace element found in the environment, and a
pollutant that is released to the environment by human (anthropogenic) activities,
including the combustion of coal to produce electricity. The combustion of coal at power
plants represents the largest source category of mercury emissions in the U .S
.
Mercury is a persistent, bioaccumaulative neurotoxin. Unborn children, infants and
young children are at greatest risk from mercury. Fetal exposure to excessive levels of
mercury has been linked to mental retardation, cerebral palsy, lower IQ, slowed motor
function, deafness, blindness and other health problems . Recent studies indicate that as
many as 10 percent of children born in the United States have been exposed to excessive
levels of mercury in the womb . Because of the risk mercury poses to unborn children
and infants, mercury exposure is of concern for pregnant women and women of
childbearing age who may become pregnant
.
18
Regulatory Background
Mercury is listed as a Hazardous Air Pollutant (HAP) under Section 112(b) of the federal
Clean Air Act . Section 112 requires the U .S. EPA to establish Maximum Achievable
Control Technology (MACT) standards for both new and existing source categories that
are major emitters of HAPs. The stringent system of emissions controls encompassed
under the MACT provisions is intended to ensure control technology is used to minimize
emissions of HAPs from the major emitters
.
Under Section 112(n) of the CAA, U.S. EPA was directed to conduct a study of electric
utility boilers to assess the hazards to public health from their emissions of HAPs, and
submit it to Congress. U.S. EPA submitted the study to Congress in 1998, referred to as
the
"Mercury Study Report to Congress "
(December 1997) .
Based on the Mercury Study, on December 20, 2000, U.S. EPA issued a finding under
Section 112(n) that it was appropriate and necessary to regulate coal and oil-fired utility
boilers under Section 112 (Regulatory Finding). U.S. EPA concluded that this
affirmative determination under Section 112(n) constituted a decision to list coal and oil-
fired power plants on the Section 112(c) source category list, thereby requiring it to
develop a MACT standard for HAP emissions from those sources
.
On January 30, 2004, U.S. EPA published a notice of proposed rulemaking setting forth
three alternative regulatory approaches to reducing emissions of mercury from coal-fired
power plants . In two of the three alternatives, U .S. EPA proposed to rescind its
Regulatory Finding, which would require MACT-level control of mercury emissions, and
instead imposed state-wide mercury emissions budgets to regulate power plants that
could be met through a cap and trade program .
In response to the proposed rules, the Illinois EPA submitted comments on these
proposed alternatives, making the following key points
:
19
•
Mercury is a powerful neurotoxin that needs to be regulated under Section 112(d)
of the Clean Air Act (CAA), and as such, the mercury emissions from the power
plants must be subject to a MACT standard
;
•
The mercury limits must be more stringent than set forth in the proposed rule
;
•
Any mercury rule for power plants must be fuel neutral, without favoring coal
from any particular region of the country, and thus there should be a common
standard for bituminous and subbituminous coal;R
•
Illinois EPA opposes emissions trading of mercury allowances unless the units
involved in a trading can demonstrate that mercury hot spots are prevented; and
•
Mercury emission reductions can and should occur by 2010
.
The comments also stated that U .S. EPA gave insufficient support for its extended
compliance deadline of 2018, which U .S. EPA acknowledged could extend compliance
out to 2025 or 2030 due to banking elements of the trading program .
Despite receiving an enormous number of negative comments on its proposal, and over
five years after U .S. EPA issued its Regulatory Finding, U . S. EPA published the CAMR
on May 18, 2005. Notably, CAMR did not apply a MACT standard to mercury and other
HAP emissions from coal-fired power plants, and instead established "standards of
performance" limiting mercury emissions from new and existing coal-fired power plants
and created a market-based cap-and-trade program to reduce nationwide power plant
emissions of mercury in two separate phases . The first phase cap is 38 tons and was set
by determining the level of mercury reductions achieved as a "co-benefit" of
requirements for reducing sulfur dioxide (SO2) and nitrogen oxides (NOx) emissions
under the federal Clean Air Interstate Rule (CAIR) . In the second phase, due in 2018,
coal-fired power plants will be subject to a second cap, which will limit emissions to 15
20
tons upon full implementation. Illinois' budget under CAMR is 1 .594 tons per year of
mercury for Phase I and 0.629 tons per year for Phase 11. This equates to a reduction in
mercury emissions from Illinois coal-fired EGUs of approximately 47 percent by 2010
and 78 percent by 2018
.
The Illinois EPA determined that CAMR will not result in sufficient reductions of
mercury in a timely manner, and that CAMR will impede its efforts to encourage clean-
coal technology that will allow Illinois' abundant coal reserves to be used in an
environmentally responsible manner . Illinois EPA requested that the Illinois Attorney
General's Office file an appeal of CAMR and the Delisting Action. On May 27, 2005,
the State of Illinois filed Petitions for Review with the United States Court of Appeals for
the District of Columbia Circuit challenging both rules. Thirteen other states also filed
one or more appeals of the CAMR and the Delisting Action . These appeals are pending .
Other Programs to Control Mercury in the Environment
Because mercury is of such a significant concern to human health and the environment,
Illinois has adopted legislation and/or implemented a number of programs to reduce
mercury emissions to the environment from sources other than coal-fired power plants
.
These programs, as well as pending legislation, include the following
:
•
Prohibitions on the sale of mercury electrical switches and relays in consumer and
commercial products, and restrictions on the use of elemental mercury and
mercury-containing scientific equipment in K-12 schools
;
•
A bill is pending before the general assembly to require automakers to create a
statewide program to collect and recycle mercury switches from discarded or end-
of-life vehicles before they are processed as scrap metal, and if capture rate
targets are not met, the auto recyclers and scrap metal processors would collect a
$2 bounty for each switch removed
;
2 1
•
A program to help K-12 schools properly dispose of waste chemicals used for
teaching purposes, including bulk mercury and mercury-containing devices
;
•
Collection of mercury containing products as part of the Household Hazardous
Waste Collections ;
•
Teaming up with the Illinois State Dental Society to arrange for mercury and
mercury amalgams to be disposed of in an environmentally friendly manner at the
household hazardous waste collections ;
•
Promotion of the National Thermostat Recycling Corporation's thermostat
collection program to Heating, Ventilation, and Air Conditioning contractors in
the state through direct mailings and other educational outreach activities
;
•
Adoption of regulations addressing emissions of hazardous pollutants, including
mercury, from the combustion of hospital and medical/infectious wastes, which
resulted in the shut down of all but 12 of the 98 affected incinerators at hospitals
;
and ;
•
Governor Blagojevich's continuing initiative to require all hospital waste
incinerators to shut down and find other waste disposal options
.
Illinois Coal-Fired Power Plants
Today, around 40% of Illinois' electricity comes from coal-fired power plants . Illinois is
home to 21 coal-fired power plants, most of which are over 25 years old . These coal-
fired power plants constitute the largest source of uncontrolled mercury emissions in the
State, emitting an estimated 3.85 tons per year of mercury into the atmosphere. The
State's fleet of power plants are scattered throughout Illinois, with many located near
major bodies of water .
22
Proposed Illinois Mercury Rule
The proposed Illinois mercury rule is designed to achieve a high level of mercury control,
based on Illinois EPA's finding that there exists mercury control technology that is both
technically feasible and economically reasonable
.
Briefly, the proposed rule requires mercury reductions from Illinois' coal-fired power
plants in two phases . During phase I, which begins on July 1, 2009, coal-fired power
plants must comply with either an output-based emission standard of 0.0080 lbs
mercury/GWh, or a minimum 90-percent capture of inlet mercury, both on a rolling 12-
month basis. However, plants with the same owner/operator may elect to comply with
the limit on a system-wide basis by averaging across their entire fleet of plants in Illinois,
provided that each plant meets a minimum output-based emission standard of 0 .020 lbs
mercury/GWh or a minimum 75-percent capture of inlet mercury. In Phase II, beginning
January 1, 2013, plants must comply with either of an output-based emission standard of
0.0080 lbs mercury/GWh or a minimum 90-percent capture of inlet mercury, both on a
rolling 12-month basis . The proposed rule ensures that reductions occur both in Illinois
and at every power plant in Illinois in order to address local impacts . The rule does not
allow for the trading, purchasing or the banking of allowances
.
The Impacts of the Proposed Illinois Mercury Rule
The fleet of coal-fired power plants in Illinois will be the largest in the nation to be
subject to stringent mercury reduction requirements. The mercury reductions obtained
from Illinois' proposed rule will be beyond those of the federal CAMR and will occur
more quickly. Whereas CAMR would cap Illinois' annual mercury emissions at 3,188
pounds by 2010, the proposed Illinois rule results in annual mercury emissions of only
around 770 pounds beginning mid-2009. Therefore, the proposed rule should eliminate
approximately 2,418 additional pounds per year of harmful mercury pollution, and do so
six months earlier than the federal CAMR . The reductions obtained under the proposed
Illinois rule will likewise be greater than those required in Phase II of CAMR, which does
23
not go into effect until 2018. The CAMR budget for Illinois in Phase II is 1,258 pounds
per year, but with banking allowed under CAMR, it is not expected that actual emission
reductions will occur until 2020 or later. Compared to CAMR, the proposed Illinois rule
should result in an estimated 488 fewer pounds of mercury emissions per year about
seven years sooner. It is important to note that CAMR is a cap and trade program and
therefore, under CAMR, Illinois power plants could postpone or avoid some mercury
reductions through the purchase or banking of allowances, an option not allowed under
Illinois' proposed rule
.
Section 8 of the document provides a detailed review of the current and developing
mercury control technologies and the control effectiveness that can be achieved from
these technologies. Mercury emissions may be reduced through the application of
control technology specifically designed to control mercury (e.g., sorbent injection), or
through co-benefit from other control techno logies designed to control SO2 NOx, and
particulate matter (e.g ., flue gas desulfurization, selective non-catalytic or selective
catalytic reduction, fabric filters, electrostatic precipitators) . Depending on several
variables, including coal and boiler type, there are a number of control technologies that
will achieve 90+% removal of mercury . Mercury emissions control technology is a
rapidly advancing field, with use of halogenated sorbents being an affordable and
effective option for many applications. Although there may be some challenges to
achieving 90% removal of mercury, each of these challenges can be overcome or
addressed through technology that is economically reasonable and available today
.
In addition to the detailed mercury control and cost analysis performed in Section 8 of
this document by Illinois' technical expert, Dr. James Staudt, Illinois utilized the services
of ICF Resources Incorporated (ICF) to evaluate the economic impact of the proposed
rule on Illinois' electricity rates and affected power plants. ICF used the Integrated
Planning Model (IPM) to evaluate these costs . While there are some additional costs
predicted from the proposed rule when compared to CAMR, the costs are deemed to be
reasonable in light of the concerns presented by mercury pollution
.
24
Over time, Illinois expects to see reductions in mercury water deposition to Illinois' lakes
and streams and corresponding methylmercury decreases in Illinois fish tissues, making
fish caught in Illinois waters safer to eat . Our review of fish consumption literature
discussed in Section 5 of this document provides convincing evidence that sport anglers
currently consume amounts of sport-caught fish that could cause them and their families
to exceed health-based limits for mercury contamination. The literature regarding
anglers' consumption of their catch strongly suggests that a subset of these anglers have
meal frequencies that exceed the state-wide fish consumption advisory for mercury,
putting them well above the recommended rates for even fairly low levels of
contamination
.
There will be several recognized benefits to the State from tighter mercury controls
beyond the expected public health benefits that come with a reduction in water and fish
methylmercury levels. Such benefits include support for existing and the potential for
additional jobs resulting from the installation and operating requirements for additional
pollution control devices . There also exists a potential for an increase in tourism and
recreational fishing as mercury levels drop in fish, bringing an associated positive impact
to local economies and the State overall . With the predicted increase in the use of
bituminous coal, there should be a positive economic impact on the Illinois coal industry
and Illinois coal mining jobs
.
25
1 .0
Introduction
This technical support document (TSD) provides the bases for the Illinois Environmental
Protection Agency's proposed mercury emissions standards for Illinois' coal-fired
electric generating units (EGUs). Coal-fired EGUs represent the largest unregulated
source of mercury emissions in the State. On January 30, 2004, U .S. EPA proposed rules
for regulating mercury emissions from coal-fired EGUs (69
Fed. Reg .
4652). U.S. EPA
proposed two options for controlling mercury emissions either through a control
technology standard with emissions limits or a cap-and-trade approach. On May 18,
2005, the Clean Air Mercury Rule (CAMR) was published in the
Federal Register (70
Fed. Reg.
28606). The CAMR finalized standards for new sources that are less stringent
than were proposed in January 2004, and finalized a cap-and-trade rule for EGUs
.
Illinois, and several other states including New Jersey, California, Connecticut,
Delaware, Maine, Massachusetts, New Hampshire, New Mexico, New York,
Pennsylvania, Rhode Island, Vermont and Wisconsin disagreed with U .S. EPA, and
challenged CAMR in federal actions . Illinois EPA believes that coal-fired EGUs should
be regulated under Section 112 of the CAA to protect public health . Illinois EPA also
believes that control technology, in addition to various optimization processes as
explained in Section 8 .0 of this TSD, is available to coal-fired power plants in order to
achieve the reduction of mercury emissions at the proposed levels
.
This TSD explains the rationale behind Illinois' proposal and is organized in the
following manner: Section 2.0 of this TSD provides a brief background on mercury, the
toxic pollutant of concern that is the subject of various studies, including U .S. EPA's
Mercury Study and Utility Air Toxics Study . Also discussed in this Section are the
various sources of mercury emissions in the U.S. and the list of coal-fired electric
generating units in Illinois
.
The adverse health effects from mercury and methylmercury contamination, the major
reason for developing this proposal, are explained in Section 3
.0. An overview of past
26
occurrences of mercury poisoning, adverse health effects and impacts of mercury and
methylmercury exposure, and costs of environmental exposure to methylmercury are
included in Section 3.0. This section is based in large part from the Michigan Mercury
Report (Michigan's Mercury Electric Utility Workgroup, "Final Report on Mercury
Emissions from Coal-Fired Power Plants," June 20, 2005) and the attached Appendix A
of this TSD "Review of the Nervous system and Cardiovascular Effects of
Methylmercury Exposure." Detailed discussions on neurotoxicity and cardiovascular
effects, and societal costs associated with methylmercury exposure in the United States
are found in Appendix A
.
Section 4.0 gives a description of the state of mercury-impaired waters in the state, the
impact of mercury releases to the Illinois aquatic systems and how human health-based
concentrations of methylmercury in fish tissues tested in Illinois influence the current
level of fish consumption advisories in the State
.
Section 5.0 provides a detailed discussion on atmospheric deposition of mercury and
analyses of recent source receptor modeling studies that relates atmospheric deposition of
mercury to local emissions sources .
Section 6.0 of this TSD provides the format and rationale for the proposed Illinois
standards for mercury emissions from Illinois' coal-fired electric generating units
.
Section 7.0 gives an overview of the various mercury regulations in other states and on-
going regulatory activities, at the federal and state levels, related to the reduction of
mercury emissions from coal-fired EGUs. Also discussed in Section 7 .0 are other
programs in Illinois that prohibit or minimize mercury releases into the environment
.
Section 8.0 of this TSD discusses the technical feasibility of mercury controls,
specifically through sorbent injection . Also covered in this Section is an analysis of
potential costs for Illinois EGUs to comply with the proposed mercury rule . Other
discussions include coal cleaning, mercury control technologies currently available, and
27
mercury removal co-benefits from conventional pollution control equipment typically
installed on Illinois EGUs, e.g ., cold-side electrostatic precipitators (CS-ESPs), hot-side
electrostatic precipitators (HS-ESP), fabric filters
(FF), wet and dry flue gas
desulfurization (FGD) scrubbers, and nitrogen oxides ("NOx") control systems
.
The results of Illinois' IPM modeling are discussed in Section 9 .0 of this TSD
.
Section 10.0 covers other relevant issues considered in the development of the proposed
Illinois mercury standards .
Upon promulgation of the Clean Air Mercury Rule (CAMR) on May 18, 2005, Illinois is
required to submit a state implementation plan ("SIP") that would address mercury
emissions from coal-fired power plants under section 111 of the Clean Air Act . This
TSD is in support of the Illinois SIP, addressing mercury emissions from coal-fired EGUs
that is due for review and approval by U .S. EPA on November 17, 2006
.
2 8
2.0
Background Information on Mercury
2.1
What is Mercury?
Mercury is a toxic heavy metal that is of significant concern as an environmental
pollutant
(See: Agency for Toxic Substance and Disease Registry, Toxicological Profile :
Mercury 1999, (A TSDR, 1999)(www.atsdr.cdc.gov/toxprofiles/tp46.html) .
It exists in the
environment naturally and as a product of man-made processes, including waste
incineration and fossil fuel combustion . Mercury is a persistent environmental
contaminant, which cannot be degraded or destroyed
.
Mercury exists in two general forms in the environment : inorganic, which include
elemental mercury, and organic forms. Elemental or metallic mercury is a heavy, silvery-
white liquid metal at typical ambient temperature . Metallic mercury can readily vaporize
into colorless and odorless vapors at room temperature . The higher the temperature, the
more mercury vapors will be released to the environment
.
When combined with carbon, mercury forms compounds referred to as organic mercury
or "organomercurials." Inorganic mercury compounds are formed when mercury
combines with other non-carbon elements such as chlorine, sulfur or oxygen . Three
different forms of inorganic mercury emissions are typically modeled in atmospheric
transport models . These are elemental (Hg°), gas phase divalent mercury (Hg2) (also
referred to as reactive gaseous mercury), and particulate-bound divalent mercury (Hg p)
(See: "Economic Valuation of Human Health Benefits of Controlling Mercury Emissions
from U.S. Coal-Fired Power Plants" Northeast States for Coordinated Air Use
Management (NESCAUM, February 2005)(www.nescaum.org) .
The reactive gaseous
and particulate-bound forms of mercury are readily deposited to the surface of the earth
through wet or dry deposition
.
(See
Section 5 .0 of this TSD for more discussions on
atmospheric deposition modeling)
.
29
Mercury deposited into the aquatic systems transforms into methylmercury through
microbial activity. Methylmercury is toxic and is the most common organic form of
mercury found in the environment . It is very soluble and bioaccumulates within the
tissues of wildlife (fish, aquatic invertebrates, mammals) as well as humans. (Mercury
Study, 1997)
The Uility Air Toxics Study issued by U .S. EPA in February 1998 identified mercury as
the hazardous air pollutant of "greatest potential concern" associated with coal-fired
power plants
.
2.2
Sources and Uses of Mercury
The Michigan Mercury Report (Michigan Electric Utility Workgroup, Final Report on
Mercury Emissoins from Coal-Fired Power Plants," June 20, 2005) indicated that the
toxicity and use of mercury has been known as far back as the early Roman Empire .
Prisoners sent to work in cinnabar ore mines died from exposure to mercury vapors . In
the 1800s, workers using mercury in manufacturing felt hats were poisoned and had
physical symptoms that was referred to as "mad as a hatter."
Mercury is a mined commodity and is also produced as a by-product of gold and bauxite
mining. Mercury is currently used in thousands of industrial, agricultural, medical and
household applications due to its unique properties. Some examples of current mercury
use include :
•
Thermometers and sphygmomanometers
•
Thermostats, barometers and manometers
•
Relays and various switches (float switches in septic tanks, sump pumps and
bilge pumps)
•
Fluorescent and high intensity discharge lamps
•
Preservative in vaccines
30
For a detailed tabulation of mercury sources and product usage, see Appendix D of the
Michigan Mercury Report
.
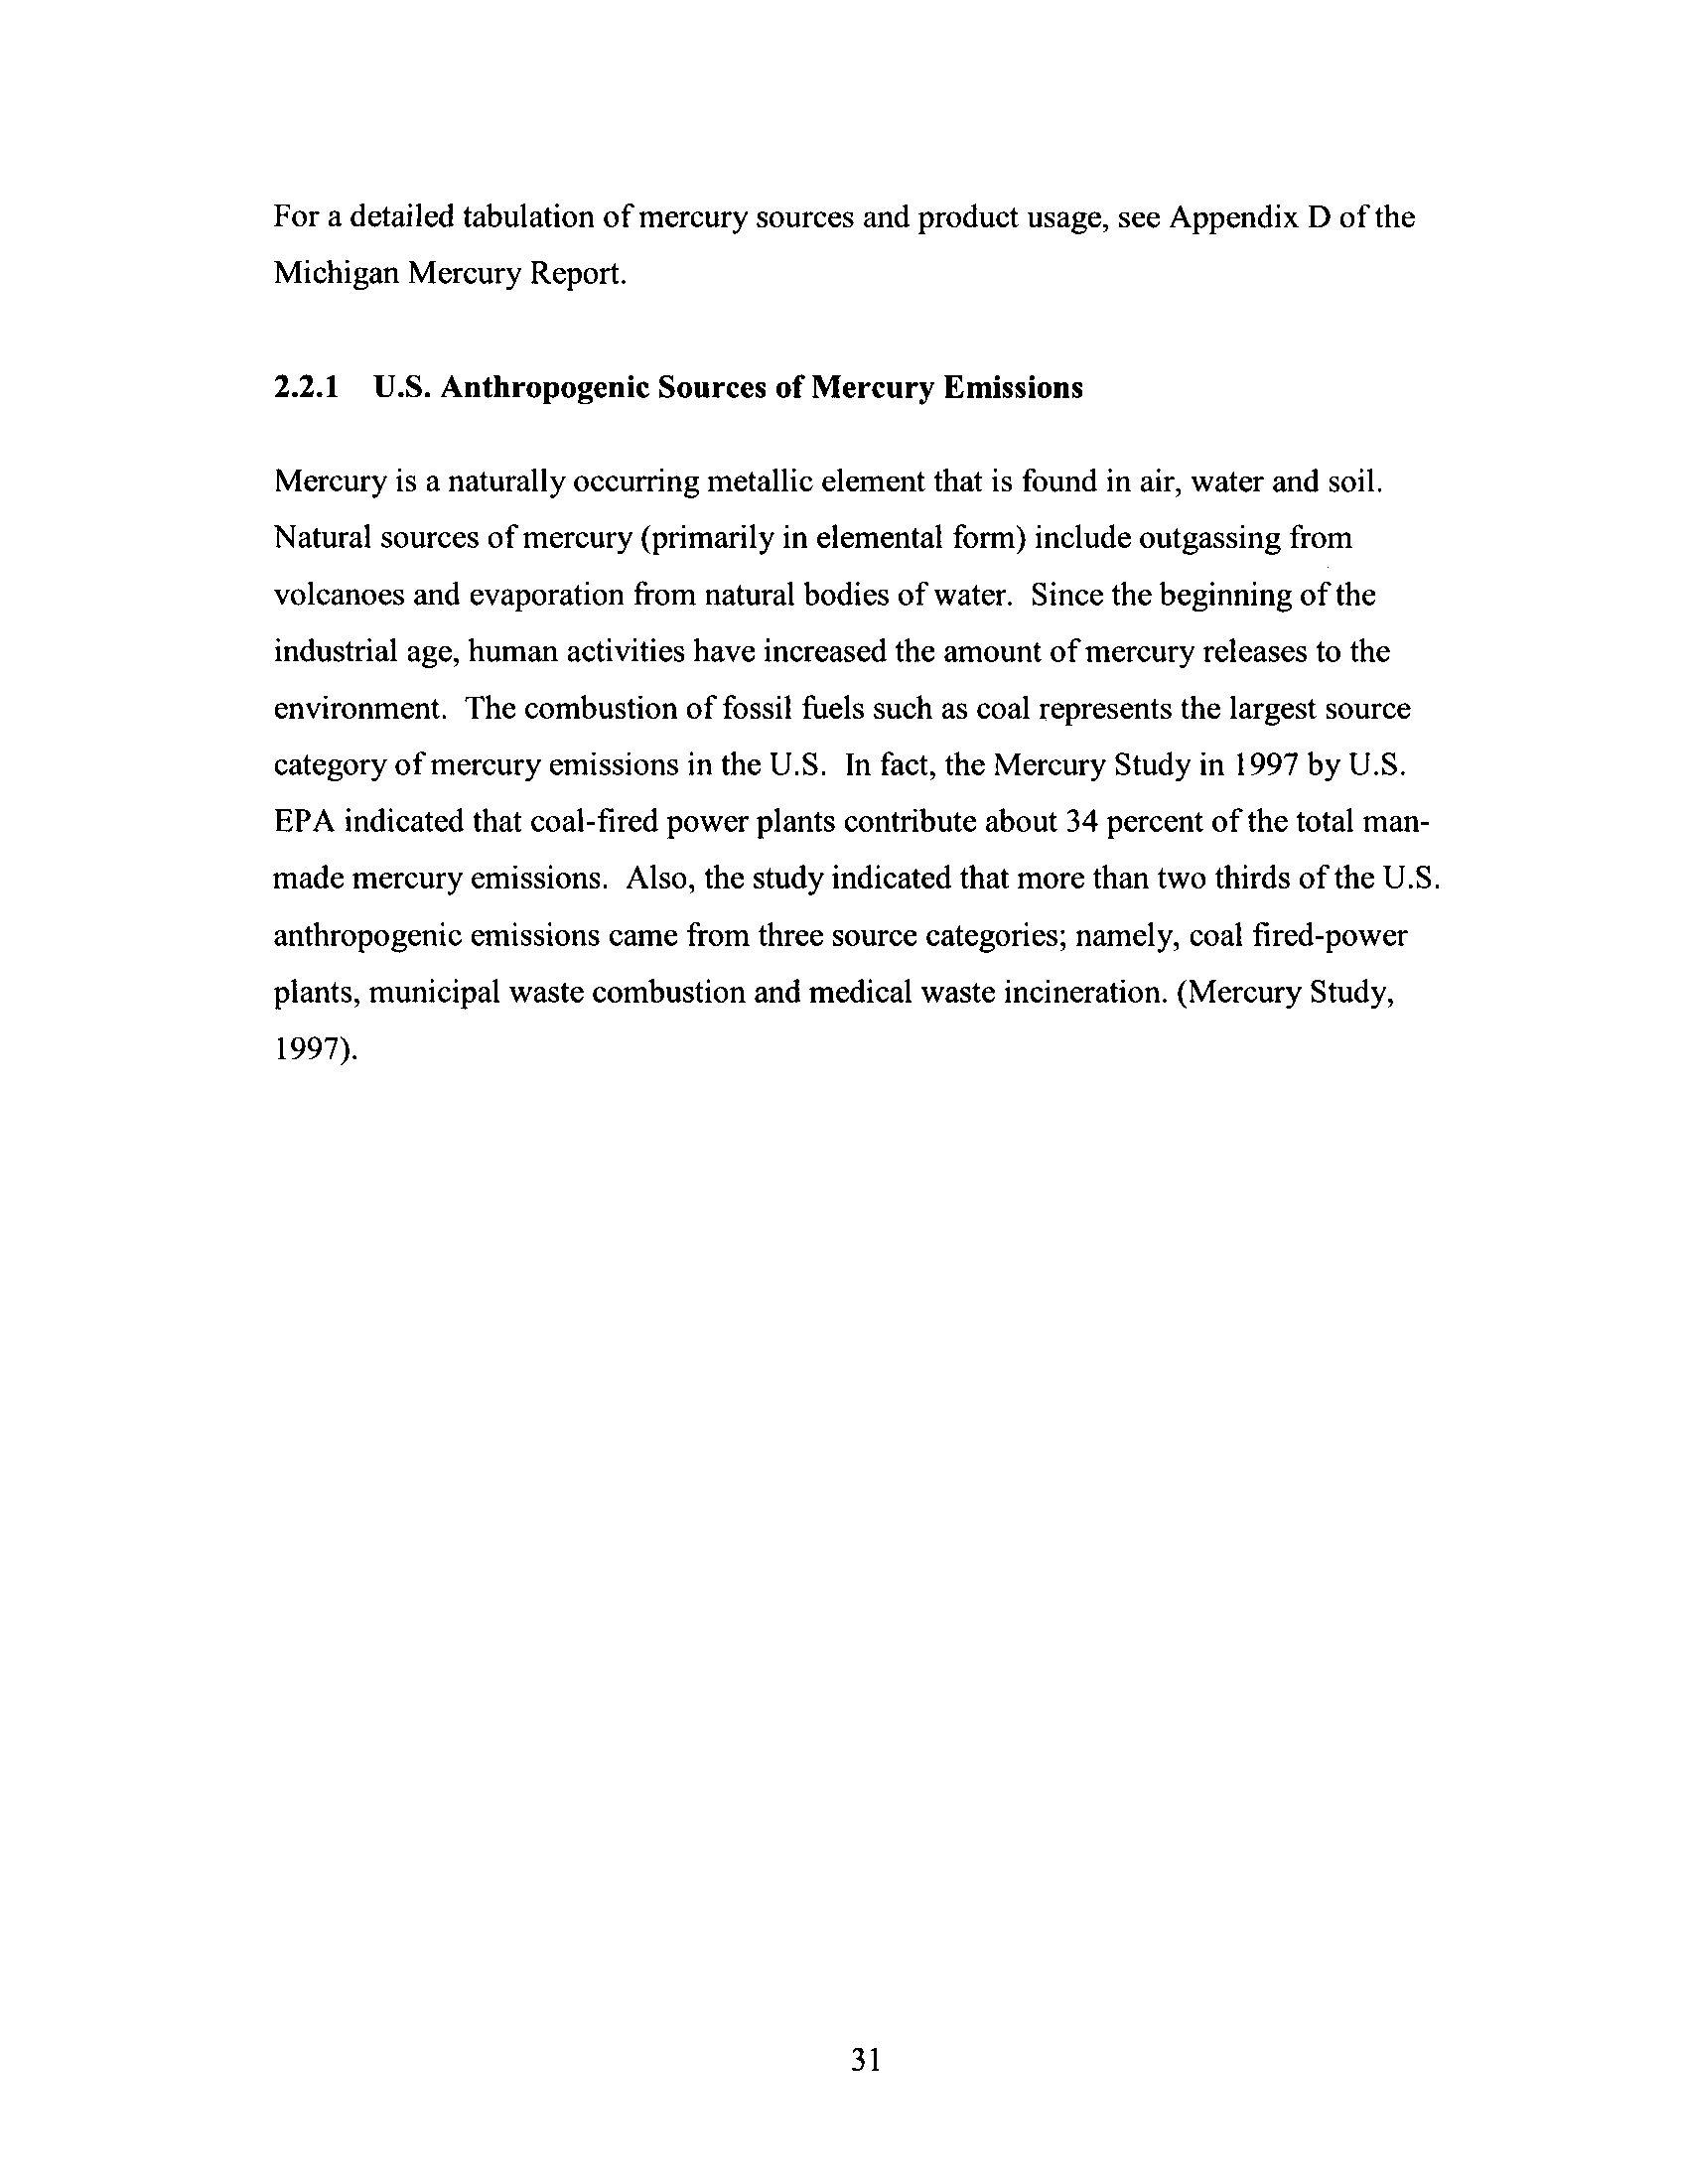
2.2.1
U.S . Anthropogenic Sources of Mercury Emissions
Mercury is a naturally occurring metallic element that is found in air, water and soil
.
Natural sources of mercury (primarily in elemental form) include outgassing from
volcanoes and evaporation from natural bodies of water . Since the beginning of the
industrial age, human activities have increased the amount of mercury releases to the
environment. The combustion of fossil fuels such as coal represents the largest source
category of mercury emissions in the U .S. In fact, the Mercury Study in 1997 by U .S .
EPA indicated that coal-fired power plants contribute about 34 percent of the total man-
made mercury emissions. Also, the study indicated that more than two thirds of the U .S
.
anthropogenic emissions came from three source categories ; namely, coal fired-power
plants, municipal waste combustion and medical waste incineration . (Mercury Study,
1997) .
3 1
Figure 2.1 - U.S. Anthropogenic Emissions 1994-1995*
Other Combustion
Sources
Chlor-alkali sources
3%
5%
Manufacturing
Sources
2%
Hazardous Waste
Combustors
5%
Medical Waste
Incinerators
-
10
Municipal Waste
Combustors
19%
Commercial &
Industrial Boilers
18%
32
Coal-fired Utility
boilers
34%
*From Table 5-I Point Estimates of 1994-1995 National Mercury Emission Rates by Category, Volume 11, Mercury Study Report to
Congress
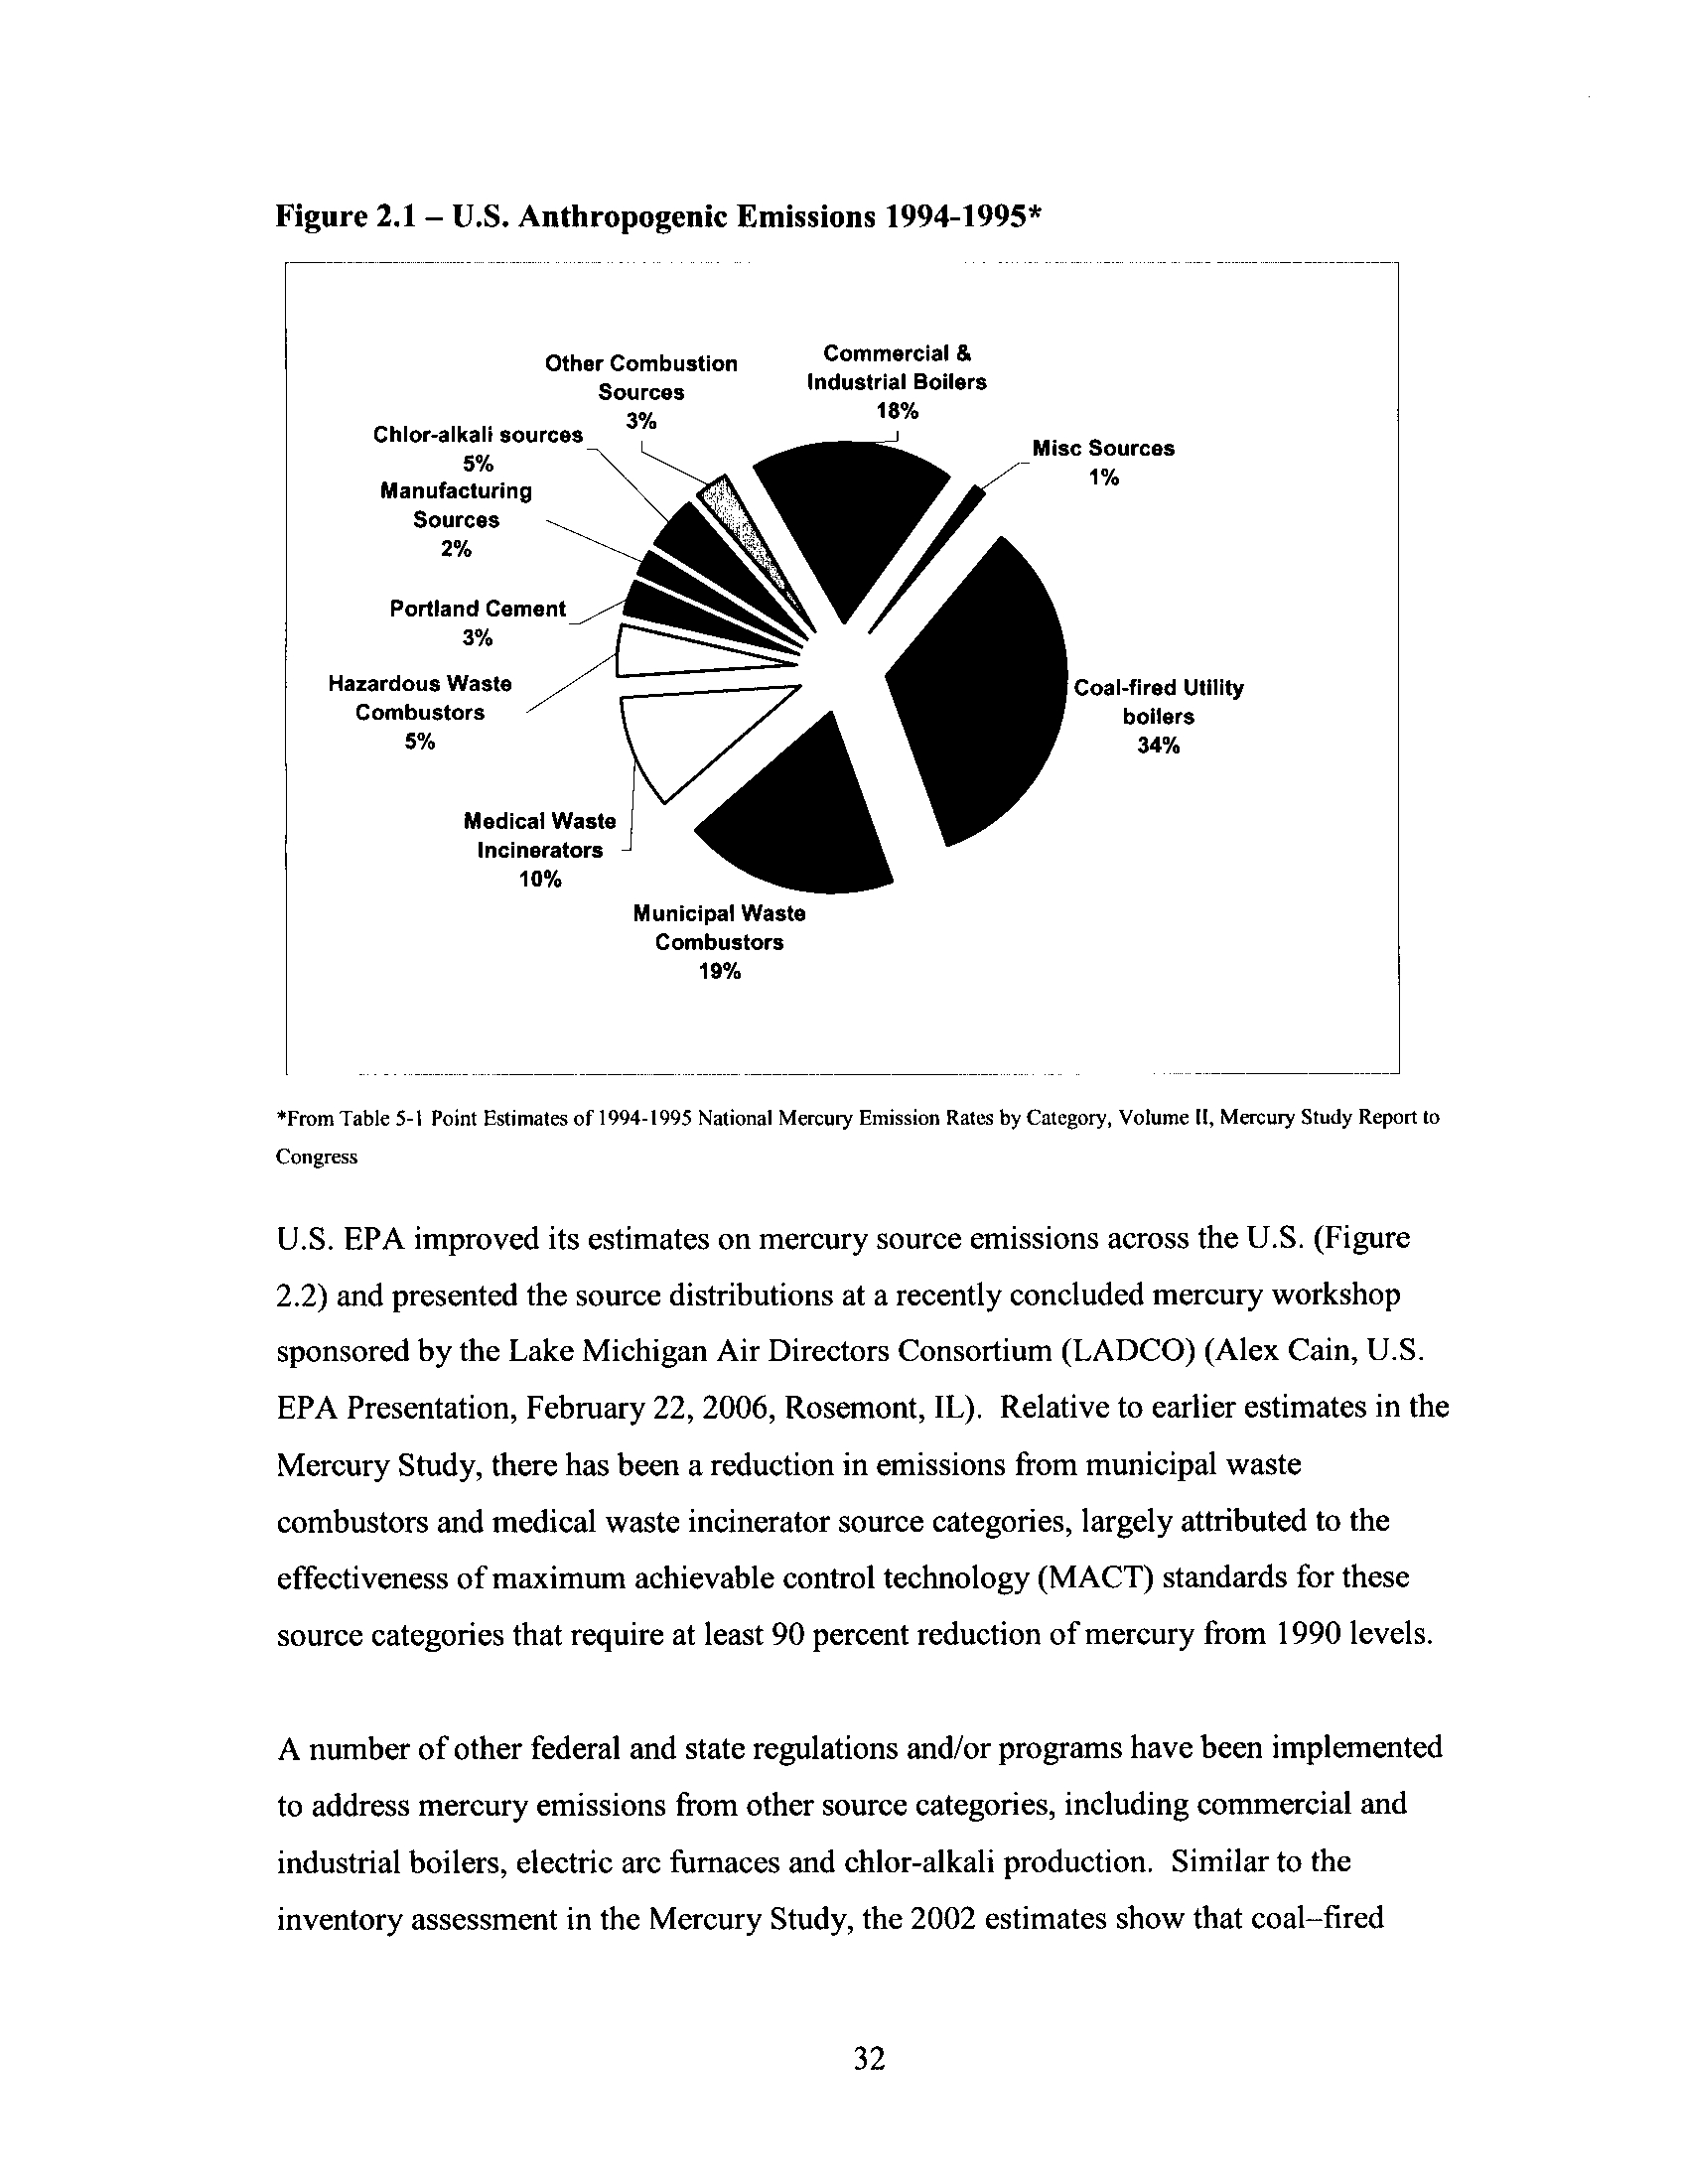
U.S. EPA improved its estimates on mercury source emissions across the U .S. (Figure
2.2) and presented the source distributions at a recently concluded mercury workshop
sponsored by the Lake Michigan Air Directors Consortium (LADCO) (Alex Cain, U .S .
EPA Presentation, February 22, 2006, Rosemont, IL). Relative to earlier estimates in the
Mercury Study, there has been a reduction in emissions from municipal waste
combustors and medical waste incinerator source categories, largely attributed to the
effectiveness of maximum achievable control technology (MACT) standards for these
source categories that require at least 90 percent reduction of mercury from 1990 levels
.
A number of other federal and state regulations and/or programs have been implemented
to address mercury emissions from other source categories, including commercial and
industrial boilers, electric arc furnaces and chlor-alkali production . Similar to the
inventory assessment in the Mercury Study, the 2002 estimates show that coal-fired
power plants remain the largest unregulated source category of mercury emissions
.
Approximately 44 percent of the U .S. anthropogenic mercury emissions are attributed to
coal-fired power plants from a total of about 111 .4 total tons of mercury annually,
estimated by U .S. EPA
.
Figure 2.2 - U .S . Anthropogenic Emissions 2002*
Hazardous waste
Incineration
4%
Electric Arc Furnaces
10%
Medical waste Incinerators
Ind'Ucomm'Uinst'I boilers
and process heaters
9%
Municipal waste combustors
4%
Utility coal boilers
44%
*USEPA Presentation, LADCO Mercury Workshop, O'Hare International Center Auditorium, Rosemont, Illinois, Feb
. 22, 2006
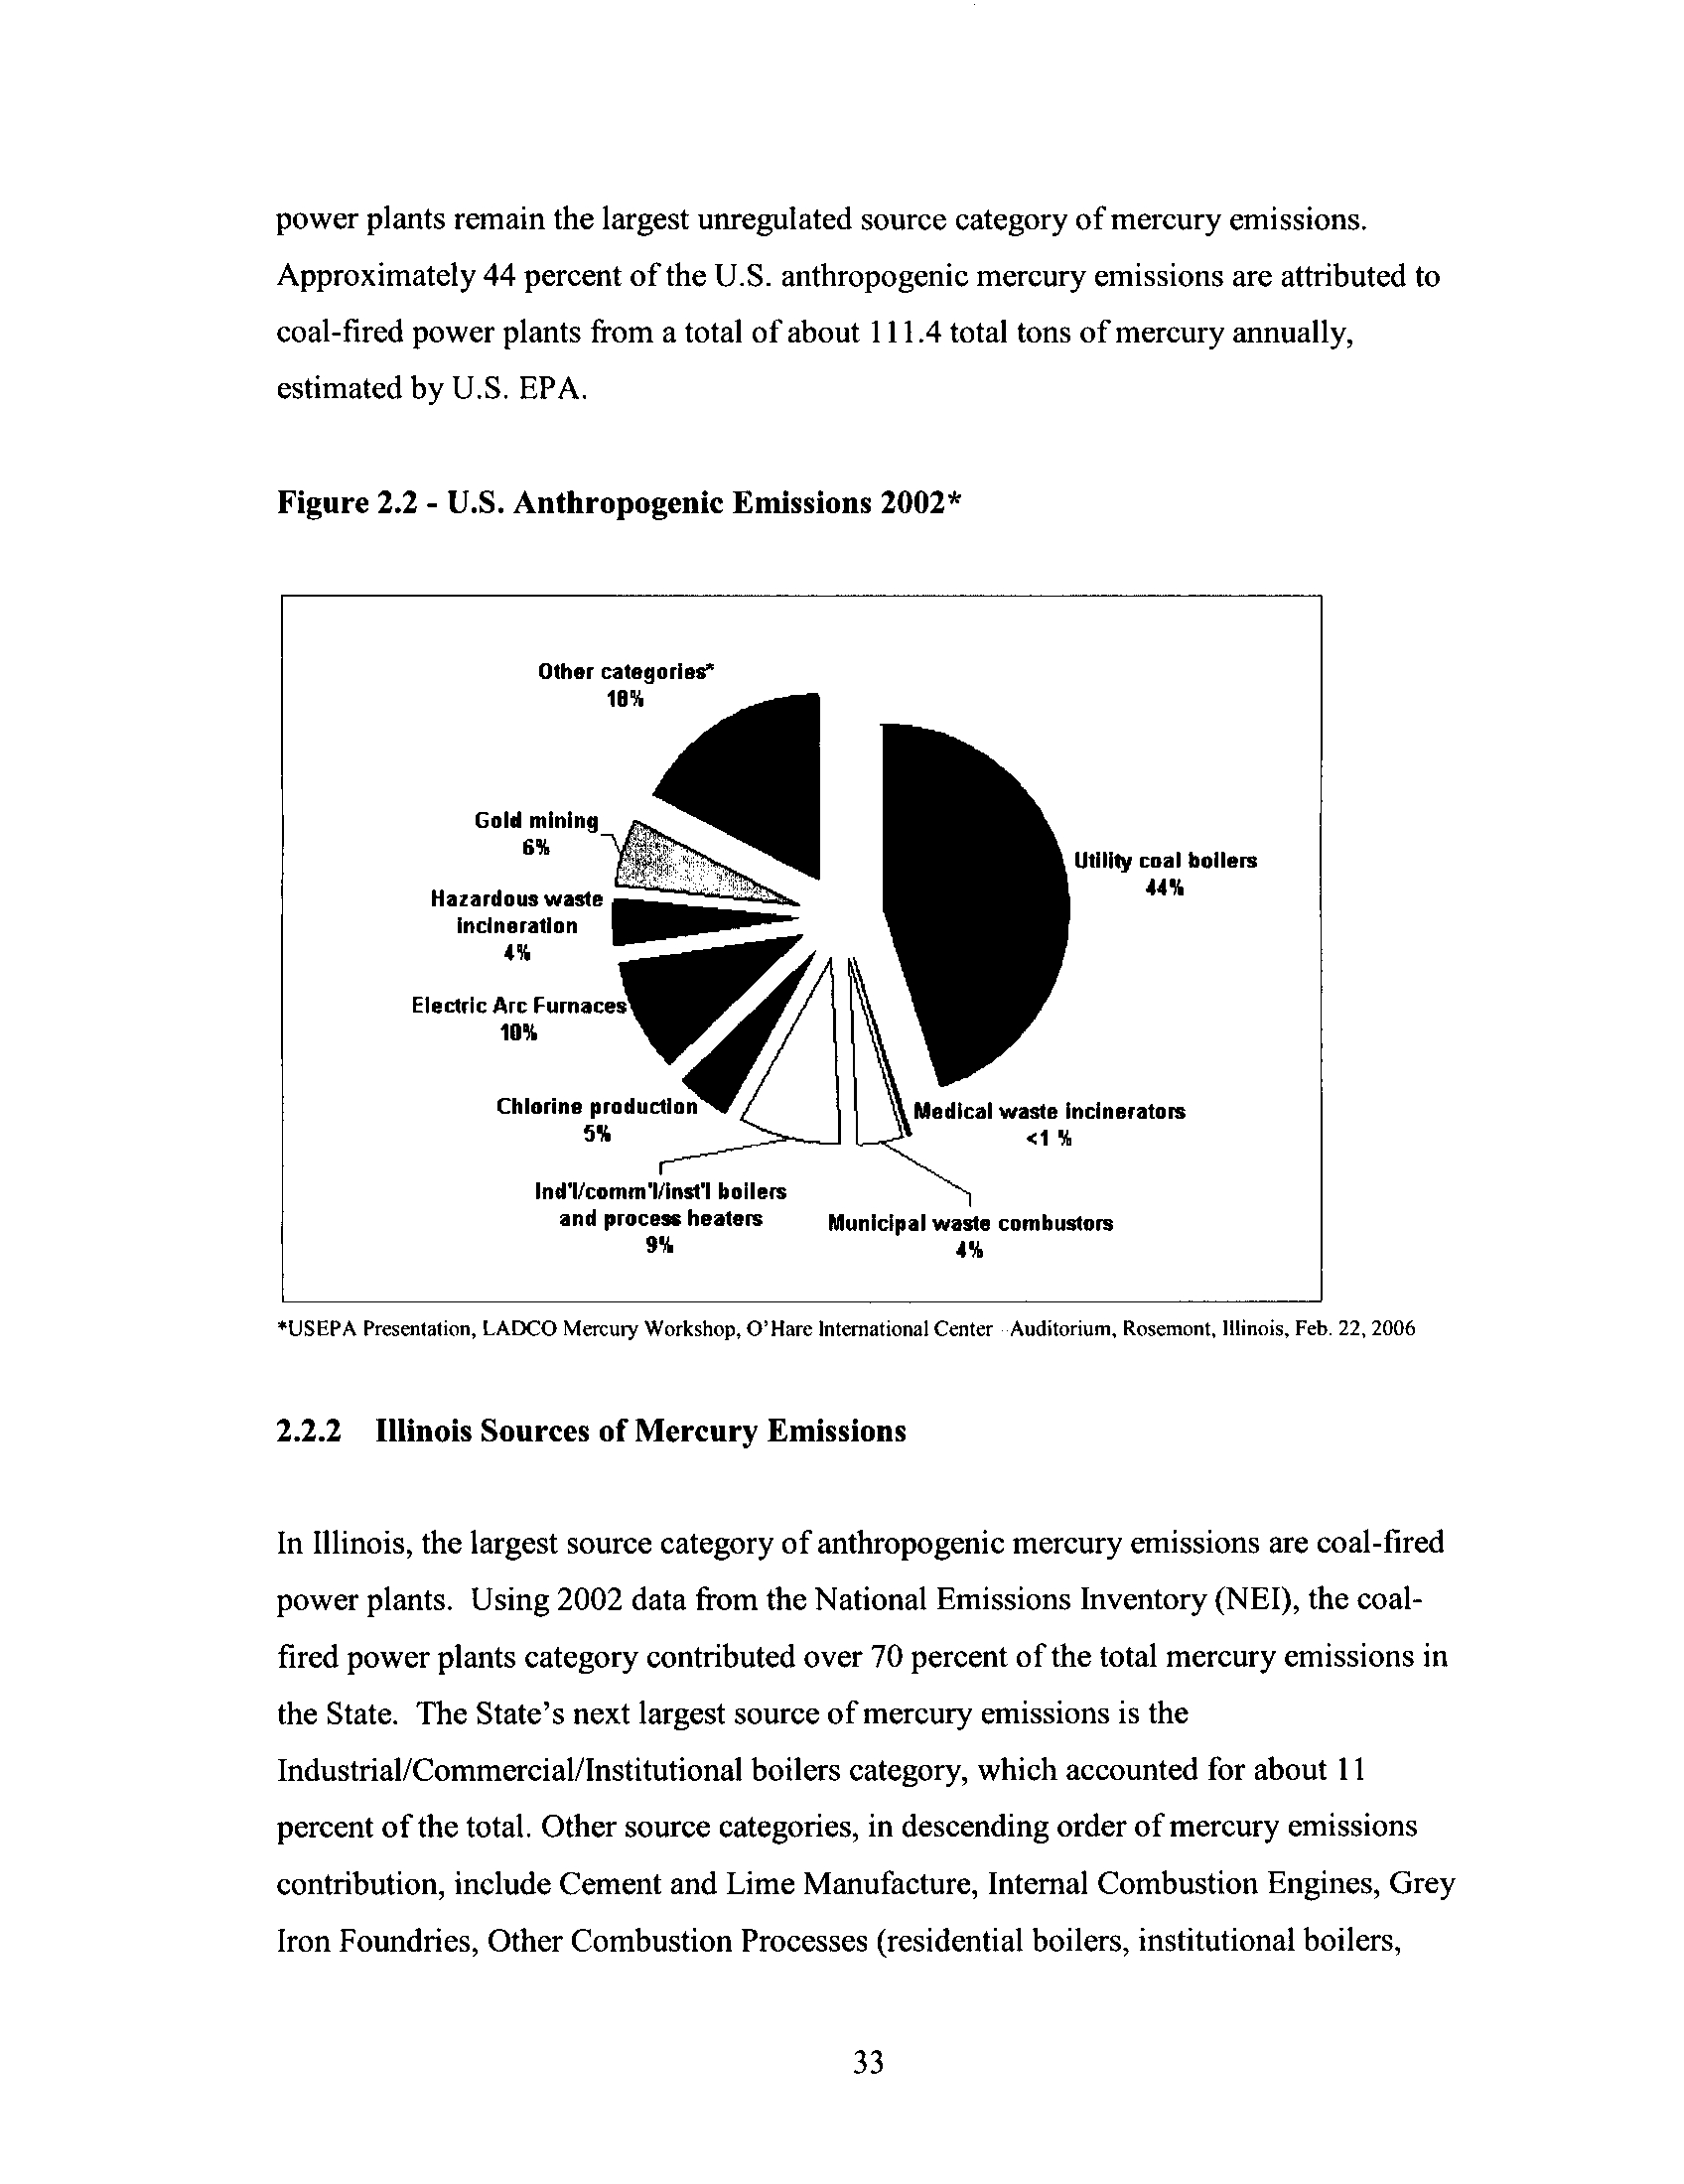
2.2.2
Illinois Sources of Mercury Emissions
In Illinois, the largest source category of anthropogenic mercury emissions are coal-fired
power plants. Using 2002 data from the National Emissions Inventory (NEI), the coal-
fired power plants category contributed over 70 percent of the total mercury emissions in
the State. The State's next largest source of mercury emissions is the
Industrial/Commercial/Institutional boilers category, which accounted for about 11
percent of the total . Other source categories, in descending order of mercury emissions
contribution, include Cement and Lime Manufacture, Internal Combustion Engines, Grey
Iron Foundries, Other Combustion Processes (residential boilers, institutional boilers,
33
crematories), Other Industrial Processes, Hazardous Waste Incinerators and Medical
Waste Incinerators
.
Figure 2.3 - 2002 Illinois Anthropogenic Sources of Mercury Emissions*
71%
Coal-fired Utility Units
Hazardous Waste
1% Combustors
4% Cement& Lime Manufacture
Internal Combustion
Engines
11% Indi/Comml/Instl
Boilers
3% Other Industrial Process
c 1% Medical Waste Combustors
3%
Other Combustion
Process
*(based from 2002 National Emissions Inventory data)
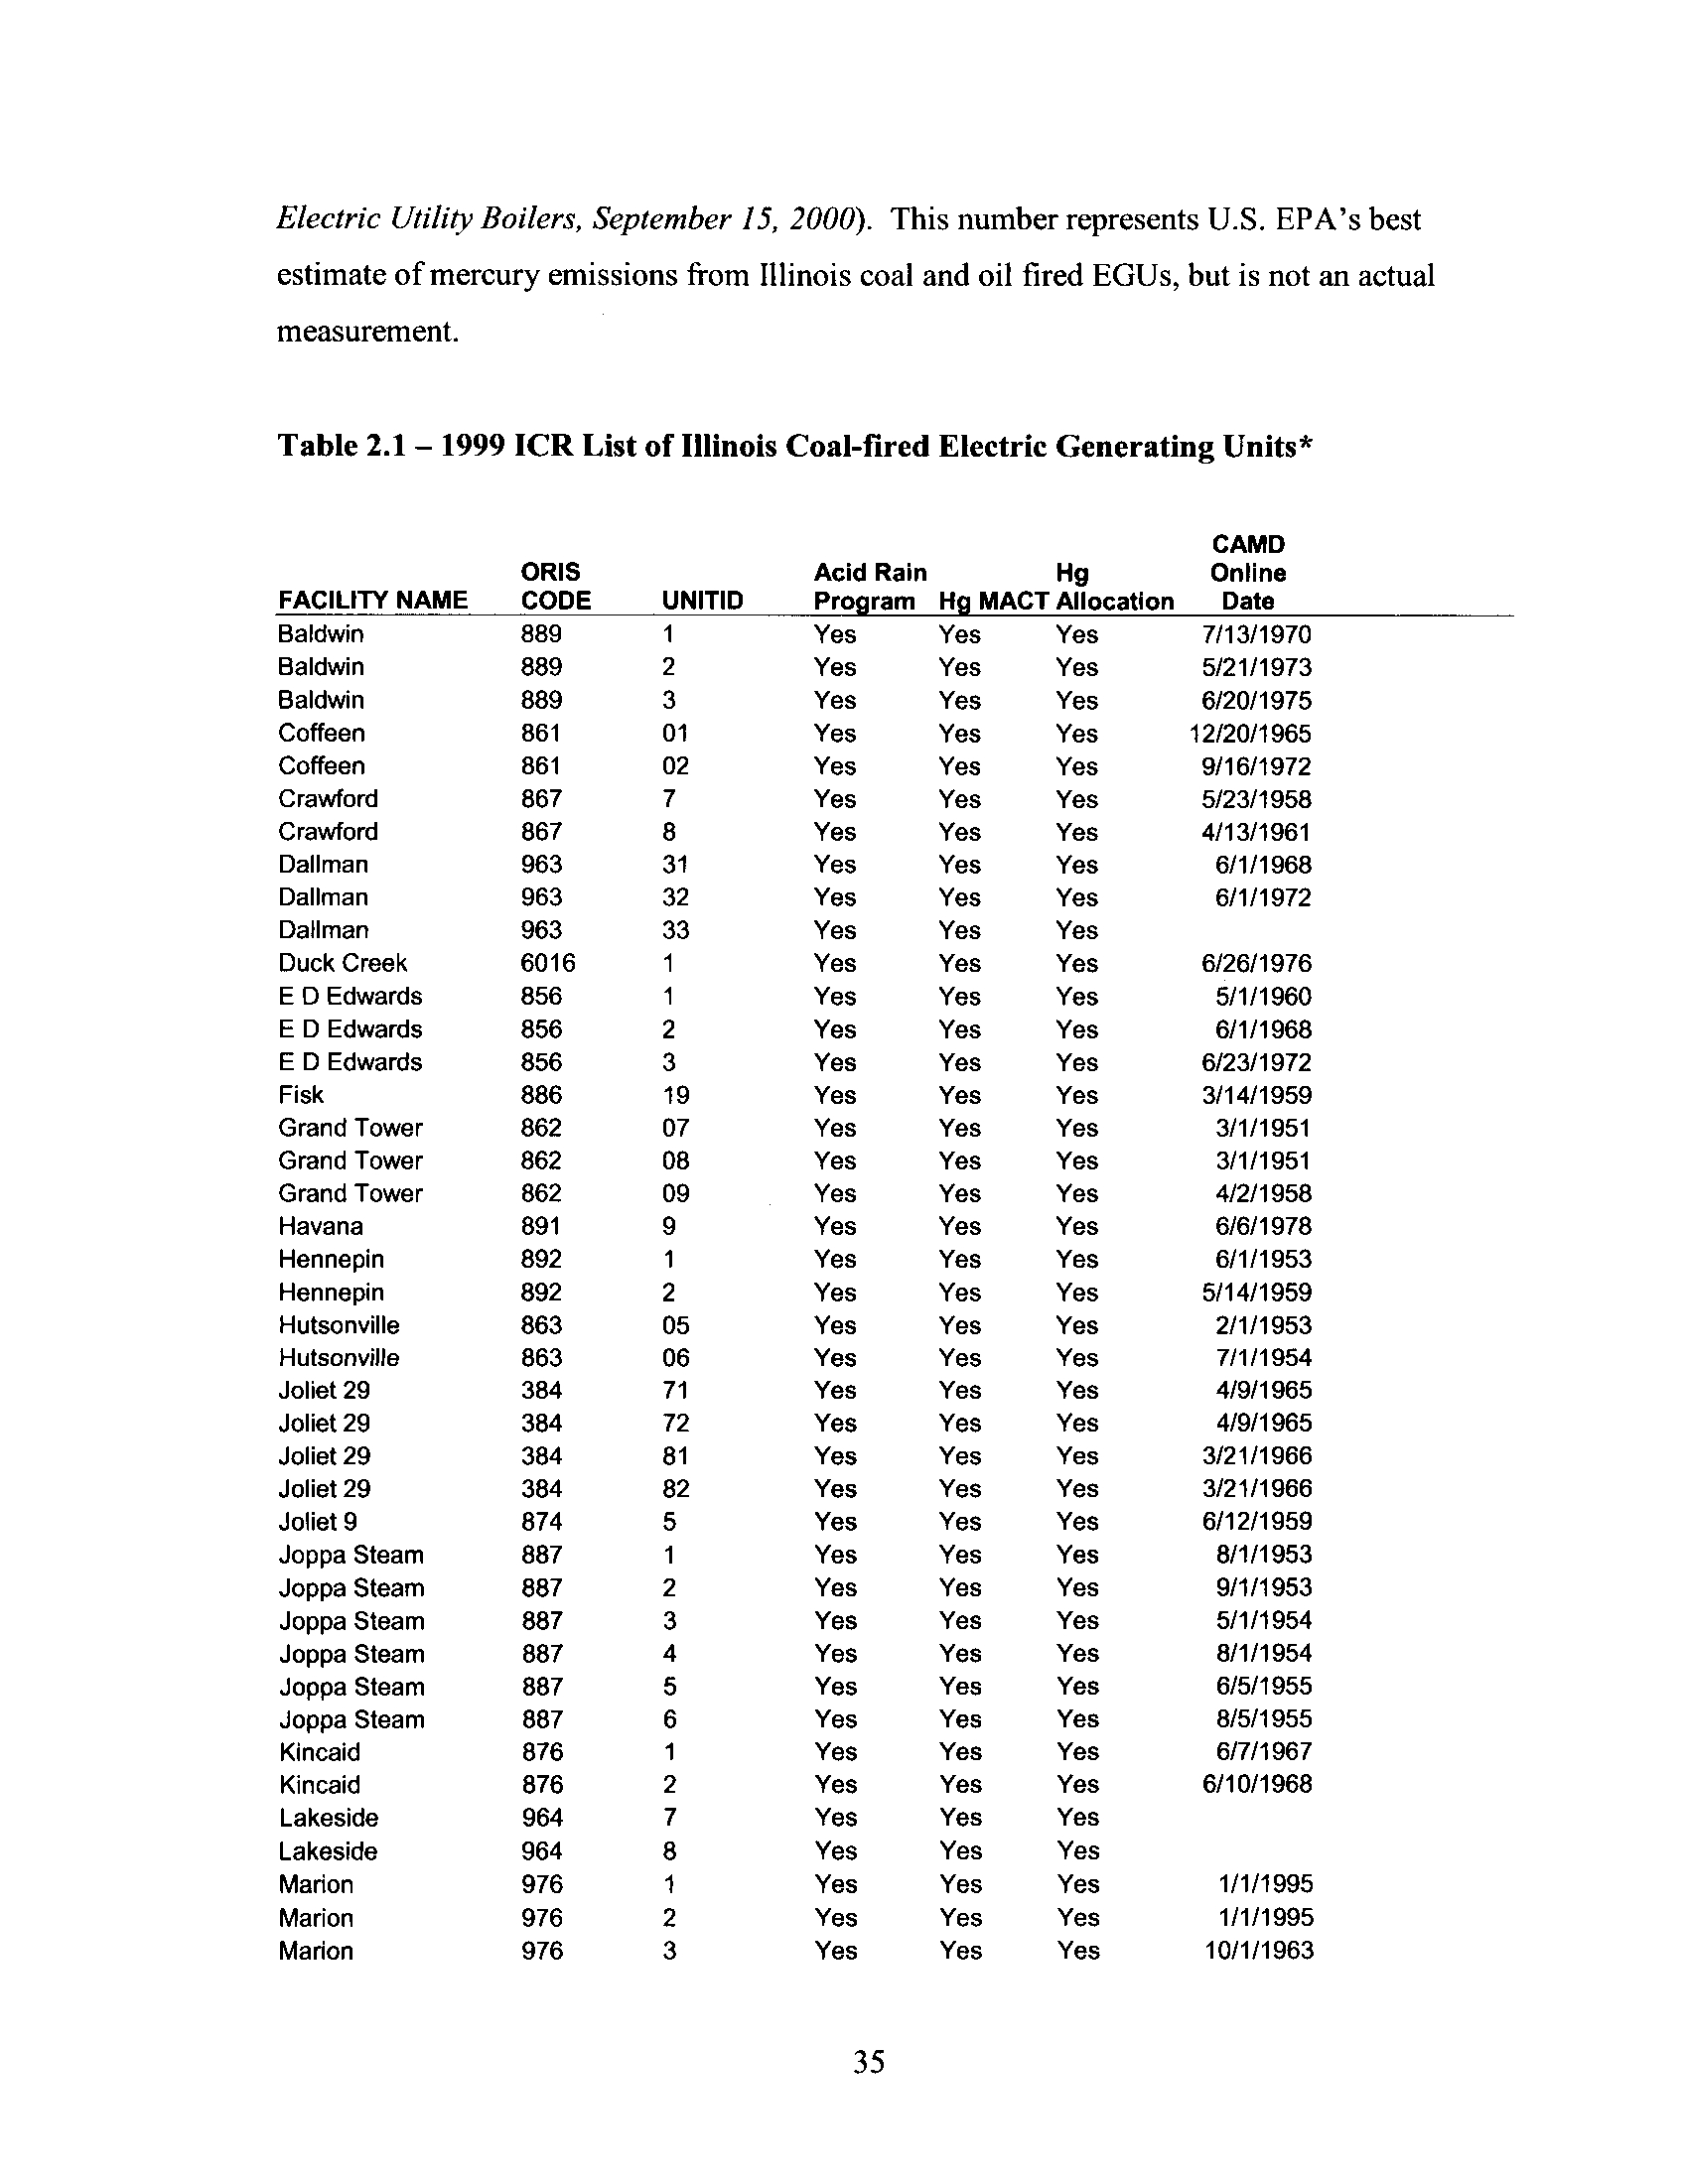
2.2.3 Mercury Emissions from Illinois' Electric Generating Units
There were 64 coal-fired electric generating units in Illinois that were included in U
.S
.
EPA's 1999 Information Collection Request (ICR) to support the development of the
federal CAMR (Table 2.1) . According to U.S. EPA's estimates, Illinois power plants
emitted about 2.99 tons or 5,980 pounds of mercury in 1999 . This estimate for Illinois
was taken from the national estimates, which were calculated by U.S. EPA based on the
collection of data for over 152,000 coal shipments from 1,143 units at 464 coal-fired
power plants .
(See U.S. EPA, Electricity Utility Steam Generating Unit Mercury
Emissions Information Collection Effort, Appendix B Background Material of
Methodology Used to Estimate 1999 National Mercury Emissions from Coal-Fired
34
Electric Utility Boilers, September 15, 2000). This
number represents U.S. EPA's best
estimate of mercury emissions from Illinois coal and oil fired EGUs, but is not an actual
measurement .
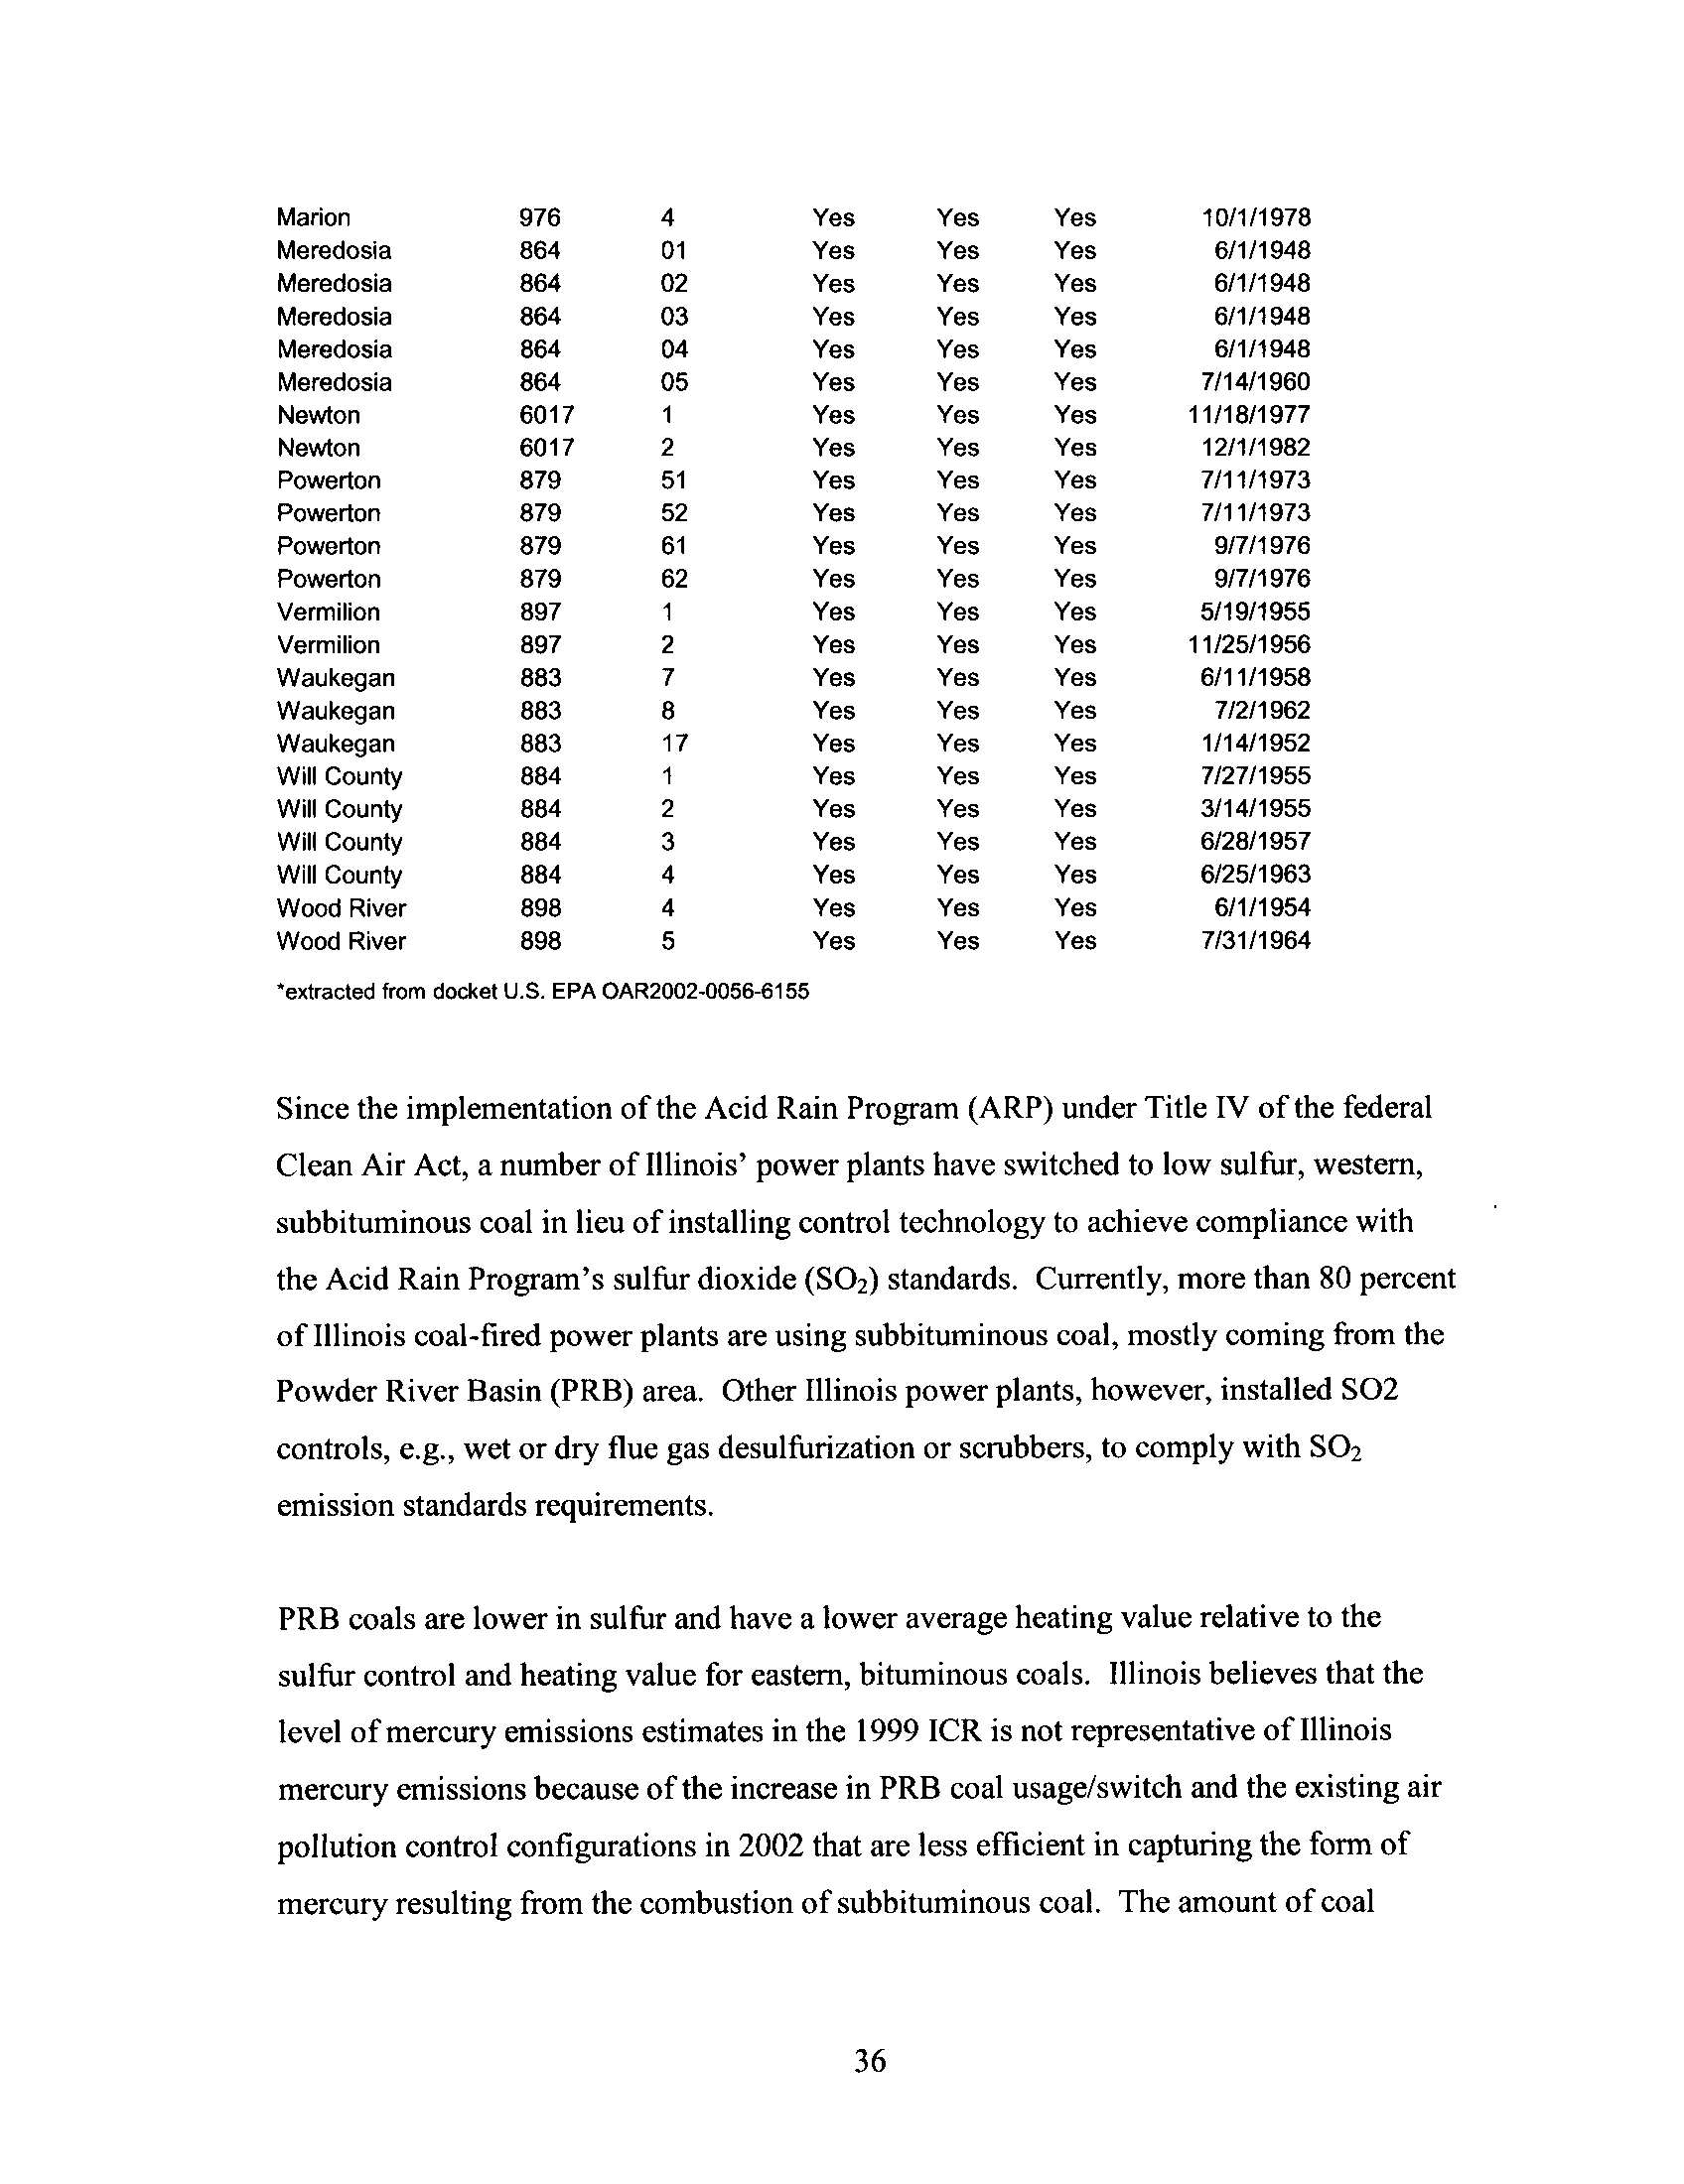
Table 2.1 - 1999 ICR List of Illinois Coal-fired Electric Generating Units*
35
FACILITY NAME
ORIS
CODE
UNITID
Acid Rain
Program
Hg
Hg MACT Allocation
CAMD
Online
Date
Baldwin
889
1
Yes
Yes
Yes
7/13/1970
Baldwin
889
2
Yes
Yes
Yes
5/21/1973
Baldwin
889
3
Yes
Yes
Yes
6/20/1975
Coffeen
861
01
Yes
Yes
Yes
12/20/1965
Coffeen
861
02
Yes
Yes
Yes
9/16/1972
Crawford
867
7
Yes
Yes
Yes
5/23/1958
Crawford
867
8
Yes
Yes
Yes
4/13/1961
Dallman
963
31
Yes
Yes
Yes
6/1/1968
Dallman
963
32
Yes
Yes
Yes
6/1/1972
Dallman
963
33
Yes
Yes
Yes
Duck Creek
6016
1
Yes
Yes
Yes
6/26/1976
E D Edwards
856
1
Yes
Yes
Yes
5/1/1960
E D Edwards
856
2
Yes
Yes
Yes
6/1/1968
E D Edwards
856
3
Yes
Yes
Yes
6/23/1972
Fisk
886
19
Yes
Yes
Yes
3/14/1959
Grand Tower
862
07
Yes
Yes
Yes
3/1/1951
Grand Tower
862
08
Yes
Yes
Yes
3/1/1951
Grand Tower
862
09
Yes
Yes
Yes
4/2/1958
Havana
891
9
Yes
Yes
Yes
6/6/1978
Hennepin
892
1
Yes
Yes
Yes
6/1/1953
Hennepin
892
2
Yes
Yes
Yes
5/14/1959
Hutsonville
863
05
Yes
Yes
Yes
2/1/1953
Hutsonville
863
06
Yes
Yes
Yes
7/1/1954
Joliet 29
384
71
Yes
Yes
Yes
4/9/1965
Joliet 29
384
72
Yes
Yes
Yes
4/9/1965
Joliet 29
384
81
Yes
Yes
Yes
3/21/1966
Joliet 29
384
82
Yes
Yes
Yes
3/21/1966
Joliet 9
874
5
Yes
Yes
Yes
6/12/1959
Joppa Steam
887
1
Yes
Yes
Yes
8/1/1953
Joppa Steam
887
2
Yes
Yes
Yes
9/1/1953
Joppa Steam
887
3
Yes
Yes
Yes
5/1/1954
Joppa Steam
887
4
Yes
Yes
Yes
8/1/1954
Joppa Steam
887
5
Yes
Yes
Yes
6/5/1955
Joppa Steam
887
6
Yes
Yes
Yes
8/5/1955
Kincaid
876
1
Yes
Yes
Yes
6/7/1967
Kincaid
876
2
Yes
Yes
Yes
6/10/1968
Lakeside
964
7
Yes
Yes
Yes
Lakeside
964
8
Yes
Yes
Yes
Marion
976
1
Yes
Yes
Yes
1/1/1995
Marion
976
2
Yes
Yes
Yes
1/1/1995
Marion
976
3
Yes
Yes
Yes
10/1/1963
'extracted from docket U.S. EPA OAR2002-0056-6155
Since the implementation of the Acid Rain Program (ARP) under Title IV of the federal
Clean Air Act, a number of Illinois' power plants have switched to low sulfur, western,
subbituminous coal in lieu of installing control technology to achieve compliance with
the Acid Rain Program's sulfur dioxide (SO 2) standards. Currently, more than 80 percent
of Illinois coal-fired power plants are using subbituminous coal, mostly coming from the
Powder River Basin (PRB) area . Other Illinois power plants, however, installed SO2
controls, e.g., wet or dry flue gas desulfurization or scrubbers, to comply with S02
emission standards requirements
.
PRB coals are lower in sulfur and have a lower average heating value relative to the
sulfur control and heating value for eastern, bituminous coals . Illinois believes that the
level of mercury emissions estimates in the 1999 ICR is not representative of Illinois
mercury emissions because of the increase in PRB coal usage/switch and the existing air
pollution control configurations in 2002 that are less efficient in capturing the form of
mercury resulting from the combustion of subbituminous coal . The amount of coal
36
Marion
976
4
Yes
Yes
Yes
10/1/1978
Meredosia
864
01
Yes
Yes
Yes
6/1/1948
Meredosia
864
02
Yes
Yes
Yes
6/1/1948
Meredosia
864
03
Yes
Yes
Yes
6/1/1948
Meredosia
864
04
Yes
Yes
Yes
6/1/1948
Meredosia
864
05
Yes
Yes
Yes
7/14/1960
Newton
6017
1
Yes
Yes
Yes
11/18/1977
Newton
6017
2
Yes
Yes
Yes
12/1/1982
Powerton
879
51
Yes
Yes
Yes
7/11/1973
Powerton
879
52
Yes
Yes
Yes
7/11/1973
Powerton
879
61
Yes
Yes
Yes
9/7/1976
Powerton
879
62
Yes
Yes
Yes
9/7/1976
Vermilion
897
1
Yes
Yes
Yes
5/19/1955
Vermilion
897
2
Yes
Yes
Yes
11/25/1956
Waukegan
883
7
Yes
Yes
Yes
6/11/1958
Waukegan
883
8
Yes
Yes
Yes
7/2/1962
Waukegan
883
17
Yes
Yes
Yes
1/14/1952
Will County
884
1
Yes
Yes
Yes
7/27/1955
Will County
884
2
Yes
Yes
Yes
3/14/1955
Will County
884
3
Yes
Yes
Yes
6/28/1957
Will County
884
4
Yes
Yes
Yes
6/25/1963
Wood River
898
4
Yes
Yes
Yes
6/1/1954
Wood River
898
5
Yes
Yes
Yes
7/31/1964
sample-tested for mercury and stack testing data from the 1999 ICR offers the most
comprehensive mercury data available that can be used to estimate mercury emissions for
later years. Hence, Illinois EPA has estimated (2002) mercury emissions from Illinois'
coal-fired EGUs by using the methodology employed by U .S. EPA in its Emissions and
Generation Resource Integrated Database (eGrid)
(http://www.epa.gov/cleanenergy/egrid/index.htm) for power plant emissions (and also as
adopted by the Commission for Environmental Cooperation (CEC) in their estimate of
power plant emissions for North America
(See: North American Power Plant Air
Emissions" by Paul Migler and Chris Van Aten, Commission for Environmental Co-
operation of North America" (Montreal, Quebec 2004), i.e.,
using estimating parameters
such as plant specific ratio from the 1999 ICR and coal usage reported in 2002 by power
plants to the U .S. Department of Energy's (DOE) Energy Information Administration
(EIA). The plant specific ratio was derived by dividing mercury emissions estimate in
1999 ICR by the coal usage for each plant in 1999 . This plant specific ratio was then
used to scale the estimates for 2002 using the reported coal usage for each plant in 2002
.
Using this methodology, Illinois' estimated mercury emissions from coal-fired power
plants for 2002 was estimated at around 7022 pounds
.
3.0
Mercury Impacts on Human Health
Various chemical forms of mercury, e.g. elemental mercury, inorganic mercury salts, and
organic alkyl mercury compounds, are known to induce toxic responses in the human
body. For the known environmental exposure pathways of mercury compounds to human
beings, it is generally felt that methylmercury ingestion through fish consumption poses
the greatest exposure risk to human beings. The Minamata, Japan and Niigata Prefecture
(Japan) methylmercury poisoning incidents of the 1950s and 1960s, respectively, are well
known examples of mercury poisoning epidemics resulting from fish consumption. A
significant mercury poisoning event in Iraq in the 1970s was due to ingestion of flour
made from grain seeds treated with methylmercury . These acute poisoning incidents have
yielded information on the symptoms and neurological effects of methylmercury
poisoning, as have reports regarding low-level exposures . The effects can be different for
an adult as compared to an infant or fetus, but the infant and fetus are known to be more
37
sensitive to the neurotoxin. Sensory impairment, speech impairment, muscle weakness,
tremor, mental deficits (memory, learning), malformed brains, hypersensitive reflexes,
and mental retardation are included among the known neuropathological manifestations
of methylmercury poisoning in humans .
As a result of the mass methylmercury poisoning incidents previously mentioned, three
longitudinal prospective epidemiological studies---studies in which individuals are tested
on more than one occasion---were conducted in the late 1970s and 1980s to assess human
developmental effects linked to mercury exposure from predominantly fish-eating
populations. Scholastic and psychological test batteries were administered in all of these
studies. A case-control study---a study investigating those with and those without a
particular health condition---was conducted in New Zealand of 74 children representing
white, Maori, and Pacific Islander ethnic groups . When tested at the age of four, 52% of
this group had abnormal results when compared to 17% of the children in a control
group. A study on approximately 750 children (black population) on the Seychelles
Islands yielded results, from evaluations at 66 months of age, for which evidence of
adverse effects was not strong. Further testing of the Seychelles Island population at 9
years of age yielded one adverse association . The results of this study contrast markedly
with one involving over 900 children (white population) on the Faroe Islands
.
Statistically significant associations were found between umbilical cord blood mercury
levels and poorer performance on certain assessment tests for the Faroe Island
population. A recent analysis of all three longitudinal studies indicates that the results are
not discordant with respect to mercury effects on IQ . This integrative analysis yielded a
decrement of 0.13 IQ point for each 1 ppm increase in maternal hair mercury . Other
prospective studies---studies aimed at determining the onset of disease---have been
conducted in the Philippines, Poland, and the United States . Results consistent with those
from the Faroe Islands study have been reported for these studies .
Cross-sectional studies---those which compare the current health and exposure status of
study members, and then evaluate similarities---assessing development in children from
the Madeira Islands, Brazilian Amazon, French Guiana, and Ecuador have shown test
38
outcomes significantly associated with the metrics of mercury hair concentrations or
blood mercury levels. Similarly, cognitive function and motor function tests on adults in
Italy, United States, Brazil and Quebec have shown associations with total urinary
mercury, mercury in blood, and/or hair mercury content
.
The physiological and behavioral effects of developmental exposure to methylmercury
have been studied in monkeys and rodents and provide insights for human
neuropathological effects . In all species (including humans), exposure at high doses
results in damage to the brain and decreased brain size. Diminished visual and auditory
functionality, decreased motor function and cognitive impairment have been
demonstrated in test animals subject to elevated methylmercury exposure during
development. Testing conducted on animals long after the cessation of dosing has shown
that impairments are often permanent . Research has also provided evidence of delayed
neurotoxicity---obesity, neuropsychological deficits, somatosensory damage, etc.---
resulting from developmental exposure to methylmercury . There is also compelling
evidence of delayed neurotoxicity in human populations long after the cessation of
exposure to methylmercury. Though the precise molecular mechanism of delayed
neurotoxicity is unknown, it is clear that exposure can result in permanent impairment
.
The potential impact on the human body of methylmercury exposure includes evidence
for cardiovascular and coronary disease . In a recent study of 2500 men in Finland, the
highest measured hair mercury concentrations were associated with increased incidences
of myocardial infarction. The results of this study also indicate that high levels of
methylmercury in the body may negate the beneficial effects of fish oils in protecting
against coronary disease
.
The NHANES survey and other studies intended to provide information on mercury body
burdens in the U .S. population provide evidence of a strong association between fish
consumption and increased mercury levels. For some populations, a substantial
percentage of individuals have methylmercury body burdens greater than that associated
with the reference dose. The reference dose (RfD) for methylmercury is 0.1
39
micrograms/kg/day, and it represents an estimation of a daily exposure to the human
population (including sensitive subgroups) that is likely to be without appreciable risk of
deleterious effects during a lifetime . It is not a "bright line" cutoff for known health
effects versus no-effect levels . The RID is based on the lower bound of a 95% confidence
interval on the dose, which produces a 5% effect level (in addition to a 5% background
level), and it includes an uncertainty factor of 10 to account for maternal to fetal dose
ratio variability and an individual's dose sensitivity. The Centers for Disease Control has
estimated that approximately 6% of women of childbearing age have blood mercury
levels at or exceeding the reference dose. Umbilical cord blood mercury concentration of
5.8 micrograms/liter (on average, this is equated to a maternal blood level of 3
.4)
corresponds to the U.S. EPA reference dose . This in turn corresponds with a hair mercury
level of 0.65 ppm. A model has been used which provides an estimate of the maternal
intake of methylmercury relative to blood mercury levels under steady state conditions. A
median intake value of 0 .81 micrograms/kg/day would be associated with an umbilical
cord blood concentration of 58 micrograms/liter
.
Researchers have estimated the costs of environmental exposure to methylmercury
associated with IQ decrement and increased occurrences of mental retardation . Using
data from the Faroe Islands study, the loss in lifetime earnings associated with IQ
decrement has been estimated at $8 .7 billion annually (in Year 2000 US dollars) . The
cost of increased occurrences of mental retardation (excluding lost wages) was estimated
at $2.0 billion annually. Neuropsychological effects not related to IQ decrement (e.g .
attention deficits), potential cardiovascular and coronary effects, potential blood pressure
effects, and potential cognitive deficits, which are not monetized, result in cost
underestimates related to methylmercury exposure . (The majority of statements made in
this portion of the report are based, at least in part, on statements contained within the
Michigan's Electric Utility Workgroup Final Report on Mercury Emissions from Coal-
Fired Power Plants (June 20, 2005) (Michigan Mercury Report)) and the attached
Appendix A,
"Review of the Nervous System and Cardiovascular
Effects
of
Methylmercury Exposure" (March 2006) .)
40
3.1
Quantifying and Monetizing Impacts of Mercury in Illinois
Elevated exposure to mercury through the consumption of contaminated fish adversely
affects the economy of a given region through direct effects to human health . Studies to
quantify and monetize the benefits to human health as a result of reductions in mercury
emissions from U.S. power plants have been conducted by U .S. EPA, NESCAUM,
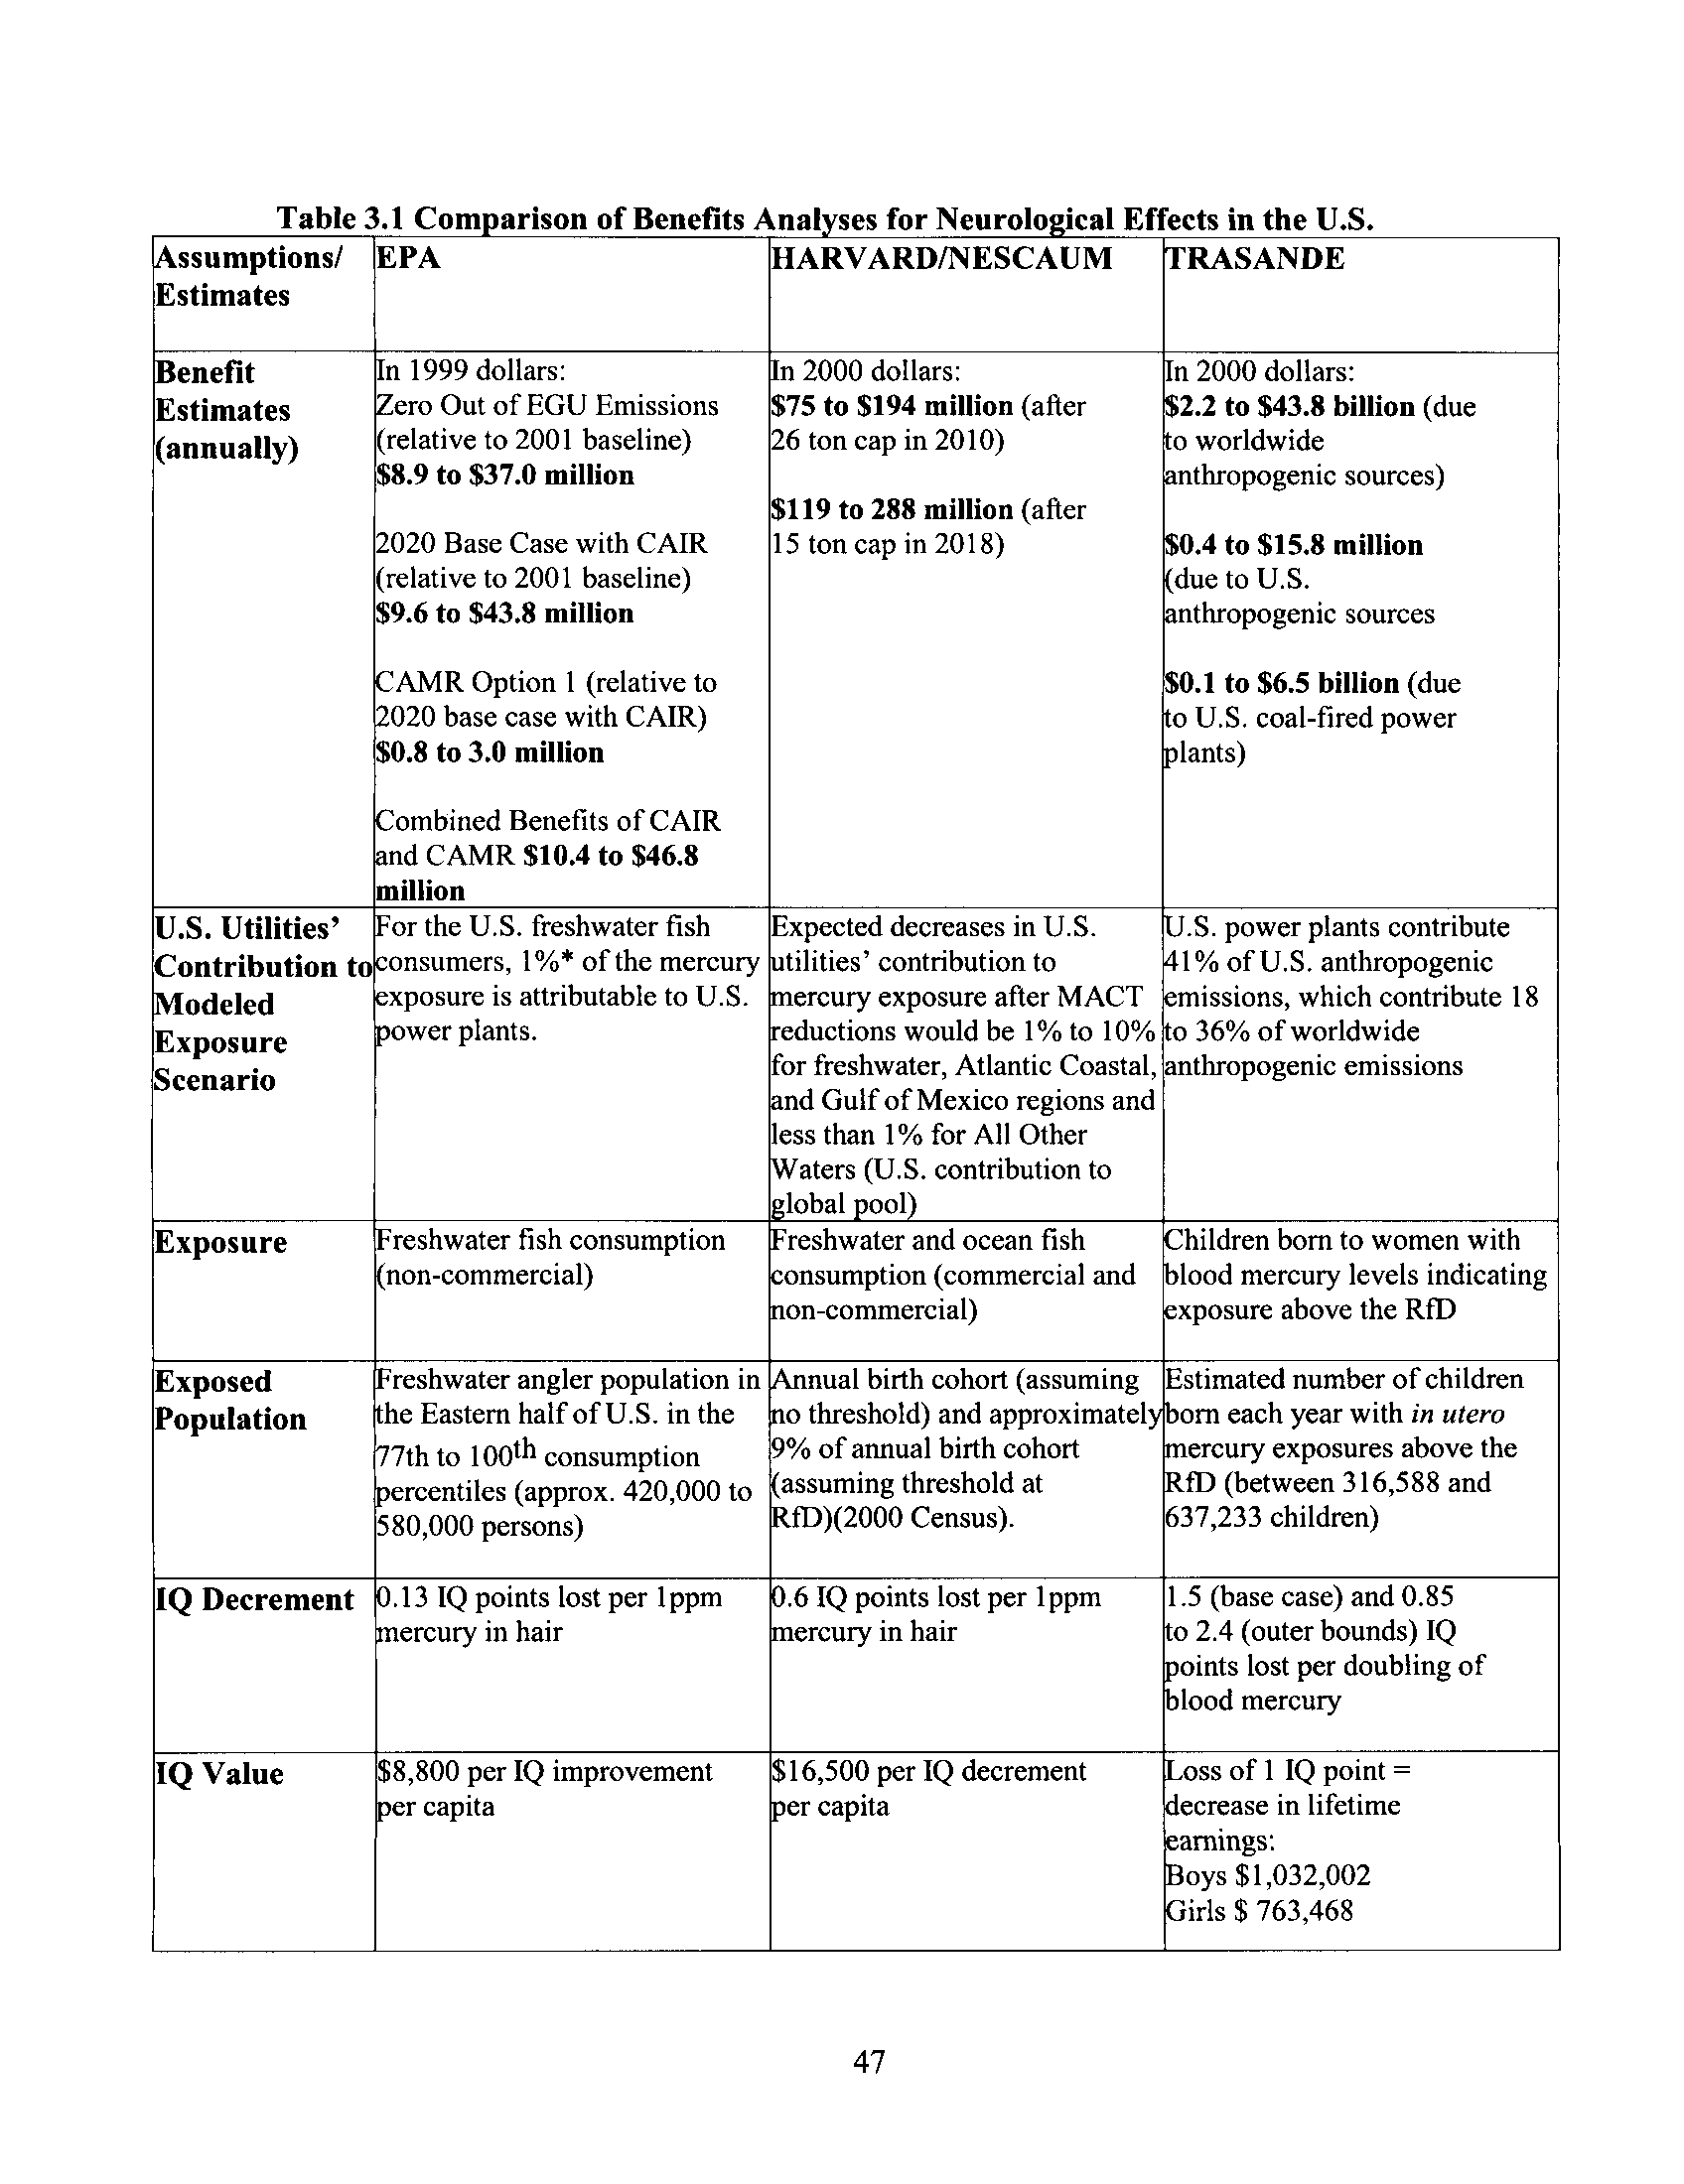
Harvard, and Trasande et al. They have been summarized in Section 2 .5.4 of Michigan's
Mercury Electric Utility Workgroup's Final Report on Mercury Emissions from Coal-
fired Power Plants. The following summaries are taken from that report
.
U.S. EPA CAMR Regulatory Impact Analysis (CAMR RIA)
In the U.S. EPA's final CAMR released March 15, 2005, the benefits of reduced
mercury emissions from the utility sector were estimated based on monetized
"improvements in IQ decrements" for a subset of the U .S. population exposed in
utero
which included the freshwater angler population (women of childbearing
age) in the eastern half of the U .S. EPA also analyzed a smaller subset of the
population who consume greater amounts of fish than the general population,
which included subsistence fishers, certain Native Americans, and Asian
Americans .
U.S. EPA reasoned that since the largest change in power plant deposition
associated with the final Clean Air Interstate Rule (CAIR) and CAMR programs
would occur in the eastern-half of the U .S., the unquantified benefits for the
western-half of the U.S. would be expected to be quite small (CAMR RIA ;
Section 10-1). U .S. EPA stated that the focus of their analysis was limited to
freshwater fish consumption exposure due to limitations in the modeling of how
changes in mercury deposition will affect fish tissue concentrations from other
consumption pathways (namely ocean fish consumption) (CAMR RIA ; Section
10-1). EPA's analysis further indicated that only freshwater fish are significantly
impacted by U .S. power plants. EPA did recognize, however, that ocean fish
4 1
consumption is the predominant pathway for methylmercury exposure in the U
.S .
(approximately 90%) (CAMR RIA ; Section 10-144) . EPA stated that
"exclusion of these commercial pathways means that this benefit analysis, while
covering an important source of exposure to domestic mercury emissions excludes
a large and potentially important group of individuals . "
EPA's benefit estimates represent the monetary values of expected IQ
improvements assessed in terms of future foregone earnings recovered after
reductions are achieved via the final CAMR . This considered, EPA assessed
exposure reductions for each of the regulatory options utilizing various control
scenarios, timelines, and lag times between reductions and subsequent benefits .
EPA's core analysis used a primary dose-response curve that implies that each I
part per million (ppm) increase in mercury in hair results in a 0 .13 IQ decrement .
The monetized value of avoided IQ decrements was estimated to be between $0 .8
and $3.0 million annually at a 3% discount rate (1999 dollars), under CAMR
Option 1 assuming no threshold (CAMR RIA, Table 11-7). Combined benefits of
CAIR and CAMR resulted in a range of estimated benefits between $10 .4 to
$46.8 million annually (1999 dollars) (CAMR RIA ; Table 10-1c). The benefits
associated with each of the emission reduction scenarios were estimated as the
difference (reduction) in the total value of IQ losses, going from the relevant
baseline scenario to conditions with emissions reductions in place (CAMR RIA
;
Table 10-11)
.
U.S. EPA recognized that full scale IQ might not be the cognitive endpoint that is
most sensitive to prenatal mercury exposure (CAMR RIA; Table 9-9) . They state
that their benefits assessment has several known uncertainties and biases and that
these biases are both in the upward and downward direction but that, taken
together
42
"the Agency believes that the benefits presented in this section likely
underestimate the total benefits of reducing mercury emissions from power plants
due to the potential health effects and potentially exposed populations that are not
quantified in this analysis . "
In addition to quantifying benefits based on IQ improvements, U .S. EPA
acknowledged that other health and ecosystem benefits (other neurological effects
besides IQ, cardiovascular, genotoxic, immunotoxic, and ecological) may also
result from reductions . However, they did not feel confident in quantifying these
potential benefits. These benefits were addressed qualitatively and listed in Table
10-45 in EPA's CAMR RIA. Furthermore, U .S. EPA performed an illustrative
analysis to monetize co-benefits of avoided premature adult mortality expected to
result from reductions in emissions of PM2 .5 (fine particulate matter with a
diameter of y 2.5 microns) if ACI with the addition of a polishing baghouse is
used (such as TOXECONTM). Potential benefits resulting from Option 1 ranged
from $1.5 to $44 million depending upon the availability of advanced sorbents
technology. Similarly, potential benefits under Option 2 ranged from $1 .5 to $130
million, again depending upon the status of advanced sorbent technology. The
explanation and rationale for U.S. EPA's approach is described in Johnson
(2005), as well as CAMR RIA .
Harvard /NESCAUM Study
In a separate analysis, researchers from the Harvard Center for Risk Analysis, on
contract with the Northeast States for Coordinated Air Use Management
(NESCAUM), assessed the health benefits of reducing mercury from U .S. coal-
fired power plants based on targeted emission amounts similar to those U .S. EPA
had proposed in their draft maximum achievable control technology (MACT)
standard (i.e . preliminary reduction to 26 tons of mercury emissions annually, and
final reduction to 15 tons after 2018) . The researchers relied on regional
deposition modeling results from U.S. EPA's analysis of the Clear Skies Initiative
43
as the basis for expected changes in fish tissue mercury levels . Modeling was
based on five freshwater regions (Northeast, Mid-Atlantic, Southeast, Midwest,
and West) and three saltwater regions (Atlantic Coastal, Gulf of Mexico, and All
Other Waters). Estimated expected decreases in freshwater regions and the
Atlantic Coastal and Gulf of Mexico regions ranged from 1 % to 10%. Estimated
expected decreases to the "All Other Waters" region was assumed to be
proportional to the change in total global emissions which equates to less than
1% .
The health effects considered in this analysis were "cognitive abilities" (including
IQ), and also cardiovascular effects, which were not quantitatively monetized by
U.S. EPA (CAMR RIA). Human exposure pathways considered included
commercially and non-commercially harvested fish based on FDA and U.S. EPA
consumption rates. The exposed population for calculating IQ benefits consisted
of U .S. women of childbearing age with estimated exposure levels above the RID
(roughly 9% of U.S. females). The exposed population for calculating
cardiovascular benefits was the U .S. population of men and women over the age
of 39 (based on 2000 Census data) . A slope estimate of the dose-response
relationship was estimated to be 0 .6 IQ points lost per 1 ppm increase in hair
mercury concentration which was stated as a central tendency estimate based on
existing literature. They utilized a cost-of-illness approach to derive a value of
$16,500 (year 2000 dollars) for each IQ decrement. Their results indicated
average national benefits due to IQ increases alone in the annual birth cohort
ranged between $75 and $194 million (after the MACT Phase 126 ton cap) and
between $119 and $288 million (after the MACT Phase 11 15 ton cap), depending
on whether or not a neurotoxicity threshold is assumed (all dollar values are year
2000). The researchers assumed that
" . ..increases in a child's intelligence
quotient (IQ) that result from decreases in intrauterine methyl mercury exposures
capture some
of
the neurodevelopmental delays reported in positive
epidemiological studies."
They indicated that these values were likely a
conservative estimate of the total value individuals place on IQ changes, because
44
such changes may have value that is independent of their impact on lifetime
earnings .
According to the Harvard/NESCAUM study, the potential cardiovascular effects
of methyl mercury exposure are less well understood and therefore any monetized
values representing cardiovascular benefits are accompanied with a great deal of
uncertainty. It is noted that this uncertainty was the U .S. EPA (CAMR RIA)
rationale for focusing their quantitative analysis on IQ benefits, which are better
established including an available model for monetizing benefits . The
Harvard/NESCAUM study derived two estimates based on epidemiological
studies of methylmercury exposure in males who consumed non-fatty freshwater
fish. The endpoints evaluated in these studies were increased risk of non-fatal
myocardial infarction and premature mortality from myocardial infarction. Using
a cost-of-illness approach (2000 value year), the estimated value of myocardial
infarction was $50,000 per individual. Using a willingness-to-pay approach for
the same value year, the estimated value of premature fatality was $6,000,000 per
individual. Total benefits of $4.9 billion annually due to reduced cardiovascular
disease were estimated, assuming benefits are extended to the entire adult
population. The authors strongly cautioned against the use of these predicted
benefits until further study and review was available to support the relationship
between increased cardiovascular risk and methyl mercury exposure
.
Trasande et al. Study
In another available study, Trasande et al . (2005) estimated the national, annual
cost associated with methylmercury exposure due to lost productivity during the
lifetimes of children who were exposed in utero resulting in neurological effects
(IQ loss). The rationale for this approach was that loss of intelligence causes
diminished economic productivity that persists over the entire lifetime of affected
children. Their cost estimates included direct costs of health care, costs of
rehabilitation, and lost productivity . They also estimated the fraction of that loss
45
which is attributable to mercury emissions from U .S. power plants. The exposed
population is the estimated number of children bom each year with cord blood
mercury levels greater than the level associated with the RID, which is protective
of effects on IQ. That information was obtained from national blood mercury
prevalence data from the CDC. The resulting at-risk subgroup was estimated as
between
316,588
and
637,233
exposed children, which includes children exposed
through any maternal consumption pathway including consumption of freshwater
and ocean fish. The estimated cost of loss in productivity due to the reduction in
intelligence was estimated to be between
$2 .2
and
$43 .8
billion, depending on
fetal effect level assumptions . Based on these estimates,
$1 .3
billion (range: $0.1
to
$6.5
billion) annually was attributable to emissions from U .S. coal-fired power
plants according to the researchers . This study did not discuss or include
quantification or monetization of potential cardiovascular effects of
methylmercury exposure (Trasande et al .,
2005) .
Table
3 .1
summarizes the key assumptions and value estimates made in each of
the three benefits analyses presented above .
46
Table 3.1 Com arison of Benefits Anal ses for Neurolo ical Effects in the U .S .
47
Assumptions/
Estimates
EPA
HARVARD/NESCAUM
RASANDE
Benefit
Estimates
(annually)
n 1999 dollars
:
ero Out of EGU Emissions
(relative to 2001 baseline)
$8.9 to $37.0 million
2020 Base Case with CAIR
(relative to 2001 baseline)
$9.6 to $43.8 million
AMR Option I (relative to
020 base case with CAIR)
$0.8 to 3 .0 million
ombined Benefits of CAIR
I n 2000 dollars
:
$75 to $194 million (after
26 ton cap in 2010)
$119 to 288 million (after
15 ton cap in 2018)
n 2000 dollars :
.2.2 to $43.8 billion (due
o worldwide
nthropogenic sources)
.0.4 to $15.8 million
due to U.S
.
.nthropogenic sources
.0.1 to $6.5 billion (due
o U.S. coal-fired power
lants)
.nd CAMR $10.4 to $46.8
million
U.S . Utilities'
Contribution to
Modeled
Exposure
Scenario
I or the U.S. freshwater fish
onsumers, 1%* of the mercury
-xposure is attributable to U .S .
mower plants .
Expected decreases in U .S .
tilities' contribution to
ercury exposure after MACT
eductions would be 1% to 10%
for freshwater, Atlantic Coastal,
nd Gulf of Mexico regions and
less than 1 % for All Other
aters (U.S . contribution to
lobal ool
S. power plants contribute
1 % of U.S. anthropogenic
-missions, which contribute 18
o 36% of worldwide
anthropogenic emissions
Exposure
reshwater fish consumption
non-commercial)
reshwater and ocean fish
onsumption (commercial and
on-commercial)
hildren born to women with
lood mercury levels indicating
xposure above the RfD
Exposed
Population
reshwater angler population in
he Eastern half of U .S. in the
7th to 100th consumption
ercentiles (approx. 420,000 to
580,000 persons)
nual birth cohort (assuming
o threshold) and approximatel
9% of annual birth cohort
assuming threshold at
fD)(2000 Census)
.
Estimated number of children
orn each year with
in utero
ercury exposures above the
fl) (between 316,588 and
637,233 children)
IQ Decrement
13 IQ points lost per lppm
ercury in hair
1 5 (base case) and 0.85
o 2.4 (outer bounds) IQ
soints lost per doubling of
.lood mercury
IQ Value
$8,800 per IQ improvement
I
s
r capita
oss of 1 IQ point =
a
ecrease in lifetime
arnings :
oys $1,032,002
rls $ 763,468
* 1% is the product of combining the 8% contribution of U .S. utilities to U.S. deposition (and freshwater fish levels) ;
from page 8 to 14 of CAMR RIA and the 13% contribution of wild fresh water fish to the U.S. fish diet; from page 4 to
46 of CAM R RIA .
** Trasande et al. attributed 33% of the total cost of IQ deficits to U .S. power plants. This equates to $1 .3 billion out of
a total cost of $3 .9 billion .
4.0
Mercury Impaired Waters in Illinois
High mercury levels in fish tissue pose a public health risk, but their presence also
imposes a regulatory requirement for Illinois under the federal Clean Water Act (CWA)
.
This section describes the applicability of the Clean Water Act to mercury-impaired
waters, how mercury impairments have been identified, an analysis of the amount of
mercury reduction needed in fish tissue to reach attainment, sources of mercury loading
and the experience of two other states in addressing mercury contamination of fish tissue .
4.1
Background on Clean Water Act Requirements
4.1 .1
Water Pollution Control Regulatory Scheme/Water Quality Standards
Water pollution control programs are designed to protect the "beneficial uses" of the
water resources of the state . Each state has the responsibility to set water quality
standards that protect these beneficial uses, also called "designated uses." Illinois waters
are designated for various uses including aquatic life, wildlife, agricultural use, primary
contact (e.g ., swimming, water skiing), secondary contact (e.g., boating, fishing),
industrial use, fish consumption, drinking water, food-processing water supply and
aesthetic quality.
48
Cost Approach Monetized "improvements in
Cost of illness approach as
Cost of illness approach
IQ decrements" in terms of
future foregone earnings
recovered after reductions
under CAMR/CAIR are
achieved
dollars saved (in terms of
future foregone earnings)
after reductions under
proposed MACT rule are
achieved
as lifetime lost
productivity (in terms of
lost productivity and direct
costs of health care and
rehabilitation) from
exposure to mercury
above the RID
Table 4.1 Illinois Designated Uses and Applicable Water Quality Standards
.
1 . As defined in 35 Ill. Adm. Code 302.201 and 302.303 .
The Illinois Pollution Control Board (Board) is responsible for setting water quality
standards to protect designated uses in waterbodies. The federal Clean Water Act
requires the states to review and update water quality standards every three years . Illinois
EPA, in conjunction with U . S. EPA, identifies and prioritizes those standards to be
developed or revised during this three-year period . Illinois EPA is responsible for
developing scientifically-based water quality standards and proposing them to the Illinois
Pollution Control Board for adoption into State rules and regulations
.
The Board has established four primary sets (or categories) of narrative and numeric
water quality standards for surface waters . Each set of standards is designed to help
49
Illinois EPA
Designated Uses
Illinois Waterbodies in which the Designated
Use and Standards Apply( "
Applicable Illinois Water
Quality Standards
Aquatic Life
Streams, Inland Lakes
General Use Standards
Lake Michigan-basin waters
Lake Michigan Basin
Standards
Aesthetic Quality
Streams, Inland Lakes
General Use Standards
Lake Michigan-basin waters
Lake Michigan Basin
Standards
Indigenous Aguatic
Specific Chicago Area Waterbodies
Secondary Contact and
Indigenous Aquatic Life
Standards
Lid
Primary Contact
(Swimming)
Streams, Inland Lakes
General Use Standards
Lake Michigan-basin waters
Lake Michigan Basin
Standards
Secondary Contact
Streams, Inland Lakes
General Use Standards
Lake Michigan-basin waters
Lake Michigan Basin
Standards
Specific Chicago Area Waterbodies
Secondary Contact and
Indigenous Aquatic Life
Standards
Public and Food
Processing Water
Supply
Streams, Inland Lakes, Lake Michigan-basin
waters
Public and Food Processing
Water Supply Standards
Fish Consumption
Streams, Inland Lakes
General Use Standards
(Human Health)
Lake Michigan-basin waters
Lake Michigan Basin
Standards (Human Health)
Specific Chicago Area Waterbodies
Secondary Contact and
Indigenous Aquatic Life
Standards
protect various designated uses established for each category . The fish consumption use
is covered under the general use category .
The Board's
General Use Standards (35 Ill
.
Adm. Code Part
302,
Subpart B) - apply to
almost all waters of the State and are intended to protect aquatic life, wildlife,
agricultural, primary contact, secondary contact, and most industrial uses . These General
Use standards are also designed to ensure the aesthetic quality of the state's aquatic
environment and to protect human health from disease or other harmful effects that
could occur from ingesting aquatic organisms taken from surface waters of the State
(Emphasis added) .
The general use standards for mercury include standards for protection of aquatic life and
human health. Part
302
of
35 Ill
Adm. Code, Subpart B, lists acute and chronic standards
for protection of aquatic life which are
2 .2
and 1 .1 micrograms per liter dissolved
mercury, respectively. Sections
302.208
(c) and (1) of
35 Ill
.
Adm. Code identify a much
more stringent standard for human health protection
:
0.012
micrograms per liter total
mercury. This level is the national criterion applicable to water to address the potential
for mercury to bioaccumulate in fish tissue.
4.1 .2
Point Source Pollution Control
Discharges that enter surface waters through a pipe, ditch or other well-defined point of
discharge are broadly referred to as "point sources ." Common point source discharges
include wastewater treatment facilities serving municipalities, industries, residential
developments, retail and commercial complexes, schools, mobile home parks, military
installations, state parks, resorts/campgrounds, prisons, and individual residences. Other
wastewater point source discharges can come from municipal combined sewer overflows
(CSOs), concentrated animal feeding operations, mines, groundwater remediation
projects, and water treatment plants
.
The National Pollutant Discharge Elimination System (NPDES) was established by the
Clean Water Act in
1972
and has been administered by Illinois EPA since
1973 .
The
50
program requires permits for the discharge of treated municipal effluent, treated industrial
effluent, storm water and other discharges . The permits establish the conditions under
which the discharge may occur, so that water quality and designated uses are protected,
and establish monitoring and reporting requirements .
Permit conditions for mercury depend on the type of point source . Industrial discharges
from processes involving mercury typically have mercury effluent limits that must be
met, based on the water quality standard . All major municipal dischargers must monitor
for very low levels of mercury
.
4 .1 .3
Non-Point Source Pollution Control
Sources of water pollution other than point sources are designated as non-point sources
and can have very significant impact on water quality. Non-point source pollution can
result from precipitation moving over and through the ground that picks up pollutants
from farms, cities, mined lands, and other landscapes and carries these pollutants into
rivers, lakes, wetlands, and groundwater . Non-point source pollution can include
numerous, diffuse sources such as clusters of malfunctioning septic systems
.
Atmospheric deposition of pollutants to water (from air emission sources) is another non-
point water pollution source
.
Discharges from these sources are mainly regulated through implementing corrective and
preventative best management practices (BMPs) on a watershed scale.
4.1.4
Requirements to Report on Conditions of State Waters
According to Section 305(b) of the Clean Water Act and guidance provided by the U .S .
EPA, each state, territory, tribe, and interstate commission (hereafter collectively called
"state") must report to U.S. EPA on the quality of the surface water (e.g., lakes, streams,
wetlands) and groundwater resources in their jurisdiction . Specifically, states must report
the resource quality of their waters in terms of the degree to which the certain beneficial
uses of those waters are attained . States are also required to report the reasons (causes
5 1
and sources) if beneficial uses are not attained . In addition, states are required to provide
an assessment of the water quality of all publicly-owned lakes, including the status and
trends of such water quality as specified in section 314(a)(1) of the Clean Water Act
.
Section 303(d) of the Clean Water Act requires states to submit to U .S. EPA a list of
water quality-limited waters
(i .e ., waters where uses are impaired), the pollutants causing
impairment to those waters and a priority ranking for the development of Total Maximum
Daily Load (TMDL) calculations (including waters targeted for TMDL development
within the next two years). This list is often called the 303(d) List .
The most current 305(b)/303(d) report is the draft "Illinois Integrated Water Quality
Report and Section 303(d) Report, 2006" found at
www.epa.state.il.us/water/watershed/reports/303d-report/2006/303d-report .pdf
4.1.5
303(d)/Total Maximum Daily Load Program (TMDL)
As stated earlier, section 303(d) of the federal Clean Water Act requires states to identify
waters that do not meet applicable water quality standards or do not fully support their
designated uses. States are required to submit a prioritized list of impaired waters, known
as the 303(d) List, to the U .S. EPA for review and approval
.
The CWA also requires that a TMDL be developed for each pollutant of an impaired
waterbody. The establishment of a TMDL sets the pollutant reduction goal necessary to
improve impaired waters. TMDL calculations determine the amount of a pollutant a
waterbody can assimilate without exceeding the state's water quality standards or
impairing the waterbody's designated uses. It determines the load (i.e ., quantity) of any
given pollutant that can be allowed in a particular water body. A TMDL must consider
all potential sources of pollutants, whether point or nonpoint . It also takes into account a
margin of safety, which reflects scientific uncertainty, as well as the effects of seasonal
variation
.
52
After the reduced pollutant loads have been determined, an implementation plan is
developed for the watershed spelling out the actions necessary to achieve the goals
. The
plan specifies limits for point source discharges and recommends best management
practices for nonpoint sources. It also estimates associated costs and lays out a schedule
for implementation
4.2
Identification of Mercury Impaired Waters in Illinois
4.2.1 Fish Consumption Advisories
Fish consumption advisories are issued when concentrations above human health-based
limits of one or more of contaminants such as PCBs, chlordane, and mercury are detected
in fish tissue. For mercury, there is a statewide fish consumption advisory in place in
Illinois for all predator fish species . The advisories are based on tissue analysis of such
sports fish as flathead catfish, all species of bass (including largemouth, smallmouth,
spotted, white and striped), walleye, musky and northern pike . The human health-based
concentrations in fish tissue for issuing the advisories due to mercury are presented in
Table 4.2 .
Table 4.2. Current Human Health-Based Concentrations in Fish Tissue for Issuing
Consumption Advisories due to Mercury (mg/kg in fillets, wet weight)
Consumption advice is given through the Illinois Fish Contaminant Monitoring Program
(IFCMP), which consists of staff from the departments of Agriculture, Natural Resources,
and Public Health, the Illinois Emergency Management Agency and Illinois EPA
.
53
Unlimited
1 Meal per
week
1 Meal per
month
1 Meal per
2 Months
Do Not
Eat
Women of Child-bearing Age
and Children under 15 Years
Old
< 0.05
0.06-0.22
0.23-0.95
0.96-1 .89
>1 .89
Men Over 15 Years Old and
Women beyond Child-bearing
Age
< 0.15
0.16-0.65
0.66-2.82
2.83-5.62
>5.62
"One meal a week" (52 meals per year), "one meal a month" (12 meals per year) and
"one meal every two months" (six meals per year) is advice for how long to wait before
eating one's next meal of sport fish. "Do not eat" means no one should eat those fish
because of very high contamination . One meal is assumed to be one-half pound of fish
(weight before cooking) for a 150-pound person. The meal advice is equally protective
for larger people who eat larger meals and smaller people who eat smaller meals
.
The Illinois Department of Public Health advises
:
"In order to protect the most sensitive populations, pregnant or nursing women,
women of childbearing age, and children less than 15 years of age are advised to eat
no more than one meal per week of predator fish . Mercury is stored in the muscle of
fish that eat mercury-contaminated food or live in mercury-contaminated water .
Mercury is a metal that occurs naturally in small amounts in the environment . It also
is thought to come from burning coal or trash, as well as from industrial waste
.
Mercury gets into lakes and rivers several ways, including rain and runoff. When
conditions are right in the water, certain kinds of bacteria change inorganic mercury
into methylmercury. This form of mercury is one of the most likely to get into fish ."
(http://www.idph.state.il.us/envhealth/factsheets/fishadv .htm)
Fish consumption use is associated with all waterbodies in the state . The assessment of
fish consumption use is based on waterbody-specific fish tissue data and resulting fish
consumption advisories issued by the IFCMP . In accordance with U .S. EPA guidance
("Guidance for 2006 Assessment, Listing and Reporting Requirements Pursuant to
Section 303(d), 305(b) and 314 of the Clean Air Act ", (U.S. EPA, July 29, 2005)),
general
statewide fish-consumption advisories were not used to assess the attainment of fish
consumption use. The IFCMP is responsible for determining the levels of contaminants
in Illinois sport fish and issuing consumption advisories for species found to be
contaminated above specified levels . In the past, the IFCMP relied on a criterion for
mercury in sport fish of 0.5 mg/kg, developed by the Illinois Department of Public Health
using data from the World Health Organization . This criterion was applied as a "bright
54
line" value, with samples exceeding the criterion given "Do not eat" advice for the entire
population and samples below the criterion placed in the "Unlimited" category . With the
adoption of the
Protocol for a Uniform Great Lakes Sport Fish Consumption Advisory
(Anderson et al
.; 1993), as the basis for developing sport fish advisories by the IFCMP, it
became necessary to replace the bright line approach for mercury in order to make the
mercury advisories consistent with the five categories of consumption advice specified in
the Protocol. Since the protocol did not contain a Health Protection Value (HPV) for
mercury at that time, the IFCMP adopted U .S. EPA's Reference Dose for methylmercury
of 0.0001 mg/kg/d as the HPV used to calculate the various concentrations in fish
corresponding to the protocol's meal frequencies found above in Table 4 .2 for women of
child-bearing age and children under 15 . In adopting the Reference Dose as the HPV, the
IFCMP reasoned that the thorough review of the toxicity database for methylmercury by
the National Academy of Sciences, which formed the basis for U .S. EPA's Reference
Dose, provided an adequate justification for using the Reference Dose until the Great
Lakes states could develop an HPV for use with the Protocol. Since the Reference Dose
was derived specifically to protect the developing nervous system of the fetus and
children, the IFCMP has specified that the meal advice developed from it pertains to
women of childbearing age and children less than 15 years old . It should be noted that
the Great Lakes states have since adopted the Reference Dose as the HPV for
methylmercury in the protocol
.
The IFCMP operates under a Memorandum of Agreement (MOA), last renewed in 1989,
that spells out many details of the responsibilities of the participating agencies (Illinois
Departments of Agriculture, Natural Resources, Emergency Management Agency, Public
Health and Illinois EPA) . However, certain procedures and criteria for the determination
and issuance of consumption advisories are now outdated or not specified in the MOA,
leaving these elements to the discretion of the agencies. To address this, the IFCMP now
closely follows the procedures recommended in the Great Lakes Protocol, and has
adopted as policy over the years certain other procedures that replace outdated procedures
in the MOA or are not specifically addressed by the MOA for the determination of
55
advisories. Key elements of the procedures and policies for issuing the advisories
include :
- The MOA lays out various tasks for the member agencies that allow the IFCMP to
collect, process, analyze, and preserve for possible future analysis sufficient numbers and
sizes of sport fish samples from across the State to evaluate levels of contaminants in
most bodies of water accessible to anglers . The goal of the IFCMP is to sample most
accessible waters every five to ten years, except for waters already under an advisory
. In
these cases, more frequent sampling is used to assess whether changes in the advisory are
needed .
-
The MOA specifies the collection of filet and whole fish samples from a network of
73 permanent stations for annual or biennial monitoring of trends in contaminant levels
over time, plus additional samples from across the State to evaluate important sport-
fishing waters. However, the funding source for trend monitoring has since been lost,
and the existing funding at this time is dedicated to the analysis of filet samples for
advisory purposes. Therefore, since 1993 only filet samples are analyzed and the
permanent monitoring stations are sampled at the same frequency as similar stations
across the State.
- The MOA specifies collection of a core set of samples from each body of water to be
evaluated. These samples are to be composites of filets from 3-5 fish of similar size, and
are to include two different sizes of bottom-feeders (preferably carp), one sample of an
omnivorous species (preferably channel catfish), and one sample of a predatory species
(preferably largemouth or smallmouth bass) . These samples are analyzed for a suite of
14 bioaccumulative organic chemicals and mercury. If a sample is found to contain one
or more of the analyses above a criterion, the IFCMP has adopted a policy of requiring a
second set of samples from the water, which should include two bottom-feeders, two
omnivores, two predators, and one or more additional species of local importance to
confirm the original findings and provide sufficient data for the issuance of advisories if
needed
.
56
-
The MOA specifies the use of the U .S. Food & Drug Administration's Action Levels
as criteria for determining the need for advisories . However, the risk-based process
developed in the
Protocol for a Uniform Great Lakes Sport Fish Consumption Advisory
has been used to replace these criteria for mercury (Table 4 .3) . The protocol requires the
determination of a Health Protection Value (HPV) for a contaminant, which is then used
with five assumed meal consumption frequencies (8 ounces of uncooked filet): Unlimited
(140 meals/year); One meal/week (52 meals/year); One meal/month (12 meals/year); One
meal/two months (6 meals/year); and Do not eat (0 meals/year), to calculate the level of
contaminant in fish that will not result in exceeding the HPV at the specified
consumption frequency. The HPVs, target populations and critical health effects to be
protected by the HPVs, and new criteria for these three chemicals for the various meal
frequencies specified in the Protocol are listed in Table 4.3 .
-
The protocol stresses the benefits of fish consumption . Language relaying this
message is included with all consumption advisories issued
.
-
The IFCMP has adopted a policy that, except in extraordinary circumstances, two or
more recent sampling events in a water body finding fish exceeding a level of concern for
one or more contaminants are necessary for issuing or changing an advisory . Similarly,
two or more recent samples finding no fish exceeding criteria are necessary for
rescinding an advisory.
57
Table 4.3. Health Protection Values (HPVs) and Criteria Levels For Sport Fish
Consumption Advisories For Methylmercury .
= Sensitive Population includes pregnant or nursing women, women of childbearing age,
and children under 15; Non-sensitive Population includes women beyond childbearing
age and men over 15
.
4.2.2 Assessment of Fish Consumption Advisories
The assessment of whether a waterbody is supporting the fish consumption use is based
on the presence or absence of fish consumption advisories, as noted in Table 4 .4. If it is
determined that a waterbody is "not supporting" the fish consumption use, then that
waterbody is identified as impaired and is placed on the 303(d) list
.
58
CHEMICAL
HPV
TARGET
MEAL
CRITERIA
(ug/kg/d)
POPULATION,
EFFECT
FREQUENCY
LEVELS
(mg/kg)
Methylmercury
0.1
Sensitive*
Unlimited
0-0.05
Reproductive
1 meal/week
0.06-0.22
Developmental
1 meal/month
0.23-0.95
effects
1 meal/2months
0.96-1 .9
Do not eat
>1 .9
Methylmercury
0.3
Non-sensitive*,
Unlimited
0-0.15
Nervous system
1 meal/week
0.16-0.65
effects
1 meal/month
0.66-2.8
1 meal/2months
2.9-5.6
Do not eat
>5 .6
Table 4.4. Guidelines for Assessing Fish Consumption Use in Illinois Streams, Inland
Lakes, and Lake Michigan-Basin Waters Degree of Use Support Guidelines
4.2.3 Waters in Illinois Currently Impaired for Fish Consumption Use Due to
Mercury
When fish in a particular lake, river or stream are not safe for unlimited consumption
because of mercury, a state is obligated to list that waterbody as impaired due to the
requirements of Section 303(d) of the federal Clean Water Act and develop a TMDL to
address the issue. According to the latest (2004) Illinois list of impaired waters, there are
61 river segments (1,034 miles) and 8 lakes (6,264 acres) that have mercury listed as a
potential cause of impairment due to restrictions on fish consumption
.
59
Degree of Use Support
Guidelines
Fully
Supporting
(Good)
No waterbody-specific fish consumption
advisory in effect
Not
Supporting
(Fair)
A "restricted consumption" advisory is in
effect for the general human population or
a subpopulation potentially at greater risk
(e.g., pregnant women, children) .
Restricted consumption is defined as limits
on the number of meals or size of meals
consumed per unit time for one or more
fish species. In Illinois, "restricted
consumption" advisories are: 1 meal/week,
1 meal/month, or 6 meals/year .
Not Supporting
(Poor)
A "no consumption" (i .e., "Do Not Eat")
fish consumption advisory, for at least
one fish species, is in effect for the general
human population, or a commercial fishing
ban is in effect
.
Figure 4.1. Mercury Impaired Waters in the 2004 303(d) List
(Waters identified by name
and IEPA segment IDs)
Legend
•
Lakes impaired with Mercury
Streams Impaired with Merwry
j County Boundaries
The listing of a number of Illinois rivers and lakes as being impaired for fish
consumption use due to mercury triggers a requirement that the state develop a TMDL to
address the impairment. As discussed previously, Illinois EPA will need to determine
what is the maximum amount of mercury loading from point sources and from nonpoint
sources (with consideration of a margin of safety and seasonal variation) that can be
60
introduced into the impaired rivers and lakes and still prevent mercury accumulation in
fish tissue to unsafe levels .
Mercury TMDLs are complicated. The mechanisms controlling mercury accumulation in
fish tissue are variable and difficult to model, resulting in questionable results
. Finally,
state water programs are challenged in addressing atmospheric loading of mercury, which
has been shown to be a dominant contributor to many waters, because the sources may be
outside the watershed, state or nation
.
In view of the difficulty in producing useful TMDLs, the Environmental Council of
States (ECOS) urged U .S. EPA in 2004 to adopt a national strategy to reduce mercury
inputs to the environment (air, land and water) to the greatest extent possible . States
recognized that putting resources into reducing the mercury problem would be more
useful than spending them on a TMDL study to assure that every ounce of mercury
loading was appropriately allocated .
4.3 Reductions in Fish Tissue Mercury Levels Needed to Address Impairment
In order to establish a "target" for what amount of reduction in fish tissue levels of
mercury would be needed to get below fish consumption advisory levels and address this
use impairment, Illinois EPA conducted an analysis of data from Illinois' ongoing fish
contaminant monitoring program .
4.3.1 Description of Data
There are a total of 815 samples for mercury concentrations in fish tissue for all waters in
Illinois for samples collected between May 17, 1985 and November 11, 2004 (see
Appendix A: Illinois EPA, Bureau of Water, "Illinois 2004 Section 303(d)
List, "November 2004)
.
Each sample is associated with information on sampling location
(Station code, stream/lake name, county name, and site description), sampling date (day,
month, and year), fish species, number of individuals in the sample, average weight (in
pounds) and length (in inches) of the individual in the sample, mercury concentration
6 1
(mg/kg) in fish tissue, mercury detection level (mg/kg) and lipid content (percent) . Data
are also recorded on whether a whole fish or fish fillet was used in analysis for mercury
concentration
.
Largemouth bass (LMB) data from 397 samples were selected from this dataset and
evaluated for purposes of this report . LMB are a top predator in all waters of the state
and represent a large subset of all fish tissue data . Mercury content in all LMB in this
dataset was determined for several statistical endpoints (mean, median, percentiles,
standard deviation, etc.). We selected the target concentration for mercury at the 95°
percentile of the LMB data and calculated the necessary reduction in mercury needed to
achieve 0.05 mg/kg, the highest acceptable level of mercury in fish tissue for unlimited
consumption
(i.e., the percent reduction needed to guarantee that 95% of all largemouth
bass can be eaten in unlimited quantities)
.
4.3.2
Analysis
Largemouth bass,
Micropterus salmoides
(Lacepede), data from 397 samples were
selected from the large set of data for all fish collected and analyzed for contaminant
concentrations in Illinois. LMB were collected between May 1985 and May 2004 and
are based on analysis of fillet samples . LMB are top predators and it is for this reason
that the IFCMP targets LMB and two other bass species (smallmouth and spotted) as the
primary indicators of contaminant presence prior to collecting fish tissue from other
species. The LMB samples collected for fish tissue analysis constitute a significant part
(48.7%) of the samples collected for all species
.
LMB are widely distributed in Illinois waters and are tolerant of ecological conditions
(Smith). In regard to the uptake of mercury, the young feed on plankton, while later life-
stages feed on insects, crustaceans and fish (Smith ; Jenkins and Burkhead) . LMB are
reputed to be the most important species of black bass in 42 states and the most important
game fish in 11 (Jenkins and Burkhead)
.
62
Table 4.5 shows the results for various calculations for mercury concentrations in LMB
based on the IFCMP dataset. The minimum concentration (0 .10 mg/kg) represents the
limit of detection for mercury analysis in fish tissue . To account for potential mercury
concentrations in fillets lower than the level of detection, additional calculations were
made based on an adjusted lower limit equal to half the detection limit (0 .05 mg/kg), also
shown in Table 4.5. Beginning in 2005, Illinois EPA modified the mercury analytical
procedure to achieve a lower detection limit of approximately 0.01 mg/kg. These lower
detection limit values were not adjusted to 0.05mg/kg. Of the 397 fish tissue samples in
this database, 141 (35.5%) were reported at or below the detection limit applicable at that
time .
Table 4.5. Mercury Concentrations in Largemouth Bass in Illinois (mg/kg)
.
We selected the target concentration for mercury in LMB tissue at the 95 th percentile of
the LMB data and calculated the necessary reduction in mercury needed to achieve 0 .05
mg/kg, the highest acceptable level of mercury in fish tissue for unlimited consumption
.
This level of protection provides the reduction needed to guarantee that 95% of all
largemouth bass can be eaten in unlimited quantities by even the most sensitive sub-
population (i.e., women of child-bearing age and children under 15 years old) . At this
level of protection, fish consumption would no longer be an impaired use, currently
impaired waters would not be identified in under Section 303(d) as such and the need to
develop mercury TMDLs will have been eliminated. The results for load reduction
scenarios are shown in Table 4.6 .
63
AllLMB (n = 397)
Detection Limit= 0.10
All LMB (n = 397)
Detection Limit = 0.05
Average
0.1893
0.1723
Maximum
1 .4
1 .4
Median
0.12
0.12
Minimum
0.01
0.01
95`h Percentile
0.544
0.523
25th Percentile
0 .1
0.05
Standard deviation
0.1783
0.1840
Table 4 .6. Mercury Reductions needed to attain unlimited consumption (mg/kg,
unless otherwise shown) .
The reduction required for unlimited consumption by childbearing age women and
children under 15 years of age, the most sensitive and restrictive sub-population, is about
90% .
4.4
Inputs of Mercury to Illinois Waters
Where does mercury come from and how does it get into the fish in Illinois waters? As
in other parts of the United States, it is presumed that the mercury comes from natural
and man-made sources. The man-made sources can directly discharge into waters or can
release emissions into the air. Atmospheric deposition of mercury can come from local,
regional and global emission sources
.
4.4.1
Fate of Mercury in the Environment
The following discussion, reprinted from Section 2 .4 of the Michigan Mercury Report
(June, 2005), provides the basic information on the mercury cycle .
The mercury cycle is quite complex . Mercury is released into the atmosphere
from anthropogenic emissions as either a gas or attached to particles and is
transferred to the earth's surface via wet or dry deposition or gas transfer
.
Mercury is emitted to the atmosphere in three basic forms: elemental mercury
:
(Hg°)
; reactive gaseous mercury or RGM (RGM is also known as Hg(II) and
oxidized gaseous mercury); and particulate mercury [Hg(p)]
. (NOTE: These
three abbreviations for mercury [Hg° , RGM, and Hg(p)] will be utilized
64
All LMB (n = 397)
Detection Limit = 0.10
All LMB (n = 397)
Detection Limit = 0 .05
95th Percentile
0.544
0.523
Reduction needed
0.494
0.473
Percent reduction
90.8%
90.4%
throughout the remainder of this document.) Natural emissions are mainly in Hg °
form. Hg° may reside in the atmosphere for up to one year, allowing global
circulation systems to transport Hg ° releases from the source to anywhere on earth
before transformation and deposition take place . Figure 4.2 shows the mercury
cycle .
Mercury is continuously mobilized, deposited, and re-mobilized in the
environment. The only means to permanently capture mercury from the
biosphere include deep- sea sediments, well-controlled landfills or amalgamation
processes. For example, to isolate mercury from the biosphere, Sweden has
recommended that mercury waste be stabilized and stored in a permanent deep
bedrock repository (Swedish EPA, 2001)
.
The majority of mercury in surface soil is in the form of oxidized mercury
compounds, such as mercuric sulfide . However, a small fraction is
methylmercury and Hg °
. Mercury complexes deposited in soils can be
transformed back into gaseous mercury by light and humic substances and re-
enter the atmosphere. Mercury can also be taken up by plants, both via root
uptake in soils and through absorption of elemental or inorganic mercury through
the air.
65
Figure 4.2: Mercury Cycle
As part of a whole-ecosystem mercury cycling study, mercury was measured in
the foliage of deciduous trees in Pellston, Michigan over the course of the
growing season (Rea et al ., 2002). This study found that total foliar mercury
accumulation was substantially less than vapor phase Hgo deposition as estimated
by a different study (Lindberg et al., 1992) . It was determined that Hg(p) and
RGM dry deposition were rapidly washed off foliar surfaces, and therefore foliar
accumulation of mercury most likely represents vapor phase Hgo assimilation
(Rea et al., 2001). Recently, independently performed controlled pot and chamber
studies with aspen trees determined that all foliar accumulation of mercury was
due to vapor uptake, regardless of soil mercury concentration (Ericksen et al, .
2003), supporting the Rea 2001 study conclusions . In addition, monitoring of
mercury has been done through the use of mosses and lichens, including near
industrial facilities (Lodenius, 1994) .
66
In addition to direct deposition, mercury can also reach water from soil run-off,
although the amount partitioning to run-off is expected to be small since mercury
binds to soil . Mercury in run-off is probably bound to suspended sediments . Once
in water, mercury can either enter and biomagnifying in the food chain, settle into
sediment, or volatilize back into the atmosphere (see previous Figure 4.2) .
Entrance into the food chain begins with bacteria in water, which can take
mercury in its inorganic form and metabolize it to methylmercury . All inorganic
forms of mercury that are not bound to sediment are potentially available for
methylation by microorganisms. A number of factors effect the potential for
methylation of mercury in aquatic systems, but key variables are the potential of
hydrogen ([pH] - a measurement of a solution), the oxidizing state
(i.e., redox
conditions), the levels of sulfur, and the presence of sulfate-reducing bacteria
(Ullrich et al., 2001)
.
Methylmercury-containing bacteria may be consumed by the next level in the
food chain, or the bacteria may excrete methylmercury into the water where it can
adsorb to plankton and be consumed by the next level in the food chain and so on
.
Even small environmental concentrations of mercury in water can readily
accumulate to potentially harmful concentrations in fish and fish-eating animals,
including humans
.
The concentration of methylmercury in predatory fish such as largemouth bass or
walleye can be 1 to 10 million times higher than the surrounding surface water as
a result of biomagnification (Ullrich et al ., 2001). In general, fish higher in the
food chain such as walleye, pike, shark and swordfish have higher mercury
concentrations than fish lower on the food chain like perch. The ratios of
methylmercury in fish can vary depending on fish age, size and species as well as
watershed characteristics
.
67
4.4.2
Loading of Mercury to Illinois Waters from Wastewater Discharges
In order to evaluate the loading of mercury, particularly to impaired waters, Illinois EPA
conducted an analysis of existing Agency data. Discharge monitoring results from
regulated point sources (NPDES permit holders) for the period of September 1986
through July 2005 was obtained from Illinois EPA Permit Compliance System (PCS) . Of
the 195 point sources identified as contributors of Hg to the Illinois surface waters, 18
point sources had permit effluent limits for Hg and 177 were required only to monitor the
concentrations of Hg in their effluent . Further, Hg concentrations in the effluent were
reported above detection limits (ADL) by 137 facilities and below detection limits (BDL)
by 58 facilities. For a summary of pertinent information about point sources and
concentration of mercury in their effluents see Appendix B of the Illinois 2004 Section
303(d) List (Illinois EPA, "Illinois 2004 Section 303(d) List," November 2004)
.
Of the 137 facilities with ADL mercury concentrations, 89 facilities fell in six major
watersheds, which contained waterbodies listed as potentially impaired due to mercury in
the 2004 303(d) report. The remaining 48 facilities were in the watersheds that did not
contain any waterbody potentially impaired due to mercury . Table 4.7 shows mercury
data for some of the major river basins in Illinois, based on the reported average and
maximum effluent discharges. Pertinent information on how mercury loads from point
sources were calculated is in Appendix C of the Illinois 2004 Section 303(d) List
(Illinois
EPA, "Illinois 2004 Section 303(d) List," November 2004)
.
Table 4.7. Mercu
Loads for Selected Watersheds with Im aired Se ments, 1986-2005 .
68
Watershed Name
# of Facilities
with ADL
Average Load
(tons/year)
Maximum* Load
(tons/year)
Rock River
10
0.0002609
0.0172808
Des Plaines River
28
0.0013262
0.4855664
Fox River
14
0.000311
0.018718965
Illinois River
26
0.0112418
0.659966246
Wabash River
8
0.0002672
0.0232629
Ohio River
3
0.000168
0.0199586
Sub-Total
89
0.0134071
1.2247538
Others**
48
0.0088908
0.2652383
Total
137
0.0222979
1.48999215
ADL = Above detection limit
= potential maximum
** = watersheds with ADL facilities but not on 2004 303(d) List Load
(tons/years)
The lowest (0.0000005 mg/L) and highest (33 .7 mg/L),( probably an outlier)
concentrations of mercury were found in the effluent of Cordova Energy Company
(IL0074438) in March 2003 and 2004 and Deerfield WRF (IL0028347) in May 2005,
respectively. After eliminating potential outliers from consideration, it was determined
that on a statewide basis, the contribution of mercury from all point sources to surface
waters on an average was 0 .02229791 tons (44.5958 pounds) per year. This average
contribution includes, in some cases, the average value of daily maximum concentration
of mercury in the effluent of point source due to unavailability of 30-day average
concentration values .
The statewide average of all point source discharges of mercury (0 .02229791 ton per
year) was only 0.745 % of the base year total emissions of mercury (2.99466 tons per
year) in Illinois
.
In summary, wastewater discharges to receiving streams and rivers in Illinois provide an
average annual loading of 45 pounds of mercury per year . However, several of the lakes
in Illinois that are listed for fish consumption impairment due to mercury, and have the
highest fish tissue levels of mercury detected in the state, have no point source discharges
at all .
4.4.3 Study of Mercury Concentrations in Ambient Water
In 2004, Illinois EPA sampled water from selected streams and lakes in Illinois. One
goal of the study was to measure concentrations of total mercury in a subset of Illinois
surface waters and compare the results to the Illinois human health-based water quality
standard of 12 parts per trillion . Samples were collected from 52 stream locations and 32
lake locations spread geographically throughout the State as shown in the two maps
below. The lakes sampled included several that are listed as impaired for fish
69
consumption due to mercury. Sample collection was made using EPA Method 1699 and
sample analysis by EPA Method 1631, the preferred methods for accurate low-level
mercury measurement. A complete discussion of this study is provided in Appendix D of
Illinois 2004 Section 303(d)List (Illinois EPA, "Illinois 2004 Section 303(d) List,"
November 2004) .
70
Figure 4.3
2004 Lake Mercury Sampling Sites
a
Legend
•
Lake ark ahes
•
Memory Adnsory _axes
5ttes catedrg Mercury
VZQS o' 12 ng-
Ccuny
7 1
•
Frentress
•
Le-Aqua-Na
P
ierce
Lake n the Hills
0Carkon
Marquette
•P
ark*
Miclc&ian Rose
G
eorge
•
*OePue
MoneeRes
.
Johnson Sacek Trail
*Senachwine
Bracken
B
locmrgtcn
Homer
•
U
zs
0
Paris Twin East
Pans Twin West
M4shoon
•
Charleston SCR
•
Mull Creek
Sara
•
Newton
Stephen A. fates
•
Oney East Fork
Racooon
••C
exralia
W
ashington
Kinkaid
•
C~itdearpus
Glen O. Jones
CedZLde Grassy
Glencale
•
sa
Mlles
Figure 4.4
2004 Stream Mercury Sampling Sites
72
F! 15
•
DTl35
HCC-"
G-15,
f
•
M-04
DT~* -
g-
3g
L
A
= P&-04
G-2
3
gHti.42
•
Dt-4B
D-23,
F'-02
•
*D-30
a
K-04'
p
t
•'
*E-25
E-2B
BP-01
1
(1
•
D-~2
~~
* DD-i 4
•
>£
0-02
J-05
BE-p7
•
•
O-0u
1
'
1
L
0-20'x
•"
NJ-07
•
,
L8-
,,
•
0-30
1
C-x3
N:
4ATG,03
ATH-05I
AK-o$
•
Legend
•
Stream Sampleg Sues
*
Sees epceedng Mercury WOS o112 ntyL
county
so
2S
0
w
The results found concentrations of total mercury in most samples did not exceed the human
health water quality standard of 12 parts per trillion (see Figure 4 .5 and 4.6) . Three of 52 stream
samples and two of 32 lake samples exceeded the standard. Interestingly, the lakes where the
ambient mercury levels were higher than the standard are not lakes with specific fish
consumption advisories
(i.e., not listed as impaired)
.
Figure 4.5 Illinois Ambient Water Quality Monitoring Network Core
Stream Samples, Mar-Oct 2004
0
annnIHNNN~NN~I
N N
Sea.. Sample
* HHS = human health standard;
GLWS = Great Lakes Water Quality Standard
Figure 4.6 Illinois Ambient Lakes Samples, Aug - Oct 2004
30
25
20
10
5
0
HHS'
12 ng/L
GLWS
3 ng/L
Mean = 2.1
Median = 01
Range =0.5-25 .1
Makes wilk Flsh Advisories for Hg
-----------------------------------------------------------------------
1
2
3
4
5
6
7
8
9
10
11
12
13 14 15 16 17 16 19
20
21
22
23
24
25
26
27
28
29
30
31
32
33
Lake Sample
* HHS = human health standard;
GLWS = Great Lakes Water Quality Standard
HHS'
12/ng/L
GLWS'
1 .3 ng/L
10
Mean =4 .6
Median = 3 4
Range =0.5-13.7
i 8
S
6
4.5
Fish Consumption and At-Risk Anglers
Annually, Illinois anglers purchase over 700,000 fishing licenses. In order to answer the
question of how these anglers and their families might be at risk of consuming chemical
contaminants at levels greater than health-based limits in the fish they caught, Illinois EPA has
reviewed several studies and reports of fish consumption by the general population and by sport
anglers. Since the Illinois Department of Natural Resources and the Illinois Natural History
Survey do not include questions regarding consumption of sport fish caught by anglers in their
angler surveys, it was necessary to evaluate fish consumption rates by Illinois anglers in other
ways in order to evaluate at-risk anglers. An in-depth report of fish consumption in California
and in the United States by the California EPA (2001) has been valuable in our evaluation
.
National Surveys - Several national surveys have been conducted to evaluate fish and shellfish
consumption by the general public. It must be kept in mind that these surveys were conducted
for different purposes over different time frames, using different methodologies . Nevertheless,
California EPA (2001) reports that the range of national per capita fish and shellfish
consumption rates is very consistent among studies considered to be valid, from 10 grams per
day (g/d) to 17.9 g/d or approximately 16-28 eight-ounce meals per year
(See attached Table 2
from California EPA, 2001) .
It should be noted that surveys of the general population contain persons who eat no fish . A few
of these surveys also contain information on respondents that had consumed fish during the
survey period. These "consumers only" data can provide a more reasonable estimate of fish and
shellfish consumption by persons who eat seafood. For example, Pao et al. (1982) evaluated the
"consumers only" data from the 1977-1978 USDA Nationwide Food Consumption Survey
(NFCS) (USDA, 1983), and found that the mean overall fish and shellfish consumption rate for
consumers was 48 g/d, or approximately 77 eight-ounce meals/year, versus the rate for the
general population from the NFCS of 12 g/d (19 meals/yr) . Another study by Popkin et al
.
(1989) provides additional data that maybe particularly relevant to evaluating potential risks due
to seafood consumption. This study reviewed data for female "consumers only" of childbearing
age (ages 19-50) from both the NFCS and the 1985-1986 USDA Continuing Survey of Food
Intake by Individuals (CSFII) (USDA, 1987 ; USDA 1988). This study found that these female
74
consumers reported an average consumption of fish and shellfish of 111 g/d (approximately 178
meals/year) from the NFCS data and 88 .2 g/d (141 meals/year) from the CSFII data
.
Surveys of Consumers of Sport Fish - The literature regarding persons who eat sport-caught fish
is limited in comparison to studies of the general population's consumption of all types of
seafood. As is the case for the "consumers only" populations discussed above, anglers consume
more seafood meals per year than the general population (see attached Table 6 from California
EPA, 2001). This table shows that mean levels of fish consumption in these studies range from
12.3 to 63.2 g/d (approximately 19-101 eight-ounce meals/year) . Most of these studies also
provide high-end rates of sport fish consumption (95th or 96th percentiles, or maximum
reported), which range from 17 .9 to 220 g/d (28-353 meals/year) .
Studies of sport fish consumption by angler cohorts in Michigan and California provide the most
thorough evaluations of consumers of sport fish. The studies of Michigan anglers (the Michigan
Sport Anglers study; West et al., 1992, 1993, Murray and Burmaster, 1994) provide data for total
amounts of fish and self-caught fish consumed by various sub-groups of the cohort (see attached
Table 8 from California EPA, 2001) . From the table, it can be seen that this group also
consumes much more fish than the general population, with mean and 95th percentile rates as
high as 61 .3 and 123.9 g/d (99 and 199 meals/year), respectively . Particularly relevant for
describing at-risk populations are the information regarding females (ages not specified), with
mean and 95th percentile of total fish consumption reported to be 42 .3 and 85 .7 g/d (68 and 138
meals/year), respectively
.
The studies of California anglers provide very similar results, although this study evaluated
consumption of marine fish . These studies (the 1991-1992 Santa Monica Bay Seafood
Consumption Study; SCCWRP and MBC, 1994, Allen, et al ., 1996) reported an overall mean
consumption rate by Bay anglers of 49.6 g/d (80 meals/year), which is consistent with the mean
values for the Michigan anglers from Table 8 . The Santa Monica Bay Study also includes data
on various ethnic groups that demonstrate considerable variability; the 90th percentiles ranged
from a low of 64.3 g/d (103 meals/year) for Hispanics to a high of 173.6 g/d (279 meals/year) for
"Other" (primarily Pacific Islanders) anglers .
75
Study of Illinois Lake Michigan Anglers - Using Illinois Natural History Survey data from creel
surveys of anglers fishing the Illinois portion of Lake Michigan from 1987 to 1993, Pellettieri et
al. (1996) evaluated the potential for these anglers to exceed the Health Protection Value (HPV)
adopted by the Great Lakes states for daily intake of polychlorinated biphenyls (PCBs) of 3
.5
micrograms per day (ug/d) as a result of their consumption of sport-caught fish from Lake
Michigan. This study used data from Illinois and Wisconsin to determine PCB levels in five
commonly caught species (yellow perch, brown and rainbow trout, and coho and Chinook
salmon). These calculated PCB concentrations were then combined with the five meal
consumption frequencies chosen by the Great Lakes states for issuing consumption advice
(Unlimited = 225 meals/year; One meal/week = 52 meals/year ; One meal/month = 12
meals/year; 6 meals/year; and Do not eat) to estimate anglers' intakes of PCBs for nine survey
time periods covering spring, summer, and fall. The study found that if anglers consume their
catch at the Unlimited rate, the acceptable daily PCB intake would be exceeded for all time
periods (range of intakes 7.27 to 71 .85 ug/d), and even consumption at the One meal/week rate
would exceed the limit in four time periods (those periods when more highly contaminated
salmon were most likely to be caught ; range 1 .67 to 16.60 ug/d) .
Conclusions - Our review of fish consumption literature provides convincing evidence that sport
anglers may consume amounts of sport-caught fish that could allow them and their families to
exceed health-based limits for chemical contaminants in their catch . The literature regarding
anglers' consumption of their catch strongly suggests that a subset of these anglers have meal
frequencies that put them well above the recommended rates for even fairly low levels of
contamination. For example, even the mean rates of consumption for sport-caught fish, in the
range of 60-80 meals/year based on the Michigan and California studies, exceed the
recommended meal frequency of one meal/week for lower levels of contamination. These
consumption rates also exceed the Illinois Fish Contaminant Monitoring Program' s state-wide
advisory for mercury, which recommends that women of child-bearing age and children under 15
limit their consumption of predator species to no more than one meal/week .
If anglers at the upper end of the meal frequency distribution are eating relatively contaminated
fish, the risks to the anglers and their families are even greater . This is clearly illustrated by the
76
upper percentile results noted above, with high-end consumers of sport fish eating 100 to 300+
meals/year. Such consumption rates would place these anglers and their families at risk from
even low levels of contamination in their catch, and if contaminant levels are moderate or high
the risks are correspondingly elevated. This is further demonstrated by the results from the
Illinois Lake Michigan anglers, who were found to exceed recommended levels of PCB intake at
the Unlimited meal frequency and even the one meal/week rate for some time periods . Thus, we
can say with a high level of confidence that it is possible for anglers and their families to
consume enough sport fish to put themselves and their families at risk from chemical
contaminants in their catch .
5.0
Deposition of Mercury
5.1
Mercury in the Atmosphere
Mercury is emitted into the atmosphere by both natural and man-made, or anthropogenic,
emission sources, and is then removed from the atmosphere by precipitation or dry deposition
processes. Mercury can be transported hundreds, or thousands, of miles, or it can be deposited
on the ground, on vegetatative surfaces, or into water-bodies downwind of emission sources
.
The behavior of mercury in the atmosphere depends on its physical state, whether gaseous or
particulate, and on its chemical speciation . Gaseous mercury exists as elemental mercury
(Hg(0)), monovalent mercury (Hg(l)), or divalent mercury (Hg(2)). Elemental mercury in
gaseous form is relatively insoluable, and is therefore less susceptible to wet deposition . As a
result, elemental mercury can be transported great distances and is the most prevalent form of
mercury in the atmosphere . In contrast, divalent mercury (Hg(2)) is soluble, combining readily
with cloud droplets and precipitation. Hg(2) may also react with particles in a stack or in the
atmosphere. Particle-borne mercury (Hg(p)) can be deposited on the ground by either wet or dry
processes .
Although elemental mercury is less susceptible to wet or dry deposition, it can react, or oxidize,
in the atmosphere under the right conditions, making it more readily available for deposition
.
The rate of conversion from Hg(0) to Hg(2) is not well understood. In a report prepared under
contract to Illinois EPA (included as Appendix B) entitled
:
"Atmospheric Deposition of
77
Mercury" (March 2006),
Dr. Gerald Keeler of the University of Michigan describes the
association of ambient ozone concentrations and the production of Hg(2) from Hg(0) in the
Midwest. In his review of current studies, Keeler suggests that the lifetime of elemental mercury
in the atmosphere is likely much shorter than previously believed . Thus, mercury may be
deposited much closer to its source, even if emitted in elemental form, if oxidizing compounds
are present in the atmosphere
.
Keeler has summarized a number of ambient mercury measurement
(i.e., monitoring) studies
performed in the Midwest
(See
Appendix B). These studies include
:
1 . The Lake Michigan Urban Air Toxics Study (1991)
;
2. The Great Lakes Atmospheric Mercury Assessment Project (1994-1996)
;
3. The Lake Michigan Mass Balance Study(1994-1995) ; and
4. The Atmospheric Exchange Over Lakes and Oceans Study (1994-1995) .
These studies document the importance of local sources of mercury emissions to mercury
deposition in downwind locations. Significant gradients of mercury deposition downwind of
high emission source regions were identified in these studies. Subsequent studies summarized
by Keeler, including measurements in Detroit (2000-2002) and Steubenville, Ohio (2002) also
demonstrate the significance of local and regional emission sources
.
In the Utility Air Toxics Study report to Congress, U.S. EPA identified coal-fired power plants
as the largest domestic anthropogenic source of mercury in the atmosphere. Various modeling
techniques have been developed to evaluate the relative importance of coal-fired power plants
and other emission sources. U.S. EPA used the Community Multi-Scale Air Quality model
(CMAQ) to evaluate the effectiveness of the CAMR cap-and-trade program . CMAQ is a grid-
based model that incorporates a detailed inventory of emission sources, both natural and man-
made, to simulate the transport, dispersion, chemical transformation, and deposition of mercury
in the atmosphere. At a recent "Mercury Workshop" sponsored by the Lake Michigan Air
Directors Consortium (LADCO) (February 2006), U.S. EPA presented the results of their current
CMAQ modeling simulations. These results are depicted in the following Figures 5 .1 and 5 .2 .
78
Figure 5.1
CMAQ - Simulated Mercury Deposition
For 2001, Base Case
CMAQ-simulated total mercury deposition for 2001
(micrograms perpuare meter)
Base case
79
30,
25
20
Is
10
5
0
Figure 5.2
CMAQ- Simulated Mercury Deposition
For 2001, Utility Zero Out
CMAQ-simulated total mercury deposition for 2001
(micmgrama persquare meter)
Utility Zero Out
Figure 5.1 depicts modeled mercury deposition in the U .S. for the year 2001 . The modeled
results indicate relatively high mercury deposition on the West Coast and along the Ohio River
valley, and relatively low deposition in the north-central U .S. Figure 5.2 depicts modeled
deposition assuming zero emissions from coal-fired power plants . In this simulation, predicted
deposition rates in the Ohio River valley are reduced dramatically, compared to the 2001 base
scenario. From these results, U .S. EPA concluded that, on an overall basis, coal-fired power
plants contribute less than 5% of the total deposition in theU.S ., but locally the impacts of coal-
fired power plants vary from as little as 0.05% to as much as 85.9% .
Grid-based models can be useful tools for evaluating source-receptor relationships, but because
of uncertainties in model formulations and inputs, the results must be used with caution. These
uncertainties include the scarcity of appropriate ambient measurements, especially measurements
downwind of large emission sources and the lack of dry deposition measurements, the lack of
speciated stack test data from coal-fired power plants and other significant emission sources, and
uncertainties in simulating the effects of boundary conditions which are used to represent the
contribution of sources outside the modeling domain
.
In its comments to U .S. EPA's
"Revision of December 2000 Regulatory Finding on the
Emissions of Hazardous Air Pollutants From Electric Utility Steam Generating Units " (70
Federal Register
208, October 28, 2005), the Electric Power Research Institute (EPRI)
presented modeling results using the Trace Element and Analysis Model (TEAM) and the Total
Risk of Utility Emissions (TRUE) model. Both models were developed by EPRI. The TEAM
model is a grid-based model (similar to U .S. EPA's CMAQ model), while the TRUE model uses
the traditional Gaussian plume approach (similar to U .S. EPA's Industrial Source Complex (ISC)
model). EPRI compared the results of these two models to evaluate whether grid-based models
over-estimate mercury deposition . As mentioned above, grid-based models, including EPRI's
TEAM model have inherent uncertainties, as mentioned above . In addition, traditional steady-
state Gaussian models, although better suited for "close-to-the-source" ambient concentration
predictions, also contain inherent uncertainties . Making model-to-model comparisons, as offered
by EPRI may provide useful information, but may also compound the uncertainties . Again, the
lack of adequate field monitoring, especially measurements of dry deposition of mercury, for
comparison to and validation of modeled predictions limit the usefulness of the results
.
80
Multi-variate statistical receptor models provide another useful means for evaluating the impacts
of local and regional emission sources. Receptor models do not attempt to simulate complex
transport and chemical processes, but rather rely on detailed ambient measurements at a specific
location or receptor. Keeler summarizes the results of several studies that have used receptor
modeling techniques. These studies document the importance of local and regional source
contributions to mercury deposition in some locations. One of these studies, performed from
ambient monitoring of mercury and other compounds in Steubenville, Ohio, indicated that coal-
fired power plants contributed up to 70% of the wet deposition observed at that location
.
In summary, recent monitoring, modeling, and other research in recent years has led to an
increased understanding of the sources of mercury, the chemical transformations that effect it,
and the processes in the atmosphere that cause it to be deposited to the ground. Although many
uncertainties remain and much research is still needed, the importance of anthropogenic sources,
including coal-fired power plants, have been well documented . Thus, it can be expected that
significant mercury emission reductions in Illinois will yield significant reductions of mercury
deposition in Illinois
.
5.2
Response of Fish Tissue Mercury Levels in Key Waterbodies in Florida and
Massachusetts to Local Reductions in Mercury Emissions
5.2.1
Florida Experience
The State of Florida recognized in the late
1980s
that mercury was a problem in the Everglades
and it set about to resolve that problem. The first fish consumption advisories for the Everglades
were issued in the
1980s
for largemouth bass. It was determined that atmospheric deposition of
mercury was contributing
98% of
mercury loading to the Everglades. Between state and federal
requirements, a substantial reduction in mercury emissions occurred in the
1990s .
8 1
Figure 5.3
Emissions of total Mercury by Major Source Category for
Dade, Broward, and Palm Beach Counties
_
-
. . ... .. ...
. .. . . .
Power Generation
-f-
Sugar
MWI
MWC
T
Total
.
.
..
.. . ..
. .. . . . . . .. .
... . . . .. .
... . .
1980
1985
1990
Year/Source
82
1995
2000
Within a few years, measurements of mercury in egret feathers, tissue of largemouth bass and
mosquitofish showed substantial declines
.
3,500
3,000
2,500
rn
Y
x
2,000
7
LL
C
0
1,500
U)
E
1,000
W
500
0
Figure 5.4 Mercury Concentrations in Feathers of Egrets
Figure 5.5 Mercury Concentrations in Largemouth Bass
Everglades Canals L-37B and L-67A
Geometric mean by year. Diamonds show +1 SE of the Mean
3.5
3.0
2.5
1 .0
0.5
986
1988
1990
1992
1994
1996
1998
2000
Year
DMaOWrftWdradLang., FWC .
83
Figure 5.6 Largemouth Bass Hg Trends at Canal and Marsh Trend Monitoring Sites
The relationship between mercury load to the Everglades and the body
burden of 3-year-old largemouth bass has been modeled. Response is nearly 1 to 1
.
84
Figure 5.7 Relation between Atmospheric Mercury
Load and Body Burden in Largemouth Bass
,
AOA,,
A
y =
= ?ece
.9408x. + a.0o61si1i
y
+ 0
0
0.1
0.2
0.3
0.4
0.5
0.6
0.7
0.8
0 .9
1
Fraction of current atmospheric Hg(ll) deposition
(wet and dry, ug/m2/yr)
-Proportional response
•
E-MCM predicted -Linear fit of E-MCM results
From its experience over the last decade, Florida has concluded that reduction in local
atmospheric emissions of mercury has led to >75% declines in the mercury in fish tissues and
wildlife in less than 15 years since peak deposition . They have noted that reduction in emissions
of mercury in the reactive gaseous form (RGM) will show benefits at the local or regional scale
within years to decades. The main driver of the Everglades mercury problem is mercury load,
overwhelmingly from atmospheric deposition. Interestingly, the reduction in mercury loading
was significant, even in the presence of a substantial global mercury pool . Complete reports on
Florida's work can be found at http://www.dep.state.fl.us/labs/mercury/
85
5.2.2
Massachusetts Experience
Like most states in the Eastern United States, Massachusetts has a statewide fish consumption
advisory due to mercury. However, modeling and monitoring identified a deposition "hotspot"
in northeastern Massachusetts. As part of a region-wide mercury action plan, Massachusetts has
implemented extensive multi-media programs to reduce mercury inputs, including pollution
prevention, requirements for management of waste dental amalgam and reduction of air
emissions of mercury . Atmospheric deposition of mercury from fossil fuel combustion and
medical waste incineration were identified as significant contributors of mercury loading to
northeastern Massachusetts .
Medical waste incinerator controls were implemented in the late 1990s. As in the Florida
experience, steep reductions in mercury emissions resulted in a similarly steep decline in fish
tissue levels from the waters in northeastern Massachusetts within 5 years .
Figure 5.8 Representative Fish Tissue Mercury and
Incinerator Emissions Changes Versus Time in NE MA
.
86
Figure 5.9 Mercury Concentration in Yellow Perch and
Largemouth Bass in 1999, 2004
6.0
Regulatory Activities
- Federal and Other States
6.1
Federal Actions
6.1 .1
Mercury Study Report to Congress
The Mercury Study is a report to Congress prepared by U .S. EPA to fullfill the requirements of
section 112 (n)(1)(B) of the Clean Air Act, as amended in 1990 . The Mercury Study provides an
assessment of the magnitude of mercury emissions from power plants and other industrial
sources, the health and environmental impacts of those emissions, and the availability and cost of
control technologies . These findings provide a snapshot of U .S. EPA's understanding of
mercury when the Mercury Study was issued in December 1997
.
(http://www.eva.gov/mercury/report.htm)
6 .1 .2
Utility Electric Generating Units Toxics Study
Under the Clean Air Act, as amended in 1990, U .S. EPA was required to conduct a study of the
public health impacts of emissions of air toxics from electric generating utilities that burn fossil
fuels. Emissions from utilities include 67 air toxics, including arsenic, nickel, chromium,
radionuclides and mercury
.
87
The Utility Air Toxics Study issued in February 1998 evaluated electric generating utilities that
bum coal, oil, or gas to generate electricity and are greater than 25 megawatts in size . The Utility
Air Toxics Study includes the description of the utility industry ; an analysis of air toxics
emissions data from fossil-fuel (coal, oil and gas) fired utilities ; an assessment of risks to public
health from exposure to toxics emissions through inhalation ; assessment of potential risks to the
public health from exposure to four specific air toxics (radionuclides, mercury, arsenic and
dioxins) through other indirect means of exposure (e.g., food ingestion, dermal absorption) ; a
general assessment of the fate and transport of mercury through environmental media ; and a
discussion of alternative control strategies
.
The Utility Air Toxics Study's key findings indicated that mercury emissions from coal-fired
electric generating units are the "hazardous air pollutant of greatest potential public health
concern." The modeling assessment in the Utility Air Toxics Study also indicated evidence of a
plausible link between emissions of mercury from electric generating units and the
methylmercury found in soil, water, air and fish .
6.1.3
Utility Air Toxics Determination
On December 14, 2000, following the issuance of the Utility Air Toxics Study, U .S. EPA
announced its finding that it was "appropriate and necessary" to regulate power plant emissions
under section 112 of the Clean Air Act, as amended in 1990 . This finding triggered a
requirement for U.S. EPA to propose regulations to control air toxics emissions, including
mercury from power plants, by December 15, 2003 . Details of the notice of regulatory finding
can be found in the
Federal Register
published December 20, 2000 (65
Federal Register
79825) .
6.1.4
Clean Air Mercury Rule (CAMR)
U.S. EPA proposed the Clean Air Mercury Rule on December 15, 2003, and it was eventually
promulgated and published in the
Federal Register
on May 18, 2005. The CAMR used the New
Source Performance Standards (NSPS) under Section 111 of the CAA to set emissions limits for
new sources and a cap-and-trade system for all existing and new coal-fired EGUs . Table 6.1 lists
the final NSPS for mercury that must be met by new coal-fired EGUs
.
88
Table 6.1 - Emissions Standards for New Units, 40 CFR Part 60, Subpart Da
The NSPS limits in CAMR are more than three times less stringent than the MACT limits issued
in the proposed rule, and are less stringent than the level of emissions reduction achieved by the
best performing unit in each of the subcategories for which U .S. EPA issued a standard
.
The CAMR cap and trade system is largely based on U .S. EPA's Acid Rain Program. The
CAMR is designed as a two-phased cap and trade system . The first phase sets a nationwide cap
of 38 tons in 2010, the level of mercury emissions reductions expected as co-benefit controls
from the Clean Air Interstate Rule ("CAIR") . In the second phase of the CAMR trading system,
mercury emissions are capped nationwide to 15 tons per year by 2018
.
The cap-and-trade program allows EGUs to purchase mercury emission allowances from other
EGUs and potentially bank these allowances to meet compliance requirements in future years
.
This would allow many power plants to avoid any reductions in their mercury emissions, and
could delay full compliance with the 2018 cap until many years later.
Illinois' budget under CAMR is equivalent to 51,001 ounces of mercury for the first phase in
2010 and 20,126 ounces of mercury for the second phase in 2018 . Under CAMR requirements,
each state must submit a plan describing how the mercury emissions budget will be achieved by
89
New Units
Emission Standards
Bituminous units
Subituminous units
0.0026 nanogram per joule
(21 x 10-6 pounds per megawatt hour (lb/MWh))
wet FGD
0.0053 ng/J (42 x 10-6 lb/MWh)
dry FGD
0 .0098 ng/J (78 x 10-6 lb/MWh)
Lignite Units
0.0183 ng/J (145 x 10-6 lb/MWh)
Coal Refuse Units
0.00018 ng/J (1 .4 x 10-6 lb/MWh)
IGCC
0.0025 ng/J (20 x 10 -6 lb/MWh)
coal-fired power plants, although the States are not required to adopt a trading scheme or set unit
caps to demonstrate compliance
.
CAMR includes a model rule that states can adopt to achieve and maintain their own mercury
emissions budgets. States may join the trading program by adopting the model trading rule in
state regulations, or they may adopt regulations that mirror the necessary components of the
model trading rule . For states that opt out of the trading program, mercury allocations set by
CAMR become fixed emission budgets .
6.1.5
Other Federal Actions
On October 21, 2005, U .S. EPA issued a notice of proposed rulemaking to reconsider certain
aspects of its final Clean Air Mercury Rule . This action was in response to petitions submitted
by 14 states and various interests groups objecting to the CAMR proposal
.
In a separate action, U.S. EPA also published a proposed action to reconsider certain aspects of
its final action revising the December 2000 decision regarding regulation of electric utility steam
generating units under section 112 of the Clean Air Act, as amended in 1990
.
The CAMR and the related "Revision of December 2000 Regulatory Finding on the Emissions
of Hazardous Air Pollutants From Electric Utility Steam Generating Units and the Removal of
Coal- and Oil-Fired Electric Utility Steam Generating Units from the Section 112(c) List" are
currently being challenged by a number of Petitioners in the United States Court of Appeals for
the District of Columbia Circuit
.
See State of New Jersey, et. al. v United States Environmental
Protection Agency,
Docket No. 05-1097 and consolidated cases . In addition, the U.S. EPA
granted reconsideration of certain aspects of the CAMR and the related revisions of the
December 2000 Regulatory Finding as a result of receiving Petitions for Reconsideration
.
See,
70 Federal Register
62200 and 62213 (October 28, 2005). Both challenges have been
consolidated, and the proceedings are being held in abeyance pending completion of the U .S
.
EPA's reconsideration proceedings, which the U .S. EPA anticipates completing by May
31,2006
.
90
6.2
Other States Efforts to Reduce Mercury Emissions from Electric Generating Units
(EGUs)
There is a growing list of states that have adopted regulatory programs that are more stringent
than the recommended requirements in the final CAMR. The states of Connecticut,
Massachusetts, Minnesota, New Hampshire, New Jersey, North Carolina and Wisconsin have all
adopted legislation or regulations that far exceed CAMR requirements (Table 6.2) .
Other states,
including Michigan, Maryland, Montana, New Hampshire, New York, North Carolina, and
Virginia have announced plans, or have pending proposals addressing mercury emissions from
coal-fired EGUs that exceed CAMR requirements
.
Table 6.2: Existing State Programs to Control Mercury emissions from Coal-Fired
Electric Generating Units
State
Program
Connecticut
90 percent control or 0.06 lbs per trillion BTU, whichever is less stringent, by
2008 (statute)
Massachusetts
85 percent capture or 0.0075 lbs/GWh by 1/1/2008; 95 percent or 0 .0025
lbs/GWh by 10/1/2012 (regulation)
Minnesota
70 percent reduction in mercury emissions from 1990 levels by 2005
(statutory requirement - applies to all emissions, including utilities) . 93
percent reduction goal proposed-the schedule and methods of achieving
the goal are to be developed
.
New Hampshire
A cap of 50 lbs per year after federal compliance dates ; cap of 24 lbs per
year four years later
.
New Jersey
90 percent reduction in emissions or 3 mg per MWh by 12/15/2007
(regulation); 5-year extension to 12/15/2012 available if multipollutant control
is being installed on all units for NOx, S02, total suspended particulates and
mercury .
North Carolina
64 percent reduction in mercury by 2013 ; recommendations for additional
reduction due in 2005 (statute)
Wisconsin
40 percent reduction by 2010; 75 percent reduction by 2015 (regulation)
.
Goal of 80 percent reduction by 2018 (regulation)
In a more recent action, Pennsylvania unveiled plans to require 80 percent mercury removal by
2010 and 90 percent by 2015 . Georgia proposed to require 80-85 percent average capture
efficiency by 2010, followed by 90 percent capture efficiency between 2012 and 2015 (Argus
9 1
Air Daily, 2/23/2006)
.
6.3
Illinois Mercury Reduction Programs
Because mercury is of such a significant concern to human health and the environment, Illinois
EPA has adopted legislation and implemented a number of programs to reduce mercury
emissions to the environment . These programs, as well as pending legislation, are described
below .
6.3.1 Existing Programs
6.3.1 .1. Mercury Switches, Relays and School Use of Mercury
In 2004, P.A. 93-964/SB 2551 was enacted, prohibiting the sale of mercury electrical switches
and relays (with exemptions) in consumer and commercial products, effective July 1, 2007. It
also restricted the use of elemental mercury and mercury-containing scientific equipment in K-12
schools, effective July 1, 2005. The ban does not apply to the sale of mercury switches or relays
used as replacement parts in existing manufacturing equipment or machinery, or where they are
integrated with other components. Manufactures and users of mercury switches and relays may
petition Illinois EPA for an exemption from the sales prohibition if an effective program for
recycling such items is in place . Illinois EPA has developed rules to review requests for
exemptions. The Pollution Control Board also adopted an Illinois EPA proposal to designate
mercury switches and relays as "universal waste" to facilitate the recycling of such items at the
end of their useful life
.
6.3.1 .2. Mercury Switch Thermostats and Vehicle Components
P.A. 93-964/SB 2551 required Illinois EPA to prepare a report on options for reducing and
recycling mercury found in motor vehicle components as well as wall-mounted thermostats used
for heating and cooling purposes . In February 2005, Illinois EPA issued a report recommending
that a statewide program be created and funded by automakers, steel manufacturers, and auto
shredders to remove and safely manage mercury switches from end-of-life vehicles before they
are processed as scrap metal . Illinois EPA recommended that auto recyclers and dismantlers be
reimbursed for the costs of removing mercury switches from such vehicles . Illinois EPA
92
estimated the cost of managing a mercury switch collection program in Illinois to be
approximately $1 million a year for the first several years of operation . The report also
recommended several improvements for the recycling of mercury switch thermostats by the
Thermostat Recycling Corporation .
In January 2006, HB 5578 was introduced into the General Assembly, which would require
automakers to create a statewide program to collect, transport and recycle mercury switches from
discarded or end-of-life vehicles before they are processed as scrap metal . Mercury switches
may be found in hood and trunk convenience lighting of vehicles manufactured before 2003 and
some anti-lock brake systems on four-wheel drive vehicles. An agreement was reached among
the interested parties to make the program voluntary in the first year of operation . Illinois EPA
would work with the automakers to promote the program and educate auto recyclers and
dismantlers on proper switch removal and handling practices . If capture rate targets are not met
in the second or third year of operation, the automakers would provide auto recyclers and scrap
metal processors a $2 bounty for each switch removed . Auto recyclers would also be required
to remove all reasonably accessible switches before end-of-life vehicles are sent off-site for
shredding and recycling. The law would sunset on July 1, 2011 . The bill passed the House and
is currently pending in the Senate . A companion bill, SB 2884, passed the Senate and is pending
in the House
.
6.3 .1 .3
School Chemical Collections
Illinois EPA has created a program to help K-12 schools properly dispose of waste chemicals
used for teaching purposes. Over the last three years, approximately 419 schools have received
assistance in properly disposing of more than 1,086 fifty-five gallon drums of waste chemicals,
including more than 97 drums of bulk mercury and mercury-containing devices. Most of these
same schools participated in Illinois EPA's
Safe Chemicals in Education
Workshops
.
6.3.1 .4. Household Hazardous Waste Collections
Illinois EPA's Bureau of Land program on household hazardous waste collections has been
collecting mercury containing products as part of its Household Hazardous Waste Collections for
a number of years
.
93
6.3.1 .5. Mercury Monitoring
Illinois EPA has one of the most extensive mercury monitoring programs underway in the
nation. An air sampling station in Northbrook in 2000 is one of only two continuous mercury-
monitoring stations in the U.S. Mercury samples are also being collected using advanced
scientific techniques at several inland lakes and streams across the state
.
It is Illinois EPA's intent to change the general mercury monitoring requirements in NPDES
permits. Beginning with new or reissued permits public noticed in July, any effluent mercury
monitoring must use U.S. EPA Method 1631 . The new laboratory method allows the evaluation
of the State's water quality standard for mercury (12 ppt for most) . Neighboring states have
required Method 1631 for several years . This includes all major municipal permits and
pretreatment communities . While not all industrial facilities monitor for mercury, industries
such as power plants that may have coal residues in their wastewater effluents are required to
conduct monitoring.
6.3 .1.6. Quicksilver Caucus Participation
Illinois EPA participates in the Quicksilver Caucus, a national mercury work group
.
6.3 .1.7. Dental Amalgam Partnership
Illinois EPA has teamed up with the Illinois State Dental Society to arrange for mercury and
mercury amalgams to be disposed of in an environmentally friendly manner at the household
hazardous waste collections being held around the state this spring .
6.3.1.8 Mercury Thermostat Workgroup
Illinois EPA, in conjunction with Region V, is participating on the Product Stewardship
Institute's mercury thermostat workgroup. The goal of the workgroup is to increase participation
in programs for recycling mercury thermostats . Illinois EPA has been promoting the National
Thermostat Recycling Corporation's thermostat collection program to HVAC contractors in the
state through direct mailings and other educational outreach activities
.
94
6.3.1.9 Outreach and Education
Public education and outreach efforts on the hazards of mercury are being conducted by Illinois
EPA through the distribution of brochures, public service announcements, and the Agency's web
site
.
6.3.2 Mercury Reductions from Municipal Waste Combustion Source
The combustion of municipal solid wastes (MWC) was a source category identified by U.S. EPA
in its Mercury Study (U .S . EPA Mercury Study, 1997) as a significant contributor of mercury
emissions. U .S. EPA issued final emissions guidelines (EG) for large MWC,
i.e., units with
combustion design capacity over 250 tons per day capacity, on December 19, 1995 (60
Federal
Register
65387), and for small MWCs, i.e., units with combustion design capacity of over 35
tons per day to less than or equal to 250 tons per day capacity, on December 6, 2000 (65
Federal
Register
76378). New MWC sources are subject to the NSPS for both large and small MWC,
while existing sources are covered under plans developed by states to enforce the requirements
of the final Emissions Guidelines for both large and small MWCs under Clean Air Act Section
129 .
Illinois' plan for large MWC was approved by U.S. EPA
(62 Federal Register
67572) in
December 1997. There were no municipal waste combustion units affected by the small MWC
EG. Hence, a negative declaration for small MWC EG was filed with U .S. EPA and approved
on November 30, 2001 (66
Federal Register
59713) .
The NSPS/EG for large MWC affected two large sources in Illinois,
i.e., Northwest Waste to
Energy (Northwest) and Robbins Resource Recovery Company (Robbins). Northwest shutdown
incinerator operations during the regulatory development process, and Robbins shutdown
incinerator operations in 1998 . Thus, Illinois does not have any mercury emissions from the
municipal waste combustors category
.
95
6.3.3 .
Mercury Reductions from Medical Waste Incinerator Sources
Medical Waste Incinerators were also identified as major contributors of mercury emissions in
the Mercury Study. U.S. EPA proposed NSPS standards and guidelines for new and existing
medical waste incinerators on February 27, 1995 (60
Federal Register
10654). Final standards
and emission guidelines for medical waste incinerators (Subpart Ce, 40 CFR Part 60) were
promulgated on September 15, 1997
(62
Federal Register
48348). The promulgated standards
and guidelines established emissions limits for particulate matter (PM), opacity, sulfur dioxide
(S02), hydrogen chloride (HCI), oxides of nitrogen (NOx), carbon monoxide (CO), lead (Pb),
cadmium (Cd), mercury (Hg), dioxins and dibenzofurans (dioxins/furans), and fugitive ash
emissions .
Illinois' SIP for medical waste incinerators was approved by U .S. EPA on July 7, 1999. The
State rule adopted the promulgated emission guidelines addressing all hazardous pollutants,
including mercury emissions, from the combustion of hospital and medical/infectious wastes
.
There were 98 potentially affected sources in Illinois at the time of rule development . With the
implementation of the State plan, the majority of the 98 affected sources have ceased
incineration operations and have opted for other disposal options for their hospital and medical
wastes. There are currently five medical waste incinerator units in operation at hospitals . As of
this writing, all but three of these units have approved plans to shutdown their operations
.
Thus, mercury emissions from medical waste incinerators in the State have been trending
significantly lower since the development of the State plan
.
7.0 Illinois Mercury Emissions Standards for Coal-fired Electric Generating Units
7.1 Rule Development Considerations
7.1.1 Basic Guiding Principles
Illinois recognizes that technology advancements over the last several years have contributed to
both a significant reduction in costs and an increased effectiveness of controlling mercury
96
emissions. Based in part on these developments, Illinois believes it is appropriate to require
emission reductions that go beyond the federal CAMR . Expectations are that technological
advancements will continue, which provides further justification for controlling mercury beyond
CAMR .
In developing the proposed rule, Illinois relied on several basic principles as guidance
:
•
The need to protect human health, fish and wildlife, and the environment from the
harmful effects of mercury and methylmercury
•
The need to control the unregulated mercury emissions from Illinois' coal-fired power
plants to the greatest level possible and as quickly as possible in a cost-effective manner
•
Must consider the latest control technology that has been shown effective in controlling
mercury emissions and which can be reasonably employed, in a cost effective manner,
across the full fleet of Illinois power plants and coal types
•
Must ensure that the required mercury reductions occur both in Illinois and at every
power plant in Illinois to address local impacts
•
The final rule needs to incorporate flexibility in complying with the proposed standards
to assist in widespread compliance and to help reduce compliance costs ; and
•
The proposed rule must be consistent with the Governor's proposal to reduce mercury
emissions in Illinois by 90 percent
7.1.2 Other Rule Development Considerations
The Illinois mercury rule is designed to achieve a high level of mercury control in a cost-
effective manner so as to minimize the potential for any adverse impacts, such as those on
Illinois' economy. Accordingly, Illinois crafted the rule using a combination of the following
:
•
Careful selection of an achievable, reasonable and cost-effective mercury reduction
target
•
Rule flexibility
97
7.1 .2.1 Selecting an Achieveable; Reasonable; and Cost-Effective Level of Mercury Control
Forecasting the costs of mercury controls is complex due to the many variables involved in such
a determination, including coal type, existing controls, boiler type, fly ash needs, timing, etc
.
Also, with the advance of new regulations affecting nearly every pollutant emitted from power
plants, many plant characteristics may change as a result of different control strategies employed
to address the other pollutants (e.g., S02 and NOx). For example, a unit that is either now
controlled by, or in the future will be controlled by the combination of a scrubber, SCR, and ESP
may not need to add ACI to achieve the required mercury reductions as these existing controls
may do so as a co-benefit. Furthermore, as previous regulations influenced the decision to
switch to lower sulfur western coals in Illinois, upcoming regulations may make a return to
Illinois coals more desirable. Obviously, the costs of controls and plant configurations are
changing and the many variables involved lead to the determination of "best estimates" of costs
and technology employed to meet regulations .
The cost estimates presented in this document are based on the best and most current information
available, but may need to be updated as the landscape evolves . The notable trend that is
expected to continue is one where technological advances and vendor expansion lead to
decreasing costs and increasing control efficiencies and options
.
In compiling information and reaching conclusions on costs and controls, Illinois considered
information from a number of sources. These included discussions with acknowledged experts
in the power sector, numerous literature reviews, analyses of widely accepted technological tools
such as the Integrated Planning model, review of publications by other relevant organizations
(e.g . Michigan Mercury Report), review of U .S. EPA publications on control equipment costs,
detailed review of the Illinois power sector, and the knowledge and experience of staff
.
Deference was given to more recent information since the technologies and costs involved are
rapidly advancing.
Section 8.0 provides a detailed discussion of data supporting 90 percent reduction as an
achievable and reasonable level of mercury control . Section 8.0 also shows that the costs of
98
controlling mercury are consistent with Illinois' goals .
7.1.2.2 Rule Flexibility
Providing flexibility in rules is always desirable provided the objectives of the rule are still
achieved. Giving flexibility serves to reduce compliance costs in a variety of manners, including
allowing sources to choose the most cost-effective means of compliance among different
options. For example, compliance with an output-based standard may be more desirable for a
source that utilizes washed bituminous coal and has existing controls consisting of a scrubber,
SCR, and ESP. Such a source could likely avoid the cost of installing any additional control
device since the existing controls would likely achieve compliance with the standard . Illinois
can achieve the required mercury reductions proposed by Governor Blagojevich and give some
flexibility to sources on compliance
.
Flexibility provided by the Illinois rule includes the following
:
•
The rule does not mandate a certain compliance standard, rather it provides the option of
choosing between two standards derived differently . One standard is a mercury reduction
efficiency and the other is an output based emission rate
.
•
The rule does not prescribe how compliance with the selected standard is to be achieved
.
Instead, the source makes the ultimate decision on how compliance is obtained . For
example, a source may choose to install mercury specific controls, to optimize existing
controls, or to employ a multi-pollutant control strategy that achieves the required
mercury control as a co-benefit .
•
The rule phases in standards over a period of 3
%2
years, with a less restrictive standard in
phase one. Phasing in standards, such that earlier phases are less restrictive, allows time
for knowledge and experience to be gained and applied to final compliance methods and
strategies - as well as to provide time for technology advancements
.
•
The rule allows a source to demonstrate compliance by averaging. Phase 1 allows for
both system-wide and plant-wide averaging . Phase 2 allows for plant-wide averaging.
Averaging allows for EGUs that can be overcontrolled to compensate for those that
99
cannot readily reach compliance, or for units that it is decided should not reach that level
of control, because the system or plant is still able to achieve compliance
.
•
The rule allows for sources that commit to shutdown within a certain timetable to avoid
installing controls. This allows sources to avoid unnecessary costs and expenditure of
resources on units that will soon be permanently shutdown and emit no mercury
.
Overall, careful consideration was given to the effect mercury control requirements will have on
Illinois' economy, including consumers and the power sector. The costs associated with
controlling mercury have decreased considerably as technologies have improved and options
have expanded. This trend is expected to continue . Compliance flexibility should also serve to
minimize costs. Regardless of all the mechanisms one can utilize to forecast a rule's impact on
costs it must be recognized that there lies a degree of uncertainty that can never be eliminated
.
In Illinois this may be particularly true as the State moves toward deregulation with the lifting of
a 10 year freeze on retail rates in January 2007 .
7.2
Proposed Illinois Mercury Standards
7.2.1
Applicability
The proposed mercury standards apply to all stationary coal-fired electric generating units
(EGUs), with a nameplate capacity of more 25 MWe producing electricity for sale. The proposal
also applies to any cogeneration units that serve a generator with a nameplate capacity of more
than 25 Mwe and supplying in any calendar year more than one-third of the unit's potential
electric output capacity or 219,000 MWh
.
7.2.2
Proposed Mercury Standards and Emissions Limits
7.2.2.1 Input Mercury Reductions or Output-Based Emissions Limit
The proposed mercury standard requires that affected units comply with a 90 percent mass-based
reduction of input mercury, or in the alternative, meet an output-based emissions limits of 0 .0080
pounds of mercury per gigawatt-hour (GWh) of gross electrical output across their affected units
.
The proposed rule is implemented in two phases . The first phase, which begins July 1, 2009,
100
allows owners and operators of one or more affected EGUs or cogeneration units in Illinois the
option to comply with either the mass-based reduction or the emission limits through a system-
wide averaging demonstration as explained further below. This format provides maximum
flexibility for affected sources to achieve compliance with the proposed standards. In addition,
and to prevent the potential for "hot spots," each source (or plant) in the averaging demonstration
must meet at least a 75 percent reduction of input mercury, or in the alternative, meet an output-
based emission limit of 0.020 lbs/GWh gross electrical output .
The second phase, which begins in January 1, 2013, requires a 90 percent mass-based reduction
of input mercury at each source, or in the alternative, meet an output-based source-wide
emissions limit of 0.0080 lbs/GWh
.
In all cases, compliance with the above standards is on a 12-month rolling basis and may be
demonstrated through the `averaging demonstration' as described in section 7
.2.2.3 below .
7.2.2.2 Rationale for the Proposed Mercury Standards
The output-based mercury emissions limit was developed based on four key goals
:
•
Give some credit for mercury removal from pre-combustion processes such as coal
washing
•
Provide compliance flexibility
•
Obtain mercury cuts consistent with the Governor Blagojevich's proposal
•
Encourage efficiency
Pre-Combustion Mercury Removal
Credit for pre-combustion mercury removal operations, such as coal washing, was desirable
since the standard performance based control efficiency does not account for mercury removed
during the coal washing process . However, it is clear that pre-combustion mercury removal is a
viable means of reducing mercury emissions . The main focus was on coal washing since this is
l01
currently the only pre-combustion process in use in Illinois. Although companies wash coal for
several reasons other than mercury control, significant levels of mercury can be removed through
washing and prevented from being emitted as a result of combustion . Giving total credit for all
the mercury removed during washing was contemplated, however, this would require a mercury
content measurement and verification of "run of mine" coal . This process presented several
significant compliance issues, including most importantly, reliance upon data from parties
outside of those directly responsible for compliance . In addition, coal washing is occurring and
will continue regardless of credit being given for the mercury removed . Furthermore, giving full
credit for coal washing could present problems with a demonstration of general equivalence with
the 90 percent reduction requirement or even the requirements of CAMR since its cap accounted
for mercury removal due to coal washing
.
The following is a rough calculation performed for purposes of estimating an appropriate lower-
end output-based limit for giving partial credit for coal washing
:
Median Illinois coal mercury content assumed to be 10.24 lb Hg/TBtu. (Note that
approximately 60% of Illinois coal is between 4 and 13 lb.) Conversion factor: 1 .0
lb/TBtu = 0.011 lb/GWh
When considering coal washing, average reduction due to coal washing = 47%
.
10.24 lb Hg/TBtu x (1
- .47) = 5.43 lbs Hg/TBtu washed coal .
Unwashed, the burning of this coal would require a control system to achieve 90%
reduction. Solving for the equivalent output based standard at 90% control gives
:
(5.43 lb Hg/TBtu x 0.011 lb/GWh) x (1
- .90) = 0.0060 lbs Hg/GWh .
Therefore, any output based standard above 0 .0060 lbs Hg/GWh affords some credit for
coal washing as 90% mercury removal would not be required post combustion, instead a
lower level would be necessary to the extent the output based standard is higher . This
limit could be considered the lower bound for any output based standard
.
For example, if an output based standard of 0.0080 lbs Hg/GWH were selected, one
could solve for the required post combustion mercury control required, as follows
:
(5.43 lb Hg/TBtu x 0.011 lb/GWh) x (1 - X) = 0.0080 lbs Hg/GWh .
Where X = the necessary mercury control to reach compliance . X = 87% .
102
Power plants in Illinois that bum Illinois coal typically have a scrubber and ESP control and have
or are expected to have an SCR. A mercury control level of 87% is achievable with optimization
of these existing controls
.
Flexibility
Compliance flexibility was desired because the control efficiency standard is aggressive and
flexibility assists in the achievement of widespread compliance . The availability of a second
option for compliance, instead of only a single option of the control efficiency requirement,
introduces considerable flexibility . When options for compliance are allowed, flexibility is
provided. The proposed rule offers flexibility by allowing owners and operators the option to
comply with either a mass-based or output-based standard . Further flexibility is included in the
proposed rule as it provides sources the option to alternate standards as often as they wish, so
long as only one standard is used per calendar month
.
Encourage Boiler Efficiency
An improvement in boiler efficiency results in less coal being burned, and hence fewer emissions
from a boiler, to generate the same amount of electrical output . An output-based limit
accommodates and inherently encourages changes to improve boiler efficiency
.
Mercury Reductions
The emission reductions obtained from an optional output based standard need to be roughly
equivalent to the reductions required by the control efficiency standard . In the original gross
estimate of the reductions resulting from a 90% control efficiency requirement, the 2002
uncontrolled mercury emissions in Illinois were estimated to be 7,022 pounds . Therefore, a 90%
reduction from this starting point results in final mercury emissions, after the Governor
Blagojevich's proposal, of 702 pounds per year. In computing an output based emission limit
that would be roughly equivalent to 90% reduction, a logical starting point would be the 702
pounds of mercury emissions,
i.e., the expected final outcome of the proposal. Back calculating
from this number using Illinois' total electrical output gives an emission rate that can be
considered to provide the same level of reductions as the 90% control requirement
.
103
Illinois electric gross output reported for 2002 per EIA for Illinois coal-fired EGU's
equals 84 TWh.
702 lbs Hg/(84 TWh x 1000 GWh/TWh) = 0 .0084 lbs Hg/GWh .
Therefore, any emission rate lower than this rate could be considered to result in less than
702 pounds of mercury per year . This can be considered an upper bound value to any
proposed output based standard
.
Based on the above discussions, an output based limit of 0.0080 lbs Hg/GWh was
chosen. This limit is within the range of 0 .0060 - 0.0084 lbs Hg/GWh.
Note that 702 pounds is significantly lower (44%) than the final federal mercury budget
under CAMR of 1,258 pounds per year starting at 2018
.
For purposes of determining an output based standard to correlate with the 75% plant-
wide reduction levels in phase 1, a pro rata calculation was used
:
0.0080/(1-.90) = X/(1- .75) = 0.020 lbs Hg/GWh .
7.2.2.3 Averaging Demonstration
Owners and operators of affected sources may demonstrate compliance with the proposed
standards through an "averaging demonstration" (Demonstration) . Averaging demonstration
means compliance that is based on the combined performance of one or more EGUs at different
plants (system-wide averaging) or two or more EGUs at a single plant (source-wide averaging) .
Compliance by source-wide demonstration means that the source shall meet or exceed, on a 12-
month rolling basis, the 90 percent or the minimum 75 percent mass-based reduction of input
mercury. As an alternative to the mass-based reduction requirement, the source shall not exceed,
on a 12-month rolling basis, the output-based limit of 0 .0080 lbs/GWh or the minimum of 0.020
lbs/GWh
.
System-wide demonstration means averaging between two or more plants and requires that the
owner or operator identify the affected units and sources (or plants) that will be included in the
demonstration. Compliance through system-wide demonstration means that the actual average
mass-based reduction shall be at or above 90 percent system-wide, and at least 75 percent
source-wide reduction .
104
7.2.3
Monitoring Requirements
The proposed Illinois mercury rule would require sources to conduct emissions monitoring for
mercury that is identical to the emissions monitoring that would be required under CAMR
.
These monitoring practices have been promulgated by U .S. EPA at 40 CFR Part 75, Subpart I,
Hg Mass Emission Provisions, and 40 CFR Part 75, Appendix K, Quality Assurance and
Operating Procedures for Sorbent Trap Monitoring Systems . As provided under CAMR, a
source may use the excepted "low mass" emissions monitoring methodology at 40 CFR 75 .81(b)
for an EGU that is eligible for this methodology, with annual emissions of no more than 29
.0
pounds of mercury. The assessment of the costs of such monitoring was addressed by USEPA
and can be found at 70 Fed. Reg. 28639, Section V and 28640, Section, (May 18, 2005)
.
In addition to monitoring mercury emissions to the atmosphere, the proposed rule would require
a source complying with the 90 percent reduction standard to conduct sampling and analysis for
the mercury content of the coal being burned in the EGU . This is necessary to determine the
input mercury to the EGU so that the mercury removal efficiency can be calculated . Most
sources already collect and analyze coal samples on a routine basis for operational reasons . The
provisions for sampling in the proposed rule were developed to ensure an accurate determination
of the input mercury to the EGU. Since the mercury content of coal varies, even when coming
from a single mine and coal seam, and the amount of coal consumed by an EGU can vary from
day to day, daily sampling of the coal supply to the EGU is required. The coal supply must be
sampled at a point after long-term storage, where the sample will be representative of the coal
being burned in the EGU on the day that the sample is taken . This location for coal sampling
was selected after consultation with industry representatives to provide flexibility in the point at
which samples are collected while ensuring that the resulting data accurately reflects the coal that
is actually being burned in the EGU . Certain ASTM Methods were selected for the required
analyses,
i.e., ASTM D6414-01 (Standard Test Method for Total Mercury in Coal and Coal
Combustion Residues by Acid Extraction or Wet Oxidation/Cold Vapor Atomic Absorption) and
ASTM D3684-01 (Standard Test Method for Total Mercury in Coal by the Oxygen Bomb
Combustion/Atomic Absorption Method). These methods were chosen after consultation with
industry representatives and experts on coal analysis because these methods are accurate, sources
105
and commercial laboratories are familiar with these methods, and the costs of these methods are
reasonable.
7.2.3.1 Illinois Electric Generating Units
Below is the list of Illinois EGUs . There are currently 59 electric generating units (Table 7 .1)
operating at 21 power plants across the State, as shown in Figure 7
.1
.
106
107
Table 7.1 - Existing Illinois Electric Generating Units
OWNER
I
Facilityld
I
FACILITY NAME
I
ORIS
/
UNIT
Dynegy Power Corporation (Owner/Operator)
157851 AAA
Baldwin Energy Complex
889
1
Dynegy Power Corporation (Owner/Operator)
157851AAA
Baldwin Energy Complex
889
2
Dynegy Power Corporation (Owner/Operator)
157851AAA
Baldwin Energy Complex
889
3
Ameren Energy Generating Company (Owner/Operator)
135803AAA
Coffeen
861
1
Ameren Energy Generating Company (Owner/Operator)
135803AAA
Coffeen
861
2
Midwest Generation EME, LLC (Owner/Operator)
031600AIN
Crawford
867
7
Midwest Generation EME, LLC (Owner/Operator)
031600AIN
Crawford
867
8
City of Springfield, IL (Owner/Operator)
167120AA0
Dallman
963
31
City of Springfield, IL (Owner/Operator)
167120AA0
Dallman
963
32
City of Springfield, IL (Owner/Operator)
167120AA0
Dallman
963
33
AmerenEnergy Resources Generating Company (Owner/Operator)
057801 AAA
Duck Creek
6016
1
AmerenEnergy Resources Generating Company (Owner/Operator)
143805AAG
E D Edwards
856
1
AmerenEnergy Resources Generating Company (Owner/Operator)
143805AAG
E D Edwards
856
2
AmerenEnergy Resources Generating Company (Owner/Operator)
143805AAG
E D Edwards
856
3
Midwest Generation LLC (Owner/Operator)
031600AM1
Fisk
886
19
Dynegy Power Corporation (Owner/Operator)
125804AAB
Havana
891
9
Dynegy Power Corporation (Owner/Operator)
155010AAA
Hennepin Power Station
892
1
Dynegy Power Corporation (Owner/Operator)
155010AAA
Hennepin Power Station
892
2
Ameren Energy Generating Company (Owner/Operator)
033801 AAA
Hutsonville
863
5
Ameren Energy Generating Company (Owner/Operator)
033801AAA
Hutsonville
863
6
Midwest Generation EME, LLC (Owner/Operator)
197809AA0
Joliet 29
384
71
Midwest Generation EME, LLC (Owner/Operator)
197809AA0
Joliet 29
384
72
Midwest Generation EME, LLC (Owner/Operator)
197809AA0
Joliet 29
384
81
Midwest Generation EME, LLC (Owner/Operator)
197809AA0
Joliet 29
384
82
Midwest Generation EME, LLC (Owner/Operator)
197809AA0
Joliet 9
874
5
Electric Energy, Inc. (Owner/Operator)
127855AAC
Joppa Steam
887
1
Electric Energy, Inc. (Owner/Operator)
127855AAC
Joppa Steam
887
2
Electric Energy, Inc. (Owner/Operator)
127855AAC
Joppa Steam
887
3
Electric Energy, Inc. (Owner/Operator)
127855AAC
Joppa Steam
887
4
Electric Energy, Inc . (Owner/Operator)
127855AAC
Joppa Steam
887
5
Electric Energy, Inc. (Owner/Operator)
127855AAC
Joppa Steam
887
6
Dominion Energy Services Co (Operator) Kincaid Generation, LLC (Owner)
021814AAB
Kincaid Station
876
1
Dominion Energy Services Co (Operator) Kincaid Generation, LLC (Owner)
021814AA8
Kincaid Station
876
2
City of Springfield, IL (Owner/Operator)
167120AA0
Lakeside
964
7
City of Springfield, IL (Owner/Operator)
167120AA0
Lakeside
964
8
Southern Illinois Power Cooperative (Owner/Operator)
199856AAC
Marion
976
123
Southern Illinois Power Cooperative (Owner/Operator)
199856AAC
Marion
976
4
Ameren Energy Generating Company (Owner/Operator)
137805AAA
Meredosia
864
1
Ameren Energy Generating Company (Owner/Operator)
137805AAA
Meredosia
864
2
Ameren Energy Generating Company (Owner/Operator)
137805AAA
Meredosia
864
3
Ameren Energy Generating Company (Owner/Operator)
137805AAA
Meredosia
864
4
Ameren Energy Generating Company (Owner/Operator)
137805AAA
Meredosia
864
5
Ameren Energy Generating Company (Owner/Operator)
079808AAA
Newton
6017
1
Ameren Energy Generating Company (Owner/Operator)
079808AAA
Newton
6017
2
Midwest Generation EME, LLC (Owner/Operator)
179801AAA
Powerton
879
51
Midwest Generation EME, LLC (Owner/Operator)
179801AAA
Powerton
879
52
Midwest Generation EME, LLC (Owner/Operator)
179801AAA
Powerton
879
61
Midwest Generation EME, LLC (Owner/Operator)
179801AAA
Powerton
879
62
Dynegy Midwest Generation, Inc. (Owner/Operator)
183814AAA
Vermilion Power Station
897
1
Dynegy Midwest Generation, Inc. (Owner/Operator)
183814AAA
Vermilion Power Station
897
2
Midwest Generation EME, LLC (Owner/Operator)
097190AAC
Waukegan
883
17
Midwest Generation EME, LLC (Owner/Operator)
097190AAC
Waukegan
883
7
Midwest Generation EME, LLC (Owner/Operator)
097190AAC
Waukegan
883
8
Midwest Generation EME, LLC (Owner/Operator)
197810AAK
Will County
884
1
Midwest Generation EME, LLC (Owner/Operator)
197810AAK
Will County
884
2
Figure 7.1 - Locations of Illinois Coal-Fired Power Plants
Statewide Coal-Fired
Power Plants
Legend
•
Existing Power Plant
•
Mercury Impaired Lakes
-N.- Mercy Impaired W tens
Kw1r
r
edosle
me
E
D
u kCreak~Ameren
.'mowx
avana(Dyn
NIB
ood R
D. Edwa ds
0
o
Rock! rd
Bran)
don`
oI
.I
M'
oveen (Ameren)
(Dyn gy)
Sa
Baldwin
Jolt
axwox
ectdc Ener
dwe
a
P
dwast Generation)
Bloomington
Vermilion
S
a
Me on (Southern Illlnol
rove
a
x
xw7
Sprln
aid C
Water LIp_ and Po
J
Incald(Dominion)
(Dominion)-
SISSY
Joppa .(
Ion)
'x Fisk(Midwest
oli
Crawford (Midwest Goner
Will
couny(MI"West
ettelatlon)
t (M
I
at Generation)
Dynegy)
.etON
.0.
RMa
Hutsonwlle.(Ameren)
e'eV
Newton (Ameren)
fame
ower Coop)
108
8.0
Technological Feasibility of Controlling Mercury Emissions from Coal-Fired Power
Plants in Illinois
The mercury emissions from a coal-fired power plant are the result of the mercury content in the
coal that is burned and the extent that processes in the boiler prevent the mercury from being
released with the exhaust gases of the power plant . Mercury can be removed from the coal prior
to combustion of the coal . This may be achieved by coal cleaning or by some other treatment of
the coal . Or, mercury can be removed from the boiler flue gases by air pollution control (APC)
equipment. Sometimes the APC equipment that removes the mercury is equipment that is
installed primarily to remove other pollutants, such as particle matter (PM) or acid gases in a flue
gas desulfurization system (FGD) . These are called co-benefit mercury removal. Mercury may
also be removed by air pollution control systems that are specifically designed to remove
mercury from the flue gases
.
Mercury emissions control technology is a rapidly advancing field . New developments
continually improve capabilities to reduce mercury emissions from coal-fired power plants . The
following sections address a current understanding of how mercury emissions from Illinois coal-
fired power plants may be controlled
.
8.1
Mercury Removal from Coal
Run of mine (ROM) bituminous coal is frequently cleaned for the following purposes
:
•
Removal of impurities to improve the heating value of the coal
•
Reduction of transportation costs for coal to the power plant and ash from the power
plant
•
Maintenance of ash content in coal supply within contract requirements
•
Removal of sulfur, mainly as pyrites, lowering SO2 emissions when the coal is burned
.
However, cleaning ROM coal will provide the added benefit of removing mercury from the coal
.
This is because mercury in the coal is preferentially associated with pyrites and other non-
109
combustible materials that are removed in coal washing . In conventional cleaning methods the
coal is crushed and separated into course, medium and fine fractions . Each of these size
fractions is cleaned by different methods that may include jigs or heavy media baths (coarse),
cyclones and concentrating tables (intermediate), or disposal or froth floatation (fines) .
Conventional cleaning methods can remove on average 47% of the coal mercury in ROM Illinois
bituminous coal, as shown in Figure 8.1. Research shows that advanced cleaning techniques,
such as advanced floatation or gravity separation can remove higher amounts of mercury from
Illinois bituminous coal, as high as 84% . However, more advanced cleaning methods increase
the amount of waste material, the amount of energy expended and the amount of coal that must
be mined to produce a given amount of product coal . Therefore, there are economic and
environmental trade-offs beyond mercury removal that must be considered
.
0
c0
0
E
9)
Q)
8.1 .1. Wastewater Issues in Coal Washing
Coal washing is a process capable of removing mercury from mined coal by separation of pyrites
and other trace minerals. It has been estimated by the Illinois Clean Coal Institute (ICCI) that
approximately 60% of mercury found in Illinois coal can be removed by routine coal washing
.
Even more mercury may be removed using enhanced gravity separation methods such as
cyclones and flotation. Currently, most coal mines in the state of Illinois utilize some form of
coal washing for various reasons including reduction in sulfur content, and enhancing burn
1 10
Figure 8 .1
. Mercury
removal efficiency of coal
cleaning methods on
Illinois coal cleaned by :
•
conventional cleaning
(C) ;
•
advanced flotation (F) ;
and
•
advanced gravity
separation (G)
(Rostam-
Abadi, 2005)
characteristics with less ash . The washing activities are carried out at the mine preparation plants
prior to shipment to customers, including coal-fired power plants. In wet washing processes the
fines end up in a slurry that must be disposed of by some means. Typically, the slurry is stored
in an impoundment or pumped underground
.
Currently, discharges from coal washing facilities are permitted along with their associated coal
mines under the NPDES permitting program . In cases where an impoundment is utilized to store
the slurry, ground water monitoring is required as a condition of the facility's NPDES permit .
The Class I groundwater standard for mercury (total) is 0.002 mg/I. Mercury groundwater
monitoring has not been required on a routine basis, but existing mercury sampling data indicates
that mercury has generally not exceeded groundwater standards due to slurry ponds. It must be
noted, however, that the analytical methods used to measure mercury in groundwater are not
capable of detecting mercury down to levels of interest when surface water standards are
considered. The pH of the water in the slurry ponds is typically in the range of 7 to 8
.
Therefore, it would not appear that the mercury sulfide bound up with the pyrites would leach
.
However, it is conceivable that mercury monitoring (using test methods adequate for assessment)
for these impoundments will become more commonplace if coal washing activities are increased
.
The larger size fraction of material separated from the coal ends up in gob piles . Runoff from
the gob piles is managed by routing it to sedimentation basins . Discharges from the basins are
also governed by the facility's NPDES permit. Mercury is not typically a regulated parameter in
the NPDES permits for sedimentation basin discharges at coal mines. The surface water quality
aquatic life standards for mercury are 1 .1 ug/l (chronic) and 2.2 ug/l (acute) in the dissolved
form, but these standards are not constraining on a day to day basis. It is not anticipated that
mercury water quality will be an issue for these discharges based on factors such as the form of
mercury, settling in the basins, and the pH of wastewater . Again, it is conceivable, and probably
likely, that increased monitoring for mercury will be included in new and reissued NPDES
permits for various discharges in an attempt to better quantify the extent of mercury present
.
1 1 1
8.2 The Fate of Mercury During Coal Combustion
Mercury that is present in trace amounts in the coal is released from the coal during combustion
.
At furnace conditions, the released mercury is present in a gaseous state in the elemental form
that is denoted as Hg° .
As the combustion exhaust gases cool in the boiler, chemistry shifts to
favor an oxidized, or ionic, form of mercury, denoted as Hg 2+ . The temperature window where
this transformation occurs varies based upon flue gas conditions, and may vary from about 620
°F to 1250 °F (EPA-600/R-01-109, 2002). The most common form of Hg2+ is as mercuric
chloride, HgC12. As the flue gas cools, some of the mercury may also form particulate or be
adsorbed onto solid particles in the combustion gases. This particulate form of mercury is
denoted HgP .
At conditions after the last heat exchanger, normally around 300 °F, one would
expect all of the mercury to be in the form of Hg, or Hg 2+ if the chemical reactions went to
completion. However, in practice, the form of the mercury is normally such that some
significant portion (from a few percent to over 90%) of the mercury actually remains in the
elemental form (Hg°) . Therefore, the transformation of elemental mercury to oxidized mercury
is kinetically limited-that is to say that the chemical reactions associated with mercury
oxidation slow down and stop before they can reach completion
.
The speciation of mercury - as Hg° , Hg2+' or HgP - is important because it impacts the capture of
mercury by boiler air pollution control equipment . Hg° is not removed by pollution control
equipment without first converting it to another form of mercury - either 1-192+ or Hgp .
Hg,, is
effectively removed by particulate matter control devices such as electrostatic precipitators
(ESPs) and fabric filters (FFs) and Hg2+ is water soluble and is efficiently removed by flue gas
desulfurization equipment. The oxidation of Hg° to Hg2+ may occur in gas-phase reactions or in
heterogeneous, or catalytically-assisted, reactions. The gas-phase oxidation is believed to be
influenced by several parameters - temperature and concentration of certain other constituents in
the fluegas such as chlorine. The heterogeneous reactions occur mostly on fly ash surfaces or
boiler surfaces. If the fly ash contains high amounts of unburned carbon the catalytic effect is
greater. In addition, carbon in the fly ash acts as a sorbent . Chlorination of carbon by HCl is a
likely first step toward catalytic oxidation of Hg ° to HgC12 on the surface of fly ash, and
chemisorption of the mercury onto the fly ash carbon can occur this way . Through this
1 12
mechanism Hg° can be transformed into Hgp, which can be captured by downstream PM control
devices. Hence, fly ash characteristics - especially carbon - as well as coal chlorine content play
an important role in mercury speciation and capture . Other constituents in the flue gas -
S02
and
H2O - have also been shown to affect mercury speciation, tending to suppress Hg ° oxidation to
Hg2+ somewhat as concentration of
S02
or H2O is increased. But, the effects of S02 and H2O are
not as significant as the effects of temperature, carbon and chlorine (EPA-600/R-01-109, 2002)
.
Two types of coals are burned at power plants in the state of Illinois - bituminous and
subbituminous. Bituminous coals burned in Illinois are usually native Illinois basin coals .
Subbituminous coals are usually imported from the western states and are attractive for their low
sulfur content. Bituminous coals tend to have higher chlorine contents and also tend to produce
higher levels of unburned carbon (UBC) in the fly ash than subbituminous coals . Because of the
importance of chlorine and carbon in oxidation of Hg ° , bituminous coals are more likely to
produce low proportion of mercury as Hg ° while subbituminous and lignite coals produce more
mercury as Hg° .
Since the Hg° is not easily captured by existing pollution controls, the plants
that burn subbituminous coals would be expected to have higher mercury emissions for the same
air pollution control configuration
.
8.3
Mercury Removal by Co-Benefit from PM, NOx and SO2 Controls
Mercury may be captured by co-benefit of particulate matter (PM) controls or SO2 controls
.
NOx controls can enhance the capture that is achieved in PM and SO2 controls . Results of
measurements of co-benefit mercury removal rates taken in response to the U .S. EPA's
Information Collection Request (ICR) as part of the development of the federal Clean Air
Mercury Rule are shown in Figure 8 .2 for bituminous and subbituminous coals with various air
pollution control configurations. Figure 8.2 shows the average removal rates as well as the range
that was measured for each APC configuration. There are some important trends in this figure
.
•
In every case, the average mercury removal rate for bituminous coal was greater than
the average removal rate of subbituminous coal for the same APC configuration
.
1
1 3
•
Mercury removal for a FF was significantly higher than for a cold-side ESP (CS-ESP)
than for a hot-side ESP (HS-ESP) for both bituminous and subbituminous coals
.
•
Removal for a bituminous coal fired boiler with Spray Dryer Absorber and FF
(SDA/FF) was very high (over 95%), while for subbituminous coals removal with
SDA/FF was actually less than for a FF alone
.
•
In several cases there was a high level of variability in capture efficiency
.
Figure 8.2 Mercury Removal Rates Measured for Bituminous and Subbituminous Coals
(USEPA, 2005)
Bituminous Coal
f
t
f
100
90
80
70
60
50
40
30
20
10
0
Sub-bituminous Coal
1 14
•
CS-ESP is cold-side ESP
•
HS-ESP is hot-side ESP
•
FF is fabric filter
•
FF/SDA is lime spray drier
followed by fabric filter
•
CS-ESP/FGD is CS-ESP
followed by wet flue gas
desulfurization
•
HS-ESP/FGD is HS-ESP
followed by wet flue gas
desulfurization
The tendency for mercury to be captured more efficiently from boilers firing bituminous coal is
likely a result of the higher chlorine contents that these coals tend to have and the higher
unburned carbon in the fly ash of these coals . Both factors will contribute to lower proportions
of mercury as Hg
°
and greater proportions of mercury as Hg
2'
or Hgp, both of which are easier to
capture than Hg
°
.
The carbon in fly ash also acts as a sorbent material to capture the mercury .
I
The improved mercury capture by FF over ESPs can be explained by the intimate contact the gas
has with fly ash (and unburned carbon, or UBC) as it passes through the fabric filter. This will
contribute to greater catalytic oxidation and subsequent adsorption of the mercury. Bituminous
coals, generally having higher UBC contents in the fly ash, would be expected to produce higher
removal rates in combination with a FF than subbituminous coals with an FF, and this is the
case .
I
0
C
a
u
0 0
4
0
0
N
U)
0
0 0
W
a
a
a
N
W
Jh
V
W
U)
2
U-
u
u
a.
a
N N
N
l ~I
41
W
C)
N
2
N
r
U 2
100
90
80
a°
•
70
A
0
60
9
50
Z
40
a3
30
I
f
20
I
10
0
a a
N N
N
U
The poor removal of mercury by SDA/FF on subbituminous coals can be explained by the
capture of much of the HCI by the SDA, leaving inadequate HCl at the FF to participate in the
oxidation of Hg° and adsorption onto particulate that can be captured on the FF . While not used
in Illinois power plants, lignite coals exhibit behavior that is similar to subbituminous coals due
to their low halogen content. For bituminous coals, which usually have a higher percentage of
Hg as Hg2
, this HCI stripping effect is not significant and SDA/FFs have very high mercury
removal efficiencies
.
The high variability of mercury capture for several situations indicates that for these cases there
are other important factors besides coal type and APC configuration. For example, the
bituminous coal with CS-ESP data covers a range of coal chlorine, fly ash carbon (and content),
ESP inlet temperature and coal sulfur levels - all of which can impact mercury capture
efficiency. So, even within any classification of coal or control technology, there may be a
significant amount of variability
.
Since the ICR data was originally collected by U.S. EPA, several test programs have examined
other configurations not covered in the ICR data . One configuration is Selective Catalytic
Reduction equipment for NOx removal followed by flue gas desulfurization . Mercury is very
effectively captured from the flue gas of boilers that fire bituminous coals and are equipped with
both SCR and FGD . The catalyst of the SCR system helps to oxidize the elemental mercury in
the flue gas. The oxidized mercury is then very efficiently captured by the FGD system . As
shown in the Figure 8.3, effective capture in the range of about 90% appears to occur for all
types of FGD when SCR is used in combination with FGD. Without the SCR, mercury removal
by the FGD is in the range of about 50% to 70% (roughly consistent with the ICR data)
.
For subbituminous coals, the beneficial effect of SCR on mercury capture by FGD does not
appear to be as great. This is believed to be due to the lower halogen concentrations in the flue
gas of subbituminous coals than bituminous coals, which tends to favor elemental over oxidized
mercury .
1 15
Figure 8.3. Mercury Removal by Wet FGD Technology With and Without SCR (USEPA,
2005)
100
90
w
w
N
0-
w
m
U
U
U
a
N
w
E
E
N
E
E
13
% Hg(total) Removal w !o SCR
∎ % Hg(total) Removal w! SCR
u
fA
a
N
a
J
a
W
N
U
U
J
a
N
w
0
V
W
1 16
L
U
U
U
U
a
a
N
U
•
MEL is
Magnesium
Enhanced Lime
•
LSFO is
Limestone
Forced
Oxidation
•
JBR is Jet
Bubbling
Reactor
•
LSNO is
Limestone
Natural
Oxidation by
fabric filter
•
SDA is Spray
Drier Absorber
8.3.1
Methods to Optimize Co-benefit Controls
Methods to improve the mercury capture efficiency ofPM and S02 controls are being developed
and have proven to be effective in many cases . Most approaches focus on methods to increase
the proportion ofmercury as Hg2+ or Hgp, which tends to be much more easily captured. Others
are focused on modifying some other aspect offlue gas chemistry. A description ofthe common
methods follow
:
•
Combustion Staging - Combustion Staging is known as a method for NOx control .
However, it has also been shown to help improve capture ofmercury in the ESP
.
This is at least in part due to increased carbon in the fly ash that often results from
combustion staging. The increased carbon loading tends to promote formation of
Hg2+ and also acts as a sorbent to capture the mercury. Another effect is suppression
ofoxidation ofS02 to SO3 (sulfur trioxide). SO3 has been shown to suppress the
mercury removal of sorbents . This is possibly because it may compete with mercury
for oxidation and adsorption sites . In most cases it is not necessary to make
MEL
Lime
LSFO
JBR
LSNO
SDA
V.nde
.
J
J
W
W
w_
N
0 0
O O
0-
w
a
Z
0
0
-
LL
lY
hardware changes to affect the fuel staging. This is often achievable by making
adjustments to existing hardware to reduce excess air . The extent that combustion
staging will improve co-benefit mercury emissions will vary from one unit to another
and for any unit would be determined in a test program .
•
Coal Blending
-For subbituminous coals, which tend to have low halogen content
and also tend to produce low carbon content in the fly ash, improved mercury capture
by existing equipment can result through blending with bituminous coal . For
example, at Holcomb Station in Kansas, a 360 MW, PRB-fired boiler equipped with
SDA/FF for SO2 and PM control, mercury capture across the fabric filter was
increased from zero to nearly 80% by blending about 15% western bituminous coal
with the PRB coal (Sjostrom, 2004) . Of course, in any particular situation, coal
blending may not be the best choice because there could be impacts on the
combustion system. Coal blending can also improve performance of mercury-
specific technologies as well, such as sorbent injection
.
•
Fuel and Flue Gas Additives -
Both subbituminous and lignite coals behave similarly
with respect to mercury capture due to low halogen contents in these coals . Fuel and
flue gas additives have been developed for the purpose of increasing the halogen
content of the flue gas or to otherwise promote formation of Hg2
over Hg° . From a
mercury control perspective, these additives can make facilities firing subbituminous
or lignite coals behave more like a facility that fires bituminous coals . At Laskin 2
(firing PRB) and at Stanton 10 (firing ND lignite), chlorine salts were added to the
fuel to assess the impact of increasing fuel chlorine in this way has on mercury
oxidation and capture. Laskin 2 is equipped with a Particle Scrubber (PS) and
Stanton 10 with a SDA/FF . In both cases, mercury oxidation increased, although for
some salts the mercury capture did not increase (Richardson et al ., 2003). Additives
might also be injected directly into the flue gas or into the air pollution control
equipment, as shown in Figure 8.4. Long-term effects, such as corrosion, plugging,
impacts on combustion equipment could not be assessed during the short-term
parametric tests. Therefore, the use of coal additives offers some promise at
improving mercury capture; however, they may have other impacts that need to be
evaluated .
1
17
Figure 8.4 Locations for Addition of Oxidizing Chemicals or Oxidizing Catalysts
•
Flue Gas Catalysts -
In the same manner that SCR catalyst improves mercury
oxidation, other catalysts might be added upstream of the wet FGD to promote
oxidation of Hg° to Hg2+ which is easily captured in the FGD . Although there has
been some testing of catalysts for this purpose, catalyst lifetime remains a concern
.
•
Wet FGD Additives-
Wet FGD systems are usually very effective at removing Hg 2+ .
However, under some operating conditions of a wet FGD a very small portion of the
Hg2+ will be chemically reduced to Hg ° and the Hg° will then be reemitted (Nolan et
al., 2003). This will reduce the overall Hg removal effectiveness of the FGD
somewhat. In some of these cases, especially for limestone forced oxidation
scrubbing systems, the chemical reductions of Hg2+ to Hgo and subsequent
reemission have been abated with the help of sulfide-donating liquid reagent
.
Experience has shown that Hg2+ reduction and reemission may be more difficult to
avoid in magnesium-enhanced lime scrubbers than LSFO scrubbers due to the much
higher sulfite concentration in these systems (Renninger et al ., 2004). Development
continues in this area to improve the effectiveness of these chemicals at improving
mercury control efficiency of wet FGD systems
.
8.4
Mercury-Specific Controls
The previous Section addressed the important factors impacting mercury capture by co-benefit
from NOx, PM or
SO2
control technologies . As discussed, boilers that fire subbituminous coal -
1
1 8
which there currently are many of in Illinois - are not likely to achieve high levels of mercury
removal from co-benefits alone . Some of the bituminous coal fired boilers may not achieve
adequately low mercury emissions by co-benefits alone. Therefore, these plants may need
additional controls to achieve the levels of mercury removal that are being required in the
proposed rule. The level of additional removal needed by mercury-specific controls is shown in
Figure 8 .5 for 90% total removal and 75% total removal . As shown in Figure 8.5, the additional
removal required of mercury specific technology can be substantially reduced by high levels of
co-benefit removal
.
Figure 8.5. Additional Mercury Removal Required of Mercury-Specific Control
Technology to Achieve 90% and 75% Total Removal as a Function of the
Co-Benefit Mercury Removal.
0%
10% 20% 30% 40%
Co-Benefit Removal
1 19
50% 60% 70% 80%
90% 100%
In this section, removal of mercury by injection of Powdered Activated Carbon and other dry,
injected sorbents will be described. Mercury removal by Sorbent Injection is a control
technology that has been used in other industries for mercury control and has been tested at
numerous coal-fired units in the United States . After co-benefit from other controls, SI
technology is the mercury control technology that is most likely to be deployed at coal-fired
power plants
.
100%
90%
V
80%
N
70%
rc
a
60%
E
E
50%
d
K
40%
IV
c
0
30%
9
O
20%
Q
10%
SI technology is a well-established method to control mercury from Municipal Waste
Combustors (MWCs) in the United States and Europe . The most widely used sorbent is PAC
.
However, other sorbents or reactive chemicals have been used . Whether on a MWC or on a
coal-fired power plant, the equipment for a sorbent injection system consists of a storage silo,
metering valve, pneumatic conveying system and a series of pipes that direct the sorbent that is
blown into the plant ductwork. The sorbent is always injected upstream of a particulate matter
collection device-typically either an electrostatic precipitator or fabric filter as in Figure 8
.6 .
The dry particles are dispersed in the flue gas stream and are captured by the downstream PM
collection device. When an ESP collects the sorbent, the mercury capture must occur as the
sorbent and mercury interact "in-flight" . For a fabric filter, there is "in-flight" interaction, but
most interaction between the sorbent and mercury occurs as the gas passes through a layer of
PAC collected on the surface of the filter bag.
For coal-fired applications, where it may be desirable to keep the sorbent separate from the
captured fly ash (such as when the fly ash is sold for use in cement), the sorbent may be injected
between fields of the ESP . This is called a TOXECON II arrangement . The bulk of the fly ash
is collected in the ESP upstream of the sorbent injection point and is separated from the sorbent
and remaining fly ash that is collected in the ESP downstream of the injection point as shown in
the TOXECON II arrangement of Figure 8.6. In other cases it may be preferable to install a new
fabric filter downstream of the existing ESP . In this case the configuration is a TOXECON
arrangement as shown in Figure 8 .7. This configuration has the benefits of providing
segregation of fly ash from sorbent and higher mercury removal efficiencies at lower sorbent
injection rates. However, the disadvantage is that the equipment is more expensive than in the
case of Figure 8 .6 .
120
Figure 8.6. Arrangement for a Typical Sorbent Injection System, Normal Arrangement in
Solid and TOXECON II in Dashed
I
Boiler
I
I
Sorbent Storage
Toxecon II
Figure 8.7 Sorbent Injection in a TOXECON Arrangement
Existing
ESP
I
Boiler
I
1 2
1
Existing
ESP or FF
I
Sorbenl Storage
Additional
Fabric Filter
Stack
Stack
The sorbent injection hardware does not take up much space and is relatively easy to retrofit onto
an existing plant. Figure 8.8 shows a photo of the equipment used at one coal-fired power plant
.
The size of the storage silo is relatively small compared to existing APC equipment . Except in
the case of TOXECON, it is not necessary to make any major alterations to ductwork or existing
equipment when installing a sorbent injection system
.
Figure 8.8 Sorbent Injection
equipment compared to other air
pollution control equipment
(Durham, 2005) .
Although the equipment used for injecting sorbent into the flue gases of coal-fired power plants
is essentially the same as that used at waste incinerators, significant differences in gas conditions
exist between these two applications. In the case of MWCs, the concentrations of mercury and
chlorides are typically much higher and the concentration of SO 2 is often lower. Gas
temperatures at the sorbent injection point are often lower as well . For these reasons, gas
conditions for high mercury capture efficiency using PAC are better in MWCs . Therefore, the
air pollution control industry has developed new sorbent materials that are optimized for
application in coal-fired power plant flue gas and generally perform better than the PAC sorbents
that are used in MWC combustors and for other industrial applications . In recent years, the most
widely tested of these are halogenated PACs offered by Sorbent Technologies (Twinsburg, OH)
and NORIT (Marshall, TX/Borne, Netherlands) .
8.4.1
Early Field Testing Experience with Sorbent Injection
Experience controlling mercury emissions from coal-fired boilers has been gained through
laboratory and pilot testing programs that have led to numerous field test programs conducted to
test sorbent injection systems on the flue gas of coal-fired electric power plants
.
122
Figure 8 .9 shows the results of some early full-scale field tests using untreated PAC sorbent .
Mercury removal resulting from the PAC injection (this is the percent removal of mercury
remaining after co-benefit removal) is plotted against the injection concentration of the sorbent
measured in pounds of sorbent per million actual cubic feet of flue gas (lb/MMact). These
parametric tests showed the following:
•
Based upon experience at Southern Company's Gaston Plant, high levels (over 90%)
removal are achievable over short periods on bituminous coals with untreated PAC
when a fabric filter was used to capture the PAC in a TOXECON arrangement
.
•
Based upon pilot testing at Public Service of Colorado's Comanche Station, high
levels (over 90%) removal are achievable over short periods on bituminous coals with
untreated PAC when a fabric filter was used to capture the PAC and there is not an
upstream spray dryer absorber .
•
Based upon experience at New England Power's Brayton Point Power Plant, high
levels of mercury removal (90%) are achievable over short periods on boilers firing
low sulfur bituminous coals with untreated PAC through in-flight capture, but at very
high PAC injection rates
.
•
Based upon experience at WE Energies Pleasant Prairie Power Plant, high levels of
mercury removal (90%) are not achievable over short periods on boilers firing
subbituminous coal with untreated PAC through in-flight capture .
This early experience raised serious questions regarding the ability to achieve high mercury
removal rates on units firing subbituminous coals using untreated PAC - where coal chlorine
content is often very low (often under 50 ppm) . Testing at other units firing low-rank coals
(subbituminous or lignite), which tend to have low halogen content showed similar behavior
when untreated PAC was used as the sorbent . Although lignite coals are not used in Illinois,
methods used to solve the problem of low halogen content with lignite coals are applicable to
subbituminous coals as well .
123
Since these early tests were short-term parametric tests, they also left questions regarding the
long-term performance of these technologies that were to be addressed in future testing
.
Figure 8.9 Early Parametric Field Testing Results for Mercury Control by Untreated PAC
Injection .
8.4.2
Results of Additional Field Testing
Since the first field test programs of PAC performed in 2001(Bustard et al ., 2001) the focus of
additional testing has been on unanswered questions from the initial tests, new sorbents, and on
other applications not addressed in the initial tests . Table 8.1 lists several of these test programs
.
These tests have shown that low-rank coals (lignite and subbituminous) have similar challenges
with regard to mercury removal by sorbent injection. As a result, lessons learned in lignite test
programs have been shown to be useful for subbituminous applications, and vice-versa
.
Chemically treated sorbents manufactured by Norit and Sorbent Technologies have been
developed to overcome the shortcomings of untreated PAC in low-rank coal applications. Field
tests have been performed at numerous plants
(see
Table 8.1 below) with halogenated sorbents to
compare their performance for mercury removal to that achieved with untreated PAC in the early
124
100
E . flit,ToXrCAN„
E. Bi[!ESPs
•
PfB.ESP
•
s- l
t.iQnite CaaI'ESP
20
•
DOE Fek1 Oata
0 0
0
10
15
20
25
30
Inlectlon Concentration, Ib1MMaci
Table 8.1 Sorbent Injection Field Demonstrations
(Durham 2005, Nelson 2005,
Kang et al. 2005, Tran et al. 2005)
125
Station
Coal
Equipment
Notes
Gaston (l month)
Low-S Bit
FF
complete
Pleasant Prairie
PRB
CS-ESP
complete
Brayton Point
Low-S Bit
C-ESP
complete
Abbott
High-S Bit
C-ESP/FGD
complete
Salem Harbor
Low-S SA Bit
C-ESP
complete
Stanton 10
ND Lignite
SDA/FF
complete
Laskin
PRB
Wet P Scrbr
complete
Coal Creek
ND Lignite
C-ESP
complete
Gaston (1 year)
Low-S Bit
FF
complete
Holcomb
PRB
SDA/FF
complete
Stanton 10
ND Lignite
SDA/FF
complete
Yates I
Low-S Bit
C-ESP
complete
Yates 2
Low-S Bit
ESP/FGD
complete
Leland Olds
ND Lignite
C-ESP
complete
Meramec
PRB
C-ESP
complete
Dave Johnston #3
PRB
C-ESP
complete
Leland Olds
ND Lignite
C-ESP
complete
Portland #1
Bit
C-ESP
In progress or planned
Brayton Point
Low-S Bit
C-ESP
complete
6 Commercial Tests
Low-S Bit
ESP
In progress or planned
Laramie River
PRB
SDA/ESP
In progress or planned
Conesville
High-S Bit
ESP/FGD
In progress or planned
DTE Monroe
PRB/Bit
ESP
complete
Antelope Valley
ND Lignite
SDA/FF
In progress or planned
Stanton I
ND Lignite
C-ESP
In progress or planned
Council Bluffs 2
PRB
H-ESP
In progress or planned
Louisa
PRB
H-ESP
In progress or planned
tests for both bituminous and western fuels. Field test programs have also focused on long-term
performance over periods extending to several weeks to as long as over a year
.
8.4.2.1 In-Flight Mercury Removal
Figure 8.10 shows the in-flight mercury capture performance of halogenated PAC (B-PAC from
Sorbent Technologies and Darco Hg LH from NORIT) at full-scale tests (and one pilot-scale test
at the Pleasant Prairie power plant). Percent total mercury removal attributed to sorbent injection
is plotted against the injection concentration of sorbent in pounds per million actual cubic feet of
flue gas (lb/MMacf) . Included in this data are results of two 30-day tests at St . Clair station and
at Meramec Station .
These two 30-day tests showed that over 90% mercury removal was
achievable at sorbent injection rates near 3 lb/MMacf. These 30-day tests follow the trend of the
parametric test data and even lie somewhat better than the trend of the parametric test data . The
pilot test data from the Pleasant Prairie power plant (denoted PPPP ESP Pilot) is included
because previous full-scale testing at Pleasant Prairie showed that only 60%-70% removal was
possible with
untreated
PAC at injection rates as high as 12 lb/MMacf. These pilot results at
126
Independence
PRB
C-ESP
In progress or planned
Gavin
High-S Bit
C-ESP FGD
In progress or planned
Presque Isle HS-ESP
PRB
ESP TOXECON
In progress
Allen Duke
Bitum. Low-S
CS ESP
complete
Lausche Ohio U
Bitum. High-S
CS-ESP
complete
Merrimack PSNH
Bitum. High S03
HS ESP
complete
Cliffside Duke
Bitum. Low-S
HS ESP
complete
Buck Duke
Bitum. Low-S
HS ESP
complete
St. Clair Detroit Ed .
Subbitum.Blend
CS-ESP
complete
St. Clair Detroit Ed .
Subbituminous
CS-ESP
complete
Stanton 1 GRE
Subbituminous
CS-ESP
complete
Stanton 10
Lignite
SD/FF
complete
Stanton 10
Lignite
CS-ESP
complete
Miami Fort
Bitum, Med S
CS-ESP
In progress
Figure 8.10. In-Flight Mercury Removal Results of Full Scale Field Tests of Halogenated
PAC Sorbent Injection on Low-Rank Coals (Durham 2005, Staudt 2005, Nelson
2005)
0
I
127
average for 30-day
test periods
•
BPAC-PPPP ESP Pilot
•
BPAC Stanton 10, Lignite (in flight after SDA)
•
BPAC St Clair, Sub, ESP
A BPAC Stanton 1
a
Darco LH Stanton 1
•
BPAC- 30 St Clair 30 Day
o
Darco LH-Meramec-30 day
2
3
4
5
6
7
Injection concentration (Ib/MMacf)
Pleasant Prairie with halogenated PAC are completely consistent with the trend shown at other
plants with halogenated PAC where 90% removal is achieved at around 3 lb/MMacf
.
Although halogenated PAC sorbents were developed primarily to overcome the shortcomings of
untreated PAC on boilers firing western coal, they have also been field tested on boilers firing
bituminous coal with various sulfur levels. Untreated PAC is not effective when there is high
coal sulfur content or particularly when there is a high SO 3 content in the flue gas. Figure 8.11
shows the results of the parametric testing of halogenated PAC at Lausche and Allen plants . The
Allen plant is a low-sulfur coal application and Lausche Plant has a higher sulfur coal (although
not as high a sulfur level as in most bituminous coals fired in Illinois) . As shown, 90% removal
is approached at injection rates of 7 lb/MMacf. There is currently no test data on units with
sulfur levels as high as those of Illinois coals. Future testing is planned for higher sulfur
applications (i.e., American Electric Power (AEP) Company's Gavin plant in Ohio) whose coal
supply is similarof those in Illinois
.
Figure 8.11 In-Flight Mercury Removal Results of Full Scale Field Tests of Halogenated
PAC Sorbent Injection on Bituminous Coals
(Durham 2005, Nelson 2005)
•
BPAC Allen, ESP
∎ BPAC, Lausche, 1000 ppm S02,20 ppm S03
O Darco LH-Allen
3
4
5
Injection concentration (Ib/MMacf)
In-flight removal by sorbent injection has proven to be difficult for units equipped with hot-side
ESPs. At these high temperatures (typically over 600
°F) the sorbent is not as effective
.
Nevertheless, testing of sorbents on units with hot-side ESPs has shown some promising results
.
At Duke Power's Cliffside and Buck Stations, which fire bituminous coals, 50%-70% mercury
removal was achieved in short-term tests using a specially formulated halogenated PAC
.
Additional testing of advanced sorbents is planned for 2006 on PRB units as well (Durham 2005,
Nelson 2005) .
128
8.4.2.2 TOXECON and Fabric Filters
Except on western coals downstream of a Spray Dryer Absorber, PAC (untreated or halogenated)
in TOXECON arrangements or fabric filter arrangements is generally accepted to be capable of
over 90% removal because the sorbent is in very intimate contact with the gas stream as it passes
through the filter cake of the fabric filter. Numerous full-scale and pilot tests, some extending
over one year in duration, have confirmed these results. Issues regarding TOXECON relate
largely to cost and to design issues relating to the fabric filter. Cost will be addressed in the next
section .
The long-term field tests at Southern Company's Gaston Station addressed some of the
TOXECON fabric filter design issues as they relate to fabric filter sizing and the fabrics that are
best suited for this type of installation. It is important to note that the fabric filter at Gaston
station was originally designed to capture only the small amount of fly ash that escapes the hot-
side ESP, not the additional sorbent material that is introduced for capturing mercury . Therefore,
when introducing sorbent the cleaning frequency of the fabric filter at Gaston increased to the
point where damage might have occurred to the cloth filter bags over an extended time . For this
reason the long-term test could not be performed at 90% mercury removal, but did achieve an
average removal of 85% over the long-term test . As shown in Table 8.2, short-term tests at a
simulated air-to-cloth ratio of 6 .0 resulted in mercury removal as high as 97% while maintaining
cleaning frequency below the limit of 1 .5 pulses/bag/hour and using untreated PAC (DOE/NETL
2005) .
Table 8 .2. Short-Term Test Results at Gaston Under Simulated Air-to-Cloth Ratio of 6 .0
(DOE/NETL 2005)
129
Injection
Rate
Ob/h)
Injection
Concentration
pbs/MMnct)
Inlet Hg
Concentration
(µg/Nm3)
Outlet Hg
Concentration
(pg/Nm3)
RE
(%)
Cleaning
Frequency
(pulses/baglhour)
20
0.9
20.6
3.2
84.2
0.6
45
2 .0
22.2
1 .0
94.6
0.8
70
3 .3
21 .4
0.61
97 .1
1 .4
The following was a conclusion of the one-year test program of TOXECON at Southern
Company's Plant Gaston (Berry et al ., 2004)
.
•
"TOXECON units designed at lower air-to-cloth ratios than COHPAC units are
capable of high, 90%, mercury removal. For TOXECON baghouses, it is
recommended that the maximum design gross air-to-cloth ratio be 6.0 ft/min."
8.4.3 Costs of Sorbent Injection Systems
8.4.3.1 Capital Costs
The sorbent injection systems themselves - sorbent storage equipment, metering valves,
pneumatic conveying system, injection piping, controls and associated installation and startup
costs - cost in the range of $2/KW (somewhat higher for small units and somewhat lower for
very large units), or about $1 million for a 500 MW plant . This is based upon estimates from
technology suppliers, the U.S. EPA, and the U.S. DOE (Nelson 2005, Staudt et al . 2003,
Srivastava et al. 2000). By comparison, an SCR system at a typical cost of $100/KW might cost
around $50 million for the same 500 MW plant .
However, if a TOXECON system is necessary the capital costs will be much higher than a
simple sorbent injection system, typically in the range of about $40-$60/KW due to the need to
install a fabric filter system (Staudt et al . 2003). However, it is possible for the cost of a
TOXECON system to be much higher in unusual circumstances. For example, at the U.S. DOE
TOXECON demonstration program at WE Energies' Presque Isle power plant in Marquette, MI,
the project entailed installing a single fabric filter on three small (-90 MW each) units . A long,
complex, duct arrangement (see Figure 8.12) to and from the fabric filter was required due to
inadequate space near the stack - where the fabric filter would have ideally been located with
shorter, simpler, duct runs . For that reason the project capital cost was roughly double what
would have been expected . In fact the cost estimate of the TOXECON system for the Presque
Isle plant shows that the costs of structural steel and the mechanical and structure installation
were more than the supply and erection of the key component- the fabric filter (Johnson et al .,
1 30
www.netl.doe.gov) .
So, depending upon the situation, the retrofit cost of a TOXECON might be
higher than what is expected for most plants .
8.4.3.2 Operating Costs
For simple sorbent injection systems the largest operating cost is sorbent . There are costs
associated with the power to run the pneumatic conveying system and the controls, but these are
usually small compared to the sorbent cost. There are maintenance costs, but as the sorbent
injection system is relatively simple, these are modest as well
.
For a TOXECON system, sorbent cost will be lower since the sorbent is more efficiently
utilized. However, the pressure drop across the fabric filter and the maintenance cost for the
fabric filter result in higher operating and maintenance costs
.
Figure 8.12. Configuration of the TOXECON system at the Presque Isle Plant in
Marquette, MI (Johnson et al., www.netl.doe.gov)
Fa
m
1 3 1
Ash Sib
0
A
Cwt S
Halogenated PAC sorbent currently costs in the range of $0 .75 to $0.85/lb, depending upon
source and shipping costs, etc. Untreated PAC sorbent costs about $0.50/lb. Using a cost of
$0.80/lb of sorbent, the treatment rates of Figures 8 .10 and 8.11, a gas flow rate of about 3,700
ACFM/MW for bituminous coal and 3,860 ACFM/MW for subbituminous coal, and heat rate of
10,500 BTU/KWhr, the control cost for sorbent (in $/MWhr or mills/KWhr) is shown in Figures
8.13 and 8 .14 for subbituminous and bituminous coal fired boilers respectively. The contribution
of capital cost to generation cost for a simple sorbent injection system ($2/KW) at a capacity
factor of 80% and capital recovery factor of 14% is only about $0.04/MWhr - almost negligible
compared to the effect of sorbent cost
.
Figure 8.13 Estimated Cost Impact to Generation of Sorbent for Mercury Removal on a
subbituminous coal-fired boiler using halogenated PAC
100%
90%
80%
70%
60%
50% -
40%
30%
20%
10%
0%
0
0 .2
0.4
0.6
0.8
1
1.2
Sorbent Cost ($/MWhr or mlIIs1KW hr)
1 32
Figure 8.14 Estimated Cost Impact to Generation of Sorbent for Mercury Removal on a
Bituminous Coal-Fired Boiler using Halogenated PAC
1 3 3
Sorbent Cost ($IMWhr or mills/K Whr)
For a TOXECON system the sorbent cost will be significantly less but the capital cost will be
much higher. At a capital cost of $50/KW and 80% capacity factor and 14% capital recovery the
impact to generation cost is about $1/MWhr. At a cost of parasitic power (mostly from increased
fan load) of $30/MWhr, and pressure drop of 8 inches of water column, parasitic power cost is
estimated at $0.17/MWhr and other O&M (excluding sorbent, such as bag replacement and
equipment maintenance) is expected to total about the same amount . Hence, before sorbent costs
the total cost impact is about $1.34/MWhr (or 1 .34 mills/KWhr) (Staudt et al. 2003) .
Assuming an injection concentration of untreated PAC at 2 lb/MMacf for 90% removal with a
cost of $0.50/lb and a gas flow rate of 3,860 ACFM/MW, the cost impact of sorbent is
$0.23/MWhr (or 0.23 mills/KWhr)
.
For a TOXECON arrangement capital cost is higher than operating cost and has the most cost
uncertainty. Therefore, TOXECON is not likely to be selected by a power plant for mercury
control if a simple sorbent injection system will provide adequate removal unless there are other
reasons to install the fabric filter . At this point in time, however, TOXECON is the only
approach that has demonstrated a capability to achieve 90% removal on units equipped with hot-
side ESPs. Notably, Illinois has only three EGUs with hot-side ESPs, Midwest Generation's
Waukegan 7 and Will County 3 and Dynegy's Havana unit
.
8.4.4 Balance of Plant Issues
Because of the newness of mercury control technology for coal-fired boilers, there are issues of
concern to the power plant industry that are explored below
.
8.4.4.1 Impact on Other Equipment
Sorbent injection has the potential to impact downstream equipment, especially the PM control
devices such as the ESP or the FF . For an ESP, additional material has the potential to influence
the capture efficiency of the ESP .
There have been dozens of test programs where sorbent was injected upstream of an ESP. Of
these, only at Southern Company's Plant Yates (Dombrowski et al . 2004, 2005) and Great River
Energies' Coal Creek Plant (Starns et al . 2004) have any adverse impacts been observed. At
Southern Company's Plant Yates, which fires eastern bituminous coal, the ESPs are very small
(Specific Collection Area (SCA) =173
ft2/1000ACFM for Unit I and 144
ft3/1000ACFM for unit
2). During testing these units experienced an increase in arc rate and a slight increase in
particulate matter out while injecting untreated PAC at rates up to 12 lb/Mmacf.. At the Coal
Creek plant, which fires North Dakota Lignite, a TOXECON II system was installed on an ESP
with an SCA of 599 ft2/1000 ACFM. The sorbent was injected between fields 3 and 4 as shown
in Figure 8.15. Untreated PAC sorbent was also used in this field test and therefore sorbent
injection rates were quite high (up to 12 lb/MMACF) . Particulate emissions from the ESP
increased during periods of carbon injection from an average of 0 .027 gr/dscf to an average of
0.054 gr/dscf.
The tests at Yates and Coal Creek that showed some impact on the ESP were performed with
untreated rather than halogenated PAC. Halogenated PAC would have significantly reduced the
sorbent injection rate at any given removal level and would likely have reduced, if not
134
eliminated, the adverse impacts to these plants . There have been dozens of field test where
sorbent was injected to control mercury emissions and, other than these two tests there have been
no tests where ESP performance was reported to be adversely impacted
.
To date there have been no reported impacts on equipment corrosion or erosion, plugging or any
other adverse effect on downstream equipment
.
Figure 8.15 TOXECON II Arrangement at Coal Creek Plant (Starns et al . 2004)
For units equipped with fabric filters downstream of the sorbent injection system, no problems
have been observed or are expected for fabric filters designed to collect the full boiler fly ash
stream. Sorbent will only increase the mass loading of the fly ash by at most a few percent and
often by less than one percent . The experience at Gaston showed that for fabric filters installed
downstream of ESPs (designed for lower particulate loading), the air-to-cloth ratio should remain
under 6.0 .
8.4 .4.2 Environmental Impact of Sorbent Disposal
There have been numerous tests of both untreated and halogenated PAC sorbents to determine if
toxic materials leach from these sorbents. Leaching studies have been conducted on the spent
sorbent on most of the tests conducted to date . All have shown that any leached material is well
below U.S. EPA guidelines with most below the detectable limit of 0 .01 µg/liter. Therefore, the
mercury appears to be tightly bound to the sorbent and there is no reason to believe that fly ash
1 35
that is otherwise non-hazardous may be reclassified as a hazardous material as a result of sorbent
injection
.
8.4.4.3 Impact on Coal Combustion Product Utilization
Fly ash is an inexpensive replacement for portland cement used in concrete, while it actually
improves strength, segregation, and ease of pumping of the concrete . Fly ash is also used as an
ingredient in brick, block, paving, and structural fills . However, concrete is the most valuable
use. About 20% of the fly ash from U .S. coal fired power plants is sold to the cement industry
.
The value of the fly ash as a concrete additive is determined by its mineral constituents, the
impurities present (such as unburned carbon from the coal), and other properties . The ASTM
has maximum allowable standards for accepting coal fly ash with carbon in it for specific
purposes. However, this normally is not the limiting criteria . Carbon (especially activated
carbon) absorbs an Air Entrainment Admixture (AEA) that is added to cement to control cement
strength .
Figure 8 .16 shows the estimated carbon contribution to fly ash at a range of injection rates . At
these injection rates, which are well below those of Figures 8 .10 or 8.11, the carbon content
remains well below the ASTM limit (6% per ASTM C-618)
.
If the fly ash that was otherwise sold for cement purposes is no longer marketable for cement
purposes, the cost impact to generation will vary depending upon
.
•
The amount of fly ash that is being generated at the power plant (which depends on coal
ash content, heating value and unit heat rate, etc.)
•
The marketable value of the ash as a cement material
•
The marketable value of the ash for lower quality applications
•
The cost to dispose of the ash, if necessary
1 36
Figure 8.16 Estimated Carbon Content in Fly Ash for different Coals and Injection Rates
(Nelson, 2005)
0 1 2 3 4 5 6 7 8
9 10 11 12
Sorbent Injection Rate (IbIMMacf)
Depending upon these factors, the effect could potentially be quite significant - up to about 1
mill/KWhr. Therefore, there is a great deal of effort being expended to address this potential
concern .
To address the problem with the effects on the cement AEA additive, there are several possible
solutions
:
•
Separation of the carbonaceous portion of the fly ash from the mineral portion. The
mineral portion may be sold and the carbonaceous portion disposed, which would
require equipment for separation and material handling
.
•
Another promising technique being examined by the Electric Power Research
Institute (EPRI) and U .S. DOE is ozone passivation (Hurt et al .,
www.netl.doe.gov)
.
Passivating the fly ash will neutralize the sorbent properties that impact the AEA
additive. Cement grade ash that has 6% carbon can still be marketed for cement
purposes .
•
High carbon fly ash may actually be used in the cement kiln, as has been done at
Illinois Cement Company, located in LaSalle, Illinois, using a high-carbon fly ash
1 37
OH bIL
--M LIgnIte
50
a
50
50 -
~~
50~~
from Coffeen Power Station . Using high carbon fly ash, the cement plant achieved
fuel savings of approximately 3.9%, the production increased by approximately 9 .7%,
and several key processing parameters were improved Illinois Clean Coal Institute
(ICCI), www.icci.org/oofinal/bhatty99.htm .
•
Sorbent Technologies has an approach for making their sorbent "cement friendly"
.
This sorbent material has been successfully demonstrated to remove mercury
effectively (similar effectiveness as their brominated PAC) and to produce a low
"foam index"- a measure of the effect on the AEA additive - that leaves fly ash
marketable for cement purposes
.
•
Finally, Engelhard (Iselin, NJ) is developing a mineral-based sorbent that will not
have any impact on the fly ash. In fact, they are also able to take fly ash, chemically
treat it, and use it as the sorbent material. This is a new technology and the first full-
scale 30-day test of a mineral sorbent is currently in progress at the Cinergy Miami
Fort Plant in Ohio (Hutson, 2005) .
8.4.4.4 Environmental Impacts of Brominated Sorbents
Bromine is an ozone depleting agent and can also contribute to the formation of toxic materials
in combustion systems. Studies have shown that the bromine remains adhered to the carbon and
is not emitted to the atmosphere. With regard to toxic emissions, testing was performed by U
.S .
EPA at two units, one with a CS-ESP and the other with a HS-ESP, to determine if
polychlorinated dibenzo-p-dioxin (PCDD) and polychlorinated dibenzofuran (PCDF) or
polybromininated dibenzo-p-dioxin (PBrDD) and polybrominated dibenzofuran (PBrDF) are
formed when brominated PAC is injected. Tests showed that they do not appear to be formed,
and if any may be formed, they are well below the limits established by U .S. EPA for these
materials (Hutson 2005) .
8.4.4.5 Impacts on Selective Catalytic Reduction
If PAC is injected prior to an SCR, which is possible in a hot-side ESP arrangement, no impact is
expected on the SCR because: 1) the PAC is captured in the hot-side ESP prior to the SCR; and
1 38
2) carbon has no negative impact on SCR catalyst . SCR catalyst is designed to accommodate
some fly ash build up, and the fly ash has some carbon in it . Therefore, any injected PAC that
manages to escape the hot-side ESP will not have an impact on the SCR .
8.4.4.6 Performance Over Various Temperature Ranges
Untreated PAC is known to loose much of its mercury sorbert capacity at temperatures greater
than about 325 °F. Therefore, for those units with CS-ESPs that operate at or above that
temperature, untreated PAC may perform very poorly in capturing mercury. On the other hand,
halogenated PAC has been shown to be effective over a much wider range of temperatures . At
temperatures in the range expected for CS-ESPs (up to around 400 °F), little or no change in
performance is expected. Only at very high temperatures typical of a HS-ESP would a
significant performance shortfall be anticipated
.
8.4.5 Issues Relating to Commercial Availability and Impact to the Utility Sector
There are a number of issues that were raised during outreach meetings with the power industry
regarding the potential impact to plant reliability and whether mercury control technologies are
commercially available. This section will discuss the various issues raised under this general
category .
8.4 .5.1 Time and Materials to Engineer, Procure Install Sorbent Injection Systems
Sorbent injection systems can generally be fully installed and commissioned within about six
months from a power plant placing an order. This includes engineering, procurement,
installation and start up. Because the equipment required is not very specialized (silo, feeder
valve, blower, piping, and controls), the equipment is readily purchased from a number of
suppliers. Interface with the boiler system involves installation of penetrations for injection
piping. These can normally be installed over an outage of a few days . Therefore, there should
be no impact to the operation of the plant for a simple sorbent injection system
.
1 39
In the event a fabric filter system is installed as part of the mercury control system, engineering,
procurement and installation will take longer (likely over a year) and will require more extensive
outages. The Presque Isle program was planned to be just under two years from start of design
to completion of start up (March 2004 to January 2006) (Johnson et al .,
www.ned.doe.gov) .
Considering the complexity of that particular installation, most systems would likely take less
time .
Installation of mercury control equipment can be performed during a planned outage of the unit
boiler. When air pollution control equipment such as a fabric filter is added, outages are only
necessary when existing ductwork is altered . This way the equipment can be erected with the
boiler on line and outage time is minimized . In some cases, especially if a bypass is available,
the outage can be taken early in the project and any later outage, if needed, can be of a very brief
duration. So, even if a TOXECON system is installed on a boiler, it is expected to have little or
no impact to unit availability .
8.4.5.2 Guarantees
Guarantees are a subject that is raised by industry when "Commercial Availability" is discussed
.
According to the Institute of Clean Air Companies, pollution control equipment suppliers are
currently offering mercury control technologies with commercial guarantees on performance
(ICAC 2004)
.
While the specifics of the guarantees in any contract are negotiated between supplier and buyer,
these guarantees typically include a guarantee on the pollutant removal performance of the
technology (under specified process conditions), the usage rates of consumables (such as sorbent
feed rate and power), and remedies to address any shortcomings in performance . The following
is part of the guarantee wording taken from a portion of a proposal from Sorbent Technologies
(Nelson, 2005). As shown, the guarantee language stipulates a required performance at a
particular sorbent feed rate under specified conditions . (Nelson, 2005)
140
PERFORMANCE GUARANTEES
Sorbent Technolonle
will nuarantee the more restrictive of ninety (90) oercent removal
or to a Ieyel of 20x10 lb of Hn/MWI-l of total mercury in the flue gas using brominated
B-PAC
Ai
powdered activated carbon at a rate not to exceed
230
lbs/hr based on the
design flow rate of about
1,535,000 ACFM
for each boiler. The removal rate is from the
air preheater outlet to the stack. The mercury removal guarantee is valid only when the
units are firing the coals described in the Customer Specification, when the air heater
outlet flue gas temperatures are maintained at below
370°F,
when the fabric filters are
operating properly, and when the relative
S03
mass flow rates at the air preheater are
no greater than that specified. If no certified continuous mercury emissions analyzers
are available, compliance shall be determined by others using certified CEMs or another
method as determined by the March 15 utility mercury regulation . This guarantee shall
be met according to page D-4 of Schedule D
.
Normally, the liability to the vendor to remedy a performance shortfall as specified in the
performance guarantees is limited to an amount that is related to the cost of the project. This is
typical for all air pollution control equipment guarantees and for other types of guarantees or
warranties in general. These guarantees are currently offered by suppliers of mercury control
technology, although the specifics of their guarantees may differ because they are negotiated
with the buyer .
Consequential damages are associated with a power plant's lost profits that may result from the
lost revenues and increased costs that may result from an unplanned outage or a reduction in
plant output. Because these consequential damages have the potential to be many times greater
than the cost of the pollution control equipment, consequential damages are rarely included in a
contract. This is very similar to the fact that the electric company will not reimburse a business
for lost profits during a power shortage. In order to accept such a potentially unlimited liability
for the small profit of selling electricity, the electric company would have to make the electricity
very expensive. The same holds true for pollution control equipment. And, therefore,
consequential damages are rarely, if ever, included in a contract . In some cases liquidated
damages may be agreed to. However, these are normally a fixed amount associated with time
out of service up to a total amount of limited liability
.
14 1
8.4 .5.3 Supply of Sorbent
Activated carbon sorbents are available from a number of suppliers, including Norit, Calgon,
HOK and several other companies. Halogenated (particularly brominated
) activated carbon
sorbents are available from Norit and from Sorbent Technologies . The halogenated sorbents are
manufactured from an untreated carbon that is treated with bromine or another halogen
.
Treatment of the sorbent is a relatively simple process that can be scaled up quickly . These
companies have committed to increasing the supply of halogenated sorbents to meet the market
needs. The availability of activated carbon is high at this time. There is currently an oversupply
of carbon in the U.S. that is compounded by oversupply worldwide because there was a period of
overbuilding of capacity in the 1990s . If demand did grow to the point where supply had to be
increased, it would take 2-3 years to add a plant (EPA-600/R-02/073, 2002) . Therefore, there is
plenty of capacity of PAC for Illinois power plants and if demand throughout the U .S. increases
to where more capacity is needed, it can be built in time to meet demand
.
8.4.5.4 Long-Term Experience
Sorbent injection systems have been in operation on numerous MWCs for several years . Thus,
experience with the equipment is well established. Questions therefore are associated with the
ability of the sorbent to provide reliable mercury removal on a day-to-day basis in power plant
flue gas applications .
As previously discussed, impacts to downstream fabric filters have been examined, especially for
TOXECON arrangements. As a result of these studies, design parameters for TOXECON fabric
filter systems have been developed to address these concerns
.
In the configuration where halogenated sorbent is injected upstream of a cold-side ESP on a
boiler firing subbituminous coal there have been several tests, some several weeks in length, with
very consistent results - not only at the unit over the test period but also consistent when
comparing different units . As a result, the confidence that the sorbent will perform as expected
over the range of normal operation for these units is rather high . In fact, longer-term tests have
shown better performance than short-term tests . Tests indicate that some of the PAC builds up
over time on ductwork surfaces . While this PAC accumulates during short-term tests it is not
142
contributing to mercury removal. But, over periods of several weeks when the PAC that is built
up on duct surfaces and becomes re-entrained in the gas stream, it contributes to mercury
removal. This explains why longer-term tests have shown better performance than short-term
tests .
For less conventional applications, such as TOXECON II, there is far less data and there is
reason to have some concern about the limitations of the ESP . Several test programs are
underway to examine this potential issue
.
Unlike SCR systems, where long-term catalyst activity is a serious concern, and unlike FGD
systems where reliability of equipment in highly corrosive environments is a concern, sorbent
injection systems use a material that is continually injected and has shown no tendency to
corrode or degrade equipment. Moreover, there is no technical basis reason to believe it might
induce corrosion. Therefore, many of the long term issues that existed for other air pollution
control technologies do not exist to any great extent with sorbent injection
.
8.5. Other Emerging Control Technologies
This Section focused primarily on technologies that are available in the near term and are most
likely to be deployed by Illinois power plants . But, there are technologies that are emerging
quickly and which could address some of the concerns with existing available controls
.
8.5.1
Improved Sorbents and Sorbent-Related Technology
Work is underway to develop improved mercury sorbents that overcome some of the
shortcomings of existing PAC and halogenated PAC sorbents . These include
:
•
PAC-based sorbents designed for high temperature applications that may make high
removal rates possible from boilers with hot-side ESPs without the need for a
TOXECON system
.
143
•
PAC-based sorbents designed for high sulfur coal applications that can provide high
removal efficiencies at low treatment rates
.
•
Mineral-based sorbents that utilize either treated clays or treated coal fly ash to capture
mercury. This sorbent is being developed by Engelhard Corporation and also Amended
Silicates Corporation and is being tested at the full scale. The advantages of mineral-
based sorbents potentially are : 1) lower sorbent costs since fly ash is "free" to a power
plant; 2) no adverse impact to fly ash marketability; and 3) potentially higher
temperature applications
.
•
Chemical additives for the fuel or ductwork that improve sorbent utilization and
combinations with advanced sorbents, such as mer-cure technology from ALSTROM,
which was tested as PacifiCorp's Dave Johnston Unit #3 in Wyoming to achieve well
over 90% removal as shown in Figure 8 .17
.
•
Passivation technology that mitigates the effect activated carbon has on the AEA additive
for cement. Fly ash with a small amount of activated carbon can be treated and then used
as a high value cement additive .
8.5.2 Advanced Fuel Beneficiation
KFX (Denver, CO) offers K-Fuel that thermally treats otherwise unmarketable subbituminous
coal to increase the heating value and to reduce the emissions when the fuel is burned. KFX has
shown high mercury removal rates of about 70% with KFuel . Through the use of a treated coal
such as KFuel, it would be easier to meet the output-based standard in the proposed rule
.
144
Figure 8.17. Preliminary Data Demonstrating Mercury Control Performance of Mer-
CureTMystem Collected at Dave Johnson Unit 3 During Parametric Testing (Srinivasachar,
2005)
A
r
E o
v
c
0 =
100%
v
60%
0
8.5.3 Multipollutant Controls
Currently, there are a number of multipollutant controls that are being commercially deployed
that may also remove mercury . The following is an incomplete list
:
AN ~R
WAAW,A
WATA
r
WIF
WA
•
MerClean 2
•
MerClean 4
A MerClean 6
•
MerClean 8
1
2
3
Ib/MMacf
4
5
•
Electro-Catalytic Oxidation (ECO) is a multipollutant control technology that is being
commercially deployed at First Energy's Bay Shore Plant in Toledo, OH, on 215 MW
Unit 4. ECO has shown in a commercial scale demonstration that it is capable of high
NOx, SO2, and mercury removal
.
•
Mobotec's ROFA and ROTAMIX technology uses rotating overfire air (ROFA) to
reduce NOx and also uses injection of NOx reducing reagents, SO 2 sorbents and mercury
sorbents for reduction of NOx, SO2 and mercury (ROTAMIX). ROFA and ROTAMIX
are commercially deployed for NOx and SO2 control. ROTAMIX is currently
commercially deployed at the Dynegy's Vermillion power plant Unit I for NOx control
.
145
Mercury control by ROTAMIX has been tested at full-scale in field trials. At Richmond
Power & Light's Whitewater Valley Unit #2 in Richmond, IN, 98% mercury removal
was achieved with MinPlus sorbent injected at about 2000 °F or more with injection rates
of 10-20 lb/MMacf. Whitewater Valley Unit #2 is bituminous coal-fired unit with a CS-
ESP that operates above 400 °F. Fixed bed laboratory tests shown in Figure 8 .18 suggest
that MinPlus mercury capture occurs above 1500 °F (Biermann et al ., 2006). Therefore,
this appears to be an approach that may be useful for boilers with hot-side ESPs without
adding a fabric filter for a TOXECON arrangement
.
•
Enviroscrub's Pahlman process is a sorbent-based process for combined NOx, 502, and
mercury removal while using a regenerable sorbent. It is not commercially deployed at
this time.
146
Figure 8.18 Fixed Bed Laboratory Tests Comparing Hg Sorption by Various Sorbents
(MinPlus Sorbent, 2005)
8.6. Control Options for Coal-Fired Boilers in Illinois
This section describes the control options that appear to be available to Illinois coal-fired boilers
.
8.6.1 Control Options for Boilers Firing Bituminous Coals
Air pollution control technologies at plants burning Illinois bituminous coal include
:
•
CS-ESP
•
SCR+CS-ESP
•
SCR+CS-ESP+wet FGD
•
FBC+SNCR+FF
The units that have SCR and FGD as well as the unit with FBC + FF are likely already achieving
relatively high levels of mercury removal and may already comply with 2012 requirements of the
proposed rule. If not, these units may be able to come into compliance through optimization or
addition of oxidizing chemicals to improve FGD capture efficiency . However, if additional
mercury removal is required, sorbent injection can provide this additional removal at a
147
reasonable cost because the incremental removal is likely to be quite low . Although untreated
PAC has been shown to have poor effectiveness in removing mercury from the flue gas of high
sulfur coal, tests with halogenated PAC sorbent injection technology indicate that this should
provide the additional removal necessary for compliance
.
The Coffeen and Hutsonville units are not likely to be achieving adequate mercury removal
through co-benefits alone. However, 90% mercury removal is expected to be achieved through a
combination of co-benefit optimization, and halogenated sorbent injection
.
Under consent decree is Dynegy's Vermillion plant that has agreed to install a fabric filter and
sorbent injection mercury control technology. Therefore, it will be able to achieve over 90%
control of mercury through combination of the fabric filter and sorbent injection
.
•
For bituminous coal fired boilers equipped with SCR, ESP and FGD, 90% removal is
achievable through co-benefit of these controls. Ninety percent (90%) removal, and close
to it, has been measured at several facilities . Test programs with chemical additives to
enhance oxidation have demonstrated an ability to improve mercury capture further
.
Therefore, additional mercury-specific controls are not likely to be necessary on such
units. If additional controls are needed, low sorbent injection rates are anticipated due to
the small incremental mercury removal needed
.
•
For bituminous coal fired boilers equipped with a cold-side ESP, with or without SCR,
around 30% or more may be achieved through co-benefit . Additional mercury removal
to 90% can be achieved by injection or halogenated sorbent .
•
Mercury capture from a Circulating Fluidized Bed (CFB) boiler with a fabric filter firing
bituminous coal is expected to be high - about 90% or possibly better . The Southern
Illinois Power Cooperative's (SIPCO) CFB may also install a limestone spray tower,
which will improve mercury control even further.
148
8.6.2 Control Options for Boilers Firing Subbituminous Coals
The subbituminous coal fired boilers in the State (including those that bum primarily
subbituminous coal and a small amount of bituminous coal) generally have cold-side ESPs, with
a small number of units equipped with hot-side ESPs . A few units have SCR as well. The units
with cold-side ESPs can be effectively controlled to 90% removal with halogenated sorbent .
However, the units with hot-side ESPs are a greater challenge because at this point in time
TOXECON is the only control technology that has been shown to be effective in providing 90%
or better control of mercury emissions on unscrubbed units equipped with hot-side ESPs
.
Dynegy's Havana unit has a HS-ESP & SCR, and is under consent decree to install a spray dryer
absorber and fabric filler. These have been shown to provide a high level of mercury control
over 90%. However, neither of Midwest Generation's two HS-ESP units, Will County #3 and
Waukegan #7, is under any consent decree or any other requirement to install any additional air
pollution control equipment . TOXECON, as noted earlier, is more costly than a simple SI
system. ROTAMIX using the MinPlus sorbent may also prove to be an option for these units that
is less expensive than TOXECON
.
•
For subbituminous coal fired boilers equipped with cold-side ESPs, 90% removal can be
achieved with halogenated PAC at treatment rates in the range of 3 lb/MMacf . This has
been achieved at several short-term parametric test programs and also for 30-day test
periods. The consistency of these results at several test programs on low-rank coal
increases the confidence that this method is likely to provide the high level of mercury
reductions needed over long term operation .
•
For units with HS-ESPs, TOXECON is currently the only proven technology for
achieving 90% removal. Dynegy's Havana unit has a HS-ESP & SCR, and is under
consent decree to install a spray dryer absorber and fabric filter. With sorbent injection in
addition to the equipment required for the consent decree, high mercury removal over
90% can be assured. However, neither of Midwest Generation's two HS-ESP units, Will
County #3 and Waukegan 7, are not under any consent decree or any other requirement to
149
install any additional air pollution control . Therefore, to achieve 90% removal at these
units
TOXECON is
necessary but was not otherwise planned
.
•
For unscrubbed units with hot-side
ESPs, TOXECON is
the technology that is certain to
be capable of providing 90% mercury removal . ROTAMIX with MinPlus sorbent may
be an alternative. Another, more expensive, alternative to
TOXECON is
addition of a
scrubber combined with use of oxidizing chemicals and/or coal blending and an SCR
which could provide 90% removal. This approach would also provide
NOx
and SO2
control benefits and may be considered by the owner or operator since its units must
comply with the
NOx
and SO2 reduction requirements of the Clean Air Interstate Rule
.
Tables 8 .3 and 8.4 shows the various fuel and APC equipment configurations and possible
methods for achieving 90% mercury removal. With the exception of the units with hot-side
ESPs,
most units should be able to achieve 90% or better removal through optimization of co-
benefits, combination of co-benefits with halogenated sorbent injection, or through halogenated
sorbent injection alone. Therefore, most units are capable of achieving 90% mercury removal
with a relatively small capital expenditure
.
The units with hot-side
ESPs
pose a more difficult challenge. The current sorbent technology
that is known to be capable of achieving 90% removal from subbituminous units with hot-side
ESPs is
the
TOXECON
arrangement. Sorbent technology is improving and there have been
some promising results on hot-side
ESPs. TOXECON
does provide air pollution control benefits
beyond mercury control and should be considered for these benefits. However, ROTAMIX with
MinPlus sorbent may be a promising alternative to
TOXECON
and has been shown to achieve
over 90% mercury removal on a bituminous coal fired unit at high temperatures . Field testing on
subbituminous coal has not yet been performed . ROTAMIX may also provide other pollutant
control benefits, such as
NOx
and SO2. Other approaches available to operators of these units
include FGD retrofit with fuel blending, which would have S02 as well as mercury control
benefits .
1 50
Table 8.3 Summary of Boiler Types and Control Options for Bituminous Coal Fired
Boilers
15 1
Coal Type
Existing
Configuration
Hg Control Technology
Comments
Bituminous
SCR+ESP+FGD
Coal Cleaning
90%+achievable
Co-benefit optimization
Additives
CS-ESP
Coal Cleaning
Use in combination with
sorbent injection
Co-benefit Optimization
Halogenated PAC
90% achievable
SCR + CS-ESP
Wet FGD or Spray Drier & FF
90% achievable
HS-ESP
TOXECON
90%+ achievable
ROTAMIX with Min Plus
90%+ may be achievable
Halogenated PAC
50%-70% achievable
HS-ESP + SCR
Wet FGD or Spray Drier & FF
90% achievable
CFB + FF
Co-benefit optimization
90% may already be
achieved without
additional controls
CFB + SDA + FF
Co-benefit optimization
90%+ achievable
Table 8.4 Summary of Boiler Types and Control Options for Subbituminous Coal Fired
Boilers
8.7
Estimate of Cost of Mercury Control and Cost per Unit of Mercury Reduction
In estimating the cost of controlling mercury at Illinois power plants, we used fuel use data as
reported in the Statewide Coal-Fired Electric Utilities Report, as Fly Ash and Bottom Ash
Disposal Cost and Sales Revenue data per Energy Information Administrative (EIA) Form 767
152
Coal Type
Existing
Configuration
Hg Control Technology
Comments
Subbituminous
CS-ESP
Fuel Blending (increase co-
benefit) +
Halogenated PAC
90% achievable
Halogenated PAC
CS-ESP+SCR
Fuel Blending or oxidizing
chemical + FGD
90% achievable
HS-ESP
Halogenated PAC
90% not yet achieved
Fuel Blending and/or
oxidizing chemical + FGD
90% may be achievable
TOXECON
90%+ achievable
ROTAMIX with MinPlus
90%+ shown on
bituminous, performance
on subbituminous not yet
known
HS-ESP+ SCR
Halogenated PAC
90% not achievable
Fuel Blending and/or
oxidizing chemical + FGD
90% achievable
ROTAMIX with MinPlus
90%+ may be possible
(impact to SCR needs to
be examined)
TOXECON
90%+ achievable
data, and also fuel mercury data per the "Illinois Coal Properties in Regard to Mercury"
PowerPoint presentation by Massoud Rostam-Abadi of the Illinois State Geological Survey,
University of Illinois at Urbana Champaign at the ICCI Mercury Meeting, November 9, 2005
.
Table 8.5 shows typical characteristics of the coals being fired, although it is understood that the
actual characteristics at particular units will vary from this .
T ble 8 5 T
ical Characteristics of Fuels Fired 2005 Massoud Rostam-Abadi
These fuel characteristics were used to estimate the mercury input into the plants and the
emissions levels will be achieved after the addition of controls
.
Using historical coal use (average of highest three years from 5-year look back) the fuel use and
mercury in coal are projected in Table 8 .6 .
Table 8.6 Pro ected Coal Use and H in Coal
.
Using the above table to estimate mercury emissions (which is only one of several methods) . The
proposed rule would result in statewide emissions from these units roughly at or below 16,693
ounces (calculated based on 10% of an "average" bituminous and subbituminous coal mercury
input) beginning mid 2009 . Alternatively, the output based limit of 0 .008 lb/GWhr if applied to
all units would be about 11,136 ounces for the existing units that will be covered by this rule
.
For most units, especially those firing subbituminous coal, the output based limit is more
stringent. The 90% control level of 16,693 ounces or less for existing units is compared to
CAMR allocations of 51,008 ounces (1 .594 tons) from 2010 to 2017 and 20,128 ounces (0 .628
tons) beginning in 2018. Without the proposed rule, in order to comply with CAMR it will be
necessary for Illinois plants to reduce emissions (or buy allowances) by over 70% in the period
1 5 3
Fuel Type
Heating Value
(BTU/Ib)
Hg Content of Coal
(mg/MMBtu)
lbfrbtu
Hg, mg/kg
Bituminous Fuel
11,613
3 .1
6.83
0.08
Subbituminous Fuel
8,090
5.7
12.56
0.1
Coal Use, 1000 tpy
Hp in Coal, oz
Bituminous
6,689
17,125
Subbituminous
47,170
150,943
Total
53,859
168,068
Note: columns may not add due to rounding
from 2010-2017 and over 88% beginning 2018 . The cost of the proposed rule over that of
CAMR would therefore be the incremental cost of complying with one rather than the other
.
Estimating Costs:
Costs of control considered in this analysis are the following
:
•
Capital cost of the equipment being installed
.
•
The cost of any sorbent being injected
•
Other operating and maintenance costs
•
Costs associated with any impact to fly ash
For a simple sorbent injection (SI) system, capital costs are in the range of about $2/kw to $3/kw .
We assume $2.5/kw in this analysis. For a TOXECON system, the capital costs are significantly
higher and will vary somewhat based upon the difficulty associated with retrofitting a particular
plant. For this analysis it will be assumed that TOXECON costs $60/kw, but recognizing that
the costs for the plants that may implement TOXECON may differ substantially from this
.
Direct operating and maintenance (O&M) costs include sorbent consumption as well as energy
used, maintenance, and other replaceable items (i.e., filter bags for TOXECON systems) . For a
simple SI system, sorbent dominates the O&M costs and other O&M costs can mostly be
neglected because they are relatively small . In the case of a TOXECON system, there are
parasitic load impacts, filter bag replacements, and maintenance that increase costs
.
With regard to the costs associated with impact to fly ash, in the cost analysis it was assumed
that all fly ash revenues were lost for those plants that reported fly ash revenues in their 2004
EIA Form 767 and were projected to use activated carbon injection. For these units it was
assumed that fly ash disposal costs increased as well. Table 8.8 shows reported 2004 Form 767
data and calculated $/ton values for disposal expense and sales revenue for Illinois units affected
by this rule .
Sorbent injection has the potential to reduce fly ash sales revenues and increase fly ash disposal
costs. From the data in Table 8 .8, it was determined that $25/ton would be used for this
combined effect for affected plants . In most cases this $25/ton differential exceeds the actual
cost differential in Table 8.8. Moreover, this amount is likely to overestimate the impact because
fly ash may be marketable for other less valuable purposes and because technologies for
1 54
addressing fly ash with carbon are likely to be used to eliminate the need to dispose of fly ash
with carbon in it. As a result, the ash disposal costs estimated in this analysis should be regarded
as worst case .
To estimate the cost of complying with the proposal, it was assumed that each unit will attempt
to achieve 90% mercury reduction or more . It is assumed that nearly all units install controls,
although some are assumed to have adequate control from optimization of cobenefit controls .
The installation of SI or TOXECON on all units that are not expected to achieve 90% through
cobenefits is reasonable since it is likely that nearly all units - and all units of any significant size
- will want to achieve close to 90% control or better in order to comply with the rule . This will
most likely result in more mercury removal than needed because 30-day tests with sorbent
injection have shown that about 93% removal is achieved with injection rates of about 3
lb/MMacf. However, the additional 3% "safety factor" over 90% removal is something the
power plant owners will not likely take for granted - at least initially
.
The units that are assumed to have adequate cobenefit controls with no additional controls
needed are
:
•
Ameren's Dallman and Duck Creek units, and both of SIPCO's Marion units . These
units fire bituminous coal and either have SCR and wet FGD or are CFB boilers with a
fabric filter, which have been shown to result in 90% or near 90% removal . It is possible
that these units may choose to install SI simply as a precaution . But, it is not envisioned
that the SI will be used much, if at all . Since most of the cost of SI is the sorbent rather
than the cost of the equipment it is reasonable to disregard as negligible possible
installation costs
.
All other units are assumed to require sorbent injection . Since Dynergy's Havana and
Vermillion units are currently under consent decree to install a fabric filter, the costs of the fabric
filter are not attributed to the proposed Illinois mercury rule, but the sorbent costs and any
disposal costs are attributed to the proposed rule . Midwest Generation's Waukegan #7 and Will
County #3 units are assumed to install a fabric filter/TOXECON since they have hot-side ESPs .
The cost of the TOXECON retrofit is assumed to be $60/KW for these two units
. All other units
are assumed to install sorbent injection at about $2.50/KW. Of course, the sorbent injection
155
systems will fall in at a range of costs from possibly under $2/KW to maybe $3/KW or more
.
Although there could be a factor of 2 difference from the high end to the low end of the range,
when costs are evaluated on an annualized basis, a factor of two difference in the capital costs for
the SI equipment is fairly negligible since the most significant cost is that of the sorbent
.
According to information submitted to Illinois EPA by Dynegy, its Baldwin plant is already
achieving 80% mercury removal. Since Dynegy must install fabric filters and FGD on three
units, mercury removal is likely to improve . At worst, a sorbent injection system to achieve 50%
removal of mercury (removes half of the remaining 20% to achieve a total 90% removal) could
be installed with a sorbent injection rate below I lb/MMacf Also, once the fabric filters are
installed, the impact to fly ash sales will be mitigated by use of a TOXECON system . To
accomplish this, it will be necessary to move the sorbent injection point from upstream of the
CS-ESP to upstream of the fabric filter .
It is recognized that for some units that are small, owners may decide that it is not initially
beneficial to install sorbent injection on these units to comply with the 2009 deadline . Therefore,
some of these costs may be deferred from 2009 compliance to 2012 . However, this should not
make a large difference in the overall cost due to the small size of the units
.
The estimated costs for compliance are shown in Table 8 .7. Costs are shown for
:
•
All units achieving 90% with current technology
•
All units achieving 90% except for Midwest Generation's Waukegan #7 and Will County
3, which install halogenated sorbent injection in lieu of TOXECON to achieve 50%
removal
•
Compliance with 2010 CAMR budget levels through control technology
The assumed control strategies for CAMR represent assumed approaches that minimize the
annualized cost while achieving reduction under the CAMR budget . Actual power plant
behavior may differ based on individual preferences . However, it is unlikely that a substantially
higher or lower cost would result
.
1 56
Levelized Constant 2006 Dollar Annual Capital cost is estimated by multiplying the total capital
cost by an assumed Capital Recovery Factor of 14% . Costs per pound of mercury removed for
compliance with the IL rule are around $8,100/lb of mercury captured . Estimated for the cost to
comply with the 2010 CAMR state budget through use of control technology are also shown in
Table 8.7, and the cost is lower at around $5,800/lb of mercury removal . Detailed unit costs are
shown in Tables 8 .9, and 8 .10
.
It is important to note that these estimates assume very
conservatively high (worst-case) fly-ash disposal costs, which due to improved technology or
alternative marketable uses for the fly ash, will likely drop substantially
.
Table 8.7 Estimated Cost for IL Utilities of Complying with IL Mercury Rule and with
2010 CAMR
In Table 8.7 the estimated costs for meeting the proposed rule are compared with the estimated
costs for complying with CAMR through installation of control technology. However, under
CAMR power plants in Illinois may purchase allowances from power plants out of state that may
have surplus allowances. These allowances will have a cost reflecting at least the cost of
implementing control technology. Even if a company currently has allowances in excess of their
needs, they will have value to the company because they can be banked and used to defer
installation of control technology to a future date when it presumably will be more expensive to
control mercury.
Allowance price predictions are uncertain and vary over a wide range. In any event, it is
reasonable to say that the cost of allowances should be somewhat higher than the cost in the
157
Cost
Units
IL Rule
2010
CAMR
Capital Cost
$1000
$75,593
$35,515
Annualized Capital Cost (14% CRF)
$1000
$10,583
$4,972
Annual Sorbent Cost
$1000
$41,729
$18,665
Annual Ash Disposal Cost
$1000
$13,403
$9,900
Annualized TOXECON O&M
(excluding sorbent)
$1000
$425
$0
Total Annual Cost
$1000
$66,140
$33,537
Ounces Hg removed *
1000 ounces
130*
93*
Cost per oz Hg removed *
$/ounce
$507
$361
Cost per lb Hg removed *
$/Ib
$8,118
,
$5,783
NOTE: columns may not add due to rounding
*No credit is taking for Hg reductions from cobenefits (-25,000 oz) because these would
happen regardless of IL rule or CAMR
market for producing the allowances. Based upon estimates by the US DOE shown in Figure
8.19, the cost to produce allowances may be as low as $4,000-$6,000 per pound (not including
impacts on fly ash disposal/sales) . So, this may be a reasonable estimate to use for a lowest
estimate of cost .
However, some expect allowance prices to cost much more than what DOE predicts as the price
to produce them. According to Platts Power website 10/6/05,
On mercury, the ICF study points out that cost of mercury reduction under EPA's
program is between 20 cents/MWh and 40 cents/MWh . EPA has projected mercury
allowances under its trading program to cost roughly $40,000/lb .
(http://www.platts.com/Magazines/POWER/Power%2ONews/2005/10060 5
5 .xinl)
It should be kept in mind that ICF's estimates for U .S. EPA did not incorporate the most recent
technology developments - particularly halogenated sorbents. Thus, those estimates of control
cost are likely high. Nevertheless, allowances could sell for far more than their cost to produce .
If an average CAMR mercury allowance price is assumed to be $5,000/lb (near the low end of
the estimated cost to produce), then the annual expenditure on allowances by IL power plants
will be roughly $29 million per year - only slightly lower than what is estimated in Table 8 .7 as
the cost to comply with CAMR through implementation of control technology . If, on the other
hand, an average CAMR mercury allowance price is assumed to be $40,000/lb (EPA's recent
estimate), then the annual expenditure on allowances by IL utilities will be roughly $232 million
per year -many times what is estimated in Table 8 .7 as the cost to comply with CAMR through
implementation of control technology. So, relying on the currently non-existent CAMR
allowance market is very risky for IL power plants, potentially resulting in far higher compliance
cost than implementation of controls per Table 8 .7 .
This raises the practical matter of risk management. Since the capital costs of sorbent injection
are fairly low and the risks of relying on the CAMR mercury allowance market are very high, it
is reasonable to expect that most utilities in IL that do not have high co-benefit removal (most of
the PRB units) will install sorbent injection equipment in advance of the CAMR date, regardless
158
of the IL Rule. Therefore, the power plants in IL will incur much of the estimated capital
expenditures associated with the IL Rule in any event
.
Figure 8.19 Incremental Cost of 70% Mercury Control
(Feeley, US DOE at PADEP Mercury
Stakeholder Meeting, November 18, 2005)
Based upon this analysis, we can use the values in Table 8 .7 as reasonable estimates of the cost
of compliance with the IL rule and with CAMR . With these numbers, it is estimated that the
annualized
additional
cost of compliance with the IL mercury rule over the CAMR is roughly
$32 million per year during the period of 2010 to 2017 (roughly $66 million/yr minus roughly
$34 million/yr). Most of this cost is associated with additional sorbent usage. If the $29 million
minimum
estimated cost to comply with CAMR through purchase of allowances is used, then
this incremental cost between the cost of the IL rule and 2010 CAMR is as high as $37 million
.
But, for the reasons cited earlier, the difference is very likely to be less than this
.
Because the 2018 CAMR limit is roughly equal to the requirements for compliance with the
proposed rule, the incremental cost will be negligible for 2018 compliance . In fact, the CAMR
requirements could be somewhat more stringent than the 90% reduction target for IL at some
point in the near future due to potential or planned growth in generation
.
Tables 8.9 and 8.10 show details of calculations to estimate the cost to comply with the IL
mercury rule and the cost to comply with 2010 CAMR . These are just examples of technology
159
$10.000
.000
W11.0
DOE 2007 Goal: -$45,000/lb Hg Removed
0
0
I
$'0.00
I
$20.00
$10,00
1
i
PRO
PRII
PRR
VI)L""'
NDl .ipnila
NDliynile
(l5'-FSI'
(S-I:SP
SDA.II
(S-E.V'
(sl~$V
NDAFF
PAC
IIron,.PA('
Iron. P.'
O_ ;'
. PA( .
(Fm .VA(
Oron,PAC
51:A
161
Table 8.8. 2004 Form 767 Reported Fly Ash and Calculated per ton Revenue and Disposal Expense
Company
NAME
CITY
Fly Ash (1000 tons)
Disposal Expense
Revenue
Total
Landfill
Ponds
Onsite
Sold
Offsite
$1000
$/ton *
$1000
$/ton *
Ameren
Coffeen
St Louis
11 .9
11 .9
EN **
Ameren
Hutsonville
St Louis
22.8
22.8
EN **
Ameren
Meredosia
St Louis
34.6
34.6
EN **
Ameren
Newton
St Louis
151 .5
7.4
42.1
102
EN **
$934
$9.16
Ameren
Duck Crk
St Louis
62.4
62.4
EN **
Ameren
Edwards
St Louis
179.5
179.5
EN **
Dominion
Kincaid
Kincaid
96.3
96.3
$728
$7.56
Dynegy
Baldwin
Decatur
203
102
101
$0.00
$11
$0.11
Dynegy
Havana
Decatur
92
69
23
$0.00
$0.00
Dynegy
Hennepin
Decatur
44
19
25
$0.00
$191
$7 .64
Dynegy
Vermilion
Decatur
34
12
8
14
$127
$6.35
$45
$3.21
Dynegy
Wood Rvr
Decatur
59
11
48
$0.00
$0.00
EEI
Joppa
Joppa
174 .3
174.3
$174
$1 .00
Midwest
Collins
Chicago
0
Midwest
Crawford
Chicago
58.4
32.7
25.7
$598
$23.27
$141
$4.31
Midwest
Fisk
Chicago
31 .8
16.6
15.2
$359
$23.62
$78
$4.70
Midwest
Joliet 29
Chicago
114
105
9
$189
$21 .00
$489
$4.66
Midwest
Joliet 9
Chicago
20.6
20.6
$438
$21 .25
Midwest
Powerton
Chicago
120
120
$0.00
Midwest
Waukegan
Chicago
70.6
42.7
27 .9
$640
$22.94
$205
$4.80
Midwest
Will Cnty
Chicago
98.8
9.4
89 .4
$1,898
$21 .23
$51
$5.43
SILCO
Marion
Marion
42.3
42 .3
$328
$7.75
CWLP
Dallman
Springfield
53.9
31 .6
22.3
$117
$3.70
$0.00
Total *
1775.7
19.4
402.5
179.5
716.0
458.30
$5,422
$2,319
Percent of Total Fly Ash *
100%
1 %
23%
10%
40%
26%
All values as reported in EIA Form 767 except as denoted by asterisk
** Ameren did not report Disposal Expense
ction an Cost for IL Mercu
Rule Com liance
162
Owner
Plant Name
Capacity
MW
Technology
Capital
Cost,
$1000
Sorbent
Cost
$1000/yr
TOXECON
O&M,
$1000
Ash
disposal,
$1000
Annual
Coal Use
(1000
tons)
Hg
reduced
Hg
Output
Ameren
DUCK CREEK
441
Cobenefit
$0
$0
$0
$0
989
2,278
253
Ameren
NEWTON
617
SI
$1,543
$1,833
$0
$2,550
2,220
6,608
497
Ameren
NEWTON
617
SI
$1,543
$1,893
$0
$0
2,172
6,463
486
Ameren
E 0 EDWARDS
136
SI
$340
$331
$0
$0
449
1,338
101
Ameren
E D EDWARDS
281
SI
$703
$711
$0
$0
909
2,705
204
Ameren
E D EDWARDS
361
SI
$903
$1,055
$0
$0
1,211
3,603
271
Ameren
COFFEEN
389
SI
$973
$2,288
$0
$0
968
2,306
174
Ameren
COFFEEN
617
SI
$1,543
$4,032
$0
$0
1,702
4,052
305
Ameren
HUTSONVILLE
76
SI
$190
$284
$0
$0
130
310
23
Ameren
HUTSONVILLE
77
SI
$193
$359
$0
$0
165
392
30
Ameren
MEREDOSIA
31
SI
$78
$15
$0
$0
20
60
5
Ameren
MEREDOSIA
31
SI
$78
$15
$0
$0
19
57
4
Ameren
MEREDOSIA
31
SI
$78
$30
$0
$0
36
107
8
Ameren
MEREDOSIA
31
SI
$78
$30
$0
$0
38
113
9
Ameren
MEREDOSIA
239
SI
$598
$605
$0
$0
721
2,147
162
CWLP
DALLMAN
87.5
Cobenefit
$0
$0
$0
$0
281
646
72
CWLP
DALLMAN
86
Cobenefit
$0
$0
$0
$0
274
631
70
CWLP
DALLMAN
207
Cobenefit
$0
$0
$0
$0
600
1,383
154
Dynegy
BALDWIN
623
SI
$1,558
$439
$0
$0
2,324
6,917
521
Dyneqy
BALDWIN
635
SI
$1,588
$455
$0
$0
2,253
6,704
505
Dynegy
BALDWIN
635
SI
$1,588
$505
$0
$0
2,504
7,451
561
Dynegy
HAVANA
488
S1
$1,220
$511
$0
$0
1,190
3,542
267
Dyneqy
HENNEPIN
74
SI
$185
$216
$0
$625
276
822
62
Dyneqy
HENNEPIN
231
SI
$578
$709
$0
$0
874
2,601
196
Dynegy
VERMILION
74
SI
$185
$112
$0
$0
206
490
37
Dyneqy
VERMILION
109
SI
$273
$178
$0
$0
311
740
56
Dyneqy
WOOD RIVER
113
SI
$283
$275
$0
$1,200
351
1,044
79
163
Dynegy
WOOD RIVER
372
SI
$930
$942
$0
$0
1,048
3.117
235
Joppa
JOPPA STEAM
183
SI
$458
$713
$0
$0
819
2,439
184
Joppa
JOPPASTEAM
183
SI
$458
$713
$0
$0
814
2,423
182
Joppa
JOPPA STEAM
183
SI
$458
$713
$0
$0
822
2,445
184
Joppa
JOPPA STEAM
183
SI
$458
$731
$0
$0
842
2,505
189
Joppa
JOPPA STEAM
183
SI
$458
$757
$0
$4,350
875
2,603
196
Joppa
JOPPA STEAM
183
SI
$458
$757
$0
$0
869
2,586
195
Kincaid
KINCAID
660
SI
$1,650
$1,607
$0
$0
1,824
5,427
408
Kincaid
KINCAID
660
SI
$1,650
$1,928
$0
$0
2,122
6,314
475
Marion
MARION
170
cobenefit
$0
$0
$0
$0
642
1,478
164
Marion
MARION
120
cobenefit
$0
$0
$0
$0
422
973
108
Midwest
JOLIET 29
330
SI
$825
$643
$0
$0
766
2,280
172
Midwest
JOLIET 29
330
SI
$825
$787
$0
$0
939
2,793
210
Midwest
JOLIET 29
330
SI
$825
$803
$0
$0
958
2,850
215
Midwest
JOLIET 29
330
SI
$825
$803
$0
$0
958
2,850
215
Midwest
JOLIET 9
360
SI
$900
$1,402
$0
$2,625
1,420
4,225
318
Midwest
CRAWFORD
239
SI
$598
$594
$0
$825
755
2,248
169
Midwest
CRAWFORD
358
St
$895
$906
$0
$0
1,119
3,331
251
Midwest
POWERTON
446.5
SI
$1,116
$1,304
$0
$0
1,520
4,522
340
Midwest
POWERTON
446.5
SI
$1,116
$1,217
$0
$0
1,418
4,221
318
Midwest
POWERTON
446.5
SI
$1,116
$1,217
$0
$0
1,418
4,221
318
Midwest
POWERTON
446.5
SI
$1,116
$1,196
$0
$0
1,393
4,145
312
Midwest
WAUKEGAN
121
SI
$303
$354
$0
$636
446
1,327
100
Midwest
WAUKEGAN
328
TOXECON
$19,680
$479
$241
$0
1,106
3,185
354
Midwest
WAUKEGAN
355
SI
$888
$1,072
$0
$0
1,217
3,621
273
Midwest
WILL COUNTY
188
SI
$470
$229
$0
$191
286
851
64
Midwest
WILL COUNTY
184
SI
$460
$269
$0
$0
343
1,021
77
Midwest
WILL COUNTY
299
TOXECON
$17,940
$364
$183
$0
858
2,472
275
Midwest
WILL COUNTY
598
SI
$1,495
$1,456
$0
$0
1,653
4,921
370
Midwest
FISK
374
SI
$935
$892
$0
$400
996
2,964
223
Total
$75,593
$41,729
$425
$13,403
53,859
155,869
12,200
Table 8.10 E ample Technology Selection and Cost for Compliance with 2010 CAMR
165
11 Ameren
NEWTON
617
II
SI
11
$0
$0
$0
$0
2,220
'
0
7,105
Ameren
I
NEWTON
617
SI
$1,543
$789
$0
1
$0
2,172
4,864 '
..
2,085
Ameren
E D EDWARDS
136
SI
$340
$138
$0
$0
449
1,007
432
Ameren
E D EDWARDS
281
$0
$0
$0
$0
909
0
2,909
Ameren
E D EDWARDS
361
$0
'
$0
$0
$0
843
2,159
Ameren
COFFEEN
389
SI
$973
'
$1,525
$0
$0
968
1,736
744
Am ran
COFFEEN
617
SI
$1,543
$2,688 ''.
$0
$0
1,702
3,050
'..
1,307
Ameren
HUTSONVILLE
6
SI
$190
$62
$0
$0 1
187
418
179
Ameren
HUTSONVILLE
77
SI
$193
$78
$0
$0
236
530
227
Ameren
MEREDOSIA
31
$0
1
$0
$0
$0
20
:
0
64
Ameren
MEREDOSIA
31
$0
:
$0
$0
$0
13
0
34
Ameren
MEREDOSIA
31
$0
$0
$0
.
$0
36
0
115
Ameren
MEREDOSIA
31
$0
$0
$0
$0
38
122
Ameren
MEREDOSIA
239
'
$0
$0
:
$0
$0
721
2,308
CWLP
DALLMAN
87.5
'..
cobenefit
$0
$0
$0
$0
281
1
646
72
CWLP
I DALLMAN
86
cobenefit
$0
$0
$0
1
$0
274
631
70
CWLP
DALLMAN
207
cobenefit
$0
$0
$0
$0
600
1,383
154
Dyneqy
BALDWIN
623
SI
$1,558
$439
$0
$0
2,324
5,207
2,231
Dyneqy
BALDWIN
635
SI
$1,588
$455
$0
$0
2,253
5,046
2,162
Dyneqy
BALDWIN
635
SI
$1,588
$505
'
$0
$0
2,504
5,608
2,404
Dynegy
HAVANA
1
488
SI
$1,220
$511
$0
I
$0
!
1,190
3,428 ',
381
Dyneqy
HENNEPIN
74
SI
$185
$90
$0
$625
276
619
265
Dyneqy
HENNEPIN
231
SI
1
$578
$295
I
$0
$0
874
1
1,958
839
Dynegy
VERMILION
74
'
SI
$185
$112
$0
$0
206
474
,
53
Dyneqy
VERMILION
109
SI
$273
$178
$0
$0
311
716
80
Dyneqy
WOOD RIVER
113
SI
$283
$115
$0
;
$1,200
351
786
337
Dyneqy
I
WOOD RIVER
372
SI
$930
$392
,
$0
$0
,
1,048
2,346
I
1,006 1
Capital
Sorbent
TOXECON
Ash
Annual
Coal Use
Capacity I
Cost,
I
Cost
O&M,
disposal,
(1000
1 Hg
Hg
Owner
Plant Name
MW
' Technology
I
$1000
1
1 $1000/yr
$1000
$1000
tons)
: reduced
I Output
Ameren
I DUCK CREEK
441
cobenefit
$0
0
0 1
166
Midwest
JOLIET 29
330
SI
$825
$335 1
,
$0
$0 i
958
2,758
306
Midwest
JOLIET 9
360
SI
$900
$584
$0
$2,6251
1,420
4,089
454'
Midwest
CRAWFORD
239 SI
$598
$247
$0
$825
755
2,175 1
242
Midwest
CRAWFORD
358
SI
$895
$378
$0
$0
1,119
3,223
!
358
Midwest
POWERTON
446.5
'
SI
$1,116
1
$544 1
$0
$0 i
1,520
'..
4,376
486
Midwest
' POWERTON
446.5
S
$1 116 I
$507
$0
$0
1418
4085
454
1.
Midwest
POWERTON
446.5
SI
$1 116
$507
$0
$0
418
4085
54
Midwest
POWERTON
446.5
SI
$1 116
$498
$0
$0
393 i
4 012
446
Mid est
WAUKEGAN
121
S1
$303
$147
$0
$1,075
446
1284
143
Midwest
WAUKEGAN
328
$0
$0
$0
$0
1 106
0
3 539
Midwest
WAUKEGAN
355
SI
$888
$447
$0
$0
1217 I
3504
389
Midwest
WILLCOUNTY
188
SI
$470
$95
$0
$250
286
824
1
92
Midwest
WILL COUNTY
184
SI
$460
$112
$0
$0
343
988
110
Midwest
W LL COUNTY
299
$0
$0
$0
$0
858
0
2,747
Midwest
WILL COUNTY
598
SI
$1495
$607
1
$0
$0
1,653
4,762
529
"'
Mid as
FISK
374
S1
$935
$372
$0
$400
996
2,869
319
Total
$35,515
$19297
$0
$9,900
53,615
117,504
49,422
',
Owner
Plant Name
i
Capacity 1
,
MW
Technoloqy
Capital
Cost,
$1000
Sorbent
TOXECON
Cost
O&M,
$1000/yr
1il $1000
Ash
disposal,
$1000
Annual
I
Coal Use
1
(1000
1
tons)
Hg
reduced
Hg
Output
Joppa
JOPPA STEAM
183
SI
$458 1
$297
$0
$0
819
1 836
787
Joppa
1 JOPPA STEAM
183
SI
$458
$297
$0
$0
814
1 824
782
'.,
Joppa
JOPPA STEAM
183
SI
$458
$297 i
$0
$2900
822
1 840
789
Joppa
JOPPA STEAM
183
SI
$458
$304
$0 '
$0
842
885
808
Joppa
JOPPA STEAM
183
$0
$0
$0
$0
875
0
2,799
1
Joppa
JOPPA STEAM
183
$0
$0
$0
$0
869
0
2,781 1
Kincaid
KINCAID
660
SI
$1 650
$670
$0
$0
1,824 1
4,085
1 751
Kincaid
KINCAID
660
SI
$1 650
$803
$0
$0 1
2 22
4,753 I
2,037
Marion
MARION
170
cobenefit
$0
$0
$0
$0
642
1,478
164
Marion
I MARION
120 i cobenefit
$0
$0
1
$0
$0
422
973
108
Midwest
JOLIET 29
330
SI
$825
$268
$0
$0
766
2,206
245
Midwest
JOLIET 29
330
SI
$825
$328
$0
1
$0
939
2,703
1
300
Midwest
JOLIET 29
I
330
SI
$825
$335
$0
$0
958 1
2,758
306
choices. Of course, the power plant would make its own decision about the best
approach to compliance .
9.0
Economic Modeling
In addition to the detailed mercury control and cost analysis performed in Section 8 of
this document, Illinois utilized the services of ICF Resources Incorporated (ICF) to
evaluate the economic impact of the Illinois Mercury Rule using the Integrated Planning
Model (IPM®) . Developed by ICF and used to support public and private sector clients,
IPM is a multi-regional, dynamic, deterministic linear programming model of the U .S
.
electric power sector. It provides forecasts of least-cost capacity expansion, electricity
dispatch, and emission control strategies for meeting energy demand and environmental,
transmission, dispatch, and reliability constraints . IPM can be used to evaluate the cost
and emissions impacts of proposed policies to limit emissions of sulfur dioxide (S02),
nitrogen oxides (NOx), carbon dioxide (CO2), and mercury (Hg) from the electric power
sector. The IPM was a key analytical tool in developing the Clean Air Interstate Rule
(CAIR) and the President's Clear Skies Initiative
.
Specifically, ICF conducted a study utilizing IPM to analyze the cost impacts of the
proposed rule, referenced to the "Illinois Mercury Rule" . This study focused on the
impacts of the mercury rule in terms of costs to the power sector and costs to electricity
consumers. National level and state level results were determined and presented . In
addition, the study highlighted the effects on generation, coal consumption, control
equipment, and emissions
.
Of note is that Illinois updated several of the assumptions and inputs used in previous
IPM runs involving Illinois EGUs, including :
•
Costs of mercury controls, in particular the costs of halogenated PAC
•
Coal type utilized by Illinois EGUs
•
Existing control configurations at Illinois EGUs
•
Estimated mercury emissions from Illinois EGUs
167
In paritucular, for modeling the proposed mercury rule, Illinois modified the IPM
mercury control assumptions to include mercury control using halogenated PAC . The
mercury control assumptions used for IPM modeling performed for U . S. EPA had been
based on data developed several years ago using untreated activated carbon as the basic
mercury control technology. Therefore, ICF modified these control technology
assumptions to be consistent with current understanding of control technologies and
costs .
9 .1
Scenarios Examined
ICF examined three cases (or scenarios) using IPM
:
(i)
A Base Case with no additional Federal air regulations in place beyond
existing regulations, including the Title IV SO2 program, the NO x SIP
Call requirements, and other state regulations in place (the Base Case)
;
(ii)
A case based upon the run above, but also including the final CAIR and
CAMR as put forth by U.S. EPA (the CAIR/CAMR case)
;
(iii)
A case with the CAIR in place, the CAMR in place for all states but
Illinois, and the proposed Illinois Mercury Rule for affected sources in
Illinois, referred to the Policy Case
.
The difference between the Base Case and either of the two regulatory scenarios
represents the impact of that regulation . In this study, differences between the second
and first case represent the costs of the CAIR/CAMR rule, based on the assumptions
underlying this study. The differences between the third and the first case represent the
costs of the proposed rule, based again on the underlying assumptions. A comparison of
these two cost impact estimates reflects the incremental cost of the proposed rule over the
168
CAIR/CAMR case. The report focused on this difference (i.e., difference between
scenarios iii vs . ii)
.
ICF was not able to model the exact features of the proposed rule. Based on discussions
with Illinois, and given the available time for this analysis, ICF structured the analysis as
follows :
•
First, ICF assumed that compliance with Phase I of the rule is required at the
beginning of 2009, although actual compliance is not required until July 1, 2009 ;
•
Second, rather than model unit level emission rate limits for existing units, ICF
simulated unit level emission rate limits based on unit level emissions caps
calculated by Illinois EPA . For subbituminous units, the unit level cap was based
on a 90 reduction in emissions from historic levels (after accounting for increased
use of subbituminous coal). For bituminous plants, the cap reflects the rate limit
and a fixed generation level. IPM model plant level emissions caps are the sum of
the individual unit caps. Note that using caps to simulate a rate limit is a more
restrictive policy. Under a rate limit policy, a unit would be able to increase
generation and emissions so long as it remained under the rate . Under a cap,
emissions do not increase over time
.
•
The rate limits
(i.e ., 0.020 or 0.0080 lbs Hg/GWh) were implemented for all
potential coal and potential IGCC units in IPM's Mid-America Interconnected
Network-04 (MANO) region (Illinois capacity consists of 88 percent of region's
capacity)
.
•
In addition to the plant level caps implemented across the two phases, a system
level emissions limit was imposed that reflected the 90 percent reduction
requirements of Phase I. This was calculated based on the 0 .0080 lbs Hg/GWh
emission rate limit. This system cap was applied to all Illinois affected units,
which, in comparison, is a less restrictive requirement than the proposed rule
.
169
IPM is a capacity planning and dispatch model that simulates the operation of the electric
power system based upon engineering and economic fundamentals . It is supported by a
detailed set of data and assumptions that characterize the current generation and
transmission system; fuel markets; demand ; environmental requirements ; and system
constraints. Additional inputs include new technology costs (including pollution control
equipment), current environmental laws and regulations, and any potential future policies
being modeled
.
9.2
Results
This section provides ICF's basic summary of the results of the analysis focusing on the
incremental impacts of the proposed rule, as represented by the differences between cases
(iii) the proposed Mercury Rule, and (ii) the CAIR/CAMR rules
.
Table 9.1 shows the changes in emissions for mercury, SO2 and NOx for Illinois and at
the national level. Due to the more stringent nature of the proposed mercury rule in
Illinois relative to Illinois' allocations under CAMR, emissions of mercury in Illinois are
lower by 4,754 lbs in 2009 . This is an 85 percent reduction in Illinois mercury emissions
relative to the Base and CAIR/CAMR cases
.
Emission levels decrease in Illinois over time under the Policy Case reflecting increased
stringency of the emissions constraints and reduced flexibility in compliance. Emissions
in Illinois from all units total 883 lbs in 2009, falling to 789 lbs in 2015 . This represents
a reduction of 4,726 pounds and 1,674 pounds in 2009 and 2015, respectively . (Note that
under the CAIR/CAMR case, Illinois would be a net purchaser of mercury emission
allowances in 2018 given that its state budget under CAMR is 1,258 pounds of mercury .)
The SO2 and NO, emissions in Illinois are also lower under the Policy Case relative to
the CAIR/CAMR case. This results from reductions in coal-fired generation and an
170
increase in scrubber installations in 2009 as a result of the proposed rule . The mercury
emissions are also lower nation-wide, reflecting the reductions from Illinois units
.
Table 9.1
Emissions (thousand Tons or Lbs)
Table 9.2 shows the changes in generation in Illinois and nationally from the Policy Case
.
The total generation in Illinois is lower by 2 percent in 2009 relative to the CAIR/CAMR
case. By 2015 and 2018, total generation under the Policy Case has decreased by 7 and 5
percent, respectively, relative to the CAIR/CAMR case
.
This reduction is driven by reductions in coal-fired generation in Illinois . Illinois is a net
exporter of energy - that is, it generates more than is required to meet its internal
demand. Under the CAIR/CAMR case, Illinois coal fired generation would be reduced
somewhat - by 2 percent in 2009, and 6 percent in 2018
. However, under the Policy
Case, the impact is more pronounced with reductions in coal-fired generation in
2009,
2015, and 2018 of4 percent, 15 percent, and 10 percent, respectively, relative to the
CAIR/CAMR case. With more stringent regulations in place in Illinois, the Illinois coal
plants are somewhat less competitive, and thus, have fewer opportunities to export coal-
fired generation .
17 1
(iii) Policy Case with IL
Rule
(ii) Base Case with
CAIR/CAMR
Delta (iii - ii)
Pollutant
2009
1
2015
1
2018
2009
1
2015
1
2018
2009
1
2015
1
2018
IL State
Hg
1
SO2 (Title IV)
NOx (SIP Call)
883
232
63
789
212
62
799
206
61
5,609
309
67
2,463
268
68
1,926
266
68
(4,726)
(77)
(4)
(1,674)
(56)
(6)
(1,127)
(60)
(7)
National
Hg
1
SO2 (Title IV)
NOx (SIP Call)
81,822
6,725
2,514
59,828
5,204
2,366
56,676
4,795
2,272
86,201
6,765
2,516
61,552
5,195
2,365
57,914
4,815
2,268
(4,379)
(40)
(2)
(1,724)
9
1
(1,238)
(20)
4
1 . Mercury emissions are reported in pounds; all other pollutants are reported in short tons
.
The projected decrease in coal generation is slightly compensated by an increase in
generation for oil and natural gas-fired units in Illinois . However, the bulk of the
displaced Illinois generation is made up in the rest of MANO and in neighboring regions
.
Illinois remains a net exporter, but to a lesser degree. Thus, decreases in generation from
Illinois units result in a net decline in exports of energy from the MANO region. Total
generation decreases overall at the national level, reflecting marginal changes in losses,
pumped storage activity and transmission
.
172
Table 9.2
Generation (GWh)
173
(iii) Policy Case with IL Rule
(ii) Base Case with CAIR/CAMR
Delta (iii - ii)
Generation
2009
2015
2018
2009
2015
2018
2009
1
2015
1
2018
IL State
Coal
102,514
93,733
98,375
107,327
109,692
109,523
(4,813)
(15,958)
(11,148)
Hydro
92
92
92
92
92
92
-
-
-
Nuclear
95,092
95,259
96,575
95,092
95,259
96,575
-
-
-
Oil/Natural Gas
3,693
7,528
8,648
3,367
5,815
7,908
326
1,713
739
Other
166
166
166
166
166
166
-
-
-
Renewables
589
1,097
1,097
589
1,097
1,097
-
-
-
Grand Total
202,146
197,875
204,953
206,633
212,120
215,361
(4,487)
(14,245)
(10,408)
National
Coal
2,187,043
2,448,517
2,650,066
2,189,406
2,448,364
2,640,484
(2,362)
153
9,582
Hydro
287,113
290,063
288,249
287,218
290,205
289,165
(104)
(142)
(916)
Nuclear
796,715
810,065
807,698
796,715
810,065
807,698
-
-
-
Oil/Natural Gas
889,675
1,023,427
1,063,795
887,468
1,023,775
1,073,736
2,207
(348)
(9,940)
Other
44,066
51,731
49,497
44,066
51,731
49,497
-
-
-
Renewables
81,947
101,232
108,330
81,947
101,178
108,361
-
54
(31)
Grand Total
4,286,560
4,725,036
4,967,636
4,286,820
4,725,318
4,968,941
(260)
(283)
(1,305)
Table 9.3 shows the impact on total production costs under the Policy Case, as compared
to the CAIR/CAMR case. Production costs shown are the total going-forward costs for
meeting electricity demand, including fuel costs, variable operating and maintenance
costs, fixed operating and maintenance costs, and annualized capital costs (including
costs for new capacity and retrofits). As shown in Table 9.3, the total costs at the
national level are higher under the Policy Case by $147 to $267 million per year over the
time frame analyzed. These are very small impacts relative to total national costs (about
two-tenths of a percent) .
Under the Policy Case, production costs in Illinois are higher in 2009, by about half the
national level ($68 million). This reflects a mix of increased capital costs and variable
operating and maintenance costs due to additional controls required, partially offset by
displaced fuel consumption from lost generation.
In later years under Phase 11 of the proposed Illinois Mercury Rule, production costs are
lower in all years (by $188 and $53 million, in 2015 and 2018, respectively) . This
reduction in costs reflects the lower level of generation that occurs in Illinois due to the
proposed rule (which is down by between 5-7 percent in these years), offset by the
increased cost of retrofit decisions. Capital costs are up in these years ; however, these
costs are offset by the reduced fuel costs and net decreases in variable operating and
maintenance costs .
Note that these costs are production costs and do not reflect the opportunity costs (i.e .,
lost revenues and associated profits) of the lost exports. Generation in Illinois is sufficient
to meet internal load and export power to neighboring regions (this assumes that Illinois
generators share proportionally in the exports). Under the Illinois Mercury Rule, this
remains true ; however, the level of exports declines, with attendant loss of revenues from
these sales. ICF did not quantify these lost revenues
.
174
Table 9.3
Im acts of the Illinois Mercur Rule
Table 9.4 shows the changes in total costs, generation, and average production costs in
Illinois and nationally under the two policy cases . Despite lower overall production costs
in Illinois (due to lower generation levels), average production costs increase under the
Policy Case. They increase by
$0.80
per MWh in
2009, $0.64
per MWh in
2015,
and
$0.92
per MWh in
2018 .
Thus, average production costs in Illinois increase by
4
percent,
3
percent, and
4
percent in
2009, 2015
and
2018,
respectively under the Policy Case. The
increase at the national level is minimal (less than two-tenths of a percent) in all years
.
The decrease in total costs in Illinois is a result of the decrease in generation levels from
Illinois units offset by the increased costs for compliance . In these years, these
reductions outweigh the increase in production costs due to the mercury rule . Though the
decrease in generation leads to a decrease in the exports of energy, the MANO region is
still a net exporter of energy. However, the region must import capacity in order to meet
summer peak reserve requirements .
1 75
(iii) Policy Case with IL
Rule
(ii) Base Case with
CAIR/CAMR
Delta (iii - ii)
Plant Type
2009
1
2015
1
2018
2009
1
2015
1
2018
2009
1
2015
1
2018
IL State
Variable O&M
357
340
355
306
372
382
51
(32)
(27)
Fixed O&M
2,030
2,137
2,316
2,003
2,134
2,300
28
3
16
Fuel Total
1,931
1,908
1,963
1,995
2,069
2,102
(63)
(162)
(140)
Capital
84
105
295
32
101
198
53
3
97
Total Cost
4,403
4,488
4,929
4,335
4,676
4,982
68
(188)
(53)
National
Variable O&M
7835
9495
10549
7780
9496
10511
56
(2)
38
Fixed O&M
28926
31772
33432
28910
31749
33388
16
23
44
Fuel Total
61818
65527
68945
61759
65480
69139
59
47
(194)
Capital
2574
13256
19167
2558
13057
18807
6
199
360
Total Cost
101,153
120,049
132,094
101007
119782
131846
147
267
248
Table 9.4
e Production Costs 1999 $/MWh
176
(iii) Policy Case with IL Rule
(ii) Base Case with CAIR/CAMR
Delta (iii - ii
Plant Type
j
2009
2015
2018
2009
I
2015
2018
2009
2015
2018
IL State
Total Costs (MM$)
Total Generation (GWh)
Average Costs (mills/kWh)
4,403
202,146
21.78
4,488
197,875
22.68
4,929
204,953
24.05
4,335
206,633
20.98
4,676
212,120
22.04
4,982
215,361
23.13
68
(4,487)
0.80
(188)
(14,245)
0.64
(53)
(10,408)
0.92
National
Total Costs (MM$)
Total Generation (GWh)
Average Costs (mills/kWh)
101,153
4,286,560
23.60
120,049
4,725,036
25.41
132,094
4,967,636
26.59
101,007
4,286,820
23.56
119,782
4,725,318
25.35
131,846
4,968,941
26.53
147
(260)
0.04
267
(283)
0.06
248
(1,305)
0.06
Table 9.5 shows the changes in firm wholesale electricity prices between the two policy
cases being compared. The firm price is made up of two components : marginal energy
and marginal capacity prices . Firm prices in Illinois under the Policy Case increase by
$0.50/MWh in 2009, by $1 .46/MWh in 2015, and $1 .00/MWh in 2018 . Marginal energy
prices reflect the production costs of the marginal plant - the last plant to be dispatched in
each hour. The Policy Case results on an increase in production costs and increases the
costs of the marginal unit, and thus increases the marginal energy prices over the
CAIR/CAMR case. This in turn leads to higher firm prices for all the years. The rule has
a negligible impact on firm electricity prices nation-wide
-- $0.07-0.15/MWh across the
study horizon
.
Table 9 .5
Wholesale Firm Electricity Price (1999 $/MWh)
IPM is a wholesale power market model. As such, its outputs include estimates of
increased generation system costs (and hence average cost increases) and impacts on
marginal energy and capacity costs. It does not provide projections of retail rates or retail
price impacts. Therefore, it is necessary to estimate retail rate impacts based on the
available outputs of the model
.
Final retail rates depend on the nature of the market in each state (deregulated or not) and
the ratemaking process, including how costs increases are allocated among sectors, what
177
(iii) Policy Case with
IL Rule
(ii) Base Case with
CAIR/CAMR
Delta (iii - ii)
Region
2009
2015
2018
2009
2015
2018
2009
2015
2018
IL (MANO)
27.40
41.08
50.29
26.90
39.62
49.29
0.50
1.46
1 00
National
37.73
39.33
45.45
37.66
39.23
45.31
0.07
0.10
0.14
** The firm wholesale price represents the sum of marginal energy costs and marginal
capacity price, spread across all generation .
The prices are energy weighted
segmental prices
.
** Wholesale marginal energy and capacity prices in IPM are forecast at the IPM model
region level for each run-year, season, and segment . The wholesale prices for MANO
are presented as representative of Illinois
.
returns are ultimately allowed, and other factors . In Illinois, an auction process was
recently established that allows for the procurement of electricity at wholesale by Ameren
and ComEd for delivery to Illinois retail consumers, requiring supply service from their
local distribution utility beginning in 2007 .
The estimate of retail rate impacts estimated here reflects an assumption that retail rates
over the study horizon would increase by the increase in wholesale energy prices . Given
the competitive nature of wholesale markets in Illinois, this is not an unreasonable
assumption
.
A number of other inputs and assumptions are required to calculate the retail rate impact
.
It is assumed that the increase is applied equally across all sectors - that is, all sectors
bear the same incremental per kWh wholesale cost increases . Second, a forecast of
baseline retail rates is required to which to add this increase . For this purpose, ICF
obtained from the U.S. DOE's "Energy Information Agency's (EIA) Annual Energy
Outlook (AEO) 2006", a forecast of retail electricity rates over the study horizon for the
MAIN (Mid-America Interconnected Network) region . The underlying assumption is
that forecast retail rates for MAIN are applicable to the State of Illinois . The AEO 2006
scenario from which this rate is taken is comparable to the CAIR/CAMR case in that
those two rules are assumed to be in place in the AEO analysis . However, it is important
to note that the two cases may differ on other aspects
.
Table 9.6 shows the changes in retail electricity prices by sector. ICF calculated the retail
electricity prices by applying the IPM projected increase in firm wholesale electricity
prices resulting from the proposed Illinois rule to the retail rates obtained from AEO 2006
(adjusted to be consistent year dollars) . The Policy Case would result in an increase in
the production costs and thus energy prices. This, in turn, leads to higher retail prices for
all sectors
.
Price increases range from 0 .05 cents per kWh to 0.15 cents per kWh over the study
horizon. These represent increases of one to two percent in the residential and industrial
178
sectors and one to
3 .5
percent in the commercial sector. Under this methodology,
increases in the commercial and industrial sectors are proportionately higher given the
lower starting base rates
.
Table 9.6
Estimated Impacts on Retail Electricity Prices in Illinois
(1999
cents per kWh)*
Tables
9.7
and
9 .8
show the changes in total expenditures for each sector on an annual
and monthly basis under the Policy Case. In
2009,
residential customer expenditures
increase by
$28
million; industrial expenditures for electricity increase by
$31
million
while commercial expenditures increase by
$27
million. In
2015,
increased expenditures
total
$87, $101,
and
$83
million for the residential, commercial, and industrial sectors,
respectively. On a monthly basis, the average household will pay
$0.49, $1 .50
and
$1 .06
more in
2009, 2015
and
2018,
respectively, as a result of incremental impact of the
proposed Illinois Mercury Rule . These numbers are the increase in monthly expenditures
in the residential sector (in Table
9.8)
divided by the number of households in Illinois .
The number of households in Illinois was estimated based on forecasts of total population
and an estimate of current persons per households, based on Census data
.
179
(iii) Policy Case with
IL Rule
(ii) Base
CAIR/CAMR
Case with
Delta (iii - ii)
Region
120091 2015
1
2018
2009
1
2015
1
2018
2009 2015 12018
IL State
Residential
Industrial
Commercial
7.43
7.67
7.75
6.65
4.45
7.38
7.52
7.65
0 05
0.15
0.15
0.15
0.10
0
10
0.10
6.44
6.35
6.55
0.05
6.50
6.50
4.53
4.17
4.35
0.05
4.58
4.32
*Retail price are estimated by adding the incremental increase in Firm Wholesale
Electricity Prices (shown in Table
1-5)
between the cases to the retail prices by
sector. Retail prices by sector were obtained from EIA's AEO
2006
data. Refer to
Table
62
:
Electric Power Projections by EMM
region was used to estimate prices for Illinois
.
region". Data for the "MAIN"
Table 9.7
Total Ex enditures for Electrici
b Sector 1999 million dollars
Table 9.8
Impacts on Monthly Expenditures for Electricity by Sector
1999 million dollars
Table
9.9
shows the changes in control technology retrofits between the two policy cases
.
The proposed Illinois Mercury Rule requires an additional 11 gigawatts (GW) of
activated carbon injection (ACI) controls and
2
GW of flue gas desulfurization (FGD)
controls by
2009 .
The incremental level of retrofits required by the proposed rule shrinks
by
2018
as the difference between the stringency of the Illinois rule and CAMR rule
shrinks. By
2018,
the level of scrubber retrofits required is lower than that predicted
180
(iii) Policy Case
with IL Rule
(ii) Base Case with
CAIR/CAMR
Delta (iii - ii)
Region
12009
1 2015
2018
2009
J 2015
1 2018
2009
2015
2018
IL State
Residential
342
381
399
340
374
394
Industrial
336
374
404
334
365
398
3
8
6
Commercial
207
204
214
205
197
209
2
7
5
These costs are calculated by dividing the annual payments in
1-7
by
12 .
(iii) Policy Case with
IL Rule
(ii) Base Case with
CAIR/CAMR
Delta (iii - ii)
Region
2009
1 2015
1 2018
2009 1 2015
1 2018
2009 12015
2018
IL State
Residential
4,109
4,569
4,786
4,081
4,482
4,724
28
87
62
Industrial
4,038
4,482
4,848
4,007
4,382
4,775
31
101
73
Commercial
2,488
2,449
2,570
2,461
2,366
2,512
27
83
58
Total bill payments for each sector are calculated as follows. First, an estimate of
sales to each sector in Illinois is made based the AEO
2006
projections of each
sector's share of total retail sales (for the MAIN region) . For example, if AEO
projects that in
2010
residential customers will account for x percent of total retail
electricity sales, ICF assumed the same share. ICF estimates Illinois sales based on
the assumption that Illinois sales as a proportion of total Illinois generation are the
same as that of the MANO region. Finally, the retail prices estimated in Table
1-6
are multiplied by generation to derive total annual expenditures for electricity by
sector.
under CAIR/CAMR, and the least-cost response to the proposed Illinois Mercury Rule is
to add some scrubbers earlier. Similarly, for ACI, the least-cost response is to add about
8 GW of ACI earlier than would occur under CAIR/CAMR case . By 2018, the
incremental level of ACI retrofits in Illinois is 2 GW . Note that incremental ACI retrofits
occur in the rest of the nation (an additional 1 .5 GW by 2015) . This is due to the
increased level of generation in the rest of the nation that makes up for lost exports from
Illinois .
18 1
Table 9.9
Control Technology Retrofits (Cumulative MW)
Table 9.10 summarizes the changes in coal consumption between the two cases . It also
provides a full comparison of the Policy Case vs . the Base Case without CAIR/CAMR
(second section of the table), and the CAIR /CAMR case vs. a case with neither rule in
place (third section) .
Under the CAIR/CAMR case, bituminous coal consumption falls by about 18 to 68 tons
per trillion Btu (Thtu) (or about 8 to 24 percent over the study horizon) . Under the Policy
Case, bituminous fuel consumption rises by 48 TBtu in 2009. It falls slightly in 2018 (18
TBtu or 10 percent) under the Policy Case, but by a much lesser amount than under the
CAIR/CAMR case. Hence, relative to CAIR/CAMR case, the Policy Case leads to an
increase in the use of bituminous coal and a decrease in the use of subbituminous coal in
Illinois units . This reflects the incremental use of scrubbers in early years . These
decreases in subbituminous coal consumption are substantially offset by increases in the
rest of the nation. Coal prices are not affected by the proposed Illinois rule
.
182
(iii) Policy Case with IL
Rule
(ii) Base Case with
CAIR/CAMR
Delta (iii
- ii)
Technology
2009
1
2015
1
2018
2009
1
2015
2018
2009
1
2015
1 2018
IL State
FGD
2,556
2,762
2,762
387
2,836
2,836
2,168
(74)
(74)
SCR
1,748
1,826
1,826
1,799
2,121
2,121
(51)
(295)
(295)
SNCR
-
-
-
-
-
-
-
-
-
ACI
10,590
10,727
11,023
-
7,185
8,498
10,590
3,542
2,525
National
FGD
38,578
72,100
85,019
36,948
73,530
85,543
1,630
(1,431)
(525)
SCR
34,362
51,042
64,747
34,223
51,213
65,181
139
(171)
(434)
SNCR
2,039
2,575
2,925
2,041
2,578
3,106
(3)
(3)
(181)
ACI
18,493
63,788
72,423
7,934
58,723
67,672
10,559
5,065
4,751
Table 9.10
Coal Consum tion TBtu
1 83
Comparison of Two Policy Cases
(iii) Policy Case with IL
Rule
(ii) Base Case with
CAIR/CAMR
Delta (iii - ii)
Coal Type
2009
2015
2018
2009
2015
2018
2009 2015
2018
IL State
Bituminous
Subbituminous
Lignite
Total
268
808
-
1,077
254
728
-
982
262
751
-
1,013
201
924
-
1,126
214
942
-
1,156
212
942
-
1,154
67
(116)
-
(49)
40
(214)
-
(174)
50
(191)
-
(141)
National
Bituminous
Subbituminous
Lignite
Total
12,940
8,990
774
22,704
14,114
9,995
774
24,882
15,153
10,680
774
26,607
12,945
8,990
792
22,727
14,070
10,053
792
24,915
15,068
10,701
792
26,560
(5)
-
(18)
(23)
44
(58)
(18)
(32)
86
(21)
(18)
47
Impact of the Illinois Rule
(iii) Policy Case with IL
Rule
(i) Base Case without
CAIR/CAMR
Delta (iii - i)
IL State
Bituminous
Subbituminous
Lignite
Total
268
808
-
1,077
254
728
-
982
262
751
-
1,013
220
920
-
1,140
243
938
-
1,181
280
936
-
1,215
48
(112)
-
(63)
11
(211)
-
(200)
(18)
(185)
-
(202)
National
Bituminous
Subbituminous
Lignite
Total
12,940
8,990
774
22,704
14,114
9,995
774
24,882
15,153
10,680
774
26,607
13,117
8,989
801
22,908
13,570
10,813
801
25,184
14,418
11,683
801
26,902
(177)
1
(27)
(203)
544
(818)
(27)
(302)
735
(1,003)
(27)
(295)
Impact of CAIR/CAMR
(ii) Base Case with
CAIR/CAMR
(i) Base Case without
CAIR/CAMR
Delta (ii - i)
IL State
Bituminous
Subbituminous
Lignite
Total
201
924
-
1,126
214
942
-
1,156
212
942
-
1,154
220
920
-
1,140
243
938
-
1,181
280
936
-
1,215
(18)
4
-
(14)
(29)
3
-
(26)
(68)
6
-
(62)
National
Bituminous
Subbituminous
Lignite
Total
12,945
8,990
792
22,727
14,070
10,053
792
24,915
15,068
10,701
792
26,560
13,117
8,989
801
22,908
13,570
10,813
801
25,184
14,418
11,683
801
26,902
(172)
1
(10)
(180)
500
(760)
(10)
(269)
650
(981)
(10)
(341)
Table 9.11 summarized coal plant retirements resulting from the rule . IPM retires units
when it is uneconomic for them to continue operation, in comparison to the alternatives
of running existing units harder, building new units, and when considering whether their
continued operation is required for reserve margin purposes. This decision reflects the
situation over the entire study horizon. Relative to the CAIR/CAMR case, the Policy
Case results in a small amount of coal-fired capacity to be uneconomic and thus retire
(252 MW). These plants are Hutsonville Units 5 and 6 (partial) and Meredosia Units 1-4
.
These units are currently 50 years old or older. In practice, units that become
uneconomic when the rule takes effect may be "mothballed" until fuel prices or other
conditions change, they may retire, or may be kept in service for grid reliability purposes
.
Table 9.11
Cumulative Coal Plant Retirements (MW)
(iii) Policy Case with IL
Rule
Plant
T e
2018
2009
2018
2009
2018
Coal
2,085
1
2,788
1
2,788 11,880
(ii) Base Case with
CAIR/CAMR
Delta (iii - ii)
2,585
1
2,585
II
205
1
203
~
203
* Retirement figures are cumulative
.
9.3
Conclusions
ICF identified the principal findings of the study as :
•
The proposed Illinois Mercury Rule reduces coal-fired generation in Illinois by 15
percent in 2015 (7 percent reduction in total generation). This generation lowers
exports to neighboring regions
.
•
Total production costs in the region increase by about 2 percent in the first year of
the policy. However, in subsequent years, costs fall as exports fall and associated
1 84
production costs offset compliance cost increases . This also implies that revenues
from exports fall .
•
Average production costs in Illinois increase 2-3 percent as a result of the rule
.
Marginal prices increase 2-4 percent across the study period
.
•
Mercury emissions drop to 883 pounds of mercury by 2009, 84 percent below
levels under the CAMR. By 2018, they fall to 799 pounds, 58 percent below
CAMR levels .
•
The retail electricity prices and costs across all sectors (residential, industrial and
commercial) are higher as a result of the rule relative to the CAMR, but by only a
small percentage- I to 3.5 percent over the study horizon. On an average bill
basis, residential customers pay less than $1 .50 per month more under the Illinois
rule relative to CAMR across the study horizon
.
10.0
Other Relevant Issues and Additional Considerations
This section addresses several issues that were contemplated, researched, and discussed
during the course of developing the proposed Illinois mercury rule . This section also
expounds upon previously addressed issues in this document .
10.1
Clean Air Interstate Rule (CAIR)
In May 2005, USEPA issued in final form the CAIR to regulate NOx and SO2 emissions
from the eastern region of the United States. Illinois is currently finalizing a regulatory
proposal to satisfy the requirements of the CAIR and will be submitting the proposal to
the Board shortly after the submittal of the mercury rule
.
IPM shows that the costs attributed to the implementation of the CAIR rule in Illinois are
far greater than those of the mercury rule . In essence, the modeling shows that the cost
effects associated with the CAIR rule on electric rates and the power sector are several
orders of magnitude higher than those of the proposed Illinois mercury rule . The benefit-
cost analysis performed by USEPA for CAIR shows that substantial net economic
1 85
benefits to society are likely to be achieved due to reductions in emissions resulting from
CAIR .
10.2
Safety and Reliability of the Electricity Distribution Grid
As a matter of general grid safety, all generation units in Illinois, regardless of generation
source, are required to meet specific worker and public safety standards . These standards
are administered by various organizations including the Illinois Commerce Commission
([CC), the Occupational Health and Safety Administration (OSHA), and the National
Electric Safety Code. Under no scenario is a generation facility allowed to compromise
its obligation to adhere to worker and public safety requirements
.
A concern in developing the proposed rule was the effect, if any, the rule would have on
the reliability of the electrical grid . This concern manifests when the costs for mercury
controls are so large that they would cause the shutdown of some EGUs or even some
power plants . Illinois addressed this issue by examining the likelihood of the proposed
mercury control requirements resulting in unit and/or plant shutdowns using the IPM and
by consulting with experts who have the responsibility for ensuring the safety and
reliability of the grid
.
For background purposes, the electric utility industry initially developed as a loosely
connected network of individual companies, each building power plants and distribution
and transmission lines to serve a franchised service territory . Over the years, the industry
has undergone many changes with more changes expected in the near future. As time
passed, the individual transmission systems were integrated with others to improve
reliability and facilitate transfer of power across companies . Illinois became part of the
Mid-America Interconnected Network (MAIN) in the Eastern Interconnect . Regional
Transmission Organizations (RTOs) were also created in order to facilitate cooperation
between power companies. Illinois power plants are members of two different RTOs
.
The area generally served by Commonwealth Edison is in the PJM Interconnection (PJM)
and the remainder of the state is in the Midwest Independent System Operator (MISO)
territory. The federal and state governments also regulate wholesale and retail electricity
186
pricing. The Federal Energy Regulatory Commission (FERC), among other
responsibilities, oversees the transmission and wholesale sales of electricity in interstate
commerce. The ICC regulates the retail aspect of the business. RTOs play a major role
in assuring the reliability and safety of Illinois' power grid
.
The reliability of the transmission system depends upon critical voltage support and
resource capability at key locations in the grid . Actions that lead to reductions in these
critical factors can ultimately cause widespread service interruptions or exacerbate a
failure of the grid as witnessed in the northern portion of the U.S. and parts of Canada
during August 2003 . The August 2003 blackout extended to eight states and was not
completely restored for days to weeks depending on the affected area . Costs to residents
in the affected areas were estimated at $6 .4 billion. The August 2003 power outage
demonstrates the importance for Illinois to have a reliable power supply . During such
outages it is essential that "blackstart" units or plants are available to assist in restoring
the grid. A blackstart unit is defined as a generating unit that is able to start without an
outside electrical supply or the demonstrated ability of a base load unit to remain
operating, at reduced levels, when automatically disconnected from the grid. A blackstart
plant is simply a generating plant that includes one or more blackstart units
.
Grid congestion problems can become particularly acute where certain generating plants
must run because their operation is essential to maintaining grid reliability. Certain older
power plants in Illinois are categorized as "must run" in that they would need to remain
in operation at least through 2008 to maintain grid reliability principally because they
supply needed voltage support .
Although several state-sponsored initiatives have been launched since 1999 to encourage
development of new plants firing Illinois coal, no additional base-load or replacement
generating capacity is under construction. While construction permits have been issued
for three new plants, the permits are not yet effective because they have been challenged
by a number of environmental groups. At this time, Illinois cannot rely on any new
1 87
baseload generating capacity in the near future . Also, no significant construction to
address transmission grid reliability issues is known to be planned within the State or
within the MAIN electric transmission region
.
Given these issues, the Illinois EPA consulted the State's two RTOs to better understand
any effect the proposed mercury rule would have on grid reliability . Although the RTOs
generally found that accurate predictions are extremely difficult to make, there were no
significant concerns expressed in regards to the reliability and safety of Illinois' power
grid resulting from the proposed mercury rule . Illinois has two must run coal-fired power
plants, one of which is also a blackstart plant . Analysis shows that these plants should be
able to comply with the proposed rule utilizing a cost-effective strategy for mercury
control, such as installation of halogenated PAC . Predictive modeling performed (IPM)
indicates that these plants will continue to operate and would not be shut down as a result
of Illinois' proposed mercury rule .
The North American Electric Reliability Council, which governs reliability issues,
requires the RTOs (PJM and MISO) carry 15% of peak capacity in reserve . Because of
this requirement, the scenario in which the reliability of the Illinois electric grid (or the
nation's electric grid for that matter) would be in question would be one in which more
than 15% of all generating units in the state were to unexpectedly and simultaneously
shut down. Were that to occur, the reserve margin would potentially be exceeded and
reliability could be compromised . Numerous economic incentives, physical safeguards,
and regulatory requirements make such a scenario extremely unlikely.
Because of the strong economic incentive for a generation unit to run during periods of
peak load, it is also unlikely that any plant operator would choose to take a unit off line to
install a mercury control device during that time and even less likely that all plant
operators in the state would choose to do so simultaneously . Furthermore, because of the
capacity payment structure PJM and MISO provide to generation units, there is a strong
economic incentive to keep units available to run during peak load times. Note that the
188
service outage that would occur to install either an ACI system or ACI and a fabric filter
is quite small
.
10.3 Potential Economic Benefits Other Than Health Related
There will be several recognized benefits to the State from tighter mercury controls
.
Such benefits include reduced risk to public health and welfare and an increased potential
for the support of existing jobs and addition of new jobs resulting from the installation
and operating requirements for additional pollution control devices . There also exists a
potential for an increase in tourism and recreational fishing as mercury levels drop in
fish, bringing an associated positive impact to local economies and the State overall .
Any improvement, or prevention of loss, to Illinois' fish and wildlife activities through
implementation of Illinois' mercury rule could have a positive impact to this important
industry. The most recent survey conducted by the U . S. Fish and Wildlife Service
indicates that more than 4.5 million people participated in wildlife-associated recreation
activities in Illinois in 2001, including fishing, hunting, and bird watching . Expenditures
for trips and equipment for these activities in Illinois included $1 .35 billion for fishing
and hunting, and $596 million for wildlife watching (activities such as observing,
feeding, and photographing wildlife) . All told, wildlife-associated recreation
expenditures in Illinois contribute more than $1 .9 billion to the State economy . The
American Sportfishing Association took the U . S. Fish and Wildlife Service data one step
further and analyzed the broader economic impact of sportfishing in Illinois (including
sportfishing in the Great Lakes) to be worth more than $1 .6 billion to the State economy
when considering the salaries from jobs created, as well as sales and motor fuel taxes,
and State and federal income taxes
.
1 89
Table 10.1 Economic Information on Sportfishing in Illinois for 2001
NOTE: The figures above only include fishing activity attributed to anglers 16 years old and o cr . T ere are a t ona
economic impacts generated by minors
.
The expenditures reported here are greater than those reported by the U .S. Fish and Wildlife Service. Sportsmen often
attributed purchases to both fishing and hunting (especially vehicles and big-ticket items) . These items were not
included in the Service's fishing expenditure estimates . Such items were included above by prorating each item's cost
based on each respondent's total days of hunting and fishing activity
.
10.4
Potential Effect of Activated Carbon Injection (ACI) on Particulate Matter
(PM) Emissions
A concern was expressed during the stakeholder meetings regarding the potential for
increases in the emissions of PM and other pollutants from the flue gas stacks due to the
use of ACI . In particular, an increase in PM emissions, and associated opacity, has been
theorized due to the additional particulate loading to an existing electro-static precipitator
(ESP) after the upstream injection of sorbent and the inability of the ESP to accommodate
and adequately control the additional particulate load
.
Field testing of ACI systems at boilers with ESPs has not validated increases in PM
emissions as a common, or even likely, occurrence . Despite numerous tests with
halogenated activated carbon, none of these tests have shown any adverse effect on cold-
side or hot-side ESP performance . Of the dozens of sorbent injection field test programs
that have been performed, only two have shown any adverse impact on ESP performance
or PM emissions- and these tests were performed with untreated powdered activated
carbon (PAC) at injection rates many times greater than the treatment rates that would be
necessary with halogenated PAC . Therefore, there is no reason to expect that proper use
of halogenated PAC for mercury control will cause any PM emission problem
.
A review of a scenario where typical levels of halogenated PAC are injected to achieve a
high level of mercury control in conjunction with an ESP shows that the amount of
190
Economic
Output
Retail Sales
Salaries and
Wages
Jobs
Sales and
Motor Fuel
Taxes
State
Income
Taxes
Federal
Income
Taxes
$1,623,449,163
$736,575,125
$398,275,277
12,886
$50,445,665
$9,377,569
$73,123,710
sorbent is very small in comparison to the loading of particulate contained in the flue gas
stream. For a typical coal-fired boiler, the increased loading to the ESP from sorbent
would be less than one percent. Even for a cyclone-fired boiler that reinjects fly ash, in
which more of the ash leaves the boiler as bottom ash, the increased loading to the ESP
from sorbent would be less than five percent . According to EIA form 767 data, there is
only one unit in Illinois (i .e ., SIPCO's Marion 1 unit) that reinjects fly ash. This unit is
not expected to require sorbent injection due to very high mercury removal as co-benefit
of other controls
.
The loading of particulate entering into ESPs at coal fired utility boilers is measured in
thousands of pounds, orders of magnitude greater than the rates at which sorbent is
injected with ACI. Day to day variations in coal likely far exceed the additional loading
from sorbent. Testing of PM emissions of the coal-fired boilers in Illinois shows that
existing ESPs routinely comply with the applicable PM emission standards by an ample
margin of compliance. As such, the effect of sorbent injection on overall PM emissions,
as well as opacity, from a coal-fired utility boiler should be negligible . Of note is that the
amount of sorbent needed to achieve a high level of mercury control reaches a plateau
such that there is little additional control beyond a given rate of injection . This, along
with the cost benefit of using as little sorbent as possible, will serve to provide incentive
for company's to use the most effective level of sorbent possible as opposed to high or
excessive levels .
If an increase in PM emissions would occur, it is believed it would be minimal, again due
to the small addition to the particulate loading to the ESP from sorbent injection
.
However, in the unlikely scenario that installation of an ACI system could result in a
measurable increase in PM emissions, there are several options available to the source
.
First, the source could appropriately manage the rate of sorbent injection to assure that
the increase in PM emissions would not reach the level at which it would be considered
significant for purposes of New Source Review . The annual thresholds for a significant
increase in PM emissions are 25 tons of PM and 15 tons of PM 10, which means that the
hourly increases in emissions would have to be more than five pounds of PM or three
19 1
pounds of PM10 before the increase would be considered significant. Second, the source
could "tweak" the ESP to compensate for some or all of the potential increase in PM
emissions. This could be accomplished by relatively simple means, such as
improvements in operating and maintenance practices for the ESP, enhanced use of a flue
gas conditioning system, if one is present, or installation of one of a variety of upgrades
that is available for an existing ESP, such as an agglomerator or skewed gas flow
.
Finally, for units located in areas that are attainment for the PM2 .5 air quality standard, a
source could obtain a permit for a major modification under the PSD program, which
would accommodate a significant increase in PM emissions . PSD review does allow for
considerations of the overall net benefit of a project . Although PSD permitting can be a
lengthy process, especially if a permit is challenged, a PSD permit could in all likelihood
eventually be issued to allow for any incidental increase in PM emissions accompanying
use of ACI for control of mercury emissions
.
Likewise, ACI systems should have no adverse impact on emissions of other pollutants
from power plants, such as sulfur dioxide or nitrogen oxides, or their associated controls
.
10.5
Illinois Coal Industry Considerations
At the end of 2003, coal production in Illinois totaled 31 .1 million tons, down more than
2.3 million tons from 2002. The loss of coal mines and coal mining jobs has had a
significant negative impact on the economic structure of southern Illinois . Although
mining salaries doubled between 1980 and 2003, from $22,000 a year to $45,500 a year,
the total economic payroll of the mining industry in Illinois decreased by 60 percent
during the same time period. Moreover, until the adoption of CAMR the regulatory
climate concerning Illinois coal remained uncertain with mixed signals from the federal
government over proposed mercury reduction standards that would serve to benefit
western coal, again at the expense of coal mined here in Illinois
.
Bituminous coal is generally mined in states east of the Mississippi river, including
Illinois, and is referred to as "eastern coal," while the majority of the coal mined west of
192
the Mississippi river can be classified as either sub-bituminous or lignite coal, and is
called "western coal" .
Similar to other forecasts, the impact of the proposed Illinois mercury rule on the coal
industry in Illinois is difficult to determine . This is true due to the ultimate decision on
how a source will comply being at the discretion of the source . The rule does not
mandate the use of any specific type of coal or control device . However, the rule does
seek to treat all coals in a comparable manner, while acknowledging and providing credit
for existing coal washing operations being performed that reduce the mercury content in
coal, and hence mercury emissions .
The proposed Illinois rule is fuel-neutral in that it is not biased towards any particular
coal type. The rule does not treat sources differently or establish different requirements
based on the type of coal being used. This is contrary to CAMR, which established State
mercury budgets, as well as proposes a baseline allocation scheme, that provides higher
allowances for units burning coal types other than bituminous. For example, CAMR
established Illinois and other state budgets by multiplying each units baseline by 1
.0 for
bituminous coal, 1 .25 for sub-bituminous, and 3 .0 for lignite. This methodology
obviously provided higher allowances to sources using western coals and was thus
considered to benefit sources that utilized western coals, and perhaps thereby
encouraging a shift to use such coals . The proposed Illinois mercury rule does not
contain this favorable "bias" toward western coals . This may be of particular
significance since recent advances in mercury control technology have substantially
improved the ability and cost-effectiveness of controlling mercury emissions for sources
using western coals, whereas the inability to control western coals as readily and cost
effectively as bituminous coals was one of the stated reasons why the weighted allowance
scheme was adopted in CAMR .
Furthermore, the proposed Illinois rule allows for compliance with an output-based
standard in recognition of coal washing. This optional compliance standard recognizes
193
pre-combustion mercury removal due to coal washing . Eastern or bituminous coals such
as those mined and sold in Illinois are currently washed whereas western coals are not
.
Through the aforementioned mechanisms, Illinois has sought to eliminate any
unwarranted incentive of the proposed rule toward the use of subbituminous or lignite
coals, and thus cause any harm to the Illinois coal industry . In fact, predictive IPM
modeling shows an increase in the use of bituminous coal as a direct result of Illinois'
proposed mercury rule. This increase should have a positive impact on Illinois coal
related operations, such as Illinois coal mines and jobs, since most of the bituminous coal
fired in Illinois is mined in Illinois . The modeling also shows a corresponding decrease
in the use of subbituminus coal, which is mined in western States . Of particulate interest
is that were Illinois to implement CAMR instead of the proposed mercury rule, IPM
modeling shows a decrease in bituminous coal use
.
10.6
Effect on other Pollutants and Upcoming Regulations
The proposed mercury rule will be in addition to other existing rules and will not
supersede or replace any other rule regulating air emissions from EGUs . In particular,
the Illinois EPA looked at the effect the proposed mercury rule could have on CAIR and
multi-pollutant control strategies . The costs of mercury specific controls are relatively
low in comparison to the costs of CAIR compliance and controls. Sources may elect a
multi-pollutant control strategy that should allow them to achieve all of the mercury
control required as a co-benefit of the installation of controls needed to comply with
CAIR (e.g., scrubbers and SCRs). IPM modeling shows that under the proposed rule
some EGUs will expedite planned installations of, or elect to install, scrubbers as a result
of Illinois' rule. The modeling does show a negative impact to scrubber installation after
the initial period modeled . The modeling also shows that the rule results in some SCRs
not being installed
.
10.7
Shutdown and Replacements
194
Illinois designed the proposed rule so that EGUs targeted for permanent shutdown or
replacement within a relatively short timeframe after the initial compliance date of the
rule are not required to comply with the control requirements and are likewise excluded
from compliance calculations . This provision is intended to allow sources to avoid
unnecessary costs and expenditure of resources. Once such units are permanently
shutdown they will obviously emit no mercury and any interim level of control achieved
between the compliance period and final shutdown would have been minimal
.
10.8
Compliance with CAMR
The CAMR requires that Illinois reduce and maintain mercury emission levels from coal-
fired EGUs at or below 3,188 pounds per year beginning in 2010 . Under CAMR,
mercury emissions from all coal-fired EGUs statewide are budgeted at 1,258 pounds
annually beginning in 2018
.
Even though Illinois' proposed mercury rule requires greater mercury emission
reductions, and requires that the reductions be achieved sooner than CAMR, the proposed
rule does not impose an "emissions budget" as established by the federal rule
.
Potentially, future growth of electric generation by coal-fired EGUs in Illinois could
cause mercury emissions to increase above the level of the CAMR emissions budget
.
Although CAMR does not require a state to adopt a cap and trade program, the rule does
require that a state not using the cap and trade provisions demonstrate that it will not
exceed the budget. Illinois will submit a plan that ensures that the State's CAMR
emissions budget will never be exceeded. Illinois has prepared a projection of expected
mercury emissions in Illinois from coal-fired EGUs for the first 10 years of the CAMR
program (2010-2020) that projects Illinois mercury emissions will remain below budget
levels during this period (see Figure 10 .1). This is based on projected growth in coal
consumption by EGUs during this timeframe and the control requirements contained in
Illinois' proposed rule .
195
8000
7000
6000
N
5000
V
c
o 4000
0.
=
3000
2000
1000
0
Figure 10.1
Current and Projected Mercury Emissions
from Coal-Fired Power Plants in Illinois
IL Hg Emissions ~
CAMR Budget
L_
.
2002
2003
2004
2005
2006
2007
2008 2009 2070
2011
2012
2013
2014
2015 2016 2017 1018
2019
2020
I-
-CAMR Budget - IL Hg
Further, Illinois EPA will commit to provide to USEPA on an annual basis beginning in
2011, subsequent to the first year of the CAMR program, a report that tabulates mercury
emissions reported by the affected emission sources for the preceding year to demonstrate
that actual emissions have not exceeded the State's CAMR emissions budget . The annual
report to be submitted by Illinois EPA will also include a projection of mercury emissions
from coal-fired EGUs in Illinois for the next 10-year period . In the event that annual
emissions exceed the applicable CAMR mercury budget, based on either the previous
year's reported emissions or on the 10-year projection, the Illinois EPA will take
corrective actions to limit mercury emissions as needed to comply . The corrective
actions may include submission of more stringent emission limitations to the Illinois
Pollution Control Board and to USEPA . Illinois' commitment to prepare the annual
report, including the 10-year projection, and to take corrective actions in the event that
the CAMR budget is exceeded is an integral part of Illinois' plan, and will be submitted
to USEPA as a SIP revision
.
10.9 Hot Spots
196
There are several uses of the term "hot spots" in the literature addressing mercury
emissions with no known formal definition . A common use of the term hot spots is to
define areas that show up on mercury deposition maps as red, where red areas indicate
locations of high mercury concentrations . The term is also used to define areas in a cap
and trade program where reductions are less likely to occur due to allowances being
purchased or use of banked allowances in order to avoid mercury reductions and/or
installation of mercury controls. In any event, the Illinois proposed rule addresses this
potential situation by not allowing trading, or the banking or purchase of allowances, and
by requiring mercury reductions at all power plants. The emission reductions required by
the proposed rule will occur in Illinois and at all locations where power plants exists and
thereby address the issue of local impacts and hot spots
.
10.10 Temporary Technology Based Standard (TTBS)
Illinois had considered the possibility of including a TTBS to provide additional
regulatory flexibility for compliance with the rule . This concept was presented at several
of the stakeholder meetings. A limited number of comments were received with no
stakeholders stating that this provision would be utilized
.
One potential application of the TTBS concept would be to address the compliance of
EGUs that are equipped with hot-side ESP's . Units with hot-side ESP's, and no S02 or
NOx controls, would likely not be able to achieve a 90% reduction with the installation of
halogenated PAC alone. Nonetheless, those EGUs would be able to achieve a 90%
reduction with the installation of a fabric filter along with ACI . Note that 90% mercury
reduction without the addition of a fabric filter may be achievable on such units in the
future from additional sorbents and optimization techniques that are currently being
developed and tested .
197
The number of EGUs that may be required to install fabric filters in order to achieve
compliance is very limited. Illinois currently has three EGUs with hot-side ESPs . One
EGU is already required to install a fabric filter pursuant to an existing judicial consent
decree, although the installation date would need to occur around 2
%2
years earlier than
required by the consent decree. Of note is that the public health and environmental
benefits would be achieved sooner. The costs of installation of a fabric filter at each of
the two remaining units with hot-side ESP's could be amortized over a number of years
and balanced against the numerous remaining EGUs under ownership by the same
company where fabric filters are less likely to be required.
Furthermore, there is flexibility built into the proposed rule to help negate the need for a
temporary standard. Each phase of the rule allows some form of aggregate compliance or
averaging, with the first compliance period allowing the use of system-wide averaging
.
That makes it permissible for select plants to achieve only a 75% reduction so long as the
system-wide average is 90% . Additional flexibility is also built into the rule with the
alternate output-based standard .
This is approach is also consistent with the recommendation made by STAPPA-
ALAPCO, as no such technology-based mechanism is built into its mercury reduction
model rule. Consequently, after further review and consideration, Illinois has decided to
not include the TTBS provision in the rule
.
10.11 Effect on Illinois Jobs
10.11.1 Power Sector Jobs
According to industry estimates, there are approximately 4,100 jobs directly involved in
operating Illinois power plants. In addition, approximately 6,000 more jobs provide
skilled contractual labor and miscellaneous support . These jobs produce a combined
payroll and benefits that amount to over $700 million a year for employees. There are
also another 5,500 retirees whose health insurance could be impacted by the financial
viability of the power plants. Furthermore, the approximate value of goods and services
purchased locally related to these jobs is over $300 million . Illinois' coal-fired power
198
plants pay about $21 million a year in property taxes to local taxing bodies, the majority
of which goes to support local school systems
.
A concern raised was that an EGU or power plant would potentially need to shutdown as
a result of the costs of complying with the proposed Illinois mercury rule . This of course
would likely lead to job loss . Illinois EPA must emphasize that it is clearly not the intent
of the proposed mercury rule to impose costly standards that result in EGUs shutting
down and thereby causing any corresponding job loss . As indicated in Section 7,
measures were taken, such as inclusion of broad flexibility, to minimize the likelihood of
any such scenario occurring. The proposed rule does not mandate the shutdown of any
EGU or power plant. Instead, the rule requires compliance with a standard and provides
flexibility on how compliance with that standard is achieved . The proposed rule does not
prescribe how compliance is to be achieved and in not doing so allows companies the
opportunity to explore and select the most cost effective approach to obtaining
compliance. The Illinois EPA believes that cost-effective mercury controls are available
and can be readily installed for compliance purposes. Of note is that the costs associated
with mercury specific controls are magnitudes lower than the costs associated with the
control devices for other pollutants, such as a scrubber for SO2 control or SCR for NOx
control
.
The IPM does forecast that some coal-fired units become uneconomic as a result of
Illinois' rule and are therefore retired . In practice, units that become uneconomic when
the rule takes effect may be "mothballed" until fuel prices or other conditions change,
they may actually be retired, or they may be kept in service for grid reliability purposes
.
The model shows that this is a concern for six EGUs, consisting of the two units at
Ameren's Hutsonville plant and four smaller units at Ameren's Merodosia plant
.
Hutsonville operates two very old units of around 76 MW each, which were constructed
in 1952 and 1953 . These two units comprise all the units at the plant, however, IPM
predicts only "partial" retirement of unit 6, and therefore it cannot be concluded that the
plant will shutdown. In explanation, IPM is a linear programming model, not integer
.
199
The implication is that when IPM makes a decision that affects units
(e.g., retires, builds,
retrofits) it doesn't do it in "whole units" . For example, IPM might show the construction
of a 250 MW coal-fired unit when, in fact, the smallest size that could be built in practice
would be 500 MW. IPM makes predictions and works linearly or continuously
.
Therefore, IPM may retire a unit "partially" or, using the example, it may retire only 250
MW of a 500 MW unit. The implications to the Hutsonville plant of only partial
retirement of a unit as opposed to full retirement is that there is an increased likelihood
that some portion of the plant would remain economical to continue operation and not be
fully retired. This could result in the plant remaining open and not shutting down
.
The Meredosia plant consists of four small, very old units of 31 MW each constructed in
1945 and 1946, and one larger unit of around 239 MW constructed in 1957 . IPM shows
the four smaller units retiring and the larger unit continuing to operate . Since the larger
unit is forecasted to continue operation, IPM does not predict that this plant would shut
down.
Below is information on the annual operating hours of the retired units, out of a possible
8,760 hours per year.
Table 10.2 Annual Operating Hours Based on Acid Rain Data
Obviously there is the potential for jobs to be lost should these retirements occur . The
Hutsonville and Meredosia plants are estimated to have around 60 and 100 employees,
respectively .
10.11.2 Coal Industry Jobs
200
Plant
Unit
2005
2004
2003
Hutsonville
5
7,145
6,888
7,024
6
6,962
7,374
7,322
Meredosia
1
3,213
2,136
1,701
2
3,141
2,551
2,089
3
2,145
2,449
1,709
4
3,273
2,741
2,281
Concern has also been expressed in the area of detrimental impacts from the proposed
rule to the Illinois coal industry and related jobs . As previously identified, Illinois has
lost a significant number of coal mines and coal mining jobs since 1980. This loss has
had a negative impact on the Illinois economy, especially in southern Illinois . The
modeling used to forecast the proposed mercury rule's effect shows an increase in the use
of bituminous coal due to the proposed mercury rule when compared to CAMR, and also
when compared to no mercury control, projected out to 2015 . Such an increase should
have a positive impact on Illinois coal related operations, such as coal mines and jobs,
since most of the bituminous coal fired in Illinois is mined in Illinois . The increase in
bituminous coal demand would logically result in an increase in the need to supply the
coal, triggering a stimulus for either higher production at existing mines or the opening of
new mines, thus resulting in support for existing jobs and the potential for new jobs . It is
important to note that the modeling shows a negative impact, or decrease, in bituminous
coal use if Illinois implemented CAMR instead of it's proposed rule . Therefore, the
proposed Illinois rule is forecasted by IPM to essentially reverse the impact to bituminous
coal use in Illinois from a negative to a positive outcome,
i.e., instead of less bituminous
coal use due to mercury control through CAMR, there should instead be more bituminous
coal use due to mercury control through Illinois' proposed mercury rule .
10.11.3 Other Jobs
Another of the concerns regarding a possible negative impact of the proposed Illinois
mercury rule on jobs in Illinois rests with the belief that job loss would result from higher
electricity rates. Jobs cuts would then potentially occur from industrial and commercial
facilities going out of business or from layoffs made to offset increased costs from such
facilities having to pay higher electricity rates. IPM modeling shows an incremental
increase of one to two percent for industrial electricity rates, and one to three and a half
percent for commercial electricity rates as a result of Illinois' proposed mercury rule
.
The effect on jobs from these incremental increases is difficult to determine, however, the
percentage increases are small
.
201
One area that should see a beneficial impact to jobs from Illinois' proposed mercury rule
are those construction and maintenance jobs associated with mercury control devices,
such as halogenated ACI. Also, if the fishing and tourism industries are positively
impacted by the proposed rule, then it is reasonable to conclude that this would provide
support for existing jobs, as well the potential for new jobs, to provide the appropriate
related services, such as increased sales in fishing equipment
.
10.12 Effect on Electricity Rates
Careful consideration was given to the effect Illinois' proposed mercury requirements
will have on Illinois' economy in the form of any increase to the electric rates paid by
residential consumers as well as industrial and commercial facilities .
IPM results show a small incremental impact to Illinois electricity rates from the
proposed mercury rule requirements when compared to the impact expected from the
federal CAMR. In particular, the modeling projects an approximate increase in
residential electric bills of less than $1 .50 per month, or $18 per year, or about one to two
percent. Retail electricity prices as well as costs across all sectors (residential, industrial
and commercial) are higher as a result of Illinois' rule relative to CAMR by about one to
three and a half percent over the length of the study . The modeling also showed that the
effects on rates from either of the modeled mercury rules
(i .e ., CAMR or Illinois'
proposed rule) were small in comparison to the effect attributed to the federal CAIR
.
This would be expected since compliance with the CAIR requirements is generally
considered to be more costly, in part due to installation of controls that are much more
expensive than mercury specific controls, as well as CAIR being for multiple pollutants
(i.e ., NOx and S02) .
Illinois had also conducted a previous modeling run utilizing IPM to provide insight on,
among other things, how a 90% mercury control requirement in Illinois phased in from
2009 to 2012 would impact Illinois consumer electric bills . This run also found a small
impact to rates when compared to the impact expected from CAMR . Specifically, results
202
showed a similar increase to residential consumer electric bills of around $6 per year for
2009 and $15 per year for 2012
.
Other studies have found similar impacts to electricity rates resulting from 90% mercury
control in Illinois. The National Wildlife Federation's (NWF) report,
"Getting the Job
Done: Affordable Mercury Control at Coal-Burning Power Plants"
(October 2004)
provides cost estimates for 90% mercury control at power plants in Illinois. The NWF
cost estimates are based on an assumption that activated carbon injection and a polishing
fabric filter would be needed to reliably reach 90% mercury capture at most boilers in
Illinois. NWF applied USEPA cost estimates for these technologies and power plant
configurations to calculate the cost of retrofitting Illinois' power plants . NWF estimated
that total annual cost of 90% mercury control at $138 .9 million dollars .
The study further estimated an increase to the average residential household electricity
rate in Illinois at $0.69 per month, or about 1 .1 % of the existing electric bill . This
equated to roughly 0.1 cent/kWh. The study found that the difference in costs from 70%
to 90% was not significant. This study is consistent with at least two other cost studies
performed, namely; 1) Institute for Clean Air Technologies, 1 .3% - 3.7% increase in
rates, and 2) Department of Energy, 0 .13 to 0.24 cents per kWh for mercury control
ranging between 60 -90%
.
The 2004 NWF study found the affect to commercial and industrial electric bills were a
similar 1% increase, adding approximately $5.82/month and $305 .47/month,
respectively. A notable factor when reviewing the NWF study is that it assumed that a
power plant equipped with only an ESP would install both ACI and a polishing fabric
filter regardless of coal type, an assumption that would lend the results to be
conservative . Recent tests have shown that halogenated PAC and a cold-side ESP are
capable of high mercury control without the addition of a polishing fabric filter, a
particulate control device with a capital costs at least 10 times greater than the mercury
specific halogenated PAC
.
203
10.13
Other Considerations and Influencing Factors on the Costs of Electricity
There are several factors outside of the proposed mercury rule that stand to play a large
role in determining the cost of electricity in Illinois over the coming years . Illinois
sought to analyze such factors and review the effect or role that the proposed mercury
rule had in conjunction with some of these driving factors
.
10.13.1 Lifting of Rate Freeze and Deregulation
Illinois is scheduled to lift a 10 year cap or freeze on retail electricity rates in January
2007. As Illinois utilities move towards an auction-based procurement methodology
through the deregulation process now underway, all generators will be able to choose
how and where they bid their electricity into the auction . Some generators may analyze
their options and choose not to bid into the utility auction and may instead choose to sell
their power directly into the RTO markets on a day ahead or real time basis . Regardless
of any generator's decision, the cost of electricity to retail customers, especially
residential and small business customers, will continue to be regulated by the Illinois
Commerce Commission (ICC) through tariffed rates. The ICC is still debating various
proposals on the absolute effect of the auction outcome on residential and small business
customers. Independent of the ICCs decision, the effects of the proposed mercury control
requirements are difficult to determine
.
10.13.2 Power Generation from Sources Other than Coal-Fired Utilities
The ICC sets rates for residential and small business customers . The ICC has approved a
procurement plan for Illinois starting January 1, 2007, which will likely cause electric
rates to rise but that outcome has no connection to the proposed mercury rule
requirements. In fact, electric generation in Illinois is today, and will likely continue to
be, dominated by nuclear power (see Chart 1), a form of generation that is not subject to
the proposed mercury control rule. In 2004, 55% of the megawatt hours generated in the
State were from nuclear resources while 41 % came from coal . Due to the heavy reliance
204
on nuclear energy in the State, the impact of the proposed mercury rule is minimized to
the extent that it does not impose additional requirements and associated costs on the
largest source of power generation in the state .
Figure 10.2 Illinois Electricity Fuel Sources
Illinois Electricity Fuel Sources
(Distribution by MWh Generated, 2004)
Renewables
Unknown
1%
2%
Gas
10.13.3 Interstate Competition
The effects of the proposed mercury rule on the ability of an Illinois coal-fired power
plant to effectively compete in the interstate trading of electricity is difficult to determine
.
Illinois is served by two transmissions organizations (PJM and MISO) that set both the
rules for the fair transmission of electricity and provide the financial marketplace for the
dispatch of power on a minute-to-minute basis . PJM and MISO set the price of power
based on the demand for power. As demand for power increases, the value of power
increases. Generators tell the market operators a day ahead (or in real time) the price
they are willing to sell at to run their facility. The generator is only obligated to run their
facility if they have committed to run their facility. The operating cost of every
generation unit in the country is different because each plant's debt structure, regulatory
205
Coal
41%
compliance cost, labor, maintenance, and a myriad of other costs are site specific . The
implementation of the proposed mercury rule in Illinois may change the cost structure of
a plant in a way that makes it more or less competitive as it bids into a transmission
market. The costs associated with the installation and operation of mercury controls have
been thoroughly addressed in this document
.
The minute-by-minute price of electricity is set by the most recent, and most expensive,
plant dispatched into the grid . Since the inception of the transmission organizations, the
last form of generation into the grid has always been natural gas . Because gas generated
electricity is expensive, any form of generation (such as generation from coal, nuclear or
wind) with a marginal cost below that of gas, is profitable for the unit owner. The effect
of the mercury rule is related to the extent that the rule changes the economics of these
resources and to the extent that power generated by coal-fired EGUs remains economical
for resale in an interstate system
.
IPM shows a reduction in electricity generation from Illinois' coal-fired power plants as a
result of the proposed mercury rule . The loss in generation lowers exports to neighboring
regions. Some of this lost generation is due to the predicted retirement of the six units
previously identified . The remaining loss in coal-generated electricity may be due to lost
competitive pricing advantage due to additional costs associated with the proposed
mercury rule. IPM shows that average production costs increase two to four percent
across the study period. It should be noted that regardless of the potential loss in
electricity generation from coal, the model foresees that Illinois will remain a net exporter
of electricity, albeit at lower levels than if no mercury rule were implemented .
10.14 Summary of Costs to Industry and Consumers vs . Public Health
Benefits/Costs
Table 10.3 provides a summary of estimated costs to the power sector and Illinois
consumers taken from aforementioned studies by Staudt and IPM modeling performed by
206
ICF. The table also illustrates the cost benefits of mercury pollution control taken from
the aforementioned studies by USEPA, Harvard/NESCAUM, Trasande et al., and Rice .
Table 10.3 Summary of Cost-Benefit Analyses
Some discrepancies in costs associated with the proposed Illinois mercury rule and
CAMR can be attributed to differences in assumptions concerning the state of the art in
mercury control technology. USEPA studies make the assumption that reliable and cost
effective mercury specific control technology will not be available until 2018 . Studies by
207
Study
Hi
li
is
IPM Model
Proposed Illinois
Mercury Rule vs. CAMR
•
∎
∎
∎
Proposed Illinois mercury rule results in increased retail electricity prices
- 0.05 cents/kWh in 2009, 0 .15 cents/kWh in 2015, 0.10 cents/kWh in
2018
Less than $1.50 increase per month for residential consumers
Average production cost increase 2-3%
Additional compliance cost to power sector in 2009 - $68 million or $0.80
per MWh
Staudt
Proposed Illinois
Mercury Rule vs. CAMR
•
∎
•
Additional compliance to power sector - $29 million annually from 2010 -
2017
Negligible difference in compliance cost in 2018 and after between
CAMR and proposed Illinois mercury rule
Greatest portion of increased costs is associated with additional sorbent
usage
USEPA
Health benefits of
mercury control
•
$10.4 to 46.8 million annually in benefits from neurological effects in the
U.S. from CAIR/CAMR
Harvard/NESCAUM
Health benefits of
mercury control
•
•
$75 to $194 million annually (after 26 ton cap in 2010) nationally in benefits
from neurological effects in the U.S. from CAIR/CAMR
$119 to 288 million annually (after 15 ton cap in 2018) nationally in benefits
from neurological effects in the U .S. from CAIR/CAMR
Trasande et al .
Cost to society of
mercury pollution from
U.S. power plants
•
•
$0.4 to $15.8 billion (due to U .S. anthropogenic sources) in costs to society
from neurological effects in the U.S. from CAIR/CAMR
$0.1 to $6.5 billion (due to U .S. coal-fired power plants) in costs to society
from neurological effects in the U .S. from CAIR/CAMR
Rice
Cost to society of
mercury pollution from
U .S. power plants
•
•
∎
$1.3 billion annual cost to society attributed to U .S. power plants due to
loss in IQ
$289 million annual cost to society attributed to U .S. power plants due to
mental retardation
Effects of cognitive deficits in adults, accelerated aging, and impairment
of the elderly to live independently due to methylmercury exposure,
remain unmonetized. Cost to society of mercury exposure may be
substantially underestimated
.
Staudt and ICF reflect more recent knowledge of mercury control technology, as well as
other updated information on operations at Illinois coal-fired power plants
.
Some discrepancies in estimates of human health benefits associated with mercury
pollution are due to differences in research goals . The USEPA and Harvard/NESCAUM
studies focused on monetized health benefits of mercury emission reductions due to
regulation of the power sector. The studies conducted by Rice and Trasande et al. focus
on the cost to society of mercury pollution from U .S. power plants. In both of these
studies it is suggested that the societal burden due to mercury pollution may be
underestimated. In addition, the studies measuring health benefits of mercury control do
not take into account evidence from Florida and Massachusetts suggesting that local
reductions in mercury emissions can substantially reduce mercury contamination in fish
.
Such local reductions could magnify the local economic benefit of improved health
impacts in Illinois
.
It should also be noted that a review by the Office of Inspector General of the USEPA
found that the studies conducted by the USEPA in developing CAMR did not meet the
requirements of several executive orders and were inconsistent with accepted standards in
conducting thorough cost-benefit analysis . It is also noted by the Office of Inspector
General that CAMR was finalized before a comprehensive children's health analysis was
completed .
208
References
Anderson, H.A ., J.F. Amrhein, P. Shubat, and J. Hesse. Protocol for a Uniform Great
Lakes Sport Fish Consumption Advisory. Great Lakes Fish Advisory Task Force
Protocol Drafting Committee. 1993
.
Berry, M., Irvin, N., Monroe, L., Bustard, J., Lindsey, C., Brignac, P., Taylor, T .,
Schlager, R., Sjostrom, S., Stains, T., Chang, R., O'Palko, A., "Field Test Program
for Long-Term Operation of a COHPAC® System for Removing Mercury from
Coal-Fired Flue Gas", Presented at the Joint EPRI DOE EPA Combined Utility Air
Pollution Control Symposium, The Mega Symposium, August 31-September 2,
2004, Washington, D.C .
Biermann, J ., Higgins, B., Wendt, J.O., Senior, C., Wang, D. "Mercury Reduction at a
Coal Fired Power Plant at over 2000 °F Using MinPlus Sorbent Through Furnace
Sorbent Injection", 2006 Electric Utilities Environmental Conference, Tucson, AZ,
January 22-25, 2006; Available online athttp://www.mobotecusa.com
Bustard, J .; Durham, M .; Lindsey, C .; Starns, T .; Baldrey, K
.; Martin, C
.; Schlager, R . ;
Sjostrom, S
.; Slye, R
.; Renninger, S .; Monroe, L .; Miller, R.; Chang, R., "Full-Scale
Evaluation of Mercury Control with Sorbent Injection and COHPAC at Alabama
Power E.C ., Gaston," DOE-EPRI-U.S. EPA-A&WMA Power Plant Air Pollutant
Control Mega Symposium, Chicago, IL, August 20-23, 2001
.
California Environmental Protection Agency. "Chemicals in Fish: Consumption of Fish
and Shellfish in California and the United States." October 2001
.
Cain, Alex, U .S. Environmental Protection Agency Presentation, LADCO Mercury
Workshop, O'Hare International Center -Auditorium, Rosemont, Illinois, February
22, 2006 .
Crelling, J. Dr., Carty, R. Dr. "Prediction of Mercury Removal Efficiencies with Current
Coal Washing Practices." Interim Final Technical Report. September 1, 2004
through August 31, 2005
.
Dombrowski, K., Richardson, C., "Sorbent Injection for Small ESP Mercury Control in
Bituminous Coal Flue Gas", DOEINETL's Mercury Control Technology R&D
Program Review, Pittsburgh, PA, July 12-13, 2005
.
Dombrowski, K., Richardson, C., Machalek, T., Chapman, D., Chang, R., Monroe, L .,
Berry, M ., Irvin, N., McBee, K., Sjostrom, S., "Sorbent Injection for Mercury
Control Upstream of Small-SCA ESPs", Presented at the Joint EPRI DOE EPA
Combined Utility Air Pollution Control Symposium, The Mega Symposium,
"August 31-September 2, 2004, Washington, D .C .
209
Durham, "Advances in Mercury Control Technology", Pennsylvania Mercury Rule
Workgroup Meeting, November 18, 2005 .
"Field Test Program for Long-Term Operation of a COHPAC® System for Removing
Mercury", DOE/NETL's Mercury Control Technology R&D Program Review,
Pittsburgh, PA, July 12-13, 2005
.
Foerter, David C. Institute of Clean Air Companies. Testimony Before the USEPA on
CAIR and CAMR. February 26, 2004
.
Hurt, R., Suuberg, E., Yu-Ming, Mehta, A., "The Passivation of Carbon for Improvement
of Air Entrainment in Fly Ash Concrete",
http://www.netl.doe.gov/publications/proceedings/00/ubc00/HURT .PDF
Hutson, N., "Brominated Sorbents : Effects on Emissions of Halogenated Air Toxics",
DOE/NETL's Mercury Control Technology R&D Program Review, Pittsburgh, PA,
July 12-13, 2005
Illinois Department of Natural Resources . "2006 Illinois Fishing Information." 2006 .
Illinois Department of Public Health. Environmental Health Fact Sheet - Fish Advisories
in Illinois. Illinois Department of Public Health, Division of Environmental Health,
Springfield, IL. 2006 .
Illinois Environmental Protection Agency. Illinois 2004 Section 303(d) List .
IEPA/BOW/04-005. Bureau of Water, Watershed Management Section
:
Springfield, IL. November 2004
Illinois Environmental Protection Agency. DRAFT - Illinois Integrated Water Quality
Report and Section 303(d) list - 2006. Clean Water Act Sections 303(d), 305(b)
and 314. Water Resource Assessment Information and Listing of Impaired Waters
.
Bureau of Water, Watershed Management Section, Surface Water Section
:
Springfield, IL .
Institute of Clean Air Companies, "Status and Capabilities of Mercury Control
Technologies," Presentation to EPA Administrator Leavitt, Washington, D.C., July
20, 2004,
Jenkins, R.E., Burkhead, N.M., 1993. Freshwater Fishes of Virginia . American Fisheries
Society. Bethesda, Maryland. Pages732-736 .
Johnson, D., Cummings, J., "TOXECONTM Retrofitfor Mercury and Multi-Pollutant
Control", presentation on Clean Coal Power Initiative, downloaded from
www.netl.doe.gov
2
10
Khan, S. and Srinivasachar, S., "Field Demonstration of Enhanced Sorbent Injection for
Mercury Control", DOE-NETL, Mercury Control Program, Review Meeting, July
12, 2005 .
Michigan Electric Utility Workgroup, "Final Report on Mercury Emissions from Coal-
Fired Power Plants", June 20,2005
.
Migler, Paul, VanAten, Chris . "North American Power Plant Air Emissions . Commission
for Environmental Cooperation of North America, 2004 .
MinPlus Sorbent: Non Carbon Sorbent for Mercury Control in Coal Fired Boilers,
August 2005
.
National Wildlife Federation, Getting the Job Done: Affordable Mercury Control at Coal-
Burning Power Plants, October 2004
.
Nelson, S., "Sorbent Technology for Mercury Control", Pennsylvania Mercury Rule
Workgroup Meeting, November 18, 2005 .
Nelson, Sid, Brickett, Lynn. Large Scale Mercury Control Field Testing- Phase II
.
"Advanced Utility Mercury-Sorbent Field Testing Program." Progress Report. July
2005
.
Nolan, P., Downs, W., Bailey, R., Vecci, S., "Use of Sulfide Containing Liquors for
Removing Mercury from Flue Gases", U .S. Patent # 6,503,470, January 7, 2003
.
Northeast States for Coordinated Air Use Management (NESCAUM), "Economic
Valuation of Human Health Benefits for Controlling Mercury Emissions from U
.S
.
Coal-Fired Power Plants", February 2005
.
Northeast States for Coordinated Air Use Management (NESCAUM), "Mercury
Emissions from Coal-Fired Power Plants. The Case for Regulatory Action,"
October 2003
.
O'Palko, A ., Sjostrom, S., Stams, T. "Evaluation of Sorbent Injection for Mercury
Control. NETL Meeting. July 12, 2005
.
Pellettieri . M.B., Hallenbeck,W.H., Brenniman, G.R ., Cailas, M., Clark, M. "PCB Intake
from Sport Fishing Along the Northern Illinois Shore of Lake Michigan ."
Environmental Contamination and Toxicology. 1996
.
Princiotta, F.T ., Technical Memorandum, Control of Mercury Emissions from Coal-Fired
Utility Boilers. October 25, 2000
.
211
Renninger, S., Farthing, G., Ghorishi, S.B., Teets, C ., Neureuter, J., "Effects of SCR
Catalyst, Ammonia Injection and Sodium Hydrosulfide on the Speciation and
Removal of Mercury within a Forced-Oxidized Limestone Scrubber", Presented at
the Joint EPRI DOE EPA Combined Utility Air Pollution Control Symposium, The
Mega Symposium, August 31-September 2, 2004, Washington, D .C .
Richardson, C., Machalek, T., Marsh, B ., Miller, S., Richardson, M ., Chang, R., Strohfus
M., Smokey, S., Hagley, T., Juip G., Rosvold, R., "Chemical Addition for Mercury
Control in Flue Gas Derived from Western Coals" Presented at the Joint EPRI DOE
EPA Combined Utility Air Pollution Control Symposium, The Mega Symposium,
May 19-22, 2003, Washington, D .C .
Rostam-Abadi, M., "Illinois Coal Properties In Regard to Mercury", ICCI Mercury
Meeting, Chicago, IL, November 9, 2005
.
Smith, Philip W. The Fishes of Illinois. University of Illinois Press. Pages 232-233 .
1979 .
Srinivasachar, S., Kang, S., "Field Demonstration of Enhanced Sorbent Injection for
Mercury Control: Quarterly Technical Progress Report", Report Period : July 1 -
September 30,2005, Prepared for U.S. Department of Energy National Energy
Technology Laboratory, Pittsburgh, Pennsylvania (Under Contract DE-FC26-
04NT42306), November 8, 2005
.
Srivastava, R.K . ; Sedman, C.B .
; Kilgroe,
J.D., "Performance and cost of Mercury
Emission Control Technology Applications on Electric Utility Boilers," EPA-
6001R-00-083, September 2000 .
Srivastava, R.K., Staudt, James E., Jozewicz, W. "Preliminary Estimates of Performance
and Cost of Mercury Emission Control Technology Applications on Electric
Utility Boilers: An Update."
Starns, T., Amrhein, J ., Martin, C., Sjostrom, S., Bullinger, C., Stockdill, D., Strohfus,
TM
M., Chang, R., "Full-Scale Evaluation of TOXECON II
on a Lignite-Fired
Boiler", Presented at the Joint EPRI DOE EPA Combined Utility Air Pollution
Control Symposium, The Mega Symposium, "August 31-September 2, 2004,
Washington, D.C .
Staudt, J., "Mercury Allowances and Strategies : Peering Through the Mist", EUCI's
Navigating the Mercury Issue, October 19-20, 2005, Arlington, VA .
Staudt, J., Jozewicz, W., "Performance and Cost of Mercury and Multipollutant Emission
Control Technology Applications on Electric Utility Boilers", EPA/600/R-03/110
;
U .S. Environmental Protection Agency, Office of Research and Development,
National Risk Management Research Laboratory, Research Triangle Park, NC,
October 2003 .
2
12
Tran, P ., Shore, L., Yang, X., Hizny, W., Butz, J ., "Mercury Control: Novel Non-Carbon
Sorbents", Power-Gen International, Las Vegas, NV, December 6-8, 2005 .
Trasande, L., Landrigan, P ., Schechter, C., "Public Health and Economic Consequences
of Mehtylmercury Toxicity to the Developing Brain," Environmental Health
Perspective, February 28, 2005 . Available online at http ://dx.doi .org
"Use of High-Carbon Illinois Fly Ash in Cement Manufacturing Demonstration Phase,"
ICCI Project Number: 99-1/2.1A-1 http://www.icci.org/00final/bhatty99.htm
U.S. Department of Health and Human Services, Agency for Toxic Substances and
Disease Registry (ATSDR). 1999. Toxicological Profile of Mercury . Public Health
Service, Atlanta, GA
.
U.S. Environmental Protection Agency . Mercury Study Report to Congress. An
Inventory of Anthropogenic Mercury Emissions in the United States . Volume II
(EPA-452/R-97-004); December 1997
.
U.S. Environmental Protection Agency Mercury Study Report to Congress, Execute
Summary. Volume I (EPA-US 2/R-97-003); December 1197
U.S. Environmental Protection Agency . Mercury Study Report to Congress. Health
Effects of Mercury and Mercury Compounds . Volume V. (EPA-452/R-97-007) .
1997
.
U .S. Environmental Protection Agency . Mercury Study Report to Congress
.
Characterization of Human Health and Wildlife Risks from Mercury Exposure in
the United States. Vol. VII (EPA-452/R-97-009). December 1997
.
U.S. Environmental Protection Agency, "Control of Mercury Emissions from Coal-Fired
Electric Utility Boilers : Interim Report", EPA-600/R-01-109, April 2002 .
U.S. Environmental Protection Agency, "Engineering and Economic Factors Affecting
the Installation of Control Technologies for Multipollutant Strategies", EPA-600/R-
02/073, October 2002 .
U.S. Environmental Protection Agency, "Study of Hazardous Air Pollutant Emissions
from Electric Utility Steam Generating Units - Final Report to Congress," EPA-
453/R-98-004, February 1998 .
2 13
U.S. Environmental Protection Agency, 2005, Air Pollution Prevention and Control
Division, National Risk Management Research Laboratory, Office of Research and
Develoment, "Control of Mercury Emissions from Coal Fired Electric Utility
Boilers: An Update", Research Triangle Park, NC, February 18, 2005 .
U.S. Environmental Protection Agency, Emission Generation Resource Grid (eGrid),
User's Manual, Prepared by E .H. Pechan & Associates Inc., April 2003; Available
Online at
: (http://www.epa.Qov/cleanenerpv/earid/index .htm)
U .S. Environmental Protection Agency, Regulatory Impact Analysis of the Clean Air
Mercury Rule, Final Report, EPA-452/R-05-002 . March 2005
.
U.S. Environmental Protection Agency. Guidance for 2006 Assessment, Listing and
Reporting Requirements Pursuant to Sections 303(d), 305(b) and 314 of the Clean
Water Act. Watershed Branch Assessment and Watershed Protection Division,
Office of Wetlands, Oceans, and Watersheds, Office of Water. July 29, 2005
.
U .S. Environmental Protection Agency . Office of Inspector General. Evaluation Report .
Additional Analyses of Mercury Emissions Needed Before EPA Finalizes Rules for
Coal-Fired Electric Utilities. Report No. 2005-P-00003. February 3, 2005
.
U.S. Environmental Protection Agency. Appendix B Background Material of
Methodology Used to Estimate 1999 National Mercury Emissions from Coal-Fired
Electric Utility Boilers. Electricity Utility Steam Generating Unit Mercury
Emissions Information Collection Effort. September 15, 2000
.
U .S. Geological Survey. "Coal Quality Information-Key to the Efficient and
Environmentally Sound Use of Coal." February 9, 2006 .
World Health Organization . Methyl Mercury, Volume 101 . Distribution and Sales
Service, International Programme on Chemical Safety, Geneva, Switzerland . 1990 .
2 14